Embed Size (px)
Citation preview

CuuDuongThanCong.com https://fb.com/tailieudientucntt

SoftwareEngineeringHandbook
CuuDuongThanCong.com https://fb.com/tailieudientucntt
The ABCs of IP Addressing
Gilbert Held
ISBN: 0-8493-1144-6
The ABCs of TCP/IP
Gilbert Held
ISBN: 0-8493-1463-1
Building an Information Security
Awareness Program
Mark B. Desman
ISBN: 0-8493-0116-5
Building a Wireless Office
Gilbert Held
ISBN: 0-8493-1271-X
The Complete Book of Middleware
Judith Myerson
ISBN: 0-8493-1272-8
Computer Telephony Integration,
2nd Edition
William A. Yarberry, Jr.
ISBN: 0-8493-1438-0
Cyber Crime Investigator’s Field Guide
Bruce Middleton
ISBN: 0-8493-1192-6
Cyber Forensics: A Field Manual for
Collecting, Examining, and Preserving
Evidence of Computer Crimes
Albert J. Marcella and Robert S. Greenfield,
Editors
ISBN: 0-8493-0955-7
Global Information Warfare:
How Businesses, Governments, and
Others Achieve Objectives and Attain
Competitive Advantages
Andy Jones, Gerald L. Kovacich,
and Perry G. Luzwick
ISBN: 0-8493-1114-4
Information Security Architecture
Jan Killmeyer Tudor
ISBN: 0-8493-9988-2
Information Security Management
Handbook, 4th Edition, Volume 1
Harold F. Tipton and Micki Krause, Editors
ISBN: 0-8493-9829-0
Information Security Management
Handbook, 4th Edition, Volume 2
Harold F. Tipton and Micki Krause, Editors
ISBN: 0-8493-0800-3
Information Security Management
Handbook, 4th Edition, Volume 3
Harold F. Tipton and Micki Krause, Editors
ISBN: 0-8493-1127-6
Information Security Management
Handbook, 4th Edition, Volume 4
Harold F. Tipton and Micki Krause, Editors
ISBN: 0-8493-1518-2
Information Security Policies,
Procedures, and Standards:
Guidelines for Effective Information
Security Management
Thomas R. Peltier
ISBN: 0-8493-1137-3
Information Security Risk Analysis
Thomas R. Peltier
ISBN: 0-8493-0880-1
A Practical Guide to Security Engineering
and Information Assurance
Debra Herrmann
ISBN: 0-8493-1163-2
The Privacy Papers:
Managing Technology and Consumers,
Employee, and Legislative Action
Rebecca Herold
ISBN: 0-8493-1248-5
Secure Internet Practices:
Best Practices for Securing Systems in
the Internet and e-Business Age
Patrick McBride, Jody Patilla,
Craig Robinson, Peter Thermos,
and Edward P. Moser
ISBN: 0-8493-1239-6
Securing and Controlling Cisco Routers
Peter T. Davis
ISBN: 0-8493-1290-6
Securing E-Business Applications and
Communications
Jonathan S. Held and John R. Bowers
ISBN: 0-8493-0963-8
Securing Windows NT/2000:
From Policies to Firewalls
Michael A. Simonyi
ISBN: 0-8493-1261-2
Six Sigma Software Development
Christine B. Tayntor
ISBN: 0-8493-1193-4
A Technical Guide to IPSec Virtual Private
Networks
James S. Tiller
ISBN: 0-8493-0876-3
Telecommunications Cost Management
Brian DiMarsico, Thomas Phelps IV,
and William A. Yarberry, Jr.
ISBN: 0-8493-1101-2
AUERBACH PUBLICATIONSwww.auerbach-publications.com
To Order Call: 1-800-272-7737 • Fax: 1-800-374-3401
E-mail: [email protected]
OTHER AUERBACH PUBLICATIONS
CuuDuongThanCong.com https://fb.com/tailieudientucntt
AUERBACH PUBLICATIONS
A CRC Press Company
Boca Raton London New York Washington, D.C.
SoftwareEngineeringHandbookJessica Keyes
CuuDuongThanCong.com https://fb.com/tailieudientucntt
"
Vjku"dqqm"eqpvckpu"kphqtocvkqp"qdvckpgf"htqo"cwvjgpvke"cpf"jkijn"tgictfgf"uqwtegu0"Tgrtkpvgf"ocvgtkcnku"swqvgf"ykvj"rgtokuukqp."cpf"uqwtegu"ctg"kpfkecvgf0"C"ykfg"xctkgv"qh"tghgtgpegu"ctg"nkuvgf0"Tgcuqpcdngghhqtvu"jcxg"dggp"ocfg"vq"rwdnkuj"tgnkcdng"fcvc"cpf"kphqtocvkqp."dwv"vjg"cwvjqtu"cpf"vjg"rwdnkujgt"ecppqvcuuwog"tgurqpukdknkv"hqt"vjg"xcnkfkv"qh"cnn"ocvgtkcnu"qt"hqt"vjg"eqpugswgpegu"qh"vjgkt"wug0
Pgkvjgt"vjku"dqqm"pqt"cp"rctv"oc"dg"tgrtqfwegf"qt"vtcpuokvvgf"kp"cp"hqto"qt"d"cp"ogcpu."gngevtqpkeqt"ogejcpkecn." kpenwfkpi"rjqvqeqrkpi."oketqÞnokpi."cpf"tgeqtfkpi."qt"d"cp"kphqtocvkqp"uvqtcig"qttgvtkgxcn"uuvgo."ykvjqwv"rtkqt"rgtokuukqp"kp"ytkvkpi"htqo"vjg"rwdnkujgt0
Vjg"eqpugpv"qh"ETE"Rtguu"NNE"fqgu"pqv"gzvgpf"vq"eqrkpi"hqt"igpgtcn"fkuvtkdwvkqp."hqt"rtqoqvkqp."hqtetgcvkpi"pgy"yqtmu."qt"hqt"tgucng0"UrgekÞe"rgtokuukqp"owuv"dg"qdvckpgf"kp"ytkvkpi"htqo"ETE"Rtguu"NNEhqt"uwej"eqrkpi0
Fktgev"cnn"kpswktkgu"vq"ETE"Rtguu"NNE."4222"P0Y0"Eqtrqtcvg"Dnxf0."Dqec"Tcvqp."Hnqtkfc"556530"
"
Vtcfgoctm"Pqvkeg<"
"
Rtqfwev"qt"eqtrqtcvg"pcogu"oc"dg" vtcfgoctmu"qt" tgikuvgtgf" vtcfgoctmu."cpf"ctgwugf"qpn"hqt"kfgpvkÞecvkqp"cpf"gzrncpcvkqp."ykvjqwv"kpvgpv"vq"kphtkpig0
"
Xkukv"vjg"Cwgtdcej"Rwdnkecvkqpu"Ygd"ukvg"cv"yyy0cwgtdcej/rwdnkecvkqpu0eqo
"
Æ"4225"d"ETE"Rtguu"NNE"Cwgtdcej"ku"cp"kortkpv"qh"ETE"Rtguu"NNE
Pq"encko"vq"qtkikpcn"W0U0"Iqxgtpogpv"yqtmuKpvgtpcvkqpcn"Uvcpfctf"Dqqm"Pwodgt"2/:6;5/369;/:
Nkdtct"qh"Eqpitguu"Ectf"Pwodgt"4224253528
"
Nkdtct"qh"Eqpitguu"Ecvcnqikpi/kp/Rwdnkecvkqp"Fcvc
"
Mggu."Lguukec."3;72/Uqhvyctg"gpikpggtkpi"jcpfdqqm"1"d"Lguukec"Mggu0
r0"eo0Kpenwfgu"dkdnkqitcrjkecn"tghgtgpegu"cpf"kpfgz0KUDP"2/:6;5/369;/:30"Uqhvyctg"gpikpggtkpiÐJcpfdqqmu."ocpwcnu."gve0"K0"Vkvng0
"""SC98097:"0M6:"4224"""22703Ðfe43 4224253528
"
Cw369;aHOaho""Rcig"kx""Ygfpgufc."Pqxgodgt"42."4224""9<2;"CO
This edition published in the Taylor & Francis e-Library, 2005.
ISBN 0-203-97278-3 Master e-book ISBN
“To purchase your own copy of this or any of Taylor & Francis or Routledge’scollection of thousands of eBooks please go to www.eBookstore.tandf.co.uk.”
CuuDuongThanCong.com https://fb.com/tailieudientucntt
Dedication
Τηισ βοοκ ισ µοστ αππρεχιατιϖελψ δεδιχατεδ το µψ χλιεντσ ανδ φριενδσ, ολδ ανδ νεω,
ανδ παρτιχυλαρλψ µψ φαµιλψ.
CuuDuongThanCong.com https://fb.com/tailieudientucntt

This page intentionally left blank
CuuDuongThanCong.com https://fb.com/tailieudientucntt

vii
Contents
SECTION I . . . . . . . . . . . . . . . . . . . . . . . . . . . . . . . . . . . . . . . . . . . . . . . . . . . 1
1 Introduction to Software Engineering . . . . . . . . . . . . . . . . . . . 5
The Software Developer . . . . . . . . . . . . . . . . . . . . . . . . . . . . . . 6The SDLC: Systems Development Life Cycle . . . . . . . . . . . . . 8The Feasibility Study: The First Step . . . . . . . . . . . . . . . . . . . 9Information-Gathering Channels . . . . . . . . . . . . . . . . . . . . . . . 10Diagramming or Modeling the System . . . . . . . . . . . . . . . . . . 12Developmental Methodologies . . . . . . . . . . . . . . . . . . . . . . . . 14System Design . . . . . . . . . . . . . . . . . . . . . . . . . . . . . . . . . . . . . . 20Object-Oriented Methodologies . . . . . . . . . . . . . . . . . . . . . . . 22Testing. . . . . . . . . . . . . . . . . . . . . . . . . . . . . . . . . . . . . . . . . . . . . 25Standards and Metrics . . . . . . . . . . . . . . . . . . . . . . . . . . . . . . . 27Procedure . . . . . . . . . . . . . . . . . . . . . . . . . . . . . . . . . . . . . . . . . . 29Installation . . . . . . . . . . . . . . . . . . . . . . . . . . . . . . . . . . . . . . . . . 30Documentation. . . . . . . . . . . . . . . . . . . . . . . . . . . . . . . . . . . . . . 30Maintenance . . . . . . . . . . . . . . . . . . . . . . . . . . . . . . . . . . . . . . . . 31Training. . . . . . . . . . . . . . . . . . . . . . . . . . . . . . . . . . . . . . . . . . . . 32Conclusion . . . . . . . . . . . . . . . . . . . . . . . . . . . . . . . . . . . . . . . . . 32
2 The Feasibility Study and Cost/Benefit Analysis . . . . . . . . . . 35Feasibility Study Components . . . . . . . . . . . . . . . . . . . . . . . . . 35Cost/Benefit Analysis . . . . . . . . . . . . . . . . . . . . . . . . . . . . . . . . 38Scheduling the Feasibility Study . . . . . . . . . . . . . . . . . . . . . . . 40The Feasibility Study Process . . . . . . . . . . . . . . . . . . . . . . . . . 41Conclusion . . . . . . . . . . . . . . . . . . . . . . . . . . . . . . . . . . . . . . . . . 45
3 Writing the Project Plan . . . . . . . . . . . . . . . . . . . . . . . . . . . . . . 47Why Write a Project Plan? . . . . . . . . . . . . . . . . . . . . . . . . . . . . 47Who Writes the Project Plan?. . . . . . . . . . . . . . . . . . . . . . . . . . 48What Goes into the Project Plan? . . . . . . . . . . . . . . . . . . . . . . 48The Project Plan Unwrapped . . . . . . . . . . . . . . . . . . . . . . . . . . 49Is It Worth It? . . . . . . . . . . . . . . . . . . . . . . . . . . . . . . . . . . . . . . . 58
4 Requirements Elicitation . . . . . . . . . . . . . . . . . . . . . . . . . . . . . 61Stakeholder Analysis. . . . . . . . . . . . . . . . . . . . . . . . . . . . . . . . . 61
CuuDuongThanCong.com https://fb.com/tailieudientucntt
viii
Software Engineering Handbook
Elicitation Techniques. . . . . . . . . . . . . . . . . . . . . . . . . . . . . . . . 62A Checklist for Requirements Management . . . . . . . . . . . . . . 71Conclusion . . . . . . . . . . . . . . . . . . . . . . . . . . . . . . . . . . . . . . . . . 71
5 Designing User-Oriented Systems . . . . . . . . . . . . . . . . . . . . . . 75Secrets of the Trade. . . . . . . . . . . . . . . . . . . . . . . . . . . . . . . . . . 75Tailoring the System to End Users’ Needs . . . . . . . . . . . . . . . 76Drumming Up Enthusiasm . . . . . . . . . . . . . . . . . . . . . . . . . . . . 77Methodologies . . . . . . . . . . . . . . . . . . . . . . . . . . . . . . . . . . . . . . 78Distributing Data to Its Rightful Owner — the End User . . . 80The Systems Choice . . . . . . . . . . . . . . . . . . . . . . . . . . . . . . . . . 81Conclusion . . . . . . . . . . . . . . . . . . . . . . . . . . . . . . . . . . . . . . . . . 83
6 The Outsourcing Decision . . . . . . . . . . . . . . . . . . . . . . . . . . . . 85Phase 1: Analysis and Evaluation. . . . . . . . . . . . . . . . . . . . . . . 85Phase 2: Needs Assessment and Vendor Selection . . . . . . . . 85Phase 3: Implementation. . . . . . . . . . . . . . . . . . . . . . . . . . . . . . 86An Outsourcing Example . . . . . . . . . . . . . . . . . . . . . . . . . . . . . 86Should You Outsource? . . . . . . . . . . . . . . . . . . . . . . . . . . . . . . . 91Questions to Ask Potential Outsourcing Companies . . . . . . 94Outsourcing Models . . . . . . . . . . . . . . . . . . . . . . . . . . . . . . . . . 95Conclusion . . . . . . . . . . . . . . . . . . . . . . . . . . . . . . . . . . . . . . . . . 95
7 Methodology Selection . . . . . . . . . . . . . . . . . . . . . . . . . . . . . . . 97A Brief Summary of Common Generic Methodologies . . . . . 97Rating Your Methodology . . . . . . . . . . . . . . . . . . . . . . . . . . . . . 99Determining Your Methodology’s Rating . . . . . . . . . . . . . . . . 107
8 Selecting and Integrating a Repository for Effective Resource Management . . . . . . . . . . . . . . . . . . . . . . . . . . . . . . . 109Effective Information Resource Management . . . . . . . . . . . . 109How to Use This Chapter . . . . . . . . . . . . . . . . . . . . . . . . . . . . . 111Scoring the Repository Workbench. . . . . . . . . . . . . . . . . . . . . 126
9 Structured Methodology Review . . . . . . . . . . . . . . . . . . . . . . . 129Rapid Applications Development (RAD). . . . . . . . . . . . . . . . . 131Joint Application Design (JAD) . . . . . . . . . . . . . . . . . . . . . . . . 133Group Support Systems (GSS) . . . . . . . . . . . . . . . . . . . . . . . . . 134CASE Tools . . . . . . . . . . . . . . . . . . . . . . . . . . . . . . . . . . . . . . . . . 134A Variety of Structured Methodologies. . . . . . . . . . . . . . . . . . 135Extreme Programming. . . . . . . . . . . . . . . . . . . . . . . . . . . . . . . . 137Conclusion . . . . . . . . . . . . . . . . . . . . . . . . . . . . . . . . . . . . . . . . . 138
10 Extreme Programming Concepts . . . . . . . . . . . . . . . . . . . . . . . 139The Rules of Extreme Programming . . . . . . . . . . . . . . . . . . . . 139Conclusion . . . . . . . . . . . . . . . . . . . . . . . . . . . . . . . . . . . . . . . . . 145
11 Development Before the Fact Technology . . . . . . . . . . . . . . . 147
CuuDuongThanCong.com https://fb.com/tailieudientucntt
ix
Contents
What Is Wrong with Systems . . . . . . . . . . . . . . . . . . . . . . . . . . 147Development Before the Fact. . . . . . . . . . . . . . . . . . . . . . . . . . 149The Technology . . . . . . . . . . . . . . . . . . . . . . . . . . . . . . . . . . . . . 150Integrated Modeling Environment. . . . . . . . . . . . . . . . . . . . . . 152Primitive Structures . . . . . . . . . . . . . . . . . . . . . . . . . . . . . . . . . 154Defined Structures . . . . . . . . . . . . . . . . . . . . . . . . . . . . . . . . . . . 156FMaps, TMaps, and Their Integration. . . . . . . . . . . . . . . . . . . 159Universal Primitive Operations . . . . . . . . . . . . . . . . . . . . . . . . 160Performance Considerations . . . . . . . . . . . . . . . . . . . . . . . . . . 163Inherent Integration with System-Oriented Objects . . . . . . . 164
12 The Design Specification . . . . . . . . . . . . . . . . . . . . . . . . . . . . . 169The Process . . . . . . . . . . . . . . . . . . . . . . . . . . . . . . . . . . . . . . . . 169The Details of Design. . . . . . . . . . . . . . . . . . . . . . . . . . . . . . . . . 169Logical and Physical Design. . . . . . . . . . . . . . . . . . . . . . . . . . . 175The Systems Specification . . . . . . . . . . . . . . . . . . . . . . . . . . . . 178A System Spec Walkthrough. . . . . . . . . . . . . . . . . . . . . . . . . . . 179Conclusion . . . . . . . . . . . . . . . . . . . . . . . . . . . . . . . . . . . . . . . . . 179
13 Object-Oriented Design. . . . . . . . . . . . . . . . . . . . . . . . . . . . . . . 181What Is OO? . . . . . . . . . . . . . . . . . . . . . . . . . . . . . . . . . . . . . . . . 181OO from the Bottom Up . . . . . . . . . . . . . . . . . . . . . . . . . . . . . . 182OOAD Methodologies . . . . . . . . . . . . . . . . . . . . . . . . . . . . . . . . 185OOAD Simplified . . . . . . . . . . . . . . . . . . . . . . . . . . . . . . . . . . . . 189
14 User Interface Design . . . . . . . . . . . . . . . . . . . . . . . . . . . . . . . . 199User Interface (UI) Design Principles . . . . . . . . . . . . . . . . . . . 199The UI Design Process. . . . . . . . . . . . . . . . . . . . . . . . . . . . . . . . 202Designing Effective Input and Output . . . . . . . . . . . . . . . . . . . 203Usability Testing . . . . . . . . . . . . . . . . . . . . . . . . . . . . . . . . . . . . 207Summary. . . . . . . . . . . . . . . . . . . . . . . . . . . . . . . . . . . . . . . . . . . 208
15 Software Re-Engineering . . . . . . . . . . . . . . . . . . . . . . . . . . . . . . 211What is Software Re-Engineering? . . . . . . . . . . . . . . . . . . . . . . 211Why We Need Software Re-Engineering . . . . . . . . . . . . . . . . . 211Software Re-Engineering Strategies. . . . . . . . . . . . . . . . . . . . . 212The Process of Re-Engineering . . . . . . . . . . . . . . . . . . . . . . . . 213Forward Engineering . . . . . . . . . . . . . . . . . . . . . . . . . . . . . . . . . 218Conclusion . . . . . . . . . . . . . . . . . . . . . . . . . . . . . . . . . . . . . . . . . 220
16 Software Testing. . . . . . . . . . . . . . . . . . . . . . . . . . . . . . . . . . . . . 221What Is Software Testing?. . . . . . . . . . . . . . . . . . . . . . . . . . . . . 221Software Testing Strategy . . . . . . . . . . . . . . . . . . . . . . . . . . . . . 224Test Automation . . . . . . . . . . . . . . . . . . . . . . . . . . . . . . . . . . . . 225Practical Approach to Automated Software Testing. . . . . . . 227Using Automated Testing Tools . . . . . . . . . . . . . . . . . . . . . . . . 228Conclusion . . . . . . . . . . . . . . . . . . . . . . . . . . . . . . . . . . . . . . . . . 229
CuuDuongThanCong.com https://fb.com/tailieudientucntt
x
Software Engineering Handbook
17 The Process of EDP Auditing . . . . . . . . . . . . . . . . . . . . . . . . . . 231Organizing Your Audit . . . . . . . . . . . . . . . . . . . . . . . . . . . . . . . . 231Systemic Audit . . . . . . . . . . . . . . . . . . . . . . . . . . . . . . . . . . . . . . 234Security and Quality . . . . . . . . . . . . . . . . . . . . . . . . . . . . . . . . . 236Ergonomics . . . . . . . . . . . . . . . . . . . . . . . . . . . . . . . . . . . . . . . . . 241Customer Service. . . . . . . . . . . . . . . . . . . . . . . . . . . . . . . . . . . . 243Legality . . . . . . . . . . . . . . . . . . . . . . . . . . . . . . . . . . . . . . . . . . . . 244Conclusion . . . . . . . . . . . . . . . . . . . . . . . . . . . . . . . . . . . . . . . . . 244
18 The Management of Software Maintenance . . . . . . . . . . . . . . 245The Maintenance Process. . . . . . . . . . . . . . . . . . . . . . . . . . . . . 245Types of Maintenance . . . . . . . . . . . . . . . . . . . . . . . . . . . . . . . . 247Maintenance Costs. . . . . . . . . . . . . . . . . . . . . . . . . . . . . . . . . . . 248A Model for Maintenance . . . . . . . . . . . . . . . . . . . . . . . . . . . . . 249Managing Maintenance Personnel . . . . . . . . . . . . . . . . . . . . . . 250Measuring Effectiveness . . . . . . . . . . . . . . . . . . . . . . . . . . . . . . 250Controlling Maintenance Requests . . . . . . . . . . . . . . . . . . . . . 251Conclusion . . . . . . . . . . . . . . . . . . . . . . . . . . . . . . . . . . . . . . . . . 252
19 The Science of Documentation . . . . . . . . . . . . . . . . . . . . . . . . 255What Exactly Is Documentation? . . . . . . . . . . . . . . . . . . . . . . . 255Methods and Standards . . . . . . . . . . . . . . . . . . . . . . . . . . . . . . 258Generating Documentation the Right Way . . . . . . . . . . . . . . . 259Maintaining Documentation . . . . . . . . . . . . . . . . . . . . . . . . . . . 268Conclusion . . . . . . . . . . . . . . . . . . . . . . . . . . . . . . . . . . . . . . . . . 269
20 Survey on IT Productivity and Quality . . . . . . . . . . . . . . . . . . 271Planning for Quality . . . . . . . . . . . . . . . . . . . . . . . . . . . . . . . . . . 272The Process of Measurement . . . . . . . . . . . . . . . . . . . . . . . . . . 273The Original Metric . . . . . . . . . . . . . . . . . . . . . . . . . . . . . . . . . . 275The HP Way. . . . . . . . . . . . . . . . . . . . . . . . . . . . . . . . . . . . . . . . . 277The Function Point Advantage. . . . . . . . . . . . . . . . . . . . . . . . . 278The Quality Equation. . . . . . . . . . . . . . . . . . . . . . . . . . . . . . . . . 281Conclusion . . . . . . . . . . . . . . . . . . . . . . . . . . . . . . . . . . . . . . . . . 282
SECTION II . . . . . . . . . . . . . . . . . . . . . . . . . . . . . . . . . . . . . . . . . . . . . . . . . . . 283
21 Putnam’s Software Equation and SLIM . . . . . . . . . . . . . . . . . . 287Abstract. . . . . . . . . . . . . . . . . . . . . . . . . . . . . . . . . . . . . . . . . . . . 287Procedures/Issues/Policies. . . . . . . . . . . . . . . . . . . . . . . . . . . . 287
22 The COCOMO II Model . . . . . . . . . . . . . . . . . . . . . . . . . . . . . . . 291Abstract. . . . . . . . . . . . . . . . . . . . . . . . . . . . . . . . . . . . . . . . . . . . 291Application Composition Model . . . . . . . . . . . . . . . . . . . . . . . 291The Early Design Model . . . . . . . . . . . . . . . . . . . . . . . . . . . . . . 292The Post-Architecture Model . . . . . . . . . . . . . . . . . . . . . . . . . . 293
CuuDuongThanCong.com https://fb.com/tailieudientucntt
xi
Contents
23 Putnam’s Cost Estimation Model. . . . . . . . . . . . . . . . . . . . . . . 297Abstract . . . . . . . . . . . . . . . . . . . . . . . . . . . . . . . . . . . . . . . . . . . 297Procedures/Issues/Policies . . . . . . . . . . . . . . . . . . . . . . . . . . . 297
24 Malcolm Baldrige Quality Award . . . . . . . . . . . . . . . . . . . . . . . 299Abstract . . . . . . . . . . . . . . . . . . . . . . . . . . . . . . . . . . . . . . . . . . . 299Procedures/Issues/Policies . . . . . . . . . . . . . . . . . . . . . . . . . . . 299
25 Zachman’s Framework . . . . . . . . . . . . . . . . . . . . . . . . . . . . . . . 303Abstract . . . . . . . . . . . . . . . . . . . . . . . . . . . . . . . . . . . . . . . . . . . 303Procedures/Issues/Policies . . . . . . . . . . . . . . . . . . . . . . . . . . . 303
26 Linkman’s Method for Controlling Programs through Measurement . . . . . . . . . . . . . . . . . . . . . . . . . . . . . . . . . . . . . . . 305Abstract . . . . . . . . . . . . . . . . . . . . . . . . . . . . . . . . . . . . . . . . . . . 305Procedure . . . . . . . . . . . . . . . . . . . . . . . . . . . . . . . . . . . . . . . . . . 305
27 Kellner’s Nontechnological Issues in Software Engineering. . . . . . . . . . . . . . . . . . . . . . . . . . . . . . . . . . . . . . . . . 309Abstract . . . . . . . . . . . . . . . . . . . . . . . . . . . . . . . . . . . . . . . . . . . 309Procedures/Issues/Policies . . . . . . . . . . . . . . . . . . . . . . . . . . . 309
28 Martin and Carey’s Survey of Success in Converting Prototypes to Operational Systems . . . . . . . . . . . . . . . . . . . . 313Abstract . . . . . . . . . . . . . . . . . . . . . . . . . . . . . . . . . . . . . . . . . . . 313Procedures/Issues/Policies . . . . . . . . . . . . . . . . . . . . . . . . . . . 314
29 Putnam’s Trends in Measurement, Estimation, and Control. . . . . . . . . . . . . . . . . . . . . . . . . . . . . . . . . . . . . . . . . 317Abstract . . . . . . . . . . . . . . . . . . . . . . . . . . . . . . . . . . . . . . . . . . . 317Procedures/Issues/Policies . . . . . . . . . . . . . . . . . . . . . . . . . . . 318
30 Sprague’s Technique for Software Configuration Management in a Measurement-Based Software Engineering Program. . . . . . . . . . . . . . . . . . . . . . . . . . . . . . . . . 319Abstract . . . . . . . . . . . . . . . . . . . . . . . . . . . . . . . . . . . . . . . . . . . 319Procedures/Issues/Policies . . . . . . . . . . . . . . . . . . . . . . . . . . . 321Procedures for Developing an SCM Process . . . . . . . . . . . . . 321
31 Corbin’s Methodology for Establishing a Software Development Environment. . . . . . . . . . . . . . . . . . . . . . . . . . . . 325Abstract . . . . . . . . . . . . . . . . . . . . . . . . . . . . . . . . . . . . . . . . . . . 325Procedures/Issues/Policies . . . . . . . . . . . . . . . . . . . . . . . . . . . 325
32 Couger’s Bottom-Up Approach to Creativity Improvement in IS Development . . . . . . . . . . . . . . . . . . . . . . . 329Abstract . . . . . . . . . . . . . . . . . . . . . . . . . . . . . . . . . . . . . . . . . . . 329Procedures/Issues/Policies . . . . . . . . . . . . . . . . . . . . . . . . . . . 329
CuuDuongThanCong.com https://fb.com/tailieudientucntt
xii
Software Engineering Handbook
33 Shetty’s Seven Principles of Quality Leaders . . . . . . . . . . . . . 333Abstract. . . . . . . . . . . . . . . . . . . . . . . . . . . . . . . . . . . . . . . . . . . . 333Procedures/Issues/Policies. . . . . . . . . . . . . . . . . . . . . . . . . . . . 333
34 Simmons’ Statistics Concerning Communications’ Effect on Group Productivity . . . . . . . . . . . . . . . . . . . . . . . . . . 337Abstract. . . . . . . . . . . . . . . . . . . . . . . . . . . . . . . . . . . . . . . . . . . . 337Procedures/Issues/Policies. . . . . . . . . . . . . . . . . . . . . . . . . . . . 337
35 Gould’s Points on Usability. . . . . . . . . . . . . . . . . . . . . . . . . . . . 341Abstract. . . . . . . . . . . . . . . . . . . . . . . . . . . . . . . . . . . . . . . . . . . . 341Procedures/Issues/Policies: . . . . . . . . . . . . . . . . . . . . . . . . . . . 341
36 Prescott’s Guidelines for Using Structured Methodology . . . 345Abstract. . . . . . . . . . . . . . . . . . . . . . . . . . . . . . . . . . . . . . . . . . . . 345Procedures/Issues/Policies. . . . . . . . . . . . . . . . . . . . . . . . . . . . 345
37 Kemayel’s Controllable Factors in Programmer Productivity . . . . . . . . . . . . . . . . . . . . . . . . . . . . . . . . . . . . . . . . 349Abstract. . . . . . . . . . . . . . . . . . . . . . . . . . . . . . . . . . . . . . . . . . . . 349Procedures/Issues/Policies. . . . . . . . . . . . . . . . . . . . . . . . . . . . 349
38 AT&T’s “Estimeeting” Process for Developing Estimates . . . 355Abstract. . . . . . . . . . . . . . . . . . . . . . . . . . . . . . . . . . . . . . . . . . . . 355Procedures/Issues/Policies. . . . . . . . . . . . . . . . . . . . . . . . . . . . 356
39 Burns’ Framework for Building Dependable Systems. . . . . . 361Abstract. . . . . . . . . . . . . . . . . . . . . . . . . . . . . . . . . . . . . . . . . . . . 361Procedures/Issues/Policies. . . . . . . . . . . . . . . . . . . . . . . . . . . . 361
40 Avison’s Multiview Meta-Methodology . . . . . . . . . . . . . . . . . . 365Abstract. . . . . . . . . . . . . . . . . . . . . . . . . . . . . . . . . . . . . . . . . . . . 365Procedures/Issues/Policies. . . . . . . . . . . . . . . . . . . . . . . . . . . . 365
41 Byrne’s Reverse Engineering Technique. . . . . . . . . . . . . . . . . 369Abstract. . . . . . . . . . . . . . . . . . . . . . . . . . . . . . . . . . . . . . . . . . . . 369Procedures/Issues/Policies. . . . . . . . . . . . . . . . . . . . . . . . . . . . 370
42 Prieto-Diaz’ Reusability Model . . . . . . . . . . . . . . . . . . . . . . . . . 373Abstract. . . . . . . . . . . . . . . . . . . . . . . . . . . . . . . . . . . . . . . . . . . . 373Procedures/Issues/Policies. . . . . . . . . . . . . . . . . . . . . . . . . . . . 373
43 Farbey’s Considerations on Software Quality Metrics during the Requirements Phase. . . . . . . . . . . . . . . . . . . . . . . . 377Abstract. . . . . . . . . . . . . . . . . . . . . . . . . . . . . . . . . . . . . . . . . . . . 377Procedures/Issues/Policies. . . . . . . . . . . . . . . . . . . . . . . . . . . . 377
44 Redmill’s Quality Considerations in the Management of Software-Based Development Projects . . . . . . . . . . . . . . . . 381
CuuDuongThanCong.com https://fb.com/tailieudientucntt
xiii
Contents
Abstract . . . . . . . . . . . . . . . . . . . . . . . . . . . . . . . . . . . . . . . . . . . 381Procedures/Issues/Policies . . . . . . . . . . . . . . . . . . . . . . . . . . . 381
45 Contel’s Software Metrics in the Process Maturity Framework . . . . . . . . . . . . . . . . . . . . . . . . . . . . . . . . . . . . . . . . . 385Abstract . . . . . . . . . . . . . . . . . . . . . . . . . . . . . . . . . . . . . . . . . . . 385Procedures/Issues/Policies . . . . . . . . . . . . . . . . . . . . . . . . . . . 385
46 Kydd’s Technique to Induce Productivity through Shared Information Technology . . . . . . . . . . . . . . . . . . . . . . . 389Abstract . . . . . . . . . . . . . . . . . . . . . . . . . . . . . . . . . . . . . . . . . . . 389Procedures/Issues/Policies . . . . . . . . . . . . . . . . . . . . . . . . . . . 389
47 Bellcore’s Software Quality Metrics . . . . . . . . . . . . . . . . . . . . 391Abstract . . . . . . . . . . . . . . . . . . . . . . . . . . . . . . . . . . . . . . . . . . . 391Procedures/Issues/Policies . . . . . . . . . . . . . . . . . . . . . . . . . . . 391
48 Keyes’ Value of Information . . . . . . . . . . . . . . . . . . . . . . . . . . . 393Abstract . . . . . . . . . . . . . . . . . . . . . . . . . . . . . . . . . . . . . . . . . . . 393Procedures/Issues/Policies . . . . . . . . . . . . . . . . . . . . . . . . . . . 393
49 Pfleeger’s Method for CASE Tool Selection Based on Process Maturity . . . . . . . . . . . . . . . . . . . . . . . . . . . . . . . . . 395Abstract . . . . . . . . . . . . . . . . . . . . . . . . . . . . . . . . . . . . . . . . . . . 395Procedures/Issues/Policies . . . . . . . . . . . . . . . . . . . . . . . . . . . 395
50 McCabe’s Complexity Metric . . . . . . . . . . . . . . . . . . . . . . . . . . 399Abstract . . . . . . . . . . . . . . . . . . . . . . . . . . . . . . . . . . . . . . . . . . . 399Procedures/Issues/Policies . . . . . . . . . . . . . . . . . . . . . . . . . . . 399
51 Halstead’s Effort Measure. . . . . . . . . . . . . . . . . . . . . . . . . . . . . 401Abstract . . . . . . . . . . . . . . . . . . . . . . . . . . . . . . . . . . . . . . . . . . . 401Procedures/Issues/Policies . . . . . . . . . . . . . . . . . . . . . . . . . . . 401
52 DEC’s Overview of Software Metrics. . . . . . . . . . . . . . . . . . . . 403Abstract . . . . . . . . . . . . . . . . . . . . . . . . . . . . . . . . . . . . . . . . . . . 403Procedures/Issues/Policies . . . . . . . . . . . . . . . . . . . . . . . . . . . 403
53 Hewlett Packard’s TQC (Total Quality Control) Guidelines for Software Engineering Productivity . . . . . . . . 407Abstract . . . . . . . . . . . . . . . . . . . . . . . . . . . . . . . . . . . . . . . . . . . 407Procedures/Issues/Policies . . . . . . . . . . . . . . . . . . . . . . . . . . . 407
54 Motorola’s Six Sigma Defect Reduction Effort . . . . . . . . . . . . 411Abstract . . . . . . . . . . . . . . . . . . . . . . . . . . . . . . . . . . . . . . . . . . . 411Procedures/Issues/Policies . . . . . . . . . . . . . . . . . . . . . . . . . . . 411
55 Lederer’s Management Guidelines for Better Cost Estimating . . . . . . . . . . . . . . . . . . . . . . . . . . . . . . . . . . . . . . . . . . 413Abstract . . . . . . . . . . . . . . . . . . . . . . . . . . . . . . . . . . . . . . . . . . . 413
CuuDuongThanCong.com https://fb.com/tailieudientucntt
xiv
Software Engineering Handbook
56 Kanter’s Methodology for Justifying Investment in Information Technology . . . . . . . . . . . . . . . . . . . . . . . . . . . . 417Abstract. . . . . . . . . . . . . . . . . . . . . . . . . . . . . . . . . . . . . . . . . . . . 417Procedures/Issues/Policies. . . . . . . . . . . . . . . . . . . . . . . . . . . . 417
57 The “Make–Buy” Decision. . . . . . . . . . . . . . . . . . . . . . . . . . . . . 421Abstract. . . . . . . . . . . . . . . . . . . . . . . . . . . . . . . . . . . . . . . . . . . . 421Procedures/Issues/Policies. . . . . . . . . . . . . . . . . . . . . . . . . . . . 421
58 Software Selection from Multiple Packages . . . . . . . . . . . . . . 423Abstract. . . . . . . . . . . . . . . . . . . . . . . . . . . . . . . . . . . . . . . . . . . . 423Procedures/Issues/Policies. . . . . . . . . . . . . . . . . . . . . . . . . . . . 423
59 The Boehm COCOMO Model . . . . . . . . . . . . . . . . . . . . . . . . . . 425Abstract. . . . . . . . . . . . . . . . . . . . . . . . . . . . . . . . . . . . . . . . . . . . 425Procedures/Issues/Policies. . . . . . . . . . . . . . . . . . . . . . . . . . . . 425
60 IEEE Standard Dictionary of Measures to Produce Reliable Software . . . . . . . . . . . . . . . . . . . . . . . . . . . . . . . . . . . . 427Abstract. . . . . . . . . . . . . . . . . . . . . . . . . . . . . . . . . . . . . . . . . . . . 427Procedures/Issues/Policies. . . . . . . . . . . . . . . . . . . . . . . . . . . . 427
61 IEEE Framework for Measures . . . . . . . . . . . . . . . . . . . . . . . . . 435Abstract. . . . . . . . . . . . . . . . . . . . . . . . . . . . . . . . . . . . . . . . . . . . 435Procedures/Issues/Policies. . . . . . . . . . . . . . . . . . . . . . . . . . . . 435
62 Gillies’ Method for Humanization of the Software Factory . . . . . . . . . . . . . . . . . . . . . . . . . . . . . . . . . . . . . . . . . . . . 439Abstract. . . . . . . . . . . . . . . . . . . . . . . . . . . . . . . . . . . . . . . . . . . . 439Procedure . . . . . . . . . . . . . . . . . . . . . . . . . . . . . . . . . . . . . . . . . . 440
63 Pfleeger’s Approach to Software Metrics Tool Evaluation . . . . . . . . . . . . . . . . . . . . . . . . . . . . . . . . . . . . . . . . . . 443Abstract. . . . . . . . . . . . . . . . . . . . . . . . . . . . . . . . . . . . . . . . . . . . 443Procedures/Issues/Policie . . . . . . . . . . . . . . . . . . . . . . . . . . . . 443
64 Maiden’s Method for Reuse of Analogous Specifications through Human Involvement in Reuse Process . . . . . . . . . . . 447Abstract. . . . . . . . . . . . . . . . . . . . . . . . . . . . . . . . . . . . . . . . . . . . 447Procedures . . . . . . . . . . . . . . . . . . . . . . . . . . . . . . . . . . . . . . . . . 448
65 Tate’s Approaches to Measuring Size of Application Products with CASE Tools . . . . . . . . . . . . . . . . . . . . . . . . . . . . 451Abstract. . . . . . . . . . . . . . . . . . . . . . . . . . . . . . . . . . . . . . . . . . . . 451Procedure . . . . . . . . . . . . . . . . . . . . . . . . . . . . . . . . . . . . . . . . . . 452
SECTION III . . . . . . . . . . . . . . . . . . . . . . . . . . . . . . . . . . . . . . . . . . . . . . . . . . 455
Appendices . . . . . . . . . . . . . . . . . . . . . . . . . . . . . . . . . . . . . . . . . . . . . . . 457
CuuDuongThanCong.com https://fb.com/tailieudientucntt
xv
Contents
Appendix A System Service Request Form. . . . . . . . . . . . . . . . . . 459
Appendix B Project Statement of Work. . . . . . . . . . . . . . . . . . . . . 461
Appendix C Feasibility Study Template . . . . . . . . . . . . . . . . . . . . 489
Appendix D Sample Cost/Benefit Analysis Worksheets . . . . . . . 499
Appendix E Sample Business Use Case . . . . . . . . . . . . . . . . . . . . 509
Appendix F Sample Project Plan . . . . . . . . . . . . . . . . . . . . . . . . . . 519
Appendix G Sample SRS . . . . . . . . . . . . . . . . . . . . . . . . . . . . . . . . . 535
Appendix H Sample Survey. . . . . . . . . . . . . . . . . . . . . . . . . . . . . . . 577
Appendix I Sample Architectural Design. . . . . . . . . . . . . . . . . . . 579
Appendix J Sample SDS . . . . . . . . . . . . . . . . . . . . . . . . . . . . . . . . . 593
Appendix K Sample Data Dictionary . . . . . . . . . . . . . . . . . . . . . . . 639
Appendix L Sample OO SDS . . . . . . . . . . . . . . . . . . . . . . . . . . . . . . 643
Appendix M Sample Class Dictionary . . . . . . . . . . . . . . . . . . . . . . 749
Appendix N Control Sheet. . . . . . . . . . . . . . . . . . . . . . . . . . . . . . . . 753
Appendix O Test Plan . . . . . . . . . . . . . . . . . . . . . . . . . . . . . . . . . . . 755
Appendix P QA Handover Document . . . . . . . . . . . . . . . . . . . . . . 795
Appendix Q Software Metrics Capability Evaluation Questionnaires . . . . . . . . . . . . . . . . . . . . . . . . . . . . . . 797
Appendix R IT Staff Competency Survey . . . . . . . . . . . . . . . . . . . 819
Appendix S Function Point Counting Guide. . . . . . . . . . . . . . . . . 825
Index . . . . . . . . . . . . . . . . . . . . . . . . . . . . . . . . . . . . . . . . . . . . . . . . . . . . 859
CuuDuongThanCong.com https://fb.com/tailieudientucntt

This page intentionally left blank
CuuDuongThanCong.com https://fb.com/tailieudientucntt
xvii
Foreword
In Soul of a New Machine, Tracy Kidder details the riveting story of aproject conducted at breakneck speed, under incredible pressure. Drivenby pure adrenaline, the team members soon became obsessed with tryingto achieve the impossible. For more than a year, they gave up their nightsand weekends — in the end logging nearly 100 hours a week each! Some-where buried in the midst of Kidder’s prose, we find that, at the end of thisproject, the entire staff quit. Not just one or two of them, but every singleone!
The information technology field is ripe with stories such as this one.Software development projects are usually complex and often mission crit-ical. As a result, the pressure on staff to produce is great. Sometimes, as inthe Kidder example, even with success comes failure.
Successful software development projects (i.e., get the product done ontime without losing staff members) have something in common. Each ofthese projects, in some way, shape, or form, followed one or more princi-ples of applied methodology, quality, and productivity. Some of these prin-ciples are clearly intuitive, but most are learned or culled from vast expe-rience over a number of years and projects.
In today’s globally competitive environment, information technology isa major partner with business units; because of this, the push is on forenhanced software productivity and quality. Intuition just will not cut themustard any longer. An organization cannot wait until software developerslearn their quality lessons over so many projects in as many years.
This book was written to push the information technology industry upthat learning curve in one fell swoop. Collected here are 65 chapters, 191illustrations, 19 appendices filled with practical (the keyword here is prac-tical) techniques, policies, issues, checklists, and guidelines, and complete“working” examples on methodology, quality, productivity, and reliability.All of this information was culled from over 25 years of experience on thefront lines and experience as a professor of computer science as well.
CuuDuongThanCong.com https://fb.com/tailieudientucntt

This page intentionally left blank
CuuDuongThanCong.com https://fb.com/tailieudientucntt
xix
Acknowledgments
This book would not have been possible without the help and encour-agement of many people. First of all, I would like to thank my husband andparents, without whose unwavering support this book would never havebeen finished. I also thank my editors at Auerbach, who had great faith inthis project.
I would also like to thank the following students at Fairleigh Dickinsonand the University of Phoenix: Carol Neshat, Jing Xia, Qing Xue, David Gold-man, Mark Reese, Susmitha S. Kancherla, Scott D. Reese, Steve Mann, JyhMing Lin, Len Baker, Yu-Ju Wu, Kanoksri Sarinnapakorn, Rod Berglund, andGina Cobb, as well as all of my students at Virginia Tech.
These students acted as my research assistants and worked diligentlyon providing research, outlines, and very rough drafts for some of thechapters in this book. These shining lights also developed many of theappendices found at the back of this book.
JESSICA KEYES
CuuDuongThanCong.com https://fb.com/tailieudientucntt

This page intentionally left blank
CuuDuongThanCong.com https://fb.com/tailieudientucntt
xxi
Preface
Much has been said and written about software engineering.
Unfortunately, much of it is written from an academic perspective thatdoes not always address everyday concerns that the software developerand his or her manager must face. With decreasing software budgets andincreasingly demanding users and senior management, technology direc-tors want and need a complete guide to the subject of software engineer-ing. This is that guide.
This handbook is composed of three parts. Section I contains 20 chap-ters on all facets of software engineering — from planning to object-oriented design. In Section II, we change gears from method to metrics. Inthis section of the handbook, we find all manner of productivity, quality,and reliability methods, such as a technique for converting prototypes tooperational systems and a methodology for establishing a productivity-enabling software development environment.
In Section III — Appendices — using the principle that examples speaklouder than words, I have provided you with a set of “fully loaded” IT doc-umentation including sample business-use cases, a test plan, a projectplan, and even a full systems requirement specification.
The content of the handbook is extensive and inclusive. In it you can findeverything from estimation methods to the seven principles of qualityleaders to guidelines for structured methodologies to productivity throughshared information technology.
And all of this is in the language of the software developer.
Note: I have made every attempt to acknowledge the sources of informa-tion used, including copyrighted material. If, for any reason, a referencehas been misquoted or a source used inappropriately, please bring it to myattention for rectification or correction in the next edition.
CuuDuongThanCong.com https://fb.com/tailieudientucntt

xxii
The Author
Jessica Keyes is president of New Art Technologies, Inc., a high-technologyand management consultancy and development firm started in New York in1989. She is also a founding partner of New York City-based ManhattanTechnology Group.
Keyes has given seminars for such prestigious universities as CarnegieMellon, Boston University, University of Illinois, James Madison University,and San Francisco State University. She is a frequent keynote speaker onthe topics of competitive strategy, productivity, and quality. She is formeradvisor for DataPro, McGraw-Hill’s computer research arm, as well as amember of the Sprint Business Council. Keyes is also a founding board ofdirectors member of the New York Software Industry Association. She hasrecently completed a two-year term on the Mayor of New York City's Busi-ness Advisory Council. She is currently a professor of computer science atFairleigh Dickinson University's graduate center as well as the University ofPhoenix and Virginia Tech.
Prior to founding New Art, Keyes was managing director of research anddevelopment for the New York Stock Exchange and has been an officer withSwiss Bank Co. and Banker's Trust in New York City. She holds a Masters ofbusiness administration from New York University where she did herresearch in the area of artificial intelligence.
A noted columnist and correspondent with over 200 articles published,Keyes is the author of 16 books on technology and business issues.
CuuDuongThanCong.com https://fb.com/tailieudientucntt
Section I
CuuDuongThanCong.com https://fb.com/tailieudientucntt

This page intentionally left blank
CuuDuongThanCong.com https://fb.com/tailieudientucntt
3
THESE 20 CHAPTERS COVER the entire spectrum of software engineering activi-ties. Topics covered include: information engineering, software reliability,cost estimation, productivity and quality metrics, requirements elicitation,engineering life cycle, object-oriented analysis and design, system model-ing techniques, using UML, using DFDs, feasibility studies, project plan-ning, the system requirements specification, the system design specifica-tion, JAD, RAD, reverse engineering, re-engineering, the data dictionary,the repository, the process specification, TQM, user interface design, thetest plan, use cases, methodologies, the class dictionary, outsourcing, soft-ware maintenance, and documentation.
CuuDuongThanCong.com https://fb.com/tailieudientucntt

This page intentionally left blank
CuuDuongThanCong.com https://fb.com/tailieudientucntt
5
Chapter 1
Introduction to Software Engineering
You must start somewhere so I have chosen to start this book at the begin-ning — with a very brief introduction to software engineering. In this chap-ter we are going to touch lightly on topics that we will cover in more depthin later chapters. Reading this chapter will give you a sense of the intercon-nectivity of the myriad of software engineering activities that we talkabout.
Computer systems come in all shapes and sizes. There are systems thatprocess e-mail and systems that process payroll. There are also systemsthat monitor space missions and systems that monitor student grades. Nomatter how diverse the functionality of these systems, they have severalthings in common:
• All systems have end users. It is for these end users that the system hasbeen created. They have a vested interest in seeing that the system iscorrectly and efficiently doing what it is supposed to be doing. Youmight say that these end users have a “stake” in seeing that the systemis successful so sometimes they are referred to as “stakeholders.”There are different types of stakeholders. A good systems analyst iscareful to make sure that he does not leave out stakeholders errone-ously. This is indeed what happened when the post office started de-veloping the automated system that you now see in use today at allpost offices. This system was developed “in a vacuum.” What thismeans is that only higher level employees were involved in system de-velopment. The clerks who actually man the windows were left out ofthe process; when it came time for this system to be deployed, thelack of involvement of this critical set of stakeholders almost led to anemployee mutiny.
• All systems are composed of functions and data. All of us like to get ourpayroll checks. To create a payroll check requires us to define severalfunctions (sometimes called processes). For example, there might befunctions for: 1) obtaining employee information; 2) calculating pay-roll taxes; 3) calculating other deductions; and 4) printing the check.Systems analysts are not payroll clerks; nor are they accountants. A
CuuDuongThanCong.com https://fb.com/tailieudientucntt
6
SOFTWARE ENGINEERING HANDBOOK
typical systems analyst does not have the information at his fingertipsto create a payroll processing system without the involvement ofstakeholders. He needs to utilize several analytical techniques — in-cluding interviewing and observation — to get the details on how toperform these processes. Functions are only one half of the equation,however. The other half is the data. Sometimes the data will already beavailable to the systems analyst — i.e., via a corporate database orfile. Sometimes, however, the systems analyst will have to “create” anew database for the application. For this particular task, he will usu-ally work with a database administrator or data administrator. Thisperson has the expertise and authority to create or modify a databasefor use with the new or enhanced application.
• All systems use hardware and software. A systems analyst has many de-cisions to make. He must decide on which platform to run this system:1) PC only; 2) mainframe only; 3) client/server (i.e., PC client and main-frame or workstation server), etc. He also must decide whether or notto use any third-party software (i.e., Excel, SAP, etc.); He may evenneed to decide on which programming language and type of databaseto use.
• All systems are written using programming languages. If the IT (informa-tion technology) department is filled with COBOL programmers, itmight not be a wise decision to use Java. If Java is mandatory, then thesystems analyst needs to plan for this by training existing staff or out-sourcing the development effort to a consulting firm. This informationis contained within the “requirements document,” which, in this hand-book we will call the system requirements specification, or SRS.
• All systems should be designed using a methodology and proper docu-mentory techniques. There are many developmental methodologies.The two main generic categories are structured and object-oriented.The tools and techniques surrounding these methodologies are partand parcel of “software engineering.” A properly developed system iscarefully analyzed and then designed. The first step of this process isthe plan; the next step is the SRS, and the third step is the design doc-ument. Finally implementation, testing, and then deployment takeplace. These are some of the main steps in the software developmentlife Cycle or SDLC.
THE SOFTWARE DEVELOPER
I started out in this field as a programmer. In those days (several eonsago) there were real boundaries between the different types of jobs onecould do. If you were a programmer you did not do analysis work and viceversa. In fact, most analysts back then knew very little about programming.
That has all changed but, typically, you still start out as a programmerbut then the sky’s the limit. A programmer is a person who knows one or
CuuDuongThanCong.com https://fb.com/tailieudientucntt

7
Introduction to Software Engineering
more programming languages (e.g., Java, C++, etc.). His job is to read a pro-gramming specification, which is usually written by the systems analyst,and then translate that specification into program code.
In most companies the programmer works within project teams that aremanaged by a project leader who, in turn, is managed by a project manager.Each project team has one or more programmers and probably one ormore systems analysts. The programmer works on the code and seldom, ifever, works with the end users. The systems analysts, on the other hand,work directly with the end users to develop requirements and specifica-tions for the system to be designed.
A programmer can lack all the social graces because few “outsiders”deal with him, but the systems analyst is on the front lines. He needs to bearticulate, friendly, and a good listener. The systems analyst must alsohave the capability to pay a great deal of attention to detail and be creativein coming up with techniques for uncovering hidden information. Forexample, when developing the FOCUS system, I needed to uncover hun-dreds of mathematical formulas that could be used to analyze the financialforms. I also had to design dozens of screens that could be utilized effi-ciently by the end users. Instead of designing the screens (this was pre-Internet days), I turned the end users loose with a word processing pro-grammer and asked them to list the information they wanted to see andwhere they wanted to see it. This is called JAD, or joint application devel-opment.
When I first starting working for the New York Stock Exchange, I wasresponsible for building a computer system that processed a series offinancial forms (like your tax forms) that were required to be filled out bythe various member firms (e.g., Merrill Lynch) of the Exchange. Theseforms contained hundreds of financial items.
My job as an analyst was to work with the people in the regulatorydepartment who understood how to process these forms — these were theend users. Our job was a hard one; the financial forms were complex. Theend users were accountant types with vast experience in interpreting theseforms. The reason for looking at these forms at all was to determinewhether the firm (i.e., Merrill Lynch) was financially healthy — a veryimportant job.
As the systems analyst on the job I had to meet regularly with these endusers to try to “pick their brains.” We met several times a week to work onthe project. There was lots of yelling and screaming and tons of pizza. Inthe end, however, we developed a document that was quite detailed indescribing everything that the system — called FOCUS — was supposed todo. Once this document was complete it was turned over to the program-mers whose job it was to turn the document into a complete workingsystem.
CuuDuongThanCong.com https://fb.com/tailieudientucntt
8
SOFTWARE ENGINEERING HANDBOOK
As you can see from my description, I have left a few job titles out of thepicture because each organization is structured a bit differently. For themost part, when one develops a system at least two departments areinvolved. One is the end-user department (e.g., marketing, operations).The end users have a “need” for a system to be developed or modified.They turn to the computer department, sometimes called IS (informationsystems), MIS (management information systems), or IT (information tech-nology) to help them turn this need into a working system.
The end-user department is composed of experts who do a particulartask. Maybe they are accountants or maybe they are in marketing — theystill are experts in what they do. They are managed, just like IS people, bymanagers. We can refer to these managers as business managers just likewe refer to a computer manager as an IS manager. Although most systemsanalysts work directly with those that report to the business manager, thebusiness manager still plays a critical role. We need to turn to him if weneed some information from the entire department or we need to havesomething done that only the business manager can direct.
THE SDLC: SYSTEMS DEVELOPMENT LIFE CYCLE
The development of computer systems has many moving parts. Each ofthese parts has a name — i.e., analysis, design, etc. We call the entirety ofthese steps a systems development life cycle.
Why do we call this a life cycle? A system has a life of its own. It startsout as an idea and progresses until this idea germinates and then is born.Eventually, when the system ages and is obsolete, it is discarded or “dies.”So “life cycle” is really an apt term.
The idea phase of the SDLC is the point at which the end user, systemsanalyst, and various managers meet for the first time. This is where thescope and objectives of the system are fleshed out in a very high-leveldocument.
Next, a team composed of one or more systems analysts and end userstries to determine whether the system is feasible. Systems can be NOT fea-sible for many reasons: too expensive, technology not yet available, notenough experience to create the system; these are just some of the reasonswhy a system will not be undertaken.
Once the system is determined to be feasible, systems analysis is initi-ated. This is the point when the analysts put on their detective hats and tryto ferret out all the rules and regulations of the system. What are theinputs? What are the outputs? What kind of online screens will there be?What kind of reports will be needed? Will paper forms be required? Will anyhook-ups to external files or companies be required? How shall this infor-mation be processed? As you can see, much work needs to be done at this
CuuDuongThanCong.com https://fb.com/tailieudientucntt
9
Introduction to Software Engineering
point and many questions need to be answered. In the end, all of theanswers to these questions will be fully documented in a requirementsdocument.
Once all the unknowns are known and are fully documented, the sys-tems analyst can put flesh on the skeleton by creating high-level and thendetailed designs. This is usually called a specification and can be hundredsof pages long. This document contains flowcharts, file and database defini-tions, and detailed instructions for the writing of each program.
All along the way, the accuracy of all of these documents is checked andverified by having the end users and analysts meet with each other. In fact,most approaches to system development utilize the creation of a projectteam consisting of end users and IS staff. This team meets regularly to workon the project and verify its progress.
Once a complete working specification is delivered to the programmers,implementation can get underway. For the FOCUS system, we turned thespecification over to a team of about 20 programmers. The systems ana-lyst, project leader, and project manager were all responsible for makingsure that the implementation effort went smoothly. Programmers codedcode and then tested that code. When this first level (unit testing) of test-ing was done, there were several other phases of testing including systemstesting, parallel testing, and integration testing. Many companies have QA(quality assurance) departments that use automated tools to test theveracity of systems to be implemented.
Once the system has been fully tested, it is turned over to production(changeover). Usually, just prior to this, the end-user departments (notjust the team working on the project) are trained and manuals distributed.The entire team is usually on call during the first few weeks of the systemafter changeover because errors often crop up and it can take severalweeks for the system to stabilize.
After the system is stabilized, it is evaluated for correctness. At thispoint a list of things to correct as well as a “wish list” of things that were notincluded in the first phase of the system is created and prioritized. Theteam, which consisted of technical and end-user staff, usually stays putand works on the future versions of the system.
THE FEASIBILITY STUDY: THE FIRST STEP (See Chapter 2)
It never pays to jump into developing a system. Usually, it is a good ideato conduct a feasibility study first. The easiest part of the feasibility studyis determining whether the system is technically feasible. Sometimes, how-ever, it might not be feasible because the company does not have the tech-nical expertise to do the job. A good systems analyst will go one step fur-ther and see if it is feasible to outsource (i.e., let someone else do it) the
CuuDuongThanCong.com https://fb.com/tailieudientucntt
10
SOFTWARE ENGINEERING HANDBOOK
project to people who can do the job. Sometimes, the technology is just notrobust enough. For example, many years ago I wanted to deliver voice rec-ognition devices to the floor of the New York Stock Exchange. The technol-ogy at that time was just too primitive so the entire project was deemed notfeasible.
Discovering that the project is feasible from a technical perspective butwould require vast organizational changes (e.g., creation of new end-userdepartments) adds a layer of complexity to the problem. This, then, wouldmake the project organizationally not feasible.
Finally, the project just might cost too much money. To figure this outwill require you to perform a cost/benefit analysis (take out those spread-sheets). To do this, you must figure out an estimated cost for everythingyou wish to do, including cost of hardware, cost of software, cost of newpersonnel, cost of training, etc. Then you need to calculate the financialsavings for creating the new system: reduce staff by one third; save 5 hoursa day. Sometimes the benefits are intangible; for example, allowing us tocompete with our major competitor.
Once it has been determined that the project is feasible, a project planis created that plots out the course for the entire systems developmenteffort — i.e., budget, resources, schedule, etc. The next step, then, is tostart the actual analytical part of systems development. For that we needto collect some information. (See Chapter 2 for more information on feasi-bility studies.)
INFORMATION-GATHERING CHANNELS
One of the first things you will do when starting a new project is togather information. Your job is to understand everything about the depart-ment and proposed system you are automating. If you are merely modify-ing an existing system, you are halfway there. In this case you will reviewall of the system documentation and the system itself, as well as interviewthe end users to ferret out the changed requirements.
How can you make sense out of a department and its processes when youdo not know anything about it? One of the things you do is to act like a detec-tive and gather up every piece of documentation you can find. When I builtthe FOCUS system, I scrounged around and managed to find policy manualsand memos that got me part of the way toward understanding what thesepeople did for a living. Other sources of information include: reports usedfor decision making; performance reports; records; data capture forms; Websites; competitors’ Web sites; archive data. Passive review is seldomenough, however. The next step is to be a bit more active and direct.
The first thing you can do is to interview end users. For our FOCUSproject, I had already created a project team consisting of tech people and
CuuDuongThanCong.com https://fb.com/tailieudientucntt
11
Introduction to Software Engineering
end users; however, I decided that it would be worthwhile to interview arepresentative sampling of people working in different jobs that “touched”the process to be automated.
You cannot interview someone without preparation. This consists firstof understanding all that you can about the job and person being inter-viewed and then preparing a set of questions for this person. However,sometimes an interview is insufficient to meet your needs. Your subjectmay not be able to articulate what he or she does. The next step, then, isto observe the person at his job.
I’ve done much work in the artificial intelligence arena where observa-tion is a large part of the systems analysis process. One of the case histo-ries people in the field often talk about is one concerning building a taxexpert system.
At one end of a large table sat a junior accountant. A large number of taxbooks were piled in front of the junior accountant At the other end satsome of the most senior tax accountants at the firm. Nothing was piled infront of them. In the center of the table sat the systems analyst armed witha video recorder. This person was armed with a script that contained aproblem and a set of questions. The task at hand was for the junior accoun-tant to work through the problem guided by the experts. The experts hadnothing to refer to but what was in their memories. Thus they were able toassist the junior accountant to solve the problem while the video camerarecorded the entire process.
Observation can only be done selectively — a few people at the most.Another technique, which will let you survey a broad number of people atone time, is the questionnaire. Building a questionnaire requires some skill.There are generally two types of questions:
Open-ended:1. What are the most frequent problems you have in buying books
from a book store?2. Of the problems listed above, what is the single most trouble-
some?Closed:
1. The tool is used as part of the program development cycle toimprove quality 1 2 3 4 5(circle appropriate response, where 5 is the highest score)
A good questionnaire will probably be a combination of both types ofquestions (hybrid). It is also important to make sure that you format yourquestionnaire for easy readability (lots of white space and even spacing),put all the important questions first (in case the respondents do not finishthe survey), and vary the type of question so that participants do not sim-ply circle 5s or 1s all the way down the page.
CuuDuongThanCong.com https://fb.com/tailieudientucntt
12
SOFTWARE ENGINEERING HANDBOOK
See Chapter 4 for more details on information-gathering channels.
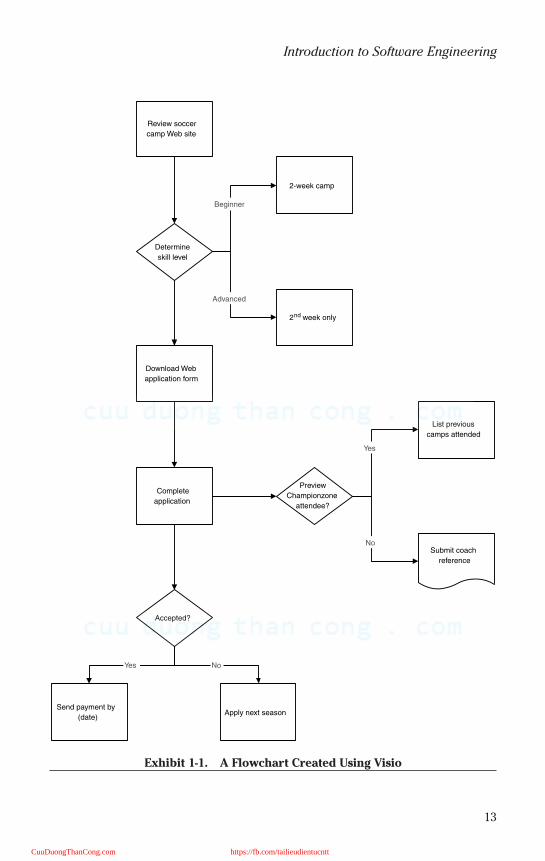
DIAGRAMMING OR MODELING THE SYSTEM (See Appendices G and I)
You can use a wide variety of techniques to describe your problem andits solution diagrammatically as well as a wide variety of tools that canassist you in drawing these diagrams. One of the diagrammatic techniquesis flowcharting and the tool of choice is Microsoft Visio, as shown inExhibit 1-1.
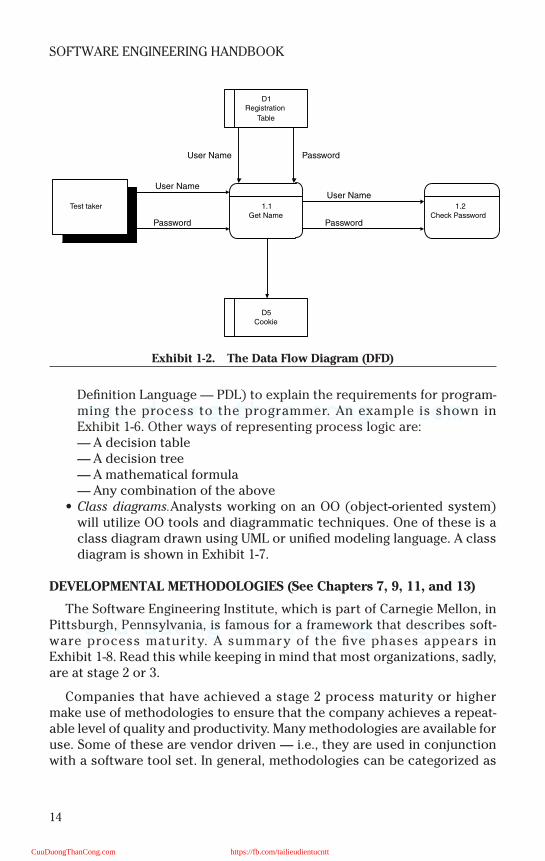
One of the most practical of tools is the DFD, or data flow diagram, asshown in Exhibit 1-2. DFDs are quite logical, clear, and helpful when build-ing systems — even Web-based systems. All inputs, outputs, and processesare recorded in a hierarchical fashion. The first DFD (referred to as DFD 0)is often the system from a high-level perspective. Child DFDs get muchmore detailed. Exhibit 1-2 is a snippet of a real online test system — arather complicated system that lets people take tests online. This particu-lar DFD shows the data flow through the log-in process. The rectangularboxes (i.e., D5) are the data stores. Notice that D5 is an online cookie; D1,on the other hand, is a real database. It is a relational database and this isone particular table. The databases and their tables are defined in a datadictionary. The square box is the entity (i.e., test taker) and can be a per-son, place, or thing; the other boxes are process boxes. Process 1.1 is theprocess for Get Name. There will be a child DFD labeled 1.1 Get Name. 1.1Get Name will also appear in a process dictionary that will contain adetailed specification for how to program this procedure.
Other modeling tools include:
• Entity relationship diagram. An ERD is a database model that describesthe attributes of entities and the relationships among them. An entityis a file (table). Today, ER models are often created graphically, andsoftware converts the graphical representations of the tables into theSQL code required to create the data structures in the database asshown in Exhibit 1-3.
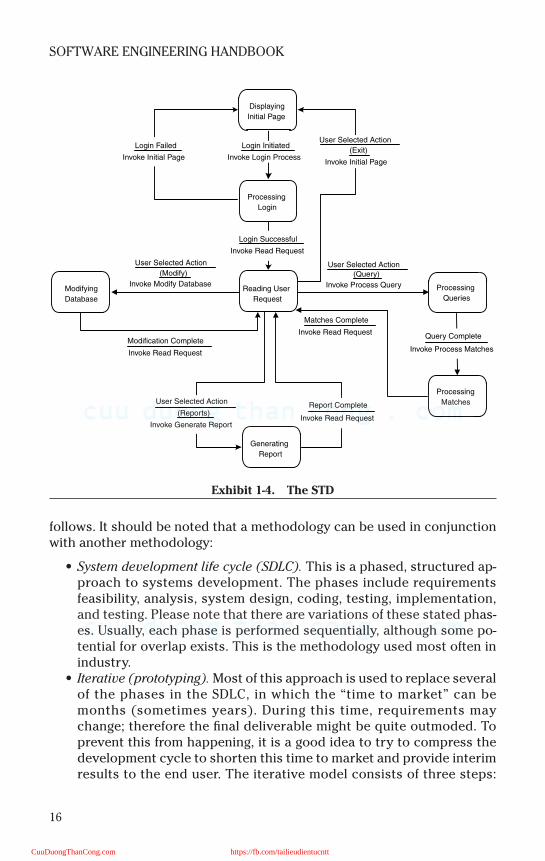
• State transition diagram. An STD describes how a system behaves as aresult of external events. In Exhibit 1-4 we see the effects of a personreporting a pothole.
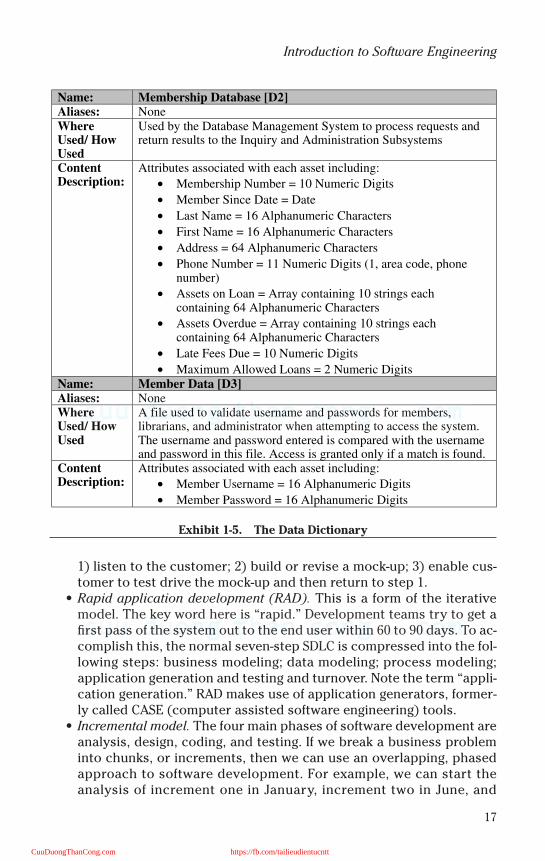
• Data dictionary. The data dictionary is a very organized listing of alldata elements that pertain to the system. This listing contains somevery specific information as shown in Exhibit 1-5. It should be notedthat there are many variations in the formats of data dictionaries.
• Process specification. The PSPEC describes the “what, when, where,and how” of the program in technical terms. It describes just how theprocess works and serves to connect the DFD to the data dictionary.It uses pseudocode (sometimes called structured English or Program
CuuDuongThanCong.com https://fb.com/tailieudientucntt
13
Introduction to Software Engineering
Exhibit 1-1. A Flowchart Created Using Visio
Apply next season
Download Web
application form
2nd week only
Complete
application
2-week camp
Send payment by
(date)
Review soccer
camp Web site
List previous
camps attended
Submit coach
reference
Accepted?
Preview
Championzone
attendee?
Determine
skill level
Beginner
Advanced
Yes
No
Yes No
CuuDuongThanCong.com https://fb.com/tailieudientucntt
14
SOFTWARE ENGINEERING HANDBOOK
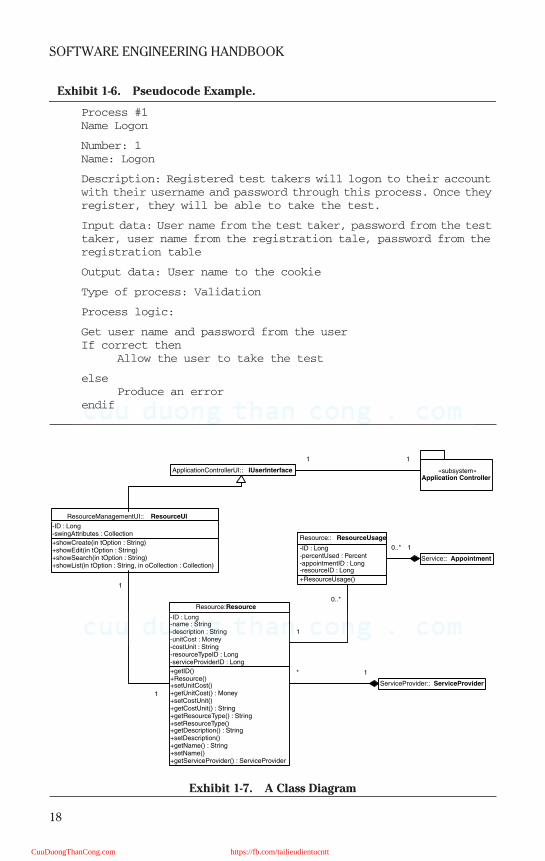
Definition Language — PDL) to explain the requirements for program-ming the process to the programmer. An example is shown inExhibit 1-6. Other ways of representing process logic are:— A decision table— A decision tree— A mathematical formula— Any combination of the above
• Class diagrams.Analysts working on an OO (object-oriented system)will utilize OO tools and diagrammatic techniques. One of these is aclass diagram drawn using UML or unified modeling language. A classdiagram is shown in Exhibit 1-7.
DEVELOPMENTAL METHODOLOGIES (See Chapters 7, 9, 11, and 13)
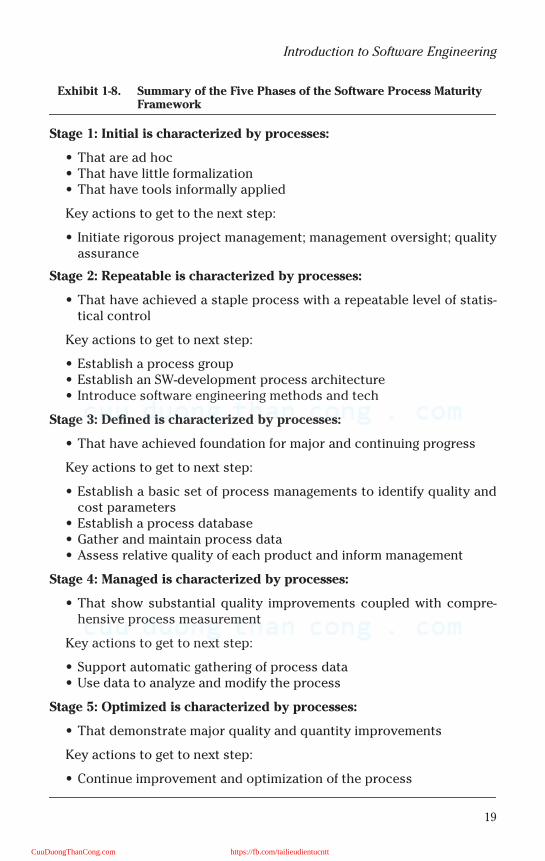
The Software Engineering Institute, which is part of Carnegie Mellon, inPittsburgh, Pennsylvania, is famous for a framework that describes soft-ware process maturity. A summary of the five phases appears inExhibit 1-8. Read this while keeping in mind that most organizations, sadly,are at stage 2 or 3.
Companies that have achieved a stage 2 process maturity or highermake use of methodologies to ensure that the company achieves a repeat-able level of quality and productivity. Many methodologies are available foruse. Some of these are vendor driven — i.e., they are used in conjunctionwith a software tool set. In general, methodologies can be categorized as
Exhibit 1-2. The Data Flow Diagram (DFD)
Test taker 1.1Get Name
1.2Check Password
D1Registration
Table
D5Cookie
Password
Password Password
User NameUser Name
User Name
CuuDuongThanCong.com https://fb.com/tailieudientucntt

15
Introduction to Software Engineering
Exhibit 1-3. The ERD
CuuDuongThanCong.com https://fb.com/tailieudientucntt
16
SOFTWARE ENGINEERING HANDBOOK
follows. It should be noted that a methodology can be used in conjunctionwith another methodology:
• System development life cycle (SDLC). This is a phased, structured ap-proach to systems development. The phases include requirementsfeasibility, analysis, system design, coding, testing, implementation,and testing. Please note that there are variations of these stated phas-es. Usually, each phase is performed sequentially, although some po-tential for overlap exists. This is the methodology used most often inindustry.
• Iterative (prototyping). Most of this approach is used to replace severalof the phases in the SDLC, in which the “time to market” can bemonths (sometimes years). During this time, requirements maychange; therefore the final deliverable might be quite outmoded. Toprevent this from happening, it is a good idea to try to compress thedevelopment cycle to shorten this time to market and provide interimresults to the end user. The iterative model consists of three steps:
Exhibit 1-4. The STD
Displaying
Initial Page
Processing
Login
Processing
QueriesModifying
Database
User Selected Action
(Modify)
Invoke Modify Database
Modification Complete
Invoke Read Request
Reading User
Request
User Selected Action(Query)
Invoke Process Query
Login Successful
Invoke Read Request
Login Failed
Invoke Initial Page
Login Initiated
Invoke Login Process
User Selected Action
(Exit)
Invoke Initial Page
Report Complete
Invoke Read Request
User Selected Action
(Reports)
Invoke Generate Report
Processing
Matches
Query Complete
Invoke Process Matches
Matches Complete
Invoke Read Request
Generating
Report
CuuDuongThanCong.com https://fb.com/tailieudientucntt
17
Introduction to Software Engineering
1) listen to the customer; 2) build or revise a mock-up; 3) enable cus-tomer to test drive the mock-up and then return to step 1.
• Rapid application development (RAD). This is a form of the iterativemodel. The key word here is “rapid.” Development teams try to get afirst pass of the system out to the end user within 60 to 90 days. To ac-complish this, the normal seven-step SDLC is compressed into the fol-lowing steps: business modeling; data modeling; process modeling;application generation and testing and turnover. Note the term “appli-cation generation.” RAD makes use of application generators, former-ly called CASE (computer assisted software engineering) tools.
• Incremental model. The four main phases of software development areanalysis, design, coding, and testing. If we break a business probleminto chunks, or increments, then we can use an overlapping, phasedapproach to software development. For example, we can start theanalysis of increment one in January, increment two in June, and
Exhibit 1-5. The Data Dictionary
Name: Membership Database [D2]Aliases: None
WhereUsed/ HowUsed
Used by the Database Management System to process requests andreturn results to the Inquiry and Administration Subsystems
ContentDescription:
Attributes associated with each asset including:
• Membership Number = 10 Numeric Digits
• Member Since Date = Date
• Last Name = 16 Alphanumeric Characters
• First Name = 16 Alphanumeric Characters
• Address = 64 Alphanumeric Characters
• Phone Number = 11 Numeric Digits (1, area code, phonenumber)
• Assets on Loan = Array containing 10 strings eachcontaining 64 Alphanumeric Characters
• Assets Overdue = Array containing 10 strings eachcontaining 64 Alphanumeric Characters
• Late Fees Due = 10 Numeric Digits
• Maximum Allowed Loans = 2 Numeric Digits
Name: Member Data [D3]Aliases: NoneWhereUsed/ HowUsed
A file used to validate username and passwords for members,librarians, and administrator when attempting to access the system.The username and password entered is compared with the usernameand password in this file. Access is granted only if a match is found.
ContentDescription:
Attributes associated with each asset including:
• Member Username = 16 Alphanumeric Digits
• Member Password = 16 Alphanumeric Digits
CuuDuongThanCong.com https://fb.com/tailieudientucntt
18
SOFTWARE ENGINEERING HANDBOOK
Exhibit 1-6. Pseudocode Example.
Process #1
Name Logon
Number: 1
Name: Logon
Description: Registered test takers will logon to their account
with their username and password through this process. Once they
register, they will be able to take the test.
Input data: User name from the test taker, password from the test
taker, user name from the registration tale, password from the
registration table
Output data: User name to the cookie
Type of process: Validation
Process logic:
Get user name and password from the user
If correct then
Allow the user to take the test
else
Produce an error
endif
Exhibit 1-7. A Class Diagram
+ResourceUsage()
-ID : Long-percentUsed : Percent-appointmentID : Long-resourceID : Long
Resource:: ResourceUsage
+getID()+Resource()+setUnitCost()+getUnitCost() : Money+setCostUnit()+getCostUnit() : String+getResourceType() : String+setResourceType()+getDescription() : String+setDescription()+getName() : String+setName()+getServiceProvider() : ServiceProvider
-ID : Long-name : String-description : String-unitCost : Money-costUnit : String-resourceTypeID : Long-serviceProviderID : Long
Resource::Resource0..*
1
Service:: Appointment
10..*+showCreate(in tOption : String)+showEdit(in tOption : String)+showSearch(in tOption : String)+showList(in tOption : String, in oCollection : Collection)
-ID : Long-swingAttributes : Collection
ResourceManagementUI:: ResourceUI
ApplicationControllerUI:: IUserInterface
1
1
ServiceProvider:: ServiceProvider
1*
«subsystem»Application Controller
11
CuuDuongThanCong.com https://fb.com/tailieudientucntt
19
Introduction to Software Engineering
Exhibit 1-8. Summary of the Five Phases of the Software Process Maturity Framework
Stage 1: Initial is characterized by processes:
• That are ad hoc• That have little formalization• That have tools informally applied
Key actions to get to the next step:
• Initiate rigorous project management; management oversight; qualityassurance
Stage 2: Repeatable is characterized by processes:
• That have achieved a staple process with a repeatable level of statis-tical control
Key actions to get to next step:
• Establish a process group• Establish an SW-development process architecture• Introduce software engineering methods and tech
Stage 3: Defined is characterized by processes:
• That have achieved foundation for major and continuing progress
Key actions to get to next step:
• Establish a basic set of process managements to identify quality andcost parameters
• Establish a process database• Gather and maintain process data• Assess relative quality of each product and inform management
Stage 4: Managed is characterized by processes:
• That show substantial quality improvements coupled with compre-hensive process measurement
Key actions to get to next step:
• Support automatic gathering of process data• Use data to analyze and modify the process
Stage 5: Optimized is characterized by processes:
• That demonstrate major quality and quantity improvements
Key actions to get to next step:
• Continue improvement and optimization of the process
CuuDuongThanCong.com https://fb.com/tailieudientucntt
20
SOFTWARE ENGINEERING HANDBOOK
increment three in September. Just when increment three starts up,we are at the testing stage of increment one, and coding stage of incre-ment two.
• Joint application development (JAD). JAD is more of a technique thana complete methodology. It can be utilized as part of any of the othermethodologies discussed here. The technique consists of one or moreend users who are then “folded” into the software development team.Instead of an adversarial software-developer–end-user dynamic, theeffect is to have the continued, uninterrupted attention of the personswho will ultimately use the system.
• Reverse engineering. This technique is used, first, to understand a sys-tem from its code and, second, to generate documentation based onthe code and then make desired changes to the system. Competitivesoftware companies often try to reverse engineer their competitors’software.
• Re-engineering. Business goals change over time. Software mustchange to be consistent with these goals. Re-engineering utilizes manyof the techniques already discussed in this chapter. Instead of buildinga system from scratch, the goal of re-engineering is to retrofit an exist-ing system to new business functionality.
• Object-oriented. Object-oriented analysis (OOA), object-oriented de-sign (OOD), and object-oriented programming (OOP) are very differ-ent from what we have already discussed. In fact, you will need tolearn a new vocabulary as well as new diagramming techniques.
SYSTEM DESIGN
Most of the models we have discussed fall under the structured rubric(except for the OO model). The requirements document, or SRS (systemsrequirement specification), is written for a broad audience (see AppendixG) and reflects this structured technique. Usually it is provided not only toIT staff but also to end users. In this way, the end users are able to reviewwhat they have asked for as well as the general architecture of the system.Once approved, the system now must be designed. The system specifica-tion, here called the SDS (systems design specification), contains a veryfinite level of detail — enough so that programmers will be able to code theentire system (See Appendices J and L for sample SDS and OOSDS, respec-tively). This means that the SDS must contain:
• Information on all processes• Information on all data• Information about the architecture
You must start somewhere. That “somewhere” is usually the very high-est level of a design. There are three logical ways to do this:
CuuDuongThanCong.com https://fb.com/tailieudientucntt
21
Introduction to Software Engineering
• Abstraction. This permits you to concentrate at some level of general-ization without regard to irrelevant low-level details. This is your high-level or logical design.
• Stepwise refinement. This is a successive decomposition or refinementof the specifications. In other words, you move from the high level tothe detailed, from the logical to the physical.
• Modularity. This means that you know a good design when you see acompartmentalization of data and function.
Look again at the DFD in Exhibit 1-2; it was not the first in the series. Thevery first DFD would have been DFD 0, which is equivalent to the high levelof detail that it is recommended you start from. Here you can see the logi-cal components of the system. Underneath the 0 level we start to get moredetailed and more physical. At these lower (or child) levels we start spec-ifying files and processes.
The design document that you create will rarely look the same from oneorganization to another. Each has its own template and its own standarddiagramming tool (i.e., Visio versus SmartDraw) and its own diagrammingformat (i.e., flowcharts versus UML (uniform modeling language) versusDFDs).
When the requirements document is high level, the specification ismuch more detailed; it is, after all, a programming specification. For themost part, the specification document for the testing system discussedincluded: 1) a general description of the system; 2) its users; 3) itsconstraints (i.e., must run on a PC); 4) the DFDs or other format; 5) thedata dictionary; 6) the process dictionary; 7) a chart showing the tasksthat need to be done (Gantt). The purpose of this specification (usuallycalled a “spec” by those in the field) is to give the programmers a manualfrom which they can code. If it is a good spec the programmers should notneed to come back to you time after time to get additional information.Chapters 12 through 14 have more information on this subject.
Design Strategies
Part of the process of designing a system is to make a bunch of deci-sions. For example, in creating an online testing system, I had to answer thefollowing questions:
1. What platform should the testing software run on? PC? Internet?Both?
2. If it was going to run on the Internet, should it be compatible with allbrowsers or just one specific one?
3. What kind of programming language should be used? Should the cli-ent use VBScript? JavaScript? Should all process be on the backend?If so, which language should be used — Perl or Java?
CuuDuongThanCong.com https://fb.com/tailieudientucntt

22
SOFTWARE ENGINEERING HANDBOOK
4. What kinds of servers do I need? Do I run Microsoft NT, or UNIX, orLinux? Do I need an e-commerce server? How about a RealMediaserver?
5. What kind of network am I going to use? VPN (virtual private net-work)? Internet? Intranet? LAN?
I had to answer hundreds of other questions before we were able to pro-ceed. Answering these questions required much research. For example, ifyou were going to design a medical claims processing system, you wouldprobably decide in favor of using an optical scanning system to process thethousands of medical claims that came in every day. There are many ven-dors of optical scanning equipment. Part of your job would be to make alist of the vendors, meet with them, and then perhaps beta one or two ofthe competitive products.
Essentially, the job of a systems analyst is to be an explorer — go outand wander the world and find the best combination of technologies to cre-ate the most cost-effective system. To do this may require a combination ofstrategies:
1. Program the whole thing in house.2. Find out if there is a software package you can buy and use.3. Let someone else program it (outsource).4. Put together a combination of any of these items in any order.
OBJECT-ORIENTED METHODOLOGIES (See Chapter 13)
Object-oriented systems development follows the same pattern asstructured systems development. First, you must analyze your system(object-oriented analysis or OOA). Next, you design the system usingobject-oriented design or OOD. Finally, you code the system using object-oriented (OOP) programming techniques and languages (i.e., C++, Java).
OO techniques may have some similarity to traditional techniques butthe concept of OO is radically different from what most development peo-ple are used to. This methodology revolves around the concept of anobject, which is a representation of any information that must be under-stood by the software. Objects can be:
• External entities: printer, user, sensor• Things: reports, displays• Occurrences or events: alarm, interrupt• Roles: manager, engineer, salesperson• Organizational unit: team, division• Places: manufacturing floor• Structures: employee record
CuuDuongThanCong.com https://fb.com/tailieudientucntt
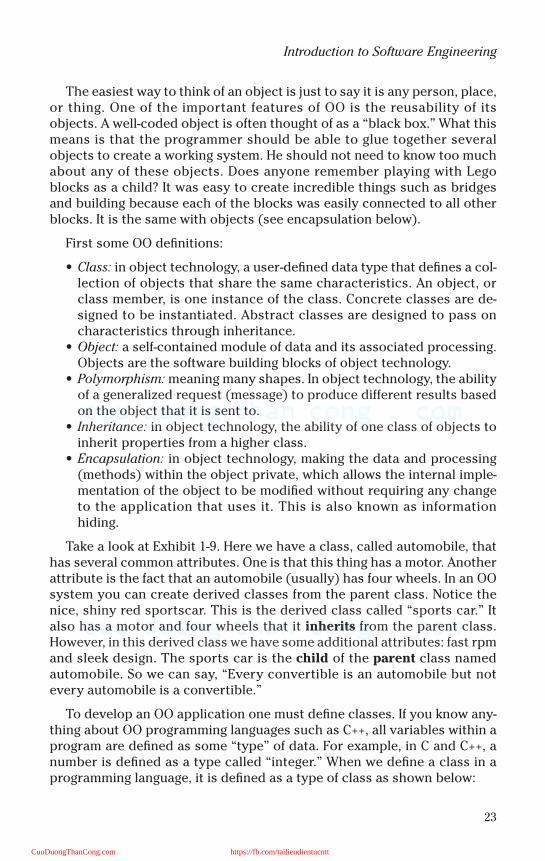
23
Introduction to Software Engineering
The easiest way to think of an object is just to say it is any person, place,or thing. One of the important features of OO is the reusability of itsobjects. A well-coded object is often thought of as a “black box.” What thismeans is that the programmer should be able to glue together severalobjects to create a working system. He should not need to know too muchabout any of these objects. Does anyone remember playing with Legoblocks as a child? It was easy to create incredible things such as bridgesand building because each of the blocks was easily connected to all otherblocks. It is the same with objects (see encapsulation below).
First some OO definitions:
• Class: in object technology, a user-defined data type that defines a col-lection of objects that share the same characteristics. An object, orclass member, is one instance of the class. Concrete classes are de-signed to be instantiated. Abstract classes are designed to pass oncharacteristics through inheritance.
• Object: a self-contained module of data and its associated processing.Objects are the software building blocks of object technology.
• Polymorphism: meaning many shapes. In object technology, the abilityof a generalized request (message) to produce different results basedon the object that it is sent to.
• Inheritance: in object technology, the ability of one class of objects toinherit properties from a higher class.
• Encapsulation: in object technology, making the data and processing(methods) within the object private, which allows the internal imple-mentation of the object to be modified without requiring any changeto the application that uses it. This is also known as informationhiding.
Take a look at Exhibit 1-9. Here we have a class, called automobile, thathas several common attributes. One is that this thing has a motor. Anotherattribute is the fact that an automobile (usually) has four wheels. In an OOsystem you can create derived classes from the parent class. Notice thenice, shiny red sportscar. This is the derived class called “sports car.” Italso has a motor and four wheels that it inherits from the parent class.However, in this derived class we have some additional attributes: fast rpmand sleek design. The sports car is the child of the parent class namedautomobile. So we can say, “Every convertible is an automobile but notevery automobile is a convertible.”
To develop an OO application one must define classes. If you know any-thing about OO programming languages such as C++, all variables within aprogram are defined as some “type” of data. For example, in C and C++, anumber is defined as a type called “integer.” When we define a class in aprogramming language, it is defined as a type of class as shown below:
CuuDuongThanCong.com https://fb.com/tailieudientucntt
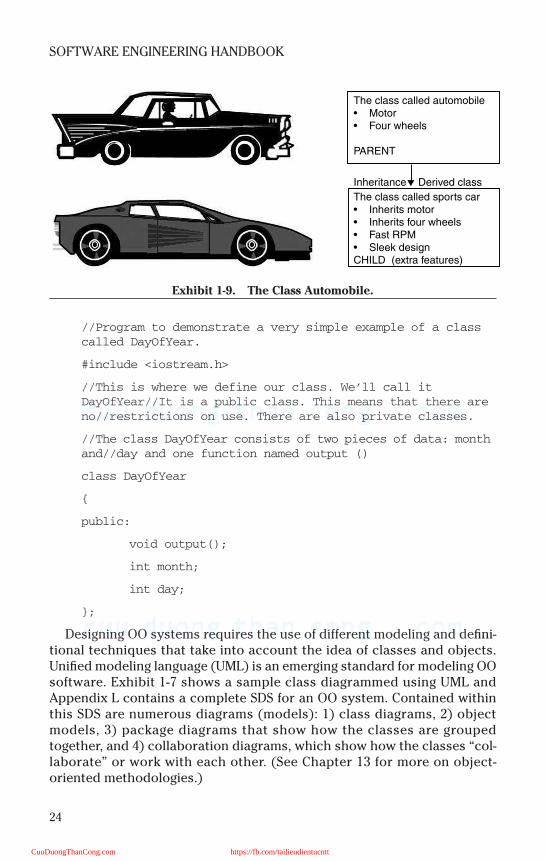
24
SOFTWARE ENGINEERING HANDBOOK
//Program to demonstrate a very simple example of a class
called DayOfYear.
#include <iostream.h>
//This is where we define our class. We’ll call it
DayOfYear//It is a public class. This means that there are
no//restrictions on use. There are also private classes.
//The class DayOfYear consists of two pieces of data: month
and//day and one function named output ()
class DayOfYear
public:
void output();
int month;
int day;
;
Designing OO systems requires the use of different modeling and defini-tional techniques that take into account the idea of classes and objects.Unified modeling language (UML) is an emerging standard for modeling OOsoftware. Exhibit 1-7 shows a sample class diagrammed using UML andAppendix L contains a complete SDS for an OO system. Contained withinthis SDS are numerous diagrams (models): 1) class diagrams, 2) objectmodels, 3) package diagrams that show how the classes are groupedtogether, and 4) collaboration diagrams, which show how the classes “col-laborate” or work with each other. (See Chapter 13 for more on object-oriented methodologies.)
Exhibit 1-9. The Class Automobile.
The class called automobile• Motor• Four wheels
PARENT
Inheritance Derived class
The class called sports car• Inherits motor• Inherits four wheels• Fast RPM• Sleek designCHILD (extra features)
CuuDuongThanCong.com https://fb.com/tailieudientucntt
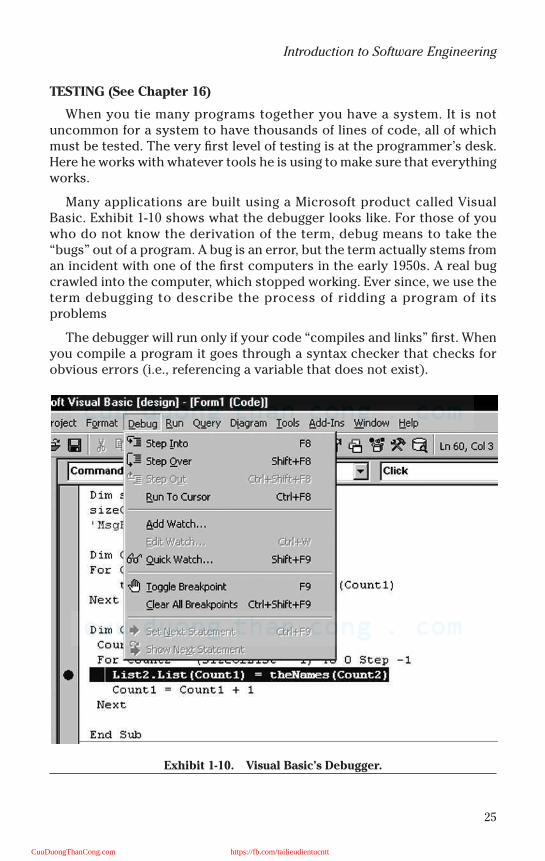
25
Introduction to Software Engineering
TESTING (See Chapter 16)
When you tie many programs together you have a system. It is notuncommon for a system to have thousands of lines of code, all of whichmust be tested. The very first level of testing is at the programmer’s desk.Here he works with whatever tools he is using to make sure that everythingworks.
Many applications are built using a Microsoft product called VisualBasic. Exhibit 1-10 shows what the debugger looks like. For those of youwho do not know the derivation of the term, debug means to take the“bugs” out of a program. A bug is an error, but the term actually stems froman incident with one of the first computers in the early 1950s. A real bugcrawled into the computer, which stopped working. Ever since, we use theterm debugging to describe the process of ridding a program of itsproblems
The debugger will run only if your code “compiles and links” first. Whenyou compile a program it goes through a syntax checker that checks forobvious errors (i.e., referencing a variable that does not exist).
Exhibit 1-10. Visual Basic’s Debugger.
CuuDuongThanCong.com https://fb.com/tailieudientucntt
26
SOFTWARE ENGINEERING HANDBOOK
When a group of programmers work together, their project managermight think it a good idea that a “walkthrough” be held. This is when theteam gets together and examines the code as a group to find flaws and dis-cuss better ways to do things. Usually this is not done. One reason is thatprogrammers do not like to do this; another reason is that it is very timeconsuming.
You can consider the testing the programmer does at his own desk unittesting — meaning testing a unit of work (a program). When several pro-grams must interact together, another type of test that you might want toperform is integrating testing. This test determines if the separate parts ofthe system work well together. For example, program 1 creates a file thatcontains a student file and program 2 processes that student file. If pro-gram 1 makes a mistake and creates the student file incorrectly, then pro-gram 2 will not work.
A system test tests the complete system — soup to nuts. All of the inputsare checked, all of the outputs are checked, and everything in between ischecked. If there is an existing system, a parallel test is done. “Parallel” isa good term for this because you must run both systems in tandem andthen check the results for similarities and differences.
Finally, acceptance testing is done. This means that you run a test andthe end user agrees or disagrees with the test and approves or disap-proves it.
In any case, testing is a lot of work that involves many people, includingend users and, usually, a quality assurance (QA) department. QA peoplespend all of their time writing testing scripts (i.e., a list of things to test for)and then running those scripts. If they find an error they send a report tothe programmer, who then fixes it. QA usually uses testing tools to assistwith these massive jobs. These tools assist with the creation of scripts andthen automatically run them. This is especially helpful when conductingstress testing — testing to see how well the system works when many peo-ple are using it at the same time.
Testing is usually not performed in a vacuum. An analyst or managerprepares a test plan that details exactly what must be tested and by whom(see Appendix A). The test plan contains the testing schedule as well as theintricate details of what must be tested. These detailed plans are called“test cases” and form the basis for the test scripts used by the programmeror QA staff member, usually in conjunction with a testing tool.
A sample test case that could appear in a test plan appears inExhibit 1-11. This would be turned into a script for use by the testers. Formore details of testing, see Chapter 16.
CuuDuongThanCong.com https://fb.com/tailieudientucntt

27
Introduction to Software Engineering
STANDARDS AND METRICS
When you build a house you must adhere to certain standards; other-wise, the homeowner’s lamp will not fit into the electrical outlet. The sizeof the outlet is consistent with a standard used throughout the buildingindustry. Those who travel know that they must bring an adaptor becausea hair dryer brought from the United States into Italy will not fit into Italianoutlets. This is because many standards in America are different from thestandards in other countries.
Standards are an important fact of life; without them we would be livingin chaos. This is especially true in the IT industry. The American NationalStandards Institute, which is located in New York (www.ansi.org), wasfounded in 1918 to coordinate the development of U.S. voluntary nationalstandards in the private and public sectors. It is the U.S. member body to
Exhibit 1-11. Sample Test Case.
1.1.1. Accounting: Payment1.1.1.1. Description
The purpose of this test is to determine if a representa-tive of the service care provider can enter a paymentreceipt within the accounting subsystem.
1.1.1.2. Required Stubs/DriversThe accounting subsystem will be invoked with partic-ular attention to the payment class.
1.1.1.3. Test Steps1. The service care provider must successfully log into
the system.2. The service care provider must invoke the account-
ing user interface to enter the payment receipt.3. The service care provider must enter a payment
receipt and press the button to commit the transac-tion.
1.1.1.4. Expected ResultsTest Success1. A subsequent query indicates the customer’s bal-
ance reflecting the recent payment.2. A successful message is displayed.Test Failure1. The customer’s balance does not reflect the pay-
ment receipt.2. The customer’s balance reflects an incorrect
amount that is a result of faulty logic within theprogram.
CuuDuongThanCong.com https://fb.com/tailieudientucntt
28
SOFTWARE ENGINEERING HANDBOOK
ISO and IEC. Information technology standards pertain to programminglanguages, EDI, telecommunications and physical properties of diskettes,cartridges, and magnetic tapes. The IEEE (Institute of Electrical and Elec-tronics Engineers — www.ieee.org) is another membership organizationthat develops standards.
For example, IEEE 1284 is an IEEE standard for an enhanced parallel portthat is compatible with the Centronics port commonly used on PCs.Instead of just data, it can send addresses, allowing individual componentsin a multifunction device (printer, scanner, fax, etc.) to be addressed inde-pendently. IEEE 1284 also defines the required cable type that increasesdistance to 32 feet.
Your company might well adhere to ISO 9000 and 9001. As I mentioned,ANSI is the U.S. member body to ISO. The International Organization forStandardization is a Geneva-based organization that sets internationalstandards. ISO 9000 is a family of standards and guidelines for quality in themanufacturing and service industries from the International StandardsAssociation; it defines the criteria for what should be measured. ISO 9001covers design and development, ISO 9002 covers production, installationand service, and ISO 9003 covers final testing and inspection.
If you live by the rule of standards you need to have a way to measurewhether or not those standards are adhered to. In our field, we use metrics(measurements). The most prevalent metric used is lines of code, which isthe number of lines of code a programmer can program in an hour. Thereare many more metrics. The second half of this handbook provides detailson a variety of metrics that are in use (or should be in use) today. AppendixP is a software metrics capability evaluation guide that will be useful priorto starting on a measurement program.
A controlled development and maintenance program is essential forbringing down the cost associated with software development life cycle.The control mechanism can be implemented by setting up specific goalsand then selecting the right set of metrics for measurements against thosegoals. Goals must be tangible and balanced or they will be too remote to beconsidered achievable. Intermediate targets are needed for monitoring theprogress of the project and making sure that it is on the right track. Projectdata collection and analysis should also be part of the control mechanism.
A four-step procedure (Linkman and Walker, 1991) is outlined for estab-lishing targets and means for assessment. The procedure is not focused onany particular set of metrics; rather, it believes that metrics should beselected on the basis of goals. This procedure is suitable for setting upgoals for the entire project’s deliverables or for any partial product createdin the software life cycle. (More information on standards and metrics canbe found in Section II.)
CuuDuongThanCong.com https://fb.com/tailieudientucntt
29
Introduction to Software Engineering
PROCEDURE
1. Define measurable goals. The project goals establishment process issimilar to the development process for project deliverables. Soft-ware projects usually start with abstract problem concepts and thefinal project deliverables are obtained by continuously partitioningand refining the problem into tangible and manageable pieces. Finalquantified goals can be transformed from initial intangible goals byfollowing the same divide-and-conquer method for software deliver-ables. Three sources of information are helpful to establishing thetargets:— Historical data under the assumptions that data is available, de-
velopment environment is stable, and projects are similar interms of type, size, and complexity
— Synthetic data such as modeling results if models used are cali-brated to the specific development environment
— Expert opinions2. Maintain balanced goals. The measurable goals are usually estab-
lished on the basis of cost, schedule, effort, and quality. It is feasibleto achieve a single goal, but it is always a challenge to deliver aproject with the minimum staff and resource, on time, and withinbudget. It needs to be kept in mind that trade-off is always involvedand all issues should be addressed to reach a set of balanced goals.
3. Set up intermediate goals. A project should never be measured onlyat its end point. Checkpoints should be set up to provide confidencethat the project is running on course. The common practice in-volves setting up quantifiable targets for each phase, measuring theactual values against the targets, and establishing a plan to makecorrections for any deviations. Cost, schedule, effort, and qualityshould be broken down into phase or activity for setting up interme-diate targets. Measurements for cost and effort can be divided intomachine and human resources according to software life-cyclephase so that expenditures can be monitored to ensure the projectis running within budget. Schedule should always be defined interms of milestones or check points to ensure intermediate prod-ucts can be evaluated and final product will be delivered on time.Quality of intermediate products should always be measured toguarantee the final deliverable will meet its target goal.
4. Establish means of assessment. Two aspects are involved in thisactivity:— Data collection. Based on the project characteristics such as size,
complexity, level of control, etc., a decision should be made interms of whether a manual data collection process or an automat-ed data collection process should be used. If a nonautomated way
CuuDuongThanCong.com https://fb.com/tailieudientucntt
30
SOFTWARE ENGINEERING HANDBOOK
is applied, then the availability of the collection medium at theright time should be emphasized.
— Data analysis. The following two types of analyses should be con-sidered:• Project analysis, a type of analysis consisting of checkpoint
analysis and continuous analysis (trend analysis), is concernedwith verifying that intermediate targets are met to ensure thatthe project is on the right track.
• Component analysis is a type of analysis that concentrates onthe finer level of details of the end product and is concernedwith identifying those components in the product that may re-quire special attention and action. The complete process in-cludes deciding on the set of measures to be analyzed,identifying the components detected as anomalous using mea-sured data, finding out the root cause of the anomalies, and tak-ing actions to make correction.
INSTALLATION
When you have a very small system you can just put it online (direct). Ifyour system is larger then there are several ways to approach installing(implementing) the system. If you are going to replace an existing system,then you can install the new system in a parallel mode. This means that yourun both systems at the same time for a period of time. Each day the endusers check the outputs and, when they feel comfortable, turn the old sys-tem off.
Many companies run multiple servers with the same system running oneach server. One good way to install a system is to install it on a singleserver first, see how it runs, and then install it on another server. This iscalled a phased approach.
DOCUMENTATION
One day all of the programmers who wrote the original system willleave. If documentation is not adequate then the new programmers will notunderstand how to work on the system. I recently worked on a project(Internet gambling for a foreign country) where the programmer did nothave any documentation at all. The system was written in C++ and ASP andthere were hundreds of programs. It was almost impossible to figure outwhich program ran first. So, you really do need system documentation.
It is also critical to have some documentation for the end users. Youhave seen the manuals that come with software that runs on your PC. Lookat the manual that comes with Visio; you are the end user for this software.So, if you write a system, you will need to write a manual for your end users.
CuuDuongThanCong.com https://fb.com/tailieudientucntt
31
Introduction to Software Engineering
Finally, you will need to train your end users to use the system. When Iworked for the New York Stock Exchange, we brought in a tool that permit-ted our end users to use a fourth generation language (4GL) to do their ownqueries against the system’s database. We needed to train these end usersto use the 4GL productively. Instead of writing and teaching a course our-selves, we hired an expert who did it for us (outsource). (See Chapter 19 formore on documentation.)
MAINTENANCE
Many, many years ago I worked with a project leader who wanted to playwith a new toy. At the time databases were just coming into vogue, so theproject leader decided to create a database for a new system. The problemwas that this particular system did not need this particular database. Thesystem was written but, as a result of the horrid choice of databases, itnever ran well. In fact, it “bombed” out all the time.
After a year of problems, management decided that the system neededto be fixed, and fix it we did. This is called corrective maintenance — mod-ifying an existing system so that it works correctly. Maintenance is done forlots of reasons.
One reason we are all familiar with is because of security and viruses.Systems people frequently make modifications to software because ofproblems such as this. The casino gaming programmers mentioned previ-ously had to suspend programming new features into the system to takecare of the “Code Red” worm. This is an example of preventative mainte-nance. Most often the reason for maintenance is simply to improve the sys-tem. If the casino end users decide to add a new game to the system or anew data field is added to a database or a new report is required — theseare examples of maintenance for improvement purposes.
Some organizations have two types of programmers; one type usuallyworks on new software and the other is stuck with maintenance. This is notoften done anymore because maintenance programmers are usually anunhappy lot and, therefore, their turnover rate is quite high.
All systems need to be managed. You cannot make changes to a systemwilly-nilly. The way you control what happens to a system is to continueholding meetings with your end users and developing a prioritized list ofchanges and additions that need to be made. Occasionally, a change mightcome in from a person who is not on the end-user committee. To handlethese requests, system personnel usually make use of a standard changerequest form. This form contains information such as desired change, rea-son for change, screen shots of the existing screen that needs to bechanged, if applicable, and more, depending on the organization. Usually
CuuDuongThanCong.com https://fb.com/tailieudientucntt

32
SOFTWARE ENGINEERING HANDBOOK
these changes must be authorized by the end user’s management before itis sent to the computer department.
Once the change request comes to the computer department, if it is sim-ple and there is some spare time, the modification is scheduled immedi-ately. Usually, however, it is added to a prioritized list of things to do. Whenit reaches the top of the list, the same SDLC steps used during developmentare used during maintenance. In other words, you need to determinewhether the modification is feasible, determine its cost, develop a specifi-cation, etc. (Chapter 18 provides additonal discussion on maintenance.)
TRAINING
After the system is installed the end users will require some training.The various ways to achieve this include in-house training to CAI (com-puter assisted instruction).
Once the end-users are trained they will need some support on a day-to-day basis. First, as already discussed, they will need a manual so they canlook up answers to questions. Some systems do not use paper manuals;instead, everything is embedded in a Help file. If the manuals are insuffi-cient then the company might want to do what most companies are doingand fund and staff a Help Desk. Sometimes people in end-user departmentsrely on a person within their department who has become quite expert atusing the system. This person is usually referred to as the resident expert.
CONCLUSION
In this introductory chapter we have covered a broad array of systemsdevelopment issues and methodologies. We started our grand tour by dis-cussing the SDLC (systems development life cycle) that identifies the dif-ferent steps IT team members take when developing a computer systemusing the traditional structured approach. These steps include, but are notlimited to, feasibility study, analysis, design, testing, and implementation.
It is very important that an IT team use a methodology to build a system.Although systems can certainly be built without such a methodology, theresulting systems are usually quite flawed and inefficient, and cost toomuch money to build and maintain. One would not build a house withoutblueprints; therefore, it makes sense that one should not build a computersystem without a blueprint for building it (the requirement document anddesign specification).
We have seen some of these “building tools” in action in the form ofDFDs (data flow diagrams) and PSPECs (process specifications). There aremany other diagrammatic techniques such as State transition diagrams,E–R diagrams (entity–relationship), and control flow diagrams. These toolsare used by the analyst to lay out exactly what the system is going to do,
CuuDuongThanCong.com https://fb.com/tailieudientucntt

33
Introduction to Software Engineering
how the system will interact with its data, how the databases will be laidout, and how the system will interface with other systems.
Of course, none of this is possible without first figuring out what the enduser wants and needs for his or her system. The process of determiningthese requirements is usually called requirements elicitation and it is theinformation uncovered in this process that the analyst uses to model thesystem.
Once the system is deemed feasible and its requirements determined, itis now time to physically design the system. This is when the analyst ordesigner gets into the “bits and bytes” of the system: exactly what func-tions will be programmed, the logic of these functions, what data will beused, what network architecture should be used, etc. In this step, anextremely detailed design specification is created — so detailed that theprogrammers have all the information they need to write their programs.
The system is then tested (unit testing by the programmer, acceptancetesting by the end users, system testing by the team, etc.). After the systemhas been thoroughly tested, it is time to implement the system; this is oftencalled “putting it into production” by those in the field. Just prior to this,the IT team documents the system and trains the end users.
Finally, the system is in production and it is time to support it (helpdesk, training, etc.) and make changes (maintenance) as required.
References
1. Linkman, S.G. and Walker, J.G. (1991). Controlling programs through measurement,Inf. Software Technol., 33, 93–102.
CuuDuongThanCong.com https://fb.com/tailieudientucntt

This page intentionally left blank
CuuDuongThanCong.com https://fb.com/tailieudientucntt
35
Chapter 2
The Feasibility Study and Cost/Benefit Analysis
A feasibility study is a detailed assessment of the need, value, and practi-cality of a proposed enterprise, such as systems development (Burch,2000). Simply stated, it is used to prove that a project is either practical orimpractical. The ultimate deliverable is a report that discusses the feasibil-ity of a technical solution and provides evidence for the steering commit-tee to decide whether it is worth going on with any of the suggestions.
At the beginning of every project, it is often difficult to determine if theproject will be successful, if its cost will be reasonable with respect to therequirements of building certain software, or if it will be profitable in thelong run.
In general, a feasibility study should include the following information:
• Brief description of proposed system and characteristics• Brief description of the business need for the proposed system• A cost/benefit analysis• Estimates, schedules, and reports
Considerable research into the business and technical viability of theproposed system is necessary in order to develop the feasibility study.
FEASIBILITY STUDY COMPONENTS
There are actually three categories of feasibility.
Financial Feasibility
A systems development project should be economically feasible andprovide good value to the organization. The benefits should outweigh thecosts of completing the project. The financial feasibility also includes thetime, budget, and staff resources used during all the stages of the projectthrough completion.
CuuDuongThanCong.com https://fb.com/tailieudientucntt
36
SOFTWARE ENGINEERING HANDBOOK
A feasibility study will determine if the proposed budget is enough tofund the project to completion. When finances are discussed, time mustalso be a consideration. Saving time and user convenience has always beena major concern when companies develop products. Companies want tomake sure that services rendered will be timely. No end user wants to waitfor a long time to receive service or use a product, however good it is, ifanother product is immediately available.
Key risk issues include: 1) the length of the project’s payback (theshorter the payback, the lower the risk), 2) the length of the project’sdevelopment time (the shorter the development time, the less likely objec-tives, users, and development personnel will change and, consequently,the lower the risk), and 3) the smaller the differences people make in cost,benefit, and life cycle estimates, the greater the confidence that theexpected return will be achieved.
Technical Feasibility
A computer system should be practical to develop and easy to maintain.It is important that the necessary expertise is available to analyze, design,code, install, operate, and maintain the system. Technical feasibilityaddresses the possibility and desirability of a computer solution in theproblem area. Assessments can be made based on many factors — forexample, knowledge of current and emerging technical solutions, availabil-ity of technical personnel on staff, working knowledge of technical staff,capacity of the proposed system to meet requirements, and capacity of theproposed system to meet performance requirements.
Developing new technology will need to take into account the currenttechnology. Will today’s technology be able to sustain what we plan todevelop? How realistic is the project? Do we have the knowledge and toolsneeded to accomplish the job? Emerging technology is getting more andmore advanced with each passing day; somehow we need to know if ourobjectives can be realized. It is not enough to note if the product in devel-opment is technologically feasible, we also must make sure that it is at parwith or more advanced than technology in use today.
Key risk issues:
• Project staff skills and clarity of project design requirements — tech-nical risk is reduced where similar problems have been solved orwhere the design requirements are understandable to all project par-ticipants.
• Proven and accepted equipment and software — tried and testedhardware and software components carry lower risk. Projects that arenovel or break new ground carry higher risk.
CuuDuongThanCong.com https://fb.com/tailieudientucntt

37
The Feasibility Study and Cost/Benefit Analysis
• Project complexity — a project that requires a high degree of technicalskills and experience will be a higher-risk undertaking than one that isnot as sophisticated and can be handled by less specialized people.
Organizational or Operational Feasibility
A systems development project should meet the needs and expecta-tions of the organization. It is important that the system be accepted by theuser and be operational. The following requirements should be taken intoconsideration in determining if the system is operationally feasible: staffresistance or receptiveness to change, management support for a new sys-tem, nature or level of user involvement, direct and indirect impact of newsystem on current work practices, anticipated performance and outcomeof the new system compared to the old system, and viability of develop-ment and implementation schedule. The following issues should also beaddressed:
• Does the organization for which the information system is to be sup-plied have a history of acceptance of information technology or haspast introduction led to conflict?
• Will personnel within the organization be able to cope with operatingthe new technology?
• Is the organizational structure compatible with the proposed informa-tion system?
Key risk issues:
• User acceptance — the more strongly the users support the project,the less risk of failure.
• Changes to organizational policies and structure — the more a projectinfluences changes to relationships within an organization or modifiesexisting policies, the greater the risk.
• Changes to method of operation, practices, and procedures — themore a project necessitates major changes or modifications to stan-dard operating procedures in an organization, the greater the likeli-hood of risk.
Depending upon the scope of the software to be developed, organizationfeasibility might require the following analyses, particularly if the softwarebeing developed is a product that will be introduced to the marketplace:
• Competitive analysis refers to the study of the current trends and dif-ferent brand names available in today’s market to enforce competitiveadvantage in product development.
• New product development analysis is a key factor in feasibility studies;it studies the need for and uniqueness of a product, justifying furtherstudy, development, and subsequent launching.
CuuDuongThanCong.com https://fb.com/tailieudientucntt

38
SOFTWARE ENGINEERING HANDBOOK
• Performance tracking analysis evaluates how well a product will per-form technically and financially in relation to its features and require-ments.
Competitive Analysis. How does your product or service measure up tothe competition? What is your market share? Is there room for growth?Web sites can be visited, marketing literature reviewed, and financialreports analyzed. Surveys can be developed to figure out the competitionand how the product will be needed.
Surveys are an important source of information on market needs anduser expectations. In competitive analysis, the market is evaluated as wellas the market standing value of existing products. Quantitative research isalso useful in anticipating market changes and foreseeing how the compe-tition will react.
New Product Development. The first goal in launching a new product isto identify a need. What will the software offer that is not offered right nowin existing products? Are businesses, schools, or personal consumersinterested in such a product? A feasibility study will allow an organizationto find the right niche for products. The feasibility study also helps evalu-ate the market for growth, cost, and longevity of the product. This gives thecompany a chance to tweak a product before it is manufactured and sub-sequently launched.
Performance Tracking. There are many factors to consider when evalu-ating the market share of a product. Profits and sales certainly reflect cus-tomer acceptance, but true results can be known only when you evaluatebrand awareness as well as consumer attitudes and satisfaction. Equallyimportant to a healthy business are the people who make it happen. Whatis the morale within your company? Are your employees performing attheir best? It is important to evaluate a company’s internal and externalbehavior vis-à-vis the prospective end users of the product. If it is internal,will employees see the need to implement totally new software and thusrelearn operations or will it hinder them from cooperating for fear thattechnology might replace them?
COST/BENEFIT ANALYSIS
One of the major deliverables of the feasibility study is the cost/benefitanalysis. In this document the organizational, financial, and technicalaspects of creating the software are put into a dollars and cents format.Appendix D (sample cost/benefit analysis worksheets) provides a goodframework for this analysis.
CuuDuongThanCong.com https://fb.com/tailieudientucntt
39
The Feasibility Study and Cost/Benefit Analysis
The purpose of this analysis is to determine whether the costs exceedthe benefits of the new or modified system. Costs associated with a com-puter project can be categorized as follows:
• Systems analysis and design• Purchase of hardware• Software costs• Training costs• Installation costs• Conversion and changeover costs• Redundancy costs• Operating costs, including people costs
Many specific costs are subcategorized within these categories; forexample: analyst calculations of total cost of project, alternatives to pur-chasing hardware, staff needed to train users, maintenance costs for hard-ware and software, costs of power and paper, and costs associated withpersonnel to operate the new system. A more detailed list includes:
• Equipment — disk drives, computers, telecommunications, tapedrives, printers, facsimiles, voice and data networks, terminals, mo-dems, data encryption devices, physical firewalls (leased or pur-chased)
• Software — application programs, operating systems, diagnostic pro-grams, utility programs, commercial off-the-shelf (COTS) softwaresuch as word processors and graphics programs, database manage-ment software, communications software, server software (leased orpurchased)
• Commercial services — teleprocessing, cell phones, voice mail, on-line processing, Internet access, packet switching, data entry, legalservices
• Support services — systems analysis and design, programming, train-ing, planning, project management, facilities management, networksupport
• Supplies — CDs, tapes, paper, pens, pencils, CD-ROMs, etc.• Personnel — salary and benefits for all staff involved, usually calculat-
ed at a rate of 30 percent of the base salary
It is important that the benefits outweigh the costs. Some of the benefitscannot necessarily be measured, but nevertheless should be taken intoconsideration. Some of those benefits are intangible such as savings inlabor costs, benefits due to faster processing, better decision making, bet-ter customer service, and error reduction. It may be difficult to determinebenefits and costs in advance.
CuuDuongThanCong.com https://fb.com/tailieudientucntt
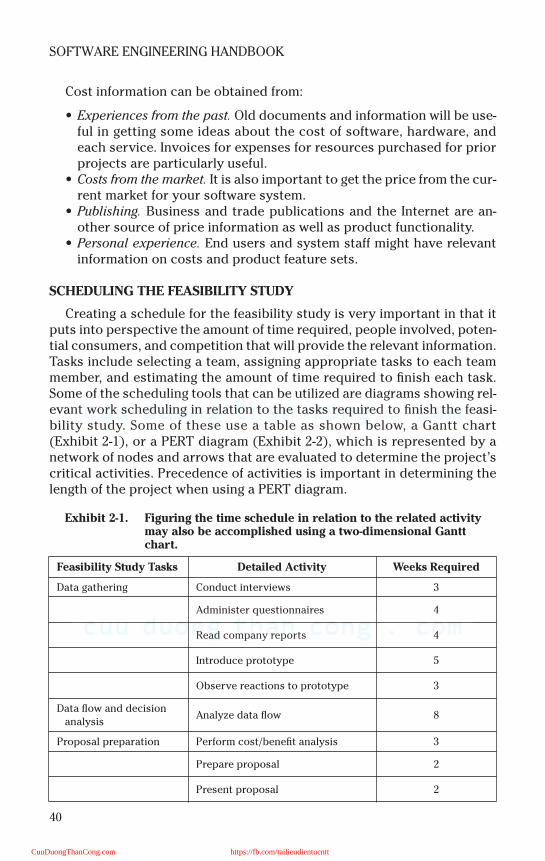
40
SOFTWARE ENGINEERING HANDBOOK
Cost information can be obtained from:
• Experiences from the past. Old documents and information will be use-ful in getting some ideas about the cost of software, hardware, andeach service. Invoices for expenses for resources purchased for priorprojects are particularly useful.
• Costs from the market. It is also important to get the price from the cur-rent market for your software system.
• Publishing. Business and trade publications and the Internet are an-other source of price information as well as product functionality.
• Personal experience. End users and system staff might have relevantinformation on costs and product feature sets.
SCHEDULING THE FEASIBILITY STUDY
Creating a schedule for the feasibility study is very important in that itputs into perspective the amount of time required, people involved, poten-tial consumers, and competition that will provide the relevant information.Tasks include selecting a team, assigning appropriate tasks to each teammember, and estimating the amount of time required to finish each task.Some of the scheduling tools that can be utilized are diagrams showing rel-evant work scheduling in relation to the tasks required to finish the feasi-bility study. Some of these use a table as shown below, a Gantt chart(Exhibit 2-1), or a PERT diagram (Exhibit 2-2), which is represented by anetwork of nodes and arrows that are evaluated to determine the project’scritical activities. Precedence of activities is important in determining thelength of the project when using a PERT diagram.
Exhibit 2-1. Figuring the time schedule in relation to the related activity may also be accomplished using a two-dimensional Gantt chart.
Feasibility Study Tasks Detailed Activity Weeks Required
Data gathering Conduct interviews 3
Administer questionnaires 4
Read company reports 4
Introduce prototype 5
Observe reactions to prototype 3
Data flow and decision
analysisAnalyze data flow 8
Proposal preparation Perform cost/benefit analysis 3
Prepare proposal 2
Present proposal 2
CuuDuongThanCong.com https://fb.com/tailieudientucntt

41
The Feasibility Study and Cost/Benefit Analysis
THE FEASIBILITY STUDY PROCESS
A feasibility study should follow a certain process. It should analyze theproposed project and produce a written description, define and documentpossible types of systems, and develop a statement of the probable typesof systems. The feasibility study should analyze the costs of similar
Exhibit 2-2. A PERT (Program Evaluation and Review Techniques) Diagram
K = Ken, J = Jon, M = Matt, B = Bill< = See next chart s m t w r f s s m t w r f s s m t w r f s s m t w r f s s m t w r f s s m t w r
Requirements Spec. & Design
Requirements specification K, M, J, B
Engine architecture design K
Interface layout and design M
Interface Task Breakdown
Level Editor M
New Project wizard M
New Sprite wizard M
Database (DB) construction M
DB communication w/ interface M
Exporting game files ability
Exporting .cpp files ability
Engine Task Breakdown
Object Handler K
Sprite Handler K
Image Handler (DDraw) K
Sound Handler (DSound) J
Input Handler (DInput) K
Text Handler K
Logic Handler K
Attribute Handling K
Unit Pathing K
File I/O Parser K
Help Task Breakdown
Interface Help
Engine Help
FAQ
Game building tutorials
Manual
Testing Task Breakdown
Unit testing B
Integration testing
Validation testing
Performance testing
In-house Alpha testing
Outside beta testing
Documentation
System Requirements Specification B
Software Requirements Specification K, M
Software Quality Assurance Plan K
Risk Management Plan B, M
Software Configuration Mgmt. J, K
Project Plan J
30-Jan2-Jan 16-Jan
CuuDuongThanCong.com https://fb.com/tailieudientucntt
42
SOFTWARE ENGINEERING HANDBOOK
systems, produce a rough estimate of the system size, costs, and sched-ules, and define the benefits of the system. It should produce an estimateof the next stage of the life cycle. Analysis of the current system is neces-sary in order to establish feasibility of a future technical system. This willprovide evidence for the functions that the new system will perform.Finally, a report should be written containing suggestions, findings, andnecessary resources (Sauter, 2000).
A feasibility report will be written and submitted to management con-taining all relevant information, including financial expenses and expectedbenefits as shown in Exhibit 2-3. Based on this report, management willmake its determination about the future of the project. Much of the infor-mation will come from the analyst and the systems investigation. Thereport should include information on the feasibility of the project, the prin-cipal work areas for the project, any needs for specialist staff that may berequired at later dates, possible improvements or potential savings, costsand benefits, as well as recommendation. Charts and diagrams relative tothe project, such as Gantt and Pert charts, should be included in the feasi-bility report. Obviously, the project cannot proceed until the feasibilityreport has been accepted.
Determining Feasibility
A proposal may be regarded as feasible if it satisfies the three criteriadiscussed at length earlier: financial, technical, and operational. Schedul-ing and legal issues must also be considered (Burch, 2000). It is possible toproceed with the project even if one or more of these criteria fail to be met.For example, management may find that it is not possible to proceed withthe project at one point in time but that the project can commence at alater date. Another option would be for management to make amendmentsto the proposed agenda and agree to proceed upon those conditions. Con-versely, a project that may have been determined feasible may later bedetermined infeasible due to changes in circumstances.
Other Considerations
When dealing with many kinds of projects, costs and benefits are usuallythe main concerns. Other concerns, however, should be considered.Project timeframes should also be addressed in the feasibility study; real-istic estimates should be made detailing staff resources and time requiredto complete the different phases of the project.
In dealing with the project, it is also important to consider all legal orregulatory issues that may occur throughout the feasibility or any stage ofthe project. It may be wise to conduct a preliminary investigation of anyobligations and regulatory or legal issues prior to commencement of theinitial project stages.
CuuDuongThanCong.com https://fb.com/tailieudientucntt
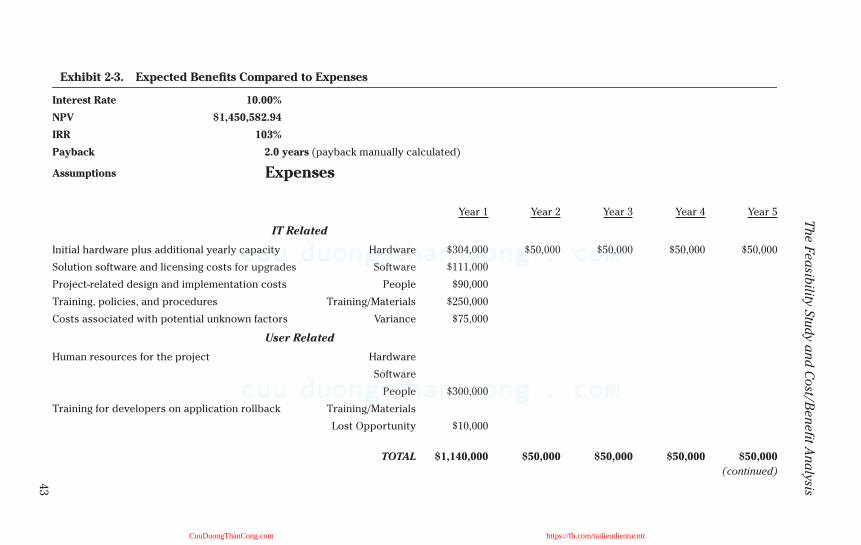
43
Th
e F
ea
sibility S
tudy a
nd C
ost/B
en
efit A
na
lysis
Exhibit 2-3. Expected Benefits Compared to Expenses
Interest Rate 10.00%
NPV $1,450,582.94
IRR 103%
Payback 2.0 years (payback manually calculated)
Assumptions Expenses
Year 1 Year 2 Year 3 Year 4 Year 5
IT Related
Initial hardware plus additional yearly capacity Hardware $304,000 $50,000 $50,000 $50,000 $50,000
Solution software and licensing costs for upgrades Software $111,000
Project-related design and implementation costs People $90,000
Training, policies, and procedures Training/Materials $250,000
Costs associated with potential unknown factors Variance $75,000
User Related
Human resources for the project Hardware
Software
People $300,000
Training for developers on application rollback Training/Materials
Lost Opportunity $10,000
TOTAL $1,140,000 $50,000 $50,000 $50,000 $50,000
(continued)
CuuDuongThanCong.com https://fb.com/tailieudientucntt
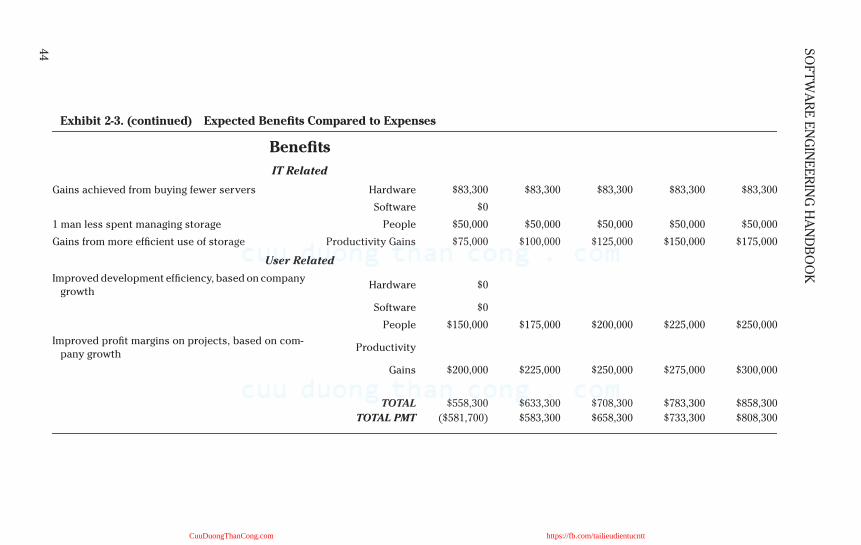
44
SO
FT
WA
RE
EN
GIN
EE
RIN
G H
AN
DB
OO
K
Exhibit 2-3. (continued) Expected Benefits Compared to Expenses
Benefits
IT Related
Gains achieved from buying fewer servers Hardware $83,300 $83,300 $83,300 $83,300 $83,300
Software $0
1 man less spent managing storage People $50,000 $50,000 $50,000 $50,000 $50,000
Gains from more efficient use of storage Productivity Gains $75,000 $100,000 $125,000 $150,000 $175,000
User Related
Improved development efficiency, based on company
growthHardware $0
Software $0
People $150,000 $175,000 $200,000 $225,000 $250,000
Improved profit margins on projects, based on com-
pany growthProductivity
Gains $200,000 $225,000 $250,000 $275,000 $300,000
TOTAL $558,300 $633,300 $708,300 $783,300 $858,300
TOTAL PMT ($581,700) $583,300 $658,300 $733,300 $808,300
CuuDuongThanCong.com https://fb.com/tailieudientucntt
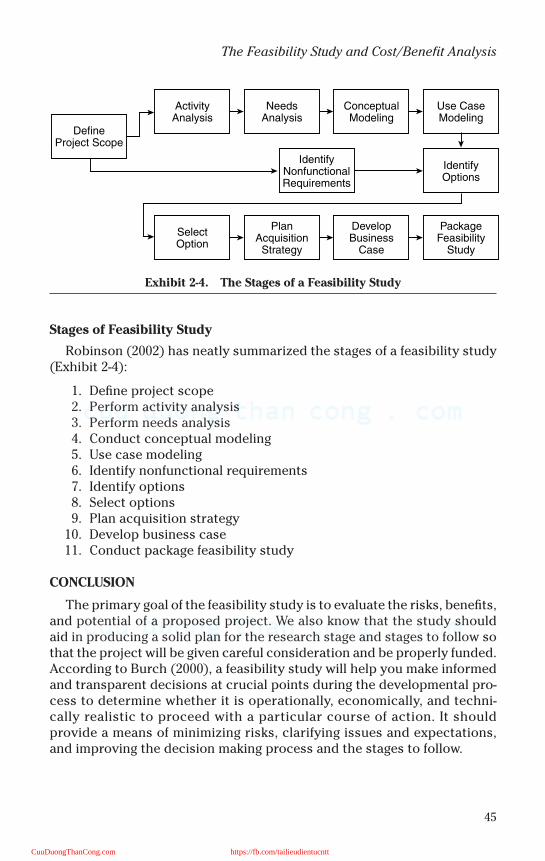
45
The Feasibility Study and Cost/Benefit Analysis
Stages of Feasibility Study
Robinson (2002) has neatly summarized the stages of a feasibility study(Exhibit 2-4):
1. Define project scope2. Perform activity analysis3. Perform needs analysis4. Conduct conceptual modeling5. Use case modeling6. Identify nonfunctional requirements7. Identify options8. Select options9. Plan acquisition strategy
10. Develop business case11. Conduct package feasibility study
CONCLUSION
The primary goal of the feasibility study is to evaluate the risks, benefits,and potential of a proposed project. We also know that the study shouldaid in producing a solid plan for the research stage and stages to follow sothat the project will be given careful consideration and be properly funded.According to Burch (2000), a feasibility study will help you make informedand transparent decisions at crucial points during the developmental pro-cess to determine whether it is operationally, economically, and techni-cally realistic to proceed with a particular course of action. It shouldprovide a means of minimizing risks, clarifying issues and expectations,and improving the decision making process and the stages to follow.
Exhibit 2-4. The Stages of a Feasibility Study
DefineProject Scope
ActivityAnalysis
NeedsAnalysis
ConceptualModeling
Use CaseModeling
SelectOption
PlanAcquisition
Strategy
DevelopBusiness
Case
PackageFeasibility
Study
IdentifyOptions
IdentifyNonfunctionalRequirements
CuuDuongThanCong.com https://fb.com/tailieudientucntt

46
SOFTWARE ENGINEERING HANDBOOK
References and Further Reading
Allen, G.W. (1998). The position of the feasibility study in project management, (Online) Avail-able: http://www.dis.port.ac.uk/~allangw/papers/feas-stu.htm.
Anonymous. (1996). Feasibility study and initial assessment, (Online) Available: http://cyg-nus.uwa.edu.au/~belle/ScafEng/feasibil.htm.
Burch, J. G. (2000). Designing and implementing record keeping systems, (Online). Available:http://www.records.nsw.gov.au/publicsector/DIRKS/exposure_draft/feasibility_analysis.htm.
Curtis, G., Hoffer, J., George, J., and Valacich, J. (2000). Introduction to Business Systems Anal-ysis, Pearson Custom Publishing, Boston, 17, 19, 23, 25–229.
Kendall, K.E. and Kendall, J.E. (1999). Systems Analysis and Design, 4th ed., Prentice Hall, NewYork, 54–68.
Putnam, L. and Myers, W. (1997). How solved is the cost estimation problem? IEEE Software,14(6), 105–107.
Pressman, R.S. (2001). Software Engineering: a Practitioner’s Approach, 5th ed., McGraw Hill,New York, 117–118.
Robinson, P. (2002). Lyonsdale systems. Feasibility study, (Online) Available: http://mem-bers.iinet.net.au/~lonsdale/bm/bm21.htm.
Sauter, V. (2000). The feasibility study, (Online) Available: http://www.umsl.edu/~sauter/anal-ysis/deliverables.htm.
CuuDuongThanCong.com https://fb.com/tailieudientucntt
47
Chapter 3
Writing the Project Plan
In the beginning there was just code and nothing but code. The art of soft-ware engineering was just a blip on the horizon and project planning didnot even have a name. In the early days of software development, one per-son could carry out the whole process of requirement collection, analysis,designing, development, testing, and maintenance by himself. Of course,he did not recognize these processes as independent steps with the namesI have used.
As computers became ubiquitous software engineering, the “policiesand procedures” of developing computer systems became an important —and organized — discipline. Project planning became an indispensablepart of software engineering.
The project plan is the roadmap that details all of the components of asoftware engineering effort. It is a work product generated by the planningtasks in a software engineering process that contains detailed informationabout budgets, schedules, and processes. It necessarily addresses a broadaudience, including management, staff, and customers. For this purpose itshould be comprehensive but concise.
WHY WRITE A PROJECT PLAN?
Projects often go awry. A China Airlines Airbus took off from Taipei Inter-national Airport on April 26, 1994, and continued flying according to itsflight plan. While approaching Nagoya Airport for landing, the aircraftcrashed. On board were 271 persons: 256 passengers (including 2 infants)and 15 crew members, of whom 264 persons (249 passengers including 2infants and 15 crew members) were killed and 7 seriously injured. The air-craft ignited and was destroyed.
While the aircraft was making an approach under manual control by theflight officer, he inadvertently activated the GO lever, which caused the FD(flight director) to GO AROUND mode and caused a thrust increase. Thismade the aircraft deviate above its normal glide path, which, in turn led to
CuuDuongThanCong.com https://fb.com/tailieudientucntt

48
SOFTWARE ENGINEERING HANDBOOK
the chain of events that ultimately caused the airplane to stall and thencrash.
Computers are increasingly being introduced into safety-critical sys-tems and, as a consequence, have been involved in more than a few acci-dents. Some of the most widely cited software-related accidents in safety-critical systems have involved a computerized radiation therapy machinecalled the Therac-25. Between June, 1985, and January, 1987, six knownaccidents involved massive overdoses by the Therac-25 — with resultantdeaths and serious injuries. They have been described as the worst seriesof radiation accidents in the 35-year history of medical accelerators.
Software disasters like these could have been avoided had the softwarebeen designed and tested properly. Productivity and quality oriented soft-ware design cannot be accomplished without adequate project planning.
A realistic project plan must be developed at the beginning of a project.It must be monitored during the project and modified, if necessary. Ulti-mately, a project plan is a vehicle and focal point that enables the projectmanager to carry out all sorts of project management activities. It providesa roadmap for a successful software project.
WHO WRITES THE PROJECT PLAN?
The project manager or team leader normally writes the project plan,although experienced consultants are often called in for this aspect of theproject. In truth, there are as many ways to write a project plan as there arecompanies that write them. If the project is large, the proposed systemmight be divided into subsystems — each with its own team. Each teamleader may need to write his own part of the project plan. The project man-ager then compiles each subplan into a plan for the whole project.
Another alternative is to divide the project plan into discrete tasks andparcel out the effort to team members. Appendix F contains a sampleproject plan. As you can see from its table of contents, it is easily divisible.
WHAT GOES INTO THE PROJECT PLAN?
Pressman (2001) has defined the prototypical project plan. A studentimplementation of this guideline can be found in Appendix F; the reader isdirected there for a concrete example of how a project plan is orchestrated.
The first section introduces the system and describes its purpose. Theproject scope and objectives need to be defined here. This subsection con-tains a formal statement of scope, description of major functions, concernson performance issues, and a list of management and technical constraints.
The second section discusses project estimates and resources. Histor-ical data used for estimates needs to be specified, as do estimation
CuuDuongThanCong.com https://fb.com/tailieudientucntt
49
Writing the Project Plan
techniques. As a result of the estimation process, the estimates of effort,cost, and duration need to be reported here. Resources are required to bediscussed in terms of people and minimal hardware and softwarerequirements.
The third section discusses risk management strategy. A risk tableneeds to be created at first, followed by more detailed discussions on risksto be managed. Based on that, a risk mitigation, monitoring, and manage-ment (contingency) plan needs to be created for each risk that has beenaddressed.
The fourth section is an actual project schedule in terms of deliverablesand milestones. A project work breakdown structure, or WBS, needs to becreated, followed by a task network and a timeline chart (Gantt chart). Inaddition, a resource table describes the demand for and availability ofresources by time windows. In a WBS the total task is broken down intoseries of smaller tasks. The smaller tasks are chosen based on size andscope to fit in the management structure of the project. Therefore, efficientplanning and execution are possible.
The fifth section discusses staff organization. Usually a project is carriedout by a group of people and therefore a team structure needs to be definedand a management reporting relationship specified.
The sixth section lays out a picture on tracking and control mecha-nisms. It can be divided into two subsections: quality assurance and con-trol and change management and control.
At the end of the project plan, all supporting materials that do not fit intothe body of the document can be attached in the appendices section.
Most project managers have a difficult time writing a project planbecause it is often required at project inception, which, unfortunately, iswhen information is most scarce. The project manager must choose a pro-cess model most appropriate for the project, and then define a preliminaryplan based on the set of common process framework activities. The possi-ble models include linear sequential model, prototyping model, RAD model(Mantei, 1991), incremental model (McDermid and Rook, 1993), spiralmodel, etc. — many of which are described in other chapters of this hand-book. Afterward, process decomposition (partitioning) is carried out, gen-erating a complete plan reflecting the work tasks required to populate theframework activities.
THE PROJECT PLAN UNWRAPPED
Software Scope
Determination of software scope needs to be ascertained first. Oneestablishes software scope by answering questions about context,
CuuDuongThanCong.com https://fb.com/tailieudientucntt
50
SOFTWARE ENGINEERING HANDBOOK
information objectives, function, performance, and reliability. The contextusually includes hardware, existing software, users, and work procedures.Normally a system specification developed by a system analyst suppliesthe information necessary to bound the scope.
Techniques like question and answer sessions and FAST (facilitatedapplication specification techniques) can be used to gather requirementsand establish project scope (Zahniser, 1990).
The following is a minimum that needs to be ascertained:
• Major functions are the customers’ requirements as to what the soft-ware should be able to do.
• Performance issues are about speed, response time, and other perfor-mance-related requirements. They can have serious impacts on the re-quirement of effort and therefore should be clarified here.
• Management and technical constraints should be listed as foundationfor the next section’s estimation.
Project Estimates
Estimation is the one activity that lays a foundation for all other projectplanning activities. However, a project manager should not be overly manicin estimation. If an iterative process model is adopted, it is possible torevisit and revise the estimates when customer requirements change.
Historical Data Used for Estimates. Historical data is key to a good esti-mation. The availability of reliable historical software metrics from previ-ous projects assists the project planner in translating the product size esti-mation into effort, time and cost estimations. Baseline productivitymetrics (e.g., LOC (lines of code) or FP (function points)) should be storedby project domain for use in future estimation efforts.
Estimation Techniques. If similar projects have already been completed,estimates can easily be based on that available data. Otherwise, a decom-position technique or an empirical model can be used. There are also soft-ware tools that automate the process using the two preceding approaches.At least two estimation methods should be used, with the final estimationa triangulation of the two. Even so, common sense and experience shouldbe the ultimate judge.
In the example provided in Appendix F two estimation methodologiesare used:
• Process based where the system is decomposed into discrete taskssuch as analysis of the user interface and design of the user interfacewith an estimated amount of time allocated to each. For the online
CuuDuongThanCong.com https://fb.com/tailieudientucntt
51
Writing the Project Plan
resource scheduling system the process-based estimate was 7.5 per-son months.
• LOC, or line of code, estimation is much harder to estimate manually.A tool such as COCOMO (an abbreviation of cost construction model)makes the effort much easier. A wealth of information as well as a freeversion of the COCOMO automated tool can be found on the CSE cen-ter for software engineering web site (http://sunset.usc.edu/re-search/COCOMOII/index.html).
COCOMO II is a model that allows one to estimate the cost, effort, andschedule when planning a software developmental activity. It is based onthe original COCOMO model devised by Dr. Barry Boehm in 1981. TheCOCOMO II model is actually derived from the following original mathe-matical formula that is described in the second half of this book:
m = c1 * KLOCa*PROD[f i]
COCOMO II permits the estimator to estimate a project cost in terms ofLOC or function points (FP). FP calculation is quite complex; a chapterexplaining function points can be found in this section.
Exhibit 3-1 shows the COCOMO II tool set in action. Although a bit cum-bersome — the nonfree COCOMO tools are much more user friendly — thefree version is quite functional. In this real-world example, I used COCOMOto estimate the cost of building an Internet gaming system using the LOCoption (see module size). If you look down at the bottom of the screen shot,you will notice three estimates: optimistic, most likely and pessimistic. TheCOCOMO tool set has many features. I would recommend that you down-load this tool and try it out.
Thus, the planner first needs to estimate the size of the product to bebuilt, and then translate the size estimate into human effort, calendar time,and dollars.
Decomposition Techniques
According to Putnam and Myers (1992), several approaches can be usedto handle the project sizing problem: “fuzzy-logic” sizing, which usesapproximate reasoning technique as in the art of “guestimating,” functionpoint sizing, standard component sizing (i.e., modules, screens, reports,etc.), and change sizing, which is used in estimating the size of an effort tomodify an existing system.
Problem-based estimation techniques include FP- and LOC-based esti-mation, which we just discussed. Both require the project planner todecompose the software into problem functions that can be estimated indi-vidually. Then the project planner estimates LOC or FP (or other estima-tion variable) for each function and applies the baseline productivity
CuuDuongThanCong.com https://fb.com/tailieudientucntt
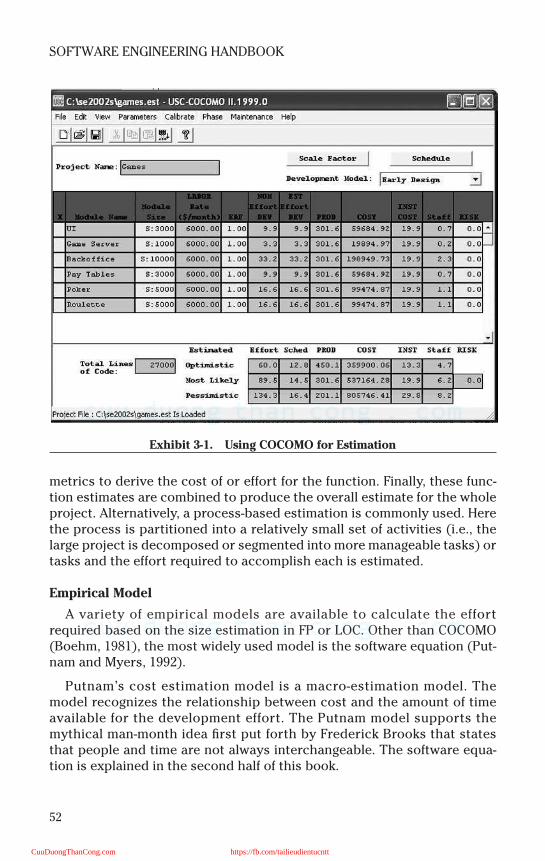
52
SOFTWARE ENGINEERING HANDBOOK
metrics to derive the cost of or effort for the function. Finally, these func-tion estimates are combined to produce the overall estimate for the wholeproject. Alternatively, a process-based estimation is commonly used. Herethe process is partitioned into a relatively small set of activities (i.e., thelarge project is decomposed or segmented into more manageable tasks) ortasks and the effort required to accomplish each is estimated.
Empirical Model
A variety of empirical models are available to calculate the effortrequired based on the size estimation in FP or LOC. Other than COCOMO(Boehm, 1981), the most widely used model is the software equation (Put-nam and Myers, 1992).
Putnam’s cost estimation model is a macro-estimation model. Themodel recognizes the relationship between cost and the amount of timeavailable for the development effort. The Putnam model supports themythical man-month idea first put forth by Frederick Brooks that statesthat people and time are not always interchangeable. The software equa-tion is explained in the second half of this book.
Exhibit 3-1. Using COCOMO for Estimation
CuuDuongThanCong.com https://fb.com/tailieudientucntt
53
Writing the Project Plan
The results of these estimation techniques are estimates of effort, cost,and duration. They, in turn, are used in other sections of the project plan.
Risk Management Strategy
A proactive risk strategy should always be adopted. It is better to planfor possible risk than to need to react to it in a crisis. Software risks includeproject risks, technical risks, and business risks; they can also be catego-rized as known, predictable, or unpredictable risks. First, risks need to beidentified. One method is to create a risk item checklist. The sampleproject plan in Appendix F lists the following risks:
• Customer will change or modify requirements• Lack of sophistication of end users• Users will not attend training• Delivery deadline will be tightened• End users resist system• Server may not be able to handle larger number of users simultaneously• Technology will not meet expectations• Larger number of users than planned• Lack of training of end users• Inexperienced project team• System (security and firewall) will be hacked
Then risks need to be projected in two dimensions: likelihood and con-sequences. This section can be a separate RMMM (risk, mitigation, moni-toring, and management) plan and used as part of the overall project plan.
Risk Table. A risk table is a simple tool for risk projection. First, basedon the risk item checklist, list all risks in the first column of the table. Thenin the following columns fill in each risk’s category, probability of occur-rence, and assessed impact. Afterward, sort the table by probability andthen by impact, study it, and define a cut-off line.
Discussion of Risks to Be Managed. All risks above the cut-off line mustbe managed and discussed. Factors influencing their probability andimpact should be specified.
RMMM Plan for Each Risk. A risk mitigation plan is a tool that can help inavoiding risks. Causes of the risks must be identified and mitigated. Riskmonitoring activities take place as the project proceeds and should beplanned early. Risk management — i.e., the contingency plan — is a list ofactivities that are put into action in the event a risk is realized. A planshould be created well before that.
CuuDuongThanCong.com https://fb.com/tailieudientucntt
54
SOFTWARE ENGINEERING HANDBOOK
Schedules
Before drafting a schedule several things need to be done. The projectmanager needs to first decide the type of the project from four choices:concept development, new application development, application enhance-ment, and re-engineering projects. Then the project manager needs to com-pute a task set selector value (Pressman, 2001) by: 1) grading the projectfor a set of adaptation criteria including its size, requirements, and con-straints, 2) assigning weighting factors to each criterion, 3) multiplying thegrade by weighting factors and by the entry point multiplier for the type ofthe project, and 4) computing the average of all results in the previousstep. Based on this average value, the project manager can choose thedegree of rigor required for the project from four options: casual, struc-tured, strict, and quick reaction. Afterward, the task set can be decided anddistributed on the project time line based on the process model choice: lin-ear sequential, iterative, or evolutionary.
A sample from the schedule created for use in Appendix F appears inExhibit 3-2.
Project tasks, also known as project work breakdown structure (WBS)are now defined as shown in Exhibit 3-3.
Alternatively, a textual WBS can be created as shown in Exhibit 3-4.
Task Network. Interdependencies among tasks are defined using a tasknetwork as shown in Exhibit 3-5. A task network is also known as an activitynetwork because it shows all of the activities for the project — and eachactivity’s dependencies. In Exhibit 3-5, task 1.1 must be completed prior toinitiation of task 1.2, and so on. A variety of automated tools implementingprogram evaluation and review technique (PERT) and critical path method(CPM) (Moder et al., 1983) can be used for project scheduling.
DuPont developed the CPM for use in chemical plants. The objective isto determine the trade-off between project duration and the total projectcost, which is accomplished by identifying the critical path through activitynetwork. The critical path can help management to change the duration ofthe project. In CPM, an activity time is assumed to be known or predictable.
Project evaluation and review technique was developed by the Navywhen the Polaris missile was designed. When accurate time estimates arenot available, PERT is an ideal tool for Project Planning since it uses prob-ability theory.
Exhibit 3-2. Project Work Breakdown Structure
Activities Deliverable From Date To Date Milestone
Meetings Weekly meetings 02/04/02 05/07/02 05/07/02
CuuDuongThanCong.com https://fb.com/tailieudientucntt
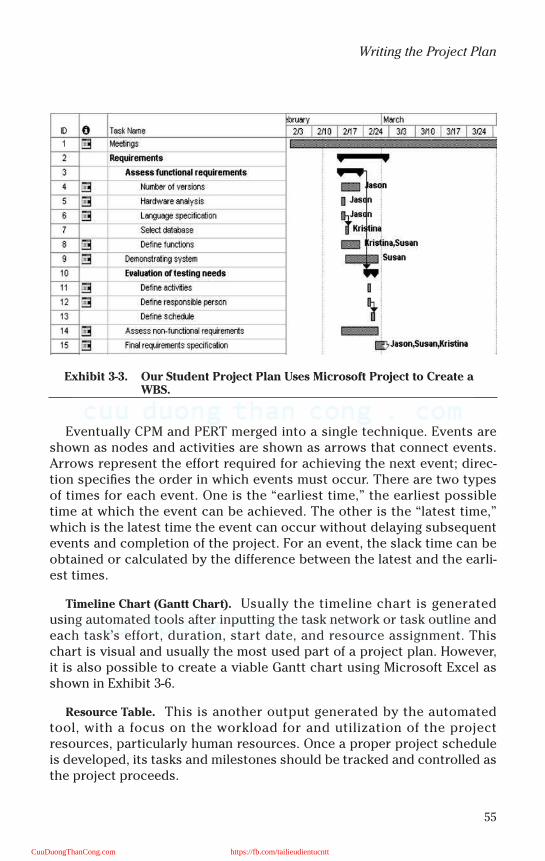
55
Writing the Project Plan
Eventually CPM and PERT merged into a single technique. Events areshown as nodes and activities are shown as arrows that connect events.Arrows represent the effort required for achieving the next event; direc-tion specifies the order in which events must occur. There are two typesof times for each event. One is the “earliest time,” the earliest possibletime at which the event can be achieved. The other is the “latest time,”which is the latest time the event can occur without delaying subsequentevents and completion of the project. For an event, the slack time can beobtained or calculated by the difference between the latest and the earli-est times.
Timeline Chart (Gantt Chart). Usually the timeline chart is generatedusing automated tools after inputting the task network or task outline andeach task’s effort, duration, start date, and resource assignment. Thischart is visual and usually the most used part of a project plan. However,it is also possible to create a viable Gantt chart using Microsoft Excel asshown in Exhibit 3-6.
Resource Table. This is another output generated by the automatedtool, with a focus on the workload for and utilization of the projectresources, particularly human resources. Once a proper project scheduleis developed, its tasks and milestones should be tracked and controlled asthe project proceeds.
Exhibit 3-3. Our Student Project Plan Uses Microsoft Project to Create a WBS.
CuuDuongThanCong.com https://fb.com/tailieudientucntt
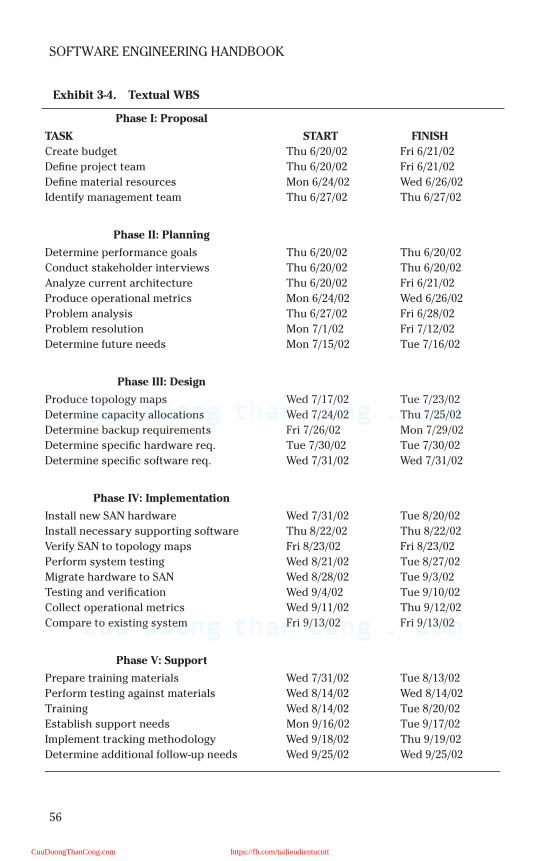
56
SOFTWARE ENGINEERING HANDBOOK
Exhibit 3-4. Textual WBS
Phase I: Proposal
TASK START FINISH
Create budget Thu 6/20/02 Fri 6/21/02
Define project team Thu 6/20/02 Fri 6/21/02
Define material resources Mon 6/24/02 Wed 6/26/02
Identify management team Thu 6/27/02 Thu 6/27/02
Phase II: Planning
Determine performance goals Thu 6/20/02 Thu 6/20/02
Conduct stakeholder interviews Thu 6/20/02 Thu 6/20/02
Analyze current architecture Thu 6/20/02 Fri 6/21/02
Produce operational metrics Mon 6/24/02 Wed 6/26/02
Problem analysis Thu 6/27/02 Fri 6/28/02
Problem resolution Mon 7/1/02 Fri 7/12/02
Determine future needs Mon 7/15/02 Tue 7/16/02
Phase III: Design
Produce topology maps Wed 7/17/02 Tue 7/23/02
Determine capacity allocations Wed 7/24/02 Thu 7/25/02
Determine backup requirements Fri 7/26/02 Mon 7/29/02
Determine specific hardware req. Tue 7/30/02 Tue 7/30/02
Determine specific software req. Wed 7/31/02 Wed 7/31/02
Phase IV: Implementation
Install new SAN hardware Wed 7/31/02 Tue 8/20/02
Install necessary supporting software Thu 8/22/02 Thu 8/22/02
Verify SAN to topology maps Fri 8/23/02 Fri 8/23/02
Perform system testing Wed 8/21/02 Tue 8/27/02
Migrate hardware to SAN Wed 8/28/02 Tue 9/3/02
Testing and verification Wed 9/4/02 Tue 9/10/02
Collect operational metrics Wed 9/11/02 Thu 9/12/02
Compare to existing system Fri 9/13/02 Fri 9/13/02
Phase V: Support
Prepare training materials Wed 7/31/02 Tue 8/13/02
Perform testing against materials Wed 8/14/02 Wed 8/14/02
Training Wed 8/14/02 Tue 8/20/02
Establish support needs Mon 9/16/02 Tue 9/17/02
Implement tracking methodology Wed 9/18/02 Thu 9/19/02
Determine additional follow-up needs Wed 9/25/02 Wed 9/25/02
CuuDuongThanCong.com https://fb.com/tailieudientucntt
57
Writing the Project Plan
Project Resources
Estimation of resources required is an important component of softwareplanning. For each resource the planner needs to specify with these char-acteristics: description, statement of availability, and time window.
• People: the planner needs to specify the organizational position andspecialty of human resources required by the project. Only after esti-mating the development effort can we define the number of peoplerequired.
• Hardware and software: hardware and software form the foundation ofthe software engineering environment (Naur and Randall, 1969). Theproject planner must determine its time window and verify its avail-ability. Reusable software components should also be specified, alter-natives evaluated, and acquisition made early.
• Special resources: any other resources not covered in the previous twosections should be listed here.
• Staff organization: people are the critical factor in a software develop-ment effort. In a typical software project, the players fall into five cat-egories: senior managers, project (technical) managers, practitioners,customers, and end users. A good team leader should be able to moti-vate other players, organize the process, and innovate or encouragepeople to be creative.
• Team structure (if applicable): a project manager should decide on theorganizational structure for the team. According to Mantei (1981),these three generic team organizations exist: democratic decentral-ized (DD), controlled decentralized (CD), and controlled centralized(CC). The factors that influence the team structure decision include:difficulty of the problem, size of the resultant programs, team lifetime,problem modularity, criticality of the solution, rigidity of timeline, andcommunications required. Generally speaking, a DD structure is bestfor difficult problems and a CC or CD structure is best for very largeprojects.
• Management reporting: coordination and communication issues, in-cluding management reporting relationships, should be addressedhere.
Tracking and Control Mechanisms
This may be the last section, but not the least important. Errors andchanges are inevitable, and we need to plan ahead to stay prepared forwhen they actually happen.
• Quality assurance and control: software quality assurance activities(SQA) happen at each step of the software process and are carried outby software engineers and an SQA group. Software engineers assurequality by applying rigorous technical methods and measures, and
CuuDuongThanCong.com https://fb.com/tailieudientucntt
58
SOFTWARE ENGINEERING HANDBOOK
conducting formal technical reviews and well-planned testing. SQAgroup assists software engineers through a set of activities that ad-dress quality assurance planning, oversight, record keeping, analysis,and reporting. We need to plan these activities in this subsection.
• Change management and control: the later the changes happen in aproject, the higher the cost. Change control combines human proce-dures and automated tools to provide a mechanism for the control ofchanges that, if uncontrolled, can rapidly lead a large project to chaos.The change control process begins with a change request, leads to adecision to make or reject the request, and culminates with a con-trolled update of the software configuration item to be changed. Thispart of the activities should be planned here.
Appendices
Any supporting materials to the preceding sections should be attachedin this section.
IS IT WORTH IT?
Like any other software engineering task, project planning and writing adetailed project plan take time and costs money. Therefore a natural ques-tion arises: is it worth it? The answer is yes. If you want a system that iscost effective, does not go over budget, and actually works, a project planis mandatory.
More than a few people in this field use the “roadmap” metaphor todescribe the role of a project plan; however, it is also a “compass.” Its esti-mation and scheduling part may be like a rough roadmap (never preciseenough at the beginning of a project), but its risk management, organiza-tion plan, tracking, and control part are definitely a compass. It guides theproject team in handling unpredictable risks or undesired events.
A good project plan benefits not only the project, but also the domain aswhole by its measures and metrics, which can be historical data for laterprojects.
References
Boehm, B. (1981). Software Engineering Economics, Prentice-Hall, New York.
Kerr, J. and Hunter, R. (1994). Inside RAD, McGraw-Hill, New York.
Mantei, M. (1981). The effect of programming team structures on programming tasks, CACM,24, 106–113.
McDermid, J. and Rook, P., Eds. (1993). Software development process models, in Software En-gineer’s Reference Book, CRC Press, Boca Raton, FL, 28–66.
Moder, J.J., Phillips, C.R., and Davis, E.W. (1983). Project Management with CPM, PERT and Pre-cedence Diagramming, 3rd ed., Van Nostrand Reinhold, New York.
CuuDuongThanCong.com https://fb.com/tailieudientucntt
59
Writing the Project Plan
Naur, P. and Randall, B., Eds. (1969). Software Engineering: a Report on a Conference Sponsoredby the NATO Science Committee, NATO.
Pressman, R. (2001). Software Engineering, a Practitioner’s Approach, 5th ed., McGraw Hill, NewYork.
Putnam, L. and Myers, W. (1992). Measures for Excellence, Yourdon Press, New York.
CuuDuongThanCong.com https://fb.com/tailieudientucntt

This page intentionally left blank
CuuDuongThanCong.com https://fb.com/tailieudientucntt
61
Chapter 4
Requirements Elicitation
Without proper information it is difficult, if not impossible, to define orstart a systems development project. Information gathered in this processis called requirements elicitation; it will enable the project manager or ana-lyst to create a blueprint of current systems and allow definition of objec-tives, description of processes, and deployment of objectives for the newsystem. In addition, if the systems analyst is careful, he can lay the founda-tion of efficient and effective communications with stakeholders that willlead to a higher likelihood of a successful project.
STAKEHOLDER ANALYSIS
Stakeholders are the people needed to ensure the success of theproject, for example, daily users and their managers, as well as technicalsupport people. It is important to find all the stakeholder groups anddetermine their interests and needs. The first step, then, in requirementselicitation is stakeholder analysis in which you try to find answers to thefollowing questions:
• Who are the stakeholders?• What goals do they see for the system?• Why would they like to contribute?• What risks and costs do they see?• What kind of solutions and suppliers do they see?
Stakeholders could be:
• The sponsor who pays for the development of the product• People who will be using the product on a daily basis• Managers of departments looking to increase work force efficiency• The company’s customers (clients of the system), without whose sup-
port there will be no business advantages• Business partners: suppliers, carriers, and banks that also need to in-
teract with the system• IT people and hotline staff in case the product is to be developed with-
in the company• IT people at the client’s site
CuuDuongThanCong.com https://fb.com/tailieudientucntt
62
SOFTWARE ENGINEERING HANDBOOK
Stakeholders should be carefully interviewed (Curtis et al., 2000) to:
• Define financial constraints• Define the current and proposed information systems• Define current and proposed development process• Define current and proposed hardware assets and availability• Define current and proposed software assets and availability• Define current and future goals and objectives of the stakeholders
Information gathered from the financial constraints will allow examina-tion of realistic designs and eliminate unnecessary expenditures ofresources on unrealistic approaches. One must also know the currentinformation systems in place and hardware assets as well as the currentsoftware assets available within the company. It is also critical that thedevelopment team fully understand the current development methodolo-gies and tool sets that the company utilizes. The goals and objectives of theinformation gathering process are to be able to accumulate enough infor-mation to define all of these items as well as the goals of the stakeholders.
ELICITATION TECHNIQUES
Various methods can be used to obtain the information necessary toprepare a project plan. These methods include interviewing, question-naires, observation, participation, documentation, research, businessintelligence (BI), competitive intelligence (CI), reverse engineering, andbenchmarking.
Interviewing
The most common method of gathering information is by interviewingpeople. Interviewing can serve two purposes at the same time. The first isa fact-finding mission to discover what each person’s goals and objectivesare with respect to the project; the second is to begin a communicationsprocess that enables one to set realistic expectations for the project.
A wide variety of stakeholders can and should be interviewed. Stake-holders are those with an interest in seeing this project successfully com-pleted — i.e., they have a “stake” in the project. As discussed earlier, stake-holders include employees, management, clients, and partners.
Employees. It is amazing to me that some analysts develop systemswithout ever interviewing those whose jobs will be affected the most. Thisoccurred most notably at the U.S. Post Office when the clerical staff wasautomated in the 1980s. So little information was shared about what thenew system was going to do that the clerks got the misimpression that theywere soon to be replaced.
CuuDuongThanCong.com https://fb.com/tailieudientucntt
63
Requirements Elicitation
The number and type of employees that will need to be interviewed willdepend on the type of system being developed. Systems generally fall intotwo categories: tactical and strategic. Tactical systems are usually transac-tional-based systems such as check processing, student registration, andmedical billing where data volumes are high and staff members accessingthose systems are clerical. Strategic systems support the decision makingprocess and are utilized by middle and senior managers. It is possible fora system to be a hybrid of both these system types. An example of thiswould be a transactional back end that collects data for analysis by man-agers at the front end.
Interviews can have some major obstacles to overcome. The inter-viewee may resist giving information out of fear, may relate his perceptionof how things should be done rather than how they are really done, or mayhave difficulty in expressing himself. On the other hand, the analyst’s ownmindset may also act as a filter. The interviewer sometimes needs to setaside his own technical orientation and make a strong effort to put himselfin the position that the interviewee is in. This requires that the analystdevelop a certain amount of empathy.
An interview outline should contain the following information:
• Name of interviewee• Name of interviewer• Date and time• Objectives of interview — i.e., what areas you are going to explore and
what data you are going to collect• General observations• Unresolved issues and topics not covered• Agenda — i.e., introduction, questions, summary of major points,
closing
Recommended guidelines for handling the employee interview processinclude:
• Determine the system type (tactical, strategic, hybrid).• Make a list of departments affected by the new system.• For each department, request or develop an organization chart that
shows the departmental breakdown along with the name, extension,and list of responsibilities of each employee.
• Meet with the department head to request recommendations and thenformulate a plan that details which employees are the best interviewprospects. The “best” employees to interview are those: 1) who arevery experienced (i.e., senior) in performing their job functions;2) who may have come from a competing company and, thus, have aunique perspective; 3) who have had a variety of positions within thedepartment or company.
CuuDuongThanCong.com https://fb.com/tailieudientucntt
64
SOFTWARE ENGINEERING HANDBOOK
• Plan to meet with employees from all units of the department. In otherwords, if you are automating the marketing function and interviewingthe marketing department, you will want to meet with employees fromthe marketing communications unit, marketing research unit, publicrelations group, etc. In some cases, you may find that interviewing sev-eral employees at a time is more effective than dealing with a singleemployee because interviewing a group of employees permits them tobounce ideas off each other.
• If a departmental unit contains many employees, it is not optimum tointerview every one. It would be wrong to assume that the more peo-ple in a department, the higher the number of interviewees should be.Instead, sampling should be used. Sampling is used to: 1) containcosts; 2) improve effectiveness; 3) speed up the data-gathering pro-cess; 4) reduce bias. Systems analysts often use a random sample;however, calculating a sample size based on population size and yourdesired confidence interval is more accurate. Rather than provide aformula and instructions on how to calculate sample size here, I directthe reader to the sample size calculator located at http://www.survey-system.com/sscalc.htm.
• Carefully plan your interview sessions. Prepare your interview ques-tions in advance. Be familiar with any technical vocabulary your inter-view subjects might use.
• No meeting should last longer than an hour. A half hour is optimum.There is a point of diminishing returns with the interview process.Your interviewees are busy and usually easily distracted. Keep inmind that some of your interviewees may be doing this against theirwill.
Customers. If the new or modified system will be affecting customers inany way, one should interview several customers to obtain their impres-sions of the current process and what features would be desirable. Thisinformation can be very enlightening. Often customers just live with thefrustrations and never mention them to anyone at the company. Custom-ers often have experiences with other vendors or suppliers and can offerinsight into the processes that other companies use or that they haveexperienced.
Guidelines for interviewing customers include:
• Work with the sales and marketing departments to select knowledge-able and cooperative customers.
• Prepare an adequate sample size as discussed in the prior section.• Carefully plan your interview sessions. Prepare your interview ques-
tions in advance.
CuuDuongThanCong.com https://fb.com/tailieudientucntt
65
Requirements Elicitation
Companies and Consultants. Another source of potentially valuableinformation is other companies in the industry and consultants who spe-cialize in the areas that will change with the new processes. Consultantscan be easily located and paid for their expert advice, but it is wise to treadslowly when working with other companies who are current or potentialcompetitors.
Guidelines for interviewing other companies include:
• Work with senior management and marketing to create a list of poten-tial companies to interview. This list should contain the names of trad-ing partners, vendors (companies that your company buys from), andcompetitors.
• Attend industry trade shows to meet and mingle with competitor em-ployees and listen to speeches made by competitive companies.
• Attend trade association meetings; sit on policy and standardscommittees.
Suppliers. Suppliers of the products you are considering are also animportant source of ideas for the problem you are facing. These suppliersknow a great deal about how their product has been used and how prob-lems have been overcome in different systems. They can also give you along list of features they provide.
Types of Questions. When interviewing anyone it is important to beaware of how to ask questions properly. Open-ended questions are best forgaining the most information because they do not limit individuals to pre-defined answers. Other benefits of using open-ended questions are that it:puts the interviewee at ease, provides more detail, induces spontaneity,and is far more interesting for the interviewee. Open-ended questionsrequire more than a yes or no answer (Yate, 1993). An example of an open-ended question is “What types of problems do you see on a daily basis withthe current process?” These questions allow individuals to elaborate onthe topics and potentially uncover the hidden problems at hand that mightnot be discoverable with a question that requires a yes or no answer.
Often one starts a systems development effort with the intention of solv-ing a problem that turns out to be a symptom of a larger problem. If theexamination of problems leads to the underlying issues, the resolution ofthose issues will be more valuable to the company in the end. Many symp-toms are a result of the same problem, and a simple change can fix manyissues at once. One disadvantage of open-ended questions is that they cre-ate lengthier interviews. Another is that it is easy for the interview to getoff track and it takes an interviewer with skill to maintain the interview inan efficient manner (Yates, 1993).
CuuDuongThanCong.com https://fb.com/tailieudientucntt
66
SOFTWARE ENGINEERING HANDBOOK
Closed-ended questions are, by far, the most common questions in inter-viewing. They are questions that have yes and no answers and are utilizedto elicit definitive responses.
Past-performance questions can be useful to determine past experi-ences with similar problems (Yates, 1993). Often interviewees are reluctantto discuss problems so questions about past-performance can allow theperson to discuss an issue with similar problems. An example of how apast-performance question is used is, “In your past job how did you dealwith these processes?”
Reflexive questions are appropriate for closing a conversation or mov-ing forward to a new topic (Yates, 1993). Reflexive questions are createdwith a statement of confirmation and adding a phrase such as: Don’t you?Couldn’t you? Wouldn’t you?
Mirror questions are a subtle form of probing and are useful in obtainingadditional detail on a subject. After the interviewee makes a statement,pause and repeat the statement with an additional or leading question: “So,when this problem occurs, you simply move on to more pressing issues?”
Often answers do not give the interviewer enough detail so one followsthe question with additional questions to prod the interviewee to divulgemore details on the subject. For example:
• Can you give some more details on that?• What did you learn from that experience?
Another, more subtle, prodding technique can be used by merely sittingback and saying nothing. The silence will feel uncomfortable causing theinterviewee to expand on his or her last statement.
Questionnaires and Surveys
If large numbers of people need to be interviewed, one might start witha questionnaire and then follow up with certain individuals that presentunusual ideas or issues in the questionnaires. Survey development andimplementation is composed of the following tasks, according to CreativeResearch Systems, makers of a software solution for survey creation (sur-veysolutions.com):
• Establish the goals of the project — what you want to learn.• Determine your sample — whom you will interview.• Choose interviewing methodology — how you will interview.• Create your questionnaire — what you will ask.• Pretest the questionnaire, if practical — test the questions.• Conduct interviews and enter data — ask the questions.• Analyze the data — produce the reports.
CuuDuongThanCong.com https://fb.com/tailieudientucntt
67
Requirements Elicitation
Similar to interviews, questionnaires may contain closed-end or open-ended questions or a combination of the two.
Appendix H contains a survey that was created for a Y2K software prod-uct. This survey demonstrates the use of a hybrid questionnaire. Althoughmost of the questions are quite specific, and thus closed-ended, there areat least two open-ended questions. Questions 6 and 8 under the heading of“management aspects” permit the respondent to reply to an essay type ofquestion.
Survey creation is quite an art form. Guidelines for creation of a surveyinclude:
• Provide an introduction to the survey. Explain why it is important torespond to it. Thank participants for their time and effort.
• Put all important questions first because it is rare that all questionswill be responded to. Those filling out the survey often become tiredof or bored with the process.
• Use plenty of “white space.” Use an appropriate font (i.e., Arial) andfont size (i.e., at least 12), and do skip lines.
• Use nominal scales if you wish to classify things (i.e., What make isyour computer? 1 = Dell, 2 = Gateway, 3 = IBM).
• Use ordinal scales to imply rank (i.e., How helpful was this class?3 = not helpful at all, 2 = moderately helpful, 1 = very helpful).
• Use interval scales when you want to perform some mathematical cal-culations on the results; i.e.:
How helpful was this class?Not useful at all Very useful1 2 3 4 5
Tallying the responses will provide a “score” that assists in makinga decision that requires the use of quantifiable information. Whenusing interval scales, keep in mind that not all questions will carrythe same weight. Hence, it is a good idea to use a weighted averageformula during calculation. To do this, assign a “weight” or level ofimportance to each question. For example, the preceding questionmight be assigned a weight of 5 on a scale of 1 to 5, meaning thatthis is a very important question. On the other hand, a questionsuch as “Was the training center comfortable” might carry aweight of only 3. The weighted average is calculate by multiplyingthe weight by the score (w * s) to get the final score. Thus the for-mula is
snew = w * s.
Several problems might result from a poorly constructed questionnaire.Leniency is caused by respondents who grade nonsubjectively — in other
CuuDuongThanCong.com https://fb.com/tailieudientucntt
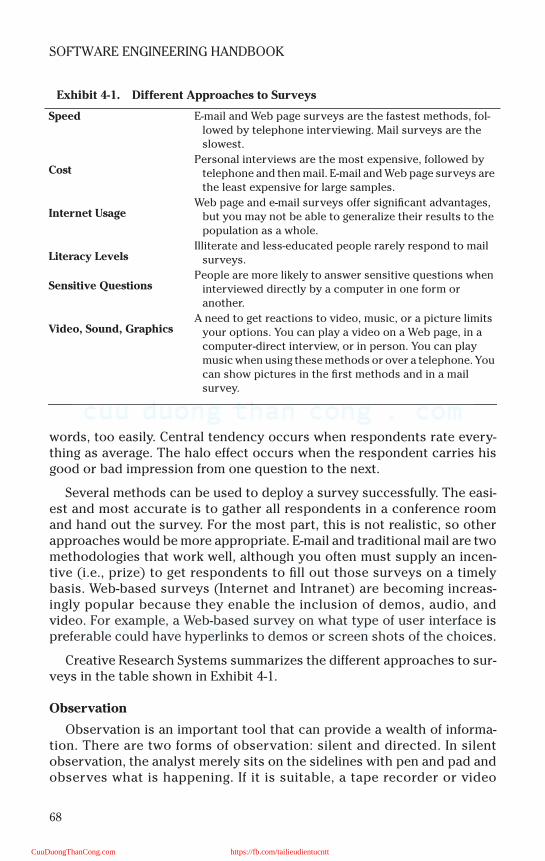
68
SOFTWARE ENGINEERING HANDBOOK
words, too easily. Central tendency occurs when respondents rate every-thing as average. The halo effect occurs when the respondent carries hisgood or bad impression from one question to the next.
Several methods can be used to deploy a survey successfully. The easi-est and most accurate is to gather all respondents in a conference roomand hand out the survey. For the most part, this is not realistic, so otherapproaches would be more appropriate. E-mail and traditional mail are twomethodologies that work well, although you often must supply an incen-tive (i.e., prize) to get respondents to fill out those surveys on a timelybasis. Web-based surveys (Internet and Intranet) are becoming increas-ingly popular because they enable the inclusion of demos, audio, andvideo. For example, a Web-based survey on what type of user interface ispreferable could have hyperlinks to demos or screen shots of the choices.
Creative Research Systems summarizes the different approaches to sur-veys in the table shown in Exhibit 4-1.
Observation
Observation is an important tool that can provide a wealth of informa-tion. There are two forms of observation: silent and directed. In silentobservation, the analyst merely sits on the sidelines with pen and pad andobserves what is happening. If it is suitable, a tape recorder or video
Exhibit 4-1. Different Approaches to Surveys
Speed E-mail and Web page surveys are the fastest methods, fol-lowed by telephone interviewing. Mail surveys are the slowest.
CostPersonal interviews are the most expensive, followed by
telephone and then mail. E-mail and Web page surveys are the least expensive for large samples.
Internet UsageWeb page and e-mail surveys offer significant advantages,
but you may not be able to generalize their results to the population as a whole.
Literacy LevelsIlliterate and less-educated people rarely respond to mail
surveys.
Sensitive QuestionsPeople are more likely to answer sensitive questions when
interviewed directly by a computer in one form or another.
Video, Sound, GraphicsA need to get reactions to video, music, or a picture limits
your options. You can play a video on a Web page, in a computer-direct interview, or in person. You can play music when using these methods or over a telephone. You can show pictures in the first methods and in a mail survey.
CuuDuongThanCong.com https://fb.com/tailieudientucntt

69
Requirements Elicitation
recorder can record what is observed. However, this is not recommendedif the net result will be several hours of random footage.
Silent observation is best used to capture the spontaneous nature of aparticular process or procedure. For example:
• When customers will be interacting with staff• During group meetings• On the manufacturing floor• In the field
Directed observation provides the analyst with a chance to microcon-trol a process or procedure so that it is broken down into its observableparts. At one accounting firm a tax system was being developed. The ana-lysts requested that several senior tax accountants be coupled with a jun-ior staff member. The group was given a problem as well as all of the man-uals and materials needed. The junior accountant sat at one end of thetable with the pile of manuals and forms while the senior tax accountantssat at the other end. A tough tax problem was posed. The senior taxaccountants were directed to think through the process and then directthe junior member to follow through on their directions to solve this prob-lem. The catch was that the senior members could not walk over to the jun-ior person or touch any of the reference guides. This whole exercise had tobe verbal and use just their memories and expertise. The entire processwas videotaped. The net result was that the analyst had a complete recordof how to perform one of the critical functions of the new system.
Participation
The flip side of observation is participation. Actually becoming a mem-ber of the staff and thereby learning exactly what it is that the staff does, sothat it might be automated, is an invaluable experience.
Documentation
It is logical to assume that a wide variety of documentation will be avail-able to the analyst. This includes, but is not limited to, the following:
• Documentation from existing systems, including requirements and de-sign specifications, program documentation, user manuals, and helpfiles. (This also includes whatever “wish” lists have been developedfor the existing system.)
• Archival information• Policies and procedures manuals• Reports• Memos• Standards• E-mail
CuuDuongThanCong.com https://fb.com/tailieudientucntt
70
SOFTWARE ENGINEERING HANDBOOK
• Minutes from meetings• Government and other regulatory guidelines and regulations• Industry or association manuals, guidelines, and standards (e.g., ac-
countants are guided not only by in-house “rules and regulations” butalso by industry and other rules and regulations)
Competitive Intelligence
Competitive intelligence (CI) is business intelligence that is limited tocompetitors and how that information affects strategy, tactics, and opera-tions (Brock, 2000b). 4Sight partners (2000) define competitive intelligenceas “a systematic and ethical program for gathering, analyzing, and manag-ing external information that can affect your company’s plans, decisions,and operations.” 4Sight goes on to state that utilization of the Internet asthe method of gathering information on individuals and companies hasbecome widespread and automatic. CI enables management to makeinformed decisions about everything from marketing, R & D, and investingtactics to long-term business strategies (SCIP, 2002).
CI data can be gathered from the following sources:
• Internet discussion groups (listservs) and news groups (Usenet). Sim-ple searches on the Internet can obtain expert discussions on issuesin listservs and Usenet (Graef, 2002). Often a quick form of CI is tosearch these Internet postings for discussions of similar issues. Thelevel of detail contained in these discussions is beneficial for things todo and also things that will not work (Graef, 2002). This is one of thequickest and most cost-effective methods of obtaining informationabout a project (Graef, 2002).
• Former employees of your competitors often are invaluable in provid-ing information about your competitors’ operations, products, andplans.
• Your competitors’ Web sites usually contain marketing informationabout products and services offered as well as press releases, whitepapers, and even product demos. Product demos enable the analystand business manager to effectively “reverse engineer” the competi-tive product (i.e., see how it ticks).
• If your competitor is a public company then its investor relations Webpage will contain a wealth of financial information such as annual re-ports. An alternative source of financial filings can be found atwww.sec.gov. A company’s 10Q (quarterly) and 10K (annual) reportscontain information on products, services, products, budgets, etc.
Normally, it is the role of the business or marketing manger to performcompetitive intelligence. However, when this is obviously not being done,a proactive systems analyst will take the lead.
CuuDuongThanCong.com https://fb.com/tailieudientucntt
71
Requirements Elicitation
Brainstorming
In a brainstorming session you gather together a group of people, createa stimulating and focused atmosphere, and let people come up with ideaswithout risk of being ridiculed. Even seemingly stupid ideas may turn outto be “golden.”
Focus groups
Focus groups are derived from marketing. These are structured sessionswhere a group of stakeholders are presented with a solution to a problemand then are closely questioned on their views about that solution.
Prototyping
A prototype is a simplified version of part of the final system. Develop-ers experiment with the prototype to get an idea of how it would work inreal life and what its problems and plus points are.
A CHECKLIST FOR REQUIREMENTS MANAGEMENT
The requirements management checklist shown in Exhibit 4-2 is used bythe U.S. Department of the Navy.
CONCLUSION
Information gathering is a very intensive process with many aspects.The more information one has about a project from the start, the betterprepared one will be to complete the project. Successful project manage-ment demands that enough information be known at the beginning of aproject to anticipate potential problems in the systems development lifecycle (Keogh, 2000). The role of a systems analyst in information gatheringis to gain knowledge and interpret it to the benefit of the project plan.Anthony Smith said that turning information into knowledge is the creativeskill of our age (ASH, 2002).
CuuDuongThanCong.com https://fb.com/tailieudientucntt
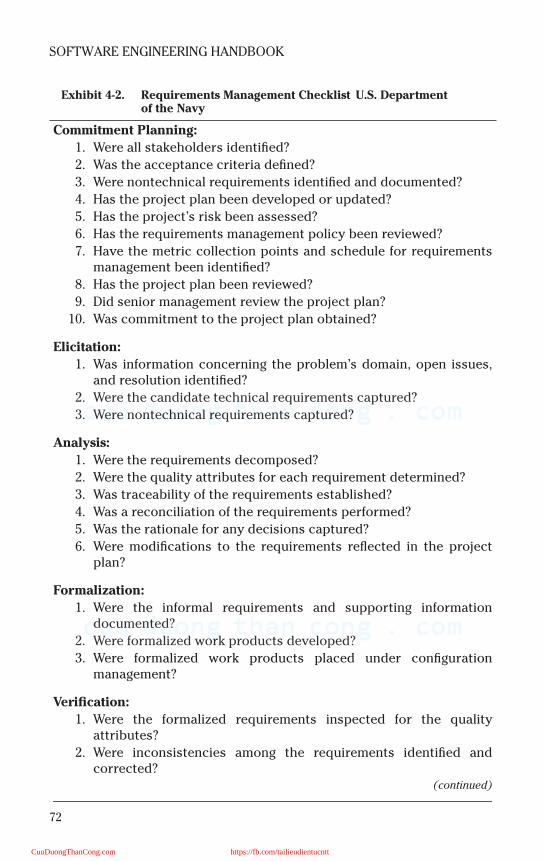
72
SOFTWARE ENGINEERING HANDBOOK
Exhibit 4-2. Requirements Management Checklist U.S. Department of the Navy
Commitment Planning:
1. Were all stakeholders identified?
2. Was the acceptance criteria defined?
3. Were nontechnical requirements identified and documented?
4. Has the project plan been developed or updated?
5. Has the project’s risk been assessed?
6. Has the requirements management policy been reviewed?
7. Have the metric collection points and schedule for requirementsmanagement been identified?
8. Has the project plan been reviewed?
9. Did senior management review the project plan?
10. Was commitment to the project plan obtained?
Elicitation:
1. Was information concerning the problem’s domain, open issues,and resolution identified?
2. Were the candidate technical requirements captured?
3. Were nontechnical requirements captured?
Analysis:
1. Were the requirements decomposed?
2. Were the quality attributes for each requirement determined?
3. Was traceability of the requirements established?
4. Was a reconciliation of the requirements performed?
5. Was the rationale for any decisions captured?
6. Were modifications to the requirements reflected in the projectplan?
Formalization:
1. Were the informal requirements and supporting informationdocumented?
2. Were formalized work products developed?
3. Were formalized work products placed under configurationmanagement?
Verification:
1. Were the formalized requirements inspected for the qualityattributes?
2. Were inconsistencies among the requirements identified andcorrected?
(continued)
CuuDuongThanCong.com https://fb.com/tailieudientucntt
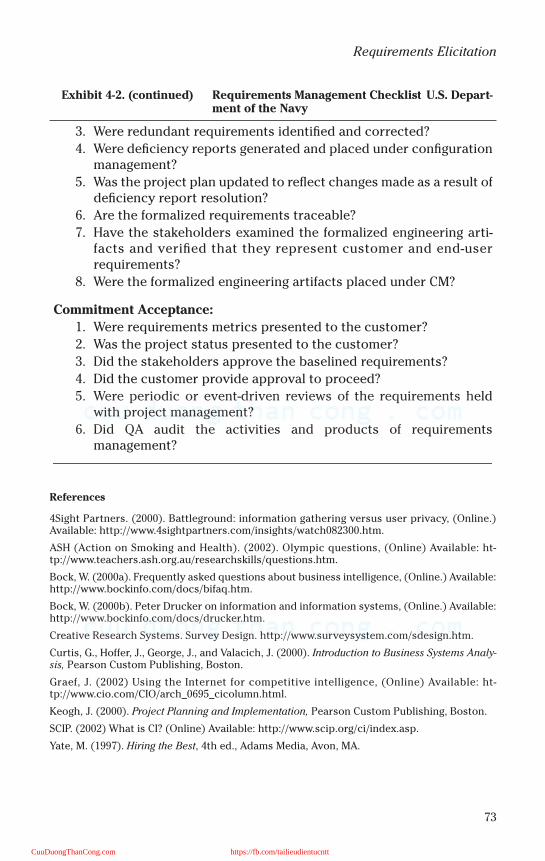
73
Requirements Elicitation
References
4Sight Partners. (2000). Battleground: information gathering versus user privacy, (Online.)Available: http://www.4sightpartners.com/insights/watch082300.htm.
ASH (Action on Smoking and Health). (2002). Olympic questions, (Online) Available: ht-tp://www.teachers.ash.org.au/researchskills/questions.htm.
Bock, W. (2000a). Frequently asked questions about business intelligence, (Online.) Available:http://www.bockinfo.com/docs/bifaq.htm.
Bock, W. (2000b). Peter Drucker on information and information systems, (Online.) Available:http://www.bockinfo.com/docs/drucker.htm.
Creative Research Systems. Survey Design. http://www.surveysystem.com/sdesign.htm.
Curtis, G., Hoffer, J., George, J., and Valacich, J. (2000). Introduction to Business Systems Analy-sis, Pearson Custom Publishing, Boston.
Graef, J. (2002) Using the Internet for competitive intelligence, (Online) Available: ht-tp://www.cio.com/CIO/arch_0695_cicolumn.html.
Keogh, J. (2000). Project Planning and Implementation, Pearson Custom Publishing, Boston.
SCIP. (2002) What is CI? (Online) Available: http://www.scip.org/ci/index.asp.
Yate, M. (1997). Hiring the Best, 4th ed., Adams Media, Avon, MA.
Exhibit 4-2. (continued) Requirements Management Checklist U.S. Depart-ment of the Navy
3. Were redundant requirements identified and corrected?
4. Were deficiency reports generated and placed under configurationmanagement?
5. Was the project plan updated to reflect changes made as a result ofdeficiency report resolution?
6. Are the formalized requirements traceable?
7. Have the stakeholders examined the formalized engineering arti-facts and verified that they represent customer and end-userrequirements?
8. Were the formalized engineering artifacts placed under CM?
Commitment Acceptance:
1. Were requirements metrics presented to the customer?
2. Was the project status presented to the customer?
3. Did the stakeholders approve the baselined requirements?
4. Did the customer provide approval to proceed?
5. Were periodic or event-driven reviews of the requirements heldwith project management?
6. Did QA audit the activities and products of requirementsmanagement?
CuuDuongThanCong.com https://fb.com/tailieudientucntt

This page intentionally left blank
CuuDuongThanCong.com https://fb.com/tailieudientucntt
75
Chapter 5
Designing User-Oriented Systems
Developers of system software need to involve users in the design processfrom the start. Until now, developers have kept the secrets of their tradeto themselves. At the same time, they have failed to take an interest in thework of the business for which they are producing a tool. Users frequentlyshare in the development process only through beta tests of productslong after they have been designed. Users can frequently be a constantsource of data on work habits, loads, and performance requirements.Developers can keep up with user needs the same way they are requiredto keep up with changes in technology. Maintaining a good relationshipbetween the development and user communities ensures a healthy devel-opment process.
SECRETS OF THE TRADE
During the last few decades while automation of the business world hasproceeded at an ever-accelerating pace, the practitioners of the black artof systems development have jealously guarded the secrets of their trade.Members of today’s computer cult, who talk among themselves in tonguesof Java, C++, and all things Internet, have forgotten the sounds of thehuman language — so much so that it is often necessary to hire a translatorto explain the systems developer’s work to the confused customer, theactual user of the cult’s handiwork.
This translator would not be needed if companies would design theirsystems with the user in mind. That means involving end users at the startof the systems development process. To accomplish this, the technicalstaff must take some time away from studying the nuts and bolts of newtools to learn the tricks of the users’ trades.
It also means that the end users need to be encouraged to get involvedin the entire systems development effort, from the specification stage toactual application testing. Their involvement will help ensure that the
CuuDuongThanCong.com https://fb.com/tailieudientucntt
76
SOFTWARE ENGINEERING HANDBOOK
finished system meets their needs and, in turn, the information needs ofthe corporation.
Today, under traditional systems analysis methods, the user is fre-quently left out of the loop. During the standard requirements definitionphase, representatives from the user department are interviewed. Then awork flow analysis may be performed to determine the relationshipsbetween functions within that department. Finally, several months afterthe requirements definition, some customer testing is conducted — testingthat unfortunately constitutes the sum total of user involvement. So it isnot surprising that a plethora of changes must be made after the userfinally reviews the test results.
TAILORING THE SYSTEM TO END USERS’ NEEDS
The systems staff can avoid this last-minute retrofit by building a systemtailored to specific end-user needs. To do that tailoring, the IT team shouldapply the same quick-study principle used in keeping up with new technol-ogy to learning end-user job functions. In fact, systems designers shouldknow these functions at least as well as a six-month employee who is doingthat work.
The necessary knowledge, however, is not always easy to come bybecause, all too often, systems gurus balk at attending user meetings. A bigprice tag may be attached to such behavior, as the New York StockExchange (NYSE) found out during my tenure there. During the mid-1980s,a series of user meetings was held to determine the rules and regulationsof an important regulatory system that the Exchange wanted to develop.The NYSE’s IT group found these critical meetings boring and, as a conse-quence, the finished system ended up incomplete; much money had to bespent adding enhancement features.
A thorough immersion in the customer’s culture also negates the “we”versus “them” attitude that exists between many end users and the sup-porting IT staff. Top managers in the IT division at a major New York-basedSwiss Bank learned this lesson the hard way. The bank’s foreign exchangetrading group was adamant about needing a foreign exchange trading sys-tem. The head of the Swiss Bank’s IT department disagreed, so the tradinggroup brought in an outside consultant who spoke their language and care-fully listened to what they had to say.
As a result, the consultant was able to develop a usable, mostly error-free system that the users proudly showed off to other departments at thebank. At the next IT status meeting, users demanded to know why the ITstaff could not or would not deliver systems as fast and as good as the onebuilt by the foreign exchange group. Needless to say, the management ofSwiss Bank’s IT group was soon replaced.
CuuDuongThanCong.com https://fb.com/tailieudientucntt
77
Designing User-Oriented Systems
DRUMMING UP ENTHUSIASM
Once you have a user-friendly IT staff, then you need to drum up enthu-siasm and interest among the user community so that it will want to beinvolved every painful step of the way. “Community” is the operative wordhere because as many users as is feasible should be involved in the sys-tems development process. In today’s systems world, however, the norm isto have only one user who serves as the liaison for the entire group andassists the IT team as it develops specifications and tests the application.
Can one person adequately represent an entire user group? The answeris almost always no if you want a system worth its development dollars.Although involving many users can cause giant headaches, if the process isproperly handled, the resulting system will be superior.
That was the experience I had at the NYSE when faced with the challeng-ing chore of devising a system for over 150 professional users spreadthrough five separate departments.
Despite the fact that each of the five departments did the exact samejob, the diversity of opinion among the people in these units was nearlyoverwhelming. It took the great organizational skills of a talented analyst topull all the heterogeneous information together into one cohesive specifi-cation. What resulted was far more complex, but a much more accurateand usable system that covered all the bases.
To cover all those bases, the NYSE IT team formed a working committeeof users made up of one very verbal representative from each of the fivedepartments. For roughly three months prior to the start of the specifica-tion stage, this working group would sometimes meet as often as two orthree times a week.
The meetings were spent discussing actual use cases upon which thesystem would be based. In this way, the users were able to come up with allof the criteria that would ultimately be used in developing the system. Itwas during this conceptual phase of system definition that NYSE’s IS staffand the departmental end users were able to reach a meeting of the mindsin terms of desired inputs and outputs.
Determining the users’ real information needs is indeed the stickiestwicket of the entire specification process. If all you do is translate thepaper avalanche to the tube, then the ultimate system will not be muchbetter than the former manual one. In fact, many of these paperwork clonesystems actually decrease productivity.
The key to pinpointing the users’ actual information needs is not topresent more data, but to present less, but more meaningful or relevant,data. To date, IT has applied the pitch-hit-and-run theory to most systems
CuuDuongThanCong.com https://fb.com/tailieudientucntt
78
SOFTWARE ENGINEERING HANDBOOK
development. Little, if any, consideration has been given to the differinginformation requirements of the various decision-making levels within anorganization. As a result, you end up with fancy applications that spit outa kludge of irrelevant information.
METHODOLOGIES
To avoid that systems scenario and to present the optimum mix of detailand composite data to users, the developer can follow several time-testedmethods. All of the methods recognize a relationship between the type ofuser and the level of detail needed to do the job or make a decision.
The three types of users — technical, tactical, and strategic — corre-spond to the three levels of workers in today’s typical corporation. Thetechnical users are generally the paper pushers in the corporate hierarchy.These employees —check processors and complaint takers, for example— are the people who need to see all the data. They input and review awealth of data, normally in rote fashion.
At the opposite end of the spectrum are the senior managers, who useinformation gathered at the lower rungs for strategic purposes. A wholerange of executive information and decision support systems is now avail-able to help this corporate vanguard. These wares feature flashy colors ontouch screens notable for the scarcity of data displayed. The data is likelyto show sales projections, profitability numbers, and comparisons with thecompetition.
In the middle, between the strategic users and the technical users, arethe tactical users. These are the middle managers, the poor unfortunatesburied under the paper avalanche. It is these professionals who thereforeneed the most careful balance of data.
As always, users’ needs dictate the data representation discipline used.Human resources or utility users, for example, are good candidates fordescriptive models in the form of organization charts or floor plans. Mod-eling is also a good mode for operations management students who wantto apply game theory to problems that lack supporting information. On theother hand, a normative representation of data is an apt choice for budgetpersonnel, who need the best answer to a given problem.
Deciding on the type of information and how to present it to a particulargroup of users is the job of IT personnel. Sometimes they get carried awaywith their mission. At the NYSE, for example, the systems staff realizedthey had gone too far when a display for a large customer exceeded 91screens of information. Going back to the drawing board, they came upwith a plan to make the 91-screen monster more manageable. What theydid was use graphics to tame the tangle of numbers displayed, coupledwith embedded expert systems that enabled users to navigate quickly and
CuuDuongThanCong.com https://fb.com/tailieudientucntt
79
Designing User-Oriented Systems
more effectively through the data. In this filtering process, the systemsdeveloper sifts through the data, displaying only what is relevant at anypoint in time.
One way to do the filtering is by using the monitoring method, whichserves up data to the user on an exception basis. This can take the form ofvariance reporting, in which the system produces only exceptions basedon a programmatic review of the data. After reviewing credit card pay-ments, a system can, for instance, display only those accounts where thepayment is overdue or below the minimum. The monitoring method canalso be used in programmed decision-making applications, in which casethe system makes all of the technical decisions and many of the tacticalones as well.
American Express made the decision to go with a monitoring methodthat simplified its complex credit authorization chores. An expert system,aptly named Authorizer Assistant, helped Amex reduce the percentage ofbad credit authorizations. It also reduced the number of screens needed toreview customer data from a high of 12 to a manageable 2.
The advent of fourth generation languages (4GLs), which enabled endusers to access corporate databases with an easy-to-use query syntax, hasmade interrogative methods of systems design more popular today.Implicit in this approach is the understanding that on many occasionsusers in complex decision-making environments cannot identify the infor-mation they need to perform ad hoc analyses. In these cases, all of the dataelements must be resident in an accessible database. There must also be atool that allows users to easily develop queries and variations on thesequeries against the data.
The ease-of-use factor provided by a 4GL came in very handy whenBankers Trust in New York (now Deutsche Bank) opted to leave the retailbusiness. The data processing effort required to achieve this feat wasenormous. With the help of Focus, the 4GL product from InformationBuilders in New York (www.ibi.com), the bank was able to ensure a smoothtransfer of accounts from Bankers to many other far-flung financial institu-tions. Some accounts were spun off to a bank in Chicago and some toAlbany, New York, while a few high rollers were retained as privilegedBankers Trust customers.
Once users are certain about the correct way to handle the data, the ITsquad can then translate this information into the specification that spellsout how the system should run. In many IT shops, how a system should runis a function of what is available in-house. This means that user require-ments are forcibly fit into an existing tool set and — just like a bad shoe fit— a bad system fit causes users great pain.
CuuDuongThanCong.com https://fb.com/tailieudientucntt

80
SOFTWARE ENGINEERING HANDBOOK
Some of that pain was felt at the Securities Industry Automation Corp.(SIAC), which originally cramped its users by limiting itself to just onedatabase product. SIAC began using Total from Cincom Systems Inc.,Cincinnati, back in 1977, when few database tools were on the market.There was absolutely nothing wrong with Total; what was wrong was theimplicit order to use it for all systems. Use it SIAC did — for everything!
Total is now gone from SIAC (Cincom has since retired the Total data-base and folded its functionality into the Supra product), replaced by a bet-ter stocked tool chest that includes a wide variety of database and 4GL toolsets. SIAC learned that a greater selection of software arms the designerwith the options needed to tailor a system to specific user demands.
Good tailoring is particularly crucial when it comes to designing theexternal component of a system that the users see. Although users are notexposed to internal intricacies like utilities and overnight updating, theyroutinely work with external features such as on-line updates and reports,and PC uploading and downloading.
DISTRIBUTING DATA TO ITS RIGHTFUL OWNER — THE END USER
Most IT shops today design superbly efficient systems — for batch andtransaction-based systems. Unfortunately, these systems are then jury-rigged for the part of the system visible to the user. Such technology tink-ering often leaves the user out on a limb.
That is exactly where some end users at the NYSE found themselveswhen a billing system using a hierarchical production database wasdefined to a 4GL. The database, which was composed of numerous seg-ments of data keyed by a brokerage firm number, ran very fast during over-night update processing due to its efficient design, specifically laboredover for this purpose.
Meanwhile, some NYSE users were anticipating a new system with theextra added attraction of ad hoc inquiry. By a happy coincidence — or soit was originally thought —a 4GL had just been brought into the Exchangefor end-user computing. The hierarchically defined database was dutifullydefined to RAMIS; the users were trained and then let loose. RAMIS cameup empty.
The problem was that bane of logic, the JOIN. Although the internaldatabase was segmented into a logical structure for efficiencies, the dataon every brokerage house was dispersed throughout, making it difficult forthe users to get to it without understanding a bit more than they wanted toknow about information processing.
There are as many ways of designing systems as there are people to usethem. Most systems are designed out of prejudice: John Doe, the database
CuuDuongThanCong.com https://fb.com/tailieudientucntt
81
Designing User-Oriented Systems
administrator at the Widget Corp., is expert at Microsoft Access; therefore,all systems at the company are designed using Microsoft Access. Mostcorporate systems are designed around some sort of heavy-duty database.There are several types of database architectures: hierarchical, as in IBMIMS; networked, as in Computer Associates’ IDMS, which has lately mor-phed into a combination networked and relational database; relational, asin Microsoft’s SQL Server; and object oriented, as in Objectivity’s Objectiv-ity/DB. The proper choice depends upon many factors, not the least ofwhich should be ease of access by the user.
Serious decisions must also be made regarding the system platform. Ina world of mainframes, PCs, minicomputers, advanced workstations, Inter-net, and Intranets, the endless possibilities boggle the systems developer’smind. Solutions run the gamut from pure mainframe to a cluster of con-nected micros and minis to web-based distributed. In vogue today is anany-to-any environment where a user with a smart workstation has easyaccess to various mainframes, minis, or PCs across an Intranet.
THE SYSTEMS CHOICE
Choosing hardware and software is truly the fun part of systems design.Visits to vendors and trips to trade shows where you can play with testequipment transport you into an IT Disneyland. But while you are out therehigh-teching it up, at some point you had better come down to earth andget the user involved. If not, your dream machine will turn into an expen-sive nightmare. So, no matter what platform or program you pick, the uservariables in making your selection must be examined at every technologi-cal turn. Among those user considerations are cost, ease of use, access tocorporate data, graphics requirements compatibility with current environ-ment, and particular preferences.
Ease of use was the major criterion that caused some equipment theNYSE was considering to be scuttled. Bar code readers for use in the fieldwere the equipment under investigation. The technical group at theExchange, who thought they had found the perfect solution, promptlyordered sample equipment and found that it worked like a charm. How-ever, in order for it to work properly, the credit-card size readers had to beheld at a certain angle. It was a good thing the users were consultedbecause it turned out that they were not able to hold the devices at thatprecise angle.
The lesson here is that just because you find it easy to use does notmean the user will necessarily agree with you. Also, keep in mind that justbecause it is state of the art and your technical staff adores it does notmean the user will concur. It all adds up to input: the user needs to have asay in the selection process.
CuuDuongThanCong.com https://fb.com/tailieudientucntt
82
SOFTWARE ENGINEERING HANDBOOK
This lesson is particularly pertinent when it comes to developing thespecification for online screens and reports — the most visible part of anysystem. What frequently happens is that the IS people gather informationand create a specification. After six to twelve months, they are ready todemo the system they developed to the users. With so much time interven-ing, the users have invariably changed their minds about or forgotten whatthey want.
At Bankers Trust, when it was developing an equipment leasing system,that time was not allowed to elapse without user feedback. Instead, thebank decided to rapid-prototype (RAD) the system for users. During thespecification stage, a series of screens were put up on the system within amatter of days. Users were given an ID into the system so they could playwith the prototype. They got the feel for the system and were able to voicetheir opinions and objections immediately.
An even more daring user approach was taken by the NYSE. CertainExchange users were given an online editor and told to develop the screensutilizing a JAD (joint application development) methodology. IT staffersheld their breath for many days, fearing the outcome of this experiment.They need not have feared; users know what they want to see and how theywant to see it. Therefore, forget about textbook cases of good screendesign and give your users a paintbrush.
Far more control is necessary in the system testing phase, however.Users are notorious for their lax standards when they are involved in test-ing. Therefore, the IT group must carefully oversee a test plan that coversall facets of the system, using as many test cases and as many users aspossible.
In one company the systems squad exercised both caution and controlin testing a very large financial system that was distributed across a groupof seven users. The users were asked to compare test results with rawdata and to annotate screen printouts or reports as appropriate. Becausethe users were given very specific tasks and very specific instructions(not the usual “take a look at the system and let me know if you see any-thing wrong”), the system was 99 percent debugged before it went intoproduction.
Once the system has been tested, it is time to go live. Ideally, the usershave been involved every step of the way in the design process, and painshave been taken to keep all those who will ultimately use the systeminformed of its progress.
Several years ago, the Securities & Exchange Commission stirred upuser interest by running a contest to name their system and giving outawards to the winner — a move that would qualify as good user PR.Another tried-and-true PR ploy is to stage glitzy system demos complete
CuuDuongThanCong.com https://fb.com/tailieudientucntt
83
Designing User-Oriented Systems
with refreshments. After show time, it is important to keep the name of thesystem in front of the potential users. NYSE developers who designed asystem named Force did just that by distributing pens inscribed with theslogan “May the FORCE be with you.”
CONCLUSION
The points I have mentioned are all quite obvious, but they are oftenoverlooked by harried IT staffs. This results in installed systems that aredeemed successful by technicians but are dubbed flops by users. Thus, todesign a system for all-around success, “May the USER be with you.”
CuuDuongThanCong.com https://fb.com/tailieudientucntt

This page intentionally left blank
CuuDuongThanCong.com https://fb.com/tailieudientucntt
85
Chapter 6
The Outsourcing Decision
Outsourcing is a three-phased process:
Phase 1. Analysis and evaluationPhase 2. Needs assessment and vendor selectionPhase 3. Implementation and management
PHASE 1: ANALYSIS AND EVALUATION
In order to understand the services that need to be outsourced, organi-zational goals need to be identified — particularly the core competencies.Once the goals and core competencies are identified, information relatedto these activities is gathered to compare the cost of performing the func-tions in-house with the cost of outsourcing them. This enables the com-pany to answer nonfinancial questions such as “How critical are thesefunctions and activities?” or “What depends on these activities?” or “Willthis activity become a ‘mission critical’ activity?” This will help organiza-tions reach decisions about whether or not to outsource. Long-term costand investment implications, work morale, and support should also beconsidered (see Appendix D for sample cost-benefit analysis worksheets).
PHASE 2: NEEDS ASSESSMENT AND VENDOR SELECTION
The objective of this phase is to develop a detailed understanding ofthe needs of the organization and the capabilities of possible solutionproviders.
In this phase a “request for a proposal” (RFP) is developed and deliveredto applicable vendors. RFPs need to be structured in a manner to facilitateassessment and comparison of the various vendors. They should containthe complete requirements, problem that needs to be resolved, desires,etc. A clearly structured and documented RFP also helps vendors under-stand and evaluate what a company is looking for and assists them inassessing whether they can provide the required service.
When evaluating the vendor proposals, the organization should look notonly at the technological capability of the vendor but also at factors such
CuuDuongThanCong.com https://fb.com/tailieudientucntt
86
SOFTWARE ENGINEERING HANDBOOK
as the vendor’s financial stability, track record, and customer support rep-utation. Contacting vendor’s existing and previous clients would give theorganization a good idea about the vendor’s abilities.
Once a vendor is selected, the organization needs to make sure that afair and reasonable contract, beneficial to the organization, is negotiated.It is imperative to define service levels and the consequences of not meet-ing them clearly. Both parties should make sure that they understand theperformance measurement criteria (see Appendix Q for a software metricscapabilities guide).
PHASE 3: IMPLEMENTATION
The final phase in the outsourcing decision process is the implementa-tion. During this phase a clear definition of the task needs to be identified,so establishing a time frame would be very helpful. Mechanisms need to beestablished to monitor and evaluate performance during the vendor’sdevelopmental process. This is important even after implementation tomake sure that the outsourced tasks are being delivered by the vendor asagreed upon. Ability to identify, communicate, and resolve issues promptlyand fairly will help the company achieve mutual benefits and make a rela-tionship successful.
Depending on the size of the outsourcing contract, the manager respon-sible for the program’s delivery and integration may be responsible for allof the process, or only some. These are the horizontal and vertical factorsof outsourcing management. A manager of the horizontal process is ofteninvolved in the decision to outsource, and is then responsible for definingthe work, selecting and engaging the vendor, and managing the deliveryand completion of the program. This manager normally handles all day-to-day negotiations. With larger programs, particularly those on a globalscale, a decision is often made at senior levels to outsource. A negotiationteam is appointed to work through the complex agreements, usually understrict confidentiality, until the agreement is finalized and announced. It isthen the role of the manager of the vertical component to implement andmanage the ongoing program. Part of this role is the interpretation of theagreement and identification of areas not covered by the agreement.
AN OUTSOURCING EXAMPLE
In this chapter we will break down the outsourcing decision-making pro-cess using an e-business system as an example. Since the Internet openedfor business just a short ten years ago and despite the boom–bust cyclicalnature of the market, few companies have not jumped into the foray bybuilding a corporate Internet presence. The Internet is the one thing mostcompanies have in common.
CuuDuongThanCong.com https://fb.com/tailieudientucntt

87
The Outsourcing Decision
Visit Gateway.com and wander over to their accessory store(http://www.gtwaccessories.com). Here you can buy everything from digi-tal cameras to software to printers. Sounds like quite an operation does itnot? The store might have the Gateway logo on it, but you will not find it onany Gateway corporate computer. Where you will find it is at Vcom-merce.com — a company that is in the business of putting other compa-nies in the e-commerce business. According to Gateway, by outsourcingthe entire function, it is able to sell products and grow revenues whilefocusing its attention on its core competencies.
In other words, Gateway, no slouch in the computer expertise depart-ment, has decided that even they do not have the expertise or desire to runa sophisticated e-commerce site. Instead, they decided to give the problemto someone else — someone with the expertise. What, then, does this sayabout the rest of us?
Outsourcing Issues
It is important to understand the ramifications of systems developmentin the world of high-risk interconnected computers. In order to make anROI-enhancing decision, the CIO must gather much information from adiversity of areas:
• Legal issues. It is amazing how many Web sites are without benefit oflegal counsel. This stems from the days when the Web had the reputa-tion of the “Wild, Wild West.” Today, the CIO must be concerned aboutissues such as copyright infringement of images and text, the use ofonline warranties, licensing, contracts, and spamming.
• Regulatory issues. Right now purchases on the Web are not taxed butexpect that this reprieve will not last forever. Other taxation issues toconsider include the effect of telecommuting Web developers on thejurisdictional exposure of the corporation. Of course, we all know bynow that online gambling is prohibited, but what about lotteries andcontests — even if you offer them as a promotional gimmick? Thenconsider First Amendment issues, pornography issues — et cetera, etcetera, et cetera.
• Security. Once you open your doors you will probably be letting inmore than customers. Hackers, crackers, and other malevolent crea-tures of the night seem to spend all of their waking hours figuring outnew ways to wreak havoc on unsuspecting organizations. Top this offwith a veritable plague of new viruses, concerns about fire, sloppydata entry, and attacks by internal employees and security becomes afull-time job. Things you need to understand are uses of firewalls, en-cryption, and authentication — ultracomplex technologies not for thetechnologically faint of heart. Even the most sophisticated of preven-tive measures will not ward off all attacks. Think back to the massive
CuuDuongThanCong.com https://fb.com/tailieudientucntt
88
SOFTWARE ENGINEERING HANDBOOK
denial of service attacks on sites such as Yahoo and eTrade in Febru-ary, 2000, and the various klez viruses that plagued us in 2002.
• Staffing issues. Do you have the staff to implement an e-business initia-tive successfully? E-business is hard work; it is 24 × 7 × 52. Also keepin mind that new bells and whistles are invented almost daily. You willneed to invest a substantial sum to keep your staff trained so that theycan take advantage of these new technologies.
• System usability. Long gone are the days when you could throw up aWeb site and expect kudos. With a plethora of tool sets such as Mac-romedia Flash, Web conferencing, instant chat, etc., the stakes for ausable Web site have gotten a lot higher — and much more expensive.Given the size of many Web sites, ergonomics and navigability issuesmust be explored. Would GM ever release a new kind of car withoutsome sort of driver-acceptance testing?
• System functionality. It was so much easier just five years ago to throwup a Web site and have it considered novel. Today all things novelprobably have already been done so you will not be able to lure newweb visitors to your site with the promise of the “newest and the great-est.” Instead you must focus on your site’s functionality. For example,a small golf Web site named swapgolf.com offers a wide variety of func-tions: a golf shopping mall, ability to swap golf tee times, a bulletinboard, and even golf puzzles. Notice all the functionality is related tothe golf theme. CNBC.com, on the other hand, is a large site with manymore financial resources than swapgolf so it is no wonder that this siteis loaded with functionality. Note too that CNBC.com offers theme-related functionality. Because CNBC is a financial news service,Web site functionality includes financial-related services such asMoneyTalk, Quote Box, and Markets. Also keep in mind that a Web siteis a high maintenance project that needs to be fed constantly.
• System reliability. Perhaps the most irritating problem Web surfers en-counter is sites that have bad links, databases that decline to work,and general overall system development sloppiness. It is almost as ifmany sites were thrown online without any testing whatsoever.Netslaves is a most intriguing Web site that takes delight in shootingdown what they consider to be myths and outright lies about all thingsInternet. Self-professed Netslave media assassin Steve Gilliard has thisto say about the Net myth that “things move fast online and we haveto stay ahead.” He explains, “It takes time to develop a reliable busi-ness. The faster you move, the more likely you are to screw up. It takestime, years, to get things right, develop trust in key employees and sta-bilize. Moving fast in many cases is an excuse for incompetence.”
• System integration. Web-based systems should never operate in a vac-uum. Instead, they should be fully integrated into your current corpo-rate systems. For example, your marketing and sales systems needinformation about who is visiting your site, what they are looking at,
CuuDuongThanCong.com https://fb.com/tailieudientucntt
89
The Outsourcing Decision
and what they are buying. Only a solid integrative infrastructure willaccomplish this. Real synergy occurs when internal and external sys-tems are effectively linked together, creating more efficient ways tomarket, sell, and process and deliver orders. This translates to inte-grating a whole spate of disparate systems, including inventory, order-ing, and invoicing, along with supply-chain data from businesspartners — in other words, the organization’s ERP (enterprise re-source planning) resource.
• Meaningful metrics. It really does not pay to spend $5 million to buildan e-commerce system if you will never know how it affects the bot-tom line. Will it increase sales by 10 percent or boost customer reten-tion by 15 percent? Before you ever do the technology planning for ane-business, you should decide just what it is you are hoping to accom-plish (i.e., your business strategy plan) and then develop meaningfulmetrics to measure your progress.
• Costs. Even if you plan carefully, there will always be those hidden andunexpected costs for hardware, software, communications, and evennew staff.
What Does It Cost?
Back in 1995, Tom Vassos, an instructor at the University of Toronto, waspart of an IBM team that created IBM’s Web site. It had 10,000 documentsspread across 30 Web servers around the world. Their requirementsincluded everything from translation into multiple languages, download-able documents, demonstration tools, contents of entire IBM magazinesand publications, graphics images, audio clips, and fulfillment mechanismsfor other deliverables such as CD Roms.
The site cost several million dollars initially, with an IBM commitment tospending several more to maintain and expand the site.
Some experts estimate that a large site should cost $6 million over twoyears, a medium site $2 million, and $500,000 for a small site over twoyears. These numbers include many costs for site and product promotionand content upkeep.
The Gartner Group surveyed 100 leading companies operating e-com-merce sites and found that the average firm had spent three-quarters of amillion dollars on the technology (i.e., hardware/software/peopleware)alone. Add to that the cost of marketing that site and you may need a bud-get as high as amazon.com, which now spends upward of $40 million perquarter to market itself.
Using an ISP (Internet Service Provider)
With the rise of Web-hosting companies, today the organization has awide variety of less expensive alternatives. For example, a small business
CuuDuongThanCong.com https://fb.com/tailieudientucntt
90
SOFTWARE ENGINEERING HANDBOOK
using a typical ISP such as VeriSign would pay about $376 per month formonthly service, file storage and data transfer fees, and a shopping cart.An even smaller business can get away with a bare-bones site for about $10per month at Schogini.com. In neither of these cases does Web design fig-ure into the equation. That is a separate cost.
Web site design costs vary considerably among web design firms. Onecompany I have worked with charged $2,000 for a 10-page site and $10,000for a 25-page site. A high-end site for a mid-sized business I worked with setthe company back around $50,000. This got them about 50 pages andassorted add-ons such as user tracking, image maps, frames, Shockwave orQuicktime animation, audio, database, shopping cart, SSL (secure transac-tion server), creative illustrations, CGI, and database programming. Host-ing charges were separate. For a mid-sized business low end costs about$100 to $160 a month, mid level $160 to $350 a month and high end about$350 a month. Add $1,500 a month for a T-1 communications line.
A good place to start doing comparative research is www.thelist.com,which provides a list of virtually all of the ISPs in the world and the servicesand price structures they offer. As mentioned, you will find wide variationin prices.
Rolling Your Own
The other choice, one that only very large companies seem to taketoday, is to roll your own. Rough estimates for a start-up configuration fora small to mid-sized company are as follows:
• Computer. Keep in mind that the IBM site described previously had 30Web servers. Just one of them can cost you between $5,000 and$25,000, which includes only the hardware. This is a one-time cost al-though maintenance upgrades will need to be figured into theequation.
• OS/server software. This can cost anywhere from $0 if you run a freeversion of Linux to over $10,000. Usually either UNIX or Win-dows/NT/2000 is used, with Linux quickly gaining ground. You mayalso need to buy multiple Web servers. First there is the Web serverthat runs the actual Web site. Add an additional Web server if you arerunning an e-commerce server. Add a third server if you need to runsomething like RealAudio. Again, this is a one-time cost requiringmaintenance upgrades.
• Modems. Modem pricing varies, depending upon how many you needand their capabilities. Modems, in case you did not know, are used forthose people who might need to dial into your system. This is a one-time cost.
CuuDuongThanCong.com https://fb.com/tailieudientucntt
91
The Outsourcing Decision
• Connectivity hardware. Hardware or software devices such as routersand couplers will run you anywhere from $1000 to $5000+. This is aone-time cost.
• Communications. You cannot simply hook up your PC to a slow modemand expect to be able to use that as your Web site. Connecting your PCto the Net will require you to lease a high-speed telephone line. A T-1will cost you about $1500 a month. A T-3, which has a higher speed,will cost you even more.
Labor Costs
As is true for most labor costs, the price of labor is all across the board.Staff salaries for technology experts are rather high, with an average costof about $60,000 a year for someone with several years of experience.
Hiring consultants will bring a variety of proposals to your doorstep.Web page authors charge anywhere from $30 to $150 an hour with thehigher-end price going to those that can build you a database or write youa custom script using Perl or Java.
The Gartner Group has estimated that, through 2004, IT contractors andother outside resources will be used to complete 50 percent of the e-busi-ness work in large enterprises.
Costs Depend on What You Put on the Site
Whether you outsource or not, figuring out what your Web site will costis a lengthy, complicated process. The first thing to do is to make a list (seeExhibit 6-1) of exactly what you expect to put on this site, how often youwill update it, and the site’s expected functionality.
Once this list is made, you can send out RFPs (requests for proposal) tovarious Web-hosting companies to determine their cost structure todevelop your site. Your IT department should be given a chance to bid aswell.
SHOULD YOU OUTSOURCE?
Moving to an e-business model requires an enormous commitment. Askyourself whether you are up to it. Also ask yourself whether your companyis up to it.
There are many good reasons to outsource as Gateway discovered whenit decided to outsource many of its own e-business functions. Decidingwhether or not to outsource is a very individual decision based on manycorporate factors:
CuuDuongThanCong.com https://fb.com/tailieudientucntt
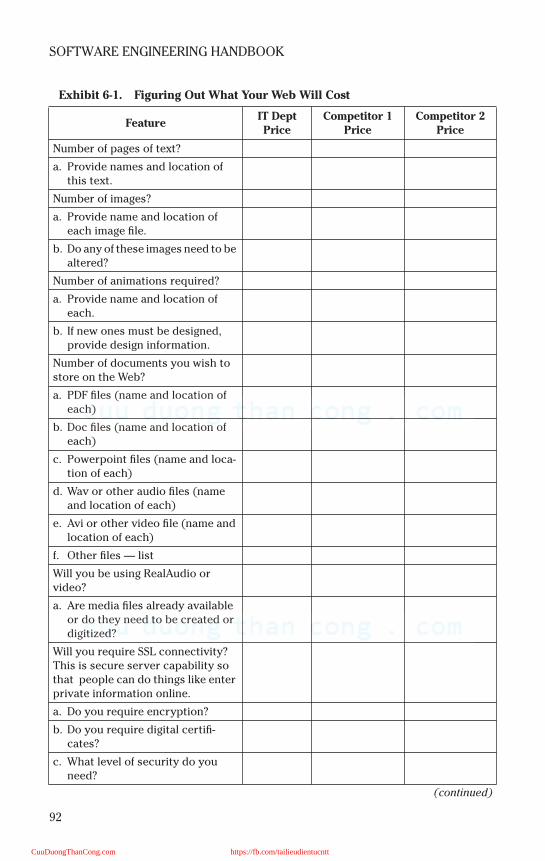
92
SOFTWARE ENGINEERING HANDBOOK
Exhibit 6-1. Figuring Out What Your Web Will Cost
FeatureIT Dept Price
Competitor 1 Price
Competitor 2 Price
Number of pages of text?
a. Provide names and location of this text.
Number of images?
a. Provide name and location of each image file.
b. Do any of these images need to be altered?
Number of animations required?
a. Provide name and location of each.
b. If new ones must be designed, provide design information.
Number of documents you wish to store on the Web?
a. PDF files (name and location of each)
b. Doc files (name and location of each)
c. Powerpoint files (name and loca-tion of each)
d. Wav or other audio files (name and location of each)
e. Avi or other video file (name and location of each)
f. Other files — list
Will you be using RealAudio or video?
a. Are media files already available or do they need to be created or digitized?
Will you require SSL connectivity? This is secure server capability so that people can do things like enter private information online.
a. Do you require encryption?
b. Do you require digital certifi-cates?
c. What level of security do you need?
(continued)
CuuDuongThanCong.com https://fb.com/tailieudientucntt
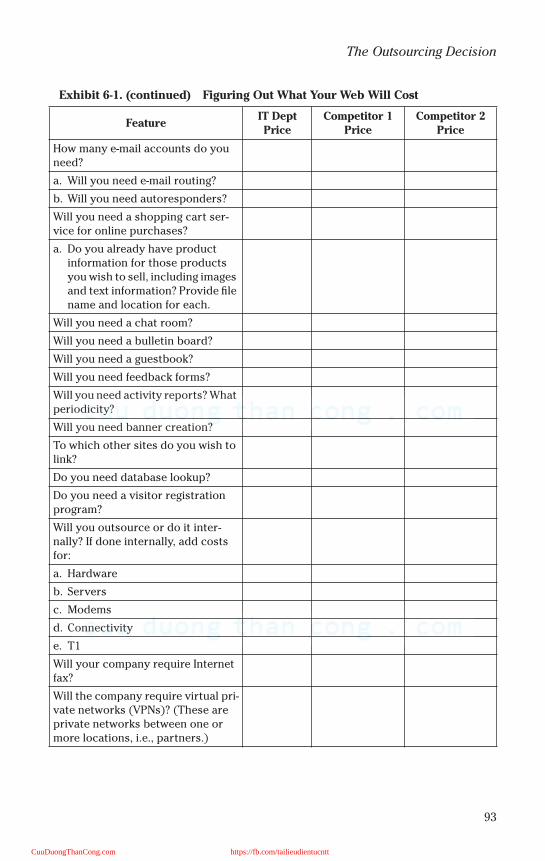
93
The Outsourcing Decision
Exhibit 6-1. (continued) Figuring Out What Your Web Will Cost
FeatureIT Dept Price
Competitor 1 Price
Competitor 2 Price
How many e-mail accounts do you need?
a. Will you need e-mail routing?
b. Will you need autoresponders?
Will you need a shopping cart ser-vice for online purchases?
a. Do you already have product information for those products you wish to sell, including images and text information? Provide file name and location for each.
Will you need a chat room?
Will you need a bulletin board?
Will you need a guestbook?
Will you need feedback forms?
Will you need activity reports? What periodicity?
Will you need banner creation?
To which other sites do you wish to link?
Do you need database lookup?
Do you need a visitor registration program?
Will you outsource or do it inter-nally? If done internally, add costs for:
a. Hardware
b. Servers
c. Modems
d. Connectivity
e. T1
Will your company require Internet fax?
Will the company require virtual pri-vate networks (VPNs)? (These are private networks between one or more locations, i.e., partners.)
CuuDuongThanCong.com https://fb.com/tailieudientucntt

94
SOFTWARE ENGINEERING HANDBOOK
Here are some reasons why outsourcing might be a good idea for yourcompany.
• Price. Rolling your own is often much more expensive than outsourc-ing to a reputable service provider.
• Expertise. Few companies have the level of expertise in-house thatbuilding a sophisticated Web site requires.
• Obsolescence. Hardware and software turn obsolete within six monthsand upgrades are often expensive. Outsourcing makes this someoneelse’s problem. For the outsourcer to stay in business, it must stay atthe most current release and use the most sophisticated equipment. Itdoes this so you do not need to.
• Security. As mentioned earlier, encryption, virus protection, and all ofthe other security paraphernalia such as site backup and disaster re-covery are quite expensive to perform on your own.
• Complete solution. If you select a reputable hosting company with lotsof experience you benefit from this experience and its expertise. It canprovide you with everything from hosting to design to maintenance,all in one place.
• Scalability. It is likely that your site will grow in complexity and func-tionality. A Web-hosting company will be able to scale up without ser-vice interruptions.
• Of course, there are disadvantages to outsourcing as well:• Hidden charges. If you exceed your quotas (i.e., data transfer, disk
space) you will be charged an additional premium.• Their rules and not yours. The Web hosting company makes the rules
and not you. You will need to modify your own corporate policy to ac-commodate the outsourcer.
• Timeliness. Say the Web hosting company runs an advertising blitz toget new customers — and it works. Your request for modificationsmight need to wait a while.
• Mergers and acquisitions. The Net world moves fast and is on an acqui-sition binge. What happens if the company you are using is acquired?
QUESTIONS TO ASK POTENTIAL OUTSOURCING COMPANIES
A company cannot choose a hosting company out of a hat. Ask the fol-lowing questions:
• What capabilities do you offer and at what prices? Can you provide uswith everything on our list of requirements?
• What is your level of expertise? Demonstrate by showing a portfolio ofWeb sites developed at different levels of sophistication.
• How long have you been in business?• What are your sales?• Provide three references.
CuuDuongThanCong.com https://fb.com/tailieudientucntt
95
The Outsourcing Decision
• How quickly do you respond to telephone and e-mail customer servicequestions?
• What measures do you have in place to secure our data on yourservers?
• Are you 24 × 7?• What type of disaster recovery services do you provide?• How often do you upgrade your hardware and software?• If some of your staff are using dial-up lines to access your outsourced
servers, can they get online without busy signals? Can staff membersuse local phone numbers to dial into the network?
• What are the speed and capacity of the hosting company’s link to theInternet? (This is called throughput.)
• Will the hosting company accept large file transfers?• Will the hosting company permit e-mail broadcasting?
OUTSOURCING MODELS
Outsourcing does not need to be an all or nothing proposition; severalmodels are available:
• In-house. If you are a large company with a significant existing technol-ogy infrastructure with commensurate expertise, this approach mightbe the most cost-beneficial to you. Of course, you will not know wheth-er this is the right approach unless you cost out the other alternatives.
• Full outsource. Turn over the entire spectrum of development to anoutsourcing company or combination of outsourcing companies andconsulting firms.
• Partial outsource. Possible alternatives are hosting your own serversbut hiring a consultancy to program them; outsourcing your serverhosting but programming it in-house, and hosting your servers butpurchasing third-party software packages to run on those servers.
CONCLUSION
Whether to outsource or not is a difficult decision and involves the anal-ysis of many variables. Ultimately the success — and bottom line — of theorganization rests on making the right decision.
CuuDuongThanCong.com https://fb.com/tailieudientucntt

This page intentionally left blank
CuuDuongThanCong.com https://fb.com/tailieudientucntt

97
Chapter 7
Methodology Selection
It is surprising how few IT organizations utilize a formal methodology.Although the vast majority employ a wide variety of automated tool sets toassist their programmers in developing and testing complex code, the “pro-cess” of systems development is still largely chaotic in most organizations.
A systems methodology guides the activities of developing and evolvingsystems starting from the initial feasibility study and culminating onlywhen the system is finally retired. Use of a methodology assures the orga-nization that its process of developing and maintaining systems is sustain-able and repeatable.
Life would be simple if there were only one methodology. Unfortunately,or fortunately depending upon your perspective, you can choose fromhundreds of methodologies (http://www.wwweb.org/smo/bmc/). Some areindustry standard and some are proprietary to a particular consultingorganization. Given this vast choice, it is important that you are able todetermine whether a systems methodology will meet the specific needs ofyour organization. The way to do this is by evaluating the methodology.This is the focus of this chapter.
A BRIEF SUMMARY OF COMMON GENERIC METHODOLOGIES
There is a wide variety of methodologies. Organizations will select theones most appropriate for their mode of development. It is not unusual foran organization to utilize more than one methodology. Typically, a struc-tured and an object-oriented approach can peacefully co-exist within onecompany.
• System development life cycle (SDLC). This is a phased, structured ap-proach to systems development. The phases include requirementsfeasibility, analysis, system design, coding, testing, implementation,and testing. Please note that there are variations of these stated phas-es. Usually, each phase is performed sequentially, although some po-tential for overlap exists. This is the methodology that is used mostoften in industry.
CuuDuongThanCong.com https://fb.com/tailieudientucntt
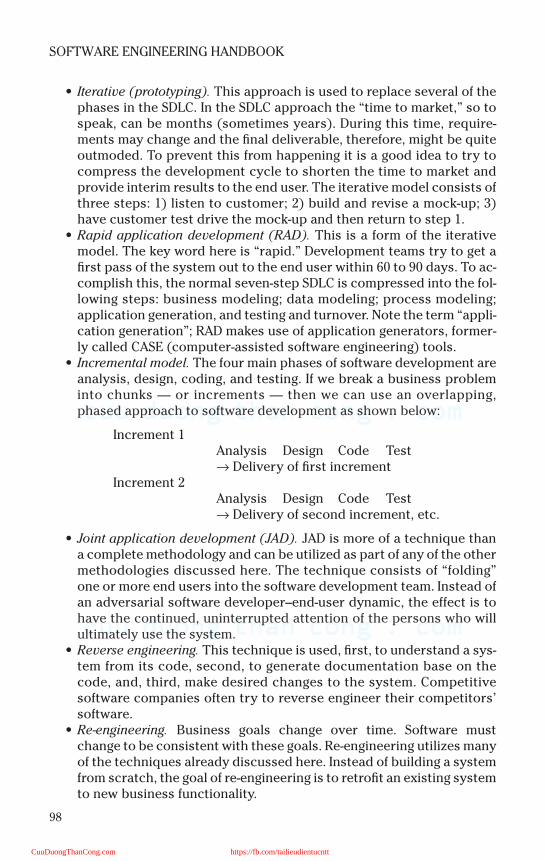
98
SOFTWARE ENGINEERING HANDBOOK
• Iterative (prototyping). This approach is used to replace several of thephases in the SDLC. In the SDLC approach the “time to market,” so tospeak, can be months (sometimes years). During this time, require-ments may change and the final deliverable, therefore, might be quiteoutmoded. To prevent this from happening it is a good idea to try tocompress the development cycle to shorten the time to market andprovide interim results to the end user. The iterative model consists ofthree steps: 1) listen to customer; 2) build and revise a mock-up; 3)have customer test drive the mock-up and then return to step 1.
• Rapid application development (RAD). This is a form of the iterativemodel. The key word here is “rapid.” Development teams try to get afirst pass of the system out to the end user within 60 to 90 days. To ac-complish this, the normal seven-step SDLC is compressed into the fol-lowing steps: business modeling; data modeling; process modeling;application generation, and testing and turnover. Note the term “appli-cation generation”; RAD makes use of application generators, former-ly called CASE (computer-assisted software engineering) tools.
• Incremental model. The four main phases of software development areanalysis, design, coding, and testing. If we break a business probleminto chunks — or increments — then we can use an overlapping,phased approach to software development as shown below:
Increment 1Analysis Design Code Test→ Delivery of first increment
Increment 2Analysis Design Code Test→ Delivery of second increment, etc.
• Joint application development (JAD). JAD is more of a technique thana complete methodology and can be utilized as part of any of the othermethodologies discussed here. The technique consists of “folding”one or more end users into the software development team. Instead ofan adversarial software developer–end-user dynamic, the effect is tohave the continued, uninterrupted attention of the persons who willultimately use the system.
• Reverse engineering. This technique is used, first, to understand a sys-tem from its code, second, to generate documentation base on thecode, and, third, make desired changes to the system. Competitivesoftware companies often try to reverse engineer their competitors’software.
• Re-engineering. Business goals change over time. Software mustchange to be consistent with these goals. Re-engineering utilizes manyof the techniques already discussed here. Instead of building a systemfrom scratch, the goal of re-engineering is to retrofit an existing systemto new business functionality.
CuuDuongThanCong.com https://fb.com/tailieudientucntt
99
Methodology Selection
• Object-oriented (OO). OO primarily consists of object-oriented analy-sis (OOA), object-oriented design (OOD), and object oriented pro-gramming (OOP). These methodologies are radically different fromtraditional, more structured methodologies.
RATING YOUR METHODOLOGY
1. Does the methodology identify the steps necessary to produce each deliverable of a systems development effort?
Methodologies are necessarily very “step” oriented. One cannot andshould not proceed to step two without adequately completing step one.A person using a particular methodology should be provided with a cleardelineation of all steps as well as what initiates and terminates each ofthese steps. A good methodology will define answers to the followingquestions:
• What must be done?• How long will it take?• Why is the step done?• How should it be done?• What is produced?• Who will do it?• When should it be done?• Which tools are to be used?
Rate this attribute:
Low High0 1 2 3 4| | |
Poor Adequate Excellent
2. Does the methodology simplify the systems development process?
Some methodologies are so complicated that they are impossible to use.If it is not clear to the user of the methodology how to use that particularmethodology, the systems development effort will fail.
Rate this attribute:
Low High0 1 2 3 4| | |
Poor Adequate Excellent
CuuDuongThanCong.com https://fb.com/tailieudientucntt
100
SOFTWARE ENGINEERING HANDBOOK
3. Does the methodology encourage and provide the means to implement a standard and repeatable approach to systems development?
The Software Engineering Institute (http://www.sei.cmu.edu/sei-home.html) in Pittsburgh is the creator of the well-known capability matu-rity model (CMM). The framework consists of several levels of maturitythat an IT department goes through on its way to becoming completelyoptimized and productive:
• Initial. This level is ad hoc and chaotic.• Repeatable. Basic project management processes are established to
track cost, schedule, and functionality.• Defined. Management and engineering activities are documented,
standardized, and integrated into the organization.• Quantitatively managed. This level uses detailed measures.• Optimizing. Continuous process improvement is enabled by quantita-
tive feedback and from testing innovative ideas and technologies.
An often quoted statistic is that 80 percent of us are sitting on top oflevel one. Use of a methodology implies that the organization is at levelthree — defined. A methodology enables the organization to implement astandardized procedure for the development of systems so that the pro-cess of developing these systems is standardized and can be repeated eas-ily by one or more project teams.
Rate this attribute:
Low High0 1 2 3 4| | |
Poor Adequate Excellent
4. Can the methodology be customized to meet the specific requirements of the organization or is it unyielding and uncustomizable?
Every organization is unique in terms of its policies and procedures,industry, and standards it applies to its practices. It makes sense, there-fore, that any methodology selected needs to be flexible so that it canaccommodate the way the organization works today — as well as the waythe organization will work tomorrow. The very best methodologies arethose that permit the organization full customization capabilities interms of:
• Can the names of methodology components be changed to those theorganization is more familiar with?
• Can the descriptions of methodology components be changed?• Can new components be added and related to existing components?• Can component definitions (designs) be altered, extended, or deleted?
CuuDuongThanCong.com https://fb.com/tailieudientucntt
101
Methodology Selection
• Can new paths be defined to describe unique uses of the methodology?• Can the underlying methods and deliverables be changed?
Rate this attribute:
Low High0 1 2 3 4| | |
Poor Adequate Excellent
5. Is the methodology “state of the art?”
Each month brings new innovations to the IT industry. The Internet hasbeen with us for less than a decade. Flat file systems have morphed intorelational database systems that have morphed into object-oriented data-bases.
Because the tools and techniques of developing systems are continuallyimproving, it makes sense that the methodology chosen needs to have thecapability of interacting with these newer tools and techniques — in casethe methodology becomes as obsolete as the tools it thinks you are using.Tools that your methodology should support include:
• Computer-assisted systems engineering (CASE), as well as visual de-velopment tools such as Visual Basic, Visual C++, etc.
• Data dictionaries, repositories, and data warehouses• Java and XML• Relational databases and object-oriented databases• Client-server• Cooperative and collaborative processing• Internet and Intranet• Accelerated and user-centered development such as JAD (joint appli-
cation development) and RAD (rapid application development)• Integration (across business area, system data, and function sharing)
Rate this attribute:
Low High0 1 2 3 4| | |
Poor Adequate Excellent
6. Is the methodology complete?
Most formal systems development activities are based around severalsteps collectively known as the SDLC or systems development life cycle.The SDLC consists of:
• Planning. In this step we uncover the mission and goals of the projectand ascertain the resources required to implement the system.
CuuDuongThanCong.com https://fb.com/tailieudientucntt

102
SOFTWARE ENGINEERING HANDBOOK
• Feasibility. This step determines whether or not the project is econom-ically or technically feasible.
• Analysis. In this step the business and technical requirements of pro-posed systems are uncovered, modeled, and documented.
• Design. During this phase system high-level as well as low-level archi-tectures are crafted that are traceable back to the business require-ments uncovered in the analysis phase.
• Implementation. In this phase programs are coded and tested.• Production. Once the programs have been written and tested, this
phase will oversee the introduction of the system into the business.• Maintenance. No system is ever complete. During the maintenance
phase, modifications are made to the system to fix errors and to en-hance the system per new requirements.
Some methodologies pertain only to the latter phases of the SDLC. A pre-ferred methodology will encompass the entire range of SDLC activities.
Rate this attribute:
Low High0 1 2 3 4| | |
Poor Adequate Excellent
7. Can the methodology be broken down into components?
Although the methodology should cover all phases of the SDLC, the pre-ferred methodology will be object oriented in nature. For example, itshould be possible to extract the piece of the methodology relevant to thefeasibility study easily.
Rate this attribute:
Low High0 1 2 3 4| | |
Poor Adequate Excellent
8. Is the methodology adaptable across industries?
Organizations across industry boundaries exhibit different attributes. Apreferred methodology is adaptable to all industries, across all boundaries.
Rate this attribute:
Low High0 1 2 3 4| | |
Poor Adequate Excellent
CuuDuongThanCong.com https://fb.com/tailieudientucntt
103
Methodology Selection
9. Does the methodology produce documentation?
A formal process necessitates the creation of deliverables at certain pre-designated milestones. For example, upon completion of the analysisphase it is typical that a requirements specification be created. The partic-ular methodology will specify the format and timeliness of the document.
Rate this attribute:
Low High0 1 2 3 4| |
Poor Adequate Excellent
10. Does the methodology have discrete methods for each step in each phase of the SDLC?
A formal methodology breaks down the systems development processinto phases (e.g., SDLC). Each phase, in turn, has its own unique steps. Agood methodology will supply methods that will instruct the developer inapplying that segment of the methodology to the particular step in ques-tion. For example, a unique step of the analysis phase is to interview endusers. A good methodology will provide instructions on:
• Who performs this task• How to perform this task• What tools to use to perform this task• What deliverable, if any, is required
Rate this attribute:
Low High0 1 2 3 4| |
Poor Adequate Excellent
11. Does the methodology provide techniques that describe how to conduct its methods?
For a methodology to be usable it must detail the techniques of perform-ing the tasks outlined within it. For example, for the task “interview endusers” techniques should include:
• How to select the end users• What sampling techniques to use• How to devise questionnaires and surveys• How to use a tape or video recorder effectively
CuuDuongThanCong.com https://fb.com/tailieudientucntt
104
SOFTWARE ENGINEERING HANDBOOK
Rate this attribute:
Low High0 1 2 3 4| |
Poor Adequate Excellent
12. Will the methodology incorporate standards and practices of the organization?
All organizations are different. Each publishes its own set of policiesand procedures (i.e., naming conventions, tool usage guidelines, etc.),which may or may not be consistent within the industry. A good method-ology enables the organization to maintain its unique set of standards andpractices.
Rate this attribute:
Low High0 1 2 3 4| |
Poor Adequate Excellent
13. Does the methodology identify roles played by various members of the project team?
A wide variety of people constitutes a typically project team.
• Project manager — manages one or more projects.• Project leader — manages a specific project.• Systems analyst — handles the analytical aspects of the system.• Designer — designs the systems (might be the same person as the
analyst).• Network administrator — is responsible for implementing the network
aspects of the system.• Database administrator — designs the database and file systems.• Web designer — handles the front end of any Internet or Intranet
systems.
An effective methodology links required skills with each method inorder to identify appropriate roles.
Rate this attribute:
Low High0 1 2 3 4| |
Poor Adequate Excellent
CuuDuongThanCong.com https://fb.com/tailieudientucntt
105
Methodology Selection
14. Does the methodology identify support tools appropriate for execution of each method?
A wide variety of tools on the market will automate many of the tasksdelineated in the methodology (i.e., survey generation, program code gen-eration, model building).
It should be noted that many methodologies were developed by soft-ware vendors for the express purpose of supporting a particular tool set.In other words, the methodology was developed as a marketing vehicle forthe tool set.
Rate this attribute:
Low High0 1 2 3 4| |
Poor Adequate Excellent
15. Is the methodology verifiable?
A formal methodology must have a visible model. This model must beable to be verified for correctness and completeness and modified asneeds dictate. Only methodologies that are coupled with automated toolsets are capable of this.
Rate this attribute:
Low High0 1 2 3 4| |
Poor Adequate Excellent
16. Can the methodology be searched?
Methodology is the road map to the development of a system. As dis-cussed, the methodology contains information on how to approach eachphase in the SDLC along with techniques and tools for executing the meth-ods specified for that particular phase. From the perspective of the sys-tems developer, the methodology is a knowledge base that instructs him orher on the “how-tos” as well as the “why tos” and “when tos” of systemsdevelopment. It makes sense, therefore, that the system developer be per-mitted to search through this methodology knowledge base to retrievespecific information.
Because it is a knowledge base, the information contained there shouldbe navigable from multiple perspectives. The systems developer should beable to forward chain through the knowledge base from top to bottom, aswell as backward chain upward from the lowest level to the highest level ofabstraction.
CuuDuongThanCong.com https://fb.com/tailieudientucntt
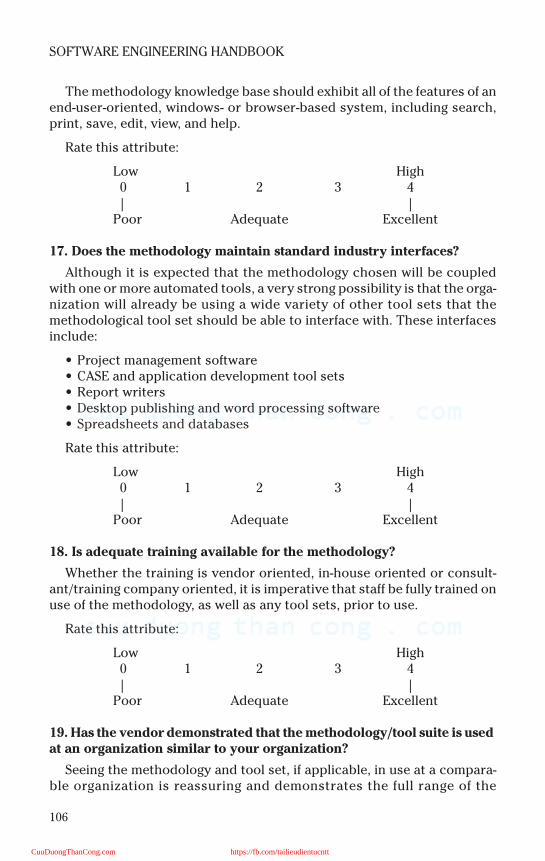
106
SOFTWARE ENGINEERING HANDBOOK
The methodology knowledge base should exhibit all of the features of anend-user-oriented, windows- or browser-based system, including search,print, save, edit, view, and help.
Rate this attribute:
Low High0 1 2 3 4| |
Poor Adequate Excellent
17. Does the methodology maintain standard industry interfaces?
Although it is expected that the methodology chosen will be coupledwith one or more automated tools, a very strong possibility is that the orga-nization will already be using a wide variety of other tool sets that themethodological tool set should be able to interface with. These interfacesinclude:
• Project management software• CASE and application development tool sets• Report writers• Desktop publishing and word processing software• Spreadsheets and databases
Rate this attribute:
Low High0 1 2 3 4| |
Poor Adequate Excellent
18. Is adequate training available for the methodology?
Whether the training is vendor oriented, in-house oriented or consult-ant/training company oriented, it is imperative that staff be fully trained onuse of the methodology, as well as any tool sets, prior to use.
Rate this attribute:
Low High0 1 2 3 4| |
Poor Adequate Excellent
19. Has the vendor demonstrated that the methodology/tool suite is used at an organization similar to your organization?
Seeing the methodology and tool set, if applicable, in use at a compara-ble organization is reassuring and demonstrates the full range of the
CuuDuongThanCong.com https://fb.com/tailieudientucntt
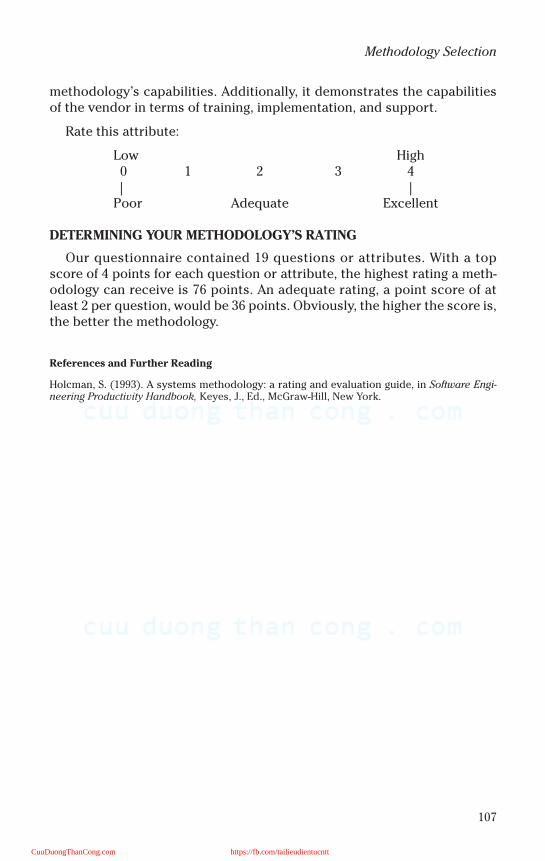
107
Methodology Selection
methodology’s capabilities. Additionally, it demonstrates the capabilitiesof the vendor in terms of training, implementation, and support.
Rate this attribute:
Low High0 1 2 3 4| |
Poor Adequate Excellent
DETERMINING YOUR METHODOLOGY’S RATING
Our questionnaire contained 19 questions or attributes. With a topscore of 4 points for each question or attribute, the highest rating a meth-odology can receive is 76 points. An adequate rating, a point score of atleast 2 per question, would be 36 points. Obviously, the higher the score is,the better the methodology.
References and Further Reading
Holcman, S. (1993). A systems methodology: a rating and evaluation guide, in Software Engi-neering Productivity Handbook, Keyes, J., Ed., McGraw-Hill, New York.
CuuDuongThanCong.com https://fb.com/tailieudientucntt

This page intentionally left blank
CuuDuongThanCong.com https://fb.com/tailieudientucntt

109
Chapter 8
Selecting and Integrating a Repository for Effective Resource Management
Τηε χορπορατιον οφ τηε φυτυρε ωιλλ βε ρυν ωιτη α ϖαστ µεση οφ ιντεραχτινγ χοµ−
πυτερσ ανδ δατα−βασεδ σψστεµσ. Ιτ ωιλλ βε ιµποσσιβλε το µαναγε ανδ βυιλδ τηε προ−
χεδυρεσ το τακε αδϖανταγε οφ τηισ τεχηνολογψ ωιτηουτ σοµε φορµ οφ ινφορµατιον
ενγινεερινγ, αππροπριατελψ αυτοµατεδ. Τηε ενχψχλοπεδια, ωηιχη ισ τηε ηεαρτ οφ
ινφορµατιον ενγινεερινγ, ωιλλ βε α ϖιταλ χορπορατε ρεσουρχε.
ϑαµεσ Μαρτιν (1989)
EFFECTIVE INFORMATION RESOURCE MANAGEMENT
There are many roads to productivity. The one least traveled, but perhapsmost profitable, is the one where software tools are integrated in a mannerproducing accessible and timely information.
The three keywords here are information, tools, and integration. Infor-mation is really the most important asset a company owns. With properutilization, information becomes a potent competitive force. In today’svery global — and very competitive — economy, information may, in fact,be the deciding factor in determining the color of the organization’sbottom-line.
Understanding that information is a resource to be valued, organiza-tions have made a heavy investment in information technology. Thisinvestment, to the tune of billions of dollars, included development of newsystems as well as purchase of a variety of software tools.
CuuDuongThanCong.com https://fb.com/tailieudientucntt
110
SOFTWARE ENGINEERING HANDBOOK
Software tools are decidedly two-flavored. On the one hand are the enduser-oriented tools, which include report writers and 4GLs; on the otherhand are tools that specifically target the development function. Thesetools run the gamut from compilers to data administration tools to visualdevelopment tools. Common among all of these tools has been the decidedlack of interconnectivity, or integration.
Lack of integration is a subtle defect with a powerfully negative impacton the productivity and competitiveness of an organization. It translates toan inability to manage information in a consistent and nonredundant fash-ion. Because software tools have seams, information cannot flow easilyfrom one tool to anther, forcing organizations to move the informationmanually between tools — or worse, to create redundant and conflictinginformation stores.
Recognizing the ramifications of these problems, the industry has begunto move in the direction of development frameworks. The goal of theseframeworks is to provide a boundaryless environment to spur the free flowof information through the use of standards and guidelines for develop-ment of software tools.
Metadata repositories, the focus of this chapter, have historicallyfocused on application development and data warehousing. Recently thismission has been extended to support component middleware frame-works and business objects. In the near future, knowledge managementand enterprise information portal environments will be supported as well.
A metadata repository, which I will call a repository workbench, hasthree functions. It is a repository, it provides tools, and it forms the “con-necting glue” of the development framework — in other words, integration.
A short and standard definition of a repository is “an organized refer-ence to the data content of something. That something could be a system,a database, or a collection of all the files, program databases, and manualrecords maintained by a large organization.” Although the definition oftools should be self-evident, in this context it is not.
Tools in a repository workbench environment encompass a broad spec-trum of functionality that goes beyond what is commonly available. The lastcomponent of the repository workbench equation is integration; this com-ponent meshes the repository and the repository-based tools into an orga-nization’s environment. The net sum of the repository equation is the abil-ity to better leverage the skill set of a wide range of the organization’s staff— from data administrators to programmers to analysts and end users.This leveraging of skill sets leads to a dramatic increase in productivity.
CuuDuongThanCong.com https://fb.com/tailieudientucntt
111
Selecting and Integrating a Repository for Effective Resource Management
The remainder of this chapter assists the reader in three areas: evaluat-ing the benefits of a repository workbench solution, planning for its imple-mentation, and measuring it.
HOW TO USE THIS CHAPTER
In the first section — Evaluating the Repository Workbench — a quanti-tative approach is taken to assist the reader in understanding the featuresof a repository workbench and comparing these features across competi-tive products. Twenty-three distinct criteria are divided into three catego-ries: repository, integration, and tools; each criterion is presented in theform of a set of features. To quantify the assessment, each should be ratedin terms of its importance to the organization. A rating, or weight, of 1 to 3should be used (1 = not important to the organization, 2 = required by theorganization, 3 = of high importance to the organization).
Each of the features describing the criteria should next be rated accord-ing to how well the vendor fulfills the requirement. A scale of 1 through 5should be used: (1 = fails, 2 = weak, 3 = adequate, 4 = good, 5 = excellent).
After you finish rating all 23 criteria, your scores can be transferred tothe charts at the end of this chapter. These charts allow you to add uprepository scores and to make overall evaluations and comparisons.
In the second section — Preparing for the Repository Workbench — aseries of checklists is provided to assist the reader in deciding whether ornot a repository workbench solution is desirable and in developing a planfor repository workbench implementation.
In the third section — Repository Metrics — a series of measurementsis provided to assist the reader in determining how well the repository isutilized.
Evaluating the Repository workbench
Selecting a repository workbench is not a simple process. Repositoryworkbench software is quite complex and the selection process mirrorsthis complexity. Because a repository workbench offers a composite offunctionality, the evaluation team needs to review three discrete levels offunctionality: the repository component, the workbench component, andthe integrative component. What follows is a set of categories that willassist in this process; each represents a different level of functionality thata product of this type should have.
The repository is the heart of the repository workbench. It is much morethan a data dictionary or a data warehouse. It stores information aboutobjects — whether those objects are file definitions or process rules. The
CuuDuongThanCong.com https://fb.com/tailieudientucntt
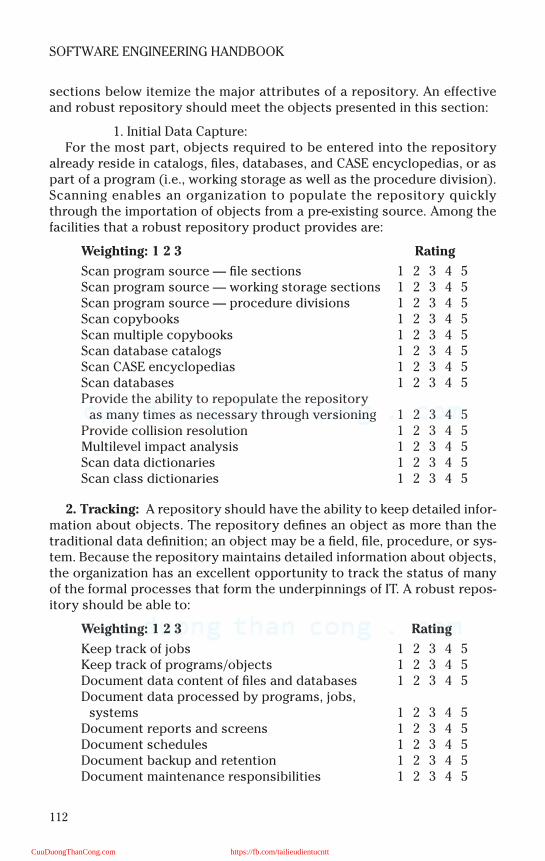
112
SOFTWARE ENGINEERING HANDBOOK
sections below itemize the major attributes of a repository. An effectiveand robust repository should meet the objects presented in this section:
1. Initial Data Capture:For the most part, objects required to be entered into the repository
already reside in catalogs, files, databases, and CASE encyclopedias, or aspart of a program (i.e., working storage as well as the procedure division).Scanning enables an organization to populate the repository quicklythrough the importation of objects from a pre-existing source. Among thefacilities that a robust repository product provides are:
Weighting: 1 2 3 Rating
Scan program source — file sections 1 2 3 4 5Scan program source — working storage sections 1 2 3 4 5Scan program source — procedure divisions 1 2 3 4 5Scan copybooks 1 2 3 4 5Scan multiple copybooks 1 2 3 4 5Scan database catalogs 1 2 3 4 5Scan CASE encyclopedias 1 2 3 4 5Scan databases 1 2 3 4 5Provide the ability to repopulate the repository
as many times as necessary through versioning 1 2 3 4 5Provide collision resolution 1 2 3 4 5Multilevel impact analysis 1 2 3 4 5Scan data dictionaries 1 2 3 4 5Scan class dictionaries 1 2 3 4 5
2. Tracking: A repository should have the ability to keep detailed infor-mation about objects. The repository defines an object as more than thetraditional data definition; an object may be a field, file, procedure, or sys-tem. Because the repository maintains detailed information about objects,the organization has an excellent opportunity to track the status of manyof the formal processes that form the underpinnings of IT. A robust repos-itory should be able to:
Weighting: 1 2 3 Rating
Keep track of jobs 1 2 3 4 5Keep track of programs/objects 1 2 3 4 5Document data content of files and databases 1 2 3 4 5Document data processed by programs, jobs,
systems 1 2 3 4 5Document reports and screens 1 2 3 4 5Document schedules 1 2 3 4 5Document backup and retention 1 2 3 4 5Document maintenance responsibilities 1 2 3 4 5
CuuDuongThanCong.com https://fb.com/tailieudientucntt

113
Selecting and Integrating a Repository for Effective Resource Management
3. Source and Use: All organizations are different in the policies, meth-ods, and procedures of their IT processes. The repository workbench mustintegrate itself as well as act as an integrator of these policies, methods,and procedures. The repository workbench must be flexible enough to:
Weighting: 1 2 3 Rating
Support data model 1 2 3 4 5Support object model 1 2 3 4 5Support information center usage 1 2 3 4 5Support application generator 1 2 3 4 5Support life cycle methodology 1 2 3 4 5Support distributed processing 1 2 3 4 5Document communications network 1 2 3 4 5Maintain hardware inventory 1 2 3 4 5Support data security planning 1 2 3 4 5Support forms control 1 2 3 4 5Support change and problem control 1 2 3 4 5Support procedures and standards for repository
update and maintenance 1 2 3 4 5
4. User Access: Studies on productivity have shown that the user inter-face has the greatest impact on the usability of the system. For the functionof data administration, a flexible user interface is mandatory if the organi-zation is to leverage the resources of skilled professionals. The repositoryworkbench product should offer the following features:
Weighting: 1 2 3 Rating
Mainframe-based:Easy to use 1 2 3 4 5Contextual help facility 1 2 3 4 5SAA/CUA compliant 1 2 3 4 5Customizable 1 2 3 4 5Pull-down menus 1 2 3 4 5Pop-up windows 1 2 3 4 5Fast-path commands 1 2 3 4 5
Client/Server based:GUI 1 2 3 4 5Graphical representation of E-R model 1 2 3 4 5Point and click 1 2 3 4 5Multiple platforms 1 2 3 4 5CPI-C 1 2 3 4 5XML 1 2 3 4 5
Online 1 2 3 4 5Batch 1 2 3 4 5Internet/Intranet 1 2 3 4 5
CuuDuongThanCong.com https://fb.com/tailieudientucntt

114
SOFTWARE ENGINEERING HANDBOOK
5. Dialog: A robust repository dialog should provide a simple, intuitivemeans for maintaining and querying information assets, as well as access-ing tools. Features should include:
Weighting: 1 2 3 Rating
Contextual menus 1 2 3 4 5Menus rebuilt automatically as tools are added 1 2 3 4 5Self-maintaining 1 2 3 4 5E-R rule-based data entry screens 1 2 3 4 5Project-based menus 1 2 3 4 5Context-sensitive feedback 1 2 3 4 5Reusable panels 1 2 3 4 5Scrollable panels 1 2 3 4 5Spreadsheet-like displays 1 2 3 4 5Customize forms 1 2 3 4 5End-user SQL queries 1 2 3 4 5Project-defined SQL queries 1 2 3 4 5Multilevel impact analysis 1 2 3 4 5Attribute anchoring 1 2 3 4 5Meaningful labels for DB names 1 2 3 4 5Multiple text types 1 2 3 4 5
6. Extensibility: A robust repository workbench is not rigid; it shouldsupport growth. This growth should not be limited merely to data defini-tions. In an object-based environment a repository workbench should havethe flexibility to add new sources of information as well as new tools,reports, and procedures. Each of these is defined as an object. Extensibilityfeatures should include:
Weighting: 1 2 3 Rating
Dialog assistance 1 2 3 4 5Automatic rebinding 1 2 3 4 5Automatic creation of repository table spaces 1 2 3 4 5(Re)creation of repository indices 1 2 3 4 5Reorg 1 2 3 4 5Error handling and correction 1 2 3 4 5(Re)granting of table privileges 1 2 3 4 5Integration with repository tools 1 2 3 4 5Ability to add on in-house tools 1 2 3 4 5Ability to add on third party tools 1 2 3 4 5Ease in defining migration rules 1 2 3 4 5Ease in defining security 1 2 3 4 5Ease in defining validation rules 1 2 3 4 5Ease in defining integrity rules 1 2 3 4 5Ease in defining derivation rules 1 2 3 4 5Ease in defining domain constraints 1 2 3 4 5
CuuDuongThanCong.com https://fb.com/tailieudientucntt
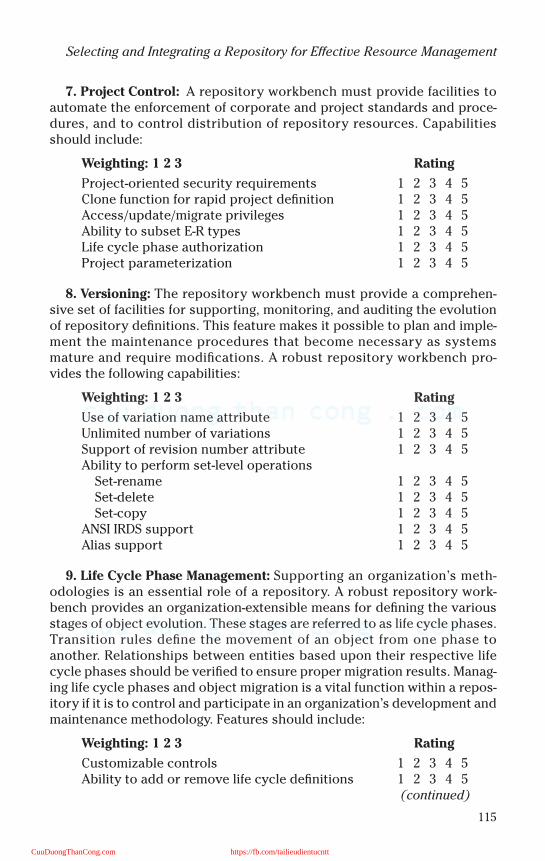
115
Selecting and Integrating a Repository for Effective Resource Management
7. Project Control: A repository workbench must provide facilities toautomate the enforcement of corporate and project standards and proce-dures, and to control distribution of repository resources. Capabilitiesshould include:
Weighting: 1 2 3 Rating
Project-oriented security requirements 1 2 3 4 5Clone function for rapid project definition 1 2 3 4 5Access/update/migrate privileges 1 2 3 4 5Ability to subset E-R types 1 2 3 4 5Life cycle phase authorization 1 2 3 4 5Project parameterization 1 2 3 4 5
8. Versioning: The repository workbench must provide a comprehen-sive set of facilities for supporting, monitoring, and auditing the evolutionof repository definitions. This feature makes it possible to plan and imple-ment the maintenance procedures that become necessary as systemsmature and require modifications. A robust repository workbench pro-vides the following capabilities:
Weighting: 1 2 3 Rating
Use of variation name attribute 1 2 3 4 5Unlimited number of variations 1 2 3 4 5Support of revision number attribute 1 2 3 4 5Ability to perform set-level operations
Set-rename 1 2 3 4 5Set-delete 1 2 3 4 5Set-copy 1 2 3 4 5
ANSI IRDS support 1 2 3 4 5Alias support 1 2 3 4 5
9. Life Cycle Phase Management: Supporting an organization’s meth-odologies is an essential role of a repository. A robust repository work-bench provides an organization-extensible means for defining the variousstages of object evolution. These stages are referred to as life cycle phases.Transition rules define the movement of an object from one phase toanother. Relationships between entities based upon their respective lifecycle phases should be verified to ensure proper migration results. Manag-ing life cycle phases and object migration is a vital function within a repos-itory if it is to control and participate in an organization’s development andmaintenance methodology. Features should include:
Weighting: 1 2 3 Rating
Customizable controls 1 2 3 4 5Ability to add or remove life cycle definitions 1 2 3 4 5
(continued)
CuuDuongThanCong.com https://fb.com/tailieudientucntt

116
SOFTWARE ENGINEERING HANDBOOK
Weighting: 1 2 3 (continued) Rating
Transition rules 1 2 3 4 5Migration paths 1 2 3 4 5Relationship-state rules 1 2 3 4 5Project-controlled life cycle phases 1 2 3 4 5Versioning within life cycle phase 1 2 3 4 5
Integration. Developmental frameworks like AD/Cycle are philoso-phies. For the most part, software engineering tools such as CASE maintainkey positions within this framework but do little to integrate effectivelywith other tools in other quadrants of the framework — or even other toolswithin the same quadrant. The objectives in this section, if met by the toolbeing evaluated, will assure the organization that the repository will beseamlessly integrated with repository tools as well as in-house-developedand third-party tools.
10. Architecture: A repository workbench is a unique hybrid of reposi-tory, tools, and an integrative vehicle. In order to support this threefoldfunctionality, the underlying architecture of a repository workbench prod-uct must provide openness and an extensible framework. The organizationmust be able to easily integrate into and expand upon the framework. Thearchitectural features of a robust architectural framework include:
Weighting: 1 2 3 Rating
Object-based approach 1 2 3 4 5Extensible 1 2 3 4 5Easily configurable 1 2 3 4 5Easily modifiable 1 2 3 4 5Easy integration 1 2 3 4 5Underlying meta–meta model 1 2 3 4 5Vendor-supplied meta model 1 2 3 4 5Security, backup, and recovery 1 2 3 4 5Referential integrity 1 2 3 4 5
11. Standards: The basis of any open framework is the standards that itrests on. For this framework to be fully integrative with an organization’senvironment, the framework must conform to and support the standardsand guidelines that the industry has embraced. Additionally, the reposi-tory workbench must provide the organization with the ability to supportthe standards that it has developed as part of its policies and procedures.This might includes where applicable:
Weighting: 1 2 3 Rating
XML 1 2 3 4 5Web services 1 2 3 4 5
(continued)
CuuDuongThanCong.com https://fb.com/tailieudientucntt
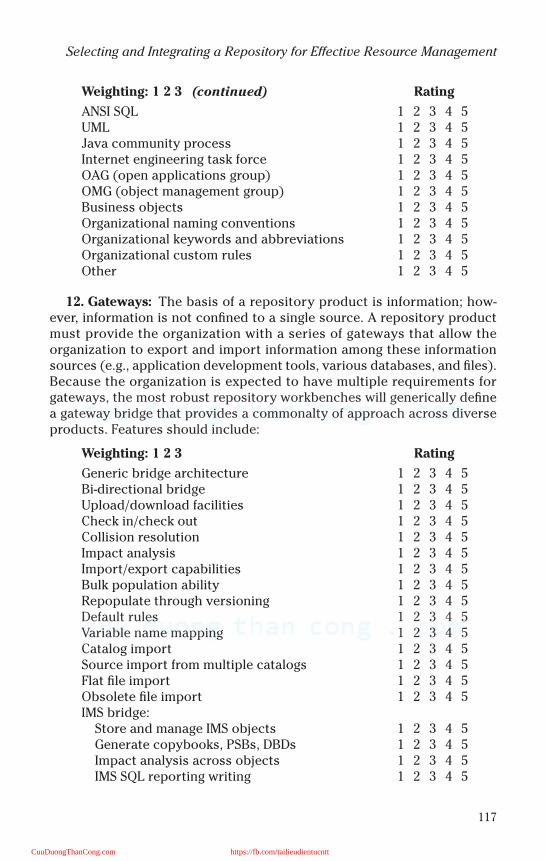
117
Selecting and Integrating a Repository for Effective Resource Management
Weighting: 1 2 3 (continued) Rating
ANSI SQL 1 2 3 4 5UML 1 2 3 4 5Java community process 1 2 3 4 5Internet engineering task force 1 2 3 4 5OAG (open applications group) 1 2 3 4 5OMG (object management group) 1 2 3 4 5Business objects 1 2 3 4 5Organizational naming conventions 1 2 3 4 5Organizational keywords and abbreviations 1 2 3 4 5Organizational custom rules 1 2 3 4 5Other 1 2 3 4 5
12. Gateways: The basis of a repository product is information; how-ever, information is not confined to a single source. A repository productmust provide the organization with a series of gateways that allow theorganization to export and import information among these informationsources (e.g., application development tools, various databases, and files).Because the organization is expected to have multiple requirements forgateways, the most robust repository workbenches will generically definea gateway bridge that provides a commonalty of approach across diverseproducts. Features should include:
Weighting: 1 2 3 Rating
Generic bridge architecture 1 2 3 4 5Bi-directional bridge 1 2 3 4 5Upload/download facilities 1 2 3 4 5Check in/check out 1 2 3 4 5Collision resolution 1 2 3 4 5Impact analysis 1 2 3 4 5Import/export capabilities 1 2 3 4 5Bulk population ability 1 2 3 4 5Repopulate through versioning 1 2 3 4 5Default rules 1 2 3 4 5Variable name mapping 1 2 3 4 5Catalog import 1 2 3 4 5Source import from multiple catalogs 1 2 3 4 5Flat file import 1 2 3 4 5Obsolete file import 1 2 3 4 5IMS bridge:
Store and manage IMS objects 1 2 3 4 5Generate copybooks, PSBs, DBDs 1 2 3 4 5Impact analysis across objects 1 2 3 4 5IMS SQL reporting writing 1 2 3 4 5
CuuDuongThanCong.com https://fb.com/tailieudientucntt
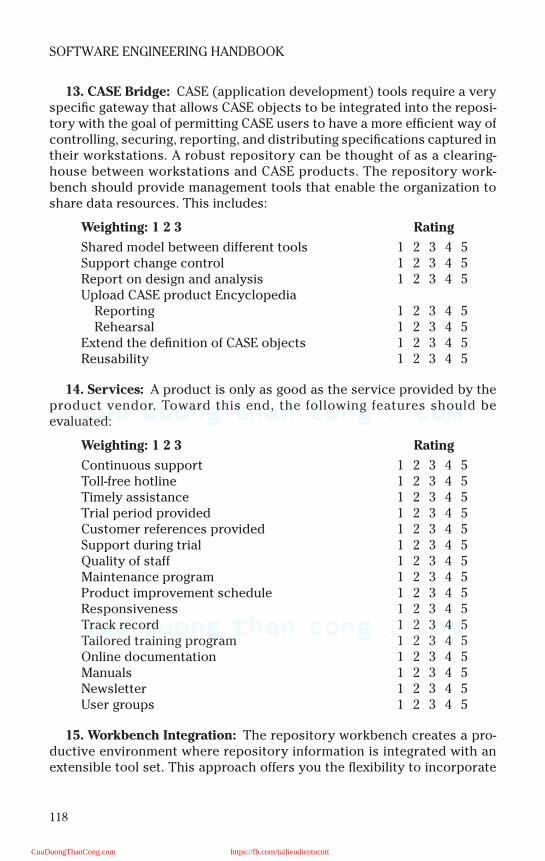
118
SOFTWARE ENGINEERING HANDBOOK
13. CASE Bridge: CASE (application development) tools require a veryspecific gateway that allows CASE objects to be integrated into the reposi-tory with the goal of permitting CASE users to have a more efficient way ofcontrolling, securing, reporting, and distributing specifications captured intheir workstations. A robust repository can be thought of as a clearing-house between workstations and CASE products. The repository work-bench should provide management tools that enable the organization toshare data resources. This includes:
Weighting: 1 2 3 Rating
Shared model between different tools 1 2 3 4 5Support change control 1 2 3 4 5Report on design and analysis 1 2 3 4 5Upload CASE product Encyclopedia
Reporting 1 2 3 4 5Rehearsal 1 2 3 4 5
Extend the definition of CASE objects 1 2 3 4 5Reusability 1 2 3 4 5
14. Services: A product is only as good as the service provided by theproduct vendor. Toward this end, the following features should beevaluated:
Weighting: 1 2 3 Rating
Continuous support 1 2 3 4 5Toll-free hotline 1 2 3 4 5Timely assistance 1 2 3 4 5Trial period provided 1 2 3 4 5Customer references provided 1 2 3 4 5Support during trial 1 2 3 4 5Quality of staff 1 2 3 4 5Maintenance program 1 2 3 4 5Product improvement schedule 1 2 3 4 5Responsiveness 1 2 3 4 5Track record 1 2 3 4 5Tailored training program 1 2 3 4 5Online documentation 1 2 3 4 5Manuals 1 2 3 4 5Newsletter 1 2 3 4 5User groups 1 2 3 4 5
15. Workbench Integration: The repository workbench creates a pro-ductive environment where repository information is integrated with anextensible tool set. This approach offers you the flexibility to incorporate
CuuDuongThanCong.com https://fb.com/tailieudientucntt
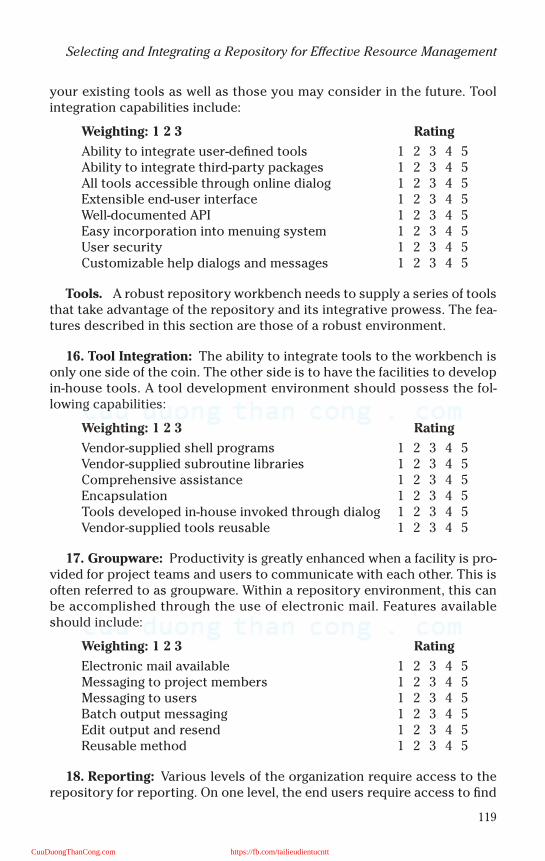
119
Selecting and Integrating a Repository for Effective Resource Management
your existing tools as well as those you may consider in the future. Toolintegration capabilities include:
Weighting: 1 2 3 Rating
Ability to integrate user-defined tools 1 2 3 4 5Ability to integrate third-party packages 1 2 3 4 5All tools accessible through online dialog 1 2 3 4 5Extensible end-user interface 1 2 3 4 5Well-documented API 1 2 3 4 5Easy incorporation into menuing system 1 2 3 4 5User security 1 2 3 4 5Customizable help dialogs and messages 1 2 3 4 5
Tools. A robust repository workbench needs to supply a series of toolsthat take advantage of the repository and its integrative prowess. The fea-tures described in this section are those of a robust environment.
16. Tool Integration: The ability to integrate tools to the workbench isonly one side of the coin. The other side is to have the facilities to developin-house tools. A tool development environment should possess the fol-lowing capabilities:
Weighting: 1 2 3 Rating
Vendor-supplied shell programs 1 2 3 4 5Vendor-supplied subroutine libraries 1 2 3 4 5Comprehensive assistance 1 2 3 4 5Encapsulation 1 2 3 4 5Tools developed in-house invoked through dialog 1 2 3 4 5Vendor-supplied tools reusable 1 2 3 4 5
17. Groupware: Productivity is greatly enhanced when a facility is pro-vided for project teams and users to communicate with each other. This isoften referred to as groupware. Within a repository environment, this canbe accomplished through the use of electronic mail. Features availableshould include:
Weighting: 1 2 3 Rating
Electronic mail available 1 2 3 4 5Messaging to project members 1 2 3 4 5Messaging to users 1 2 3 4 5Batch output messaging 1 2 3 4 5Edit output and resend 1 2 3 4 5Reusable method 1 2 3 4 5
18. Reporting: Various levels of the organization require access to therepository for reporting. On one level, the end users require access to find
CuuDuongThanCong.com https://fb.com/tailieudientucntt
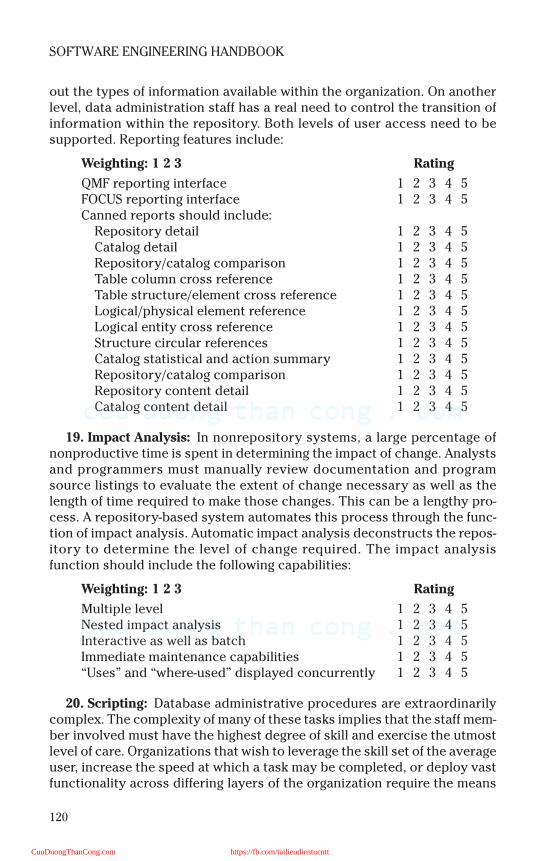
120
SOFTWARE ENGINEERING HANDBOOK
out the types of information available within the organization. On anotherlevel, data administration staff has a real need to control the transition ofinformation within the repository. Both levels of user access need to besupported. Reporting features include:
Weighting: 1 2 3 Rating
QMF reporting interface 1 2 3 4 5FOCUS reporting interface 1 2 3 4 5Canned reports should include:
Repository detail 1 2 3 4 5Catalog detail 1 2 3 4 5Repository/catalog comparison 1 2 3 4 5Table column cross reference 1 2 3 4 5Table structure/element cross reference 1 2 3 4 5Logical/physical element reference 1 2 3 4 5Logical entity cross reference 1 2 3 4 5Structure circular references 1 2 3 4 5Catalog statistical and action summary 1 2 3 4 5Repository/catalog comparison 1 2 3 4 5Repository content detail 1 2 3 4 5Catalog content detail 1 2 3 4 5
19. Impact Analysis: In nonrepository systems, a large percentage ofnonproductive time is spent in determining the impact of change. Analystsand programmers must manually review documentation and programsource listings to evaluate the extent of change necessary as well as thelength of time required to make those changes. This can be a lengthy pro-cess. A repository-based system automates this process through the func-tion of impact analysis. Automatic impact analysis deconstructs the repos-itory to determine the level of change required. The impact analysisfunction should include the following capabilities:
Weighting: 1 2 3 Rating
Multiple level 1 2 3 4 5Nested impact analysis 1 2 3 4 5Interactive as well as batch 1 2 3 4 5Immediate maintenance capabilities 1 2 3 4 5“Uses” and “where-used” displayed concurrently 1 2 3 4 5
20. Scripting: Database administrative procedures are extraordinarilycomplex. The complexity of many of these tasks implies that the staff mem-ber involved must have the highest degree of skill and exercise the utmostlevel of care. Organizations that wish to leverage the skill set of the averageuser, increase the speed at which a task may be completed, or deploy vastfunctionality across differing layers of the organization require the means
CuuDuongThanCong.com https://fb.com/tailieudientucntt
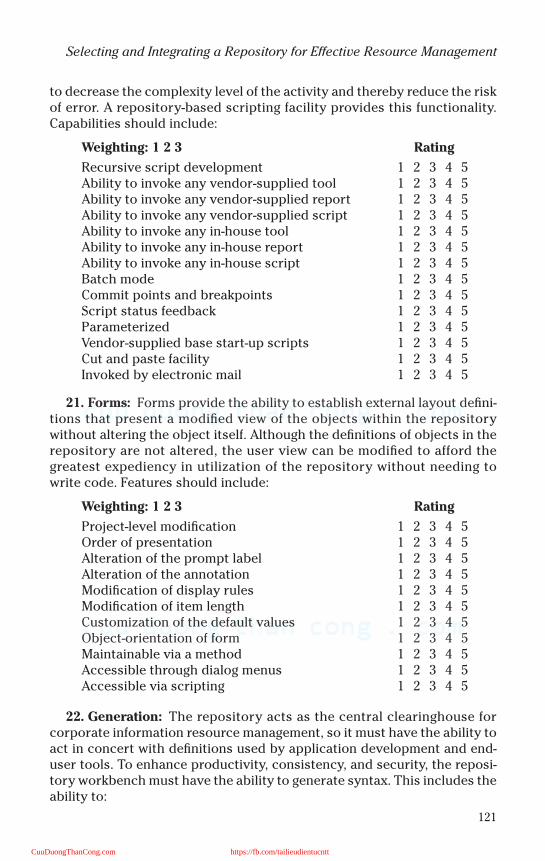
121
Selecting and Integrating a Repository for Effective Resource Management
to decrease the complexity level of the activity and thereby reduce the riskof error. A repository-based scripting facility provides this functionality.Capabilities should include:
Weighting: 1 2 3 Rating
Recursive script development 1 2 3 4 5Ability to invoke any vendor-supplied tool 1 2 3 4 5Ability to invoke any vendor-supplied report 1 2 3 4 5Ability to invoke any vendor-supplied script 1 2 3 4 5Ability to invoke any in-house tool 1 2 3 4 5Ability to invoke any in-house report 1 2 3 4 5Ability to invoke any in-house script 1 2 3 4 5Batch mode 1 2 3 4 5Commit points and breakpoints 1 2 3 4 5Script status feedback 1 2 3 4 5Parameterized 1 2 3 4 5Vendor-supplied base start-up scripts 1 2 3 4 5Cut and paste facility 1 2 3 4 5Invoked by electronic mail 1 2 3 4 5
21. Forms: Forms provide the ability to establish external layout defini-tions that present a modified view of the objects within the repositorywithout altering the object itself. Although the definitions of objects in therepository are not altered, the user view can be modified to afford thegreatest expediency in utilization of the repository without needing towrite code. Features should include:
Weighting: 1 2 3 Rating
Project-level modification 1 2 3 4 5Order of presentation 1 2 3 4 5Alteration of the prompt label 1 2 3 4 5Alteration of the annotation 1 2 3 4 5Modification of display rules 1 2 3 4 5Modification of item length 1 2 3 4 5Customization of the default values 1 2 3 4 5Object-orientation of form 1 2 3 4 5Maintainable via a method 1 2 3 4 5Accessible through dialog menus 1 2 3 4 5Accessible via scripting 1 2 3 4 5
22. Generation: The repository acts as the central clearinghouse forcorporate information resource management, so it must have the ability toact in concert with definitions used by application development and end-user tools. To enhance productivity, consistency, and security, the reposi-tory workbench must have the ability to generate syntax. This includes theability to:
CuuDuongThanCong.com https://fb.com/tailieudientucntt
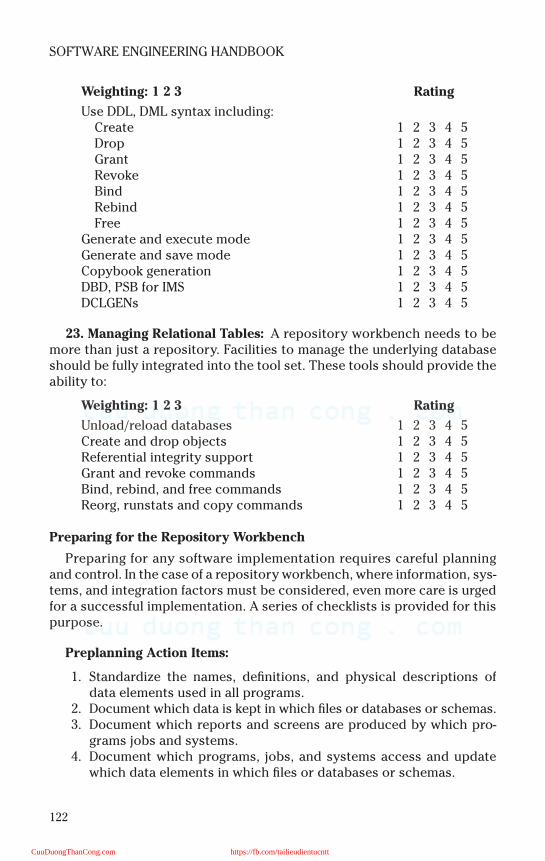
122
SOFTWARE ENGINEERING HANDBOOK
Weighting: 1 2 3 Rating
Use DDL, DML syntax including:Create 1 2 3 4 5Drop 1 2 3 4 5Grant 1 2 3 4 5Revoke 1 2 3 4 5Bind 1 2 3 4 5Rebind 1 2 3 4 5Free 1 2 3 4 5
Generate and execute mode 1 2 3 4 5Generate and save mode 1 2 3 4 5Copybook generation 1 2 3 4 5DBD, PSB for IMS 1 2 3 4 5DCLGENs 1 2 3 4 5
23. Managing Relational Tables: A repository workbench needs to bemore than just a repository. Facilities to manage the underlying databaseshould be fully integrated into the tool set. These tools should provide theability to:
Weighting: 1 2 3 Rating
Unload/reload databases 1 2 3 4 5Create and drop objects 1 2 3 4 5Referential integrity support 1 2 3 4 5Grant and revoke commands 1 2 3 4 5Bind, rebind, and free commands 1 2 3 4 5Reorg, runstats and copy commands 1 2 3 4 5
Preparing for the Repository Workbench
Preparing for any software implementation requires careful planningand control. In the case of a repository workbench, where information, sys-tems, and integration factors must be considered, even more care is urgedfor a successful implementation. A series of checklists is provided for thispurpose.
Preplanning Action Items:
1. Standardize the names, definitions, and physical descriptions ofdata elements used in all programs.
2. Document which data is kept in which files or databases or schemas.3. Document which reports and screens are produced by which pro-
grams jobs and systems.4. Document which programs, jobs, and systems access and update
which data elements in which files or databases or schemas.
CuuDuongThanCong.com https://fb.com/tailieudientucntt
123
Selecting and Integrating a Repository for Effective Resource Management
5. Document which modules and subprograms are included in whichprograms.
6. Document processing schedules, file back-up and retention, and re-sponsibilities for program and jobstream maintenance.
Questions to ask for sizing of data collection effort:
1. How many systems are there?2. What is the quality of system documentation?3. If documentation is inadequate, can the required data be obtained
from the original developers or from users?4. How many programs are in each system?5. How good are the run books and program documentation?6. Have these been kept up to date as changes have been made?7. Are job control statements kept in a single file or library?8. Are program source statements kept in a single file or library?9. Is some type of source library maintenance system in use?
10. Is library content really kept up to date?11. How many FILEs, DATABASEs, and SCHEMAs are in each system?12. How many different record types are there?13. How many different relational tables are there?14. Are standard record descriptions used?15. Are they kept in a central library?16. Are data element names standardized?17. Are the names meaningful?18. Are good definitions available?19. Is there documentation of coding structures?20. How well are reports, display screens, and input transactions docu-
mented?21. Can the data content be obtained from user manuals?22. If the information above is not readily available, how will it be ob-
tained? Who will compile it?23. Who will do the actual work of preparing repository input?24. How will it be done?25. Can part of the data be obtained by scanning source programs or
copy libraries?26. Who will review edit lists and resolve naming discrepancies and oth-
er problems?
Questions to ask concerning technical and operational issues:
1. Will the repository always be running? System initialization must beamended to include this.
2. Will reports be produced automatically on some predeterminedschedule? Will they be triggered by specific events, such as the im-plementation of a new system? Will they be on a run-on-request
CuuDuongThanCong.com https://fb.com/tailieudientucntt
124
SOFTWARE ENGINEERING HANDBOOK
basis? Who will initiate the jobs to produce the reports? How willthey be distributed? How will special requests be handled?
3. How will repository problems be reported and resolved?4. Will computer operations think of the repository as a production
system?5. Will procedures for the turnover of new systems or system changes
incorporate steps that will ensure that the repository has been cor-rectly updated?
Questions to ask about security:
1. Who should be allowed to access what? Can project teams alter datathat they think of as their own?
2. Will passwords be controlled and changed from time to time? Willthey be changed when employees resign or are discharged?
3. Does repository software provide a mechanism to prevent access tothe repository via means other than the repository software?
Questions to ask concerning redundant and inconsistent data:
1. Can you identify all occurrences of the same information?2. Can you determine which elements are calculated or derived and
how?3. Will you know the original sources of all elements?4. Will you know the uses of the elements?5. Can the repository implementation help to determine whether there
are procedures or programs to ensure consistency?6. Will the repository implementation provide for validation rules and
criteria?7. Does it provide for data consistency and integrity rules?8. What about procedures to ensure that such rules are entered in the
repository?
Questions to ask about complexity and interdependence:
1. Does the repository help us determine who actually uses the re-ports or screens?
2. Does it help identify screens and reports that contain the same in-formation?
3. Does it help the user identify the tasks and procedures that requireuse of the information contained in the reports and screens?
4. Will it help improve documentation?5. Will it decrease complexity by providing reusability?
Repository Metrics
These criteria measure how well a repository or data dictionary col-lects, maintains, and retrieves information about data. The objectives of
CuuDuongThanCong.com https://fb.com/tailieudientucntt
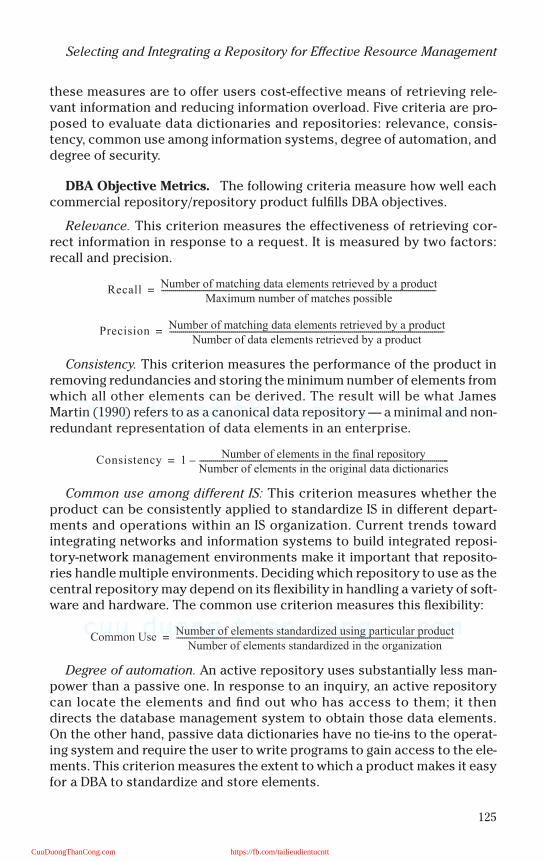
125
Selecting and Integrating a Repository for Effective Resource Management
these measures are to offer users cost-effective means of retrieving rele-vant information and reducing information overload. Five criteria are pro-posed to evaluate data dictionaries and repositories: relevance, consis-tency, common use among information systems, degree of automation, anddegree of security.
DBA Objective Metrics. The following criteria measure how well eachcommercial repository/repository product fulfills DBA objectives.
Relevance. This criterion measures the effectiveness of retrieving cor-rect information in response to a request. It is measured by two factors:recall and precision.
Consistency. This criterion measures the performance of the product inremoving redundancies and storing the minimum number of elements fromwhich all other elements can be derived. The result will be what JamesMartin (1990) refers to as a canonical data repository — a minimal and non-redundant representation of data elements in an enterprise.
Common use among different IS: This criterion measures whether theproduct can be consistently applied to standardize IS in different depart-ments and operations within an IS organization. Current trends towardintegrating networks and information systems to build integrated reposi-tory-network management environments make it important that reposito-ries handle multiple environments. Deciding which repository to use as thecentral repository may depend on its flexibility in handling a variety of soft-ware and hardware. The common use criterion measures this flexibility:
Degree of automation. An active repository uses substantially less man-power than a passive one. In response to an inquiry, an active repositorycan locate the elements and find out who has access to them; it thendirects the database management system to obtain those data elements.On the other hand, passive data dictionaries have no tie-ins to the operat-ing system and require the user to write programs to gain access to the ele-ments. This criterion measures the extent to which a product makes it easyfor a DBA to standardize and store elements.
ΡεχαλλΝυµβερ οφ µατχηινγ δατα ελεµεντσ ρετριεϖεδ βψ α προδυχτ
Μαξιµυµ νυµβερ οφ µατχηεσ ποσσιβλε−−−−−−−−−−−−−−−−−−−−−−−−−−−−−−−−−−−−−−−−−−−−−−−−−−−−−−−−−−−−−−−−−−−−−−−−−−−−−−−−−−−−−−−−−−−−−−−−−−−−−−−−−−−−−−−−−−−−−−−−−−−−−−−−−−−−−−−−−−=
ΠρεχισιονΝυµβερ οφ µατχηινγ δατα ελεµεντσ ρετριεϖεδ βψ α προδυχτ
Νυµβερ οφ δατα ελεµεντσ ρετριεϖεδ βψ α προδυχτ−−−−−−−−−−−−−−−−−−−−−−−−−−−−−−−−−−−−−−−−−−−−−−−−−−−−−−−−−−−−−−−−−−−−−−−−−−−−−−−−−−−−−−−−−−−−−−−−−−−−−−−−−−−−−−−−−−−−−−−−−−−−−−−−−−−−−−−−−−=
Χονσιστενχψ 1Νυµβερ οφ ελεµεντσ ιν τηε φιναλ ρεποσιτορψ
Νυµβερ οφ ελεµεντσ ιν τηε οριγιναλ δατα διχτιοναριεσ−−−−−−−−−−−−−−−−−−−−−−−−−−−−−−−−−−−−−−−−−−−−−−−−−−−−−−−−−−−−−−−−−−−−−−−−−−−−−−−−−−−−−−−−−−−−−−−−−−−−−−−−−−−−−−−−−−−−−−−−−−−−−=
Χοµµον ΥσεΝυµβερ οφ ελεµεντσ στανδαρδιζεδ υσινγ παρτιχυλαρ προδυχτ
Νυµβερ οφ ελεµεντσ στανδαρδιζεδ ιν τηε οργανιζατιον−−−−−−−−−−−−−−−−−−−−−−−−−−−−−−−−−−−−−−−−−−−−−−−−−−−−−−−−−−−−−−−−−−−−−−−−−−−−−−−−−−−−−−−−−−−−−−−−−−−−−−−−−−−−−−−−−−−−−−−−−−−−−−−−−−−−−−−−−−−=
CuuDuongThanCong.com https://fb.com/tailieudientucntt
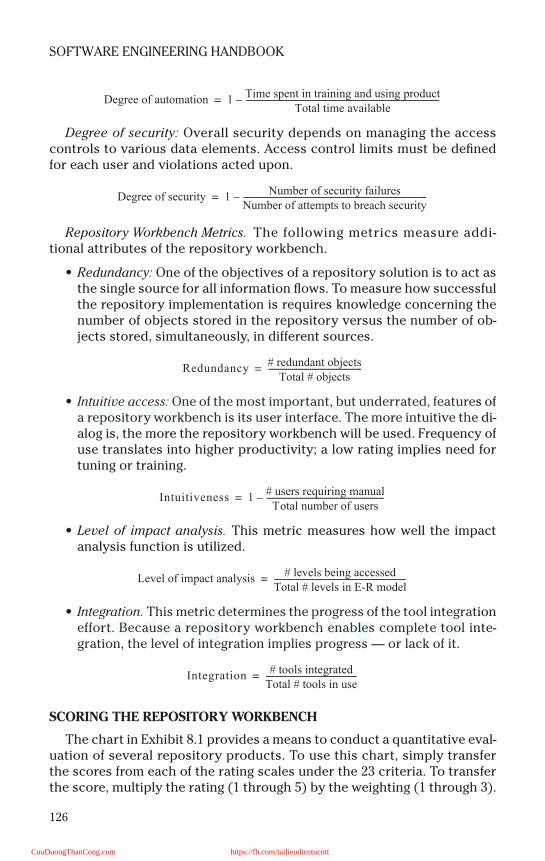
126
SOFTWARE ENGINEERING HANDBOOK
Degree of security: Overall security depends on managing the accesscontrols to various data elements. Access control limits must be definedfor each user and violations acted upon.
Repository Workbench Metrics. The following metrics measure addi-tional attributes of the repository workbench.
• Redundancy: One of the objectives of a repository solution is to act asthe single source for all information flows. To measure how successfulthe repository implementation is requires knowledge concerning thenumber of objects stored in the repository versus the number of ob-jects stored, simultaneously, in different sources.
• Intuitive access: One of the most important, but underrated, features ofa repository workbench is its user interface. The more intuitive the di-alog is, the more the repository workbench will be used. Frequency ofuse translates into higher productivity; a low rating implies need fortuning or training.
• Level of impact analysis. This metric measures how well the impactanalysis function is utilized.
• Integration. This metric determines the progress of the tool integrationeffort. Because a repository workbench enables complete tool inte-gration, the level of integration implies progress — or lack of it.
SCORING THE REPOSITORY WORKBENCH
The chart in Exhibit 8.1 provides a means to conduct a quantitative eval-uation of several repository products. To use this chart, simply transferthe scores from each of the rating scales under the 23 criteria. To transferthe score, multiply the rating (1 through 5) by the weighting (1 through 3).
∆εγρεε οφ αυτοµατιον 1Τιµε σπεντ ιν τραινινγ ανδ υσινγ προδυχτ
Τοταλ τιµε αϖαιλαβλε−−−−−−−−−−−−−−−−−−−−−−−−−−−−−−−−−−−−−−−−−−−−−−−−−−−−−−−−−−−−−−−−−−−−−−−−−−−−−−−−−−−−−−−−−−−−−−−−−=
∆εγρεε οφ σεχυριτψ 1Νυµβερ οφ σεχυριτψ φαιλυρεσ
Νυµβερ οφ αττεµπτσ το βρεαχη σεχυριτψ−−−−−−−−−−−−−−−−−−−−−−−−−−−−−−−−−−−−−−−−−−−−−−−−−−−−−−−−−−−−−−−−−−−−−−−−−−−−−−−−−−−−−−−−−−−−=
Ρεδυνδανχψ# ρεδυνδαντ οβϕεχτσ
Τοταλ # οβϕεχτσ−−−−−−−−−−−−−−−−−−−−−−−−−−−−−−−−−−−−−−−−−−−−−−−=
Ιντυιτιϖενεσσ 1# υσερσ ρεθυιρινγ µανυαλ
Τοταλ νυµβερ οφ υσερσ−−−−−−−−−−−−−−−−−−−−−−−−−−−−−−−−−−−−−−−−−−−−−−−−−−−−−−−−−−−=
Λεϖελ οφ ιµπαχτ αναλψσισ# λεϖελσ βεινγ αχχεσσεδ
Τοταλ # λεϖελσ ιν Ε−Ρ µοδελ−−−−−−−−−−−−−−−−−−−−−−−−−−−−−−−−−−−−−−−−−−−−−−−−−−−−−−−−−−−−−−−−−−=
Ιντεγρατιον# τοολσ ιντεγρατεδ
Τοταλ # τοολσ ιν υσε−−−−−−−−−−−−−−−−−−−−−−−−−−−−−−−−−−−−−−−−−−−−−−=
CuuDuongThanCong.com https://fb.com/tailieudientucntt
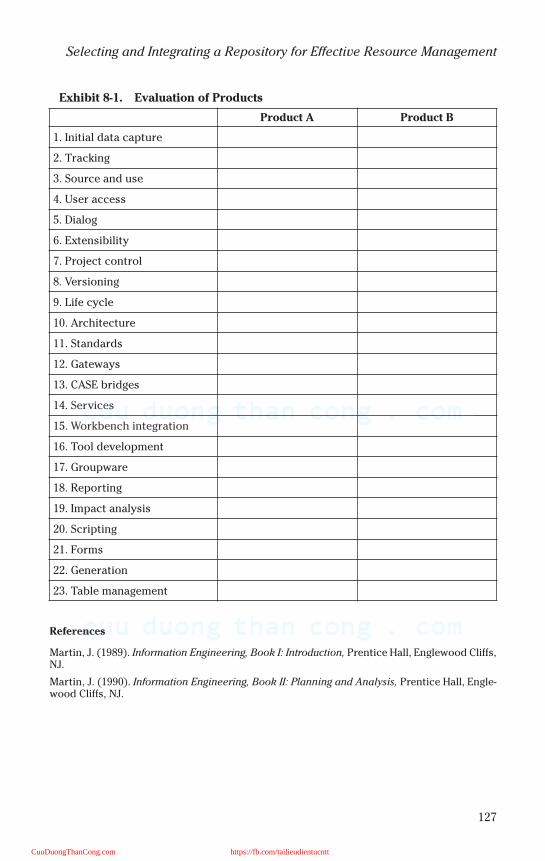
127
Selecting and Integrating a Repository for Effective Resource Management
References
Martin, J. (1989). Information Engineering, Book I: Introduction, Prentice Hall, Englewood Cliffs,NJ.
Martin, J. (1990). Information Engineering, Book II: Planning and Analysis, Prentice Hall, Engle-wood Cliffs, NJ.
Exhibit 8-1. Evaluation of Products
Product A Product B
1. Initial data capture
2. Tracking
3. Source and use
4. User access
5. Dialog
6. Extensibility
7. Project control
8. Versioning
9. Life cycle
10. Architecture
11. Standards
12. Gateways
13. CASE bridges
14. Services
15. Workbench integration
16. Tool development
17. Groupware
18. Reporting
19. Impact analysis
20. Scripting
21. Forms
22. Generation
23. Table management
CuuDuongThanCong.com https://fb.com/tailieudientucntt

This page intentionally left blank
CuuDuongThanCong.com https://fb.com/tailieudientucntt
129
Chapter 9
Structured Methodology Review
A variety of methodologies is available to the systems analyst. Many areproprietary methodologies utilized in conjunction with a softwareapplication development tool set (CASE — computer assisted softwareengineering).
The original and still frequently used systems development constructdictates that systems are developed through a series of distinct stages. Itis necessary for each stage to be completed before going to the next. Thisis a linear progression of system development, hence the name “waterfall”method. Waterfall design methods are a one-way flow from the require-ments process toward the working system (Coffee, 2001).
Once a stage of the project is complete, it is sent to the next stage witha “deliverable,” which is evidence or documentation that the stage hasbeen completed and the project is ready for the next process. There areeight generally accepted stages of a systems development life cycle tech-nique (see Exhibit 9-1):
• Determination of scope and objectives — overall scope of the project isagreed upon.
• Systems investigation and feasibility study — a report on the feasibilityof a technical solution to the problem is prepared.
• Systems analysis —a logical model of the existing system is built.• System design — the analyst develops two or three alternative designs.• Detailed design — detailed physical specifications are made so that
the system can be built.• Implementation — the system is physically created.• Changeover — the old system is replaced by the new system.• Evaluation and maintenance —hardware and software are maintained.
A real benefit of this approach is the division of a lengthy project intostages, which makes it more manageable. This is realized throughout theproject in terms of better project control and communication, and duringthe working life of the system in terms of its meeting user requirements and
CuuDuongThanCong.com https://fb.com/tailieudientucntt
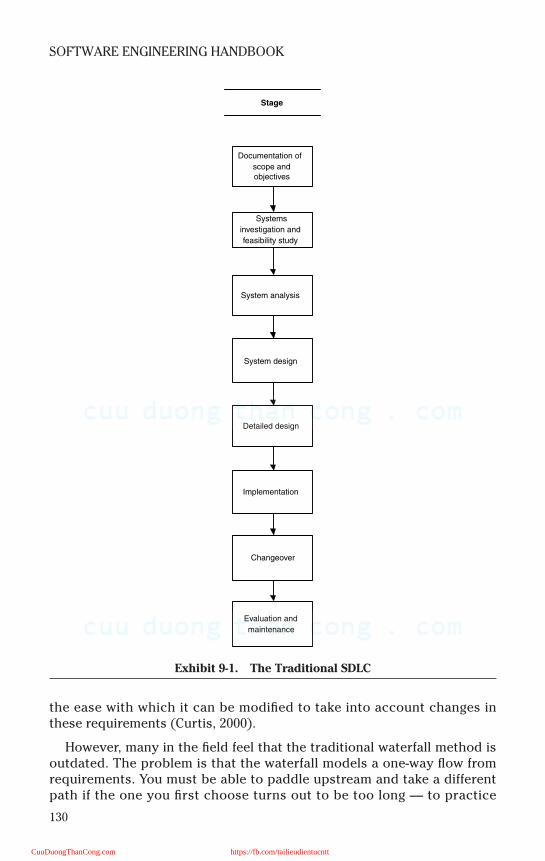
130
SOFTWARE ENGINEERING HANDBOOK
the ease with which it can be modified to take into account changes inthese requirements (Curtis, 2000).
However, many in the field feel that the traditional waterfall method isoutdated. The problem is that the waterfall models a one-way flow fromrequirements. You must be able to paddle upstream and take a differentpath if the one you first choose turns out to be too long — to practice
Exhibit 9-1. The Traditional SDLC
Documentation of
scope andobjectives
Systems
investigation and
feasibility study
System analysis
System design
Detailed design
Implementation
Changeover
Evaluation and
maintenance
Stage
CuuDuongThanCong.com https://fb.com/tailieudientucntt
131
Structured Methodology Review
white-water kayaking, rather than just going over the waterfall and hopingyou will like where you land (Coffee, 2001). Today’s business is fast pacedand systems need to be developed as quickly as possible to meet organiza-tional needs, with early delivery of the easy portions of an application foron-the-job testing and comments (Coffee, 1994).
Fast-changing requirements and shorter lead times might require theuse of different methodologies.
RAPID APPLICATIONS DEVELOPMENT (RAD)
It is no longer adequate to take two or three years to build a system. Morethan ever, businesses are in a race against time (Glen, 1993). Directlyopposed to the traditional and lengthy life cycle approach is rapid applica-tions development, or RAD for short. RAD is a loosely used term (like manyother design terms) that describes any approach to a fast-designed system.
RAD has been described as a set of tactics and techniques to minimizedevelopment time — a radical departure from the traditional waterfallmethod (Glen, 1993). Essentially, RAD uses time boxing to control develop-ment time for each phase of the project. If a deadline is in danger of beingmissed, lower-priority requirements are moved back to a later time box orthe next phase of an incremental delivery (Tudhope, 2000). RAD requiresmanagement to accept consensus management and joint applicationdesign (JAD). Specialists with advanced technology (SWAT teams) workclosely with the users to define and refine applications.
SWAT (also referred to by Glen as “slaves without any time”) is an effec-tive tactic in many RAD projects in that small, multidisciplined IT teamswork with users directly. This fosters team building. SWAT members arenot confined to separate floors or buildings. This approach is different thanassembling many systems specialists with inch-wide and mile-deep knowl-edge in specific areas to build applications in IT ghettos (Glen, 1993).
RAD has four phases, as shown in Exhibit 9-2 (Curtis et al., 2000):
1. Requirements planning — joint requirements planning (JRP), estab-lishes high-level objectives
2. Applications development — JAD follows JRP, involves users in work-shops
3. Systems construction — design specifications, used to develop de-tailed and generate code
4. Cutover — users trained and the system tested
According to Tudhope (2000), the majority of developers who are awareof RAD tend to select elements of the methodology rather than following itstrictly. Others use generally similar techniques without identifying themas RAD.
CuuDuongThanCong.com https://fb.com/tailieudientucntt
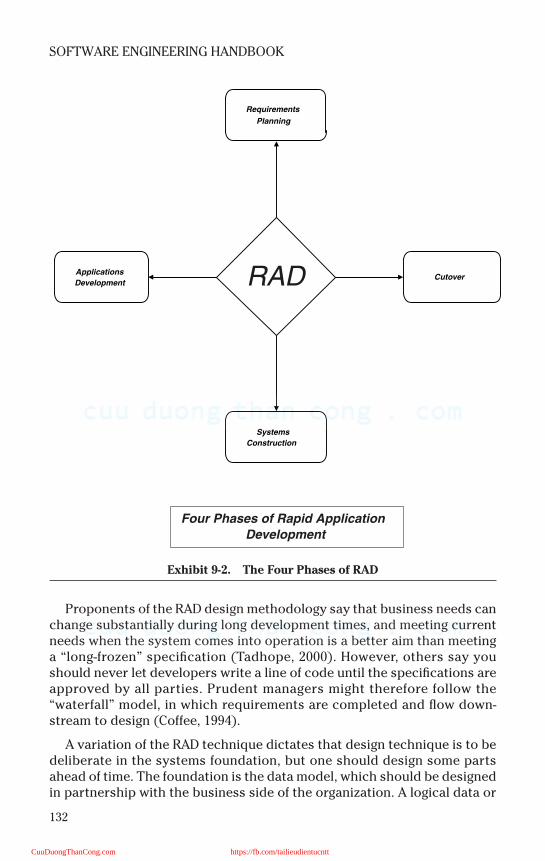
132
SOFTWARE ENGINEERING HANDBOOK
Proponents of the RAD design methodology say that business needs canchange substantially during long development times, and meeting currentneeds when the system comes into operation is a better aim than meetinga “long-frozen” specification (Tadhope, 2000). However, others say youshould never let developers write a line of code until the specifications areapproved by all parties. Prudent managers might therefore follow the“waterfall” model, in which requirements are completed and flow down-stream to design (Coffee, 1994).
A variation of the RAD technique dictates that design technique is to bedeliberate in the systems foundation, but one should design some partsahead of time. The foundation is the data model, which should be designedin partnership with the business side of the organization. A logical data or
Exhibit 9-2. The Four Phases of RAD
RAD
Requirements
Planning
Applications
Development
Systems
Construction
Cutover
Four Phases of Rapid Application
Development
CuuDuongThanCong.com https://fb.com/tailieudientucntt

133
Structured Methodology Review
object design process allows definition of how business is currently con-ducted and plans for future changes. RAD is used for screens, reports, busi-ness rules, and communications, but only after the database or objectmodel is in place. Involving users in the process that takes the longestmakes development time less of an issue; end users see the prototype indays or hours once the foundation is laid (Boyer, 1995). Boyer recom-mends that we build the walls of the application and roof as quickly as pos-sible, but to make sure the foundation is in place first.
JOINT APPLICATION DESIGN (JAD)
In joint application design, analysts work with groups during the devel-opment of the system; they integrate groups of technical and businessexperts (Exhibit 9-3). These groups may include programmers, designers,and project managers, as well as user reps, department management peo-ple, and the controller or CIO. These JAD sessions are usually run by atrained facilitator.
The JAD process has four stages: framework presentation, project scop-ing, preliminary definitions development, and detailed requirements devel-opment (Dodson, 1994).
In the framework presentation stage the facilitator sets the tone for theproject, explaining the JAD approach. Usually this stage involves a coreteam of business experts and will last between one half to a full day. Projectscoping involves the same group of people identifying project prioritiesacross department lines. This should take a total of 6 to 12 hours. The pre-liminary definitions stage produces the context diagram; the entire coreteam participates in this phase. The context diagram shows the system’splace in the flow of the organization’s information, which should take aboutone day. The detailed requirements stage should take five to ten days insession; however, the detailed requirements can take weeks to develop.
Attending all of these sessions is the “scribe” responsible for document-ing all the information gathered during each meeting and providing it to the
Exhibit 9-3. The JAD Process
JAD
Facilitator
Bring together groups of people
Technical experts-
programmers, designers,
project managers.
_________________________
Business Experts-User reps,
department mgt. people,controller or CIO
CuuDuongThanCong.com https://fb.com/tailieudientucntt
134
SOFTWARE ENGINEERING HANDBOOK
team as needed. This relieves other participants from taking notes, whichdiverts their attention from the matters at hand.
GROUP SUPPORT SYSTEMS (GSS)
One of the problems with meetings in the JAD approach is that only alimited number of people can participate effectively before the meetingbecomes inefficient (Dennis et al., 1999). Nevertheless, it is important toreceive input from all the experts because no one expert usually has theexpertise to document business processes completely. Another problemwith JAD sessions is that only one person can speak at a time. This createsa problem in that experts blocked from contributing their ideas whileanother is speaking may forget or suppress them because they seem lessrelevant later. Also, many times a group session is dominated by just a fewpeople. This could lead to a model that favors the dominating participants.
In recent years computer technology called group support systems hasbeen designed to provide same-time, same-place interactions in which par-ticipants use computers to interact and exchange ideas (Dennis et al.,1999). This is designed to reduce group interaction problems and may helpto improve meetings by using parallel communication, anonymity, andgroup memory.
GSS also reduces meeting time and allows group members to share theirideas simultaneously through the use of the collaborative software. Partic-ipants can also remove themselves from the discussion to pause and thinkwithout worrying about remembering what the other members have said.
Of course electronic meetings also have their negative effects. It is saidthat this type of communication is often “less rich” than verbal communi-cation and that resolving differences with electronic meetings is more dif-ficult. The effectiveness of GSS greatly depends on the size of the group.GSS was found to produce greater gains with larger groups; however, ver-bal meetings are more effective where differences of opinion need to beresolved (Dennis et al., 1999).
CASE TOOLS
The broadest definition of a CASE tool is any software tool that providesautomated assistance for software development, maintenance, or projectmanagement activities (McMurtrey et al., 2000). CASE tools are not end-user oriented; they are used by professionals for carrying out part of thedesign and helping to speed the development process.
They have been trumpeted as the “silver bullet” of applications develop-ment but have not necessarily lived up to that name because they are nota “fix-all” solution to systems design. However, they are a feasible optionfor practitioners of systems development.
CuuDuongThanCong.com https://fb.com/tailieudientucntt

135
Structured Methodology Review
Case tools assist in (Curtis et al., 2000):
• Corporate planning of info systems — used to track relationships be-tween various components.
• Creating specification requirements — information system is analyzedinto its data requirements.
• Creating design specifications —tools are used to specify a design forthe system.
• Code-generation tools — accept output of the design specification andproduce code for direct execution.
• Information repository — stores information on entities, processes,data structures, business rules, source code, and project management.
• Development methodology — provides automated diagramming facili-ties for data-flow diagrams.
The many benefits of CASE include increased productivity, restructuringof poorly written code, decrease of application development time, and aidin project management. However, with benefits there are usually draw-backs, and CASE is no exception. Some of the drawbacks are a reliance onstructured methodologies, a lengthy learning curve, possible user resis-tance, limited functions, and a required working knowledge of the underly-ing methodology.
A VARIETY OF STRUCTURED METHODOLOGIES
As mentioned, a wide variety of systems development methodologiescan be chosen from, some accompanied by CASE tools and some withoutthem. Most are based on the methodologies discussed previously. A list ofreferences to some of the most common structured methodologies follows:
1. Yourdon, E.E. and Constantine L.L. (1977). Structured Design: Funda-mentals of a Discipline of Computer Program and System Design, Your-don Press
2. DeMarco, T. (1979). Structured Analysis and Systems Specification,Prentice Hall, Englewood Cliffs, NJ.
3. Gane, G. and Sarson, T. (1979). Structured Systems Analysis, PrenticeHall, Englewood Cliffs, NJ.
4. Jackson, M. (1975). Principles of Program Design, Academic Press,New York.
5. Jackson, M. (1983). System Development, Prentice Hall, EnglewoodCliffs, NJ.
6. Martin, J. (1988). Information Engineering: Book 1 Introduction, Book2 Planning and Analysis, Book 3 Design and Construction, PrenticeHall, Englewood Cliffs, NJ.
James Martin worked with Clive Finkelstein in designing informationengineering. Interestingly, two models were actually derived from this
CuuDuongThanCong.com https://fb.com/tailieudientucntt
136
SOFTWARE ENGINEERING HANDBOOK
exercise. Martin’s model is IT-driven while Finkelstein’s model is enter-prise, or business, driven. I find Finkelstein’s the more useful of the two andhave included a brief summary here.
Finkelstein Information Engineering
Clive Finkelstein’s (1989) version of information engineering starts witha business strategic planning exercise to identify important informationsystems required by the business. Then it develops chosen priority sys-tems through successively detailed analysis and design, through to imple-mentation.
Strategic planning consists of the following stages:
• Stage 1. Identifying the current plan. Use any existing strategic or tac-tical statements that may exist or a management questionnaire togather information about business strategy
• Stage 2. Evaluation of current status consists of eight steps:1. Analyze mission and purpose to identify major data subjects
that are represented in a high level mission model2. Identify potential goals (critical success factors)3. Define goals4. Identify issues5. Define strategies to deal with each issue6. Identify current functions (e.g., personnel, finance, etc.)7. Allocate strategies to functions8. Define functional responsibility (a detailed functional specifica-
tion for each functional manager)• Stage 3. Setting strategic direction consists of three steps: (1, 2) inter-
nal, and external appraisal: analysis of business, and business envi-ronment (3) strategic evaluation: create the strategic agenda; deviseproactive strategic options and select; define strategic statement: for-mal documentation of strategic decisions, rational, assumptions, con-clusions and alternatives.
Once we complete the strategic plan we can proceed to the develop-ment of more detailed data models and process models. These are built upin three successive levels:
• Strategic modeling: a high-level schematic data model, of interest to se-nior managers. Steps involve:1. Identifying data subjects2. Identifying data entities from mission3. Identifying preliminary functions4. Identifying data entities from strategies5. Identifying potential functions6. Identifying strategic attributes
CuuDuongThanCong.com https://fb.com/tailieudientucntt
137
Structured Methodology Review
7. Defining purpose descriptions• Tactical modeling: the strategic model is refined into areas of more de-
tail to describe data of more interest to middle managers. Typically ap-proximately 20 of these tactical areas exist for any one strategicmodel.
• Operational modeling: any one tactical area may have typically threeoperational systems that need to be developed. Operational modelingdevelops the data and process models for a particular operationalarea to a level of detail to enable implementation.
• The final phase of the Finkelstein methodology is implementation. Im-plementation is technology dependent and is carried out using suit-able DBMS, CASE, and other development tools. The major techniquesused are:
• Business data modeling: a “business oriented” version of data modeling• Process modeling: modeling of processes acting on “data,” especially
generic, reusable processes such as: Verify, Add, Read, Display,Change, Delete.
• Dynamic performance monitoring: the use of a generic approach to per-formance monitoring (a common requirement for most systems).
EXTREME PROGRAMMING
Extreme programming (XP) is a new programming methodology that isgetting fairly heavy notice these days. Kent Beck (1999) is one of its mainproponents and seems to have coined the term, so it seems reasonable totreat his book as the defining standard of the field. XP is the application ofa group of practices to software development projects:
• The planning game: collaboration of business and programming pro-fessionals to estimate the time for short tasks (called “stories” in XP)
• Small releases: a ship cycle measured in weeks rather than years• Metaphor: “a single overarching metaphor” to guide development sub-
stitutes for a formal architectural specification• Simple design: no provision in the code for future changes or flexibility• Testing: every piece of code exercised by unit tests when written, and
the full suite of tests when integrated• Refactoring: any piece of code subject to rewriting to make it simpler• Pair programming: all production code jointly written by two developers • Collective ownership: the right of any developer to change any piece of
code on the project• Continuous integration: code integrated to the main line every few
hours• 40-hour week: no overtime• On-site customer: a business person dedicated to the project• Coding standards: one standard per project
CuuDuongThanCong.com https://fb.com/tailieudientucntt
138
SOFTWARE ENGINEERING HANDBOOK
XP amounts to abandoning the traditional “waterfall model” of develop-ment entirely in favor of what has often been called “cowboy coding.” Beckargues that it is no longer vastly more expensive to fix problems in produc-tion than in planning; as a result, it is not necessary to plan. Instead, letyour programmers program, trust them to solve problems as they comeup, and plan and ship frequently so that you get feedback from the cus-tomer on a regular basis.
CONCLUSION
In this handbook’s chapter on OO methodologies you will find a com-pletely different take on the topic of methodologies. OO is a newer, fastmethod for creating software. In spite of OO’s increasing popularity, it isnot expected that the more traditional methodologies discussed in thischapter will fade into oblivion any time soon.
References
Beck, K. (1999). Extreme Programming Explained, Addison-Wesley, Reading, MA.
Boyer, P. (1995). Is RAD all wet? Datamation, 41(16), 84.
Coffee, P. (2001). Coding over the waterfalls, eWeek, 18(13), 39.
Coffee, P. (1994). The development dilemma: figuring out how to use contradictory tech-niques is the only safe bet in programming your C/S apps, PC Week, 11(36), 32.
Dennis, A.R., Hayes, G.S., and Daniels, Jr., R.M. (1999). Business process modeling with groupsupport systems, J. Manage. Inf. Syst., 15(4), 115.
Dodson, W.R. (1994). Secrets of a high performing teams: joint application design (JAD), DataBased Advisor, 12(12), 46.
Finkelstein, C. (1989). An Introduction to Information Engineering, Addison-Wesley, Reading,MA.
Glen, R. (1993). RAD requires radical thinking, I.T. Mag., 25(11), 36.
McMurtrey, M.E., Teng, J.T.C., Grover,V., and Kher, H.V. (2000). Current utilization of CASEtechnology: lessons from the field, Industrial Manage. Data Syst., 100(1/2), 22.
Tudhope, D. (2000). Prototyping Praxis, constructing computer systems and building belief,Hum.—Comput. Interaction, 15(4), 353.
CuuDuongThanCong.com https://fb.com/tailieudientucntt

139
Chapter 10
Extreme Programming Concepts
Extreme programming is a software methodology developed by Kent Beckto help software developers to design and build a system more efficientlyand successfully. Extreme programming is a disciplined and well-plannedapproach to software development. What makes this programming so pop-ular is that it is one of the first lightweight methodologies. A lightweightmethodology has only a few rules and practices or ones that are easy to fol-low. Extreme programming does not require any additional paperwork andprogrammers do not need to go through tons of methods. It stresses cus-tomer satisfaction and can be used when the customer is not certain of hisrequirements or when new technology is to be introduced.
THE RULES OF EXTREME PROGRAMMING
Extreme programming applies four rules in developing the softwareproject:
• Communication. The programmer must communicate with the cus-tomer and elicit his requirements, thus the emphasis on customer sat-isfaction. The programmer also needs to communicate with fellowworkers, thus the emphasis on team work.
• Simplicity. The design is maintained as simply as possible.• Feedback. The software is tested from its early stages, feedback is ob-
tained, and changes are made. This is a cyclical process.• Courage. The programmer can make changes even at the last stages
and implement new technologies as and when they are introduced.
Extreme programming is a process of project development, as shown inExhibit 10-1. Customer requirements are obtained in the form of user sto-ries; the programmer selects the user stories to be implemented first withhelp from the customers. A plan is released that indicates how many userstories can be implemented in a single iteration, thus starting iterativedevelopment. The user stories are broken down into programming tasks
CuuDuongThanCong.com https://fb.com/tailieudientucntt

140
SOFTWARE ENGINEERING HANDBOOK
and assigned to programmers. The time required to complete these tasksis estimated first; these initial estimates are referred to as uncertain esti-mates. By using feedback, the programmer can adjust the estimates andmake them more certain.
Once these programming tasks have been implemented, they are sentfor acceptance testing. If these tasks produce an error or indicate a bug,they are sent back to be recoded in the next iteration. Once the program-ming tasks are approved by the customer, a small release of the tasks ismade to check functionality.
The components of extreme programming include:
• User stories. User stories are written by the customer and describe therequirements of a system. The customer need not specify his require-ments using any particular format or technical language; he merelywrites these in his own words. Aside from describing what the systemmust be, the user stories are used to calculate the time estimates forrelease planning. At the time of the implementation of the user storiesthe developer obtains detailed information from the customer. Thetime estimate is usually in the form of ideal development time — de-fined as how long it would take to implement the story in code if therewere no distractions, no other assignments, and the programmerknew exactly what to do. Typically, each story will get one to threeweeks. The user stories are also used to produce test scenarios for ac-ceptance testing by the customer as well as to verify that the user sto-ries have been implemented correctly.
Exhibit 10-1. The Extreme Programming Process of Software Development
Learn and communicate
Pair ProgrammingIteration Unfinished Refactor Mercilessly Funtionalityplan Tasks Move People Around
Share CRC CardsTasks Too much 100% Unit
To do Tests Passed
Stand upMeeting Next Task
Failed or FailedAcceptance Acceptance TestTests Acceptance
Test PassedBug Fixes
Day by Day
Collective codeownership
CuuDuongThanCong.com https://fb.com/tailieudientucntt
141
Extreme Programming Concepts
• Release planning. Release planning produces the release plan followedduring development of the system; it is also called the “planninggame.” During release planning a meeting is set up with the customersand the development team. During this meeting a set of rules is set upby the customers and developers to which all agree. A schedule isthen prepared. A development team is selected to calculate each userstory in terms of ideal programming weeks, which is how long it wouldtake to implement that story if absolutely nothing else needed to bedone.
Release planning is guided by four values:
• Scope — how much needs to be done?• Resources — how many people are available?• Time — when will the project or release be done?• Quality — how good and how well tested will the software be?
Candidate systems for XP are those that are reusable, testable, and havegood business values.
Iteration
At the beginning of every iteration, an iteration planning meeting is heldat which the user stories to be implemented during that iteration are cho-sen; the customer selects the user stories. The selected stories are brokendown into discrete programming tasks during the planning session. Theprogramming tasks are specified in the programmer’s language.
The number of selected user stories or programming tasks increases ordecreases the project velocity. Each programming task is estimated basedon ideal programming days, which are the number of days it would take toprogram a task if no distractions or interruptions occurred.
After these programming tasks have been developed, they are tested. Ifbugs are found, the offending programming tasks are added back into therelease plan to be handled by the next iteration.
During each iteration (see Exhibit 10-2), the plan is checked to detectduplicate programming tasks. If such tasks are found, they are removed orconsolidated. If a single iteration has too much to do, several user storiesare dropped; if the iteration has too little to do, a few are added.
Development
During the development phase, stand-up meetings are held every morn-ing to discuss the problems faced during the development effort, to devisea solution to these problems, and, perhaps most importantly, to promotefocus. No individual programmer owns his or her code. Instead, the code is
CuuDuongThanCong.com https://fb.com/tailieudientucntt

142
SOFTWARE ENGINEERING HANDBOOK
collectively owned and collaboratively worked upon. The focus of develop-ment is on small, manageable releases that can be thoroughly tested.
CRC Cards
CRC stands for class, responsibilities, and collaboration. CRC cards(Exhibit 10-3) contain information about the class, responsibilities and col-laboration for designing the system as a team. CRC cards allow all the mem-bers of the project team to contribute to the project which will provide anumber of good ideas which can then be incorporated in the design.
Exhibit 10-2. The Iterative Nature of XP
Exhibit 10-3. CRC Card
New User Story,Project Velocity
Learn andCommunication
Release User Stories New FunctionalityPlan Unfinished Tasks
Project
Next Velocity Iteration Bugs Fixes LatestIteration Planned Version
Iteration Failed Acceptance Plan
Tests Day by DayBugs
Development
CLS025
Class Name: ResourceUsage
Class Type:
Class Characteristics:
Responsibilities: Collaborations:
Receive Usage Information Order
Store Usage Information Resource
Provide Usage Information Service Schedule
Authors: Jane Doe
CuuDuongThanCong.com https://fb.com/tailieudientucntt
143
Extreme Programming Concepts
Each CRC card is used to represent an object. The class name of theobject can be written at the top of the CRC card; the responsibilities of theclass are written on the left side of the card and the collaborating classesare written to the right of each responsibility. A CRC session consists of aperson simulating the system by speaking about the relationships betweenthe objects and the process. In this way, weaknesses and problems can beeasily discerned and the various design alternatives can be exploredquickly by simulating the proposed design.
System Metaphor
Classes, objects, and methods coded by the programmer can be reused.Instead of writing the code for a class, object, or method that alreadyexists, it is important to name the objects in a standardized manner thatenables other programmers to seek and reuse these objects. Thus, a com-mon system or common system description is used by all programmers.
Collective Code Ownership
Collective code ownership is a contribution of the programmers to theproject in the form of ideas to any segment of the project. Any programmercan add or change code, fix bugs, or refactor — i.e., reuse the code. Theentire team is responsible for the system’s architecture. Although it is hardto believe that a whole team can have authority over the entire project, itis actually possible. Each developer creates unit tests for his or her code asthe code is developed. Code is released into a source code repository afterbeing thoroughly tested.
Unit Test
Unit tests are written by the programmer before he starts coding. Writ-ing the unit tests first gives the programmer a better understanding of therequirements specified by the customer. In addition, writing unit testsprior to coding helps programmers write the code more easily and faster.
Acceptance Test
Within the XP methodology, “functional” tests have been renamed“acceptance” tests to indicate that the system is accepted by the customer.The customer specifies the test scenarios during specification of the userstories; each story will have one or more acceptance tests. The acceptancetests are the expectation of the customer for the system. These acceptancetests are black box system tests, which enable the programmer to derivesets of input conditions that will fully exercise all functional requirementsfor a program. The user reviews the results of the acceptance tests anddetermines the priorities of the test failures. The team schedules time to fixthe failed test for every iteration.
CuuDuongThanCong.com https://fb.com/tailieudientucntt

144
SOFTWARE ENGINEERING HANDBOOK
Project Velocity
The project velocity is used to measure how much work is being com-pleted on the project; it is obtained by adding up the estimates of user sto-ries completed during the iteration. Project velocity can also be obtainedby adding up the estimates for tasks during the iteration. If the projectvelocity shows significant variations, a release planning meeting is con-ducted and a new plan is released. Project velocity is a measure of accu-racy. How accurately are we able to produce results on time? How well arewe able to make estimates?
Small Releases
The development team releases small iterative versions of the system tothe customer. It is essential to get customer feedback on time instead ofwaiting until the last moment, which results in making changes at the lastminute as well.
Simple Design
The design is kept as simple as possible. A complex design is hard tounderstand when changes are to be made in the future.
Coding Standard
Programmers follow a specific set of standard rules in writing code. Thishelps in communication among teams and enables a programmer to under-stand the code written by any other programmer easily.
Refactoring
Refactoring is the art of removing any duplicate code — i.e., the reuse ofcode that is already present. This helps in keeping the system design sim-ple. Refactoring also saves a lot of time and increases the quality of thesystem.
Pair Programming
Pair programming specifies that a pair of programmers work collabora-tively on a task. This helps assess the code as it is written. Pair program-ming increases software quality and takes the same time to deliver the sys-tem as a single programmer working on a single machine.
Continuous Integration
Coding is done by dividing big projects into small, manageable program-ming tasks. After coding, the discrete programming tasks are joinedtogether; however, each of these tasks is tested individually for bugs. Dur-ing integration of the programming tasks, it is quite possible that new bugs
CuuDuongThanCong.com https://fb.com/tailieudientucntt
145
Extreme Programming Concepts
will arise. Therefore, after every integration, the integrated code is retestedfor bugs.
Changes may be made on the request of the customer. All the changesmade to the code are integrated at least daily. The tests are then run beforeand after the changes. The code is not released if any bugs are found.
40-Hour Week
Each programmer works for only 40 hours per week. This helps the pro-ductivity of the project in the long term. No programmer is overloadedwith work and no overtime is allowed. Overtime usually exhausts the pro-grammer and chances are he or she will make mistakes.
On-Site Customer
A single customer or a group of customers is available at all times for theprogrammers. This helps in resolving the ambiguities that developersencounter during development of the project, in setting priorities, and inproviding live scenarios.
CONCLUSION
Extreme programming can be stated as a fast and highly organized pro-cess for development of a software system. XP emphasizes communica-tion, which is essential in order to encourage new ideas. Because pair pro-gramming is stressed in this method, the fear of losing any programmer inthe middle of the project is substantially decreased. Theoretically, XPreduces competition among programmers by insisting that they all work asa single team.
Extreme programming can be used where the requirements change rap-idly and the customer is not sure of those requirements. Feedback is inte-gral to this process; thus, the end product will be developed according tocustomer requirements.
References
Beck, K. (1999). Extreme Programming Explained, Addison-Wesley, Reading, MA.
http://www.extremeprogramming.org. Extreme programming: a gentle introduction.
CuuDuongThanCong.com https://fb.com/tailieudientucntt

This page intentionally left blank
CuuDuongThanCong.com https://fb.com/tailieudientucntt
147
Chapter 11
Development Before the Fact Technology
I met Margaret Hamilton a little over a decade ago. At the time I was writingarticles on software engineering for Software Magazine. I interviewedHamilton for one of these articles. This is when I became intrigued by herradically different developmental technology called Development Beforethe Fact (DBTF).
Hamilton had run the software engineering division of the Charles StarkDraper Labs at MIT where the onboard flight software was being createdunder her direction for the Apollo and Skylab missions. As you can wellimagine, software had to be developed to send people up into space andthen to bring them safely home. It was critical, therefore, to develop soft-ware without any flaws. In her study of software developed for these mis-sions, Hamilton tracked a variety of causes of software error — most nota-bly interface errors. From her findings she developed the technology thatis the topic of this chapter.
DBTF (and its associated 001 tool set) is quite unique. System modelsare visually created and then virtually bug-free code is automatically gen-erated by the tool set, which generates the documentation as well. Aston-ishingly, the 001 tool set actually generated itself.
WHAT IS WRONG WITH SYSTEMS
Today's traditional system engineering and software development envi-ronments support their users in “fixing wrong things” rather than in “doingthem the right way in the first place.” Things happen too late, if at all. Sys-tems are of diminished quality and an unthinkable amount of dollars iswasted. This becomes apparent when analyzing the major problems of sys-tem engineering and software development.
In defining requirements, developers rely on many different types of mis-matched methods to capture aspects of even a single definition. In fact, theuniversal modeling language (UML) resurrects and supports this verypractice. Among other things, data flow is defined using one method, statetransitions another, dynamics another, data types another, and structures
CuuDuongThanCong.com https://fb.com/tailieudientucntt
148
SOFTWARE ENGINEERING HANDBOOK
using still another method. Once these aspects of requirements aredefined, there is no way to integrate them. Designers are forced to thinkand design this way because of limitations of technologies available tothem.
This leads to further problems. Integration of object to object, moduleto module, phase to phase, type of application to type of application, orsystems to software become even more of a challenge than solving theproblem at hand. This is compounded by a mismatch of products used fordesign and development. Integration of all forms is left to the devices of amyriad of developers well into the development process. The resulting sys-tem is hard to understand, objects cannot be traced, and there is little cor-respondence to the real world.
With these traditional methods, systems are actually encouraged byinformal (or semiformal) languages to be defined as ambiguous and incor-rect. Interfaces are incompatible and errors propagate throughout devel-opment. Once again the developers inherit the problem. The system andits development are out of control.
Requirements are defined to concentrate on the application needs of theuser, but they do not consider that the user changes his mind or that hisenvironment changes. Developers are forced to use a technology withoutan open architecture. The result is “locked in” designs, such as beinglocked into a specific database schema or GUI; the user is forced to makeresource allocation a part of the application. Porting becomes a new devel-opment for each new architecture, operating system, database, GUI envi-ronment, language, or language configuration; critical functionality isavoided for fear of the unknown and maintenance is both risky and themost expensive part of the life cycle. When a system is targeted for a dis-tributed environment, it is often defined and developed for a single proces-sor environment and then redeveloped for a distributed environment —another unnecessary development.
Insufficient information about a system’s run-time performance, includ-ing that concerning the decisions to be made between algorithms or archi-tectures, is incorporated into a system definition. This results in designdecisions that depend on analysis of outputs from exercising a multitude ofad hoc implementations and associated testing scenarios. A system isdefined without considering how to separate it from its target environ-ment. It is not known if a design is a good one until its implementation hasfailed or succeeded.
The focus for reuse is late into development during the coding phase.Requirements definitions lack properties to help find, create, and inher-ently make use of commonality. Modelers are forced to use informal andmanual methods to find ways to divide a system into components natural
CuuDuongThanCong.com https://fb.com/tailieudientucntt
149
Development Before the Fact Technology
for reuse. Why reuse something in today’s changing market if it is not ableto be integrated, not portable or adaptable, and error prone? The result islittle incentive for reuse, and redundancy is a way of life. Again, errorspropagate accordingly.
Automation is an inherently reusable process. If a solution does notexist for reuse, it does not exist for automation. Systems are defined withinsufficient intelligence for automated tools to use them as input. Toooften, automated tools concentrate on supporting the manual processinstead of doing the real work.
Definitions supported by “make work” automation are given to develop-ers to turn into code manually. A process that could have been mechanizedonce for reuse is performed manually over and over again. When automa-tion attempts to do the real work, it is often incomplete across applicationdomains or even within a domain, resulting in incomplete code such asskeleton or shell code. Manual processes are needed to complete unfin-ished automations. An automation for one part of a system (e.g., the GUI)needs to be integrated manually with an automation for another part of thesystem (e.g., communications algorithms) or with the results of a manualprocess. The code generated is often inefficient or hardwired to a particu-lar architecture, language, or even a particular version of a language. Mostof the development process is needlessly manual. Again, all these manualprocesses are creating new errors each time.
A promising solution to these problems is DBTF. Whereas the traditionalapproach is after the fact, or curative, the DBTF approach is preventative.
DEVELOPMENT BEFORE THE FACT
With DBTF, each system is defined with properties that control its owndesign and development. With this paradigm, a life cycle inherently pro-duces reusable systems, realized in terms of automation. Unlike before, anemphasis is placed on defining things the right way the first time. Problemsare prevented before they happen. Each system definition not only modelsits application but also models its own life cycle.
From the very beginning, a system inherently integrates all of its ownobjects (and all aspects of and about these objects) and the combinationsof functionality using these objects. It maximizes its own reliability andflexibility to change and the unpredictable; capitalizes on its own parallel-ism; supports its own run-time performance analysis and the ability tounderstand the integrity of its own design; and maximizes the potential forits own reuse, automation, and evolution. The system is developed withbuilt-in quality and built-in productivity.
A curative means to obtain quality is to continue testing the system untilthe errors are eliminated; a preventative (i.e., DBTF) means is to not allow
CuuDuongThanCong.com https://fb.com/tailieudientucntt
150
SOFTWARE ENGINEERING HANDBOOK
errors to creep in, in the first place. Whereas a curative means to acceler-ate a particular design and development process is to add resources suchas people or processors, a preventative approach would find a more effi-cient way to perform this process, such as capitalizing more on reuse oreliminating parts of it altogether, yet still reaching the desired results.Effective reuse is a preventative concept. Reusing something with noerrors, to obtain a desired functionality, avoids the errors of a newly devel-oped system; time and money will not be wasted in developing that newsystem. For successful reuse, a system must be worth reusing and must bereused for each user requiring functionality equivalent to it. This meansstarting from the beginning of a life cycle, not at the end, which is typicallythe case with traditional methods. Then a system is reused for each newphase of development. No matter what kind, every ten reuses save tenunnecessary developments.
THE TECHNOLOGY
The DBTF technology embodies and is based on a formal theory; it hasa formal systems language, a generic process, and an automation, all basedon the formal theory. Once understood, the characteristics of good designcan be reused by incorporating them into a language for defining any sys-tem. The language is the key to DBTF. It has the capability to define anyaspect of any system (and any aspect about that system) and integrate itwith any other aspect. These aspects are directly related to the real world.
This same language can be used to define and integrate system require-ments, specifications, design, and detailed design for functional, resource,and resource allocation architectures throughout all levels and layers of“seamless” definition, including hardware, software, and peopleware. Itcould be used to define missile or banking systems as well as real-time,Internet, or database environments.
With this language, every object is a system-oriented object (SOO)developed in terms of other SOOs. An SOO integrates all aspects of a sys-tem including that which is function, object, and timing oriented. Everysystem is an object; every object is a system. Instead of object-orientedsystems, DBTF has system-oriented objects and can be used to define sys-tems with diverse degrees of fidelity and completeness. Such a languagecan always be considered a design language because design is relative: oneperson’s design phase is another person’s implementation phase.
This implementation-independent language has mechanisms to definemechanisms for defining systems. Although the core language is generic,the user “language,” a by-product of a development, can be applicationspecific because the language is semantics dependent but syntax indepen-dent. Unlike formal languages that are not friendly and friendly languagesthat are not formal, this language is formal and friendly.
CuuDuongThanCong.com https://fb.com/tailieudientucntt
151
Development Before the Fact Technology
The first step in building a DBTF system is to define a model (withoutconcern for resource allocation details such as how many processes areneeded) with the language. This process could be in any phase of develop-ment, including problem analysis, operational scenarios, and design. Themodel is automatically analyzed to ensure it was defined properly. Thisincludes static analysis for preventative properties and dynamic analysisfor user-intent properties.
A complete and fully production-ready and fully integrated softwareimplementation (and documentation) for any kind or size of application,consistent with the model, is then automatically generated by the genericgenerator for a selected target environment in the language of choice (e.g.,C, Java, or XML) and the architecture of choice. If the selected environmenthas already been configured, it is selected directly; if not, the generator isconfigured for a new language and new architecture before it is selected.
The resulting system can then be executed. If the desired system is soft-ware, the system can now be tested for further user-intent errors. Itbecomes operational after testing. Before the fact testing is inherently partof every DBTF development step. Errors are prevented simply by construc-tion with the language and because of that which is inherent or automated;for example, since the generator automatically generates all the code, nomanual coding errors will be made. Target changes are made to the defini-tion, not to the code. Target architecture changes are made to the configu-ration of the generator environment, not to the code. If the real system ishardware or peopleware, the generated software system can serve as aform of simulation upon which the real system can be based.
DBTF is a system-oriented object approach based upon a unique con-cept of control. The foundations are based on a set of axioms and on theassumption of the existence of a universal set of objects. Each axiomdefines a relation of immediate domination; the union of the relationsdefined by the axioms is control. Among other things, the axioms establishthe relationships of an object for invocation, input and output, input andoutput access rights, error detection and recovery, and ordering during itsdevelopmental and operational states.
This approach is used throughout a life cycle, starting with require-ments and continuing with systems engineering, specification, analysis,design, implementation, testing, and maintenance. Its users include man-agers, system engineers, software engineers, and test engineers, as well asend users.
In addition to experience with real-world systems, 001 takes its roots inmany other areas, including systems theory, formal methods, formal linguis-tics, and object technologies. It would be natural to make assumptionsabout what is possible and impossible based on its superficial resemblance
CuuDuongThanCong.com https://fb.com/tailieudientucntt
152
SOFTWARE ENGINEERING HANDBOOK
to other techniques such as traditional object technologies. It helps, how-ever, to suspend any and all preconceived notions when first introduced toit because it is a world unto itself — a completely new way to think aboutsystems and software.
The DBTF approach had its beginnings in 1968 with the Apollo spacemissions when research was performed for developing software for man-rated missions. This led to the finding that interface errors accounted forapproximately 75 percent of all errors found in the flight software duringfinal testing. These include data flow, and priority and timing errors at thehighest and lowest levels of a system to the finest grain detail. Each errorwas placed into a category according to the means taken to prevent it bythe very way a system was defined. A theory was derived for defining a sys-tem such that this entire class of interface errors would be eliminated.
INTEGRATED MODELING ENVIRONMENT
The first technology derived from this theory concentrated on definingand building reliable systems in terms of functional maps. Since that timethis technology has been further developed to design and build systemswith DBTF properties in terms of an integration of functional and typemaps, where a map is a control hierarchy and a network of interactingobjects. The philosophy behind this approach is inherently recursive andreusable where reliable systems are defined in terms of reliable systems.Only reliable systems are used as building blocks and as mechanisms tointegrate these building blocks to form a new system. The new systembecomes a reusable for building other systems.
Every model is defined in terms of function maps (FMaps) to representthe dynamic world of action by capturing functional and time (includingpriorities) behavior and type maps (TMaps) to represent the static worldof objects by capturing space behavior (Exhibit 11-1). FMaps and TMapsguide the designer in thinking through concepts at all levels of systemdesign. With these maps, everything you need to know (no more, no less)is available. All model viewpoints can be obtained from FMaps and TMaps,including data flow, control flow, state transitions, data and object struc-ture, and dynamics. FMaps are inherently integrated with TMaps.
On an FMap, a function at each node is defined in terms of and controlsits children functions. For example, the function “build the table” could bedecomposed into and control its children functions “make parts andassemble.” On a TMap, a type at each node is defined in terms of and con-trols its children types. For example, “type, table,” could be decomposedinto and control its children types, “legs and top.”
Every type on a TMap owns a set of inherited primitive operations. Eachfunction on an FMap has one or more objects as its input and one or more
CuuDuongThanCong.com https://fb.com/tailieudientucntt

153
Development Before the Fact Technology
objects as its output. Each object resides in an object map (OMap), aninstance of a TMap, and is a member of a type from a TMap. FMaps areinherently integrated with TMaps by using these objects and their primi-tive operations. FMaps are used to define, integrate, and control the trans-formations of objects from one state to another state (e.g., a table with abroken leg to a table with a fixed leg). Uses of primitive operations on typesdefined in the TMap reside at the bottom nodes of an FMap. Primitive typesreside at the bottom nodes of a TMap.
When a system has all of its object values plugged in for a particular per-formance pass, it exists in the form of an execution map (EMap), aninstance of an FMap.
Typically, a team of designers will begin to design a system at any level(hardware, software, peopleware, or some combination) by sketching aTMap of their application. This is where they decide on the types of objects(and the relationships between these objects) that they will have in theirsystem. Often a road map (RMap), which organizes all system objectsincluding FMaps and TMaps, will be sketched in parallel with the TMap. AnRMap can also be automatically generated from a set of FMaps and TMapsupon demand.
Once a TMap has been agreed upon, the FMaps begin almost to fall intoplace for the designers because of the natural partitioning of functionality(or groups of functionality) provided to the designers by the TMap system.
Exhibit 11-1. FMaps Are Inherently Integrated with TMaps.
Control Structure Function
Type and its methodsConstraint
Objects (Members of Types)
Relations
Model Type Behavior (Space)with Type Map (TMap)
Model Functional Behavior (Time)with Function Map (FMap)
CuuDuongThanCong.com https://fb.com/tailieudientucntt
154
SOFTWARE ENGINEERING HANDBOOK
The TMap provides the structural criteria from which to evaluate the func-tional partitioning of the system (e.g., the shape of the structural partition-ing of the FMaps is balanced against the structural organization of theshape of the objects as defined by the TMap). With FMaps and TMaps, asystem (and its viewpoints) is divided into functionally natural compo-nents and groups of functional components that naturally work together; asystem is defined from the very beginning to inherently integrate and makeunderstandable its own real world definition.
PRIMITIVE STRUCTURES
All FMaps and TMaps are ultimately defined in terms of three primitivecontrol structures: a parent controls its children to have a dependent rela-tionship, an independent relationship, or a decision-making relationship. Aformal set of rules is associated with each primitive structure. If these rulesare followed, interface errors are “removed” before the fact by preventingthem in the first place. As a result, all interface errors (75 to 90 percent ofall errors normally found during testing in a traditional development) areeliminated at the definition phase. Using the primitive structures supportsa system to be defined from the very beginning to inherently maximize itsown elimination of errors.
Use of the primitive structures is shown in the definition of the FMapfor system, MakeATable (Exhibit 11-2). The top node function has FLAT-wood and ROUNDwood as its inputs and produces Table as its output.MakeATable, as a parent, is decomposed with a Join into its children func-tions, MakeParts and Assemble. MakeParts takes in as input FLATwoodand ROUNDwood from its parent and produces Top and Legs as its out-put. Top and Legs are given to Assemble as input. Assemble is controlledby its parent to depend on MakeParts for its input. Assemble producesTable as output and sends it to its parent.
. As a parent, MakeParts is decomposed into children, MakeLegs andMakeTop, who are controlled to be independent of each other with theInclude primitive control structure. MakeLegs takes in part of its parent’sinput and MakeTop takes in the other part. MakeLegs provides part of itsoutput (Legs) to its parent and MakeTop provides the rest. MakeTop con-trols its children, FinishSoftWood and FinishHardWood, with an Or. Here,both children take in the same input and provide the same output becauseonly one of them will be performed for a given performance pass. Finish-SoftWood will be performed if the decision function “is:Soft,Wood” returnsTrue; otherwise, FinishHardWood will be performed. Notice that input(e.g., FLATwood) is traceable down the system from parent to children andoutput (e.g., Table) is traceable up the system from children to parent. Allobjects in a DBTF system are traceable. MakeATable’s TMap, Table, uses
CuuDuongThanCong.com https://fb.com/tailieudientucntt
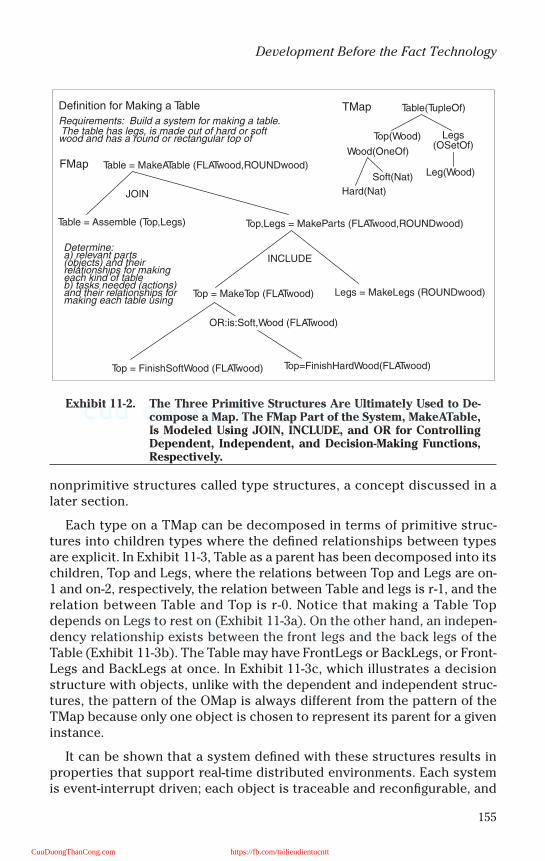
155
Development Before the Fact Technology
nonprimitive structures called type structures, a concept discussed in alater section.
Each type on a TMap can be decomposed in terms of primitive struc-tures into children types where the defined relationships between typesare explicit. In Exhibit 11-3, Table as a parent has been decomposed into itschildren, Top and Legs, where the relations between Top and Legs are on-1 and on-2, respectively, the relation between Table and legs is r-1, and therelation between Table and Top is r-0. Notice that making a Table Topdepends on Legs to rest on (Exhibit 11-3a). On the other hand, an indepen-dency relationship exists between the front legs and the back legs of theTable (Exhibit 11-3b). The Table may have FrontLegs or BackLegs, or Front-Legs and BackLegs at once. In Exhibit 11-3c, which illustrates a decisionstructure with objects, unlike with the dependent and independent struc-tures, the pattern of the OMap is always different from the pattern of theTMap because only one object is chosen to represent its parent for a giveninstance.
It can be shown that a system defined with these structures results inproperties that support real-time distributed environments. Each systemis event-interrupt driven; each object is traceable and reconfigurable, and
Exhibit 11-2. The Three Primitive Structures Are Ultimately Used to De-compose a Map. The FMap Part of the System, MakeATable,Is Modeled Using JOIN, INCLUDE, and OR for ControllingDependent, Independent, and Decision-Making Functions,Respectively.
Definition for Making a Table
FMap Table = MakeATable (FLATwood,ROUNDwood)
Top,Legs = MakeParts (FLATwood,ROUNDwood)
Legs = MakeLegs (ROUNDwood)Top = MakeTop (FLATwood)
Top=FinishHardWood(FLATwood)Top = FinishSoftWood (FLATwood)
Table = Assemble (Top,Legs)
JOIN
INCLUDEDetermine:a) relevant parts(objects) and theirrelationships for makingeach kind of tableb) tasks needed (actions)and their relationships formaking each table using
OR:is:Soft,Wood (FLATwood)
Requirements: Build a system for making a table. The table has legs, is made out of hard or softwood and has a round or rectangular top of
Table(TupleOf)
Leg(Wood)
Top(Wood)
TMap
Legs(OSetOf)
Wood(OneOf)
Hard(Nat)
Soft(Nat)
CuuDuongThanCong.com https://fb.com/tailieudientucntt
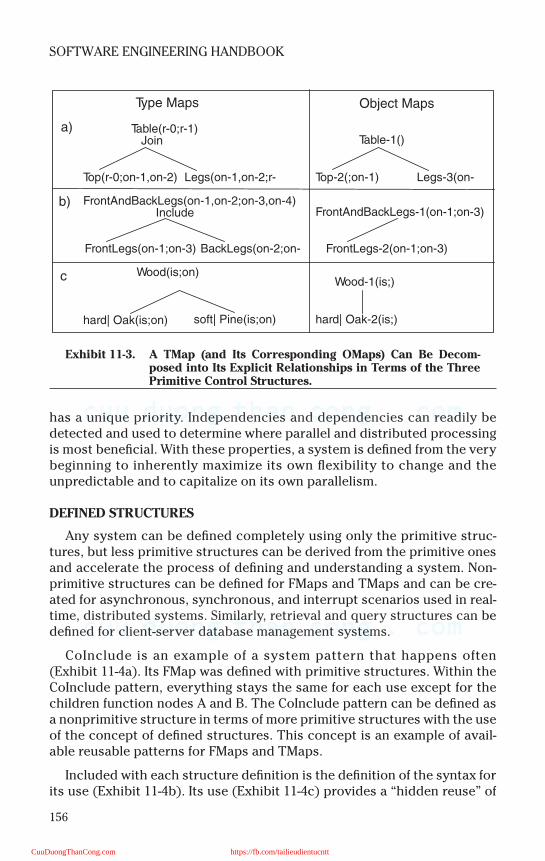
156
SOFTWARE ENGINEERING HANDBOOK
has a unique priority. Independencies and dependencies can readily bedetected and used to determine where parallel and distributed processingis most beneficial. With these properties, a system is defined from the verybeginning to inherently maximize its own flexibility to change and theunpredictable and to capitalize on its own parallelism.
DEFINED STRUCTURES
Any system can be defined completely using only the primitive struc-tures, but less primitive structures can be derived from the primitive onesand accelerate the process of defining and understanding a system. Non-primitive structures can be defined for FMaps and TMaps and can be cre-ated for asynchronous, synchronous, and interrupt scenarios used in real-time, distributed systems. Similarly, retrieval and query structures can bedefined for client-server database management systems.
CoInclude is an example of a system pattern that happens often(Exhibit 11-4a). Its FMap was defined with primitive structures. Within theCoInclude pattern, everything stays the same for each use except for thechildren function nodes A and B. The CoInclude pattern can be defined asa nonprimitive structure in terms of more primitive structures with the useof the concept of defined structures. This concept is an example of avail-able reusable patterns for FMaps and TMaps.
Included with each structure definition is the definition of the syntax forits use (Exhibit 11-4b). Its use (Exhibit 11-4c) provides a “hidden reuse” of
Exhibit 11-3. A TMap (and Its Corresponding OMaps) Can Be Decom-posed into Its Explicit Relationships in Terms of the ThreePrimitive Control Structures.
Type Maps Object Maps
Wood(is;on)
soft| Pine(is;on)hard| Oak(is;on)
FrontAndBackLegs(on-1,on-2;on-3,on-4) Include
FrontLegs(on-1;on-3) BackLegs(on-2;on-
Table(r-0;r-1) Join
Top(r-0;on-1,on-2) Legs(on-1,on-2;r-
FrontAndBackLegs-1(on-1;on-3)
FrontLegs-2(on-1;on-3)
Table-1()
Top-2(;on-1) Legs-3(on-
Wood-1(is;)
hard| Oak-2(is;)
a)
b)
c
CuuDuongThanCong.com https://fb.com/tailieudientucntt
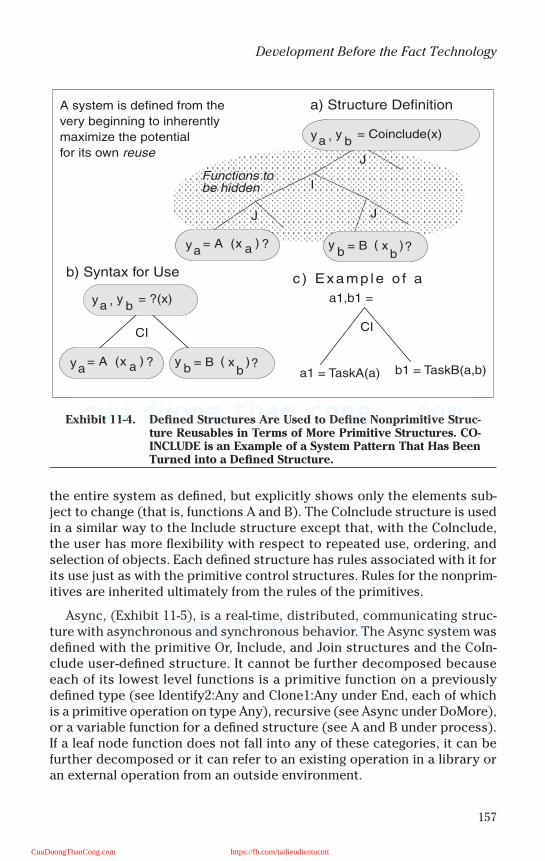
157
Development Before the Fact Technology
the entire system as defined, but explicitly shows only the elements sub-ject to change (that is, functions A and B). The CoInclude structure is usedin a similar way to the Include structure except that, with the CoInclude,the user has more flexibility with respect to repeated use, ordering, andselection of objects. Each defined structure has rules associated with it forits use just as with the primitive control structures. Rules for the nonprim-itives are inherited ultimately from the rules of the primitives.
Async, (Exhibit 11-5), is a real-time, distributed, communicating struc-ture with asynchronous and synchronous behavior. The Async system wasdefined with the primitive Or, Include, and Join structures and the CoIn-clude user-defined structure. It cannot be further decomposed becauseeach of its lowest level functions is a primitive function on a previouslydefined type (see Identify2:Any and Clone1:Any under End, each of whichis a primitive operation on type Any), recursive (see Async under DoMore),or a variable function for a defined structure (see A and B under process).If a leaf node function does not fall into any of these categories, it can befurther decomposed or it can refer to an existing operation in a library oran external operation from an outside environment.
Exhibit 11-4. Defined Structures Are Used to Define Nonprimitive Struc-ture Reusables in Terms of More Primitive Structures. CO-INCLUDE is an Example of a System Pattern That Has BeenTurned into a Defined Structure.
A system is defined from the
very beginning to inherently
maximize the potential
for its own reuse
b) Syntax for Use c ) Examp le o f a
a) Structure Definition
J
I
J J
= Coinclude(x)b
yay ,
Functions tobe hidden
?= B )(b
xb
yy = A )(xa a ?
CI
= ?(x)b
yay , a1,b1 =
a1 = TaskA(a) b1 = TaskB(a,b)
CI
?= B )(b
xb
yy = A )(xa a ?
CuuDuongThanCong.com https://fb.com/tailieudientucntt

158
SOFTWARE ENGINEERING HANDBOOK
CoordinateTasks uses Async as a reusable where TurnAndPlan andMove are dependent, communicating, concurrent, synchronous, and asyn-chronous functions. The two robots in this system work together to per-form a task such as building a table. Here, one phase of the planning robot,RB, is coordinated with the next phase of the slave robot, RA.
Reusability can be used with a TMap model by using user-defined typestructures, which are defined structures that provide the mechanism todefine a TMap without their particular relations explicitly defined. TMapTable (Exhibit 11-2) uses a set of default user-defined type structures.Table as a parent type controls its children types, Top and Legs, in terms ofa TupleOf type structure, Legs controls its child, Leg, in terms of OSetOf,and Wood controls Hard and Soft with a OneOf. A TupleOf is a collection ofa fixed number of possibly different types of objects, OSetOf is a collectionof a variable number of the same types of objects (in a linear order), andOneOf is a classification of possibly different types of objects from whichone object is selected to represent the class. These type structures, alongwith TreeOf, can be used for designing any kind of TMap. TreeOf is a collec-tion of the same types of objects ordered using a tree indexing system.With the use of mechanisms such as defined structures, a system is defined
Exhibit 11-5. Async is a Defined Structure That Can Be Used to DefineDistributed Systems with Synchronous and AsynchronousBehavior.
Syntax
b1 = B(I,b0)?I1,a1 = A(I,a0)?
a,b = ? (I,a0,b0)
Async: Continue?
Use RB,RA =
RB,RA = CoordinateTasks(plans1,RB1,RA1)
NextStep,RB2 = TurnAndPlan(plans1,RB1)
RA2 = Move(plans1,RA1)
Async: TasksDone
Join
= Initializeplans1,RB1,RA
plans0,RB0,RA( )
Structure
a = Identify2:Any(I,a0)
b = Clone1:Any(b0)
a,b = End(I,a0,b0)
CI
Join
a,b =
a,b = DoMore(I,a0,b0)
I1,a1,b1 =
OR:Continue?(I,a0,b0)
I1,a1 = A(I,a0)? b1 = B(I,b0)?
a,b = Async(I,a0,b0)
Include
CuuDuongThanCong.com https://fb.com/tailieudientucntt
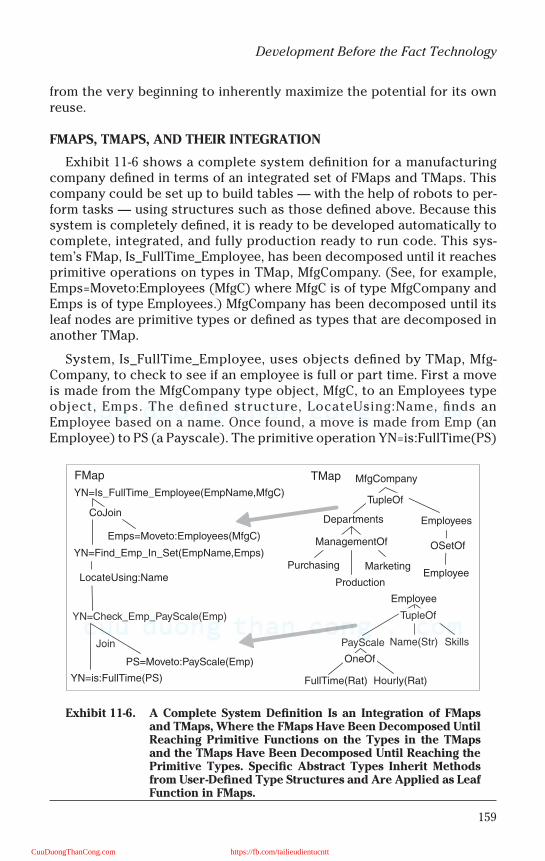
159
Development Before the Fact Technology
from the very beginning to inherently maximize the potential for its ownreuse.
FMAPS, TMAPS, AND THEIR INTEGRATION
Exhibit 11-6 shows a complete system definition for a manufacturingcompany defined in terms of an integrated set of FMaps and TMaps. Thiscompany could be set up to build tables — with the help of robots to per-form tasks — using structures such as those defined above. Because thissystem is completely defined, it is ready to be developed automatically tocomplete, integrated, and fully production ready to run code. This sys-tem’s FMap, Is_FullTime_Employee, has been decomposed until it reachesprimitive operations on types in TMap, MfgCompany. (See, for example,Emps=Moveto:Employees (MfgC) where MfgC is of type MfgCompany andEmps is of type Employees.) MfgCompany has been decomposed until itsleaf nodes are primitive types or defined as types that are decomposed inanother TMap.
System, Is_FullTime_Employee, uses objects defined by TMap, Mfg-Company, to check to see if an employee is full or part time. First a moveis made from the MfgCompany type object, MfgC, to an Employees typeobject, Emps. The defined structure, LocateUsing:Name, finds anEmployee based on a name. Once found, a move is made from Emp (anEmployee) to PS (a Payscale). The primitive operation YN=is:FullTime(PS)
Exhibit 11-6. A Complete System Definition Is an Integration of FMapsand TMaps, Where the FMaps Have Been Decomposed UntilReaching Primitive Functions on the Types in the TMapsand the TMaps Have Been Decomposed Until Reaching thePrimitive Types. Specific Abstract Types Inherit Methodsfrom User-Defined Type Structures and Are Applied as LeafFunction in FMaps.
Name(Str) Skills
Employee
FullTime(Rat) Hourly(Rat)
PayScale
TupleOf
OneOf
Employees
OSetOf
TMap MfgCompany
Purchasing
Production
Marketing
Departments
ManagementOf
TupleOf
Employee
FMap
YN=Is_FullTime_Employee(EmpName,MfgC)
Emps=Moveto:Employees(MfgC)
YN=Find_Emp_In_Set(EmpName,Emps)
YN=Check_Emp_PayScale(Emp)
PS=Moveto:PayScale(Emp)
YN=is:FullTime(PS)
Join
LocateUsing:Name
CoJoin
CuuDuongThanCong.com https://fb.com/tailieudientucntt
160
SOFTWARE ENGINEERING HANDBOOK
is then used to determine from PS if Emp is full time. When PS is FullTime,YN will be True.
Each type structure assumes its own set of possible relations for its par-ent and children types. In this example, TMap, MfgCompany is decom-posed into Departments and Employees in terms of TupleOf. Departmentsis decomposed in terms of ManagementOf (a user-defined type structure)into Purchasing, Production, and Marketing. Employees is decomposed interms of OSetOf. One of the children of Employee, PayScale, is decomposedin terms of the type structure, OneOf.
Abstract types decomposed with the same type structure on a TMapinherit (or reuse) the same primitive operations and therefore the samebehavior. So, for example, MfgCompany and Employee inherit the sameprimitive operations from type structure, TupleOf. An example of this canbe seen in the FMap where both types, MfgCompany and Employee, use theprimitive operation, MoveTo, which was inherited from TupleOf.
Here each use of the MoveTo is an instantiation of the Child=MoveTo:Child(Parent) operation of the TupleOf type structure. For example,Emps=MoveTo:Employees(MfgC) allows one to navigate to an employee’sobject contained in a MfgCompany object. A type may be nonprimitive(e.g., Departments), primitive (e.g., FullTime as a rational number), or adefinition that is defined in another type subtree (e.g., Employees). Whena leaf node type has the name of another type subtree, the child object willbe contained in the place holder controlled by the parent object (definedas Skills) or a reference to an external object will be contained in the childplace holder controlled by the parent object (forming a relation betweenthe parent and the external object).
UNIVERSAL PRIMITIVE OPERATIONS
The TMap provides universal primitive operations, which are used forcontrolling objects and object states inherited by all types. They create,destroy, copy, reference, move, access a value, detect and recover fromerrors, and access the type of an object. They provide an easy way tomanipulate and think about different types of objects. With universal prim-itive operations, building systems can be accomplished in a more uniformmanner. TMap and OMap are also available as types to facilitate the abilityof a system to understand itself better and manipulate all objects the sameway when it is beneficial to do so.
TMap properties ensure the proper use of objects in an FMap. A TMaphas a corresponding set of control properties for controlling spatial rela-tionships between objects. One cannot, for example, put a leg on a tablewhere a leg already exists; conversely, one cannot remove a leg from thetable where there is no leg. A reference to the state of an object cannot bemodified if there are other references to that state in the future; reject
CuuDuongThanCong.com https://fb.com/tailieudientucntt
161
Development Before the Fact Technology
values exist in all types, allowing the FMap user to recover from failures ifthey are encountered.
The same types of definition mechanisms are used to define RotateRo-tateArm, a hardware system (Exhibit 11-7), as were used to define the pre-ceding software system. Note that this system also includes the use ofprimitives for numeric calculation. In this system, the rotation of the robotarm is calculated to move from one position to another in a manufacturingcell to transfer a part. The universal operation (an example of another formof reusable with polymorphism), Replace, is used twice in this example.Each use of a universal operation has function qualifiers that select aunique TMap parent–child combination to be used during the applicationof the function.
Exhibit 11-8 has a definition that takes further advantage of the expres-sive power of a TMap with the option of using explicitly defined relations.In this example, a stack of bearings is described. A bearing in the stack maybe under (with relation on-0) or on (with relation on-1) another bearingobject in the stack as defined by the DSetOf structured type. A bearingobject is decomposed into a Cap, a RetainerWith Balls, and a Base. Objectrelationships at this level show that the Cap is above the RetainerWith-Balls, which is, in turn, above the Base. Further detail reveals that a Retainerhas (with the has-n relation) some number of RetainerHoleWithBallobjects. The set of RetainerHoleWithBall objects are independent of eachother, defined by the ISetOf structured type. This structure allows for phys-ically independent relations on the objects in the set. Here, different por-tions of the Cap surface are independently related (with the on-Balls rela-tion) to each individual Ball object (with the on-Ball relation).
As experience is gained with different types of applications, new reus-ables emerge for general or specific use. For example, a set of reusables hasbeen derived to form a higher level set of mechanisms for defining maps ofinterruptable, asynchronous, communicating, distributed controllers. Thisis essentially a second-order control system (with rules that parallel theprimary control system of the primitive structures) defined with the formallogic of user-defined structures that can be represented using a graphicalsyntax (Exhibit 11-9).
In such a system, each distributed region is cooperatively working withother distributed regions and each parent controller may interrupt thechildren under its control. In this example, the robot controller may applyan arm controller or a sensor controller. If the arm controller is activated,the two grippers may concurrently use an Include to hold two ends of someobject. If the sensor controller is activated, a sensor unit uses a Join tosense some image, followed by an image unit matcher. These reusables canalso be used to manage other types of processes such as those used tomanage a software development environment or a corporation.
CuuDuongThanCong.com https://fb.com/tailieudientucntt
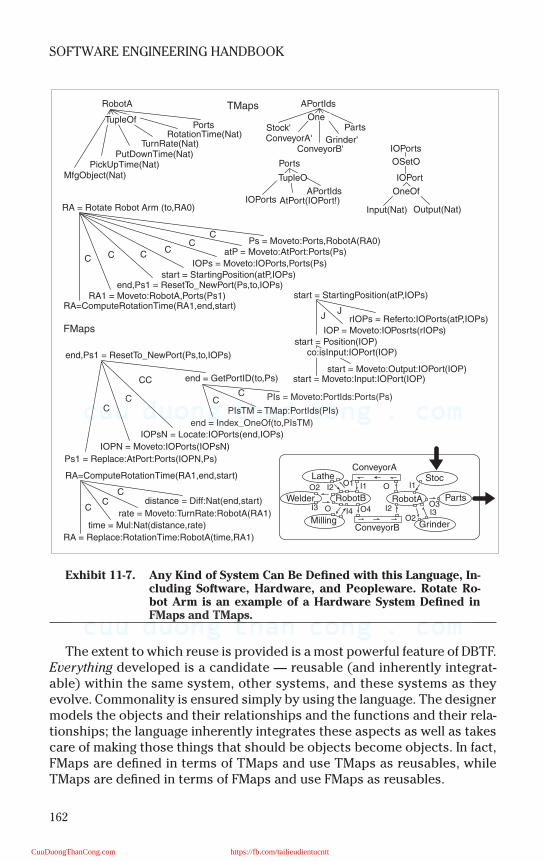
162
SOFTWARE ENGINEERING HANDBOOK
The extent to which reuse is provided is a most powerful feature of DBTF.Everything developed is a candidate — reusable (and inherently integrat-able) within the same system, other systems, and these systems as theyevolve. Commonality is ensured simply by using the language. The designermodels the objects and their relationships and the functions and their rela-tionships; the language inherently integrates these aspects as well as takescare of making those things that should be objects become objects. In fact,FMaps are defined in terms of TMaps and use TMaps as reusables, whileTMaps are defined in terms of FMaps and use FMaps as reusables.
Exhibit 11-7. Any Kind of System Can Be Defined with this Language, In-cluding Software, Hardware, and Peopleware. Rotate Ro-bot Arm is an example of a Hardware System Defined inFMaps and TMaps.
FMaps
RA = Rotate Robot Arm (to,RA0)
Ps = Moveto:Ports,RobotA(RA0)atP = Moveto:AtPort:Ports(Ps)
IOPs = Moveto:IOPorts,Ports(Ps)
end,Ps1 = ResetTo_NewPort(Ps,to,IOPs)start = StartingPosition(atP,IOPs)
RA=ComputeRotationTime(RA1,end,start)RA1 = Moveto:RobotA,Ports(Ps1)
C C CC
CC
start = StartingPosition(atP,IOPs)
rIOPs = Referto:IOPorts(atP,IOPs)IOP = Moveto:IOPosrts(rIOPs)
start = Position(IOP)
start = Moveto:Output:IOPort(IOP)start = Moveto:Input:IOPort(IOP)
JJ
co:isInput:IOPort(IOP)
Ports
APortIdsAtPort(IOPort!)IOPorts
TupleO
ConveyorB'
APortIds
Stock'ConveyorA' Grinder'
PartsOne
IOPorts
IOPort
Input(Nat) Output(Nat)
OneOf
OSetO
TMapsRobotA
TupleOf
RotationTime(Nat)TurnRate(Nat)
PutDownTime(Nat)PickUpTime(Nat)
MfgObject(Nat)
Ports
end,Ps1 = ResetTo_NewPort(Ps,to,IOPs)
end = GetPortID(to,Ps)
PIs = Moveto:PortIds:Ports(Ps)
PIsTM = TMap:PortIds(PIs)
end = Index_OneOf(to,PIsTM)
IOPsN = Locate:IOPorts(end,IOPs)
IOPN = Moveto:IOPorts(IOPsN)
Ps1 = Replace:AtPort:Ports(IOPN,Ps)
CC
CC
CC
distance = Diff:Nat(end,start)
rate = Moveto:TurnRate:RobotA(RA1)
time = Mul:Nat(distance,rate)
RA = Replace:RotationTime:RobotA(time,RA1)
CC
C
RA=ComputeRotationTime(RA1,end,start)
O4O
O2
O3
O2
OO1 I1
I2 I3
I1I2
I3 I4
ConveyorA
ConveyorB
RobotB RobotA
Grinder
Parts
Stoc
Milling
Lathe
Welder
CuuDuongThanCong.com https://fb.com/tailieudientucntt

physical object(side view)
TMap
Retainer(around;restraints)
RetainerHolesWithBalls(restraints,on-balls;on-Basen) ISetOf
RetainerHoleWithBall(restraint,on-ball;on-Base1) CJ
RetainerHole(restraint;contains) Ball(contains,on-ball;on-Base1)
StackOfBearings(on;on-n) DSetOf
Bearing(on;on-1)
Cap(on;around,on-balls) Base(on-Basen;on-
RetainerWithBalls(around,on-balls;on-Basen) CJ
163
Development Before the Fact Technology
PERFORMANCE CONSIDERATIONS
When designing a system environment, it is important to understand theperformance constraints of the functional architecture and to have theability to change configurations rapidly. A system is flexible to changingresource requirements if the functional architecture definition is separatedfrom its resource definitions. To support such flexibility with the necessarybuilt-in controls, with DBTF the same language is used to define functional,resource, and allocation architectures. The meta-language properties ofthe language can be used to define global and local constraints for FMapsand TMaps. Constraints can be defined in terms of FMaps and TMaps. If weplace a constraint on the definition of a function (e.g., Where F takesbetween two and five seconds), then this constraint influences all func-tions that use this definition. Such a constraint is global with respect to theuses of F.
Exhibit 11-8. Explicitly Defined Relations Can Be Used to Take FurtherAdvantage of the Expressive Power of a TMap. Here, aTMap Is Used for Defining a Bearing ManufacturingProcess.
CuuDuongThanCong.com https://fb.com/tailieudientucntt
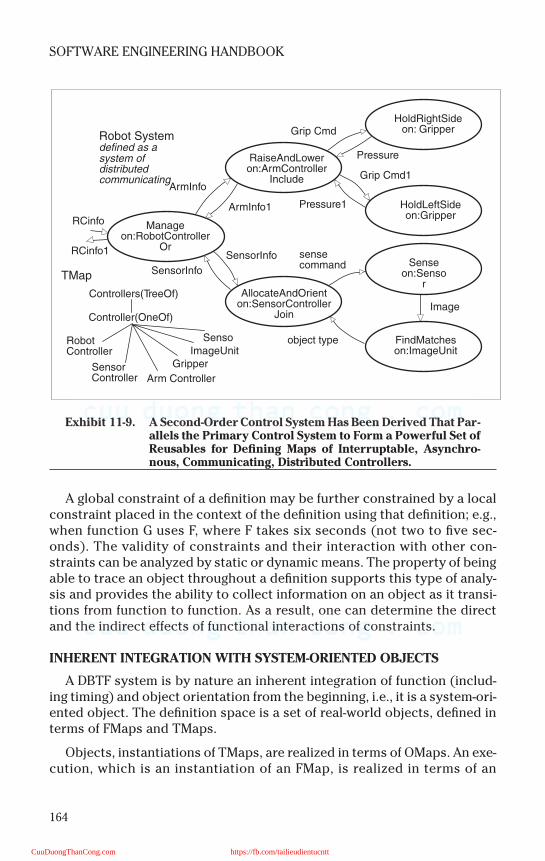
164
SOFTWARE ENGINEERING HANDBOOK
A global constraint of a definition may be further constrained by a localconstraint placed in the context of the definition using that definition; e.g.,when function G uses F, where F takes six seconds (not two to five sec-onds). The validity of constraints and their interaction with other con-straints can be analyzed by static or dynamic means. The property of beingable to trace an object throughout a definition supports this type of analy-sis and provides the ability to collect information on an object as it transi-tions from function to function. As a result, one can determine the directand the indirect effects of functional interactions of constraints.
INHERENT INTEGRATION WITH SYSTEM-ORIENTED OBJECTS
A DBTF system is by nature an inherent integration of function (includ-ing timing) and object orientation from the beginning, i.e., it is a system-ori-ented object. The definition space is a set of real-world objects, defined interms of FMaps and TMaps.
Objects, instantiations of TMaps, are realized in terms of OMaps. An exe-cution, which is an instantiation of an FMap, is realized in terms of an
Exhibit 11-9. A Second-Order Control System Has Been Derived That Par-allels the Primary Control System to Form a Powerful Set ofReusables for Defining Maps of Interruptable, Asynchro-nous, Communicating, Distributed Controllers.
Image
sensecommand
object type
SensorInfo
ArmInfo
ArmInfo1
RCinfo
RCinfo1
SensorInfo
Grip Cmd
Pressure
Grip Cmd1
Pressure1 HoldLeftSideon:Gripper
HoldRightSideon: Gripper
Senseon:Senso
r
FindMatcheson:ImageUnit
AllocateAndOrienton:SensorController
Join
RaiseAndLoweron:ArmController
Include
Manageon:RobotController
Or
Controllers(TreeOf)
Controller(OneOf)
SensoImageUnit
Gripper
Arm ControllerSensorController
RobotController
TMap
Robot Systemdefined as asystem ofdistributedcommunicating
CuuDuongThanCong.com https://fb.com/tailieudientucntt
165
Development Before the Fact Technology
EMap. Definitions are independent of a particular implementation — e.g.,building block definitions with a focus on objects are independent of par-ticular object-oriented implementations. Properties of classical object-ori-ented systems such as inheritance, encapsulation, polymorphism, andpersistence are supported with the use of generalized functions on OMapsand TMaps.
The DBTF approach derives from the combination of steps taken tosolve the problems of the traditional “after the fact” approach. Collectiveexperience strongly confirms that quality and productivity increase withthe increased use of DBTF properties. A major factor is the inherent reusein these systems, culminating in ultimate reuse, which is either inherent orautomation itself.
From FMaps and TMaps, any kind of system can be automatically devel-oped, resulting in complete, integrated, and production-ready target sys-tem code and documentation. This is accomplished by the 001 Tool Suite,an automation of the technology. The tool suite also has a means toobserve the behavior of a system as it is evolved and executed in terms ofOMaps and EMaps.
If asked if there were a way to develop any kind of software with:
• Seamless integration, including systems to software• Correctness by built-in language properties• No interface errors• Defect rates reduced by a factor of ten• Guarantee of function integrity after implementation• Complete traceability and evolvability (changing applications, archi-
tectures, and technologies)• Full life cycle automation• No manual coding• Maximized reuse including that which is automated or inherent• Minimum time and minimum effort• A tool suite
— all defined and automatically generated by itself, most people would saythis is impossible, at least in the foreseeable future.
This is not impossible; in fact, it is possible today with the 001 systemsdesign and software development environment (Exhibit 11-10 contains asummary that compares the traditional “after the fact” environment with aDBTF environment). Why can it do what it does? It is not magic. Simply put,it is because this environment automates and is based on the DevelopmentBefore The Fact paradigm.
CuuDuongThanCong.com https://fb.com/tailieudientucntt
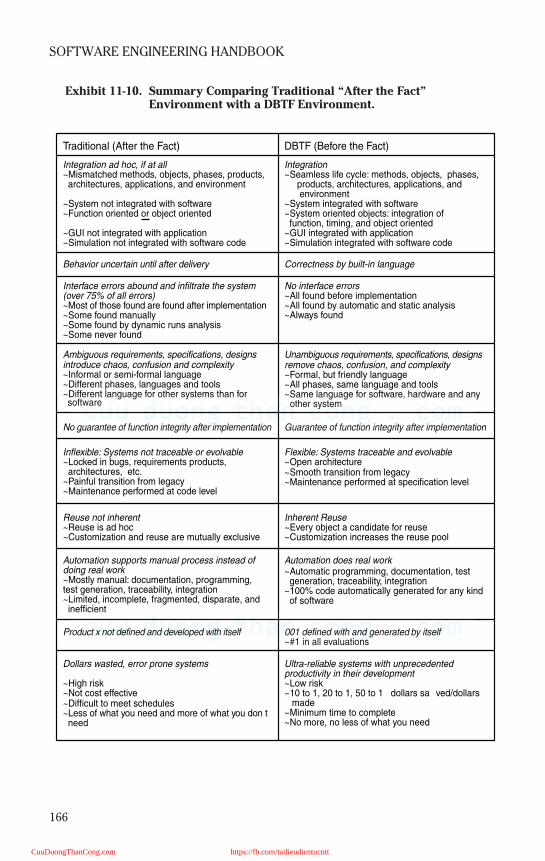
166
SOFTWARE ENGINEERING HANDBOOK
Exhibit 11-10. Summary Comparing Traditional “After the Fact” Environment with a DBTF Environment.
Traditional (After the Fact)
Behavior uncertain until after delivery
Interface errors abound and infiltrate the system(over 75% of all errors)~Most of those found are found after implementation~Some found manually~Some found by dynamic runs analysis~Some never found
Ambiguous requirements, specifications, designsintroduce chaos, confusion and complexity~Informal or semi-formal language~Different phases, languages and tools~Different language for other systems than for
No guarantee of function integrity after implementation
Inflexible: Systems not traceable or evolvable~Locked in bugs, requirements products, architectures, etc.~Painful transition from legacy~Maintenance performed at code level
Reuse not inherent~Reuse is ad hoc~Customization and reuse are mutually exclusive
Automation supports manual process instead ofdoing real work~Mostly manual: documentation, programming,test generation, traceability, integration~Limited, incomplete, fragmented, disparate, and inefficient
Product x not defined and developed with itself
Dollars wasted, error prone systems
~High risk~Not cost effective~Difficult to meet schedules~Less of what you need and more of what you don t need
Integration ad hoc, if at all~Mismatched methods, objects, phases, products, architectures, applications, and environment
~System not integrated with software~Function oriented or object oriented
~GUI not integrated with application~Simulation not integrated with software code
DBTF (Before the Fact)
Correctness by built-in language
No interface errors~All found before implementation~All found by automatic and static analysis~Always found
Unambiguous requirements, specifications, designsremove chaos, confusion, and complexity~Formal, but friendly language~All phases, same language and tools~Same language for software, hardware and any
Guarantee of function integrity after implementation
Flexible: Systems traceable and evolvable~Open architecture~Smooth transition from legacy~Maintenance performed at specification level
Inherent Reuse~Every object a candidate for reuse~Customization increases the reuse pool
Automation does real work~Automatic programming, documentation, test generation, traceability, integration~100% code automatically generated for any kind of software
001 defined with and generated by itself~#1 in all evaluations
Ultra-reliable systems with unprecedentedproductivity in their development~Low risk~10 to 1, 20 to 1, 50 to 1 dollars sa ved/dollars made~Minimum time to complete~No more, no less of what you need
Integration~Seamless life cycle: methods, objects, phases, products, architectures, applications, and environment~System integrated with software~System oriented objects: integration of function, timing, and object oriented~GUI integrated with application~Simulation integrated with software code
software other system
CuuDuongThanCong.com https://fb.com/tailieudientucntt

167
Development Before the Fact Technology
Note:
001, 001 Tool Suite, DBTF, Development Before the Fact, FunctionMap, FMap, TypeMap, TMap,ObjectMap, OMap, RoadMap, RMap, ExecutionMap, EMap, RAT, System Oriented Object,SOO, 001AXES, are all trademarks of Hamilton Technologies, Inc.
Selected Bibliography
Hamilton, M. (1986). Zero-defect software: the elusive goal, IEEE Spectrum, 23, 48–531986.
Hamilton, M. and Hackler, R. (1990). 001: a rapid development approach for rapid prototypingbased on a system that supports its own life cycle, IEEE Proc.1st Int. Workshop Rapid Sys. Pro-totyping, Research Triangle Park, NC, June 4, 1990.
Hamilton, M. and Hackler, W.R. (in press). System Oriented Objects: Development Before theFact
Hamilton, M. and Hackler, W.R. (2000). Towards cost effective and timely end-to-end testing,HTI, prepared for Army Research Laboratory, Contract No. DAKF11-99-P-1236.
Hamilton, M. (1994). Inside Development Before the Fact, Electron. Design, 31.
Hamilton, M. (1994). Development Before the Fact in action, Electron. Design, (ESSoftware En-gineering Tools Experiment-Final Report, Vol. 1, Experiment Summary, Table 1, p. 9, Depart-ment of Defense, Strategic Defense Initiative, Washington, D.C.)
Hornstein, R. and Hamilton, M. (in preparation). Realizing the potential for COTS utilization:creating and assembling reusable components right the first time, NASA, Washington, D.C.,Hamilton Technologies, Inc., Cambridge, MA.
Krut, Jr., B. (1993). Integrating 001 tool support in the feature-oriented domain analysis meth-odology (CMU/SEI-93-TR-11, ESC-TR-93-188), Pittsburgh, Software Engineering Institute, Carn-egie Mellon University.
Ouyang, M. and Golay, M.W. (1994). An integrated formal approach for developing high qualitysoftware of safety-critical systems, Massachusetts Institute of Technology, Cambridge, MA,Report No. MIT-ANP-TR-035.
001 Tool Suite. Hamilton Technologies, Inc. Version 3.3.1 (1986-2002) [www. htius.com]
CuuDuongThanCong.com https://fb.com/tailieudientucntt

This page intentionally left blank
CuuDuongThanCong.com https://fb.com/tailieudientucntt
169
Chapter 12
The Design Specification
The process of information systems development must pass through anumber of distinct phases in order to be successful. This process is com-monly known as the systems development life cycle (SDLC) and the designspecification is an essential and integral component of it. Design specifica-tions are blueprints showing what to build and how to build it.
THE PROCESS
By the time the systems designer comes to the design phase of thesystem life cycle, he or she has a pretty clear understanding of what thenew system should do and why. This information is recorded in severaldocuments:
• The feasibility study discusses the pros, cons, and costs of buildingthe system (see Appendix C).
• The project plan provides preliminary information about the project,its mission and goals, its schedule, and its cost estimate (see Appen-dix F).
• The system requirements specification (SRS) contains detailed infor-mation about the requirements of the system (see Appendix G).
In spite of this detailed documentation, there may still be some uncer-tainty regarding future capabilities of the new system due to the differentand changing perspectives of the end users and other stakeholders. Differ-ent people will see different possibilities for the new system, which is whya push to propose alternative solutions may take place. The designer mustthen consider the different views, covering all structured requirements,and transform them into several competing design strategies. Only onedesign will eventually be pursued.
THE DETAILS OF DESIGN
A variety of models were used in the analysis phase to help create ahigh-level process model. These tools, which include data flow diagrams(Exhibit 12-1), entity relationship diagrams (Exhibit 12-2), and state transition
CuuDuongThanCong.com https://fb.com/tailieudientucntt
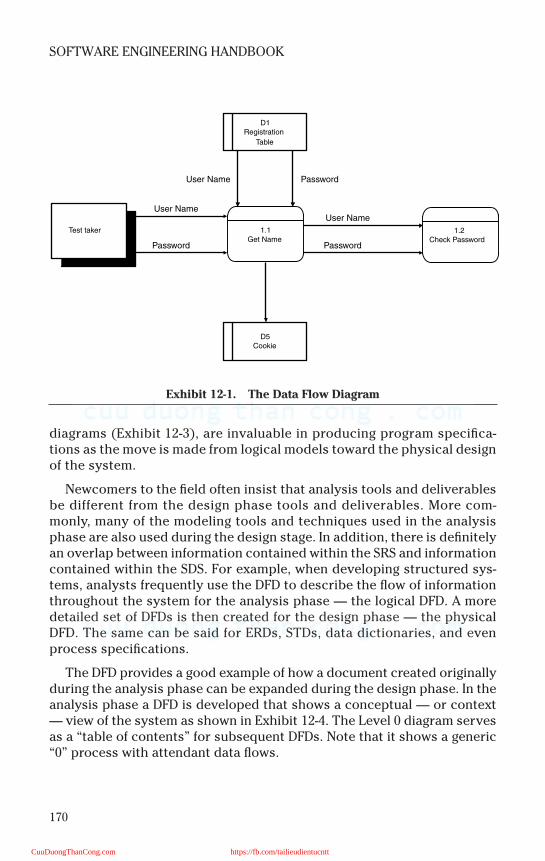
170
SOFTWARE ENGINEERING HANDBOOK
diagrams (Exhibit 12-3), are invaluable in producing program specifica-tions as the move is made from logical models toward the physical designof the system.
Newcomers to the field often insist that analysis tools and deliverablesbe different from the design phase tools and deliverables. More com-monly, many of the modeling tools and techniques used in the analysisphase are also used during the design stage. In addition, there is definitelyan overlap between information contained within the SRS and informationcontained within the SDS. For example, when developing structured sys-tems, analysts frequently use the DFD to describe the flow of informationthroughout the system for the analysis phase — the logical DFD. A moredetailed set of DFDs is then created for the design phase — the physicalDFD. The same can be said for ERDs, STDs, data dictionaries, and evenprocess specifications.
The DFD provides a good example of how a document created originallyduring the analysis phase can be expanded during the design phase. In theanalysis phase a DFD is developed that shows a conceptual — or context— view of the system as shown in Exhibit 12-4. The Level 0 diagram servesas a “table of contents” for subsequent DFDs. Note that it shows a generic“0” process with attendant data flows.
Exhibit 12-1. The Data Flow Diagram
Test taker
D1Registration
Table
D5Cookie
Password
Password Password
User NameUser Name
User Name
1.2Check Password
1.1Get Name
CuuDuongThanCong.com https://fb.com/tailieudientucntt

171
The Design Specification
Exhibit 12-2. An ERD
CuuDuongThanCong.com https://fb.com/tailieudientucntt

172
SOFTWARE ENGINEERING HANDBOOK
When drawing a DFD, a top–down approach is the most effective. Stepsinclude (Kendall, 2002):
1. Develop a list of typical business activities and use it to determineexternal entities, data flows, processes, and data stores.
2. Draw a context diagram that depicts external entities and data flowsto and from the system. The context diagram should be abstract —i.e., do not show any detailed processes or data flows.
3. Now draw diagram 0, which can be likened to a table of contents. Di-agram 0 is the next level of detail when using a top–down approach.As we move down the hierarchy, we move from abstract and less de-tailed to more detailed and more concrete.
4. Create a child diagram for each process depicted in diagram 0.5. Check for any errors and make sure the labels assigned to processes
and data flows are logical and meaningful.6. Now develop a physical data flow diagram from the logical data flow
diagram.7. Partition the physical data flow by separating the parts of the dia-
gram to facilitate programming and implementation.
Exhibit 12-3. A STD
Displaying
Initial Page
Processing
Login
Processing
QueriesModifying
Database
User Selected Action
(Modify)
Invoke Modify Database
Modification Complete
Invoke Read Request
Reading User
Request
User Selected Action
(Query)
Invoke Process Query
Login Successful
Invoke Read Request
Login Failed
Invoke Initial Page
Login Initiated
Invoke Login Process
User Selected Action
(Exit)
Invoke Initial Page
Report Complete
Invoke Read Request
User Selected Action
(Reports)
Invoke Generate Report
Processing
Matches
Query Complete
Invoke Process Matches
Matches Complete
Invoke Read Request
Generating
Report
CuuDuongThanCong.com https://fb.com/tailieudientucntt
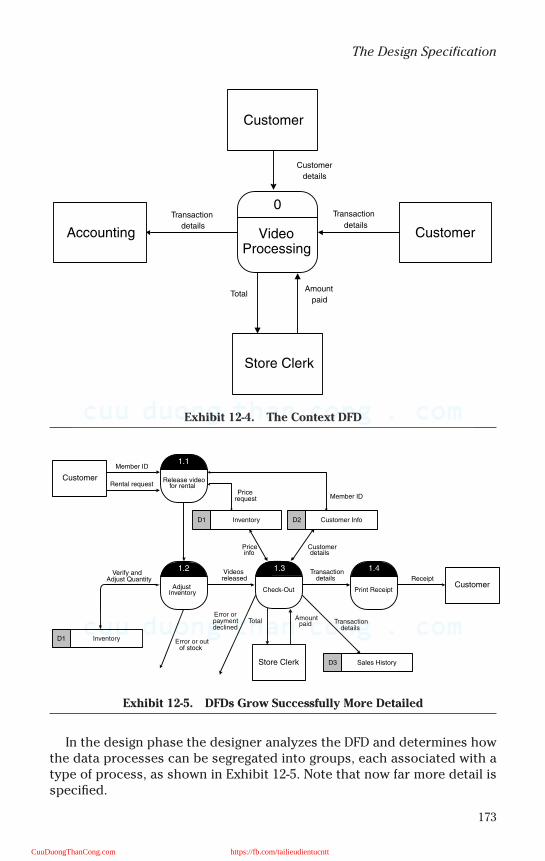
173
The Design Specification
In the design phase the designer analyzes the DFD and determines howthe data processes can be segregated into groups, each associated with atype of process, as shown in Exhibit 12-5. Note that now far more detail isspecified.
Exhibit 12-4. The Context DFD
Exhibit 12-5. DFDs Grow Successfully More Detailed
0
Customer
Store Clerk
Customer
details
TotalAmount
paid
Transaction
details
Transaction
details
VideoProcessing
Customer
Accounting
Customer Release videofor rental
Member ID
Rental request
AdjustInventory
1.3
Check-Out
1.4
Print ReceiptCustomer
InventoryD1
Customer InfoD2
Sales HistoryD3
InventoryD1
Store Clerk
Verify andAdjust Quantity
Error or outof stock
Pricerequest Member ID
Priceinfo
Customerdetails
Total Amountpaid Transaction
details
Transactiondetails
Error orpaymentdeclined
ReceiptVideosreleased
1.1
1.2
CuuDuongThanCong.com https://fb.com/tailieudientucntt

174
SOFTWARE ENGINEERING HANDBOOK
Key functions of each group are determined and these functions arethen broken down (i.e., decomposed) in order to obtain cohesive modules.Each module is then specified separately (i.e., the process specification orPSPEC), as shown in Exhibit 12-6, to ensure that data collections arerecorded, and that data produced by the modules corresponds to the datapassed between processes in the data flow diagrams.
DFDs are very flexible and are used during the analysis and designphases. As discussed, you may draw logical or physical DFDs. The logicalset of DFDs diagrams how a business operates and details its businessactivities. Logical DFDs show collections of data but not the detail of howthat data is stored or where it is stored. On the other hand, a physical setof DFDs tries to diagram exactly how the system will or does operate. Phys-ical DFDs show programs, databases, and other information necessary forthe implementation of a particular system.
Designers must obtain a deep appreciation of the system and its func-tions because the production of a modular structural chart is not amechanical task (Curtis et al., 2000).
Exhibit 12-6. The Process Specification
Process #1
Name: (LOGON)
Number: 1
Name: Logon
Description: registered test takers will log on to their accounts with their user names and passwords through this process. They do not need to register again. Once they log on, they enter their test subject and then they can take the test.
Input data: user name from the test taker, password from the test taker, user name from the registration table, password from the registration table
Output data: user name to the cookie
Type of process: manual check
Process logic:
Get user name and password from the user
if correct then
Allow the user to take the test
else
produce an error
endif
CuuDuongThanCong.com https://fb.com/tailieudientucntt
175
The Design Specification
LOGICAL AND PHYSICAL DESIGN
Design consists of two discrete steps: logical design and physicaldesign. To understand the components of each it is necessary to discusslogical and physical analysis.
Logical and physical analysis
The physical analysis phase requires the systems analyst to determinethe specifics of the existing processes that the system will automate,whether these processes are currently part of a technology system or arecompletely manual. Physical analysis involves the process of determining,in specific detail, exactly who does what and when he or she does it in theprocess or problem being solved (Curtis et al., 2000). This analysis showswhat is really going on in the system, and helps the systems analyst putsome structure around the new system’s requirements.
Physical analysis occurs after the initial round of interviews with stake-holders and end users. At this point in the process, the systems analyst islikely to have an unwieldy batch of interview notes, details of observa-tions, questionnaire responses, and sundry documents (Curtis et al.,2000). This information provides the basis for building a methodicaldescription of the existing manual system. Building this description is thefoundation of physical analysis. This work is considered physical analysisbecause the ultimate result of this work is a very nuts-and-bolts descrip-tion of the actual (manual) steps and processes comprising the system,with little to no logical abstraction.
A primary vehicle for accomplishing the physical analysis phase is themanual system flowchart. This chart is very much like the process flow-charts that many people are familiar with, with some minor changes. Thechart is structured in such a way that it is apparent which department,organization, or person owns each task, as shown in Exhibit 12-7.
As you can see, this is a very detailed and physically oriented diagram,showing the passage of documents and data through very specific check-points. This provides the data presentation required in order to gain therequired level of understanding of the system as it exists, but you could notdevelop a system from this picture; a logical diagram is required for that.
The logical analysis phase is focused on abstracting the details uncov-ered during physical analysis out to a level of logical representation, whichwill allow them to be manipulated. Logical analysis produces the ultimateresult of the systems analysis process: the decomposition of the functionsof the system into their logical constituents and the production of a logicalmodel of the processes and data flows (Curtis et al., 2000).
CuuDuongThanCong.com https://fb.com/tailieudientucntt

176
SOFTWARE ENGINEERING HANDBOOK
As the systems analyst and end user work through the flowcharts pro-duced from the physical analysis and the preliminary logical model basedupon it, the goal should be to jointly produce a detailed written descriptionof all activities within the end user’s purview that fall within the scope ofthe system (Bloor and Butler, 1989). The systems analyst and the end usermust agree that this list is complete and precise. The entries in the listshould be mutually exclusive and the list must be comprehensivelyexhaustive. Combined with the manual system flowcharts and logical dia-grams, this list will serve as basic system requirements. Ultimately a
Exhibit 12-7. Task Analysis Flowchart
Skills Tracking
Consultant Manager Analyst
ApprovedProfile
ApprovedProfile
Skill Profile Skill Profile
Skill Profile
Skill Profile
Rejected Profile
Completed Report
Add to OverallSkills
ExamineProfile &Approve
orReject
CuuDuongThanCong.com https://fb.com/tailieudientucntt

177
The Design Specification
detailed system requirements specification will be created (see AppendixG). With these documents in hand, the design phase can begin.
The analysis phase was broken down into two components: physicalanalysis and logical analysis. The design phase is also broken down intotwo components, although in the design phase logical design precedesphysical design.
Logical Design
The logical analysis and logical design phases are very similar and over-lapping. Martin Butler and Robin Bloor stress that, in the logical phase, wecreate a model of the application area that matches the events occurringwithin the intended system. As these events are identified, each must beexamined to determine specific criteria for it (Bloor and Butler, 1989):
• What initiates the event?• What is changed by the event?• What subsequent events are triggered by the event?• What error conditions can arise?
These descriptions are crucial inputs for the physical design phasebecause they will allow us to derive the required objects and methods. It isthis process that is likely the most important aspect of systems design; allof the blueprints for future code are based upon this logical model.
The tools of the logical paradigm are somewhat different from those ofphysical analysis discussed previously. Physical analysis tools, such asmanual system flowcharts, are very concerned with the specific steps anddecision points inherent in moving through the system. The logical analy-sis and design tools are more focused on definition of individual compo-nents of the system and the ways these components interact. The tools ofchoice for the logical phase of the systems development process are thedata-flow diagram (DFD) and the entity-relationship diagram when usingthe traditional, structured paradigm.
At this stage of the process, with the logical design of the system com-plete, all that remains to complete the design is to define the physicaldesign of the software.
Physical Design
The physical design is the blueprint for actual development of the soft-ware and deployment of the system. The physical phase is concerned withmatching the logical model to the hardware and software at our disposal.Thus, we are transforming a logical model into a workable model that canbe implemented (Bloor and Butler, 1989). Unlike the logical phases thatimmediately precede this work, the physical design phase is focused onspecific implementation of the system. The logical design was built on the
CuuDuongThanCong.com https://fb.com/tailieudientucntt
178
SOFTWARE ENGINEERING HANDBOOK
requirements defined during the physical and logical analysis phases. Thisfact allows the designer to build a physical design that implements the log-ical design without worrying about meeting the functional requirements ofthe end users; if the logical design is implemented, these requirements willbe fulfilled.
The physical design phase is also where some specific implementationdecisions must be made. Many, if not most, automated systems today usethird-party software for pieces of the solution. Database software, Javaapplication server software, and object messaging software are someexamples of the kinds of third-party components that are often required.The logical design need not be concerned with the specific vendor choice,only with a requirement for one, because the logical design is intended tobe abstracted away from the specific details of the implementation. Thephysical design, however, must answer these questions (Curtis et al.,2000). This fact illustrates the true distinction between the logical andphysical design phases: the logical design is focused on what the systemwill do and the physical design is focused on how the system will do it.
THE SYSTEMS SPECIFICATION
The detailed design that has been achieved at this point in the processresults in a systems specification. No agreed-on standard format for thisspecification exists and some insist that writing a design spec is more of anart form than a scientific process. Most IT professionals have sought a“cookie-cutter” explanation of how to write a good design spec, but onesimply does not exist. Curtis et al. (2000) give a good basic outline of whata design specification should include:
• An executive summary in order to provide a quick summary of the ma-jor points in the specification
• A description of the proposed system and its objectives (may also in-clude flow block diagrams and data flow diagrams may be used)
• A description of all programs to include module specifications andstructure charts, together with test data
• A description of all input to include specimen source documents,screen layouts, menu structures, and control procedures
• A description of all output to include specimen output reports andcontents of listings.
• A description of all data storage to include specification of file and da-tabase structure
• A detailed specification of controls operating over procedures withinthe system
• A specification of all hardware requirements and performance charac-teristics to be satisfied
CuuDuongThanCong.com https://fb.com/tailieudientucntt
179
The Design Specification
• A specification of clerical procedures and responsibilities surround-ing the system
• A detailed schedule for the implementation of the system• Cost estimates and constraints
Appleton (1997) states that the design specification should meet the fol-lowing criteria:
• It should adequately serve as training material for new project mem-bers so that they are able to understand what is said in design meet-ings.
• It should serve as “objective evidence” that the designers are follow-ing through on their commitment to implement the functionality de-scribed in the requirements spec.
• It needs to be as detailed as possible, while at the same time not im-posing too much of a burden on the designers.
A SYSTEM SPEC WALKTHROUGH
Appendix J is a complete SDS for a working student-created system:
• Section 1 provides an overview of the system, its mission and goals,and any other supporting documentation deemed necessary by thesupport team. Much of this can be copied from the SRS (Appendix G),project plan (Appendix F), and feasibility study (Appendix C).
• Section 2 provides a list of design considerations that includes: as-sumptions, dependencies, frequency of use, database requirements,memory, and hardware and software constraints, as well as a descrip-tion of the system environment — i.e., user interfaces, software inter-faces, and communications interfaces. Section 2 also discussespolicies and procedures, design methodology, and system risks.
• Section 3 specifies the architecture of the system. (Appendix I)• Section 4 provides a high-level design spec of the system. A detailed
set of DFDs can be found in this section.• Section 5, the low-level design, provides a complete set of PSPECs as
well as a data dictionary (Appendix K).• Section 6 is reserved for a list of business-use cases as well as a series
of screen shots showing the design of the user interface. (Appendix E).
CONCLUSION
Davis (2002) makes an important point when he states that without acomplete, unambiguous design specification document, one could be set-ting oneself up for “costly” rewrites. Therefore it is important to recognizethat the systems specification is used as (Curtis et al., 2000):
• The exit criterion from the stage of detailed design prior to the stageof implementation
CuuDuongThanCong.com https://fb.com/tailieudientucntt
180
SOFTWARE ENGINEERING HANDBOOK
• A source documentation from which programs are written and hard-ware “tenders” are brought about
• A historical reference of the system for future users and developers• A comparative document during the assessment phase once the sys-
tem is being used
An analyst who refers to the basic outline of design specification thatconsiders everything from goals and objectives, to subsystems descrip-tion, to potential project issues, should be able to develop a spec docu-ment that is understood by developers and at least somewhat by custom-ers. These specifications should also help in avoiding errors and expensiverewrites.
A functional design specification is like a pyramid. The top reflects abroad overview that describes the wide spectrum of the system and itscomponents. At each level below the overview, one has an overview ofeach of the primary components and as much detail as one’s developersrequire (Davis, 2002).
References
Bloor, R. and Butler, M. (1989a). Object orientation…let’s get physical, DEC User, December,42.
Curtis, G., Hoffer, J.A., George, J.F., and Valacich, J. (2000). Introduction to Business SystemsAnalysis, Pearson Custom Publishing, Boston.
Davis, J. (2002). Design specifications: how much detail is enough? Available: http://build-er.com.com/article.jhtml?id = r00120020206jed03.htm&src = search:.
Harrington, J.L. (1998). Relational Database Design Clearly Explained, Morgan Kaufmann, SanDiego.
Kendall, K.E. and Kendall, J.E. (2002). Systems Analysis and Design, Prentice Hall, New York.
CuuDuongThanCong.com https://fb.com/tailieudientucntt
181
Chapter 13
Object-Oriented Design
Current code is a liability, not an asset. The challenge is to develop newcode that is truly an asset. This challenge was issued by Vaughan Merlyn,one of the luminaries of our industry. It is one that bottom-line-conscioussoftware engineering managers are now taking seriously. To meet this chal-lenge, developers will need to do more than just tweak some code and livenup user interfaces. They will need to dramatically alter the way in whichthey code.
WHAT IS OO?
Object orientation (OO), which views the abstractions manipulated bycomputer software as counterparts to real-world objects, has promiseddevelopers a brave new world. Object-oriented development emerged asthe dominant software development methodology of the 1990s. Not sur-prisingly, many organizations are jumping on the OO bandwagon.
The concept of an object is the fundamental building block on which theobject-oriented paradigm rests. Four pivotal concepts are behind objectorientation: encapsulation, message passing, dynamic binding, and inher-itance. To the extent that a tool or language incorporates these concepts,it becomes qualified as an object-oriented tool kit.
We can explain these concepts using a simple letter as an analogy. Sup-pose a user wrote an e-mail letter to a colleague in another department.The letter is an object that has many properties in common with other let-ters: it contains information and has associated procedures that allow theuser to manipulate it (read, write, and send). These properties, whengrouped together, constitute the concept of the letter object. This processof combining data and functions all in one object is encapsulation.
Now suppose the e-mail system only allows users to write letters inEnglish, but the company just hired an employee who speaks only Japa-nese. The company now needs the facility to create and manipulate Japa-nese letters. This is done by putting letter objects in discrete categories,referred to as classes.
CuuDuongThanCong.com https://fb.com/tailieudientucntt

182
SOFTWARE ENGINEERING HANDBOOK
A class is a collection of objects that share the same functionality andcharacteristics (procedures and data). In this example, two classes are cre-ated: an English letter class and a Japanese letter class. Both classes havemany functions and characteristics in common. By identifying those thingsheld in common we can create a super or parent class. Thus, the Englishletter and the Japanese letter become subclasses with each pinpointinghow it differs from its parent and siblings.
The English and Japanese letter subclasses inherit the functionality of“reading, writing, and sending” from the parent object. However, the Japa-nese subclass is different in that it has the extra characteristic of translat-ing text into the Japanese language, and the English subclass is different inthat it translates into English. This is the meat behind the OO concept ofinheritance.
The letter object permits the user to request certain tasks or services,such as “read a letter,” “write a letter,” or “send a letter.” This is commonlycalled “sending a message to an object” — or to use OO parlance, messagepassing.
Sending a message is not quite the same as issuing a function call, a pro-cess familiar to most developers. Different objects can respond to the samemessage in different ways. For example, as just discussed, the “read” mes-sage is handled one way by the English object and another way by the Jap-anese object. In fact, the OO term “polymorphism” is used to describe theability to send general-purpose messages to objects that will then handlethem appropriately. The objects handle the specific details.
In sending these messages, the user never needs to specify the type ofobject with which he or she is dealing. OO systems utilize what is known asdynamic binding to determine the object type at run time when the code isexecuted.
The benefits of OO can be summed up as: quality, productivity, predict-ability, and control of complexity.
OO FROM THE BOTTOM UP
If we build object-oriented systems, we need tools that support the build-ing of these applications. Developers building today’s applications areessentially using the traditional, structured process methodologies devel-oped by experts like Ed Yourdon, Tom DeMarco, and Chris Gane and TrishSarson, as well as the data modeling methodology pioneered by Peter Chen.
Currently, information engineering techniques pivot around data and itsrelationships as documented in data-flow diagrams (Exhibit 13-1) andentity-relationship diagrams (Exhibit 13-2). Structured analysis is notbased on objects, however.
CuuDuongThanCong.com https://fb.com/tailieudientucntt
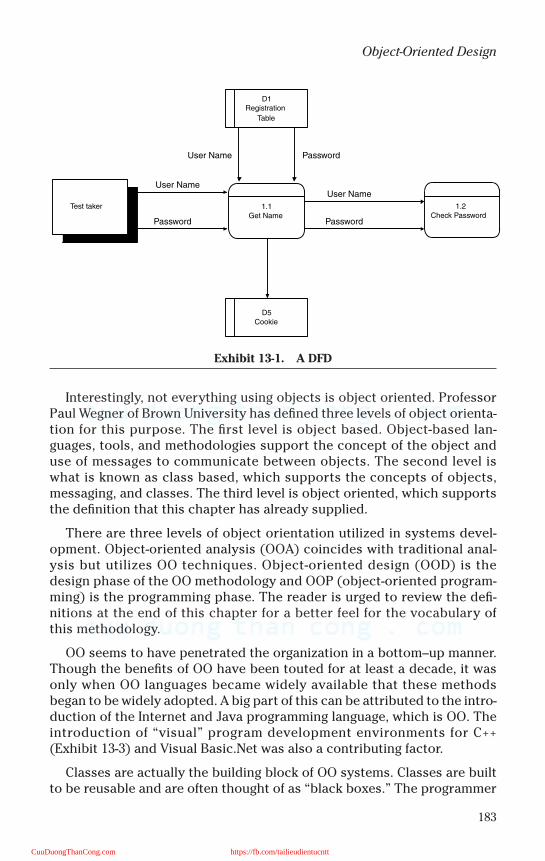
183
Object-Oriented Design
Interestingly, not everything using objects is object oriented. ProfessorPaul Wegner of Brown University has defined three levels of object orienta-tion for this purpose. The first level is object based. Object-based lan-guages, tools, and methodologies support the concept of the object anduse of messages to communicate between objects. The second level iswhat is known as class based, which supports the concepts of objects,messaging, and classes. The third level is object oriented, which supportsthe definition that this chapter has already supplied.
There are three levels of object orientation utilized in systems devel-opment. Object-oriented analysis (OOA) coincides with traditional anal-ysis but utilizes OO techniques. Object-oriented design (OOD) is thedesign phase of the OO methodology and OOP (object-oriented program-ming) is the programming phase. The reader is urged to review the defi-nitions at the end of this chapter for a better feel for the vocabulary ofthis methodology.
OO seems to have penetrated the organization in a bottom–up manner.Though the benefits of OO have been touted for at least a decade, it wasonly when OO languages became widely available that these methodsbegan to be widely adopted. A big part of this can be attributed to the intro-duction of the Internet and Java programming language, which is OO. Theintroduction of “visual” program development environments for C++(Exhibit 13-3) and Visual Basic.Net was also a contributing factor.
Classes are actually the building block of OO systems. Classes are builtto be reusable and are often thought of as “black boxes.” The programmer
Exhibit 13-1. A DFD
Test taker
D1Registration
Table
D5Cookie
Password
Password Password
User NameUser Name
User Name
1.1Get Name
1.2Check Password
CuuDuongThanCong.com https://fb.com/tailieudientucntt
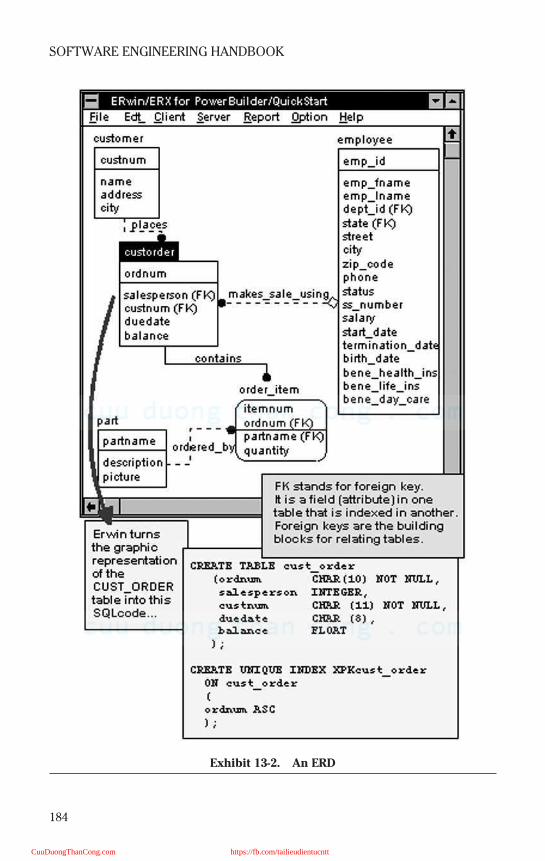
184
SOFTWARE ENGINEERING HANDBOOK
Exhibit 13-2. An ERD
CuuDuongThanCong.com https://fb.com/tailieudientucntt
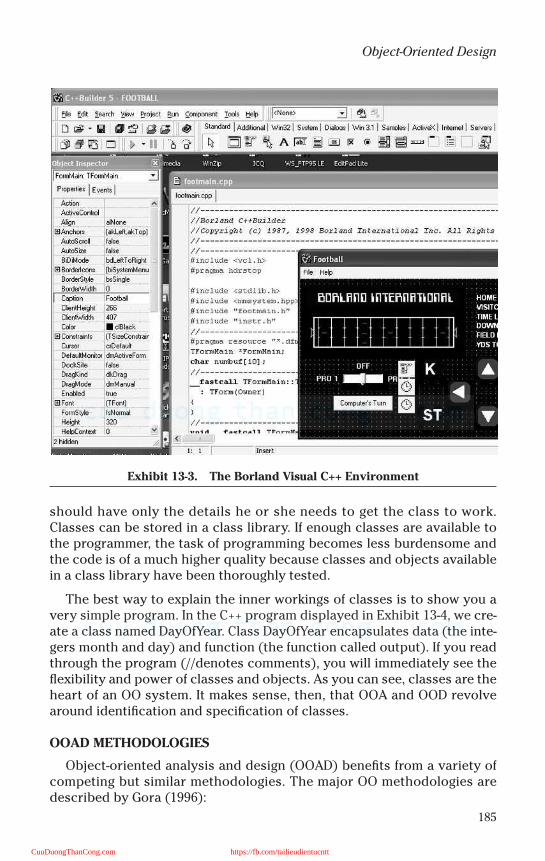
185
Object-Oriented Design
should have only the details he or she needs to get the class to work.Classes can be stored in a class library. If enough classes are available tothe programmer, the task of programming becomes less burdensome andthe code is of a much higher quality because classes and objects availablein a class library have been thoroughly tested.
The best way to explain the inner workings of classes is to show you avery simple program. In the C++ program displayed in Exhibit 13-4, we cre-ate a class named DayOfYear. Class DayOfYear encapsulates data (the inte-gers month and day) and function (the function called output). If you readthrough the program (//denotes comments), you will immediately see theflexibility and power of classes and objects. As you can see, classes are theheart of an OO system. It makes sense, then, that OOA and OOD revolvearound identification and specification of classes.
OOAD METHODOLOGIES
Object-oriented analysis and design (OOAD) benefits from a variety ofcompeting but similar methodologies. The major OO methodologies aredescribed by Gora (1996):
Exhibit 13-3. The Borland Visual C++ Environment
CuuDuongThanCong.com https://fb.com/tailieudientucntt
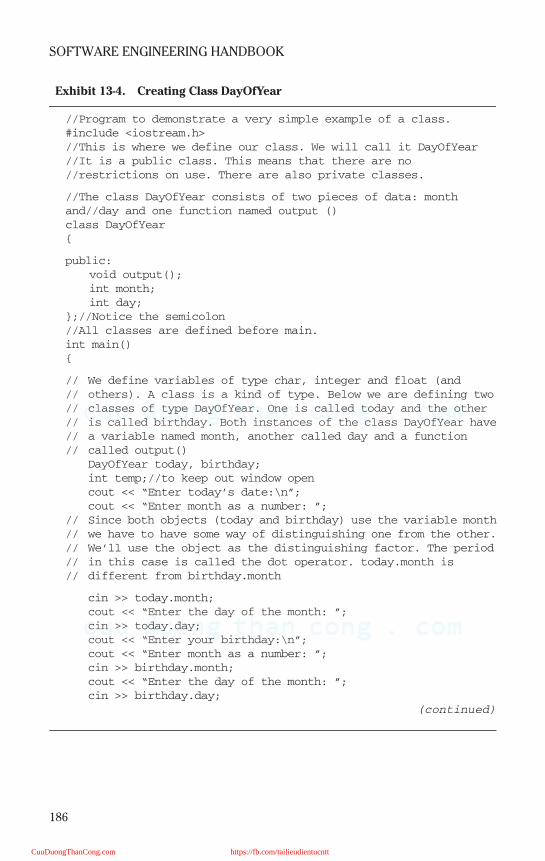
186
SOFTWARE ENGINEERING HANDBOOK
Exhibit 13-4. Creating Class DayOfYear
//Program to demonstrate a very simple example of a class.
#include <iostream.h>
//This is where we define our class. We will call it DayOfYear
//It is a public class. This means that there are no
//restrictions on use. There are also private classes.
//The class DayOfYear consists of two pieces of data: month
and//day and one function named output ()
class DayOfYear
public:
void output();
int month;
int day;
;//Notice the semicolon
//All classes are defined before main.
int main()
// We define variables of type char, integer and float (and
// others). A class is a kind of type. Below we are defining two
// classes of type DayOfYear. One is called today and the other
// is called birthday. Both instances of the class DayOfYear have
// a variable named month, another called day and a function
// called output()
DayOfYear today, birthday;
int temp;//to keep out window open
cout << “Enter today’s date:\n”;
cout << “Enter month as a number: ”;
// Since both objects (today and birthday) use the variable month
// we have to have some way of distinguishing one from the other.
// We’ll use the object as the distinguishing factor. The period
// in this case is called the dot operator. today.month is
// different from birthday.month
cin >> today.month;
cout << “Enter the day of the month: ”;
cin >> today.day;
cout << “Enter your birthday:\n”;
cout << “Enter month as a number: ”;
cin >> birthday.month;
cout << “Enter the day of the month: ”;
cin >> birthday.day;
(continued)
CuuDuongThanCong.com https://fb.com/tailieudientucntt

187
Object-Oriented Design
Booch
Grady Booch’s approach to OOAD (Object-Oriented Design with Applica-tions, Benjamin/Cummings, 1994) is one of the most popular and is sup-ported by a variety of reasonably priced tools ranging from Visio to Ratio-nal Rose.
Coad and Yourdon
Coad and Yourdon published two of the first books on OOAD (Object-Ori-ented Analysis and Object-Oriented Design, Prentice-Hall, New York, 1990and 1991, respectively). Their methodology focuses on analysis of busi-ness problems. Analysis proceeds in five stages, called SOSAS:
• Subjects: these are similar to the levels or layers in data-flow diagrams.• Objects: object classes are specified in this stage.• Structures: there are two types: classification structures and composi-
tion structures. Classification structures correspond to the inherit-ance relationship between classes. Composition structures define the
Exhibit 13-4. (continued) Creating Class DayOfYear
// Now we will call the function called output for the two
// objects: once for today and once for birthday.
// Notice — because we see nothing between the parentheses — that
// no arguments are passed to the output function
cout << “Today’s date is ”;
today.output();
cout << “Your birthday is ”;
birthday.output();
// The && means AND
if (today.month = = birthday.month
&& today.day = = birthday.day)
cout << “Happy Birthday!\n”;
else
cout << “Happy Unbirthday!\n”;
cin >> temp;
return 0;
// Here is the function output that was defined in the class
// DayOfYear. Notice the interesting way of starting this
// function. The :: is called a scope resolution operator
void DayOfYear::output()
cout << “month = ” << month
<< ,” day = ” << day << endl;
CuuDuongThanCong.com https://fb.com/tailieudientucntt

188
SOFTWARE ENGINEERING HANDBOOK
other types of relationships between classes. Methodologies deal withthese structures.
• Attributes: these are handled similarly to attributes in relational analysis.• Services: what other methodologies call methods or operations is
identified.
In design, these activities are refined into four components:
• Problem domain component: classes that deal with the problem do-main; for example, customer classes and order classes
• Human interaction component: user-interface classes such as windowclasses
• Task management component: system-management classes such as er-ror classes and security classes
• Data management component: database access method classes andthe like
Jacobson: Objectory and OOSE
Jacobson’s full OOAD methodology, Objectory, is proprietary. Hisobject-oriented software engineering (OOSE) is a simplified version ofObjectory (Object-Oriented Systems Engineering, Addison-Wesley, Reading,MA, 1992).
The major distinguishing feature in Jacobson is the use case. A use-casedefinition consists of a diagram and a description of the interactionbetween the actor and a system. An actor may be an end user or someother object in the system.
According to Jacobson, a use case is any description of a single way touse a system or application, or any class of top-level usage scenarios, thatcaptures how actors use their black-box applications. A use case is anybehaviorally related sequence of transactions that a single actor performsin a dialog with a system in order to provide some measurable value to theactor.
Use cases are used to document user requirements in terms of user dia-logs with a system. They appear first in the requirements model and arethen used to generate a domain object model with objects drawn from theentities of the business, as mentioned in the use cases. This is then con-verted into an analysis model by classifying the domain objects into threetypes: interface objects, entity objects, and control objects.
LBMS SEOO
Systems engineering OO (SEOO) is a proprietary methodology and toolkit from the U.K.-based company LBMS. The four major components of theSEOO methodology are:
CuuDuongThanCong.com https://fb.com/tailieudientucntt
189
Object-Oriented Design
• Work-breakdown structures and techniques• An object modeling methodology• GUI design techniques• Relational database linkages to provide ER modeling and 4GL-specific
features
Rumbaugh OMT
James Rumbaugh’s methodology is described in his book Object-Ori-ented Modeling and Design (Prentice-Hall, New York, 1991). Rumbaughstarts by assuming that a requirements specification exists. Analysis con-sists of building three separate models:
• The object model (OM): definition of classes, together with attributesand methods; the notation is similar to that of ER modeling with meth-ods (operations) added
• The dynamic model (DM): state transition diagrams (STDs) for eachclass, as well as global event-flow diagrams
• The functional model (FM): diagrams very similar to data-flowdiagrams
Shlaer and Mellor
Shlaer and Mellor’s work is one of the earliest examples of OO method-ology. (See Shlaer and Mellor’s books, Object-Oriented Systems Analysis:Modeling the World in Data and Object Lifecycles: Modeling the World inStates, Prentice-Hall, New York, 1988 and 1992, respectively.)
The Shlaer and Mellor methodology starts with an information modelthat describes objects, attributes, and relationships. Next, a state modeldocuments the states of objects and the transitions between them. Finally,a data-flow diagram shows the process model.
OOAD SIMPLIFIED
Organizations that have purchased an OO software tool generallyadhere to the OOAD methodology that the tool encompasses (i.e., Objec-tory, LBMS, etc.). Other organizations, however, are free to mix and matchthe “best of breed” components of a wide variety of OOAD methodologies.This section explains one such simplified approach.
1. Create the system boundary diagram. The first step in the analysisand design is the creation of a system boundary diagram. This dia-grams the domain model and its relationship with external systemsor users, as shown in Exhibit 13-5. The model structure diagram de-picts the relationship of the domain objects.
CuuDuongThanCong.com https://fb.com/tailieudientucntt
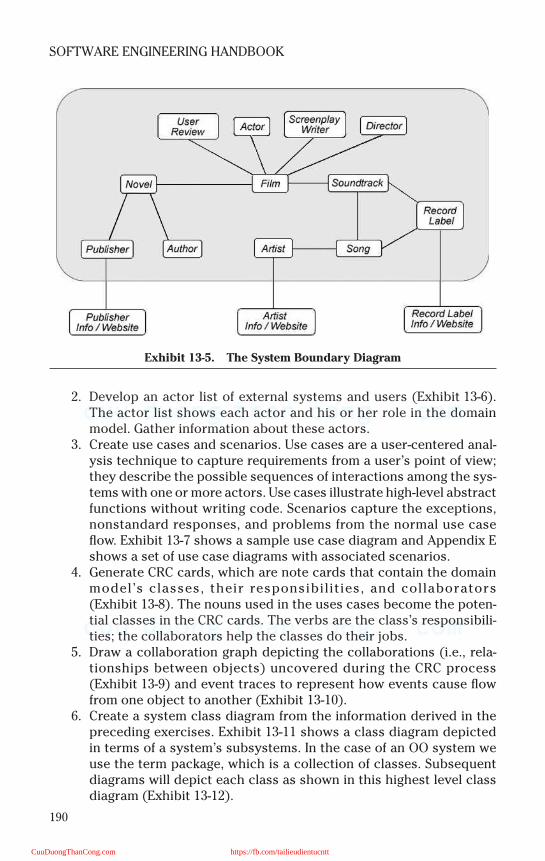
190
SOFTWARE ENGINEERING HANDBOOK
2. Develop an actor list of external systems and users (Exhibit 13-6).The actor list shows each actor and his or her role in the domainmodel. Gather information about these actors.
3. Create use cases and scenarios. Use cases are a user-centered anal-ysis technique to capture requirements from a user’s point of view;they describe the possible sequences of interactions among the sys-tems with one or more actors. Use cases illustrate high-level abstractfunctions without writing code. Scenarios capture the exceptions,nonstandard responses, and problems from the normal use caseflow. Exhibit 13-7 shows a sample use case diagram and Appendix Eshows a set of use case diagrams with associated scenarios.
4. Generate CRC cards, which are note cards that contain the domainmodel’s classes, their responsibilities, and collaborators(Exhibit 13-8). The nouns used in the uses cases become the poten-tial classes in the CRC cards. The verbs are the class’s responsibili-ties; the collaborators help the classes do their jobs.
5. Draw a collaboration graph depicting the collaborations (i.e., rela-tionships between objects) uncovered during the CRC process(Exhibit 13-9) and event traces to represent how events cause flowfrom one object to another (Exhibit 13-10).
6. Create a system class diagram from the information derived in thepreceding exercises. Exhibit 13-11 shows a class diagram depictedin terms of a system’s subsystems. In the case of an OO system weuse the term package, which is a collection of classes. Subsequentdiagrams will depict each class as shown in this highest level classdiagram (Exhibit 13-12).
Exhibit 13-5. The System Boundary Diagram
CuuDuongThanCong.com https://fb.com/tailieudientucntt
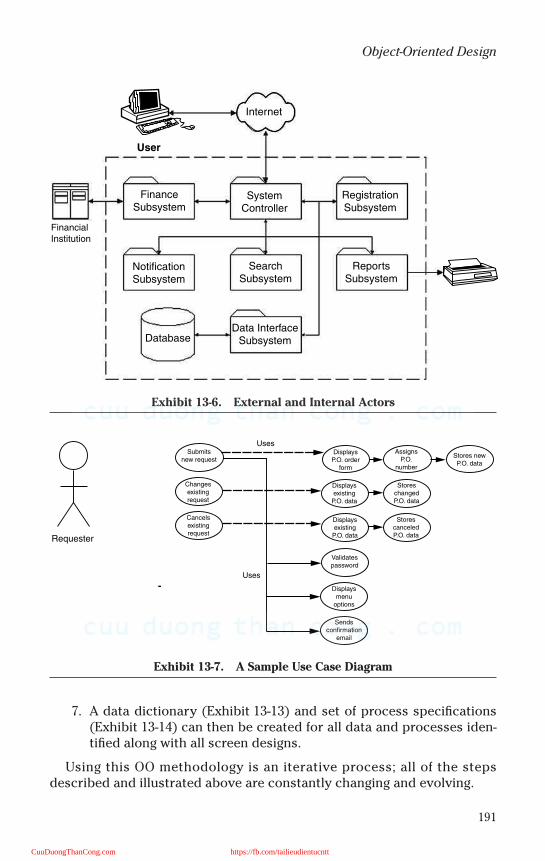
191
Object-Oriented Design
7. A data dictionary (Exhibit 13-13) and set of process specifications(Exhibit 13-14) can then be created for all data and processes iden-tified along with all screen designs.
Using this OO methodology is an iterative process; all of the stepsdescribed and illustrated above are constantly changing and evolving.
Exhibit 13-6. External and Internal Actors
Exhibit 13-7. A Sample Use Case Diagram
FinancialInstitution
User
Internet
FinanceSubsystem
NotificationSubsystem
Database
SystemController
SearchSubsystem
Data InterfaceSubsystem
ReportsSubsystem
RegistrationSubsystem
Requester
Uses
Uses
Submitsnew request
Cancelsexistingrequest
Changesexistingrequest
DisplaysP.O. order
form
Displaysexisting
P.O. data
Displaysexisting
P.O. data
Validatespassword
Displaysmenu
options
Sendsconfirmation
AssignsP.O.
number
StorescanceledP.O. data
StoreschangedP.O. data
Stores newP.O. data
CuuDuongThanCong.com https://fb.com/tailieudientucntt
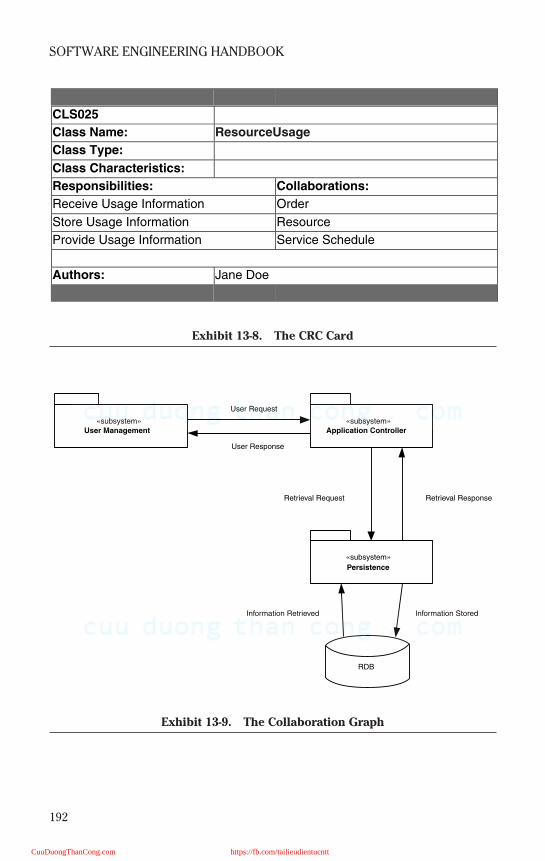
192
SOFTWARE ENGINEERING HANDBOOK
Exhibit 13-8. The CRC Card
Exhibit 13-9. The Collaboration Graph
CLS025
Class Name: ResourceUsage
Class Type:
Class Characteristics:
Responsibilities: Collaborations:
Receive Usage Information Order
Store Usage Information Resource
Provide Usage Information Service Schedule
Authors: Jane Doe
«subsystem»User Management
«subsystem»Application Controller
«subsystem»
Persistence
Information StoredInformation Retrieved
Retrieval ResponseRetrieval Request
User Request
User Response
RDB
CuuDuongThanCong.com https://fb.com/tailieudientucntt
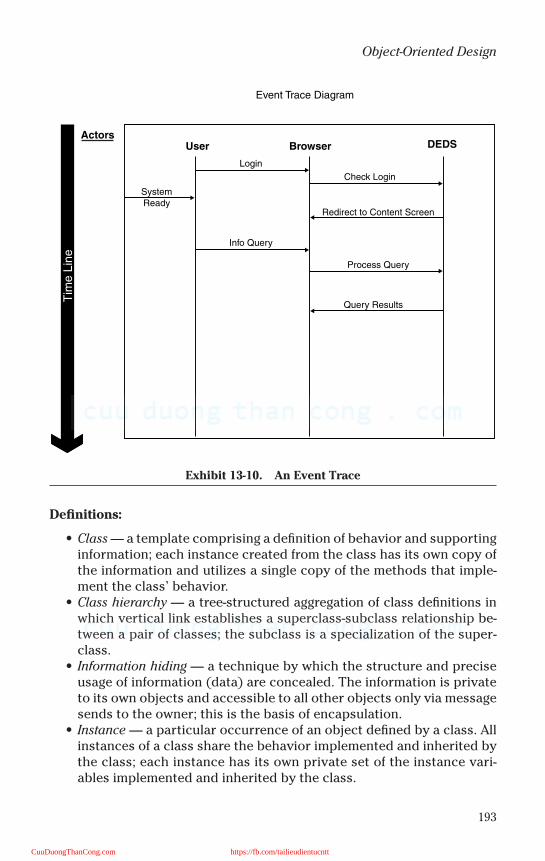
193
Object-Oriented Design
Definitions:
• Class — a template comprising a definition of behavior and supportinginformation; each instance created from the class has its own copy ofthe information and utilizes a single copy of the methods that imple-ment the class’ behavior.
• Class hierarchy — a tree-structured aggregation of class definitions inwhich vertical link establishes a superclass-subclass relationship be-tween a pair of classes; the subclass is a specialization of the super-class.
• Information hiding — a technique by which the structure and preciseusage of information (data) are concealed. The information is privateto its own objects and accessible to all other objects only via messagesends to the owner; this is the basis of encapsulation.
• Instance — a particular occurrence of an object defined by a class. Allinstances of a class share the behavior implemented and inherited bythe class; each instance has its own private set of the instance vari-ables implemented and inherited by the class.
Exhibit 13-10. An Event Trace
Actors
SystemReady
Login
Info Query
Check Login
Redirect to Content Screen
Process Query
Query Results
User Browser DEDS
Event Trace Diagram
Tim
e L
ine
CuuDuongThanCong.com https://fb.com/tailieudientucntt
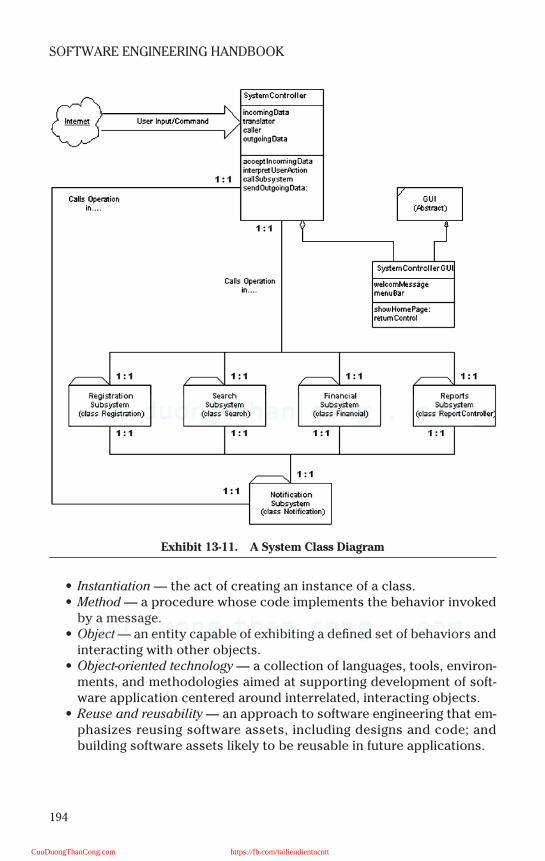
194
SOFTWARE ENGINEERING HANDBOOK
• Instantiation — the act of creating an instance of a class.• Method — a procedure whose code implements the behavior invoked
by a message.• Object — an entity capable of exhibiting a defined set of behaviors and
interacting with other objects.• Object-oriented technology — a collection of languages, tools, environ-
ments, and methodologies aimed at supporting development of soft-ware application centered around interrelated, interacting objects.
• Reuse and reusability — an approach to software engineering that em-phasizes reusing software assets, including designs and code; andbuilding software assets likely to be reusable in future applications.
Exhibit 13-11. A System Class Diagram
CuuDuongThanCong.com https://fb.com/tailieudientucntt
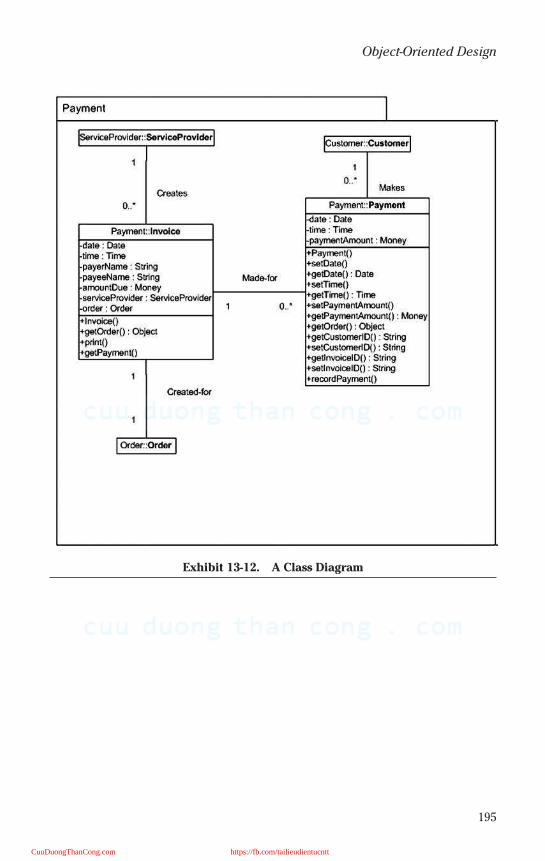
195
Object-Oriented Design
Exhibit 13-12. A Class Diagram
CuuDuongThanCong.com https://fb.com/tailieudientucntt
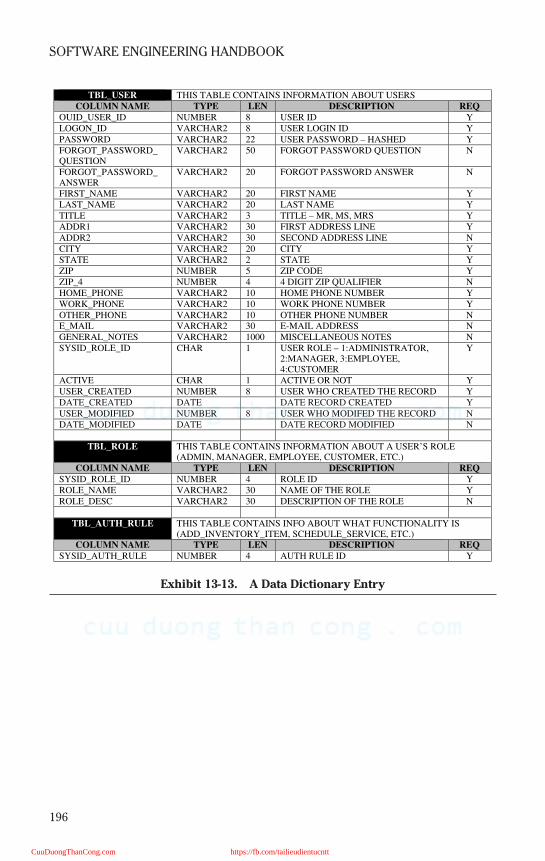
196
SOFTWARE ENGINEERING HANDBOOK
Exhibit 13-13. A Data Dictionary Entry
TBL_USER THIS TABLE CONTAINS INFORMATION ABOUT USERS
COLUMN NAME TYPE LEN DESCRIPTION REQ
OUID_USER_ID NUMBER 8 USER ID Y
LOGON_ID VARCHAR2 8 USER LOGIN ID Y
PASSWORD VARCHAR2 22 USER PASSWORD – HASHED Y
FORGOT_PASSWORD_QUESTION
VARCHAR2 50 FORGOT PASSWORD QUESTION N
FORGOT_PASSWORD_ANSWER
VARCHAR2 20 FORGOT PASSWORD ANSWER N
FIRST_NAME VARCHAR2 20 FIRST NAME Y
LAST_NAME VARCHAR2 20 LAST NAME Y
TITLE VARCHAR2 3 TITLE – MR, MS, MRS Y
ADDR1 VARCHAR2 30 FIRST ADDRESS LINE Y
ADDR2 VARCHAR2 30 SECOND ADDRESS LINE N
CITY VARCHAR2 20 CITY Y
STATE VARCHAR2 2 STATE Y
ZIP NUMBER 5 ZIP CODE Y
ZIP_4 NUMBER 4 4 DIGIT ZIP QUALIFIER N
HOME_PHONE VARCHAR2 10 HOME PHONE NUMBER Y
WORK_PHONE VARCHAR2 10 WORK PHONE NUMBER Y
OTHER_PHONE VARCHAR2 10 OTHER PHONE NUMBER N
E_MAIL VARCHAR2 30 E-MAIL ADDRESS N
GENERAL_NOTES VARCHAR2 1000 MISCELLANEOUS NOTES N
SYSID_ROLE_ID CHAR 1 USER ROLE – 1:ADMINISTRATOR,2:MANAGER, 3:EMPLOYEE,4:CUSTOMER
Y
ACTIVE CHAR 1 ACTIVE OR NOT Y
USER_CREATED NUMBER 8 USER WHO CREATED THE RECORD Y
DATE_CREATED DATE DATE RECORD CREATED Y
USER_MODIFIED NUMBER 8 USER WHO MODIFED THE RECORD N
DATE_MODIFIED DATE DATE RECORD MODIFIED N
TBL_ROLE THIS TABLE CONTAINS INFORMATION ABOUT A USER’S ROLE(ADMIN, MANAGER, EMPLOYEE, CUSTOMER, ETC.)
COLUMN NAME TYPE LEN DESCRIPTION REQ
SYSID_ROLE_ID NUMBER 4 ROLE ID Y
ROLE_NAME VARCHAR2 30 NAME OF THE ROLE Y
ROLE_DESC VARCHAR2 30 DESCRIPTION OF THE ROLE N
TBL_AUTH_RULE THIS TABLE CONTAINS INFO ABOUT WHAT FUNCTIONALITY IS(ADD_INVENTORY_ITEM, SCHEDULE_SERVICE, ETC.)
COLUMN NAME TYPE LEN DESCRIPTION REQ
SYSID_AUTH_RULE NUMBER 4 AUTH RULE ID Y
CuuDuongThanCong.com https://fb.com/tailieudientucntt
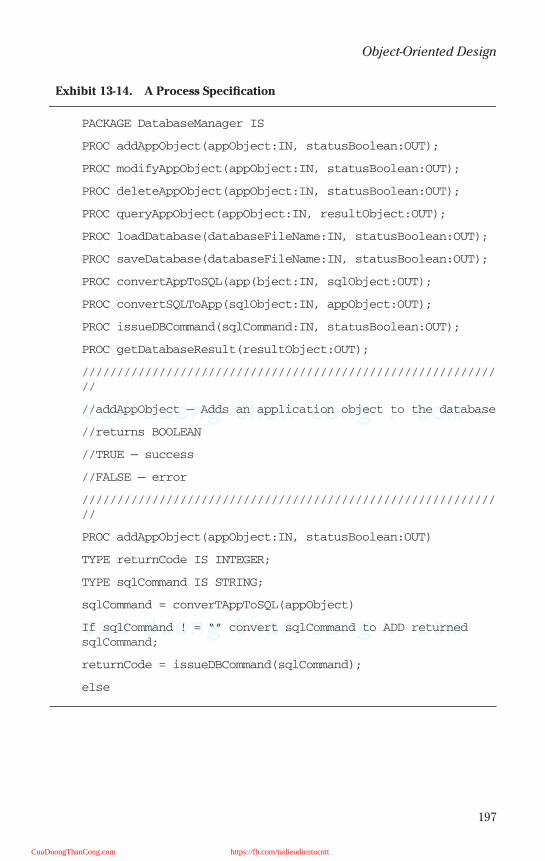
197
Object-Oriented Design
Exhibit 13-14. A Process Specification
PACKAGE DatabaseManager IS
PROC addAppObject(appObject:IN, statusBoolean:OUT);
PROC modifyAppObject(appObject:IN, statusBoolean:OUT);
PROC deleteAppObject(appObject:IN, statusBoolean:OUT);
PROC queryAppObject(appObject:IN, resultObject:OUT);
PROC loadDatabase(databaseFileName:IN, statusBoolean:OUT);
PROC saveDatabase(databaseFileName:IN, statusBoolean:OUT);
PROC convertAppToSQL(app(bject:IN, sqlObject:OUT);
PROC convertSQLToApp(sqlObject:IN, appObject:OUT);
PROC issueDBCommand(sqlCommand:IN, statusBoolean:OUT);
PROC getDatabaseResult(resultObject:OUT);
///////////////////////////////////////////////////////////
//
//addAppObject — Adds an application object to the database
//returns BOOLEAN
//TRUE — success
//FALSE — error
///////////////////////////////////////////////////////////
//
PROC addAppObject(appObject:IN, statusBoolean:OUT)
TYPE returnCode IS INTEGER;
TYPE sqlCommand IS STRING;
sqlCommand = converTAppToSQL(appObject)
If sqlCommand ! = “” convert sqlCommand to ADD returned
sqlCommand;
returnCode = issueDBCommand(sqlCommand);
else
CuuDuongThanCong.com https://fb.com/tailieudientucntt
198
SOFTWARE ENGINEERING HANDBOOK
References
Gora, M. (1996). Object-oriented analysis and design, DBMS Online. http://www.dbms-mag.com/9606d15.html.
CuuDuongThanCong.com https://fb.com/tailieudientucntt
199
Chapter 14
User Interface Design
Like many aspects of software engineering, in order to be effective, userinterface design needs to be analyzed, planned, and implemented in adetailed and organized manner. With the demand for enhanced functional-ity and implementation of increasingly complex systems, the pressure toproduce user interfaces that satisfy all user requirements becomes a greatchallenge. Without guiding principles and a fundamental plan of attack,developers are doomed to failure. Fortunately, as computer systems havegrown more complex, facilities for creating user interfaces quickly andmore efficiently have also come on stream. However, tools alone do notmake for a good user interface design.
User interfaces have matured rapidly over the last decade. The increas-ing speed and power of the PC and the growth of the Internet have fueledthe development of larger and more complex applications requiring easierand more intuitive user interfaces. As application developers deliver moresophisticated and robust applications, users expect and demand betterand more intuitive user interfaces to accompany those applications. Com-petition among application developers is fierce and a product’s user inter-face plays a key role in adoption and acceptance by its user community.
USER INTERFACE (UI) DESIGN PRINCIPLES
No discussion of user interface design would be complete without refer-ence to the underlying principles that guide good user interface design.Volumes have been written on the subject. The following are pointers to afew of the lists of user interface design principles from various sources:
• Design Basics, from the Internet, http://www-3.ibm.com/ibm/easy/eou_ext.nsf/Publish/6 (IBM ).
• Practical Real World Design, First Principles, from the Internet,http://www.asktog.com/basics/firstPrinciples.html (Tognazzini, ).
• Principles of Good GUI Design, from the Internet, http://axp16.ii.e.,org.mx/Monitor/v01n03/ar_ihc2.htm ( Hobart, ).
The perspectives are somewhat different, but all espouse the samebasic principles, reiterated here for emphasis:
• Put the user in control. The user is obviously the most important playerin this game and should be able to customize the interface to suit his
CuuDuongThanCong.com https://fb.com/tailieudientucntt

200
SOFTWARE ENGINEERING HANDBOOK
or her preferences or needs. Whenever possible, account for the us-er’s skill level; categories such as novice, occasional user, and fre-quent user make a good starting point. One example of this is aMacintosh word processing product. A set of five options enables theuser to set the desired level of experience ranging from “novice” to“power user.” Choosing a level results in filtering menus for only thoseoptions required by a user of the selected experience. A user gainingmore experience at a specific level can move to the next level whenready.
• Be direct. The user should be allowed to work with the informationpresented by the application directly. When a user performs an action,the result of the action should be immediately apparent.
• Use appropriate metaphors. Whenever possible use metaphors thatare familiar to the user. Metaphors help to make the user more com-fortable when using the software and provides for a more intuitive in-terface. For example, a checkbook is a suitable metaphor for anapplication that manages a user’s bank account.
• Make the interface consistent. Consistency in design makes it easier forthe user to apply skills learned on one task to another task. Usersshould not need to spend time trying to remember differences in be-havior among objects. Many Windows applications, for example, havethe same basic pattern for menus; File and Edit are always the first twomenus on the left and Help is typically the last menu on the right, asindicated in Exhibit 14-1.
Regular users of Windows applications expect these menus in thisorder; therefore, it does not make sense to break this paradigm.
• Provide shortcuts. For novice users, shortcuts may not be all that im-portant, but as the user gains experience with the interface, inevitablyhe will look for faster and more efficient ways of getting the job done.
Exhibit 14-1. Menu Order Consistency
CuuDuongThanCong.com https://fb.com/tailieudientucntt
201
User Interface Design
Shortcuts play a key role here and are greatly appreciated by powerusers. I know one technical writer who works in Microsoft Word withthe toolbar and menu bar hidden, doing all formatting work with onlyshortcuts. Quite amazing!
• Be forgiving. The user should be allowed to change his mind and re-verse a previously performed action. If circumstances make it impos-sible to reverse the result of an action, provide an indication to theuser up front, indicating that the action about to take place cannotbe reversed. It is also important to make error recovery as easy aspossible.
• Provide feedback. It is important that the user know what task is beingperformed. We all know how frustrating it can be when a programfreezes the system while it is performing a task with no visual indica-tion that the task is being performed or completed. Visual queuesshould be used to provide user interaction and feedback appropriateto the task performed.
• Make the interface aesthetically pleasing. An important aspect of theuser interface is its visual appearance. Visual elements on the screencompete for the user’s attention. It is not a simple task to get the rightbalance so that the user’s attention is focused on the right elements atthe right time. Often it is necessary to acquire the services of a graph-ics designer to get the right result. A professionally designed, aesthet-ically pleasing application is more likely to gain acceptance amongusers than one that lacks this characteristic.
• Be as simple as possible. This may sound simple, but from the devel-oper’s perspective simplifying the user interface typically involvesquite a bit of work. In a complex application or product, try to developa user interface that exposes only information necessary for the userto get the task done.
• Provide help. A help system is vital. Many different types of help sys-tems are available. Embedded help is totally integrated within the ap-plication; it provides help instructions for every screen that is part ofthe user interface. Online help, typically accessible by choosing anitem from the help menu, is a set of topics about the product; a tableof contents, index, and search mechanism are typically provided sothat the user can browse or search for a topic of interest. Context-sen-sitive help provides information about the current context; for exam-ple, when a specific dialog is displayed, the user can press F1 to getinformation about that dialog. Tooltip help displays hints; for exam-ple, when the cursor hovers over a toolbar button, help text is dis-played as shown in Exhibit 14-2.
Two industry standards that provide excellent information on userinterface design principles are The Windows Interface Guidelines for Soft-ware Design and Macintosh Human Interface Guidelines. Two websites that
CuuDuongThanCong.com https://fb.com/tailieudientucntt

202
SOFTWARE ENGINEERING HANDBOOK
provide some excellent examples of good and bad user interface design arethe Interface Hall of Fame, http://www.iarchitect.com/mfame.htm and theInterface Hall of Shame, http://www.iarchitect.com/mshame.htm. See thereference list at the end of this chapter for more details about thesesources.
THE UI DESIGN PROCESS
Principles are good, but how and when do we apply them? One of themost popular user interface design methodologies is one that mimics theoverall software development process. This process consists of fourphases; each phase is repeated during each iteration of the cycle. A sum-mary of the design process is shown graphically in Exhibit 14-3 and each ofits phases is described briefly below:
• Analysis. This phase involves collection of information about the userand the tasks that he or she will want to perform using the application.An excellent, highly rated book on this subject is User and Task Analy-sis for Interface Design (Hackos and Redish, 1998). This book clearly
Exhibit 14-2. Tooltip Help
Exhibit 14-3. Phases of User Interface Design
CuuDuongThanCong.com https://fb.com/tailieudientucntt
203
User Interface Design
separates analysis from design and provides guidelines and tech-niques for eliciting task information from prospective users.
• Design. Once the analysis has been completed and all tasks have beenidentified, the process of identifying the required objects and the ac-tions to be performed can begin. User scenarios play a key role in thisphase. From the scenario narrative, the designer can extract the ob-jects (typically nouns) and the actions (typically verbs) to build a listof required elements. One book that addresses many of the issues thatthe developer faces during the design phase is User Interface Design forProgrammers (Spolsky, 2000).
• Implementation. In the implementation phase, a prototype is pro-duced. This is typically achieved using one of the many fourth-gener-ation languages or programming development environments (VisualBasic, Visual C++, Visual J++, Java, etc.) that allow the rapid develop-ment of user interfaces using predefined libraries of components suchas Windows, Menus, Buttons, Drop-Down list controls, Tree controls,etc.
• Test. When the prototype is complete, the developer can take the soft-ware to the customer for user interface evaluation. Users can testdrive the software and make suggestions for improvements, which be-come part of the analysis phase. Then the cycle can begin again to re-fine the process further. Pamela Savage compares three differentevaluation techniques: 1) expert reviews, 2) user reviews, and 3) inter-active usability testing, with the conclusion that all three play a role inthe evaluation process.
One aspect of good user interface design not immediately apparent fromthe four phases of the design cycle described here is that the designinvolves input from many different disciplines in addition to softwaredevelopment. These disciplines include visual designers, writers, humanfactors experts, and, of course, the user. A well-balanced team of peopleproviding input from different perspectives is critical to the success of theuser interface.
DESIGNING EFFECTIVE INPUT AND OUTPUT
Some systems analysts believe that designing input and output is themost important task in designing a system because it is the part the enduser actually sees. Even though some people might disagree with this pointof view, poorly designed input and output may cause an otherwise well-designed and solidly implemented system to fail. When systems analystsdesign input and output, there are three aspects of concern: (1) the inputand output data (data flow) between software components, (2) the designof input and output between the software and other nonhuman producersand consumers of information, (3) the interaction between the user andthe computer.
CuuDuongThanCong.com https://fb.com/tailieudientucntt
204
SOFTWARE ENGINEERING HANDBOOK
Designing Input
A key factor for developing the design input is the customer’s require-ments. This includes, but is not limited to: end-user expectations, patternsof end-user usage, security, and performance. The customer should not bethe only consideration, however. All factors relevant to the design of thesystem should be considered, including management requirements, inter-face requirements, and other related processing requirements.
A variety of media and methods is used to capture and input data so thatit can be used properly, including: (1) paper forms combined with data-entry screens, (2) electronic forms, and (3) direct entry devices.
Even though the usage of computers is very common, it would be sur-prising to find a system that did not have at least one input or output paperform. Paper forms carry data physically. In every business or organizationthere are manual transactions that might require the use of manual forms,such as order forms, sales transactions, and surveys. The data captured onthese forms, therefore, must be entered into the system for processing.Guidelines for designing a paper form include:
• Select proper paper. Papers of different colors, grades, and weightmight be used to print a form. When we select a paper for our form, weneed to consider some factors, for example: how long the companywill keep it, how to fill in the form (handwritten or printed), how it willbe handled (gently, roughly), and if the paper is easy and convenientto use.
• The size of paper should be appropriate. The most popular size is 8.5 by11 inches. If you require a smaller form, try to use half of this standardsize: 8.5 by 5.5. For card forms, the standards start with 8 by 10 inches.It is best not to use nonstandard sizes because those sizes often haveproblems in handling and filing and usually increase the cost of devicesand papers.
• Forms should be easy to fill out. To make forms easy to fill out, the fol-lowing techniques are used: (1) Put simple instructions or exampleson the form to assist users. (2) Form flow should be designed to followa logical sequence (left to right, top to bottom) (See Exhibit 14-4).(3) Group-related data should be in the same section. (4) Each sectionand field should have a caption that tells the user what to put there.(5) Use proper space to make the form clearer. (6) Using lines and box-es can also help. (7) Have alternative selections capability (i.e., use ofa check box).
• Design to meet the purpose of a form. A systems analyst should designdifferent forms to better reflect different process requirements even ifseveral forms are similar to each other.
• Make the form attractive. An attractive form can encourage the user tocomplete it. A form should be designed to look neat and the input
CuuDuongThanCong.com https://fb.com/tailieudientucntt
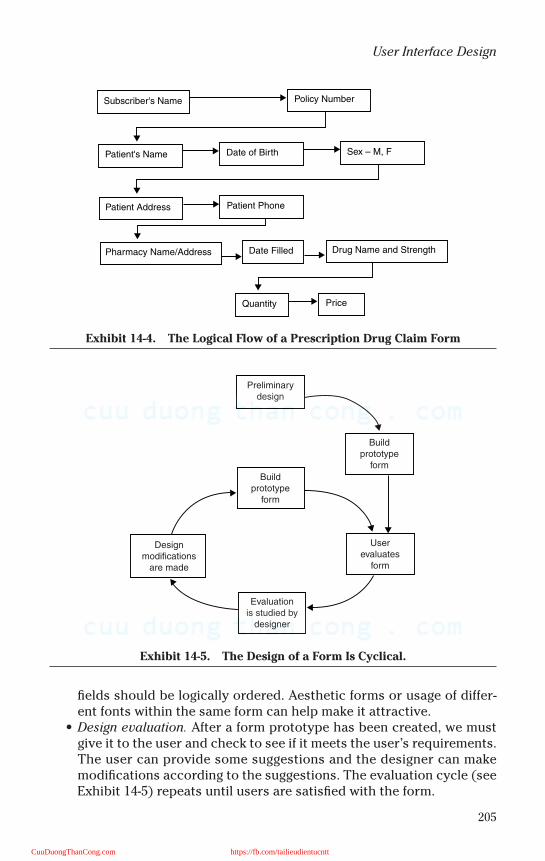
205
User Interface Design
fields should be logically ordered. Aesthetic forms or usage of differ-ent fonts within the same form can help make it attractive.
• Design evaluation. After a form prototype has been created, we mustgive it to the user and check to see if it meets the user’s requirements.The user can provide some suggestions and the designer can makemodifications according to the suggestions. The evaluation cycle (seeExhibit 14-5) repeats until users are satisfied with the form.
Exhibit 14-4. The Logical Flow of a Prescription Drug Claim Form
Exhibit 14-5. The Design of a Form Is Cyclical.
Patient Address
Patient's Name
Subscriber's Name
Pharmacy Name/Address
Policy Number
Date of Birth Sex – M, F
Patient Phone
Date Filled Drug Name and Strength
Quantity Price
Preliminarydesign
Buildprototype
form
Designmodifications
are made
Evaluationis studied by
designer
Userevaluates
form
Buildprototype
form
CuuDuongThanCong.com https://fb.com/tailieudientucntt

206
SOFTWARE ENGINEERING HANDBOOK
Designing Electronic Forms. When we talk about electronic forms sys-tems (see Exhibit 14-6), we turn our attention from paper to screens.Designers must design electronic forms to reflect the organization of thedata source. When it is used by people (customer, clerk, etc.), it must bedesigned with all the captions, data entry fields, and instructions arrangedin a logical manner that can help users completing the forms. The design-ing guideline for the paper form can also apply to screen form becauseboth have the same components.
Electronic forms have many advantages over paper that make use of thisautomated capability much more efficient: (1) the ability to process calcu-lations; (2) the ability to retrieve data and populate the electronic form toreduce the number of fields that the user must fill in; (3) ability to validateeach field automatically; (4) the ability to coordinate processes betweentasks; (5) the ability to provide immediate help.
In most situations, electronic forms can replace all paper forms andsubstantially reduce the cost of a system. Factors that affect the cost
Exhibit 14-6. An Electronic Forms System
Screen
Screen Screen Screen
User User User
Database
Server
Form Library
FormDevelopment
CuuDuongThanCong.com https://fb.com/tailieudientucntt
207
User Interface Design
include: (1) printers might run out of paper, causing the system to pause;(2) electronic forms can prevent many data entry errors and the end userfrom using the wrong form; (3) electronic forms can be easily modified tomeet new business requirements; (4) electronic form databases efficientlymanage the many forms in use in an organization.
Direct Entry Devices. When using electronic forms, the keyboard isthe most common input device. However, there are some instanceswhere data is not input by a user or a keyboard is not practical. Otherdata entry devices include:
• Scanner or optical character reader (OCR)• Point-of-sale (POS) device• Automatic teller machines (ATMs)• Mouse• Voice recognition
Designing Output
Output can be produced in a variety of ways: printing, screen, audio,microform, CD ROM, or electronic output. Each technology has differentspeed and cost, and affects the end user differently. When we choose anoutput technology, the following should be considered: (1) the purpose ofthe output; (2) the person who needs the information; (3) the reason theoutput is needed; (4) the way the output will be used; (5) what specificinformation will be included; (6) how the output will be viewed, i.e., printedon paper, stored on secondary storage such as tape, CD, tape, etc., orviewed on the screen; (7) how often the output is to be updated; (8) anysecurity issues.
USABILITY TESTING
A user interface design can benefit greatly from usability testing.Although this testing involves quite a lot of up-front investment, the resultsare worth the investment, especially for commercial applications that havepotentially a wide audience. Usability testing involves observing users asthey use the application to perform their required tasks. The tests are gen-erally administered by human factors specialists and are usually per-formed in a special work area where the specialists are separated from theusers by a one-way mirror that enables the specialists to observer users asthe tasks are performed. Users typically describe what they want to do andhow they are going about it using the software. The specialists study thesepatterns and use the data to improve the user interface. This technique isa very effective means of detecting misunderstood or misinterpreted areasof the user interface. These areas can be redesigned and the tests can beperformed again to check for improvement.
CuuDuongThanCong.com https://fb.com/tailieudientucntt

208
SOFTWARE ENGINEERING HANDBOOK
SUMMARY
Providing a good user interface is a critical skill for application develop-ers today. Good user interface design does not happen automaticallydespite the myriad of tools available to help developers create them.
A good portion of this chapter has been devoted to stressing the designprinciples; this is not an accident. The developer must learn and applybasic principles and follow the tried and true process that leads to qualityuser interface designs. The formula already exists; it merely needs to beapplied. The developer must always keep the users’ interests in mind,especially in cases of conflict between satisfying a user requirement andtaking an easier implementation route. The user interface should strive todelight and help the user get the job done faster and more efficiently. Devel-opers must gain as much experience as possible when working with andbeing exposed to good user interface designs.
The user interface is a key component when it comes to the acceptanceof an application or product. It can mean the difference between adoptionand obscurity.
References
Hackos, J. and Redish, J. (1998) User and Task Analysis for Interface Design, John Wiley & Sons,New York.
Hobart, J. Principles of good GUI design, from the Internet, http://axp16.ii.e.,org.mx/Moni-tor/v01n03/ar_ihc2.htm.
IBM. Design basics, from the Internet, http://www-3.ibm.com/ibm/easy/eou_ext.nsf/Publish/6.
Isys Information Architects. Interface hall of fame, from the Internet http://www.iarchi-tect.com/mfame.htm.
Isys Information Architects. Interface hall of shame, from the Internet http://www.iarchi-tect.com/mshame.htm.
Macintosh Human Interface Guidelines. (1993) Addison-Wesley, Reading, MA.
Savage, Pamela. AT&T Bell Laboratories, User interface evaluation in an iterative design pro-cess: a comparison of three techniques, from the internet, http://www.acm.org/sig-chi/chi96/proceedings/shortpap/Savage/sp_txt.html.
Spolsky, J. (2000) User interface design for programmers, from the Internet, http://www.joelon-software.com/uibook/chapters/fog0000000065.html.
The Windows Interface Guidelines for Software Design. (1995) Microsoft Press, Redmond, WA.
Tognazzini, B. Practical real world design, first principles, from the Internet, http://www.ask-tog.com/basics/firstPrinciples.html.
Two additional general sources of information that are worth a mention even though they are not explicitly referenced in this chapter are:
Sumit, GUI design links, from the Internet, http://www.sum-it.nl/enguilin.html.
Wilson, C. User interface design bibliography, from the Internet, http://world.std.com/~uieweb/biblio.htm.
CuuDuongThanCong.com https://fb.com/tailieudientucntt
209
User Interface Design
Other Sources:
Blum, B.I. (1992) Software Engineering: a Holistic View, Oxford University Press, Inc., New York.
Burch, J.G. (1992) System Analysis, Design, and Implementation, Boyd & Fraser PublishingCompany, Boston.
Kendall, K.E. and Kendall, J.E. (2001) System Analysis and Design, 5th ed., Prentice Hall, Inc.,Upper Saddle River, NJ.
Pressman, R.S. (2001) Software Engineering: a Practitioner’s Approach, 5th ed., McGraw-HillCompanies, Inc., New York.
Shaw, M. and Garlan, D. (1996) Software Architecture: Perspectives on an Emerging Discipline,Prentice Hall, Inc., Upper Saddle River, NJ.
www.sxu.edu/~rogers/bu433/index.html: System design: input, output, user interface.
www.webster.edu/~crawfodj/2810/pdf/2810ch07.pdf, User interface, input, and output design.
CuuDuongThanCong.com https://fb.com/tailieudientucntt

This page intentionally left blank
CuuDuongThanCong.com https://fb.com/tailieudientucntt

211
Chapter 15
Software Re-Engineering
Organizations spend much money building software applications custom-ized according to their business rules. In other words, software is the real-ization of business rules. When business rules change, software must alsochange. Software change is very important because organizations are nowcompletely dependent upon their software and have invested millions ofdollars in these systems. Therefore, organizations must invest in systemchange to maintain the value of these systems. Software re-engineering isa strategy for software change. It rebuilds existing legacy systems thathave become expensive to maintain or architecturally obsolete.
WHAT IS SOFTWARE RE-ENGINEERING?
Software re-engineering is (usually) concerned with reimplementing leg-acy systems to make them more maintainable. Re-engineering may involveredocumenting the system, organizing and restructuring the system, trans-lating the system to a more modern programming language, or modifyingand updating the structure and values of the system’s data. The function-ality of the software is not changed and, normally, the system architecturealso remains the same. Re-engineering improves the system structure, cre-ates new system documentation, and makes it easier to understand.
WHY WE NEED SOFTWARE RE-ENGINEERING
Computer software is the product that software engineers design andbuild. Once software is put into use, new requirements emerge and existingrequirements change as the business rules change. Parts of software mayneed to be modified to correct errors or improve its performance.
As time goes on, software gets old and frequently breaks down. As thesoftware is modified, it becomes more and more complicated and difficultto maintain. The level of difficulty of maintainability is directly proportion-ate to the cost of maintaining the system.
We are consequently faced with a dilemma. If we continue to use the sys-tem and make changes as required, our costs will inevitably increase. If we
CuuDuongThanCong.com https://fb.com/tailieudientucntt

212
SOFTWARE ENGINEERING HANDBOOK
decide to replace the system with a new system, costs will be incurred andthe new system might not be as good as the old system.
Software engineering techniques extend the lifetime of legacy systemsand reduce the costs of keeping these systems in use. We can create a prod-uct with added functionality, better performance and reliability, andimproved maintainability by means of rebuilding the legacy system. Re-engineering may involve some structural modifications but does not usu-ally involve major architectural change.
SOFTWARE RE-ENGINEERING STRATEGIES
A major problem for organizations is implementing and managingchange to their legacy systems so that these systems continue to supportthe organization’s business operations. There are a number of differentstrategies for software change:
• Software maintenance• Architectural transformation — e.g., migration to servers or to
Intranets• Software re-engineering
Software maintenance is the general process of changing a system afterit has been delivered; this strategy does not normally involve major archi-tectural changes to the system. The following are three types of softwaremaintenance:
1. Maintenance to repair software faults:• Coding errors are very cheap to correct.• Design errors are more expensive because this may involve rewrit-
ing several program components.• Requirement errors are most expensive to repair due to the exten-
sive system redesign that may be necessary.2. Maintenance to adapt the software to a different operating
environment3. Maintenance to add to or modify the system’s functionality
• External and internal factors, such as changing markets, changinglaws, management changes, and structural reorganization, meanthat businesses undergo continual change. These changes gener-ate new or modified software requirements, so all useful softwaresystems inevitably change as the business changes.
Approximately 20 percent of all maintenance efforts are spent fixing mis-takes. The remaining 80 percent is spent adapting existing systems tochanges in their external environment, making enhancements requestedby users, and re-engineering an application for future use (Pressman,2001).
CuuDuongThanCong.com https://fb.com/tailieudientucntt

213
Software Re-Engineering
After software has been corrected, adapted, and enhanced many times,it usually becomes unstable. The more maintainence on the software, themore frequently unexpected and serious side effects may occur. Althoughthe system still works, its maintenance costs increase and its valuedecreases.
THE PROCESS OF RE-ENGINEERING
The main activities in a typical re-engineering process are:
1. Source Code Translation
The simplest form of software re-engineering is program translationwhere source code in one programming language is automatically trans-lated to source code in another language (i.e., COBOL to Java). The struc-ture and organization of the program are unchanged but have higher qual-ity than the original program. One reason for this is that the target languagemay be an updated version of the original language or may be a translationto a completely different language. Source-level translation may be neces-sary for the following reasons:
• Hardware platform update: the organization may wish to change itsstandard hardware platform, but compilers for the original languagemay not be available on the new hardware.
• Organizational policy changes: an organization may want to standard-ize on a particular language to minimize its support software costs.Maintaining many versions of old compilers can be very expensive.
• Lack of software support: the suppliers of the language compiler mayhave gone out of business or may discontinue support for theirproduct.
• Developers want to make the system easier to understand, test, andmaintain: Some legacy systems have solid program architecture; how-ever, individual modules were coded in a way that makes them diffi-cult to understand, test, and maintain. In this situation, the code canbe restructured (Pressman, 2001).
2. Reverse Engineering
Reverse engineering is the process of analyzing software with the objec-tive of recovering its design and specification. The software source code isusually available as input to the reverse engineering process. Reverse engi-neering is different from re-engineering. Its purpose is to derive the designor specification of a system from its source code, while the objective of re-engineering is to produce a new, more maintainable system. Of course,reverse engineering to develop a better understanding of a system is oftenpart of the re-engineering process.
CuuDuongThanCong.com https://fb.com/tailieudientucntt

214
SOFTWARE ENGINEERING HANDBOOK
Reverse engineering can be used during software re-engineering torecover the original program design to help developers understand a pro-gram before reorganizing its structure. However, re-engineering need notalways follow reverse engineering:
• The design and specification of an existing system may be reverse en-gineered so that they can serve as input to the requirements specifica-tion for that program’s replacement.
• Alternatively, the design and specification may be reverse engineeredso that they are available to help program maintenance. With this ad-ditional information, it may not be necessary to re-engineer the sys-tem source code.
The reverse engineering process is illustrated in Exhibit 15-1. The pro-cess starts with an analysis phase, during which the system is analyzedusing automated tools to discover its structure. In itself, this is not enoughto recreate the system design. Engineers then work with the system sourcecode and its structural model, adding information that they have collectedby understanding the system. This information is maintained as a directedgraph linked to the program source code.
Information store browsers are used to compare the graph structureand the code and to annotate the graph with extra information. Documentsof various types, such as program and data structure diagrams and trace-ability matrices, can be generated from the directed graph. Traceabilitymatrices show where entities in the system are defined and referenced.
Tools for program understanding may be used to support the reverseengineering process. These usually present different system views andallow easy navigation through the source code. For example, they allowusers to select a data definition, and then move through the code to wherethat data item is used. Examples of such program browsers are discussedby Cleveland (1989), Oman and Cook (1990), and Ning et al. (1994).
Exhibit 15-1. The Reverse Engineering Process
Automatedanalysis
Manualannotation
Systeminformationstore
Documentgeneration
Program structurediagrams
Data structurediagrams
Traceabilitymatrices
System to bere-engineered
CuuDuongThanCong.com https://fb.com/tailieudientucntt

215
Software Re-Engineering
After the system design documentation has been generated, furtherinformation may be added to the information store to help recreate the sys-tem specification. This usually involves further manual annotation of thesystem structure. The specification cannot be deduced automatically fromthe system model.
3. Program Structure Improvement
The need to optimize memory use and the lack of understanding of soft-ware engineering by many programmers have meant that many legacy sys-tems are not well structured. Their control structure is tangled with manyunconditional branches and unintuitive control logic. This structure mayalso have been degraded by regular maintenance. Changes to the programmay have made some code unreachable, but this can only be discoveredafter extensive analysis. Maintenance programmers often dare not removecode in case it may be accessed indirectly.
Typically, programs develop complex logic structure as they are modi-fied during maintenance. New conditions and associated actions are addedwithout changing the existing control structure. In the short term, this is aquicker and less risky solution because it reduces the chances of introduc-ing faults into the system. In the long term, however, it leads to incompre-hensible code. Complex code structures can also arise when programmerstry to avoid duplicating code. Along with unstructured control, complexconditions can also be simplified as part of the program restructuring pro-cess. For instance,
Complex condition:
If not (a > b and (c < d or not (e > f)))…
Simplified condition:
If a < = b and (c > = d or e > f)…
This is how a conditional statement including “not” logic may be mademore understandable.
If the program is data driven, with components tightly coupled throughshared data structures, restructuring the code may not lead to a significantimprovement in understandability. Program modularization may also benecessary. If the program is written in a nonstandard language dialect,standard restructuring tools may not work properly and significant manualintervention may be required.
In some cases, it may not be cost-effective to restructure all of the pro-grams in a system. Some may be of better quality than others and somemay not be subject to frequent change. Arthur (1988) suggests that datashould be collected to help identify those programs that could benefitmost from restructuring: The metrics, such as failure rate, percentage of
CuuDuongThanCong.com https://fb.com/tailieudientucntt
216
SOFTWARE ENGINEERING HANDBOOK
source code changed per year, component complexity, and the degree towhich programs or components meet current standards, can be used toidentify the candidates for restructuring.
4. Program Modularization
Program modularization is the process of reorganizing a program sothat related program parts are collected together and considered as a sin-gle module. Once this has been done, it becomes easier to remove redun-dancies in these related components, to optimize their interactions, and tosimplify their interface with the rest of the program. A number of types ofmodule may be created during the program modularization process.
• Data abstractions. In order to save memory space, many legacy sys-tems depend on use of shared tables and common data areas. The in-formation stored in these areas is globally accessible and may be usedby different parts of the system in different ways. It is expensive mak-ing changes to these global data areas due to the costs of analyzingchange impacts across all uses of the data. To reduce the costs ofchanges to these shared data areas, the program modularization pro-cess may focus on the identification of data abstractions. Data ab-stractions or abstract data types collect data and associatedprocessing and are resilient to change.
• Hardware modules. These are related to data abstractions and gatherall of the functions used to control a particular hardware device.
• Functional modules. For instance, all of the functions concerned withinput and input validation may be incorporated in a single module.This type of modularization should be considered where it is imprac-tical to recover program data abstractions.
• Process support modules. All of the functions and specific data items re-quired to support a particular business process are grouped here.
5. Data Re-Engineering
Until now, most of our discussion on software evolution has focused onthe problems of program modification. However, in many cases, associatedproblems of storage, organization, and format of the data processed by leg-acy programs may need to evolve to reflect changes to the software. Theprocess of analyzing and reorganizing the data structures and, sometimes,the data values in a system to make it more understandable is called datare-engineering.
In principle, data re-engineering should not be necessary if the function-ality of a system is unchanged. In practice, however, there are a number ofreasons why you may need to modify the data as well as the programs in alegacy system:
CuuDuongThanCong.com https://fb.com/tailieudientucntt
217
Software Re-Engineering
• Data degradation. Over time, the quality of data tends to decline.Change to the data incurs errors, redundant values may have beencreated, and changes to the external environment may not be reflect-ed in the data. This is unavoidable because the lifetime of data is oftenvery long.
• Inherent limits built into the program. Programs are now often re-quired to process much more data than was originally envisioned bytheir developers. Data re-engineering may be required to removethese limitations.
• Architectural evolution. If a centralized system is migrated to a distrib-uted architecture, it is essential that the core of that architecture be adata management system that can be accessed from remote clients.This may require a large data re-engineering effort to move data froma mainframe to a server-based database management system. Themove to a distributed program architecture may also be initiatedwhen an organization decides to move from file-based data manage-ment to a database management system.
Because data architecture has a strong influence on program architec-ture and the algorithms that populate it, changes to the data will invariablyresult in architectural or code-level changes. Rickets (1993) mentions someof the problems with data that can arise in legacy systems made up of sev-eral cooperating programs:
• Data naming problems. Name may be cryptic and difficult to under-stand. Different names may be given to the same logical entity in dif-ferent programs in the system. The same name may be used indifferent programs to mean different things.
• Field length problems. When field lengths in records are explicitly as-signed in the program, the same item may be assigned differentlengths in different programs or the field length may be too short torepresent current data.
• Record organization problems. Records representing the same entitymay be organized differently in different programs.
• Hard-coded literals. Absolute values, such as tax rates, are included di-rectly in the program rather than referenced using some symbolicname.
• Lack of a data dictionary.• Inconsistent data definitions. Data values may also be stored in an in-
consistent way. After the data definitions have been re-engineered, thedata values must also be converted to conform to the new structure.
Exhibit 15-2 illustrates the process of data re-engineering, assuming thatdata values converted. The change summary tables hold details of all thechanges to be made. They are therefore used at all stages of the data re-engineering process.
CuuDuongThanCong.com https://fb.com/tailieudientucntt
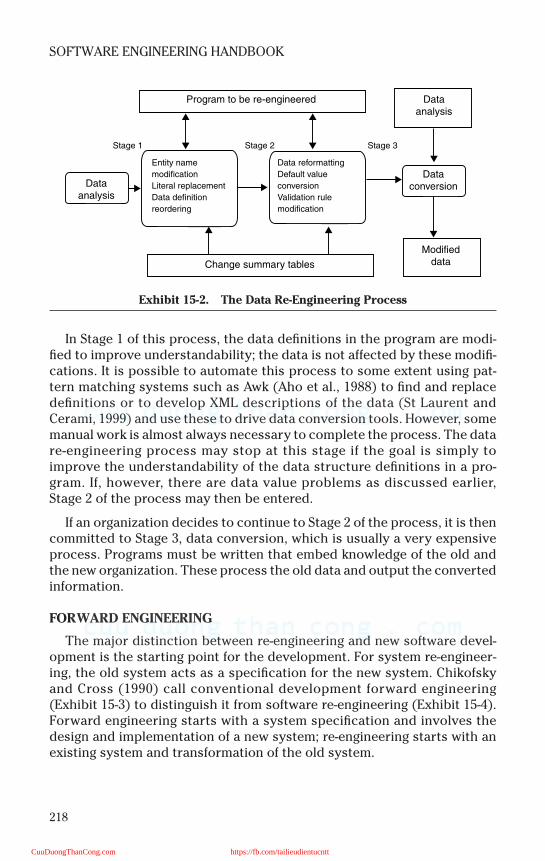
218
SOFTWARE ENGINEERING HANDBOOK
In Stage 1 of this process, the data definitions in the program are modi-fied to improve understandability; the data is not affected by these modifi-cations. It is possible to automate this process to some extent using pat-tern matching systems such as Awk (Aho et al., 1988) to find and replacedefinitions or to develop XML descriptions of the data (St Laurent andCerami, 1999) and use these to drive data conversion tools. However, somemanual work is almost always necessary to complete the process. The datare-engineering process may stop at this stage if the goal is simply toimprove the understandability of the data structure definitions in a pro-gram. If, however, there are data value problems as discussed earlier,Stage 2 of the process may then be entered.
If an organization decides to continue to Stage 2 of the process, it is thencommitted to Stage 3, data conversion, which is usually a very expensiveprocess. Programs must be written that embed knowledge of the old andthe new organization. These process the old data and output the convertedinformation.
FORWARD ENGINEERING
The major distinction between re-engineering and new software devel-opment is the starting point for the development. For system re-engineer-ing, the old system acts as a specification for the new system. Chikofskyand Cross (1990) call conventional development forward engineering(Exhibit 15-3) to distinguish it from software re-engineering (Exhibit 15-4).Forward engineering starts with a system specification and involves thedesign and implementation of a new system; re-engineering starts with anexisting system and transformation of the old system.
Exhibit 15-2. The Data Re-Engineering Process
Dataanalysis
Dataanalysis
Dataconversion
Modifieddata
Program to be re-engineered
Change summary tables
Stage 1 Stage 2 Stage 3
Entity name
modification
Literal replacement
Data definition
reordering
Data reformatting
Default value
conversion
Validation rule
modification
CuuDuongThanCong.com https://fb.com/tailieudientucntt
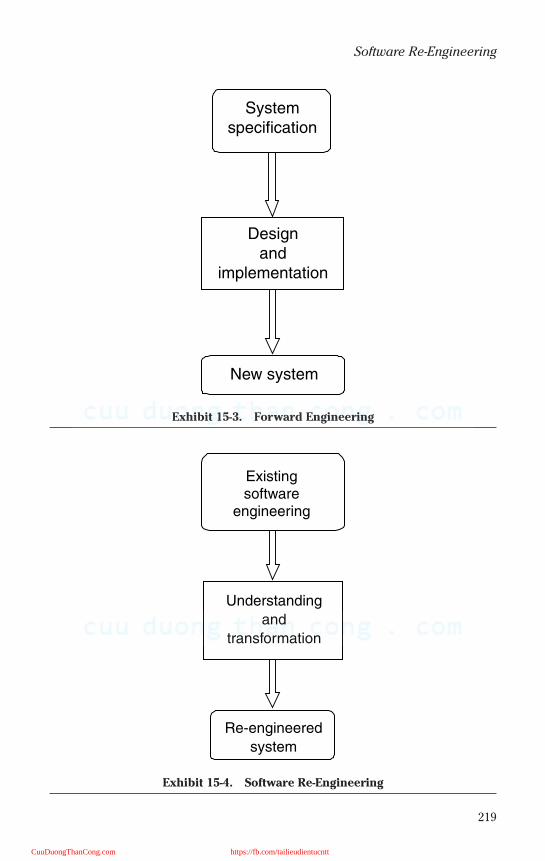
219
Software Re-Engineering
Exhibit 15-3. Forward Engineering
Exhibit 15-4. Software Re-Engineering
Systemspecification
New system
Designand
implementation
Existingsoftware
engineering
Understanding
and
transformation
Re-engineered
system
CuuDuongThanCong.com https://fb.com/tailieudientucntt
220
SOFTWARE ENGINEERING HANDBOOK
CONCLUSION
Developing a custom-built system requires a lot of money and time.Hence, organizations need to maintain their old systems in order to reducethe cost and increase the lifetime of the old system. For these purposes, re-engineering becomes a useful way to convert old, obsolete systems tomore efficient, streamlined systems.
Software re-engineering encompasses a series of activities that includesource code translation, reverse engineering, program structure improve-ment, program modularization, and data re-engineering. The intent ofthese activities is to create versions of existing programs that exhibithigher quality and better maintainability.
References
Aho, A.V., Kernighan, B.W., et al. (1988). The Awk Programming Language, Prentice-Hall, Engle-wood Cliffs, NJ, Chapters 8, 28.
CAS88. (1988). CASE tools for reverse engineering, CASE Outlook, CASE Consulting Group, 2,1–15.
Chikofsky, E.J. and Cross, J.H. (1990). Reverse engineering and design recovery: a taxonomy,IEEE Software, 7, 13–17.
Cleveland, L. (1989). A program understanding support environment, IBM Sys.J., 28, 324–344.
Ning, J.Q., Engberts, A., et al. (1994). Automated support for legacy code understanding, IEEESoftware, 37, 50–57.
Oman, P.W. and Cook, C.R. (1990). The book paradigm for improved maintenance, IEEE Soft-ware, 7, 39–45.
Pressman, R.S. (2001). Software Engineering: a Practitioner’s Approach, 5th ed., McGraw-Hill,Boston, 799–824.
Rickets, J.A. DelMonaco, J.C., et al. (1993). Data reengineering for application systems, in Soft-ware Reengineering Arnold, R.S., Ed., IEEE Press, Los Alamitos, CA, 288–293.
St Laurent, S. and Cerami, E. (1999). Building XML Applications, McGraw-Hill, New York, Chap-ter 9.
CuuDuongThanCong.com https://fb.com/tailieudientucntt
221
Chapter 16
Software Testing
Testing is a critical component of software development. Its goal is touncover and correct errors found in software. Because software is com-plex, it is reasonable to presume that software testing is a labor- andresource-intensive process. Automated software testing helps to improvetesters’ productivity and reduce resources that may be required. By itsvery nature, automated software testing increases test coverage levels,speeds up test turnaround time, and cuts costs of testing. Unfortunately,due to a variety of reasons, not all test automation projects will achievethese returns on investment. In this chapter, a practical approach to auto-mated software testing is discussed.
WHAT IS SOFTWARE TESTING?
A critical component in the process of software development is softwaretesting. The classic software life cycle model suggests a systematic,sequential approach to software development that progresses throughsoftware requirements analysis, design, code generation, and testing. Thatis, once source code has been generated, program testing begins with thegoal of finding differences between the expected behavior specified by sys-tem models and the observed behavior of the system.
The process of creating error-free software applications requires techni-cal sophistication in the analysis, design, and implementation of that soft-ware and proper test planning, as well as robust automated testing tools.When planning and executing tests, software testers must consider thesoftware and the function it performs, the inputs and how they can be com-bined, and the environment in which the software will eventually operate.
During early stages of the testing process, the programmer usually per-forms all tests. This stage of testing is referred to as unit testing. Here theprogrammer usually works with the debugger that accompanies his or hercompiler. For example Visual Basic, as shown in Exhibit 16-1, enables theprogrammer to “step through” a program’s (or object’s) logic, one line ofcode at a time, viewing the value of any and all variables as the programproceeds.
A particular program is usually made up of many modules. An OO sys-tem is composed of many objects. Programmers usually architect theirprograms in a top–down modular fashion. Integration testing proves that
CuuDuongThanCong.com https://fb.com/tailieudientucntt
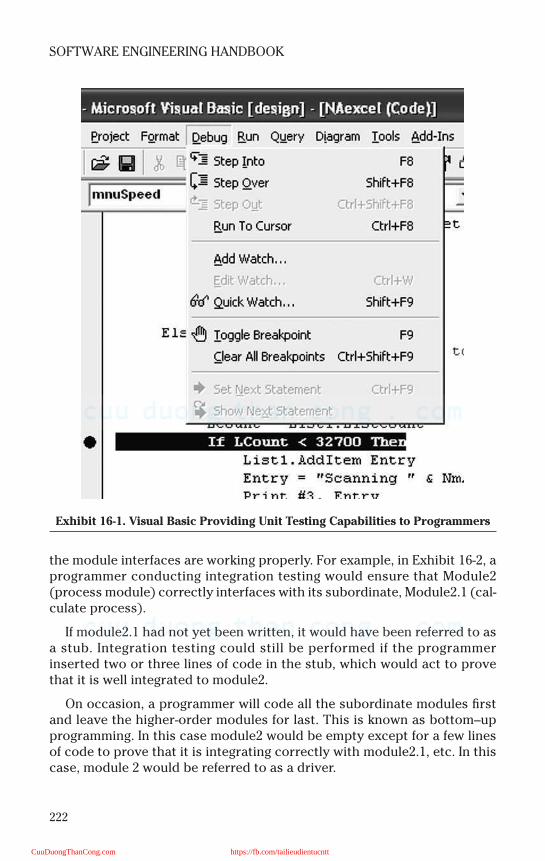
222
SOFTWARE ENGINEERING HANDBOOK
the module interfaces are working properly. For example, in Exhibit 16-2, aprogrammer conducting integration testing would ensure that Module2(process module) correctly interfaces with its subordinate, Module2.1 (cal-culate process).
If module2.1 had not yet been written, it would have been referred to asa stub. Integration testing could still be performed if the programmerinserted two or three lines of code in the stub, which would act to provethat it is well integrated to module2.
On occasion, a programmer will code all the subordinate modules firstand leave the higher-order modules for last. This is known as bottom–upprogramming. In this case module2 would be empty except for a few linesof code to prove that it is integrating correctly with module2.1, etc. In thiscase, module 2 would be referred to as a driver.
Exhibit 16-1. Visual Basic Providing Unit Testing Capabilities to Programmers
CuuDuongThanCong.com https://fb.com/tailieudientucntt
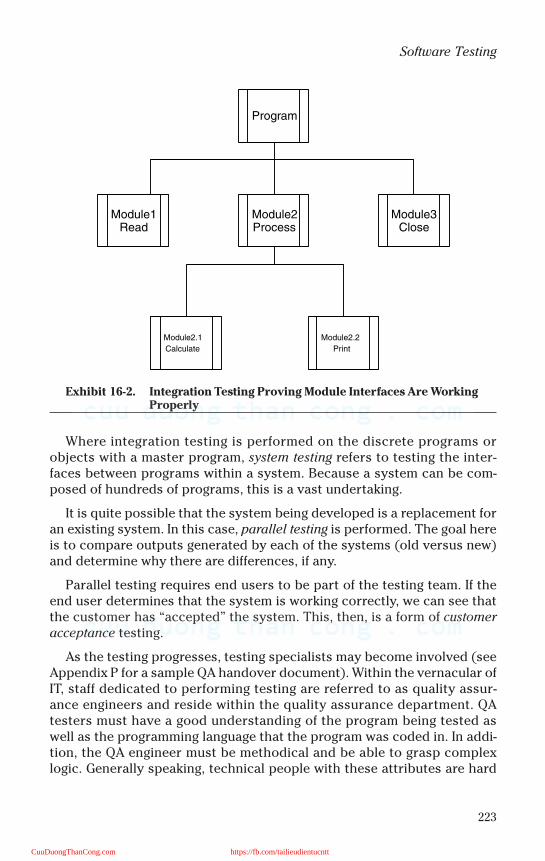
223
Software Testing
Where integration testing is performed on the discrete programs orobjects with a master program, system testing refers to testing the inter-faces between programs within a system. Because a system can be com-posed of hundreds of programs, this is a vast undertaking.
It is quite possible that the system being developed is a replacement foran existing system. In this case, parallel testing is performed. The goal hereis to compare outputs generated by each of the systems (old versus new)and determine why there are differences, if any.
Parallel testing requires end users to be part of the testing team. If theend user determines that the system is working correctly, we can see thatthe customer has “accepted” the system. This, then, is a form of customeracceptance testing.
As the testing progresses, testing specialists may become involved (seeAppendix P for a sample QA handover document). Within the vernacular ofIT, staff dedicated to performing testing are referred to as quality assur-ance engineers and reside within the quality assurance department. QAtesters must have a good understanding of the program being tested aswell as the programming language that the program was coded in. In addi-tion, the QA engineer must be methodical and be able to grasp complexlogic. Generally speaking, technical people with these attributes are hard
Exhibit 16-2. Integration Testing Proving Module Interfaces Are Working Properly
Program
Module1Read
Module2Process
Module3Close
Module2.1
Calculate
Module2.2
CuuDuongThanCong.com https://fb.com/tailieudientucntt
224
SOFTWARE ENGINEERING HANDBOOK
to come by and even harder to keep because most of them aspire tobecome programmers.
Even simple software can present testers with obstacles. Couple thiscomplexity with the difficulty in attracting and keeping QA staff and youhave the main reason that many organizations now automate parts of thetesting process.
SOFTWARE TESTING STRATEGY
Software testing is one critical element of software quality assurance(SQA) that aims at determining the quality of the system and its relatedmodels. In such a process, a software system will be executed to determinewhether it matches its specification and executes in its intended environ-ment. To be more precise, the testing process focuses on the logical inter-nals of the software, ensuring that all statements have been tested, and onthe functional externals by conducting tests to uncover errors and ensurethat defined input will produce actual results that agree with requiredresults.
To ensure that the testing process is complete and thorough it is neces-sary to create a test plan (Appendix O). A thorough test plan consists of thefollowing:
1. Revision history2. System introduction
2.1. Goals and objectives2.2. Statement of scope2.3. Major constraints
3. Test plan3.1. System description3.2. Testing strategy3.3. Testing resources3.4. Testing metrics3.5. Testing artifacts3.6. Testing schedule
4. Test procedures4.1. Class testing4.2. Integration testing
5. Appendix 1: class testing test cases5.1. Application controller subsystem5.2. User management subsystem5.3. Resource management subsystem5.4. Order subsystem5.5. Accounting subsystem5.6. Customer relationship management subsystem5.7. Persistence subsystem
CuuDuongThanCong.com https://fb.com/tailieudientucntt
225
Software Testing
6. Appendix 2: integration testing test cases6.1. Customer registration6.2. Reallocate resources6.3. Search for service provider and initiate order6.4. Place order6.5. Pay for service
7. Appendix: project schedule
A sample test plan, created by my students for an OO dog grooming sys-tem, can be found in Appendix O. Although all components of this test planare important, you will note that the plan is really focused around threethings:
1. The test cases2. Metrics that will determine whether there has been testing success
or failure3. The schedule
TEST AUTOMATION
The usual practice in software development is that the software is writ-ten as quickly as possible and, once the application is done, it is testedand debugged. However, this is a costly and ineffective way because thesoftware testing process is difficult, time consuming, and resource inten-sive. With manual test strategies, this can be even more complicated andcumbersome. A better alternative is to perform unit testing independentof the rest of the code. During unit testing, developers compare the objectdesign model with each object and subsystem. Errors detected at the unitlevel are much easier to fix; we only need to debug the code in that smallunit. Unit testing is widely recognized as one of the most effective ways toensure application quality; however, it is a laborious and tedious task. Theworkload for unit testing is tremendous, so to perform unit testing manu-ally is practically impossible and hence the need for automatic unit test-ing. Another good reason to automate unit testing is that, when perform-ing manual unit testing, we run the risk of making mistakes (Aivazis, 2000).
Besides saving time and preventing human errors, automatic unit test-ing helps facilitate integration testing. After unit testing has removederrors in each subsystem, combinations of subsystems are integrated intolarger subsystems and tested. When tests do not reveal new errors, addi-tional subsystems are added to the group, and another iteration of integra-tion testing is performed. The re-execution of a subset of tests that havealready been conducted is regression testing. It ensures that no errors areintroduced as a result of adding new modules or modification in the soft-ware (Kolawa, 2001).
CuuDuongThanCong.com https://fb.com/tailieudientucntt
226
SOFTWARE ENGINEERING HANDBOOK
As integration testing proceeds, the number of regression tests cangrow very large. Therefore, it is inefficient and impractical to re-executeevery test manually once a change has occurred. The use of automatedcapture and playback tools may prove useful in this case. They enable thesoftware engineer to capture test cases and results for subsequent play-back and comparison.
Test automation can improve testers’ productivity; they can apply oneof several types of testing tools and techniques at various points of codeintegration. Some examples of automatic testing tools in the marketinclude:
• C++Test for automatic C/C++ unit testing by ParaSoft• Cantata++ for dynamic testing of C++ by IPL• WinRunner for unit and system tests by Mercury Interactive
WinRunner is probably one of the more popular tools in use todaybecause it automates much of the painful process of testing. Used in con-junction with a series of test cases (see Appendix O, Section 5), a bigchunk of the manual processes that constitute the bulk of testing can beautomated. The WinRunner product actually records a particular busi-ness process by recording the keystrokes a user makes (e.g., emulatesuser actions of placing an order). The QA person can then directly edit thetest script that WinRunner generates and add checkpoints and other vali-dation criteria.
When done correctly with appropriate testing tools and strategies, auto-mating software testing provides worthwhile benefits such as repeatabilityand significant time saving. This is true especially when the system movesinto system test. Higher quality is also a result because less time is spentin tracking down test environmental variables and in rewriting poorly writ-ten test cases (Raynor, 1999).
Principles for Test Automation
Test automation can be applied at unit testing, one or more layers ofintegration testing, and system testing (which is another form of integra-tion). Tests should be executed soon after the code is written, before toomuch code integration has occurred, so that bugs will not be carried for-ward. When strategizing for test automation, consider automating thesetests as early as possible, as well as later in the testing cycle (Zallar,2002).
Pettichord (2001) describes several principles that testers shouldadhere to in order to succeed with test automation. These principlesinclude:
CuuDuongThanCong.com https://fb.com/tailieudientucntt

227
Software Testing
• Taking testing seriously• Being careful who you choose to perform these tests• Choosing what parts of the testing process to automate• Being able to build maintainable and reliable test scripts• Using error recovery
Testers need to realize that test automation is a software developmentactivity and so needs to adhere to standard software development prac-tices. That is, test automation systems need to be tested and subjected tofrequent review and improvement to make sure that they are indeedaddressing the testing needs of the organization.
Because automating test scripts is part of the testing effort, good judg-ment is required in selecting appropriate tests to automate. Not everythingcan or should be automated. For example, overly complex tests are notworth automating; manual testing is still necessary in this case.
Zambelich (2002) provides a guideline to make automated testing costeffective. He says that automated testing is expensive and does not replacethe need for manual testing or enable you to “down-size” your testingdepartment. Automated testing is an addition to your testing process.Some pundits claim that it can take between three to ten times as long (orlonger) to develop, verify, and document an automated test case than tocreate and execute a manual test case. Zambelich indicates that this isespecially true if you elect to use the “record/playback” feature (containedin most test tools) as your primary automated testing methodology. In fact,Zambelich says that record/playback is the least cost-effective method ofautomating test cases. Automated testing can be made to be cost-effective,according to Zambelich, if some common sense is applied to the process:
• Choose a test tool that best fits the testing requirements of your orga-nization or company. An automated testing handbook is availablefrom the Software Testing Institute (http://www.softwaretestinginsti-tute.com).
• Understand that it does not make sense to automate everything. Over-ly complex tests are often more trouble to automate than they areworth. Concentrate on automating the majority of your tests, whichare probably fairly straightforward. Leave the overly complex tests formanual testing.
• Only automate tests that will be repeated; one-time tests are not worthautomating.
PRACTICAL APPROACH TO AUTOMATED SOFTWARE TESTING
Isenberg (1994) explains requirements for success in automated soft-ware testing. In order to succeed, the following four interrelated compo-nents must work together and support one another.
CuuDuongThanCong.com https://fb.com/tailieudientucntt

228
SOFTWARE ENGINEERING HANDBOOK
• Automated testing system — it must be flexible and easy to update.• Testing infrastructure — this includes a good bug tracking system, stan-
dard test case format, baseline test data, and comprehensive testplans.
• Software testing life cycle — it defines a set of phases outlining whattest activities to perform and when to conduct them. These phases areplanning, analysis, design, construction, testing (initial test cycles,bug fixes, and retesting), final testing and implementation, and post-implementation.
• Corporate support — automation cannot succeed without the corpora-tion’s commitment to adopting and supporting repeatable processes.
Automated testing systems should have the ability to adjust andrespond to unexpected changes to the software under test, which meansthat the testing systems will stay useful over time. Some of the practicalfeatures of automated software testing systems suggested by Isenberg are:
• Run all day and night in unattended mode• Continue running even if a test case fails• Write out meaningful logs• Keep test environment up to date• Track tests that pass, as well as tests that fail
USING AUTOMATED TESTING TOOLS
When automated testing tools are introduced, test engineers may needto face some difficulties. Project management should be used to plan theimplementation of testing tools. Without proper management and selec-tion of the right tool for the job, automated test implementation will fail(Hendrickson, 1998). Dustin (1999) has accumulated a list of “automatedtesting lessons learned” from his experiences with real projects and testengineer feedback. Some are presented here:
• The various tools used throughout the development life cycle do notintegrate easily if they are from different vendors.
• Automated testing tools can speed up the testing effort; however, itshould be introduced early in the testing life cycle in order to gainbenefits.
• Duplicate information that is kept in multiple repositories is difficultto maintain. As a matter of fact, in many instances the implementationof more tools can result in less productivity.
• The automated testing tool drives the testing effort. Often when a newtool is used for the first time, more time is spent on installation, train-ing, initial test case development, and automating test scripts than onactual testing.
• It is not necessary for everyone on the testing staff to spend his or hertime automating scripts.
CuuDuongThanCong.com https://fb.com/tailieudientucntt
229
Software Testing
• Sometimes elaborate test scripts are developed through overuse ofthe testing tool’s programming language, which duplicates the devel-opment effort. That is, too much time is spent on automating scriptswithout much additional value gained. Therefore, it is important toconduct an automation analysis and to determine the best approachto automation by estimating the highest return.
• Automated test script creation is cumbersome. It does not happen au-tomatically.
• Tool training needs to be initiated early in the project so that test en-gineers have the knowledge to use the tool.
• Testers often resist new tools. When introducing a new tool to the test-ing program, mentors and advocates of the tool are very important.
• There are expectations of early payback. When a new tool is intro-duced to a project, project members anticipate that the tool will nar-row the testing scope right away. In reality, it is the opposite — i.e.,initially the tool will increase the testing scope.
CONCLUSION
Test engineers can enjoy productivity increases as a testing taskbecomes automated and a thorough test plan is implemented. Creating agood and comprehensive automated test system requires an additionalinvestment of time and consideration, but it is cost effective in the longrun. More tests can be executed while the amount of tedious work on con-struction and validation of test cases is reduced.
Automated software testing is by no means a complete substitute formanual testing. In other words, manual testing cannot be totally elimi-nated; it should always precede automated testing. In this way, the timeand effort saved by using of automated testing can now be focused onmore important testing areas.
References
Aivazis, M., (2000). Automatic unit testing, Computer, 33, back cover.
Dustin, E. (1999) Lessons in test automation, STQE Mag., and from the World Wide Web:http://www.stickyminds.com/pop_print.asp?ObjectId = 1802&ObjectType = ARTCO, October,41.
Hendrickson, E. (1998). The difference between test automation failure and success, QualityTree Software, retrieved from http://www.qualitytree.com/feature/dbtasaf.pdf.
Isenberg, H.M. (1994) The practical organization of automated software testing, Multi-LevelVerification Conference 95, December 1994, retrieved from http://www.automated-test-ing.com/PATfinal.htm.
Kolawa, A., (2001). Regression testing at the unit level? Computer, 34, back cover.
Pettichord, B. (2001). Success with test automation, retrieved from http://www.io.com/~wazmo/succpap.htm.
CuuDuongThanCong.com https://fb.com/tailieudientucntt

230
SOFTWARE ENGINEERING HANDBOOK
Raynor, D.A. (1999). Automated software testing, retrieved from http://www.trainersdi-rect.com/resources/articles/ProjectManagement/AutomatedSoftwareTestingRaynor.html.
Zallar, K. (2002). Automated software testing — a perspective, retrieved from http://www.test-ingstuff.com/autotest.html.
Zambelich, K. (2002). Totally data-driven automated testing, retrieved from http://www.sqa-test.com/w_paper1.html.
CuuDuongThanCong.com https://fb.com/tailieudientucntt
231
Chapter 17
The Process of EDP Auditing
For as long as there have been computer departments there have been EDP(electronic data processing) auditors. These were and are the people whomake sure a system does what it is supposed to do. In this chapter we dis-cuss a methodology for EDP auditing using a Web-based system as anexample.
In the “Wild West” days of the Internet, companies were “plopping” sys-tems online faster than you could say “dot-com crash and burn.” Now thatthose heady days appear to be over, smart organizations are beginning tothink of their Web-based systems in the same terms as they do their moreconventional systems.
In their quest toward increasing market share while lowering costs,these organizations are finally delving into the intricacies of the Web-basedsystem to scrutinize such things as response time/availability, accessibil-ity, ergonomics, logistics, customer service, and security and privacy.
This chapter provides the IT manager with a series of checklists that canbe used to audit the Web-based system and easily modified to audit con-ventional systems. Audits should be done regularly, with the results usedto fine-tune the system. Ultimately, think of these checklists as a set ofissues that can be considered “food for thought.”
ORGANIZING YOUR AUDIT
It is recommended that you hire an external consulting firm to performthis critical effort; however, your EDP audit department, with adequatetraining, would be a sufficient alternative. The reason why I much prefer anexternal auditor is that “neutral third parties” are usually more objectivebecause they are not stakeholders and are not friendly with stakeholders.There is nothing like an unbiased opinion.
CuuDuongThanCong.com https://fb.com/tailieudientucntt
232
SOFTWARE ENGINEERING HANDBOOK
At a minimum, the auditor should obtain the following documentation:
• A diagram of the application system. A Web-based system is not unlikeany other computer system. It has processes (e.g., process creditcard) and entities (e.g., airline ticket) and shows the flow of data be-tween the entities via the processes. Exhibit 17-1 shows an excerptfrom a typical data-flow diagram.
• A network diagram. Most modern computer systems are developed us-ing one of several traditional network architectures (i.e., two-tier,three-tier, etc.). Add EDI or Internet connectivity and you have quite asophisticated environment. The auditor will need a roadmap to thisenvironment to be able to determine any connectivity issues.Exhibit 17-2 demonstrates what a simple network diagram should looklike.
• Staff hierarchy diagram. A complete list, preferably a diagram thatshows direct reports, along with phone numbers and e-mail addressesis required. A good starting point is shown in Exhibit 17-3.
One would think that a modern organization would have these threeitems readily available. Think again. In my own experience, few of the orga-nizations that I audit possess all three of these required items. Few possesseven two.
If these are not available to the auditor, my recommendation is to startthe audit effort with a series of brainstorming sessions in which at least thetwo diagrams are created. Even if diagrams are available, one or morebrainstorming sessions are still advisable. This provides the auditors a“walk through” where system and network architects can be questioneddirectly and invariably speeds up the audit process.
Once the preliminary step has been completed (i.e., understanding thesystem), the auditor can proceed through his or her paces in a logical andmethodical manner. The following sections, presented as a series of check-lists, represent areas of the audit that can be performed in any order.
The checklist is actually a series of questions or areas to be studied. Theresponses to these questions form the data collected for input to the finalaudit report. This report will contain problems found and issues over-looked, as well as recommendations for improvement. For example, theauditor might find that the company has done inadequate security testing.The recommendation here might be to bring in a “white hat” to performpenetration as well as intrusion testing. Alternatively, the audit mightuncover a deficiency in fulfillment processes the company follows to shipproducts to the customer. Again, the audit report will make recommenda-tions for improvement.
We will begin at the beginning.
CuuDuongThanCong.com https://fb.com/tailieudientucntt
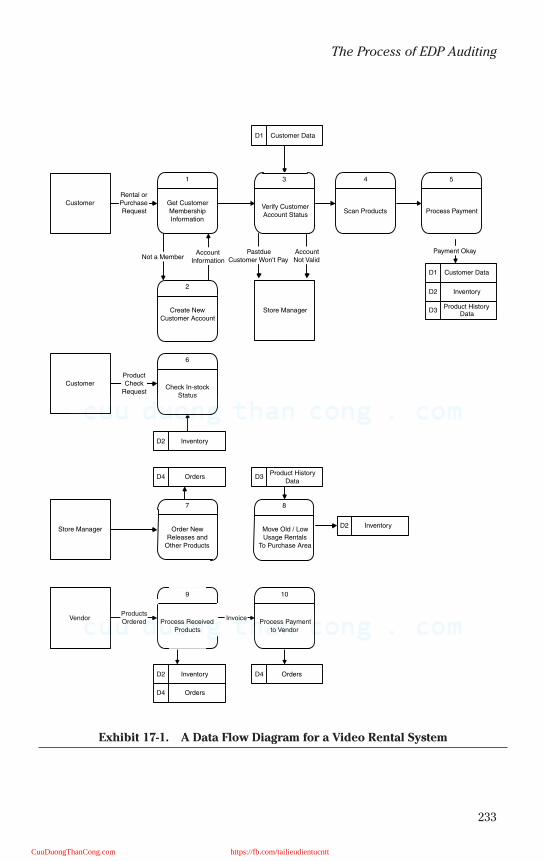
233
The Process of EDP Auditing
Exhibit 17-1. A Data Flow Diagram for a Video Rental System
10
Process Paymentto Vendor
Invoice
Customer
Customer
Store Manager
1
Get CustomerMembershipInformation
2
Create NewCustomer Account
Not a MemberAccount
Information
3
Verify CustomerAccount Status
PastdueCustomer Won't Pay
AccountNot Valid
4
Scan Products
5
Process Payment
Payment Okay
Rental orPurchaseRequest
Customer DataD1
InventoryD2
Product HistoryData
D3
Customer DataD1
6
Check In-stockStatus
ProductCheck
Request
InventoryD2
Store Manager
OrdersD4
Vendor
7
Order NewReleases and
Other Products
Product HistoryData
D3
8
Move Old / LowUsage Rentals
To Purchase Area
InventoryD2
ProductsOrdered
InventoryD2
OrdersD4
OrdersD4
9
Process ReceivedProducts
CuuDuongThanCong.com https://fb.com/tailieudientucntt
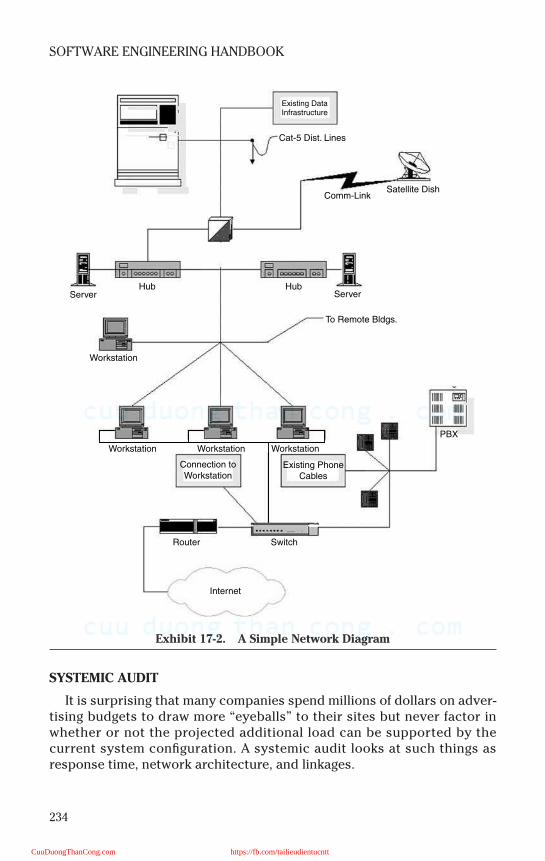
234
SOFTWARE ENGINEERING HANDBOOK
SYSTEMIC AUDIT
It is surprising that many companies spend millions of dollars on adver-tising budgets to draw more “eyeballs” to their sites but never factor inwhether or not the projected additional load can be supported by thecurrent system configuration. A systemic audit looks at such things asresponse time, network architecture, and linkages.
Exhibit 17-2. A Simple Network Diagram
Cat-5 Dist. Lines
Existing DataInfrastructure
Comm-LinkSatellite Dish
HubHubServer
To Remote Bldgs.
PBX
SwitchRouter
Internet
Server
Workstation
WorkstationWorkstation Workstation
Connection toWorkstation
Existing PhoneCables
CuuDuongThanCong.com https://fb.com/tailieudientucntt
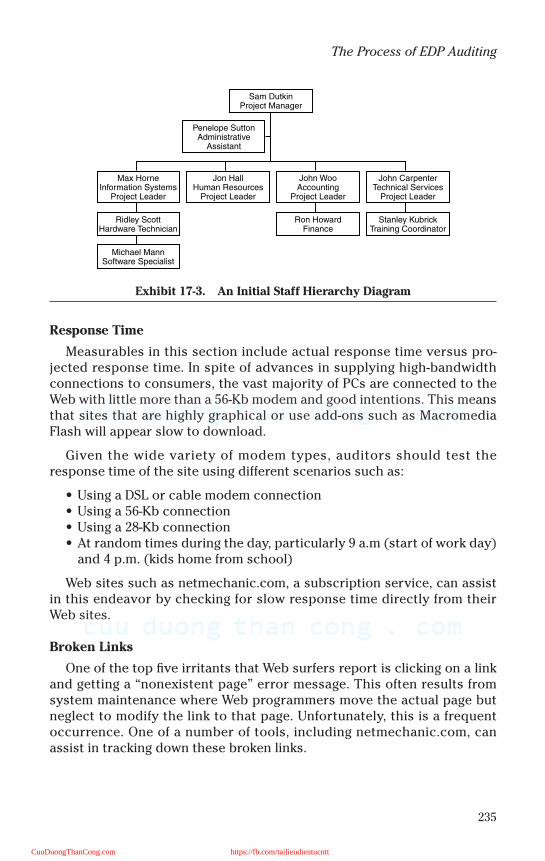
235
The Process of EDP Auditing
Response Time
Measurables in this section include actual response time versus pro-jected response time. In spite of advances in supplying high-bandwidthconnections to consumers, the vast majority of PCs are connected to theWeb with little more than a 56-Kb modem and good intentions. This meansthat sites that are highly graphical or use add-ons such as MacromediaFlash will appear slow to download.
Given the wide variety of modem types, auditors should test theresponse time of the site using different scenarios such as:
• Using a DSL or cable modem connection• Using a 56-Kb connection• Using a 28-Kb connection• At random times during the day, particularly 9 a.m (start of work day)
and 4 p.m. (kids home from school)
Web sites such as netmechanic.com, a subscription service, can assistin this endeavor by checking for slow response time directly from theirWeb sites.
Broken Links
One of the top five irritants that Web surfers report is clicking on a linkand getting a “nonexistent page” error message. This often results fromsystem maintenance where Web programmers move the actual page butneglect to modify the link to that page. Unfortunately, this is a frequentoccurrence. One of a number of tools, including netmechanic.com, canassist in tracking down these broken links.
Exhibit 17-3. An Initial Staff Hierarchy Diagram
Max HorneInformation Systems
Project Leader
Ridley ScottHardware Technician
Michael MannSoftware Specialist
Jon HallHuman Resources
Project Leader
Penelope SuttonAdministrative
Assistant
John WooAccounting
Project Leader
Ron HowardFinance
Sam DutkinProject Manager
John CarpenterTechnical Services
Project Leader
Stanley KubrickTraining Coordinator
CuuDuongThanCong.com https://fb.com/tailieudientucntt
236
SOFTWARE ENGINEERING HANDBOOK
Database Audit
Originally the Web was a simple place consisting mostly of text; nary adatabase was in sight. Today, the Web is filled to the brim with databases.The addition of databases makes the audit process even more complex.Because programming code is used to query, and perhaps even calculate,against that database, it is imperative that random checks be performed inan effort to pinpoint database query and calculation errors.
Essentially, auditing database access is similar to traditional IT (infor-mation technology) QA (quality assurance) process. One or more scriptsmust be written that will take that database through its paces. For example,if a database program calculates insurance rates based on a zip code, thenthat calculation should be duplicated manually or in a different parallelautomated fashion to ensure that the result is correct. The same can besaid for information that visitors to the site enter via a form. Is the informa-tion entered the same as that sent to the database?
Network Audit
The network, including node servers, should be tested to see if it iseffectively configured to provide optimum response. It is not uncommon tofind the Web development group separated from the traditional IT develop-ment group. This means that one frequently finds network configurationsdesigned inappropriately for the task at hand. For example, a site attract-ing tens of thousands of hits a day would do well to run a multitude of Webservers rather than just one.
Most organizations use one or more ISPs (Internet service providers) tohost their sites. The auditor should carefully gauge the level of service pro-vided by these ISPs as well.
SECURITY AND QUALITY
No one topic is discussed more in the press than Internet security. From“love bug” viruses to wily hackers breaking into Western Union, security isan important component of the audit.
It is worthwhile to keep in mind that the auditor is not a security auditor,nor should he be. His role is to conduct a top level assessment of the secu-rity of the Internet- or Intranet-based system and, if warranted, recommendthe services of a security firm well versed in penetration and intrusion test-ing. The entire issue of security is wrapped up within the more comprehen-sive issue of quality. This section will address both issues.
CuuDuongThanCong.com https://fb.com/tailieudientucntt
237
The Process of EDP Auditing
Review the Security Plan
All organizations must possess a security plan in writing. If they do nothave this then they are severely deficient. The plan, at a minimum, shouldaddress:
• Authentication. Is the person who he says he is.• Authorization. What users have what privileges; in other words, “who
can do what?”• Information integrity. Can the end user maliciously modify the infor-
mation?• Detection. Once a problem is identified, how is it handled?
Passwords
Passwords are the first shield of protection against malicious attacksupon your eBusiness. Questions to ask in this section include:
• Is anonymous login permitted? Under what conditions?• Is a password scanner periodically used to determine if passwords
can be hacked? Examples of this sort of utility include L0phtcrack.comfor NT and www.users.dircon.co.uk/~crypto for UNIX.
• How often are passwords changed?• How often are administrative accounts used to log on to systems?
Passwords are hard to remember. This means that, in order to gain en-trance to systems quickly, administrative and programming systemspeople often create easy-to-remember passwords such as “admin.”These are the first passwords that hackers try to gain entrance into asystem.
Staff Background
Administrative network staff must have a security background as well asa technical background. Those wishing to train their staffs would do well tolook into the security skills certification program provided by www.sans.org.
Connectivity
Today’s organization may have many external connections (i.e., part-ners, EDI, etc.), each of which the auditor should examine:
• The data passed between organizations: is what the company sent re-ceived correctly?
• The security of the connection: how is the data transmitted? Is it re-quired to be secure? Is encryption used?
• If encryption is indeed used, it must be determined whether an appro-priate algorithm is deployed.
CuuDuongThanCong.com https://fb.com/tailieudientucntt
238
SOFTWARE ENGINEERING HANDBOOK
The Product Base
All organizations invest in and then use a great deal of third-party soft-ware. As publicized by the press, much of this software — particularlybrowsers and e-mail packages, but word processing packages as well —contain security holes that, left unpatched, put the organization at risk.Therefore, for each software package used (for Net purposes):
• Check for publicized security holes.• Check for availability of software patches. Always upgrade to the lat-
est version of software and apply the latest patches.• Check to see if patches have been successfully applied.• Check security software for security holes. Security software, such as
a firewall, can contain security holes just like any other type of soft-ware. Check for updates.
In-House Development
The vast majority of Web-based software is written by in-house program-ming staff. When writing for the Web it is important to ensure that yourown staff does not leave gaping holes through which malicious outsiderscan gain entrance. There are a variety of programming “loopholes” thatopen the door wide to hackers:
• In programming parlance, a “GET” sends data from the browser (cli-ent) to the server. For example, look at the query string below:
http://www.site.com/process_card.asp?cardnumber = 123456789
All HTTP (hypertext transport protocol) requests get logged asstraight text into the server log as shown below:
2000–09–15 00:12:30 — W3SVC1 GET/process_card.asp
cardnumber = 123456789 200 0 623 360 570
80 HTTP/1.1 Mozilla/4.0+(compatible;+5.01;+Windows+NT)
Not only is the credit card number clearly visible in the log, but itmight also be stored in the browser’s history file, thus exposingthis sensitive information to someone else using the same machinelater. Security organizations recommend utilization of the POSTmethod rather than the GET method for this reason.
• Are the programmers using “hidden” fields to pass sensitive informa-tion? An example of this is relying on hidden form fields used withshopping carts. The hidden fields are sometimes used to send theitem price when the customer submits the form. It is rather easy for amalicious user to save the Web page to his own PC, change the hiddenfield to reflect any price he wants, and then submit it.
• One way to combat the problem discussed in the previous item is touse a hash methodology. A hash is a function that processes a
CuuDuongThanCong.com https://fb.com/tailieudientucntt

239
The Process of EDP Auditing
variable-length input and produces a fixed-length output. Because it isdifficult to reverse the process, the sensitive data transmitted in thismatter is secured. The auditor is required to assess the utilization ofthis methodology given any problems he might find in assessing theprevious item.
• Is sensitive data stored in ASP or JSP pages? Microsoft’s Internet infor-mation server (IIS) contains a number of security flaws that, undercertain circumstances, allows the source of an ASP or JSP page to bedisplayed rather than executed. In other words, the source code is vis-ible to anyone browsing that particular Web site. If sensitive data,such as passwords, is stored in the code then they will be displayed aswell. The rule here is not to hardcode any security credentials into thepage.
• Are application-specific accounts with rights identified early in the de-velopment cycle? There are two types of security. One is referred to as“declarative” and takes place when access control is set from outsidethe application program. “Programmatic” security occurs when theprogram checks the rights of the person accessing the system. Whendeveloping code for the Web, it is imperative that the rights issue beaddressed early in the development cycle. Questions to ask include:— How many groups will be accessing the data?— Will each group have the same rights?— Will you need to distinguish between different users within a group?— Will some pages permit anonymous access while others enforce au-
thentication?• How are you dealing with cross-site scripting? When sites accept user-
provided data (e.g., registration information, bulletin boards), whichis then used to build dynamic pages (i.e., pages created on the spur ofthe moment), the potential for security problems is increased 100-fold. No longer is the Web content created entirely by the Web design-ers; some of it now comes from other users. The risk comes from theexistence of a number of ways in which text can be entered to simulatecode. This code can then be executed as any other code written by theWeb designers — except that it was written by a malicious user in-stead. Javascript and html can be manipulated to contain maliciouscode, which can perform a number of activities such as redirecting us-ers to other sites, modifying cookies, etc. More information on thistopic can be obtained from CERT’s Website at http://www.cert.org/ad-visories/CA-2000–02.html and http://www.cert.org/tech_tips/malicious_code_mitigation.html.
• Have you checked Wizard-generated or sample code? Often program-mers “reuse” sample code they find on the Web or make use of gener-ated code from Web development tools. Often the sample orgenerated code contains hardcoded credentials to access databases,
CuuDuongThanCong.com https://fb.com/tailieudientucntt
240
SOFTWARE ENGINEERING HANDBOOK
directories, etc. The auditor will want to make sure that this is not thecase in the code being audited.
• Are code reviews performed? Nothing is worse than the lone program-mer. Many of the problems discussed in the previous sections can benegated if the code that all programmers write is subject to a peer re-view. Code reviews, a mainstay of traditional quality-oriented pro-gramming methodology, are rarely done in today’s fast-paced Internetenvironment. This is one of the reasons why so many security break-ins occur.
• It is necessary to conduct a Web server review. In order to run pro-grams on the Web, many organizations use the CGI (common gatewayinterface) to enable programs (i.e., scripts) to run on their servers.CGI is not only a gateway for your programming code (i.e., via data col-lections forms) but also a gateway for hackers to gain access to yoursystems. Vulnerable CGI programs present an attractive target tointruders because they are easy to locate and usually operate with theprivileges and power of the Web server software. The replacement ofJanet Reno’s picture with that of Hitler on the Department of JusticeWeb site is an example of this sort of CGI hole. The following questionsmust be asked of developers using CGI:— Are CGI interpreters located in bin directories? This should not be
the case because you are providing the hacker with all the capabil-ities he needs to insert malicious code and then run it directly fromyour server.
— Is CGI support configured when not needed?— Are you using remote procedure calls (RPC)? These calls allow pro-
grams on one computer to execute programs on a second comput-er. Much evidence indicates that the majority of distributed denialof service attacks launched during 1999 and early 2000 were execut-ed by systems that had RPC vulnerabilities. It is recommended,wherever possible, to turn off or remove these services on ma-chines directly accessible from the Internet. If this is not possible,then at least ensure that the latest patches to the software are in-stalled; these mitigate some of the known security holes.
— Is IIS used? This is the software used on most Web sites deployed onWindows NT and Windows 2000 servers. Programming flaws in IISremote data services (RDS) are used by hackers to run remote com-mands with administrator privileges. Microsoft’s Web site discuss-es methodologies to use to combat these flaws.
Testing
Pre-PC testing was a slow and meticulous process. Today’s faster pacemeans that inadequate testing is performed by most organizations. In
CuuDuongThanCong.com https://fb.com/tailieudientucntt
241
The Process of EDP Auditing
addition, many organizations forego security testing entirely. In this sec-tion of the audit, we determine whether adequate security is performed.
• Has penetration testing been done? This testing is used to assess thetype and extent of security-related vulnerabilities in systems and net-works, test network security perimeters, and empirically verify theresistance of applications to misuse and exploitation. It is possiblethat system administrators are sophisticated enough to be able toutilize the tool sets available to scan the systems for vulnerabilities;however, a whole host of “white hat” hacker security consulting firmshave sprung up over the past several years and these people arerecommended.
• Has intrusion testing been done? Many software tools are available onthe market today that “monitor” systems and report on possible intru-sions. These are referred to as intrusion detection systems (IDS). Inthis section of the audit, we determine whether an IDS is used and, ifso, how effectively.
• Is there a QA (quality assurance) function? Although QA departmentshave been a traditional part of the IT function for decades, many new-er pure-play Internet companies seem to ignore this function. In thissection, the auditor will determine if the QA function is present; if it is,then it will be reviewed.
Reporting
Logging of all logins, attempted intrusions, etc. must be maintained fora reasonable period of time. In this section, the auditor will determine ifthese logs are maintained and, if so, for how long.
Backup
In the event of failure it is usual that the last backup be used to restorethe system. In this section, the auditor will determine the frequency ofbackups and whether this schedule is reasonable.
ERGONOMICS
At this stage the auditor becomes involved in more abstract issues. Inthe last section on security, we could be very specific about what a systemrequires. In the section on ergonomics we need to be more subjective.
To achieve this end will require the auditor to meet with the systemdevelopers and with the end users. At times, these end users will be cur-rent or potential customers of the system; therefore, it might be necessaryto develop surveys and perform focus groups. The goal here is nothing lessthan determining a “thumbs up” or “thumbs down” on the Web-based sys-tem vis-à-vis other Web-based systems.
CuuDuongThanCong.com https://fb.com/tailieudientucntt
242
SOFTWARE ENGINEERING HANDBOOK
Navigability
Navigation means determination of whether or not the site makes sensein terms of browsing it.
• How easy is it to find something on this site? If looking for a specificproduct, how many pages does one need to surf through to find it?
• Is there a search engine? If so, review for correctness and complete-ness. Many sites do not have search engines (in this instance we aretalking about a search engine to search the site only, rather than theInternet). If the Web site exhibits depth (i.e., many pages), it becomesrather difficult to navigate around it. If a search engine is available, theauditor must check to see if what is being searched for can be correct-ly found.
• Is there a site map? If so, review for correctness and completeness.While not required and not often found, site maps are one of the mostuseful of site navigation tools. If available, the auditor will determinecorrectness of this tool.
• Are back and forward (or other) buttons provided? What tools are pro-vided to the end user for moving backward and forward within thesite? Are the browser’s back and forward buttons the only navigationtools — or did the Web designers provide fully functional toolbars? Ifso, do these toolbars work on all pages? We have found that, of thosefirms audited, 10 percent of the pages pointed to by the toolbars can-not be found.
• Are frames used? If so, do toolbars and other navigation tools stillwork?
Usability
In the end it comes down to one question really: “How usable is the Website?” In this section we ask:
• How easy is it to use this site? Although the auditor might have anopinion that might well be valid, here we resort to surveys and focusgroups to determine the answer.
• How useful is this site?
Content
In this section we assess the value of the information contained withinthe site compared to competitive sites.
• Is content updated regularly?• Is content relevant?• Do visitors consider content worthwhile? The auditor will use survey
techniques to determine the answer to this question.
CuuDuongThanCong.com https://fb.com/tailieudientucntt
243
The Process of EDP Auditing
• How does content compare with competitors’? The auditor will usesurvey techniques to determine the answer to this question.
Search Engine
The use of search engines as a way to find a site has declined in popular-ity, but it is still an important marketing vehicle on the Web. In this sectionthe auditor will determine where the site places when performing a searchusing the top ten search engines.
CUSTOMER SERVICE
The Web is a doorway to the company’s business; however, it is just onepart of the business. Tangential services must be audited as well. Customerservice is one of the biggest problem areas for Net firms. There have beenmany well-publicized instances of shoddy customer service. It is in thecompany’s best interests, therefore, to assess customer service within thefirm vis-a-vis its Web presence.
Accessibility
How easy is it for your customers to reach you?
• Review e-mail response. How long does it take you to respond to a cus-tomer e-mail?
• Review telephone response. How long does a customer wait on holdbefore a person answers his or her query?
E-Commerce
If your site doubles as an e-commerce site (i.e., you sell goods or ser-vices from your site), you need to assess the quality of this customerexperience.
• Check shopping experience. Using a “mystery shopper” approach, theauditor will endeavor to make routine purchases using the Web site.Determine:— Is the shopping cart correct (i.e., are the goods you purchased in
the shopping cart)?— Does the e-commerce software calculate taxes properly?— Does the e-commerce software calculate shipping charges properly?
• Check the fulfillment experience:— Is a confirmation e-mail sent to the purchaser?— Is the return policy carefully explained?— How quickly does the company refund money on returns?
CuuDuongThanCong.com https://fb.com/tailieudientucntt
244
SOFTWARE ENGINEERING HANDBOOK
Privacy
At a minimum, the auditor must review the company’s privacy policystatement. He or she should then review the data flow to determine if theprivacy policy is adhered to.
LEGALITY
The digital age makes it easy to perform illegal and potentially litigiousacts. From a corporate perspective, this can be anything from a Webdesigner illegally copying a copyrighted piece of art to employees down-loading pornography.
Copyright
Check the content ownership of text on your site. It is quite easy to copytext from one site to another. Ensure that your copy is completely originalor that you have the correct permissions to reprint the data. In the sameway, check image ownership.
Employee Web Usage
In a number of court cases employees have claimed harassment whenother employees within the organization downloaded and e-mailed por-nography. The company is responsible for the actions of its employees;therefore, it is highly recommended that the company:
• Create a policy memo detailing what can and cannot be done on the In-ternet (include e-mail). Make sure all employees sign and return thismemo. Use tools such as those on surfcontrol.com to monitor employ-ee Net usage.
• Determine whether any e-mail monitoring software is used and deter-mine its effectiveness.
CONCLUSION
Auditing IT systems is an important activity. It is surprising, then, that sofew companies take the time and effort to perform this necessary activity.EDP auditing not only pinpoints potentially troublesome technical areasbut it can also serve as reinforcement for stakeholder support by identify-ing human factor issues as well.
CuuDuongThanCong.com https://fb.com/tailieudientucntt
245
Chapter 18
The Management of Software Maintenance
Maintenance is often called the enigma of software. Enormous amounts ofdollars are spent on it but little management attention is given to it. Soft-ware maintenance presents a real conundrum — hardware deterioratesbecause of lack of maintenance, whereas software often deterioratesbecause of the presence of maintenance.
Maintenance is also the most expensive component of the software lifecycle, as shown in Exhibit 18-1. IT departments spend from 75 to 80 percentof their budget (Guimaraes, 1983) and time on the maintenance process ofsystem development. In addition, the cost of fixing an error rises dramati-cally as the software progresses through the life cycle. This amply demon-strates that maintenance costs more than any other phase and also thatmaintenance costs (per fixing the error) are enormous.
Once a new system is implemented, the real work begins for most ITdepartments. As users utilize the system, errors are discovered, andchanges are requested. As systems have become more widely used withincritical departments of the organization, the maintenance process hastaken on a more important role. The management of systems maintenancehas become perhaps the most critical phase of systems development.
THE MAINTENANCE PROCESS
As the new system is implemented and users begin to work with it,errors occur or changes are needed. Just as in the development of a newsystem, maintenance requires that steps be taken carefully in makingchanges or fixing errors. In the event of an error, this can be even more crit-ical. Each step of the maintenance process is similar to steps in the sys-tems development life cycle (Curtis et al., 2000) as seen in Exhibit 18-2.This is a logical extension of the development process because changesmade to the system can affect the whole system and need to be controlledcarefully.
CuuDuongThanCong.com https://fb.com/tailieudientucntt
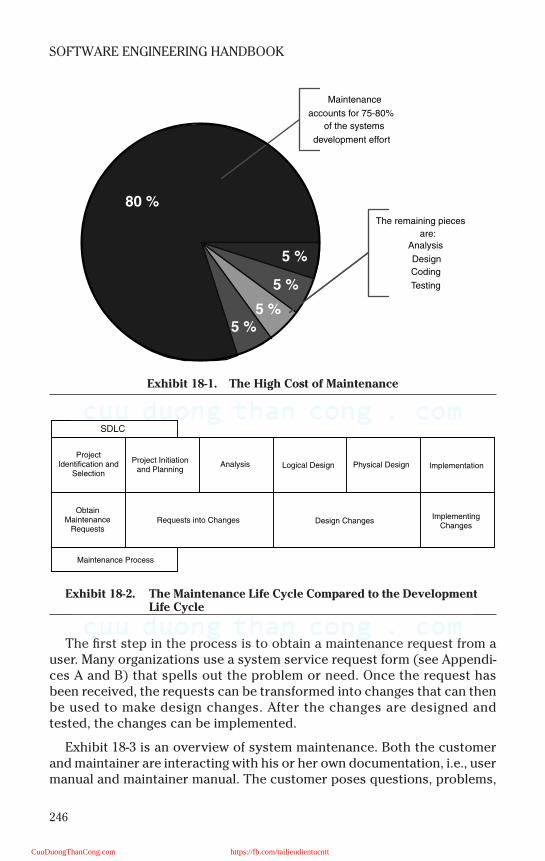
246
SOFTWARE ENGINEERING HANDBOOK
The first step in the process is to obtain a maintenance request from auser. Many organizations use a system service request form (see Appendi-ces A and B) that spells out the problem or need. Once the request hasbeen received, the requests can be transformed into changes that can thenbe used to make design changes. After the changes are designed andtested, the changes can be implemented.
Exhibit 18-3 is an overview of system maintenance. Both the customerand maintainer are interacting with his or her own documentation, i.e., usermanual and maintainer manual. The customer poses questions, problems,
Exhibit 18-1. The High Cost of Maintenance
Exhibit 18-2. The Maintenance Life Cycle Compared to the Development Life Cycle
5 %
5 %
5 %
80 %
5 %
Maintenance
accounts for 75-80%
of the systems
development effort
The remaining pieces
are:
Analysis
Design
Coding
Testing
SDLC
ProjectIdentification and
Selection
Project Initiationand Planning
Analysis
Requests into ChangesObtain
MaintenanceRequests
Maintenance Process
Logical Design
Design Changes
Physical Design Implementation
ImplementingChanges
CuuDuongThanCong.com https://fb.com/tailieudientucntt
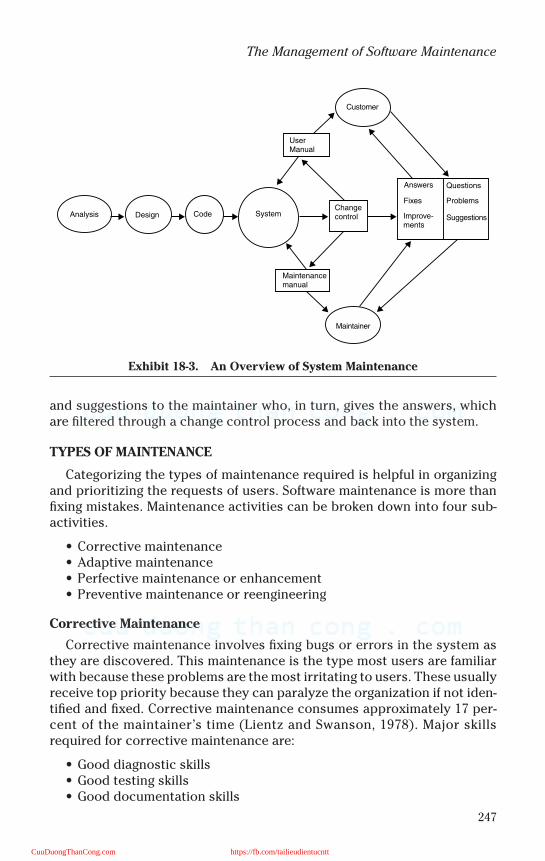
247
The Management of Software Maintenance
and suggestions to the maintainer who, in turn, gives the answers, whichare filtered through a change control process and back into the system.
TYPES OF MAINTENANCE
Categorizing the types of maintenance required is helpful in organizingand prioritizing the requests of users. Software maintenance is more thanfixing mistakes. Maintenance activities can be broken down into four sub-activities.
• Corrective maintenance• Adaptive maintenance• Perfective maintenance or enhancement• Preventive maintenance or reengineering
Corrective Maintenance
Corrective maintenance involves fixing bugs or errors in the system asthey are discovered. This maintenance is the type most users are familiarwith because these problems are the most irritating to users. These usuallyreceive top priority because they can paralyze the organization if not iden-tified and fixed. Corrective maintenance consumes approximately 17 per-cent of the maintainer’s time (Lientz and Swanson, 1978). Major skillsrequired for corrective maintenance are:
• Good diagnostic skills• Good testing skills• Good documentation skills
Exhibit 18-3. An Overview of System Maintenance
Questions
Problems
Suggestions
Customer
Maintainer
Analysis Design Code System
UserManual
Maintenancemanual
Changecontrol
Answers
Fixes
Improve-ments
CuuDuongThanCong.com https://fb.com/tailieudientucntt
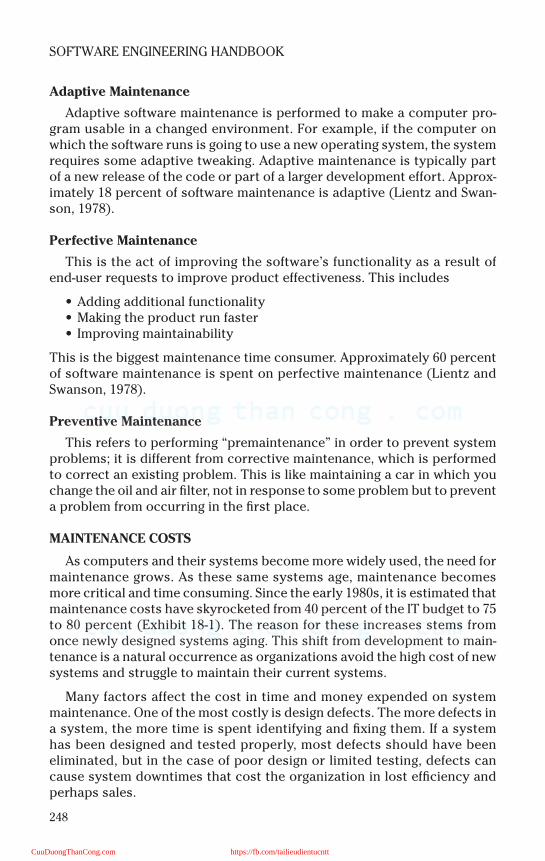
248
SOFTWARE ENGINEERING HANDBOOK
Adaptive Maintenance
Adaptive software maintenance is performed to make a computer pro-gram usable in a changed environment. For example, if the computer onwhich the software runs is going to use a new operating system, the systemrequires some adaptive tweaking. Adaptive maintenance is typically partof a new release of the code or part of a larger development effort. Approx-imately 18 percent of software maintenance is adaptive (Lientz and Swan-son, 1978).
Perfective Maintenance
This is the act of improving the software’s functionality as a result ofend-user requests to improve product effectiveness. This includes
• Adding additional functionality• Making the product run faster• Improving maintainability
This is the biggest maintenance time consumer. Approximately 60 percentof software maintenance is spent on perfective maintenance (Lientz andSwanson, 1978).
Preventive Maintenance
This refers to performing “premaintenance” in order to prevent systemproblems; it is different from corrective maintenance, which is performedto correct an existing problem. This is like maintaining a car in which youchange the oil and air filter, not in response to some problem but to preventa problem from occurring in the first place.
MAINTENANCE COSTS
As computers and their systems become more widely used, the need formaintenance grows. As these same systems age, maintenance becomesmore critical and time consuming. Since the early 1980s, it is estimated thatmaintenance costs have skyrocketed from 40 percent of the IT budget to 75to 80 percent (Exhibit 18-1). The reason for these increases stems fromonce newly designed systems aging. This shift from development to main-tenance is a natural occurrence as organizations avoid the high cost of newsystems and struggle to maintain their current systems.
Many factors affect the cost in time and money expended on systemmaintenance. One of the most costly is design defects. The more defects ina system, the more time is spent identifying and fixing them. If a systemhas been designed and tested properly, most defects should have beeneliminated, but in the case of poor design or limited testing, defects cancause system downtimes that cost the organization in lost efficiency andperhaps sales.
CuuDuongThanCong.com https://fb.com/tailieudientucntt
249
The Management of Software Maintenance
The number of users can also affect the cost of system maintenance.The more users, the more time will be spent on changes to the system.More importantly, the more platforms the system is installed on, the higherthe cost of maintenance. If a single system needs a change, then the time ittakes to change the system is limited, but if that system resides on plat-forms across the country, e.g., in many branch offices of corporations, thenthe cost is increased significantly.
The quality of the documentation can also affect the overall cost ofmaintenance. Poor documentation can result in many lost hours searchingfor an answer that should have been explained in the documentation(Lientz and Swanson, 1981). The documentation is a type of road map tothe system; when the map is well defined, finding your way through the sys-tem and understanding it become much easier.
The quality of the people and their skill level can also cost an IT depart-ment many wasted hours. An inexperienced or overloaded programmercan increase the cost of maintenance in two ways. First he or she can wastehours learning on the job at the IT department’s expense. Second, a pro-grammer overwhelmed with projects, may skip steps in the maintenanceprocess and, in turn, make mistakes that cost time and money to fix.
The tools available to maintenance personnel can save many hours ofwork. Using automation tools such as CASE tools, debuggers, and otherscan help the programmer pinpoint problems faster or make changes moreeasily.
The structure of the software can also contribute to maintenance costs(Gibson, 1989). If software is built in a rational and easy-to-follow manner,making changes will be much easier and thus much faster, saving time andresources. Software maintenance costs can be reduced significantly if thesoftware architecture is well defined and clearly documented, and createsan environment that promotes design consistency through the use ofguidelines and design patterns (Hulse et al., 1989).
A MODEL FOR MAINTENANCE
Harrison and Cook have developed a new model of software mainte-nance based upon an objective decision rule, which determines whether agiven software module can be effectively modified or if it should be rewrit-ten. Their take is that completely rewriting a module can be expensive.However, it can be even more expensive if the module’s structure has beenseverely degraded over successive maintenance activities. A module thatis likely to experience significant maintenance activity is called “changeprone.” Their paper suggests that early identification of change-pronemodules through the use of change measures across release cycles can bean effective technique in efficiently allocating maintenance resources.
CuuDuongThanCong.com https://fb.com/tailieudientucntt
250
SOFTWARE ENGINEERING HANDBOOK
In maintenance requests for nonchange-prone modules, the processflow is as follows:
Analyze code and identify change →Implement change and update documentation →Apply metric analysis →Compare with baseline →Check to see if it exceeds the threshold →If yes, then declare module to be “change prone;”
otherwise, declare module to be non-change prone.
The process for maintenance requests for a change-prone module is asfollows:
Identify the highest level artifact affected by the request →Regenerate artifact →Identify artifacts that can be reused →Iterate through “development” →Declare module to be non-change prone.
MANAGING MAINTENANCE PERSONNEL
As systems age and demand increases for maintenance personnel, therehas been a loud debate over just who should be doing the maintaining.Should it be the original developers? Or should it be a separate mainte-nance department? Many have argued that the people who developed thesystem should maintain it because they will best understand the systemand be better able to change it (Swanson, 1990). This logic is correct butdifficult to fulfill because developers want to keep building new systemsand consider maintenance a less desirable function. IT professionals viewmaintenance as fixing someone else’s mistakes. One solution to this prob-lem that has been tried recently involves rotating the IT personnel fromdevelopment to maintenance and back to allow everyone to share in thedesirable as well as undesirable functions of the department.
MEASURING EFFECTIVENESS
An important part of managing maintenance is to understand and mea-sure the effectiveness of the maintenance process. As a system is imple-mented, service requests may be quite high as bugs are worked out andneeds for change are discovered. If the maintenance process is operatingproperly an immediate decrease in failures should be seen (Exhibit 18-4).Good management of maintenance should include recording failures overtime and analyzing these for effectiveness. If a decrease is not noticed, theproblem should be identified and resolved.
CuuDuongThanCong.com https://fb.com/tailieudientucntt
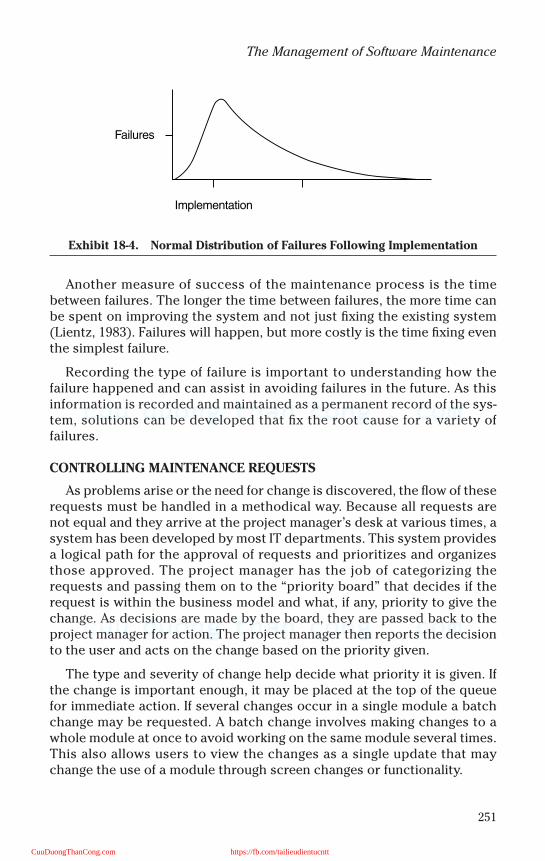
251
The Management of Software Maintenance
Another measure of success of the maintenance process is the timebetween failures. The longer the time between failures, the more time canbe spent on improving the system and not just fixing the existing system(Lientz, 1983). Failures will happen, but more costly is the time fixing eventhe simplest failure.
Recording the type of failure is important to understanding how thefailure happened and can assist in avoiding failures in the future. As thisinformation is recorded and maintained as a permanent record of the sys-tem, solutions can be developed that fix the root cause for a variety offailures.
CONTROLLING MAINTENANCE REQUESTS
As problems arise or the need for change is discovered, the flow of theserequests must be handled in a methodical way. Because all requests arenot equal and they arrive at the project manager’s desk at various times, asystem has been developed by most IT departments. This system providesa logical path for the approval of requests and prioritizes and organizesthose approved. The project manager has the job of categorizing therequests and passing them on to the “priority board” that decides if therequest is within the business model and what, if any, priority to give thechange. As decisions are made by the board, they are passed back to theproject manager for action. The project manager then reports the decisionto the user and acts on the change based on the priority given.
The type and severity of change help decide what priority it is given. Ifthe change is important enough, it may be placed at the top of the queuefor immediate action. If several changes occur in a single module a batchchange may be requested. A batch change involves making changes to awhole module at once to avoid working on the same module several times.This also allows users to view the changes as a single update that maychange the use of a module through screen changes or functionality.
Exhibit 18-4. Normal Distribution of Failures Following Implementation
Failures
Implementation
CuuDuongThanCong.com https://fb.com/tailieudientucntt
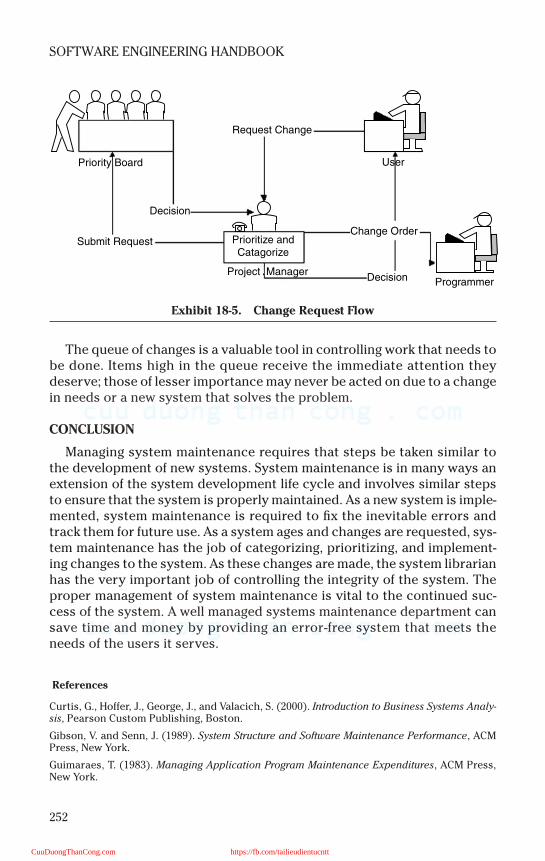
252
SOFTWARE ENGINEERING HANDBOOK
The queue of changes is a valuable tool in controlling work that needs tobe done. Items high in the queue receive the immediate attention theydeserve; those of lesser importance may never be acted on due to a changein needs or a new system that solves the problem.
CONCLUSION
Managing system maintenance requires that steps be taken similar tothe development of new systems. System maintenance is in many ways anextension of the system development life cycle and involves similar stepsto ensure that the system is properly maintained. As a new system is imple-mented, system maintenance is required to fix the inevitable errors andtrack them for future use. As a system ages and changes are requested, sys-tem maintenance has the job of categorizing, prioritizing, and implement-ing changes to the system. As these changes are made, the system librarianhas the very important job of controlling the integrity of the system. Theproper management of system maintenance is vital to the continued suc-cess of the system. A well managed systems maintenance department cansave time and money by providing an error-free system that meets theneeds of the users it serves.
References
Curtis, G., Hoffer, J., George, J., and Valacich, S. (2000). Introduction to Business Systems Analy-sis, Pearson Custom Publishing, Boston.
Gibson, V. and Senn, J. (1989). System Structure and Software Maintenance Performance, ACMPress, New York.
Guimaraes, T. (1983). Managing Application Program Maintenance Expenditures, ACM Press,New York.
Exhibit 18-5. Change Request Flow
Priority Board
Decision
Submit Request
Request Change
Prioritize andCatagorize
Project Manager
User
Change Order
Decision Programmer
CuuDuongThanCong.com https://fb.com/tailieudientucntt
253
The Management of Software Maintenance
Harrison, W. and Cook, C. Insights on improving the maintenance process through softwaremeasurement. http://www.cs.pdx.edu/~warren/Papers/CSM.htm.
Hulse, C., Edgerton, S., Ubnoske, M., and Vazquez, L. (1999). Reducing Maintenance Coststhrough the Application of Modern Software Architecture Principles, ACM Press, New York.
Lientz, B. (1983). Issues in Software Maintenance, ACM Press, New York.
Lientz, B.P. and Swanson, E.B. (1978). Characteristics of application software maintenance,Commn. ACM, 21, 466–481.
Lientz, B.P. and Swanson, B. (1981). Problems in Application Software Maintenance, ACM Press,New York.
Swanson, E. (1990). Departmentalization in Software Development and Maintenance, ACMPress, New York.
CuuDuongThanCong.com https://fb.com/tailieudientucntt

This page intentionally left blank
CuuDuongThanCong.com https://fb.com/tailieudientucntt

255
Chapter 19
The Science of Documentation
The one thing that software developers hate to do is to document their pro-grams and their systems. Therefore, it is understandable that softwaredocumentation is the one of the most neglected areas in information tech-nology. However, documentation is one of the most important componentsof systems development. Without adequate documentation, the systemcan be neither utilized efficiently nor maintained properly.
WHAT EXACTLY IS DOCUMENTATION?
According to Ambler (2002), a document is any artifact external tosource code whose purpose is to convey information in a persistent man-ner; documentation includes documents and comments in source code. Amodel is an abstraction that describes one or more aspects of a problem ora potential solution.
All professionals in the field agree that documentation promotes soft-ware quality. There are numerous, well-documented reasons for this. DavidTufflye, a consultant who specializes in producing high-quality documenta-tion to a predefined standard, says that consistent, accurate project docu-mentation is known to be a major factor contributing to information sys-tems quality. He goes on to say that document production, version control,and filing are often not performed, contributing to a higher number of soft-ware defects that impact the real and perceived quality of the software, aswell as leading to time and expense spent on rework and higher mainte-nance costs (Tufflye, 2002).
Marcello Alfredo Visconti proposes a software system documentationprocess maturity model that is consistent with — and runs in conjunctionwith — the Software Engineering Institute’s (SEI) software process andcapability maturity model. He argues that one of the major goals of soft-ware engineering is to produce the best possible working software alongwith the best possible supporting documentation.
Decades’ worth of empirical data shows that software documentationprocesses and products are key components of software quality. These
CuuDuongThanCong.com https://fb.com/tailieudientucntt
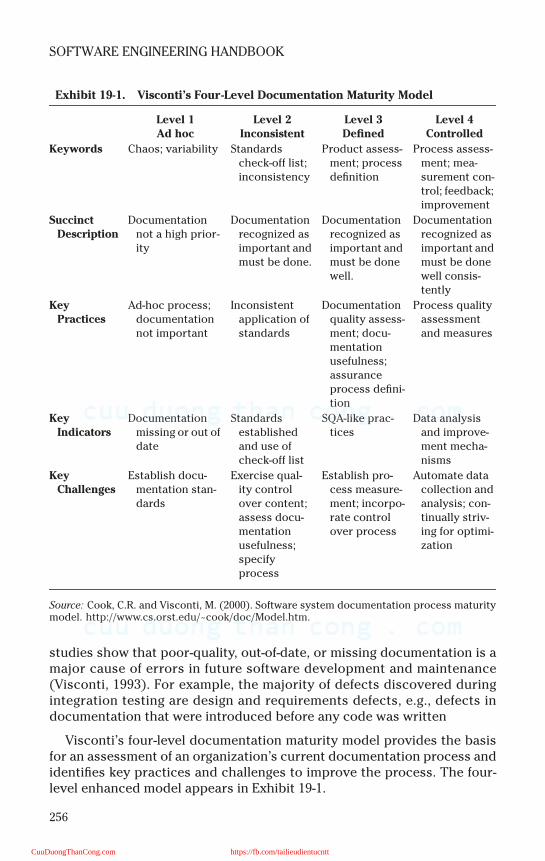
256
SOFTWARE ENGINEERING HANDBOOK
studies show that poor-quality, out-of-date, or missing documentation is amajor cause of errors in future software development and maintenance(Visconti, 1993). For example, the majority of defects discovered duringintegration testing are design and requirements defects, e.g., defects indocumentation that were introduced before any code was written
Visconti’s four-level documentation maturity model provides the basisfor an assessment of an organization’s current documentation process andidentifies key practices and challenges to improve the process. The four-level enhanced model appears in Exhibit 19-1.
Exhibit 19-1. Visconti’s Four-Level Documentation Maturity Model
Level 1Ad hoc
Level 2Inconsistent
Level 3Defined
Level 4Controlled
Keywords Chaos; variability Standards check-off list; inconsistency
Product assess-ment; process definition
Process assess-ment; mea-surement con-trol; feedback; improvement
Succinct Description
Documentation not a high prior-ity
Documentation recognized as important and must be done.
Documentation recognized as important and must be done well.
Documentation recognized as important and must be done well consis-tently
Key Practices
Ad-hoc process; documentation not important
Inconsistent application of standards
Documentation quality assess-ment; docu-mentation usefulness; assurance process defini-tion
Process quality assessment and measures
Key Indicators
Documentation missing or out of date
Standards established and use of check-off list
SQA-like prac-tices
Data analysis and improve-ment mecha-nisms
Key Challenges
Establish docu-mentation stan-dards
Exercise qual-ity control over content; assess docu-mentation usefulness; specify process
Establish pro-cess measure-ment; incorpo-rate control over process
Automate data collection and analysis; con-tinually striv-ing for optimi-zation
Source: Cook, C.R. and Visconti, M. (2000). Software system documentation process maturitymodel. http://www.cs.orst.edu/~cook/doc/Model.htm.
CuuDuongThanCong.com https://fb.com/tailieudientucntt
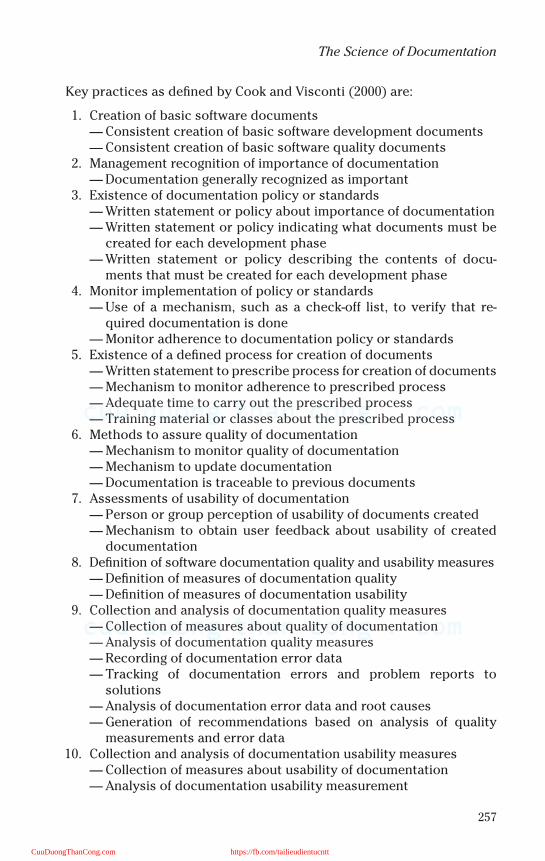
257
The Science of Documentation
Key practices as defined by Cook and Visconti (2000) are:
1. Creation of basic software documents— Consistent creation of basic software development documents— Consistent creation of basic software quality documents
2. Management recognition of importance of documentation— Documentation generally recognized as important
3. Existence of documentation policy or standards— Written statement or policy about importance of documentation— Written statement or policy indicating what documents must be
created for each development phase— Written statement or policy describing the contents of docu-
ments that must be created for each development phase4. Monitor implementation of policy or standards
— Use of a mechanism, such as a check-off list, to verify that re-quired documentation is done
— Monitor adherence to documentation policy or standards5. Existence of a defined process for creation of documents
— Written statement to prescribe process for creation of documents— Mechanism to monitor adherence to prescribed process— Adequate time to carry out the prescribed process— Training material or classes about the prescribed process
6. Methods to assure quality of documentation— Mechanism to monitor quality of documentation— Mechanism to update documentation— Documentation is traceable to previous documents
7. Assessments of usability of documentation— Person or group perception of usability of documents created— Mechanism to obtain user feedback about usability of created
documentation8. Definition of software documentation quality and usability measures
— Definition of measures of documentation quality— Definition of measures of documentation usability
9. Collection and analysis of documentation quality measures— Collection of measures about quality of documentation— Analysis of documentation quality measures— Recording of documentation error data— Tracking of documentation errors and problem reports to
solutions— Analysis of documentation error data and root causes— Generation of recommendations based on analysis of quality
measurements and error data10. Collection and analysis of documentation usability measures
— Collection of measures about usability of documentation— Analysis of documentation usability measurement
CuuDuongThanCong.com https://fb.com/tailieudientucntt
258
SOFTWARE ENGINEERING HANDBOOK
— Generation of recommendations based on analysis of usabilitymeasurements
— Generation of documentation usage profile11. Process improvement feedback loop
— Mechanism to feedback improvements to documentationprocess
— Mechanism to incorporate feedback on quality of documentation— Mechanism to incorporate feedback on usability of documentation
An assessment procedure was developed to determine where an organi-zation’s documentation process stands relative to the model. This enablesmapping from an organization’s past performance to a documentationmaturity level and ultimately generates a documentation process profile.The profile indicates key practices for that level and identifies areas ofimprovement and challenges to move to the next higher level.
Application of the model has a definite financial benefit. The softwaredocumentation maturity model and assessment procedure have been usedto assess a number of software organizations and projects; a cost/benefitanalysis of achieving documentation maturity levels has been performedusing COCOMO that yielded an estimated return on investment of about6:1 when moving from the least mature level to the next. According toVisconti, these results support the main claim of this research: softwareorganizations that are at a higher documentation process maturity levelalso produce higher-quality software, resulting in reduced software testingand maintenance effort (Visconti, 1993).
METHODS AND STANDARDS
The many approaches to producing documentation are practicallyunique to each organization. Although the majority of software documen-tation is produced manually — i.e., done with word processing programsor with tools such as Microsoft Visio, some systems are designed to easethe process and will produce “automatic” documentation. Some of theautomatic documentation capabilities are a subset of systems of a widerrange of capabilities; this is the case with many computer-assisted soft-ware engineering (CASE) tools. These products are designed to supportdevelopment efforts throughout the software development life cycle(SDLC), with documentation just one small part.
An example of one such tool is Hamilton Technologies 001 which is dis-cussed at length in this handbook. 001 is a CASE tool (now usually calledapplication development tool in lieu of the term CASE) that surroundsitself with an intriguing methodology called “development before the fact”(DBTF). The premise behind 001 and DBTF is that developing systems in aquality manner begets quality and error-reduced systems. One of the
CuuDuongThanCong.com https://fb.com/tailieudientucntt
259
The Science of Documentation
intriguing features of the 001 tool set is that it not only generates program-ming source code from maps (i.e., models) of a business problem, but alsogenerates the documentation for the system.
On one end of the documentation spectrum, many companies utilize notools other than a word processor and a drawing tool to extract documen-tation from their reluctant programmers. On the other end, forward-think-ing companies make significant investments in their software developmentdepartments by outfitting them with tool suites such as 001. The vastmajority of organizations lie somewhere between these two extremes.
The world of client/server has afforded the developer with new oppor-tunities and decisions to make in terms of which tool set to use. WhenMicrosoft Office was first introduced, it was utilized mostly for word pro-cessing. Today, Microsoft Access, the database component of the MS Officeproduct set, has become a significant player in corporations with a require-ment for a robust but less complex database than that of the powerhousecomputers that run their back offices (i.e., Sybase, Oracle, Microsoft SQLServer).
Microsoft Access enables the automated production of several kinds ofdocuments related to the datasets implemented with the program. Thedocuments describe schemas, queries, and entity relationship diagrams(ERDs) as shown in Exhibit 19-2.
Some products are dedicated to producing documentation. One suchproduct is Doc-o-Matic by toolsfactory.com. It is designed to work with theBorland Delphi software development environment. The product workswith Delphi’s internal structures, which may consist of: Author, Bugs, Con-ditions, Examples, Exceptions, History, Ignore, Internal, Notes, Parameters,Remarks, Return Value, See Also, Todo, and Version ( Leahey, 2002). Doc-o-Matic has been compared to a gigantic parsing routine. As software sys-tems grow in size and sophistication, it becomes harder for humans tounderstand them and anticipate their behavior, says Charles Robert Wal-lace in his dissertation, “Formal Specification of Software Using AbstractState Machines.” This method essentially enables walk-through beforecode is written. Wallace argues that normal specification techniques aim tofoster understanding and increase reliability by providing a mathematicalfoundation to software documentation (Wallace, 2000). His technique callsfor layering information onto a model through a series of refinements.
GENERATING DOCUMENTATION THE RIGHT WAY
At present, many organizations are practicing a “hit or miss ” form ofsoftware documentation. These are usually the companies that follow noor few policies and procedures and loosely follow standards. Good soft-ware development is standards based; thus, documentations must also be
CuuDuongThanCong.com https://fb.com/tailieudientucntt
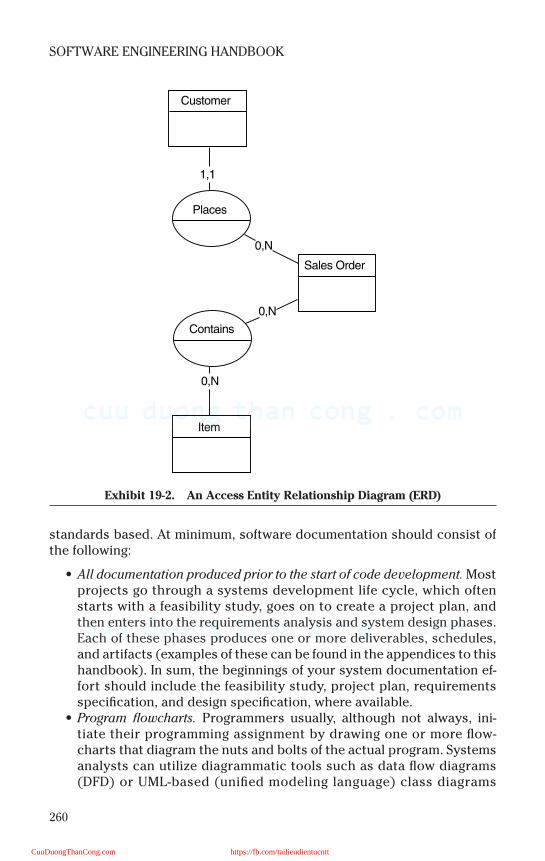
260
SOFTWARE ENGINEERING HANDBOOK
standards based. At minimum, software documentation should consist ofthe following:
• All documentation produced prior to the start of code development. Mostprojects go through a systems development life cycle, which oftenstarts with a feasibility study, goes on to create a project plan, andthen enters into the requirements analysis and system design phases.Each of these phases produces one or more deliverables, schedules,and artifacts (examples of these can be found in the appendices to thishandbook). In sum, the beginnings of your system documentation ef-fort should include the feasibility study, project plan, requirementsspecification, and design specification, where available.
• Program flowcharts. Programmers usually, although not always, ini-tiate their programming assignment by drawing one or more flow-charts that diagram the nuts and bolts of the actual program. Systemsanalysts can utilize diagrammatic tools such as data flow diagrams(DFD) or UML-based (unified modeling language) class diagrams
Exhibit 19-2. An Access Entity Relationship Diagram (ERD)
Customer
1,1
Places
0,N
0,N
0,N
Contains
Item
Sales Order
CuuDuongThanCong.com https://fb.com/tailieudientucntt

261
The Science of Documentation
(Exhibits 19-3 and 19-4) to depict the entire system from a physical de-sign level; however, the programmer is often required to utilize flow-charts (Exhibit 19-5) to depict the flow of a particular component ofthe DFD or UML class diagram.
Exhibit 19-3. A DFD
Customer
Customer
Store Manager
1
Get CustomerMembershipInformation
2
Create NewCustomer Account
Not a MemberAccount
Information
3
Verify CustomerAccount Status
PastdueCustomer Won't Pay
AccountNot Valid
4
Scan Products
5
Process Payment
Payment Okay
Rental orPurchaseRequest
Customer DataD1
InventoryD2
Product HistoryData
D3
Customer DataD1
6
Check In-stockStatus
ProductCheck
Request
InventoryD2
Store Manager
OrdersD4
Vendor
7
Order NewReleases and
Other Products
Product HistoryData
D3
8
Move Old / LowUsage Rentals
To Purchase Area
InventoryD2
ProductsOrdered
InventoryD2
OrdersD4
9
Process ReceivedProducts
OrdersD4
10
Process Paymentto Vendor
Invoice
CuuDuongThanCong.com https://fb.com/tailieudientucntt
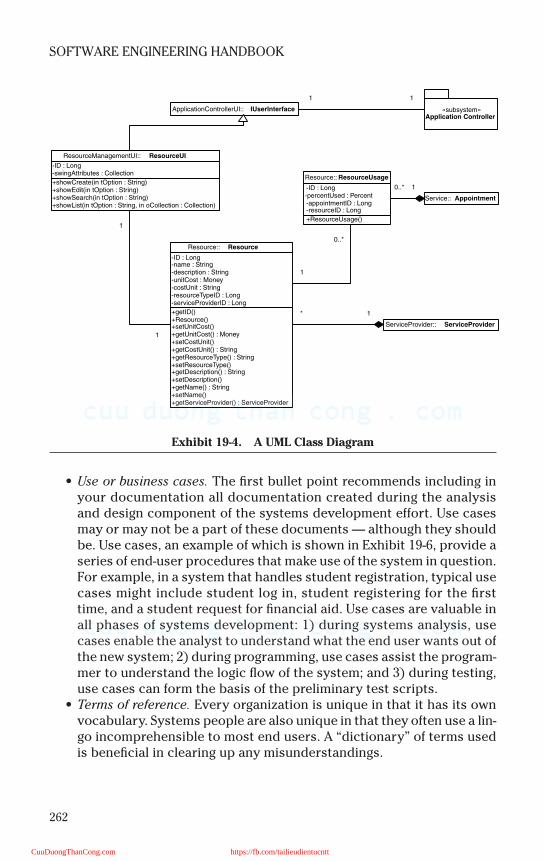
262
SOFTWARE ENGINEERING HANDBOOK
• Use or business cases. The first bullet point recommends including inyour documentation all documentation created during the analysisand design component of the systems development effort. Use casesmay or may not be a part of these documents — although they shouldbe. Use cases, an example of which is shown in Exhibit 19-6, provide aseries of end-user procedures that make use of the system in question.For example, in a system that handles student registration, typical usecases might include student log in, student registering for the firsttime, and a student request for financial aid. Use cases are valuable inall phases of systems development: 1) during systems analysis, usecases enable the analyst to understand what the end user wants out ofthe new system; 2) during programming, use cases assist the program-mer to understand the logic flow of the system; and 3) during testing,use cases can form the basis of the preliminary test scripts.
• Terms of reference. Every organization is unique in that it has its ownvocabulary. Systems people are also unique in that they often use a lin-go incomprehensible to most end users. A “dictionary” of terms usedis beneficial in clearing up any misunderstandings.
Exhibit 19-4. A UML Class Diagram
+ResourceUsage()
-ID : Long-percentUsed : Percent-appointmentID : Long-resourceID : Long
Resource:: ResourceUsage
+getID()+Resource()+setUnitCost()+getUnitCost() : Money+setCostUnit()+getCostUnit() : String+getResourceType() : String+setResourceType()+getDescription() : String+setDescription()+getName() : String+setName()+getServiceProvider() : ServiceProvider
-ID : Long-name : String-description : String-unitCost : Money-costUnit : String-resourceTypeID : Long-serviceProviderID : Long
Resource:: Resource0..*
1
Service:: Appointment
10..*+showCreate(in tOption : String)+showEdit(in tOption : String)+showSearch(in tOption : String)+showList(in tOption : String, in oCollection : Collection)
-ID : Long-swingAttributes : Collection
ResourceManagementUI:: ResourceUI
ApplicationControllerUI:: IUserInterface
1
1
ServiceProvider:: ServiceProvider
1*
«subsystem»Application Controller
11
CuuDuongThanCong.com https://fb.com/tailieudientucntt
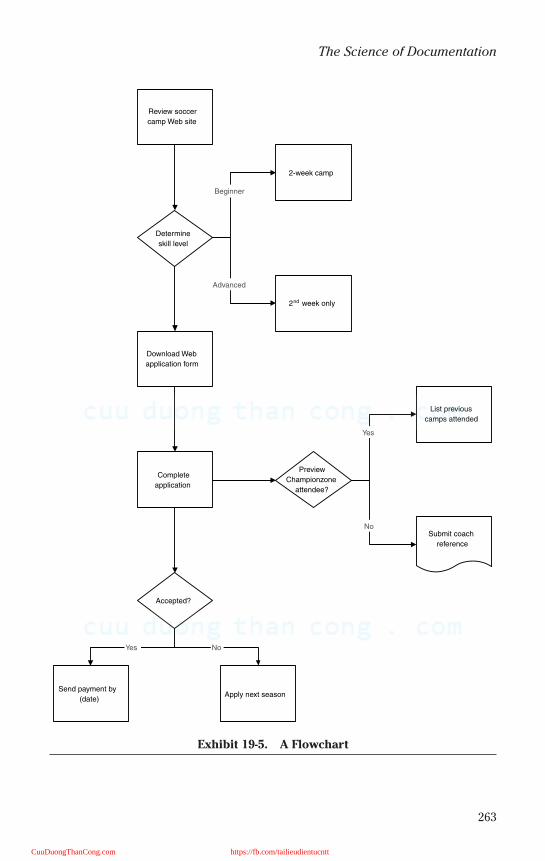
263
The Science of Documentation
Exhibit 19-5. A Flowchart
Apply next season
Download Web
application form
2nd week only
Complete
application
2-week camp
Send payment by
(date)
Review soccer
camp Web site
List previous
camps attended
Submit coach
reference
Accepted?
Preview
Championzone
attendee?
Determine
skill level
Beginner
Advanced
Yes
No
Yes No
CuuDuongThanCong.com https://fb.com/tailieudientucntt
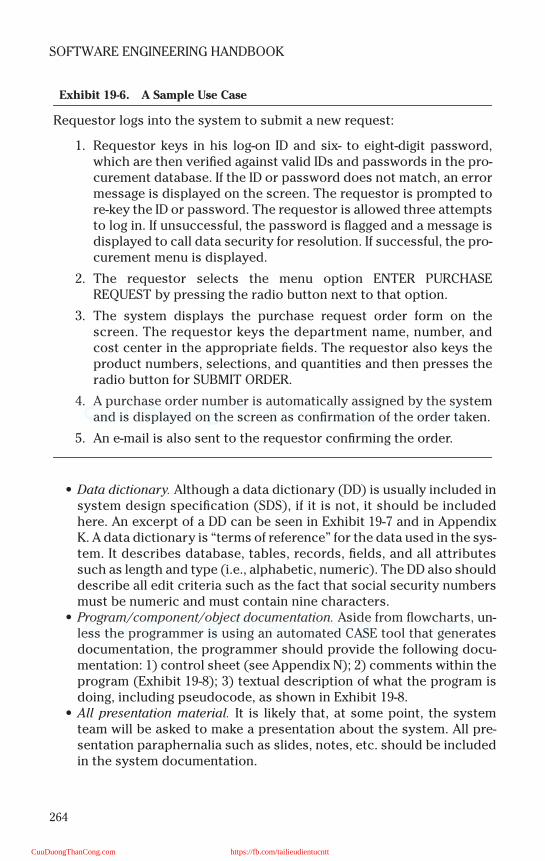
264
SOFTWARE ENGINEERING HANDBOOK
• Data dictionary. Although a data dictionary (DD) is usually included insystem design specification (SDS), if it is not, it should be includedhere. An excerpt of a DD can be seen in Exhibit 19-7 and in AppendixK. A data dictionary is “terms of reference” for the data used in the sys-tem. It describes database, tables, records, fields, and all attributessuch as length and type (i.e., alphabetic, numeric). The DD also shoulddescribe all edit criteria such as the fact that social security numbersmust be numeric and must contain nine characters.
• Program/component/object documentation. Aside from flowcharts, un-less the programmer is using an automated CASE tool that generatesdocumentation, the programmer should provide the following docu-mentation: 1) control sheet (see Appendix N); 2) comments within theprogram (Exhibit 19-8); 3) textual description of what the program isdoing, including pseudocode, as shown in Exhibit 19-8.
• All presentation material. It is likely that, at some point, the systemteam will be asked to make a presentation about the system. All pre-sentation paraphernalia such as slides, notes, etc. should be includedin the system documentation.
Exhibit 19-6. A Sample Use Case
Requestor logs into the system to submit a new request:
1. Requestor keys in his log-on ID and six- to eight-digit password,which are then verified against valid IDs and passwords in the pro-curement database. If the ID or password does not match, an errormessage is displayed on the screen. The requestor is prompted tore-key the ID or password. The requestor is allowed three attemptsto log in. If unsuccessful, the password is flagged and a message isdisplayed to call data security for resolution. If successful, the pro-curement menu is displayed.
2. The requestor selects the menu option ENTER PURCHASEREQUEST by pressing the radio button next to that option.
3. The system displays the purchase request order form on thescreen. The requestor keys the department name, number, andcost center in the appropriate fields. The requestor also keys theproduct numbers, selections, and quantities and then presses theradio button for SUBMIT ORDER.
4. A purchase order number is automatically assigned by the systemand is displayed on the screen as confirmation of the order taken.
5. An e-mail is also sent to the requestor confirming the order.
CuuDuongThanCong.com https://fb.com/tailieudientucntt
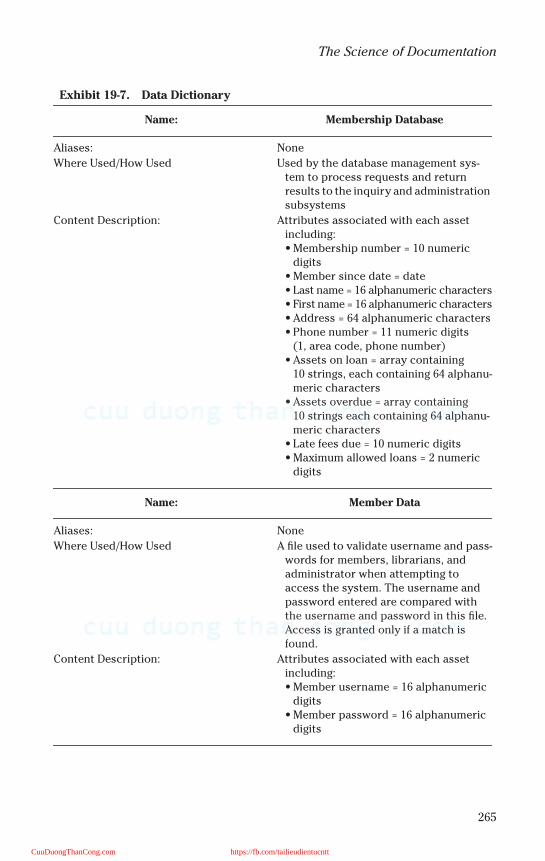
265
The Science of Documentation
Exhibit 19-7. Data Dictionary
Name: Membership Database
Aliases: None
Where Used/How Used Used by the database management sys-tem to process requests and return results to the inquiry and administration subsystems
Content Description: Attributes associated with each asset including:• Membership number = 10 numeric
digits• Member since date = date• Last name = 16 alphanumeric characters• First name = 16 alphanumeric characters• Address = 64 alphanumeric characters• Phone number = 11 numeric digits
(1, area code, phone number)• Assets on loan = array containing
10 strings, each containing 64 alphanu-meric characters
• Assets overdue = array containing 10 strings each containing 64 alphanu-meric characters
• Late fees due = 10 numeric digits• Maximum allowed loans = 2 numeric
digits
Name: Member Data
Aliases: None
Where Used/How Used A file used to validate username and pass-words for members, librarians, and administrator when attempting to access the system. The username and password entered are compared with the username and password in this file. Access is granted only if a match is found.
Content Description: Attributes associated with each asset including:• Member username = 16 alphanumeric
digits• Member password = 16 alphanumeric
digits
CuuDuongThanCong.com https://fb.com/tailieudientucntt
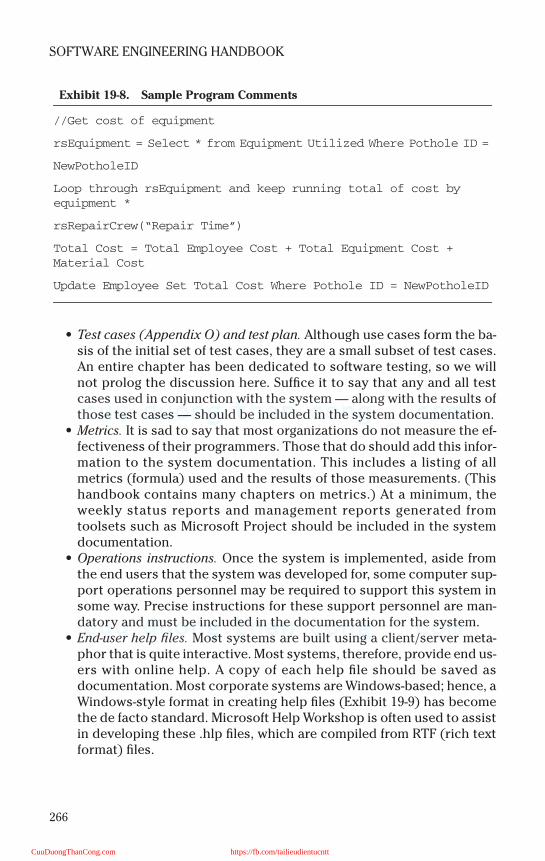
266
SOFTWARE ENGINEERING HANDBOOK
• Test cases (Appendix O) and test plan. Although use cases form the ba-sis of the initial set of test cases, they are a small subset of test cases.An entire chapter has been dedicated to software testing, so we willnot prolog the discussion here. Suffice it to say that any and all testcases used in conjunction with the system — along with the results ofthose test cases — should be included in the system documentation.
• Metrics. It is sad to say that most organizations do not measure the ef-fectiveness of their programmers. Those that do should add this infor-mation to the system documentation. This includes a listing of allmetrics (formula) used and the results of those measurements. (Thishandbook contains many chapters on metrics.) At a minimum, theweekly status reports and management reports generated fromtoolsets such as Microsoft Project should be included in the systemdocumentation.
• Operations instructions. Once the system is implemented, aside fromthe end users that the system was developed for, some computer sup-port operations personnel may be required to support this system insome way. Precise instructions for these support personnel are man-datory and must be included in the documentation for the system.
• End-user help files. Most systems are built using a client/server meta-phor that is quite interactive. Most systems, therefore, provide end us-ers with online help. A copy of each help file should be saved asdocumentation. Most corporate systems are Windows-based; hence, aWindows-style format in creating help files (Exhibit 19-9) has becomethe de facto standard. Microsoft Help Workshop is often used to assistin developing these .hlp files, which are compiled from RTF (rich textformat) files.
Exhibit 19-8. Sample Program Comments
//Get cost of equipment
rsEquipment = Select * from Equipment Utilized Where Pothole ID =
NewPotholeID
Loop through rsEquipment and keep running total of cost by
equipment *
rsRepairCrew(“Repair Time”)
Total Cost = Total Employee Cost + Total Equipment Cost +
Material Cost
Update Employee Set Total Cost Where Pothole ID = NewPotholeID
CuuDuongThanCong.com https://fb.com/tailieudientucntt
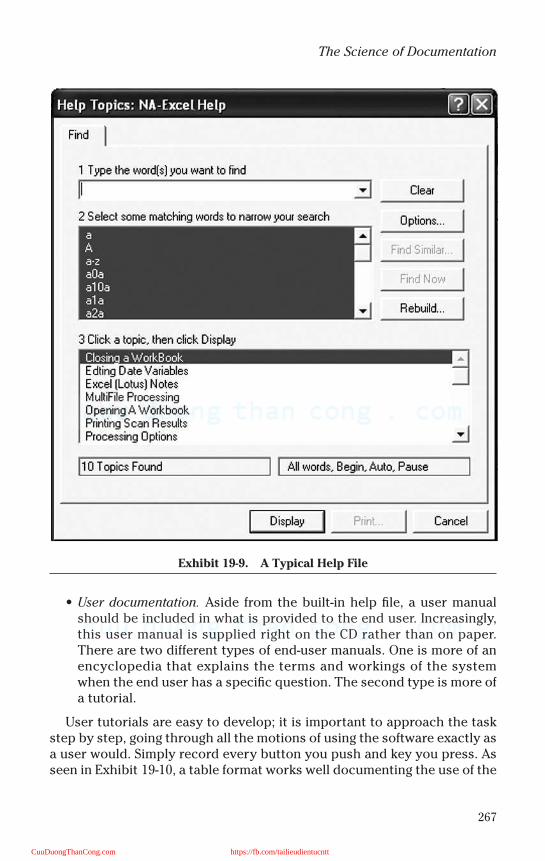
267
The Science of Documentation
• User documentation. Aside from the built-in help file, a user manualshould be included in what is provided to the end user. Increasingly,this user manual is supplied right on the CD rather than on paper.There are two different types of end-user manuals. One is more of anencyclopedia that explains the terms and workings of the systemwhen the end user has a specific question. The second type is more ofa tutorial.
User tutorials are easy to develop; it is important to approach the taskstep by step, going through all the motions of using the software exactly asa user would. Simply record every button you push and key you press. Asseen in Exhibit 19-10, a table format works well documenting the use of the
Exhibit 19-9. A Typical Help File
CuuDuongThanCong.com https://fb.com/tailieudientucntt
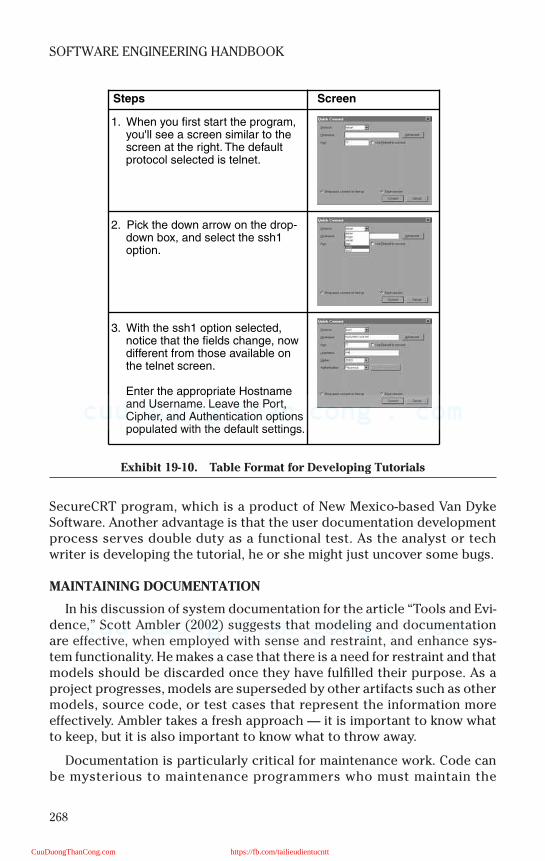
268
SOFTWARE ENGINEERING HANDBOOK
SecureCRT program, which is a product of New Mexico-based Van DykeSoftware. Another advantage is that the user documentation developmentprocess serves double duty as a functional test. As the analyst or techwriter is developing the tutorial, he or she might just uncover some bugs.
MAINTAINING DOCUMENTATION
In his discussion of system documentation for the article “Tools and Evi-dence,” Scott Ambler (2002) suggests that modeling and documentationare effective, when employed with sense and restraint, and enhance sys-tem functionality. He makes a case that there is a need for restraint and thatmodels should be discarded once they have fulfilled their purpose. As aproject progresses, models are superseded by other artifacts such as othermodels, source code, or test cases that represent the information moreeffectively. Ambler takes a fresh approach — it is important to know whatto keep, but it is also important to know what to throw away.
Documentation is particularly critical for maintenance work. Code canbe mysterious to maintenance programmers who must maintain the
Exhibit 19-10. Table Format for Developing Tutorials
1. When you first start the program,you'll see a screen similar to thescreen at the right. The defaultprotocol selected is telnet.
2. Pick the down arrow on the drop-down box, and select the ssh1option.
3. With the ssh1 option selected,notice that the fields change, nowdifferent from those available onthe telnet screen.
Enter the appropriate Hostnameand Username. Leave the Port,Cipher, and Authentication optionspopulated with the default settings.
Steps Screen
CuuDuongThanCong.com https://fb.com/tailieudientucntt

269
The Science of Documentation
system for years after the original system was written and the original pro-grammers have moved on to other jobs (Graham et al., 2000).
Documentation is becoming more important. Ravi Shankar Kalakota(1996) wrote about organizing practices in his 1996 dissertation, “Organiz-ing for Electronic Commerce.” Organizing is crucial, he says, and the prob-lem of organizing has three distinct dimensions:
• Organizing large amounts of data and digital documents• Organizing business processes and workflows• Organizing computing and processing
Kalakota offers resolution for each of these challenges, but for our pur-poses, I will limit discussion to the specific issues.
Distributed documents must be organized such that users and pro-grams are able to locate, track, and use online documents. The growth ofnetworking brings with it a corresponding increase in the number of docu-ments to be organized. Current document organization techniques arederived from techniques used in file systems and are not sufficient for orga-nizing the large number of heterogeneous documents that are becomingavailable for various purposes.
Second, Kalakota believes that new computing forms must be devel-oped to process, filter, and customize online documents. He asserts thatthe traditional notion of client/server computing is not sufficient to dealwith the complexity and needs of electronic commerce. Third, workflowsneed to be structured to take advantage of online documents. Workflowsoften dictate organization structure but are difficult to study because theyare essentially complex patterns of interaction between agents (Kalakota,1996). We can easily characterize the variable properties of sequentialactions, but not real-time patterns for tasks occurring in parallel.
CONCLUSION
Documentation is an often neglected but very necessary component ofthe software development life cycle (SDLC). Numerous approaches andmethods are available to software development teams to assist with thetask. Most important are a commitment to documenting software, settingstandards for the organization, and making them stick, that is, adhering tothe standards.
References
Ambler, S.W. (2002). Tools and evidence. Software development. Online. Available: ht-tp://www.sdmagazine.com/documents/s = 7134/sdm0205i/0205i.htm.
Applied Information Science International. (1996). Entity relationship diagram. [Online].Available: http://www.aisintl.com/case/olais/pb96/er_model.htm.
CuuDuongThanCong.com https://fb.com/tailieudientucntt
270
SOFTWARE ENGINEERING HANDBOOK
Cook, C.R. and Visconti, M. (2000). Software system documentation process maturity model.http://www.cs.orst.edu/~cook/doc/Model.htm.
Graham, C., Hoffer, J.A., George, J.F., and Valacich, J.S. (2000). Introduction to Business SystemsAnalysis. Pearson Custom Publishing, Boston.
Kalakota, R.S. (1996). Organizing for electronic commerce. DAI-A. 57/02. (From University ofPhoenix Online Collection. [ProQuest Digital Dissertations]. Publication number: AAT9617262. Available: http://www.apollolibrary.com:2118/dissertations/fullcit/9617262.)
Leahey, R. (2002). Doc-O-Matic 1.0: generates docs in WinHelp, RTF, HTML or HTML Help. Del-ph i In formant . On l ine . Ava i lab le : h t tp : / /www.de lph iz ine .com/productre -views/2001/07/di200107rl_p/di200107rl_p.asp.
Tufflye, D. (2002). How to write, version and file software development documentation. On-line. Available: http://tuffley.hispeed.com/tcs20006.htm.
Visconti, M.A. (1993). Software system documentation process maturity model. DAI-B. 55/03.(From University of Phoenix Online Collection. [ProQuest Digital Dissertations]. Publicationnumber: AAT 9422184. Available: http://www.apollolibrary.com:2118/dissertations/fullcit/9422184.)
Wallace, C.R. (2000). Formal specification of software using abstract state machines. DAI-B.61/02. (From University of Phoenix Online Collection. [ProQuest Digital Dissertations]. IBSN:0–599–63514–2. Available: http://www.apollolibrary.com:2118/dissertations/fullcit/9959880.)
CuuDuongThanCong.com https://fb.com/tailieudientucntt
271
Chapter 20
Survey on IT Productivity and Quality
Who among us does not remember the soulful tale of Alice? In her journeythrough Wonderland she comes upon the Queen of Hearts who, at onepoint in the fantasy, makes sport of the game of chess with live chesspieces, including our very own Alice. The Queen makes Alice run fast, butAlice finds that she is merely running in place…running so very fast just tocatch up.
Have productivity and quality risen? Or, like Alice, are more and morefirms merely running in place — too tired from continual day to day oper-ational battles or too shell-shocked from retrenching to support the newparadigms of client/server architectures, object orientation, and Intranetsto pay heed to TQM (total quality management)?
Many years ago, sometime in the 1920s, some social scientists werestudying the productivity of workers at a Western Electric plant in Haw-thorne, Illinois. They discovered that when they turned up the lighting,productivity went up. They also found that when they turned down thelighting, productivity went up again. What these social scientists foundwas that when the Hawthorne workers realized that people were payingattention to them, they started to do better work. This became known asthe “Hawthorne effect.”
Even though the jury is still out on the effects of quality programs on theprocess of information technology, there is no doubt that the industry isextremely interested in its potential. According to some industry statistics,less than 5 percent of IT organizations are doing this sort of thing. Eventhough TQM is strongly rooted in many industries as a whole, for example,the 60 to 70 percent of those in manufacturing who have some sort of qual-ity program in place, IT tends to be a black hole.
However, interest in the concept is increasing. One should start off theprocess by understanding a single principle — that change is painful and
CuuDuongThanCong.com https://fb.com/tailieudientucntt

272
SOFTWARE ENGINEERING HANDBOOK
lengthy. In fact, to effectuate any kind of change you need something like aten-year plan. Ten years is a long time, however, and management’spatience is short. So how can you motivate change over that time period?
PLANNING FOR QUALITY
The secret is to make management extremely dissatisfied with the statusquo; to do that, you need to look at the cost of the status quo. One way ofaccomplishing this is to examine the cost of poor quality.
By answering questions such as “what are we spending on detectingdefects?” and “what are we spending on repairing defects?” the IT organi-zation can begin to accumulate the statistics it needs to make the push forchange. The data need not be hard to track; in most cases it is already avail-able through project management systems that track walkthroughs,reviews, defect rates, etc. About 40 to 50 percent of the IT budget is spenton fixing defects due to poor quality. With statistics like this, it should berather easy to motivate massive change.
Techniques to introduce TQM programs to the “black hole” of IT varyfrom company to company, but some commonalities are shown below:
• Conduct a customer satisfaction survey.• Get management sponsorship to fix what the surveys found wrong.• Top management needs to make a visible and personal commitment to
any quality program.• Customers as well as suppliers need to be involved.• Define the processes.• Come up with ways to improve the process.• Determine metrics to measure the improvement of the process.
In the 1990s Coopers & Lybrand, now PriceWaterhouseCoopers after amerger, had a substantial TQM federal practice. This group focused on tak-ing appropriate elements of TQM and applying them to software deliveryorganizations. The end result was the development of a specific methodol-ogy for doing that. This methodology provided a framework for managingcontinuous improvement for software delivery.
This group had first-hand experience of the endemic behaviors in most ofus attracted to this business that are contrary to the quality tenets of TQM.One of these is the “code or die” syndrome. The greater the deadline pres-sures, the more we focus on “I got to code right now.” This is a quality prob-lem because it speaks to the fact that we are generally product oriented andwhen the pressure is on we fundamentally have no faith in the process.However, TQM says if you want to improve the quality of the product, youfocus on improving the process. So this is a behavior that gets us into trou-ble every time. In order to combat behaviors that seem to sabotage the
CuuDuongThanCong.com https://fb.com/tailieudientucntt

273
Survey on IT Productivity and Quality
drive toward quality, Coopers & Lybrand modified their four-phase TQMmethodology to suit the tenets of software engineering.
The centerpiece of the assessment phase of the Coopers & Lybrandmethodology is development of metrics by which the quality baseline isassessed and by which improvements over time can be measured. There isno specific list of metrics; the choice of metrics depends upon the clientbecause quality is different things for different people. What you think arekey quality issues should drive what you are trying to measure. In order todetermine the appropriate metrics for any particular client, Coopers con-sultants utilized a method first developed by NASA and then put into thepublic domain. Called goal–question–metric (GQM), it is a disciplined tech-nique used to refine from key quality issues their individual componentsand, ultimately, the metrics that might be derived from them.
The second phase of the Coopers methodology, planning, is based onwhat we see today, our vision, or where we want to take ourselves. Here welook at the highest priority quality issues and think about what we want todo to build ourselves in that direction. The “plan” developed is actually ashort list of things to do over the next six months. This is actually a list of“low-hanging fruit” — the list must contain the greatest near-term opportu-nities to increase quality.
The third phase, process improvement, is actually a phase of experi-mentation. It is here that the low-hanging fruit can be picked, and if deter-mined not to have any nutritive value to the process, tossed quickly aside.Finally, in the fourth phase of the Coopers TQM methodology, integration,the best things from these experiments are built into the organization.
THE PROCESS OF MEASUREMENT
Organizations that apply measure productivity and quality do so for thesame reasons. Software is becoming more complex and user demands andexpectations are increasing. The need to develop better software, faster,translates to a need to quantify the project’s progress and the system’sattributes.
A variety of productivity and quality metrics are available; choosing themost appropriate one can be as tricky as picking winning lottery numbers:
• Lines of code• Pages of documentation• Number and size of texts• Function count• Variable count• Number of modules• Depth of nesting
CuuDuongThanCong.com https://fb.com/tailieudientucntt
274
SOFTWARE ENGINEERING HANDBOOK
• Count of changes required• Count of discovered defects• Count of changed lines of code• Time to design, code, test• Defect discovery rate by phase of development• Cost to develop• Number of external interfaces• Number of tools used and why• Reusability percentage• Variance of schedule• Staff years of experience with team• Staff years of experience with language• Staff years of experience with software tools• MIPs per person• Support to development personnel ratio• Nonproject to project time ratio
Measuring does have its detractors. Many “artists” still refuse to be mea-sured. Ironically, measuring often produces the unusual effect of increasingproductivity only in the areas that are measured.
In most situations, the term “metric” is used in conjunction with the pro-gramming process only. However, programming is the smallest part of thesystems development life cycle. For an effective measurement program,each component of the cycle must include its own measures — or a mea-sure must be used that encompasses the entire spectrum of development.
The software development process is one of the most complex pro-cesses a human can perform; it includes numerous formidable tasks.Although variations abound in the number of executable steps in a lifecycle, most IT organizations perform the same functionality.
Metrics must consider several esoteric items, such as user involvement,which is positively correlated with productivity increases. Human factorsmust also be taken into account, such as the square footage allocated perprogrammer. Capers Jones , a prominent researcher in this field, has shownthat a full 78 square feet of floor space increases programmer productivitymore than any application development tool. Design, programming, andquality factors must also be weighed.
Quality measurements are frequently overlooked in the race to imple-ment on or before deadline. However, no matter what the time pressure,certain measures undertaken seriously can enhance the quality of outputof any software investment. The following matrix has proven useful whenfilled out by end users:
CuuDuongThanCong.com https://fb.com/tailieudientucntt

275
Survey on IT Productivity and Quality
Circle the number applicable to each measure. Add together for total score. 1 = low to 5 = high
1. How easy is it to use? 1 2 3 4 5
2. How secure is it? 1 2 3 4 5
3. What is the level of confidence in it? 1 2 3 4 5
4. How well does it conform to requirements? 1 2 3 4 5
5. How easy is it to upgrade? 1 2 3 4 5
6. How easy is it to change? 1 2 3 4 5
7. How portable is it? 1 2 3 4 5
8. How easy is it to locate a problem? 1 2 3 4 5
9. Is the response time fast enough? 1 2 3 4 5
10. How easy is it to train staff? 1 2 3 4 5
11. How easy is it to test? 1 2 3 4 5
12. Is there efficient use of computing resources? 1 2 3 4 5
13. Is it easy to couple this system to another? 1 2 3 4 5
14. Does the system minimize storage requirements? 1 2 3 4 5
15. Is the system self-descriptive? 1 2 3 4 5
16. Does the system exhibit modularity? 1 2 3 4 5
17. Is there a program for on-going quality awareness? 1 2 3 4 5
18. Is supplier quality checked? 1 2 3 4 5
19. Is there a quality department? 1 2 3 4 5
20. Is this the right system to be developed? 1 2 3 4 5
Measurement of quality is often thought of as a manufacturing process.Computer companies that manufacture hardware and software usuallyapply metrics to the manufacture of both. Digital Equipment, acquired byCompaq, which itself was acquired by HP in 2002, was famous for its soft-ware quality controls. DEC ran upward of 22,000 quality checks on the VAXCobol compiler (Compaq recently retired the VAX computer in favor of itsAlpha server (http://www.compaq.com/alphaserver/vax/).
With 22,000 tests, it was impossible to test the compiler thoroughly, soDEC wrote VaxScan, which looked at many micro-oriented measures suchas rate of change and how much the program was tested. It also measuredthe introduction of new errors.
THE ORIGINAL METRIC
Those who measure most often use a simple source-lines-of-code(SLOC) metric. With this metric, however, there is room for variation. Intheir 1986 book, Software Engineering Metrics and Models, published by the
CuuDuongThanCong.com https://fb.com/tailieudientucntt
276
SOFTWARE ENGINEERING HANDBOOK
Benjamin/Cummings Publishing Company, Conte, Dunsmore, and Shenproposed this definition of SLOC:
A line of code is any line of program text that is not a comment or blankline, regardless of the number of statements or fragments of statementson that line. This specifically includes all lines containing programheaders, declarations and executable and nonexecutable statements.
The SLOC metric is often further redefined into distinguishing the numberof noncomment source lines of code (NCSLOC) from the lines of code con-taining comment statements (CSLOC).
Along with SLOC measurements, the weekly time sheet provides othergross statistics often used for productivity measurement. The total num-ber of labor hours expended, divided by the total number of NCSLOC, pro-vides an overall statistic that can be used to compare productivity fromproject to project.
One problem with the SLOC measurement is that it does not take intoaccount the complexity of the code being developed or maintained. Linesof code and man-months hide some very important things. For example,the SLOC measurement for a name and address file update program mightbe 600 lines of code per day. On the other hand, the output for softwarethat tracks satellites might be in the range of 40 to 50 lines of code per day.To look at this output on a purely gross statistical level, one would con-clude that the name and address project was more productive and efficientthan the satellite project. This conclusion would be wrong.
Starting from this base, two researchers at the Massachusetts Instituteof Technology’s Center for Information Systems Research in Cambridge,Massachusetts, examined this complexity issue. Chris F. Kemerer and Geof-frey K. Gill studied the software development projects undertaken by anaerospace defense contracting firm from 1984 to 1989.
The Kemerer and Gill team began their research by reviewing the origi-nal measure for complexity as developed by Thomas McCabe, now presi-dent of McCabe & Associates, a Columbia, Maryland, consulting group, inhis article, “A Complexity Measure.” McCabe proposed that a valid mea-surement of complexity would be the number of possible paths in a soft-ware module. In 1978, W.J. Hansen in his article, “Measurement of ProgramComplexity by the Pair,” interpreted McCabe’s mathematical formula intofour simple rules that would produce a numerical measure of complexity(i.e., the higher the number, the more complex):
• Add 1 for every IF, case, or other alternate execution construct.• Add 1 for every iterative DO, DOWHILE, or other repetitive construct.• Add 2 less than the number of logical alternatives in a case.• Add 1 for each AND or OR in an IF statement.
CuuDuongThanCong.com https://fb.com/tailieudientucntt
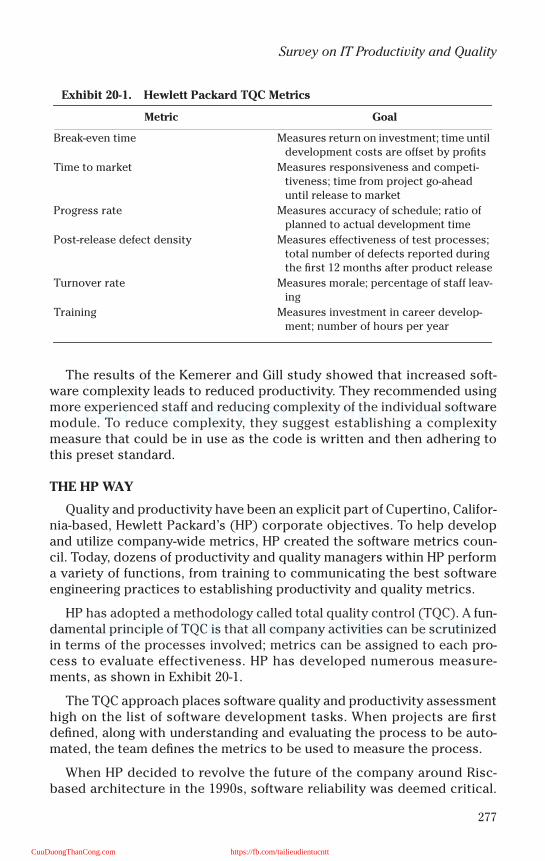
277
Survey on IT Productivity and Quality
The results of the Kemerer and Gill study showed that increased soft-ware complexity leads to reduced productivity. They recommended usingmore experienced staff and reducing complexity of the individual softwaremodule. To reduce complexity, they suggest establishing a complexitymeasure that could be in use as the code is written and then adhering tothis preset standard.
THE HP WAY
Quality and productivity have been an explicit part of Cupertino, Califor-nia-based, Hewlett Packard’s (HP) corporate objectives. To help developand utilize company-wide metrics, HP created the software metrics coun-cil. Today, dozens of productivity and quality managers within HP performa variety of functions, from training to communicating the best softwareengineering practices to establishing productivity and quality metrics.
HP has adopted a methodology called total quality control (TQC). A fun-damental principle of TQC is that all company activities can be scrutinizedin terms of the processes involved; metrics can be assigned to each pro-cess to evaluate effectiveness. HP has developed numerous measure-ments, as shown in Exhibit 20-1.
The TQC approach places software quality and productivity assessmenthigh on the list of software development tasks. When projects are firstdefined, along with understanding and evaluating the process to be auto-mated, the team defines the metrics to be used to measure the process.
When HP decided to revolve the future of the company around Risc-based architecture in the 1990s, software reliability was deemed critical.
Exhibit 20-1. Hewlett Packard TQC Metrics
Metric Goal
Break-even time Measures return on investment; time until development costs are offset by profits
Time to market Measures responsiveness and competi-tiveness; time from project go-ahead until release to market
Progress rate Measures accuracy of schedule; ratio of planned to actual development time
Post-release defect density Measures effectiveness of test processes; total number of defects reported during the first 12 months after product release
Turnover rate Measures morale; percentage of staff leav-ing
Training Measures investment in career develop-ment; number of hours per year
CuuDuongThanCong.com https://fb.com/tailieudientucntt
278
SOFTWARE ENGINEERING HANDBOOK
The development of the systems software was the largest developmenteffort in HP’s history, and the first that required multiple divisions to pro-duce software that would be combined into a single software system.
Charles A. Krueger , a professor at the University of Wisconsin in Madi-son, has pointed out the productivity paradox of budget versus getting tomarket: is it more important to stay within the targeted confines of moneyallocated, or to get the product out on time? He quotes a McKinsey & Co.study indicating that going over budget by 50 percent and getting a prod-uct out on time reduces profits by only 4 percent. Staying on budget andgetting to market five months late reduces profits to a third. Krueger insiststhat productivity is really a measure of how successfully you achieve yourresults.
Hewlett-Packard came to the same conclusion as Krueger, so the com-pany insisted on reliable software and delivery on time. HP established thesystems software certification program to ensure measurable, consistent,high-quality software through defining metrics, setting goals, collectingand analyzing data, and certifying products for release. This programdeveloped four metrics for the Risc project:
• Breadth — measures the testing coverage of user-accessible and inter-nal functionality of the product.
• Depth — measures the proportion of instructions or blocks of instruc-tions executed during testing.
• Reliability — measures the stability and robustness of a product andits ability to recover gracefully from error conditions.
• Defect density — measures the quantity and severity of reported de-fects and a product’s readiness.
HP’s results were impressive. Defects were caught and corrected early,when costs to find and fix are lower. Less time was spent in the costly sys-tem test and integration phases, and on maintenance. This resulted inlower overall support costs and higher productivity. It also increased qual-ity for HP’s customers.
HP’s success demonstrates what a corporate-wide commitment to pro-ductivity and quality measures can achieve. The commitment to thesegains was so strong that HP invested in full-time productivity and qualitymanagers, which is indeed unique.
THE FUNCTION POINT ADVANTAGE
In 1983, A.J. Albrecht, with IBM at that time, first proposed the function-point concept in a paper called “Software Function, Source Lines of Codeand Development Effort Prediction: a Software Science Validation.” Thismetric is a combination of metrics that assesses the functionality of thedevelopment process (see Appendix S for a more detailed description).
CuuDuongThanCong.com https://fb.com/tailieudientucntt
279
Survey on IT Productivity and Quality
The function-point metric assesses the functionality of the software devel-opment process by first counting the number of external inputs (transac-tion types), external outputs (report types), logical internal files (nonphys-ical), external interface files (files accessed by the application but notmaintained or updated by it), and external inquiries.
Using a set of standards for assessing complexity, these components arethen classified as relatively low, average, or high. Once the total number offunction counts is computed according to a statistical formula, the secondstep assesses the impact of 14 general system characteristics:
• Data communications• Distributed functions• Performance• Heavily used configuration• Transaction rate• Online data entry• End-user efficiency• Online update• Complex processing• Reusability• Installation ease• Operational ease• Multiple sites• Facilitates change
These values are then summed to compute what is known as the valueadjustment factor (VAF). The VAF is then multiplied with the total functioncount to create the number of function points.
The one aspect of function-point measurement programs that makesthem so valuable is the presence of large databases of information thatcompanies can use for comparison. SPR (www.spr.com), for example,maintains a database of over 9000 completed projects. It is used to com-pare an organization to industry norms — i.e., a benchmark.
Aside from these external comparative databases, many in-house data-bases have been painstakingly accumulated. As Kemerer states in his the-sis, “from a control perspective, organizations using a variant methodwould have difficulty in comparing their function-point productivity ratesto those of other organizations that switched methods; the new data mightbe sufficiently inconsistent as to render trend analysis meaningless.”
Most people are using the function point metric because it offers theonly metric that comes close to matching the economic definition of pro-ductivity — costs or services produced per unit of labor and expense. Inthe 1990s, using Capers Jones’ SPR research base of 400 studied compa-nies, the national average was calculated to be five function points per
CuuDuongThanCong.com https://fb.com/tailieudientucntt
280
SOFTWARE ENGINEERING HANDBOOK
person-month; IT groups averaged eight function points per person-month. These numbers can dramatically increase with tool usage to thedegree that it is possible to achieve 65 function points per person-monthwith a full application tool environment and reusable code. This metric willdecrease when the development environment is new, but will regainmomentum when familiarity with the tool set increases.
American Management Systems was an early believer in the function-point concept. With over 2200 systems professionals supporting 28 prod-uct lines, AMS needed a methodology that worked. The company had beenmeasuring productivity for years, but found that its traditional metrics oflines of code and work-months was hiding some very important informa-tion: not all work-months are created equal. The problem was that thereare experienced people and not so experienced people, expensive peopleand not so expensive people. If the company could find a way of optimizingthis mix, then AMS would find increased productivity. To this end, AMSneeded a measure that would foster economic productivity. Functionpoints filled the bill.
Function points were created in an era prior to the Internet and prior tothe introduction of object-oriented systems. As technologies and method-ologies must grow to meet new business requirements, so too must ourmetrics.
Dr. Chris Kemerer, now at the University of Pittsburgh, but then a profes-sor at MIT’s prestigious Sloan School of Management, wrote a paper enti-tled, “Towards a Metrics Suite for Object-Oriented Design.” This paper,authored with Dr. Shyam Chidamber, was presented at the October, 1991,ACM OOPSLA conference (object-oriented programming, systems, lan-guages, and applications). Kemerer asserts his position as perhaps the firstperson to talk about measurement for object-oriented systems and pro-poses a series of six metrics that serve to measure the depth and breath ofobject-oriented design:
• Metric 1: WMC (weighted methods per class). This relates to the defini-tion of complexity of an object. The number and complexity of meth-ods involved are indicators of how how much time and effort isrequired to develop and maintain the object.
• Metric 2: DIT (depth of inheritance tree). DIT is a measure of how manyancestor classes can potentially affect a class. It is useful to have ameasure of how deep a particular class is in the hierarchy so that theclass can be designed with reuse of inherited methods.
• Metric 3: NOC (number of children). NOC is a measure of how manysubclasses will inherit the methods of a parent class. NOC gives anidea of the potential influence a class has on the design. If a class hasa large number of children, it may require more testing of the methodsin that class.
CuuDuongThanCong.com https://fb.com/tailieudientucntt
281
Survey on IT Productivity and Quality
• Metric 4: CBO (coupling between objects). This is a count of the numberof noninheritance-related couples with other classes. Excessive cou-pling between objects outside the inheritance hierarchy is detrimen-tal to modular design and prevents reuse. This measure is useful todetermine how complex the testing of various parts of the design islikely to be.
• Metric 5: RFC (response for a class). The response set is a set of meth-ods available to the object. Because it specifically includes methodscalled from outside the object, it is also a measure of communicationbetween objects. If a large number of methods can be invoked, thetesting and debugging of the object become more complicated.
• Metric 6: LCOM (lack of cohesion in methods). LCOM uses the notion ofdegree of similarity of methods. Fewer disjoint sets imply greater sim-ilarity of methods. Cohesiveness of methods within a class is desirablebecause it promotes encapsulation of objects.
It is easy to pinpoint how Kemerer’s metrics differ from conventionalmeasurements. Object-oriented metrics are specifically oriented to object-oriented methodologies, which are quite different from conventional meth-odologies. The notion is to try to go after those things that are differentabout the object-oriented approach.
The easiest one to explain to most people is the notion of inheritance.Our metric is to measure depth of inheritance. In this way we can deter-mine to what degree people are using inheritance. The goal here is toaddress the optimal mix between complexity and usability. When a pro-grammer uses no inheritance, then he is not taking advantage of reusabilityand therefore negates productivity gains of the object-oriented technique.When the programmer “goes really deep,” this may also be bad because itwill be hard to test. Indeed it may be too much for one person to keep inmind.
THE QUALITY EQUATION
Quality and productivity are tightly linked; the approaches used toaddress these issues — metrics, methodology, and tools — must be inter-connected. Simply throwing technology or methodology at the problem isnot enough. Information technology (IT) departments must also use “peo-pleware” solutions (Exhibit 20-2.).
Ed Yourdon (www.yourdon.com), an esteemed software guru, says thatone way to improve development is to hire better developers. This solu-tion is the closest thing to a silver bullet.
Rather than spend lots of money trying to bring in a new methodology,why not simply bring in better people? We know that there is a 25 to 1 dif-ferential between the best and the worst people and a 4 to 1 differential
CuuDuongThanCong.com https://fb.com/tailieudientucntt
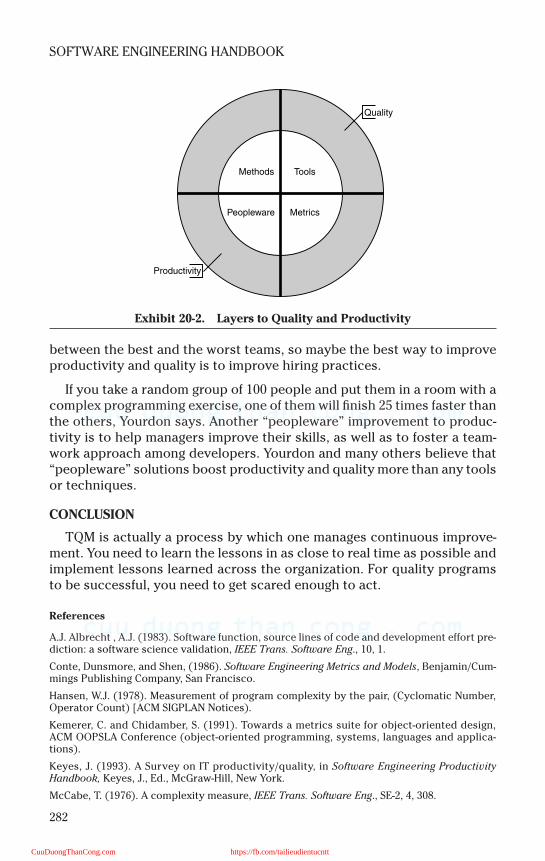
282
SOFTWARE ENGINEERING HANDBOOK
between the best and the worst teams, so maybe the best way to improveproductivity and quality is to improve hiring practices.
If you take a random group of 100 people and put them in a room with acomplex programming exercise, one of them will finish 25 times faster thanthe others, Yourdon says. Another “peopleware” improvement to produc-tivity is to help managers improve their skills, as well as to foster a team-work approach among developers. Yourdon and many others believe that“peopleware” solutions boost productivity and quality more than any toolsor techniques.
CONCLUSION
TQM is actually a process by which one manages continuous improve-ment. You need to learn the lessons in as close to real time as possible andimplement lessons learned across the organization. For quality programsto be successful, you need to get scared enough to act.
References
A.J. Albrecht , A.J. (1983). Software function, source lines of code and development effort pre-diction: a software science validation, IEEE Trans. Software Eng., 10, 1.
Conte, Dunsmore, and Shen, (1986). Software Engineering Metrics and Models, Benjamin/Cum-mings Publishing Company, San Francisco.
Hansen, W.J. (1978). Measurement of program complexity by the pair, (Cyclomatic Number,Operator Count) [ACM SIGPLAN Notices).
Kemerer, C. and Chidamber, S. (1991). Towards a metrics suite for object-oriented design,ACM OOPSLA Conference (object-oriented programming, systems, languages and applica-tions).
Keyes, J. (1993). A Survey on IT productivity/quality, in Software Engineering ProductivityHandbook, Keyes, J., Ed., McGraw-Hill, New York.
McCabe, T. (1976). A complexity measure, IEEE Trans. Software Eng., SE-2, 4, 308.
Exhibit 20-2. Layers to Quality and Productivity
Methods Tools
Peopleware Metrics
Quality
Productivity
CuuDuongThanCong.com https://fb.com/tailieudientucntt

Section II
CuuDuongThanCong.com https://fb.com/tailieudientucntt

This page intentionally left blank
CuuDuongThanCong.com https://fb.com/tailieudientucntt
285
This section is a compendium of techniques, guidelines, and philosophiesthat will assist the developer in understanding, and then putting into placea quality and productivity program. The 45 chapters contained in this sec-tion offer the reader a wealth of information and advice in a multitude ofareas, including management of resources, methods, quality, and metrics.
Each chapter is composed of the following:
Abstract: discussing the goals and principles behind the techniqueProcedures/Issues/Polices: a step-by-step implementation sectionReferences: where the reader can obtain a detailed version of the
technique synopsized in the chapterSelected Bibliography: for further reading
CuuDuongThanCong.com https://fb.com/tailieudientucntt

This page intentionally left blank
CuuDuongThanCong.com https://fb.com/tailieudientucntt

287
Chapter 21
Putnam’s Software Equation and SLIM
ABSTRACT
Putnam developed a constraint model called SLIM that would be usefulfor projects exceeding 70,000 lines of code. This model assumes that effortfor software projects is distributed similarly to a collection of Rayleighcurves.
The Norden-Rayleigh curve (Exhibit 21-1) represents manpower as afunction of time. Norden observed that the Rayleigh distribution providesa good approximation of the manpower curve for various hardware devel-opment processes. Development effort is assumed to represent only 40percent of the total life cycle cost. Requirements specification is notincluded in the model. Estimation using SLIM is not expected to take placeuntil design and coding.
Putnam suggests that staffing rises smoothly during the project andthen drops sharply during acceptance testing. The SLIM model isexpressed as two equations describing the relation between the develop-ment effort and the schedule. The first equation, called the software equa-tion, states that development effort is proportional to the cube of the sizeand inversely proportional to the fourth power of the development time.The second equation, the manpower-buildup equation, states that theeffort is proportional to the cube of the development time.
PROCEDURES/ISSUES/POLICIES
The software equation is calculated as follows:
Ss = CK1/3 td4/3
where:
Ss = the estimated size of the software systemK = the total lifecycle effort in programmer yearsC = the technology constant
Td = the development time in years
CuuDuongThanCong.com https://fb.com/tailieudientucntt
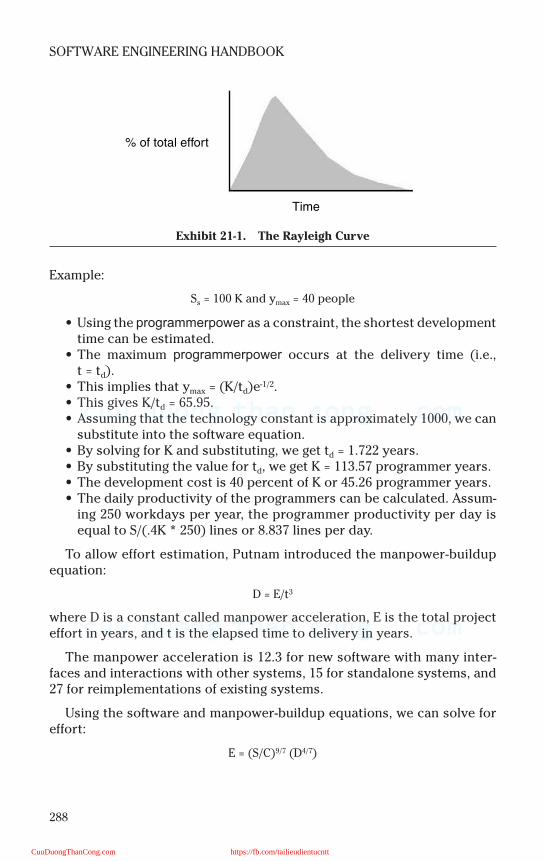
288
SOFTWARE ENGINEERING HANDBOOK
Example:
Ss = 100 K and ymax = 40 people
• Using the προγραµµερποωερ as a constraint, the shortest developmenttime can be estimated.
• The maximum προγραµµερποωερ occurs at the delivery time (i.e.,t = td).
• This implies that ymax = (K/td)e-1/2.• This gives K/td = 65.95.• Assuming that the technology constant is approximately 1000, we can
substitute into the software equation.• By solving for K and substituting, we get td = 1.722 years.• By substituting the value for td, we get K = 113.57 programmer years.• The development cost is 40 percent of K or 45.26 programmer years.• The daily productivity of the programmers can be calculated. Assum-
ing 250 workdays per year, the programmer productivity per day isequal to S/(.4K * 250) lines or 8.837 lines per day.
To allow effort estimation, Putnam introduced the manpower-buildupequation:
D = E/t3
where D is a constant called manpower acceleration, E is the total projecteffort in years, and t is the elapsed time to delivery in years.
The manpower acceleration is 12.3 for new software with many inter-faces and interactions with other systems, 15 for standalone systems, and27 for reimplementations of existing systems.
Using the software and manpower-buildup equations, we can solve foreffort:
E = (S/C)9/7 (D4/7)
Exhibit 21-1. The Rayleigh Curve
Time
% of total effort
CuuDuongThanCong.com https://fb.com/tailieudientucntt
289
Putnam’s Software Equation and SLIM
References
Fenton, N.E. and Pfleeger, S.L. (1997). Software Metrics: a Rigorous and Practical Approach,International Thomson Computer Press. Stamford, CN.
Johnson, K. Software Cost Estimation: Metrics and Models, University of Calgary, Canada.
http://sern.ucalgary.ca/courses/seng/621/W98/johnsonk/cost.htm#The%20Software%20Equation.
Putnam, L.H. (1978). A general empirical solution to the macro software sizing and estimatingproblem, IEEE Transactions on Software Engineering, SE-4:4.
Dr. Shmuel Rotenstreich, Software cost estimation, http://www.seas.gwu.edu/~ shmuel/cs272/14/index.htm. September 1999. George Washington University, Washington, D.C.
CuuDuongThanCong.com https://fb.com/tailieudientucntt

This page intentionally left blank
CuuDuongThanCong.com https://fb.com/tailieudientucntt
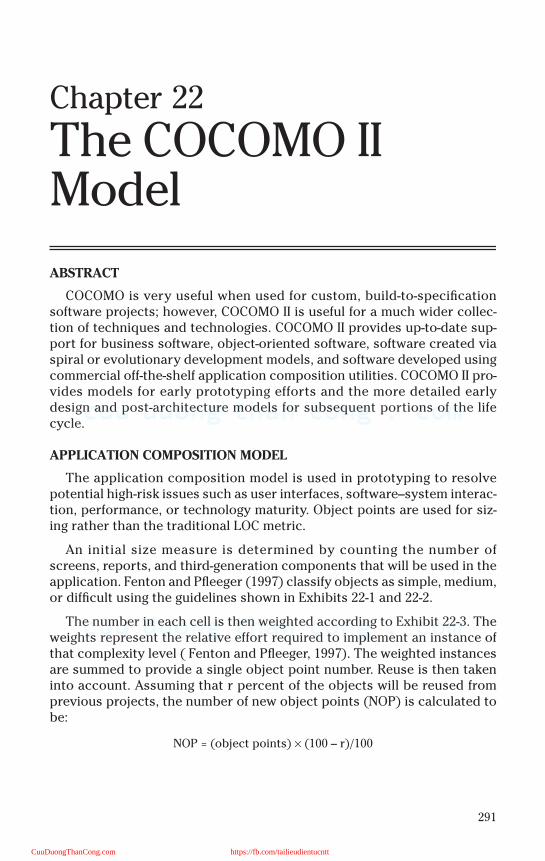
291
Chapter 22
The COCOMO II Model
ABSTRACT
COCOMO is very useful when used for custom, build-to-specificationsoftware projects; however, COCOMO II is useful for a much wider collec-tion of techniques and technologies. COCOMO II provides up-to-date sup-port for business software, object-oriented software, software created viaspiral or evolutionary development models, and software developed usingcommercial off-the-shelf application composition utilities. COCOMO II pro-vides models for early prototyping efforts and the more detailed earlydesign and post-architecture models for subsequent portions of the lifecycle.
APPLICATION COMPOSITION MODEL
The application composition model is used in prototyping to resolvepotential high-risk issues such as user interfaces, software–system interac-tion, performance, or technology maturity. Object points are used for siz-ing rather than the traditional LOC metric.
An initial size measure is determined by counting the number ofscreens, reports, and third-generation components that will be used in theapplication. Fenton and Pfleeger (1997) classify objects as simple, medium,or difficult using the guidelines shown in Exhibits 22-1 and 22-2.
The number in each cell is then weighted according to Exhibit 22-3. Theweights represent the relative effort required to implement an instance ofthat complexity level ( Fenton and Pfleeger, 1997). The weighted instancesare summed to provide a single object point number. Reuse is then takeninto account. Assuming that r percent of the objects will be reused fromprevious projects, the number of new object points (NOP) is calculated tobe:
NOP = (object points) × (100 – r)/100
CuuDuongThanCong.com https://fb.com/tailieudientucntt
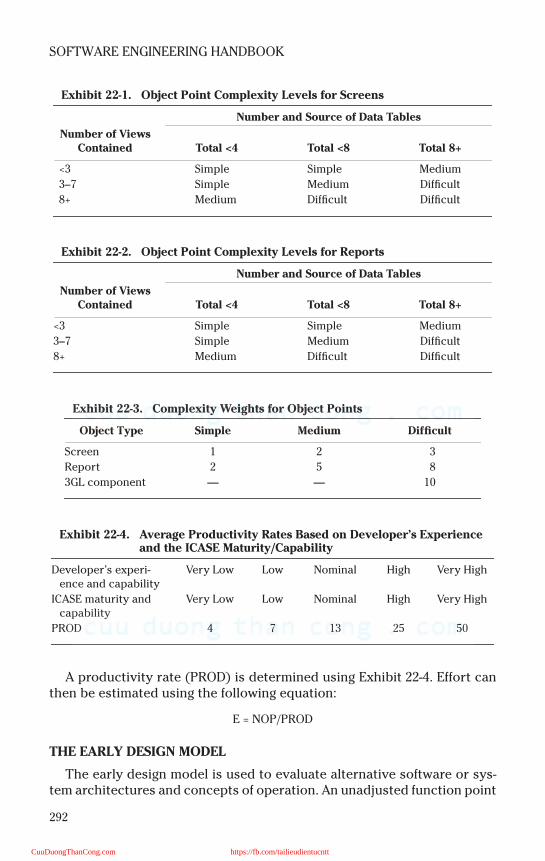
292
SOFTWARE ENGINEERING HANDBOOK
A productivity rate (PROD) is determined using Exhibit 22-4. Effort canthen be estimated using the following equation:
E = NOP/PROD
THE EARLY DESIGN MODEL
The early design model is used to evaluate alternative software or sys-tem architectures and concepts of operation. An unadjusted function point
Exhibit 22-1. Object Point Complexity Levels for Screens
Number and Source of Data Tables
Number of Views Contained Total <4 Total <8 Total 8+
<3 Simple Simple Medium
3–7 Simple Medium Difficult
8+ Medium Difficult Difficult
Exhibit 22-2. Object Point Complexity Levels for Reports
Number and Source of Data Tables
Number of Views Contained Total <4 Total <8 Total 8+
<3 Simple Simple Medium
3–7 Simple Medium Difficult
8+ Medium Difficult Difficult
Exhibit 22-3. Complexity Weights for Object Points
Object Type Simple Medium Difficult
Screen 1 2 3
Report 2 5 8
3GL component — — 10
Exhibit 22-4. Average Productivity Rates Based on Developer’s Experience and the ICASE Maturity/Capability
Developer’s experi-ence and capability
Very Low Low Nominal High Very High
ICASE maturity and capability
Very Low Low Nominal High Very High
PROD 4 7 13 25 50
CuuDuongThanCong.com https://fb.com/tailieudientucntt
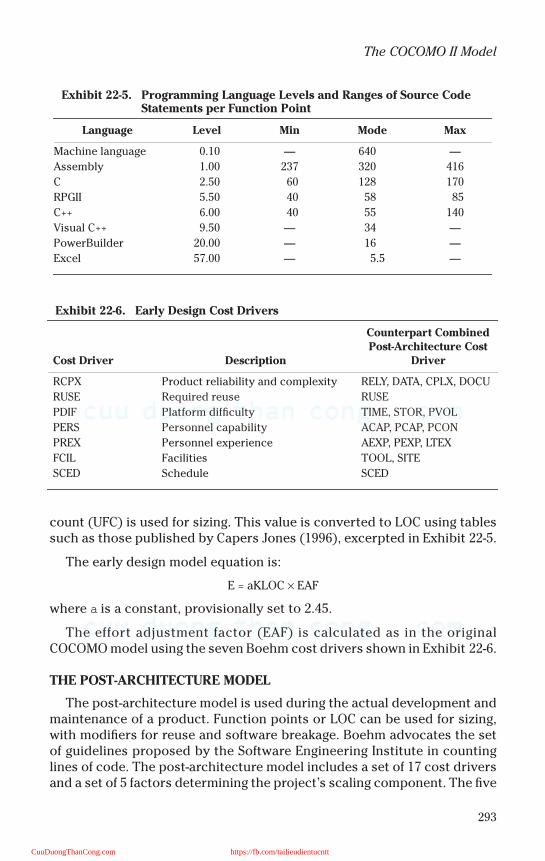
293
The COCOMO II Model
count (UFC) is used for sizing. This value is converted to LOC using tablessuch as those published by Capers Jones (1996), excerpted in Exhibit 22-5.
The early design model equation is:
E = aKLOC × EAF
where a is a constant, provisionally set to 2.45.
The effort adjustment factor (EAF) is calculated as in the originalCOCOMO model using the seven Boehm cost drivers shown in Exhibit 22-6.
THE POST-ARCHITECTURE MODEL
The post-architecture model is used during the actual development andmaintenance of a product. Function points or LOC can be used for sizing,with modifiers for reuse and software breakage. Boehm advocates the setof guidelines proposed by the Software Engineering Institute in countinglines of code. The post-architecture model includes a set of 17 cost driversand a set of 5 factors determining the project’s scaling component. The five
Exhibit 22-5. Programming Language Levels and Ranges of Source Code Statements per Function Point
Language Level Min Mode Max
Machine language 0.10 — 640 —
Assembly 1.00 237 320 416
C 2.50 60 128 170
RPGII 5.50 40 58 85
C++ 6.00 40 55 140
Visual C++ 9.50 — 34 —
PowerBuilder 20.00 — 16 —
Excel 57.00 — 5.5 —
Exhibit 22-6. Early Design Cost Drivers
Cost Driver Description
Counterpart Combined Post-Architecture Cost
Driver
RCPX Product reliability and complexity RELY, DATA, CPLX, DOCU
RUSE Required reuse RUSE
PDIF Platform difficulty TIME, STOR, PVOL
PERS Personnel capability ACAP, PCAP, PCON
PREX Personnel experience AEXP, PEXP, LTEX
FCIL Facilities TOOL, SITE
SCED Schedule SCED
CuuDuongThanCong.com https://fb.com/tailieudientucntt
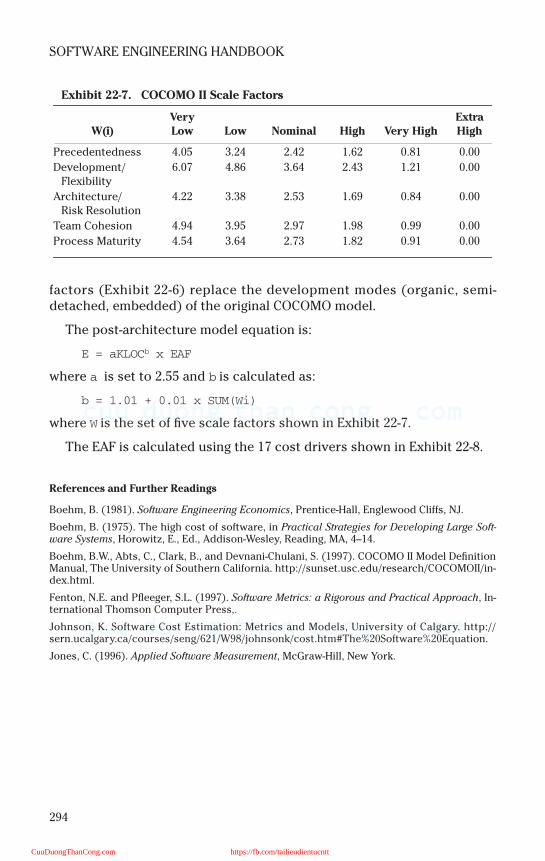
294
SOFTWARE ENGINEERING HANDBOOK
factors (Exhibit 22-6) replace the development modes (organic, semi-detached, embedded) of the original COCOMO model.
The post-architecture model equation is:
E = aKLOCb x EAF
where a is set to 2.55 and b is calculated as:
b = 1.01 + 0.01 x SUM(Wi)
where W is the set of five scale factors shown in Exhibit 22-7.
The EAF is calculated using the 17 cost drivers shown in Exhibit 22-8.
References and Further Readings
Boehm, B. (1981). Software Engineering Economics, Prentice-Hall, Englewood Cliffs, NJ.
Boehm, B. (1975). The high cost of software, in Practical Strategies for Developing Large Soft-ware Systems, Horowitz, E., Ed., Addison-Wesley, Reading, MA, 4–14.
Boehm, B.W., Abts, C., Clark, B., and Devnani-Chulani, S. (1997). COCOMO II Model DefinitionManual, The University of Southern California. http://sunset.usc.edu/research/COCOMOII/in-dex.html.
Fenton, N.E. and Pfleeger, S.L. (1997). Software Metrics: a Rigorous and Practical Approach, In-ternational Thomson Computer Press,.
Johnson, K. Software Cost Estimation: Metrics and Models, University of Calgary. http://sern.ucalgary.ca/courses/seng/621/W98/johnsonk/cost.htm#The%20Software%20Equation.
Jones, C. (1996). Applied Software Measurement, McGraw-Hill, New York.
Exhibit 22-7. COCOMO II Scale Factors
W(i)Very Low Low Nominal High Very High
Extra High
Precedentedness 4.05 3.24 2.42 1.62 0.81 0.00
Development/Flexibility
6.07 4.86 3.64 2.43 1.21 0.00
Architecture/Risk Resolution
4.22 3.38 2.53 1.69 0.84 0.00
Team Cohesion 4.94 3.95 2.97 1.98 0.99 0.00
Process Maturity 4.54 3.64 2.73 1.82 0.91 0.00
CuuDuongThanCong.com https://fb.com/tailieudientucntt
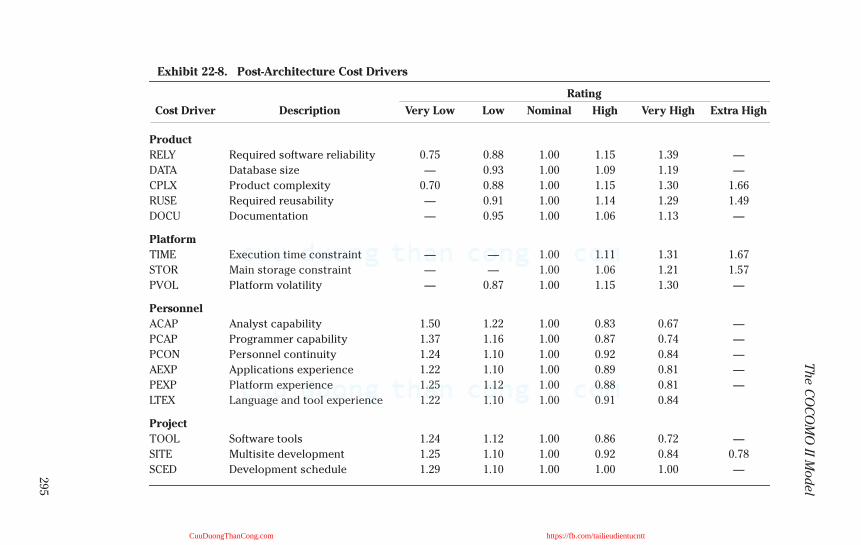
295
Th
e C
OC
OM
O II M
odel
Exhibit 22-8. Post-Architecture Cost Drivers
Rating
Cost Driver Description Very Low Low Nominal High Very High Extra High
Product
RELY Required software reliability 0.75 0.88 1.00 1.15 1.39 —
DATA Database size — 0.93 1.00 1.09 1.19 —
CPLX Product complexity 0.70 0.88 1.00 1.15 1.30 1.66
RUSE Required reusability — 0.91 1.00 1.14 1.29 1.49
DOCU Documentation — 0.95 1.00 1.06 1.13 —
Platform
TIME Execution time constraint — — 1.00 1.11 1.31 1.67
STOR Main storage constraint — — 1.00 1.06 1.21 1.57
PVOL Platform volatility — 0.87 1.00 1.15 1.30 —
Personnel
ACAP Analyst capability 1.50 1.22 1.00 0.83 0.67 —
PCAP Programmer capability 1.37 1.16 1.00 0.87 0.74 —
PCON Personnel continuity 1.24 1.10 1.00 0.92 0.84 —
AEXP Applications experience 1.22 1.10 1.00 0.89 0.81 —
PEXP Platform experience 1.25 1.12 1.00 0.88 0.81 —
LTEX Language and tool experience 1.22 1.10 1.00 0.91 0.84
Project
TOOL Software tools 1.24 1.12 1.00 0.86 0.72 —
SITE Multisite development 1.25 1.10 1.00 0.92 0.84 0.78
SCED Development schedule 1.29 1.10 1.00 1.00 1.00 —
CuuDuongThanCong.com https://fb.com/tailieudientucntt
This page intentionally left blank
CuuDuongThanCong.com https://fb.com/tailieudientucntt
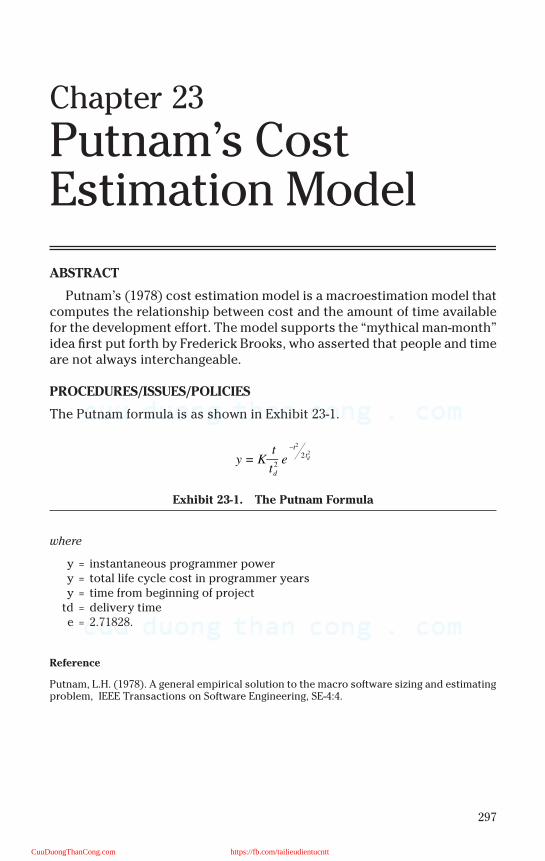
297
Chapter 23
Putnam’s Cost Estimation Model
ABSTRACT
Putnam’s (1978) cost estimation model is a macroestimation model thatcomputes the relationship between cost and the amount of time availablefor the development effort. The model supports the “mythical man-month”idea first put forth by Frederick Brooks, who asserted that people and timeare not always interchangeable.
PROCEDURES/ISSUES/POLICIES
The Putnam formula is as shown in Exhibit 23-1.
where
y = instantaneous programmer powery = total life cycle cost in programmer yearsy = time from beginning of project
td = delivery timee = 2.71828.
Reference
Putnam, L.H. (1978). A general empirical solution to the macro software sizing and estimatingproblem, IEEE Transactions on Software Engineering, SE-4:4.
Exhibit 23-1. The Putnam Formula
y = K— et
t2
2
d
–t2
t2d
CuuDuongThanCong.com https://fb.com/tailieudientucntt

This page intentionally left blank
CuuDuongThanCong.com https://fb.com/tailieudientucntt
299
Chapter 24
Malcolm Baldrige Quality Award
ABSTRACT
The Malcolm Baldrige Quality Award is an annual award to recognizeU.S. companies that excel in quality achievement and quality management.The award promotes awareness of quality as an increasingly important ele-ment in competitiveness, understanding of the requirements for qualityexcellence, and sharing of information on successful quality strategies andon benefits derived from implementation of these strategies.
Although only one part of the examination is related to technology, allthe Baldrige award tenets of quality apply to the IT process. In this chapter,a synopsis of the requirements is highlighted.
PROCEDURES/ISSUES/POLICIES
1. The award is built upon a number of key concepts:• Quality is defined by the customer.• The senior leadership of business needs to create clear quality
values and build the values into the way the company operates.• Quality excellence derives from well-designed and well-
executed systems and processes.• Continuous improvement must be part of the management of
all systems and processes.• Companies need to develop goals, as well as strategic and
operational plans, to achieve quality leadership.• Shortening the response time of all operations and processes of
the company needs to be part of the quality improvement effort.• Operations and decisions of the company need to be based
upon facts and data.• All employees must be suitably trained and developed, and
involved in quality activities.• Design quality and defect and error prevention should be
major elements of the quality system.• Companies need to communicate quality requirements to sup-
pliers and work to elevate suppliers’ quality performance.
CuuDuongThanCong.com https://fb.com/tailieudientucntt
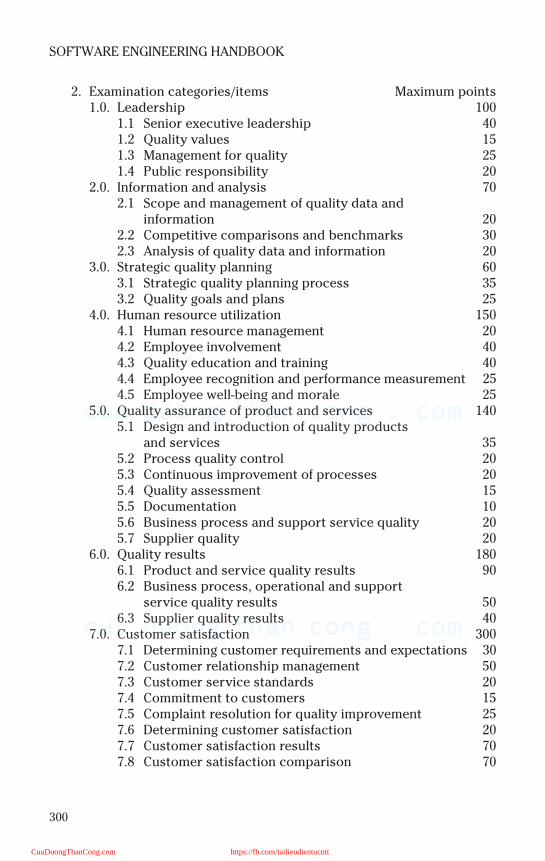
300
SOFTWARE ENGINEERING HANDBOOK
2. Examination categories/items Maximum points1.0. Leadership 100
1.1 Senior executive leadership 401.2 Quality values 151.3 Management for quality 251.4 Public responsibility 20
2.0. Information and analysis 702.1 Scope and management of quality data and
information 202.2 Competitive comparisons and benchmarks 302.3 Analysis of quality data and information 20
3.0. Strategic quality planning 603.1 Strategic quality planning process 353.2 Quality goals and plans 25
4.0. Human resource utilization 1504.1 Human resource management 204.2 Employee involvement 404.3 Quality education and training 404.4 Employee recognition and performance measurement 254.5 Employee well-being and morale 25
5.0. Quality assurance of product and services 1405.1 Design and introduction of quality products
and services 355.2 Process quality control 205.3 Continuous improvement of processes 205.4 Quality assessment 155.5 Documentation 105.6 Business process and support service quality 205.7 Supplier quality 20
6.0. Quality results 1806.1 Product and service quality results 906.2 Business process, operational and support
service quality results 506.3 Supplier quality results 40
7.0. Customer satisfaction 3007.1 Determining customer requirements and expectations 307.2 Customer relationship management 507.3 Customer service standards 207.4 Commitment to customers 157.5 Complaint resolution for quality improvement 257.6 Determining customer satisfaction 207.7 Customer satisfaction results 707.8 Customer satisfaction comparison 70
CuuDuongThanCong.com https://fb.com/tailieudientucntt
301
Malcolm Baldrige Quality Award
Reference
United States Department of Commerce, National Institute of Standards and Technology,Gaithersburg, MD.
CuuDuongThanCong.com https://fb.com/tailieudientucntt

This page intentionally left blank
CuuDuongThanCong.com https://fb.com/tailieudientucntt

303
Chapter 25
Zachman’s Framework
ABSTRACT
In his seminal work, Zachman (1987) makes the observation that, just asa builder needs a detailed set of plans for a building, a systems developerneeds a detailed set of plans for a complex system. He continues thisobservation by saying that different types of plans are prepared by differ-ent parties for different purposes and represent very different views of thesame building. Zachman created an architectural framework that is basi-cally a “set of representations” of differing orientations and focuses. Thischapter gives a brief overview of Zachman’s framework.
PROCEDURES/ISSUES/POLICIES
1. The framework is a two-dimensional classification of the variouscomponents of an information systems architecture. One dimensionconsists of scope description, business model, information systemmodel, technology model and detailed description. The second di-mension consists of data description, process description, and net-work description.
2. Zachman’s framework (see Exhibit 25-1)3. At the scope description level:
• Data description: a list of entities relevant to the business orproject
• Process description: a list of business processes• Network description: a list of locations at which the business oper-
ates or at which the processes of interest are performed4. At the business model level:
• Data description: an entity-relationship diagram• Process description: possibly a functional flow diagram• Network description: some form of logistic definition of the enter-
prise
CuuDuongThanCong.com https://fb.com/tailieudientucntt
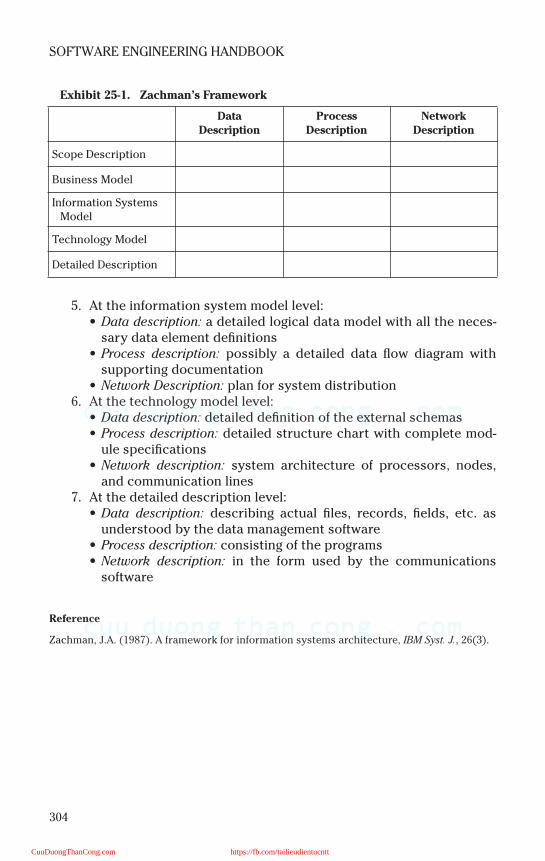
304
SOFTWARE ENGINEERING HANDBOOK
5. At the information system model level:• Data description: a detailed logical data model with all the neces-
sary data element definitions• Process description: possibly a detailed data flow diagram with
supporting documentation• Network Description: plan for system distribution
6. At the technology model level:• Data description: detailed definition of the external schemas• Process description: detailed structure chart with complete mod-
ule specifications• Network description: system architecture of processors, nodes,
and communication lines7. At the detailed description level:
• Data description: describing actual files, records, fields, etc. asunderstood by the data management software
• Process description: consisting of the programs• Network description: in the form used by the communications
software
Reference
Zachman, J.A. (1987). A framework for information systems architecture, IBM Syst. J., 26(3).
Exhibit 25-1. Zachman’s Framework
Data Description
Process Description
Network Description
Scope Description
Business Model
Information Systems Model
Technology Model
Detailed Description
CuuDuongThanCong.com https://fb.com/tailieudientucntt
305
Chapter 26
Linkman’s Method for Controlling Programs through Measurement
ABSTRACT
A controlled development and maintenance program is essential forbringing down the cost associated with software development life cycle.The control mechanism can be implemented first by setting up specificgoals and then selecting the right set of metrics for measurements againstthose goals. Goals must be tangible and balanced or they will be tooremote to be considered achievable. Intermediate targets are needed formonitoring the progress of the project and making sure it is on the righttrack. Project data collection and analysis should also be part of the con-trol mechanism.
A four-step procedure is outlined for establishing targets and means forassessment (Linkman and Walker, 1991). The procedure is not focused onany particular set of metrics; rather, metrics should be selected on the basisof goals. This procedure is suitable for setting up goals for the entire projectdeliverables or for any partial product created in the software life cycle.
PROCEDURE
1. Define measurable goals: the project goals establishment process issimilar to the development process for project deliverables. Soft-ware projects usually start with abstract problem concepts; the finalproject deliverables are obtained by continuously partitioning andrefining the problem into tangible and manageable pieces. Finalquantified goals can be transformed from initial intangible goals byfollowing the same divide-and-conquer method for software deliver-ables. Three sources of information are helpful to establishing thetargets:
CuuDuongThanCong.com https://fb.com/tailieudientucntt
306
SOFTWARE ENGINEERING HANDBOOK
• Historical data is useful under the assumptions that data is avail-able, development environment is stable, and projects are similarin terms of type, size, and complexity.
• Synthetic data such as modeling results is useful if models usedare calibrated to specific development environment.
• Expert opinions can be helpful.2. Maintain balanced goals: the measurable goals are usually estab-
lished on the basis of four factors: cost, schedule, effort, and quality.It is feasible to achieve just a single goal, but it is always a challengeto deliver a project with the minimum staff and resources, on time,and within budget. It needs to be kept in mind that trade-off is al-ways involved and all issues should be addressed to reach a set ofbalanced goals.
3. Set up intermediate goals: a project should never be measured onlyat its end point. Checkpoints should be set up to provide confidencethat the project is running on course. The common practice in-volves setting up quantifiable targets for each phase, measuring theactual values against the targets, and establishing a plan to makecorrections for any deviations. All four aforementioned factorsshould be broken down into phase or activity for setting up interme-diate targets. Measurements for cost and effort can be divided intomachine and human resources according to software life cyclephase so that expenditures can be monitored to ensure the projectis running within budget. The schedule should always be defined interms of milestones or checkpoints to ensure that intermediateproducts can be evaluated and the final product will be delivered ontime. Quality of intermediate products should always be measuredto guarantee the final deliverable will meet its target goal.
4. Establish means of assessment: two aspects are involved in thisactivity:• Data collection: based on project characteristics such as size,
complexity, level of control, etc., a decision should be made interms of whether a manual or an automated data collection pro-cess should be used. If a nonautomated process is applied, thenthe availability of the collection medium at the right time shouldbe emphasized.
• Data analysis: the following two types of analyses should be con-sidered:— Project analysis — this type of analysis, consisting of check-
point analysis and continuous analysis (trend analysis), is con-cerned with verifying that intermediate targets are met toensure that the project is on the right track.
— Component analysis — this type of analysis concentrates onthe finer level of details of the end product and is concernedwith identifying those components in the product that may
CuuDuongThanCong.com https://fb.com/tailieudientucntt
307
Linkman’s Method for Controlling Programs through Measurement
require special attention and action. The complete processincludes deciding on the set of measures to be analyzed, iden-tifying the components detected as anomalous using mea-sured data, finding out the root cause of the anomalies, andtaking actions to make corrections.
Reference
Linkman, S.G. and Walker, J.G. (1991). Controlling programs through measurement, Inf. Soft-ware Technol., 33, 93–102.
Selected Bibliography
Kitchenham, B.A., Packard, L.M., and Linkman, S.G. (1990). An evaluation of some design met-rics, Software Eng. J., 5, 50–58.
Linkman, S.G. (1990). Quantitative monitoring of software development by time-based and in-tercheckpoint monitoring, Software Eng. J., 5, 43–49.
Walker, J.G. and Kitchenham, B.A. (1989). Quality requirements specification and evaluation,in Measurement for Software Control and Assurance, Kitchenham, B.A. and Littlewood, B., Eds.,Elsevier Applied Science, New York.
CuuDuongThanCong.com https://fb.com/tailieudientucntt

This page intentionally left blank
CuuDuongThanCong.com https://fb.com/tailieudientucntt
309
Chapter 27
Kellner’s Nontechnological Issues in Software Engineering
ABSTRACT
Although much of the emphasis in current literature is on the technicalissues of software engineering, a number of substantive nontechnologicalproblems pose dangers to the effective practice of software engineering. Alack of software engineering productivity can be caused by managerial,organizational, economic, political, legal, behavioral, psychological, andsocial factors.
To achieve an acceptable level of software engineering productivity, asmuch emphasis must be placed on “people” issues as on technologicalissues. As Boehm puts it, “Personnel attributes and human relations activ-ities provide by far the largest source of opportunity for improving soft-ware productivity” (Boehm, 1981).
PROCEDURES/ISSUES/POLICIES
1. Recognize that the process of software engineering is “sufficientlyconfused and incoherent that nontechnological factors impede theeffective application of technology” (Humphrey, 1989).
2. Many nontechnological issues are intertwined with software engi-neering. Although any of these is a potential impediment, the Kell-ner panel focused on three:• The software engineering profession, for the most part, has not
developed a block of capable and competent managers.• In spite of a concerted effort toward making software develop-
ment an engineering discipline, it is still very much of an individ-ual creative activity, rather than a team effort.
• Little has been done to reduce performance differences amongindividuals or across teams.
CuuDuongThanCong.com https://fb.com/tailieudientucntt
310
SOFTWARE ENGINEERING HANDBOOK
3. Poor management produces:• Unrealistic project plans due to poor planning, scheduling, and
estimation skills• Unmotivated staff due to inability of management to manage a
creative staff• Lack of teamwork due to inability to build and manage effective
teams• Poor project execution due to inadequate organization, delega-
tion, and monitoring• Technical problems due to lack of management understanding of
disciplines such as quality assurance and configuration manage-ment
• Inadequately trained staff due to a short-sighted rather than along-term perspective
4. Possible solutions to poor management problems:• Definition of dual career paths for technical and managerial staff• Training in managerial skills and techniques• Active mentoring and supervision by senior managers• Increased delegation of responsibility and matching authority
5. Reasons for lack of teamwork:• Desire for autonomy• A culture that reinforces individual efforts more than team efforts• Concentration of key application knowledge by a few individuals• Desire for privacy• The “not invented here” syndrome translated to the “not
invented by me” syndrome• Large productivity differences from one individual to another• Political considerations between powerful individuals and man-
agers6. Possible solutions to teamwork problems:
• Objective assessment of team contributions with appropriaterewards
• Development of an organizational culture that condones andrewards group efforts
• Active efforts to disperse crucial application knowledge acrossproject staff
• Improvements in communication and coordination across organi-zational layers
• Adoption of “egoless” programming techniques7. Large performance differences between individuals negate produc-
tivity increases. Boehm estimates that productivity ranges of 3:1 to5:1 are typical, with some studies documenting differences as highas 26:1 among experienced programmers (Boehm, 1981). This vari-ability is often due to:• Misguided staffing practices
CuuDuongThanCong.com https://fb.com/tailieudientucntt
311
Kellner’s Nontechnological Issues in Software Engineering
• Poor team development• Inattention to the critical role of motivation• Poor management
8. Techniques to increase effective level of productivity:• Enhanced training• Investment in productivity tools (tools, methods)• Standard practices• Professional development opportunities• Recognition• Effective staffing• Top talent• Job matching• Career progression• Team balance• Improved management
References
Boehm, B.W. (1981). Software Engineering Economics, Prentice-Hall, Inc., New York.
Ηυµπηρεψ, Ω.Σ. (1989). Μαναγινγ τηε Σοφτωαρε Προχεσσ, Αδδισον−Ωεσλεψ, Ρεαδινγ, ΜΑ.
Selected Bibliography
Brooks, F.P. (1987). No silver bullet, Computer, 20, 10–19.
Curtis, B., Krasner, H., and Iscoe, N. (1988). A field study of the software design process forlarge systems, Commn. ACM, 31, 1268–1287.
Humphrey, W.S., Kitson, D.H., and Kasse, T.C. (1989). The State of Software Engineering Prac-tice: a Preliminary Report. Tech Rept. CMU/SEI-89-TR-1, Software Engineering Institute, Carn-egie Mellon University, Pittsburgh.
Kellner, M.I. Software Engineering Institute, with panelists Bill Curtis, Software Engineering In-stitute, Tom DeMarco, The Atlantic Systems Guild, Kouichi Kisida, Software Research Associ-ates, Inc., Maurice Schlumberger, Cap Gemeini Innovation, Colin Tully, IndependentConsultant for IEEE, 1991, 144–146.
CuuDuongThanCong.com https://fb.com/tailieudientucntt

This page intentionally left blank
CuuDuongThanCong.com https://fb.com/tailieudientucntt
313
Chapter 28
Martin and Carey’s Survey of Success in Converting Prototypes to Operational Systems
ABSTRACT
The use of prototyping has increased within the ranks of MIS groups dur-ing the last few years; however, a difference of opinion exists as to how aprototype should be implemented as well as about the steps taken to makethe prototype operational. One school of thought stresses that the proto-type is never meant to become an operational system. Therefore, the lan-guages used as well as the platform selected should be experimental. Onthe other side of the argument are those stressing that the prototypicalsystem should be as close to the operational system as possible. This dis-agreement has left MIS organizations without clear guidelines for the use ofprototypes in their companies.
Martin and Carey (1991) conducted an extensive survey of a sector ofMIS shops within the manufacturing industry and found that “prototypemodels were usually not thrown away, prototypes were usually pro-grammed in the same language as the operational system, prototyping inthird generational languages was common, and prototyping models weredocumented as they were developed.” These findings, although contraryto much of the literature on prototyping, are important in that they open afresh perspective on an important topic.
According to Martin and Carey, “prototyping is the process of quicklybuilding a model of the final software system which is used primarily as acommunication tool to assess and meet the information needs of the user.”
CuuDuongThanCong.com https://fb.com/tailieudientucntt
314
SOFTWARE ENGINEERING HANDBOOK
Their survey found that the use of prototyping was born out of some majordifficulties in the traditional software development approach, including:
• End users do not often possess a clear and concise understanding ofwhat they need and what they want.
• The methodologies and tools currently employed by MIS, data-flow di-agrams and the like cannot demonstrate the workings of an actual sys-tem to the liking, or understanding, of a naive end user.
• As the development team grows, so does the complexity of the task ofcommunication between group members.
• Systems developed along traditional lines are often difficult to learnand use.
• As the technology becomes more complex, so do the systems created.As a result, systems are often developed over longer time periods.
• Traditional approaches have been plagued by late delivery and costlyoverruns.
• It comes as no surprise to MIS staff that a rather large application devel-opment backlog exists. According to Martin and Carey, “the users whorequested them are frustrated, disillusioned, and ready to revolt.”
Observed in the abstract, two schools of thought exist concerning pro-totypes; each has adopted a distinct type of prototype. The iterative type(labeled Type I by Martin and Carey) implements the final version of theprototype after a series of modifications. The Martin and Carey Type II pro-totype, the throwaway, is often built in a fourth generation language and is,indeed, only a model of the final system. At prototype’s end, this model is“thrown away” and the system is ultimately implemented in a third gener-ation language.
PROCEDURES/ISSUES/POLICIES
1. In general, the use of prototyping appears more appropriate for smalldecision support systems than for large transaction processing sys-tems. Decision support systems may beneficially use Type I iterativesystems. However, it has also been found that a transaction process-ing system might benefit from a Type II throwaway prototype.
2. In planning a prototype, the development team should take note ofpossible differences between the prototype and operational envi-ronments, including:• Language• Range of transactions• Documentation requirements• Computer architecture• Access control• Procedures
CuuDuongThanCong.com https://fb.com/tailieudientucntt
315
Martin and Carey’s Survey of Success in Converting Prototypes to Operational
3. The programming language for the ultimate operational systemshould be self-documenting. There are inherent differences betweenthird generation languages of the operational environment andfourth generation languages of the prototype environment. Theseinclude:• 4GLs are not as self-documenting as 3GLs.• 4GLs more than likely have features not available in 3GLs, such as
rapid database inquiry.• 4GLs often use recursive paths not compatible with the struc-
tured, top–down operational language requirements.4. Of a system’s inputs, 4.20 percent usually represent 80 percent of
the transaction volume. Therefore, it is this 20 percent that shouldbe the domain of prototyping, according to Martin and Carey, be-cause “a prototype is designed to show users what typically willhappen, rather than all that can happen.”
5. Turning a prototype into an operational system requires the devel-opment team to account for 100 percent of the system’s transac-tions, rather than the 20 percent accountable in the prototype.
6. Prototypes are often run on a microcomputer because:• The PC is portable for demonstrations.• It will not be disrupted by operational problems.• It will not disrupt operations systems.
7. Systems are composed of more than just software. Systems also in-clude hardware, people, and data. The procedures used to tie all ofthese together in the prototype are far less complex than proce-dures required in an operational system.
8. Conversion from an iterative prototype to a full operational systemis complex and time consuming. Steps required include:• Language conversion• Expansion to full transaction range• Extensive documentation• Change from microenvironment to operational platform• Establishment of access control• Development of procedures
9. The pain of prototype to operational system conversion can beeased somewhat by careful development of the prototype. Ap-proaches that accomplish this goal include:• The prototype should be programmed in the same language as
the ultimate operational system.• The prototype should be documented as it evolves.• The prototype should be developed on the ultimate platform. If
the system is intended for use on a mainframe, then prototype iton a mainframe
CuuDuongThanCong.com https://fb.com/tailieudientucntt
316
SOFTWARE ENGINEERING HANDBOOK
10. The Martin and Carey survey documented the prototyping charac-teristics discussed above as the techniques used in a segment ofcommercial industry. The specific survey results follow:• Prototype models were not usually thrown away.• Throwaway prototypes were not actually thrown away; they were
often used for other purposes, such as training.• Prototypes were usually programmed in the same language as the
operational system.• Prototyping in 3GLs was not uncommon. According to Martin and
Carey, “the power of reusable code for a 3GL such as COBOLshould not be underestimated.”
• Prototyping models were documented as they were developed.• The primary goal of the prototype process was user communica-
tions and involvement, not system development efficiency.
Reference
Martin, M.P. and Carey, J.M. (1991). Converting prototypes to operational systems: evidencefrom preliminary industrial survey, Inf. Software Technol., 33, 351–356.
Selected Bibliography
Carey, J.M. and McLeod Jr., R. (1987). Use of system development methodology and tools,J. Syst. Manage., 39, 30–35.
Carey, J.M. (1989). Prototyping:alternative systems development methodology, Inf. SoftwareTechnol., September, 31(8).
Kingler, D.E. (1986). Rapid prototyping revisited, Datamation, 32, 131–132.
Martin, M.P. (1988). The transition between the prototype and the operational environment,Proc. Western Region of Deciison Sciences Institute (April 1988).
Martin, M.P. (1987). Designing systems for change, J. Syst. Manage., 39, 14–18.
CuuDuongThanCong.com https://fb.com/tailieudientucntt
317
Chapter 29
Putnam’s Trends in Measurement, Estimation, and Control
ABSTRACT
Although most MIS managers have read about the different techniquesof measurement, estimation, and control, they are still confused about howto apply them to their own situations. In addition, a plethora of informationabout this topic has served only to confuse these practitioners, rather thanenlighten them.
Putnam estimates that, in the development of complex systems, from 50to 70 percent of these projects come in late, over budget, or in error. Mostacademicians as well as notables in the field, Putnam included, concludethat one of the major problems is that MIS departments have not devel-oped the facilities to gauge where they are or where they should be. Theold stand-by, lines of code (LOC), is, according to Putnam, “the worse met-ric.” Twelve years of Putnam’s research has shown that “both the numera-tor (number of lines) and the denominator (number of man-months) varywith a host of factors related to the environment and management prac-tices in complex, ill-understood, nonlinear ways that cause it to behaveunintuitively” (Putnam, 1991). The result is that the LOC metric is wrongapproximately 90 percent of the time.
In the late 1980s and in the 1990s, emphasis on measurement has beenrenewed. MIS shops are now attempting to evaluate the reliability of soft-ware. In this chapter, a series of issues is raised in this area that the pro-fessional intent on installing a measurement program will want to reviewcarefully.
CuuDuongThanCong.com https://fb.com/tailieudientucntt
318
SOFTWARE ENGINEERING HANDBOOK
PROCEDURES/ISSUES/POLICIES
1. Putnam defines a set of workable metrics as that which is simple,single valued, and which the boss understands. The following is theset that he recommends:• Quantity of function (such as source lines of code and function
points)• Schedule (the elapsed calendar time)• People (the monthly head count)• Effort (the sum of the people applied over time)• Defects (the number of valid problem trouble reports over some
time interval. This can easily be converted to mean time todefect.)
2. Making total quality realistic in a software engineering environment:• Take quality seriously.• Take productivity improvement seriously.• Measure progress with the right metrics.• Set realistic goals.• Focus MIS investment and education on the weaker spots.• Aim for a small gain every day.
3. Use statistical process control on projects. This technique couplesstatistical techniques with the metrics outlined above. The basics ofsoftware control:• Milestone accomplishments (schedule)• Effort expenditure (in man-months)• Code production• Defect identification (trouble reports)
4. These statistics should be captured each month and compared withthe plan.
5. Unfavorable variations indicate slippage and overrun.6. Statistical software packages should be used because a simple ex-
trapolation to predict the future is not useful. Statistical curve-fittingtechniques, readily available in this type of software, are a desirabletool for control.
7. Putnam’s outlook for the future:• Control offices will be established to measure, plan, and control
projects. This will be called the software-data repository and willbe responsible for measuring process–productivity improvementas well as for generating realistic and consistent work plans forthe individual project teams.
8. Executive managers will begin to take a more active interest in de-velopment because they realize that it is strategically important tothe organization.
Reference
Putnam, L.H. (1991). Trends in measurement, estimation, and control, IEEE Software, March,105–107.
CuuDuongThanCong.com https://fb.com/tailieudientucntt
319
Chapter 30
Sprague’s Technique for Software Configuration Management in a Measurement-Based Software Engineering Program
ABSTRACT
The role of software configuration management (SCM) has increased insignificance over the last few years. Sprague enumerates several reasonsfor SCM’s expanded role:
The size of software projects has grown meaning that there are morecomponents to manage.
The introduction of CASE tools has increased the number and types ofmachine-readable objects that must be maintained.
New computing topologies and application structures have come on thescene.
These reasons, coupled with an increasing awareness of the competitiveand strategic organizational issues vis-a-vis technology, have placed anemphasis on being able to control the technology environment.
CuuDuongThanCong.com https://fb.com/tailieudientucntt
320
SOFTWARE ENGINEERING HANDBOOK
Sprague’s definition of SCM expands on the traditional meaning, whichis control over the source code. Sprague emphasizes that SCM should con-sider all of the work products associated with a project including:
• Contracts• Memorandums• Letters• Project plans• Schedules• System and software requirements• Design documentation• Source, object, and executable code• Data• Build and installation files• Test descriptions, results, and reports• Systems and network options• Metrics• Technical reports• Education and training documents• Presentation slides• Videos• Business models and plans
SCM is a formal engineering discipline, as described in the 1983 IEEEstandard 828–1983. “Standard for Software Configuration ManagementPlans” is the means through which the integrity of the software product isrecorded, communicated, and controlled. Derived from hardware-orientedconfiguration management (CM), SCM’s objective is the cost-effective man-agement of a software system’s life cycle and the resultant configuration.As Sprague (1991) suggests, “it is the process of ensuring the software andassociated products are visible, traceable, and formally controlledthroughout their evolution.”
Perhaps the most important concept behind SCM is baseline manage-ment. A baseline is a specification or product, formally reviewed andagreed upon, which thereafter serves as the basis for further develop-ment — one that can be changed only through formal change controlprocedures.
Four functions are employed to manage the baseline and its products:configuration identification, configuration control, configuration statusaccounting, and configuration auditing. This chapter presents an overviewof SCM as well as a process for implementing it.
CuuDuongThanCong.com https://fb.com/tailieudientucntt
321
Technique for Software Configuration Management
PROCEDURES/ISSUES/POLICIES
1. Configuration identification is the process of designating the config-uration items in a system and recording their characteristics. Thisprocess entails determination of the constituent parts of the soft-ware and of the relationship of those parts, assignment of a labeland a name to each part, and graphical depiction of the identifiedsoftware.
2. Configuration control provides the administrative mechanism forprecipitating, preparing, evaluating, approving or disapproving, andimplementing every change to all the products in a baseline. Thepurpose of configuration control is to assure:• Comprehensive system impact analysis• Cost and schedule impact analysis• Optimum and coordinated implementation• Accurate configuration records• Supportability
3. Configuration status accounting is the process of collecting, record-ing, and reporting on configuration control information. The follow-ing information is typically maintained as well as archived:• The time at which each baseline was established• The time at which each item and change was included in the
baseline• A description of each software configuration item• The status of each software-related engineering change• The description of each software change• The documentation status for each baseline• The changes planned for each identified future baseline.
4. Configuration auditing is the process of verifying that all requiredconfiguration items have been produced, that the current versionagrees with the specified requirements, that the technical documen-tation describes the configuration items, and that all change re-quests have been resolved.
PROCEDURES FOR DEVELOPING AN SCM PROCESS
1. Develop an SCMP.• The first step is to develop a plan tailored to the needs of the
project and organization. The plan addresses the four compo-nents of SCM described above. The SCMP should address thefollowing:
• The characteristics of the work products controlled• The work products to be controlled• The different interfaces to be managed
CuuDuongThanCong.com https://fb.com/tailieudientucntt
322
SOFTWARE ENGINEERING HANDBOOK
• The expected duration of the project• The available resources• The organizational responsibilities of project members• The identification procedures that will be used on each project• The procedures for checking items into and out of the software
libraries• The procedures for managing the change process• The authority, membership, and decision-making process of
the group charged with this information’s control• The procedures to create and approve the promotion of a
baseline• The membership data that will be collected, stored, and
reported• The procedures to collect, store, and report the measurement
data• The mechanism to transfer objects between repositories• The procedures for releasing versions• The automated tools that will be used to support the SCM pro-
cess• The procedure for recovering work products in the event of a
disaster2. Implement the SCMP:
• This step requires that those charged with the SCM takeactions to ensure that it is implemented. This implies that theSCMP be periodically reviewed — and revised, if necessary.
3. Identify and control the work products.• This task is accomplished by identifying each object checked
into the repository, securing an electronic or paper copy of theobject, placing the object in a location where it cannot be mod-ified, and, finally, making a log entry describing the events thattook place during the transaction.
4. Collect, store, and report preliminary measurements.• This should be done at each phase of the development project.
The benefits derived from collecting and analyzing the mea-surements at each stage provide the manager with insight intohow the project is doing in terms of cost, schedule, and size.
5. Transfer the work products to the work group responsible for SCM,who will secure and control it.
6. Deliver the work products to the customer.7. Collect, store, and report the final measurements to project mem-
bers and users, as well as to senior management.
CuuDuongThanCong.com https://fb.com/tailieudientucntt

323
Technique for Software Configuration Management
Reference
Sprague, K.G. (1991). The role of software configuration management in a measurement-basedsoftware engineering program, ACM SIGSOFT Software Eng. Notes, 16, 1–10.
Selected Bibliography
Bryan, W.L. and Siegel, S. (1988). Software Product Assurance: Techniques for Reducing SoftwareRisk, Elsevier Science Publishing, New York.
Forte, G. (1990). Configuration management survey, CASE Outlook, 90, 24–51.
Humphrey, W.S. (1989). Managing the Software Process, Addison-Wesley Publishing Co., Read-ing, MA.
Tichy, W.F. (1989). Tools for software configuration management, 11th International Confer-ence on Software Engineering, May 15–18, 1989.
CuuDuongThanCong.com https://fb.com/tailieudientucntt

This page intentionally left blank
CuuDuongThanCong.com https://fb.com/tailieudientucntt
325
Chapter 31
Corbin’s Methodology for Establishing a Software Development Environment
ABSTRACT
The software development environment (SDE) is actually the integrationof a number of processes, tools, standards, methodologies, and related ele-ments whose purpose is to provide a framework for building quality soft-ware (Corbin, 1991). This chapter discusses the elements of SDE andshows how to develop one.
PROCEDURES/ISSUES/POLICIES
1. The elements of SDE:• Project management• Business plan• Architecture• Methodologies• Techniques• Tools• Metrics• Policies and procedures• Technology platform• Support• Standards• Education and training
CuuDuongThanCong.com https://fb.com/tailieudientucntt

326
SOFTWARE ENGINEERING HANDBOOK
2. The benefits of SDE:• Improved problem definition• Selection of the “right” problem according to the customer• Joint customer and IS responsibility and accountability• Acknowledgment of customer ownership of system• Reduced costs of systems development and maintenance• Reusability of software, models, and data definitions• Acceptance of the disciplined approach to software engineering
using a consistent methodology• Productivity improvements through team efforts and tools such
as CASE3. Sample goals of SDE:
• Reduce systems development costs• Reduce maintenance costs• Reduce MIS turnover rateThese goals should be quantifiable wherever possible. For example,the first goal could be stated as “reduce systems development costsby 50 percent over the next five years.”
4. Architecture: many organizations do not have a formal, documentedarchitecture. There are three types:• Business architecture is a model of the business and identifies
such things as processes and entities in the form of models.• Computing architecture, at a minimum, identifies hardware, soft-
ware, and data communications. This breaks out into compo-nents such as operating systems, data resource management,network protocols, and user interface.
• Enterprise architecture is a combination of business and comput-ing architectures.
5. Business plan:• Create a steering committee that provides direction to the MIS
function• Translate the organization’s business plan into an actionable MIS
plan that supports the company’s goals and objectives• The steering committee should be responsible for funding
projects, setting priorities, resolving business issues, and review-ing MIS policies and procedures.
6. Education and training: make sure that analysts, programmers, andusers are trained and ready to start the development project. Train-ing might include the following:• Software engineering concepts• Prototyping• System development life cycle• Joint application development• Software quality assurance and testing• Project management
CuuDuongThanCong.com https://fb.com/tailieudientucntt

327
Corbin’s Methodology for Establishing a Software Development Environment
• Data and process modeling• CASE
7. Methodologies: whether the methodology chosen by the MIS de-partment is a standard one, supplied from a vendor, or developed in-ternally, the MIS group must follow one to ensure consistency fromproject to project. This will enable staff to be able to move fromproject to project without retraining while, at the same time, ensur-ing consistent deliverables. Questions to ask when selecting a meth-odology are:• Does your methodology support the entire systems development
life cycle?• Does it include maintenance?• Is it clearly documented?• Does it focus on deliverables instead of activities?• Is it CASE tool-independent?• Can you use your metrics and techniques with it?
8. Project Management: questions to ask include:• Do you have a formal project management discipline in place?• Do you have a training program to support this?• Is a software tool used?• Do you have program planning and control to help manage the
project?• Do you get routine reports showing the project work breakdown
structure, status reports, resource loading, and cost projections?• Is there a formal reporting mechanism done on a timely basis to
resolve problems?9. Standards: some of the areas in which standards are required are:
• Systems analysis and design• Data administration• Database administration• Systems testing• Prototyping• Documentation• Data entry• Systems productionChange/configuration management questions to ask:• Have you identified all of the standards required to support your
SDE?• Do you have someone responsible for developing and maintain-
ing standards?10. Support options:
• External consulting• A sharing arrangement where you can provide services in
exchange for those needed• User groups• Special-interest groups
CuuDuongThanCong.com https://fb.com/tailieudientucntt
328
SOFTWARE ENGINEERING HANDBOOK
11. Automated tool questions:• Have you identified the tools you need in the SDE?• Have they been approved, acquired, and installed?• Do they support the methodologies?• Do they support the technology platform?• Do they support the standards?• Is technical support available to support the tools?• Do you have templates for use in systems development?• Do you have a data dictionary or repository for your data?• Do you have tools to support each phase of the life cycle?
References
Corbin, D.S. (1991). Establishing the software development environment, J. Syst. Manage., Sep-tember, 28–31.
CuuDuongThanCong.com https://fb.com/tailieudientucntt
329
Chapter 32
Couger’s Bottom-Up Approach to Creativity Improvement in IS Development
ABSTRACT
The majority of IS organizations use a top–down approach to generatingproductivity improvements. In this chapter, a process for generating pro-ductivity via a series of bottom–up creativity techniques is addressed. Theauthors are all staff members of the United Technologies MicroelectronicCenter who, upon a six-month review of all available IS literature, foundthat very little research had been published in the area of creativity gener-ation techniques in information systems organization. Couger and co-workers (1991) decided to cull creativity-generating techniques that hadbeen proven successful in other disciplines. As a result, a two-prongedapproach was selected for the UTMC creativity program:
• Improvement of the environment for creativity and innovation• Training in specific techniques for creativity generation and evaluation
The results of the institution of this approach were exciting. Accordingto the authors, the creativity program more than paid for itself in efficiencyimprovements alone — in savings of computer processing time and com-puter programming time. In addition, the UTMC group saw great improve-ments in the effectiveness of their systems.
PROCEDURES/ISSUES/POLICIES
1. Survey participants were to obtain perceptions on the environmentfor creativity and innovation. This same instrument should be usedto obtain new perceptions as a measurement of the results.
CuuDuongThanCong.com https://fb.com/tailieudientucntt

330
SOFTWARE ENGINEERING HANDBOOK
2. Participants were asked to keep a “creativity log” in which they keeptrack of their creativity improvements.
3. A training workshop was instituted to teach a variety of creativitygeneration and evaluation techniques.
4. One third of the workshop was spent in discussing how to improvethe climate for creativity in the IS organization. The methodologyused for this assessment was to ask the employees to identify posi-tive and negative contributors to the creativity environment.
5. Creativity generation and evaluation techniques were used:• Analogy/metaphor. An analogy is a statement about how objects,
people, situations, or actions are similar in process or relation-ship. Metaphors, on the other hand, are merely figures of speech.Both of these techniques can be used to create fictional situa-tions for gaining new perspectives on problem definition and res-olution.
• Brainstorming. This technique is perhaps the most familiar of allthe techniques discussed here. It is used to generate a large quan-tity of ideas in a short period of time.
• Blue slip. Ideas are individually generated and recorded on a 3 × 5in. sheet of blue paper. Because this is done anonymously tomake people feel more at ease, people readily share ideas. Eachidea is on a separate piece of blue paper, so the sorting andgrouping of like ideas is facilitated.
• Extrapolation. A technique or approach, already used by the orga-nization, is stretched to apply to a new problem.
• Progressive abstraction technique. By moving through progres-sively higher levels of abstraction, it is possible to generate alter-native problem definitions from an original problem. When aproblem is enlarged in a systematic way, it is possible to generatemany new definitions that can then be evaluated for their useful-ness and feasibility. Once an appropriate level of abstraction isreached, possible solutions are more easily identified.
• 5Ws and H technique. This is the traditional journalistic approachof “who–what–where–when–why–how.” Use of this techniqueserves to expand a person’s view of the problem and to assist inmaking sure that all related aspects of the problem have beenaddressed and considered.
• Force field analysis technique. The name of this technique comesfrom its ability to identify forces contributing to or hindering asolution to a problem. This technique stimulates creative think-ing in three ways:— It defines direction.— It identifies strengths that can be maximized.— It identifies weaknesses that can be minimized.
CuuDuongThanCong.com https://fb.com/tailieudientucntt
331
Couger’s Bottom-Up Approach to Creativity Improvement in IS Development
• Peaceful setting. This is not so much a technique as it is an envi-ronment. Taking people away from their hectic surroundingsenables “a less cluttered open mental process.”
• Problem reversal. Reversing a problem statement often provides adifferent framework for analysis. For example, in attempting tocome up with ways to improve productivity, try considering theopposite: how to decrease productivity.
• Associations/image technique. Most of us have played the game,at one time or another, where a person names a person, place, orthing and asks for the first thing that pops into the second per-son’s mind. The linking of combining processes is another way ofexpanding the solution space.
• Wishful thinking. This technique enables people to loosen analyti-cal parameters to consider a larger set of alternatives than theymight ordinarily consider. By permitting a degree of fantasy in theprocess, the result just might be a new and unique approach.
6. Follow-up sessions were scheduled for reinforcement. At thesemeetings, primarily staff meetings, employees were invited to iden-tify results of creative activity.
Reference
Couger, J.D., McIntyre, S.C., Higgins, L.F., and Snow, T.A. (1991). Using a bottom–up approachto creativity improvement in IS development, J. Syst. Manage., September, 23–36.
CuuDuongThanCong.com https://fb.com/tailieudientucntt

This page intentionally left blank
CuuDuongThanCong.com https://fb.com/tailieudientucntt
333
Chapter 33
Shetty’s Seven Principles of Quality Leaders
ABSTRACT
Y. K. Shetty, a professor of management at Utah State University’s Col-lege of Business and the co-editor of The Quest for Competitiveness (Quo-rum Books, 1991), suggests that even though most corporate executivesbelieve that quality and productivity are the most critical issues facingAmerican business, many do not know how to achieve it. Shetty lists 16organizations that have vigorously attacked this challenge: Hewlett-Pack-ard, IBM, Procter and Gamble, Johnson & Johnson, Maytag, Dana Corpora-tion, Intel, Texas Instruments, 3M, Caterpillar, Delta, Marriott, McDonald’s,Dow Chemical, Xerox, and General Electric. Shetty’s chapter discusses thecommon principles shared by this elite group.
PROCEDURES/ISSUES/POLICIES
Principle 1: Quality improvement requires the firm commitment of top man-agement. All top management, including the CEO, must be personally com-mitted to quality. The keyword here is “personally.” Many CEOs pay onlylip service to this particular edit. Therefore, top management must be con-sistent and reflect its commitment through the company’s philosophy,goals, policies, priorities, and executive behavior. Steps that managementcan take to accomplish this end include:
• Establish and communicate a clear vision of corporate philosophy,principles, and objectives relevant to product and service quality.— Channel resources toward these objectives and define roles and re-
sponsibilities in this endeavor.— Invest time to learn about quality issues and monitor the progress
of any initiatives.— Encourage communication between management and employees,
among departments, and among various units of the firm andcustomers.
— Be a good role model in communication and action.
CuuDuongThanCong.com https://fb.com/tailieudientucntt

334
SOFTWARE ENGINEERING HANDBOOK
Principle 2: Quality is a strategic issue.
• It must be a part of a company’s goals and strategies.• Must be consistent with and reinforce a company’s other strategic
objectives.• It must be integrated into budgets and plans — the way the company
does business.• It must be a corporate mission with planned goals and strategies.• Quality should be at the heart of every action.
Principle 3: Employees are the key to consistent quality.
• The organization must have a people-oriented philosophy.• Poorly managed people convey their disdain for quality and service
when they work.• Pay special attention to employee recruitment, selection, and
socialization.• Reinforce socialization and quality process with continuous training
and education. This should include training in:— Awareness of quality— Each employee’s role in the process— Statistical process control— Problem-solving techniques
• Incorporate quality into performance appraisal and reward systems.• Encourage employee participation and involvement.• Effective communication throughout the department, between de-
partments, and throughout the organization is required to reinforcethe deep commitment of management and create an awareness andunderstanding of the role of quality and customer service.
Principle 4: Quality standards and measurements must be customer-driven. They can be measured by:
• Formal customer surveys• Focus groups• Customer complaints• Quality audits• Testing panels• Statistical quality controls• Interaction with customers
Principle 5: Many programs and techniques can be used to improve quality,such as:
• Statistical quality control• Quality circles• Suggestion systems• Quality-of-work-life projects• Competitive benchmarking
CuuDuongThanCong.com https://fb.com/tailieudientucntt
335
Shetty’s Seven Principles of Quality Leaders
Principle 6: All company activities have potential for improving productquality; therefore, teamwork is vital.
• Quality improvement requires close cooperation between managersand employees and among departments.
• Total quality management involves preventing errors at the pointwhere work is performed.
• Every employee and department is responsible for quality.
Principle 7: Quality is a never-ending process.
• Quality must be planned.• Quality must be organized.• Quality must be monitored.• Quality must be continuously revitalized.
Reference
Shetty, Y.K. (1991–1992). A point of view: seven principles of quality leaders, Natl. ProductivityRev., Winter, 3–7.
CuuDuongThanCong.com https://fb.com/tailieudientucntt

This page intentionally left blank
CuuDuongThanCong.com https://fb.com/tailieudientucntt

337
Chapter 34
Simmons’ Statistics Concerning Communications’ Effect on Group Productivity
ABSTRACT
In this chapter Simmons (1991) details the many factors that dominatesoftware group productivity. He defines dominator as a single factor thatcauses productivity to decline tenfold. The two dominators discussed arecommunications and design partition. What follows is a set of rules andstatistics that the reader can use as a comparison in his or her own effortsto increase productivity.
PROCEDURES/ISSUES/POLICIES
1. Factors that developers must cope with in developing largesystems:• Personnel turnover• Hardware/software turnover• Major ideas incorporated late• Latent bugs
2. A Delphi survey performed by Scott and Simmons (1974) to uncoverfactors that affect productivity found that the main factors are:• External documentation• Programming language• Programming tools• Programmer experience• Communications• Independent modules for task assignment (design partition)• Well-defined programming practices
CuuDuongThanCong.com https://fb.com/tailieudientucntt
338
SOFTWARE ENGINEERING HANDBOOK
3. Improvement statistics:• Any step toward the use of structured techniques, interactive
development, inspections, etc. can improve productivity by up to25 percent.
• Use of these techniques in combination could yield improve-ments of between 25 and 50 percent.
• Change in programming language can, by itself, yield a productiv-ity improvement of more than 50 percent.
• Gains of between 50 and 75 percent can be achieved by singlehigh achievers or teams of high achievers.
• Gains of 100 percent can be achieved by database user languages,application generators, and software reuse.
4. Dominators are factors that can suppress the effects of other fac-tors and can reduce software group productivity by an order ofmagnitude.
5. Poor design partition can dominate group productivity. To obtainhigh productivity in the development of large software systems, thedesigner must break down the system in chunks that can be devel-oped in parallel. The difference between great and average design-ers is an order of magnitude.
6. Communications can dominate productivity. Most project problemsarise as the result of poor communications between workers. If nworkers are on the team, then there are n(n — 1)/2 interfaces acrosswhich communications problems may occur.
7. Productivity of individual programmers varies as much as 26 to 1.8. An individual working alone has no interruptions from fellow group
members and, therefore, the productivity can be quite high for a mo-tivated individual. It is estimated that one programmer working 60hours a week can complete a project in the same calendar time astwo others working normal hours, but at three-quarters of the cost.
9. Small groups of experienced and productive software developerscan create large systems. An example is given of a company, PyburnSystems, which scours the country for the best analytical thinkers.Its senior programmers typically earn $125,000 a year and can bepaid bonuses of two to three times that amount. They work in smallteams, never more than five, to produce large, complex systems. Incomparison, most MIS departments produce large systems usingnormal development teams with developers of average ability.
10. In general, the difference between the cost to produce an individualprogram to be run by the program author and the cost to produce aprogramming system product developed by a software group is atleast nine times more expensive.
11. At some point coordination overheads outweigh any benefits thatcan be obtained by the addition of further staff. Statistics that sup-port this were pioneered during the 19th century in work on a military
CuuDuongThanCong.com https://fb.com/tailieudientucntt
339
Simmons’ Statistics Concerning Communications’ Effect on Group Productivity
organization. It was noted that as the number of workers who had tocommunicate increased arithmetically, from two to three to four tofive…, the number of communication channels among them in-creased geometrically, from one to three to six to ten…. From thisstudy, it was concluded that the upper limit of effective staff size forcooperative projects is about eight.
12. It has been shown in studies that when the number of staff increasedto 12 or more, the efficiency of the group decreased to less than 30percent.
13. The productive time of a typical software developer during a work-ing day can vary from 51 to 79 percent. It was found that the averageduration of work interruption was five minutes for a typical pro-grammer. The average time to regain a train of thought after an in-terruption was two minutes. Thus, the average total time spent onan interruption was seven minutes. If we assume five productivehours each day, then each interruption takes 2.33 percent of theworking day; ten interruptions would take up 23 percent of the dayand 20 interruptions would take approximately 50 percent.
14. The optimum group size for a software development team is be-tween five to eight members. The overall design should be parti-tioned into successively smaller chunks, until the developmentgroup has a chunk of software to develop that minimizes intragroupand intergroup communications.
References
Scott, R.F. and Simmons, D.B. (1974). Programmer productivity and the Delphi technique,Datamation, 72–73.
Simmons, D.B. (1991). Communications: a software group productivity dominator, SoftwareEng. J., November, 454–462.
Selected Bibliography
Factor, R.M. and Smith, W.B. (1988). A discipline for improving software productivity, AT&TTech. J., July/August 1988, 2–9.
Grady, R.B. and Caswell, D.L. (1987). Software Metrics: Establishing a Company-Wide Program,Prentice-Hall, Englewood Cliffs, NJ.
Jones, C. (1977). Program quality and programmer productivity, IBM Technical Report TR02.764, January 1977, 42–78.
Simmons, D.B. (1972). The art of writing large programs, Computer, March/April, 43–49.
Software Productivity Metrics Working Group. (1989). Standard for software productivity met-rics, IEEE, Standard P1045/32.0, November 20, 1989.
CuuDuongThanCong.com https://fb.com/tailieudientucntt

This page intentionally left blank
CuuDuongThanCong.com https://fb.com/tailieudientucntt
341
Chapter 35
Gould’s Points on Usability
ABSTRACT
Few in the industry have added usability design to their rostrum ofdesign issues. However, Gould, Boies, and Lewis (1991) note that this pro-cess leads to usable, useful, likable computer systems and applications.The authors present Strong evidence that readers can use to support theirown efforts in this, perhaps, new terrain. This chapter also details a pro-cess that can be used to design effective and usable systems. In effect, thischapter proposes:
• Greater reliance on existing methodologies for establishing testableusability and productivity-enhancing goals
• A new method for identifying and focusing attention on long-termtrends about the effects that computer applications have on end-userproductivity
• A new approach to application development, particularly the develop-ment of user interfaces
The authors conclude that a three-way split among style of the userinterface, content of the user interface, and the functional code allowschanges to be made in the user interface that still preserve the integrity ofthe functional code. Iterative design, a necessity when looking towardusability, proceeds rapidly. On the style side, a particular style can be pro-totyped and iteratively engineered. From the set of styles developed overtime, a subset of workable, usable styles will emerge that have attained thefavor of organizations or end users. Ultimately, the best work of the styleside and the functional side of development will be better leveraged.
PROCEDURES/ISSUES/POLICIES:
1. The usability process consists of four activities:• Early focus on users should be via interviews, surveys, observa-
tions, and participatory design with an aim toward understandingusers’ cognitive, behavioral, and attitudinal characteristics.
CuuDuongThanCong.com https://fb.com/tailieudientucntt
342
SOFTWARE ENGINEERING HANDBOOK
• All facets of usability, for example, user interface, help system,training plan, and documentation, should evolve in parallel,rather than be defined sequentially and be under one manage-ment.
• User testing should be early and continual. This should includeobservation and measurement of user behavior and careful eval-uation of feedback. Ultimately, a strong motivation to makedesign changes should exist.
• Iterative design must be used. Because the system under designmust be continually modified due to results of behavioral testsof function, the system must have the ability to be changedcontinually.
2. This type of development effort has been used with great success:• Xerox’s Star system• Apple’s Lisa system• IBM Audio Distribution Systems (ADS)• IBM’s Rexx• Tektronix’s Graphic Input Workstation• Boeing’s banking terminal• Digital Equipment Corporation’s VAX text processing utility• IBM’s QMF• Lotus Development Corporation’s Lotus 1–2–3
3. Six interacting, organizational reasons why usability design is notused:• Usability is seldom a goal in development.• There is a belief that usability cannot be measured — even
though there is much evidence to the contrary.• An apparent conflict between meeting deadlines and achieving
usability exists. Project managers often lack confidence in manag-ing something that does not have clear goals or the tools toaddress problems efficiently as they arise.
• Designers report that software development is not organized tocarry out the process of usability. Iterative design is thought tobe too risky, time consuming, and too difficult.
• Designers need better tools to do iterative design.• Nearly every new application creates its own user interface,
which creates an enormous amount of work. Also, these inter-faces are not usually developed by people skilled in user-inter-
face design.
4. Usability metrics can be created. They must be clearly stated, easilycommunicated, and verifiable. The results must be made public. Ex-perience has shown that these results are then taken seriously bymanagement. This has always been the case in logging system per-formance data. This operation-room metric is a viable usability met-ric. Measures here include percent system available, downtime per
CuuDuongThanCong.com https://fb.com/tailieudientucntt
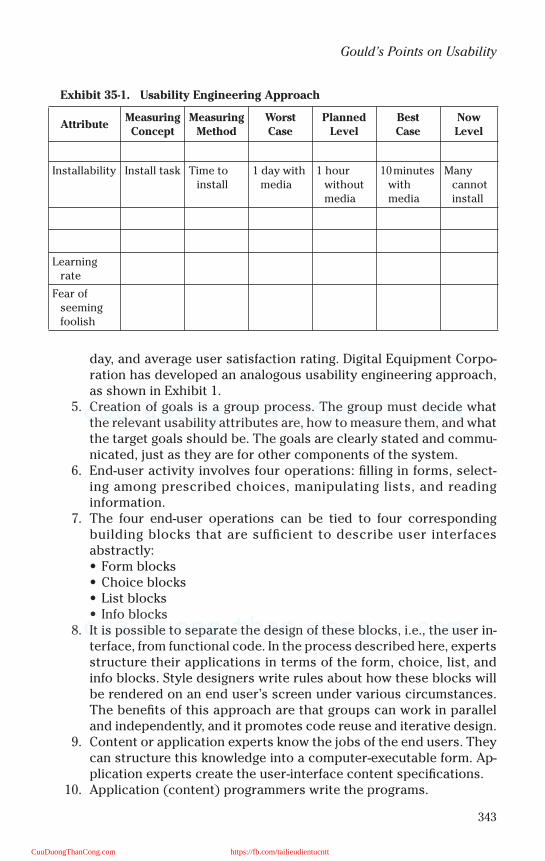
343
Gould’s Points on Usability
day, and average user satisfaction rating. Digital Equipment Corpo-ration has developed an analogous usability engineering approach,as shown in Exhibit 1.
5. Creation of goals is a group process. The group must decide whatthe relevant usability attributes are, how to measure them, and whatthe target goals should be. The goals are clearly stated and commu-nicated, just as they are for other components of the system.
6. End-user activity involves four operations: filling in forms, select-ing among prescribed choices, manipulating lists, and readinginformation.
7. The four end-user operations can be tied to four correspondingbuilding blocks that are sufficient to describe user interfacesabstractly:• Form blocks• Choice blocks• List blocks• Info blocks
8. It is possible to separate the design of these blocks, i.e., the user in-terface, from functional code. In the process described here, expertsstructure their applications in terms of the form, choice, list, andinfo blocks. Style designers write rules about how these blocks willbe rendered on an end user’s screen under various circumstances.The benefits of this approach are that groups can work in paralleland independently, and it promotes code reuse and iterative design.
9. Content or application experts know the jobs of the end users. Theycan structure this knowledge into a computer-executable form. Ap-plication experts create the user-interface content specifications.
10. Application (content) programmers write the programs.
Exhibit 35-1. Usability Engineering Approach
AttributeMeasuring Concept
Measuring Method
Worst Case
Planned Level
Best Case
Now Level
Installability Install task Time to install
1 day with media
1 hour without media
10 minutes with media
Many cannot install
Learning rate
Fear of seeming foolish
CuuDuongThanCong.com https://fb.com/tailieudientucntt
344
SOFTWARE ENGINEERING HANDBOOK
11. Style designers have skills in human factors and graphic design.Their role is mainly of advocacy; they identify problems and de-scribe solutions. They specify style rules.
12. Style programmers write programs necessary for making an interac-tion work.
13. Content (application) specifications are created by the applicationexpert and include the messages to end users, flow of control, con-nections to function, and guidance to style.
14. Content (application) actions are created by application program-mers. These are atomic programs with general utility. For example,a module might transfer the contents of one list to another.
15. Style specifications are created by the style designers. These are therules regulating the set of human–computer interaction techniquesused to render content, including interaction methods (e.g., entryvs. selection), appearance of the end user’s screen, and the interac-tion devices.
16. The team works with a series of tools. Over time, they build up a li-brary of well-tested approaches to human interface, which can thenbe mapped onto an application’s content blocks.
Reference
Gould, J.D., Boies, S.J., and Lewis, C. (1991). Making usable, useful, productivity-enhancingcomputer applications, Commn. ACM, 34,.
Selected Bibliography
Attewell, P. (1990). The productivity paradox, unpublished manuscript.
Good, M., Spine, T.M., Whiteside, J., and George, P. (1986). User-derived impact analysis as atool for usabiliuty engineering, Human factors in computing systems, CHI’86 Proceedings,ACM, New York, 241–246.
Gould, J.D. (1988). How to design usable systems, in Handbook of Human–Computer Interac-tion, Helander, M., Ed., Elsevier Science North-Holland Publishers, 757–789.
Hartson, R. (1989). User interface management control and communication, IEEE Software,January, 62–70.
Wiecha, C., Bennett, W., Boies, S., and Gould, J. (1989). Generating highly interactive user in-terfaces, Proceedings of CHI’88 (Austin, Texas, April 30-May 4, 1989), ACM, New York, 277–282.
CuuDuongThanCong.com https://fb.com/tailieudientucntt
345
Chapter 36
Prescott’s Guidelines for Using Structured Methodology
ABSTRACT
The science of software engineering is composed of many methodolo-gies and each has its own variations. In this chapter, Prescott (1991) offersan itemized set of guidelines for those interested in using structured meth-odology to ensure their project’s success.
Structured methodology is an approach to defining a particular task andin defining a solution to that task. It provides a methodology for partition-ing a complex task into a manageable series of “black boxes.” The underly-ing organization of this network of black boxes progresses from abstrac-tion at the top level to details at the lower levels. Not only are the specificsof each black box charted out, but the interfaces between each of theseblack boxes are also specified.
One of the main reasons for using structured methodology is the sheercomplexity and cost of a problem. The discipline associated with this tech-nique is reflected in the need to document each particular phase of devel-opment to ensure compliance with demanding requirements for quality,performance, and reliability.
PROCEDURES/ISSUES/POLICIES
1. Structured methodology will only be successful if:• The company’s management is willing to make a firm commit-
ment to the substantial time investment required to build a qual-ity project.
• A software development plan for the development of software isused. It provides management with the means to coordinateschedules, control resources, initiate actions, and monitorprogress of the development effort. It also provides detailedknowledge of the schedule, organization, and resource allocation
CuuDuongThanCong.com https://fb.com/tailieudientucntt

346
SOFTWARE ENGINEERING HANDBOOK
planned by the contractor. In addition, it contains definitions anddiscussions of software quality and configuration management,as well as design and programming standards and conventions.
• Walkthroughs of at least five people for up to one and three quar-ters hours at the most are held in the requirements, design, cod-ing, and testing phases.
2. A software requirement must be expressed in very clear English.3. Decompose each function into related subfunctions. For example,
initialization may be decomposed into initialize local variables andinitialize global variables subfunctions.
4. For each function or task and subfunction, a narrative is written thatclearly describes the function in terms of what the function does.The source of the required data and its destination as output fromthe function must also be defined and documented. The narrativeshould include the following:• Module name• Module called by• Module purpose• Inputs• Outputs• Unit description
5. Define a local database that will house the data items pertinent tothe data requirements.
6. For each function, a detailed design document must be created thatwill, ultimately, be used to create the code. This document containsthe following information:• Name of function• Function’s purpose• Description• Calling sequence — if this submodule is called by another mod-
ule or calls another module• Calling parameters — if called or calling, then what are the
parameters passed• Updates — the files that it updates• Variables — the variables that it uses• Algorithm — pseudocoded processing logic such as:
— Clear error flag— If code entered is equal to code in table— Update table.
7. Module is then coded using programming standards that enforcereadability and understanding.
8. A test plan is created that takes into consideration schedule, envi-ronment, and available resources.
9. Test procedures that test each requirement must be documented.This translates into a series of test cases or scenarios. The test, the
CuuDuongThanCong.com https://fb.com/tailieudientucntt
347
Prescott’s Guidelines for Using Structured Methodology
input, and the expected output are documented. This document isknown as a requirements traceability matrix, which establishes thecorrespondence between a software product specification and thesuccessful testing of each such specification.
10. Systems integration and maintenance must be considered.11. Tools and techniques that assist in the process of structured
methodology:• Use of formal walkthroughs• A structured approach to software design, coding, and testing• Use of structured programming• The use of standardized coding conventions• The use of graphics devices such as a functional block diagram
for module specification
Reference
Prescott, J.R. (1991). Using structured methodology for software project success, J. Syst. Man-age., July, 28–31.
CuuDuongThanCong.com https://fb.com/tailieudientucntt

This page intentionally left blank
CuuDuongThanCong.com https://fb.com/tailieudientucntt
349
Chapter 37
Kemayel’s Controllable Factors in Programmer Productivity
ABSTRACT
Based on extensive research performed in Tunisia by Kemayel et al., thischapter seeks to identify the characteristics of the programmer’s workpotential. The impact of certain controllable factors in the productivity ofprogrammers is investigated. These factors are divided into three catego-ries: factors pertaining to personnel, factors pertaining to the process, andfactors pertaining to the user community.
PROCEDURES/ISSUES/POLICIES
1. Programmer productivity paradoxes:• There is an enormous variance in the productivity of programmers.
This variance can be as wide as a factor of one to ten. (Otherresearchers report an even wider variance.) There is a largeopportunity to improve programmer productivity within thiswide range.
• Productivity invariance with respect to experience. According tostatistical measures by Boehm (1981), when the experience of aprogrammer increases from one month to three years (36-foldincrease), productivity is improved by only 34 percent. Thisappears to show that experience has no effect on softwareproject costs.
• Productivity invariance with respect to tools. According to Boehm,the difference in productivity between a programmer who usesno tools at all and one who uses the most up-to-date, powerfultools available, on the most powerful machines, is no larger than50 percent.
CuuDuongThanCong.com https://fb.com/tailieudientucntt

350
SOFTWARE ENGINEERING HANDBOOK
• Suitability of motivation factors. Studies have shown that program-mers have a motivation pattern different from that of their man-agers and those of workers in other industries. This differencemight well explain why some well-intentioned software managersfail to motivate their programmers.
2. The 33 productivity factors that are proposed can be divided intothree categories:• Factors related to personnel• Factors related to the software process• Factors related to the user community
3. Personnel factors. Two sets of controllable factors are likely to affectthe productivity of data processing personnel: motivation factorsand experience factors.
4. Personnel motivation consists of many factors; 16 derived from re-search appear below:• Recognition. This is the reaction of the organization to the pro-
grammer’s performance. Indifference leads to a drop in motiva-tion, which leads to a decline in productivity.
• Achievement. This represents the satisfaction that the program-mer gets from doing a challenging task. This implies that the orga-nization must keep supplying the programmer with challengingtasks to maintain motivation.
• The work. The nature of the tasks that must be executed is a pow-erful tool to motivate a programmer.
• Responsibility. This is derived from basic management theory.That is, if you want something to happen, make someone specifi-cally responsible for it.
• Advancement. A programmer who feels that he or she has thepossibility of career advancement in the organization is moremotivated than one who does not.
• Salary. A programmer who feels that he or she is paid adequately,and who anticipates that salary increases will continue on parwith performance, will be more motivated than one who doesnot.
• Possibility for growth. This factor measures the possibilities forprofessional growth within a programmer’s company.
• Interpersonal relations with subordinates.• Status. This measures the importance of the worker in his or her
company, e.g., participation at meetings, participation in decisionmaking, ceremonial functions, usage of restricted services, andprivileges of the corporation.
• Interpersonal relations, superiors. This is controllable to the extentthat the manager has latitude in assigning group leaders.
CuuDuongThanCong.com https://fb.com/tailieudientucntt
351
Kemayel’s Controllable Factors in Programmer Productivity
• Interpersonal relations, peers. Because teamwork is a key ingredi-ent for the success of any group effort, the manager should takecare in dividing staff into working groups.
• Technical supervision. This measures the willingness of the pro-grammer’s supervisor to help the programmer solve technicalproblems, orient efforts, and make choices.
• Company policy and administration. This factor measures howclearly the command structure of the company is defined, howrational it is, and how easy it is to determine to whom eachworker reports.
• Working conditions. This factor represents working conditions inthe traditional sense, such as office space, light.
• Factors in personal life. Given that the programmer’s personal lifeinfluences motivation and job performance, the manager canassign key positions or tasks to those that have the best condi-tions.
• Job security. This factor is very important.5. Personnel experience is equally important. Four factors are
discussed:• Applications domain experience• Virtual machine experience — the aggregate of hardware, operat-
ing system, utilities, and software packages• Programming language experience• Experience with the user community — to what extent the pro-
grammer is familiar with the user community as a workingpartner
6. Two classes of controllable factors pertaining to the software pro-cess have been identified by the authors: project management andprogramming environments.
7. Project management consists of four controllable factors:• Using a goal structure — to what extent the programming team
uses a goal structure, and to what extent the team depends on itfor its day-to-day decision making.
• Adherence to a software life cycle — to what extent a team usesand depends on a software life cycle.
• Adherence to an activity distribution — to what extent the pro-gramming team uses a precise definition of life cycle activities,and to what extent they depend on it for decision making.
• Usage of cost estimation procedures — to what extent the pro-gramming team uses a software cost-estimation model and towhat extent they depend on it for decision making.
8. Programming environment is composed of four controllable factors:• Programming tools.To what extent the programmer uses software
tools and how powerful these tools are (i.e., debuggers, editors).
CuuDuongThanCong.com https://fb.com/tailieudientucntt
352
SOFTWARE ENGINEERING HANDBOOK
• Modern programming practices. To what extent does the program-mer use modern programming practices and how powerful arethey? This includes modular programming, program libraries,and reuse.
• Programming standards. To what extent are standards used, howstringent are they, and how strictly are they adhered to? Exam-ples include test standards, verification standards, validationstandards, and standards of unit size.
• Power of equipment used. Barry Boehm introduced two factorspertaining to the power of equipment used: a factor that mea-sures memory space limitations and a factor that measures timelimitations.
9. The participation of users has been found to have an important im-pact on programmer productivity. Well prepared users reduce thecost of software maintenance.• Previous education in computing. What is the duration level of the
users’ previous education in computing.• Experience in computing. To what extent has the user used com-
puters in the past? Previous experience gives users a bettersense of what computers can do for them and enables them toexpress their desires more effectively.
• Experience with the type of application. Experience in buildingcomputer systems in the same application domain is valuable.The major incentive for rapid prototyping is to have a high ratingfor this factor.
• Experience with the group of programmers and analysts.10. Survey results on Tunisian subjects:
• Of the 16 motivation factors, 5 were statistically significant andaccount for 18.89 percent of programmer productivity: technicalsupervision, working conditions, achievement, responsibilities,and recognition.
• Of the four personnel experience factors, only two were found tobe statistically significant and account for 7.49 percent of pro-grammer productivity: experience with the virtual machine anduser community.
• Of the factors used to assess project management, two wereproved significant and explain 5.57 percent of programmer pro-ductivity: the definition and use of a software life cycle and soft-ware cost estimation.
• In the programming environment area two factors explained9.62 percent of programmer productivity: the use of modernprogramming practices and the power of equipment used fordevelopment.
CuuDuongThanCong.com https://fb.com/tailieudientucntt

353
Kemayel’s Controllable Factors in Programmer Productivity
• Two user factors were found to be significant and explained a5.33 percent of programmer productivity: experience of the usercommunity with computers and the experience of the user com-munity with the group of programmers and analysts.
References
Boehm, B.W. (1981). Software Engineering Economics. Prentice-Hall, Englewood Cliffs, NJ.
Kemayel, L., Mili, A., and Ouederni, I. (1991). Controllable factors for programmer productiv-ity: a statistical study, J. Syst. Software, 16, 151–163.
Selected Bibliography
Basili, V.R. and Weiss, D.M. (1984). A methdology for collecting valid software engineering da-ta, IEEE Trans. Software Eng., SE-10, 728–737.
Mills, H.D. (1983). Programmer Productivity, Little, Brown and Co., Boston, MA.
CuuDuongThanCong.com https://fb.com/tailieudientucntt

This page intentionally left blank
CuuDuongThanCong.com https://fb.com/tailieudientucntt
355
Chapter 38
AT&T’s “Estimeeting” Process for Developing Estimates
ABSTRACT
This chapter presents a method for estimating a software developmenteffort in the early phases of a large software-intensive project. For each fea-ture of the project to be estimated, a “feature team” generates a detailedfeature definition that is used in what the Taff, Borchering, and Hudgins(1991) term an “estimeeting.” Using this process it is possible to build insoftware quality, by design, in the early stages of development and notadded on later in a series of fixes to problems uncovered in testing. Build-ing in quality requires “front loading” the development process, yieldingbetter designs and fewer errors that are more easily and cleanly isolatedand repaired.
More complete work in the early stages can serve to identify tools orspecial testing needs earlier. If the estimates for a project are too low, thenproject staffing will also be too low. As needs become apparent, staff are“back-end loaded,” which is the reverse of what is desirable for a high-qual-ity product. The “estimeeting” process described in this chapter can beused to estimate a software project accurately. The benefits of this pro-cess, as identified by the authors, are as follows:
• Better estimates. There is an ability to predict resources moreaccurately.
• Earlier and closer subsystem involvement. Subsystem owners attendmeetings earlier, see what new features may be down the pike, and asa result, can make allowances.
• Early direct relationships. The meetings foster teamwork.• Early expert high-level designs. Byproducts of these meetings are ideas
that are useful for the next level of design.
CuuDuongThanCong.com https://fb.com/tailieudientucntt
356
SOFTWARE ENGINEERING HANDBOOK
• Problem detection. There is a better understanding of potential prob-lems of resources and performance.
• General acceptance of estimates. Results are readily accepted asofficial.
• Clearly defined milestones. The process has clearly defined outputsand events.
• Better transitions to development. Smoother transitions occur betweenstages.
• Better quality. Multiexpertise team leads to better definition, require-ments, and design.
• Features interactions and synergy. This leads to a better understandingof how all features interact.
• Project knowledge base. This improves the expertise and knowledgebase for estimators, helping to produce more system experts.
• Confidence. The product management organization has increased con-fidence in the estimates.
PROCEDURES/ISSUES/POLICIES
1. An estimeeting is a standardized working meeting with regularly at-tending estimators. The meeting capitalizes on the synergy of hav-ing the key people together. The preparation for and agenda of thesemeetings are described. Success requires good feature require-ments and a high-level design proposal in advance and attendanceby a specific group of experienced people.
2. The front-end process constitutes the selection process throughwhich feature candidates are picked for development. It begins witha list of feature candidates and ends when a subset has been ap-proved for development. This process attempts to balance the con-flicting needs of business. One of these needs is to respond quicklyto changes in market conditions; a conflicting need is to reduce“throw-away” effort by deciding early what will be developed. An-other need is to reduce risks. These conflicting needs can be re-solved by reviewing the list of features three times, during which theset of potential features in a release is refined and distilled. Each ofthe three iterations generates a list of features for which furtherwork will proceed but work is stopped on features that do not makethe cuts. These “cut” features may be reconsidered for a later re-lease. The needs of the market are considered as well as technicalfeasibility. Estimates of development cost will play a critical role.
3. Project-planning. Estimates are used for project management oncethe project begins. In addition to project planning, long-range plan-ning is also based on development estimates. Multirelease planningtries to account for: 1) experienced staff, 2) test facilities, and 3) in-teractions with other products such as billing, etc.
CuuDuongThanCong.com https://fb.com/tailieudientucntt
357
AT&T’s “Estimeeting” Process for Developing Estimates
4. Software is grouped into subsystems. The subsystems are organizedfunctionally for the various tasks that the ultimate product mustperform. Each subsystem is the responsibility of people knowledge-able in the details of existing hardware and software and standardindustry practice for the subsystem function.
5. The large size of a project has implications. Project planning andmanagement have large economic impacts; errors in estimation canhave serious consequences.
6. Estimation can be broken down into two major parts. The first is jobsize, which is the size and complexity of the code. The second partof estimation is the effort required once the size is known. This ef-fort depends on the productivity of the development organization.
7. In this model, people compare the job they are estimating with theirown experience. Estimates are made on a highly componentizedsystem. This breaking down of the problem into components is akey element of this methodology. The model has these advantages:• The components will better match the past jobs done by the
estimators.• Statistical errors in estimating the components often cancel, giv-
ing a higher probability that the resultant number is correct.• Potentially overlooked parts of the job have a better chance of
being exposed.8. The estimeeting methodology evolved from three principles:
• Estimates are important numbers because they help determineproduct content. Underestimating can cause failure to meet com-mitments with dire consequences for business. Estimates impactquality because they control the distribution of effort over thedevelopment cycle
• Experienced people give the best values. Estimators compare thejob to be estimated with one from their own experience. There-fore, the more extensive the experience, the more likely it is thatthe estimate will be accurate.
• Cooperative meetings give excellent results. It has been proventhat team consensus improves on the best individual solution.
9. The concept behind the estimeeting is to get into one room peoplehighly experienced in all the major aspects of feature and subsystemdevelopment and with the authority to represent the technical view-point of their organizations. In this meeting, they come to a commonunderstanding of a new feature, agree on an informal, nonbinding,high-level design proposal, and estimate development effort in theirown areas of expertise.
10. With a preliminary recommendations feature list, a schedule is setdown and for each feature on the list a feature team is formed. Overa chosen time period, each team produces two outputs — the
CuuDuongThanCong.com https://fb.com/tailieudientucntt
358
SOFTWARE ENGINEERING HANDBOOK
external feature requirements (FSPs) and the internal feature design(FAP).
11. These documents are distributed to estimators, the engineers within-depth knowledge of the subsystems. The estimators are not onfeature teams; they represent the development interests of theirsubsystems and receive these requirements and design documentsfor every feature that impacts their subsystems.
12. Team members are drawn from the concerned organizations (sys-tems engineering, development). Some individuals join more thanone feature team. Each feature team is responsible for estimeetingpreparation, presentation, and follow-up for its feature. Althoughcomposition of the team may evolve, it is initially composed of:• Systems engineer — owns and ensures the completeness and
timely delivery of the FSP with the feature’s mandatory andoptional requirements. The engineer presents the requirementsat the estimeeting.
• The feature engineer — owns the technical aspects of the fea-ture’s operation. Even when the feature is in production, the fea-ture engineer will serve as a point of contact with a vestedinterest in design and resolution of issues. Along with the systemarchitect, the feature engineer owns and generates the high-leveldesign proposal (FAP) and identifies impacted subsystems. Thisperson gives the high-level design and subsystem impact por-tions of the estimeeting presentation.
• The system architect — works with the feature engineer on theFAP and ensures its completeness and timely delivery. The sys-tem architect describes the FAP’s architectural impact during theestimeeting. In nonestimeeting work, the system architect devel-ops broad architectural guidelines.
• The planner — is a technical person who participates in the front-end process early in the release cycle. He or she is knowledge-able about proposed features when feature teams are formed.Planners are coordinators of the feature teams and may co-author the FAP. After the estimeeting, the responsibility for thefeature moves from the planner to the feature engineer. Plannersshare their expertise about the features.
• The product manager — is responsible for ensuring that the scopeand design of the feature remains consistent with the strategicintent and cost goals throughout the estimeeting process.
13. The FAP (feature architecture proposal) can be thought of as an ex-istence proof for the feature. It is an informal document that doesnot require signoff signatures. The intent is to produce this docu-ment quickly with a minimum cost. It contains:• Description of new internal architectures where applicable
CuuDuongThanCong.com https://fb.com/tailieudientucntt
359
AT&T’s “Estimeeting” Process for Developing Estimates
• High-level functional description of how the feature works fromhardware and software design viewpoints
• Itemization of all impacted areas internal and external to the fea-ture
• Expected feature performance• Dependencies and interactions with other new or existing
features• Open issues of design and architecture and proposed solutions
14. The FSP (feature selection proposal) consists of:• Feature operation (typical user scenarios)• Feature interaction with other features• Feature impact• Constraints• Restrictions
15. Contents of subsystem estimation form:• Feature name and number• Date estimate made• Estimator’s name• Area (subsystem) represented• Estimator’s experience in this area in years• Estimator’s preparation time• Consultation time with FAP authors in hours• Estimator’s quality assessment (1 to 5 scale) of FSP and FAP• Estimate for mandatory part of feature• Estimate for optional part of feature• Assumptions made to arrive at estimate• Concerns and uncertainties that could affect the estimate• Itemized work areas that make up estimate
16. Prior to the first estimeeting, the following package is assembled:• Cover sheet with meeting specifics and feature team
membership• People expected to attend• FSP (external requirements)• FAP (design and system-impact checklist)• Subsystem estimation form
17. The estimeeting takes about two hours for a single feature. A mod-erator begins by introducing the feature team members and maybriefly discuss the agenda and ground rules.
18. The system engineer presents feature description and requirementsand delineates what is optional and mandatory.
19. The system architect and feature engineer jointly present the fea-ture design. The architect gives the architectural impact perspec-tive and the feature engineer covers the impact on subsystems.
CuuDuongThanCong.com https://fb.com/tailieudientucntt

360
SOFTWARE ENGINEERING HANDBOOK
20. A secretary, often the planner, takes notes and records assumptionsand issues. A question and answer period typically follows thepresentations.
21. Estimators are asked to complete their individual subsystem esti-mation forms in an “estimate collection” interval. Estimators and en-gineers consult with each other over finer points.
22. Following the estimeeting, the feature engineer is responsible for re-solving any open issues resulting from the estimeeting and collect-ing any outstanding subsystem estimates. The feature engineer thencompletes a feature estimate summary form, audits the estimeetingoutputs for completeness, and reports the estimeeting results. Theestimate, FSP, and FAP now become the formal output of the front-end-process and form the project baseline.
Reference
Taff, L.M., Borchering, J.W., and Hudgins, Jr., W.R. (1991). Estimeetings: development esti-mates and a front-end process for a large project, IEEE Trans. Software Eng., 17, 839–849.
Selected Bibliography
Lehder, Jr., W.D., Smith, D.P., and Yu, W.D. (1988). Software estimation technology, AT&T Tech-nol. J., 67, 10–18.
Londeix, B. (1987). Cost Estimation for Software Development. Addison-Wesley, Reading, MA.
Myers. W. (1989). Allow plenty of time for large-scale software, IEEE Software, 6, 92.
CuuDuongThanCong.com https://fb.com/tailieudientucntt
361
Chapter 39
Burns’ Framework for Building Dependable Systems
ABSTRACT
The role and importance of nonfunctional requirements in the develop-ment of complex critical applications have, up until now, been inade-quately appreciated. It has been shown, through experience, that thisapproach fails to produce dependable systems.
Nonfunctional requirements include dependability (e.g., reliability,availability, safety, and security), timeliness (e.g., responsiveness, orderli-ness, freshness, temporal predictability, and temporal controllability) anddynamic change management (i.e., incorporating evolutionary changesinto a nonstop system).
The purpose of the framework described in this chapter (Burns andLister, (1991) is to:
• Impose a design discipline that ensures that appropriate abstractionsare used at each level of the design
• Allow assertions to be developed that the nonfunctional requirementscan be met by the design if implemented in a particular environment
• Allow interactions between these nonfunctional requirements to beanalyzed so that dependencies can be identified
• Allow the nonfunctional and functional requirements to be traded offagainst each other
PROCEDURES/ISSUES/POLICIES
1. A constructive way of describing the process of system design is aprogression of increasingly specific commitments that define prop-erties of the system design which designers operating at a more de-tailed level are not at liberty to change. For example, early in thedesign there may already be commitments to the structure of a sys-tem, in terms of module definitions and relationships.
CuuDuongThanCong.com https://fb.com/tailieudientucntt

362
SOFTWARE ENGINEERING HANDBOOK
2. Those aspects of a design to which no commitment is made at someparticular level in the design hierarchy are the subject of obligationsthat lower levels of design must address. For example, the behaviorof the defined “committed to modules” is the subject of obligationsthat must be met during further design and implementation.
3. The process of refining a design — transforming obligations intocommitments — is often subject to constraints imposed primarilyby the execution environment.
4. The execution environment is the set of hardware and software com-ponents on top of which a system is built. It may impose resourceconstraints (e.g., processor speed) and constraints of mechanism(e.g., data locking).
5. The framework controls the introduction of necessary implementa-tion details into the design process by distinguishing two phases inthe construction of an architectural design of any application:• Logical architecture — embodies commitments that can be made
independently of the constraints imposed by the execution envi-ronment and is aimed at satisfying the functional requirements.
• Physical architecture — takes constraints into account andembraces nonfunctional requirements.
6. The nonfunctional requirements of an application can be consid-ered as projections onto the physical architecture. Distinct projectsapply to timeliness, safety, etc. The physical architecture makes itexplicit where projections interact and enables criteria to be devel-oped that cater for these interactions.
7. The framework is grounded in the object-oriented approach to sys-tem design. This approach is widely regarded as offering a concep-tual framework for mastering the complexities of the designprocess:• Objects are an adequate modeling tool for the functional require-
ments of the system.• They can be used to provide traceability through all stages of the
design process.• They are an adequate basis for expressing nonfunctional
requirements.• They provide an appropriate granularity for replication, check-
pointing, dynamic change management, configuration, anddynamic reconfiguration.
• They assist error containment through encapsulation.• They can support dynamic security by access right mechanisms
on operations.• They can represent schedulable entities.• Commonly encountered standard architectures can be imple-
mented by means of redefined classes and methods.
CuuDuongThanCong.com https://fb.com/tailieudientucntt

363
Burns’ Framework for Building Dependable Systems
8. The logical architecture is concerned with defining a set of objectclasses, their interfaces, and relationships, which together meet allthe functional requirements. In the logical architecture, communica-tion between the classes is represented by invocation of methods.
9. The physical architecture is concerned with objects, that is, instanc-es of the classes defined in the logical architecture. It refines the log-ical architecture in two ways:• It instantiates objects from the classes defined in the logical
architecture and maps them onto the target executionenvironment.
• It annotates the objects and their methods with attributes (such asdeadlines) derived from the nonfunctional requirements.
Reference
Burns, A. and Lister, A.M. (1991). A framework for building dependable systems, Computer J.,34, 173–181.
Selected Bibliography
Burns, A. and Wellings, A.J, (1989). Real-Time Systems and Their Programming Languages, Ad-dison Wesley, Reading, MA.
Burns, A. and Lister, A.M. (1990). An architectural framework for timely and reliable distribut-ed information systems (TARDIS): description and case study,. YCS. 140, Department of Com-puter Science, University of York, U.K..
Meyer, B. (1987). Reusability: the case study for object-oriented design, IEEE Software, 4,50–64.
Meyer, B. (1988). Object-Oriented Software Construction, Prentice-Hall, Inc., Englewood Cliffs,NJ.
CuuDuongThanCong.com https://fb.com/tailieudientucntt

This page intentionally left blank
CuuDuongThanCong.com https://fb.com/tailieudientucntt

365
Chapter 40
Avison’s Multiview Meta-Methodology
ABSTRACT
The proliferation of systems development methodologies has resultedin much confusion. In fact, it has been estimated that hundreds of more orless similar methodologies exist. In practice, most organizations havedeveloped their own methodology. There have been many attempts tocompare methodologies; past research by Avison managed to categorizemethodologies into six broad themes. This chapter describes a contin-gency framework, called Multiview (Avison and Wood-Harper,1991), whichincludes descriptions of relevant techniques and tools. Analysts and usersselect those aspects of the approach appropriate to the application, ineffect, creating a unique methodology for each application.
PROCEDURES/ISSUES/POLICIES
1. Problems with methodologies in practice:• Failure to meet needs of management• Unambitious systems design• Inflexibility due to the output-driven design• User dissatisfaction• Problems with documentation• Maintenance workload• Application backlog
2. Categories:• Category 1: Systems approach highlights the importance of the
relationship between an organization and its environment, and ofmultidisciplinary teams to understand organizations.
• Category 2: Planning approaches involve strategic management ininformation systems work so that their needs are analyzed andinformation systems are implemented that do more than comput-erize the operations level applications. This approach attemptsto identify the needs of management and plans the ways of meet-ing these needs.
CuuDuongThanCong.com https://fb.com/tailieudientucntt
366
SOFTWARE ENGINEERING HANDBOOK
• Category 3: In a participative approach all users are expected tocontribute to and gain from any information system; this shouldincrease the potential for success.
• Category 4: Prototyping enables users to comment on the pro-posed information system and its inputs, processing, and outputsbefore the system has been designed in its final form.
• Category 5: Structured approaches aid the understanding of acomplex problem through functional decomposition and theassociated documentation techniques. This approach tends toemphasize decision trees, decision tables, data-flow diagrams,etc.
• Category 6: Data analysis is a useful modeling tool in which thedata model produced is likely to be relevant for a longer periodthan models of processes, which can be unstable.
3. It has been suggested that one approach cannot be the answer:• The tools and techniques appropriate for one set of circum-
stances may not be appropriate for others.• The fuzziness of some applications requires attack on a number
of fronts.• As an information system develops, it takes on very different per-
spectives and any methodology adopted should be able to incor-porate these views.
4. It has been argued that the contingency approach to informationsystems development, an approach where the methodology chosenwill depend on the particular circumstances where it will be applied,might be the solution. The methodology selected will be contingenton the particular situation according to its level of uncertainty.
5. The choice of tools and techniques used in an application followinga contingency framework will depend on:• The comprehensiveness and depth of the information systems
design process required• Whether the designers choose a goal-oriented strategy or an
alternative-oriented strategy. The goal-oriented strategy negoti-ates on what is to be achieved, and then finds ways to accom-plish the tasks. The alternative-oriented strategy does notassume that consensus can be reached on the goals, but ratherthat negotiation must occur on how to do things.
• The choice of an appropriate adaptation strategy reflecting theperception about future events. One choice is to ignore futurerequirements, the second is to presume they are predictable, andthe third is to presume that they are unpredictable, but can bedealt with.
• The choice of an appropriate implementation strategy6. Multiview is a contingency approach that provides a flexible frame-
work as an alternative to choosing between different methodologies
CuuDuongThanCong.com https://fb.com/tailieudientucntt
367
Avison’s Multiview Meta-Methodology
or standardizing on one particular methodology. Multiview is ablended methodology drawing on aspects from each of the six cate-gories of methodologies as summarized above. It is an explorativestructure which can be called a meta-methodology.
7. The multiview meta-methodology:• Step 1: Analysis of human activity. This stage concerns the search
for view of the organization, representing a subjective as well asobjective perception of the problem situation in diagrammaticand pictorial form. It is used to identify problem themes. Throughdebate within the organization, it is possible to identify relevantsystems that may relieve problem themes. The root definitiondescribes the system on which to focus attention. The root defini-tion is analyzed to make sure that all necessary elements havebeen identified including the owner of the system, the client, thetransformation that takes place, and the environment in which ittakes place.
• Step 2: Analysis of information. At this stage, the entities and func-tions of the system described are analyzed. By using functionaldecomposition, it is possible to break down the main function(clear in a well-formed root definition) into subfunctions. Usingdata-flow diagrams, it is possible to analyze the sequence ofevents. In developing an entity model, the problem solverextracts and names entities, relationships between entities, andattributes that describe the entities.
• Step 3: Analysis and design of sociotechnical aspects. At this stage,the problem solver produces a design from an analysis of peopleand their needs and the working environment along with consid-eration for the organizational structure, computers, and the nec-essary work tasks. The social and technical objectives are set andalternatives specified and compared so that the best solution canbe selected. Once selected, computer tasks, role tasks, and peo-ple tasks can be defined. The emphasis at this stage is not ondevelopment, but on a statement of alternatives, according toimportant social and technical considerations.
• Step 4: Design of the human computer interface. Decisions aremade as to batch versus online versus command, etc. Specificconversations and interactions are then designed; users areexpected to be the major contributors of this stage. Technicalrequirements to fulfill these human–computer interfaces can thenbe designed.
• Step 5: Design of technical aspects. Using the entity model cre-ated in Step 2 and the technical requirements from Step 4, amore technical view can be taken by the analyst because humanconsiderations are already integrated with the forthcoming
CuuDuongThanCong.com https://fb.com/tailieudientucntt
368
SOFTWARE ENGINEERING HANDBOOK
technical considerations. The technical design will include theapplication subsystems and the nonapplication subsystems.These include the information retrieval subsystem, database,database maintenance subsystem, control subsystem, etc.
8. These five stages incorporate five different views that are appropri-ate to the progressive development of an analysis and designproject. Because it is a multiview approach, it covers computer-related questions and also matters relating to people and businessfunctions Each step addresses one of the following five questions:• How is the information system supposed to further the aims of
the organization using it?• How can it be fit into the working lives of the people in the organi-
zation who will use it?• How can individuals concerned best relate to the computer in
terms of operating it and using the output from it?• What information processing function is the system to perform?• What is the technical specification of a system that will come
close enough to doing the things written down in the answers tothe other four questions?
Reference
Avison, D.E. and Wood-Harper, A.T. (1991). Information systems development research: an ex-ploration of ideas in practice, Computer J., 34(2).
Selected Bibliography
Avison, D.E. and Wood-Harper, A.T. (1986). Multiview — an exploration in informal system de-velopment, Aust. Computer J., 18 ,.
Avison, D.E. and Fitzgerald, G. (1988). Information Systems Development — Methodologies,Techniques and Tools, Blackwell Scientific Publications, Oxford.
Avison, D.E. and Wood-Harper, A.T. (1990). Multiview: an Exploration in Information SystemsDevelopment, Blackwell Scientific Publications, Oxford.
Davies, L.J. and Wood-Harper, A.T. (1989). Information systems development: theoreticalframeworks, J. Appl. Syst. Anal., 16.
Hirschheim, R. and Klein, H.R. (1989). Four paradigms for information systems development,Commn. ACM, 32.
Iivari, J.A. (1989). Methodology for IS development as an organizational change: a pragmaticcontingency approach, in Klein & Kumar (1989).
CuuDuongThanCong.com https://fb.com/tailieudientucntt

369
Chapter 41
Byrne’s Reverse Engineering Technique
ABSTRACT
The problem of reimplementing an existing system in a different pro-gramming language is a problem around which there are three generalapproaches:
• Manually rewrite the existing system.• Use an automatic language translator.• Redesign and reimplement the system.
There are problems with each of these approaches. Manually translatedsource code often retains the style and flavor of the original implementa-tion. This approach is labor intensive and error prone. Automatic transla-tion, a better technique, has problems as well.
The source language may not yield itself to simple translation into thetarget language. Most automated translator tools perform the easier partsof the translation process, leaving the more complex details for a human.Perhaps the biggest problem with this technique is, as Byrne (1991) sug-gests, its tendency to replicate the same problems plaguing the originalversion — in other words, “garbage in, garbage out.”
Of the three approaches, redesign and reimplementation has the bestchance of producing a successful system; however, this technique has itsdisadvantages too. This approach has the highest cost because it is theequivalent of building a new system. Perhaps the most serious disadvan-tage is that, for many systems, it may not be possible to redesign from sys-tem requirements because the requirements may not exist.
Reverse engineering provides a new approach by producing a recon-structed design that captures the functionality of the system. This chapterdescribes a reverse engineering technique that successfully translated aFORTRAN program into the Ada language.
CuuDuongThanCong.com https://fb.com/tailieudientucntt
370
SOFTWARE ENGINEERING HANDBOOK
PROCEDURES/ISSUES/POLICIES
1. Collect information. The reverse engineering process begins by ex-tracting detailed design information and from that extracting a high-level design abstraction. Detailed design information is extractedfrom the source code and existing design documents. This informa-tion includes structure charts as well as data descriptions to de-scribe processing details. In the collect information step, allpossible information about the program is collected. Sources of in-formation include source code, design documents, and documenta-tion for system calls and external routines. Personnel experiencedwith the software should also be identified. This last requirement isnot to be underestimated; lack of “domain knowledge” can make de-sign recovery extremely difficult, if not impossible.
2. Examine information. In this step the information collected in stepone is examined to allow the person doing the recovery work to be-come familiar with the system and its parts. Staff responsible for re-verse engineering formulate a plan for dissecting and recording therecovered information. It should be noted that becoming familiarwith the language implementation of the module can bias the re-verse engineering effort by influencing the perspective of whatshould be recovered and how it should be expressed.
3. Extract the structure. The information is reviewed in an attempt toidentify the structure of the program. This is used to create a set ofstructure charts where each node in the chart corresponds to a rou-tine called in the program. Therefore, the chart created actuallyrecords the calling hierarchy of the program. For each edge in thechart, the data passed to a node and returned by that node must berecorded. It should be noted that software tools are generally avail-able to assist in the development of structure charts. Associatingstructure chart nodes with source code routines raises the issue oftraceability. In reverse engineering, it is desirable to record the linksbetween the recovered design and the original source code or doc-umentation. In this case, it would be desirable to give a node a mean-ingful name and record the name of the implemented function towhich it corresponds. As the structure chart is recorded, the dataitems passed between nodes should also be recorded.
4. Record functionality. For each node, the processing done by thatnode is recorded. At this step, the program routines’ functionality aswell as the functionality of system and library routines is describedin English or using a more formal notation. If debugging statementsare used within the program, then they should be recorded as well.Conditional compilation code, that is, the procedural code that di-rects the software to a particular hardware platform, needs to be re-viewed carefully.
CuuDuongThanCong.com https://fb.com/tailieudientucntt
371
Byrne’s Reverse Engineering Technique
5. Record data-flow. The recovered program structure and processinglogic can be analyzed to identify the data transformations in thesoftware that show the actual data processing done in the program.This information can be used to develop a set of hierarchical data-flow diagrams that model the software.
6. Record control flow. At this stage the high-level control of the pro-gram is identified. This refers to the level of control that affects theoverall operation of the software. A problem in this step might be indistinguishing between low-level control structures that involve theimplementation of a routine and high-level control structures thatserve to control the software operation. The former should be in-cluded as part of the processing described in the detailed design;the latter needs to be recorded in a control-flow diagram and its con-trol specification. Byrne found that there is a temptation to recovertoo much of the control structure.
7. Review the recovered design for consistency. At this stage, missingitems are identified and an attempt is made to locate them. The de-sign is now checked to see if it accurately represents the program.
8. Generate documentation. This last step’s purpose is to generate de-sign documentation. Information explaining the purpose of the pro-gram, program overview, history, etc. will be recorded.
Reference
Byrne, E.J. (1991). Software reverse engineering: a case study, Software — Pract. Exp., 21,1349–1364.
Selected Bibliography
Biggerstaff, T.J. (1989). Design recovery for maintenance and reuse, Computer, 22, 36–49.
Chikofsky, E.J. and Cross II, J.H. (1990). Reverse engineering and design recovery: a taxonomy,IEEE Software, 7, 13–17.
Choi, S.C and Scacchi, W. (1990). Extracting and restructuring the design of large systems,IEEE Software, 7, 66–71.
Ricketts, J.A., DelMonaco, J.C., and Weeks, M.W. (1989). Data re-engineering for applicationsystems, Conference on Software Maintenance, Miami Florida, October 16–19, 174–179.
CuuDuongThanCong.com https://fb.com/tailieudientucntt

This page intentionally left blank
CuuDuongThanCong.com https://fb.com/tailieudientucntt
373
Chapter 42
Prieto-Diaz’ Reusability Model
ABSTRACT
Software reuse is still far from a standard practice in the software engi-neering community even though it was first conceived of over 20 years ago.The problem, according to Prieto-Diaz (1991), is not one of technology butof unwillingness to address the most important issues influencing softwarereuse.
A model for implementing software reuse programs is discussed in thischapter. This model is based on an incremental strategy and addressesmany issues that were thought to be external to the software process. Thisincludes managerial, economic, performance, cultural, and technologytransfer issues. The approach addressed here is practical and effective,and has potential to make reuse a regular practice in the software develop-ment process.
PROCEDURES/ISSUES/POLICIES
1. Factors that influence reuse include:• Managerial factors — organizational, motivational, and financial• Economic factors — integrating reuse in cost/benefit analysis, sys-
tem costing and estimation, pricing criteria, contracting strate-gies, and support costs
• Legal factors — software copyright, liabilities, proprietary issues,contractual requirements
2. Justifications for an incremental approach:• Provides an immediate return on investment• Builds confidence within the organization• Easier to manage• Allows for tuning and refining the reuse process• Facilitates monitoring and evaluating reuse
3. A key ingredient is management support, which is a common factorin all successful reuse programs (Raytheon, Toshiba, Hartford). Thiscommitment is necessary because reuse programs demand changesin the way software is developed.
CuuDuongThanCong.com https://fb.com/tailieudientucntt
374
SOFTWARE ENGINEERING HANDBOOK
4. Inputs to the reuse program include software from existing systemsand requirements for future systems.
5. The products of a reuse program include a series of software cata-logs, an automated library system, generic architectures, and a col-lection of reusable components.
6. The assessment report includes: feasibility analysis, domain stabili-ty assessment, cost/benefit analysis, and an implementation plan.
7. Questions for a feasibility analysis:• Does the organization have enough financial and human
resources to implement a reuse program?• Can the organization afford it?• Is reuse necessary in the organization?• Does the organization want to do it?• Is management committed to implementing a reuse program?• How many systems of the same kind will be produced?• Are variations from implementation to implementation large or
small?• Is existing software already available for reuse? What would be
the estimated cost for each alternative?• Does a critical mass of software engineers exist?• Is software production large enough to justify a reuse program?
8. Questions for an analysis of domain suitability:• Is the domain, line of business, broad or narrow?• Is the domain mature and well understood or is it new and not
well understood?• Is the domain complex or simple?• Is the domain stable or rapidly changing?• Is the domain very technology dependent?• Is it in a state of developing concepts or does it rely on well-estab-
lished principles, methods, and formalisms?9. Questions for cost/benefit analysis:
• How much does it cost?• Is a reuse program economically feasible?• What alternatives exist for implementing a reuse program?• What is the scope?• How big a program is contemplated?• What are the expectations?• What is the desired level of reuse (partial, opportunistic, formal,
total)?10. The following organizational structure is recommended to establish
a successful reuse program:• Asset management group — provides initiatives, funding, and poli-
cies for reuse.
CuuDuongThanCong.com https://fb.com/tailieudientucntt
375
Prieto-Diaz’ Reusability Model
• Identification and qualification group — identifies potential reus-ability areas and collects and certifies new additions to thecollection.
• Maintenance group — maintains and updates reusable softwarecomponents.
• Development group — creates new reusable components.• Reuser support group — assists and trains users and runs tests
and evaluations of reusable components.• Librarian — updates and distributes catalogs, classifies new
assets, maintains library system, and manages asset orders. Sev-eral roles may be assigned to one person. However, staff size for alarge corporate endeavor might exceed ten.
11. A reuse program can be implemented in four basic stages: initiation,expansion, contraction, and steady state.
12. Stage 1: Initiation. Existing software is analyzed to select potentiallyreusable components. Descriptors of these components are extract-ed manually or automatically and a preliminary index is produced.A stage 1 catalog is produced. This catalog informs software engi-neers in the organization about potentially reusable software.
13. Stage 2: Expansion. The size of the catalogs increases as more of theexisting software is identified for reuse. At this point, a classificationscheme is necessary. An initial faceted classification scheme is pro-duced and included with the stage 2 catalog. Based on the feasibilitystudy, a case can be made to support an automated library system.The faceted classification scheme requires the resources of a librar-ian and a domain expert. A faceted scheme provides basic domainmodels in the form of taxonomies and standard descriptions or lex-icons, which in turn support bootstrapping the domain analysisprocess.
14. Stage 3: Contraction. In this stage, domain analysis is the key activity.Early domain models from stage 2 coupled with more detailed infor-mation from existing systems and from requirements for future sys-tems are used for domain analysis. Standard architectures andfunctional models are derived and common components aregrouped to support basic generic functions. Redundant and ineffec-tive components are identified and retired from the collection. Thisresults in contraction in the size of the collection. The collection andclassification are updated and a stage 3 catalog is made available. Inthis stage, a domain analyst, one or more domain experts, a softwareengineer, and a librarian are required.
15. Stage 4: Steady State. Now that the essential components have beenidentified for a specific domain, these components are progressivelyreplaced by components supporting domain-specific functions.These components are reusable because they are designed to plugdirectly into the architecture.
CuuDuongThanCong.com https://fb.com/tailieudientucntt
376
SOFTWARE ENGINEERING HANDBOOK
Reference
Prieto-Diaz, R. (1991). Making software reuse work: an implmentation model, ACM SIGSOFT,Software Eng. Notes, 16, 61–68.
Selected Bibliography
Barnes, B.H. and Bollinger, T.B. (1991). Making reuse cost-effective, IEEE Software, 8, 13–24.
Basili, V.R. and Rombach, H.D. (1988). Towards a comprehensive framework for reuse: a reuse-enabling software evolution environment, Tech. Report CS-TR-2158, Dept of Computer Sci-ence, University of Maryland, College Park, MD,.
Frakes, W.B. (1991). A survey of software reuse, position paper for the 1st International Work-shop on Software Reuse, Dortmund, Germany, July 1991.
Freeman, P. (1983). Reusable Software Engineering: Concepts and Research Directions, in Work-shop on Reusability in Programming, Alan Perlis, ed., 3–26. ITT Programming, Newport, RI.
Prieto-Diaz, R. (1991). Implementing faceted classification for software reuse, Commn. ACM,34, 88–97.
CuuDuongThanCong.com https://fb.com/tailieudientucntt
377
Chapter 43
Farbey’s Considerations on Software Quality Metrics during the Requirements Phase
ABSTRACT
In this chapter Farbey (1990) expands on the general view of quality asthe difference between what is expected and what is experienced:
quality = expectations – experience
Four questions are addressed:
• Effectiveness. Does the specification, considered as a solution, solvethe right problem?
• Serviceability. Does the specification, considered as a starting point,provide a firm basis on which to proceed?
• Prediction. Does the requirement specification (together with the sys-tem test specification) provide useful measures for predicting the finalquality outcome?
• Process. Does the process by which the specification is produced en-courage effectiveness, serviceability, and quality prediction?
PROCEDURES/ISSUES/POLICIES
1. Effectiveness. The first question concerns the quality of the specifi-cation as a solution — how well does the specification capture theproblem? The ultimate effectiveness of a system depends not on thequality of software or specification, but on the degree to which theproblem is correctly perceived. Focus on the specification as a prod-uct by asking questions like the ones that follow:
CuuDuongThanCong.com https://fb.com/tailieudientucntt
378
SOFTWARE ENGINEERING HANDBOOK
• Is the process by which it has been produced conducive to bring-ing out and clarifying objectives?
• Is it complete in that it exhausts the objectives and needs that areknown?
• Is the specification maintainable?• Is it readable?Quality attributes covered here include:• Functionality. Does the specification capture all of the required
functions?• Performance. Does the specification meet the users’ demands?• Usability. Does the specification offer ease of use, learning, and
relearning?2. Serviceability. The second question concerns the quality of its con-
tent and implications for later system development. The following isa list of questions of efficiency, in this context meaning “doing thingsright:”• Are the requirements consistent?• Are the requirements unambiguous?• Are the requirements compatible with the methods of later devel-
opment stages?• Are the requirements readable?• Are the requirements modifiable?• Are the requirements traceable?• Are the requirements usable after implementation?• Are the requirements maintainable?• Are the requirements in compliance with documentation
standards?3. Prediction. The third question concerns the value of measures of
quality that will act as predictor measurements for the eventualquality of the finished software. A predictor metric is used to predictthe value of a property of a system that will become directly observ-able only during a later stage of system development.
4. Process. Three processes of development are worth considering:• A life-cycle process such as SSADM (structured systems analysis
and design) is based on a waterfall model. In this model require-ments specification occurs at an early stage and is then fixed asany associated metrics would be.
• A prototyping approach offers an early normalization, but alsooffers a more flexible model of system development that recog-nizes the problem of changing requirements.
CuuDuongThanCong.com https://fb.com/tailieudientucntt
379
Farbey’s Considerations on Software Quality Metrics During Requirement Phase
• Approaches recognize specifically the social setting in whichrequirements specifications takes place. Control of quality duringany process will probably be one of instituting checkliststogether with a program for completing them and acting on theresults. Questions to ask at this point include:— Is the system easy to learn?— Is the system easy to relearn?— Is there stability and maturity in the system?
Reference
Farbey, B. (1990). Software quality metrics: considerations about requirements and require-ment specifications, Inf. Software Technol., 32, 60–64.
Selected Bibliography
Schafer, G. (1988). Functional Analysis of Office Requirements — a Multi-Perspective Approach,John Wiley & Sons, Chichester, U.K.
Stamper, R. (1984). Information: mystical fluid or a subject for scientific inquiry? Computer J.Symp., November.
Watts, R. (1988). Measuring software quality NCC, Manchester, U.K.
CuuDuongThanCong.com https://fb.com/tailieudientucntt

This page intentionally left blank
CuuDuongThanCong.com https://fb.com/tailieudientucntt
381
Chapter 44
Redmill’s Quality Considerations in the Management of Software-Based Development Projects
ABSTRACT
It comes as no surprise that the majority of software developmentprojects are late, over budget, and out of specification. Project managerspoint to a number of technical problems, most of which are related to tech-nical tasks specific to software development. This chapter shows that inad-equate management and a lack of attention to quality are the main causesof the problem (Redmill, 1990).
PROCEDURES/ISSUES/POLICIES
1. Most common reasons given by project managers for failure to meetbudget, time scale, and specification are as follows:• Incomplete and ambiguous requirements• Incomplete and imprecise specifications• Difficulties in modeling systems• Uncertainties in cost and resource estimation• General lack of visibility• Difficulties with progress monitoring• Complicated error and change control• Lack of agreed-upon metrics• Difficulties in controlling maintenance• Lack of common terminology
CuuDuongThanCong.com https://fb.com/tailieudientucntt
382
SOFTWARE ENGINEERING HANDBOOK
• Uncertainties in software or hardware apportionment• Rapid changes in technology• Determining suitability of languages• Measuring and predicting reliability• Problems with interfacing• Problems with integration
2. Audits of systems development efforts reveal shortcomings inprojects:• Lack of standards• Failure to comply with existing standards• Nonadherence to model in use• No sign-off at end of stages• Lack of project plans• No project control statistics recorded or stored• No quality assurance (QA) procedures• No change-control procedures• No configuration control procedures• No records of test data and results
3. The three causes for the lack of control of projects:• Attitude to quality• Attitude to management• Attitude to project
4. In finding solutions, the principal reasons for project managementshortcomings should be reviewed, e.g., the project manager:• Has no experience working where a quality culture predominates• Has not been trained in TQM (total quality management)• Has not received adequate management training• Has not been managed in accordance with TQM principles by
supervisors• Has not overcome an inclination toward technical matters and
finds that they offer a more friendly environment than the lessfamiliar affairs of management
5. Solutions:• Training: project manager and team must be trained in TQM.• Management commitment: must always be seen to be 100 percent.• Standards: a comprehensive set of standards for all aspects of
work should be instituted and used. The project life cycle mustbe covered as well as other pertinent issues.
• Guidelines, procedures, and checklists: assist workers to meet thestandards and QA agents to check the products.
• Quality assurance: should be carried out at all stages of the lifecycle and for all end-products.
• QA team: should be independent of the development team.
CuuDuongThanCong.com https://fb.com/tailieudientucntt
383
Redmill’s Considerations in Management of Software-Based Development
• Audits: should be carried out during the project to ensure thatmanagement and QA procedures are adhered to. The projectmanager should always initiate a review of the auditors’ recom-mendations and of all resulting correction action.
• Planning: the project manager should be fastidious in drawing upplans and ensuring their use for control. Plans should include theproject plan, stage plans, and a quality plan, which details thequality requirements of the project.
• Reporting: a reporting system should be instituted to ensure thatproblems are quickly escalated to the management level appro-priate to the action needed.
• Feedback: statistics that assist in project control and theimprovement of quality should be collected, analyzed, and used.
• Continuous review: the whole quality system (components, modeof operation, and quality of results) should be reviewed andimproved continuously.
• Project manager: must not be too technically involved. Technicalduties should be delegated to a development team manager whoreports to the project manager.
• Nontechnical support team: should be appointed to assist in non-developmental matters including coordination and interpretationof resource and time statistics, recording all expenditures andtracking against budget, and tracking milestones. This teamshould report to project manager.
Reference
Redmill, F.J. (1990). Considering quality in the management of software-based developmentprojects, Inf. Software Technol., 32, 18–22.
Selected Bibliography
Rathbone, M. (1988). Software quality system, Computer Tech., February.
Redmill, F.J. (1987). Difficulties of specifying users’ requirements for computer systems andmethods of mitigating them, Br. Telecommn. Eng., 6, Part 1, April.
Wingrove, A. (1987). Software failures are management failures, in Software Reliability:Achievement and Assessment, Littlewood, B., Ed., Blackwell, Oxford, U.K.
CuuDuongThanCong.com https://fb.com/tailieudientucntt

This page intentionally left blank
CuuDuongThanCong.com https://fb.com/tailieudientucntt

385
Chapter 45
Contel’s Software Metrics in the Process Maturity Framework
ABSTRACT
The Contel Technology Center’s software engineering lab has as one ofits prime goals the improvement of software engineering productivity. As aresult of work in this area, Pfleeger and McGowan (1990) have suggested aset of metrics for which data is to be collected and analyzed. This set ofmetrics is based on a process maturity framework developed at the Soft-ware Engineering Institute at Carnegie Mellon University. The SEI frame-work divides organizations into five levels based on how mature (i.e., orga-nized, professional, aligned to software tenets) the organization is. The fivelevels range from initial, or ad hoc, to an optimizing environment. Contelrecommends that metrics be divided into five levels as well. Each level isbased on the amount of information made available to the developmentprocess. As the development process matures and improves, additionalmetrics can be collected and analyzed.
PROCEDURES/ISSUES/POLICIES
1. Level 1: Initial Process. This level is characterized by an ad hoc ap-proach to software development. Inputs to the process are not welldefined but the outputs are as expected. Preliminary baselineproject metrics should be gathered at this level to form a basis forcomparison as improvements are made and maturity increases.This can be accomplished by comparing new project measurementswith the baseline ones.
2. Level 2: Repeatable Process. At this level the process is repeatable inmuch the same way that a subroutine is repeatable. The require-ments act as input and the code as output; constraints are suchthings as budget and schedule. Even though proper inputs produce
CuuDuongThanCong.com https://fb.com/tailieudientucntt
386
SOFTWARE ENGINEERING HANDBOOK
proper outputs, there is no means to discern easily how the outputsare actually produced. Only project-related metrics make sense atthis level because the activities within the transitions from input tooutput are not available to be measured. Measures at this level caninclude:• Amount of effort needed to develop the system• Overall project cost• Software size: noncommented lines of code, function points,
object and method count• Personnel effort: actual person-months of effort, reported per-
son-months of effort• Requirements volatility: requirements changes
3. Level 3: Defined Process. At this level the activities of the process areclearly defined. This additional structured means that the input toand output from each well-defined functional activity can be exam-ined, which permits a measurement of the intermediate products.Measures include:• Requirements complexity: number of distinct objects and actions
addressed in requirements• Design complexity: number of design modules, Cyclomatic com-
plexity, McCabe design complexity• Code complexity: number of code modules, Cyclomatic complexity• Test complexity: Number of paths to test, of object-oriented devel-
opment, then number of object interfaces to test• Quality metrics: defects discovered, defects discovered per unit
size (defect density), requirements faults discovered, designfaults discovered, fault density for each product
• Pages of documentation4. Level 4: Managed Process. At this level, feedback from early project
activities is used to set priorities for later project activities. Activi-ties are readily compared and contrasted, and the effects of changesin one activity can be tracked in the others. At this level measure-ments can be made across activities and are used to control and sta-bilize the process so that productivity and quality can matchexpectation. The following types of data are recommended to be col-lected. Metrics at this stage, although derived from the following da-ta, are tailored to the individual organization.• Process type. What process model is used and how is it correlated
to positive or negative consequences?• Amount of producer reuse. How much of the system is designed
for reuse? This includes reuse of requirements, design modules,test plans, and code.
CuuDuongThanCong.com https://fb.com/tailieudientucntt
387
Contel’s Software Metrics in the Process Maturity Framework
• Amount of consumer reuse. How much does the project reusecomponents from other projects? This includes reuse of require-ments, design modules, test plans, and code. (By reusing tested,proven components, effort can be minimized and quality can beimproved.)
• Defect identification. How and when are defects discovered?Knowing this will indicate whether those process activities areeffective.
• Use of defect density model for testing. To what extent does thenumber of defects determine when testing is complete? This con-trols and focuses testing as well as increases the quality of thefinal product.
• Use of configuration management. Is a configuration managementscheme imposed on the development process? This permits trace-ability, which can be used to assess the impact of alterations.
• Module completion over time. At what rates are modules com-pleted? This reflects the degree to which the process and devel-opment environment facilitate implementation and testing.
5. Level 5: Optimizing Process. At this level measures from activities areused to change and improve the process; this change can affect theorganization and the project as well. Studies by SEI report that 85percent of organizations are at level 1, 14 percent at level 2, and1 percent at level 3. None of the firms surveyed had reached levels4 or 5; therefore, the authors have not recommended a set of metricsfor level 5.
6. Steps to take in using metrics:• Assess the process: determine the level of process maturity• Determine the appropriate metrics to collect• Recommend metrics, tools, and techniques• Estimate project cost and schedule• Collect appropriate level of metrics• Construct project database of metrics data that can be used for
analysis and to track value of metrics over time• Cost and schedule evaluation: when the project is complete, eval-
uate the initial estimates of cost and schedule for accuracy anddetermine which of the factors may account for discrepanciesbetween predicted and actual values
• Form a basis for future estimates
Reference
Pfleeger, S.L. and McGowan, C. (1990). Software metrics in the process maturity framework,J. Syst. Software, 12, 255–261.
CuuDuongThanCong.com https://fb.com/tailieudientucntt
388
SOFTWARE ENGINEERING HANDBOOK
Selected Bibliography
Boehm, B.W. (1988). A spiral model of software development and enhancement, IEEE Com-puter, May.
Conte, S.D., Dunsmore, H.E., and Shen, V.Y. (1986). Software Engineering Metrics and Models,Benjamin-Cummings Publishing Co., Menlo Park, CA.
Humphrey, W. (1989). Managing the Software Process, Addison-Wesley, Reading, MA.
Pfleeger, S.L. (1989). Recommendations for an initial set of metrics, Contel Technology CenterTechnical Report CTC-TR-89–017, Chantilly, VA.
CuuDuongThanCong.com https://fb.com/tailieudientucntt
389
Chapter 46
Kydd’s Technique to Induce Productivity through Shared Information Technology
ABSTRACT
Organizations have made large investments in shared information tech-nology (SIT) over the years under the guise of electronic mail systems, dis-tributed databases, and group decision support systems. Kydd and Jones(1989) contend that SIT may not be appropriate for every organization —that, in order for SIT to be successful, the corporate culture must be onethat supports sharing of information across boundaries. In this chapter,the authors give general guidelines that can be used concerning conditionsunder which high-return SIT can be implemented.
PROCEDURES/ISSUES/POLICIES
1. There are two organizational prerequisites for successful invest-ment in SIT:• The organizational culture must be “right,” that is, appropriate
for and supportive of the sharing of information.• Successful execution of a significant number of jobs must require
timely access to shared information.2. In “excellent” companies, a great deal of communication takes place
among people in different functional areas. There may also be cross-functional management of cost, quality, and scheduling. This im-plies that communication occurs across traditional organizationalboundaries and that information is shared.
3. In traditional American businesses, the organization is through a hi-erarchical structure in which corporate norms have dictated that
CuuDuongThanCong.com https://fb.com/tailieudientucntt
390
SOFTWARE ENGINEERING HANDBOOK
communications paths follow the hierarchy — allowing certain man-agers to monopolize information. SIT, in contrast, allows workers towork in a cooperative manner across traditional organizationalboundaries.
4. Rich communications media foster productivity:• Group meetings• One-on-one meetings• Telephone contact
5. Guidelines for implementing high-return SIT:• Assess the environment within the organization to determine
whether shared information will further the strategic objectivesof the organization. In addition, determine whether or not the cul-ture of the organization fosters information sharing.
• If SIT is not strategically important, defer SIT until it is.• If it is strategically important but the culture does not encourage
information sharing, then plan and implement an improvementprogram that focuses on a single, measurable objective of strate-gic importance (such as a quality improvement program) andrequires involvement by everyone in the organization. The objec-tive is to develop a culture in which everyone is concerned withcontinuous improvement, measurable results, and shared infor-mation. Ensure that management behavior is consistent with theobjectives of the program and that the organization’s reward sys-tem encourages information sharing.
• If the improvement program is successful, develop a plan forimplementing SIT. This plan should include plans for developingan information infrastructure with standardized definitions of keydata elements, an information technology infrastructure that pro-vides access to corporate and external data bases, and a uniformset of user-friendly tools. This set should include tools that estab-lish communication protocols between individuals and reinforcethe new collaborative norms.
Reference
Κψδδ, Χ.Τ. ανδ ϑονεσ, Λ.Η. (1989). Χορπορατε προδυχτιϖιτψ ανδ σηαρεδ ινφορµατιον τεχηνολ−
ογψ, Ινφ. Μαναγε., 17, 277281.
Selected Bibliography
Draft, R.L. and Lengel, R.H. (1986). Organizational information requriements, media richnessand structural design, Manage. Sci., 5, 554–571.
CuuDuongThanCong.com https://fb.com/tailieudientucntt

391
Chapter 47
Bellcore’s Software Quality Metrics
ABSTRACT
The Bellcore quality assurance engineering software (QAES) group forBellcore client companies (BCCs) has developed and implemented a com-prehensive quality assurance program that focuses on resolving the under-lying problems associated with developing quality software (Hon, 1990).The objective of QAES’ surveillance program is to develop “cooperative”relationships that cause vendors to focus on (1) implementing methodsand techniques to improve control of software development, (2) improvingthe effectiveness of the underlying process used to develop and supportsoftware, thus improving the quality, and (3) understanding the needs andrequirements of the BCCs. This chapter discusses this approach andexplores measurements utilized whose objectives are to assure adequatevendor quality control, minimize defects, and optimize buyer satisfaction.
PROCEDURES/ISSUES/POLICIES
1. Assure adequate vendor quality control. Measures have been imple-mented in the surveillance program to track the accomplishment ofmilestone criteria. These include:• Requirements, design, coding, and unit test-phase measurements:
— Phase deliverable completion— Number of open correction actions requests— Review coverage
• Test-phase measurements:— Test coverage as measured by structure, functions, or paths— Number of test cases executed and passed— Number of trouble reports— Number of open trouble reports by severity— Trouble report initiation rates— Product-specific quality, reliability, and stability
2. Minimize defects and improve the effectiveness of the software de-velopment process:
CuuDuongThanCong.com https://fb.com/tailieudientucntt

392
SOFTWARE ENGINEERING HANDBOOK
• Review of software development artifacts (e.g., requirements,specifications, and code) and testing results provide measurableevidence about the effectiveness of the implemented softwaredevelopment process, that is, specific information about the typeand quantity of defects produced.
• Specific measurements used in “real time” to minimize defectsinclude:— Average number of defects detected in modules and sub-
systems by type— Historical system, subsystem, and module fault densities— Number of defects detected during reviews
3. A long-term approach is to collect comprehensive defect data. Infor-mation about defect type, its origin, the mechanism used for detec-tion, and defect severity are required to isolate ineffective processesand detection mechanisms. Defects found during reviews and test-ing are classified according to the phase detected (x axis) and origi-nated (y axis). After defect data is accumulated, simple calculationswill determine the percentage of total defects attributable to certainphases of the life cycle and the effectiveness of phase defect detec-tion efforts. For example, the percentage of total defects attribut-able to “requirements” is calculated as the total number ofrequirements defects divided by the total number of defects multi-plied by 100.
4. Quality and reliability measures include:• Number and duration of system outages due to software failure• Number of customer trouble reports• Customer trouble report cause analysis• Patch statistics where a patch is defined as an interim fix
5. Buyer support measures include:• Customer service response time• Number of open trouble reports• Site distribution of open fault reports• Aging of open customer trouble reports by severity• Time-to-correct customer trouble reports
Reference
Hon, S.E. (1990). Assuring software quality through measurements: a buyer’s perspective,J. Syst. Software, 13, 117–130.
Selected Bibliography
Grady, R.B. (1987). Measuring and managing software maintenance, IEEE Software, Septem-ber, 35–45.
Jones, T.C. (1986). Programmer Productivity, McGraw-Hill, New York.
CuuDuongThanCong.com https://fb.com/tailieudientucntt
393
Chapter 48
Keyes’ Value of Information
ABSTRACT
If it will be difficult to make the point that the corporate informationresource is a worthy vehicle to protect with a dictionary workbench, thencalculating the value of information (VOI) will be a useful exercise (Keyes,1992). It will assist the organization in determining the true worth of itsinvestment in information. The ultimate goal of this exercise is to assign amonetary value to each unitary piece of information. In this way an orga-nization accustomed to assessing relative worth based on bottom-line sta-tistics can instantly recognize the value of information in terms that itunderstands.
PROCEDURES/ISSUES/POLICIES
The following steps should be taken for this assessment:
1. Assign each system (i.e., payroll) a weighting relative to its impor-tance to the organization. Permissible weights for the entirety of thisexercise are one for a low relative value, two for a middle relativevalue, and three for a high relative value.
2. For each data element within a system, assign a weighting thatshows that data element’s importance relative to that system. Again,use weightings one through three.
3. Multiply these two numbers to get the total weighting of a data ele-ment relative to all data in the organization.
4. Each data element should have an annotation next to it indicatingthe number of systems in which this data element is cross refer-enced. For example, it is possible that “customer name” is used inthe sales, inventory, and marketing systems. This would give a totalof three systems. The product calculated in instruction three is nowmultiplied by the number determined in this instruction.
5. Convert this number to a percentage.6. Using the last audited net income amount for the organization (for a
quarter or for an entire year), calculate the VOI by multiplying thepercentage calculated in instruction five by the net income amount.
CuuDuongThanCong.com https://fb.com/tailieudientucntt
394
SOFTWARE ENGINEERING HANDBOOK
Reference
Keyes, J. (1992). INFOTRENDS: the Competitive Use of Information, McGraw-Hill, New York.
CuuDuongThanCong.com https://fb.com/tailieudientucntt
395
Chapter 49
Pfleeger’s Method for CASE Tool Selection Based on Process Maturity
ABSTRACT
A wide variety of computer-assisted software engineering (CASE) toolsare available in the software market for various types of applications in thesoftware development process. It is not a trivial issue for an organization tomake the appropriate selections and incorporate the CASE tools at theright stages for its own environment. The five process maturity levelsdefined by the Software Engineering Institute can be used as guidelines foran organization to determine the proper types of CASE tools to use basedon its own process maturity (Pfleeger and Fitzgerald, Jr., 1991).
It is obvious that the CASE tools chosen for a particular project havedirect impacts on its success in terms of productivity, schedule, quality,etc. Without any clearly defined procedures or guidelines, it is rather diffi-cult for an organization to make intelligent decisions on selecting properCASE tools to use for a particular process and for a particular project. Themethod presented here clearly defines the most suitable types of tools touse based on the software development process maturity of an organiza-tion. It is valuable for organizations that have already introduced CASEtools with emphasis on continuous process improvement or organizationsthat plan on migrating from no previous CASE tools involvement to a pro-cess with fully integrated CASE tools support.
PROCEDURES/ISSUES/POLICIES
The table in Exhibit 49-1 describes the characteristics for each processmaturity level defined by the Software Engineering Institute.
CuuDuongThanCong.com https://fb.com/tailieudientucntt
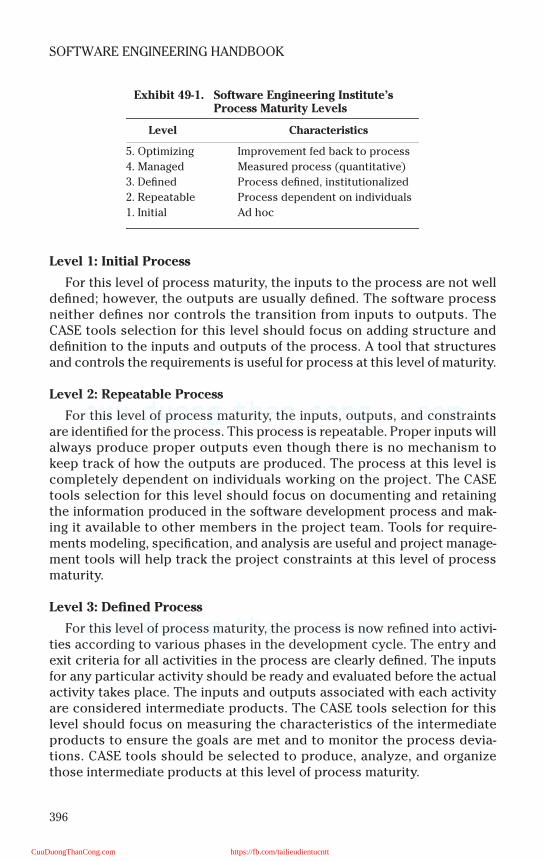
396
SOFTWARE ENGINEERING HANDBOOK
Level 1: Initial Process
For this level of process maturity, the inputs to the process are not welldefined; however, the outputs are usually defined. The software processneither defines nor controls the transition from inputs to outputs. TheCASE tools selection for this level should focus on adding structure anddefinition to the inputs and outputs of the process. A tool that structuresand controls the requirements is useful for process at this level of maturity.
Level 2: Repeatable Process
For this level of process maturity, the inputs, outputs, and constraintsare identified for the process. This process is repeatable. Proper inputs willalways produce proper outputs even though there is no mechanism tokeep track of how the outputs are produced. The process at this level iscompletely dependent on individuals working on the project. The CASEtools selection for this level should focus on documenting and retainingthe information produced in the software development process and mak-ing it available to other members in the project team. Tools for require-ments modeling, specification, and analysis are useful and project manage-ment tools will help track the project constraints at this level of processmaturity.
Level 3: Defined Process
For this level of process maturity, the process is now refined into activi-ties according to various phases in the development cycle. The entry andexit criteria for all activities in the process are clearly defined. The inputsfor any particular activity should be ready and evaluated before the actualactivity takes place. The inputs and outputs associated with each activityare considered intermediate products. The CASE tools selection for thislevel should focus on measuring the characteristics of the intermediateproducts to ensure the goals are met and to monitor the process devia-tions. CASE tools should be selected to produce, analyze, and organizethose intermediate products at this level of process maturity.
Exhibit 49-1. Software Engineering Institute’s Process Maturity Levels
Level Characteristics
5. Optimizing Improvement fed back to process
4. Managed Measured process (quantitative)
3. Defined Process defined, institutionalized
2. Repeatable Process dependent on individuals
1. Initial Ad hoc
CuuDuongThanCong.com https://fb.com/tailieudientucntt
397
Pfleeger’s Method for CASE Tool Selection Based on Process Maturity
Level 4: Managed Process
For this level of process maturity, the software development processtends to be dynamic in the sense that feedback and experience learnedfrom early project activities can be used to determine and modify the pri-ority of later project activities. The effectiveness of process factors such asreuse, testing, and reviews can be evaluated. The causal analysis can bedone throughout the development process to prevent future mistakes andto analyze defects injected in the early activities. The software develop-ment process is now carefully controlled rather than just monitored. TheCASE tools selection for this level should focus on collecting and analyzingprocess-wide metrics for confidence measurement and course correctionto allow management and control of the development process.
Level 5: Optimizing Process
This is the ultimate level of process maturity. Projects in this level arefully dynamic in terms of real-time intra- and interprocess improvementsand modifications. The software process evolves and corrects itself. TheCASE tools selection for this level should focus on dynamic evaluation,configuration, and reconfiguration of an environment based on the currentstatus of the process to ensure product confidence level is met. Processprogramming and process simulation tools should be considered for pro-cess at this level of maturity.
Reference
Pfleeger, S.L. and Fitzgerald, Jr., J.C. (1991). Software metrics tool kit: support for selection,collection and analysis, Inf. Software Technol., September, 33(7).
Selected Bibliography
Boehm, B.W. (1988). A spiral model of software development and enhancement, Computer,May.
Guidelines: a framework for the evaluation and comparison of software development tools(FIPS Publication 99), National Bureau of Standards, Gaitherburg, MD, March, 1983.
Humphrey, W. (1989). Managing the Software Process, Addison-Wesley, Reading, MA.
Pfleeger, S.L. and McGowan, C.L. (1990). Software metrics in a process maturity framework,J. Syst. Software, July.
CuuDuongThanCong.com https://fb.com/tailieudientucntt

This page intentionally left blank
CuuDuongThanCong.com https://fb.com/tailieudientucntt
399
Chapter 50
McCabe’s Complexity Metric
ABSTRACT
McCabe’s (1976) metric to assess the complexity of software is perhapsone of the most well-known and well-used metrics. It is presented here in asimplified format.
PROCEDURES/ISSUES/POLICIES
McCabe’s proposal for a cyclomatic complexity number was the firstattempt to quantify the “flow of control” complexity of software objec-tively. The metric is computed by decomposing the program into adirected graph that represents its flow of control. The cyclomatic complex-ity number is then calculated using this formula:
V(g) = edges — nodes + 2
In its shortened form, the cyclomatic complexity number is a count of deci-sion points within a program with a single entry and a single exit plus one.
Reference
McCabe, T.A. (1976). Complexity measure, IEEE Trans. Software Eng., December, 308–320.
CuuDuongThanCong.com https://fb.com/tailieudientucntt

This page intentionally left blank
CuuDuongThanCong.com https://fb.com/tailieudientucntt
401
Chapter 51
Halstead’s Effort Measure
ABSTRACT
In the 1970s, Maurice Halstead (1977) developed a theory regarding thebehavior of software. Some of his findings evolved into software metrics.One of these is referred to as “effort” or just “E,” and is a well-known com-plexity metric.
PROCEDURES/ISSUES/POLICIES
The effort measure is calculated as:
E = Volume/Level
where Volume is a measure of the size of a piece of code and Level is a mea-sure of how “abstract” the program is. The level of abstracting varies fromalmost zero for programs with low abstraction to almost one for programsthat are highly abstract.
Reference
Halstead, M. (1977). Elements of Software Science, Elsevier, New York.
CuuDuongThanCong.com https://fb.com/tailieudientucntt

This page intentionally left blank
CuuDuongThanCong.com https://fb.com/tailieudientucntt
403
Chapter 52
DEC’s Overview of Software Metrics
ABSTRACT
Nowhere are productivity and quality more important than in a hard-ware/software vendor. Digital Equipment Corporation’s view of productiv-ity and quality is presented in this chapter and provides a fine overview ofthe principles of this book (DEC, 1990). DEC was later acquired by Compaq,which itself has been acquired by HP.
PROCEDURES/ISSUES/POLICIES
1. Software productivity: why do we care?• Expectations of customers and users• Increasing complexity• Effective use of technology• Missed opportunities• Shortage of skilled software developers• Increasing need for higher-quality software
2. Productivity: what do we really want?• Better products• Better focus• Better resource utilization• Better control
3. Productivity: why measure?• Quantify the project’s progress• Quantify attributes of the software system
4. Why use metrics?• Understand and manage the process• Measure the impact of change to the process: new methods,
training• Know when a goal has been met: usability, performance, test
coverage5. Software system metrics:
• Characterization of the parts of the system— Requirements— Specifications
CuuDuongThanCong.com https://fb.com/tailieudientucntt
404
SOFTWARE ENGINEERING HANDBOOK
— Code— Documentation— Tests— Training
• Attributes include— Usability— Maintainability— Extendibility— Size— Defect level— Performance— Completeness
6. Software development process metrics:• Characterizations of the process of developing the system• Attributes include cost of development, predictability of sched-
ule, rate of defect discovery, and repair7. Characteristics of metrics
• Collectable• Reproducible• Pertinent• System independent
8. Questions to ask:• How is time spent on a project?• Has the defect rate gone down?• What tools are being used?• What are the reasons for rework?• Are problem reports under control?• Is this a reasonable schedule?
9. Caveats:• Behavior modifies toward what is being measured• Measure the attributes that are important• Measure multiple attributes
— Size versus quality— Source code versus source + comments— Executable lines of code versus data declarations
10. Product metrics:• Size: lines of code, pages of documentation, number and size of
test, token count, function count• Complexity: decision count, variable count, number of modules,
size/volume, depth of nesting• Reliability: count of changes required by phase, count of discov-
ered defects, defect density = number of defects/size, count ofchanged lines of code
CuuDuongThanCong.com https://fb.com/tailieudientucntt
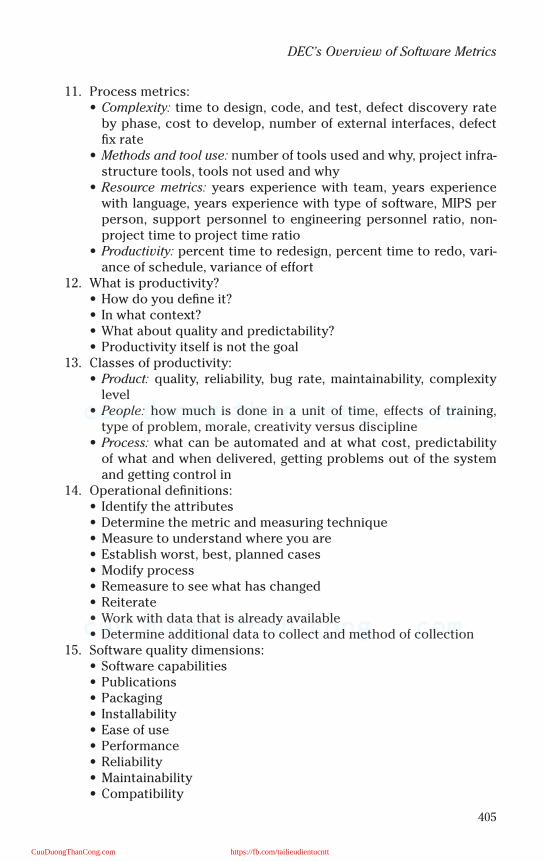
405
DEC’s Overview of Software Metrics
11. Process metrics:• Complexity: time to design, code, and test, defect discovery rate
by phase, cost to develop, number of external interfaces, defectfix rate
• Methods and tool use: number of tools used and why, project infra-structure tools, tools not used and why
• Resource metrics: years experience with team, years experiencewith language, years experience with type of software, MIPS perperson, support personnel to engineering personnel ratio, non-project time to project time ratio
• Productivity: percent time to redesign, percent time to redo, vari-ance of schedule, variance of effort
12. What is productivity?• How do you define it?• In what context?• What about quality and predictability?• Productivity itself is not the goal
13. Classes of productivity:• Product: quality, reliability, bug rate, maintainability, complexity
level• People: how much is done in a unit of time, effects of training,
type of problem, morale, creativity versus discipline• Process: what can be automated and at what cost, predictability
of what and when delivered, getting problems out of the systemand getting control in
14. Operational definitions:• Identify the attributes• Determine the metric and measuring technique• Measure to understand where you are• Establish worst, best, planned cases• Modify process• Remeasure to see what has changed• Reiterate• Work with data that is already available• Determine additional data to collect and method of collection
15. Software quality dimensions:• Software capabilities• Publications• Packaging• Installability• Ease of use• Performance• Reliability• Maintainability• Compatibility
CuuDuongThanCong.com https://fb.com/tailieudientucntt
406
SOFTWARE ENGINEERING HANDBOOK
• Evolvability• Cost• Timeliness
16. The relative cost of fixing problems:• Just before code 1• During code 1.5• Just before test 10• During test 60• In the field 100
Reference
Digital Equipment Corporation. (1990). Software metrics: an overview — tools for managingsoftware development, company presentation.
CuuDuongThanCong.com https://fb.com/tailieudientucntt
407
Chapter 53
Hewlett Packard’s TQC (Total Quality Control) Guidelines for Software Engineering Productivity
ABSTRACT
Engineering productivity is extremely important to HP because the com-pany relies on new product development to maintain its competitivestrength. On average, HP introduces one new product every business day;70 percent of HP’s engineers are involved in software development and halfof all R&D projects are exclusively devoted to software development.
It was this significant investment in software development thatprompted HP’s president to issue a challenge to achieve a tenfold improve-ment in software quality within five years. He also asked that new productdevelopment time be reduced by 50 percent.
This chapter points out the techniques Hewlett Packard (1989) utilizedto meet this vast quality and productivity challenge.
PROCEDURES/ISSUES/POLICIES
1. HP’s productivity equation:
Productivity = function of doing the right things * function of doing things right
2. Cultural and organizational issues are addressed to be able to moti-vate and support positive changes. Productivity managers are usedin each division:
CuuDuongThanCong.com https://fb.com/tailieudientucntt
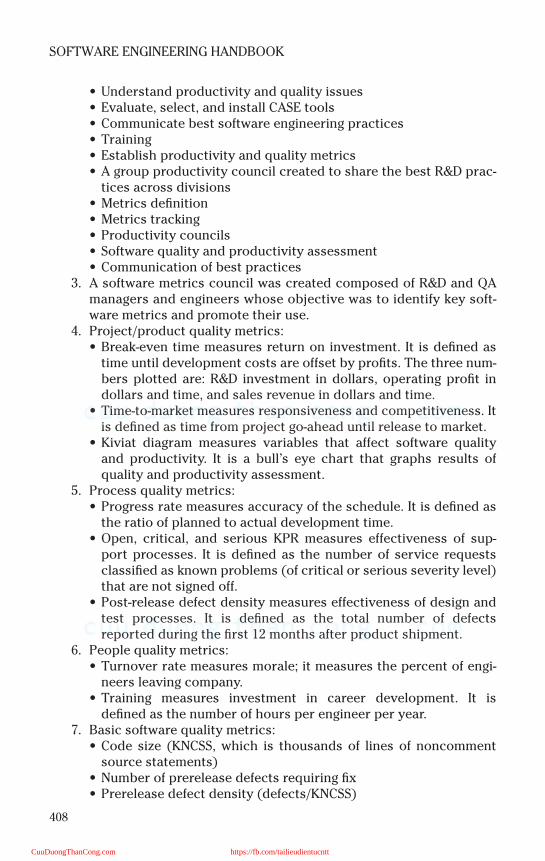
408
SOFTWARE ENGINEERING HANDBOOK
• Understand productivity and quality issues• Evaluate, select, and install CASE tools• Communicate best software engineering practices• Training• Establish productivity and quality metrics• A group productivity council created to share the best R&D prac-
tices across divisions• Metrics definition• Metrics tracking• Productivity councils• Software quality and productivity assessment• Communication of best practices
3. A software metrics council was created composed of R&D and QAmanagers and engineers whose objective was to identify key soft-ware metrics and promote their use.
4. Project/product quality metrics:• Break-even time measures return on investment. It is defined as
time until development costs are offset by profits. The three num-bers plotted are: R&D investment in dollars, operating profit indollars and time, and sales revenue in dollars and time.
• Time-to-market measures responsiveness and competitiveness. Itis defined as time from project go-ahead until release to market.
• Kiviat diagram measures variables that affect software qualityand productivity. It is a bull’s eye chart that graphs results ofquality and productivity assessment.
5. Process quality metrics:• Progress rate measures accuracy of the schedule. It is defined as
the ratio of planned to actual development time.• Open, critical, and serious KPR measures effectiveness of sup-
port processes. It is defined as the number of service requestsclassified as known problems (of critical or serious severity level)that are not signed off.
• Post-release defect density measures effectiveness of design andtest processes. It is defined as the total number of defectsreported during the first 12 months after product shipment.
6. People quality metrics:• Turnover rate measures morale; it measures the percent of engi-
neers leaving company.• Training measures investment in career development. It is
defined as the number of hours per engineer per year.7. Basic software quality metrics:
• Code size (KNCSS, which is thousands of lines of noncommentsource statements)
• Number of prerelease defects requiring fix• Prerelease defect density (defects/KNCSS)
CuuDuongThanCong.com https://fb.com/tailieudientucntt

409
TQC Guidelines for Software Engineering
• Calendar months for prerelease QA• Total prerelease QA test hours• Number of post-release defects reported after one year• Post-release defect density (defects/KNCSS)• Calendar months from investigation checkpoint to release
8. Strategy for code reuse:• Share code (use exactly as is) whenever possible.• If sharing is not possible, try to leverage (minimal modifications).• If neither sharing nor leveraging is possible, look for similar algo-
rithms (design reuse).• As a last resort, invent something new.
9. The systems software certifications program was established to en-sure measurable, consistent, high-quality software. The four metricschosen were:• Breadth — measures the testing coverage of user-accessible and
internal functionality of the product.• Depth — measures the proportion of instructions or blocks of
instructions executed during the testing process.• Reliability — measures the stability and robustness of a product
and its ability to recover gracefully from error conditions.• Defect density — measures the quantity and severity of reported
defects found and a product’s readiness for use.
Reference
Hewlett Packard. (1989). Software Engineering Productivity, company report.
CuuDuongThanCong.com https://fb.com/tailieudientucntt

This page intentionally left blank
CuuDuongThanCong.com https://fb.com/tailieudientucntt
411
Chapter 54
Motorola’s Six Sigma Defect Reduction Effort
ABSTRACT
In 1987 Motorola set in motion a five-year quality improvement programcalled Six Sigma. The term “six sigma” is one used by statisticians and engi-neers to describe a state of zero defects. This program has resulted in pro-ductivity gains of 40 percent, as well as winning the Malcolm BaldrigeNational Quality Award in 1988 (Rifkin, 1991). Benefits include:
• Increased productivity by 40 percent• Reduced backlog from years to months• Increased customer service levels• Shifted IS time from correcting mistakes to value-added work• More motivated staff• Saved $1.5 billion in reduced cost
PROCEDURES/ISSUES/POLICIES
1. Identify your product. Determine what service or product you areproducing. IS must align what they do with what the customerswant.
2. Identify customer requirements. IS must determine what the cus-tomer perceives as a defect-free product or service. The unit of workthat the user is dealing with must be considered, for example, a gen-eral ledger system in which the user worries about defects per jour-nal voucher and not defects per thousand lines of code.
3. Diagnose the frequency and source of errors. Four categories of met-rics were established to target defect reduction:• New software development• Service delivery• Cycle time• Customer satisfaction, which is composed of a detailed service
with the intent of validating the first three metrics
CuuDuongThanCong.com https://fb.com/tailieudientucntt
412
SOFTWARE ENGINEERING HANDBOOK
4. Define a process for doing the task. Motorola refers to this processas mapping, but closely aligned to the re-engineering process. Theprocess involves using personal computer-based tools to determineflow-through of processes and answering the following questions:• Which processes can be eliminated?• Which processes can be simplified?
5. Make the process mistake proof. By streamlining a process and elim-inating any unnecessary steps, it is possible to make the processmistake proof. By using metrics, a process control mechanism is putinto place so that problems can be addressed before they affectoutput.
6. Put permanent control measures in place. Once Six Sigma isreached, this level must be maintained. At this step, the Six Sigmametrics are set up to be used to monitor the process continuously:• Monthly quality review meetings are held where each person dis-
cusses his or her metric, its trend, diagnosis of source cause oferrors, and action plan to correct them.
Reference
Rifkin, G. (1991). No more defects, Computerworld, July, 59–62.
CuuDuongThanCong.com https://fb.com/tailieudientucntt
413
Chapter 55
Lederer’s Management Guidelines for Better Cost Estimating
ABSTRACT
Inaccurately estimating software project costs wastes limited resources,fails to make expected contributions, and ultimately destroys the credibil-ity of estimators and developers. This chapter results from a study by Led-erer and Prasad (1992) of the cost-estimating practices reported by 115computing managers and professionals.
PROCEDURES/ISSUES/POLICIES
1. Causes of inaccurate estimates: (listed in order of descending value)• Frequent requests for changes• Overlooked tasks• Users lack understanding of their own requirements• Insufficient communication between user and analyst• Poor or imprecise problem definition• Insufficient analysis when developing estimate• Lack of coordination between systems development, technical
services, operations, etc.• Lack of an adequate methodology or guidelines for estimating• Changes in information systems department personnel• Insufficient time for testing• Lack of historical data regarding past estimates and actuals• Lack of setting and review of standard duration for use in
estimating• Pressure from managers, users, or others to increase or reduce
estimate• Inability to anticipate skills of project team members• “Red tape”
CuuDuongThanCong.com https://fb.com/tailieudientucntt
414
SOFTWARE ENGINEERING HANDBOOK
• Lack of project control comparing estimates and actuals• Users lack data processing understanding• Inability to tell where past estimates failed• Reduction of project scope or quality to stay within estimate,
resulting in extra work later• Lack of careful examination of estimate by management• Lack of participation in estimating by systems analysts and pro-
grammers who develop system• Performance reviews do not consider whether estimates were
met• Lack of diligence by systems analysts and programmers• Removal of padding from the estimate by management
2. Influences on the estimate: (listed in order of descending value)• Complexity of proposed system• Required integration with other systems• Complexity of programs in system• Size of the system in number of functions• Capabilities of the project team members• Size of the system in number of programs• Project team’s experience with the application• Anticipated frequency or extent of potential changes in user
requirements• Project team’s experience with the programming language• Data management system• Number of project team members• Extent of programming or documentation standards• Availability of software productivity tools• Development mode (batch or online)• Particular programming language used• Project team’s experience with the hardware• Availability of testing aids• Availability of test time on the hardware• Computer memory and secondary storage constraints• Size of the system in number of lines of code
3. The uses of cost estimates: (listed in order of descending value)• Staff projects• Control or monitor project implementation• Select proposed projects for implementation• Schedule projects• Quote charges to users for projects• Audit project success• Evaluate project developers• Evaluate project estimators
CuuDuongThanCong.com https://fb.com/tailieudientucntt
415
Lederer’s Management Guidelines for Better Cost Estimating
4. Software packages in use: (listed in order of descending value)• Estimacs• Spectrum/Estimator• In-house package• Project Workbench• Nolan/Prompt• AGS PAC III• DEC/VAX Software Project Manager• Microsoft Project
5. Guideline one: Assign the initial estimating task to the final develop-ers. There are two schools of thought concerning the estimationprocess. One is that a separate group of people should be given theresponsibility of estimating all software projects — much in thesame way as a professional estimator estimates constructionprojects. This study found that this was not valid; the best estimatescome from the ultimate developers of the product.
6. Guideline two: Delay finalizing the initial estimate until the end of athorough study. If the estimators cannot come up with an accurateestimate, then they should delay announcing it until it can be as ac-curate as possible. Project overruns are a direct result of improvis-ing an estimate. The researchers found that coming up with anestimate under pressure serves no purpose because revising an es-timate may not correct it.
7. Guideline three: Anticipate and control user changes. Estimatorsshould thoroughly understand the user requirements that motivat-ed the proposed system before they estimate the costs. By doing so,they can probably reduce and therefore control the frequent re-quests for changes.
8. Guideline four: Monitor the progress of the proposed project. Thestudy found that the percentage of large projects that overrun theirestimates and the percentage of those for which formal monitoringof project progress compares it to its project plan were negative.Thus, formal monitoring is important.
9. Guideline five: Evaluate proposed project progress by using inde-pendent auditors. The monitoring of a project is usually done bythose involved with it. The survey shows, however, that more accu-rate estimates occur when independent auditors are present. Ap-parently, an independent evaluation is an advance warning toestimators and developers that computing management is con-cerned about creating an accurate estimate and meeting it. It alsomakes it harder to cheat. Within systems analysts and program-mers, 25 percent refrain from accurately reporting their actualhours in order to meet the estimates; 36 percent of computing de-partments postpone the delivery of part of a project and then claimon-time delivery for the rest of the project, and 68 percent of the
CuuDuongThanCong.com https://fb.com/tailieudientucntt
416
SOFTWARE ENGINEERING HANDBOOK
projects in this study had programmers work disproportionatelyharder in the final days of the project to meet the targeted comple-tion date.
10. Guideline six: Use the estimate to evaluate project personnel. Great-er accuracy is found in estimating when such evaluation is done.The authors recommend informing personnel in advance of the in-tended use of the estimate and giving favorable recognition to per-sonnel whose projects meet their estimates.
11. Guideline seven: Computing management should carefully study andapprove the cost estimate. For 58 percent of an organization’s largeprojects, a cost/benefit analysis is used to justify systems develop-ment. Computing management approval, rather than user manage-ment approval, increases estimating accuracy.
12. Guideline eight: Rely on documented facts, standards, and simplearithmetic formulas rather than on guessing, intuition, personalmemory, and complex formulas.
13. Guideline nine: Do not rely on cost estimating software for an accu-rate estimate. The study found that the use of software estimatingpackages had no significant effect on reducing overruns.
Reference
Lederer, A.L. and Prasad, J. (1992). Nine management guidelines for better cost estimating,Commn. ACM, 35, 51–59.
Selected Bibliography
Albrecht, A.J. (1979). Measuring application development productivity, GUIDE/SHARE Appl.Dev. Symp. Proc., February, 83–92.
Conte, S.D., Dunsmore, H.E., and Shen, V.Y. (1986). Software Engineering Metrics and Models,Benjamin/Cummings Publishing Company, Inc., Menlo Park, CA.
Lederer, A.L., Mirani, R., Neo, B.S., Pollard, C., Prasad, J., and Ramamurthy, K. (1990). Informa-tion system cost estimating: a management perspective, MIS Q., 14, 159–178.
CuuDuongThanCong.com https://fb.com/tailieudientucntt
417
Chapter 56
Kanter’s Methodology for Justifying Investment in Information Technology
ABSTRACT
A survey of over 100 corporate CEOs found that 64 percent felt that theirorganizations were not getting the most for their information systemsinvestments (Kanter, 1990). This short chapter focuses on how to justifythe IS function.
PROCEDURES/ISSUES/POLICIES
1. Decide whether or not you need to justify the past or whether youwant to work only on new expenditures. A strong argument can bemade for comprehensive budgeting of past activities as a base pointfor future planning.
2. Once a scoping is made, budgets can be sorted by many categoriessuch as specific department and activity or by qualitative breakoutssuch as architecture, skills mix, and systems development.
3. Many IS executives measure information technology expendituresagainst industry averages. To assure balance, analyze by major ap-plication areas such as marketing, manufacturing, or finance. Useone or more third-party yardsticks to measure strategic or compet-itive advantage applications such as:• Computerworld Premier 100 — based on a six-part formula that
includes:
CuuDuongThanCong.com https://fb.com/tailieudientucntt
418
SOFTWARE ENGINEERING HANDBOOK
— Annual IS budget as percent of revenue (30 percent)— Market value of equipment as percent of revenue
(15 percent)— Company profitability over five years (15 percent)— Percent of IS budget for people (10 percent)— Percent of IS budget on education (15 percent)— Number of PCs/Terminals as percent of total headcount (15
percent) ( percent = weighting value)• CIO Magazine Top 100 —MIS operations evaluated by experts on
four factors that foster a competitive edge:— Demonstrated importance of customer service— Not who you know, but how you connect to them— Value of information as equal to money as an asset— Illuminate shifts in IS usage
• Nolan, Norton — IT expenditure by industry compared to totalrevenue, then application portfolio by function, compared tobusiness strategy and broken out by spending for:— Institutional systems— Professional support— Physical automation— External support
• SoCal Gas Company — based on a University of St. Louis method,company evolved a four-point plan:
• Economic impact (65 pts)• Strategic alignment (22)• MIS support (13)• Definitional uncertainty (plus/minus pts)• Rivard & Kaiser — value placed on intangible and probabilistic
returns including:— Incremental analysis— Value analysis— Expected value— Worst/most likely/best case analysis
• Index Group PRISM — broad use of questionnaires to measureuser satisfaction and performance within corporate culture andstrategy guidelines
4. Conduct a qualitative survey, application by application, of all majorsystems. Have two groups respond. For each application, IS staffshould rate cost/value in terms of maintainability, adequacy of hard-ware/software, staffing requirements, etc. Each user departmentshould rate effectiveness of each application in terms of mission, ful-fillment, timeliness, adequacy, method of reporting, productivitybenefit, etc. This survey permits:
CuuDuongThanCong.com https://fb.com/tailieudientucntt

419
Kanter’s Methodology for Justifying Investment in Information Technology
• Gain alignment and consensus for action• Make cuts• Clearly identify high-ROI applications
5. The next step is to assess future costs. Best approach builds on ba-sic value analysis as represented by return-on-investment measure-ment. In this instance, it is important to place value on intangiblebenefits and strategic uses of information technology.
Example: Placing terminals in customers’ offices has an intangible valueunless you ask: how much more will that customer buy? How many cus-tomers do we normally lose in a year, and how many will we keep now? Theanswers can be found by extrapolation, projection, or survey.
The expected-value method can be used to assess the probabilities ofcertain outcomes. This allows you to draw and adjust quantified value con-clusions of the type that senior management will respect.
Example: Assume average annual downtime for a paper mill is two weekswith each down week costing $2 million. A new information system has agoal of reducing downtime by improving maintenance decisions. If theassumption is made that a 50 percent chance downtime can be reduce 10percent, then these are tangible figures that can be brought to management.
Reference
Kanter, J. (1990). It’s time to justify your organization’s investment in information technology,Cambex STOR/age, 1, from a paper prepared for MIS sponsors of Babson College’s Center forInformation Management.
CuuDuongThanCong.com https://fb.com/tailieudientucntt

This page intentionally left blank
CuuDuongThanCong.com https://fb.com/tailieudientucntt
421
Chapter 57
The “Make–Buy” Decision
ABSTRACT
Many projects can make use of package software to satisfy part or all ofa functional requirement. In making this decision, the purchase cost of thepackage must be weighed against the development costs estimated as partof the planning step. As part of this process the questions in this chaptershould be answered.
PROCEDURES/ISSUES/POLICIES
1. Does the vendor-supplied software meet all functional requirementsdefined in the scope of the plan? If not, what percentage of the func-tion will need to be enhanced or added locally? What costs are asso-ciated with these enhancements?
2. Has the vendor-supplied software been developed using softwareengineering methods? Is it maintainable? Does a good documenta-tion base exist? What documentation is supplied with the package?
3. Does the vendor-supplied software meet human interface require-ments for the system to be developed?
4. Does the vendor-supplied software already have a user base? Howmany users are working in an environment identical to (hardware,operating system, database)? Are current users happy with thepackage and with vendor’s support of the package? Is there a usergroup?
5. What is the vendor’s policy on software maintenance and on errorcorrection and reporting? What are the vendor’s rates for future ad-aptation or enhancement of the software? Does a maintenance con-tract exist? Is the vendor the original developer of the package?
6. Will the vendor supply source code or will the source code beplaced in escrow?
7. Have adequate benchmark and validation tests been conducted onthe vendor’s software?
8. Is there more than one candidate vendor package? Have all the can-didates been evaluated? Have benchmark tests been conducted?
CuuDuongThanCong.com https://fb.com/tailieudientucntt
422
SOFTWARE ENGINEERING HANDBOOK
9. How are new releases of the package handled? How long are the old-er releases supported? What is the frequency (based on past perfor-mance) of new releases?
10. Is special training required to use the package? To operate the pack-age? Is training conducted at the local site? Is any cost associatedwith training?
Reference
General Electric Company. (1986). Software Engineering Handbook, McGraw-Hill, New York.
CuuDuongThanCong.com https://fb.com/tailieudientucntt
423
Chapter 58
Software Selection from Multiple Packages
ABSTRACT
Many projects can make use of package software to satisfy part or all ofa functional requirement. In making this decision, the purchase cost of thepackage must be weighed against the development costs estimated as partof the planning step. The decision is further complicated when more thanone software package is evaluated. This chapter provides a recommendedevaluation procedure.
PROCEDURES/ISSUES/POLICIES
1. Cost — the real cost of vendor-supplied software (purchase price +cost to modify + cost to add + maintenance fee)
2. Service and support — based on other users with identicalenvironments
3. Documentation — for users and local maintenance4. Expandability and flexibility — to address future applications or
changes in environment5. Reputation — of the vendor and the vendor-supplied software6. Stability — based on the age of the package and the number of re-
leases over the past two years7. Machine or operating system dependency — based on programming
languages used, special features tied to special hardware8. Completeness — of function and performance based on software
scope
A software evaluation matrix should be developed to evaluate softwarepackages against each other. First, establish a weight factor, based onimportance, for each characteristic. Grade each candidate package on a
CuuDuongThanCong.com https://fb.com/tailieudientucntt
424
SOFTWARE ENGINEERING HANDBOOK
scale of one to ten for each characteristic listed above. The final grade foreach package is:
Σ [(characteristic)k(weighting factor)k]
where k = 1 to 8.
Reference
General Electric Company. (1986). Software Engineering Handbook, McGraw-Hill, New York.
CuuDuongThanCong.com https://fb.com/tailieudientucntt
425
Chapter 59
The Boehm COCOMO Model
ABSTRACT
COCOMO (constructive cost model) describes factors that affect theultimate cost of computer software. The factors fall into four broad catego-ries: product, computer, personnel, and project. Each of these factors isassigned quantitative values.
The software development effort is modeled as a nonlinear function ofthe number of estimated lines of code to be developed. COCOMO equa-tions take the form of:
m = c1 * KLOCa*PROD[fi]
where:
m = number of person-months for development effortc1 = model coefficienta = model exponentfi = cost factors (i = 1 to 16)
Each model cost factor is assigned values based on the degree of itsimportance and impact.
PROCEDURES/ISSUES/POLICIES
1. Product cost factors• Required software reliability: degree to which effort will be
expended to assure software reliability (number of reviews, qual-ity assurance effort)
• Data base size: size and complexity of the database to be devel-oped or integrated (number of information elements, accessmethods)
• Software product complexity: logical and structural complexity ofthe software to be developed
2. Computer cost factors• Execution time constraints: degree to which program execution time
is tied to successful accomplishment of software requirements• Memory constraint: memory limitations
CuuDuongThanCong.com https://fb.com/tailieudientucntt
426
SOFTWARE ENGINEERING HANDBOOK
• Environmental volatility: frequency and extent to which the envi-ronment external to the software (i.e., operating system, hard-ware, etc.) will change during development
• Computer turnaround time: responsiveness of the programmingenvironment
3. Personnel cost factors• Analyst capability: experience and expertise• Application experience: experience of development personnel
with user application domain• Programmer capability: experience and expertise• Environment expertise: experience and expertise with software
environment• Language experience: experience and expertise in programming
language4. Project cost factors
• Programming practices: use of modern programming practicesduring project
• Software tools: availability of software tools for each of the soft-ware engineering steps
• Schedule constraints: the degree to which scheduling constraintswill affect the application of software engineering techniques
5. Other cost considerations• Language: Cost per source instruction in assembly language is
about twice the cost per source instruction in a higher levellanguage.
• Real-time applications: Cost per instruction is about five timesthat of conventional applications.
• Point on learning curve: An experienced programming grouprequires 50 to 100 percent more effort to develop an unfamiliarprogram than some variant of a familiar program.
• Amount of documentation: Documentation costs run about 10 per-cent of the total software development cost.
• Amount of previous software used: The cost of adapting existingsoftware into a new project may be determined by estimating themodification and interface costs for the new application.
• Representations of development environment: The added costrequired to adapt software to actual operational conditions canbe quite significant — up to 95 pecent — but can only be esti-mated subjectively.
Further Readings
Boehm, B. (1981). Software Engineering Economics, Prentice-Hall, New York.
Boehm, B. (1975). The high cost of software, in Practical Strategies for Developing Large Soft-ware Systems, Horowitz, E., Ed., Addison-Wesley, Reading, MA, 4–14.
CuuDuongThanCong.com https://fb.com/tailieudientucntt
427
Chapter 60
IEEE Standard Dictionary of Measures to Produce Reliable Software
ABSTRACT
The IEEE standards were written with the objective of providing the soft-ware community with defined measures currently used as indicators ofreliability. By emphasizing early reliability assessment, this standard sup-ports methods through measurement to improve product reliability. Thischapter presents a subset of the IEEE standard easily adaptable by the gen-eral IS community.
PROCEDURES/ISSUES/POLICIES
1. Fault density. This measure can be used to predict remaining faultsby comparison with expected fault density, determine if sufficienttesting has been completed, and establish standard fault densitiesfor comparison and prediction.
Fd = F/KSLOC
where:
F = total number of unique faults found in a given interval resultingin failures of a specified severity level
KSLOC = number of source lines of executable code and nonexecutabledata declarations in thousands
2. Defect density. This measure can be used after design and code in-spections of new development or large block modifications. If thedefect density is outside the norm after several inspections, it is anindication of a problem.
CuuDuongThanCong.com https://fb.com/tailieudientucntt
428
SOFTWARE ENGINEERING HANDBOOK
where:
Di = total number of unique defects detected during the ith design orcode inspection process
I = total number of inspectionsKSLOD = in the design phase, the number of source lines of executable
code and nonexecutable data declarations in thousands
3. Cumulative failure profile. This is a graphical method used to predictreliability, estimate additional testing time to reach an acceptablyreliable system, and identify modules and subsystems that requireadditional testing. A plot is drawn of cumulative failures versus asuitable time base.
4. Fault-days number. This measure represents the number of days thatfaults spend in the system from their creation to their removal. Foreach fault detected and removed during any phase, the number ofdays from its creation to its removal is determined (fault-days). Thefault-days are then summed for all faults detected and removed, toget the fault-days number at system level, including all faults detect-ed and removed up to the delivery date. In cases where the creationdate of the fault is not known, the fault is assumed to have been cre-ated at the middle of the phase in which it was introduced.
5. Functional or modular test coverage. This measure is used to quantifya software test coverage index for a software delivery. From the sys-tem’s functional requirements, a cross reference listing of associat-ed modules must first be created.
Functional (Modular) Test Coverage Index =
where:
FE = number of the software functional (modular) requirements for whichall test cases have been satisfactorily completed
FT = total number of software functional (modular) requirements
6. Requirements traceability. This measure aids in identifying require-ments that are missing from or in addition to the originalrequirements.
TM = * 100%
∆∆
∆ιι 1=
Ι
∑ΚΣΛΟ∆−−−−−−−−−−−−−−−−−−−−−=
ΦΕ
ΦΤ−−−−−−−
Ρ1
Ρ2−−−−−−−
CuuDuongThanCong.com https://fb.com/tailieudientucntt
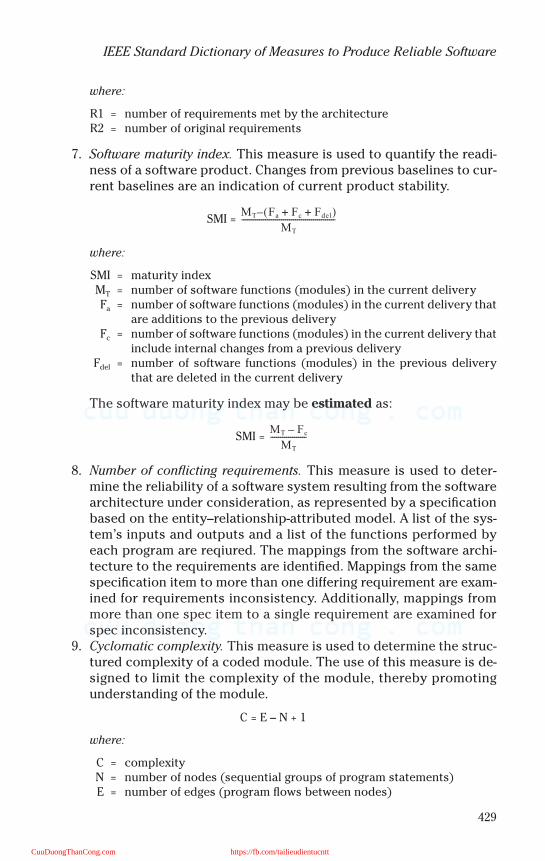
429
IEEE Standard Dictionary of Measures to Produce Reliable Software
where:
R1 = number of requirements met by the architectureR2 = number of original requirements
7. Software maturity index. This measure is used to quantify the readi-ness of a software product. Changes from previous baselines to cur-rent baselines are an indication of current product stability.
SMI =
where:
SMI = maturity indexMT = number of software functions (modules) in the current deliveryFa = number of software functions (modules) in the current delivery that
are additions to the previous deliveryFc = number of software functions (modules) in the current delivery that
include internal changes from a previous deliveryFdel = number of software functions (modules) in the previous delivery
that are deleted in the current delivery
The software maturity index may be estimated as:
SMI =
8. Number of conflicting requirements. This measure is used to deter-mine the reliability of a software system resulting from the softwarearchitecture under consideration, as represented by a specificationbased on the entity–relationship-attributed model. A list of the sys-tem’s inputs and outputs and a list of the functions performed byeach program are reqiured. The mappings from the software archi-tecture to the requirements are identified. Mappings from the samespecification item to more than one differing requirement are exam-ined for requirements inconsistency. Additionally, mappings frommore than one spec item to a single requirement are examined forspec inconsistency.
9. Cyclomatic complexity. This measure is used to determine the struc-tured complexity of a coded module. The use of this measure is de-signed to limit the complexity of the module, thereby promotingunderstanding of the module.
C = E – N + 1
where:
C = complexityN = number of nodes (sequential groups of program statements)E = number of edges (program flows between nodes)
ΜΤ Φα Φχ Φδελ+ +( )
ΜΤ
−−−−−−−−−−−−−−−−−−−−−−−−−−−−−−−−−−−−−−−−−−−−−−−
ΜΤ Φχ
ΜΤ
−−−−−−−−−−−−−−−−−−
CuuDuongThanCong.com https://fb.com/tailieudientucntt
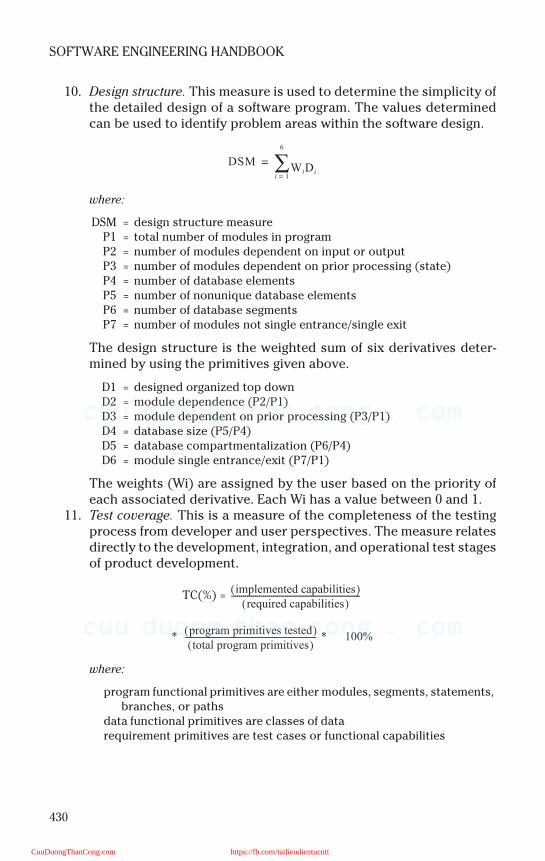
430
SOFTWARE ENGINEERING HANDBOOK
10. Design structure. This measure is used to determine the simplicity ofthe detailed design of a software program. The values determinedcan be used to identify problem areas within the software design.
where:
DSM = design structure measureP1 = total number of modules in programP2 = number of modules dependent on input or outputP3 = number of modules dependent on prior processing (state)P4 = number of database elementsP5 = number of nonunique database elementsP6 = number of database segmentsP7 = number of modules not single entrance/single exit
The design structure is the weighted sum of six derivatives deter-mined by using the primitives given above.
D1 = designed organized top downD2 = module dependence (P2/P1)D3 = module dependent on prior processing (P3/P1)D4 = database size (P5/P4)D5 = database compartmentalization (P6/P4)D6 = module single entrance/exit (P7/P1)
The weights (Wi) are assigned by the user based on the priority ofeach associated derivative. Each Wi has a value between 0 and 1.
11. Test coverage. This is a measure of the completeness of the testingprocess from developer and user perspectives. The measure relatesdirectly to the development, integration, and operational test stagesof product development.
TC(%) =
where:
program functional primitives are either modules, segments, statements, branches, or paths
data functional primitives are classes of data requirement primitives are test cases or functional capabilities
∆ΣΜΩι∆ι
ι 1=
6
∑=
ιµπλεµεντεδ χαπαβιλιτιεσ( )ρεθυιρεδ χαπαβιλιτιεσ( )
−−−−−−−−−−−−−−−−−−−−−−−−−−−−−−−−−−−−−−−−−−−−−−−−−−−−−−−−−−−−−−−−−
∗ προγραµ πριµιτιϖεσ τεστεδ( )τοταλ προγραµ πριµιτιϖεσ( )−−−−−−−−−−−−−−−−−−−−−−−−−−−−−−−−−−−−−−−−−−−−−−−−−−−−−−−−−−−−−−−−−− ∗ 100%
CuuDuongThanCong.com https://fb.com/tailieudientucntt
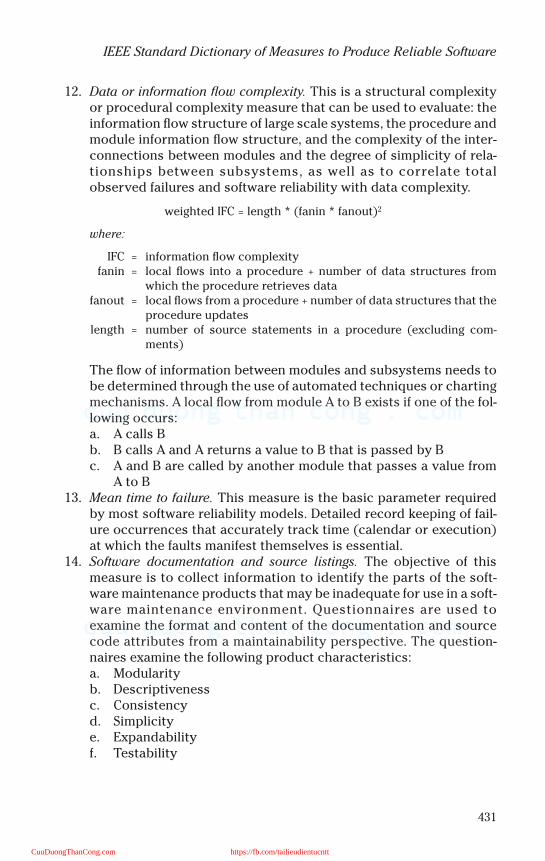
431
IEEE Standard Dictionary of Measures to Produce Reliable Software
12. Data or information flow complexity. This is a structural complexityor procedural complexity measure that can be used to evaluate: theinformation flow structure of large scale systems, the procedure andmodule information flow structure, and the complexity of the inter-connections between modules and the degree of simplicity of rela-tionships between subsystems, as well as to correlate totalobserved failures and software reliability with data complexity.
weighted IFC = length * (fanin * fanout)2
where:
IFC = information flow complexityfanin = local flows into a procedure + number of data structures from
which the procedure retrieves datafanout = local flows from a procedure + number of data structures that the
procedure updateslength = number of source statements in a procedure (excluding com-
ments)
The flow of information between modules and subsystems needs tobe determined through the use of automated techniques or chartingmechanisms. A local flow from module A to B exists if one of the fol-lowing occurs:a. A calls Bb. B calls A and A returns a value to B that is passed by Bc. A and B are called by another module that passes a value from
A to B13. Mean time to failure. This measure is the basic parameter required
by most software reliability models. Detailed record keeping of fail-ure occurrences that accurately track time (calendar or execution)at which the faults manifest themselves is essential.
14. Software documentation and source listings. The objective of thismeasure is to collect information to identify the parts of the soft-ware maintenance products that may be inadequate for use in a soft-ware maintenance environment. Questionnaires are used toexamine the format and content of the documentation and sourcecode attributes from a maintainability perspective. The question-naires examine the following product characteristics:a. Modularityb. Descriptivenessc. Consistencyd. Simplicitye. Expandabilityf. Testability
CuuDuongThanCong.com https://fb.com/tailieudientucntt
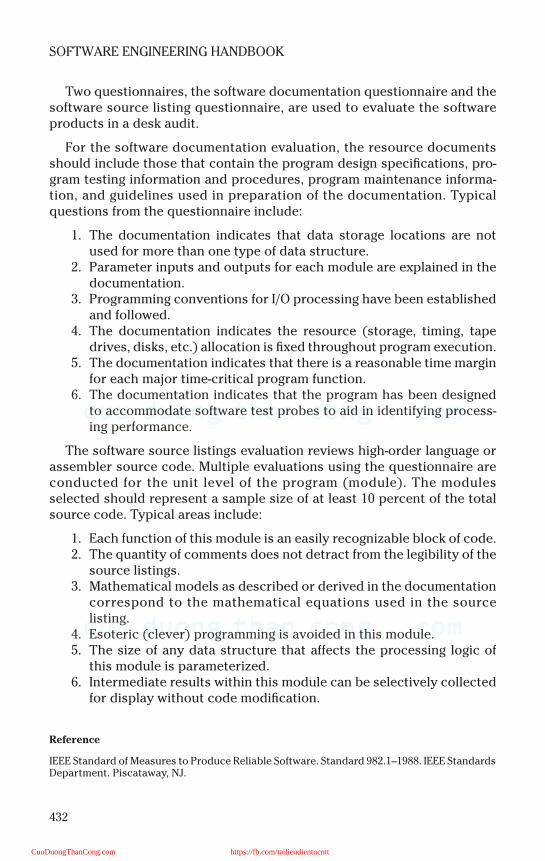
432
SOFTWARE ENGINEERING HANDBOOK
Two questionnaires, the software documentation questionnaire and thesoftware source listing questionnaire, are used to evaluate the softwareproducts in a desk audit.
For the software documentation evaluation, the resource documentsshould include those that contain the program design specifications, pro-gram testing information and procedures, program maintenance informa-tion, and guidelines used in preparation of the documentation. Typicalquestions from the questionnaire include:
1. The documentation indicates that data storage locations are notused for more than one type of data structure.
2. Parameter inputs and outputs for each module are explained in thedocumentation.
3. Programming conventions for I/O processing have been establishedand followed.
4. The documentation indicates the resource (storage, timing, tapedrives, disks, etc.) allocation is fixed throughout program execution.
5. The documentation indicates that there is a reasonable time marginfor each major time-critical program function.
6. The documentation indicates that the program has been designedto accommodate software test probes to aid in identifying process-ing performance.
The software source listings evaluation reviews high-order language orassembler source code. Multiple evaluations using the questionnaire areconducted for the unit level of the program (module). The modulesselected should represent a sample size of at least 10 percent of the totalsource code. Typical areas include:
1. Each function of this module is an easily recognizable block of code.2. The quantity of comments does not detract from the legibility of the
source listings.3. Mathematical models as described or derived in the documentation
correspond to the mathematical equations used in the sourcelisting.
4. Esoteric (clever) programming is avoided in this module.5. The size of any data structure that affects the processing logic of
this module is parameterized.6. Intermediate results within this module can be selectively collected
for display without code modification.
Reference
IEEE Standard of Measures to Produce Reliable Software. Standard 982.1–1988. IEEE StandardsDepartment. Piscataway, NJ.
CuuDuongThanCong.com https://fb.com/tailieudientucntt
433
IEEE Standard Dictionary of Measures to Produce Reliable Software
Note:
The information contained herein is copyrighted information of the IEEE, extracted from IEEEStd. 982.1–1988, IEEE Standard Dictionary of Measures to Produce Reliable Software. This in-formation was written within the context of IEEE Std 982.1–1988 and the IEEE takes no respon-sibility for or liability for damages resulting from the reader’s misinterpretation of saidinformation resulting from the placement and context of this publication. Information is re-produced with the permission of the IEEE.
CuuDuongThanCong.com https://fb.com/tailieudientucntt

This page intentionally left blank
CuuDuongThanCong.com https://fb.com/tailieudientucntt
435
Chapter 61
IEEE Framework for Measures
ABSTRACT
Software reliability measurements take place in an environment thatincludes user needs and requirements, a process for developing productsmeeting those needs, and a user environment within which the deliver soft-ware satisfies those needs. This measurement environment establishes aframework for determining and interpreting indicators of software reliabil-ity. This chapter provides IEEE’s recommended process for measurement.This process formalizes the data collection practices in development andsupport and provides for product evaluation at major milestones in the lifecycle. It also relates measures from one life cycle phase to another. It is thebasis for reliability measurement of a product.
PROCEDURES/ISSUES/POLICIES
The process can be described in nine stages, which may overlap or occurin different sequences depending on organization needs. Each of thesestages in the measurement process influences the production of a deliv-ered product with the potential for high reliability. Other factors influenc-ing the measurement process include the following: a firm managementcommitment to continually assess product and process maturity, or stabil-ity, or both during the project; use of trained personnel in applying mea-sures to the project in a useful way; software support tools; and a clearunderstanding of the distinctions among errors, faults, and failures.
1. Product measures:• Errors, faults, and failures is the count of defects with respect to
human cause, program bugs, and observed system malfunctions.• Mean time to failure and failure rate is a derivative measure of
defect occurrence and time.• Reliability growth and projection is the assessment of change in
failure-freeness of the product under testing or operation.• Remaining product faults is the assessment of how fault-free the
product is in development, test, or maintenance.
CuuDuongThanCong.com https://fb.com/tailieudientucntt
436
SOFTWARE ENGINEERING HANDBOOK
• Completeness and consistency is the assessment of the presenceand agreement of all necessary software system parts.
• Complexity is the assessment of complicating factors in a system.2. Process measures
• Management control measures address the quantity and distribu-tion of error and faults and the trend of cost necessary for defectremoval.
• Coverage measures allow one to monitor the ability of developersand managers to guarantee the required completeness in all theactivities of the life cycle and support the definition of correctiveactions.
• Risk, benefit, and cost evaluation measures support delivery deci-sions based on technical and cost criteria. Risk can be assessedbased on residual faults present in the product at delivery andthe cost with the resulting support activity.
3. Errors, faults, and failures:• Errors — human action that results in software containing a fault.• Faults — accidental condition that causes a functional unit to fail
to perform its required function. It is also a manifestation of anerror in software that, if encountered, may cause a failure.
• Failure — termination of the ability of a function unit to performits required function. It is also an event in which a system or sys-tem component does not perform a required function withinspecified limits. A failure may be produced when a fault isencountered.
4. Stage 1: Plan organizational strategy. Initiate a planning process.Form a planning group and review reliability constraints and objec-tives, giving consideration to user needs and requirements. Identifythe reliability characteristics of a software product necessary toachieve these objectives. Establish a strategy for measuring andmanaging software reliability. Document practices for conductingmeasurements.
5. Stage 2: Determine software reliability goals. Define the reliabilitygoals for the software being developed in order to optimize reliabil-ity in light of realistic assessments of project constraints, includingsize scope, cost, and schedule.• Review the requirements for the specific development effort, in
order to determine the desired characteristics of the deliveredsoftware. For each characteristic, identify specific reliabilitygoals that can be demonstrated by the software or measuredagainst a particular value or condition. Establish an acceptablerange of values. Consideration should be given to user needs andrequirements.
• Establish intermediate reliability goals at various points in thedevelopment effort.
CuuDuongThanCong.com https://fb.com/tailieudientucntt
437
IEEE Framework for Measures
6. Stage 3: Implement measurement process. Establish a software reli-ability measurement process that best fits an organization’s needs.Review the rest of the process and select stages that best lead to op-timum reliability. Add to or enhance these stages as needed. Consid-er the following suggestions:• Select appropriate data collection and measurement practices
designed to optimize software reliability.• Document the measures required, the intermediate and final mile-
stones when measurements are taken, the data collectionrequirements, and the acceptable values for each measure.
• Assign responsibilities for performing and monitoring measure-ments and provide necessary support for these activities fromacross the internal organization.
• Initiate a measure selection and evaluation process.• Prepare educational material for training personnel in concepts,
principles, and practices of software reliability and reliabilitymeasures.
7. Stage 4: Select potential measures. Identify potential measures thatwould be helpful in achieving the reliability goals established instage 2.
8. Stage 5: Prepare data collection and measurement plan. Prepare a datacollection and measurement plan for the development and supporteffort. For each potential measure, determine the primitives neededto perform the measurement. Data should be organized so that infor-mation related to events during the development effort can be prop-erly recorded in a database and retained for historical purposes.• For each intermediate reliability goal identified in stage 2, identify
the measures needed to achieve this goal. Identify the points dur-ing development when the measurements are to be taken. Estab-lish acceptable values or a range of values to assess whether theintermediate reliability goals are achieved.
• Include in the plan an approach for monitoring the measurementeffort. The responsibility for collecting and reporting data, verify-ing its accuracy, computing measures, and interpreting theresults should be described.
9. Stage 6: Monitor the measurements. Once the data collection and re-porting begins, monitor the measurements and the progress madeduring development, so as to manage the reliability and therebyachieve the goals for the delivered product. The measurements as-sist in determining whether the intermediate reliability goals areachieved and whether the final goal is achievable. Analyze the mea-sure and determine if the results are sufficient to satisfy the reliabil-ity goals. Decide whether a measure result assists in affirming thereliability of the product or process being measured. Take correc-tive action.
CuuDuongThanCong.com https://fb.com/tailieudientucntt
438
SOFTWARE ENGINEERING HANDBOOK
10. Stage 7: Assess reliability. Analyze measurements to ensure that reli-ability of the delivered software satisfies the reliability objectivesand that the reliability as measured, is acceptable.• Identify assessment steps that are consistent with the reliability
objectives documented in the data collection and measurementplan. Check the consistency of acceptance criteria and the suffi-ciency of tests to demonstrate satisfactorily that the reliabilityobjectives have been achieved. Identify the organization respon-sible for determining final acceptance of the reliability of the soft-ware. Document the steps in assessing the reliability of thesoftware.
11. Stage 8: Use software. Assess the effectiveness of the measurementeffort and perform necessary corrective action. Conduct a follow-upanalysis of the measurement effort to evaluate reliability assess-ment and development practices, record lessons learned, and eval-uate user satisfaction with the software’s reliability.
12. Stage 9: Retain software measurement data. Retain measurementdata on the software throughout the development and operationphases for use by future projects. This data provides a baseline forreliability improvement and an opportunity to compare the samemeasures across completed projects. This information can assist indeveloping future guidelines and standards.
Reference
IEEE Guide for the Use of IEEE Standard Dictionary of Measures to Produce Reliable Software.Standard 982.2–1988. June 12, 1989. IEEE Standards Department, Piscatawy, NJ.
CuuDuongThanCong.com https://fb.com/tailieudientucntt
439
Chapter 62
Gillies’ Method for Humanization of the Software Factory
ABSTRACT
In order to introduce computer-assisted software engineering technol-ogy successfully to an organization, human issues such as goals, objec-tives, fears, job impacts, etc. must be taken into consideration first. Amethod is presented here to address those human issues and at the sametime to develop a quality definition that is agreed upon by the entire soft-ware development community of an organization (Gillies, 1991). Themethod takes the following approach:
• Educate people about quality.• Resolve different viewpoints of quality.• Reach a realistic consensus view of quality that is achievable by all
parties.
The CASE technology has been widely used in the computer softwareindustry for many years. As more CASE tools become available and CASEtechnology becomes mature, it is more noticeable that CASE education isbeyond technology; the human issues must also be focused on such thatwhen those issues are addressed, the CASE users such as software devel-opment staff will be more likely to perceive that the new technology willserve as an aid to the staff instead of a threat to jobs. The methoddescribed here should be considered part of CASE education for theintroduction of any new CASE technology to an organization to ensurethat the cooperation of staff will help in realization of the potential of newtechnology.
CuuDuongThanCong.com https://fb.com/tailieudientucntt

440
SOFTWARE ENGINEERING HANDBOOK
PROCEDURE
1. Educate People about Quality.
The following definitions of quality from various sources can serve as astarting point for education on quality:
Quality is the degree of excellence.
— The Oxford English Dictionary
The totality of features and characteristics of a product or services thatbear on its ability to satisfy specified or implied needs
— The International Organization for Standardization
The transcendent view: relates quality to innate excellence.
The product-based view: the economist’s view — the higher the quality,the higher the cost.
The user-based view can be summarized as fitness for purpose.
The manufacturing view: quality measured in terms of conformance torequirements.
The value-based view: the ability to provide what the user wants at anaffordable cost.
— Garvin
Quality means the degree of user satisfaction. Previously, good qualitymeant that a national or an in-house standard was satisfied, This is nec-essary, but it is not sufficient alone for producing high-quality products.Quality depends upon user satisfaction,
• Software match to specification
• Specification match to user needs
— Yasuda
It is important to realize that the purpose of a starting point for a discus-sion of quality is to understand that the definition of quality varies dramat-ically from different viewpoints. Any one of these quality definitions is notsufficient by itself but is necessary to be considered for reaching a corpo-rate consensus on quality.
2. Resolve Different Viewpoints of Quality. Establish Relationship Characteristics.
This is done by a two-part exercise involving an enabler and a mix of per-sonnel from developers and users. The first part of the exercise focuses onreaching a consensus on quality that reflects the beliefs of all parties. The
CuuDuongThanCong.com https://fb.com/tailieudientucntt
441
Gillies’ Method for Humanization of the Software Factory
second part focuses on understanding the interrelationship and conflictsthat exist between different quality criteria. Relationships between charac-teristics are classified in terms of trade-offs (if A is enhanced, B isdegraded), affinity (if A is enhanced, B is affected), and resonance (if A isenhanced, B is enhanced).
The purpose of establishing the relationship between quality character-istics is for people to have realistic expectations. All quality criteria aredesirable, but perfection is almost impossible to achieve with all aspects ofquality characteristics included. Previous experiences indicate that thesuccess of quality improvement is based on critical criteria, not the entireset. The relationships help people to appreciate clearly the consequencesof emphasizing only those characteristics.
3. Reach a Realistic Consensus View of Quality.
The purpose of this step is to ensure a higher probability for the accep-tance of quality definition and improvement. It is noted that, if all partiesinvolved feel that the quality consensus takes their special needs into con-sideration and understands the needs of others, then it is more likely thatthe quality consensus will be accepted. In an environment where qualityconsensus is reached and clearly defined, CASE technology can then beintroduced as the means to achieve specific goals identified in the qualityconsensus model. This obviously increases the likelihood of CASE beingviewed as an aid rather than a hindrance to the software developer.
Reference
Gillies, A.C. (1991). Humanization of the software factory, Inf. Software Technol., 33, 641–646.
Selected Bibliography
Gavin, D. (1984). What does product quality mean? Sloane Manage. Rev., 4.
Gilb, T. (1988). Principles of Software Engineering Management, Addison- Wesley, Reading, MA.
International Organization for Standardization (ISO), www.iso.ch, Switzerland (1986).
Yasuda, K. (1989). Software quality assurance activities in Japan, in Japanese Perspectives inSoftware Engineering, Matsumoto, Y., Ed., Addison-Wesley, Reading, MA.
CuuDuongThanCong.com https://fb.com/tailieudientucntt

This page intentionally left blank
CuuDuongThanCong.com https://fb.com/tailieudientucntt
443
Chapter 63
Pfleeger’s Approach to Software Metrics Tool Evaluation
ABSTRACT
The process and environment for software development are constantlychanging as technology advances. Different projects usually utilize differ-ent quantified data for their usage in terms of project management, control,and forecast. For an organization that employs software metrics tools in itssoftware development environment, it is not uncommon to have a widerange of software metrics tools available for various projects. Often prod-uct managers make the selection of tools based on sources such as previ-ous experience, vendor specifications, input from other groups, etc. Asmore software metrics tools are acquired, it becomes more important toidentify the characteristics common to each tool and to store this informa-tion in a repository. The repository is desirable because the comparisoncan be easily made against various tools in order to select the best set oftools for a particular use.
Software metrics are widely used in understanding, managing, and con-trolling the software development process. Attempts have been made toquantify the characteristics of various aspects of the software develop-ment process in terms of metrics. Software metrics tools are often used tocollect and analyze data specific to project process maturity, developmentenvironment, and management needs and preferences. The approach sug-gested here describes a comprehensive way to collect essential informa-tion for each software metrics tool, and a project metrics database thatsupports monitoring, decision making, trend analysis, predictions, and set-ting up standards for future projects.
PROCEDURES/ISSUES/POLICIES
Pfleeger and Fitzgerald, Jr. (1991) describe a two-stage approach to eval-uation below.
CuuDuongThanCong.com https://fb.com/tailieudientucntt
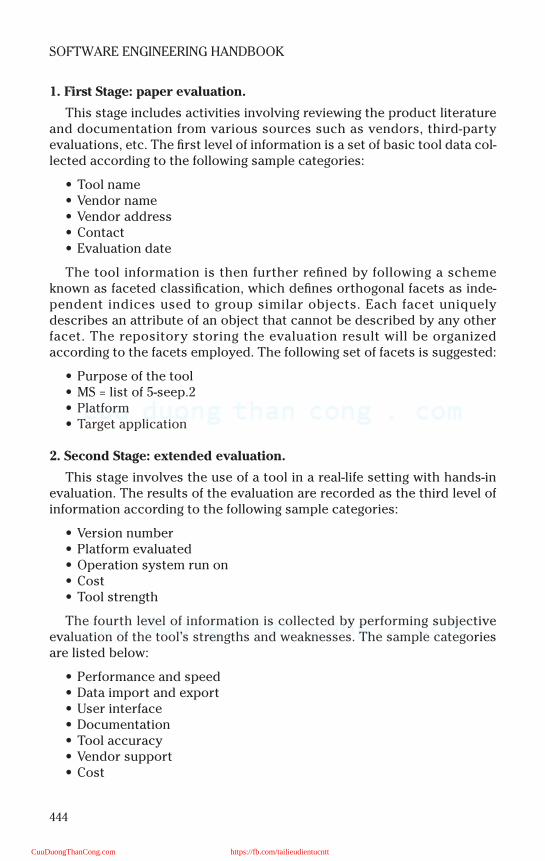
444
SOFTWARE ENGINEERING HANDBOOK
1. First Stage: paper evaluation.
This stage includes activities involving reviewing the product literatureand documentation from various sources such as vendors, third-partyevaluations, etc. The first level of information is a set of basic tool data col-lected according to the following sample categories:
• Tool name• Vendor name• Vendor address• Contact• Evaluation date
The tool information is then further refined by following a schemeknown as faceted classification, which defines orthogonal facets as inde-pendent indices used to group similar objects. Each facet uniquelydescribes an attribute of an object that cannot be described by any otherfacet. The repository storing the evaluation result will be organizedaccording to the facets employed. The following set of facets is suggested:
• Purpose of the tool• MS = list of 5-seep.2• Platform• Target application
2. Second Stage: extended evaluation.
This stage involves the use of a tool in a real-life setting with hands-inevaluation. The results of the evaluation are recorded as the third level ofinformation according to the following sample categories:
• Version number• Platform evaluated• Operation system run on• Cost• Tool strength
The fourth level of information is collected by performing subjectiveevaluation of the tool’s strengths and weaknesses. The sample categoriesare listed below:
• Performance and speed• Data import and export• User interface• Documentation• Tool accuracy• Vendor support• Cost
CuuDuongThanCong.com https://fb.com/tailieudientucntt
445
Pfleeger’s Approach to Software Metrics Tool Evaluation
For each category, a raw score is obtained based on evaluation results;a weight based on project needs and goals is assigned. The final score foreach category is computed by multiplying the raw score by the assignedweight. The overall rating of the tool is calculated by summing the finalscore of each category. The repository will hold all four levels of informa-tion for each tool evaluated. Project managers can then retrieve the level ofinformation desired and build the software metrics tools kit based on inter-ests and needs.
Reference
Pfleeger, S.L. and Fitzgerald, Jr., J.C. (1991). Software metrics tool kit: support for selection,collection and analysis, Inf. Software Technol., 33, 477–482.
Selected Bibliography
Humphrey, W. (1989). Managing the Software Process, Addison-Wesley, Reading MA.
Pfleeger, S.L. (1989). Recommendations for an initial set of software metrics, Technical reportCTC-TR-89–017 Contel Technology Center, Chantilly, VA.
Pfleeger, S.L. and McGowan, C.L. (1990). Software metrics in a process maturity framework,J. Syst. Software, July.
Prieto-Diaz, R. and Freeman, P. (1987). Classifying software for reusability, IEEE Software,January.
CuuDuongThanCong.com https://fb.com/tailieudientucntt

This page intentionally left blank
CuuDuongThanCong.com https://fb.com/tailieudientucntt
447
Chapter 64
Maiden’s Method for Reuse of Analogous Specifications through Human Involvement in Reuse Process
ABSTRACT
The concept of software reuse has been applied in various softwaredeliverables such as design, coding, test cases, etc., and has been realizedwith the advance of CASE tools revolution. An alternative paradigm is pro-posed by Maiden (1991) for reuse of specifications during requirementanalysis through the concept of analogy. The analogy recognition processis knowledge intensive and requires involvement from a software analyst ina pragmatic approach to perform problem classification, reusable specifi-cation candidate selection, and customization of the selected reusablespecification for the new problem domain.
Specification reuse is a concept that should be implemented at somelevel higher than reusable code or reusable design. Reusable code or reus-able design addresses only an isolated piece-wise solution that usually isidentified at the design or coding phase of the software life cycle. Reusablespecification must be identified during the requirement analysis; thus, itprovides a better picture of software productivity and quality during thoseearly stages of software life cycle and avoids costly faults and omissionsthat could happen in its later phases.
CuuDuongThanCong.com https://fb.com/tailieudientucntt
448
SOFTWARE ENGINEERING HANDBOOK
PROCEDURES
A good definition or analogy can be found from Carbonell (1985):
Analogical problem solving consists of transferring knowledge frompast problem-solving episodes to new problems that share significantaspects with corresponding past experience — and using transferredknowledge to construct solutions to new problems.
Analogy is not a process that matches for syntactic similarities; it basi-cally transfers a network of domain and method knowledge representingsolution in its entirety. Analogy is concerned with finding the affinitiesbetween the problem domains rather than just the reusable specifications.This domain and method knowledge is best presented by a set of intercon-nected causal relations constrained by abstraction. Normally domain andmethod knowledge are separately stored in the existing systems, butexpert software engineers usually memorize abstract and concrete specifi-cations in a form integrated with domain and method knowledge. Methodand problem domain knowledge is usually required by intelligent CASEtools to assist the analytic problem-solving process. This indicates thatspecifications reuse must be a human-supported task; the important roleof the software analyst must be emphasized to achieve a successful anal-ogy process.
The analogy process for specification reuse can never be achievedsolely by software tools. It involves the following steps in which extensiveanalyst participation is essential:
1. Retrieve the correct specification from a repository. Considerableknowledge is obviously needed to understand different problem do-mains and the analogy between them. The analyst is required tobring knowledge of the target domain to the process, which requiresthat key features of the new problem be defined and applied as in-puts to the reusable specifications retrieval mechanism. The keyfeatures are used to match critical features of those candidate soft-ware engineering problems in the repository. This is normally an it-erative process of retrieval and understanding.
2. Selection of candidate specifications under the same problem cate-gory. The requirement analyst must use his knowledge of the targetand the reusable domains to understand each candidate and com-pare it against the functional and nonfunctional requirements of thetarget problem. Supports such as diagnostics and explanation toolsare needed for the analyst to identify possible misconceptionsabout the analogy and to guide him during specification reuse sothat the most appropriate specification will be selected.
3. Customization of the selected specification to the new domain. Thisalso requires an analyst with extensive knowledge of the target andreusable domains to make successful modifications of a reusable
CuuDuongThanCong.com https://fb.com/tailieudientucntt
449
Maiden’s Method for Reuse of Analogous Specifications
specification. Functional requirements of the new problem shouldbe tested against the analogous specifications. Prototyping is appro-priate to provide confidence that the reused specification will mostlikely meet the target problem requirements.
References
Carbonell, J.G., (1985). Derivational analogy: a theory of reconstructive problem solving andexpertise acquisition, Technical report CMU-CS-85–115 Computer Science Department, Carn-egie-Mellon University, Pittsburgh, PA.
Maiden, N.A.M. (1991). Saving reuse from the noose: reuse of analogous specification throughhuman involvement in reuse process, Inf. Software Technol., 33, 780–790.
Selected Bibliography
Maiden, N.A.M. (1991). Analogy as a paradigm for specification reuse, Software Eng. J., 6, 3–15.
Maiden, N.A.M. and Sutcliffe, A.G. (1991). Analogical matching for specification reuse, in Proc.6th Knowledge-Based Software Eng. Conf., IEEE Computer Society Press.
CuuDuongThanCong.com https://fb.com/tailieudientucntt

This page intentionally left blank
CuuDuongThanCong.com https://fb.com/tailieudientucntt
451
Chapter 65
Tate’s Approaches to Measuring Size of Application Products with CASE Tools
ABSTRACT
Computer-assisted software engineering (CASE) tools have been widelyused in the software development environment. CASE tools have evolvedand are now equipped with the capability to generate end products in var-ious forms, including programming language source codes, graphical userinterface, data dictionary entries, etc. This implies that counting lines ofcode (LOC) in many cases is no longer adequate for measuring productiv-ity as well as process performance. Methods such as dictionary tokencounts, vector metrics, and function metrics are considered as alternativeapproaches for productivity measurements.
Measuring the size of the CASE application product is basically anattempt to measure the technology productivity and the development pro-ductivity. Technology productivity indicates the performance of a specifictype of CASE technology or CASE tool. Development productivity focuseson the performance of an individual developer or a development group.Because software deliverables may come in various forms, it is necessaryto include all objects of the end products in order to make comprehensivemeasurements. These measurements can then be used to produce tangibleproductivity numbers such as development cost, development effort, ortime-per-unit size of the job done, etc.
CuuDuongThanCong.com https://fb.com/tailieudientucntt
452
SOFTWARE ENGINEERING HANDBOOK
PROCEDURE
The overall size of any software product basically should consist of rep-resentations from all object types delivered for the end product, and canbe determined by one of the following two ways (Tate and Verner, 1991).
1. Find a common measure, for example, lines of code counts, for allobjects.
2. Construct a composite measure that is a function of different weight-ed objects. This is commonly known as function points or functionweight.
Three different types of measurements are listed as possible approachesfor measurement of CASE application products (CAPs).
1. Dictionary token counts. CASE tools are concerned with a wide arrayof object types, e.g., source codes, entities, relationships, datatypes, data flows, graphical interfaces, forms, etc. All objects shouldbe entered in a dictionary as tokens or fields. Those tokens can thenbe weighted and added together to form a single measurement. Thefollowing advantages are noted: tokens are simple and easy tocount; tokens provide a useful measure across many CASE tools; atoken can be considered as an atomic decision instance that the de-veloper makes, thus better representing the software developmenteffort as a whole. It is noted that tokens are most suitable for generalpurposes and for objective target sizes.
2. Size metric vectors. This approach implies that a concept such assize has more than one dimension and should not be represented ina single value. Many objects, such as data-flow diagrams, data mod-els, user interfaces, etc., can be sized separately. The size metricvectors should be tailored based on the objects involved in the endproducts. It is noted that size metric vectors should not replacecommon or composite size metrics. They are simply complementa-ry to one another.
3. Function metric vectors (composite units of size measure). One com-mon composite measure is function points. The composite mea-sures provide early size measures based on a partial system model.The success of composite measures is based on the purpose forwhich they are constructed and their suitability for that purpose.Some possible purposes include the forecast of• Downstream effort and cost for particular stages and CAP parts,
or for a completed CAP• Downstream development time for similar categories • Downstream size in tokens or lines of source or machine code
CuuDuongThanCong.com https://fb.com/tailieudientucntt
453
Maiden’s Method for Reuse of Analogous Specifications
Composite metrics are most suitable for particular purposes becausethey assign weights to different component types and object counts can betailored for special needs.
Reference
Tate, G. and Verner, J.M. (1991). Approaches to measuring size of application products withCASE tools, Inf. Software Technol., 33, 622–628.
Selected Bibliography
Basili, V.R. and Rombach, H.D. (1988). The TAME project: towards improvements orientedsoftware environments, IEEE Trans. Software Eng., 14, 758–773.
Verner, J., Tate, G., Jackson, B., and Hayward, R. (1989). Technology dependence in functionpoint analysis: a case study and critical review, in Proc. llth Int. Conf. Software Eng., Pittsburgh,PA.
Verner, J. (1989). A generic model for software size estimation based on component partition-ing, Ph.D. Thesis, Massey University, New Zealand.
CuuDuongThanCong.com https://fb.com/tailieudientucntt

This page intentionally left blank
CuuDuongThanCong.com https://fb.com/tailieudientucntt

Section III
CuuDuongThanCong.com https://fb.com/tailieudientucntt

This page intentionally left blank
CuuDuongThanCong.com https://fb.com/tailieudientucntt
457
Appendices
These 19 appendices are filled with guides, templates, forms, and filled-outexamples for every facet of software engineering.
CuuDuongThanCong.com https://fb.com/tailieudientucntt

This page intentionally left blank
CuuDuongThanCong.com https://fb.com/tailieudientucntt
459
Appendix A
System Service Request Form
CuuDuongThanCong.com https://fb.com/tailieudientucntt
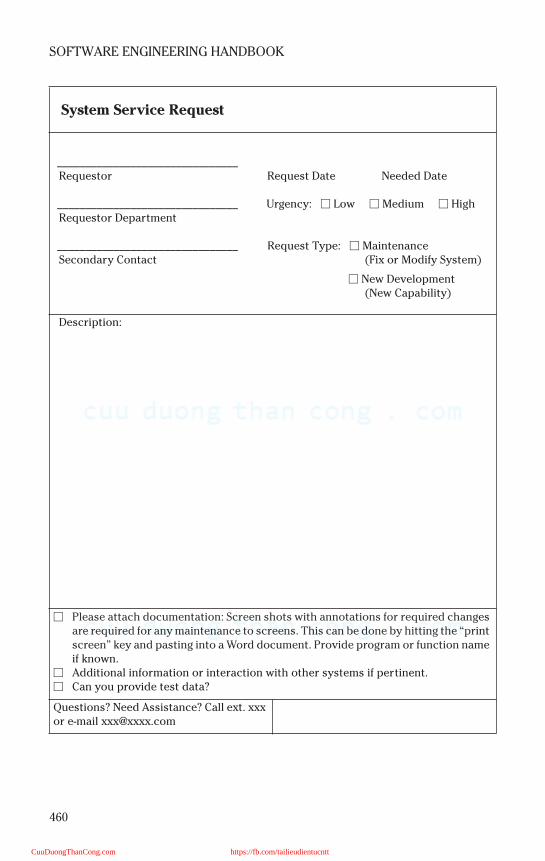
460
SOFTWARE ENGINEERING HANDBOOK
System Service Request
________________________________Requestor Request Date Needed Date
________________________________ Urgency: Low Medium HighRequestor Department
________________________________ Request Type: Maintenance Secondary Contact (Fix or Modify System)
New Development(New Capability)
Description:
Please attach documentation: Screen shots with annotations for required changes are required for any maintenance to screens. This can be done by hitting the “print screen” key and pasting into a Word document. Provide program or function name if known.
Additional information or interaction with other systems if pertinent. Can you provide test data?
Questions? Need Assistance? Call ext. xxx or e-mail [email protected]
CuuDuongThanCong.com https://fb.com/tailieudientucntt
461
Appendix B
Project Statement of Work
TABLE OF CONTENTS
Project Information ........................................................................................ 462Project Request......................................................................................... 462Project Number and Title ........................................................................ 462Executive Sponsor or Delegate ............................................................... 462
Project Definition............................................................................................ 462Background ............................................................................................... 462Project Objectives .................................................................................... 463Business Units Involved........................................................................... 463
Internal ................................................................................................. 463External ................................................................................................ 463Business Impacts ................................................................................ 463Business Benefits ................................................................................ 464
Risks ........................................................................................................... 464Risk Rating ........................................................................................... 464Identified Risks.................................................................................... 464Risk Mitigation .................................................................................... 464
Proposed Solution.......................................................................................... 465Current ....................................................................................................... 465
Proposed Solution.......................................................................................... 465Project Scope .................................................................................................. 465
Inclusions................................................................................................... 465Exclusions.................................................................................................. 465Security Statement ................................................................................... 466
Project Approach ........................................................................................... 466Project Management ................................................................................ 466Methodology ............................................................................................. 466Deliverables............................................................................................... 467
Key Project Deliverables.................................................................... 467Approvals............................................................................................. 467
Acceptance Criteria.................................................................................. 467Assumptions.............................................................................................. 467Key Facts.................................................................................................... 469
CuuDuongThanCong.com https://fb.com/tailieudientucntt
462
SOFTWARE ENGINEERING HANDBOOK
Issue Management ....................................................................................469Change Management ................................................................................469Communication Plan ................................................................................470Project Status ............................................................................................470Project Team..............................................................................................471Project Team Roles and Responsibilities...............................................471Project Estimates and Costs....................................................................471Research and Experimentation Tax Credit Eligibility ..........................471
Appendix B-1: Statement of Work Approval ................................................477Appendix B-3: Potential Tax Credit Tests ....................................................482Appendix B-4: Change Management Form and Instructions.....................483
Procedure...................................................................................................483Procedure...................................................................................................484
Appendix B-6: List of Requirements Scheduled for Release ?? .................487
Project manager: <name>Created: <date>Last updated: <date>Created by: <name>
PROJECT INFORMATION
Project Request
This project has been requested to provide various business lines newor improved functionality within the <application name> System. Some ofthe requested changes will be beneficial for the customer also.
Project Number and Title
This project will be referred to as the “?? Project.” The project numberis ??.
Executive Sponsor or Delegate
The business group head for this project is <group head name> of <com-pany name> and the executive sponsor is <executive sponsor name>,group technology executive.
PROJECT DEFINITION
Background
There are several requirements requested for Release ??. These require-ments will be funded by various business lines and will benefit several dif-ferent areas as well as the customer in many cases.
CuuDuongThanCong.com https://fb.com/tailieudientucntt
463
Project Statement of Work
Release ?? is one of two remaining releases scheduled for <year> by theenterprise. The planned implementation date for Release ?? is <date>. Thisrelease will be coordinated with the <project name> scheduled between<month> and <month> <year>.
Project Objectives
To provide more functionality and data accessibility in the ?? systemto the business lines and the customer in the least amount of timefor the most reasonable cost
Business Units Involved
Internal. Impacts to the following applications were determined in theinitial data gathering phase of this project. Certain applications have beendefaulted to testing only because no response was obtained during thedata gathering phase. Formal sizing has been gathered from all impactedapplications as a part of the requirements phase of this project. This listrepresents the internal interfaces.
Internal Applications/Areas: Impacts:
1. Application name: No development — setup and testing needed
2. Application name: Application name — Development, test-ing needed
Application name — Development
Application name — Testing needed
3. Application name: Development, testing needed
Subsystem name Testing needed
Subsystem name No development; setup and testing needed
Subsystem name Testing needed
External. The external organizations impacted by this project include:
Third party package name New process and procedures; develop-ment, testing needed
Business Impacts. This project will have the following business impacts:
1. Changes for all <application name> customers2. Changes for wholesale sales and relationship managers3. Changes for regional managers4. Changes for operations5. Changes for central implementation and regional implementation
centers
CuuDuongThanCong.com https://fb.com/tailieudientucntt
464
SOFTWARE ENGINEERING HANDBOOK
Business Benefits. This project will have the following businessbenefits:
1. Improved presentation of customer statements and reports2. Productivity gains on automating various processes.3. Productivity gains on making specific data more readily available to
analysts for problem resolution4. Compliance with corporate branding standards
Risks
Risk Rating. The risk score for this project is 82. As a result of the riskrating, this project has been rated as a medium-risk project. There is addi-tional risk due to some of the requested changes to be implemented in con-junction to the release implementation date. There is a conflict betweenthe release date and the upgrade date. See Appendix B-2 Risk Assessmentform.
Identified Risks. The risks identified for this project include thefollowing:
• Late deliverables if resource constraints• Resource constraints if work needed on other higher priorities such
as production issues• Retaining key project team resources• Conflicting project priorities• Communication, coordination, and task management of all affected
applications is necessary for successful implementation• Risk of impacted customers due to the complexity of some changes
Risk Mitigation. The following actions will be taken to address the iden-tified risks.
• Hire contractors as necessary to assist the team in completing the as-signed tasks.
• Work with business lines early in the requirements gathering phase todocument detailed requirements.
• Produce more accurate estimates due to detailed business require-ments.
• Hold regularly scheduled meetings to keep all affected applications upto date on tasks.
• Include adequate checkpoint reviews in the project process to ensureaccurate and complete information.
• Coordinate testing with all impacted applications to ensure the chang-es are correct.
CuuDuongThanCong.com https://fb.com/tailieudientucntt
465
Project Statement of Work
PROPOSED SOLUTION
Current
Not all functionality was built into the new <application name> systemfrom the old <application name> system. This lack of functionality is caus-ing many manual work-arounds and in some cases loss of revenue. Some ofthe requested changes also position <application name> in compliancewith the <company name> strategic standards.
PROPOSED SOLUTION
The <application name> management team is working with the projectmanager to ensure that detailed business requirements are fully docu-mented and to prioritize those requirements based on business need.Those requirements have been sized and presented to the various busi-ness lines. A resource plan will be updated to reflect the number ofresources available during the Release ?? timeframe. The business lineswill then obtain funding for the requirements that can be completed in thatRelease ?? timeframe. The project plan will be updated and an issues logand task plan will be maintained throughout the term of the project.
PROJECT SCOPE
Inclusions
The scope of this project includes the following:
• Defining and communicating the business requirements to all affectedapplications that are included in the Release ?? requirements.
• Assessing and managing the impacts to the various Operational/Sup-port Groups/Business Lines.
• Participation in development of customer, department, and vendorcommunications.
• Participation in development of customer or internal training.• Participation in development of user documentation and procedures.• Participation in regression testing.• Validation of requirements, design, development, and unit and system
testing of application changes necessary to the applications listed inthe Business Units Involved.
• Changes needed for other applications requirements.
A list of the requirements scheduled for Release ?? is attached as AppendixB-6.
Exclusions
The scope of this project does not include the following:
CuuDuongThanCong.com https://fb.com/tailieudientucntt

466
SOFTWARE ENGINEERING HANDBOOK
• Any non-<APPLICATION NAME> accounts• <APPLICATION NAME> (??) application conversion (although it is a
dependency).
Security Statement
The security plan is prepared to ensure that appropriate controls aredesigned to meet security policy and standards. The plan should identifyrisks and exposures to information, systems, and networks that may resultfrom any exceptions to the standards. The system managers are responsi-ble for ensuring that the security plans are updated or created for allsystems.
PROJECT APPROACH
Project Management
<Project Manager name> has been assigned to manage the project. Theresponsibilities of the project manager will be:
• Establish and execute a project plan• Ensure completion of project estimates, as required• Track actual costs against budget/planned costs• Assist in maintaining the overall project direction• First point of escalation of project issues• Obtain project resource commitments• Define project milestones• Create and maintain a project issues log• Schedule and conduct project status meetings• Complete project status meeting minutes• Complete project status reports• Contact lists for all project participants with defined roles and
responsibilities• Ensure detailed test plans are complete• Participate in the post event review• Communicate with the other end-to-end project managers• Close the project
Methodology
This project will follow the <methodology name> methodology. Oneoverall project manager will be assigned as the end-to-end project manageras well as the technical lead. This project manager will manage the detailsof the <APPLICATION NAME> system development efforts. The projectmanager will maintain a common format for issues, project plans, and tech-nical requirements. The project manager will provide day-to-day manage-ment for the technical team and provide a roll up of all issues, plans, andrequirements.
CuuDuongThanCong.com https://fb.com/tailieudientucntt

467
Project Statement of Work
Deliverables
Key Project Deliverables. Key deliverables from this project include:
• Statement of work• Risk assessment• Project change requests• Project requirements document• Design documents• Communication plan• Data security plan• Resource plan• Critical success factors document• Master test plan• Training plan• Implementation plan• Post-implementation review
Approvals. Approval of key project deliverables must be received fromthe individuals listed in Exhibit B-1. See Appendix B-1 for a signature sheet.
Acceptance Criteria
This project will be considered completed when the following accep-tance criteria have been met:
• Each system change has passed all levels of test successfully and isimplemented into production successfully.
• Delivered system functionality meets agreed-upon functionality• No undue fallout up to two weeks after implementation.
Assumptions
The following assumptions are made for this project:
1. Resources assumption — the key resource assumptions for labor,space, and equipment are:• Technical lead will be identified and assigned.• A test coordination leader is identified and assigned for <APPLI-
CATION NAME>.• Testing assumptions in general:
1. Test coordination with all affected applications will be man-aged by an assigned resource from testing. Other testingresources will be drawn from each of the applications.
2. Testing by all affected applications will be conducted at thespecified time established by release management for thisrelease.
• All business line resources are available to the overall project.• Project support resources are available to the overall project.
CuuDuongThanCong.com https://fb.com/tailieudientucntt
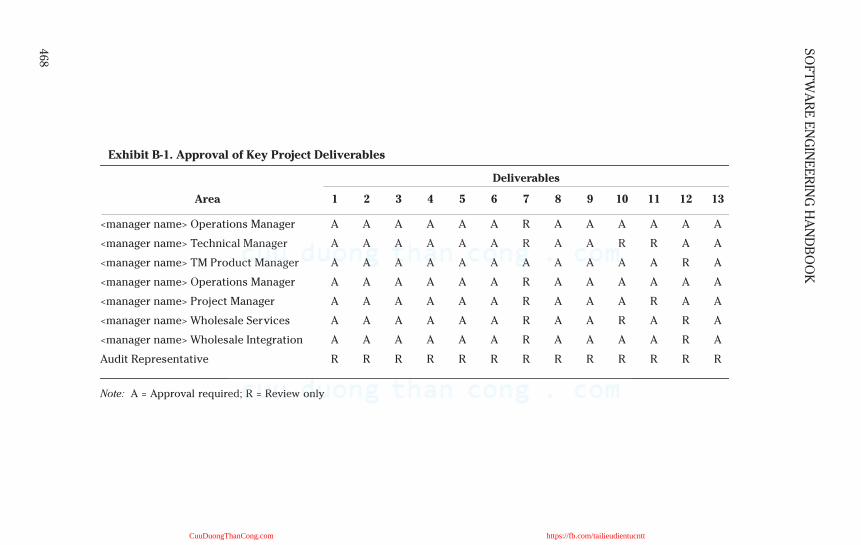
468
SO
FT
WA
RE
EN
GIN
EE
RIN
G H
AN
DB
OO
K
Exhibit B-1. Approval of Key Project Deliverables
Deliverables
Area 1 2 3 4 5 6 7 8 9 10 11 12 13
<manager name> Operations Manager A A A A A A R A A A A A A
<manager name> Technical Manager A A A A A A R A A R R A A
<manager name> TM Product Manager A A A A A A A A A A A R A
<manager name> Operations Manager A A A A A A R A A A A A A
<manager name> Project Manager A A A A A A R A A A R A A
<manager name> Wholesale Services A A A A A A R A A R A R A
<manager name> Wholesale Integration A A A A A A R A A A A R A
Audit Representative R R R R R R R R R R R R R
Note: A = Approval required; R = Review only
CuuDuongThanCong.com https://fb.com/tailieudientucntt
469
Project Statement of Work
2. Production support has the highest priority for resources. Other re-source issues will be addressed and prioritized at the steering com-mittee meeting level.
3. The Release ?? key dates will not be changed and various phases ofthe project will start and end on time.
Key Facts
Key facts identified for this project include the following:
• If the ?? requirement is not implemented with this release, we will con-tinue to lose revenue at the rate of approximately $?? a month.
• If the new statement paper and logo requirement are not implementedwith this release, <APPLICATION NAME> will continue to be out ofcompliance with enterprise standards.
• If <requirement> is not implemented with this release, there will bestaffing impacts to the operations group.
• All <APPLICATION NAME> and <application name> related changesmust be implemented concurrently.
• If <requirement> is not implemented, there will be customer and oper-ational impacts.
• If the file format changes are not made, there will be customerimpacts.
• If the <requirement> changes are not made, there will be customerimpact.
Issue Management
Project related issues will be tracked, prioritized, assigned, resolved,and communicated as follows:
• The project manager and participants will report issues that are iden-tified throughout the life of the project.
• The project manager will maintain a log of all issues and report on thestatus of issues.
• The project manager will assign the priority to and ownership of theissue. If necessary, the executive sponsors will assist the project man-ager in assigning appropriate ownership for resolution.
• Individual team members assigned to resolve the issue will be respon-sible for communicating the issue status to the project manager.
See Appendix B-5 for the issue log template.
Change Management
A change management procedure will be used by this project to helpensure that changes impacting the project are assessed, understood, andagreed upon by stakeholders before the change is made or before initiating
CuuDuongThanCong.com https://fb.com/tailieudientucntt
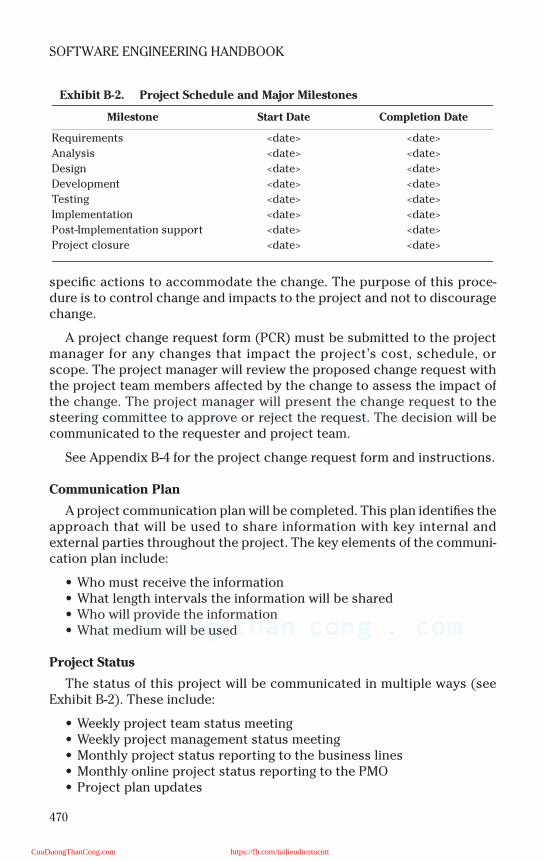
470
SOFTWARE ENGINEERING HANDBOOK
specific actions to accommodate the change. The purpose of this proce-dure is to control change and impacts to the project and not to discouragechange.
A project change request form (PCR) must be submitted to the projectmanager for any changes that impact the project’s cost, schedule, orscope. The project manager will review the proposed change request withthe project team members affected by the change to assess the impact ofthe change. The project manager will present the change request to thesteering committee to approve or reject the request. The decision will becommunicated to the requester and project team.
See Appendix B-4 for the project change request form and instructions.
Communication Plan
A project communication plan will be completed. This plan identifies theapproach that will be used to share information with key internal andexternal parties throughout the project. The key elements of the communi-cation plan include:
• Who must receive the information• What length intervals the information will be shared• Who will provide the information• What medium will be used
Project Status
The status of this project will be communicated in multiple ways (seeExhibit B-2). These include:
• Weekly project team status meeting• Weekly project management status meeting• Monthly project status reporting to the business lines• Monthly online project status reporting to the PMO• Project plan updates
Exhibit B-2. Project Schedule and Major Milestones
Milestone Start Date Completion Date
Requirements <date> <date>
Analysis <date> <date>
Design <date> <date>
Development <date> <date>
Testing <date> <date>
Implementation <date> <date>
Post-Implementation support <date> <date>
Project closure <date> <date>
CuuDuongThanCong.com https://fb.com/tailieudientucntt
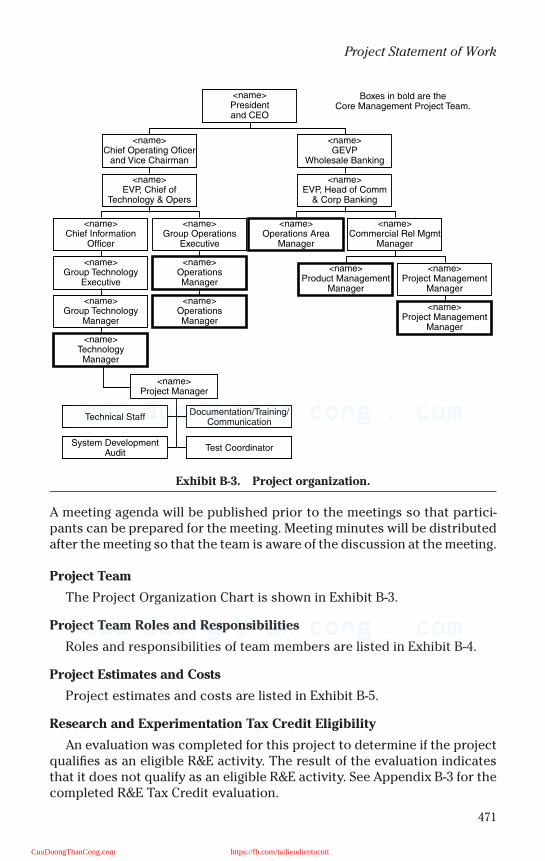
471
Project Statement of Work
A meeting agenda will be published prior to the meetings so that partici-pants can be prepared for the meeting. Meeting minutes will be distributedafter the meeting so that the team is aware of the discussion at the meeting.
Project Team
The Project Organization Chart is shown in Exhibit B-3.
Project Team Roles and Responsibilities
Roles and responsibilities of team members are listed in Exhibit B-4.
Project Estimates and Costs
Project estimates and costs are listed in Exhibit B-5.
Research and Experimentation Tax Credit Eligibility
An evaluation was completed for this project to determine if the projectqualifies as an eligible R&E activity. The result of the evaluation indicatesthat it does not qualify as an eligible R&E activity. See Appendix B-3 for thecompleted R&E Tax Credit evaluation.
Exhibit B-3. Project organization.
Boxes in bold are theCore Management Project Team.
<name>TechnologyManager
<name>Project Manager
<name>Group Technology
Manager
<name>Group Technology
Executive
<name>Chief Information
Officer
<name>OperationsManager
<name>OperationsManager
<name>Group Operations
Executive
<name>Product Management
Manager
<name>Operations Area
Manager
<name>EVP, Chief of
Technology & Opers
<name>EVP, Head of Comm
& Corp Banking
<name>Chief Operating Oficer
and Vice Chairman
<name>GEVP
Wholesale Banking
<name>Presidentand CEO
<name>Project Management
Manager
<name>Project Management
Manager
<name>Commercial Rel Mgmt
Manager
Documentation/Training/Communication
Technical Staff
Test CoordinatorSystem Development
Audit
CuuDuongThanCong.com https://fb.com/tailieudientucntt
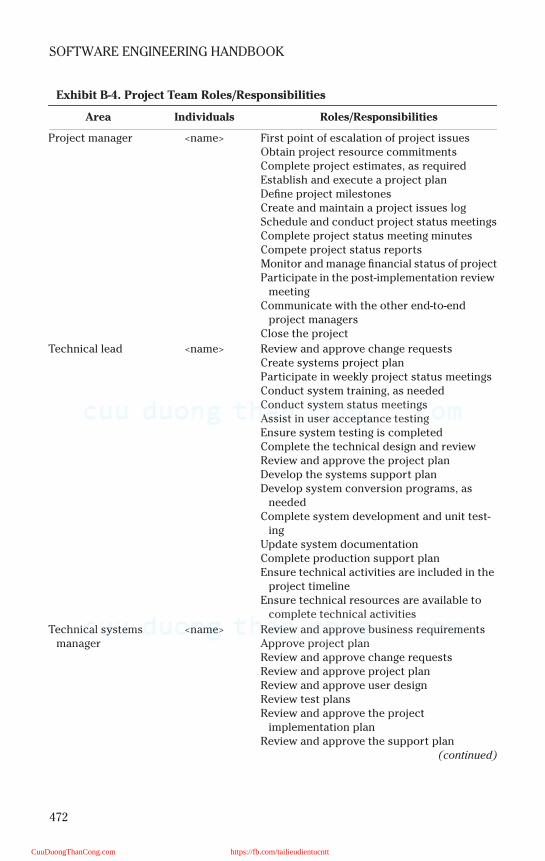
472
SOFTWARE ENGINEERING HANDBOOK
Exhibit B-4. Project Team Roles/Responsibilities
Area Individuals Roles/Responsibilities
Project manager <name> First point of escalation of project issuesObtain project resource commitmentsComplete project estimates, as requiredEstablish and execute a project planDefine project milestonesCreate and maintain a project issues logSchedule and conduct project status meetingsComplete project status meeting minutesCompete project status reportsMonitor and manage financial status of projectParticipate in the post-implementation review
meetingCommunicate with the other end-to-end
project managersClose the project
Technical lead <name> Review and approve change requestsCreate systems project planParticipate in weekly project status meetingsConduct system training, as neededConduct system status meetingsAssist in user acceptance testingEnsure system testing is completedComplete the technical design and reviewReview and approve the project planDevelop the systems support planDevelop system conversion programs, as
neededComplete system development and unit test-
ingUpdate system documentationComplete production support planEnsure technical activities are included in the
project timelineEnsure technical resources are available to
complete technical activities
Technical systems manager
<name> Review and approve business requirementsApprove project planReview and approve change requestsReview and approve project planReview and approve user designReview test plansReview and approve the project
implementation planReview and approve the support plan
(continued)
CuuDuongThanCong.com https://fb.com/tailieudientucntt
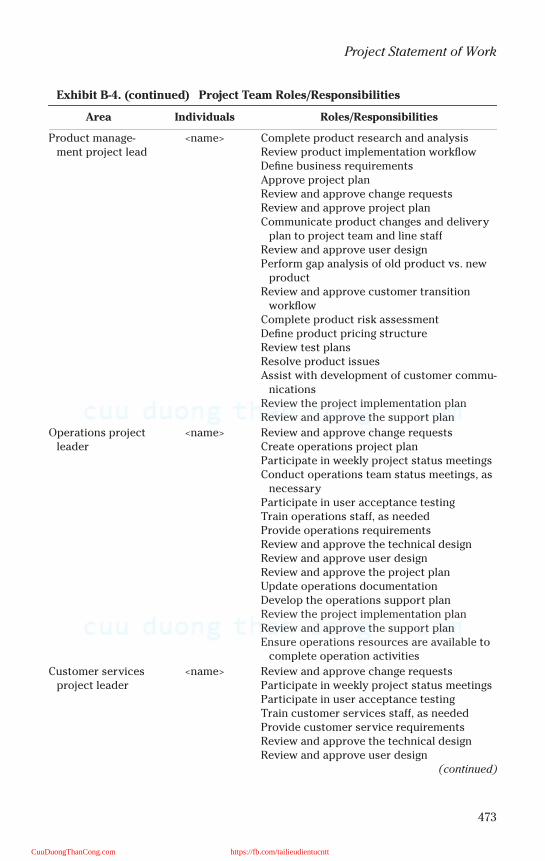
473
Project Statement of Work
Exhibit B-4. (continued) Project Team Roles/Responsibilities
Area Individuals Roles/Responsibilities
Product manage-ment project lead
<name> Complete product research and analysisReview product implementation workflowDefine business requirementsApprove project planReview and approve change requestsReview and approve project planCommunicate product changes and delivery
plan to project team and line staffReview and approve user designPerform gap analysis of old product vs. new
productReview and approve customer transition
workflowComplete product risk assessmentDefine product pricing structureReview test plansResolve product issuesAssist with development of customer commu-
nicationsReview the project implementation planReview and approve the support plan
Operations project leader
<name> Review and approve change requestsCreate operations project planParticipate in weekly project status meetingsConduct operations team status meetings, as
necessaryParticipate in user acceptance testingTrain operations staff, as neededProvide operations requirementsReview and approve the technical designReview and approve user designReview and approve the project planUpdate operations documentationDevelop the operations support planReview the project implementation planReview and approve the support planEnsure operations resources are available to
complete operation activities
Customer services project leader
<name> Review and approve change requestsParticipate in weekly project status meetingsParticipate in user acceptance testingTrain customer services staff, as neededProvide customer service requirementsReview and approve the technical designReview and approve user design
(continued)
CuuDuongThanCong.com https://fb.com/tailieudientucntt
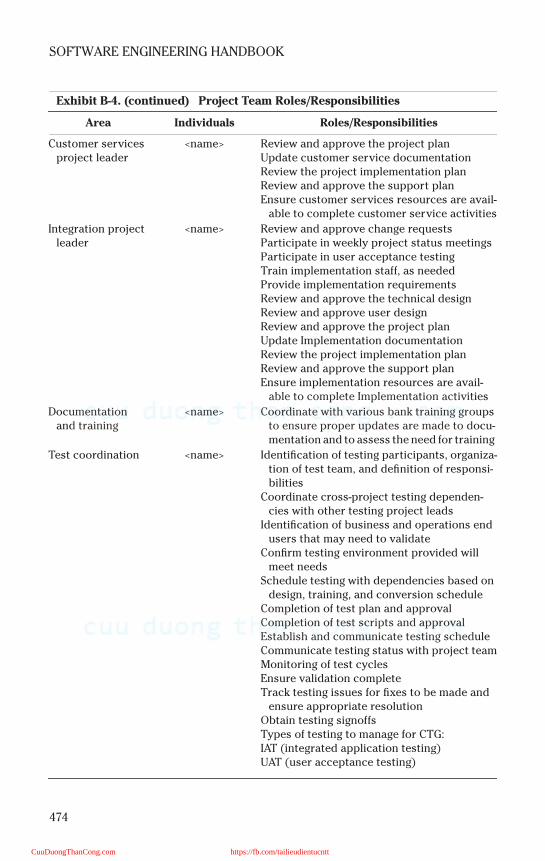
474
SOFTWARE ENGINEERING HANDBOOK
Exhibit B-4. (continued) Project Team Roles/Responsibilities
Area Individuals Roles/Responsibilities
Customer services project leader
<name> Review and approve the project planUpdate customer service documentationReview the project implementation planReview and approve the support planEnsure customer services resources are avail-
able to complete customer service activities
Integration project leader
<name> Review and approve change requestsParticipate in weekly project status meetingsParticipate in user acceptance testingTrain implementation staff, as neededProvide implementation requirementsReview and approve the technical designReview and approve user designReview and approve the project planUpdate Implementation documentationReview the project implementation planReview and approve the support planEnsure implementation resources are avail-
able to complete Implementation activities
Documentation and training
<name> Coordinate with various bank training groups to ensure proper updates are made to docu-mentation and to assess the need for training
Test coordination <name> Identification of testing participants, organiza-tion of test team, and definition of responsi-bilities
Coordinate cross-project testing dependen-cies with other testing project leads
Identification of business and operations end users that may need to validate
Confirm testing environment provided will meet needs
Schedule testing with dependencies based on design, training, and conversion schedule
Completion of test plan and approvalCompletion of test scripts and approvalEstablish and communicate testing scheduleCommunicate testing status with project teamMonitoring of test cyclesEnsure validation completeTrack testing issues for fixes to be made and
ensure appropriate resolutionObtain testing signoffsTypes of testing to manage for CTG:IAT (integrated application testing)UAT (user acceptance testing)
CuuDuongThanCong.com https://fb.com/tailieudientucntt
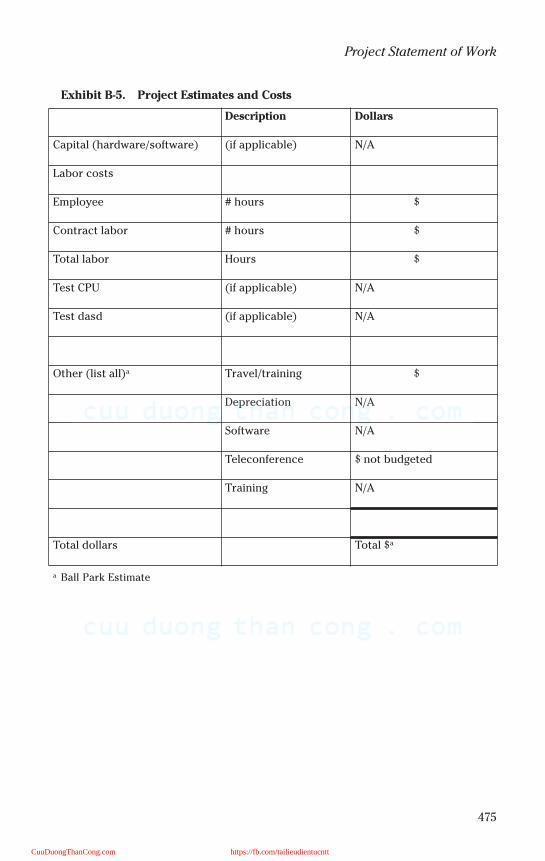
475
Project Statement of Work
Exhibit B-5. Project Estimates and Costs
Description Dollars
Capital (hardware/software) (if applicable) N/A
Labor costs
Employee # hours $
Contract labor # hours $
Total labor Hours $
Test CPU (if applicable) N/A
Test dasd (if applicable) N/A
Other (list all)a Travel/training $
Depreciation N/A
Software N/A
Teleconference $ not budgeted
Training N/A
Total dollars Total $a
a Ball Park Estimate
CuuDuongThanCong.com https://fb.com/tailieudientucntt

This page intentionally left blank
CuuDuongThanCong.com https://fb.com/tailieudientucntt
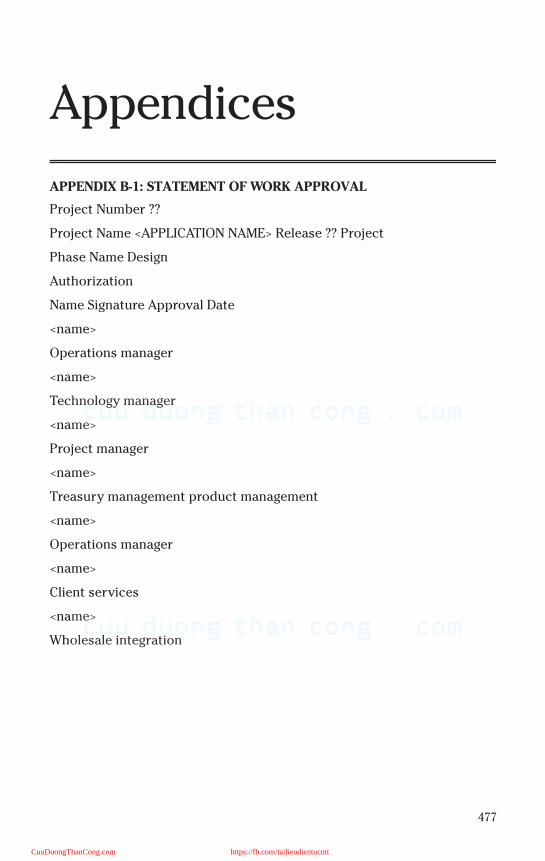
477
Appendices
APPENDIX B-1: STATEMENT OF WORK APPROVAL
Project Number ??
Project Name <APPLICATION NAME> Release ?? Project
Phase Name Design
Authorization
Name Signature Approval Date
<name>
Operations manager
<name>
Technology manager
<name>
Project manager
<name>
Treasury management product management
<name>
Operations manager
<name>
Client services
<name>
Wholesale integration
CuuDuongThanCong.com https://fb.com/tailieudientucntt
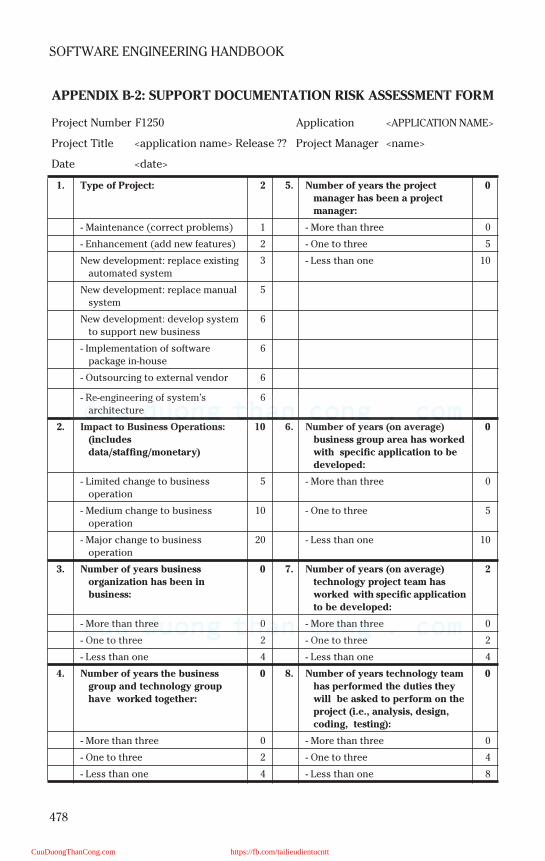
478
SOFTWARE ENGINEERING HANDBOOK
APPENDIX B-2: SUPPORT DOCUMENTATION RISK ASSESSMENT FORM
Project Number F1250 Application <APPLICATION NAME>
Project Title <application name> Release ?? Project Manager <name>
Date <date>
1. Type of Project: 2 5. Number of years the project manager has been a project manager:
0
- Maintenance (correct problems) 1 - More than three 0
- Enhancement (add new features) 2 - One to three 5
New development: replace existing
automated system
3 - Less than one 10
New development: replace manual
system
5
New development: develop system
to support new business
6
- Implementation of software
package in-house
6
- Outsourcing to external vendor 6
- Re-engineering of system’s
architecture
6
2. Impact to Business Operations: (includes data/staffing/monetary)
10 6. Number of years (on average) business group area has worked with specific application to be developed:
0
- Limited change to business
operation
5 - More than three 0
- Medium change to business
operation
10 - One to three 5
- Major change to business
operation
20 - Less than one 10
3. Number of years business organization has been in business:
0 7. Number of years (on average) technology project team has worked with specific application to be developed:
2
- More than three 0 - More than three 0
- One to three 2 - One to three 2
- Less than one 4 - Less than one 4
4. Number of years the business group and technology group have worked together:
0 8. Number of years technology team has performed the duties they will be asked to perform on the project (i.e., analysis, design, coding, testing):
0
- More than three 0 - More than three 0
- One to three 2 - One to three 4
- Less than one 4 - Less than one 8
CuuDuongThanCong.com https://fb.com/tailieudientucntt
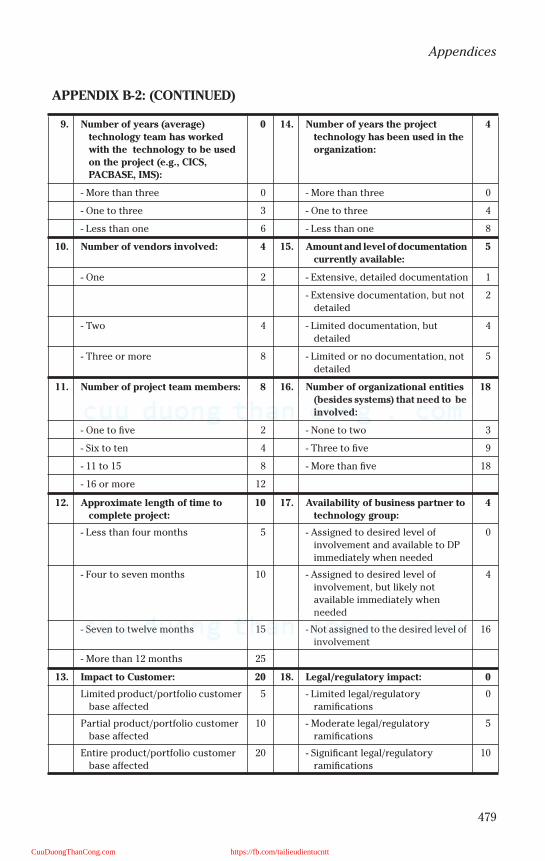
479
Appendices
APPENDIX B-2: (CONTINUED)
9. Number of years (average) technology team has worked with the technology to be used on the project (e.g., CICS, PACBASE, IMS):
0 14. Number of years the project technology has been used in the organization:
4
- More than three 0 - More than three 0
- One to three 3 - One to three 4
- Less than one 6 - Less than one 8
10. Number of vendors involved: 4 15. Amount and level of documentation currently available:
5
- One 2 - Extensive, detailed documentation 1
- Extensive documentation, but not
detailed
2
- Two 4 - Limited documentation, but
detailed
4
- Three or more 8 - Limited or no documentation, not
detailed
5
11. Number of project team members: 8 16. Number of organizational entities (besides systems) that need to be involved:
18
- One to five 2 - None to two 3
- Six to ten 4 - Three to five 9
- 11 to 15 8 - More than five 18
- 16 or more 12
12. Approximate length of time to complete project:
10 17. Availability of business partner to technology group:
4
- Less than four months 5 - Assigned to desired level of
involvement and available to DP
immediately when needed
0
- Four to seven months 10 - Assigned to desired level of
involvement, but likely not
available immediately when
needed
4
- Seven to twelve months 15 - Not assigned to the desired level of
involvement
16
- More than 12 months 25
13. Impact to Customer: 20 18. Legal/regulatory impact: 0
Limited product/portfolio customer
base affected
5 - Limited legal/regulatory
ramifications
0
Partial product/portfolio customer
base affected
10 - Moderate legal/regulatory
ramifications
5
Entire product/portfolio customer
base affected
20 - Significant legal/regulatory
ramifications
10
CuuDuongThanCong.com https://fb.com/tailieudientucntt
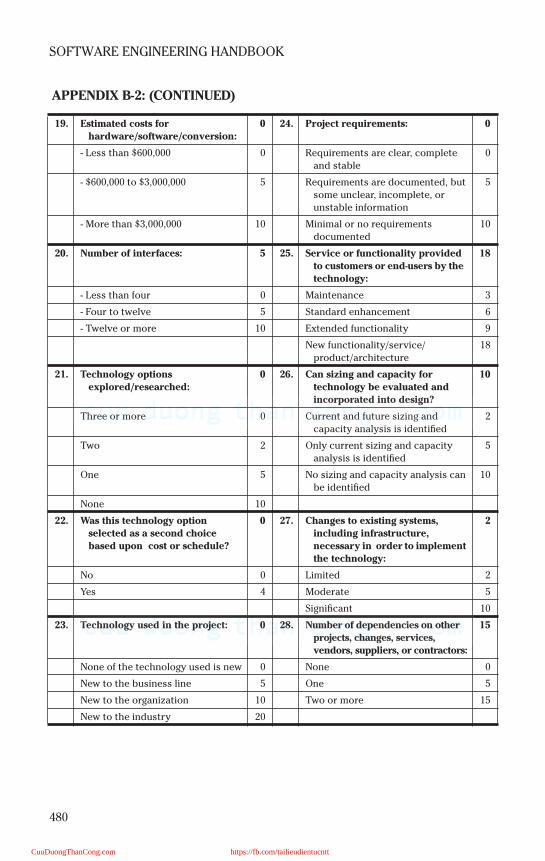
480
SOFTWARE ENGINEERING HANDBOOK
APPENDIX B-2: (CONTINUED)
19. Estimated costs for hardware/software/conversion:
0 24. Project requirements: 0
- Less than $600,000 0 Requirements are clear, complete
and stable
0
- $600,000 to $3,000,000 5 Requirements are documented, but
some unclear, incomplete, or
unstable information
5
- More than $3,000,000 10 Minimal or no requirements
documented
10
20. Number of interfaces: 5 25. Service or functionality provided to customers or end-users by the technology:
18
- Less than four 0 Maintenance 3
- Four to twelve 5 Standard enhancement 6
- Twelve or more 10 Extended functionality 9
New functionality/service/
product/architecture
18
21. Technology options explored/researched:
0 26. Can sizing and capacity for technology be evaluated and incorporated into design?
10
Three or more 0 Current and future sizing and
capacity analysis is identified
2
Two 2 Only current sizing and capacity
analysis is identified
5
One 5 No sizing and capacity analysis can
be identified
10
None 10
22. Was this technology option selected as a second choice based upon cost or schedule?
0 27. Changes to existing systems, including infrastructure, necessary in order to implement the technology:
2
No 0 Limited 2
Yes 4 Moderate 5
Significant 10
23. Technology used in the project: 0 28. Number of dependencies on other projects, changes, services, vendors, suppliers, or contractors:
15
None of the technology used is new 0 None 0
New to the business line 5 One 5
New to the organization 10 Two or more 15
New to the industry 20
CuuDuongThanCong.com https://fb.com/tailieudientucntt
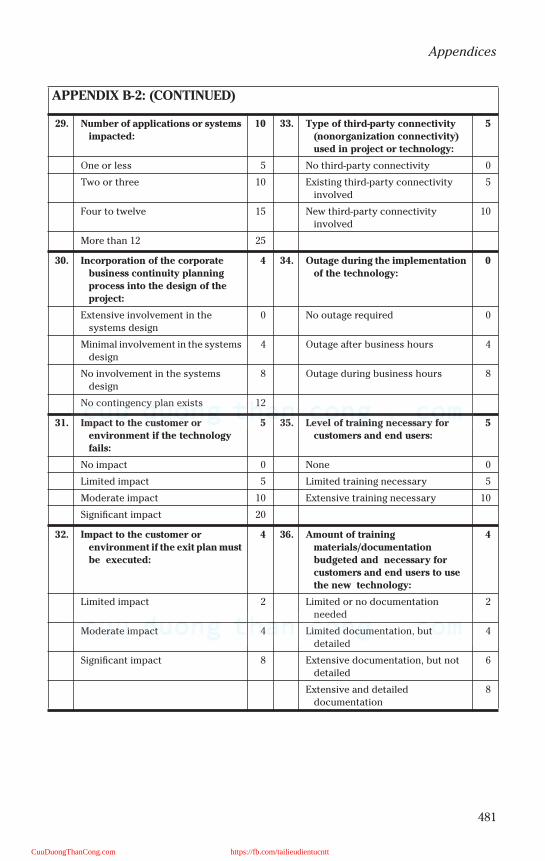
481
Appendices
APPENDIX B-2: (CONTINUED)
29. Number of applications or systems impacted:
10 33. Type of third-party connectivity (nonorganization connectivity) used in project or technology:
5
One or less 5 No third-party connectivity 0
Two or three 10 Existing third-party connectivity
involved
5
Four to twelve 15 New third-party connectivity
involved
10
More than 12 25
30. Incorporation of the corporate business continuity planning process into the design of the project:
4 34. Outage during the implementation of the technology:
0
Extensive involvement in the
systems design
0 No outage required 0
Minimal involvement in the systems
design
4 Outage after business hours 4
No involvement in the systems
design
8 Outage during business hours 8
No contingency plan exists 12
31. Impact to the customer or environment if the technology fails:
5 35. Level of training necessary for customers and end users:
5
No impact 0 None 0
Limited impact 5 Limited training necessary 5
Moderate impact 10 Extensive training necessary 10
Significant impact 20
32. Impact to the customer or environment if the exit plan must be executed:
4 36. Amount of training materials/documentation budgeted and necessary for customers and end users to use the new technology:
4
Limited impact 2 Limited or no documentation
needed
2
Moderate impact 4 Limited documentation, but
detailed
4
Significant impact 8 Extensive documentation, but not
detailed
6
Extensive and detailed
documentation
8
CuuDuongThanCong.com https://fb.com/tailieudientucntt
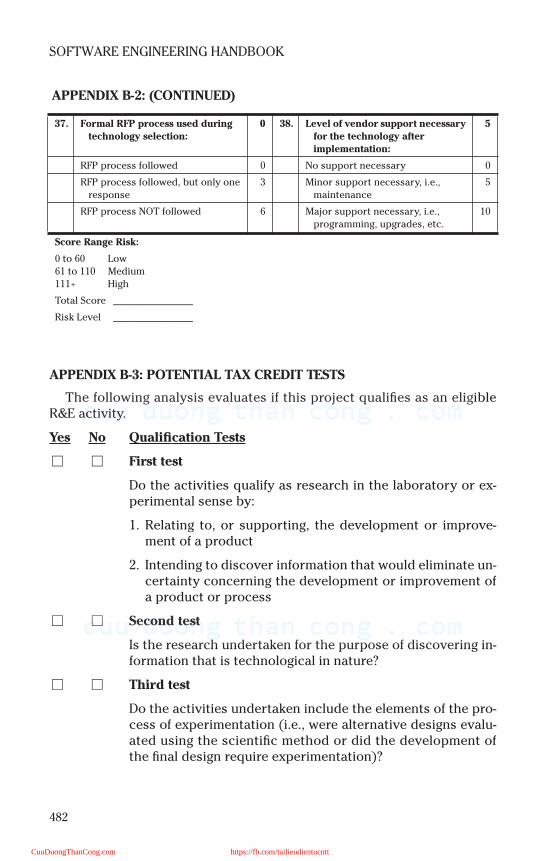
482
SOFTWARE ENGINEERING HANDBOOK
APPENDIX B-3: POTENTIAL TAX CREDIT TESTS
The following analysis evaluates if this project qualifies as an eligibleR&E activity.
Yes No Qualification Tests
First test
Do the activities qualify as research in the laboratory or ex-perimental sense by:
1. Relating to, or supporting, the development or improve-ment of a product
2. Intending to discover information that would eliminate un-certainty concerning the development or improvement ofa product or process
Second test
Is the research undertaken for the purpose of discovering in-formation that is technological in nature?
Third test
Do the activities undertaken include the elements of the pro-cess of experimentation (i.e., were alternative designs evalu-ated using the scientific method or did the development ofthe final design require experimentation)?
APPENDIX B-2: (CONTINUED)
37. Formal RFP process used during technology selection:
0 38. Level of vendor support necessary for the technology after implementation:
5
RFP process followed 0 No support necessary 0
RFP process followed, but only one
response
3 Minor support necessary, i.e.,
maintenance
5
RFP process NOT followed 6 Major support necessary, i.e.,
programming, upgrades, etc.
10
Score Range Risk:
0 to 60 Low
61 to 110 Medium
111+ High
Total Score ________________
Risk Level ________________
CuuDuongThanCong.com https://fb.com/tailieudientucntt
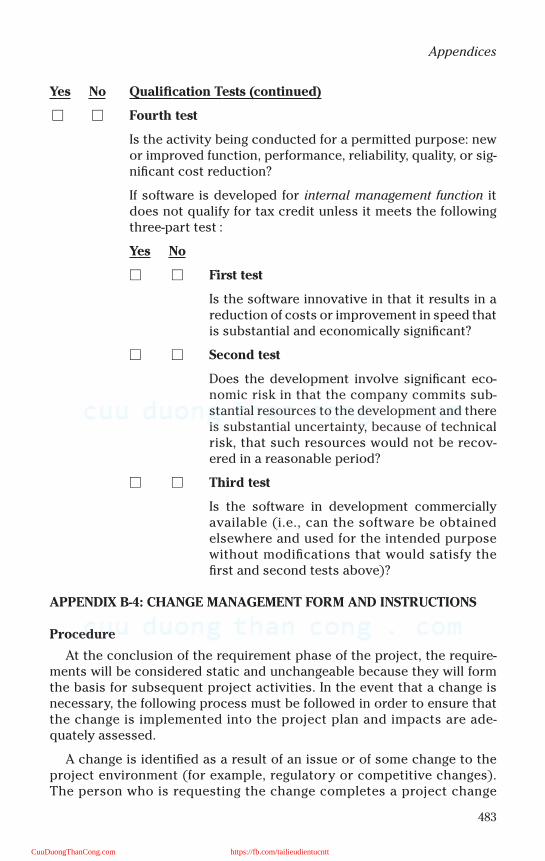
483
Appendices
Yes No Qualification Tests (continued)
Fourth test
Is the activity being conducted for a permitted purpose: newor improved function, performance, reliability, quality, or sig-nificant cost reduction?
If software is developed for internal management function itdoes not qualify for tax credit unless it meets the followingthree-part test :
Yes No
First test
Is the software innovative in that it results in areduction of costs or improvement in speed thatis substantial and economically significant?
Second test
Does the development involve significant eco-nomic risk in that the company commits sub-stantial resources to the development and thereis substantial uncertainty, because of technicalrisk, that such resources would not be recov-ered in a reasonable period?
Third test
Is the software in development commerciallyavailable (i.e., can the software be obtainedelsewhere and used for the intended purposewithout modifications that would satisfy thefirst and second tests above)?
APPENDIX B-4: CHANGE MANAGEMENT FORM AND INSTRUCTIONS
Procedure
At the conclusion of the requirement phase of the project, the require-ments will be considered static and unchangeable because they will formthe basis for subsequent project activities. In the event that a change isnecessary, the following process must be followed in order to ensure thatthe change is implemented into the project plan and impacts are ade-quately assessed.
A change is identified as a result of an issue or of some change to theproject environment (for example, regulatory or competitive changes).The person who is requesting the change completes a project change
CuuDuongThanCong.com https://fb.com/tailieudientucntt
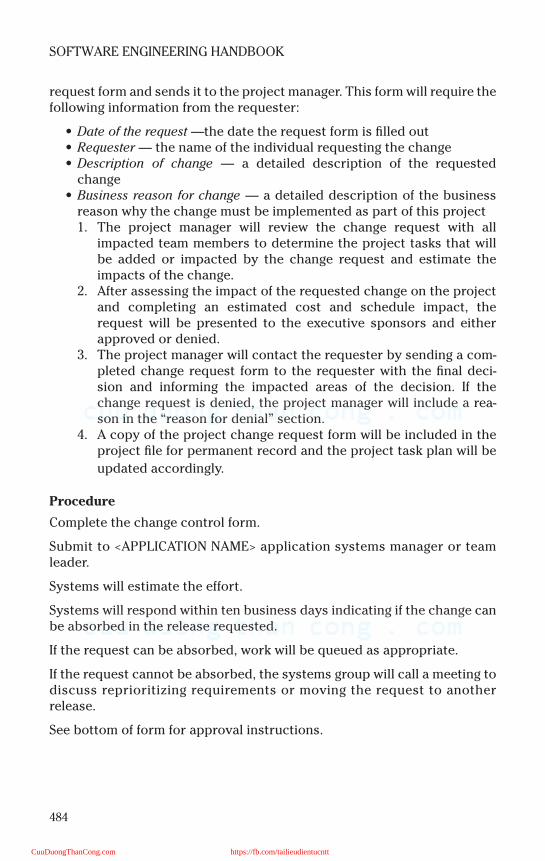
484
SOFTWARE ENGINEERING HANDBOOK
request form and sends it to the project manager. This form will require thefollowing information from the requester:
• Date of the request —the date the request form is filled out• Requester — the name of the individual requesting the change• Description of change — a detailed description of the requested
change• Business reason for change — a detailed description of the business
reason why the change must be implemented as part of this project1. The project manager will review the change request with all
impacted team members to determine the project tasks that willbe added or impacted by the change request and estimate theimpacts of the change.
2. After assessing the impact of the requested change on the projectand completing an estimated cost and schedule impact, therequest will be presented to the executive sponsors and eitherapproved or denied.
3. The project manager will contact the requester by sending a com-pleted change request form to the requester with the final deci-sion and informing the impacted areas of the decision. If thechange request is denied, the project manager will include a rea-son in the “reason for denial” section.
4. A copy of the project change request form will be included in theproject file for permanent record and the project task plan will be
updated accordingly.
Procedure
Complete the change control form.
Submit to <APPLICATION NAME> application systems manager or teamleader.
Systems will estimate the effort.
Systems will respond within ten business days indicating if the change canbe absorbed in the release requested.
If the request can be absorbed, work will be queued as appropriate.
If the request cannot be absorbed, the systems group will call a meeting todiscuss reprioritizing requirements or moving the request to anotherrelease.
See bottom of form for approval instructions.
CuuDuongThanCong.com https://fb.com/tailieudientucntt
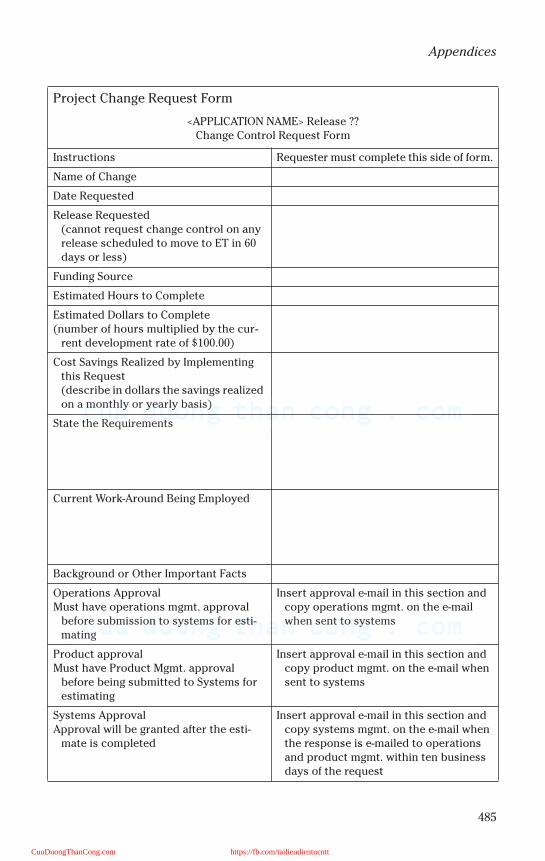
485
Appendices
Project Change Request Form
<APPLICATION NAME> Release ??Change Control Request Form
Instructions Requester must complete this side of form.
Name of Change
Date Requested
Release Requested(cannot request change control on any release scheduled to move to ET in 60 days or less)
Funding Source
Estimated Hours to Complete
Estimated Dollars to Complete(number of hours multiplied by the cur-
rent development rate of $100.00)
Cost Savings Realized by Implementing this Request(describe in dollars the savings realized on a monthly or yearly basis)
State the Requirements
Current Work-Around Being Employed
Background or Other Important Facts
Operations ApprovalMust have operations mgmt. approval
before submission to systems for esti-mating
Insert approval e-mail in this section and copy operations mgmt. on the e-mail when sent to systems
Product approvalMust have Product Mgmt. approval
before being submitted to Systems for estimating
Insert approval e-mail in this section and copy product mgmt. on the e-mail when sent to systems
Systems ApprovalApproval will be granted after the esti-
mate is completed
Insert approval e-mail in this section and copy systems mgmt. on the e-mail when the response is e-mailed to operations and product mgmt. within ten business days of the request
CuuDuongThanCong.com https://fb.com/tailieudientucntt
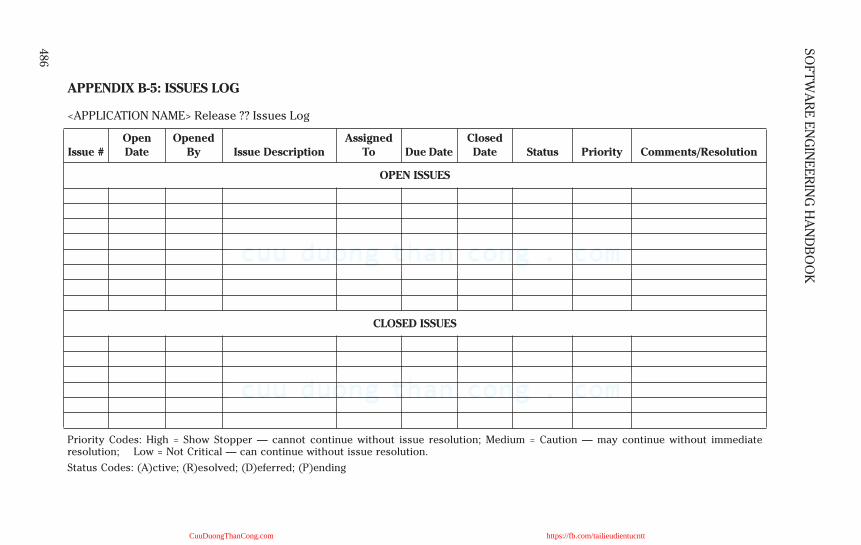
486
SO
FT
WA
RE
EN
GIN
EE
RIN
G H
AN
DB
OO
K
APPENDIX B-5: ISSUES LOG
<APPLICATION NAME> Release ?? Issues Log
Issue #Open Date
Opened By Issue Description
Assigned To Due Date
Closed Date Status Priority Comments/Resolution
OPEN ISSUES
CLOSED ISSUES
Priority Codes: High = Show Stopper — cannot continue without issue resolution; Medium = Caution — may continue without immediateresolution; Low = Not Critical — can continue without issue resolution.
Status Codes: (A)ctive; (R)esolved; (D)eferred; (P)ending
CuuDuongThanCong.com https://fb.com/tailieudientucntt
487
Appendices
APPENDIX B-6: LIST OF REQUIREMENTS SCHEDULED FOR RELEASE ??
<APPLICATION NAME> New File Format
New File Format
New <APPLICATION NAME> Stmt Paper and Logo
CuuDuongThanCong.com https://fb.com/tailieudientucntt

This page intentionally left blank
CuuDuongThanCong.com https://fb.com/tailieudientucntt
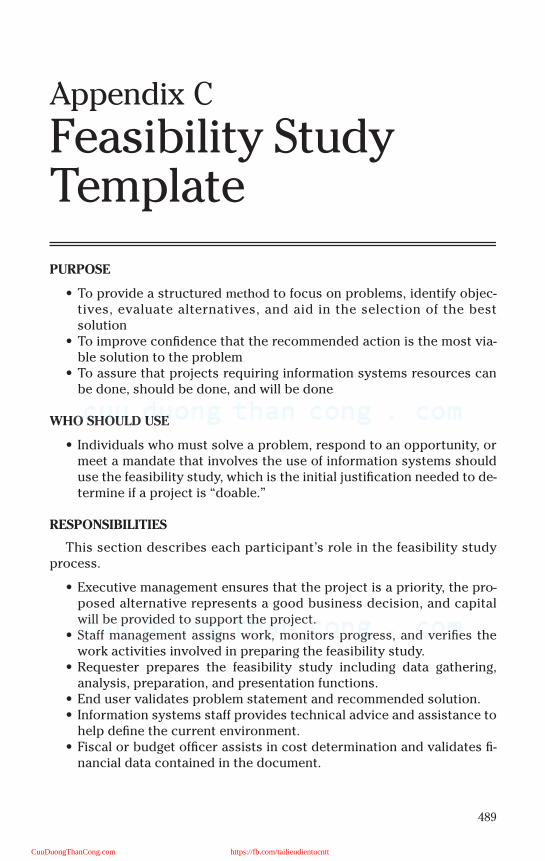
489
Appendix C
Feasibility Study Template
PURPOSE
• To provide a structured method to focus on problems, identify objec-tives, evaluate alternatives, and aid in the selection of the bestsolution
• To improve confidence that the recommended action is the most via-ble solution to the problem
• To assure that projects requiring information systems resources canbe done, should be done, and will be done
WHO SHOULD USE
• Individuals who must solve a problem, respond to an opportunity, ormeet a mandate that involves the use of information systems shoulduse the feasibility study, which is the initial justification needed to de-termine if a project is “doable.”
RESPONSIBILITIES
This section describes each participant’s role in the feasibility studyprocess.
• Executive management ensures that the project is a priority, the pro-posed alternative represents a good business decision, and capitalwill be provided to support the project.
• Staff management assigns work, monitors progress, and verifies thework activities involved in preparing the feasibility study.
• Requester prepares the feasibility study including data gathering,analysis, preparation, and presentation functions.
• End user validates problem statement and recommended solution.• Information systems staff provides technical advice and assistance to
help define the current environment.• Fiscal or budget officer assists in cost determination and validates fi-
nancial data contained in the document.
CuuDuongThanCong.com https://fb.com/tailieudientucntt
490
SOFTWARE ENGINEERING HANDBOOK
DEFINITION
• A feasibility study is a controlled process for identifying problems,opportunities, or mandates, determining objectives, describing cur-rent situations and successful outcomes, and assessing the range ofcosts and benefits associated with several alternatives for solving aproblem.
OUTLINE FOR PREPARING A FEASIBILITY STUDY
• Part 1: describe problem • Part 2: identify success factors• Part 3: describe current situation• Part 4: consider approaches• Part 5: prepare solution analysis• Part 6: prepare implementation schedule• Part 7: obtain management approval• Part 8: prepare supporting documentation
The amount of detail will vary. Some feasibility studies may be one to twopages, others may run considerably longer. Length and detail of the studyshould be commensurate with the complexity and novelty of the effort.
PART 1: DESCRIBE PROBLEM
As answers depend upon the questions asked, so do solutions dependupon the problem statement. Otherwise, you will not know if the solutionis an appropriate and adequate way to fix the problem. Your job here is towrite a concise statement of the problem to be solved, opportunity avail-able to you, or mandate to which you must respond.
Task 1: Describe the Problem, Opportunity, or Mandate
Step 1: Identify the Problem, Opportunity, or Mandate• Problems adversely affect clients or members within your organi-
zation. Do you have a problem that should be resolved?• Opportunities are potentially favorable — other departments
with which you work or circumstances that may allow yourdepartment to operate more effectively or efficiently. Is an oppor-tunity available to your department that could be realized?
• Mandates are statutory or managerial requirements of yourdepartment to do something new or different. Are you faced witha task that must be done?
Step 2: Describe the Problem• Try to keep your description to one paragraph. It should discuss
what you are unable to do now, not what you want to do (ends)or how you want to do it (means).
CuuDuongThanCong.com https://fb.com/tailieudientucntt
491
Feasibility Study Template
Task 2: Support Your Statement
Step 1: Explain who or what prompted your department into actionon the subject. Try to keep your description to one paragraph.
Step 2: List affected parties. Explain briefly how the following are af-fected or what they are currently unable to do:• Clients your department serves• Other departments with which you work• Groups or individuals inside your department
Task 3: Validate the Statement
Step 1: Test the statement — verify that your description is not asymptom, solution, or someone else’s problem.
Step 2: Critique for accuracy — ask several affected parties to critiquethe problem statement for accuracy, completeness, and authenticity.
Step 3: Amend if necessary.Step 4: Obtain concurrence — if you identified someone in task 2,
step 1, as initiating the study, obtain concurrence that your state-ment is accurate
PART 2: IDENTIFY SUCCESS FACTORS
Your job in this part of the study is to determine what results must beachieved to satisfy the problem defined in part 1. Also, identify items thatwould contribute to the success of your project.
Task 1: Write a Scenario for Success
You cannot see the future, but visualizing the way things should be canbe a step in making things come true. Some techniques you may find usefulin determining desired outcomes are:
Step 1: Assemble a think tank —a small group of your staff who areknowledgeable of the project.
Step 2: Time travel — have the group pick a time in the future thatwould be appropriate to assess the project’s positive performancein solving the problem. Probably six to twelve months would be ap-propriate in most cases.
Step 3: List players — include affected parties identified in part 1along with the individuals and groups who will be responsible forthis project.
Step 4: Describe success in functional terms — satisfaction from newproducts, services, or capabilities; limitations of time or money; re-solved issues or mandates; existing policy or operations consider-ations; performance characteristics such as reliability or ease ofuse; or any other factors that would be important to the affected
CuuDuongThanCong.com https://fb.com/tailieudientucntt

492
SOFTWARE ENGINEERING HANDBOOK
parties identified in part 1 or the individuals and groups responsiblefor the project.:• Example: The group leader starts out with, “Imagine that it is one
year from now — our boss is elated and congratulates everyonefor fixing our problem.” The group leader then asks everyone,‘What results caused the boss to say this?” Under the title“BOSS,” list each item. Add a new category, “SELF.” What shouldhappen in the next year to make YOU feel that excitement fromsuccess?
Step 5: Consolidate the requirements and develop success factors.Review the requirements of each group for common themes. Devel-op a list of outcomes that must occur (success factors) to satisfy allthe requirements.
Task 2: Rank and Evaluate The Key Success Factors
Step 1: Rank the success factors. List the factors from most to leastimportant.
Step 2: Evaluate the factors. Underline the success factors that abso-lutely must get done to distinguish from those that could be done.
Task 3: Set Objectives
Ask yourself who needs to do what by when to accomplish the priori-tized list of success factors.
Task 4: Validate the Objectives
Start with the first item on the list of success factors. Describe:
• What must be done?• Who will be responsible?• When must it be completed?
Repeat the process for each success factor.
Step 1: Achievable and doable? Are the objectives achievable and willyou know when they have been accomplished?
Step 2: Acceptable? Will the affected parties concur that meetingthese objectives will allow them to do what they were unable to doto in an acceptable time frame?
Step 3: Harmonious? Are the objectives logical? Do they work towardthe same end or do they contradict each other?
Step 4: Capable? Is each individual capable of achieving the objec-tives assigned?
CuuDuongThanCong.com https://fb.com/tailieudientucntt

493
Feasibility Study Template
Step 5: Say yes! If you say yes to the preceding steps — good job!• Examples of objective statements:
— By May, 2003, DMV’s project manager, Otto Mobile, will re-duce the citizen’s average waiting time at DMV offices toless than five minutes.
— By December, 2004, without increasing personnel, Ida Fixitof the license section will use an online licensing system tocertify 3000 automobile mechanics.
PART 3: DESCRIBE CURRENT SITUATION
Providing a “snapshot” of your organization allows others to understandyour environment. Things that may appear obvious to you may not beobvious to others (even in your work group). Documenting the importantfeatures of your organization, work processes, products, and clients willbring the pieces together in an understandable format. Your job in this partof the study is to identify how things are done now and what resources areavailable.
Task 1: Describe How Things Are Done Currently
Step 1: Describe your organization. Briefly explain the structure andpurpose. For example, 30 employees conduct environmental studiesrequired for project approvals. They are organized in four workgroups: the administration unit has five employees, including thesection manager…
Step 2: Explain the purpose of each group. Support the descriptionused in step 1.• For example, the administration unit is responsible for personnel,
budget, policy, and clerical support…Step 3: Describe the information flow. Include the data’s source, des-
tination, method of filing (manual and automated), and frequency.(Often a flow diagram is useful for this step.)
Step 4: Develop your assessment. Identify strengths and weaknessesof the system. Give it an overall grade.
Task 2: List Existing Resources
Step 1: People: in task 1 you described the organizational structure,purpose, and business functions. In this step identify their skills andavailability.
Step 2: Tools: list what types of mechanical and electronic tools areavailable (in terms of access and capacity) and how they are used.This step primarily will describe your existing automation and uses.Include what systems you need to access outside your organization.
CuuDuongThanCong.com https://fb.com/tailieudientucntt
494
SOFTWARE ENGINEERING HANDBOOK
Step 3: Funds: identify how much money is available and whether it isfrom general fund, department revenue, federal, grant, or othersources.
PART 4: CONSIDER APPROACHES
Chance dictates the future when you do not have information aboutyour choices. During a feasibility study, chance and doubt are replacedwith control and confidence. You will know what is in each box and canmake an informed choice. Your job in this part is to list practicalapproaches, describe them in a consistent format, and select the bestalternative. For comparison, always include retaining the current systemfor a baseline.
Task 1: Identify Approaches
Step 1: List the approaches that merit consideration. Approaches youwill want to consider include:• Retaining the current system• Reorganizing• Expanded manual operations• Modifying the current system• Adding new or expanding automation
Complete tasks 2 through 5 for each approach.
Task 2: Determine Life Cycle
Step 1: Determine life cycle. How many years do you expect to use thesystem that you select for solving the problem?
Task 3: Estimate Costs
Step 1: New costs: estimate the cost of new resources required to de-velop and operate the project for this approach. Quantify these val-ues in categories of personal services, services and supplies, andcapital investment through the project life cycle.
Step 2: Use of existing resources: estimate the amount of existing re-sources required to develop and operate the project with this ap-proach. List the people and the hours required throughout theproject life cycle.
Step 3: Describe adverse impacts: describe any adverse environmen-tal, organizational, or procedural impacts from this approach.
CuuDuongThanCong.com https://fb.com/tailieudientucntt
495
Feasibility Study Template
Task 4: Estimate Benefits
Step 1: Tangible: identify anticipated benefits in three categories:• Cost savings: estimate anticipated dollar savings in categories of
cost reduction, new revenue, or reimbursements tied directly tothis method throughout the life cycle.
• Staff time to be gained: list people or positions and estimate thestaff time to be gained throughout the project life cycle.
• New products or services: describe what they are and list therecipients.
Step 2: Intangible: describe any new potential, increased control, orother advantages that would come from this approach (i.e., im-proved worker morale).
Task 5: Evaluation
Step 1: Assessment: rate each approach for its ability to solve yourproblem and meet your success factors.
Step 2: Special consideration: are any assumptions, conditions, factors,variables, or practices for or against one or more of the approaches?
Task 6: Select Approach
Step 1: Reduce your list of approaches to a manageable number. If youhave more than three, eliminate any that are too costly or obviouslyunacceptable. Provide justification for deciding to eliminate them.
Step 2: Compare the costs and benefits. Use the project life cycle tocalculate the net difference of new costs to develop and operate ver-sus anticipated dollars to recover and staff time required versus an-ticipated hours to be gained. Compare these figures and yourassessments of the adverse and beneficial aspects of each approach.
Step 3: Recommend approach: select the approach you believe is bestfor your department.
Step 4: Give reasons: discuss the significant reasons for your choiceof this option.
PART 5: PROVIDE SOLUTION ANALYSIS
TASK 1: IMPACT ANALYSIS
Step 1: Describe impacts of recommended approach. Your reviewshould include any changes or new requirements for the following:• Training• Modifications to space and facilities
CuuDuongThanCong.com https://fb.com/tailieudientucntt
496
SOFTWARE ENGINEERING HANDBOOK
• Staffing effects (+ or –)• Changes in procedures• Changes in forms• Impacts to manual or automated systems• Individual resistance to change• Organizational changes• Security• Procurement requirements
PART 6: PROVIDE IMPLEMENTATION SCHEDULE
Your job in this part is to identify critical implementation elements andestablish reporting milestones.
Task 1: Plan
Step 1: Identify activities. List the major tasks. Include checkpointsfor review and approval. Consider tasks relating to procurement, in-stallation, and commissioning.
Step 2: Add logic. Rank the tasks in the order they must be performed.A diagram is useful for more complex plans.
Step 3: Assign resources. Identify who is responsible for completingeach task.
Task 2: Schedule
Step 1: Estimate the duration. Determine if hours, days, weeks, ormonths are the appropriate time unit. Estimate a duration for eachactivity. Milestones will not have duration.
Step 2: Schedule the activity. Review the logic and duration of each ac-tivity against your target completion and the availability of each re-source. Assign forecasts for activity starts and compilation.(Computer-assisted project management tools may be useful forcomplex schedules.)
For further assistance see project management guideline.
PART 7: OBTAIN MANAGEMENT APPROVAL
Your job in this part is to obtain key players’ endorsement and yourmanagement’s approval.
Task 1: Endorsement
Review your findings with end users, the data processing manager, keyprogram managers, department budget analyst, and the departmentadministrator to verify they agree with your recommendation. An exampleof a formal authorization is shown below.
CuuDuongThanCong.com https://fb.com/tailieudientucntt
497
Feasibility Study Template
Task 2: Obtain Formal Authorization
We have read through this feasibility study and concur with its recom-mendations. We believe this project can be done, should be done, and willbe done.
CuuDuongThanCong.com https://fb.com/tailieudientucntt

This page intentionally left blank
CuuDuongThanCong.com https://fb.com/tailieudientucntt
499
Appendix D
Sample Cost/Benefit Analysis Worksheets
CuuDuongThanCong.com https://fb.com/tailieudientucntt

500
SO
FT
WA
RE
EN
GIN
EE
RIN
G H
AN
DB
OO
KCost/Benefit Study
Form 1: Developmental CostsProject Name: Division:Alternative:Date: Prepared by:
CATEGORIESFiscal Year
Fiscal Year
Fiscal Year
Fiscal Year
Fiscal Year
TOTAL (Years)
1 2 3 4 5 6
PERSONAL SERVICES
New Personnel $0
Benefits Package (O.P.E) $0
Other (Specify) $0
Subtotal $0 $0 $0 $0 $0 $0
SERVICES & SUPPLIESTraining and Education $0
Travel and Lodging $0
Outside Professional Services $0
Supplies $0
Maintenance $0
Billable Computing Services $0
Equipment and Software $0
Telecommunications $0
Facility $0
Utilities $0
Other (Specify) $0
$0
$0
Subtotal $0 $0 $0 $0 $0 $0
CuuDuongThanCong.com https://fb.com/tailieudientucntt
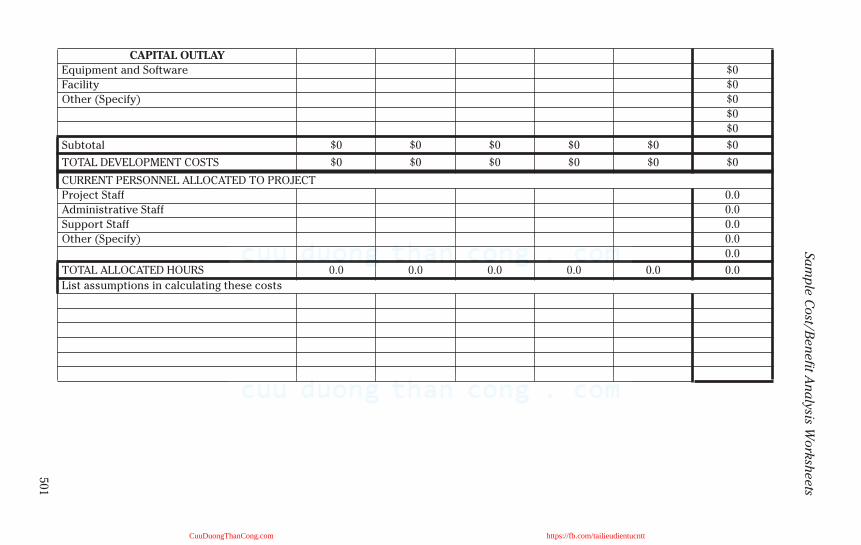
501
Sa
mp
le C
ost/B
en
efit A
na
lysis Work
sheets
CAPITAL OUTLAY
Equipment and Software $0
Facility $0
Other (Specify) $0
$0
$0
Subtotal $0 $0 $0 $0 $0 $0
TOTAL DEVELOPMENT COSTS $0 $0 $0 $0 $0 $0
CURRENT PERSONNEL ALLOCATED TO PROJECT
Project Staff 0.0
Administrative Staff 0.0
Support Staff 0.0
Other (Specify) 0.0
0.0
TOTAL ALLOCATED HOURS 0.0 0.0 0.0 0.0 0.0 0.0
List assumptions in calculating these costs
CuuDuongThanCong.com https://fb.com/tailieudientucntt
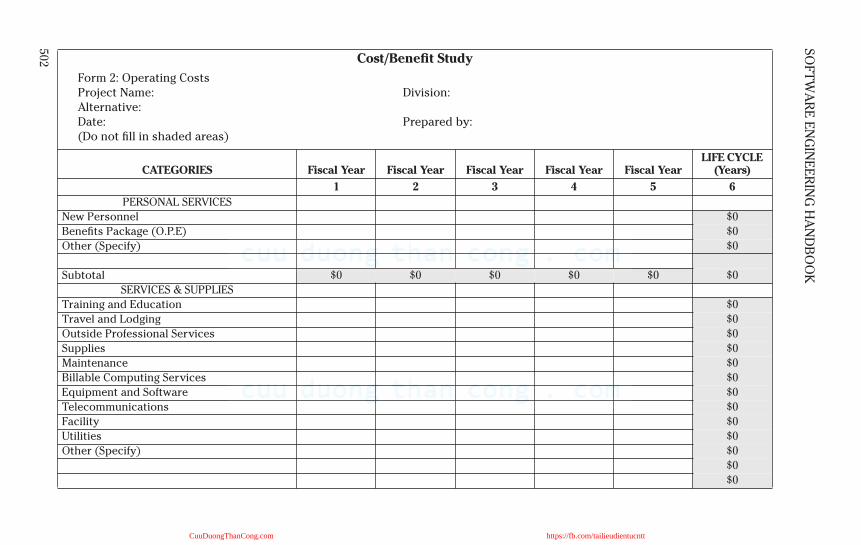
502
SO
FT
WA
RE
EN
GIN
EE
RIN
G H
AN
DB
OO
KCost/Benefit Study
Form 2: Operating CostsProject Name: Division:Alternative:Date: Prepared by:(Do not fill in shaded areas)
CATEGORIES Fiscal Year Fiscal Year Fiscal Year Fiscal Year Fiscal YearLIFE CYCLE
(Years)
1 2 3 4 5 6
PERSONAL SERVICES
New Personnel $0
Benefits Package (O.P.E) $0
Other (Specify) $0
Subtotal $0 $0 $0 $0 $0 $0
SERVICES & SUPPLIES
Training and Education $0
Travel and Lodging $0
Outside Professional Services $0
Supplies $0
Maintenance $0
Billable Computing Services $0
Equipment and Software $0
Telecommunications $0
Facility $0
Utilities $0
Other (Specify) $0
$0
$0
CuuDuongThanCong.com https://fb.com/tailieudientucntt
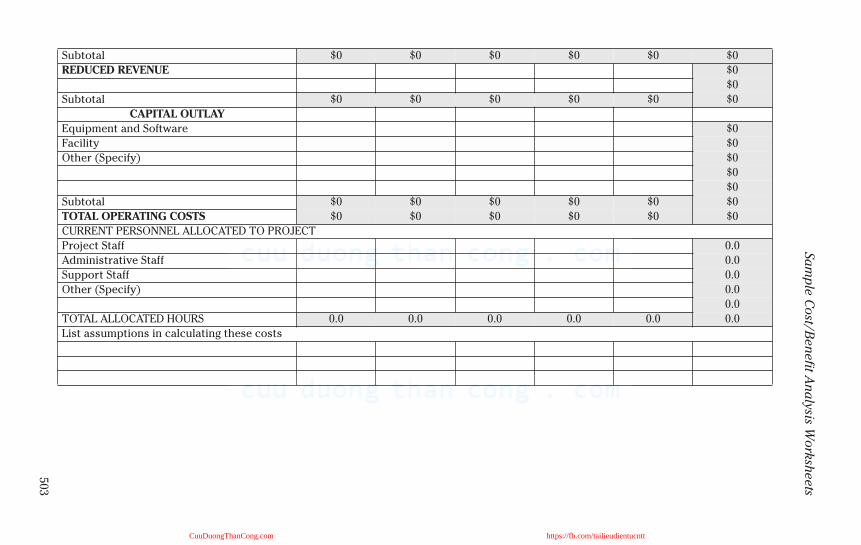
503
Sa
mp
le C
ost/B
en
efit A
nalysis W
ork
sheets
Subtotal $0 $0 $0 $0 $0 $0
REDUCED REVENUE $0
$0
Subtotal $0 $0 $0 $0 $0 $0
CAPITAL OUTLAY
Equipment and Software $0
Facility $0
Other (Specify) $0
$0
$0
Subtotal $0 $0 $0 $0 $0 $0
TOTAL OPERATING COSTS $0 $0 $0 $0 $0 $0
CURRENT PERSONNEL ALLOCATED TO PROJECT
Project Staff 0.0
Administrative Staff 0.0
Support Staff 0.0
Other (Specify) 0.0
0.0
TOTAL ALLOCATED HOURS 0.0 0.0 0.0 0.0 0.0 0.0
List assumptions in calculating these costs
CuuDuongThanCong.com https://fb.com/tailieudientucntt
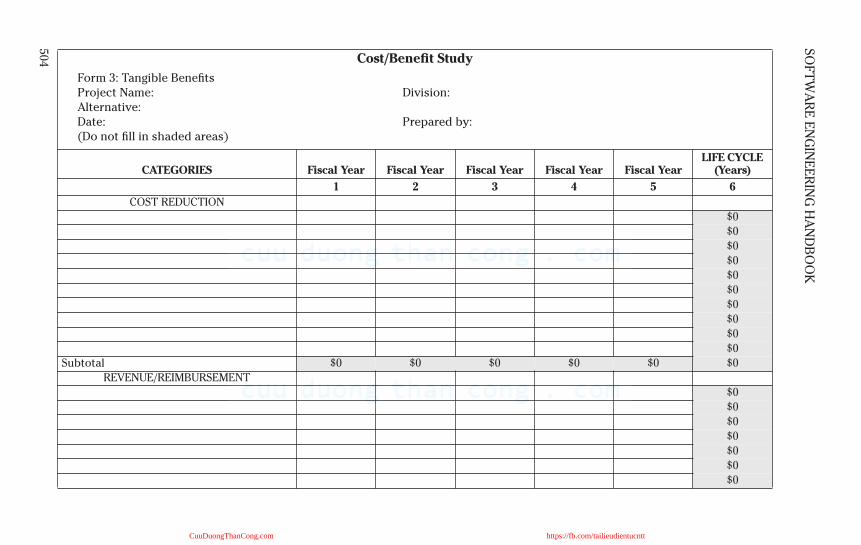
504
SO
FT
WA
RE
EN
GIN
EE
RIN
G H
AN
DB
OO
KCost/Benefit Study
Form 3: Tangible BenefitsProject Name: Division:Alternative:Date: Prepared by:(Do not fill in shaded areas)
CATEGORIES Fiscal Year Fiscal Year Fiscal Year Fiscal Year Fiscal YearLIFE CYCLE
(Years)
1 2 3 4 5 6
COST REDUCTION
$0
$0
$0
$0
$0
$0
$0
$0
$0
$0
Subtotal $0 $0 $0 $0 $0 $0
REVENUE/REIMBURSEMENT
$0
$0
$0
$0
$0
$0
$0
CuuDuongThanCong.com https://fb.com/tailieudientucntt
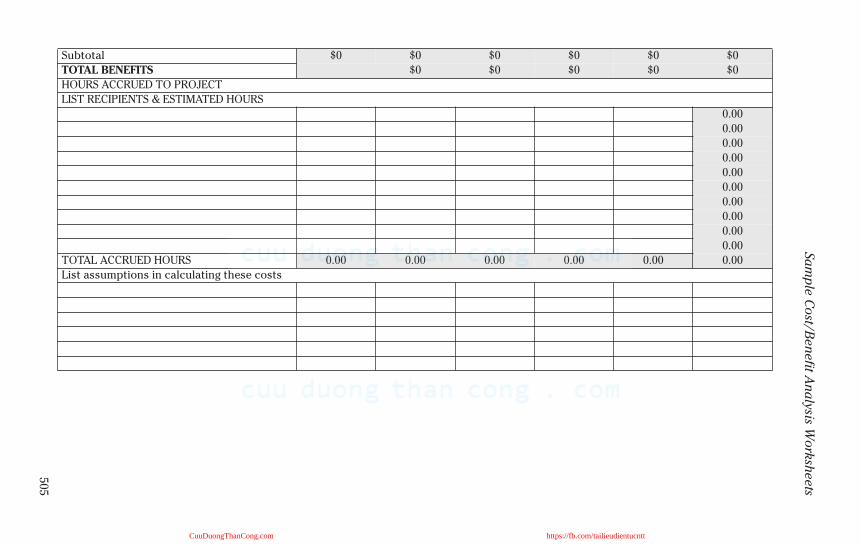
505
Sa
mp
le C
ost/B
en
efit A
na
lysis Work
sheets
Subtotal $0 $0 $0 $0 $0 $0
TOTAL BENEFITS $0 $0 $0 $0 $0
HOURS ACCRUED TO PROJECT
LIST RECIPIENTS & ESTIMATED HOURS
0.00
0.00
0.00
0.00
0.00
0.00
0.00
0.00
0.00
0.00
TOTAL ACCRUED HOURS 0.00 0.00 0.00 0.00 0.00 0.00
List assumptions in calculating these costs
CuuDuongThanCong.com https://fb.com/tailieudientucntt
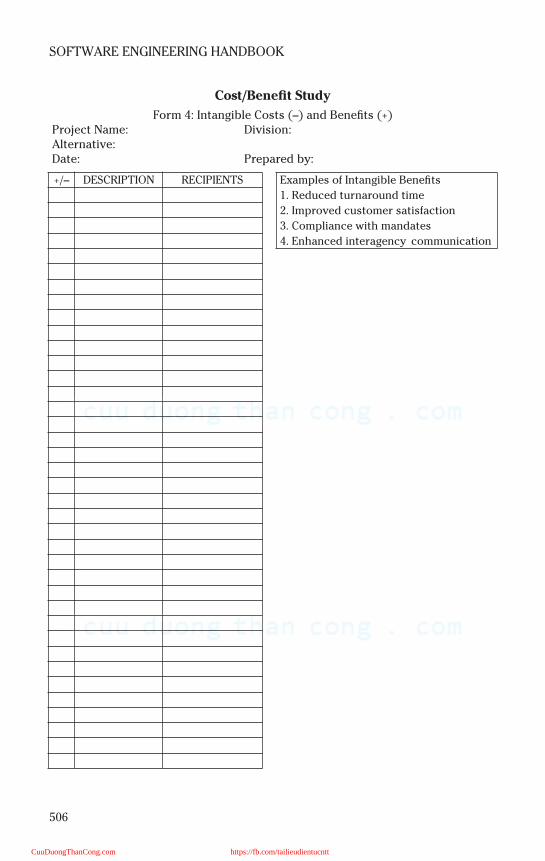
506
SOFTWARE ENGINEERING HANDBOOK
Cost/Benefit Study
Form 4: Intangible Costs (–) and Benefits (+)Project Name: Division:Alternative:Date: Prepared by:
+/– DESCRIPTION RECIPIENTS Examples of Intangible Benefits
1. Reduced turnaround time
2. Improved customer satisfaction
3. Compliance with mandates
4. Enhanced interagency communication
CuuDuongThanCong.com https://fb.com/tailieudientucntt
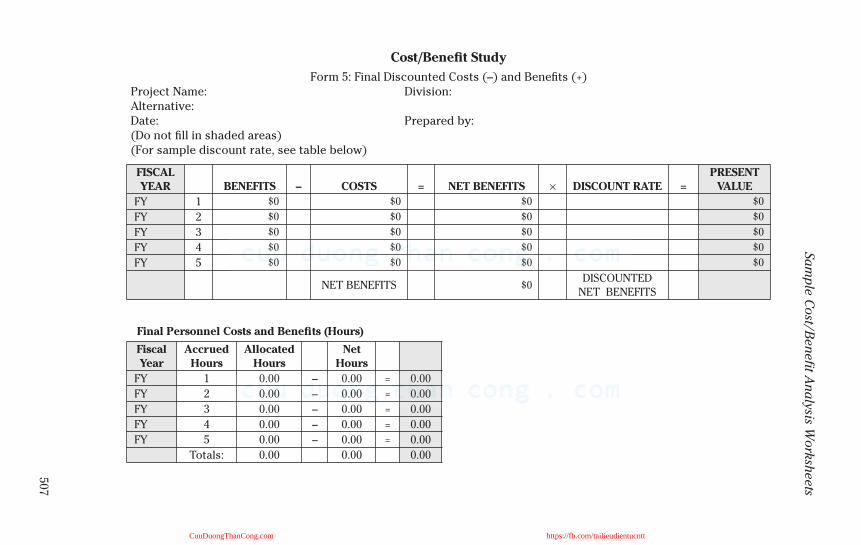
507
Sa
mp
le C
ost/B
en
efit A
na
lysis Work
sheets
Cost/Benefit Study
Form 5: Final Discounted Costs (–) and Benefits (+)Project Name: Division:Alternative:Date: Prepared by:(Do not fill in shaded areas)(For sample discount rate, see table below)
FISCAL YEAR BENEFITS – COSTS = NET BENEFITS × DISCOUNT RATE =
PRESENT VALUE
FY 1 $0 $0 $0 $0
FY 2 $0 $0 $0 $0
FY 3 $0 $0 $0 $0
FY 4 $0 $0 $0 $0
FY 5 $0 $0 $0 $0
NET BENEFITS $0DISCOUNTED
NET BENEFITS
Final Personnel Costs and Benefits (Hours)
Fiscal Year
Accrued Hours
Allocated Hours
Net Hours
FY 1 0.00 – 0.00 = 0.00
FY 2 0.00 – 0.00 = 0.00
FY 3 0.00 – 0.00 = 0.00
FY 4 0.00 – 0.00 = 0.00
FY 5 0.00 – 0.00 = 0.00
Totals: 0.00 0.00 0.00
CuuDuongThanCong.com https://fb.com/tailieudientucntt
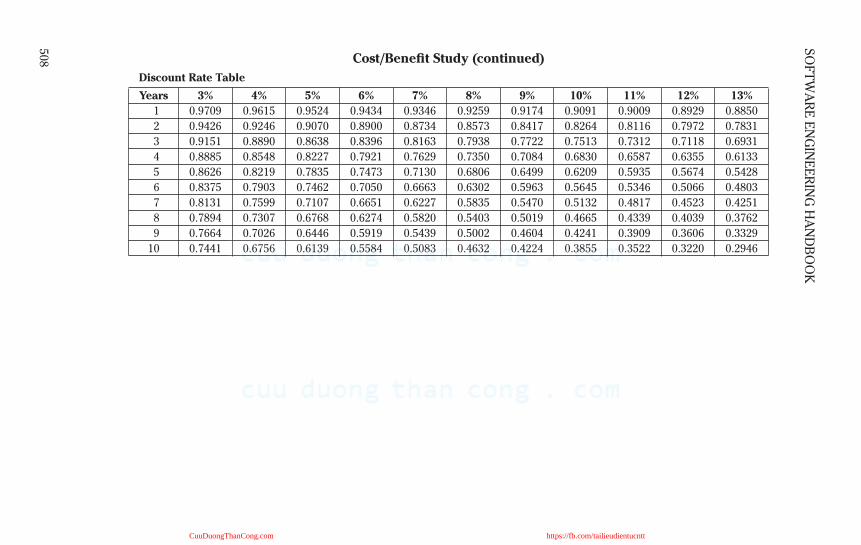
508
SO
FT
WA
RE
EN
GIN
EE
RIN
G H
AN
DB
OO
KCost/Benefit Study (continued)
Discount Rate Table
Years 3% 4% 5% 6% 7% 8% 9% 10% 11% 12% 13%
1 0.9709 0.9615 0.9524 0.9434 0.9346 0.9259 0.9174 0.9091 0.9009 0.8929 0.8850
2 0.9426 0.9246 0.9070 0.8900 0.8734 0.8573 0.8417 0.8264 0.8116 0.7972 0.7831
3 0.9151 0.8890 0.8638 0.8396 0.8163 0.7938 0.7722 0.7513 0.7312 0.7118 0.6931
4 0.8885 0.8548 0.8227 0.7921 0.7629 0.7350 0.7084 0.6830 0.6587 0.6355 0.6133
5 0.8626 0.8219 0.7835 0.7473 0.7130 0.6806 0.6499 0.6209 0.5935 0.5674 0.5428
6 0.8375 0.7903 0.7462 0.7050 0.6663 0.6302 0.5963 0.5645 0.5346 0.5066 0.4803
7 0.8131 0.7599 0.7107 0.6651 0.6227 0.5835 0.5470 0.5132 0.4817 0.4523 0.4251
8 0.7894 0.7307 0.6768 0.6274 0.5820 0.5403 0.5019 0.4665 0.4339 0.4039 0.3762
9 0.7664 0.7026 0.6446 0.5919 0.5439 0.5002 0.4604 0.4241 0.3909 0.3606 0.3329
10 0.7441 0.6756 0.6139 0.5584 0.5083 0.4632 0.4224 0.3855 0.3522 0.3220 0.2946
CuuDuongThanCong.com https://fb.com/tailieudientucntt
509
Appendix E
Sample Business Use Case
PROCUREMENT SYSTEM USE CASES
Team C’s project is to develop and implement a procurement system forJCE. The company currently handles its purchase orders manually. A fewexternal entities will interact with this procurement system. Differentmenus are displayed depending on the user’s access. Orders are allowedfor entry as long as the user is authorized for the order amount requested.If the order amount exceeds the user’s authorized amount, a message isdisplayed on the screen. Due to limited knowledge of procurement sys-tems, ideas were gathered from EventHelix.com Inc., which is dedicated todeveloping tools and techniques for real-time and embedded system devel-opment. Following are ten of the use cases for the procurement system.
Requestor
The requestor requests a product (see Exhibit E-1), requests a change inthe product, or cancels an ordered product. The requestor can makerequests by telephone, fax, or keying the information directly into the sys-tem, if authorized.
Requestor Logs into the System to Submit a New Request:
1. Requestor keys in his log-on ID and six- to eight-digit password,which are then verified against valid IDs and passwords in the pro-curement database. If the ID or password does not match, an errormessage is displayed on the screen. The requestor is prompted tore-key the ID or password. The requestor is allowed three attemptsto log in. If unsuccessful, the password is flagged and a message isdisplayed to call data security for resolution. If successful, the pro-curement menu is displayed.
2. The requestor selects the menu option ENTER PURCHASE REQUESTby pressing the radio button next to that option.
3. The system displays the purchase request order form on the screen.The requestor keys the department name, number, and cost centerin the appropriate fields. The requestor also keys the product
CuuDuongThanCong.com https://fb.com/tailieudientucntt
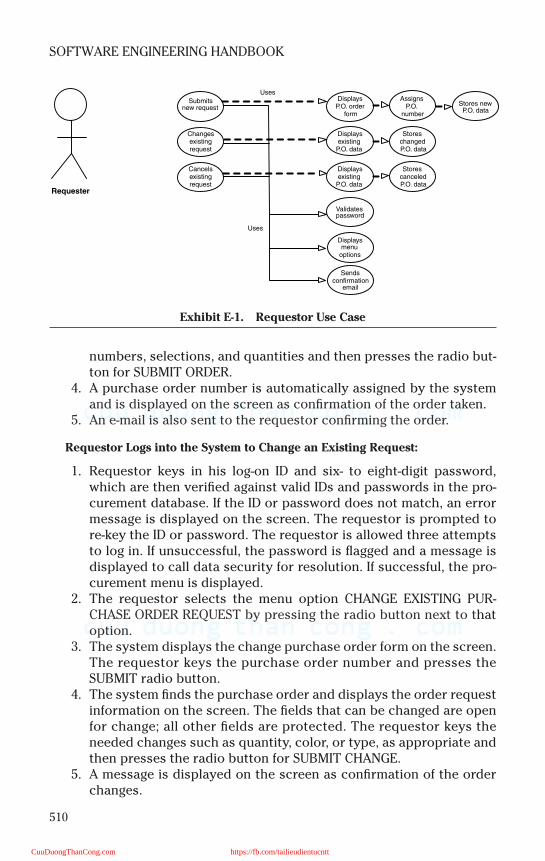
510
SOFTWARE ENGINEERING HANDBOOK
numbers, selections, and quantities and then presses the radio but-ton for SUBMIT ORDER.
4. A purchase order number is automatically assigned by the systemand is displayed on the screen as confirmation of the order taken.
5. An e-mail is also sent to the requestor confirming the order.
Requestor Logs into the System to Change an Existing Request:
1. Requestor keys in his log-on ID and six- to eight-digit password,which are then verified against valid IDs and passwords in the pro-curement database. If the ID or password does not match, an errormessage is displayed on the screen. The requestor is prompted tore-key the ID or password. The requestor is allowed three attemptsto log in. If unsuccessful, the password is flagged and a message isdisplayed to call data security for resolution. If successful, the pro-curement menu is displayed.
2. The requestor selects the menu option CHANGE EXISTING PUR-CHASE ORDER REQUEST by pressing the radio button next to thatoption.
3. The system displays the change purchase order form on the screen.The requestor keys the purchase order number and presses theSUBMIT radio button.
4. The system finds the purchase order and displays the order requestinformation on the screen. The fields that can be changed are openfor change; all other fields are protected. The requestor keys theneeded changes such as quantity, color, or type, as appropriate andthen presses the radio button for SUBMIT CHANGE.
5. A message is displayed on the screen as confirmation of the orderchanges.
Exhibit E-1. Requestor Use Case
Requester
Submitsnew request
Changesexistingrequest
Cancelsexistingrequest
DisplaysP.O. order
form
Displaysexisting
P.O. data
Displaysexisting
P.O. data
Validatespassword
Displaysmenu
options
Stores newP.O. data
AssignsP.O.
number
Sendsconfirmation
StoreschangedP.O. data
StorescanceledP.O. data
Uses
Uses
CuuDuongThanCong.com https://fb.com/tailieudientucntt
511
Sample Business Use Case
6. An e-mail is also sent to the requestor confirming the order changes.
Requestor Logs into the System to Cancel an Existing Request:
1. Requestor keys in his log-on ID and six- to eight-digit password,which are then verified against valid IDs and passwords in the pro-curement database. If the ID or password does not match, an errormessage is displayed on the screen. The requestor is prompted tore-key the ID or password. The requestor is allowed three attemptsto log in. If unsuccessful, the password is flagged and a message isdisplayed to call data security for resolution. If successful, the pro-curement menu is displayed.
2. The requestor selects the menu option CANCEL EXISTING PUR-CHASE ORDER by pressing the radio button next to that option.
3. The system displays the cancel purchase order form on the screen.The requestor keys the purchase order number and presses theSUBMIT radio button.
4. The system finds the purchase order and displays the order requestinformation on the screen. The requestor presses the radio buttonfor CANCEL ORDER.
5. A message is displayed on the screen as confirmation of the can-celed order.
6. An e-mail is also sent to the requestor confirming the ordercancellation.
Purchasing Agent
The purchasing agent requests a product (see Exhibit E-2), requests achange in the product, or cancels an ordered product when the request istelephoned or faxed to the purchasing department.
Purchasing Agent Logs into the System to Submit a New Request:
1. Purchasing agent keys in his log-on ID and six- to eight-digit pass-word, which are then verified against valid IDs and passwords in theprocurement database. If the ID or password does not match, an er-ror message is displayed on the screen. The purchasing agent isprompted to re-key the ID or password. The purchasing agent is al-lowed three attempts to log in. If unsuccessful, the password isflagged and a message is displayed to call data security for resolu-tion. If successful, the procurement menu is displayed.
2. The purchasing agent selects the menu option ENTER PURCHASEREQUEST by pressing the radio button next to that option.
3. The system displays the purchase request order form on the screen.The purchasing agent keys the department name, number, and costcenter in the appropriate fields. The purchasing agent also keys theproduct numbers, product selections, and quantities. If this order is
CuuDuongThanCong.com https://fb.com/tailieudientucntt

512
SOFTWARE ENGINEERING HANDBOOK
for a department other than the purchasing agent’s department, heflags the order in a special field to indicate that this order is an au-thorized over-ride. The purchasing agent presses the radio buttonfor SUBMIT ORDER.
4. A purchase order number is automatically assigned by the systemand is displayed on the screen as confirmation of the order taken.
5. An e-mail is also sent to the original requestor confirming the order.
Purchasing Agent Logs into the System to Change an Existing Request:
1. Purchasing agent keys in his log-on ID and six- to eight-digit pass-word, which are then verified against valid IDs and passwords in theprocurement database. If the ID or password does not match, an er-ror message is displayed on the screen. The purchasing agent isprompted to re-key the ID or password. The purchasing agent is al-lowed three attempts to log in. If unsuccessful, the password isflagged and a message is displayed to call data security for resolu-tion. If successful, the procurement menu is displayed.
2. The purchasing agent selects the menu option CHANGE EXISTINGPURCHASE ORDER REQUEST by pressing the radio button next tothat option.
3. The system displays the change purchase order form on the screen.The purchasing agent keys the purchase order number and pressesthe SUBMIT radio button.
4. The system finds the purchase order and displays the order requestinformation on the screen. The fields that can be changed are open
Exhibit E-2. Purchasing Agent Use Case
Purchasing Agent
Submitsnew request
Changesexistingrequest
Cancelsexistingrequest
Updatesnegotiated
prices
DisplaysP.O. order
form
DisplaysexistingP.O. data
Displaysexisting
P.O. data
Validatespassword
Displaysmenu
options
Stores newP.O. data
AssignsP.O.
number
Sendsconfirmation
StoreschangedP.O. data
StorescanceledP.O. data
Uses
Uses
Displayslist of rawmaterials
Stores updídraw material
data
CuuDuongThanCong.com https://fb.com/tailieudientucntt
513
Sample Business Use Case
for change; all other fields are protected. The purchasing agent keysthe needed changes such as quantity, color, or type, as appropriate.If this change is for a department other than the purchasing agent’sdepartment, he flags the order in a special field to indicate that thischange is an authorized over-ride. The purchasing agent presses theradio button for SUBMIT CHANGE.
5. A message is displayed on the screen as confirmation of the orderchanges.
6. An e-mail is also sent to the original requestor confirming the orderchanges.
Purchasing Agent Logs into the System to Cancel an Existing Request:
1. Purchasing agent keys in his log-on ID and six- to eight-digit pass-word, which are then verified against valid IDs and passwords in theprocurement database. If the ID or password does not match, an er-ror message is displayed on the screen. The purchasing agent isprompted to re-key the ID or password. The purchasing agent is al-lowed three attempts to log in. If unsuccessful, the password isflagged and a message is displayed to call data security for resolu-tion. If successful, the procurement menu is displayed.
2. The purchasing agent selects the menu option CANCEL EXISTINGPURCHASE ORDER by pressing the radio button next to that option.
3. The system displays the cancel purchase order form on the screen.The purchasing agent keys the purchase order number and pressesthe SUBMIT radio button.
4. The system finds the purchase order and displays the order requestinformation on the screen. If this cancel is for a department otherthan the purchasing agent’s department, he flags the order in a spe-cial field to indicate that this cancel is an authorized over-ride. Thepurchasing agent presses the radio button for CANCEL ORDER.
5. A message is displayed on the screen as confirmation of the can-celed order.
6. An e-mail is also sent to the original requestor confirming the ordercancellation.
Purchasing Agent Logs into the System to Update Negotiated Prices:
1. Purchasing agent keys in his log-on ID and six- to eight-digit pass-word, which are then verified against valid IDs and passwords in theprocurement database. If the ID or password does not match, an er-ror message is displayed on the screen. The purchasing agent isprompted to re-key the ID or password. The purchasing agent isallowed three attempts to log in. If unsuccessful, the password isflagged and a message is displayed to call data security for resolu-tion. If successful, the procurement menu is displayed.
CuuDuongThanCong.com https://fb.com/tailieudientucntt
514
SOFTWARE ENGINEERING HANDBOOK
2. The purchasing agent selects the menu option UPDATE PRICES bypressing the radio button next to that option.
3. The system displays another menu with various options for chang-ing prices. The purchasing agent selects the RAW MATERIAL PRICESradio button.
4. The system displays on the screen a list of the raw materials listedin the database. The purchasing agent selects the appropriate rawmaterial by paging through the list of raw materials and clicking theleft side of the mouse button over the raw material name or by key-ing the name of the raw material in the SEARCH field and pressingthe SUBMIT radio button.
5. The system finds the raw material in the database and displays theraw material’s specifications on the screen. Some of the informationdisplayed is price, suppliers, supplier codes, description, raw mate-rial ID, etc. Because the purchasing agent has authorization to up-date these fields, he changes the price of the raw material andpresses the SUBMIT radio button.
6. The system returns to the raw material list and the new price isreflected.
7. The system records this status change in the historical databaseand reports the change on the monthly status report log.
Receiving Department
The receiving department (Exhibit E-3) receives the purchase order forthe raw material, checks it for accuracy and good condition, and places theraw material into stock.
Receiving Department Receives the New Purchase Order:
1. Receiving department receives an e-mail notifying it of the new pur-chase order. Receiving agent logs into the procurement system toverify and accept the order. Receiving agent keys in his log-on ID andsix- to eight-digit password, which are then verified against valid IDsand passwords in the procurement database. If the ID or passworddoes not match, an error message is displayed on the screen. The re-ceiving agent is prompted to re-key the ID or password. The receiv-ing agent is allowed three attempts to log in. If unsuccessful, thepassword is flagged and a message is displayed to call data securityfor resolution. If successful, the procurement menu is displayed.
2. The receiving agent selects the menu option ACCEPT NEW PUR-CHASE ORDER by pressing the radio button next to that option.
3. The receiving agent keys the purchase order number and pressesthe SUBMIT radio button.
CuuDuongThanCong.com https://fb.com/tailieudientucntt
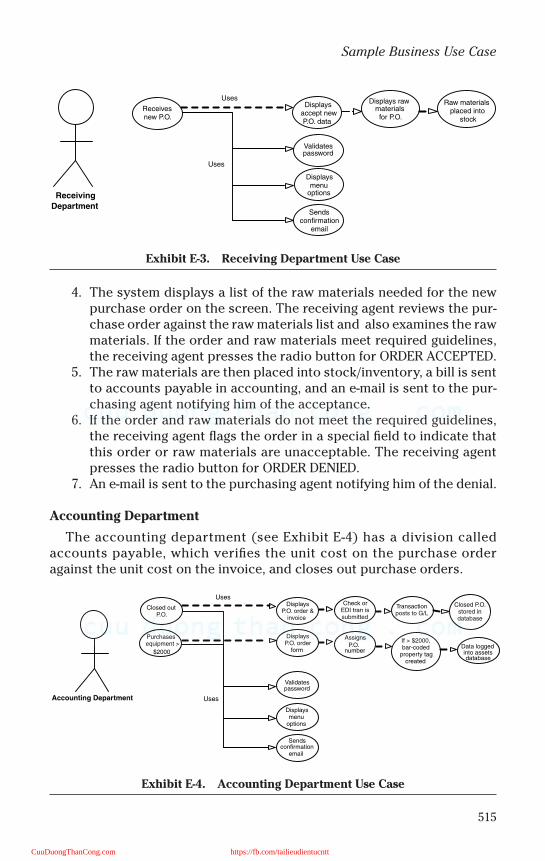
515
Sample Business Use Case
4. The system displays a list of the raw materials needed for the newpurchase order on the screen. The receiving agent reviews the pur-chase order against the raw materials list and also examines the rawmaterials. If the order and raw materials meet required guidelines,the receiving agent presses the radio button for ORDER ACCEPTED.
5. The raw materials are then placed into stock/inventory, a bill is sentto accounts payable in accounting, and an e-mail is sent to the pur-chasing agent notifying him of the acceptance.
6. If the order and raw materials do not meet the required guidelines,the receiving agent flags the order in a special field to indicate thatthis order or raw materials are unacceptable. The receiving agentpresses the radio button for ORDER DENIED.
7. An e-mail is sent to the purchasing agent notifying him of the denial.
Accounting Department
The accounting department (see Exhibit E-4) has a division calledaccounts payable, which verifies the unit cost on the purchase orderagainst the unit cost on the invoice, and closes out purchase orders.
Exhibit E-3. Receiving Department Use Case
Exhibit E-4. Accounting Department Use Case
Receiving
Department
Receivesnew P.O.
Displaysaccept newP.O. data
Validatespassword
Displaysmenu
options
Raw materialsplaced into
stock
Displays rawmaterialsfor P.O.
Sendsconfirmation
Uses
Uses
Accounting Department
Closed outP.O.
Purchasesequipment >
$2000
DisplaysP.O. order &
invoice
DisplaysP.O. order
form
Validatespassword
Displaysmenu
options
Transactionposts to G/L
Check orEDI tran issubmitted
Sendsconfirmation
AssignsP.O.
number
Closed P.O.stored indatabase
Uses
Uses
If > $2000,bar-coded
property tagcreated
Data loggedinto assetsdatabase
CuuDuongThanCong.com https://fb.com/tailieudientucntt
516
SOFTWARE ENGINEERING HANDBOOK
Accounts Payable Closes out a Purchase Order:
1. Accounts payable (A/P) receives an e-mail notifying them of the pur-chase order invoice. The A/P agent logs into the procurement sys-tem to verify and accept the order. A/P agent keys in his log-on IDand six- to eight-digit password, which are then verified against validIDs and passwords in the procurement database. If the ID or pass-word does not match, an error message is displayed on the screen.The A/P agent is prompted to re-key the ID or password. The A/Pagent is allowed three attempts to log in. If unsuccessful, thepassword is flagged and a message is displayed to call data securityfor resolution. If successful, the procurement menu is displayed.
2. The A/P agent selects the menu option CLOSE OUT PURCHASE OR-DER by pressing the radio button next to that option.
3. The A/P agent keys the purchase order number and presses theSUBMIT radio button.
4. The system displays the purchase order as well as its associated in-voice. The A/P agent verifies the unit cost on the purchase orderagainst the unit cost on the invoice. If the verification is approved,the A/P agent presses the radio button for SUBMIT PAYMENT.
5. A check or an EDI transaction is submitted, depending on the sup-plier’s request, for payment of the invoice. An e-mail is sent to thepurchasing agent notifying him of the payment approval. The trans-action is then posted to the general ledger and the purchase orderis closed.
6. If the verification is not approved, the A/P agent presses the radiobutton for PAYMENT DENIED.
7. An e-mail is sent to the purchasing agent notifying him of the pay-ment denial.
The accounting department monitors equipment with a value over $2000.The equipment can be purchased through the procurement system pro-vided proper authorization has been obtained.
Accounting Agent or Authorized Person Purchases Equipment Priced Greater Than $2000:
1. The accounting agent logs into procurement system to order equip-ment priced greater than $2000. Accounting agent keys in his log-onID and six- to eight-digit password, which are then verified againstvalid IDs and passwords in the procurement database. If the ID orpassword does not match, an error message is displayed on thescreen. The accounting agent is prompted to re-key the ID or pass-word. The accounting agent is allowed three attempts to log in. If un-successful, the password is flagged and a message is displayed tocall data security for resolution. If successful, the procurementmenu is displayed.
CuuDuongThanCong.com https://fb.com/tailieudientucntt

517
Sample Business Use Case
2. The accounting agent selects the menu option ENTER PURCHASEREQUEST by pressing the radio button next to that option.
3. The system displays the purchase request order form on the screen.The accounting agent keys the department name, number, and costcenter in the appropriate fields. The accounting agent also keys theproduct numbers, product selections, and quantities and thenpresses the radio button for SUBMIT ORDER.
4. A purchase order number is automatically assigned by the systemand is displayed on the screen as confirmation of the order taken.
5. An e-mail is also sent to the accounting agent confirming the order.6. If the equipment requested is priced greater than $2000, the system
assigns a bar-coded equipment property tag. The property tag num-ber is logged into the database.
7. Once the equipment purchase order is closed out, the informationabout the equipment is also logged into the company assets data-base along with the property tag number.
CuuDuongThanCong.com https://fb.com/tailieudientucntt

This page intentionally left blank
CuuDuongThanCong.com https://fb.com/tailieudientucntt
519
Appendix F
Sample Project Plan
TABLE OF CONTENTS
1. Goals and Objectives ............................................................................... 5201.1 System Statement of Scope ............................................................ 520
1.1.1 General Requirements......................................................... 5201.1.2 Database Administration Interface.................................... 5201.1.3 Online Help ........................................................................... 5201.1.4 Training ................................................................................. 521
1.2 System Context ................................................................................ 5211.3 Major Constraints............................................................................ 521
1.3.1 Security ................................................................................. 5211.3.2 Database................................................................................ 521
2. Project Estimates...................................................................................... 5212.1 Historical Data Used for Estimates ............................................... 5212.2 Estimation Techniques Applied and Results ............................... 522
2.2.1 Process-Based Estimation................................................... 5222.2.2 LOC-Based Estimation......................................................... 522
2.3 Project Resources............................................................................ 5242.3.1 People.................................................................................... 5242.3.2 Minimal Hardware Requirements ...................................... 5252.3.3 User Server Side................................................................... 5252.3.4 User Client Side .................................................................... 5252.3.5 Minimal Software Requirements ........................................ 525
3. Risk Management...................................................................................... 5263.1 Scope and Intent of RMMM Activities........................................... 5263.2 Risk Management Organizational Role ......................................... 5263.3 Risk Description............................................................................... 526
3.3.1 Description of Risks............................................................. 5263.4 Risk Table ......................................................................................... 528
3.4.1 Probability and Impact for Risk ......................................... 5284. Project Schedule....................................................................................... 528
4.1 Deliverables and Milestones .......................................................... 5284.2 Work Breakdown Structure ............................................................ 529
5. Project Team Organization...................................................................... 5295.1 Team Structure ................................................................................ 529
5.1.1 Conceptual Planning............................................................ 5295.1.2 Software Design and Development .................................... 529
CuuDuongThanCong.com https://fb.com/tailieudientucntt
520
SOFTWARE ENGINEERING HANDBOOK
5.1.3 Editing, Master Testing, and Maintenance........................5295.1.4 Training and User Documentation .....................................529
6. Tracking and Control Mechanisms.........................................................5346.1 Quality Assurance Mechanisms.....................................................5346.2 Change Management and Control .................................................534
1. GOALS AND OBJECTIVES
The online resource scheduling system (ORSS) is a Web-based schedulingsystem designed for colleges, universities, and schools. The purpose ofthis system is to provide an online service for the faculty to reserve anytype of resource such as computer systems, VCRs, projectors, and video-tapes. This scheduling system can accept the requestors’ orders, make aschedule for the orders, and perform some critical checks. It will enablethe faculty to place their orders at any time and from any place. The systemwill be able to create new orders and update old orders.
1.1 System Statement of Scope
1.1.1 General Requirements
The following general requirements were specified for our project titledORSS:
• A Web-based application allowing users easy access and use• The ability to originate or update resource reservations• The ability to link to the faculty database to verify “authorized users”• A method to maintain and update a resource database• The ability to limit simultaneous reservations against total resources
available• A way to search for resources available• A method to disallow duplication of “special” classrooms• The ability to disallow duplicate orders from the same user• A method to print a confirmation from the Website• The ability to send e-mail confirmations to the user• The ability to print a daily list
1.1.2 Database Administration Interface
There will be a need for the resource center office to maintain the data-base of the resources and to link to the faculty database to verify “autho-rized users.” If neither of these databases exists, Global Associates willneed to create them and train personnel in their maintenance andadministration.
1.1.3 Online Help
We will need to develop an online help program for this system, whichwill include a detailed help menu and “online” telephone assistance.
CuuDuongThanCong.com https://fb.com/tailieudientucntt
521
Sample Project Plan
1.1.4 Training
We will need to conduct training for the resource center staff as well asfor all full-time faculty. We may consider a training manual for the adjunctfaculty or conduct training sessions at times that they are available
1.2 System Context
Multiple users will be using the product simultaneously from many dif-ferent locations. The only requirement is access to the Internet.
1.3 Major Constraints
1.3.1 Security
This project will be uploaded to a server that will be exposed to the out-side world, so we need to research and develop security protection. We willneed to know how to configure a firewall and how to restrict access to“authorized users.” We will need to know how to deal with load balance ifthe amount of visits to the site is very large at one time.
1.3.2 Database
We will need to know how to maintain the database in order to make itmore efficient, and what type of database we should use. We will also havea link to the faculty database to verify the users.
2. PROJECT ESTIMATES
This portion of the document provides cost, effort, and time estimatesfor the project using two estimation techniques — process-based and linesof code (COCOMO II model).
2.1 Historical Data Used for Estimates
We obtained the following data according to “2001 Computer IndustrySalary Survey” from EDP Staffing Service Inc. for the Northeast:
Job Function: Web Developer (Java/ASP)Low US$ 79,500Median US$ 92,500High US$ 105,500
Job Function: Sr. Database Analyst/Admin.Low US$ 78,100Median US$ 87,200High US$ 105,900
Low is the salary paid at the 25th percentile of all respondents in this dataset; median is the 50th percentile and high is the 75th percentile (EDP Staff-ing Service Inc., 2001).
CuuDuongThanCong.com https://fb.com/tailieudientucntt
522
SOFTWARE ENGINEERING HANDBOOK
We estimate labor cost per month for two Web programmers and onedatabase analyst using the low salary level. (The low salary level is useddue to the slowdown in the U.S. economy.) Note that 15 percent overheadis added in the average labor cost per month
$(((79,500/12)*2 + (78,100/12)*1)/3) * 1.15 ≈ $7,500
Note: Members’ roles will be discussed in the section on project teamorganization.
2.2 Estimation Techniques Applied and Results
Two estimation techniques have been used to generate two indepen-dent results for higher accuracy.
• Process-based• Lines of code (LOC) → COCOMO II Model
2.2.1 Process-Based Estimation
The process is divided into smaller tasks for process-based estimationpurposes. We estimated, in person-months, the effort required to performeach task. We defined the following software functions as:
• User interface UI• Database management DB• Report generation RG• Bug fixing BF• Program integration PI
Based on the historical data obtained, the estimated effort is approxi-mately 7.5 person-months and the estimated project cost is $7500 × 7.5 ≈$56,250 (see Exhibit F-1).
2.2.2 LOC-Based Estimation
The estimates in Exhibit F-2 are based on “best-effort” estimation fromprevious programming experiences and existing software size.
The estimates for LOC are plugged into the COCOMO II formula for effortand duration estimation. The basic COCOMO II model is used (SeeExhibit F-3).
Results in Exhibit F-4 indicate that total effort is 8.8 person-months tofinish the project. Because we have three team members, we will finish theproject in approximately three months. Based on that calculation, the esti-mated project cost will be $7500 × 3 × 3 ≈ $67,500.
CuuDuongThanCong.com https://fb.com/tailieudientucntt
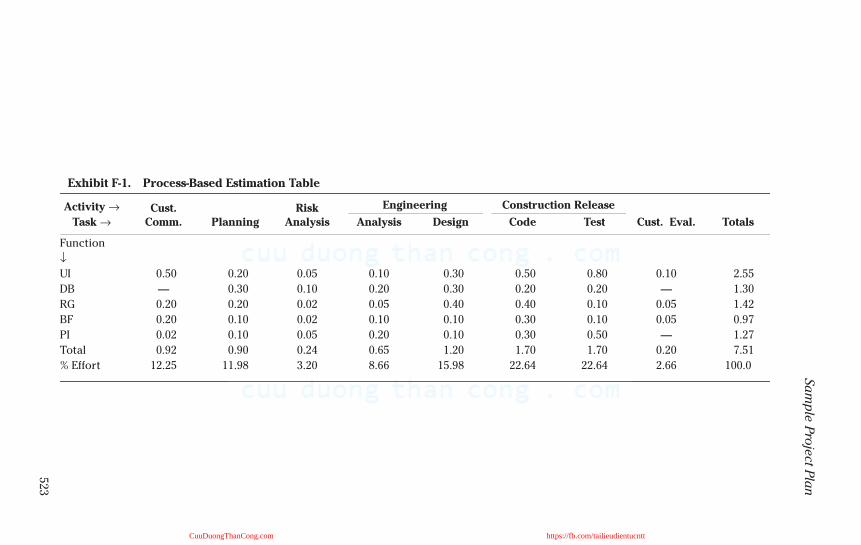
523
Sa
mp
le P
roje
ct Pla
n
Exhibit F-1. Process-Based Estimation Table
Activity → Cust. Comm. Planning
Risk Analysis
Engineering Construction Release
Cust. Eval. TotalsTask → Analysis Design Code Test
Function
↓
UI 0.50 0.20 0.05 0.10 0.30 0.50 0.80 0.10 2.55
DB — 0.30 0.10 0.20 0.30 0.20 0.20 — 1.30
RG 0.20 0.20 0.02 0.05 0.40 0.40 0.10 0.05 1.42
BF 0.20 0.10 0.02 0.10 0.10 0.30 0.10 0.05 0.97
PI 0.02 0.10 0.05 0.20 0.10 0.30 0.50 — 1.27
Total 0.92 0.90 0.24 0.65 1.20 1.70 1.70 0.20 7.51
% Effort 12.25 11.98 3.20 8.66 15.98 22.64 22.64 2.66 100.0
CuuDuongThanCong.com https://fb.com/tailieudientucntt
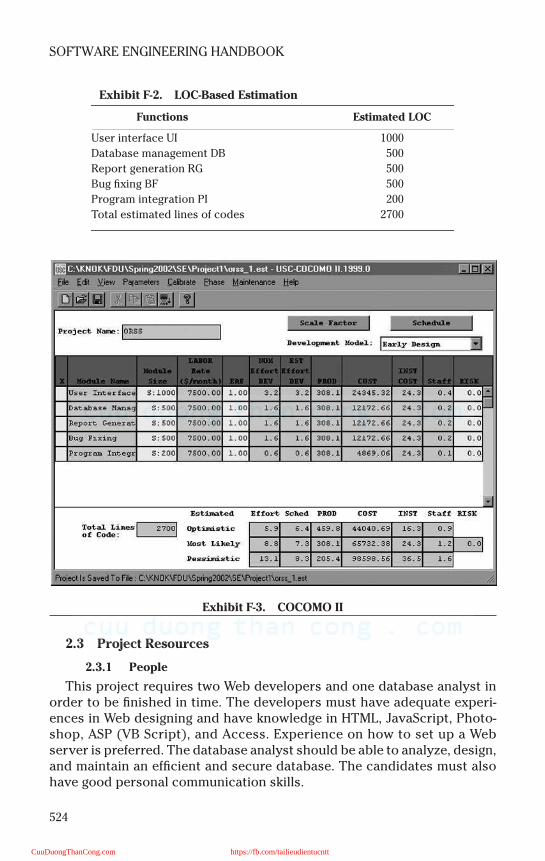
524
SOFTWARE ENGINEERING HANDBOOK
2.3 Project Resources
2.3.1 People
This project requires two Web developers and one database analyst inorder to be finished in time. The developers must have adequate experi-ences in Web designing and have knowledge in HTML, JavaScript, Photo-shop, ASP (VB Script), and Access. Experience on how to set up a Webserver is preferred. The database analyst should be able to analyze, design,and maintain an efficient and secure database. The candidates must alsohave good personal communication skills.
Exhibit F-2. LOC-Based Estimation
Functions Estimated LOC
User interface UI 1000
Database management DB 500
Report generation RG 500
Bug fixing BF 500
Program integration PI 200
Total estimated lines of codes 2700
Exhibit F-3. COCOMO II
CuuDuongThanCong.com https://fb.com/tailieudientucntt
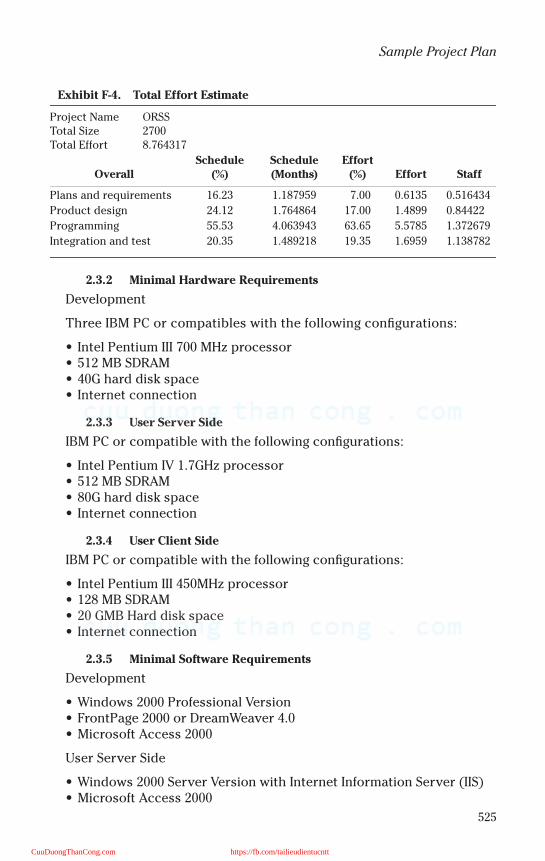
525
Sample Project Plan
2.3.2 Minimal Hardware Requirements
Development
Three IBM PC or compatibles with the following configurations:
• Intel Pentium III 700 MHz processor• 512 MB SDRAM• 40G hard disk space• Internet connection
2.3.3 User Server Side
IBM PC or compatible with the following configurations:
• Intel Pentium IV 1.7GHz processor• 512 MB SDRAM• 80G hard disk space• Internet connection
2.3.4 User Client Side
IBM PC or compatible with the following configurations:
• Intel Pentium III 450MHz processor• 128 MB SDRAM• 20 GMB Hard disk space• Internet connection
2.3.5 Minimal Software Requirements
Development
• Windows 2000 Professional Version• FrontPage 2000 or DreamWeaver 4.0• Microsoft Access 2000
User Server Side
• Windows 2000 Server Version with Internet Information Server (IIS)• Microsoft Access 2000
Exhibit F-4. Total Effort Estimate
Project Name ORSSTotal Size 2700Total Effort 8.764317
OverallSchedule
(%)Schedule (Months)
Effort (%) Effort Staff
Plans and requirements 16.23 1.187959 7.00 0.6135 0.516434
Product design 24.12 1.764864 17.00 1.4899 0.84422
Programming 55.53 4.063943 63.65 5.5785 1.372679
Integration and test 20.35 1.489218 19.35 1.6959 1.138782
CuuDuongThanCong.com https://fb.com/tailieudientucntt
526
SOFTWARE ENGINEERING HANDBOOK
User Client Side
• Windows 98 or higher operating system• Internet Explorer Browser 4.0 or Netscape Navigator 4.0
3. RISK MANAGEMENT
3.1 Scope and Intent of RMMM Activities
This project will be uploaded to a server that will be exposed to the out-side world, so we need to develop security protection. We will need toconfigure a firewall and restrict access to “authorized users” through thelinked faculty database. We will need to know how to deal with load bal-ance if the amount of visits to the site is very large at one time.
We will need to know how to maintain the database in order to make itmore efficient, what type of database we should use, who should have theresponsibility to maintain it, and who should be the administrator. Propertraining of these personnel is very important so that the database and thesystem contain accurate information.
3.2 Risk Management Organizational Role
The software project manager must track the efforts and schedules ofthe team. They must anticipate any “unwelcome” events that may occurduring the development or maintenance stages and establish plans toavoid these events or minimize their consequences.
It is the responsibility of everyone on the project team — with the regu-lar input of the customer — to assess potential risks throughout theproject. Communication among everyone involved is very important to thesuccess of the project. In this way, it is possible to mitigate and eliminatepossible risks before they occur. This is known as a proactive approach orstrategy for risk management.
3.3 Risk Description
This section describes risks that may occur during this project.
3.3.1 Description of Risks
Business Impact Risk:
This risk would entail that the software produced does not meet theneeds of the client who requested the product. It would also have a busi-ness impact if the product no longer fits into the overall business strategyfor the company.
CuuDuongThanCong.com https://fb.com/tailieudientucntt

527
Sample Project Plan
Customer Characteristics Risks:
This risk is the customer’s lack of involvement in the project and non-availability to meet with the developers in a timely manner. Also, the cus-tomer’s sophistication as to the product being developed and ability to useit are part of this risk.
Development Risks:
Pressman (2001) describes this as “risks associated with the availabilityand quality of the tools to be used to build the product.” The client-pro-vided equipment and software on which to run the product must be com-patible to the software project being developed.
Process Definition Risks:
Does the software being developed meet the requirements as originallydefined by the developer and client? Did the development team follow thecorrect design throughout the project? These are examples of processrisks.
Product Size:
The product size risk involves the overall size of the software being builtor modified. Risks involved would include the customer not providing theproper size of the product to be developed or if the software developmentteam misjudges the size or scope of the project. The latter problem couldcreate a product that is too small (rarely) or too large for the client andcould result in a loss of money to the development team because the costof developing a larger product cannot be recouped from the client.
Staff Size and Experience Risk:
This would include appropriate and knowledgeable programmers tocode the product as well as the cooperation of the entire software projectteam. It would also mean that the team has enough team members who arecompetent and able to complete the project.
Technology Risk:
Technology risk could occur if the product being developed is obso-lete by the time it is ready to be sold. The opposite effect could also be afactor: a product so “new” that the end users would have problems usingthe system and resisting the changes made. The “newness”of a techno-logical product could also result in problems using it. This type of riskwould also include the complexity of the design of the system beingdeveloped.
CuuDuongThanCong.com https://fb.com/tailieudientucntt
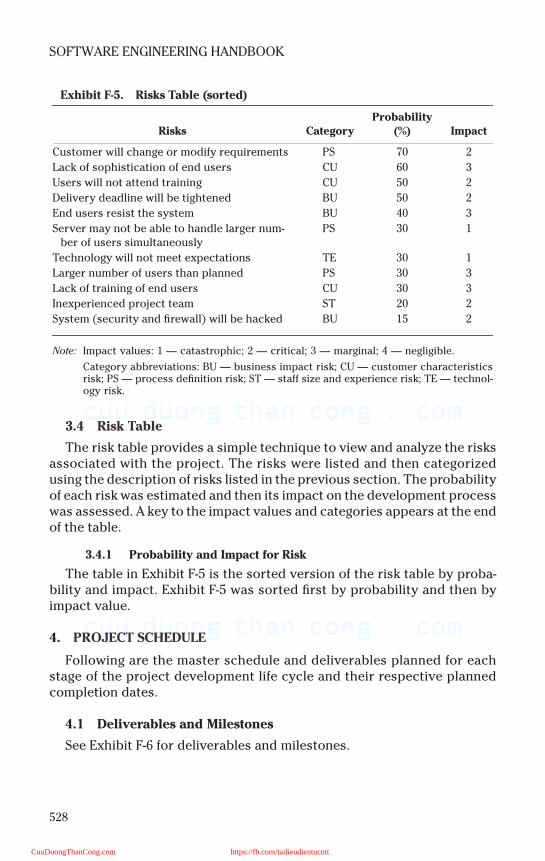
528
SOFTWARE ENGINEERING HANDBOOK
3.4 Risk Table
The risk table provides a simple technique to view and analyze the risksassociated with the project. The risks were listed and then categorizedusing the description of risks listed in the previous section. The probabilityof each risk was estimated and then its impact on the development processwas assessed. A key to the impact values and categories appears at the endof the table.
3.4.1 Probability and Impact for Risk
The table in Exhibit F-5 is the sorted version of the risk table by proba-bility and impact. Exhibit F-5 was sorted first by probability and then byimpact value.
4. PROJECT SCHEDULE
Following are the master schedule and deliverables planned for eachstage of the project development life cycle and their respective plannedcompletion dates.
4.1 Deliverables and Milestones
See Exhibit F-6 for deliverables and milestones.
Exhibit F-5. Risks Table (sorted)
Risks CategoryProbability
(%) Impact
Customer will change or modify requirements PS 70 2
Lack of sophistication of end users CU 60 3
Users will not attend training CU 50 2
Delivery deadline will be tightened BU 50 2
End users resist the system BU 40 3
Server may not be able to handle larger num-ber of users simultaneously
PS 30 1
Technology will not meet expectations TE 30 1
Larger number of users than planned PS 30 3
Lack of training of end users CU 30 3
Inexperienced project team ST 20 2
System (security and firewall) will be hacked BU 15 2
Note: Impact values: 1 — catastrophic; 2 — critical; 3 — marginal; 4 — negligible.
Category abbreviations: BU — business impact risk; CU — customer characteristicsrisk; PS — process definition risk; ST — staff size and experience risk; TE — technol-ogy risk.
CuuDuongThanCong.com https://fb.com/tailieudientucntt
529
Sample Project Plan
4.2 Work Breakdown Structure
See Exhibit F-7 for a work breakdown structure.
5. PROJECT TEAM ORGANIZATION
The structure of the team and the roles of the team members are definedin this section. The project team organization is divided into four parts:
1. Conceptual planning2. Software design and development3. Editing, master testing, and maintenance4. Training and user documentation
5.1 Team Structure
We separate part of the team project by following the responsibilities ofthe team members and dividing the functions of the system.
5.1.1 Conceptual Planning
• Interview and specify software scope• Database re-engineering• Overall process specifications• Draft documentation
5.1.2 Software Design and Development
• Database design and development• User interface and control facilities• Function development• Report generation• Draft documentation
5.1.3 Editing, Master Testing, and Maintenance
• Maintenance system• Integration testing• Report software errors• System documentation
5.1.4 Training and User Documentation
• Training sessions• User documentation
This organization of the project team allows the project planner to knowthe area of responsibility for each team member and all of the functions ofthe team project.
CuuDuongThanCong.com https://fb.com/tailieudientucntt
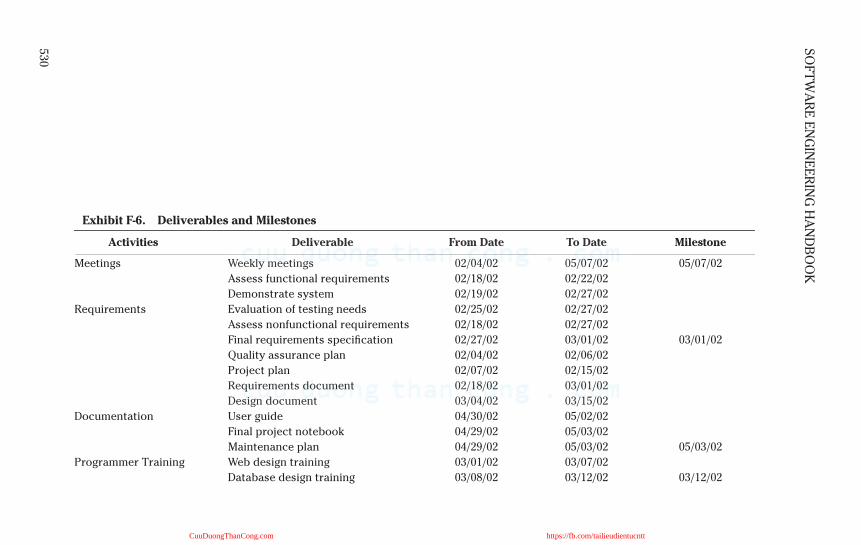
530
SO
FT
WA
RE
EN
GIN
EE
RIN
G H
AN
DB
OO
K
Exhibit F-6. Deliverables and Milestones
Activities Deliverable From Date To Date Milestone
Meetings Weekly meetings 02/04/02 05/07/02 05/07/02
Assess functional requirements 02/18/02 02/22/02
Demonstrate system 02/19/02 02/27/02
Requirements Evaluation of testing needs 02/25/02 02/27/02
Assess nonfunctional requirements 02/18/02 02/27/02
Final requirements specification 02/27/02 03/01/02 03/01/02
Quality assurance plan 02/04/02 02/06/02
Project plan 02/07/02 02/15/02
Requirements document 02/18/02 03/01/02
Design document 03/04/02 03/15/02
Documentation User guide 04/30/02 05/02/02
Final project notebook 04/29/02 05/03/02
Maintenance plan 04/29/02 05/03/02 05/03/02
Programmer Training Web design training 03/01/02 03/07/02
Database design training 03/08/02 03/12/02 03/12/02
CuuDuongThanCong.com https://fb.com/tailieudientucntt
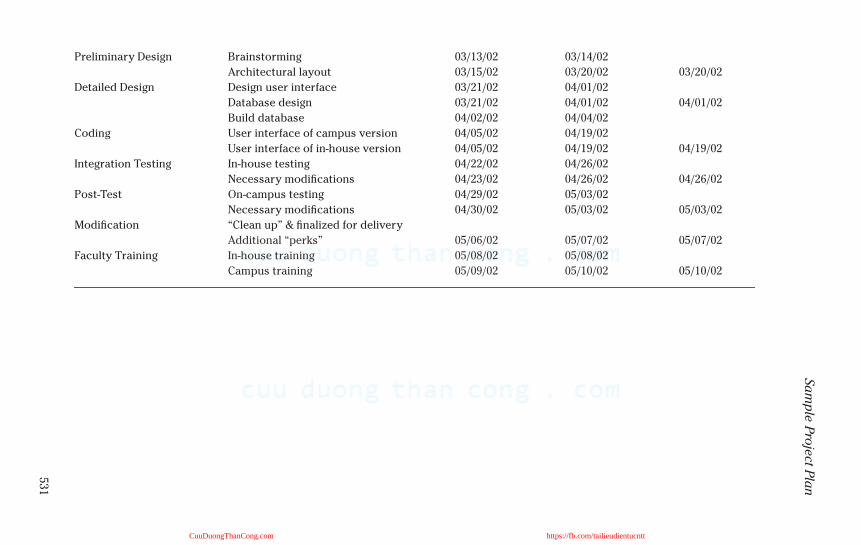
531
Sa
mp
le P
roje
ct Pla
nPreliminary Design Brainstorming 03/13/02 03/14/02
Architectural layout 03/15/02 03/20/02 03/20/02
Detailed Design Design user interface 03/21/02 04/01/02
Database design 03/21/02 04/01/02 04/01/02
Build database 04/02/02 04/04/02
Coding User interface of campus version 04/05/02 04/19/02
User interface of in-house version 04/05/02 04/19/02 04/19/02
Integration Testing In-house testing 04/22/02 04/26/02
Necessary modifications 04/23/02 04/26/02 04/26/02
Post-Test On-campus testing 04/29/02 05/03/02
Necessary modifications 04/30/02 05/03/02 05/03/02
Modification “Clean up” & finalized for delivery
Additional “perks” 05/06/02 05/07/02 05/07/02
Faculty Training In-house training 05/08/02 05/08/02
Campus training 05/09/02 05/10/02 05/10/02
CuuDuongThanCong.com https://fb.com/tailieudientucntt
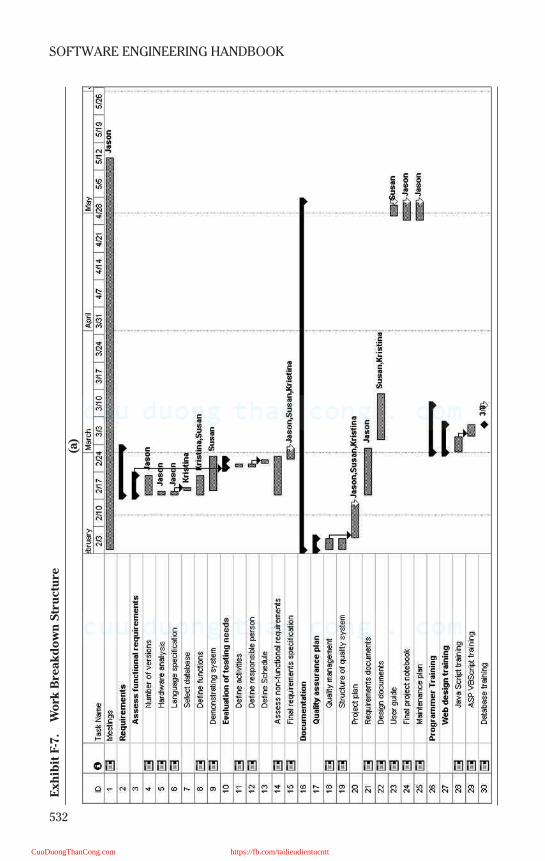
532
SOFTWARE ENGINEERING HANDBOOKE
xh
ibit
F-7
.W
ork
Bre
ak
do
wn
Str
uct
ure
(a)
CuuDuongThanCong.com https://fb.com/tailieudientucntt
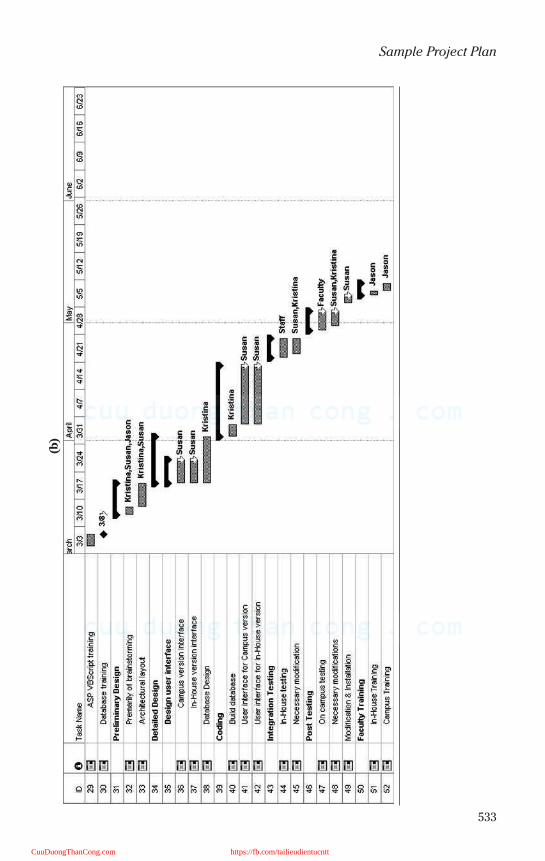
533
Sample Project Plan(b
)
CuuDuongThanCong.com https://fb.com/tailieudientucntt
534
SOFTWARE ENGINEERING HANDBOOK
6. TRACKING AND CONTROL MECHANISMS
6.1 Quality Assurance Mechanisms
• Careful monitoring of the project• Maintaining close contact with the client by using weekly meetings
and regular e-mail contacts to communicate• Periodic status meetings in which each team member reports on his
or her progress and problems• Careful monitoring of each phase as it relates to the milestone dates
listed in Chapter 4• Paying careful attention to all of the testing results, making needed
changes as quickly and reasonably as possible, and then retesting thechanges
6.2 Change Management and Control
• A change request is submitted and evaluated to assess technical mer-it, potential side effects, overall impact on other configuration objectsand system functions, and the projected cost of the change.
• An engineering change order is generated for each approved change.• Access control and synchronization control are implemented.• The change is made, and appropriate software quality assurance
(SQA) activities are applied.• Appropriate version control mechanisms are used to create the next
version of the software.
References
EDP Staffing Service Inc. (2001). Data: 2001 computer industry salary survey. http://www.edp-staffing.com/salary.html.
Pressman, R.S. (2001). Software Engineering: a Practitioner’s Approach, 5th ed., McGraw Hill,New York, 117–118.
CuuDuongThanCong.com https://fb.com/tailieudientucntt

535
Appendix G
Sample SRS
TABLE OF CONTENTS
1. Introduction .............................................................................................. 5371.1 Purpose............................................................................................. 5371.2 Scope................................................................................................. 5371.3 Definitions, Acronyms, and Abbreviations................................... 5371.4 References ........................................................................................ 5381.5 Overview........................................................................................... 538
2. Overall Description .................................................................................. 5392.1 Product Perspective........................................................................ 539
2.1.1 System Interfaces................................................................. 5402.1.2 User Interfaces ..................................................................... 5402.1.3 Hardware Interfaces............................................................. 5402.1.4 Software Interfaces .............................................................. 5402.1.5 Communications Interfaces................................................ 5412.1.6 Memory Constraints............................................................ 5412.1.7 Operations ............................................................................ 5412.1.8 Site Adaptation Requirements ........................................... 542
2.2 Product Functions ........................................................................... 5422.3 User Characteristics........................................................................ 5422.4 Constraints ....................................................................................... 543
2.4.1 Regulatory Policies .............................................................. 5432.4.2 Hardware Limitations .......................................................... 5432.4.3 Interfaces to Other Applications........................................ 5432.4.4 Parallel Applications............................................................ 5432.4.5 Audit Requirements............................................................. 5442.4.6 Control Functions ................................................................ 5442.4.7 High Order Language Functions......................................... 5442.4.8 Signal Handshaking Protocols............................................ 5442.4.9 Reliability Requirements..................................................... 5442.4.10 Criticality of the Application ............................................ 5442.4.11 Safety and Security of the System.................................... 544
2.5 Assumptions and Dependencies ................................................... 5452.6 Apportioning of Requirements ...................................................... 545
3. Specific Requirements ............................................................................. 5453.1 External Interface Requirements ................................................... 545
3.1.1 User Interfaces ..................................................................... 545
CuuDuongThanCong.com https://fb.com/tailieudientucntt
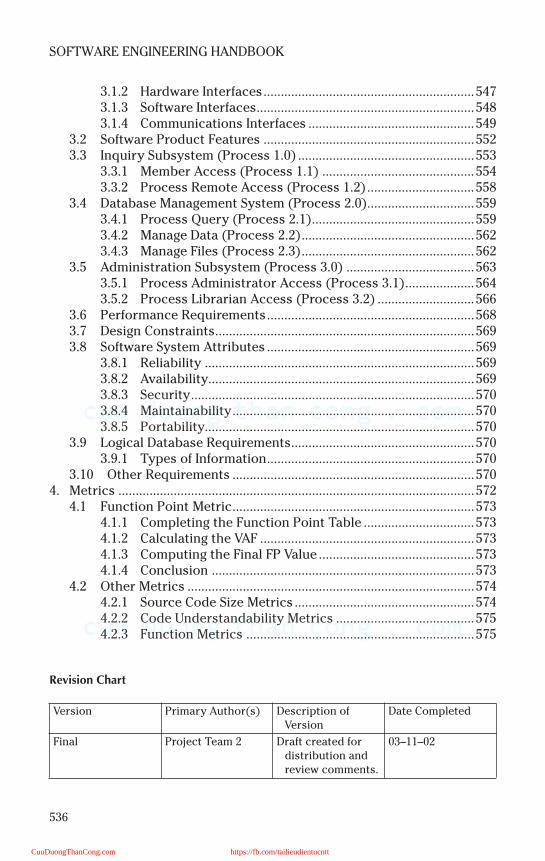
536
SOFTWARE ENGINEERING HANDBOOK
3.1.2 Hardware Interfaces.............................................................5473.1.3 Software Interfaces...............................................................5483.1.4 Communications Interfaces ................................................549
3.2 Software Product Features .............................................................5523.3 Inquiry Subsystem (Process 1.0) ...................................................553
3.3.1 Member Access (Process 1.1) ............................................5543.3.2 Process Remote Access (Process 1.2)...............................558
3.4 Database Management System (Process 2.0)...............................5593.4.1 Process Query (Process 2.1)...............................................5593.4.2 Manage Data (Process 2.2)..................................................5623.4.3 Manage Files (Process 2.3)..................................................562
3.5 Administration Subsystem (Process 3.0) .....................................5633.5.1 Process Administrator Access (Process 3.1)....................5643.5.2 Process Librarian Access (Process 3.2) ............................566
3.6 Performance Requirements............................................................5683.7 Design Constraints...........................................................................5693.8 Software System Attributes ............................................................569
3.8.1 Reliability ..............................................................................5693.8.2 Availability.............................................................................5693.8.3 Security..................................................................................5703.8.4 Maintainability......................................................................5703.8.5 Portability..............................................................................570
3.9 Logical Database Requirements.....................................................5703.9.1 Types of Information............................................................570
3.10 Other Requirements ......................................................................5704. Metrics .......................................................................................................572
4.1 Function Point Metric......................................................................5734.1.1 Completing the Function Point Table ................................5734.1.2 Calculating the VAF ..............................................................5734.1.3 Computing the Final FP Value .............................................5734.1.4 Conclusion ............................................................................573
4.2 Other Metrics ...................................................................................5744.2.1 Source Code Size Metrics ....................................................5744.2.2 Code Understandability Metrics ........................................5754.2.3 Function Metrics ..................................................................575
Revision Chart
Version Primary Author(s) Description of Version
Date Completed
Final Project Team 2 Draft created for distribution and review comments.
03–11–02
CuuDuongThanCong.com https://fb.com/tailieudientucntt
537
Sample SRS
1. INTRODUCTION
1.1 Purpose
The purpose of this software requirements specification is to capturerequirements for developing a library management system for a small- tomedium-sized library. The document is intended for use by all stakehold-ers involved in the development of such a system. Stakeholders includecustomer representatives (marketing personnel) and software representa-tives (analysts, developers, and testers). This document has been pre-pared to capture the requirements of all stakeholders so that thoserequirements are traceable to the end product. Capturing requirements inthe early stages of the development cycle reduces the risk of schedule slip-page or budget overspending and enables developers to develop the sys-tem in a more efficient manner.
1.2 Scope
The ACME Library Management System is intended for use in a small- tomedium-sized library, such as a library in a small town or on a college cam-pus. It is not intended to support very large libraries such as the New YorkPublic Library. The system includes the hardware and software to supportthe day-to-day operation of the library. It provides services to members,librarians, and administrators. These services have been designed to helpusers get their jobs done faster and more efficiently. The system also pro-vides services to remote users via the Internet.
The goal is to provide a system that is responsive, efficient, reliable,easy to use, and easy to maintain. The system must provide a good userexperience for all users.
1.3 Definitions, Acronyms, and Abbreviations
Definitions for some of the common terms used throughout this docu-ment are:
• Administrator — a person responsible for administering the system• Asset database — a database that contains information about all the
assets in the library• Librarian — a person responsible for serving the needs of the
members• Member — a person that has a membership number and password to
gain access to the system from a member terminal on the librarypremises
• Member database — a database that contains information about allmembers of the library
• Public — a person that accesses the services of the library from a re-mote terminal via the Internet
CuuDuongThanCong.com https://fb.com/tailieudientucntt
538
SOFTWARE ENGINEERING HANDBOOK
The following acronyms and abbreviations are used in this document:
• ADO — active data object• DBMS — database management system• GUI — graphical user interface• IIS — internet information server• LAN — local area network• ODBC — open database connectivity
1.4 References
• Roger Pressman, Software Engineering, “A Practitioner’s Approach” —5th edition, McGraw-Hill, January 2001
• Web site associated with the book immediately above at:http://www.mhhe.com/engcs/compsci/pressman/student_index.html
• Course web site at: http://www.newartech.com/se• Thomas Connolly, “Database Systems” — 3rd edition, Addison-Wesley,
2002• Ian Summerville, “Software Engineering,” 5th edition, Addison-Wesley,
1995• Edward Yourdon, “Modern Structured Analysis,” Prentice Hall, 2000• Suzanne Robertson, James Robertson, “Mastering the Requirement
Process,” Addison-Wesley, 1999• Some useful background information on function points is located at:
htpp://ourworld.compuserve.com/homepages/softcomp/fp-faq.htm#WhatAreFunctionPoints
• Product documentation for Microsoft Windows 2000 Server is located at:http://www.microsoft.com/windows2000/en/server/help
• Product documentation for Microsoft Internet Information Server (IIS) islocated at: http://www.microsoft.com/windows2000/en/server/iis/
• Product documentation for Microsoft SQL Server is located at:http://www.microsoft.com/qul/techinfo/productdoc/2000/books.asp
1.5 Overview
The remainder of this document describes the system requirements forthe ACME library management system. The next section contains adescription of the overall system, assumptions, dependencies, con-straints, and its intended users. The third section on specific requirementscontains a detailed description of system requirements necessary for test-ing the ACME library management system. The fourth section on metrics-contains information on the function points metric that was chosen togauge the size of the system relative to other systems of this type devel-oped by our company.
CuuDuongThanCong.com https://fb.com/tailieudientucntt
539
Sample SRS
2. OVERALL DESCRIPTION
2.1 Product Perspective
The ACME library management system provides the hardware, soft-ware, and interfaces to support the various system users. For each usertype, the system will operate in a different mode:
• Public mode — for library members and users accessing the systemvia the Web
• Private mode — for librarians• Administration mode — for administrators
In each mode, a user has access to a different set of services helping to con-trol access to the system and maintain the integrity of the data stored inthe library databases.
PCs placed at strategic locations throughout the library provide thehardware interfaces through which members access the system. There arealso PCs at the librarian and administrator desks. At the librarian’s desk, abar code reader provides an additional hardware interface. This readerenables the librarian to scan membership cards and asset bar codes, thusalleviating the need to enter the information manually.
Web browsers running on the various PCs provide the user interfaces tothe system. A system access page is displayed on each PC type and eachuser must enter a username and password to gain access. Depending onthe user type and the PC from which the system is accessed, different ser-vices are accessible:
• Members have access to services such as the ability to check the sta-tus of any checked-out assets with overdue fees (if applicable), searchfor an asset in the library, reserve, etc.
• Librarians have access to services such as the ability to check in orcheck out assets, the ability to accept payment of overdue fees, etc.
• Administrators have access to services such as the ability to add anasset, remove an asset, check the status of an asset, etc.
In addition, remote users can browse the library’s Web page and accessa subset of the member services with some additional services for remoteusers, such as the ability to enter a home location and get directions to thelibrary from that location.
The system also has a number of software interfaces to other softwareproducts. These software products include the internet information server(IIS) and a database management system (DBMS). The IIS provides supportfor the Web pages that make up the user interface and the DBMS hostsdatabases for membership and asset information and processes all infor-mation queries generated by the system.
CuuDuongThanCong.com https://fb.com/tailieudientucntt
540
SOFTWARE ENGINEERING HANDBOOK
The communication interfaces include the library’s previously installedEthernet network, which is used to interconnect the various system com-ponents, its previously installed Internet gateway that provides access forremote users, and a firewall to restrict access to selected services.
2.1.1 System Interfaces
System interfaces for the ACME library management system includeinterfaces of the following types:
• User interfaces — describe how users (members, librarians, and ad-ministrator) access and interact with the system.
• Hardware interfaces — describe the hardware components in the sys-tem, such as PCs, bar code reader, etc. and how they connect to thesystem.
• Software interfaces — describe how the software being developed in-terfaces with other major software components in the system, such asthe operating system, the IIS, and the DBMS.
• Communication interfaces — describe how the various components inthe system communicate with each other.
2.1.2 User Interfaces
All user interfaces are implemented in HTML format and displayedinside an Internet web browser. Because the system is designed to supportmembers of the public from a wide variety of backgrounds, the graphicaluser interface (GUI) will be designed to be both intuitive and easy-to-user.The same look-and-feel will be used for members, remote users, librarians,and administrators. (See Section 3.1.1.)
2.1.3 Hardware Interfaces
Hardware interface requirements for the ACME library management sys-tem include the following:
• Each PC will be equipped with a 10/100 BASE-T Ethernet network in-terface card that will enable the PC to connect to a hub or router onthe LAN.
• The bar code reader will connect directly to the serial port on the li-brarian’s PC and use serial transmission to communicate with the PC.(See Section 3.1.2 for specific requirements.)
2.1.4 Software Interfaces
The software developed for the ACME library management systemmust interoperate with several other software components in the systemincluding:
CuuDuongThanCong.com https://fb.com/tailieudientucntt
541
Sample SRS
• The operating system running on each PC• The Internet information server running on the administrator’s PC• The DBMS running on the administrator’s PC
See Section 3.1.3 for specific requirements.
2.1.5 Communications Interfaces
The communication interfaces in the system include:
• Remote users use their home telephone lines to access the remote ser-vices provided by the ACME library management system.
• The bar code reader connects to the librarian’s PC via the PC’s serialport.
See Section 3.1.4 for specific requirements.
2.1.6 Memory Constraints
To support reliable and efficient operation of the various PCs runningthe Microsoft Windows operating system, the following memory configura-tions are required for the PCs associated with each of the user types:
• Member’s PC — 128 MB• Librarian’s PC — 128 MB• Administrator’s PC — 512 MB
The larger memory size on the administrator’s PC reflects the fact thatthis PC is running the IIS and the DBMS. Also, the administrator’s PC has amuch higher disk space requirement: 1 GB, as opposed to the disk spacerequirement of 200 MB for member and librarian PCs.
2.1.7 Operations
The system will experience most use during normal opening hours ofthe library 9:30 a.m. to 9:30 p.m. During this time the system will be capableof sustaining service without undue delays in processing requests by mem-bers or the librarian. The system will be capable of handling multiple clientrequests without dropping a request.
Membership and asset data will be stored in databases managed by theDBMS system. The database information will be automatically backed upeach night at 2:00 a.m. This will provide one level of protection against dataloss should a failure occur.
A procedure will be developed to provide instructions for the adminis-trator to perform a recovery operation in the event of a failure during day-time hours. The objective of such a procedure will be to bring the systemback into normal operation within two hours.
CuuDuongThanCong.com https://fb.com/tailieudientucntt
542
SOFTWARE ENGINEERING HANDBOOK
2.1.8 Site Adaptation Requirements
The system will use the library’s previously installed Ethernet network.The network is a 10BASE-T network and therefore the PCs will need to beequipped with network interface cards that support the 10BASE-T networktype. The system will also use the library’s existing Internet gateway. Thegateway will connect to the library’s network and provide firewall protec-tion against remote users’ accessing unauthorized services.
2.2 Product Functions
The ACME library management system will control user access and pro-vide services to the various user types. The different users and the ser-vices provided for each user are:
• Members— Check the status of checked-out assets— Search for an asset— Reserve an asset— View list of coming events— View library floor map— View general library information
• Remote User— Search for an asset— Get library directions— View list of coming events— View library floor map— View general library information
• Librarian— Check out or check in an asset— Assess and collect fees— Print overdue notices— Reserve assets— Determine asset status— Determine member’s records— Read membership card and asset numbers with bar code reader
• Administrator— Manage library assets— Maintain membership— Generate reports
2.3 User Characteristics
Because the ACME library management system is intended for small-tomedium-sized libraries, people from many different educational back-grounds will want to take advantage of the services provided by the library.
CuuDuongThanCong.com https://fb.com/tailieudientucntt
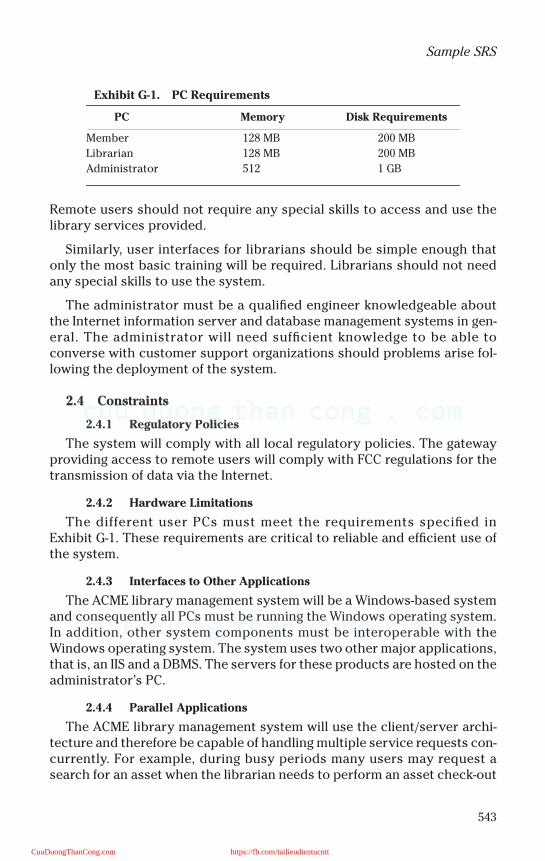
543
Sample SRS
Remote users should not require any special skills to access and use thelibrary services provided.
Similarly, user interfaces for librarians should be simple enough thatonly the most basic training will be required. Librarians should not needany special skills to use the system.
The administrator must be a qualified engineer knowledgeable aboutthe Internet information server and database management systems in gen-eral. The administrator will need sufficient knowledge to be able toconverse with customer support organizations should problems arise fol-lowing the deployment of the system.
2.4 Constraints
2.4.1 Regulatory Policies
The system will comply with all local regulatory policies. The gatewayproviding access to remote users will comply with FCC regulations for thetransmission of data via the Internet.
2.4.2 Hardware Limitations
The different user PCs must meet the requirements specified inExhibit G-1. These requirements are critical to reliable and efficient use ofthe system.
2.4.3 Interfaces to Other Applications
The ACME library management system will be a Windows-based systemand consequently all PCs must be running the Windows operating system.In addition, other system components must be interoperable with theWindows operating system. The system uses two other major applications,that is, an IIS and a DBMS. The servers for these products are hosted on theadministrator’s PC.
2.4.4 Parallel Applications
The ACME library management system will use the client/server archi-tecture and therefore be capable of handling multiple service requests con-currently. For example, during busy periods many users may request asearch for an asset when the librarian needs to perform an asset check-out
Exhibit G-1. PC Requirements
PC Memory Disk Requirements
Member 128 MB 200 MB
Librarian 128 MB 200 MB
Administrator 512 1 GB
CuuDuongThanCong.com https://fb.com/tailieudientucntt
544
SOFTWARE ENGINEERING HANDBOOK
operation for another member. In these circumstances, the system will pro-cess all requests without significant delays. (See Section 3.6 PerformanceRequirements for more information.)
2.4.5 Audit Requirements
No auditing functions are required in this system.
2.4.6 Control Functions
The only control functions provided in the system are those functionsused to manipulate the data in the asset and membership databases.
2.4.7 High Order Language Functions
The ACME library management system uses a DBMS to manage the data-bases for membership and asset information. The system will use struc-tured query language (SQL) to query for and update any information in thedatabase.
2.4.8 Signal Handshaking Protocols
The ACME library management system will use cookies to help identifyusers attempting to access the system via the Internet. This will provideanother level of security.
2.4.9 Reliability Requirements
The DBMS software will provide a backup capability to ensure protec-tion of the data in the database. In addition, the DBMS software provides atransaction recording feature that can be used to keep track of all transac-tions during normal daytime operation. If a failure occurs, the transactionrecord can be used to roll back to the last successful transaction so that aminimum amount of information is lost.
2.4.10 Criticality of the Application
Although failure of the system will never be life threatening, providing areliable and continuous service to users is one of the key requirements ofthe system. When a failure occurs, system downtime will be kept to a min-imum. The target is to have the system operational within two hours fol-lowing a serious failure.
2.4.11 Safety and Security of the System
Access to the ACME library management system by remote users will becontrolled by the Internet gateway installed on the library premises. Thegateway will provide a firewall that allows access to a subset of the ser-vices provided to library members. In addition, the IIS and the DBMS pro-vide extensive security features to help protect data in the system. All sys-
CuuDuongThanCong.com https://fb.com/tailieudientucntt
545
Sample SRS
tem components must comply with regulations for equipment in a publiclocation.
2.5 Assumptions and Dependencies
The ACME library management system uses equipment alreadyinstalled at the library premises, including the existing network and theInternet gateway.
Over time, the technologies employed by the ACME library managementsystem may change. New versions of the IIS and the DBMS will becomeavailable. New features will help the administrator maintain the databases,improve the response time for simultaneous transactions, and prompt thedevelopment of new features for librarians and members.
2.6 Apportioning of Requirements
The ACME library management system will be designed so that new fea-tures for member, librarian, or administrator can be added very easily. Thecombination of the IIS and the DBMS provide the mechanism throughwhich the data stored in the membership and asset databases can be usedin many different ways to provide new services.
3. SPECIFIC REQUIREMENTS
3.1 External Interface Requirements
3.1.1 User Interfaces
All user interfaces will be HTML-based and will be displayed in a webbrowser.
3.1.1.1. Process Member Access Screens
• Validate membership screen (see Exhibit G-2)• Reserve asset screen (see Exhibit G-3)• Request search screen (see Exhibit G-4)• Request status screen (see Exhibit G-5)• Coming event screen (see Exhibit G-6)• Get library directions screen (see Exhibit G-7)• View floor map screen (see Exhibit G-8)• View general information screen (see Exhibit G-9)
3.1.1.2. Process Librarian Access Screens
• Check out asset screen (see Exhibit G-10)• Check in asset screen (see Exhibit G-11)• Generate reports screen (see Exhibit G-12)
CuuDuongThanCong.com https://fb.com/tailieudientucntt
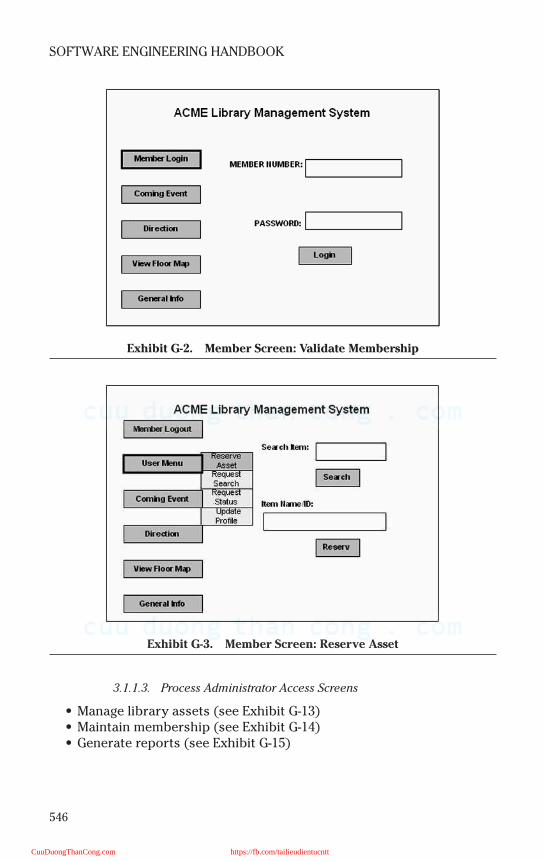
546
SOFTWARE ENGINEERING HANDBOOK
3.1.1.3. Process Administrator Access Screens
• Manage library assets (see Exhibit G-13)• Maintain membership (see Exhibit G-14)• Generate reports (see Exhibit G-15)
Exhibit G-2. Member Screen: Validate Membership
Exhibit G-3. Member Screen: Reserve Asset
CuuDuongThanCong.com https://fb.com/tailieudientucntt
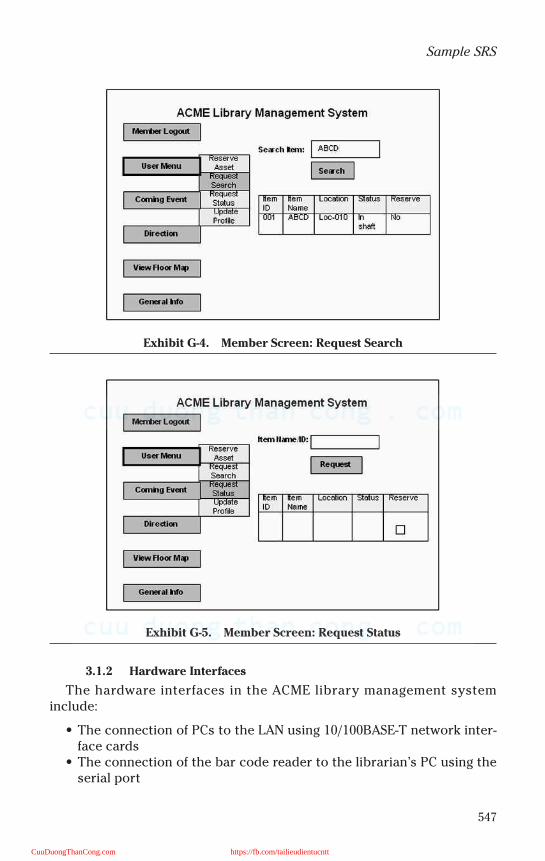
547
Sample SRS
3.1.2 Hardware Interfaces
The hardware interfaces in the ACME library management systeminclude:
• The connection of PCs to the LAN using 10/100BASE-T network inter-face cards
• The connection of the bar code reader to the librarian’s PC using theserial port
Exhibit G-4. Member Screen: Request Search
Exhibit G-5. Member Screen: Request Status
CuuDuongThanCong.com https://fb.com/tailieudientucntt
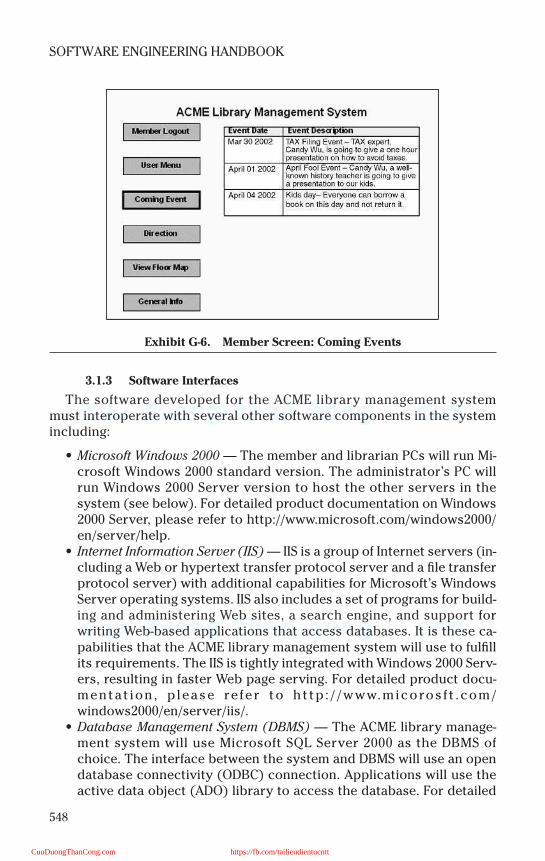
548
SOFTWARE ENGINEERING HANDBOOK
3.1.3 Software Interfaces
The software developed for the ACME library management systemmust interoperate with several other software components in the systemincluding:
• Microsoft Windows 2000 — The member and librarian PCs will run Mi-crosoft Windows 2000 standard version. The administrator’s PC willrun Windows 2000 Server version to host the other servers in thesystem (see below). For detailed product documentation on Windows2000 Server, please refer to http://www.microsoft.com/windows2000/en/server/help.
• Internet Information Server (IIS) — IIS is a group of Internet servers (in-cluding a Web or hypertext transfer protocol server and a file transferprotocol server) with additional capabilities for Microsoft’s WindowsServer operating systems. IIS also includes a set of programs for build-ing and administering Web sites, a search engine, and support forwriting Web-based applications that access databases. It is these ca-pabilities that the ACME library management system will use to fulfillits requirements. The IIS is tightly integrated with Windows 2000 Serv-ers, resulting in faster Web page serving. For detailed product docu-mentat ion , p lease re fer to ht tp : / /www.micoros f t .com/windows2000/en/server/iis/.
• Database Management System (DBMS) — The ACME library manage-ment system will use Microsoft SQL Server 2000 as the DBMS ofchoice. The interface between the system and DBMS will use an opendatabase connectivity (ODBC) connection. Applications will use theactive data object (ADO) library to access the database. For detailed
Exhibit G-6. Member Screen: Coming Events
CuuDuongThanCong.com https://fb.com/tailieudientucntt
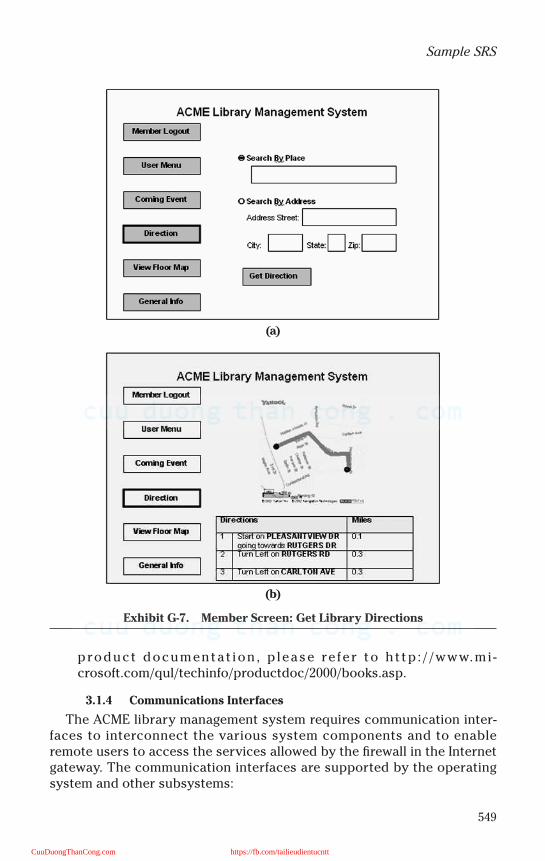
549
Sample SRS
product documentat ion , p lease re fer to ht tp : / /www.mi -crosoft.com/qul/techinfo/productdoc/2000/books.asp.
3.1.4 Communications Interfaces
The ACME library management system requires communication inter-faces to interconnect the various system components and to enableremote users to access the services allowed by the firewall in the Internetgateway. The communication interfaces are supported by the operatingsystem and other subsystems:
(a)
(b)
Exhibit G-7. Member Screen: Get Library Directions
CuuDuongThanCong.com https://fb.com/tailieudientucntt
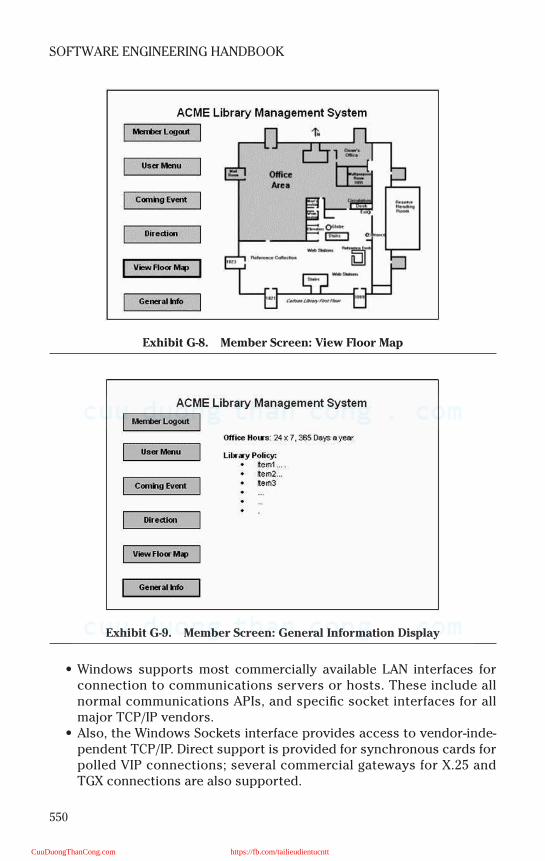
550
SOFTWARE ENGINEERING HANDBOOK
• Windows supports most commercially available LAN interfaces forconnection to communications servers or hosts. These include allnormal communications APIs, and specific socket interfaces for allmajor TCP/IP vendors.
• Also, the Windows Sockets interface provides access to vendor-inde-pendent TCP/IP. Direct support is provided for synchronous cards forpolled VIP connections; several commercial gateways for X.25 andTGX connections are also supported.
Exhibit G-8. Member Screen: View Floor Map
Exhibit G-9. Member Screen: General Information Display
CuuDuongThanCong.com https://fb.com/tailieudientucntt

551
Sample SRS
• For the firewall, a set of three layers of protocols standardizes the wayin which the host system interfaces with users. Physical layer: definesthe transmission media permissible under fire wire and the electricaland signaling characteristics of each. Link layer: describes thetransmission of data in the packets. Transaction layer: defines arequest–response protocol that hides the lower layer details of fire-wall from applications.
Exhibit G-10. Librarian Screen: Check Out Asset
Exhibit G-11. Librarian Screen: Check In Asset
CuuDuongThanCong.com https://fb.com/tailieudientucntt
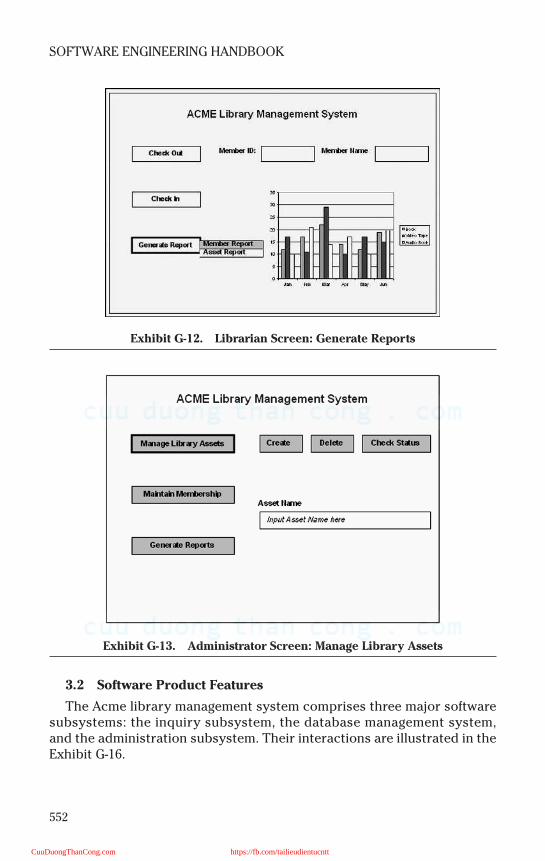
552
SOFTWARE ENGINEERING HANDBOOK
3.2 Software Product Features
The Acme library management system comprises three major softwaresubsystems: the inquiry subsystem, the database management system,and the administration subsystem. Their interactions are illustrated in theExhibit G-16.
Exhibit G-12. Librarian Screen: Generate Reports
Exhibit G-13. Administrator Screen: Manage Library Assets
CuuDuongThanCong.com https://fb.com/tailieudientucntt

553
Sample SRS
3.3 Inquiry Subsystem (Process 1.0)
The inquiry subsystem is responsible for handling transactions andrequests between the library and the user. Users fall into two categories:member and public. A member is allowed to view his membership status,perform searches, and reserve library assets. A public user is allowed toperform searches and request library information. The inquiry subsystemis decomposed into two major processes to handle these user actions.Exhibit G-17 illustrates their data flows.
Exhibit G-14. Administrator Screen: Maintain Membership
Exhibit G-15. Administrator Screen: Generate Reports
CuuDuongThanCong.com https://fb.com/tailieudientucntt
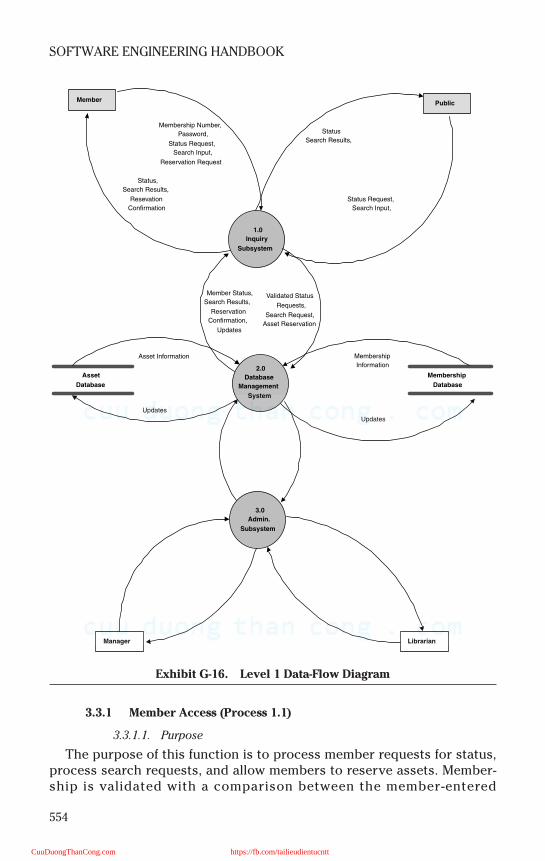
554
SOFTWARE ENGINEERING HANDBOOK
3.3.1 Member Access (Process 1.1)
3.3.1.1. Purpose
The purpose of this function is to process member requests for status,process search requests, and allow members to reserve assets. Member-ship is validated with a comparison between the member-entered
Exhibit G-16. Level 1 Data-Flow Diagram
Asset
Database
2.0
Database
Management
System
Member
1.0
Inquiry
Subsystem
3.0
Admin.
Subsystem
Membership
Database
Membership Number,
Password,
Status Request,
Search Input,
Reservation Request
Status,
Search Results,
Resevation
Confirmation
Public
Status Request,
Search Input,
Status
Search Results,
Asset Information
Updates
Membership
Information
Updates
Validated Status
Requests,
Search Request,
Asset Reservation
Member Status,
Search Results,
Reservation
Confirmation,
Updates
Manager Librarian
CuuDuongThanCong.com https://fb.com/tailieudientucntt
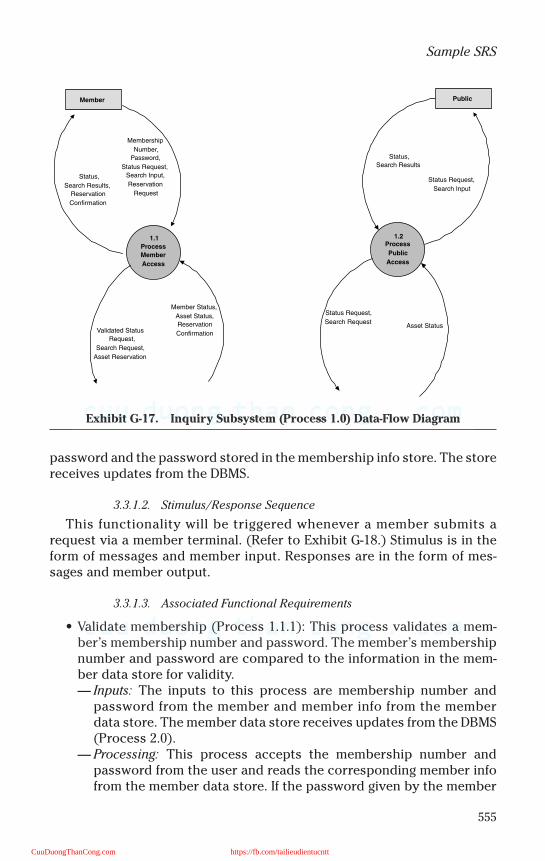
555
Sample SRS
password and the password stored in the membership info store. The storereceives updates from the DBMS.
3.3.1.2. Stimulus/Response Sequence
This functionality will be triggered whenever a member submits arequest via a member terminal. (Refer to Exhibit G-18.) Stimulus is in theform of messages and member input. Responses are in the form of mes-sages and member output.
3.3.1.3. Associated Functional Requirements
• Validate membership (Process 1.1.1): This process validates a mem-ber’s membership number and password. The member’s membershipnumber and password are compared to the information in the mem-ber data store for validity.— Inputs: The inputs to this process are membership number and
password from the member and member info from the memberdata store. The member data store receives updates from the DBMS(Process 2.0).
— Processing: This process accepts the membership number andpassword from the user and reads the corresponding member infofrom the member data store. If the password given by the member
Exhibit G-17. Inquiry Subsystem (Process 1.0) Data-Flow Diagram
Member
1.1
Process
Member
Access
Membership
Number,
Password,
Status Request,
Search Input,
Reservation
Request
1.2Process
Public
Access
Status Request,
Search Input
Status,
Search Results
Member Status,
Asset Status,
Reservation
ConfirmationValidated Status
Request,
Search Request,
Asset Reservation
Status,
Search Results,
Reservation
Confirmation
Status Request,
Search RequestAsset Status
Public
CuuDuongThanCong.com https://fb.com/tailieudientucntt
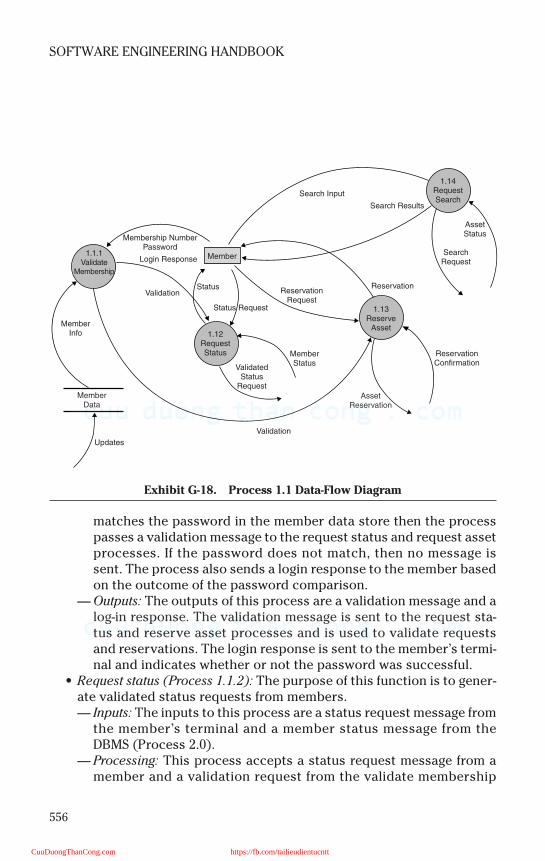
556
SOFTWARE ENGINEERING HANDBOOK
matches the password in the member data store then the processpasses a validation message to the request status and request assetprocesses. If the password does not match, then no message issent. The process also sends a login response to the member basedon the outcome of the password comparison.
— Outputs: The outputs of this process are a validation message and alog-in response. The validation message is sent to the request sta-tus and reserve asset processes and is used to validate requestsand reservations. The login response is sent to the member’s termi-nal and indicates whether or not the password was successful.
• Request status (Process 1.1.2): The purpose of this function is to gener-ate validated status requests from members.— Inputs: The inputs to this process are a status request message from
the member’s terminal and a member status message from theDBMS (Process 2.0).
— Processing: This process accepts a status request message from amember and a validation request from the validate membership
Exhibit G-18. Process 1.1 Data-Flow Diagram
MemberData
MemberStatus
MemberInfo
Updates
1.1.1Validate
Membership
Membership NumberPassword
Login Response Member
Validation
Validation
Status
Status Request
1.12RequestStatus
ValidatedStatus
Request
Search Input
ReservationRequest
Search Results
1.14RequestSearch
SearchRequest
Reservation
1.13Reserve
Asset
AssetStatus
ReservationConfirmation
AssetReservation
CuuDuongThanCong.com https://fb.com/tailieudientucntt
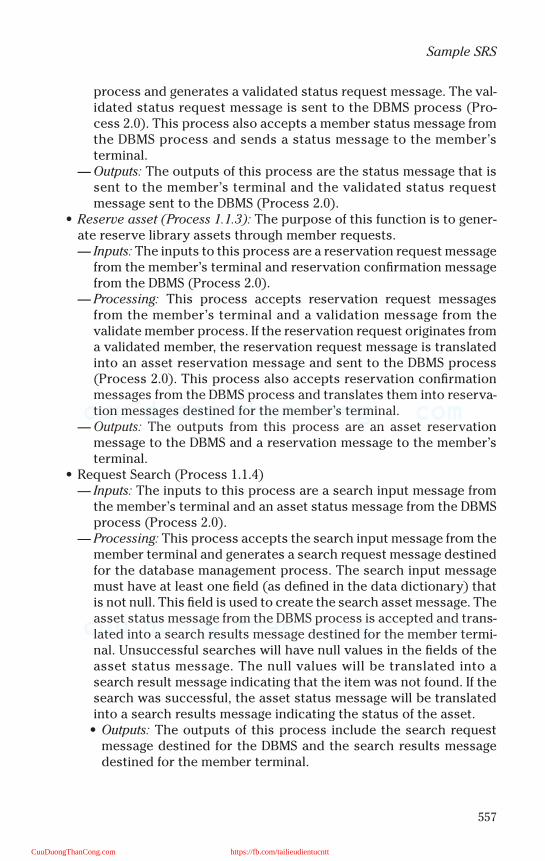
557
Sample SRS
process and generates a validated status request message. The val-idated status request message is sent to the DBMS process (Pro-cess 2.0). This process also accepts a member status message fromthe DBMS process and sends a status message to the member’sterminal.
— Outputs: The outputs of this process are the status message that issent to the member’s terminal and the validated status requestmessage sent to the DBMS (Process 2.0).
• Reserve asset (Process 1.1.3): The purpose of this function is to gener-ate reserve library assets through member requests.— Inputs: The inputs to this process are a reservation request message
from the member’s terminal and reservation confirmation messagefrom the DBMS (Process 2.0).
— Processing: This process accepts reservation request messagesfrom the member’s terminal and a validation message from thevalidate member process. If the reservation request originates froma validated member, the reservation request message is translatedinto an asset reservation message and sent to the DBMS process(Process 2.0). This process also accepts reservation confirmationmessages from the DBMS process and translates them into reserva-tion messages destined for the member’s terminal.
— Outputs: The outputs from this process are an asset reservationmessage to the DBMS and a reservation message to the member’sterminal.
• Request Search (Process 1.1.4)— Inputs: The inputs to this process are a search input message from
the member’s terminal and an asset status message from the DBMSprocess (Process 2.0).
— Processing: This process accepts the search input message from themember terminal and generates a search request message destinedfor the database management process. The search input messagemust have at least one field (as defined in the data dictionary) thatis not null. This field is used to create the search asset message. Theasset status message from the DBMS process is accepted and trans-lated into a search results message destined for the member termi-nal. Unsuccessful searches will have null values in the fields of theasset status message. The null values will be translated into asearch result message indicating that the item was not found. If thesearch was successful, the asset status message will be translatedinto a search results message indicating the status of the asset.
• Outputs: The outputs of this process include the search requestmessage destined for the DBMS and the search results messagedestined for the member terminal.
CuuDuongThanCong.com https://fb.com/tailieudientucntt
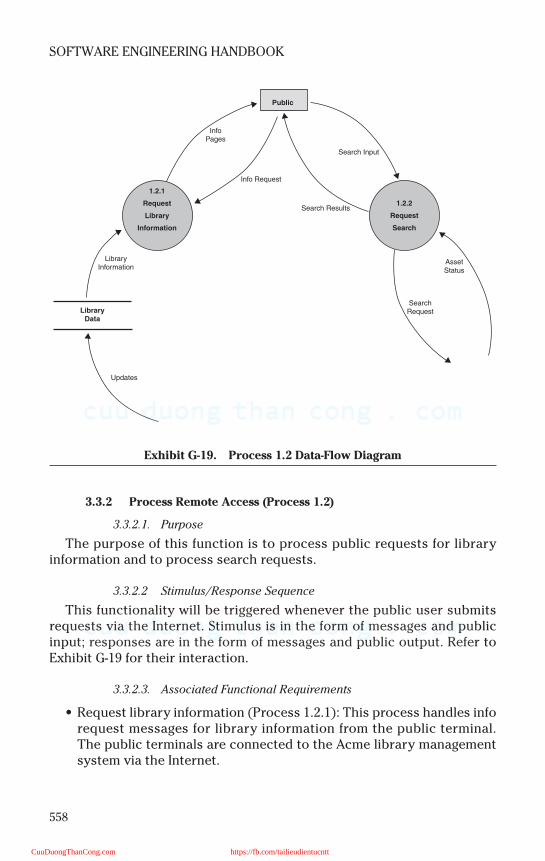
558
SOFTWARE ENGINEERING HANDBOOK
3.3.2 Process Remote Access (Process 1.2)
3.3.2.1. Purpose
The purpose of this function is to process public requests for libraryinformation and to process search requests.
3.3.2.2 Stimulus/Response Sequence
This functionality will be triggered whenever the public user submitsrequests via the Internet. Stimulus is in the form of messages and publicinput; responses are in the form of messages and public output. Refer toExhibit G-19 for their interaction.
3.3.2.3. Associated Functional Requirements
• Request library information (Process 1.2.1): This process handles inforequest messages for library information from the public terminal.The public terminals are connected to the Acme library managementsystem via the Internet.
Exhibit G-19. Process 1.2 Data-Flow Diagram
Updates
LibraryData
LibraryInformation
InfoPages
Info Request
Public
Search Input
Search Results
AssetStatus
SearchRequest
1.2.1
Request
Library
Information
1.2.2
Request
Search
CuuDuongThanCong.com https://fb.com/tailieudientucntt
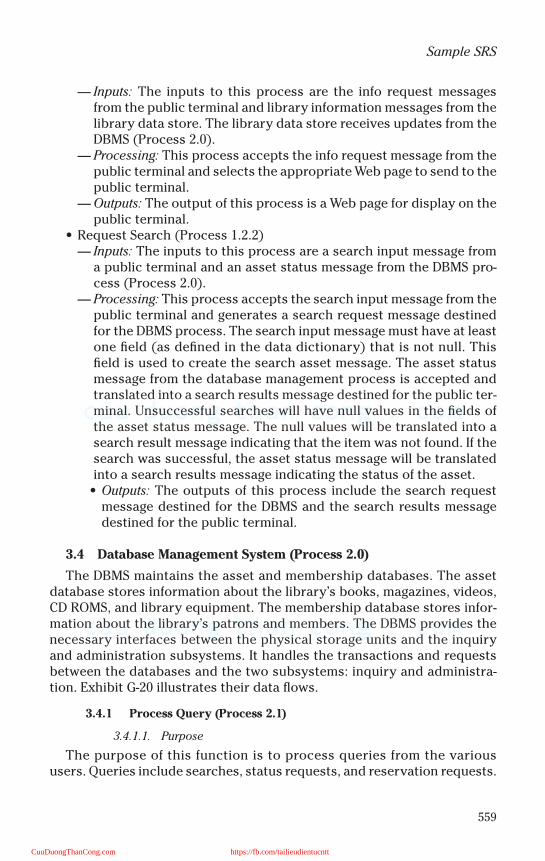
559
Sample SRS
— Inputs: The inputs to this process are the info request messagesfrom the public terminal and library information messages from thelibrary data store. The library data store receives updates from theDBMS (Process 2.0).
— Processing: This process accepts the info request message from thepublic terminal and selects the appropriate Web page to send to thepublic terminal.
— Outputs: The output of this process is a Web page for display on thepublic terminal.
• Request Search (Process 1.2.2)— Inputs: The inputs to this process are a search input message from
a public terminal and an asset status message from the DBMS pro-cess (Process 2.0).
— Processing: This process accepts the search input message from thepublic terminal and generates a search request message destinedfor the DBMS process. The search input message must have at leastone field (as defined in the data dictionary) that is not null. Thisfield is used to create the search asset message. The asset statusmessage from the database management process is accepted andtranslated into a search results message destined for the public ter-minal. Unsuccessful searches will have null values in the fields ofthe asset status message. The null values will be translated into asearch result message indicating that the item was not found. If thesearch was successful, the asset status message will be translatedinto a search results message indicating the status of the asset.
• Outputs: The outputs of this process include the search requestmessage destined for the DBMS and the search results messagedestined for the public terminal.
3.4 Database Management System (Process 2.0)
The DBMS maintains the asset and membership databases. The assetdatabase stores information about the library’s books, magazines, videos,CD ROMS, and library equipment. The membership database stores infor-mation about the library’s patrons and members. The DBMS provides thenecessary interfaces between the physical storage units and the inquiryand administration subsystems. It handles the transactions and requestsbetween the databases and the two subsystems: inquiry and administra-tion. Exhibit G-20 illustrates their data flows.
3.4.1 Process Query (Process 2.1)
3.4.1.1. Purpose
The purpose of this function is to process queries from the varioususers. Queries include searches, status requests, and reservation requests.
CuuDuongThanCong.com https://fb.com/tailieudientucntt

560
SOFTWARE ENGINEERING HANDBOOK
3.4.1.2. Stimulus/Response Sequence
This functionality will be triggered whenever a request is sent byanother process. No direct interaction with the user is available. Theresponse is in the form of messages sent to the requesting process. Referto the Exhibit G-21.
3.4.1.3. Associated Functional Requirements
• Query Decomposition (Process 2.1.1)— Inputs: The inputs to this process are search member request mes-
sages and search request messages from other processes and re-sponses from the manage file process.
Exhibit G-20. Database Management System (Process 2.0) Data-Flow Diagram
2.1
Process
Query
Member Status
Asset Status
Asset Reservation
2.2
Manage
Data
Asset Update Request
Member Update
Request
Response
Query
Member Request
Search Request
Reservation
Confirmation
DML Update
Asset
Database
Membership
Database
Asset Information
Updates
Updates
Asset Update
Member Information
2.3
Manage
Files
CuuDuongThanCong.com https://fb.com/tailieudientucntt
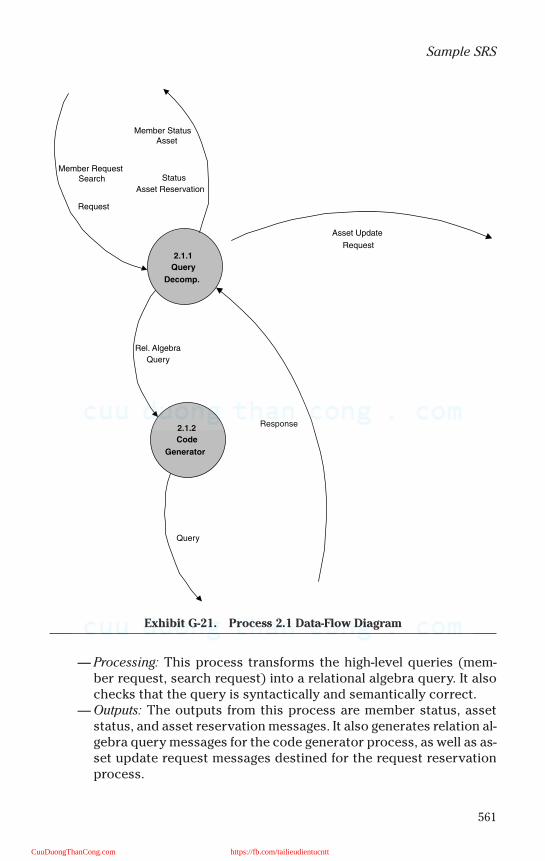
561
Sample SRS
— Processing: This process transforms the high-level queries (mem-ber request, search request) into a relational algebra query. It alsochecks that the query is syntactically and semantically correct.
— Outputs: The outputs from this process are member status, assetstatus, and asset reservation messages. It also generates relation al-gebra query messages for the code generator process, as well as as-set update request messages destined for the request reservationprocess.
Exhibit G-21. Process 2.1 Data-Flow Diagram
2.1.1
Query
Decomp.
Member StatusAsset
Status
Asset Reservation
Response
Rel. Algebra
Query
Member RequestSearch
Request
2.1.2
Code
Generator
Query
Asset Update
Request
CuuDuongThanCong.com https://fb.com/tailieudientucntt
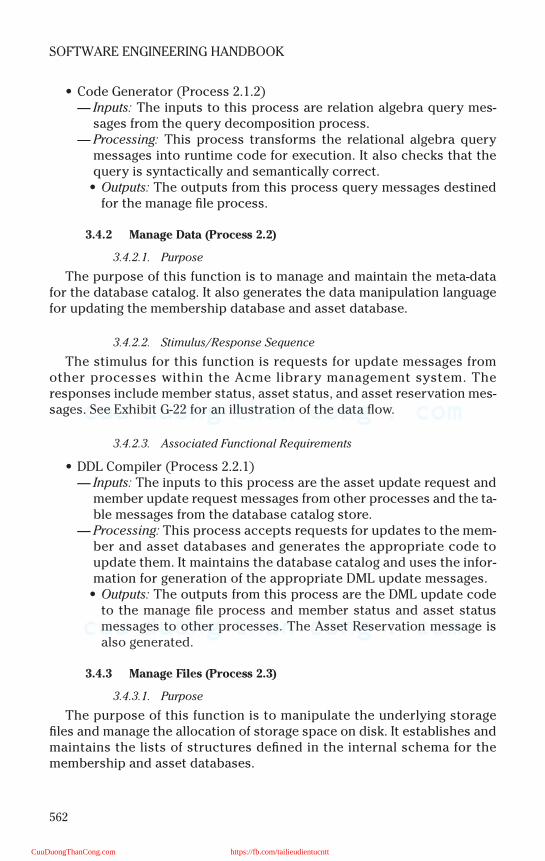
562
SOFTWARE ENGINEERING HANDBOOK
• Code Generator (Process 2.1.2)— Inputs: The inputs to this process are relation algebra query mes-
sages from the query decomposition process.— Processing: This process transforms the relational algebra query
messages into runtime code for execution. It also checks that thequery is syntactically and semantically correct.
• Outputs: The outputs from this process query messages destinedfor the manage file process.
3.4.2 Manage Data (Process 2.2)
3.4.2.1. Purpose
The purpose of this function is to manage and maintain the meta-datafor the database catalog. It also generates the data manipulation languagefor updating the membership database and asset database.
3.4.2.2. Stimulus/Response Sequence
The stimulus for this function is requests for update messages fromother processes within the Acme library management system. Theresponses include member status, asset status, and asset reservation mes-sages. See Exhibit G-22 for an illustration of the data flow.
3.4.2.3. Associated Functional Requirements
• DDL Compiler (Process 2.2.1)— Inputs: The inputs to this process are the asset update request and
member update request messages from other processes and the ta-ble messages from the database catalog store.
— Processing: This process accepts requests for updates to the mem-ber and asset databases and generates the appropriate code toupdate them. It maintains the database catalog and uses the infor-mation for generation of the appropriate DML update messages.
• Outputs: The outputs from this process are the DML update codeto the manage file process and member status and asset statusmessages to other processes. The Asset Reservation message isalso generated.
3.4.3 Manage Files (Process 2.3)
3.4.3.1. Purpose
The purpose of this function is to manipulate the underlying storagefiles and manage the allocation of storage space on disk. It establishes andmaintains the lists of structures defined in the internal schema for themembership and asset databases.
CuuDuongThanCong.com https://fb.com/tailieudientucntt
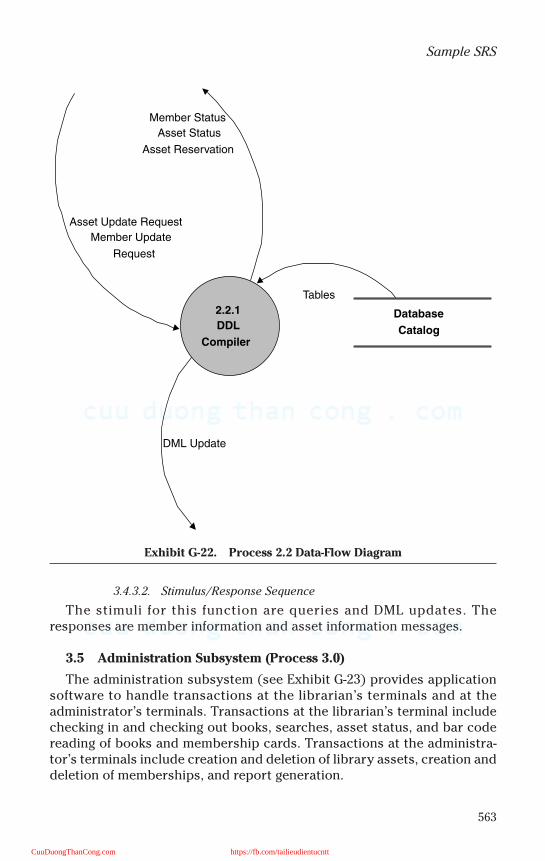
563
Sample SRS
3.4.3.2. Stimulus/Response Sequence
The stimuli for this function are queries and DML updates. Theresponses are member information and asset information messages.
3.5 Administration Subsystem (Process 3.0)
The administration subsystem (see Exhibit G-23) provides applicationsoftware to handle transactions at the librarian’s terminals and at theadministrator’s terminals. Transactions at the librarian’s terminal includechecking in and checking out books, searches, asset status, and bar codereading of books and membership cards. Transactions at the administra-tor’s terminals include creation and deletion of library assets, creation anddeletion of memberships, and report generation.
Exhibit G-22. Process 2.2 Data-Flow Diagram
2.2.1
DDL
Compiler
Member Status
Asset Status
Asset Reservation
DML Update
Asset Update Request
Member Update
Request
Database
Catalog
Tables
CuuDuongThanCong.com https://fb.com/tailieudientucntt

564
SOFTWARE ENGINEERING HANDBOOK
3.5.1 Process Administrator Access (Process 3.1)
3.5.1.1. Purpose
The purpose of this function is to process administrator requests andtransactions.
3.5.1.2. Stimulus/Response Sequence
This functionality will be triggered whenever the administrator submitsrequests or transactions to the system. Stimulus is in the form of messagesand other administrator generated input. Responses are in the form ofmessages and terminal output. Refer to Exhibit G-24 for their interaction.
3.5.1.3. Associated Functional Requirements
• Manage assets (Process 3.1.1): The purpose of this feature is to allowthe administrator to control and manage the library assets by theACME library management system. The administrator can choose thefollowing actions: create asset, delete asset, or check asset status.— Inputs: The inputs to this process are create asset, delete asset, and
asset request messages from the administrator terminal. It also ac-cepts the asset status and asset update response messages fromthe DBMS process (Process 2.0).
Exhibit G-23. Administration Subsystem (Process 3.0) Data-Flow Diagram
Administrator
3.1
Process
Admin.
Access
Create Member
Delete MemberMember Request
Create Asset
Delete Asset
Asset Request
3.2
Process
LIbrarian
Access
Member Status
Asset Response
Member Request
Asset Request
Asset Check In
Asset Check Out
Report Request
Member Update
Response
Member Status
Asset Update
Response
Asset StatusMember Update
Request
Member Request
Asset Update Request
Asset Request
Asset StatusStatus Report
Status Request
Member Request
Asset Update Request
Member Update
Request
Asset Status
Member Status
Librarian
CuuDuongThanCong.com https://fb.com/tailieudientucntt
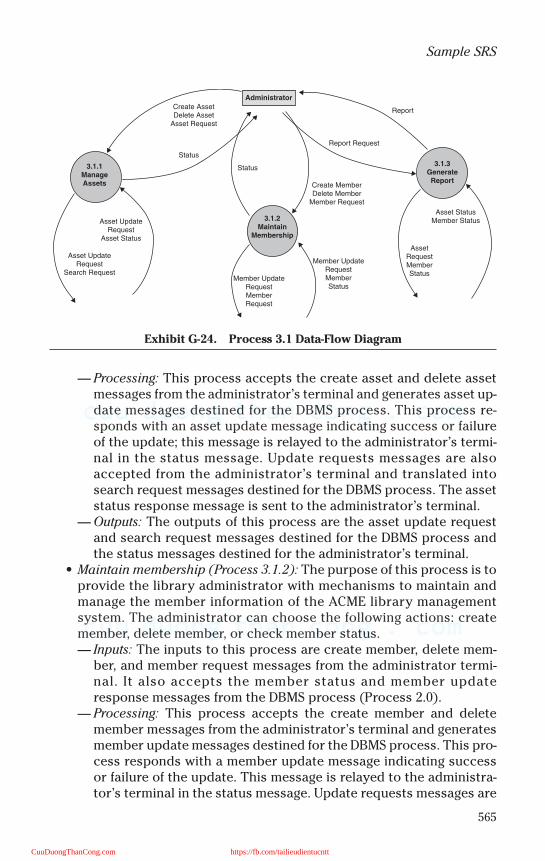
565
Sample SRS
— Processing: This process accepts the create asset and delete assetmessages from the administrator’s terminal and generates asset up-date messages destined for the DBMS process. This process re-sponds with an asset update message indicating success or failureof the update; this message is relayed to the administrator’s termi-nal in the status message. Update requests messages are alsoaccepted from the administrator’s terminal and translated intosearch request messages destined for the DBMS process. The assetstatus response message is sent to the administrator’s terminal.
— Outputs: The outputs of this process are the asset update requestand search request messages destined for the DBMS process andthe status messages destined for the administrator’s terminal.
• Maintain membership (Process 3.1.2): The purpose of this process is toprovide the library administrator with mechanisms to maintain andmanage the member information of the ACME library managementsystem. The administrator can choose the following actions: createmember, delete member, or check member status.— Inputs: The inputs to this process are create member, delete mem-
ber, and member request messages from the administrator termi-nal. It also accepts the member status and member updateresponse messages from the DBMS process (Process 2.0).
— Processing: This process accepts the create member and deletemember messages from the administrator’s terminal and generatesmember update messages destined for the DBMS process. This pro-cess responds with a member update message indicating successor failure of the update. This message is relayed to the administra-tor’s terminal in the status message. Update requests messages are
Exhibit G-24. Process 3.1 Data-Flow Diagram
Asset UpdateRequest
Search Request
Asset UpdateRequest
Asset Status
3.1.1ManageAssets
Status
Status
Create AssetDelete Asset
Asset Request
Create MemberDelete Member
Member Request
Report Request
Administrator
Report
3.1.2Maintain
Membership
Member UpdateRequestMemberRequest
Member UpdateRequestMemberStatus
AssetRequestMemberStatus
Asset StatusMember Status
3.1.3GenerateReport
CuuDuongThanCong.com https://fb.com/tailieudientucntt
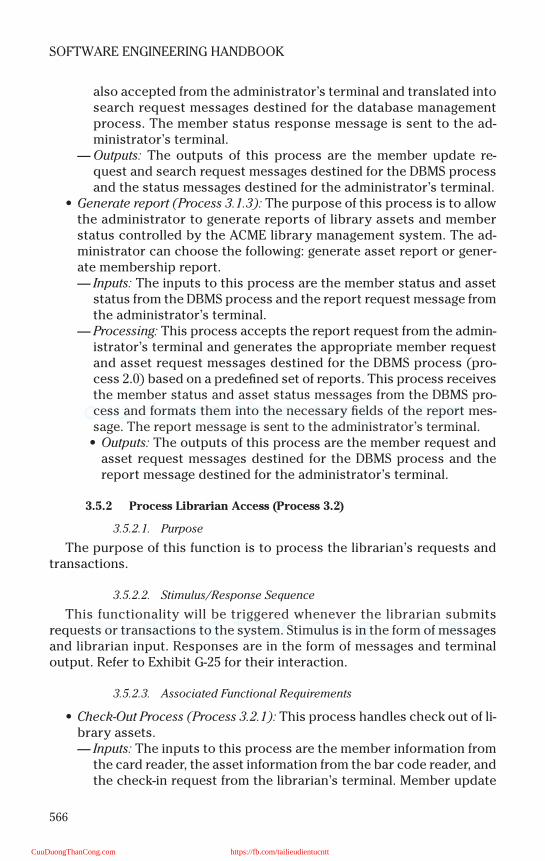
566
SOFTWARE ENGINEERING HANDBOOK
also accepted from the administrator’s terminal and translated intosearch request messages destined for the database managementprocess. The member status response message is sent to the ad-ministrator’s terminal.
— Outputs: The outputs of this process are the member update re-quest and search request messages destined for the DBMS processand the status messages destined for the administrator’s terminal.
• Generate report (Process 3.1.3): The purpose of this process is to allowthe administrator to generate reports of library assets and memberstatus controlled by the ACME library management system. The ad-ministrator can choose the following: generate asset report or gener-ate membership report.— Inputs: The inputs to this process are the member status and asset
status from the DBMS process and the report request message fromthe administrator’s terminal.
— Processing: This process accepts the report request from the admin-istrator’s terminal and generates the appropriate member requestand asset request messages destined for the DBMS process (pro-cess 2.0) based on a predefined set of reports. This process receivesthe member status and asset status messages from the DBMS pro-cess and formats them into the necessary fields of the report mes-sage. The report message is sent to the administrator’s terminal.
• Outputs: The outputs of this process are the member request andasset request messages destined for the DBMS process and thereport message destined for the administrator’s terminal.
3.5.2 Process Librarian Access (Process 3.2)
3.5.2.1. Purpose
The purpose of this function is to process the librarian’s requests andtransactions.
3.5.2.2. Stimulus/Response Sequence
This functionality will be triggered whenever the librarian submitsrequests or transactions to the system. Stimulus is in the form of messagesand librarian input. Responses are in the form of messages and terminaloutput. Refer to Exhibit G-25 for their interaction.
3.5.2.3. Associated Functional Requirements
• Check-Out Process (Process 3.2.1): This process handles check out of li-brary assets.— Inputs: The inputs to this process are the member information from
the card reader, the asset information from the bar code reader, andthe check-in request from the librarian’s terminal. Member update
CuuDuongThanCong.com https://fb.com/tailieudientucntt
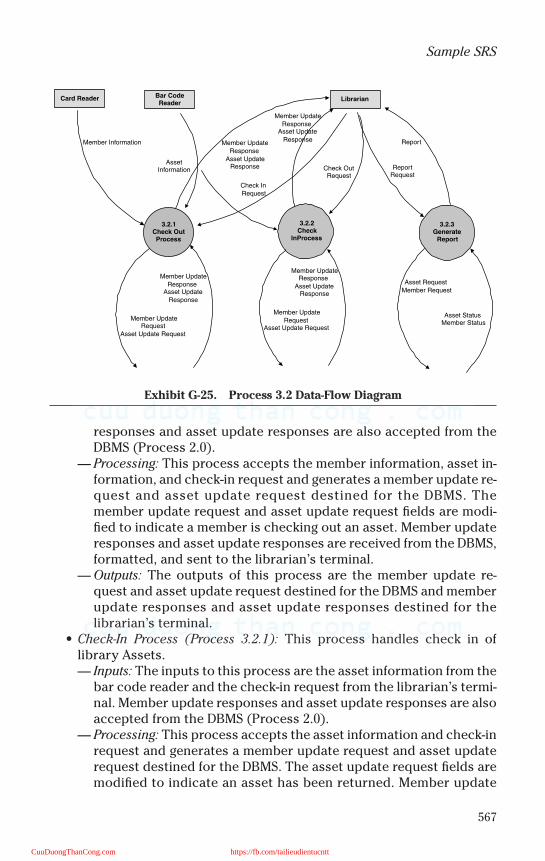
567
Sample SRS
responses and asset update responses are also accepted from theDBMS (Process 2.0).
— Processing: This process accepts the member information, asset in-formation, and check-in request and generates a member update re-quest and asset update request destined for the DBMS. Themember update request and asset update request fields are modi-fied to indicate a member is checking out an asset. Member updateresponses and asset update responses are received from the DBMS,formatted, and sent to the librarian’s terminal.
— Outputs: The outputs of this process are the member update re-quest and asset update request destined for the DBMS and memberupdate responses and asset update responses destined for thelibrarian’s terminal.
• Check-In Process (Process 3.2.1): This process handles check in oflibrary Assets.— Inputs: The inputs to this process are the asset information from the
bar code reader and the check-in request from the librarian’s termi-nal. Member update responses and asset update responses are alsoaccepted from the DBMS (Process 2.0).
— Processing: This process accepts the asset information and check-inrequest and generates a member update request and asset updaterequest destined for the DBMS. The asset update request fields aremodified to indicate an asset has been returned. Member update
Exhibit G-25. Process 3.2 Data-Flow Diagram
Card Reader
3.2.1Check OutProcess
3.2.3Generate
Report
Report
Member UpdateResponse
Asset UpdateResponse
Member UpdateRequest
Asset Update Request
Asset RequestMember Request
Asset StatusMember Status
LibrarianBar CodeReader
3.2.2Check
InProcess
AssetInformation
Member Information
Check InRequest
Check OutRequest
ReportRequest
Member UpdateRequest
Asset Update Request
Member UpdateResponse
Asset UpdateResponse
Member UpdateResponse
Asset UpdateResponse
Member UpdateResponse
Asset UpdateResponse
CuuDuongThanCong.com https://fb.com/tailieudientucntt
568
SOFTWARE ENGINEERING HANDBOOK
responses and asset update responses are received from the DBMS,formatted, and sent to the librarian’s terminal.
— Outputs: The outputs of this process are the asset update requestdestined for the DBMS and asset update responses destined for thelibrarian’s terminal.
• Generate Report (Process 3.2.3): The purpose of this process is to allowthe librarian to generate reports of library assets and member statuscontrolled by the ACME library management system. The administra-tor can choose the following: generate asset report or generate mem-bership report.— Inputs: The inputs to this process are the member status and asset
status from the DBMS process and the report request message fromthe librarian’s terminal.
— Processing: This process accepts the report request from the librar-ian’s terminal and generates the appropriate member request andasset request messages destined for the DBMS process (Process2.0) based on a predefined set of reports. It receives the memberstatus and asset status messages from the DBMS process and for-mats them into the necessary fields of the report message. The re-port message is sent to the librarian’s terminal.
• Outputs: The outputs of this process are the member request andasset request messages destined for the DBMS process and thereport message destined for the librarian’s terminal.
3.6 Performance Requirements
The ACME library management system will support up to five memberPCs, two librarian PCs, and one administrator PC. The bar code reader atthe librarian’s desk will be capable of reading membership cards and barcodes on assets with no noticeable delay. The response time should be nogreater than 0.5 seconds.
Under normal operating conditions, a user (member, librarian, oradministrator) can expect a response from the system within five sec-onds. Time-consuming operations such as search operations that requirethe retrieval of a large amount of data from the database will be designedwith performance in mind. For example, part of the result set can be dis-played while the query continues in parallel. More results are displayed ifrequested by the user.
The system will be capable of handling up to ten simultaneous transac-tions (including transactions to handle remote users) without any notice-able degradation of service to the supported users and without droppingany of the requested services.
CuuDuongThanCong.com https://fb.com/tailieudientucntt
569
Sample SRS
The existing Internet gateway will not impose any degradation of perfor-mance on the system. Response to remote users is partly dependent onInternet traffic and therefore cannot be the sole responsibility of the ACMElibrary management system.
The system will be tested to ensure conformance to the performancerequirements mentioned in this section. A separate functional test specifica-tion will be developed containing details of on-site tests required to test thesystem under normal and load conditions. User interaction (includingremote users) will be simulated to get a reading on how well the systemperforms and provide indications of how to improve performance if neces-sary. The response time for each service provided for each user type willbe measured and evaluated.
Databases will need to be tuned to optimize queries against them. Suchtuning can only be done effectively after the databases are populated andthe system is up and running.
3.7 Design Constraints
The location of the PCs for members, librarians, and administrator mustconform to the limitations imposed by the network topology. For example,if a PC connects to a hub or router, it must be located as close to the hubor router as deemed necessary by the specification.
3.8 Software System Attributes
3.8.1 Reliability
The system must be properly installed and tested by ACME engineers.
The software and hardware used by the system will be compatible toincrease the reliability of the overall system. Where possible, software froma single vendor will be used to improve interoperability and reliability.
3.8.2 Availability
The system will remain operational even when the library is not open tothe public. It is anticipated that the administrator will perform many tasksduring periods of lower activity, such as when the library is closed. Also,the system needs to remain operational to provide service to remote usersaccessing the system via the Internet.
The system will not be available, even via the Internet, while the data-bases are backed up. This operation will be performed during the earlyhours of the morning when the system is not expected to be used.
CuuDuongThanCong.com https://fb.com/tailieudientucntt
570
SOFTWARE ENGINEERING HANDBOOK
3.8.3 Security
The system will provide a number of different security features. First, allmembers must log into the system at member PCs and must provide ausername and password before gaining access to the system. Similarly, thelibrarian and administrator access the system via their respective PCs andare authenticated by username and password. Second, remote usersaccess the system via a gateway that provides a firewall. The firewall allowsaccess to services designated as remote access services, but blocks accessto all other services, such as administrator services. Cookies will also beused to aid in identifying remote users.
The DBMS provides a high level of security. Security profiles for the dif-ferent user types will be created so that specific users have only the per-missions (create, update, delete) on selected data objects. For example,only the administrator will have create and delete permissions in the assetdatabase. Stored procedures will be used to maintain referential integrityin the databases.
3.8.4 Maintainability
The system will be designed so that it will be easily extensible; that is,new services for each user type (member, librarian, and administrator) canbe added using the same paradigm. While developers are required toextend the system, the code to develop new services is not expected to becomplex. Software from a single vendor will be used to improve interoper-ability and reliability.
3.8.5 Portability
This section is not applicable. The system will integrate PCs running theWindows platform. There is no requirement to port the system to any otherplatform.
3.9 Logical Database Requirements
3.9.1 Types of Information
The types of data that will be stored in the database will be the standardnumeric, string, date, and enumeration data types. Information membersand assets will be stored in databases. Username and passwords for useraccess will be stored in a separate file
Exhibit G-26 shows the data dictionary that identifies by name eachpiece of data that will be stored by the ACME library management systemand the general type of each piece of data.
3.10 Other Requirements
Not applicable.
CuuDuongThanCong.com https://fb.com/tailieudientucntt
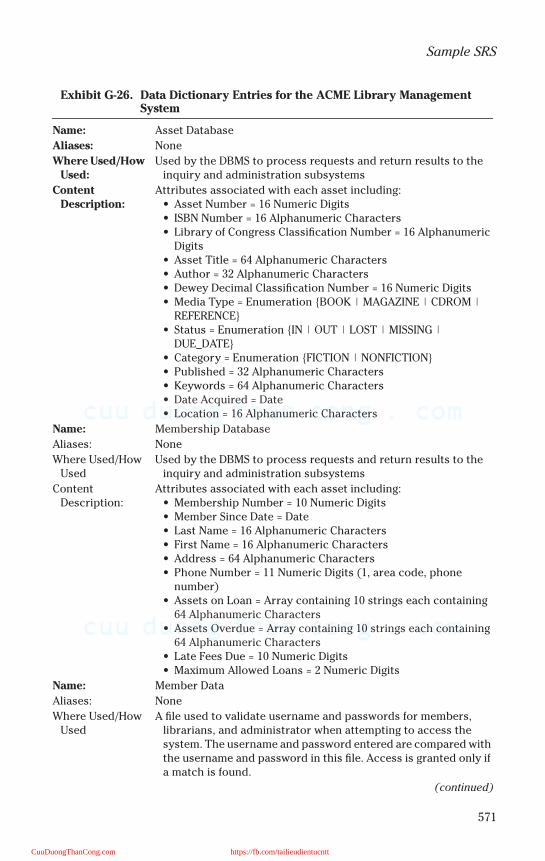
571
Sample SRS
Exhibit G-26. Data Dictionary Entries for the ACME Library Management System
Name: Asset Database
Aliases: None
Where Used/How Used:
Used by the DBMS to process requests and return results to the inquiry and administration subsystems
Content Description:
Attributes associated with each asset including:• Asset Number = 16 Numeric Digits• ISBN Number = 16 Alphanumeric Characters• Library of Congress Classification Number = 16 Alphanumeric
Digits• Asset Title = 64 Alphanumeric Characters• Author = 32 Alphanumeric Characters• Dewey Decimal Classification Number = 16 Numeric Digits• Media Type = Enumeration BOOK | MAGAZINE | CDROM |
REFERENCE• Status = Enumeration IN | OUT | LOST | MISSING |
DUE_DATE• Category = Enumeration FICTION | NONFICTION• Published = 32 Alphanumeric Characters• Keywords = 64 Alphanumeric Characters• Date Acquired = Date• Location = 16 Alphanumeric Characters
Name: Membership Database
Aliases: None
Where Used/How Used
Used by the DBMS to process requests and return results to the inquiry and administration subsystems
Content Description:
Attributes associated with each asset including:• Membership Number = 10 Numeric Digits• Member Since Date = Date• Last Name = 16 Alphanumeric Characters• First Name = 16 Alphanumeric Characters• Address = 64 Alphanumeric Characters• Phone Number = 11 Numeric Digits (1, area code, phone
number)• Assets on Loan = Array containing 10 strings each containing
64 Alphanumeric Characters• Assets Overdue = Array containing 10 strings each containing
64 Alphanumeric Characters• Late Fees Due = 10 Numeric Digits• Maximum Allowed Loans = 2 Numeric Digits
Name: Member Data
Aliases: None
Where Used/How Used
A file used to validate username and passwords for members, librarians, and administrator when attempting to access the system. The username and password entered are compared with the username and password in this file. Access is granted only if a match is found.
(continued)
CuuDuongThanCong.com https://fb.com/tailieudientucntt
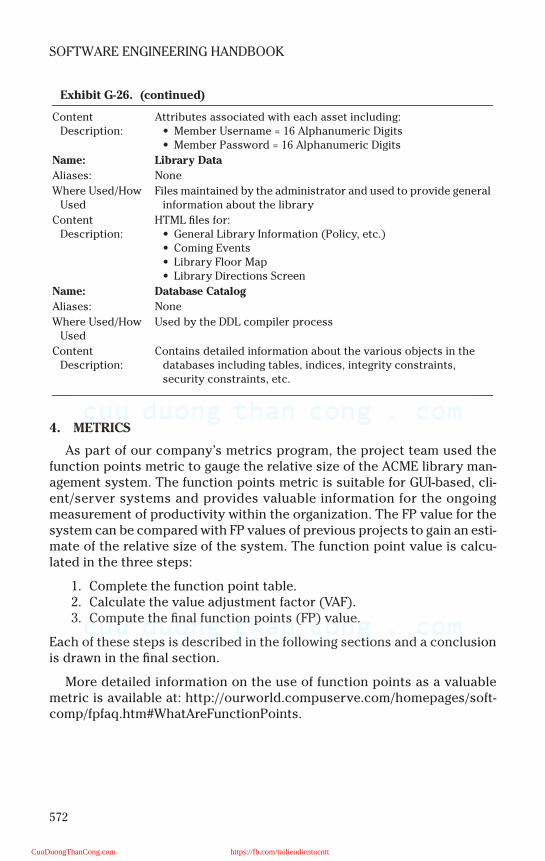
572
SOFTWARE ENGINEERING HANDBOOK
4. METRICS
As part of our company’s metrics program, the project team used thefunction points metric to gauge the relative size of the ACME library man-agement system. The function points metric is suitable for GUI-based, cli-ent/server systems and provides valuable information for the ongoingmeasurement of productivity within the organization. The FP value for thesystem can be compared with FP values of previous projects to gain an esti-mate of the relative size of the system. The function point value is calcu-lated in the three steps:
1. Complete the function point table.2. Calculate the value adjustment factor (VAF).3. Compute the final function points (FP) value.
Each of these steps is described in the following sections and a conclusionis drawn in the final section.
More detailed information on the use of function points as a valuablemetric is available at: http://ourworld.compuserve.com/homepages/soft-comp/fpfaq.htm#WhatAreFunctionPoints.
Exhibit G-26. (continued)
Content Description:
Attributes associated with each asset including:• Member Username = 16 Alphanumeric Digits• Member Password = 16 Alphanumeric Digits
Name: Library Data
Aliases: None
Where Used/How Used
Files maintained by the administrator and used to provide general information about the library
Content Description:
HTML files for:• General Library Information (Policy, etc.)• Coming Events• Library Floor Map• Library Directions Screen
Name: Database Catalog
Aliases: None
Where Used/How Used
Used by the DDL compiler process
Content Description:
Contains detailed information about the various objects in the databases including tables, indices, integrity constraints, security constraints, etc.
CuuDuongThanCong.com https://fb.com/tailieudientucntt
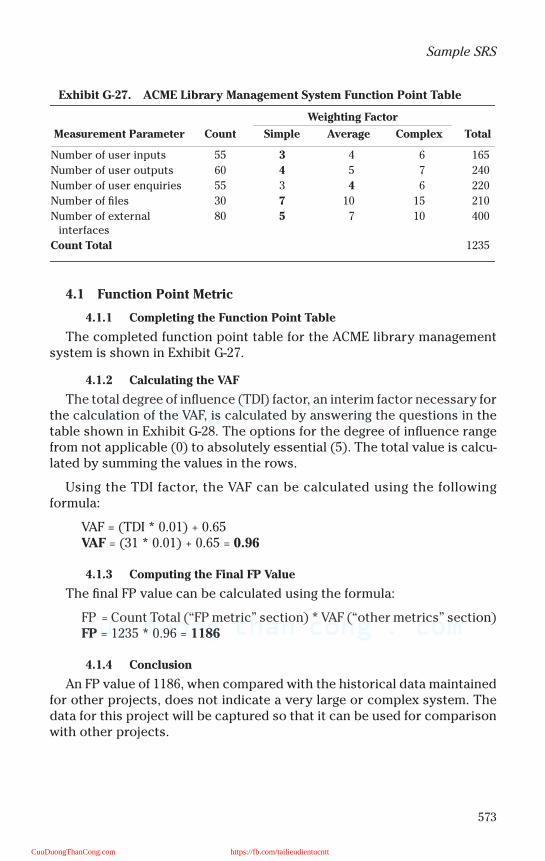
573
Sample SRS
4.1 Function Point Metric
4.1.1 Completing the Function Point Table
The completed function point table for the ACME library managementsystem is shown in Exhibit G-27.
4.1.2 Calculating the VAF
The total degree of influence (TDI) factor, an interim factor necessary forthe calculation of the VAF, is calculated by answering the questions in thetable shown in Exhibit G-28. The options for the degree of influence rangefrom not applicable (0) to absolutely essential (5). The total value is calcu-lated by summing the values in the rows.
Using the TDI factor, the VAF can be calculated using the followingformula:
VAF = (TDI * 0.01) + 0.65VAF = (31 * 0.01) + 0.65 = 0.96
4.1.3 Computing the Final FP Value
The final FP value can be calculated using the formula:
FP = Count Total (“FP metric” section) * VAF (“other metrics” section)FP = 1235 * 0.96 = 1186
4.1.4 Conclusion
An FP value of 1186, when compared with the historical data maintainedfor other projects, does not indicate a very large or complex system. Thedata for this project will be captured so that it can be used for comparisonwith other projects.
Exhibit G-27. ACME Library Management System Function Point Table
Weighting Factor
Measurement Parameter Count Simple Average Complex Total
Number of user inputs 55 3 4 6 165
Number of user outputs 60 4 5 7 240
Number of user enquiries 55 3 4 6 220
Number of files 30 7 10 15 210
Number of external interfaces
80 5 7 10 400
Count Total 1235
CuuDuongThanCong.com https://fb.com/tailieudientucntt
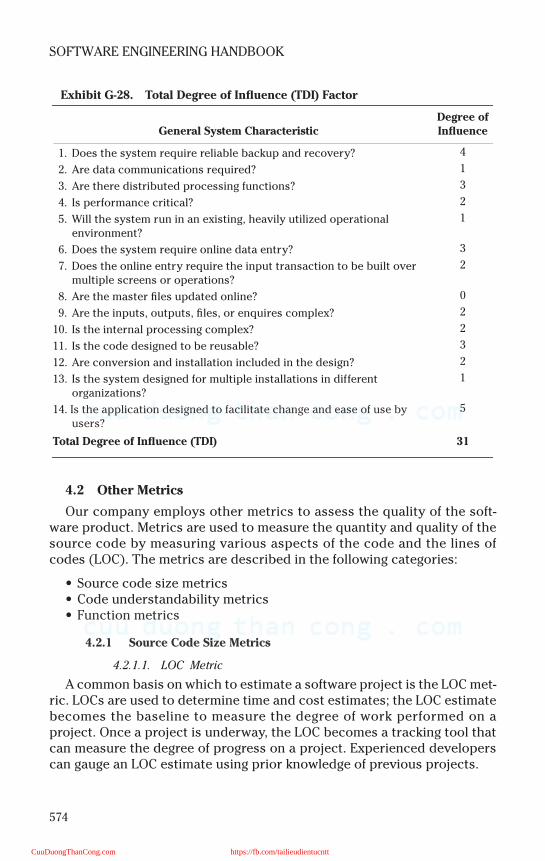
574
SOFTWARE ENGINEERING HANDBOOK
4.2 Other Metrics
Our company employs other metrics to assess the quality of the soft-ware product. Metrics are used to measure the quantity and quality of thesource code by measuring various aspects of the code and the lines ofcodes (LOC). The metrics are described in the following categories:
• Source code size metrics• Code understandability metrics• Function metrics
4.2.1 Source Code Size Metrics
4.2.1.1. LOC Metric
A common basis on which to estimate a software project is the LOC met-ric. LOCs are used to determine time and cost estimates; the LOC estimatebecomes the baseline to measure the degree of work performed on aproject. Once a project is underway, the LOC becomes a tracking tool thatcan measure the degree of progress on a project. Experienced developerscan gauge an LOC estimate using prior knowledge of previous projects.
Exhibit G-28. Total Degree of Influence (TDI) Factor
General System CharacteristicDegree of Influence
1. Does the system require reliable backup and recovery? 4
2. Are data communications required? 1
3. Are there distributed processing functions? 3
4. Is performance critical? 2
5. Will the system run in an existing, heavily utilized operational environment?
1
6. Does the system require online data entry? 3
7. Does the online entry require the input transaction to be built over multiple screens or operations?
2
8. Are the master files updated online? 0
9. Are the inputs, outputs, files, or enquires complex? 2
10. Is the internal processing complex? 2
11. Is the code designed to be reusable? 3
12. Are conversion and installation included in the design? 2
13. Is the system designed for multiple installations in different organizations?
1
14. Is the application designed to facilitate change and ease of use by users?
5
Total Degree of Influence (TDI) 31
CuuDuongThanCong.com https://fb.com/tailieudientucntt
575
Sample SRS
4.2.1.2. Effective Lines of Code
An effective line of code is the measurement of all lines that are not com-ments, blank lines, or standalone braces or parentheses. This measure-ment more closely represents the quantity of work performed. It is com-mon for programmers to use a single brace or parenthesis on a line todenote a specific block of code. A single character on a line should notreally count as a line of code. This type of coding style can thereforeincrease the LOC metric by 20 to 40 percent.
4.2.2 Code Understandability Metrics
4.2.2.1. Comment Line Metric
The number of comments in a source program is a measure of the caretaken by the programmer to make the source code and algorithms under-standable. Code that is not well commented is very difficult to maintain.Comments can occur by themselves on a physical line or be co-mingledwith source code. A line is considered a comment line if the physical linecontains a comment.
4.2.2.2. Blank Line and White Space Metric
The number of blank lines within a program determines the readability.White space highlights the logical grouping of constructs and variables.Programs that use few blank lines are difficult to read and more expensiveto maintain.
4.2.3 Function Metrics
4.2.3.1. Function Count Metric
The total number of functions within a program determines the degreeof modularity. This metric is used to quantify the average number of LOCper function, maximum LOC per function, and the minimum LOC perfunction.
4.2.3.2. Average LOC/Function Metric
The average LOC/function indicates how the code meets the acceptedstandard. The accepted industry standard of 200 LOC/function is desiredas the average. Functions that have a larger number of lines of code perfunction are difficult to understand and difficult to maintain. They providea good indication that a function should be broken into smaller functions.
4.2.3.3. Maximum LOC/Function Metric
Although the average LOC per function gives an interesting source codetrend, the maximum LOC per function gives an indication of the largestfunction in the system.
CuuDuongThanCong.com https://fb.com/tailieudientucntt

576
SOFTWARE ENGINEERING HANDBOOK
4.2.3.4. Minimum LOC/Function Metric
An LOC value of 2 may indicated that functions are just prototypes andwill need to be completed later.
Selected Bibliography
Connolly, T. (2002). Database Systems, 3rd ed., Addison-Wesley, Reading, MA.
Pressman, R. (2001). Software Engineering, a Practitioner’s Approach, 5th ed., McGraw-Hill,New York. (Web site associated with Pressman’s book at: http://www.mhhe.com/engcs/comp-sci/pressman/stundent_index.html).
Robertson, S. and Robertson, J. (1999). Mastering the Requirements Process, Addison-Wesley,Reading, MA.
Summerville, I. (1995). Software Engineering, 5th ed., Addison-Wesley, Reading, MA.
Yourdon, E. (2000). Modern Structured Analysis, Prentice Hall, New York.
Course web site at: http://www.newartech.com/se.
Some useful background information on function points is located at: http://ourworld.com-puserve.com/homepages/softcomp/fpfaq.htm#WhatAreFunctionPoints.
Product documentation for Microsoft Windows 2000 Server is located at: http://www.mi-crosoft.com/windows2000/en/server/help.
Product documentation for Microsoft Internet Information Server (IIS) is located at: ht-tp://www.microsoft.com/windows2000/en/server/iis/.
Product documentation for Microsoft SQL Server is located at: http://www.mi-crosoft.com/qul/techinfo/productdoc/2000/books.asp.
CuuDuongThanCong.com https://fb.com/tailieudientucntt
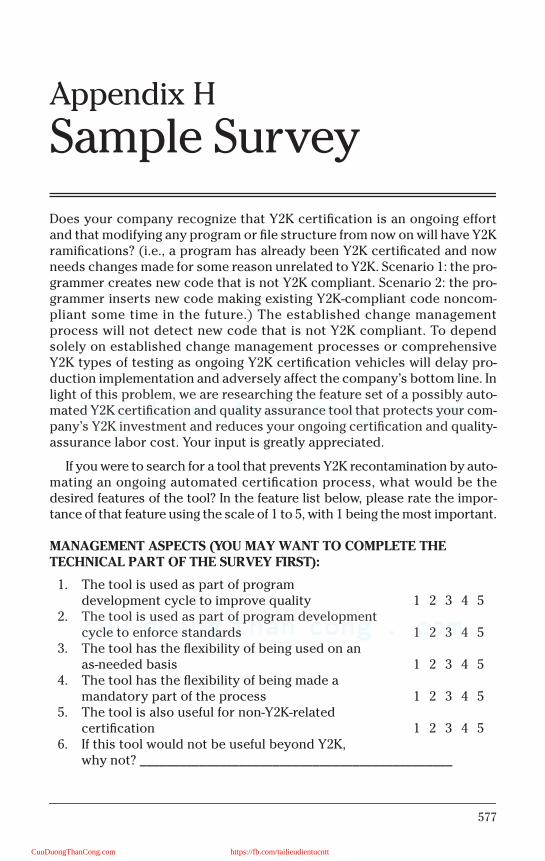
577
Appendix H
Sample Survey
Does your company recognize that Y2K certification is an ongoing effortand that modifying any program or file structure from now on will have Y2Kramifications? (i.e., a program has already been Y2K certificated and nowneeds changes made for some reason unrelated to Y2K. Scenario 1: the pro-grammer creates new code that is not Y2K compliant. Scenario 2: the pro-grammer inserts new code making existing Y2K-compliant code noncom-pliant some time in the future.) The established change managementprocess will not detect new code that is not Y2K compliant. To dependsolely on established change management processes or comprehensiveY2K types of testing as ongoing Y2K certification vehicles will delay pro-duction implementation and adversely affect the company’s bottom line. Inlight of this problem, we are researching the feature set of a possibly auto-mated Y2K certification and quality assurance tool that protects your com-pany’s Y2K investment and reduces your ongoing certification and quality-assurance labor cost. Your input is greatly appreciated.
If you were to search for a tool that prevents Y2K recontamination by auto-mating an ongoing automated certification process, what would be thedesired features of the tool? In the feature list below, please rate the impor-tance of that feature using the scale of 1 to 5, with 1 being the most important.
MANAGEMENT ASPECTS (YOU MAY WANT TO COMPLETE THE TECHNICAL PART OF THE SURVEY FIRST):
1. The tool is used as part of program development cycle to improve quality 1 2 3 4 5
2. The tool is used as part of program development cycle to enforce standards 1 2 3 4 5
3. The tool has the flexibility of being used on an as-needed basis 1 2 3 4 5
4. The tool has the flexibility of being made a mandatory part of the process 1 2 3 4 5
5. The tool is also useful for non-Y2K-related certification 1 2 3 4 5
6. If this tool would not be useful beyond Y2K, why not? _______________________________________________
CuuDuongThanCong.com https://fb.com/tailieudientucntt
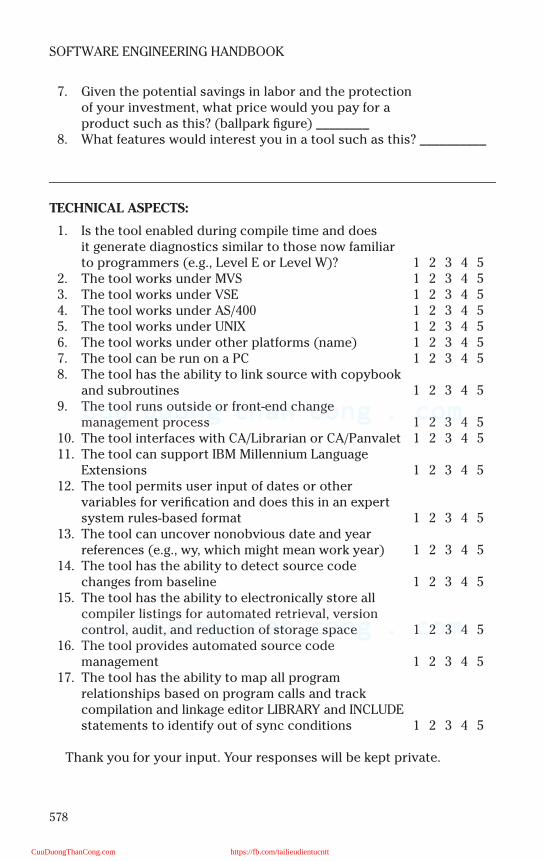
578
SOFTWARE ENGINEERING HANDBOOK
7. Given the potential savings in labor and the protection of your investment, what price would you pay for a product such as this? (ballpark figure) ________
8. What features would interest you in a tool such as this? __________
TECHNICAL ASPECTS:
1. Is the tool enabled during compile time and does it generate diagnostics similar to those now familiar to programmers (e.g., Level E or Level W)? 1 2 3 4 5
2. The tool works under MVS 1 2 3 4 53. The tool works under VSE 1 2 3 4 54. The tool works under AS/400 1 2 3 4 55. The tool works under UNIX 1 2 3 4 56. The tool works under other platforms (name) 1 2 3 4 57. The tool can be run on a PC 1 2 3 4 58. The tool has the ability to link source with copybook
and subroutines 1 2 3 4 59. The tool runs outside or front-end change
management process 1 2 3 4 510. The tool interfaces with CA/Librarian or CA/Panvalet 1 2 3 4 511. The tool can support IBM Millennium Language
Extensions 1 2 3 4 512. The tool permits user input of dates or other
variables for verification and does this in an expert system rules-based format 1 2 3 4 5
13. The tool can uncover nonobvious date and year references (e.g., wy, which might mean work year) 1 2 3 4 5
14. The tool has the ability to detect source code changes from baseline 1 2 3 4 5
15. The tool has the ability to electronically store all compiler listings for automated retrieval, version control, audit, and reduction of storage space 1 2 3 4 5
16. The tool provides automated source code management 1 2 3 4 5
17. The tool has the ability to map all program relationships based on program calls and trackcompilation and linkage editor LIBRARY and INCLUDE statements to identify out of sync conditions 1 2 3 4 5
Thank you for your input. Your responses will be kept private.
CuuDuongThanCong.com https://fb.com/tailieudientucntt

579
Appendix I
Sample Architectural Design
TABLE OF CONTENTS
1 Introduction .............................................................................................. 5791.1 Purpose............................................................................................. 5801.2 Scope................................................................................................. 580
2 Overall System Architecture ................................................................... 5802.1 Description ....................................................................................... 5802.2 Major Subsystems ........................................................................... 582
3 Layers......................................................................................................... 5823.1 Presentation ..................................................................................... 5823.2 Application ....................................................................................... 5833.3 Domain.............................................................................................. 5843.4 Business Infrastructure .................................................................. 5853.5 Technical Services........................................................................... 585
3.5.1 Persistence Subsystem ....................................................... 5853.5.2 Logging Subsystem .............................................................. 5863.5.3 Rule Engine Subsystem ....................................................... 5863.5.4 SOAP ...................................................................................... 5873.5.5 Security ................................................................................. 587
3.6 Foundation ....................................................................................... 5873.6.1 Relational Database ............................................................. 5873.6.2 String and Math Utilities ..................................................... 588
4 Interpackage and Interlayer Coupling ................................................... 5884.1 Presentation Interactions ............................................................... 5884.2 Application Interactions ................................................................. 5884.3 Domain Interactions........................................................................ 5884.4 Business Infrastructure Interactions ............................................ 5894.5 Technical Services Interactions..................................................... 5904.6 Foundation Interactions ................................................................. 5904.7 Summary........................................................................................... 590
1 INTRODUCTION
This section provides an introduction to the Dog E-DayCare system’s archi-tectural design.
CuuDuongThanCong.com https://fb.com/tailieudientucntt
580
SOFTWARE ENGINEERING HANDBOOK
1.1 Purpose
The purpose of this document is to provide a logical architectural viewof the Dog E-DayCare system. This document will describe the system interms of its conceptual organization, using the layers architectural pattern.
1.2 Scope
The Dog E-DayCare system will connect dog owners to dog care serviceproviders by providing a Web-based forum to locate, purchase, and moni-tor dog care services. The Dog E-DayCare system will allow dog owners tosearch for dog care service providers within a location of their choice,based on their specific needs. Once a dog owner selects a service, the DogE-DayCare system will permit the user to communicate with the selecteddog care service provider, submit all required information, schedule, andpay for services. Depending upon the dog care service provider selected,dog owners will also be able to view their dogs online, receive an update ofthe dog’s status, and participate in discussion forums and chat rooms ded-icated to dog care.
The Dog E-DayCare system will support dog care service providersthrough two different forums: client software resident on the dog care ser-vice provider’s workstations and through a Web-based forum. The systemwill notify dog care service providers of potential clients and permit themto communicate with dog owners and access information submitted bydog owners seeking a dog care service provider. In using the Dog E-DayCaresystem, dog care service providers will be able to coordinate scheduling ofmultiple clients, relay updates and messages, and bill their clients. In addi-tion, in an effort to foster a greater sense of community, discussion forumsand chat rooms will also be available for dog care service providers, to beused as a service for their clients.
The Dog E-DayCare system will maintain information about dog care ser-vice providers, dog owners, and their dogs. Information will be stored in adatabase accessible to dog care service providers and dog owners. Thisaccess will be through a Web-based forum for the dog owners and a com-bination of client software and a Web-based forum for the dog care serviceproviders.
2 OVERALL SYSTEM ARCHITECTURE
This section provides an overview of the Dog E-DayCare system’s archi-tectural design.
2.1 Description
The Dog E-DayCare application is composed of six layers containing var-ious subsystems that interact with each other in order to accomplish the
CuuDuongThanCong.com https://fb.com/tailieudientucntt
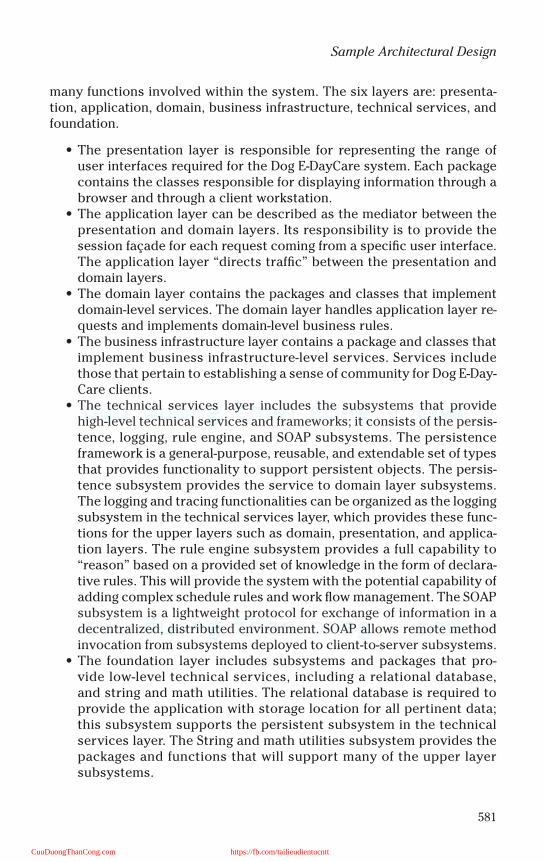
581
Sample Architectural Design
many functions involved within the system. The six layers are: presenta-tion, application, domain, business infrastructure, technical services, andfoundation.
• The presentation layer is responsible for representing the range ofuser interfaces required for the Dog E-DayCare system. Each packagecontains the classes responsible for displaying information through abrowser and through a client workstation.
• The application layer can be described as the mediator between thepresentation and domain layers. Its responsibility is to provide thesession façade for each request coming from a specific user interface.The application layer “directs traffic” between the presentation anddomain layers.
• The domain layer contains the packages and classes that implementdomain-level services. The domain layer handles application layer re-quests and implements domain-level business rules.
• The business infrastructure layer contains a package and classes thatimplement business infrastructure-level services. Services includethose that pertain to establishing a sense of community for Dog E-Day-Care clients.
• The technical services layer includes the subsystems that providehigh-level technical services and frameworks; it consists of the persis-tence, logging, rule engine, and SOAP subsystems. The persistenceframework is a general-purpose, reusable, and extendable set of typesthat provides functionality to support persistent objects. The persis-tence subsystem provides the service to domain layer subsystems.The logging and tracing functionalities can be organized as the loggingsubsystem in the technical services layer, which provides these func-tions for the upper layers such as domain, presentation, and applica-tion layers. The rule engine subsystem provides a full capability to“reason” based on a provided set of knowledge in the form of declara-tive rules. This will provide the system with the potential capability ofadding complex schedule rules and work flow management. The SOAPsubsystem is a lightweight protocol for exchange of information in adecentralized, distributed environment. SOAP allows remote methodinvocation from subsystems deployed to client-to-server subsystems.
• The foundation layer includes subsystems and packages that pro-vide low-level technical services, including a relational database,and string and math utilities. The relational database is required toprovide the application with storage location for all pertinent data;this subsystem supports the persistent subsystem in the technicalservices layer. The String and math utilities subsystem provides thepackages and functions that will support many of the upper layersubsystems.
CuuDuongThanCong.com https://fb.com/tailieudientucntt
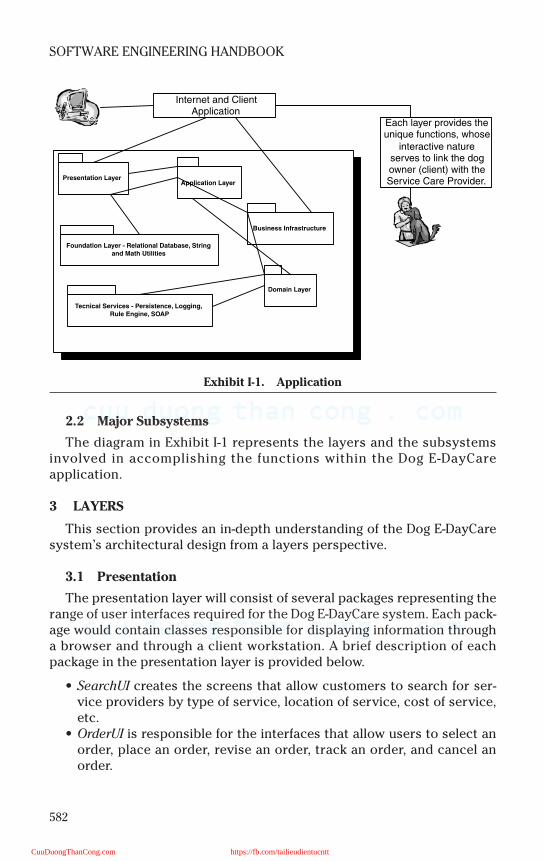
582
SOFTWARE ENGINEERING HANDBOOK
2.2 Major Subsystems
The diagram in Exhibit I-1 represents the layers and the subsystemsinvolved in accomplishing the functions within the Dog E-DayCareapplication.
3 LAYERS
This section provides an in-depth understanding of the Dog E-DayCaresystem’s architectural design from a layers perspective.
3.1 Presentation
The presentation layer will consist of several packages representing therange of user interfaces required for the Dog E-DayCare system. Each pack-age would contain classes responsible for displaying information througha browser and through a client workstation. A brief description of eachpackage in the presentation layer is provided below.
• SearchUI creates the screens that allow customers to search for ser-vice providers by type of service, location of service, cost of service,etc.
• OrderUI is responsible for the interfaces that allow users to select anorder, place an order, revise an order, track an order, and cancel anorder.
Exhibit I-1. Application
Presentation LayerApplication Layer
Domain Layer
Business Infrastructure
Foundation Layer - Relational Database, String
and Math Utilities
Tecnical Services - Persistence, Logging,
Rule Engine, SOAP
Internet and ClientApplication
Each layer provides theunique functions, whose
interactive natureserves to link the dogowner (client) with theService Care Provider.
CuuDuongThanCong.com https://fb.com/tailieudientucntt
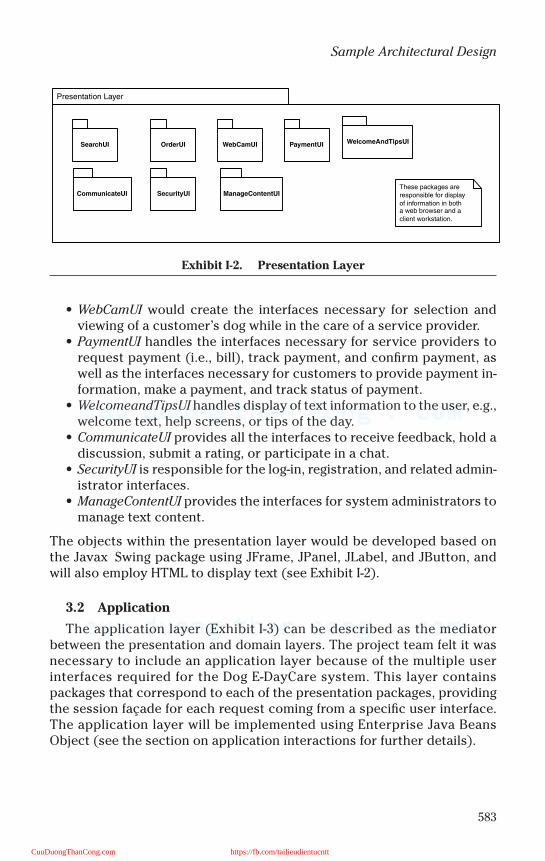
583
Sample Architectural Design
• WebCamUI would create the interfaces necessary for selection andviewing of a customer’s dog while in the care of a service provider.
• PaymentUI handles the interfaces necessary for service providers torequest payment (i.e., bill), track payment, and confirm payment, aswell as the interfaces necessary for customers to provide payment in-formation, make a payment, and track status of payment.
• WelcomeandTipsUI handles display of text information to the user, e.g.,welcome text, help screens, or tips of the day.
• CommunicateUI provides all the interfaces to receive feedback, hold adiscussion, submit a rating, or participate in a chat.
• SecurityUI is responsible for the log-in, registration, and related admin-istrator interfaces.
• ManageContentUI provides the interfaces for system administrators tomanage text content.
The objects within the presentation layer would be developed based onthe Javax Swing package using JFrame, JPanel, JLabel, and JButton, andwill also employ HTML to display text (see Exhibit I-2).
3.2 Application
The application layer (Exhibit I-3) can be described as the mediatorbetween the presentation and domain layers. The project team felt it wasnecessary to include an application layer because of the multiple userinterfaces required for the Dog E-DayCare system. This layer containspackages that correspond to each of the presentation packages, providingthe session façade for each request coming from a specific user interface.The application layer will be implemented using Enterprise Java BeansObject (see the section on application interactions for further details).
Exhibit I-2. Presentation Layer
Presentation Layer
SecurityUI ManageContentUI
SearchUI OrderUI WebCamUI PaymentUI
CommunicateUI
WelcomeAndTipsUI
These packages areresponsible for displayof information in botha web browser and aclient workstation.
CuuDuongThanCong.com https://fb.com/tailieudientucntt
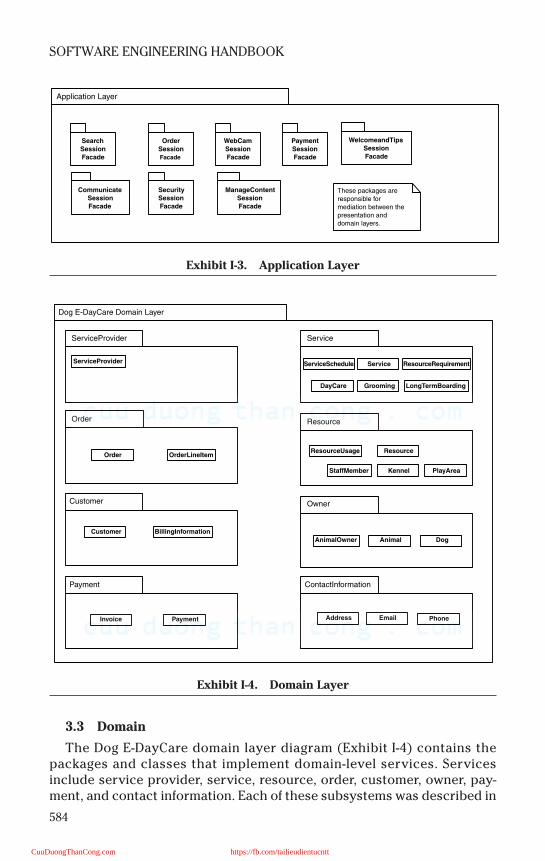
584
SOFTWARE ENGINEERING HANDBOOK
3.3 Domain
The Dog E-DayCare domain layer diagram (Exhibit I-4) contains thepackages and classes that implement domain-level services. Servicesinclude service provider, service, resource, order, customer, owner, pay-ment, and contact information. Each of these subsystems was described in
Exhibit I-3. Application Layer
Exhibit I-4. Domain Layer
Application Layer
Security
Session
Facade
ManageContent
Session
Facade
Search
Session
Facade
Order
Session
Facade
WebCam
Session
Facade
Payment
Session
Facade
Communicate
Session
Facade
WelcomeandTips
Session
Facade
These packages areresponsible formediation between thepresentation anddomain layers.
Dog E-DayCare Domain Layer
Resource
ResourceUsage Resource
StaffMember Kennel PlayArea
ServiceProvider
ServiceProvider
ContactInformation
Address Email Phone
Customer
Customer BillingInformation
Owner
AnimalOwner Animal Dog
Service
ServiceServiceSchedule ResourceRequirement
DayCare Grooming LongTermBoarding
Order
Order OrderLineItem
Payment
Invoice Payment
CuuDuongThanCong.com https://fb.com/tailieudientucntt
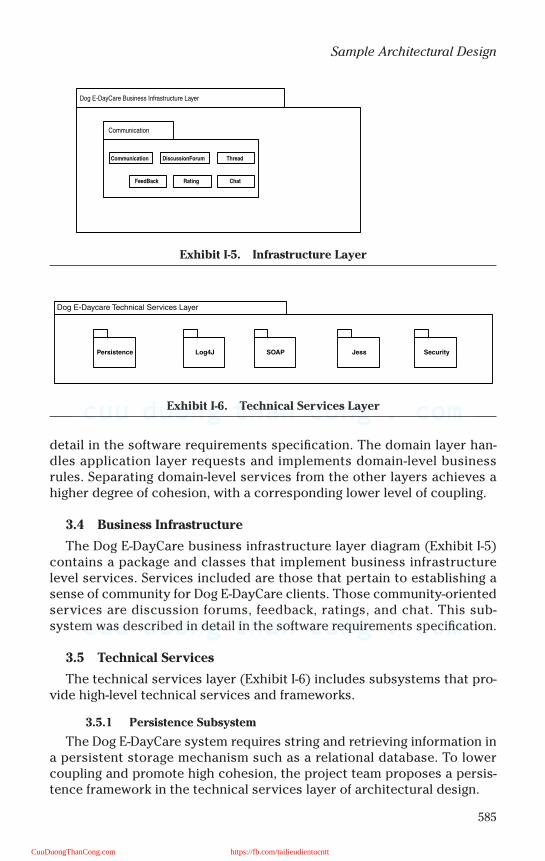
585
Sample Architectural Design
detail in the software requirements specification. The domain layer han-dles application layer requests and implements domain-level businessrules. Separating domain-level services from the other layers achieves ahigher degree of cohesion, with a corresponding lower level of coupling.
3.4 Business Infrastructure
The Dog E-DayCare business infrastructure layer diagram (Exhibit I-5)contains a package and classes that implement business infrastructurelevel services. Services included are those that pertain to establishing asense of community for Dog E-DayCare clients. Those community-orientedservices are discussion forums, feedback, ratings, and chat. This sub-system was described in detail in the software requirements specification.
3.5 Technical Services
The technical services layer (Exhibit I-6) includes subsystems that pro-vide high-level technical services and frameworks.
3.5.1 Persistence Subsystem
The Dog E-DayCare system requires string and retrieving information ina persistent storage mechanism such as a relational database. To lowercoupling and promote high cohesion, the project team proposes a persis-tence framework in the technical services layer of architectural design.
Exhibit I-5. Infrastructure Layer
Exhibit I-6. Technical Services Layer
Dog E-DayCare Business Infrastructure Layer
Communication
Communication DiscussionForum Thread
FeedBack Rating Chat
Dog E-Daycare Technical Services Layer
Log4JPersistence JessSOAP Security
CuuDuongThanCong.com https://fb.com/tailieudientucntt
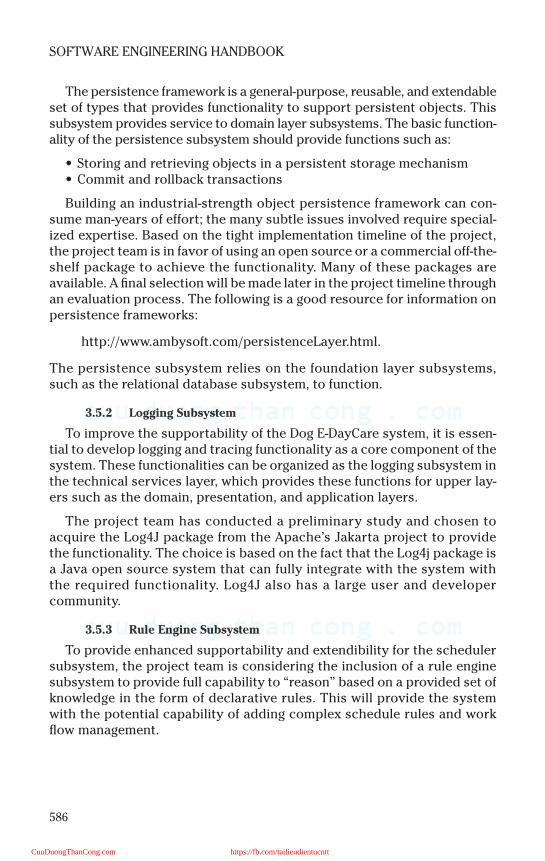
586
SOFTWARE ENGINEERING HANDBOOK
The persistence framework is a general-purpose, reusable, and extendableset of types that provides functionality to support persistent objects. Thissubsystem provides service to domain layer subsystems. The basic function-ality of the persistence subsystem should provide functions such as:
• Storing and retrieving objects in a persistent storage mechanism• Commit and rollback transactions
Building an industrial-strength object persistence framework can con-sume man-years of effort; the many subtle issues involved require special-ized expertise. Based on the tight implementation timeline of the project,the project team is in favor of using an open source or a commercial off-the-shelf package to achieve the functionality. Many of these packages areavailable. A final selection will be made later in the project timeline throughan evaluation process. The following is a good resource for information onpersistence frameworks:
http://www.ambysoft.com/persistenceLayer.html.
The persistence subsystem relies on the foundation layer subsystems,such as the relational database subsystem, to function.
3.5.2 Logging Subsystem
To improve the supportability of the Dog E-DayCare system, it is essen-tial to develop logging and tracing functionality as a core component of thesystem. These functionalities can be organized as the logging subsystem inthe technical services layer, which provides these functions for upper lay-ers such as the domain, presentation, and application layers.
The project team has conducted a preliminary study and chosen toacquire the Log4J package from the Apache’s Jakarta project to providethe functionality. The choice is based on the fact that the Log4j package isa Java open source system that can fully integrate with the system withthe required functionality. Log4J also has a large user and developercommunity.
3.5.3 Rule Engine Subsystem
To provide enhanced supportability and extendibility for the schedulersubsystem, the project team is considering the inclusion of a rule enginesubsystem to provide full capability to “reason” based on a provided set ofknowledge in the form of declarative rules. This will provide the systemwith the potential capability of adding complex schedule rules and workflow management.
CuuDuongThanCong.com https://fb.com/tailieudientucntt

587
Sample Architectural Design
3.5.4 SOAP
To allow remote method invocation from subsystems deployed to client-to-server subsystems, the project team has chosen to use simple objectaccess protocol (SOAP).
SOAP is a lightweight protocol for exchange of information in a decen-tralized, distributed environment. It is an XML-based protocol that con-sists of three parts: an envelope that defines a framework for describingwhat is in a message and how to process it, a set of encoding rules forexpressing instances of application-defined data types, and a conventionfor representing remote procedure calls and responses. SOAP can be usedin combination with a variety of protocols such as HTTP.
The advantage of SOAP is that it is based on industry standards like XMLand HTTP. It is platform independent and can be used inside and acrossnetwork boundaries such as a firewall.
3.5.5 Security
The security subsystem manages the users and roles of the system andcontrols access to the system by users.
3.6 Foundation
The Dog E-DayCare foundation layer (Exhibit I-7) includes subsystemsand packages that provide low-level technical services. Those servicesinclude a relational database, and string and math utilities.
3.6.1 Relational Database
The project team has chosen to use a relational database as the persis-tent storage mechanism for storing the system information. The relationaldatabase subsystem supports the persistent subsystem in the technicalservices layer.
Exhibit I-7. Foundation Layer
Dog E-DayCare Foundation Layer
Relational Database String Utilities Math Utilities
CuuDuongThanCong.com https://fb.com/tailieudientucntt

588
SOFTWARE ENGINEERING HANDBOOK
3.6.2 String and Math Utilities
String and math utilities will also be used in the system. They are pack-aged in string and math utilities subsystems that will support many of theupper layer subsystems.
4 INTERPACKAGE AND INTERLAYER COUPLING
This section provides an in-depth understanding of the Dog E-DayCaresystem’s coupling among layers, packages, and classes.
4.1 Presentation Interactions
The packages in the presentation layer are highly coherent and have noexplicit dependencies among them. (Within the packages, there would bedependencies among the various classes.) The most relevant interactionsfor the presentation layer are those with the application layer, with eachpresentation package having a counterpart session façade package in theapplication layer.
4.2 Application Interactions
The application layer has no significant interactions among its pack-ages. Nevertheless, it has critical interactions with the presentation andthe domain layers. As mentioned above, the application layer’s primaryfunction is to direct traffic between these layers.
The presentation layer may ask the domain layer for information. Therequest is received at the application layer and the corresponding sessionfaçade is invoked. This session, in turn, takes the request to the domainlayer, where the information is processed and retrieved. The domain layerthen sends the information back to the presentation layer via the applica-tion layer’s session façade. Each session is an integral part of the overallsystem architecture. The session bean is accessed by a single client at atime (a session) and then is removed by the server. Its “life span” is thelength of time it takes to service a request.
The session objects will be implemented using the Enterprise JavaBeans Object.
4.3 Domain Interactions
There are several interactions among the packages of the Dog E-DayCaresystem’s domain layer, as well as between the domain layer and other lay-ers in the system.
Within the domain layer, the service provider package is coupled to theservice package and the contact information package. The service package
CuuDuongThanCong.com https://fb.com/tailieudientucntt
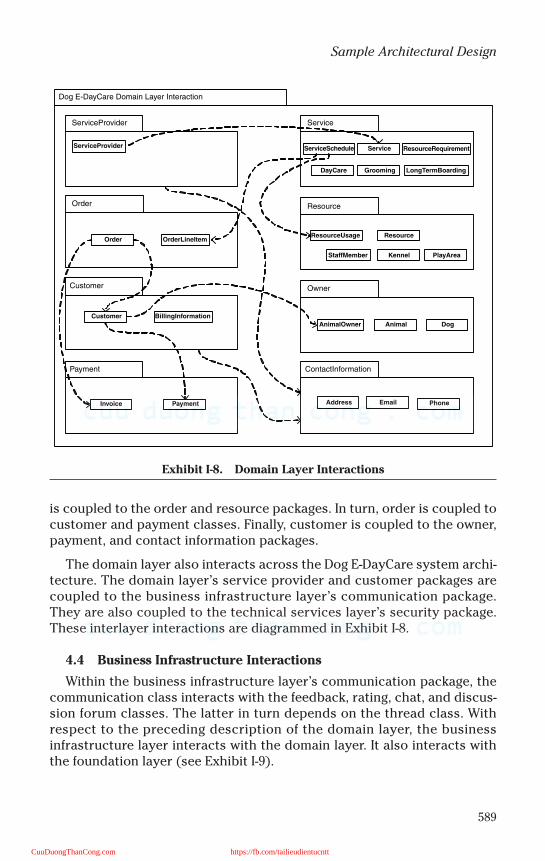
589
Sample Architectural Design
is coupled to the order and resource packages. In turn, order is coupled tocustomer and payment classes. Finally, customer is coupled to the owner,payment, and contact information packages.
The domain layer also interacts across the Dog E-DayCare system archi-tecture. The domain layer’s service provider and customer packages arecoupled to the business infrastructure layer’s communication package.They are also coupled to the technical services layer’s security package.These interlayer interactions are diagrammed in Exhibit I-8.
4.4 Business Infrastructure Interactions
Within the business infrastructure layer’s communication package, thecommunication class interacts with the feedback, rating, chat, and discus-sion forum classes. The latter in turn depends on the thread class. Withrespect to the preceding description of the domain layer, the businessinfrastructure layer interacts with the domain layer. It also interacts withthe foundation layer (see Exhibit I-9).
Exhibit I-8. Domain Layer Interactions
Dog E-DayCare Domain Layer Interaction
Resource
ResourceUsage Resource
StaffMember Kennel PlayArea
ServiceProvider
ServiceProvider
ContactInformation
Address Email Phone
Customer
Customer BillingInformation
Owner
AnimalOwner Animal Dog
Service
ServiceServiceSchedule ResourceRequirement
DayCare Grooming LongTermBoarding
Order
Order OrderLineItem
Payment
Invoice Payment
CuuDuongThanCong.com https://fb.com/tailieudientucntt
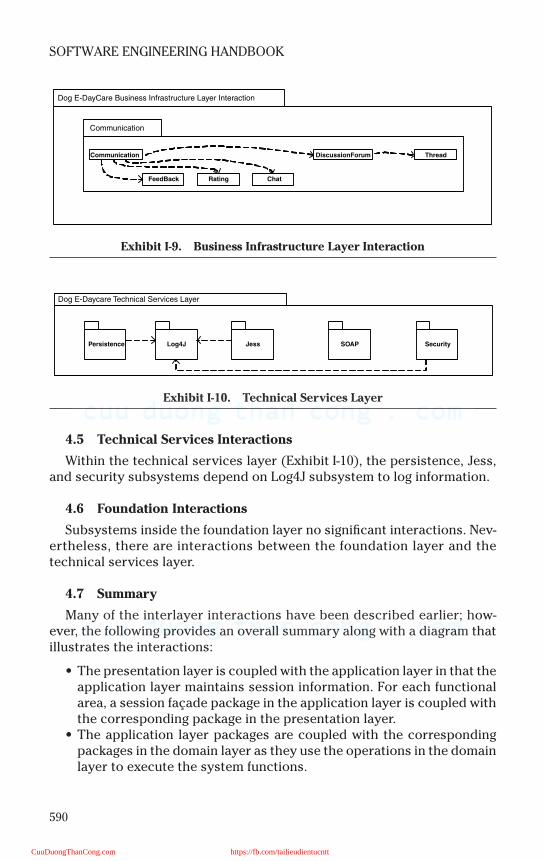
590
SOFTWARE ENGINEERING HANDBOOK
4.5 Technical Services Interactions
Within the technical services layer (Exhibit I-10), the persistence, Jess,and security subsystems depend on Log4J subsystem to log information.
4.6 Foundation Interactions
Subsystems inside the foundation layer no significant interactions. Nev-ertheless, there are interactions between the foundation layer and thetechnical services layer.
4.7 Summary
Many of the interlayer interactions have been described earlier; how-ever, the following provides an overall summary along with a diagram thatillustrates the interactions:
• The presentation layer is coupled with the application layer in that theapplication layer maintains session information. For each functionalarea, a session façade package in the application layer is coupled withthe corresponding package in the presentation layer.
• The application layer packages are coupled with the correspondingpackages in the domain layer as they use the operations in the domainlayer to execute the system functions.
Exhibit I-9. Business Infrastructure Layer Interaction
Exhibit I-10. Technical Services Layer
Dog E-DayCare Business Infrastructure Layer Interaction
Communication
Communication DiscussionForum Thread
FeedBack Rating Chat
Dog E-Daycare Technical Services Layer
SOAP SecurityPersistence Log4J Jess
CuuDuongThanCong.com https://fb.com/tailieudientucntt
591
Sample Architectural Design
• In the domain layer, ServiceProvider and customer packages are cou-pled with the communication package in the business infrastructurelayer. The ServiceProvider and customer packages are also coupledwith the security subsystem in the technical services layer. The ser-vice package is also coupled with the Jess subsystem to obtain sup-port for rule-based processing. In general, the packages in the domainlayer are coupled with the persistence and logging subsystems. Theyalso rely on the SOAP package to pass remote function invocations.
• The technical services layer’s persistence subsystem is coupled withthe relational database subsystem in the foundation layer. The stringand math utilities packages are coupled with any package in the sys-tem that uses their functions.
Exhibit I-11 shows the interlayer coupling of the subsystems to differentsystem layers.
CuuDuongThanCong.com https://fb.com/tailieudientucntt
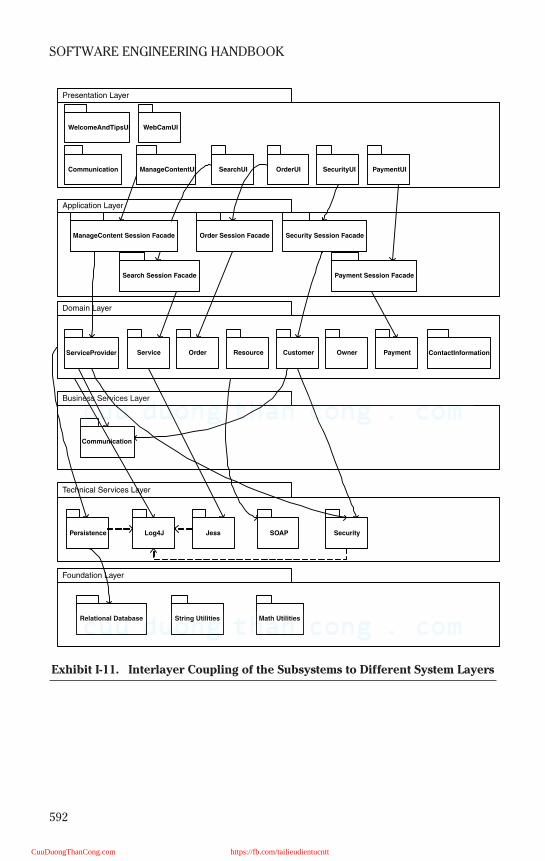
592
SOFTWARE ENGINEERING HANDBOOK
Exhibit I-11. Interlayer Coupling of the Subsystems to Different System Layers
Domain Layer
ServiceProvider Service Order Resource Customer Owner Payment ContactInformation
Technical Services Layer
Persistence Log4J Jess SOAP Security
Foundation Layer
Relational Database String Utilities Math Utilities
Presentation Layer
SearchUI OrderUI
WebCamUI
PaymentUI
WelcomeAndTipsUI
Communication SecurityUIManageContentUI
Application Layer
Search Session Facade
Order Session Facade Security Session Facade
Payment Session Facade
ManageContent Session Facade
Business Services Layer
Communication
CuuDuongThanCong.com https://fb.com/tailieudientucntt

593
Appendix J
Sample SDS
TABLE OF CONTENTS
1 Introduction .............................................................................................. 5941.1 System Overview............................................................................. 5941.2 Purpose............................................................................................. 5941.3 Document Overview........................................................................ 5951.4 Supporting Material ........................................................................ 5951.5 Definitions and Acronyms .............................................................. 595
2 Design Considerations ............................................................................. 5962.1 Assumptions and Dependencies ................................................... 596
2.1.0 Frequency of Use.................................................................. 5962.1.1 Database Requirement ........................................................ 5962.1.2 Track Resources................................................................... 5962.1.3 User........................................................................................ 596
2.2 Drivers and Constraints.................................................................. 5962.2.0 Memory Constraints............................................................ 5962.2.1 Regulatory Policies .............................................................. 5972.2.2 Hardware Limitations .......................................................... 5972.2.3 Interfaces to Other Applications........................................ 5972.2.4 High Order Language Requirements ................................. 5972.2.5 Reliability Requirements..................................................... 5972.2.6 Criticality of the Application .............................................. 5972.2.7 Security Constraints ............................................................ 5972.2.8 Databases.............................................................................. 597
2.3 System Environment ....................................................................... 5982.3.0 User Interfaces ..................................................................... 5982.3.1 Software Interfaces .............................................................. 6002.3.2 Communications Interfaces................................................ 600
2.4 Processes, Policies, Conventions, and Tactics ............................ 6002.5 Design Methodology ....................................................................... 6002.6 Risks and Volatile Areas.................................................................. 600
2.6.0 Performance Risks ............................................................... 6002.6.1 Technology Risks ................................................................. 600
3 Architecture .............................................................................................. 6013.1 Overview........................................................................................... 6013.2 Subsystem, Component, or Module 1…n..................................... 602
3.2.0 Sub Element 1…n................................................................. 602
CuuDuongThanCong.com https://fb.com/tailieudientucntt
594
SOFTWARE ENGINEERING HANDBOOK
3.3 Strategies ..........................................................................................6023.3.0 Strategy 1…n.........................................................................602
4 High-Level Design .....................................................................................6024.1 ORSS: DFD Level 1: see Exhibit J-1 .................................................6024.2 Procedures........................................................................................604
5 Low-Level Design ......................................................................................6105.1 Procedures and Details ...................................................................6105.2 Processes and Details......................................................................6125.3 Data Dictionary Entries for ORSS ..................................................625
6 Appendix....................................................................................................6286.1 Use Cases ..........................................................................................6286.2 User Interface Screens ....................................................................631
REVISIONS
1 INTRODUCTION
1.1 System Overview
The Online Resource Scheduling System is a Web-based scheduling sys-tem designed for colleges, universities, and schools. The purpose of thissystem is to provide an online service for the faculty to reserve any type ofresource such as computer systems, VCRs, projectors, and videotapes.This scheduling system can accept the requestors’ orders, make a sched-ule for the orders, and do some critical checks. It will enable the faculty tobe able to submit their orders at any time and from any place. The systemwill be able to create new orders and update old orders.
1.2 Purpose
The purpose of this software requirement specification is to produce aWeb-based (online) scheduling system that will be used at colleges, univer-sities, and schools. The faculty will be able to reserve equipment, class-rooms, films, and other peripherals to be used during their classes. Thestaff of the resource center will be able to monitor these resources and tosee what equipment is needed, by whom, at what time, and for what date.The resources will be maintained in a database created by ORSS that willbe an easy method to keep track of the equipment. By testing these speci-fications as we progress through the design stage, we will be able to find
Version Primary Author(s) Description of Version
Date Completed
First Draft Initial draft to be submitted and reviewed for comments.
4/14/2002
CuuDuongThanCong.com https://fb.com/tailieudientucntt

595
Sample SDS
errors and misjudgments as they occur instead of at the end of the project.This will save time in the long run; because mistakes are identified and cor-rected earlier, project development will not be delayed.
1.3 Document Overview
This document describes the proposed online registration system andthe system requirements necessary to make the registration system effec-tive. The second section describes design considerations, assumptionsand dependencies, drivers and constraints, design methodology, and risks.The third section describes the different architecture styles and how theyare incorporated into our design of the online resource scheduling system.The fourth section describes the high-level design, including DFD level 1and 12 different processes. The fifth section describes the low-level design,including the procedures and details. We have included the structuredEnglish description of the different processes here, as well as the data dic-tionary. The last section is an appendix that describes use cases andincludes the user interface screens.
1.4 Supporting Material
Roger Pressman, Software Engineering, “A Practitioner’s Approach” — 5thedition, McGraw-Hill, January 2001.
“Handbook of Software Engineering Productivity,” editor Jessica Keyes,McGraw-Hill, 1993
http://www.laynetworks.com/users/webs/cs10.htm
http://www.mhhe.com/engcs/compsci/pressman/student_index.mhtml
http://www.newarttech.com/se
http://www.uburst.com/uReserve
1.5 Definitions and Acronyms
• Campus user interface —the sign-on page allowing the faculty to con-nect to the system
• IIS — Internet information server
• JSP — Java server page
• Materials — a table in the resource database that is an in-house cata-log of all available films and videos by type and format
• ORSS — online resource scheduling system, which is a Web-basedscheduling system providing an online service for faculty to reserveany type of resource
• SSL — secure socket layer
CuuDuongThanCong.com https://fb.com/tailieudientucntt
596
SOFTWARE ENGINEERING HANDBOOK
2 DESIGN CONSIDERATIONS
2.1 Assumptions and Dependencies
2.1.0 Frequency of Use
ORSS is designed for continuous 24 hours a day, 7 days a week opera-tion. This demands a high-availability architecture, which often requires aback-up server that needs to be in sync with the primary server. Clusteringcan also be used to supply high availability.
2.1.1 Database Requirement
• A faculty directory service is available now and will continue to beavailable to integrate directly with ORSS.
• A resource database is not available now and needs to be created andmaintained by the database administrator of ORSS.
2.1.2 Track Resources
It is always assumed that the user will check out and return the reservedresource as scheduled. Currently no automatic mechanism traces the sta-tus of the resource. Either the administrator manually logs the activity ora future enhancement is added when a scanner and bar code system canautomate this data entry effort.
2.1.3 User
The ORSS is designed for colleges, universities, and schools. Most of theusers of this system are faculty. The user interface is designed so that theusers can access the system more easily. For the basic education of users,they should have the knowledge to operate the computer, such as enteringthe system online, turning the system on, inputting data such as password,and information about the resource needed. This knowledge will require aminimum education level of middle school or higher. Moreover, facultymembers should have the ability to use the Internet. Because most of theusers of the system are the faculty of the school, they should have thisknowledge (and a higher education level). The users do not need to havemore than a basic technical knowledge. A help menu will include a detailedhelp list; this menu will help a user who does not understand when usingand accessing the process.
2.2 Drivers and Constraints
2.2.0 Memory Constraints
Because we need to run I.E. or Netscape on the Windows operating sys-tem, the client’s computer must have at least 64 MB of memory. The servermust have at least 128 MB of memory because it will need to do a lot of dataprocessing.
CuuDuongThanCong.com https://fb.com/tailieudientucntt
597
Sample SDS
2.2.1 Regulatory Policies
The data will be transmitted over the Internet and needs to allow onlineprocessing.
2.2.2 Hardware Limitations
The memory for the client site computer will be limited to at least 64 MBof memory because the user needs to access our Website by using a Webbrowser that must run on a Windows platform. The memory for the serverneeds to be at least 128 MB. The bandwidth should be at least 512 Kbpsbecause many users could possibly access the server at the same time.The hard drive for our server must have at least 8 GB of space in order tostore a lot of data (i.e., the databases).
2.2.3 Interfaces to Other Applications
The online resource scheduling system will be Windows based so thatall of the systems work with each other; therefore, the system must be Win-dows compliant. The ORSS will be a Web-based system. We use ADO as aninterface with the MS Access databases.
2.2.4 High Order Language Requirements
ORSS uses a client/server architecture that makes use of the JavaScript,HTML, and ASP.
2.2.5 Reliability Requirements
ORSS will have a UPS installed so that, if the power is lost, the systemwill continue to operate as normal and no information will be lost.
2.2.6 Criticality of the Application
The server must run 24 hours a day, 7 days a week. The system willneed to perform some checks so that the users do not make conflictingrequests or complete the orders incorrectly. Moreover, a clustering tech-nology is needed to make sure that the server is always running.
2.2.7 Security Constraints
Security is the most important issue in our system. To avoid hackersinvading our system, we need to set up a firewall and apply a securitypatch. This product will be uploaded to a server exposed to the outsideworld, so we need to research and develop adequate security protection.We will need to know how to configure a firewall and how to restrict accessto only “authorized users.” We will need to know how to deal with load bal-ance if the amount of visits to the site is very large at one time.
2.2.8 Databases
We will need to know how to maintain the different databases in order tomake them more efficient, and the appropriate type of database that we
CuuDuongThanCong.com https://fb.com/tailieudientucntt
598
SOFTWARE ENGINEERING HANDBOOK
should use. We will also have a link to the faculty database to verify theusers.
2.3 System Environment
The ORSS has three interfaces: user, software, and communicationsinterfaces.
• The user interface allows the user to interact with the system, provid-ing Web pages that will display information. It also provides the differ-ent forms for users to use to input their requests.
• The software interface comprise ORSS and the operating system, theIIS, and the databases.
• The communications interface allows users to utilize campus net-works or their ISP from home in order to use the system through theInternet.
2.3.0 User Interfaces
ORSS allows the user to make requests through a Website. The user inter-face will be composed of several Web pages that will be displayed on theuser’s Web browser. There should be two different versions of the userinterface: one for the faculty and one for the resource center staff. Each ofthem will include many pages that have different purposes.
Campus version:
• Campus log-on• Make request• Update request• Search resource• Confirmation
The user gains access to the ORSS by entering user name and a uniquenumeric password. Once the user has correctly entered name and pass-word into ORSS, he will be able to make requests, update old requests, andsearch all of the resources from the resource database. Clicking the itemsin the user menu can activate each of these functions.
The Request Form page allows the user to select the equipment andmaterials needed for reservations. Users can select equipment by clickingthe dropdown list and checking the boxes that contain all of the equip-ment types. There is a total of five kinds of equipment (audio, video, digi-tal, projection, and PCs) to use during presentations; each category con-sists of several pieces of equipment. The user should be able to select theequipment by checking the check box beside the type of equipment. Also,the user will be able to select the quantity needed.
CuuDuongThanCong.com https://fb.com/tailieudientucntt
599
Sample SDS
In the Request Form, the user will be able to enter material numbers andtitles for requests in one of two ways. One is to let the system automaticallyfill out the textboxes after the user selects specific items in the SearchMaterial page. Another way is for the users to fill out the material numbersand titles (if they know them). Users need to fill out their general informa-tion before they submit requests. The general information includes name,department, phone number, etc.
The Search Material page helps users to find out the material numbersand titles that they want by using some keywords. The page must be ableto pass the result to the Request Form after the user clicks the “select” but-ton. The Confirmation page needs to display all of the information aboutthat specific request, and needs to have a “print” button that will allowusers to print out their confirmations. The Search Resource page will allowusers to do two types of searching. One is to search the materials and theother one is to search for the equipment. Users who want to search thematerials can enter the material number or the material title to make aquery. When the users want to search the equipment, they can enter theequipment name or the equipment type to make a query.
Resource Center Version:
• Resource center staff log on• Request form• Search request• Update request• Search resource• Add new resource• Update resource• Display daily list
The resource center system has the same functions as the campus ver-sion plus additional functions to be used only by the employees who workin resource center.
The Display Request page provides an interface for the user to make adaily report of requests for a specific date. The Search Request form willallow users to search a specific request by entering the confirmation num-ber of that request or any information on the request, such as user name,extension number, date required, or room number. The system must allowusers to update requests (modify or cancel requests). This function will beimplemented by the Update Request form. The Search Resource formallows the users to search for a specific resource by entering the resourcename, resource number or resource type. The resource center user will beable to add new resources or update the resources. This function will beimplemented by the Update Resource form.
CuuDuongThanCong.com https://fb.com/tailieudientucntt
600
SOFTWARE ENGINEERING HANDBOOK
2.3.1 Software Interfaces
Client site:
• The ORSS will run on any Windows operating system with a browseron the client’s computer.
Server site:
• The server side needs to run on the Windows NT operating system orWindows 2000 professional operating system that has the IIS. The Win-dows 2000 server can also be used to run this program.
• The operating system also needs Microsoft Access to use for the data-bases.
• The software will be designed and coded in ASP, JavaScript, andHTML.
2.3.2 Communications Interfaces
The users can access campus networks or their ISP from their homes inorder to use the system through the Internet.
2.4 Processes, Policies, Conventions, and Tactics
Not applicable.
2.5 Design Methodology
Global Associates used a traditional structured approach in designingthe ORSS. We used the linear sequential model, which begins at the systemlevel and progresses through analysis, design, coding, testing, and support.
2.6 Risks and Volatile Areas
2.6.0 Performance Risks
The system needs to ensure that the following cross checks are in placein order to function adequately:
• The user cannot make a request for weekends.• Notice of 24 hours is required for reservations.• The system must not allow a user to reserve the same materials at the
same time.• The system must not allow a user to use the same equipment in the
same room at the same time.
2.6.1 Technology Risks
The following enhancements need to be implemented to ensure that theproduct retains its competitive edge:
CuuDuongThanCong.com https://fb.com/tailieudientucntt
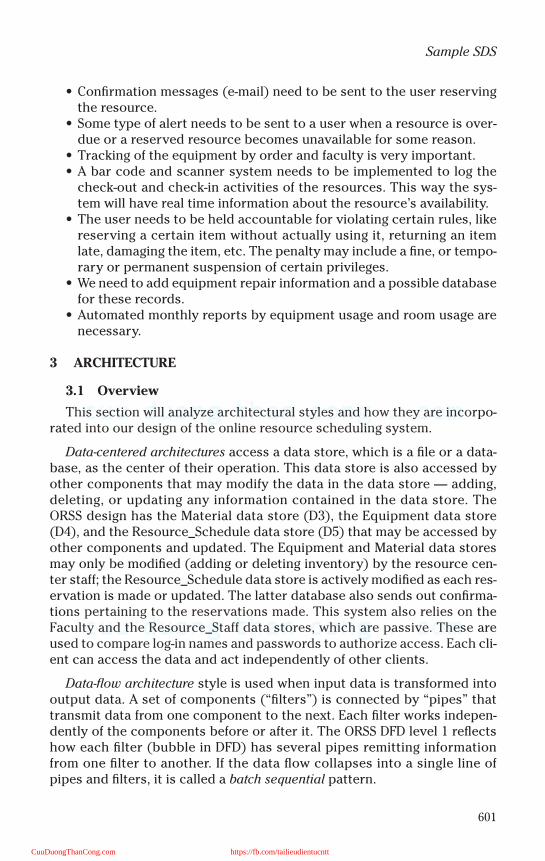
601
Sample SDS
• Confirmation messages (e-mail) need to be sent to the user reservingthe resource.
• Some type of alert needs to be sent to a user when a resource is over-due or a reserved resource becomes unavailable for some reason.
• Tracking of the equipment by order and faculty is very important.• A bar code and scanner system needs to be implemented to log the
check-out and check-in activities of the resources. This way the sys-tem will have real time information about the resource’s availability.
• The user needs to be held accountable for violating certain rules, likereserving a certain item without actually using it, returning an itemlate, damaging the item, etc. The penalty may include a fine, or tempo-rary or permanent suspension of certain privileges.
• We need to add equipment repair information and a possible databasefor these records.
• Automated monthly reports by equipment usage and room usage arenecessary.
3 ARCHITECTURE
3.1 Overview
This section will analyze architectural styles and how they are incorpo-rated into our design of the online resource scheduling system.
Data-centered architectures access a data store, which is a file or a data-base, as the center of their operation. This data store is also accessed byother components that may modify the data in the data store — adding,deleting, or updating any information contained in the data store. TheORSS design has the Material data store (D3), the Equipment data store(D4), and the Resource_Schedule data store (D5) that may be accessed byother components and updated. The Equipment and Material data storesmay only be modified (adding or deleting inventory) by the resource cen-ter staff; the Resource_Schedule data store is actively modified as each res-ervation is made or updated. The latter database also sends out confirma-tions pertaining to the reservations made. This system also relies on theFaculty and the Resource_Staff data stores, which are passive. These areused to compare log-in names and passwords to authorize access. Each cli-ent can access the data and act independently of other clients.
Data-flow architecture style is used when input data is transformed intooutput data. A set of components (“filters”) is connected by “pipes” thattransmit data from one component to the next. Each filter works indepen-dently of the components before or after it. The ORSS DFD level 1 reflectshow each filter (bubble in DFD) has several pipes remitting informationfrom one filter to another. If the data flow collapses into a single line ofpipes and filters, it is called a batch sequential pattern.
CuuDuongThanCong.com https://fb.com/tailieudientucntt
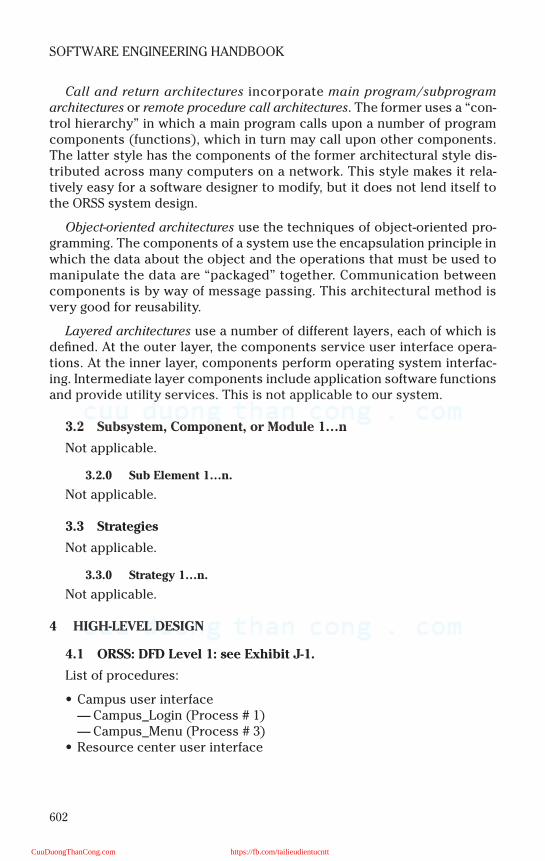
602
SOFTWARE ENGINEERING HANDBOOK
Call and return architectures incorporate main program/subprogramarchitectures or remote procedure call architectures. The former uses a “con-trol hierarchy” in which a main program calls upon a number of programcomponents (functions), which in turn may call upon other components.The latter style has the components of the former architectural style dis-tributed across many computers on a network. This style makes it rela-tively easy for a software designer to modify, but it does not lend itself tothe ORSS system design.
Object-oriented architectures use the techniques of object-oriented pro-gramming. The components of a system use the encapsulation principle inwhich the data about the object and the operations that must be used tomanipulate the data are “packaged” together. Communication betweencomponents is by way of message passing. This architectural method isvery good for reusability.
Layered architectures use a number of different layers, each of which isdefined. At the outer layer, the components service user interface opera-tions. At the inner layer, components perform operating system interfac-ing. Intermediate layer components include application software functionsand provide utility services. This is not applicable to our system.
3.2 Subsystem, Component, or Module 1…n
Not applicable.
3.2.0 Sub Element 1…n.
Not applicable.
3.3 Strategies
Not applicable.
3.3.0 Strategy 1…n.
Not applicable.
4 HIGH-LEVEL DESIGN
4.1 ORSS: DFD Level 1: see Exhibit J-1.
List of procedures:
• Campus user interface— Campus_Login (Process # 1)— Campus_Menu (Process # 3)
• Resource center user interface
CuuDuongThanCong.com https://fb.com/tailieudientucntt

603
Sample SDS
— ResourceCenter_Login (Process # 2)— ResourceCenter_Menu (Process # 4)
• Make/update requests— Make_Request (Process # 5)
• Check_Request (Process # 6)• Save_Request (Process # 7)• Display_Confirmation (Process # 8)
— Update_Request (Process # 9)• Check_Request (Process # 6)• Save_Request (Process # 7)• Display_Confirmation (Process # 8)
• Request information— Search_Request (Process # 10)
• Search resource— Search_Resource (Process # 11)
• Add/update resource— Add_Resource (Process # 12)— Update_Resource (Process # 13)
Exhibit J-1. ORSS: DFD Level 1
ORSS: DFD Level 1
Faculty
2.0Resource
Center userinterface
1.0Campus
userinterface
ResourceCenterStaff
ResourceCenterStaff
6.0Request
information
5.0Add/Updateresources
4.0Search
resources
3.0Make/Update
requests
FacultyFaculty NamePassword
Staff Name Password
Confirmation number/Request information
Confirmation number/Request information
Resourceinformation
Resourceinformation
Resourceinformation
Resourceinformation
Requestinformation
Resource IDor Name
Resource IDor Name
Date orConfirmationNumber orFaculty name
Confirmation
CuuDuongThanCong.com https://fb.com/tailieudientucntt
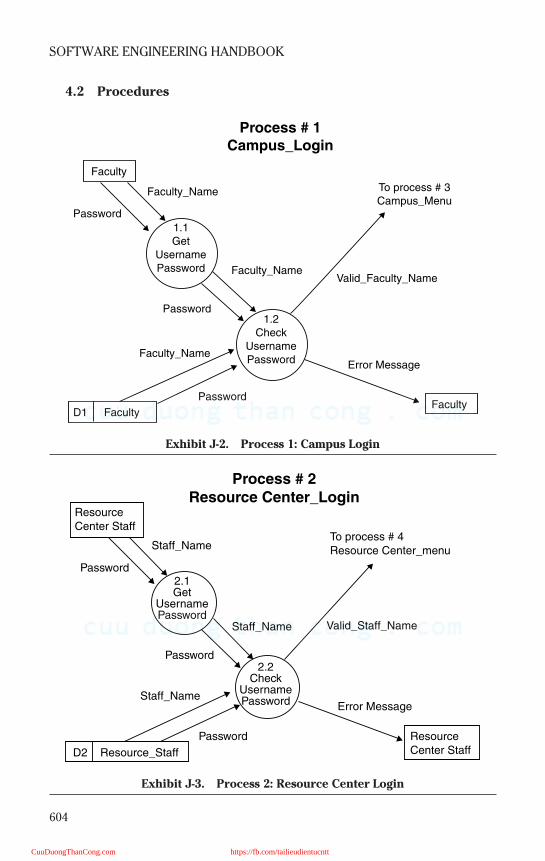
604
SOFTWARE ENGINEERING HANDBOOK
4.2 Procedures
Exhibit J-2. Process 1: Campus Login
Exhibit J-3. Process 2: Resource Center Login
Process # 1
Campus_Login
Faculty
Faculty
1.1Get
UsernamePassword
1.2Check
UsernamePassword
D1 Faculty
Faculty_Name
Faculty_Name
Faculty_Name
Password
Password
Password
To process # 3Campus_Menu
Error Message
Valid_Faculty_Name
Process # 2
Resource Center_LoginResourceCenter Staff
Password
Password
Password
Staff_Name
Staff_Name
Staff_Name
D2 Resource_Staff
2.1Get
UsernamePassword
2.2Check
UsernamePassword
To process # 4Resource Center_menu
Error Message
Valid_Staff_Name
ResourceCenter Staff
CuuDuongThanCong.com https://fb.com/tailieudientucntt
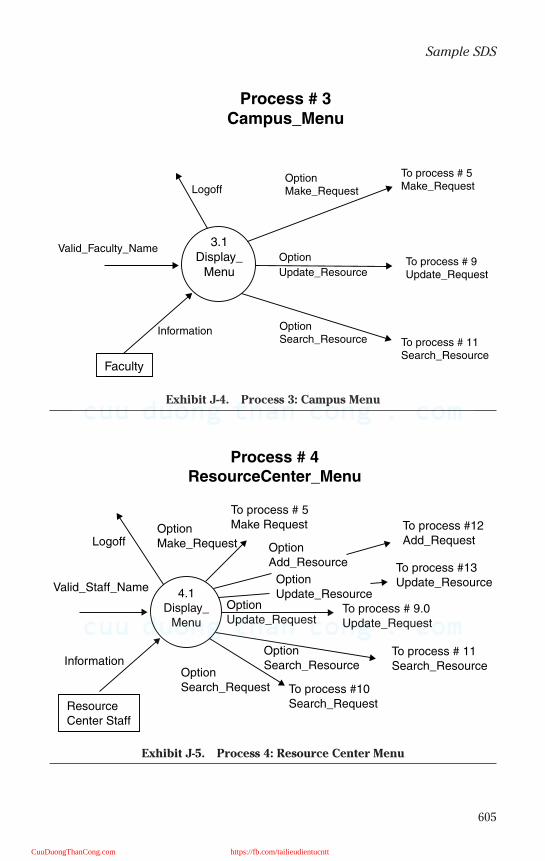
605
Sample SDS
Exhibit J-4. Process 3: Campus Menu
Exhibit J-5. Process 4: Resource Center Menu
Process # 3
Campus_Menu
Faculty
3.1Display_
Menu
Logoff
Valid_Faculty_Name
Information OptionSearch_Resource
Option
Update_Resource
OptionMake_Request
To process # 9Update_Request
To process # 11Search_Resource
To process # 5Make_Request
Process # 4
ResourceCenter_Menu
ResourceCenter Staff
4.1Display_
Menu
Logoff
Valid_Staff_Name
InformationOptionSearch_Request
OptionSearch_Resource
OptionUpdate_Request
OptionMake_Request
To process # 5Make Request
OptionUpdate_Resource
OptionAdd_Resource
To process #12Add_Request
To process #13Update_Resource
To process # 9.0Update_Request
To process # 11Search_Resource
To process #10Search_Request
CuuDuongThanCong.com https://fb.com/tailieudientucntt
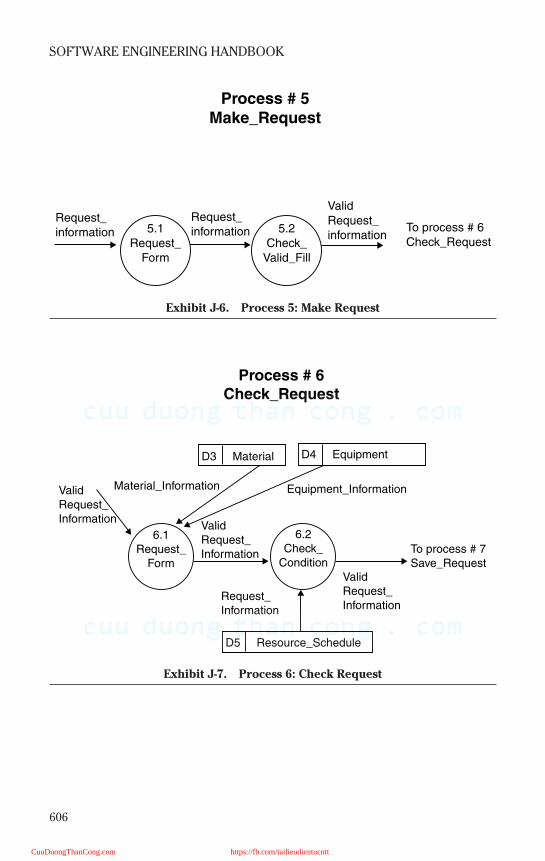
606
SOFTWARE ENGINEERING HANDBOOK
Exhibit J-6. Process 5: Make Request
Exhibit J-7. Process 6: Check Request
Process # 5
Make_Request
5.1Request_
Form
5.2Check_
Valid_Fill
Request_information
Request_information
ValidRequest_information
To process # 6Check_Request
Process # 6
Check_Request
6.2Check_
Condition
6.1Request_
Form
ValidRequest_Information
ValidRequest_Information
ValidRequest_Information
Material_Information Equipment_Information
Request_Information
To process # 7Save_Request
D5 Resource_Schedule
D3 Material D4 Equipment
CuuDuongThanCong.com https://fb.com/tailieudientucntt
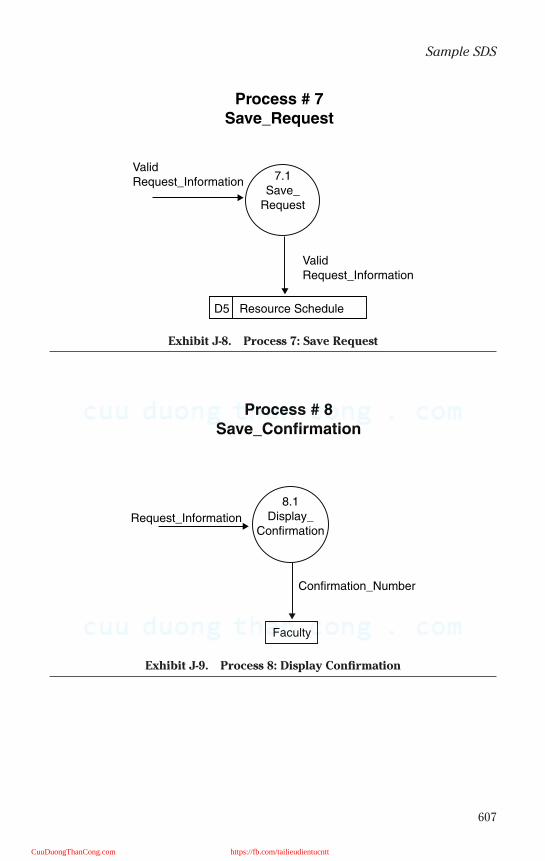
607
Sample SDS
Exhibit J-8. Process 7: Save Request
Exhibit J-9. Process 8: Display Confirmation
ValidRequest_Information
ValidRequest_Information
D5 Resource Schedule
7.1Save_
Request
Process # 7
Save_Request
8.1Display_
Confirmation
Confirmation_Number
Request_Information
Faculty
Process # 8
Save_Confirmation
CuuDuongThanCong.com https://fb.com/tailieudientucntt
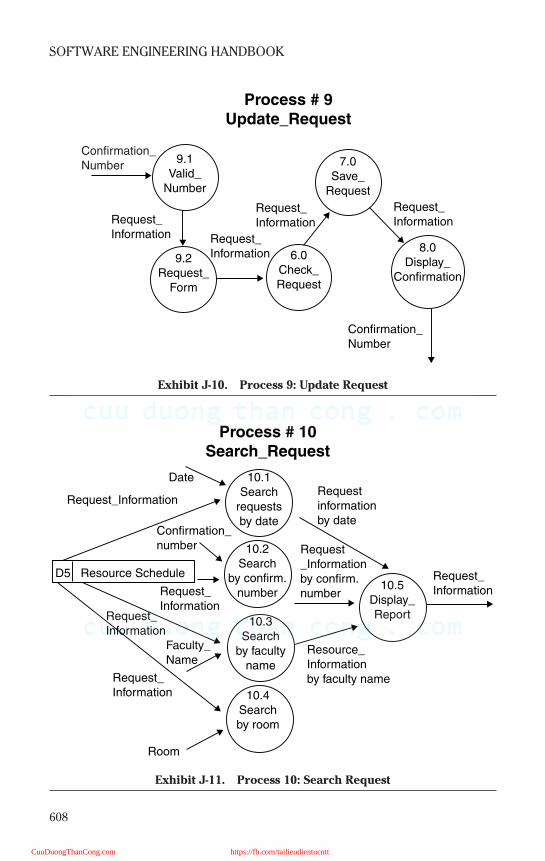
608
SOFTWARE ENGINEERING HANDBOOK
Exhibit J-10. Process 9: Update Request
Exhibit J-11. Process 10: Search Request
Process # 9
Update_Request
9.2Request_
Form
9.1Valid_
Number
6.0Check_Request
7.0Save_
Request
8.0Display_
Confirmation
Request_Information
Request_Information
Request_Information
Request_Information
Confirmation_Number
Confirmation_Number
Process # 10
Search_Request
10.2Search
by confirm.number
10.1Search
requestsby date
10.3Search
by facultyname
10.4Searchby room
10.5Display_Report
D5 Resource Schedule
Date
Request_Information
Request_Information
Request_Information
Request_Information
Request_Information
Confirmation_number
Faculty_Name
Room
Requestinformationby date
Request_Informationby confirm.number
Resource_Informationby faculty name
CuuDuongThanCong.com https://fb.com/tailieudientucntt

609
Sample SDS
Exhibit J-12. Process 11: Search Resource
Exhibit J-13. Process 12: Add Resource
Process # 11
Search_Resource
11.1Search
by materialnumber
11.3Search
byequipment
name
11.2Search
by materialtitle
11.4Search
byequipment
type
11.5Display/Printreport
D3 Material
D4 Equipment
Catalog_Number
Material_Information
Material_Information
Material_Information
Material_Information
EquipmentInformation
Equipment_Type
Equipment_Name
Material_Title
Equipment_Information
ResourceInformation
Process # 12
Add_Resource
12.2Add_
Equipment
12.1Add_
Material
Equipment_Information
UpdatedCatalog_Information
UpdatedEquipment_Information
Material_Information
D3 Material
D4 Equipment
CuuDuongThanCong.com https://fb.com/tailieudientucntt

610
SOFTWARE ENGINEERING HANDBOOK
5 LOW-LEVEL DESIGN
5.1 Procedures and Details
The following are the procedures and their details.
Campus_Login
Program will redirect Campus Login page to Campus Main Menu page ifthe user name and password match with valid name and password.
ResourceCenter_Login
Program will redirect Resource Center Login page to Resource CenterMain Menu page if the user name and password match with valid name andpassword.
Campus_Menu
After the user (faculty) logs on ORSS, the campus menu will display onthe screen. It allows the user to make decisions to make/update therequest or to search resources.
Exhibit J-14. Process 13: Update Resource
Process # 13
Update_Resource
13.2Update_
Equipment
13.1Update_Material
Equipment_Information
UpdatedCatalog_Information
UpdatedEquipment_Information
Material_Information
D3 Material
D4 Equipment
CuuDuongThanCong.com https://fb.com/tailieudientucntt

611
Sample SDS
Resource Center_Menu
After the user (staff) logs on ORSS, the resource center menu will displayon the screen. It will open other Web pages when the user makes his selec-tion.
Make_Request
This allows the user to make a new request. When he selects “make anew request,” a blank request form will display on the screen. The proce-dure will check some information after the user submits the request.
Check_Request
The process will compare the new request with the requests in the data-base asking for equipment or materials at the same time. The purpose ofthis procedure is to make sure that no conflict between a new request andexisting requests occurs.
Save_Request
Save request to database if the new request is acceptable.
Display_Confirmation
Display a confirmation page to the user. This page will include all of theinformation about the reservation that the user just requested.
Update_Request
Allow user to enter request number. Retrieve the requested informationfrom the database. After the user modifies the reservation, the form ischecked and if everything is ok, then it is saved.
Search_Requests
Procedure will search requests in the database and display all thatmatch the conditions.
Search_Resources
Procedure will search the resources in the database and display all thatmatch the conditions.
Add_Resource
This will allow resource center staff to add new resources to the data-base.
Update_Resource
This allows resource center staff to update resource information ordelete resources from the database.
CuuDuongThanCong.com https://fb.com/tailieudientucntt
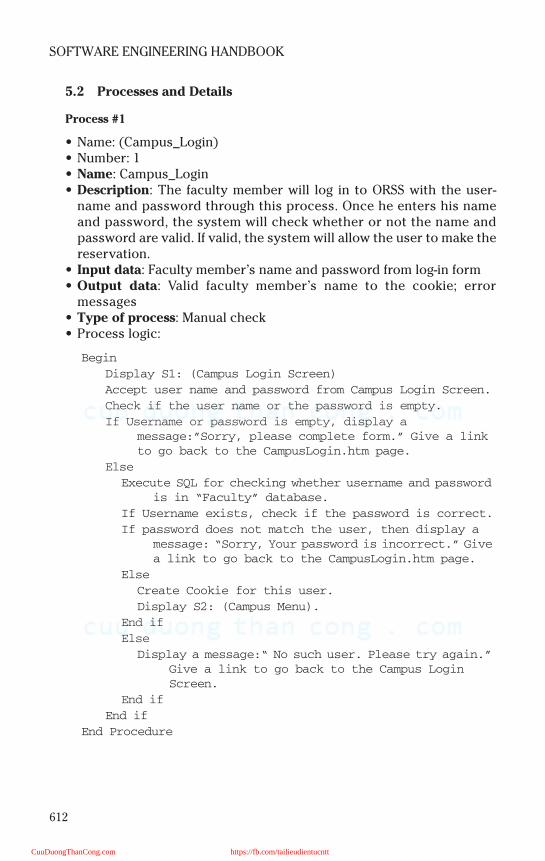
612
SOFTWARE ENGINEERING HANDBOOK
5.2 Processes and Details
Process #1
• Name: (Campus_Login)• Number: 1• Name: Campus_Login• Description: The faculty member will log in to ORSS with the user-
name and password through this process. Once he enters his nameand password, the system will check whether or not the name andpassword are valid. If valid, the system will allow the user to make thereservation.
• Input data: Faculty member’s name and password from log-in form• Output data: Valid faculty member’s name to the cookie; error
messages• Type of process: Manual check• Process logic:
Begin
Display S1: (Campus Login Screen)
Accept user name and password from Campus Login Screen.
Check if the user name or the password is empty.
If Username or password is empty, display a
message:”Sorry, please complete form.” Give a link
to go back to the CampusLogin.htm page.
Else
Execute SQL for checking whether username and password
is in “Faculty” database.
If Username exists, check if the password is correct.
If password does not match the user, then display a
message: “Sorry, Your password is incorrect.” Give
a link to go back to the CampusLogin.htm page.
Else
Create Cookie for this user.
Display S2: (Campus Menu).
End if
Else
Display a message:“ No such user. Please try again.”
Give a link to go back to the Campus Login
Screen.
End if
End if
End Procedure
CuuDuongThanCong.com https://fb.com/tailieudientucntt

613
Sample SDS
Process #2
• Name: (ResourceCenter_Login)• Number: 2• Name: ResourceCenter_Login• Description: Resource center staff member will log in to ORSS with the
username and password through this process. Once name and pass-word are entered, the system will check whether or not they are valid.If valid, then the system will allow the user to make the reservation.
• Input data: Resource center staff member’s name and password fromlogin form
• Output data: Resource center staff member’s name to the cookie; er-ror messages
• Type of process: Manual check• Process logic:
Begin
Display S3: (Resource Center Login Screen)
Accept user name and password from login form
Check if the user name or the password is empty.
If Username or password is empty, display a
message:“Sorry, please complete form,” Give a link
to go back to the ResourceCenterlogin.htm page.
Else
Execute SQL for checking whether username and password
is in “ResourceCenter_Login” database.
If Username exists, check if the password is correct.
If password does not match, display a
message:“Sorry, Your password is incorrect,”
Give a link to go back to the
ResourceCenterlogin.htm page.
Else
Create Cookie for this user.
Display S4: (Resource Center Menu).
End if
Else
Display a message:“No such user. Please try again.”
Give a link to go back to the Resource Center
Login Screen.
End if
End if
End Procedure
CuuDuongThanCong.com https://fb.com/tailieudientucntt
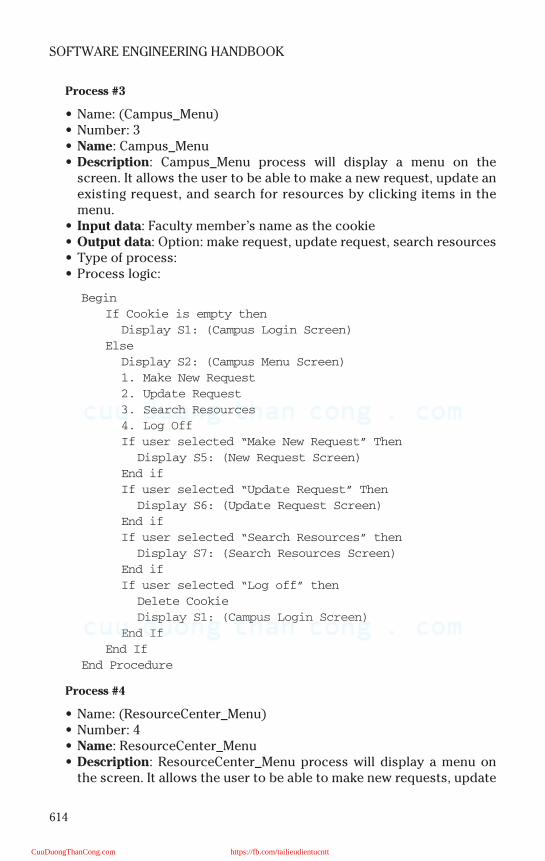
614
SOFTWARE ENGINEERING HANDBOOK
Process #3
• Name: (Campus_Menu)• Number: 3• Name: Campus_Menu• Description: Campus_Menu process will display a menu on the
screen. It allows the user to be able to make a new request, update anexisting request, and search for resources by clicking items in themenu.
• Input data: Faculty member’s name as the cookie• Output data: Option: make request, update request, search resources• Type of process:• Process logic:
Begin
If Cookie is empty then
Display S1: (Campus Login Screen)
Else
Display S2: (Campus Menu Screen)
1. Make New Request
2. Update Request
3. Search Resources
4. Log Off
If user selected “Make New Request” Then
Display S5: (New Request Screen)
End if
If user selected “Update Request” Then
Display S6: (Update Request Screen)
End if
If user selected “Search Resources” then
Display S7: (Search Resources Screen)
End if
If user selected “Log off” then
Delete Cookie
Display S1: (Campus Login Screen)
End If
End If
End Procedure
Process #4
• Name: (ResourceCenter_Menu)• Number: 4• Name: ResourceCenter_Menu• Description: ResourceCenter_Menu process will display a menu on
the screen. It allows the user to be able to make new requests, update
CuuDuongThanCong.com https://fb.com/tailieudientucntt
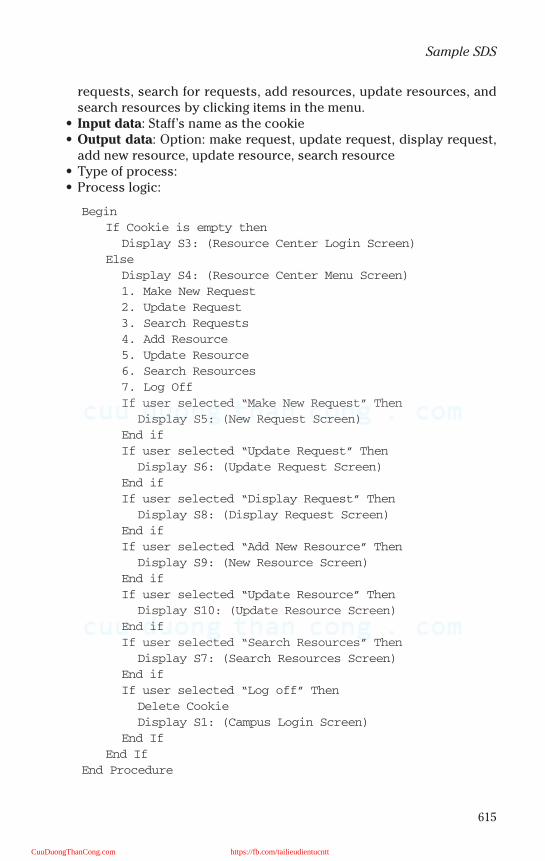
615
Sample SDS
requests, search for requests, add resources, update resources, andsearch resources by clicking items in the menu.
• Input data: Staff’s name as the cookie• Output data: Option: make request, update request, display request,
add new resource, update resource, search resource• Type of process:• Process logic:
Begin
If Cookie is empty then
Display S3: (Resource Center Login Screen)
Else
Display S4: (Resource Center Menu Screen)
1. Make New Request
2. Update Request
3. Search Requests
4. Add Resource
5. Update Resource
6. Search Resources
7. Log Off
If user selected “Make New Request” Then
Display S5: (New Request Screen)
End if
If user selected “Update Request” Then
Display S6: (Update Request Screen)
End if
If user selected “Display Request” Then
Display S8: (Display Request Screen)
End if
If user selected “Add New Resource” Then
Display S9: (New Resource Screen)
End if
If user selected “Update Resource” Then
Display S10: (Update Resource Screen)
End if
If user selected “Search Resources” Then
Display S7: (Search Resources Screen)
End if
If user selected “Log off” Then
Delete Cookie
Display S1: (Campus Login Screen)
End If
End If
End Procedure
CuuDuongThanCong.com https://fb.com/tailieudientucntt
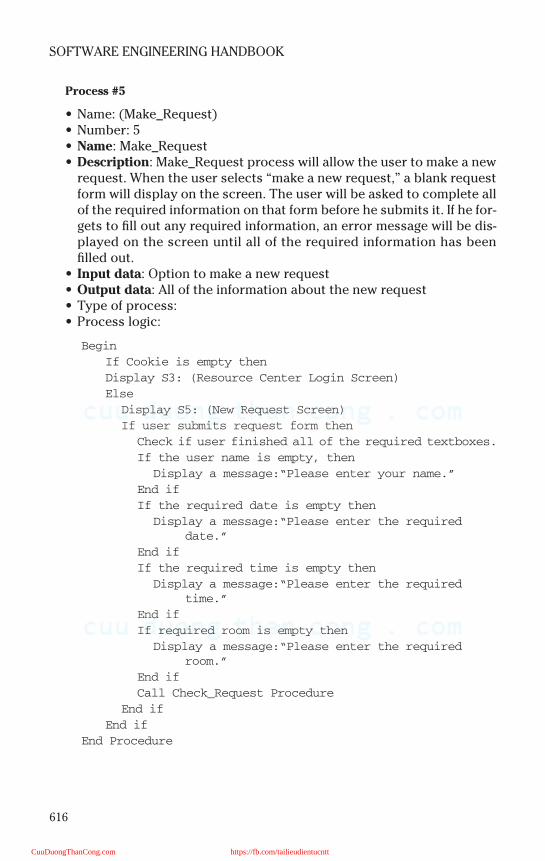
616
SOFTWARE ENGINEERING HANDBOOK
Process #5
• Name: (Make_Request)• Number: 5• Name: Make_Request• Description: Make_Request process will allow the user to make a new
request. When the user selects “make a new request,” a blank requestform will display on the screen. The user will be asked to complete allof the required information on that form before he submits it. If he for-gets to fill out any required information, an error message will be dis-played on the screen until all of the required information has beenfilled out.
• Input data: Option to make a new request• Output data: All of the information about the new request• Type of process:• Process logic:
Begin
If Cookie is empty then
Display S3: (Resource Center Login Screen)
Else
Display S5: (New Request Screen)
If user submits request form then
Check if user finished all of the required textboxes.
If the user name is empty, then
Display a message:“Please enter your name.”
End if
If the required date is empty then
Display a message:“Please enter the required
date.”
End if
If the required time is empty then
Display a message:“Please enter the required
time.”
End if
If required room is empty then
Display a message:“Please enter the required
room.”
End if
Call Check_Request Procedure
End if
End if
End Procedure
CuuDuongThanCong.com https://fb.com/tailieudientucntt
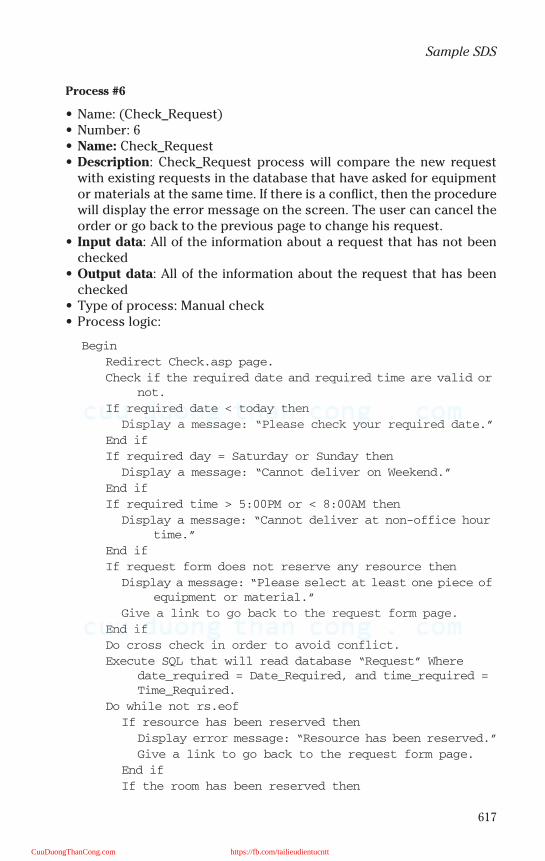
617
Sample SDS
Process #6
• Name: (Check_Request)• Number: 6• Name: Check_Request• Description: Check_Request process will compare the new request
with existing requests in the database that have asked for equipmentor materials at the same time. If there is a conflict, then the procedurewill display the error message on the screen. The user can cancel theorder or go back to the previous page to change his request.
• Input data: All of the information about a request that has not beenchecked
• Output data: All of the information about the request that has beenchecked
• Type of process: Manual check• Process logic:
Begin
Redirect Check.asp page.
Check if the required date and required time are valid or
not.
If required date < today then
Display a message: “Please check your required date.”
End if
If required day = Saturday or Sunday then
Display a message: “Cannot deliver on Weekend.”
End if
If required time > 5:00PM or < 8:00AM then
Display a message: “Cannot deliver at non-office hour
time.”
End if
If request form does not reserve any resource then
Display a message: “Please select at least one piece of
equipment or material.”
Give a link to go back to the request form page.
End if
Do cross check in order to avoid conflict.
Execute SQL that will read database “Request” Where
date_required = Date_Required, and time_required =
Time_Required.
Do while not rs.eof
If resource has been reserved then
Display error message: “Resource has been reserved.”
Give a link to go back to the request form page.
End if
If the room has been reserved then
CuuDuongThanCong.com https://fb.com/tailieudientucntt

618
SOFTWARE ENGINEERING HANDBOOK
Display error message: “Room has been reserved for
another class.”
Give a link to go back to the request form page.
End if
Loop
If everything is ok then call Save_Request Procedure
End Procedure
Process #7
• Name: (Save_Request)• Number: 7• Name: Save_Request• Description: Save_Request process will save request into request da-
tabase.• Input data: All of the information about a request that has been
checked• Output data: All of the information about the request that has been
checked (include a confirmation number)• Type of process:• Process logic:
Begin
Redirect Save.asp page.
Generate a confirmation Number.
Execute SQL that will open “Request” database.
Add new request to the database.
Update Request Database
Close Database
Call Display_Confirmation Procedure.
End Procedure
Process #8
• Name: (Display_Confirmation)• Number: 8• Name: Display_Confirmation• Description: Display_Confirmation process will display on the screen
all of the information that the user just entered. This informationshould contain a confirmation_Number generated by our system afterthe check_request procedure accepts all of the information from theuser. This page will provide a print button so that the user may printa hard copy of the confirmation page. Also, the procedure will auto-matically send a confirmation e-mail to the user.
• Input data: All of the information about a request that has not yet beenchecked
CuuDuongThanCong.com https://fb.com/tailieudientucntt
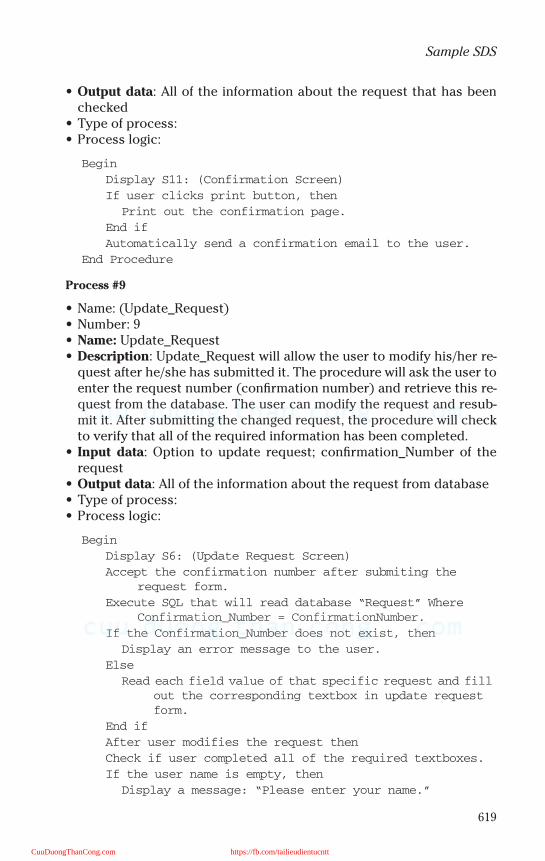
619
Sample SDS
• Output data: All of the information about the request that has beenchecked
• Type of process:• Process logic:
Begin
Display S11: (Confirmation Screen)
If user clicks print button, then
Print out the confirmation page.
End if
Automatically send a confirmation email to the user.
End Procedure
Process #9
• Name: (Update_Request)• Number: 9• Name: Update_Request• Description: Update_Request will allow the user to modify his/her re-
quest after he/she has submitted it. The procedure will ask the user toenter the request number (confirmation number) and retrieve this re-quest from the database. The user can modify the request and resub-mit it. After submitting the changed request, the procedure will checkto verify that all of the required information has been completed.
• Input data: Option to update request; confirmation_Number of therequest
• Output data: All of the information about the request from database• Type of process:• Process logic:
Begin
Display S6: (Update Request Screen)
Accept the confirmation number after submiting the
request form.
Execute SQL that will read database “Request” Where
Confirmation_Number = ConfirmationNumber.
If the Confirmation_Number does not exist, then
Display an error message to the user.
Else
Read each field value of that specific request and fill
out the corresponding textbox in update request
form.
End if
After user modifies the request then
Check if user completed all of the required textboxes.
If the user name is empty, then
Display a message: “Please enter your name.”
CuuDuongThanCong.com https://fb.com/tailieudientucntt
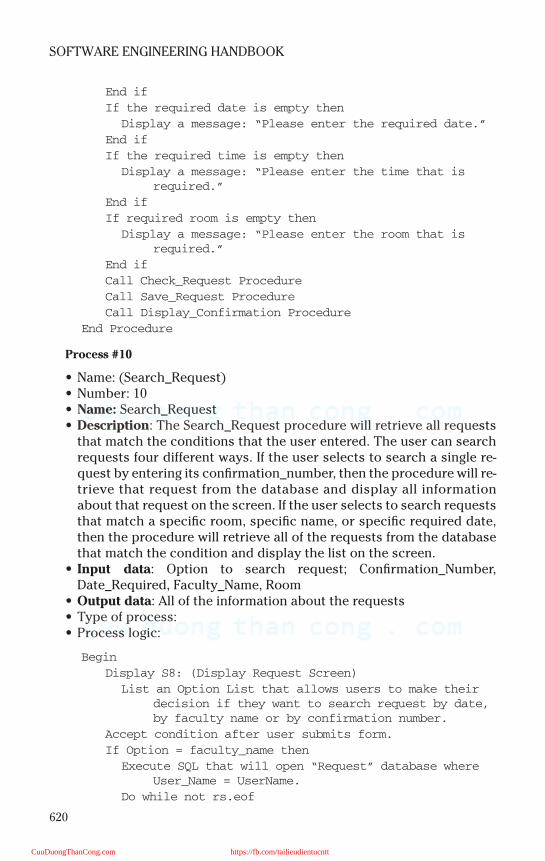
620
SOFTWARE ENGINEERING HANDBOOK
End if
If the required date is empty then
Display a message: “Please enter the required date.”
End if
If the required time is empty then
Display a message: “Please enter the time that is
required.”
End if
If required room is empty then
Display a message: “Please enter the room that is
required.”
End if
Call Check_Request Procedure
Call Save_Request Procedure
Call Display_Confirmation Procedure
End Procedure
Process #10
• Name: (Search_Request)• Number: 10• Name: Search_Request• Description: The Search_Request procedure will retrieve all requests
that match the conditions that the user entered. The user can searchrequests four different ways. If the user selects to search a single re-quest by entering its confirmation_number, then the procedure will re-trieve that request from the database and display all informationabout that request on the screen. If the user selects to search requeststhat match a specific room, specific name, or specific required date,then the procedure will retrieve all of the requests from the databasethat match the condition and display the list on the screen.
• Input data: Option to search request; Confirmation_Number,Date_Required, Faculty_Name, Room
• Output data: All of the information about the requests• Type of process:• Process logic:
Begin
Display S8: (Display Request Screen)
List an Option List that allows users to make their
decision if they want to search request by date,
by faculty name or by confirmation number.
Accept condition after user submits form.
If Option = faculty_name then
Execute SQL that will open “Request” database where
User_Name = UserName.
Do while not rs.eof
CuuDuongThanCong.com https://fb.com/tailieudientucntt
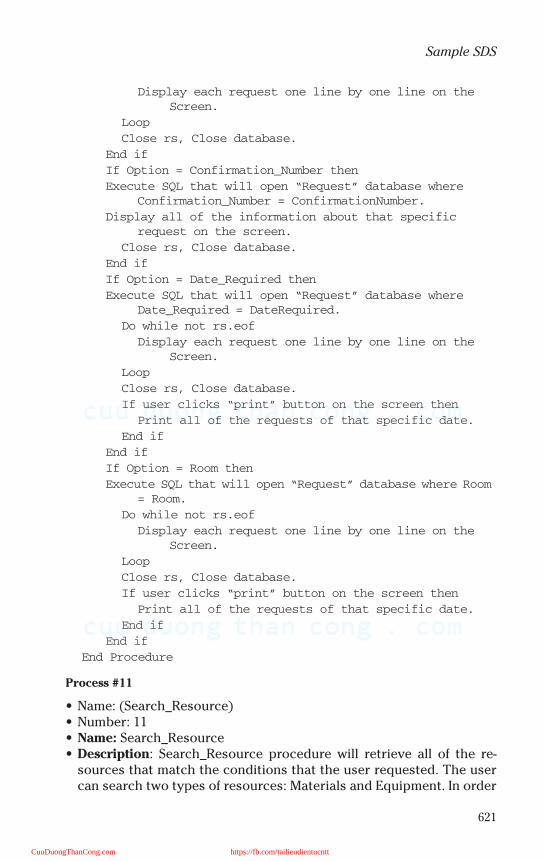
621
Sample SDS
Display each request one line by one line on the
Screen.
Loop
Close rs, Close database.
End if
If Option = Confirmation_Number then
Execute SQL that will open “Request” database where
Confirmation_Number = ConfirmationNumber.
Display all of the information about that specific
request on the screen.
Close rs, Close database.
End if
If Option = Date_Required then
Execute SQL that will open “Request” database where
Date_Required = DateRequired.
Do while not rs.eof
Display each request one line by one line on the
Screen.
Loop
Close rs, Close database.
If user clicks “print” button on the screen then
Print all of the requests of that specific date.
End if
End if
If Option = Room then
Execute SQL that will open “Request” database where Room
= Room.
Do while not rs.eof
Display each request one line by one line on the
Screen.
Loop
Close rs, Close database.
If user clicks “print” button on the screen then
Print all of the requests of that specific date.
End if
End if
End Procedure
Process #11
• Name: (Search_Resource)• Number: 11• Name: Search_Resource• Description: Search_Resource procedure will retrieve all of the re-
sources that match the conditions that the user requested. The usercan search two types of resources: Materials and Equipment. In order
CuuDuongThanCong.com https://fb.com/tailieudientucntt
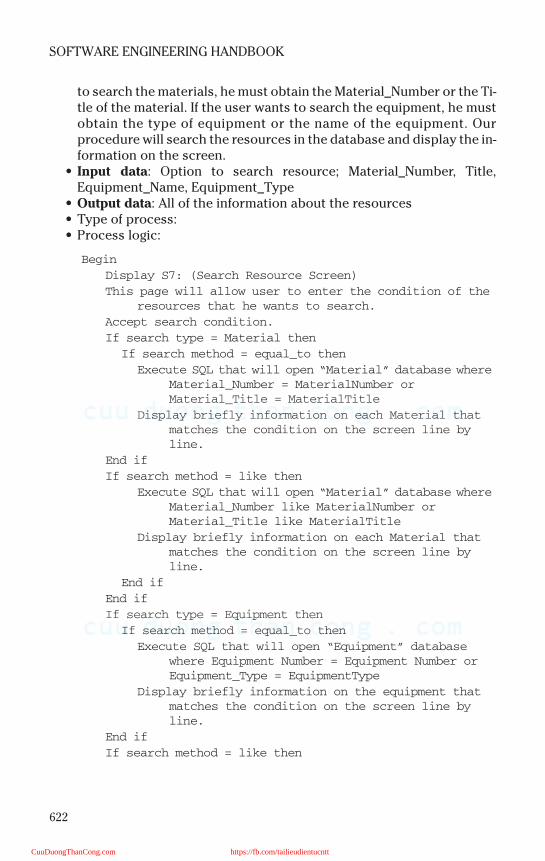
622
SOFTWARE ENGINEERING HANDBOOK
to search the materials, he must obtain the Material_Number or the Ti-tle of the material. If the user wants to search the equipment, he mustobtain the type of equipment or the name of the equipment. Ourprocedure will search the resources in the database and display the in-formation on the screen.
• Input data: Option to search resource; Material_Number, Title,Equipment_Name, Equipment_Type
• Output data: All of the information about the resources• Type of process:• Process logic:
Begin
Display S7: (Search Resource Screen)
This page will allow user to enter the condition of the
resources that he wants to search.
Accept search condition.
If search type = Material then
If search method = equal_to then
Execute SQL that will open “Material” database where
Material_Number = MaterialNumber or
Material_Title = MaterialTitle
Display briefly information on each Material that
matches the condition on the screen line by
line.
End if
If search method = like then
Execute SQL that will open “Material” database where
Material_Number like MaterialNumber or
Material_Title like MaterialTitle
Display briefly information on each Material that
matches the condition on the screen line by
line.
End if
End if
If search type = Equipment then
If search method = equal_to then
Execute SQL that will open “Equipment” database
where Equipment Number = Equipment Number or
Equipment_Type = EquipmentType
Display briefly information on the equipment that
matches the condition on the screen line by
line.
End if
If search method = like then
CuuDuongThanCong.com https://fb.com/tailieudientucntt
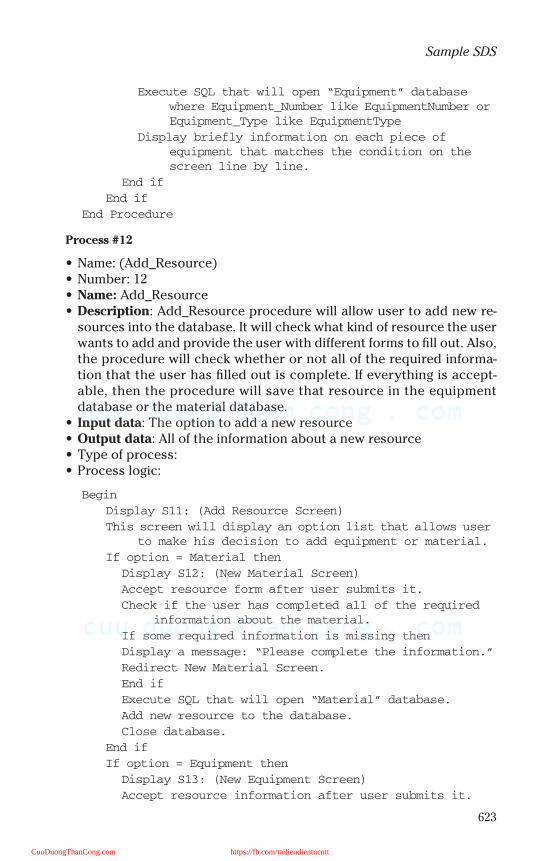
623
Sample SDS
Execute SQL that will open “Equipment” database
where Equipment_Number like EquipmentNumber or
Equipment_Type like EquipmentType
Display briefly information on each piece of
equipment that matches the condition on the
screen line by line.
End if
End if
End Procedure
Process #12
• Name: (Add_Resource)• Number: 12• Name: Add_Resource• Description: Add_Resource procedure will allow user to add new re-
sources into the database. It will check what kind of resource the userwants to add and provide the user with different forms to fill out. Also,the procedure will check whether or not all of the required informa-tion that the user has filled out is complete. If everything is accept-able, then the procedure will save that resource in the equipmentdatabase or the material database.
• Input data: The option to add a new resource• Output data: All of the information about a new resource• Type of process:• Process logic:
Begin
Display S11: (Add Resource Screen)
This screen will display an option list that allows user
to make his decision to add equipment or material.
If option = Material then
Display S12: (New Material Screen)
Accept resource form after user submits it.
Check if the user has completed all of the required
information about the material.
If some required information is missing then
Display a message: “Please complete the information.”
Redirect New Material Screen.
End if
Execute SQL that will open “Material” database.
Add new resource to the database.
Close database.
End if
If option = Equipment then
Display S13: (New Equipment Screen)
Accept resource information after user submits it.
CuuDuongThanCong.com https://fb.com/tailieudientucntt
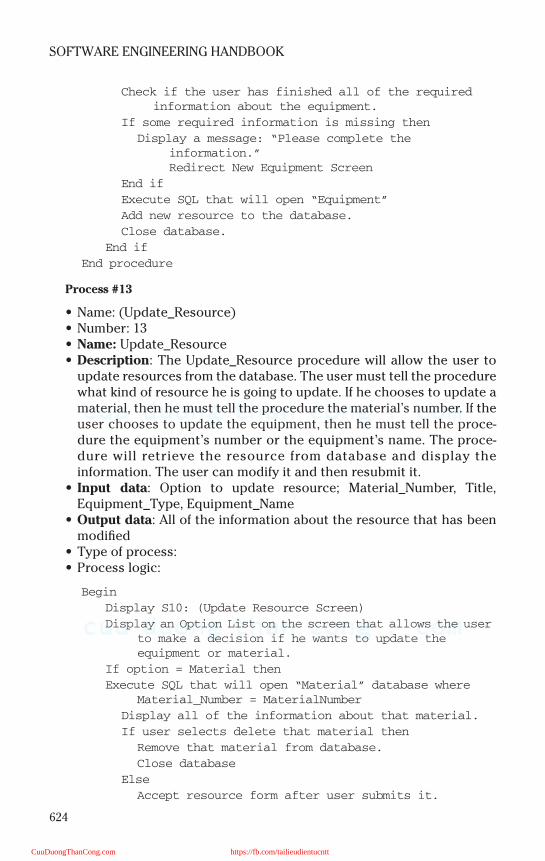
624
SOFTWARE ENGINEERING HANDBOOK
Check if the user has finished all of the required
information about the equipment.
If some required information is missing then
Display a message: “Please complete the
information.”
Redirect New Equipment Screen
End if
Execute SQL that will open “Equipment”
Add new resource to the database.
Close database.
End if
End procedure
Process #13
• Name: (Update_Resource)• Number: 13• Name: Update_Resource• Description: The Update_Resource procedure will allow the user to
update resources from the database. The user must tell the procedurewhat kind of resource he is going to update. If he chooses to update amaterial, then he must tell the procedure the material’s number. If theuser chooses to update the equipment, then he must tell the proce-dure the equipment’s number or the equipment’s name. The proce-dure will retrieve the resource from database and display theinformation. The user can modify it and then resubmit it.
• Input data: Option to update resource; Material_Number, Title,Equipment_Type, Equipment_Name
• Output data: All of the information about the resource that has beenmodified
• Type of process:• Process logic:
Begin
Display S10: (Update Resource Screen)
Display an Option List on the screen that allows the user
to make a decision if he wants to update the
equipment or material.
If option = Material then
Execute SQL that will open “Material” database where
Material_Number = MaterialNumber
Display all of the information about that material.
If user selects delete that material then
Remove that material from database.
Close database
Else
Accept resource form after user submits it.
CuuDuongThanCong.com https://fb.com/tailieudientucntt
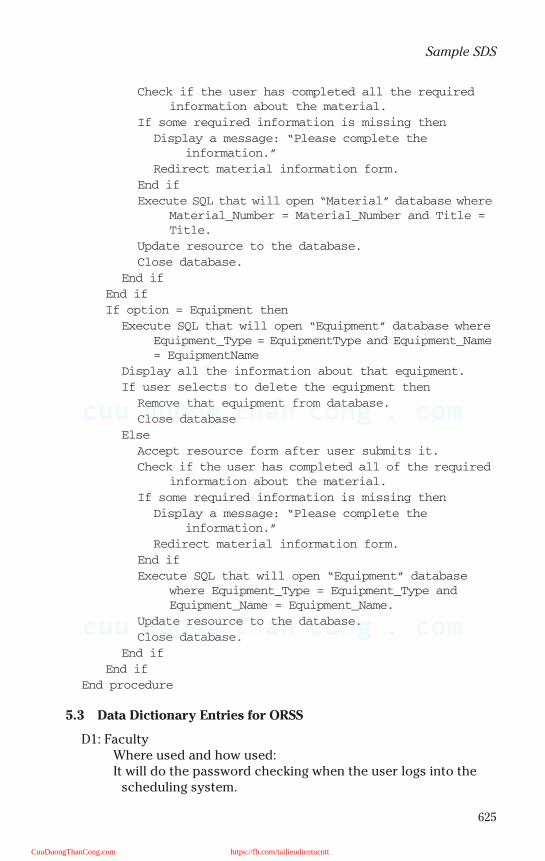
625
Sample SDS
Check if the user has completed all the required
information about the material.
If some required information is missing then
Display a message: “Please complete the
information.”
Redirect material information form.
End if
Execute SQL that will open “Material” database where
Material_Number = Material_Number and Title =
Title.
Update resource to the database.
Close database.
End if
End if
If option = Equipment then
Execute SQL that will open “Equipment” database where
Equipment_Type = EquipmentType and Equipment_Name
= EquipmentName
Display all the information about that equipment.
If user selects to delete the equipment then
Remove that equipment from database.
Close database
Else
Accept resource form after user submits it.
Check if the user has completed all of the required
information about the material.
If some required information is missing then
Display a message: “Please complete the
information.”
Redirect material information form.
End if
Execute SQL that will open “Equipment” database
where Equipment_Type = Equipment_Type and
Equipment_Name = Equipment_Name.
Update resource to the database.
Close database.
End if
End if
End procedure
5.3 Data Dictionary Entries for ORSS
D1: FacultyWhere used and how used:It will do the password checking when the user logs into the
scheduling system.
CuuDuongThanCong.com https://fb.com/tailieudientucntt
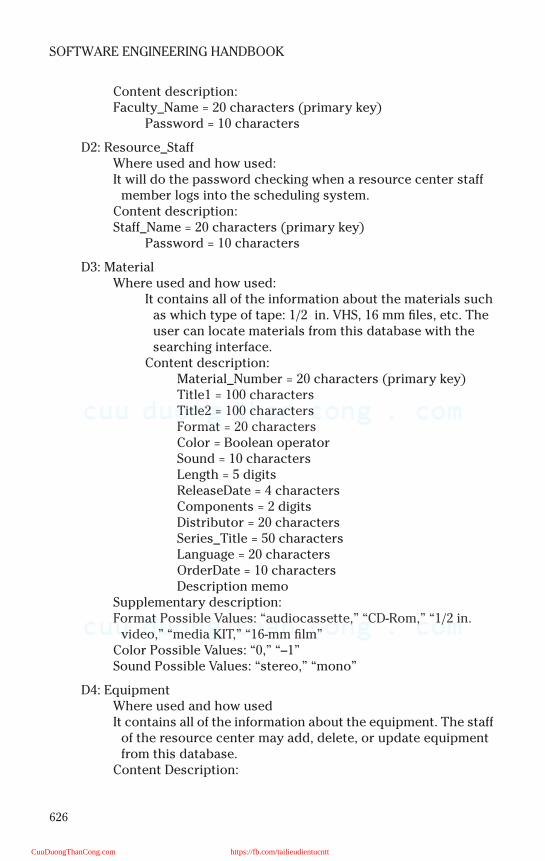
626
SOFTWARE ENGINEERING HANDBOOK
Content description:Faculty_Name = 20 characters (primary key)
Password = 10 characters
D2: Resource_StaffWhere used and how used:It will do the password checking when a resource center staff
member logs into the scheduling system.Content description:Staff_Name = 20 characters (primary key)
Password = 10 characters
D3: MaterialWhere used and how used:
It contains all of the information about the materials such as which type of tape: 1/2 in. VHS, 16 mm files, etc. The user can locate materials from this database with the searching interface.
Content description:Material_Number = 20 characters (primary key)Title1 = 100 charactersTitle2 = 100 charactersFormat = 20 charactersColor = Boolean operatorSound = 10 charactersLength = 5 digitsReleaseDate = 4 charactersComponents = 2 digitsDistributor = 20 charactersSeries_Title = 50 charactersLanguage = 20 charactersOrderDate = 10 charactersDescription memo
Supplementary description:Format Possible Values: “audiocassette,” “CD-Rom,” “1/2 in.
video,” “media KIT,” “16-mm film”Color Possible Values: “0,” “–1”Sound Possible Values: “stereo,” “mono”
D4: EquipmentWhere used and how usedIt contains all of the information about the equipment. The staff
of the resource center may add, delete, or update equipment from this database.
Content Description:
CuuDuongThanCong.com https://fb.com/tailieudientucntt
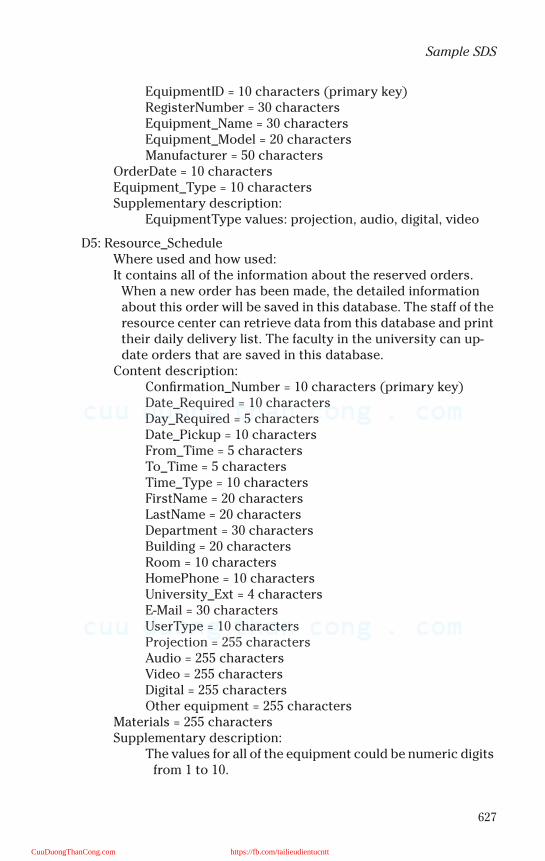
627
Sample SDS
EquipmentID = 10 characters (primary key)RegisterNumber = 30 charactersEquipment_Name = 30 charactersEquipment_Model = 20 charactersManufacturer = 50 characters
OrderDate = 10 charactersEquipment_Type = 10 charactersSupplementary description:
EquipmentType values: projection, audio, digital, video
D5: Resource_ScheduleWhere used and how used:It contains all of the information about the reserved orders.
When a new order has been made, the detailed information about this order will be saved in this database. The staff of the resource center can retrieve data from this database and print their daily delivery list. The faculty in the university can up-date orders that are saved in this database.
Content description:Confirmation_Number = 10 characters (primary key)Date_Required = 10 charactersDay_Required = 5 charactersDate_Pickup = 10 charactersFrom_Time = 5 charactersTo_Time = 5 charactersTime_Type = 10 charactersFirstName = 20 charactersLastName = 20 charactersDepartment = 30 charactersBuilding = 20 charactersRoom = 10 charactersHomePhone = 10 charactersUniversity_Ext = 4 charactersE-Mail = 30 charactersUserType = 10 charactersProjection = 255 charactersAudio = 255 charactersVideo = 255 charactersDigital = 255 charactersOther equipment = 255 characters
Materials = 255 charactersSupplementary description:
The values for all of the equipment could be numeric digits from 1 to 10.
CuuDuongThanCong.com https://fb.com/tailieudientucntt
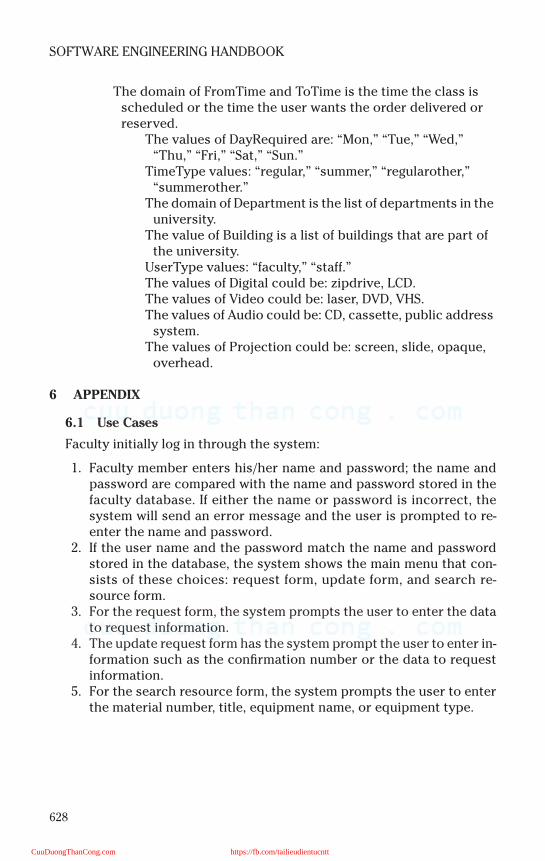
628
SOFTWARE ENGINEERING HANDBOOK
The domain of FromTime and ToTime is the time the class is scheduled or the time the user wants the order delivered or reserved.
The values of DayRequired are: “Mon,” “Tue,” “Wed,” “Thu,” “Fri,” “Sat,” “Sun.”
TimeType values: “regular,” “summer,” “regularother,” “summerother.”
The domain of Department is the list of departments in the university.
The value of Building is a list of buildings that are part of the university.
UserType values: “faculty,” “staff.”The values of Digital could be: zipdrive, LCD.The values of Video could be: laser, DVD, VHS.The values of Audio could be: CD, cassette, public address
system.The values of Projection could be: screen, slide, opaque,
overhead.
6 APPENDIX
6.1 Use Cases
Faculty initially log in through the system:
1. Faculty member enters his/her name and password; the name andpassword are compared with the name and password stored in thefaculty database. If either the name or password is incorrect, thesystem will send an error message and the user is prompted to re-enter the name and password.
2. If the user name and the password match the name and passwordstored in the database, the system shows the main menu that con-sists of these choices: request form, update form, and search re-source form.
3. For the request form, the system prompts the user to enter the datato request information.
4. The update request form has the system prompt the user to enter in-formation such as the confirmation number or the data to requestinformation.
5. For the search resource form, the system prompts the user to enterthe material number, title, equipment name, or equipment type.
CuuDuongThanCong.com https://fb.com/tailieudientucntt
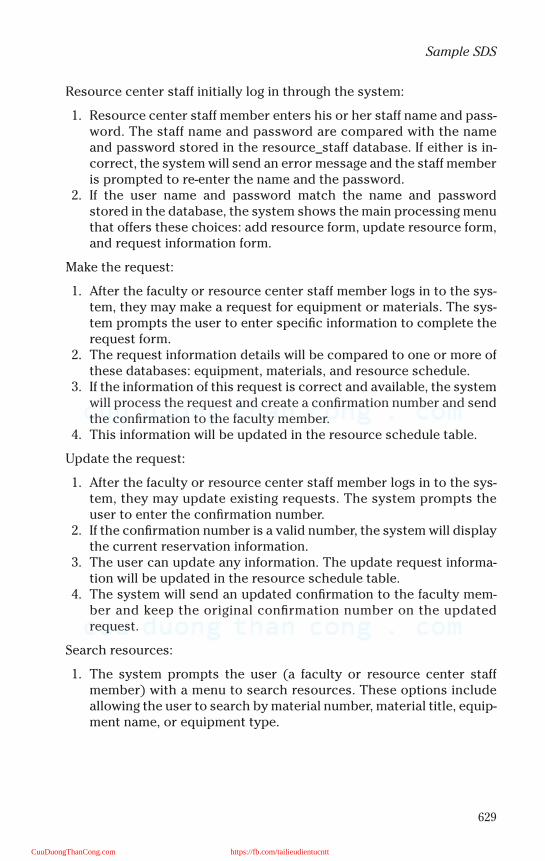
629
Sample SDS
Resource center staff initially log in through the system:
1. Resource center staff member enters his or her staff name and pass-word. The staff name and password are compared with the nameand password stored in the resource_staff database. If either is in-correct, the system will send an error message and the staff memberis prompted to re-enter the name and the password.
2. If the user name and password match the name and passwordstored in the database, the system shows the main processing menuthat offers these choices: add resource form, update resource form,and request information form.
Make the request:
1. After the faculty or resource center staff member logs in to the sys-tem, they may make a request for equipment or materials. The sys-tem prompts the user to enter specific information to complete therequest form.
2. The request information details will be compared to one or more ofthese databases: equipment, materials, and resource schedule.
3. If the information of this request is correct and available, the systemwill process the request and create a confirmation number and sendthe confirmation to the faculty member.
4. This information will be updated in the resource schedule table.
Update the request:
1. After the faculty or resource center staff member logs in to the sys-tem, they may update existing requests. The system prompts theuser to enter the confirmation number.
2. If the confirmation number is a valid number, the system will displaythe current reservation information.
3. The user can update any information. The update request informa-tion will be updated in the resource schedule table.
4. The system will send an updated confirmation to the faculty mem-ber and keep the original confirmation number on the updatedrequest.
Search resources:
1. The system prompts the user (a faculty or resource center staffmember) with a menu to search resources. These options includeallowing the user to search by material number, material title, equip-ment name, or equipment type.
CuuDuongThanCong.com https://fb.com/tailieudientucntt
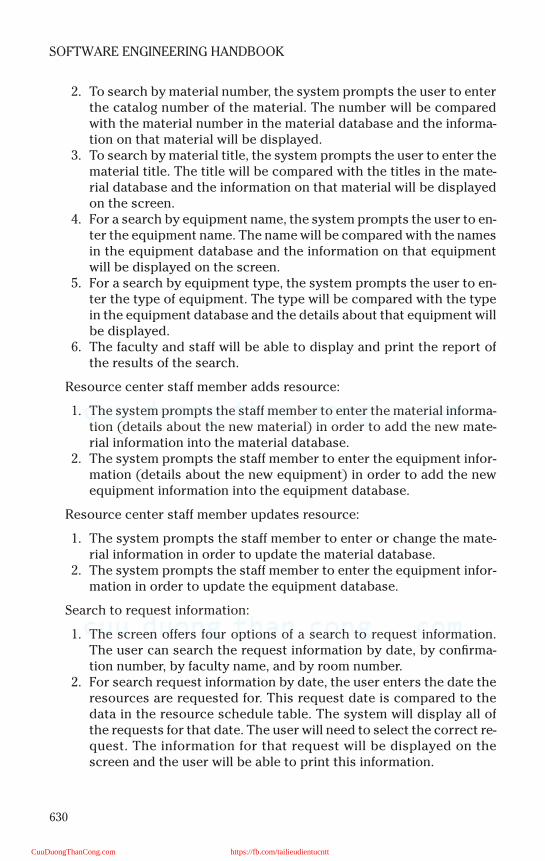
630
SOFTWARE ENGINEERING HANDBOOK
2. To search by material number, the system prompts the user to enterthe catalog number of the material. The number will be comparedwith the material number in the material database and the informa-tion on that material will be displayed.
3. To search by material title, the system prompts the user to enter thematerial title. The title will be compared with the titles in the mate-rial database and the information on that material will be displayedon the screen.
4. For a search by equipment name, the system prompts the user to en-ter the equipment name. The name will be compared with the namesin the equipment database and the information on that equipmentwill be displayed on the screen.
5. For a search by equipment type, the system prompts the user to en-ter the type of equipment. The type will be compared with the typein the equipment database and the details about that equipment willbe displayed.
6. The faculty and staff will be able to display and print the report ofthe results of the search.
Resource center staff member adds resource:
1. The system prompts the staff member to enter the material informa-tion (details about the new material) in order to add the new mate-rial information into the material database.
2. The system prompts the staff member to enter the equipment infor-mation (details about the new equipment) in order to add the newequipment information into the equipment database.
Resource center staff member updates resource:
1. The system prompts the staff member to enter or change the mate-rial information in order to update the material database.
2. The system prompts the staff member to enter the equipment infor-mation in order to update the equipment database.
Search to request information:
1. The screen offers four options of a search to request information.The user can search the request information by date, by confirma-tion number, by faculty name, and by room number.
2. For search request information by date, the user enters the date theresources are requested for. This request date is compared to thedata in the resource schedule table. The system will display all ofthe requests for that date. The user will need to select the correct re-quest. The information for that request will be displayed on thescreen and the user will be able to print this information.
CuuDuongThanCong.com https://fb.com/tailieudientucntt
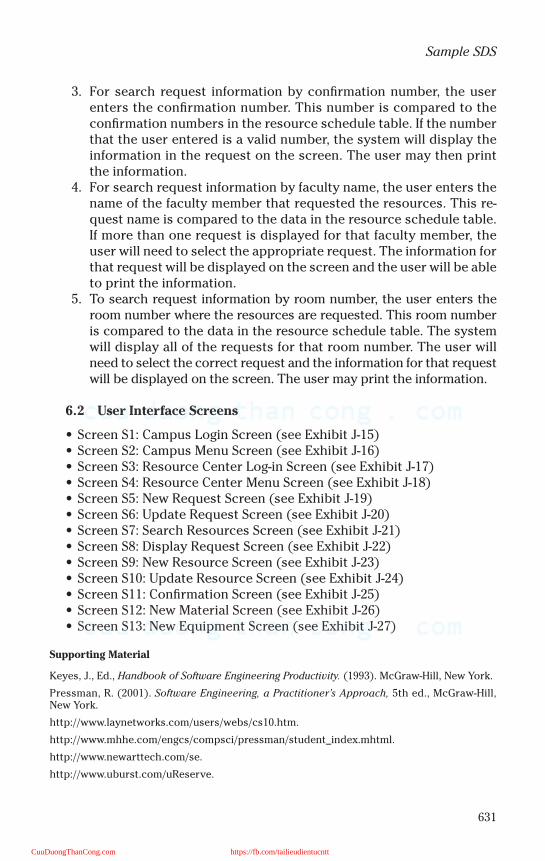
631
Sample SDS
3. For search request information by confirmation number, the userenters the confirmation number. This number is compared to theconfirmation numbers in the resource schedule table. If the numberthat the user entered is a valid number, the system will display theinformation in the request on the screen. The user may then printthe information.
4. For search request information by faculty name, the user enters thename of the faculty member that requested the resources. This re-quest name is compared to the data in the resource schedule table.If more than one request is displayed for that faculty member, theuser will need to select the appropriate request. The information forthat request will be displayed on the screen and the user will be ableto print the information.
5. To search request information by room number, the user enters theroom number where the resources are requested. This room numberis compared to the data in the resource schedule table. The systemwill display all of the requests for that room number. The user willneed to select the correct request and the information for that requestwill be displayed on the screen. The user may print the information.
6.2 User Interface Screens
• Screen S1: Campus Login Screen (see Exhibit J-15)• Screen S2: Campus Menu Screen (see Exhibit J-16)• Screen S3: Resource Center Log-in Screen (see Exhibit J-17)• Screen S4: Resource Center Menu Screen (see Exhibit J-18)• Screen S5: New Request Screen (see Exhibit J-19)• Screen S6: Update Request Screen (see Exhibit J-20)• Screen S7: Search Resources Screen (see Exhibit J-21)• Screen S8: Display Request Screen (see Exhibit J-22)• Screen S9: New Resource Screen (see Exhibit J-23)• Screen S10: Update Resource Screen (see Exhibit J-24)• Screen S11: Confirmation Screen (see Exhibit J-25)• Screen S12: New Material Screen (see Exhibit J-26)• Screen S13: New Equipment Screen (see Exhibit J-27)
Supporting Material
Keyes, J., Ed., Handbook of Software Engineering Productivity. (1993). McGraw-Hill, New York.
Pressman, R. (2001). Software Engineering, a Practitioner’s Approach, 5th ed., McGraw-Hill,New York.
http://www.laynetworks.com/users/webs/cs10.htm.
http://www.mhhe.com/engcs/compsci/pressman/student_index.mhtml.
http://www.newarttech.com/se.
http://www.uburst.com/uReserve.
CuuDuongThanCong.com https://fb.com/tailieudientucntt

632
SOFTWARE ENGINEERING HANDBOOK
Exhibit J-15. Screen S1: Campus Login Screen
Exhibit J-16. Screen S2: Campus Menu Screen
Exhibit J-17. Screen S3: Resource Center Login Screen
Exhibit J-18. Screen S4: Resource Center Menu Screen
CuuDuongThanCong.com https://fb.com/tailieudientucntt

633
Sample SDS
Exhibit J-19. Screen S5: New Request Screen
CuuDuongThanCong.com https://fb.com/tailieudientucntt
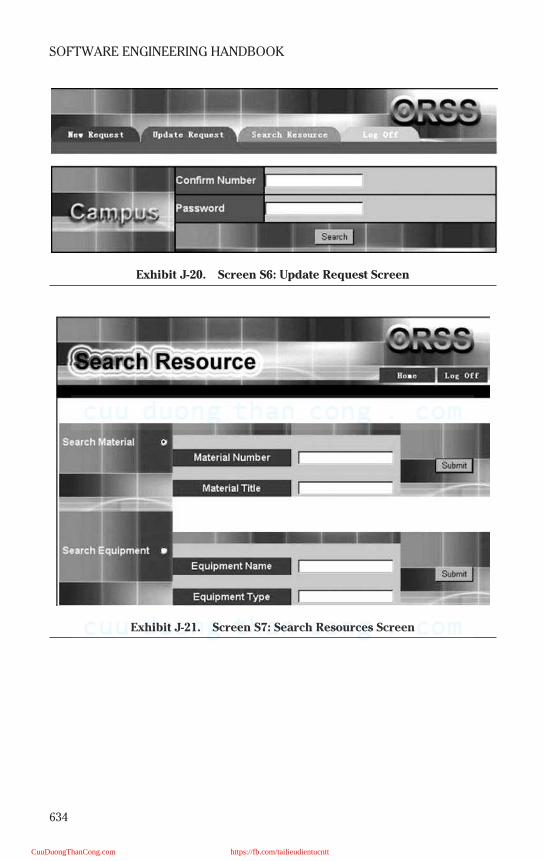
634
SOFTWARE ENGINEERING HANDBOOK
Exhibit J-20. Screen S6: Update Request Screen
Exhibit J-21. Screen S7: Search Resources Screen
CuuDuongThanCong.com https://fb.com/tailieudientucntt
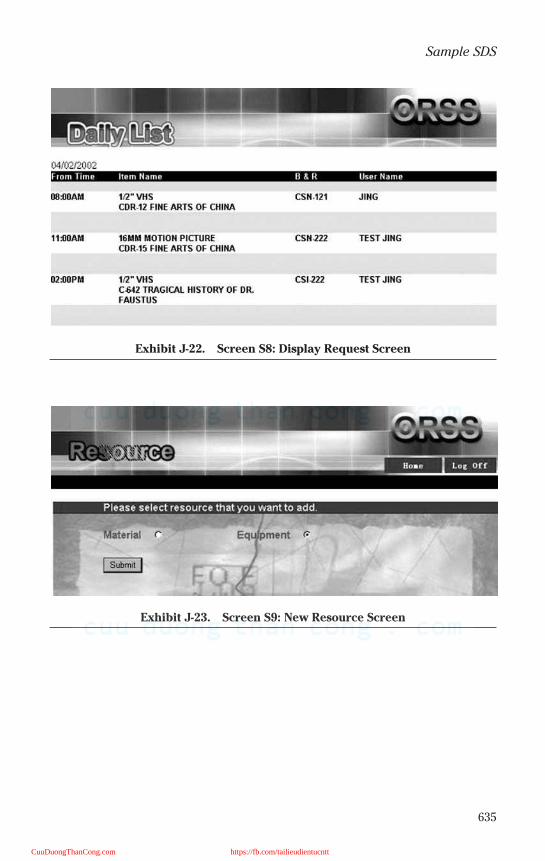
635
Sample SDS
Exhibit J-22. Screen S8: Display Request Screen
Exhibit J-23. Screen S9: New Resource Screen
CuuDuongThanCong.com https://fb.com/tailieudientucntt
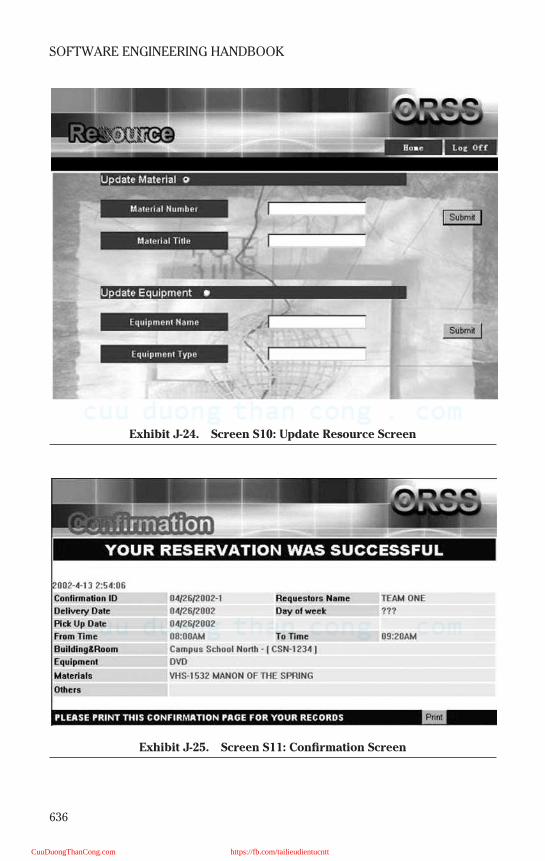
636
SOFTWARE ENGINEERING HANDBOOK
Exhibit J-24. Screen S10: Update Resource Screen
Exhibit J-25. Screen S11: Confirmation Screen
CuuDuongThanCong.com https://fb.com/tailieudientucntt
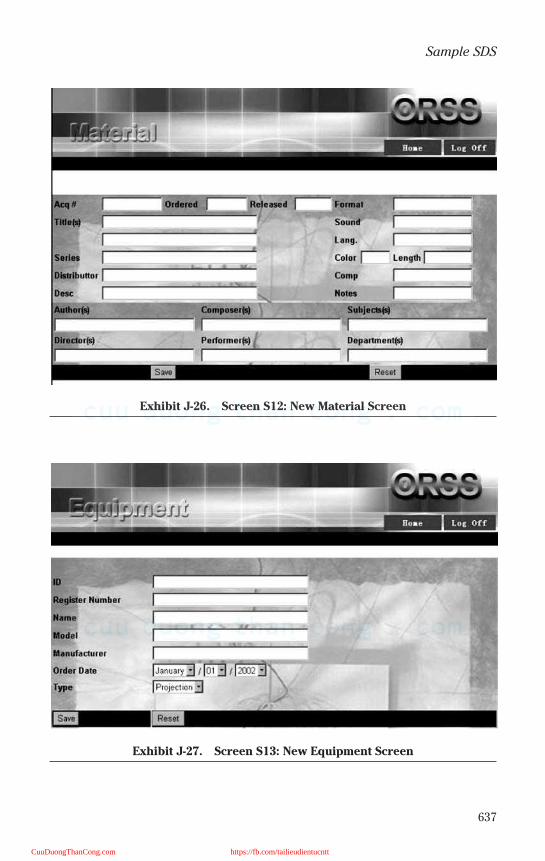
637
Sample SDS
Exhibit J-26. Screen S12: New Material Screen
Exhibit J-27. Screen S13: New Equipment Screen
CuuDuongThanCong.com https://fb.com/tailieudientucntt

This page intentionally left blank
CuuDuongThanCong.com https://fb.com/tailieudientucntt
639
Appendix K
Sample Data Dictionary
CuuDuongThanCong.com https://fb.com/tailieudientucntt
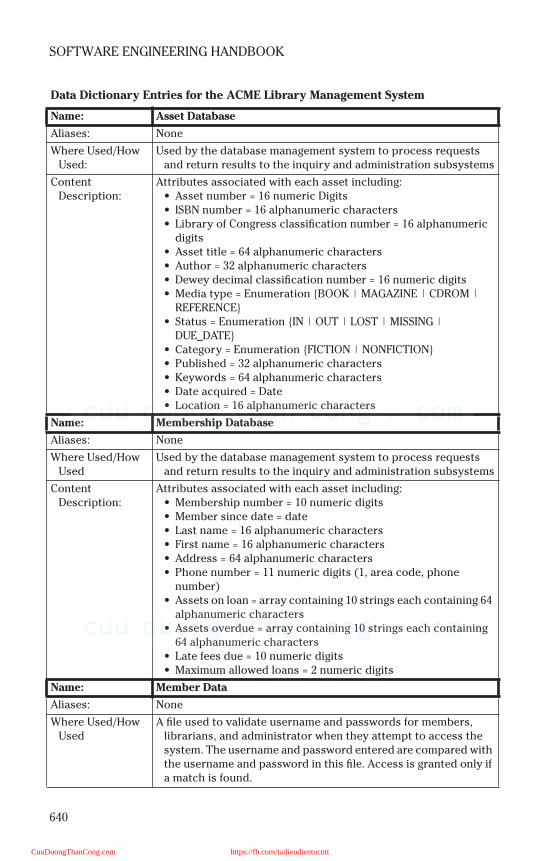
640
SOFTWARE ENGINEERING HANDBOOK
Data Dictionary Entries for the ACME Library Management System
Name: Asset Database
Aliases: None
Where Used/How Used:
Used by the database management system to process requests and return results to the inquiry and administration subsystems
Content Description:
Attributes associated with each asset including:• Asset number = 16 numeric Digits• ISBN number = 16 alphanumeric characters• Library of Congress classification number = 16 alphanumeric
digits• Asset title = 64 alphanumeric characters• Author = 32 alphanumeric characters• Dewey decimal classification number = 16 numeric digits• Media type = Enumeration BOOK | MAGAZINE | CDROM |
REFERENCE• Status = Enumeration IN | OUT | LOST | MISSING |
DUE_DATE• Category = Enumeration FICTION | NONFICTION• Published = 32 alphanumeric characters• Keywords = 64 alphanumeric characters• Date acquired = Date• Location = 16 alphanumeric characters
Name: Membership Database
Aliases: None
Where Used/How Used
Used by the database management system to process requests and return results to the inquiry and administration subsystems
Content Description:
Attributes associated with each asset including:• Membership number = 10 numeric digits• Member since date = date• Last name = 16 alphanumeric characters• First name = 16 alphanumeric characters• Address = 64 alphanumeric characters• Phone number = 11 numeric digits (1, area code, phone
number)• Assets on loan = array containing 10 strings each containing 64
alphanumeric characters• Assets overdue = array containing 10 strings each containing
64 alphanumeric characters• Late fees due = 10 numeric digits• Maximum allowed loans = 2 numeric digits
Name: Member Data
Aliases: None
Where Used/How Used
A file used to validate username and passwords for members, librarians, and administrator when they attempt to access the system. The username and password entered are compared with the username and password in this file. Access is granted only if a match is found.
CuuDuongThanCong.com https://fb.com/tailieudientucntt
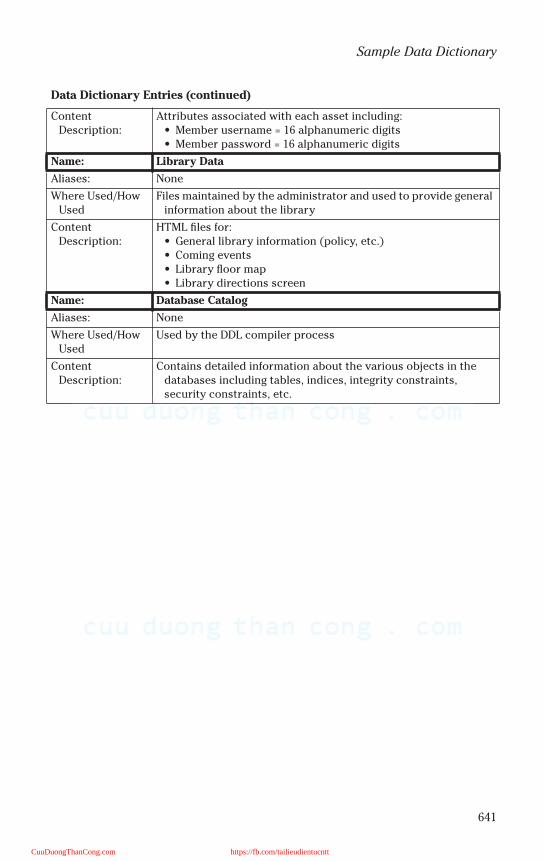
641
Sample Data Dictionary
Data Dictionary Entries (continued)
Content Description:
Attributes associated with each asset including:• Member username = 16 alphanumeric digits• Member password = 16 alphanumeric digits
Name: Library Data
Aliases: None
Where Used/How Used
Files maintained by the administrator and used to provide general information about the library
Content Description:
HTML files for:• General library information (policy, etc.)• Coming events• Library floor map• Library directions screen
Name: Database Catalog
Aliases: None
Where Used/How Used
Used by the DDL compiler process
Content Description:
Contains detailed information about the various objects in the databases including tables, indices, integrity constraints, security constraints, etc.
CuuDuongThanCong.com https://fb.com/tailieudientucntt

This page intentionally left blank
CuuDuongThanCong.com https://fb.com/tailieudientucntt

643
Appendix L
Sample OO SDS
1. INTRODUCTION
1.1 Goals and Objectives
The main purpose of Dog E-DayCare System (DEDS) is to provide a data-base-driven, Web-enabled application to manage and track services pro-vided by a canine care facility. The goals of DEDS are:
• To maintain a database of customer and canine information• To accept inquiries for and scheduling of canine services• To track services and specific instructions on customer canines
individually• To process financial transactions and provide billing services to
customers• To utilize a simple, elegant Web interface for interaction with all users
1.2 Scope
Your dog is by nature a gregarious animal, needing socialization andattention that can be provided by the high-quality care and comfort of theDog E-DayCare System (DEDS). The DEDS is a pet daycare service special-izing in pampered pet lodging, dog training, and a variety of in-house careservices. Our pet spa services feature the finest in pet grooming for allbreeds of dogs. We take pride in accommodating most special requests. Weare committed to providing the best care in a relaxing environment suit-able for all pets.
Our services also consist of providing daycare for dogs in an open, cage-free environment. Special activities are included, such as playtime withstaff and other dogs, nature walks, and obedience training. We also have aveterinarian on site for treatment of any medical problems. Certified dogtrainers are available for help with behavioral problems. In addition weoffer a full-service grooming salon and an on-site professional obediencetrainer
The DEDS system will interact with clients through a Web interface fordata entry and business transactions. The system will accept informationfrom existing and future clients and will provide an interface for specificcare instructions, present available dog services, accept inquiries for
CuuDuongThanCong.com https://fb.com/tailieudientucntt
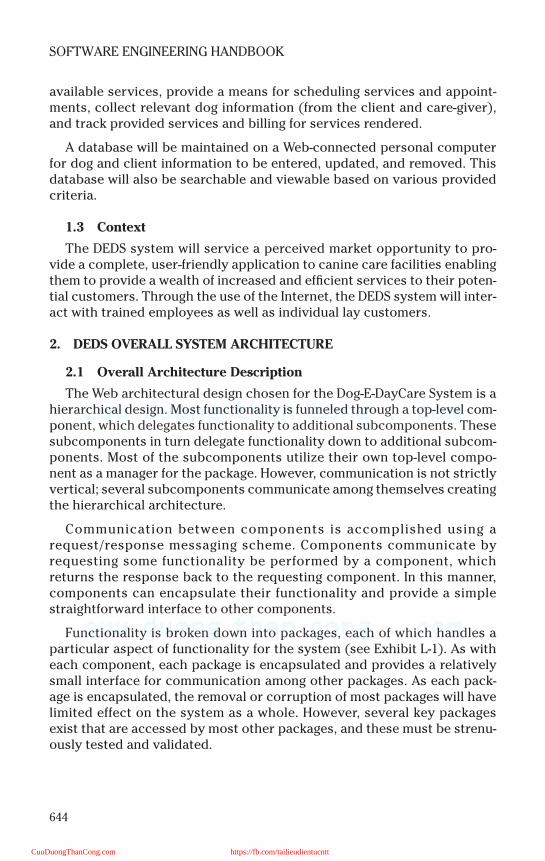
644
SOFTWARE ENGINEERING HANDBOOK
available services, provide a means for scheduling services and appoint-ments, collect relevant dog information (from the client and care-giver),and track provided services and billing for services rendered.
A database will be maintained on a Web-connected personal computerfor dog and client information to be entered, updated, and removed. Thisdatabase will also be searchable and viewable based on various providedcriteria.
1.3 Context
The DEDS system will service a perceived market opportunity to pro-vide a complete, user-friendly application to canine care facilities enablingthem to provide a wealth of increased and efficient services to their poten-tial customers. Through the use of the Internet, the DEDS system will inter-act with trained employees as well as individual lay customers.
2. DEDS OVERALL SYSTEM ARCHITECTURE
2.1 Overall Architecture Description
The Web architectural design chosen for the Dog-E-DayCare System is ahierarchical design. Most functionality is funneled through a top-level com-ponent, which delegates functionality to additional subcomponents. Thesesubcomponents in turn delegate functionality down to additional subcom-ponents. Most of the subcomponents utilize their own top-level compo-nent as a manager for the package. However, communication is not strictlyvertical; several subcomponents communicate among themselves creatingthe hierarchical architecture.
Communication between components is accomplished using arequest/response messaging scheme. Components communicate byrequesting some functionality be performed by a component, whichreturns the response back to the requesting component. In this manner,components can encapsulate their functionality and provide a simplestraightforward interface to other components.
Functionality is broken down into packages, each of which handles aparticular aspect of functionality for the system (see Exhibit L-1). As witheach component, each package is encapsulated and provides a relativelysmall interface for communication among other packages. As each pack-age is encapsulated, the removal or corruption of most packages will havelimited effect on the system as a whole. However, several key packagesexist that are accessed by most other packages, and these must be strenu-ously tested and validated.
CuuDuongThanCong.com https://fb.com/tailieudientucntt
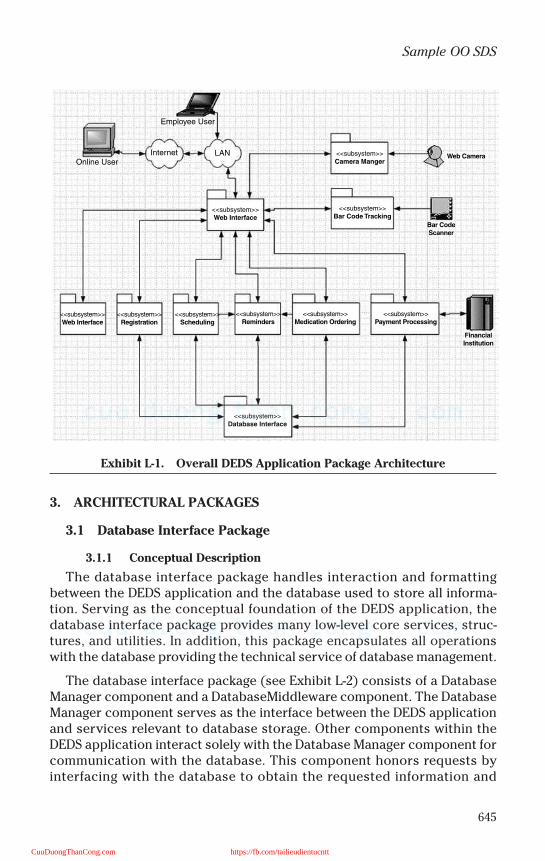
645
Sample OO SDS
3. ARCHITECTURAL PACKAGES
3.1 Database Interface Package
3.1.1 Conceptual Description
The database interface package handles interaction and formattingbetween the DEDS application and the database used to store all informa-tion. Serving as the conceptual foundation of the DEDS application, thedatabase interface package provides many low-level core services, struc-tures, and utilities. In addition, this package encapsulates all operationswith the database providing the technical service of database management.
The database interface package (see Exhibit L-2) consists of a DatabaseManager component and a DatabaseMiddleware component. The DatabaseManager component serves as the interface between the DEDS applicationand services relevant to database storage. Other components within theDEDS application interact solely with the Database Manager component forcommunication with the database. This component honors requests byinterfacing with the database to obtain the requested information and
Exhibit L-1. Overall DEDS Application Package Architecture
Online User
Employee User
Internet LAN
<<subsystem>>Bar Code Tracking
<<subsystem>>Web Interface
<<subsystem>>Web Interface
<<subsystem>>Registration
<<subsystem>>Scheduling
<<subsystem>>Reminders
<<subsystem>>Medication Ordering
<<subsystem>>Payment Processing
<<subsystem>>Database Interface
<<subsystem>>Camera Manger
Web Camera
Bar Code
Scanner
Financial
Institution
CuuDuongThanCong.com https://fb.com/tailieudientucntt
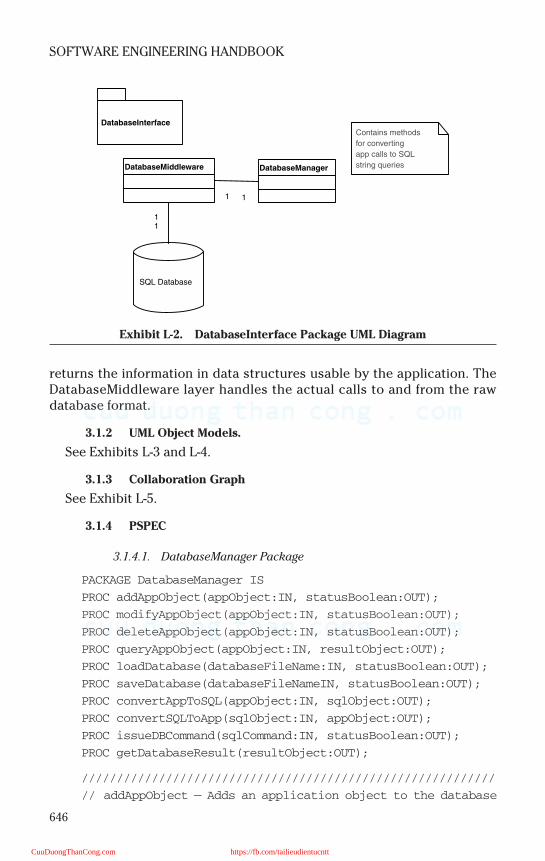
646
SOFTWARE ENGINEERING HANDBOOK
returns the information in data structures usable by the application. TheDatabaseMiddleware layer handles the actual calls to and from the rawdatabase format.
3.1.2 UML Object Models.
See Exhibits L-3 and L-4.
3.1.3 Collaboration Graph
See Exhibit L-5.
3.1.4 PSPEC
3.1.4.1. DatabaseManager Package
PACKAGE DatabaseManager IS
PROC addAppObject(appObject:IN, statusBoolean:OUT);
PROC modifyAppObject(appObject:IN, statusBoolean:OUT);
PROC deleteAppObject(appObject:IN, statusBoolean:OUT);
PROC queryAppObject(appObject:IN, resultObject:OUT);
PROC loadDatabase(databaseFileName:IN, statusBoolean:OUT);
PROC saveDatabase(databaseFileNameIN, statusBoolean:OUT);
PROC convertAppToSQL(appObject:IN, sqlObject:OUT);
PROC convertSQLToApp(sqlObject:IN, appObject:OUT);
PROC issueDBCommand(sqlCommand:IN, statusBoolean:OUT);
PROC getDatabaseResult(resultObject:OUT);
///////////////////////////////////////////////////////////
// addAppObject — Adds an application object to the database
Exhibit L-2. DatabaseInterface Package UML Diagram
SQL Database
DatabaseManager
DatabaseInterface
Contains methods
for converting
app calls to SQL
string queriesDatabaseMiddleware
1 1
11
CuuDuongThanCong.com https://fb.com/tailieudientucntt
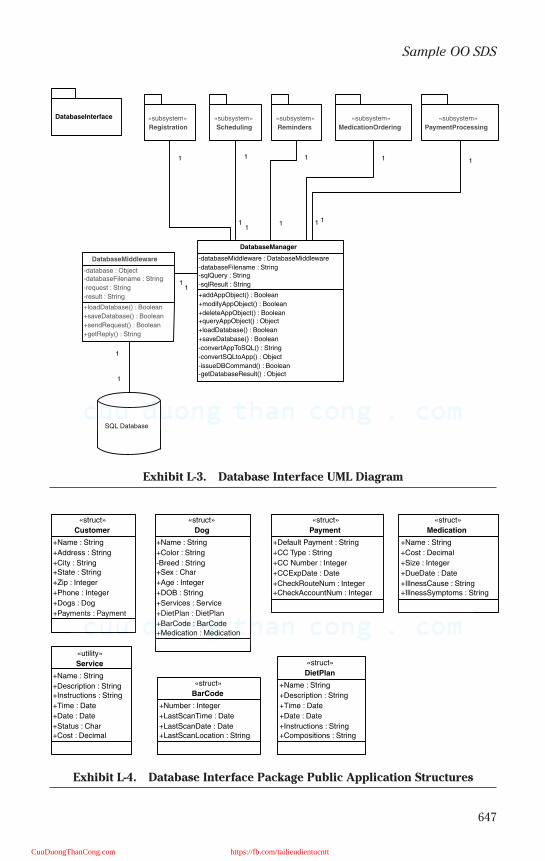
647
Sample OO SDS
Exhibit L-3. Database Interface UML Diagram
Exhibit L-4. Database Interface Package Public Application Structures
SQL Database
11
1
1
+addAppObject() : Boolean
+modifyAppObject() : Boolean
+deleteAppObject() : Boolean+queryAppObject() : Object
+loadDatabase() : Boolean
+saveDatabase() : Boolean
-convertAppToSQL() : String
-convertSQLtoApp() : Object
-issueDBCommand() : Boolean-getDatabaseResult() : Object
-databaseMiddleware : DatabaseMiddleware
-databaseFilename : String-sqlQuery : String
-sqlResult : String
DatabaseManager
«subsystem»
Registration
«subsystem»
Scheduling
«subsystem»
Reminders
«subsystem»
MedicationOrdering
«subsystem»
PaymentProcessing
DatabaseInterface
1
1
1
1
1
1
1
1
+loadDatabase() : Boolean
+saveDatabase() : Boolean
+sendRequest() : Boolean
+getReply() : String
-database : Object-databaseFilename : String
-request : String
-result : String
DatabaseMiddleware
1
1
+Name : String
+Address : String
+City : String+State : String
+Zip : Integer
+Phone : Integer
+Dogs : Dog
+Payments : Payment
«struct»
Customer
+Name : String
+Color : String
-Breed : String+Sex : Char
+Age : Integer
+DOB : String
+Services : Service
+DietPlan : DietPlan
+BarCode : BarCode+Medication : Medication
«struct»
Dog
+Name : String
+Description : String+Instructions : String
+Time : Date
+Date : Date
+Status : Char+Cost : Decimal
«utility»
Service
+Number : Integer
+LastScanTime : Date
+LastScanDate : Date+LastScanLocation : String
«struct»
BarCode+Name : String
+Description : String
+Time : Date
+Date : Date
+Instructions : String+Compositions : String
«struct»
DietPlan
+Name : String
+Cost : Decimal
+Size : Integer
+DueDate : Date
+IllnessCause : String+IllnessSymptoms : String
«struct»
Medication
+Default Payment : String
+CC Type : String
+CC Number : Integer
+CCExpDate : Date
+CheckRouteNum : Integer+CheckAccountNum : Integer
«struct»
Payment
CuuDuongThanCong.com https://fb.com/tailieudientucntt
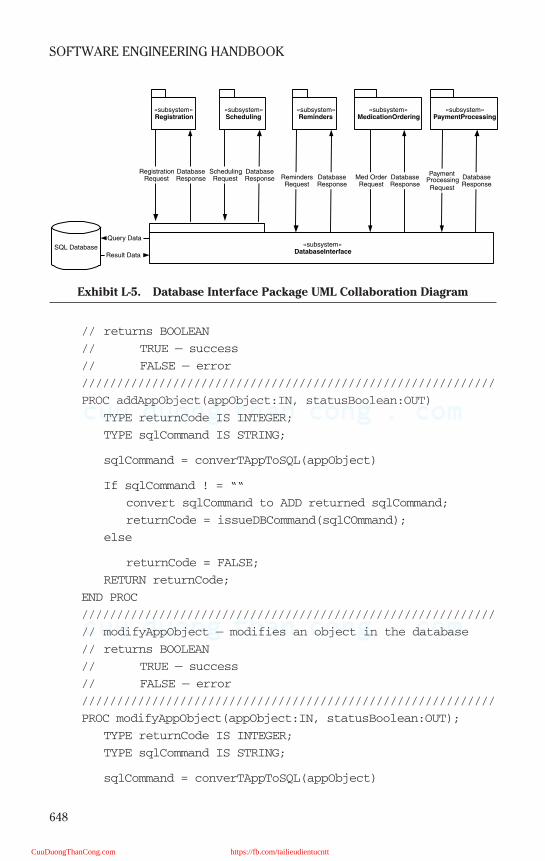
648
SOFTWARE ENGINEERING HANDBOOK
// returns BOOLEAN
// TRUE — success
// FALSE — error
///////////////////////////////////////////////////////////
PROC addAppObject(appObject:IN, statusBoolean:OUT)
TYPE returnCode IS INTEGER;
TYPE sqlCommand IS STRING;
sqlCommand = converTAppToSQL(appObject)
If sqlCommand ! = ““
convert sqlCommand to ADD returned sqlCommand;
returnCode = issueDBCommand(sqlCOmmand);
else
returnCode = FALSE;
RETURN returnCode;
END PROC
///////////////////////////////////////////////////////////
// modifyAppObject — modifies an object in the database
// returns BOOLEAN
// TRUE — success
// FALSE — error
///////////////////////////////////////////////////////////
PROC modifyAppObject(appObject:IN, statusBoolean:OUT);
TYPE returnCode IS INTEGER;
TYPE sqlCommand IS STRING;
sqlCommand = converTAppToSQL(appObject)
Exhibit L-5. Database Interface Package UML Collaboration Diagram
SQL Database
«subsystem»Registration
«subsystem»Scheduling
«subsystem»Reminders
«subsystem»MedicationOrdering
«subsystem»PaymentProcessing
«subsystem»DatabaseInterface
Query Data
Result Data
RegistrationRequest
DatabaseResponse
SchedulingRequest
DatabaseResponse Reminders
RequestDatabaseResponse
Med OrderRequest
DatabaseResponse
PaymentProcessingRequest
DatabaseResponse
CuuDuongThanCong.com https://fb.com/tailieudientucntt

649
Sample OO SDS
If sqlCommand ! = ““
convert sqlCommand to MODIFY returned sqlCommand;
returnCode = issueDBCommand(sqlCommand);
else
returnCode = FALSE;
RETURN returnCode;
END PROC
///////////////////////////////////////////////////////////
// modifyAppObject — deletes an object in the database
// returns BOOLEAN
// TRUE — success
// FALSE — error
///////////////////////////////////////////////////////////
PROC deleteAppObject(appObject:IN, statusBoolean:OUT);
TYPE returnCode IS INTEGER;
TYPE sqlCommand IS STRING;
sqlCommand = convertAppToSQL(appObject)
If sqlCommand ! = ““
convert sqlCommand to REMOVE returned sqlCommand;
returnCode = issueDBCommand(sqlCOmmand);
else
returnCode = FALSE;
RETURN returnCode;
END PROC
///////////////////////////////////////////////////////////
// queryAppObject — queries and returns the current state
// of an object in the database
// returns OBJECT
///////////////////////////////////////////////////////////
PROC queryAppObject(appObject:IN, resultObject:OUT)
TYPE returnObject IS OBJECT;
TYPE sqlCommand IS STRING;
sqlCommand = convertAppToSQL(appObject)
If sqlCommand ! = ““
convert sqlCommand to RETURN returned sqlCommand;
returnCode = issueDBCommand(sqlCOmmand);
if returnCode ! = FALSE
getDatabaseResult(returnObject);
CuuDuongThanCong.com https://fb.com/tailieudientucntt
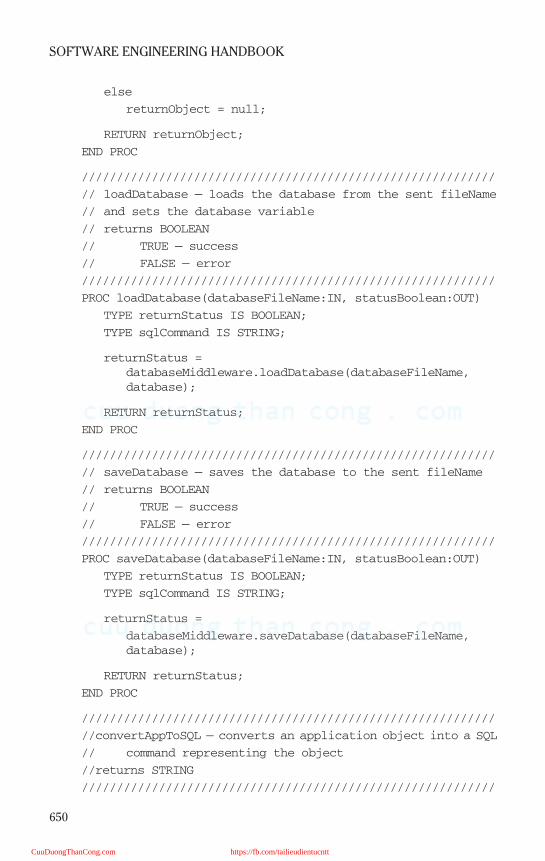
650
SOFTWARE ENGINEERING HANDBOOK
else
returnObject = null;
RETURN returnObject;
END PROC
///////////////////////////////////////////////////////////
// loadDatabase — loads the database from the sent fileName
// and sets the database variable
// returns BOOLEAN
// TRUE — success
// FALSE — error
///////////////////////////////////////////////////////////
PROC loadDatabase(databaseFileName:IN, statusBoolean:OUT)
TYPE returnStatus IS BOOLEAN;
TYPE sqlCommand IS STRING;
returnStatus =
databaseMiddleware.loadDatabase(databaseFileName,
database);
RETURN returnStatus;
END PROC
///////////////////////////////////////////////////////////
// saveDatabase — saves the database to the sent fileName
// returns BOOLEAN
// TRUE — success
// FALSE — error
///////////////////////////////////////////////////////////
PROC saveDatabase(databaseFileName:IN, statusBoolean:OUT)
TYPE returnStatus IS BOOLEAN;
TYPE sqlCommand IS STRING;
returnStatus =
databaseMiddleware.saveDatabase(databaseFileName,
database);
RETURN returnStatus;
END PROC
///////////////////////////////////////////////////////////
//convertAppToSQL — converts an application object into a SQL
// command representing the object
//returns STRING
///////////////////////////////////////////////////////////
CuuDuongThanCong.com https://fb.com/tailieudientucntt
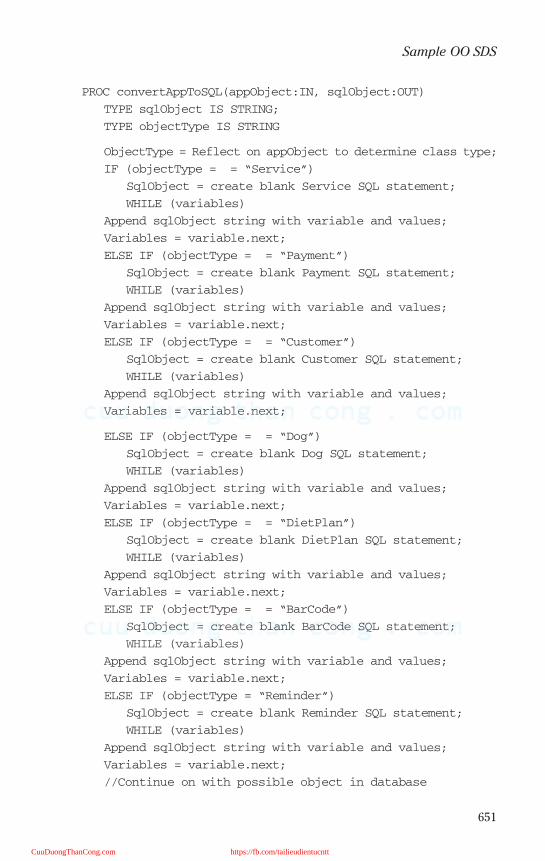
651
Sample OO SDS
PROC convertAppToSQL(appObject:IN, sqlObject:OUT)
TYPE sqlObject IS STRING;
TYPE objectType IS STRING
ObjectType = Reflect on appObject to determine class type;
IF (objectType = = “Service”)
SqlObject = create blank Service SQL statement;
WHILE (variables)
Append sqlObject string with variable and values;
Variables = variable.next;
ELSE IF (objectType = = “Payment”)
SqlObject = create blank Payment SQL statement;
WHILE (variables)
Append sqlObject string with variable and values;
Variables = variable.next;
ELSE IF (objectType = = “Customer”)
SqlObject = create blank Customer SQL statement;
WHILE (variables)
Append sqlObject string with variable and values;
Variables = variable.next;
ELSE IF (objectType = = “Dog”)
SqlObject = create blank Dog SQL statement;
WHILE (variables)
Append sqlObject string with variable and values;
Variables = variable.next;
ELSE IF (objectType = = “DietPlan”)
SqlObject = create blank DietPlan SQL statement;
WHILE (variables)
Append sqlObject string with variable and values;
Variables = variable.next;
ELSE IF (objectType = = “BarCode”)
SqlObject = create blank BarCode SQL statement;
WHILE (variables)
Append sqlObject string with variable and values;
Variables = variable.next;
ELSE IF (objectType = “Reminder”)
SqlObject = create blank Reminder SQL statement;
WHILE (variables)
Append sqlObject string with variable and values;
Variables = variable.next;
//Continue on with possible object in database
CuuDuongThanCong.com https://fb.com/tailieudientucntt
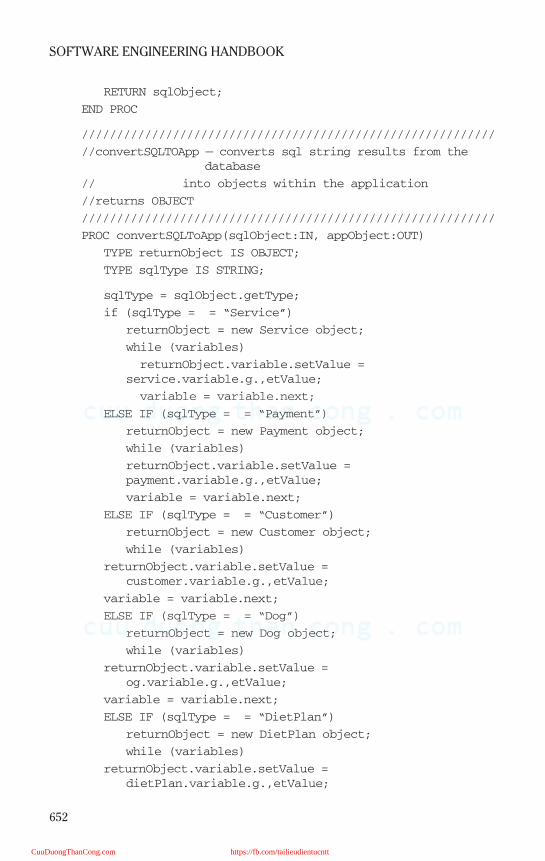
652
SOFTWARE ENGINEERING HANDBOOK
RETURN sqlObject;
END PROC
///////////////////////////////////////////////////////////
//convertSQLTOApp — converts sql string results from the
database
// into objects within the application
//returns OBJECT
///////////////////////////////////////////////////////////
PROC convertSQLToApp(sqlObject:IN, appObject:OUT)
TYPE returnObject IS OBJECT;
TYPE sqlType IS STRING;
sqlType = sqlObject.getType;
if (sqlType = = “Service”)
returnObject = new Service object;
while (variables)
returnObject.variable.setValue =
service.variable.g.,etValue;
variable = variable.next;
ELSE IF (sqlType = = “Payment”)
returnObject = new Payment object;
while (variables)
returnObject.variable.setValue =
payment.variable.g.,etValue;
variable = variable.next;
ELSE IF (sqlType = = “Customer”)
returnObject = new Customer object;
while (variables)
returnObject.variable.setValue =
customer.variable.g.,etValue;
variable = variable.next;
ELSE IF (sqlType = = “Dog”)
returnObject = new Dog object;
while (variables)
returnObject.variable.setValue =
og.variable.g.,etValue;
variable = variable.next;
ELSE IF (sqlType = = “DietPlan”)
returnObject = new DietPlan object;
while (variables)
returnObject.variable.setValue =
dietPlan.variable.g.,etValue;
CuuDuongThanCong.com https://fb.com/tailieudientucntt
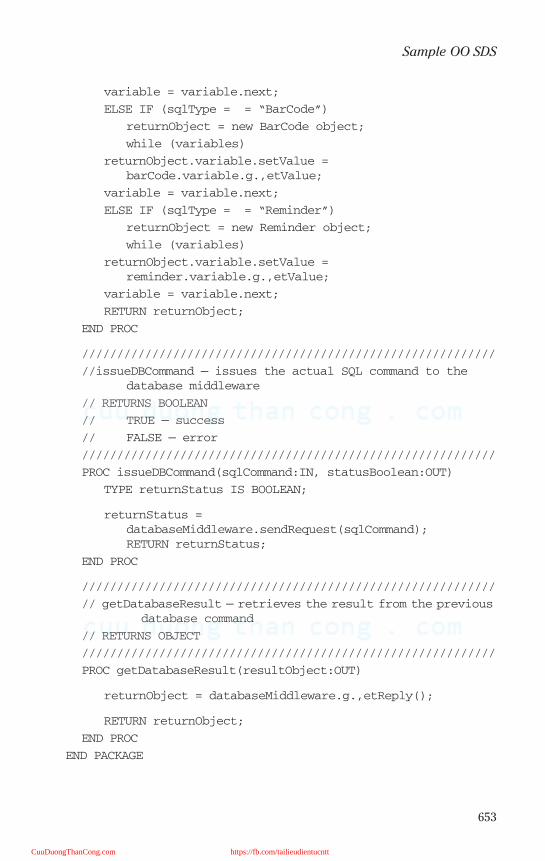
653
Sample OO SDS
variable = variable.next;
ELSE IF (sqlType = = “BarCode”)
returnObject = new BarCode object;
while (variables)
returnObject.variable.setValue =
barCode.variable.g.,etValue;
variable = variable.next;
ELSE IF (sqlType = = “Reminder”)
returnObject = new Reminder object;
while (variables)
returnObject.variable.setValue =
reminder.variable.g.,etValue;
variable = variable.next;
RETURN returnObject;
END PROC
///////////////////////////////////////////////////////////
//issueDBCommand — issues the actual SQL command to the
database middleware
// RETURNS BOOLEAN
// TRUE — success
// FALSE — error
///////////////////////////////////////////////////////////
PROC issueDBCommand(sqlCommand:IN, statusBoolean:OUT)
TYPE returnStatus IS BOOLEAN;
returnStatus =
databaseMiddleware.sendRequest(sqlCommand);
RETURN returnStatus;
END PROC
///////////////////////////////////////////////////////////
// getDatabaseResult — retrieves the result from the previous
database command
// RETURNS OBJECT
///////////////////////////////////////////////////////////
PROC getDatabaseResult(resultObject:OUT)
returnObject = databaseMiddleware.g.,etReply();
RETURN returnObject;
END PROC
END PACKAGE
CuuDuongThanCong.com https://fb.com/tailieudientucntt
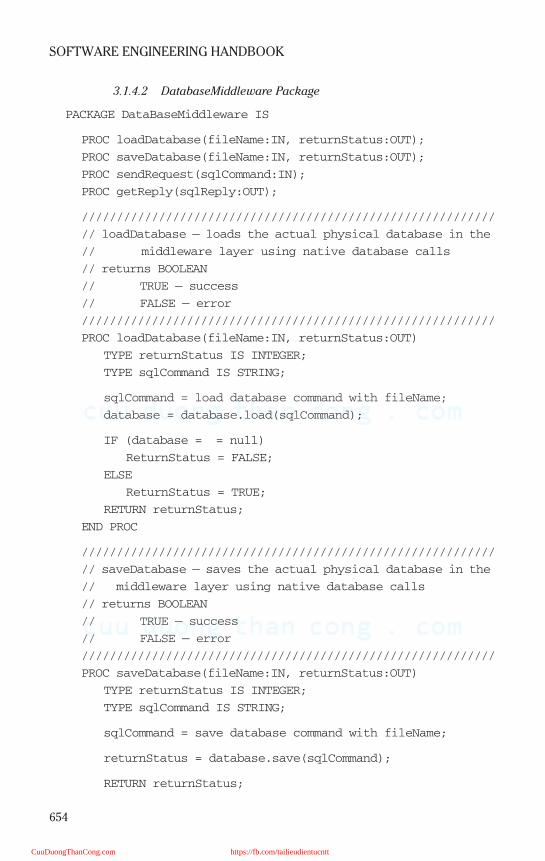
654
SOFTWARE ENGINEERING HANDBOOK
3.1.4.2 DatabaseMiddleware Package
PACKAGE DataBaseMiddleware IS
PROC loadDatabase(fileName:IN, returnStatus:OUT);
PROC saveDatabase(fileName:IN, returnStatus:OUT);
PROC sendRequest(sqlCommand:IN);
PROC getReply(sqlReply:OUT);
///////////////////////////////////////////////////////////
// loadDatabase — loads the actual physical database in the
// middleware layer using native database calls
// returns BOOLEAN
// TRUE — success
// FALSE — error
///////////////////////////////////////////////////////////
PROC loadDatabase(fileName:IN, returnStatus:OUT)
TYPE returnStatus IS INTEGER;
TYPE sqlCommand IS STRING;
sqlCommand = load database command with fileName;
database = database.load(sqlCommand);
IF (database = = null)
ReturnStatus = FALSE;
ELSE
ReturnStatus = TRUE;
RETURN returnStatus;
END PROC
///////////////////////////////////////////////////////////
// saveDatabase — saves the actual physical database in the
// middleware layer using native database calls
// returns BOOLEAN
// TRUE — success
// FALSE — error
///////////////////////////////////////////////////////////
PROC saveDatabase(fileName:IN, returnStatus:OUT)
TYPE returnStatus IS INTEGER;
TYPE sqlCommand IS STRING;
sqlCommand = save database command with fileName;
returnStatus = database.save(sqlCommand);
RETURN returnStatus;
CuuDuongThanCong.com https://fb.com/tailieudientucntt
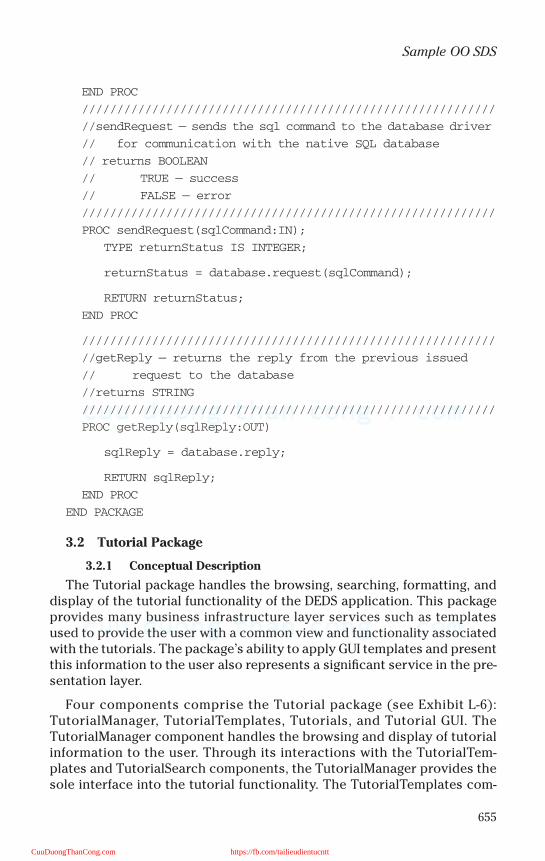
655
Sample OO SDS
END PROC
///////////////////////////////////////////////////////////
//sendRequest — sends the sql command to the database driver
// for communication with the native SQL database
// returns BOOLEAN
// TRUE — success
// FALSE — error
///////////////////////////////////////////////////////////
PROC sendRequest(sqlCommand:IN);
TYPE returnStatus IS INTEGER;
returnStatus = database.request(sqlCommand);
RETURN returnStatus;
END PROC
///////////////////////////////////////////////////////////
//getReply — returns the reply from the previous issued
// request to the database
//returns STRING
///////////////////////////////////////////////////////////
PROC getReply(sqlReply:OUT)
sqlReply = database.reply;
RETURN sqlReply;
END PROC
END PACKAGE
3.2 Tutorial Package
3.2.1 Conceptual Description
The Tutorial package handles the browsing, searching, formatting, anddisplay of the tutorial functionality of the DEDS application. This packageprovides many business infrastructure layer services such as templatesused to provide the user with a common view and functionality associatedwith the tutorials. The package’s ability to apply GUI templates and presentthis information to the user also represents a significant service in the pre-sentation layer.
Four components comprise the Tutorial package (see Exhibit L-6):TutorialManager, TutorialTemplates, Tutorials, and Tutorial GUI. TheTutorialManager component handles the browsing and display of tutorialinformation to the user. Through its interactions with the TutorialTem-plates and TutorialSearch components, the TutorialManager provides thesole interface into the tutorial functionality. The TutorialTemplates com-
CuuDuongThanCong.com https://fb.com/tailieudientucntt
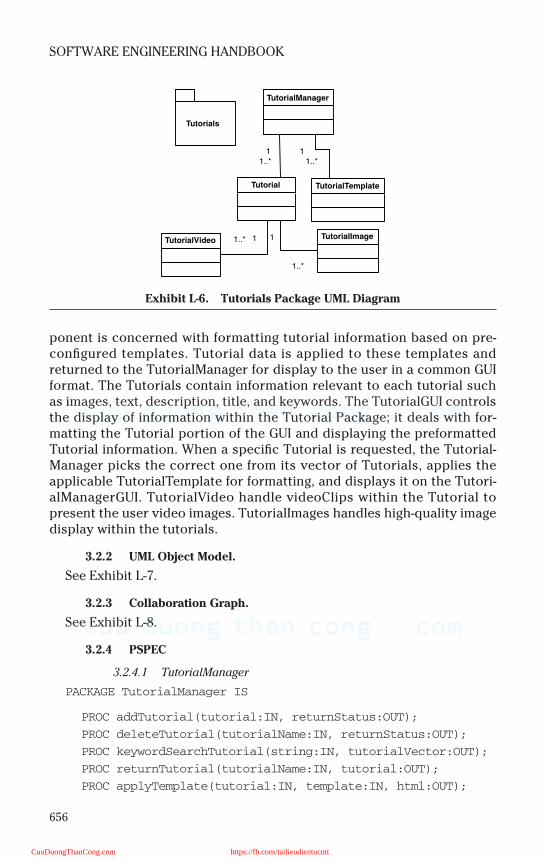
656
SOFTWARE ENGINEERING HANDBOOK
ponent is concerned with formatting tutorial information based on pre-configured templates. Tutorial data is applied to these templates andreturned to the TutorialManager for display to the user in a common GUIformat. The Tutorials contain information relevant to each tutorial suchas images, text, description, title, and keywords. The TutorialGUI controlsthe display of information within the Tutorial Package; it deals with for-matting the Tutorial portion of the GUI and displaying the preformattedTutorial information. When a specific Tutorial is requested, the Tutorial-Manager picks the correct one from its vector of Tutorials, applies theapplicable TutorialTemplate for formatting, and displays it on the Tutori-alManagerGUI. TutorialVideo handle videoClips within the Tutorial topresent the user video images. TutorialImages handles high-quality imagedisplay within the tutorials.
3.2.2 UML Object Model.
See Exhibit L-7.
3.2.3 Collaboration Graph.
See Exhibit L-8.
3.2.4 PSPEC
3.2.4.1 TutorialManager
PACKAGE TutorialManager IS
PROC addTutorial(tutorial:IN, returnStatus:OUT);
PROC deleteTutorial(tutorialName:IN, returnStatus:OUT);
PROC keywordSearchTutorial(string:IN, tutorialVector:OUT);
PROC returnTutorial(tutorialName:IN, tutorial:OUT);
PROC applyTemplate(tutorial:IN, template:IN, html:OUT);
Exhibit L-6. Tutorials Package UML Diagram
TutorialManager
TutorialTemplateTutorial
Tutorials
11..*
11..*
TutorialVideoTutorialImage11..* 1
1..*
CuuDuongThanCong.com https://fb.com/tailieudientucntt
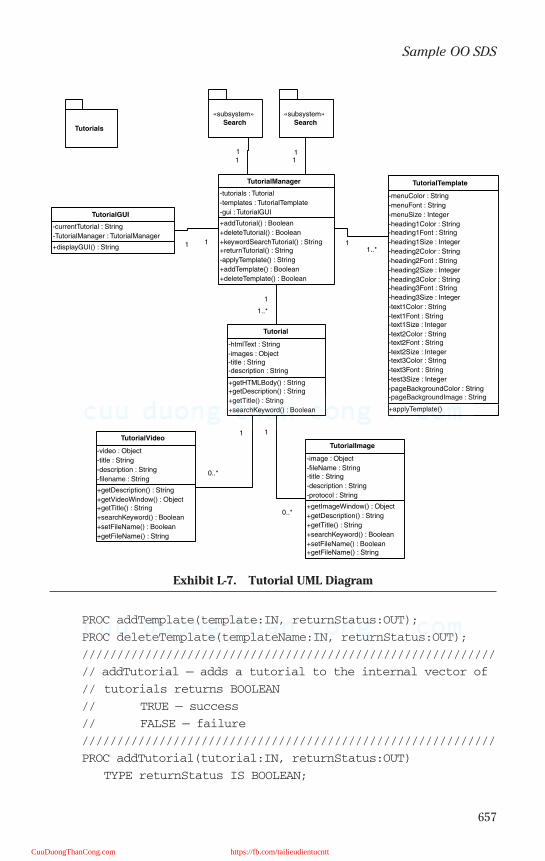
657
Sample OO SDS
PROC addTemplate(template:IN, returnStatus:OUT);
PROC deleteTemplate(templateName:IN, returnStatus:OUT);
///////////////////////////////////////////////////////////
// addTutorial — adds a tutorial to the internal vector of
// tutorials returns BOOLEAN
// TRUE — success
// FALSE — failure
///////////////////////////////////////////////////////////
PROC addTutorial(tutorial:IN, returnStatus:OUT)
TYPE returnStatus IS BOOLEAN;
Exhibit L-7. Tutorial UML Diagram
11
+addTutorial() : Boolean
+deleteTutorial() : Boolean
+keywordSearchTutorial() : String+returnTutorial() : String
-applyTemplate() : String
+addTemplate() : Boolean
+deleteTemplate() : Boolean
-tutorials : Tutorial
-templates : TutorialTemplate
-gui : TutorialGUI
TutorialManager
+applyTemplate()
-menuColor : String
-menuFont : String
-menuSize : Integer
-heading1Color : String-heading1Font : String
-heading1Size : Integer
-heading2Color : String
-heading2Font : String
-heading2Size : Integer
-heading3Color : String-heading3Font : String
-heading3Size : Integer
-text1Color : String
-text1Font : String-text1Size : Integer
-text2Color : String-text2Font : String
-text2Size : Integer-text3Color : String
-text3Font : String
-test3Size : Integer
-pageBackgroundColor : String-pageBackgroundImage : String
TutorialTemplate
+getHTMLBody() : String+getDescription() : String
+getTitle() : String
+searchKeyword() : Boolean
-htmlText : String
-images : Object-title : String-description : String
Tutorial
Tutorials
11..*
1
1..*
«subsystem»Search
11
«subsystem»Search
+displayGUI() : String
-currentTutorial : String
-TutorialManager : TutorialManager
TutorialGUI
1 1
+getDescription() : String
+getVideoWindow() : Object+getTitle() : String
+searchKeyword() : Boolean
+setFileName() : Boolean
+getFileName() : String
-video : Object
-title : String
-description : String
-filename : String
TutorialVideo
+getImageWindow() : Object
+getDescription() : String
+getTitle() : String
+searchKeyword() : Boolean
+setFileName() : Boolean+getFileName() : String
-image : Object
-fileName : String-title : String
-description : String
-protocol : String
TutorialImage
1
0..*
1
0..*
CuuDuongThanCong.com https://fb.com/tailieudientucntt
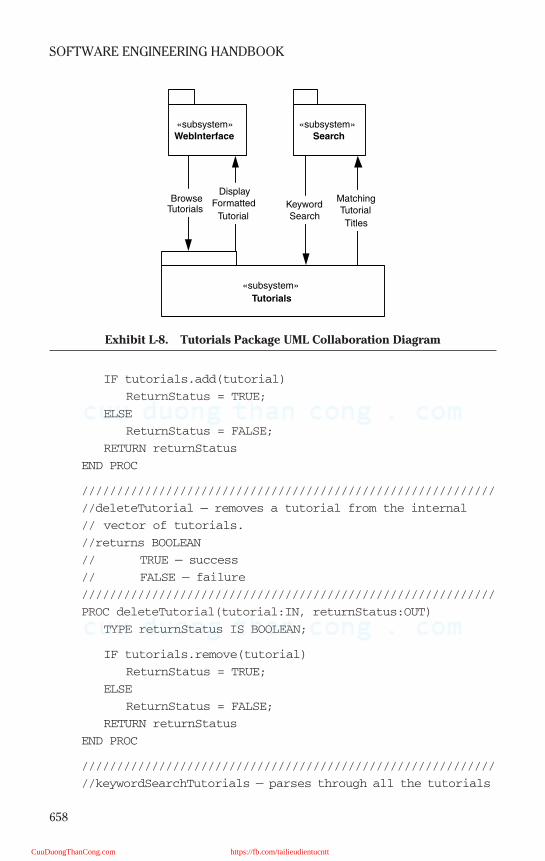
658
SOFTWARE ENGINEERING HANDBOOK
IF tutorials.add(tutorial)
ReturnStatus = TRUE;
ELSE
ReturnStatus = FALSE;
RETURN returnStatus
END PROC
///////////////////////////////////////////////////////////
//deleteTutorial — removes a tutorial from the internal
// vector of tutorials.
//returns BOOLEAN
// TRUE — success
// FALSE — failure
///////////////////////////////////////////////////////////
PROC deleteTutorial(tutorial:IN, returnStatus:OUT)
TYPE returnStatus IS BOOLEAN;
IF tutorials.remove(tutorial)
ReturnStatus = TRUE;
ELSE
ReturnStatus = FALSE;
RETURN returnStatus
END PROC
///////////////////////////////////////////////////////////
//keywordSearchTutorials — parses through all the tutorials
Exhibit L-8. Tutorials Package UML Collaboration Diagram
«subsystem»WebInterface
«subsystem»Search
«subsystem»
Tutorials
BrowseTutorials
DisplayFormatted
TutorialKeywordSearch
MatchingTutorial
Titles
CuuDuongThanCong.com https://fb.com/tailieudientucntt
659
Sample OO SDS
// in the vector and checks if the tutorial contains
// the keyword If it does then it is added to the return
// vector
//returns VECTOR
// contains name of tutorials
///////////////////////////////////////////////////////////
PROC keywordSearchTutorial(string:IN, tutorialVector:OUT)
TYPE returnVector IS VECTOR;
WHILE (tutorials)
IF tutorial.searchKeyword = = TRUE
TutorialVector.add(tutorial.getName);
Tutorial = tutorial.next;
RETURN tutorialVector;
END PROC
///////////////////////////////////////////////////////////
//returnTutorial — returns the tutorial with the given
tutorial name
//returns TUTORIAL
// tutorial object containing tutorial information or null
// if not existing in tutorialVector
///////////////////////////////////////////////////////////
PROC returnTutorial(tutorialName:IN, tutorial:OUT)
TYPE returnTutorial IS TUTORIAL;
If tutorials.contains(tutorialName)
ReturnTutorial = tutorials.getTutorial(tutorialName);
ELSE
ReturnTutorial = null;
RETURN returnTutorial;
END PROC
///////////////////////////////////////////////////////////
//applyTemplate — applies the given template to the given
// tutorial and returns the resulting HTML code
//returns STRING
// html of the tutorial with the template applied
///////////////////////////////////////////////////////////
PROC applyTemplate(tutorial:IN, template:IN, html:OUT)
TYPE html IS STRING;
Html = template.apply(tutorial);
RETURN html;
CuuDuongThanCong.com https://fb.com/tailieudientucntt

660
SOFTWARE ENGINEERING HANDBOOK
END PROC
///////////////////////////////////////////////////////////
//addTemplate — adds a template to the internal vector of
// templates
//returns BOOLEAN
// TRUE — success
// FALSE — failure
///////////////////////////////////////////////////////////
PROC addTemplate(template:IN, returnStatus:OUT)
TYPE returnStatus IS BOOLEAN;
IF templates.add(template)
ReturnStatus = TRUE;
ELSE
ReturnStatus = FALSE;
RETURN returnStatus
END PROC
///////////////////////////////////////////////////////////
//deleteTemplate — removes a template from the internal
// vector of tutorials.
//returns BOOLEAN
// TRUE — success
// FALSE — failure
///////////////////////////////////////////////////////////
PROC deleteTemplate(template:IN, returnStatus:OUT)
TYPE returnStatus IS BOOLEAN;
IF templates.remove(template)
ReturnStatus = TRUE;
ELSE
ReturnStatus = FALSE;
RETURN returnStatus
END PROC
END PACKAGE
3.2.4.2 Tutorial Package
PACKAGE Tutorial IS
PROC getHTMLBody(returnHTML:OUT);
PROC getDescription(returnDescription:OUT);
CuuDuongThanCong.com https://fb.com/tailieudientucntt
661
Sample OO SDS
PROC getTitle(returnTitle:OUT);
PROC searchKeyword(keyword:IN, found:OUT);
///////////////////////////////////////////////////////////
//getHTMLBody — gets the html body of the tutorial
//returns STRING
// html body
///////////////////////////////////////////////////////////
PROC getHTMLBody(returnHTML:OUT)
TYPE returnHTML IS STRING;
ReturnHTML = description;
RETURN returnHTML;
END PROC
///////////////////////////////////////////////////////////
//getDescription — gets the description of the tutorial
//returns STRING
// description
///////////////////////////////////////////////////////////
PROC getDescription(returnDescription:OUT)
TYPE returnDescription IS STRING;
ReturnDescription = description;
RETURN returnHTML;
END PROC
///////////////////////////////////////////////////////////
//getTitle — gets the title of the tutorial
//returns STRING
// title
///////////////////////////////////////////////////////////
PROC getTitle(returnTitle:OUT)
TYPE returnTitle IS STRING;
returnTitle = description;
RETURN returnTitle;
END PROC
///////////////////////////////////////////////////////////
//searchKeyword — searches the tutorial description and html
// for the sent keyword and returns whether
// it was found
//returns BOOLEAN
CuuDuongThanCong.com https://fb.com/tailieudientucntt
662
SOFTWARE ENGINEERING HANDBOOK
// TRUE — found keyword
// FALSE — did not find keyword
///////////////////////////////////////////////////////////
PROC searchKeyword(keyword:IN, found:OUT)
TYPE found IS BOOLEAN;
FOUND = FALSE;
IF title.indexOf(keyword) ! = —1
Found = TRUE;
ELSE if htmlText.indexOf(keyword ! = —1)
Found = TRUE;
ELSE
WHILE (images)
Found = Image.keywordSearch(keyword)
Image = images.next;
WHILE (videos)
Found = video.keywordSearch(keyword)
Video = video.next;
RETURN Found;
END PROC
END PACKAGE
3.2.4.3 TutorialVideo
PACKAGE TutorialVideo IS
PROC getVideoWindow(videoPanel:OUT);
PROC getDescription(returnDescription:OUT);
PROC getTitle(returnTitle:OUT);
PROC searchKeyword(keyword:IN, found:OUT);
PROC setFileName(fileName:IN, returnResult:OUT);
PROC getFileName(fileName:OUT);
///////////////////////////////////////////////////////////
//getVideoWindow — returns a panel containing the video
// player to be displayed to the user
//returns PANEL
// video window
///////////////////////////////////////////////////////////
PROC getVideoWindow(videoPanel:OUT)
TYPE videoPanel IS JPanel;
JavaX Multimedia Extensions get codec
Get codec player
VideoPanel = Codec player.getPanel();
CuuDuongThanCong.com https://fb.com/tailieudientucntt
663
Sample OO SDS
RETURN videoPanel;
END PROC
///////////////////////////////////////////////////////////
//getDescription — gets the description of the video
//returns STRING
// description
///////////////////////////////////////////////////////////
PROC getDescription(returnDescription:OUT)
TYPE returnDescription IS STRING;
ReturnDescription = description;
RETURN returnHTML;
END PROC
///////////////////////////////////////////////////////////
//getTitle — gets the title of the video
//returns STRING
// title
///////////////////////////////////////////////////////////
PROC getTitle(returnTitle:OUT)
TYPE returnTitle IS STRING;
returnTitle = description;
RETURN returnTitle;
END PROC
///////////////////////////////////////////////////////////
//searchKeyword — searches the tutorial descrpition and html
// for the sent keyword and returns whether
// was found
//returns BOOLEAN
// TRUE — found keyword
// FALSE — did not find keyword
///////////////////////////////////////////////////////////
PROC searchKeyword(keyword:IN, found:OUT)
TYPE found IS BOOLEAN;
IF title.indexOf(keyword) ! = —1
Found = TRUE;
ELSE if description.indexOf(keyword ! = —1)
Found = TRUE;
ELSE
Found = FALSE;
CuuDuongThanCong.com https://fb.com/tailieudientucntt
664
SOFTWARE ENGINEERING HANDBOOK
RETURN Found;
END PROC
///////////////////////////////////////////////////////////
//setFileName — sets the internal filename if the video was
// found
//returns BOOLEAN
// TRUE — success
// FALSE — failure, file does not exist
///////////////////////////////////////////////////////////
PROC setFileName(fileName:IN, returnResult:OUT)
TYPE returnResult IS BOOLEAN;
IF fileName.exists()
This.fileName = fileName
ReturnResult = TRUE;
ELSE
ReturnResult = FALSE;
RETURN returnResult
END PROC
///////////////////////////////////////////////////////////
//getFileName — returns the fileName of the video
//returns STRING
// Filename of the video or null if no fileName
///////////////////////////////////////////////////////////
PROC getFileName(fileName:OUT);
TYPE fileName IS STRING;
FileName = this.fileName;
RETURN fileName;
END PROC
END PACKAGE
3.2.4.4 TutorialImage Package
PACKAGE TutorialImage IS
PROC getImageWindow(imagePanel:OUT);
PROC getDescription(returnDescription:OUT);
PROC getTitle(returnTitle:OUT);
PROC searchKeyword(keyword:IN, found:OUT);
PROC setFileName(fileName:IN, returnResult:OUT);
PROC getFileName(fileName:OUT);
CuuDuongThanCong.com https://fb.com/tailieudientucntt
665
Sample OO SDS
///////////////////////////////////////////////////////////
//getImageWindow — returns a panel containing the image
// to be displayed to the user
//returns PANEL
// video window
///////////////////////////////////////////////////////////
PROC getVImageWindow(imagePanel:OUT)
TYPE videoPanel IS JPanel;
JavaX Multimedia Extensions get codec
Get codec player
imagePanel = Codec player.getPanel();
RETURN imagePanel;
END PROC
///////////////////////////////////////////////////////////
//getDescription — gets the description of the image
//returns STRING
// description
///////////////////////////////////////////////////////////
PROC getDescription(returnDescription:OUT)
TYPE returnDescription IS STRING;
ReturnDescription = description;
RETURN returnHTML;
END PROC
///////////////////////////////////////////////////////////
//getTitle — gets the title of the image
//returns STRING
// title
///////////////////////////////////////////////////////////
PROC getTitle(returnTitle:OUT)
TYPE returnTitle IS STRING;
returnTitle = description;
RETURN returnTitle;
END PROC
///////////////////////////////////////////////////////////
//searchKeyword — searches the description and title for the
//sent keyword and returns whether was found
//returns BOOLEAN
CuuDuongThanCong.com https://fb.com/tailieudientucntt
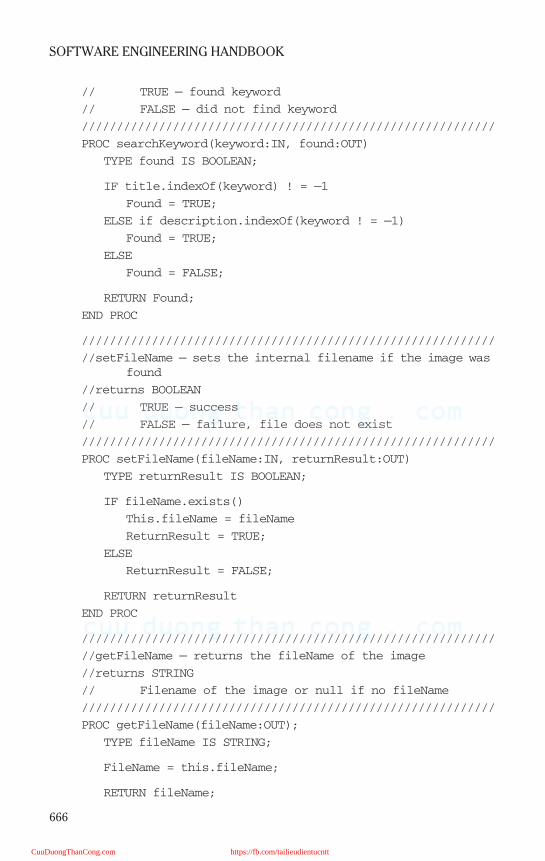
666
SOFTWARE ENGINEERING HANDBOOK
// TRUE — found keyword
// FALSE — did not find keyword
///////////////////////////////////////////////////////////
PROC searchKeyword(keyword:IN, found:OUT)
TYPE found IS BOOLEAN;
IF title.indexOf(keyword) ! = —1
Found = TRUE;
ELSE if description.indexOf(keyword ! = —1)
Found = TRUE;
ELSE
Found = FALSE;
RETURN Found;
END PROC
///////////////////////////////////////////////////////////
//setFileName — sets the internal filename if the image was
found
//returns BOOLEAN
// TRUE — success
// FALSE — failure, file does not exist
///////////////////////////////////////////////////////////
PROC setFileName(fileName:IN, returnResult:OUT)
TYPE returnResult IS BOOLEAN;
IF fileName.exists()
This.fileName = fileName
ReturnResult = TRUE;
ELSE
ReturnResult = FALSE;
RETURN returnResult
END PROC
///////////////////////////////////////////////////////////
//getFileName — returns the fileName of the image
//returns STRING
// Filename of the image or null if no fileName
///////////////////////////////////////////////////////////
PROC getFileName(fileName:OUT);
TYPE fileName IS STRING;
FileName = this.fileName;
RETURN fileName;
CuuDuongThanCong.com https://fb.com/tailieudientucntt
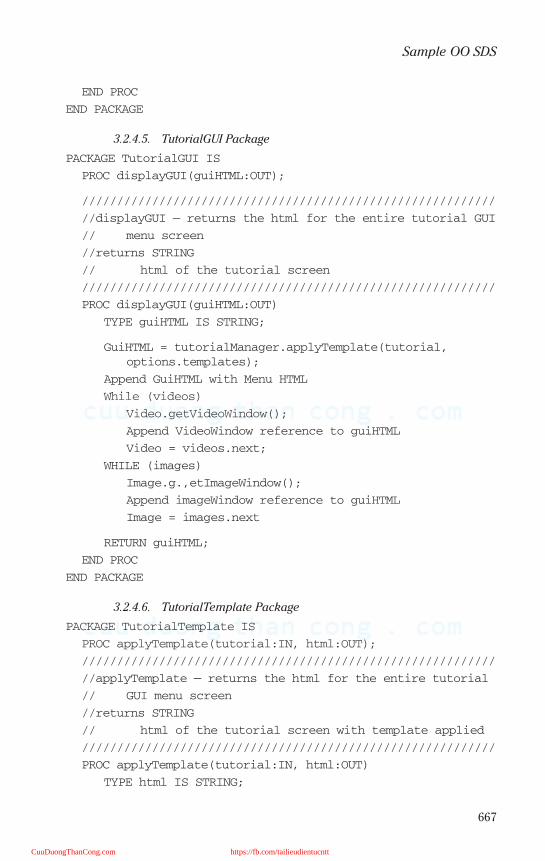
667
Sample OO SDS
END PROC
END PACKAGE
3.2.4.5. TutorialGUI Package
PACKAGE TutorialGUI IS
PROC displayGUI(guiHTML:OUT);
///////////////////////////////////////////////////////////
//displayGUI — returns the html for the entire tutorial GUI
// menu screen
//returns STRING
// html of the tutorial screen
///////////////////////////////////////////////////////////
PROC displayGUI(guiHTML:OUT)
TYPE guiHTML IS STRING;
GuiHTML = tutorialManager.applyTemplate(tutorial,
options.templates);
Append GuiHTML with Menu HTML
While (videos)
Video.getVideoWindow();
Append VideoWindow reference to guiHTML
Video = videos.next;
WHILE (images)
Image.g.,etImageWindow();
Append imageWindow reference to guiHTML
Image = images.next
RETURN guiHTML;
END PROC
END PACKAGE
3.2.4.6. TutorialTemplate Package
PACKAGE TutorialTemplate IS
PROC applyTemplate(tutorial:IN, html:OUT);
///////////////////////////////////////////////////////////
//applyTemplate — returns the html for the entire tutorial
// GUI menu screen
//returns STRING
// html of the tutorial screen with template applied
///////////////////////////////////////////////////////////
PROC applyTemplate(tutorial:IN, html:OUT)
TYPE html IS STRING;
CuuDuongThanCong.com https://fb.com/tailieudientucntt

668
SOFTWARE ENGINEERING HANDBOOK
html = tutorial.getHTMLBody();
html.replace(H1 color with template H1 color);
html.replace(H1 font with template H1 font);
html.replace(H1 size with template H1 size);
html.replace(H2 color with template H2 color);
html.replace(H2 font with template H2 font);
html.replace(H2 size with template H2 size);
html.replace(H3 color with template H3 color);
html.replace(H3 font with template H3 font);
html.replace(H3 size with template H3 size);
html.replace(text1 color with template text1 color);
html.replace(text1 font with template text1 font);
html.replace(text1 size with template text1 size);
html.replace(text2 color with template text2 color);
html.replace(text2 font with template text2 font);
html.replace(text2 size with template text2 size);
html.replace(text3 color with template text3 color);
html.replace(text3 font with template text3 font);
html.replace(text3 size with template text3 size);
html.replace(menuColor with template menuColor);
html.replace(menuFont with template menuFont);
html.replace(menuSize with template menuSize);
html.replace(backgroundColor with template
backGroundColor);
html.replace(backgroundImage with template
backgroundImage);
RETURN html;
END PROC
END PACKAGE
3.3 Payment Package
3.3.1 Conceptual Description
Payment subsystem is responsible for setting up different paymentmethods, processing payment requests, and billing information for a cus-tomer. It also conducts the verification operations with external financialinstitutions for automatic debit operations.
The Payment package provides many business infrastructure layer ser-vices such as security, currency conversion routines, automatic debit pro-cess, and credit card validation used to provide the user with a commonview and functionality associated with the payment. This package providesthe ability to apply GUI templates and present this information to the user;
CuuDuongThanCong.com https://fb.com/tailieudientucntt
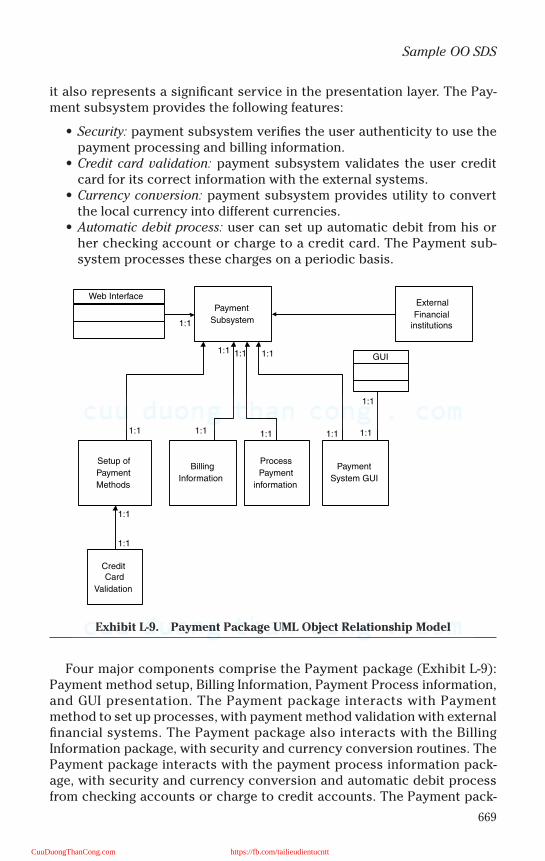
669
Sample OO SDS
it also represents a significant service in the presentation layer. The Pay-ment subsystem provides the following features:
• Security: payment subsystem verifies the user authenticity to use thepayment processing and billing information.
• Credit card validation: payment subsystem validates the user creditcard for its correct information with the external systems.
• Currency conversion: payment subsystem provides utility to convertthe local currency into different currencies.
• Automatic debit process: user can set up automatic debit from his orher checking account or charge to a credit card. The Payment sub-system processes these charges on a periodic basis.
Four major components comprise the Payment package (Exhibit L-9):Payment method setup, Billing Information, Payment Process information,and GUI presentation. The Payment package interacts with Paymentmethod to set up processes, with payment method validation with externalfinancial systems. The Payment package also interacts with the BillingInformation package, with security and currency conversion routines. ThePayment package interacts with the payment process information pack-age, with security and currency conversion and automatic debit processfrom checking accounts or charge to credit accounts. The Payment pack-
Exhibit L-9. Payment Package UML Object Relationship Model
Payment
Subsystem
Setup of
Payment
Methods
Billing
Information
Process
Payment
information
Payment
System GUI
CreditCard
Validation
1:1
External
Financialinstitutions
GUI
1:1
1:1 1:1
1:1
1:1
1:11:1
1:1
1:1
1:1
1:1
Web Interface
CuuDuongThanCong.com https://fb.com/tailieudientucntt
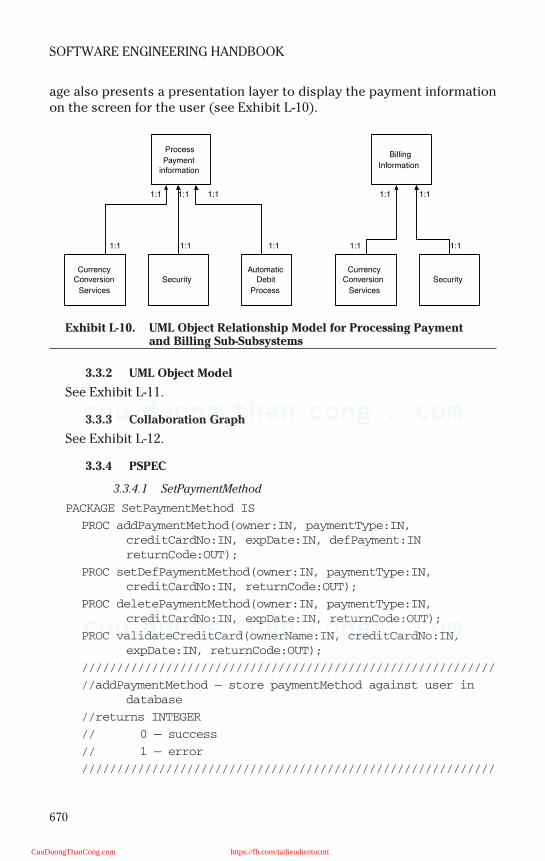
670
SOFTWARE ENGINEERING HANDBOOK
age also presents a presentation layer to display the payment informationon the screen for the user (see Exhibit L-10).
3.3.2 UML Object Model
See Exhibit L-11.
3.3.3 Collaboration Graph
See Exhibit L-12.
3.3.4 PSPEC
3.3.4.1 SetPaymentMethod
PACKAGE SetPaymentMethod IS
PROC addPaymentMethod(owner:IN, paymentType:IN,
creditCardNo:IN, expDate:IN, defPayment:IN
returnCode:OUT);
PROC setDefPaymentMethod(owner:IN, paymentType:IN,
creditCardNo:IN, returnCode:OUT);
PROC deletePaymentMethod(owner:IN, paymentType:IN,
creditCardNo:IN, expDate:IN, returnCode:OUT);
PROC validateCreditCard(ownerName:IN, creditCardNo:IN,
expDate:IN, returnCode:OUT);
///////////////////////////////////////////////////////////
//addPaymentMethod — store paymentMethod against user in
database
//returns INTEGER
// 0 — success
// 1 — error
///////////////////////////////////////////////////////////
Exhibit L-10. UML Object Relationship Model for Processing Payment and Billing Sub-Subsystems
Process
Paymentinformation
CurrencyConversion
Services
SecurityAutomatic
Debit
Process
Billing
Information
CurrencyConversion
Services
Security
1:1
1:11:1
1:1
1:1
1:1
1:1
1:1 1:1
1:1
CuuDuongThanCong.com https://fb.com/tailieudientucntt
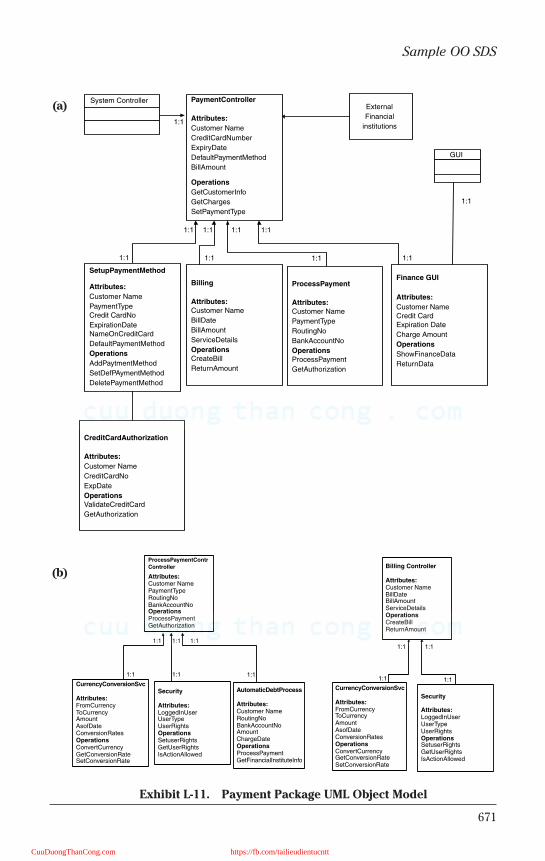
671
Sample OO SDS
(a)
(b)
Exhibit L-11. Payment Package UML Object Model
1:1
External
Financial
institutions
GUI
1:1
1:11:1 1:1
1:1
1:1
1:1 1:1
1:1
1:1
1:1
System Controller
Finance GUI
Attributes:
Customer NameCredit CardExpiration Date
Charge Amount
Operations
ShowFinanceData
ReturnData
SetupPaymentMethod
Attributes:
Customer Name
PaymentTypeCredit CardNo
ExpirationDateNameOnCreditCard
DefaultPaymentMethod
Operations
AddPaytmentMethod
SetDefPAymentMethod
DeletePaymentMethod
Billing
Attributes:
Customer Name
BillDate
BillAmount
ServiceDetails
Operations
CreateBill
ReturnAmount
ProcessPayment
Attributes:
Customer Name
PaymentType
RoutingNo
BankAccountNo
Operations
ProcessPayment
GetAuthorization
CreditCardAuthorization
Attributes:
Customer Name
CreditCardNo
ExpDate
Operations
ValidateCreditCard
GetAuthorization
PaymentController
Attributes:
Customer Name
CreditCardNumber
ExpiryDate
DefaultPaymentMethod
BillAmount
Operations
GetCustomerInfo
GetCharges
SetPaymentType
1:1
1:11:1
1:1
1:1
1:1
1:1
1:1 1:1
1:1
Billing Controller
Attributes:Customer NameBillDateBillAmountServiceDetailsOperationsCreateBillReturnAmount
CurrencyConversionSvc
Attributes:FromCurrencyToCurrencyAmountAsofDateConversionRatesOperationsConvertCurrencyGetConversionRateSetConversionRate
Security
Attributes:LoggedInUserUserTypeUserRightsOperationsSetuserRightsGetUserRightsIsActionAllowed
ProcessPaymentContr
Controller
Attributes:Customer NamePaymentTypeRoutingNoBankAccountNoOperationsProcessPaymentGetAuthorization
CurrencyConversionSvc
Attributes:FromCurrencyToCurrencyAmountAsofDateConversionRatesOperationsConvertCurrencyGetConversionRateSetConversionRate
Security
Attributes:LoggedInUserUserTypeUserRightsOperationsSetuserRightsGetUserRightsIsActionAllowed
AutomaticDebtProcess
Attributes:Customer NameRoutingNoBankAccountNoAmountChargeDateOperationsProcessPaymentGetFinancialInstituteInfo
CuuDuongThanCong.com https://fb.com/tailieudientucntt
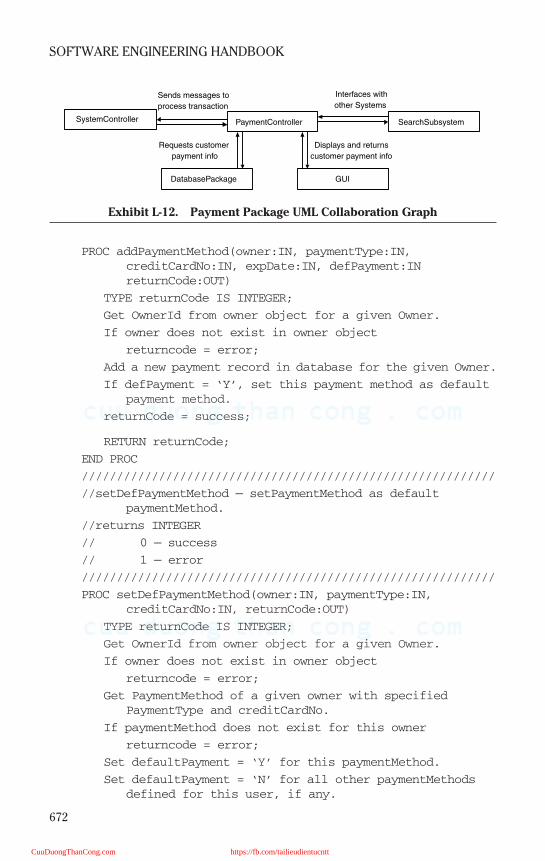
672
SOFTWARE ENGINEERING HANDBOOK
PROC addPaymentMethod(owner:IN, paymentType:IN,
creditCardNo:IN, expDate:IN, defPayment:IN
returnCode:OUT)
TYPE returnCode IS INTEGER;
Get OwnerId from owner object for a given Owner.
If owner does not exist in owner object
returncode = error;
Add a new payment record in database for the given Owner.
If defPayment = ‘Y’, set this payment method as default
payment method.
returnCode = success;
RETURN returnCode;
END PROC
///////////////////////////////////////////////////////////
//setDefPaymentMethod — setPaymentMethod as default
paymentMethod.
//returns INTEGER
// 0 — success
// 1 — error
///////////////////////////////////////////////////////////
PROC setDefPaymentMethod(owner:IN, paymentType:IN,
creditCardNo:IN, returnCode:OUT)
TYPE returnCode IS INTEGER;
Get OwnerId from owner object for a given Owner.
If owner does not exist in owner object
returncode = error;
Get PaymentMethod of a given owner with specified
PaymentType and creditCardNo.
If paymentMethod does not exist for this owner
returncode = error;
Set defaultPayment = ‘Y’ for this paymentMethod.
Set defaultPayment = ‘N’ for all other paymentMethods
defined for this user, if any.
Exhibit L-12. Payment Package UML Collaboration Graph
PaymentControllerSystemController
DatabasePackage GUI
SearchSubsystem
Interfaces with
other Systems
Displays and returns
customer payment info
Requests customer
payment info
Sends messages to
process transaction
CuuDuongThanCong.com https://fb.com/tailieudientucntt

673
Sample OO SDS
returnCode = success;
RETURN returnCode;
END PROC
///////////////////////////////////////////////////////////
//deletePaymentMethod — delete paymentMethod from the
database for this owner.
//returns INTEGER
// 0 — success
// 1 — error
///////////////////////////////////////////////////////////
PROC deletePaymentMethod(owner:IN, paymentType:IN,
creditCardNo:IN, returnCode:OUT)
TYPE returnCode IS INTEGER;
Get OwnerId from owner object for a given Owner.
If owner does not exist in owner object
returncode = error;
Get PaymentMethod of a given owner with specified
PaymentType and creditCardNo.
If paymentMethod does not exist for this owner
returncode = error;
Delete selected paymentMethod for this owner.
RETURN returnCode;
END PROC
///////////////////////////////////////////////////////////
//validateCreditCard — Validate creditCards using external
interface.
//returns INTEGER
// 0 — success
// 1 — error
///////////////////////////////////////////////////////////
PROC validateCreditCard(ownerName:IN, creditCardNo:IN,
expDate:IN, returnCode:OUT);
TYPE returnCode IS INTEGER;
Validate specified credit card using external interface.
If creditCard is valid
ReturnCode = success
Else returnCode = error;
RETURN returnCode;
END PROC
END PACKAGE
CuuDuongThanCong.com https://fb.com/tailieudientucntt
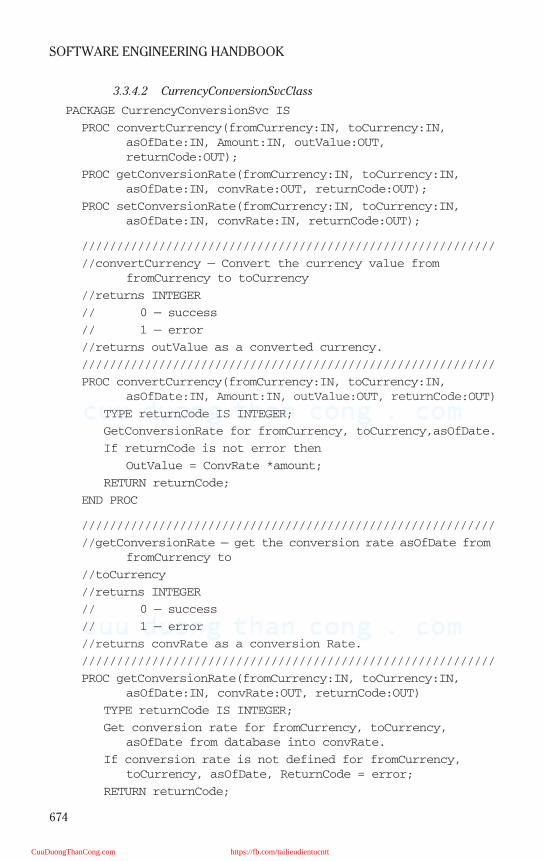
674
SOFTWARE ENGINEERING HANDBOOK
3.3.4.2 CurrencyConversionSvcClass
PACKAGE CurrencyConversionSvc IS
PROC convertCurrency(fromCurrency:IN, toCurrency:IN,
asOfDate:IN, Amount:IN, outValue:OUT,
returnCode:OUT);
PROC getConversionRate(fromCurrency:IN, toCurrency:IN,
asOfDate:IN, convRate:OUT, returnCode:OUT);
PROC setConversionRate(fromCurrency:IN, toCurrency:IN,
asOfDate:IN, convRate:IN, returnCode:OUT);
///////////////////////////////////////////////////////////
//convertCurrency — Convert the currency value from
fromCurrency to toCurrency
//returns INTEGER
// 0 — success
// 1 — error
//returns outValue as a converted currency.
///////////////////////////////////////////////////////////
PROC convertCurrency(fromCurrency:IN, toCurrency:IN,
asOfDate:IN, Amount:IN, outValue:OUT, returnCode:OUT)
TYPE returnCode IS INTEGER;
GetConversionRate for fromCurrency, toCurrency,asOfDate.
If returnCode is not error then
OutValue = ConvRate *amount;
RETURN returnCode;
END PROC
///////////////////////////////////////////////////////////
//getConversionRate — get the conversion rate asOfDate from
fromCurrency to
//toCurrency
//returns INTEGER
// 0 — success
// 1 — error
//returns convRate as a conversion Rate.
///////////////////////////////////////////////////////////
PROC getConversionRate(fromCurrency:IN, toCurrency:IN,
asOfDate:IN, convRate:OUT, returnCode:OUT)
TYPE returnCode IS INTEGER;
Get conversion rate for fromCurrency, toCurrency,
asOfDate from database into convRate.
If conversion rate is not defined for fromCurrency,
toCurrency, asOfDate, ReturnCode = error;
RETURN returnCode;
CuuDuongThanCong.com https://fb.com/tailieudientucntt
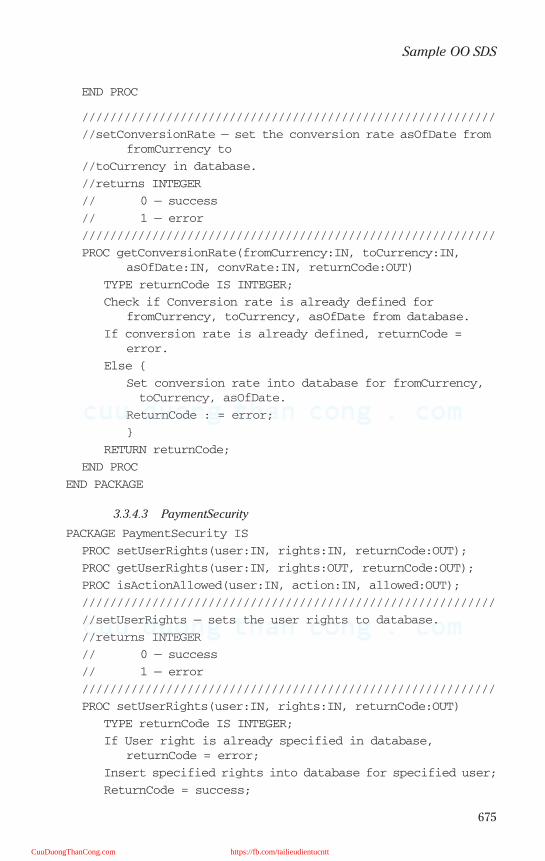
675
Sample OO SDS
END PROC
///////////////////////////////////////////////////////////
//setConversionRate — set the conversion rate asOfDate from
fromCurrency to
//toCurrency in database.
//returns INTEGER
// 0 — success
// 1 — error
///////////////////////////////////////////////////////////
PROC getConversionRate(fromCurrency:IN, toCurrency:IN,
asOfDate:IN, convRate:IN, returnCode:OUT)
TYPE returnCode IS INTEGER;
Check if Conversion rate is already defined for
fromCurrency, toCurrency, asOfDate from database.
If conversion rate is already defined, returnCode =
error.
Else
Set conversion rate into database for fromCurrency,
toCurrency, asOfDate.
ReturnCode : = error;
RETURN returnCode;
END PROC
END PACKAGE
3.3.4.3 PaymentSecurity
PACKAGE PaymentSecurity IS
PROC setUserRights(user:IN, rights:IN, returnCode:OUT);
PROC getUserRights(user:IN, rights:OUT, returnCode:OUT);
PROC isActionAllowed(user:IN, action:IN, allowed:OUT);
///////////////////////////////////////////////////////////
//setUserRights — sets the user rights to database.
//returns INTEGER
// 0 — success
// 1 — error
///////////////////////////////////////////////////////////
PROC setUserRights(user:IN, rights:IN, returnCode:OUT)
TYPE returnCode IS INTEGER;
If User right is already specified in database,
returnCode = error;
Insert specified rights into database for specified user;
ReturnCode = success;
CuuDuongThanCong.com https://fb.com/tailieudientucntt
676
SOFTWARE ENGINEERING HANDBOOK
RETURN returnCode;
END PROC
///////////////////////////////////////////////////////////
//getUserRights — gets the user rights from database.
//returns INTEGER
// 0 — success
// 1 — error
///////////////////////////////////////////////////////////
PROC setUserRights(user:IN, rights:IN, returnCode:OUT)
TYPE returnCode IS INTEGER;
If User right is not defined in database, returnCode =
error;
Select rights feom database for specified user;
Concatenate them in a string format.
ReturnCode = success;
RETURN returnCode;
END PROC
///////////////////////////////////////////////////////////
//getUserRights — gets the user rights from database.
//returns Y if right exists, N if not.
///////////////////////////////////////////////////////////
PROC isActionAllowed(user:IN, action:IN, allowed:OUT)
TYPE returnCode IS INTEGER;
If User right is defined in database,allowed = ‘Y’;
Else allowed = ‘N’
RETURN allowed;
END PROC
END PACKAGE
3.3.4.4 AutomaticDebitProcess
PACKAGE EventLog IS
PROC ProcessPayments(owner:IN, routingNumber:IN,
AccountNumber:IN, amount:IN, authorization:OUT,
returnCode:OUT);
PROC getFinancialInstituteInfo(routingNumber:IN,
bankName:OUT);
///////////////////////////////////////////////////////////
//ProcessPayments — Process Payments to be automatically
debted from bank
//accounts.
//returns INTEGER
CuuDuongThanCong.com https://fb.com/tailieudientucntt
677
Sample OO SDS
// 0 — success
// 1 — error
//returns authorization as INTEGER
///////////////////////////////////////////////////////////
PROC ProcessPayments(owner:IN, routingNumber:IN,
AccountNumber:IN, amount:IN, authorization:OUT,
returnCode:OUT)
TYPE returnCode IS INTEGER;
Validate given routingNumber;
Validate given accountNumber;
Post ‘amount’ onto given routingNumber+accountNumber
account.
If Error during posting amount, returnCode = error.
getAuthorization.
RETURN returnCode;
END PROC
///////////////////////////////////////////////////////////
//getFinancialInstituteInfo — Get bank name for a given
routing Number
//returns INTEGER
// 0 — success
// 1 — error
///////////////////////////////////////////////////////////
PROC getFinancialInstituteInfo(routingNumber:IN,
bankName:OUT)
TYPE returnCode IS INTEGER;
From external system, get bank name for routingNumber.
RETURN returnCode;
END PROC
END PACKAGE
3.3.4.5 Billing
PACKAGE Billing IS
PROC createBill(customer:IN, ServiceDetails:IN,
BillDate:OUT, BillAmount:OUT, returnCode:OUT);
PROC returnAmount(customer:IN, billDate:IN, billAmount:OUT,
returnCode:OUT);
///////////////////////////////////////////////////////////
//createBill — create a bill for given service details for a
customer.
//returns INTEGER
// 0 — success
// 1 — error
CuuDuongThanCong.com https://fb.com/tailieudientucntt
678
SOFTWARE ENGINEERING HANDBOOK
//returns billDate as date
//returns billAmount as float
///////////////////////////////////////////////////////////
PROC createBill(customer:IN, ServiceDetails:IN,
BillDate:OUT, BillAmount:OUT, returnCode:OUT)
TYPE returnCode IS INTEGER;
Get OwnerId for given customer.
If Customer does not exist, returnCode = error;
From the service details provided,
Build a string of all services provided for all his
dogs.
Compute the total price of all services.
Set the billDate as today.
Set the paymentDateas Today + 20 days.
returnCode = success
RETURN returnCode;
END PROC
///////////////////////////////////////////////////////////
//returnAmount — retrieve the amount of bill for a customer
and billdate
//returns INTEGER
// 0 — success
// 1 — error
//returns billAmount as float
///////////////////////////////////////////////////////////
PROC returnAmount(customer:IN, billDate:IN, billAmount:OUT,
returnCode:OUT)
Get OwnerId for given customer.
If Customer does not exist, returnCode = error;
TYPE returnCode IS INTEGER;
Get billAmount from database for a specified customer and
billDate.
RETURN returnCode;
END PROC
END PACKAGE
3.4 Reminders Package
3.4.1 Conceptual Description
Reminders subsystem of DEDS is responsible for creating and sendingout birthday, medication, and registration reminders to dog owners as andwhen required. The Reminders subsystem will accept system message,
CuuDuongThanCong.com https://fb.com/tailieudientucntt

679
Sample OO SDS
then connect to data objects, which interface with DB, to generate remind-ers to send to the user.
The Reminders package provides many business infrastructure layerservices such as reminder templates used to provide the user with a com-mon view and functionality associated with the reminders. This package’sability to apply GUI templates and present this information to the user alsorepresents a significant service in the presentation layer.
Three components comprise the Reminders package (see Exhibit L-13):Birthday Reminders, Medication Reminders, and Registration Reminders.
Each of these reminders can have multiple sets of templates to be selectedfor use. The Reminders component handles the browsing and display ofreminder information to the user. Through its interactions, the Remindersubsystem provides the sole interface into the tutorial functionality.
3.4.2 UML Object Model.
See Exhibit L-14.
3.4.3 Collaboration Graph
See Exhibit L-15.
3.4.4 PSPEC
3.4.4.1 BirthDay Reminder
PACKAGE BirthDayReminders IS
Exhibit L-13. UML Object Relationship Model
Reminders
Subsystem
Birthdayreminders
Medicationreminders
RegistrationReminders
B'Day
reminderformat /
template
Medication
reminder
format /
template
Registration
reminder
format /
template
1
1
1
1
1
1
1
1
1
1
1
Notify - GUI
GUI
Webpage
CuuDuongThanCong.com https://fb.com/tailieudientucntt
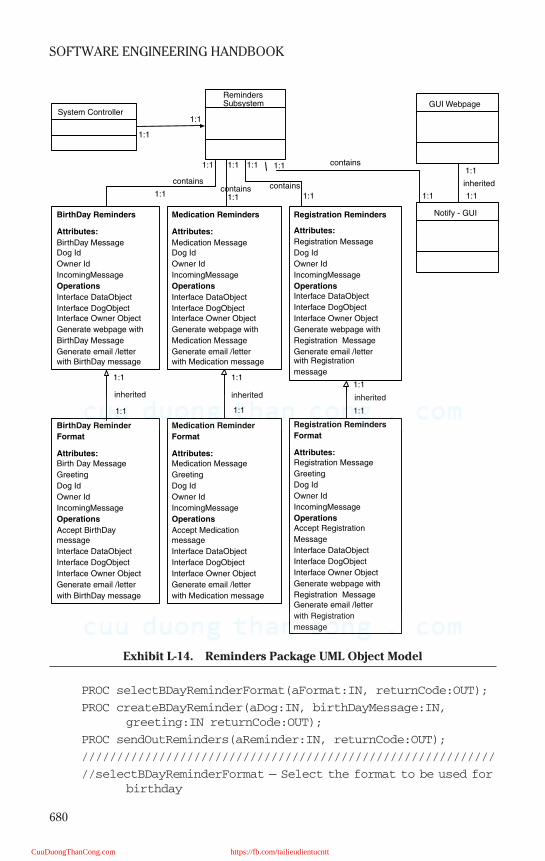
680
SOFTWARE ENGINEERING HANDBOOK
PROC selectBDayReminderFormat(aFormat:IN, returnCode:OUT);
PROC createBDayReminder(aDog:IN, birthDayMessage:IN,
greeting:IN returnCode:OUT);
PROC sendOutReminders(aReminder:IN, returnCode:OUT);
///////////////////////////////////////////////////////////
//selectBDayReminderFormat — Select the format to be used for
birthday
Exhibit L-14. Reminders Package UML Object Model
1:1
GUI Webpage
Notify - GUI
RemindersSubsystem
contains
inherited
1:1
1:11:1
containscontains
contains
1:11:11:1
1:11:11:1
Medication Reminders
Attributes:
Medication MessageDog Id
Owner Id
IncomingMessage
Operations
Interface DataObject
Interface DogObjectInterface Owner Object
Generate webpage with
Medication Message
Generate email /letterwith Medication message
BirthDay Reminders
Attributes:
BirthDay MessageDog Id
Owner Id
IncomingMessage
Operations
Interface DataObject
Interface DogObjectInterface Owner Object
Generate webpage with
BirthDay Message
Generate email /letterwith BirthDay message
Registration Reminders
Attributes:
Registration Message
Dog Id
Owner Id
IncomingMessage
Operations
Interface DataObject
Interface DogObject
Interface Owner Object
Generate webpage with
Registration Message
Generate email /letterwith Registration
message
contains
BirthDay Reminder
Format
Attributes:
Birth Day Message
Greeting
Dog Id
Owner Id
IncomingMessage
Operations
Accept BirthDaymessage
Interface DataObject
Interface DogObject
Interface Owner Object
Generate email /letter
with BirthDay message
Medication Reminder
Format
Attributes:
Medication Message
Greeting
Dog Id
Owner Id
IncomingMessage
Operations
Accept Medicationmessage
Interface DataObject
Interface DogObject
Interface Owner Object
Generate email /letter
with Medication message
Registration Reminders
Format
Attributes:
Registration Message
Greeting
Dog Id
Owner Id
IncomingMessage
Operations
Accept Registration
Message
Interface DataObject
Interface DogObject
Interface Owner Object
Generate webpage with
Registration MessageGenerate email /letter
with Registration
message
1:1
1:1
inherited
1:1
1:1
inherited
1:1
1:1
inherited
System Controller1:1
1:1
CuuDuongThanCong.com https://fb.com/tailieudientucntt
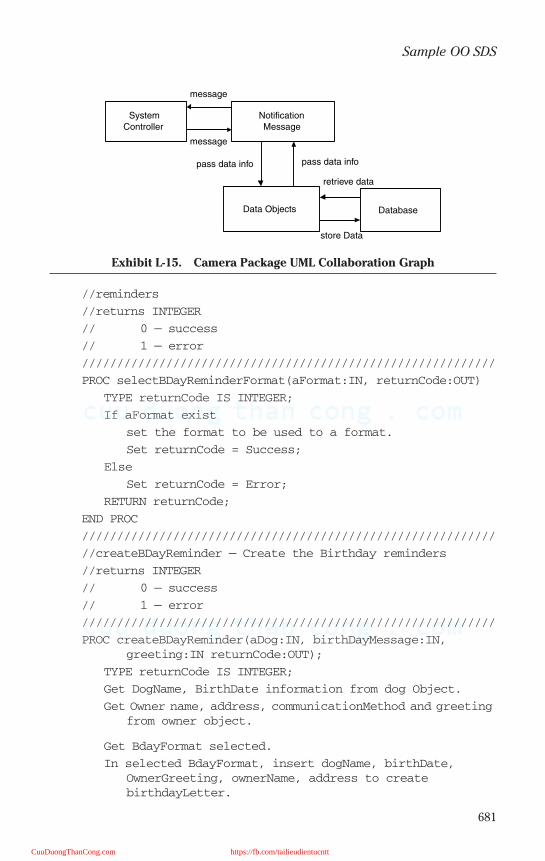
681
Sample OO SDS
//reminders
//returns INTEGER
// 0 — success
// 1 — error
///////////////////////////////////////////////////////////
PROC selectBDayReminderFormat(aFormat:IN, returnCode:OUT)
TYPE returnCode IS INTEGER;
If aFormat exist
set the format to be used to a format.
Set returnCode = Success;
Else
Set returnCode = Error;
RETURN returnCode;
END PROC
///////////////////////////////////////////////////////////
//createBDayReminder — Create the Birthday reminders
//returns INTEGER
// 0 — success
// 1 — error
///////////////////////////////////////////////////////////
PROC createBDayReminder(aDog:IN, birthDayMessage:IN,
greeting:IN returnCode:OUT);
TYPE returnCode IS INTEGER;
Get DogName, BirthDate information from dog Object.
Get Owner name, address, communicationMethod and greeting
from owner object.
Get BdayFormat selected.
In selected BdayFormat, insert dogName, birthDate,
OwnerGreeting, ownerName, address to create
birthdayLetter.
Exhibit L-15. Camera Package UML Collaboration Graph
SystemController
NotificationMessage
Data Objects Database
message
pass data info
message
pass data info
retrieve data
store Data
CuuDuongThanCong.com https://fb.com/tailieudientucntt

682
SOFTWARE ENGINEERING HANDBOOK
If birthDayLetter created successfully
returnCode = Success
else
returnCode = error
RETURN (returnCode);
END PROC
///////////////////////////////////////////////////////////
//sendOutReminders — Sends the reminders out
//returns INTEGER
// 0 — success
// 1 — error
///////////////////////////////////////////////////////////
PROC sendOutReminders(aReminder:IN, returnCode:OUT);
TYPE returnCode IS INTEGER;
If communication type is email then
send email to address specified.
ReturnCode = Success;
elseif communication type is usps then
print the reminder letter.
ReturnCode = Success;
else return code = error;
RETURN returnCode;
END PROC
END PACKAGE
3.4.4.2 Medication Reminder
PACKAGE MedicationReminders IS
PROC selectMedicationReminderFormat(aFormat:IN,
returnCode:OUT);
PROC createMedicationReminder(aDog:IN,
MedicationMessage:IN, greeting:IN
returnCode:OUT);
PROC sendOutReminders(aReminder:IN, returnCode:OUT);
///////////////////////////////////////////////////////////
//selectMedicationReminderFormat — Select the format to be
used for medication
//reminders
//returns INTEGER
// 0 — success
// 1 — error
///////////////////////////////////////////////////////////
CuuDuongThanCong.com https://fb.com/tailieudientucntt
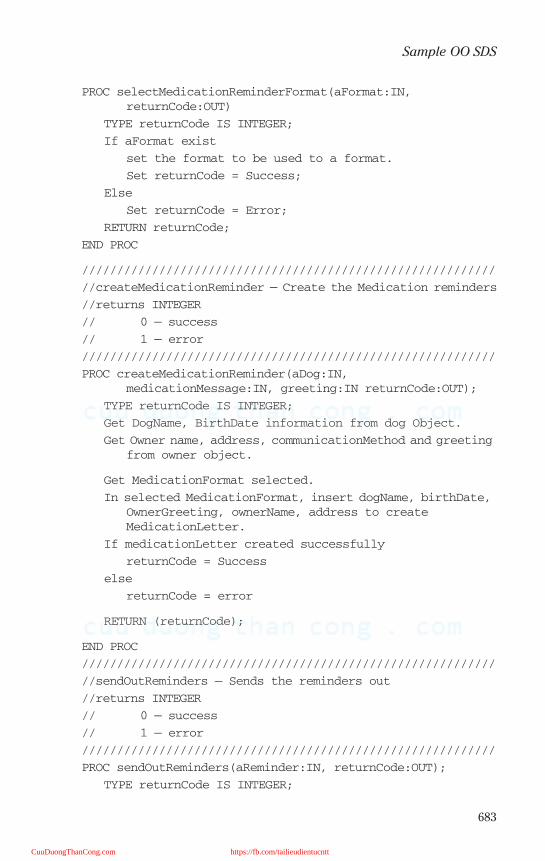
683
Sample OO SDS
PROC selectMedicationReminderFormat(aFormat:IN,
returnCode:OUT)
TYPE returnCode IS INTEGER;
If aFormat exist
set the format to be used to a format.
Set returnCode = Success;
Else
Set returnCode = Error;
RETURN returnCode;
END PROC
///////////////////////////////////////////////////////////
//createMedicationReminder — Create the Medication reminders
//returns INTEGER
// 0 — success
// 1 — error
///////////////////////////////////////////////////////////
PROC createMedicationReminder(aDog:IN,
medicationMessage:IN, greeting:IN returnCode:OUT);
TYPE returnCode IS INTEGER;
Get DogName, BirthDate information from dog Object.
Get Owner name, address, communicationMethod and greeting
from owner object.
Get MedicationFormat selected.
In selected MedicationFormat, insert dogName, birthDate,
OwnerGreeting, ownerName, address to create
MedicationLetter.
If medicationLetter created successfully
returnCode = Success
else
returnCode = error
RETURN (returnCode);
END PROC
///////////////////////////////////////////////////////////
//sendOutReminders — Sends the reminders out
//returns INTEGER
// 0 — success
// 1 — error
///////////////////////////////////////////////////////////
PROC sendOutReminders(aReminder:IN, returnCode:OUT);
TYPE returnCode IS INTEGER;
CuuDuongThanCong.com https://fb.com/tailieudientucntt

684
SOFTWARE ENGINEERING HANDBOOK
If communication type is email then
send email to address specified.
ReturnCode = Success;
elseif communication type is usps then
print the reminder letter.
ReturnCode = Success;
else return code = error;
RETURN returnCode;
END PROC
END PACKAGE
3.4.4.3 Registration Reminders
PACKAGE RegistrationReminders IS
PROC selectRegistrationReminderFormat(aFormat:IN,
returnCode:OUT);
PROC createRegistrationReminder(aDog:IN,
registrationMessage:IN, greeting:IN returnCode:OUT);
PROC sendOutReminders(aReminder:IN, returnCode:OUT);
///////////////////////////////////////////////////////////
//selectRegistrationReminderFormat — Select the format to be
used for
//registration reminders
//returns INTEGER
// 0 — success
// 1 — error
///////////////////////////////////////////////////////////
PROC selectRegistrationReminderFormat(aFormat:IN,
returnCode:OUT)
TYPE returnCode IS INTEGER;
If aFormat exist
set the format to be used to a format.
Set returnCode = Success;
Else
Set returnCode = Error;
RETURN returnCode;
END PROC
///////////////////////////////////////////////////////////
//createRegistrationReminder — Create the Registration
reminders
//returns INTEGER
// 0 — success
// 1 — error
CuuDuongThanCong.com https://fb.com/tailieudientucntt
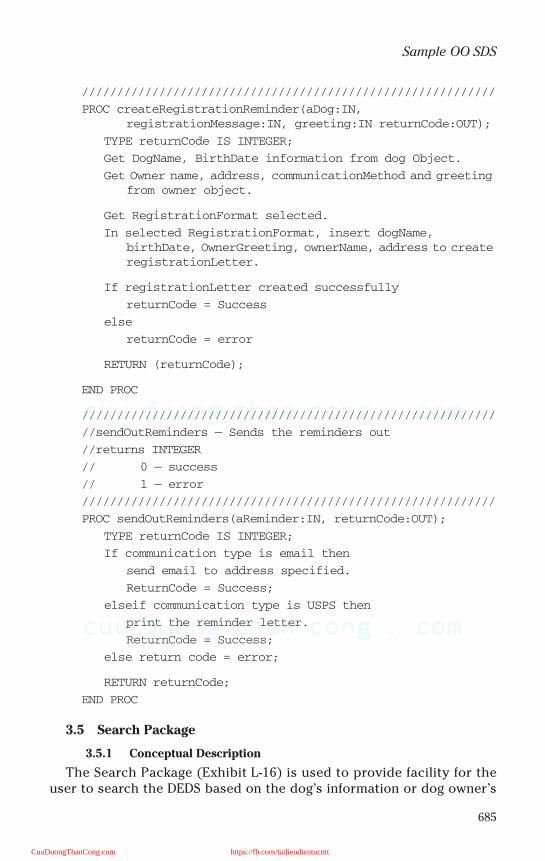
685
Sample OO SDS
///////////////////////////////////////////////////////////
PROC createRegistrationReminder(aDog:IN,
registrationMessage:IN, greeting:IN returnCode:OUT);
TYPE returnCode IS INTEGER;
Get DogName, BirthDate information from dog Object.
Get Owner name, address, communicationMethod and greeting
from owner object.
Get RegistrationFormat selected.
In selected RegistrationFormat, insert dogName,
birthDate, OwnerGreeting, ownerName, address to create
registrationLetter.
If registrationLetter created successfully
returnCode = Success
else
returnCode = error
RETURN (returnCode);
END PROC
///////////////////////////////////////////////////////////
//sendOutReminders — Sends the reminders out
//returns INTEGER
// 0 — success
// 1 — error
///////////////////////////////////////////////////////////
PROC sendOutReminders(aReminder:IN, returnCode:OUT);
TYPE returnCode IS INTEGER;
If communication type is email then
send email to address specified.
ReturnCode = Success;
elseif communication type is USPS then
print the reminder letter.
ReturnCode = Success;
else return code = error;
RETURN returnCode;
END PROC
3.5 Search Package
3.5.1 Conceptual Description
The Search Package (Exhibit L-16) is used to provide facility for theuser to search the DEDS based on the dog’s information or dog owner’s
CuuDuongThanCong.com https://fb.com/tailieudientucntt

686
SOFTWARE ENGINEERING HANDBOOK
information and get complete dog and dog owner information for all pos-sible search matches. Search package also provides interface with tuto-rial, payment, reminders, scheduling, medication, ordering, registration,camera, and barcode subsystems. Moreover, the system manager can ben-efit from this module for searching statistical data about customers, reve-nue, and number of potential matches provided to users. System environ-ment settings, network speed, database performance, and other relevanttechnical information required by the system administrator are alsoobtained by using this module of the system.
3.5.2 UML Object Model.
See Exhibit L-17.
3.5.3 Collaboration Graph.
See Exhibit L-18.
3.5.4 PSPEC
3.5.4.1 SeachDogOwnerInfo
PACKAGE SearchDogOwnerInfo IS
PROC setDogOwnerSearchCriteria(anSearchCriteria:IN,
returnCode:OUT);
Exhibit L-16. Search Package UML Object Relationship Model
Search
Controller
Search Dog/
Owners info
Update
database
Query
financial,
Historical
data
Search GUI
Query
SystemData
1:1
GUI
1:1
1:1
1:1
1:1
1:1
1:1
1:1
1:1
1:1 1:1
1:1
System Controller
Search
1:1
1:1
1:1
CuuDuongThanCong.com https://fb.com/tailieudientucntt
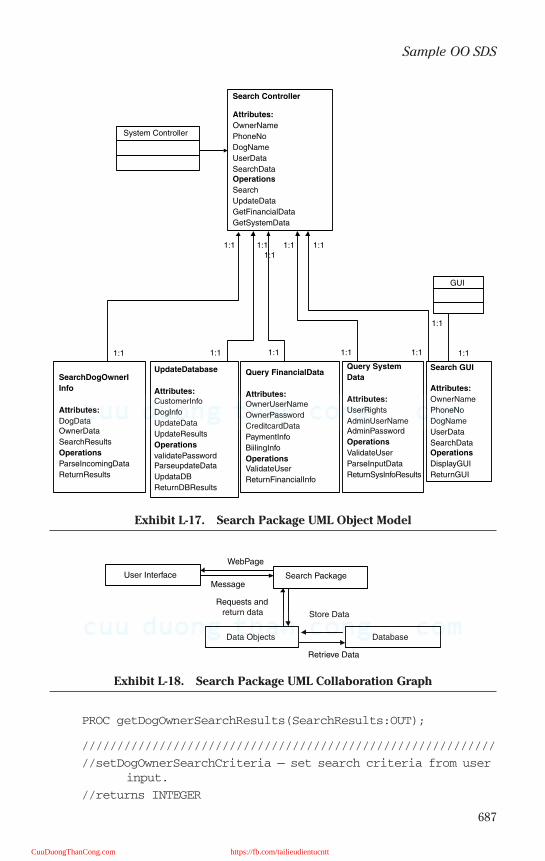
687
Sample OO SDS
PROC getDogOwnerSearchResults(SearchResults:OUT);
///////////////////////////////////////////////////////////
//setDogOwnerSearchCriteria — set search criteria from user
input.
//returns INTEGER
Exhibit L-17. Search Package UML Object Model
Exhibit L-18. Search Package UML Collaboration Graph
GUI
1:1 1:1
1:11:1
1:1
1:11:1
1:1
1:1 1:1
1:1
System Controller
1:1
Search Controller
Attributes:
OwnerName
PhoneNo
DogName
UserData
SearchDataOperations
Search
UpdateData
GetFinancialData
GetSystemData
Search GUI
Attributes:
OwnerName
PhoneNo
DogName
UserData
SearchDataOperations
DisplayGUI
ReturnGUI
Query System
Data
Attributes:
UserRights
AdminUserNameAdminPassword
Operations
ValidateUser
ParseInputData
ReturnSysInfoResults
SearchDogOwnerI
Info
Attributes:
DogDataOwnerData
SearchResults
Operations
ParseIncomingData
ReturnResults
UpdateDatabase
Attributes:
CustomerInfo
DogInfo
UpdateData
UpdateResults
Operations
validatePasswordParseupdateData
UpdataDB
ReturnDBResults
Query FinancialData
Attributes:
OwnerUserName
OwnerPassword
CreditcardData
PaymentInfo
BiilingInfo
Operations
ValidateUser
ReturnFinancialInfo
Search PackageUser Interface
Data Objects Database
Requests andreturn data
WebPage
Retrieve Data
Store Data
Message
CuuDuongThanCong.com https://fb.com/tailieudientucntt
688
SOFTWARE ENGINEERING HANDBOOK
// 0 — success
// 1 —— error
///////////////////////////////////////////////////////////
PROC setDogOwnerSearchCriteria(anSearchCriteria:IN,
returnCode:OUT);
TYPE returnCode IS INTEGER;
Parse the search criteria for required columns.
If required columns are identified, returnCode = success
Else returnCode = error
RETURN returnCode;
END PROC
///////////////////////////////////////////////////////////
//getDogOwnerSearchResults —— retrieve dog/owner information
from the database
//based on search criteria
///////////////////////////////////////////////////////////
PROC getDogOwnerSearchResults(SearchResults:OUT);
Get Dog and Owner information for the set search criteria.
Retrieve columns using database package.
Cast the results into a searchResults object
Return SearchResults;
END PROC
END PACKAGE
3.5.4.2 SearchFinancialInfo
PACKAGE SearchFinancialInfo IS
PROC setFinancialSearchCriteria(anSearchCriteria:IN,
returnCode:OUT);
PROC getFinancialSearchResults(SearchResults:OUT);
///////////////////////////////////////////////////////////
//setFinancialSearchCriteria —— set search criteria from
user input.
//returns INTEGER
// 0 —— success
// 1 —— error
///////////////////////////////////////////////////////////
PROC setFinancialSearchCriteria(anSearchCriteria:IN,
returnCode:OUT);
TYPE returnCode IS INTEGER;
Parse the search criteria for required columns.
CuuDuongThanCong.com https://fb.com/tailieudientucntt

689
Sample OO SDS
If required columns are identified, returnCode = success
Else returnCode = error
RETURN returnCode;
END PROC
///////////////////////////////////////////////////////////
//getFinancialSearchResults —— retrieve Financial
information from the database
//based on search criteria
///////////////////////////////////////////////////////////
PROC getFinancialSearchResults(SearchResults:OUT);
Get Financial information of dog owners for the set search
criteria.
Retrieve columns using database package.
Cast the results into a searchResults object
Return SearchResults;
END PROC
END PACKAGE
3.5.4.3 SearchSystemInfo
PACKAGE SearchSystemInfo IS
PROC setSystemSearchCriteria(anSearchCriteria:IN,
returnCode:OUT);
PROC getSystemSearchResults(SearchResults:OUT);
///////////////////////////////////////////////////////////
//setSystemSearchCriteria —— set search criteria from user
input.
//returns INTEGER
// 0 —— success
// 1 —— error
///////////////////////////////////////////////////////////
PROC setSystemSearchCriteria(anSearchCriteria:IN,
returnCode:OUT);
TYPE returnCode IS INTEGER;
Parse the search criteria for required columns.
If required columns are identified, returnCode = success
Else returnCode = error
RETURN returnCode;
END PROC
///////////////////////////////////////////////////////////
CuuDuongThanCong.com https://fb.com/tailieudientucntt
690
SOFTWARE ENGINEERING HANDBOOK
//getSystemSearchResults —— retrieve System information from
the database
//based on search criteria
///////////////////////////////////////////////////////////
PROC getSystemSearchResults(SearchResults:OUT);
Get System information for the set search criteria.
Retrieve columns using database package.
Cast the results into a searchResults object
Return SearchResults;
END PROC
END PACKAGE
3.6 Registration Package
3.6.1 Conceptual Description
The Registration package is responsible for allowing new customers toregister with the DEDS. This package will take the customer’s name,address, and emergency phone number, establish a user ID and password,as well as take information on the pet. Verification of customer and dog reg-istration information for the DEDS application is performed and then thisvital information is stored to the database.
Four components make up the Registration package (see Exhibit L-19):Registration Manager, Customer Registration, Dog Registration, andRegistration GUI. As mentioned earlier, the Registration Manager could beconsidered one of the key components in the business work flow processand therefore serve as a component in the application layer. It will handlethe collection and display of the relevant information and send it to therespective components.
The format of information is then checked in the Customer Registrationand Dog Registration components and sent to the Registration GUI compo-nent. The Customer Registration and Dog Registration components inter-face with the database subsystem to check for duplication of information.If appropriate, the information is written to the database. This subsystemshould be included in the technical services layer as an informationexchange service.
3.6.2 Registration Object Model.
See Exhibit L-20.
3.6.3 Registration Collaboration Graph.
See Exhibit L-21.
CuuDuongThanCong.com https://fb.com/tailieudientucntt

691
Sample OO SDS
3.6.4 PSPEC
3.6.4.1 Customer Registration Package
PACKAGE customerRegistrationRecord IS
TYPE customerRegistrationRecord data
PROC setFirstName, setLastName, setStreetaddress,
PROC setState, setZipCode, setCustphone, setCustEmail,
PROC setID, setPassword
PRIVATE
PACKAGE BODY customerRegistrationRecord IS
PRIVATE
OwnerFirstName, OwnerLastName, streetAddress,
state, phoneNumber, eMailAddress, OwnerId,
password IS STRING LENGTH (20);
//////////////////////////////////////////////////////
//setFirstName —— set the customer’s first name.
Exhibit L-19. Registration Package UML Object Relationship Model
RegistrationGUI
Customer Registration Object
RegstrationManager
Dog Registration Object
Registration
«subsystem»
Database Interface
CollaboratesCollaborates
ContainsContains
Contains
«subsystem»Web Interface
Collaborates
CuuDuongThanCong.com https://fb.com/tailieudientucntt
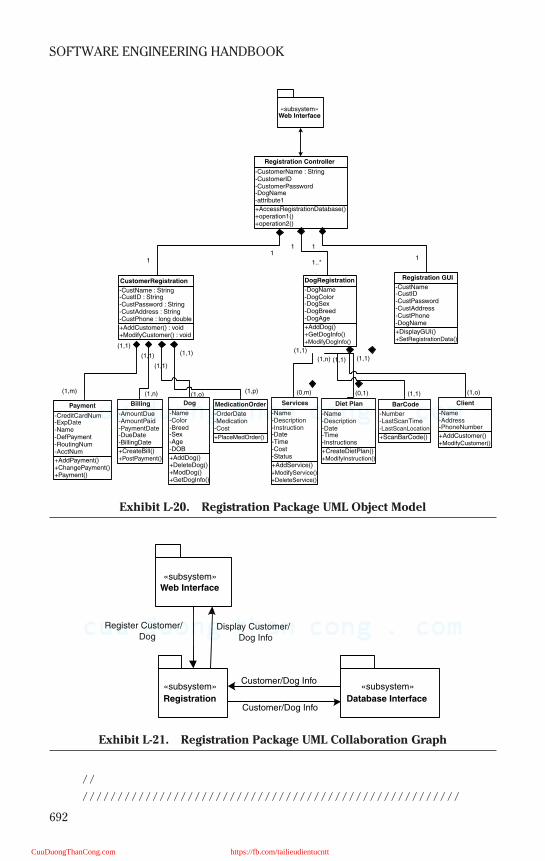
692
SOFTWARE ENGINEERING HANDBOOK
//
//////////////////////////////////////////////////////
Exhibit L-20. Registration Package UML Object Model
Exhibit L-21. Registration Package UML Collaboration Graph
(1,m)
+AddPayment()+ChangePayment()+Payment()
-CreditCardNum-ExpDate-Name-DefPayment-RoutingNum-AcctNum
Payment
+AccessRegistrationDatabase()+operation1()+operation2()
-CustomerName : String-CustomerID-CustomerPassword-DogName-attribute1
Registration Controller
+DisplayGUI()+SetRegistrationData()
-CustName-CustID-CustPassword-CustAddress-CustPhone-DogName
Registration GUI
+AddDog()+GetDogInfo()+ModifyDogInfo()
-DogName-DogColor-DogSex-DogBreed-DogAge
DogRegistration
+AddCustomer() : void+ModifyCustomer() : void
-CustName : String-CustID : String-CustPassword : String-CustAddress : String-CustPhone : long double
CustomerRegistration
(1,1)
(1,n) (1,1) (1,1)
(0,m) (0,1) (1,1) (1,o)
(1,1)
(1,1)
(1,1)
(1,1)
(1,n) (1,o)(1,p)
«subsystem»Web Interface
+CreateBill()+PostPayment()
-AmountDue-AmountPaid-PaymentDate-DueDate-BillingDate
Billing
+AddDog()+DeleteDog()+ModDog()+GetDogInfo()
-Name-Color-Breed-Sex-Age-DOB
Dog
+PlaceMedOrder()
-OrderDate-Medication-Cost
MedicationOrder
+AddService()+ModifyService()+DeleteService()
-Name-Description-Instruction-Date-Time-Cost-Status
Services
+CreateDietPlan()+ModifyInstruction()
-Name-Description-Date-Time-Instructions
Diet Plan
+ScanBarCode()
-Number-LastScanTime-LastScanLocation
BarCode
+AddCustomer()+ModifyCustomer()
-Name-Address-PhoneNumber
Client
1
1
1
1..*
11
«subsystem»Web Interface
«subsystem»
Registration
«subsystem»
Database Interface
Register Customer/Dog
Display Customer/Dog Info
Customer/Dog Info
Customer/Dog Info
CuuDuongThanCong.com https://fb.com/tailieudientucntt
693
Sample OO SDS
PROC setFirstName(String first)
OwnerFirstName = first;
END PROC
//////////////////////////////////////////////////////
//getFirstName —— return the customer’s first name.
//
//returns —— STRING
//////////////////////////////////////////////////////
PROC getFirstName
return OwnerFirstName;
END PROC
//////////////////////////////////////////////////////
//setLastName —— set the customer’s last name.
//
//////////////////////////////////////////////////////
PROC setLastName (String last)
OwnerLastName = last;
END PROC
//////////////////////////////////////////////////////
//getLastName —— return the customer’s last name.
//
//returns —— STRING
//////////////////////////////////////////////////////
PROC getlastName
return OwnerLastName;
END PROC
//////////////////////////////////////////////////////
//setStreetaddress — set the customer’s street
//address.
//
//////////////////////////////////////////////////////
PROC setStreetaddress(stAddress)
streetAddress = stAddress;
END PROC
//////////////////////////////////////////////////////
//getStreetAddress — return the customer’s street
CuuDuongThanCong.com https://fb.com/tailieudientucntt
694
SOFTWARE ENGINEERING HANDBOOK
//address.
//
//returns — STRING
//////////////////////////////////////////////////////
PROC getStreetAddress
return streetAddress;
END PROC
//////////////////////////////////////////////////////
//setState — set the customer’s state.
//
//////////////////////////////////////////////////////
PROC setState(st)
state = st;
END PROC
//////////////////////////////////////////////////////
//getState — return the customer’s state.
//
//returns — STRING
//////////////////////////////////////////////////////
PROC getState
return state;
END PROC
//////////////////////////////////////////////////////
//setZipCode — set the customer’s postal code.
//
//////////////////////////////////////////////////////
PROC setZipCode(zip)
zipCode = zip;
END PROC
//////////////////////////////////////////////////////
//getzipCode — return the customer’s postal code.
//
//returns — STRING
//////////////////////////////////////////////////////
PROC getZipCode
return zipCode;
CuuDuongThanCong.com https://fb.com/tailieudientucntt
695
Sample OO SDS
END PROC
//////////////////////////////////////////////////////
//setCustPhone — set the customer’s phone number.
//
//////////////////////////////////////////////////////
PROC setCustPhone(phNum)
phoneNumber = phNum;
END PROC
//////////////////////////////////////////////////////
//getzipCode — return the customer’s phone number.//
//returns — STRING
//////////////////////////////////////////////////////
PROC getCustPhone
return phoneNumber;
END PROC
//////////////////////////////////////////////////////
//setCustEmail — set the customer’s email address.
//
//////////////////////////////////////////////////////
PROC setCustEmail (eMail)
eMailAddress = eMail;
END PROC
//////////////////////////////////////////////////////
//getCustEmail — return the customer’s email address.//
//returns — STRING
//////////////////////////////////////////////////////
PROC getCustEmail
return eMailAddress;
END PROC
//////////////////////////////////////////////////////
//setID — set the customer’s identification.
//
//////////////////////////////////////////////////////
PROC setID (id)
OwnerId = id;
CuuDuongThanCong.com https://fb.com/tailieudientucntt
696
SOFTWARE ENGINEERING HANDBOOK
END PROC
//////////////////////////////////////////////////////
//getID — return the customer’s identification.
//
//returns — STRING
//////////////////////////////////////////////////////
PROC getID
return OwnerId;
END PROC
//////////////////////////////////////////////////////
//setPassword — set the customer’s password.
//
//////////////////////////////////////////////////////
PROC setPassword (pwd)
password = pwd;
END PROC
//////////////////////////////////////////////////////
//getPassword — return the customer’s password.
//
//returns — STRING
//////////////////////////////////////////////////////
PROC getPassword
return password;
END PROC
END PACKAGE customerRegistrationRecord
3.6.4.2 DogRegistrationRecord
PACKAGE dogRegistrationRecord IS
TYPE dogRegistrationRecord data
PROC setDogName, setColor, setBreed, setSex, setAge,
setBirthDate
PRIVATE
PACKAGE BODY dogRegistrationRecord IS
PRIVATE
dogName, dogColor, dogBreed
IS STRING LENGTH (20);
CuuDuongThanCong.com https://fb.com/tailieudientucntt
697
Sample OO SDS
sex IS STRING LENGTH (7);,
dogAge, birtDate IS INTEGER;
//////////////////////////////////////////////////////
//setDogName — set the dog’s name.
//
//////////////////////////////////////////////////////
PROC setDogName(String name)
dogName = name;
END PROC
//////////////////////////////////////////////////////
//getDogName — return the dog’s name.
//
//returns — STRING
//////////////////////////////////////////////////////
PROC getDogName
return dogName;
END PROC
//////////////////////////////////////////////////////
//setColor — set the dog’s color.
//
//////////////////////////////////////////////////////
PROC setColor (String color)
dogColor = color;
END PROC
//////////////////////////////////////////////////////
//getColor — return the dog’s color.
//
//returns — STRING
//////////////////////////////////////////////////////
PROC getColor
return dogColor;
END PROC
//////////////////////////////////////////////////////
//setBreed — set the dog’s breed.
//
//////////////////////////////////////////////////////
CuuDuongThanCong.com https://fb.com/tailieudientucntt

698
SOFTWARE ENGINEERING HANDBOOK
PROC setBreed (String breed)
dogBreed = breed;
END PROC
//////////////////////////////////////////////////////
//getBreed — return the dog’s breed.
//
//returns — STRING
//////////////////////////////////////////////////////
PROC getBreed
return dogBreed;
END PROC
//////////////////////////////////////////////////////
//setSex — set the dog’s sex.
//
//////////////////////////////////////////////////////
PROC setSex (String sex)
dogSex = sex;
END PROC
//////////////////////////////////////////////////////
//getSex — return the dog’s sex.
//
//returns — STRING
//////////////////////////////////////////////////////
PROC getSex
return dogSex;
END PROC
//////////////////////////////////////////////////////
//setAge — set the dog’s age.
//
//////////////////////////////////////////////////////
PROC setAge (int age)
dogAge = age;
END PROC
//////////////////////////////////////////////////////
//setAge — return the dog’s age.
CuuDuongThanCong.com https://fb.com/tailieudientucntt
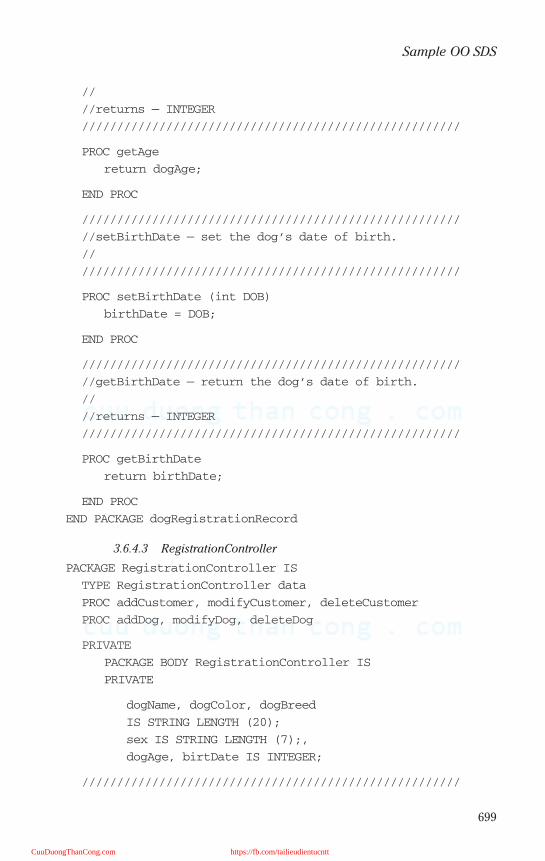
699
Sample OO SDS
//
//returns — INTEGER
//////////////////////////////////////////////////////
PROC getAge
return dogAge;
END PROC
//////////////////////////////////////////////////////
//setBirthDate — set the dog’s date of birth.
//
//////////////////////////////////////////////////////
PROC setBirthDate (int DOB)
birthDate = DOB;
END PROC
//////////////////////////////////////////////////////
//getBirthDate — return the dog’s date of birth.
//
//returns — INTEGER
//////////////////////////////////////////////////////
PROC getBirthDate
return birthDate;
END PROC
END PACKAGE dogRegistrationRecord
3.6.4.3 RegistrationController
PACKAGE RegistrationController IS
TYPE RegistrationController data
PROC addCustomer, modifyCustomer, deleteCustomer
PROC addDog, modifyDog, deleteDog
PRIVATE
PACKAGE BODY RegistrationController IS
PRIVATE
dogName, dogColor, dogBreed
IS STRING LENGTH (20);
sex IS STRING LENGTH (7);,
dogAge, birtDate IS INTEGER;
//////////////////////////////////////////////////////
CuuDuongThanCong.com https://fb.com/tailieudientucntt
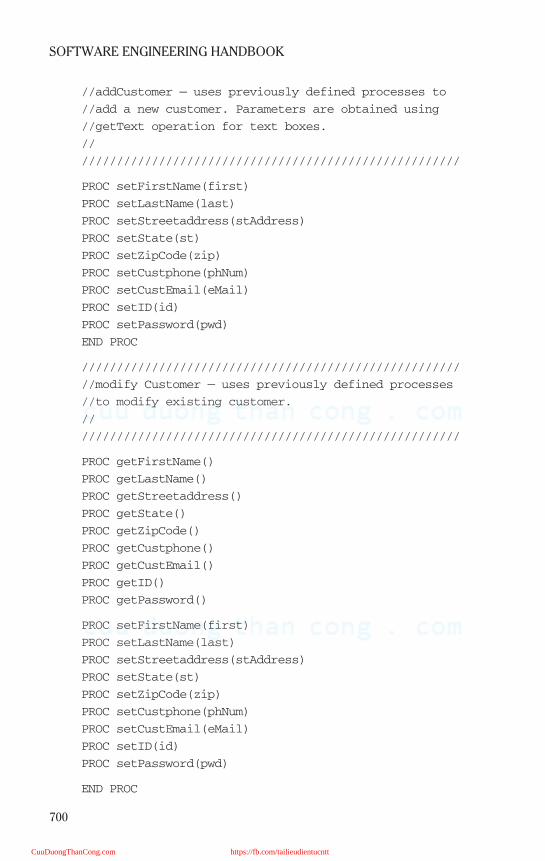
700
SOFTWARE ENGINEERING HANDBOOK
//addCustomer — uses previously defined processes to
//add a new customer. Parameters are obtained using
//getText operation for text boxes.
//
//////////////////////////////////////////////////////
PROC setFirstName(first)
PROC setLastName(last)
PROC setStreetaddress(stAddress)
PROC setState(st)
PROC setZipCode(zip)
PROC setCustphone(phNum)
PROC setCustEmail(eMail)
PROC setID(id)
PROC setPassword(pwd)
END PROC
//////////////////////////////////////////////////////
//modify Customer — uses previously defined processes
//to modify existing customer.
//
//////////////////////////////////////////////////////
PROC getFirstName()
PROC getLastName()
PROC getStreetaddress()
PROC getState()
PROC getZipCode()
PROC getCustphone()
PROC getCustEmail()
PROC getID()
PROC getPassword()
PROC setFirstName(first)
PROC setLastName(last)
PROC setStreetaddress(stAddress)
PROC setState(st)
PROC setZipCode(zip)
PROC setCustphone(phNum)
PROC setCustEmail(eMail)
PROC setID(id)
PROC setPassword(pwd)
END PROC
CuuDuongThanCong.com https://fb.com/tailieudientucntt
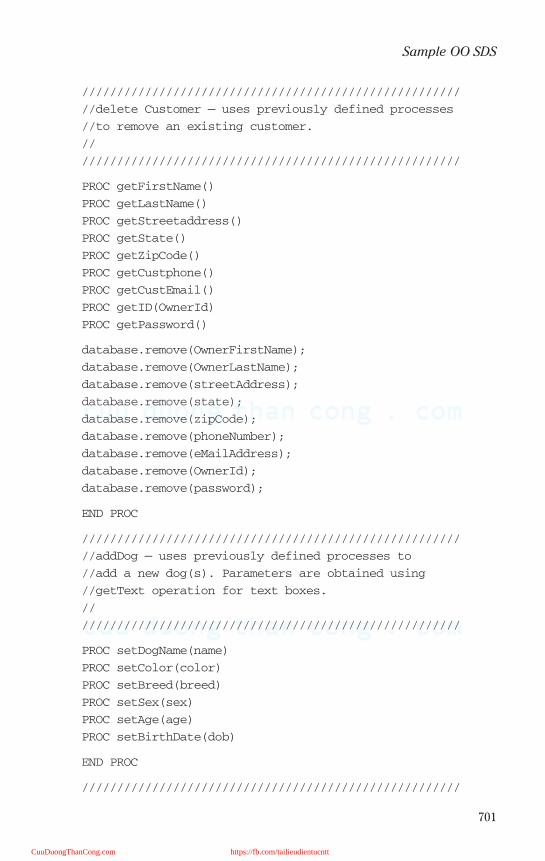
701
Sample OO SDS
//////////////////////////////////////////////////////
//delete Customer — uses previously defined processes
//to remove an existing customer.
//
//////////////////////////////////////////////////////
PROC getFirstName()
PROC getLastName()
PROC getStreetaddress()
PROC getState()
PROC getZipCode()
PROC getCustphone()
PROC getCustEmail()
PROC getID(OwnerId)
PROC getPassword()
database.remove(OwnerFirstName);
database.remove(OwnerLastName);
database.remove(streetAddress);
database.remove(state);
database.remove(zipCode);
database.remove(phoneNumber);
database.remove(eMailAddress);
database.remove(OwnerId);
database.remove(password);
END PROC
//////////////////////////////////////////////////////
//addDog — uses previously defined processes to
//add a new dog(s). Parameters are obtained using
//getText operation for text boxes.
//
//////////////////////////////////////////////////////
PROC setDogName(name)
PROC setColor(color)
PROC setBreed(breed)
PROC setSex(sex)
PROC setAge(age)
PROC setBirthDate(dob)
END PROC
//////////////////////////////////////////////////////
CuuDuongThanCong.com https://fb.com/tailieudientucntt
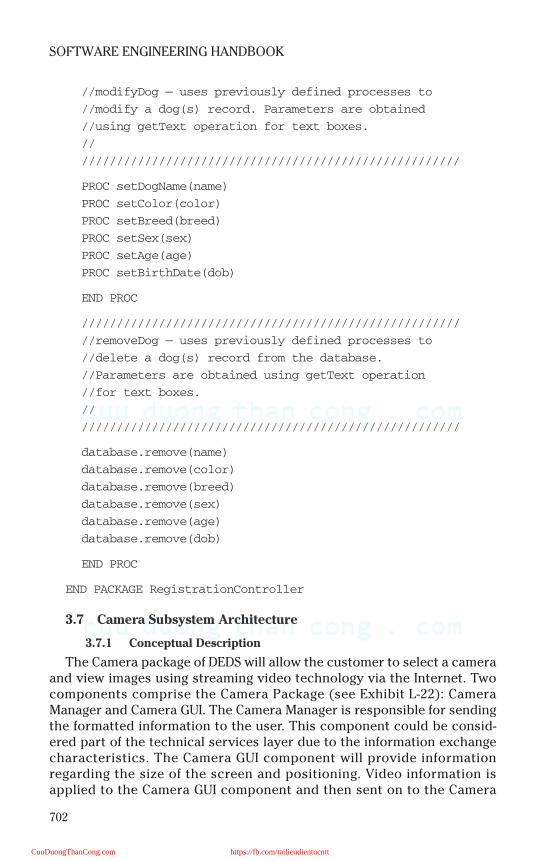
702
SOFTWARE ENGINEERING HANDBOOK
//modifyDog — uses previously defined processes to
//modify a dog(s) record. Parameters are obtained
//using getText operation for text boxes.
//
//////////////////////////////////////////////////////
PROC setDogName(name)
PROC setColor(color)
PROC setBreed(breed)
PROC setSex(sex)
PROC setAge(age)
PROC setBirthDate(dob)
END PROC
//////////////////////////////////////////////////////
//removeDog — uses previously defined processes to
//delete a dog(s) record from the database.
//Parameters are obtained using getText operation
//for text boxes.
//
//////////////////////////////////////////////////////
database.remove(name)
database.remove(color)
database.remove(breed)
database.remove(sex)
database.remove(age)
database.remove(dob)
END PROC
END PACKAGE RegistrationController
3.7 Camera Subsystem Architecture
3.7.1 Conceptual Description
The Camera package of DEDS will allow the customer to select a cameraand view images using streaming video technology via the Internet. Twocomponents comprise the Camera Package (see Exhibit L-22): CameraManager and Camera GUI. The Camera Manager is responsible for sendingthe formatted information to the user. This component could be consid-ered part of the technical services layer due to the information exchangecharacteristics. The Camera GUI component will provide informationregarding the size of the screen and positioning. Video information isapplied to the Camera GUI component and then sent on to the Camera
CuuDuongThanCong.com https://fb.com/tailieudientucntt
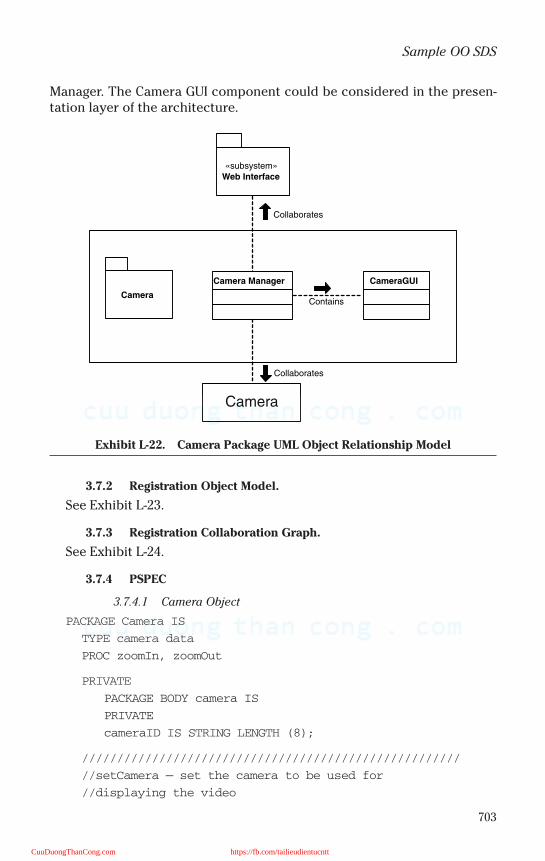
703
Sample OO SDS
Manager. The Camera GUI component could be considered in the presen-tation layer of the architecture.
3.7.2 Registration Object Model.
See Exhibit L-23.
3.7.3 Registration Collaboration Graph.
See Exhibit L-24.
3.7.4 PSPEC
3.7.4.1 Camera Object
PACKAGE Camera IS
TYPE camera data
PROC zoomIn, zoomOut
PRIVATE
PACKAGE BODY camera IS
PRIVATE
cameraID IS STRING LENGTH (8);
//////////////////////////////////////////////////////
//setCamera — set the camera to be used for
//displaying the video
Exhibit L-22. Camera Package UML Object Relationship Model
«subsystem»Web Interface
Camera Manager CameraGUI
Camera
Camera
Collaborates
Collaborates
Contains
CuuDuongThanCong.com https://fb.com/tailieudientucntt
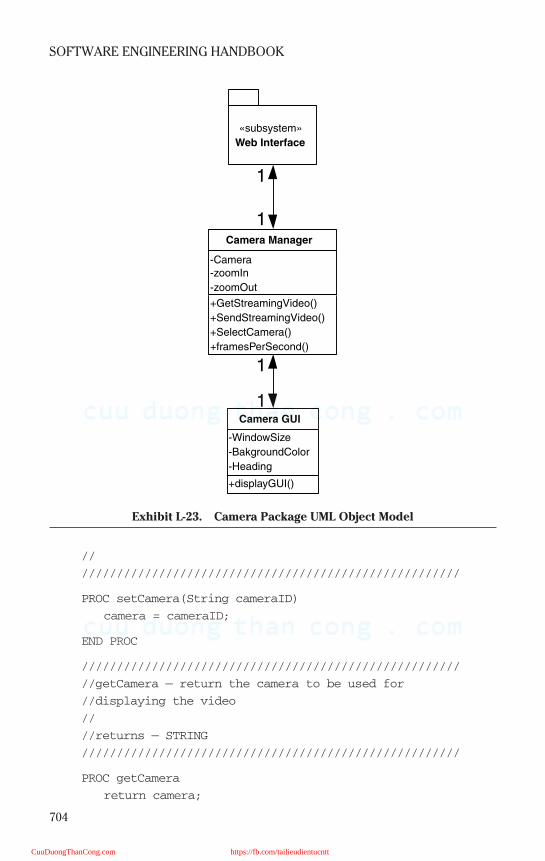
704
SOFTWARE ENGINEERING HANDBOOK
//
//////////////////////////////////////////////////////
PROC setCamera(String cameraID)
camera = cameraID;
END PROC
//////////////////////////////////////////////////////
//getCamera — return the camera to be used for
//displaying the video
//
//returns — STRING
//////////////////////////////////////////////////////
PROC getCamera
return camera;
Exhibit L-23. Camera Package UML Object Model
+GetStreamingVideo()
+SendStreamingVideo()
+SelectCamera()
+framesPerSecond()
-Camera-zoomIn
-zoomOut
Camera Manager
+displayGUI()
-WindowSize
-BakgroundColor
-Heading
Camera GUI
«subsystem»
Web Interface
1
1
1
1
CuuDuongThanCong.com https://fb.com/tailieudientucntt
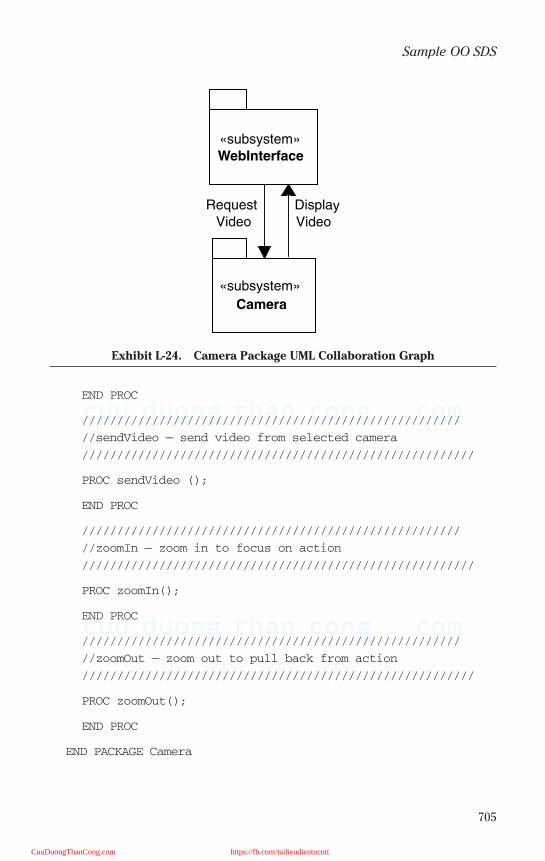
705
Sample OO SDS
END PROC
//////////////////////////////////////////////////////
//sendVideo — send video from selected camera
////////////////////////////////////////////////////////
PROC sendVideo ();
END PROC
//////////////////////////////////////////////////////
//zoomIn — zoom in to focus on action
////////////////////////////////////////////////////////
PROC zoomIn();
END PROC
//////////////////////////////////////////////////////
//zoomOut — zoom out to pull back from action
////////////////////////////////////////////////////////
PROC zoomOut();
END PROC
END PACKAGE Camera
Exhibit L-24. Camera Package UML Collaboration Graph
«subsystem»
Camera
«subsystem»WebInterface
RequestVideo
DisplayVideo
CuuDuongThanCong.com https://fb.com/tailieudientucntt
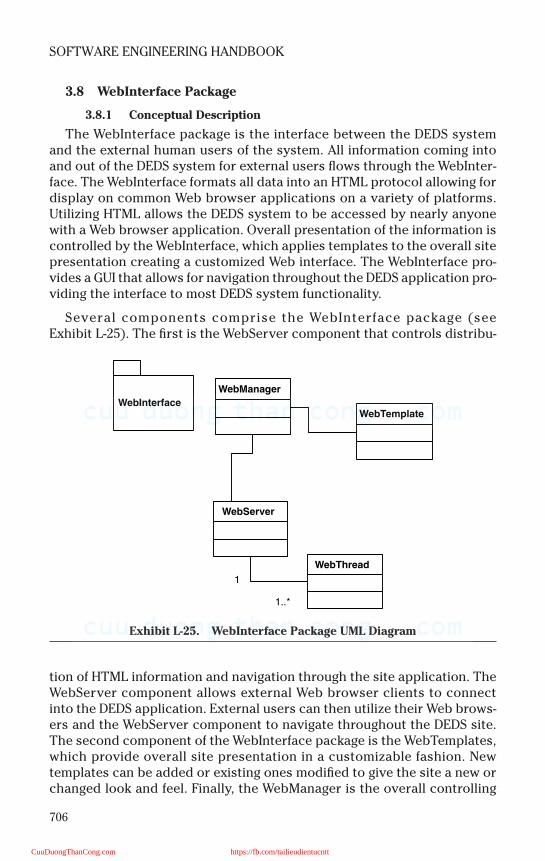
706
SOFTWARE ENGINEERING HANDBOOK
3.8 WebInterface Package
3.8.1 Conceptual Description
The WebInterface package is the interface between the DEDS systemand the external human users of the system. All information coming intoand out of the DEDS system for external users flows through the WebInter-face. The WebInterface formats all data into an HTML protocol allowing fordisplay on common Web browser applications on a variety of platforms.Utilizing HTML allows the DEDS system to be accessed by nearly anyonewith a Web browser application. Overall presentation of the information iscontrolled by the WebInterface, which applies templates to the overall sitepresentation creating a customized Web interface. The WebInterface pro-vides a GUI that allows for navigation throughout the DEDS application pro-viding the interface to most DEDS system functionality.
Several components comprise the WebInterface package (seeExhibit L-25). The first is the WebServer component that controls distribu-
tion of HTML information and navigation through the site application. TheWebServer component allows external Web browser clients to connectinto the DEDS application. External users can then utilize their Web brows-ers and the WebServer component to navigate throughout the DEDS site.The second component of the WebInterface package is the WebTemplates,which provide overall site presentation in a customizable fashion. Newtemplates can be added or existing ones modified to give the site a new orchanged look and feel. Finally, the WebManager is the overall controlling
Exhibit L-25. WebInterface Package UML Diagram
WebManager
WebTemplate
WebServer
WebInterface
WebThread
1
1..*
CuuDuongThanCong.com https://fb.com/tailieudientucntt
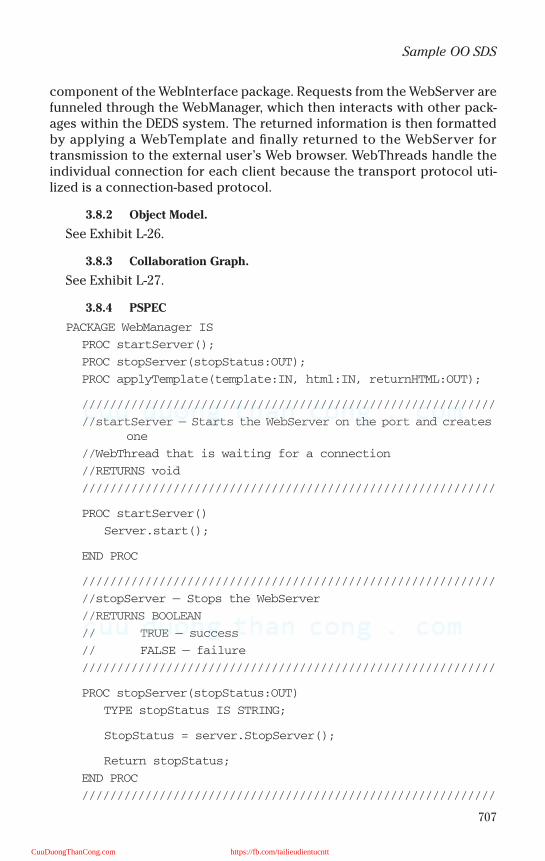
707
Sample OO SDS
component of the WebInterface package. Requests from the WebServer arefunneled through the WebManager, which then interacts with other pack-ages within the DEDS system. The returned information is then formattedby applying a WebTemplate and finally returned to the WebServer fortransmission to the external user’s Web browser. WebThreads handle theindividual connection for each client because the transport protocol uti-lized is a connection-based protocol.
3.8.2 Object Model.
See Exhibit L-26.
3.8.3 Collaboration Graph.
See Exhibit L-27.
3.8.4 PSPEC
PACKAGE WebManager IS
PROC startServer();
PROC stopServer(stopStatus:OUT);
PROC applyTemplate(template:IN, html:IN, returnHTML:OUT);
///////////////////////////////////////////////////////////
//startServer — Starts the WebServer on the port and creates
one
//WebThread that is waiting for a connection
//RETURNS void
///////////////////////////////////////////////////////////
PROC startServer()
Server.start();
END PROC
///////////////////////////////////////////////////////////
//stopServer — Stops the WebServer
//RETURNS BOOLEAN
// TRUE — success
// FALSE — failure
///////////////////////////////////////////////////////////
PROC stopServer(stopStatus:OUT)
TYPE stopStatus IS STRING;
StopStatus = server.StopServer();
Return stopStatus;
END PROC
///////////////////////////////////////////////////////////
CuuDuongThanCong.com https://fb.com/tailieudientucntt
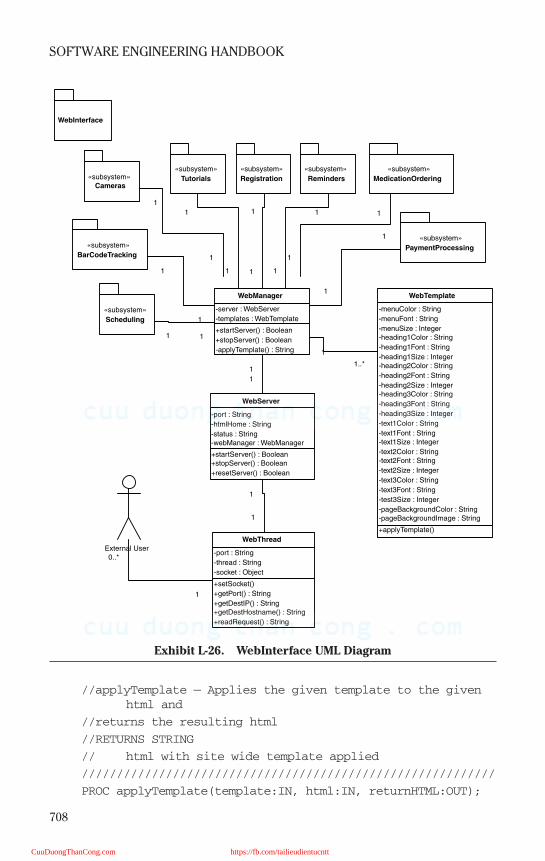
708
SOFTWARE ENGINEERING HANDBOOK
//applyTemplate — Applies the given template to the given
html and
//returns the resulting html
//RETURNS STRING
// html with site wide template applied
///////////////////////////////////////////////////////////
PROC applyTemplate(template:IN, html:IN, returnHTML:OUT);
Exhibit L-26. WebInterface UML Diagram
1
1
+startServer() : Boolean
+stopServer() : Boolean
-applyTemplate() : String
-server : WebServer
-templates : WebTemplate
WebManager
+applyTemplate()
-menuColor : String
-menuFont : String
-menuSize : Integer-heading1Color : String
-heading1Font : String
-heading1Size : Integer-heading2Color : String
-heading2Font : String
-heading2Size : Integer-heading3Color : String
-heading3Font : String
-heading3Size : Integer
-text1Color : String
-text1Font : String-text1Size : Integer
-text2Color : String-text2Font : String
-text2Size : Integer
-text3Color : String
-text3Font : String
-test3Size : Integer
-pageBackgroundColor : String-pageBackgroundImage : String
WebTemplate
+startServer() : Boolean+stopServer() : Boolean
+resetServer() : Boolean
-port : String
-htmlHome : String
-status : String-webManager : WebManager
WebServer
WebInterface
1
1..*1
1
1 1
«subsystem»
Scheduling
1
1
1
1
«subsystem»
Tutorials
«subsystem»
Registration
«subsystem»
Reminders
«subsystem»
MedicationOrdering
«subsystem»
PaymentProcessing«subsystem»
BarCodeTracking
«subsystem»Cameras
1
1
1
1
1
1
1
1
External User0..*
1
+setSocket()
+getPort() : String
+getDestIP() : String+getDestHostname() : String
+readRequest() : String
-port : String
-thread : String
-socket : Object
WebThread
1
1
CuuDuongThanCong.com https://fb.com/tailieudientucntt
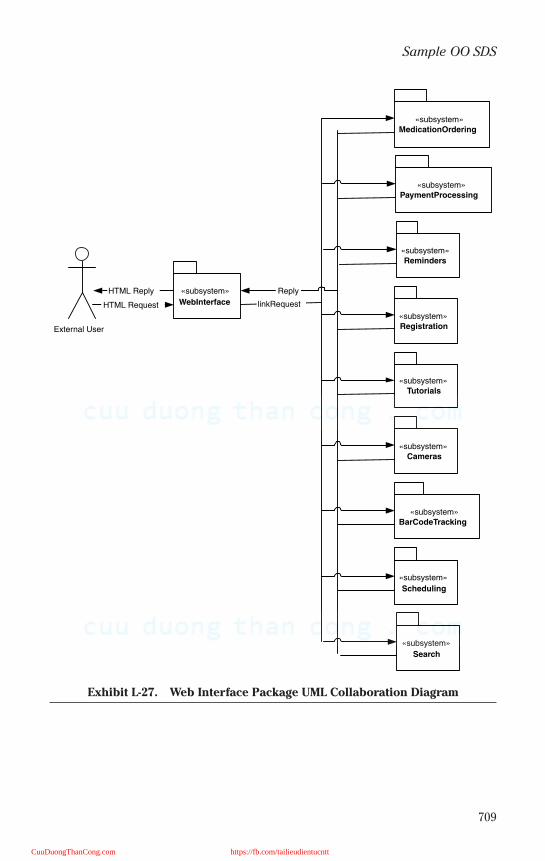
709
Sample OO SDS
Exhibit L-27. Web Interface Package UML Collaboration Diagram
«subsystem»
Scheduling
«subsystem»Tutorials
«subsystem»Registration
«subsystem»Reminders
«subsystem»MedicationOrdering
«subsystem»PaymentProcessing
«subsystem»BarCodeTracking
«subsystem»Cameras
External User
«subsystem»
WebInterface linkRequest
Reply
HTML Request
HTML Reply
«subsystem»
Search
CuuDuongThanCong.com https://fb.com/tailieudientucntt
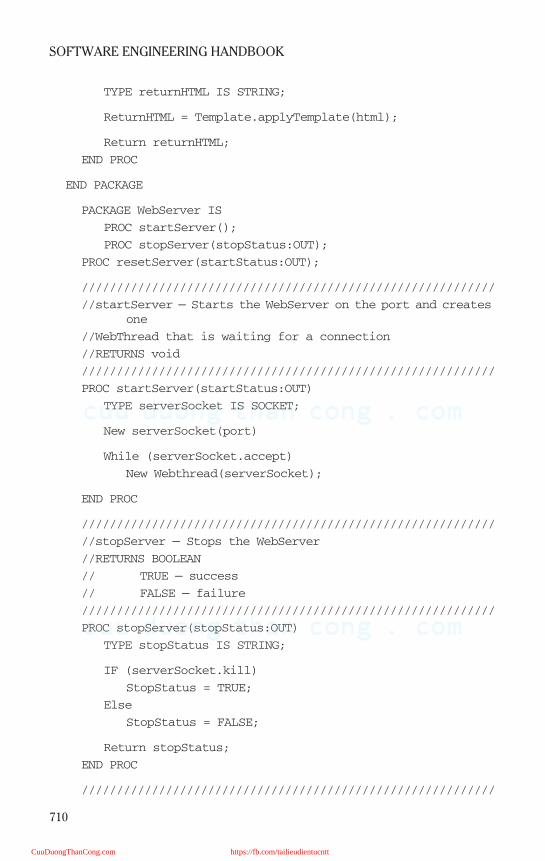
710
SOFTWARE ENGINEERING HANDBOOK
TYPE returnHTML IS STRING;
ReturnHTML = Template.applyTemplate(html);
Return returnHTML;
END PROC
END PACKAGE
PACKAGE WebServer IS
PROC startServer();
PROC stopServer(stopStatus:OUT);
PROC resetServer(startStatus:OUT);
///////////////////////////////////////////////////////////
//startServer — Starts the WebServer on the port and creates
one
//WebThread that is waiting for a connection
//RETURNS void
///////////////////////////////////////////////////////////
PROC startServer(startStatus:OUT)
TYPE serverSocket IS SOCKET;
New serverSocket(port)
While (serverSocket.accept)
New Webthread(serverSocket);
END PROC
///////////////////////////////////////////////////////////
//stopServer — Stops the WebServer
//RETURNS BOOLEAN
// TRUE — success
// FALSE — failure
///////////////////////////////////////////////////////////
PROC stopServer(stopStatus:OUT)
TYPE stopStatus IS STRING;
IF (serverSocket.kill)
StopStatus = TRUE;
Else
StopStatus = FALSE;
Return stopStatus;
END PROC
///////////////////////////////////////////////////////////
CuuDuongThanCong.com https://fb.com/tailieudientucntt
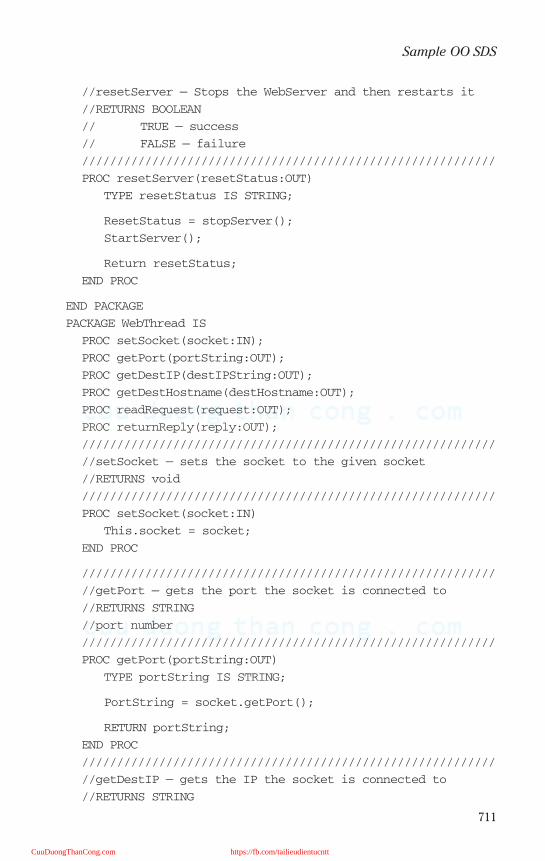
711
Sample OO SDS
//resetServer — Stops the WebServer and then restarts it
//RETURNS BOOLEAN
// TRUE — success
// FALSE — failure
///////////////////////////////////////////////////////////
PROC resetServer(resetStatus:OUT)
TYPE resetStatus IS STRING;
ResetStatus = stopServer();
StartServer();
Return resetStatus;
END PROC
END PACKAGE
PACKAGE WebThread IS
PROC setSocket(socket:IN);
PROC getPort(portString:OUT);
PROC getDestIP(destIPString:OUT);
PROC getDestHostname(destHostname:OUT);
PROC readRequest(request:OUT);
PROC returnReply(reply:OUT);
///////////////////////////////////////////////////////////
//setSocket — sets the socket to the given socket
//RETURNS void
///////////////////////////////////////////////////////////
PROC setSocket(socket:IN)
This.socket = socket;
END PROC
///////////////////////////////////////////////////////////
//getPort — gets the port the socket is connected to
//RETURNS STRING
//port number
///////////////////////////////////////////////////////////
PROC getPort(portString:OUT)
TYPE portString IS STRING;
PortString = socket.getPort();
RETURN portString;
END PROC
///////////////////////////////////////////////////////////
//getDestIP — gets the IP the socket is connected to
//RETURNS STRING
CuuDuongThanCong.com https://fb.com/tailieudientucntt
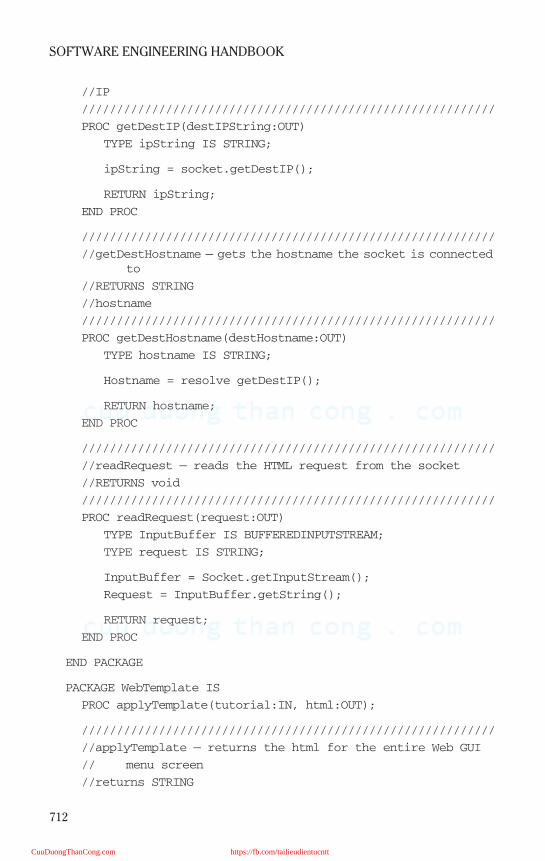
712
SOFTWARE ENGINEERING HANDBOOK
//IP
///////////////////////////////////////////////////////////
PROC getDestIP(destIPString:OUT)
TYPE ipString IS STRING;
ipString = socket.getDestIP();
RETURN ipString;
END PROC
///////////////////////////////////////////////////////////
//getDestHostname — gets the hostname the socket is connected
to
//RETURNS STRING
//hostname
///////////////////////////////////////////////////////////
PROC getDestHostname(destHostname:OUT)
TYPE hostname IS STRING;
Hostname = resolve getDestIP();
RETURN hostname;
END PROC
///////////////////////////////////////////////////////////
//readRequest — reads the HTML request from the socket
//RETURNS void
///////////////////////////////////////////////////////////
PROC readRequest(request:OUT)
TYPE InputBuffer IS BUFFEREDINPUTSTREAM;
TYPE request IS STRING;
InputBuffer = Socket.getInputStream();
Request = InputBuffer.getString();
RETURN request;
END PROC
END PACKAGE
PACKAGE WebTemplate IS
PROC applyTemplate(tutorial:IN, html:OUT);
///////////////////////////////////////////////////////////
//applyTemplate — returns the html for the entire Web GUI
// menu screen
//returns STRING
CuuDuongThanCong.com https://fb.com/tailieudientucntt

713
Sample OO SDS
// html of the Web screen with template applied
///////////////////////////////////////////////////////////
PROC applyTemplate(html:IN, html:OUT)
TYPE html IS STRING;
html.replace(H1 color with template H1 color);
html.replace(H1 font with template H1 font);
html.replace(H1 size with template H1 size);
html.replace(H2 color with template H2 color);
html.replace(H2 font with template H2 font);
html.replace(H2 size with template H2 size);
html.replace(H3 color with template H3 color);
html.replace(H3 font with template H3 font);
html.replace(H3 size with template H3 size);
html.replace(text1 color with template text1 color);
html.replace(text1 font with template text1 font);
html.replace(text1 size with template text1 size);
html.replace(text2 color with template text2 color);
html.replace(text2 font with template text2 font);
html.replace(text2 size with template text2 size);
html.replace(text3 color with template text3 color);
html.replace(text3 font with template text3 font);
html.replace(text3 size with template text3 size);
html.replace(menuColor with template menuColor);
html.replace(menuFont with template menuFont);
html.replace(menuSize with template menuSize);
html.replace(backgroundColor with template
backGroundColor);
html.replace(backgroundImage with template
backgroundImage);
RETURN html;
END PROC
END PACKAGE
3.9 Scheduling Package
3.9.1 Conceptual Description
The Scheduling subsystem (see Exhibit L-28) is responsible for linkingavailable services to customers. In doing so, it also manages the operatingcalendar schedule by adding and removing appointments with customers.The scheduler is available to the customer and to in-house staff, therebyallowing both parties to create and remove appointments. The scheduling
CuuDuongThanCong.com https://fb.com/tailieudientucntt

714
SOFTWARE ENGINEERING HANDBOOK
subsystem is linked to the database because all the services and customerinformation are inherently stored in the database subsystem.
The interface of the package is extremely significant to its structure. Allof the information is shown through various GUI displays; the ability toselect services and select them on certain dates for the customer is runthrough a GUI view of a calendar. The major portions of the scheduling sub-system are the Scheduling Manager, Service Manager, and Verify Appoint-ment Addition/Deletion. Their purposes are as follow:
• Scheduling Manager: allows the user to view the current schedule forany day on any upcoming or past week. This view can be for appoint-ments, for vacant time slots, or for both. The staff user has full func-tional use, which means he or she can view information relating to thevarious appointments; the customer can only see that time slots arevacant or filled. Time slots also have a various amount of resourcesavailable to them because more than one service can be provided at agiven time for different customers, depending on the scheduledservices.
• Scheduling Service Manager: allows customer user to search for his up-coming appointments. Staff user has an additional option of searchingfor a certain service’s upcoming date and times.
• Service View Manager: shows the available services for the customerand indicates the scheduling constraints uniquely innate to each.
• Appointment Manager: allows customer or staff user to select a servicefrom the Service View Manager and a large enough time slot from the
Exhibit L-28. Scheduling Package UML Diagram
SchedulingSubsystem
SchedulingManager
AppointmentManager
Service ViewManager
VerifyAppointment
SchedulingSearchManager
Database Web Interface Reminders
External SubsystemRequests
Returnsdiscovered info
Sends message toprocess
transactionSendsTimes
Asks forTimes
Request for timelock and then
commit
SendsVerifyInfo
Sends Services
RequestsServices
CuuDuongThanCong.com https://fb.com/tailieudientucntt

715
Sample OO SDS
scheduling, thereby creating an appointment. Appointments for a cus-tomer can also be cancelled by the same customer or employee withthis portion of the subsystem. The added or removed appointment isrecorded and the Scheduling Manager information is now included.
• Verify Appointment Addition/Deletion: once the appointment has beenselected for addition or removal, a verification process is undertakenand ultimately the appointment time is updated. When the verificationappointment process goes into effect, the Scheduling Manager, if in-voked by another user, will display the given time slot as temporallytaken so that other clients cannot attempt to fill the time slot’sresources.
3.9.2 Schedule Service Object Model.
See Exhibit L-29.
3.9.3 Schedule Service Collaboration Graph.
See Exhibit L-30.
3.9.4 PSPEC
3.9.4.1 SearchSchedulingManager
PACKAGE SearchSchedulingManager IS
PROC setSchedulingSearchCriteria(anSearchCriteria:IN,
returnCode:OUT);
PROC getSchedulingSearchResults(SearchResults:OUT);
///////////////////////////////////////////////////////////
//setSchedulingSearchCriteria — set search criteria from
user input.
//returns INTEGER
// 0 — success
// 1 — error
///////////////////////////////////////////////////////////
PROC setSchedulingSearchCriteria(anSearchCriteria:IN,
returnCode:OUT);
TYPE returnCode IS INTEGER;
Parse the search criteria for required columns.
If required columns are identified, returnCode = success
Else returnCode = error
RETURN returnCode;
END PROC
CuuDuongThanCong.com https://fb.com/tailieudientucntt
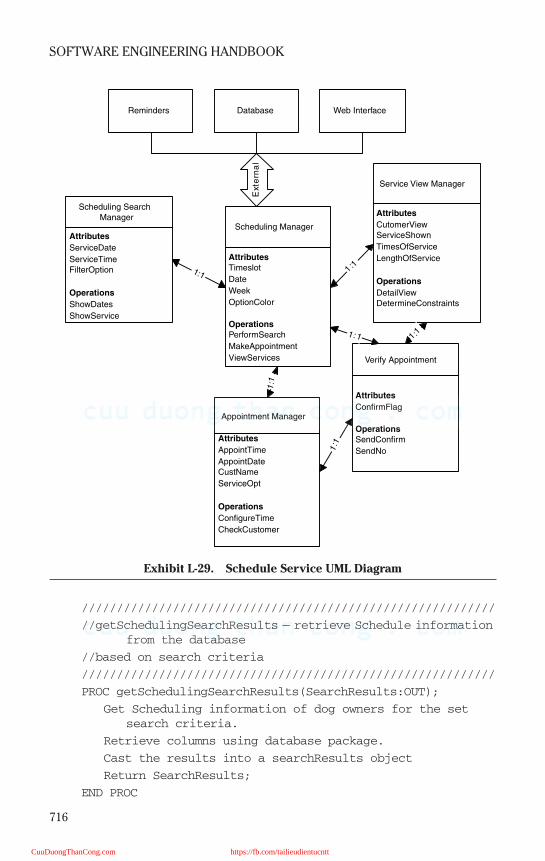
716
SOFTWARE ENGINEERING HANDBOOK
///////////////////////////////////////////////////////////
//getSchedulingSearchResults — retrieve Schedule information
from the database
//based on search criteria
///////////////////////////////////////////////////////////
PROC getSchedulingSearchResults(SearchResults:OUT);
Get Scheduling information of dog owners for the set
search criteria.
Retrieve columns using database package.
Cast the results into a searchResults object
Return SearchResults;
END PROC
Exhibit L-29. Schedule Service UML Diagram
DatabaseReminders Web Interface
Ext
ern
al
Scheduling SearchManager
Attributes
ServiceDate
ServiceTimeFilterOption
Operations
ShowDates
ShowService
Attributes
Timeslot
Date
Week
OptionColor
Operations
PerformSearch
MakeAppointment
ViewServices
Scheduling Manager
Appointment Manager
Attributes
AppointTime
AppointDateCustName
ServiceOpt
Operations
ConfigureTime
CheckCustomer
Attributes
CutomerViewServiceShown
TimesOfService
LengthOfService
Operations
DetailViewDetermineConstraints
Service View Manager
Verify Appointment
Attributes
ConfirmFlag
Operations
SendConfirm
SendNo
1:1 1 :1
1:1
1 :11
:11:1
CuuDuongThanCong.com https://fb.com/tailieudientucntt
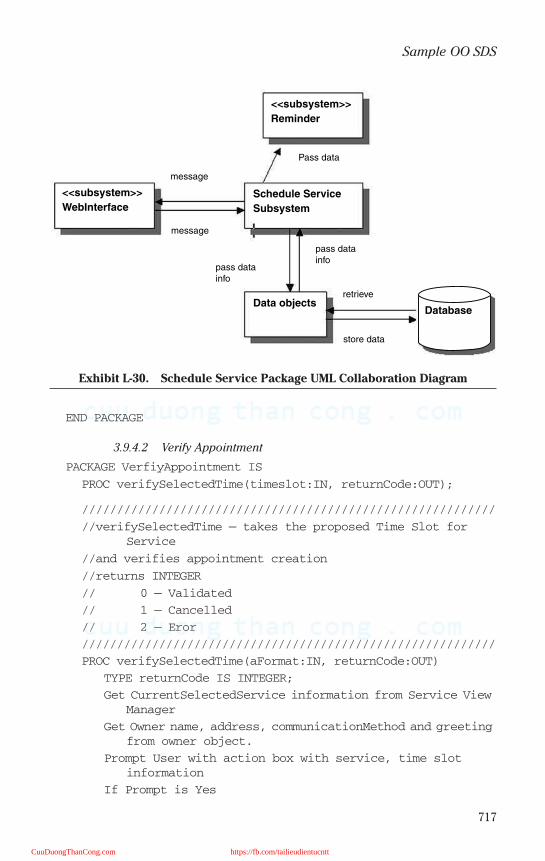
717
Sample OO SDS
END PACKAGE
3.9.4.2 Verify Appointment
PACKAGE VerfiyAppointment IS
PROC verifySelectedTime(timeslot:IN, returnCode:OUT);
///////////////////////////////////////////////////////////
//verifySelectedTime — takes the proposed Time Slot for
Service
//and verifies appointment creation
//returns INTEGER
// 0 — Validated
// 1 — Cancelled
// 2 — Eror
///////////////////////////////////////////////////////////
PROC verifySelectedTime(aFormat:IN, returnCode:OUT)
TYPE returnCode IS INTEGER;
Get CurrentSelectedService information from Service View
Manager
Get Owner name, address, communicationMethod and greeting
from owner object.
Prompt User with action box with service, time slot
information
If Prompt is Yes
Exhibit L-30. Schedule Service Package UML Collaboration Diagram
<<subsystem>>
Reminder
<<subsystem>>
WebInterface
Pass data
message
message
pass datainfo
pass datainfo
retrieve
store data
DatabaseData objects
Schedule Service
Subsystem
CuuDuongThanCong.com https://fb.com/tailieudientucntt
718
SOFTWARE ENGINEERING HANDBOOK
returnCode = 0
If Prompt is No
ReturnCode = 1
else
returnCode = 2
RETURN (returnCode);
END PROC
END PACKAGE
3.9.4.3 Scheduling Manager
PACKAGE SchedulingManager IS
PROC CreateAppointment(timeslot:IN, returnCode:OUT);
///////////////////////////////////////////////////////////
//CreateAppointment — takes the proposed Time Slot for Service
//and calls the verify process then adds it if validated
//returns INTEGER
// 0 — Validated
// 1 — Canceled
///////////////////////////////////////////////////////////
PROC CreateAppointment(timeslot:IN, returnCode:OUT)
TYPE returnCode IS INTEGER;
Get CurrentSelectedService information from Service View
Manager
Get Owner name, address, communicationMethod and greeting
from owner object.
Call verifySelectedTime
If verifySelectedTime is validated
Send Appointment to Database
Return(0)
Else
RETURN (1)
End proc
END PROC
END PACKAGE
3.9.4.4 Service View Manager
PACKAGE ServiceViewManager IS
PROC DetailView(custID:IN,services:OUT);
PROC DetermineConstraints(custID:IN,constraintcode:OUT);
CuuDuongThanCong.com https://fb.com/tailieudientucntt
719
Sample OO SDS
///////////////////////////////////////////////////////////
//DetailView — Shows the services available to Given
//Customer
//returns ComboBox consisting of services
///////////////////////////////////////////////////////////
PROC DetailView(custID:IN,services:OUT)
TYPE services IS ComboBox;
Get Owner name, address, communicationMethod and greeting
from owner object.
Get Service, Service Description, ServiceLevel from
Service object
Call DetermineConstraints
Show all Services allowed by DetermineConstraints return
as combobox
Return services
END PROC
///////////////////////////////////////////////////////////
//DetermineConstraints — limits shown services available to
Given
//Customer
//returns list of allowed service codes
///////////////////////////////////////////////////////////
PROC DetermineConstraints(custID:IN,constraintcode:OUT)
TYPE constraintcode IS list;
Use sql to create list of allowed for customer
Get Service, Service Description, ServiceLevel from
Service object
Return constraintcode
END PROC
END PACKAGE
3.10 Medication Ordering Package
3.10.1 Conceptual Description
The Medication ordering subsystem (see Exhibit L-31) is responsible forallowing the customer to order medication as well as ensuring the com-pany has a reasonable supply of all prescribed medications in stock. Itmanages the company side and the customer side of the medicine spec-trum. In doing so, it accesses the database for the various medicines’ infor-mation. In regard to the customer, it accesses the customer information,knows when the medicine was given to the customer and when it shouldrun out, and then communicates with the notification system for the cus-tomer’s benefit. For the company, the medication ordering keeps a track of
CuuDuongThanCong.com https://fb.com/tailieudientucntt
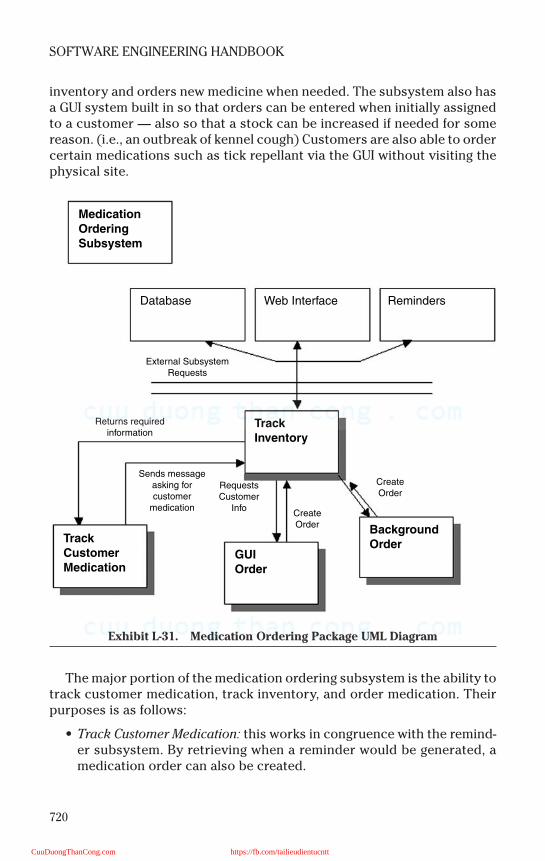
720
SOFTWARE ENGINEERING HANDBOOK
inventory and orders new medicine when needed. The subsystem also hasa GUI system built in so that orders can be entered when initially assignedto a customer — also so that a stock can be increased if needed for somereason. (i.e., an outbreak of kennel cough) Customers are also able to ordercertain medications such as tick repellant via the GUI without visiting thephysical site.
The major portion of the medication ordering subsystem is the ability totrack customer medication, track inventory, and order medication. Theirpurposes is as follows:
• Track Customer Medication: this works in congruence with the remind-er subsystem. By retrieving when a reminder would be generated, amedication order can also be created.
Exhibit L-31. Medication Ordering Package UML Diagram
Medication
Ordering
Subsystem
Database Web Interface Reminders
Track
Inventory
Track
Customer
MedicationGUI
Order
Background
Order
External SubsystemRequests
Returns requiredinformation
Sends messageasking forcustomer
medicationCreateOrder
RequestsCustomer
Info
CreateOrder
CuuDuongThanCong.com https://fb.com/tailieudientucntt
721
Sample OO SDS
• Track Inventory: whenever medication is given or sold to a customer,a record of its depletion is updated, thereby allowing for constantknowledge of a given medicine’s stock.
• GUI Order Medication: through GUI screens orders can be generatedfor the customer and the staff users. The GUI screens are estheticallylaid out and allowed medications can be browsed and added to a buylist. The GUI for the staff side allows a greater spectrum of options (inregard to what is available).
• Background Order Medication: background processing of medicationorders creates order lists for the staff employees to fulfill. This func-tion works in congruence with the track inventory function and ordersmedicine when asked.
3.10.2 Ordering Medication Object Model.
See Exhibit L-32.
3.10.3 Collaboration Graph.
See Exhibit L-33.
3.10.4 PSPEC
3.10.4.1 Track Inventory
PACKAGE TrackInventory IS
PROC IncreaseQuant, DecreaseQuant,NewItem,RemoveItem,
MedicationReport;
///////////////////////////////////////////////////////////
//IncreaseQuant — Increases certain Medication Quantity
///////////////////////////////////////////////////////////
PROC IncreaseQuant(MedicationID:IN, Quantity:IN,
Amount:IN,returncode:OUT)
If exist
Increase Quantity by amount
Set returnCode = Success;
Else
Set returnCode = Error;
RETURN returnCode;
END PROC
///////////////////////////////////////////////////////////
//IncreaseQuant — increases certain Medication Quantity
///////////////////////////////////////////////////////////
PROC IncreaseQuant(MedicationID:IN, Quantity:IN,
Amount:IN,returncode:OUT)
If exist
CuuDuongThanCong.com https://fb.com/tailieudientucntt
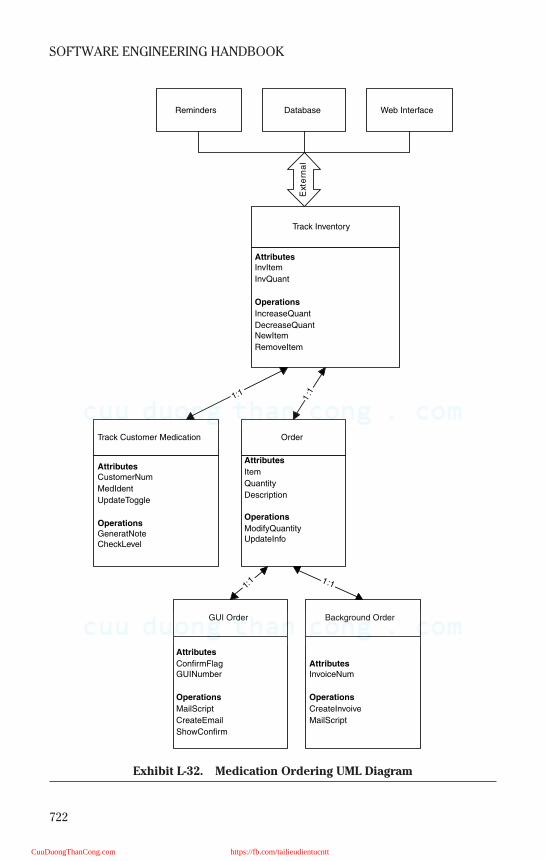
722
SOFTWARE ENGINEERING HANDBOOK
Exhibit L-32. Medication Ordering UML Diagram
DatabaseReminders Web Interface
Ext
ern
al
Track Customer Medication
Attributes
CustomerNum
MedIdent
UpdateToggle
Operations
GeneratNoteCheckLevel
Attributes
InvItem
InvQuant
Operations
IncreaseQuant
DecreaseQuantNewItem
RemoveItem
Track Inventory
Order
Attributes
Item
Quantity
Description
Operations
ModifyQuantityUpdateInfo
Background Order
Attributes
InvoiceNum
Operations
CreateInvoive
MailScript
1:1 1:1
1:1
GUI Order
Attributes
ConfirmFlagGUINumber
Operations
MailScript
CreateEmail
ShowConfirm
1:1
CuuDuongThanCong.com https://fb.com/tailieudientucntt
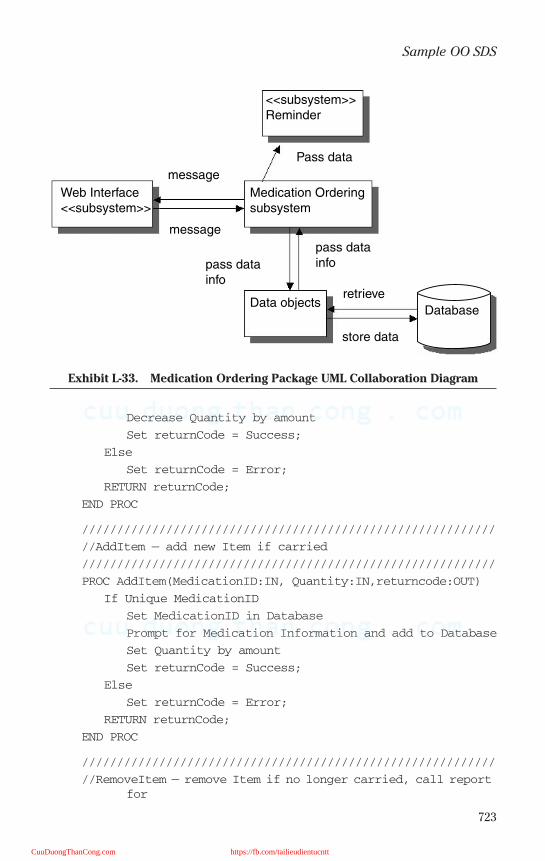
723
Sample OO SDS
Decrease Quantity by amount
Set returnCode = Success;
Else
Set returnCode = Error;
RETURN returnCode;
END PROC
///////////////////////////////////////////////////////////
//AddItem — add new Item if carried
///////////////////////////////////////////////////////////
PROC AddItem(MedicationID:IN, Quantity:IN,returncode:OUT)
If Unique MedicationID
Set MedicationID in Database
Prompt for Medication Information and add to Database
Set Quantity by amount
Set returnCode = Success;
Else
Set returnCode = Error;
RETURN returnCode;
END PROC
///////////////////////////////////////////////////////////
//RemoveItem — remove Item if no longer carried, call report
for
Exhibit L-33. Medication Ordering Package UML Collaboration Diagram
<<subsystem>>Reminder
Web Interface<<subsystem>>
message
message
pass datainfopass data
info
Pass data
retrieve
store data
Data objects
Medication Orderingsubsystem
Database
CuuDuongThanCong.com https://fb.com/tailieudientucntt

724
SOFTWARE ENGINEERING HANDBOOK
//excess leftover
///////////////////////////////////////////////////////////
PROC IncreaseQuant(MedicationID:IN, Quantity:IN,
Amount:IN,returncode:OUT)
If exist
If Currently medication in stock Call
medicationreport(MedicationID)
Delete Medication from Database
Set returnCode = Success;
Else
Set returnCode = Error;
RETURN returnCode;
END PROC
///////////////////////////////////////////////////////////
//MedicationReport — print report of leftover medication for
records
///////////////////////////////////////////////////////////
PROC MedicationReport(MedicationID:IN, Quantity:IN)
Print document with medication id and info called from
database
END PROC
END PACKAGE
3.10.4.2 Track Customer Medication
PACKAGE TrackCustomerMedication IS
PROC GeneratNote, CheckLevel
///////////////////////////////////////////////////////////
//GenerateNote — creates note of Customer Medications
///////////////////////////////////////////////////////////
PROC GenerateNote(MedicationID:IN,
CustomerID:IN,returncode:OUT)
If exist
Increase Quantity by amount
Set returnCode = Success;
Else
Set returnCode = Error;
RETURN returnCode;
END PROC
///////////////////////////////////////////////////////////
//CheckLevel — checks level of Customer Medication quantity
///////////////////////////////////////////////////////////
CuuDuongThanCong.com https://fb.com/tailieudientucntt

725
Sample OO SDS
PROC CheckLevel(MedicationID:IN, Quantity:IN,
Amount:IN,returncode:OUT)
If exist
Decrease Quantity by amount
Set returnCode = Success;
Else
Set returnCode = Error;
RETURN returnCode;
END PROC
END PACKAGE
3.10.4.3 Order Medication
PACKAGE OrderMedication IS
PROC MakeOrder,UpdateInfo,PrintOrder
///////////////////////////////////////////////////////////
//MakeOrder — creates Order for Medication
///////////////////////////////////////////////////////////
PROC MakeOrder(MedicationID:IN, Quantity:IN)
If exist
Increase Quantity by amount
Set returnCode = Success;
Else
Set returnCode = Error;
RETURN returnCode;
END PROC
///////////////////////////////////////////////////////////
//UpdateInfo — used to indicate pending order and arrival
///////////////////////////////////////////////////////////
PROC UpdateInfo(MedicationID:IN, Quantity:IN, Date:IN)
If arrived
Increase Quantity
Remove Pending
Else
Increase Quantity
Set Pending for Quantity with Date
END PROC
///////////////////////////////////////////////////////////
//PrintOrder — createReadout
///////////////////////////////////////////////////////////
PROC PrintOrder(MedicationID:IN, Quantity:IN,DatE:IN)
CuuDuongThanCong.com https://fb.com/tailieudientucntt
726
SOFTWARE ENGINEERING HANDBOOK
Call Database for Medication Details
Create Printout for Medication Order
END PROC
END PACKAGE
4. GUI DESCRIPTION
The GUI for DEDS allows the user to perform all the necessary andimperative functions required to provide optimum dog care. The screensavailable to the user are all esthetically pleasing, while conforming to astandard powerful screen layout that allows fast and efficient use of DEDS.The system is available to users via the Internet as well as to employeeslocated in house. Both will be shown identical screens, although theemployees have access to a wider range of options. Regardless of the usertype, the initial entrance into the system involves a welcome screen to theDog-E-DayCare Website (see Exhibit L-34). From there the log-on process isinvoked (see Exhibit L-35); ultimately the user will log-off and be bid adieuby the goodbye view. In between these two screens is a range of similarlydesigned screens allowing access to the various system features. The keyscreens involved in the GUI are as follows:
1. Welcome and Access Screen2. New User Signup Page3. Modify User Screen4. Adding Service5. Modifying/Deleting Service6. Adding Reminder7. Modifying/Deleting Reminder8. Web Camera View9. Submitting Payment
10. Tutorial Pages11. Exit Screen
Users of the system are greeted with the greeting screen and have theability to log in as an existing user or create a new account. Employeeshave specially assigned log-in names, while customers can log in usingtheir user number or first and last name (middle initial requested uponmultiple users with the same first and last name cases). New users can alsoview the daycare introduction before committing themselves to the newuser process. Once logged in, a registered user can select any of the otheravailable options.
If a user labels himself as a new user, then he goes through the signuppage, where he provides pertinent information concerning living location,contact information, payment details, etc. New users also enter informa-tion concerning their dogs. For the dogs, they input all the information
CuuDuongThanCong.com https://fb.com/tailieudientucntt
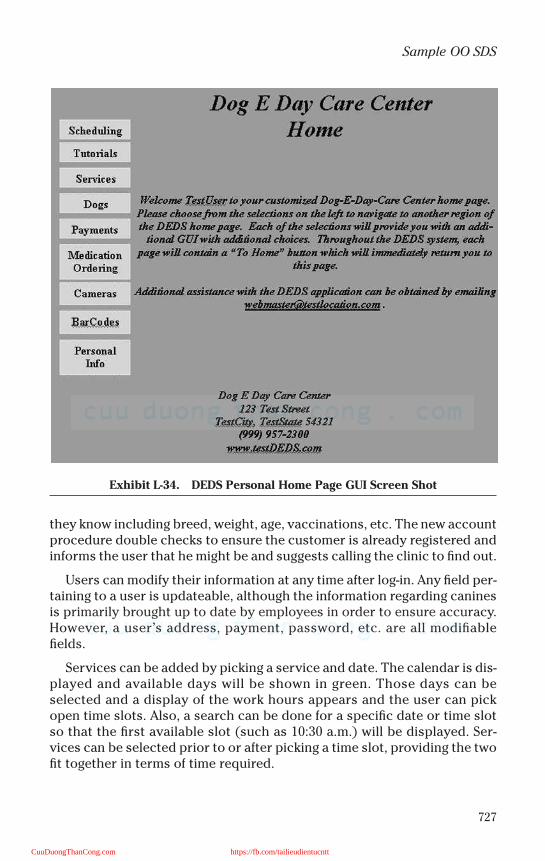
727
Sample OO SDS
they know including breed, weight, age, vaccinations, etc. The new accountprocedure double checks to ensure the customer is already registered andinforms the user that he might be and suggests calling the clinic to find out.
Users can modify their information at any time after log-in. Any field per-taining to a user is updateable, although the information regarding caninesis primarily brought up to date by employees in order to ensure accuracy.However, a user’s address, payment, password, etc. are all modifiablefields.
Services can be added by picking a service and date. The calendar is dis-played and available days will be shown in green. Those days can beselected and a display of the work hours appears and the user can pickopen time slots. Also, a search can be done for a specific date or time slotso that the first available slot (such as 10:30 a.m.) will be displayed. Ser-vices can be selected prior to or after picking a time slot, providing the twofit together in terms of time required.
Exhibit L-34. DEDS Personal Home Page GUI Screen Shot
CuuDuongThanCong.com https://fb.com/tailieudientucntt
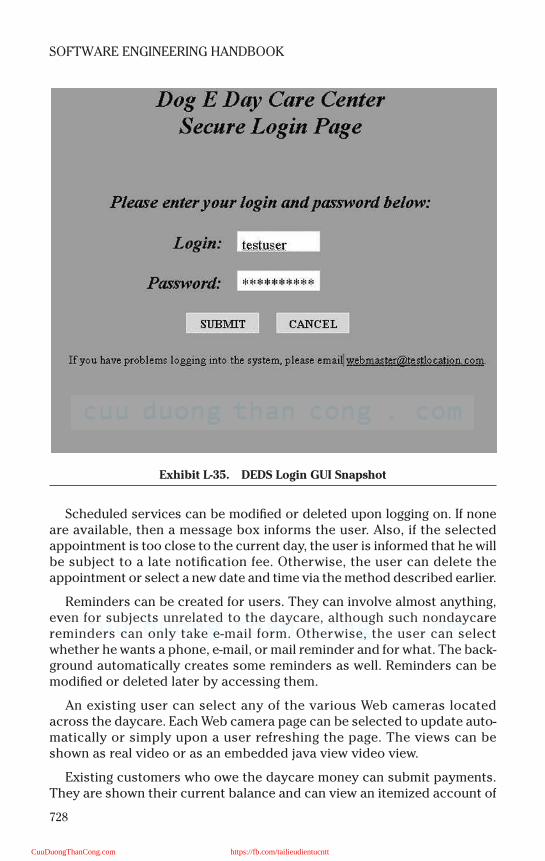
728
SOFTWARE ENGINEERING HANDBOOK
Scheduled services can be modified or deleted upon logging on. If noneare available, then a message box informs the user. Also, if the selectedappointment is too close to the current day, the user is informed that he willbe subject to a late notification fee. Otherwise, the user can delete theappointment or select a new date and time via the method described earlier.
Reminders can be created for users. They can involve almost anything,even for subjects unrelated to the daycare, although such nondaycarereminders can only take e-mail form. Otherwise, the user can selectwhether he wants a phone, e-mail, or mail reminder and for what. The back-ground automatically creates some reminders as well. Reminders can bemodified or deleted later by accessing them.
An existing user can select any of the various Web cameras locatedacross the daycare. Each Web camera page can be selected to update auto-matically or simply upon a user refreshing the page. The views can beshown as real video or as an embedded java view video view.
Existing customers who owe the daycare money can submit payments.They are shown their current balance and can view an itemized account of
Exhibit L-35. DEDS Login GUI Snapshot
CuuDuongThanCong.com https://fb.com/tailieudientucntt
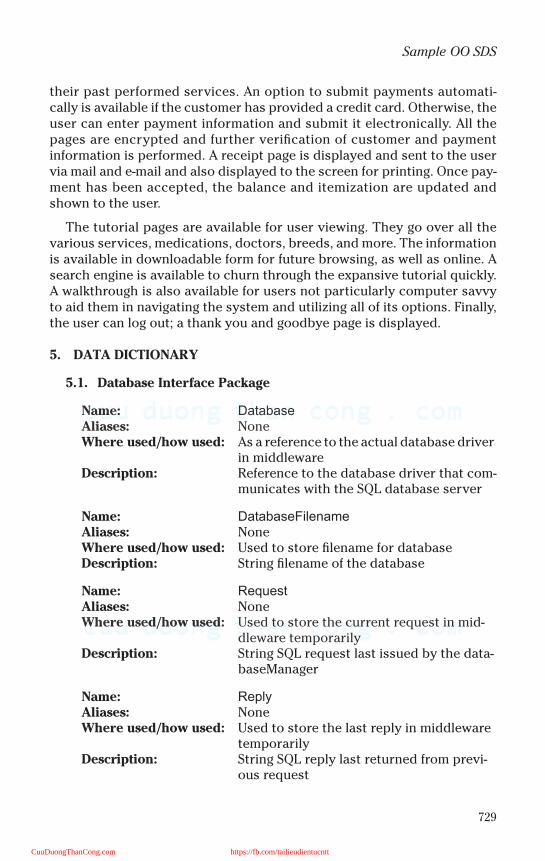
729
Sample OO SDS
their past performed services. An option to submit payments automati-cally is available if the customer has provided a credit card. Otherwise, theuser can enter payment information and submit it electronically. All thepages are encrypted and further verification of customer and paymentinformation is performed. A receipt page is displayed and sent to the uservia mail and e-mail and also displayed to the screen for printing. Once pay-ment has been accepted, the balance and itemization are updated andshown to the user.
The tutorial pages are available for user viewing. They go over all thevarious services, medications, doctors, breeds, and more. The informationis available in downloadable form for future browsing, as well as online. Asearch engine is available to churn through the expansive tutorial quickly.A walkthrough is also available for users not particularly computer savvyto aid them in navigating the system and utilizing all of its options. Finally,the user can log out; a thank you and goodbye page is displayed.
5. DATA DICTIONARY
5.1. Database Interface Package
Name: ∆αταβασε
Aliases: NoneWhere used/how used: As a reference to the actual database driver
in middlewareDescription: Reference to the database driver that com-
municates with the SQL database server
Name: ∆αταβασεΦιλεναµε
Aliases: NoneWhere used/how used: Used to store filename for databaseDescription: String filename of the database
Name: Ρεθυεστ
Aliases: NoneWhere used/how used: Used to store the current request in mid-
dleware temporarilyDescription: String SQL request last issued by the data-
baseManager
Name: Ρεπλψ
Aliases: NoneWhere used/how used: Used to store the last reply in middleware
temporarilyDescription: String SQL reply last returned from previ-
ous request
CuuDuongThanCong.com https://fb.com/tailieudientucntt
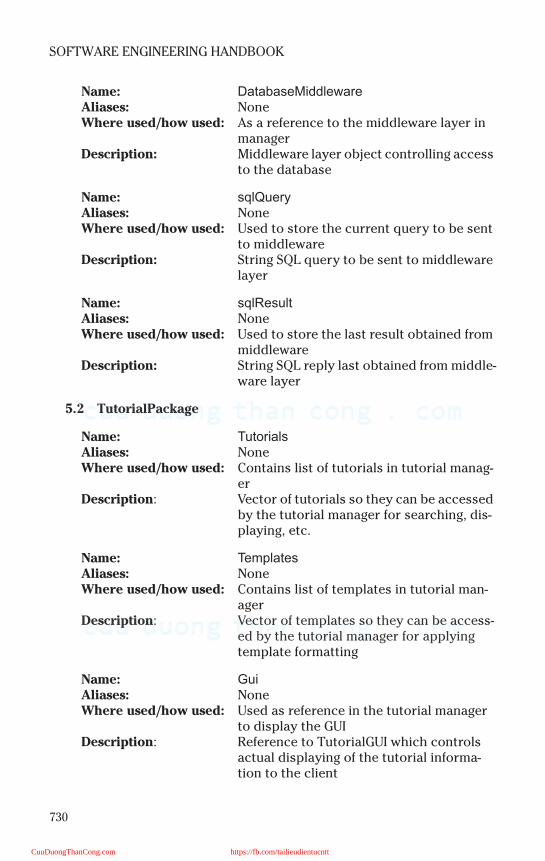
730
SOFTWARE ENGINEERING HANDBOOK
Name: ∆αταβασεΜιδδλεωαρε
Aliases: NoneWhere used/how used: As a reference to the middleware layer in
managerDescription: Middleware layer object controlling access
to the database
Name: σθλΘυερψ
Aliases: NoneWhere used/how used: Used to store the current query to be sent
to middlewareDescription: String SQL query to be sent to middleware
layer
Name: σθλΡεσυλτ
Aliases: NoneWhere used/how used: Used to store the last result obtained from
middlewareDescription: String SQL reply last obtained from middle-
ware layer
5.2 TutorialPackage
Name: Τυτοριαλσ
Aliases: NoneWhere used/how used: Contains list of tutorials in tutorial manag-
erDescription: Vector of tutorials so they can be accessed
by the tutorial manager for searching, dis-playing, etc.
Name: Τεµπλατεσ
Aliases: NoneWhere used/how used: Contains list of templates in tutorial man-
agerDescription: Vector of templates so they can be access-
ed by the tutorial manager for applying template formatting
Name: Γυι
Aliases: NoneWhere used/how used: Used as reference in the tutorial manager
to display the GUIDescription: Reference to TutorialGUI which controls
actual displaying of the tutorial informa-tion to the client
CuuDuongThanCong.com https://fb.com/tailieudientucntt
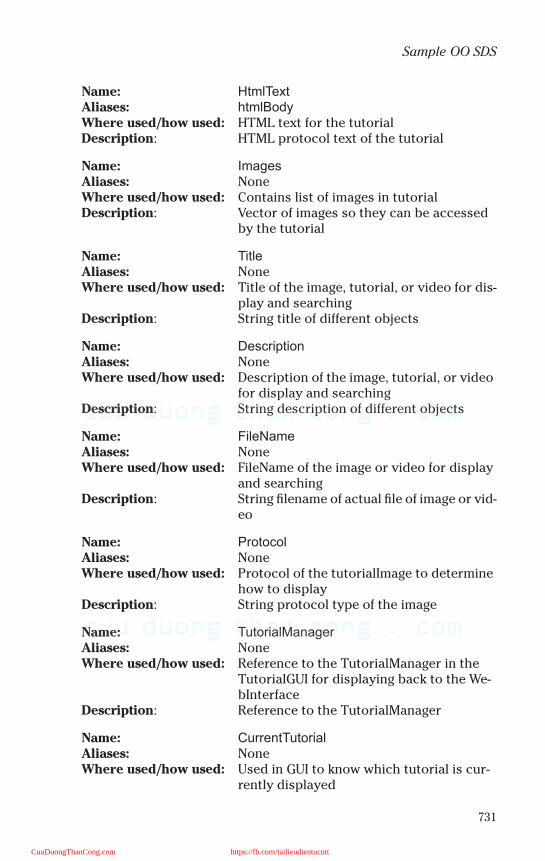
731
Sample OO SDS
Name: ΗτµλΤεξτ
Aliases: ητµλΒοδψ
Where used/how used: HTML text for the tutorialDescription: HTML protocol text of the tutorial
Name: Ιµαγεσ
Aliases: NoneWhere used/how used: Contains list of images in tutorialDescription: Vector of images so they can be accessed
by the tutorial
Name: Τιτλε
Aliases: NoneWhere used/how used: Title of the image, tutorial, or video for dis-
play and searchingDescription: String title of different objects
Name: ∆εσχριπτιον
Aliases: NoneWhere used/how used: Description of the image, tutorial, or video
for display and searchingDescription: String description of different objects
Name: ΦιλεΝαµε
Aliases: NoneWhere used/how used: FileName of the image or video for display
and searchingDescription: String filename of actual file of image or vid-
eo
Name: Προτοχολ
Aliases: NoneWhere used/how used: Protocol of the tutorialImage to determine
how to displayDescription: String protocol type of the image
Name: ΤυτοριαλΜαναγερ
Aliases: NoneWhere used/how used: Reference to the TutorialManager in the
TutorialGUI for displaying back to the We-bInterface
Description: Reference to the TutorialManager
Name: ΧυρρεντΤυτοριαλ
Aliases: NoneWhere used/how used: Used in GUI to know which tutorial is cur-
rently displayed
CuuDuongThanCong.com https://fb.com/tailieudientucntt
732
SOFTWARE ENGINEERING HANDBOOK
Description: String name of the current tutorial
Name: µενυΧολορ
Aliases: NoneWhere used/how used: Used in template to know which color to
make the menuDescription: String name of the color
Name: µενυΦοντ
Aliases: NoneWhere used/how used: Used in template to know which font to
make the menuDescription: String name of the font
Name: µενυΣιζε
Aliases: NoneWhere used/how used: Used in template to know which size to
make the menuDescription: Integer size number
Name: ηεαδινγ1Χολορ
Aliases: NoneWhere used/how used: Used in template to know which color to
make heading1Description: String name of the color
Name: ηεαδινγ1Φοντ
Aliases: NoneWhere used/how used: Used in template to know which font to
make heading1Description: String name of the font
Name: ηεαδινγ1Σιζε
Aliases: NoneWhere used/how used: Used in template to know which size to
make heading 1Description: Integer size number
Name: ηεαδινγ2Χολορ
Aliases: NoneWhere used/how used: Used in template to know which color to
make heading2Description: String name of the color
Name: ηεαδινγ2Φοντ
Aliases: NoneWhere used/how used: Used in template to know which font to
make heading2
CuuDuongThanCong.com https://fb.com/tailieudientucntt
733
Sample OO SDS
Description: String name of the font
Name: ηεαδινγ2Σιζε
Aliases: NoneWhere used/how used: Used in template to know which size to
make heading2Description: Integer size number
Name: ηεαδινγ3Χολορ
Aliases: NoneWhere used/how used: Used in template to know which color to
make heading3Description: String name of the color
Name: ηεαδινγ3Φοντ
Aliases: NoneWhere used/how used: Used in template to know which font to
make heading3Description: String name of the font
Name: ηεαδινγ3Σιζε
Aliases: NoneWhere used/how used: Used in template to know which size to
make heading3Description: Integer size number
Name: τεξτ1Χολορ
Aliases: NoneWhere used/how used: Used in template to know which color to
make text1Description: String name of the color
Name: τεξτ1Φοντ
Aliases: NoneWhere used/how used: Used in template to know which font to
make text1Description: String name of the font
Name: τεξτ1Σιζε
Aliases: NoneWhere used/how used: Used in template to know which size to
make text1Description: Integer size number
Name: τεξτ2Χολορ
Aliases: NoneWhere used/how used: Used in template to know which color to
make text2
CuuDuongThanCong.com https://fb.com/tailieudientucntt
734
SOFTWARE ENGINEERING HANDBOOK
Description: String name of the color
Name: τεξτ2Φοντ
Aliases: NoneWhere used/how used: Used in template to know which font to
make text2Description: String name of the font
Name: τεξτ2Σιζε
Aliases: NoneWhere used/how used: Used in template to know which size to
make text2Description: Integer size number
Name: τεξτ3Χολορ
Aliases: NoneWhere used/how used: Used in template to know which color to
make text3Description: String name of the color
Name: τεξτ3Φοντ
Aliases: NoneWhere used/how used: Used in template to know which font to
make text3Description: String name of the font
Name: τεξτ3Σιζε
Aliases: NoneWhere used/how used: Used in template to know which size to
make text3Description: Integer size number
Name: παγεΒαχκγρουνδΧολορ
Aliases: NoneWhere used/how used: Used in template to know which color to
make the backgroundDescription: String name of the background color
Name: παγεΒαχκγρουνδΙµαγε
Aliases: NoneWhere used/how used: Used in template to know which image to
set the backgroundDescription: String name of the background image file
5.3 WebInterfacePackage
Name: Σερϖερ
Aliases: None
CuuDuongThanCong.com https://fb.com/tailieudientucntt
735
Sample OO SDS
Where used/how used: Contains a reference to the WebServer ob-ject in manager
Description: WebServer object
Name: Τεµπλατεσ
Aliases: NoneWhere used/how used: Contains list of templates in Web managerDescription: Vector of templates so they can be access-
ed by the Web manager for applying tem-plate formatting
Name: Πορτ
Aliases: NoneWhere used/how used: Used as port number for server in the serv-
er and thread to know which port to bind to
Description: Integer port number for the server
Name: ΗΤΜΛΗοµε
Aliases: NoneWhere used/how used: Used in server to locate the home directo-
ry for Web pagesDescription: Directory containing the HTML
Name: ωεβΜαναγερ
Aliases: NoneWhere used/how used: Reference to WebManager in the server to
allow access to itDescription: WebManager object
Name: Τηρεαδ
Aliases: NoneWhere used/how used: Used in Web thread to allow the class to be
run by this thread of the operating systemDescription: Native thread in the operating system
Name: Σοχκετ
Aliases: NoneWhere used/how used: Used in thread to allow access to the
streams and connection status of that par-ticular client
Description: Connection to the client
Name: µενυΧολορ
Aliases: NoneWhere used/how used: Used in template to know which color to
make the menu
CuuDuongThanCong.com https://fb.com/tailieudientucntt
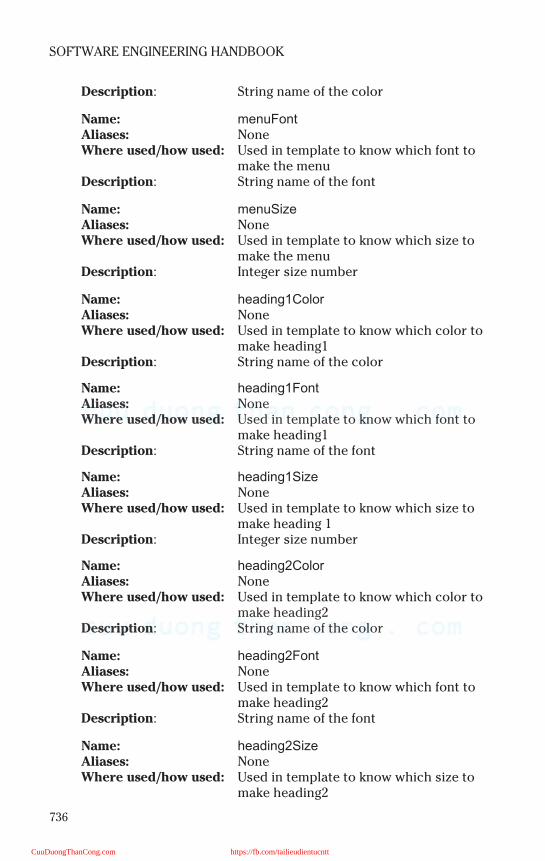
736
SOFTWARE ENGINEERING HANDBOOK
Description: String name of the color
Name: µενυΦοντ
Aliases: NoneWhere used/how used: Used in template to know which font to
make the menuDescription: String name of the font
Name: µενυΣιζε
Aliases: NoneWhere used/how used: Used in template to know which size to
make the menuDescription: Integer size number
Name: ηεαδινγ1Χολορ
Aliases: NoneWhere used/how used: Used in template to know which color to
make heading1Description: String name of the color
Name: ηεαδινγ1Φοντ
Aliases: NoneWhere used/how used: Used in template to know which font to
make heading1Description: String name of the font
Name: ηεαδινγ1Σιζε
Aliases: NoneWhere used/how used: Used in template to know which size to
make heading 1Description: Integer size number
Name: ηεαδινγ2Χολορ
Aliases: NoneWhere used/how used: Used in template to know which color to
make heading2Description: String name of the color
Name: ηεαδινγ2Φοντ
Aliases: NoneWhere used/how used: Used in template to know which font to
make heading2Description: String name of the font
Name: ηεαδινγ2Σιζε
Aliases: NoneWhere used/how used: Used in template to know which size to
make heading2
CuuDuongThanCong.com https://fb.com/tailieudientucntt
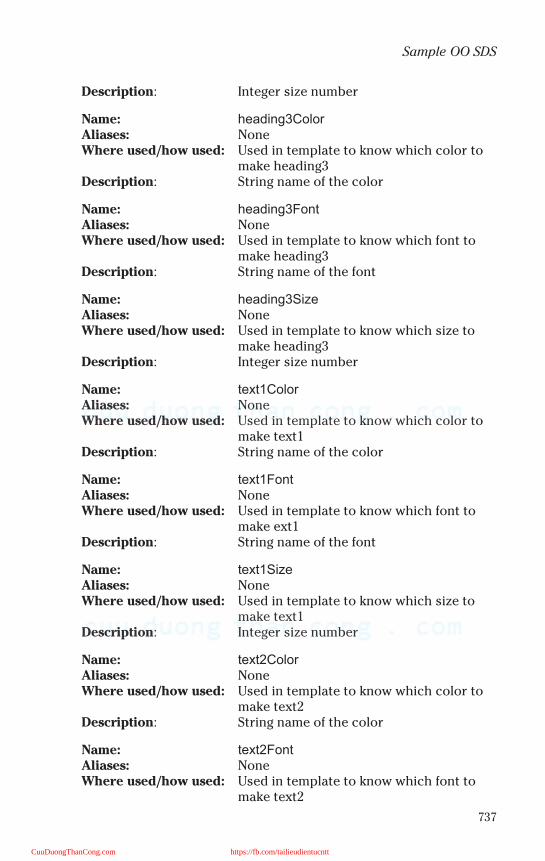
737
Sample OO SDS
Description: Integer size number
Name: ηεαδινγ3Χολορ
Aliases: NoneWhere used/how used: Used in template to know which color to
make heading3Description: String name of the color
Name: ηεαδινγ3Φοντ
Aliases: NoneWhere used/how used: Used in template to know which font to
make heading3Description: String name of the font
Name: ηεαδινγ3Σιζε
Aliases: NoneWhere used/how used: Used in template to know which size to
make heading3Description: Integer size number
Name: τεξτ1Χολορ
Aliases: NoneWhere used/how used: Used in template to know which color to
make text1Description: String name of the color
Name: τεξτ1Φοντ
Aliases: NoneWhere used/how used: Used in template to know which font to
make ext1Description: String name of the font
Name: τεξτ1Σιζε
Aliases: NoneWhere used/how used: Used in template to know which size to
make text1Description: Integer size number
Name: τεξτ2Χολορ
Aliases: NoneWhere used/how used: Used in template to know which color to
make text2Description: String name of the color
Name: τεξτ2Φοντ
Aliases: NoneWhere used/how used: Used in template to know which font to
make text2
CuuDuongThanCong.com https://fb.com/tailieudientucntt

738
SOFTWARE ENGINEERING HANDBOOK
Description: String name of the font
Name: τεξτ2Σιζε
Aliases: NoneWhere used/how used: Used in template to know which size to
make text2Description: Integer size number
Name: τεξτ3Χολορ
Aliases: NoneWhere used/how used: Used in template to know which color to
make text3Description: String name of the color
Name: τεξτ3Φοντ
Aliases: NoneWhere used/how used: Used in template to know which font to
make text3Description: String name of the font
Name: τεξτ3Σιζε
Aliases: NoneWhere used/how used: Used in template to know which size to
make text3Description: Integer size number
Name: παγεΒαχκγρουνδΧολορ
Aliases: NoneWhere used/how used: Used in template to know which color to
make the backgroundDescription: String name of the background color
Name: παγεΒαχκγρουνδΙµαγε
Aliases: NoneWhere used/how used: Used in template to know which image to
set the backgroundDescription: String name of the background image file
5.4 Scheduling Package
Name: ∆ογΙδ
Aliases: NoneWhere used/how used: To generate reminder and to look up dog in-
formationDescription: Unique Identifier of a Dog — used from
database
CuuDuongThanCong.com https://fb.com/tailieudientucntt
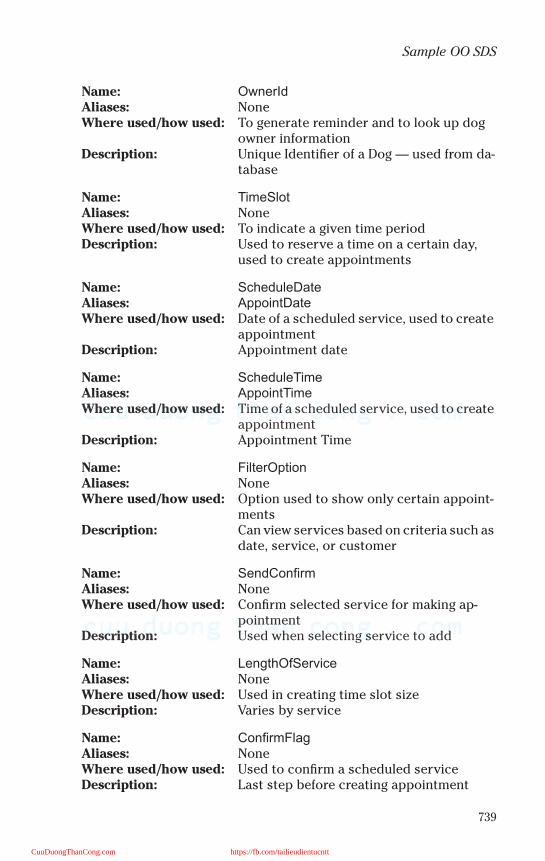
739
Sample OO SDS
Name: ΟωνερΙδ
Aliases: NoneWhere used/how used: To generate reminder and to look up dog
owner informationDescription: Unique Identifier of a Dog — used from da-
tabase
Name: ΤιµεΣλοτ
Aliases: NoneWhere used/how used: To indicate a given time periodDescription: Used to reserve a time on a certain day,
used to create appointments
Name: Σχηεδυλε∆ατε
Aliases: Απποιντ∆ατε
Where used/how used: Date of a scheduled service, used to create appointment
Description: Appointment date
Name: ΣχηεδυλεΤιµε
Aliases: ΑπποιντΤιµε
Where used/how used: Time of a scheduled service, used to create appointment
Description: Appointment Time
Name: ΦιλτερΟπτιον
Aliases: NoneWhere used/how used: Option used to show only certain appoint-
mentsDescription: Can view services based on criteria such as
date, service, or customer
Name: ΣενδΧον⇒ρµ
Aliases: NoneWhere used/how used: Confirm selected service for making ap-
pointmentDescription: Used when selecting service to add
Name: ΛενγτηΟφΣερϖιχε
Aliases: NoneWhere used/how used: Used in creating time slot sizeDescription: Varies by service
Name: Χον⇒ρµΦλαγ
Aliases: NoneWhere used/how used: Used to confirm a scheduled serviceDescription: Last step before creating appointment
CuuDuongThanCong.com https://fb.com/tailieudientucntt
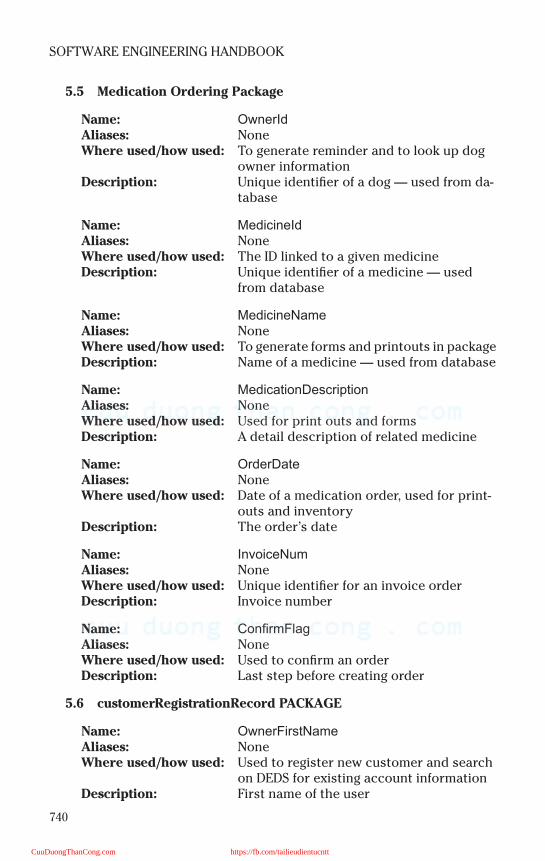
740
SOFTWARE ENGINEERING HANDBOOK
5.5 Medication Ordering Package
Name: ΟωνερΙδ
Aliases: NoneWhere used/how used: To generate reminder and to look up dog
owner informationDescription: Unique identifier of a dog — used from da-
tabase
Name: ΜεδιχινεΙδ
Aliases: NoneWhere used/how used: The ID linked to a given medicineDescription: Unique identifier of a medicine — used
from database
Name: ΜεδιχινεΝαµε
Aliases: NoneWhere used/how used: To generate forms and printouts in packageDescription: Name of a medicine — used from database
Name: Μεδιχατιον∆εσχριπτιον
Aliases: NoneWhere used/how used: Used for print outs and formsDescription: A detail description of related medicine
Name: Ορδερ∆ατε
Aliases: NoneWhere used/how used: Date of a medication order, used for print-
outs and inventoryDescription: The order’s date
Name: ΙνϖοιχεΝυµ
Aliases: NoneWhere used/how used: Unique identifier for an invoice orderDescription: Invoice number
Name: Χον⇒ρµΦλαγ
Aliases: NoneWhere used/how used: Used to confirm an orderDescription: Last step before creating order
5.6 customerRegistrationRecord PACKAGE
Name: ΟωνερΦιρστΝαµε
Aliases: NoneWhere used/how used: Used to register new customer and search
on DEDS for existing account informationDescription: First name of the user
CuuDuongThanCong.com https://fb.com/tailieudientucntt
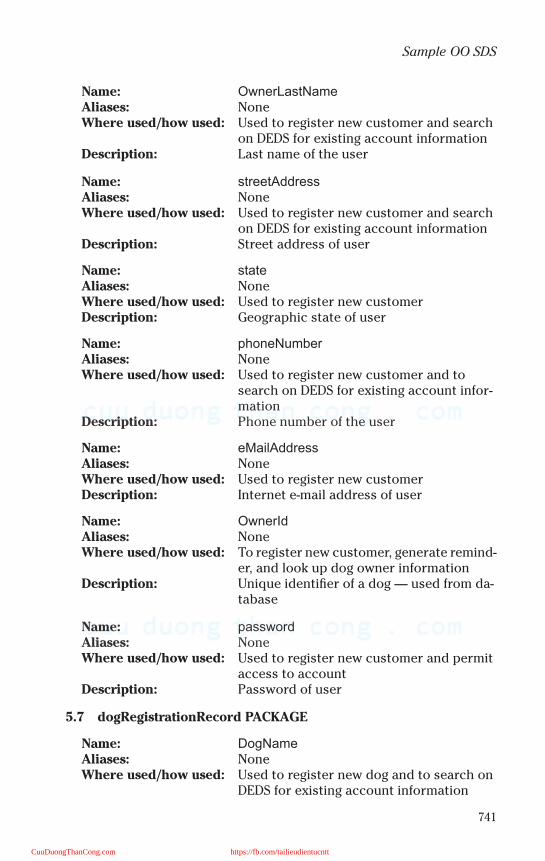
741
Sample OO SDS
Name: ΟωνερΛαστΝαµε
Aliases: NoneWhere used/how used: Used to register new customer and search
on DEDS for existing account informationDescription: Last name of the user
Name: στρεετΑδδρεσσ
Aliases: NoneWhere used/how used: Used to register new customer and search
on DEDS for existing account informationDescription: Street address of user
Name: στατε
Aliases: NoneWhere used/how used: Used to register new customerDescription: Geographic state of user
Name: πηονεΝυµβερ
Aliases: NoneWhere used/how used: Used to register new customer and to
search on DEDS for existing account infor-mation
Description: Phone number of the user
Name: εΜαιλΑδδρεσσ
Aliases: NoneWhere used/how used: Used to register new customerDescription: Internet e-mail address of user
Name: ΟωνερΙδ
Aliases: NoneWhere used/how used: To register new customer, generate remind-
er, and look up dog owner informationDescription: Unique identifier of a dog — used from da-
tabase
Name: πασσωορδ
Aliases: NoneWhere used/how used: Used to register new customer and permit
access to accountDescription: Password of user
5.7 dogRegistrationRecord PACKAGE
Name: ∆ογΝαµε
Aliases: NoneWhere used/how used: Used to register new dog and to search on
DEDS for existing account information
CuuDuongThanCong.com https://fb.com/tailieudientucntt
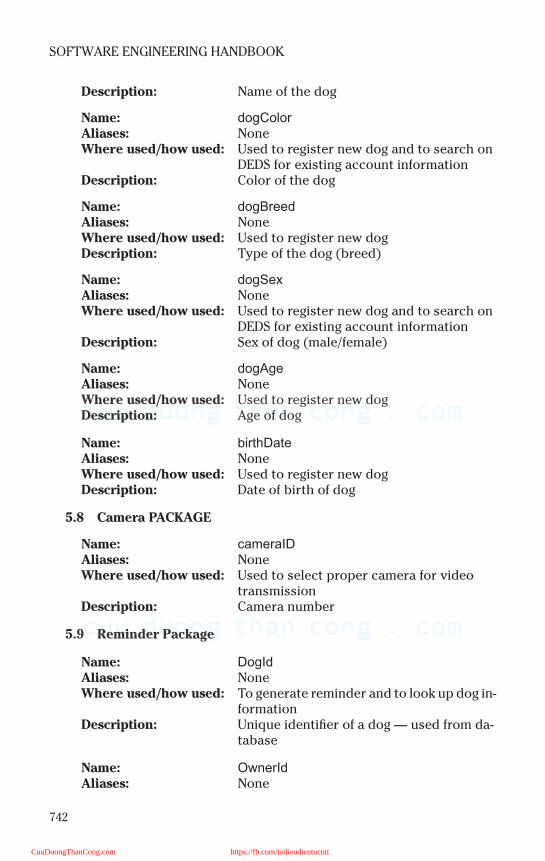
742
SOFTWARE ENGINEERING HANDBOOK
Description: Name of the dog
Name: δογΧολορ
Aliases: NoneWhere used/how used: Used to register new dog and to search on
DEDS for existing account informationDescription: Color of the dog
Name: δογΒρεεδ
Aliases: NoneWhere used/how used: Used to register new dogDescription: Type of the dog (breed)
Name: δογΣεξ
Aliases: NoneWhere used/how used: Used to register new dog and to search on
DEDS for existing account informationDescription: Sex of dog (male/female)
Name: δογΑγε
Aliases: NoneWhere used/how used: Used to register new dogDescription: Age of dog
Name: βιρτη∆ατε
Aliases: NoneWhere used/how used: Used to register new dogDescription: Date of birth of dog
5.8 Camera PACKAGE
Name: χαµεραΙ∆
Aliases: NoneWhere used/how used: Used to select proper camera for video
transmissionDescription: Camera number
5.9 Reminder Package
Name: ∆ογΙδ
Aliases: NoneWhere used/how used: To generate reminder and to look up dog in-
formationDescription: Unique identifier of a dog — used from da-
tabase
Name: ΟωνερΙδ
Aliases: None
CuuDuongThanCong.com https://fb.com/tailieudientucntt
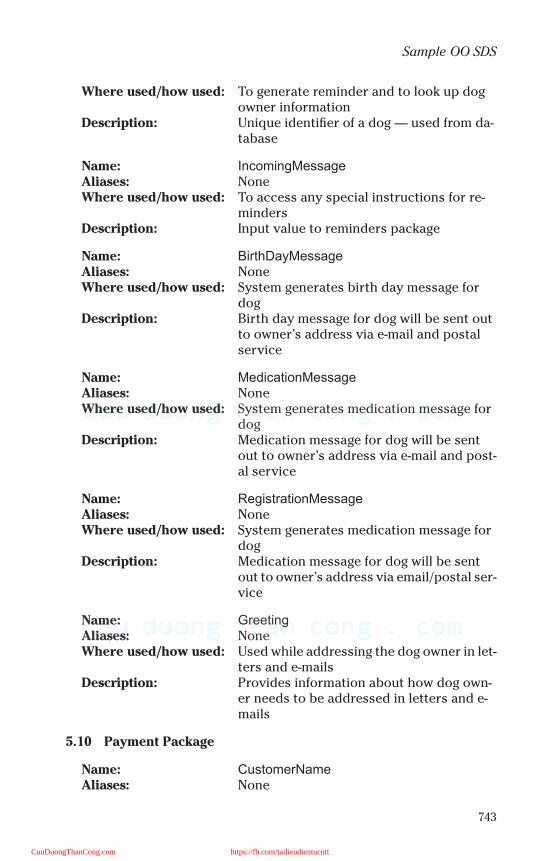
743
Sample OO SDS
Where used/how used: To generate reminder and to look up dog owner information
Description: Unique identifier of a dog — used from da-tabase
Name: ΙνχοµινγΜεσσαγε
Aliases: NoneWhere used/how used: To access any special instructions for re-
mindersDescription: Input value to reminders package
Name: Βιρτη∆αψΜεσσαγε
Aliases: NoneWhere used/how used: System generates birth day message for
dogDescription: Birth day message for dog will be sent out
to owner’s address via e-mail and postal service
Name: ΜεδιχατιονΜεσσαγε
Aliases: NoneWhere used/how used: System generates medication message for
dogDescription: Medication message for dog will be sent
out to owner’s address via e-mail and post-al service
Name: ΡεγιστρατιονΜεσσαγε
Aliases: NoneWhere used/how used: System generates medication message for
dogDescription: Medication message for dog will be sent
out to owner’s address via email/postal ser-vice
Name: Γρεετινγ
Aliases: NoneWhere used/how used: Used while addressing the dog owner in let-
ters and e-mailsDescription: Provides information about how dog own-
er needs to be addressed in letters and e-mails
5.10 Payment Package
Name: ΧυστοµερΝαµε
Aliases: None
CuuDuongThanCong.com https://fb.com/tailieudientucntt
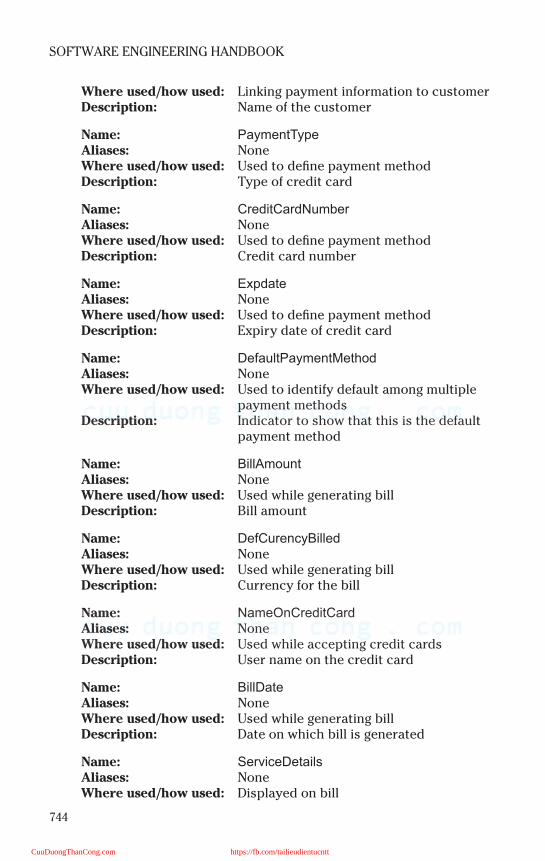
744
SOFTWARE ENGINEERING HANDBOOK
Where used/how used: Linking payment information to customerDescription: Name of the customer
Name: ΠαψµεντΤψπε
Aliases: NoneWhere used/how used: Used to define payment methodDescription: Type of credit card
Name: ΧρεδιτΧαρδΝυµβερ
Aliases: NoneWhere used/how used: Used to define payment methodDescription: Credit card number
Name: Εξπδατε
Aliases: NoneWhere used/how used: Used to define payment methodDescription: Expiry date of credit card
Name: ∆εφαυλτΠαψµεντΜετηοδ
Aliases: NoneWhere used/how used: Used to identify default among multiple
payment methodsDescription: Indicator to show that this is the default
payment method
Name: ΒιλλΑµουντ
Aliases: NoneWhere used/how used: Used while generating billDescription: Bill amount
Name: ∆εφΧυρενχψΒιλλεδ
Aliases: NoneWhere used/how used: Used while generating billDescription: Currency for the bill
Name: ΝαµεΟνΧρεδιτΧαρδ
Aliases: NoneWhere used/how used: Used while accepting credit cardsDescription: User name on the credit card
Name: Βιλλ∆ατε
Aliases: NoneWhere used/how used: Used while generating billDescription: Date on which bill is generated
Name: Σερϖιχε∆εταιλσ
Aliases: NoneWhere used/how used: Displayed on bill
CuuDuongThanCong.com https://fb.com/tailieudientucntt
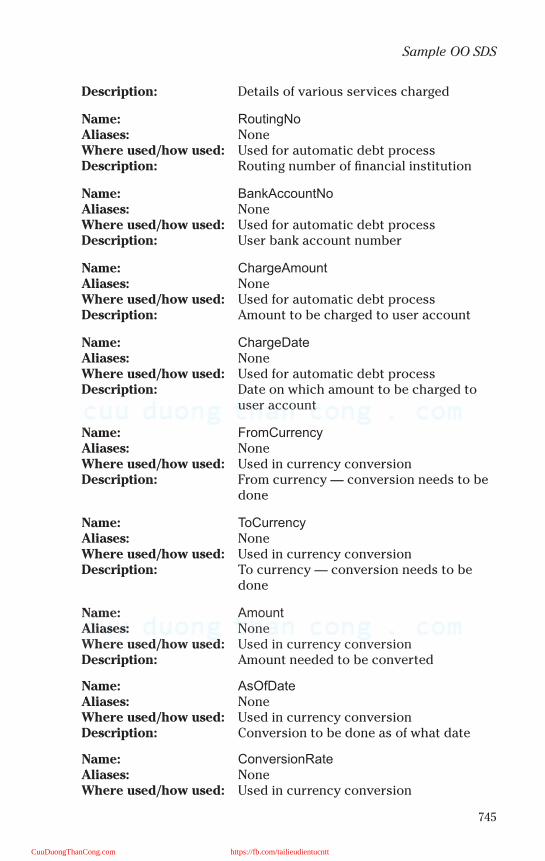
745
Sample OO SDS
Description: Details of various services charged
Name: ΡουτινγΝο
Aliases: NoneWhere used/how used: Used for automatic debt processDescription: Routing number of financial institution
Name: ΒανκΑχχουντΝο
Aliases: NoneWhere used/how used: Used for automatic debt processDescription: User bank account number
Name: ΧηαργεΑµουντ
Aliases: NoneWhere used/how used: Used for automatic debt processDescription: Amount to be charged to user account
Name: Χηαργε∆ατε
Aliases: NoneWhere used/how used: Used for automatic debt processDescription: Date on which amount to be charged to
user account
Name: ΦροµΧυρρενχψ
Aliases: NoneWhere used/how used: Used in currency conversionDescription: From currency — conversion needs to be
done
Name: ΤοΧυρρενχψ
Aliases: NoneWhere used/how used: Used in currency conversionDescription: To currency — conversion needs to be
done
Name: Αµουντ
Aliases: NoneWhere used/how used: Used in currency conversionDescription: Amount needed to be converted
Name: ΑσΟφ∆ατε
Aliases: NoneWhere used/how used: Used in currency conversionDescription: Conversion to be done as of what date
Name: ΧονϖερσιονΡατε
Aliases: NoneWhere used/how used: Used in currency conversion
CuuDuongThanCong.com https://fb.com/tailieudientucntt
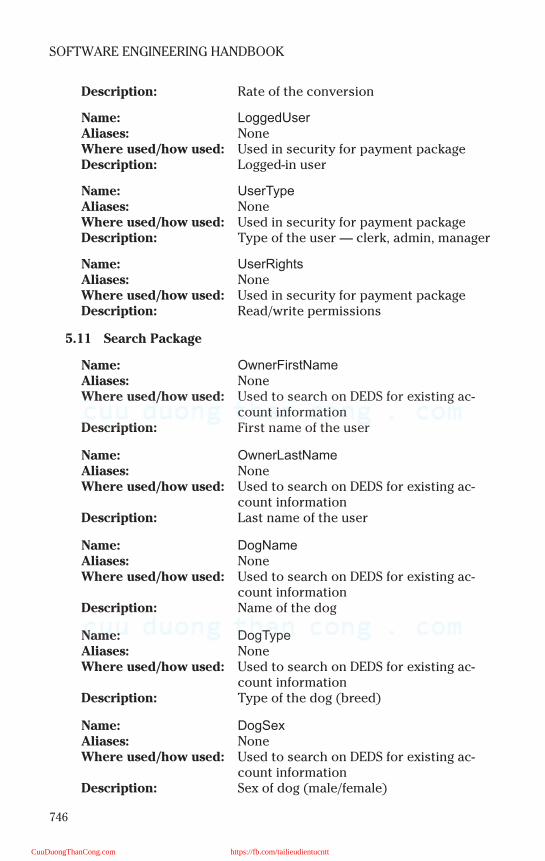
746
SOFTWARE ENGINEERING HANDBOOK
Description: Rate of the conversion
Name: ΛογγεδΥσερ
Aliases: NoneWhere used/how used: Used in security for payment packageDescription: Logged-in user
Name: ΥσερΤψπε
Aliases: NoneWhere used/how used: Used in security for payment packageDescription: Type of the user — clerk, admin, manager
Name: ΥσερΡιγητσ
Aliases: NoneWhere used/how used: Used in security for payment packageDescription: Read/write permissions
5.11 Search Package
Name: ΟωνερΦιρστΝαµε
Aliases: NoneWhere used/how used: Used to search on DEDS for existing ac-
count informationDescription: First name of the user
Name: ΟωνερΛαστΝαµε
Aliases: NoneWhere used/how used: Used to search on DEDS for existing ac-
count informationDescription: Last name of the user
Name: ∆ογΝαµε
Aliases: NoneWhere used/how used: Used to search on DEDS for existing ac-
count informationDescription: Name of the dog
Name: ∆ογΤψπε
Aliases: NoneWhere used/how used: Used to search on DEDS for existing ac-
count informationDescription: Type of the dog (breed)
Name: ∆ογΣεξ
Aliases: NoneWhere used/how used: Used to search on DEDS for existing ac-
count informationDescription: Sex of dog (male/female)
CuuDuongThanCong.com https://fb.com/tailieudientucntt
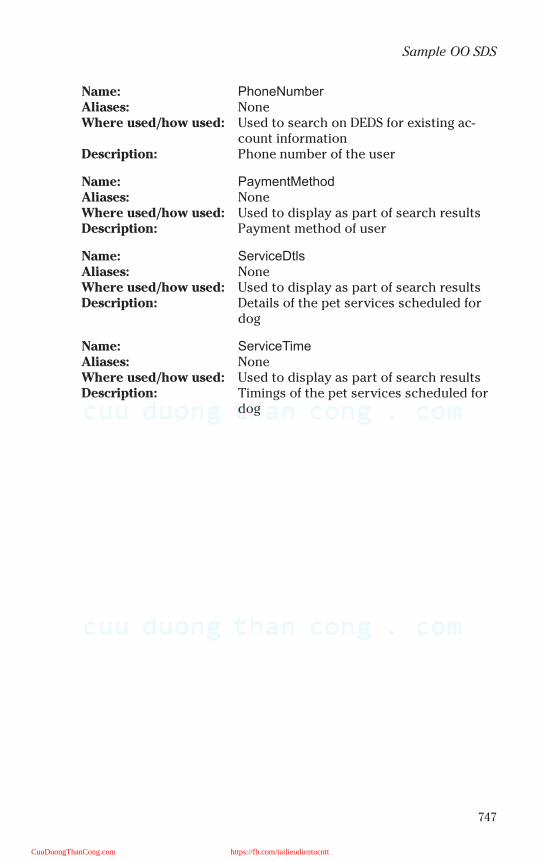
747
Sample OO SDS
Name: ΠηονεΝυµβερ
Aliases: NoneWhere used/how used: Used to search on DEDS for existing ac-
count informationDescription: Phone number of the user
Name: ΠαψµεντΜετηοδ
Aliases: NoneWhere used/how used: Used to display as part of search resultsDescription: Payment method of user
Name: Σερϖιχε∆τλσ
Aliases: NoneWhere used/how used: Used to display as part of search resultsDescription: Details of the pet services scheduled for
dog
Name: ΣερϖιχεΤιµε
Aliases: NoneWhere used/how used: Used to display as part of search resultsDescription: Timings of the pet services scheduled for
dog
CuuDuongThanCong.com https://fb.com/tailieudientucntt
This page intentionally left blank
CuuDuongThanCong.com https://fb.com/tailieudientucntt

749
Appendix M
Sample Class Dictionary
Name: Class_Header
Aliases: None
Where used / How used: Stores header information for document class types. The system allows for an unlimited number of document classes.
Content Description:
FIELD DATATYPE PK FK NULLS? NOTES
chID Int Y N Identity
chName Varchar
ChDesc Varchar
ModifyBy Varchar
ModifyDate Varchar
Name: Attrib_Header
Aliases: None
Where used/How used: Stores attribute information for each class type. For example, the tool kit part class has multiple dimensions and each dimen-sion is defined as an attribute with a cor-responding label. This allows the user to define new part/document class types dynamically.
Content Description:
FIELD DATATYPE PK FK NULLS? NOTES
ahID Int Y N Identity
ahcID Int Y N Stores class ID
ahLabel Varchar Label that displays on the screen
ModifyBy Varchar
ModifyDate Varchar
CuuDuongThanCong.com https://fb.com/tailieudientucntt
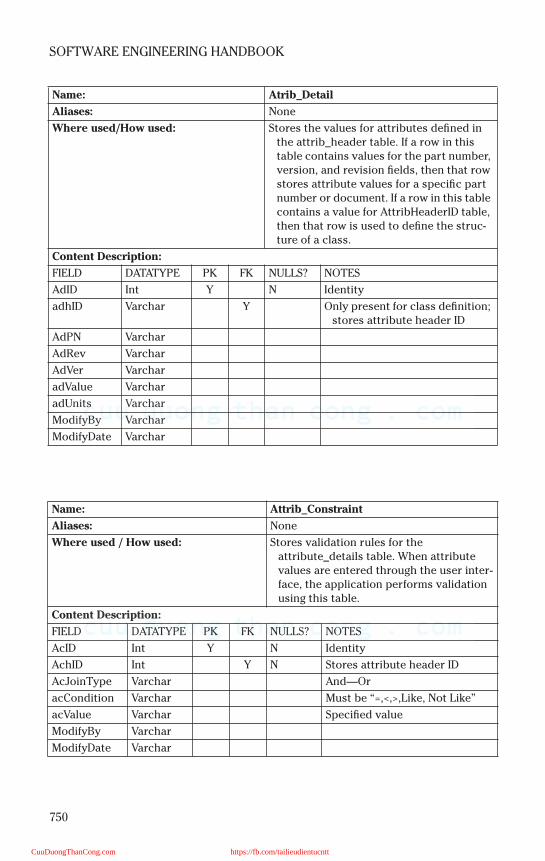
750
SOFTWARE ENGINEERING HANDBOOK
Name: Atrib_Detail
Aliases: None
Where used/How used: Stores the values for attributes defined in the attrib_header table. If a row in this table contains values for the part number, version, and revision fields, then that row stores attribute values for a specific part number or document. If a row in this table contains a value for AttribHeaderID table, then that row is used to define the struc-ture of a class.
Content Description:
FIELD DATATYPE PK FK NULLS? NOTES
AdID Int Y N Identity
adhID Varchar Y Only present for class definition; stores attribute header ID
AdPN Varchar
AdRev Varchar
AdVer Varchar
adValue Varchar
adUnits Varchar
ModifyBy Varchar
ModifyDate Varchar
Name: Attrib_Constraint
Aliases: None
Where used / How used: Stores validation rules for the attribute_details table. When attribute values are entered through the user inter-face, the application performs validation using this table.
Content Description:
FIELD DATATYPE PK FK NULLS? NOTES
AcID Int Y N Identity
AchID Int Y N Stores attribute header ID
AcJoinType Varchar And—Or
acCondition Varchar Must be “=,<,>,Like, Not Like”
acValue Varchar Specified value
ModifyBy Varchar
ModifyDate Varchar
CuuDuongThanCong.com https://fb.com/tailieudientucntt
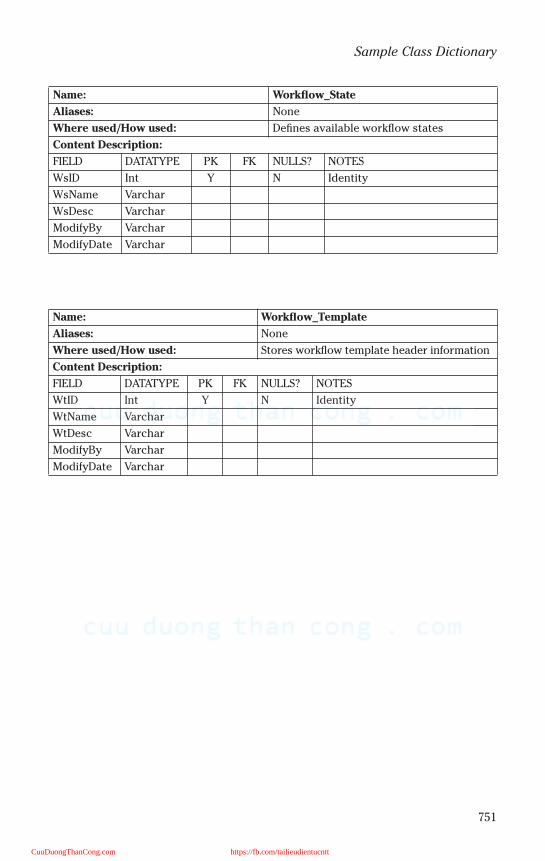
751
Sample Class Dictionary
Name: Workflow_State
Aliases: None
Where used/How used: Defines available workflow states
Content Description:
FIELD DATATYPE PK FK NULLS? NOTES
WsID Int Y N Identity
WsName Varchar
WsDesc Varchar
ModifyBy Varchar
ModifyDate Varchar
Name: Workflow_Template
Aliases: None
Where used/How used: Stores workflow template header information
Content Description:
FIELD DATATYPE PK FK NULLS? NOTES
WtID Int Y N Identity
WtName Varchar
WtDesc Varchar
ModifyBy Varchar
ModifyDate Varchar
CuuDuongThanCong.com https://fb.com/tailieudientucntt

This page intentionally left blank
CuuDuongThanCong.com https://fb.com/tailieudientucntt
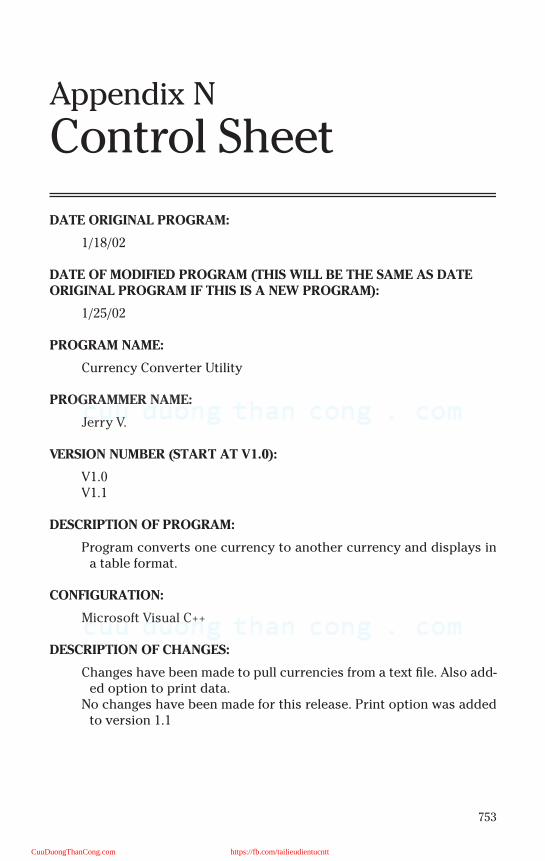
753
Appendix N
Control Sheet
DATE ORIGINAL PROGRAM:
1/18/02
DATE OF MODIFIED PROGRAM (THIS WILL BE THE SAME AS DATE ORIGINAL PROGRAM IF THIS IS A NEW PROGRAM):
1/25/02
PROGRAM NAME:
Currency Converter Utility
PROGRAMMER NAME:
Jerry V.
VERSION NUMBER (START AT V1.0):
V1.0V1.1
DESCRIPTION OF PROGRAM:
Program converts one currency to another currency and displays ina table format.
CONFIGURATION:
Microsoft Visual C++
DESCRIPTION OF CHANGES:
Changes have been made to pull currencies from a text file. Also add-ed option to print data.
No changes have been made for this release. Print option was addedto version 1.1
CuuDuongThanCong.com https://fb.com/tailieudientucntt

This page intentionally left blank
CuuDuongThanCong.com https://fb.com/tailieudientucntt
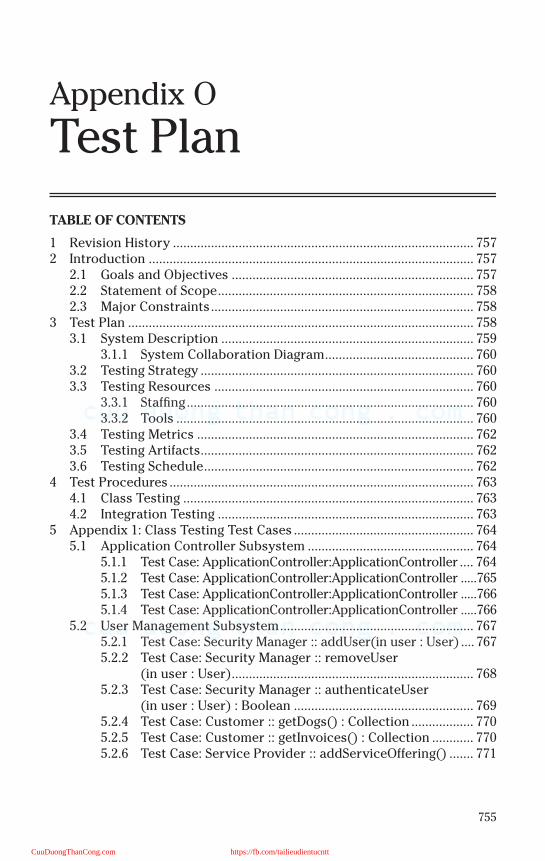
755
Appendix O
Test Plan
TABLE OF CONTENTS
1 Revision History ....................................................................................... 7572 Introduction .............................................................................................. 757
2.1 Goals and Objectives ...................................................................... 7572.2 Statement of Scope.......................................................................... 7582.3 Major Constraints............................................................................ 758
3 Test Plan .................................................................................................... 7583.1 System Description ......................................................................... 759
3.1.1 System Collaboration Diagram........................................... 7603.2 Testing Strategy ............................................................................... 7603.3 Testing Resources ........................................................................... 760
3.3.1 Staffing................................................................................... 7603.3.2 Tools ...................................................................................... 760
3.4 Testing Metrics ................................................................................ 7623.5 Testing Artifacts............................................................................... 7623.6 Testing Schedule.............................................................................. 762
4 Test Procedures ........................................................................................ 7634.1 Class Testing .................................................................................... 7634.2 Integration Testing .......................................................................... 763
5 Appendix 1: Class Testing Test Cases .................................................... 7645.1 Application Controller Subsystem ................................................ 764
5.1.1 Test Case: ApplicationController:ApplicationController .... 7645.1.2 Test Case: ApplicationController:ApplicationController .....7655.1.3 Test Case: ApplicationController:ApplicationController .....7665.1.4 Test Case: ApplicationController:ApplicationController .....766
5.2 User Management Subsystem........................................................ 7675.2.1 Test Case: Security Manager :: addUser(in user : User) .... 7675.2.2 Test Case: Security Manager :: removeUser
(in user : User)...................................................................... 7685.2.3 Test Case: Security Manager :: authenticateUser
(in user : User) : Boolean .................................................... 7695.2.4 Test Case: Customer :: getDogs() : Collection .................. 7705.2.5 Test Case: Customer :: getInvoices() : Collection ............ 7705.2.6 Test Case: Service Provider :: addServiceOffering() ....... 771
CuuDuongThanCong.com https://fb.com/tailieudientucntt
756
SOFTWARE ENGINEERING HANDBOOK
5.2.7 Test Case: Service Provider:: getAddress() ......................7725.3 Resource Management Subsystem................................................773
5.3.1 Test Case: ResourceUI :: showCreate()..............................7735.3.2 Test Case: ResourceUI :: showEdit() ..................................7745.3.3 Test Case: ResourceUI :: showSearch() .............................775
5.4 Order Subsystem .............................................................................7765.4.1 Test Case: OrderUI :: showCreate()....................................7765.4.2 Test Case: OrderUI :: showEdit() ........................................7775.4.3 Test Case: OrderUI :: showSearch() ...................................7775.4.4 Test Case: OrderUI :: showList().........................................7785.4.5 Test Case: OrderLineItem....................................................7795.4.6 Test Case: ServiceResourceRequirement..........................7805.4.7 Test Case: Service ................................................................7815.4.8 Test Case: Order ...................................................................782
5.5 Accounting Subsystem....................................................................7835.5.1 Test Case: Accounting:InvoicePrint ...................................7835.5.2 Test Case: Accounting:Payment .........................................7835.5.3 Test Case: Accounting:InvoiceList .....................................784
5.6 Customer Relationship Management Subsystem ........................7855.6.1 Test Case: This Feature Set Will Be Available in Phase II....785
5.7 Persistence Subsystem ...................................................................7855.7.1 Test Case: PersistenceManager :: loadXMLConfig() ........7855.7.2 Test Case: PersistenceManager :: saveObject() ...............7865.7.3 Test Case: PersistenceManager :: retrieveObject()..........787
6 Appendix 2: Integration Testing Tests....................................................7886.1 Test Case: Customer Registration..................................................788
6.1.1 Description............................................................................7886.1.2 Required Stubs/Drivers .......................................................7886.1.3 Test Steps ..............................................................................7886.1.4 Expected Results ..................................................................788
6.2 Test Case: Reallocate Resources....................................................7896.2.1 Description............................................................................7896.2.2 Required Stubs/Drivers .......................................................7896.2.3 Test Steps ..............................................................................7896.2.4 Expected Results ..................................................................789
6.3 Test Case: Search for Service Provider and Initiate Order .........7906.3.1 Description............................................................................7906.3.2 Required Stubs/Drivers .......................................................7906.3.3 Test Steps ..............................................................................7906.3.4 Expected Results ..................................................................790
6.4 Test Case: Place Order ....................................................................7906.4.1 Description............................................................................7906.4.2 Required Stubs/Drivers .......................................................7916.4.3 Test Steps ..............................................................................7916.4.4 Expected Results ..................................................................791
CuuDuongThanCong.com https://fb.com/tailieudientucntt
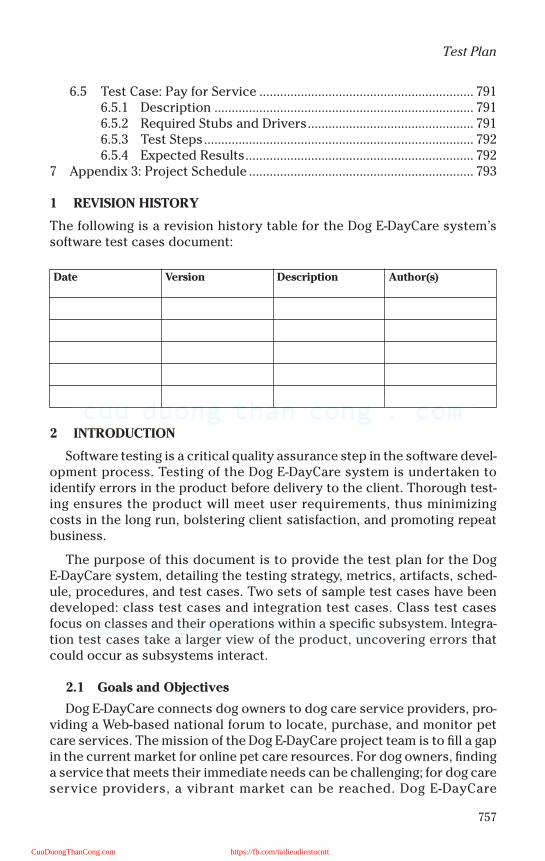
757
Test Plan
6.5 Test Case: Pay for Service .............................................................. 7916.5.1 Description ........................................................................... 7916.5.2 Required Stubs and Drivers................................................ 7916.5.3 Test Steps.............................................................................. 7926.5.4 Expected Results.................................................................. 792
7 Appendix 3: Project Schedule ................................................................. 793
1 REVISION HISTORY
The following is a revision history table for the Dog E-DayCare system’ssoftware test cases document:
2 INTRODUCTION
Software testing is a critical quality assurance step in the software devel-opment process. Testing of the Dog E-DayCare system is undertaken toidentify errors in the product before delivery to the client. Thorough test-ing ensures the product will meet user requirements, thus minimizingcosts in the long run, bolstering client satisfaction, and promoting repeatbusiness.
The purpose of this document is to provide the test plan for the DogE-DayCare system, detailing the testing strategy, metrics, artifacts, sched-ule, procedures, and test cases. Two sets of sample test cases have beendeveloped: class test cases and integration test cases. Class test casesfocus on classes and their operations within a specific subsystem. Integra-tion test cases take a larger view of the product, uncovering errors thatcould occur as subsystems interact.
2.1 Goals and Objectives
Dog E-DayCare connects dog owners to dog care service providers, pro-viding a Web-based national forum to locate, purchase, and monitor petcare services. The mission of the Dog E-DayCare project team is to fill a gapin the current market for online pet care resources. For dog owners, findinga service that meets their immediate needs can be challenging; for dog careservice providers, a vibrant market can be reached. Dog E-DayCare
Date Version Description Author(s)
CuuDuongThanCong.com https://fb.com/tailieudientucntt
758
SOFTWARE ENGINEERING HANDBOOK
envisions bringing together dog owners and service providers nationallyto support this challenge.
2.2 Statement of Scope
Although several online directories of pet care services are available,few e-businesses offer a service locator as well as the ability to purchaseand monitor pet care services online.
The Dog E-DayCare system will be released in two phases. In the firstphase, it will allow dog owners to search for services within a radius oftheir choice and based on their specific needs, whether they are lookingfor on-going in-home daycare, daycare outside the home, or an afternoonwalk and grooming. Once a dog owner selects a service, the Dog E-DayCaresystem will allow him to submit all required information, and schedule, andpay for service.
Dog care service providers who have registered with Dog E-DayCare willhave access to the system through two different forums: client software ontheir workstations and the Web. The system will notify service providers ofpotential clients, allowing them to communicate with dog owners andaccess submitted information. Service providers will be able to coordinatescheduling of multiple clients, and to e-mail and bill clients.
Phase II of the Dog E-DayCare system will introduce a range of additionaltools to facilitate communication between the customer and service pro-vider. Discussion forums, chat rooms, and instant messaging will greatlyenhance customer-service provider relations. In addition, with selectedservice providers, customers will be able to view their dogs online andreceive an update of the dog’s status. Dog E-DayCare users will also be ableto access dog care “tips of the day.”
Dog E-DayCare also envisions partnering with community service orga-nizations — for example, matching puppy raisers to puppies for GuidingEyes for the Blind, or potential dog owners to rescued dogs on behalf ofLab Rescue. Community service is the foundation on which Dog E-DayCareis built.
2.3 Major Constraints
As identified in the Software Requirements Specification, the most obvi-ous limitation in this project is the experience of the project team. This isour first attempt to go through the entire software development life cycleand present a product that satisfies requirements in a timely and efficientmanner. Thorough testing is particularly imperative in this context.
3 TEST PLAN
The test plan provides an incremental and iterative process of testingfrom small to large. The Dog E-DayCare system has been designed using an
CuuDuongThanCong.com https://fb.com/tailieudientucntt
759
Test Plan
object-oriented approach. Its smallest components are the classes thatencapsulate the responsibilities and attributes associated with the sys-tem’s various functions. Sets of related classes have been organized intosubsystems. The testing process first examines the classes within sub-systems through class testing, and then examines the interactions amongsubsystems through integration testing. Integration testing is followed byvalidation testing and system testing, which are not addressed in this plan.
The overall system description, test strategy, testing resources and out-put, and test schedule are detailed below.
3.1 System Description
The Dog E-DayCare system is composed of seven subsystems; each hasan associated interface and represents a set of related responsibilities. Thesubsystems comprise the following:
• Application controller• User management• Resource management• Order• Accounting• Customer relationship management (available in Phase II)• Persistence
The application controller subsystem provides a “core” for the entireapplication, acting as “Grand Central Station” for every process that takesplace within the scope of the application. The user management sub-system provides a central location for handling each piece of user data.The resource management subsystem provides the application with itsoverall scheduling capabilities and the order subsystem has responsibilityfor supporting the ordering of products and services from service provid-ers by Dog E-DayCare clients. The accounting subsystem is responsible forprocessing financial transactions. The customer relationship managementsubsystem enables the application to provide an opportunity for interac-tion between customers and service care providers. (This feature set willbe available in Phase II.) Finally, the persistence subsystem is responsiblefor storage, retrieval, and update of data.
The system collaboration diagram demonstrates the collaboration or“hand-shaking” that takes place throughout the major subsystems withinthe application. The application controller is the core of the system — eachsubsystem generates a request and a corresponding response. The appli-cation controller must handle the request and the response; it receives therequest, processes a response, and returns the response to the callingfunction. This can also cross over into other layers of the system. Forexample, if the accounting subsystem request requires information from
CuuDuongThanCong.com https://fb.com/tailieudientucntt
760
SOFTWARE ENGINEERING HANDBOOK
the ordering subsystem in order to accomplish its tasks, the applicationcontroller mediates between these subsystems to formulate a responseand provide it to the requestor.
3.1.1 System Collaboration Diagram
Exhibit O-1 depicts the collaborations that exist between the major DogE-DayCare subsystems.
3.2 Testing Strategy
In the object-oriented context, no operation can be tested in isolation;this poses a challenge to testers. The overall objective of testing is touncover errors. The strategy for testing the Dog E-DayCare system entailsfirst thoroughly testing the classes within subsystems through class test-ing, and then testing interactions among subsystems through scenario-based integration testing.
A set of test cases is developed for each testing method. Test cases forboth methods must exercise the requirements of the system. For the pur-pose of this test plan, a sample of tests have been developed and are pro-vided in Appendices 1 and 2. Further details on class and integration test-ing in general are provided in the section on testing procedures below.
3.3 Testing Resources
3.3.1 Staffing
The project team developing the Dog E-DayCare system consists of fourmembers as detailed in the table below. Testing is a joint activity in whichall team members participate. This activity is led by the documentationspecialist.
Team Members:
• Senior Web software developer• Senior Web designer• Senior documentation specialist• Project lead — software engineer
3.3.2 Tools
The hardware used for testing the Dog E-DayCare system will include:
• SQL server 2000 to host the system• Desktop (Pentium III processor) with a standard 56 K modem to ac-
cess the system• Laptop to record test results
Software required for testing will include the stubs and drivers developedto support class testing.
CuuDuongThanCong.com https://fb.com/tailieudientucntt
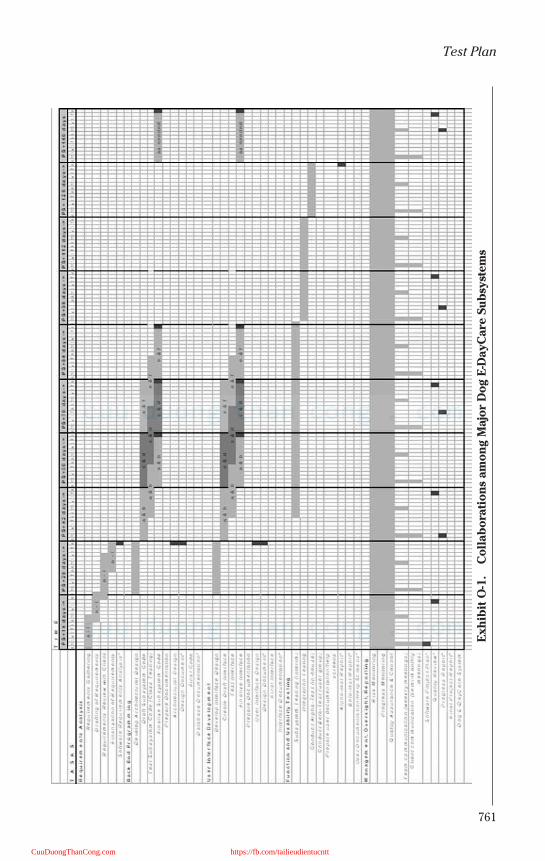
761
Test Plan
Exh
ibit
O-1
.C
oll
ab
ora
tio
ns
am
on
g M
ajo
r D
og E
-Day
Care
Su
bsy
stem
s
CuuDuongThanCong.com https://fb.com/tailieudientucntt
762
SOFTWARE ENGINEERING HANDBOOK
3.4 Testing Metrics
It is envisioned that class and integration testing will be carried outthrough several iterations until all errors are corrected. For each iteration,class testing will involve recording the following metrics:
• For each class, indicators of test failure (as identified in the test cases)• Number of failure indicators per class• Number of failure indicators per subsystem• A categorization of failure indicators by severity• Number of repeat failures (not resolved in the previous iteration)• Hours spent by test team in test process• Hours spent by development team in correcting failures
Integration testing will involve recording a similar set of metrics for eachiteration; however, the level of analysis will be the scenario. In other words:
• For each scenario, indicators of test failure (as identified in the testcases)
• Number of failure indicators per scenario• A categorization of failure indicators by severity• Number of repeat failures (not resolved in the previous iteration)• Hours spent by test team in test process• Hours spent by development team in correcting failures
3.5 Testing Artifacts
The artifacts of testing provided to the client include:
• Test plan• Test cases• Test results• Test report
3.6 Testing Schedule
Class testing will be undertaken as each set of subsystems is com-pleted. The following provides general information on how testing will bescheduled:
• PS + 35 days: class testing of application controller and persistencesubsystems
• PS + 49 days: class testing of user management and order subsystems• PS + 64 days: class testing of resource management and accounting
subsystems• PS + 86 days: scenario-based integration testing
A detailed project schedule is provided in Appendix 3.
CuuDuongThanCong.com https://fb.com/tailieudientucntt
763
Test Plan
4 TEST PROCEDURES
4.1 Class Testing
Based on the project schedule, class testing will take place as pairs ofsubsystems have been completed. Test cases for class testing must beexplicitly associated with the class to be tested; effective class testingdepends on well-articulated test cases. The test cases detail the:
• Description. The description includes the test purpose, i.e., whichclass will be tested and the particular responsibilities to be tested.
• Required stubs and drivers. As stated previously, components of an ob-ject-oriented system cannot be tested in isolation. Because of the col-laborations that must take place within and across subsystems, classtesting will likely require the use of stubs and drivers. In object-orient-ed testing, a stub is a stand-in for a subclass and a driver is a type oftester class that accepts test case data, passes data back to the class,and prints relevant results.
• Test steps. The test steps detail the events and states the system willmove through from the beginning through the end of the test.
• Expected results. The expected results provide indicators of test suc-cess and test failure.
4.2 Integration Testing
Based on the project schedule, integration testing will take place onceall subsystems have been developed and tested. Test cases are scenariobased, reflecting what users need to do with the Dog E-DayCare system.Similar to the preceding test cases, the integration test cases detail the:
• Description. The description includes the test purpose, i.e., which sce-nario or use case will be tested, and the particular subsystems thatmust interact in order for the scenario to be completed.
• Required stubs andr drivers. In object-oriented testing, stubs and driv-ers are critical for class testing. However, if class testing is thorough,stubs and drivers would not be necessary for completion of integra-tion testing.
• Test steps. The test steps detail the events and states the system willmove through from the beginning through the end of the test.
• Expected results. The expected results provide indicators of test suc-cess and test failure.
Sample class and integration test cases are provided in Appendices 1 and2, respectively.
CuuDuongThanCong.com https://fb.com/tailieudientucntt
764
SOFTWARE ENGINEERING HANDBOOK
5 APPENDIX 1: CLASS TESTING TEST CASES
Class tests are developed for each subsystem of the Dog E-DayCare sys-tem. A sample of class test cases follows.
5.1 Application Controller Subsystem
The application controller subsystem provides a “core” for the entireapplication. The controller acts as “Grand Central Station” for every pro-cess that takes place within the scope of the application.
5.1.1 Test Case: ApplicationController:ApplicationController
5.1.1.1 Description
This test case tests to see if the user functions invoked by the applica-tion user interface are handled correctly. This interface is invoked by theother subsystems when actions are performed and requests are made fromtheir respective user interfaces. This particular test focuses on the userwho is attempting to search for a service care provider within his area.
5.1.1.2 Required Stubs/Drivers
• The SearchUI that is part of the presentation layer will be invoked.
5.1.1.3 Test Steps
1. The user will press the search button within the order subsystem,which is part of the presentation layer.
2. The user will be presented with a form to fill in the search criteria.3. The search criteria will be concatenated to form a full select query
against the database. (“Select * from ServiceSchedule where loca-tion = inputlocation and date/time = inputdatetime and servicetype= inputservicetype order by location”)
4. The user’s search criteria will be evaluated and the results dis-played.
5. The user may then select the desired result and schedule theservice.
5.1.1.4 Expected Results
Test success
1. The application controller subsystem successfully handles the rout-ing of the information so that the query data goes from the presen-tation layer to the application controller layer, to the persistencelayer and, ultimately, is used to query the database. Success will bemeasured by the accuracy of the information (results) returned as aresult of the query string.
CuuDuongThanCong.com https://fb.com/tailieudientucntt

765
Test Plan
Test failure
1. The concatenation that must take place to form the query could beinvalid, which would result in an error message when the query isexecuted against the database.
2. The route that the application controller must take may not be fol-lowed because of a flaw in the logic.
3. The query string concatenation may not be sufficient and the wrongdata could be returned.
5.1.2 Test Case: ApplicationController:ApplicationController
5.1.2.1 Description
This test case tests to see if the user functions invoked by the applica-tion user interface are handled correctly. This interface is invoked by theother subsystems when actions are performed and requests are made fromtheir respective user interfaces. This particular test will verify that the useris able to view the tip of the day when the tip-of-the-day button is pressed.
5.1.2.2 Required Stubs and Drivers
The CommunicationUI from the customer relationship managementmodule will be used heavily in conjunction with the communication classwithin that same subsystem.
5.1.2.3 Test Steps
• The user will successfully log into the system.• The user will press the tip-of-the-day button.• The tip of the day will be displayed within the user interface.
5.1.2.4 Expected Results
Test successs
1. The success of the test must be measured based on the applicationcontroller subsystem’s ability to use the system data to determinethe date and then use that date as the query string to invoke the per-sistence subsystem, which will use the query string against the da-tabase. The test passes if the tip of the day is returned with thecorrect tip of the day for today’s date.
Test failure
1. An exception may occur if the incorrect date is retrieved from thesystem time; therefore, the wrong tip of the day is returned.
2. An exception may also occur if the correct tip is displayed, but in anincorrect format.
CuuDuongThanCong.com https://fb.com/tailieudientucntt
766
SOFTWARE ENGINEERING HANDBOOK
5.1.3 Test Case: ApplicationController:ApplicationController
5.1.3.1 Description
This test case tests to see if the user functions invoked by the applica-tion user interface are handled correctly. This interface is invoked by theother subsystems when actions are performed and requests are made fromtheir respective user interfaces. This specific test will determine if theuser’s account balance is updated after a payment is made.
5.1.3.2 Required Stubs/Drivers
1. The PaymentUI, which is part of the presentation layer, must havebeen invoked and a payment must be attempted.
2. The accounting subsystem and its interfaces will be invoked.
5.1.3.3 Test Steps
1. The user will successfully log into the system.2. The user will navigate to his account information.3. The user will select the option to make a payment on their balance.4. The user will be presented a form with which to indicate the amount
of the payment and to provide or change credit card information.5. The user will enter an amount and use the preregistered credit card
information.6. The user will press the pay button.
5.1.3.4 Expected Results
Test success
1. The success of this test can be measured by the user’s new balancereflecting the recent payment on the account balance. Performing aquery against the database to determine if the account balance iscorrect will test this. The ApplicationController is tested because itis responsible for ensuring that the correct route is followed to ulti-mately commit the transaction and return a successful message.
Test failure
1. An exception may occur if the query string is malformed. This couldbe caused by invalid data entry or faulty logic.
2. An exception may also occur if the update is unsuccessful and thequery returns an invalid balance.
5.1.4 Test Case: ApplicationController:ApplicationController
5.1.4.1 Description
This test case tests to see if the user functions invoked by the applica-tion user interface are handled correctly. This interface is invoked by theother subsystems when actions are performed and requests are made from
CuuDuongThanCong.com https://fb.com/tailieudientucntt
767
Test Plan
their respective user interfaces. This particular test will ensure that theservice care provider can successfully update scheduling information.
5.1.4.2 Required Stubs/Drivers
The resource management subsystem will be invoked with particularattention to the resource class, which is used for scheduling.
5.1.4.3 Test Steps
1. The service care provider will successfully log into the system.2. The service care provider will press the resource button.3. A form will be presented that will allow the service care provider to
specify that he wants to edit the resource schedule.4. The service care provider will modify the employee schedule to ex-
clude the dog shearer on a particular day.
5.1.4.4 Expected Results
Test success
1. The success of this test can be determined by a query performedagainst the database, which is invoked when the user attempts tosearch for that particular service. The application controller will betested because its responsibility is to accept the query string andcommit the transaction to the database via the persistence sub-system.
Test failure
1. An exception may occur if the concatenation of the query string isfaulty, which will result in a database SQL error.
2. An exception may also occur if the user cannot see the changes up-dated via the user interface, which indicates that the test wasunsuccessful.
5.2 User Management Subsystem
The user management subsystem provides a central location for han-dling every piece of user data. This is very important in the parsing of thesystem.
5.2.1 Test Case: Security Manager :: addUser(in user : User)
5.2.1.1 Description
The purpose of the test is to determine whether the security managerclass is carrying out its responsibilities as expected. Security manager is acritical class of the user management subsystem, adding and removingusers and their roles, and authenticating users. This test will focus specif-ically on adding a user to the system.
CuuDuongThanCong.com https://fb.com/tailieudientucntt
768
SOFTWARE ENGINEERING HANDBOOK
5.2.1.2 Required Stubs/Drivers
Driver: IUserInterfaceDriver (smaller version of IUserInterface class)RegisterUIDriver (smaller version of RegisterUI class)
Stubs: UserStub (smaller version of user class)NextStub (captures next button clicks)
5.2.1.3 Test Steps
1. Open register user interface.2. Input information “about you.”3. Click next.4. Input information “about your dog.”5. Click next.6. Input user name and password.7. Click finish.8. View results.
5.2.1.4 Expected Results
Test success
1. Driver displays information entered for user.
Test failure
1. Driver does not display information entered for user.
5.2.2 Test Case: Security Manager :: removeUser(in user : User)
5.2.2.1 Description
The purpose of the test is to determine whether the security managerclass is carrying out its responsibilities as expected. Security manager is acritical class of the user management subsystem, adding and removingusers and their roles, and authenticating users. This test will focus specif-ically on removing a user.
5.2.2.2 Required Stubs/Drivers
Driver: IUserInterfaceDriver (smaller version of IUserInterface class)RegisterUIDriver (smaller version of RegisterUI class)
Stubs: UserStub (smaller version of user class)NextStub (captures next button clicks)
5.2.2.3 Test Steps
1. Open register user interface.2. Select option to “cancel registration.”3. Input user ID in appropriate field.4. Click “remove.”5. View results.
CuuDuongThanCong.com https://fb.com/tailieudientucntt

769
Test Plan
5.2.2.4 Expected Results
Test success
1. User ID removed no longer appears in user ID table.
Test failure
1. User ID removed persists in user ID table.
5.2.3 Test Case: Security Manager :: authenticateUser(in user : User) : Boolean
5.2.3.1 Description
The purpose of the test is to determine whether the security managerclass is carrying out its responsibilities as expected. Security manager is acritical class of the user management subsystem, adding and removingusers and their roles, and authenticating users. This test will focus specif-ically on user authentication.
5.2.3.2 Required Stubs/Drivers
Driver: IUserInterfaceDriver (smaller version of IUserInterface class)LoginUIDriver (smaller version of LoginUI class)
Stubs: UserStub (smaller version of User class)NextStub (captures next button clicks)RoleStub (captures role assigned to user)
5.2.3.3 Test Steps
1. Open login user interface.2. Input user name and password.3. Click login.4. View results.
5.2.3.4 Expected Results
Test success
1. User enters a correct user name and password, the welcome pageappears and the name of the user is displayed in the upper rightcorner.
2. User enters an incorrect name and password. A login failure mes-sage is displayed asking the user to try again.
Test failure
1. User enters a correct user name and password. A login failure mes-sage is displayed.
CuuDuongThanCong.com https://fb.com/tailieudientucntt
770
SOFTWARE ENGINEERING HANDBOOK
2. User enters an incorrect user name and password, the welcomepage appears and the name of the user is displayed in the upperright corner.
5.2.4 Test Case: Customer :: getDogs() : Collection
5.2.4.1 Description
The purpose of the test is to determine whether the customer class iscarrying out its responsibilities as expected. The customer’s role in theuser management subsystem is to receive, store, and return a range ofinformation associated with a particular customer. This test will focus spe-cifically on retrieving a list of all dogs belonging to a specific customer.
5.2.4.2 Required Stubs/Drivers
Driver: IUserInterfaceDriver (smaller version of IUserInterface class)SearchUIDriver (smaller version of SearchUI class)
Stubs: UserStub (smaller version of user class)NextStub (captures next button clicks)DogStub (small version of animal owner, animal, and dogclasses)
5.2.4.3 Test Steps
1. Open search user interface (for service providers).2. Input customer ID.3. Click search.4. View results.
5.2.4.4 Expected Results
Test success
1. The names of all dogs owned by the customer are listed in theresults page.
Test failure
1. The names of dogs owned by other customers are listed in theresults.
2. No dog names are listed in the results.
5.2.5 Test Case: Customer :: getInvoices() : Collection
5.2.5.1 Description
The purpose of the test is to determine whether the customer class iscarrying out its responsibilities as expected. The customer’s role in theuser management subsystem is to receive, store, and return a range ofinformation associated with a particular customer. This test will focusspecifically on retrieving a correct list of all invoices associated with acustomer.
CuuDuongThanCong.com https://fb.com/tailieudientucntt
771
Test Plan
5.2.5.2 Required Stubs/Drivers
Driver: IUserInterfaceDriver (smaller version of IUserInterface class)SearchUIDriver (smaller version of SearchUI class)
Stubs: UserStub (smaller version of user class)NextStub (captures next button clicks)InvoiceStub (smaller version of invoice class)
5.2.5.3 Test Steps
1. Open Dog E-DayCare search interface (for service providers).2. Enter customer ID.3. Click on search.4. View results.
5.2.5.4 Expected Results
Test success
1. All invoices associated with the customer are listed.
Test failure
1. Invoices associated with another customer are listed.2. None of the invoices associated with the customer is listed.
5.2.6 Test Case: Service Provider :: addServiceOffering()
5.2.6.1 Description
The purpose of the test is to determine whether the service providerclass is carrying out its responsibilities as expected. The service provider’srole in the user management subsystem is to receive, store, and return arange of information associated with a particular service provider. Thistest will focus specifically on adding a service offering for a specific serviceprovider.
5.2.6.2 Required Stubs/Drivers
Driver: IUserInterfaceDriver (smaller version of IUserInterface class)RegisterUIDriver (smaller version of RegisterUI class)
Stubs: ServiceProviderStub (smaller version of service providerclass)ServiceStub(smaller version of service class)NextStub (captures next button clicks)
5.2.6.3 Test Steps
1. Open service details page of company registration.2. Input service information requested.3. Click “add another service.”4. Input service information requested.
CuuDuongThanCong.com https://fb.com/tailieudientucntt
772
SOFTWARE ENGINEERING HANDBOOK
5. Click “next.”6. View results.
5.2.6.4 Expected Results
Test success
1. Services information for particular company is present in servicetable.
Test failure
1. Service information for particular company is not present in servicetable.
5.2.7 Test Case: Service Provider:: getAddress()
5.2.7.1 Description
The purpose of the test is to determine whether the service providerclass is carrying out its responsibilities as expected. The service provider’srole in the user management subsystem is to receive, store, and return arange of information associated with a particular service provider. Thistest will focus specifically on retrieving address information for a serviceprovider.
5.2.7.2 Required Stubs/Drivers
Driver: IUserInterfaceDriver (smaller version of IUserInterface class)SearchUIDriver (smaller version of SearchUI class)
Stubs: ServiceProviderStub (smaller version of ServiceProviderclass)NextStub (captures next button clicks)
5.2.7.3 Test Steps
1. Open Dog E-DayCare search interface (for customers).2. Enter name of service provider.3. Click on “search.”4. View results.
5.2.7.4 Expected Results
Test success
1. If address information is available, correct address information isdisplayed in search results.
2. If address information is not available, no address information is dis-played in search results.
CuuDuongThanCong.com https://fb.com/tailieudientucntt
773
Test Plan
Test failure
1. If address information is available, incorrect address information isdisplayed in search results.
2. If address information is not available, someone else’s address infor-mation is displayed in search results.
5.3 Resource Management Subsystem
This resource management subsystem provides the application with itsoverall scheduling capabilities. It uses various respective classes and sub-systems to ensure that the user has up-to-date information regarding theservices he is interested in.
5.3.1 Test Case: ResourceUI :: showCreate()
5.3.1.1 Description
The purpose of this test case is to test the resource management userinterface class’s (ResourceUI) showCreate() method to determine if it candisplay the “register company — resource details” screen as an add screen.
5.3.1.2 Required Stubs/Drivers
Driver: IUserInterfaceDriver (smaller version of IUserInterface class)Stubs: ResourceStub (smaller version of resource class)
NextStub (captures next button clicks)OtherButtonsStub (captures other buttons clicked)
5.3.1.3 Test Steps
1. Execute the IUserInterfaceDriver in a Web browser.2. Select “staff” from the resource type drop down list.3. Enter a staff member’s first name (if resource type = staff).4. Enter a staff member’s last name (if resource type = staff).5. Select an item in the position drop down list.6. Determine that the height, width, and length fields are protected.7. Press the next button.
5.3.1.4 Expected Results
Test success
1. The IUserInterfaceDriver should display the “Register company —resource details” screen in the Web browser.
2. The resource type drop down list should contain an entry for staffand permit its selection.
3. The staff member first name can be entered.4. The staff member last name can be entered.
CuuDuongThanCong.com https://fb.com/tailieudientucntt
774
SOFTWARE ENGINEERING HANDBOOK
5. The position drop down list can be entered and should permit theselection of one of its items.
6. The height, width, and length fields should be protected.7. The next stub should return a basic Web page.
Test failure
1. Report all failures.
5.3.2 Test Case: ResourceUI :: showEdit()
5.3.2.1 Description
The purpose of this test case is to test the resource management userinterface class’s (ResourceUI) showEdit() method to determine if it can dis-play the “register company — resource details” screen as an edit screen.
5.3.2.2 Required Stubs/Drivers
Driver: IUserInterfaceDriver (smaller version of IUserInterface class)Stubs: ResourceStub (smaller version of resource class)
NextStub (captures next button clicks)OtherButtonsStub (captures other buttons clicked)
5.3.2.3 Test Steps
1. Execute the IUserInterfaceDriver in a Web browser.2. Determine that “staff” is displayed from the resource type drop
down list.3. Update the staff member’s first name (if resource type = staff).4. Update the staff member’s last name (if resource type = staff).5. Select another item in the position drop down list.6. Determine that the height, width, and length fields are protected.7. Press the next button.
5.3.2.4 Expected Results
Test success
1. The IUserInterfaceDriver should display the “register company —resource details” screen in the Web browser.
2. The resource type drop down list should display an entry for staff.3. The staff member first name should be updated.4. The staff member last name should be updated.5. The position drop down list should be enterable and permit the se-
lection of one of its items.6. The height, width, and length fields should be protected.7. The next stub should return a basic Web page.
CuuDuongThanCong.com https://fb.com/tailieudientucntt
775
Test Plan
Test failure
1. Report all failures.
5.3.3 Test Case: ResourceUI :: showSearch()
5.3.3.1 Description
The purpose of this test case is to test the resource management userinterface class’s (ResourceUI) showSearch() method to determine if it candisplay resource search screen (example not present in SDS).
5.3.3.2 Required Stubs/Drivers
Driver: IUserInterfaceDriver (smaller version of IUserInterface class)Stubs: ServiceProviderStub (smaller version of ServiceProvider
class)ResourceStub (smaller version of resource class)SearchStub (captures search button clicks)OtherButtonsStub (captures other buttons clicked)
5.3.3.3 Test Steps
1. Execute the IUserInterfaceDriver in a Web browser.2. Determine that the service provider drop down list displayed.3. Determine that the resource type drop down list displayed.4. Select a service provider from the service provider drop down list.5. Select a resource type from the resource type drop down list.6. Press the search button.
5.3.3.4 Expected Results
Test success
1. The IUserInterfaceDriver should display the “register company —resource details” screen in the Web browser.
2. The service provider drop down list should display serviceproviders.
3. The resource type drop down list should display the resource typesthat the selected service provider supports.
4. The service provider selected should be visible in the drop downlist.
5. The resource type selected should be visible in the drop down list.6. The search stub should return a basic Web page.
Test failure
1. Report all failures.
CuuDuongThanCong.com https://fb.com/tailieudientucntt
776
SOFTWARE ENGINEERING HANDBOOK
5.4 Order Subsystem
The Order Subsystem has responsibility for supporting the ordering ofproducts and services from Service Providers by Dog E-DayCareTM clients.
5.4.1 Test Case: OrderUI :: showCreate()
5.4.1.1 Description
The purpose of this test case is to test the order user interface class’s(OrderUI) showCreate() method to determine if it can display the “order —initiate order” screen (see SDS section 11.10) and if the drop down lists arepopulated.
5.4.1.2 Required Stubs/Drivers
Driver: IUserInterfaceDriver (smaller version of IUserInterface class)Stubs: OrderStub (smaller version of order class)
ServiceProviderStub (smaller version of ServiceProviderclass)ServiceStub (smaller version of service class)AppointmentStub (smaller version of appointment class)OtherButtonsStub (captures other buttons clicked)
5.4.1.3 Test Steps
1. Execute the IUserInterfaceDriver in a Web browser.2. Select an item in the service provider drop down list.3. Select an item in the service drop down list.4. Select an item in the service duration drop down list.5. Select an item in the time frame drop down list.
5.4.1.4 Expected Results
Test success
1. The IUserInterfaceDriver should display the “order — initiate order”screen in the Web browser.
2. The service provider drop down list should contain a list of serviceproviders.
3. The service drop down list should contain a list of services offeredby the selected service provider.
4. The service duration drop down list should contain a list of servicedurations available for the selected service.
5. The time frame drop down list should contain a list of all opening forthe selected service.
Test failure
1. Report all failures.
CuuDuongThanCong.com https://fb.com/tailieudientucntt
777
Test Plan
5.4.2 Test Case: OrderUI :: showEdit()
5.4.2.1 Description
The purpose of this test case is to test the order user interface class’s(OrderUI) showEdit() method to determine if it can display the “order —order details” screen.
5.4.2.2 Required Stubs/Drivers
Driver: IUserInterfaceDriver (smaller version of IUserInterface class)Stubs: OrderStub (smaller version of Order class)
OtherButtonsStub (captures other buttons clicked)
5.4.2.3 Test Steps
1. Execute the IUserInterfaceDriver in a Web browser.2. Determine if the correct service provider is displayed.3. Determine if the correct service is displayed.4. Determine if the correct location is displayed.5. Determine if the correct phone number is displayed.6. Determine if the correct e-mail address is displayed.7. Determine if the correct appointment is displayed.
5.4.2.4 Expected Results
Test success
1. The IUserInterfaceDriver should display the “order — order details”screen in the Web browser.
2. The service provider name should display.3. The service name should display.4. The location should display.5. The phone number should display.6. The e-mail address should display.7. The appointment should display.
Test failure
1. Report all failures.
5.4.3 Test Case: OrderUI :: showSearch()
5.4.3.1 Description
The purpose of this test case is to test the order user interface class’s(OrderUI) showSearch() method to determine if it can display the “search”screen and conduct a search using a stub to display the “results.”
CuuDuongThanCong.com https://fb.com/tailieudientucntt

778
SOFTWARE ENGINEERING HANDBOOK
5.4.3.2 Required Stubs/Drivers
Driver: IUserInterfaceDriver (smaller version of IUserInterface class)Stubs: SearchStub (captures search button clicks)
OtherButtonsStub (captures other buttons clicked)
5.4.3.3 Test Steps
1. Execute the IUserInterfaceDriver in a Web browser.2. Enter a value in the customer ID field.3. Press the search button.4. Enter a value in the customer name field.5. Press the search button.6. Enter a value in the order ID field.7. Press the search button.8. Enter a value in the invoice ID field.9. Press the search button.
5.4.3.4 Expected Results
Test success
1. The IUserInterfaceDriver should display the “search” screen in theWeb browser.
2. The screen should permit entry of a customer ID.3. The search stub should return a basic Web page.4. The screen should permit entry of a customer name.5. The search stub should return a basic Web page.6. The screen should permit entry of an order ID.7. The search stub should return a basic Web page.8. The screen should permit entry of an invoice ID.9. The search stub should return a basic Web page.
Test failure
1. Report all failures.
5.4.4 Test Case: OrderUI :: showList()
5.4.4.1 Description
The purpose of this test case is to test the order user interface class’s(OrderUI) showList() method to determine if it can display the “searchresults — customer search results” screen.
5.4.4.2 Required Stubs/Drivers
Driver: IUserInterfaceDriver (smaller version of IUserInterface class)Stubs: OrderStub (smaller version of order class)
InvoiceStub (smaller version of the invoice class)
CuuDuongThanCong.com https://fb.com/tailieudientucntt
779
Test Plan
AddressStub(smaller version of the address class)OtherButtonsStub (captures other buttons clicked)
5.4.4.3 Test Steps
1. Execute the IUserInterfaceDriver in a Web browser.2. Determine if the correct customer name is displayed.3. Determine if the correct address is displayed.4. Determine if the correct e-mail address is displayed.5. Determine if the correct phone number is displayed.6. Determine if the correct order numbers are displayed.7. Determine if the correct invoice numbers are displayed.
5.4.4.4 Expected Results
Test success
1. The IUserInterfaceDriver should display the “search results — cus-tomer search results” screen in the Web browser.
2. The customer name should display.3. The address should display.4. The e-mail address should display5. The phone number should display.6. The order numbers should display.7. The invoice numbers should display.
Test failure
1. Report all failures.
5.4.5 Test Case: OrderLineItem
5.4.5.1 Description
The purpose of this test case is to test the OrderLineItem class to deter-mine if it correctly handles order line item-related data.
5.4.5.2 Required Stubs/Drivers
Driver: OrderLineItem test driver: a small console application thatassigns a value to the OrderLineItem and prints out the resultin a console window
Stub: N/A
5.4.5.3 Test Steps
1. Execute the OrderLineItem test driver in a console window. The testdriver application should execute the following methods of OrderLi-neItem class:a. SetServiceName()b. SetUnitPrice()
CuuDuongThanCong.com https://fb.com/tailieudientucntt
780
SOFTWARE ENGINEERING HANDBOOK
c. SetQuantity()d. GetServiceName()e. GetUnitPrice()f. GetQuantity()g. GetTotalPrice()h. GetTax()i. GetTotalPriceWithTax()
2. Review the console printout to see if all property values are correct-ly assigned and returned.
3. Review the console printout to see if the getTotalPrice method re-turn value is the result of quantity multiplied by UnitPrice and thenadd tax.
5.4.5.4 Expected Results
Test success
1. All property values assigned match property values returned.2. The total price matches the calculation from quantity, unit price,
and tax values.
Test failure
1. Property values assigned do not match property values returned.2. Total price does not match the calculation from quantity, unit price,
and tax values.
5.4.6 Test Case: ServiceResourceRequirement
5.4.6.1 Description
The purpose of this test case is to test the ServiceResourceRequirementclass to determine if it correctly handles the service resource requirement-related data.
5.4.6.2 Required Stubs/Drivers
Driver: ServiceResourceRequirement test driver: a small console ap-plication that assigns a value to ServiceResourceRequire-ment and prints out the result in a console window.
Stubs: N/A
5.4.6.3 Test Steps
1. Execute the ServiceResourceRequirement test driver in a consolewindow. The test driver application should execute the followingmethods of order class:a. SetQuantity()b. SetPercentage()
CuuDuongThanCong.com https://fb.com/tailieudientucntt
781
Test Plan
c. SetResourceType()d. GetQuantity()e. GetPercentage()f. GetResourceType()
2. Review the console printout to see if all property values are correct-ly assigned and returned.
5.4.6.4 Expected Results
Test success
1. All property values assigned match property values returned.2. If quantity value is less than 1, an exception is raised.3. If percentage value is greater than 1, an exception is raised.
Test failure
1. Property values assigned do not match property values returned.2. If quantity value is less than 1, no exception is raised.3. If percentage value is greater than 1, no exception is raised.
5.4.7 Test Case: Service
5.4.7.1 Description
The purpose of this test case is to test the service class to determine ifit correctly handles the service related data.
5.4.7.2 Required Stubs/Drivers
Driver: service test driver: a small console application that assigns avalue to the order and prints out the result in a consolewindow
Stubs: ServiceResourceRequirement class or stub
5.4.7.3 Test Steps
1. Execute the service test driver in a console window. The test driverapplication should execute the following methods of order class:a. SetName()b. SetDescription()c. SetUnitCost()d. GetResourceRequirement()e. GetName()f. GetDescription()g. GetUnitCost()
2. Review the console printout to see if all property values are correct-ly assigned and returned.
CuuDuongThanCong.com https://fb.com/tailieudientucntt
782
SOFTWARE ENGINEERING HANDBOOK
5.4.7.4 Expected Result
Test success
1. All property values assigned match property values returned.
Test failure
1. Property values assigned do not match property values returned.
5.4.8 Test Case: Order
5.4.8.1 Description
The purpose of this test case is to test the order class to determine if itcorrectly handles the order-related data.
5.4.8.2 Required Stubs/Drivers
Driver: order test driver: a small console application that assigns avalue to the order and prints out the result in a consolewindow
Stubs: OrderLineItem class or stubInvoice class or stubPayment class or stubCustomer class or stub
5.4.8.3 Test Steps
1. Execute the order test driver in a console window. The test driverapplication should execute the following methods of order class:a. SetOrderDateTimeb. SetCompletionDateTimec. SetOrderStatusd. GetOrderLineItemse. GetTotalPricef. GetCustomerg. GetPaymenth. GetInvoice
2. Review the console printout to see if all property values are correct-ly assigned and returned.
3. Review the console printout to see if the getTotalPrice method re-turn value is the total of all OrderLineItem price.
5.4.8.4 Expected Results
Test success
1. All property values assigned match property values returned.2. The total price matches the calculation from order line items.
CuuDuongThanCong.com https://fb.com/tailieudientucntt
783
Test Plan
Test failure
1. Property values assigned do not match property values returned.2. Total price does not match the calculation from order line items.
5.5 Accounting Subsystem
The accounting subsystem is responsible for processing the financialtransactions.
5.5.1 Test Case: Accounting:InvoicePrint
5.5.1.1 Description
The purpose of this test is to determine if the service care provider isable to print invoices for billing.
5.5.1.2 Required Stubs/Drivers
1. Orders must be placed against the service care provider in questionvia the order subsystem and the OrderService class.
2. The accounting subsystem will be invoked with the invoice class inparticular.
5.5.1.3 Test Steps
1. A test customer order must be placed against a predetermined ser-vice care provider.
2. The service care provider must log into the system successfully.3. The service care provider must select the invoices to be printed.
5.5.1.4 Expected Results
Test success
1. Invoices printing out successfully with the correct data will deter-mine the success of the test.
Test failure
1. The test can be deemed unsuccessful if the invoice does not print.2. The test will also be unsuccessful if the format is incorrect3. The test will be unsuccessful if the wrong line items are printed.
5.5.2 Test Case: Accounting:Payment
5.5.2.1 Description
The purpose of this test is to determine if a representative of the servicecare provider can enter a payment receipt within the accounting sub-system.
CuuDuongThanCong.com https://fb.com/tailieudientucntt
784
SOFTWARE ENGINEERING HANDBOOK
5.5.2.2 Required Stubs/Drivers
The accounting subsystem will be invoked with particular attention tothe payment class.
5.5.2.3 Test Steps
1. The service care provider must successfully log into the system.2. The service care provider must invoke the accounting user interface
to enter the payment receipt.3. The service care provider must enter a payment receipt and press
the button to commit the transaction.
5.5.2.4 Expected Results
Test success
1. A subsequent query indicates the customer’s balance reflects the re-cent payment.
2. A successful message is displayed.
Test failure
1. The customer’s balance does not reflect the payment receipt.2. The customer’s balance reflects an incorrect amount that is a result
of faulty logic within the program.
5.5.3 Test Case: Accounting:InvoiceList
5.5.3.1 Description
The purpose of this test is to ensure that every time a service care pro-vider requests to view invoices, the correct invoices will be displayed.
5.5.3.2 Required Stubs/Drivers
The application subsystem is required, with particular attention to theinvoice class.
5.5.3.3 Test Steps
1. The service care provider will successfully log into the system2. The service care provider will select the button to view invoices.3. The system will determine who is logged on and display the appro-
priate invoices for that user.
5.5.3.4 Expected Results
Test success
1. All invoices for the particular service care provider are displayedwith the correct information.
CuuDuongThanCong.com https://fb.com/tailieudientucntt
785
Test Plan
Test failure
1. The invoices displayed are for another service care provider.2. The invoices indicate an incorrect balance or other incorrect
information
5.6 Customer Relationship Management Subsystem
The customer relationship management subsystem provides the appli-cation with the ability to provide for interaction between the customersand service care providers. It also provides the system administrator withthe ability to gain feedback from the customer in an effort to revamp theapplication continually.
5.6.1 Test Case: This Feature Set Will Be Available in Phase II.
5.7 Persistence Subsystem
The persistence subsystem has responsibility for supporting persistentdata.
The purpose of this group of test cases is to determine whether the Per-sistenceManager class is carrying out its responsibilities as expected. Per-sistenceManager is a critical part of the system that handles the persis-tence activities of all objects. Based on the system architecture design, thepersistence layer java code library from http://artyomr.narod.ru has beenselected to execute the majority of the persistence functionality. The per-sistence layer code library uses an XML file to store the database map andclass map information. So the correctness of the XML file in terms of cor-rectly mapping the class structure design with the database design willessentially determine whether the objects can be correctly persisted to thedatabase. This will be a major area of potential fault of the implementationand hence one of the major focuses of the testing of the persistence sub-system.
Due to limit of space, the document specifies in detail the example ofcustomer object persistence. Note that tests in similar patterns will needto be executed for EVERY object that needs to be persisted.
5.7.1 Test Case: PersistenceManager :: loadXMLConfig()
5.7.1.1 Description/Purpose
This test case tests the persistence manager’s functionality to load classmap and database map from XML file. Potential errors are usually relatedto bad XML file entries that are not valid XML files or do not load correctlyinto the class map and database map.
CuuDuongThanCong.com https://fb.com/tailieudientucntt
786
SOFTWARE ENGINEERING HANDBOOK
5.7.1.2 Required Stubs/Drivers
1. DatabaseMap and ClassMap configuration XML file in format speci-fied by http://artyomr.narod.ru/docs/pl/XMLConfigLoader.html
5.7.1.3 Test Steps
1. Edit Config.xml with all database map and class map information ac-cording to http://artyomr.narod.ru/docs/pl/XMLConfigLoader.html.
2. Start PersistenceManager application by running java Persistence-Manager.class from command prompt, loading Config.xml as theconfiguration.
3. Exit PersistenceManager application.
5.7.1.4 Expected Results
Test success
1. The PersistenceManager application successfully starts without er-ror messages.
Test failure
1. XML parser error when loading Config.xml2. Error parsing class map and database map information
5.7.2 Test Case: PersistenceManager :: saveObject()
5.7.2.1 Description/Purpose
This test case tests the persistence manager’s functionality to save theobject to the database.
5.7.2.2 Required Stubs/Drivers
1. DatabaseMap and ClassMap configuration XML file in format speci-fied by http://artyomr.narod.ru/docs/pl/XMLConfigLoader.html
2. Customer registration screens
5.7.2.3 Test Steps
1. Edit Config.xml with all database map and class map information ac-cording to http://artyomr.narod.ru/docs/pl/XMLConfigLoader.html.
2. Start PersistenceManager application by running java Persistence-Manager.class from command prompt, loading Config.xml as theconfiguration.
3. Browse to Dog E-Day-Care home page from the Web site.4. Click register button.5. Input customer information.6. Click register to create a new customer.7. Use SQL tool to open the database.
CuuDuongThanCong.com https://fb.com/tailieudientucntt

787
Test Plan
8. Execute “SELECT * FROM CUSTOMER” SQL statement and reviewthe result.
9. Execute “SELECT * FROM DOG” SQL statement and review theresult.
5.7.2.4 Expected Results
Test success
1. The customer and dog information should exist in the database.
Test failure
1. RMI error when clicking register button2. Error executing SQL statement3. Customer and dog not get added to the database
5.7.3 Test Case: PersistenceManager :: retrieveObject()
5.7.3.1 Description/Purpose
This test case tests the persistence manager’s functionality to retrievean object from the database.
5.7.3.2 Required Stubs/Drivers
1. DatabaseMap and ClassMap configuration XML file in format speci-fied by http://artyomr.narod.ru/docs/pl/XMLConfigLoader.html
2. Customer information screens
5.7.3.3 Test Steps
1. Edit Config.xml with all database map and class map information ac-cording to http://artyomr.narod.ru/docs/pl/XMLConfigLoader.html.
2. Start persistencemanager application by running java Persistence-Manager.class from command prompt, loading Config.xml as theconfiguration.
3. Browse to Dog E-Day-Care home page from the Web site.4. Log in to Dog E-Day-Care system.5. Click edit customer profile button6. Review the information retrieved from persistence manager
5.7.3.4 Expected Results
Test success
1. The customer and dog information should be retrieved and matchwhat was input.
Test failure
1. RMI error when clicking edit customer profile button2. Cannot retrieve customer and dog information
CuuDuongThanCong.com https://fb.com/tailieudientucntt
788
SOFTWARE ENGINEERING HANDBOOK
3. Error executing SQL statement4. Customer and dog information retrieved but does not match the
data that was input
6 APPENDIX 2: INTEGRATION TESTING TESTS
Integration tests are scenario based, capturing key activities that theDog E-DayCare SystemΤΜ allows the user to perform.
6.1 Test Case: Customer Registration
6.1.1 Description
Registering with the Dog E-DayCare system is the key task that allowsusers to take advantage of the services Dog E-DayCare offers. Registrationrequires collaboration among three subsystems: user management, appli-cation controller, and persistence. The purpose of this test is to find errorsin the interactions that must take place across these subsystems.
6.1.2 Required Stubs/Drivers
No stubs or drivers are required.
6.1.3 Test Steps
1. User opens Dog E-DayCare welcome page.2. User selects “register.”3. Register customer/about you page displays.4. User fills in fields and clicks next.5. Register customer/about your dog page displays.6. User fills in fields and clicks next.7. Register customer/user ID, password page displays.8. User fills in fields and clicks next.9. Register customer/verify Information page displays with appropri-
ate information.10. User reviews information and clicks finish.11. Register customer/thank you page displays.12. User receives confirmation e-mail.
6.1.4 Expected Results
Test success
1. User is able to move through each step of the registration processsuccessfully. User information displayed in the verify informationpage is correct. Thank you page appears and user receives e-mailconfirmation.
CuuDuongThanCong.com https://fb.com/tailieudientucntt

789
Test Plan
Test failure
1. User cannot click from one step in the registration process to the next.2. User information displayed in the verify information page is incorrect.3. User does not receive a confirmation e-mail.
6.2 Test Case: Reallocate Resources
6.2.1 Description
One of the key services Dog E-DayCare provides to dog care companiesis the ability to manage their resources (e.g., staff, kennels, and play areas),allocating and reallocating resources, for example, in response to staff ill-ness, rainy weather, etc. Reallocating resources requires collaborationamong several subsystems: user management, order, resource manage-ment, application controller, and persistence. The purpose of this test is tofind errors in the interactions that must take place across these sub-systems.
6.2.2 Required Stubs/Drivers
No stubs or drivers are required.
6.2.3 Test Steps
1. User opens schedule/this week page.2. User selects appointment whose resources need to be reallocated.3. Schedule/appointment details page displays.4. User selects option to “reallocate” resources.5. Schedule/resource details page displays.6. User revises resource details as necessary and clicks next.7. Schedule/confirm changes page displays.8. User clicks finish.9. Revised schedule/appointment details page displays.
6.2.4 Expected Results
Test success
1. User is able to move through each step of the reallocation processsuccessfully. Reallocation information displayed in the confirmchanges page is correct. Appointment details have been updated.
Test failure
1. User cannot click from one step in the reallocation process to thenext.
2. User information displayed in the confirm changes page is incorrect.3. Appointment details have not been updated.
CuuDuongThanCong.com https://fb.com/tailieudientucntt
790
SOFTWARE ENGINEERING HANDBOOK
6.3 Test Case: Search for Service Provider and Initiate Order
6.3.1 Description
The Dog E-DayCare system allows customers to search for service pro-viders based on geographic location and service desired. From the searchresults, a user can initiate an order.
Searching for a service provider and initiating an order require collabo-ration among several subsystems: user management, order, applicationcontroller, and persistence. The purpose of this test is to find errors in theinteractions that must take place across these subsystems.
6.3.2 Required Stubs/Drivers
No stubs or drivers are required.
6.3.3 Test Steps
1. User opens search for service provider page.2. User enters required information and clicks “search.”3. Search results page displays all service providers that match crite-
ria.4. User selects “initiate order” button associated with the service pro-
vider of choice.5. Order/initiate order page displays.
6.3.4 Expected Results
Test success
1. The search results page displays service providers matching the us-er’s criteria. The order/initiate order page displays the name of theservice provider selected and the services available from this pro-vider in the appropriate fields.
Test failure
1. Search results page does not display.2. Search results do not match criteria.3. Order/initiate order page does not display correct service provider
information.
6.4 Test Case: Place Order
6.4.1 Description
The Dog E-DayCare system allows customers to place an order for theservice they need, from a service provider of their choice, within a desiredtimeframe. Placing an order requires collaboration among several
CuuDuongThanCong.com https://fb.com/tailieudientucntt
791
Test Plan
subsystems: order, user management, resource management, applicationcontroller, and persistence. The purpose of this test is to find errors in theinteractions that must take place across these subsystems.
6.4.2 Required Stubs/Drivers
No stubs or drivers required.
6.4.3 Test Steps
1. Order/initiate order page is displayed.2. User fills in all fields.3. User selects “view openings.”4. Order/openings page displays.5. User selects an available appointment time.6. Order/order details page displays.7. User selects “place order.”8. Order/order confirmation page displays.9. An e-mail is sent to user.
6.4.4 Expected Results
Test success
1. The user is able to move successfully through each step in the pro-cess of placing an order. The Order/openings page displays the cor-rect information on available appointment times. The Order/orderdetails page displays the correct information. An email is sent to theuser.
Test failure
1. The order/openings page displays incorrect information2. The order/order details page displays incorrect information.3. An e-mail is not sent to the user.
6.5 Test Case: Pay for Service
6.5.1 Description
The Dog E-DayCare system allows customers to pay online for the dogcare services they have received. Paying for service requires collaborationamong several subsystems: accounting, order, user management, applica-tion controller, and persistence. The purpose of this test is to find errors inthe interactions that must take place across these subsystems.
6.5.2 Required Stubs and Drivers
No stubs or drivers are required.
CuuDuongThanCong.com https://fb.com/tailieudientucntt

6.5.3 Test Steps
1. User opens the payment/initiate payment page.2. User enters the order ID number and clicks “next.”3. The payment/payment details page displays.4. User reviews payment details and selects “next.”5. The payment/billing address page displays.6. User reviews information and clicks “next.”7. The payment/credit card details page displays.8. User enters information and clicks “next.”9. The payment/make payment page displays.
10. User reviews information and clicks “pay now.”11. The payment/payment confirmation page displays.12. An e-mail is sent to user.
6.5.4 Expected Results
Test success
1. The user is able to move successfully through each step in the pro-cess of making a payment for service. The payment/payment detailspage displays the correct information. The payment/billing addresspage displays the correct information. The payment/make paymentpage displays the correct information. An e-mail is sent to the user.
Test failure
1. The payment/payment details page displays incorrect information2. The payment/billing address page displays incorrect information.3. The payment/make payment page displays incorrect information.4. An e-mail is not sent to the user.
CuuDuongThanCong.com https://fb.com/tailieudientucntt
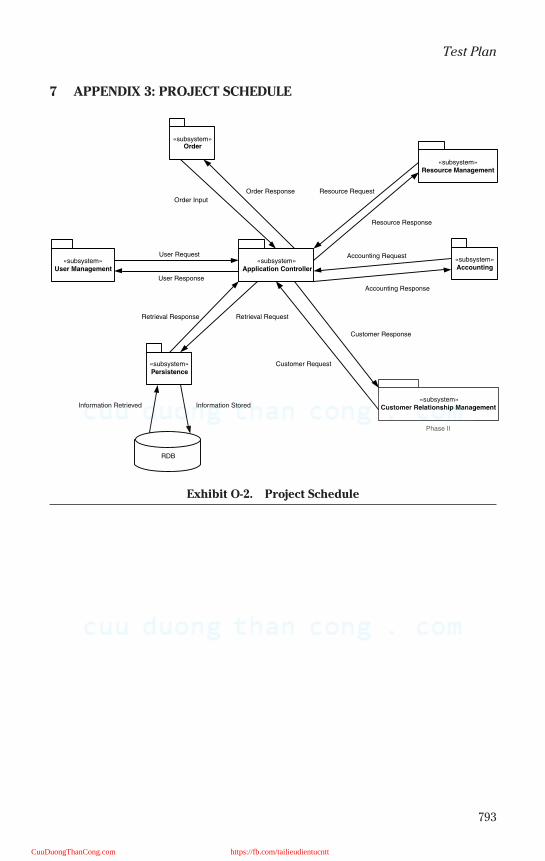
793
Test Plan
7 APPENDIX 3: PROJECT SCHEDULE
Exhibit O-2. Project Schedule
«subsystem»Order
«subsystem»Resource Management
«subsystem»Persistence
«subsystem»Accounting
«subsystem»User Management
«subsystem»Application Controller
User Request
User Response
Information StoredInformation Retrieved
Order Input
Order Response Resource Request
Resource Response
Accounting Request
Accounting Response
Retrieval Response Retrieval Request
«subsystem»Customer Relationship Management
Customer Response
Customer Request
Phase II
RDB
CuuDuongThanCong.com https://fb.com/tailieudientucntt

This page intentionally left blank
CuuDuongThanCong.com https://fb.com/tailieudientucntt

795
Appendix P
QA Handover Document
QA Handover Document
__________________________ ________ _______________ ___________________
Submitted: Dept. Phone number Submission date
______________________________ _____________________________ ______________________
Application/module Product/form to test (required) Implementation date
______________________________ _____________________________ ______________________
Handover item name/description Version/built New/modified
Brief but thorough description of the modification, along with any special testing requirements
_______________________________________________________________________________________
_______________________________________________________________________________________
_______________________________________________________________________________________
_______________________________________________________________________________________
_______________________________________________________________________________________
_______________________________________________________________________________________
Testing done at the development stage (attach documentation [required])
_______________________________________________________________________________________
_______________________________________________________________________________________
_______________________________________________________________________________________
_______________________________________________________________________________________
_______________________________________________________________________________________
Known issues (documentation attached [required])
_______________________________________________________________________________________
_______________________________________________________________________________________
_______________________________________________________________________________________
_______________________________________________________________________________________
_______________________________________________________________________________________
Team member/developer ___________________________________
Project manager ___________________________________
QA analyst ___________________________________
QA manager ___________________________________
Systems manager ___________________________________
CuuDuongThanCong.com https://fb.com/tailieudientucntt

This page intentionally left blank
CuuDuongThanCong.com https://fb.com/tailieudientucntt
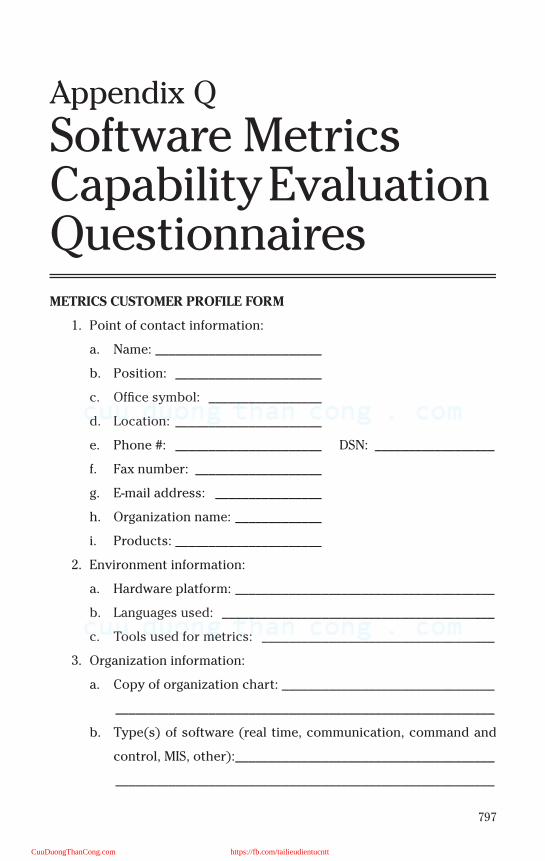
797
Appendix Q
Software Metrics Capability Evaluation QuestionnairesMETRICS CUSTOMER PROFILE FORM
1. Point of contact information:
a. Name: _________________________
b. Position: ______________________
c. Office symbol: _________________
d. Location: ______________________
e. Phone #: ______________________ DSN: __________________
f. Fax number: ___________________
g. E-mail address: ________________
h. Organization name: _____________
i. Products: ______________________
2. Environment information:
a. Hardware platform: _______________________________________
b. Languages used: _________________________________________
c. Tools used for metrics: ___________________________________
3. Organization information:
a. Copy of organization chart: ________________________________
_________________________________________________________
b. Type(s) of software (real time, communication, command and
control, MIS, other):_______________________________________
_________________________________________________________
CuuDuongThanCong.com https://fb.com/tailieudientucntt
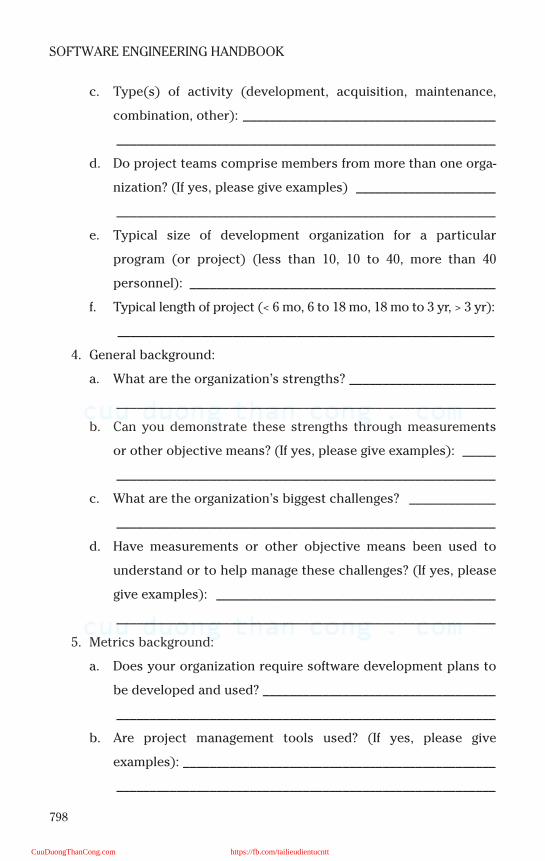
798
SOFTWARE ENGINEERING HANDBOOK
c. Type(s) of activity (development, acquisition, maintenance,
combination, other): ______________________________________
_________________________________________________________
d. Do project teams comprise members from more than one orga-
nization? (If yes, please give examples) _____________________
_________________________________________________________
e. Typical size of development organization for a particular
program (or project) (less than 10, 10 to 40, more than 40
personnel): ______________________________________________
f. Typical length of project (< 6 mo, 6 to 18 mo, 18 mo to 3 yr, > 3 yr):
___________________________________________________________
4. General background:
a. What are the organization’s strengths? ______________________
_________________________________________________________
b. Can you demonstrate these strengths through measurements
or other objective means? (If yes, please give examples): _____
_________________________________________________________
c. What are the organization’s biggest challenges? _____________
_________________________________________________________
d. Have measurements or other objective means been used to
understand or to help manage these challenges? (If yes, please
give examples): __________________________________________
_________________________________________________________
5. Metrics background:
a. Does your organization require software development plans to
be developed and used? ___________________________________
_________________________________________________________
b. Are project management tools used? (If yes, please give
examples): _______________________________________________
_________________________________________________________
CuuDuongThanCong.com https://fb.com/tailieudientucntt

799
Software Metrics Capability Evaluation Questionnaires
c. How is project status reported? (Please give examples): ______
_________________________________________________________
d. How is product quality reported? (Please give examples): ____
_________________________________________________________
e. What forces are driving the interest in metrics in your
organization? ____________________________________________
_________________________________________________________
ACQUISITION ORGANIZATION QUESTIONNAIRE
Questions for Metrics Capability Level 2
Theme 1: Formalization of Source Selection and Contract Monitoring Process
# Question Yes No NA ?
1a Is a software capability evaluation (SCE) or software development capability evaluation (SDCE) for developers part of your source se-lection process?
Comments:
1b Is proof of a specific CMM level required from developers as part of your source selection process?
Comments:
2 Does your organization require and evaluate developers’ draft software development plans as part of the source selection process?
Comments:
3 Are software metrics required as part of devel-opers’ software development plans (or other contractually binding metrics plans)?
Comments:
4 Are software cost and schedule estimates re-quired from the developer as part of the source selection process?
Comments:
CuuDuongThanCong.com https://fb.com/tailieudientucntt
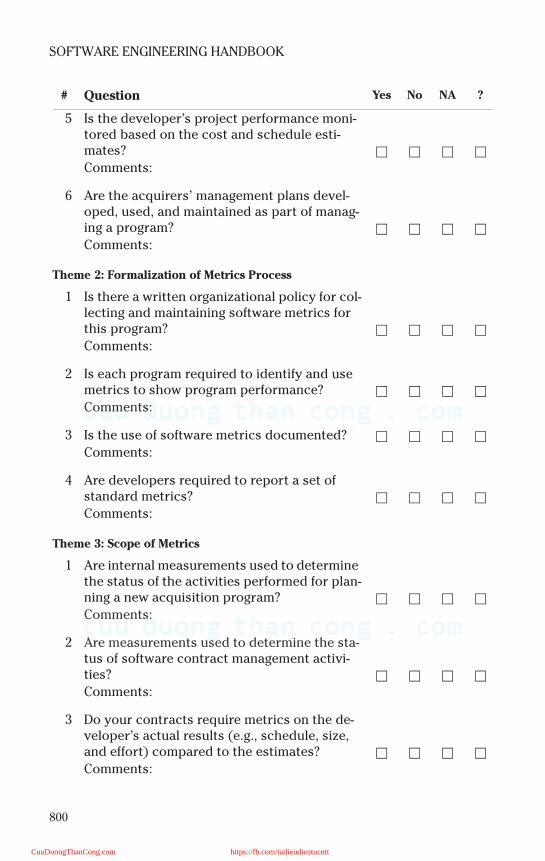
800
SOFTWARE ENGINEERING HANDBOOK
# Question Yes No NA ?
5 Is the developer’s project performance moni-tored based on the cost and schedule esti-mates?
Comments:
6 Are the acquirers’ management plans devel-oped, used, and maintained as part of manag-ing a program?
Comments:
Theme 2: Formalization of Metrics Process
1 Is there a written organizational policy for col-lecting and maintaining software metrics for this program?
Comments:
2 Is each program required to identify and use metrics to show program performance?
Comments:
3 Is the use of software metrics documented?
Comments:
4 Are developers required to report a set of standard metrics?
Comments:
Theme 3: Scope of Metrics
1 Are internal measurements used to determine the status of the activities performed for plan-ning a new acquisition program?
Comments:
2 Are measurements used to determine the sta-tus of software contract management activi-ties?
Comments:
3 Do your contracts require metrics on the de-veloper’s actual results (e.g., schedule, size, and effort) compared to the estimates?
Comments:
CuuDuongThanCong.com https://fb.com/tailieudientucntt
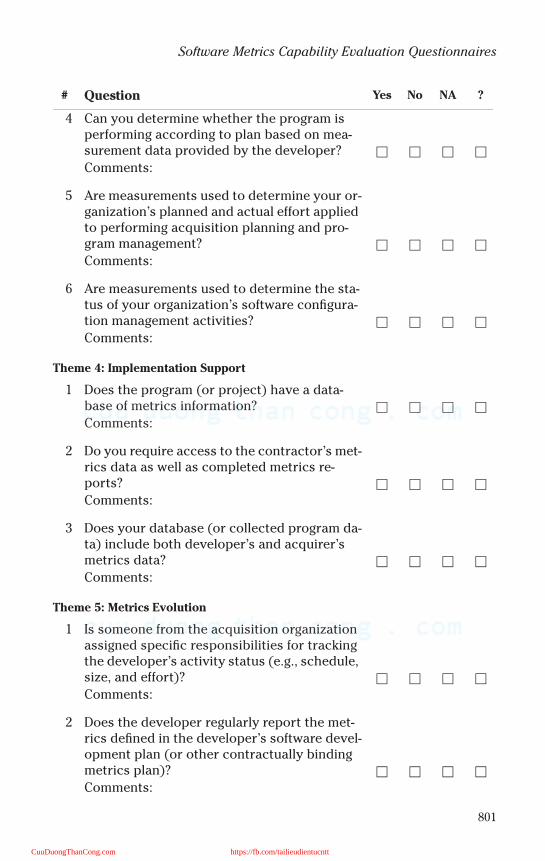
801
Software Metrics Capability Evaluation Questionnaires
# Question Yes No NA ?
4 Can you determine whether the program is performing according to plan based on mea-surement data provided by the developer?
Comments:
5 Are measurements used to determine your or-ganization’s planned and actual effort applied to performing acquisition planning and pro-gram management?
Comments:
6 Are measurements used to determine the sta-tus of your organization’s software configura-tion management activities?
Comments:
Theme 4: Implementation Support
1 Does the program (or project) have a data-base of metrics information?
Comments:
2 Do you require access to the contractor’s met-rics data as well as completed metrics re-ports?
Comments:
3 Does your database (or collected program da-ta) include both developer’s and acquirer’s metrics data?
Comments:
Theme 5: Metrics Evolution
1 Is someone from the acquisition organization assigned specific responsibilities for tracking the developer’s activity status (e.g., schedule, size, and effort)?
Comments:
2 Does the developer regularly report the met-rics defined in the developer’s software devel-opment plan (or other contractually binding metrics plan)?
Comments:
CuuDuongThanCong.com https://fb.com/tailieudientucntt
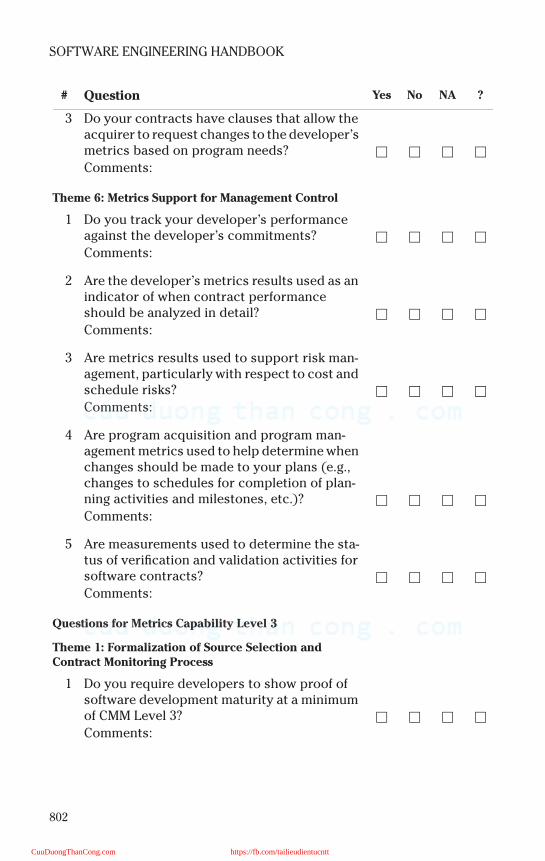
802
SOFTWARE ENGINEERING HANDBOOK
# Question Yes No NA ?
3 Do your contracts have clauses that allow the acquirer to request changes to the developer’s metrics based on program needs?
Comments:
Theme 6: Metrics Support for Management Control
1 Do you track your developer’s performance against the developer’s commitments?
Comments:
2 Are the developer’s metrics results used as an indicator of when contract performance should be analyzed in detail?
Comments:
3 Are metrics results used to support risk man-agement, particularly with respect to cost and schedule risks?
Comments:
4 Are program acquisition and program man-agement metrics used to help determine when changes should be made to your plans (e.g., changes to schedules for completion of plan-ning activities and milestones, etc.)?
Comments:
5 Are measurements used to determine the sta-tus of verification and validation activities for software contracts?
Comments:
Questions for Metrics Capability Level 3
Theme 1: Formalization of Source Selection and Contract Monitoring Process
1 Do you require developers to show proof of software development maturity at a minimum of CMM Level 3?
Comments:
CuuDuongThanCong.com https://fb.com/tailieudientucntt
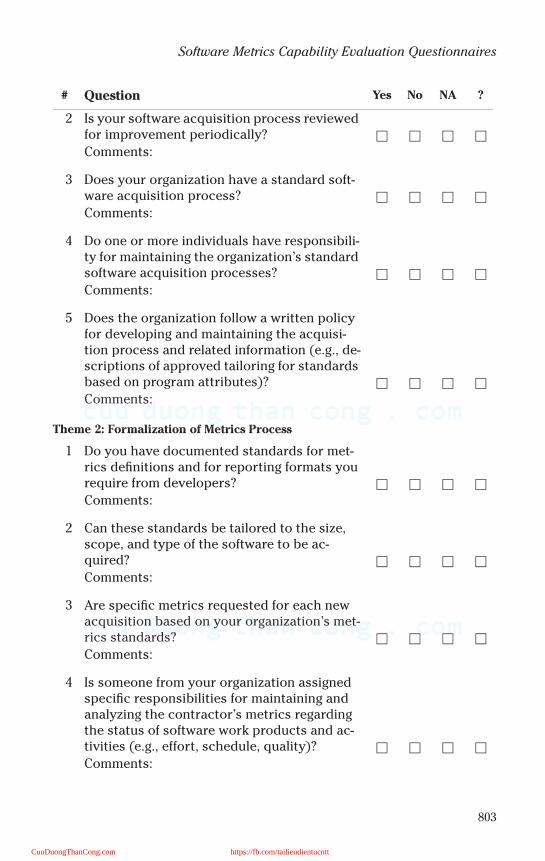
803
Software Metrics Capability Evaluation Questionnaires
# Question Yes No NA ?
2 Is your software acquisition process reviewed for improvement periodically?
Comments:
3 Does your organization have a standard soft-ware acquisition process?
Comments:
4 Do one or more individuals have responsibili-ty for maintaining the organization’s standard software acquisition processes?
Comments:
5 Does the organization follow a written policy for developing and maintaining the acquisi-tion process and related information (e.g., de-scriptions of approved tailoring for standards based on program attributes)?
Comments:
Theme 2: Formalization of Metrics Process
1 Do you have documented standards for met-rics definitions and for reporting formats you require from developers?
Comments:
2 Can these standards be tailored to the size, scope, and type of the software to be ac-quired?
Comments:
3 Are specific metrics requested for each new acquisition based on your organization’s met-rics standards?
Comments:
4 Is someone from your organization assigned specific responsibilities for maintaining and analyzing the contractor’s metrics regarding the status of software work products and ac-tivities (e.g., effort, schedule, quality)?
Comments:
CuuDuongThanCong.com https://fb.com/tailieudientucntt
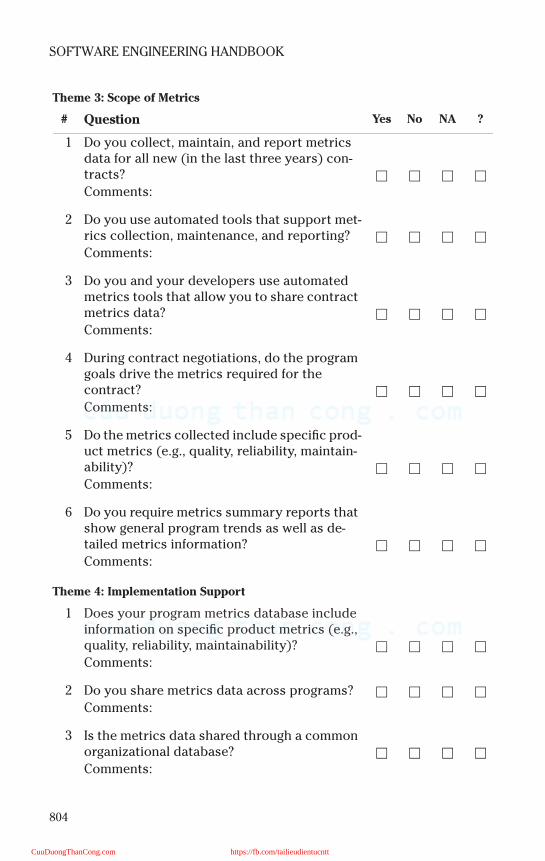
804
SOFTWARE ENGINEERING HANDBOOK
Theme 3: Scope of Metrics
# Question Yes No NA ?
1 Do you collect, maintain, and report metrics data for all new (in the last three years) con-tracts?
Comments:
2 Do you use automated tools that support met-rics collection, maintenance, and reporting?
Comments:
3 Do you and your developers use automated metrics tools that allow you to share contract metrics data?
Comments:
4 During contract negotiations, do the program goals drive the metrics required for the contract?
Comments:
5 Do the metrics collected include specific prod-uct metrics (e.g., quality, reliability, maintain-ability)?
Comments:
6 Do you require metrics summary reports that show general program trends as well as de-tailed metrics information?
Comments:
Theme 4: Implementation Support
1 Does your program metrics database include information on specific product metrics (e.g., quality, reliability, maintainability)?
Comments:
2 Do you share metrics data across programs?
Comments:
3 Is the metrics data shared through a common organizational database?
Comments:
CuuDuongThanCong.com https://fb.com/tailieudientucntt
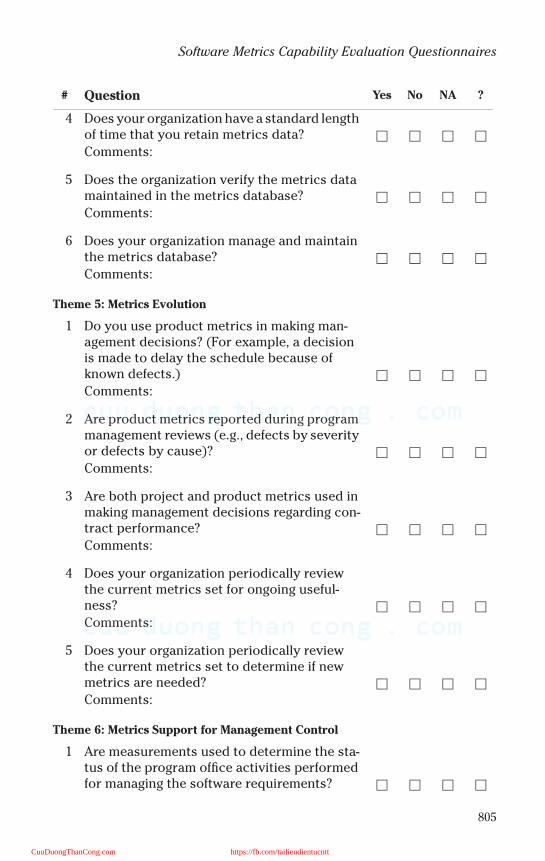
805
Software Metrics Capability Evaluation Questionnaires
# Question Yes No NA ?
4 Does your organization have a standard length of time that you retain metrics data?
Comments:
5 Does the organization verify the metrics data maintained in the metrics database?
Comments:
6 Does your organization manage and maintain the metrics database?
Comments:
Theme 5: Metrics Evolution
1 Do you use product metrics in making man-agement decisions? (For example, a decision is made to delay the schedule because of known defects.)
Comments:
2 Are product metrics reported during program management reviews (e.g., defects by severity or defects by cause)?
Comments:
3 Are both project and product metrics used in making management decisions regarding con-tract performance?
Comments:
4 Does your organization periodically review the current metrics set for ongoing useful-ness?
Comments:
5 Does your organization periodically review the current metrics set to determine if new metrics are needed?
Comments:
Theme 6: Metrics Support for Management Control
1 Are measurements used to determine the sta-tus of the program office activities performed for managing the software requirements?
CuuDuongThanCong.com https://fb.com/tailieudientucntt
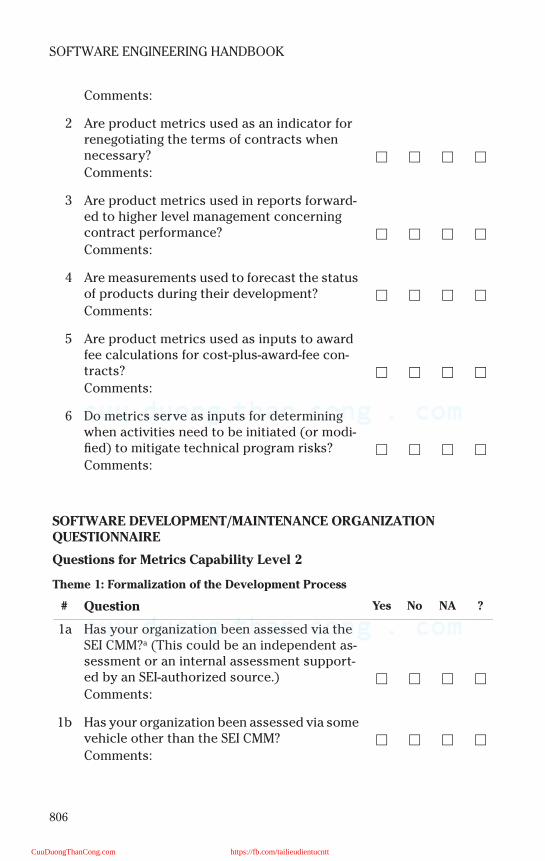
806
SOFTWARE ENGINEERING HANDBOOK
Comments:
2 Are product metrics used as an indicator for renegotiating the terms of contracts when necessary?
Comments:
3 Are product metrics used in reports forward-ed to higher level management concerning contract performance?
Comments:
4 Are measurements used to forecast the status of products during their development?
Comments:
5 Are product metrics used as inputs to award fee calculations for cost-plus-award-fee con-tracts?
Comments:
6 Do metrics serve as inputs for determining when activities need to be initiated (or modi-fied) to mitigate technical program risks?
Comments:
SOFTWARE DEVELOPMENT/MAINTENANCE ORGANIZATION QUESTIONNAIRE
Questions for Metrics Capability Level 2
Theme 1: Formalization of the Development Process
# Question Yes No NA ?
1a Has your organization been assessed via the SEI CMM?a (This could be an independent as-sessment or an internal assessment support-ed by an SEI-authorized source.)
Comments:
1b Has your organization been assessed via some vehicle other than the SEI CMM?
Comments:
CuuDuongThanCong.com https://fb.com/tailieudientucntt
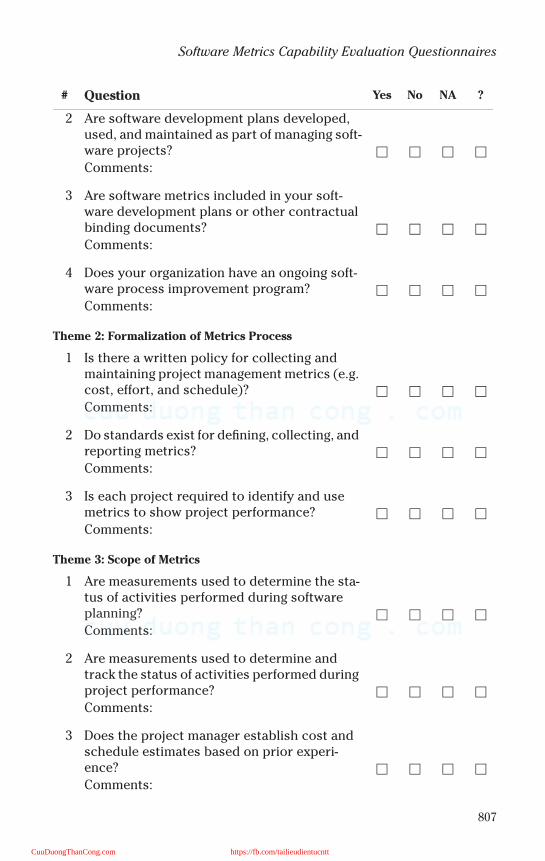
807
Software Metrics Capability Evaluation Questionnaires
# Question Yes No NA ?
2 Are software development plans developed, used, and maintained as part of managing soft-ware projects?
Comments:
3 Are software metrics included in your soft-ware development plans or other contractual binding documents?
Comments:
4 Does your organization have an ongoing soft-ware process improvement program?
Comments:
Theme 2: Formalization of Metrics Process
1 Is there a written policy for collecting and maintaining project management metrics (e.g. cost, effort, and schedule)?
Comments:
2 Do standards exist for defining, collecting, and reporting metrics?
Comments:
3 Is each project required to identify and use metrics to show project performance?
Comments:
Theme 3: Scope of Metrics
1 Are measurements used to determine the sta-tus of activities performed during software planning?
Comments:
2 Are measurements used to determine and track the status of activities performed during project performance?
Comments:
3 Does the project manager establish cost and schedule estimates based on prior experi-ence?
Comments:
CuuDuongThanCong.com https://fb.com/tailieudientucntt
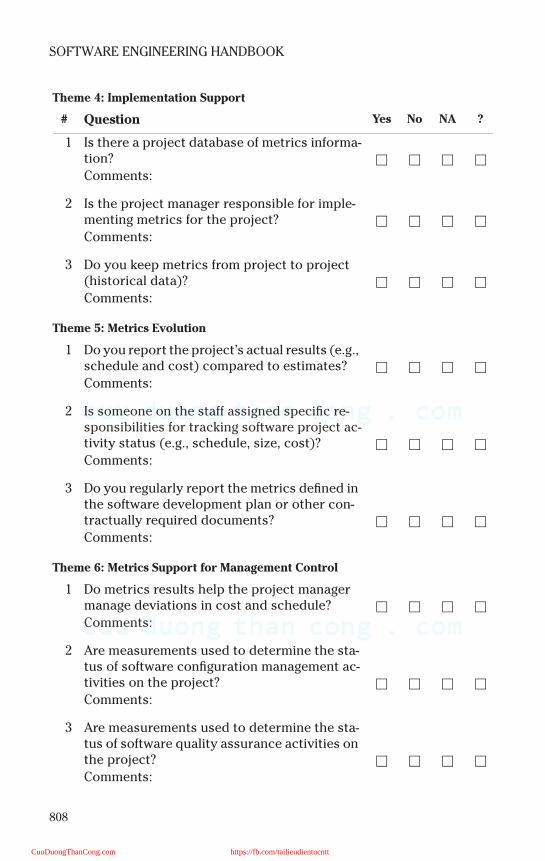
808
SOFTWARE ENGINEERING HANDBOOK
Theme 4: Implementation Support
# Question Yes No NA ?
1 Is there a project database of metrics informa-tion?
Comments:
2 Is the project manager responsible for imple-menting metrics for the project?
Comments:
3 Do you keep metrics from project to project (historical data)?
Comments:
Theme 5: Metrics Evolution
1 Do you report the project’s actual results (e.g., schedule and cost) compared to estimates?
Comments:
2 Is someone on the staff assigned specific re-sponsibilities for tracking software project ac-tivity status (e.g., schedule, size, cost)?
Comments:
3 Do you regularly report the metrics defined in the software development plan or other con-tractually required documents?
Comments:
Theme 6: Metrics Support for Management Control
1 Do metrics results help the project manager manage deviations in cost and schedule?
Comments:
2 Are measurements used to determine the sta-tus of software configuration management ac-tivities on the project?
Comments:
3 Are measurements used to determine the sta-tus of software quality assurance activities on the project?
Comments:
CuuDuongThanCong.com https://fb.com/tailieudientucntt
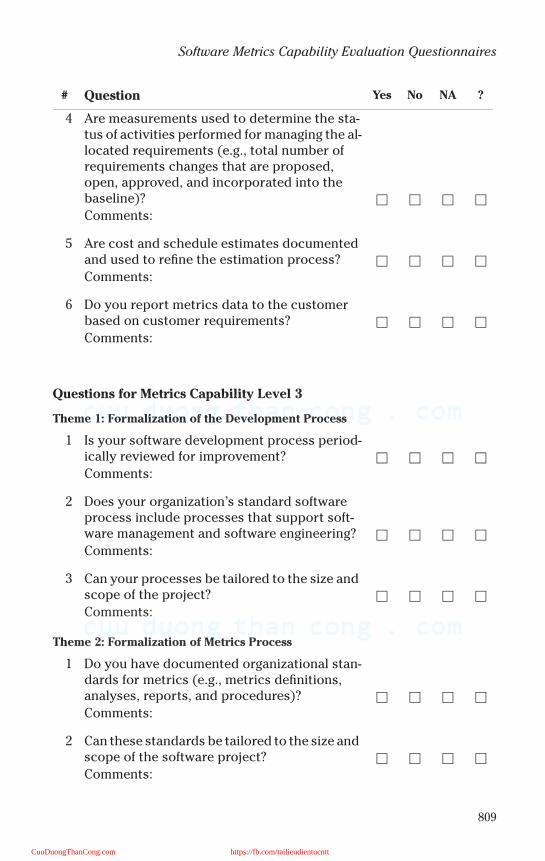
809
Software Metrics Capability Evaluation Questionnaires
# Question Yes No NA ?
4 Are measurements used to determine the sta-tus of activities performed for managing the al-located requirements (e.g., total number of requirements changes that are proposed, open, approved, and incorporated into the baseline)?
Comments:
5 Are cost and schedule estimates documented and used to refine the estimation process?
Comments:
6 Do you report metrics data to the customer based on customer requirements?
Comments:
Questions for Metrics Capability Level 3
Theme 1: Formalization of the Development Process
1 Is your software development process period-ically reviewed for improvement?
Comments:
2 Does your organization’s standard software process include processes that support soft-ware management and software engineering?
Comments:
3 Can your processes be tailored to the size and scope of the project?
Comments:
Theme 2: Formalization of Metrics Process
1 Do you have documented organizational stan-dards for metrics (e.g., metrics definitions, analyses, reports, and procedures)?
Comments:
2 Can these standards be tailored to the size and scope of the software project?
Comments:
CuuDuongThanCong.com https://fb.com/tailieudientucntt
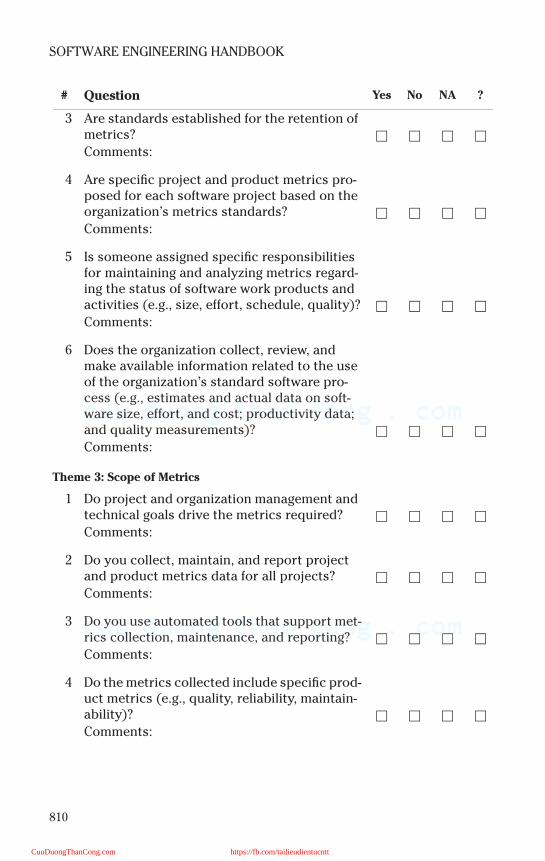
810
SOFTWARE ENGINEERING HANDBOOK
# Question Yes No NA ?
3 Are standards established for the retention of metrics?
Comments:
4 Are specific project and product metrics pro-posed for each software project based on the organization’s metrics standards?
Comments:
5 Is someone assigned specific responsibilities for maintaining and analyzing metrics regard-ing the status of software work products and activities (e.g., size, effort, schedule, quality)?
Comments:
6 Does the organization collect, review, and make available information related to the use of the organization’s standard software pro-cess (e.g., estimates and actual data on soft-ware size, effort, and cost; productivity data; and quality measurements)?
Comments:
Theme 3: Scope of Metrics
1 Do project and organization management and technical goals drive the metrics required?
Comments:
2 Do you collect, maintain, and report project and product metrics data for all projects?
Comments:
3 Do you use automated tools that support met-rics collection, maintenance, and reporting?
Comments:
4 Do the metrics collected include specific prod-uct metrics (e.g., quality, reliability, maintain-ability)?
Comments:
CuuDuongThanCong.com https://fb.com/tailieudientucntt
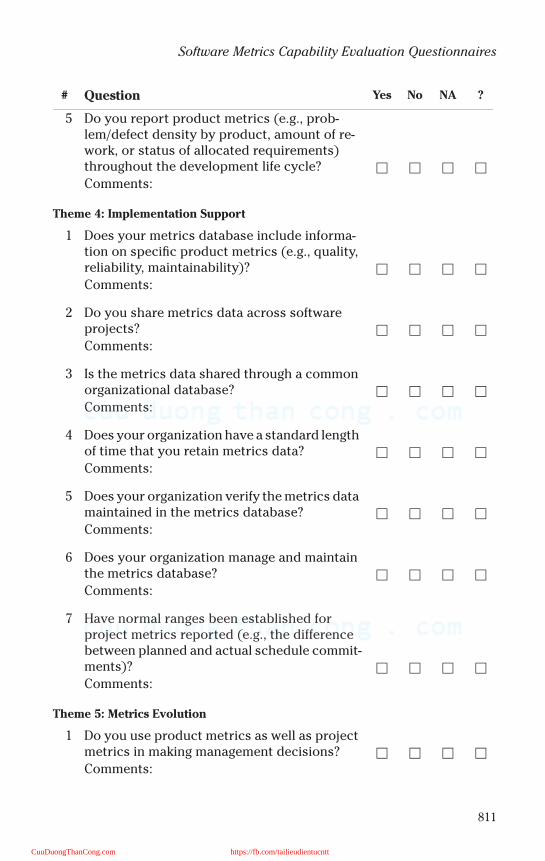
811
Software Metrics Capability Evaluation Questionnaires
# Question Yes No NA ?
5 Do you report product metrics (e.g., prob-lem/defect density by product, amount of re-work, or status of allocated requirements) throughout the development life cycle?
Comments:
Theme 4: Implementation Support
1 Does your metrics database include informa-tion on specific product metrics (e.g., quality, reliability, maintainability)?
Comments:
2 Do you share metrics data across software projects?
Comments:
3 Is the metrics data shared through a common organizational database?
Comments:
4 Does your organization have a standard length of time that you retain metrics data?
Comments:
5 Does your organization verify the metrics data maintained in the metrics database?
Comments:
6 Does your organization manage and maintain the metrics database?
Comments:
7 Have normal ranges been established for project metrics reported (e.g., the difference between planned and actual schedule commit-ments)?
Comments:
Theme 5: Metrics Evolution
1 Do you use product metrics as well as project metrics in making management decisions?
Comments:
CuuDuongThanCong.com https://fb.com/tailieudientucntt
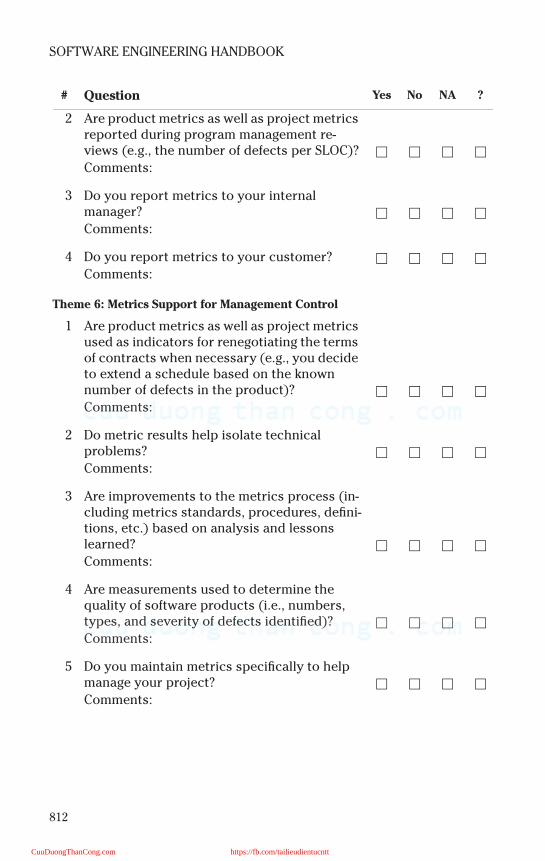
812
SOFTWARE ENGINEERING HANDBOOK
# Question Yes No NA ?
2 Are product metrics as well as project metrics reported during program management re-views (e.g., the number of defects per SLOC)?
Comments:
3 Do you report metrics to your internal manager?
Comments:
4 Do you report metrics to your customer?
Comments:
Theme 6: Metrics Support for Management Control
1 Are product metrics as well as project metrics used as indicators for renegotiating the terms of contracts when necessary (e.g., you decide to extend a schedule based on the known number of defects in the product)?
Comments:
2 Do metric results help isolate technical problems?
Comments:
3 Are improvements to the metrics process (in-cluding metrics standards, procedures, defini-tions, etc.) based on analysis and lessons learned?
Comments:
4 Are measurements used to determine the quality of software products (i.e., numbers, types, and severity of defects identified)?
Comments:
5 Do you maintain metrics specifically to help manage your project?
Comments:
CuuDuongThanCong.com https://fb.com/tailieudientucntt
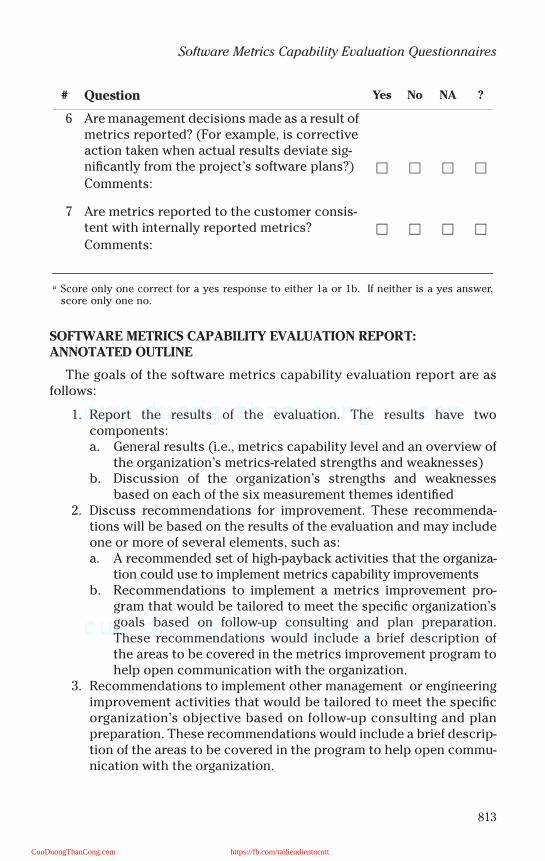
813
Software Metrics Capability Evaluation Questionnaires
SOFTWARE METRICS CAPABILITY EVALUATION REPORT: ANNOTATED OUTLINE
The goals of the software metrics capability evaluation report are asfollows:
1. Report the results of the evaluation. The results have twocomponents:a. General results (i.e., metrics capability level and an overview of
the organization’s metrics-related strengths and weaknesses)b. Discussion of the organization’s strengths and weaknesses
based on each of the six measurement themes identified2. Discuss recommendations for improvement. These recommenda-
tions will be based on the results of the evaluation and may includeone or more of several elements, such as:a. A recommended set of high-payback activities that the organiza-
tion could use to implement metrics capability improvementsb. Recommendations to implement a metrics improvement pro-
gram that would be tailored to meet the specific organization’sgoals based on follow-up consulting and plan preparation.These recommendations would include a brief description ofthe areas to be covered in the metrics improvement program tohelp open communication with the organization.
3. Recommendations to implement other management or engineeringimprovement activities that would be tailored to meet the specificorganization’s objective based on follow-up consulting and planpreparation. These recommendations would include a brief descrip-tion of the areas to be covered in the program to help open commu-nication with the organization.
# Question Yes No NA ?
6 Are management decisions made as a result of metrics reported? (For example, is corrective action taken when actual results deviate sig-nificantly from the project’s software plans?)
Comments:
7 Are metrics reported to the customer consis-tent with internally reported metrics?
Comments:
a Score only one correct for a yes response to either 1a or 1b. If neither is a yes answer,score only one no.
CuuDuongThanCong.com https://fb.com/tailieudientucntt
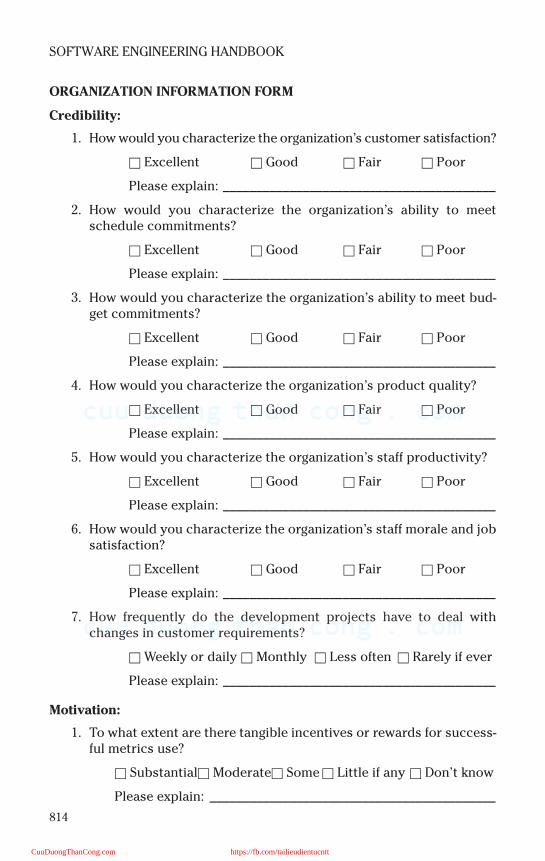
814
SOFTWARE ENGINEERING HANDBOOK
ORGANIZATION INFORMATION FORM
Credibility:
1. How would you characterize the organization’s customer satisfaction?
Excellent Good Fair Poor
Please explain: _________________________________________
2. How would you characterize the organization’s ability to meetschedule commitments?
Excellent Good Fair Poor
Please explain: _________________________________________
3. How would you characterize the organization’s ability to meet bud-get commitments?
Excellent Good Fair Poor
Please explain: _________________________________________
4. How would you characterize the organization’s product quality?
Excellent Good Fair Poor
Please explain: _________________________________________
5. How would you characterize the organization’s staff productivity?
Excellent Good Fair Poor
Please explain: _________________________________________
6. How would you characterize the organization’s staff morale and jobsatisfaction?
Excellent Good Fair Poor
Please explain: _________________________________________
7. How frequently do the development projects have to deal withchanges in customer requirements?
Weekly or daily Monthly Less often Rarely if ever
Please explain: _________________________________________
Motivation:
1. To what extent are there tangible incentives or rewards for success-ful metrics use?
Substantial Moderate Some Little if any Don’t know
Please explain: ___________________________________________
CuuDuongThanCong.com https://fb.com/tailieudientucntt
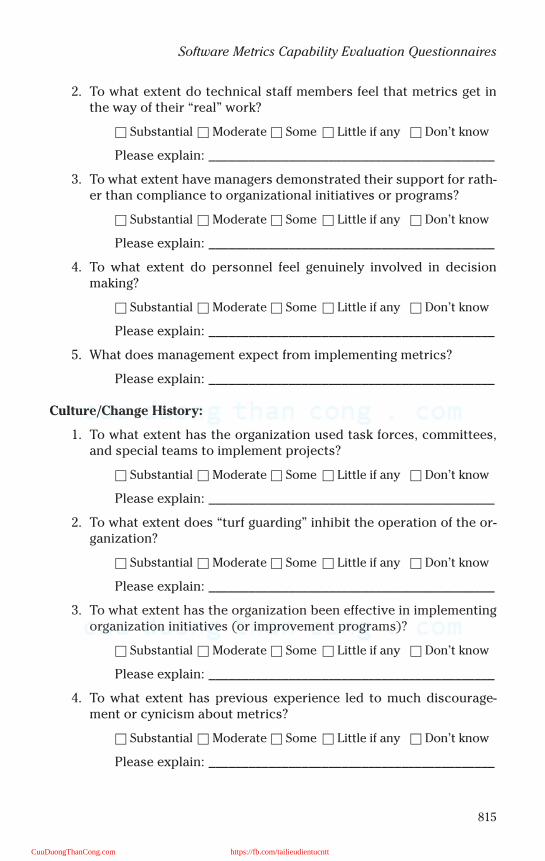
815
Software Metrics Capability Evaluation Questionnaires
2. To what extent do technical staff members feel that metrics get inthe way of their “real” work?
Substantial Moderate Some Little if any Don’t know
Please explain: ___________________________________________
3. To what extent have managers demonstrated their support for rath-er than compliance to organizational initiatives or programs?
Substantial Moderate Some Little if any Don’t know
Please explain: ___________________________________________
4. To what extent do personnel feel genuinely involved in decisionmaking?
Substantial Moderate Some Little if any Don’t know
Please explain: ___________________________________________
5. What does management expect from implementing metrics?
Please explain: ___________________________________________
Culture/Change History:
1. To what extent has the organization used task forces, committees,and special teams to implement projects?
Substantial Moderate Some Little if any Don’t know
Please explain: ___________________________________________
2. To what extent does “turf guarding” inhibit the operation of the or-ganization?
Substantial Moderate Some Little if any Don’t know
Please explain: ___________________________________________
3. To what extent has the organization been effective in implementingorganization initiatives (or improvement programs)?
Substantial Moderate Some Little if any Don’t know
Please explain: ___________________________________________
4. To what extent has previous experience led to much discourage-ment or cynicism about metrics?
Substantial Moderate Some Little if any Don’t know
Please explain: ___________________________________________
CuuDuongThanCong.com https://fb.com/tailieudientucntt
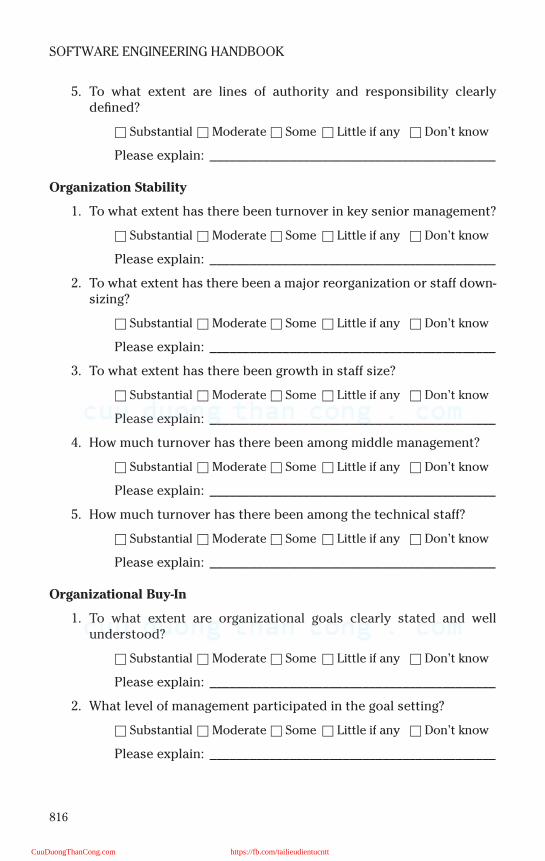
816
SOFTWARE ENGINEERING HANDBOOK
5. To what extent are lines of authority and responsibility clearlydefined?
Substantial Moderate Some Little if any Don’t know
Please explain: ___________________________________________
Organization Stability
1. To what extent has there been turnover in key senior management?
Substantial Moderate Some Little if any Don’t know
Please explain: ___________________________________________
2. To what extent has there been a major reorganization or staff down-sizing?
Substantial Moderate Some Little if any Don’t know
Please explain: ___________________________________________
3. To what extent has there been growth in staff size?
Substantial Moderate Some Little if any Don’t know
Please explain: ___________________________________________
4. How much turnover has there been among middle management?
Substantial Moderate Some Little if any Don’t know
Please explain: ___________________________________________
5. How much turnover has there been among the technical staff?
Substantial Moderate Some Little if any Don’t know
Please explain: ___________________________________________
Organizational Buy-In
1. To what extent are organizational goals clearly stated and wellunderstood?
Substantial Moderate Some Little if any Don’t know
Please explain: ___________________________________________
2. What level of management participated in the goal setting?
Substantial Moderate Some Little if any Don’t know
Please explain: ___________________________________________
CuuDuongThanCong.com https://fb.com/tailieudientucntt
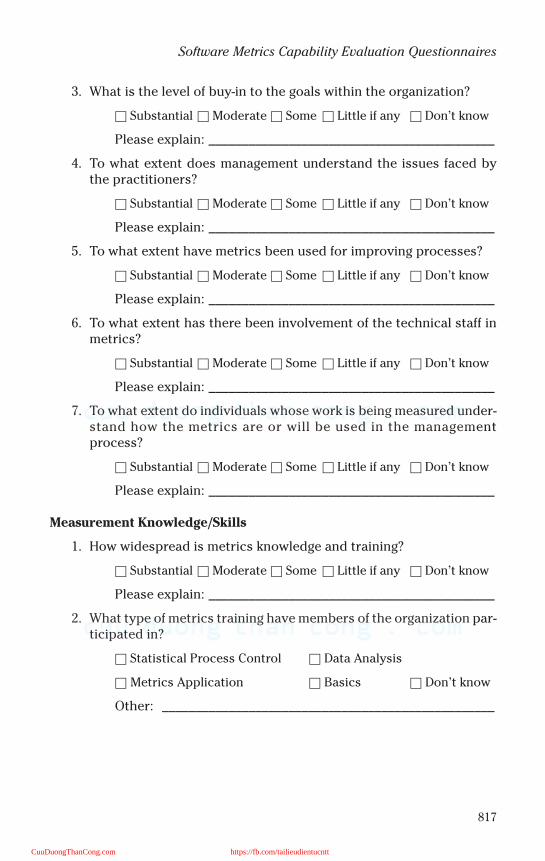
817
Software Metrics Capability Evaluation Questionnaires
3. What is the level of buy-in to the goals within the organization?
Substantial Moderate Some Little if any Don’t know
Please explain: ___________________________________________
4. To what extent does management understand the issues faced bythe practitioners?
Substantial Moderate Some Little if any Don’t know
Please explain: ___________________________________________
5. To what extent have metrics been used for improving processes?
Substantial Moderate Some Little if any Don’t know
Please explain: ___________________________________________
6. To what extent has there been involvement of the technical staff inmetrics?
Substantial Moderate Some Little if any Don’t know
Please explain: ___________________________________________
7. To what extent do individuals whose work is being measured under-stand how the metrics are or will be used in the managementprocess?
Substantial Moderate Some Little if any Don’t know
Please explain: ___________________________________________
Measurement Knowledge/Skills
1. How widespread is metrics knowledge and training?
Substantial Moderate Some Little if any Don’t know
Please explain: ___________________________________________
2. What type of metrics training have members of the organization par-ticipated in?
Statistical Process Control Data Analysis
Metrics Application Basics Don’t know
Other: __________________________________________________
CuuDuongThanCong.com https://fb.com/tailieudientucntt

This page intentionally left blank
CuuDuongThanCong.com https://fb.com/tailieudientucntt
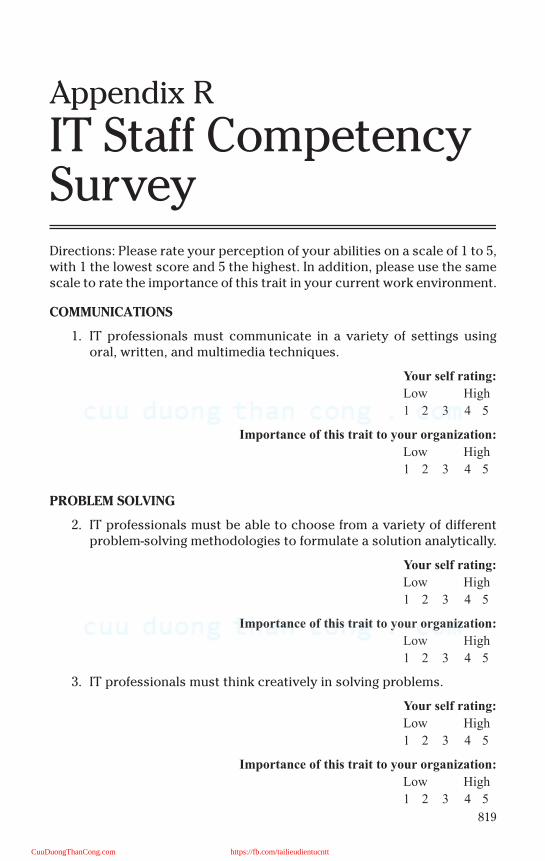
819
Appendix R
IT Staff Competency SurveyDirections: Please rate your perception of your abilities on a scale of 1 to 5,with 1 the lowest score and 5 the highest. In addition, please use the samescale to rate the importance of this trait in your current work environment.
COMMUNICATIONS
1. IT professionals must communicate in a variety of settings usingoral, written, and multimedia techniques.
Ψουρ σελφ ρατινγ:
Λοω Ηιγη
1 2 3 4 5
Ιµπορτανχε οφ τηισ τραιτ το ψουρ οργανιζατιον:
Λοω Ηιγη
1 2 3 4 5
PROBLEM SOLVING
2. IT professionals must be able to choose from a variety of differentproblem-solving methodologies to formulate a solution analytically.
Ψουρ σελφ ρατινγ:
Λοω Ηιγη
1 2 3 4 5
Ιµπορτανχε οφ τηισ τραιτ το ψουρ οργανιζατιον:
Λοω Ηιγη
1 2 3 4 5
3. IT professionals must think creatively in solving problems.
Ψουρ σελφ ρατινγ:
Λοω Ηιγη
1 2 3 4 5
Ιµπορτανχε οφ τηισ τραιτ το ψουρ οργανιζατιον:
Λοω Ηιγη
1 2 3 4 5
CuuDuongThanCong.com https://fb.com/tailieudientucntt

820
SOFTWARE ENGINEERING HANDBOOK
4. IT professionals must be able to work on project teams and usegroup methods to define and solve problems.
Ψουρ σελφ ρατινγ:
Λοω Ηιγη
1 2 3 4 5
Ιµπορτανχε οφ τηισ τραιτ το ψουρ οργανιζατιον:
Λοω Ηιγη
1 2 3 4 5
ORGANIZATION AND SYSTEMS THEORY
5. IT professionals must be grounded in the principles of systemstheory.
Ψουρ σελφ ρατινγ:
Λοω Ηιγη
1 2 3 4 5
Ιµπορτανχε οφ τηισ τραιτ το ψουρ οργανιζατιον:
Λοω Ηιγη
1 2 3 4 5
6. IT professionals must have sufficient background to understand thefunctioning of organizations because the information system mustbe congruent with and supportive of the strategy, principles, goals,and objectives of the organization.
Ψουρ σελφ ρατινγ:
Λοω Ηιγη
1 2 3 4 5
Ιµπορτανχε οφ τηισ τραιτ το ψουρ οργανιζατιον:
Λοω Ηιγη
1 2 3 4 5
7. IT professionals must understand and be able to function in the mul-tinational and global context of today’s information-dependentorganizations.
Ψουρ σελφ ρατινγ:
Λοω Ηιγη
1 2 3 4 5
Ιµπορτανχε οφ τηισ τραιτ το ψουρ οργανιζατιον:
Λοω Ηιγη
1 2 3 4 5
CuuDuongThanCong.com https://fb.com/tailieudientucntt
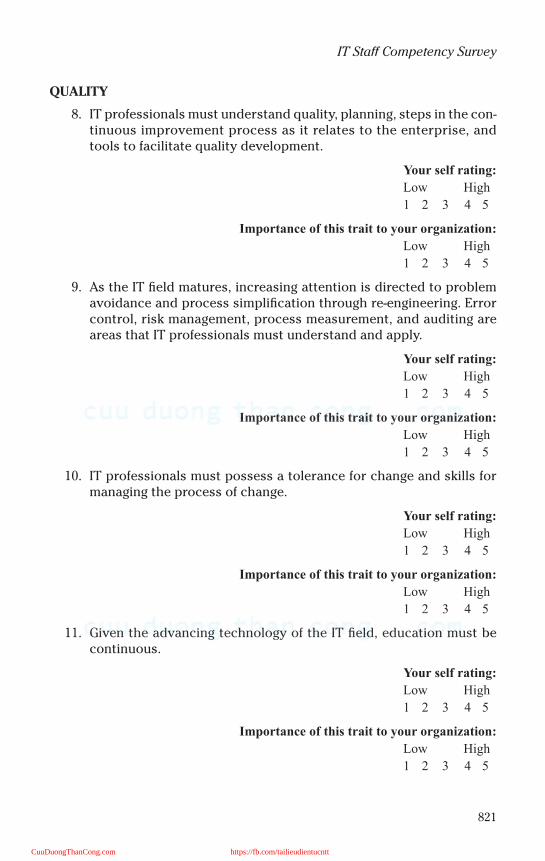
821
IT Staff Competency Survey
QUALITY
8. IT professionals must understand quality, planning, steps in the con-tinuous improvement process as it relates to the enterprise, andtools to facilitate quality development.
Ψουρ σελφ ρατινγ:
Λοω Ηιγη
1 2 3 4 5
Ιµπορτανχε οφ τηισ τραιτ το ψουρ οργανιζατιον:
Λοω Ηιγη
1 2 3 4 5
9. As the IT field matures, increasing attention is directed to problemavoidance and process simplification through re-engineering. Errorcontrol, risk management, process measurement, and auditing areareas that IT professionals must understand and apply.
Ψουρ σελφ ρατινγ:
Λοω Ηιγη
1 2 3 4 5
Ιµπορτανχε οφ τηισ τραιτ το ψουρ οργανιζατιον:
Λοω Ηιγη
1 2 3 4 5
10. IT professionals must possess a tolerance for change and skills formanaging the process of change.
Ψουρ σελφ ρατινγ:
Λοω Ηιγη
1 2 3 4 5
Ιµπορτανχε οφ τηισ τραιτ το ψουρ οργανιζατιον:
Λοω Ηιγη
1 2 3 4 5
11. Given the advancing technology of the IT field, education must becontinuous.
Ψουρ σελφ ρατινγ:
Λοω Ηιγη
1 2 3 4 5
Ιµπορτανχε οφ τηισ τραιτ το ψουρ οργανιζατιον:
Λοω Ηιγη
1 2 3 4 5
CuuDuongThanCong.com https://fb.com/tailieudientucntt
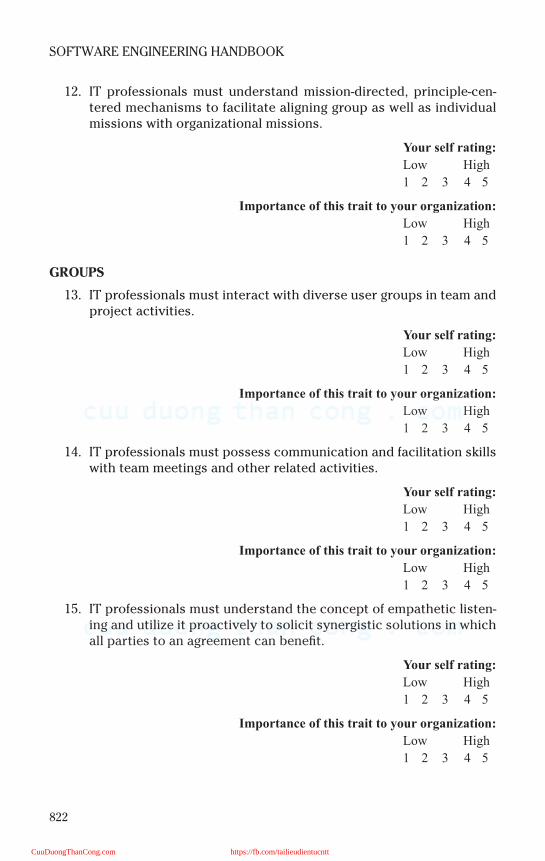
822
SOFTWARE ENGINEERING HANDBOOK
12. IT professionals must understand mission-directed, principle-cen-tered mechanisms to facilitate aligning group as well as individualmissions with organizational missions.
Ψουρ σελφ ρατινγ:
Λοω Ηιγη
1 2 3 4 5
Ιµπορτανχε οφ τηισ τραιτ το ψουρ οργανιζατιον:
Λοω Ηιγη
1 2 3 4 5
GROUPS
13. IT professionals must interact with diverse user groups in team andproject activities.
Ψουρ σελφ ρατινγ:
Λοω Ηιγη
1 2 3 4 5
Ιµπορτανχε οφ τηισ τραιτ το ψουρ οργανιζατιον:
Λοω Ηιγη
1 2 3 4 5
14. IT professionals must possess communication and facilitation skillswith team meetings and other related activities.
Ψουρ σελφ ρατινγ:
Λοω Ηιγη
1 2 3 4 5
Ιµπορτανχε οφ τηισ τραιτ το ψουρ οργανιζατιον:
Λοω Ηιγη
1 2 3 4 5
15. IT professionals must understand the concept of empathetic listen-ing and utilize it proactively to solicit synergistic solutions in whichall parties to an agreement can benefit.
Ψουρ σελφ ρατινγ:
Λοω Ηιγη
1 2 3 4 5
Ιµπορτανχε οφ τηισ τραιτ το ψουρ οργανιζατιον:
Λοω Ηιγη
1 2 3 4 5
CuuDuongThanCong.com https://fb.com/tailieudientucntt
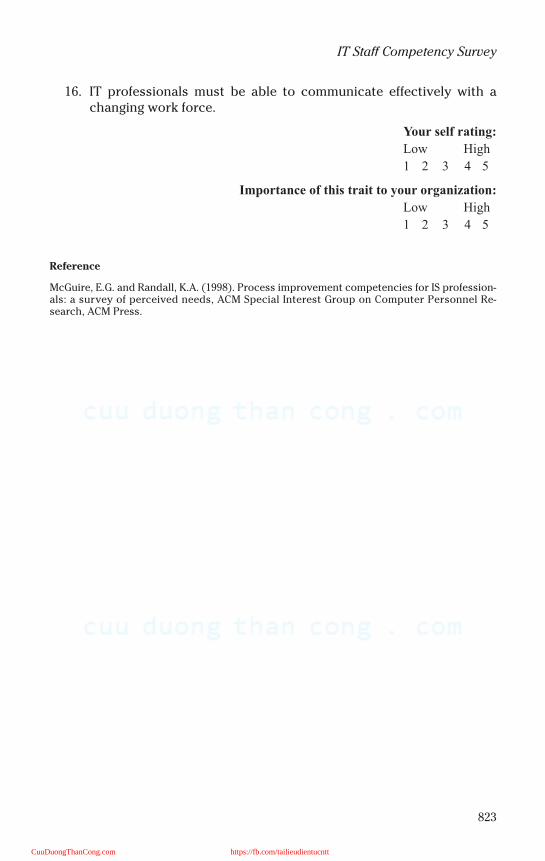
823
IT Staff Competency Survey
16. IT professionals must be able to communicate effectively with achanging work force.
Ψουρ σελφ ρατινγ:
Λοω Ηιγη
1 2 3 4 5
Ιµπορτανχε οφ τηισ τραιτ το ψουρ οργανιζατιον:
Λοω Ηιγη
1 2 3 4 5
Reference
McGuire, E.G. and Randall, K.A. (1998). Process improvement competencies for IS profession-als: a survey of perceived needs, ACM Special Interest Group on Computer Personnel Re-search, ACM Press.
CuuDuongThanCong.com https://fb.com/tailieudientucntt

This page intentionally left blank
CuuDuongThanCong.com https://fb.com/tailieudientucntt
825
Appendix S
Function Point Counting GuideIn the late 1970s IBM asked one of its employees, Allan Albrecht, to developa language-independent approach to estimating software developmenteffort. The result was the function point technique. Several years later afunction point counting manual was produced by IBM’s GUIDE organiza-tion. By the late 1980s, the International Function Point Users Group(IFPUG) had been founded and duly published its own counting practicesmanual. In 1994, IFPUG produced Release 4.0 of its counting practices man-ual. IFPUG is now up to Release 4.1.1 of the manual.
Function points are a measure of the size of computer applications andthe projects that build them. The size is measured from a functional pointof view. The counting methodology is independent of computer language,development methodology, technology, or capability of the project teamused to develop the application. Function points are not a perfect measureof effort to develop an application or of its business value, although thesize in function points is typically an important factor in measuring each.
Function points measure software by quantifying the functionality pro-vided external to itself, based primarily on logical design. With this inmind, the objectives of function point counting are to:
• Measure what the user requested and received• Measure independently of technology used for implementation• Provide a sizing metric to support quality and productivity analysis• Provide a vehicle for software estimation• Provide a normalization factor for software comparison
In addition to meeting these objectives, the process of counting functionpoints should be:
• Simple enough to minimize the overhead of the measurement process• Simple yet concise, to allow for consistency over time, projects, and
practitioners
The function point metric measures an application based on two areasof evaluation. The first results in the unadjusted function point count andreflects the specific countable functionality provided to the user by theapplication. The second area of evaluation, which produces the value
CuuDuongThanCong.com https://fb.com/tailieudientucntt

826
SOFTWARE ENGINEERING HANDBOOK
adjustment factor (VAF), evaluates the general functionality provided tothe user of the application.
UNADJUSTED FUNCTION POINT COUNT
An application’s specific user functionality is evaluated in terms of whatis delivered by the application, not how it is delivered; only user-requestedand visible components are counted. These components are categorizedinto function types, which in turn are categorized as data or transactional.
Data:
• Internal logical files (ILFs) — internally maintained logical group ofdata
• External interface files (EIFs) — externally maintained logical group ofdata
Transactional:
• External inputs (EIs) — maintain internally stored data• External outputs (EOs) — data output• External inquiries (EQs) — combination of input (request) and output
(retrieval)
Each function type is further categorized based on its relative functionalcomplexity as:
• Low• Average• High
Function point values ranging from 3 to 15, depending on the functiontype and functional complexity rating, are assigned and totaled, producingthe unadjusted function point count. The unadjusted function point countis then weighted by the VAF to produce the final function point count.
VALUE ADJUSTMENT FACTOR
The VAF comprises 14 general system characteristic (GSC) questionsthat assess the general functionality of the application:
1. Data communication2. Distributed function3. Performance4. Heavily used configuration5. Transaction rates6. Online data entry7. Design for end-user efficiency8. Online update9. Complex processing
CuuDuongThanCong.com https://fb.com/tailieudientucntt
827
Function Point Counting Guide
10. Usable in other applications11. Installation ease12. Operational ease13. Multiple sites14. Facilitate change
The questions are answered using degrees of influence (DI) on a scale ofzero to five:
• 0 Not present, or no influence• 1 Incidental influence• 2 Moderate influence• 3 Average influence• 4 Significant influence• 5 Strong influence throughout
TYPES OF FUNCTION POINT COUNTS
Function point counts can be associated to projects or to applications.The three types of function point counts are:
• Development (project) function point count —function point count as-sociated with the initial installation of new software. This count mea-sures the function provided to the end users by the project. It includesthe functionality provided by data conversion and associated conver-sion reporting requirements. The development function point count,minus those function points associated with conversion activities, be-comes the application function point count once the project is in-stalled.
• Enhancement (project) function point count — function point count as-sociated with the enhancement of existing software. This count mea-sures the modifications to the existing application that add, change, ordelete user function within the scope of a project. It includes the func-tionality provided by data conversion and associated conversion re-porting requirements. When an enhancement project is installed, theapplication function point count must be updated to reflect changes inthe application’s functionality.
• Application function point count — function point count associatedwith an installed application. It is also referred to as the baseline or in-stalled function point count. This count provides a measure of the cur-rent function that the application provides to the end user. Thisnumber is initialized at the time the development function point countis completed. This count does not include the functionality providedby data conversion and associated conversion reporting require-ments. It can therefore differ from the development function pointcount. It is altered every time an enhancement alters the application’sfunction.
CuuDuongThanCong.com https://fb.com/tailieudientucntt
828
SOFTWARE ENGINEERING HANDBOOK
BOUNDARIES
Boundaries identify the border between the application or project mea-sured and either external applications or the user domain. Boundaries areused to establish the scope of the work product measured. Additionally,they are used to establish data ownership and processing relationshipsthat are required when conducting a function point count. Associated mea-surement data (e.g., effort, cost, defects) should be collected at the samelevel as the application or project boundaries.
Application Boundary
Look at the application from the user’s point of view — what the user canunderstand and describe. The boundary between related applicationsshould be based on separate business functions as seen by the user, not ontechnological concerns. Use the system external specifications or get asystem flow chart and draw a boundary around it to highlight what is inter-nal and what is external to the application. The boundary should be stableand correspond to how the application is maintained.
Development (Project) Boundary
Again, look at the application from the user’s point of view — what theuser can understand and describe. Use the system external specificationsor get a system flow chart and draw a boundary around it to highlight whatis internal and what is external to the application.
Enhancement (Project) Boundary
An enhancement project’s boundary must conform to the boundariesalready established for the application being modified. For ease of devel-opment, separate or small phases should not be considered separateproject boundaries.
COUNTING RULES
The function point metric measures the application based on two areasof evaluation. The first produces the unadjusted function point count thatis a measure of the specific, countable functionality provided to the user bythe application. The second area of evaluation, which produces the VAF,evaluates the general functionality of the application. This is done basedon the 14 general system characteristics discussed in detail in a later sec-tion. The five function types discussed briefly next are discussed in detailin following sections.
Unadjusted Function Point Count
Unadjusted function points are calculated based on those components ofan application that are requested and visible to the user; these components
CuuDuongThanCong.com https://fb.com/tailieudientucntt
829
Function Point Counting Guide
are categorized into function types, which in turn can be categorized as dataor transactional.
Data function types represent the functionality provided to the user tomeet internal and external data requirements.
• Internal logical files (ILFs) reside internal to an application’s boundaryand reflect data storage functionality provided to the user. ILFs mustbe maintained and utilized by the application.
• External interface files (EIFs) reside external to an application’sboundary and reflect the functionality provided by the applicationthrough the use of data maintained by other applications.
Although ILFs and EIFs contain the word “file” in their titles, they are notfiles in the traditional data processing sense. In this case, file refers to a log-ically related group of data and not the physical implementation.
Transactional function types represent the functionality provided to theuser for processing data by an application.
• External inputs (EIs) reflect the functionality provided to the user forthe receipt and maintenance (add, change, and delete) of data on in-ternal logical files.
• External outputs (EOs) reflect the functionality provided to the userfor output generated by the application from internal logical files orexternal interface files.
• External inquiries (EQs) reflect the functionality provided to the userfor queries of internal logical files or external interface files.
INTERNAL LOGICAL FILES
Internal logical files represent an application’s maintainable data stor-age requirements. These files are evaluated and contribute to the functionpoint count based on their number and relative functional complexity.
Definitions
• An ILF is a user-identifiable group of logically related data or controlinformation maintained and utilized within the boundary of theapplication.
• User identifiable group of logically related data refers to data related atsuch a level that an experienced user would identify the data as fulfill-ing a specific user requirement of the application. The data analysisequivalent to such high-level logical groupings is singularly nameddata stores on a data-flow diagram.
• Control information is data used by the application to ensure compli-ance with business function requirements specified by the user.
• Maintained is the ability to add, change, or delete data through a stan-dardized process of application.
CuuDuongThanCong.com https://fb.com/tailieudientucntt
830
SOFTWARE ENGINEERING HANDBOOK
Methodology
Identification
• Identify all data that is:— Stored internal to the application’s boundary— Maintained through a standardized process of the application— Identified as a requirement of the application by the users
• Group the data logically based on the user’s view:— Group data at the level of detail at which the user can first catego-
rize the data as satisfying unique requirements of the application.— View the data logically. Some storage technologies, such as tables
in a relational DBMS or a sequential flat file, relate closely to internallogical files; however, do not assume that one physical file equalsone logical file.
Examples
To identify potential ILFs, look at the type of data stored and how a userwould view or group the data, rather than storage technology such astables, flat files, indices, and paths. Each type of data on the following listcan relate to one or more ELFs, depending on the user’s view.
• Application data (master files such as those for tax information andpersonnel information)
• Application security data• Audit data• Help messages• Error messages• Edit data
The following are ILFs:
• Back-up data is counted ONLY if specifically requested by the user dueto legal or similar requirements.
• ILFs maintained by more than one application are credited to both ap-plications at the time each is counted.
The following are not ILFs:
• Temporary files• Work files• Sort files• Suspense files (These are files containing incomplete transactions from
an external Input. Do not count unless data on the suspense file can beaccessed or maintained by the user through unique EIs, EOs, or EQs.)
• Back-up data required for corporate back-up and recovery procedures
CuuDuongThanCong.com https://fb.com/tailieudientucntt

831
Function Point Counting Guide
• Files introduced only because of technology used; for example, a filecontaining JCL required for job submission
• Alternate indices (These are an alternative physical access method.)
Issues and Resolutions
The following are not discussed in Albrecht’s 1984 document but aredecisions of the IFPUG Counting Practices Committee (CPC):
1. Back-up files are counted only if specifically requested by the user tomeet legal or similar requirements. Back-up files required for normalback-up and recovery procedures are not counted.
2. ILFs maintainable by more than one application are credited to bothapplications at the time each is counted.
3. Suspense/carry around files are counted as an ILF only if the sus-pense file can be accessed or maintained by the user through uniqueEIs, EOs, or EQs.
EXTERNAL INTERFACE FILES
External interface files represent an application’s externally maintaineddata storage requirements. EIFs are evaluated and contribute to the func-tion point count based on their number and relative functional complexity.
Definitions
• An EIF is a user identifiable group of logically related data or control in-formation utilized by the application, but maintained by another appli-cation.
• User identifiable group of logically related data is defined as data relat-ed at such a level that an experienced user would identify the data asfulfilling a specific user requirement of the application.
• Control information is data used by the application to assure compli-ance with business function requirements specified by the user.
Methodology
Identification
• Identify all data that is:— Stored external to the application’s boundary— Not maintained by this application— Identified as a requirement of the application by the users
• Group the data logically based on the user’s view:— View data at the level of detail at which the user can first categorize
the data as satisfying unique requirements of the application
CuuDuongThanCong.com https://fb.com/tailieudientucntt
832
SOFTWARE ENGINEERING HANDBOOK
— View the data logically. Some storage technologies, such as tablesin a relational DBMS or a sequential flat file, relate closely to EIFs;however, do not assume that one physical file equals one logical file.
Examples
When identifying potential EIFs, look at the type of data and how a userwould view it rather than storage technologies such as tables, flat files,indexes, and paths. Each type of data on the following list can relate to oneor more EIFs, depending on the user’s view:
• Reference data (external data utilized by the application, but notmaintained on internal logical files)
• Help messages• Error messages• Edit data (criteria)
The following are not EIFs:
• Data received from another application that adds, changes, or deletesdata on an ILF (This is considered transaction data and therefore theprocess of maintaining the data is counted as external input.)
• Data maintained by the application being counted, but accessed andutilized by another application
• Data formatted and processed for use by another application (count-ed as an external output)
Issues and Resolutions
The following decision of the IFPUG CPC differs from Albrecht’s 1984document:
EIF is not credited to the “sending application”: Albrecht’s methodologycredits EIFs to the application maintaining the data and to the applica-tion using the data by differentiating EIFs from EIs and EOs based on thedirectional flow and use of the data by the application.
Function type determination is based on how the application thatreceives the data utilizes it. If the data is used to update an ILF, it iseither an EI or EO, depending on data flow. If the data is not maintainedon an ILF, it is an EIF, regardless of the data flow.
Two issues have been raised with Albrecht’s 1984 method of identifyingEIFs:
• Function point counts must be updated if, subsequent to the count,access to an ILF is given to another application.
• Because it cannot always be determined how the other application isusing the data, various methods have evolved to handle this situation,resulting in inconsistent counting rules.
CuuDuongThanCong.com https://fb.com/tailieudientucntt
833
Function Point Counting Guide
To resolve these problems, only the application receiving the data canhave EIFs. As a result, an application’s function point count is dependentonly on the application as it currently exists and not on future events oranother application’s use of data.
EXTERNAL INPUTS
EIs represent an application’s data maintenance and control processingrequirements. They are evaluated and contribute to the function pointcount based on their number and relative functional complexity.
Definitions
• An EI processes data or processes control information that enters theapplication’s external boundary. Through a unique logical process,the processed data maintains an ILF. Control information is data usedby a process within an application boundary to assure compliancewith business function requirements specified by the user. Control in-formation may or may not directly maintain an ILF. An EI should beconsidered unique if it has a different format or if the logical design re-quires processing logic different from that of other EIs of the same for-mat. An external input is considered unique if— Data is maintained on an ILF and— The input format is unique or— The processing logic is unique
• Control information is data used by the application to assure compli-ance with business function requirements specified by the user. Donot include the input side of an EI.
• Maintain is the ability to add, change, or delete data through a stan-dardized process of the application.
• Format is defined as unique data elements or a unique arrangement ororder of data elements.
• Processing logic is defined as unique edits, calculations or algorithms,and sorts specifically requested by the user.
Methodology
Identification
• Identify all processes that update an ILF.• For each process identified:
— Consider each format a separate process if the data used by theprocess can be received in more than one format.
— Credit an EI for each data maintenance activity (add, change, anddelete) performed.
CuuDuongThanCong.com https://fb.com/tailieudientucntt

834
SOFTWARE ENGINEERING HANDBOOK
Examples
Assuming the preceding conditions are met, the following are EIs:
• Transactional data: external data that is used to maintain ILFs.• Screen input: count one EI for each function that maintains ILFs. If add,
change, and delete capabilities are present, the screen would count asthree EIs.
• Batch input: for each unique process that maintains an ELF, count oneEI for each add, change, and delete.
Batch inputs should be identified based on the processing required toapply the data. One physical input file can, when viewed logically, corre-spond to a number of EIs. Conversely, two or more physical input files cancorrespond to one EI, if the processing logic and format are identical foreach physical file.
One way to identify multiple EIs when processing one physical file is tolook at the record types on the file. Exclude header and trailer records aswell as those record types required due to physical space limitations. Lookat the remaining record types for unique processing requirements andassociate an EI for each unique process. Do not assume a one-to-one corre-spondence between the remaining record types and EIs.
• Duplicate EIs: see the section• Suspense file updates: see the section on issues and resolution
The following are not EIs:
• Reference data: external data utilized by the application, but not main-tained on ILFs
• Input side of an EI: data input used to drive selection for data retrieval• Menu screens: see section on issues and resolution• Logon screens: see the section on issues and resolution• Multiple methods of invoking the same input logic, for example, entering
“A” or “add” on a command line or using a PF key should be countedonly once
Issues and Resolutions
The following are not discussed in Albrecht’s 1984 document but aredecisions of the IFPUG CPC:
• Duplicate EIs: input processes that, if specifically requested by the us-er, duplicate a previously counted EI, are each counted. An example isa banking system that accepts identical deposit transactions, onethrough an automated teller machine (ATM) transaction and a secondthrough a manual teller deposit transaction.
CuuDuongThanCong.com https://fb.com/tailieudientucntt
835
Function Point Counting Guide
• Suspense file updates: Input processes that maintain an ILF or a sus-pense/carry around file (depending on edit evaluation) should becounted based on the following:— If the suspense/carry around file is accessed or maintained by the
user, it is counted as an ILF. Thus, count EIs for each data mainte-nance activity performed on both ILFs.
— If the suspense/carry around file cannot be maintained or accessedby the user, count EIs for each data maintenance activity performedon the original ILF.
In either instance, the process of reapplying data from the sus-pense/carry around file to the ILF is not counted.
• Logon screen: screens that facilitate entry into an application and donot maintain an ILF are not EIs.
The following decision of the IFPUG CPC is in agreement with Albrecht’s1984 document:
• Menu screens that provide only selection or navigational functionalityand do NOT maintain an ILF are not counted.
EXTERNAL OUTPUT
EOs represent an application’s output processing requirements; theyare evaluated and contribute to the function point count based on theirnumber and relative functional complexity.
Definitions
• An EO processes data or control information that exits the application’sexternal boundary. An EO should be considered unique if it has a dif-ferent format, or if the logical design requires processing logic differentfrom other EOs of the same format. An external output is consideredunique if:— The output format is unique or— The processing logic is unique
• Control information is data used by the application to assure compli-ance with business function requirements specified by the user.
• Format is defined as unique data elements or a unique arrangement ororder of data elements.
• Processing logic is defined as unique edits, calculations or algorithms,and sorts specifically requested by the user.
CuuDuongThanCong.com https://fb.com/tailieudientucntt
836
SOFTWARE ENGINEERING HANDBOOK
Methodology
Identification
• Identify all processes that:— Send data external to the applications’s boundary or— Control data external to the application’s boundary
• For each process identified:— Consider each format a separate process if the data used by the
process is sent in more than one format.• Credit an EO for each process
Examples
Assuming the preceding conditions are met, the following are EOs:
• Data transfer to other applications: data residing on an ILF that is for-matted and processed for use by an external application. Outputs areidentified based on the processing required to manipulate the data.One physical output file can, when viewed logically, correspond to anumber of EOs. Conversely, two or more physical output files can cor-respond to one EO, if the processing logic and format are identical foreach physical file.
• A method for identifying multiple EOs from the processing of onephysical file is to look at the record types on the file. Exclude headerand trailer records as well as those record types required due to phys-ical space limitations. Review the remaining record types for uniqueprocessing requirements and associate an EO for each unique pro-cess. Do not assume a one-to-one correspondence between the re-maining record types and EOs.
• Reports: each report produced by the application is counted as an EO.Two identically formatted reports at the detail and summary levels arecounted as two EOs because each report requires unique processinglogic and unique calculations.
• Duplicate reports: see the section on issues and resolutions• Online reports: online output of data that is not the output side of an
EQ• Error/confirmation messages: see the section on issues and resolutions • Derived data: derived data that does not necessarily update a file• Graphics: see the section on issues and resolutions• Report Generators: see the section on issues and resolutions
The following are not EOs:
• Help: see external inquiry• Multiple methods of invoking the same output logic: for example, enter-
ing “R” or “report” on a command line or using a PF key should becounted only once
CuuDuongThanCong.com https://fb.com/tailieudientucntt
837
Function Point Counting Guide
• Error/confirmation messages associated with function types other thanEIs: for example, an EO would not be counted for the error/confirma-tion messages associated to an EQ.
• Multiple reports/unique data values: identical reports that have thesame format and processing logic, but exist due to unique data values,are not counted as separate EOs. For example, two reports identical informat and processing logic where the first contains customer namesbeginning with “A” through “L” and the second has customer namesbeginning with “M” through “Z” are counted as only one EO.
• Summary fields (column totals): summary fields on a detail report donot constitute a unique EO.
• Ad-hoc reporting: when the user directs and is responsible for the cre-ation (through the use of a language such as FOCUS or SQL) of an un-defined number of reports, no EOs are counted.
• Query language: a tool used in the ad-hoc environment.
Issues and Resolutions
The following decisions of the IFPUG CPC are not discussed in Albrecht’s1984 document:
• Duplicate reports: identical reports, produced on different media dueto specific user requirements, are counted as separate EOs. The pro-cessing required to produce different output media is considered tobe unique processing logic. Identical reports, one on paper and one onmicrofiche, if specifically requested by the user, are counted as twoEOs.
• Graphical format: graphical outputs should be counted as if they hadbeen presented in textual format. Each different graphical display re-quested by the user should be counted as an EO. Statistical data pre-sented in a table, bar chart, pie chart, and exploded pie chart shouldbe counted as four EOs.
• Report generator: output developed for the user with a report genera-tor should be counted as an EO for each specified unique report. If areport generator facility is requested by the user as part of an applica-tion for do-it-yourself report generation, one EI should be counted foreach report definition parameter or unique command (e.g., select,compare, sort, merge, extract, calculate, summarize, format, etc.) re-quested by the user to control the report generation, and one EOshould be counted for the total report program; and one ILF should becounted if a new file is created and saved.
The following decision of the IFPUG CPC is in agreement with Albrecht’s1984 document:
• Error/confirmation messages: an EO should be credited for each exter-nal input having error or confirmation messages.
CuuDuongThanCong.com https://fb.com/tailieudientucntt
838
SOFTWARE ENGINEERING HANDBOOK
External Inquiries
External inquiries represent an application’s inquiry processing require-ments; they are evaluated and contribute to the function point count basedon their number and relative functional complexity.
Definitions
• An EQ is a unique input/output combination that results in the retrievalof data required for immediate output, does not contain derived data,and does not update an ILF. An EQ is considered unique if it has a for-mat different from other those EQs in its input or output parts or if thelogical design requires edits and sorts different from those of otherEQs. An input/output combination is considered unique if:— The input format is unique or— The edits and sorts are different or— The output format is unique
• Format is defined as unique data elements or a unique arrangement ororder of data elements.
• Derived data is defined as data that requires processing other than di-rect retrieval, editing, and sorting of information from ILFs or EIFs.
Methodology
Identification
• Identify all processes where an input triggers an immediate retrieval ofdata.
• For each process identified:— Verify that each input/output combination is unique and consider
each unique input/output combination a separate process— Credit an EQ for each process
Examples
Assuming the preceding conditions are met, the following are EQs:
• Immediate retrieval of data: selection of data retrieval is based on datainput.
• Implied inquiries: Change/delete screens that provide data retrievalcapabilities prior to change/delete functionality are credited with anEQ, provided the inquiry capability can be and is used as a stand-alonefunction.
• If the input and output sides of the EQ are identical for change and de-lete functions, count only one EQ. If identical inquiry functions areavailable from the change/delete screens and a separate inquiryscreen, count only one EQ.
• Menus having implied inquiries: see the section on issues andresolutions.
CuuDuongThanCong.com https://fb.com/tailieudientucntt

839
Function Point Counting Guide
• Log-on screens: see the section on issues and resolutions.• Help: see the section on issues and resolutions.
Two categories of help are considered EQs:
• Full-screen help: a help facility that is dependent on the applicationscreen displays help text relating to the calling screen. Credit one lowcomplexity EQ per calling screen regardless of the number of helppanels or screens returned.
• Field-sensitive help: a help facility, dependent on the location of thecursor or some other method of identification, displays help docu-mentation specific to that field. Credit one EQ per screen. Each fieldthat is sensitive to help should be considered one DET on the inputside.
The following are not EQs:
• Error/confirmation messages: see EOs.• Multiple methods of invoking the same inquiry logic: multiple methods,
such as entering “I” or “inq” on a command line, or using a PF key arecounted only once.
• Help text: help that can be accessed from multiple areas or screens ofan application, or accessed and browsed independently of the associ-ated application, is counted only once.
• Menu screens: see the section on issues and resolutions.• Derived data: derived data would be treated as an input/output versus
retrieval of data.• Online documentation: system documentation available online, in lieu
of or in addition to that available in hard copy, is not counted. Onlinedocumentation by itself should not be considered software functiondelivered.
• Test systems: test systems are included in system development andshould not be counted.
Issues and Resolutions
The following decisions of the IFPUG CPC differ from Albrecht’s 1984document:
• Menu screens: screens that provide only selection functionality are notcounted.
• Menus having implied inquiries: menu screens that provide screen se-lection and data retrieval selection input for the called screen arecounted as EQs because the menu is the input side of the EQ and thecalled screen is the output side.
The following are not discussed in Albrecht’s 1984 document but aredecisions of the IFPUG CPC:
CuuDuongThanCong.com https://fb.com/tailieudientucntt

840
SOFTWARE ENGINEERING HANDBOOK
• Log-on screens: log-on screens that provide security functionality arecounted as EQs.
• Help: help is an inquiry pair where the input and the output (explana-tory text) are each unique. Credit help text that can be accessed ordisplayed through different request techniques or from different areasof an application only once.
• Duplicate output side: identical queries, produced on different mediadue to specific user requirements, are counted as separate EQs.
• Graphical formats: each different graphical display requested by theuser should be counted as an additional EQ.
• User-maintained help facility: a user-maintained help facility should becounted separately.
• Independent teaching (tutorial) systems: computer-assisted instruction(CAI), computer-based training (CBT) systems, or other independentsoftware teaching systems that are different from the production sys-tem and maintained separately should be counted as separate appli-cations. Training systems identical to the production system shouldbe considered additional sites; do not count them as separate func-tions, but consider the sites when calculating general system charac-teristic 13 (multiple sites).
GENERAL SYSTEMS CHARACTERISTICS
Each general system characteristic (GSC) must be evaluated in terms ofits degree of influence (DI) on a scale of zero to five. The descriptions listedunder “score as” are meant to be guides in determining the DI. If none of theguideline descriptions fits the application exactly, a judgment must bemade about which DI most closely applies to the application. The generalsystem characteristics are:
1. Data communication2. Distributed function3. Performance4. Heavily used configuration5. Transaction rates6. Online data entry7. Design for end-user efficiency8. Online update9. Complex processing
10. Usable in other applications11. Installation ease12. Operational ease13. Multiple sites14. Facilitate change
CuuDuongThanCong.com https://fb.com/tailieudientucntt
841
Function Point Counting Guide
The questions are answered using DI on a scale of zero to five.
• 0 Not present or no influence• 1 Incidental influence• 2 Moderate influence• 3 Average influence• 4 Significant influence• 5 Strong influence throughout
Data Communications
The data and control information used in the application are sent orreceived over communication facilities. Terminals connected locally to thecontrol unit are considered to be using communication facilities. Protocolis a set of conventions that permit the transfer or exchange of informationbetween two systems or devices. All data communication links requiresome type of protocol.
Score as:
• 0 — Application is pure batch processing or a stand alone PC.• 1 — Application is batch but has remote data entry or remote printing.• 2 — Application is batch but has remote data entry and remote
printing.• 3 — Online data collection or TP (teleprocessing) is front end to a
batch process or query system.• 4 — More than a front end, but the application supports only one type
of TP communications protocol.• 5 — More than a front-end, but the application supports more than
one type of TP communications protocol.
Distributed Data Processing
Distributed data or processing functions are a characteristic of theapplication within the application boundary.
Score as:
• 0 — Application does not aid the transfer of data or processing func-tion between components of the system.
• 1 — Application prepares data for end-user processing on anothercomponent of the system such as PC spreadsheets and PC DBMS.
• 2 — Data is prepared for transfer, transferred, and processed on an-other component of the system (not for end-user processing).
• 3 — Distributed processing and data transfer are online and in one di-rection only.
CuuDuongThanCong.com https://fb.com/tailieudientucntt

842
SOFTWARE ENGINEERING HANDBOOK
• 4 — Distributed processing and data transfer are online and in bothdirections.
• 5 — Processing functions are dynamically performed on the most ap-propriate component of the system.
Performance
Application performance objectives, stated or approved by the user inresponse or throughput, influenced (or will influence) the design, develop-ment, installation, and support of the application.
Score as:
• 0 — No special performance requirements were stated by the user.• 1 — Performance and design requirements were stated and reviewed
but no special actions required.• 2 — Response time or throughput is critical during peak hours. No
special design for CPU utilization was required. Processing deadline isfor the next business day.
• 3 — Response time or throughput is critical during all business hours.No special design for CPU utilization was required. Processing dead-line requirements with interfacing systems are constraining.
• 4 — Stated user performance requirements are stringent enough to re-quire performance analysis tasks in the design phase.
• 5 — In addition, performance analysis tools were used in the design,development, or implementation phases to meet the stated user per-formance requirements.
Heavily Used Configuration
A heavily used operational configuration, requiring special design con-siderations, is a characteristic of the application. (For example, the userwants to run the application on existing or committed equipment that willbe heavily used.)
Score as:
• 0 — There are no explicit or implicit operational restrictions.• 1 — Operational restrictions do exist, but are less restrictive than a
typical application. No special effort is needed to meet therestrictions.
• 2 — Some security or timing considerations exist.• 3 — There are specific processor requirements for a specific piece of
the application.• 4 — Stated operation restrictions require special constraints on the
application in the central processor or a dedicated processor.• 5 — In addition, there are special constraints on the application in the
distributed components of the system.
CuuDuongThanCong.com https://fb.com/tailieudientucntt
843
Function Point Counting Guide
Transaction Rate
The transaction rate is high and it influenced the design, development,installation, and support of the application.
Score as:
• 0 — No peak transaction period is anticipated.• 1 — Peak transaction period (e.g., monthly, quarterly, seasonally, an-
nually) is anticipated.• 2 — Weekly peak transaction period is anticipated.• 3 — Daily peak transaction period is anticipated.• 4 — High transaction rates stated by the user in the application re-
quirements or service level agreements are high enough to requireperformance analysis tasks in the design phase.
• 5 — High transaction rates stated by the user in the application re-quirements or service level agreements are high enough to require per-formance analysis tasks and, in addition, require the use ofperformance analysis tools in the design, development, or installationphases.
Online Data Entry
Online data entry and control functions are provided in the application.
Score as:
• 0 — All transactions are processed in batch mode.• 1 — 1 to 7 percent of transactions are interactive data entry.• 2 — 8 to 15 percent of transactions are interactive data entry.• 3 — 16 to 23 percent of transactions are interactive data entry.• 4 — 24 to 30 percent of transactions are interactive data entry.• 5 — Over 30 percent of transactions are interactive data entry.
End-User Efficiency
The online functions provided emphasize a design for end-user effi-ciency. They include:
• Navigational aids (e.g., function keys, jumps, dynamically generatedmenus)
• Menus• Online help/documents• Automated cursor movement• Scrolling• Remote printing (via online transactions)• Preassigned function keys• Submission of batch jobs from online transactions• Cursor selection of screen data
CuuDuongThanCong.com https://fb.com/tailieudientucntt
844
SOFTWARE ENGINEERING HANDBOOK
• Heavy use of reverse video, highlighting, colors, underlining, and oth-er indicators
• Hard-copy user documentation of online transactions• Mouse interface• Pop-up windows• As few screens as possible to accomplish a business function• Bilingual support (supports two languages; count as four items)• Multilingual support (supports more than two languages; count as six
items)
Score as:
• 0 — None of the above• 1 — One to three of the above• 2 — Four to five of the above• 3 — Six or more of the above but no specific user requirements related
to efficiency• 4 — Six or more of the above and stated requirements for end-user ef-
ficiency strong enough to require design tasks for human factors to beincluded (for example, minimize key strokes, maximize defaults, use oftemplates, etc.).
• 5 — Six or more of the above and stated requirements for end-user ef-ficiency strong enough to require use of special tools and processes inorder to demonstrate that objectives have been achieved
OnLine Update
The application provides online update for the ILFs.
Score as:
• 0 — None• 1 — Online update of one to three control files; low volume of updating
and easy recovery • 2 — Online update of four or more control files; low volume of updat-
ing and easy recovery• 3 — Online update of major ILFs• 4 — In addition, protection against data loss essential and specially
designed and programmed in the system• 5 — In addition, high volumes bring cost considerations into the re-
covery process; highly automated recovery procedures with mini-mum of operator intervention
Complex Processing
Complex processing is a characteristic of the application. Categoriesare:
CuuDuongThanCong.com https://fb.com/tailieudientucntt
845
Function Point Counting Guide
• Sensitive control (for example, special audit processing) or applica-tion-specific security processing
• Extensive logical processing• Extensive mathematical processing• Much exception processing resulting in incomplete transactions that
must be processed again; for example, incomplete ATM transactionscaused by TP interruption, missing data values, or failed edits
• Complex processing to handle multiple input/output possibilities; forexample, multimedia, device independence
Score as:
• 0 — None of the above• 1 — Any one of the above• 2 — Any two of the above• 3 — Any three of the above• 4 — Any four of the above• 5 — Any five of the above
Reusability
The application and the code in the application have been specificallydesigned, developed, and supported to be usable in other applications.
Score as:
• 0 — No reusable code• 1 — Reusable code is used within the application• 2 — Less than 10 percent of the application considered more than one
user’s needs• 3 — 10 percent or more of the application considered more than one
user’s needs• 4 — Application specifically packaged or documented to ease reuse
and customized by user at source code level• 5 — Application specifically packaged or documented to ease reuse
and customized for use by means of user parameter maintenance
Installation Ease
Conversion and installation ease are characteristics of the application.A conversion and installation plan or conversion tools were provided andtested during the system test phase.
Score as:
• 0 — No special considerations were stated by user and no special set-up required for installation
• 1 — No special considerations were stated by user but special set-uprequired for installation
CuuDuongThanCong.com https://fb.com/tailieudientucntt

846
SOFTWARE ENGINEERING HANDBOOK
• 2 — Conversion and installation requirements stated by user and con-version and installation guides provided and tested impact of conver-sion on the project not considered to be important
• 3 — Conversion and installation requirements stated by the user andconversion and installation guides provided and tested; impact of con-version on the project considered to be important
• 4 — In addition to (2), automated conversion and installation toolsprovided and tested
• 5 — In addition to (3), automated conversion and installation toolsprovided and tested
Operational Ease
Operational ease is characteristic of the application. Effective start-up,back-up, and recovery procedures were provided and tested during thesystem test phase. The application minimizes the need for manual activi-ties such as tape mounts, paper handling, and direct on-location manualintervention.
Score as:
• 0 — No special operational considerations, other than normal back-upprocedures, were stated by the user.
• 1–4 — Select the following items that apply to the application. Eachitem has a point value of one, except as noted otherwise.— Effective start-up, back-up, and recovery processes were provided
but operator intervention is required.— Effective start-up, back-up, and recovery processes were provided
but no operator intervention is required (count as two items).— The application minimizes the need for tape mounts.— The application minimizes the need for paper handling.
• 5 — Application is designed for unattended operation. Unattended op-eration means no operator intervention is required to operate the sys-tem other than to start up or shut down the application. Automaticerror recovery is a feature of the application.
Multiple Sites
The application has been specifically designed, developed, and sup-ported to be installed at multiple sites for multiple organizations.
Score as:
• 0 — There is no user requirement to consider the needs of more thanone user installation site.
• 1 — Needs of multiple sites were considered in the design and the ap-plication is designed to operate only under identical hardware andsoftware environments.
CuuDuongThanCong.com https://fb.com/tailieudientucntt
847
Function Point Counting Guide
• 2 — Needs of multiple sites were considered in the design and the ap-plication is designed to operate only under similar hardware and soft-ware environments.
• 3 — Needs of multiple sites were considered in the design and the ap-plication is designed to operate under different hardware and softwareenvironments.
• 4 — Documentation and support plans are provided and tested to sup-port the application at multiple sites and application is as describedby (1) or (2).
• 5 — Documentation and support plans are provided and tested to sup-port the application at multiple sites and application is as describedby (3).
Facilitate Change
The application has been specifically designed, developed, and sup-ported to facilitate change. Examples are:
• Flexible query/report capability is provided.• Business control data is grouped in tables maintainable by the user.
Score as:
• 0 — No special user requirement to design the application to minimizeor facilitate change.
• 1–5 — Select which of the following items apply to the application:— Flexible query/report facility is provided that can handle simple re-
quests; for example, and/or logic can be applied to only one ILF(count as one item).
— Flexible query/report facility is provided that can handle requestsof average complexity; for example, and/or logic can be applied tomore than one ILF (count as two items).
— Flexible query/report facility is provided that can handle complexrequests; for example, and/or logic combinations on one or moreILFs (count as three items).
— Control data is kept in tables maintained by the user with online in-teractive processes but changes take effect only on the next busi-ness day.
— Control data is kept in tables maintained by the user with online in-teractive processes and the changes take effect immediately (countas two items.)
FUNCTION POINT CALCULATION
The function point calculation is a three-step process. Step 1 producesthe unadjusted function point count. Step 2 produces the value adjustmentfactor (VAF). Step 3 adjusts the unadjusted function point count by the VAFto produce the final function point count.
CuuDuongThanCong.com https://fb.com/tailieudientucntt
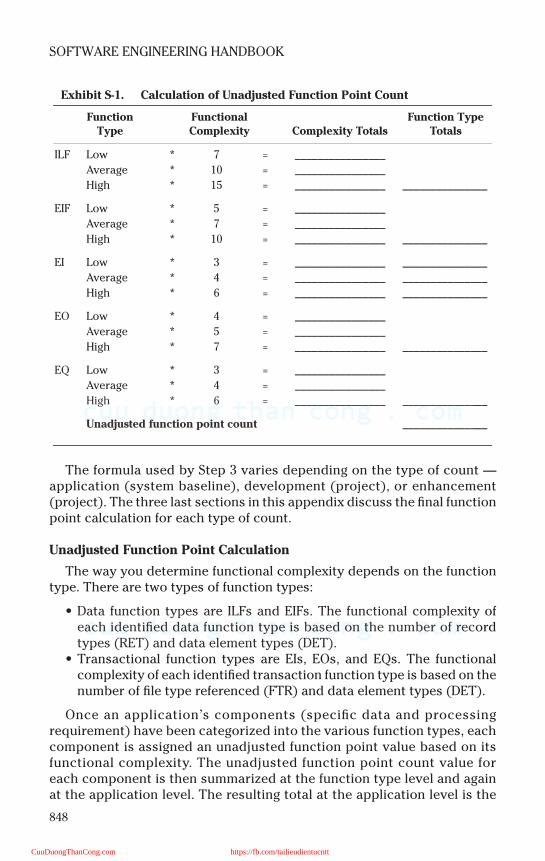
848
SOFTWARE ENGINEERING HANDBOOK
The formula used by Step 3 varies depending on the type of count —application (system baseline), development (project), or enhancement(project). The three last sections in this appendix discuss the final functionpoint calculation for each type of count.
Unadjusted Function Point Calculation
The way you determine functional complexity depends on the functiontype. There are two types of function types:
• Data function types are ILFs and EIFs. The functional complexity ofeach identified data function type is based on the number of recordtypes (RET) and data element types (DET).
• Transactional function types are EIs, EOs, and EQs. The functionalcomplexity of each identified transaction function type is based on thenumber of file type referenced (FTR) and data element types (DET).
Once an application’s components (specific data and processingrequirement) have been categorized into the various function types, eachcomponent is assigned an unadjusted function point value based on itsfunctional complexity. The unadjusted function point count value foreach component is then summarized at the function type level and againat the application level. The resulting total at the application level is the
Exhibit S-1. Calculation of Unadjusted Function Point Count
Function Type
FunctionalComplexity Complexity Totals
Function Type Totals
ILF Low * 7 = ________________
Average * 10 = ________________
High * 15 = ________________ _______________
EIF Low * 5 = ________________
Average * 7 = ________________
High * 10 = ________________ _______________
EI Low * 3 = ________________ _______________
Average * 4 = ________________ _______________
High * 6 = ________________ _______________
EO Low * 4 = ________________
Average * 5 = ________________
High * 7 = ________________ _______________
EQ Low * 3 = ________________
Average * 4 = ________________
High * 6 = ________________ _______________
Unadjusted function point count _______________
CuuDuongThanCong.com https://fb.com/tailieudientucntt
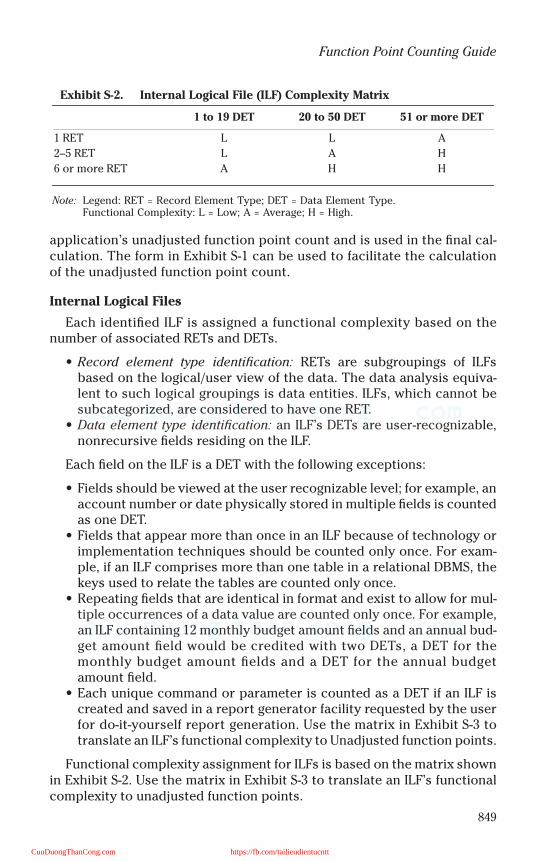
849
Function Point Counting Guide
application’s unadjusted function point count and is used in the final cal-culation. The form in Exhibit S-1 can be used to facilitate the calculationof the unadjusted function point count.
Internal Logical Files
Each identified ILF is assigned a functional complexity based on thenumber of associated RETs and DETs.
• Record element type identification: RETs are subgroupings of ILFsbased on the logical/user view of the data. The data analysis equiva-lent to such logical groupings is data entities. ILFs, which cannot besubcategorized, are considered to have one RET.
• Data element type identification: an ILF’s DETs are user-recognizable,nonrecursive fields residing on the ILF.
Each field on the ILF is a DET with the following exceptions:
• Fields should be viewed at the user recognizable level; for example, anaccount number or date physically stored in multiple fields is countedas one DET.
• Fields that appear more than once in an ILF because of technology orimplementation techniques should be counted only once. For exam-ple, if an ILF comprises more than one table in a relational DBMS, thekeys used to relate the tables are counted only once.
• Repeating fields that are identical in format and exist to allow for mul-tiple occurrences of a data value are counted only once. For example,an ILF containing 12 monthly budget amount fields and an annual bud-get amount field would be credited with two DETs, a DET for themonthly budget amount fields and a DET for the annual budgetamount field.
• Each unique command or parameter is counted as a DET if an ILF iscreated and saved in a report generator facility requested by the userfor do-it-yourself report generation. Use the matrix in Exhibit S-3 totranslate an ILF’s functional complexity to Unadjusted function points.
Functional complexity assignment for ILFs is based on the matrix shownin Exhibit S-2. Use the matrix in Exhibit S-3 to translate an ILF’s functionalcomplexity to unadjusted function points.
Exhibit S-2. Internal Logical File (ILF) Complexity Matrix
1 to 19 DET 20 to 50 DET 51 or more DET
1 RET L L A
2–5 RET L A H
6 or more RET A H H
Note: Legend: RET = Record Element Type; DET = Data Element Type.Functional Complexity: L = Low; A = Average; H = High.
CuuDuongThanCong.com https://fb.com/tailieudientucntt
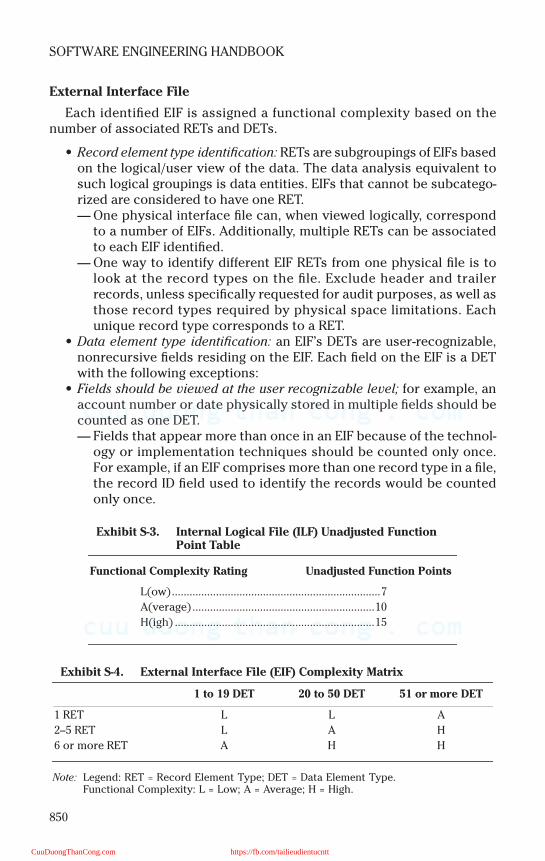
850
SOFTWARE ENGINEERING HANDBOOK
External Interface File
Each identified EIF is assigned a functional complexity based on thenumber of associated RETs and DETs.
• Record element type identification: RETs are subgroupings of EIFs basedon the logical/user view of the data. The data analysis equivalent tosuch logical groupings is data entities. EIFs that cannot be subcatego-rized are considered to have one RET.— One physical interface file can, when viewed logically, correspond
to a number of EIFs. Additionally, multiple RETs can be associatedto each EIF identified.
— One way to identify different EIF RETs from one physical file is tolook at the record types on the file. Exclude header and trailerrecords, unless specifically requested for audit purposes, as well asthose record types required by physical space limitations. Eachunique record type corresponds to a RET.
• Data element type identification: an EIF’s DETs are user-recognizable,nonrecursive fields residing on the EIF. Each field on the EIF is a DETwith the following exceptions:
• Fields should be viewed at the user recognizable level; for example, anaccount number or date physically stored in multiple fields should becounted as one DET.— Fields that appear more than once in an EIF because of the technol-
ogy or implementation techniques should be counted only once.For example, if an EIF comprises more than one record type in a file,the record ID field used to identify the records would be countedonly once.
Exhibit S-3. Internal Logical File (ILF) Unadjusted Function Point Table
Functional Complexity Rating Unadjusted Function Points
L(ow).......................................................................7
A(verage)..............................................................10
H(igh) ....................................................................15
Exhibit S-4. External Interface File (EIF) Complexity Matrix
1 to 19 DET 20 to 50 DET 51 or more DET
1 RET L L A
2–5 RET L A H
6 or more RET A H H
Note: Legend: RET = Record Element Type; DET = Data Element Type.Functional Complexity: L = Low; A = Average; H = High.
CuuDuongThanCong.com https://fb.com/tailieudientucntt
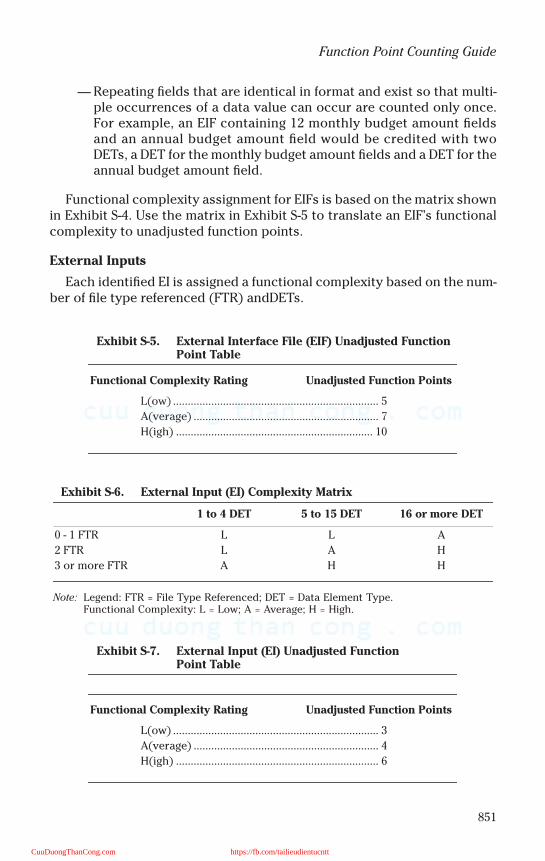
851
Function Point Counting Guide
— Repeating fields that are identical in format and exist so that multi-ple occurrences of a data value can occur are counted only once.For example, an EIF containing 12 monthly budget amount fieldsand an annual budget amount field would be credited with twoDETs, a DET for the monthly budget amount fields and a DET for theannual budget amount field.
Functional complexity assignment for EIFs is based on the matrix shownin Exhibit S-4. Use the matrix in Exhibit S-5 to translate an EIF’s functionalcomplexity to unadjusted function points.
External Inputs
Each identified EI is assigned a functional complexity based on the num-ber of file type referenced (FTR) andDETs.
Exhibit S-5. External Interface File (EIF) Unadjusted Function Point Table
Functional Complexity Rating Unadjusted Function Points
L(ow) ...................................................................... 5
A(verage) ............................................................... 7
H(igh) ................................................................... 10
Exhibit S-6. External Input (EI) Complexity Matrix
1 to 4 DET 5 to 15 DET 16 or more DET
0 - 1 FTR L L A
2 FTR L A H
3 or more FTR A H H
Note: Legend: FTR = File Type Referenced; DET = Data Element Type.Functional Complexity: L = Low; A = Average; H = High.
Exhibit S-7. External Input (EI) Unadjusted Function Point Table
Functional Complexity Rating Unadjusted Function Points
L(ow) ...................................................................... 3
A(verage) ............................................................... 4
H(igh) ..................................................................... 6
CuuDuongThanCong.com https://fb.com/tailieudientucntt
852
SOFTWARE ENGINEERING HANDBOOK
File Type Referenced Identification
An FTR is counted for each ILF maintained or referenced and each EIFreferenced during the processing of the external input.
Data Element Type Identification:
The DET count is the maximum number of user-recognizable, nonrecur-sive fields that are maintained on an ILF by the EI.
Each field maintainable on an ILF by the EI is a DET with the followingexceptions:
• Fields should be viewed at the user-recognizable level; for example, anaccount number or date physically stored in multiple fields should becounted as one DET.
• Fields that appear more than once in an ILF because of technology orimplementation techniques should be counted only once. For exam-ple, if an ILF comprises more than one table in a relational DBMS, thekeys used to relate the tables would be counted only once.
Additional DETs are credited to the EI for the following capabilities:
• Command lines or PF/Action keys that provide the capability to spec-ify the action to be taken by the EI — one additional DET per externalinput, not per command PF/action key.
• Fields that are not entered by the user, but through an EI, are main-tained on an ILF, should be counted. For example, a system generatedsequenced key, maintained on an ILF, but not entered by the user,would be counted as a DET.
Functional complexity assignment for EIs is based on the matrix shownin Exhibit S-6. Use the matrix in Exhibit S-7 to translate an EI’s functionalcomplexity to unadjusted function points.
External Outputs
Each identified EO is assigned a functional complexity based on thenumber of FTR and DETs.
• File type referenced identification: an FTR should be counted for eachILF and EIF referenced during the processing of the EO.
• Data element type identification: a DET should be counted for eachuser-recognizable, nonrecursive field that appears on the EO.
Each field on the EO is a DET with the following exceptions:
• Fields are viewed at the user-recognizable level; for example, an ac-count number or date physically stored in multiple fields is counted asone DET.
CuuDuongThanCong.com https://fb.com/tailieudientucntt
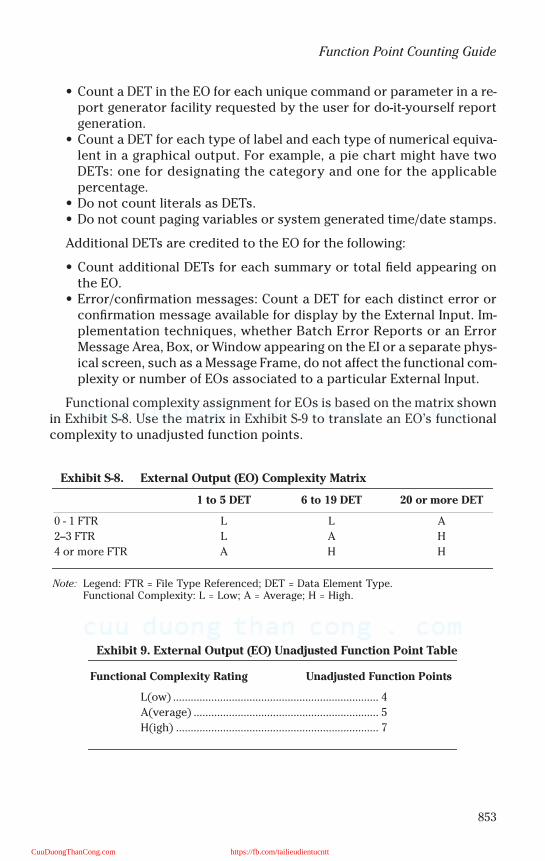
853
Function Point Counting Guide
• Count a DET in the EO for each unique command or parameter in a re-port generator facility requested by the user for do-it-yourself reportgeneration.
• Count a DET for each type of label and each type of numerical equiva-lent in a graphical output. For example, a pie chart might have twoDETs: one for designating the category and one for the applicablepercentage.
• Do not count literals as DETs.• Do not count paging variables or system generated time/date stamps.
Additional DETs are credited to the EO for the following:
• Count additional DETs for each summary or total field appearing onthe EO.
• Error/confirmation messages: Count a DET for each distinct error orconfirmation message available for display by the External Input. Im-plementation techniques, whether Batch Error Reports or an ErrorMessage Area, Box, or Window appearing on the EI or a separate phys-ical screen, such as a Message Frame, do not affect the functional com-plexity or number of EOs associated to a particular External Input.
Functional complexity assignment for EOs is based on the matrix shownin Exhibit S-8. Use the matrix in Exhibit S-9 to translate an EO’s functionalcomplexity to unadjusted function points.
Exhibit S-8. External Output (EO) Complexity Matrix
1 to 5 DET 6 to 19 DET 20 or more DET
0 - 1 FTR L L A
2–3 FTR L A H
4 or more FTR A H H
Note: Legend: FTR = File Type Referenced; DET = Data Element Type.Functional Complexity: L = Low; A = Average; H = High.
Exhibit 9. External Output (EO) Unadjusted Function Point Table
Functional Complexity Rating Unadjusted Function Points
L(ow) ...................................................................... 4
A(verage) ............................................................... 5
H(igh) ..................................................................... 7
CuuDuongThanCong.com https://fb.com/tailieudientucntt
854
SOFTWARE ENGINEERING HANDBOOK
External Inquiries
Use the following steps to assign an unadjusted function point value toeach EQ:
1. Calculate the functional complexity for the input side of the EQ.2. Calculate the functional complexity for the output side of the EQ.3. Select the higher of the two functional complexities. Using the EQ
unadjusted function point table, transcribe the complexity rating tounadjusted function points.
• File type referenced identification — input and output sides: an FTR iscounted for each ILF and EIF referenced during the processing of theEQ.
• Data element type identification — input side: a DET is counted forthose fields entered that specify the external inquiry to be executed orspecify data selection criteria.
• Data element type identification — output side: a DET is counted foreach user-recognizable, nonrecursive field that appears on the outputside of the EQ.
Each field appearing on the EO is a DET with the following exceptions:
• Fields are viewed at the user recognizable level; for example, an ac-count number or date physically stored in multiple fields is counted asone DET.
• Fields that, because of technology or implementation techniques, ap-pear more than once in an ILF should be counted only once. Do notcount literals as DETs.
• Do not count paging variables or system generated time/date stamps.
Additional DETs are credited to the EQ for the following:
• Count additional DETs for each summary or total field appearing onthe EQ.
Help Messages
The three categories of help are full screen help, field sensitive help, andhelp subsystems. DET determination varies between each and is discussedbelow:
• Full-screen help: credit a low-complexity EQ per calling screen regard-less of the number of FTRs or DETs involved.
• Field-sensitive help: credit an EQ having a complexity, using the inputside, based on the number of fields that are field sensitive and thenumber of FTRs. Each field-sensitive field corresponds to a DET.
• Help subsystems: specific counting rules are not available at this time.
CuuDuongThanCong.com https://fb.com/tailieudientucntt
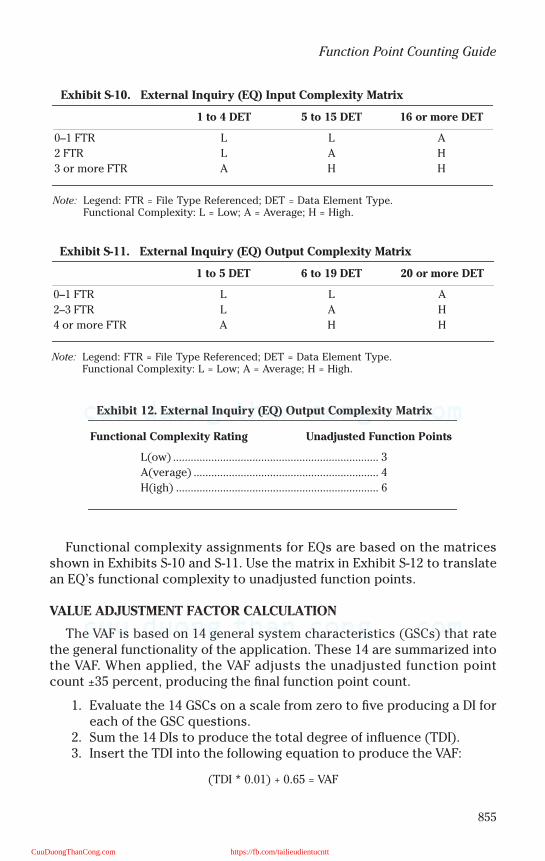
855
Function Point Counting Guide
Functional complexity assignments for EQs are based on the matricesshown in Exhibits S-10 and S-11. Use the matrix in Exhibit S-12 to translatean EQ’s functional complexity to unadjusted function points.
VALUE ADJUSTMENT FACTOR CALCULATION
The VAF is based on 14 general system characteristics (GSCs) that ratethe general functionality of the application. These 14 are summarized intothe VAF. When applied, the VAF adjusts the unadjusted function pointcount ±35 percent, producing the final function point count.
1. Evaluate the 14 GSCs on a scale from zero to five producing a DI foreach of the GSC questions.
2. Sum the 14 DIs to produce the total degree of influence (TDI).3. Insert the TDI into the following equation to produce the VAF:
(TDI * 0.01) + 0.65 = VAF
Exhibit S-10. External Inquiry (EQ) Input Complexity Matrix
1 to 4 DET 5 to 15 DET 16 or more DET
0–1 FTR L L A
2 FTR L A H
3 or more FTR A H H
Note: Legend: FTR = File Type Referenced; DET = Data Element Type.Functional Complexity: L = Low; A = Average; H = High.
Exhibit S-11. External Inquiry (EQ) Output Complexity Matrix
1 to 5 DET 6 to 19 DET 20 or more DET
0–1 FTR L L A
2–3 FTR L A H
4 or more FTR A H H
Note: Legend: FTR = File Type Referenced; DET = Data Element Type.Functional Complexity: L = Low; A = Average; H = High.
Exhibit 12. External Inquiry (EQ) Output Complexity Matrix
Functional Complexity Rating Unadjusted Function Points
L(ow) ...................................................................... 3
A(verage) ............................................................... 4
H(igh) ..................................................................... 6
CuuDuongThanCong.com https://fb.com/tailieudientucntt
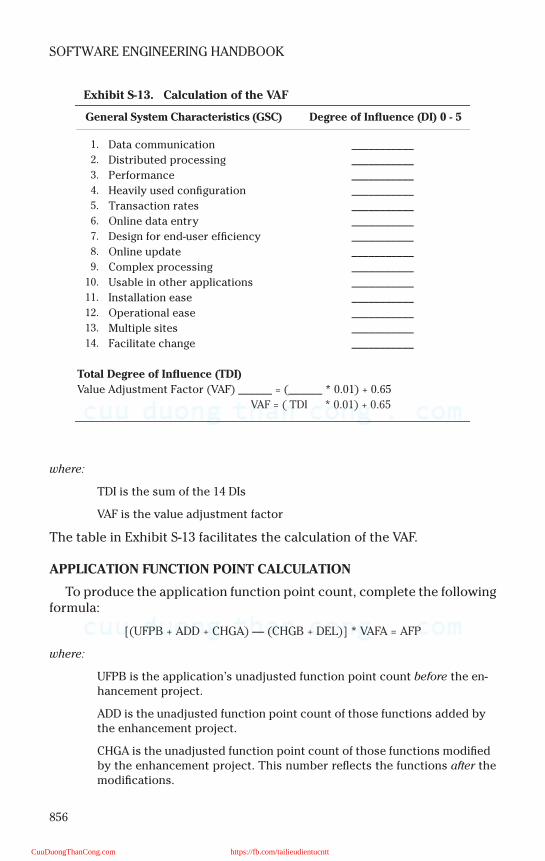
856
SOFTWARE ENGINEERING HANDBOOK
where:
TDI is the sum of the 14 DIs
VAF is the value adjustment factor
The table in Exhibit S-13 facilitates the calculation of the VAF.
APPLICATION FUNCTION POINT CALCULATION
To produce the application function point count, complete the followingformula:
[(UFPB + ADD + CHGA) — (CHGB + DEL)] * VAFA = AFP
where:
UFPB is the application’s unadjusted function point count before the en-hancement project.
ADD is the unadjusted function point count of those functions added by the enhancement project.
CHGA is the unadjusted function point count of those functions modified by the enhancement project. This number reflects the functions after themodifications.
Exhibit S-13. Calculation of the VAF
General System Characteristics (GSC) Degree of Influence (DI) 0 - 5
1. Data communication ___________
2. Distributed processing ___________
3. Performance ___________
4. Heavily used configuration ___________
5. Transaction rates ___________
6. Online data entry ___________
7. Design for end-user efficiency ___________
8. Online update ___________
9. Complex processing ___________
10. Usable in other applications ___________
11. Installation ease ___________
12. Operational ease ___________
13. Multiple sites ___________
14. Facilitate change ___________
Total Degree of Influence (TDI)
Value Adjustment Factor (VAF) ______ = (______ * 0.01) + 0.65
VAF = ( TDI * 0.01) + 0.65
CuuDuongThanCong.com https://fb.com/tailieudientucntt
857
Function Point Counting Guide
CHGB is the unadjusted function point count of those functions modified by the enhancement before the modification.
DEL is the unadjusted function point count of those functions deleted by the enhancement project.
VAFA is the VAF of the application after the enhancement project.
AFP is the application’s adjusted function point count.
This formula can be used to establish an application’s initial applicationfunction point count or re-establish an application function point countafter an enhancement project has modified the application’s functionality.(Do not include conversion requirements in an application function pointcount. If unavailable, the application’s prior unadjusted function pointcount can be calculated using the following formula:
AFPB/VAFB = UFPB
where:
AFPB is the adjusted application function point count before the enhance-ment project. VAFB is the VAF of the application before the enhancementproject.
UFPB is the application’s unadjusted function point before the enhance-ment project.)
When establishing an application function point count in which func-tionality is only being added, not changed or deleted, the formula in effectbecomes:
ADD * VAFA = AFP
where:
ADD is the unadjusted function point count of those functions that were in-stalled by the development project.
VAFA is the VAF of the application.
AFP is the initial application function point count.
DEVELOPMENT (PROJECT) FUNCTION POINT CALCULATION
To produce the development (project) function point count, completethe following formula:
UFP * VAF = DFP
where:
UFP is the unadjusted function point count.
VAF is the value adjustment factor.
DFP is the development (project) function point count.
CuuDuongThanCong.com https://fb.com/tailieudientucntt
858
SOFTWARE ENGINEERING HANDBOOK
ENHANCEMENT (PROJECT) FUNCTION POINT CALCULATION
To produce the enhancement (project) function point count, completethe following formula:
((ADD + CHGA) * VAFA) + (DEL* VAFB) = EFP
where:
ADD is the unadjusted function point count of those functions that were added by the enhancement project.
CHGA is the unadjusted function point count of those functions that were modified by the enhancement project. This number reflects the functionsafter the modifications.
DEL is the unadjusted function point count of those functions that were deleted by the enhancement project.
VAFA is the VAF of the application after the enhancement project.
VAFB is the VAF of the application before the enhancement project.
EFP is the enhancement (project) function point count.
Reference
Deveaux, P. (1993). Counting function points, in Software Engineering Productivity Handbook,Keyes, J., ed., McGraw-Hill, New York.
CuuDuongThanCong.com https://fb.com/tailieudientucntt
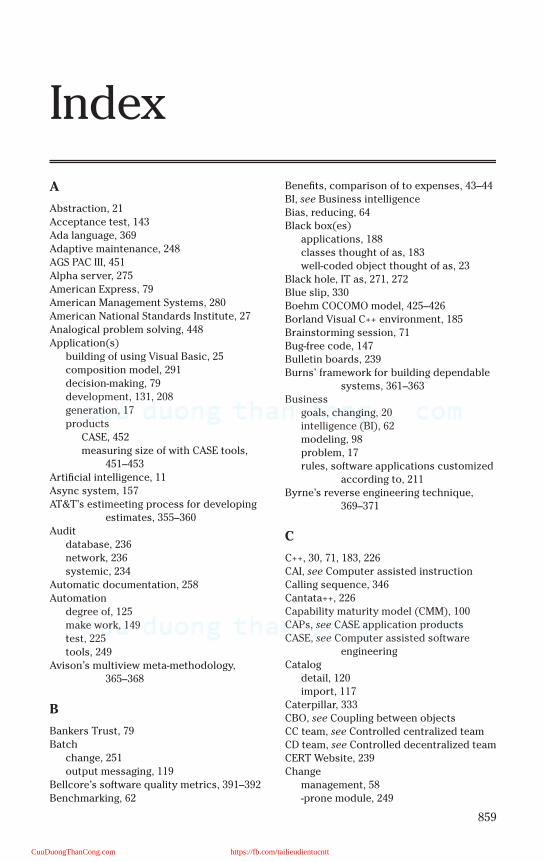
859
Index
A
Abstraction, 21
Acceptance test, 143
Ada language, 369
Adaptive maintenance, 248
AGS PAC III, 451
Alpha server, 275
American Express, 79
American Management Systems, 280
American National Standards Institute, 27
Analogical problem solving, 448
Application(s)
building of using Visual Basic, 25
composition model, 291
decision-making, 79
development, 131, 208
generation, 17
products
CASE, 452
measuring size of with CASE tools,
451–453
Artificial intelligence, 11
Async system, 157
AT&T’s estimeeting process for developing
estimates, 355–360
Audit
database, 236
network, 236
systemic, 234
Automatic documentation, 258
Automation
degree of, 125
make work, 149
test, 225
tools, 249
Avison’s multiview meta-methodology,
365–368
B
Bankers Trust, 79
Batch
change, 251
output messaging, 119
Bellcore’s software quality metrics, 391–392
Benchmarking, 62
Benefits, comparison of to expenses, 43–44
BI, see Business intelligence
Bias, reducing, 64
Black box(es)
applications, 188
classes thought of as, 183
well-coded object thought of as, 23
Black hole, IT as, 271, 272
Blue slip, 330
Boehm COCOMO model, 425–426
Borland Visual C++ environment, 185
Brainstorming session, 71
Bug-free code, 147
Bulletin boards, 239
Burns’ framework for building dependable
systems, 361–363
Business
goals, changing, 20
intelligence (BI), 62
modeling, 98
problem, 17
rules, software applications customized
according to, 211
Byrne’s reverse engineering technique,
369–371
C
C++, 30, 71, 183, 226
CAI, see Computer assisted instruction
Calling sequence, 346
Cantata++, 226
Capability maturity model (CMM), 100
CAPs, see CASE application products
CASE, see Computer assisted software
engineering
Catalog
detail, 120
import, 117
Caterpillar, 333
CBO, see Coupling between objects
CC team, see Controlled centralized team
CD team, see Controlled decentralized team
CERT Website, 239
Change
management, 58
-prone module, 249
CuuDuongThanCong.com https://fb.com/tailieudientucntt
860
SOFTWARE ENGINEERING HANDBOOK
request, 32, 252
CI, see Competitive intelligence
Class
automobile, 24
DayOfYear, creation of, 186–187
definition of, 23
diagrams, 14, 195
hierarchy, 193
Closed-ended questions, 66
CM, see Configuration management
CMM, see Capability maturity model
CNBC, 88
COBOL, 6, 213, 316
COCOMO model (constructive cost model),
258, 425
Boehm, 425–426
use of for estimation, 52
COCOMO II model, 51, 291–295
application composition model, 291292
early design model, 292–293
post-architecture model, 293–294
Code
generation tools, 135
reuse, strategy for, 409
Code or die syndrome, 272
Code Red worm, 31
Coding standard, 144
CoInclude, 156, 157
Collaboration graph, 192
Collective code ownership, 143
Comment source lines of code (CSLOC), 276
Commercial off-the-shelf (COTS) software,
39
Communications
algorithms, 149
media, rich, 390
Compaq, 275
Competitive analysis, 37, 38
Competitive intelligence (CI), 62
Complex condition, 215
Complexity metric, McCabe’s, 399
Component analysis, 30
Composite metrics, 453
Computer assisted instruction (CAI), 32
Computer assisted software engineering
(CASE), 129
application products (CAPs), 452
benefits of, 135
bridge, 118
tool(s), 17, 101, 106, 116, 249, 259
availability of, 395
definition of, 134
evolution of, 451
introduction of, 319
measuring size of application
products with, 451–453
revolution, advance of, 447
selection based on process maturity,
395–397
users, 439
view of, 441
Computer systems
policies and procedures of developing,
47
things in common, 5
Configuration management (CM), 320
Connectivity hardware, 91
Constructive cost model, see COCOMO
model
Contel
software metrics in process maturity
framework, 385–388
Technology Center, 385
Control
flow
diagrams, 32
recording of, 371
logic, 215
system, second-order, 161
Controlled centralized (CC) team, 57
Controlled decentralized (CD) team, 57
Corbin’s methodology for establishing
software development
environment, 325–328
Corrective maintenance, 247
Cost
/benefit analysis, see Feasibility study
and cost/benefit analysis
drivers
early design, 293
post-architecture, 295
estimating, management guidelines for
better, 413–416
COTS software, see Commercial off-the-shelf
software
Couger’s bottom-up approach to creativity
improvement in IS development,
329–331
Couplers, cost of, 91
Coupling between objects (CBO), 281
Cowboy coding, 138
CPM, see Critical path method
Crackers, 87
CRC cards, 142, 143, 190, 192
Credit card number, visible, 238
Critical path method (CPM), 54
Cross-site scripting, 239
CSLOC, see Comment source lines of code
CuuDuongThanCong.com https://fb.com/tailieudientucntt

861
Index
Current code, as liability, 181
Custom-built system, development of, 220
Customer
acceptance testing, 223
name, 393
satisfaction, 411
Cutover, 131
CV++ environment, 185
D
Dana Corporation, 333
Data
abstractions, 216
analysis, 30, 306
collection, 29, 123
degradation, 217
description, 303, 304
dictionary (DD), 12, 17, 191, 196, 217,
264, 265
encryption devices, 39
entry, sloppy, 87
flow, recording of, 371
flow diagram (DFD), 12, 14, 32, 169, 170,
183, 233, 260, 261
context, 173
detailed, 173
first, 21
flexibility of, 174
table of contents for, 170
use of for logical phase of systems
development, 177
-gathering process, speed of, 64
inconsistent, 124
modeling, 98
naming problems, 217
redundant, 124
re-engineering, 216, 218
representation discipline, user needs
dictating, 78
transfer fees, 90
type of, 23
XML descriptions of, 218
Database(s), 106
administrator, 104
audit, 236
bad choice of, 31
hierarchically defined, 80
object-oriented, 101
software, 178
DBA objective metrics, 125
DBTF technology, see Development Before
the Fact technology
DD, see Data dictionary
DD team, see Democratic decentralized
team
Debugger, 25
DEC, see Digital Equipment Corporation
Decision-making applications, programmed,
79
Default rules, 117
Defect
density, 278, 387, 427
identification, 318
Defined structures, 156
Definition mechanisms, 161
Delta, 333
Democratic decentralized (DD) team, 57
Dependable systems, Burns’ framework for
building, 361–363
Depth of inheritance tree (DIT), 280
Design, discrete steps of, 175
Design specification, 169–180
cookie-cutter explanation of writing
good, 178
details of design, 169–174
logical and physical design, 175–178
logical design, 177
logical and physical analysis, 175–177
physical design, 177–178
process, 169
systems specification, 178–179
walkthrough, 179
Deutsche Bank, 79
Development
phase, stand-up meetings during, 141
projects, software-based, 381–383
Development Before the Fact (DBTF)
technology, 147–167
defined structures, 156–159
FMaps, TMaps, and integration, 159–160
inherent integration with system-
oriented objects, 164–166
integrated modeling environment,
152–154
performance considerations, 163–164
primitive structures, 154–156
technology, 150–152
universal primitive operations, 160–163
what is wrong with systems, 147–149
DFD, see Data flow diagram
Diagnostic programs, 39
Dictionary token counts, 452
Digital Equipment Corporation (DEC), 275,
342, 403
overview of software metrics, 403–406
/VAX Software Project Manager, 415
Directed observation, 68, 69
CuuDuongThanCong.com https://fb.com/tailieudientucntt

862
SOFTWARE ENGINEERING HANDBOOK
Direct entry devices, 207
Disaster recovery services, 95
DIT, see Depth of inheritance tree
DM, see Dynamic model
DML syntax, 122
Document(s)
backup, 112
communications network, 113
creation of basic, 257
organization techniques, 269
Documentation
automatic, 258
generation of, 371
maintaining, 268
mathematical foundation to, 259
maturity model, 256
prototype, 315
quality of, 249, 257
science of, 255–270
definition of documentation, 255–258
generating documentation correctly,
259–268
maintaining documentation, 268–269
methods and standards, 258–259
user, 267
Dow Chemical, 333
DuPont, development of critical path
method by, 54
Dynamic binding, 181
Dynamic model (DM), 189
Dynamic performance monitoring, 137
E
EAF, see Effort adjustment factor
Early design cost drivers, 293
E-business
initiative, staffing to implement, 88
system, decision–making process, 86
E-commerce server, 22, 90
EDP auditing, see Electronic data processing
auditing
Effective reuse, 150
Effort
adjustment factor (EAF), 293
measure, Halstead’s, 401
Egoless programming techniques, 310
Electronic data processing (EDP) auditing,
231–224
customer service, 243–244
accessibility, 243
e-commerce, 243
privacy, 244
ergonomics, 241–243
content, 242–243
navigability, 242
search engine, 243
usability, 242
legality, 244
copyright, 244
employee Web usage, 244
organization of audit, 231–234
security and quality, 236–241
backup, 241
connectivity, 237
in-house development, 238–240
passwords, 237
product base, 238
reporting, 241
review of security plan, 237
staff background, 237
testing, 240–241
systemic audit, 234–236
broken links, 235
database audit, 236
network audit, 236
response time, 235
Electronic forms, designing, 206
E-mail, 68, 69, 119
EMap, see Execution map
Empirical model, 52
Employee
interview process, guidelines for
handling, 63–64
Web usage, 244
Encapsulation, 23, 181
End user(s), 5
acceptance testing by, 33
data distribution to, 80
help files, 266
support, 32
Enterprise resource planning (ERP), 89
Entity relationship diagram (ERD), 12, 15,
32, 171, 184, 259
Microsoft Access, 260
use of for systems development, 177
Equation
manpower-buildup, 287
software, 287
ERD, see Entity relationship diagram
Ergonomics, 241
ERP, see Enterprise resource planning
Error(s), 436
detection, 225
discovery of, 245
handling, 114
message, nonexistent page, 235
CuuDuongThanCong.com https://fb.com/tailieudientucntt

863
Index
prevention of, 161
Estimacs, 415
Estimation techniques, problem-based, 51
Estimeeting process for developing
estimates, AT&T’s, 355–360
Event trace, 193
Execution map (EMap), 153
Extreme programming (XP), 137, 139–145
acceptance test, 143
coding standard, 144
collective code ownership, 143
components of, 140
continuous integration, 144–145
CRC cards, 142–143
development, 141–142
40-hour week, 145
iterative nature of, 141, 142
methodology, functional tests within,
143
on-site customer, 145
pair programming,144
popularity of, 139
project velocity, 144
refactoring, 144
simple design, 144
small releases, 144
system metaphor, 143
unit test, 143
F
Facilitated application specification
techniques (FAST), 50
Failures following implementation, 251
FAP, see Feature architecture proposal
Farbey’s considerations on software quality
metrics during requirements
phase, 377–379
FAST, see Facilitated application
specification techniques
Feasibility study and cost/benefit analysis,
35–46
cost/benefit analysis, 38–40
feasibility study components, 35–38
feasibility study process, 41–45
financial feasibility, 35–36
organizational or operational
feasibility, 37–38
scheduling of feasibility study, 40–41
technical feasibility, 36–37
Feature
architecture proposal (FAP), 358
selection proposal (FSP), 359
Feedback, 201, 383
Field length problems, 217
Financial feasibility, 35
Finkelstein, information engineering, 136,
137
Firewalls, 39, 53
First Amendment issues, 87
Flight software, errors found in, 152
Flowchart(s), 262
task analysis, 176
UML versus, 21
FM, see Functional model
FMaps, see Function maps
FOCUS
reporting interface, 120
system, 7, 9,10
Focus groups, 71
Form(s)
cyclical design of, 205
electronic, designing, 206
paper, guidelines for designing, 204
prescription drug claim, 205
prototype, 205
FORTRAN, 369
Forward engineering, 218, 219
4GLs, see Fourth generation languages
Fourth generation languages (4GLs), 31, 79
FPs, see Function points
FSP, see Feature selection proposal
Functional model (FM), 189
Function maps (FMaps) 152, 154, 155
integration of, 159
performance considerations, 163
Function points (FPs), 50, 51, 278
Fuzzy-logic sizing, 51
G
Gantt chart, 21, 40, 42, 49, 55
Gateway.com, 87
General Electric, 333
Gillies’ method for humanization of
software factory, 439–441
Goal(s)
business, 20
defining of measurable, 305
intermediate, 306
productivity-enhancing, 341
project, 29
–question–metric (GQM), 273
Gould’s points on usability, 341–344
GQM, see Goal–question–metric
Group productivity, statistics concerning
communications’ effect on,
337–339
CuuDuongThanCong.com https://fb.com/tailieudientucntt
864
SOFTWARE ENGINEERING HANDBOOK
GUI, 149
H
Hackers, 53, 87, 236
Halstead’s effort measure, 401
Hardware, deterioration of, 245
Hawthorne effect, 271
Help
Desk, staffing, 32
file, 266, 267
system, 201
Hewlett Packard (HP), 277, 333
success of, 278
TQC guidelines for software engineering
productivity, 407–409
TQC metrics, 277
HP, see Hewlett Packard
Human errors prevention of, 225
I
IBM, 333, 342
Audio Distribution Systems, 342
Web site, 89
IEEE, see Institute of Electrical and
Electronics Engineers
IIS, see Microsoft Internet Information
Server
Image maps, 90
Impact analysis, level of, 126
Inconsistent data, questions to ask
concerning, 124
Incremental model, 17, 98
Industry trade shows, 65
Information
analysis, 367
engineering, Finkelstein, 136, 137
gathering, 10, 71
hiding, 193
integrity, 237
repository, 135
resource management, 109
store browsers, 214
systems (IS), 8
common use among different, 125
development, creativity
improvement in, 329–331
technology (IT), 236, see also IT
productivity and quality, survey
on
as black hole, 271, 272
departments, peopleware solutions
used in, 281
investment in, 417–419
staff, user-friendly, 77
Inheritance, 23, 181, 182
Institute of Electrical and Electronics
Engineers (IEEE), 28
framework for measures, 435–438
standard dictionary of measures to
produce reliable software,
427–433
Integration, 221, 273
Intel, 333
Interface
aesthetically pleasing, 201
consistent, 200
International Organization for
Standardization (ISO), 28
Internet, 68, 86
service provider (ISP), 89, 236
Wild West days of, 231
Interpersonal relations, 351
Interview(s), 62
obstacles, 63
outline, information in, 63
Intranet, 68
IS, see Information systems
ISO, see International Organization for
Standardization
ISO 9000, 28
ISO 9001, 28
ISO 9003, 28
ISP, see Internet service provider
IT, see Information technology
Iteration planning meeting, 141
Iterative prototyping, 98
IT productivity and quality, survey on,
271–282
function point advantage, 278–281
HP way, 277–278
original metric, 275–277
planning for quality, 272–273
process of measurement, 273–275
quality education, 281–282
J
JAD, see Joint application development
Java, 7, 75, 161, 178, 183, 203, 213
Job
matching, 311
requirements planning (JRP), 131
security, 351
Johnson & Johnson, 333
CuuDuongThanCong.com https://fb.com/tailieudientucntt
865
Index
Joint application development (JAD), 20,
101
definition of, 98
problem with meetings in, 134
process, stage of, 133
requirement of management to accept,
131
JRP, see Job requirements planning
K
Kanter’s methodology for justifying
investment in information
technology, 417–419
Kellner’s nontechnological issues in
software engineering, 309–311
Kemayel’s controllable factors in
programmer productivity,
349–353
Keyes’ value of information, 393–394
Knowledge base, 105
Kydd’s technique to induce productivity
through shared information
technology, 389–390
L
Lack of cohesion in methods (LCOM), 281
Language(s)
Ada, 369
ASP, 30
C, 161
C++, 7, 22, 30, 75
COBOL, 213
DBTF technology, 150
fourth generation, 31, 79
implementation-dependent, 150
Java, 21, 75, 161, 183, 213
levels, 293
Perl, 21
Program Definition, 12–14
universal modeling, 21, 24, 147
user, 150
XML, 161
LCOM, see Lack of cohesion in methods
Lederer’s management guidelines for better
cost estimating, 413–416
Legacy systems, program architecture of,
213
Life cycle phase management, 115
Lines of code (LOC), 50, 317, 451
Linkman’s methods for controlling
programs through
measurement, 305–307
LOC, see Lines of code
Locked in designs, 148
Logical analysis, 175
Logins, logging of, 241
Love bug viruses, 236
M
Macintosh word processing product, 200
Macro-estimation model, 52
Maiden’s method for reuse of analogous
specifications through human
involvement in reuse process,
447–449
Maintenance
adaptive, 248
corrective, 247
costs, 248
high cost of, 246
perfective, 248
preventive, 248
types of, 247
Make–buy decision, 421–422
Make work automation, definitions
supported by, 149
Malcolm Baldrige Quality Award, 299–301
Management information systems (MIS), 8,
317
Manpower
acceleration, 288
-buildup equation, 287
Marriott, 333
Martin and Carey’s survey of success in
converting prototypes to
operational systems, 313–316
Maytag, 333
McCabe’s complexity metric, 399
McDonald’s, 333
Mean time to failure, 431, 435
Measurement
detractors, 274
estimation, and control, Putnam’s trends
in, 317–318
Linkman’s methods for controlling
programs through, 305–307
Measures, IEEE framework for, 435–438
Menu order consistency, 200
Merrill Lynch, 7
Message passing, 181
Metadata repository, 110
Meta-language properties, 163
Meta–meta model, 116
Meta-methodology, 365–368
Metaphor, 200, 330
CuuDuongThanCong.com https://fb.com/tailieudientucntt

866
SOFTWARE ENGINEERING HANDBOOK
Methodology selection, 97–107
common generic methodologies, 97–99
determining methodology’s rating, 107
rating of methodology, 99–107
Metrics, selection of, 305
Microsoft
Access, 81, 259, 260
Internet Information Server (IIS), 239
Office, 259
Project, 55, 415
SQL Server, 81, 259
Visio, 12, 21
Visual Basic
applications built using, 25
Debugger, 25
Windows/NT/2000, 90
Minor questions, 66
MIS, see Management information systems
Model
application composition, 291
COCOMO, 52, 258, 425–426
COCOMO II, 51, 291–295
defect density, 387
documentation maturity, 256
dynamic, 189
early design, 292, 293
empirical, 52
functional, 189
incremental, 17, 98
macro-estimation, 52
maintenance, 249
meta–meta, 116
object, 20, 189
outsourcing, 95
post-architecture, 293
process, creation of high-level, 169
prototype, 313
Putnam, 52
reusability, 373–376
SLIM, 287
software life cycle, 221
thrown away, 313, 314
TMap, 158
vendor supplied meta, 116
waterfall, 132, 138
Modeling
dynamic performance, 137
operational, 137
process, 137
strategic, 136
tactical, 137
Modem
pricing, 90
slow, 91
Modules, committed to, 362
Motivation factors, 350
Motorola’s six sigma defect reduction effort,
411–412
Multiview meta-methodology, Avison’s,
365–368
Mystery shopper, 243
Mythical man-month idea, 297
N
Naming conventions, 104
NASA, 273
Navigation, 242
Net firms, problem area for, 243
Netslave media assassin, 88
Network
administrator, 104
audit, 236
description, 303, 304
diagram, 232, 234
New object points (NOP), 291
New product development, 37, 38
New York Stock Exchange (NYSE), 7, 10, 31,
76, 78, 80 83
NOC, see Number of children
Nolan/Prompt, 415
Nonchange-prone module, 250
Noncomment source lines of code (NSLOC),
276, 386
NOP, see New object points
Norden-Rayleigh curve, 287
NSLOC, see Noncomment source lines of
code
Number of children (NOC), 280
NYSE, see New York Stock Exchange
O
Object
-based environment, repository
workbench in, 114
definition of, 23
map (OMap), 153, 155, 164
model (OM), 189
orientation (OO), 14, 20, 99, 181
definitions, 23
dog grooming system, 225
model, 20
software tool, 189
systems, 24, 188
Object-oriented analysis (OOA), 20, 22, 99,
183
CuuDuongThanCong.com https://fb.com/tailieudientucntt
867
Index
Object-oriented analysis and design
(OOAD), 185, 187, 189
Object-oriented databases, 101
Object-oriented design (OOD), 99, 181–198
object orientation, 181–182
OOAD methodologies, 185–189
Booch, 187
Coad and Yourdon, 187–188
Jacobson, 188
LBMS SEOO, 188–189
Rumbaugh OMT, 189
Shaler and Mellor, 189
OOAD simplified, 189–197
OO from bottom up, 182–1185
Object-oriented metrics, 281
Object-oriented programming (OOP), 20, 22,
99
Object-oriented software engineering, 188
Object-oriented system, properties of, 165
Object-oriented technology, 194
Observation
directed, 68, 69
forms of, 68
silent, 68, 69
Obsolescence, 94
OM, see Object model
OMap, see Object map
Online warranties, 87
OO, see Object orientation
OOA, see Object-oriented analysis
OOAD, see Object-oriented analysis and
design
OOD, see Object-oriented design
OOP, see Object-oriented programming
Open-ended questions, 65
Operational modeling, 137
Operational systems, conversion of
prototypes to, 313–316
Oracle, 259
Organization
culture, 389
expectations of, 37
relationship between environment and,
365
OS/server software, 90
Outsourcing
contract, size of, 86
models, 95
Outsourcing decision, 85–95
analysis and evaluation, 85
implementation, 86
needs assessment and vendor selection,
85–86
outsourcing example, 86–91
costs, 89, 91
labor costs, 91
outsourcing issues, 87–89
rolling your own, 90–91
using Internet service provider, 89–90
outsourcing models, 95
questions to ask potential outsourcing
companies, 94–95
reasons to outsource, 91–94
P
Pair programming, 144
Paper form, guidelines for designing, 204
Parallel testing, 223
Passwords, 237
Past-performance questions, 66
PDL, see Program Definition Language
Penetration testing, 241
People
issues, 309
quality metrics, 408
Peopleware solutions, 281
Perfective maintenance, 248
Performance
requirements, users as source of data
on, 75
tracking analysis, 38
Personnel attributes, 309
PERT, see Program evaluation and review
techniques (PERT)
Pfleeger’s approach to software metrics tool
evaluation, 443–445
Pfleeger’s method for CASE tool selection
based on process maturity,
393–397
Physical analysis, 175
Planning
game, 137, 141
robot, 158
Polymorphism, 23, 182
Pornography issues, 87
Post-architecture model, 293
Prescott’s guidelines for using structured
methodology, 345–347
Prescription drug claim form, logical flow of,
205
Preventive maintenance, 248
Prieto-Diaz’ reusability model, 373–376
Primitive structures, 154
Priority board, 251
Problem
-based estimation techniques, 51
CuuDuongThanCong.com https://fb.com/tailieudientucntt
868
SOFTWARE ENGINEERING HANDBOOK
reversal, 331
solving, analogical, 448
Process
description, 303, 304
improvement, 273
maturity
CASE tool selection based on,
395–397
framework, Contel’s software metrics
in, 385–388
model, creation of high-level, 169
modeling, 98, 137
specification (PSPEC), 12, 32, 174, 197
support modules, 216
Procter and Gamble, 333
Product
development, 37, 38
faults, 435
metrics, 404, 408
promotion, 89
valuation, 127
Productivity
classes of, 405
-enhancing goals, 341
fostering, 390
improvements, top–down approach to
generating, 329
layers to, 282
metrics, baseline, 50
paradox, 278
rate, 292
Program
comments, sample, 266
Definition Language (PDL), 12–14
evaluation and review techniques
(PERT), 40, 41, 54
modularization, 215, 216
understanding, tools for, 214
Programmatic security, 239
Programmer(s)
capability, 426
exhausted, 145
hidden fields used by, 238
productivity
Kemayel’s controllable factors in,
349–353
paradoxes, 349
Programming, see also Extreme
programming
language, see also Language
levels, 293
overuse of testing tool’s, 229
systems written in, 6
pair, 144
standards, 346, 352
tasks, development of, 141
techniques, egoless, 310
Progressive abstraction, 330
Project(s)
analysis, 30, 306
complexity, 37
costs associated with, 39
data collection, 305
design requirements, clarity of, 36
development
process of, 139, 140
time, length of, 36
estimation techniques, 50
execution, poor, 310
goals establishment process, 29
gone awry, 47
management software, 106
parameterization, 115
payback, length of, 36
team, people constituting, 104
timeframes, 42
velocity, 144
Workbench, 415
work products associated with, 320
Project plan, writing of, 47–59
person writing project plan, 48
project plan unwrapped, 49–58
decomposition techniques, 51–52
empirical model, 52–53
project estimates, 50–51
project resources, 57
risk management strategy, 53
schedules, 54–56
software scope, 49–50
tracking and control mechanisms,
57–58
reason for, 47–48
value of, 58
what goes into project plan, 48–49
Prototype(s), 16, 71
conversion of to operational systems,
313–316
documentation of, 315
iterative, 98
model, 313
Pseudocode example, 18
PSPEC, see Process specification
Putnam formula, 297
Putnam model, 52
Putnam’s cost estimation model, 297
Putnam’s software equation, 287–289
Putnam’s trends in measurement,
estimation, and control, 317–318
CuuDuongThanCong.com https://fb.com/tailieudientucntt
869
Index
Q
QA, see Quality assurance
QAES, see Quality assurance engineering
software
Quality
assurance (QA), 9, 236
department, testing involving, 26
engineer, 223
engineering software (QAES), 391
procedures, lack of, 382
software, 57, 58, 224
layers to, 282
leaders, principles of, 333–335
Questionnaires, 11, 62, 66
Questions
closed-ended, 66
minor, 66
open-ended, 65
past-performance, 66
reflexive, 66
types of, 65
Quicktime animation, 90
R
RAD, see Rapid application development
Rapid application development (RAD), 17,
82, 101
application generators used by, 17
definition of, 98
description of, 131
phases of, 131, 132
technique, variation of, 132
uses, 133
Rational Rose, 176
Rayleigh curve, 287, 288
RealAudio, 90
RealMedia server, 22
Redmill’s quality considerations in
management of software-based
development projects, 381–383
Redundancy, 39, 126
Redundant data, questions to ask
concerning, 124
Re-engineering, see Software re-engineering
Refactoring, 144
Referential integrity support, 122
Reflexive questions, 66
Release planning, values, 141
Remote procedure calls (RPC), 240
Reports, canned, 120
Repository workbench, evaluation of,
111–122
architecture, 116
CASE bridge, 118
dialog, 114
extensibility, 114
forms, 121
gateways, 117
generation, 121–122
groupware, 119
impact analysis, 120
initial data capture, 112
life cycle phase management, 115–116
managing relational tables, 122
project control, 115
reporting, 119–120
scripting, 120–121
services, 118
source and use, 113
standards, 116–117
tool integration, 119
tracking, 112
user access, 113
versioning, 115
workbench integration, 118–119
Request for proposal (RFP), 85
Requirements
management, checklist for, 71, 72–73
planning, 131
traceability matrix, 347
Requirements elicitation, 61–73
checklist for requirements management,
71, 72–73
elicitation techniques, 62–71
brainstorming, 71
competitive intelligence, 70
focus groups, 71
interviewing, 62–66
observation, 68–69
participation, 69–70
prototyping, 71
questionnaires and surveys, 66–68
stakeholder analysis, 61–62
Resource management, selection and
integration of repository for
effective, 109–127
effective information resource
management, 109–111
evaluating repository workbench,
111–122
architecture, 116
CASE bridge, 118
dialog, 114
extensibility, 114
CuuDuongThanCong.com https://fb.com/tailieudientucntt
870
SOFTWARE ENGINEERING HANDBOOK
forms, 121
gateways, 117
generation, 121–122
groupware, 119
impact analysis, 120
initial data capture, 112
life cycle phase management,
115–116
managing relational tables, 122
project control, 115
reporting, 119–120
scripting, 120–121
services, 118
source and use, 113
standards, 116–117
tool integration, 119
tracking, 112
user access, 113
versioning, 115
workbench integration, 118–119
preparing for repository workbench,
122–124
repository metrics, 124–126
scoring repository workbench, 126–127
Response for class (RFC), 281
Reusability model, Prieto-Diaz’, 373–376
Reusable code, 447
Reuse process, human involvement in,
447–449
Reverse engineering, 20, 62, 70, 213, 214
definition of, 98
technique, Byrne’s, 369–371
RFC, see Response for class
RFP, see Request for proposal
Rich text format (RTF) files, 266
Risk
issues, 36
management strategy, 53
mitigation, monitoring, and management
(RMMM), 53
table, 53
RMap, see Road map
RMMM, see Risk, mitigation, monitoring,
and management
Road map (RMap), 153
Robot
controller, 161
planning, 158
ROI
applications, high-, 419
-enhancing decision, 87
Routers, cost of, 91
RPC, see Remote procedure calls
RTF files, see Rich text format files
S
Safety-critical systems, computers
introduced into, 48
SCM, see Software configuration
management, Sprague’s
technique for
Script status feedback, 121
SDE, see Software development
environment, Corbin’s
methodology for establishing
SDLC, see Systems development life cycle
SDS, see System design specification
Second-order control system, 161
Secure transaction server, 90
Securities & Exchange Commission, 82
Securities Industry Automatic Corp. (SIAC),
80
Security
degree of, 126
holes, publicized, 238
programmatic, 239
requirements, project-oriented, 115
SEI, see Software Engineering Institute
SEOO, see Systems engineering OO
Server
Alpha, 275
e-commerce, 22, 90
Java application, 178
Microsoft SQL, 81
RealMedia, 22
secure transaction, 90
software, 39
Web, 240
Shared information technology (SIT),
Kydd’s technique to induce
productivity through, 389–390
Shetty’s seven principles of quality leaders,
333–335
Shockwave animation, 90
Shopping experience, 243
SIAC, see Securities Industry Automatic
Corp.
Silent observation, 68, 69
Simmons’ statistics concerning
communications’ effect on
group productivity, 337–339
Simplified condition, 215
SIT, see Shared information technology,
Kydd’s technique to induce
productivity through
Six sigma defect reduction effort,
Motorola’s, 411–412
SLIM, 287–289
CuuDuongThanCong.com https://fb.com/tailieudientucntt
871
Index
SmartDraw, Visio versus, 21
Software
AGS PAC III, 451
applications, creation of error-free, 221
companies, competitive, 98
database, 178
DEC/VAX Software Project Manager, 415
development
critical component of, 221
early days of, 47
environment (SDE), Corbin’s
methodology for establishing,
325–328
life cycle, cost associated with, 28, 29
main phases of, 98
projects, quality considerations in
management of, 381–383
disasters, 48
documentation
creation of, 257
mathematical foundation to, 259
quality, definition of, 257
equation, Putnam’s, 287–289
error, causes of, 147
Estimacs, 415
factory, humanization of, 439–441
flight, errors found in, 152
Java application server, 178
life cycle, 305
model, 221
most expensive component of, 245
maintenance, 212
maturity index, 429
measures to produce reliable, 427–433
metrics, 443
DEC’s overview of, 403–406
tool evaluation, Pfleeger’s approach
to, 443–445
Microsoft Project, 415
modified, 211
Nolan/Prompt, 415
OS/server, 90
process maturity framework, 19
product, Y2K, 67
Project Workbench, 415
quality assurance (SQA), 57, 58, 224, 391
quality metrics
Bellcore’s, 391–392
considerations on during
requirements phase, 377–379
reliability, 277, 425
requirements, expression of, 346
selection from multiple packages,
423–424
server, 39
source code, 213
Spectrum/Estimator, 415
testing, 221–230
definition, 221–224
life cycle, 228
practical approach to automated
software testing, 227–228
strategy, 224–225
test automation, 225–227
using automated testing tools,
228–229
third-party, 6
tool(s)
OO, 189
two-flavored, 110
Software configuration management (SCM),
Sprague’s technique for, 319–323
procedures for developing SCM process,
321–322
procedures/issues/policies, 321
Software engineering, 5–33
developmental methodologies, 14–20
diagramming or modeling of system,
12–14
documentation, 30–31
feasibility study, 9–10
information-gathering channels, 10–12
installation, 30
Kellner’s nontechnological issues in,
309–311
maintenance, 31–32
object-oriented, 22–24, 188
procedure, 29–30
productivity, Hewlett Packard’s TQC
guidelines for, 407–409
software developer, 6–8
standards and metrics, 27–28
system(s)
design, 20–22
development life cycle, 8–9
testing, 25–27
training, 32
variations, 345
Software Engineering Institute (SEI), 14, 100,
255
Software maintenance, management of,
245–253
controlling maintenance requests,
251–252
maintenance costs, 248–249
maintenance process, 245–247
managing maintenance personnel, 250
measuring effectiveness, 250–251
CuuDuongThanCong.com https://fb.com/tailieudientucntt
872
SOFTWARE ENGINEERING HANDBOOK
model for maintenance, 249–250
types of maintenance, 247–248
adaptive maintenance, 248
corrective maintenance, 247
perfective maintenance, 248
preventive maintenance, 248
Software re-engineering, 211–220
definition, 211
forward engineering, 218–219
need for, 211–212
process, 213–218
data re-engineering, 216–218
program modularization, 216
program structure improvement,
215–216
reverse engineering, 213–215
source code translation, 213
strategies, 212–213
SOO, see System-oriented object
SOSAS, 187
Source code, 213
Spamming, 87
Specialists with advanced technology
(SWAT teams), 131
Spectrum/Estimator, 415
Sprague’s technique for software
configuration management,
319–323
procedures for developing SCM process,
321–322
procedures/issues/policies, 321
Spreadsheets, 106, 114
SQA, see Software quality assurance
SRS, see System requirements specifications
SSL, 90
Staff hierarchy diagram, 232, 235
Stakeholders, 5, 61
Start-up scripts, vendor-supplied, 121
State transition diagram (STD), 12, 16, 32,
169–170, 172, 189
STD, see State transition diagram
Stepwise refinement, 21
Strategic modeling, 136
Strategic systems, 63
Structured English, 12
Structured methodology, 129–138
CASE tools, 134–135
extreme programming, 137–138
group support systems, 134
joint application design, 133–134
Prescott’s guidelines for using, 345–347
rapid applications development,
131–133
variety of structured methodologies,
135–137
Subsystem estimation form, 359
Survey(s)
creation, guidelines for, 67
development, 66
different approaches to, 68
Web-based, 68
SWAT teams, see Specialists with advanced
technology
Swiss Bank, 76
Sybase, 259
Synergy, occurrence of when linking internal
and external systems, 89
System(s)
analysis
methods, user left out under, 76
process, observation in, 11
Async, 157
boundary diagram, 190
change, way to control, 31
characteristics, impact of, 279
class design, 194
construction, 131
design, 20
fun part of, 81
specification (SDS), 264
development life cycle (SDLC), 8, 16, 32,
103, 269
definition of, 97
design specification, 169
methodology covering all phases of,
102
seven-step, 17
traditional, 130
development methodologies,
proliferation of, 365
of custom-built, 220
most critical phase of, 245
pitch-hit-and-run theory applied to,
77–78
use of DFD for, 177
use of ERD for, 177
of in vacuum, 5
engineering OO (SEOO), 188
evaluation of for correctness, 9
hacked, 53
investigation, 129
maintenance, overview of system, 247
metaphor, 143
object-oriented,165
-oriented object (SOO), 150
pattern, example of, 156
requirements specifications (SRS), 169
CuuDuongThanCong.com https://fb.com/tailieudientucntt

873
Index
run-time performance, insufficient
information about, 148
specification, 178
spec walkthrough, 179
testing, 223
ultimate effectiveness of, 377
T
Tactical modeling, 137
Tactical systems, examples of, 63
Tangential service, auditing of, 243
Task analysis flowchart, 176
Tate’s approaches to measuring size of
application products with CASE
tools, 451
Tax problem, 69
Team
development, poor, 311
organizations, generic, 57
Teamwork, lack of, 310
Technical feasibility, 36
Tektronix, 342
Telephone line, high-speed, 91
Test
automation, 225, 226, 227
case(s)
sample, 27
test scripts formed by, 26
script creation, automatic, 229
Testing
acceptance, 33
customer acceptance, 223
department, downsizing of, 227
infrastructure, 228
integration, 221
parallel, 223
penetration, 241
pre-PC, 240
system, 223
unit, 221
Texas Instruments, 333
Therac-25, 48
Timeline chart, 55
Time to market, 16
T-1 line, 91
T-3 line, 91
TMaps, see Type maps
Tool usage guidelines, 104
Total quality control (TQC), 277
Total quality management (TQM), 271, 382
TQC, see Total quality control
TQM, see Total quality management
Transaction-based systems, 63
Tutorials, table format for developing, 268
Type maps (TMaps), 152, 154, 156
initiations of, 164
integration of, 159
performance considerations, 163
reusability used with, 158
universal primitive operations provided
by, 160
U
UI, see User interface
UML, see Uniform modeling language
Uniform modeling language (UML), 21, 24,
147, 260, 261, 262
United Technologies Microelectronic
Center, 329
Unit testing, 221
Universal primitive operations, 160
UNIX, 90
Usability
engineering, 343
Gould’s points on, 341–344
testing
interactive, 203
investment, 207
Use case, sample, 191, 264
User(s)
acceptance, 37
control, 199
documentation, 267
-friendly IT staff, 77
interface (UI), 199
language, 150
tracking, 90
types of, 78
User interface design, 199–209
aspect of good, 203
bad, 202
designing effective input and output,
203–207
designing input, 204–207
designing output, 207
good, 202, 208
phases of, 202
principles, 199–202
process, 202–203
usability testing, 207
User-oriented systems, design of, 75–83
distributing data to end user, 80–81
drumming up enthusiasm, 77–78
methodologies, 78–80
systems choice, 81–83
tailoring system to end users’ needs, 76
CuuDuongThanCong.com https://fb.com/tailieudientucntt
874
SOFTWARE ENGINEERING HANDBOOK
trade secrets, 75–76
U.S. Post Office, automation of clerical staff,
62
Utility programs, 39
UTMC creativity program, 329
V
VAF, see Value adjustment factor
Value adjustment factor (VAF), 279
Value of information (VOI), Keyes’, 393–394
Van Dyke Software, 268
VAX Cobol compiler, 275
VaxScan, 275
Vcommerce.com, 87
Vendor
financial stability, 86
-supplied meta model, 116
Verisign, 90
Virtual private network (VPN), 22
Viruses, 31, 236
Visio, 21, 187
Visual Basic, 101, 203, 221, 222
Visual Basic.Net, 183
Visual C++, 101, 203
Visual development tools, 101
Visual J++, 203
VOI, see Value of information, Keyes’
VPN, see Virtual private network
W
Walkthrough
formal, 347
system spec, 179
Waterfall
design methods, 129, 132
model, 132, 138
WBS, see Work breakdown structure
Web
-based surveys, 68
cost, 92–93
-hosting companies, sending out of RFPs
to, 91
nonexistent page error message, 235
server review, 240
site(s)
functionality, 88
IBM, 89
marketing information contained in,
70
usability, 242
surfers, irritants reported by, 235
usage, employee, 244
Weighted methods per class (WMC), 280
Western Electric, 271
Western Union, hackers breaking into, 236
WinRunner, 226
Wishful thinking, 331
Wish lists, 69
Wizard-generated code, 239
WMC, see Weighted methods per class
Word processing product, Macintosh, 200
Work
breakdown structure (WBS), 49, 54
textual, 56
use of Microsoft Project to create, 55
habits, users as source of data on, 75
Working conditions, 351
Worm, Code Red, 31
X
Xerox, 333
XML, 161
XP, see Extreme programming
Y
Y2K software product, 67
Z
Zachman’s framework, 303–304
CuuDuongThanCong.com https://fb.com/tailieudientucntt


