Embed Size (px)
Citation preview
materials
Article
New Edge Crush Test Configuration Enhanced with Full-FieldStrain Measurements
Tomasz Garbowski 1 , Anna Knitter-Piatkowska 2,* and Aleksander Marek 3
�����������������
Citation: Garbowski, T.;
Knitter-Piatkowska, A.; Marek, A.
New Edge Crush Test Configuration
Enhanced with Full-Field Strain
Measurements. Materials 2021, 14,
5768. https://doi.org/10.3390/
ma14195768
Academic Editor: Aniello Riccio
Received: 31 August 2021
Accepted: 29 September 2021
Published: 2 October 2021
Publisher’s Note: MDPI stays neutral
with regard to jurisdictional claims in
published maps and institutional affil-
iations.
Copyright: © 2021 by the authors.
Licensee MDPI, Basel, Switzerland.
This article is an open access article
distributed under the terms and
conditions of the Creative Commons
Attribution (CC BY) license (https://
creativecommons.org/licenses/by/
4.0/).
1 Department of Biosystems Engineering, Poznan University of Life Sciences, Wojska Polskiego 50,60-627 Poznan, Poland; [email protected]
2 Institute of Structural Analysis, Poznan University of Technology, Piotrowo 5, 60-965 Poznan, Poland3 Faculty of Engineering and Physical Sciences, University of Southampton, Highfield SO17 1BJ, UK;
[email protected]* Correspondence: [email protected]
Abstract: The standard edge crush test (ECT) allows the determination of the crushing strengthof the corrugated cardboard. Unfortunately, this test cannot be used to estimate the compressivestiffness, which is an equally important parameter. This is because any attempt to determine thisparameter using current lab equipment quickly ends in a fiasco. The biggest obstacle is obtaininga reliable measurement of displacements and strains in the corrugated cardboard sample. In thispaper, we present a method that not only allows for the reliable identification of the stiffness in theloaded direction of orthotropy in the corrugated board sample, but also the full orthotropic materialstiffness matrix. The proposed method uses two samples: (a) traditional, cut crosswise to the wavedirection of the corrugated core, and (b) cut at an angle of 45◦. Additionally, in both cases, an opticalsystem with digital image correlation (DIC) was used to measure the displacements and strains onthe outer surfaces of samples. The use of a non-contact measuring system allowed us to avoid usingthe measurement of displacements from the crosshead, which is burdened with a large error. Apartfrom the new experimental configuration, the article also proposes a simple algorithm to quicklycharacterize all sought stiffness parameters. The obtained results are finally compared with theresults obtained in the homogenization procedure of the cross-section of the corrugated board. Theresults were consistent in both cases.
Keywords: corrugated cardboard; edge crush test; orthotropic elasticity; digital image correlation;compressive stiffness
1. Introduction
The increasing consumer demands and absorptive power of the merchant marketin today’s world, resulting in the need to pack, store and securely ship more and morevarious goods, in addition to growing ecological awareness, have led to the increasinginterest of manufacturers in cardboard packaging. This fact, in turn, has triggered theinevitable, continuous, and intensive development of numerous corrugated cardboardtesting techniques over the last decades.
Assessing the load-bearing capacity of corrugated cardboard products is crucial fortheir proper design, production final usage, and re-use processes. It is important toemphasize here that corrugated cardboard comprises a few layers, and thus can be calleda sandwich structure. Its mechanical properties are directly related to two characteristicin-plane directions of orthotropy, i.e., a machine direction (MD) that is perpendicular tothe main axis of the fluting and parallel to the paperboard fiber alignment, and a crossdirection (CD), which is parallel to the fluting.
Numerous approaches to sandwich element strength determination, including for cor-rugated cardboard, can be found in the literature. Analytical methods, starting already inthe 1950s, were presented, e.g., in [1–5], whereas numerical methods can be found in [6–11],
Materials 2021, 14, 5768. https://doi.org/10.3390/ma14195768 https://www.mdpi.com/journal/materials

Materials 2021, 14, 5768 2 of 18
and analytical-numerical techniques in [12–16]. Analytical calculations of the edge crushresistance of cellular paperboard, both in MD and CD, based on the paperboard’s geometricparameters and the mechanical properties of the materials used for its production, was dis-cussed by Kmita-Fudalej et al. [17]. Park et al. [18] investigated the edgewise compressionbehavior of corrugated paperboard while applying the finite element method (FEM) aswell as experimental analysis, i.e., load vs. displacement plots, edge crush tests (ECT) andfailure mechanisms. In recent years, methods of artificial intelligence, including artificialneural networks, have become widespread to predict the strength of composite materials,e.g., sandwich structures as presented by Wong et al. [19].
While executing numerical simulations in examining corrugated cardboard, the com-prehensive knowledge of each layer’s material properties is necessary. By reason of theanisotropy of the paper-based materials, this is a demanding task. In such a case a goodsolution is to implement a method called homogenization. This approach efficiently allowsus to simplify multi-layer models into single-layered model, described by the effectiveproperties of the composite [9,10,20]. The application of this technique has the benefitsof significant savings in computation time while maintaining the accuracy of the results.Hohe [21] presented the strain energy approach as being applicable to sandwich pan-els for homogenization and proposed an equivalence of a representative element of theheterogeneous and homogenized elements for this purpose.
Another option, in addition to analytical or numerical analysis, for the estimationof corrugated board strength is to carry out measurements from an experiment. Physicaltesting is very common in the paper industry, and a number of typical tests have beendeveloped to unify the process of the characterization of corrugated cardboard mechanicalproperties. The aforementioned ECT is used to evaluate the compressive strength, theload during this examination is applied perpendicularly to the axis of the flutes. In thebending test (BNT), four-point bending is executed, two supports are at the bottom of thecardboard whereas two equal forces act on the sample from the opposite side. The shearstiffness test (SST) involves twisting the cardboard cross-section by applying a pair of forcesto opposite corners while the other two remain supported. In the torsional stiffness test(TST) the cardboard sample is twisted in both directions. The box compressive test (BCT)is conducted to examine the load bearing capacity of the whole cardboard box [12–14,22].The bursting and humidity tests should also be mentioned here.
Since ECT is standardized, four different methods have been described, i.e., theedge-clamping method [23], the neck-down method [24], the rectangular test specimenmethod [24–26] and the edge-reinforced method [27,28]. One of the major characteristicswhich differentiates these tests is the shape of the samples. To assemble the measurementsfrom the outer surfaces of the specimen during the examination, video extensometry canbe employed. Such a procedure is based on the measurement of the relative distancesbetween pairs of points traced across images captured at different load values [15]. This is amethod comparable to, yet simpler than digital image correlation (DIC) which, as full-fieldnon-contact optical measurement method, is gaining more popularity in the field of experi-mental mechanics since it ensures very high accuracy of data acquisition. Hägglund et al.applied DIC while examining thickness changes during the ECT of damaged and undam-aged panels made of corrugated paperboard [29]. The implementation of DIC for theinvestigation of the strain and stress fields of paperboard panels subjected to BCT andanalysis of their post-buckling behavior was discussed by Viguié et al. in [30–32]. A dis-tortional hardening plasticity model for paperboard was presented by Borgqvist et al. [33],who introduced a yield surface characterized by multiple hardening variables attainedfrom simple uniaxial tests. The comparison between the results acquired from the modeland the experimental results received while using DIC were demonstrated as well. Com-bined compression and bending tests of paperboards and laminates for liquid containerswhile applying DIC were executed by Cocchetti et al. [34,35], who identified the materialparameters of anisotropic elastic-plastic material models of foils. For this purpose, inverseanalysis was employed while processing the results received from both the experiment

Materials 2021, 14, 5768 3 of 18
and the numerical FEM simulations. DIC and the virtual fields method (VFM) for therecognition of general anisotropy parameters of a filter paper and a paperboard have beendiscussed by Considine [36]. Åslund et al. applied the detailed FEM for the investigationof the corrugated sandwich panel failure mechanism while performing the ECT and com-pared the results with the measurements obtained with the use of DIC [37]. Zappa et al.studied the inflation of the paperboard composites which are used in the packaging ofbeverages while applying DIC [38]. Paperboard boxes with ventilation holes subjected to acompression load were investigated using DIC by Fadiji et al. [39].
It should be pointed out that in a large part of the above-mentioned studies, 3-plycorrugated cardboard specimens were tested. In this study, 5-ply double-wall corrugatedcardboard samples were examined. While performing ECT, an optical system with digitalimage correlation (DIC) is used to determine the displacements on the outer surface of thespecimen. The proposed method uses two types of samples, i.e., traditional, cut crosswise tothe direction of the wave direction of the corrugated core, and a novel procedure involvinga cut at an angle of 45◦. Such an approach not only allows for the reliable identification ofthe stiffness in one direction of orthotropy, but also for the measurement of the full materialstiffness matrix, i.e., 4 independent parameters. The obtained results were verified by theresults acquired in the homogenization procedure of the cross-section of the corrugatedboard. As proven, in both cases, the outcomes were very consistent.
2. Materials and Methods2.1. Corrugated Cardboard
In the current study, a 5-ply corrugated cardboard marked as EB-650 was used. Thetop liner is made of white, coated, recycled cardboard TLWC with a grammage of 140 g/m2.The cross-section has two corrugated layers: (a) low flute (E wave) and (b) high flute (Bwave). Both the wavy layers and the flat layer between them, forming the mid liner, aremade of lightweight WB cardboard, also recycled, with a grammage of 100 g/m2. As abottom liner, again the white recycled test liner with a grammage of 120 g/m2 is used.The geometry of the cross-section of the corrugated board and the configuration of therespective layers are shown in Figure 1, where 5 samples are placed one on top of the other.
Materials 2021, 14, x FOR PEER REVIEW 3 of 18
analysis was employed while processing the results received from both the experiment
and the numerical FEM simulations. DIC and the virtual fields method (VFM) for the
recognition of general anisotropy parameters of a filter paper and a paperboard have been
discussed by Considine [36]. Åslund et al. applied the detailed FEM for the investigation
of the corrugated sandwich panel failure mechanism while performing the ECT and com-
pared the results with the measurements obtained with the use of DIC [37]. Zappa et al.
studied the inflation of the paperboard composites which are used in the packaging of
beverages while applying DIC [38]. Paperboard boxes with ventilation holes subjected to
a compression load were investigated using DIC by Fadiji et al. [39].
It should be pointed out that in a large part of the above-mentioned studies, 3-ply
corrugated cardboard specimens were tested. In this study, 5-ply double-wall corrugated
cardboard samples were examined. While performing ECT, an optical system with digital
image correlation (DIC) is used to determine the displacements on the outer surface of the
specimen. The proposed method uses two types of samples, i.e., traditional, cut crosswise
to the direction of the wave direction of the corrugated core, and a novel procedure in-
volving a cut at an angle of 45°. Such an approach not only allows for the reliable identi-
fication of the stiffness in one direction of orthotropy, but also for the measurement of the
full material stiffness matrix, i.e., 4 independent parameters. The obtained results were
verified by the results acquired in the homogenization procedure of the cross-section of
the corrugated board. As proven, in both cases, the outcomes were very consistent.
2. Materials and Methods
2.1. Corrugated Cardboard
In the current study, a 5-ply corrugated cardboard marked as EB-650 was used. The
top liner is made of white, coated, recycled cardboard TLWC with a grammage of 140
g/m2. The cross-section has two corrugated layers: (a) low flute (E wave) and (b) high flute
(B wave). Both the wavy layers and the flat layer between them, forming the mid liner,
are made of lightweight WB cardboard, also recycled, with a grammage of 100 g/m2. As a
bottom liner, again the white recycled test liner with a grammage of 120 g/m2 is used. The
geometry of the cross-section of the corrugated board and the configuration of the respec-
tive layers are shown in Figure 1, where 5 samples are placed one on top of the other.
Figure 1. Visualization of 5 samples (stacked on top of each other) of the analyzed corrugated card-
board.
Table 1 presents the geometrical parameters of both wavy layers (flutes). The second
and third columns of Table 1 shows the wave period (pitch) and the wave amplitude
(height), respectively. The take-up ratio, which defines the ratio of the length of the non-
fluted corrugated medium to the length of the fluted web, is specified in the last column
of Table 1.
Figure 1. Visualization of 5 samples (stacked on top of each other) of the analyzed corrugated cardboard.
Table 1 presents the geometrical parameters of both wavy layers (flutes). The secondand third columns of Table 1 shows the wave period (pitch) and the wave amplitude (height),respectively. The take-up ratio, which defines the ratio of the length of the non-flutedcorrugated medium to the length of the fluted web, is specified in the last column of Table 1.
Materials 2021, 14, 5768 4 of 18
Table 1. The geometrical features of both corrugated layers of EB-650.
Wave (Flute) Pitch (mm) Height (mm) Take-Up Ratio (–)
E 3.50 1.18 1.242B 6.48 2.5 1.315
Paperboard, which is a main component of corrugated board, is made of cellulosefibers. The orientation of fibers is not random, but rather results from the productionprocess, which causes that their vast majority is arranged along the web, called the machinedirection (MD). The second direction, perpendicular to the MD, is called the cross direction(CD). Paperboard is both stronger and stiffer along the fiber direction.
In general, materials whose mechanical properties depend on fiber orientation arecalled orthotropic materials. As a component of corrugated cardboard is paper, it is alsoable to be considered as an orthotropic material. The orientation of the fibers, shown inFigure 2, makes the corrugated board stronger along the direction of the wave. Thus,the corrugated layers compensate (through the take-up factor) for the weaker mechanicalproperties of the board in CD.
Materials 2021, 14, x FOR PEER REVIEW 4 of 18
Table 1. The geometrical features of both corrugated layers of EB-650.
Wave (Flute) Pitch (mm) Height (mm) Take-Up Ratio (–)
E 3.50 1.18 1.242
B 6.48 2.5 1.315
Paperboard, which is a main component of corrugated board, is made of cellulose
fibers. The orientation of fibers is not random, but rather results from the production pro-
cess, which causes that their vast majority is arranged along the web, called the machine
direction (MD). The second direction, perpendicular to the MD, is called the cross direc-
tion (CD). Paperboard is both stronger and stiffer along the fiber direction.
In general, materials whose mechanical properties depend on fiber orientation are
called orthotropic materials. As a component of corrugated cardboard is paper, it is also
able to be considered as an orthotropic material. The orientation of the fibers, shown in
Figure 2, makes the corrugated board stronger along the direction of the wave. Thus, the
corrugated layers compensate (through the take-up factor) for the weaker mechanical
properties of the board in CD.
Figure 2. Material orientation in the corrugated board.
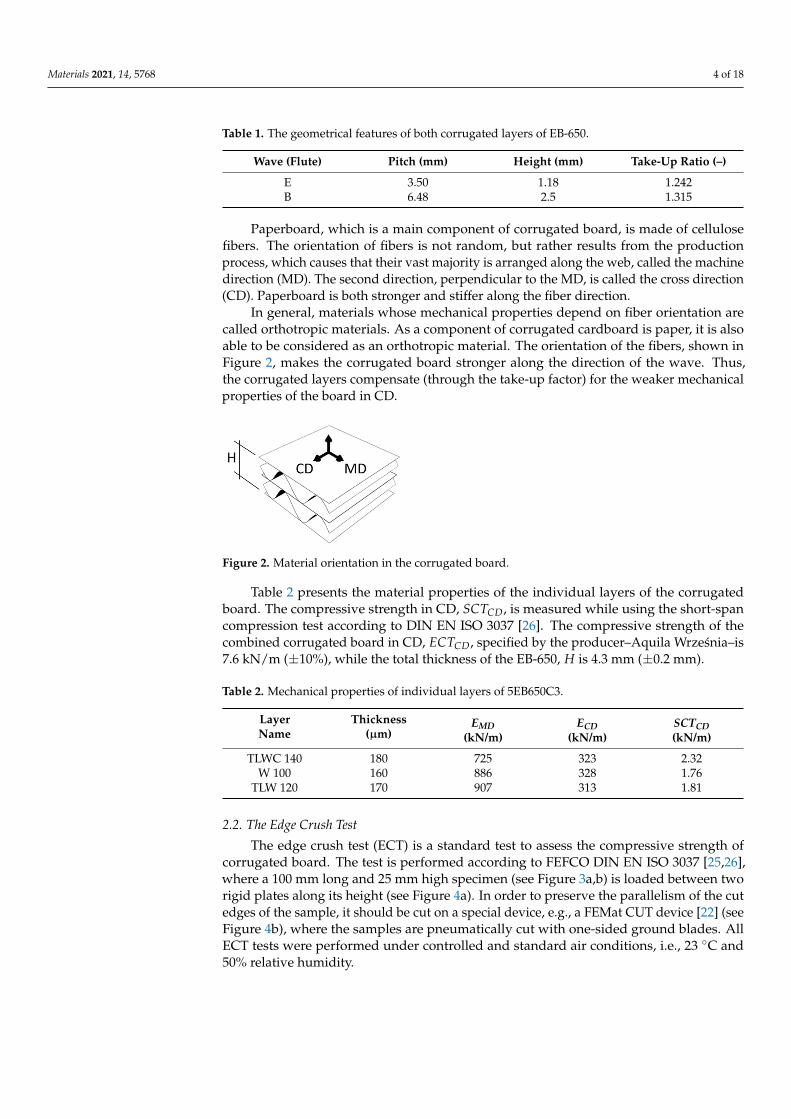
Table 2 presents the material properties of the individual layers of the corrugated
board. The compressive strength in CD, �����, is measured while using the short-span
compression test according to DIN EN ISO 3037 [26]. The compressive strength of the
combined corrugated board in CD, �����, specified by the producer–Aquila Września–
is 7.6 kN/m (±10%), while the total thickness of the EB-650, � is 4.3 mm (±0.2 mm).
Table 2. Mechanical properties of individual layers of 5EB650C3.
Layer
Name
Thickness
(��)
���
(kN/m)
���
(kN/m)
�����
(kN/m)
TLWC 140 180 725 323 2.32
W 100 160 886 328 1.76
TLW 120 170 907 313 1.81
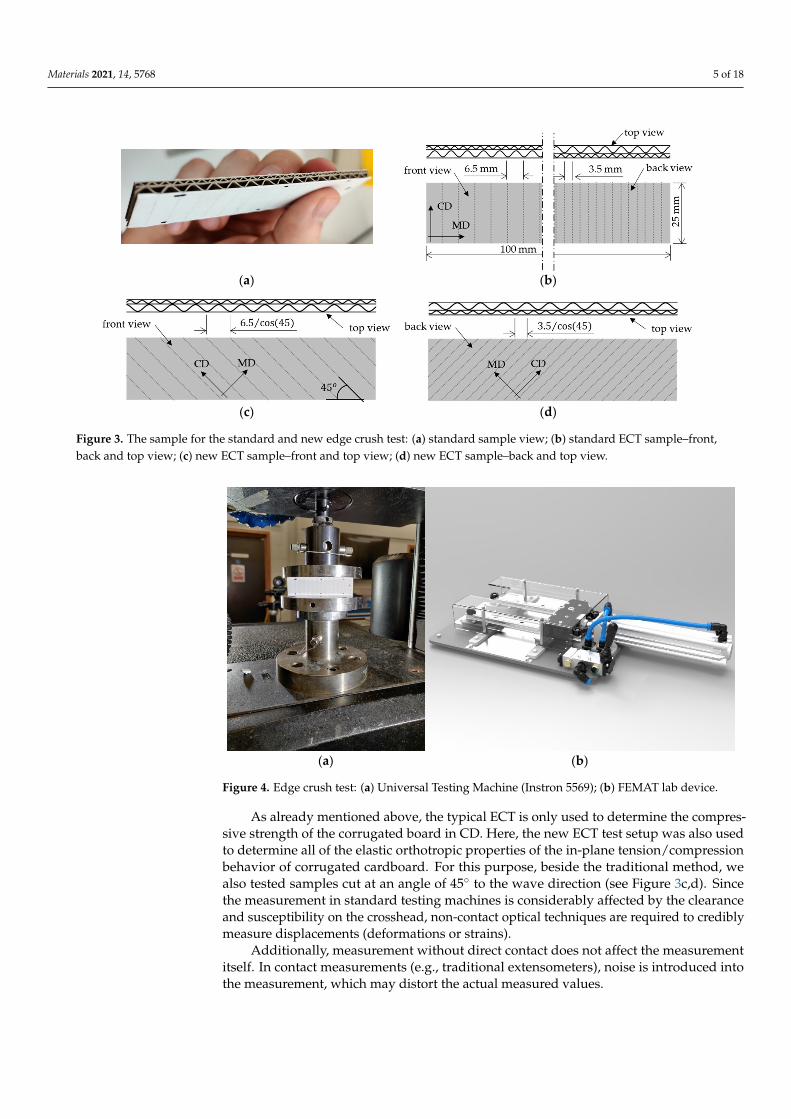
2.2. The Edge Crush Test
The edge crush test (ECT) is a standard test to assess the compressive strength of
corrugated board. The test is performed according to FEFCO DIN EN ISO 3037 [25,26],
where a 100 mm long and 25 mm high specimen (see Figure 3a,b) is loaded between two
rigid plates along its height (see Figure 4a). In order to preserve the parallelism of the cut
edges of the sample, it should be cut on a special device, e.g., a FEMat CUT device [22]
(see Figure 4b), where the samples are pneumatically cut with one-sided ground blades.
All ECT tests were performed under controlled and standard air conditions, i.e., 23 °C and
50% relative humidity.
As already mentioned above, the typical ECT is only used to determine the compres-
sive strength of the corrugated board in CD. Here, the new ECT test setup was also used
to determine all of the elastic orthotropic properties of the in-plane tension/compression
behavior of corrugated cardboard. For this purpose, beside the traditional method, we
Figure 2. Material orientation in the corrugated board.
Table 2 presents the material properties of the individual layers of the corrugatedboard. The compressive strength in CD, SCTCD, is measured while using the short-spancompression test according to DIN EN ISO 3037 [26]. The compressive strength of thecombined corrugated board in CD, ECTCD, specified by the producer–Aquila Wrzesnia–is7.6 kN/m (±10%), while the total thickness of the EB-650, H is 4.3 mm (±0.2 mm).
Table 2. Mechanical properties of individual layers of 5EB650C3.
LayerName
Thickness(µm)
EMD(kN/m)
ECD(kN/m)
SCTCD(kN/m)
TLWC 140 180 725 323 2.32W 100 160 886 328 1.76
TLW 120 170 907 313 1.81
2.2. The Edge Crush Test
The edge crush test (ECT) is a standard test to assess the compressive strength ofcorrugated board. The test is performed according to FEFCO DIN EN ISO 3037 [25,26],where a 100 mm long and 25 mm high specimen (see Figure 3a,b) is loaded between tworigid plates along its height (see Figure 4a). In order to preserve the parallelism of the cutedges of the sample, it should be cut on a special device, e.g., a FEMat CUT device [22] (seeFigure 4b), where the samples are pneumatically cut with one-sided ground blades. AllECT tests were performed under controlled and standard air conditions, i.e., 23 ◦C and50% relative humidity.
Materials 2021, 14, 5768 5 of 18
Materials 2021, 14, x FOR PEER REVIEW 5 of 18
also tested samples cut at an angle of 45° to the wave direction (see Figure 3c,d). Since the
measurement in standard testing machines is considerably affected by the clearance and
susceptibility on the crosshead, non-contact optical techniques are required to credibly
measure displacements (deformations or strains).
(a) (b)
(c) (d)
Figure 3. The sample for the standard and new edge crush test: (a) standard sample view; (b) standard ECT sample–front,
back and top view; (c) new ECT sample–front and top view; (d) new ECT sample–back and top view.
(a) (b)
Figure 4. Edge crush test: (a) Universal Testing Machine (Instron 5569); (b) FEMAT lab device.
Additionally, measurement without direct contact does not affect the measurement
itself. In contact measurements (e.g., traditional extensometers), noise is introduced into
the measurement, which may distort the actual measured values.
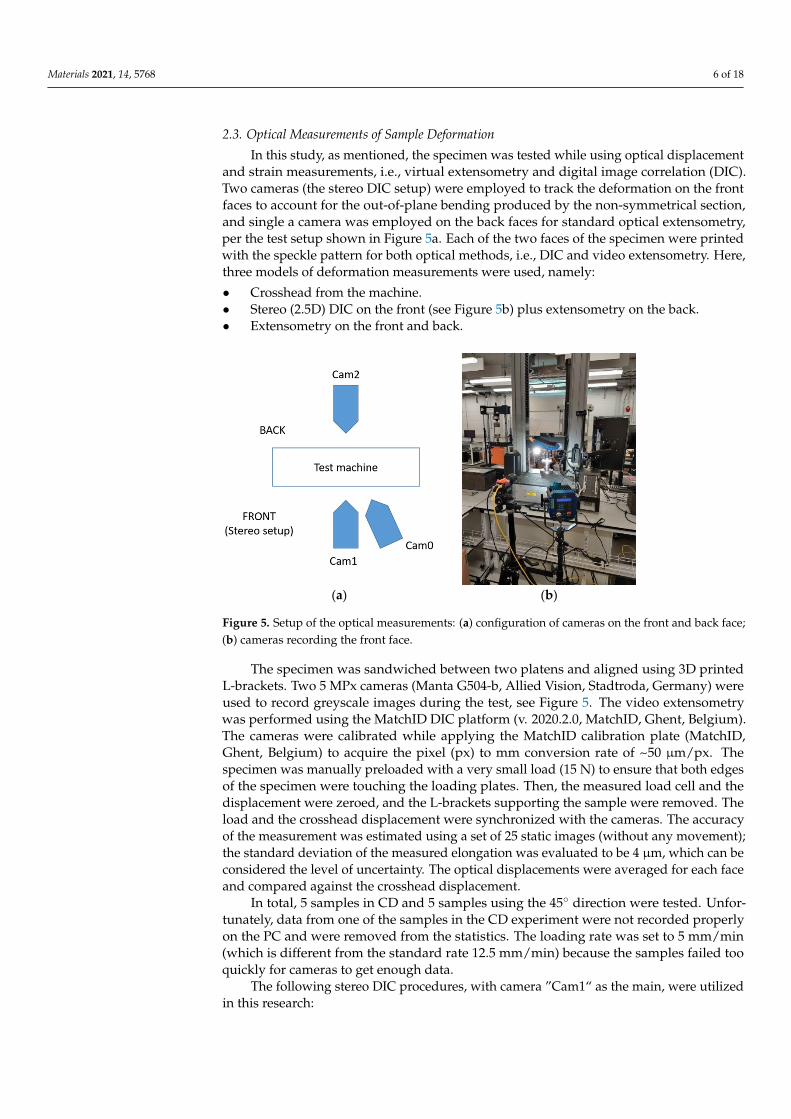
2.3. Optical Measurements of Sample Deformation
In this study, as mentioned, the specimen was tested while using optical displace-
ment and strain measurements, i.e., virtual extensometry and digital image correlation
(DIC). Two cameras (the stereo DIC setup) were employed to track the deformation on
the front faces to account for the out-of-plane bending produced by the non-symmetrical
Figure 3. The sample for the standard and new edge crush test: (a) standard sample view; (b) standard ECT sample–front,back and top view; (c) new ECT sample–front and top view; (d) new ECT sample–back and top view.
Materials 2021, 14, x FOR PEER REVIEW 5 of 18
also tested samples cut at an angle of 45° to the wave direction (see Figure 3c,d). Since the
measurement in standard testing machines is considerably affected by the clearance and
susceptibility on the crosshead, non-contact optical techniques are required to credibly
measure displacements (deformations or strains).
(a) (b)
(c) (d)
Figure 3. The sample for the standard and new edge crush test: (a) standard sample view; (b) standard ECT sample–front,
back and top view; (c) new ECT sample–front and top view; (d) new ECT sample–back and top view.
(a) (b)
Figure 4. Edge crush test: (a) Universal Testing Machine (Instron 5569); (b) FEMAT lab device.
Additionally, measurement without direct contact does not affect the measurement
itself. In contact measurements (e.g., traditional extensometers), noise is introduced into
the measurement, which may distort the actual measured values.
2.3. Optical Measurements of Sample Deformation
In this study, as mentioned, the specimen was tested while using optical displace-
ment and strain measurements, i.e., virtual extensometry and digital image correlation
(DIC). Two cameras (the stereo DIC setup) were employed to track the deformation on
the front faces to account for the out-of-plane bending produced by the non-symmetrical
Figure 4. Edge crush test: (a) Universal Testing Machine (Instron 5569); (b) FEMAT lab device.
As already mentioned above, the typical ECT is only used to determine the compres-sive strength of the corrugated board in CD. Here, the new ECT test setup was also usedto determine all of the elastic orthotropic properties of the in-plane tension/compressionbehavior of corrugated cardboard. For this purpose, beside the traditional method, wealso tested samples cut at an angle of 45◦ to the wave direction (see Figure 3c,d). Sincethe measurement in standard testing machines is considerably affected by the clearanceand susceptibility on the crosshead, non-contact optical techniques are required to crediblymeasure displacements (deformations or strains).
Additionally, measurement without direct contact does not affect the measurementitself. In contact measurements (e.g., traditional extensometers), noise is introduced intothe measurement, which may distort the actual measured values.
Materials 2021, 14, 5768 6 of 18
2.3. Optical Measurements of Sample Deformation
In this study, as mentioned, the specimen was tested while using optical displacementand strain measurements, i.e., virtual extensometry and digital image correlation (DIC).Two cameras (the stereo DIC setup) were employed to track the deformation on the frontfaces to account for the out-of-plane bending produced by the non-symmetrical section,and single a camera was employed on the back faces for standard optical extensometry,per the test setup shown in Figure 5a. Each of the two faces of the specimen were printedwith the speckle pattern for both optical methods, i.e., DIC and video extensometry. Here,three models of deformation measurements were used, namely:
• Crosshead from the machine.• Stereo (2.5D) DIC on the front (see Figure 5b) plus extensometry on the back.• Extensometry on the front and back.
Materials 2021, 14, x FOR PEER REVIEW 6 of 18
section, and single a camera was employed on the back faces for standard optical exten-
sometry, per the test setup shown in Figure 5a. Each of the two faces of the specimen were
printed with the speckle pattern for both optical methods, i.e., DIC and video extensome-
try. Here, three models of deformation measurements were used, namely:
Crosshead from the machine.
Stereo (2.5D) DIC on the front (see Figure 5b) plus extensometry on the back.
Extensometry on the front and back.
The specimen was sandwiched between two platens and aligned using 3D printed L-
brackets. Two 5 MPx cameras (Manta G504-b, Allied Vision, Stadtroda, Germany) were
used to record greyscale images during the test, see Figure 5. The video extensometry was
performed using the MatchID DIC platform (v. 2020.2.0, MatchID, Ghent, Belgium). The
cameras were calibrated while applying the MatchID calibration plate (MatchID, Ghent,
Belgium) to acquire the pixel (px) to mm conversion rate of ~50 µm/px. The specimen was
manually preloaded with a very small load (15 N) to ensure that both edges of the speci-
men were touching the loading plates. Then, the measured load cell and the displacement
were zeroed, and the L-brackets supporting the sample were removed. The load and the
crosshead displacement were synchronized with the cameras. The accuracy of the meas-
urement was estimated using a set of 25 static images (without any movement); the stand-
ard deviation of the measured elongation was evaluated to be 4 µm, which can be consid-
ered the level of uncertainty. The optical displacements were averaged for each face and
compared against the crosshead displacement.
(a) (b)
Figure 5. Setup of the optical measurements: (a) configuration of cameras on the front and back face;
(b) cameras recording the front face.
In total, 5 samples in CD and 5 samples using the 45° direction were tested. Unfortu-
nately, data from one of the samples in the CD experiment were not recorded properly on
the PC and were removed from the statistics. The loading rate was set to 5 mm/min (which
is different from the standard rate 12.5 mm/min) because the samples failed too quickly
for cameras to get enough data.
The following stereo DIC procedures, with camera ”Cam1“ as the main, were utilized
in this research:
Perform DIC on the sample’s face while using images from Cam1 and Cam0; region
of interest (ROI) visible in Figure 6b.
Align the data coordinate system with the specimen material direction, i.e., 11 =
��, 22 = ��, �� = vertical (see Figure 6a).
Calculate strain from the displacements.
Figure 5. Setup of the optical measurements: (a) configuration of cameras on the front and back face;(b) cameras recording the front face.
The specimen was sandwiched between two platens and aligned using 3D printedL-brackets. Two 5 MPx cameras (Manta G504-b, Allied Vision, Stadtroda, Germany) wereused to record greyscale images during the test, see Figure 5. The video extensometrywas performed using the MatchID DIC platform (v. 2020.2.0, MatchID, Ghent, Belgium).The cameras were calibrated while applying the MatchID calibration plate (MatchID,Ghent, Belgium) to acquire the pixel (px) to mm conversion rate of ~50 µm/px. Thespecimen was manually preloaded with a very small load (15 N) to ensure that both edgesof the specimen were touching the loading plates. Then, the measured load cell and thedisplacement were zeroed, and the L-brackets supporting the sample were removed. Theload and the crosshead displacement were synchronized with the cameras. The accuracyof the measurement was estimated using a set of 25 static images (without any movement);the standard deviation of the measured elongation was evaluated to be 4 µm, which can beconsidered the level of uncertainty. The optical displacements were averaged for each faceand compared against the crosshead displacement.
In total, 5 samples in CD and 5 samples using the 45◦ direction were tested. Unfor-tunately, data from one of the samples in the CD experiment were not recorded properlyon the PC and were removed from the statistics. The loading rate was set to 5 mm/min(which is different from the standard rate 12.5 mm/min) because the samples failed tooquickly for cameras to get enough data.
The following stereo DIC procedures, with camera ”Cam1“ as the main, were utilizedin this research:
Materials 2021, 14, 5768 7 of 18
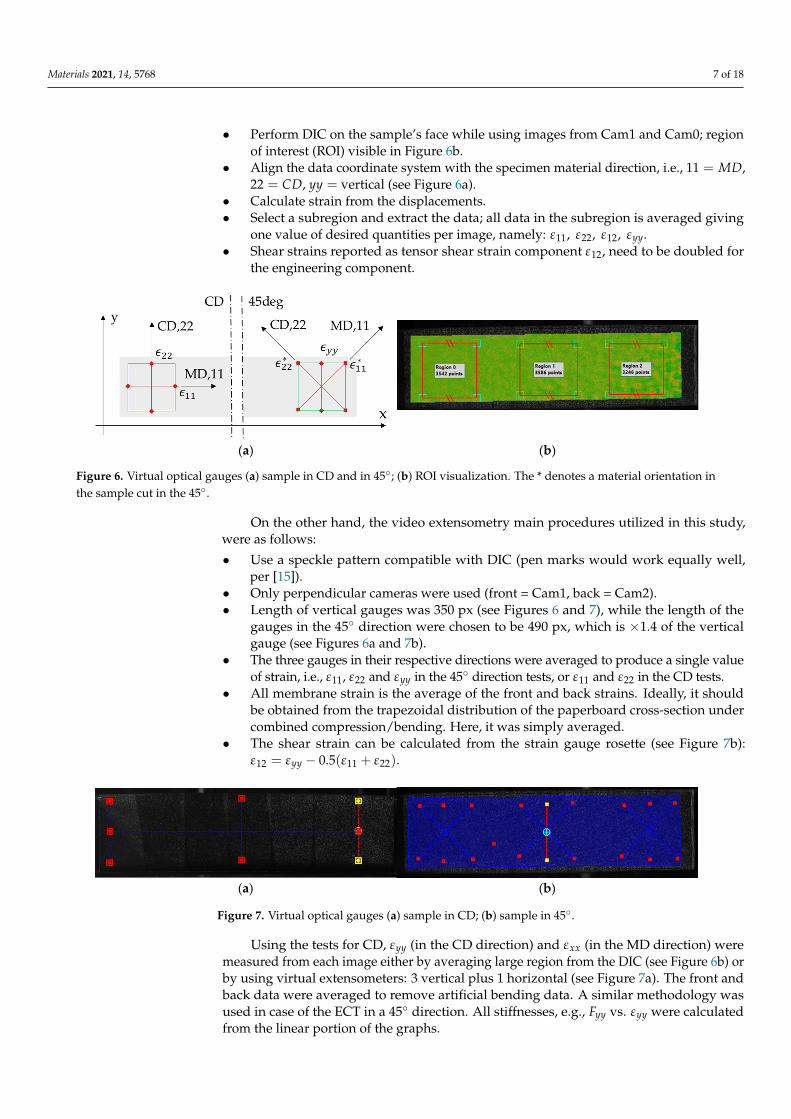
• Perform DIC on the sample’s face while using images from Cam1 and Cam0; regionof interest (ROI) visible in Figure 6b.
• Align the data coordinate system with the specimen material direction, i.e., 11 = MD,22 = CD, yy = vertical (see Figure 6a).
• Calculate strain from the displacements.• Select a subregion and extract the data; all data in the subregion is averaged giving
one value of desired quantities per image, namely: ε11, ε22, ε12, εyy.• Shear strains reported as tensor shear strain component ε12, need to be doubled for
the engineering component.
Materials 2021, 14, x FOR PEER REVIEW 7 of 18
Select a subregion and extract the data; all data in the subregion is averaged giving
one value of desired quantities per image, namely: ���, ���, ���, ���.
Shear strains reported as tensor shear strain component ���, need to be doubled for
the engineering component.
(a) (b)
Figure 6. Virtual optical gauges (a) sample in CD and in 45°; (b) ROI visualization. The * denotes a material orientation
in the sample cut in the 45°.
On the other hand, the video extensometry main procedures utilized in this study,
were as follows:
Use a speckle pattern compatible with DIC (pen marks would work equally well, per
[15]).
Only perpendicular cameras were used (front = Cam1, back = Cam2).
Length of vertical gauges was 350 px (see Figures 6 and 7), while the length of the
gauges in the 45° direction were chosen to be 490 px, which is × 1.4 of the vertical
gauge (see Figures 6a and 7b).
The three gauges in their respective directions were averaged to produce a single
value of strain, i.e., ���, ��� and ��� in the 45° direction tests, or ��� and ��� in the
CD tests.
All membrane strain is the average of the front and back strains. Ideally, it should be
obtained from the trapezoidal distribution of the paperboard cross-section under
combined compression/bending. Here, it was simply averaged.
The shear strain can be calculated from the strain gauge rosette (see Figure 7b): ��� =
��� − 0.5(��� + ���).
(a) (b)
Figure 7. Virtual optical gauges (a) sample in CD; (b) sample in 45°.
Using the tests for CD, ��� (in the CD direction) and ��� (in the MD direction) were
measured from each image either by averaging large region from the DIC (see Figure 6b)
or by using virtual extensometers: 3 vertical plus 1 horizontal (see Figure 7a). The front
and back data were averaged to remove artificial bending data. A similar methodology
was used in case of the ECT in a 45° direction. All stiffnesses, e.g., ��� vs. ��� were cal-
culated from the linear portion of the graphs.
2.4. Proposed Method to Identify Matrix A
Figure 6. Virtual optical gauges (a) sample in CD and in 45◦; (b) ROI visualization. The * denotes a material orientation inthe sample cut in the 45◦.
On the other hand, the video extensometry main procedures utilized in this study,were as follows:
• Use a speckle pattern compatible with DIC (pen marks would work equally well,per [15]).
• Only perpendicular cameras were used (front = Cam1, back = Cam2).• Length of vertical gauges was 350 px (see Figures 6 and 7), while the length of the
gauges in the 45◦ direction were chosen to be 490 px, which is ×1.4 of the verticalgauge (see Figures 6a and 7b).
• The three gauges in their respective directions were averaged to produce a single valueof strain, i.e., ε11, ε22 and εyy in the 45◦ direction tests, or ε11 and ε22 in the CD tests.
• All membrane strain is the average of the front and back strains. Ideally, it shouldbe obtained from the trapezoidal distribution of the paperboard cross-section undercombined compression/bending. Here, it was simply averaged.
• The shear strain can be calculated from the strain gauge rosette (see Figure 7b):ε12 = εyy − 0.5(ε11 + ε22).
Materials 2021, 14, x FOR PEER REVIEW 7 of 18
Select a subregion and extract the data; all data in the subregion is averaged giving
one value of desired quantities per image, namely: ���, ���, ���, ���.
Shear strains reported as tensor shear strain component ���, need to be doubled for
the engineering component.
(a) (b)
Figure 6. Virtual optical gauges (a) sample in CD and in 45°; (b) ROI visualization. The * denotes a material orientation
in the sample cut in the 45°.
On the other hand, the video extensometry main procedures utilized in this study,
were as follows:
Use a speckle pattern compatible with DIC (pen marks would work equally well, per
[15]).
Only perpendicular cameras were used (front = Cam1, back = Cam2).
Length of vertical gauges was 350 px (see Figures 6 and 7), while the length of the
gauges in the 45° direction were chosen to be 490 px, which is × 1.4 of the vertical
gauge (see Figures 6a and 7b).
The three gauges in their respective directions were averaged to produce a single
value of strain, i.e., ���, ��� and ��� in the 45° direction tests, or ��� and ��� in the
CD tests.
All membrane strain is the average of the front and back strains. Ideally, it should be
obtained from the trapezoidal distribution of the paperboard cross-section under
combined compression/bending. Here, it was simply averaged.
The shear strain can be calculated from the strain gauge rosette (see Figure 7b): ��� =
��� − 0.5(��� + ���).
(a) (b)
Figure 7. Virtual optical gauges (a) sample in CD; (b) sample in 45°.
Using the tests for CD, ��� (in the CD direction) and ��� (in the MD direction) were
measured from each image either by averaging large region from the DIC (see Figure 6b)
or by using virtual extensometers: 3 vertical plus 1 horizontal (see Figure 7a). The front
and back data were averaged to remove artificial bending data. A similar methodology
was used in case of the ECT in a 45° direction. All stiffnesses, e.g., ��� vs. ��� were cal-
culated from the linear portion of the graphs.
2.4. Proposed Method to Identify Matrix A
Figure 7. Virtual optical gauges (a) sample in CD; (b) sample in 45◦.
Using the tests for CD, εyy (in the CD direction) and εxx (in the MD direction) weremeasured from each image either by averaging large region from the DIC (see Figure 6b) orby using virtual extensometers: 3 vertical plus 1 horizontal (see Figure 7a). The front andback data were averaged to remove artificial bending data. A similar methodology wasused in case of the ECT in a 45◦ direction. All stiffnesses, e.g., Fyy vs. εyy were calculatedfrom the linear portion of the graphs.

Materials 2021, 14, 5768 8 of 18
2.4. Proposed Method to Identify Matrix A
The identification of matrix A is based here on two sets of tests, namely: (a) thestandard ECT, in CD and (b) the new ECT in 45◦ direction. The well-known relationbetween cross-sectional forces and general strains has the form: σ11
σ22σ12
=
A11 A12 0A12 A22 00 0 A66
ε11ε22ε12
, (1)
where σij are the components of the sectional force vector, in [N/mm]; Aij are the stiffnesscomponents, in [N/mm]; and εij are the membrane (in-plane) strains.
From Equation (1) two sets of equations can be extracted, namely in the CD test:
A12ε11 + A22ε22 = σ22,A11ε11 + A12ε22 = 0,
(2)
and in the 45◦ direction test:
A11ε11 + A12ε22 = σ4511 = 0.5σ45,
A12ε11 + A22ε22 = σ4522 = 0.5σ45.
(3)
By building up a matrix of those equations from two experiments and solving it in theleast square sense (se e.g., [40]) the components of matrix A = [A11, A12, A22] can be easilyobtained. Component A66 can be obtained independently, from the ECT in the 45◦ direction.
If one uses stresses instead of sectional forces, the following equations can be derivedfrom the test in the CD:[
E111−ν12ν21
E22ν121−ν12ν21
E11ν211−ν12ν21
E221−ν12ν21
]{ε11ε22
}=
{0
σ22
}, (4)
and from the test in the 45◦ direction:[E11
1−ν12ν21
E22ν121−ν12ν21
E11ν211−ν12ν21
E221−ν12ν21
]{ε∗11ε∗22
}=
12
{σ45σ45
}. (5)
From the test in the CD only, just two constitutive components can be computed,namely Poisson’s ratio:
ν21 = − ε11
ε22, (6)
and the elastic modulus:E22 =
σ22
ε22. (7)
On the other hand, from both the CD and 45◦ tests, all orthotropic stiffness coefficientscan be obtained, namely elastic stiffness in MD:
E11 = − σ22σ45
ε11σ45 − 2ε∗11σ22, (8)
elastic stiffness in CD:E22 =
σ22
ε22, (9)
Poisson’s ratio ν12 :ν12 =
ε11σ45
ε11σ45 − 2ε∗11σ22, (10)
Poisson’s ratio ν21:
ν21 = 1 − 2ε∗22σ22
ε22σ45, (11)
Materials 2021, 14, 5768 9 of 18
or using the symmetry principals:
ν21 = ν12E22
E11. (12)
The stiffness in the 45◦ direction can be computed directly from the test in 45◦ direction:
E45 =σ45
εyy, (13)
and is used to compute the last missing coefficient, namely the in-plane shear stiffness:
G12 =
(2ν12
E11− 1
E11− 1
E22+
4E45
). (14)
3. Results3.1. The ECT Enhanced with Optical Measurement Techniques
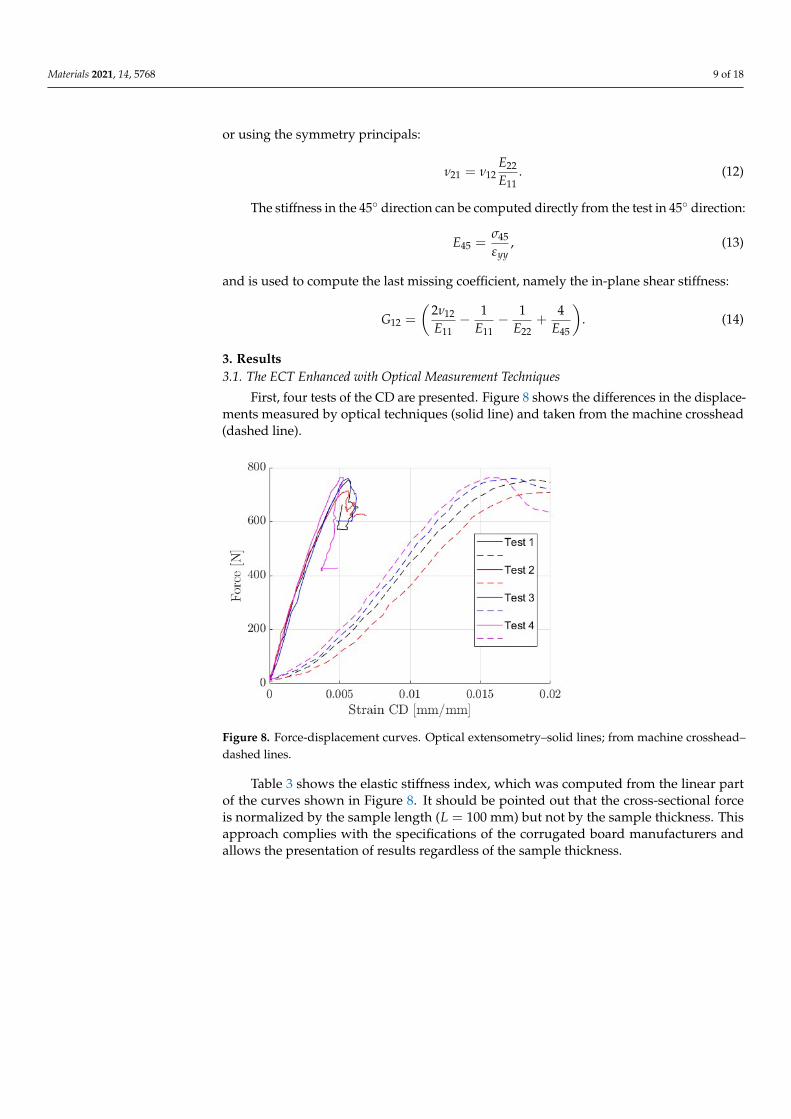
First, four tests of the CD are presented. Figure 8 shows the differences in the displace-ments measured by optical techniques (solid line) and taken from the machine crosshead(dashed line).
Materials 2021, 14, x FOR PEER REVIEW 9 of 18
��� =������
������ − 2���∗ ���
, (10)
Poisson’s ratio ���:
��� = 1 −2���
∗ ���
������, (11)
or using the symmetry principals:
��� = ���
���
���. (12)
The stiffness in the 45° direction can be computed directly from the test in 45° direc-
tion:
��� =���
���, (13)
and is used to compute the last missing coefficient, namely the in-plane shear stiffness:
��� = �2���
���−
1
���−
1
���+
4
����. (14)
3. Results
3.1. The ECT Enhanced with Optical Measurement Techniques
First, four tests of the CD are presented. Figure 8 shows the differences in the dis-
placements measured by optical techniques (solid line) and taken from the machine cross-
head (dashed line).
Figure 8. Force-displacement curves. Optical extensometry–solid lines; from machine crosshead–
dashed lines.
Table 3 shows the elastic stiffness index, which was computed from the linear part of
the curves shown in Figure 8. It should be pointed out that the cross-sectional force is
normalized by the sample length (� = 100 mm) but not by the sample thickness. This
approach complies with the specifications of the corrugated board manufacturers and al-
lows the presentation of results regardless of the sample thickness.
Table 3. Elastic stiffness index in CD computed from the displacement measurement by the optical
extensometry and from machine crosshead, as well as the edgewise compression strength in CD.
Test
ID
E—Optical
(N/mm)
E—crosshead
(N/mm)
ECT
(N/mm)
Figure 8. Force-displacement curves. Optical extensometry–solid lines; from machine crosshead–dashed lines.
Table 3 shows the elastic stiffness index, which was computed from the linear partof the curves shown in Figure 8. It should be pointed out that the cross-sectional forceis normalized by the sample length (L = 100 mm) but not by the sample thickness. Thisapproach complies with the specifications of the corrugated board manufacturers andallows the presentation of results regardless of the sample thickness.
Materials 2021, 14, 5768 10 of 18
Table 3. Elastic stiffness index in CD computed from the displacement measurement by the opticalextensometry and from machine crosshead, as well as the edgewise compression strength in CD.
TestID
E—Optical(N/mm)
E—Crosshead(N/mm)
ECT(N/mm)
1 1447.45 441.82 −7.5482 1380.25 536.82 −7.1514 1531.96 450.66 −7.6095 1615.12 611.39 −7.640
Mean (N/mm) 1493.70 510.17 −7.487Std (N/mm) 102.01 79.93 0.227
Cov (%) 6.829 15.668 −3.038
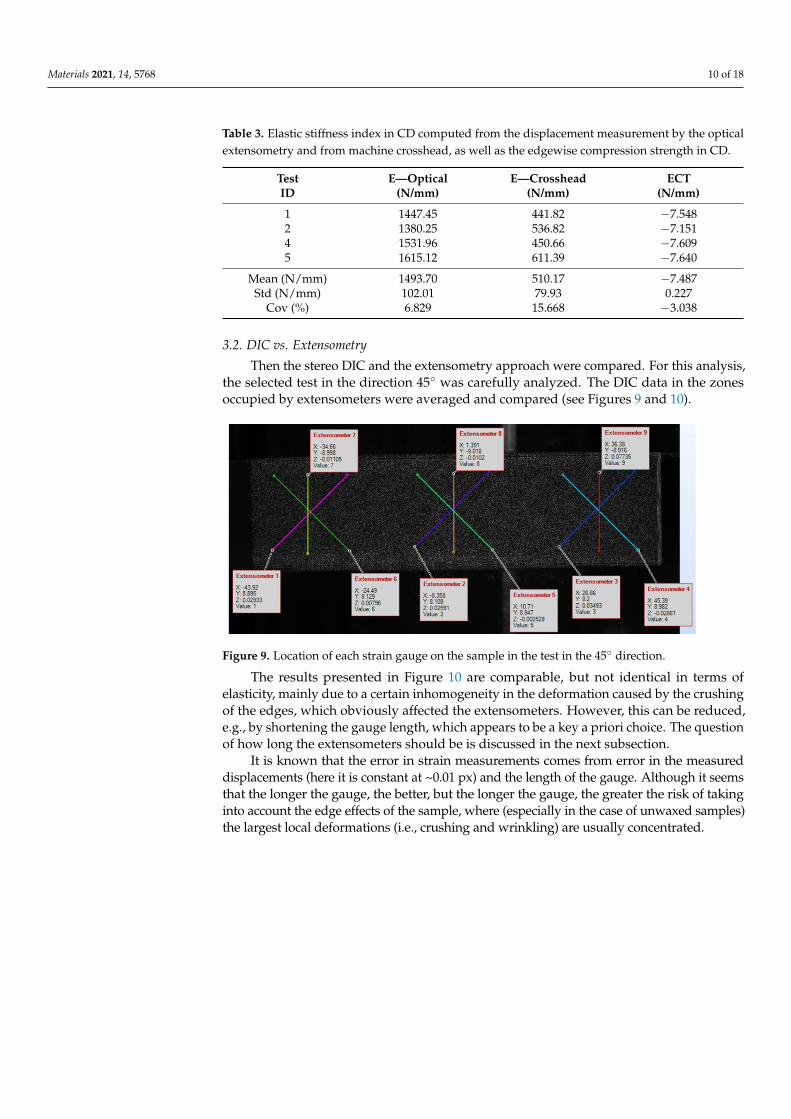
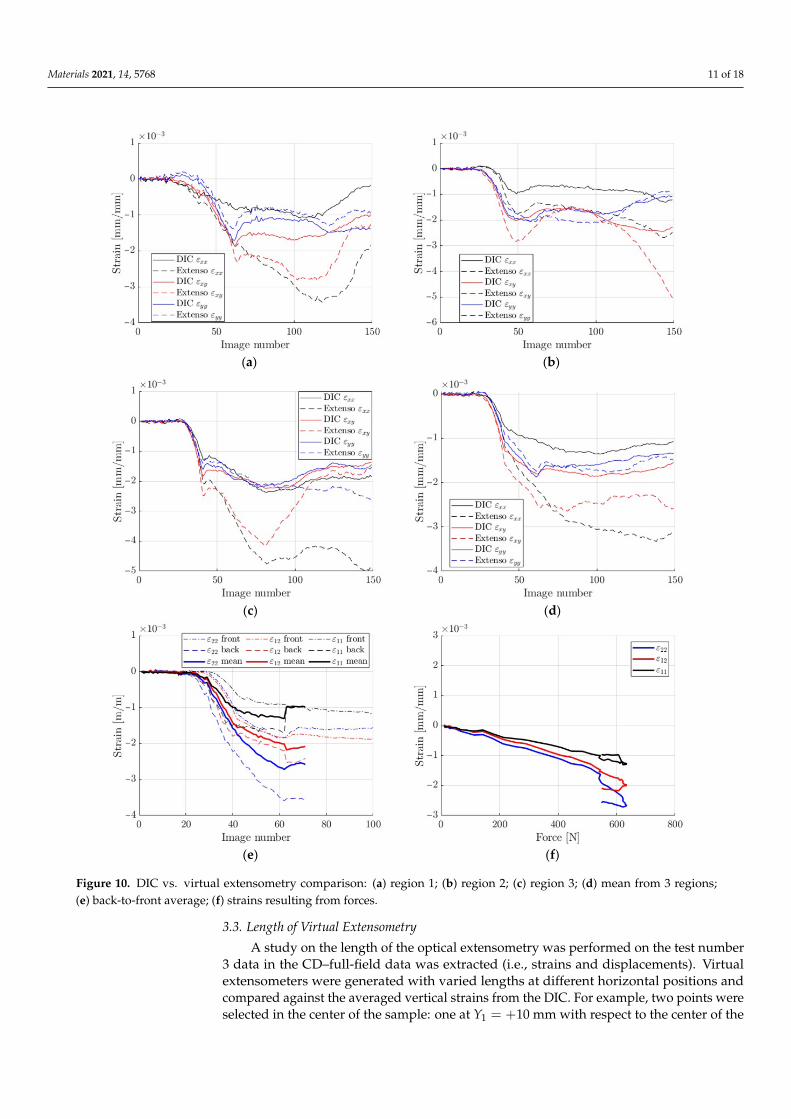
3.2. DIC vs. Extensometry
Then the stereo DIC and the extensometry approach were compared. For this analysis,the selected test in the direction 45◦ was carefully analyzed. The DIC data in the zonesoccupied by extensometers were averaged and compared (see Figures 9 and 10).
Materials 2021, 14, x FOR PEER REVIEW 10 of 18
1 1447.45 441.82 −7.548
2 1380.25 536.82 −7.151
4 1531.96 450.66 −7.609
5 1615.12 611.39 −7.640
Mean (N/mm) 1493.70 510.17 −7.487
Std (N/mm) 102.01 79.93 0.227
Cov (%) 6.829 15.668 −3.038
3.2. DIC vs. Extensometry
Then the stereo DIC and the extensometry approach were compared. For this analy-
sis, the selected test in the direction 45° was carefully analyzed. The DIC data in the zones
occupied by extensometers were averaged and compared (see Figures 9 and 10).
Figure 9. Location of each strain gauge on the sample in the test in the 45° direction.
(a) (b)
Figure 9. Location of each strain gauge on the sample in the test in the 45◦ direction.
The results presented in Figure 10 are comparable, but not identical in terms ofelasticity, mainly due to a certain inhomogeneity in the deformation caused by the crushingof the edges, which obviously affected the extensometers. However, this can be reduced,e.g., by shortening the gauge length, which appears to be a key a priori choice. The questionof how long the extensometers should be is discussed in the next subsection.
It is known that the error in strain measurements comes from error in the measureddisplacements (here it is constant at ~0.01 px) and the length of the gauge. Although it seemsthat the longer the gauge, the better, but the longer the gauge, the greater the risk of takinginto account the edge effects of the sample, where (especially in the case of unwaxed samples)the largest local deformations (i.e., crushing and wrinkling) are usually concentrated.
Materials 2021, 14, 5768 11 of 18
Materials 2021, 14, x FOR PEER REVIEW 10 of 18
1 1447.45 441.82 −7.548
2 1380.25 536.82 −7.151
4 1531.96 450.66 −7.609
5 1615.12 611.39 −7.640
Mean (N/mm) 1493.70 510.17 −7.487
Std (N/mm) 102.01 79.93 0.227
Cov (%) 6.829 15.668 −3.038
3.2. DIC vs. Extensometry
Then the stereo DIC and the extensometry approach were compared. For this analy-
sis, the selected test in the direction 45° was carefully analyzed. The DIC data in the zones
occupied by extensometers were averaged and compared (see Figures 9 and 10).
Figure 9. Location of each strain gauge on the sample in the test in the 45° direction.
(a) (b)
Materials 2021, 14, x FOR PEER REVIEW 11 of 18
(c) (d)
(e) (f)
Figure 10. DIC vs. virtual extensometry comparison: (a) region 1; (b) region 2; (c) region 3; (d) mean from 3 regions; (e)
back-to-front average; (f) strains resulting from forces.
The results presented in Figure 10 are comparable, but not identical in terms of elas-
ticity, mainly due to a certain inhomogeneity in the deformation caused by the crushing
of the edges, which obviously affected the extensometers. However, this can be reduced,
e.g., by shortening the gauge length, which appears to be a key a priori choice. The ques-
tion of how long the extensometers should be is discussed in the next subsection.
It is known that the error in strain measurements comes from error in the measured
displacements (here it is constant at ~0.01 px) and the length of the gauge. Although it
seems that the longer the gauge, the better, but the longer the gauge, the greater the risk
of taking into account the edge effects of the sample, where (especially in the case of un-
waxed samples) the largest local deformations (i.e., crushing and wrinkling) are usually
concentrated.
3.3. Length of Virtual Extensometry
A study on the length of the optical extensometry was performed on the test number
3 data in the CD–full-field data was extracted (i.e., strains and displacements). Virtual
extensometers were generated with varied lengths at different horizontal positions and
compared against the averaged vertical strains from the DIC. For example, two points
were selected in the center of the sample: one at �� = +10 mm with respect to the center
of the sample height, the other at �� = −10 mm and the extensometer strain was calcu-
lated from ��� = (�� − ��)/20.
Figure 10. DIC vs. virtual extensometry comparison: (a) region 1; (b) region 2; (c) region 3; (d) mean from 3 regions;(e) back-to-front average; (f) strains resulting from forces.
3.3. Length of Virtual Extensometry
A study on the length of the optical extensometry was performed on the test number3 data in the CD–full-field data was extracted (i.e., strains and displacements). Virtualextensometers were generated with varied lengths at different horizontal positions andcompared against the averaged vertical strains from the DIC. For example, two points wereselected in the center of the sample: one at Y1 = +10 mm with respect to the center of the

Materials 2021, 14, 5768 12 of 18
sample height, the other at Y2 = −10 mm and the extensometer strain was calculated fromεyy = (v1 − v2)/20.
Three horizontal positions of the virtual strain gauges were considered: (1) left at 25%of the width; (2) mid at 50% and (3) right at 75% of the sample width. They were alsoaveraged. Figure 11 shows the location of the optical strain gauges. The length of eachgauge varies from 4 to 20 mm.
Materials 2021, 14, x FOR PEER REVIEW 12 of 18
Three horizontal positions of the virtual strain gauges were considered: (1) left at 25%
of the width; (2) mid at 50% and (3) right at 75% of the sample width. They were also
averaged. Figure 11 shows the location of the optical strain gauges. The length of each
gauge varies from 4 to 20 mm.
Figure 11. Location of the virtual strain gauges.
Figure 12 shows a comparison of strain calculated while using different lengths of
virtual gauges with the DIC measurements.
(a) (b)
(c) (d)
Figure 12. Comparison of strains measured by different lengths of virtual gauges with DIC measurements. (a) left set; (b)
mid set; (c) right set; (d) averaged.
The main observation was that for the test in the 45° direction, the extensometers
should be arranged in a rectangular configuration (15 mm × 15 mm box, with longer
gauges on the diagonal) or circular gauges (so as to keep the gauge length of 15 mm).
Figure 11. Location of the virtual strain gauges.
Figure 12 shows a comparison of strain calculated while using different lengths ofvirtual gauges with the DIC measurements.
Materials 2021, 14, x FOR PEER REVIEW 12 of 18
Three horizontal positions of the virtual strain gauges were considered: (1) left at 25%
of the width; (2) mid at 50% and (3) right at 75% of the sample width. They were also
averaged. Figure 11 shows the location of the optical strain gauges. The length of each
gauge varies from 4 to 20 mm.
Figure 11. Location of the virtual strain gauges.
Figure 12 shows a comparison of strain calculated while using different lengths of
virtual gauges with the DIC measurements.
(a) (b)
(c) (d)
Figure 12. Comparison of strains measured by different lengths of virtual gauges with DIC measurements. (a) left set; (b)
mid set; (c) right set; (d) averaged.
The main observation was that for the test in the 45° direction, the extensometers
should be arranged in a rectangular configuration (15 mm × 15 mm box, with longer
gauges on the diagonal) or circular gauges (so as to keep the gauge length of 15 mm).
Figure 12. Comparison of strains measured by different lengths of virtual gauges with DIC measurements. (a) left set;(b) mid set; (c) right set; (d) averaged.

Materials 2021, 14, 5768 13 of 18
The main observation was that for the test in the 45◦ direction, the extensometersshould be arranged in a rectangular configuration (15 mm × 15 mm box, with longergauges on the diagonal) or circular gauges (so as to keep the gauge length of 15 mm).
3.4. Consistency of Tests in 45 Deg Direction
The last issue was to check the data consistency of the new test in the 45◦ direction.For all the CD tests, the force-strain data was very consistent, but unfortunately this wasnot the case for the 45◦ tests. For each recorded level of the force, the measured straincomponents averaged back-to-front are plotted (see Figure 13). It is visible that the testscan be split into two, more consistent groups (see Figure 14). Group 2 had a stiffer responsein the 11 (MD) direction.
Materials 2021, 14, x FOR PEER REVIEW 13 of 18
3.4. Consistency of Tests in 45 Deg Direction
The last issue was to check the data consistency of the new test in the 45° direction.
For all the CD tests, the force-strain data was very consistent, but unfortunately this was
not the case for the 45° tests. For each recorded level of the force, the measured strain
components averaged back-to-front are plotted (see Figure 13). It is visible that the tests
can be split into two, more consistent groups (see Figure 14). Group 2 had a stiffer re-
sponse in the 11 (MD) direction.
Figure 13. The consistency of the data from tests 6–10.
The reasons for the difference are not fully clear. One of the observations was that
group 1 (i.e., test 6 and 8) had a high flute oriented towards the stereo DIC setup (front
face as depicted in Figure 3c). Local buckling on that face is more pronounced and that
could have affected the measured strain. However, even when using extensometers in-
stead of full DIC, the trend stayed the same. Group 1 had (accidentally) a different orien-
tation of fluting with respect to the plate than group 2 (Figure 3c,d).
(a) (b)
Figure 13. The consistency of the data from tests 6–10.
Materials 2021, 14, x FOR PEER REVIEW 13 of 18
3.4. Consistency of Tests in 45 Deg Direction
The last issue was to check the data consistency of the new test in the 45° direction.
For all the CD tests, the force-strain data was very consistent, but unfortunately this was
not the case for the 45° tests. For each recorded level of the force, the measured strain
components averaged back-to-front are plotted (see Figure 13). It is visible that the tests
can be split into two, more consistent groups (see Figure 14). Group 2 had a stiffer re-
sponse in the 11 (MD) direction.
Figure 13. The consistency of the data from tests 6–10.
The reasons for the difference are not fully clear. One of the observations was that
group 1 (i.e., test 6 and 8) had a high flute oriented towards the stereo DIC setup (front
face as depicted in Figure 3c). Local buckling on that face is more pronounced and that
could have affected the measured strain. However, even when using extensometers in-
stead of full DIC, the trend stayed the same. Group 1 had (accidentally) a different orien-
tation of fluting with respect to the plate than group 2 (Figure 3c,d).
(a) (b)
Figure 14. The consistency of data in tests 6–10: (a) group 1 (tests 6 and 8); (b) group 2 (tests 7, 9 and 10).
Materials 2021, 14, 5768 14 of 18
The reasons for the difference are not fully clear. One of the observations was thatgroup 1 (i.e., test 6 and 8) had a high flute oriented towards the stereo DIC setup (front faceas depicted in Figure 3c). Local buckling on that face is more pronounced and that couldhave affected the measured strain. However, even when using extensometers instead offull DIC, the trend stayed the same. Group 1 had (accidentally) a different orientation offluting with respect to the plate than group 2 (Figure 3c,d).
3.5. Full Matrix A Identification
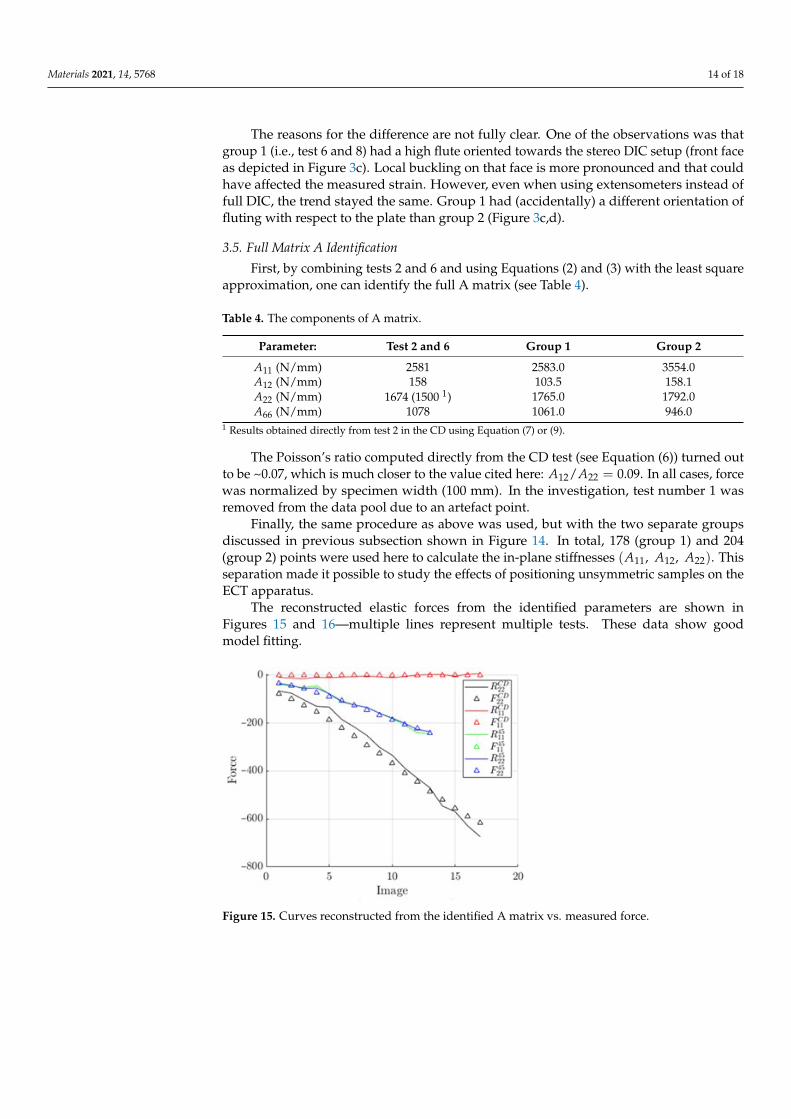
First, by combining tests 2 and 6 and using Equations (2) and (3) with the least squareapproximation, one can identify the full A matrix (see Table 4).
Table 4. The components of A matrix.
Parameter: Test 2 and 6 Group 1 Group 2
A11 (N/mm) 2581 2583.0 3554.0A12 (N/mm) 158 103.5 158.1A22 (N/mm) 1674 (1500 1) 1765.0 1792.0A66 (N/mm) 1078 1061.0 946.0
1 Results obtained directly from test 2 in the CD using Equation (7) or (9).
The Poisson’s ratio computed directly from the CD test (see Equation (6)) turned outto be ~0.07, which is much closer to the value cited here: A12/A22 = 0.09. In all cases, forcewas normalized by specimen width (100 mm). In the investigation, test number 1 wasremoved from the data pool due to an artefact point.
Finally, the same procedure as above was used, but with the two separate groupsdiscussed in previous subsection shown in Figure 14. In total, 178 (group 1) and 204(group 2) points were used here to calculate the in-plane stiffnesses (A11, A12, A22). Thisseparation made it possible to study the effects of positioning unsymmetric samples on theECT apparatus.
The reconstructed elastic forces from the identified parameters are shown inFigures 15 and 16—multiple lines represent multiple tests. These data show goodmodel fitting.
Materials 2021, 14, x FOR PEER REVIEW 14 of 18
Figure 14. The consistency of data in tests 6–10: (a) group 1 (tests 6 and 8); (b) group 2 (tests 7, 9 and 10).
3.5. Full Matrix A Identification
First, by combining tests 2 and 6 and using Equations (2) and (3) with the least square
approximation, one can identify the full A matrix (see Table 4).
Table 4. The components of A matrix.
Parameter: Test 2 and 6 Group 1 Group 2
��� (N/mm) 2581 2583.0 3554.0
��� (N/mm) 158 103.5 158.1
��� (N/mm) 1674 (1500 1) 1765.0 1792.0
��� (N/mm) 1078 1061.0 946.0 1 Results obtained directly from test 2 in the CD using Equation (7) or (9).
The Poisson’s ratio computed directly from the CD test (see Equation (6)) turned out
to be ~0.07, which is much closer to the value cited here: ���/��� = 0.09. In all cases, force
was normalized by specimen width (100 mm). In the investigation, test number 1 was
removed from the data pool due to an artefact point.
Finally, the same procedure as above was used, but with the two separate groups
discussed in previous subsection shown in Figure 14. In total, 178 (group 1) and 204
(group 2) points were used here to calculate the in-plane stiffnesses (���, ���, ���). This
separation made it possible to study the effects of positioning unsymmetric samples on
the ECT apparatus.
The reconstructed elastic forces from the identified parameters are shown in Figures
15 and 16—multiple lines represent multiple tests. These data show good model fitting.
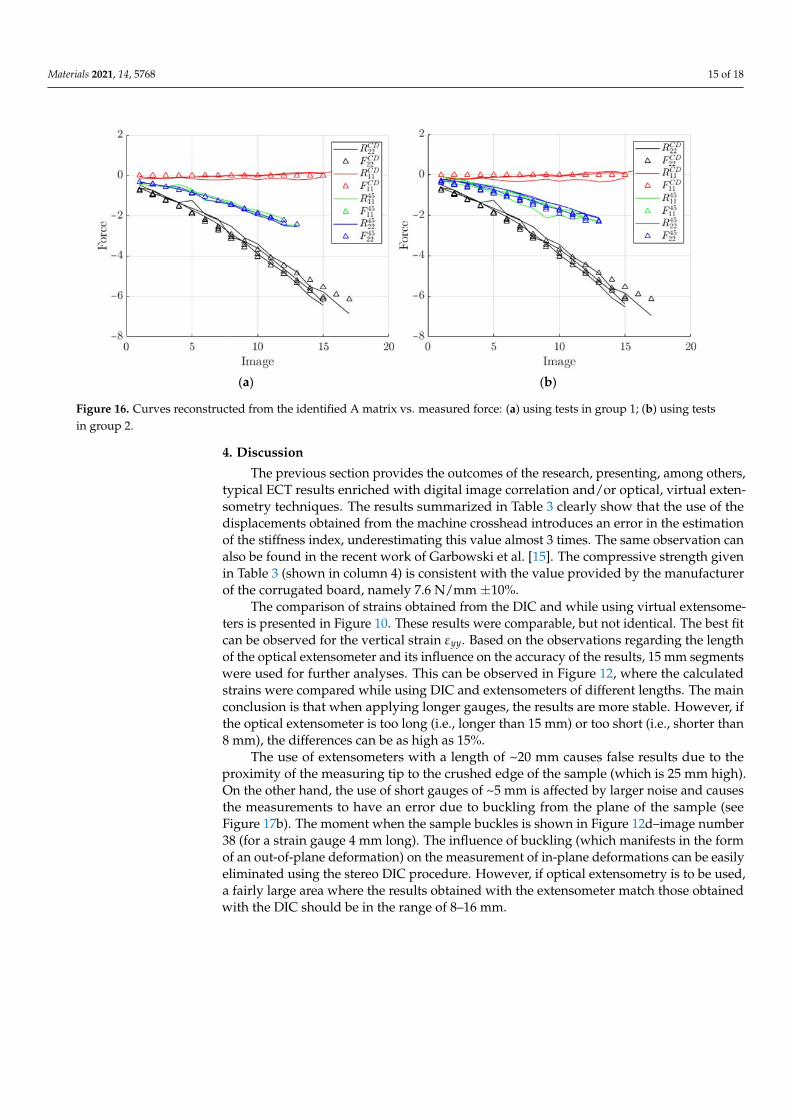
Figure 15. Curves reconstructed from the identified A matrix vs. measured force. Figure 15. Curves reconstructed from the identified A matrix vs. measured force.
Materials 2021, 14, 5768 15 of 18Materials 2021, 14, x FOR PEER REVIEW 15 of 18
(a) (b)
Figure 16. Curves reconstructed from the identified A matrix vs. measured force: (a) using tests in group 1; (b) using tests
in group 2.
4. Discussion
The previous section provides the outcomes of the research, presenting, among oth-
ers, typical ECT results enriched with digital image correlation and/or optical, virtual ex-
tensometry techniques. The results summarized in Table 3 clearly show that the use of the
displacements obtained from the machine crosshead introduces an error in the estimation
of the stiffness index, underestimating this value almost 3 times. The same observation
can also be found in the recent work of Garbowski et al. [15]. The compressive strength
given in Table 3 (shown in column 4) is consistent with the value provided by the manu-
facturer of the corrugated board, namely 7.6 N/mm ±10%.
The comparison of strains obtained from the DIC and while using virtual extensom-
eters is presented in Figure 10. These results were comparable, but not identical. The best
fit can be observed for the vertical strain ���. Based on the observations regarding the
length of the optical extensometer and its influence on the accuracy of the results, 15 mm
segments were used for further analyses. This can be observed in Figure 12, where the
calculated strains were compared while using DIC and extensometers of different lengths.
The main conclusion is that when applying longer gauges, the results are more stable.
However, if the optical extensometer is too long (i.e., longer than 15 mm) or too short (i.e.,
shorter than 8 mm), the differences can be as high as 15%.
The use of extensometers with a length of ~20 mm causes false results due to the
proximity of the measuring tip to the crushed edge of the sample (which is 25 mm high).
On the other hand, the use of short gauges of ~5 mm is affected by larger noise and causes
the measurements to have an error due to buckling from the plane of the sample (see
Figure 17b). The moment when the sample buckles is shown in Figure 12d–image number
38 (for a strain gauge 4 mm long). The influence of buckling (which manifests in the form
of an out-of-plane deformation) on the measurement of in-plane deformations can be eas-
ily eliminated using the stereo DIC procedure. However, if optical extensometry is to be
used, a fairly large area where the results obtained with the extensometer match those
obtained with the DIC should be in the range of 8–16 mm.
(a) (b)
Figure 16. Curves reconstructed from the identified A matrix vs. measured force: (a) using tests in group 1; (b) using testsin group 2.
4. Discussion
The previous section provides the outcomes of the research, presenting, among others,typical ECT results enriched with digital image correlation and/or optical, virtual exten-sometry techniques. The results summarized in Table 3 clearly show that the use of thedisplacements obtained from the machine crosshead introduces an error in the estimationof the stiffness index, underestimating this value almost 3 times. The same observation canalso be found in the recent work of Garbowski et al. [15]. The compressive strength givenin Table 3 (shown in column 4) is consistent with the value provided by the manufacturerof the corrugated board, namely 7.6 N/mm ±10%.
The comparison of strains obtained from the DIC and while using virtual extensome-ters is presented in Figure 10. These results were comparable, but not identical. The best fitcan be observed for the vertical strain εyy. Based on the observations regarding the lengthof the optical extensometer and its influence on the accuracy of the results, 15 mm segmentswere used for further analyses. This can be observed in Figure 12, where the calculatedstrains were compared while using DIC and extensometers of different lengths. The mainconclusion is that when applying longer gauges, the results are more stable. However, ifthe optical extensometer is too long (i.e., longer than 15 mm) or too short (i.e., shorter than8 mm), the differences can be as high as 15%.
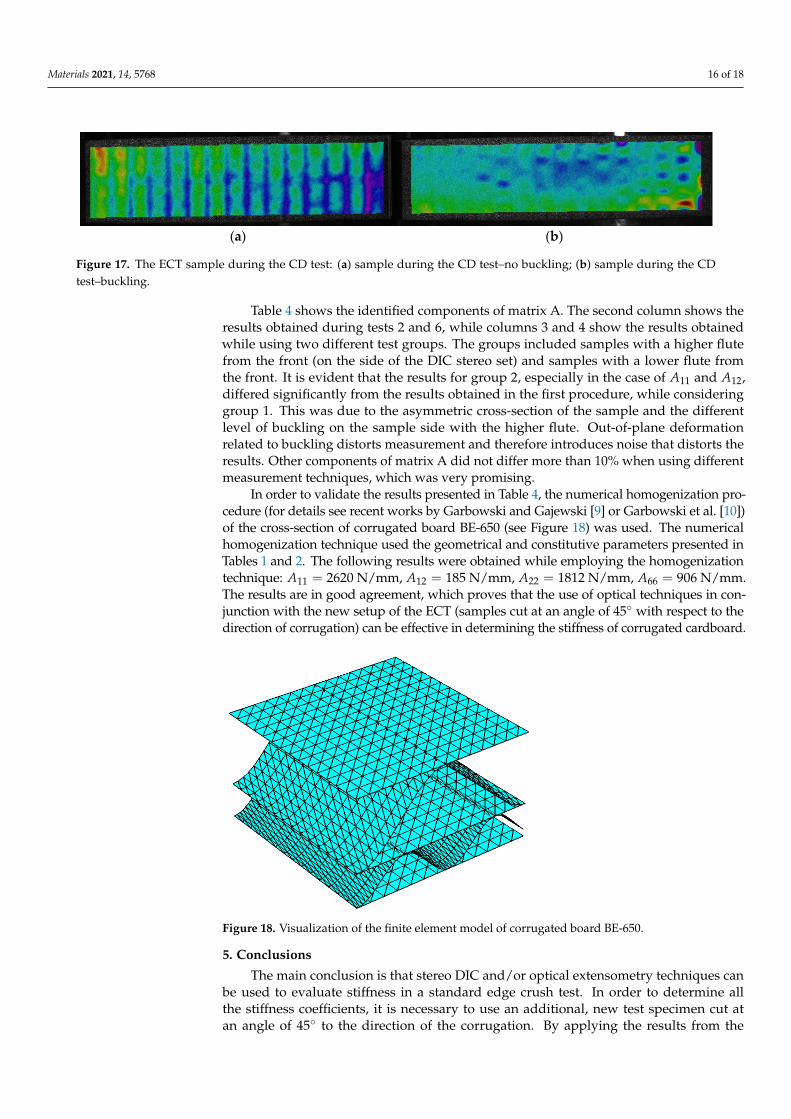
The use of extensometers with a length of ~20 mm causes false results due to theproximity of the measuring tip to the crushed edge of the sample (which is 25 mm high).On the other hand, the use of short gauges of ~5 mm is affected by larger noise and causesthe measurements to have an error due to buckling from the plane of the sample (seeFigure 17b). The moment when the sample buckles is shown in Figure 12d–image number38 (for a strain gauge 4 mm long). The influence of buckling (which manifests in the formof an out-of-plane deformation) on the measurement of in-plane deformations can be easilyeliminated using the stereo DIC procedure. However, if optical extensometry is to be used,a fairly large area where the results obtained with the extensometer match those obtainedwith the DIC should be in the range of 8–16 mm.
Materials 2021, 14, 5768 16 of 18
Materials 2021, 14, x FOR PEER REVIEW 15 of 18
(a) (b)
Figure 16. Curves reconstructed from the identified A matrix vs. measured force: (a) using tests in group 1; (b) using tests
in group 2.
4. Discussion
The previous section provides the outcomes of the research, presenting, among oth-
ers, typical ECT results enriched with digital image correlation and/or optical, virtual ex-
tensometry techniques. The results summarized in Table 3 clearly show that the use of the
displacements obtained from the machine crosshead introduces an error in the estimation
of the stiffness index, underestimating this value almost 3 times. The same observation
can also be found in the recent work of Garbowski et al. [15]. The compressive strength
given in Table 3 (shown in column 4) is consistent with the value provided by the manu-
facturer of the corrugated board, namely 7.6 N/mm ±10%.
The comparison of strains obtained from the DIC and while using virtual extensom-
eters is presented in Figure 10. These results were comparable, but not identical. The best
fit can be observed for the vertical strain ���. Based on the observations regarding the
length of the optical extensometer and its influence on the accuracy of the results, 15 mm
segments were used for further analyses. This can be observed in Figure 12, where the
calculated strains were compared while using DIC and extensometers of different lengths.
The main conclusion is that when applying longer gauges, the results are more stable.
However, if the optical extensometer is too long (i.e., longer than 15 mm) or too short (i.e.,
shorter than 8 mm), the differences can be as high as 15%.
The use of extensometers with a length of ~20 mm causes false results due to the
proximity of the measuring tip to the crushed edge of the sample (which is 25 mm high).
On the other hand, the use of short gauges of ~5 mm is affected by larger noise and causes
the measurements to have an error due to buckling from the plane of the sample (see
Figure 17b). The moment when the sample buckles is shown in Figure 12d–image number
38 (for a strain gauge 4 mm long). The influence of buckling (which manifests in the form
of an out-of-plane deformation) on the measurement of in-plane deformations can be eas-
ily eliminated using the stereo DIC procedure. However, if optical extensometry is to be
used, a fairly large area where the results obtained with the extensometer match those
obtained with the DIC should be in the range of 8–16 mm.
(a) (b)
Figure 17. The ECT sample during the CD test: (a) sample during the CD test–no buckling; (b) sample during the CDtest–buckling.
Table 4 shows the identified components of matrix A. The second column shows theresults obtained during tests 2 and 6, while columns 3 and 4 show the results obtainedwhile using two different test groups. The groups included samples with a higher flutefrom the front (on the side of the DIC stereo set) and samples with a lower flute fromthe front. It is evident that the results for group 2, especially in the case of A11 and A12,differed significantly from the results obtained in the first procedure, while consideringgroup 1. This was due to the asymmetric cross-section of the sample and the differentlevel of buckling on the sample side with the higher flute. Out-of-plane deformationrelated to buckling distorts measurement and therefore introduces noise that distorts theresults. Other components of matrix A did not differ more than 10% when using differentmeasurement techniques, which was very promising.
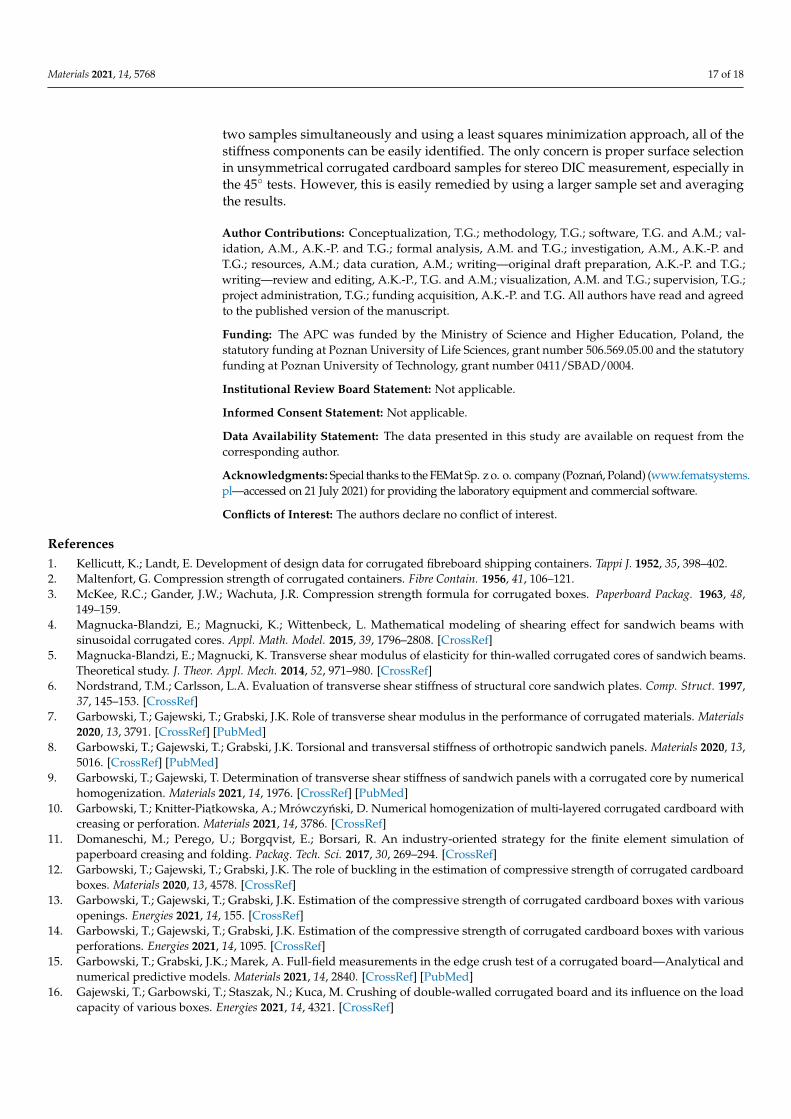
In order to validate the results presented in Table 4, the numerical homogenization pro-cedure (for details see recent works by Garbowski and Gajewski [9] or Garbowski et al. [10])of the cross-section of corrugated board BE-650 (see Figure 18) was used. The numericalhomogenization technique used the geometrical and constitutive parameters presented inTables 1 and 2. The following results were obtained while employing the homogenizationtechnique: A11 = 2620 N/mm, A12 = 185 N/mm, A22 = 1812 N/mm, A66 = 906 N/mm.The results are in good agreement, which proves that the use of optical techniques in con-junction with the new setup of the ECT (samples cut at an angle of 45◦ with respect to thedirection of corrugation) can be effective in determining the stiffness of corrugated cardboard.
Materials 2021, 14, x FOR PEER REVIEW 16 of 18
Figure 17. The ECT sample during the CD test: (a) sample during the CD test–no buckling; (b) sample during the CD test–
buckling.
Table 4 shows the identified components of matrix A. The second column shows the
results obtained during tests 2 and 6, while columns 3 and 4 show the results obtained
while using two different test groups. The groups included samples with a higher flute
from the front (on the side of the DIC stereo set) and samples with a lower flute from the
front. It is evident that the results for group 2, especially in the case of ��� and ���, dif-
fered significantly from the results obtained in the first procedure, while considering
group 1. This was due to the asymmetric cross-section of the sample and the different
level of buckling on the sample side with the higher flute. Out-of-plane deformation re-
lated to buckling distorts measurement and therefore introduces noise that distorts the
results. Other components of matrix A did not differ more than 10% when using different
measurement techniques, which was very promising.
In order to validate the results presented in Table 4, the numerical homogenization
procedure (for details see recent works by Garbowski and Gajewski [9] or Garbowski et
al. [10]) of the cross-section of corrugated board BE-650 (see Figure 18) was used. The nu-
merical homogenization technique used the geometrical and constitutive parameters pre-
sented in Tables 1 and 2. The following results were obtained while employing the ho-
mogenization technique: ��� = 2620 N/mm, ��� = 185 N/mm, ��� = 1812 N/mm,
��� = 906 N/mm. The results are in good agreement, which proves that the use of optical
techniques in conjunction with the new setup of the ECT (samples cut at an angle of 45°
with respect to the direction of corrugation) can be effective in determining the stiffness
of corrugated cardboard.
Figure 18. Visualization of the finite element model of corrugated board BE-650.
5. Conclusions
The main conclusion is that stereo DIC and/or optical extensometry techniques can
be used to evaluate stiffness in a standard edge crush test. In order to determine all the
stiffness coefficients, it is necessary to use an additional, new test specimen cut at an angle
of 45° to the direction of the corrugation. By applying the results from the two samples
simultaneously and using a least squares minimization approach, all of the stiffness com-
ponents can be easily identified. The only concern is proper surface selection in unsym-
metrical corrugated cardboard samples for stereo DIC measurement, especially in the 45°
tests. However, this is easily remedied by using a larger sample set and averaging the
results.
Figure 18. Visualization of the finite element model of corrugated board BE-650.
5. Conclusions
The main conclusion is that stereo DIC and/or optical extensometry techniques canbe used to evaluate stiffness in a standard edge crush test. In order to determine allthe stiffness coefficients, it is necessary to use an additional, new test specimen cut atan angle of 45◦ to the direction of the corrugation. By applying the results from the
Materials 2021, 14, 5768 17 of 18
two samples simultaneously and using a least squares minimization approach, all of thestiffness components can be easily identified. The only concern is proper surface selectionin unsymmetrical corrugated cardboard samples for stereo DIC measurement, especially inthe 45◦ tests. However, this is easily remedied by using a larger sample set and averagingthe results.
Author Contributions: Conceptualization, T.G.; methodology, T.G.; software, T.G. and A.M.; val-idation, A.M., A.K.-P. and T.G.; formal analysis, A.M. and T.G.; investigation, A.M., A.K.-P. andT.G.; resources, A.M.; data curation, A.M.; writing—original draft preparation, A.K.-P. and T.G.;writing—review and editing, A.K.-P., T.G. and A.M.; visualization, A.M. and T.G.; supervision, T.G.;project administration, T.G.; funding acquisition, A.K.-P. and T.G. All authors have read and agreedto the published version of the manuscript.
Funding: The APC was funded by the Ministry of Science and Higher Education, Poland, thestatutory funding at Poznan University of Life Sciences, grant number 506.569.05.00 and the statutoryfunding at Poznan University of Technology, grant number 0411/SBAD/0004.
Institutional Review Board Statement: Not applicable.
Informed Consent Statement: Not applicable.
Data Availability Statement: The data presented in this study are available on request from thecorresponding author.
Acknowledgments: Special thanks to the FEMat Sp. z o. o. company (Poznan, Poland) (www.fematsystems.pl—accessed on 21 July 2021) for providing the laboratory equipment and commercial software.
Conflicts of Interest: The authors declare no conflict of interest.
References1. Kellicutt, K.; Landt, E. Development of design data for corrugated fibreboard shipping containers. Tappi J. 1952, 35, 398–402.2. Maltenfort, G. Compression strength of corrugated containers. Fibre Contain. 1956, 41, 106–121.3. McKee, R.C.; Gander, J.W.; Wachuta, J.R. Compression strength formula for corrugated boxes. Paperboard Packag. 1963, 48,
149–159.4. Magnucka-Blandzi, E.; Magnucki, K.; Wittenbeck, L. Mathematical modeling of shearing effect for sandwich beams with
sinusoidal corrugated cores. Appl. Math. Model. 2015, 39, 1796–2808. [CrossRef]5. Magnucka-Blandzi, E.; Magnucki, K. Transverse shear modulus of elasticity for thin-walled corrugated cores of sandwich beams.
Theoretical study. J. Theor. Appl. Mech. 2014, 52, 971–980. [CrossRef]6. Nordstrand, T.M.; Carlsson, L.A. Evaluation of transverse shear stiffness of structural core sandwich plates. Comp. Struct. 1997,
37, 145–153. [CrossRef]7. Garbowski, T.; Gajewski, T.; Grabski, J.K. Role of transverse shear modulus in the performance of corrugated materials. Materials
2020, 13, 3791. [CrossRef] [PubMed]8. Garbowski, T.; Gajewski, T.; Grabski, J.K. Torsional and transversal stiffness of orthotropic sandwich panels. Materials 2020, 13,
5016. [CrossRef] [PubMed]9. Garbowski, T.; Gajewski, T. Determination of transverse shear stiffness of sandwich panels with a corrugated core by numerical
homogenization. Materials 2021, 14, 1976. [CrossRef] [PubMed]10. Garbowski, T.; Knitter-Piatkowska, A.; Mrówczynski, D. Numerical homogenization of multi-layered corrugated cardboard with
creasing or perforation. Materials 2021, 14, 3786. [CrossRef]11. Domaneschi, M.; Perego, U.; Borgqvist, E.; Borsari, R. An industry-oriented strategy for the finite element simulation of
paperboard creasing and folding. Packag. Tech. Sci. 2017, 30, 269–294. [CrossRef]12. Garbowski, T.; Gajewski, T.; Grabski, J.K. The role of buckling in the estimation of compressive strength of corrugated cardboard
boxes. Materials 2020, 13, 4578. [CrossRef]13. Garbowski, T.; Gajewski, T.; Grabski, J.K. Estimation of the compressive strength of corrugated cardboard boxes with various
openings. Energies 2021, 14, 155. [CrossRef]14. Garbowski, T.; Gajewski, T.; Grabski, J.K. Estimation of the compressive strength of corrugated cardboard boxes with various
perforations. Energies 2021, 14, 1095. [CrossRef]15. Garbowski, T.; Grabski, J.K.; Marek, A. Full-field measurements in the edge crush test of a corrugated board—Analytical and
numerical predictive models. Materials 2021, 14, 2840. [CrossRef] [PubMed]16. Gajewski, T.; Garbowski, T.; Staszak, N.; Kuca, M. Crushing of double-walled corrugated board and its influence on the load
capacity of various boxes. Energies 2021, 14, 4321. [CrossRef]
Materials 2021, 14, 5768 18 of 18
17. Kmita-Fudalej, G.; Szewczyk, W.; Kołakowski, Z. Calculation of honeycomb paperboard resistance to edge crush test. Materials2020, 13, 1706. [CrossRef] [PubMed]
18. Park, J.; Park, M.; Choi, D.S.; Jung, H.M.; Hwang, S.W. Finite element-based simulation for edgewise compression behavior ofcorrugated paperboard for packaging of agricultural products. Appl. Sci. 2020, 10, 6716. [CrossRef]
19. Wong, J.E.; Mustapha, K.B.; Shimizu, Y.; Kamiya, A.; Arumugasamy, S.K. Development of surrogate predictive models for thenonlinear elasto-plastic response of medium density fiberboard-based sandwich structures. Int. J. Lightweight Mater. Manuf. 2021,4, 302–314.
20. Marek, A.; Garbowski, T. Homogenization of sandwich panels. Comput. Assist. Methods Eng. Sci. 2015, 22, 39–50.21. Hohe, J. A direct homogenization approach for determination of the stiffness matrix for microheterogeneous plates with
application to sandwich panels. Compos. Part. B 2003, 34, 615–626. [CrossRef]22. FEMat Systems. Available online: http://fematsystems.pl/home_en (accessed on 25 April 2021).23. TAPPI T 839 om-12. Edge Compression Test for Strength of Corrugated Fiberboard Using the Clamp Method (Short Column Test); TAPPI:
Peachtree Corners, GA, USA, 2009.24. TAPPI T 838 cm-12. Edge Crush Test Using Neckdown; TAPPI: Peachtree Corners, GA, USA, 2009.25. FEFCO NO.8. Edgewise Crush Resistance of Corrugated Fiberboard; FEFCO: Brussel, Belgium, 1997.26. ISO 3037:2013. Corrugated Fibreboard—Determination of Edgewise Crush Resistance (Unwaxed Edge Method); ISO: Geneva, Switzerland,
2013.27. TAPPI T 811 om-11. Edgewise Compressive Strength of Corrugated Fibreboard (Short Column Test); TAPPI: Peachtree Corners, GA,
USA, 2009.28. ISO 13821:2002. Corrugated Fibreboard—Determination of Edgewise Crush Resistance—Waxed Edge Method; ISO: Geneva, Switzerland,
2002.29. Hägglund, R.; Åslund, P.E.; Carlsson, L.A.; Isaksson, P. Measuring thickness changes of edgewise compression loaded corrugated
board panels using digital image correlation. J. Sandw. Struct. Mater. 2010, 14, 75–94. [CrossRef]30. Viguié, J.; Dumont, P.J.J.; Vacher, P.; Orgéas, L.; Desloges, I.; Mauret, E. Analysis of the strain and stress field of cardboard box
during compression by 3D Digital Image Correlation. Appl. Mech. Mater. 2010, 24–25, 103–108. [CrossRef]31. Viguié, J.; Dumont, P.J.J.; Orgéas, L.; Vacher, P.; Desloges, I.; Mauret, E. Surface stress and strain fields on compressed panels of
corrugated board boxes. An experimental analysis by using Digital Image Stereocorrelation. Comp. Struct. 2011, 93, 2861–2873.[CrossRef]
32. Viguié, J.; Dumont, P.J.J. Analytical post-buckling model of corrugated board panels using digital image correlation measurements.Comp. Struct. 2013, 101, 243–254. [CrossRef]
33. Borgqvist, E.; Lindström, T.; Tryding, J.; Wallin, M.; Ristinmaa, M. Distortional hardening plasticity model for paperboard. Int. J.Solids Struct. 2014, 51, 2411–2423. [CrossRef]
34. Cocchetti, G.; Mahini, M.R.; Maier, G. Mechanical characterization of foils with compression in their planes. Mech. Adv. Mater.Struct. 2014, 21, 853–870. [CrossRef]
35. Garbowski, T.; Maier, G.; Novati, G. On calibration of orthotropic elastic-plastic constitutive models for paper foils by biaxial testsand inverse analyses. Struct. Multidisc. Optim. 2012, 46, 111–128. [CrossRef]
36. Considine, J.M.; Pierron, F.; Turner, K.T.; Vahey, D.W. General anisotropy identification of paperboard with virtual fields method.Exp. Mech. 2014, 54, 1395–1410. [CrossRef]
37. Åslund, P.E.; Hägglund, R.; Carlsson, L.A.; Isaksson, P. An analysis of strain localization and formation of face wrinkles inedge-wise loaded corrugated sandwich panels using a continuum damage model. Int. J. Solids Struct. 2015, 56–57, 248–257.[CrossRef]
38. Zappa, E.; Liu, R.; Bolzon, G.; Shahmardani, M. High resolution non-contact measurement techniques for three-dimensionaldeformation processes of paperboard laminates. Mater. Today Proc. 2017, 4, 5872–5876. [CrossRef]
39. Fadiji, T.; Coetzee, C.J.; Opara, U.L. Evaluating the displacement field of paperboard packages subjected to compression loadingusing digital image correlation (DIC). Food Bioprod. Process. 2020, 123, 60–71. [CrossRef]
40. Maier, G.; Bolzon, G.; Buljak, V.; Garbowski, T.; Miller, B. Synergic Combinations of Computational Methods and Experimentsfor Structural Diagnoses. In Computer Methods in Mechanics; Advanced Structured Materials; Kuczma, M., Wilmanski, K., Eds.;Springer: Berlin/Heidelberg, Germany, 2010; Volume 1, pp. 453–476.


