Embed Size (px)
Citation preview

Friday, November 16, 2018, 8:30 a.m. Peace Garden Room, State Capitol
600 E Blvd, Bismarck, ND
Revised Agenda
I. CALL TO ORDER AND ACCEPTANCE OF AGENDA II. ACCEPTANCE OF MINUTES (October 26, 2018)
III. GOVERNANCE
A. SIB Audit Committee Update (15 minutes)
1. SIB Audit Committee Report – Ms. Sara Sauter (enclosed) Board Acceptance 2. RIO Financial Audit Report June 30, 2018 – Mr. Hunter (enclosed) Board Acceptance
B. SIB Securities Litigation Update – Mr. Hunter (enclosed) (10 min) Board Acceptance
IV. INVESTMENTS A. Asset and Performance Overview - Mr. Hunter (enclosed) (15 min) Board Acceptance B. Real Estate Overview (Pension Trust) - Mr. Schulz
1. Invesco Presentation - Mr. Max Swango and Mr. Paul Michaels (enclosed) (40 min) 2. Staff Recommendation - Mr. Schulz (enclosed) (10 min) Board Action
============================== Break from 10:00 to 10:15 am ================================
C. Callan Review – Ms. Inga Sweet, Mr. Paul Erlendson, Mr. Alex Browning (1 hour) Board Acceptance 1. Pension Trust (enclosed) 2. Insurance Trust (enclosed) 3. Legacy Fund (enclosed)
D. Callan Fee Study – Mr. Paul Erlendson and Mr. Alex Browning (enclosed) (30 min) Board Acceptance E. Legacy Fund Earnings Update – Mr. Hunter (enclosed) (10 min) Informational F. Accepting New Clients – Mr. Hunter (enclosed) (5 min) Board Acceptance
V. OTHER
Next Meetings: SIB meeting - December 21, 2018, 8:30 am - RIO Conference Room (Tentative) January 25, 2019, 8:30 a.m. - Workforce Safety & Insurance SIB Securities Litigation - February 14, 2019, 3:00 pm - RIO Conference Room SIB Audit Committee meeting - February 21, 2019, 3:00 p.m. - RIO Conference Room
VI. ADJOURNMENT
Any individual requiring an auxiliary aid or service, please contact the Retirement and Investment Office (701) 328-9885 at least three (3) days prior to the scheduled meeting.
ND STATE INVESTMENT BOARD MEETING
1 10/26/18
NORTH DAKOTA STATE INVESTMENT BOARD
MINUTES OF THE OCTOBER 26, 2018, BOARD MEETING
MEMBERS PRESENT: Brent Sanford, Lt. Governor, Chair Rob Lech, TFFR Board, Vice Chair
Troy Seibel, PERS Board, Parliamentarian Toni Gumeringer, TFFR Board Adam Miller, PERS Board Mel Olson, TFFR Board Kelly Schmidt, State Treasurer Jodi Smith, Commissioner of Trust Lands
Cindy Ternes, WSI Designee
MEMBERS ABSENT: Jon Godfread, Insurance Commissioner Yvonne Smith, PERS Board
STAFF PRESENT: Eric Chin, Senior Investment Officer
Connie Flanagan, Chief Financial Officer Bonnie Heit, Asst to the Board
David Hunter, ED/CIO Sara Sauter, Audit Svs Suprv Cody Schmidt, Compliance Officer Darren Schulz, Dep CIO Susan Walcker, Investment Accountant
OTHERS PRESENT: Brian Barnett, APT, Inc. Andrew Chapman, Macquarie Anna Dayn, XTP Jeff Engleson, Dept. of Trust Lands Michael Glascott, Macquarie Greg Gordon, Cerberus Wolfram Klinger, XTP Karl Kuchel, Macquarie Anders Odegaard, Attorney General’s Office Ronald Rawald, Cerberus Bryan Reinhardt, PERS
CALL TO ORDER: Lt. Governor Sanford, Chair, called the State Investment Board (SIB) regular meeting to order at 8:32 a.m. on Friday, October 26, 2018, in the Peace Garden Room, at the State Capitol, Bismarck, ND. AGENDA: IT WAS MOVED BY MS. TERNES AND SECONDED BY DR. LECH AND CARRIED BY A VOICE VOTE TO ACCEPT THE REVISED AGENDA FOR THE OCTOBER 26, 2018, MEETING. AYES: MS. TERNES, COMMISSIONER SMITH, MS. GUMERINGER, MR. SEIBEL, MR. MILLER, DR. LECH, MR. OLSON, TREASURER SCHMIDT, AND LT. GOVERNOR SANFORD NAYS: NONE MOTION CARRIED ABSENT: COMMISSIONER GODFREAD, MS. SMITH
1626
2 10/26/18
MINUTES: IT WAS MOVED BY DR. LECH AND SECONDED BY MR. OLSON AND CARRIED BY A VOICE VOTE TO ACCEPT THE MINUTES OF THE SEPTEMBER 28, 2018, MEETING AS DISTRIBUTED. AYES: MS. GUMERINGER, COMMISSIONER SMITH, TREASURER SCHMIDT, DR. LECH, MR. OLSON, MR. SEIBEL, MR. MILLER, MS. TERNES, AND LT. GOVERNOR SANFORD NAYS: NONE MOTION CARRIED ABSENT: COMMISSIONER GODFREAD, MS. SMITH INVESTMENTS: Infrastructure Background/Overview – Mr. Schulz reviewed the current infrastructure portfolios of the SIB, the importance of diversification, and the due diligence conducted by staff to support their proposed recommendation. Macquarie Infrastructure Partners (MIP) – Representatives Mr. Kuchel, Mr. Chapman, and Mr. Glascott provided an overview and structure of the firm. After the review, IT WAS MOVED BY TREASURER SCHMIDT AND SECONDED BY DR. LECH AND CARRIED BY A VOICE VOTE TO ENTER INTO EXECUTIVE SESSION PURSUANT TO NDCC §44-04-18.4(1), §44-04-19.1(9), & §44-04-19.2 TO DISCUSS CONFIDENTIAL COMMERCIAL AND FINANCIAL INFORMATION AND PROVIDE CONTRACT NEGOTIATING INSTRUCTIONS TO ITS ATTORNEY OR NEGOTIATOR. AYES: MR. OLSON, MS. GUMERINGER, MR. MILLER, MR. SEIBEL, MS. TERNES, COMMISSIONER SMITH, DR. LECH, TREASURER SCHMIDT, AND LT. GOVERNOR SANFORD NAYS: NONE MOTION CARRIED ABSENT: COMMISSIONER GODFREAD, MS. SMITH The Board exited Open Session at 9:01 a.m. and entered into Executive Session at 9:02 a.m. The following individuals were present during Executive Session: Mr. Olson, Ms. Gumeringer, Mr. Miller, Mr. Seibel, Ms. Ternes, Commissioner Smith, Dr. Lech, Treasurer Schmidt, Lt. Governor Sanford, Mr. Odegaard, Mr. Chin, Ms. Flanagan, Ms. Heit, Mr. Hunter, Ms. Sauter, Mr. Schmidt, Mr. Schulz, Ms. Walcker, Mr. Kuchel, Mr. Chapman, and Mr. Glascott. The Board exited Executive Session at 9:50 a.m. and entered into Open Session at 9:51 a.m. Mr. Schulz reviewed staff’s proposal and felt an investment in MIP IV would be a prudent investment for the Legacy Fund and Pension Trust. An investment in MIP IV offers manager and asset diversification which would be complementary to the Pension Trust and Legacy Fund’s existing infrastructure portfolio. MIP IV’s core/core plus focus is well-suited as an anchor infrastructure allocation parallel to JP Morgan’s Infrastructure Investment Fund (IIF.) A commitment to MIP IV further diversifies the SIB’s current infrastructure investments with a focus on large core transactions supplemented by core-plus opportunities. Staff recommended a commitment up to $140 million in MIP IV ($65 million in the Pension Trust and $75 million in the Legacy Fund). After discussion,
1627
3 10/26/18
IT WAS MOVED BY TREASURER SCHMIDT AND SECONDED BY MS. TERNES AND CARRIED BY A ROLL CALL VOTE TO ACCEPT STAFF RECOMMENDATION. AYES: MS. TERNES, MR. OLSON, TREASURER SCHMIDT, COMMISSIONER SMITH, MR. SEIBEL, DR. LECH, MR. MILLER, MS. GUMERINGER, AND LT. GOVERNOR SANFORD. NAYS: NONE MOTION CARRIED ABSENT: COMMISSIONER GODFREAD, MS. SMITH The Board recessed at 10:02 a.m. and reconvened at 10:15 a.m. European Non-Performing Loan Investment – At the September 28, 2018, SIB meeting, Mr. Chin reviewed an investment opportunity for the board’s consideration in European Non-Performing Loans (NPL). Mr. Chin provided a recap of the investment opportunity. Cerberus – Representatives Mr. Rawald and Mr. Gordon provided an overview of the firm and the NPL investment opportunity. Mr. Chin reviewed staff recommendation. RIO investment personnel recommended that the SIB invest up to $120 million ($60 million Pension Trust and $60 million Legacy Fund) in the Cerberus Global NPL investment opportunity subject to continued negotiations and finalization of the contract. The investment would represent a 1% position in both the Pension Trust and the Legacy Fund. The allocation would be funded by reducing equity exposure in both portfolios. After discussion, IT WAS MOVED BY TREASURER SCHMIDT AND SECONDED BY COMMISSIONER SMITH AND CARRIED BY A ROLL CALL VOTE TO DENY STAFF RECOMMENDATION REGARDING THE NPL INVESTMENT OPPORTUNITY. AYES: COMMISSIONER SMITH, TREASURER SCHMIDT, MR. MILLER, MR. OLSON, MS. TERNES, MS. GUMERINGER, MR. SEIBEL, AND LT. GOVERNOR SANFORD NAYS: DR. LECH MOTION CARRIED ABSENT: COMMISSIONER GODFREAD, MS. SMITH Lt. Governor Sanford left the meeting and Dr. Lech presided over the meeting. Ms. Ternes also exited the meeting. Park District of the City of Grand Forks (GFPD) Investment Policy Statement IPS) – Mr. Hunter reviewed a revised IPS for the GFPD which was approved by the trustees of the GFPD on October 2, 2018. The GFPD recently completed an asset liability study conducted by Arthur J. Gallagher. IT WAS MOVED BY COMMISSIONER SMITH AND SECONDED BY MR. OLSON AND CARRIED BY A ROLL CALL VOTE TO ACCEPT THE REVISED IPS FOR THE PARK DISTRICT OF THE CITY OF GRAND FORKS. AYES: MS. GUMERINGER, COMMISSIONER SMITH, TREASURER SCHMIDT, DR. LECH, MR. OLSON, MR. SEIBEL, AND MR. MILLER NAYS: NONE MOTION CARRIED ABSENT: MS. SMITH, MS. TERNES, COMMISSIONER GODFREAD, AND LT. GOVERNOR SANFORD
1628
4 10/26/18
GOVERNANCE AND EDUCATION: Annual Evaluation of RIO vs Ends – Mr. Hunter, per Governance Policy/Annual Board Planning Cycle highlighted RIO’s adherence to the “Ends” policies for the period ending June 30, 2018. Mr. Hunter stated the vast majority of the SIB clients outperformed their respective investment benchmarks for the 5-years ended June 30, 2018 (two exceptions – Public Employees Retirement System (PERS) Retiree Health Insurance Credit and PERS Group Insurance) while adhering to approved guidelines. Mr. Hunter also stated investment fees declined from 0.65% in fiscal 2013 to approximately 0.43% in fiscal 2018. RIO has increased their transparency by enhancing public access to their website. RIO’s Internal Audit Division has conducted reviews which provide reasonable assurance that Teachers’ Fund for Retirement (TFFR) benefit recipients receive their retirement benefits in a cost effective and timely manner. TFFR member surveys support RIO management’s belief that members have access to information which allows them to become knowledgeable about retirement issues and processes. SIB and TFFR client surveys confirm that the boards and staff provide satisfactory services with SIB receiving a 3.7 score and TFFR earning a 3.8 score (on a 4.0 scale) in recent years. IT WAS MOVED BY TREASURER SCHMIDT AND SECONDED BY MR. OLSON AND CARRIED BY A VOICE VOTE TO ACCEPT THE ANNUAL REVIEW OF RIO VERSUS THE SIB GOVERNANCE “ENDS” POLICIES. AYES: MR. OLSON, MR. MILLER, TREASURER SCHMIDT, MS. GUMERINGER, COMMISSIONER SMITH, DR. LECH, AND MR. SEIBEL NAYS: NONE MOTION CARRIED ABSENT: MS. SMITH, MS. TERNES, COMMISSIONER GODFREAD, AND LT. GOVERNOR SANFORD Investment Fee Update – Mr. Hunter updated the Board on investment fees of the SIB portfolios. SIB client investment fees have declined from approximately 0.65% in fiscal year 2013 to approximately 0.43% in fiscal year 2018. Novarca was contracted by the SIB in 2014 to perform a comprehensive review of the investment fees and expenses. Novarca identified over $1 million in aggregate fee savings in addition to assisting RIO to obtain favorable terms in ongoing fee negotiations with investment firms. Callan has also been conducting biennial fee studies of the SIB’s major investment trusts and in-depth fee reviews within selected private markets. Mr. Hunter also noted the Dept. of Trust Lands investment personnel have been assisting RIO to obtain favorable market terms including a re-negotiation which is expected to generate an incremental $150,000 in annual fee savings for the SIB’s clients. Investment fee savings have also been realized between the Dept. of Trust Lands and the SIB who currently share 10 investment managers. Dr. Lech exited the meeting and Mr. Seibel presided over the remainder of the meeting. XTP Implementation Services – Representatives Ms. Dayn and Mr. Klingler provided an overview of their firm and strategy. RIO investment personnel recommended the SIB engage XTP to perform a comprehensive review of their investment fee structures and underlying expenses to further enhance transparency and potentially reduce investment costs. The recommendation would be subject to satisfactory negotiation of legal documentation including a contingent fee structure and strict terms of confidentiality. XTP would replace Novarca as Novarca has completed the terms of their contract. After discussion,
1629
5 10/26/18
IT WAS MOVED BY MR. OLSON AND SECONDED BY MR. MILLER AND CARRIED BY A ROLL CALL VOTE TO ACCEPT STAFF RECOMMENDATION AND ENGAGE XTP FOR A PERIOD OF TWO YEARS SUBJECT TO SATISFACTORY NEGOTIATION OF THE CONTRACT. AYES: TREASURER SCHMIDT, MR. OLSON, COMMISSIONER SMITH, MR. SEIBEL, MR. MILLER, AND MS. GUMERINGER NAYS: NONE MOTION CARRIED ABSENT: DR. LECH, COMMISSIONER GODFREAD, MS. SMITH, MS. TERNES, AND LT. GOVERNOR SANFORD Included in the board packet were the following reports; Client Satisfaction Survey 2018, Audit Committee Annual Report July 1, 2017 – June 30, 2018, Securities Litigation Committee Update, and Governance Manual (second reading) for the SIB’s consideration. IT WAS MOVED BY TREASURER SCHMIDT AND SECONDED BY MS. GUMERINGER AND CARRIED BY A ROLL CALL VOTE TO ACCEPT AGENDA ITEMS IV. C. CLIENT SATISFACTION SURVEY 2018, D. AUDIT COMMITTEE ANNUAL REPORT JULY 1, 2017 – JUNE 30, 2018, E. SECURITIES LITIGATION COMMITTEE UPDATE, AND F. GOVERNANCE MANUAL (SECOND READING). AYES: MR. OLSON, MR. SEIBEL, COMMISSIONER SMITH, MS. GUMERINGER, MR. MILLER, AND TREASURER SCHMIDT NAYS: NONE MOTION CARRIED ABSENT: COMMISSIONER GODFREAD, MS. SMITH, MS. TERNES, DR. LECH, AND LT. GOVERNOR SANFORD QUARTERLY MONITORING: Per Governance Policy, Board/Staff Relationship/Monitoring Executive Performance C-4, the following monitoring reports for the quarter ending September 30, 2018, were provided to the SIB for their consideration: Executive Limitations/Staff Relations, Budget/Financial Conditions, Investment Program, and Retirement Program. There was not a Watch List report provided as no SIB managers are currently on watch. Mr. Hunter stated he received one application for the Voluntary Separation Incentive Program which he has approved with a termination date of April 30, 2019. RIO intends to fill the position assuming budget availability. IT WAS MOVED BY MR. MILLER AND SECONDED BY MR. OLSON AND CARRIED BY A ROLL CALL VOTE TO ACCEPT THE QUARTERLY MONITORING REPORTS FOR THE QUARTER ENDING SEPTEMBER 30, 2018. AYES: TREASURER SCHMIDT, MS. GUMERINGER, COMMISSIONER SMITH, MR. MILLER, MR. OLSON, AND MR. SEIBEL NAYS: NONE MOTION CARRIED ABSENT: COMMISSIONER GODFREAD, MS. TERNES, MS. SMITH, DR. LECH, LT. GOVERNOR SANFORD Mr. Hunter informed the board RIO will be participating in the State Employee Survey in the next month. Mr. Hunter also informed the board he provided a market update to the Employee Benefits Programs Committee at their October 25, 2018, meeting.
1630
6 10/26/18
He also informed the board preliminary discussions have been taking place with the ND State Historical Society regarding possibly coming on board as a client of the SIB. He will keep the board informed. OTHER: The next meeting of the SIB is scheduled for November 16, 2018, at 8:30 a.m. at the State Capitol, Peace Garden Room. The next meeting of the Securities Litigation Committee meeting is scheduled for November 5, 2018, at 3:00 p.m. at the Retirement and Investment Office. The next meeting of the SIB Audit Committee is scheduled for November 15, 2018, at 3:00 p.m. at the Retirement and Investment Office. ADJOURNMENT: With no further business to come before the SIB, Mr. Seibel adjourned the meeting at 11:55 a.m. _____________________________________ Lt. Governor Sanford, Chair State Investment Board ___________ ___________________ Bonnie Heit Assistant to the Board
1631
1
2018-2019 1st Quarter Audit Activities Report
RETIREMENT AND INVESTMENT OFFICE AUDIT SERVICES
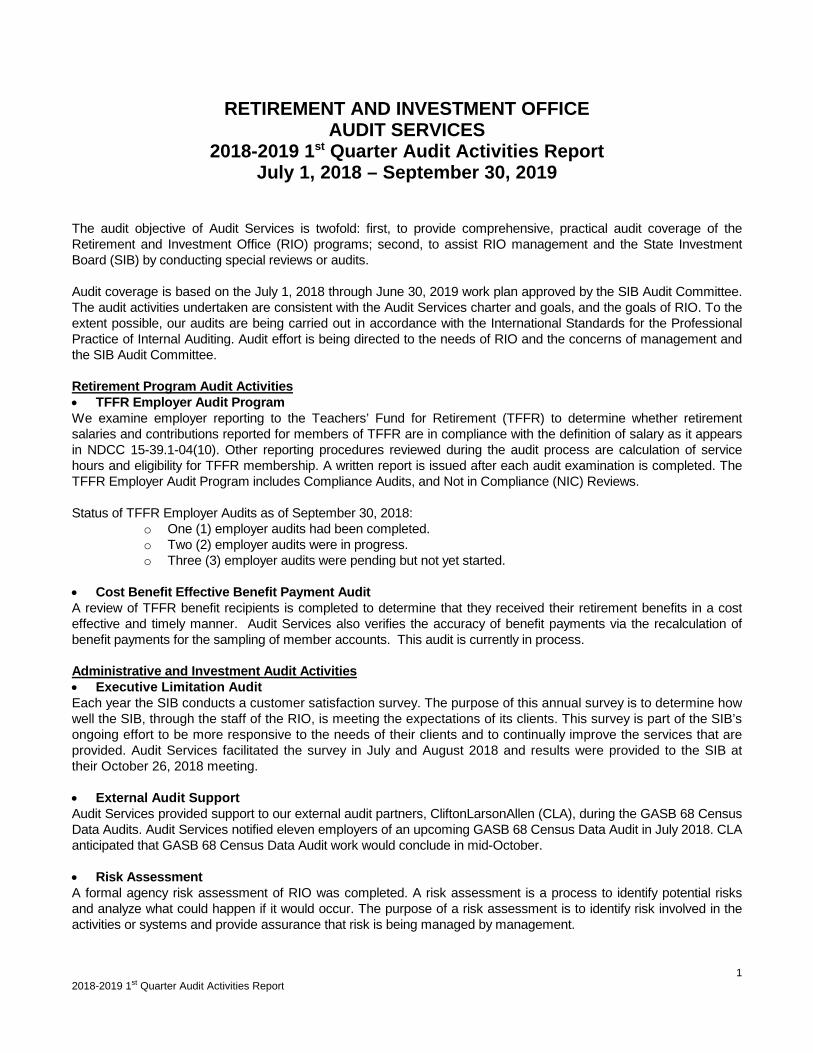
2018-2019 1st Quarter Audit Activities Report July 1, 2018 – September 30, 2019
The audit objective of Audit Services is twofold: first, to provide comprehensive, practical audit coverage of the
Retirement and Investment Office (RIO) programs; second, to assist RIO management and the State Investment
Board (SIB) by conducting special reviews or audits.
Audit coverage is based on the July 1, 2018 through June 30, 2019 work plan approved by the SIB Audit Committee.
The audit activities undertaken are consistent with the Audit Services charter and goals, and the goals of RIO. To the
extent possible, our audits are being carried out in accordance with the International Standards for the Professional
Practice of Internal Auditing. Audit effort is being directed to the needs of RIO and the concerns of management and
the SIB Audit Committee.
Retirement Program Audit Activities
• TFFR Employer Audit Program
We examine employer reporting to the Teachers’ Fund for Retirement (TFFR) to determine whether retirement
salaries and contributions reported for members of TFFR are in compliance with the definition of salary as it appears
in NDCC 15-39.1-04(10). Other reporting procedures reviewed during the audit process are calculation of service
hours and eligibility for TFFR membership. A written report is issued after each audit examination is completed. The
TFFR Employer Audit Program includes Compliance Audits, and Not in Compliance (NIC) Reviews.
Status of TFFR Employer Audits as of September 30, 2018:
o One (1) employer audits had been completed.
o Two (2) employer audits were in progress.
o Three (3) employer audits were pending but not yet started.
• Cost Benefit Effective Benefit Payment Audit
A review of TFFR benefit recipients is completed to determine that they received their retirement benefits in a cost
effective and timely manner. Audit Services also verifies the accuracy of benefit payments via the recalculation of
benefit payments for the sampling of member accounts. This audit is currently in process.
Administrative and Investment Audit Activities
• Executive Limitation Audit
Each year the SIB conducts a customer satisfaction survey. The purpose of this annual survey is to determine how
well the SIB, through the staff of the RIO, is meeting the expectations of its clients. This survey is part of the SIB’s
ongoing effort to be more responsive to the needs of their clients and to continually improve the services that are
provided. Audit Services facilitated the survey in July and August 2018 and results were provided to the SIB at
their October 26, 2018 meeting.
• External Audit Support
Audit Services provided support to our external audit partners, CliftonLarsonAllen (CLA), during the GASB 68 Census
Data Audits. Audit Services notified eleven employers of an upcoming GASB 68 Census Data Audit in July 2018. CLA
anticipated that GASB 68 Census Data Audit work would conclude in mid-October.
• Risk Assessment
A formal agency risk assessment of RIO was completed. A risk assessment is a process to identify potential risks
and analyze what could happen if it would occur. The purpose of a risk assessment is to identify risk involved in the
activities or systems and provide assurance that risk is being managed by management.

2
2018-2019 1st Quarter Audit Activities Report
Professional Development/CE/General Education
Audit Services continued its participation with the Institute of Internal Auditors (IIA) Central NoDak Chapter by
attending the September monthly meeting about data analytics.
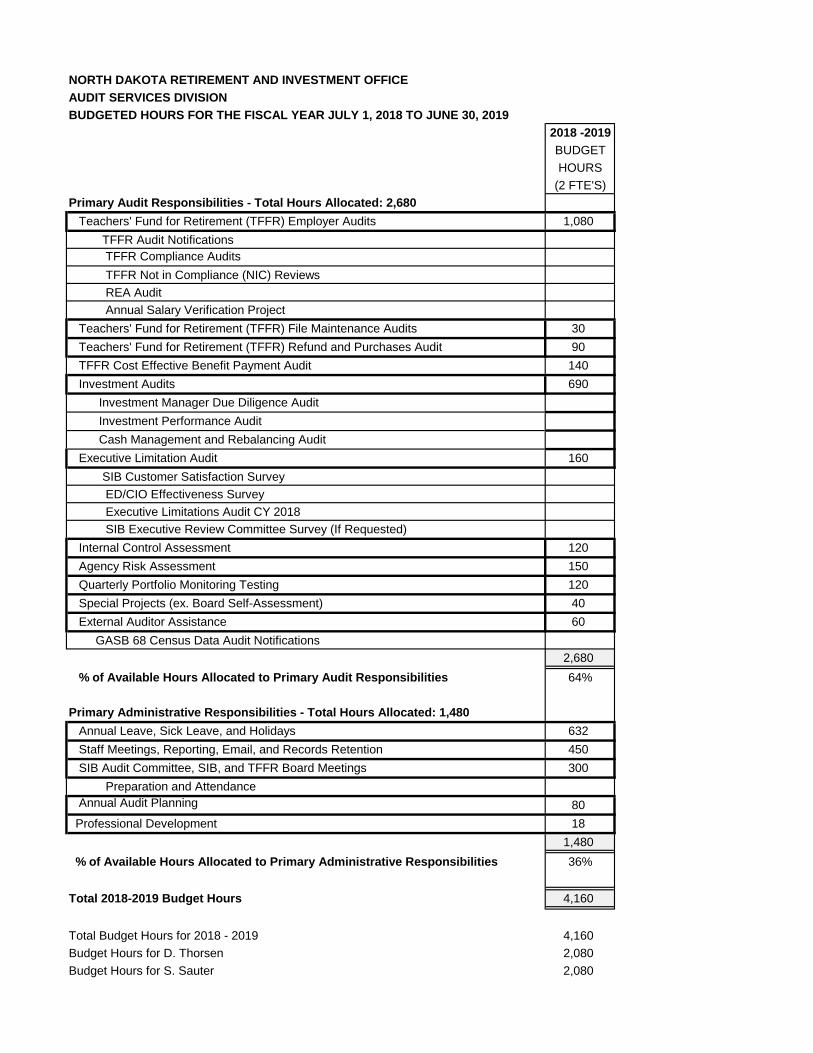
NORTH DAKOTA RETIREMENT AND INVESTMENT OFFICE
AUDIT SERVICES DIVISION
BUDGETED HOURS FOR THE FISCAL YEAR JULY 1, 2018 TO JUNE 30, 2019
2018 -2019
BUDGET
HOURS
(2 FTE'S)
Primary Audit Responsibilities - Total Hours Allocated: 2,680
Teachers' Fund for Retirement (TFFR) Employer Audits 1,080
TFFR Audit Notifications
TFFR Compliance Audits
TFFR Not in Compliance (NIC) Reviews
REA Audit
Annual Salary Verification Project
Teachers' Fund for Retirement (TFFR) File Maintenance Audits 30
Teachers' Fund for Retirement (TFFR) Refund and Purchases Audit 90
TFFR Cost Effective Benefit Payment Audit 140
Investment Audits 690
Investment Manager Due Diligence Audit
Investment Performance Audit
Cash Management and Rebalancing Audit
Executive Limitation Audit 160
SIB Customer Satisfaction Survey
ED/CIO Effectiveness Survey
Executive Limitations Audit CY 2018
SIB Executive Review Committee Survey (If Requested)
Internal Control Assessment 120
Agency Risk Assessment 150
Quarterly Portfolio Monitoring Testing 120
Special Projects (ex. Board Self-Assessment) 40
External Auditor Assistance 60
GASB 68 Census Data Audit Notifications
2,680
% of Available Hours Allocated to Primary Audit Responsibilities 64%
Primary Administrative Responsibilities - Total Hours Allocated: 1,480
Annual Leave, Sick Leave, and Holidays 632
Staff Meetings, Reporting, Email, and Records Retention 450
SIB Audit Committee, SIB, and TFFR Board Meetings 300
Preparation and Attendance
Annual Audit Planning 80
Professional Development 18
1,480
% of Available Hours Allocated to Primary Administrative Responsibilities 36%
Total 2018-2019 Budget Hours 4,160
Total Budget Hours for 2018 - 2019 4,160
Budget Hours for D. Thorsen 2,080
Budget Hours for S. Sauter 2,080
CliftonLarsonAllen LLPCLAconnect.com
State Investment Board Teachers’ Fund for Retirement North Dakota Retirement and Investment Office Bismarck, North Dakota
We have audited the financial statements of the North Dakota Retirement and Investment Office (RIO) as of and for the year ended June 30, 2018, and have issued our report thereon dated October 31, 2018. We have previously communicated to you information about our responsibilities under auditing standards generally accepted in the United States of America, as well as certain information related to the planned scope and timing of our audit. Professional standards also require that we communicate to you the following information related to our audit.
Significant audit findings
Qualitative aspects of accounting practices
Accounting policies
Management is responsible for the selection and use of appropriate accounting policies. The significant accounting policies used by RIO are described in Note 1 to the financial statements.
As described in Note 1, RIO adopted Governmental Accounting Standards Board (GASB) Statement 75, Accounting and Financial Reporting for Postemployment Benefits Other Than Pensions, in 2018. This statement replaces the requirements of Statement No. 45, Accounting and Financial Reporting by Employers for Postemployment Benefits Other Than Pensions, as amended, and improves accounting and financial reporting for postemployment benefits other than pensions.
The financial statements also include the impact of adoption of GASB Statement 82, Pension Issues-An Amendment of GASB Statements No. 67, No. 68, and No. 73, which addresses certain issues with the presentation of payroll-related measures in required supplementary information, and the classification of payments made by employers to satisfy employee contribution requirements.
We noted no transactions entered into by RIO during the year for which there is a lack of authoritative guidance or consensus. All significant transactions have been recognized in the financial statements in the proper period.
Accounting estimates
Accounting estimates are an integral part of the financial statements prepared by management and are based on management’s knowledge and experience about past and current events and assumptions about future events. Certain accounting estimates are particularly sensitive because of their significance to the financial statements and because of the possibility that future events affecting them may differ significantly from those expected. There were significant estimates in the valuation of alternative investments and the calculation of the actuarial information included in the footnotes and required supplementary information.
North Dakota Retirement and Investment Office Page 2
The valuation of alternative investments, including private equity and real asset investments, are a management estimate which is primarily based upon net asset values reported by the investment managers and comprise 16% of the total investment portfolio. The values for these investments are reported based upon the most recent financial data available and are adjusted for cash flows through June 30, 2018. Our audit procedures validated this approach through the use of confirmations sent directly to a sample of investment managers and the review of the most recent audited financial statements for these sampled funds. Furthermore, we reviewed management’s estimate and found it to be reasonable.
The actuarially calculated information was based on the assumptions and methods adopted by the Board, including an expected investment rate of return of 7.75% per annum compounded annually. The valuation takes into account all of the promised benefits required by the Retirement Code to which members are entitled as of July 1, 2018. Our audit procedures included reviewing the actuarial valuation and related assumptions used therein and we believe the estimate to be reasonable. Financial statement disclosures
Certain financial statement disclosures are particularly sensitive because of their significance to financial statement users. There were no particularly sensitive financial statement disclosures.
The financial statement disclosures are neutral, consistent, and clear.
Difficulties encountered in performing the audit
We encountered no significant difficulties in dealing with management in performing and completing our audit.
Uncorrected misstatements
Professional standards require us to accumulate all misstatements identified during the audit, other than those that are clearly trivial, and communicate them to the appropriate level of management. Management did not identify and we did not notify them of any uncorrected financial statement misstatements.
Corrected misstatements
Management did not identify and we did not notify them of any financial statement misstatements detected as a result of audit procedures.
Disagreements with management
For purposes of this letter, a disagreement with management is a financial accounting, reporting, or auditing matter, whether or not resolved to our satisfaction, that could be significant to the financial statements or the auditors’ report. No such disagreements arose during our audit.
Management representations
We have requested certain representations from management that are included in the attached management representation letter dated October 31, 2018.
Management consultations with other independent accountants
In some cases, management may decide to consult with other accountants about auditing and accounting matters, similar to obtaining a “second opinion” on certain situations. If a consultation involves application of an accounting principle to RIO’s financial statements or a determination of the type of auditors’ opinion that may be expressed on those statements, our professional standards require the consulting accountant to check with us to determine that the consultant has all the relevant facts. To our knowledge, there were no such consultations with other accountants.
North Dakota Retirement and Investment Office Page 3
Significant issues discussed with management prior to engagement
We generally discuss a variety of matters, including the application of accounting principles and auditing standards, with management each year prior to engagement as RIO’s auditors. However, these discussions occurred in the normal course of our professional relationship and our responses were not a condition to our engagement.
Other information in documents containing audited financial statements
With respect to the required supplementary information (RSI) accompanying the financial statements, we made certain inquiries of management about the methods of preparing the RSI, including whether the RSI has been measured and presented in accordance with prescribed guidelines, whether the methods of measurement and preparation have been changed from the prior period and the reasons for any such changes, and whether there were any significant assumptions or interpretations underlying the measurement or presentation of the RSI. We compared the RSI for consistency with management’s responses to the foregoing inquiries, the basic financial statements, and other knowledge obtained during the audit of the basic financial statements. Because these limited procedures do not provide sufficient evidence, we did not express an opinion or provide any assurance on the RSI.
With respect to the schedules of administrative expenses, consultant expenses, investment expenses, and appropriations – budget basis – fiduciary funds (collectively, the supplementary information) accompanying the financial statements, on which we were engaged to report in relation to the financial statements as a whole, we made certain inquiries of management and evaluated the form, content, and methods of preparing the information to determine that the information complies with accounting principles generally accepted in the United States of America, the method of preparing it has not changed from the prior period or the reasons for such changes, and the information is appropriate and complete in relation to our audit of the financial statements. We compared and reconciled the supplementary information to the underlying accounting records used to prepare the financial statements or to the financial statements themselves. We have issued our report thereon dated October 31, 2018.
Other information is being included in documents containing the audited financial statements and the auditors’ report thereon. Our responsibility for such other information does not extend beyond the financial information identified in our auditors’ report. We have no responsibility for determining whether such other information is properly stated and do not have an obligation to perform any procedures to corroborate other information contained in such documents. As required by professional standards, we read the introductory, investment, actuarial and statistical sections of the comprehensive annual financial report (the other information) in order to identify material inconsistencies between the audited financial statements and the other information. We did not identify any material inconsistencies between the other information and the audited financial statements.
Our auditors’ opinion, the audited financial statements, and the notes to financial statements should only be used in their entirety. Inclusion of the audited financial statements in a document you prepare, such as an annual report, should be done only with our prior approval and review of the document.
* * *
North Dakota Retirement and Investment Office Page 4
This communication is intended solely for the information and use of the State Investment Board, the Board of the Teachers’ Fund for Retirement and management of RIO and is not intended to be, and should not be, used by anyone other than these specified parties.
a CliftonLarsonAllen LLP
Baltimore, Maryland October 31, 2018

NORTH DAKOTA RETIREMENT AND INVESTMENT OFFICE
Bismarck, ND
FINANCIAL STATEMENTS June 30, 2018 and 2017
North Dakota Retirement and Investment Office Table of Contents
June 30, 2018 and 2017
PAGE INDEPENDENT AUDITORS’ REPORT ...................................................................................................... 1 REPORT ON INTERNAL CONTROL OVER FINANCIAL REPORTING AND ON COMPLIANCE AND OTHER MATTERS BASED ON AN AUDIT OF FINANCIAL STATEMENTS PERFORMED IN ACCORDANCE WITH GOVERNMENT AUDITING STANDARDS .................................................. 4 MANAGEMENT’S DISCUSSION AND ANALYSIS .................................................................................. 6 FINANCIAL STATEMENTS Statement of Net Position – Fiduciary Funds ............................................................................................ 12 Statement of Changes in Net Position – Fiduciary Funds ......................................................................... 13 Notes to Combined Financial Statements .................................................................................................. 14 REQUIRED SUPPLEMENTARY INFORMATION Schedule of Changes in NPL and Related Ratios – ND Teachers’ Fund for Retirement .......................... 55 Schedule of Employer Contributions – ND Teachers’ Fund for Retirement ............................................. 56 Schedule of Investment Returns – ND Teachers’ Fund for Retirement .................................................... 57 Schedule of Employer’s Share of NPL and NOL – ND Public Employees Retirement System ............... 58 Schedule of Employer Pension and OPEB Contributions – ND Public Employees Retirement System .. 59 SUPPLEMENTARY INFORMATION Combining Statement of Net Position – Investment Trust Funds – Fiduciary Funds ............................... 60 Combining Statement of Changes in Net Position – Investment Trust Funds – Fiduciary Funds ............ 62 Pension and Investment Trust Funds – Schedule of Administrative Expenses ......................................... 64 Pension and Investment Trust Funds – Schedule of Consultant Expenses ................................................ 65 Pension and Investment Trust Funds – Schedule of Investment Expenses ............................................... 66 Schedule of Appropriations – Budget Basis – Fiduciary Funds ................................................................ 67 SPECIAL COMMENTS REQUESTED BY THE LEGISLATIVE AUDIT AND FISCAL REVIEW COMMITTEE YEAR ENDED JUNE 30, 2018 ......................................... 68 AUDIT COMMITTEE COMMUNICATIONS .......................................................................................... 69
1
CliftonLarsonAllen LLPCLAconnect.com
INDEPENDENT AUDITORS' REPORT Governor Doug Burgum The Legislative Assembly David Hunter, Executive Director/CIO State Investment Board Teachers’ Fund for Retirement Board North Dakota Retirement and Investment Office Report on the Financial Statements
We have audited the accompanying financial statements of the North Dakota Retirement and Investment Office (RIO), a department of the State of North Dakota, which comprise the statement of net position – fiduciary funds as of June 30, 2018 and 2017, and the related statement of changes in net position – fiduciary funds for the years then ended, and the related notes to the financial statements, which collectively comprise RIO’s basic financial statements, and the combining and individual fund financial statements as of and for the years ended June 30, 2018 and 2017, as listed in the table of contents. Management’s Responsibility for the Financial Statements
Management is responsible for the preparation and fair presentation of these financial statements in accordance with accounting principles generally accepted in the United States of America; this includes the design, implementation, and maintenance of internal control relevant to the preparation and fair presentation of financial statements that are free from material misstatement, whether due to fraud or error. Auditors’ Responsibility
Our responsibility is to express opinions on these financial statements based on our audits. We conducted our audit in accordance with auditing standards generally accepted in the United States of America and the standards applicable to financial audits contained in Government Auditing Standards, issued by the Comptroller General of the United States. Those standards require that we plan and perform the audit to obtain reasonable assurance about whether the financial statements are free from material misstatement. An audit involves performing procedures to obtain audit evidence about the amounts and disclosures in the financial statements. The procedures selected depend on the auditors’ judgment, including the assessment of the risks of material misstatement of the financial statements, whether due to fraud or error. In making those risk assessments, the auditor considers internal control relevant to the entity’s preparation and fair presentation of the financial statements in order to design audit procedures that are appropriate in the circumstances, but not for the purpose of expressing an opinion on the effectiveness of the entity’s internal control. Accordingly, we express no such opinion. An audit also includes evaluating the appropriateness of accounting policies used and the reasonableness of significant accounting estimates made by management, as well as evaluating the overall presentation of the financial statements. We believe that the audit evidence we have obtained is sufficient and appropriate to provide a basis for our audit opinions.
2
Opinions
In our opinion, the financial statements referred to above present fairly, in all material respects, the financial position of RIO as of June 30, 2018 and 2017, and the respective changes in financial position for the years then ended in accordance with accounting principles generally accepted in the United States of America. Also, in our opinion, the combining and individual fund financial statements referred to above present fairly, in all material respects, the financial position of each of the individual funds of RIO as of June 30, 2018 and 2017, and the results of the changes in financial position of such funds for the years then ended, in conformity with accounting principles generally accepted in the United States of America. Emphasis of Matter
As discussed in Note 1, the financial statements of RIO are intended to present the financial position and the changes in financial position of only that portion of the State of North Dakota that is attributable to the transactions of RIO. They do not purport to, and do not, present fairly the financial position of the State of North Dakota as of June 30, 2018 and 2017, and the changes in its financial position for the years then ended in conformity with accounting principles generally accepted in the United States of America. Our opinion is not modified with respect to this matter. Other Matters
Required Supplementary Information
Accounting principles generally accepted in the United States of America require that the management’s discussion and analysis and the schedules of changes in NPL and related ratios - ND Teachers’ Fund for Retirement and employer contributions - ND Teachers’ Fund for Retirement, investment returns - ND Teachers’ Fund for Retirement, employer’s share of Net Pension and OPEB Liability – ND Public Employees Retirement System and employer pension and OPEB contributions – ND Public Employees Retirement System and related notes, as listed in the table of contents, be presented to supplement the basic financial statements. Such information, although not a part of the basic financial statements, is required by the Governmental Accounting Standards Board who considers it to be an essential part of financial reporting for placing the basic financial statements in an appropriate operational, economic, or historical context. We have applied certain limited procedures to the required supplementary information in accordance with auditing standards generally accepted in the United States of America, which consisted of inquiries of management about the methods of preparing the information and comparing the information for consistency with management’s responses to our inquiries, the basic financial statements, and other knowledge we obtained during our audit of the basic financial statements. We do not express an opinion or provide any assurance on the information because the limited procedures do not provide us with sufficient evidence to express an opinion or provide any assurance. Other Information
Our audit was conducted for the purpose of forming opinions on the financial statements that collectively comprise RIO’s basic financial statements and the combining and individual fund financial statements. The schedules of administrative expenses, consultant expenses, investment expenses, and appropriations – budget basis – fiduciary funds, as listed in the table of contents, are presented for purposes of additional analysis and are not a required part of the basic financial statements. These schedules are the responsibility of management and were derived from and relate directly to the underlying accounting and other records used to prepare the basic financial statements. Such information has been subjected to the auditing procedures applied in the audit of the basic financial statements and certain additional procedures, including comparing and reconciling such information directly to the underlying accounting and other records used to prepare the basic financial statements or to the basic financial statements themselves, and other additional procedures in accordance with auditing standards generally accepted in the United States of America. In our opinion, the information is fairly stated, in all material respects, in relation to the basic financial statements as a whole.
3
Other Reporting Required by Government Auditing Standards
In accordance with Government Audit Standards, we have also issued our report dated October 31, 2018, on our consideration of RIO’s internal control over financial reporting and on our tests of its compliance with certain provisions of laws, regulations, contracts and grant agreements and other matters. The purpose of that report is solely to describe the scope of our testing of internal control over financial reporting and compliance and the results of that testing, and not to provide an opinion on the effectiveness of RIO’s internal control over financial reporting or on compliance. That report is an integral part of an audit performed in accordance with Government Auditing Standards in considering RIO’s internal control over financial reporting.
a CliftonLarsonAllen LLP
Baltimore, Maryland October 31, 2018
4
CliftonLarsonAllen LLPCLAconnect.com
INDEPENDENT AUDITORS’ REPORT ON INTERNAL CONTROL OVER FINANCIAL REPORTING AND ON COMPLIANCE AND OTHER MATTERS BASED ON AN
AUDIT OF FINANCIAL STATEMENTS PERFORMED IN ACCORDANCE WITH GOVERNMENT AUDITING STANDARDS
Governor Doug Burgum The Legislative Assembly David Hunter, Executive Director/CIO State Investment Board Teacher’s Fund for Retirement Board North Dakota Retirement and Investment Office We have audited, in accordance with the auditing standards generally accepted in the United States of America and the standards applicable to financial audits contained in Government Auditing Standards issued by the Comptroller General of the United States, the basic financial statements of the North Dakota Retirement and Investment Office (RIO), a department of the State of North Dakota, which collectively comprise RIO’s basic financial statements, and the combining and individual fund financial statements, as of and for the year ended June 30, 2018, and the related notes to the financial statements, and have issued our report thereon dated October 31, 2018. Internal Control over Financial Reporting
Management of RIO is responsible for establishing and maintaining effective internal control over financial reporting. In planning and performing our audit, we considered RIO's internal control over financial reporting as a basis for designing our auditing procedures for the purpose of expressing our opinions on the financial statements, but not for the purpose of expressing an opinion on the effectiveness of RIO’s internal control over financial reporting. Accordingly, we do not express an opinion on the effectiveness of RIO’s internal control over financial reporting. A deficiency in internal control exists when the design or operation of a control does not allow management or employees, in the normal course of performing their assigned functions, to prevent, or detect and correct, misstatements on a timely basis. A material weakness is a deficiency, or a combination of deficiencies, in internal control, such that there is a reasonable possibility that a material misstatement of the entity’s financial statements will not be prevented, or detected and corrected on a timely basis. A significant deficiency is a deficiency, or a combination of deficiencies, in internal control that is less severe than a material weakness, yet important enough to merit attention by those charged with governance. Our consideration of internal control was for the limited purpose described in the first paragraph of this section and was not designed to identify all deficiencies in internal control that might be material weaknesses or significant deficiencies. Given these limitations, during our audit we did not identify any deficiencies in internal control that we consider to be material weaknesses. However, material weaknesses may exist that have not been identified.
5
Compliance and Other Matters
As part of obtaining reasonable assurance about whether RIO's financial statements are free from material misstatement, we performed tests of its compliance with certain provisions of laws, regulations, contracts, and grant agreements, noncompliance with which could have a direct and material effect on the determination of financial statement amounts. However, providing an opinion on compliance with those provisions was not an objective of our audit, and accordingly, we do not express such an opinion. The results of our tests disclosed no instances of noncompliance or other matters that are required to be reported under Government Auditing Standards. Purpose of this Report
The purpose of this report is solely to describe the scope of our testing of internal control and compliance and the result of that testing, and not to provide an opinion on the effectiveness of RIO’s internal control or on compliance. This report is an integral part of an audit performed in accordance with Government Auditing Standards in considering RIO’s internal control and compliance. Accordingly, this communication is not suitable for any other purpose.
a CliftonLarsonAllen LLP Baltimore, Maryland October 31, 2018
North Dakota Retirement and Investment Office Management’s Discussion and Analysis
June 30, 2018 and 2017
6
Our discussion and analysis of the ND Retirement and Investment Office’s (RIO) financial performance provides an overview of RIO’s financial activities for the fiscal years ended June 30, 2018 and 2017. Please read it in conjunction with the basic financial statements, which follow this discussion. RIO administers two fiduciary funds, a pension trust fund for the ND Teachers’ Fund for Retirement (TFFR) and an investment trust fund for the ND State Investment Board (SIB) consisting of 23 investment clients in two investment pools and four individual investment accounts.
Financial Highlights Total net position increased from the previous fiscal year in the fiduciary funds by $1.5 billion (11.8%) and $972 million (8.6%) in FY2018 and FY2017, respectively. Approximately 61% of the FY2018 increase and 90% of the FY2017 increase is due to the growth of the Legacy Fund. The Legacy Fund was created by a constitutional amendment in 2010. The amendment provides that 30% of oil and gas gross production and oil extraction taxes on oil produced after June 30, 2011, be transferred to the Legacy Fund. Transfers into the Legacy Fund totaled $529.9 million and $399.5 million and net investment income exceeded $361 million and $480 million in FY2018 and FY2017, respectively. Total additions in the fiduciary funds for FY2018 decreased by $78.1 (3.7%) and increased over $1 billion (93.3%) in FY2017. Net investment income decreased by $302 million in FY2018 after rising by $1.1 billion in FY2017, due to stronger financial markets in FY2017 over FY2018. There was an increase in new purchases of units in the investment program in FY2018 due to stronger oil and gas tax collections affecting the Legacy Fund and the Budget Stabilization Fund after a decrease in FY2017. Total fiduciary fund purchases of units increased $223.2 million (34.4%) in FY2018 after decreasing by $115.1 million (15.1%) in FY2017. Deductions in the fiduciary funds decreased by $562.8 million (50.7%) in FY2018 after increasing the prior year by $656.4 million (144.5%). The vast majority of the large swing between fiscal years was due to the drawdown of $572.5 million from the Budget Stabilization Fund in FY2017 to cover the State’s income shortfall during the 2015-17 biennium. Payments to TFFR members in the form of benefits and refunds increased by $11.5 million (5.8%) and $10.5 million (5.7%) in FY2018 and FY2017, respectively. These increases represented a rise in the total number of retirees drawing retirement benefits from the pension fund as well as an increase in the retirement salaries on which the benefits of new retirees are based. As of June 30, 2018 and 2017, the TFFR pension plan had a Net Pension Liability (NPL) of $1.33 billion and $1.37 billion, and Plan Fiduciary Net Position as a percent of Total Pension Liability (TPL) of 65.5% and 63.2%, respectively. Overview of the Financial Statements This report consists of four parts – management’s discussion and analysis (this section), the basic financial statements, required supplementary information, and additional supplementary information that presents combining statements for the investment trust funds. The basic financial statements include fund financial statements that focus on individual parts of RIO’s activities (fiduciary funds). The financial statements also include notes that explain some of the information in the financial statements and provide more detailed data. The statements are followed by a section of required supplementary information that further explains and supports the information in the financial statements. In addition to these required elements, we have included additional supplementary information, including combining statements that provide details about our investment trust funds, each of which are added together and presented in single columns in the basic financial statements.
North Dakota Retirement and Investment Office Management’s Discussion and Analysis
June 30, 2018 and 2017
7
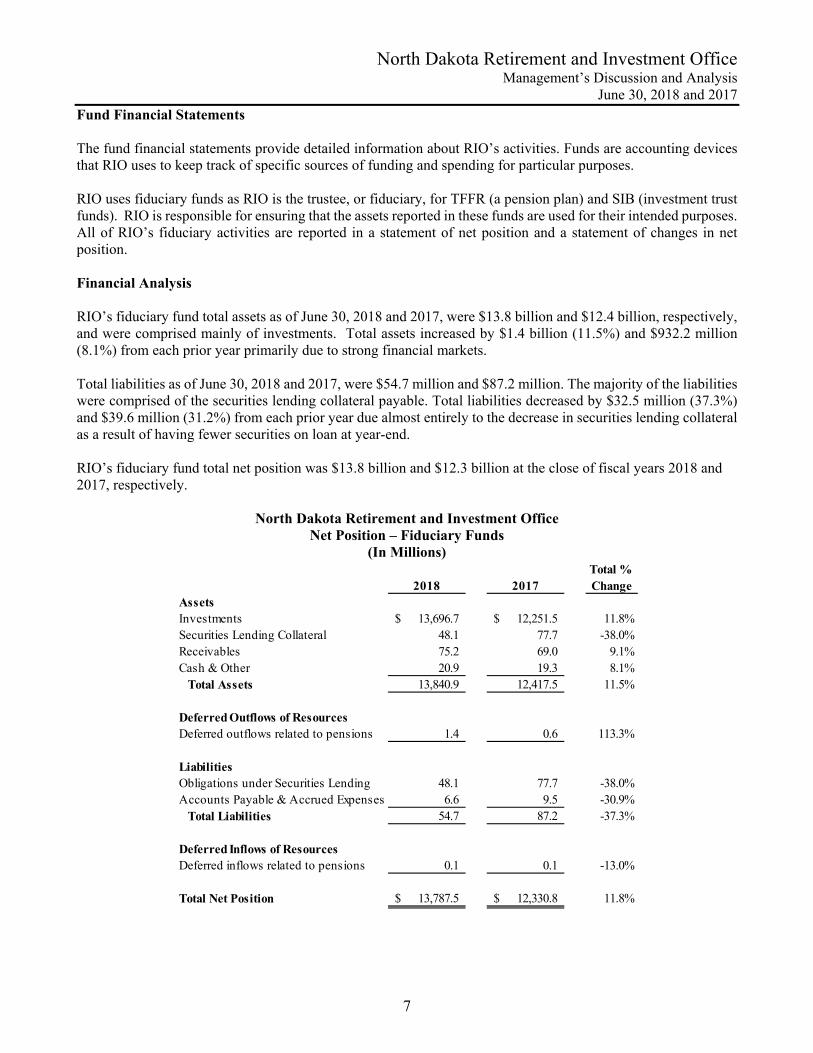
Fund Financial Statements The fund financial statements provide detailed information about RIO’s activities. Funds are accounting devices that RIO uses to keep track of specific sources of funding and spending for particular purposes. RIO uses fiduciary funds as RIO is the trustee, or fiduciary, for TFFR (a pension plan) and SIB (investment trust funds). RIO is responsible for ensuring that the assets reported in these funds are used for their intended purposes. All of RIO’s fiduciary activities are reported in a statement of net position and a statement of changes in net position. Financial Analysis RIO’s fiduciary fund total assets as of June 30, 2018 and 2017, were $13.8 billion and $12.4 billion, respectively, and were comprised mainly of investments. Total assets increased by $1.4 billion (11.5%) and $932.2 million (8.1%) from each prior year primarily due to strong financial markets. Total liabilities as of June 30, 2018 and 2017, were $54.7 million and $87.2 million. The majority of the liabilities were comprised of the securities lending collateral payable. Total liabilities decreased by $32.5 million (37.3%) and $39.6 million (31.2%) from each prior year due almost entirely to the decrease in securities lending collateral as a result of having fewer securities on loan at year-end. RIO’s fiduciary fund total net position was $13.8 billion and $12.3 billion at the close of fiscal years 2018 and 2017, respectively.
North Dakota Retirement and Investment Office Net Position – Fiduciary Funds
(In Millions)
2018 2017Total % Change
AssetsInvestments 13,696.7$ 12,251.5$ 11.8%Securities Lending Collateral 48.1 77.7 -38.0%Receivables 75.2 69.0 9.1%Cash & Other 20.9 19.3 8.1% Total Assets 13,840.9 12,417.5 11.5%
Deferred Outflows of ResourcesDeferred outflows related to pensions 1.4 0.6 113.3%
LiabilitiesObligations under Securities Lending 48.1 77.7 -38.0%Accounts Payable & Accrued Expenses 6.6 9.5 -30.9% Total Liabilities 54.7 87.2 -37.3%
Deferred Inflows of ResourcesDeferred inflows related to pensions 0.1 0.1 -13.0%
Total Net Position 13,787.5$ 12,330.8$ 11.8%
North Dakota Retirement and Investment Office Management’s Discussion and Analysis
June 30, 2018 and 2017
8
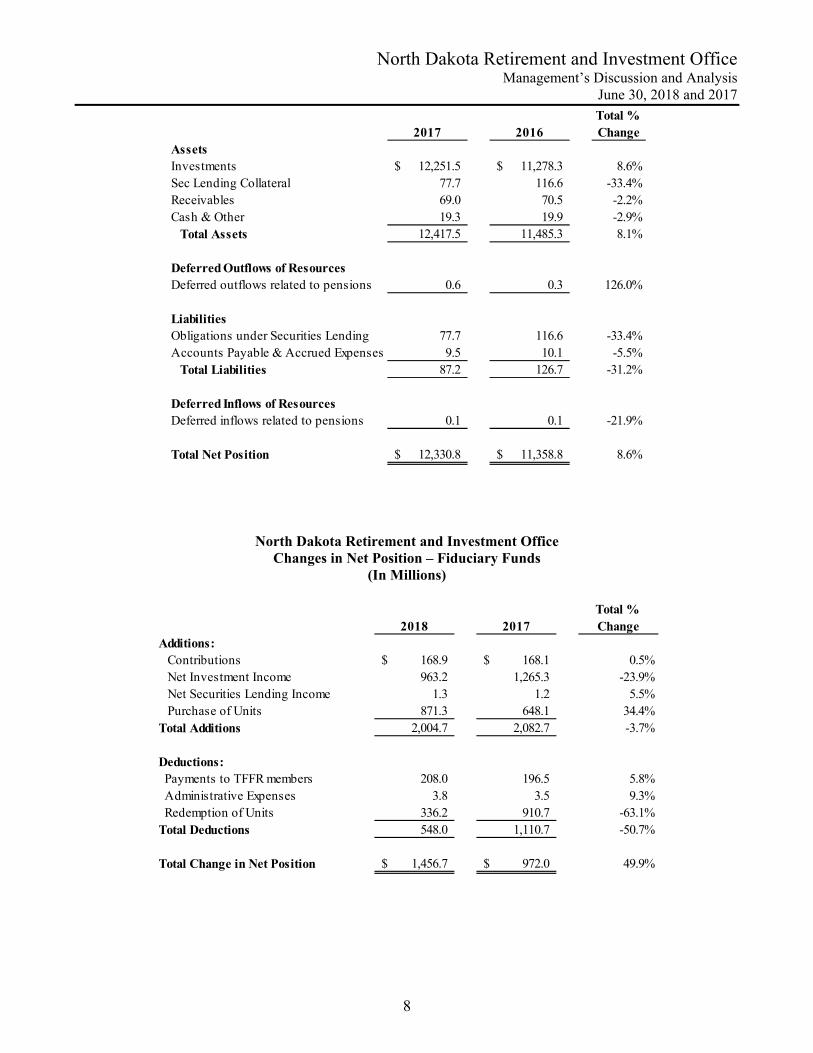
2017 2016Total % Change
AssetsInvestments 12,251.5$ 11,278.3$ 8.6%Sec Lending Collateral 77.7 116.6 -33.4%Receivables 69.0 70.5 -2.2%Cash & Other 19.3 19.9 -2.9% Total Assets 12,417.5 11,485.3 8.1%
Deferred Outflows of ResourcesDeferred outflows related to pensions 0.6 0.3 126.0%
LiabilitiesObligations under Securities Lending 77.7 116.6 -33.4%Accounts Payable & Accrued Expenses 9.5 10.1 -5.5% Total Liabilities 87.2 126.7 -31.2%
Deferred Inflows of ResourcesDeferred inflows related to pensions 0.1 0.1 -21.9%
Total Net Position 12,330.8$ 11,358.8$ 8.6%
North Dakota Retirement and Investment Office Changes in Net Position – Fiduciary Funds
(In Millions)
2018 2017Total % Change
Additions: Contributions 168.9$ 168.1$ 0.5% Net Investment Income 963.2 1,265.3 -23.9% Net Securities Lending Income 1.3 1.2 5.5% Purchase of Units 871.3 648.1 34.4%Total Additions 2,004.7 2,082.7 -3.7%
Deductions: Payments to TFFR members 208.0 196.5 5.8% Administrative Expenses 3.8 3.5 9.3% Redemption of Units 336.2 910.7 -63.1%Total Deductions 548.0 1,110.7 -50.7%
Total Change in Net Position 1,456.7$ 972.0$ 49.9%
North Dakota Retirement and Investment Office Management’s Discussion and Analysis
June 30, 2018 and 2017
9
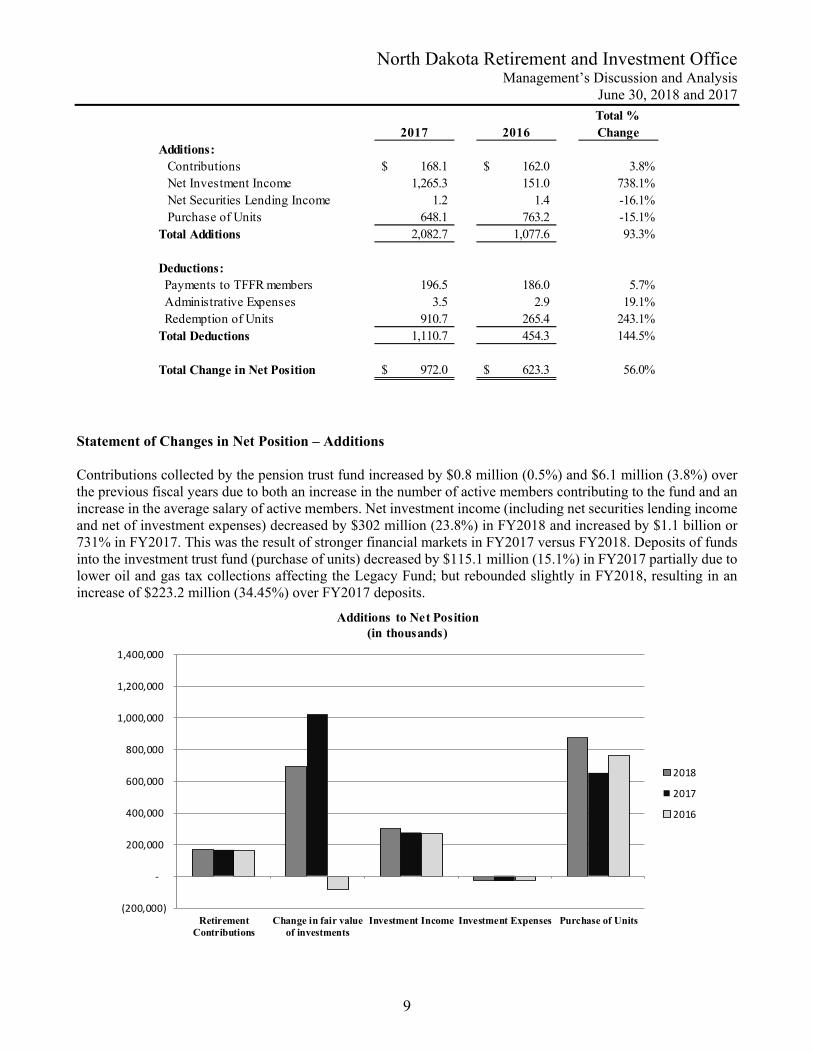
2017 2016Total % Change
Additions: Contributions 168.1$ 162.0$ 3.8% Net Investment Income 1,265.3 151.0 738.1% Net Securities Lending Income 1.2 1.4 -16.1% Purchase of Units 648.1 763.2 -15.1%Total Additions 2,082.7 1,077.6 93.3%
Deductions: Payments to TFFR members 196.5 186.0 5.7% Administrative Expenses 3.5 2.9 19.1% Redemption of Units 910.7 265.4 243.1%Total Deductions 1,110.7 454.3 144.5%
Total Change in Net Position 972.0$ 623.3$ 56.0%
Statement of Changes in Net Position – Additions Contributions collected by the pension trust fund increased by $0.8 million (0.5%) and $6.1 million (3.8%) over the previous fiscal years due to both an increase in the number of active members contributing to the fund and an increase in the average salary of active members. Net investment income (including net securities lending income and net of investment expenses) decreased by $302 million (23.8%) in FY2018 and increased by $1.1 billion or 731% in FY2017. This was the result of stronger financial markets in FY2017 versus FY2018. Deposits of funds into the investment trust fund (purchase of units) decreased by $115.1 million (15.1%) in FY2017 partially due to lower oil and gas tax collections affecting the Legacy Fund; but rebounded slightly in FY2018, resulting in an increase of $223.2 million (34.45%) over FY2017 deposits.
(200,000)
‐
200,000
400,000
600,000
800,000
1,000,000
1,200,000
1,400,000
RetirementContributions
Change in fair valueof investments
Investment Income Investment Expenses Purchase of Units
Additions to Net Position(in thousands)
2018
2017
2016
North Dakota Retirement and Investment Office Management’s Discussion and Analysis
June 30, 2018 and 2017
10
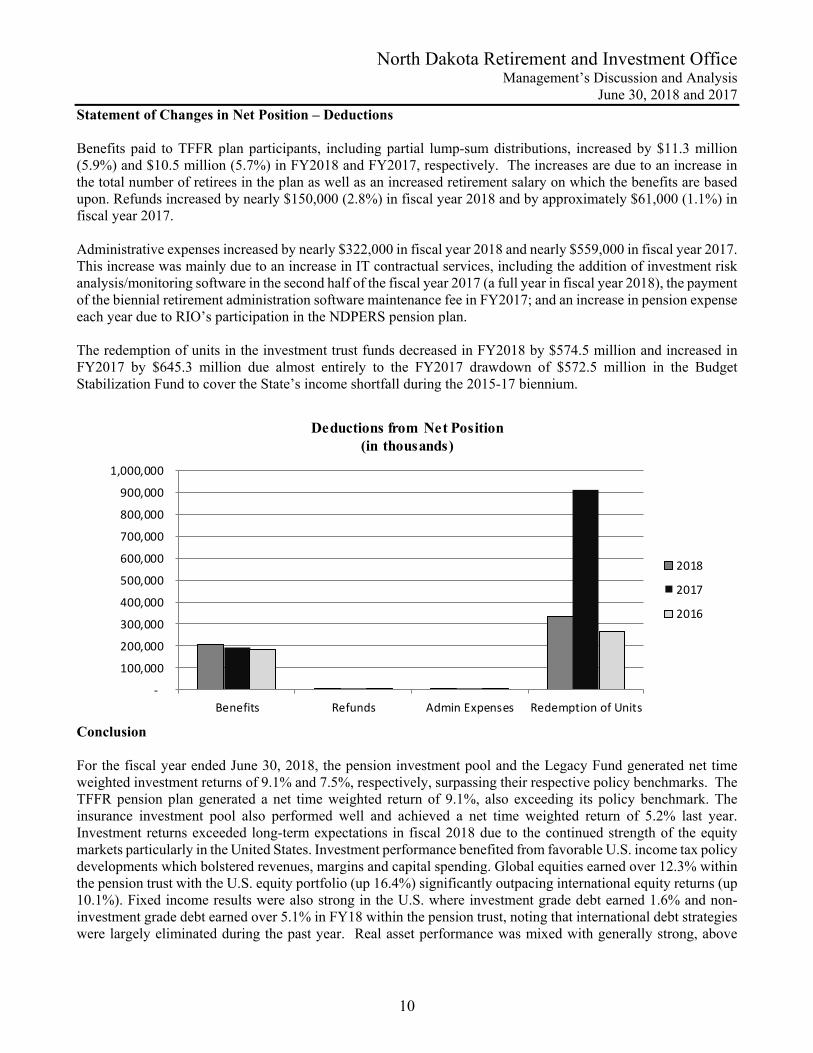
Statement of Changes in Net Position – Deductions Benefits paid to TFFR plan participants, including partial lump-sum distributions, increased by $11.3 million (5.9%) and $10.5 million (5.7%) in FY2018 and FY2017, respectively. The increases are due to an increase in the total number of retirees in the plan as well as an increased retirement salary on which the benefits are based upon. Refunds increased by nearly $150,000 (2.8%) in fiscal year 2018 and by approximately $61,000 (1.1%) in fiscal year 2017. Administrative expenses increased by nearly $322,000 in fiscal year 2018 and nearly $559,000 in fiscal year 2017. This increase was mainly due to an increase in IT contractual services, including the addition of investment risk analysis/monitoring software in the second half of the fiscal year 2017 (a full year in fiscal year 2018), the payment of the biennial retirement administration software maintenance fee in FY2017; and an increase in pension expense each year due to RIO’s participation in the NDPERS pension plan. The redemption of units in the investment trust funds decreased in FY2018 by $574.5 million and increased in FY2017 by $645.3 million due almost entirely to the FY2017 drawdown of $572.5 million in the Budget Stabilization Fund to cover the State’s income shortfall during the 2015-17 biennium.
‐
100,000
200,000
300,000
400,000
500,000
600,000
700,000
800,000
900,000
1,000,000
Benefits Refunds Admin Expenses Redemption of Units
Deductions from Net Position(in thousands)
2018
2017
2016
Conclusion For the fiscal year ended June 30, 2018, the pension investment pool and the Legacy Fund generated net time weighted investment returns of 9.1% and 7.5%, respectively, surpassing their respective policy benchmarks. The TFFR pension plan generated a net time weighted return of 9.1%, also exceeding its policy benchmark. The insurance investment pool also performed well and achieved a net time weighted return of 5.2% last year. Investment returns exceeded long-term expectations in fiscal 2018 due to the continued strength of the equity markets particularly in the United States. Investment performance benefited from favorable U.S. income tax policy developments which bolstered revenues, margins and capital spending. Global equities earned over 12.3% within the pension trust with the U.S. equity portfolio (up 16.4%) significantly outpacing international equity returns (up 10.1%). Fixed income results were also strong in the U.S. where investment grade debt earned 1.6% and non-investment grade debt earned over 5.1% in FY18 within the pension trust, noting that international debt strategies were largely eliminated during the past year. Real asset performance was mixed with generally strong, above
North Dakota Retirement and Investment Office Management’s Discussion and Analysis
June 30, 2018 and 2017
11
benchmark returns posted in real estate and infrastructure (both up over 7%), while our timber portfolio lost 2.5% within the pension trust last year. Private equity returns were also disappointing within the pension trust earning slightly over 5.25% the 1-year ended June 30, 2018. For the fiscal year ended June 30, 2017, the pension investment pool and the Legacy Fund generated net time weighted investment returns of 12.9% and 12.0%, respectively, surpassing their respective policy benchmarks. The TFFR pension plan generated a net time weighted return of 12.9%, also exceeding its policy benchmark. The insurance investment pool also performed well and achieved a net time weighted return of 7.8% last year. Investment returns exceeded long-term expectations in fiscal 2017 due to the surprising strength and resilience of the global financial markets. Investment performance benefitted from relatively low volatility throughout most of last year despite increasing concerns over geopolitical risk in the U.S. and abroad. Global equities earned 19% overall with the pension international equity portfolio (up 21%) outperforming U.S. equity (up 17%). The story was reversed within fixed income, where U.S. centric debt strategies returned over 6% while international debt earned less than 1%. Real asset performance was mixed with strong, above benchmark returns posted in real estate and infrastructure (both up 9%), while our timber portfolio lost 9% in the last year. Private equity returned 11% for the 1-year ended June 30, 2017. While cumulative returns in the post-credit crisis era have been strong, investors today face numerous challenges in the future that may limit the potential for high market returns and amplify investment risk. First, one could argue that many asset classes and strategies no longer offer compelling valuations for investors. Second, the ever-growing debt burden from unprecedented monetary policy and muted economic growth in a range of economies makes it less and less likely that authorities will be in a position to provide a cushion in a downturn when it occurs. Finally, the specter of the Federal Reserve continuing to raise short-term interest rates in the near future poses a challenge to certain asset classes and strategies to varying degrees. To meet this challenge, the State Investment Board will continue to research strategies and investment options that mitigate and diversify the sources of risk accepted to address funding issues in the challenging years ahead. TFFR’s funding objective is to meet long-term pension benefit obligations through contributions and investment income. To address TFFR’s funding shortfall, the ND State Legislature took action in 2011 and approved legislation to increase contributions (4% member and 4% employer) and modify certain benefits for non-grandfathered members. Increased contribution rates will be in effect until TFFR reaches 100% funding on an actuarial basis. This comprehensive funding recovery plan, along with solid investment performance in the future, is expected to improve TFFR’s funding level over the long term. TFFR’s funding level increased from 63.7% to 65.4% on an actuarial basis (and from 63.2% to 65.5% on a market basis) from July 1, 2017 to July 1, 2018. Investment performance for FY2017 and FY2018, and for the previous five years, has been greater than expected, resulting in improvement in TFFR’s funding status in 2017 and 2018. Over the long term, the plan’s funding level is projected to gradually improve with full funding expected in approximately 30 years, if all actuarial assumptions are met in the future, including the 7.75% investment return assumption. Protecting the long term solvency of the pension plan is the TFFR Board’s fiduciary responsibility. The Board will continue to proactively address TFFR funding issues so the plan will be financially strong and sustainable for past, present, and future ND educators. Contacting RIO Financial Management This financial report is designed to provide our Boards, our membership, our clients and the general public with a general overview of RIO’s finances and to demonstrate RIO’s accountability for the money we receive. If you have any questions about this report or need additional information, contact the North Dakota Retirement and Investment Office, PO Box 7100, Bismarck, ND 58507-7100.
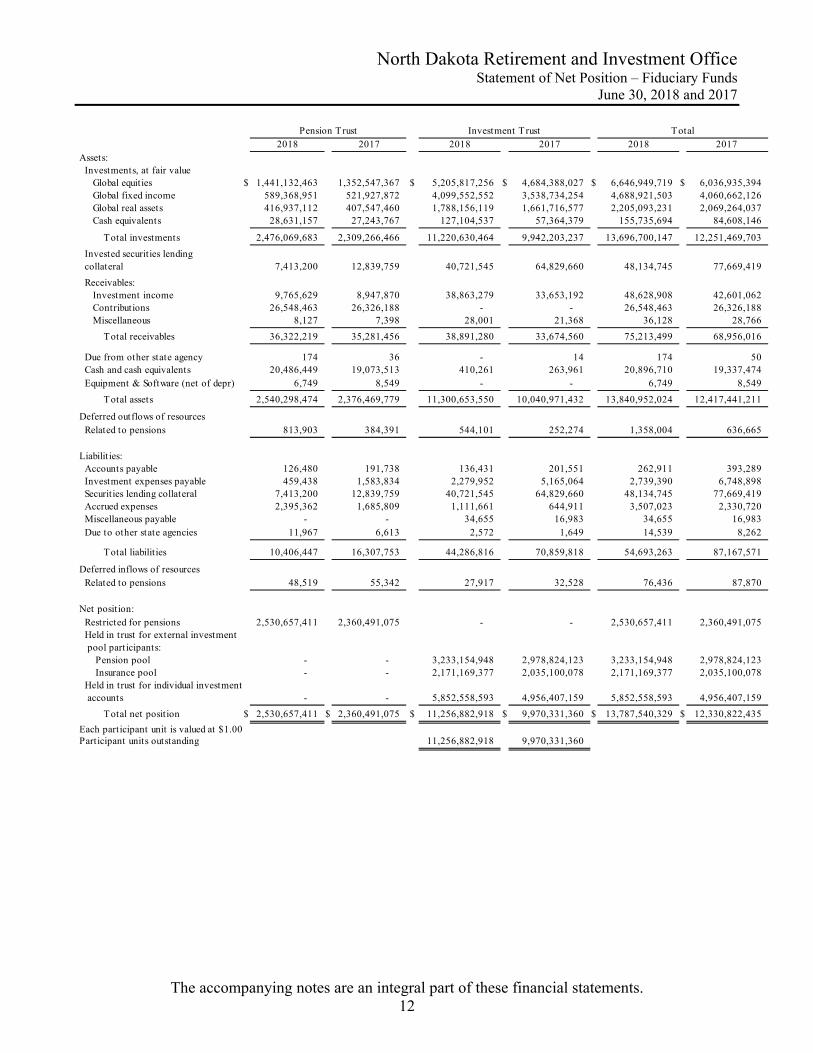
North Dakota Retirement and Investment Office Statement of Net Position – Fiduciary Funds
June 30, 2018 and 2017
The accompanying notes are an integral part of these financial statements. 12
2018 2017 2018 2017 2018 2017Assets: Investments, at fair value Global equities $ 1,441,132,463 1,352,547,367 $ 5,205,817,256 $ 4,684,388,027 $ 6,646,949,719 $ 6,036,935,394 Global fixed income 589,368,951 521,927,872 4,099,552,552 3,538,734,254 4,688,921,503 4,060,662,126 Global real assets 416,937,112 407,547,460 1,788,156,119 1,661,716,577 2,205,093,231 2,069,264,037 Cash equivalents 28,631,157 27,243,767 127,104,537 57,364,379 155,735,694 84,608,146
Total investments 2,476,069,683 2,309,266,466 11,220,630,464 9,942,203,237 13,696,700,147 12,251,469,703
Invested securities lending collateral 7,413,200 12,839,759 40,721,545 64,829,660 48,134,745 77,669,419
Receivables: Investment income 9,765,629 8,947,870 38,863,279 33,653,192 48,628,908 42,601,062 Contributions 26,548,463 26,326,188 - - 26,548,463 26,326,188 Miscellaneous 8,127 7,398 28,001 21,368 36,128 28,766
Total receivables 36,322,219 35,281,456 38,891,280 33,674,560 75,213,499 68,956,016
Due from other state agency 174 36 - 14 174 50 Cash and cash equivalents 20,486,449 19,073,513 410,261 263,961 20,896,710 19,337,474 Equipment & Software (net of depr) 6,749 8,549 - - 6,749 8,549
Total assets 2,540,298,474 2,376,469,779 11,300,653,550 10,040,971,432 13,840,952,024 12,417,441,211
Deferred outflows of resources Related to pensions 813,903 384,391 544,101 252,274 1,358,004 636,665
Liabilit ies: Accounts payable 126,480 191,738 136,431 201,551 262,911 393,289 Investment expenses payable 459,438 1,583,834 2,279,952 5,165,064 2,739,390 6,748,898 Securities lending collateral 7,413,200 12,839,759 40,721,545 64,829,660 48,134,745 77,669,419 Accrued expenses 2,395,362 1,685,809 1,111,661 644,911 3,507,023 2,330,720 Miscellaneous payable - - 34,655 16,983 34,655 16,983 Due to other state agencies 11,967 6,613 2,572 1,649 14,539 8,262
Total liabilit ies 10,406,447 16,307,753 44,286,816 70,859,818 54,693,263 87,167,571
Deferred inflows of resources Related to pensions 48,519 55,342 27,917 32,528 76,436 87,870
Net position: Restricted for pensions 2,530,657,411 2,360,491,075 - - 2,530,657,411 2,360,491,075 Held in trust for external investment pool participants: Pension pool - - 3,233,154,948 2,978,824,123 3,233,154,948 2,978,824,123 Insurance pool - - 2,171,169,377 2,035,100,078 2,171,169,377 2,035,100,078 Held in trust for individual investment accounts - - 5,852,558,593 4,956,407,159 5,852,558,593 4,956,407,159
Total net position $ 2,530,657,411 $ 2,360,491,075 $ 11,256,882,918 $ 9,970,331,360 $ 13,787,540,329 $ 12,330,822,435
Each participant unit is valued at $1.00Participant units outstanding 11,256,882,918 9,970,331,360
Pension Trust Investment Trust Total
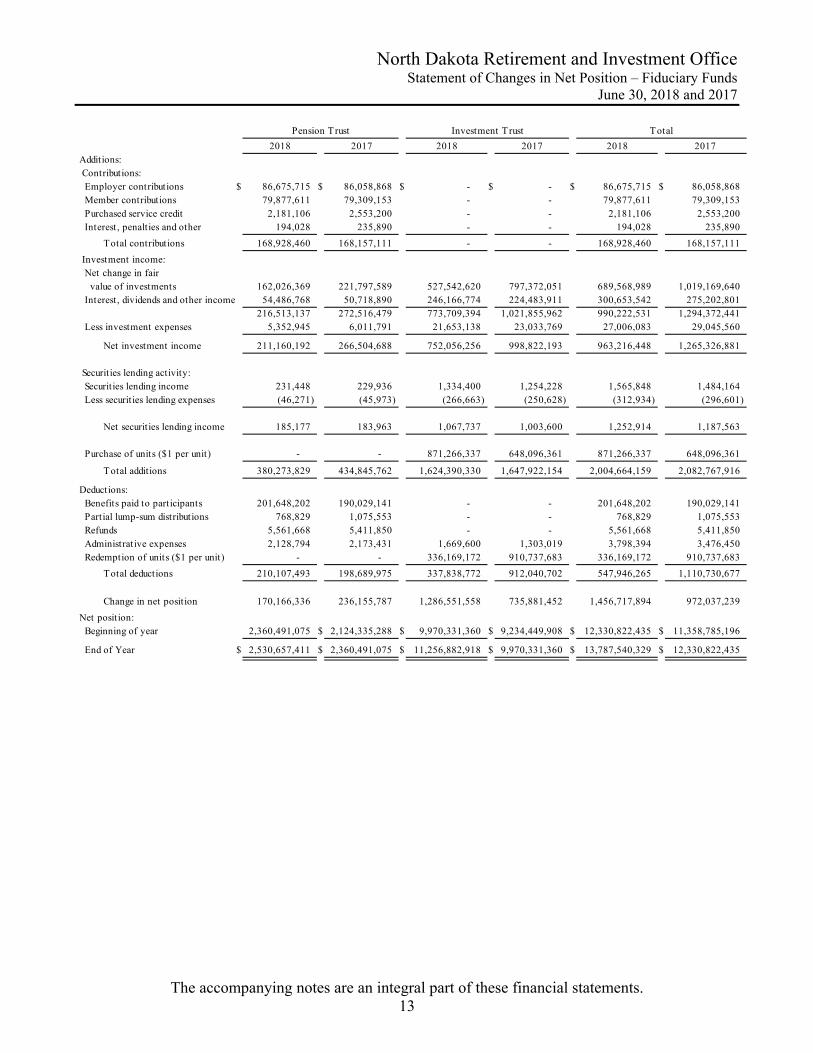
North Dakota Retirement and Investment Office Statement of Changes in Net Position – Fiduciary Funds
June 30, 2018 and 2017
The accompanying notes are an integral part of these financial statements. 13
2018 2017 2018 2017 2018 2017Additions: Contributions: Employer contributions $ 86,675,715 $ 86,058,868 $ - $ - $ 86,675,715 $ 86,058,868 Member contributions 79,877,611 79,309,153 - - 79,877,611 79,309,153 Purchased service credit 2,181,106 2,553,200 - - 2,181,106 2,553,200 Interest, penalties and other 194,028 235,890 - - 194,028 235,890
Total contributions 168,928,460 168,157,111 - - 168,928,460 168,157,111
Investment income: Net change in fair value of investments 162,026,369 221,797,589 527,542,620 797,372,051 689,568,989 1,019,169,640 Interest, dividends and other income 54,486,768 50,718,890 246,166,774 224,483,911 300,653,542 275,202,801
216,513,137 272,516,479 773,709,394 1,021,855,962 990,222,531 1,294,372,441 Less investment expenses 5,352,945 6,011,791 21,653,138 23,033,769 27,006,083 29,045,560
Net investment income 211,160,192 266,504,688 752,056,256 998,822,193 963,216,448 1,265,326,881
Securities lending activity: Securities lending income 231,448 229,936 1,334,400 1,254,228 1,565,848 1,484,164 Less securities lending expenses (46,271) (45,973) (266,663) (250,628) (312,934) (296,601)
Net securities lending income 185,177 183,963 1,067,737 1,003,600 1,252,914 1,187,563
Purchase of units ($1 per unit) - - 871,266,337 648,096,361 871,266,337 648,096,361
Total additions 380,273,829 434,845,762 1,624,390,330 1,647,922,154 2,004,664,159 2,082,767,916
Deductions: Benefits paid to participants 201,648,202 190,029,141 - - 201,648,202 190,029,141 Partial lump-sum distributions 768,829 1,075,553 - - 768,829 1,075,553 Refunds 5,561,668 5,411,850 - - 5,561,668 5,411,850 Administrative expenses 2,128,794 2,173,431 1,669,600 1,303,019 3,798,394 3,476,450 Redemption of units ($1 per unit) - - 336,169,172 910,737,683 336,169,172 910,737,683
Total deductions 210,107,493 198,689,975 337,838,772 912,040,702 547,946,265 1,110,730,677
Change in net position 170,166,336 236,155,787 1,286,551,558 735,881,452 1,456,717,894 972,037,239
Net position: Beginning of year 2,360,491,075 $ 2,124,335,288 $ 9,970,331,360 $ 9,234,449,908 $ 12,330,822,435 $ 11,358,785,196
End of Year $ 2,530,657,411 $ 2,360,491,075 $ 11,256,882,918 $ 9,970,331,360 $ 13,787,540,329 $ 12,330,822,435
Pension Trust Investment Trust Total
North Dakota Retirement and Investment Office Notes to Combined Financial Statements
June 30, 2018 and 2017
14
Note 1 - Summary of Significant Accounting Policies RIO is an agency of the State of North Dakota operating through the legislative authority of North Dakota Century Code (NDCC) Chapter 54-52.5 and is considered part of the State of North Dakota financial reporting entity and included in the State of North Dakota’s Comprehensive Annual Financial Report. For financial reporting purposes, RIO has included all funds, and has considered all potential component units for which RIO is financially accountable, and other organizations for which the nature and significance of their relationship with RIO are such that exclusion would cause RIO’s financial statements to be misleading or incomplete. The Governmental Accounting Standards Board has set forth criteria to be considered in determining financial accountability. These criteria include appointing a voting majority of an organization’s governing body and (1) the ability of RIO to impose its will on that organization or (2) the potential for the organization to provide specific financial benefits to, or impose specific financial burdens on RIO. Based upon these criteria, there are no component units to be included within RIO as a reporting entity and RIO is part of the State of North Dakota as a reporting entity. Fund Financial Statement All activities of RIO are accounted for within the pension and investment trust funds and are shown, by fund, in the fiduciary fund financial statements. Measurement Focus, Basis of Accounting and Financial Statement Presentation The financial statements of RIO are reported using the economic resources measurement focus and the accrual basis of accounting. This measurement focus includes all assets and liabilities associated with the operations of the fiduciary funds on the statements of net position. Revenues are recorded when earned and expenses are recorded when a liability is incurred, regardless of the timing of related cash flows. New Accounting Standards In fiscal year 2018, RIO implemented GASB Statement No. 75, Accounting and Financial Reporting for Postemployment Benefits Other Than Pensions, (“GASB 75”). The primary objective of this statement is to improve accounting and financial reporting by state and local governments for postemployment benefits other than pensions (other postemployment benefits or OPEB). Due to the immateriality of the amounts in relation to the previous year’s financial statements, no prior period adjustments were made to fiscal year 2017 balances; rather, all financial transactions necessary to establish the liability and deferral balances were recorded in fiscal year 2018 only. Fiduciary Fund A pension trust fund and investment trust funds have been established to account for the assets held by RIO in a trustee capacity for TFFR and as an agent for other governmental units or funds which have placed certain investment assets under the management of SIB. The SIB manages two external investment pools and four individual investment accounts. The two external investment pools consist of a pension pool and insurance pool. SIB manages the investments of the North Dakota Public Employees Retirement System, Bismarck City Employees and Police, City of Grand Forks Employees and City of Grand Forks Park District Employees pension plans in the pension pool. The investments of Workforce Safety & Insurance, State Fire and Tornado, State
North Dakota Retirement and Investment Office Notes to Combined Financial Statements
June 30, 2018 and 2017
15
Bonding, Petroleum Tank Release Compensation Fund, Insurance Regulatory Trust, North Dakota Association of Counties Fund, Risk Management, Risk Management Workers Comp, PERS Group Insurance, City of Bismarck Deferred Sick Leave, City of Fargo FargoDome Permanent Fund, Cultural Endowment Fund, ND State Board of Medicine, Lewis and Clark Interpretive Center Endowment Fund and Budget Stabilization Fund are managed in the insurance pool. The Legacy Fund, Job Service of North Dakota, Tobacco Prevention and Control Fund, and PERS Retiree Health investments are managed by SIB in individual investment accounts; except for a small portion of the Legacy Fund fixed income assets that will remain pooled until they are liquidated at a future date and their cash allocation that will remain pooled for operational efficiency. RIO has no statutory authority over, nor responsibility for, these investment trust funds other than the investment responsibility provided for by statute or through contracts with the individual agencies. The funds that are required to participate according to statute are: Public Employees Retirement System, Workforce Safety & Insurance, State Fire and Tornado, State Bonding, Petroleum Tank Release Compensation Fund, Insurance Regulatory Trust, Risk Management, Risk Management Workers Comp, Cultural Endowment Fund, Legacy Fund and Budget Stabilization Fund. RIO follows the pronouncements of the Governmental Accounting Standards Board (GASB), which is the nationally accepted standard setting body for establishing accounting principles generally accepted in the United States of America for governmental entities. Pension and Investment Trust Funds are accounted for using the accrual basis of accounting. Member contributions are recognized in the period in which they are due. Employer contributions are recognized when due and the employer has made a formal commitment to provide the contributions. Benefits and refunds are recognized when due and payable in accordance with the NDCC. Use of Estimates The preparation of financial statements in conformity with accounting principles generally accepted in the United States of America requires management to make estimates and assumptions that affect the reported amounts of assets and liabilities and disclosure of contingent assets and liabilities at the date of the financial statements and the reported amounts of revenues and expenses during the reporting period. Actual results could differ from those estimates. RIO utilizes various investment instruments. Investment securities, in general, are exposed to various risks, such as interest rate, credit, and overall market volatility. Due to the level of risk associated with certain investment securities, it is reasonably possible that changes in the values of investment securities will occur in the near term and that such change could materially affect the amounts reported in the statements of net position. Budgetary Process RIO operates through a biennial appropriation, which represents appropriations recommended by the Governor and presented to the General Assembly (the Assembly) at the beginning of each legislative session. The Assembly enacts RIO’s budget through passage of a specific appropriation bill. The State of North Dakota’s budget is prepared principally on a modified accrual basis. The Governor has line item veto power over all legislation, subject to legislative override. Once passed and signed, the appropriation bill becomes RIO’s financial plan for the next two years. Changes to the appropriation are limited to Emergency Commission authorization, initiative, or referendum action. The Emergency Commission can authorize receipt of federal or other moneys not appropriated by the Assembly if the Assembly did not indicate intent to reject the money. The Emergency Commission may authorize pass-through federal funds from one state agency to another. The Emergency Commission may authorize the transfer of
North Dakota Retirement and Investment Office Notes to Combined Financial Statements
June 30, 2018 and 2017
16
expenditure authority between appropriated line items, however RIO has specific authority as a special fund to transfer between the contingency line item and other line items. Unexpended appropriations lapse at the end of each biennium, except certain capital expenditures covered under the NDCC section 54-44.1-11. RIO does not use encumbrance accounting. The legal level of budgetary control is at the agency, appropriation and expenditure line item level. RIO does not formally budget revenues and it does not budget by fund. The statement of revenues, expenditures and changes in fund balances - budget and actual is not prepared because revenues are not budgeted. Capital Assets and Depreciation Capital asset expenditures greater than $5,000 are capitalized at cost in accordance with Section 54-27-21 of the NDCC. Depreciation is computed using the straight-line method over the estimated useful lives of the assets. The estimated useful lives are as follows: Years Office equipment 5 Furniture and fixtures 5 Investments NDCC Section 21-10-07 states that the SIB shall apply the prudent investor rule when investing funds under its supervision. The prudent investor rule means that in making investments, the fiduciaries shall exercise the judgment and care, under the circumstances then prevailing, that an institutional investor of ordinary prudence, discretion and intelligence exercises in the management of large investments entrusted to it, not in regard to speculation, but in regard to the permanent disposition of funds, considering probable safety of capital as well as probable income. The pension fund belonging to TFFR and investment trust funds attributable to the City of Bismarck Employee Pension Plan, the City of Bismarck Police Pension Plan, Job Service of North Dakota, City of Grand Forks Employee Pension Plan, City of Grand Forks Park District Pension Plan and the Public Employees Retirement System (PERS) must be invested exclusively for the benefit of their members. All investments are made in accordance with the respective fund’s long-term investment objectives and performance goals. Pooled Investments Most funds whose investments are under the supervision of the SIB participate in pooled investments. The agencies transfer money into the investment pools and receive an appropriate percentage ownership of the pooled portfolio based upon fair value. All activities of the investment pools are allocated to the agencies based upon their respective ownership percentages. Each participant unit is valued at $1.00 per unit.
North Dakota Retirement and Investment Office Notes to Combined Financial Statements
June 30, 2018 and 2017
17
Investment Valuation and Income Recognition Investments are reported at fair value. Quoted market prices, when available, have been used to value investments. The fair values for securities that have no quoted market price represent estimated fair value. International securities are valued based upon quoted foreign market prices and translated into U.S. dollars at the exchange rate in effect at June 30. In general, corporate debt securities have been valued at quoted market prices or, if not available, values are based on yields currently available on comparable securities of issuers with similar credit ratings. Mortgages have been valued on the basis of their future principal and interest payments discounted at prevailing interest rates for similar instruments. The fair value of real estate investments, including timberland, is based on appraisals plus fiscal year-to-date capital transactions. Publicly traded alternative investments are valued based on quoted market prices. When not readily available, alternative investment securities are valued using current estimates of fair value from the investment manager. Such valuations consider variables such as financial performance of the issuer, comparison of comparable companies’ earnings multiples, cash flow analysis, recent sales prices of investments, withdrawal restrictions, and other pertinent information. Because of the inherent uncertainty of the valuation for these other alternative investments, the estimated fair value may differ from the values that would have been used had a ready market existed. The net change in fair value of investments consists of the realized gains or losses and the unrealized increase or decrease in fair value of investments during the year. Realized gains and losses on sales of investments are computed based on the difference between the sales price and the original cost of the investment sold. Realized gains and losses on investments that had been held in more than one fiscal year and sold in the current fiscal year were included as a change in the fair value of investments reported in the prior year(s) and the current year. Unrealized gains and losses are computed based on changes in the fair value of investments between years. Security transactions are accounted for on a trade date basis. Interest income is recognized when earned. Dividend income is recorded on the ex-dividend date. Pensions and Other Postemployment Benefits (OPEB) For purposes of measuring the net pension and OPEB liabilities, deferred outflows of resources and deferred inflows of resources related to pensions and OPEB, and pension and OPEB expenses, information about the fiduciary net position of the ND Public Employees Retirement System (NDPERS) defined benefit pension and OPEB plans, and additions to/deductions from NDPERS' fiduciary net position have been determined on the same basis as they are reported by NDPERS. For this purpose, benefit payments (including refunds of employee contributions) are recognized when due and payable in accordance with the benefit terms. Investments are reported at fair value. Note 2 - Cash and Cash Equivalents Custodial Credit Risk State law generally requires that all state funds be deposited in the Bank of North Dakota. NDCC 21-04-01 provides that public funds belonging to or in the custody of the state shall be deposited in the Bank of North Dakota. Also, NDCC 6-09-07 states, “[a]ll state funds … must be deposited in the Bank of North Dakota” or must be deposited in accordance with constitutional and statutory provisions.
North Dakota Retirement and Investment Office Notes to Combined Financial Statements
June 30, 2018 and 2017
18
Pension Trust Fund Deposits held by the Pension Trust Fund at June 30, 2018 were deposited in the Bank of North Dakota. At June 30, 2018 and 2017, the carrying amount of TFFR’s deposits was $20,486,449 and $19,073,513, respectively, and the bank balance was $20,528,537 and $19,081,337, respectively. The difference results from checks outstanding or deposits not yet processed by the bank. These deposits are exposed to custodial credit risk as uninsured and uncollateralized. However, these deposits at the Bank of North Dakota are guaranteed by the State of North Dakota through NDCC Section 6-09-10. Investment Trust Funds Certificates of deposit, an insurance pool cash account and a pension pool cash account are recorded as investments and have a cost and carrying value of $88,601,097 and $92,016,033 at June 30, 2018 and 2017, respectively. In addition, these funds carry cash and cash equivalents totaling $410,261 and $263,961 at June 30, 2018 and 2017, respectively. These deposits are exposed to custodial credit risk as uninsured and uncollateralized. However, these deposits held at the Bank of North Dakota are guaranteed by the State of North Dakota through NDCC Section 6-09-10. Note 3 - Investments The investment policy of the SIB is governed by NDCC 21-10. The SIB shall apply the prudent investor rule in investing for funds under its supervision. The “prudent investor rule” means that in making investments, the fiduciaries shall exercise the judgment and care, under the circumstances then prevailing, that an institutional investor of ordinary prudence, discretion, and intelligence exercises in the management of large investments entrusted to it, not in regard to speculation but in regard to the permanent disposition of funds, considering probable safety of capital as well as probable income. The retirement funds belonging to the teachers’ fund for retirement and the public employees’ retirement system must be invested exclusively for the benefit of their members and in accordance with the respective funds’ investment goals and objectives. Interest Rate Risk Interest rate risk is the risk that changes in interest rates of debt securities will adversely affect the fair value of an investment. The price of a debt security typically moves in the opposite direction of the change in interest rates. The SIB does not have a formal investment policy that limits investment maturities as a means of managing its exposure to potential fair value losses arising from future changes in interest rates. At June 30, 2018 and 2017, the following tables show the investments by investment type and maturity (expressed in thousands).
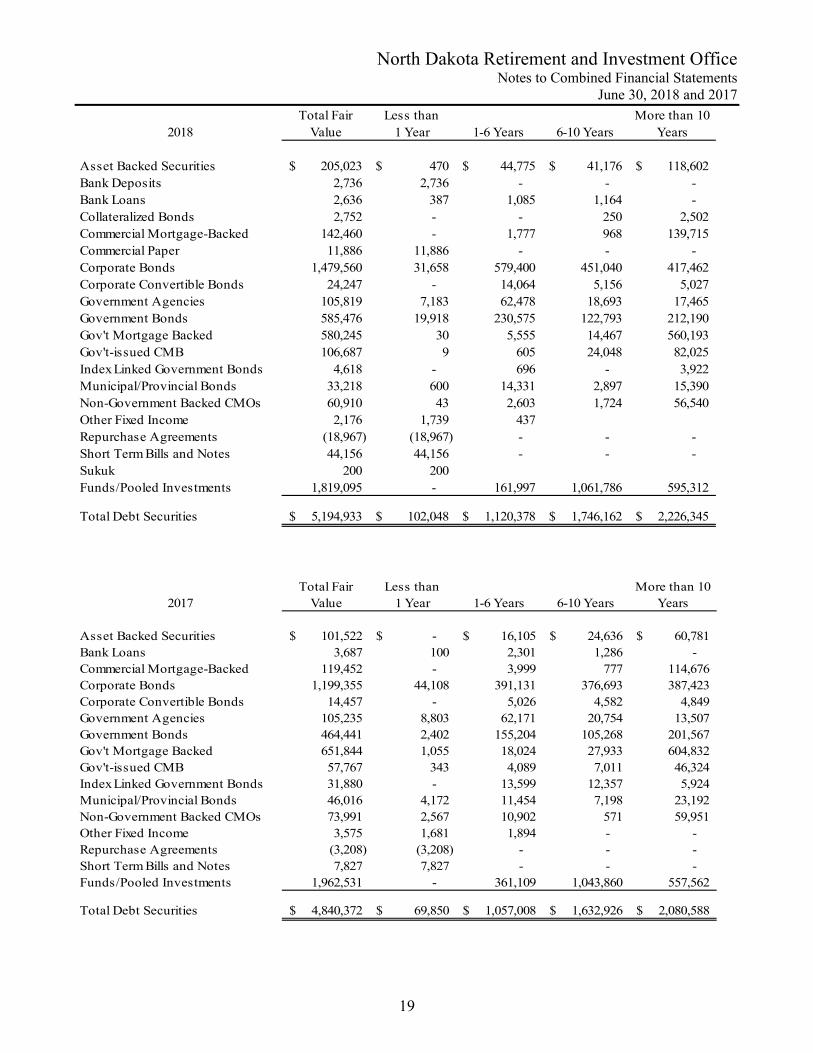
North Dakota Retirement and Investment Office Notes to Combined Financial Statements
June 30, 2018 and 2017
19
2018Total Fair
ValueLess than
1 Year 1-6 Years 6-10 YearsMore than 10
Years
Asset Backed Securities 205,023$ 470$ 44,775$ 41,176$ 118,602$ Bank Deposits 2,736 2,736 - - - Bank Loans 2,636 387 1,085 1,164 - Collateralized Bonds 2,752 - - 250 2,502 Commercial Mortgage-Backed 142,460 - 1,777 968 139,715 Commercial Paper 11,886 11,886 - - - Corporate Bonds 1,479,560 31,658 579,400 451,040 417,462 Corporate Convertible Bonds 24,247 - 14,064 5,156 5,027 Government Agencies 105,819 7,183 62,478 18,693 17,465 Government Bonds 585,476 19,918 230,575 122,793 212,190 Gov't Mortgage Backed 580,245 30 5,555 14,467 560,193 Gov't-issued CMB 106,687 9 605 24,048 82,025 Index Linked Government Bonds 4,618 - 696 - 3,922 Municipal/Provincial Bonds 33,218 600 14,331 2,897 15,390 Non-Government Backed CMOs 60,910 43 2,603 1,724 56,540 Other Fixed Income 2,176 1,739 437 Repurchase Agreements (18,967) (18,967) - - - Short Term Bills and Notes 44,156 44,156 - - - Sukuk 200 200 Funds/Pooled Investments 1,819,095 - 161,997 1,061,786 595,312
Total Debt Securities 5,194,933$ 102,048$ 1,120,378$ 1,746,162$ 2,226,345$
2017Total Fair
ValueLess than
1 Year 1-6 Years 6-10 YearsMore than 10
Years
Asset Backed Securities 101,522$ -$ 16,105$ 24,636$ 60,781$ Bank Loans 3,687 100 2,301 1,286 - Commercial Mortgage-Backed 119,452 - 3,999 777 114,676 Corporate Bonds 1,199,355 44,108 391,131 376,693 387,423 Corporate Convertible Bonds 14,457 - 5,026 4,582 4,849 Government Agencies 105,235 8,803 62,171 20,754 13,507 Government Bonds 464,441 2,402 155,204 105,268 201,567 Gov't Mortgage Backed 651,844 1,055 18,024 27,933 604,832 Gov't-issued CMB 57,767 343 4,089 7,011 46,324 Index Linked Government Bonds 31,880 - 13,599 12,357 5,924 Municipal/Provincial Bonds 46,016 4,172 11,454 7,198 23,192 Non-Government Backed CMOs 73,991 2,567 10,902 571 59,951 Other Fixed Income 3,575 1,681 1,894 - - Repurchase Agreements (3,208) (3,208) - - - Short Term Bills and Notes 7,827 7,827 - - - Funds/Pooled Investments 1,962,531 - 361,109 1,043,860 557,562
Total Debt Securities 4,840,372$ 69,850$ 1,057,008$ 1,632,926$ 2,080,588$
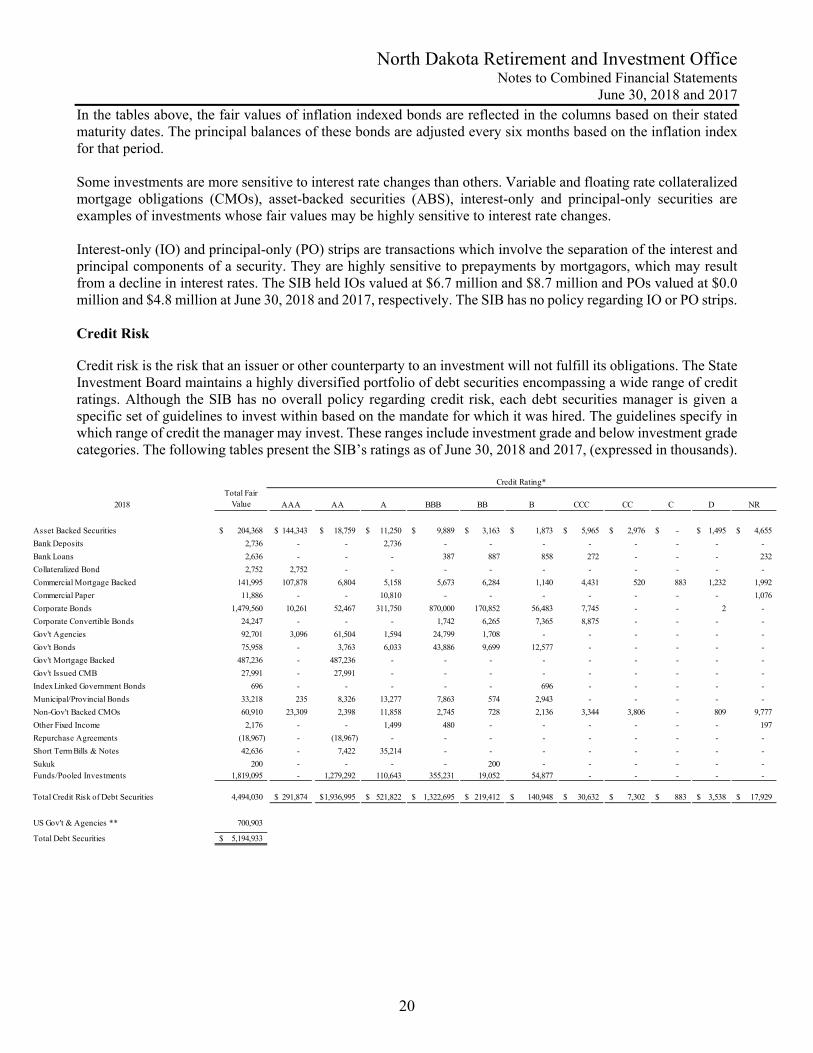
North Dakota Retirement and Investment Office Notes to Combined Financial Statements
June 30, 2018 and 2017
20
In the tables above, the fair values of inflation indexed bonds are reflected in the columns based on their stated maturity dates. The principal balances of these bonds are adjusted every six months based on the inflation index for that period. Some investments are more sensitive to interest rate changes than others. Variable and floating rate collateralized mortgage obligations (CMOs), asset-backed securities (ABS), interest-only and principal-only securities are examples of investments whose fair values may be highly sensitive to interest rate changes. Interest-only (IO) and principal-only (PO) strips are transactions which involve the separation of the interest and principal components of a security. They are highly sensitive to prepayments by mortgagors, which may result from a decline in interest rates. The SIB held IOs valued at $6.7 million and $8.7 million and POs valued at $0.0 million and $4.8 million at June 30, 2018 and 2017, respectively. The SIB has no policy regarding IO or PO strips. Credit Risk Credit risk is the risk that an issuer or other counterparty to an investment will not fulfill its obligations. The State Investment Board maintains a highly diversified portfolio of debt securities encompassing a wide range of credit ratings. Although the SIB has no overall policy regarding credit risk, each debt securities manager is given a specific set of guidelines to invest within based on the mandate for which it was hired. The guidelines specify in which range of credit the manager may invest. These ranges include investment grade and below investment grade categories. The following tables present the SIB’s ratings as of June 30, 2018 and 2017, (expressed in thousands).
2018Total Fair
Value AAA AA A BBB BB B CCC CC C D NR
Asset Backed Securities 204,368$ 144,343$ 18,759$ 11,250$ 9,889$ 3,163$ 1,873$ 5,965$ 2,976$ -$ 1,495$ 4,655$
Bank Deposits 2,736 - - 2,736 - - - - - - - -
Bank Loans 2,636 - - - 387 887 858 272 - - - 232
Collateralized Bond 2,752 2,752 - - - - - - - - - -
Commercial Mortgage Backed 141,995 107,878 6,804 5,158 5,673 6,284 1,140 4,431 520 883 1,232 1,992
Commercial Paper 11,886 - - 10,810 - - - - - - - 1,076
Corporate Bonds 1,479,560 10,261 52,467 311,750 870,000 170,852 56,483 7,745 - - 2 -
Corporate Convertible Bonds 24,247 - - - 1,742 6,265 7,365 8,875 - - - -
Gov't Agencies 92,701 3,096 61,504 1,594 24,799 1,708 - - - - - -
Gov't Bonds 75,958 - 3,763 6,033 43,886 9,699 12,577 - - - - -
Gov't Mortgage Backed 487,236 - 487,236 - - - - - - - - -
Gov't Issued CMB 27,991 - 27,991 - - - - - - - - -
Index Linked Government Bonds 696 - - - - - 696 - - - - -
Municipal/Provincial Bonds 33,218 235 8,326 13,277 7,863 574 2,943 - - - - -
Non-Gov't Backed CMOs 60,910 23,309 2,398 11,858 2,745 728 2,136 3,344 3,806 - 809 9,777
Other Fixed Income 2,176 - - 1,499 480 - - - - - - 197
Repurchase Agreements (18,967) - (18,967) - - - - - - - - -
Short Term Bills & Notes 42,636 - 7,422 35,214 - - - - - - - -
Sukuk 200 - - - - 200 - - - - - - Funds/Pooled Investments 1,819,095 - 1,279,292 110,643 355,231 19,052 54,877 - - - - -
Total Credit Risk of Debt Securities 4,494,030 291,874$ 1,936,995$ 521,822$ 1,322,695$ 219,412$ 140,948$ 30,632$ 7,302$ 883$ 3,538$ 17,929$
US Gov't & Agencies ** 700,903
Total Debt Securities 5,194,933$
Credit Rating*
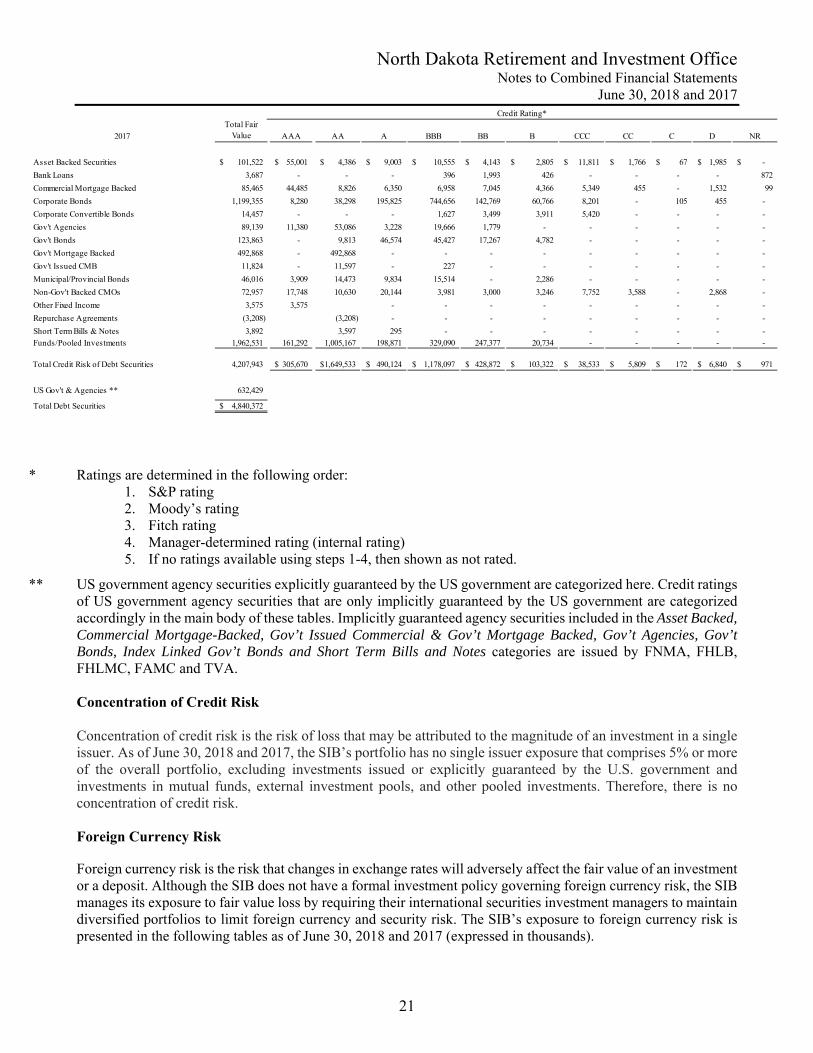
North Dakota Retirement and Investment Office Notes to Combined Financial Statements
June 30, 2018 and 2017
21
2017
Total Fair Value AAA AA A BBB BB B CCC CC C D NR
Asset Backed Securities 101,522$ 55,001$ 4,386$ 9,003$ 10,555$ 4,143$ 2,805$ 11,811$ 1,766$ 67$ 1,985$ -$
Bank Loans 3,687 - - - 396 1,993 426 - - - - 872
Commercial Mortgage Backed 85,465 44,485 8,826 6,350 6,958 7,045 4,366 5,349 455 - 1,532 99
Corporate Bonds 1,199,355 8,280 38,298 195,825 744,656 142,769 60,766 8,201 - 105 455 -
Corporate Convertible Bonds 14,457 - - - 1,627 3,499 3,911 5,420 - - - -
Gov't Agencies 89,139 11,380 53,086 3,228 19,666 1,779 - - - - - -
Gov't Bonds 123,863 - 9,813 46,574 45,427 17,267 4,782 - - - - -
Gov't Mortgage Backed 492,868 - 492,868 - - - - - - - - -
Gov't Issued CMB 11,824 - 11,597 - 227 - - - - - - -
Municipal/Provincial Bonds 46,016 3,909 14,473 9,834 15,514 - 2,286 - - - - -
Non-Gov't Backed CMOs 72,957 17,748 10,630 20,144 3,981 3,000 3,246 7,752 3,588 - 2,868 -
Other Fixed Income 3,575 3,575 - - - - - - - - -
Repurchase Agreements (3,208) (3,208) - - - - - - - - -
Short Term Bills & Notes 3,892 3,597 295 - - - - - - - -
Funds/Pooled Investments 1,962,531 161,292 1,005,167 198,871 329,090 247,377 20,734 - - - - -
Total Credit Risk of Debt Securities 4,207,943 305,670$ 1,649,533$ 490,124$ 1,178,097$ 428,872$ 103,322$ 38,533$ 5,809$ 172$ 6,840$ 971$
US Gov't & Agencies ** 632,429
Total Debt Securities 4,840,372$
Credit Rating*
* Ratings are determined in the following order:
1. S&P rating 2. Moody’s rating 3. Fitch rating 4. Manager-determined rating (internal rating) 5. If no ratings available using steps 1-4, then shown as not rated.
** US government agency securities explicitly guaranteed by the US government are categorized here. Credit ratings
of US government agency securities that are only implicitly guaranteed by the US government are categorized accordingly in the main body of these tables. Implicitly guaranteed agency securities included in the Asset Backed, Commercial Mortgage-Backed, Gov’t Issued Commercial & Gov’t Mortgage Backed, Gov’t Agencies, Gov’t Bonds, Index Linked Gov’t Bonds and Short Term Bills and Notes categories are issued by FNMA, FHLB, FHLMC, FAMC and TVA. Concentration of Credit Risk Concentration of credit risk is the risk of loss that may be attributed to the magnitude of an investment in a single issuer. As of June 30, 2018 and 2017, the SIB’s portfolio has no single issuer exposure that comprises 5% or more of the overall portfolio, excluding investments issued or explicitly guaranteed by the U.S. government and investments in mutual funds, external investment pools, and other pooled investments. Therefore, there is no concentration of credit risk. Foreign Currency Risk Foreign currency risk is the risk that changes in exchange rates will adversely affect the fair value of an investment or a deposit. Although the SIB does not have a formal investment policy governing foreign currency risk, the SIB manages its exposure to fair value loss by requiring their international securities investment managers to maintain diversified portfolios to limit foreign currency and security risk. The SIB’s exposure to foreign currency risk is presented in the following tables as of June 30, 2018 and 2017 (expressed in thousands).
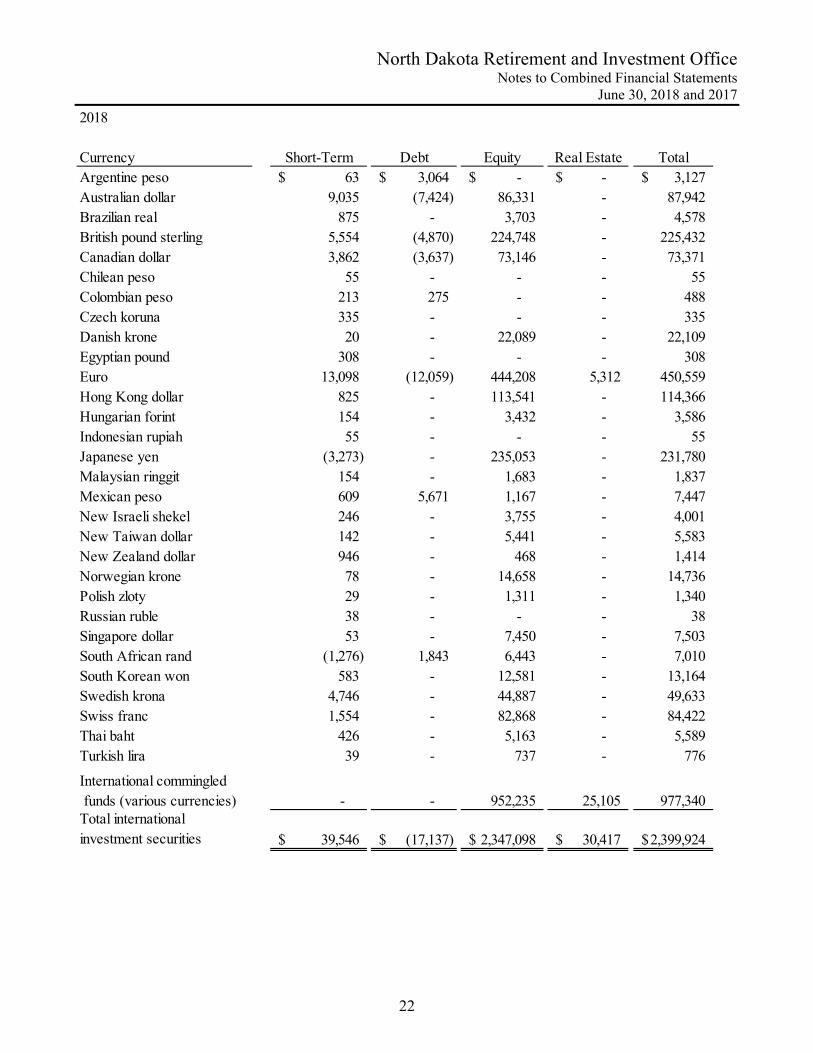
North Dakota Retirement and Investment Office Notes to Combined Financial Statements
June 30, 2018 and 2017
22
2018
Currency Short-Term Debt Equity Real Estate TotalArgentine peso 63$ 3,064$ -$ -$ 3,127$ Australian dollar 9,035 (7,424) 86,331 - 87,942 Brazilian real 875 - 3,703 - 4,578 British pound sterling 5,554 (4,870) 224,748 - 225,432 Canadian dollar 3,862 (3,637) 73,146 - 73,371 Chilean peso 55 - - - 55 Colombian peso 213 275 - - 488 Czech koruna 335 - - - 335 Danish krone 20 - 22,089 - 22,109 Egyptian pound 308 - - - 308 Euro 13,098 (12,059) 444,208 5,312 450,559 Hong Kong dollar 825 - 113,541 - 114,366 Hungarian forint 154 - 3,432 - 3,586 Indonesian rupiah 55 - - - 55 Japanese yen (3,273) - 235,053 - 231,780 Malaysian ringgit 154 - 1,683 - 1,837 Mexican peso 609 5,671 1,167 - 7,447 New Israeli shekel 246 - 3,755 - 4,001 New Taiwan dollar 142 - 5,441 - 5,583 New Zealand dollar 946 - 468 - 1,414 Norwegian krone 78 - 14,658 - 14,736 Polish zloty 29 - 1,311 - 1,340 Russian ruble 38 - - - 38 Singapore dollar 53 - 7,450 - 7,503 South African rand (1,276) 1,843 6,443 - 7,010 South Korean won 583 - 12,581 - 13,164 Swedish krona 4,746 - 44,887 - 49,633 Swiss franc 1,554 - 82,868 - 84,422 Thai baht 426 - 5,163 - 5,589 Turkish lira 39 - 737 - 776
International commingled funds (various currencies) - - 952,235 25,105 977,340 Total international investment securities 39,546$ (17,137)$ 2,347,098$ 30,417$ 2,399,924$
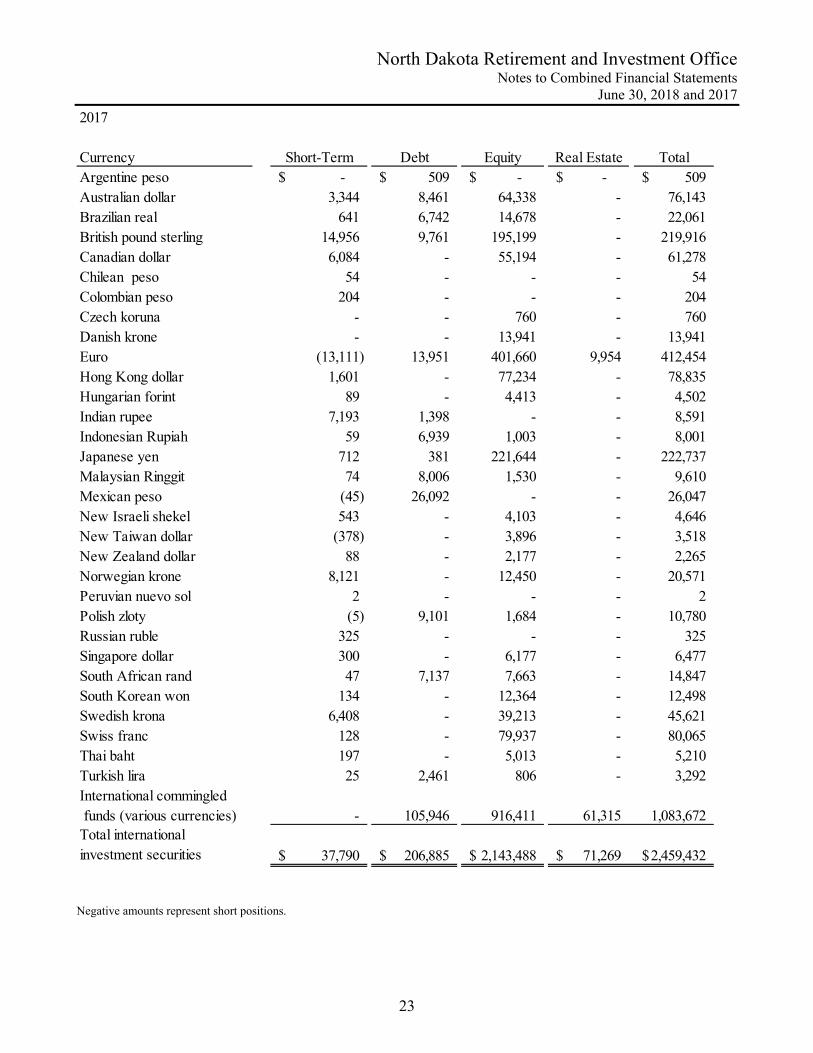
North Dakota Retirement and Investment Office Notes to Combined Financial Statements
June 30, 2018 and 2017
23
2017
Currency Short-Term Debt Equity Real Estate TotalArgentine peso -$ 509$ -$ -$ 509$ Australian dollar 3,344 8,461 64,338 - 76,143 Brazilian real 641 6,742 14,678 - 22,061 British pound sterling 14,956 9,761 195,199 - 219,916 Canadian dollar 6,084 - 55,194 - 61,278 Chilean peso 54 - - - 54 Colombian peso 204 - - - 204 Czech koruna - - 760 - 760 Danish krone - - 13,941 - 13,941 Euro (13,111) 13,951 401,660 9,954 412,454 Hong Kong dollar 1,601 - 77,234 - 78,835 Hungarian forint 89 - 4,413 - 4,502 Indian rupee 7,193 1,398 - - 8,591 Indonesian Rupiah 59 6,939 1,003 - 8,001 Japanese yen 712 381 221,644 - 222,737 Malaysian Ringgit 74 8,006 1,530 - 9,610 Mexican peso (45) 26,092 - - 26,047 New Israeli shekel 543 - 4,103 - 4,646 New Taiwan dollar (378) - 3,896 - 3,518 New Zealand dollar 88 - 2,177 - 2,265 Norwegian krone 8,121 - 12,450 - 20,571 Peruvian nuevo sol 2 - - - 2 Polish zloty (5) 9,101 1,684 - 10,780 Russian ruble 325 - - - 325 Singapore dollar 300 - 6,177 - 6,477 South African rand 47 7,137 7,663 - 14,847 South Korean won 134 - 12,364 - 12,498 Swedish krona 6,408 - 39,213 - 45,621 Swiss franc 128 - 79,937 - 80,065 Thai baht 197 - 5,013 - 5,210 Turkish lira 25 2,461 806 - 3,292 International commingled funds (various currencies) - 105,946 916,411 61,315 1,083,672 Total international investment securities 37,790$ 206,885$ 2,143,488$ 71,269$ 2,459,432$
Negative amounts represent short positions.
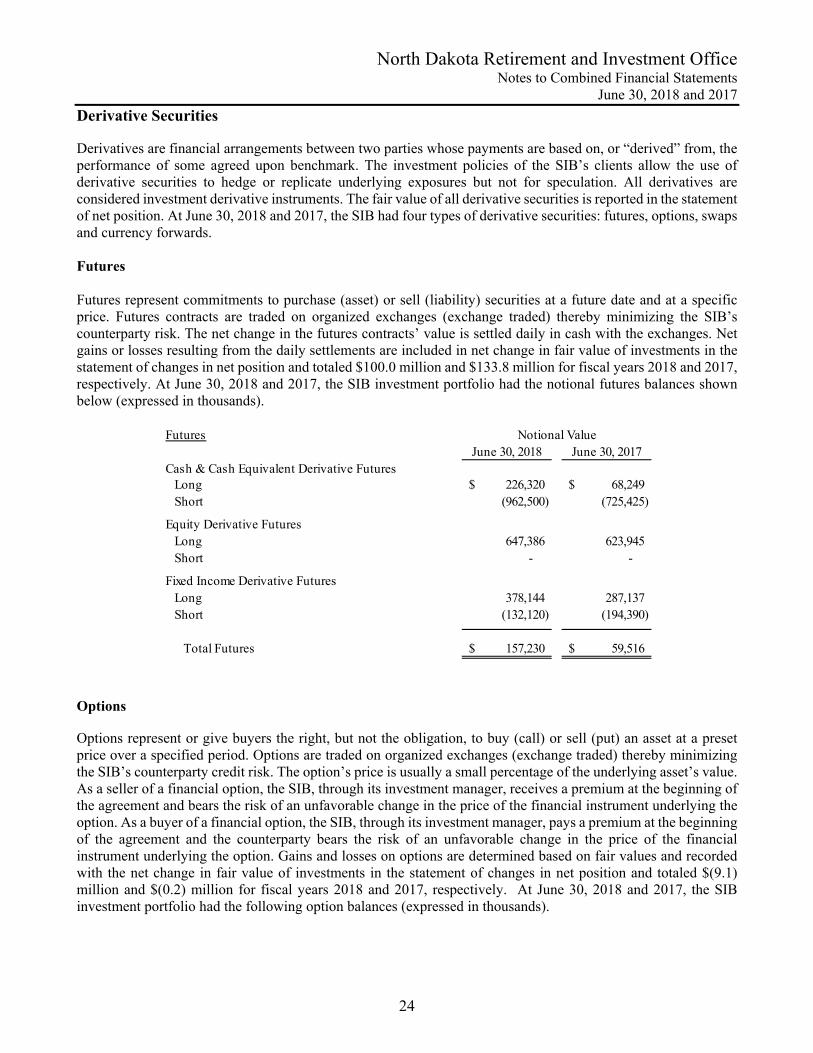
North Dakota Retirement and Investment Office Notes to Combined Financial Statements
June 30, 2018 and 2017
24
Derivative Securities Derivatives are financial arrangements between two parties whose payments are based on, or “derived” from, the performance of some agreed upon benchmark. The investment policies of the SIB’s clients allow the use of derivative securities to hedge or replicate underlying exposures but not for speculation. All derivatives are considered investment derivative instruments. The fair value of all derivative securities is reported in the statement of net position. At June 30, 2018 and 2017, the SIB had four types of derivative securities: futures, options, swaps and currency forwards. Futures Futures represent commitments to purchase (asset) or sell (liability) securities at a future date and at a specific price. Futures contracts are traded on organized exchanges (exchange traded) thereby minimizing the SIB’s counterparty risk. The net change in the futures contracts’ value is settled daily in cash with the exchanges. Net gains or losses resulting from the daily settlements are included in net change in fair value of investments in the statement of changes in net position and totaled $100.0 million and $133.8 million for fiscal years 2018 and 2017, respectively. At June 30, 2018 and 2017, the SIB investment portfolio had the notional futures balances shown below (expressed in thousands).
FuturesJune 30, 2018 June 30, 2017
Cash & Cash Equivalent Derivative Futures Long 226,320$ 68,249$ Short (962,500) (725,425)
Equity Derivative Futures Long 647,386 623,945 Short - -
Fixed Income Derivative Futures Long 378,144 287,137 Short (132,120) (194,390)
Total Futures 157,230$ 59,516$
Notional Value
Options Options represent or give buyers the right, but not the obligation, to buy (call) or sell (put) an asset at a preset price over a specified period. Options are traded on organized exchanges (exchange traded) thereby minimizing the SIB’s counterparty credit risk. The option’s price is usually a small percentage of the underlying asset’s value. As a seller of a financial option, the SIB, through its investment manager, receives a premium at the beginning of the agreement and bears the risk of an unfavorable change in the price of the financial instrument underlying the option. As a buyer of a financial option, the SIB, through its investment manager, pays a premium at the beginning of the agreement and the counterparty bears the risk of an unfavorable change in the price of the financial instrument underlying the option. Gains and losses on options are determined based on fair values and recorded with the net change in fair value of investments in the statement of changes in net position and totaled $(9.1) million and $(0.2) million for fiscal years 2018 and 2017, respectively. At June 30, 2018 and 2017, the SIB investment portfolio had the following option balances (expressed in thousands).
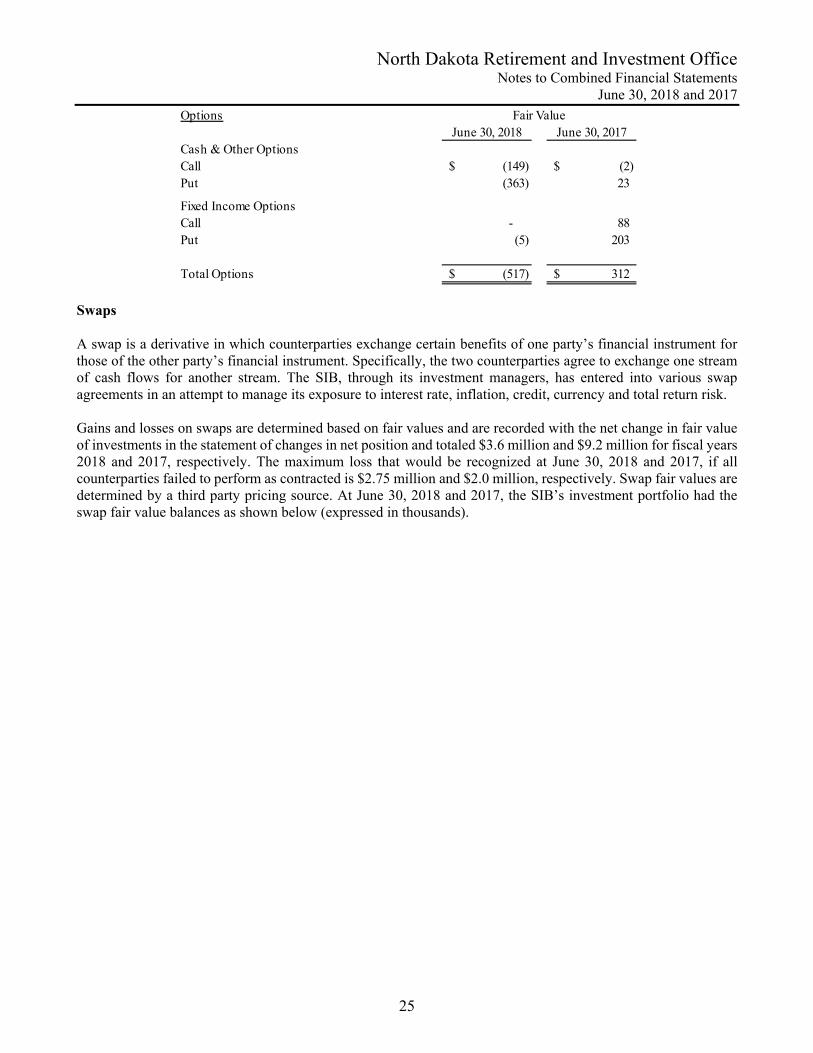
North Dakota Retirement and Investment Office Notes to Combined Financial Statements
June 30, 2018 and 2017
25
OptionsJune 30, 2018 June 30, 2017
Cash & Other OptionsCall (149)$ (2)$ Put (363) 23
Fixed Income OptionsCall - 88 Put (5) 203
Total Options (517)$ 312$
Fair Value
Swaps A swap is a derivative in which counterparties exchange certain benefits of one party’s financial instrument for those of the other party’s financial instrument. Specifically, the two counterparties agree to exchange one stream of cash flows for another stream. The SIB, through its investment managers, has entered into various swap agreements in an attempt to manage its exposure to interest rate, inflation, credit, currency and total return risk. Gains and losses on swaps are determined based on fair values and are recorded with the net change in fair value of investments in the statement of changes in net position and totaled $3.6 million and $9.2 million for fiscal years 2018 and 2017, respectively. The maximum loss that would be recognized at June 30, 2018 and 2017, if all counterparties failed to perform as contracted is $2.75 million and $2.0 million, respectively. Swap fair values are determined by a third party pricing source. At June 30, 2018 and 2017, the SIB’s investment portfolio had the swap fair value balances as shown below (expressed in thousands).
North Dakota Retirement and Investment Office Notes to Combined Financial Statements
June 30, 2018 and 2017
26
Credit Default Swaps Credit risk represents the exposure to fair value losses arising from a credit event such as default, failure to pay, restructuring or bankruptcy. In a credit default swap (CDS) contract, the protection buyer of the CDS makes a series of payments to the protection seller and, in exchange, receives a payoff if the credit instrument experiences a credit event. CDS contracts are also used to establish exposure to a desired credit instrument.
Counterparty/Moody's Rating June 30, 2018 June 30, 2017Expiration Date
Range June 30, 2018 June 30, 2017
Bank of America/A1 (2 contracts) (2,700)$ 2021 13$ Bank of America/A1 (2 contracts) (2,700) 2018 - 2021 35 BNP Paribas/A1 (2 contracts) (600) 2019 - 2022 (5) BNP Paribas/A1 (1 contract) (400) 2019 (2) Citibank/A1 (4 contracts) (7,750) 2018 - 2019 119 Citibank/A1 (23 contracts) (9,005) 2018 - 2024 (55) Credit Suisse First Boston/A1 (8 contracts) 11,705 2017 - 2022 (759) Credit Suisse First Boston/A1 (2 contracts) (89,400) 2022 - 2023 1,369 Deutsche Bank/Baa2 (2 contracts) 2,000 2059 9 Goldman Sachs/A3 (2 contracts) (1,800) 2019 - 2020 22 Goldman Sachs/A3 (10 contracts) (4,890) 2019 - 2063 37 HSBC Bank/A1 (1 contract) (100) 2022 (1) HSBC Bank/A1 (1 contract) (100) 2023 (1) JP Morgan Chase/Aa3 (3 contracts) (930) 2019 - 2020 2 JP Morgan Chase/Aa3 (1 contract) (300) 2019 4
Total Credit Default Swaps (104,795)$ (2,175)$ 1,374$ (587)$
Notional Amount Fair Value
The notional amount may be positive or negative, depending on whether the position is long or short, respectively. Currency Swaps Currency risk represents the exposure to fair value losses arising from the change in price of one currency against another. A currency swap is a foreign-exchange agreement between two parties to exchange principal and interest in one currency for the same in another currency.
Counterparty/Moody's Rating June 30, 2018 June 30, 2017Expiration Date
Range June 30, 2018 June 30, 2017
JP Morgan Chase/Aa3 (1 contract) $ - $ 106 2020 $ - $ (6)JP Morgan Chase/Aa3 (1 contract) 106 2020 (7)Total Currency Swaps $ 106 $ 106 (7)$ (6)$
Notional Amount Fair Value
The notional amount may be positive or negative, depending on whether the position is long or short, respectively.
North Dakota Retirement and Investment Office Notes to Combined Financial Statements
June 30, 2018 and 2017
27
Interest Rate Swaps Interest rate risk represents the exposure to fair value losses arising from future changes in prevailing market interest rates. In the most common type of interest rate swap arrangement, one party agrees to pay fixed interest payments on designated dates to a counterparty, who in turn agrees to make return interest payments that float with some reference rate.
Counterparty/Moody's Rating June 30, 2018 June 30, 2017Expiration Date
Range June 30, 2018 June 30, 2017
Citigroup Global Markets/A1 (5 contracts) (28,885)$ 2019 - 2025 $ 1,018 Credit Suisse First Boston/A1 (34 contracts) (62,477) 2017 - 2048 1,168 Credit Suisse First Boston/A1 (32 contracts) 94,495 2019 - 2048 2,275 Goldman Sachs/A3 (1 contract) 5 2017 - - JP Morgan Chase/Aa3 (130 contracts) (642) 2017 - 2046 1,322 JP Morgan Chase/Aa3 (176 contracts) (134,106) 2018 - 2048 3,122 Morgan Stanley/A3 (1 contract) 215 2022 (3)Total Interest Rate Swaps (68,496)$ (62,899)$ 6,415$ 2,487$
Notional Amount Fair Value
The notional amount may be positive or negative, depending on whether the position is long (fixed rate payer) or short (floating rate payer), respectively. Inflation Swaps Inflation risk represents the exposure to fair value losses arising from future changes in prevailing market inflation. In an inflation swap, one party pays a fixed rate on a notional principal amount, while the other party pays a floating rate linked to an inflation index, such as the Consumer Price Index (CPI).
Counterparty/Moody's Rating June 30, 2018 June 30, 2017Expiration Date
Range June 30, 2018 June 30, 2017
Credit Suisse First Boston/A1 (3 contracts) -$ 522$ 2020 - 2030 $ - $ (3)Goldman Sachs/A3 (5 contracts) 1,797 2020 - 2030 (14)JP Morgan Chase/Aa3 (22 contracts) 5,730 2022 - 2057 (25)Total Inflation Swaps 5,730$ 2,319$ (25)$ (17)$
Notional Amount Fair Value
The notional amount may be positive or negative, depending on whether the position is long (fixed rate payer) or short (floating rate payer), respectively. Total Return Swaps A total return swap is an agreement in which one party makes payments based on a set rate, either fixed or variable, while the other party makes payments based on the return of an underlying asset (income and capital gains). The underlying asset, or reference asset, is owned by the party receiving the set rate payment.
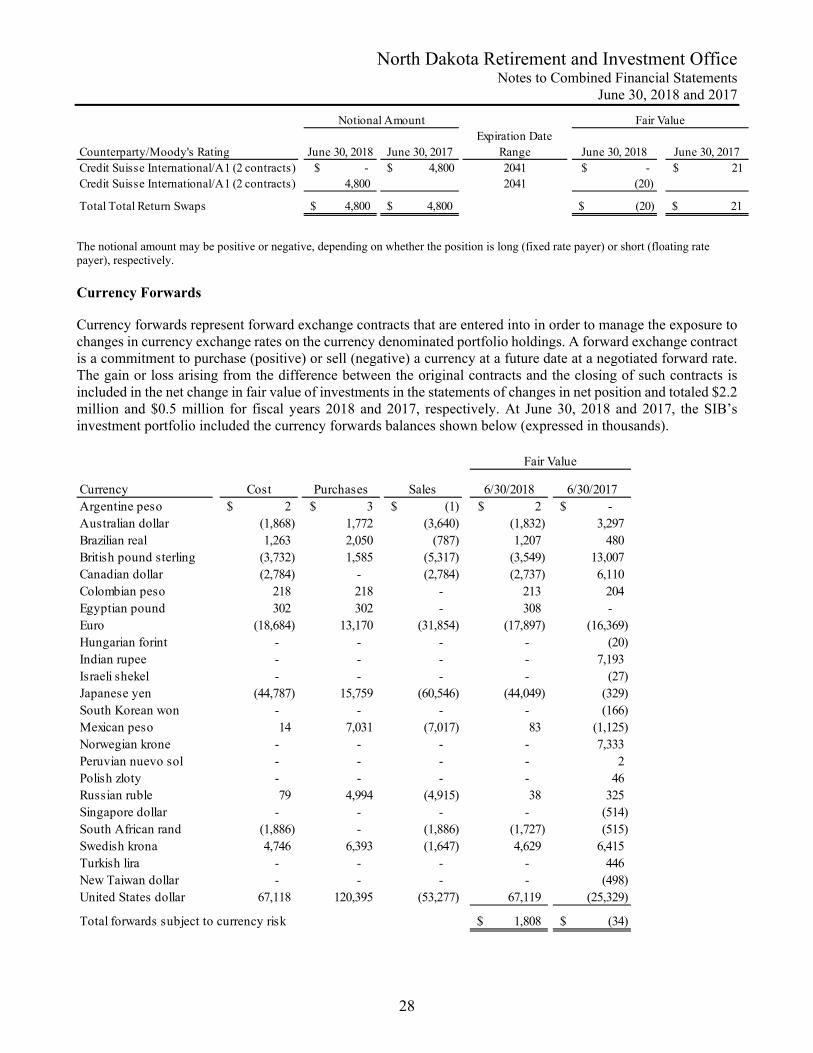
North Dakota Retirement and Investment Office Notes to Combined Financial Statements
June 30, 2018 and 2017
28
Counterparty/Moody's Rating June 30, 2018 June 30, 2017Expiration Date
Range June 30, 2018 June 30, 2017Credit Suisse International/A1 (2 contracts) $ - $ 4,800 2041 $ - $ 21 Credit Suisse International/A1 (2 contracts) 4,800 2041 (20)
Total Total Return Swaps 4,800$ 4,800$ (20)$ 21$
Notional Amount Fair Value
The notional amount may be positive or negative, depending on whether the position is long (fixed rate payer) or short (floating rate payer), respectively. Currency Forwards Currency forwards represent forward exchange contracts that are entered into in order to manage the exposure to changes in currency exchange rates on the currency denominated portfolio holdings. A forward exchange contract is a commitment to purchase (positive) or sell (negative) a currency at a future date at a negotiated forward rate. The gain or loss arising from the difference between the original contracts and the closing of such contracts is included in the net change in fair value of investments in the statements of changes in net position and totaled $2.2 million and $0.5 million for fiscal years 2018 and 2017, respectively. At June 30, 2018 and 2017, the SIB’s investment portfolio included the currency forwards balances shown below (expressed in thousands).
Currency Cost Purchases Sales 6/30/2018 6/30/2017Argentine peso 2$ 3$ (1)$ 2$ -$ Australian dollar (1,868) 1,772 (3,640) (1,832) 3,297 Brazilian real 1,263 2,050 (787) 1,207 480 British pound sterling (3,732) 1,585 (5,317) (3,549) 13,007 Canadian dollar (2,784) - (2,784) (2,737) 6,110 Colombian peso 218 218 - 213 204 Egyptian pound 302 302 - 308 - Euro (18,684) 13,170 (31,854) (17,897) (16,369) Hungarian forint - - - - (20) Indian rupee - - - - 7,193 Israeli shekel - - - - (27) Japanese yen (44,787) 15,759 (60,546) (44,049) (329) South Korean won - - - - (166) Mexican peso 14 7,031 (7,017) 83 (1,125) Norwegian krone - - - - 7,333 Peruvian nuevo sol - - - - 2 Polish zloty - - - - 46 Russian ruble 79 4,994 (4,915) 38 325 Singapore dollar - - - - (514) South African rand (1,886) - (1,886) (1,727) (515) Swedish krona 4,746 6,393 (1,647) 4,629 6,415 Turkish lira - - - - 446 New Taiwan dollar - - - - (498) United States dollar 67,118 120,395 (53,277) 67,119 (25,329)
Total forwards subject to currency risk 1,808$ (34)$
Fair Value
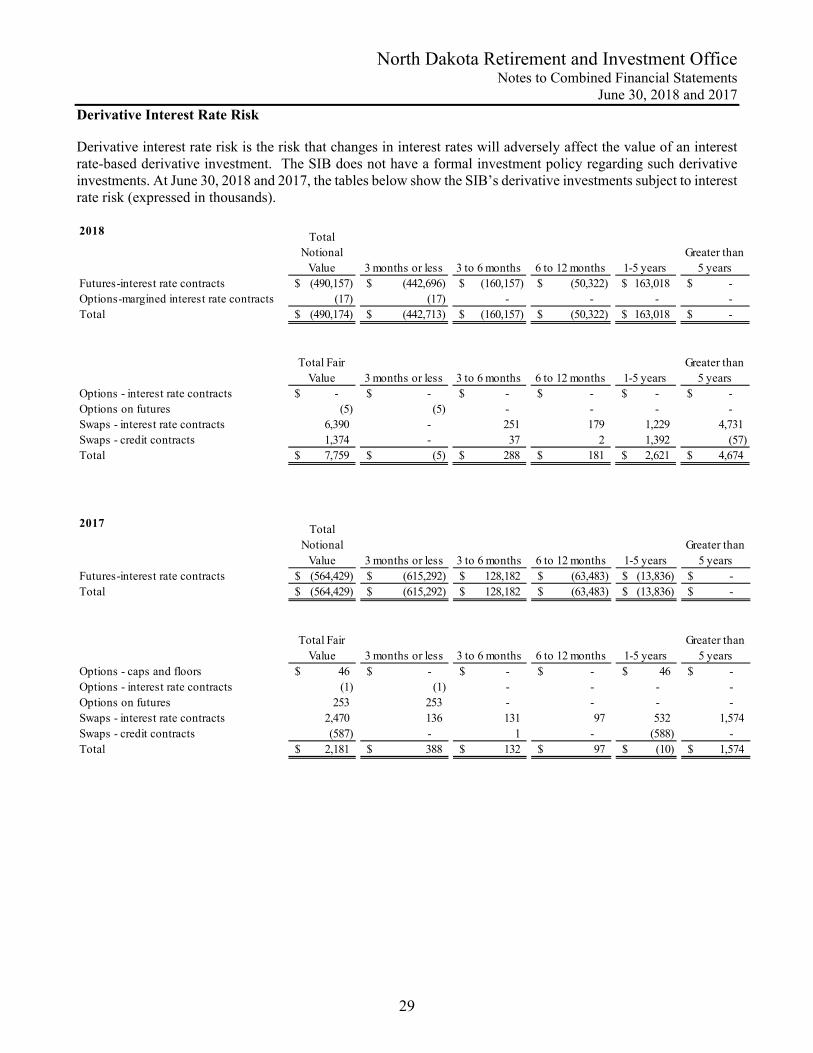
North Dakota Retirement and Investment Office Notes to Combined Financial Statements
June 30, 2018 and 2017
29
Derivative Interest Rate Risk Derivative interest rate risk is the risk that changes in interest rates will adversely affect the value of an interest rate-based derivative investment. The SIB does not have a formal investment policy regarding such derivative investments. At June 30, 2018 and 2017, the tables below show the SIB’s derivative investments subject to interest rate risk (expressed in thousands). 2018 Total
NotionalValue 3 months or less 3 to 6 months 6 to 12 months 1-5 years
Greater than 5 years
Futures-interest rate contracts (490,157)$ (442,696)$ (160,157)$ (50,322)$ 163,018$ -$ Options-margined interest rate contracts (17) (17) - - - - Total (490,174)$ (442,713)$ (160,157)$ (50,322)$ 163,018$ -$
Total FairValue 3 months or less 3 to 6 months 6 to 12 months 1-5 years
Greater than 5 years
Options - interest rate contracts -$ -$ -$ -$ -$ -$ Options on futures (5) (5) - - - - Swaps - interest rate contracts 6,390 - 251 179 1,229 4,731 Swaps - credit contracts 1,374 - 37 2 1,392 (57) Total 7,759$ (5)$ 288$ 181$ 2,621$ 4,674$
2017 Total
NotionalValue 3 months or less 3 to 6 months 6 to 12 months 1-5 years
Greater than 5 years
Futures-interest rate contracts (564,429)$ (615,292)$ 128,182$ (63,483)$ (13,836)$ -$ Total (564,429)$ (615,292)$ 128,182$ (63,483)$ (13,836)$ -$
Total FairValue 3 months or less 3 to 6 months 6 to 12 months 1-5 years
Greater than 5 years
Options - caps and floors 46$ -$ -$ -$ 46$ -$ Options - interest rate contracts (1) (1) - - - - Options on futures 253 253 - - - - Swaps - interest rate contracts 2,470 136 131 97 532 1,574 Swaps - credit contracts (587) - 1 - (588) - Total 2,181$ 388$ 132$ 97$ (10)$ 1,574$
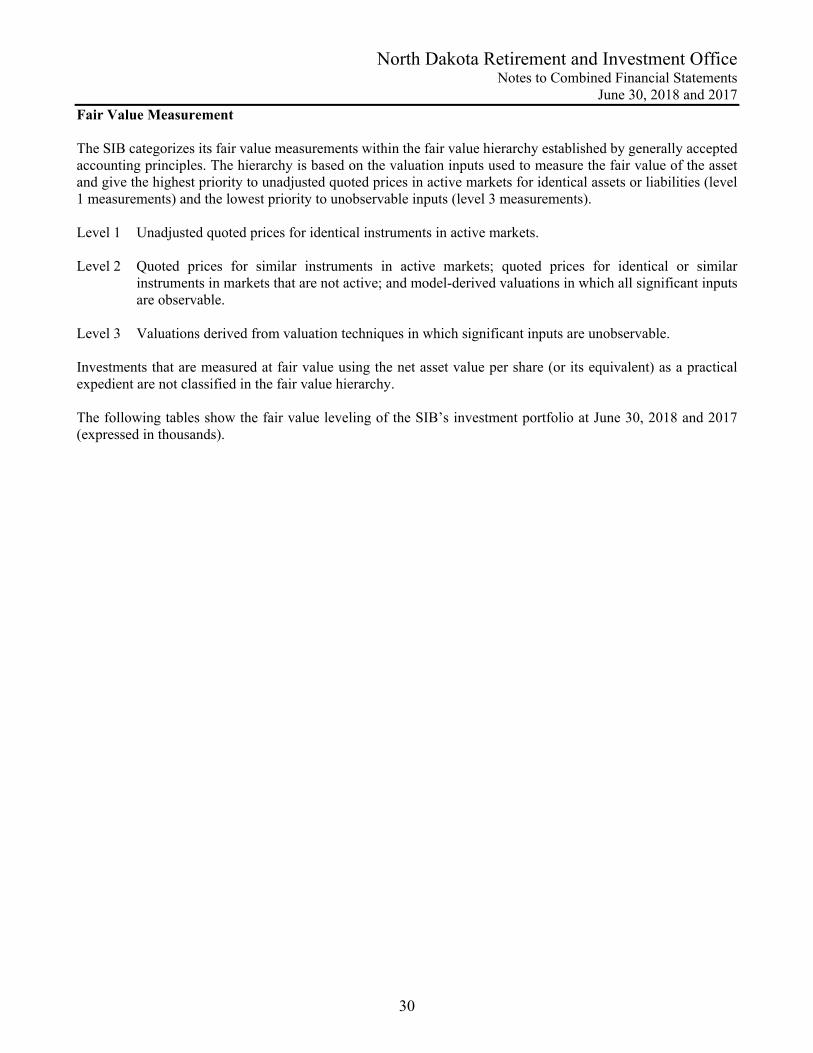
North Dakota Retirement and Investment Office Notes to Combined Financial Statements
June 30, 2018 and 2017
30
Fair Value Measurement The SIB categorizes its fair value measurements within the fair value hierarchy established by generally accepted accounting principles. The hierarchy is based on the valuation inputs used to measure the fair value of the asset and give the highest priority to unadjusted quoted prices in active markets for identical assets or liabilities (level 1 measurements) and the lowest priority to unobservable inputs (level 3 measurements). Level 1 Unadjusted quoted prices for identical instruments in active markets. Level 2 Quoted prices for similar instruments in active markets; quoted prices for identical or similar
instruments in markets that are not active; and model-derived valuations in which all significant inputs are observable.
Level 3 Valuations derived from valuation techniques in which significant inputs are unobservable. Investments that are measured at fair value using the net asset value per share (or its equivalent) as a practical expedient are not classified in the fair value hierarchy. The following tables show the fair value leveling of the SIB’s investment portfolio at June 30, 2018 and 2017 (expressed in thousands).
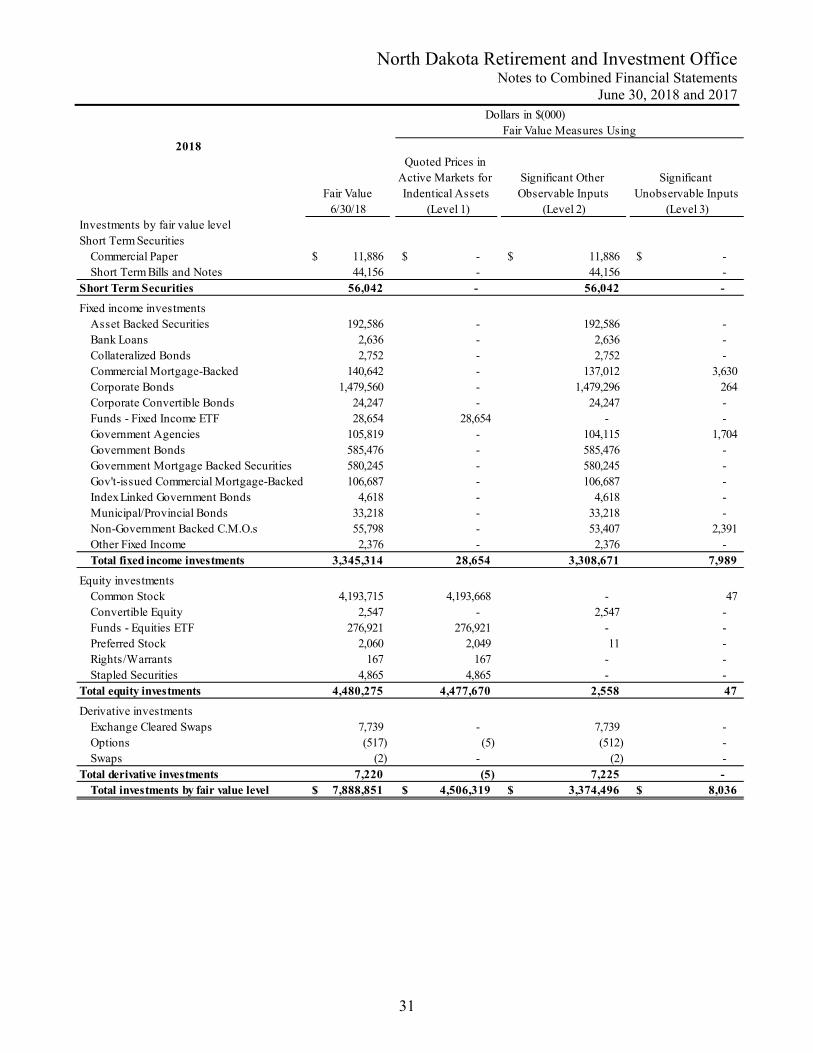
North Dakota Retirement and Investment Office Notes to Combined Financial Statements
June 30, 2018 and 2017
31
2018
Fair Value6/30/18
Quoted Prices in Active Markets for Indentical Assets
(Level 1)
Significant Other Observable Inputs
(Level 2)
Significant Unobservable Inputs
(Level 3)Investments by fair value levelShort Term Securities
Commercial Paper 11,886$ -$ 11,886$ -$ Short Term Bills and Notes 44,156 - 44,156 -
Short Term Securities 56,042 - 56,042 -
Fixed income investmentsAsset Backed Securities 192,586 - 192,586 - Bank Loans 2,636 - 2,636 - Collateralized Bonds 2,752 - 2,752 - Commercial Mortgage-Backed 140,642 - 137,012 3,630 Corporate Bonds 1,479,560 - 1,479,296 264 Corporate Convertible Bonds 24,247 - 24,247 - Funds - Fixed Income ETF 28,654 28,654 - - Government Agencies 105,819 - 104,115 1,704 Government Bonds 585,476 - 585,476 - Government Mortgage Backed Securities 580,245 - 580,245 - Gov't-issued Commercial Mortgage-Backed 106,687 - 106,687 - Index Linked Government Bonds 4,618 - 4,618 - Municipal/Provincial Bonds 33,218 - 33,218 - Non-Government Backed C.M.O.s 55,798 - 53,407 2,391 Other Fixed Income 2,376 - 2,376 - Total fixed income investments 3,345,314 28,654 3,308,671 7,989
Equity investmentsCommon Stock 4,193,715 4,193,668 - 47 Convertible Equity 2,547 - 2,547 - Funds - Equities ETF 276,921 276,921 - - Preferred Stock 2,060 2,049 11 - Rights/Warrants 167 167 - - Stapled Securities 4,865 4,865 - -
Total equity investments 4,480,275 4,477,670 2,558 47
Derivative investmentsExchange Cleared Swaps 7,739 - 7,739 - Options (517) (5) (512) - Swaps (2) - (2) -
Total derivative investments 7,220 (5) 7,225 - Total investments by fair value level 7,888,851$ 4,506,319$ 3,374,496$ 8,036$
Dollars in $(000)Fair Value Measures Using
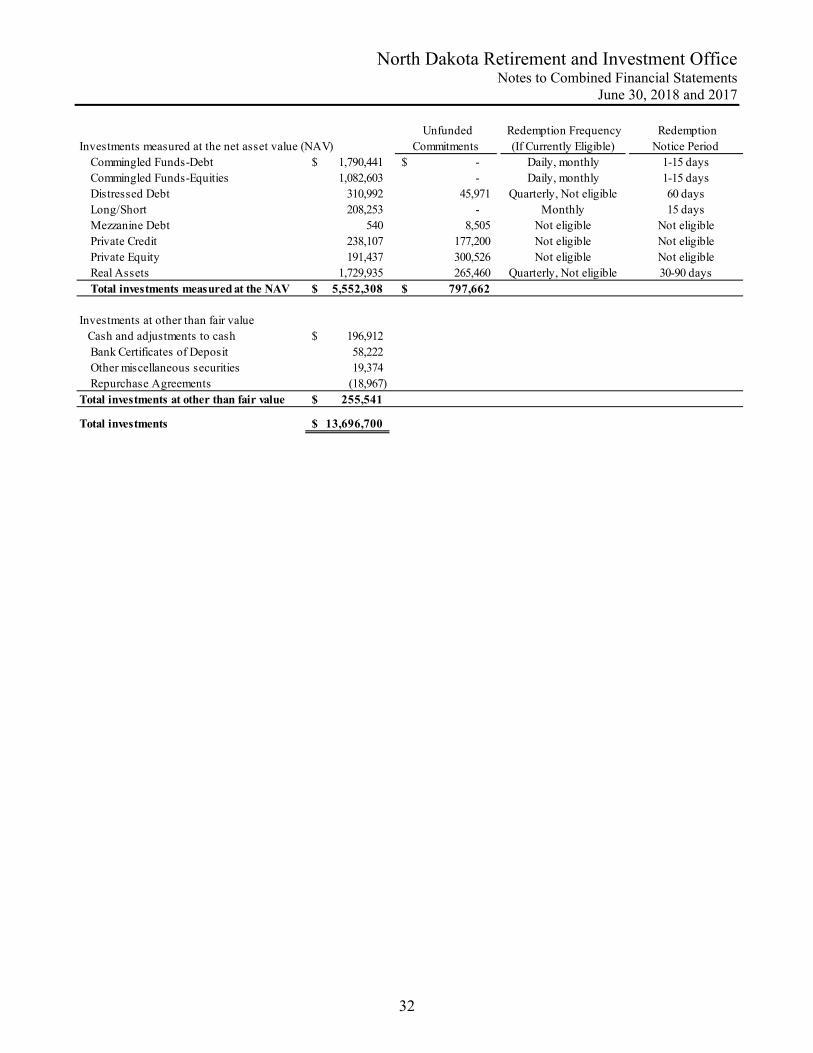
North Dakota Retirement and Investment Office Notes to Combined Financial Statements
June 30, 2018 and 2017
32
Investments measured at the net asset value (NAV) Unfunded
Commitments Redemption Frequency
(If Currently Eligible) RedemptionNotice Period
Commingled Funds-Debt 1,790,441$ -$ Daily, monthly 1-15 daysCommingled Funds-Equities 1,082,603 - Daily, monthly 1-15 daysDistressed Debt 310,992 45,971 Quarterly, Not eligible 60 daysLong/Short 208,253 - Monthly 15 daysMezzanine Debt 540 8,505 Not eligible Not eligiblePrivate Credit 238,107 177,200 Not eligible Not eligiblePrivate Equity 191,437 300,526 Not eligible Not eligibleReal Assets 1,729,935 265,460 Quarterly, Not eligible 30-90 days
Total investments measured at the NAV 5,552,308$ 797,662$
Investments at other than fair value Cash and adjustments to cash 196,912$
Bank Certificates of Deposit 58,222 Other miscellaneous securities 19,374 Repurchase Agreements (18,967)
Total investments at other than fair value 255,541$
Total investments 13,696,700$
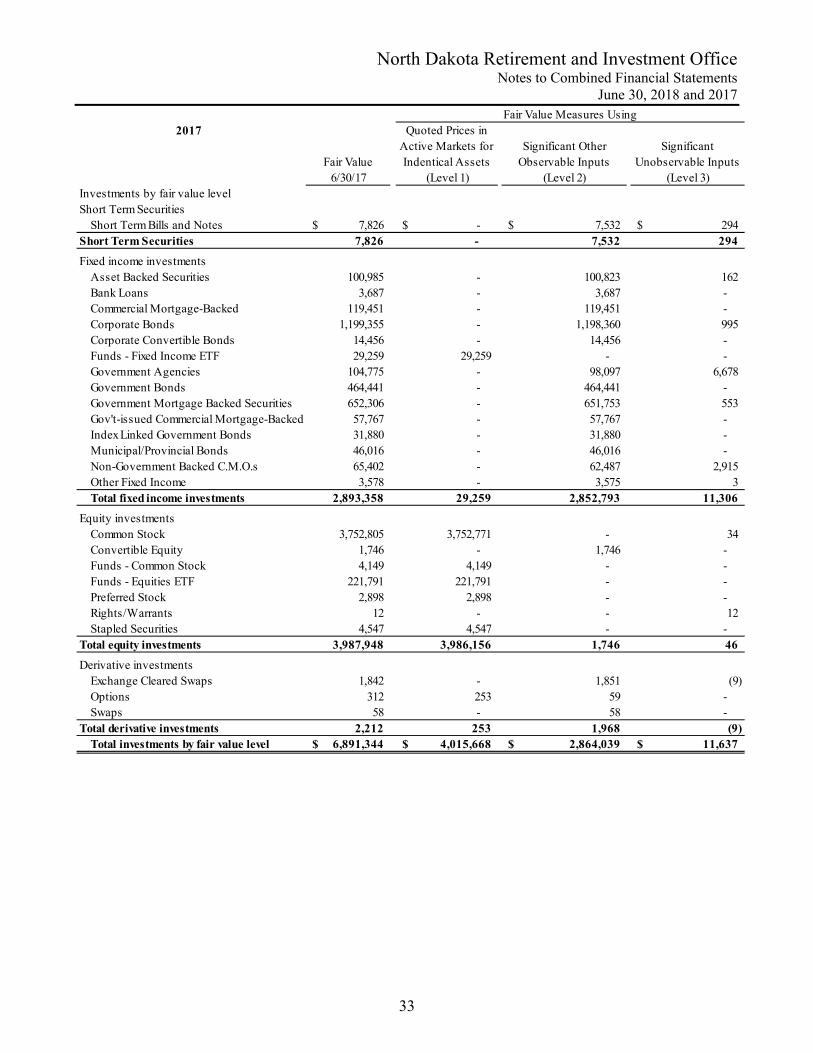
North Dakota Retirement and Investment Office Notes to Combined Financial Statements
June 30, 2018 and 2017
33
2017
Fair Value6/30/17
Quoted Prices in Active Markets for Indentical Assets
(Level 1)
Significant Other Observable Inputs
(Level 2)
Significant Unobservable Inputs
(Level 3)Investments by fair value levelShort Term Securities
Short Term Bills and Notes 7,826$ -$ 7,532$ 294$ Short Term Securities 7,826 - 7,532 294
Fixed income investmentsAsset Backed Securities 100,985 - 100,823 162 Bank Loans 3,687 - 3,687 - Commercial Mortgage-Backed 119,451 - 119,451 - Corporate Bonds 1,199,355 - 1,198,360 995 Corporate Convertible Bonds 14,456 - 14,456 - Funds - Fixed Income ETF 29,259 29,259 - - Government Agencies 104,775 - 98,097 6,678 Government Bonds 464,441 - 464,441 - Government Mortgage Backed Securities 652,306 - 651,753 553 Gov't-issued Commercial Mortgage-Backed 57,767 - 57,767 - Index Linked Government Bonds 31,880 - 31,880 - Municipal/Provincial Bonds 46,016 - 46,016 - Non-Government Backed C.M.O.s 65,402 - 62,487 2,915 Other Fixed Income 3,578 - 3,575 3 Total fixed income investments 2,893,358 29,259 2,852,793 11,306
Equity investmentsCommon Stock 3,752,805 3,752,771 - 34 Convertible Equity 1,746 - 1,746 - Funds - Common Stock 4,149 4,149 - - Funds - Equities ETF 221,791 221,791 - - Preferred Stock 2,898 2,898 - - Rights/Warrants 12 - - 12 Stapled Securities 4,547 4,547 - -
Total equity investments 3,987,948 3,986,156 1,746 46
Derivative investmentsExchange Cleared Swaps 1,842 - 1,851 (9) Options 312 253 59 - Swaps 58 - 58 -
Total derivative investments 2,212 253 1,968 (9) Total investments by fair value level 6,891,344$ 4,015,668$ 2,864,039$ 11,637$
Fair Value Measures Using
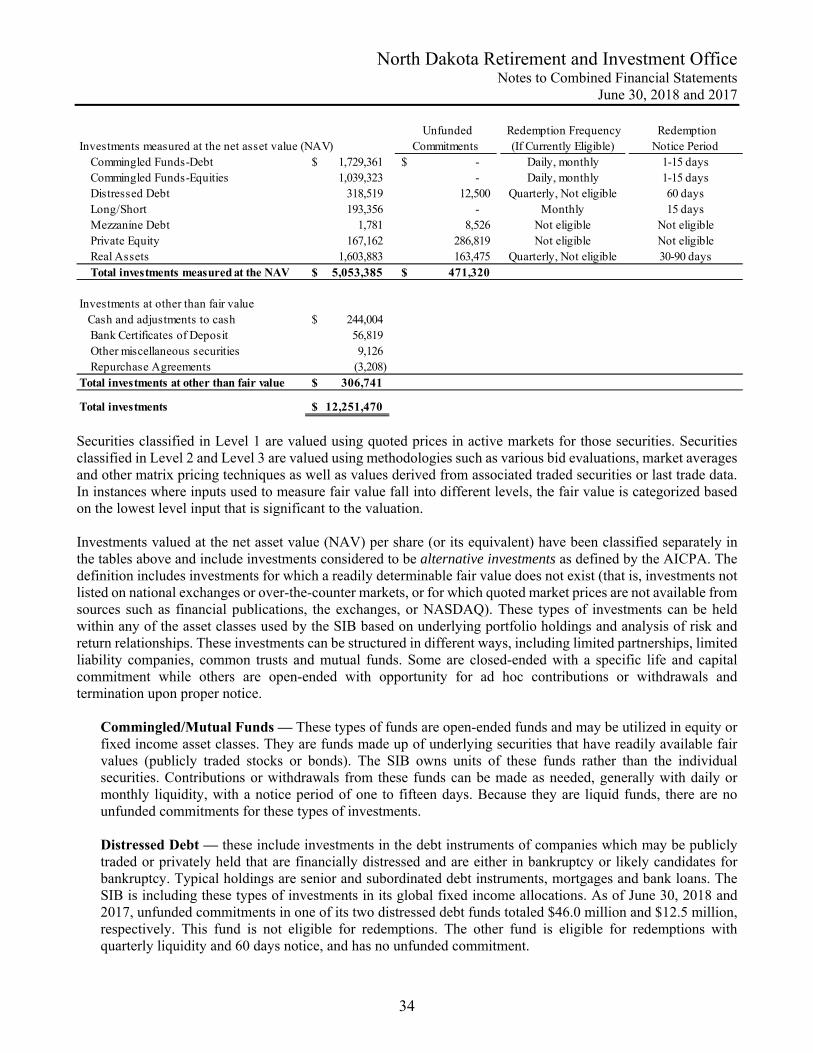
North Dakota Retirement and Investment Office Notes to Combined Financial Statements
June 30, 2018 and 2017
34
Investments measured at the net asset value (NAV) Unfunded
Commitments Redemption Frequency
(If Currently Eligible) RedemptionNotice Period
Commingled Funds-Debt 1,729,361$ -$ Daily, monthly 1-15 daysCommingled Funds-Equities 1,039,323 - Daily, monthly 1-15 daysDistressed Debt 318,519 12,500 Quarterly, Not eligible 60 daysLong/Short 193,356 - Monthly 15 daysMezzanine Debt 1,781 8,526 Not eligible Not eligiblePrivate Equity 167,162 286,819 Not eligible Not eligibleReal Assets 1,603,883 163,475 Quarterly, Not eligible 30-90 days
Total investments measured at the NAV 5,053,385$ 471,320$
Investments at other than fair value Cash and adjustments to cash 244,004$
Bank Certificates of Deposit 56,819 Other miscellaneous securities 9,126 Repurchase Agreements (3,208)
Total investments at other than fair value 306,741$
Total investments 12,251,470$
Securities classified in Level 1 are valued using quoted prices in active markets for those securities. Securities classified in Level 2 and Level 3 are valued using methodologies such as various bid evaluations, market averages and other matrix pricing techniques as well as values derived from associated traded securities or last trade data. In instances where inputs used to measure fair value fall into different levels, the fair value is categorized based on the lowest level input that is significant to the valuation. Investments valued at the net asset value (NAV) per share (or its equivalent) have been classified separately in the tables above and include investments considered to be alternative investments as defined by the AICPA. The definition includes investments for which a readily determinable fair value does not exist (that is, investments not listed on national exchanges or over-the-counter markets, or for which quoted market prices are not available from sources such as financial publications, the exchanges, or NASDAQ). These types of investments can be held within any of the asset classes used by the SIB based on underlying portfolio holdings and analysis of risk and return relationships. These investments can be structured in different ways, including limited partnerships, limited liability companies, common trusts and mutual funds. Some are closed-ended with a specific life and capital commitment while others are open-ended with opportunity for ad hoc contributions or withdrawals and termination upon proper notice.
Commingled/Mutual Funds — These types of funds are open-ended funds and may be utilized in equity or fixed income asset classes. They are funds made up of underlying securities that have readily available fair values (publicly traded stocks or bonds). The SIB owns units of these funds rather than the individual securities. Contributions or withdrawals from these funds can be made as needed, generally with daily or monthly liquidity, with a notice period of one to fifteen days. Because they are liquid funds, there are no unfunded commitments for these types of investments. Distressed Debt — these include investments in the debt instruments of companies which may be publicly traded or privately held that are financially distressed and are either in bankruptcy or likely candidates for bankruptcy. Typical holdings are senior and subordinated debt instruments, mortgages and bank loans. The SIB is including these types of investments in its global fixed income allocations. As of June 30, 2018 and 2017, unfunded commitments in one of its two distressed debt funds totaled $46.0 million and $12.5 million, respectively. This fund is not eligible for redemptions. The other fund is eligible for redemptions with quarterly liquidity and 60 days notice, and has no unfunded commitment.
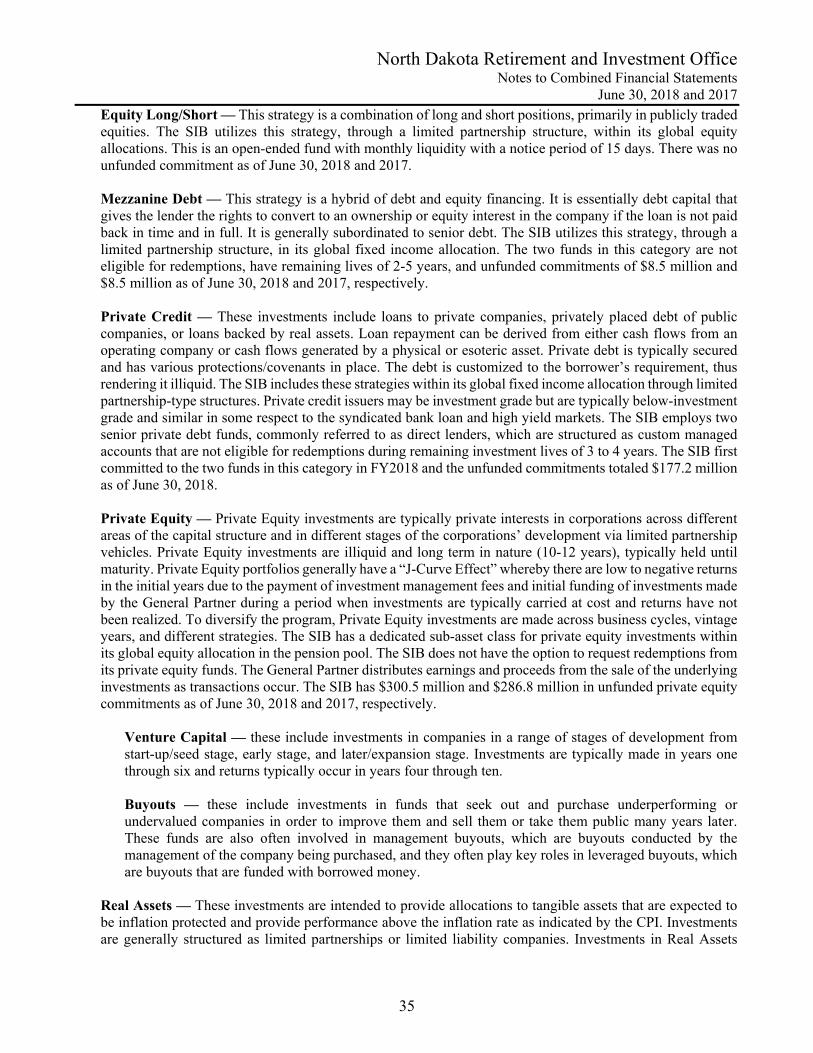
North Dakota Retirement and Investment Office Notes to Combined Financial Statements
June 30, 2018 and 2017
35
Equity Long/Short — This strategy is a combination of long and short positions, primarily in publicly traded equities. The SIB utilizes this strategy, through a limited partnership structure, within its global equity allocations. This is an open-ended fund with monthly liquidity with a notice period of 15 days. There was no unfunded commitment as of June 30, 2018 and 2017. Mezzanine Debt — This strategy is a hybrid of debt and equity financing. It is essentially debt capital that gives the lender the rights to convert to an ownership or equity interest in the company if the loan is not paid back in time and in full. It is generally subordinated to senior debt. The SIB utilizes this strategy, through a limited partnership structure, in its global fixed income allocation. The two funds in this category are not eligible for redemptions, have remaining lives of 2-5 years, and unfunded commitments of $8.5 million and $8.5 million as of June 30, 2018 and 2017, respectively. Private Credit — These investments include loans to private companies, privately placed debt of public companies, or loans backed by real assets. Loan repayment can be derived from either cash flows from an operating company or cash flows generated by a physical or esoteric asset. Private debt is typically secured and has various protections/covenants in place. The debt is customized to the borrower’s requirement, thus rendering it illiquid. The SIB includes these strategies within its global fixed income allocation through limited partnership-type structures. Private credit issuers may be investment grade but are typically below-investment grade and similar in some respect to the syndicated bank loan and high yield markets. The SIB employs two senior private debt funds, commonly referred to as direct lenders, which are structured as custom managed accounts that are not eligible for redemptions during remaining investment lives of 3 to 4 years. The SIB first committed to the two funds in this category in FY2018 and the unfunded commitments totaled $177.2 million as of June 30, 2018. Private Equity — Private Equity investments are typically private interests in corporations across different areas of the capital structure and in different stages of the corporations’ development via limited partnership vehicles. Private Equity investments are illiquid and long term in nature (10-12 years), typically held until maturity. Private Equity portfolios generally have a “J-Curve Effect” whereby there are low to negative returns in the initial years due to the payment of investment management fees and initial funding of investments made by the General Partner during a period when investments are typically carried at cost and returns have not been realized. To diversify the program, Private Equity investments are made across business cycles, vintage years, and different strategies. The SIB has a dedicated sub-asset class for private equity investments within its global equity allocation in the pension pool. The SIB does not have the option to request redemptions from its private equity funds. The General Partner distributes earnings and proceeds from the sale of the underlying investments as transactions occur. The SIB has $300.5 million and $286.8 million in unfunded private equity commitments as of June 30, 2018 and 2017, respectively.
Venture Capital — these include investments in companies in a range of stages of development from start-up/seed stage, early stage, and later/expansion stage. Investments are typically made in years one through six and returns typically occur in years four through ten. Buyouts — these include investments in funds that seek out and purchase underperforming or undervalued companies in order to improve them and sell them or take them public many years later. These funds are also often involved in management buyouts, which are buyouts conducted by the management of the company being purchased, and they often play key roles in leveraged buyouts, which are buyouts that are funded with borrowed money.
Real Assets — These investments are intended to provide allocations to tangible assets that are expected to be inflation protected and provide performance above the inflation rate as indicated by the CPI. Investments are generally structured as limited partnerships or limited liability companies. Investments in Real Assets
North Dakota Retirement and Investment Office Notes to Combined Financial Statements
June 30, 2018 and 2017
36
include:
Real Estate — includes investments in private vehicles through limited partnerships or commingled vehicles that have an ownership interest in direct real estate properties. The investment strategies may include “value added” strategies, which derive their return from both income and appreciation, “opportunistic”, which derive their return primarily through appreciation, and “alternative” which invest in less traditional types of property. Both domestic and international real estate funds are utilized. The SIB has a dedicated sub-asset class for these types of investments within global real assets. There are currently 11 different real estate funds in the portfolio. Three of those funds are open-ended vehicles that accept redemption requests quarterly with a 30-90 day notification period. One fund is in wind-down and will be distributing the final proceeds within the next 6-12 months. The remaining seven funds are closed-ended limited partnerships that are not eligible for redemptions. Those eight funds have a combined unfunded commitment of $79.2 million and $78.4 million as of June 30, 2018 and 2017, respectively. Timberland — includes investments in limited liability companies that have an ownership interest in properties where the value of the property is derived mainly from income-producing timber but also from the “higher and better use” value of the underlying land. The SIB includes these assets within its global real assets allocations. There are three funds in the portfolio and they have no unfunded commitments. The funds are not eligible for redemption other than distributions of income and/or proceeds as determined by the investment manager. The funds have remaining lives of 2-8 years. Infrastructure — includes investments in limited partnerships that have an ownership interest in transportation assets such as toll roads, tunnels and bridges; and regulated assets such as electricity transmission, gas and oil distribution and wastewater collection. Other possible investments would include communication assets and social infrastructure. The SIB includes these assets within its global real assets allocations. The infrastructure investments in the portfolio as of June 30, 2018 and 2017, include both open and closed-ended funds. The open-ended funds have no unfunded commitments and are eligible for redemptions quarterly with 90 days notice. There may be a 3-12 month queue for receiving redemptions. The closed-ended funds have unfunded commitments of $186.3 million and $85.0 million at June 30, 2018 and 2017, respectively, and are not eligible for redemptions.
Securities Lending State statutes permit and the SIB has authorized the use of securities lending – loans of securities to broker-dealers and other entities for collateral with a simultaneous agreement to return the collateral for the same securities in the future. Northern Trust is the securities lending agent for the SIB. Securities are loaned versus collateral that may include cash, U.S. government securities and irrevocable letters of credit. U.S. securities are loaned versus collateral valued at 102% of the fair value of the securities plus any accrued interest. Non-U.S. securities are loaned versus collateral valued at 105% of the fair value of the securities plus any accrued interest. Non-cash collateral cannot be pledged or sold unless the borrower defaults. All securities loans can be terminated on demand by either the lender or the borrower, although the average term of SIB loans was approximately 61 and 59 days as of June 30, 2018 and 2017, respectively. Cash open collateral is invested in a short term investment pool, which had an interest sensitivity of 3 days and 3 days as of June 30, 2018 and 2017. This pool is valued based on amortized cost. There were no violations of legal or contractual provisions, no borrower or lending agent default losses known to the securities lending agent. There are no dividends or coupon payments owing on the securities lent. Securities lending earnings are credited to participating clients on approximately the fifteenth day of the following month. Indemnification deals with the situation in which a client's securities are not returned due to the insolvency of a
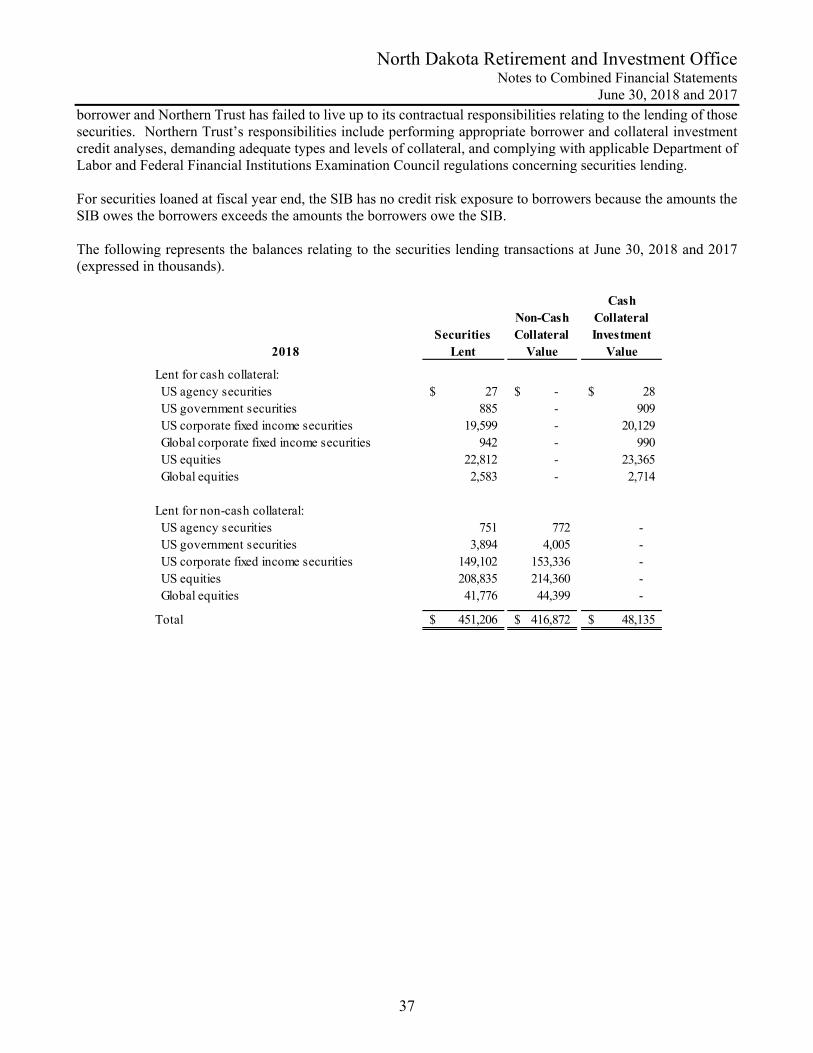
North Dakota Retirement and Investment Office Notes to Combined Financial Statements
June 30, 2018 and 2017
37
borrower and Northern Trust has failed to live up to its contractual responsibilities relating to the lending of those securities. Northern Trust’s responsibilities include performing appropriate borrower and collateral investment credit analyses, demanding adequate types and levels of collateral, and complying with applicable Department of Labor and Federal Financial Institutions Examination Council regulations concerning securities lending. For securities loaned at fiscal year end, the SIB has no credit risk exposure to borrowers because the amounts the SIB owes the borrowers exceeds the amounts the borrowers owe the SIB. The following represents the balances relating to the securities lending transactions at June 30, 2018 and 2017 (expressed in thousands).
2018Securities
Lent
Non-Cash Collateral
Value
Cash Collateral Investment
Value
Lent for cash collateral: US agency securities 27$ -$ 28$ US government securities 885 - 909 US corporate fixed income securities 19,599 - 20,129 Global corporate fixed income securities 942 - 990 US equities 22,812 - 23,365 Global equities 2,583 - 2,714
Lent for non-cash collateral: US agency securities 751 772 - US government securities 3,894 4,005 - US corporate fixed income securities 149,102 153,336 - US equities 208,835 214,360 - Global equities 41,776 44,399 -
Total 451,206$ 416,872$ 48,135$
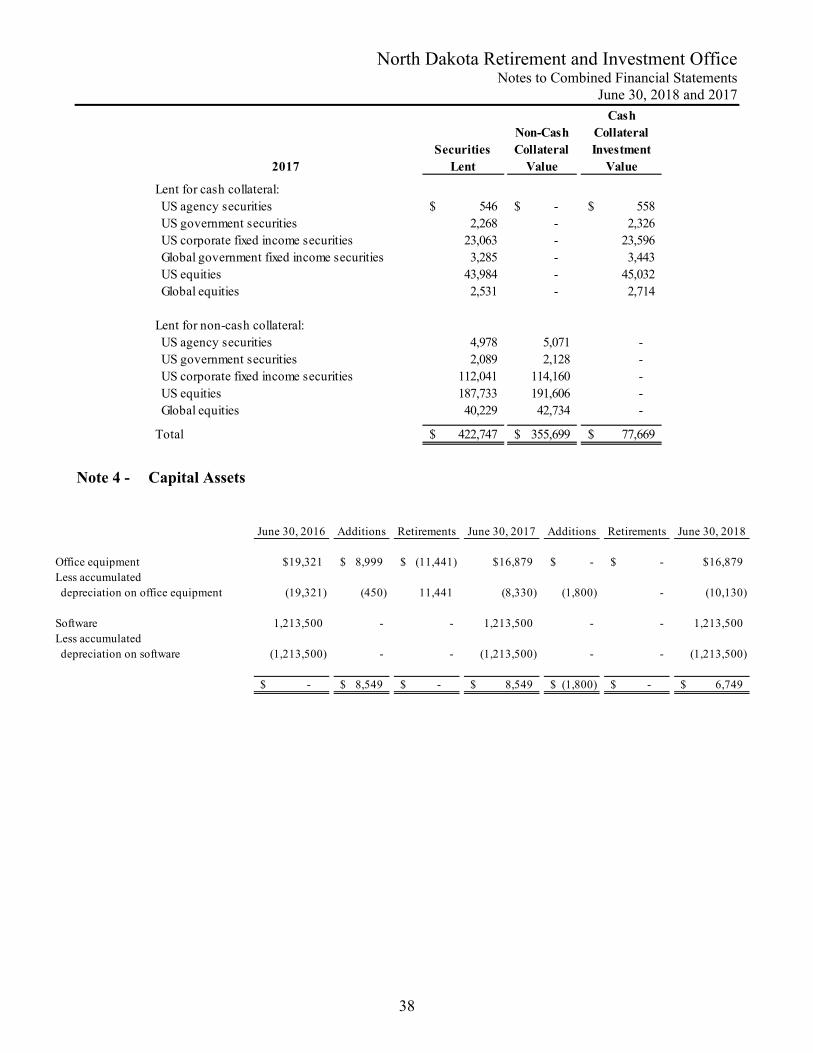
North Dakota Retirement and Investment Office Notes to Combined Financial Statements
June 30, 2018 and 2017
38
2017Securities
Lent
Non-Cash Collateral
Value
Cash Collateral Investment
Value
Lent for cash collateral: US agency securities 546$ -$ 558$ US government securities 2,268 - 2,326 US corporate fixed income securities 23,063 - 23,596 Global government fixed income securities 3,285 - 3,443 US equities 43,984 - 45,032 Global equities 2,531 - 2,714
Lent for non-cash collateral: US agency securities 4,978 5,071 - US government securities 2,089 2,128 - US corporate fixed income securities 112,041 114,160 - US equities 187,733 191,606 - Global equities 40,229 42,734 -
Total 422,747$ 355,699$ 77,669$
Note 4 - Capital Assets
June 30, 2016 Additions Retirements June 30, 2017 Additions Retirements June 30, 2018
Office equipment $19,321 8,999$ (11,441)$ $16,879 -$ -$ $16,879Less accumulated depreciation on office equipment (19,321) (450) 11,441 (8,330) (1,800) - (10,130)
Software 1,213,500 - - 1,213,500 - - 1,213,500 Less accumulated depreciation on software (1,213,500) - - (1,213,500) - - (1,213,500)
-$ 8,549$ -$ 8,549$ (1,800)$ -$ 6,749$
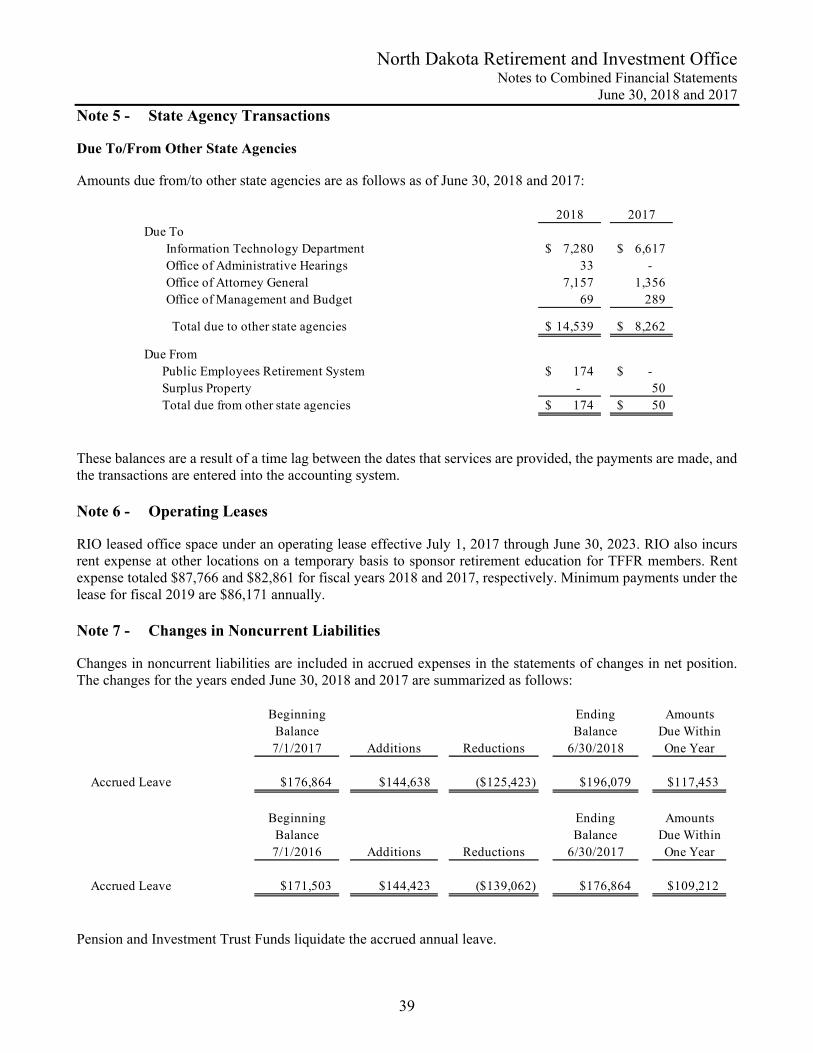
North Dakota Retirement and Investment Office Notes to Combined Financial Statements
June 30, 2018 and 2017
39
Note 5 - State Agency Transactions Due To/From Other State Agencies Amounts due from/to other state agencies are as follows as of June 30, 2018 and 2017:
2018 2017Due To
Information Technology Department 7,280$ 6,617$ Office of Administrative Hearings 33 - Office of Attorney General 7,157 1,356 Office of Management and Budget 69 289
Total due to other state agencies 14,539$ 8,262$
Due FromPublic Employees Retirement System 174$ -$ Surplus Property - 50 Total due from other state agencies 174$ 50$
These balances are a result of a time lag between the dates that services are provided, the payments are made, and the transactions are entered into the accounting system. Note 6 - Operating Leases RIO leased office space under an operating lease effective July 1, 2017 through June 30, 2023. RIO also incurs rent expense at other locations on a temporary basis to sponsor retirement education for TFFR members. Rent expense totaled $87,766 and $82,861 for fiscal years 2018 and 2017, respectively. Minimum payments under the lease for fiscal 2019 are $86,171 annually. Note 7 - Changes in Noncurrent Liabilities Changes in noncurrent liabilities are included in accrued expenses in the statements of changes in net position. The changes for the years ended June 30, 2018 and 2017 are summarized as follows:
Beginning Ending AmountsBalance Balance Due Within7/1/2017 Additions Reductions 6/30/2018 One Year
Accrued Leave $176,864 $144,638 ($125,423) $196,079 $117,453
Beginning Ending AmountsBalance Balance Due Within7/1/2016 Additions Reductions 6/30/2017 One Year
Accrued Leave $171,503 $144,423 ($139,062) $176,864 $109,212
Pension and Investment Trust Funds liquidate the accrued annual leave.
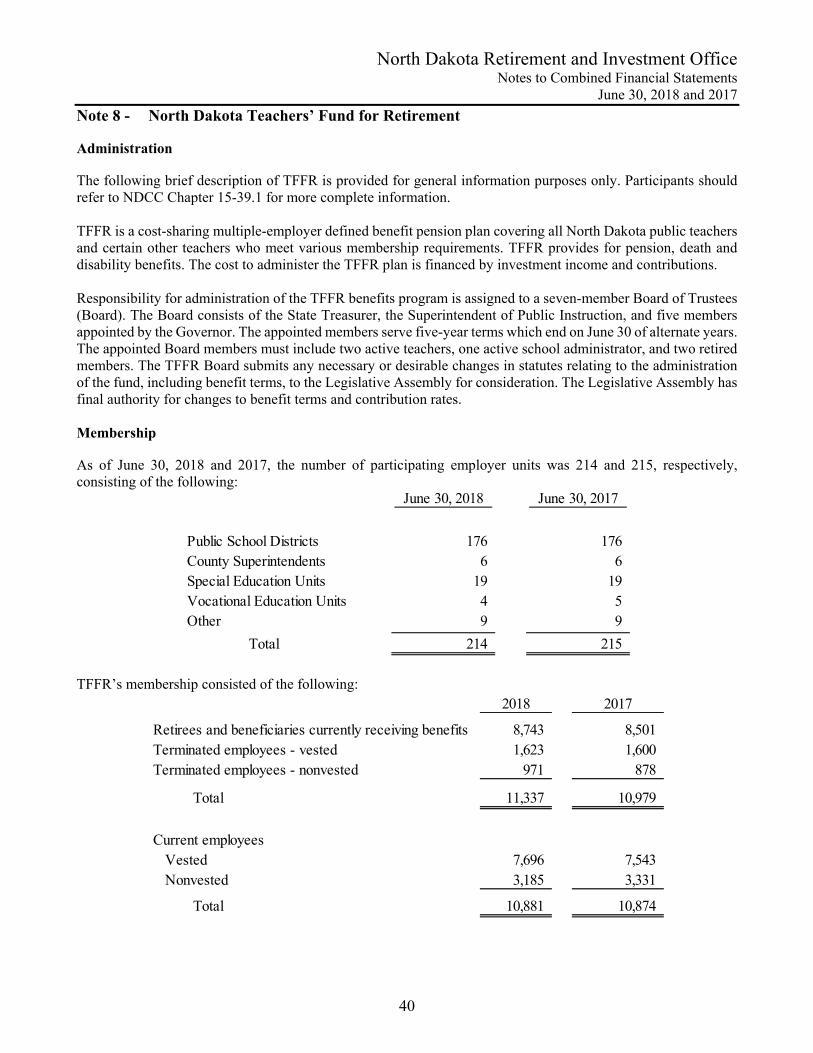
North Dakota Retirement and Investment Office Notes to Combined Financial Statements
June 30, 2018 and 2017
40
Note 8 - North Dakota Teachers’ Fund for Retirement Administration The following brief description of TFFR is provided for general information purposes only. Participants should refer to NDCC Chapter 15-39.1 for more complete information. TFFR is a cost-sharing multiple-employer defined benefit pension plan covering all North Dakota public teachers and certain other teachers who meet various membership requirements. TFFR provides for pension, death and disability benefits. The cost to administer the TFFR plan is financed by investment income and contributions. Responsibility for administration of the TFFR benefits program is assigned to a seven-member Board of Trustees (Board). The Board consists of the State Treasurer, the Superintendent of Public Instruction, and five members appointed by the Governor. The appointed members serve five-year terms which end on June 30 of alternate years. The appointed Board members must include two active teachers, one active school administrator, and two retired members. The TFFR Board submits any necessary or desirable changes in statutes relating to the administration of the fund, including benefit terms, to the Legislative Assembly for consideration. The Legislative Assembly has final authority for changes to benefit terms and contribution rates. Membership As of June 30, 2018 and 2017, the number of participating employer units was 214 and 215, respectively, consisting of the following:
June 30, 2018 June 30, 2017
Public School Districts 176 176 County Superintendents 6 6 Special Education Units 19 19 Vocational Education Units 4 5 Other 9 9
Total 214 215
TFFR’s membership consisted of the following:
2018 2017
Retirees and beneficiaries currently receiving benefits 8,743 8,501 Terminated employees - vested 1,623 1,600 Terminated employees - nonvested 971 878
Total 11,337 10,979
Current employees Vested 7,696 7,543 Nonvested 3,185 3,331
Total 10,881 10,874
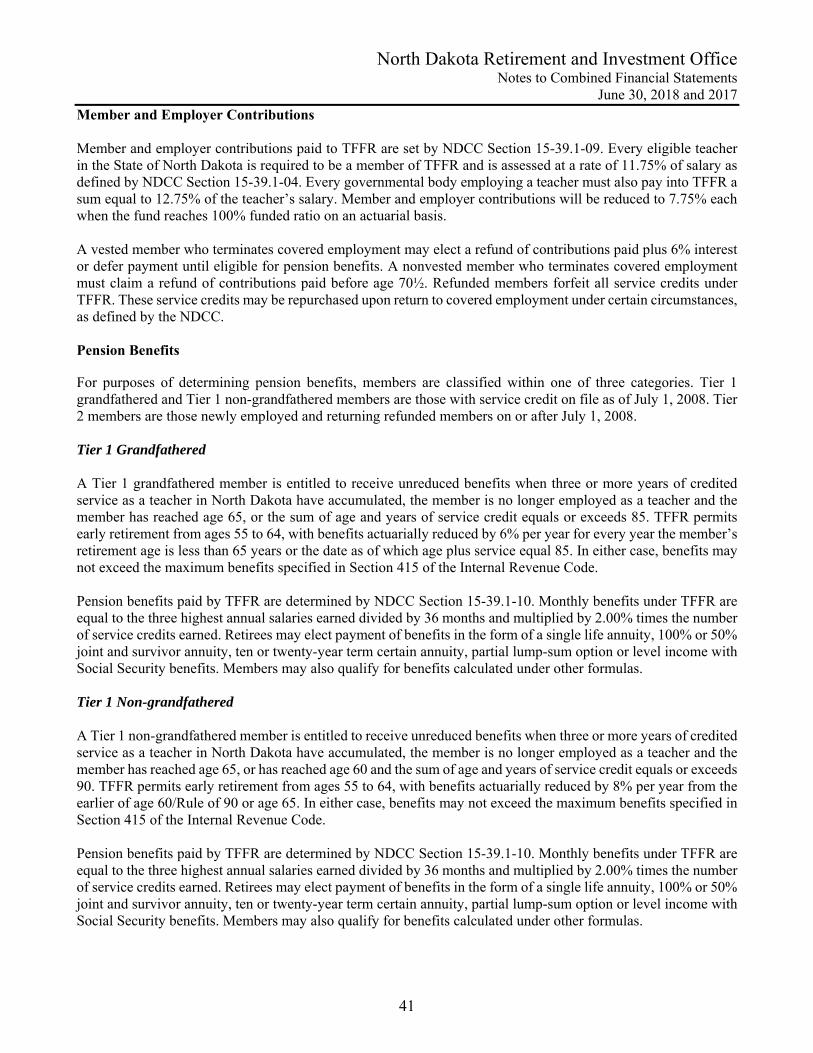
North Dakota Retirement and Investment Office Notes to Combined Financial Statements
June 30, 2018 and 2017
41
Member and Employer Contributions Member and employer contributions paid to TFFR are set by NDCC Section 15-39.1-09. Every eligible teacher in the State of North Dakota is required to be a member of TFFR and is assessed at a rate of 11.75% of salary as defined by NDCC Section 15-39.1-04. Every governmental body employing a teacher must also pay into TFFR a sum equal to 12.75% of the teacher’s salary. Member and employer contributions will be reduced to 7.75% each when the fund reaches 100% funded ratio on an actuarial basis. A vested member who terminates covered employment may elect a refund of contributions paid plus 6% interest or defer payment until eligible for pension benefits. A nonvested member who terminates covered employment must claim a refund of contributions paid before age 70½. Refunded members forfeit all service credits under TFFR. These service credits may be repurchased upon return to covered employment under certain circumstances, as defined by the NDCC. Pension Benefits For purposes of determining pension benefits, members are classified within one of three categories. Tier 1 grandfathered and Tier 1 non-grandfathered members are those with service credit on file as of July 1, 2008. Tier 2 members are those newly employed and returning refunded members on or after July 1, 2008. Tier 1 Grandfathered A Tier 1 grandfathered member is entitled to receive unreduced benefits when three or more years of credited service as a teacher in North Dakota have accumulated, the member is no longer employed as a teacher and the member has reached age 65, or the sum of age and years of service credit equals or exceeds 85. TFFR permits early retirement from ages 55 to 64, with benefits actuarially reduced by 6% per year for every year the member’s retirement age is less than 65 years or the date as of which age plus service equal 85. In either case, benefits may not exceed the maximum benefits specified in Section 415 of the Internal Revenue Code. Pension benefits paid by TFFR are determined by NDCC Section 15-39.1-10. Monthly benefits under TFFR are equal to the three highest annual salaries earned divided by 36 months and multiplied by 2.00% times the number of service credits earned. Retirees may elect payment of benefits in the form of a single life annuity, 100% or 50% joint and survivor annuity, ten or twenty-year term certain annuity, partial lump-sum option or level income with Social Security benefits. Members may also qualify for benefits calculated under other formulas. Tier 1 Non-grandfathered A Tier 1 non-grandfathered member is entitled to receive unreduced benefits when three or more years of credited service as a teacher in North Dakota have accumulated, the member is no longer employed as a teacher and the member has reached age 65, or has reached age 60 and the sum of age and years of service credit equals or exceeds 90. TFFR permits early retirement from ages 55 to 64, with benefits actuarially reduced by 8% per year from the earlier of age 60/Rule of 90 or age 65. In either case, benefits may not exceed the maximum benefits specified in Section 415 of the Internal Revenue Code. Pension benefits paid by TFFR are determined by NDCC Section 15-39.1-10. Monthly benefits under TFFR are equal to the three highest annual salaries earned divided by 36 months and multiplied by 2.00% times the number of service credits earned. Retirees may elect payment of benefits in the form of a single life annuity, 100% or 50% joint and survivor annuity, ten or twenty-year term certain annuity, partial lump-sum option or level income with Social Security benefits. Members may also qualify for benefits calculated under other formulas.
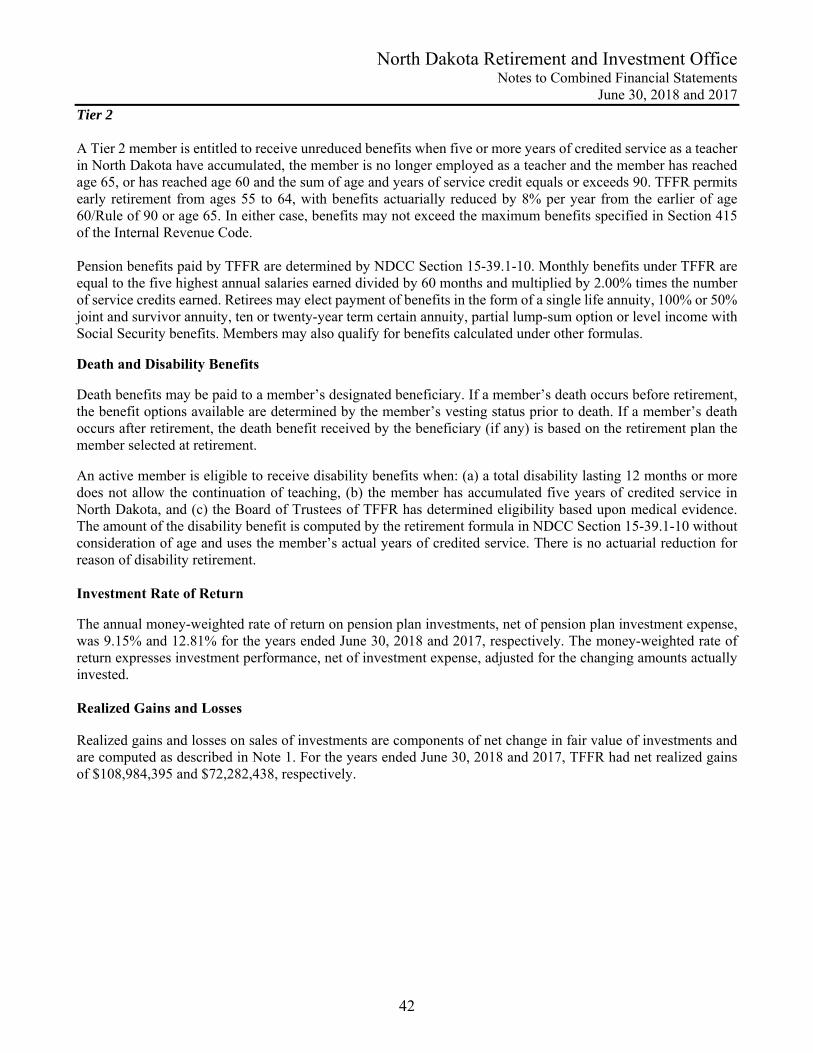
North Dakota Retirement and Investment Office Notes to Combined Financial Statements
June 30, 2018 and 2017
42
Tier 2 A Tier 2 member is entitled to receive unreduced benefits when five or more years of credited service as a teacher in North Dakota have accumulated, the member is no longer employed as a teacher and the member has reached age 65, or has reached age 60 and the sum of age and years of service credit equals or exceeds 90. TFFR permits early retirement from ages 55 to 64, with benefits actuarially reduced by 8% per year from the earlier of age 60/Rule of 90 or age 65. In either case, benefits may not exceed the maximum benefits specified in Section 415 of the Internal Revenue Code. Pension benefits paid by TFFR are determined by NDCC Section 15-39.1-10. Monthly benefits under TFFR are equal to the five highest annual salaries earned divided by 60 months and multiplied by 2.00% times the number of service credits earned. Retirees may elect payment of benefits in the form of a single life annuity, 100% or 50% joint and survivor annuity, ten or twenty-year term certain annuity, partial lump-sum option or level income with Social Security benefits. Members may also qualify for benefits calculated under other formulas. Death and Disability Benefits Death benefits may be paid to a member’s designated beneficiary. If a member’s death occurs before retirement, the benefit options available are determined by the member’s vesting status prior to death. If a member’s death occurs after retirement, the death benefit received by the beneficiary (if any) is based on the retirement plan the member selected at retirement. An active member is eligible to receive disability benefits when: (a) a total disability lasting 12 months or more does not allow the continuation of teaching, (b) the member has accumulated five years of credited service in North Dakota, and (c) the Board of Trustees of TFFR has determined eligibility based upon medical evidence. The amount of the disability benefit is computed by the retirement formula in NDCC Section 15-39.1-10 without consideration of age and uses the member’s actual years of credited service. There is no actuarial reduction for reason of disability retirement. Investment Rate of Return The annual money-weighted rate of return on pension plan investments, net of pension plan investment expense, was 9.15% and 12.81% for the years ended June 30, 2018 and 2017, respectively. The money-weighted rate of return expresses investment performance, net of investment expense, adjusted for the changing amounts actually invested. Realized Gains and Losses Realized gains and losses on sales of investments are components of net change in fair value of investments and are computed as described in Note 1. For the years ended June 30, 2018 and 2017, TFFR had net realized gains of $108,984,395 and $72,282,438, respectively.
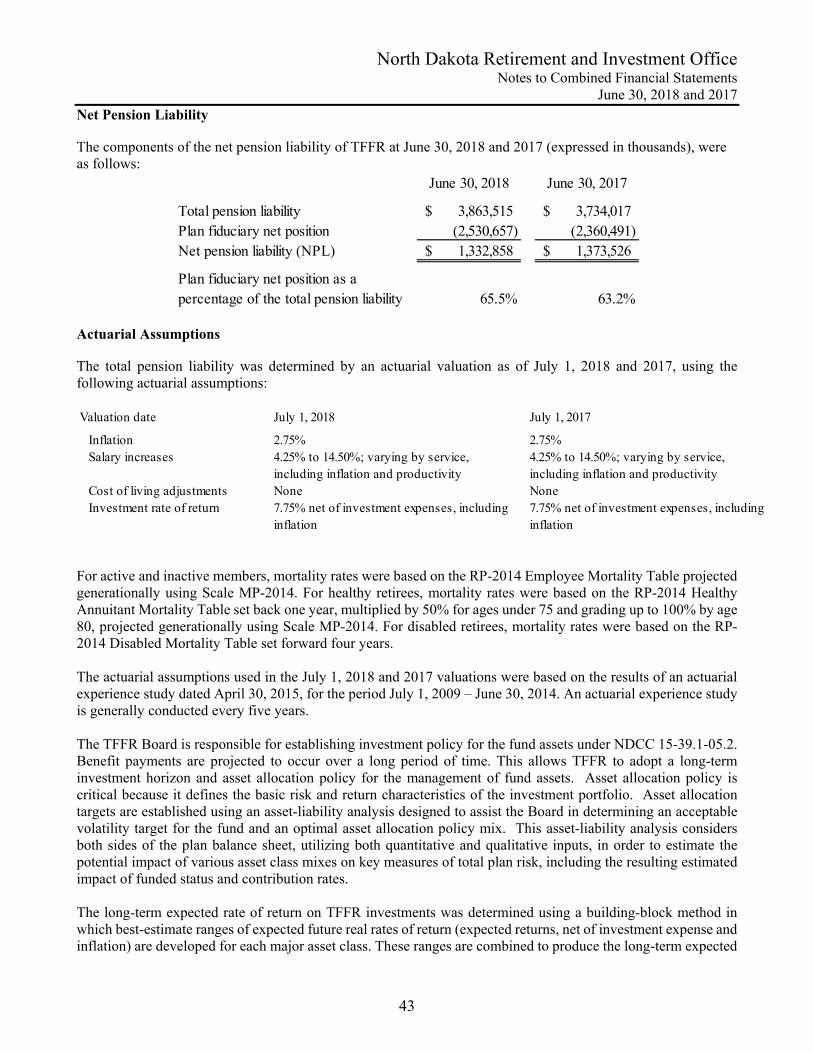
North Dakota Retirement and Investment Office Notes to Combined Financial Statements
June 30, 2018 and 2017
43
Net Pension Liability The components of the net pension liability of TFFR at June 30, 2018 and 2017 (expressed in thousands), were as follows:
June 30, 2018 June 30, 2017
Total pension liability 3,863,515$ 3,734,017$ Plan fiduciary net position (2,530,657) (2,360,491) Net pension liability (NPL) 1,332,858$ 1,373,526$
Plan fiduciary net position as a percentage of the total pension liability 65.5% 63.2%
Actuarial Assumptions The total pension liability was determined by an actuarial valuation as of July 1, 2018 and 2017, using the following actuarial assumptions: Valuation date July 1, 2018 July 1, 2017
Inflation 2.75% 2.75% Salary increases 4.25% to 14.50%; varying by service,
including inflation and productivity4.25% to 14.50%; varying by service, including inflation and productivity
Cost of living adjustments None None Investment rate of return 7.75% net of investment expenses, including
inflation7.75% net of investment expenses, including inflation
For active and inactive members, mortality rates were based on the RP-2014 Employee Mortality Table projected generationally using Scale MP-2014. For healthy retirees, mortality rates were based on the RP-2014 Healthy Annuitant Mortality Table set back one year, multiplied by 50% for ages under 75 and grading up to 100% by age 80, projected generationally using Scale MP-2014. For disabled retirees, mortality rates were based on the RP-2014 Disabled Mortality Table set forward four years. The actuarial assumptions used in the July 1, 2018 and 2017 valuations were based on the results of an actuarial experience study dated April 30, 2015, for the period July 1, 2009 – June 30, 2014. An actuarial experience study is generally conducted every five years. The TFFR Board is responsible for establishing investment policy for the fund assets under NDCC 15-39.1-05.2. Benefit payments are projected to occur over a long period of time. This allows TFFR to adopt a long-term investment horizon and asset allocation policy for the management of fund assets. Asset allocation policy is critical because it defines the basic risk and return characteristics of the investment portfolio. Asset allocation targets are established using an asset-liability analysis designed to assist the Board in determining an acceptable volatility target for the fund and an optimal asset allocation policy mix. This asset-liability analysis considers both sides of the plan balance sheet, utilizing both quantitative and qualitative inputs, in order to estimate the potential impact of various asset class mixes on key measures of total plan risk, including the resulting estimated impact of funded status and contribution rates. The long-term expected rate of return on TFFR investments was determined using a building-block method in which best-estimate ranges of expected future real rates of return (expected returns, net of investment expense and inflation) are developed for each major asset class. These ranges are combined to produce the long-term expected
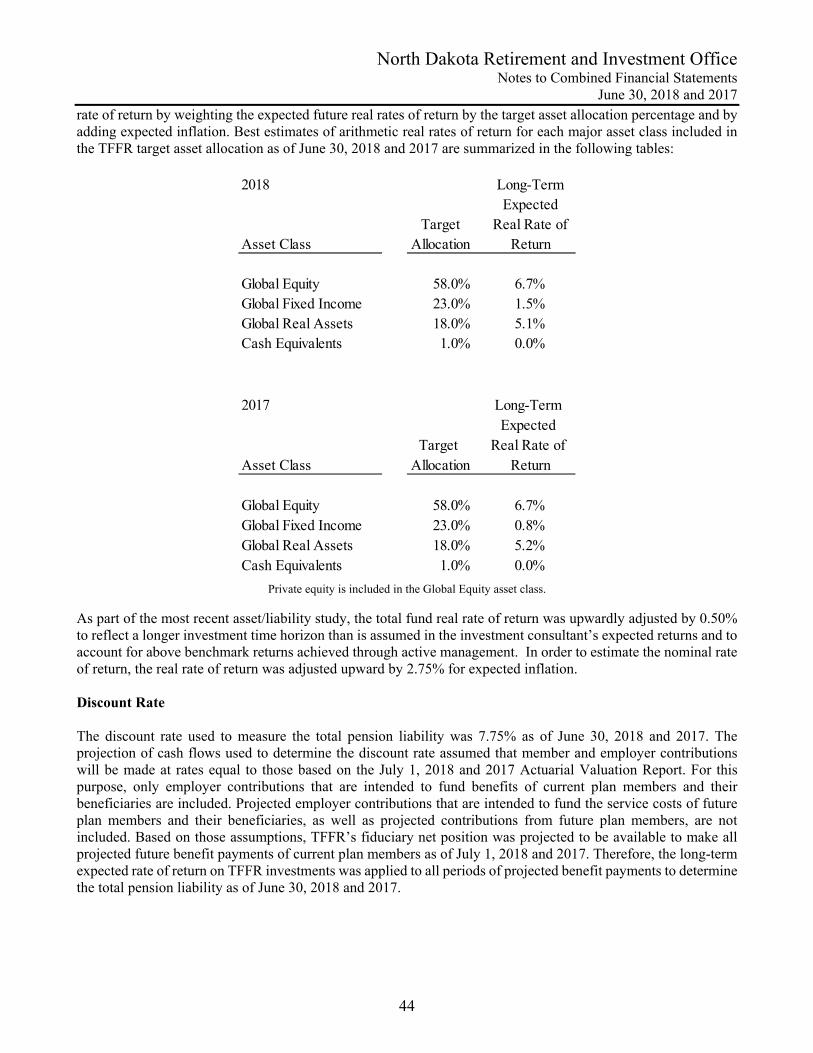
North Dakota Retirement and Investment Office Notes to Combined Financial Statements
June 30, 2018 and 2017
44
rate of return by weighting the expected future real rates of return by the target asset allocation percentage and by adding expected inflation. Best estimates of arithmetic real rates of return for each major asset class included in the TFFR target asset allocation as of June 30, 2018 and 2017 are summarized in the following tables:
2018
Asset ClassTarget
Allocation
Long-Term Expected
Real Rate of Return
Global Equity 58.0% 6.7%Global Fixed Income 23.0% 1.5%Global Real Assets 18.0% 5.1%Cash Equivalents 1.0% 0.0%
2017
Asset ClassTarget
Allocation
Long-Term Expected
Real Rate of Return
Global Equity 58.0% 6.7%Global Fixed Income 23.0% 0.8%Global Real Assets 18.0% 5.2%Cash Equivalents 1.0% 0.0%
Private equity is included in the Global Equity asset class.
As part of the most recent asset/liability study, the total fund real rate of return was upwardly adjusted by 0.50% to reflect a longer investment time horizon than is assumed in the investment consultant’s expected returns and to account for above benchmark returns achieved through active management. In order to estimate the nominal rate of return, the real rate of return was adjusted upward by 2.75% for expected inflation.
Discount Rate The discount rate used to measure the total pension liability was 7.75% as of June 30, 2018 and 2017. The projection of cash flows used to determine the discount rate assumed that member and employer contributions will be made at rates equal to those based on the July 1, 2018 and 2017 Actuarial Valuation Report. For this purpose, only employer contributions that are intended to fund benefits of current plan members and their beneficiaries are included. Projected employer contributions that are intended to fund the service costs of future plan members and their beneficiaries, as well as projected contributions from future plan members, are not included. Based on those assumptions, TFFR’s fiduciary net position was projected to be available to make all projected future benefit payments of current plan members as of July 1, 2018 and 2017. Therefore, the long-term expected rate of return on TFFR investments was applied to all periods of projected benefit payments to determine the total pension liability as of June 30, 2018 and 2017.
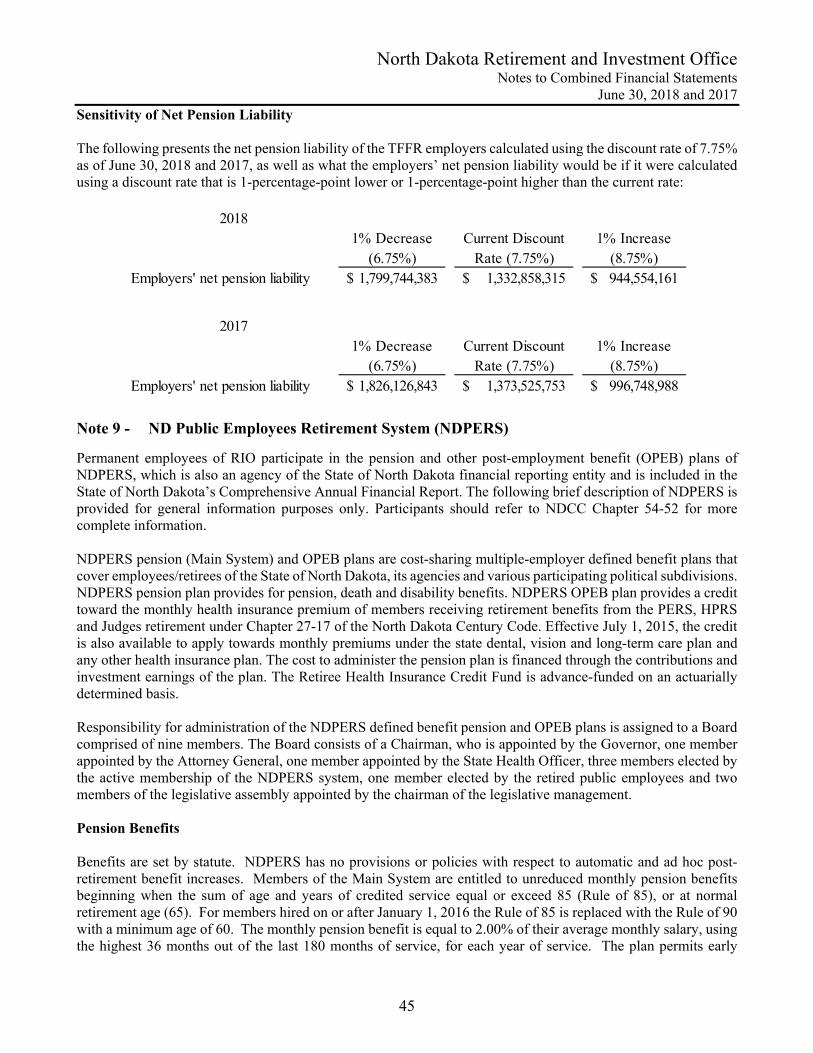
North Dakota Retirement and Investment Office Notes to Combined Financial Statements
June 30, 2018 and 2017
45
Sensitivity of Net Pension Liability The following presents the net pension liability of the TFFR employers calculated using the discount rate of 7.75% as of June 30, 2018 and 2017, as well as what the employers’ net pension liability would be if it were calculated using a discount rate that is 1-percentage-point lower or 1-percentage-point higher than the current rate:
20181% Decrease
(6.75%)Current Discount
Rate (7.75%)1% Increase
(8.75%)Employers' net pension liability 1,799,744,383$ 1,332,858,315$ 944,554,161$
20171% Decrease
(6.75%)Current Discount
Rate (7.75%)1% Increase
(8.75%)Employers' net pension liability 1,826,126,843$ 1,373,525,753$ 996,748,988$
Note 9 - ND Public Employees Retirement System (NDPERS)
Permanent employees of RIO participate in the pension and other post-employment benefit (OPEB) plans of NDPERS, which is also an agency of the State of North Dakota financial reporting entity and is included in the State of North Dakota’s Comprehensive Annual Financial Report. The following brief description of NDPERS is provided for general information purposes only. Participants should refer to NDCC Chapter 54-52 for more complete information. NDPERS pension (Main System) and OPEB plans are cost-sharing multiple-employer defined benefit plans that cover employees/retirees of the State of North Dakota, its agencies and various participating political subdivisions. NDPERS pension plan provides for pension, death and disability benefits. NDPERS OPEB plan provides a credit toward the monthly health insurance premium of members receiving retirement benefits from the PERS, HPRS and Judges retirement under Chapter 27-17 of the North Dakota Century Code. Effective July 1, 2015, the credit is also available to apply towards monthly premiums under the state dental, vision and long-term care plan and any other health insurance plan. The cost to administer the pension plan is financed through the contributions and investment earnings of the plan. The Retiree Health Insurance Credit Fund is advance-funded on an actuarially determined basis. Responsibility for administration of the NDPERS defined benefit pension and OPEB plans is assigned to a Board comprised of nine members. The Board consists of a Chairman, who is appointed by the Governor, one member appointed by the Attorney General, one member appointed by the State Health Officer, three members elected by the active membership of the NDPERS system, one member elected by the retired public employees and two members of the legislative assembly appointed by the chairman of the legislative management. Pension Benefits Benefits are set by statute. NDPERS has no provisions or policies with respect to automatic and ad hoc post-retirement benefit increases. Members of the Main System are entitled to unreduced monthly pension benefits beginning when the sum of age and years of credited service equal or exceed 85 (Rule of 85), or at normal retirement age (65). For members hired on or after January 1, 2016 the Rule of 85 is replaced with the Rule of 90 with a minimum age of 60. The monthly pension benefit is equal to 2.00% of their average monthly salary, using the highest 36 months out of the last 180 months of service, for each year of service. The plan permits early
North Dakota Retirement and Investment Office Notes to Combined Financial Statements
June 30, 2018 and 2017
46
retirement at ages 55-64 with three or more years of service. Members may elect to receive the pension benefits in the form of a single life, joint and survivor, term-certain annuity, or partial lump sum with ongoing annuity. Members may elect to receive the value of their accumulated contributions, plus interest, as a lump sum distribution upon retirement or termination, or they may elect to receive their benefits in the form of an annuity. For each member electing an annuity, total payment will not be less than the members’ accumulated contributions plus interest. Death and Disability Benefits Death and disability benefits are set by statute. If an active member dies with less than three years of service, a death benefit equal to the value of the member’s accumulated contributions, plus interest, is paid to the member’s beneficiary. If the member has earned more than three years of credited service, the surviving spouse will be entitled to a single payment refund, life-time monthly payment in an amount equal to 50% of the member’s accrued normal retirement benefit, or monthly payments in an amount equal to the member’s accrued 100% Joint and Survivor retirement benefit if the member had reached normal retirement age prior to date of death. If the surviving spouse dies before the member’s accumulated pension benefits are paid, the balance will be payable to the surviving spouse’s beneficiary. Eligible members, who become totally disabled after a minimum of 180 days of service, receive monthly disability benefits equal to 25% of their final average salary with a minimum benefit of $100. To qualify under this section, the member has to become disabled during the period of eligible employment and apply for benefits within one year of termination. The definition for disabled is set by the System in the North Dakota Administrative Code. Refunds of Member Contributions Upon termination, if a member is not vested (is not 65 or does not have three years of service credited for the NDPERS) they will receive the accumulated member contributions plus interest, or may elect to receive this amount at a later date. If a member has vested, they have the option of applying for a refund or can remain as a terminated vested participant. If a member terminated and withdrew their accumulated member contributions and is subsequently reemployed, they have the option of repurchasing their previous service. Member and Employer Contributions Member and employer contributions paid to NDPERS are set by statute and are established as a percent of salaries and wages. Member contribution rates are 7% and employer contribution rates are 7.12% of covered compensation. The member’s account balance includes the vested employer contributions equal to the member’s contributions to an eligible deferred compensation plan. The minimum member contribution is $25 and the maximum may not exceed the following: 1 to 12 months of service – Greater of one percent of monthly salary or $25 13 to 24 months of service – Greater of two percent of monthly salary or $25 25 to 36 months of service – Greater of three percent of monthly salary or $25 Longer than 36 months of service – Greater of four percent of monthly salary or $25
North Dakota Retirement and Investment Office Notes to Combined Financial Statements
June 30, 2018 and 2017
47
OPEB Benefits The employer contribution for the PERS, the HPRS and the Defined Contribution Plan is set by statute at 1.14% of covered compensation. The employer contribution for employees of the state board of career and technical education is 2.99% of covered compensation for a period of eight years ending October 1, 2015. Employees participating in the retirement plan as part-time/temporary members are required to contribute 1.14% of their covered compensation to the Retiree Health Insurance Credit Fund. Employees purchasing previous service credit are also required to make an employee contribution to the Fund. The benefit amount applied each year is shown as "prefunded credit applied" on the Statement of Changes in Plan Net Position for the OPEB trust funds. Retiree health insurance credit benefits and death and disability benefits are set by statute. There are no provisions or policies with respect to automatic and ad hoc post-retirement benefit in-creases. Employees who are receiving monthly retirement benefits from the PERS, the HPRS, the Defined Contribution Plan, the Chapter 27-17 judges or an employee receiving disability benefits, or the spouse of a deceased annuitant receiving a surviving spouse benefit or if the member selected a joint and survivor option are eligible to receive a credit toward their monthly health insurance premium under the state health plan. Effective July 1, 2015, the credit is also available to apply towards monthly premiums under the state dental, vision and long-term care plan and any other health insurance plan. The benefits are equal to $5.00 for each of the employee’s, or deceased employee's years of credited service not to exceed the premium in effect for selected coverage. The retiree health insurance credit is also available for early retirement with reduced benefits. Pension & OPEB Liabilities, Pension & OPEB Expense, and Deferred Outflows of Resources and Deferred Inflows of Resources Related to Pensions & OPEB At June 30, 2018 and 2017, RIO reported a liability of $2,629,203 and $1,490,832, respectively, for its proportionate share of the net pension and OPEB liability. Due to the net OPEB liability at June 30, 2017, being immaterial to the overall financial statements of RIO and the individual funds, no prior period adjustment was made. The net pension and OPEB liability was measured as of June 30, 2017 and 2016, and the total pension and OPEB liability used to calculate the net pension and OPEB liability was determined by an actuarial valuation as of that date. RIO's proportion of the net pension liability was based on RIO's share of covered payroll in the pension and OPEB plans relative to the covered payroll of all participating NDPERS Main System and OPEB employers. At June 30, 2017, RIO’s pension plan proportion was 0.156317 percent and as of June 30, 2016, RIO's proportion was 0.152969 percent. RIO’s OPEB plan proportion was 0.147503% as of June 30, 2017 and 2016. RIO recognized pension and OPEB expense of $405,602 and $121,469 for the years ended June 30, 2018 and 2017, respectively. At June 30, 2018 and 2017, RIO reported deferred outflows of resources and deferred inflows of resources related to pensions and OPEB from the following sources:
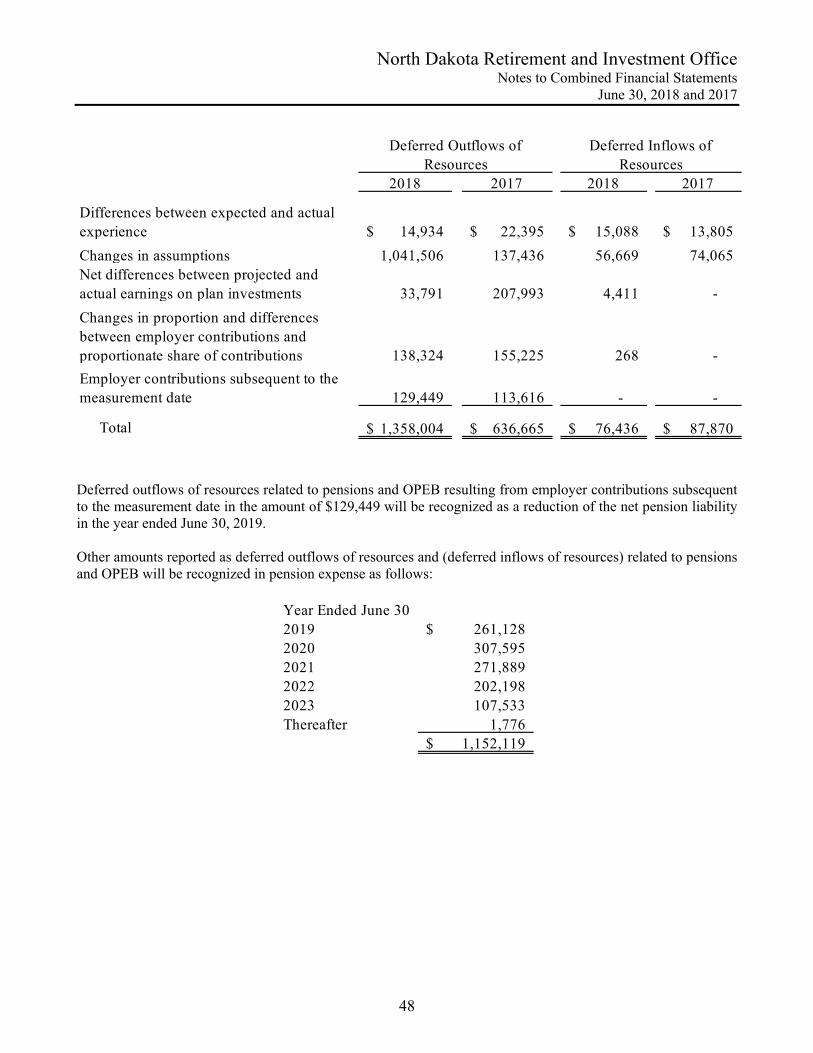
North Dakota Retirement and Investment Office Notes to Combined Financial Statements
June 30, 2018 and 2017
48
2018 2017 2018 2017
Differences between expected and actual experience 14,934$ 22,395$ 15,088$ 13,805$
Changes in assumptions 1,041,506 137,436 56,669 74,065 Net differences between projected and actual earnings on plan investments 33,791 207,993 4,411 -
Changes in proportion and differences between employer contributions and proportionate share of contributions 138,324 155,225 268 -
Employer contributions subsequent to the measurement date 129,449 113,616 - -
Total 1,358,004$ 636,665$ 76,436$ 87,870$
Deferred Outflows of Resources
Deferred Inflows of Resources
Deferred outflows of resources related to pensions and OPEB resulting from employer contributions subsequent to the measurement date in the amount of $129,449 will be recognized as a reduction of the net pension liability in the year ended June 30, 2019. Other amounts reported as deferred outflows of resources and (deferred inflows of resources) related to pensions and OPEB will be recognized in pension expense as follows:
Year Ended June 302019 261,128$ 2020 307,595 2021 271,889 2022 202,198 2023 107,533 Thereafter 1,776
1,152,119$
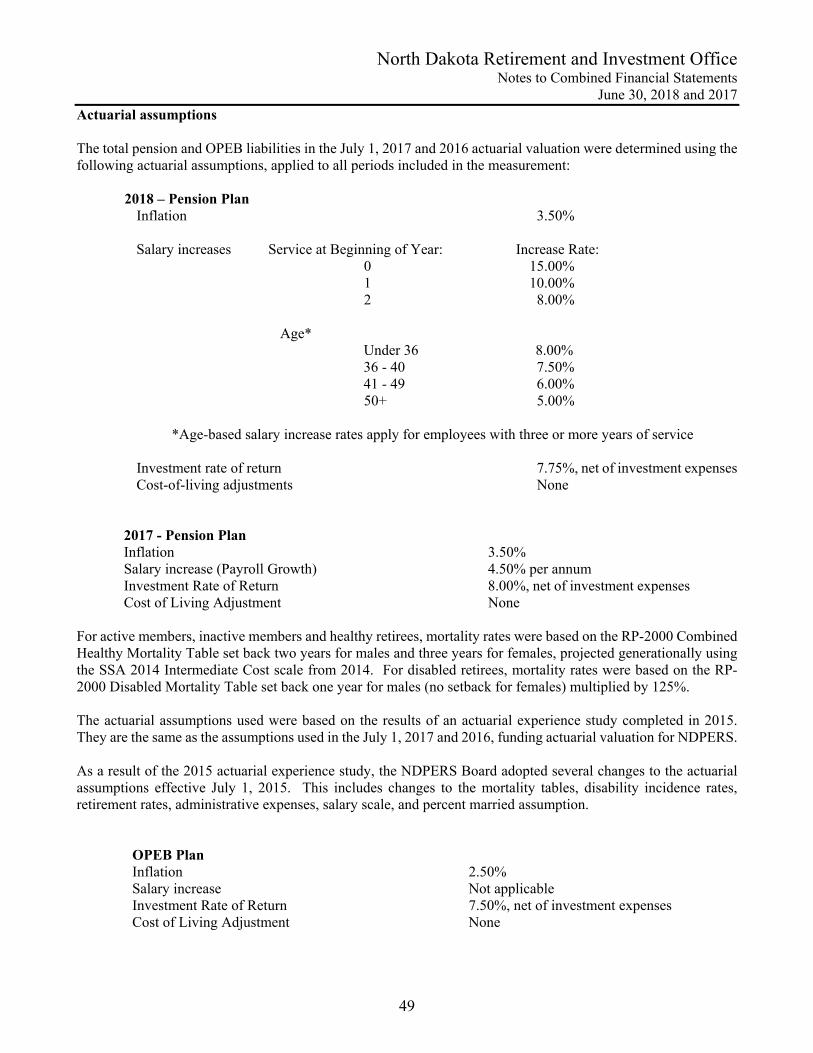
North Dakota Retirement and Investment Office Notes to Combined Financial Statements
June 30, 2018 and 2017
49
Actuarial assumptions The total pension and OPEB liabilities in the July 1, 2017 and 2016 actuarial valuation were determined using the following actuarial assumptions, applied to all periods included in the measurement: 2018 – Pension Plan
Inflation 3.50% Salary increases Service at Beginning of Year: Increase Rate: 0 15.00% 1 10.00% 2 8.00%
Age* Under 36 8.00% 36 - 40 7.50% 41 - 49 6.00% 50+ 5.00%
*Age-based salary increase rates apply for employees with three or more years of service Investment rate of return 7.75%, net of investment expenses Cost-of-living adjustments None
2017 - Pension Plan Inflation 3.50% Salary increase (Payroll Growth) 4.50% per annum Investment Rate of Return 8.00%, net of investment expenses Cost of Living Adjustment None
For active members, inactive members and healthy retirees, mortality rates were based on the RP-2000 Combined Healthy Mortality Table set back two years for males and three years for females, projected generationally using the SSA 2014 Intermediate Cost scale from 2014. For disabled retirees, mortality rates were based on the RP-2000 Disabled Mortality Table set back one year for males (no setback for females) multiplied by 125%. The actuarial assumptions used were based on the results of an actuarial experience study completed in 2015. They are the same as the assumptions used in the July 1, 2017 and 2016, funding actuarial valuation for NDPERS. As a result of the 2015 actuarial experience study, the NDPERS Board adopted several changes to the actuarial assumptions effective July 1, 2015. This includes changes to the mortality tables, disability incidence rates, retirement rates, administrative expenses, salary scale, and percent married assumption.
OPEB Plan Inflation 2.50% Salary increase Not applicable Investment Rate of Return 7.50%, net of investment expenses Cost of Living Adjustment None
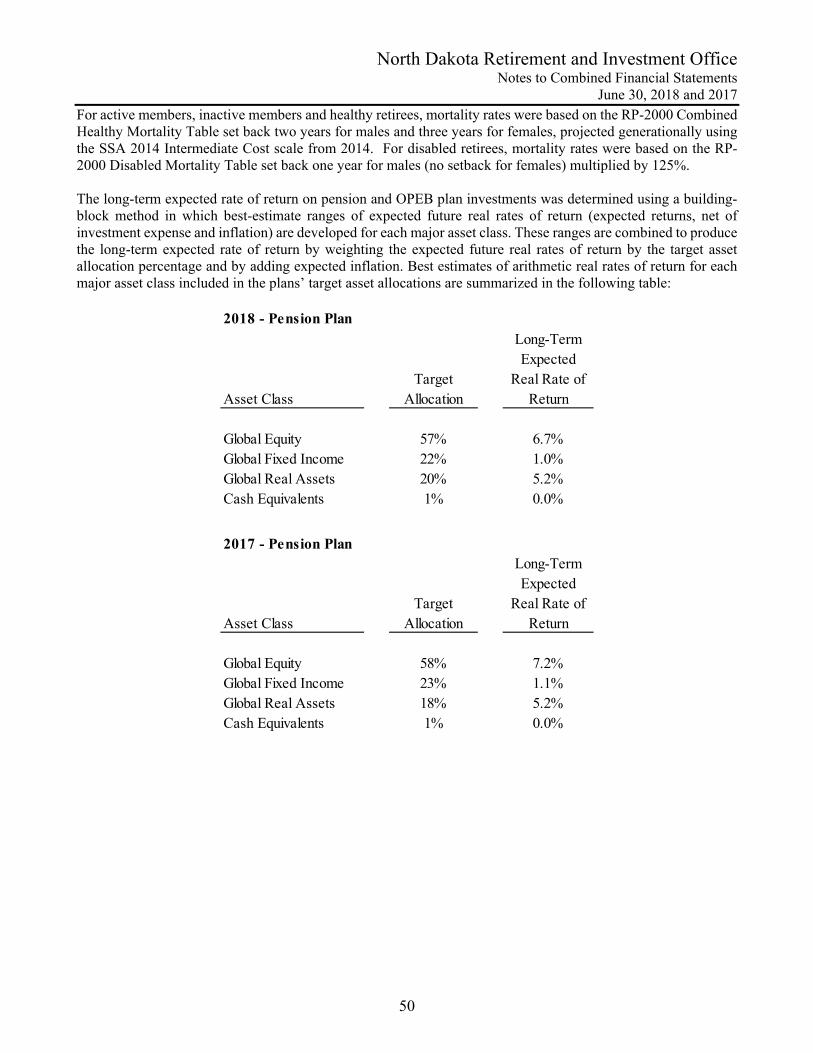
North Dakota Retirement and Investment Office Notes to Combined Financial Statements
June 30, 2018 and 2017
50
For active members, inactive members and healthy retirees, mortality rates were based on the RP-2000 Combined Healthy Mortality Table set back two years for males and three years for females, projected generationally using the SSA 2014 Intermediate Cost scale from 2014. For disabled retirees, mortality rates were based on the RP-2000 Disabled Mortality Table set back one year for males (no setback for females) multiplied by 125%. The long-term expected rate of return on pension and OPEB plan investments was determined using a building-block method in which best-estimate ranges of expected future real rates of return (expected returns, net of investment expense and inflation) are developed for each major asset class. These ranges are combined to produce the long-term expected rate of return by weighting the expected future real rates of return by the target asset allocation percentage and by adding expected inflation. Best estimates of arithmetic real rates of return for each major asset class included in the plans’ target asset allocations are summarized in the following table:
2018 - Pension Plan
Asset ClassTarget
Allocation
Long-Term Expected
Real Rate of Return
Global Equity 57% 6.7%Global Fixed Income 22% 1.0%Global Real Assets 20% 5.2%Cash Equivalents 1% 0.0%
2017 - Pension Plan
Asset ClassTarget
Allocation
Long-Term Expected
Real Rate of Return
Global Equity 58% 7.2%Global Fixed Income 23% 1.1%Global Real Assets 18% 5.2%Cash Equivalents 1% 0.0%
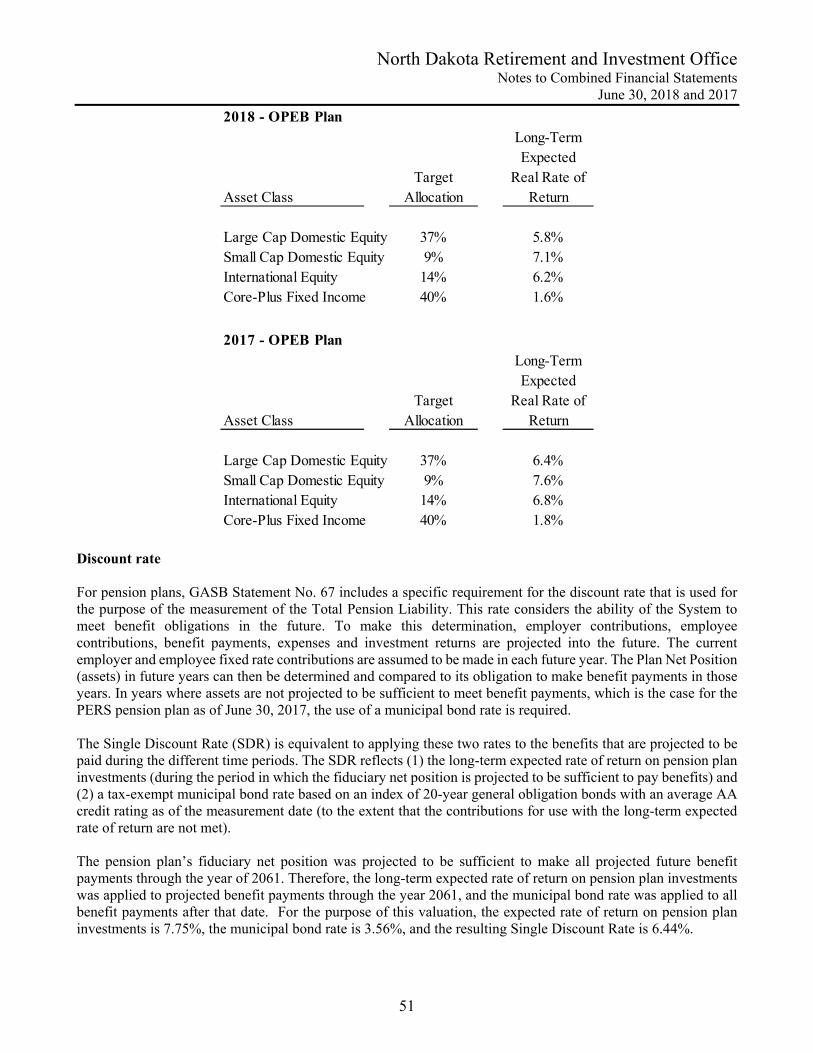
North Dakota Retirement and Investment Office Notes to Combined Financial Statements
June 30, 2018 and 2017
51
2018 - OPEB Plan
Asset ClassTarget
Allocation
Long-Term Expected
Real Rate of Return
Large Cap Domestic Equity 37% 5.8%Small Cap Domestic Equity 9% 7.1%International Equity 14% 6.2%Core-Plus Fixed Income 40% 1.6%
2017 - OPEB Plan
Asset ClassTarget
Allocation
Long-Term Expected
Real Rate of Return
Large Cap Domestic Equity 37% 6.4%Small Cap Domestic Equity 9% 7.6%International Equity 14% 6.8%Core-Plus Fixed Income 40% 1.8%
Discount rate For pension plans, GASB Statement No. 67 includes a specific requirement for the discount rate that is used for the purpose of the measurement of the Total Pension Liability. This rate considers the ability of the System to meet benefit obligations in the future. To make this determination, employer contributions, employee contributions, benefit payments, expenses and investment returns are projected into the future. The current employer and employee fixed rate contributions are assumed to be made in each future year. The Plan Net Position (assets) in future years can then be determined and compared to its obligation to make benefit payments in those years. In years where assets are not projected to be sufficient to meet benefit payments, which is the case for the PERS pension plan as of June 30, 2017, the use of a municipal bond rate is required. The Single Discount Rate (SDR) is equivalent to applying these two rates to the benefits that are projected to be paid during the different time periods. The SDR reflects (1) the long-term expected rate of return on pension plan investments (during the period in which the fiduciary net position is projected to be sufficient to pay benefits) and (2) a tax-exempt municipal bond rate based on an index of 20-year general obligation bonds with an average AA credit rating as of the measurement date (to the extent that the contributions for use with the long-term expected rate of return are not met). The pension plan’s fiduciary net position was projected to be sufficient to make all projected future benefit payments through the year of 2061. Therefore, the long-term expected rate of return on pension plan investments was applied to projected benefit payments through the year 2061, and the municipal bond rate was applied to all benefit payments after that date. For the purpose of this valuation, the expected rate of return on pension plan investments is 7.75%, the municipal bond rate is 3.56%, and the resulting Single Discount Rate is 6.44%.
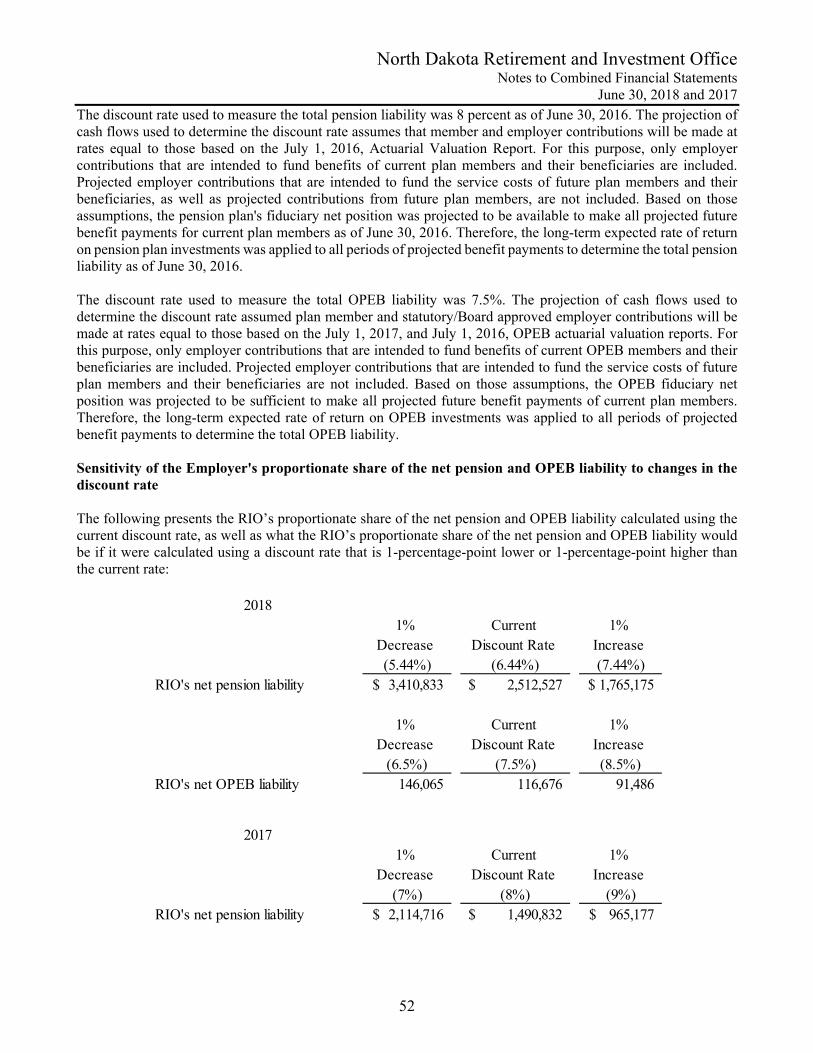
North Dakota Retirement and Investment Office Notes to Combined Financial Statements
June 30, 2018 and 2017
52
The discount rate used to measure the total pension liability was 8 percent as of June 30, 2016. The projection of cash flows used to determine the discount rate assumes that member and employer contributions will be made at rates equal to those based on the July 1, 2016, Actuarial Valuation Report. For this purpose, only employer contributions that are intended to fund benefits of current plan members and their beneficiaries are included. Projected employer contributions that are intended to fund the service costs of future plan members and their beneficiaries, as well as projected contributions from future plan members, are not included. Based on those assumptions, the pension plan's fiduciary net position was projected to be available to make all projected future benefit payments for current plan members as of June 30, 2016. Therefore, the long-term expected rate of return on pension plan investments was applied to all periods of projected benefit payments to determine the total pension liability as of June 30, 2016. The discount rate used to measure the total OPEB liability was 7.5%. The projection of cash flows used to determine the discount rate assumed plan member and statutory/Board approved employer contributions will be made at rates equal to those based on the July 1, 2017, and July 1, 2016, OPEB actuarial valuation reports. For this purpose, only employer contributions that are intended to fund benefits of current OPEB members and their beneficiaries are included. Projected employer contributions that are intended to fund the service costs of future plan members and their beneficiaries are not included. Based on those assumptions, the OPEB fiduciary net position was projected to be sufficient to make all projected future benefit payments of current plan members. Therefore, the long-term expected rate of return on OPEB investments was applied to all periods of projected benefit payments to determine the total OPEB liability. Sensitivity of the Employer's proportionate share of the net pension and OPEB liability to changes in the discount rate The following presents the RIO’s proportionate share of the net pension and OPEB liability calculated using the current discount rate, as well as what the RIO’s proportionate share of the net pension and OPEB liability would be if it were calculated using a discount rate that is 1-percentage-point lower or 1-percentage-point higher than the current rate:
20181%
Decrease (5.44%)
Current Discount Rate
(6.44%)
1% Increase (7.44%)
RIO's net pension liability 3,410,833$ 2,512,527$ 1,765,175$
1% Decrease
(6.5%)
Current Discount Rate
(7.5%)
1% Increase (8.5%)
RIO's net OPEB liability 146,065 116,676 91,486
20171%
Decrease (7%)
Current Discount Rate
(8%)
1% Increase
(9%)RIO's net pension liability 2,114,716$ 1,490,832$ 965,177$
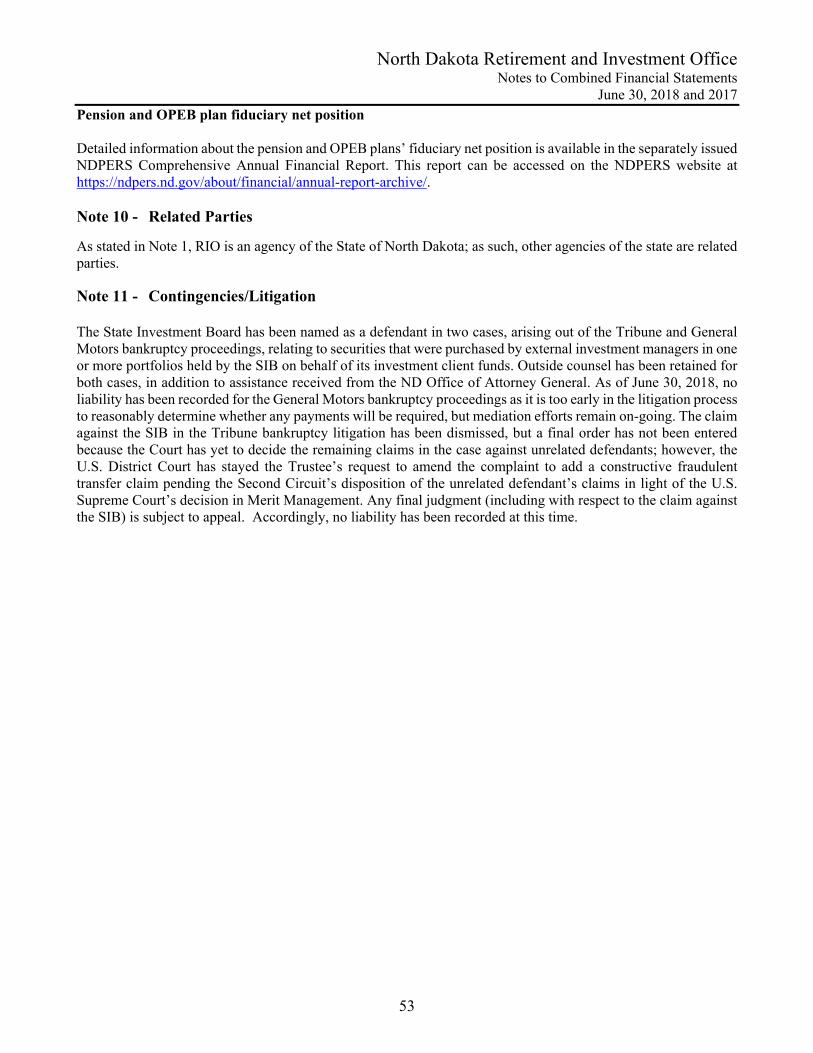
North Dakota Retirement and Investment Office Notes to Combined Financial Statements
June 30, 2018 and 2017
53
Pension and OPEB plan fiduciary net position Detailed information about the pension and OPEB plans’ fiduciary net position is available in the separately issued NDPERS Comprehensive Annual Financial Report. This report can be accessed on the NDPERS website at https://ndpers.nd.gov/about/financial/annual-report-archive/. Note 10 - Related Parties
As stated in Note 1, RIO is an agency of the State of North Dakota; as such, other agencies of the state are related parties. Note 11 - Contingencies/Litigation The State Investment Board has been named as a defendant in two cases, arising out of the Tribune and General Motors bankruptcy proceedings, relating to securities that were purchased by external investment managers in one or more portfolios held by the SIB on behalf of its investment client funds. Outside counsel has been retained for both cases, in addition to assistance received from the ND Office of Attorney General. As of June 30, 2018, no liability has been recorded for the General Motors bankruptcy proceedings as it is too early in the litigation process to reasonably determine whether any payments will be required, but mediation efforts remain on-going. The claim against the SIB in the Tribune bankruptcy litigation has been dismissed, but a final order has not been entered because the Court has yet to decide the remaining claims in the case against unrelated defendants; however, the U.S. District Court has stayed the Trustee’s request to amend the complaint to add a constructive fraudulent transfer claim pending the Second Circuit’s disposition of the unrelated defendant’s claims in light of the U.S. Supreme Court’s decision in Merit Management. Any final judgment (including with respect to the claim against the SIB) is subject to appeal. Accordingly, no liability has been recorded at this time.

54
REQUIRED SUPPLEMENTARY INFORMATION
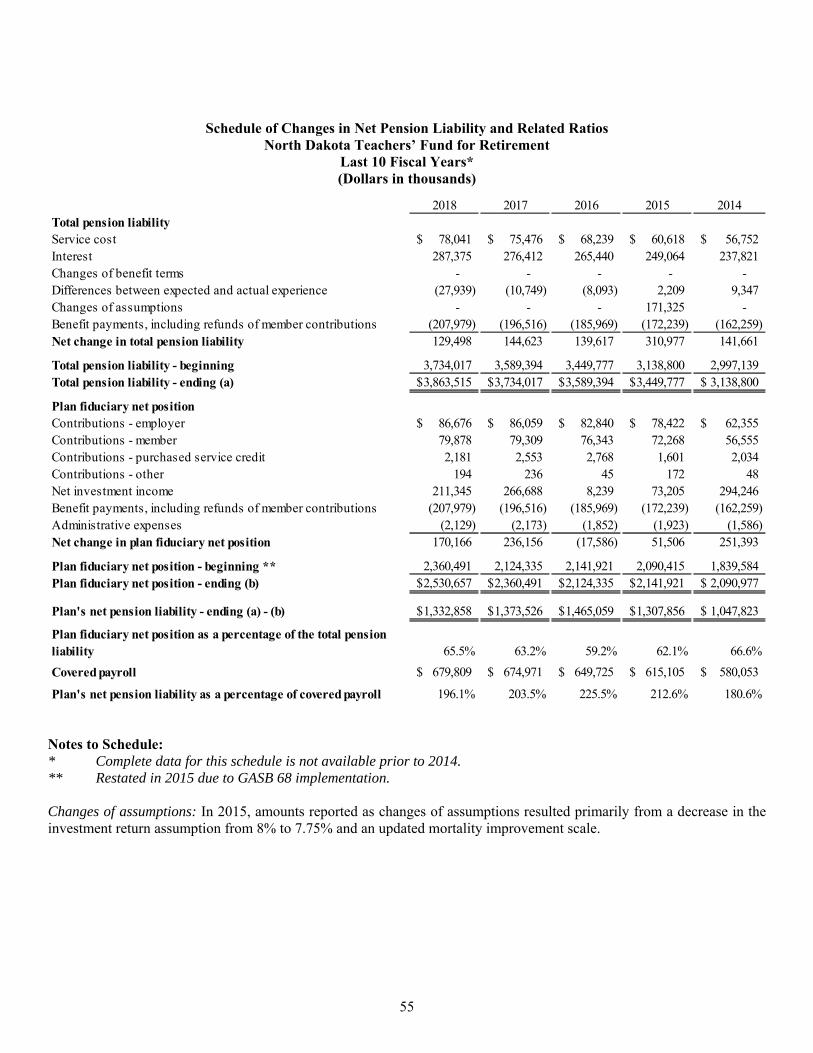
55
Schedule of Changes in Net Pension Liability and Related Ratios North Dakota Teachers’ Fund for Retirement
Last 10 Fiscal Years* (Dollars in thousands)
2018 2017 2016 2015 2014Total pension liabilityService cost 78,041$ 75,476$ 68,239$ 60,618$ 56,752$ Interest 287,375 276,412 265,440 249,064 237,821 Changes of benefit terms - - - - - Differences between expected and actual experience (27,939) (10,749) (8,093) 2,209 9,347 Changes of assumptions - - - 171,325 - Benefit payments, including refunds of member contributions (207,979) (196,516) (185,969) (172,239) (162,259) Net change in total pension liability 129,498 144,623 139,617 310,977 141,661
Total pension liability - beginning 3,734,017 3,589,394 3,449,777 3,138,800 2,997,139 Total pension liability - ending (a) 3,863,515$ 3,734,017$ 3,589,394$ 3,449,777$ 3,138,800$
Plan fiduciary net positionContributions - employer 86,676$ 86,059$ 82,840$ 78,422$ 62,355$ Contributions - member 79,878 79,309 76,343 72,268 56,555 Contributions - purchased service credit 2,181 2,553 2,768 1,601 2,034 Contributions - other 194 236 45 172 48 Net investment income 211,345 266,688 8,239 73,205 294,246 Benefit payments, including refunds of member contributions (207,979) (196,516) (185,969) (172,239) (162,259) Administrative expenses (2,129) (2,173) (1,852) (1,923) (1,586) Net change in plan fiduciary net position 170,166 236,156 (17,586) 51,506 251,393
Plan fiduciary net position - beginning ** 2,360,491 2,124,335 2,141,921 2,090,415 1,839,584 Plan fiduciary net position - ending (b) 2,530,657$ 2,360,491$ 2,124,335$ 2,141,921$ 2,090,977$
Plan's net pension liability - ending (a) - (b) 1,332,858$ 1,373,526$ 1,465,059$ 1,307,856$ 1,047,823$
Plan fiduciary net position as a percentage of the total pension liability 65.5% 63.2% 59.2% 62.1% 66.6%
Covered payroll 679,809$ 674,971$ 649,725$ 615,105$ 580,053$
Plan's net pension liability as a percentage of covered payroll 196.1% 203.5% 225.5% 212.6% 180.6%
Notes to Schedule: * Complete data for this schedule is not available prior to 2014. ** Restated in 2015 due to GASB 68 implementation. Changes of assumptions: In 2015, amounts reported as changes of assumptions resulted primarily from a decrease in the investment return assumption from 8% to 7.75% and an updated mortality improvement scale.
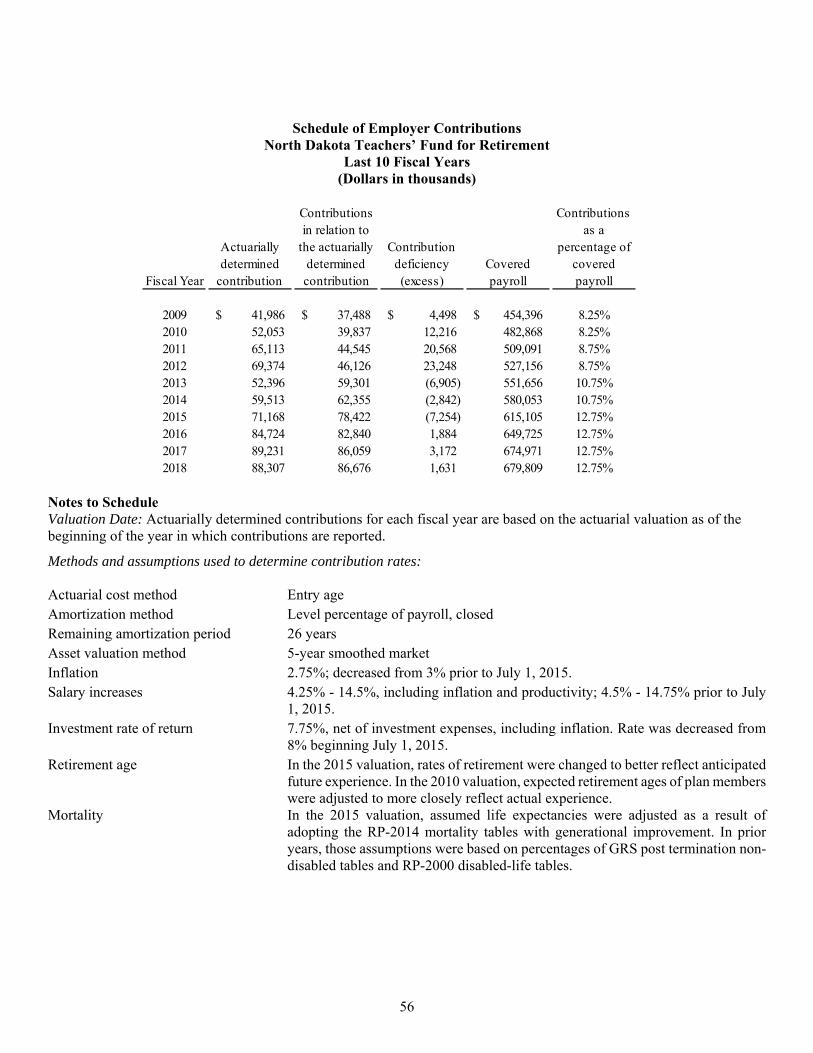
56
Schedule of Employer Contributions North Dakota Teachers’ Fund for Retirement
Last 10 Fiscal Years (Dollars in thousands)
Fiscal Year
Actuarially determined
contribution
Contributions in relation to
the actuarially determined contribution
Contribution deficiency (excess)
Covered payroll
Contributions as a
percentage of covered payroll
2009 41,986$ 37,488$ 4,498$ 454,396$ 8.25%2010 52,053 39,837 12,216 482,868 8.25%2011 65,113 44,545 20,568 509,091 8.75%2012 69,374 46,126 23,248 527,156 8.75%2013 52,396 59,301 (6,905) 551,656 10.75%2014 59,513 62,355 (2,842) 580,053 10.75%2015 71,168 78,422 (7,254) 615,105 12.75%2016 84,724 82,840 1,884 649,725 12.75%2017 89,231 86,059 3,172 674,971 12.75%2018 88,307 86,676 1,631 679,809 12.75%
Notes to Schedule Valuation Date: Actuarially determined contributions for each fiscal year are based on the actuarial valuation as of the beginning of the year in which contributions are reported. Methods and assumptions used to determine contribution rates: Actuarial cost method Entry age Amortization method Level percentage of payroll, closed Remaining amortization period 26 years Asset valuation method 5-year smoothed market Inflation 2.75%; decreased from 3% prior to July 1, 2015. Salary increases 4.25% - 14.5%, including inflation and productivity; 4.5% - 14.75% prior to July
1, 2015. Investment rate of return 7.75%, net of investment expenses, including inflation. Rate was decreased from
8% beginning July 1, 2015. Retirement age In the 2015 valuation, rates of retirement were changed to better reflect anticipated
future experience. In the 2010 valuation, expected retirement ages of plan members were adjusted to more closely reflect actual experience.
Mortality In the 2015 valuation, assumed life expectancies were adjusted as a result of adopting the RP-2014 mortality tables with generational improvement. In prior years, those assumptions were based on percentages of GRS post termination non-disabled tables and RP-2000 disabled-life tables.
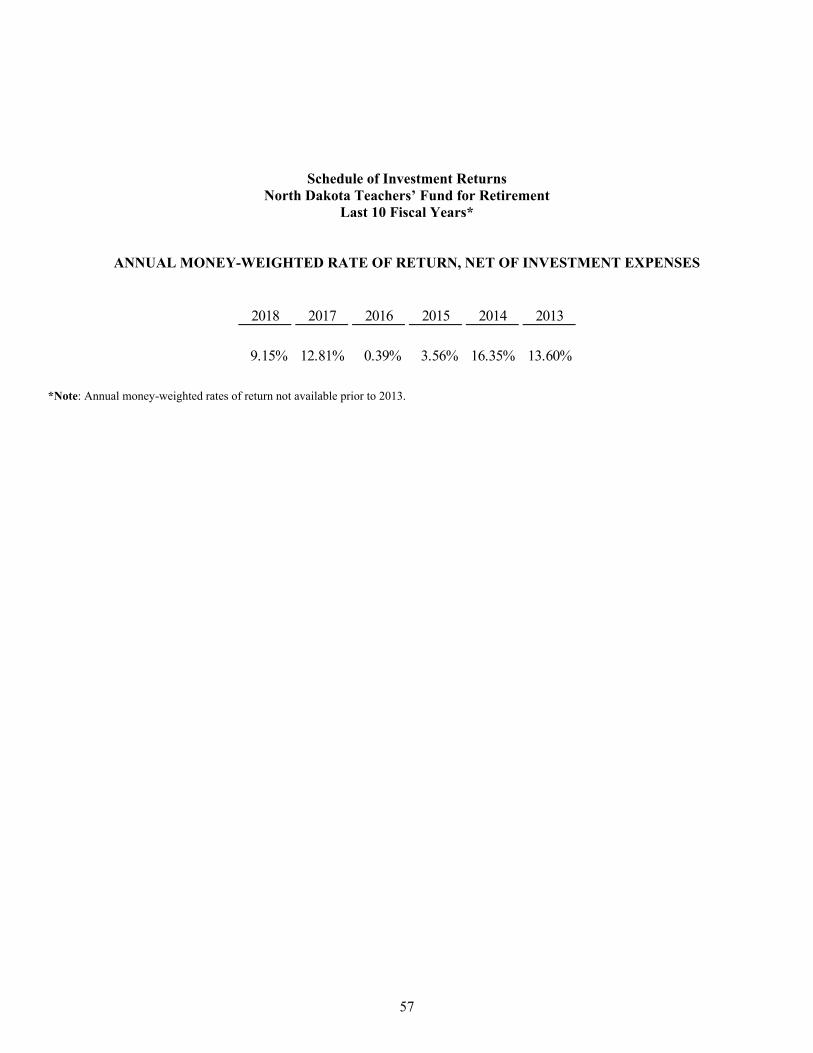
57
Schedule of Investment Returns North Dakota Teachers’ Fund for Retirement
Last 10 Fiscal Years*
ANNUAL MONEY-WEIGHTED RATE OF RETURN, NET OF INVESTMENT EXPENSES
2018 2017 2016 2015 2014 2013
9.15% 12.81% 0.39% 3.56% 16.35% 13.60%
*Note: Annual money-weighted rates of return not available prior to 2013.
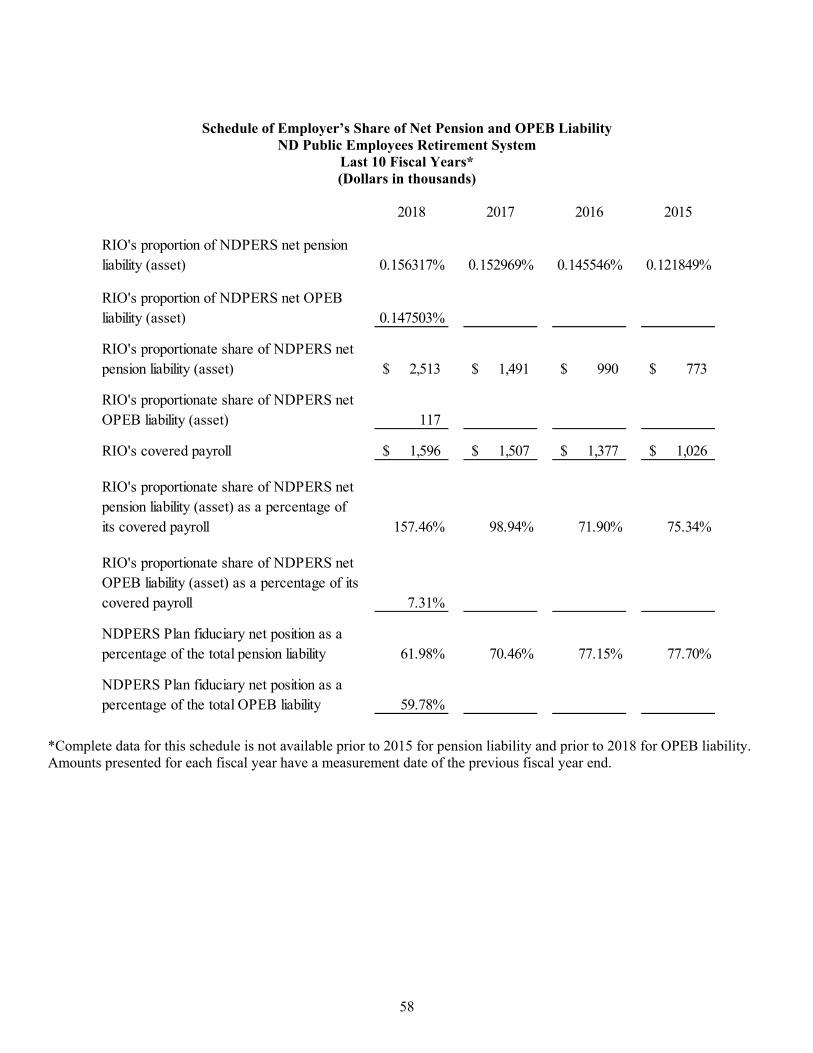
58
Schedule of Employer’s Share of Net Pension and OPEB Liability ND Public Employees Retirement System
Last 10 Fiscal Years* (Dollars in thousands)
2018 2017 2016 2015
RIO's proportion of NDPERS net pension liability (asset) 0.156317% 0.152969% 0.145546% 0.121849%
RIO's proportion of NDPERS net OPEB liability (asset) 0.147503%
RIO's proportionate share of NDPERS net pension liability (asset) 2,513$ 1,491$ 990$ 773$
RIO's proportionate share of NDPERS net OPEB liability (asset) 117
RIO's covered payroll 1,596$ 1,507$ 1,377$ 1,026$
RIO's proportionate share of NDPERS net pension liability (asset) as a percentage of its covered payroll 157.46% 98.94% 71.90% 75.34%
RIO's proportionate share of NDPERS net OPEB liability (asset) as a percentage of its covered payroll 7.31%
NDPERS Plan fiduciary net position as a percentage of the total pension liability 61.98% 70.46% 77.15% 77.70%
NDPERS Plan fiduciary net position as a percentage of the total OPEB liability 59.78%
*Complete data for this schedule is not available prior to 2015 for pension liability and prior to 2018 for OPEB liability. Amounts presented for each fiscal year have a measurement date of the previous fiscal year end.
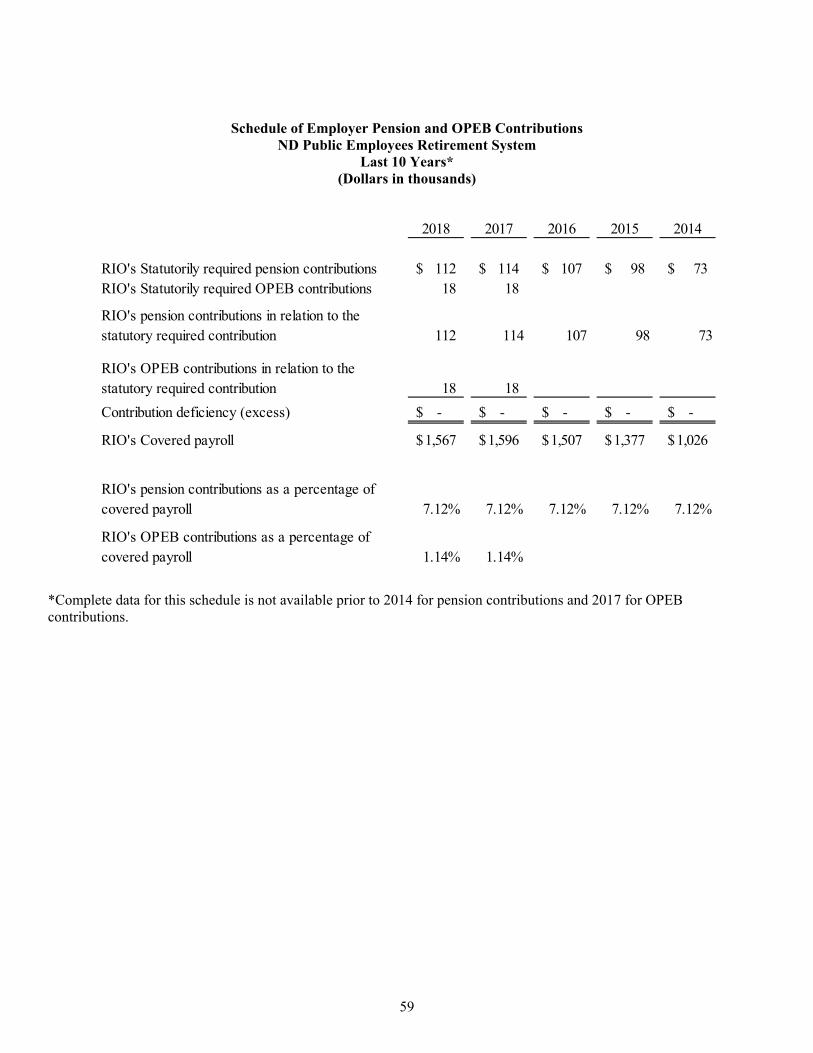
59
Schedule of Employer Pension and OPEB Contributions ND Public Employees Retirement System
Last 10 Years* (Dollars in thousands)
2018 2017 2016 2015 2014
RIO's Statutorily required pension contributions 112$ 114$ 107$ 98$ 73$ RIO's Statutorily required OPEB contributions 18 18
RIO's pension contributions in relation to the statutory required contribution 112 114 107 98 73
RIO's OPEB contributions in relation to the statutory required contribution 18 18
Contribution deficiency (excess) -$ -$ -$ -$ -$
RIO's Covered payroll 1,567$ 1,596$ 1,507$ 1,377$ 1,026$
RIO's pension contributions as a percentage of covered payroll 7.12% 7.12% 7.12% 7.12% 7.12%
RIO's OPEB contributions as a percentage of covered payroll 1.14% 1.14%
*Complete data for this schedule is not available prior to 2014 for pension contributions and 2017 for OPEB contributions.
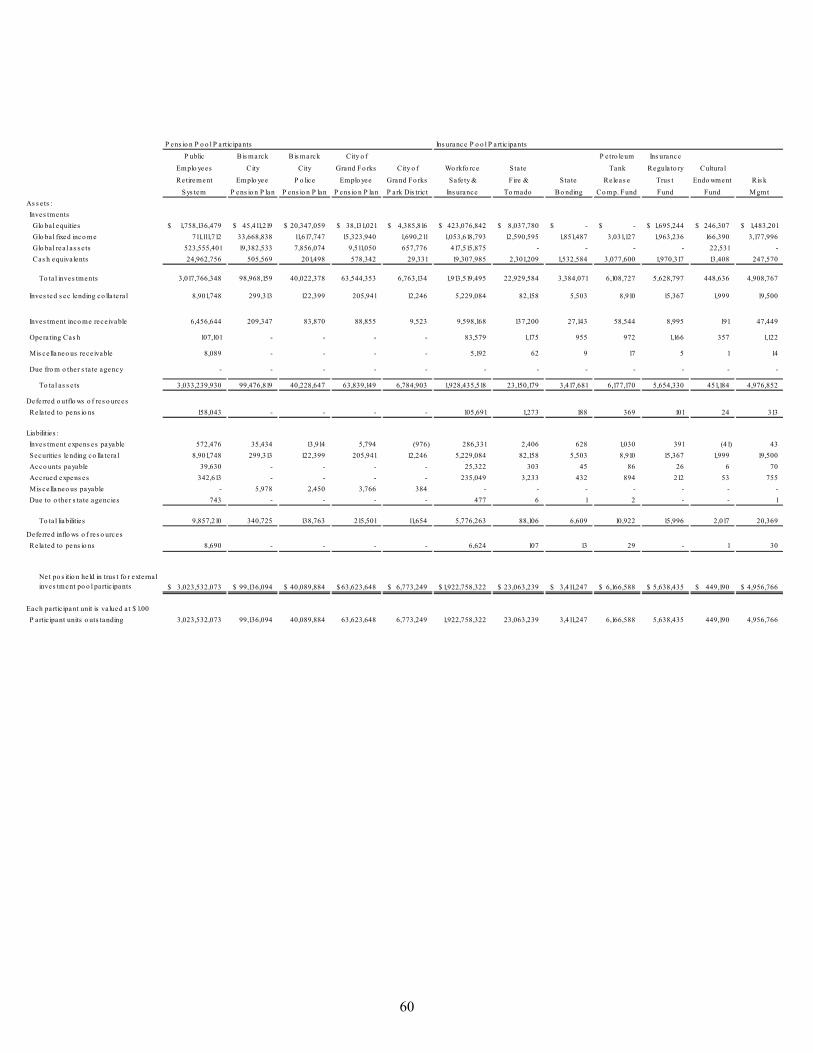
60
P ens io n P o o l P artic ipants Ins urance P o o l P artic ipants
P ublic Bis marck Bis marck City o f P e tro leum Ins urance
Emplo yees City City Grand Fo rks City o f Wo rkfo rce Sta te Tank Regula to ry Cultura l
Retirement Emplo yee P o lice Emplo yee Grand Fo rks Safe ty & Fire & Sta te Re leas e Trus t Endo wment Ris k
Sys tem P ens io n P lan P ens io n P lan P ens io n P lan P ark Dis tric t Ins urance To rnado Bo nding Co mp. Fund Fund Fund Mgmt
As s e ts :
Inves tments
Glo ba l equities 1,758,136,479$ 45,411,219$ 20,347,059$ 38,131,021$ 4,385,816$ 423,076,842$ 8,037,780$ -$ -$ 1,695,244$ 246,307$ 1,483,201$
Glo ba l fixed inco me 711,111,712 33,668,838 11,617,747 15,323,940 1,690,211 1,053,618,793 12,590,595 1,851,487 3,031,127 1,963,236 166,390 3,177,996
Glo ba l rea l as s e ts 523,555,401 19,382,533 7,856,074 9,511,050 657,776 417,515,875 - - - - 22,531 -
Cas h equiva lents 24,962,756 505,569 201,498 578,342 29,331 19,307,985 2,301,209 1,532,584 3,077,600 1,970,317 13,408 247,570
To ta l inves tments 3,017,766,348 98,968,159 40,022,378 63,544,353 6,763,134 1,913,519,495 22,929,584 3,384,071 6,108,727 5,628,797 448,636 4,908,767
Inves ted s ec lending co lla te ra l 8,901,748 299,313 122,399 205,941 12,246 5,229,084 82,158 5,503 8,910 15,367 1,999 19,500
Inves tment inco me rece ivable 6,456,644 209,347 83,870 88,855 9,523 9,598,168 137,200 27,143 58,544 8,995 191 47,449
Opera ting Cas h 107,101 - - - - 83,579 1,175 955 972 1,166 357 1,122
Mis ce llaneo us rece ivable 8,089 - - - - 5,192 62 9 17 5 1 14
Due fro m o ther s ta te agency - - - - - - - - - - - -
To ta l as s e ts 3,033,239,930 99,476,819 40,228,647 63,839,149 6,784,903 1,928,435,518 23,150,179 3,417,681 6,177,170 5,654,330 451,184 4,976,852
Deferred o utflo ws o f res o urces
Re la ted to pens io ns 158,043 - - - - 105,691 1,273 188 369 101 24 313
Liabilities :
Inves tment expens es payable 572,476 35,434 13,914 5,794 (976) 286,331 2,406 628 1,030 391 (41) 43
Securities lending co lla te ra l 8,901,748 299,313 122,399 205,941 12,246 5,229,084 82,158 5,503 8,910 15,367 1,999 19,500
Acco unts payable 39,630 - - - - 25,322 303 45 86 26 6 70
Accrued expens es 342,613 - - - - 235,049 3,233 432 894 212 53 755
Mis ce llaneo us payable - 5,978 2,450 3,766 384 - - - - - - -
Due to o ther s ta te agenc ies 743 - - - - 477 6 1 2 - - 1
To ta l liabilities 9,857,210 340,725 138,763 215,501 11,654 5,776,263 88,106 6,609 10,922 15,996 2,017 20,369
Deferred inflo ws o f res o urces
Re la ted to pens io ns 8,690 - - - - 6,624 107 13 29 - 1 30
Ne t po s itio n he ld in trus t fo r exte rna l inves tment po o l partic ipants 3,023,532,073$ 99,136,094$ 40,089,884$ 63,623,648$ 6,773,249$ 1,922,758,322$ 23,063,239$ 3,411,247$ 6,166,588$ 5,638,435$ 449,190$ 4,956,766$
Each partic ipant unit is va lued a t $ 1.00
P artic ipant units o uts tanding 3,023,532,073 99,136,094 40,089,884 63,623,648 6,773,249 1,922,758,322 23,063,239 3,411,247 6,166,588 5,638,435 449,190 4,956,766
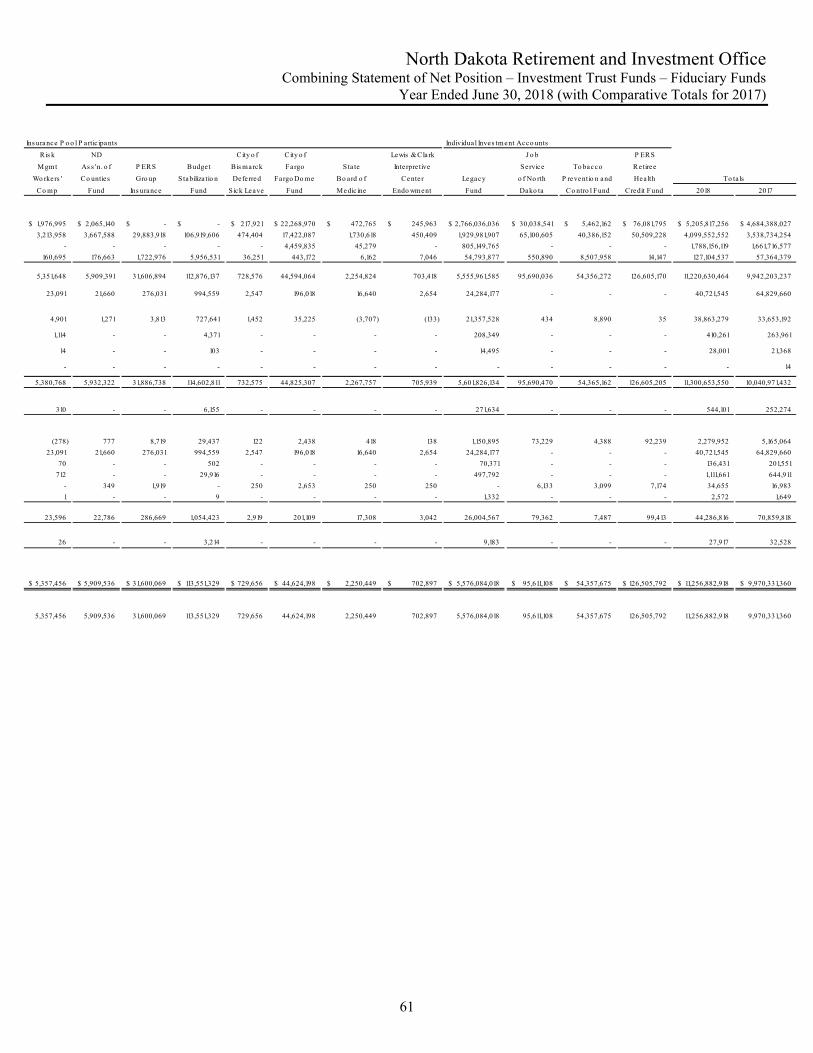
North Dakota Retirement and Investment Office Combining Statement of Net Position – Investment Trust Funds – Fiduciary Funds
Year Ended June 30, 2018 (with Comparative Totals for 2017)
61
Ris k ND City o f City o f Lewis & Clark J o b P ERS
Mgmt As s 'n. o f P ERS Budget Bis marck Fargo Sta te Inte rpre tive Service To bacco Retiree
Wo rkers ' Co unties Gro up S tabiliza tio n Deferred Fargo Do me Bo ard o f Center Legacy o f No rth P reventio n and Health
Co mp Fund Ins urance Fund Sick Leave Fund Medic ine Endo wment Fund Dako ta Co ntro l Fund Credit Fund 2018 2017
1,976,995$ 2,065,140$ -$ -$ 217,921$ 22,268,970$ 472,765$ 245,963$ 2,766,036,036$ 30,038,541$ 5,462,162$ 76,081,795$ 5,205,817,256$ 4,684,388,027$
3,213,958 3,667,588 29,883,918 106,919,606 474,404 17,422,087 1,730,618 450,409 1,929,981,907 65,100,605 40,386,152 50,509,228 4,099,552,552 3,538,734,254
- - - - - 4,459,835 45,279 - 805,149,765 - - - 1,788,156,119 1,661,716,577
160,695 176,663 1,722,976 5,956,531 36,251 443,172 6,162 7,046 54,793,877 550,890 8,507,958 14,147 127,104,537 57,364,379
5,351,648 5,909,391 31,606,894 112,876,137 728,576 44,594,064 2,254,824 703,418 5,555,961,585 95,690,036 54,356,272 126,605,170 11,220,630,464 9,942,203,237
23,091 21,660 276,031 994,559 2,547 196,018 16,640 2,654 24,284,177 - - - 40,721,545 64,829,660
4,901 1,271 3,813 727,641 1,452 35,225 (3,707) (133) 21,357,528 434 8,890 35 38,863,279 33,653,192
1,114 - - 4,371 - - - - 208,349 - - - 410,261 263,961
14 - - 103 - - - - 14,495 - - - 28,001 21,368
- - - - - - - - - - - - - 14
5,380,768 5,932,322 31,886,738 114,602,811 732,575 44,825,307 2,267,757 705,939 5,601,826,134 95,690,470 54,365,162 126,605,205 11,300,653,550 10,040,971,432
310 - - 6,155 - - - - 271,634 - - - 544,101 252,274
(278) 777 8,719 29,437 122 2,438 418 138 1,150,895 73,229 4,388 92,239 2,279,952 5,165,064
23,091 21,660 276,031 994,559 2,547 196,018 16,640 2,654 24,284,177 - - - 40,721,545 64,829,660
70 - - 502 - - - - 70,371 - - - 136,431 201,551
712 - - 29,916 - - - - 497,792 - - - 1,111,661 644,911
- 349 1,919 - 250 2,653 250 250 - 6,133 3,099 7,174 34,655 16,983
1 - - 9 - - - - 1,332 - - - 2,572 1,649
23,596 22,786 286,669 1,054,423 2,919 201,109 17,308 3,042 26,004,567 79,362 7,487 99,413 44,286,816 70,859,818
26 - - 3,214 - - - - 9,183 - - - 27,917 32,528
5,357,456$ 5,909,536$ 31,600,069$ 113,551,329$ 729,656$ 44,624,198$ 2,250,449$ 702,897$ 5,576,084,018$ 95,611,108$ 54,357,675$ 126,505,792$ 11,256,882,918$ 9,970,331,360$
5,357,456 5,909,536 31,600,069 113,551,329 729,656 44,624,198 2,250,449 702,897 5,576,084,018 95,611,108 54,357,675 126,505,792 11,256,882,918 9,970,331,360
Individua l Inves tment Acco unts
To ta ls
Ins urance P o o l P artic ipants
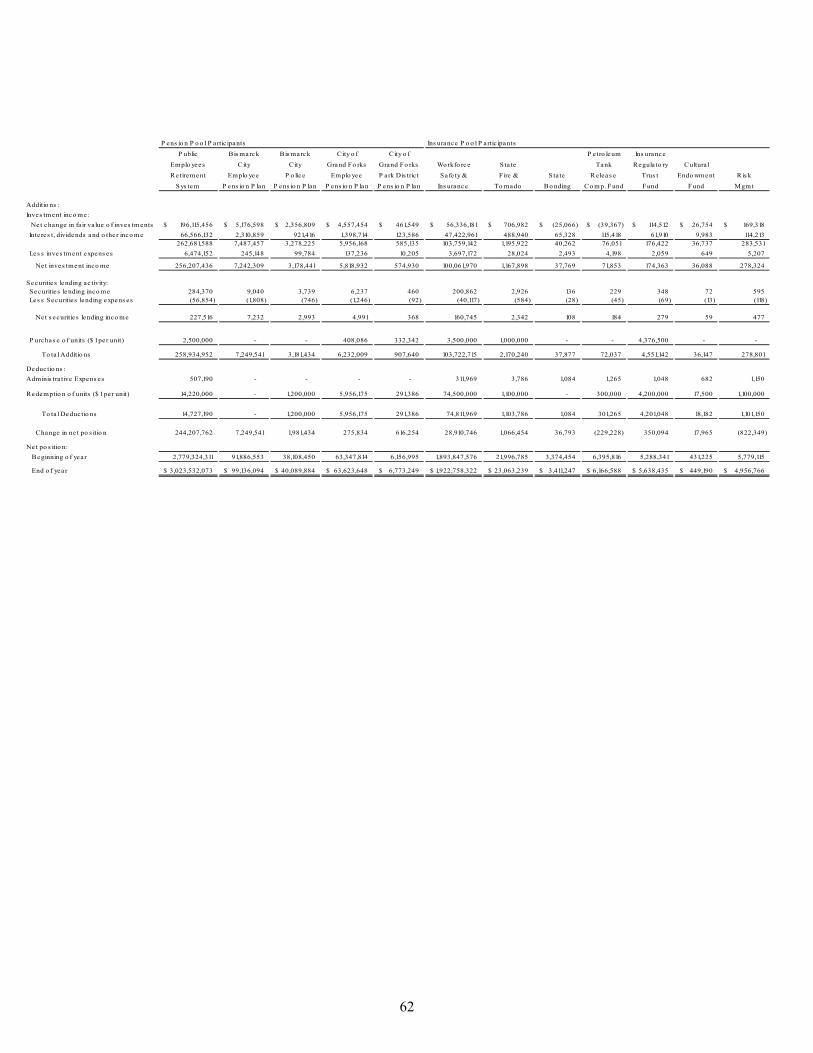
62
P ublic Bis marck Bis marck City o f City o f P etro leum Ins urance
Emplo yees City City Grand Fo rks Grand Fo rks Wo rkfo rce Sta te Tank Regula to ry Cultura l
Re tirement Emplo yee P o lice Emplo yee P ark Dis tric t Sa fe ty & Fire & State Releas e Trus t Endo wment Ris k
Sys tem P ens io n P lan P ens io n P lan P ens io n P lan P ens io n P lan Ins urance To rnado Bo nding Co mp. Fund Fund Fund Mgmt
Additio ns :
Inves tment inco me:
Ne t change in fa ir va lue o f inves tments 196,115,456$ 5,176,598$ 2,356,809$ 4,557,454$ 461,549$ 56,336,181$ 706,982$ (25,066)$ (39,367)$ 114,512$ 26,754$ 169,318$
Inte res t, dividends and o the r inco me 66,566,132 2,310,859 921,416 1,398,714 123,586 47,422,961 488,940 65,328 115,418 61,910 9,983 114,213 262,681,588 7,487,457 3,278,225 5,956,168 585,135 103,759,142 1,195,922 40,262 76,051 176,422 36,737 283,531
Les s inves tment expens es 6,474,152 245,148 99,784 137,236 10,205 3,697,172 28,024 2,493 4,198 2,059 649 5,207
Net inves tment inco me 256,207,436 7,242,309 3,178,441 5,818,932 574,930 100,061,970 1,167,898 37,769 71,853 174,363 36,088 278,324
Securitie s lending ac tivity: Securitie s lending inco me 284,370 9,040 3,739 6,237 460 200,862 2,926 136 229 348 72 595 Les s Securities lending expens es (56,854) (1,808) (746) (1,246) (92) (40,117) (584) (28) (45) (69) (13) (118)
Net s ecuritie s lending inco me 227,516 7,232 2,993 4,991 368 160,745 2,342 108 184 279 59 477
P urchas e o f units ($ 1 per unit) 2,500,000 - - 408,086 332,342 3,500,000 1,000,000 - - 4,376,500 - -
To ta l Additio ns 258,934,952 7,249,541 3,181,434 6,232,009 907,640 103,722,715 2,170,240 37,877 72,037 4,551,142 36,147 278,801
Deductio ns :
Adminis tra tive Expens es 507,190 - - - - 311,969 3,786 1,084 1,265 1,048 682 1,150
Redemptio n o f units ($ 1 per unit) 14,220,000 - 1,200,000 5,956,175 291,386 74,500,000 1,100,000 - 300,000 4,200,000 17,500 1,100,000
To ta l Deduc tio ns 14,727,190 - 1,200,000 5,956,175 291,386 74,811,969 1,103,786 1,084 301,265 4,201,048 18,182 1,101,150
Change in net po s itio n 244,207,762 7,249,541 1,981,434 275,834 616,254 28,910,746 1,066,454 36,793 (229,228) 350,094 17,965 (822,349)
Ne t po s itio n:
Beginning o f year 2,779,324,311 91,886,553 38,108,450 63,347,814 6,156,995 1,893,847,576 21,996,785 3,374,454 6,395,816 5,288,341 431,225 5,779,115
End o f yea r 3,023,532,073$ 99,136,094$ 40,089,884$ 63,623,648$ 6,773,249$ 1,922,758,322$ 23,063,239$ 3,411,247$ 6,166,588$ 5,638,435$ 449,190$ 4,956,766$
P ens io n P o o l P artic ipants Ins urance P o o l P artic ipants
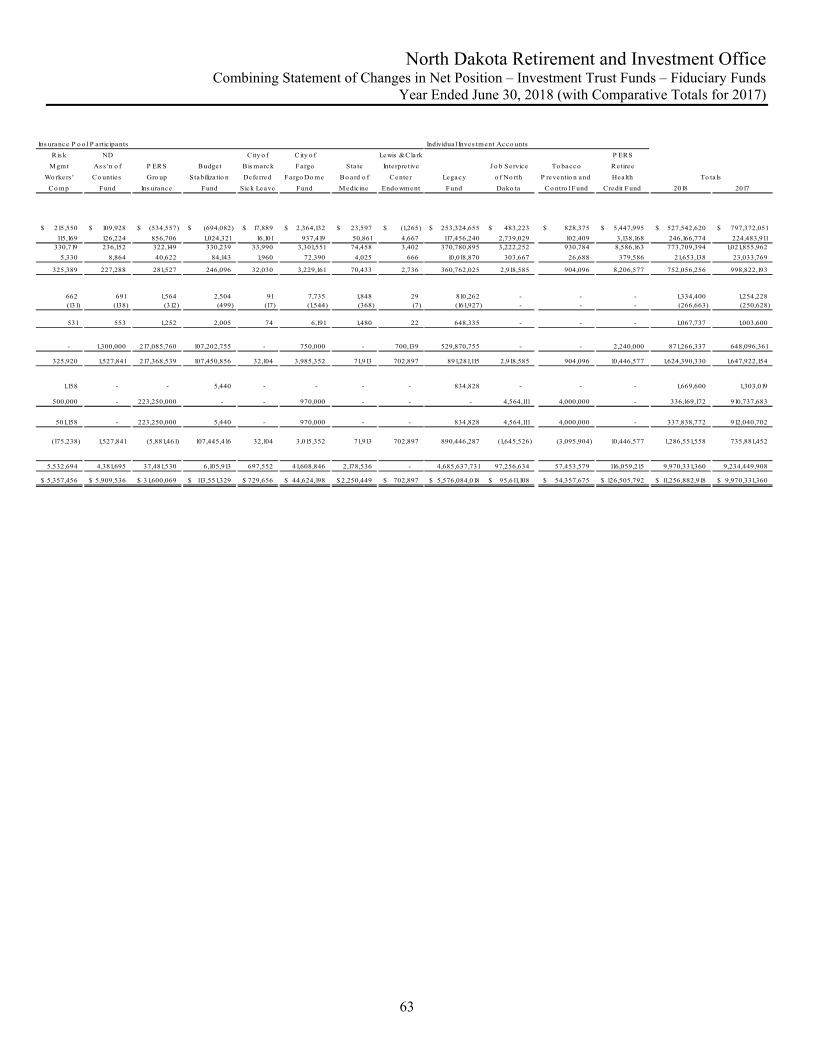
North Dakota Retirement and Investment Office Combining Statement of Changes in Net Position – Investment Trust Funds – Fiduciary Funds
Year Ended June 30, 2018 (with Comparative Totals for 2017)
63
Ins urance P o o l P artic ipants
Ris k ND City o f City o f Lewis & Clark P ERS
Mgmt As s 'n o f P ERS Budget Bis marck Fargo Sta te Interpre tive J o b Service To bacco Retiree
Wo rkers ' Co unties Gro up Stabiliza tio n Deferred Fargo Do me Bo ard o f Cente r Legacy o f No rth P reventio n and Hea lth
Co mp Fund Ins urance Fund Sick Leave Fund Medicine Endo wment Fund Dako ta Co ntro l Fund Credit Fund 2018 2017
215,550$ 109,928$ (534,557)$ (694,082)$ 17,889$ 2,364,132$ 23,597$ (1,265)$ 253,324,655$ 483,223$ 828,375$ 5,447,995$ 527,542,620$ 797,372,051$
115,169 126,224 856,706 1,024,321 16,101 937,419 50,861 4,667 117,456,240 2,739,029 102,409 3,138,168 246,166,774 224,483,911 330,719 236,152 322,149 330,239 33,990 3,301,551 74,458 3,402 370,780,895 3,222,252 930,784 8,586,163 773,709,394 1,021,855,962
5,330 8,864 40,622 84,143 1,960 72,390 4,025 666 10,018,870 303,667 26,688 379,586 21,653,138 23,033,769
325,389 227,288 281,527 246,096 32,030 3,229,161 70,433 2,736 360,762,025 2,918,585 904,096 8,206,577 752,056,256 998,822,193
662 691 1,564 2,504 91 7,735 1,848 29 810,262 - - - 1,334,400 1,254,228 (131) (138) (312) (499) (17) (1,544) (368) (7) (161,927) - - - (266,663) (250,628)
531 553 1,252 2,005 74 6,191 1,480 22 648,335 - - - 1,067,737 1,003,600
- 1,300,000 217,085,760 107,202,755 - 750,000 - 700,139 529,870,755 - - 2,240,000 871,266,337 648,096,361
325,920 1,527,841 217,368,539 107,450,856 32,104 3,985,352 71,913 702,897 891,281,115 2,918,585 904,096 10,446,577 1,624,390,330 1,647,922,154
1,158 - - 5,440 - - - - 834,828 - - - 1,669,600 1,303,019
500,000 - 223,250,000 - - 970,000 - - - 4,564,111 4,000,000 - 336,169,172 910,737,683
501,158 - 223,250,000 5,440 - 970,000 - - 834,828 4,564,111 4,000,000 - 337,838,772 912,040,702
(175,238) 1,527,841 (5,881,461) 107,445,416 32,104 3,015,352 71,913 702,897 890,446,287 (1,645,526) (3,095,904) 10,446,577 1,286,551,558 735,881,452
5,532,694 4,381,695 37,481,530 6,105,913 697,552 41,608,846 2,178,536 - 4,685,637,731 97,256,634 57,453,579 116,059,215 9,970,331,360 9,234,449,908
5,357,456$ 5,909,536$ 31,600,069$ 113,551,329$ 729,656$ 44,624,198$ 2,250,449$ 702,897$ 5,576,084,018$ 95,611,108$ 54,357,675$ 126,505,792$ 11,256,882,918$ 9,970,331,360$
Individua l Inves tment Acco unts
To ta ls
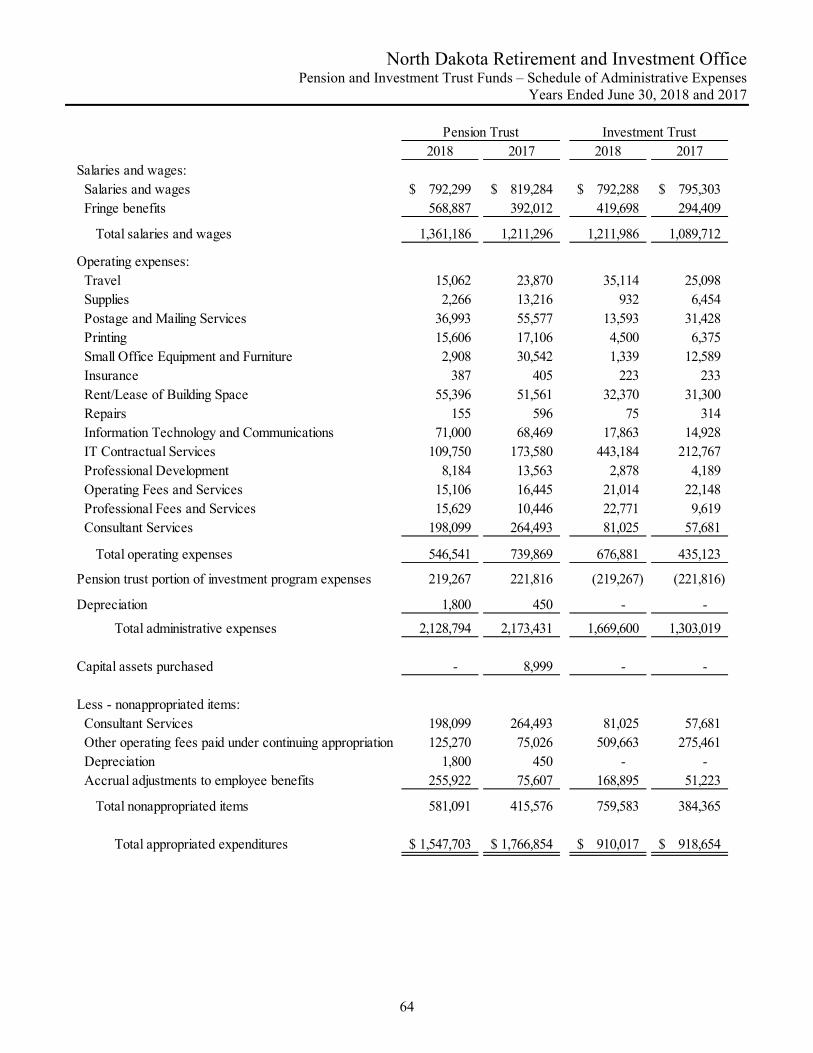
North Dakota Retirement and Investment Office Pension and Investment Trust Funds – Schedule of Administrative Expenses
Years Ended June 30, 2018 and 2017
64
2018 2017 2018 2017Salaries and wages: Salaries and wages 792,299$ 819,284$ 792,288$ 795,303$ Fringe benefits 568,887 392,012 419,698 294,409
Total salaries and wages 1,361,186 1,211,296 1,211,986 1,089,712
Operating expenses: Travel 15,062 23,870 35,114 25,098 Supplies 2,266 13,216 932 6,454 Postage and Mailing Services 36,993 55,577 13,593 31,428 Printing 15,606 17,106 4,500 6,375 Small Office Equipment and Furniture 2,908 30,542 1,339 12,589 Insurance 387 405 223 233 Rent/Lease of Building Space 55,396 51,561 32,370 31,300 Repairs 155 596 75 314 Information Technology and Communications 71,000 68,469 17,863 14,928 IT Contractual Services 109,750 173,580 443,184 212,767 Professional Development 8,184 13,563 2,878 4,189 Operating Fees and Services 15,106 16,445 21,014 22,148 Professional Fees and Services 15,629 10,446 22,771 9,619 Consultant Services 198,099 264,493 81,025 57,681
Total operating expenses 546,541 739,869 676,881 435,123
Pension trust portion of investment program expenses 219,267 221,816 (219,267) (221,816)
Depreciation 1,800 450 - -
Total administrative expenses 2,128,794 2,173,431 1,669,600 1,303,019
Capital assets purchased - 8,999 - -
Less - nonappropriated items: Consultant Services 198,099 264,493 81,025 57,681 Other operating fees paid under continuing appropriation 125,270 75,026 509,663 275,461 Depreciation 1,800 450 - - Accrual adjustments to employee benefits 255,922 75,607 168,895 51,223
Total nonappropriated items 581,091 415,576 759,583 384,365
Total appropriated expenditures 1,547,703$ 1,766,854$ 910,017$ 918,654$
Pension Trust Investment Trust
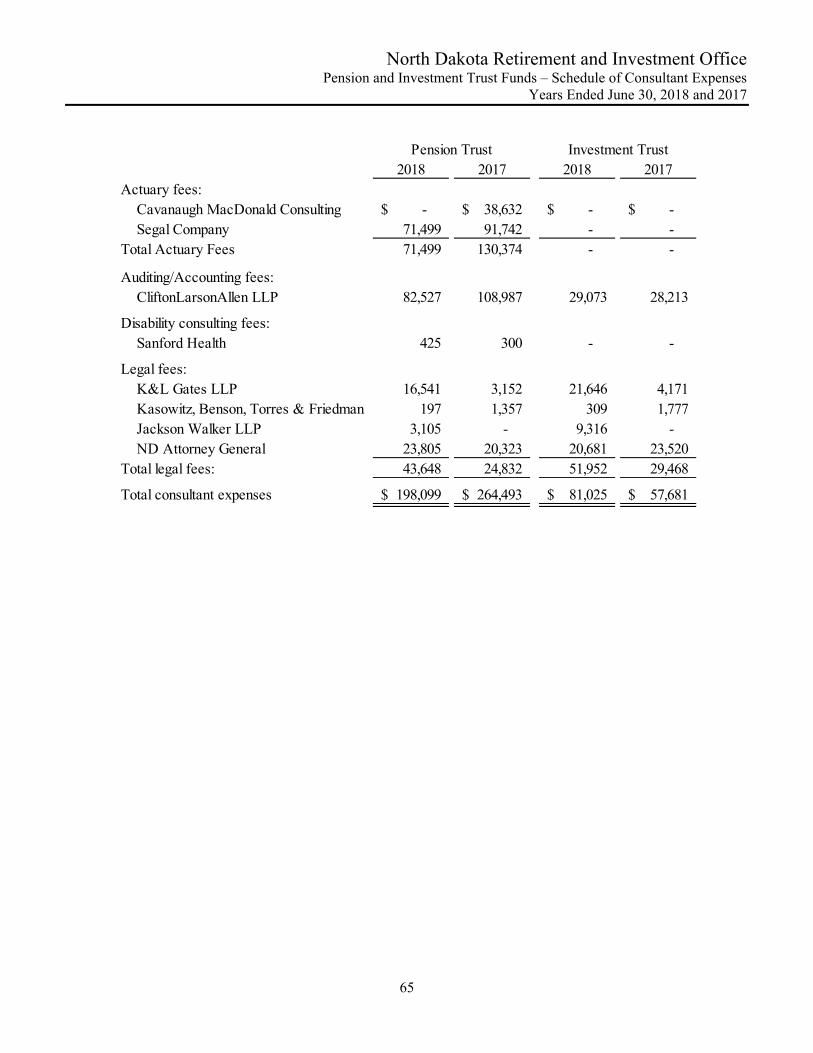
North Dakota Retirement and Investment Office Pension and Investment Trust Funds – Schedule of Consultant Expenses
Years Ended June 30, 2018 and 2017
65
2018 2017 2018 2017Actuary fees:
Cavanaugh MacDonald Consulting -$ 38,632$ -$ -$ Segal Company 71,499 91,742 - -
Total Actuary Fees 71,499 130,374 - -
Auditing/Accounting fees:CliftonLarsonAllen LLP 82,527 108,987 29,073 28,213
Disability consulting fees:Sanford Health 425 300 - -
Legal fees:K&L Gates LLP 16,541 3,152 21,646 4,171 Kasowitz, Benson, Torres & Friedman 197 1,357 309 1,777 Jackson Walker LLP 3,105 - 9,316 - ND Attorney General 23,805 20,323 20,681 23,520
Total legal fees: 43,648 24,832 51,952 29,468
Total consultant expenses 198,099$ 264,493$ 81,025$ 57,681$
Investment TrustPension Trust
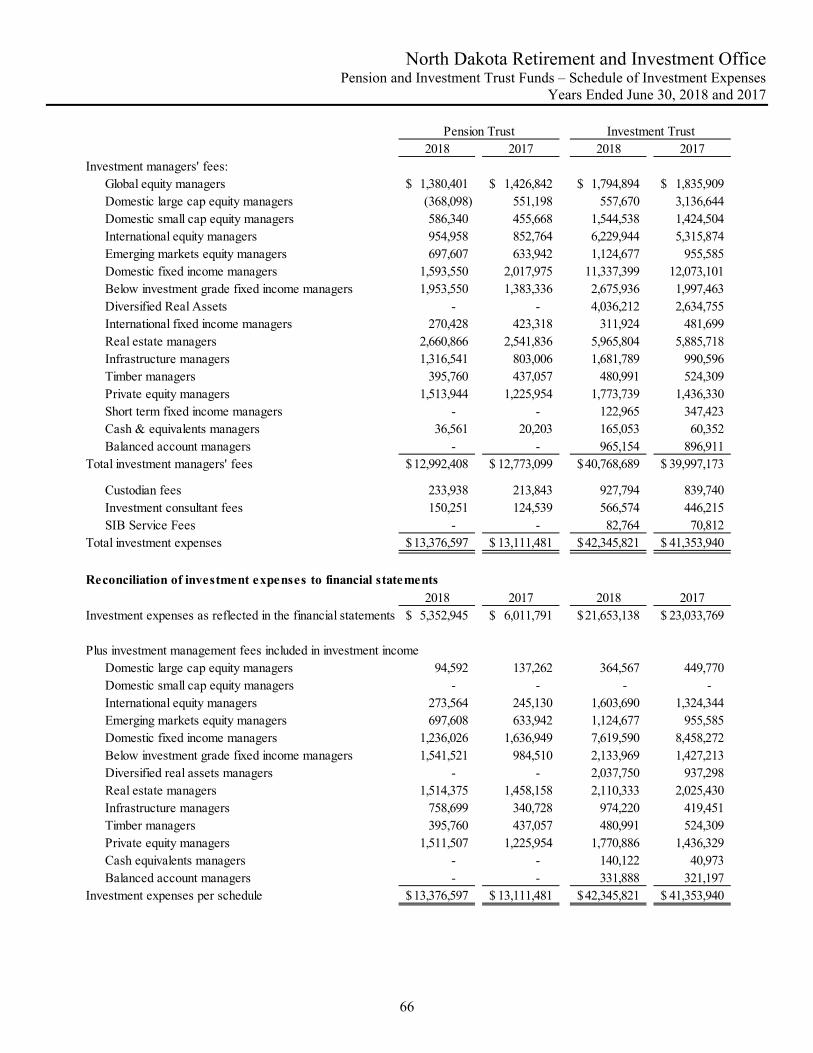
North Dakota Retirement and Investment Office Pension and Investment Trust Funds – Schedule of Investment Expenses
Years Ended June 30, 2018 and 2017
66
2018 2017 2018 2017Investment managers' fees:
Global equity managers 1,380,401$ 1,426,842$ 1,794,894$ 1,835,909$ Domestic large cap equity managers (368,098) 551,198 557,670 3,136,644 Domestic small cap equity managers 586,340 455,668 1,544,538 1,424,504 International equity managers 954,958 852,764 6,229,944 5,315,874 Emerging markets equity managers 697,607 633,942 1,124,677 955,585 Domestic fixed income managers 1,593,550 2,017,975 11,337,399 12,073,101 Below investment grade fixed income managers 1,953,550 1,383,336 2,675,936 1,997,463 Diversified Real Assets - - 4,036,212 2,634,755 International fixed income managers 270,428 423,318 311,924 481,699 Real estate managers 2,660,866 2,541,836 5,965,804 5,885,718 Infrastructure managers 1,316,541 803,006 1,681,789 990,596 Timber managers 395,760 437,057 480,991 524,309 Private equity managers 1,513,944 1,225,954 1,773,739 1,436,330 Short term fixed income managers - - 122,965 347,423 Cash & equivalents managers 36,561 20,203 165,053 60,352 Balanced account managers - - 965,154 896,911
Total investment managers' fees 12,992,408$ 12,773,099$ 40,768,689$ 39,997,173$
Custodian fees 233,938 213,843 927,794 839,740 Investment consultant fees 150,251 124,539 566,574 446,215 SIB Service Fees - - 82,764 70,812
Total investment expenses 13,376,597$ 13,111,481$ 42,345,821$ 41,353,940$
Reconciliation of investment expenses to financial statements2018 2017 2018 2017
Investment expenses as reflected in the financial statements 5,352,945$ 6,011,791$ 21,653,138$ 23,033,769$
Plus investment management fees included in investment incomeDomestic large cap equity managers 94,592 137,262 364,567 449,770 Domestic small cap equity managers - - - - International equity managers 273,564 245,130 1,603,690 1,324,344 Emerging markets equity managers 697,608 633,942 1,124,677 955,585 Domestic fixed income managers 1,236,026 1,636,949 7,619,590 8,458,272 Below investment grade fixed income managers 1,541,521 984,510 2,133,969 1,427,213 Diversified real assets managers - - 2,037,750 937,298 Real estate managers 1,514,375 1,458,158 2,110,333 2,025,430 Infrastructure managers 758,699 340,728 974,220 419,451 Timber managers 395,760 437,057 480,991 524,309 Private equity managers 1,511,507 1,225,954 1,770,886 1,436,329 Cash equivalents managers - - 140,122 40,973 Balanced account managers - - 331,888 321,197
Investment expenses per schedule 13,376,597$ 13,111,481$ 42,345,821$ 41,353,940$
Pension Trust Investment Trust
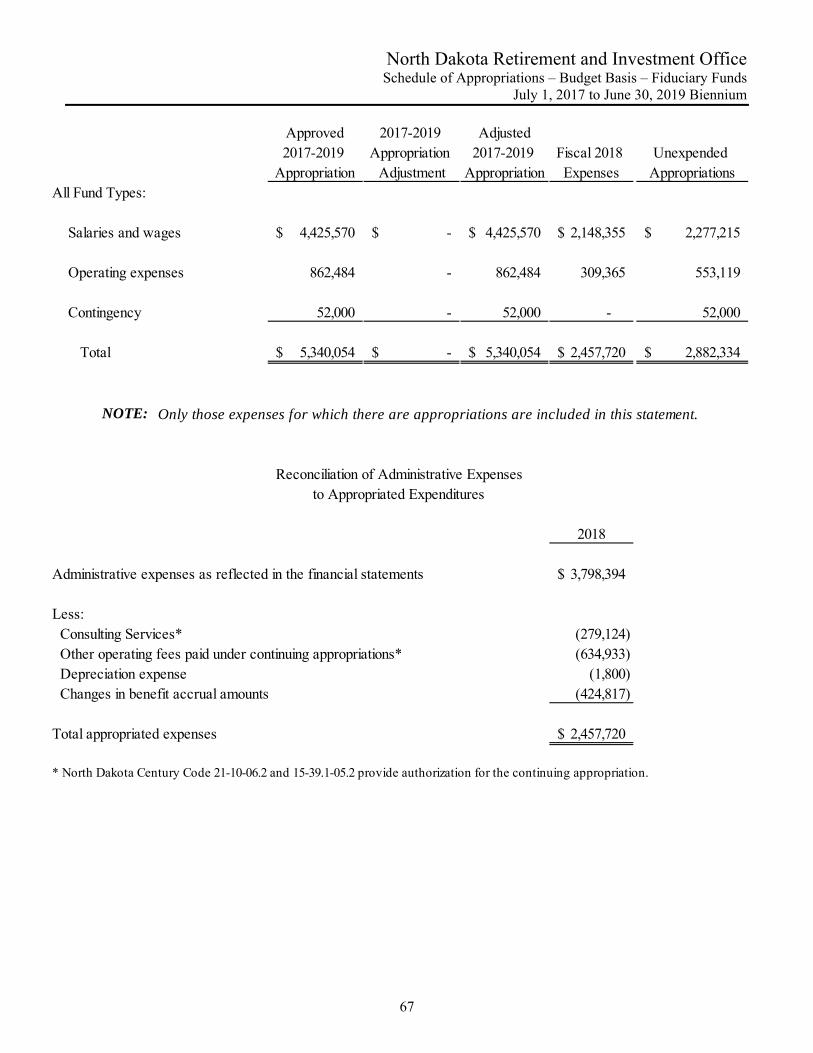
North Dakota Retirement and Investment Office Schedule of Appropriations – Budget Basis – Fiduciary Funds
July 1, 2017 to June 30, 2019 Biennium
67
Approved2017-2019
Appropriation
2017-2019 Appropriation
Adjustment
Adjusted2017-2019
AppropriationFiscal 2018 Expenses
Unexpended Appropriations
All Fund Types:
Salaries and wages 4,425,570$ -$ 4,425,570$ 2,148,355$ 2,277,215$
Operating expenses 862,484 - 862,484 309,365 553,119
Contingency 52,000 - 52,000 - 52,000
Total 5,340,054$ -$ 5,340,054$ 2,457,720$ 2,882,334$
2018
Administrative expenses as reflected in the financial statements 3,798,394$
Less: Consulting Services* (279,124) Other operating fees paid under continuing appropriations* (634,933) Depreciation expense (1,800) Changes in benefit accrual amounts (424,817)
Total appropriated expenses 2,457,720$
to Appropriated Expenditures
* North Dakota Century Code 21-10-06.2 and 15-39.1-05.2 provide authorization for the continuing appropriation.
NOTE: Only those expenses for which there are appropriations are included in this statement.
Reconciliation of Administrative Expenses
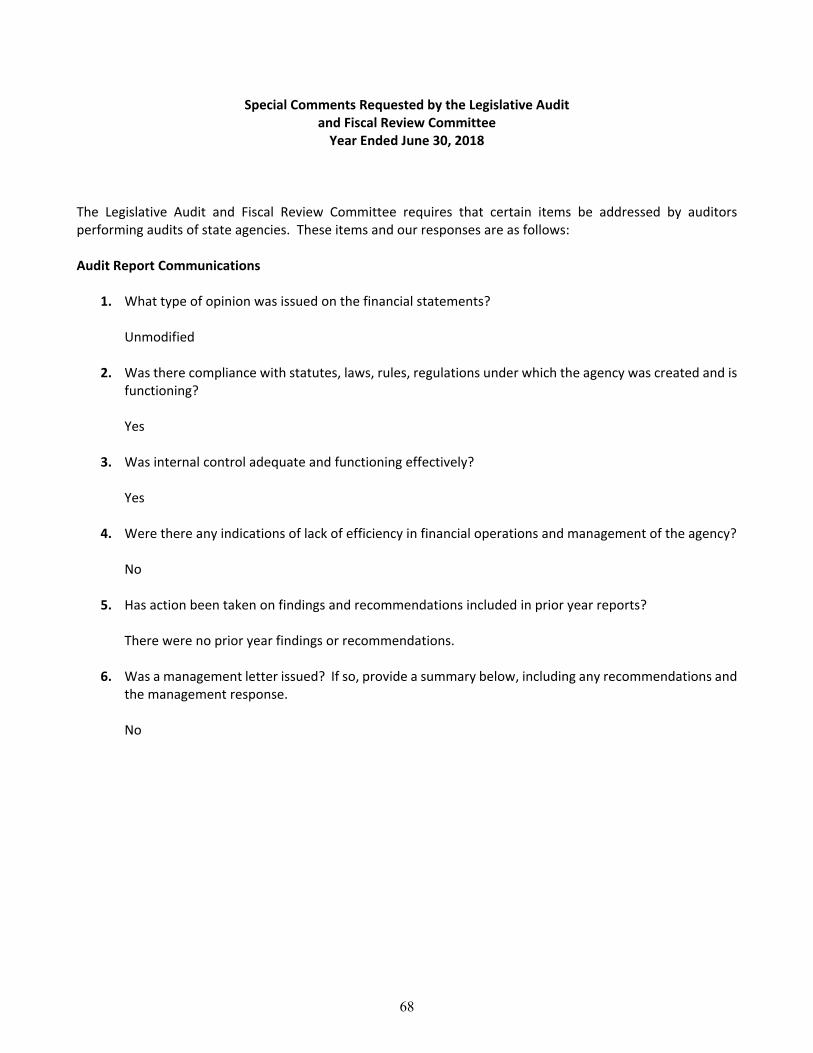
68
Special Comments Requested by the Legislative Audit and Fiscal Review Committee Year Ended June 30, 2018
The Legislative Audit and Fiscal Review Committee requires that certain items be addressed by auditors performing audits of state agencies. These items and our responses are as follows: Audit Report Communications
1. What type of opinion was issued on the financial statements? Unmodified
2. Was there compliance with statutes, laws, rules, regulations under which the agency was created and is functioning? Yes
3. Was internal control adequate and functioning effectively? Yes
4. Were there any indications of lack of efficiency in financial operations and management of the agency? No
5. Has action been taken on findings and recommendations included in prior year reports? There were no prior year findings or recommendations.
6. Was a management letter issued? If so, provide a summary below, including any recommendations and the management response. No
69
Audit Committee Communications
1. Identify any significant changes in accounting policies, any management conflicts of interest, any contingent liabilities, or any significant unusual transactions. For the year ended June 30, 2018, the financial statements include the impact of adoption of Governmental Accounting Standards Board (GASB) Statement number 75 and Statement number 82.
GASB 75, Accounting and Financial Reporting for Postemployment Benefits Other Than Pensions, replaces the requirements for Statement number 45, Accounting and Financial Reporting by Employers for Postemployment Benefits Other Than Pensions, as ameded, and improves accounting and financial reporting for postemployment benefits other than pensions. Due to the immateriality of the amounts in relation to the previous year’s financial statements, no prior period adjustments were made to fiscal year 2017 balances; rather, all financial transactions necessary to establish the liability and deferral balances were recorded in fiscal year 2018 only. GASB 82, Pension Issues‐An Amendment of GASB Statements No. 67, No. 68, and No. 73, addresses certain issues with the presentation of payroll‐related measures in required supplementary information, and the classification of payments made by employers to satisfy employee contribution requirements. Upon examinitation, it was determined that RIO is currently presenting information in accordance with the requirements.
2. Identify any significant accounting estimates, the process used by management to formulate the
accounting estimates, and the basis for the auditor’s conclusions regarding the reasonableness of those estimates. The valuation of alternative investments, including private equity and real asset investments, are a management estimate which is primarily based upon net asset values reported by the investment managers and comprise 16% of the total investment portfolio. The values for these investments are reported based upon the most recent financial data available and are adjusted for cash flows through June 30, 2018. Our audit procedures validated this approach through the use of confirmations sent directly to a sample of investment managers and the review of the most recent audited financial statements for these funds. Furthermore, we reviewed management’s estimate and found it to be reasonable. The actuarial valuation was based on the actuarial assumptions and methods adopted by the Board, including an actuarial expected investment rate of return of 7.75% per annum compounded annually. The valuation takes into account all of the promised benefits to which members are entitled as of July 1, 2018 as required by the North Dakota Century Code. The valuation provides certain information required by GASB to be disclosed in the financial statements. Additionally, the valuation is used to determine the adequacy of the current employer contribution rate. Our audit procedures included reviewing the actuarial valuation and related assumptions used therein and we believe the estimate to be reasonable.
70
3. Identify any significant audit adjustments. None
4. Identify any disagreements with management, whether or not resolved to the auditor’s satisfaction, relating to financial accounting, reporting, or auditing matters that could be significant to the financial statements. None
5. Identify any significant difficulties encountered in performing the audit. None
6. Identify any major issues discussed with management prior to retention. None
7. Identify any management consultations with other accounts about auditing and accounting matters. None
8. Identify any high‐risk information technology systems critical to operations based on the auditor’s overall assessment of the importance of the system to the agency and its mission or whether any exceptions identified in the six audit report questions addressed above are directly related to the operations of an information technology system. Based on the audit procedures performed, the Retirement and Investment Office’s critical information technology system is the CPAS system. There were no exceptions identified that were directly related to this application.
This report is intended solely for the information and use of the audit committee, management, the Legislative Audit and Fiscal Review Committee, and other state officials, and is not intended to be and should not be used by anyone other than these specified parties.
a
CliftonLarsonAllen LLP Baltimore, Maryland October 31, 2018

SIB Securities Litigation Committee Agenda March 14, 2018 Created 5/2/2018 3:24 PM
ND STATE INVESTMENT BOARD
SECURITIES LITIGATION COMMITTEE MEETING
Monday November 5, 2018 - 3:00 PM North Dakota Retirement and Investment Office (RIO)
3442 East Century Avenue, Bismarck, ND 58503
AGENDA
1. Call to Order and Approval of Agenda 2. Minutes (August 23, 2018) 3. SIB Securities Litigation: Contingent Disclosures – Mr. Hunter (10 minutes) Informational
a. General Motors (Kasowitz Benson Torres) b. Tribune (K&L Gates)
4. Securities Litigation Education by Grant & Eisenhofer – Mr. Marc Weinberg (45 minutes) Informational a. Introduction & Overview b. International Securities Litigation c. Sample Portfolio Monitoring Report d. Sample Litigation and Monitoring Agreement
5. Summary of Securities Litigation Representation Firms (15 minutes) a. Existing Defendant Firms – Kasowitz Benson Torres and K&L Gates Informational b. Existing Plaintiff Firm – Grant & Eisenhofer Informational c. Summary of Reviewed Securities Litigation Firms Committee Action
6. SIB Securities Litigation Committee Meeting Schedule (10 minutes) Committee Action
7. Other - Next Proposed SIB Securities Litigation Committee Meeting
North Dakota Retirement and Investment Office 3442 E Century Ave, Bismarck, ND 58503 Thursday, February 14, 2019 at 3:00 PM
8. Adjournment
Any individual requiring an auxiliary aid or service should contact the Retirement and Investment Office at (701) 328-9885 at least (3) days prior to the scheduled meeting.
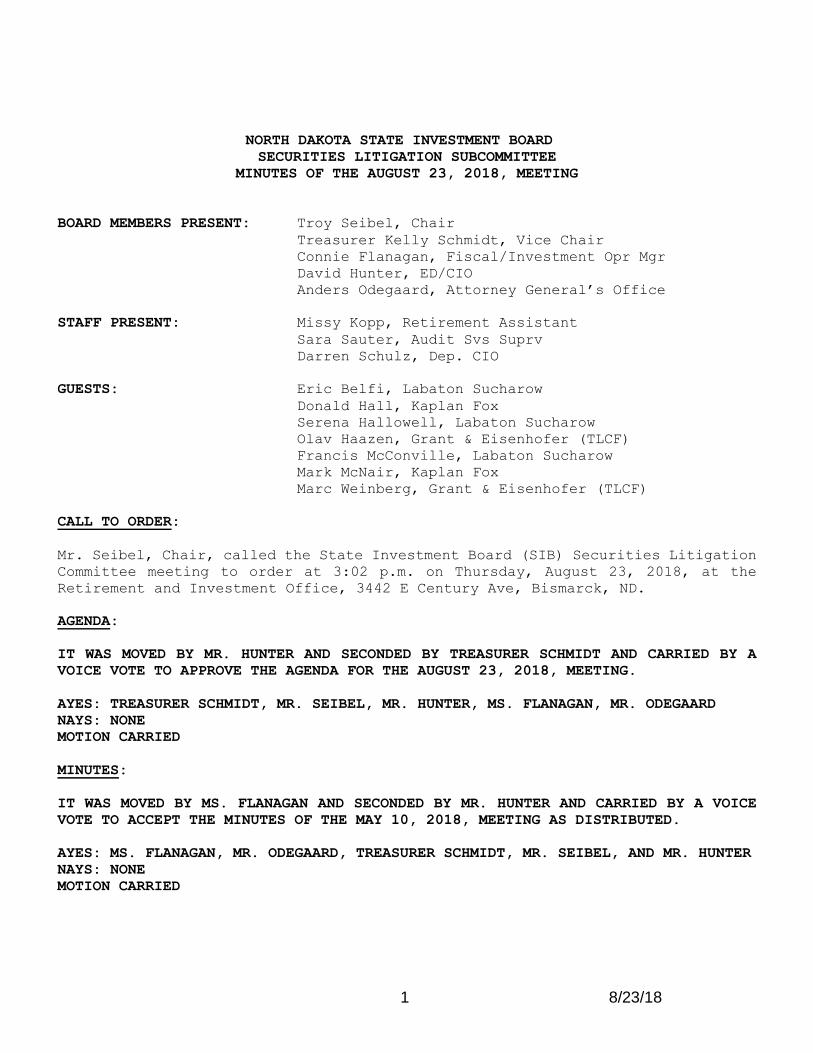
1 8/23/18
NORTH DAKOTA STATE INVESTMENT BOARD
SECURITIES LITIGATION SUBCOMMITTEE
MINUTES OF THE AUGUST 23, 2018, MEETING
BOARD MEMBERS PRESENT: Troy Seibel, Chair
Treasurer Kelly Schmidt, Vice Chair
Connie Flanagan, Fiscal/Investment Opr Mgr
David Hunter, ED/CIO
Anders Odegaard, Attorney General’s Office
STAFF PRESENT: Missy Kopp, Retirement Assistant
Sara Sauter, Audit Svs Suprv
Darren Schulz, Dep. CIO
GUESTS: Eric Belfi, Labaton Sucharow
Donald Hall, Kaplan Fox
Serena Hallowell, Labaton Sucharow
Olav Haazen, Grant & Eisenhofer (TLCF)
Francis McConville, Labaton Sucharow
Mark McNair, Kaplan Fox
Marc Weinberg, Grant & Eisenhofer (TLCF)
CALL TO ORDER:
Mr. Seibel, Chair, called the State Investment Board (SIB) Securities Litigation
Committee meeting to order at 3:02 p.m. on Thursday, August 23, 2018, at the
Retirement and Investment Office, 3442 E Century Ave, Bismarck, ND.
AGENDA:
IT WAS MOVED BY MR. HUNTER AND SECONDED BY TREASURER SCHMIDT AND CARRIED BY A
VOICE VOTE TO APPROVE THE AGENDA FOR THE AUGUST 23, 2018, MEETING.
AYES: TREASURER SCHMIDT, MR. SEIBEL, MR. HUNTER, MS. FLANAGAN, MR. ODEGAARD
NAYS: NONE
MOTION CARRIED
MINUTES:
IT WAS MOVED BY MS. FLANAGAN AND SECONDED BY MR. HUNTER AND CARRIED BY A VOICE
VOTE TO ACCEPT THE MINUTES OF THE MAY 10, 2018, MEETING AS DISTRIBUTED.
AYES: MS. FLANAGAN, MR. ODEGAARD, TREASURER SCHMIDT, MR. SEIBEL, AND MR. HUNTER
NAYS: NONE
MOTION CARRIED
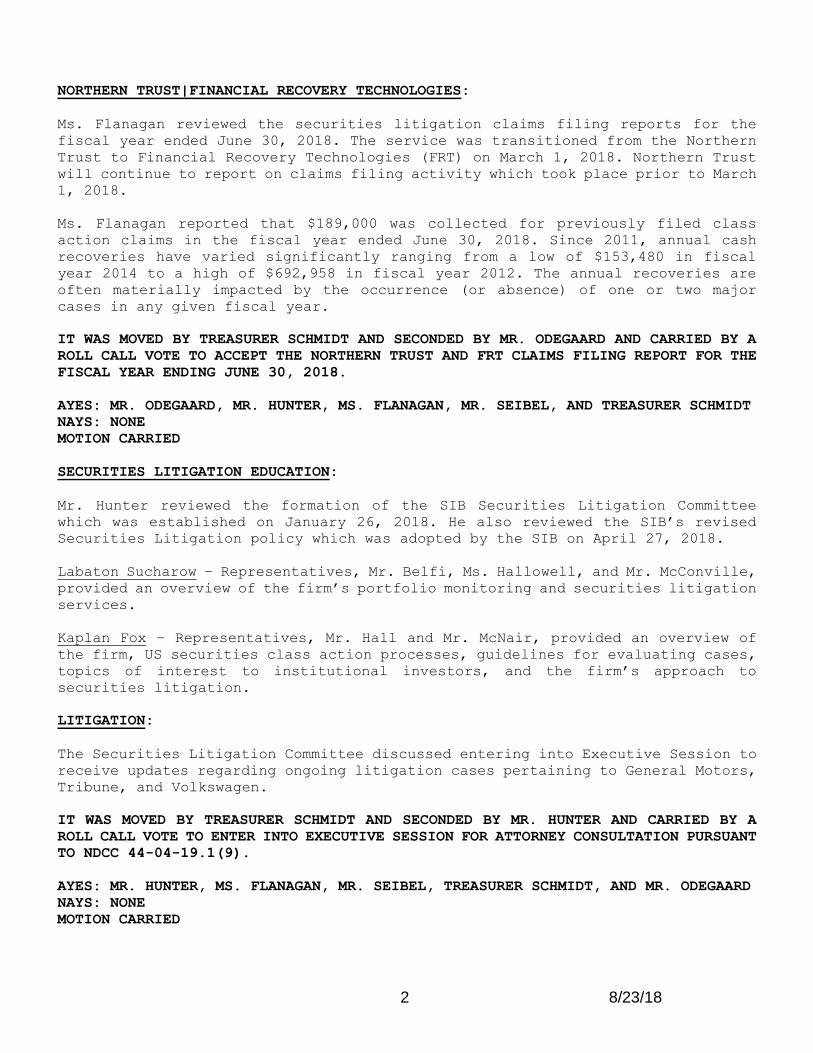
2 8/23/18
NORTHERN TRUST|FINANCIAL RECOVERY TECHNOLOGIES:
Ms. Flanagan reviewed the securities litigation claims filing reports for the
fiscal year ended June 30, 2018. The service was transitioned from the Northern
Trust to Financial Recovery Technologies (FRT) on March 1, 2018. Northern Trust
will continue to report on claims filing activity which took place prior to March
1, 2018.
Ms. Flanagan reported that $189,000 was collected for previously filed class
action claims in the fiscal year ended June 30, 2018. Since 2011, annual cash
recoveries have varied significantly ranging from a low of $153,480 in fiscal
year 2014 to a high of $692,958 in fiscal year 2012. The annual recoveries are
often materially impacted by the occurrence (or absence) of one or two major
cases in any given fiscal year.
IT WAS MOVED BY TREASURER SCHMIDT AND SECONDED BY MR. ODEGAARD AND CARRIED BY A
ROLL CALL VOTE TO ACCEPT THE NORTHERN TRUST AND FRT CLAIMS FILING REPORT FOR THE
FISCAL YEAR ENDING JUNE 30, 2018.
AYES: MR. ODEGAARD, MR. HUNTER, MS. FLANAGAN, MR. SEIBEL, AND TREASURER SCHMIDT
NAYS: NONE
MOTION CARRIED
SECURITIES LITIGATION EDUCATION:
Mr. Hunter reviewed the formation of the SIB Securities Litigation Committee
which was established on January 26, 2018. He also reviewed the SIB’s revised
Securities Litigation policy which was adopted by the SIB on April 27, 2018.
Labaton Sucharow – Representatives, Mr. Belfi, Ms. Hallowell, and Mr. McConville,
provided an overview of the firm’s portfolio monitoring and securities litigation
services.
Kaplan Fox – Representatives, Mr. Hall and Mr. McNair, provided an overview of
the firm, US securities class action processes, guidelines for evaluating cases,
topics of interest to institutional investors, and the firm’s approach to
securities litigation.
LITIGATION:
The Securities Litigation Committee discussed entering into Executive Session to
receive updates regarding ongoing litigation cases pertaining to General Motors,
Tribune, and Volkswagen.
IT WAS MOVED BY TREASURER SCHMIDT AND SECONDED BY MR. HUNTER AND CARRIED BY A
ROLL CALL VOTE TO ENTER INTO EXECUTIVE SESSION FOR ATTORNEY CONSULTATION PURSUANT
TO NDCC 44-04-19.1(9).
AYES: MR. HUNTER, MS. FLANAGAN, MR. SEIBEL, TREASURER SCHMIDT, AND MR. ODEGAARD
NAYS: NONE
MOTION CARRIED
3 8/23/18
The Securities Litigation Committee exited the open portion of the meeting at
4:40 p.m. and entered into Executive Session at 4:41 p.m.
Mr. Hunter, Ms. Flanagan, Mr. Seibel, Treasurer Schmidt, Mr. Odegaard, Mr. Schulz,
Ms. Sauter, Ms. Kopp, and Mr. Weinberg (TLCF) were in attendance.
The Securities Litigation Committee exited Executive Session at 5:01 p.m. and
entered into the open portion of the meeting at 5:02 p.m.
The Securities Litigation Committee took no further action on Litigation.
OTHER:
The next Securities Litigation meeting is scheduled for November 5, 2018, at the
Retirement and Investment Office, 3442 East Century Avenue, Bismarck, ND.
ADJOURNMENT:
With no further business to come before the Committee, Mr. Seibel adjourned the
meeting at 5:05 p.m.
__________________________________
Mr. Seibel, Chair
__________________________________
Bonnie Heit
Assistant to the Committee
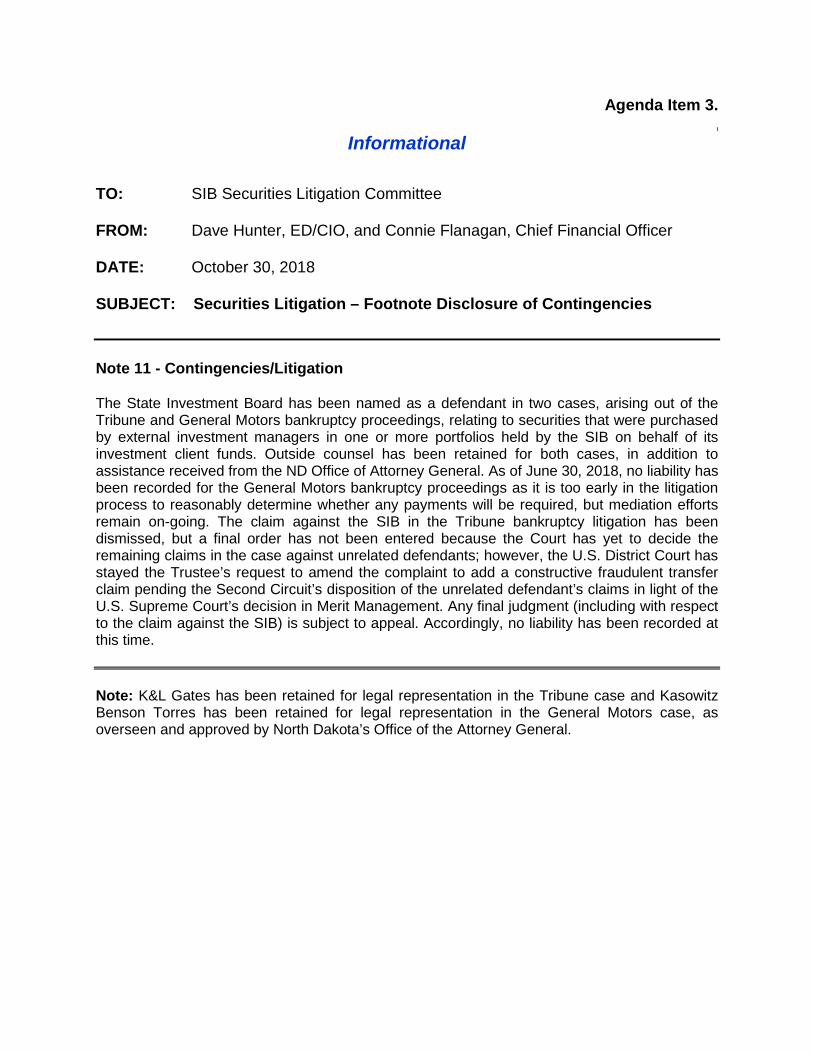
Agenda Item 3. \
Informational
TO: SIB Securities Litigation Committee FROM: Dave Hunter, ED/CIO, and Connie Flanagan, Chief Financial Officer DATE: October 30, 2018 SUBJECT: Securities Litigation – Footnote Disclosure of Contingencies
Note 11 - Contingencies/Litigation The State Investment Board has been named as a defendant in two cases, arising out of the Tribune and General Motors bankruptcy proceedings, relating to securities that were purchased by external investment managers in one or more portfolios held by the SIB on behalf of its investment client funds. Outside counsel has been retained for both cases, in addition to assistance received from the ND Office of Attorney General. As of June 30, 2018, no liability has been recorded for the General Motors bankruptcy proceedings as it is too early in the litigation process to reasonably determine whether any payments will be required, but mediation efforts remain on-going. The claim against the SIB in the Tribune bankruptcy litigation has been dismissed, but a final order has not been entered because the Court has yet to decide the remaining claims in the case against unrelated defendants; however, the U.S. District Court has stayed the Trustee’s request to amend the complaint to add a constructive fraudulent transfer claim pending the Second Circuit’s disposition of the unrelated defendant’s claims in light of the U.S. Supreme Court’s decision in Merit Management. Any final judgment (including with respect to the claim against the SIB) is subject to appeal. Accordingly, no liability has been recorded at this time.
Note: K&L Gates has been retained for legal representation in the Tribune case and Kasowitz Benson Torres has been retained for legal representation in the General Motors case, as overseen and approved by North Dakota’s Office of the Attorney General.
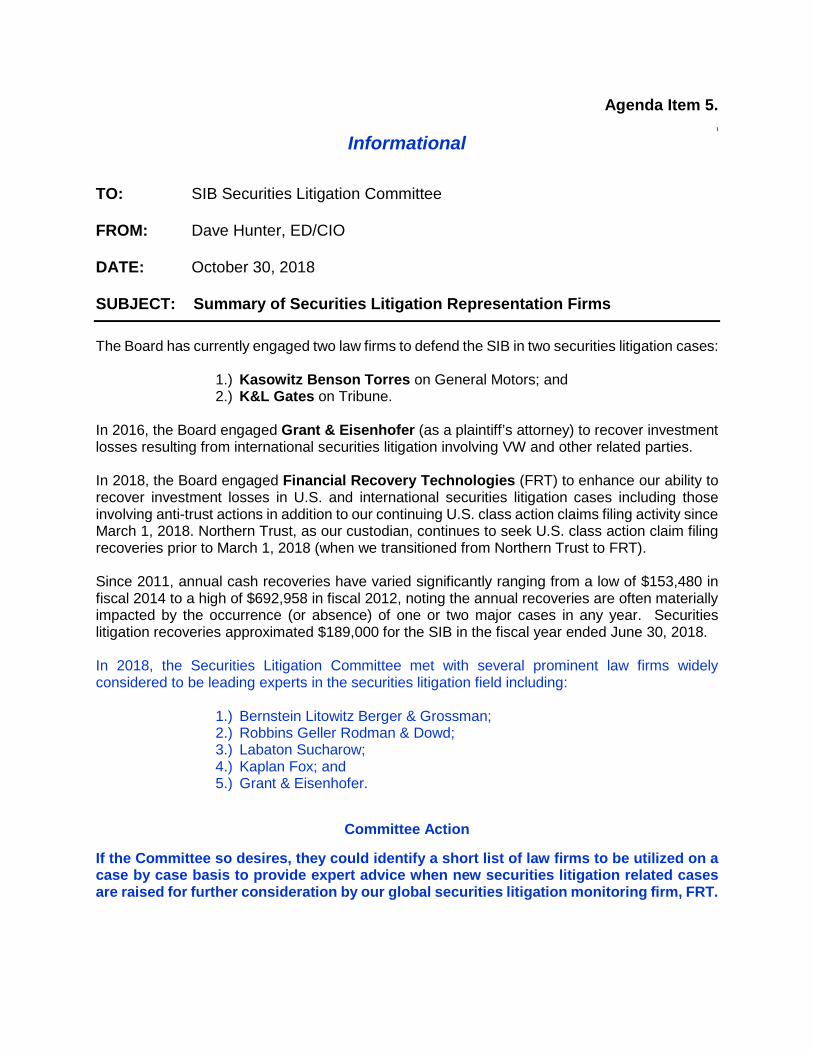
Agenda Item 5. \
Informational
TO: SIB Securities Litigation Committee FROM: Dave Hunter, ED/CIO DATE: October 30, 2018 SUBJECT: Summary of Securities Litigation Representation Firms
The Board has currently engaged two law firms to defend the SIB in two securities litigation cases:
1.) Kasowitz Benson Torres on General Motors; and 2.) K&L Gates on Tribune.
In 2016, the Board engaged Grant & Eisenhofer (as a plaintiff’s attorney) to recover investment losses resulting from international securities litigation involving VW and other related parties. In 2018, the Board engaged Financial Recovery Technologies (FRT) to enhance our ability to recover investment losses in U.S. and international securities litigation cases including those involving anti-trust actions in addition to our continuing U.S. class action claims filing activity since March 1, 2018. Northern Trust, as our custodian, continues to seek U.S. class action claim filing recoveries prior to March 1, 2018 (when we transitioned from Northern Trust to FRT). Since 2011, annual cash recoveries have varied significantly ranging from a low of $153,480 in fiscal 2014 to a high of $692,958 in fiscal 2012, noting the annual recoveries are often materially impacted by the occurrence (or absence) of one or two major cases in any year. Securities litigation recoveries approximated $189,000 for the SIB in the fiscal year ended June 30, 2018. In 2018, the Securities Litigation Committee met with several prominent law firms widely considered to be leading experts in the securities litigation field including:
1.) Bernstein Litowitz Berger & Grossman; 2.) Robbins Geller Rodman & Dowd; 3.) Labaton Sucharow; 4.) Kaplan Fox; and 5.) Grant & Eisenhofer.
Committee Action
If the Committee so desires, they could identify a short list of law firms to be utilized on a case by case basis to provide expert advice when new securities litigation related cases are raised for further consideration by our global securities litigation monitoring firm, FRT.
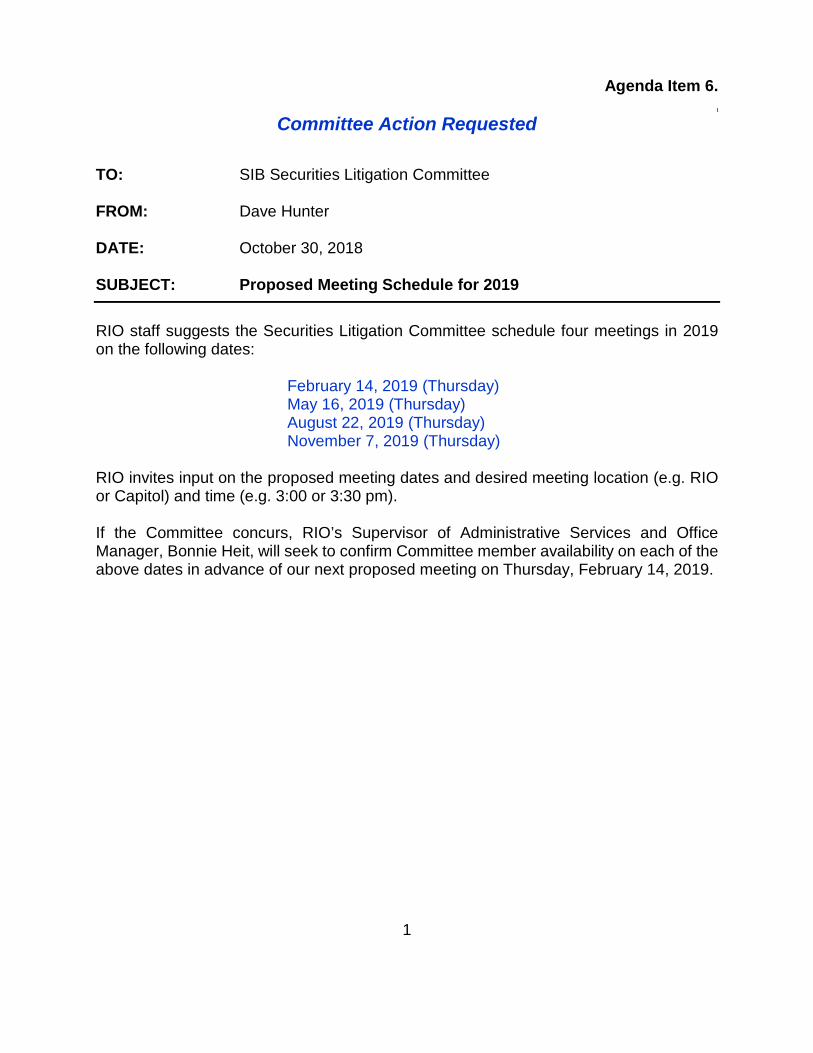
1
Agenda Item 6. \
Committee Action Requested
TO: SIB Securities Litigation Committee FROM: Dave Hunter DATE: October 30, 2018 SUBJECT: Proposed Meeting Schedule for 2019
RIO staff suggests the Securities Litigation Committee schedule four meetings in 2019 on the following dates:
February 14, 2019 (Thursday) May 16, 2019 (Thursday) August 22, 2019 (Thursday) November 7, 2019 (Thursday)
RIO invites input on the proposed meeting dates and desired meeting location (e.g. RIO or Capitol) and time (e.g. 3:00 or 3:30 pm). If the Committee concurs, RIO’s Supervisor of Administrative Services and Office Manager, Bonnie Heit, will seek to confirm Committee member availability on each of the above dates in advance of our next proposed meeting on Thursday, February 14, 2019.
Asset and Performance OverviewReview of Investment Fees and Expenses
November 9, 2018
Dave Hunter, Executive Director / CIODarren Schulz, Deputy Chief Investment Officer
Connie Flanagan, Chief Financial OfficerEric Chin, Senior Investment Analyst
ND Retirement & Investment Office (RIO)State Investment Board (SIB)
AGENDA ITEM III. A.
Board Acceptance Requested
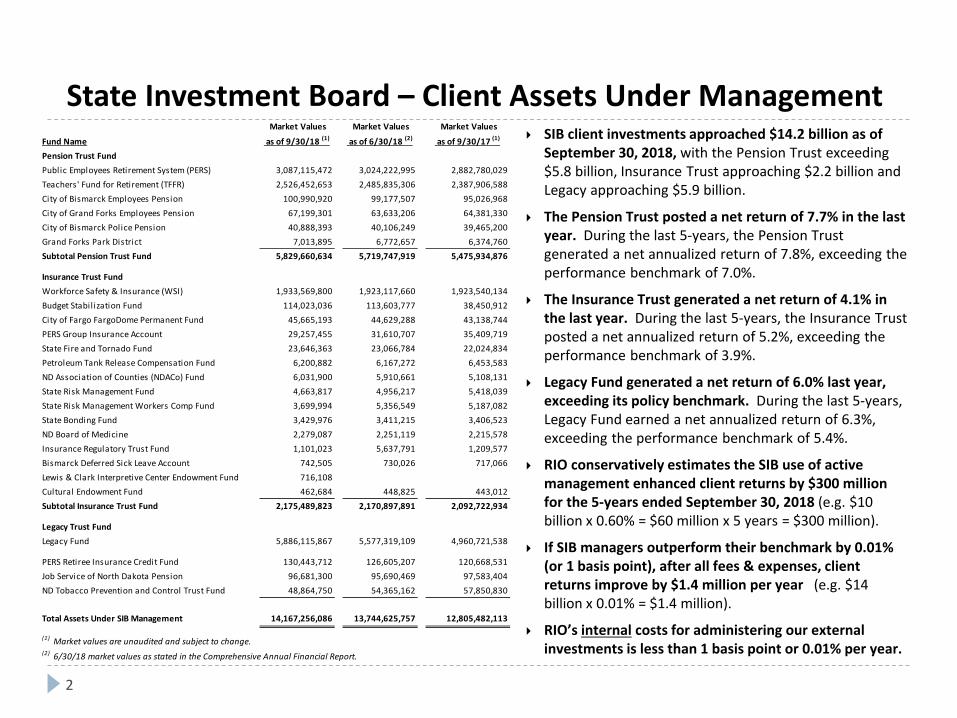
State Investment Board – Client Assets Under Management
2
SIB client investments approached $14.2 billion as of September 30, 2018, with the Pension Trust exceeding $5.8 billion, Insurance Trust approaching $2.2 billion and Legacy approaching $5.9 billion.
The Pension Trust posted a net return of 7.7% in the last year. During the last 5-years, the Pension Trust generated a net annualized return of 7.8%, exceeding the performance benchmark of 7.0%.
The Insurance Trust generated a net return of 4.1% in the last year. During the last 5-years, the Insurance Trust posted a net annualized return of 5.2%, exceeding the performance benchmark of 3.9%.
Legacy Fund generated a net return of 6.0% last year, exceeding its policy benchmark. During the last 5-years, Legacy Fund earned a net annualized return of 6.3%, exceeding the performance benchmark of 5.4%.
RIO conservatively estimates the SIB use of active management enhanced client returns by $300 million for the 5-years ended September 30, 2018 (e.g. $10 billion x 0.60% = $60 million x 5 years = $300 million).
If SIB managers outperform their benchmark by 0.01% (or 1 basis point), after all fees & expenses, client returns improve by $1.4 million per year (e.g. $14 billion x 0.01% = $1.4 million).
RIO’s internal costs for administering our external investments is less than 1 basis point or 0.01% per year.
Market Values Market Values Market Values
Fund Name as of 9/30/18 (1) as of 6/30/18 (2) as of 9/30/17 (1)
Pension Trust Fund Public Employees Retirement System (PERS) 3,087,115,472 3,024,222,995 2,882,780,029Teachers' Fund for Retirement (TFFR) 2,526,452,653 2,485,835,306 2,387,906,588City of Bismarck Employees Pension 100,990,920 99,177,507 95,026,968City of Grand Forks Employees Pension 67,199,301 63,633,206 64,381,330City of Bismarck Police Pension 40,888,393 40,106,249 39,465,200Grand Forks Park District 7,013,895 6,772,657 6,374,760Subtotal Pension Trust Fund 5,829,660,634 5,719,747,919 5,475,934,876
Insurance Trust Fund Workforce Safety & Insurance (WSI) 1,933,569,800 1,923,117,660 1,923,540,134Budget Stabil ization Fund 114,023,036 113,603,777 38,450,912City of Fargo FargoDome Permanent Fund 45,665,193 44,629,288 43,138,744PERS Group Insurance Account 29,257,455 31,610,707 35,409,719State Fire and Tornado Fund 23,646,363 23,066,784 22,024,834Petroleum Tank Release Compensation Fund 6,200,882 6,167,272 6,453,583ND Association of Counties (NDACo) Fund 6,031,900 5,910,661 5,108,131State Risk Management Fund 4,663,817 4,956,217 5,418,039State Risk Management Workers Comp Fund 3,699,994 5,356,549 5,187,082State Bonding Fund 3,429,976 3,411,215 3,406,523ND Board of Medicine 2,279,087 2,251,119 2,215,578Insurance Regulatory Trust Fund 1,101,023 5,637,791 1,209,577Bismarck Deferred Sick Leave Account 742,505 730,026 717,066Lewis & Clark Interpretive Center Endowment Fund 716,108Cultural Endowment Fund 462,684 448,825 443,012Subtotal Insurance Trust Fund 2,175,489,823 2,170,897,891 2,092,722,934
Legacy Trust FundLegacy Fund 5,886,115,867 5,577,319,109 4,960,721,538
PERS Retiree Insurance Credit Fund 130,443,712 126,605,207 120,668,531Job Service of North Dakota Pension 96,681,300 95,690,469 97,583,404ND Tobacco Prevention and Control Trust Fund 48,864,750 54,365,162 57,850,830
Total Assets Under SIB Management 14,167,256,086 13,744,625,757 12,805,482,113
(1) Market values are unaudited and subject to change.(2) 6/30/18 market values as stated in the Comprehensive Annual Financial Report.
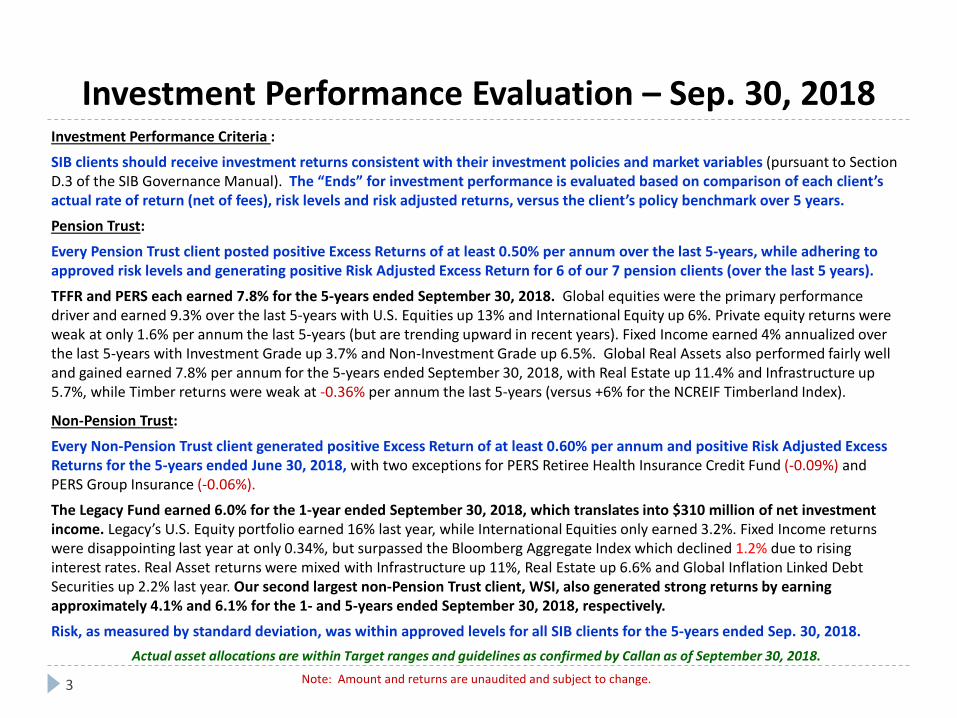
Investment Performance Evaluation – Sep. 30, 2018
3
Investment Performance Criteria :
SIB clients should receive investment returns consistent with their investment policies and market variables (pursuant to Section D.3 of the SIB Governance Manual). The “Ends” for investment performance is evaluated based on comparison of each client’s actual rate of return (net of fees), risk levels and risk adjusted returns, versus the client’s policy benchmark over 5 years.
Pension Trust:
Every Pension Trust client posted positive Excess Returns of at least 0.50% per annum over the last 5-years, while adhering to approved risk levels and generating positive Risk Adjusted Excess Return for 6 of our 7 pension clients (over the last 5 years).
TFFR and PERS each earned 7.8% for the 5-years ended September 30, 2018. Global equities were the primary performance driver and earned 9.3% over the last 5-years with U.S. Equities up 13% and International Equity up 6%. Private equity returns were weak at only 1.6% per annum the last 5-years (but are trending upward in recent years). Fixed Income earned 4% annualized over the last 5-years with Investment Grade up 3.7% and Non-Investment Grade up 6.5%. Global Real Assets also performed fairly well and gained earned 7.8% per annum for the 5-years ended September 30, 2018, with Real Estate up 11.4% and Infrastructure up 5.7%, while Timber returns were weak at -0.36% per annum the last 5-years (versus +6% for the NCREIF Timberland Index).
Non-Pension Trust:
Every Non-Pension Trust client generated positive Excess Return of at least 0.60% per annum and positive Risk Adjusted Excess Returns for the 5-years ended June 30, 2018, with two exceptions for PERS Retiree Health Insurance Credit Fund (-0.09%) and PERS Group Insurance (-0.06%).
The Legacy Fund earned 6.0% for the 1-year ended September 30, 2018, which translates into $310 million of net investment income. Legacy’s U.S. Equity portfolio earned 16% last year, while International Equities only earned 3.2%. Fixed Income returns were disappointing last year at only 0.34%, but surpassed the Bloomberg Aggregate Index which declined 1.2% due to rising interest rates. Real Asset returns were mixed with Infrastructure up 11%, Real Estate up 6.6% and Global Inflation Linked Debt Securities up 2.2% last year. Our second largest non-Pension Trust client, WSI, also generated strong returns by earning approximately 4.1% and 6.1% for the 1- and 5-years ended September 30, 2018, respectively.
Risk, as measured by standard deviation, was within approved levels for all SIB clients for the 5-years ended Sep. 30, 2018. Actual asset allocations are within Target ranges and guidelines as confirmed by Callan as of September 30, 2018.
Note: Amount and returns are unaudited and subject to change.
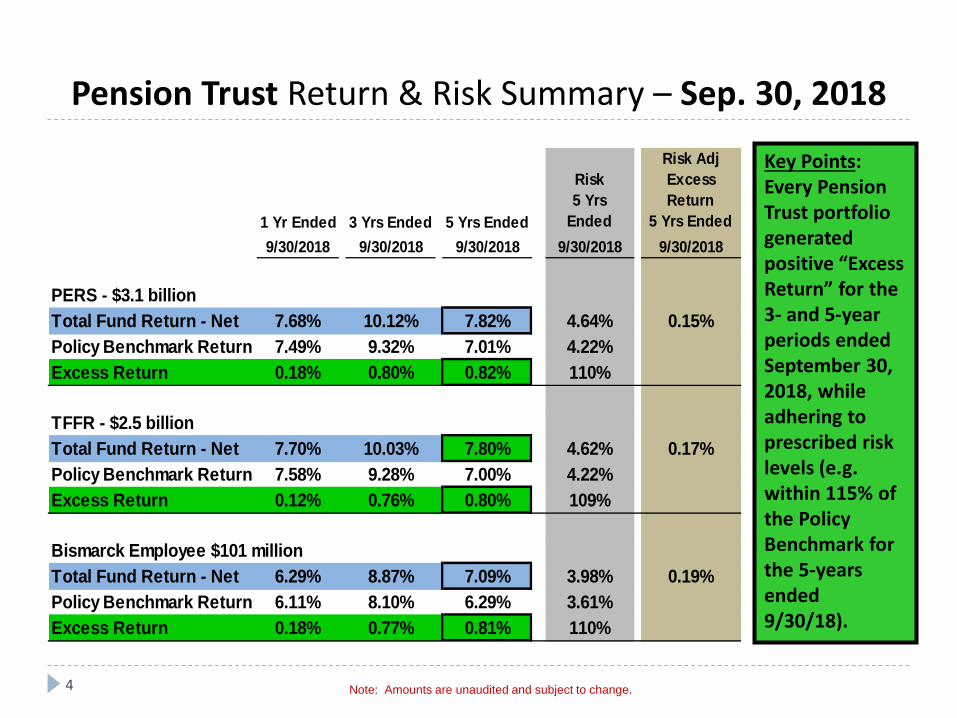
Pension Trust Return & Risk Summary – Sep. 30, 2018
4
Key Points: Every Pension Trust portfolio generated positive “Excess Return” for the 3- and 5-year periods ended September 30, 2018, while adhering to prescribed risk levels (e.g. within 115% of the Policy Benchmark for the 5-years ended 9/30/18).
Note: Amounts are unaudited and subject to change.
1 Yr Ended 3 Yrs Ended 5 Yrs Ended
Risk
5 Yrs
Ended
Risk Adj
Excess
Return
5 Yrs Ended
9/30/2018 9/30/2018 9/30/2018 9/30/2018 9/30/2018
PERS - $3.1 billion
Total Fund Return - Net 7.68% 10.12% 7.82% 4.64% 0.15%
Policy Benchmark Return 7.49% 9.32% 7.01% 4.22%
Excess Return 0.18% 0.80% 0.82% 110%
TFFR - $2.5 billion
Total Fund Return - Net 7.70% 10.03% 7.80% 4.62% 0.17%
Policy Benchmark Return 7.58% 9.28% 7.00% 4.22%
Excess Return 0.12% 0.76% 0.80% 109%
Bismarck Employee $101 million
Total Fund Return - Net 6.29% 8.87% 7.09% 3.98% 0.19%
Policy Benchmark Return 6.11% 8.10% 6.29% 3.61%
Excess Return 0.18% 0.77% 0.81% 110%
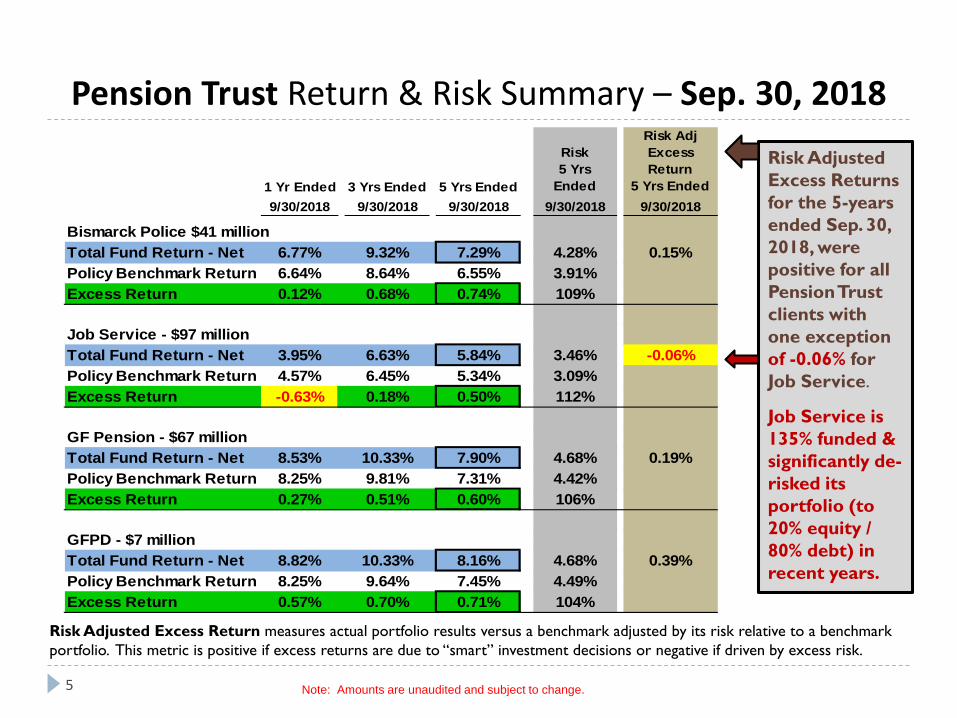
Pension Trust Return & Risk Summary – Sep. 30, 2018
5
Risk Adjusted Excess Return measures actual portfolio results versus a benchmark adjusted by its risk relative to a benchmark portfolio. This metric is positive if excess returns are due to “smart” investment decisions or negative if driven by excess risk.
Risk Adjusted Excess Returns for the 5-years ended Sep. 30, 2018, were positive for all Pension Trust clients with one exception of -0.06% for Job Service.
Job Service is 135% funded & significantly de-risked its portfolio (to 20% equity / 80% debt) in recent years.
Note: Amounts are unaudited and subject to change.
1 Yr Ended 3 Yrs Ended 5 Yrs Ended
Risk
5 Yrs
Ended
Risk Adj
Excess
Return
5 Yrs Ended
9/30/2018 9/30/2018 9/30/2018 9/30/2018 9/30/2018
Bismarck Police $41 million
Total Fund Return - Net 6.77% 9.32% 7.29% 4.28% 0.15%
Policy Benchmark Return 6.64% 8.64% 6.55% 3.91%
Excess Return 0.12% 0.68% 0.74% 109%
Job Service - $97 million
Total Fund Return - Net 3.95% 6.63% 5.84% 3.46% -0.06%
Policy Benchmark Return 4.57% 6.45% 5.34% 3.09%
Excess Return -0.63% 0.18% 0.50% 112%
GF Pension - $67 million
Total Fund Return - Net 8.53% 10.33% 7.90% 4.68% 0.19%
Policy Benchmark Return 8.25% 9.81% 7.31% 4.42%
Excess Return 0.27% 0.51% 0.60% 106%
GFPD - $7 million
Total Fund Return - Net 8.82% 10.33% 8.16% 4.68% 0.39%
Policy Benchmark Return 8.25% 9.64% 7.45% 4.49%
Excess Return 0.57% 0.70% 0.71% 104%
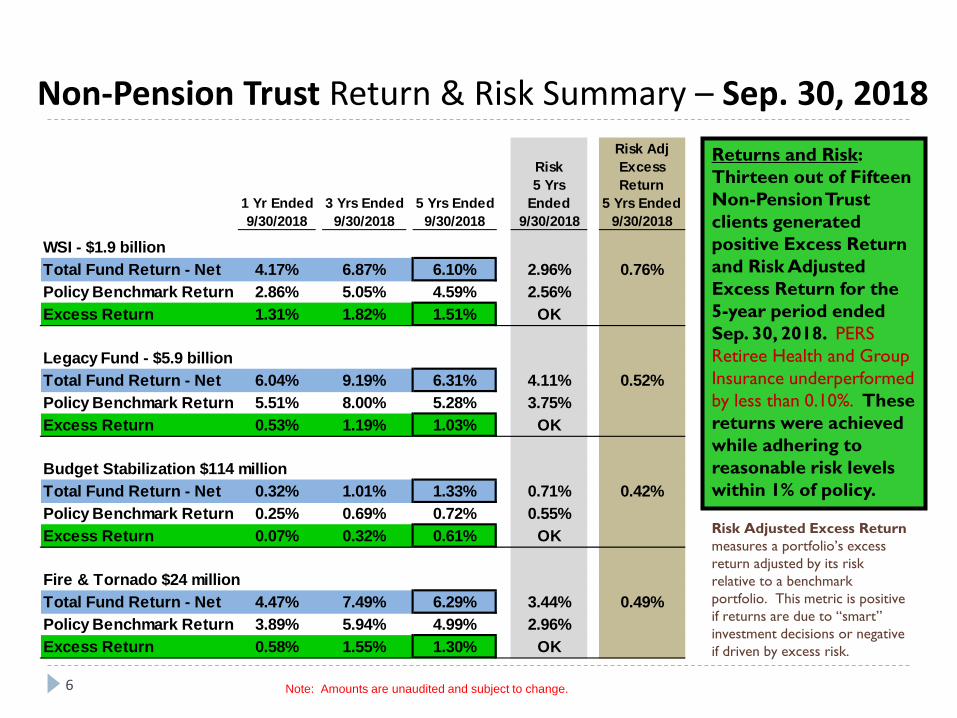
Non-Pension Trust Return & Risk Summary – Sep. 30, 2018
6
Returns and Risk: Thirteen out of Fifteen Non-Pension Trust clients generated positive Excess Return and Risk Adjusted Excess Return for the 5-year period ended Sep. 30, 2018. PERS Retiree Health and Group Insurance underperformed by less than 0.10%. These returns were achieved while adhering to reasonable risk levels within 1% of policy.
Note: Amounts are unaudited and subject to change.
Risk Adjusted Excess Return measures a portfolio’s excess return adjusted by its risk relative to a benchmark portfolio. This metric is positive if returns are due to “smart” investment decisions or negative if driven by excess risk.
1 Yr Ended 3 Yrs Ended 5 Yrs Ended
Risk
5 Yrs
Ended
Risk Adj
Excess
Return
5 Yrs Ended
9/30/2018 9/30/2018 9/30/2018 9/30/2018 9/30/2018
WSI - $1.9 billion
Total Fund Return - Net 4.17% 6.87% 6.10% 2.96% 0.76%
Policy Benchmark Return 2.86% 5.05% 4.59% 2.56%
Excess Return 1.31% 1.82% 1.51% OK
Legacy Fund - $5.9 billion
Total Fund Return - Net 6.04% 9.19% 6.31% 4.11% 0.52%
Policy Benchmark Return 5.51% 8.00% 5.28% 3.75%
Excess Return 0.53% 1.19% 1.03% OK
Budget Stabilization $114 million
Total Fund Return - Net 0.32% 1.01% 1.33% 0.71% 0.42%
Policy Benchmark Return 0.25% 0.69% 0.72% 0.55%
Excess Return 0.07% 0.32% 0.61% OK
Fire & Tornado $24 million
Total Fund Return - Net 4.47% 7.49% 6.29% 3.44% 0.49%
Policy Benchmark Return 3.89% 5.94% 4.99% 2.96%
Excess Return 0.58% 1.55% 1.30% OK
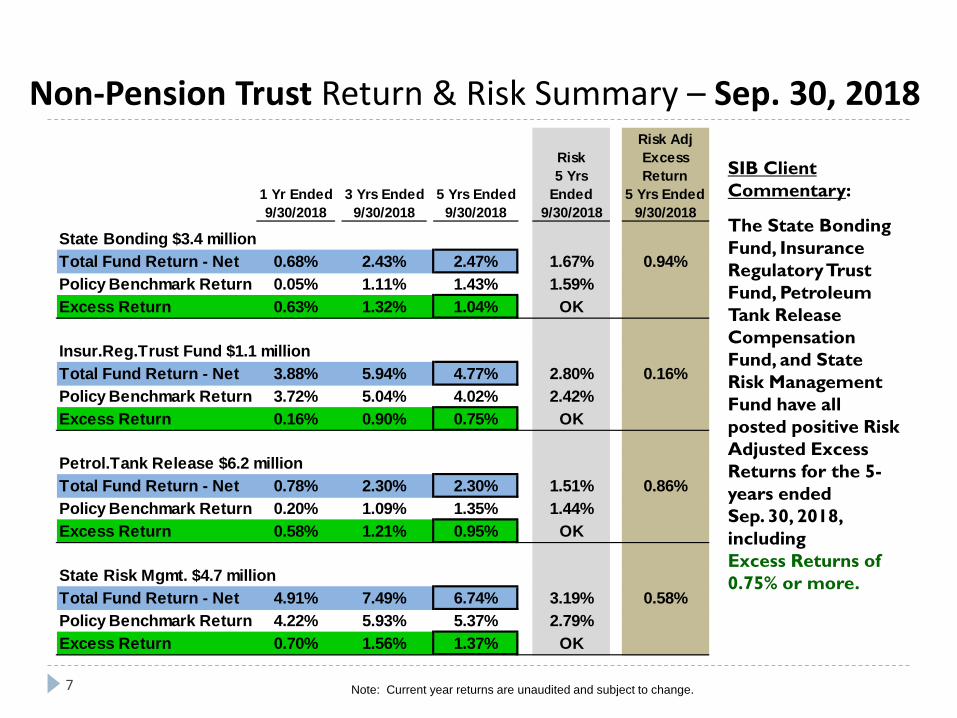
Non-Pension Trust Return & Risk Summary – Sep. 30, 2018
7 Note: Current year returns are unaudited and subject to change.
SIB Client Commentary:
The State Bonding Fund, Insurance Regulatory Trust Fund, Petroleum Tank Release Compensation Fund, and State Risk Management Fund have all posted positive Risk Adjusted Excess Returns for the 5-years ended Sep. 30, 2018, including Excess Returns of 0.75% or more.
1 Yr Ended 3 Yrs Ended 5 Yrs Ended
Risk
5 Yrs
Ended
Risk Adj
Excess
Return
5 Yrs Ended
9/30/2018 9/30/2018 9/30/2018 9/30/2018 9/30/2018
State Bonding $3.4 million
Total Fund Return - Net 0.68% 2.43% 2.47% 1.67% 0.94%
Policy Benchmark Return 0.05% 1.11% 1.43% 1.59%
Excess Return 0.63% 1.32% 1.04% OK
Insur.Reg.Trust Fund $1.1 million
Total Fund Return - Net 3.88% 5.94% 4.77% 2.80% 0.16%
Policy Benchmark Return 3.72% 5.04% 4.02% 2.42%
Excess Return 0.16% 0.90% 0.75% OK
Petrol.Tank Release $6.2 million
Total Fund Return - Net 0.78% 2.30% 2.30% 1.51% 0.86%
Policy Benchmark Return 0.20% 1.09% 1.35% 1.44%
Excess Return 0.58% 1.21% 0.95% OK
State Risk Mgmt. $4.7 million
Total Fund Return - Net 4.91% 7.49% 6.74% 3.19% 0.58%
Policy Benchmark Return 4.22% 5.93% 5.37% 2.79%
Excess Return 0.70% 1.56% 1.37% OK
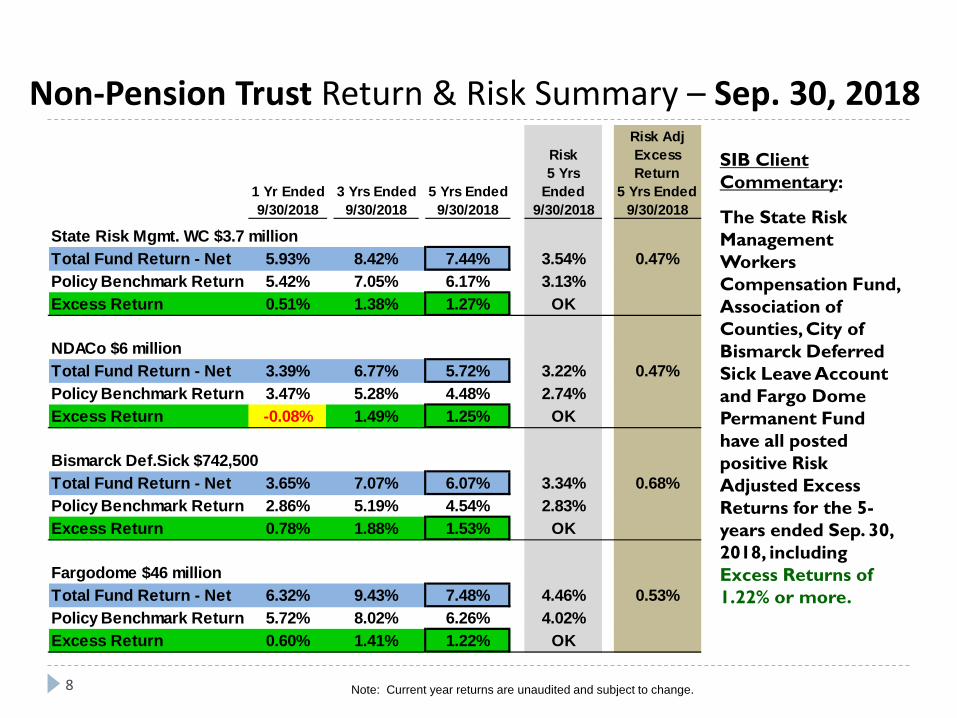
Non-Pension Trust Return & Risk Summary – Sep. 30, 2018
8
SIB Client Commentary:
The State Risk Management Workers Compensation Fund, Association of Counties, City of Bismarck Deferred Sick Leave Account and Fargo Dome Permanent Fund have all posted positive Risk Adjusted Excess Returns for the 5-years ended Sep. 30, 2018, including Excess Returns of 1.22% or more.
Note: Current year returns are unaudited and subject to change.
1 Yr Ended 3 Yrs Ended 5 Yrs Ended
Risk
5 Yrs
Ended
Risk Adj
Excess
Return
5 Yrs Ended
9/30/2018 9/30/2018 9/30/2018 9/30/2018 9/30/2018
State Risk Mgmt. WC $3.7 million
Total Fund Return - Net 5.93% 8.42% 7.44% 3.54% 0.47%
Policy Benchmark Return 5.42% 7.05% 6.17% 3.13%
Excess Return 0.51% 1.38% 1.27% OK
NDACo $6 million
Total Fund Return - Net 3.39% 6.77% 5.72% 3.22% 0.47%
Policy Benchmark Return 3.47% 5.28% 4.48% 2.74%
Excess Return -0.08% 1.49% 1.25% OK
Bismarck Def.Sick $742,500
Total Fund Return - Net 3.65% 7.07% 6.07% 3.34% 0.68%
Policy Benchmark Return 2.86% 5.19% 4.54% 2.83%
Excess Return 0.78% 1.88% 1.53% OK
Fargodome $46 million
Total Fund Return - Net 6.32% 9.43% 7.48% 4.46% 0.53%
Policy Benchmark Return 5.72% 8.02% 6.26% 4.02%
Excess Return 0.60% 1.41% 1.22% OK
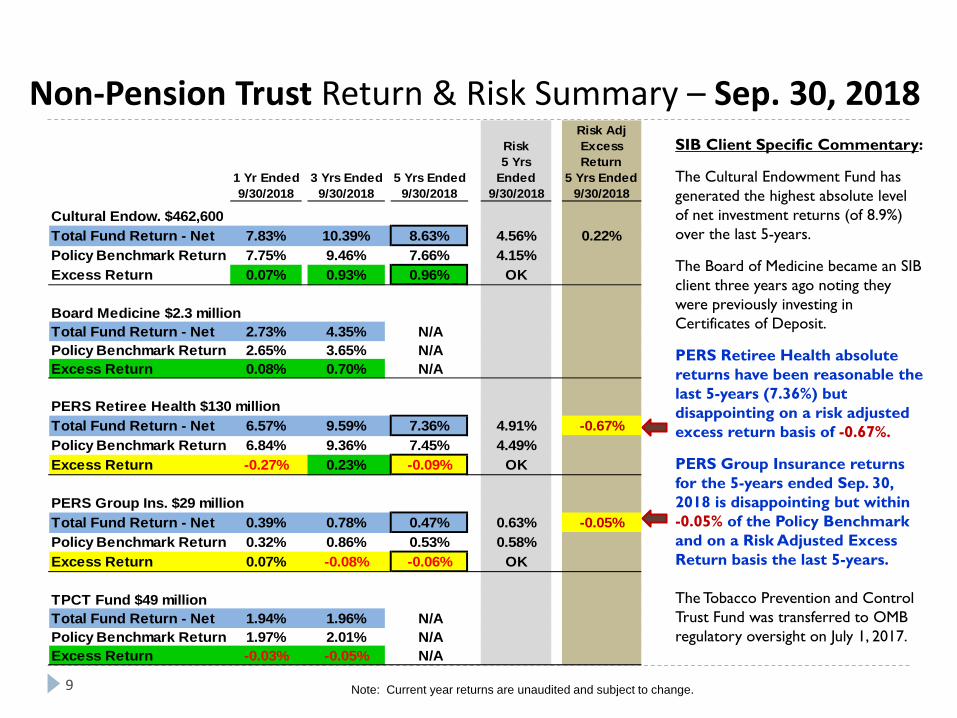
Non-Pension Trust Return & Risk Summary – Sep. 30, 2018
9
SIB Client Specific Commentary:
The Cultural Endowment Fund has generated the highest absolute level of net investment returns (of 8.9%) over the last 5-years.
The Board of Medicine became an SIB client three years ago noting they were previously investing in Certificates of Deposit.
PERS Retiree Health absolute returns have been reasonable the last 5-years (7.36%) but disappointing on a risk adjusted excess return basis of -0.67%.
PERS Group Insurance returns for the 5-years ended Sep. 30, 2018 is disappointing but within -0.05% of the Policy Benchmark and on a Risk Adjusted Excess Return basis the last 5-years.
The Tobacco Prevention and Control Trust Fund was transferred to OMB regulatory oversight on July 1, 2017.
Note: Current year returns are unaudited and subject to change.
1 Yr Ended 3 Yrs Ended 5 Yrs Ended
Risk
5 Yrs
Ended
Risk Adj
Excess
Return
5 Yrs Ended
9/30/2018 9/30/2018 9/30/2018 9/30/2018 9/30/2018
Cultural Endow. $462,600
Total Fund Return - Net 7.83% 10.39% 8.63% 4.56% 0.22%
Policy Benchmark Return 7.75% 9.46% 7.66% 4.15%
Excess Return 0.07% 0.93% 0.96% OK
Board Medicine $2.3 million
Total Fund Return - Net 2.73% 4.35% N/A
Policy Benchmark Return 2.65% 3.65% N/A
Excess Return 0.08% 0.70% N/A
PERS Retiree Health $130 million
Total Fund Return - Net 6.57% 9.59% 7.36% 4.91% -0.67%
Policy Benchmark Return 6.84% 9.36% 7.45% 4.49%
Excess Return -0.27% 0.23% -0.09% OK
PERS Group Ins. $29 million
Total Fund Return - Net 0.39% 0.78% 0.47% 0.63% -0.05%
Policy Benchmark Return 0.32% 0.86% 0.53% 0.58%
Excess Return 0.07% -0.08% -0.06% OK
TPCT Fund $49 million
Total Fund Return - Net 1.94% 1.96% N/A
Policy Benchmark Return 1.97% 2.01% N/A
Excess Return -0.03% -0.05% N/A
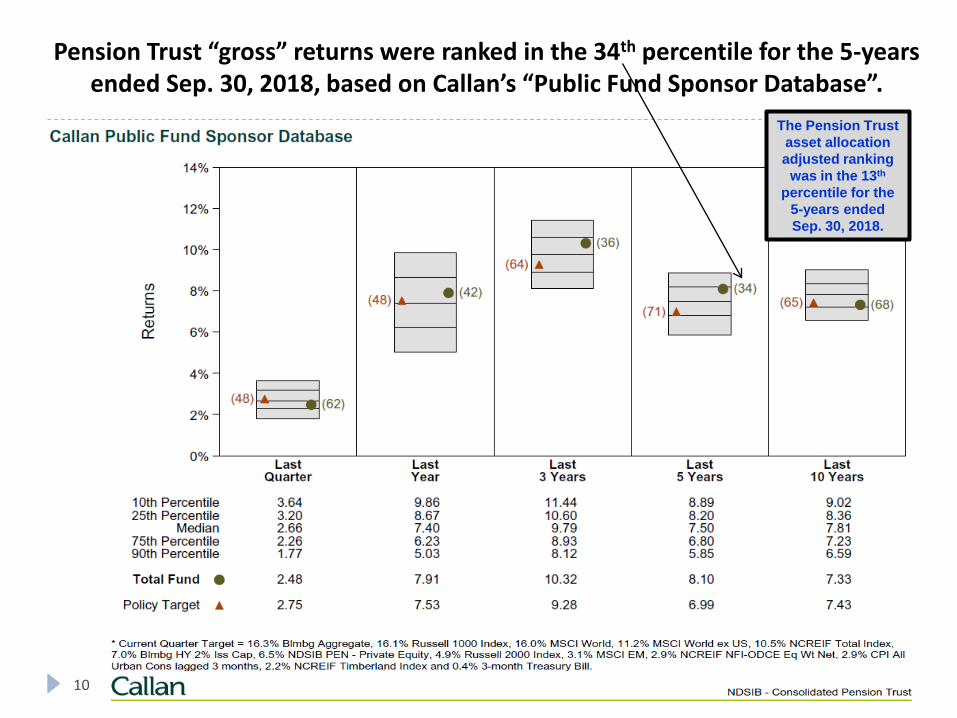
10
Pension Trust “gross” returns were ranked in the 34th percentile for the 5-years ended Sep. 30, 2018, based on Callan’s “Public Fund Sponsor Database”.
The Pension Trust
asset allocation
adjusted ranking
was in the 13th
percentile for the
5-years ended
Sep. 30, 2018.
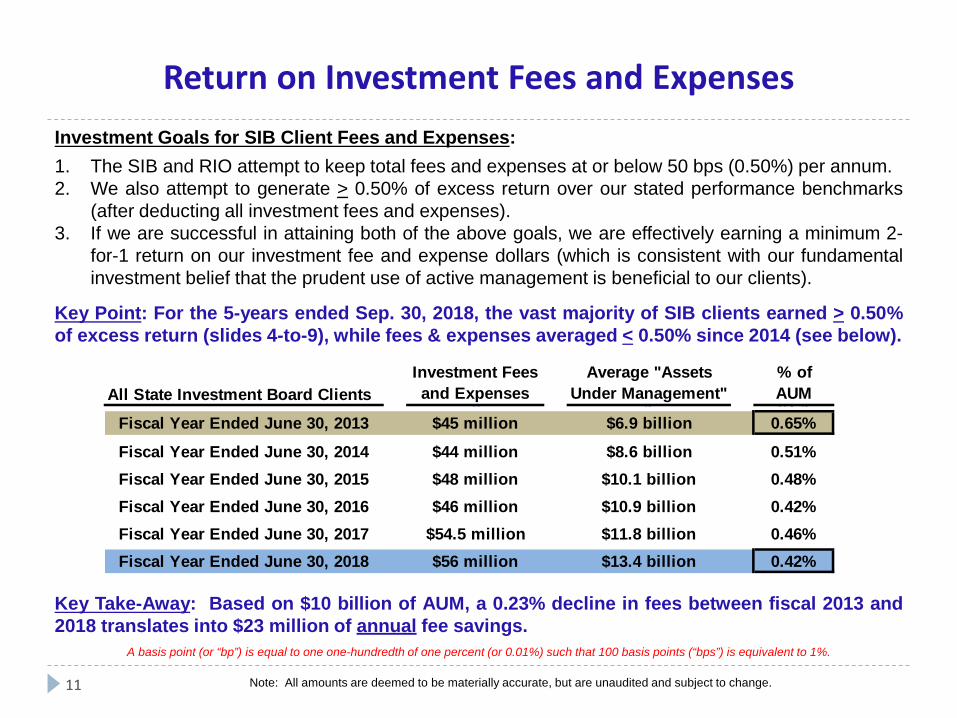
Return on Investment Fees and Expenses
11
Investment Goals for SIB Client Fees and Expenses:
1. The SIB and RIO attempt to keep total fees and expenses at or below 50 bps (0.50%) per annum.
2. We also attempt to generate > 0.50% of excess return over our stated performance benchmarks
(after deducting all investment fees and expenses).
3. If we are successful in attaining both of the above goals, we are effectively earning a minimum 2-
for-1 return on our investment fee and expense dollars (which is consistent with our fundamental
investment belief that the prudent use of active management is beneficial to our clients).
Key Point: For the 5-years ended Sep. 30, 2018, the vast majority of SIB clients earned > 0.50%
of excess return (slides 4-to-9), while fees & expenses averaged < 0.50% since 2014 (see below).
Key Take-Away: Based on $10 billion of AUM, a 0.23% decline in fees between fiscal 2013 and
2018 translates into $23 million of annual fee savings.
A basis point (or “bp”) is equal to one one-hundredth of one percent (or 0.01%) such that 100 basis points (“bps”) is equivalent to 1%.
Note: All amounts are deemed to be materially accurate, but are unaudited and subject to change.
All State Investment Board Clients
Investment Fees
and Expenses
Average "Assets
Under Management"
% of
AUMa b a / b
Fiscal Year Ended June 30, 2013 $45 million $6.9 billion 0.65%
Fiscal Year Ended June 30, 2014 $44 million $8.6 billion 0.51%
Fiscal Year Ended June 30, 2015 $48 million $10.1 billion 0.48%
Fiscal Year Ended June 30, 2016 $46 million $10.9 billion 0.42%
Fiscal Year Ended June 30, 2017 $54.5 million $11.8 billion 0.46%
Fiscal Year Ended June 30, 2018 $56 million $13.4 billion 0.42%
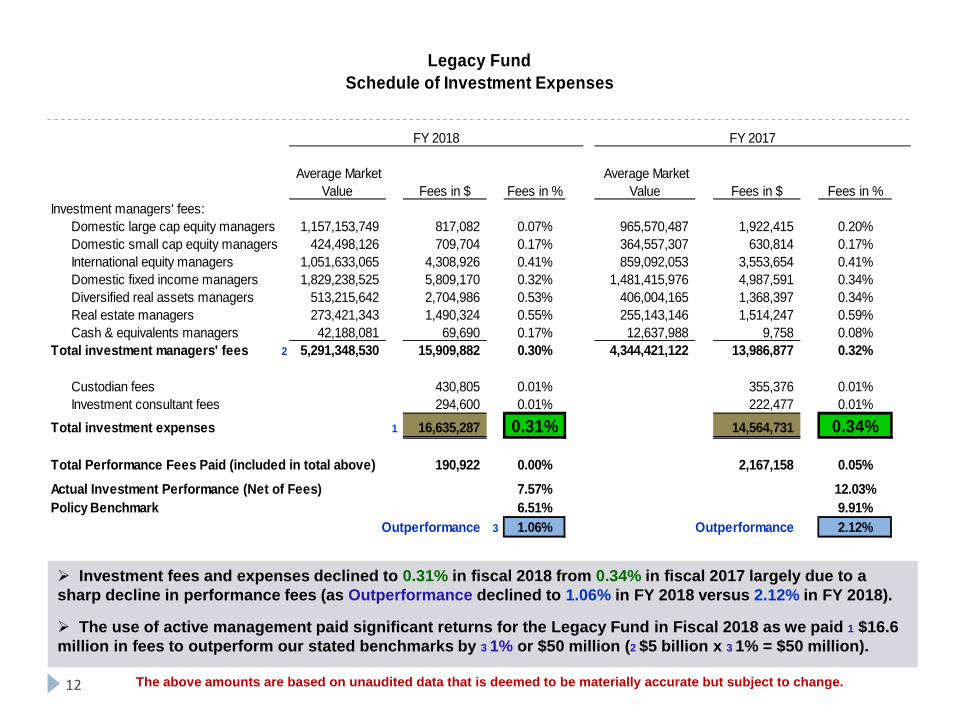
12
Investment fees and expenses declined to 0.31% in fiscal 2018 from 0.34% in fiscal 2017 largely due to a
sharp decline in performance fees (as Outperformance declined to 1.06% in FY 2018 versus 2.12% in FY 2018).
The use of active management paid significant returns for the Legacy Fund in Fiscal 2018 as we paid 1 $16.6
million in fees to outperform our stated benchmarks by 3 1% or $50 million (2 $5 billion x 3 1% = $50 million).
Average Market
Value Fees in $ Fees in %
Average Market
Value Fees in $ Fees in %
Investment managers' fees:
Domestic large cap equity managers 1,157,153,749 817,082 0.07% 965,570,487 1,922,415 0.20%
Domestic small cap equity managers 424,498,126 709,704 0.17% 364,557,307 630,814 0.17%
International equity managers 1,051,633,065 4,308,926 0.41% 859,092,053 3,553,654 0.41%
Domestic fixed income managers 1,829,238,525 5,809,170 0.32% 1,481,415,976 4,987,591 0.34%
Diversified real assets managers 513,215,642 2,704,986 0.53% 406,004,165 1,368,397 0.34%
Real estate managers 273,421,343 1,490,324 0.55% 255,143,146 1,514,247 0.59%
Cash & equivalents managers 42,188,081 69,690 0.17% 12,637,988 9,758 0.08%
Total investment managers' fees 2 5,291,348,530 15,909,882 4 0.30% 3 4,344,421,122 13,986,877 4 0.32%
Custodian fees 430,805 0.01% 355,376 0.01%
Investment consultant fees 294,600 0.01% 222,477 0.01%
Total investment expenses 1 16,635,287 0.31% 1 2 14,564,731 0.34% 1
Total Performance Fees Paid (included in total above) 190,922 0.00% 2,167,158 0.05%
Actual Investment Performance (Net of Fees) 7.57% 12.03%
Policy Benchmark 6.51% 9.91%
Outperformance 3 1.06% Outperformance 5 2.12%
FY 2018 FY 2017
Legacy Fund
Schedule of Investment Expenses
The above amounts are based on unaudited data that is deemed to be materially accurate but subject to change.
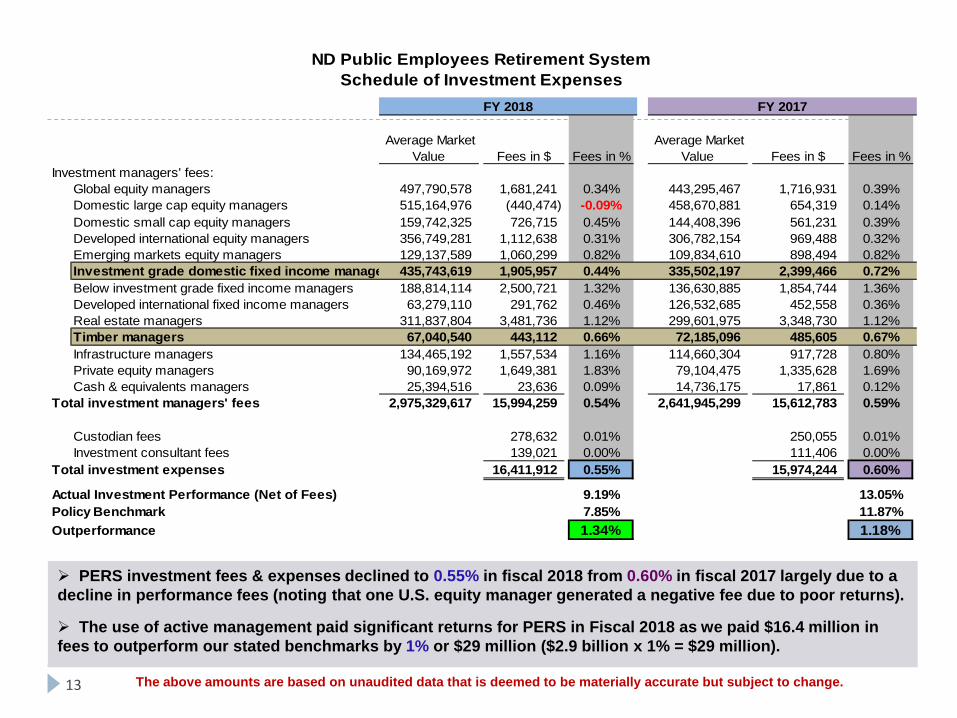
13
PERS investment fees & expenses declined to 0.55% in fiscal 2018 from 0.60% in fiscal 2017 largely due to a
decline in performance fees (noting that one U.S. equity manager generated a negative fee due to poor returns).
The use of active management paid significant returns for PERS in Fiscal 2018 as we paid $16.4 million in
fees to outperform our stated benchmarks by 1% or $29 million ($2.9 billion x 1% = $29 million).
Average Market
Value Fees in $ Fees in %
Average Market
Value Fees in $ Fees in %
Investment managers' fees:
Global equity managers 497,790,578 1,681,241 0.34% 443,295,467 1,716,931 0.39%
Domestic large cap equity managers 515,164,976 (440,474) -0.09% 458,670,881 654,319 0.14%
Domestic small cap equity managers 159,742,325 726,715 0.45% 144,408,396 561,231 0.39%
Developed international equity managers 356,749,281 1,112,638 0.31% 306,782,154 969,488 0.32%
Emerging markets equity managers 129,137,589 1,060,299 0.82% 109,834,610 898,494 0.82%
Investment grade domestic fixed income manage 435,743,619 1,905,957 0.44% 335,502,197 2,399,466 0.72%
Below investment grade fixed income managers 188,814,114 2,500,721 1.32% 136,630,885 1,854,744 1.36%
Developed international fixed income managers 63,279,110 291,762 0.46% 126,532,685 452,558 0.36%
Real estate managers 311,837,804 3,481,736 1.12% 299,601,975 3,348,730 1.12%
Timber managers 67,040,540 443,112 0.66% 72,185,096 485,605 0.67%
Infrastructure managers 134,465,192 1,557,534 1.16% 114,660,304 917,728 0.80%
Private equity managers 90,169,972 1,649,381 1.83% 79,104,475 1,335,628 1.69%
Cash & equivalents managers 25,394,516 23,636 0.09% 14,736,175 17,861 0.12%
Total investment managers' fees 2,975,329,617 15,994,259 0.54% 2,641,945,299 15,612,783 0.59%
Custodian fees 278,632 0.01% 250,055 0.01%
Investment consultant fees 139,021 0.00% 111,406 0.00%
Total investment expenses 16,411,912 0.55% 15,974,244 0.60%
Actual Investment Performance (Net of Fees) 9.19% 13.05%
Policy Benchmark 7.85% 11.87%
Outperformance 1.34% 1.18%
ND Public Employees Retirement System
Schedule of Investment Expenses
FY 2018 FY 2017
The above amounts are based on unaudited data that is deemed to be materially accurate but subject to change.
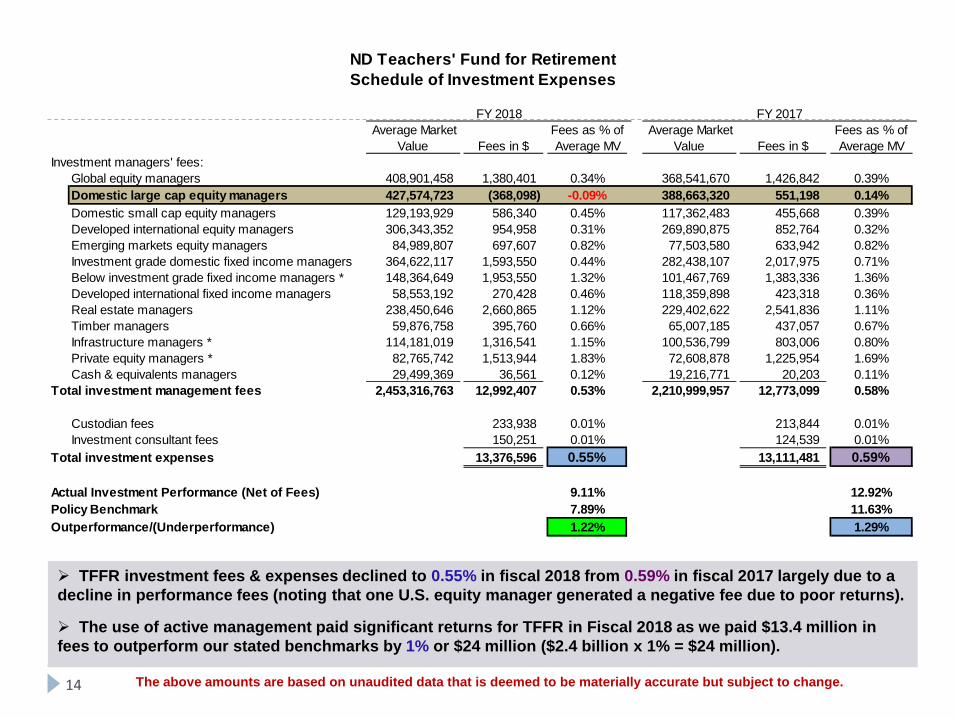
14
TFFR investment fees & expenses declined to 0.55% in fiscal 2018 from 0.59% in fiscal 2017 largely due to a
decline in performance fees (noting that one U.S. equity manager generated a negative fee due to poor returns).
The use of active management paid significant returns for TFFR in Fiscal 2018 as we paid $13.4 million in
fees to outperform our stated benchmarks by 1% or $24 million ($2.4 billion x 1% = $24 million).
The above amounts are based on unaudited data that is deemed to be materially accurate but subject to change.
Average Market
Value Fees in $
Fees as % of
Average MV
Average Market
Value Fees in $
Fees as % of
Average MV
Investment managers' fees:
Global equity managers 408,901,458 1,380,401 0.34% 368,541,670 1,426,842 0.39%
Domestic large cap equity managers 427,574,723 (368,098) -0.09% 388,663,320 551,198 0.14%
Domestic small cap equity managers 129,193,929 586,340 0.45% 117,362,483 455,668 0.39%
Developed international equity managers 306,343,352 954,958 0.31% 269,890,875 852,764 0.32%
Emerging markets equity managers 84,989,807 697,607 0.82% 77,503,580 633,942 0.82%
Investment grade domestic fixed income managers 364,622,117 1,593,550 0.44% 282,438,107 2,017,975 0.71%
Below investment grade fixed income managers * 148,364,649 1,953,550 1.32% 101,467,769 1,383,336 1.36%
Developed international fixed income managers 58,553,192 270,428 0.46% 118,359,898 423,318 0.36%
Real estate managers 238,450,646 2,660,865 1.12% 229,402,622 2,541,836 1.11%
Timber managers 59,876,758 395,760 0.66% 65,007,185 437,057 0.67%
Infrastructure managers * 114,181,019 1,316,541 1.15% 100,536,799 803,006 0.80%
Private equity managers * 82,765,742 1,513,944 1.83% 72,608,878 1,225,954 1.69%
Cash & equivalents managers 29,499,369 36,561 0.12% 19,216,771 20,203 0.11%
Total investment management fees 2,453,316,763 12,992,407 0.53% 2,210,999,957 12,773,099 0.58%
Custodian fees 233,938 0.01% 213,844 0.01%
Investment consultant fees 150,251 0.01% 124,539 0.01%
Total investment expenses 13,376,596 0.55% 13,111,481 0.59%
Actual Investment Performance (Net of Fees) 9.11% 12.92%
Policy Benchmark 7.89% 11.63%
Outperformance/(Underperformance) 1.22% 1.29%
FY 2018 FY 2017
ND Teachers' Fund for Retirement
Schedule of Investment Expenses
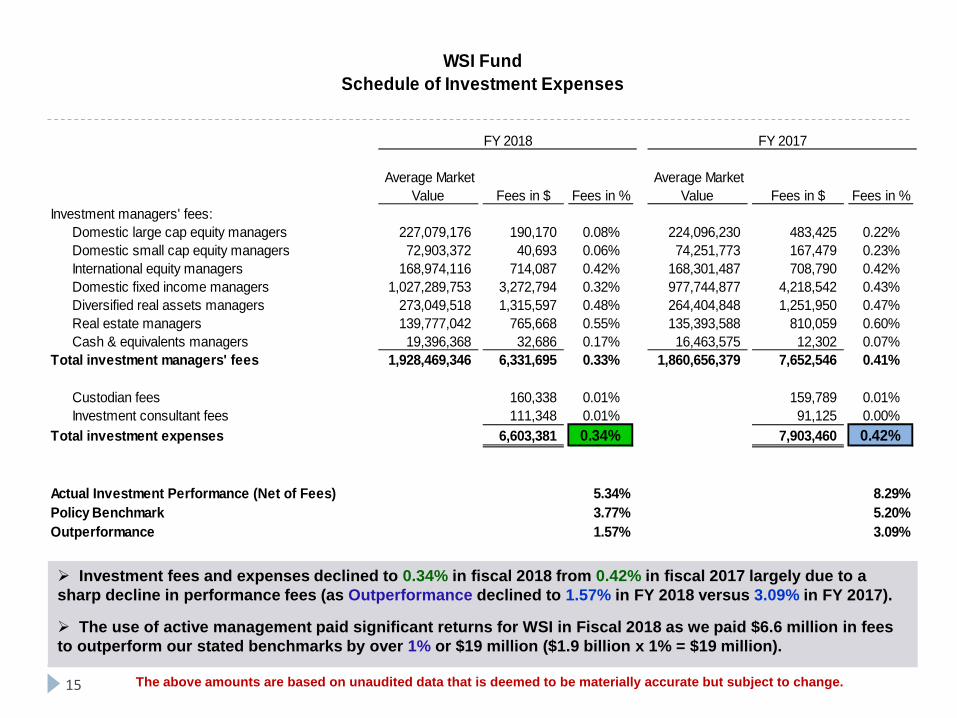
15
Investment fees and expenses declined to 0.34% in fiscal 2018 from 0.42% in fiscal 2017 largely due to a
sharp decline in performance fees (as Outperformance declined to 1.57% in FY 2018 versus 3.09% in FY 2017).
The use of active management paid significant returns for WSI in Fiscal 2018 as we paid $6.6 million in fees
to outperform our stated benchmarks by over 1% or $19 million ($1.9 billion x 1% = $19 million).
Average Market
Value Fees in $ Fees in %
Average Market
Value Fees in $ Fees in %
Investment managers' fees:
Domestic large cap equity managers 227,079,176 190,170 0.08% 224,096,230 483,425 0.22%
Domestic small cap equity managers 72,903,372 40,693 0.06% 74,251,773 167,479 0.23%
International equity managers 168,974,116 714,087 0.42% 168,301,487 708,790 0.42%
Domestic fixed income managers 1,027,289,753 3,272,794 0.32% 977,744,877 4,218,542 0.43%
Diversified real assets managers 273,049,518 1,315,597 0.48% 264,404,848 1,251,950 0.47%
Real estate managers 139,777,042 765,668 0.55% 135,393,588 810,059 0.60%
Cash & equivalents managers 19,396,368 32,686 0.17% 16,463,575 12,302 0.07%
Total investment managers' fees 1,928,469,346 6,331,695 0.33% 1,860,656,379 7,652,546 0.41%
Custodian fees 160,338 0.01% 159,789 0.01%
Investment consultant fees 111,348 0.01% 91,125 0.00%
Total investment expenses 6,603,381 0.34% 7,903,460 0.42%
Actual Investment Performance (Net of Fees) 5.34% 8.29%
Policy Benchmark 3.77% 5.20%
Outperformance 1.57% 3.09%
FY 2018 FY 2017
WSI Fund
Schedule of Investment Expenses
The above amounts are based on unaudited data that is deemed to be materially accurate but subject to change.
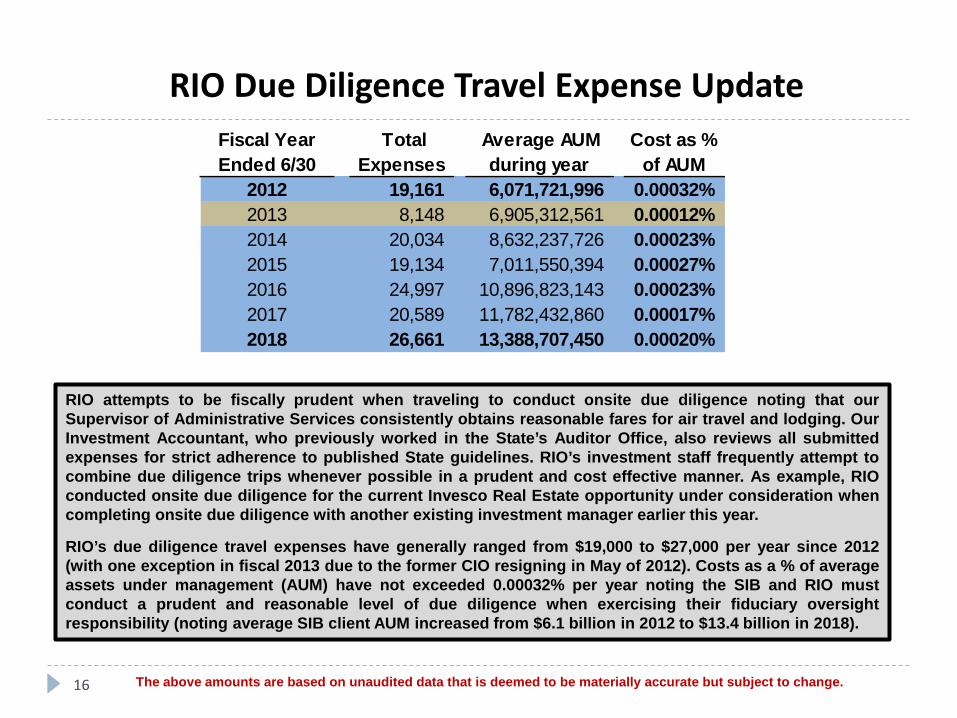
RIO Due Diligence Travel Expense Update
16
RIO attempts to be fiscally prudent when traveling to conduct onsite due diligence noting that our
Supervisor of Administrative Services consistently obtains reasonable fares for air travel and lodging. Our
Investment Accountant, who previously worked in the State’s Auditor Office, also reviews all submitted
expenses for strict adherence to published State guidelines. RIO’s investment staff frequently attempt to
combine due diligence trips whenever possible in a prudent and cost effective manner. As example, RIO
conducted onsite due diligence for the current Invesco Real Estate opportunity under consideration when
completing onsite due diligence with another existing investment manager earlier this year.
RIO’s due diligence travel expenses have generally ranged from $19,000 to $27,000 per year since 2012
(with one exception in fiscal 2013 due to the former CIO resigning in May of 2012). Costs as a % of average
assets under management (AUM) have not exceeded 0.00032% per year noting the SIB and RIO must
conduct a prudent and reasonable level of due diligence when exercising their fiduciary oversight
responsibility (noting average SIB client AUM increased from $6.1 billion in 2012 to $13.4 billion in 2018).
Fiscal Year
Ended 6/30
Total
Expenses
Average AUM
during year
Cost as %
of AUM
2012 19,161 6,071,721,996 0.00032%
2013 8,148 6,905,312,561 0.00012%
2014 20,034 8,632,237,726 0.00023%
2015 19,134 7,011,550,394 0.00027%
2016 24,997 10,896,823,143 0.00023%
2017 20,589 11,782,432,860 0.00017%
2018 26,661 13,388,707,450 0.00020%
The above amounts are based on unaudited data that is deemed to be materially accurate but subject to change.
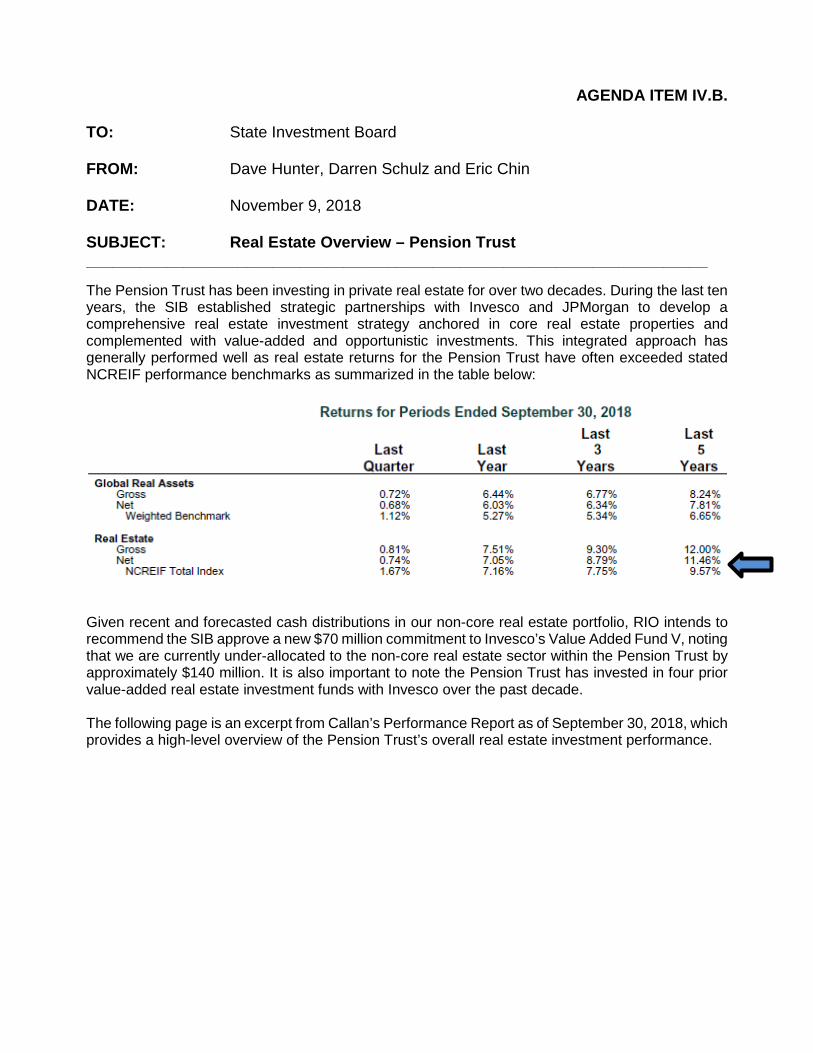
AGENDA ITEM IV.B. TO: State Investment Board FROM: Dave Hunter, Darren Schulz and Eric Chin DATE: November 9, 2018 SUBJECT: Real Estate Overview – Pension Trust ______________________________________________________________________ The Pension Trust has been investing in private real estate for over two decades. During the last ten years, the SIB established strategic partnerships with Invesco and JPMorgan to develop a comprehensive real estate investment strategy anchored in core real estate properties and complemented with value-added and opportunistic investments. This integrated approach has generally performed well as real estate returns for the Pension Trust have often exceeded stated NCREIF performance benchmarks as summarized in the table below:
Given recent and forecasted cash distributions in our non-core real estate portfolio, RIO intends to recommend the SIB approve a new $70 million commitment to Invesco’s Value Added Fund V, noting that we are currently under-allocated to the non-core real estate sector within the Pension Trust by approximately $140 million. It is also important to note the Pension Trust has invested in four prior value-added real estate investment funds with Invesco over the past decade. The following page is an excerpt from Callan’s Performance Report as of September 30, 2018, which provides a high-level overview of the Pension Trust’s overall real estate investment performance.
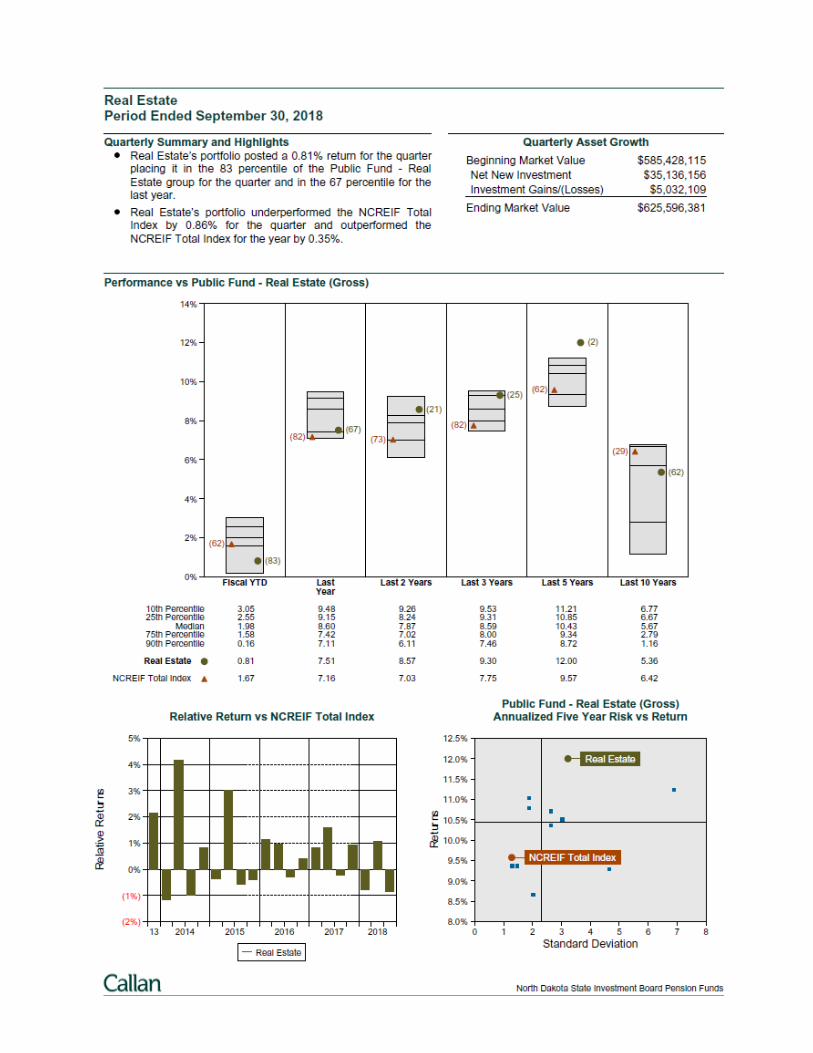
North Dakota State Investment BoardReal Estate Review
November 2018
INVESCO REAL ESTATENorth America: Dallas • San Francisco • Newport Beach • New York • AtlantaEurope: London • Paris • Munich • Prague • Madrid • LuxembourgAsia Pacific: Hong Kong • Shanghai • Tokyo • Seoul • Singapore • Sydney • Beijing
2
For one-on-one Institutional Investor use with North Dakota State Investment Board.
All material presented is compiled from sources believed to be reliable and current, but accuracy cannot be guaranteed. This is not to be construed as an offer to buy or sell any financial instruments. It is not our intention to state, indicate or imply in any manner that current or past results are indicative of future profitability or expectations. As with all investments there are associated inherent risks. Please obtain and review all financial material carefully before investing. This publication may contain confidential and proprietary information of Invesco Companies. Circulation, disclosure, or dissemination of all or any part of this material to any unauthorized persons is prohibited. Unauthorized reproduction or distribution of all or any part of this material is prohibited. For one-on-one presentations only.
1 Invesco Real Estate Overview
2 Portfolio Overview
3 Invesco U.S. Value-Add Fund V, L.P.
Table of Contents

Section 1Invesco Real Estate Overview
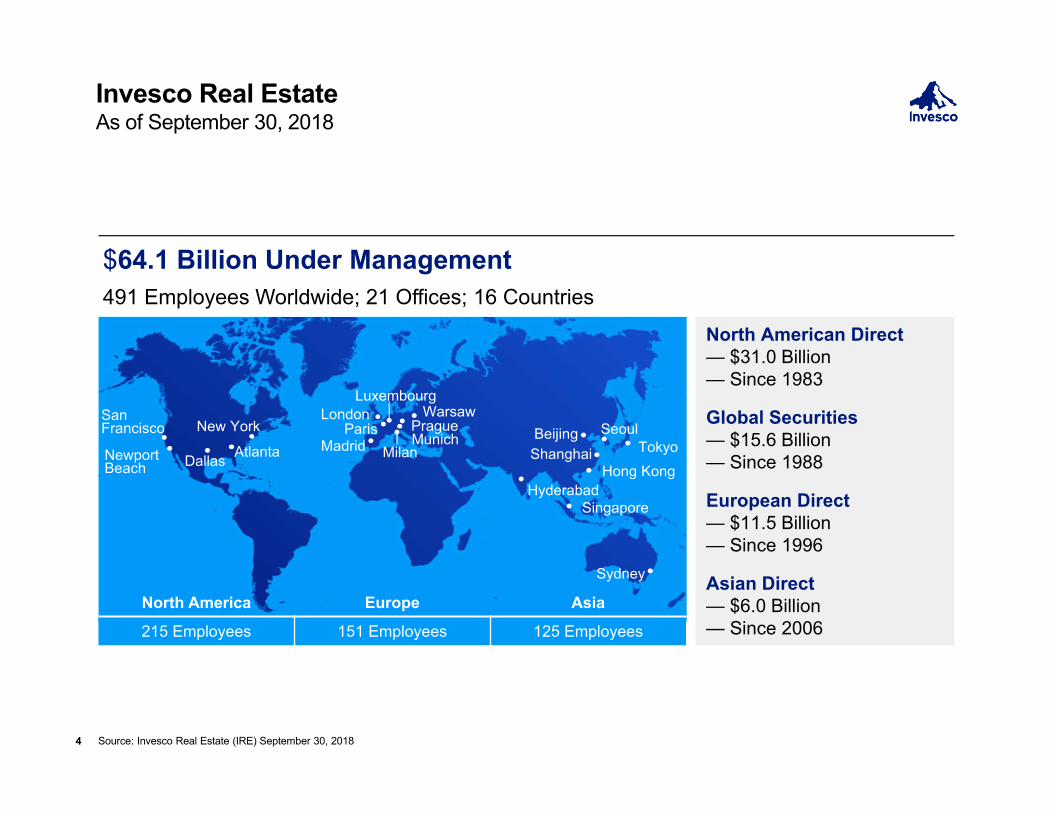
Invesco Real EstateAs of September 30, 2018
Source: Invesco Real Estate (IRE) September 30, 2018
North American Direct— $31.0 Billion— Since 1983
Global Securities— $15.6 Billion— Since 1988
European Direct— $11.5 Billion— Since 1996
Asian Direct— $6.0 Billion— Since 2006
$64.1 Billion Under Management491 Employees Worldwide; 21 Offices; 16 Countries
North America Europe Asia
215 Employees 151 Employees 125 Employees
San Francisco
Newport Beach Dallas
New York
Atlanta
London
MadridPragueMunich
Hong Kong
ParisTokyoShanghai
Luxembourg
Seoul
Singapore
Sydney
BeijingWarsaw
Milan
Hyderabad
4
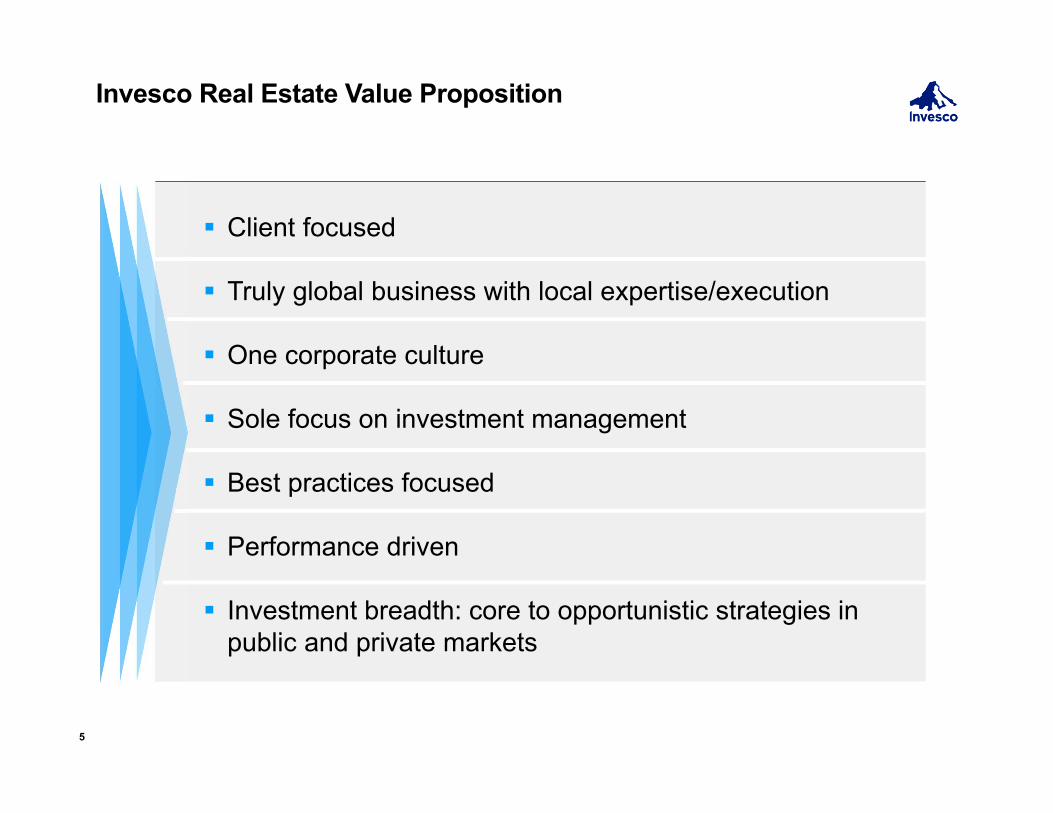
Invesco Real Estate Value Proposition
Client focused
Truly global business with local expertise/execution
One corporate culture
Sole focus on investment management
Best practices focused
Performance driven
Investment breadth: core to opportunistic strategies in public and private markets
5
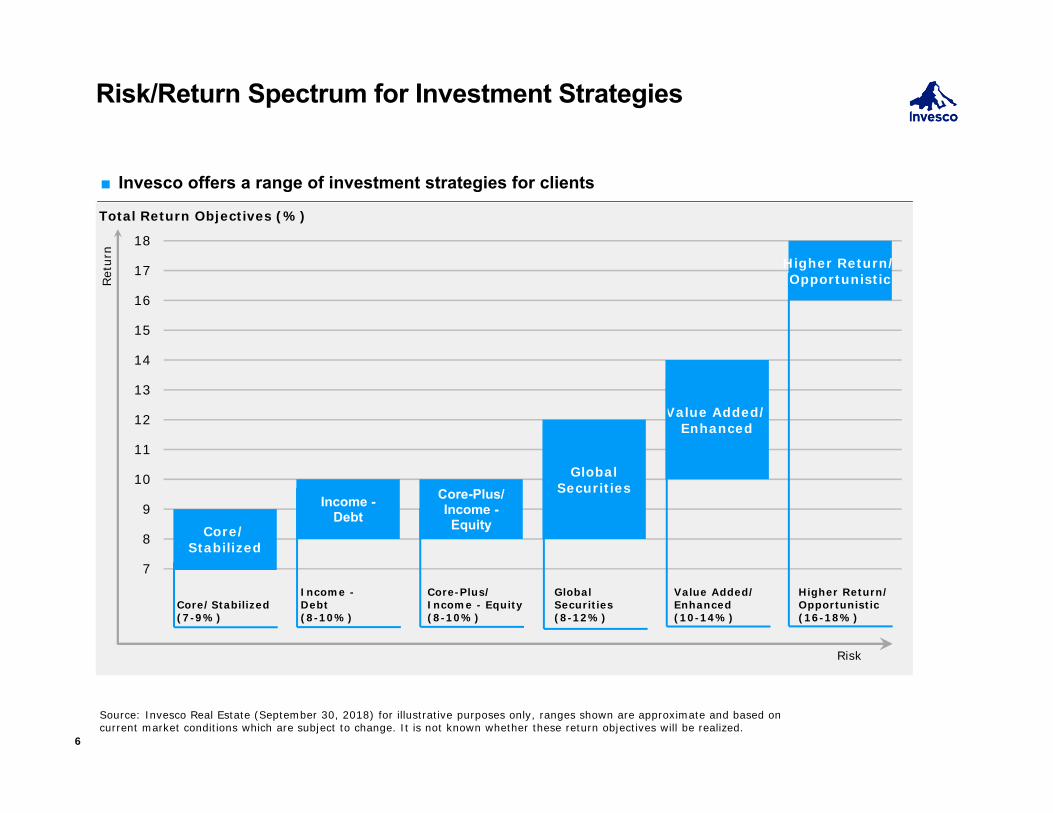
Core/Stabilized
Income -Debt
Core-Plus/Income -Equity
Global Securities
Value Added/Enhanced
Higher Return/Opportunistic
7
8
9
10
11
12
13
14
15
16
17
18
Risk/Return Spectrum for Investment Strategies
Total Return Objectives (%)
Source: Invesco Real Estate (September 30, 2018) for illustrative purposes only, ranges shown are approximate and based on current market conditions which are subject to change. It is not known whether these return objectives will be realized.
Risk
Ret
urn
■ Invesco offers a range of investment strategies for clients
Core/Stabilized(7-9%)
Income -Debt(8-10%)
Core-Plus/Income - Equity (8-10%)
Global Securities(8-12%)
Value Added/Enhanced(10-14%)
Higher Return/Opportunistic(16-18%)
6

Section 2Portfolio Overview
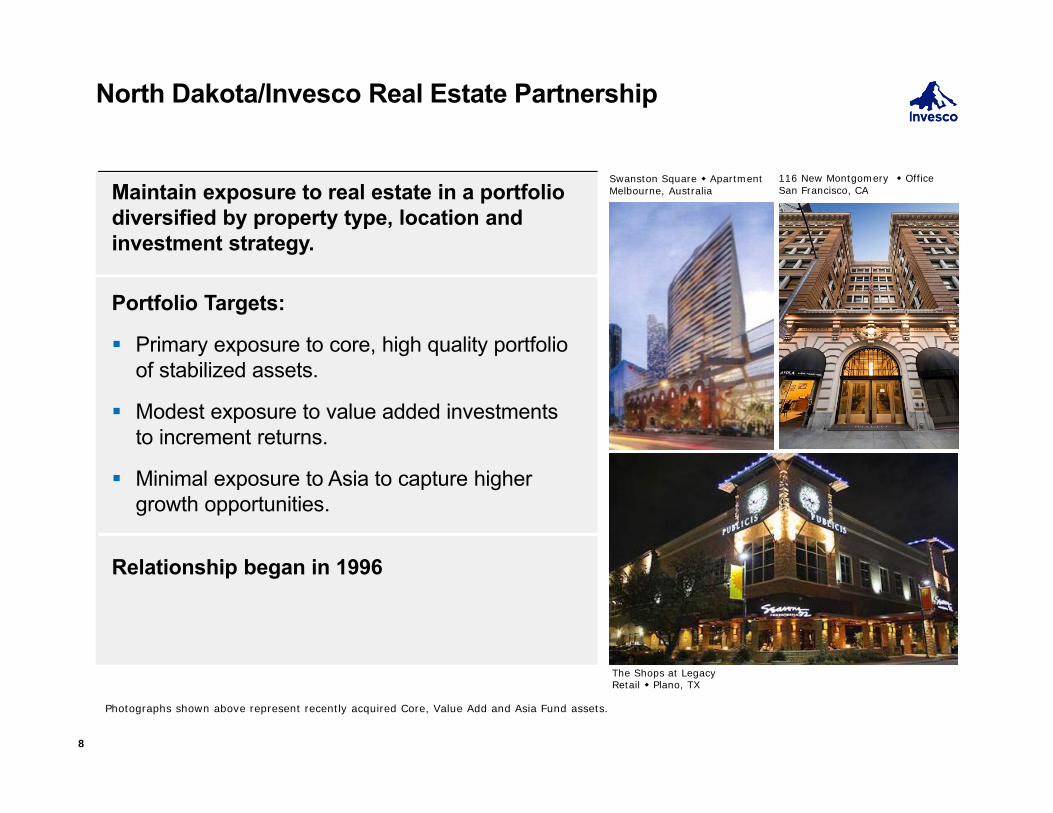
North Dakota/Invesco Real Estate Partnership
Maintain exposure to real estate in a portfolio diversified by property type, location and investment strategy.
Portfolio Targets:
Primary exposure to core, high quality portfolio of stabilized assets.
Modest exposure to value added investments to increment returns.
Minimal exposure to Asia to capture higher growth opportunities.
Relationship began in 1996
Photographs shown above represent recently acquired Core, Value Add and Asia Fund assets.
8
Swanston Square Apartment Melbourne, Australia
The Shops at LegacyRetail Plano, TX
116 New Montgomery Office San Francisco, CA
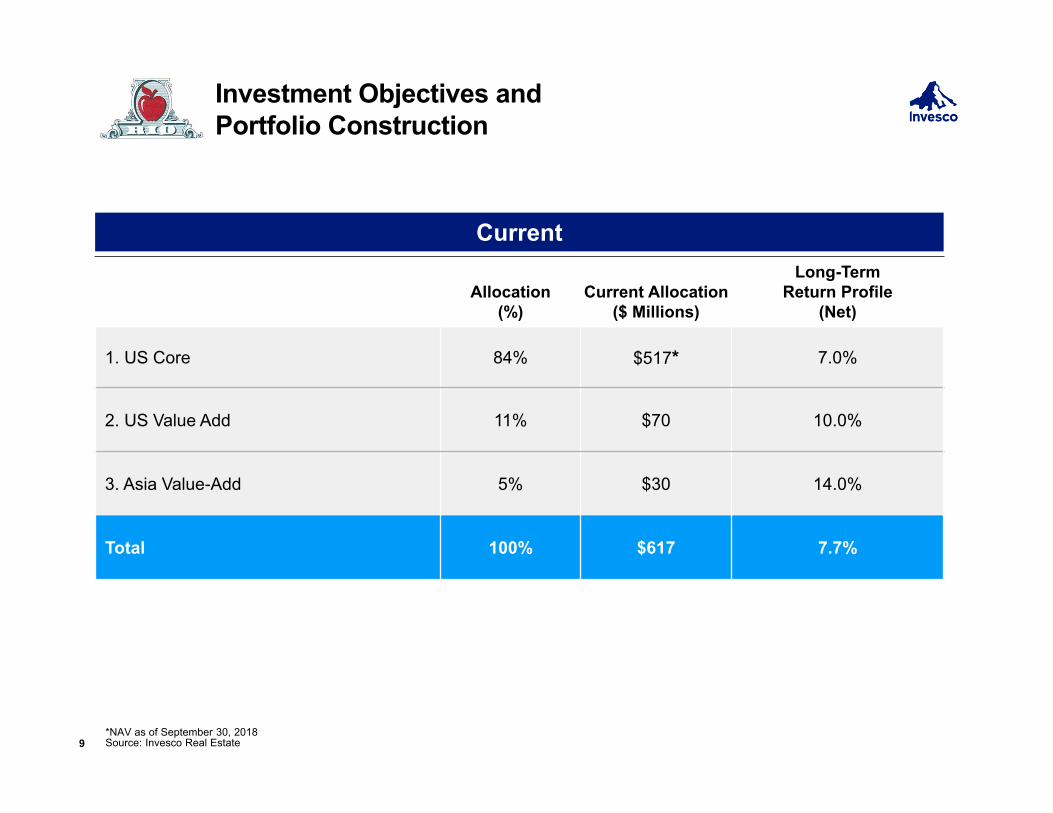
Investment Objectives and Portfolio Construction
Allocation (%)
Current Allocation ($ Millions)
Long-Term Return Profile
(Net)
1. US Core 84% $517* 7.0%
2. US Value Add 11% $70 10.0%
3. Asia Value-Add 5% $30 14.0%
Total 100% $617 7.7%
9
Current
*NAV as of September 30, 2018Source: Invesco Real Estate
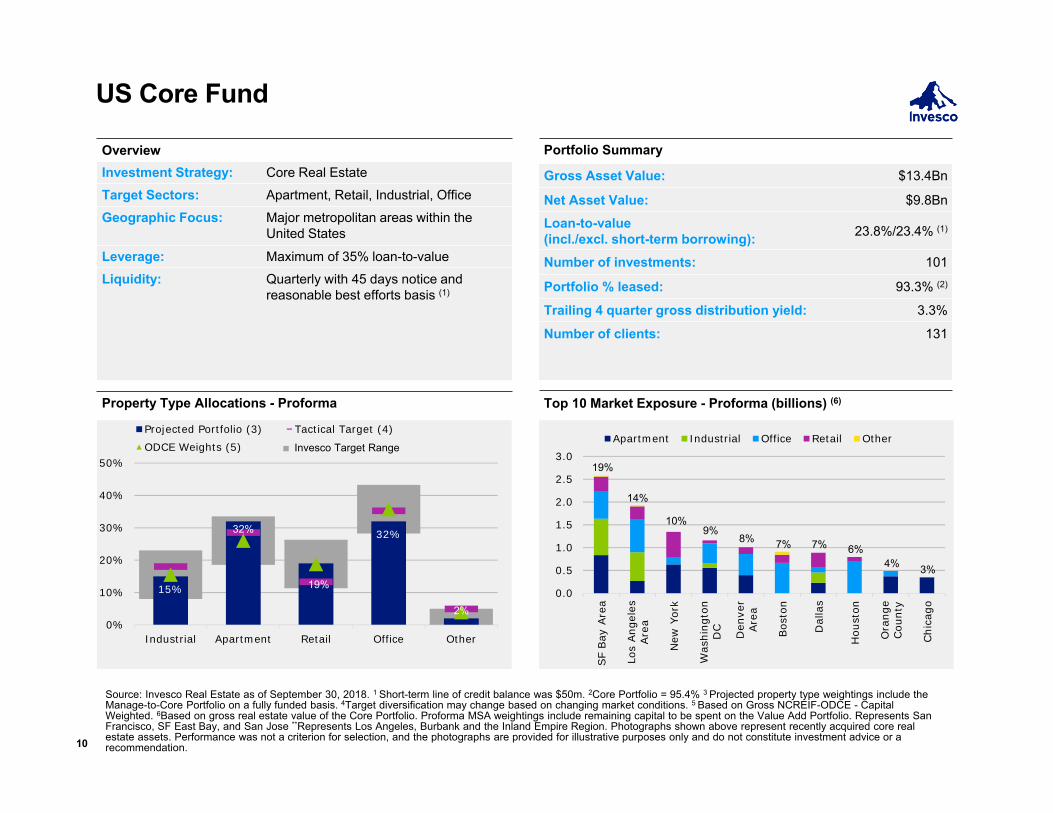
US Core Fund
OverviewInvestment Strategy: Core Real EstateTarget Sectors: Apartment, Retail, Industrial, OfficeGeographic Focus: Major metropolitan areas within the
United States
Leverage: Maximum of 35% loan-to-valueLiquidity: Quarterly with 45 days notice and
reasonable best efforts basis (1)
Property Type Allocations - Proforma
10
Portfolio Summary
Gross Asset Value: $13.4Bn
Net Asset Value: $9.8Bn
Loan-to-value(incl./excl. short-term borrowing): 23.8%/23.4% (1)
Number of investments: 101
Portfolio % leased: 93.3% (2)
Trailing 4 quarter gross distribution yield: 3.3%
Number of clients: 131
Top 10 Market Exposure - Proforma (billions) (6)
15%
32%
19%
32%
2%0%
10%
20%
30%
40%
50%
Industrial Apartment Retail Office Other
Projected Portfolio (3) Tactical Target (4)ODCE Weights (5) ■ Invesco Target Range
0.0
0.5
1.0
1.5
2.0
2.5
3.0
SF
Bay
Are
a
Los
Ang
eles
Are
a
New
Yor
k
Was
hing
ton
DC
Den
ver
Are
a
Bos
ton
Dal
las
Hou
ston
Ora
nge
Cou
nty
Chi
cago
Apartment Industrial Office Retail Other
19%
14%
10%9%
8% 7% 7% 6%4% 3%
Source: Invesco Real Estate as of September 30, 2018. 1 Short-term line of credit balance was $50m. 2Core Portfolio = 95.4% 3 Projected property type weightings include the Manage-to-Core Portfolio on a fully funded basis. 4Target diversification may change based on changing market conditions. 5 Based on Gross NCREIF-ODCE - Capital Weighted. 6Based on gross real estate value of the Core Portfolio. Proforma MSA weightings include remaining capital to be spent on the Value Add Portfolio. Represents San Francisco, SF East Bay, and San Jose **Represents Los Angeles, Burbank and the Inland Empire Region. Photographs shown above represent recently acquired core real estate assets. Performance was not a criterion for selection, and the photographs are provided for illustrative purposes only and do not constitute investment advice or a recommendation.
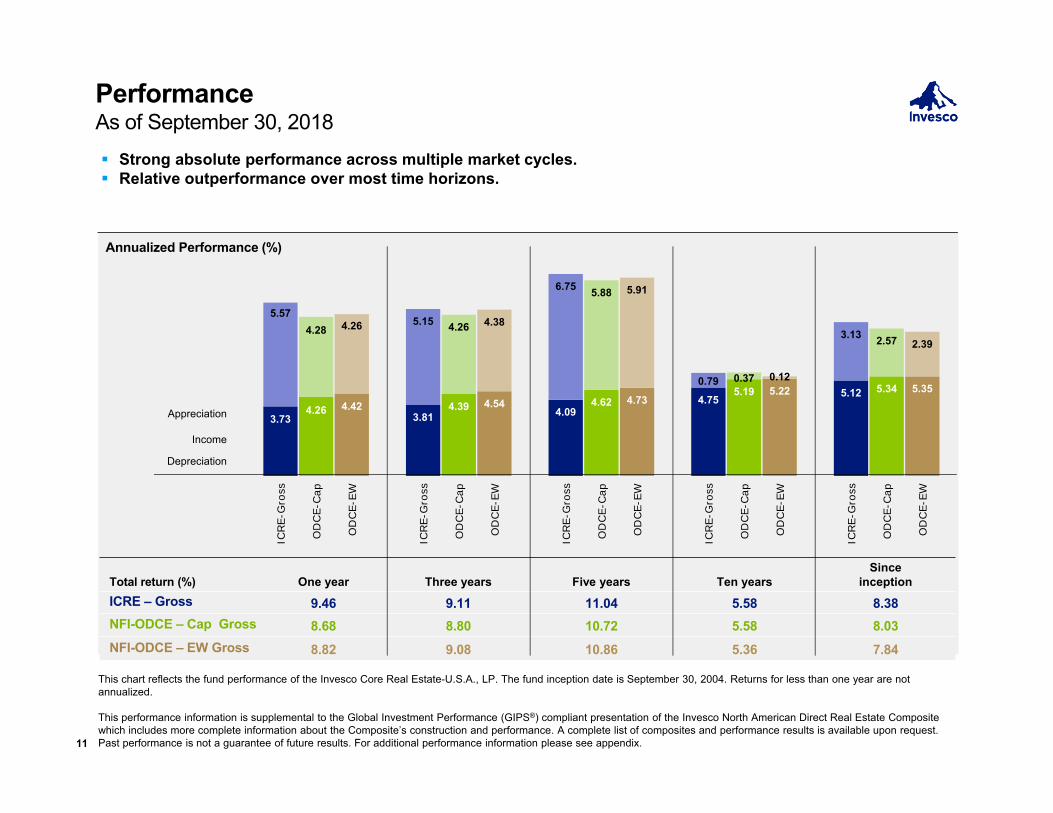
PerformanceAs of September 30, 2018 Strong absolute performance across multiple market cycles. Relative outperformance over most time horizons.
3.734.26 4.42
3.814.39 4.54
4.094.62 4.73 4.75
5.19 5.22 5.12 5.34 5.35
5.574.28 4.26 5.15 4.26 4.38
6.75 5.88 5.91
0.79 0.37 0.12
3.13 2.57 2.39
ICRE-
Gro
ss
OD
CE-
Cap
OD
CE-
EW
ICRE-
Gro
ss
OD
CE-
Cap
OD
CE-
EW
ICRE-
Gro
ss
OD
CE-
Cap
OD
CE-
EW
ICRE-
Gro
ss
OD
CE-
Cap
OD
CE-
EW
ICRE-
Gro
ss
OD
CE-
Cap
OD
CE-
EW
Appreciation
Income
Depreciation
Total return (%) One year Three years Five years Ten yearsSince
inceptionICRE – Gross 9.46 9.11 11.04 5.58 8.38NFI-ODCE – Cap Gross 8.68 8.80 10.72 5.58 8.03NFI-ODCE – EW Gross 8.82 9.08 10.86 5.36 7.84
Annualized Performance (%)
11
This chart reflects the fund performance of the Invesco Core Real Estate-U.S.A., LP. The fund inception date is September 30, 2004. Returns for less than one year are not annualized.
This performance information is supplemental to the Global Investment Performance (GIPS®) compliant presentation of the Invesco North American Direct Real Estate Composite which includes more complete information about the Composite’s construction and performance. A complete list of composites and performance results is available upon request. Past performance is not a guarantee of future results. For additional performance information please see appendix.
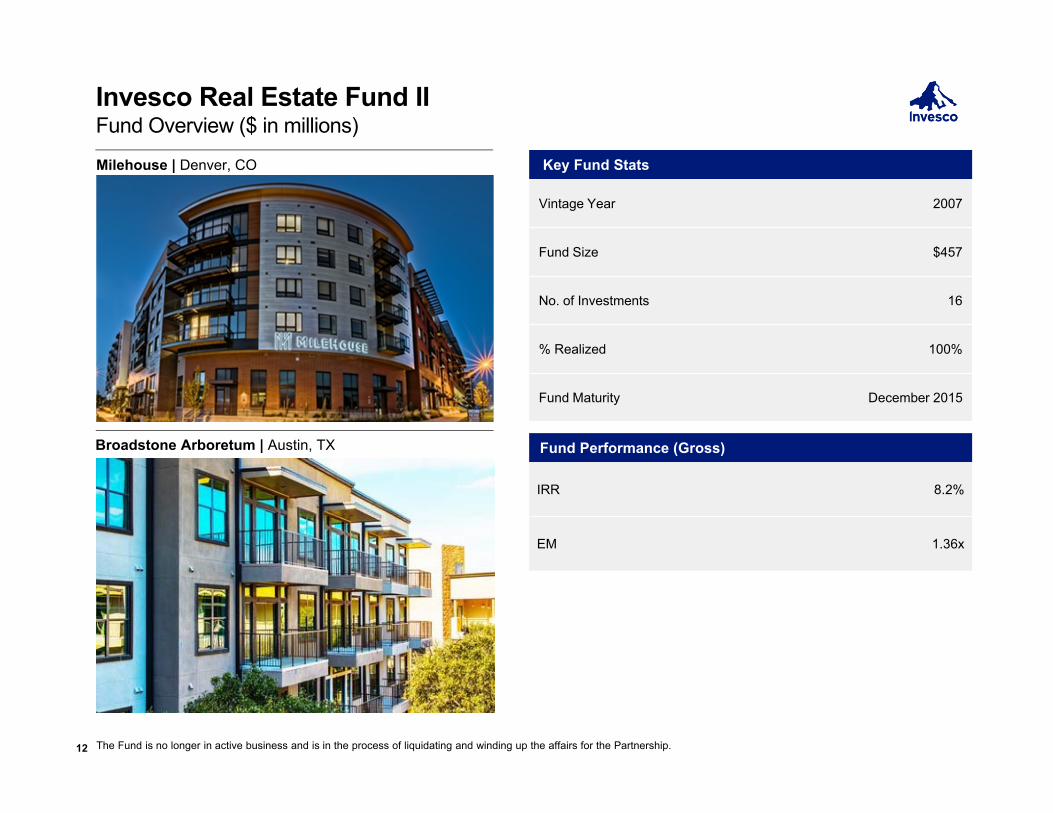
Invesco Real Estate Fund IIFund Overview ($ in millions)
Milehouse | Denver, CO
Broadstone Arboretum | Austin, TX
The Fund is no longer in active business and is in the process of liquidating and winding up the affairs for the Partnership.
Key Fund Stats
Vintage Year 2007
Fund Size $457
No. of Investments 16
% Realized 100%
Fund Maturity December 2015
Fund Performance (Gross)
IRR 8.2%
EM 1.36x
12
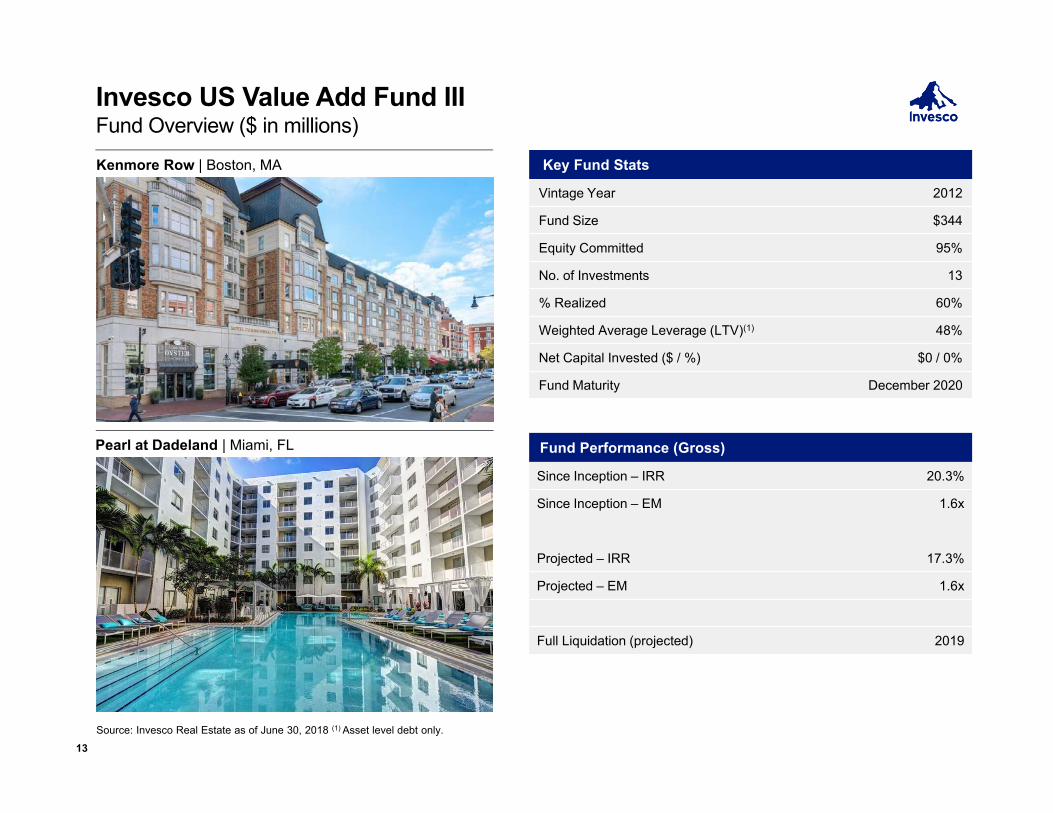
Invesco US Value Add Fund IIIFund Overview ($ in millions)
Kenmore Row | Boston, MA
Pearl at Dadeland | Miami, FL
Source: Invesco Real Estate as of June 30, 2018 (1) Asset level debt only.
Key Fund Stats
Vintage Year 2012
Fund Size $344
Equity Committed 95%
No. of Investments 13
% Realized 60%
Weighted Average Leverage (LTV)(1) 48%
Net Capital Invested ($ / %) $0 / 0%
Fund Maturity December 2020
Fund Performance (Gross)
Since Inception – IRR 20.3%
Since Inception – EM 1.6x
Projected – IRR 17.3%
Projected – EM 1.6x
Full Liquidation (projected) 2019
13
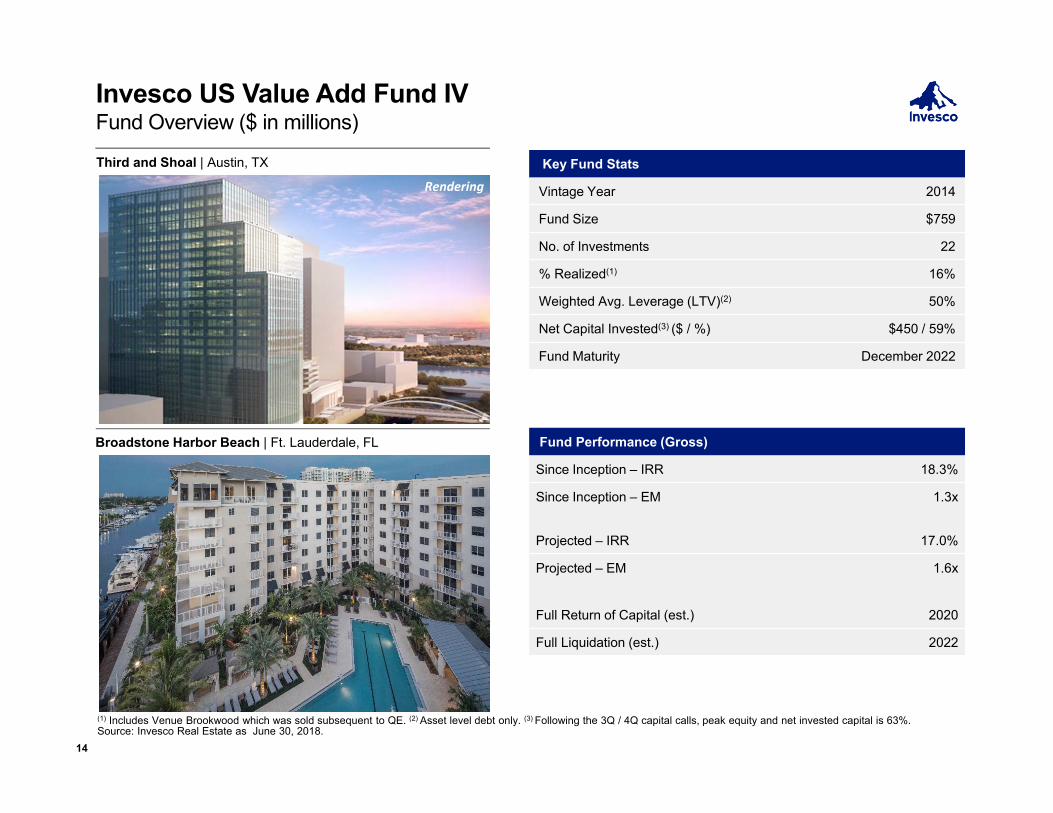
Key Fund Stats
Vintage Year 2014
Fund Size $759
No. of Investments 22
% Realized(1) 16%
Weighted Avg. Leverage (LTV)(2) 50%
Net Capital Invested(3) ($ / %) $450 / 59%
Fund Maturity December 2022
Invesco US Value Add Fund IVFund Overview ($ in millions)
(1) Includes Venue Brookwood which was sold subsequent to QE. (2) Asset level debt only. (3) Following the 3Q / 4Q capital calls, peak equity and net invested capital is 63%.Source: Invesco Real Estate as June 30, 2018.
Third and Shoal | Austin, TX
Broadstone Harbor Beach | Ft. Lauderdale, FL
Rendering
Fund Performance (Gross)
Since Inception – IRR 18.3%
Since Inception – EM 1.3x
Projected – IRR 17.0%
Projected – EM 1.6x
Full Return of Capital (est.) 2020
Full Liquidation (est.) 2022
14
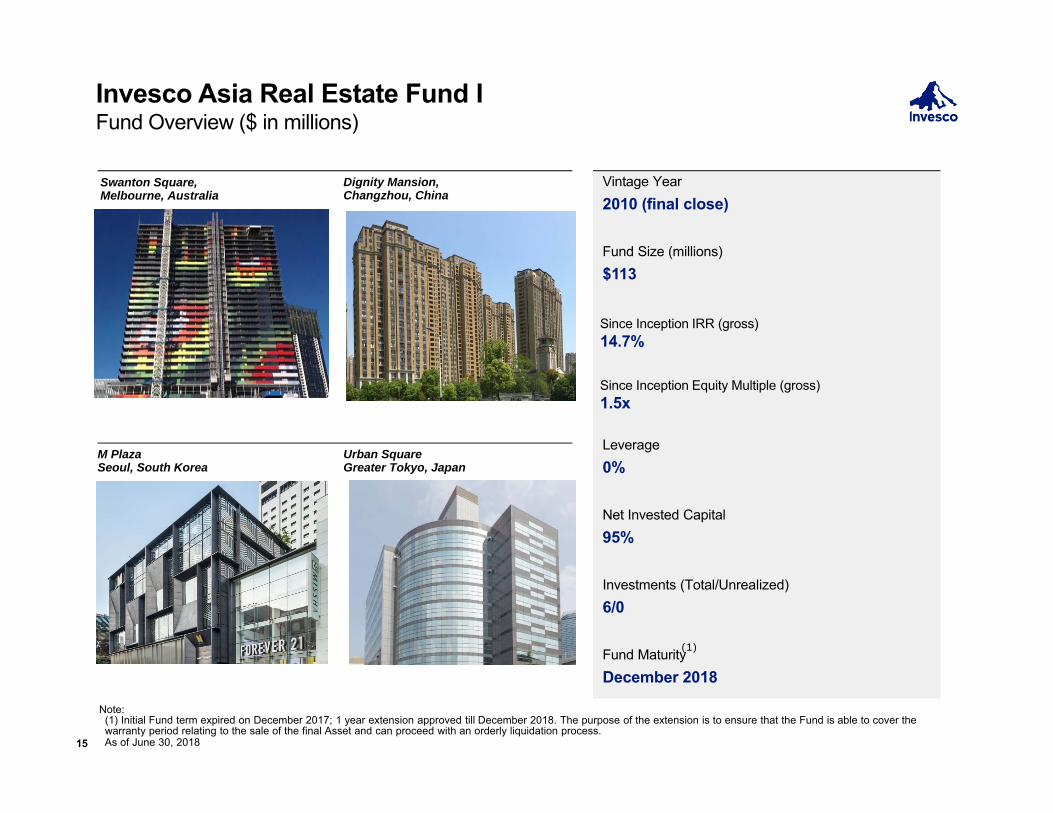
Vintage Year2010 (final close)
Fund Size (millions)$113
Since Inception IRR (gross)14.7%
Since Inception Equity Multiple (gross)1.5x
Leverage0%
Net Invested Capital95%
Investments (Total/Unrealized)6/0
Fund MaturityDecember 2018
15
Invesco Asia Real Estate Fund IFund Overview ($ in millions)
Swanton Square,Melbourne, Australia
Dignity Mansion, Changzhou, China
M PlazaSeoul, South Korea
Urban Square Greater Tokyo, Japan
As of June 30, 2018
Note:(1) Initial Fund term expired on December 2017; 1 year extension approved till December 2018. The purpose of the extension is to ensure that the Fund is able to cover the warranty period relating to the sale of the final Asset and can proceed with an orderly liquidation process.
(1)
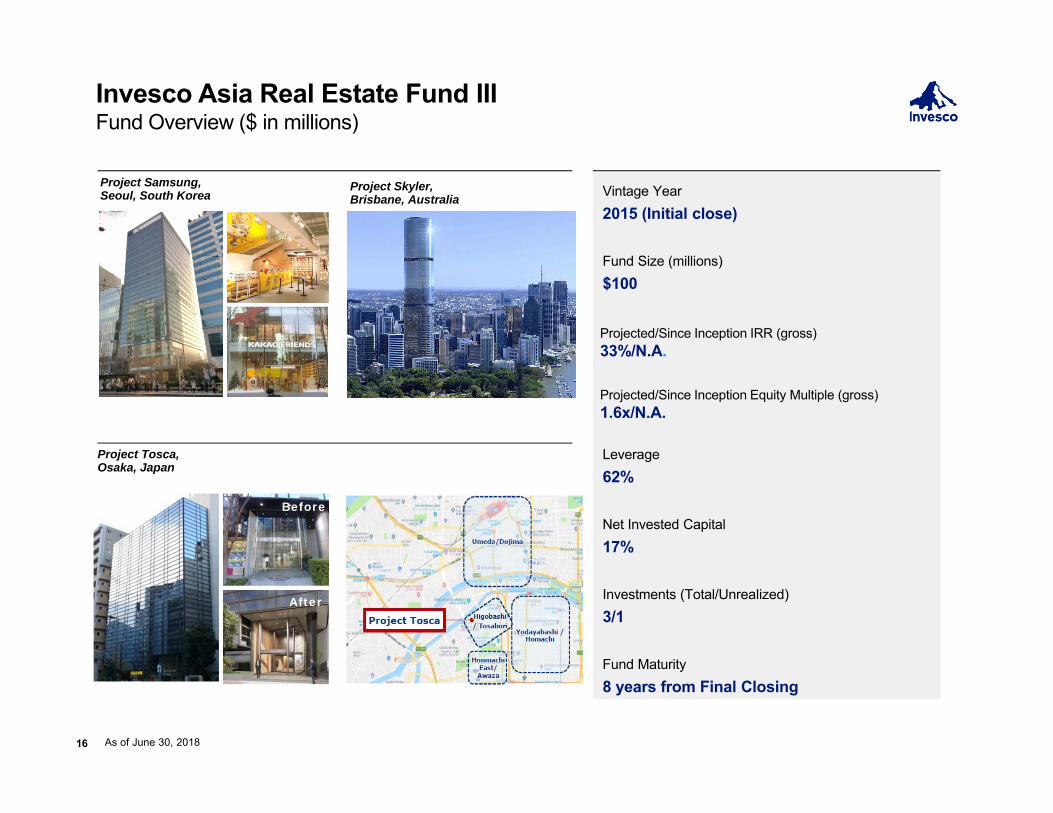
16
Invesco Asia Real Estate Fund IIIFund Overview ($ in millions)
Project Samsung,Seoul, South Korea
As of June 30, 2018
Vintage Year2015 (Initial close)
Fund Size (millions)$100
Projected/Since Inception IRR (gross)33%/N.A.
Projected/Since Inception Equity Multiple (gross)1.6x/N.A.
Leverage62%
Net Invested Capital17%
Investments (Total/Unrealized)3/1
Fund Maturity8 years from Final Closing
Project Skyler,Brisbane, Australia
Project Tosca,Osaka, Japan
Before
After

Section 3Invesco U.S. Value-Add Fund V, L.P.
Executive Summary
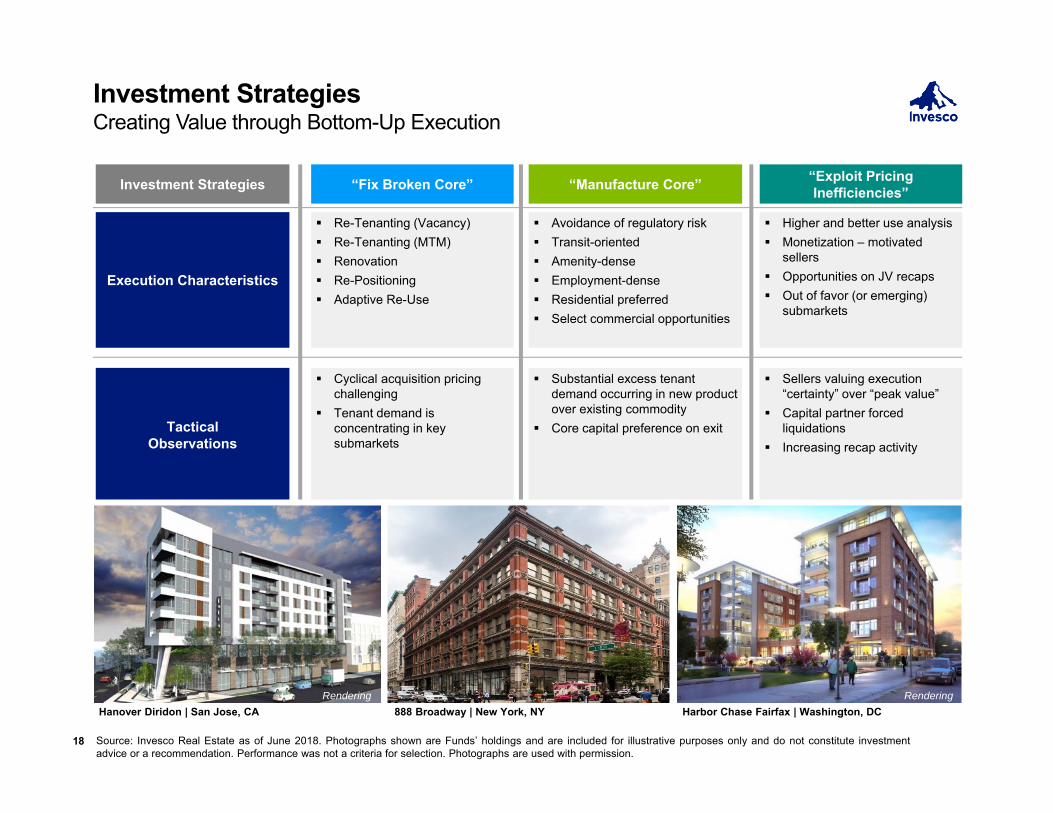
Investment StrategiesCreating Value through Bottom-Up Execution
Investment Strategies “Fix Broken Core” “Manufacture Core” “Exploit Pricing Inefficiencies”
Execution Characteristics
Re-Tenanting (Vacancy) Re-Tenanting (MTM) Renovation Re-Positioning Adaptive Re-Use
Avoidance of regulatory risk Transit-oriented Amenity-dense Employment-dense Residential preferred Select commercial opportunities
Higher and better use analysis Monetization – motivated
sellers Opportunities on JV recaps Out of favor (or emerging)
submarkets
Tactical Observations
Cyclical acquisition pricing challenging
Tenant demand is concentrating in key submarkets
Substantial excess tenant demand occurring in new product over existing commodity
Core capital preference on exit
Sellers valuing execution “certainty” over “peak value”
Capital partner forcedliquidations
Increasing recap activity
Source: Invesco Real Estate as of June 2018. Photographs shown are Funds’ holdings and are included for illustrative purposes only and do not constitute investmentadvice or a recommendation. Performance was not a criteria for selection. Photographs are used with permission.
18
Hanover Diridon | San Jose, CA 888 Broadway | New York, NY Harbor Chase Fairfax | Washington, DCRendering Rendering
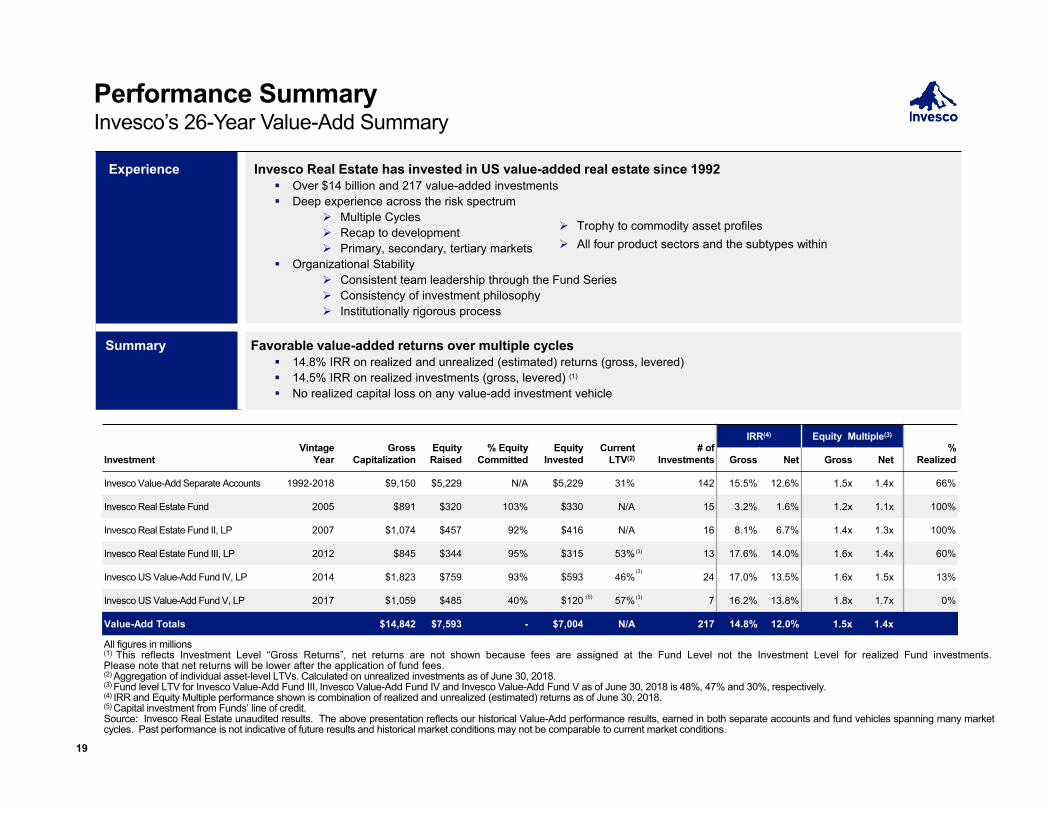
Performance SummaryInvesco’s 26-Year Value-Add Summary
All figures in millions(1) This reflects Investment Level “Gross Returns”, net returns are not shown because fees are assigned at the Fund Level not the Investment Level for realized Fund investments.Please note that net returns will be lower after the application of fund fees.(2) Aggregation of individual asset-level LTVs. Calculated on unrealized investments as of June 30, 2018.(3) Fund level LTV for Invesco Value-Add Fund III, Invesco Value-Add Fund IV and Invesco Value-Add Fund V as of June 30, 2018 is 48%, 47% and 30%, respectively.(4) IRR and Equity Multiple performance shown is combination of realized and unrealized (estimated) returns as of June 30, 2018.(5) Capital investment from Funds’ line of credit.Source: Invesco Real Estate unaudited results. The above presentation reflects our historical Value-Add performance results, earned in both separate accounts and fund vehicles spanning many marketcycles. Past performance is not indicative of future results and historical market conditions may not be comparable to current market conditions.
Experience Invesco Real Estate has invested in US value-added real estate since 1992 Over $14 billion and 217 value-added investments Deep experience across the risk spectrum
Multiple Cycles Recap to development Primary, secondary, tertiary markets
Organizational Stability Consistent team leadership through the Fund Series Consistency of investment philosophy Institutionally rigorous process
Summary Favorable value-added returns over multiple cycles 14.8% IRR on realized and unrealized (estimated) returns (gross, levered) 14.5% IRR on realized investments (gross, levered) (1)
No realized capital loss on any value-add investment vehicle
InvestmentVintage
YearGross
CapitalizationEquity Raised
% Equity Committed
Equity Invested
Current LTV(2)
# of Investments
IRR(4) Equity Multiple(3)
% RealizedGross Net Gross Net
Invesco Value-Add Separate Accounts 1992-2018 $9,150 $5,229 N/A $5,229 31% 142 15.5% 12.6% 1.5x 1.4x 66%
Invesco Real Estate Fund 2005 $891 $320 103% $330 N/A 15 3.2% 1.6% 1.2x 1.1x 100%
Invesco Real Estate Fund II, LP 2007 $1,074 $457 92% $416 N/A 16 8.1% 6.7% 1.4x 1.3x 100%
Invesco Real Estate Fund III, LP 2012 $845 $344 95% $315 53% 13 17.6% 14.0% 1.6x 1.4x 60%
Invesco US Value-Add Fund IV, LP 2014 $1,823 $759 93% $593 46% 24 17.0% 13.5% 1.6x 1.5x 13%
Invesco US Value-Add Fund V, LP 2017 $1,059 $485 40% $120 57% 7 16.2% 13.8% 1.8x 1.7x 0%
Value-Add Totals $14,842 $7,593 - $7,004 N/A 217 14.8% 12.0% 1.5x 1.4x
Trophy to commodity asset profiles All four product sectors and the subtypes within
(3)
(3)
(3)(5)
19
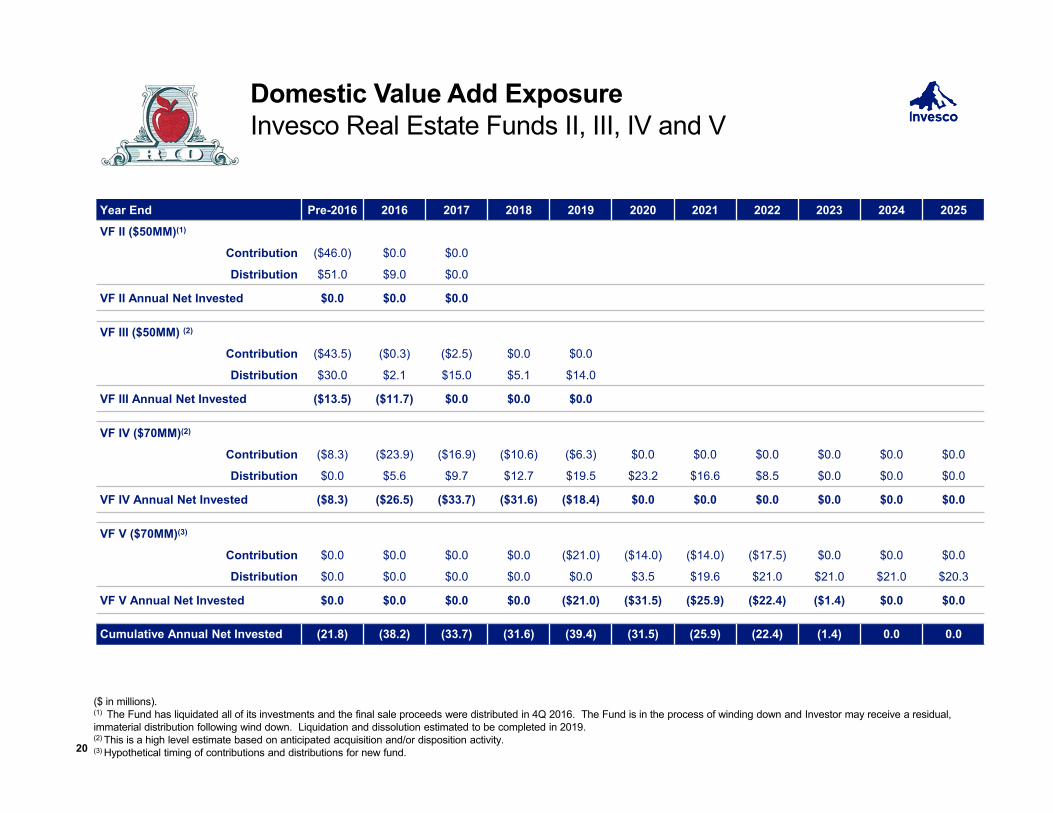
($ in millions). (1) The Fund has liquidated all of its investments and the final sale proceeds were distributed in 4Q 2016. The Fund is in the process of winding down and Investor may receive a residual, immaterial distribution following wind down. Liquidation and dissolution estimated to be completed in 2019.(2) This is a high level estimate based on anticipated acquisition and/or disposition activity.(3) Hypothetical timing of contributions and distributions for new fund.20
Year End Pre-2016 2016 2017 2018 2019 2020 2021 2022 2023 2024 2025
VF II ($50MM)(1)
Contribution ($46.0) $0.0 $0.0
Distribution $51.0 $9.0 $0.0
VF II Annual Net Invested $0.0 $0.0 $0.0
VF III ($50MM) (2)
Contribution ($43.5) ($0.3) ($2.5) $0.0 $0.0
Distribution $30.0 $2.1 $15.0 $5.1 $14.0
VF III Annual Net Invested ($13.5) ($11.7) $0.0 $0.0 $0.0
VF IV ($70MM)(2)
Contribution ($8.3) ($23.9) ($16.9) ($10.6) ($6.3) $0.0 $0.0 $0.0 $0.0 $0.0 $0.0
Distribution $0.0 $5.6 $9.7 $12.7 $19.5 $23.2 $16.6 $8.5 $0.0 $0.0 $0.0
VF IV Annual Net Invested ($8.3) ($26.5) ($33.7) ($31.6) ($18.4) $0.0 $0.0 $0.0 $0.0 $0.0 $0.0
VF V ($70MM)(3)
Contribution $0.0 $0.0 $0.0 $0.0 ($21.0) ($14.0) ($14.0) ($17.5) $0.0 $0.0 $0.0
Distribution $0.0 $0.0 $0.0 $0.0 $0.0 $3.5 $19.6 $21.0 $21.0 $21.0 $20.3
VF V Annual Net Invested $0.0 $0.0 $0.0 $0.0 ($21.0) ($31.5) ($25.9) ($22.4) ($1.4) $0.0 $0.0
Cumulative Annual Net Invested (21.8) (38.2) (33.7) (31.6) (39.4) (31.5) (25.9) (22.4) (1.4) 0.0 0.0
Domestic Value Add Exposure Invesco Real Estate Funds II, III, IV and V
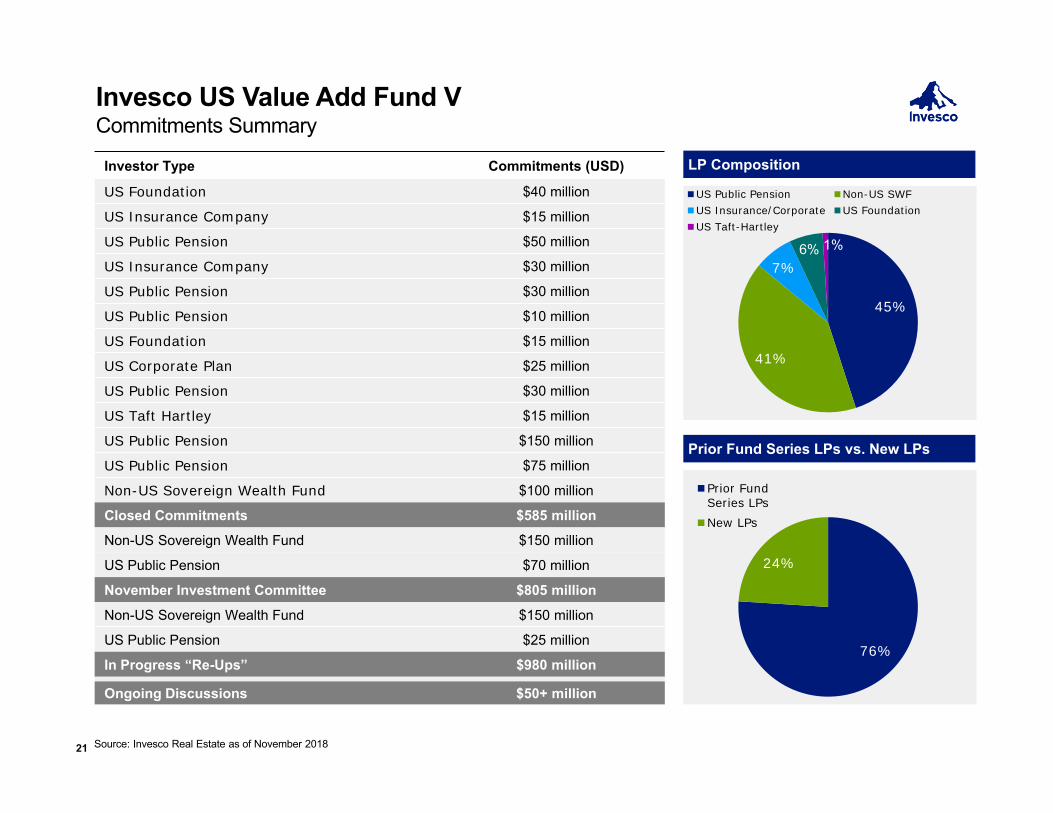
Invesco US Value Add Fund VCommitments Summary
Investor Type Commitments (USD)
US Foundation $40 million
US Insurance Company $15 million
US Public Pension $50 million
US Insurance Company $30 million
US Public Pension $30 million
US Public Pension $10 million
US Foundation $15 million
US Corporate Plan $25 million
US Public Pension $30 million
US Taft Hartley $15 million
US Public Pension $150 million
US Public Pension $75 million
Non-US Sovereign Wealth Fund $100 million
Closed Commitments $585 millionNon-US Sovereign Wealth Fund $150 million
US Public Pension $70 million
November Investment Committee $805 millionNon-US Sovereign Wealth Fund $150 million
US Public Pension $25 million
In Progress “Re-Ups” $980 million
Ongoing Discussions $50+ million
Source: Invesco Real Estate as of November 2018
LP Composition
45%
41%
7%6% 1%
US Public Pension Non-US SWFUS Insurance/Corporate US FoundationUS Taft-Hartley
Prior Fund Series LPs vs. New LPs
76%
24%
Prior FundSeries LPsNew LPs
21
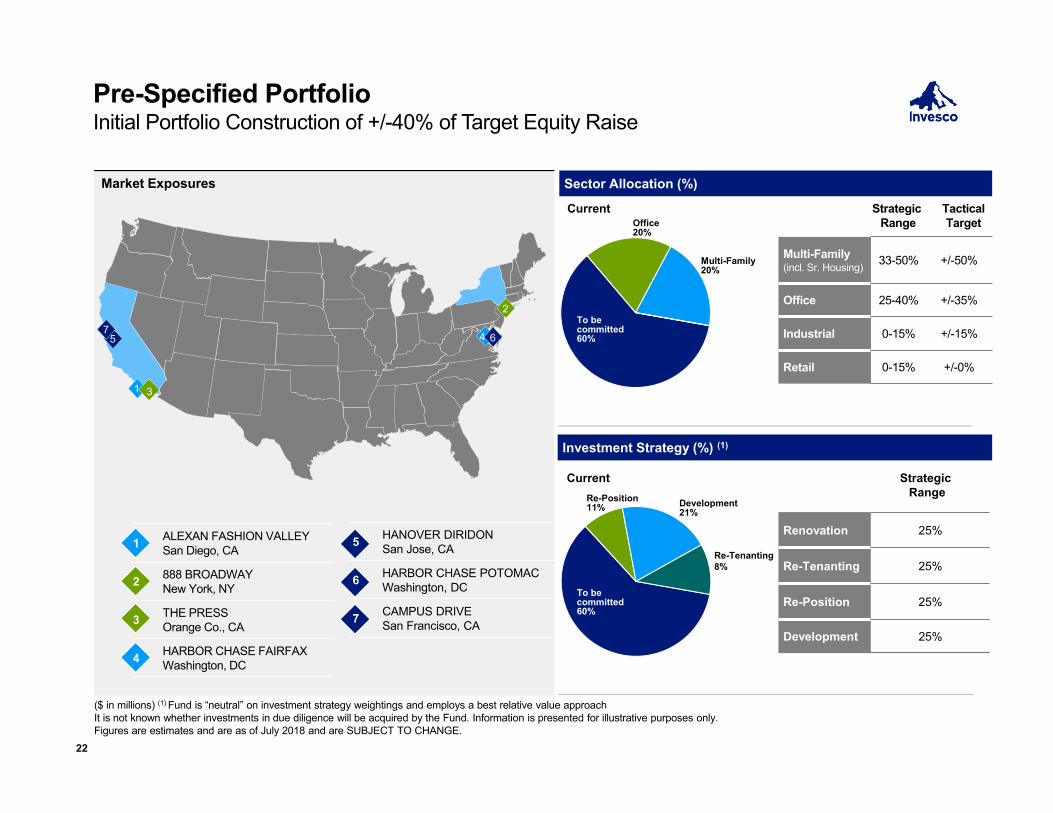
Pre-Specified PortfolioInitial Portfolio Construction of +/-40% of Target Equity Raise
($ in millions) (1) Fund is “neutral” on investment strategy weightings and employs a best relative value approachIt is not known whether investments in due diligence will be acquired by the Fund. Information is presented for illustrative purposes only.Figures are estimates and are as of July 2018 and are SUBJECT TO CHANGE.
Sector Allocation (%)
To be committed60%
Multi-Family20%
Office20%
Multi-Family (incl. Sr. Housing) 33-50% +/-50%
Office 25-40% +/-35%
Industrial 0-15% +/-15%
Retail 0-15% +/-0%
Investment Strategy (%) (1)
To be committed60%
Re-Position11% Development
21%
Renovation 25%
Re-Tenanting 25%
Re-Position 25%
Development 25%
Re-Tenanting8%
Strategic Range
Current
Strategic Range
Current
Market Exposures
1
57
3
2
4 6
1 ALEXAN FASHION VALLEYSan Diego, CA
2 888 BROADWAYNew York, NY
3 THE PRESSOrange Co., CA
4 HARBOR CHASE FAIRFAX Washington, DC
5 HANOVER DIRIDONSan Jose, CA
6 HARBOR CHASE POTOMACWashington, DC
7 CAMPUS DRIVESan Francisco, CA
TacticalTarget
22
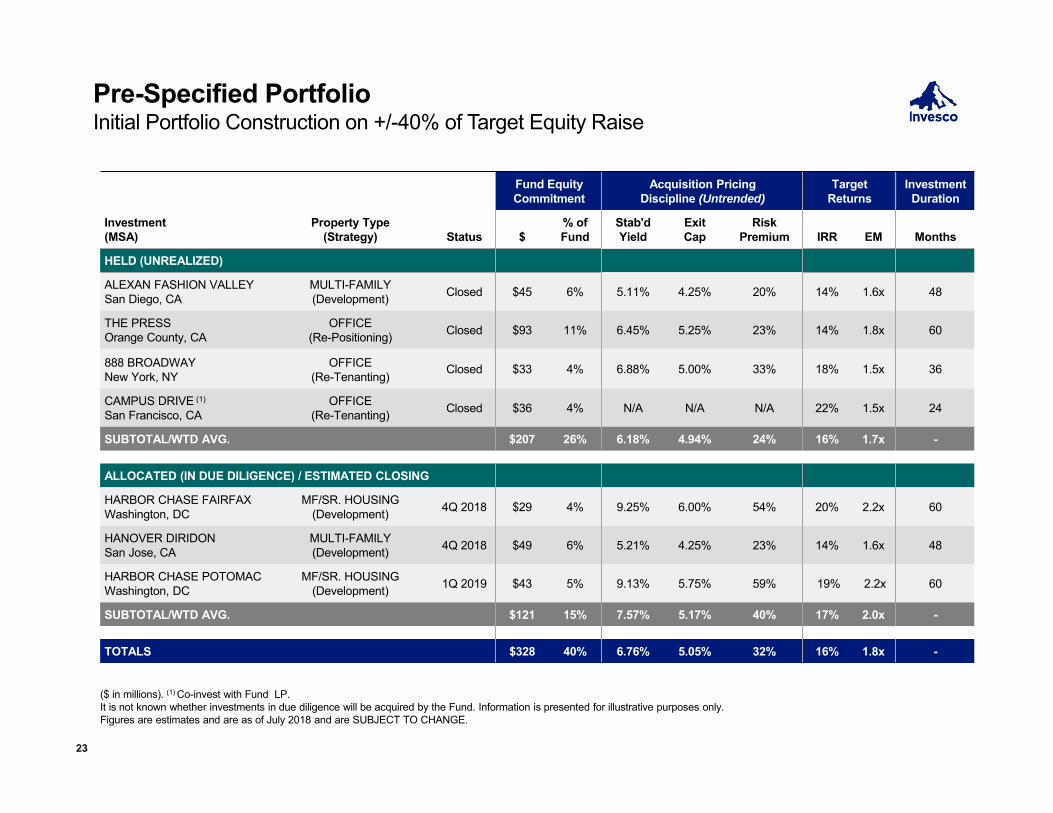
Pre-Specified PortfolioInitial Portfolio Construction on +/-40% of Target Equity Raise
($ in millions). (1) Co-invest with Fund LP.It is not known whether investments in due diligence will be acquired by the Fund. Information is presented for illustrative purposes only.Figures are estimates and are as of July 2018 and are SUBJECT TO CHANGE.
Investment(MSA)
Property Type(Strategy) Status
Fund Equity Commitment
Acquisition Pricing Discipline (Untrended)
Target Returns
InvestmentDuration
$% of Fund
Stab'd Yield
Exit Cap
Risk Premium IRR EM Months
HELD (UNREALIZED)
ALEXAN FASHION VALLEYSan Diego, CA
MULTI-FAMILY(Development) Closed $45 6% 5.11% 4.25% 20% 14% 1.6x 48
THE PRESSOrange County, CA
OFFICE(Re-Positioning) Closed $93 11% 6.45% 5.25% 23% 14% 1.8x 60
888 BROADWAYNew York, NY
OFFICE(Re-Tenanting) Closed $33 4% 6.88% 5.00% 33% 18% 1.5x 36
CAMPUS DRIVE (1)
San Francisco, CAOFFICE
(Re-Tenanting) Closed $36 4% N/A N/A N/A 22% 1.5x 24
SUBTOTAL/WTD AVG. $207 26% 6.18% 4.94% 24% 16% 1.7x -
ALLOCATED (IN DUE DILIGENCE) / ESTIMATED CLOSING
HARBOR CHASE FAIRFAX Washington, DC
MF/SR. HOUSING(Development) 4Q 2018 $29 4% 9.25% 6.00% 54% 20% 2.2x 60
HANOVER DIRIDONSan Jose, CA
MULTI-FAMILY(Development) 4Q 2018 $49 6% 5.21% 4.25% 23% 14% 1.6x 48
HARBOR CHASE POTOMACWashington, DC
MF/SR. HOUSING(Development) 1Q 2019 $43 5% 9.13% 5.75% 59% 19% 2.2x 60
SUBTOTAL/WTD AVG. $121 15% 7.57% 5.17% 40% 17% 2.0x -
TOTALS $328 40% 6.76% 5.05% 32% 16% 1.8x -
23
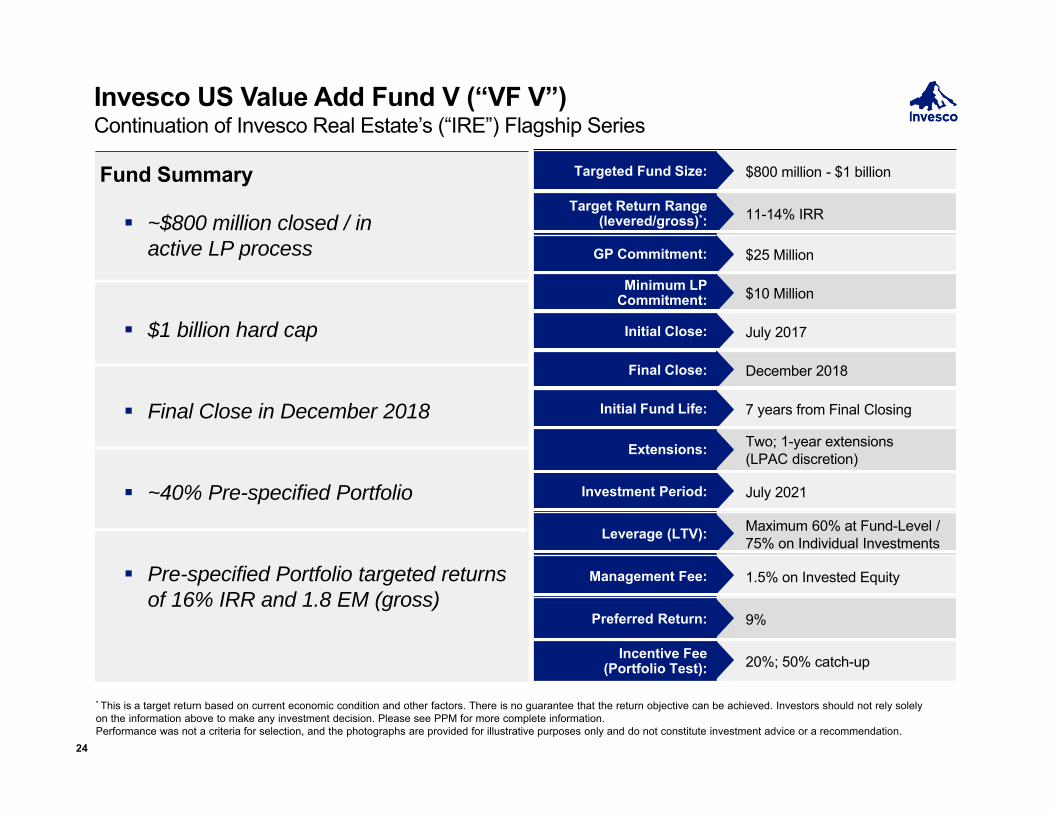
Targeted Fund Size: $800 million - $1 billion
Target Return Range (levered/gross)*: 11-14% IRR
GP Commitment: $25 Million
Minimum LP Commitment: $10 Million
Initial Close: July 2017
Final Close: December 2018
Initial Fund Life: 7 years from Final Closing
Extensions: Two; 1-year extensions(LPAC discretion)
Investment Period: July 2021
Leverage (LTV): Maximum 60% at Fund-Level / 75% on Individual Investments
Management Fee: 1.5% on Invested Equity
Preferred Return: 9%
Incentive Fee (Portfolio Test): 20%; 50% catch-up
Invesco US Value Add Fund V (“VF V”)Continuation of Invesco Real Estate’s (“IRE”) Flagship Series
* This is a target return based on current economic condition and other factors. There is no guarantee that the return objective can be achieved. Investors should not rely solely on the information above to make any investment decision. Please see PPM for more complete information.Performance was not a criteria for selection, and the photographs are provided for illustrative purposes only and do not constitute investment advice or a recommendation.
24
Fund Summary
~$800 million closed / in active LP process
$1 billion hard cap
Final Close in December 2018
~40% Pre-specified Portfolio
Pre-specified Portfolio targeted returns of 16% IRR and 1.8 EM (gross)
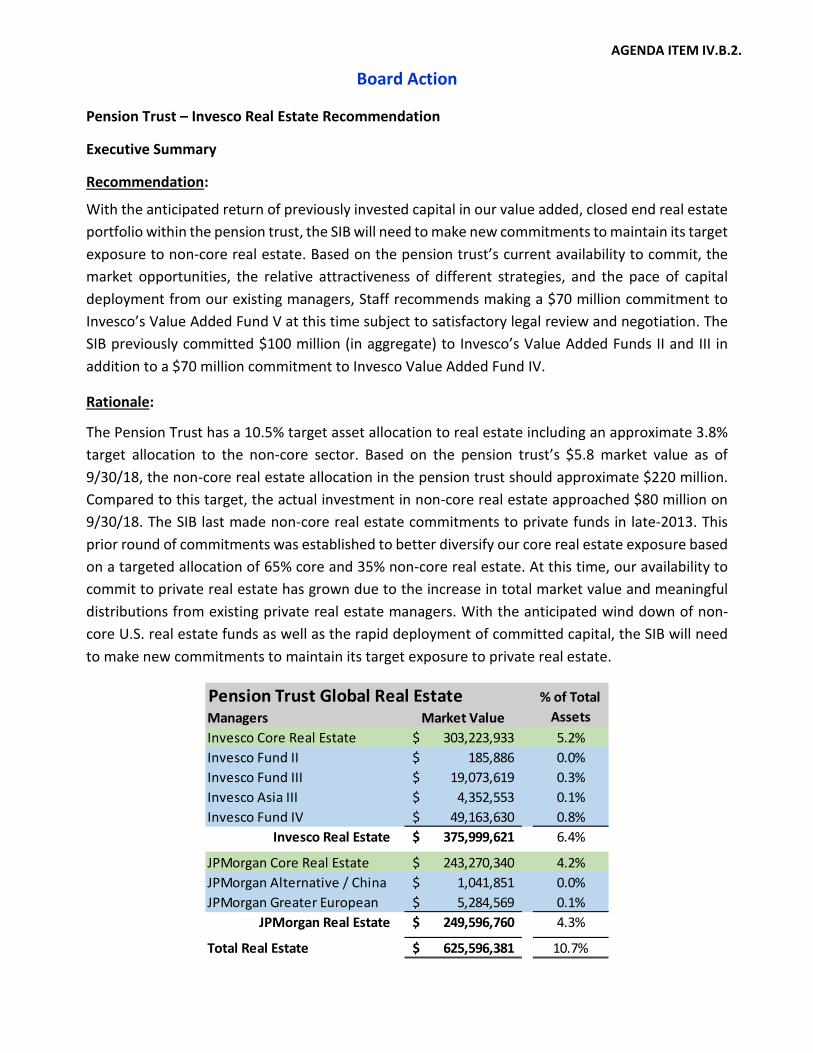
Board Action
Pension Trust – Invesco Real Estate Recommendation
Executive Summary
Recommendation:
With the anticipated return of previously invested capital in our value added, closed end real estate portfolio within the pension trust, the SIB will need to make new commitments to maintain its target exposure to non-core real estate. Based on the pension trust’s current availability to commit, the market opportunities, the relative attractiveness of different strategies, and the pace of capital deployment from our existing managers, Staff recommends making a $70 million commitment to Invesco’s Value Added Fund V at this time subject to satisfactory legal review and negotiation. The SIB previously committed $100 million (in aggregate) to Invesco’s Value Added Funds II and III in addition to a $70 million commitment to Invesco Value Added Fund IV.
Rationale:
The Pension Trust has a 10.5% target asset allocation to real estate including an approximate 3.8% target allocation to the non-core sector. Based on the pension trust’s $5.8 market value as of 9/30/18, the non-core real estate allocation in the pension trust should approximate $220 million. Compared to this target, the actual investment in non-core real estate approached $80 million on 9/30/18. The SIB last made non-core real estate commitments to private funds in late-2013. This prior round of commitments was established to better diversify our core real estate exposure based on a targeted allocation of 65% core and 35% non-core real estate. At this time, our availability to commit to private real estate has grown due to the increase in total market value and meaningful distributions from existing private real estate managers. With the anticipated wind down of non-core U.S. real estate funds as well as the rapid deployment of committed capital, the SIB will need to make new commitments to maintain its target exposure to private real estate.
Pension Trust Global Real EstateManagers Market ValueInvesco Core Real Estate 303,223,933$ 5.2%Invesco Fund II 185,886$ 0.0%Invesco Fund III 19,073,619$ 0.3%Invesco Asia III 4,352,553$ 0.1%Invesco Fund IV 49,163,630$ 0.8%
Invesco Real Estate 375,999,621$ 6.4%
JPMorgan Core Real Estate 243,270,340$ 4.2%JPMorgan Alternative / China 1,041,851$ 0.0%JPMorgan Greater European 5,284,569$ 0.1%
JPMorgan Real Estate 249,596,760$ 4.3%
Total Real Estate 625,596,381$ 10.7%
% of Total Assets
AGENDA ITEM IV.B.2.
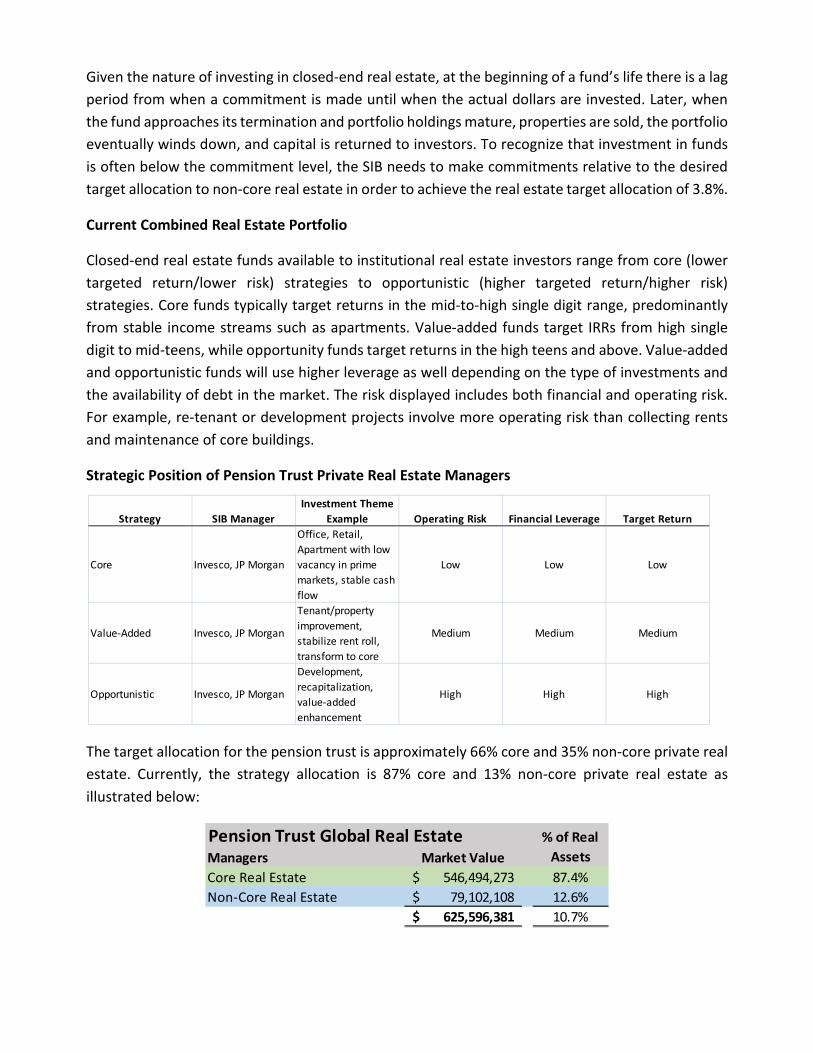
Given the nature of investing in closed-end real estate, at the beginning of a fund’s life there is a lag period from when a commitment is made until when the actual dollars are invested. Later, when the fund approaches its termination and portfolio holdings mature, properties are sold, the portfolio eventually winds down, and capital is returned to investors. To recognize that investment in funds is often below the commitment level, the SIB needs to make commitments relative to the desired target allocation to non-core real estate in order to achieve the real estate target allocation of 3.8%.
Current Combined Real Estate Portfolio
Closed-end real estate funds available to institutional real estate investors range from core (lower targeted return/lower risk) strategies to opportunistic (higher targeted return/higher risk) strategies. Core funds typically target returns in the mid-to-high single digit range, predominantly from stable income streams such as apartments. Value-added funds target IRRs from high single digit to mid-teens, while opportunity funds target returns in the high teens and above. Value-added and opportunistic funds will use higher leverage as well depending on the type of investments and the availability of debt in the market. The risk displayed includes both financial and operating risk. For example, re-tenant or development projects involve more operating risk than collecting rents and maintenance of core buildings.
Strategic Position of Pension Trust Private Real Estate Managers
The target allocation for the pension trust is approximately 66% core and 35% non-core private real estate. Currently, the strategy allocation is 87% core and 13% non-core private real estate as illustrated below:
Strategy SIB ManagerInvestment Theme
Example Operating Risk Financial Leverage Target Return
Core Invesco, JP Morgan
Office, Retail, Apartment with low vacancy in prime markets, stable cash flow
Low Low Low
Value-Added Invesco, JP Morgan
Tenant/property improvement, stabilize rent roll, transform to core
Medium Medium Medium
Opportunistic Invesco, JP Morgan
Development, recapitalization, value-added enhancement
High High High
Pension Trust Global Real EstateManagers Market ValueCore Real Estate 546,494,273$ 87.4%Non-Core Real Estate 79,102,108$ 12.6%
625,596,381$ 10.7%
% of Real Assets
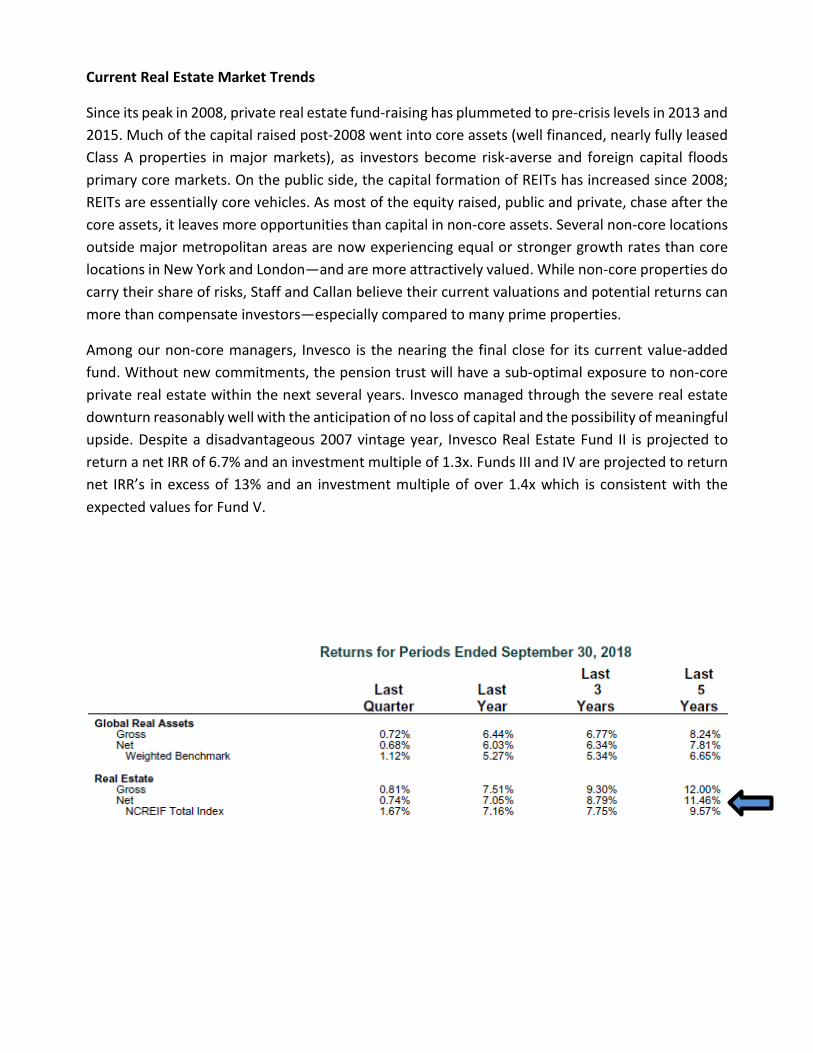
Current Real Estate Market Trends
Since its peak in 2008, private real estate fund-raising has plummeted to pre-crisis levels in 2013 and 2015. Much of the capital raised post-2008 went into core assets (well financed, nearly fully leased Class A properties in major markets), as investors become risk-averse and foreign capital floods primary core markets. On the public side, the capital formation of REITs has increased since 2008; REITs are essentially core vehicles. As most of the equity raised, public and private, chase after the core assets, it leaves more opportunities than capital in non-core assets. Several non-core locations outside major metropolitan areas are now experiencing equal or stronger growth rates than core locations in New York and London—and are more attractively valued. While non-core properties do carry their share of risks, Staff and Callan believe their current valuations and potential returns can more than compensate investors—especially compared to many prime properties.
Among our non-core managers, Invesco is the nearing the final close for its current value-added fund. Without new commitments, the pension trust will have a sub-optimal exposure to non-core private real estate within the next several years. Invesco managed through the severe real estate downturn reasonably well with the anticipation of no loss of capital and the possibility of meaningful upside. Despite a disadvantageous 2007 vintage year, Invesco Real Estate Fund II is projected to return a net IRR of 6.7% and an investment multiple of 1.3x. Funds III and IV are projected to return net IRR’s in excess of 13% and an investment multiple of over 1.4x which is consistent with the expected values for Fund V.
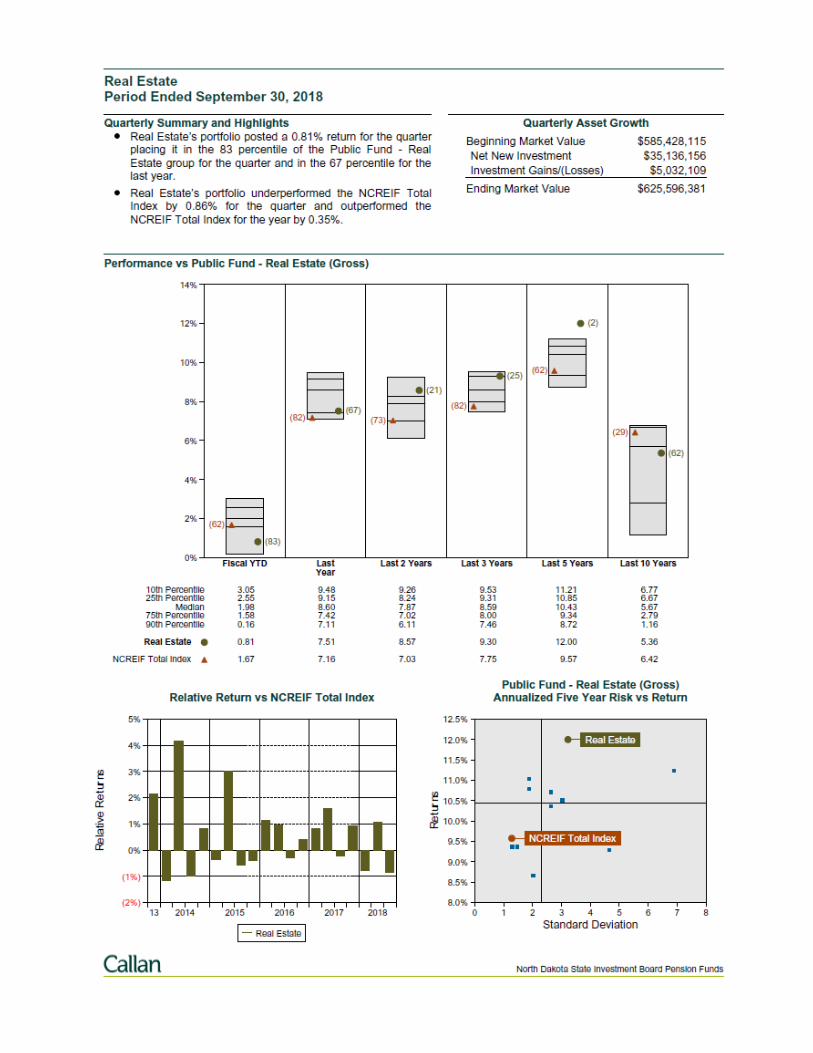
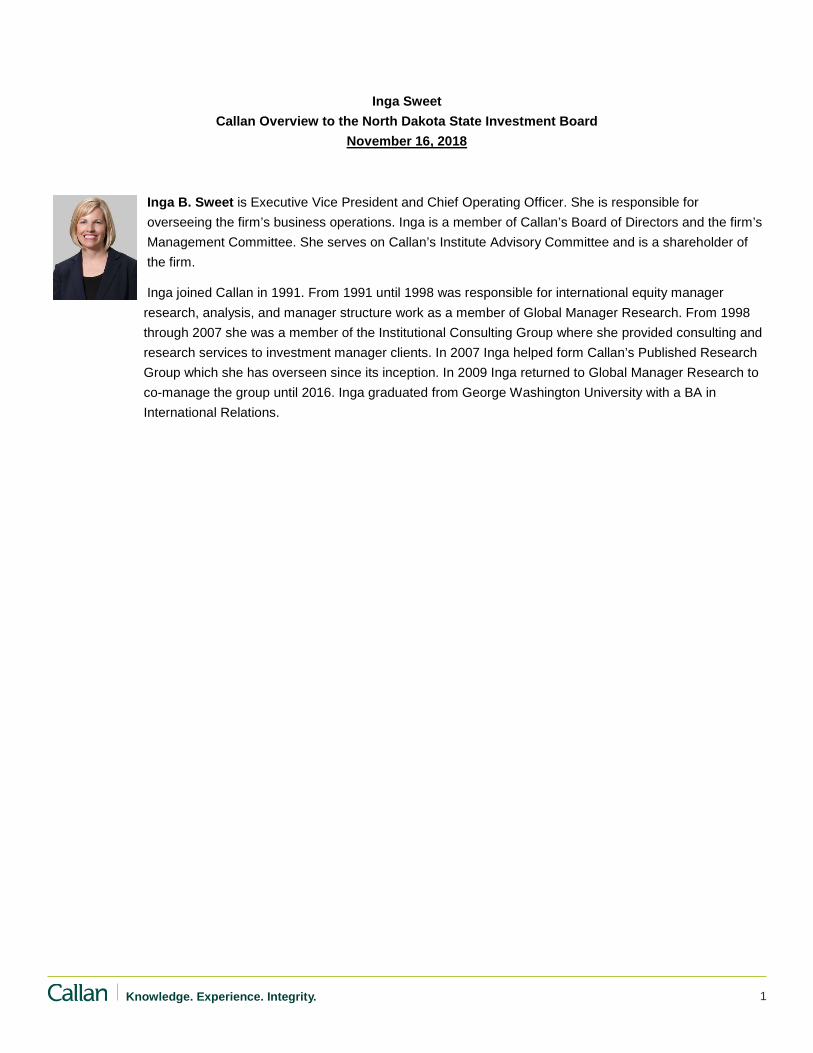
1 Knowledge. Experience. Integrity.
Inga Sweet
Callan Overview to the North Dakota State Investment Board
November 16, 2018
Inga B. Sweet is Executive Vice President and Chief Operating Officer. She is responsible for
overseeing the firm’s business operations. Inga is a member of Callan’s Board of Directors and the firm’s
Management Committee. She serves on Callan’s Institute Advisory Committee and is a shareholder of
the firm.
Inga joined Callan in 1991. From 1991 until 1998 was responsible for international equity manager
research, analysis, and manager structure work as a member of Global Manager Research. From 1998
through 2007 she was a member of the Institutional Consulting Group where she provided consulting and
research services to investment manager clients. In 2007 Inga helped form Callan’s Published Research
Group which she has overseen since its inception. In 2009 Inga returned to Global Manager Research to
co-manage the group until 2016. Inga graduated from George Washington University with a BA in
International Relations.
North Dakota State
Investment Board
Performance Evaluation as of
September 30, 2018
November 16, 2018
Paul Erlendson
Senior Vice President
Alex Browning
Senior Vice President
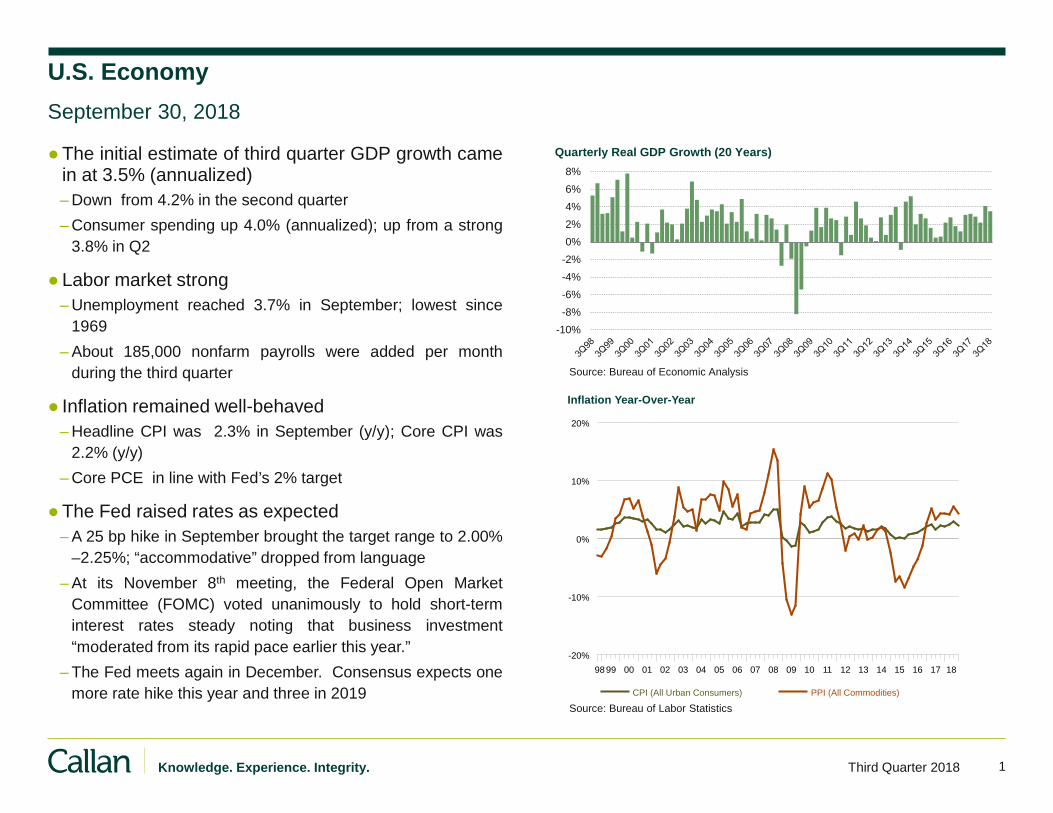
1 Knowledge. Experience. Integrity. Third Quarter 2018
U.S. Economy
●The initial estimate of third quarter GDP growth came in at 3.5% (annualized)
– Down from 4.2% in the second quarter
– Consumer spending up 4.0% (annualized); up from a strong
3.8% in Q2
●Labor market strong
– Unemployment reached 3.7% in September; lowest since
1969
– About 185,000 nonfarm payrolls were added per month
during the third quarter
● Inflation remained well-behaved
– Headline CPI was 2.3% in September (y/y); Core CPI was
2.2% (y/y)
– Core PCE in line with Fed’s 2% target
●The Fed raised rates as expected
– A 25 bp hike in September brought the target range to 2.00%
–2.25%; “accommodative” dropped from language
– At its November 8th meeting, the Federal Open Market
Committee (FOMC) voted unanimously to hold short-term
interest rates steady noting that business investment
“moderated from its rapid pace earlier this year.”
– The Fed meets again in December. Consensus expects one
more rate hike this year and three in 2019
September 30, 2018
-10%
-8%
-6%
-4%
-2%
0%
2%
4%
6%
8%
Quarterly Real GDP Growth (20 Years)
9899 00 01 02 03 04 05 06 07 08 09 10 11 12 13 14 15 16 17 18
-20%
-10%
0%
10%
20%
Inflation Year-Over-Year
CPI (All Urban Consumers) PPI (All Commodities)
Source: Bureau of Economic Analysis
Source: Bureau of Labor Statistics
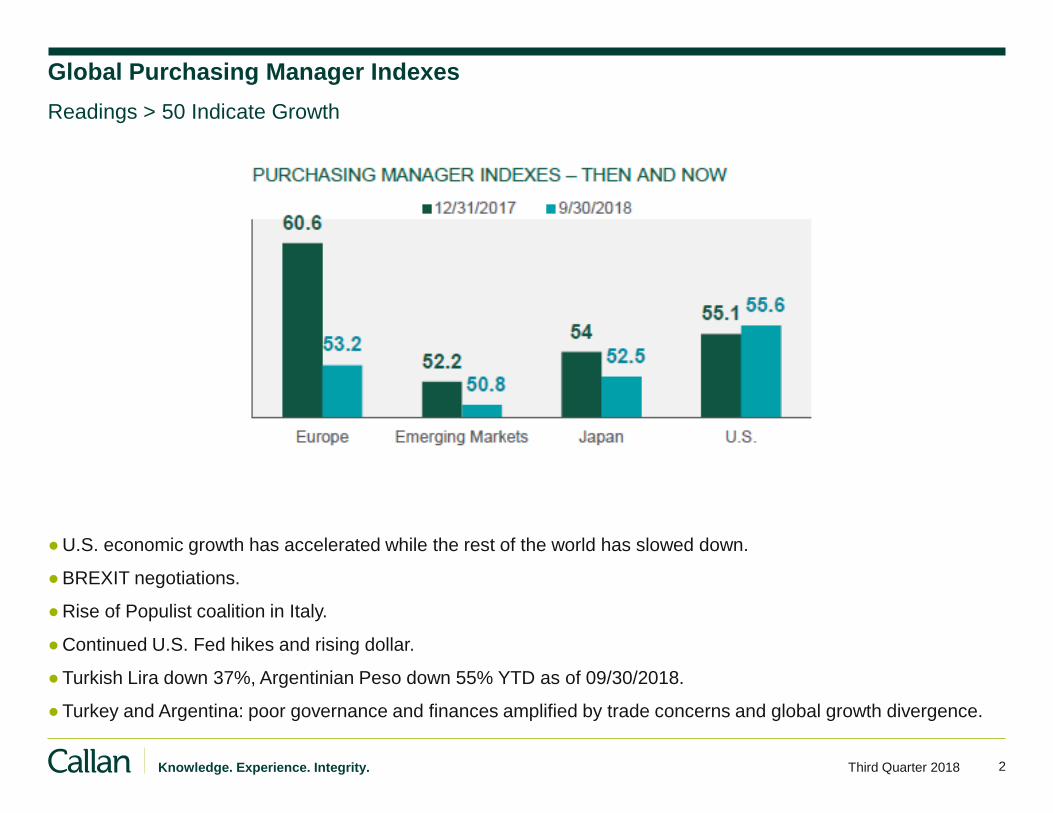
2 Knowledge. Experience. Integrity. Third Quarter 2018
Global Purchasing Manager Indexes
●U.S. economic growth has accelerated while the rest of the world has slowed down.
●BREXIT negotiations.
●Rise of Populist coalition in Italy.
●Continued U.S. Fed hikes and rising dollar.
●Turkish Lira down 37%, Argentinian Peso down 55% YTD as of 09/30/2018.
●Turkey and Argentina: poor governance and finances amplified by trade concerns and global growth divergence.
Readings > 50 Indicate Growth
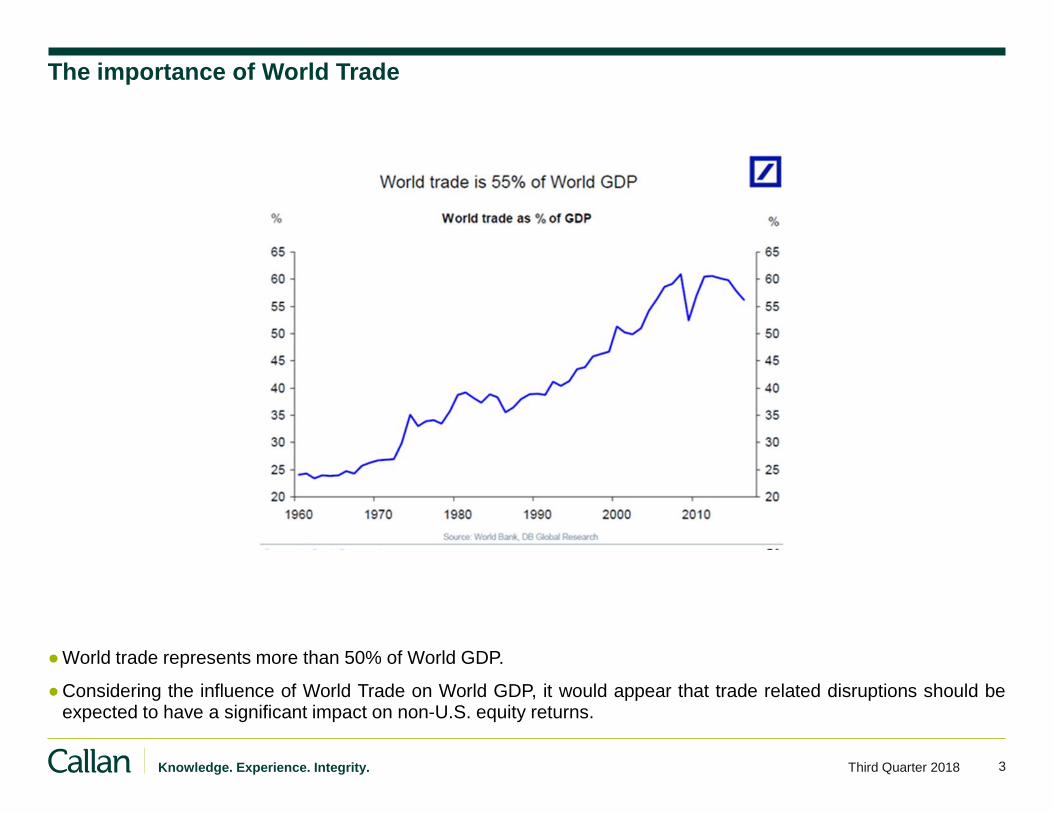
3 Knowledge. Experience. Integrity. Third Quarter 2018
The importance of World Trade
●World trade represents more than 50% of World GDP.
●Considering the influence of World Trade on World GDP, it would appear that trade related disruptions should be expected to have a significant impact on non-U.S. equity returns.
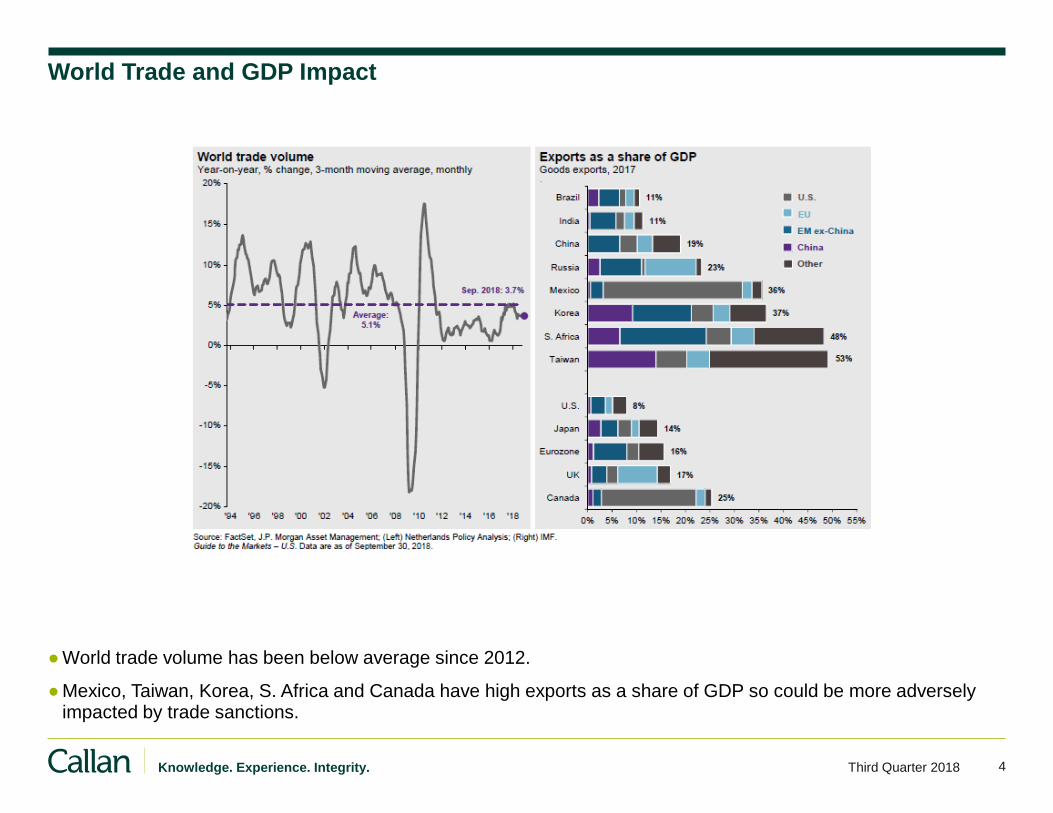
4 Knowledge. Experience. Integrity. Third Quarter 2018
World Trade and GDP Impact
●World trade volume has been below average since 2012.
●Mexico, Taiwan, Korea, S. Africa and Canada have high exports as a share of GDP so could be more adversely impacted by trade sanctions.
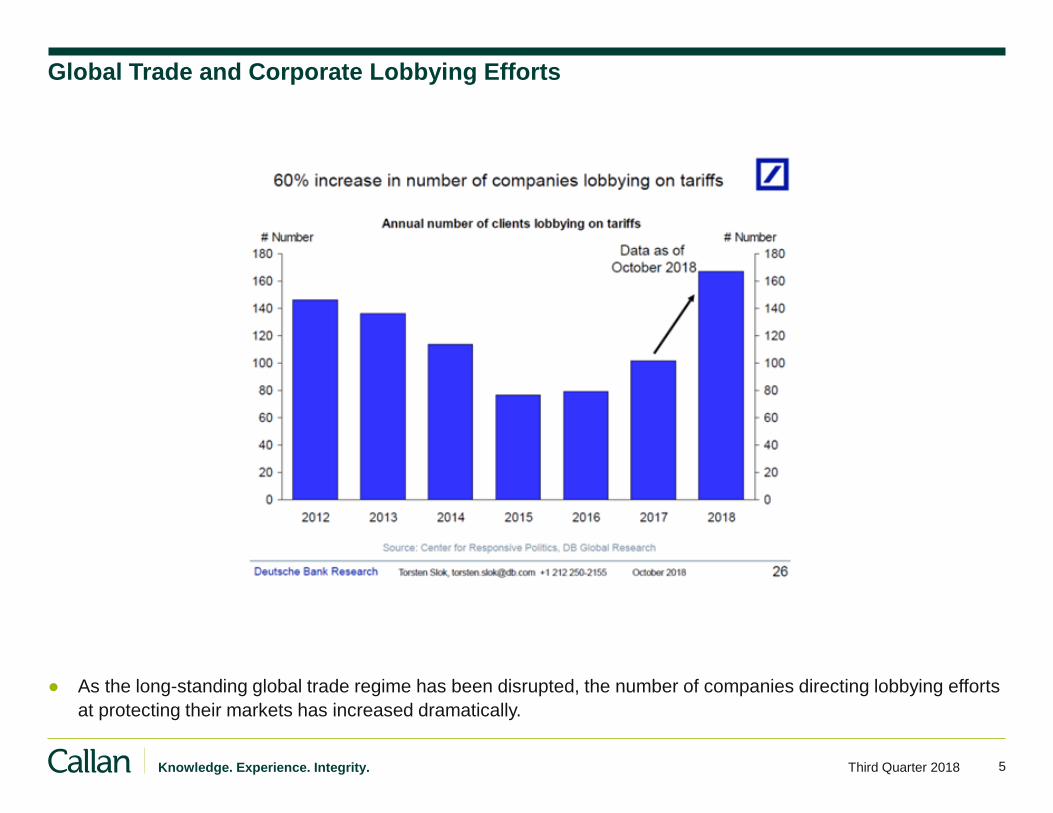
5 Knowledge. Experience. Integrity. Third Quarter 2018
Global Trade and Corporate Lobbying Efforts
● As the long-standing global trade regime has been disrupted, the number of companies directing lobbying efforts
at protecting their markets has increased dramatically.
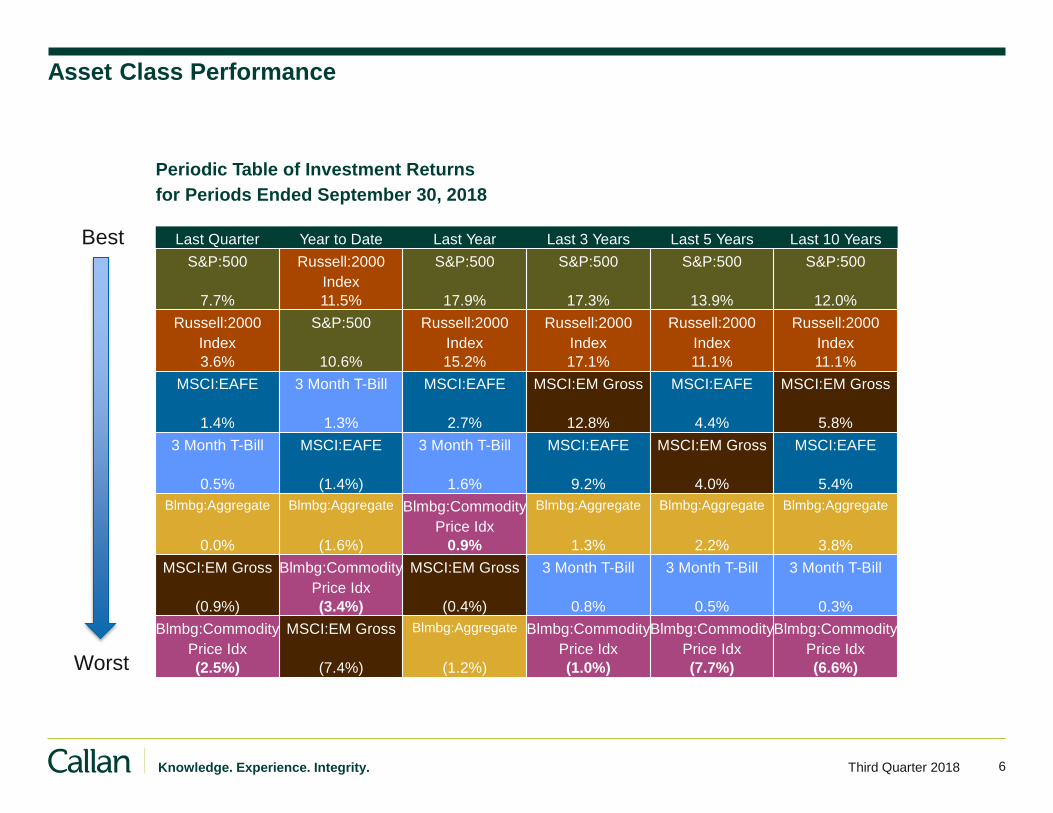
6 Knowledge. Experience. Integrity. Third Quarter 2018
Asset Class Performance
for Periods Ended September 30, 2018
Periodic Table of Investment Returns
MSCI:EM Gross
(0.9%)
MSCI:EM Gross
(7.4%)
MSCI:EM Gross
(0.4%)
MSCI:EM Gross
12.8%
MSCI:EM Gross
4.0%
MSCI:EM Gross
5.8%
MSCI:EAFE
1.4%
MSCI:EAFE
(1.4%)
MSCI:EAFE
2.7%
MSCI:EAFE
9.2%
MSCI:EAFE
4.4%
MSCI:EAFE
5.4%
Blmbg:Aggregate
0.0%
Blmbg:Aggregate
(1.6%)
Blmbg:Aggregate
(1.2%)
Blmbg:Aggregate
1.3%
Blmbg:Aggregate
2.2%
Blmbg:Aggregate
3.8%
3 Month T-Bill
0.5%
3 Month T-Bill
1.3%
3 Month T-Bill
1.6%
3 Month T-Bill
0.8%
3 Month T-Bill
0.5%
3 Month T-Bill
0.3%
S&P:500
7.7%
S&P:500
10.6%
S&P:500
17.9%
S&P:500
17.3%
S&P:500
13.9%
S&P:500
12.0%
Index
Russell:2000
3.6%
Index
Russell:2000
11.5%
Index
Russell:2000
15.2%
Index
Russell:2000
17.1%
Index
Russell:2000
11.1%
Index
Russell:2000
11.1%
Price Idx
Blmbg:Commodity
(2.5%)
Price Idx
Blmbg:Commodity
(3.4%)
Price Idx
Blmbg:Commodity
0.9%
Price Idx
Blmbg:Commodity
(1.0%)
Price Idx
Blmbg:Commodity
(7.7%)
Price Idx
Blmbg:Commodity
(6.6%)
Last Quarter Year to Date Last Year Last 3 Years Last 5 Years Last 10 YearsBest
Worst
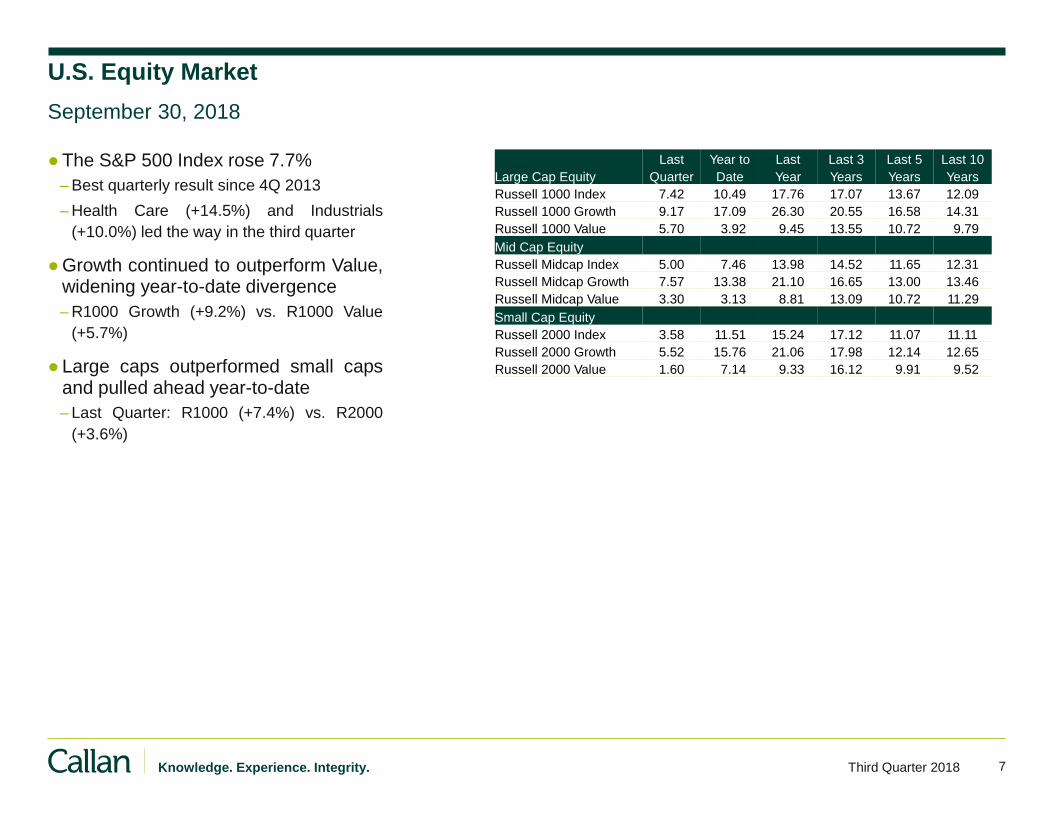
7 Knowledge. Experience. Integrity. Third Quarter 2018
U.S. Equity Market
●The S&P 500 Index rose 7.7%
– Best quarterly result since 4Q 2013
– Health Care (+14.5%) and Industrials
(+10.0%) led the way in the third quarter
●Growth continued to outperform Value, widening year-to-date divergence
– R1000 Growth (+9.2%) vs. R1000 Value
(+5.7%)
●Large caps outperformed small caps and pulled ahead year-to-date
– Last Quarter: R1000 (+7.4%) vs. R2000
(+3.6%)
September 30, 2018
Large Cap Equity Quarter
Last
Date
Year to
Year
Last
Years
Last 3
Years
Last 5
Years
Last 10
Russell 1000 Index 7.42 10.49 17.76 17.07 13.67 12.09
Russell 1000 Growth 9.17 17.09 26.30 20.55 16.58 14.31
Russell 1000 Value 5.70 3.92 9.45 13.55 10.72 9.79
Mid Cap Equity
Russell Midcap Index 5.00 7.46 13.98 14.52 11.65 12.31
Russell Midcap Growth 7.57 13.38 21.10 16.65 13.00 13.46
Russell Midcap Value 3.30 3.13 8.81 13.09 10.72 11.29
Small Cap Equity
Russell 2000 Index 3.58 11.51 15.24 17.12 11.07 11.11
Russell 2000 Growth 5.52 15.76 21.06 17.98 12.14 12.65
Russell 2000 Value 1.60 7.14 9.33 16.12 9.91 9.52
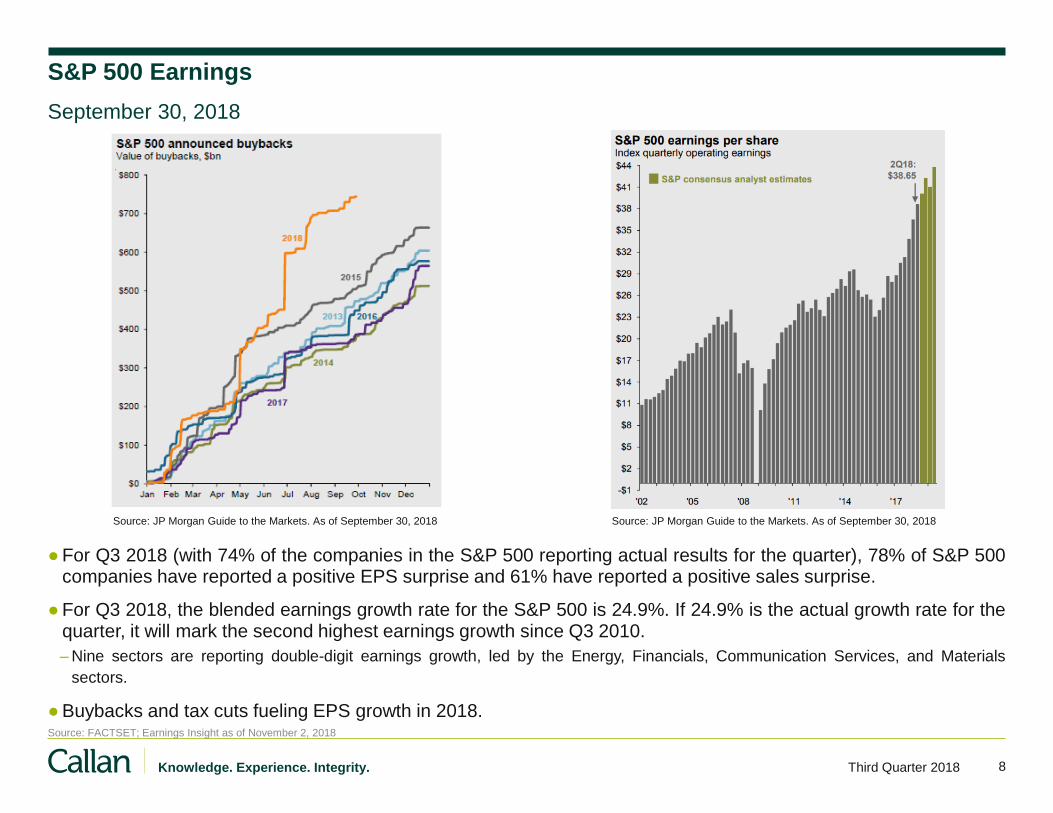
8 Knowledge. Experience. Integrity. Third Quarter 2018
S&P 500 Earnings
●For Q3 2018 (with 74% of the companies in the S&P 500 reporting actual results for the quarter), 78% of S&P 500 companies have reported a positive EPS surprise and 61% have reported a positive sales surprise.
●For Q3 2018, the blended earnings growth rate for the S&P 500 is 24.9%. If 24.9% is the actual growth rate for the quarter, it will mark the second highest earnings growth since Q3 2010.
– Nine sectors are reporting double-digit earnings growth, led by the Energy, Financials, Communication Services, and Materials
sectors.
●Buybacks and tax cuts fueling EPS growth in 2018.
September 30, 2018
Source: JP Morgan Guide to the Markets. As of September 30, 2018
Source: FACTSET; Earnings Insight as of November 2, 2018
Source: JP Morgan Guide to the Markets. As of September 30, 2018
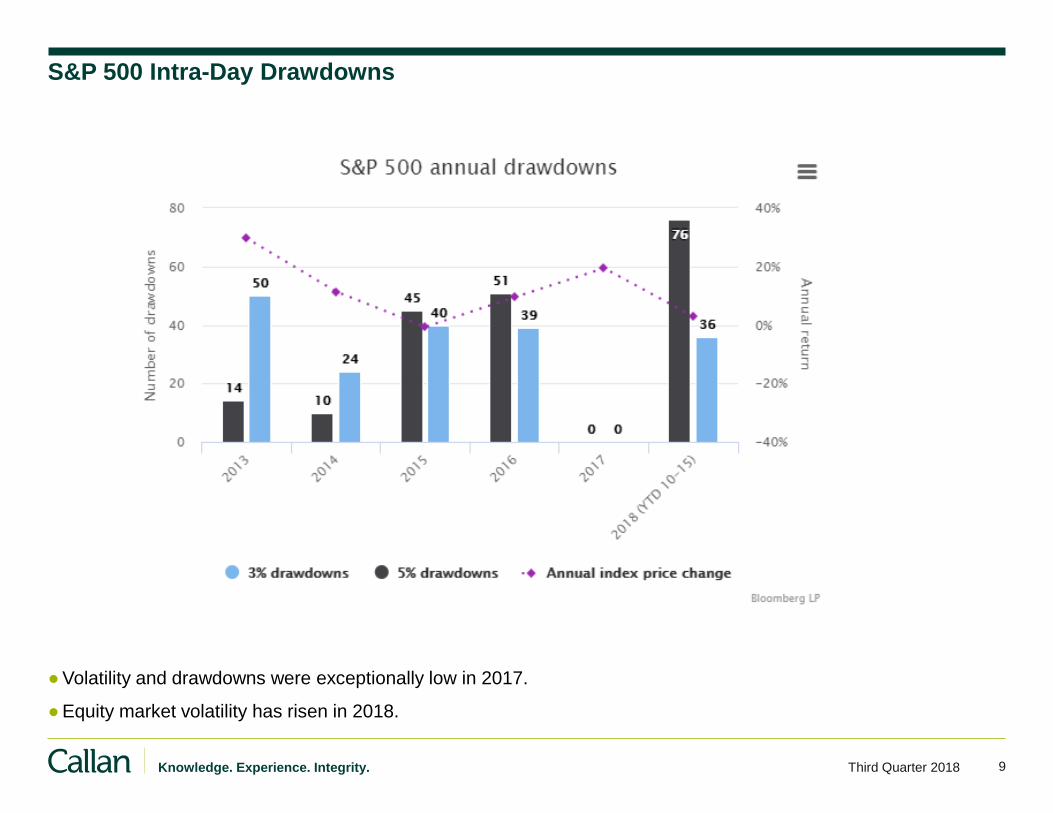
9 Knowledge. Experience. Integrity. Third Quarter 2018
S&P 500 Intra-Day Drawdowns
●Volatility and drawdowns were exceptionally low in 2017.
●Equity market volatility has risen in 2018.
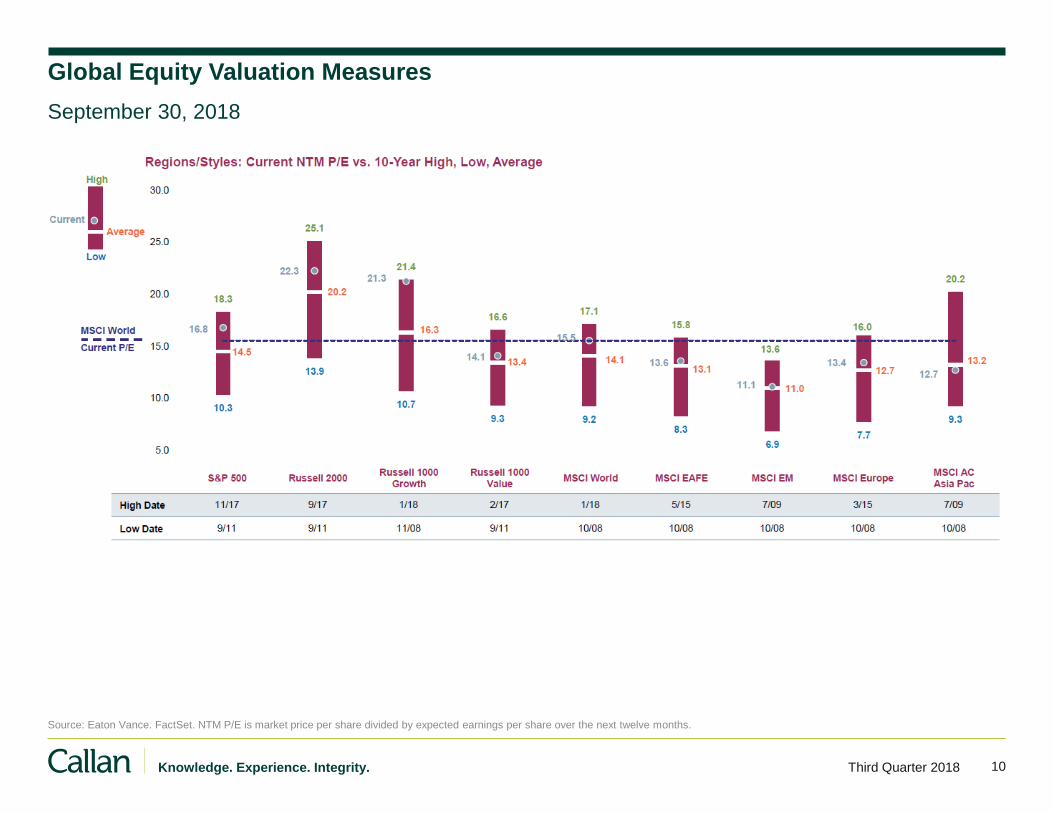
10 Knowledge. Experience. Integrity. Third Quarter 2018
Global Equity Valuation Measures
September 30, 2018
Source: Eaton Vance. FactSet. NTM P/E is market price per share divided by expected earnings per share over the next twelve months.
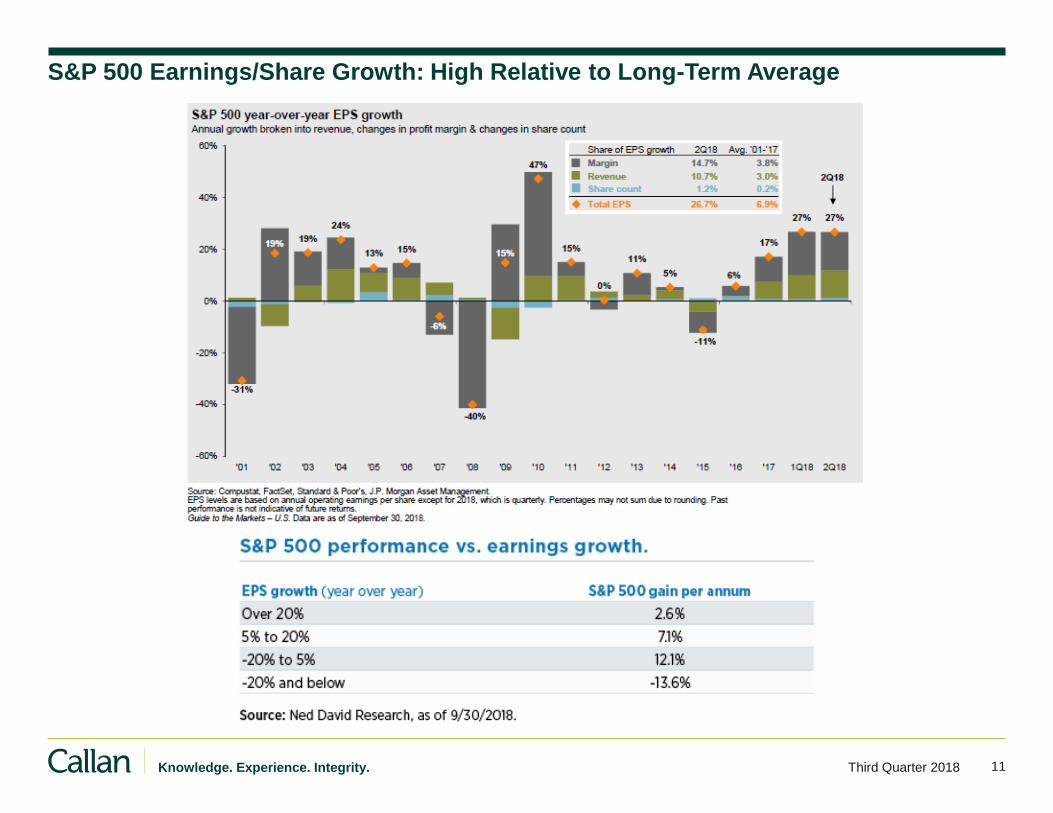
11 Knowledge. Experience. Integrity. Third Quarter 2018
S&P 500 Earnings/Share Growth: High Relative to Long-Term Average
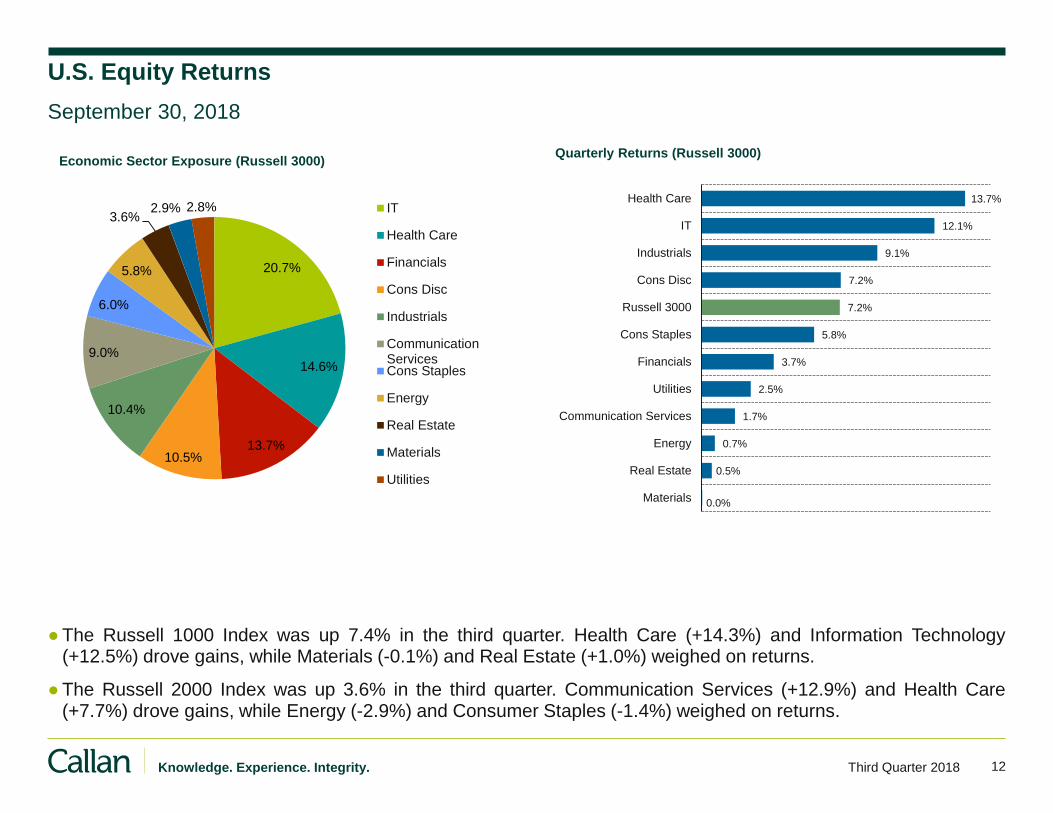
12 Knowledge. Experience. Integrity. Third Quarter 2018
U.S. Equity Returns
●The Russell 1000 Index was up 7.4% in the third quarter. Health Care (+14.3%) and Information Technology (+12.5%) drove gains, while Materials (-0.1%) and Real Estate (+1.0%) weighed on returns.
●The Russell 2000 Index was up 3.6% in the third quarter. Communication Services (+12.9%) and Health Care (+7.7%) drove gains, while Energy (-2.9%) and Consumer Staples (-1.4%) weighed on returns.
September 30, 2018
20.7%
14.6%
13.7% 10.5%
10.4%
9.0%
6.0%
5.8%
3.6% 2.9% 2.8%
Economic Sector Exposure (Russell 3000)
IT
Health Care
Financials
Cons Disc
Industrials
CommunicationServicesCons Staples
Energy
Real Estate
Materials
Utilities
0.0%
0.5%
0.7%
1.7%
2.5%
3.7%
5.8%
7.2%
7.2%
9.1%
12.1%
13.7%
Materials
Real Estate
Energy
Communication Services
Utilities
Financials
Cons Staples
Russell 3000
Cons Disc
Industrials
IT
Health Care
Quarterly Returns (Russell 3000)
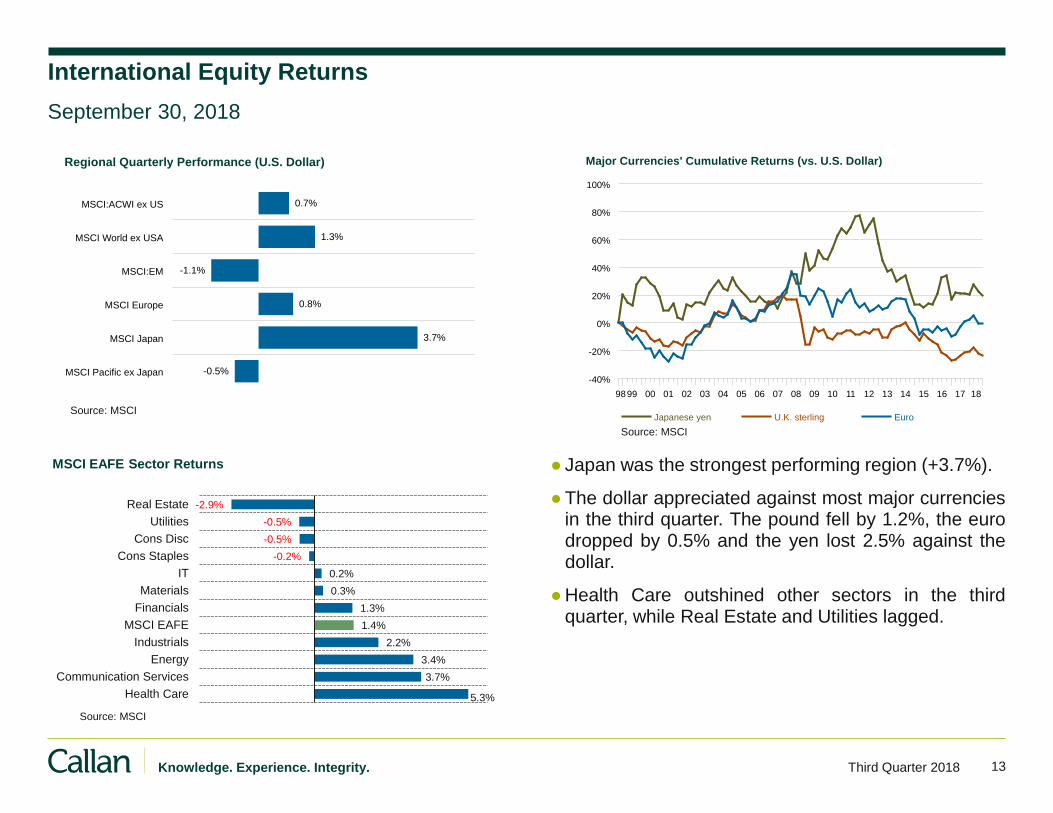
13 Knowledge. Experience. Integrity. Third Quarter 2018
International Equity Returns
September 30, 2018
● Japan was the strongest performing region (+3.7%).
●The dollar appreciated against most major currencies in the third quarter. The pound fell by 1.2%, the euro dropped by 0.5% and the yen lost 2.5% against the dollar.
●Health Care outshined other sectors in the third quarter, while Real Estate and Utilities lagged.
MSCI:ACWI ex US
MSCI World ex USA
MSCI:EM
MSCI Europe
MSCI Japan
MSCI Pacific ex Japan
Regional Quarterly Performance (U.S. Dollar)
0.7%
1.3%
-1.1%
0.8%
3.7%
-0.5%
9899 00 01 02 03 04 05 06 07 08 09 10 11 12 13 14 15 16 17 18
-40%
-20%
0%
20%
40%
60%
80%
100%
Major Currencies' Cumulative Returns (vs. U.S. Dollar)
Japanese yen U.K. sterling Euro
5.3%
3.7%
3.4%
2.2%
1.4%
1.3%
0.3%
0.2%
-0.2%
-0.5%
-0.5%
-2.9%
Health Care
Communication Services
Energy
Industrials
MSCI EAFE
Financials
Materials
IT
Cons Staples
Cons Disc
Utilities
Real Estate
MSCI EAFE Sector Returns
Source: MSCI
Source: MSCI
Source: MSCI
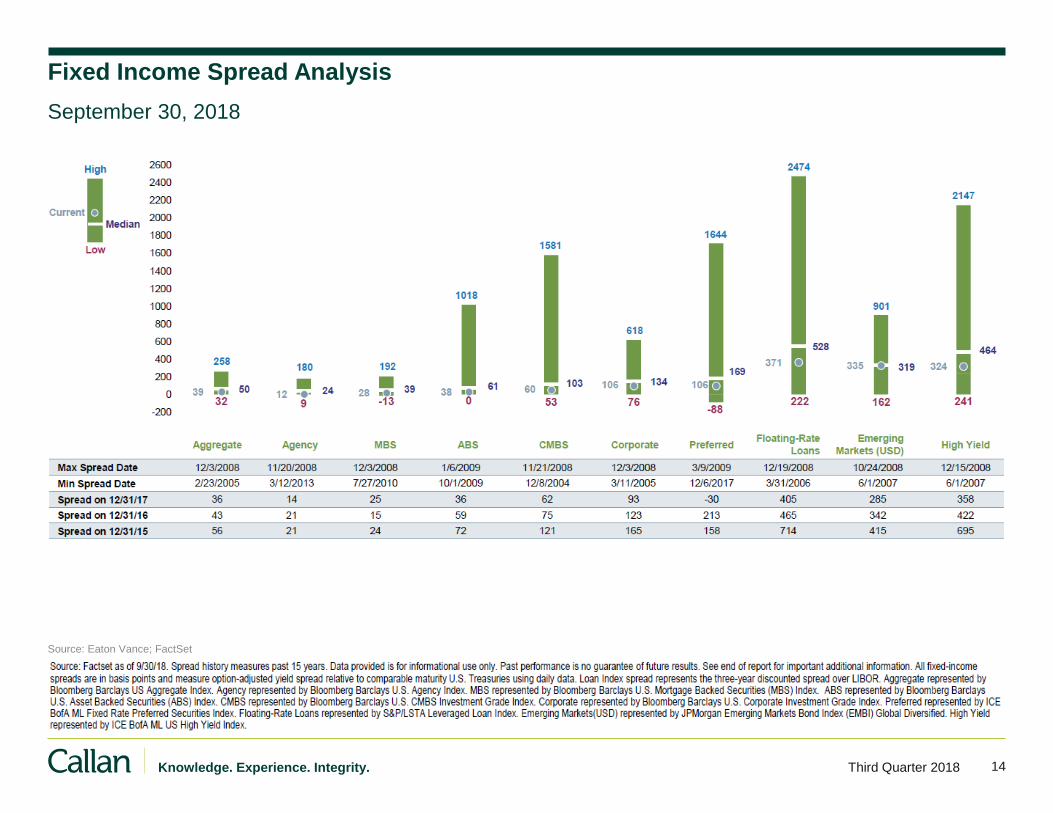
14 Knowledge. Experience. Integrity. Third Quarter 2018
Fixed Income Spread Analysis
September 30, 2018
Source: Eaton Vance; FactSet
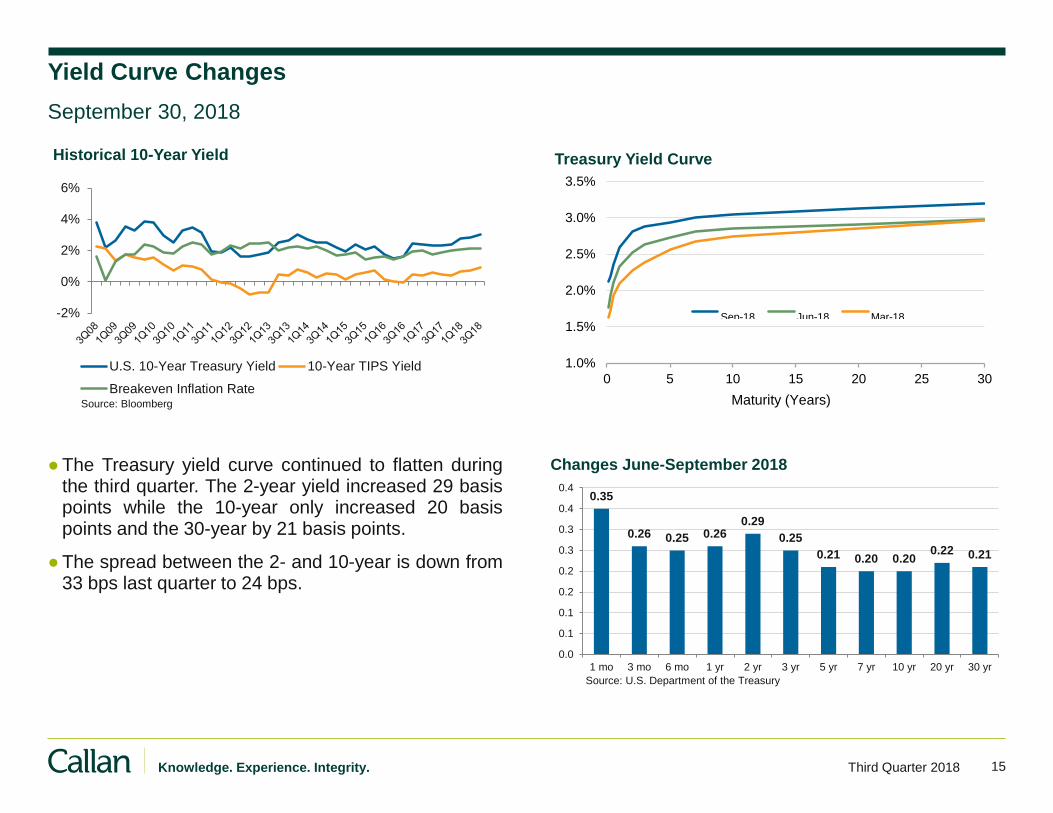
15 Knowledge. Experience. Integrity. Third Quarter 2018
Yield Curve Changes
September 30, 2018
●The Treasury yield curve continued to flatten during the third quarter. The 2-year yield increased 29 basis points while the 10-year only increased 20 basis points and the 30-year by 21 basis points.
●The spread between the 2- and 10-year is down from 33 bps last quarter to 24 bps.
-2%
0%
2%
4%
6%
Historical 10-Year Yield
U.S. 10-Year Treasury Yield 10-Year TIPS Yield
Breakeven Inflation Rate
1.0%
1.5%
2.0%
2.5%
3.0%
3.5%
0 5 10 15 20 25 30
Maturity (Years)
Treasury Yield Curve
Sep-18 Jun-18 Mar-18
0.35
0.26 0.25 0.26 0.29
0.25
0.21 0.20 0.20 0.22 0.21
0.0
0.1
0.1
0.2
0.2
0.3
0.3
0.4
0.4
1 mo 3 mo 6 mo 1 yr 2 yr 3 yr 5 yr 7 yr 10 yr 20 yr 30 yr
Changes June-September 2018
Source: Bloomberg
Source: U.S. Department of the Treasury
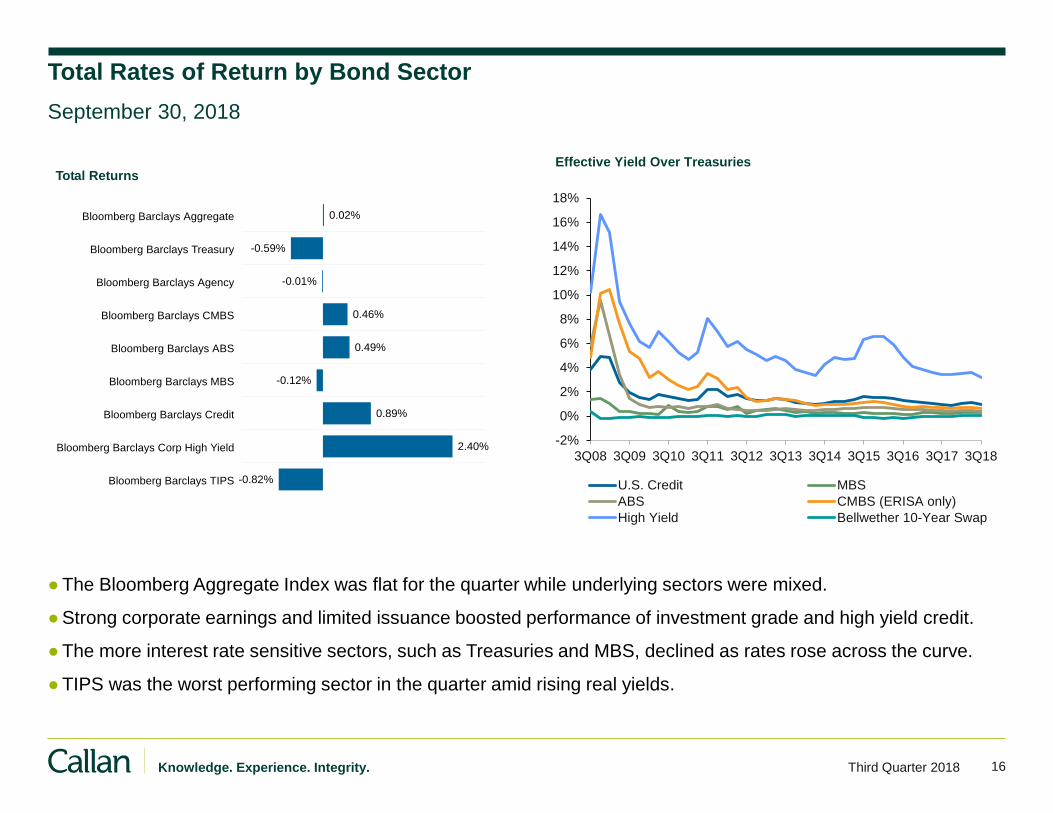
16 Knowledge. Experience. Integrity. Third Quarter 2018
Total Rates of Return by Bond Sector
●The Bloomberg Aggregate Index was flat for the quarter while underlying sectors were mixed.
●Strong corporate earnings and limited issuance boosted performance of investment grade and high yield credit.
●The more interest rate sensitive sectors, such as Treasuries and MBS, declined as rates rose across the curve.
●TIPS was the worst performing sector in the quarter amid rising real yields.
September 30, 2018
Bloomberg Barclays Aggregate
Bloomberg Barclays Treasury
Bloomberg Barclays Agency
Bloomberg Barclays CMBS
Bloomberg Barclays ABS
Bloomberg Barclays MBS
Bloomberg Barclays Credit
Bloomberg Barclays Corp High Yield
Bloomberg Barclays TIPS
Total Returns
0.02%
-0.59%
-0.01%
0.46%
0.49%
-0.12%
0.89%
2.40%
-0.82%
-2%
0%
2%
4%
6%
8%
10%
12%
14%
16%
18%
3Q08 3Q09 3Q10 3Q11 3Q12 3Q13 3Q14 3Q15 3Q16 3Q17 3Q18
Effective Yield Over Treasuries
U.S. Credit MBS
ABS CMBS (ERISA only)
High Yield Bellwether 10-Year Swap
Consolidated Pension Trusts
Quarterly Review
- Public Employees Retirement System
- Teachers’ Fund for Retirement
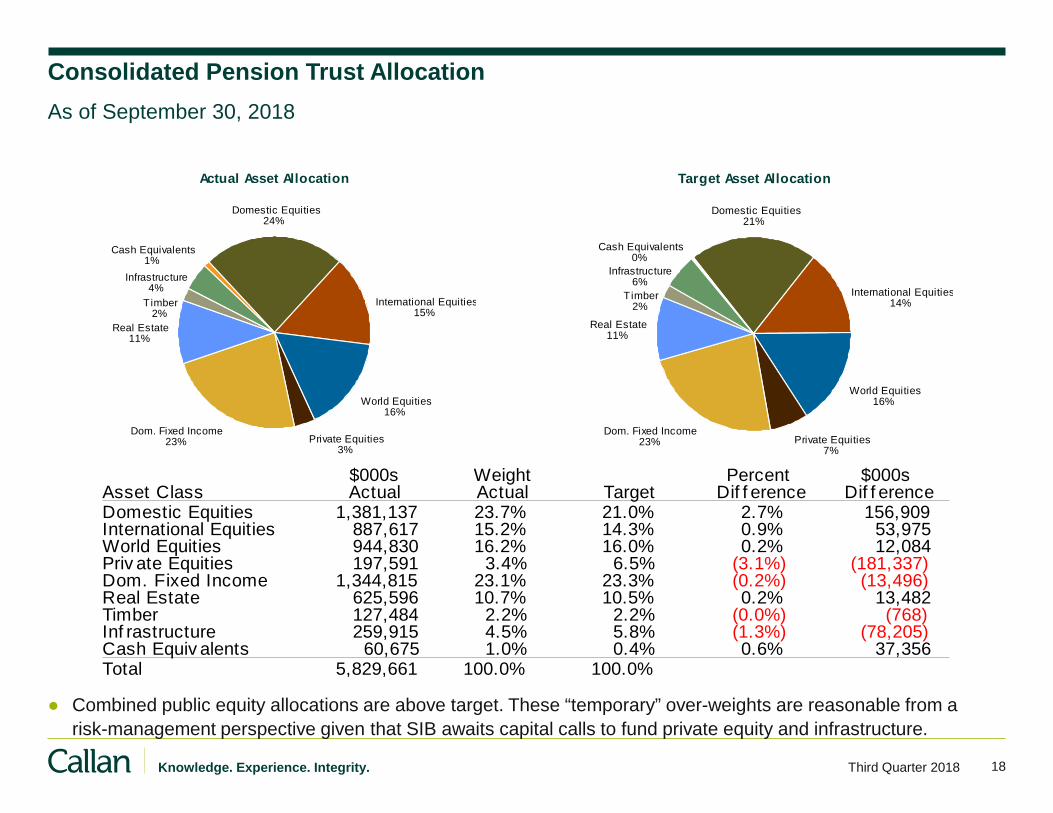
18 Knowledge. Experience. Integrity. Third Quarter 2018
Actual Asset Allocation
Domestic Equities24%
International Equities15%
World Equities16%
Private Equities3%
Dom. Fixed Income23%
Real Estate11%
Timber2%
Infrastructure4%
Cash Equivalents1%
Target Asset Allocation
Domestic Equities21%
International Equities14%
World Equities16%
Private Equities7%
Dom. Fixed Income23%
Real Estate11%
Timber2%
Infrastructure6%
Cash Equivalents0%
Consolidated Pension Trust Allocation
As of September 30, 2018
$000s Weight Percent $000sAsset Class Actual Actual Target Dif f erence Dif f erenceDomestic Equities 1,381,137 23.7% 21.0% 2.7% 156,909International Equities 887,617 15.2% 14.3% 0.9% 53,975World Equities 944,830 16.2% 16.0% 0.2% 12,084Priv ate Equities 197,591 3.4% 6.5% (3.1%) (181,337)Dom. Fixed Income 1,344,815 23.1% 23.3% (0.2%) (13,496)Real Estate 625,596 10.7% 10.5% 0.2% 13,482Timber 127,484 2.2% 2.2% (0.0%) (768)Inf rastructure 259,915 4.5% 5.8% (1.3%) (78,205)Cash Equiv alents 60,675 1.0% 0.4% 0.6% 37,356Total 5,829,661 100.0% 100.0%
● Combined public equity allocations are above target. These “temporary” over-weights are reasonable from a
risk-management perspective given that SIB awaits capital calls to fund private equity and infrastructure.
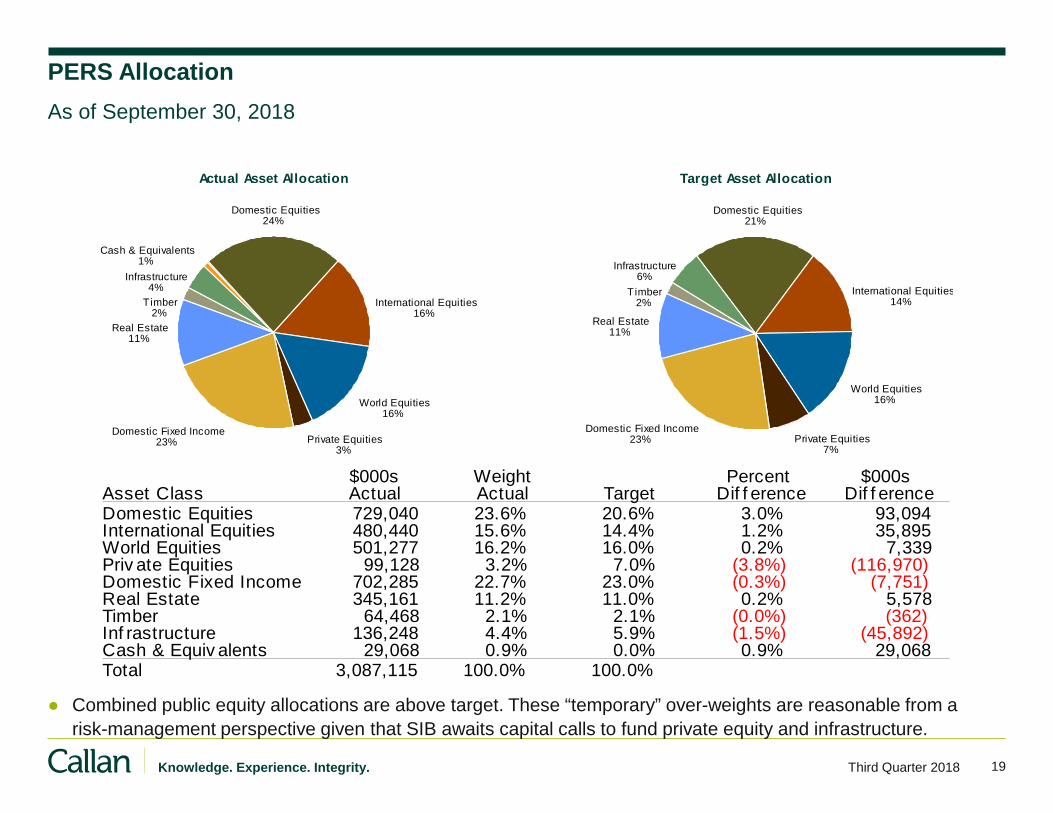
19 Knowledge. Experience. Integrity. Third Quarter 2018
$000s Weight Percent $000sAsset Class Actual Actual Target Dif f erence Dif f erenceDomestic Equities 729,040 23.6% 20.6% 3.0% 93,094International Equities 480,440 15.6% 14.4% 1.2% 35,895World Equities 501,277 16.2% 16.0% 0.2% 7,339Priv ate Equities 99,128 3.2% 7.0% (3.8%) (116,970)Domestic Fixed Income 702,285 22.7% 23.0% (0.3%) (7,751)Real Estate 345,161 11.2% 11.0% 0.2% 5,578Timber 64,468 2.1% 2.1% (0.0%) (362)Inf rastructure 136,248 4.4% 5.9% (1.5%) (45,892)Cash & Equiv alents 29,068 0.9% 0.0% 0.9% 29,068Total 3,087,115 100.0% 100.0%
PERS Allocation
As of September 30, 2018
Actual Asset Allocation
Domestic Equities24%
International Equities16%
World Equities16%
Private Equities3%
Domestic Fixed Income23%
Real Estate11%
Timber2%
Infrastructure4%
Cash & Equivalents1%
Target Asset Allocation
Domestic Equities21%
International Equities14%
World Equities16%
Private Equities7%
Domestic Fixed Income23%
Real Estate11%
Timber2%
Infrastructure6%
● Combined public equity allocations are above target. These “temporary” over-weights are reasonable from a
risk-management perspective given that SIB awaits capital calls to fund private equity and infrastructure.
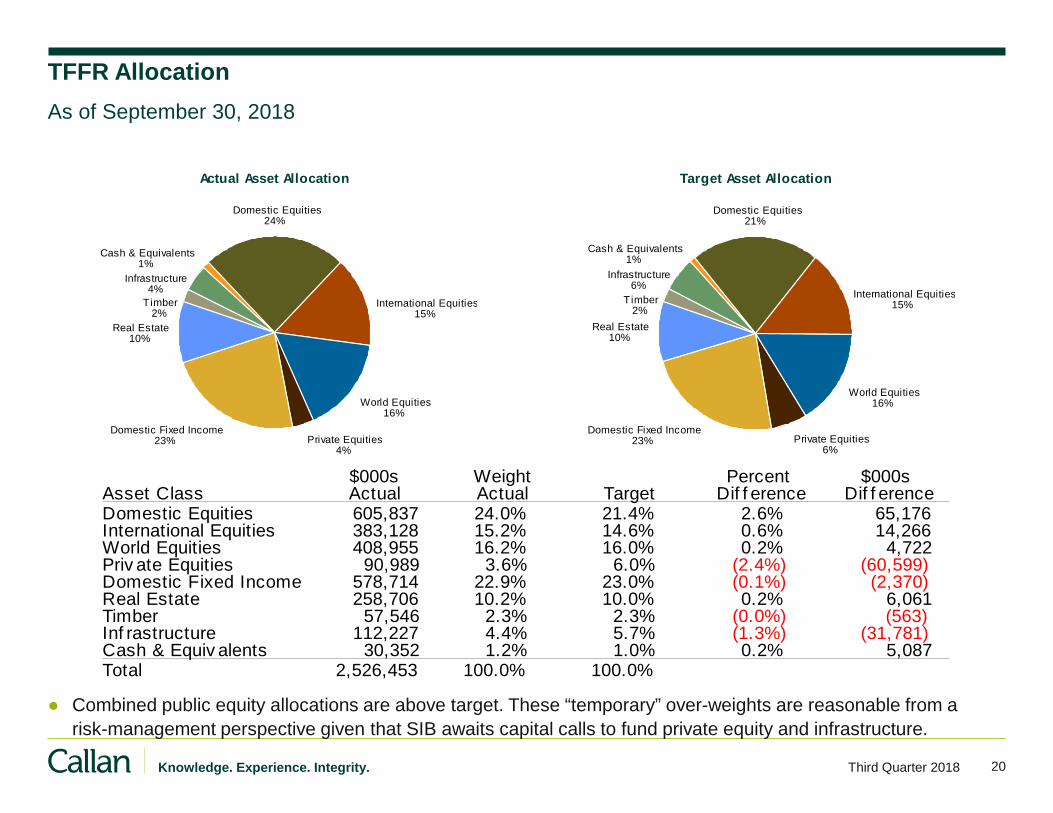
20 Knowledge. Experience. Integrity. Third Quarter 2018
$000s Weight Percent $000sAsset Class Actual Actual Target Dif f erence Dif f erenceDomestic Equities 605,837 24.0% 21.4% 2.6% 65,176International Equities 383,128 15.2% 14.6% 0.6% 14,266World Equities 408,955 16.2% 16.0% 0.2% 4,722Priv ate Equities 90,989 3.6% 6.0% (2.4%) (60,599)Domestic Fixed Income 578,714 22.9% 23.0% (0.1%) (2,370)Real Estate 258,706 10.2% 10.0% 0.2% 6,061Timber 57,546 2.3% 2.3% (0.0%) (563)Inf rastructure 112,227 4.4% 5.7% (1.3%) (31,781)Cash & Equiv alents 30,352 1.2% 1.0% 0.2% 5,087Total 2,526,453 100.0% 100.0%
Target Asset Allocation
Domestic Equities21%
International Equities15%
World Equities16%
Private Equities6%
Domestic Fixed Income23%
Real Estate10%
Timber2%
Infrastructure6%
Cash & Equivalents1%
Actual Asset Allocation
Domestic Equities24%
International Equities15%
World Equities16%
Private Equities4%
Domestic Fixed Income23%
Real Estate10%
Timber2%
Infrastructure4%
Cash & Equivalents1%
TFFR Allocation
As of September 30, 2018
● Combined public equity allocations are above target. These “temporary” over-weights are reasonable from a
risk-management perspective given that SIB awaits capital calls to fund private equity and infrastructure.
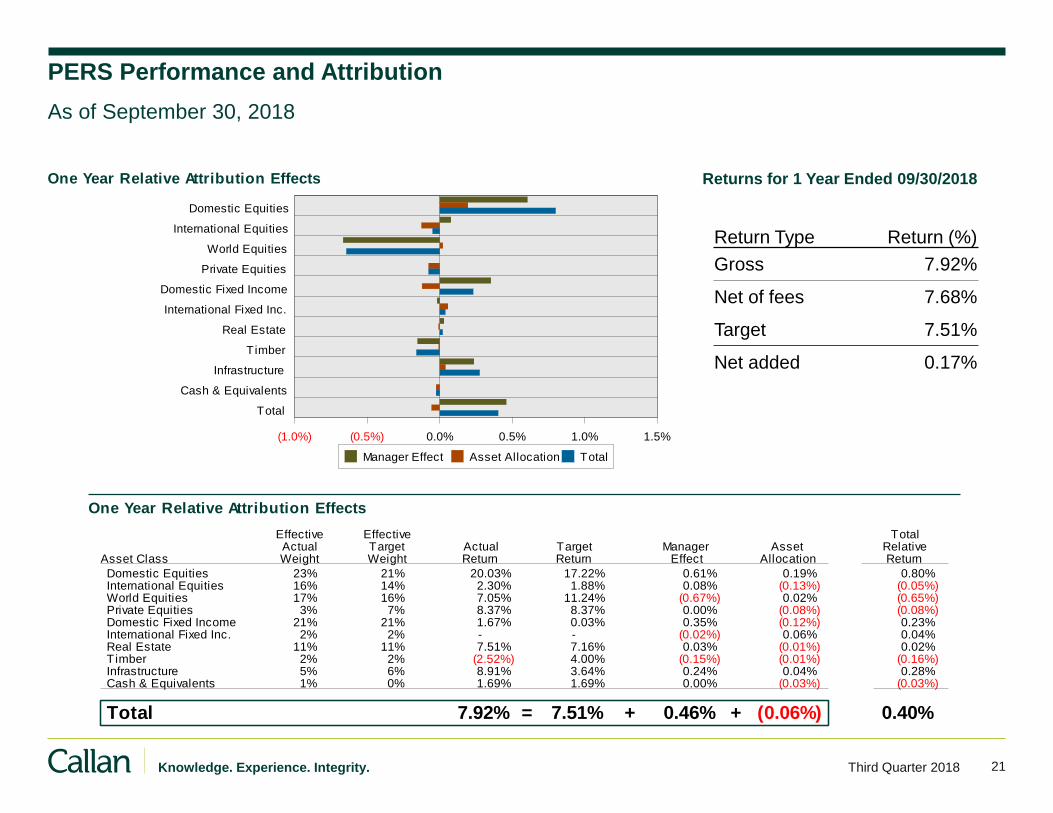
21 Knowledge. Experience. Integrity. Third Quarter 2018
One Year Relative Attribution Effects
Effective Effective TotalActual Target Actual Target Manager Asset Relative
Asset Class Weight Weight Return Return Effect Allocation Return
Domestic Equities 23% 21% 20.03% 17.22% 0.61% 0.19% 0.80%International Equities 16% 14% 2.30% 1.88% 0.08% (0.13%) (0.05%)World Equities 17% 16% 7.05% 11.24% (0.67%) 0.02% (0.65%)Private Equities 3% 7% 8.37% 8.37% 0.00% (0.08%) (0.08%)Domestic Fixed Income 21% 21% 1.67% 0.03% 0.35% (0.12%) 0.23%International Fixed Inc. 2% 2% - - (0.02%) 0.06% 0.04%Real Estate 11% 11% 7.51% 7.16% 0.03% (0.01%) 0.02%Timber 2% 2% (2.52%) 4.00% (0.15%) (0.01%) (0.16%)Infrastructure 5% 6% 8.91% 3.64% 0.24% 0.04% 0.28%Cash & Equivalents 1% 0% 1.69% 1.69% 0.00% (0.03%) (0.03%)
Total = + +7.92% 7.51% 0.46% (0.06%) 0.40%
One Year Relative Attribution Effects
(1.0%) (0.5%) 0.0% 0.5% 1.0% 1.5%
Domestic Equities
International Equities
World Equities
Private Equities
Domestic Fixed Income
International Fixed Inc.
Real Estate
Timber
Infrastructure
Cash & Equivalents
Total
Manager Effect Asset Allocation Total
PERS Performance and Attribution
As of September 30, 2018
Returns for 1 Year Ended 09/30/2018
Return Type Return (%)
Gross 7.92%
Net of fees 7.68%
Target 7.51%
Net added 0.17%
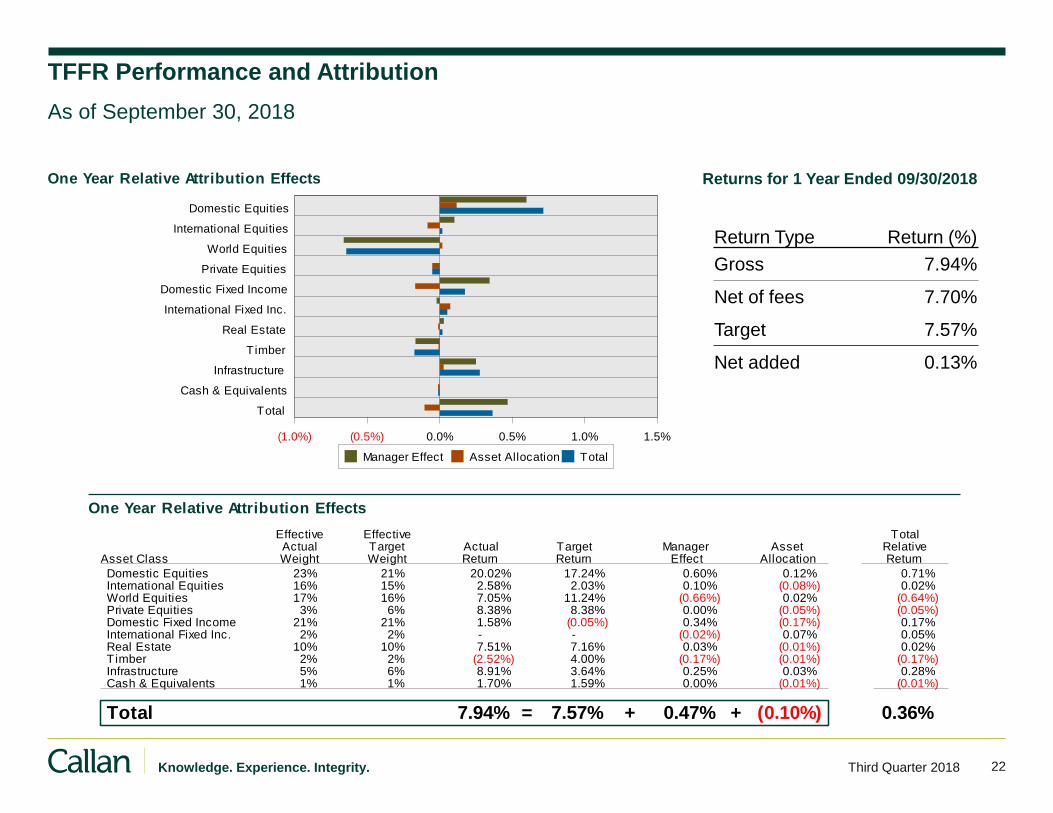
22 Knowledge. Experience. Integrity. Third Quarter 2018
One Year Relative Attribution Effects
Effective Effective TotalActual Target Actual Target Manager Asset Relative
Asset Class Weight Weight Return Return Effect Allocation Return
Domestic Equities 23% 21% 20.02% 17.24% 0.60% 0.12% 0.71%International Equities 16% 15% 2.58% 2.03% 0.10% (0.08%) 0.02%World Equities 17% 16% 7.05% 11.24% (0.66%) 0.02% (0.64%)Private Equities 3% 6% 8.38% 8.38% 0.00% (0.05%) (0.05%)Domestic Fixed Income 21% 21% 1.58% (0.05%) 0.34% (0.17%) 0.17%International Fixed Inc. 2% 2% - - (0.02%) 0.07% 0.05%Real Estate 10% 10% 7.51% 7.16% 0.03% (0.01%) 0.02%Timber 2% 2% (2.52%) 4.00% (0.17%) (0.01%) (0.17%)Infrastructure 5% 6% 8.91% 3.64% 0.25% 0.03% 0.28%Cash & Equivalents 1% 1% 1.70% 1.59% 0.00% (0.01%) (0.01%)
Total = + +7.94% 7.57% 0.47% (0.10%) 0.36%
One Year Relative Attribution Effects
(1.0%) (0.5%) 0.0% 0.5% 1.0% 1.5%
Domestic Equities
International Equities
World Equities
Private Equities
Domestic Fixed Income
International Fixed Inc.
Real Estate
Timber
Infrastructure
Cash & Equivalents
Total
Manager Effect Asset Allocation Total
Returns for 1 Year Ended 09/30/2018
Return Type Return (%)
Gross 7.94%
Net of fees 7.70%
Target 7.57%
Net added 0.13%
TFFR Performance and Attribution
As of September 30, 2018

23 Knowledge. Experience. Integrity. Third Quarter 2018
Returns for 5 Year Ended 09/30/2018
Return Type Return (%)
Gross 8.12%
Net of fees 7.82%
Target 7.01%
Net added 0.81%
Five Year Annualized Relative Attribution Effects
Effective Effective TotalActual Target Actual Target Manager Asset Relative
Asset Class Weight Weight Return Return Effect Allocation Return
Domestic Equities 23% 21% 13.85% 13.15% 0.15% 0.09% 0.24%International Equities 15% 15% 5.90% 4.23% 0.26% (0.02%) 0.24%World Equities 16% 16% 9.01% 9.28% (0.04%) 0.01% (0.03%)Private Equities 4% 6% 1.62% 1.62% 0.00% 0.06% 0.06%Domestic Fixed Income 19% 18% 4.79% 3.14% 0.31% (0.03%) 0.28%International Fixed Inc. 4% 4% - - 0.08% 0.01% 0.09%Real Estate 10% 10% 12.04% 9.57% 0.24% (0.03%) 0.21%Timber 3% 4% (0.36%) 5.99% (0.21%) (0.01%) (0.22%)Infrastructure 4% 5% 6.32% 1.61% 0.20% 0.05% 0.25%Cash & Equivalents 1% 1% 0.62% 0.59% 0.00% (0.01%) (0.01%)
Total = + +8.12% 7.01% 0.99% 0.12% 1.12%
Five Year Annualized Relative Attribution Effects
(0.5%) 0.0% 0.5% 1.0% 1.5%
Domestic Equities
International Equities
World Equities
Private Equities
Domestic Fixed Income
International Fixed Inc.
Real Estate
Timber
Infrastructure
Cash & Equivalents
Total
Manager Effect Asset Allocation Total
PERS Performance and Attribution
As of September 30, 2018
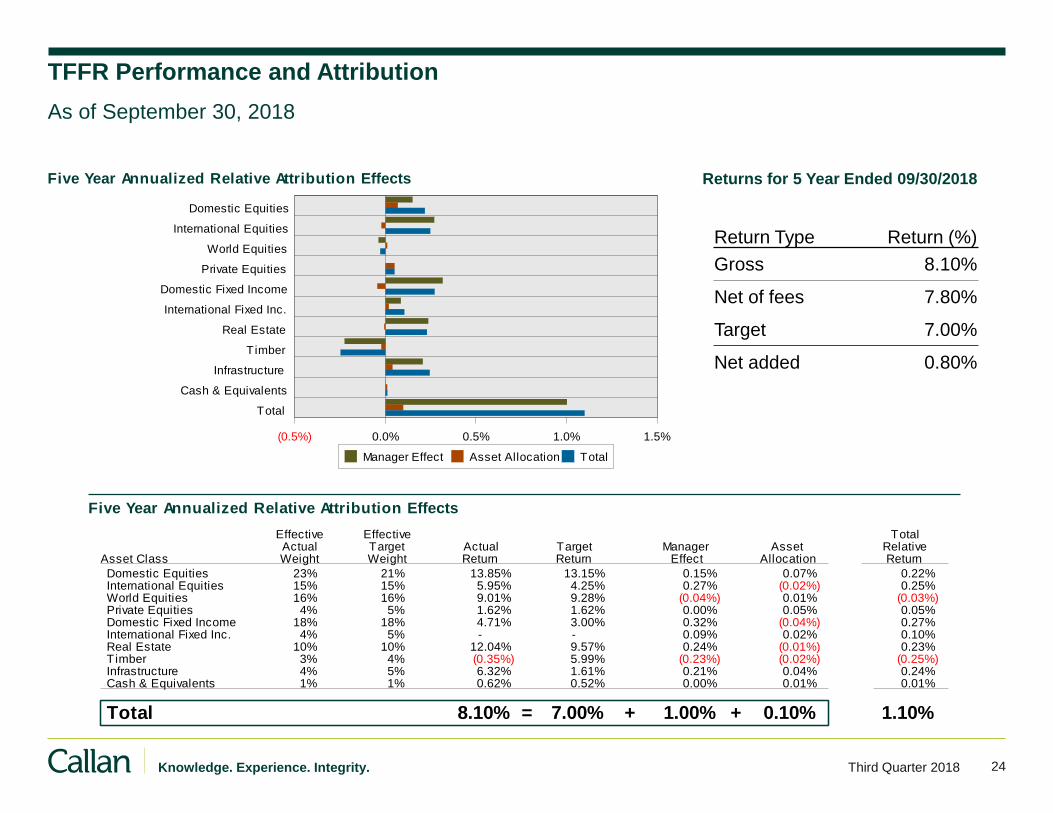
24 Knowledge. Experience. Integrity. Third Quarter 2018
Returns for 5 Year Ended 09/30/2018
Return Type Return (%)
Gross 8.10%
Net of fees 7.80%
Target 7.00%
Net added 0.80%
Five Year Annualized Relative Attribution Effects
Effective Effective TotalActual Target Actual Target Manager Asset Relative
Asset Class Weight Weight Return Return Effect Allocation Return
Domestic Equities 23% 21% 13.85% 13.15% 0.15% 0.07% 0.22%International Equities 15% 15% 5.95% 4.25% 0.27% (0.02%) 0.25%World Equities 16% 16% 9.01% 9.28% (0.04%) 0.01% (0.03%)Private Equities 4% 5% 1.62% 1.62% 0.00% 0.05% 0.05%Domestic Fixed Income 18% 18% 4.71% 3.00% 0.32% (0.04%) 0.27%International Fixed Inc. 4% 5% - - 0.09% 0.02% 0.10%Real Estate 10% 10% 12.04% 9.57% 0.24% (0.01%) 0.23%Timber 3% 4% (0.35%) 5.99% (0.23%) (0.02%) (0.25%)Infrastructure 4% 5% 6.32% 1.61% 0.21% 0.04% 0.24%Cash & Equivalents 1% 1% 0.62% 0.52% 0.00% 0.01% 0.01%
Total = + +8.10% 7.00% 1.00% 0.10% 1.10%
Five Year Annualized Relative Attribution Effects
(0.5%) 0.0% 0.5% 1.0% 1.5%
Domestic Equities
International Equities
World Equities
Private Equities
Domestic Fixed Income
International Fixed Inc.
Real Estate
Timber
Infrastructure
Cash & Equivalents
Total
Manager Effect Asset Allocation Total
TFFR Performance and Attribution
As of September 30, 2018
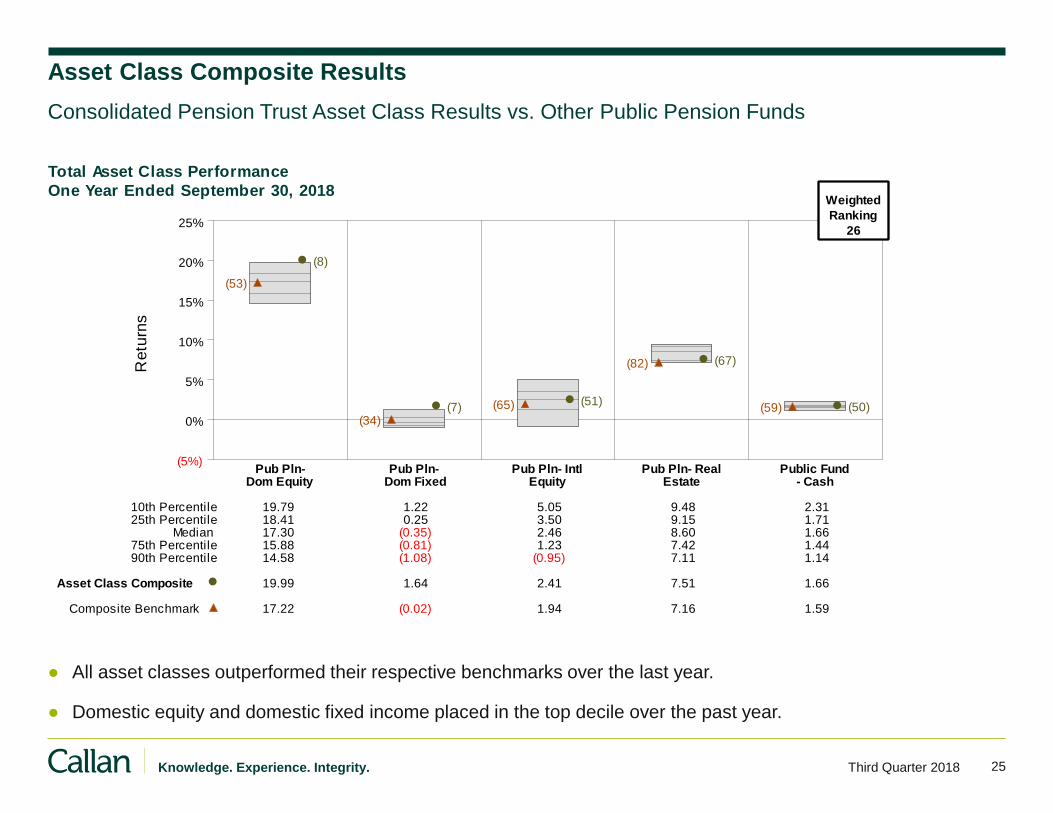
25 Knowledge. Experience. Integrity. Third Quarter 2018
Asset Class Composite Results
Consolidated Pension Trust Asset Class Results vs. Other Public Pension Funds
● All asset classes outperformed their respective benchmarks over the last year.
● Domestic equity and domestic fixed income placed in the top decile over the past year.
Total Asset Class Performance
One Year Ended September 30, 2018
Retu
rns
(5%)
0%
5%
10%
15%
20%
25%
Pub Pln- Pub Pln- Pub Pln- Intl Pub Pln- Real Public FundDom Equity Dom Fixed Equity Estate - Cash
(8)
(53)
(7)(34)
(51)(65)
(67)(82)
(50)(59)
10th Percentile 19.79 1.22 5.05 9.48 2.3125th Percentile 18.41 0.25 3.50 9.15 1.71
Median 17.30 (0.35) 2.46 8.60 1.6675th Percentile 15.88 (0.81) 1.23 7.42 1.4490th Percentile 14.58 (1.08) (0.95) 7.11 1.14
Asset Class Composite 19.99 1.64 2.41 7.51 1.66
Composite Benchmark 17.22 (0.02) 1.94 7.16 1.59
Weighted
Ranking
26
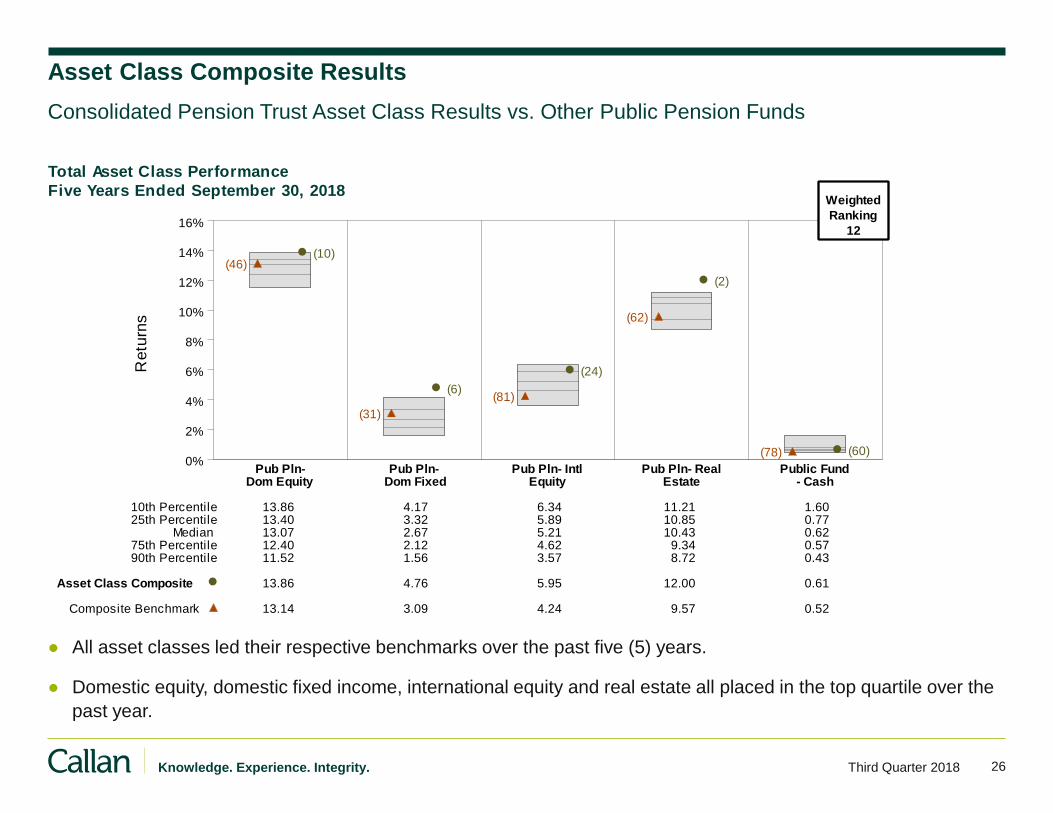
26 Knowledge. Experience. Integrity. Third Quarter 2018
Total Asset Class Performance
Five Years Ended September 30, 2018
Retu
rns
0%
2%
4%
6%
8%
10%
12%
14%
16%
Pub Pln- Pub Pln- Pub Pln- Intl Pub Pln- Real Public FundDom Equity Dom Fixed Equity Estate - Cash
(10)(46)
(6)
(31)
(24)
(81)
(2)
(62)
(60)(78)
10th Percentile 13.86 4.17 6.34 11.21 1.6025th Percentile 13.40 3.32 5.89 10.85 0.77
Median 13.07 2.67 5.21 10.43 0.6275th Percentile 12.40 2.12 4.62 9.34 0.5790th Percentile 11.52 1.56 3.57 8.72 0.43
Asset Class Composite 13.86 4.76 5.95 12.00 0.61
Composite Benchmark 13.14 3.09 4.24 9.57 0.52
Weighted
Ranking
12
Asset Class Composite Results
Consolidated Pension Trust Asset Class Results vs. Other Public Pension Funds
● All asset classes led their respective benchmarks over the past five (5) years.
● Domestic equity, domestic fixed income, international equity and real estate all placed in the top quartile over the
past year.

Consolidated Insurance Trust
Quarterly Review
- Workforce Safety and Insurance Legacy Fund
- Budget Stabilization Fund
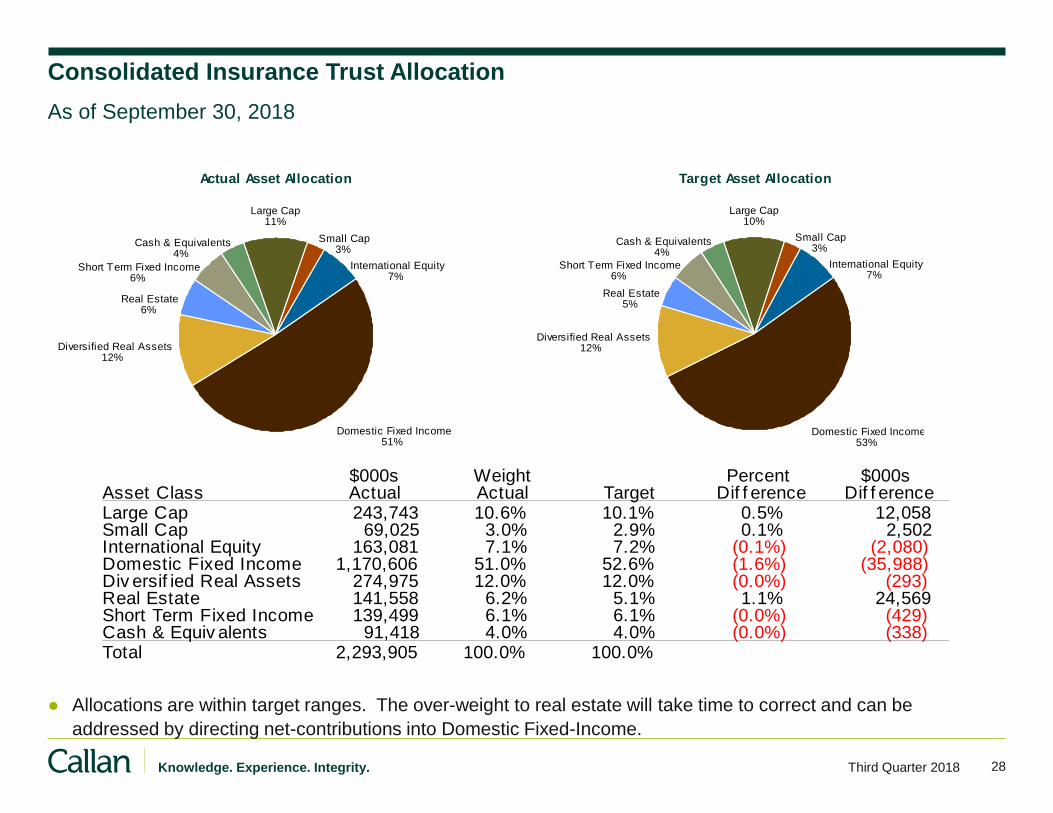
28 Knowledge. Experience. Integrity. Third Quarter 2018
$000s Weight Percent $000sAsset Class Actual Actual Target Dif f erence Dif f erenceLarge Cap 243,743 10.6% 10.1% 0.5% 12,058Small Cap 69,025 3.0% 2.9% 0.1% 2,502International Equity 163,081 7.1% 7.2% (0.1%) (2,080)Domestic Fixed Income 1,170,606 51.0% 52.6% (1.6%) (35,988)Div ersif ied Real Assets 274,975 12.0% 12.0% (0.0%) (293)Real Estate 141,558 6.2% 5.1% 1.1% 24,569Short Term Fixed Income 139,499 6.1% 6.1% (0.0%) (429)Cash & Equiv alents 91,418 4.0% 4.0% (0.0%) (338)Total 2,293,905 100.0% 100.0%
Target Asset Allocation
Large Cap10%
Small Cap3%
International Equity7%
Domestic Fixed Income53%
Diversified Real Assets12%
Real Estate5%
Short Term Fixed Income6%
Cash & Equivalents4%
Actual Asset Allocation
Large Cap11%
Small Cap3%
International Equity7%
Domestic Fixed Income51%
Diversified Real Assets12%
Real Estate6%
Short Term Fixed Income6%
Cash & Equivalents4%
Consolidated Insurance Trust Allocation
As of September 30, 2018
● Allocations are within target ranges. The over-weight to real estate will take time to correct and can be
addressed by directing net-contributions into Domestic Fixed-Income.
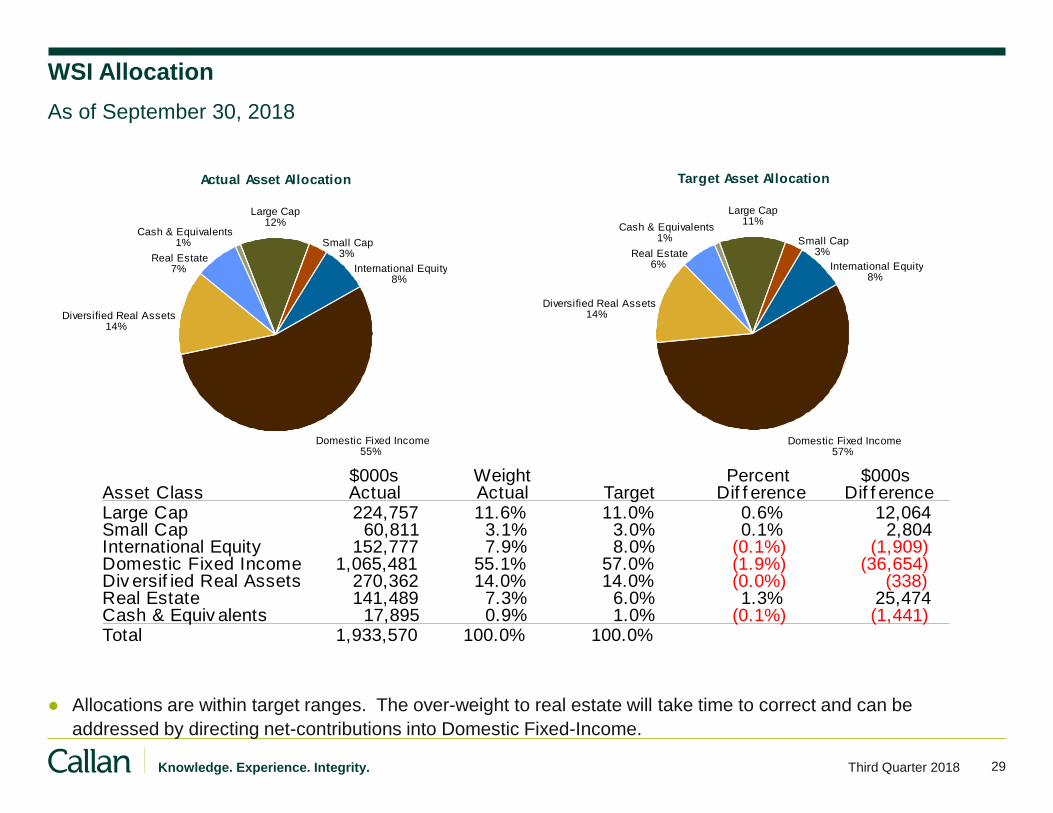
29 Knowledge. Experience. Integrity. Third Quarter 2018
$000s Weight Percent $000sAsset Class Actual Actual Target Dif f erence Dif f erenceLarge Cap 224,757 11.6% 11.0% 0.6% 12,064Small Cap 60,811 3.1% 3.0% 0.1% 2,804International Equity 152,777 7.9% 8.0% (0.1%) (1,909)Domestic Fixed Income 1,065,481 55.1% 57.0% (1.9%) (36,654)Div ersif ied Real Assets 270,362 14.0% 14.0% (0.0%) (338)Real Estate 141,489 7.3% 6.0% 1.3% 25,474Cash & Equiv alents 17,895 0.9% 1.0% (0.1%) (1,441)Total 1,933,570 100.0% 100.0%
Target Asset Allocation
Large Cap11%
Small Cap3%
International Equity8%
Domestic Fixed Income57%
Diversified Real Assets14%
Real Estate6%
Cash & Equivalents1%
WSI Allocation
As of September 30, 2018
Actual Asset Allocation
Large Cap12%
Small Cap3%
International Equity8%
Domestic Fixed Income55%
Diversified Real Assets14%
Real Estate7%
Cash & Equivalents1%
● Allocations are within target ranges. The over-weight to real estate will take time to correct and can be
addressed by directing net-contributions into Domestic Fixed-Income.
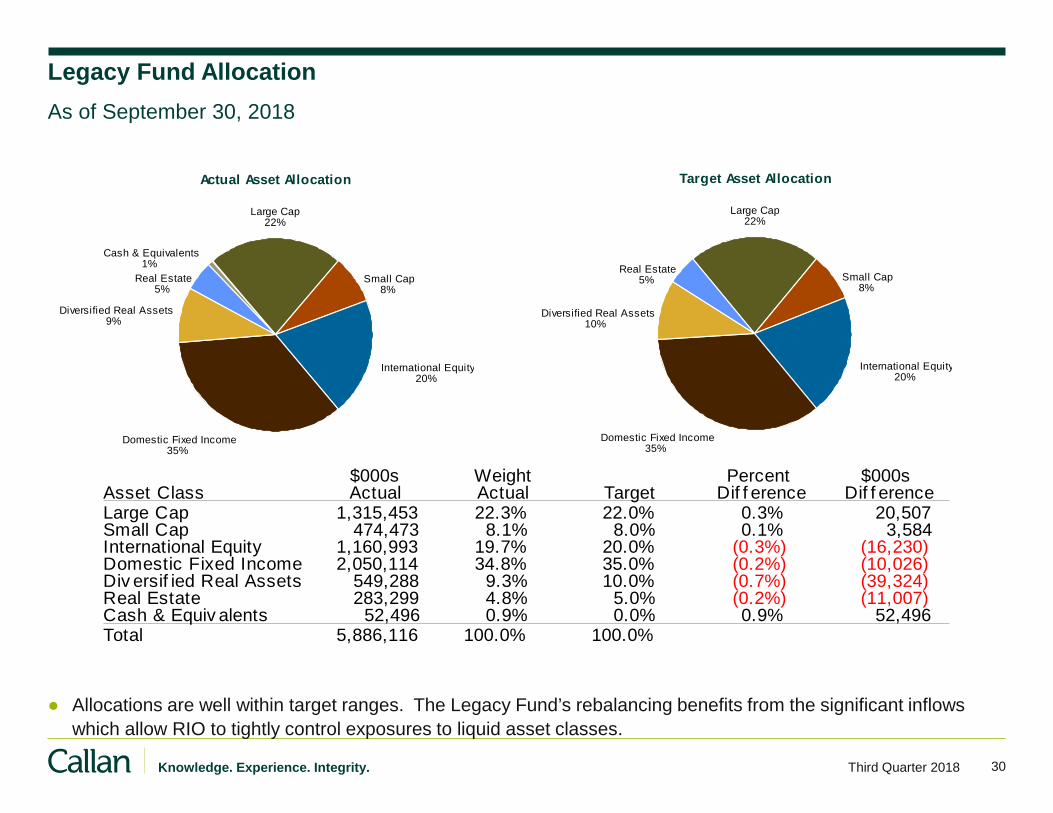
30 Knowledge. Experience. Integrity. Third Quarter 2018
$000s Weight Percent $000sAsset Class Actual Actual Target Dif f erence Dif f erenceLarge Cap 1,315,453 22.3% 22.0% 0.3% 20,507Small Cap 474,473 8.1% 8.0% 0.1% 3,584International Equity 1,160,993 19.7% 20.0% (0.3%) (16,230)Domestic Fixed Income 2,050,114 34.8% 35.0% (0.2%) (10,026)Div ersif ied Real Assets 549,288 9.3% 10.0% (0.7%) (39,324)Real Estate 283,299 4.8% 5.0% (0.2%) (11,007)Cash & Equiv alents 52,496 0.9% 0.0% 0.9% 52,496Total 5,886,116 100.0% 100.0%
Target Asset Allocation
Large Cap22%
Small Cap8%
International Equity20%
Domestic Fixed Income35%
Diversified Real Assets10%
Real Estate5%
Actual Asset Allocation
Large Cap22%
Small Cap8%
International Equity20%
Domestic Fixed Income35%
Diversified Real Assets9%
Real Estate5%
Cash & Equivalents1%
Legacy Fund Allocation
As of September 30, 2018
● Allocations are well within target ranges. The Legacy Fund’s rebalancing benefits from the significant inflows
which allow RIO to tightly control exposures to liquid asset classes.
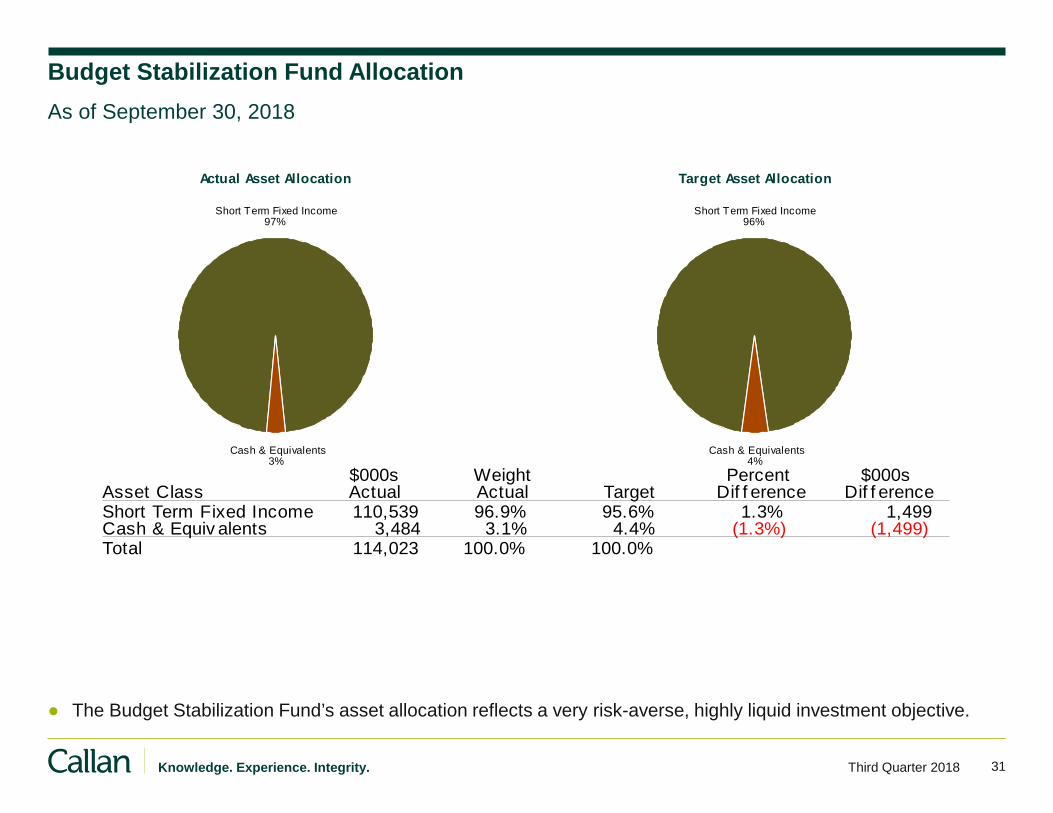
31 Knowledge. Experience. Integrity. Third Quarter 2018
Target Asset Allocation
Short Term Fixed Income96%
Cash & Equivalents4%
Actual Asset Allocation
Short Term Fixed Income97%
Cash & Equivalents3%
Budget Stabilization Fund Allocation
As of September 30, 2018
$000s Weight Percent $000sAsset Class Actual Actual Target Dif f erence Dif f erenceShort Term Fixed Income 110,539 96.9% 95.6% 1.3% 1,499Cash & Equiv alents 3,484 3.1% 4.4% (1.3%) (1,499)Total 114,023 100.0% 100.0%
● The Budget Stabilization Fund’s asset allocation reflects a very risk-averse, highly liquid investment objective.
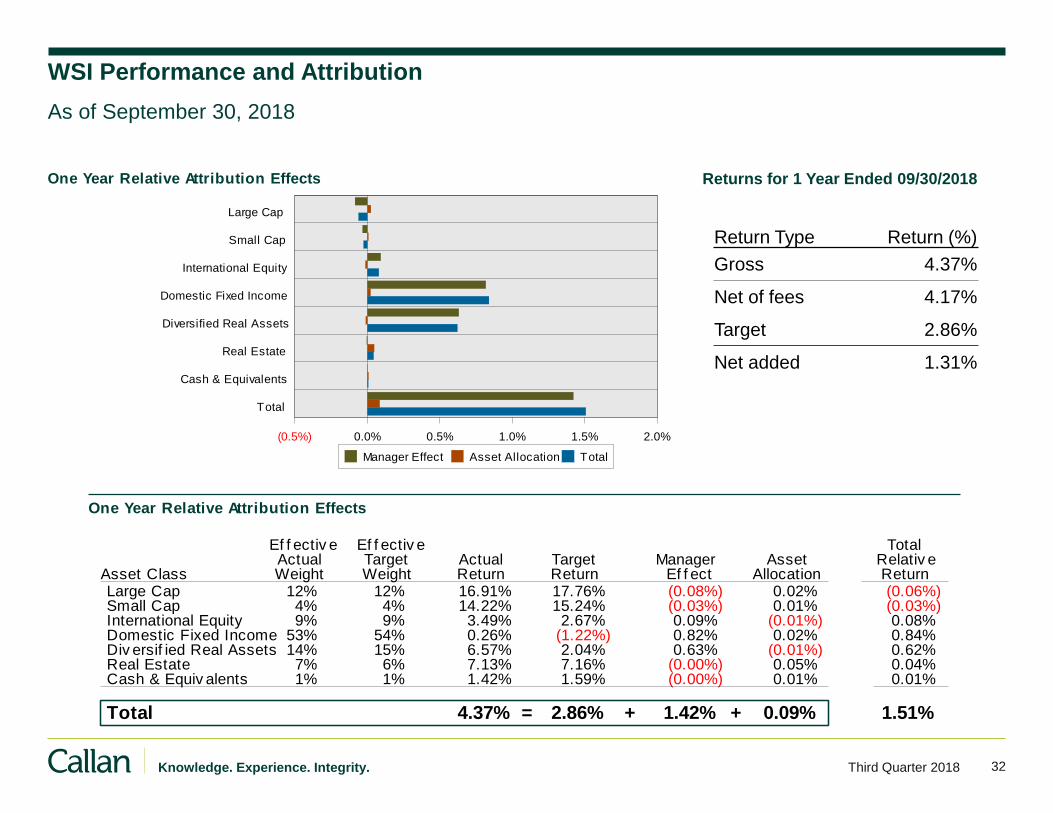
32 Knowledge. Experience. Integrity. Third Quarter 2018
Returns for 1 Year Ended 09/30/2018
Return Type Return (%)
Gross 4.37%
Net of fees 4.17%
Target 2.86%
Net added 1.31%
One Year Relative Attribution Effects
Ef f ectiv e Ef f ectiv e TotalActual Target Actual Target Manager Asset Relativ e
Asset Class Weight Weight Return Return Ef f ect Allocation ReturnLarge Cap 12% 12% 16.91% 17.76% (0.08%) 0.02% (0.06%)Small Cap 4% 4% 14.22% 15.24% (0.03%) 0.01% (0.03%)International Equity 9% 9% 3.49% 2.67% 0.09% (0.01%) 0.08%Domestic Fixed Income 53% 54% 0.26% (1.22%) 0.82% 0.02% 0.84%Div ersif ied Real Assets 14% 15% 6.57% 2.04% 0.63% (0.01%) 0.62%Real Estate 7% 6% 7.13% 7.16% (0.00%) 0.05% 0.04%Cash & Equiv alents 1% 1% 1.42% 1.59% (0.00%) 0.01% 0.01%
Total = + +4.37% 2.86% 1.42% 0.09% 1.51%
One Year Relative Attribution Effects
(0.5%) 0.0% 0.5% 1.0% 1.5% 2.0%
Large Cap
Small Cap
International Equity
Domestic Fixed Income
Diversified Real Assets
Real Estate
Cash & Equivalents
Total
Manager Effect Asset Allocation Total
WSI Performance and Attribution
As of September 30, 2018
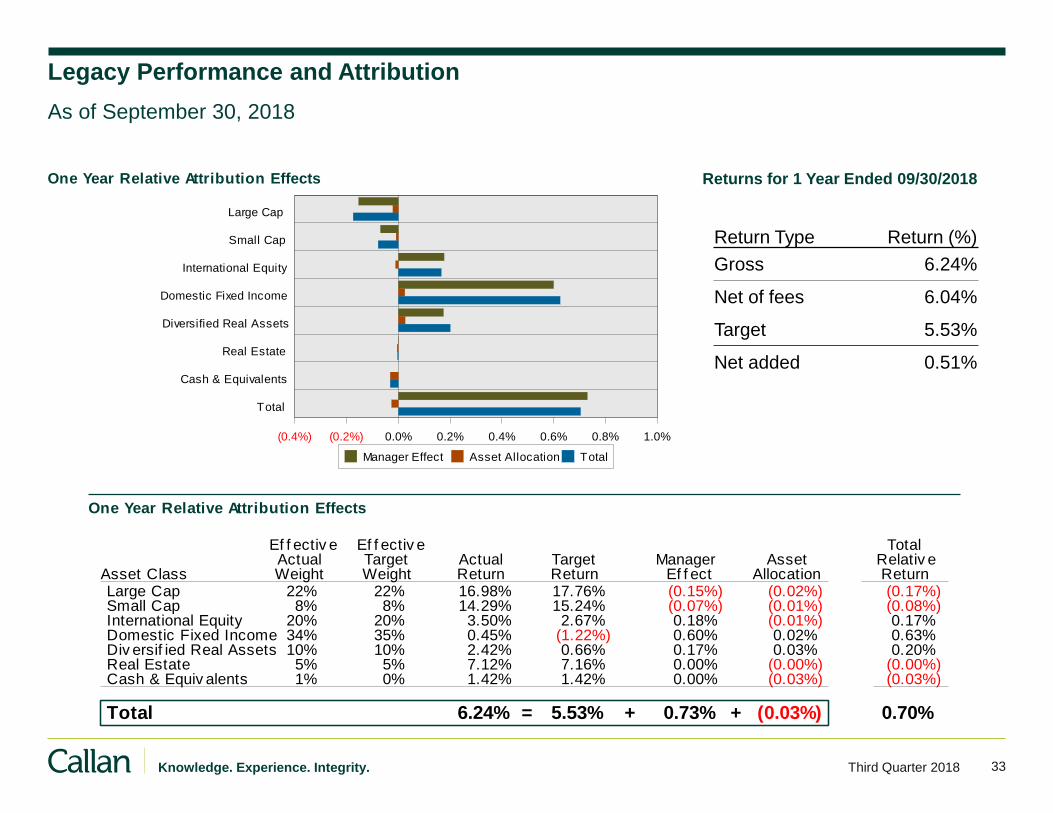
33 Knowledge. Experience. Integrity. Third Quarter 2018
Returns for 1 Year Ended 09/30/2018
Return Type Return (%)
Gross 6.24%
Net of fees 6.04%
Target 5.53%
Net added 0.51%
One Year Relative Attribution Effects
Ef f ectiv e Ef f ectiv e TotalActual Target Actual Target Manager Asset Relativ e
Asset Class Weight Weight Return Return Ef f ect Allocation ReturnLarge Cap 22% 22% 16.98% 17.76% (0.15%) (0.02%) (0.17%)Small Cap 8% 8% 14.29% 15.24% (0.07%) (0.01%) (0.08%)International Equity 20% 20% 3.50% 2.67% 0.18% (0.01%) 0.17%Domestic Fixed Income 34% 35% 0.45% (1.22%) 0.60% 0.02% 0.63%Div ersif ied Real Assets 10% 10% 2.42% 0.66% 0.17% 0.03% 0.20%Real Estate 5% 5% 7.12% 7.16% 0.00% (0.00%) (0.00%)Cash & Equiv alents 1% 0% 1.42% 1.42% 0.00% (0.03%) (0.03%)
Total = + +6.24% 5.53% 0.73% (0.03%) 0.70%
One Year Relative Attribution Effects
(0.4%) (0.2%) 0.0% 0.2% 0.4% 0.6% 0.8% 1.0%
Large Cap
Small Cap
International Equity
Domestic Fixed Income
Diversified Real Assets
Real Estate
Cash & Equivalents
Total
Manager Effect Asset Allocation Total
Legacy Performance and Attribution
As of September 30, 2018
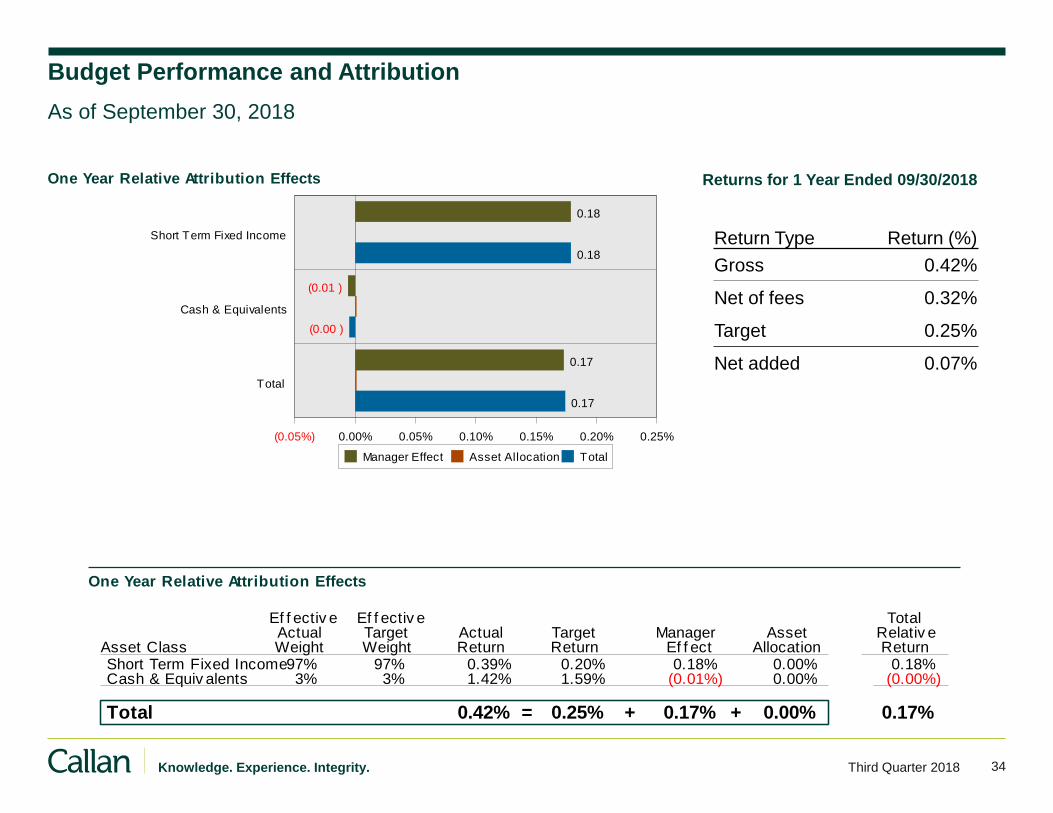
34 Knowledge. Experience. Integrity. Third Quarter 2018
Returns for 1 Year Ended 09/30/2018
Return Type Return (%)
Gross 0.42%
Net of fees 0.32%
Target 0.25%
Net added 0.07%
One Year Relative Attribution Effects
(0.05%) 0.00% 0.05% 0.10% 0.15% 0.20% 0.25%
Short Term Fixed Income
0.18
0.18
Cash & Equivalents
(0.01 )
(0.00 )
Total
0.17
0.17
Manager Effect Asset Allocation Total
Budget Performance and Attribution
As of September 30, 2018
One Year Relative Attribution Effects
Ef f ectiv e Ef f ectiv e TotalActual Target Actual Target Manager Asset Relativ e
Asset Class Weight Weight Return Return Ef f ect Allocation ReturnShort Term Fixed Income97% 97% 0.39% 0.20% 0.18% 0.00% 0.18%Cash & Equiv alents 3% 3% 1.42% 1.59% (0.01%) 0.00% (0.00%)
Total = + +0.42% 0.25% 0.17% 0.00% 0.17%
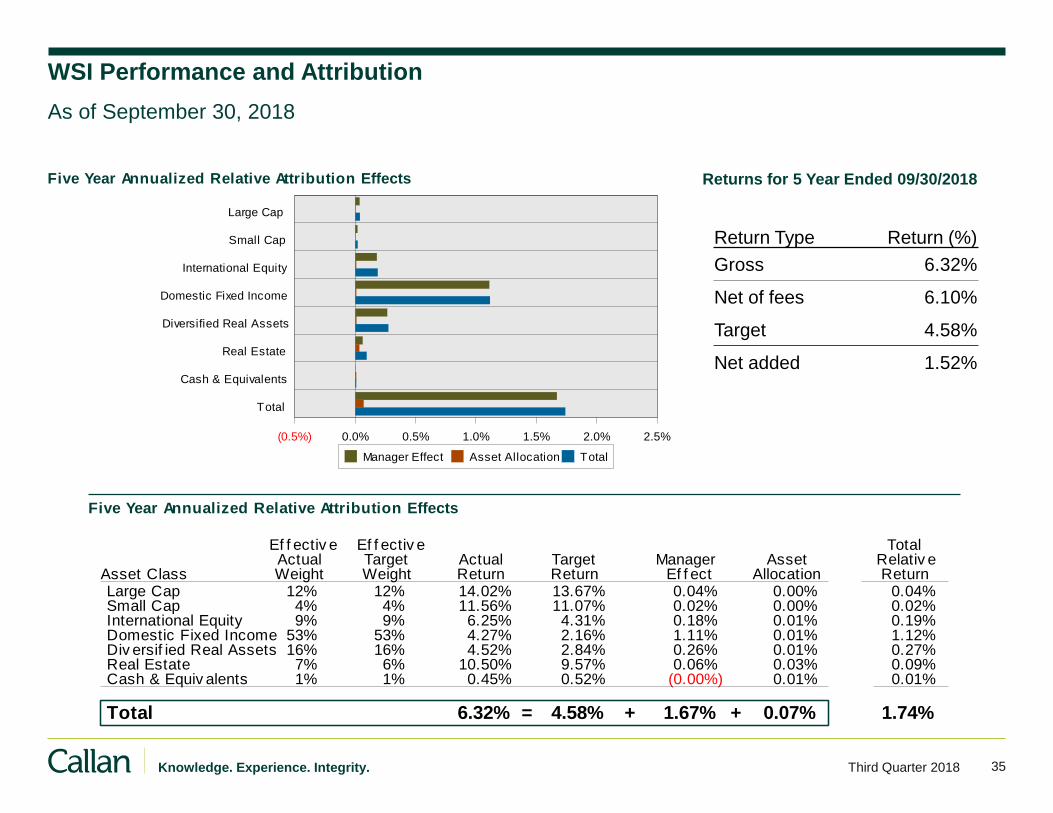
35 Knowledge. Experience. Integrity. Third Quarter 2018
Five Year Annualized Relative Attribution Effects
Ef f ectiv e Ef f ectiv e TotalActual Target Actual Target Manager Asset Relativ e
Asset Class Weight Weight Return Return Ef f ect Allocation ReturnLarge Cap 12% 12% 14.02% 13.67% 0.04% 0.00% 0.04%Small Cap 4% 4% 11.56% 11.07% 0.02% 0.00% 0.02%International Equity 9% 9% 6.25% 4.31% 0.18% 0.01% 0.19%Domestic Fixed Income 53% 53% 4.27% 2.16% 1.11% 0.01% 1.12%Div ersif ied Real Assets 16% 16% 4.52% 2.84% 0.26% 0.01% 0.27%Real Estate 7% 6% 10.50% 9.57% 0.06% 0.03% 0.09%Cash & Equiv alents 1% 1% 0.45% 0.52% (0.00%) 0.01% 0.01%
Total = + +6.32% 4.58% 1.67% 0.07% 1.74%
Five Year Annualized Relative Attribution Effects
(0.5%) 0.0% 0.5% 1.0% 1.5% 2.0% 2.5%
Large Cap
Small Cap
International Equity
Domestic Fixed Income
Diversified Real Assets
Real Estate
Cash & Equivalents
Total
Manager Effect Asset Allocation Total
Returns for 5 Year Ended 09/30/2018
Return Type Return (%)
Gross 6.32%
Net of fees 6.10%
Target 4.58%
Net added 1.52%
WSI Performance and Attribution
As of September 30, 2018
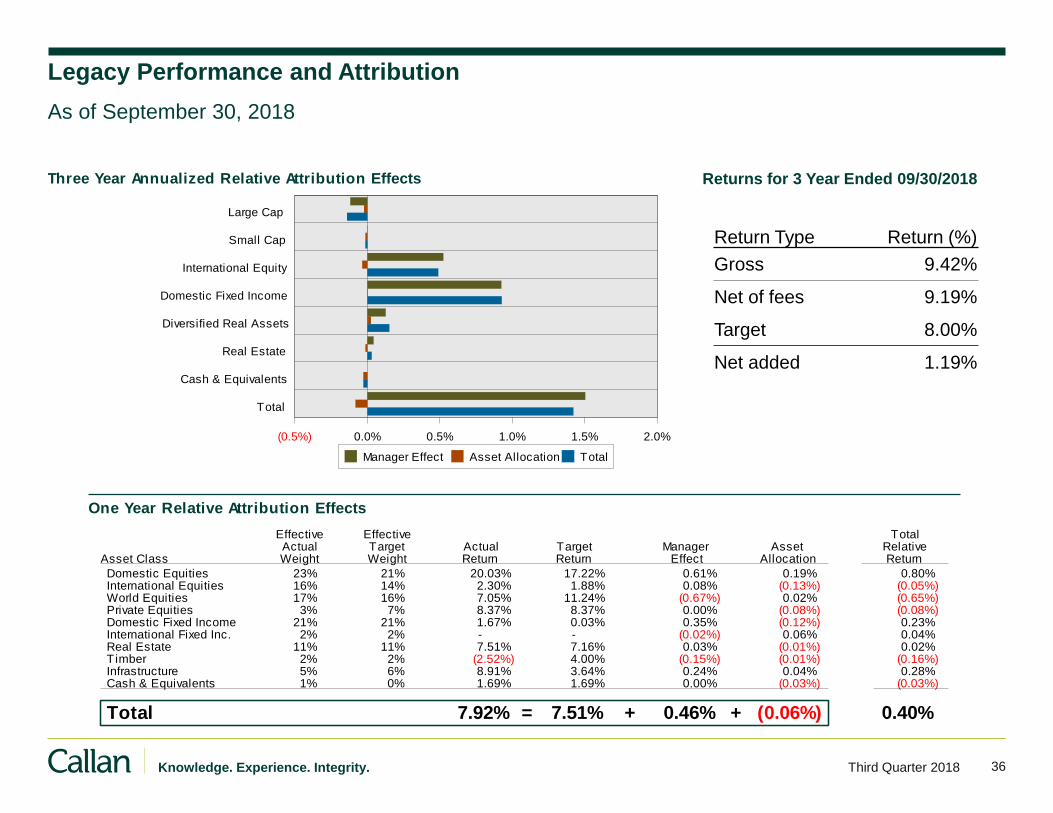
36 Knowledge. Experience. Integrity. Third Quarter 2018
One Year Relative Attribution Effects
Effective Effective TotalActual Target Actual Target Manager Asset Relative
Asset Class Weight Weight Return Return Effect Allocation Return
Domestic Equities 23% 21% 20.03% 17.22% 0.61% 0.19% 0.80%International Equities 16% 14% 2.30% 1.88% 0.08% (0.13%) (0.05%)World Equities 17% 16% 7.05% 11.24% (0.67%) 0.02% (0.65%)Private Equities 3% 7% 8.37% 8.37% 0.00% (0.08%) (0.08%)Domestic Fixed Income 21% 21% 1.67% 0.03% 0.35% (0.12%) 0.23%International Fixed Inc. 2% 2% - - (0.02%) 0.06% 0.04%Real Estate 11% 11% 7.51% 7.16% 0.03% (0.01%) 0.02%Timber 2% 2% (2.52%) 4.00% (0.15%) (0.01%) (0.16%)Infrastructure 5% 6% 8.91% 3.64% 0.24% 0.04% 0.28%Cash & Equivalents 1% 0% 1.69% 1.69% 0.00% (0.03%) (0.03%)
Total = + +7.92% 7.51% 0.46% (0.06%) 0.40%
Three Year Annualized Relative Attribution Effects
(0.5%) 0.0% 0.5% 1.0% 1.5% 2.0%
Large Cap
Small Cap
International Equity
Domestic Fixed Income
Diversified Real Assets
Real Estate
Cash & Equivalents
Total
Manager Effect Asset Allocation Total
Returns for 3 Year Ended 09/30/2018
Return Type Return (%)
Gross 9.42%
Net of fees 9.19%
Target 8.00%
Net added 1.19%
Legacy Performance and Attribution
As of September 30, 2018
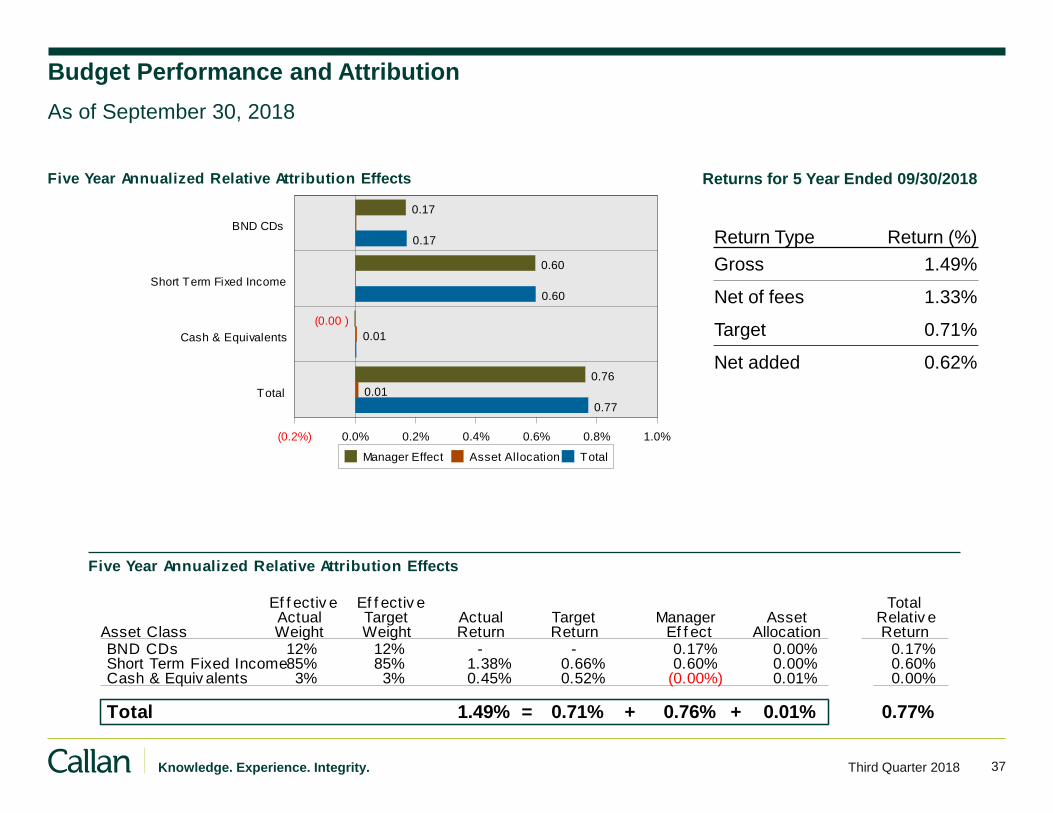
37 Knowledge. Experience. Integrity. Third Quarter 2018
Five Year Annualized Relative Attribution Effects
(0.2%) 0.0% 0.2% 0.4% 0.6% 0.8% 1.0%
BND CDs
0.17
0.17
Short Term Fixed Income
0.60
0.60
Cash & Equivalents
(0.00 )
0.01
Total
0.76
0.01
0.77
Manager Effect Asset Allocation Total
Returns for 5 Year Ended 09/30/2018
Return Type Return (%)
Gross 1.49%
Net of fees 1.33%
Target 0.71%
Net added 0.62%
Budget Performance and Attribution
As of September 30, 2018
Five Year Annualized Relative Attribution Effects
Ef f ectiv e Ef f ectiv e TotalActual Target Actual Target Manager Asset Relativ e
Asset Class Weight Weight Return Return Ef f ect Allocation ReturnBND CDs 12% 12% - - 0.17% 0.00% 0.17%Short Term Fixed Income85% 85% 1.38% 0.66% 0.60% 0.00% 0.60%Cash & Equiv alents 3% 3% 0.45% 0.52% (0.00%) 0.01% 0.00%
Total = + +1.49% 0.71% 0.76% 0.01% 0.77%
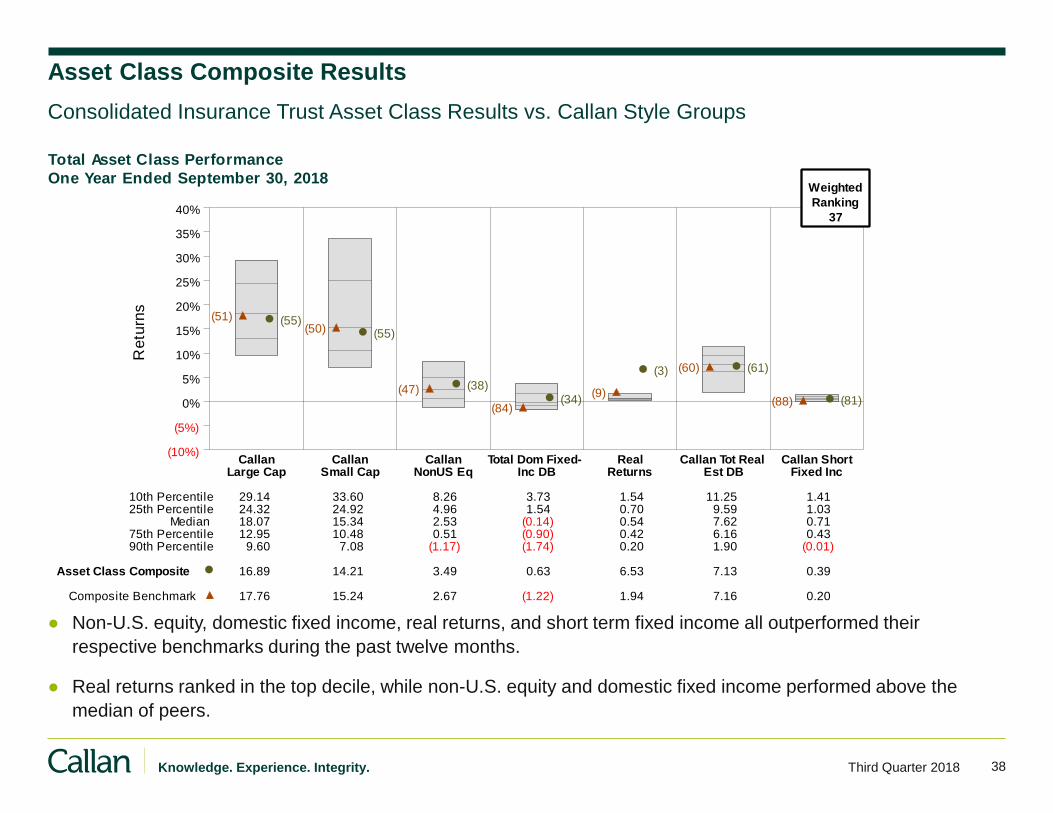
38 Knowledge. Experience. Integrity. Third Quarter 2018
Asset Class Composite Results
Consolidated Insurance Trust Asset Class Results vs. Callan Style Groups
● Non-U.S. equity, domestic fixed income, real returns, and short term fixed income all outperformed their
respective benchmarks during the past twelve months.
● Real returns ranked in the top decile, while non-U.S. equity and domestic fixed income performed above the
median of peers.
Total Asset Class Performance
One Year Ended September 30, 2018
Retu
rns
(10%)
(5%)
0%
5%
10%
15%
20%
25%
30%
35%
40%
Callan Callan Callan Total Dom Fixed- Real Callan Tot Real Callan ShortLarge Cap Small Cap NonUS Eq Inc DB Returns Est DB Fixed Inc
(55)(51)
(55)(50)
(38)(47)(34)
(84)
(3)
(9)
(61)(60)
(81)(88)
10th Percentile 29.14 33.60 8.26 3.73 1.54 11.25 1.4125th Percentile 24.32 24.92 4.96 1.54 0.70 9.59 1.03
Median 18.07 15.34 2.53 (0.14) 0.54 7.62 0.7175th Percentile 12.95 10.48 0.51 (0.90) 0.42 6.16 0.4390th Percentile 9.60 7.08 (1.17) (1.74) 0.20 1.90 (0.01)
Asset Class Composite 16.89 14.21 3.49 0.63 6.53 7.13 0.39
Composite Benchmark 17.76 15.24 2.67 (1.22) 1.94 7.16 0.20
Weighted
Ranking
37
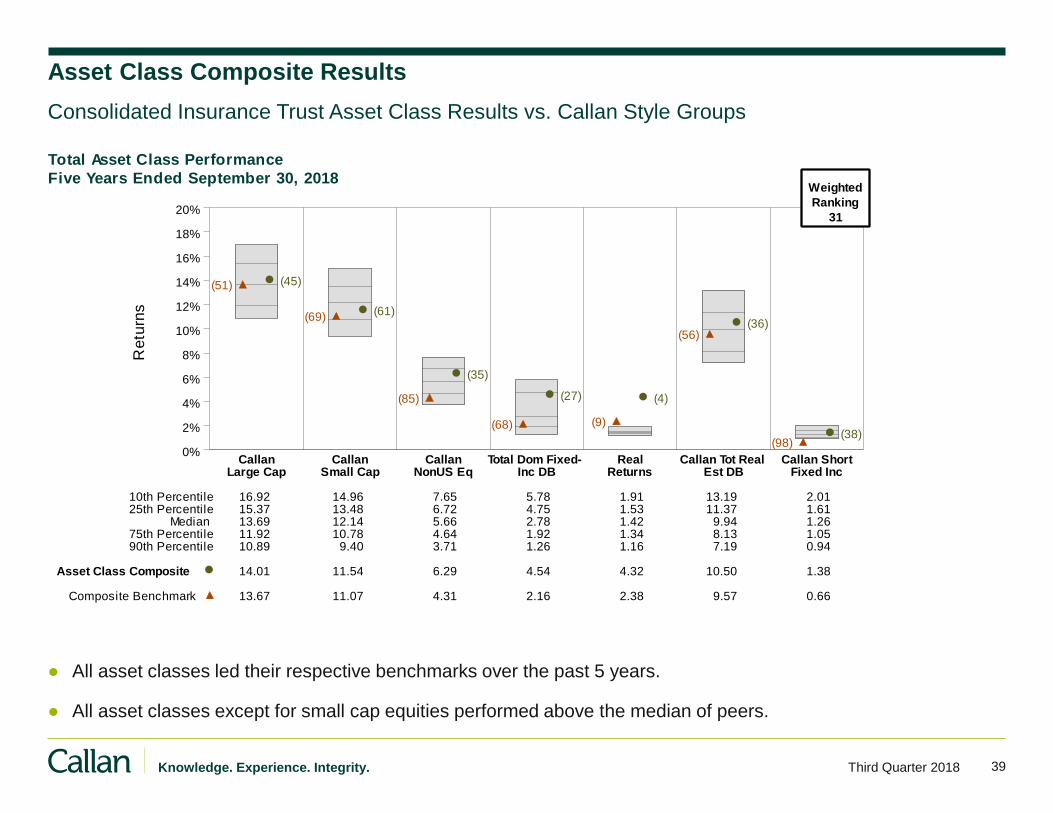
39 Knowledge. Experience. Integrity. Third Quarter 2018
Total Asset Class Performance
Five Years Ended September 30, 2018
Retu
rns
0%
2%
4%
6%
8%
10%
12%
14%
16%
18%
20%
Callan Callan Callan Total Dom Fixed- Real Callan Tot Real Callan ShortLarge Cap Small Cap NonUS Eq Inc DB Returns Est DB Fixed Inc
(45)(51)
(61)(69)
(35)
(85) (27)
(68)
(4)
(9)
(36)(56)
(38)(98)
10th Percentile 16.92 14.96 7.65 5.78 1.91 13.19 2.0125th Percentile 15.37 13.48 6.72 4.75 1.53 11.37 1.61
Median 13.69 12.14 5.66 2.78 1.42 9.94 1.2675th Percentile 11.92 10.78 4.64 1.92 1.34 8.13 1.0590th Percentile 10.89 9.40 3.71 1.26 1.16 7.19 0.94
Asset Class Composite 14.01 11.54 6.29 4.54 4.32 10.50 1.38
Composite Benchmark 13.67 11.07 4.31 2.16 2.38 9.57 0.66
Weighted
Ranking
31
Asset Class Composite Results
Consolidated Insurance Trust Asset Class Results vs. Callan Style Groups
● All asset classes led their respective benchmarks over the past 5 years.
● All asset classes except for small cap equities performed above the median of peers.
Appendix
Consolidated Asset Class Rankings
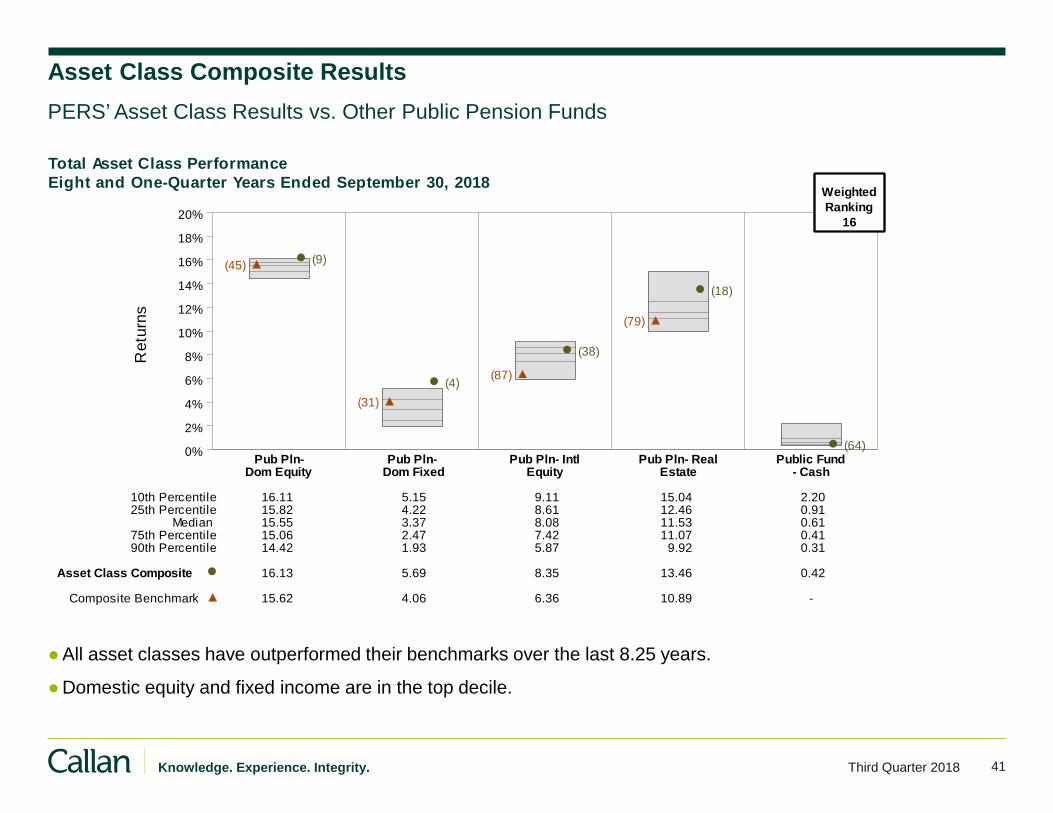
41 Knowledge. Experience. Integrity. Third Quarter 2018
Asset Class Composite Results
●All asset classes have outperformed their benchmarks over the last 8.25 years.
●Domestic equity and fixed income are in the top decile.
PERS’ Asset Class Results vs. Other Public Pension Funds
Total Asset Class Performance
Eight and One-Quarter Years Ended September 30, 2018
Retu
rns
0%
2%
4%
6%
8%
10%
12%
14%
16%
18%
20%
Pub Pln- Pub Pln- Pub Pln- Intl Pub Pln- Real Public FundDom Equity Dom Fixed Equity Estate - Cash
(9)(45)
(4)
(31)
(38)
(87)
(18)
(79)
(64)
10th Percentile 16.11 5.15 9.11 15.04 2.2025th Percentile 15.82 4.22 8.61 12.46 0.91
Median 15.55 3.37 8.08 11.53 0.6175th Percentile 15.06 2.47 7.42 11.07 0.4190th Percentile 14.42 1.93 5.87 9.92 0.31
Asset Class Composite 16.13 5.69 8.35 13.46 0.42
Composite Benchmark 15.62 4.06 6.36 10.89 -
Weighted
Ranking
16
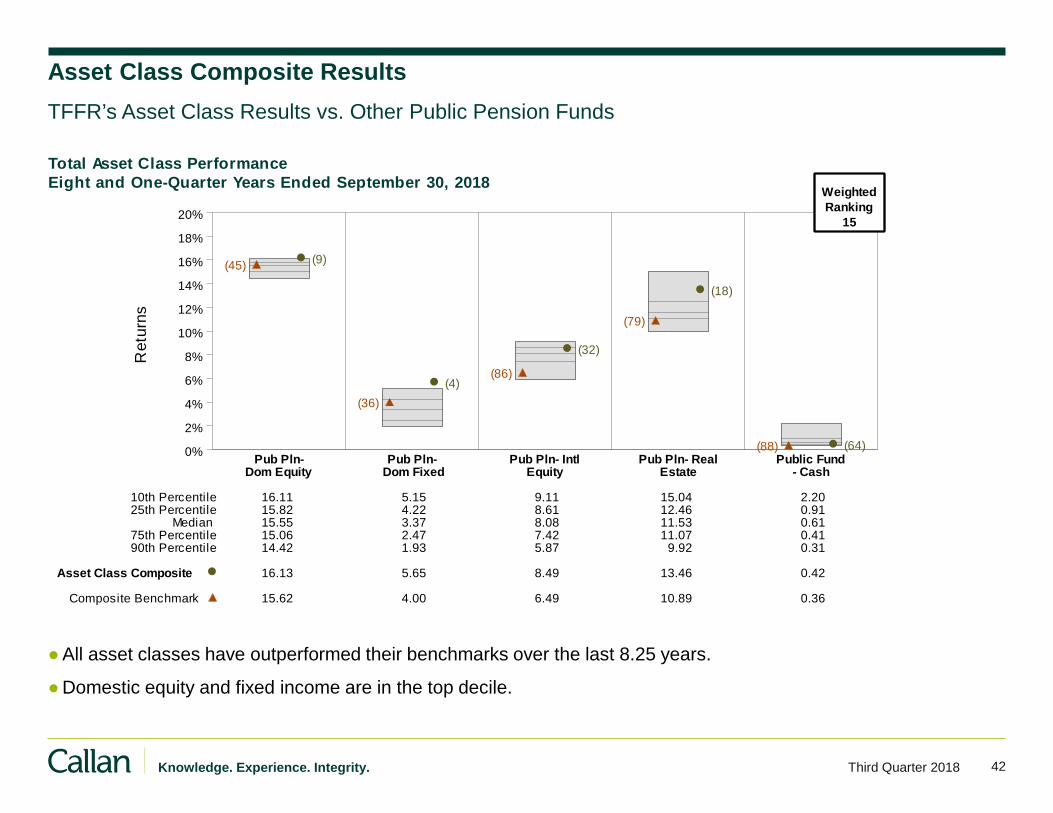
42 Knowledge. Experience. Integrity. Third Quarter 2018
Total Asset Class Performance
Eight and One-Quarter Years Ended September 30, 2018
Retu
rns
0%
2%
4%
6%
8%
10%
12%
14%
16%
18%
20%
Pub Pln- Pub Pln- Pub Pln- Intl Pub Pln- Real Public FundDom Equity Dom Fixed Equity Estate - Cash
(9)(45)
(4)
(36)
(32)
(86)
(18)
(79)
(64)(88)
10th Percentile 16.11 5.15 9.11 15.04 2.2025th Percentile 15.82 4.22 8.61 12.46 0.91
Median 15.55 3.37 8.08 11.53 0.6175th Percentile 15.06 2.47 7.42 11.07 0.4190th Percentile 14.42 1.93 5.87 9.92 0.31
Asset Class Composite 16.13 5.65 8.49 13.46 0.42
Composite Benchmark 15.62 4.00 6.49 10.89 0.36
Weighted
Ranking
15
Asset Class Composite Results
●All asset classes have outperformed their benchmarks over the last 8.25 years.
●Domestic equity and fixed income are in the top decile.
TFFR’s Asset Class Results vs. Other Public Pension Funds
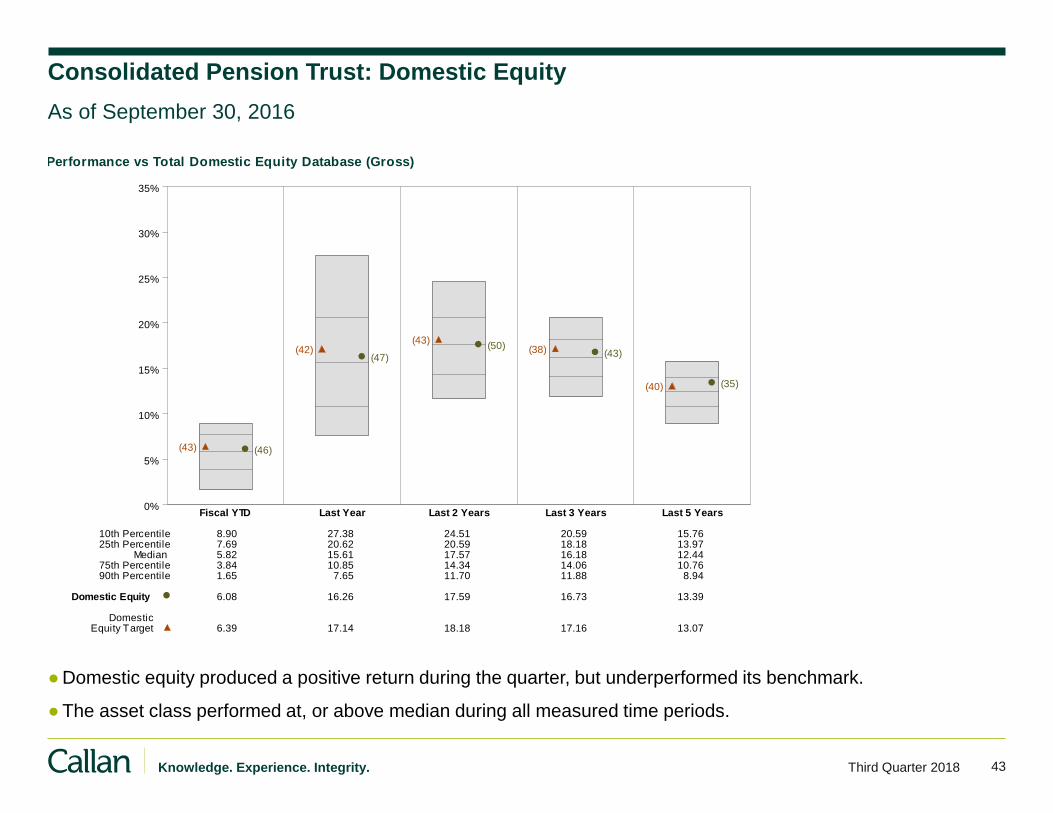
43 Knowledge. Experience. Integrity. Third Quarter 2018
Consolidated Pension Trust: Domestic Equity
●Domestic equity produced a positive return during the quarter, but underperformed its benchmark.
●The asset class performed at, or above median during all measured time periods.
As of September 30, 2016
Performance vs Total Domestic Equity Database (Gross)
0%
5%
10%
15%
20%
25%
30%
35%
Fiscal YTD Last Year Last 2 Years Last 3 Years Last 5 Years
(46)(43)
(47)(42) (50)
(43)
(43)(38)
(35)(40)
10th Percentile 8.90 27.38 24.51 20.59 15.7625th Percentile 7.69 20.62 20.59 18.18 13.97
Median 5.82 15.61 17.57 16.18 12.4475th Percentile 3.84 10.85 14.34 14.06 10.7690th Percentile 1.65 7.65 11.70 11.88 8.94
Domestic Equity 6.08 16.26 17.59 16.73 13.39
DomesticEquity Target 6.39 17.14 18.18 17.16 13.07
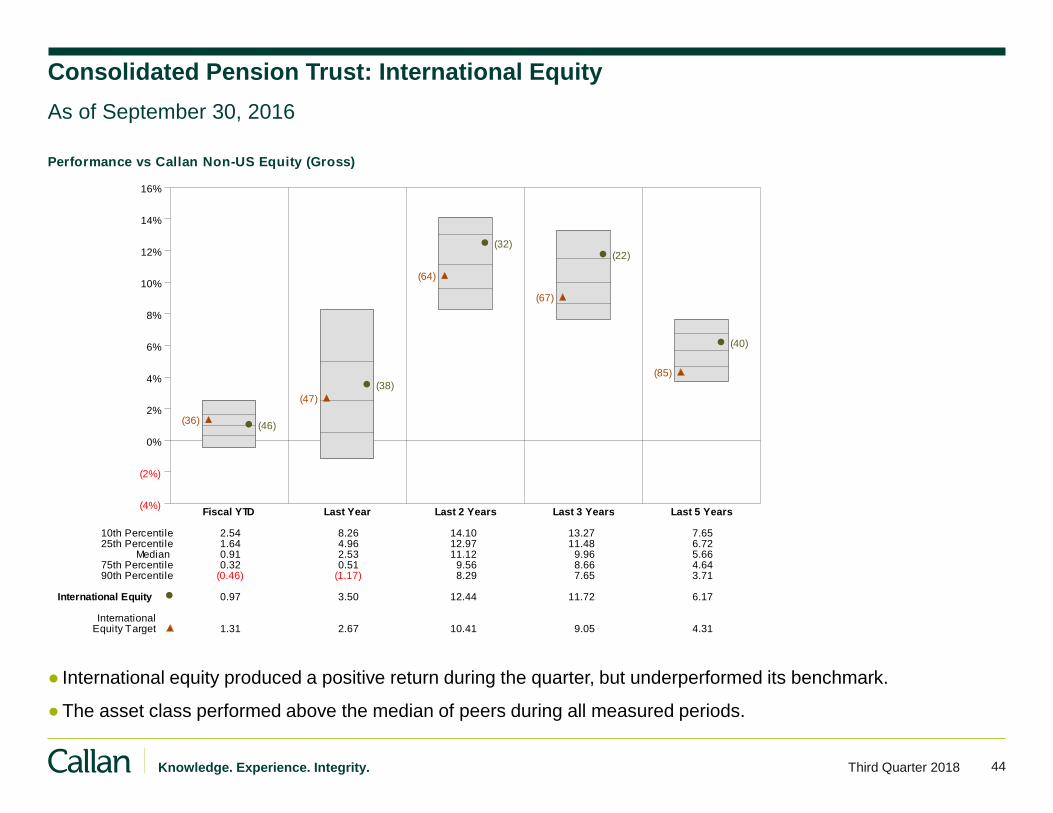
44 Knowledge. Experience. Integrity. Third Quarter 2018
Performance vs Callan Non-US Equity (Gross)
(4%)
(2%)
0%
2%
4%
6%
8%
10%
12%
14%
16%
Fiscal YTD Last Year Last 2 Years Last 3 Years Last 5 Years
(46)(36)
(38)
(47)
(32)
(64)
(22)
(67)
(40)
(85)
10th Percentile 2.54 8.26 14.10 13.27 7.6525th Percentile 1.64 4.96 12.97 11.48 6.72
Median 0.91 2.53 11.12 9.96 5.6675th Percentile 0.32 0.51 9.56 8.66 4.6490th Percentile (0.46) (1.17) 8.29 7.65 3.71
International Equity 0.97 3.50 12.44 11.72 6.17
InternationalEquity Target 1.31 2.67 10.41 9.05 4.31
Consolidated Pension Trust: International Equity
● International equity produced a positive return during the quarter, but underperformed its benchmark.
●The asset class performed above the median of peers during all measured periods.
As of September 30, 2016

45 Knowledge. Experience. Integrity. Third Quarter 2018
Performance vs Callan Core Bond Mutual Funds (Net)
(5%)
0%
5%
10%
15%
20%
Fiscal YTD Last Last 2 Years Last 3 Years Last 5 Years Last 6-3/4Year Years
A(1)
B(83)(63)
A(1)
B(16)(31)
A(1)
B(27)(38)
A(1)
B(79)(43)
A(1)
B(35)(20)
A(1)
B(74)(46)
10th Percentile 0.39 (0.61) 0.19 2.11 2.67 2.7625th Percentile 0.16 (1.15) (0.30) 1.62 2.05 2.14
Median 0.07 (1.43) (0.69) 1.14 1.86 1.8775th Percentile (0.10) (1.69) (0.87) 0.99 1.73 1.6890th Percentile (0.18) (1.95) (1.03) 0.91 1.38 1.45
PIMCO DiSCO II A 1.69 7.32 12.14 10.85 9.39 14.29Blmbg Mortgage B (0.12) (0.92) (0.31) 0.98 2.02 1.73
Blmbg Aggregate 0.02 (1.22) (0.57) 1.31 2.16 1.93
Consolidated Pension Trust: PIMCO DISCO II
As of September 30, 2016
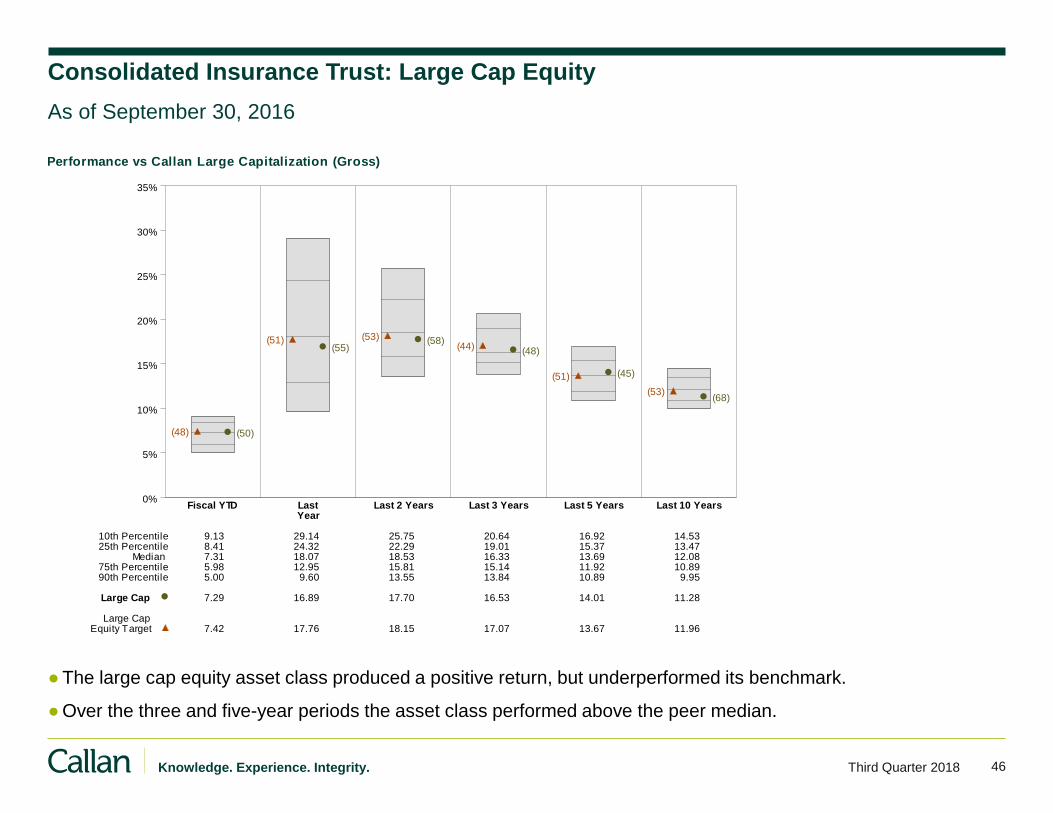
46 Knowledge. Experience. Integrity. Third Quarter 2018
Consolidated Insurance Trust: Large Cap Equity
As of September 30, 2016
Performance vs Callan Large Capitalization (Gross)
0%
5%
10%
15%
20%
25%
30%
35%
Fiscal YTD Last Last 2 Years Last 3 Years Last 5 Years Last 10 YearsYear
(50)(48)
(55)(51) (58)(53)
(48)(44)
(45)(51)
(68)(53)
10th Percentile 9.13 29.14 25.75 20.64 16.92 14.5325th Percentile 8.41 24.32 22.29 19.01 15.37 13.47
Median 7.31 18.07 18.53 16.33 13.69 12.0875th Percentile 5.98 12.95 15.81 15.14 11.92 10.8990th Percentile 5.00 9.60 13.55 13.84 10.89 9.95
Large Cap 7.29 16.89 17.70 16.53 14.01 11.28
Large CapEquity Target 7.42 17.76 18.15 17.07 13.67 11.96
●The large cap equity asset class produced a positive return, but underperformed its benchmark.
●Over the three and five-year periods the asset class performed above the peer median.
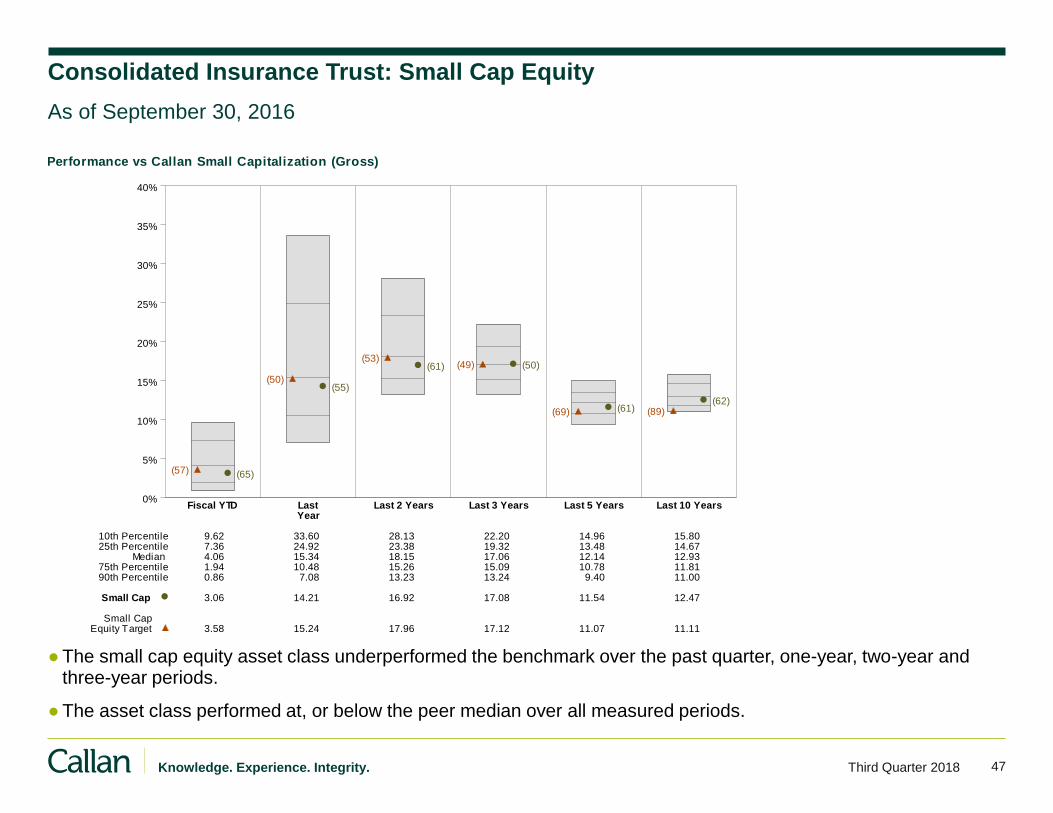
47 Knowledge. Experience. Integrity. Third Quarter 2018
Performance vs Callan Small Capitalization (Gross)
0%
5%
10%
15%
20%
25%
30%
35%
40%
Fiscal YTD Last Last 2 Years Last 3 Years Last 5 Years Last 10 YearsYear
(65)(57)
(55)(50)
(61)(53)
(50)(49)
(61)(69)(62)
(89)
10th Percentile 9.62 33.60 28.13 22.20 14.96 15.8025th Percentile 7.36 24.92 23.38 19.32 13.48 14.67
Median 4.06 15.34 18.15 17.06 12.14 12.9375th Percentile 1.94 10.48 15.26 15.09 10.78 11.8190th Percentile 0.86 7.08 13.23 13.24 9.40 11.00
Small Cap 3.06 14.21 16.92 17.08 11.54 12.47
Small CapEquity Target 3.58 15.24 17.96 17.12 11.07 11.11
Consolidated Insurance Trust: Small Cap Equity
As of September 30, 2016
●The small cap equity asset class underperformed the benchmark over the past quarter, one-year, two-year and three-year periods.
●The asset class performed at, or below the peer median over all measured periods.
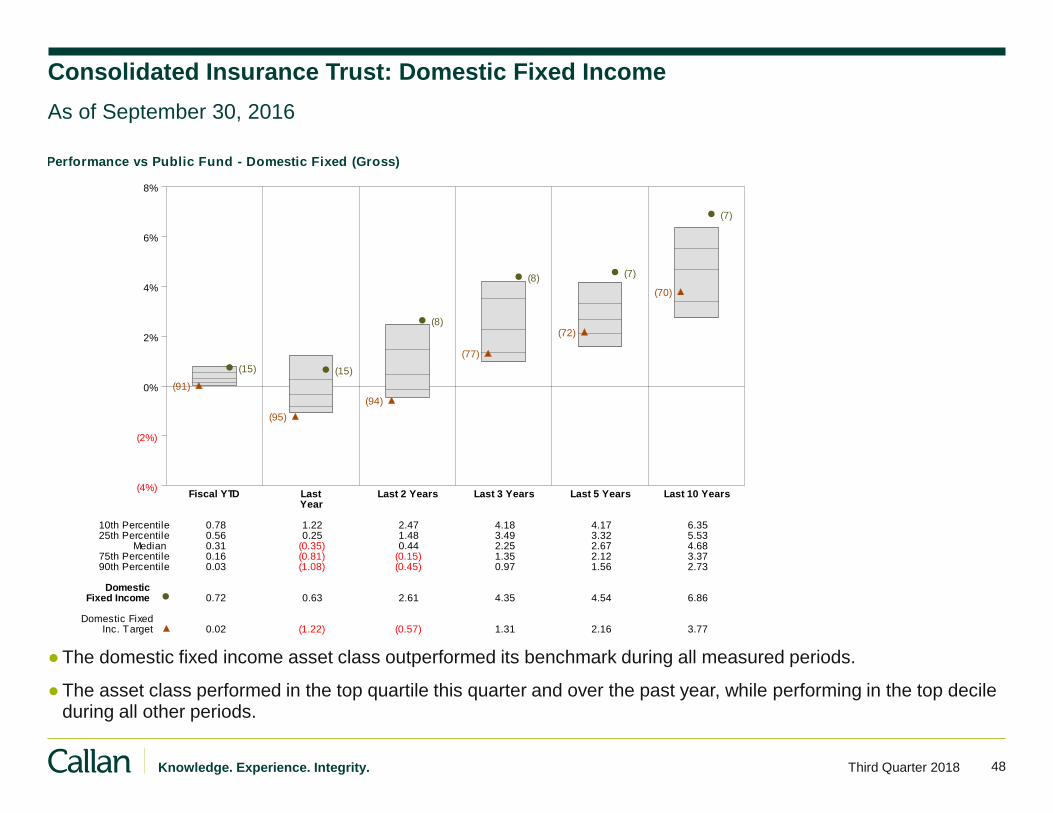
48 Knowledge. Experience. Integrity. Third Quarter 2018
Performance vs Public Fund - Domestic Fixed (Gross)
(4%)
(2%)
0%
2%
4%
6%
8%
Fiscal YTD Last Last 2 Years Last 3 Years Last 5 Years Last 10 YearsYear
(15)
(91)
(15)
(95)
(8)
(94)
(8)
(77)
(7)
(72)
(7)
(70)
10th Percentile 0.78 1.22 2.47 4.18 4.17 6.3525th Percentile 0.56 0.25 1.48 3.49 3.32 5.53
Median 0.31 (0.35) 0.44 2.25 2.67 4.6875th Percentile 0.16 (0.81) (0.15) 1.35 2.12 3.3790th Percentile 0.03 (1.08) (0.45) 0.97 1.56 2.73
DomesticFixed Income 0.72 0.63 2.61 4.35 4.54 6.86
Domestic FixedInc. Target 0.02 (1.22) (0.57) 1.31 2.16 3.77
Consolidated Insurance Trust: Domestic Fixed Income
●The domestic fixed income asset class outperformed its benchmark during all measured periods.
●The asset class performed in the top quartile this quarter and over the past year, while performing in the top decile during all other periods.
As of September 30, 2016
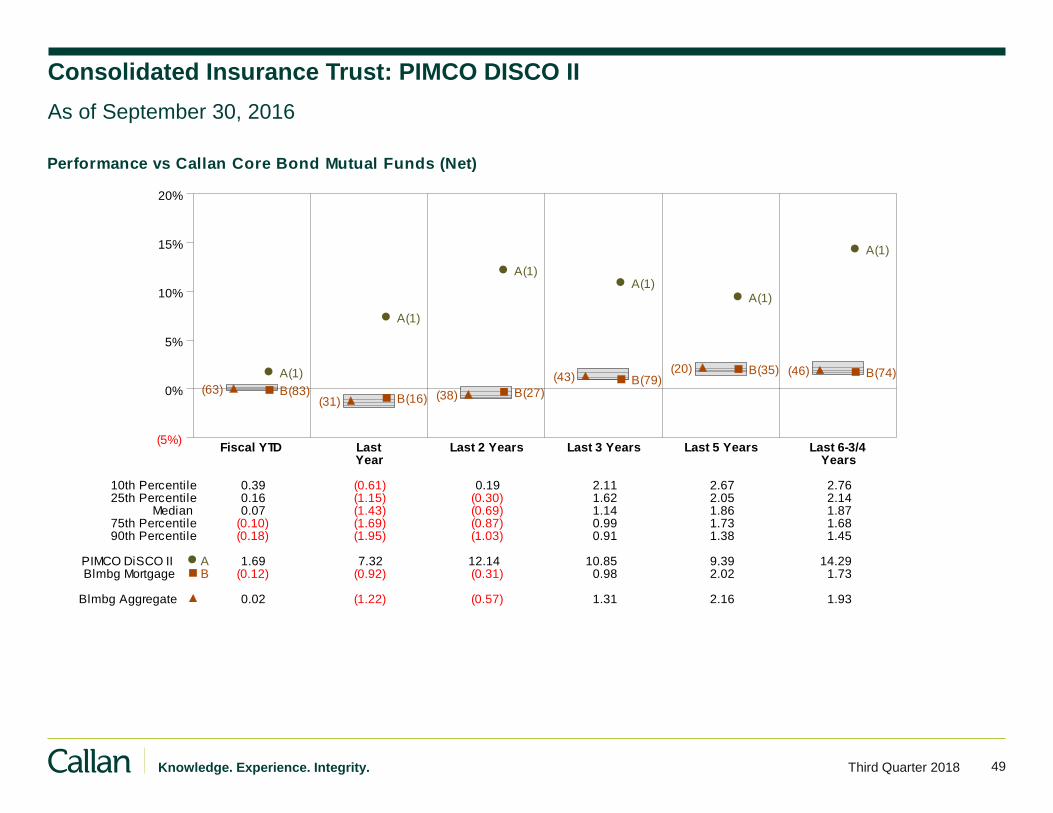
49 Knowledge. Experience. Integrity. Third Quarter 2018
Performance vs Callan Core Bond Mutual Funds (Net)
(5%)
0%
5%
10%
15%
20%
Fiscal YTD Last Last 2 Years Last 3 Years Last 5 Years Last 6-3/4Year Years
A(1)
B(83)(63)
A(1)
B(16)(31)
A(1)
B(27)(38)
A(1)
B(79)(43)
A(1)
B(35)(20)
A(1)
B(74)(46)
10th Percentile 0.39 (0.61) 0.19 2.11 2.67 2.7625th Percentile 0.16 (1.15) (0.30) 1.62 2.05 2.14
Median 0.07 (1.43) (0.69) 1.14 1.86 1.8775th Percentile (0.10) (1.69) (0.87) 0.99 1.73 1.6890th Percentile (0.18) (1.95) (1.03) 0.91 1.38 1.45
PIMCO DiSCO II A 1.69 7.32 12.14 10.85 9.39 14.29Blmbg Mortgage B (0.12) (0.92) (0.31) 0.98 2.02 1.73
Blmbg Aggregate 0.02 (1.22) (0.57) 1.31 2.16 1.93
Consolidated Insurance Trust: PIMCO DISCO II
As of September 30, 2016
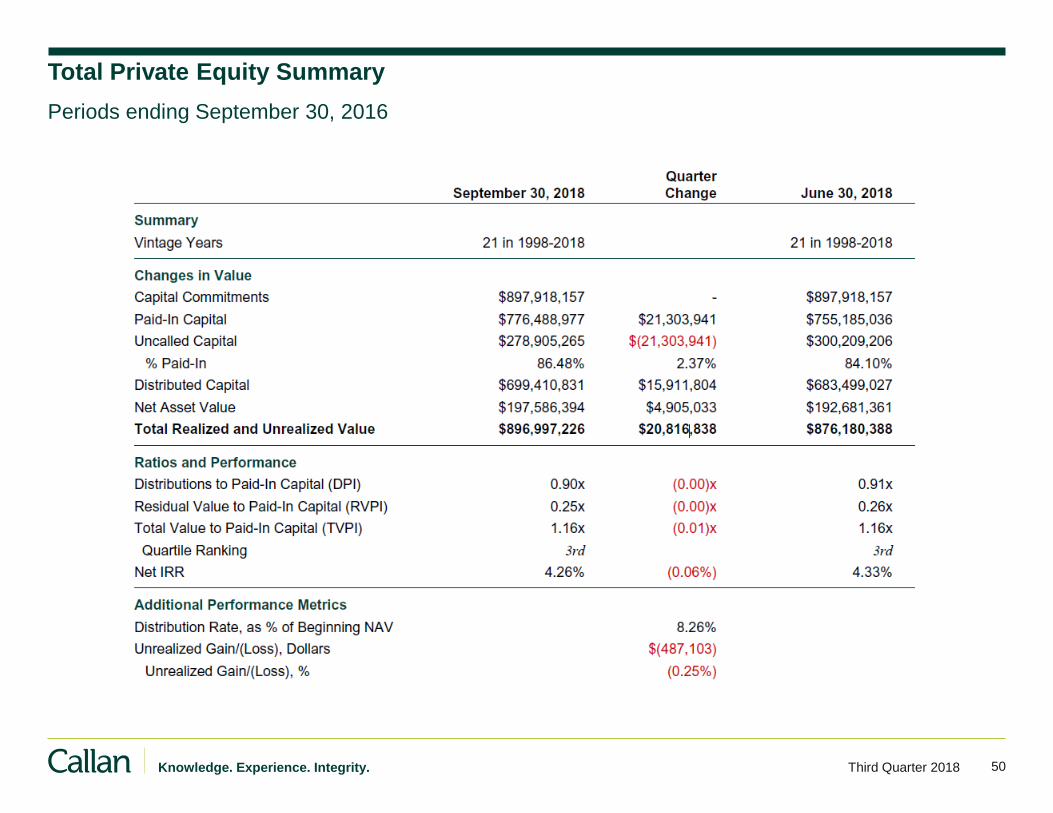
50 Knowledge. Experience. Integrity. Third Quarter 2018
Total Private Equity Summary
Periods ending September 30, 2016
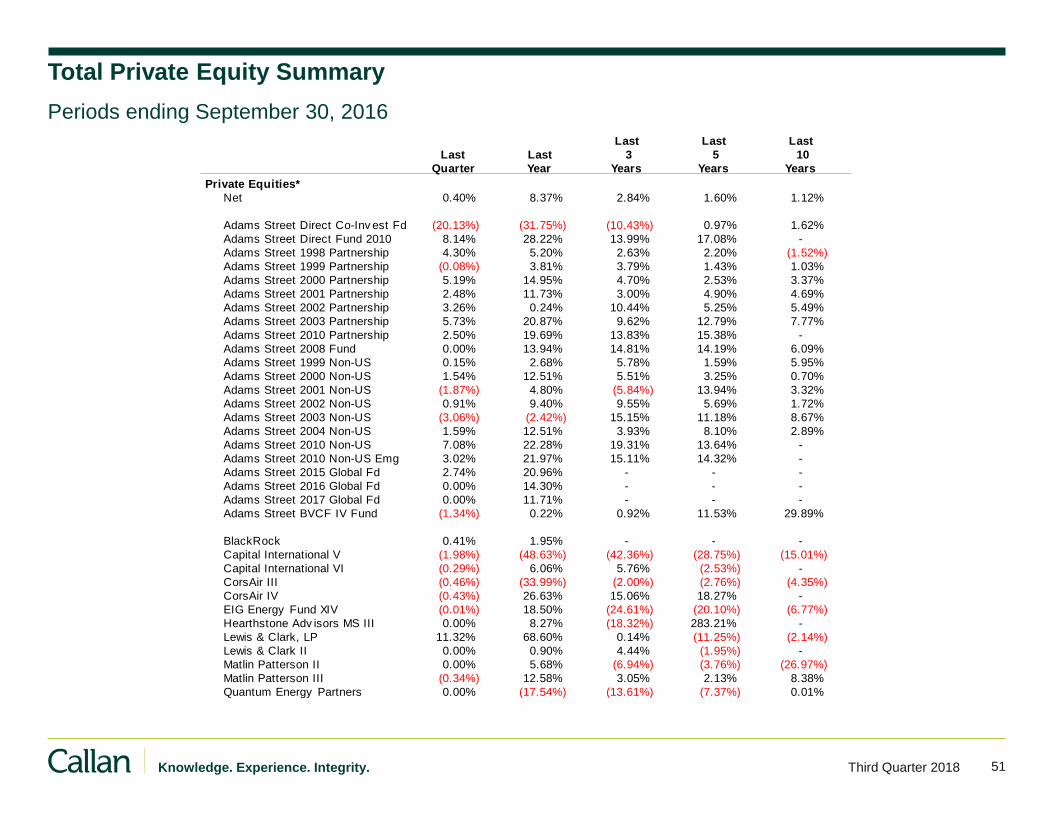
51 Knowledge. Experience. Integrity. Third Quarter 2018
Total Private Equity Summary
Periods ending September 30, 2016
Last Last Last
Last Last 3 5 10
Quarter Year Years Years Years
Private Equities*
Net 0.40% 8.37% 2.84% 1.60% 1.12%
Adams Street Direct Co-Inv est Fd (20.13%) (31.75%) (10.43%) 0.97% 1.62%
Adams Street Direct Fund 2010 8.14% 28.22% 13.99% 17.08% -
Adams Street 1998 Partnership 4.30% 5.20% 2.63% 2.20% (1.52%)
Adams Street 1999 Partnership (0.08%) 3.81% 3.79% 1.43% 1.03%
Adams Street 2000 Partnership 5.19% 14.95% 4.70% 2.53% 3.37%
Adams Street 2001 Partnership 2.48% 11.73% 3.00% 4.90% 4.69%
Adams Street 2002 Partnership 3.26% 0.24% 10.44% 5.25% 5.49%
Adams Street 2003 Partnership 5.73% 20.87% 9.62% 12.79% 7.77%
Adams Street 2010 Partnership 2.50% 19.69% 13.83% 15.38% -
Adams Street 2008 Fund 0.00% 13.94% 14.81% 14.19% 6.09%
Adams Street 1999 Non-US 0.15% 2.68% 5.78% 1.59% 5.95%
Adams Street 2000 Non-US 1.54% 12.51% 5.51% 3.25% 0.70%
Adams Street 2001 Non-US (1.87%) 4.80% (5.84%) 13.94% 3.32%
Adams Street 2002 Non-US 0.91% 9.40% 9.55% 5.69% 1.72%
Adams Street 2003 Non-US (3.06%) (2.42%) 15.15% 11.18% 8.67%
Adams Street 2004 Non-US 1.59% 12.51% 3.93% 8.10% 2.89%
Adams Street 2010 Non-US 7.08% 22.28% 19.31% 13.64% -
Adams Street 2010 Non-US Emg 3.02% 21.97% 15.11% 14.32% -
Adams Street 2015 Global Fd 2.74% 20.96% - - -
Adams Street 2016 Global Fd 0.00% 14.30% - - -
Adams Street 2017 Global Fd 0.00% 11.71% - - -
Adams Street BVCF IV Fund (1.34%) 0.22% 0.92% 11.53% 29.89%
BlackRock 0.41% 1.95% - - -
Capital International V (1.98%) (48.63%) (42.36%) (28.75%) (15.01%)
Capital International VI (0.29%) 6.06% 5.76% (2.53%) -
CorsAir III (0.46%) (33.99%) (2.00%) (2.76%) (4.35%)
CorsAir IV (0.43%) 26.63% 15.06% 18.27% -
EIG Energy Fund XIV (0.01%) 18.50% (24.61%) (20.10%) (6.77%)
Hearthstone Adv isors MS III 0.00% 8.27% (18.32%) 283.21% -
Lewis & Clark, LP 11.32% 68.60% 0.14% (11.25%) (2.14%)
Lewis & Clark II 0.00% 0.90% 4.44% (1.95%) -
Matlin Patterson II 0.00% 5.68% (6.94%) (3.76%) (26.97%)
Matlin Patterson III (0.34%) 12.58% 3.05% 2.13% 8.38%
Quantum Energy Partners 0.00% (17.54%) (13.61%) (7.37%) 0.01%

52 Knowledge. Experience. Integrity. Third Quarter 2018
39th Annual Callan Institute: January 28 – 30, 2019
Workshop Sessions
• The New Face of DC Plans
• The Evolution of Strategic
Allocations: What's Next?
• Private Equity: Primary Investment
Opportunities and Considerations
(Tuesday Only)
• Market Intelligence Panel — Live!
(Wednesday Only)
Palace Hotel, San Francisco, CA
aa
abcd
abcd
Raghuram Rajan David
Autor Condoleezza Rice
Former Governor of the Reserve Bank of India
Associate Head of the MIT Department of
Economics Former U.S. Secretary
of State
Jennifer Golbeck Kevin
Murphy Eric Weihenmayer
Director of the Social
Intelligence Lab at the University of Maryland
Professor at the
University of Chicago Booth School of
Business World-Class
Adventurer
Conference Registration:
https://www2.callan.com/2019natcallan
Hotel Registration:
https://www.starwoodmeeting.com/event
s/start.action?id=1810023702&key=3
42DEED7

September 30, 2018
North Dakota State Investment
Board Pension Funds
Investment Measurement Service
Quarterly Review
Information contained herein includes confidential, trade secret and proprietary information. Neither this Report nor any specific information contained herein is
to be used other than by the intended recipient for its intended purpose or disseminated to any other person without Callan’s permission. Certain information
herein has been compiled by Callan and is based on information provided by a variety of sources believed to be reliable for which Callan has not necessarily
verified the accuracy or completeness of or updated. This content may consist of statements of opinion, which are made as of the date they are expressed and
are not statements of fact. This content is for informational purposes only and should not be construed as legal or tax advice on any matter. Any decision you
make on the basis of this content is your sole responsibility. You should consult with legal and tax advisers before applying any of this information to your
particular situation. Past performance is no guarantee of future results. For further information, please see Appendix for Important Information and Disclosures.
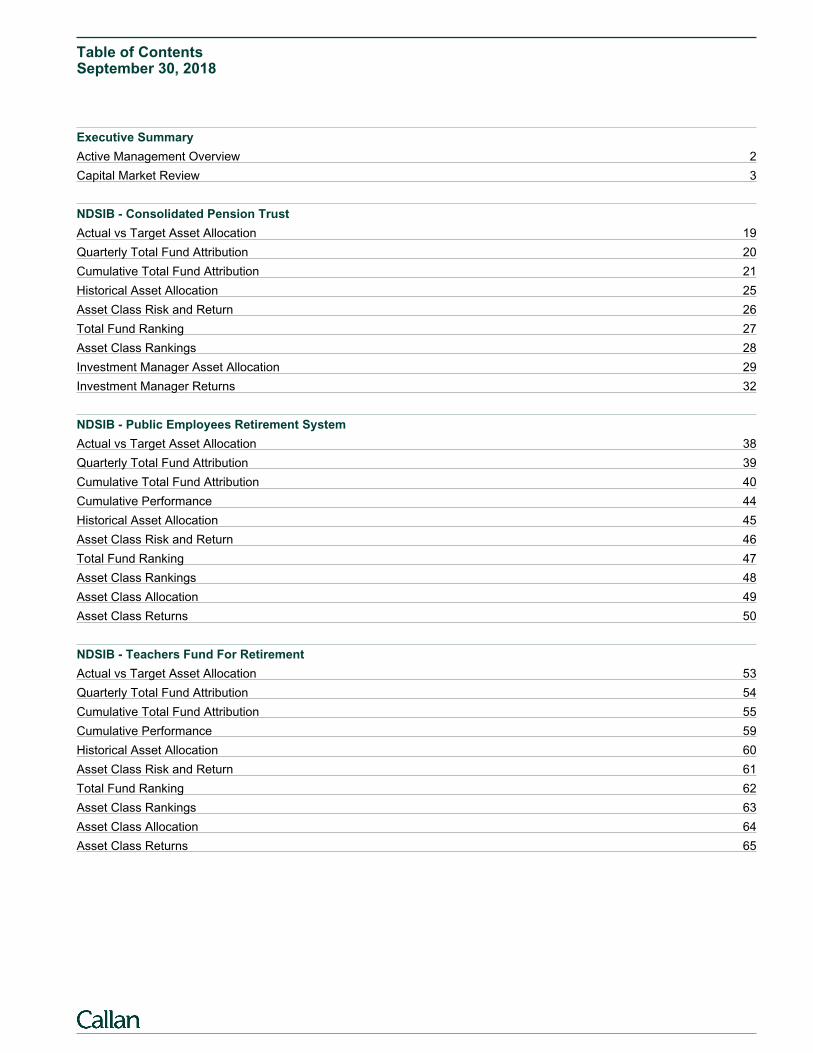
Table of ContentsSeptember 30, 2018
Executive Summary
Active Management Overview 2
Capital Market Review 3
NDSIB - Consolidated Pension Trust
Actual vs Target Asset Allocation 19
Quarterly Total Fund Attribution 20
Cumulative Total Fund Attribution 21
Historical Asset Allocation 25
Asset Class Risk and Return 26
Total Fund Ranking 27
Asset Class Rankings 28
Investment Manager Asset Allocation 29
Investment Manager Returns 32
NDSIB - Public Employees Retirement System
Actual vs Target Asset Allocation 38
Quarterly Total Fund Attribution 39
Cumulative Total Fund Attribution 40
Cumulative Performance 44
Historical Asset Allocation 45
Asset Class Risk and Return 46
Total Fund Ranking 47
Asset Class Rankings 48
Asset Class Allocation 49
Asset Class Returns 50
NDSIB - Teachers Fund For Retirement
Actual vs Target Asset Allocation 53
Quarterly Total Fund Attribution 54
Cumulative Total Fund Attribution 55
Cumulative Performance 59
Historical Asset Allocation 60
Asset Class Risk and Return 61
Total Fund Ranking 62
Asset Class Rankings 63
Asset Class Allocation 64
Asset Class Returns 65
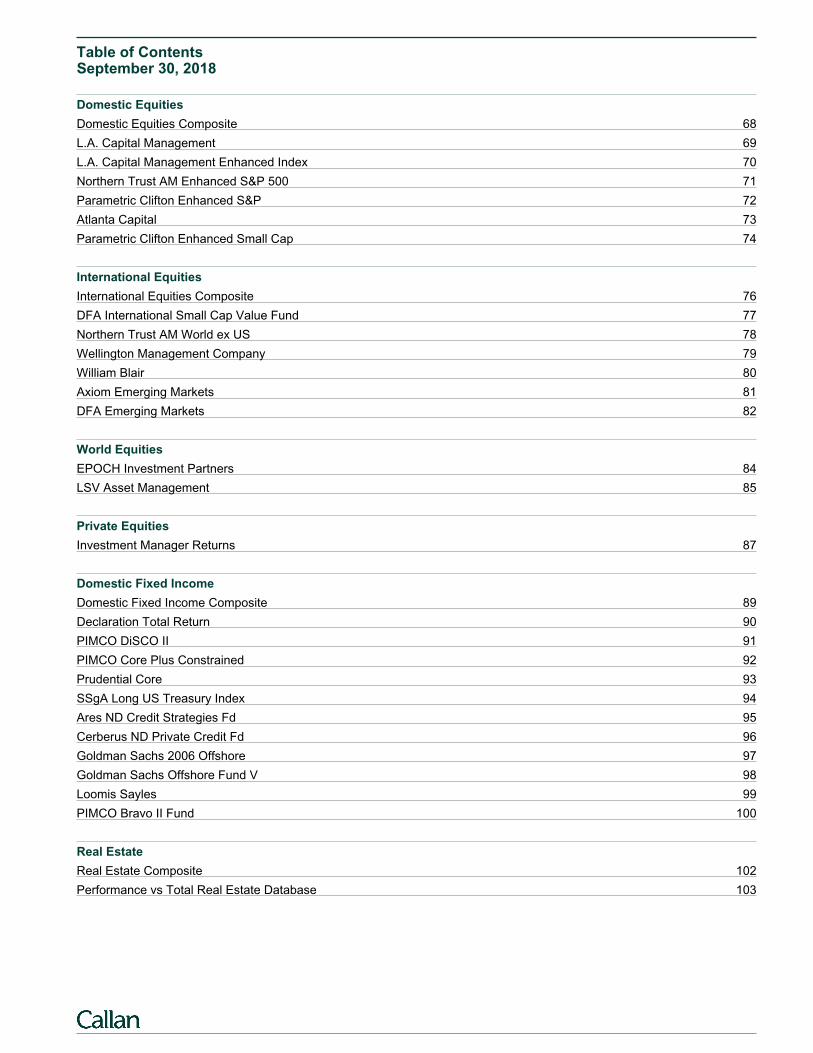
Table of ContentsSeptember 30, 2018
Domestic Equities
Domestic Equities Composite 68
L.A. Capital Management 69
L.A. Capital Management Enhanced Index 70
Northern Trust AM Enhanced S&P 500 71
Parametric Clifton Enhanced S&P 72
Atlanta Capital 73
Parametric Clifton Enhanced Small Cap 74
International Equities
International Equities Composite 76
DFA International Small Cap Value Fund 77
Northern Trust AM World ex US 78
Wellington Management Company 79
William Blair 80
Axiom Emerging Markets 81
DFA Emerging Markets 82
World Equities
EPOCH Investment Partners 84
LSV Asset Management 85
Private Equities
Investment Manager Returns 87
Domestic Fixed Income
Domestic Fixed Income Composite 89
Declaration Total Return 90
PIMCO DiSCO II 91
PIMCO Core Plus Constrained 92
Prudential Core 93
SSgA Long US Treasury Index 94
Ares ND Credit Strategies Fd 95
Cerberus ND Private Credit Fd 96
Goldman Sachs 2006 Offshore 97
Goldman Sachs Offshore Fund V 98
Loomis Sayles 99
PIMCO Bravo II Fund 100
Real Estate
Real Estate Composite 102
Performance vs Total Real Estate Database 103
Table of ContentsSeptember 30, 2018
Timber
TIR Teredo 106
TIR Springbank 107
Infrastructure
ISQ Global Infrastructure II 109
The Rohatyn Group 110
JP Morgan Infrastructure Fund 111
Grosvenor Cust. Infrastructure 112
Grosvenor Cust. Infrastructure II 113
Callan Research/Education 114
Disclosures 117

Market OverviewActive Management vs Index Returns
Market OverviewThe charts below illustrate the range of returns across managers in Callan’s Separate Account database over the mostrecent one quarter and one year time periods. The database is broken down by asset class to illustrate the difference inreturns across those asset classes. An appropriate index is also shown for each asset class for comparison purposes. As anexample, the first bar in the upper chart illustrates the range of returns for domestic equity managers over the last quarter.The triangle represents the S&P 500 return. The number next to the triangle represents the ranking of the S&P 500 in theLarge Cap Equity manager database.
Range of Separate Account Manager Returns by Asset ClassOne Quarter Ended September 30, 2018
Retu
rns
(4%)
(2%)
0%
2%
4%
6%
8%
10%
12%
Large Cap Small Cap Non-US Domestic Non-US RealEquity Equity Equity Fixed Income Fixed Income Estate
vs vs vs vs vs vsS&P 500 Russell 2000 MSCI EAFE Blmbg Aggr Bd Citi Non-US Govt NCREIF Index
(42)
(57)
(34)
(83)
(100)
(53)
10th Percentile 9.13 9.62 2.54 0.40 (0.27) 2.7325th Percentile 8.41 7.36 1.64 0.26 (0.73) 2.33
Median 7.31 4.06 0.91 0.17 (1.40) 1.7175th Percentile 5.98 1.94 0.32 0.08 (1.61) 1.2990th Percentile 5.00 0.86 (0.46) (0.09) (1.71) 0.54
Index 7.71 3.58 1.35 0.02 (2.19) 1.67
Range of Separate Account Manager Returns by Asset ClassOne Year Ended September 30, 2018
Re
turn
s
(10%)
(5%)
0%
5%
10%
15%
20%
25%
30%
35%
40%
Large Cap Small Cap Non-US Domestic Non-US RealEquity Equity Equity Fixed Income Fixed Income Estate
vs vs vs vs vs vsS&P 500 Russell 2000 MSCI EAFE Blmbg Aggr Bd Citi Non-US Govt NCREIF Index
(51)(50)
(46)
(87) (29)
(60)
10th Percentile 29.14 33.60 8.26 (0.37) 0.17 11.2525th Percentile 24.32 24.92 4.96 (0.60) (1.17) 9.59
Median 18.07 15.34 2.53 (0.81) (2.19) 7.6275th Percentile 12.95 10.48 0.51 (1.06) (3.21) 6.1690th Percentile 9.60 7.08 (1.17) (1.26) (4.27) 1.90
Index 17.91 15.24 2.74 (1.22) (1.57) 7.16
2North Dakota State Investment Board Pension Funds

Boo! More Tricks
Than Treats
PRIVATE EQUITY
Private equity investment
and exit activity
showed a general
slowdown during the third quarter.
Company investments and exits
trended slightly down, fewer new
partnerships were closed, but dollar
commitments increased. Investors
are pursuing broad diversiication.
Active Traders Grind
Forward; MACs Falter
HEDGE FUNDS/MACs
Divergent economic
forces around the globe
created a modestly prof-
itable trading environment for most
hedge funds. Callan’s Multi-Asset
Class Peer Groups continued to
struggle in the third quarter, particu-
larly those overweighting bonds and
underweighting U.S. growth stocks.
DC Plans Rebound,
TDFs Struggle
DEFINED CONTRIBUTION
The Callan DC Index™
rose 1.8% in the second
quarter and outpaced
the 1.1% gain of the Age 45 Target
Date Fund (TDF). DC plan bal-
ances grew by 1.9%, driven primar-
ily by market performance. The sec-
ond quarter marked another all-time
high for TDFs’ share of DC assets.
Strong Market Both
Here and Abroad
REAL ESTATE
Supply and demand
fundamentals were bal-
anced but peaking.
The Industrial sector performed
the strongest. U.S. and non-U.S.
REITs were trading at discounts to
net asset value. European markets
(ex-U.K.) and Asian products saw
momentum.
Equity Risk Looms
Large for Plans
FUND SPONSOR
The median plan spon-
sor in Callan’s database
gained 2.7% in the quar-
ter, lagging the 4.6% gain of a 60%
S&P 500/40% Bloomberg Barclays
Aggregate benchmark. Sponsors
are focused on equity exposure,
market volatility, and mitigating risk
in the event of an equity correction.
Knowledge. Experience. Integrity.
Everything Is Going
Great! Right?
ECONOMY
The U.S. economy has
been iring on all cylin-
ders, and the accompa-
nying run-up in the equity market
in the irst three quarters buoyed conidence that all was not just well, but great! If only we knew in
September what Halloween fright
awaited us in October.
2P A G E
12P A G E
Markets Diverge, With
U.S. Staying Strong
EQUITY
U.S. stocks posted
broad-based gains,
fueled by strong eco-
nomic growth, robust corporate
earnings, and heightened stock buy-
backs. Several indices hit records.
Non-U.S. developed and emerging
markets faltered due to geopolitical
and economic uncertainties.
4P A G E
U.S. Returns Mostly
Flat; EM Debt Volatile
FIXED INCOME
The U.S. Treasury yield
curve rose across the
maturity spectrum on bet-
ter-than-expected corporate earn-
ings and solid U.S. economic data.
The JPM EMBI Global Diversiied Index (USD denominated) gained
2.3%, but the JPM GBI-EM Global
Diversiied Index fell 1.8%.
8P A G E
6P A G E
13P A G E
15P A G E
10P A G E
Broad Market Quarterly Returns
+0.7% 0.0%+7.1% -1.7%
U.S. EquityRussell 3000
U.S. Fixed IncomeBloomberg Barclays Agg
Non-U.S. EquityMSCI ACWI ex USA
Non-U.S. Fixed IncomeBloomberg Barclays Gbl ex US
Sources: Bloomberg Barclays, MSCI, FTSE Russell
CapitalMarket ReviewINSTITUTE
Third Quarter 2018
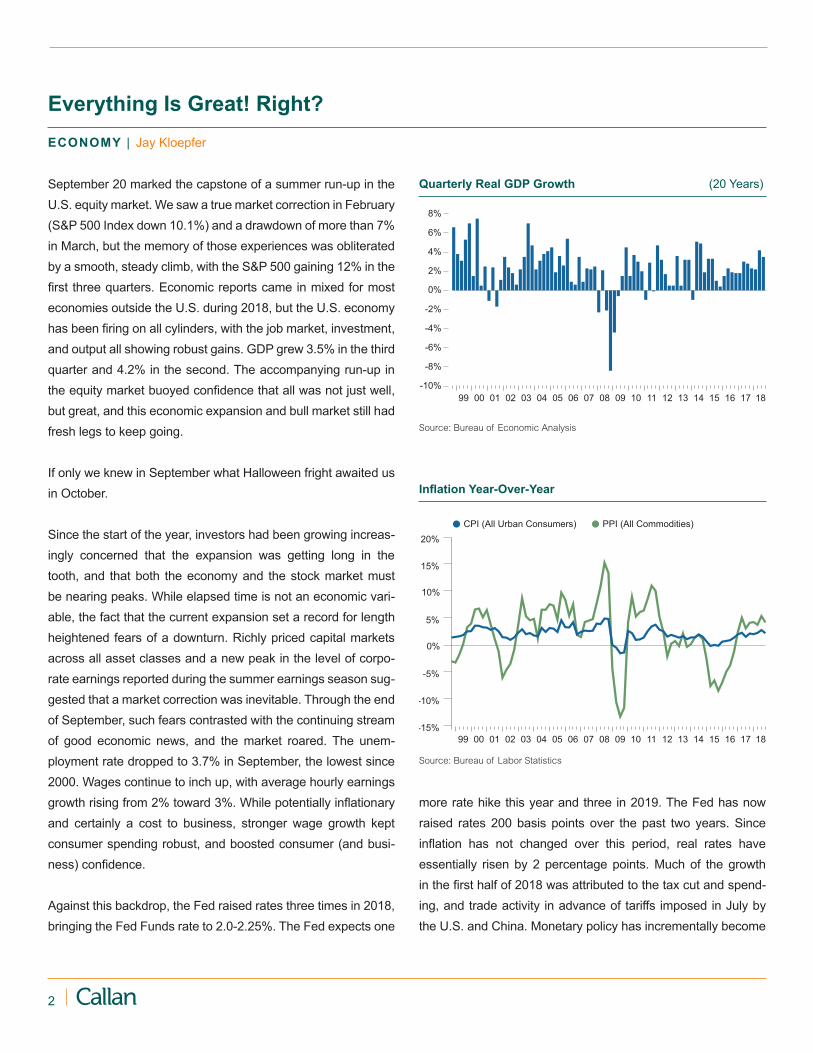
2
Everything Is Great! Right?
ECONOMY | Jay Kloepfer
02 0399 00 01 04 05 06 07 08 09 10 11 12 13 14 15 16 17
-10%
-8%
-6%
-4%
-2%
0%
2%
4%
6%
8%
18
Quarterly Real GDP Growth (20 Years)
-15%
-10%
-5%
0%
5%
10%
15%
20%
PPI (All Commodities)CPI (All Urban Consumers)
02 0399 00 01 04 05 06 07 08 09 10 11 12 13 14 15 16 17 18
Inlation Year-Over-Year
Source: Bureau of Labor Statistics
Source: Bureau of Economic Analysis
September 20 marked the capstone of a summer run-up in the
U.S. equity market. We saw a true market correction in February
(S&P 500 Index down 10.1%) and a drawdown of more than 7%
in March, but the memory of those experiences was obliterated
by a smooth, steady climb, with the S&P 500 gaining 12% in the
irst three quarters. Economic reports came in mixed for most economies outside the U.S. during 2018, but the U.S. economy
has been iring on all cylinders, with the job market, investment, and output all showing robust gains. GDP grew 3.5% in the third
quarter and 4.2% in the second. The accompanying run-up in
the equity market buoyed conidence that all was not just well, but great, and this economic expansion and bull market still had
fresh legs to keep going.
If only we knew in September what Halloween fright awaited us
in October.
Since the start of the year, investors had been growing increas-
ingly concerned that the expansion was getting long in the
tooth, and that both the economy and the stock market must
be nearing peaks. While elapsed time is not an economic vari-
able, the fact that the current expansion set a record for length
heightened fears of a downturn. Richly priced capital markets
across all asset classes and a new peak in the level of corpo-
rate earnings reported during the summer earnings season sug-
gested that a market correction was inevitable. Through the end
of September, such fears contrasted with the continuing stream
of good economic news, and the market roared. The unem-
ployment rate dropped to 3.7% in September, the lowest since
2000. Wages continue to inch up, with average hourly earnings
growth rising from 2% toward 3%. While potentially inlationary and certainly a cost to business, stronger wage growth kept
consumer spending robust, and boosted consumer (and busi-
ness) conidence.
Against this backdrop, the Fed raised rates three times in 2018,
bringing the Fed Funds rate to 2.0-2.25%. The Fed expects one
more rate hike this year and three in 2019. The Fed has now
raised rates 200 basis points over the past two years. Since
inlation has not changed over this period, real rates have essentially risen by 2 percentage points. Much of the growth
in the irst half of 2018 was attributed to the tax cut and spend-
ing, and trade activity in advance of tariffs imposed in July by
the U.S. and China. Monetary policy has incrementally become
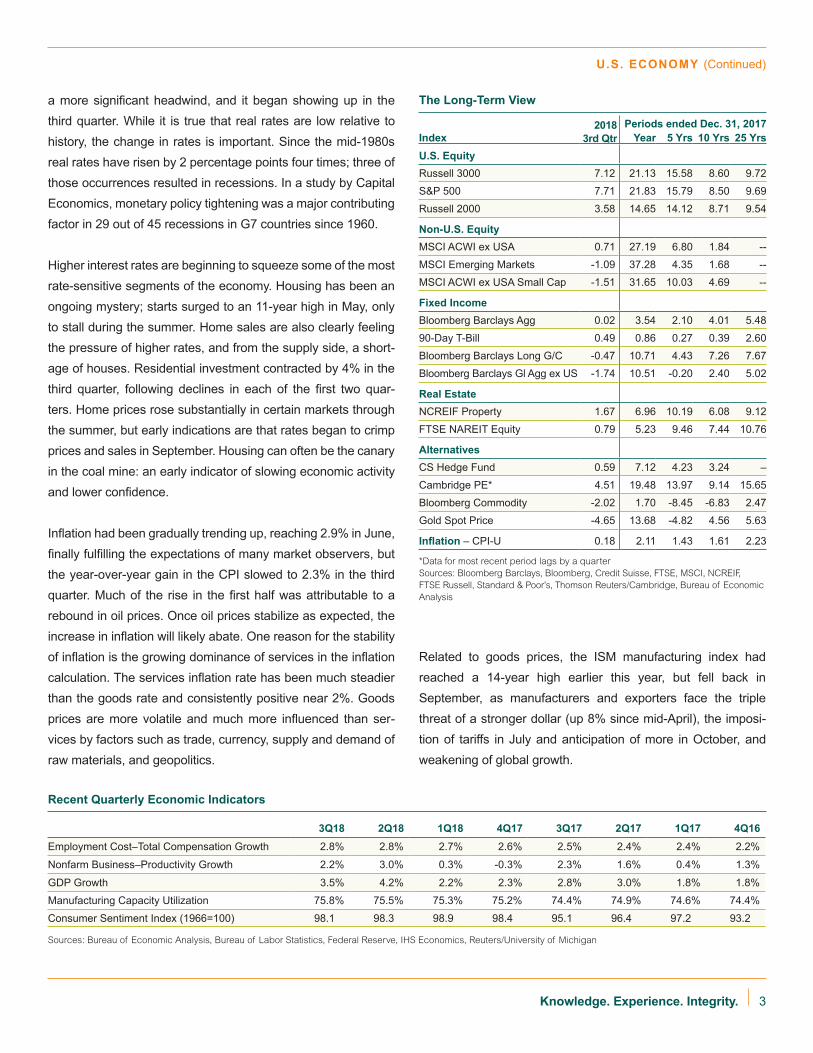
3Knowledge. Experience. Integrity.
U.S. ECONOMY (Continued)
The Long-Term View
2018
3rd Qtr
Periods ended Dec. 31, 2017
Index Year 5 Yrs 10 Yrs 25 Yrs
U.S. Equity
Russell 3000 7.12 21.13 15.58 8.60 9.72
S&P 500 7.71 21.83 15.79 8.50 9.69
Russell 2000 3.58 14.65 14.12 8.71 9.54
Non-U.S. Equity
MSCI ACWI ex USA 0.71 27.19 6.80 1.84 --
MSCI Emerging Markets -1.09 37.28 4.35 1.68 --
MSCI ACWI ex USA Small Cap -1.51 31.65 10.03 4.69 --
Fixed Income
Bloomberg Barclays Agg 0.02 3.54 2.10 4.01 5.48
90-Day T-Bill 0.49 0.86 0.27 0.39 2.60
Bloomberg Barclays Long G/C -0.47 10.71 4.43 7.26 7.67
Bloomberg Barclays Gl Agg ex US -1.74 10.51 -0.20 2.40 5.02
Real Estate
NCREIF Property 1.67 6.96 10.19 6.08 9.12
FTSE NAREIT Equity 0.79 5.23 9.46 7.44 10.76
Alternatives
CS Hedge Fund 0.59 7.12 4.23 3.24 –
Cambridge PE* 4.51 19.48 13.97 9.14 15.65
Bloomberg Commodity -2.02 1.70 -8.45 -6.83 2.47
Gold Spot Price -4.65 13.68 -4.82 4.56 5.63
Inlation – CPI-U 0.18 2.11 1.43 1.61 2.23
*Data for most recent period lags by a quarter
Sources: Bloomberg Barclays, Bloomberg, Credit Suisse, FTSE, MSCI, NCREIF,
FTSE Russell, Standard & Poor’s, Thomson Reuters/Cambridge, Bureau of Economic
Analysis
Recent Quarterly Economic Indicators
3Q18 2Q18 1Q18 4Q17 3Q17 2Q17 1Q17 4Q16
Employment Cost–Total Compensation Growth 2.8% 2.8% 2.7% 2.6% 2.5% 2.4% 2.4% 2.2%
Nonfarm Business–Productivity Growth 2.2% 3.0% 0.3% -0.3% 2.3% 1.6% 0.4% 1.3%
GDP Growth 3.5% 4.2% 2.2% 2.3% 2.8% 3.0% 1.8% 1.8%
Manufacturing Capacity Utilization 75.8% 75.5% 75.3% 75.2% 74.4% 74.9% 74.6% 74.4%
Consumer Sentiment Index (1966=100) 98.1 98.3 98.9 98.4 95.1 96.4 97.2 93.2
Sources: Bureau of Economic Analysis, Bureau of Labor Statistics, Federal Reserve, IHS Economics, Reuters/University of Michigan
a more signiicant headwind, and it began showing up in the third quarter. While it is true that real rates are low relative to
history, the change in rates is important. Since the mid-1980s
real rates have risen by 2 percentage points four times; three of
those occurrences resulted in recessions. In a study by Capital
Economics, monetary policy tightening was a major contributing factor in 29 out of 45 recessions in G7 countries since 1960.
Higher interest rates are beginning to squeeze some of the most
rate-sensitive segments of the economy. Housing has been an
ongoing mystery; starts surged to an 11-year high in May, only
to stall during the summer. Home sales are also clearly feeling
the pressure of higher rates, and from the supply side, a short-
age of houses. Residential investment contracted by 4% in the
third quarter, following declines in each of the irst two quar-ters. Home prices rose substantially in certain markets through
the summer, but early indications are that rates began to crimp
prices and sales in September. Housing can often be the canary
in the coal mine: an early indicator of slowing economic activity
and lower conidence.
Inlation had been gradually trending up, reaching 2.9% in June, inally fulilling the expectations of many market observers, but the year-over-year gain in the CPI slowed to 2.3% in the third
quarter. Much of the rise in the irst half was attributable to a rebound in oil prices. Once oil prices stabilize as expected, the
increase in inlation will likely abate. One reason for the stability of inlation is the growing dominance of services in the inlation calculation. The services inlation rate has been much steadier than the goods rate and consistently positive near 2%. Goods
prices are more volatile and much more inluenced than ser-vices by factors such as trade, currency, supply and demand of
raw materials, and geopolitics.
Related to goods prices, the ISM manufacturing index had
reached a 14-year high earlier this year, but fell back in
September, as manufacturers and exporters face the triple
threat of a stronger dollar (up 8% since mid-April), the imposi-
tion of tariffs in July and anticipation of more in October, and
weakening of global growth.

4
Equity Risk Looms Large for Plans
FUND SPONSOR
– The median fund sponsor in Callan’s database gained 2.7%
in the third quarter.
– Taft-Hartley plans (+3.0%) were the best-performing spon-
sor by type, as they were the previous quarter; corporate
plans (+2.3%) showed the lowest increase.
– By size, the strongest returns came from small plans (under
$100 million), which rose 2.9%, compared to a 2.6% gain
for medium plans ($100 million-$1 billion) and 2.3% for
large plans (more than $1 billion).
– All types and sizes lagged a 60% S&P 500/40% Bloomberg
Barclays US Aggregate benchmark, which rose 4.6%.
– Over the last year, three years, and ive years, Taft-Hartley plans had the strongest returns of all fund types, while pub-
lic plans have done best over the last 10 years.
– Investors are focused on concerns about equity exposure,
market volatility, and how to mitigate risk in the event of an
equity market correction in a rising interest rate environment.
– But they face competing fears: an equity market downturn
vs. the fear of missing out (FOMO!).
0%
1%
2%
3%
4%
Public Corporate Endow/Fndn Taft-Hartley Database Database Database Database
10th Percentile 3.64 3.62 3.86 4.01
25th Percentile 3.20 2.96 3.24 3.50
Median 2.66 2.27 2.71 3.02
75th Percentile 2.26 1.60 2.15 2.46
90th Percentile 1.77 0.71 1.38 1.79
Callan Fund Sponsor Returns for the Quarter
Source: Callan
U.S. Fixed
Non-U.S. Fixed
Real Estate
Hedge Funds
Other Alternatives
Cash
Balanced
U.S. Equity
Non-U.S. Equity
Global Equity
1.8%
Public
2.66%*
33.8%
18.1%
27.2%
2.4%
6.6%
1.0%
2.5%
5.8%
1.2%
Endowment/
Foundation
2.71%*
35.2%
19.8%
18.8%
2.0%
0.3%
6.1%
2.4%
10.2%
2.5%
Taft-Hartley
3.02%* 1.5%
Corporate
2.27%*
1.7%
2.3% 0.4%
37.1%
28.0%
12.2%
0.5%
3.5%
10.6%
3.7%
14.8%
1.7%
26.6%
39.9%
2.9%
0.7%
3.9%
4.4%
2.7%
2.9%
Callan Fund Sponsor Average Asset Allocation
*Latest median quarter return
Note: charts may not sum to 100% due to rounding
Source: Callan
– They are reining the deinition of growth to include invest-ments such as high yield, convertibles, low-volatility equity,
hedge funds, multi-asset class strategies, and options-
based strategies.
– Many sponsors are seeking higher returns outside of tradi-
tional asset classes such as equity and ixed income, and

5Knowledge. Experience. Integrity.
FUND SPONSOR (Continued)
✵�
✷✵�
✹✵�
✻✵�
✽✵�
✶✵✵�
08 09 10 11 12 13
U.S. Fixed
Non-U.S. Fixed
Real Estate
Hedge Funds
Other Alternatives
Cash
Balanced
U.S. Equity
Non-U.S. Equity
Global Equity
14 15 16 17 18
Callan Public Fund Database Average Asset Allocation (10 Years)
Source: Callan. Callan’s database includes the following groups: public deined beneit, corporate deined beneit, endowments/foundations, and Taft-Hartley plans.
Approximately 10% to 15% of the database constituents are Callan’s clients. All database group returns presented gross of fees. Past performance is no guarantee of future
results. Reference to or inclusion in this report of any product, service, or entity should not be construed as a recommendation, approval, ailiation, or endorsement of such
product, service, or entity by Callan.
worry about risk mitigation. The late stage of the economic
cycle combined with elevated equity valuations and low bond
yields is causing sponsors to explore allocations to U.S.
Treasuries, managed futures, and tail risk hedging.
– Concerns about fees and controlling costs continue among
plan sponsors, and that issue has been an incentive to
increase passive exposure.
– For deined contribution plans, fee reduction and disclo-
sure, compliance, and evaluating the structure of fund line-
ups are key areas of focus. Target date funds continue to
dominate asset lows; they now account for almost 32.5% of DC assets, according to the Callan DC Index™.
– Negotiating fee reductions and fee transparency is ongoing
for DC plan sponsors, in some cases to a signiicant extent. Interest in institutional investment structures is increasing
as another path to fee reduction.
– Non-qualiied deferred compensation (NQDC) plans are being evaluated on a standalone basis due to their design
lexibility. – Some corporate plan sponsors have made large volun-
tary contributions in 2018. As a result, plans are reaching
full funding. A glidepath strategy for gradual de-risking is
no longer needed for some; these plans can fully de-risk
immediately.
– Endowments, foundations, and sovereign wealth funds saw
a continuing focus on evaluating a sustainable distribution
rate to balance intergenerational equity.
– Interest in multi-asset class strategies continues, in particu-
lar from public and corporate deined beneit plans. Callan divides the multi-asset class universe into four categories:
long biased, absolute return, risk parity, and risk premia.
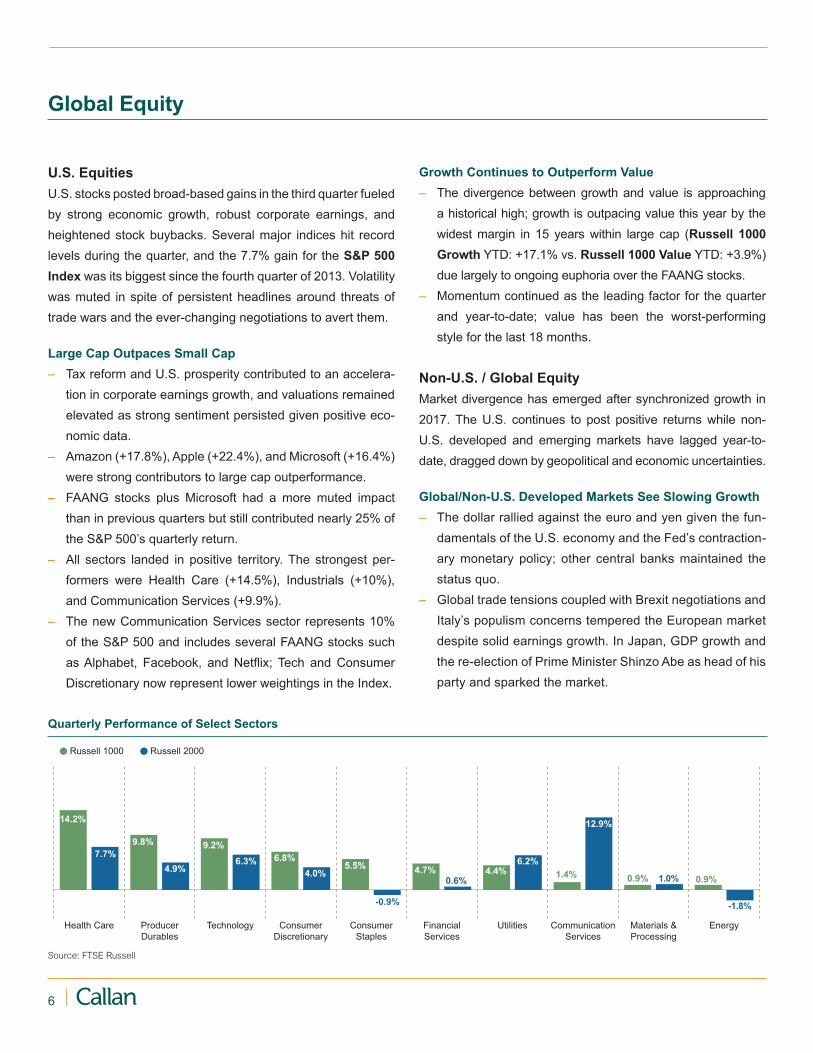
6
U.S. Equities
U.S. stocks posted broad-based gains in the third quarter fueled
by strong economic growth, robust corporate earnings, and
heightened stock buybacks. Several major indices hit record levels during the quarter, and the 7.7% gain for the S&P 500
Index was its biggest since the fourth quarter of 2013. Volatility
was muted in spite of persistent headlines around threats of
trade wars and the ever-changing negotiations to avert them.
Large Cap Outpaces Small Cap
– Tax reform and U.S. prosperity contributed to an accelera-
tion in corporate earnings growth, and valuations remained
elevated as strong sentiment persisted given positive eco-
nomic data.
– Amazon (+17.8%), Apple (+22.4%), and Microsoft (+16.4%)
were strong contributors to large cap outperformance.
– FAANG stocks plus Microsoft had a more muted impact
than in previous quarters but still contributed nearly 25% of
the S&P 500’s quarterly return.
– All sectors landed in positive territory. The strongest per-
formers were Health Care (+14.5%), Industrials (+10%),
and Communication Services (+9.9%).
– The new Communication Services sector represents 10%
of the S&P 500 and includes several FAANG stocks such
as Alphabet, Facebook, and Netlix; Tech and Consumer Discretionary now represent lower weightings in the Index.
Global Equity
Growth Continues to Outperform Value
– The divergence between growth and value is approaching
a historical high; growth is outpacing value this year by the
widest margin in 15 years within large cap (Russell 1000
Growth YTD: +17.1% vs. Russell 1000 Value YTD: +3.9%)
due largely to ongoing euphoria over the FAANG stocks.
– Momentum continued as the leading factor for the quarter
and year-to-date; value has been the worst-performing
style for the last 18 months.
Non-U.S. / Global Equity
Market divergence has emerged after synchronized growth in
2017. The U.S. continues to post positive returns while non-
U.S. developed and emerging markets have lagged year-to-
date, dragged down by geopolitical and economic uncertainties.
Global/Non-U.S. Developed Markets See Slowing Growth
– The dollar rallied against the euro and yen given the fun-
damentals of the U.S. economy and the Fed’s contraction-
ary monetary policy; other central banks maintained the
status quo.
– Global trade tensions coupled with Brexit negotiations and
Italy’s populism concerns tempered the European market
despite solid earnings growth. In Japan, GDP growth and
the re-election of Prime Minister Shinzo Abe as head of his
party and sparked the market.
Russell 1000 Russell 2000
EnergyMaterials &
Processing
Communication
Services
UtilitiesFinancial
Services
Consumer
Staples
Consumer
Discretionary
TechnologyProducer
Durables
Health Care
14.2%
7.7%
9.8%
4.9%6.3% 6.8%
4.0%5.5%
-0.9%
4.7%0.6%
0.4%
6.2%
1.4%
12.9%
0.9% 1.0%
9.2%
-1.8%
0.9%4.4%
Quarterly Performance of Select Sectors
Source: FTSE Russell
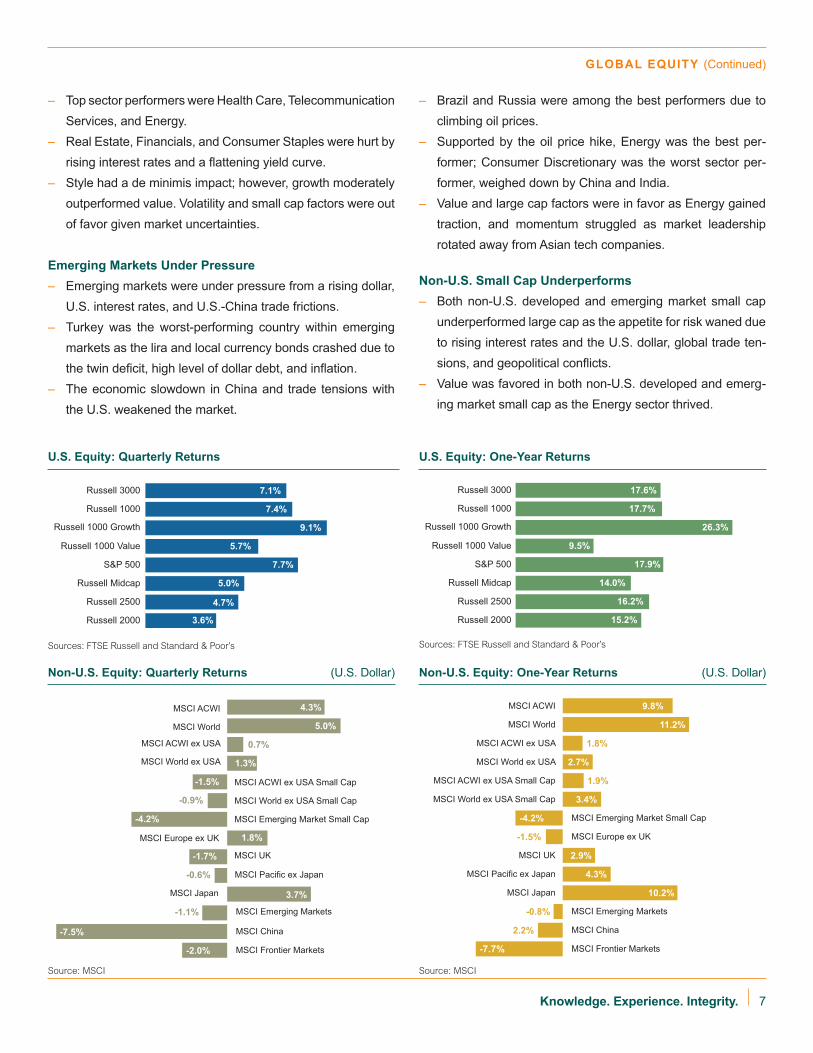
7Knowledge. Experience. Integrity.
– Brazil and Russia were among the best performers due to
climbing oil prices.
– Supported by the oil price hike, Energy was the best per-
former; Consumer Discretionary was the worst sector per-
former, weighed down by China and India.
– Value and large cap factors were in favor as Energy gained
traction, and momentum struggled as market leadership
rotated away from Asian tech companies.
Non-U.S. Small Cap Underperforms
– Both non-U.S. developed and emerging market small cap
underperformed large cap as the appetite for risk waned due
to rising interest rates and the U.S. dollar, global trade ten-
sions, and geopolitical conlicts. – Value was favored in both non-U.S. developed and emerg-
ing market small cap as the Energy sector thrived.
– Top sector performers were Health Care, Telecommunication
Services, and Energy.
– Real Estate, Financials, and Consumer Staples were hurt by
rising interest rates and a lattening yield curve. – Style had a de minimis impact; however, growth moderately
outperformed value. Volatility and small cap factors were out
of favor given market uncertainties.
Emerging Markets Under Pressure
– Emerging markets were under pressure from a rising dollar,
U.S. interest rates, and U.S.-China trade frictions.
– Turkey was the worst-performing country within emerging
markets as the lira and local currency bonds crashed due to
the twin deicit, high level of dollar debt, and inlation. – The economic slowdown in China and trade tensions with
the U.S. weakened the market.
Russell 2000
Russell 2500
Russell Midcap
S&P 500
Russell 1000 Value
Russell 1000 Growth
Russell 1000
Russell 3000
9.5%
14.0%
17.7%
17.6%
17.9%
16.2%
26.3%
15.2%Russell 2000
Russell 2500
Russell Midcap
S&P 500
Russell 1000 Value
Russell 1000 Growth
Russell 1000
Russell 3000
5.7%
5.0%
7.4%
7.1%
7.7%
4.7%
9.1%
3.6%
U.S. Equity: Quarterly Returns U.S. Equity: One-Year Returns
Sources: FTSE Russell and Standard & Poor’s Sources: FTSE Russell and Standard & Poor’s
GLOBAL EQUITY (Continued)
2.2%
1.8%
1.9%
3.4%
2.7%
9.8%
2.9%
-1.5%
10.2%
-0.8%
-7.7%
4.3%
11.2%
-4.2%
MSCI Pacific ex Japan
MSCI ACWI ex USA Small Cap
MSCI ACWI
MSCI ACWI ex USA
MSCI World ex USA Small Cap
MSCI World ex USA
MSCI World
MSCI Europe ex UK
MSCI UK
MSCI Japan
MSCI Emerging Markets
MSCI China
MSCI Frontier Markets
MSCI Emerging Market Small Cap
MSCI Pacific ex Japan
-7.5%
0.7%
-1.5%
-0.9%
1.3%
4.3%
-1.7%
1.8%
3.7%
-1.1%
-2.0%
-0.6%
MSCI ACWI ex USA Small Cap
MSCI ACWI
MSCI ACWI ex USA
MSCI World ex USA Small Cap
MSCI World ex USA
MSCI World
MSCI Europe ex UK
MSCI UK
MSCI Japan
MSCI Emerging Markets
MSCI China
MSCI Frontier Markets
5.0%
MSCI Emerging Market Small Cap-4.2%
Non-U.S. Equity: Quarterly Returns (U.S. Dollar) Non-U.S. Equity: One-Year Returns (U.S. Dollar)
Source: MSCI Source: MSCI
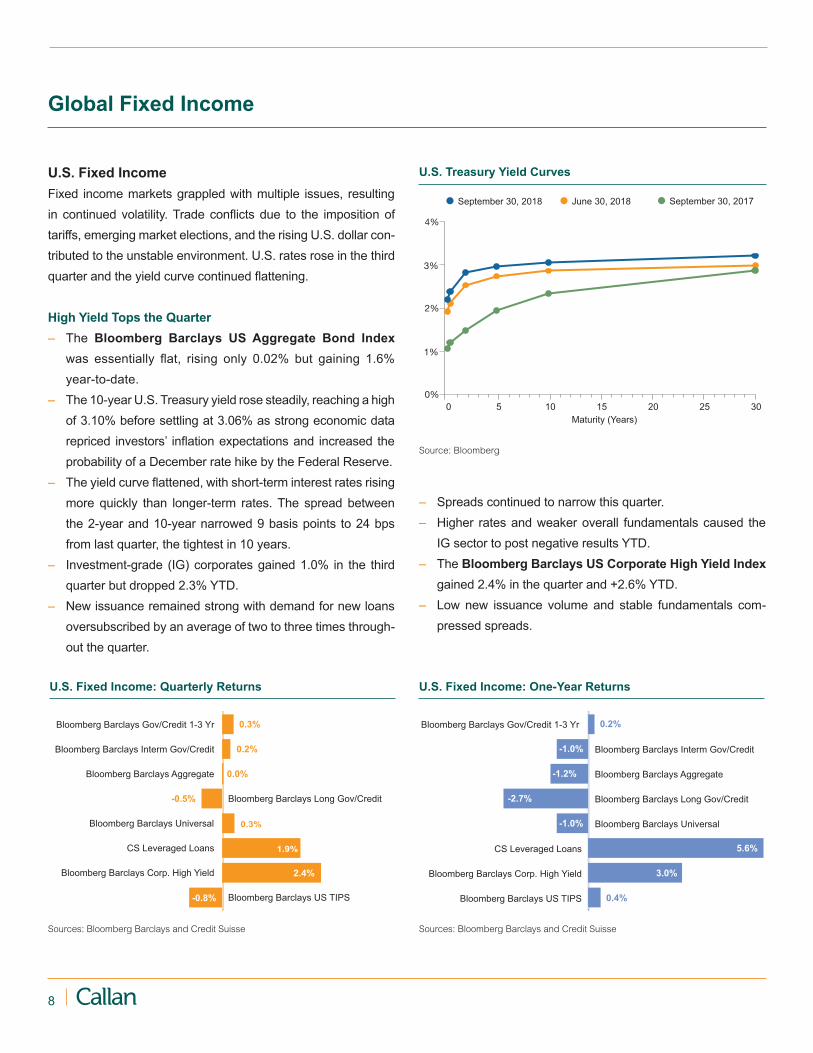
8
Global Fixed Income
U.S. Fixed Income
Fixed income markets grappled with multiple issues, resulting
in continued volatility. Trade conlicts due to the imposition of tariffs, emerging market elections, and the rising U.S. dollar con-
tributed to the unstable environment. U.S. rates rose in the third
quarter and the yield curve continued lattening.
High Yield Tops the Quarter
– The Bloomberg Barclays US Aggregate Bond Index
was essentially lat, rising only 0.02% but gaining 1.6% year-to-date.
– The 10-year U.S. Treasury yield rose steadily, reaching a high
of 3.10% before settling at 3.06% as strong economic data
repriced investors’ inlation expectations and increased the probability of a December rate hike by the Federal Reserve.
– The yield curve lattened, with short-term interest rates rising more quickly than longer-term rates. The spread between
the 2-year and 10-year narrowed 9 basis points to 24 bps
from last quarter, the tightest in 10 years.
– Investment-grade (IG) corporates gained 1.0% in the third
quarter but dropped 2.3% YTD.
– New issuance remained strong with demand for new loans
oversubscribed by an average of two to three times through-
out the quarter.
– Spreads continued to narrow this quarter.
– Higher rates and weaker overall fundamentals caused the
IG sector to post negative results YTD.
– The Bloomberg Barclays US Corporate High Yield Index
gained 2.4% in the quarter and +2.6% YTD.
– Low new issuance volume and stable fundamentals com-
pressed spreads.
U.S. Treasury Yield Curves
0%
1%
2%
3%
4%
Maturity (Years)
September 30, 2018 June 30, 2018 September 30, 2017
302520151050
Source: Bloomberg
U.S. Fixed Income: Quarterly Returns U.S. Fixed Income: One-Year Returns
Bloomberg Barclays US TIPS
-0.5%
1.9%
0.2%
0.3%
0.3%
2.4%
-0.8%
0.0%
Bloomberg Barclays Gov/Credit 1-3 Yr
Bloomberg Barclays Interm Gov/Credit
Bloomberg Barclays Aggregate
Bloomberg Barclays Long Gov/Credit
Bloomberg Barclays Universal
CS Leveraged Loans
Bloomberg Barclays Corp. High Yield
-2.7%
5.6%
-1.0%
0.2%
-1.0%
3.0%
0.4%
-1.2%
Bloomberg Barclays Gov/Credit 1-3 Yr
Bloomberg Barclays Interm Gov/Credit
Bloomberg Barclays Aggregate
Bloomberg Barclays Long Gov/Credit
Bloomberg Barclays Universal
CS Leveraged Loans
Bloomberg Barclays Corp. High Yield
Bloomberg Barclays US TIPS
Sources: Bloomberg Barclays and Credit Suisse Sources: Bloomberg Barclays and Credit Suisse

9Knowledge. Experience. Integrity.
– Bond issuance was $41 billion, 33% lower than in the third
quarter of 2017.
– Bank loans gained 1.8% in the quarter and 4.0% YTD.
– Demand continues for loating-rate securities despite cove-
nant-light structures and higher spread duration.
– Heavy issuance continued through the quarter; YTD lever-
aged loan issuance is above $900 billion, driven by lever-
aged buyout and mergers-and-acquisitions activities.
– CLO formation also increased demand in the third quarter.
Non-U.S. Fixed Income
The JPM EMBI Global Diversiied Index (USD denominated)
gained 2.3%, with all sub-regions delivering positive results.
Local currency emerging markets (EM), however, fared more
poorly. The JPM GBI-EM Global Diversiied Index fell 1.8% for
the quarter but also endured signiicant intra-quarter volatility, including a 6.1% drop in August.
Volatility Hinders Local EM Debt
– Return dispersion among countries was signiicant. Argentina (-35%) has seen its peso fall more than 50% this
year to a record low as investors were spooked by previ-
ous currency debacles and worries over the economic pic-
ture. In addition to securing support from the International
Monetary Fund, the country’s central bank hiked short-term
interest rates 15 percentage points to a global high of 60%.
– Turkey (-27%) endured a similar currency rout, though for
different reasons. U.S.-imposed sanctions and concerns
over central bank policy were the twin drivers of the lira’s
weakness. Turkey hiked short rates by 6.25 percentage
points to 24% to stem its currency slide.
– Elsewhere, returns were far more modest (positive or nega-
tive); only Russia (-6%) and Mexico (+6%) were noteworthy.
– Issuers in Europe faced a different challenge as politi-
cal uncertainties surrounding Italy caused that market to
weaken.
Non-U.S. Fixed Income: Quarterly Returns
Non-U.S. Fixed Income: One-Year Returns
JPM GBI-EM Global Diversified
JPM EMBI Global Diversified
-1.7%
-1.8%
0.0%
-0.9%
2.3%
0.2%
1.3%
2.0%
Bloomberg Barclays Global Aggregate
Bloomberg Barclays Global Agg (hdg)
Bloomberg Barclays Global High Yield
Bloomberg Barclays Global Agg ex US
JPM EMBI Gl Div / JPM GBI-EM Gl Div
JPM CEMBI
Bloomberg Barclays Global Aggregate
Bloomberg Barclays Global High Yield
JPM GBI-EM Global Diversified
Bloomberg Barclays Global Agg (hdg)
-7.4%
0.8%
-1.3%
-1.9%
-4.6%
-1.2%
0.3%
Bloomberg Barclays Global Agg ex US
JPM EMBI Global Diversified
JPM EMBI Gl Div / JPM GBI-EM Gl Div
JPM CEMBI
-1.5%
Sources: Bloomberg Barclays and JPMorgan Chase
Sources: Bloomberg Barclays and JPMorgan Chase
20 bps
17 bps
30 bps
26 bps
9 bps
Germany
U.S. Treasury
U.K.
Canada
Japan
Change in 10-Year Global Government Bond Yields
2Q18 to 3Q18
Source: Bloomberg Barclays
GLOBAL FIXED INCOME (Continued)

10
Market Robust With Private Valuations at Historic Highs
REAL ESTATE | Kevin Nagy, CAIA
– Supply and demand fundamentals are balanced but peak-
ing. Supply is in check and aided by strict commercial real
estate lending standards. Demand continues on the back of
strong U.S. growth.
– Transaction volumes took a step back from current cycle
peak levels but remain robust, supporting pricing, which
remains expensive.
– The Industrial sector is performing the strongest, beneit-ting from structural shifts in the economy, property markets,
and consumer habits, which continue to dampen demand
for traditional retail space. Ofice is performing as expected late in the cycle, and tenant improvements and other capi-
tal expenditures are increasingly eroding cash low. Multi-family remains strong except for very high-end properties
in some markets.
– U.S. core real estate returns continue to moderate and shift
toward income with limited appreciation. Appreciation that
occurs is coming from net operating income growth rather
than further cap rate compression.
– Spreads remain relatively tight between core and value-add
due to large amounts of capital in both strategies chasing
fewer available deals, combined with more core investors
chasing yield.
– Both U.S. and non-U.S. real estate investment trusts (REITs)
are trading at discounts to net asset value, indicating relative
value for public market securities compared to private real
estate valuations.
– European real estate markets (ex-U.K.) are gaining momen-
tum due to strong fundamentals in the major cities of Europe despite continued political noise across the region.
– Asian real estate products are seeing strong fundraising
momentum, with existing managers reaching target fund
sizes and Asia-focused open-end funds increasing.
– Farmland managers in the United States are concerned
more about the reworking of the North American Free Trade
Agreement than the trade war with China. Chinese tariffs on
soybeans are seen as a temporary dislocation as opposed
to a long-term headwind.
– As private real estate valuations continue to test historical
highs, investors are looking at other sectors, such as real
estate debt and REITs, to access the best risk-adjusted returns from real estate. This is resulting in the formation
of some products with very wide mandates that allow the
investment manager to place capital across real estate debt
and equity markets and up and down the capital stack based
on relative value.
Rolling One-Year Returns
-60%
-30%
0%
30%
60%
90%
120%
REIT Style Global REIT StylePrivate Real Estate Database
02 0399 00 01 04 05 06 07 08 09 10 11 12 13 14 15 16 17 18
Source: Callan
W est
South
Midwest
East
2.2%
1.3%
1.7%
0.9%
Retail
Office
Industrial
Hotels
Apartments
0.6%
3.2%
1.7%
3.4%
1.6%
Sector Quarterly Returns by Property Type and Region
Source: NCREIF

11Knowledge. Experience. Integrity.
REAL ESTATE (Continued)
NCREIF Transaction and Appraisal Capitalization Rates
Source: NCREIF
Note: Transaction capitalization rate is equal weighted.
NCREIF Capitalization Rates by Property Type
Source: NCREIF
Note: Capitalization rates are appraisal-based.
✁✂
✸✂
✄✂
✾✂
Appraisal Capitalization RatesTransaction Capitalization Rates
08 09 10 11 12 13 14 15 16 17 18
☎✆
✝✆
✞✆
✟✆
IndustrialApartment RetailOffice
08 09 10 11 12 13 14 15 16 17 18
Private Real Assets Last Quarter Year to Date Last Year Last 3 Years Last 5 Years Last 10 Years Last 15 Years
Real Estate ODCE Style 1.51 5.57 7.68 8.32 9.94 4.64 7.09
NFI-ODCE (value wt net) 1.87 5.75 7.71 7.83 9.71 4.62 7.28
NCREIF Property 1.67 5.27 7.16 7.75 9.57 6.42 8.96
NCREIF Farmland 1.13 3.62 6.66 7.12 9.86 11.62 14.62
NCREIF Timberland 1.02 2.44 4.00 3.52 5.99 4.01 7.42
Public Real Estate
Global Real Estate Style 0.25 1.00 5.57 7.18 7.10 7.64 9.62
EPRA/NAREIT Developed -0.30 0.06 3.66 6.19 5.43 6.04 --
Global ex-U.S. Real Estate Style -0.14 1.49 7.08 6.96 5.27 6.83 9.61
EPRA/NAREIT Developed ex US -0.99 -0.96 5.36 7.25 3.97 6.48 8.58
U.S. REIT Style 0.88 2.14 4.61 7.94 9.72 8.37 10.31
NAREIT Equity REITs 0.79 1.81 3.35 7.64 9.16 7.44 9.41
Callan Database Median and Index Returns* for Periods ended September 30, 2018
*Returns less than one year are not annualized.
Sources: Callan, FTSE Russell, NAREIT, NCREIF

12
Private Equity Performance Database (%) (Pooled Horizon IRRs through June 30, 2018*)
Strategy 3 Months Year 3 Years 5 Years 10 Years 15 Years 20 Years
All Venture 3.68 12.97 9.23 16.18 9.51 9.70 17.90
Growth Equity 5.83 20.09 12.21 13.63 9.95 13.04 13.47
All Buyouts 5.38 22.64 13.65 14.41 8.83 14.59 12.43
Mezzanine 3.18 14.72 9.70 10.18 8.80 9.67 8.67
Distressed 2.45 10.99 6.72 9.52 9.49 10.77 10.34
All Private Equity 3.63 15.26 10.10 10.82 9.25 11.47 11.24
S&P 500 4.82 19.11 11.94 13.97 9.12 12.97 12.81
Private equity returns are net of fees.
Sources: Standard & Poor’s and Thomson Reuters/Cambridge
*Most recent data available at time of publication
More Tricks Than Treats
PRIVATE EQUITY | Gary Robertson
Funds Closed January 1 to September 30, 2018
Strategy No. of Funds Amt ($mm) Share
Venture Capital 270 45,756 12%
Growth Equity 38 24,553 7%
Buyouts 148 175,110 47%
Mezzanine Debt 44 42,482 11%
Distressed 11 23,103 6%
Energy 22 20,222 5%
Secondary and Other 55 27,368 7%
Fund-of-funds 29 11,496 3%
Totals 617 370,090 100%
Source: PitchBook
Figures may not total due to rounding.
Note: Transaction count and dollar volume igures across all private equity measures are preliminary igures and are subject to update in subsequent versions of Capital Market
Review and other Callan publications.
Third quarter private equity partnerships holding inal closes totaled $140 billion, with 197 new partnerships formed, according
to Pitchbook. The dollar volume rose by 30% from $108 billion,
but the number of funds closing declined by 6% from 210 in the
prior quarter. Year-to-date, 2018 is running $64 billion (or 15%)
behind a year ago. Investors are pursuing broad diversiication with buyouts tracking to less than 50% of capital raised, and all
other major strategies receiving signiicant new allocations. – New buyout transactions declined although activity remained
strong overall, according to PitchBook. Funds closed 1,477
investments with $126 billion in disclosed deal value, repre-
senting a 17% decline in count and a 4% dip in dollar value
from the second quarter’s 1,775 investments and $131
billion of announced value. The $13.8 billion purchase of
Unilever’s vegetable spread business (e.g., Country Crock)
by KKR was the quarter’s largest buyout.
– According to PitchBook, new investments in venture capital
companies totaled 4,010 rounds of inancing with $53 bil-lion of announced value. The number of investments was
down 23% from the prior quarter, and announced value
fell 26%. The median pre-money valuations continued to
increase across the board, with Series D showing the larg-
est increases.
– There were 454 private M&A exits of private equity-backed
companies (excluding venture capital), PitchBook reports,
with disclosed values totaling $131 billion. Both private
sale count and announced dollar volume were down from
the prior quarter’s 620 sales and $135 billion. There were
26 private-equity backed IPOs in the third quarter raising
an aggregate $7 billion, down from 53 totaling $16 billion
previously.
– Venture-backed M&A exits totaled 276 transactions with dis-
closed value of $34 billion. The number of sales declined from
344 in the second quarter, but announced values increased
slightly from $31 billion in the second quarter. There were 53
VC-backed IPOs in the third quarter with a combined loat of $14 billion. For comparison, the second quarter had 69 IPOs
and total issuance of $19 billion.
Please see our upcoming issue of Private Equity Trends for
more in-depth coverage.

13Knowledge. Experience. Integrity.
Callan Database Median and Index Returns* for Periods ended September 30, 2018
Hedge Fund Universe Quarter Year 3 Years 5 Years 10 Years 15 Years
Callan Fund-of-Funds Database 0.37 4.53 3.96 4.04 4.54 4.89
Callan Absolute Return FOF Style 0.42 4.60 3.73 3.88 4.33 4.45
Callan Core Diversiied FOF Style 0.68 3.37 3.76 3.61 4.36 5.07
Callan Long/Short Equity FOF Style -0.30 4.86 5.17 4.87 5.33 5.89
Credit Suisse Hedge Fund 0.59 3.49 3.09 3.39 4.43 5.39
CS Convertible Arbitrage 0.92 1.86 3.97 2.56 6.05 3.97
CS Distressed 0.79 3.36 4.46 3.44 5.00 6.36
CS Emerging Markets -4.08 -3.98 5.23 3.70 4.69 6.73
CS Equity Market Neutral -0.24 1.20 1.08 1.77 -3.18 0.20
CS Event-Driven Multi 1.14 4.27 2.37 1.70 3.98 5.72
CS Fixed Income Arb 0.93 4.71 4.41 3.88 5.22 4.06
CS Global Macro -0.19 3.56 2.66 2.68 4.75 6.36
CS Long/Short Equity 1.54 5.55 4.37 5.40 5.72 6.49
CS Managed Futures 0.63 3.29 -2.66 2.84 1.42 3.15
CS Multi-Strategy 0.98 3.05 4.84 5.67 6.59 6.36
CS Risk Arbitrage 0.82 1.13 4.50 2.54 3.33 3.95
HFRI Asset Wtd Composite 0.37 3.88 3.88 3.87 4.74 --
90-Day T-Bill + 5% 1.70 6.59 5.84 5.52 5.34 6.30
*Gross of fees. Sources: Bloomberg Barclays, Callan, Credit Suisse, Hedge Fund Research, Societe Generale, and Standard & Poor’s
Active Trading Grinds Forward Under Market Stress
HEDGE FUNDS/MACs | Jim McKee
Hedge Funds
A resilient U.S. economy stimulated by tax cuts and falling
unemployment pushed up U.S. stocks and the U.S. dollar in the
third quarter. The stronger dollar tied to rising short-term rates
undermined a slowing Chinese economy as well as markets
linked to it. Divergent economic forces around the globe created
a modestly proitable trading environment for most hedge funds. The Credit Suisse Hedge Fund Index gained 0.6%.
– Aided by climbing U.S. stock prices, Long/Short Equity
(+1.5%) topped CS hedge fund strategies.
– Supported by the strong U.S. corporate environment, event-
driven strategies (Event-Driven Multi, Distressed, Risk Arb)
made modest but steady gains.
– Emerging Markets (-4.1%) suffered the most, surrendering its
excess returns over passive benchmarks from prior quarters.
– Relecting live hedge fund portfolios, the HFRI FOF
Composite Index, net of all fees, inched forward 0.3%.
Absolute Core Long/Short
Return Diversified Equity
10th Percentile 5.9 5.2 6.4
25th Percentile 4.5 4.6 5.6
Median 3.9 3.6 4.9
75th Percentile 3.1 2.7 4.1
90th Percentile 2.6 1.9 1.5
CS Hedge Fund 0.6 0.6 0.6
90-Day T-Bill +5% 1.7 1.7 1.7
0%
2%
4%
6%
8%
Hedge Fund-of-Funds Style Group Returns
Sources: Callan, Credit Suisse, Federal Reserve

14
– Representing actual hedge fund portfolios, the median man-
ager in the Callan Hedge Fund-of-Funds Database forged
ahead 0.4%, net of all fees and expenses.
– Despite the U.S. equity rally, the median Callan Long/Short
Equity FOF (-0.3%) slipped behind the Callan Absolute
Return FOF (+0.4%), which tends to beneit from event-driven deals and credit trades.
– With diversifying exposures to both non-directional and
directional styles, the Core Diversiied FOF gained 0.7%.
Multi-Asset Class (MAC) Strategies
Callan’s Multi-Asset Class (MAC) Style Groups continued
to struggle in the third quarter, particularly those overweighting
bonds and underweighting U.S. growth stocks, as a stronger
dollar and rising rates created a dificult top-down environment. – The HFR Risk Parity Index targeting 12% volatility slipped
0.3%, given its typical ixed income bias. – The CS NB Multi Asset Risk Premia Index (-1.4%) is an
equal risk-weighted index of alternative risk factors (value,
carry, momentum, and liquidity) across four capital markets
(equity, ixed income, currency, and commodities) targeting 5% volatility.
– Within CS NB MARP, Equity Value (-3.4%) sank again, add-
ing to losses from the prior two quarters for a 11.9% year-
to-date loss. Supported by rising energy prices, Commodity
Momentum (+5.9%) was strong again, leading to a 16%
YTD gain.
Absolute Risk Long Risk
Return Premia Biased Parity
10th Percentile 2.2 1.5 3.1 1.5
25th Percentile 1.8 0.8 2.8 0.8
Median 0.2 -0.2 1.2 0.0
75th Percentile -0.1 -0.5 -0.5 -0.1
90th Percentile -0.8 -1.8 -2.4 -1.9
CS NB MARP (5%v) -1.4 -1.4 -1.4 -1.4 60% S&P 500/
40% BB Barclays Agg 4.6 4.6 4.6 4.6
-3%
0%
3%
6%
– Buoyed by its usually long equity bias within a dynamic
asset allocation framework, the Callan Long Biased MAC
advanced 1.2%.
– Likely impacted by underlying tilts to an equity value risk fac-
tor, the median Callan Risk Premia MAC slipped 0.2%.
– Typically targeting equal risk-weighted allocations to major asset classes with leverage, the Callan Risk Parity MAC
(0.0%) was lat. – As the most conservative MAC style focused on non-direc-
tional strategies of long and short asset class exposures, the
Callan Absolute Return MAC edged ahead 0.2%.
Convertible Arb
Distressed
Long/Short Equity
Managed Futures
1.0%
-0.2%
0.9%
-4.1%
0.8%0.9%
1.5%
0.6%
-0.2%
0.8%1.1%
Fixed Income Arb
Risk Arbitrage
Emerging Market
Equity Mkt Neutral
Multi-Strategy
Event-Driven Multi
Global Macro
Equity Carry
Fixed Carry
Currency Carry
Commodity Carry
-1.3%
1.7%0.9%
-1.0%-0.2%
-3.4%
-0.4%
-2.6%
5.9%
-0.6%
1.0%
Equity Value
Fixed Value
Currency Value
MARP (5%v) Average
Equity Momentum
Fixed Momentum
Curr Momentum
Comm Momentum
MAC Style Group Returns
Credit Suisse Hedge Fund Strategy Returns Alternative Risk Factor Breakdown
Sources: Bloomberg Barclays, Callan, Credit Suisse, Neuberger Berman, Standard
& Poor’s
Source: Credit Suisse Sources: Credit Suisse Neuberger Berman

15Knowledge. Experience. Integrity.
The Callan DC Index is an equally weighted index tracking the cash lows and performance of nearly 90 plans, representing more than one million
DC participants and over $135 billion in assets. The Index is updated
quarterly and is available on Callan’s website, as is the quarterly DC
Observer newsletter.
– The Callan DC Index™ rebounded from irst quarter losses, returning 1.8% in the second quarter and outpacing the 1.1%
gain of the Age 45 Target Date Fund (TDF).
– TDFs suffered from their higher allocation to non-U.S. equity
and emerging markets. The average DC plan has a 5.6%
allocation to non-U.S. equity and emerging markets, com-
pared to 26.5% for the Age 45 TDF.
– Since inception, the DC Index’s annual return of 6.2% trails
the Age 45 TDF by 70 basis points.
– DC plan balances grew by 1.9%, driven primarily by market
performance. For the quarter, inlows (participant and plan sponsor contributions) accounted for only 12 bps of growth.
– TDFs absorbed approximately 92 cents of every dollar that
lowed into DC funds. – Several DC investments saw material net outlows, includ-
ing U.S. equities (large and small/mid cap), U.S./global bal-
anced, and U.S. ixed income. – Second quarter turnover (i.e., net transfer activity levels
within DC plans) increased slightly from the irst quarter to 0.35%, well below the historical average of 0.62%.
– The Callan DC Index’s equity allocation ended the quarter at
70%, modestly above its historical average (68%).
– The second quarter marked another all-time high for TDFs’
share of DC assets, expanding to 32.5%. U.S. large cap
continues to be the second-highest allocation, at 24.1%.
– While TDFs have a larger overall weight within the Index,
they remain less prevalent than the next largest plan holding,
U.S. large cap equity. In plans that offer TDFs, they account
for 35% of plan assets. U.S. large cap equity funds account
for 24% of plan assets, even though they are offered by
100% of DC plans.
DC Plans Rebound, TDFs Struggle
DEFINED CONTRIBUTION | James Veneruso, CFA, CAIA
Net Cash Flow Analysis (Second Quarter 2018)
(Top Two and Bottom Two Asset Gatherers)
Asset Class
Flows as % of
Total Net Flows
Target Date Funds 91.57%
Brokerage Window 2.33%
Company Stock -18.29%
U.S. Large Cap -44.41%
Total Turnover** 0.35%
Data provided here is the most recent available at time of publication.
Source: Callan DC Index
Note: DC Index inception date is January 2006.
* The Age 45 Fund transitioned from the average 2035 TDF to the 2040 TDF in
June 2018.
** Total Index “turnover” measures the percentage of total invested assets (transfers
only, excluding contributions and withdrawals) that moved between asset classes.
Investment Performance
Growth Sources
Second Quarter 2018
Age 45 Target Date* Total DC Index
1.76%1.11%
6.18%
Annualized Since
Inception
0.61%1.58%
6.88%
Year-to-Date
Second Quarter 2018
% Net Flows % Return Growth% Total Growth
8.12%
Annualized Since
Inception
1.94%
0.43%
6.19%
2.01%1.50%
0.12%
1.88% 1.75%
Year-to-Date
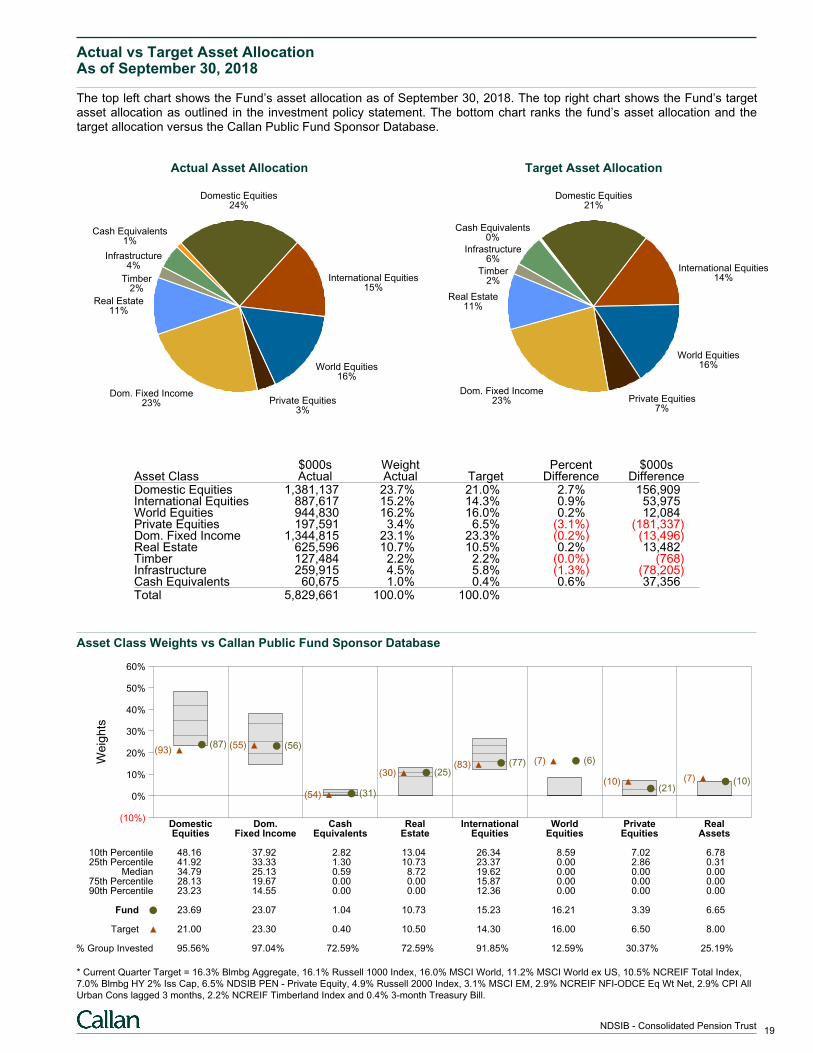
Actual vs Target Asset AllocationAs of September 30, 2018
The top left chart shows the Fund’s asset allocation as of September 30, 2018. The top right chart shows the Fund’s targetasset allocation as outlined in the investment policy statement. The bottom chart ranks the fund’s asset allocation and thetarget allocation versus the Callan Public Fund Sponsor Database.
Actual Asset Allocation
Domestic Equities24%
International Equities15%
World Equities16%
Private Equities3%
Dom. Fixed Income23%
Real Estate11%
Timber2%
Infrastructure4%
Cash Equivalents1%
Target Asset Allocation
Domestic Equities21%
International Equities14%
World Equities16%
Private Equities7%
Dom. Fixed Income23%
Real Estate11%
Timber2%
Infrastructure6%
Cash Equivalents0%
$000s Weight Percent $000sAsset Class Actual Actual Target Difference DifferenceDomestic Equities 1,381,137 23.7% 21.0% 2.7% 156,909International Equities 887,617 15.2% 14.3% 0.9% 53,975World Equities 944,830 16.2% 16.0% 0.2% 12,084Private Equities 197,591 3.4% 6.5% (3.1%) (181,337)Dom. Fixed Income 1,344,815 23.1% 23.3% (0.2%) (13,496)Real Estate 625,596 10.7% 10.5% 0.2% 13,482Timber 127,484 2.2% 2.2% (0.0%) (768)Infrastructure 259,915 4.5% 5.8% (1.3%) (78,205)Cash Equivalents 60,675 1.0% 0.4% 0.6% 37,356Total 5,829,661 100.0% 100.0%
Asset Class Weights vs Callan Public Fund Sponsor Database
We
igh
ts
(10%)
0%
10%
20%
30%
40%
50%
60%
Domestic Dom. Cash Real International World Private RealEquities Fixed Income Equivalents Estate Equities Equities Equities Assets
(87)(93) (56)(55)
(31)(54)
(25)(30)(77)(83) (6)(7)
(21)(10) (10)(7)
10th Percentile 48.16 37.92 2.82 13.04 26.34 8.59 7.02 6.7825th Percentile 41.92 33.33 1.30 10.73 23.37 0.00 2.86 0.31
Median 34.79 25.13 0.59 8.72 19.62 0.00 0.00 0.0075th Percentile 28.13 19.67 0.00 0.00 15.87 0.00 0.00 0.0090th Percentile 23.23 14.55 0.00 0.00 12.36 0.00 0.00 0.00
Fund 23.69 23.07 1.04 10.73 15.23 16.21 3.39 6.65
Target 21.00 23.30 0.40 10.50 14.30 16.00 6.50 8.00
% Group Invested 95.56% 97.04% 72.59% 72.59% 91.85% 12.59% 30.37% 25.19%
* Current Quarter Target = 16.3% Blmbg Aggregate, 16.1% Russell 1000 Index, 16.0% MSCI World, 11.2% MSCI World ex US, 10.5% NCREIF Total Index,
7.0% Blmbg HY 2% Iss Cap, 6.5% NDSIB PEN - Private Equity, 4.9% Russell 2000 Index, 3.1% MSCI EM, 2.9% NCREIF NFI-ODCE Eq Wt Net, 2.9% CPI All
Urban Cons lagged 3 months, 2.2% NCREIF Timberland Index and 0.4% 3-month Treasury Bill.
19NDSIB - Consolidated Pension Trust
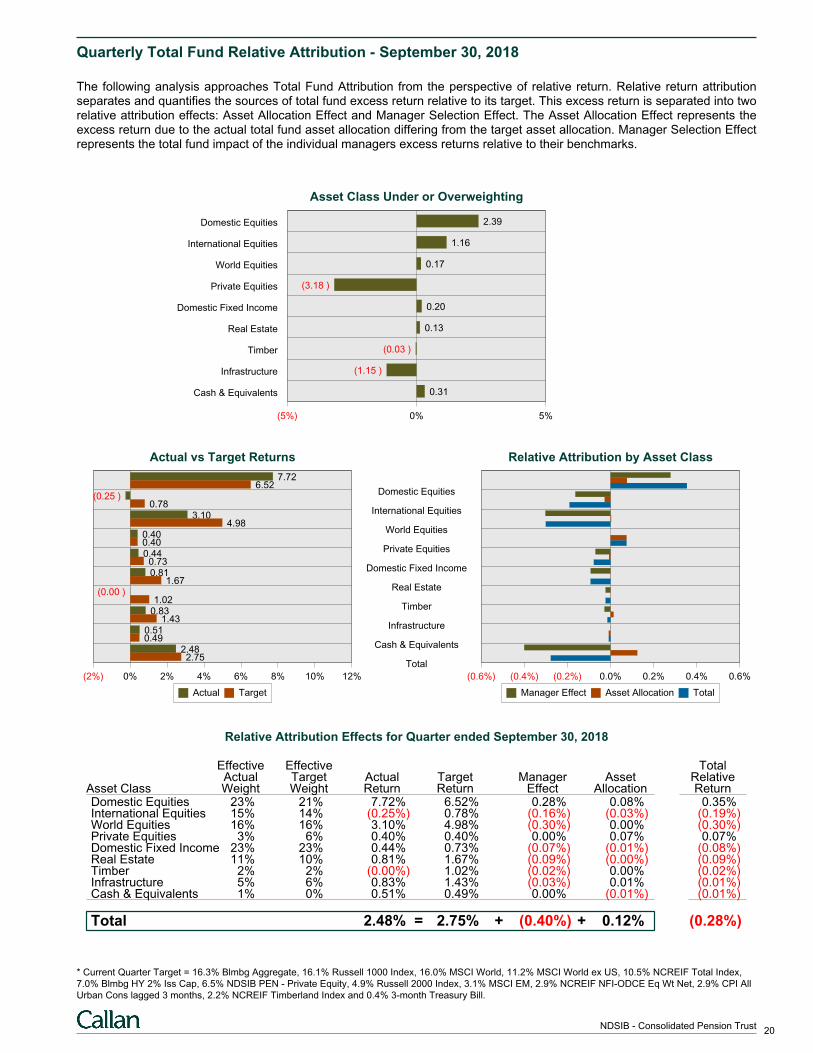
Quarterly Total Fund Relative Attribution - September 30, 2018
The following analysis approaches Total Fund Attribution from the perspective of relative return. Relative return attributionseparates and quantifies the sources of total fund excess return relative to its target. This excess return is separated into tworelative attribution effects: Asset Allocation Effect and Manager Selection Effect. The Asset Allocation Effect represents theexcess return due to the actual total fund asset allocation differing from the target asset allocation. Manager Selection Effectrepresents the total fund impact of the individual managers excess returns relative to their benchmarks.
Asset Class Under or Overweighting
(5%) 0% 5%
Domestic Equities 2.39
International Equities 1.16
World Equities 0.17
Private Equities (3.18 )
Domestic Fixed Income 0.20
Real Estate 0.13
Timber (0.03 )
Infrastructure (1.15 )
Cash & Equivalents 0.31
Domestic Equities
International Equities
World Equities
Private Equities
Domestic Fixed Income
Real Estate
Timber
Infrastructure
Cash & Equivalents
Total
Actual vs Target Returns
(2%) 0% 2% 4% 6% 8% 10% 12%
7.726.52
(0.25 )0.78
3.104.98
0.400.400.44
0.730.81
1.67(0.00 )
1.020.83
1.430.510.49
2.482.75
Actual Target
Relative Attribution by Asset Class
(0.6%) (0.4%) (0.2%) 0.0% 0.2% 0.4% 0.6%
Manager Effect Asset Allocation Total
Relative Attribution Effects for Quarter ended September 30, 2018
Effective Effective TotalActual Target Actual Target Manager Asset Relative
Asset Class Weight Weight Return Return Effect Allocation ReturnDomestic Equities 23% 21% 7.72% 6.52% 0.28% 0.08% 0.35%International Equities 15% 14% (0.25%) 0.78% (0.16%) (0.03%) (0.19%)World Equities 16% 16% 3.10% 4.98% (0.30%) 0.00% (0.30%)Private Equities 3% 6% 0.40% 0.40% 0.00% 0.07% 0.07%Domestic Fixed Income 23% 23% 0.44% 0.73% (0.07%) (0.01%) (0.08%)Real Estate 11% 10% 0.81% 1.67% (0.09%) (0.00%) (0.09%)Timber 2% 2% (0.00%) 1.02% (0.02%) 0.00% (0.02%)Infrastructure 5% 6% 0.83% 1.43% (0.03%) 0.01% (0.01%)Cash & Equivalents 1% 0% 0.51% 0.49% 0.00% (0.01%) (0.01%)
Total = + +2.48% 2.75% (0.40%) 0.12% (0.28%)
* Current Quarter Target = 16.3% Blmbg Aggregate, 16.1% Russell 1000 Index, 16.0% MSCI World, 11.2% MSCI World ex US, 10.5% NCREIF Total Index,
7.0% Blmbg HY 2% Iss Cap, 6.5% NDSIB PEN - Private Equity, 4.9% Russell 2000 Index, 3.1% MSCI EM, 2.9% NCREIF NFI-ODCE Eq Wt Net, 2.9% CPI All
Urban Cons lagged 3 months, 2.2% NCREIF Timberland Index and 0.4% 3-month Treasury Bill.
20NDSIB - Consolidated Pension Trust
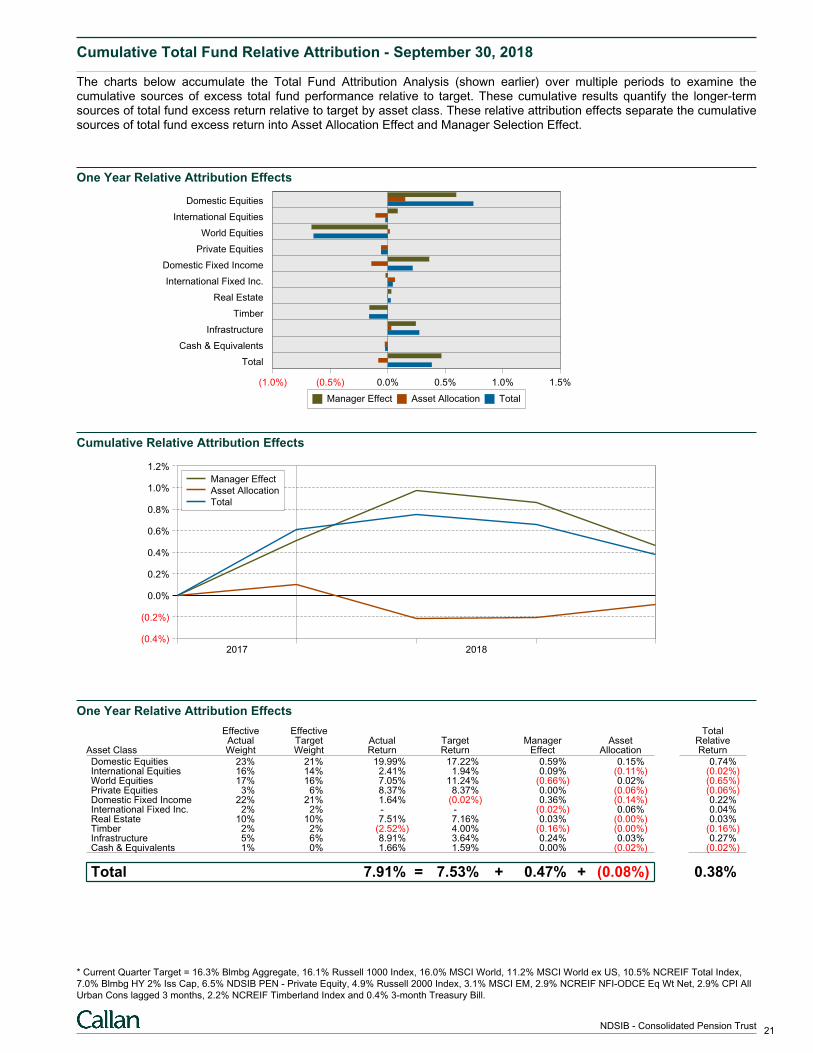
Cumulative Total Fund Relative Attribution - September 30, 2018
The charts below accumulate the Total Fund Attribution Analysis (shown earlier) over multiple periods to examine thecumulative sources of excess total fund performance relative to target. These cumulative results quantify the longer-termsources of total fund excess return relative to target by asset class. These relative attribution effects separate the cumulativesources of total fund excess return into Asset Allocation Effect and Manager Selection Effect.
One Year Relative Attribution Effects
(1.0%) (0.5%) 0.0% 0.5% 1.0% 1.5%
Domestic Equities
International Equities
World Equities
Private Equities
Domestic Fixed Income
International Fixed Inc.
Real Estate
Timber
Infrastructure
Cash & Equivalents
Total
Manager Effect Asset Allocation Total
Cumulative Relative Attribution Effects
(0.4%)
(0.2%)
0.0%
0.2%
0.4%
0.6%
0.8%
1.0%
1.2%
2017 2018
Manager Effect
Asset Allocation
Total
One Year Relative Attribution Effects
Effective Effective TotalActual Target Actual Target Manager Asset Relative
Asset Class Weight Weight Return Return Effect Allocation Return
Domestic Equities 23% 21% 19.99% 17.22% 0.59% 0.15% 0.74%International Equities 16% 14% 2.41% 1.94% 0.09% (0.11%) (0.02%)World Equities 17% 16% 7.05% 11.24% (0.66%) 0.02% (0.65%)Private Equities 3% 6% 8.37% 8.37% 0.00% (0.06%) (0.06%)Domestic Fixed Income 22% 21% 1.64% (0.02%) 0.36% (0.14%) 0.22%International Fixed Inc. 2% 2% - - (0.02%) 0.06% 0.04%Real Estate 10% 10% 7.51% 7.16% 0.03% (0.00%) 0.03%Timber 2% 2% (2.52%) 4.00% (0.16%) (0.00%) (0.16%)Infrastructure 5% 6% 8.91% 3.64% 0.24% 0.03% 0.27%Cash & Equivalents 1% 0% 1.66% 1.59% 0.00% (0.02%) (0.02%)
Total = + +7.91% 7.53% 0.47% (0.08%) 0.38%
* Current Quarter Target = 16.3% Blmbg Aggregate, 16.1% Russell 1000 Index, 16.0% MSCI World, 11.2% MSCI World ex US, 10.5% NCREIF Total Index,
7.0% Blmbg HY 2% Iss Cap, 6.5% NDSIB PEN - Private Equity, 4.9% Russell 2000 Index, 3.1% MSCI EM, 2.9% NCREIF NFI-ODCE Eq Wt Net, 2.9% CPI All
Urban Cons lagged 3 months, 2.2% NCREIF Timberland Index and 0.4% 3-month Treasury Bill.
21NDSIB - Consolidated Pension Trust
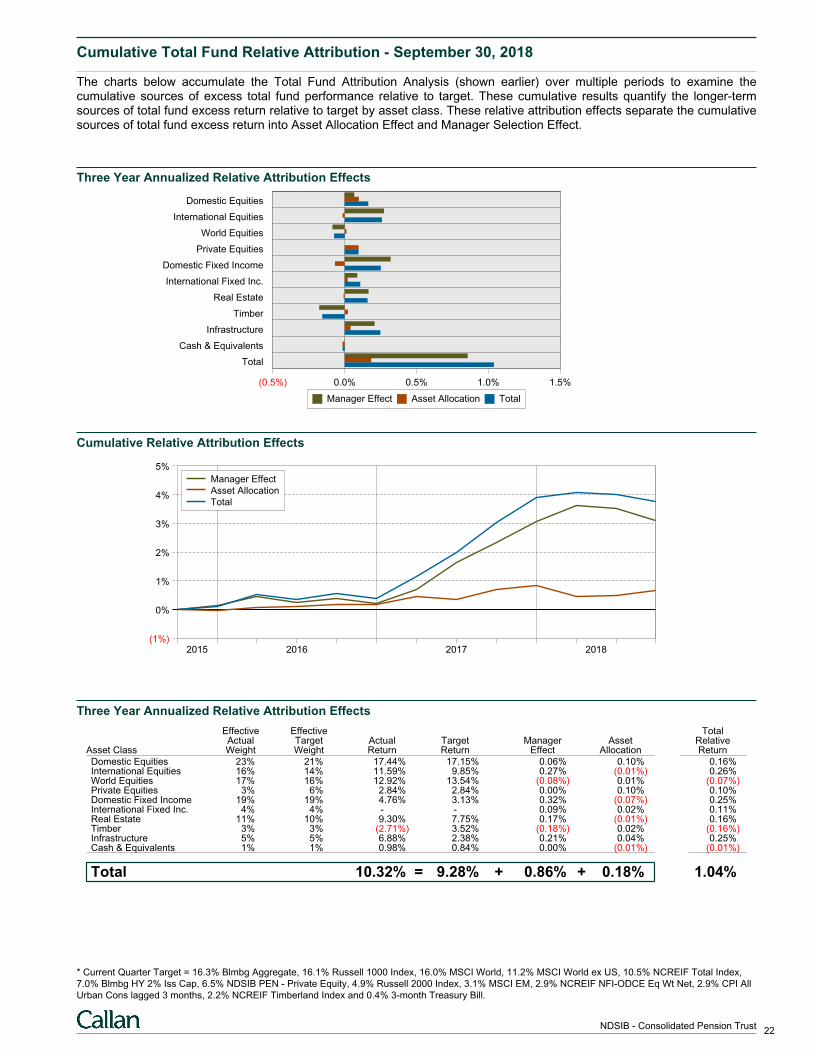
Cumulative Total Fund Relative Attribution - September 30, 2018
The charts below accumulate the Total Fund Attribution Analysis (shown earlier) over multiple periods to examine thecumulative sources of excess total fund performance relative to target. These cumulative results quantify the longer-termsources of total fund excess return relative to target by asset class. These relative attribution effects separate the cumulativesources of total fund excess return into Asset Allocation Effect and Manager Selection Effect.
Three Year Annualized Relative Attribution Effects
(0.5%) 0.0% 0.5% 1.0% 1.5%
Domestic Equities
International Equities
World Equities
Private Equities
Domestic Fixed Income
International Fixed Inc.
Real Estate
Timber
Infrastructure
Cash & Equivalents
Total
Manager Effect Asset Allocation Total
Cumulative Relative Attribution Effects
(1%)
0%
1%
2%
3%
4%
5%
2015 2016 2017 2018
Manager Effect
Asset Allocation
Total
Three Year Annualized Relative Attribution Effects
Effective Effective TotalActual Target Actual Target Manager Asset Relative
Asset Class Weight Weight Return Return Effect Allocation Return
Domestic Equities 23% 21% 17.44% 17.15% 0.06% 0.10% 0.16%International Equities 16% 14% 11.59% 9.85% 0.27% (0.01%) 0.26%World Equities 17% 16% 12.92% 13.54% (0.08%) 0.01% (0.07%)Private Equities 3% 6% 2.84% 2.84% 0.00% 0.10% 0.10%Domestic Fixed Income 19% 19% 4.76% 3.13% 0.32% (0.07%) 0.25%International Fixed Inc. 4% 4% - - 0.09% 0.02% 0.11%Real Estate 11% 10% 9.30% 7.75% 0.17% (0.01%) 0.16%Timber 3% 3% (2.71%) 3.52% (0.18%) 0.02% (0.16%)Infrastructure 5% 5% 6.88% 2.38% 0.21% 0.04% 0.25%Cash & Equivalents 1% 1% 0.98% 0.84% 0.00% (0.01%) (0.01%)
Total = + +10.32% 9.28% 0.86% 0.18% 1.04%
* Current Quarter Target = 16.3% Blmbg Aggregate, 16.1% Russell 1000 Index, 16.0% MSCI World, 11.2% MSCI World ex US, 10.5% NCREIF Total Index,
7.0% Blmbg HY 2% Iss Cap, 6.5% NDSIB PEN - Private Equity, 4.9% Russell 2000 Index, 3.1% MSCI EM, 2.9% NCREIF NFI-ODCE Eq Wt Net, 2.9% CPI All
Urban Cons lagged 3 months, 2.2% NCREIF Timberland Index and 0.4% 3-month Treasury Bill.
22NDSIB - Consolidated Pension Trust
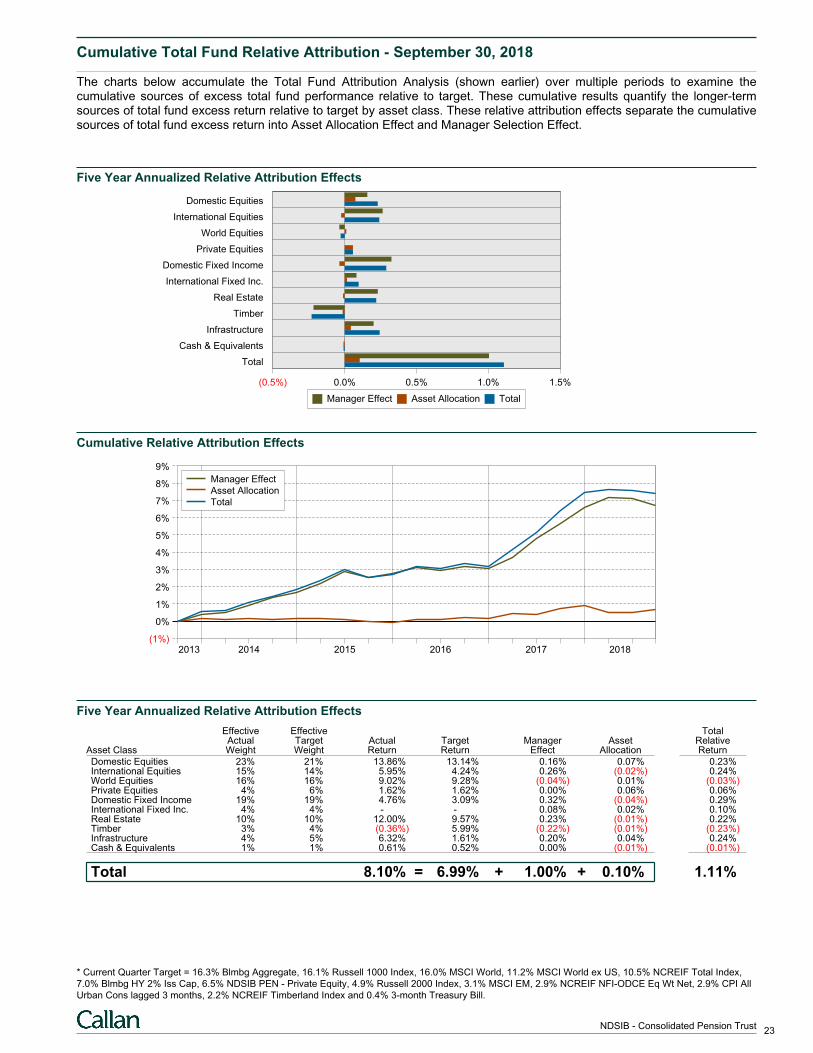
Cumulative Total Fund Relative Attribution - September 30, 2018
The charts below accumulate the Total Fund Attribution Analysis (shown earlier) over multiple periods to examine thecumulative sources of excess total fund performance relative to target. These cumulative results quantify the longer-termsources of total fund excess return relative to target by asset class. These relative attribution effects separate the cumulativesources of total fund excess return into Asset Allocation Effect and Manager Selection Effect.
Five Year Annualized Relative Attribution Effects
(0.5%) 0.0% 0.5% 1.0% 1.5%
Domestic Equities
International Equities
World Equities
Private Equities
Domestic Fixed Income
International Fixed Inc.
Real Estate
Timber
Infrastructure
Cash & Equivalents
Total
Manager Effect Asset Allocation Total
Cumulative Relative Attribution Effects
(1%)
0%
1%
2%
3%
4%
5%
6%
7%
8%
9%
2013 2014 2015 2016 2017 2018
Manager Effect
Asset Allocation
Total
Five Year Annualized Relative Attribution Effects
Effective Effective TotalActual Target Actual Target Manager Asset Relative
Asset Class Weight Weight Return Return Effect Allocation Return
Domestic Equities 23% 21% 13.86% 13.14% 0.16% 0.07% 0.23%International Equities 15% 14% 5.95% 4.24% 0.26% (0.02%) 0.24%World Equities 16% 16% 9.02% 9.28% (0.04%) 0.01% (0.03%)Private Equities 4% 6% 1.62% 1.62% 0.00% 0.06% 0.06%Domestic Fixed Income 19% 19% 4.76% 3.09% 0.32% (0.04%) 0.29%International Fixed Inc. 4% 4% - - 0.08% 0.02% 0.10%Real Estate 10% 10% 12.00% 9.57% 0.23% (0.01%) 0.22%Timber 3% 4% (0.36%) 5.99% (0.22%) (0.01%) (0.23%)Infrastructure 4% 5% 6.32% 1.61% 0.20% 0.04% 0.24%Cash & Equivalents 1% 1% 0.61% 0.52% 0.00% (0.01%) (0.01%)
Total = + +8.10% 6.99% 1.00% 0.10% 1.11%
* Current Quarter Target = 16.3% Blmbg Aggregate, 16.1% Russell 1000 Index, 16.0% MSCI World, 11.2% MSCI World ex US, 10.5% NCREIF Total Index,
7.0% Blmbg HY 2% Iss Cap, 6.5% NDSIB PEN - Private Equity, 4.9% Russell 2000 Index, 3.1% MSCI EM, 2.9% NCREIF NFI-ODCE Eq Wt Net, 2.9% CPI All
Urban Cons lagged 3 months, 2.2% NCREIF Timberland Index and 0.4% 3-month Treasury Bill.
23NDSIB - Consolidated Pension Trust
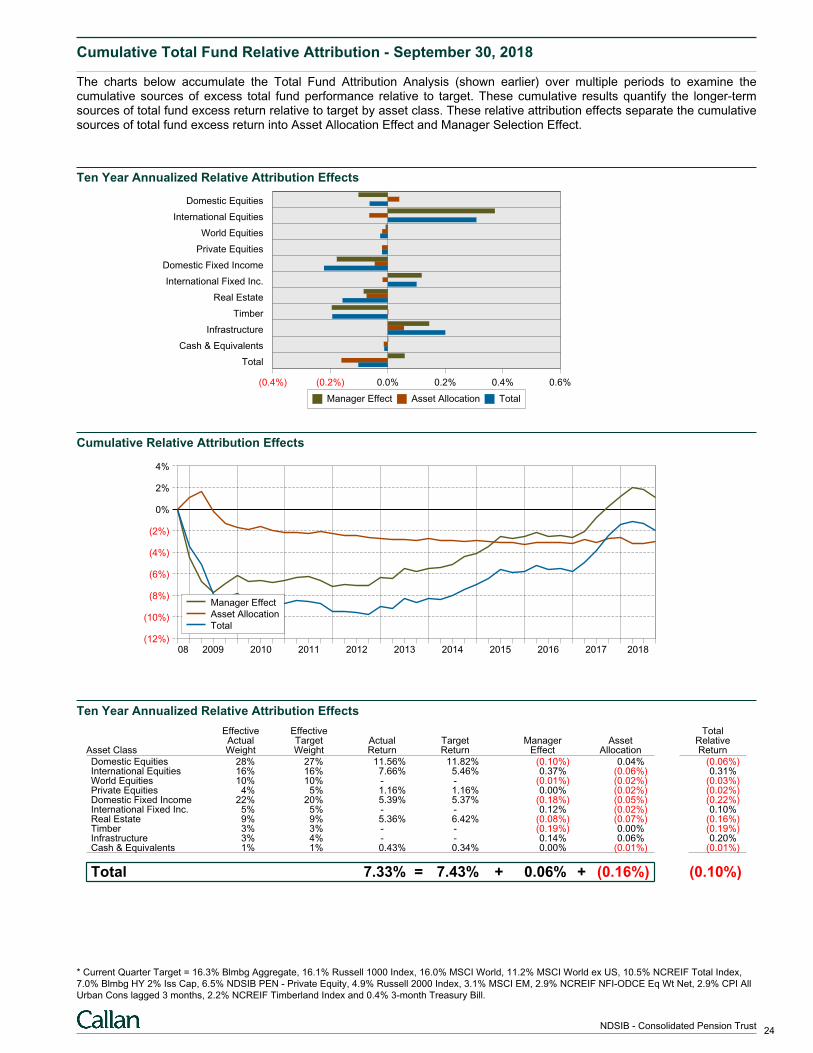
Cumulative Total Fund Relative Attribution - September 30, 2018
The charts below accumulate the Total Fund Attribution Analysis (shown earlier) over multiple periods to examine thecumulative sources of excess total fund performance relative to target. These cumulative results quantify the longer-termsources of total fund excess return relative to target by asset class. These relative attribution effects separate the cumulativesources of total fund excess return into Asset Allocation Effect and Manager Selection Effect.
Ten Year Annualized Relative Attribution Effects
(0.4%) (0.2%) 0.0% 0.2% 0.4% 0.6%
Domestic Equities
International Equities
World Equities
Private Equities
Domestic Fixed Income
International Fixed Inc.
Real Estate
Timber
Infrastructure
Cash & Equivalents
Total
Manager Effect Asset Allocation Total
Cumulative Relative Attribution Effects
(12%)
(10%)
(8%)
(6%)
(4%)
(2%)
0%
2%
4%
08 2009 2010 2011 2012 2013 2014 2015 2016 2017 2018
Manager Effect
Asset Allocation
Total
Ten Year Annualized Relative Attribution Effects
Effective Effective TotalActual Target Actual Target Manager Asset Relative
Asset Class Weight Weight Return Return Effect Allocation Return
Domestic Equities 28% 27% 11.56% 11.82% (0.10%) 0.04% (0.06%)International Equities 16% 16% 7.66% 5.46% 0.37% (0.06%) 0.31%World Equities 10% 10% - - (0.01%) (0.02%) (0.03%)Private Equities 4% 5% 1.16% 1.16% 0.00% (0.02%) (0.02%)Domestic Fixed Income 22% 20% 5.39% 5.37% (0.18%) (0.05%) (0.22%)International Fixed Inc. 5% 5% - - 0.12% (0.02%) 0.10%Real Estate 9% 9% 5.36% 6.42% (0.08%) (0.07%) (0.16%)Timber 3% 3% - - (0.19%) 0.00% (0.19%)Infrastructure 3% 4% - - 0.14% 0.06% 0.20%Cash & Equivalents 1% 1% 0.43% 0.34% 0.00% (0.01%) (0.01%)
Total = + +7.33% 7.43% 0.06% (0.16%) (0.10%)
* Current Quarter Target = 16.3% Blmbg Aggregate, 16.1% Russell 1000 Index, 16.0% MSCI World, 11.2% MSCI World ex US, 10.5% NCREIF Total Index,
7.0% Blmbg HY 2% Iss Cap, 6.5% NDSIB PEN - Private Equity, 4.9% Russell 2000 Index, 3.1% MSCI EM, 2.9% NCREIF NFI-ODCE Eq Wt Net, 2.9% CPI All
Urban Cons lagged 3 months, 2.2% NCREIF Timberland Index and 0.4% 3-month Treasury Bill.
24NDSIB - Consolidated Pension Trust
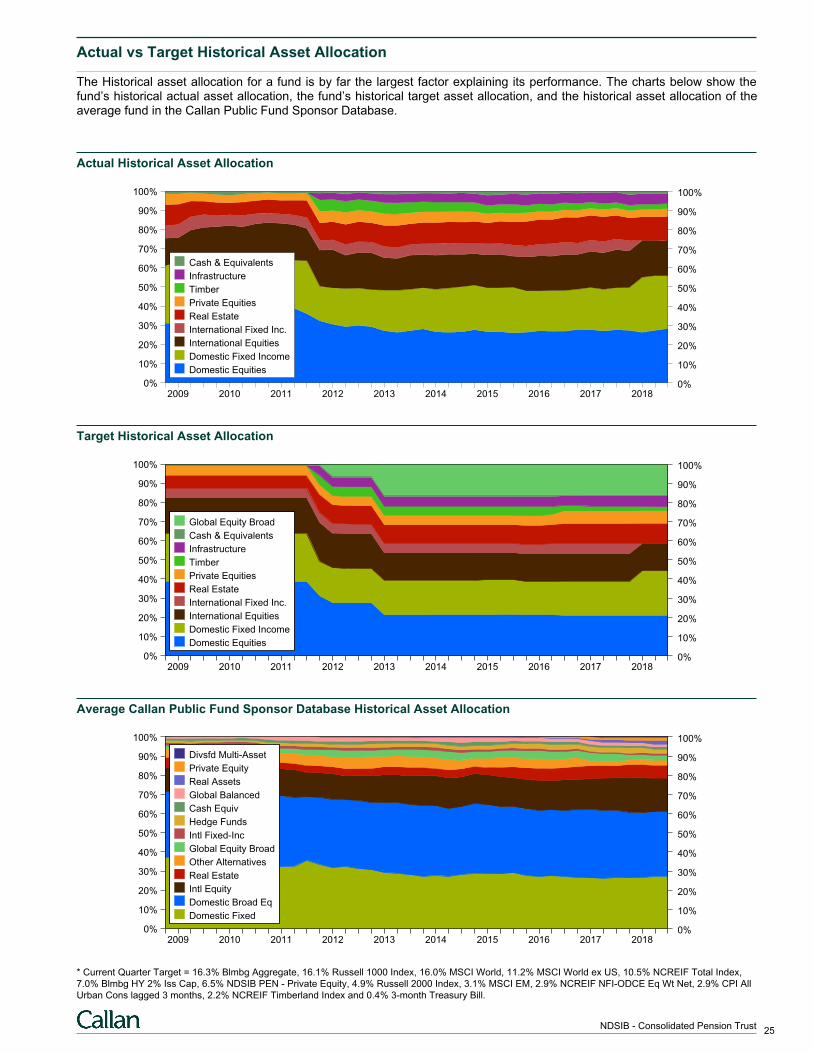
Actual vs Target Historical Asset Allocation
The Historical asset allocation for a fund is by far the largest factor explaining its performance. The charts below show thefund’s historical actual asset allocation, the fund’s historical target asset allocation, and the historical asset allocation of theaverage fund in the Callan Public Fund Sponsor Database.
Actual Historical Asset Allocation
0% 0%
10% 10%
20% 20%
30% 30%
40% 40%
50% 50%
60% 60%
70% 70%
80% 80%
90% 90%
100% 100%
2009 2010 2011 2012 2013 2014 2015 2016 2017 2018
Cash & Equivalents
Infrastructure
Timber
Private Equities
Real Estate
International Fixed Inc.
International Equities
Domestic Fixed Income
Domestic Equities
Target Historical Asset Allocation
0% 0%
10% 10%
20% 20%
30% 30%
40% 40%
50% 50%
60% 60%
70% 70%
80% 80%
90% 90%
100% 100%
2009 2010 2011 2012 2013 2014 2015 2016 2017 2018
Global Equity Broad
Cash & Equivalents
Infrastructure
Timber
Private Equities
Real Estate
International Fixed Inc.
International Equities
Domestic Fixed Income
Domestic Equities
Average Callan Public Fund Sponsor Database Historical Asset Allocation
0% 0%
10% 10%
20% 20%
30% 30%
40% 40%
50% 50%
60% 60%
70% 70%
80% 80%
90% 90%
100% 100%
2009 2010 2011 2012 2013 2014 2015 2016 2017 2018
Divsfd Multi-Asset
Private Equity
Real Assets
Global Balanced
Cash Equiv
Hedge Funds
Intl Fixed-Inc
Global Equity Broad
Other Alternatives
Real Estate
Intl Equity
Domestic Broad Eq
Domestic Fixed
* Current Quarter Target = 16.3% Blmbg Aggregate, 16.1% Russell 1000 Index, 16.0% MSCI World, 11.2% MSCI World ex US, 10.5% NCREIF Total Index,
7.0% Blmbg HY 2% Iss Cap, 6.5% NDSIB PEN - Private Equity, 4.9% Russell 2000 Index, 3.1% MSCI EM, 2.9% NCREIF NFI-ODCE Eq Wt Net, 2.9% CPI All
Urban Cons lagged 3 months, 2.2% NCREIF Timberland Index and 0.4% 3-month Treasury Bill.
25NDSIB - Consolidated Pension Trust
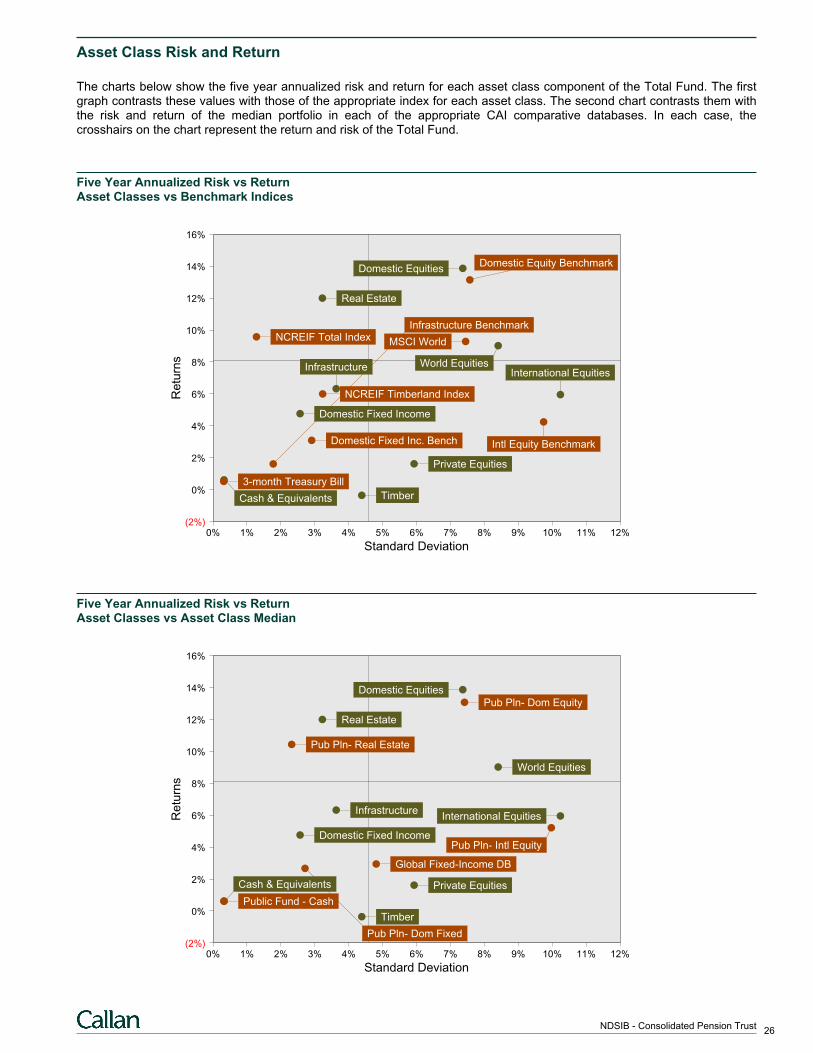
Asset Class Risk and Return
The charts below show the five year annualized risk and return for each asset class component of the Total Fund. The firstgraph contrasts these values with those of the appropriate index for each asset class. The second chart contrasts them withthe risk and return of the median portfolio in each of the appropriate CAI comparative databases. In each case, thecrosshairs on the chart represent the return and risk of the Total Fund.
Five Year Annualized Risk vs ReturnAsset Classes vs Benchmark Indices
0% 1% 2% 3% 4% 5% 6% 7% 8% 9% 10% 11% 12%(2%)
0%
2%
4%
6%
8%
10%
12%
14%
16%
Infrastructure Benchmark
Domestic Equity Benchmark
NCREIF Timberland Index
Cash & Equivalents
Domestic Equities
Real Estate
Private Equities
Timber
NCREIF Total Index
3-month Treasury Bill
Domestic Fixed Income
Intl Equity BenchmarkDomestic Fixed Inc. Bench
MSCI World
International EquitiesInfrastructure World Equities
Standard Deviation
Re
turn
s
Five Year Annualized Risk vs ReturnAsset Classes vs Asset Class Median
0% 1% 2% 3% 4% 5% 6% 7% 8% 9% 10% 11% 12%(2%)
0%
2%
4%
6%
8%
10%
12%
14%
16%
Pub Pln- Dom Fixed
Public Fund - Cash
Domestic Equities
Domestic Fixed Income
International Equities
Real Estate
World Equities
Private Equities
Timber
Infrastructure
Pub Pln- Dom Equity
Pub Pln- Real Estate
Global Fixed-Income DB
Cash & Equivalents
Pub Pln- Intl Equity
Standard Deviation
Re
turn
s
26NDSIB - Consolidated Pension Trust
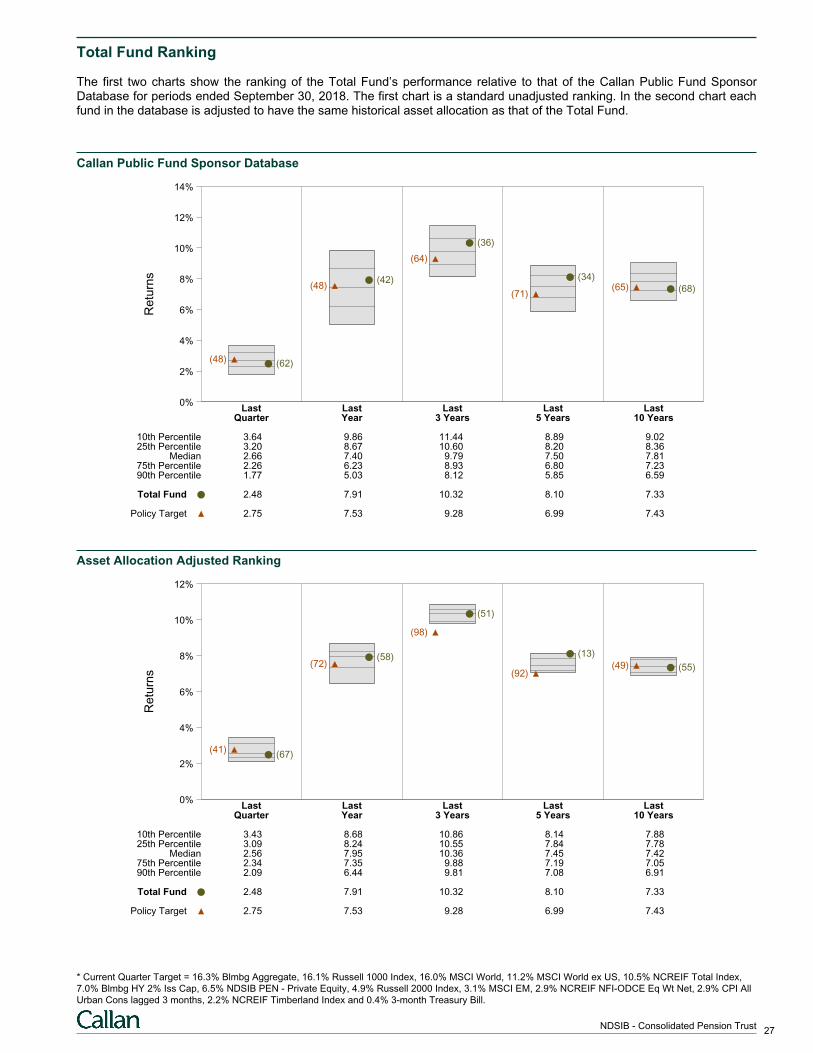
Total Fund Ranking
The first two charts show the ranking of the Total Fund’s performance relative to that of the Callan Public Fund SponsorDatabase for periods ended September 30, 2018. The first chart is a standard unadjusted ranking. In the second chart eachfund in the database is adjusted to have the same historical asset allocation as that of the Total Fund.
Callan Public Fund Sponsor DatabaseR
etu
rns
0%
2%
4%
6%
8%
10%
12%
14%
Last Last Last Last LastQuarter Year 3 Years 5 Years 10 Years
(62)(48)
(42)(48)
(36)
(64)
(34)
(71)(68)(65)
10th Percentile 3.64 9.86 11.44 8.89 9.0225th Percentile 3.20 8.67 10.60 8.20 8.36
Median 2.66 7.40 9.79 7.50 7.8175th Percentile 2.26 6.23 8.93 6.80 7.2390th Percentile 1.77 5.03 8.12 5.85 6.59
Total Fund 2.48 7.91 10.32 8.10 7.33
Policy Target 2.75 7.53 9.28 6.99 7.43
Asset Allocation Adjusted Ranking
Re
turn
s
0%
2%
4%
6%
8%
10%
12%
Last Last Last Last LastQuarter Year 3 Years 5 Years 10 Years
(67)(41)
(58)(72)
(51)
(98)
(13)
(92)(55)(49)
10th Percentile 3.43 8.68 10.86 8.14 7.8825th Percentile 3.09 8.24 10.55 7.84 7.78
Median 2.56 7.95 10.36 7.45 7.4275th Percentile 2.34 7.35 9.88 7.19 7.0590th Percentile 2.09 6.44 9.81 7.08 6.91
Total Fund 2.48 7.91 10.32 8.10 7.33
Policy Target 2.75 7.53 9.28 6.99 7.43
* Current Quarter Target = 16.3% Blmbg Aggregate, 16.1% Russell 1000 Index, 16.0% MSCI World, 11.2% MSCI World ex US, 10.5% NCREIF Total Index,
7.0% Blmbg HY 2% Iss Cap, 6.5% NDSIB PEN - Private Equity, 4.9% Russell 2000 Index, 3.1% MSCI EM, 2.9% NCREIF NFI-ODCE Eq Wt Net, 2.9% CPI All
Urban Cons lagged 3 months, 2.2% NCREIF Timberland Index and 0.4% 3-month Treasury Bill.
27NDSIB - Consolidated Pension Trust
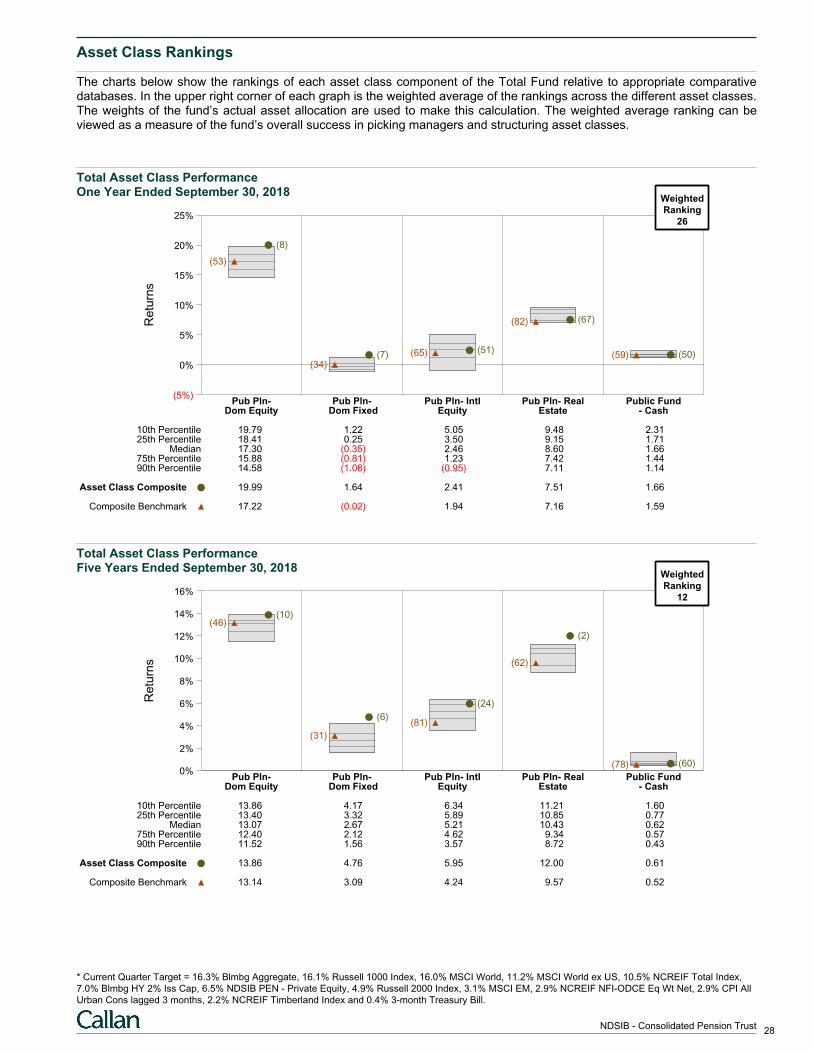
Asset Class Rankings
The charts below show the rankings of each asset class component of the Total Fund relative to appropriate comparativedatabases. In the upper right corner of each graph is the weighted average of the rankings across the different asset classes.The weights of the fund’s actual asset allocation are used to make this calculation. The weighted average ranking can beviewed as a measure of the fund’s overall success in picking managers and structuring asset classes.
Total Asset Class PerformanceOne Year Ended September 30, 2018
Re
turn
s
(5%)
0%
5%
10%
15%
20%
25%
Pub Pln- Pub Pln- Pub Pln- Intl Pub Pln- Real Public FundDom Equity Dom Fixed Equity Estate - Cash
(8)
(53)
(7)(34)
(51)(65)
(67)(82)
(50)(59)
10th Percentile 19.79 1.22 5.05 9.48 2.3125th Percentile 18.41 0.25 3.50 9.15 1.71
Median 17.30 (0.35) 2.46 8.60 1.6675th Percentile 15.88 (0.81) 1.23 7.42 1.4490th Percentile 14.58 (1.08) (0.95) 7.11 1.14
Asset Class Composite 19.99 1.64 2.41 7.51 1.66
Composite Benchmark 17.22 (0.02) 1.94 7.16 1.59
WeightedRanking
26
Total Asset Class PerformanceFive Years Ended September 30, 2018
Re
turn
s
0%
2%
4%
6%
8%
10%
12%
14%
16%
Pub Pln- Pub Pln- Pub Pln- Intl Pub Pln- Real Public FundDom Equity Dom Fixed Equity Estate - Cash
(10)(46)
(6)
(31)
(24)
(81)
(2)
(62)
(60)(78)
10th Percentile 13.86 4.17 6.34 11.21 1.6025th Percentile 13.40 3.32 5.89 10.85 0.77
Median 13.07 2.67 5.21 10.43 0.6275th Percentile 12.40 2.12 4.62 9.34 0.5790th Percentile 11.52 1.56 3.57 8.72 0.43
Asset Class Composite 13.86 4.76 5.95 12.00 0.61
Composite Benchmark 13.14 3.09 4.24 9.57 0.52
WeightedRanking
12
* Current Quarter Target = 16.3% Blmbg Aggregate, 16.1% Russell 1000 Index, 16.0% MSCI World, 11.2% MSCI World ex US, 10.5% NCREIF Total Index,
7.0% Blmbg HY 2% Iss Cap, 6.5% NDSIB PEN - Private Equity, 4.9% Russell 2000 Index, 3.1% MSCI EM, 2.9% NCREIF NFI-ODCE Eq Wt Net, 2.9% CPI All
Urban Cons lagged 3 months, 2.2% NCREIF Timberland Index and 0.4% 3-month Treasury Bill.
28NDSIB - Consolidated Pension Trust
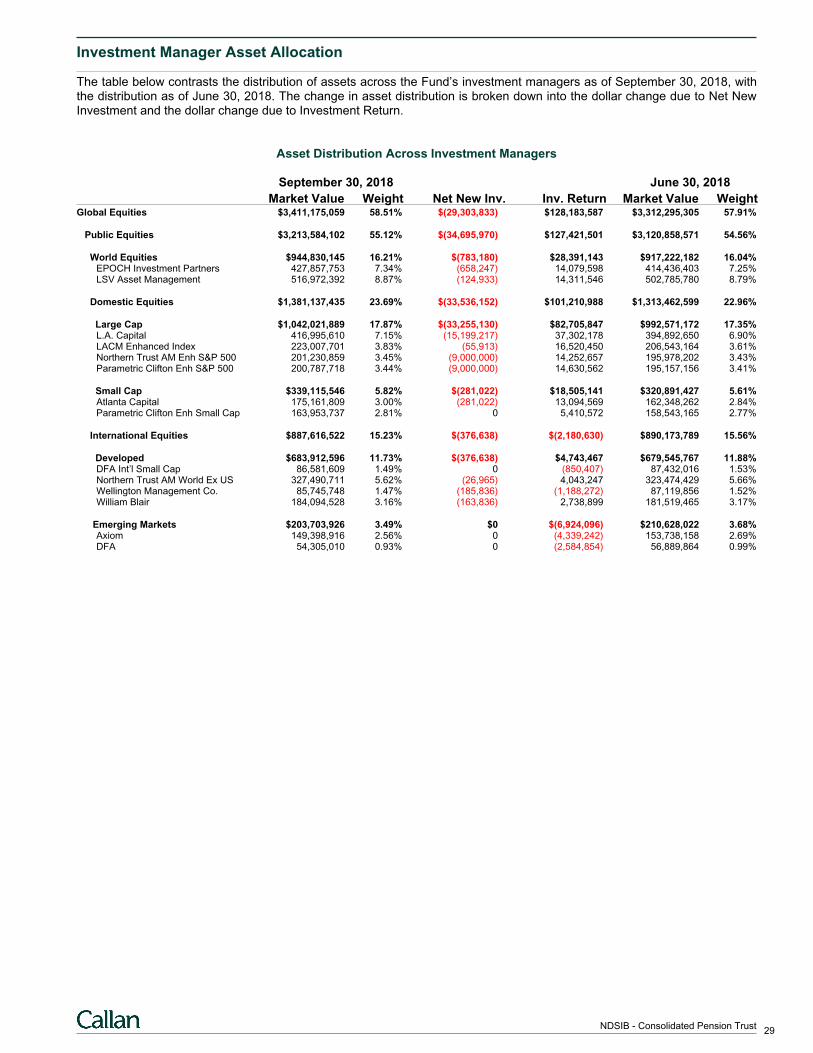
Investment Manager Asset Allocation
The table below contrasts the distribution of assets across the Fund’s investment managers as of September 30, 2018, withthe distribution as of June 30, 2018. The change in asset distribution is broken down into the dollar change due to Net NewInvestment and the dollar change due to Investment Return.
Asset Distribution Across Investment Managers
September 30, 2018 June 30, 2018
Market Value Weight Net New Inv. Inv. Return Market Value WeightGlobal Equities $3,411,175,059 58.51% $(29,303,833) $128,183,587 $3,312,295,305 57.91%
Public Equities $3,213,584,102 55.12% $(34,695,970) $127,421,501 $3,120,858,571 54.56%
World Equities $944,830,145 16.21% $(783,180) $28,391,143 $917,222,182 16.04% EPOCH Investment Partners 427,857,753 7.34% (658,247) 14,079,598 414,436,403 7.25% LSV Asset Management 516,972,392 8.87% (124,933) 14,311,546 502,785,780 8.79%
Domestic Equities $1,381,137,435 23.69% $(33,536,152) $101,210,988 $1,313,462,599 22.96%
Large Cap $1,042,021,889 17.87% $(33,255,130) $82,705,847 $992,571,172 17.35% L.A. Capital 416,995,610 7.15% (15,199,217) 37,302,178 394,892,650 6.90% LACM Enhanced Index 223,007,701 3.83% (55,913) 16,520,450 206,543,164 3.61% Northern Trust AM Enh S&P 500 201,230,859 3.45% (9,000,000) 14,252,657 195,978,202 3.43% Parametric Clifton Enh S&P 500 200,787,718 3.44% (9,000,000) 14,630,562 195,157,156 3.41%
Small Cap $339,115,546 5.82% $(281,022) $18,505,141 $320,891,427 5.61% Atlanta Capital 175,161,809 3.00% (281,022) 13,094,569 162,348,262 2.84% Parametric Clifton Enh Small Cap 163,953,737 2.81% 0 5,410,572 158,543,165 2.77%
International Equities $887,616,522 15.23% $(376,638) $(2,180,630) $890,173,789 15.56%
Developed $683,912,596 11.73% $(376,638) $4,743,467 $679,545,767 11.88% DFA Int’l Small Cap 86,581,609 1.49% 0 (850,407) 87,432,016 1.53% Northern Trust AM World Ex US 327,490,711 5.62% (26,965) 4,043,247 323,474,429 5.66% Wellington Management Co. 85,745,748 1.47% (185,836) (1,188,272) 87,119,856 1.52% William Blair 184,094,528 3.16% (163,836) 2,738,899 181,519,465 3.17%
Emerging Markets $203,703,926 3.49% $0 $(6,924,096) $210,628,022 3.68% Axiom 149,398,916 2.56% 0 (4,339,242) 153,738,158 2.69% DFA 54,305,010 0.93% 0 (2,584,854) 56,889,864 0.99%
29NDSIB - Consolidated Pension Trust
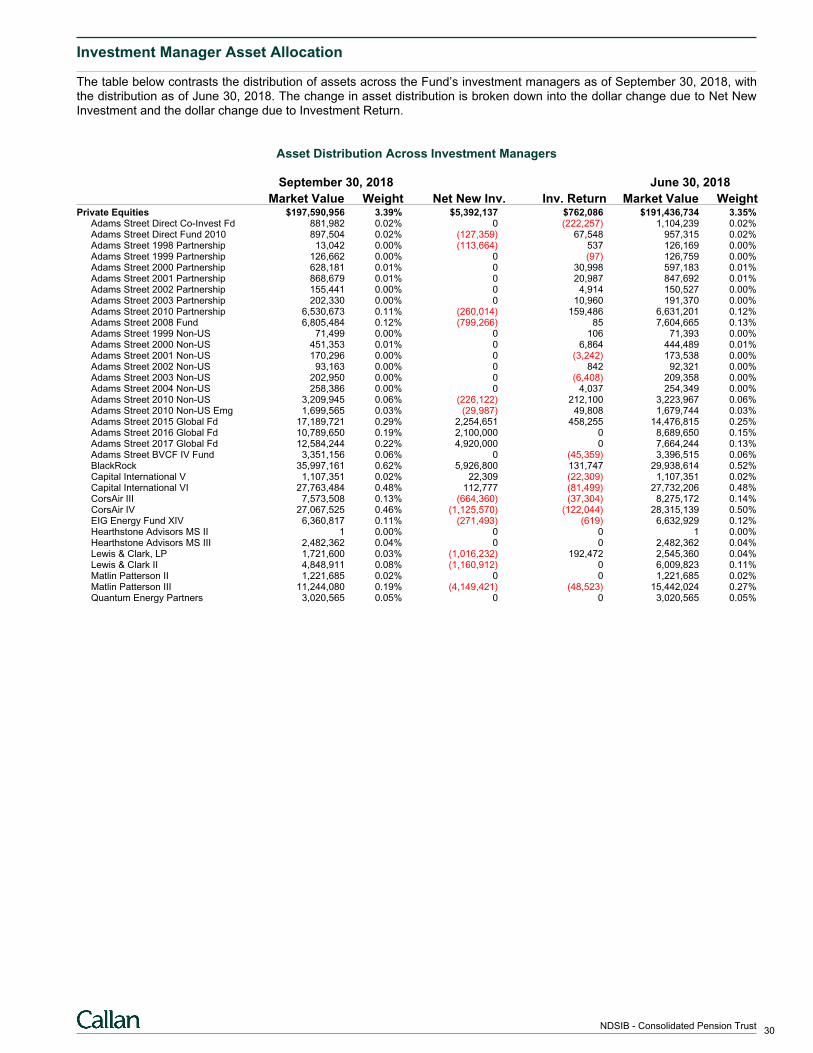
Investment Manager Asset Allocation
The table below contrasts the distribution of assets across the Fund’s investment managers as of September 30, 2018, withthe distribution as of June 30, 2018. The change in asset distribution is broken down into the dollar change due to Net NewInvestment and the dollar change due to Investment Return.
Asset Distribution Across Investment Managers
September 30, 2018 June 30, 2018
Market Value Weight Net New Inv. Inv. Return Market Value WeightPrivate Equities $197,590,956 3.39% $5,392,137 $762,086 $191,436,734 3.35%
Adams Street Direct Co-Invest Fd 881,982 0.02% 0 (222,257) 1,104,239 0.02%Adams Street Direct Fund 2010 897,504 0.02% (127,359) 67,548 957,315 0.02%Adams Street 1998 Partnership 13,042 0.00% (113,664) 537 126,169 0.00%Adams Street 1999 Partnership 126,662 0.00% 0 (97) 126,759 0.00%Adams Street 2000 Partnership 628,181 0.01% 0 30,998 597,183 0.01%Adams Street 2001 Partnership 868,679 0.01% 0 20,987 847,692 0.01%Adams Street 2002 Partnership 155,441 0.00% 0 4,914 150,527 0.00%Adams Street 2003 Partnership 202,330 0.00% 0 10,960 191,370 0.00%Adams Street 2010 Partnership 6,530,673 0.11% (260,014) 159,486 6,631,201 0.12%Adams Street 2008 Fund 6,805,484 0.12% (799,266) 85 7,604,665 0.13%Adams Street 1999 Non-US 71,499 0.00% 0 106 71,393 0.00%Adams Street 2000 Non-US 451,353 0.01% 0 6,864 444,489 0.01%Adams Street 2001 Non-US 170,296 0.00% 0 (3,242) 173,538 0.00%Adams Street 2002 Non-US 93,163 0.00% 0 842 92,321 0.00%Adams Street 2003 Non-US 202,950 0.00% 0 (6,408) 209,358 0.00%Adams Street 2004 Non-US 258,386 0.00% 0 4,037 254,349 0.00%Adams Street 2010 Non-US 3,209,945 0.06% (226,122) 212,100 3,223,967 0.06%Adams Street 2010 Non-US Emg 1,699,565 0.03% (29,987) 49,808 1,679,744 0.03%Adams Street 2015 Global Fd 17,189,721 0.29% 2,254,651 458,255 14,476,815 0.25%Adams Street 2016 Global Fd 10,789,650 0.19% 2,100,000 0 8,689,650 0.15%Adams Street 2017 Global Fd 12,584,244 0.22% 4,920,000 0 7,664,244 0.13%Adams Street BVCF IV Fund 3,351,156 0.06% 0 (45,359) 3,396,515 0.06%BlackRock 35,997,161 0.62% 5,926,800 131,747 29,938,614 0.52%Capital International V 1,107,351 0.02% 22,309 (22,309) 1,107,351 0.02%Capital International VI 27,763,484 0.48% 112,777 (81,499) 27,732,206 0.48%CorsAir III 7,573,508 0.13% (664,360) (37,304) 8,275,172 0.14%CorsAir IV 27,067,525 0.46% (1,125,570) (122,044) 28,315,139 0.50%EIG Energy Fund XIV 6,360,817 0.11% (271,493) (619) 6,632,929 0.12%Hearthstone Advisors MS II 1 0.00% 0 0 1 0.00%Hearthstone Advisors MS III 2,482,362 0.04% 0 0 2,482,362 0.04%Lewis & Clark, LP 1,721,600 0.03% (1,016,232) 192,472 2,545,360 0.04%Lewis & Clark II 4,848,911 0.08% (1,160,912) 0 6,009,823 0.11%Matlin Patterson II 1,221,685 0.02% 0 0 1,221,685 0.02%Matlin Patterson III 11,244,080 0.19% (4,149,421) (48,523) 15,442,024 0.27%Quantum Energy Partners 3,020,565 0.05% 0 0 3,020,565 0.05%
30NDSIB - Consolidated Pension Trust
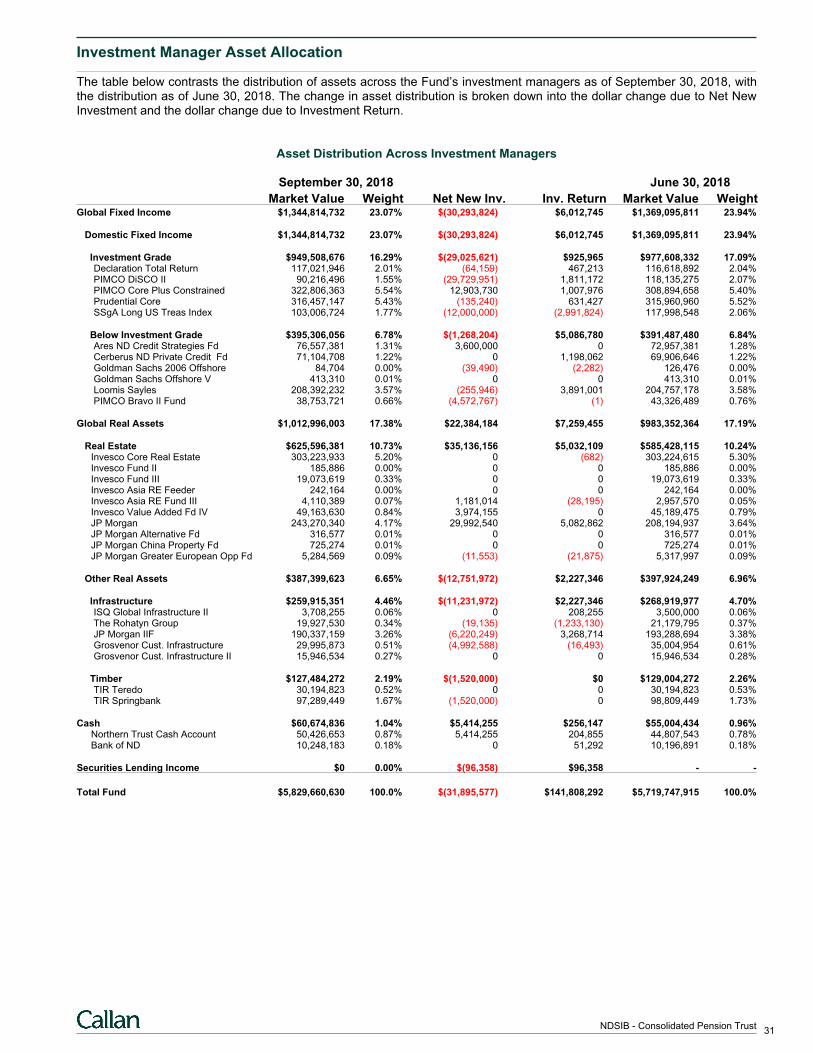
Investment Manager Asset Allocation
The table below contrasts the distribution of assets across the Fund’s investment managers as of September 30, 2018, withthe distribution as of June 30, 2018. The change in asset distribution is broken down into the dollar change due to Net NewInvestment and the dollar change due to Investment Return.
Asset Distribution Across Investment Managers
September 30, 2018 June 30, 2018
Market Value Weight Net New Inv. Inv. Return Market Value WeightGlobal Fixed Income $1,344,814,732 23.07% $(30,293,824) $6,012,745 $1,369,095,811 23.94%
Domestic Fixed Income $1,344,814,732 23.07% $(30,293,824) $6,012,745 $1,369,095,811 23.94%
Investment Grade $949,508,676 16.29% $(29,025,621) $925,965 $977,608,332 17.09% Declaration Total Return 117,021,946 2.01% (64,159) 467,213 116,618,892 2.04% PIMCO DiSCO II 90,216,496 1.55% (29,729,951) 1,811,172 118,135,275 2.07% PIMCO Core Plus Constrained 322,806,363 5.54% 12,903,730 1,007,976 308,894,658 5.40% Prudential Core 316,457,147 5.43% (135,240) 631,427 315,960,960 5.52% SSgA Long US Treas Index 103,006,724 1.77% (12,000,000) (2,991,824) 117,998,548 2.06%
Below Investment Grade $395,306,056 6.78% $(1,268,204) $5,086,780 $391,487,480 6.84% Ares ND Credit Strategies Fd 76,557,381 1.31% 3,600,000 0 72,957,381 1.28% Cerberus ND Private Credit Fd 71,104,708 1.22% 0 1,198,062 69,906,646 1.22% Goldman Sachs 2006 Offshore 84,704 0.00% (39,490) (2,282) 126,476 0.00% Goldman Sachs Offshore V 413,310 0.01% 0 0 413,310 0.01% Loomis Sayles 208,392,232 3.57% (255,946) 3,891,001 204,757,178 3.58% PIMCO Bravo II Fund 38,753,721 0.66% (4,572,767) (1) 43,326,489 0.76%
Global Real Assets $1,012,996,003 17.38% $22,384,184 $7,259,455 $983,352,364 17.19%
Real Estate $625,596,381 10.73% $35,136,156 $5,032,109 $585,428,115 10.24%Invesco Core Real Estate 303,223,933 5.20% 0 (682) 303,224,615 5.30%Invesco Fund II 185,886 0.00% 0 0 185,886 0.00%Invesco Fund III 19,073,619 0.33% 0 0 19,073,619 0.33%Invesco Asia RE Feeder 242,164 0.00% 0 0 242,164 0.00%Invesco Asia RE Fund III 4,110,389 0.07% 1,181,014 (28,195) 2,957,570 0.05%Invesco Value Added Fd IV 49,163,630 0.84% 3,974,155 0 45,189,475 0.79%JP Morgan 243,270,340 4.17% 29,992,540 5,082,862 208,194,937 3.64%JP Morgan Alternative Fd 316,577 0.01% 0 0 316,577 0.01%JP Morgan China Property Fd 725,274 0.01% 0 0 725,274 0.01%JP Morgan Greater European Opp Fd 5,284,569 0.09% (11,553) (21,875) 5,317,997 0.09%
Other Real Assets $387,399,623 6.65% $(12,751,972) $2,227,346 $397,924,249 6.96%
Infrastructure $259,915,351 4.46% $(11,231,972) $2,227,346 $268,919,977 4.70% ISQ Global Infrastructure II 3,708,255 0.06% 0 208,255 3,500,000 0.06% The Rohatyn Group 19,927,530 0.34% (19,135) (1,233,130) 21,179,795 0.37% JP Morgan IIF 190,337,159 3.26% (6,220,249) 3,268,714 193,288,694 3.38% Grosvenor Cust. Infrastructure 29,995,873 0.51% (4,992,588) (16,493) 35,004,954 0.61% Grosvenor Cust. Infrastructure II 15,946,534 0.27% 0 0 15,946,534 0.28%
Timber $127,484,272 2.19% $(1,520,000) $0 $129,004,272 2.26% TIR Teredo 30,194,823 0.52% 0 0 30,194,823 0.53% TIR Springbank 97,289,449 1.67% (1,520,000) 0 98,809,449 1.73%
Cash $60,674,836 1.04% $5,414,255 $256,147 $55,004,434 0.96%Northern Trust Cash Account 50,426,653 0.87% 5,414,255 204,855 44,807,543 0.78%Bank of ND 10,248,183 0.18% 0 51,292 10,196,891 0.18%
Securities Lending Income $0 0.00% $(96,358) $96,358 - -
Total Fund $5,829,660,630 100.0% $(31,895,577) $141,808,292 $5,719,747,915 100.0%
31NDSIB - Consolidated Pension Trust
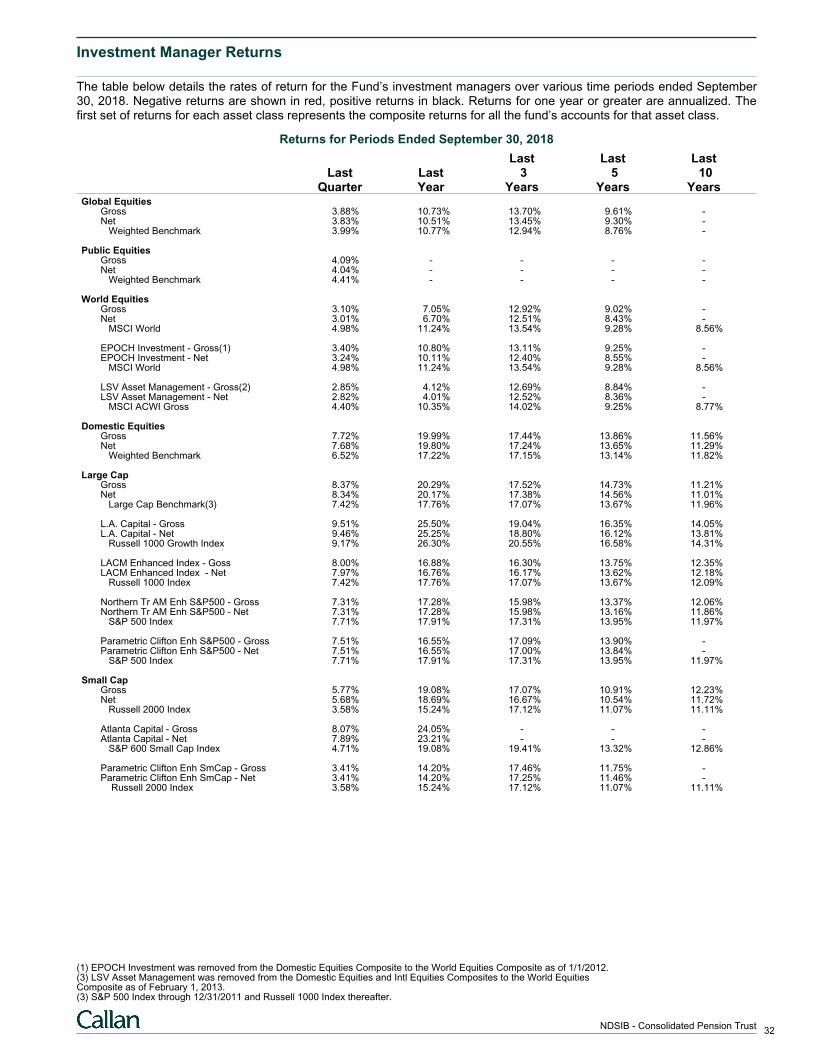
Investment Manager Returns
The table below details the rates of return for the Fund’s investment managers over various time periods ended September30, 2018. Negative returns are shown in red, positive returns in black. Returns for one year or greater are annualized. Thefirst set of returns for each asset class represents the composite returns for all the fund’s accounts for that asset class.
Returns for Periods Ended September 30, 2018
Last Last LastLast Last 3 5 10
Quarter Year Years Years YearsGlobal Equities
Gross 3.88% 10.73% 13.70% 9.61% -Net 3.83% 10.51% 13.45% 9.30% - Weighted Benchmark 3.99% 10.77% 12.94% 8.76% -
Public EquitiesGross 4.09% - - - -Net 4.04% - - - - Weighted Benchmark 4.41% - - - -
World EquitiesGross 3.10% 7.05% 12.92% 9.02% -Net 3.01% 6.70% 12.51% 8.43% - MSCI World 4.98% 11.24% 13.54% 9.28% 8.56%
EPOCH Investment - Gross(1) 3.40% 10.80% 13.11% 9.25% -EPOCH Investment - Net 3.24% 10.11% 12.40% 8.55% - MSCI World 4.98% 11.24% 13.54% 9.28% 8.56%
LSV Asset Management - Gross(2) 2.85% 4.12% 12.69% 8.84% -LSV Asset Management - Net 2.82% 4.01% 12.52% 8.36% - MSCI ACWI Gross 4.40% 10.35% 14.02% 9.25% 8.77%
Domestic EquitiesGross 7.72% 19.99% 17.44% 13.86% 11.56%Net 7.68% 19.80% 17.24% 13.65% 11.29% Weighted Benchmark 6.52% 17.22% 17.15% 13.14% 11.82%
Large CapGross 8.37% 20.29% 17.52% 14.73% 11.21%Net 8.34% 20.17% 17.38% 14.56% 11.01% Large Cap Benchmark(3) 7.42% 17.76% 17.07% 13.67% 11.96%
L.A. Capital - Gross 9.51% 25.50% 19.04% 16.35% 14.05%L.A. Capital - Net 9.46% 25.25% 18.80% 16.12% 13.81% Russell 1000 Growth Index 9.17% 26.30% 20.55% 16.58% 14.31%
LACM Enhanced Index - Goss 8.00% 16.88% 16.30% 13.75% 12.35%LACM Enhanced Index - Net 7.97% 16.76% 16.17% 13.62% 12.18% Russell 1000 Index 7.42% 17.76% 17.07% 13.67% 12.09%
Northern Tr AM Enh S&P500 - Gross 7.31% 17.28% 15.98% 13.37% 12.06%Northern Tr AM Enh S&P500 - Net 7.31% 17.28% 15.98% 13.16% 11.86% S&P 500 Index 7.71% 17.91% 17.31% 13.95% 11.97%
Parametric Clifton Enh S&P500 - Gross 7.51% 16.55% 17.09% 13.90% -Parametric Clifton Enh S&P500 - Net 7.51% 16.55% 17.00% 13.84% - S&P 500 Index 7.71% 17.91% 17.31% 13.95% 11.97%
Small CapGross 5.77% 19.08% 17.07% 10.91% 12.23%Net 5.68% 18.69% 16.67% 10.54% 11.72% Russell 2000 Index 3.58% 15.24% 17.12% 11.07% 11.11%
Atlanta Capital - Gross 8.07% 24.05% - - -Atlanta Capital - Net 7.89% 23.21% - - - S&P 600 Small Cap Index 4.71% 19.08% 19.41% 13.32% 12.86%
Parametric Clifton Enh SmCap - Gross 3.41% 14.20% 17.46% 11.75% -Parametric Clifton Enh SmCap - Net 3.41% 14.20% 17.25% 11.46% - Russell 2000 Index 3.58% 15.24% 17.12% 11.07% 11.11%
(1) EPOCH Investment was removed from the Domestic Equities Composite to the World Equities Composite as of 1/1/2012.(3) LSV Asset Management was removed from the Domestic Equities and Intl Equities Composites to the World EquitiesComposite as of February 1, 2013.(3) S&P 500 Index through 12/31/2011 and Russell 1000 Index thereafter.
32NDSIB - Consolidated Pension Trust
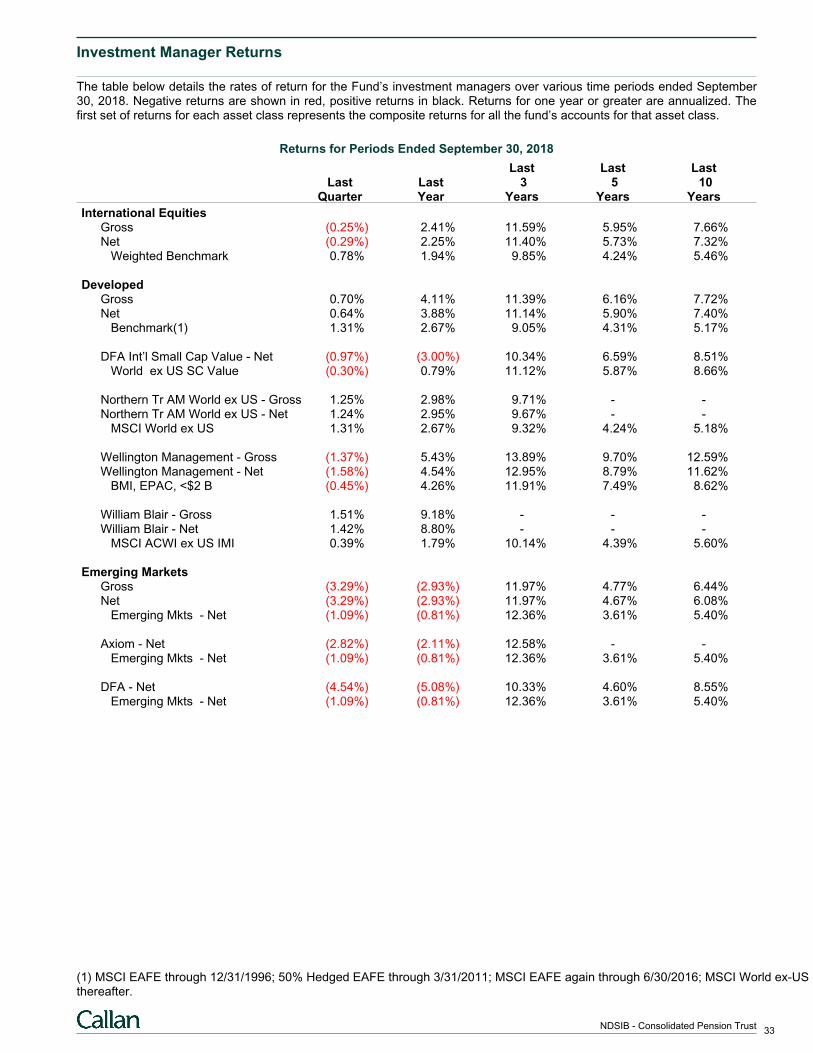
Investment Manager Returns
The table below details the rates of return for the Fund’s investment managers over various time periods ended September30, 2018. Negative returns are shown in red, positive returns in black. Returns for one year or greater are annualized. Thefirst set of returns for each asset class represents the composite returns for all the fund’s accounts for that asset class.
Returns for Periods Ended September 30, 2018
Last Last LastLast Last 3 5 10
Quarter Year Years Years Years
International EquitiesGross (0.25%) 2.41% 11.59% 5.95% 7.66%Net (0.29%) 2.25% 11.40% 5.73% 7.32% Weighted Benchmark 0.78% 1.94% 9.85% 4.24% 5.46%
DevelopedGross 0.70% 4.11% 11.39% 6.16% 7.72%Net 0.64% 3.88% 11.14% 5.90% 7.40% Benchmark(1) 1.31% 2.67% 9.05% 4.31% 5.17%
DFA Int’l Small Cap Value - Net (0.97%) (3.00%) 10.34% 6.59% 8.51% World ex US SC Value (0.30%) 0.79% 11.12% 5.87% 8.66%
Northern Tr AM World ex US - Gross 1.25% 2.98% 9.71% - -Northern Tr AM World ex US - Net 1.24% 2.95% 9.67% - - MSCI World ex US 1.31% 2.67% 9.32% 4.24% 5.18%
Wellington Management - Gross (1.37%) 5.43% 13.89% 9.70% 12.59%Wellington Management - Net (1.58%) 4.54% 12.95% 8.79% 11.62% BMI, EPAC, <$2 B (0.45%) 4.26% 11.91% 7.49% 8.62%
William Blair - Gross 1.51% 9.18% - - -William Blair - Net 1.42% 8.80% - - - MSCI ACWI ex US IMI 0.39% 1.79% 10.14% 4.39% 5.60%
Emerging MarketsGross (3.29%) (2.93%) 11.97% 4.77% 6.44%Net (3.29%) (2.93%) 11.97% 4.67% 6.08% Emerging Mkts - Net (1.09%) (0.81%) 12.36% 3.61% 5.40%
Axiom - Net (2.82%) (2.11%) 12.58% - - Emerging Mkts - Net (1.09%) (0.81%) 12.36% 3.61% 5.40%
DFA - Net (4.54%) (5.08%) 10.33% 4.60% 8.55% Emerging Mkts - Net (1.09%) (0.81%) 12.36% 3.61% 5.40%
(1) MSCI EAFE through 12/31/1996; 50% Hedged EAFE through 3/31/2011; MSCI EAFE again through 6/30/2016; MSCI World ex-USthereafter.
33NDSIB - Consolidated Pension Trust
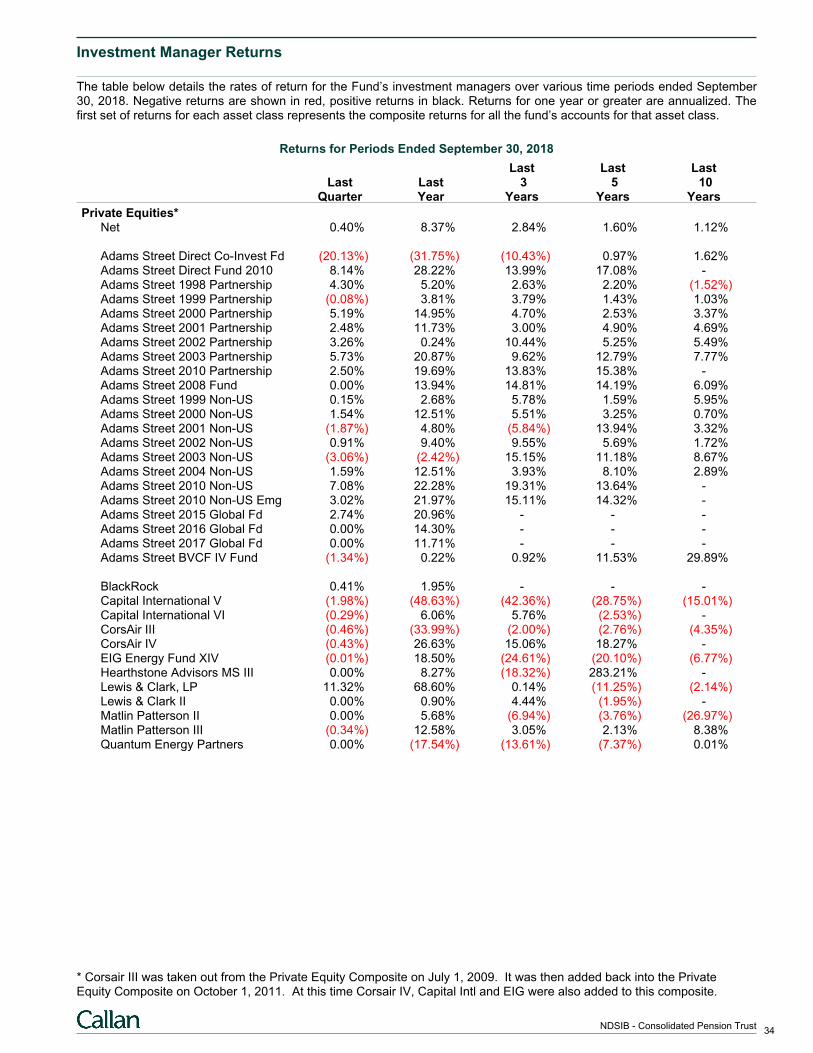
Investment Manager Returns
The table below details the rates of return for the Fund’s investment managers over various time periods ended September30, 2018. Negative returns are shown in red, positive returns in black. Returns for one year or greater are annualized. Thefirst set of returns for each asset class represents the composite returns for all the fund’s accounts for that asset class.
Returns for Periods Ended September 30, 2018
Last Last LastLast Last 3 5 10
Quarter Year Years Years Years
Private Equities*Net 0.40% 8.37% 2.84% 1.60% 1.12%
Adams Street Direct Co-Invest Fd (20.13%) (31.75%) (10.43%) 0.97% 1.62%Adams Street Direct Fund 2010 8.14% 28.22% 13.99% 17.08% -Adams Street 1998 Partnership 4.30% 5.20% 2.63% 2.20% (1.52%)Adams Street 1999 Partnership (0.08%) 3.81% 3.79% 1.43% 1.03%Adams Street 2000 Partnership 5.19% 14.95% 4.70% 2.53% 3.37%Adams Street 2001 Partnership 2.48% 11.73% 3.00% 4.90% 4.69%Adams Street 2002 Partnership 3.26% 0.24% 10.44% 5.25% 5.49%Adams Street 2003 Partnership 5.73% 20.87% 9.62% 12.79% 7.77%Adams Street 2010 Partnership 2.50% 19.69% 13.83% 15.38% -Adams Street 2008 Fund 0.00% 13.94% 14.81% 14.19% 6.09%Adams Street 1999 Non-US 0.15% 2.68% 5.78% 1.59% 5.95%Adams Street 2000 Non-US 1.54% 12.51% 5.51% 3.25% 0.70%Adams Street 2001 Non-US (1.87%) 4.80% (5.84%) 13.94% 3.32%Adams Street 2002 Non-US 0.91% 9.40% 9.55% 5.69% 1.72%Adams Street 2003 Non-US (3.06%) (2.42%) 15.15% 11.18% 8.67%Adams Street 2004 Non-US 1.59% 12.51% 3.93% 8.10% 2.89%Adams Street 2010 Non-US 7.08% 22.28% 19.31% 13.64% -Adams Street 2010 Non-US Emg 3.02% 21.97% 15.11% 14.32% -Adams Street 2015 Global Fd 2.74% 20.96% - - -Adams Street 2016 Global Fd 0.00% 14.30% - - -Adams Street 2017 Global Fd 0.00% 11.71% - - -Adams Street BVCF IV Fund (1.34%) 0.22% 0.92% 11.53% 29.89%
BlackRock 0.41% 1.95% - - -Capital International V (1.98%) (48.63%) (42.36%) (28.75%) (15.01%)Capital International VI (0.29%) 6.06% 5.76% (2.53%) -CorsAir III (0.46%) (33.99%) (2.00%) (2.76%) (4.35%)CorsAir IV (0.43%) 26.63% 15.06% 18.27% -EIG Energy Fund XIV (0.01%) 18.50% (24.61%) (20.10%) (6.77%)Hearthstone Advisors MS III 0.00% 8.27% (18.32%) 283.21% -Lewis & Clark, LP 11.32% 68.60% 0.14% (11.25%) (2.14%)Lewis & Clark II 0.00% 0.90% 4.44% (1.95%) -Matlin Patterson II 0.00% 5.68% (6.94%) (3.76%) (26.97%)Matlin Patterson III (0.34%) 12.58% 3.05% 2.13% 8.38%Quantum Energy Partners 0.00% (17.54%) (13.61%) (7.37%) 0.01%
* Corsair III was taken out from the Private Equity Composite on July 1, 2009. It was then added back into the PrivateEquity Composite on October 1, 2011. At this time Corsair IV, Capital Intl and EIG were also added to this composite.
34NDSIB - Consolidated Pension Trust
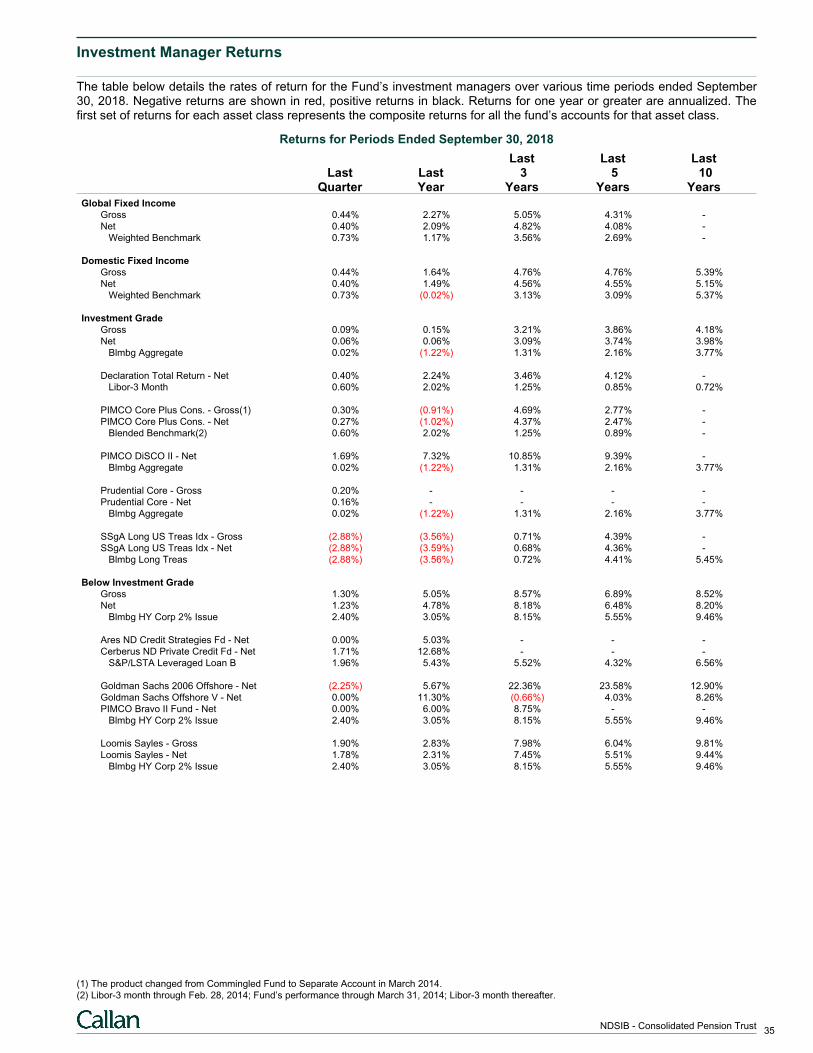
Investment Manager Returns
The table below details the rates of return for the Fund’s investment managers over various time periods ended September30, 2018. Negative returns are shown in red, positive returns in black. Returns for one year or greater are annualized. Thefirst set of returns for each asset class represents the composite returns for all the fund’s accounts for that asset class.
Returns for Periods Ended September 30, 2018
Last Last LastLast Last 3 5 10
Quarter Year Years Years Years
Global Fixed IncomeGross 0.44% 2.27% 5.05% 4.31% -
Net 0.40% 2.09% 4.82% 4.08% -
Weighted Benchmark 0.73% 1.17% 3.56% 2.69% -
Domestic Fixed IncomeGross 0.44% 1.64% 4.76% 4.76% 5.39%
Net 0.40% 1.49% 4.56% 4.55% 5.15%
Weighted Benchmark 0.73% (0.02%) 3.13% 3.09% 5.37%
Investment GradeGross 0.09% 0.15% 3.21% 3.86% 4.18%
Net 0.06% 0.06% 3.09% 3.74% 3.98%
Blmbg Aggregate 0.02% (1.22%) 1.31% 2.16% 3.77%
Declaration Total Return - Net 0.40% 2.24% 3.46% 4.12% -
Libor-3 Month 0.60% 2.02% 1.25% 0.85% 0.72%
PIMCO Core Plus Cons. - Gross(1) 0.30% (0.91%) 4.69% 2.77% -
PIMCO Core Plus Cons. - Net 0.27% (1.02%) 4.37% 2.47% -
Blended Benchmark(2) 0.60% 2.02% 1.25% 0.89% -
PIMCO DiSCO II - Net 1.69% 7.32% 10.85% 9.39% -
Blmbg Aggregate 0.02% (1.22%) 1.31% 2.16% 3.77%
Prudential Core - Gross 0.20% - - - -
Prudential Core - Net 0.16% - - - -
Blmbg Aggregate 0.02% (1.22%) 1.31% 2.16% 3.77%
SSgA Long US Treas Idx - Gross (2.88%) (3.56%) 0.71% 4.39% -
SSgA Long US Treas Idx - Net (2.88%) (3.59%) 0.68% 4.36% -
Blmbg Long Treas (2.88%) (3.56%) 0.72% 4.41% 5.45%
Below Investment GradeGross 1.30% 5.05% 8.57% 6.89% 8.52%
Net 1.23% 4.78% 8.18% 6.48% 8.20%
Blmbg HY Corp 2% Issue 2.40% 3.05% 8.15% 5.55% 9.46%
Ares ND Credit Strategies Fd - Net 0.00% 5.03% - - -
Cerberus ND Private Credit Fd - Net 1.71% 12.68% - - -
S&P/LSTA Leveraged Loan B 1.96% 5.43% 5.52% 4.32% 6.56%
Goldman Sachs 2006 Offshore - Net (2.25%) 5.67% 22.36% 23.58% 12.90%
Goldman Sachs Offshore V - Net 0.00% 11.30% (0.66%) 4.03% 8.26%
PIMCO Bravo II Fund - Net 0.00% 6.00% 8.75% - -
Blmbg HY Corp 2% Issue 2.40% 3.05% 8.15% 5.55% 9.46%
Loomis Sayles - Gross 1.90% 2.83% 7.98% 6.04% 9.81%
Loomis Sayles - Net 1.78% 2.31% 7.45% 5.51% 9.44%
Blmbg HY Corp 2% Issue 2.40% 3.05% 8.15% 5.55% 9.46%
(1) The product changed from Commingled Fund to Separate Account in March 2014.
(2) Libor-3 month through Feb. 28, 2014; Fund’s performance through March 31, 2014; Libor-3 month thereafter.
35NDSIB - Consolidated Pension Trust
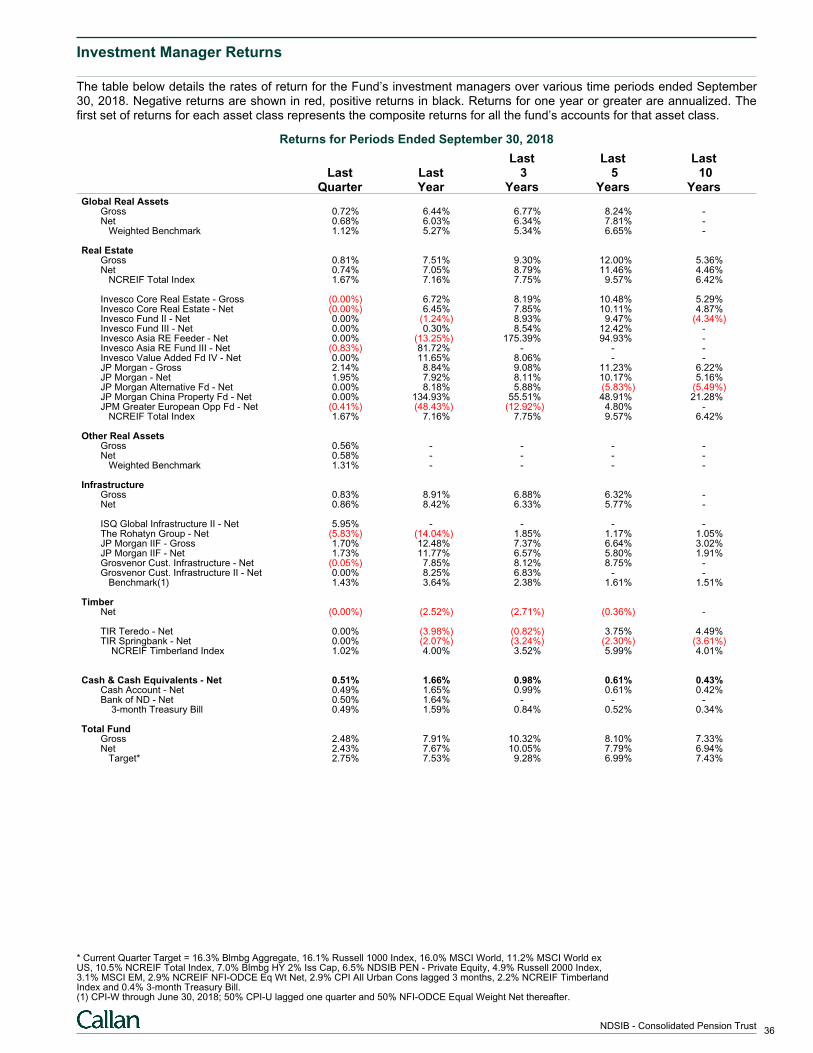
Investment Manager Returns
The table below details the rates of return for the Fund’s investment managers over various time periods ended September30, 2018. Negative returns are shown in red, positive returns in black. Returns for one year or greater are annualized. Thefirst set of returns for each asset class represents the composite returns for all the fund’s accounts for that asset class.
Returns for Periods Ended September 30, 2018
Last Last LastLast Last 3 5 10
Quarter Year Years Years YearsGlobal Real Assets
Gross 0.72% 6.44% 6.77% 8.24% -Net 0.68% 6.03% 6.34% 7.81% - Weighted Benchmark 1.12% 5.27% 5.34% 6.65% -
Real EstateGross 0.81% 7.51% 9.30% 12.00% 5.36%Net 0.74% 7.05% 8.79% 11.46% 4.46% NCREIF Total Index 1.67% 7.16% 7.75% 9.57% 6.42%
Invesco Core Real Estate - Gross (0.00%) 6.72% 8.19% 10.48% 5.29%Invesco Core Real Estate - Net (0.00%) 6.45% 7.85% 10.11% 4.87%Invesco Fund II - Net 0.00% (1.24%) 8.93% 9.47% (4.34%)Invesco Fund III - Net 0.00% 0.30% 8.54% 12.42% -Invesco Asia RE Feeder - Net 0.00% (13.25%) 175.39% 94.93% -Invesco Asia RE Fund III - Net (0.83%) 81.72% - - -Invesco Value Added Fd IV - Net 0.00% 11.65% 8.06% - -JP Morgan - Gross 2.14% 8.84% 9.08% 11.23% 6.22%JP Morgan - Net 1.95% 7.92% 8.11% 10.17% 5.16%JP Morgan Alternative Fd - Net 0.00% 8.18% 5.88% (5.83%) (5.49%)JP Morgan China Property Fd - Net 0.00% 134.93% 55.51% 48.91% 21.28%JPM Greater European Opp Fd - Net (0.41%) (48.43%) (12.92%) 4.80% - NCREIF Total Index 1.67% 7.16% 7.75% 9.57% 6.42%
Other Real AssetsGross 0.56% - - - -Net 0.58% - - - - Weighted Benchmark 1.31% - - - -
InfrastructureGross 0.83% 8.91% 6.88% 6.32% -Net 0.86% 8.42% 6.33% 5.77% -
ISQ Global Infrastructure II - Net 5.95% - - - -The Rohatyn Group - Net (5.83%) (14.04%) 1.85% 1.17% 1.05%JP Morgan IIF - Gross 1.70% 12.48% 7.37% 6.64% 3.02%JP Morgan IIF - Net 1.73% 11.77% 6.57% 5.80% 1.91%Grosvenor Cust. Infrastructure - Net (0.05%) 7.85% 8.12% 8.75% -Grosvenor Cust. Infrastructure II - Net 0.00% 8.25% 6.83% - - Benchmark(1) 1.43% 3.64% 2.38% 1.61% 1.51%
TimberNet (0.00%) (2.52%) (2.71%) (0.36%) -
TIR Teredo - Net 0.00% (3.98%) (0.82%) 3.75% 4.49%TIR Springbank - Net 0.00% (2.07%) (3.24%) (2.30%) (3.61%) NCREIF Timberland Index 1.02% 4.00% 3.52% 5.99% 4.01%
Cash & Cash Equivalents - Net 0.51% 1.66% 0.98% 0.61% 0.43%Cash Account - Net 0.49% 1.65% 0.99% 0.61% 0.42%Bank of ND - Net 0.50% 1.64% - - - 3-month Treasury Bill 0.49% 1.59% 0.84% 0.52% 0.34%
Total FundGross 2.48% 7.91% 10.32% 8.10% 7.33%Net 2.43% 7.67% 10.05% 7.79% 6.94% Target* 2.75% 7.53% 9.28% 6.99% 7.43%
* Current Quarter Target = 16.3% Blmbg Aggregate, 16.1% Russell 1000 Index, 16.0% MSCI World, 11.2% MSCI World exUS, 10.5% NCREIF Total Index, 7.0% Blmbg HY 2% Iss Cap, 6.5% NDSIB PEN - Private Equity, 4.9% Russell 2000 Index,3.1% MSCI EM, 2.9% NCREIF NFI-ODCE Eq Wt Net, 2.9% CPI All Urban Cons lagged 3 months, 2.2% NCREIF TimberlandIndex and 0.4% 3-month Treasury Bill.(1) CPI-W through June 30, 2018; 50% CPI-U lagged one quarter and 50% NFI-ODCE Equal Weight Net thereafter.
36NDSIB - Consolidated Pension Trust
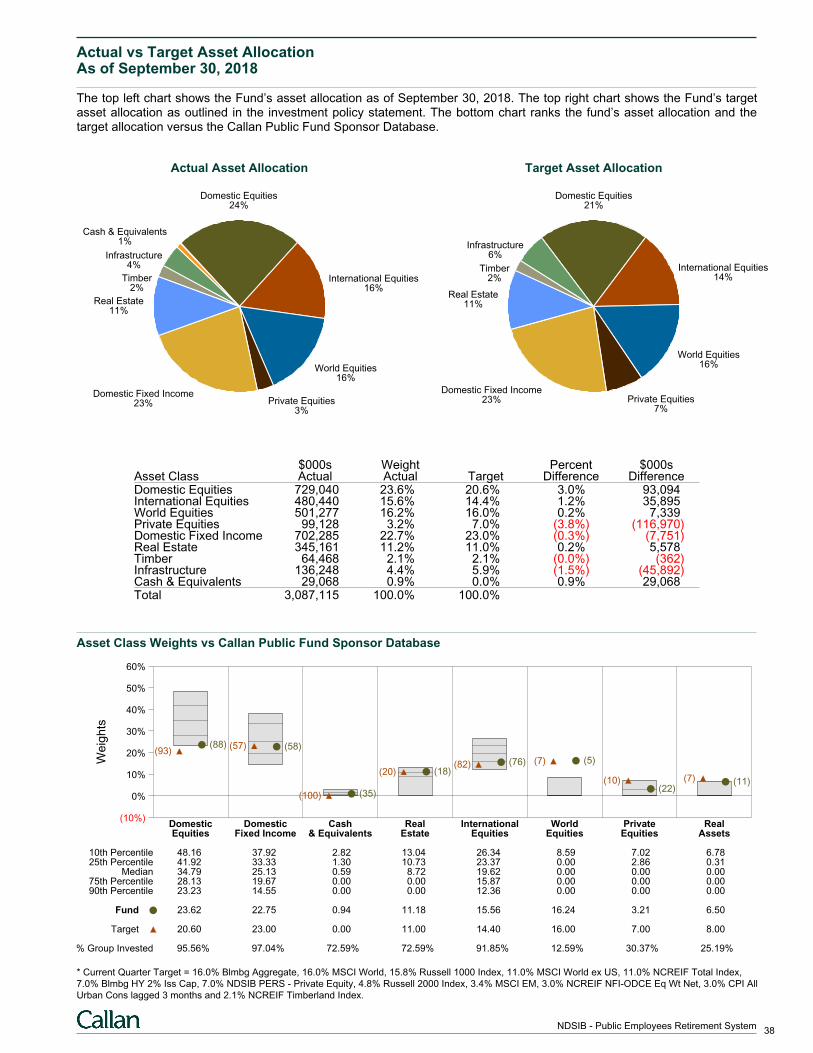
Actual vs Target Asset AllocationAs of September 30, 2018
The top left chart shows the Fund’s asset allocation as of September 30, 2018. The top right chart shows the Fund’s targetasset allocation as outlined in the investment policy statement. The bottom chart ranks the fund’s asset allocation and thetarget allocation versus the Callan Public Fund Sponsor Database.
Actual Asset Allocation
Domestic Equities24%
International Equities16%
World Equities16%
Private Equities3%
Domestic Fixed Income23%
Real Estate11%
Timber2%
Infrastructure4%
Cash & Equivalents1%
Target Asset Allocation
Domestic Equities21%
International Equities14%
World Equities16%
Private Equities7%
Domestic Fixed Income23%
Real Estate11%
Timber2%
Infrastructure6%
$000s Weight Percent $000sAsset Class Actual Actual Target Difference DifferenceDomestic Equities 729,040 23.6% 20.6% 3.0% 93,094International Equities 480,440 15.6% 14.4% 1.2% 35,895World Equities 501,277 16.2% 16.0% 0.2% 7,339Private Equities 99,128 3.2% 7.0% (3.8%) (116,970)Domestic Fixed Income 702,285 22.7% 23.0% (0.3%) (7,751)Real Estate 345,161 11.2% 11.0% 0.2% 5,578Timber 64,468 2.1% 2.1% (0.0%) (362)Infrastructure 136,248 4.4% 5.9% (1.5%) (45,892)Cash & Equivalents 29,068 0.9% 0.0% 0.9% 29,068Total 3,087,115 100.0% 100.0%
Asset Class Weights vs Callan Public Fund Sponsor Database
We
igh
ts
(10%)
0%
10%
20%
30%
40%
50%
60%
Domestic Domestic Cash Real International World Private RealEquities Fixed Income & Equivalents Estate Equities Equities Equities Assets
(88)(93)
(58)(57)
(35)(100)
(18)(20)(76)(82) (5)(7)
(22)(10) (11)(7)
10th Percentile 48.16 37.92 2.82 13.04 26.34 8.59 7.02 6.7825th Percentile 41.92 33.33 1.30 10.73 23.37 0.00 2.86 0.31
Median 34.79 25.13 0.59 8.72 19.62 0.00 0.00 0.0075th Percentile 28.13 19.67 0.00 0.00 15.87 0.00 0.00 0.0090th Percentile 23.23 14.55 0.00 0.00 12.36 0.00 0.00 0.00
Fund 23.62 22.75 0.94 11.18 15.56 16.24 3.21 6.50
Target 20.60 23.00 0.00 11.00 14.40 16.00 7.00 8.00
% Group Invested 95.56% 97.04% 72.59% 72.59% 91.85% 12.59% 30.37% 25.19%
* Current Quarter Target = 16.0% Blmbg Aggregate, 16.0% MSCI World, 15.8% Russell 1000 Index, 11.0% MSCI World ex US, 11.0% NCREIF Total Index,
7.0% Blmbg HY 2% Iss Cap, 7.0% NDSIB PERS - Private Equity, 4.8% Russell 2000 Index, 3.4% MSCI EM, 3.0% NCREIF NFI-ODCE Eq Wt Net, 3.0% CPI All
Urban Cons lagged 3 months and 2.1% NCREIF Timberland Index.
38NDSIB - Public Employees Retirement System
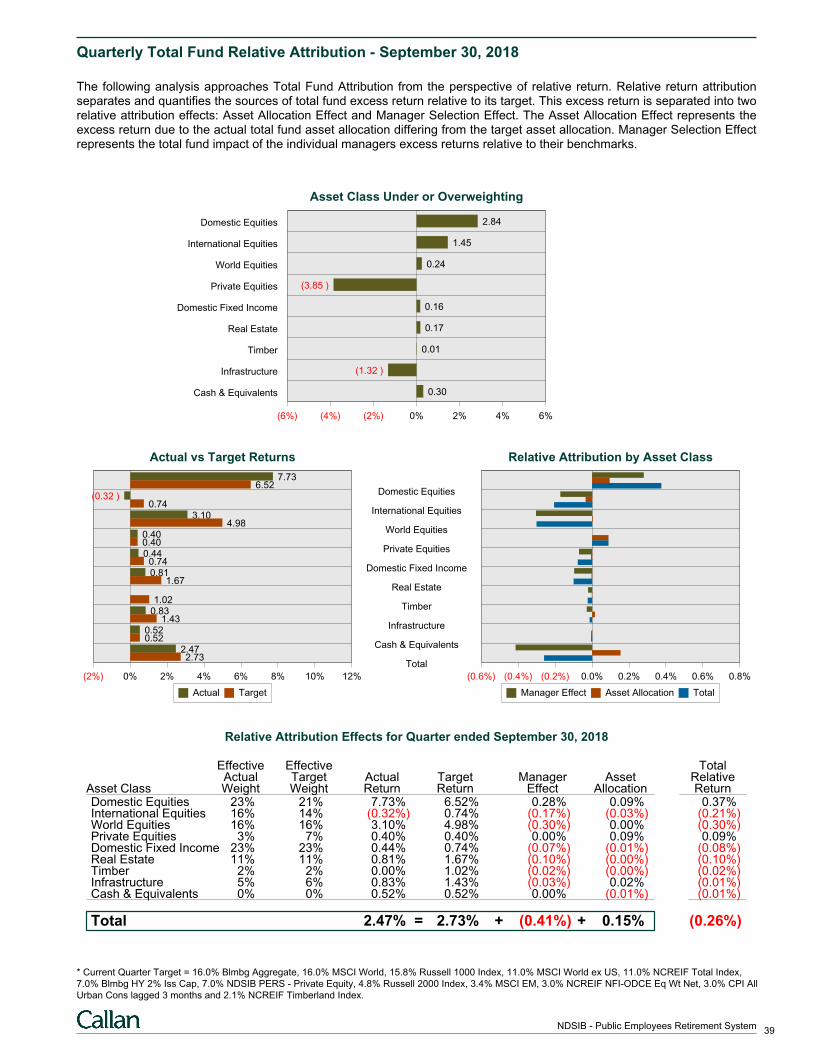
Quarterly Total Fund Relative Attribution - September 30, 2018
The following analysis approaches Total Fund Attribution from the perspective of relative return. Relative return attributionseparates and quantifies the sources of total fund excess return relative to its target. This excess return is separated into tworelative attribution effects: Asset Allocation Effect and Manager Selection Effect. The Asset Allocation Effect represents theexcess return due to the actual total fund asset allocation differing from the target asset allocation. Manager Selection Effectrepresents the total fund impact of the individual managers excess returns relative to their benchmarks.
Asset Class Under or Overweighting
(6%) (4%) (2%) 0% 2% 4% 6%
Domestic Equities 2.84
International Equities 1.45
World Equities 0.24
Private Equities (3.85 )
Domestic Fixed Income 0.16
Real Estate 0.17
Timber 0.01
Infrastructure (1.32 )
Cash & Equivalents 0.30
Domestic Equities
International Equities
World Equities
Private Equities
Domestic Fixed Income
Real Estate
Timber
Infrastructure
Cash & Equivalents
Total
Actual vs Target Returns
(2%) 0% 2% 4% 6% 8% 10% 12%
7.736.52
(0.32 )0.74
3.104.98
0.400.400.44
0.740.81
1.67
1.020.83
1.430.520.52
2.472.73
Actual Target
Relative Attribution by Asset Class
(0.6%) (0.4%) (0.2%) 0.0% 0.2% 0.4% 0.6% 0.8%
Manager Effect Asset Allocation Total
Relative Attribution Effects for Quarter ended September 30, 2018
Effective Effective TotalActual Target Actual Target Manager Asset Relative
Asset Class Weight Weight Return Return Effect Allocation ReturnDomestic Equities 23% 21% 7.73% 6.52% 0.28% 0.09% 0.37%International Equities 16% 14% (0.32%) 0.74% (0.17%) (0.03%) (0.21%)World Equities 16% 16% 3.10% 4.98% (0.30%) 0.00% (0.30%)Private Equities 3% 7% 0.40% 0.40% 0.00% 0.09% 0.09%Domestic Fixed Income 23% 23% 0.44% 0.74% (0.07%) (0.01%) (0.08%)Real Estate 11% 11% 0.81% 1.67% (0.10%) (0.00%) (0.10%)Timber 2% 2% 0.00% 1.02% (0.02%) (0.00%) (0.02%)Infrastructure 5% 6% 0.83% 1.43% (0.03%) 0.02% (0.01%)Cash & Equivalents 0% 0% 0.52% 0.52% 0.00% (0.01%) (0.01%)
Total = + +2.47% 2.73% (0.41%) 0.15% (0.26%)
* Current Quarter Target = 16.0% Blmbg Aggregate, 16.0% MSCI World, 15.8% Russell 1000 Index, 11.0% MSCI World ex US, 11.0% NCREIF Total Index,
7.0% Blmbg HY 2% Iss Cap, 7.0% NDSIB PERS - Private Equity, 4.8% Russell 2000 Index, 3.4% MSCI EM, 3.0% NCREIF NFI-ODCE Eq Wt Net, 3.0% CPI All
Urban Cons lagged 3 months and 2.1% NCREIF Timberland Index.
39NDSIB - Public Employees Retirement System
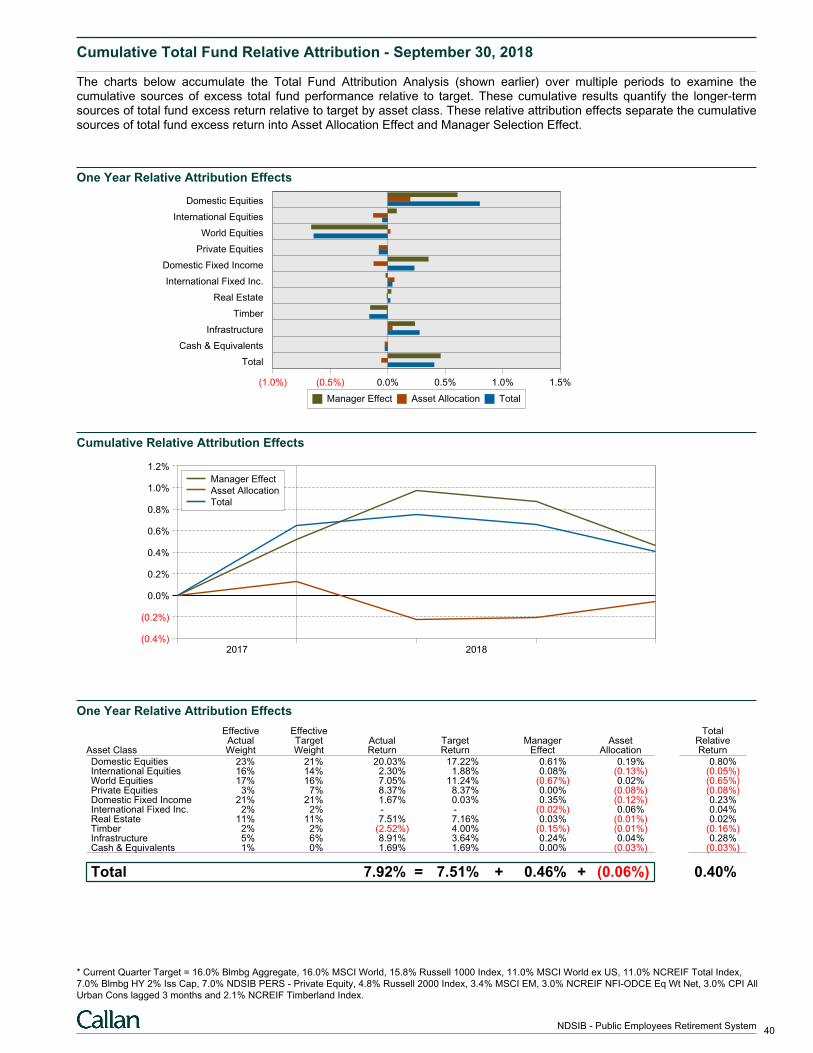
Cumulative Total Fund Relative Attribution - September 30, 2018
The charts below accumulate the Total Fund Attribution Analysis (shown earlier) over multiple periods to examine thecumulative sources of excess total fund performance relative to target. These cumulative results quantify the longer-termsources of total fund excess return relative to target by asset class. These relative attribution effects separate the cumulativesources of total fund excess return into Asset Allocation Effect and Manager Selection Effect.
One Year Relative Attribution Effects
(1.0%) (0.5%) 0.0% 0.5% 1.0% 1.5%
Domestic Equities
International Equities
World Equities
Private Equities
Domestic Fixed Income
International Fixed Inc.
Real Estate
Timber
Infrastructure
Cash & Equivalents
Total
Manager Effect Asset Allocation Total
Cumulative Relative Attribution Effects
(0.4%)
(0.2%)
0.0%
0.2%
0.4%
0.6%
0.8%
1.0%
1.2%
2017 2018
Manager Effect
Asset Allocation
Total
One Year Relative Attribution Effects
Effective Effective TotalActual Target Actual Target Manager Asset Relative
Asset Class Weight Weight Return Return Effect Allocation Return
Domestic Equities 23% 21% 20.03% 17.22% 0.61% 0.19% 0.80%International Equities 16% 14% 2.30% 1.88% 0.08% (0.13%) (0.05%)World Equities 17% 16% 7.05% 11.24% (0.67%) 0.02% (0.65%)Private Equities 3% 7% 8.37% 8.37% 0.00% (0.08%) (0.08%)Domestic Fixed Income 21% 21% 1.67% 0.03% 0.35% (0.12%) 0.23%International Fixed Inc. 2% 2% - - (0.02%) 0.06% 0.04%Real Estate 11% 11% 7.51% 7.16% 0.03% (0.01%) 0.02%Timber 2% 2% (2.52%) 4.00% (0.15%) (0.01%) (0.16%)Infrastructure 5% 6% 8.91% 3.64% 0.24% 0.04% 0.28%Cash & Equivalents 1% 0% 1.69% 1.69% 0.00% (0.03%) (0.03%)
Total = + +7.92% 7.51% 0.46% (0.06%) 0.40%
* Current Quarter Target = 16.0% Blmbg Aggregate, 16.0% MSCI World, 15.8% Russell 1000 Index, 11.0% MSCI World ex US, 11.0% NCREIF Total Index,
7.0% Blmbg HY 2% Iss Cap, 7.0% NDSIB PERS - Private Equity, 4.8% Russell 2000 Index, 3.4% MSCI EM, 3.0% NCREIF NFI-ODCE Eq Wt Net, 3.0% CPI All
Urban Cons lagged 3 months and 2.1% NCREIF Timberland Index.
40NDSIB - Public Employees Retirement System
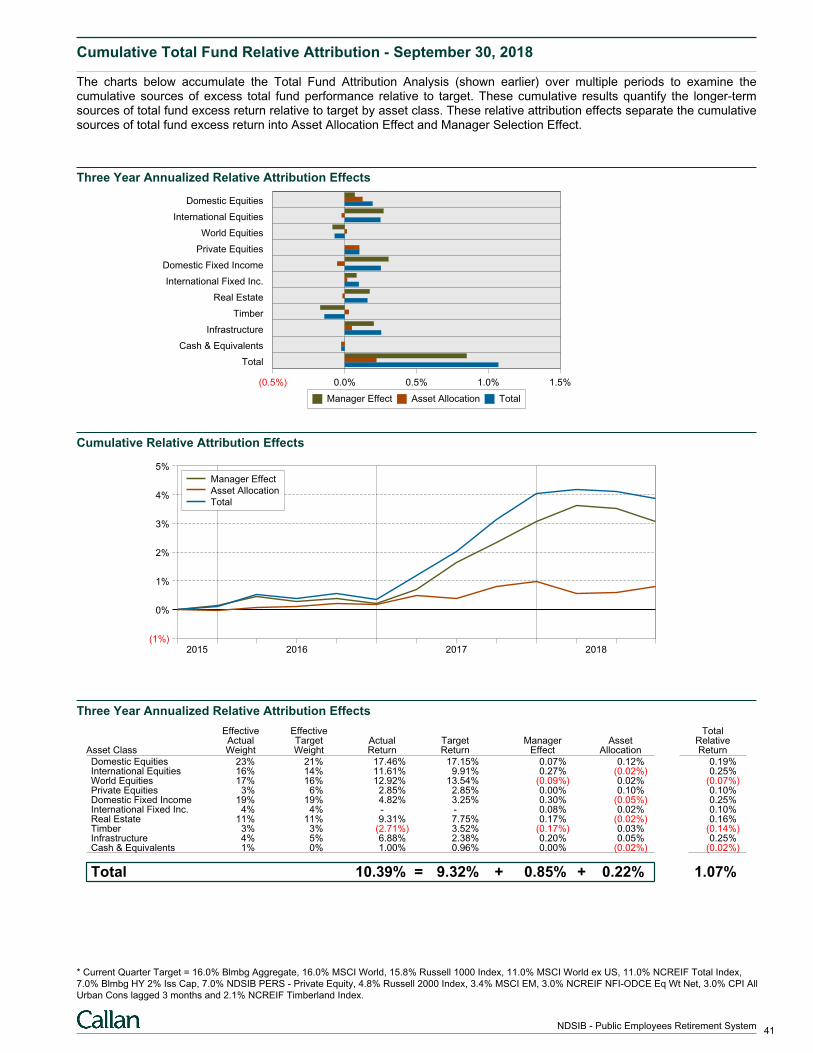
Cumulative Total Fund Relative Attribution - September 30, 2018
The charts below accumulate the Total Fund Attribution Analysis (shown earlier) over multiple periods to examine thecumulative sources of excess total fund performance relative to target. These cumulative results quantify the longer-termsources of total fund excess return relative to target by asset class. These relative attribution effects separate the cumulativesources of total fund excess return into Asset Allocation Effect and Manager Selection Effect.
Three Year Annualized Relative Attribution Effects
(0.5%) 0.0% 0.5% 1.0% 1.5%
Domestic Equities
International Equities
World Equities
Private Equities
Domestic Fixed Income
International Fixed Inc.
Real Estate
Timber
Infrastructure
Cash & Equivalents
Total
Manager Effect Asset Allocation Total
Cumulative Relative Attribution Effects
(1%)
0%
1%
2%
3%
4%
5%
2015 2016 2017 2018
Manager Effect
Asset Allocation
Total
Three Year Annualized Relative Attribution Effects
Effective Effective TotalActual Target Actual Target Manager Asset Relative
Asset Class Weight Weight Return Return Effect Allocation Return
Domestic Equities 23% 21% 17.46% 17.15% 0.07% 0.12% 0.19%International Equities 16% 14% 11.61% 9.91% 0.27% (0.02%) 0.25%World Equities 17% 16% 12.92% 13.54% (0.09%) 0.02% (0.07%)Private Equities 3% 6% 2.85% 2.85% 0.00% 0.10% 0.10%Domestic Fixed Income 19% 19% 4.82% 3.25% 0.30% (0.05%) 0.25%International Fixed Inc. 4% 4% - - 0.08% 0.02% 0.10%Real Estate 11% 11% 9.31% 7.75% 0.17% (0.02%) 0.16%Timber 3% 3% (2.71%) 3.52% (0.17%) 0.03% (0.14%)Infrastructure 4% 5% 6.88% 2.38% 0.20% 0.05% 0.25%Cash & Equivalents 1% 0% 1.00% 0.96% 0.00% (0.02%) (0.02%)
Total = + +10.39% 9.32% 0.85% 0.22% 1.07%
* Current Quarter Target = 16.0% Blmbg Aggregate, 16.0% MSCI World, 15.8% Russell 1000 Index, 11.0% MSCI World ex US, 11.0% NCREIF Total Index,
7.0% Blmbg HY 2% Iss Cap, 7.0% NDSIB PERS - Private Equity, 4.8% Russell 2000 Index, 3.4% MSCI EM, 3.0% NCREIF NFI-ODCE Eq Wt Net, 3.0% CPI All
Urban Cons lagged 3 months and 2.1% NCREIF Timberland Index.
41NDSIB - Public Employees Retirement System
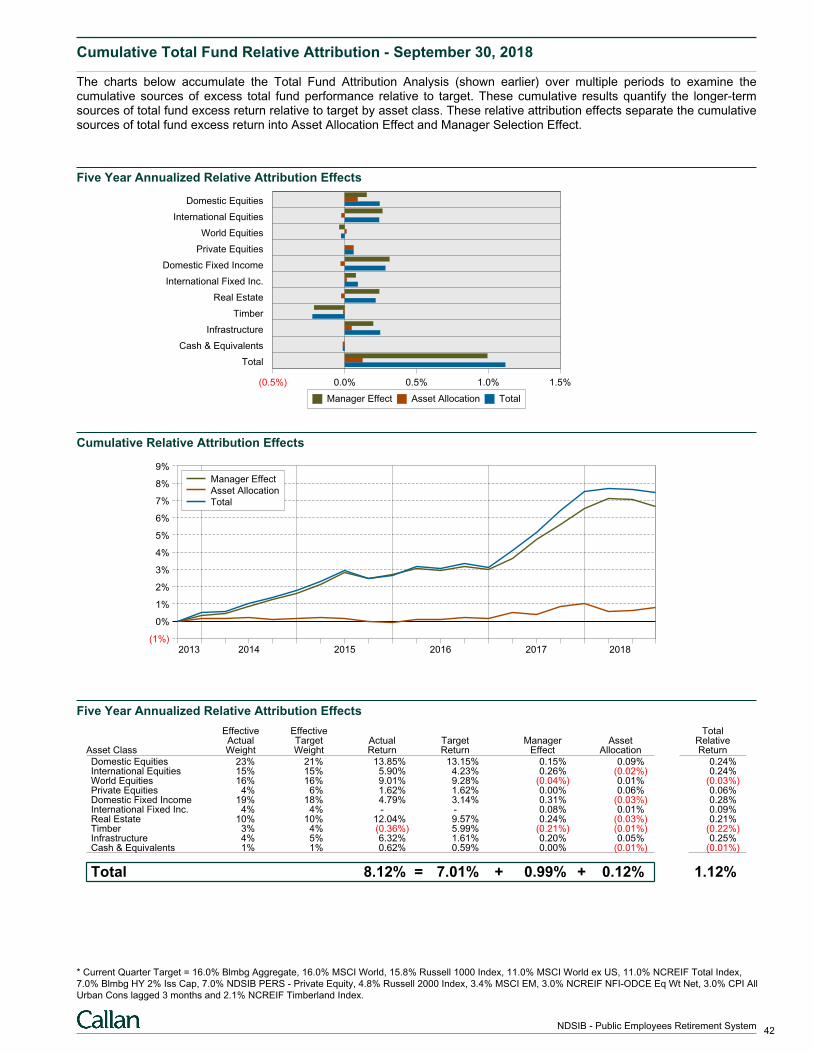
Cumulative Total Fund Relative Attribution - September 30, 2018
The charts below accumulate the Total Fund Attribution Analysis (shown earlier) over multiple periods to examine thecumulative sources of excess total fund performance relative to target. These cumulative results quantify the longer-termsources of total fund excess return relative to target by asset class. These relative attribution effects separate the cumulativesources of total fund excess return into Asset Allocation Effect and Manager Selection Effect.
Five Year Annualized Relative Attribution Effects
(0.5%) 0.0% 0.5% 1.0% 1.5%
Domestic Equities
International Equities
World Equities
Private Equities
Domestic Fixed Income
International Fixed Inc.
Real Estate
Timber
Infrastructure
Cash & Equivalents
Total
Manager Effect Asset Allocation Total
Cumulative Relative Attribution Effects
(1%)
0%
1%
2%
3%
4%
5%
6%
7%
8%
9%
2013 2014 2015 2016 2017 2018
Manager Effect
Asset Allocation
Total
Five Year Annualized Relative Attribution Effects
Effective Effective TotalActual Target Actual Target Manager Asset Relative
Asset Class Weight Weight Return Return Effect Allocation Return
Domestic Equities 23% 21% 13.85% 13.15% 0.15% 0.09% 0.24%International Equities 15% 15% 5.90% 4.23% 0.26% (0.02%) 0.24%World Equities 16% 16% 9.01% 9.28% (0.04%) 0.01% (0.03%)Private Equities 4% 6% 1.62% 1.62% 0.00% 0.06% 0.06%Domestic Fixed Income 19% 18% 4.79% 3.14% 0.31% (0.03%) 0.28%International Fixed Inc. 4% 4% - - 0.08% 0.01% 0.09%Real Estate 10% 10% 12.04% 9.57% 0.24% (0.03%) 0.21%Timber 3% 4% (0.36%) 5.99% (0.21%) (0.01%) (0.22%)Infrastructure 4% 5% 6.32% 1.61% 0.20% 0.05% 0.25%Cash & Equivalents 1% 1% 0.62% 0.59% 0.00% (0.01%) (0.01%)
Total = + +8.12% 7.01% 0.99% 0.12% 1.12%
* Current Quarter Target = 16.0% Blmbg Aggregate, 16.0% MSCI World, 15.8% Russell 1000 Index, 11.0% MSCI World ex US, 11.0% NCREIF Total Index,
7.0% Blmbg HY 2% Iss Cap, 7.0% NDSIB PERS - Private Equity, 4.8% Russell 2000 Index, 3.4% MSCI EM, 3.0% NCREIF NFI-ODCE Eq Wt Net, 3.0% CPI All
Urban Cons lagged 3 months and 2.1% NCREIF Timberland Index.
42NDSIB - Public Employees Retirement System
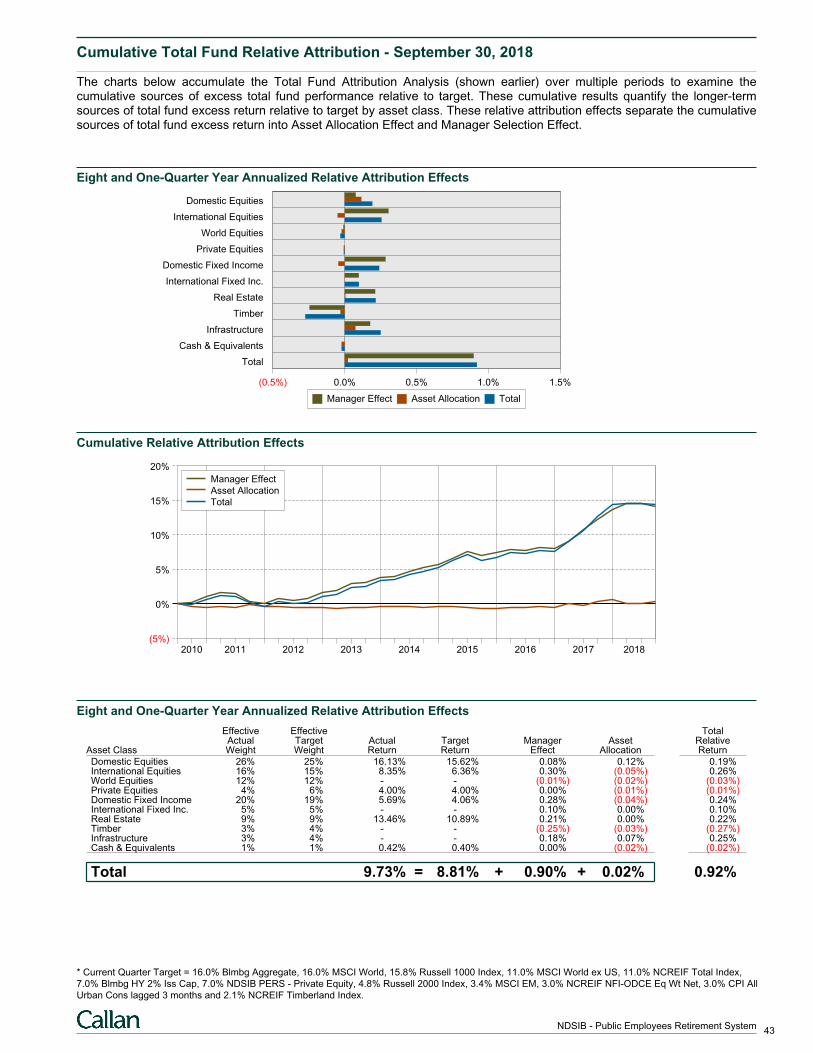
Cumulative Total Fund Relative Attribution - September 30, 2018
The charts below accumulate the Total Fund Attribution Analysis (shown earlier) over multiple periods to examine thecumulative sources of excess total fund performance relative to target. These cumulative results quantify the longer-termsources of total fund excess return relative to target by asset class. These relative attribution effects separate the cumulativesources of total fund excess return into Asset Allocation Effect and Manager Selection Effect.
Eight and One-Quarter Year Annualized Relative Attribution Effects
(0.5%) 0.0% 0.5% 1.0% 1.5%
Domestic Equities
International Equities
World Equities
Private Equities
Domestic Fixed Income
International Fixed Inc.
Real Estate
Timber
Infrastructure
Cash & Equivalents
Total
Manager Effect Asset Allocation Total
Cumulative Relative Attribution Effects
(5%)
0%
5%
10%
15%
20%
2010 2011 2012 2013 2014 2015 2016 2017 2018
Manager Effect
Asset Allocation
Total
Eight and One-Quarter Year Annualized Relative Attribution Effects
Effective Effective TotalActual Target Actual Target Manager Asset Relative
Asset Class Weight Weight Return Return Effect Allocation Return
Domestic Equities 26% 25% 16.13% 15.62% 0.08% 0.12% 0.19%International Equities 16% 15% 8.35% 6.36% 0.30% (0.05%) 0.26%World Equities 12% 12% - - (0.01%) (0.02%) (0.03%)Private Equities 4% 6% 4.00% 4.00% 0.00% (0.01%) (0.01%)Domestic Fixed Income 20% 19% 5.69% 4.06% 0.28% (0.04%) 0.24%International Fixed Inc. 5% 5% - - 0.10% 0.00% 0.10%Real Estate 9% 9% 13.46% 10.89% 0.21% 0.00% 0.22%Timber 3% 4% - - (0.25%) (0.03%) (0.27%)Infrastructure 3% 4% - - 0.18% 0.07% 0.25%Cash & Equivalents 1% 1% 0.42% 0.40% 0.00% (0.02%) (0.02%)
Total = + +9.73% 8.81% 0.90% 0.02% 0.92%
* Current Quarter Target = 16.0% Blmbg Aggregate, 16.0% MSCI World, 15.8% Russell 1000 Index, 11.0% MSCI World ex US, 11.0% NCREIF Total Index,
7.0% Blmbg HY 2% Iss Cap, 7.0% NDSIB PERS - Private Equity, 4.8% Russell 2000 Index, 3.4% MSCI EM, 3.0% NCREIF NFI-ODCE Eq Wt Net, 3.0% CPI All
Urban Cons lagged 3 months and 2.1% NCREIF Timberland Index.
43NDSIB - Public Employees Retirement System
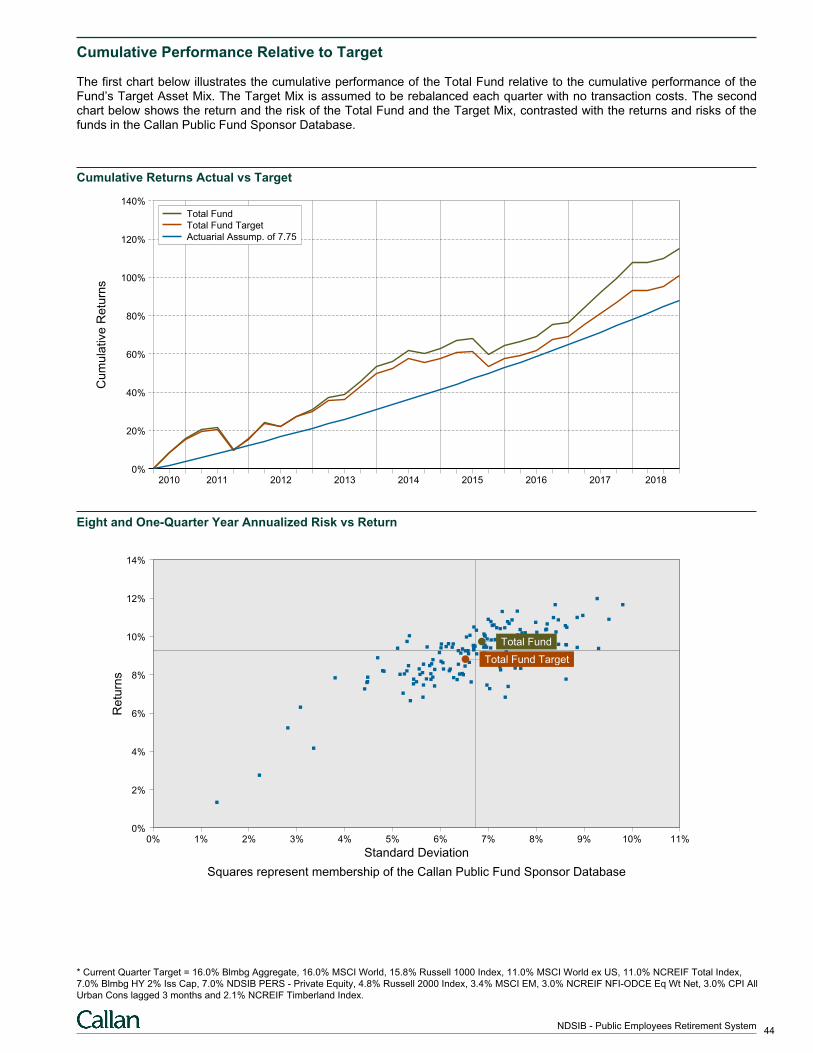
Cumulative Performance Relative to Target
The first chart below illustrates the cumulative performance of the Total Fund relative to the cumulative performance of theFund’s Target Asset Mix. The Target Mix is assumed to be rebalanced each quarter with no transaction costs. The secondchart below shows the return and the risk of the Total Fund and the Target Mix, contrasted with the returns and risks of thefunds in the Callan Public Fund Sponsor Database.
Cumulative Returns Actual vs Target
Cu
mu
lative
Re
turn
s
0%
20%
40%
60%
80%
100%
120%
140%
2010 2011 2012 2013 2014 2015 2016 2017 2018
Total Fund
Total Fund Target
Actuarial Assump. of 7.75
Eight and One-Quarter Year Annualized Risk vs Return
0% 1% 2% 3% 4% 5% 6% 7% 8% 9% 10% 11%0%
2%
4%
6%
8%
10%
12%
14%
Total Fund
Total Fund Target
Standard Deviation
Re
turn
s
Squares represent membership of the Callan Public Fund Sponsor Database
* Current Quarter Target = 16.0% Blmbg Aggregate, 16.0% MSCI World, 15.8% Russell 1000 Index, 11.0% MSCI World ex US, 11.0% NCREIF Total Index,
7.0% Blmbg HY 2% Iss Cap, 7.0% NDSIB PERS - Private Equity, 4.8% Russell 2000 Index, 3.4% MSCI EM, 3.0% NCREIF NFI-ODCE Eq Wt Net, 3.0% CPI All
Urban Cons lagged 3 months and 2.1% NCREIF Timberland Index.
44NDSIB - Public Employees Retirement System
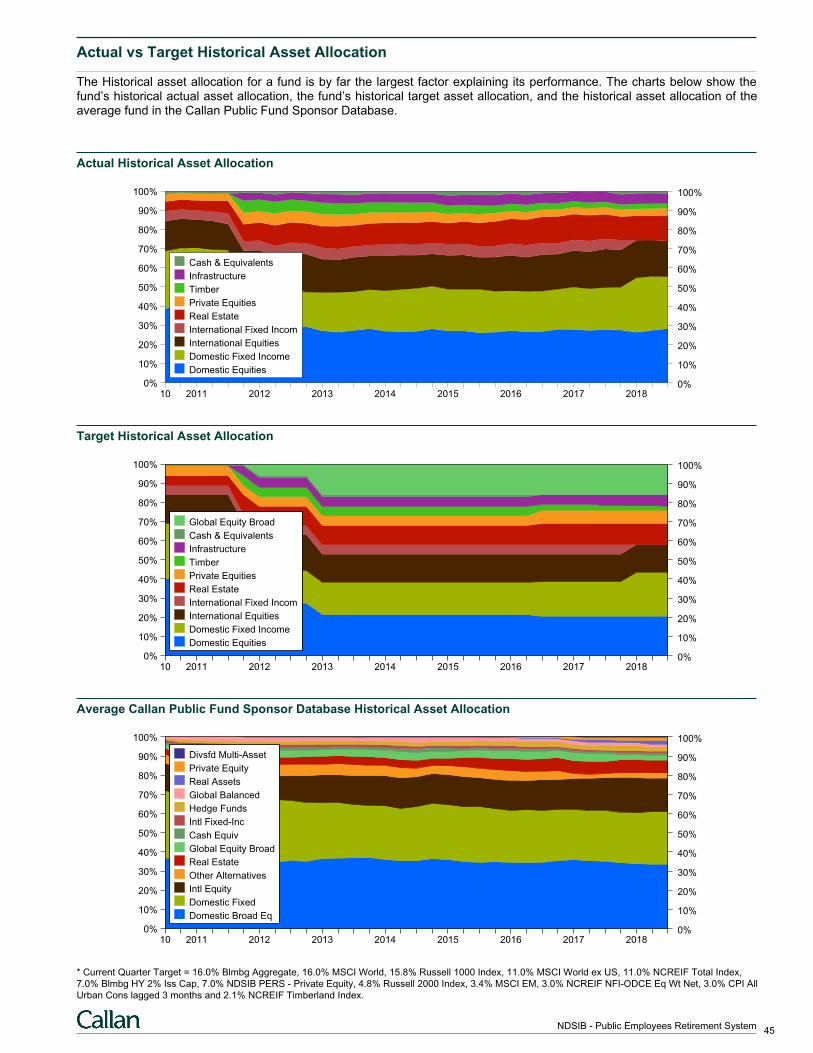
Actual vs Target Historical Asset Allocation
The Historical asset allocation for a fund is by far the largest factor explaining its performance. The charts below show thefund’s historical actual asset allocation, the fund’s historical target asset allocation, and the historical asset allocation of theaverage fund in the Callan Public Fund Sponsor Database.
Actual Historical Asset Allocation
0% 0%
10% 10%
20% 20%
30% 30%
40% 40%
50% 50%
60% 60%
70% 70%
80% 80%
90% 90%
100% 100%
10 2011 2012 2013 2014 2015 2016 2017 2018
Cash & Equivalents
Infrastructure
Timber
Private Equities
Real Estate
International Fixed Incom
International Equities
Domestic Fixed Income
Domestic Equities
Target Historical Asset Allocation
0% 0%
10% 10%
20% 20%
30% 30%
40% 40%
50% 50%
60% 60%
70% 70%
80% 80%
90% 90%
100% 100%
10 2011 2012 2013 2014 2015 2016 2017 2018
Global Equity Broad
Cash & Equivalents
Infrastructure
Timber
Private Equities
Real Estate
International Fixed Incom
International Equities
Domestic Fixed Income
Domestic Equities
Average Callan Public Fund Sponsor Database Historical Asset Allocation
0% 0%
10% 10%
20% 20%
30% 30%
40% 40%
50% 50%
60% 60%
70% 70%
80% 80%
90% 90%
100% 100%
10 2011 2012 2013 2014 2015 2016 2017 2018
Divsfd Multi-Asset
Private Equity
Real Assets
Global Balanced
Hedge Funds
Intl Fixed-Inc
Cash Equiv
Global Equity Broad
Real Estate
Other Alternatives
Intl Equity
Domestic Fixed
Domestic Broad Eq
* Current Quarter Target = 16.0% Blmbg Aggregate, 16.0% MSCI World, 15.8% Russell 1000 Index, 11.0% MSCI World ex US, 11.0% NCREIF Total Index,
7.0% Blmbg HY 2% Iss Cap, 7.0% NDSIB PERS - Private Equity, 4.8% Russell 2000 Index, 3.4% MSCI EM, 3.0% NCREIF NFI-ODCE Eq Wt Net, 3.0% CPI All
Urban Cons lagged 3 months and 2.1% NCREIF Timberland Index.
45NDSIB - Public Employees Retirement System
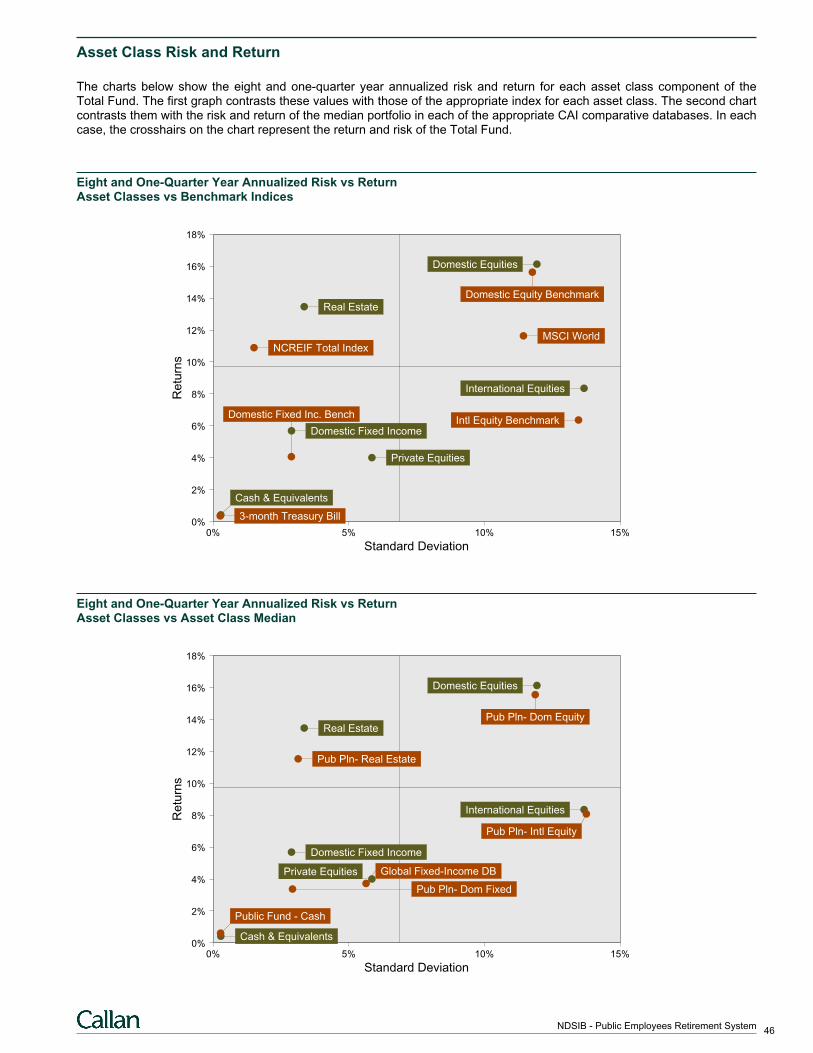
Asset Class Risk and Return
The charts below show the eight and one-quarter year annualized risk and return for each asset class component of theTotal Fund. The first graph contrasts these values with those of the appropriate index for each asset class. The second chartcontrasts them with the risk and return of the median portfolio in each of the appropriate CAI comparative databases. In eachcase, the crosshairs on the chart represent the return and risk of the Total Fund.
Eight and One-Quarter Year Annualized Risk vs ReturnAsset Classes vs Benchmark Indices
0% 5% 10% 15%0%
2%
4%
6%
8%
10%
12%
14%
16%
18%
Domestic Fixed Inc. Bench
Private Equities
Domestic Equities
Domestic Fixed Income
International Equities
Real Estate
MSCI WorldNCREIF Total Index
3-month Treasury Bill
Domestic Equity Benchmark
Intl Equity Benchmark
Cash & Equivalents
Standard Deviation
Re
turn
s
Eight and One-Quarter Year Annualized Risk vs ReturnAsset Classes vs Asset Class Median
0% 5% 10% 15%0%
2%
4%
6%
8%
10%
12%
14%
16%
18%
Pub Pln- Dom Fixed
Global Fixed-Income DB
Cash & Equivalents
Domestic Equities
Domestic Fixed Income
International Equities
Real EstatePub Pln- Dom Equity
Pub Pln- Real Estate
Public Fund - Cash
Pub Pln- Intl Equity
Private Equities
Standard Deviation
Re
turn
s
46NDSIB - Public Employees Retirement System
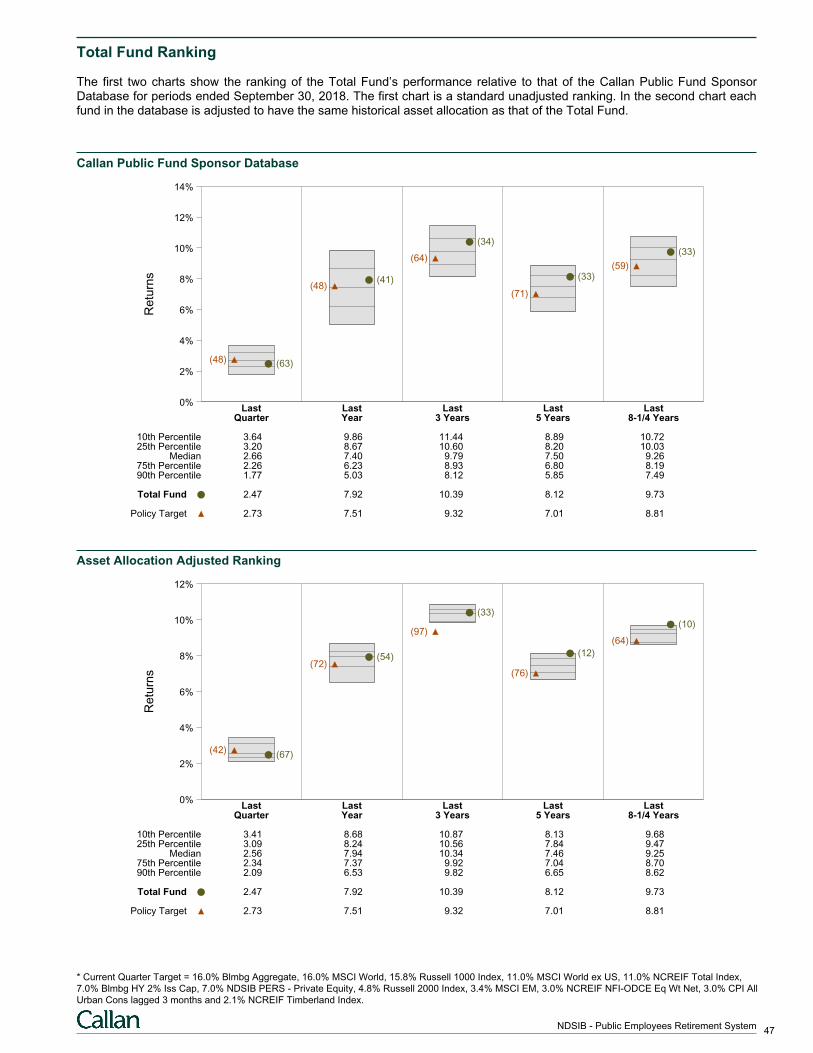
Total Fund Ranking
The first two charts show the ranking of the Total Fund’s performance relative to that of the Callan Public Fund SponsorDatabase for periods ended September 30, 2018. The first chart is a standard unadjusted ranking. In the second chart eachfund in the database is adjusted to have the same historical asset allocation as that of the Total Fund.
Callan Public Fund Sponsor DatabaseR
etu
rns
0%
2%
4%
6%
8%
10%
12%
14%
Last Last Last Last LastQuarter Year 3 Years 5 Years 8-1/4 Years
(63)(48)
(41)(48)
(34)
(64)
(33)
(71)
(33)
(59)
10th Percentile 3.64 9.86 11.44 8.89 10.7225th Percentile 3.20 8.67 10.60 8.20 10.03
Median 2.66 7.40 9.79 7.50 9.2675th Percentile 2.26 6.23 8.93 6.80 8.1990th Percentile 1.77 5.03 8.12 5.85 7.49
Total Fund 2.47 7.92 10.39 8.12 9.73
Policy Target 2.73 7.51 9.32 7.01 8.81
Asset Allocation Adjusted Ranking
Re
turn
s
0%
2%
4%
6%
8%
10%
12%
Last Last Last Last LastQuarter Year 3 Years 5 Years 8-1/4 Years
(67)(42)
(54)(72)
(33)
(97)
(12)
(76)
(10)
(64)
10th Percentile 3.41 8.68 10.87 8.13 9.6825th Percentile 3.09 8.24 10.56 7.84 9.47
Median 2.56 7.94 10.34 7.46 9.2575th Percentile 2.34 7.37 9.92 7.04 8.7090th Percentile 2.09 6.53 9.82 6.65 8.62
Total Fund 2.47 7.92 10.39 8.12 9.73
Policy Target 2.73 7.51 9.32 7.01 8.81
* Current Quarter Target = 16.0% Blmbg Aggregate, 16.0% MSCI World, 15.8% Russell 1000 Index, 11.0% MSCI World ex US, 11.0% NCREIF Total Index,
7.0% Blmbg HY 2% Iss Cap, 7.0% NDSIB PERS - Private Equity, 4.8% Russell 2000 Index, 3.4% MSCI EM, 3.0% NCREIF NFI-ODCE Eq Wt Net, 3.0% CPI All
Urban Cons lagged 3 months and 2.1% NCREIF Timberland Index.
47NDSIB - Public Employees Retirement System
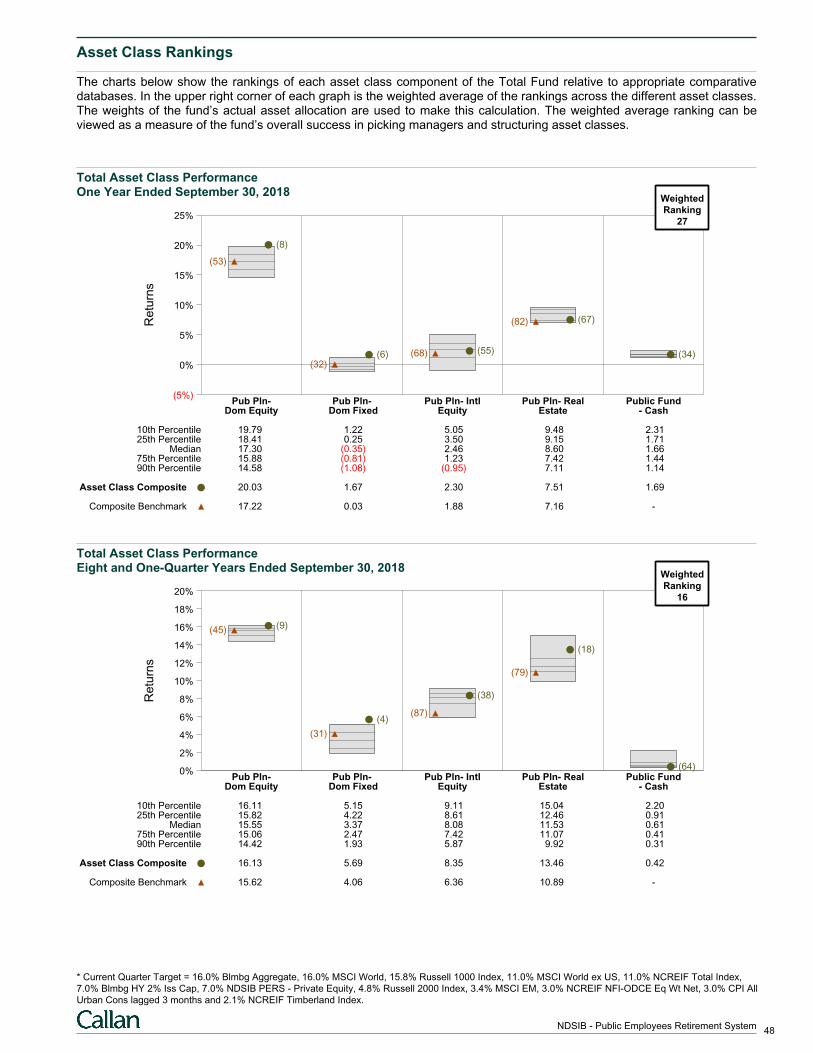
Asset Class Rankings
The charts below show the rankings of each asset class component of the Total Fund relative to appropriate comparativedatabases. In the upper right corner of each graph is the weighted average of the rankings across the different asset classes.The weights of the fund’s actual asset allocation are used to make this calculation. The weighted average ranking can beviewed as a measure of the fund’s overall success in picking managers and structuring asset classes.
Total Asset Class PerformanceOne Year Ended September 30, 2018
Re
turn
s
(5%)
0%
5%
10%
15%
20%
25%
Pub Pln- Pub Pln- Pub Pln- Intl Pub Pln- Real Public FundDom Equity Dom Fixed Equity Estate - Cash
(8)
(53)
(6)(32)
(55)(68)
(67)(82)
(34)
10th Percentile 19.79 1.22 5.05 9.48 2.3125th Percentile 18.41 0.25 3.50 9.15 1.71
Median 17.30 (0.35) 2.46 8.60 1.6675th Percentile 15.88 (0.81) 1.23 7.42 1.4490th Percentile 14.58 (1.08) (0.95) 7.11 1.14
Asset Class Composite 20.03 1.67 2.30 7.51 1.69
Composite Benchmark 17.22 0.03 1.88 7.16 -
WeightedRanking
27
Total Asset Class PerformanceEight and One-Quarter Years Ended September 30, 2018
Re
turn
s
0%
2%
4%
6%
8%
10%
12%
14%
16%
18%
20%
Pub Pln- Pub Pln- Pub Pln- Intl Pub Pln- Real Public FundDom Equity Dom Fixed Equity Estate - Cash
(9)(45)
(4)
(31)
(38)
(87)
(18)
(79)
(64)
10th Percentile 16.11 5.15 9.11 15.04 2.2025th Percentile 15.82 4.22 8.61 12.46 0.91
Median 15.55 3.37 8.08 11.53 0.6175th Percentile 15.06 2.47 7.42 11.07 0.4190th Percentile 14.42 1.93 5.87 9.92 0.31
Asset Class Composite 16.13 5.69 8.35 13.46 0.42
Composite Benchmark 15.62 4.06 6.36 10.89 -
WeightedRanking
16
* Current Quarter Target = 16.0% Blmbg Aggregate, 16.0% MSCI World, 15.8% Russell 1000 Index, 11.0% MSCI World ex US, 11.0% NCREIF Total Index,
7.0% Blmbg HY 2% Iss Cap, 7.0% NDSIB PERS - Private Equity, 4.8% Russell 2000 Index, 3.4% MSCI EM, 3.0% NCREIF NFI-ODCE Eq Wt Net, 3.0% CPI All
Urban Cons lagged 3 months and 2.1% NCREIF Timberland Index.
48NDSIB - Public Employees Retirement System

Asset Class Allocation
The table below contrasts the distribution of assets across the Fund’s investment managers as of September 30, 2018, withthe distribution as of June 30, 2018. The change in asset distribution is broken down into the dollar change due to Net NewInvestment and the dollar change due to Investment Return.
Asset Class Allocation
September 30, 2018 June 30, 2018
Market Value Weight Net New Inv. Inv. Return Market Value WeightGlobal Equities $1,809,885,918 58.63% $(17,908,194) $67,487,141 $1,760,306,970 58.21%
Public Equities $1,710,757,503 55.42% $(20,613,348) $67,104,814 $1,664,266,037 55.03%
World Equities $501,277,381 16.24% $(415,514) $15,062,853 $486,630,042 16.09%
Domestic Equities $729,040,237 23.62% $(19,998,892) $53,587,942 $695,451,188 23.00% Large Cap 549,319,075 17.79% (19,980,061) 43,789,375 525,509,761 17.38% Small Cap 179,721,163 5.82% (18,831) 9,798,567 169,941,426 5.62%
International Equities $480,439,885 15.56% $(198,942) $(1,545,980) $482,184,807 15.94% Developed 361,246,349 11.70% (198,942) 2,505,525 358,939,766 11.87% Emerging Markets 119,193,536 3.86% 0 (4,051,505) 123,245,041 4.08%
Private Equities $99,128,414 3.21% $2,705,154 $382,327 $96,040,933 3.18%
Global Fixed Income $702,285,479 22.75% $(13,512,294) $3,155,378 $712,642,395 23.56%
Domestic Fixed Income $702,285,479 22.75% $(13,512,294) $3,155,378 $712,642,395 23.56% Investment Grade 492,356,171 15.95% (13,024,844) 476,175 504,904,839 16.70% Below Investment Grade 209,929,309 6.80% (487,450) 2,679,202 207,737,557 6.87%
Global Real Assets $545,876,322 17.68% $15,668,994 $3,939,014 $526,268,313 17.40%
Real Estate $345,160,890 11.18% $22,325,453 $2,771,438 $320,063,999 10.58%
Other Real Assets $200,715,432 6.50% $(6,656,459) $1,167,577 $206,204,314 6.82% Infrastructure 136,247,842 4.41% (5,887,810) 1,167,577 140,968,074 4.66% Timber 64,467,590 2.09% (768,650) (0) 65,236,240 2.16%
Cash $29,067,752 0.94% $3,998,783 $63,655 $25,005,314 0.83%
Securities Lending Income $0 0.00% $(50,739) $50,739 - -
Total Fund $3,087,115,470 100.0% $(11,803,449) $74,695,927 $3,024,222,992 100.0%
PLEASE REFER TO PAGES 29-31 FOR INVESTMENT MANAGER LEVEL ASSET ALLOCATION.
49NDSIB - Public Employees Retirement System
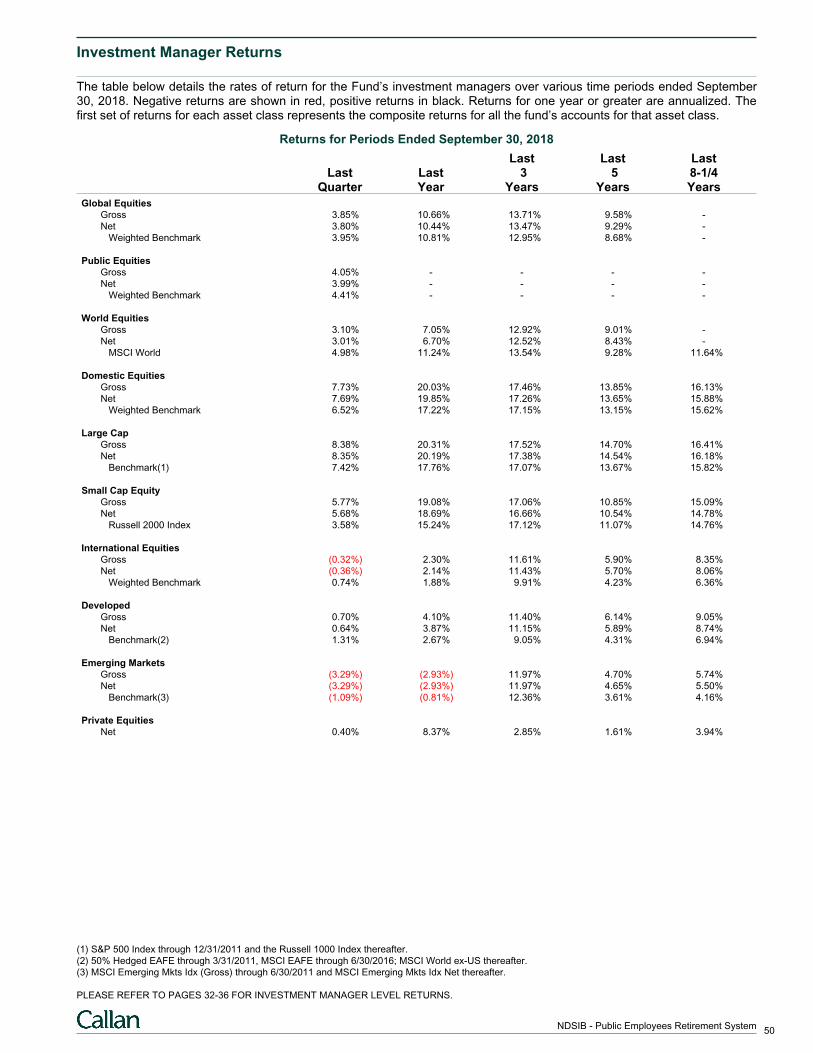
Investment Manager Returns
The table below details the rates of return for the Fund’s investment managers over various time periods ended September30, 2018. Negative returns are shown in red, positive returns in black. Returns for one year or greater are annualized. Thefirst set of returns for each asset class represents the composite returns for all the fund’s accounts for that asset class.
Returns for Periods Ended September 30, 2018
Last Last LastLast Last 3 5 8-1/4
Quarter Year Years Years Years
Global EquitiesGross 3.85% 10.66% 13.71% 9.58% -
Net 3.80% 10.44% 13.47% 9.29% -
Weighted Benchmark 3.95% 10.81% 12.95% 8.68% -
Public EquitiesGross 4.05% - - - -
Net 3.99% - - - -
Weighted Benchmark 4.41% - - - -
World EquitiesGross 3.10% 7.05% 12.92% 9.01% -
Net 3.01% 6.70% 12.52% 8.43% -
MSCI World 4.98% 11.24% 13.54% 9.28% 11.64%
Domestic EquitiesGross 7.73% 20.03% 17.46% 13.85% 16.13%
Net 7.69% 19.85% 17.26% 13.65% 15.88%
Weighted Benchmark 6.52% 17.22% 17.15% 13.15% 15.62%
Large CapGross 8.38% 20.31% 17.52% 14.70% 16.41%
Net 8.35% 20.19% 17.38% 14.54% 16.18%
Benchmark(1) 7.42% 17.76% 17.07% 13.67% 15.82%
Small Cap EquityGross 5.77% 19.08% 17.06% 10.85% 15.09%
Net 5.68% 18.69% 16.66% 10.54% 14.78%
Russell 2000 Index 3.58% 15.24% 17.12% 11.07% 14.76%
International EquitiesGross (0.32%) 2.30% 11.61% 5.90% 8.35%
Net (0.36%) 2.14% 11.43% 5.70% 8.06%
Weighted Benchmark 0.74% 1.88% 9.91% 4.23% 6.36%
DevelopedGross 0.70% 4.10% 11.40% 6.14% 9.05%
Net 0.64% 3.87% 11.15% 5.89% 8.74%
Benchmark(2) 1.31% 2.67% 9.05% 4.31% 6.94%
Emerging MarketsGross (3.29%) (2.93%) 11.97% 4.70% 5.74%
Net (3.29%) (2.93%) 11.97% 4.65% 5.50%
Benchmark(3) (1.09%) (0.81%) 12.36% 3.61% 4.16%
Private EquitiesNet 0.40% 8.37% 2.85% 1.61% 3.94%
(1) S&P 500 Index through 12/31/2011 and the Russell 1000 Index thereafter.
(2) 50% Hedged EAFE through 3/31/2011, MSCI EAFE through 6/30/2016; MSCI World ex-US thereafter.
(3) MSCI Emerging Mkts Idx (Gross) through 6/30/2011 and MSCI Emerging Mkts Idx Net thereafter.
PLEASE REFER TO PAGES 32-36 FOR INVESTMENT MANAGER LEVEL RETURNS.
50NDSIB - Public Employees Retirement System
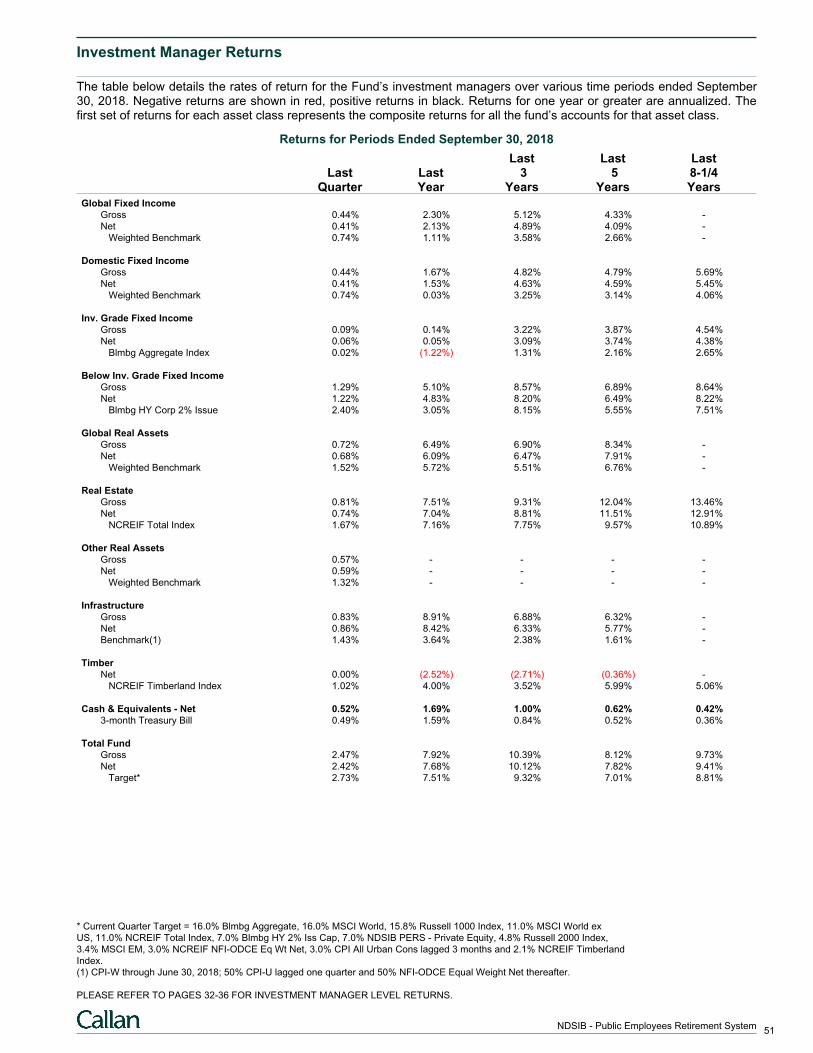
Investment Manager Returns
The table below details the rates of return for the Fund’s investment managers over various time periods ended September30, 2018. Negative returns are shown in red, positive returns in black. Returns for one year or greater are annualized. Thefirst set of returns for each asset class represents the composite returns for all the fund’s accounts for that asset class.
Returns for Periods Ended September 30, 2018
Last Last LastLast Last 3 5 8-1/4
Quarter Year Years Years Years
Global Fixed IncomeGross 0.44% 2.30% 5.12% 4.33% -
Net 0.41% 2.13% 4.89% 4.09% -
Weighted Benchmark 0.74% 1.11% 3.58% 2.66% -
Domestic Fixed IncomeGross 0.44% 1.67% 4.82% 4.79% 5.69%
Net 0.41% 1.53% 4.63% 4.59% 5.45%
Weighted Benchmark 0.74% 0.03% 3.25% 3.14% 4.06%
Inv. Grade Fixed IncomeGross 0.09% 0.14% 3.22% 3.87% 4.54%
Net 0.06% 0.05% 3.09% 3.74% 4.38%
Blmbg Aggregate Index 0.02% (1.22%) 1.31% 2.16% 2.65%
Below Inv. Grade Fixed IncomeGross 1.29% 5.10% 8.57% 6.89% 8.64%
Net 1.22% 4.83% 8.20% 6.49% 8.22%
Blmbg HY Corp 2% Issue 2.40% 3.05% 8.15% 5.55% 7.51%
Global Real AssetsGross 0.72% 6.49% 6.90% 8.34% -
Net 0.68% 6.09% 6.47% 7.91% -
Weighted Benchmark 1.52% 5.72% 5.51% 6.76% -
Real EstateGross 0.81% 7.51% 9.31% 12.04% 13.46%
Net 0.74% 7.04% 8.81% 11.51% 12.91%
NCREIF Total Index 1.67% 7.16% 7.75% 9.57% 10.89%
Other Real AssetsGross 0.57% - - - -
Net 0.59% - - - -
Weighted Benchmark 1.32% - - - -
InfrastructureGross 0.83% 8.91% 6.88% 6.32% -
Net 0.86% 8.42% 6.33% 5.77% -
Benchmark(1) 1.43% 3.64% 2.38% 1.61% -
TimberNet 0.00% (2.52%) (2.71%) (0.36%) -
NCREIF Timberland Index 1.02% 4.00% 3.52% 5.99% 5.06%
Cash & Equivalents - Net 0.52% 1.69% 1.00% 0.62% 0.42%3-month Treasury Bill 0.49% 1.59% 0.84% 0.52% 0.36%
Total FundGross 2.47% 7.92% 10.39% 8.12% 9.73%
Net 2.42% 7.68% 10.12% 7.82% 9.41%
Target* 2.73% 7.51% 9.32% 7.01% 8.81%
* Current Quarter Target = 16.0% Blmbg Aggregate, 16.0% MSCI World, 15.8% Russell 1000 Index, 11.0% MSCI World ex
US, 11.0% NCREIF Total Index, 7.0% Blmbg HY 2% Iss Cap, 7.0% NDSIB PERS - Private Equity, 4.8% Russell 2000 Index,
3.4% MSCI EM, 3.0% NCREIF NFI-ODCE Eq Wt Net, 3.0% CPI All Urban Cons lagged 3 months and 2.1% NCREIF Timberland
Index.
(1) CPI-W through June 30, 2018; 50% CPI-U lagged one quarter and 50% NFI-ODCE Equal Weight Net thereafter.
PLEASE REFER TO PAGES 32-36 FOR INVESTMENT MANAGER LEVEL RETURNS.
51NDSIB - Public Employees Retirement System

Actual vs Target Asset AllocationAs of September 30, 2018
The top left chart shows the Fund’s asset allocation as of September 30, 2018. The top right chart shows the Fund’s targetasset allocation as outlined in the investment policy statement. The bottom chart ranks the fund’s asset allocation and thetarget allocation versus the Callan Public Fund Sponsor Database.
Actual Asset Allocation
Domestic Equities24%
International Equities15%
World Equities16%
Private Equities4%
Domestic Fixed Income23%
Real Estate10%
Timber2%
Infrastructure4%
Cash & Equivalents1%
Target Asset Allocation
Domestic Equities21%
International Equities15%
World Equities16%
Private Equities6%
Domestic Fixed Income23%
Real Estate10%
Timber2%
Infrastructure6%
Cash & Equivalents1%
$000s Weight Percent $000sAsset Class Actual Actual Target Difference DifferenceDomestic Equities 605,837 24.0% 21.4% 2.6% 65,176International Equities 383,128 15.2% 14.6% 0.6% 14,266World Equities 408,955 16.2% 16.0% 0.2% 4,722Private Equities 90,989 3.6% 6.0% (2.4%) (60,599)Domestic Fixed Income 578,714 22.9% 23.0% (0.1%) (2,370)Real Estate 258,706 10.2% 10.0% 0.2% 6,061Timber 57,546 2.3% 2.3% (0.0%) (563)Infrastructure 112,227 4.4% 5.7% (1.3%) (31,781)Cash & Equivalents 30,352 1.2% 1.0% 0.2% 5,087Total 2,526,453 100.0% 100.0%
Asset Class Weights vs Callan Public Fund Sponsor Database
We
igh
ts
(10%)
0%
10%
20%
30%
40%
50%
60%
Domestic Domestic Cash Real International World Private RealEquities Fixed Income & Equivalents Estate Equities Equities Equities Assets
(86)(92) (58)(57)
(28)(33)
(32)(35)(77)(81) (6)(7)
(20)(13) (10)(7)
10th Percentile 48.16 37.92 2.82 13.04 26.34 8.59 7.02 6.7825th Percentile 41.92 33.33 1.30 10.73 23.37 0.00 2.86 0.31
Median 34.79 25.13 0.59 8.72 19.62 0.00 0.00 0.0075th Percentile 28.13 19.67 0.00 0.00 15.87 0.00 0.00 0.0090th Percentile 23.23 14.55 0.00 0.00 12.36 0.00 0.00 0.00
Fund 23.98 22.91 1.20 10.24 15.16 16.19 3.60 6.72
Target 21.40 23.00 1.00 10.00 14.60 16.00 6.00 8.00
% Group Invested 95.56% 97.04% 72.59% 72.59% 91.85% 12.59% 30.37% 25.19%
* Current Quarter Target = 16.6% Russell 1000 Index, 16.0% Blmbg Aggregate, 16.0% MSCI World, 11.8% MSCI World ex US, 10.0% NCREIF Total Index,
7.0% Blmbg HY 2% Iss Cap, 6.0% NDSIB TFFR - Private Equity, 4.8% Russell 2000 Index, 2.8% NCREIF NFI-ODCE Eq Wt Net, 2.8% CPI All Urban Cons
lagged 3 months, 2.8% MSCI EM, 2.3% NCREIF Timberland Index and 1.0% 3-month Treasury Bill.
53NDSIB - Teachers Fund For Retirement
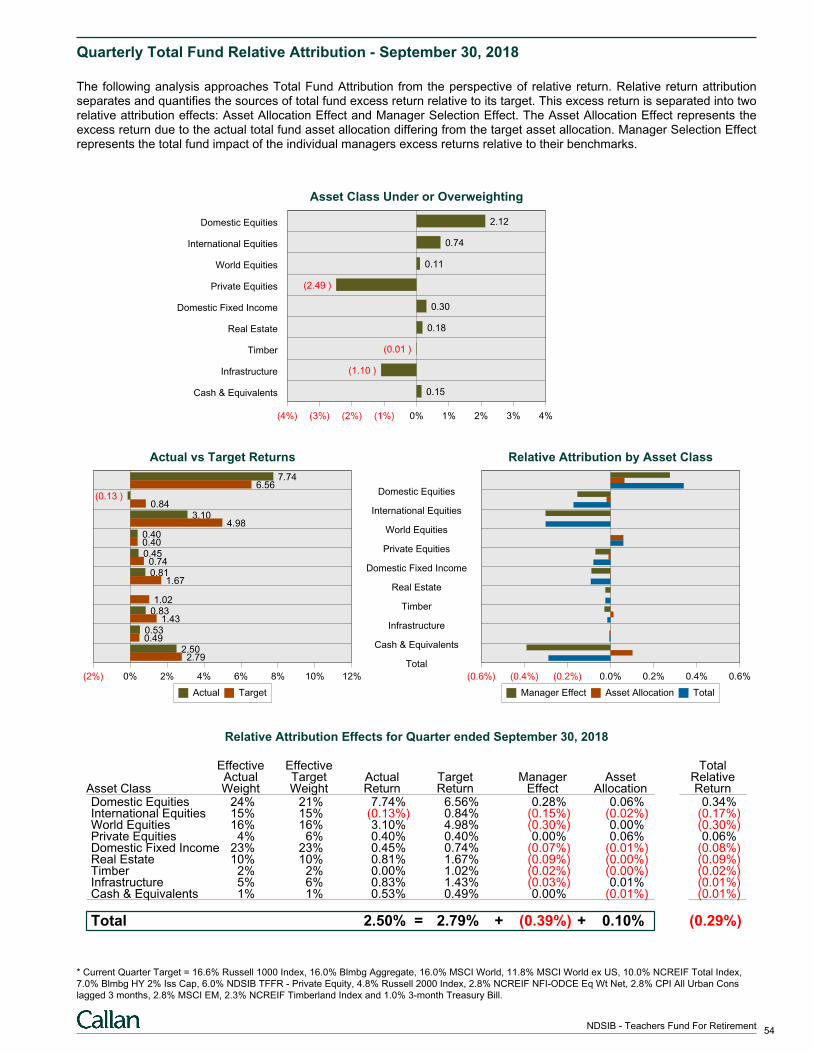
Quarterly Total Fund Relative Attribution - September 30, 2018
The following analysis approaches Total Fund Attribution from the perspective of relative return. Relative return attributionseparates and quantifies the sources of total fund excess return relative to its target. This excess return is separated into tworelative attribution effects: Asset Allocation Effect and Manager Selection Effect. The Asset Allocation Effect represents theexcess return due to the actual total fund asset allocation differing from the target asset allocation. Manager Selection Effectrepresents the total fund impact of the individual managers excess returns relative to their benchmarks.
Asset Class Under or Overweighting
(4%) (3%) (2%) (1%) 0% 1% 2% 3% 4%
Domestic Equities 2.12
International Equities 0.74
World Equities 0.11
Private Equities (2.49 )
Domestic Fixed Income 0.30
Real Estate 0.18
Timber (0.01 )
Infrastructure (1.10 )
Cash & Equivalents 0.15
Domestic Equities
International Equities
World Equities
Private Equities
Domestic Fixed Income
Real Estate
Timber
Infrastructure
Cash & Equivalents
Total
Actual vs Target Returns
(2%) 0% 2% 4% 6% 8% 10% 12%
7.746.56
(0.13 )0.84
3.104.98
0.400.400.45
0.740.81
1.67
1.020.83
1.430.530.49
2.502.79
Actual Target
Relative Attribution by Asset Class
(0.6%) (0.4%) (0.2%) 0.0% 0.2% 0.4% 0.6%
Manager Effect Asset Allocation Total
Relative Attribution Effects for Quarter ended September 30, 2018
Effective Effective TotalActual Target Actual Target Manager Asset Relative
Asset Class Weight Weight Return Return Effect Allocation ReturnDomestic Equities 24% 21% 7.74% 6.56% 0.28% 0.06% 0.34%International Equities 15% 15% (0.13%) 0.84% (0.15%) (0.02%) (0.17%)World Equities 16% 16% 3.10% 4.98% (0.30%) 0.00% (0.30%)Private Equities 4% 6% 0.40% 0.40% 0.00% 0.06% 0.06%Domestic Fixed Income 23% 23% 0.45% 0.74% (0.07%) (0.01%) (0.08%)Real Estate 10% 10% 0.81% 1.67% (0.09%) (0.00%) (0.09%)Timber 2% 2% 0.00% 1.02% (0.02%) (0.00%) (0.02%)Infrastructure 5% 6% 0.83% 1.43% (0.03%) 0.01% (0.01%)Cash & Equivalents 1% 1% 0.53% 0.49% 0.00% (0.01%) (0.01%)
Total = + +2.50% 2.79% (0.39%) 0.10% (0.29%)
* Current Quarter Target = 16.6% Russell 1000 Index, 16.0% Blmbg Aggregate, 16.0% MSCI World, 11.8% MSCI World ex US, 10.0% NCREIF Total Index,
7.0% Blmbg HY 2% Iss Cap, 6.0% NDSIB TFFR - Private Equity, 4.8% Russell 2000 Index, 2.8% NCREIF NFI-ODCE Eq Wt Net, 2.8% CPI All Urban Cons
lagged 3 months, 2.8% MSCI EM, 2.3% NCREIF Timberland Index and 1.0% 3-month Treasury Bill.
54NDSIB - Teachers Fund For Retirement
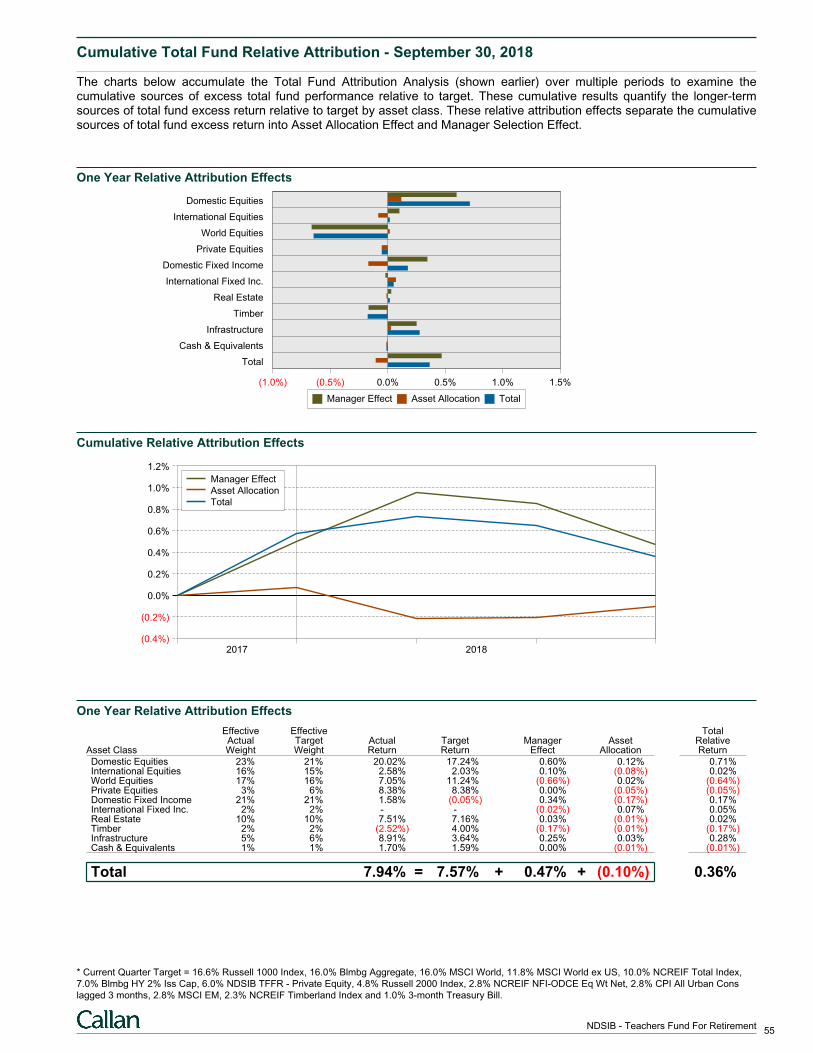
Cumulative Total Fund Relative Attribution - September 30, 2018
The charts below accumulate the Total Fund Attribution Analysis (shown earlier) over multiple periods to examine thecumulative sources of excess total fund performance relative to target. These cumulative results quantify the longer-termsources of total fund excess return relative to target by asset class. These relative attribution effects separate the cumulativesources of total fund excess return into Asset Allocation Effect and Manager Selection Effect.
One Year Relative Attribution Effects
(1.0%) (0.5%) 0.0% 0.5% 1.0% 1.5%
Domestic Equities
International Equities
World Equities
Private Equities
Domestic Fixed Income
International Fixed Inc.
Real Estate
Timber
Infrastructure
Cash & Equivalents
Total
Manager Effect Asset Allocation Total
Cumulative Relative Attribution Effects
(0.4%)
(0.2%)
0.0%
0.2%
0.4%
0.6%
0.8%
1.0%
1.2%
2017 2018
Manager Effect
Asset Allocation
Total
One Year Relative Attribution Effects
Effective Effective TotalActual Target Actual Target Manager Asset Relative
Asset Class Weight Weight Return Return Effect Allocation Return
Domestic Equities 23% 21% 20.02% 17.24% 0.60% 0.12% 0.71%International Equities 16% 15% 2.58% 2.03% 0.10% (0.08%) 0.02%World Equities 17% 16% 7.05% 11.24% (0.66%) 0.02% (0.64%)Private Equities 3% 6% 8.38% 8.38% 0.00% (0.05%) (0.05%)Domestic Fixed Income 21% 21% 1.58% (0.05%) 0.34% (0.17%) 0.17%International Fixed Inc. 2% 2% - - (0.02%) 0.07% 0.05%Real Estate 10% 10% 7.51% 7.16% 0.03% (0.01%) 0.02%Timber 2% 2% (2.52%) 4.00% (0.17%) (0.01%) (0.17%)Infrastructure 5% 6% 8.91% 3.64% 0.25% 0.03% 0.28%Cash & Equivalents 1% 1% 1.70% 1.59% 0.00% (0.01%) (0.01%)
Total = + +7.94% 7.57% 0.47% (0.10%) 0.36%
* Current Quarter Target = 16.6% Russell 1000 Index, 16.0% Blmbg Aggregate, 16.0% MSCI World, 11.8% MSCI World ex US, 10.0% NCREIF Total Index,
7.0% Blmbg HY 2% Iss Cap, 6.0% NDSIB TFFR - Private Equity, 4.8% Russell 2000 Index, 2.8% NCREIF NFI-ODCE Eq Wt Net, 2.8% CPI All Urban Cons
lagged 3 months, 2.8% MSCI EM, 2.3% NCREIF Timberland Index and 1.0% 3-month Treasury Bill.
55NDSIB - Teachers Fund For Retirement
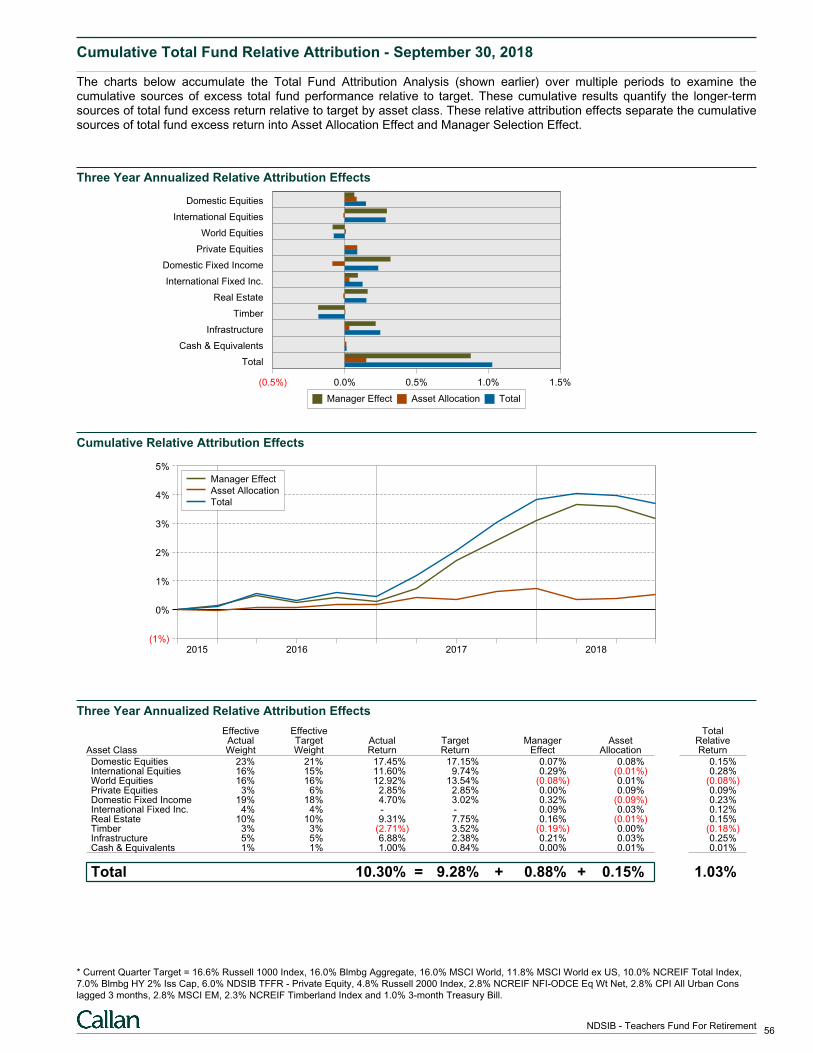
Cumulative Total Fund Relative Attribution - September 30, 2018
The charts below accumulate the Total Fund Attribution Analysis (shown earlier) over multiple periods to examine thecumulative sources of excess total fund performance relative to target. These cumulative results quantify the longer-termsources of total fund excess return relative to target by asset class. These relative attribution effects separate the cumulativesources of total fund excess return into Asset Allocation Effect and Manager Selection Effect.
Three Year Annualized Relative Attribution Effects
(0.5%) 0.0% 0.5% 1.0% 1.5%
Domestic Equities
International Equities
World Equities
Private Equities
Domestic Fixed Income
International Fixed Inc.
Real Estate
Timber
Infrastructure
Cash & Equivalents
Total
Manager Effect Asset Allocation Total
Cumulative Relative Attribution Effects
(1%)
0%
1%
2%
3%
4%
5%
2015 2016 2017 2018
Manager Effect
Asset Allocation
Total
Three Year Annualized Relative Attribution Effects
Effective Effective TotalActual Target Actual Target Manager Asset Relative
Asset Class Weight Weight Return Return Effect Allocation Return
Domestic Equities 23% 21% 17.45% 17.15% 0.07% 0.08% 0.15%International Equities 16% 15% 11.60% 9.74% 0.29% (0.01%) 0.28%World Equities 16% 16% 12.92% 13.54% (0.08%) 0.01% (0.08%)Private Equities 3% 6% 2.85% 2.85% 0.00% 0.09% 0.09%Domestic Fixed Income 19% 18% 4.70% 3.02% 0.32% (0.09%) 0.23%International Fixed Inc. 4% 4% - - 0.09% 0.03% 0.12%Real Estate 10% 10% 9.31% 7.75% 0.16% (0.01%) 0.15%Timber 3% 3% (2.71%) 3.52% (0.19%) 0.00% (0.18%)Infrastructure 5% 5% 6.88% 2.38% 0.21% 0.03% 0.25%Cash & Equivalents 1% 1% 1.00% 0.84% 0.00% 0.01% 0.01%
Total = + +10.30% 9.28% 0.88% 0.15% 1.03%
* Current Quarter Target = 16.6% Russell 1000 Index, 16.0% Blmbg Aggregate, 16.0% MSCI World, 11.8% MSCI World ex US, 10.0% NCREIF Total Index,
7.0% Blmbg HY 2% Iss Cap, 6.0% NDSIB TFFR - Private Equity, 4.8% Russell 2000 Index, 2.8% NCREIF NFI-ODCE Eq Wt Net, 2.8% CPI All Urban Cons
lagged 3 months, 2.8% MSCI EM, 2.3% NCREIF Timberland Index and 1.0% 3-month Treasury Bill.
56NDSIB - Teachers Fund For Retirement
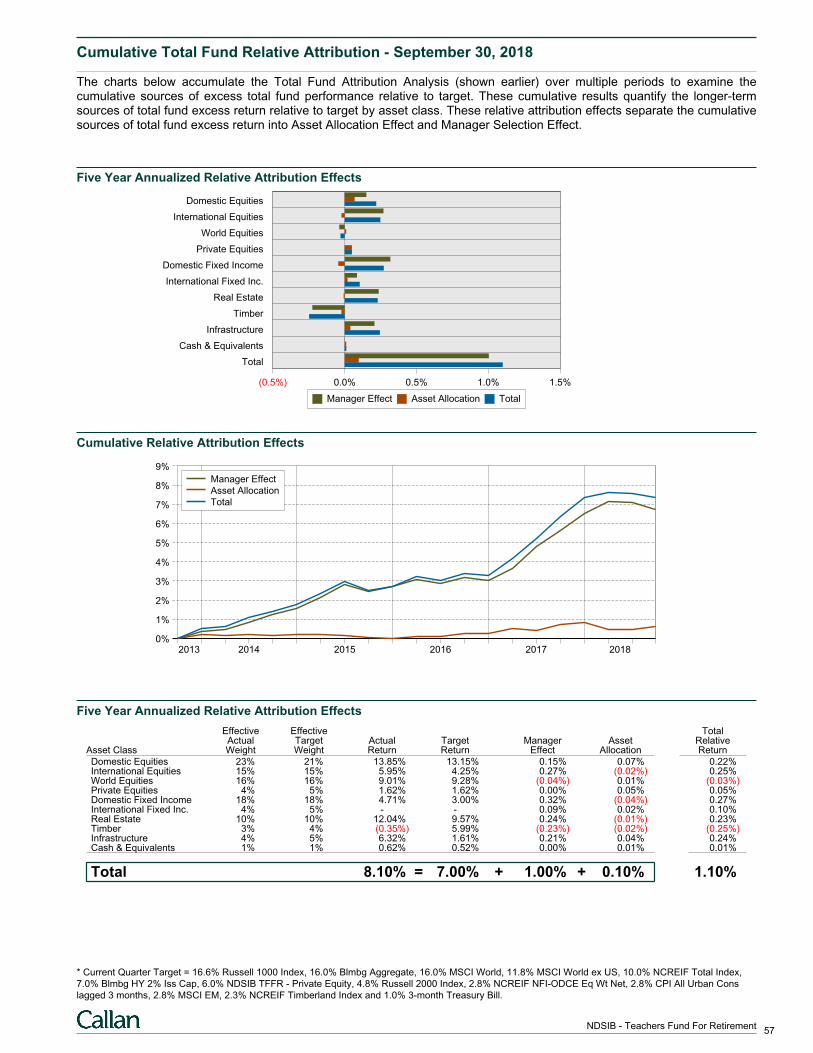
Cumulative Total Fund Relative Attribution - September 30, 2018
The charts below accumulate the Total Fund Attribution Analysis (shown earlier) over multiple periods to examine thecumulative sources of excess total fund performance relative to target. These cumulative results quantify the longer-termsources of total fund excess return relative to target by asset class. These relative attribution effects separate the cumulativesources of total fund excess return into Asset Allocation Effect and Manager Selection Effect.
Five Year Annualized Relative Attribution Effects
(0.5%) 0.0% 0.5% 1.0% 1.5%
Domestic Equities
International Equities
World Equities
Private Equities
Domestic Fixed Income
International Fixed Inc.
Real Estate
Timber
Infrastructure
Cash & Equivalents
Total
Manager Effect Asset Allocation Total
Cumulative Relative Attribution Effects
0%
1%
2%
3%
4%
5%
6%
7%
8%
9%
2013 2014 2015 2016 2017 2018
Manager Effect
Asset Allocation
Total
Five Year Annualized Relative Attribution Effects
Effective Effective TotalActual Target Actual Target Manager Asset Relative
Asset Class Weight Weight Return Return Effect Allocation Return
Domestic Equities 23% 21% 13.85% 13.15% 0.15% 0.07% 0.22%International Equities 15% 15% 5.95% 4.25% 0.27% (0.02%) 0.25%World Equities 16% 16% 9.01% 9.28% (0.04%) 0.01% (0.03%)Private Equities 4% 5% 1.62% 1.62% 0.00% 0.05% 0.05%Domestic Fixed Income 18% 18% 4.71% 3.00% 0.32% (0.04%) 0.27%International Fixed Inc. 4% 5% - - 0.09% 0.02% 0.10%Real Estate 10% 10% 12.04% 9.57% 0.24% (0.01%) 0.23%Timber 3% 4% (0.35%) 5.99% (0.23%) (0.02%) (0.25%)Infrastructure 4% 5% 6.32% 1.61% 0.21% 0.04% 0.24%Cash & Equivalents 1% 1% 0.62% 0.52% 0.00% 0.01% 0.01%
Total = + +8.10% 7.00% 1.00% 0.10% 1.10%
* Current Quarter Target = 16.6% Russell 1000 Index, 16.0% Blmbg Aggregate, 16.0% MSCI World, 11.8% MSCI World ex US, 10.0% NCREIF Total Index,
7.0% Blmbg HY 2% Iss Cap, 6.0% NDSIB TFFR - Private Equity, 4.8% Russell 2000 Index, 2.8% NCREIF NFI-ODCE Eq Wt Net, 2.8% CPI All Urban Cons
lagged 3 months, 2.8% MSCI EM, 2.3% NCREIF Timberland Index and 1.0% 3-month Treasury Bill.
57NDSIB - Teachers Fund For Retirement
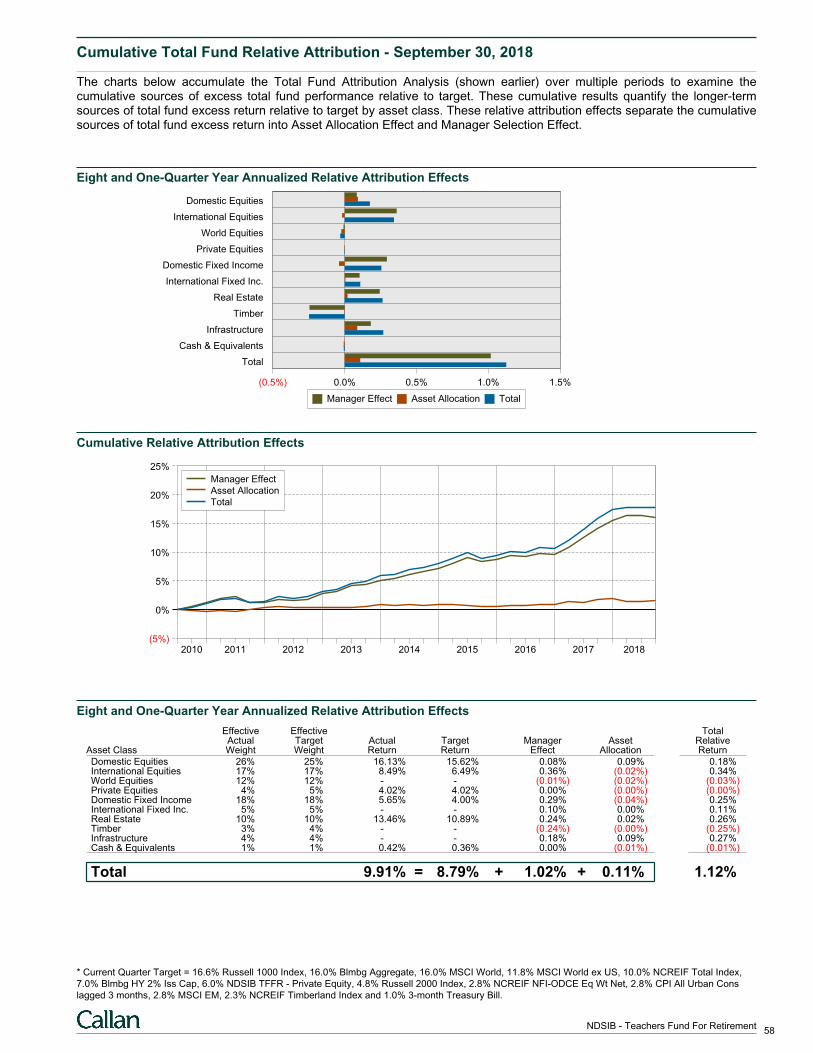
Cumulative Total Fund Relative Attribution - September 30, 2018
The charts below accumulate the Total Fund Attribution Analysis (shown earlier) over multiple periods to examine thecumulative sources of excess total fund performance relative to target. These cumulative results quantify the longer-termsources of total fund excess return relative to target by asset class. These relative attribution effects separate the cumulativesources of total fund excess return into Asset Allocation Effect and Manager Selection Effect.
Eight and One-Quarter Year Annualized Relative Attribution Effects
(0.5%) 0.0% 0.5% 1.0% 1.5%
Domestic Equities
International Equities
World Equities
Private Equities
Domestic Fixed Income
International Fixed Inc.
Real Estate
Timber
Infrastructure
Cash & Equivalents
Total
Manager Effect Asset Allocation Total
Cumulative Relative Attribution Effects
(5%)
0%
5%
10%
15%
20%
25%
2010 2011 2012 2013 2014 2015 2016 2017 2018
Manager Effect
Asset Allocation
Total
Eight and One-Quarter Year Annualized Relative Attribution Effects
Effective Effective TotalActual Target Actual Target Manager Asset Relative
Asset Class Weight Weight Return Return Effect Allocation Return
Domestic Equities 26% 25% 16.13% 15.62% 0.08% 0.09% 0.18%International Equities 17% 17% 8.49% 6.49% 0.36% (0.02%) 0.34%World Equities 12% 12% - - (0.01%) (0.02%) (0.03%)Private Equities 4% 5% 4.02% 4.02% 0.00% (0.00%) (0.00%)Domestic Fixed Income 18% 18% 5.65% 4.00% 0.29% (0.04%) 0.25%International Fixed Inc. 5% 5% - - 0.10% 0.00% 0.11%Real Estate 10% 10% 13.46% 10.89% 0.24% 0.02% 0.26%Timber 3% 4% - - (0.24%) (0.00%) (0.25%)Infrastructure 4% 4% - - 0.18% 0.09% 0.27%Cash & Equivalents 1% 1% 0.42% 0.36% 0.00% (0.01%) (0.01%)
Total = + +9.91% 8.79% 1.02% 0.11% 1.12%
* Current Quarter Target = 16.6% Russell 1000 Index, 16.0% Blmbg Aggregate, 16.0% MSCI World, 11.8% MSCI World ex US, 10.0% NCREIF Total Index,
7.0% Blmbg HY 2% Iss Cap, 6.0% NDSIB TFFR - Private Equity, 4.8% Russell 2000 Index, 2.8% NCREIF NFI-ODCE Eq Wt Net, 2.8% CPI All Urban Cons
lagged 3 months, 2.8% MSCI EM, 2.3% NCREIF Timberland Index and 1.0% 3-month Treasury Bill.
58NDSIB - Teachers Fund For Retirement
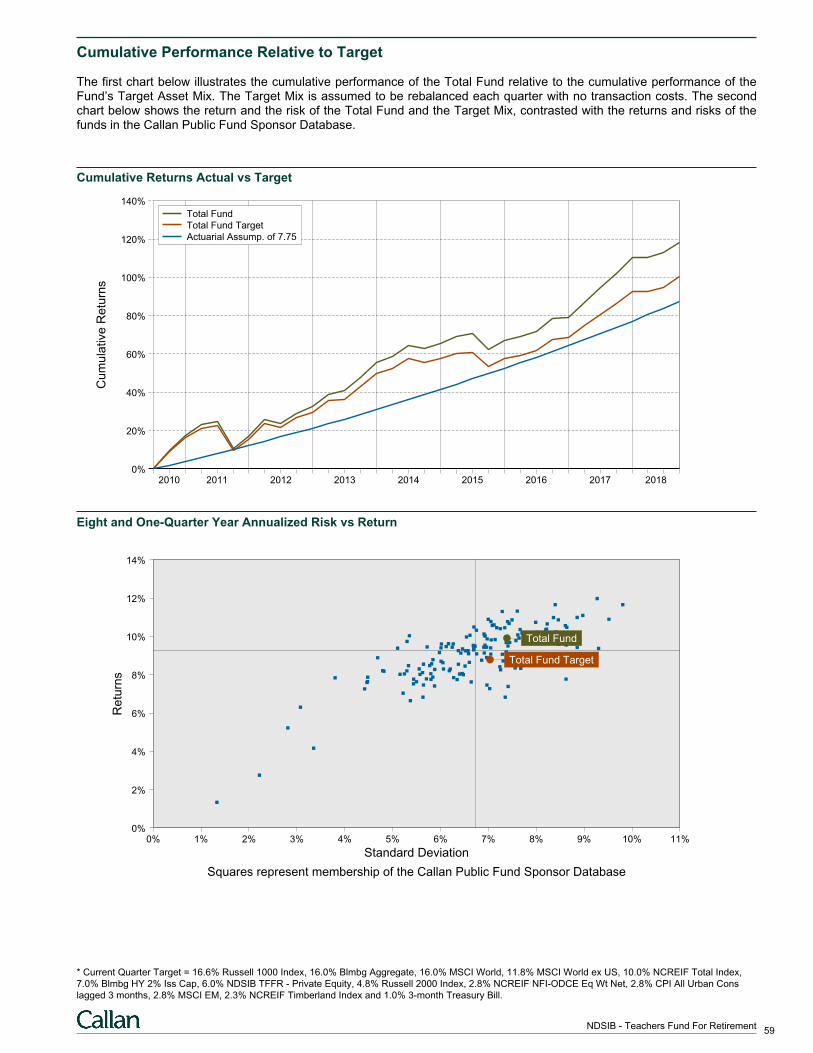
Cumulative Performance Relative to Target
The first chart below illustrates the cumulative performance of the Total Fund relative to the cumulative performance of theFund’s Target Asset Mix. The Target Mix is assumed to be rebalanced each quarter with no transaction costs. The secondchart below shows the return and the risk of the Total Fund and the Target Mix, contrasted with the returns and risks of thefunds in the Callan Public Fund Sponsor Database.
Cumulative Returns Actual vs Target
Cu
mu
lative
Re
turn
s
0%
20%
40%
60%
80%
100%
120%
140%
2010 2011 2012 2013 2014 2015 2016 2017 2018
Total Fund
Total Fund Target
Actuarial Assump. of 7.75
Eight and One-Quarter Year Annualized Risk vs Return
0% 1% 2% 3% 4% 5% 6% 7% 8% 9% 10% 11%0%
2%
4%
6%
8%
10%
12%
14%
Total Fund
Total Fund Target
Standard Deviation
Re
turn
s
Squares represent membership of the Callan Public Fund Sponsor Database
* Current Quarter Target = 16.6% Russell 1000 Index, 16.0% Blmbg Aggregate, 16.0% MSCI World, 11.8% MSCI World ex US, 10.0% NCREIF Total Index,
7.0% Blmbg HY 2% Iss Cap, 6.0% NDSIB TFFR - Private Equity, 4.8% Russell 2000 Index, 2.8% NCREIF NFI-ODCE Eq Wt Net, 2.8% CPI All Urban Cons
lagged 3 months, 2.8% MSCI EM, 2.3% NCREIF Timberland Index and 1.0% 3-month Treasury Bill.
59NDSIB - Teachers Fund For Retirement
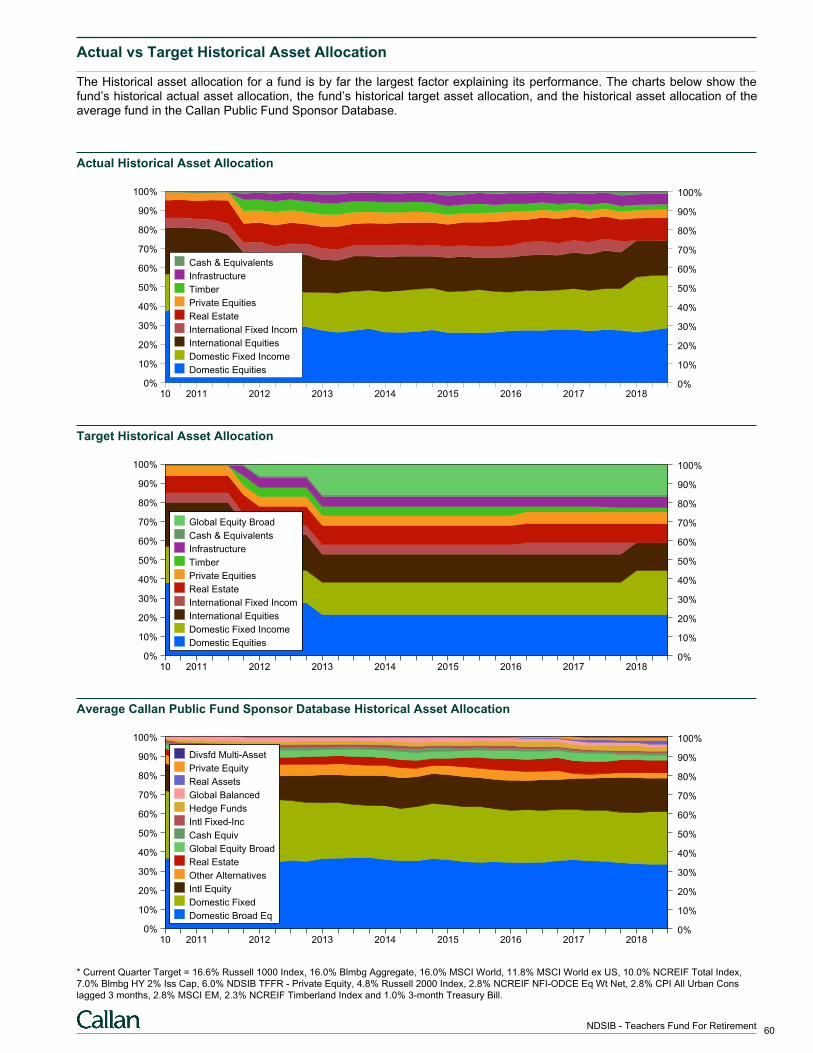
Actual vs Target Historical Asset Allocation
The Historical asset allocation for a fund is by far the largest factor explaining its performance. The charts below show thefund’s historical actual asset allocation, the fund’s historical target asset allocation, and the historical asset allocation of theaverage fund in the Callan Public Fund Sponsor Database.
Actual Historical Asset Allocation
0% 0%
10% 10%
20% 20%
30% 30%
40% 40%
50% 50%
60% 60%
70% 70%
80% 80%
90% 90%
100% 100%
10 2011 2012 2013 2014 2015 2016 2017 2018
Cash & Equivalents
Infrastructure
Timber
Private Equities
Real Estate
International Fixed Incom
International Equities
Domestic Fixed Income
Domestic Equities
Target Historical Asset Allocation
0% 0%
10% 10%
20% 20%
30% 30%
40% 40%
50% 50%
60% 60%
70% 70%
80% 80%
90% 90%
100% 100%
10 2011 2012 2013 2014 2015 2016 2017 2018
Global Equity Broad
Cash & Equivalents
Infrastructure
Timber
Private Equities
Real Estate
International Fixed Incom
International Equities
Domestic Fixed Income
Domestic Equities
Average Callan Public Fund Sponsor Database Historical Asset Allocation
0% 0%
10% 10%
20% 20%
30% 30%
40% 40%
50% 50%
60% 60%
70% 70%
80% 80%
90% 90%
100% 100%
10 2011 2012 2013 2014 2015 2016 2017 2018
Divsfd Multi-Asset
Private Equity
Real Assets
Global Balanced
Hedge Funds
Intl Fixed-Inc
Cash Equiv
Global Equity Broad
Real Estate
Other Alternatives
Intl Equity
Domestic Fixed
Domestic Broad Eq
* Current Quarter Target = 16.6% Russell 1000 Index, 16.0% Blmbg Aggregate, 16.0% MSCI World, 11.8% MSCI World ex US, 10.0% NCREIF Total Index,
7.0% Blmbg HY 2% Iss Cap, 6.0% NDSIB TFFR - Private Equity, 4.8% Russell 2000 Index, 2.8% NCREIF NFI-ODCE Eq Wt Net, 2.8% CPI All Urban Cons
lagged 3 months, 2.8% MSCI EM, 2.3% NCREIF Timberland Index and 1.0% 3-month Treasury Bill.
60NDSIB - Teachers Fund For Retirement
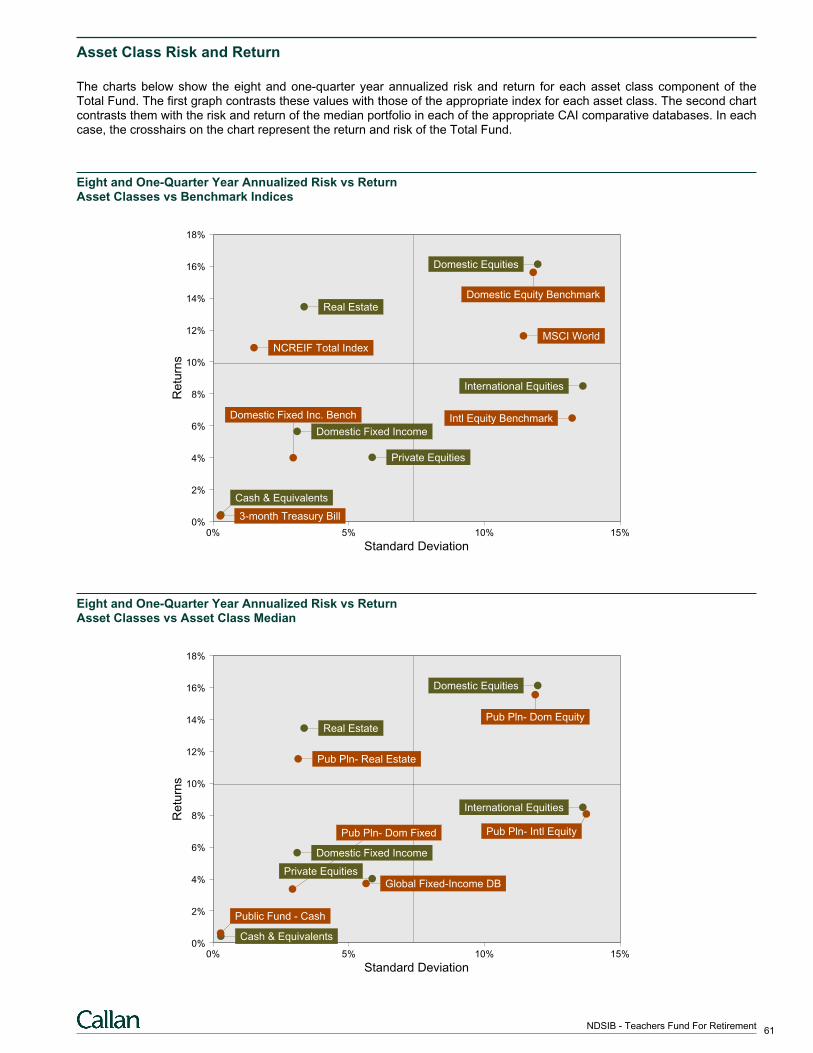
Asset Class Risk and Return
The charts below show the eight and one-quarter year annualized risk and return for each asset class component of theTotal Fund. The first graph contrasts these values with those of the appropriate index for each asset class. The second chartcontrasts them with the risk and return of the median portfolio in each of the appropriate CAI comparative databases. In eachcase, the crosshairs on the chart represent the return and risk of the Total Fund.
Eight and One-Quarter Year Annualized Risk vs ReturnAsset Classes vs Benchmark Indices
0% 5% 10% 15%0%
2%
4%
6%
8%
10%
12%
14%
16%
18%
Domestic Fixed Inc. Bench
Private Equities
Domestic Equities
Domestic Fixed Income
International Equities
Real Estate
MSCI WorldNCREIF Total Index
3-month Treasury Bill
Domestic Equity Benchmark
Intl Equity Benchmark
Cash & Equivalents
Standard Deviation
Re
turn
s
Eight and One-Quarter Year Annualized Risk vs ReturnAsset Classes vs Asset Class Median
0% 5% 10% 15%0%
2%
4%
6%
8%
10%
12%
14%
16%
18%
Pub Pln- Dom Fixed
Cash & Equivalents
Domestic Equities
Domestic Fixed Income
International Equities
Real EstatePub Pln- Dom Equity
Global Fixed-Income DB
Pub Pln- Real Estate
Public Fund - Cash
Pub Pln- Intl Equity
Private Equities
Standard Deviation
Re
turn
s
61NDSIB - Teachers Fund For Retirement
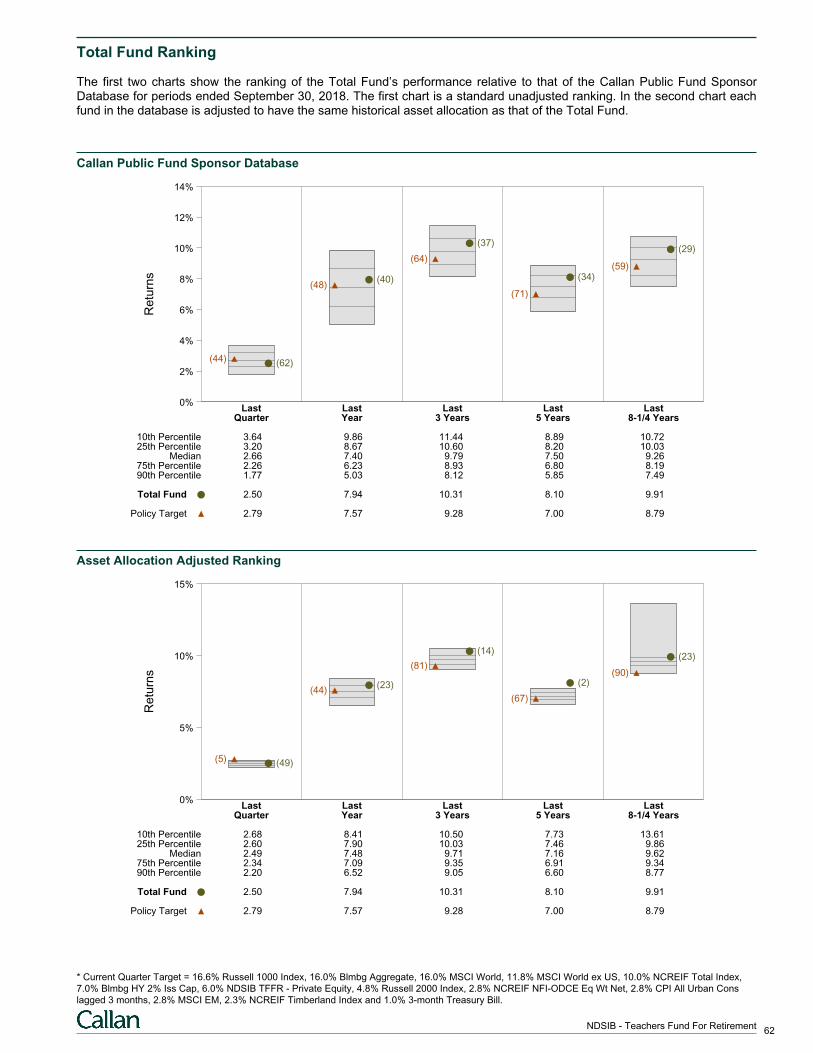
Total Fund Ranking
The first two charts show the ranking of the Total Fund’s performance relative to that of the Callan Public Fund SponsorDatabase for periods ended September 30, 2018. The first chart is a standard unadjusted ranking. In the second chart eachfund in the database is adjusted to have the same historical asset allocation as that of the Total Fund.
Callan Public Fund Sponsor DatabaseR
etu
rns
0%
2%
4%
6%
8%
10%
12%
14%
Last Last Last Last LastQuarter Year 3 Years 5 Years 8-1/4 Years
(62)(44)
(40)(48)
(37)
(64)
(34)
(71)
(29)
(59)
10th Percentile 3.64 9.86 11.44 8.89 10.7225th Percentile 3.20 8.67 10.60 8.20 10.03
Median 2.66 7.40 9.79 7.50 9.2675th Percentile 2.26 6.23 8.93 6.80 8.1990th Percentile 1.77 5.03 8.12 5.85 7.49
Total Fund 2.50 7.94 10.31 8.10 9.91
Policy Target 2.79 7.57 9.28 7.00 8.79
Asset Allocation Adjusted Ranking
Re
turn
s
0%
5%
10%
15%
Last Last Last Last LastQuarter Year 3 Years 5 Years 8-1/4 Years
(49)(5)
(23)(44)
(14)
(81)
(2)
(67)
(23)
(90)
10th Percentile 2.68 8.41 10.50 7.73 13.6125th Percentile 2.60 7.90 10.03 7.46 9.86
Median 2.49 7.48 9.71 7.16 9.6275th Percentile 2.34 7.09 9.35 6.91 9.3490th Percentile 2.20 6.52 9.05 6.60 8.77
Total Fund 2.50 7.94 10.31 8.10 9.91
Policy Target 2.79 7.57 9.28 7.00 8.79
* Current Quarter Target = 16.6% Russell 1000 Index, 16.0% Blmbg Aggregate, 16.0% MSCI World, 11.8% MSCI World ex US, 10.0% NCREIF Total Index,
7.0% Blmbg HY 2% Iss Cap, 6.0% NDSIB TFFR - Private Equity, 4.8% Russell 2000 Index, 2.8% NCREIF NFI-ODCE Eq Wt Net, 2.8% CPI All Urban Cons
lagged 3 months, 2.8% MSCI EM, 2.3% NCREIF Timberland Index and 1.0% 3-month Treasury Bill.
62NDSIB - Teachers Fund For Retirement
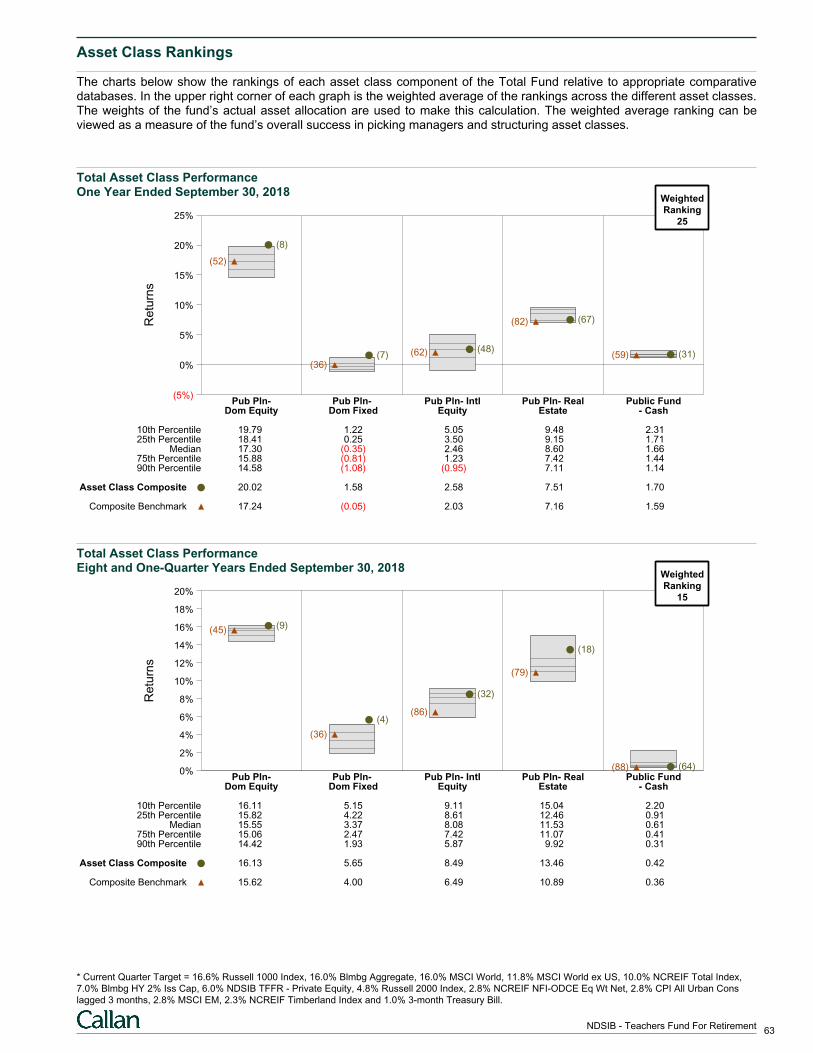
Asset Class Rankings
The charts below show the rankings of each asset class component of the Total Fund relative to appropriate comparativedatabases. In the upper right corner of each graph is the weighted average of the rankings across the different asset classes.The weights of the fund’s actual asset allocation are used to make this calculation. The weighted average ranking can beviewed as a measure of the fund’s overall success in picking managers and structuring asset classes.
Total Asset Class PerformanceOne Year Ended September 30, 2018
Re
turn
s
(5%)
0%
5%
10%
15%
20%
25%
Pub Pln- Pub Pln- Pub Pln- Intl Pub Pln- Real Public FundDom Equity Dom Fixed Equity Estate - Cash
(8)
(52)
(7)(36)
(48)(62)
(67)(82)
(31)(59)
10th Percentile 19.79 1.22 5.05 9.48 2.3125th Percentile 18.41 0.25 3.50 9.15 1.71
Median 17.30 (0.35) 2.46 8.60 1.6675th Percentile 15.88 (0.81) 1.23 7.42 1.4490th Percentile 14.58 (1.08) (0.95) 7.11 1.14
Asset Class Composite 20.02 1.58 2.58 7.51 1.70
Composite Benchmark 17.24 (0.05) 2.03 7.16 1.59
WeightedRanking
25
Total Asset Class PerformanceEight and One-Quarter Years Ended September 30, 2018
Re
turn
s
0%
2%
4%
6%
8%
10%
12%
14%
16%
18%
20%
Pub Pln- Pub Pln- Pub Pln- Intl Pub Pln- Real Public FundDom Equity Dom Fixed Equity Estate - Cash
(9)(45)
(4)
(36)
(32)
(86)
(18)
(79)
(64)(88)
10th Percentile 16.11 5.15 9.11 15.04 2.2025th Percentile 15.82 4.22 8.61 12.46 0.91
Median 15.55 3.37 8.08 11.53 0.6175th Percentile 15.06 2.47 7.42 11.07 0.4190th Percentile 14.42 1.93 5.87 9.92 0.31
Asset Class Composite 16.13 5.65 8.49 13.46 0.42
Composite Benchmark 15.62 4.00 6.49 10.89 0.36
WeightedRanking
15
* Current Quarter Target = 16.6% Russell 1000 Index, 16.0% Blmbg Aggregate, 16.0% MSCI World, 11.8% MSCI World ex US, 10.0% NCREIF Total Index,
7.0% Blmbg HY 2% Iss Cap, 6.0% NDSIB TFFR - Private Equity, 4.8% Russell 2000 Index, 2.8% NCREIF NFI-ODCE Eq Wt Net, 2.8% CPI All Urban Cons
lagged 3 months, 2.8% MSCI EM, 2.3% NCREIF Timberland Index and 1.0% 3-month Treasury Bill.
63NDSIB - Teachers Fund For Retirement
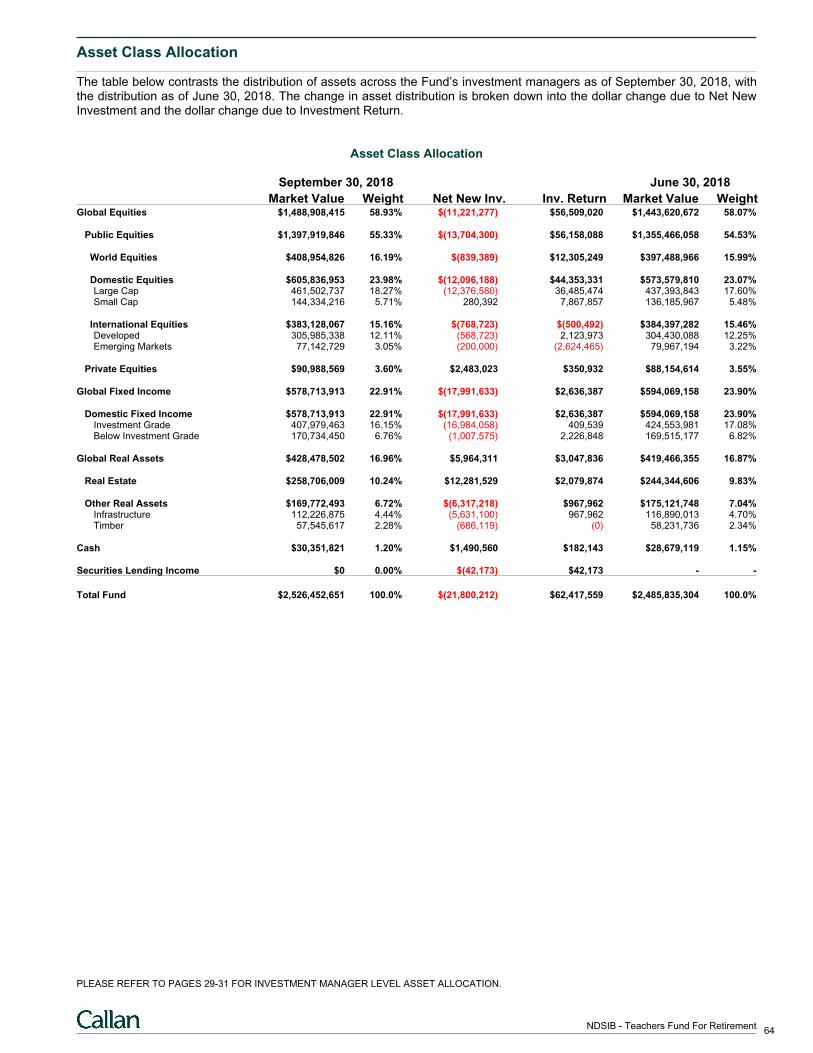
Asset Class Allocation
The table below contrasts the distribution of assets across the Fund’s investment managers as of September 30, 2018, withthe distribution as of June 30, 2018. The change in asset distribution is broken down into the dollar change due to Net NewInvestment and the dollar change due to Investment Return.
Asset Class Allocation
September 30, 2018 June 30, 2018
Market Value Weight Net New Inv. Inv. Return Market Value WeightGlobal Equities $1,488,908,415 58.93% $(11,221,277) $56,509,020 $1,443,620,672 58.07%
Public Equities $1,397,919,846 55.33% $(13,704,300) $56,158,088 $1,355,466,058 54.53%
World Equities $408,954,826 16.19% $(839,389) $12,305,249 $397,488,966 15.99%
Domestic Equities $605,836,953 23.98% $(12,096,188) $44,353,331 $573,579,810 23.07% Large Cap 461,502,737 18.27% (12,376,580) 36,485,474 437,393,843 17.60% Small Cap 144,334,216 5.71% 280,392 7,867,857 136,185,967 5.48%
International Equities $383,128,067 15.16% $(768,723) $(500,492) $384,397,282 15.46% Developed 305,985,338 12.11% (568,723) 2,123,973 304,430,088 12.25% Emerging Markets 77,142,729 3.05% (200,000) (2,624,465) 79,967,194 3.22%
Private Equities $90,988,569 3.60% $2,483,023 $350,932 $88,154,614 3.55%
Global Fixed Income $578,713,913 22.91% $(17,991,633) $2,636,387 $594,069,158 23.90%
Domestic Fixed Income $578,713,913 22.91% $(17,991,633) $2,636,387 $594,069,158 23.90% Investment Grade 407,979,463 16.15% (16,984,058) 409,539 424,553,981 17.08% Below Investment Grade 170,734,450 6.76% (1,007,575) 2,226,848 169,515,177 6.82%
Global Real Assets $428,478,502 16.96% $5,964,311 $3,047,836 $419,466,355 16.87%
Real Estate $258,706,009 10.24% $12,281,529 $2,079,874 $244,344,606 9.83%
Other Real Assets $169,772,493 6.72% $(6,317,218) $967,962 $175,121,748 7.04% Infrastructure 112,226,875 4.44% (5,631,100) 967,962 116,890,013 4.70% Timber 57,545,617 2.28% (686,119) (0) 58,231,736 2.34%
Cash $30,351,821 1.20% $1,490,560 $182,143 $28,679,119 1.15%
Securities Lending Income $0 0.00% $(42,173) $42,173 - -
Total Fund $2,526,452,651 100.0% $(21,800,212) $62,417,559 $2,485,835,304 100.0%
PLEASE REFER TO PAGES 29-31 FOR INVESTMENT MANAGER LEVEL ASSET ALLOCATION.
64NDSIB - Teachers Fund For Retirement
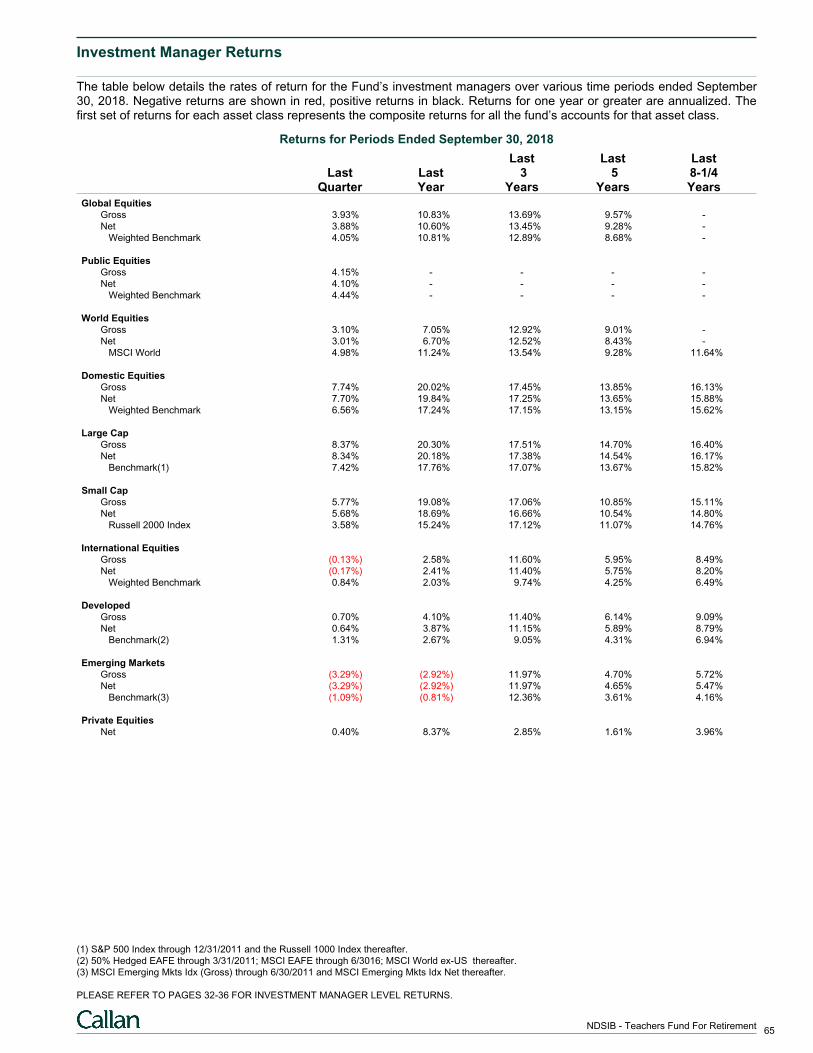
Investment Manager Returns
The table below details the rates of return for the Fund’s investment managers over various time periods ended September30, 2018. Negative returns are shown in red, positive returns in black. Returns for one year or greater are annualized. Thefirst set of returns for each asset class represents the composite returns for all the fund’s accounts for that asset class.
Returns for Periods Ended September 30, 2018
Last Last LastLast Last 3 5 8-1/4
Quarter Year Years Years Years
Global EquitiesGross 3.93% 10.83% 13.69% 9.57% -
Net 3.88% 10.60% 13.45% 9.28% -
Weighted Benchmark 4.05% 10.81% 12.89% 8.68% -
Public EquitiesGross 4.15% - - - -
Net 4.10% - - - -
Weighted Benchmark 4.44% - - - -
World EquitiesGross 3.10% 7.05% 12.92% 9.01% -
Net 3.01% 6.70% 12.52% 8.43% -
MSCI World 4.98% 11.24% 13.54% 9.28% 11.64%
Domestic EquitiesGross 7.74% 20.02% 17.45% 13.85% 16.13%
Net 7.70% 19.84% 17.25% 13.65% 15.88%
Weighted Benchmark 6.56% 17.24% 17.15% 13.15% 15.62%
Large CapGross 8.37% 20.30% 17.51% 14.70% 16.40%
Net 8.34% 20.18% 17.38% 14.54% 16.17%
Benchmark(1) 7.42% 17.76% 17.07% 13.67% 15.82%
Small CapGross 5.77% 19.08% 17.06% 10.85% 15.11%
Net 5.68% 18.69% 16.66% 10.54% 14.80%
Russell 2000 Index 3.58% 15.24% 17.12% 11.07% 14.76%
International EquitiesGross (0.13%) 2.58% 11.60% 5.95% 8.49%
Net (0.17%) 2.41% 11.40% 5.75% 8.20%
Weighted Benchmark 0.84% 2.03% 9.74% 4.25% 6.49%
DevelopedGross 0.70% 4.10% 11.40% 6.14% 9.09%
Net 0.64% 3.87% 11.15% 5.89% 8.79%
Benchmark(2) 1.31% 2.67% 9.05% 4.31% 6.94%
Emerging MarketsGross (3.29%) (2.92%) 11.97% 4.70% 5.72%
Net (3.29%) (2.92%) 11.97% 4.65% 5.47%
Benchmark(3) (1.09%) (0.81%) 12.36% 3.61% 4.16%
Private EquitiesNet 0.40% 8.37% 2.85% 1.61% 3.96%
(1) S&P 500 Index through 12/31/2011 and the Russell 1000 Index thereafter.
(2) 50% Hedged EAFE through 3/31/2011; MSCI EAFE through 6/3016; MSCI World ex-US thereafter.
(3) MSCI Emerging Mkts Idx (Gross) through 6/30/2011 and MSCI Emerging Mkts Idx Net thereafter.
PLEASE REFER TO PAGES 32-36 FOR INVESTMENT MANAGER LEVEL RETURNS.
65NDSIB - Teachers Fund For Retirement
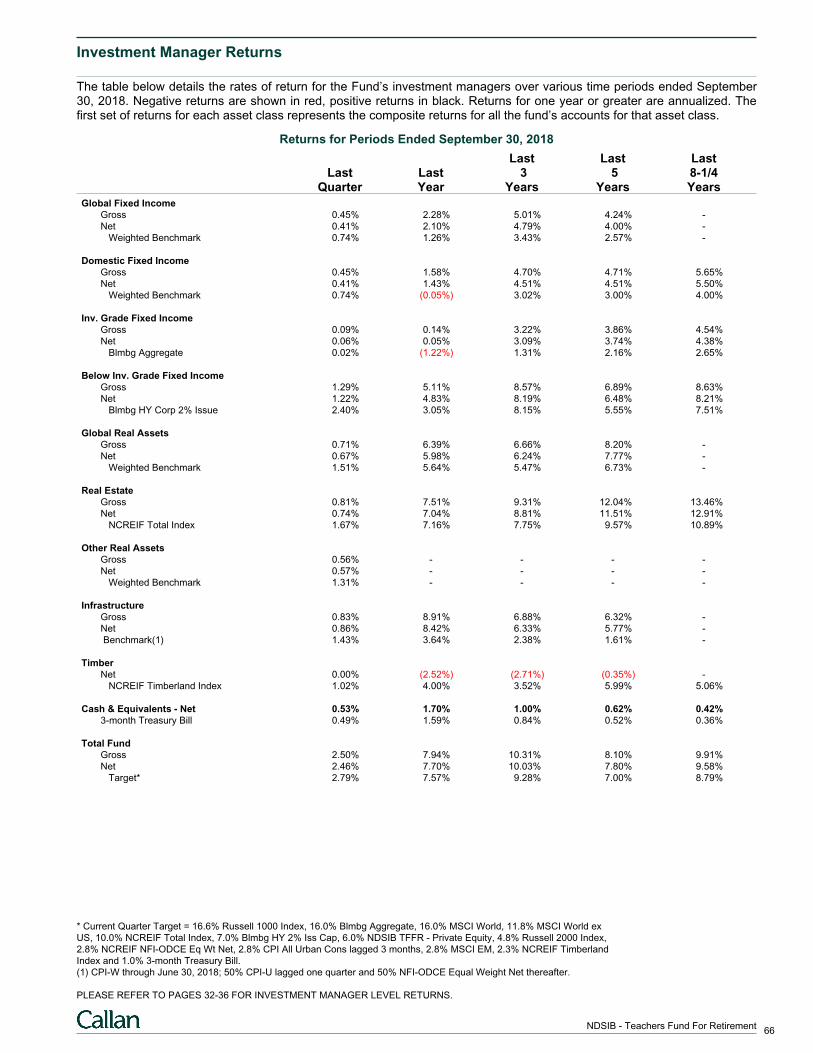
Investment Manager Returns
The table below details the rates of return for the Fund’s investment managers over various time periods ended September30, 2018. Negative returns are shown in red, positive returns in black. Returns for one year or greater are annualized. Thefirst set of returns for each asset class represents the composite returns for all the fund’s accounts for that asset class.
Returns for Periods Ended September 30, 2018
Last Last LastLast Last 3 5 8-1/4
Quarter Year Years Years Years
Global Fixed IncomeGross 0.45% 2.28% 5.01% 4.24% -
Net 0.41% 2.10% 4.79% 4.00% -
Weighted Benchmark 0.74% 1.26% 3.43% 2.57% -
Domestic Fixed IncomeGross 0.45% 1.58% 4.70% 4.71% 5.65%
Net 0.41% 1.43% 4.51% 4.51% 5.50%
Weighted Benchmark 0.74% (0.05%) 3.02% 3.00% 4.00%
Inv. Grade Fixed IncomeGross 0.09% 0.14% 3.22% 3.86% 4.54%
Net 0.06% 0.05% 3.09% 3.74% 4.38%
Blmbg Aggregate 0.02% (1.22%) 1.31% 2.16% 2.65%
Below Inv. Grade Fixed IncomeGross 1.29% 5.11% 8.57% 6.89% 8.63%
Net 1.22% 4.83% 8.19% 6.48% 8.21%
Blmbg HY Corp 2% Issue 2.40% 3.05% 8.15% 5.55% 7.51%
Global Real AssetsGross 0.71% 6.39% 6.66% 8.20% -
Net 0.67% 5.98% 6.24% 7.77% -
Weighted Benchmark 1.51% 5.64% 5.47% 6.73% -
Real EstateGross 0.81% 7.51% 9.31% 12.04% 13.46%
Net 0.74% 7.04% 8.81% 11.51% 12.91%
NCREIF Total Index 1.67% 7.16% 7.75% 9.57% 10.89%
Other Real AssetsGross 0.56% - - - -
Net 0.57% - - - -
Weighted Benchmark 1.31% - - - -
InfrastructureGross 0.83% 8.91% 6.88% 6.32% -
Net 0.86% 8.42% 6.33% 5.77% -
Benchmark(1) 1.43% 3.64% 2.38% 1.61% -
TimberNet 0.00% (2.52%) (2.71%) (0.35%) -
NCREIF Timberland Index 1.02% 4.00% 3.52% 5.99% 5.06%
Cash & Equivalents - Net 0.53% 1.70% 1.00% 0.62% 0.42%3-month Treasury Bill 0.49% 1.59% 0.84% 0.52% 0.36%
Total FundGross 2.50% 7.94% 10.31% 8.10% 9.91%
Net 2.46% 7.70% 10.03% 7.80% 9.58%
Target* 2.79% 7.57% 9.28% 7.00% 8.79%
* Current Quarter Target = 16.6% Russell 1000 Index, 16.0% Blmbg Aggregate, 16.0% MSCI World, 11.8% MSCI World ex
US, 10.0% NCREIF Total Index, 7.0% Blmbg HY 2% Iss Cap, 6.0% NDSIB TFFR - Private Equity, 4.8% Russell 2000 Index,
2.8% NCREIF NFI-ODCE Eq Wt Net, 2.8% CPI All Urban Cons lagged 3 months, 2.8% MSCI EM, 2.3% NCREIF Timberland
Index and 1.0% 3-month Treasury Bill.
(1) CPI-W through June 30, 2018; 50% CPI-U lagged one quarter and 50% NFI-ODCE Equal Weight Net thereafter.
PLEASE REFER TO PAGES 32-36 FOR INVESTMENT MANAGER LEVEL RETURNS.
66NDSIB - Teachers Fund For Retirement
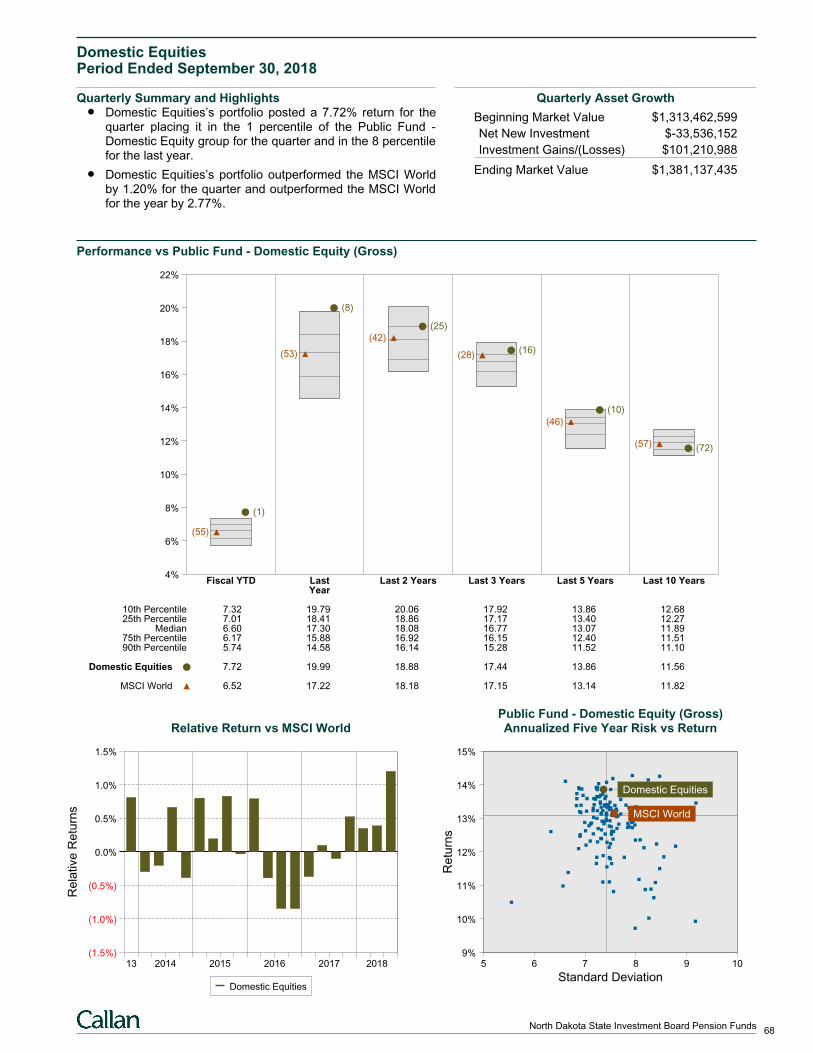
Domestic EquitiesPeriod Ended September 30, 2018
Quarterly Summary and HighlightsDomestic Equities’s portfolio posted a 7.72% return for thequarter placing it in the 1 percentile of the Public Fund -Domestic Equity group for the quarter and in the 8 percentilefor the last year.
Domestic Equities’s portfolio outperformed the MSCI Worldby 1.20% for the quarter and outperformed the MSCI Worldfor the year by 2.77%.
Quarterly Asset Growth
Beginning Market Value $1,313,462,599
Net New Investment $-33,536,152
Investment Gains/(Losses) $101,210,988
Ending Market Value $1,381,137,435
Performance vs Public Fund - Domestic Equity (Gross)
4%
6%
8%
10%
12%
14%
16%
18%
20%
22%
Fiscal YTD Last Last 2 Years Last 3 Years Last 5 Years Last 10 YearsYear
(1)
(55)
(8)
(53)
(25)
(42)
(16)(28)
(10)
(46)
(72)(57)
10th Percentile 7.32 19.79 20.06 17.92 13.86 12.6825th Percentile 7.01 18.41 18.86 17.17 13.40 12.27
Median 6.60 17.30 18.08 16.77 13.07 11.8975th Percentile 6.17 15.88 16.92 16.15 12.40 11.5190th Percentile 5.74 14.58 16.14 15.28 11.52 11.10
Domestic Equities 7.72 19.99 18.88 17.44 13.86 11.56
MSCI World 6.52 17.22 18.18 17.15 13.14 11.82
Relative Return vs MSCI World
Rela
tive
Re
turn
s
(1.5%)
(1.0%)
(0.5%)
0.0%
0.5%
1.0%
1.5%
13 2014 2015 2016 2017 2018
Domestic Equities
Public Fund - Domestic Equity (Gross)Annualized Five Year Risk vs Return
5 6 7 8 9 109%
10%
11%
12%
13%
14%
15%
Domestic Equities
MSCI World
Standard Deviation
Re
turn
s
68North Dakota State Investment Board Pension Funds
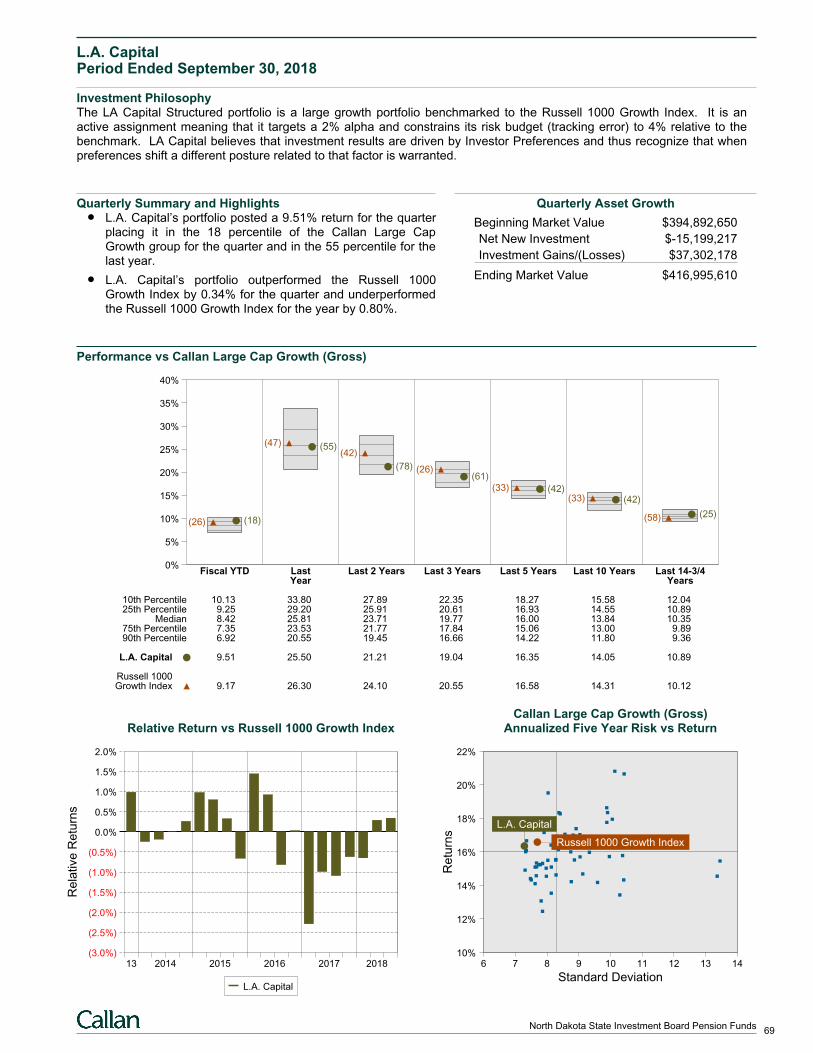
L.A. CapitalPeriod Ended September 30, 2018
Investment PhilosophyThe LA Capital Structured portfolio is a large growth portfolio benchmarked to the Russell 1000 Growth Index. It is anactive assignment meaning that it targets a 2% alpha and constrains its risk budget (tracking error) to 4% relative to thebenchmark. LA Capital believes that investment results are driven by Investor Preferences and thus recognize that whenpreferences shift a different posture related to that factor is warranted.
Quarterly Summary and HighlightsL.A. Capital’s portfolio posted a 9.51% return for the quarterplacing it in the 18 percentile of the Callan Large CapGrowth group for the quarter and in the 55 percentile for thelast year.
L.A. Capital’s portfolio outperformed the Russell 1000Growth Index by 0.34% for the quarter and underperformedthe Russell 1000 Growth Index for the year by 0.80%.
Quarterly Asset Growth
Beginning Market Value $394,892,650
Net New Investment $-15,199,217
Investment Gains/(Losses) $37,302,178
Ending Market Value $416,995,610
Performance vs Callan Large Cap Growth (Gross)
0%
5%
10%
15%
20%
25%
30%
35%
40%
Fiscal YTD Last Last 2 Years Last 3 Years Last 5 Years Last 10 Years Last 14-3/4Year Years
(18)(26)
(55)(47)
(78)
(42)
(61)(26)
(42)(33)
(42)(33)
(25)(58)
10th Percentile 10.13 33.80 27.89 22.35 18.27 15.58 12.0425th Percentile 9.25 29.20 25.91 20.61 16.93 14.55 10.89
Median 8.42 25.81 23.71 19.77 16.00 13.84 10.3575th Percentile 7.35 23.53 21.77 17.84 15.06 13.00 9.8990th Percentile 6.92 20.55 19.45 16.66 14.22 11.80 9.36
L.A. Capital 9.51 25.50 21.21 19.04 16.35 14.05 10.89
Russell 1000Growth Index 9.17 26.30 24.10 20.55 16.58 14.31 10.12
Relative Return vs Russell 1000 Growth Index
Rela
tive
Re
turn
s
(3.0%)
(2.5%)
(2.0%)
(1.5%)
(1.0%)
(0.5%)
0.0%
0.5%
1.0%
1.5%
2.0%
13 2014 2015 2016 2017 2018
L.A. Capital
Callan Large Cap Growth (Gross)Annualized Five Year Risk vs Return
6 7 8 9 10 11 12 13 1410%
12%
14%
16%
18%
20%
22%
L.A. Capital
Russell 1000 Growth Index
Standard Deviation
Re
turn
s
69North Dakota State Investment Board Pension Funds
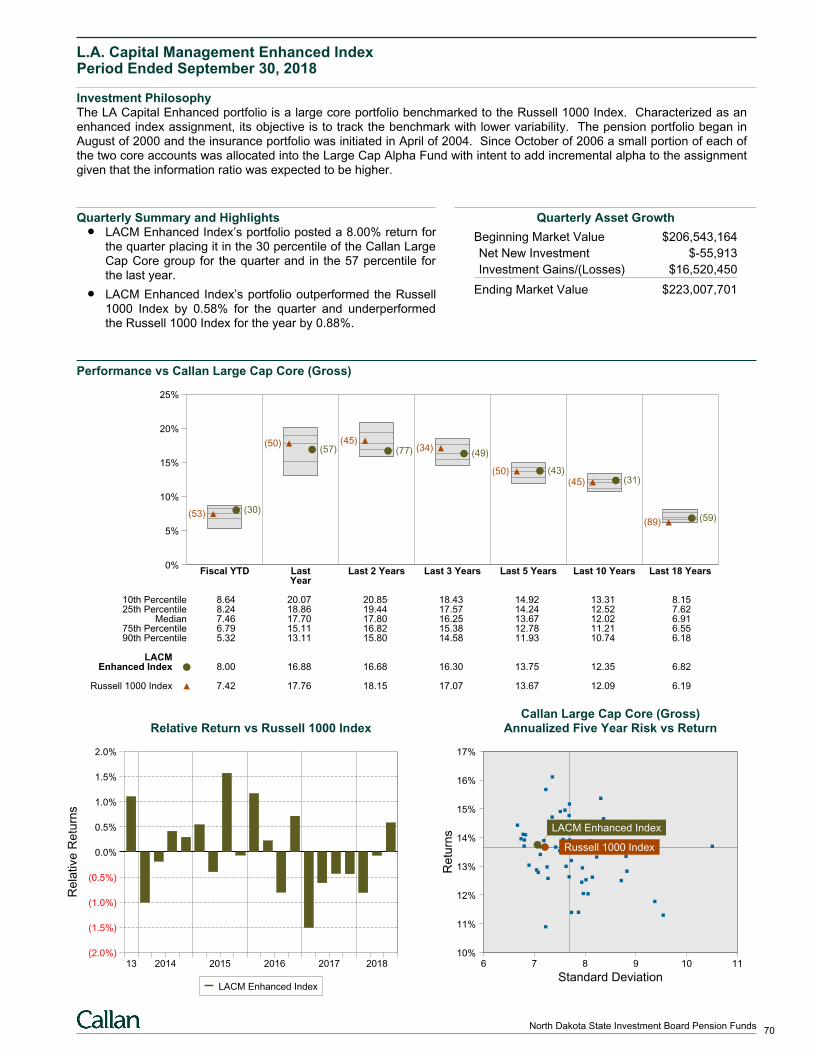
L.A. Capital Management Enhanced IndexPeriod Ended September 30, 2018
Investment PhilosophyThe LA Capital Enhanced portfolio is a large core portfolio benchmarked to the Russell 1000 Index. Characterized as anenhanced index assignment, its objective is to track the benchmark with lower variability. The pension portfolio began inAugust of 2000 and the insurance portfolio was initiated in April of 2004. Since October of 2006 a small portion of each ofthe two core accounts was allocated into the Large Cap Alpha Fund with intent to add incremental alpha to the assignmentgiven that the information ratio was expected to be higher.
Quarterly Summary and HighlightsLACM Enhanced Index’s portfolio posted a 8.00% return forthe quarter placing it in the 30 percentile of the Callan LargeCap Core group for the quarter and in the 57 percentile forthe last year.
LACM Enhanced Index’s portfolio outperformed the Russell1000 Index by 0.58% for the quarter and underperformedthe Russell 1000 Index for the year by 0.88%.
Quarterly Asset Growth
Beginning Market Value $206,543,164
Net New Investment $-55,913
Investment Gains/(Losses) $16,520,450
Ending Market Value $223,007,701
Performance vs Callan Large Cap Core (Gross)
0%
5%
10%
15%
20%
25%
Fiscal YTD Last Last 2 Years Last 3 Years Last 5 Years Last 10 Years Last 18 YearsYear
(30)(53)
(57)(50)
(77)(45)
(49)(34)
(43)(50)(31)(45)
(59)(89)
10th Percentile 8.64 20.07 20.85 18.43 14.92 13.31 8.1525th Percentile 8.24 18.86 19.44 17.57 14.24 12.52 7.62
Median 7.46 17.70 17.80 16.25 13.67 12.02 6.9175th Percentile 6.79 15.11 16.82 15.38 12.78 11.21 6.5590th Percentile 5.32 13.11 15.80 14.58 11.93 10.74 6.18
LACMEnhanced Index 8.00 16.88 16.68 16.30 13.75 12.35 6.82
Russell 1000 Index 7.42 17.76 18.15 17.07 13.67 12.09 6.19
Relative Return vs Russell 1000 Index
Rela
tive
Re
turn
s
(2.0%)
(1.5%)
(1.0%)
(0.5%)
0.0%
0.5%
1.0%
1.5%
2.0%
13 2014 2015 2016 2017 2018
LACM Enhanced Index
Callan Large Cap Core (Gross)Annualized Five Year Risk vs Return
6 7 8 9 10 1110%
11%
12%
13%
14%
15%
16%
17%
Russell 1000 Index
LACM Enhanced Index
Standard Deviation
Re
turn
s
70North Dakota State Investment Board Pension Funds
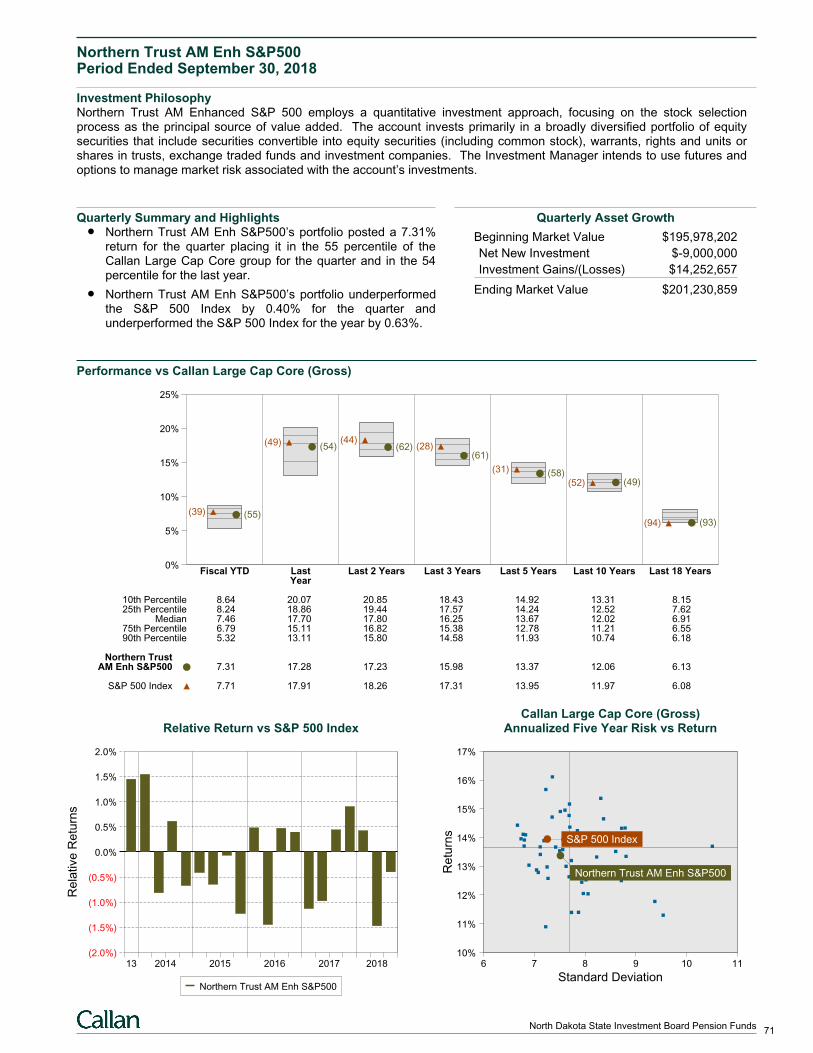
Northern Trust AM Enh S&P500Period Ended September 30, 2018
Investment PhilosophyNorthern Trust AM Enhanced S&P 500 employs a quantitative investment approach, focusing on the stock selectionprocess as the principal source of value added. The account invests primarily in a broadly diversified portfolio of equitysecurities that include securities convertible into equity securities (including common stock), warrants, rights and units orshares in trusts, exchange traded funds and investment companies. The Investment Manager intends to use futures andoptions to manage market risk associated with the account’s investments.
Quarterly Summary and HighlightsNorthern Trust AM Enh S&P500’s portfolio posted a 7.31%return for the quarter placing it in the 55 percentile of theCallan Large Cap Core group for the quarter and in the 54percentile for the last year.
Northern Trust AM Enh S&P500’s portfolio underperformedthe S&P 500 Index by 0.40% for the quarter andunderperformed the S&P 500 Index for the year by 0.63%.
Quarterly Asset Growth
Beginning Market Value $195,978,202
Net New Investment $-9,000,000
Investment Gains/(Losses) $14,252,657
Ending Market Value $201,230,859
Performance vs Callan Large Cap Core (Gross)
0%
5%
10%
15%
20%
25%
Fiscal YTD Last Last 2 Years Last 3 Years Last 5 Years Last 10 Years Last 18 YearsYear
(55)(39)
(54)(49)(62)
(44)
(61)(28)
(58)(31)
(49)(52)
(93)(94)
10th Percentile 8.64 20.07 20.85 18.43 14.92 13.31 8.1525th Percentile 8.24 18.86 19.44 17.57 14.24 12.52 7.62
Median 7.46 17.70 17.80 16.25 13.67 12.02 6.9175th Percentile 6.79 15.11 16.82 15.38 12.78 11.21 6.5590th Percentile 5.32 13.11 15.80 14.58 11.93 10.74 6.18
Northern TrustAM Enh S&P500 7.31 17.28 17.23 15.98 13.37 12.06 6.13
S&P 500 Index 7.71 17.91 18.26 17.31 13.95 11.97 6.08
Relative Return vs S&P 500 Index
Rela
tive
Re
turn
s
(2.0%)
(1.5%)
(1.0%)
(0.5%)
0.0%
0.5%
1.0%
1.5%
2.0%
13 2014 2015 2016 2017 2018
Northern Trust AM Enh S&P500
Callan Large Cap Core (Gross)Annualized Five Year Risk vs Return
6 7 8 9 10 1110%
11%
12%
13%
14%
15%
16%
17%
S&P 500 Index
Northern Trust AM Enh S&P500
Standard Deviation
Re
turn
s
71North Dakota State Investment Board Pension Funds
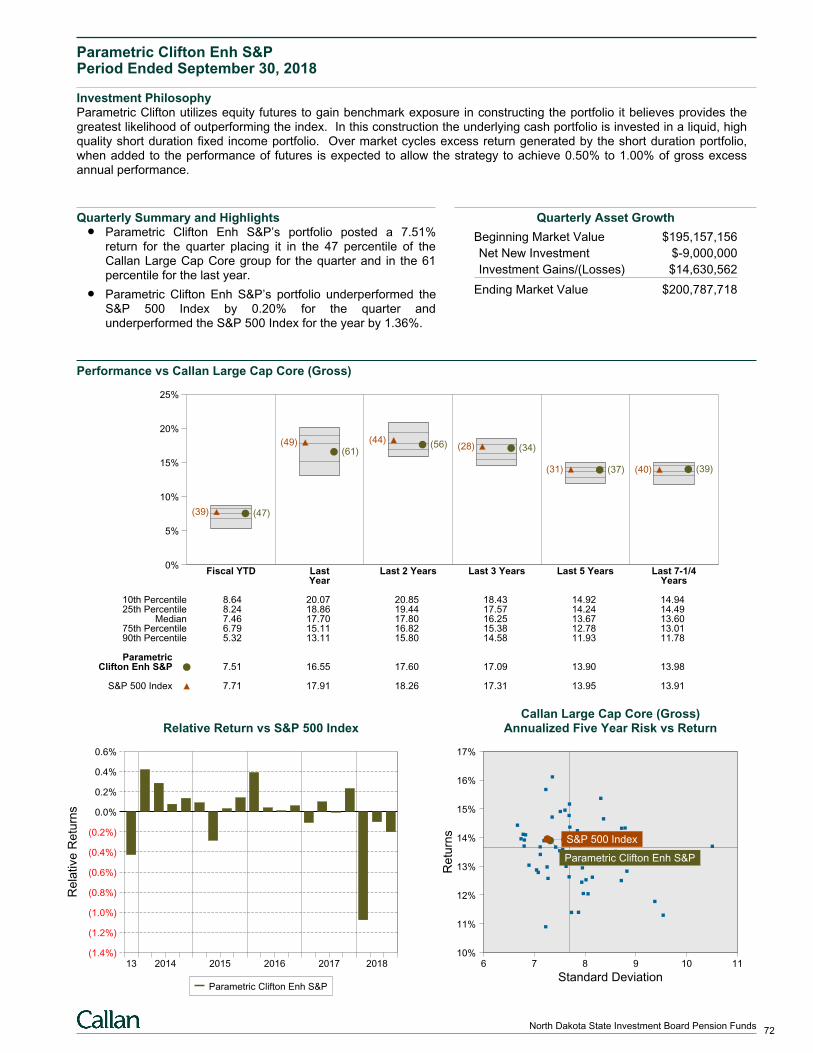
Parametric Clifton Enh S&PPeriod Ended September 30, 2018
Investment PhilosophyParametric Clifton utilizes equity futures to gain benchmark exposure in constructing the portfolio it believes provides thegreatest likelihood of outperforming the index. In this construction the underlying cash portfolio is invested in a liquid, highquality short duration fixed income portfolio. Over market cycles excess return generated by the short duration portfolio,when added to the performance of futures is expected to allow the strategy to achieve 0.50% to 1.00% of gross excessannual performance.
Quarterly Summary and HighlightsParametric Clifton Enh S&P’s portfolio posted a 7.51%return for the quarter placing it in the 47 percentile of theCallan Large Cap Core group for the quarter and in the 61percentile for the last year.
Parametric Clifton Enh S&P’s portfolio underperformed theS&P 500 Index by 0.20% for the quarter andunderperformed the S&P 500 Index for the year by 1.36%.
Quarterly Asset Growth
Beginning Market Value $195,157,156
Net New Investment $-9,000,000
Investment Gains/(Losses) $14,630,562
Ending Market Value $200,787,718
Performance vs Callan Large Cap Core (Gross)
0%
5%
10%
15%
20%
25%
Fiscal YTD Last Last 2 Years Last 3 Years Last 5 Years Last 7-1/4Year Years
(47)(39)
(61)(49) (56)(44)
(34)(28)
(37)(31) (39)(40)
10th Percentile 8.64 20.07 20.85 18.43 14.92 14.9425th Percentile 8.24 18.86 19.44 17.57 14.24 14.49
Median 7.46 17.70 17.80 16.25 13.67 13.6075th Percentile 6.79 15.11 16.82 15.38 12.78 13.0190th Percentile 5.32 13.11 15.80 14.58 11.93 11.78
ParametricClifton Enh S&P 7.51 16.55 17.60 17.09 13.90 13.98
S&P 500 Index 7.71 17.91 18.26 17.31 13.95 13.91
Relative Return vs S&P 500 Index
Rela
tive
Re
turn
s
(1.4%)
(1.2%)
(1.0%)
(0.8%)
(0.6%)
(0.4%)
(0.2%)
0.0%
0.2%
0.4%
0.6%
13 2014 2015 2016 2017 2018
Parametric Clifton Enh S&P
Callan Large Cap Core (Gross)Annualized Five Year Risk vs Return
6 7 8 9 10 1110%
11%
12%
13%
14%
15%
16%
17%
S&P 500 Index
Parametric Clifton Enh S&P
Standard Deviation
Re
turn
s
72North Dakota State Investment Board Pension Funds
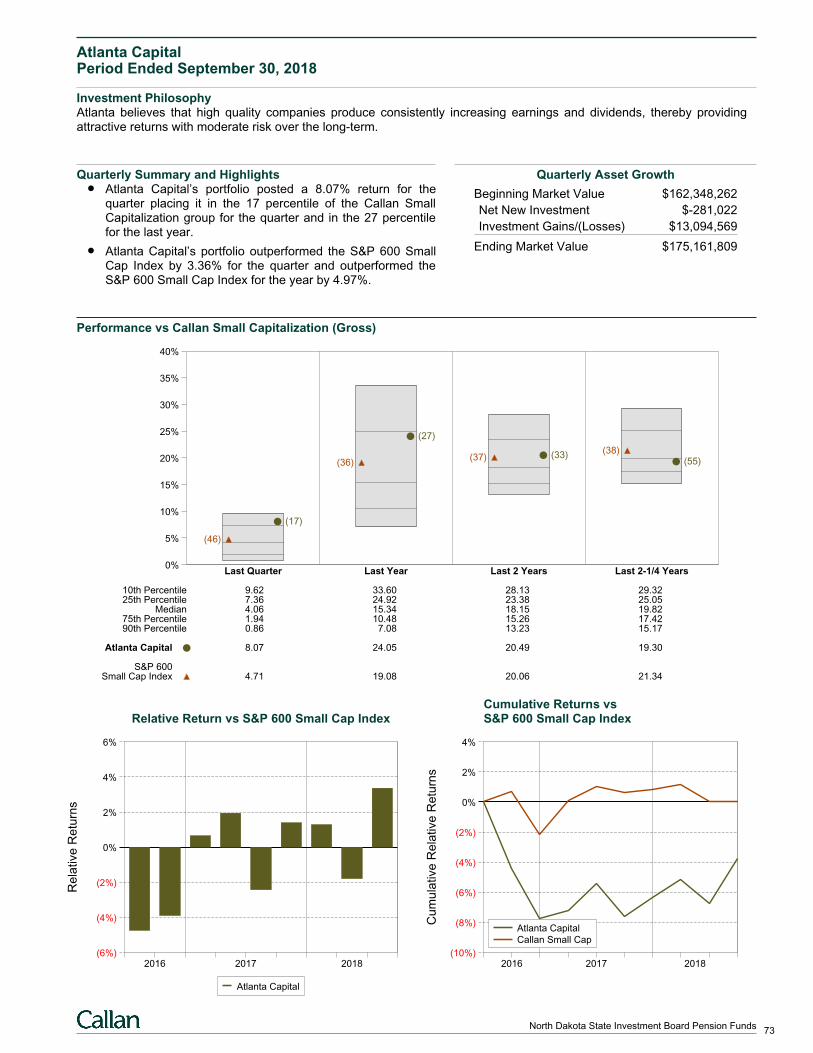
Atlanta CapitalPeriod Ended September 30, 2018
Investment PhilosophyAtlanta believes that high quality companies produce consistently increasing earnings and dividends, thereby providingattractive returns with moderate risk over the long-term.
Quarterly Summary and HighlightsAtlanta Capital’s portfolio posted a 8.07% return for thequarter placing it in the 17 percentile of the Callan SmallCapitalization group for the quarter and in the 27 percentilefor the last year.
Atlanta Capital’s portfolio outperformed the S&P 600 SmallCap Index by 3.36% for the quarter and outperformed theS&P 600 Small Cap Index for the year by 4.97%.
Quarterly Asset Growth
Beginning Market Value $162,348,262
Net New Investment $-281,022
Investment Gains/(Losses) $13,094,569
Ending Market Value $175,161,809
Performance vs Callan Small Capitalization (Gross)
0%
5%
10%
15%
20%
25%
30%
35%
40%
Last Quarter Last Year Last 2 Years Last 2-1/4 Years
(17)
(46)
(27)
(36)(33)(37) (55)
(38)
10th Percentile 9.62 33.60 28.13 29.3225th Percentile 7.36 24.92 23.38 25.05
Median 4.06 15.34 18.15 19.8275th Percentile 1.94 10.48 15.26 17.4290th Percentile 0.86 7.08 13.23 15.17
Atlanta Capital 8.07 24.05 20.49 19.30
S&P 600Small Cap Index 4.71 19.08 20.06 21.34
Relative Return vs S&P 600 Small Cap Index
Rela
tive
Re
turn
s
(6%)
(4%)
(2%)
0%
2%
4%
6%
2016 2017 2018
Atlanta Capital
Cumulative Returns vsS&P 600 Small Cap Index
Cum
ula
tive
Re
lative
Re
turn
s
(10%)
(8%)
(6%)
(4%)
(2%)
0%
2%
4%
2016 2017 2018
Atlanta Capital
Callan Small Cap
73North Dakota State Investment Board Pension Funds

Parametric Clifton Enh SmCapPeriod Ended September 30, 2018
Investment PhilosophyParametric Clifton utilizes equity futures to gain benchmark exposure in constructing the portfolio it believes provides thegreatest likelihood of outperforming the index. In this construction the underlying cash portfolio is invested in a liquid, highquality short duration fixed income portfolio. Over market cycles excess return generated by the short duration portfolio,when added to the performance of futures is expected to allow the strategy to achieve 0.50% to 1.00% of gross excessannual performance.
Quarterly Summary and HighlightsParametric Clifton Enh SmCap’s portfolio posted a 3.41%return for the quarter placing it in the 59 percentile of theCallan Small Capitalization group for the quarter and in the55 percentile for the last year.
Parametric Clifton Enh SmCap’s portfolio underperformedthe Russell 2000 Index by 0.16% for the quarter andunderperformed the Russell 2000 Index for the year by1.04%.
Quarterly Asset Growth
Beginning Market Value $158,543,165
Net New Investment $0
Investment Gains/(Losses) $5,410,572
Ending Market Value $163,953,737
Performance vs Callan Small Capitalization (Gross)
0%
5%
10%
15%
20%
25%
30%
35%
40%
Fiscal YTD Last Last 2 Years Last 3 Years Last 5 Years Last 8-3/4Year Years
(59)(57)
(55)(50)(55)(53) (46)(49)
(57)(69)
(59)(82)
10th Percentile 9.62 33.60 28.13 22.20 14.96 17.8125th Percentile 7.36 24.92 23.38 19.32 13.48 16.54
Median 4.06 15.34 18.15 17.06 12.14 14.9175th Percentile 1.94 10.48 15.26 15.09 10.78 13.8290th Percentile 0.86 7.08 13.23 13.24 9.40 13.07
ParametricClifton Enh SmCap 3.41 14.20 17.67 17.46 11.75 14.64
Russell 2000 Index 3.58 15.24 17.96 17.12 11.07 13.61
Relative Return vs Russell 2000 Index
Rela
tive
Re
turn
s
(1.2%)
(1.0%)
(0.8%)
(0.6%)
(0.4%)
(0.2%)
0.0%
0.2%
0.4%
0.6%
0.8%
13 2014 2015 2016 2017 2018
Parametric Clifton Enh SmCap
Callan Small Capitalization (Gross)Annualized Five Year Risk vs Return
6 8 10 12 14 16 182%
4%
6%
8%
10%
12%
14%
16%
18%
20%
22%
Parametric Clifton Enh SmCap
Russell 2000 Index
Standard Deviation
Re
turn
s
74North Dakota State Investment Board Pension Funds
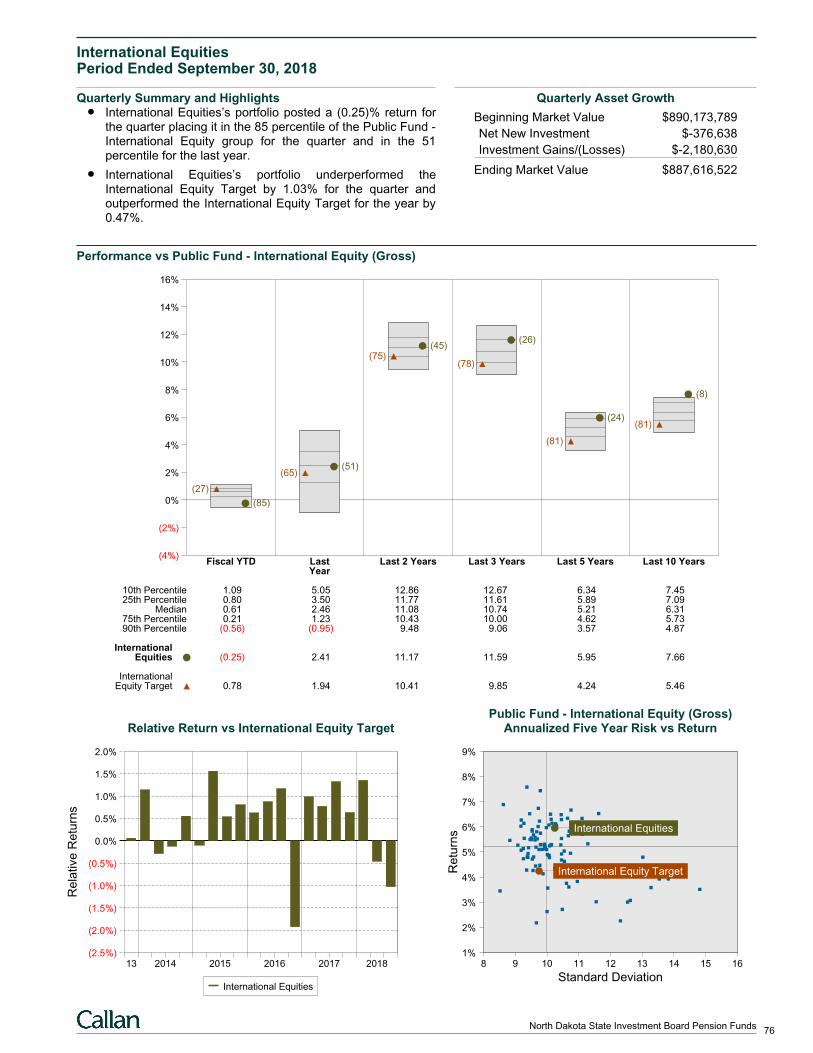
International EquitiesPeriod Ended September 30, 2018
Quarterly Summary and HighlightsInternational Equities’s portfolio posted a (0.25)% return forthe quarter placing it in the 85 percentile of the Public Fund -International Equity group for the quarter and in the 51percentile for the last year.
International Equities’s portfolio underperformed theInternational Equity Target by 1.03% for the quarter andoutperformed the International Equity Target for the year by0.47%.
Quarterly Asset Growth
Beginning Market Value $890,173,789
Net New Investment $-376,638
Investment Gains/(Losses) $-2,180,630
Ending Market Value $887,616,522
Performance vs Public Fund - International Equity (Gross)
(4%)
(2%)
0%
2%
4%
6%
8%
10%
12%
14%
16%
Fiscal YTD Last Last 2 Years Last 3 Years Last 5 Years Last 10 YearsYear
(85)
(27)
(51)(65)
(45)(75)
(26)
(78)
(24)
(81)
(8)
(81)
10th Percentile 1.09 5.05 12.86 12.67 6.34 7.4525th Percentile 0.80 3.50 11.77 11.61 5.89 7.09
Median 0.61 2.46 11.08 10.74 5.21 6.3175th Percentile 0.21 1.23 10.43 10.00 4.62 5.7390th Percentile (0.56) (0.95) 9.48 9.06 3.57 4.87
InternationalEquities (0.25) 2.41 11.17 11.59 5.95 7.66
InternationalEquity Target 0.78 1.94 10.41 9.85 4.24 5.46
Relative Return vs International Equity Target
Rela
tive
Re
turn
s
(2.5%)
(2.0%)
(1.5%)
(1.0%)
(0.5%)
0.0%
0.5%
1.0%
1.5%
2.0%
13 2014 2015 2016 2017 2018
International Equities
Public Fund - International Equity (Gross)Annualized Five Year Risk vs Return
8 9 10 11 12 13 14 15 161%
2%
3%
4%
5%
6%
7%
8%
9%
International Equities
International Equity Target
Standard Deviation
Re
turn
s
76North Dakota State Investment Board Pension Funds
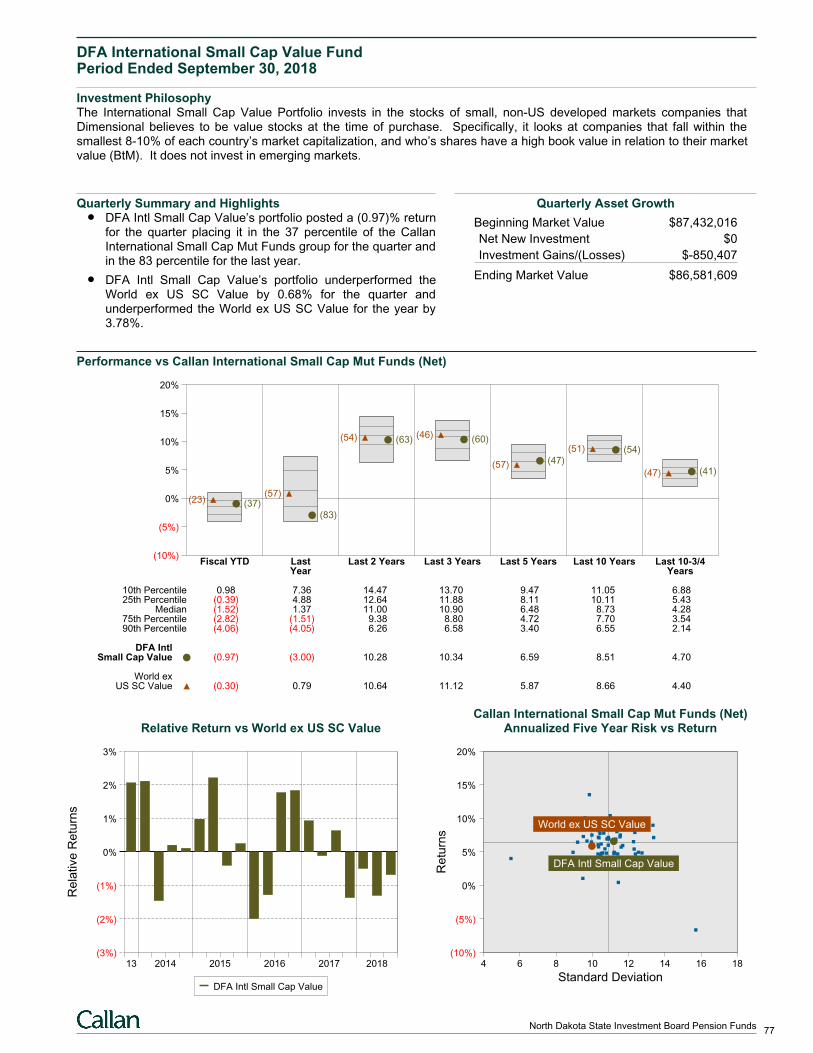
DFA International Small Cap Value FundPeriod Ended September 30, 2018
Investment PhilosophyThe International Small Cap Value Portfolio invests in the stocks of small, non-US developed markets companies thatDimensional believes to be value stocks at the time of purchase. Specifically, it looks at companies that fall within thesmallest 8-10% of each country’s market capitalization, and who’s shares have a high book value in relation to their marketvalue (BtM). It does not invest in emerging markets.
Quarterly Summary and HighlightsDFA Intl Small Cap Value’s portfolio posted a (0.97)% returnfor the quarter placing it in the 37 percentile of the CallanInternational Small Cap Mut Funds group for the quarter andin the 83 percentile for the last year.
DFA Intl Small Cap Value’s portfolio underperformed theWorld ex US SC Value by 0.68% for the quarter andunderperformed the World ex US SC Value for the year by3.78%.
Quarterly Asset Growth
Beginning Market Value $87,432,016
Net New Investment $0
Investment Gains/(Losses) $-850,407
Ending Market Value $86,581,609
Performance vs Callan International Small Cap Mut Funds (Net)
(10%)
(5%)
0%
5%
10%
15%
20%
Fiscal YTD Last Last 2 Years Last 3 Years Last 5 Years Last 10 Years Last 10-3/4Year Years
(37)(23)
(83)
(57)
(63)(54) (60)(46)
(47)(57)
(54)(51)
(41)(47)
10th Percentile 0.98 7.36 14.47 13.70 9.47 11.05 6.8825th Percentile (0.39) 4.88 12.64 11.88 8.11 10.11 5.43
Median (1.52) 1.37 11.00 10.90 6.48 8.73 4.2875th Percentile (2.82) (1.51) 9.38 8.80 4.72 7.70 3.5490th Percentile (4.06) (4.05) 6.26 6.58 3.40 6.55 2.14
DFA IntlSmall Cap Value (0.97) (3.00) 10.28 10.34 6.59 8.51 4.70
World exUS SC Value (0.30) 0.79 10.64 11.12 5.87 8.66 4.40
Relative Return vs World ex US SC Value
Rela
tive
Re
turn
s
(3%)
(2%)
(1%)
0%
1%
2%
3%
13 2014 2015 2016 2017 2018
DFA Intl Small Cap Value
Callan International Small Cap Mut Funds (Net)Annualized Five Year Risk vs Return
4 6 8 10 12 14 16 18(10%)
(5%)
0%
5%
10%
15%
20%
World ex US SC Value
DFA Intl Small Cap Value
Standard Deviation
Re
turn
s
77North Dakota State Investment Board Pension Funds
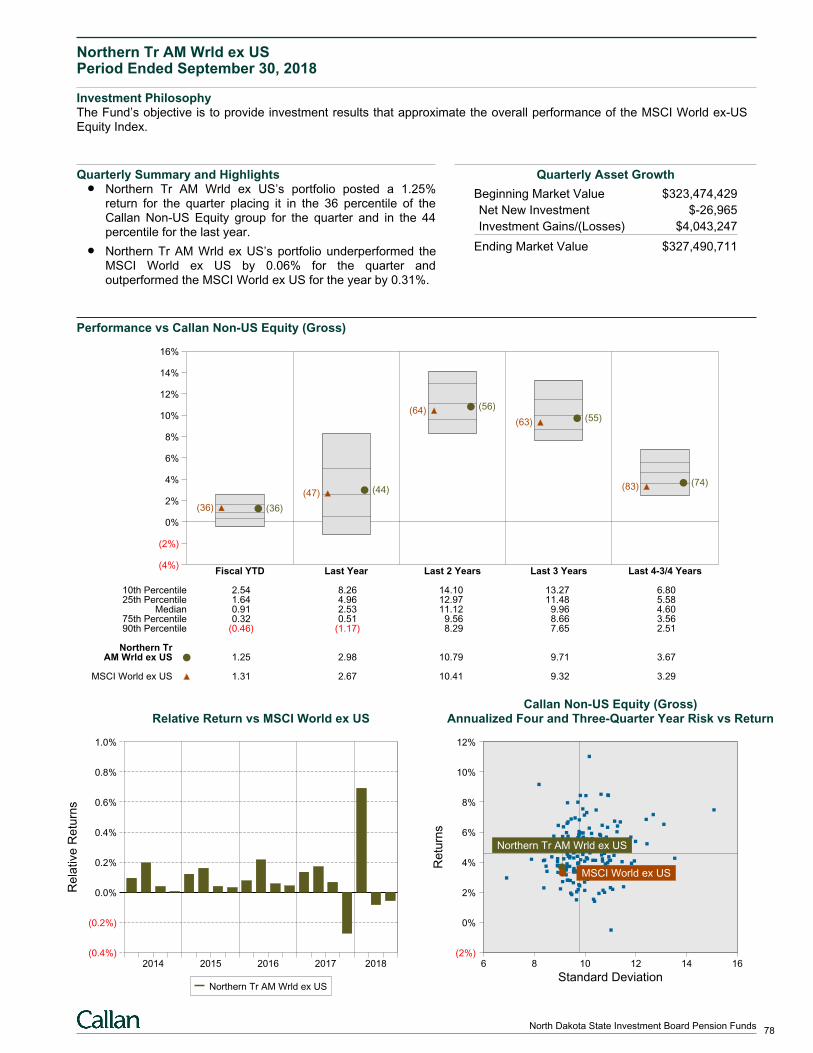
Northern Tr AM Wrld ex USPeriod Ended September 30, 2018
Investment PhilosophyThe Fund’s objective is to provide investment results that approximate the overall performance of the MSCI World ex-USEquity Index.
Quarterly Summary and HighlightsNorthern Tr AM Wrld ex US’s portfolio posted a 1.25%return for the quarter placing it in the 36 percentile of theCallan Non-US Equity group for the quarter and in the 44percentile for the last year.
Northern Tr AM Wrld ex US’s portfolio underperformed theMSCI World ex US by 0.06% for the quarter andoutperformed the MSCI World ex US for the year by 0.31%.
Quarterly Asset Growth
Beginning Market Value $323,474,429
Net New Investment $-26,965
Investment Gains/(Losses) $4,043,247
Ending Market Value $327,490,711
Performance vs Callan Non-US Equity (Gross)
(4%)
(2%)
0%
2%
4%
6%
8%
10%
12%
14%
16%
Fiscal YTD Last Year Last 2 Years Last 3 Years Last 4-3/4 Years
(36)(36)
(44)(47)
(56)(64)(55)(63)
(74)(83)
10th Percentile 2.54 8.26 14.10 13.27 6.8025th Percentile 1.64 4.96 12.97 11.48 5.58
Median 0.91 2.53 11.12 9.96 4.6075th Percentile 0.32 0.51 9.56 8.66 3.5690th Percentile (0.46) (1.17) 8.29 7.65 2.51
Northern TrAM Wrld ex US 1.25 2.98 10.79 9.71 3.67
MSCI World ex US 1.31 2.67 10.41 9.32 3.29
Relative Return vs MSCI World ex US
Rela
tive
Re
turn
s
(0.4%)
(0.2%)
0.0%
0.2%
0.4%
0.6%
0.8%
1.0%
2014 2015 2016 2017 2018
Northern Tr AM Wrld ex US
Callan Non-US Equity (Gross)Annualized Four and Three-Quarter Year Risk vs Return
6 8 10 12 14 16(2%)
0%
2%
4%
6%
8%
10%
12%
Northern Tr AM Wrld ex US
MSCI World ex US
Standard Deviation
Re
turn
s
78North Dakota State Investment Board Pension Funds
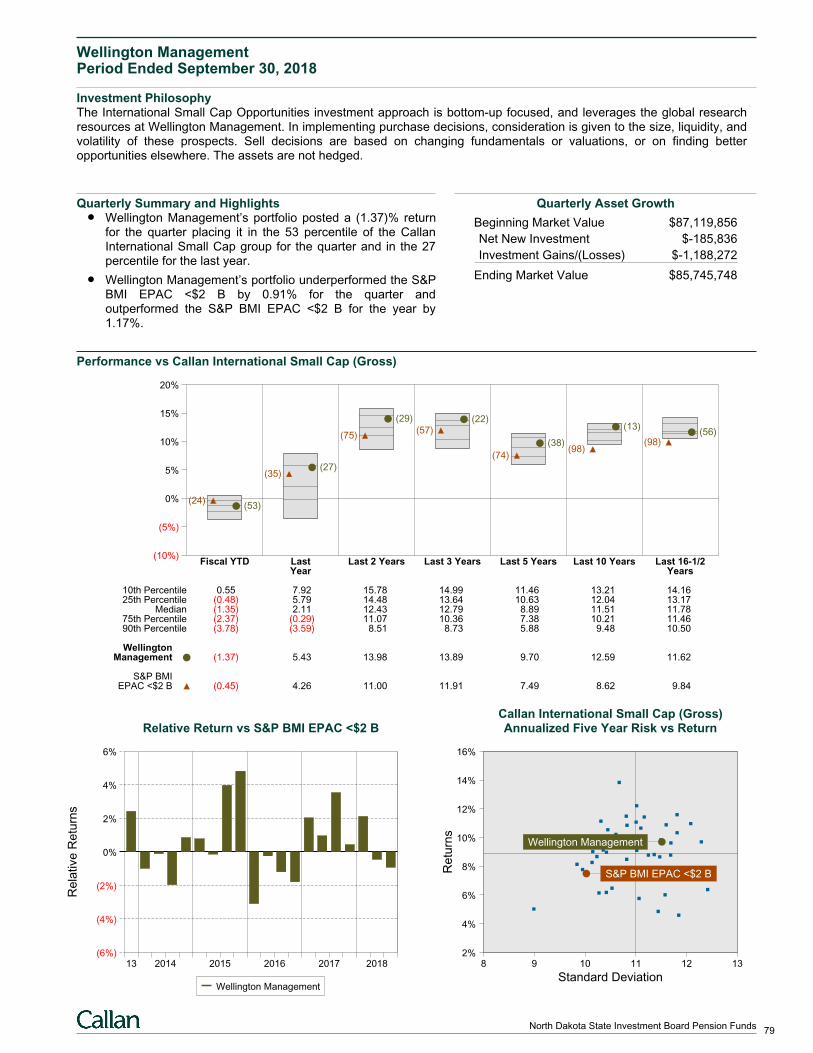
Wellington ManagementPeriod Ended September 30, 2018
Investment PhilosophyThe International Small Cap Opportunities investment approach is bottom-up focused, and leverages the global researchresources at Wellington Management. In implementing purchase decisions, consideration is given to the size, liquidity, andvolatility of these prospects. Sell decisions are based on changing fundamentals or valuations, or on finding betteropportunities elsewhere. The assets are not hedged.
Quarterly Summary and HighlightsWellington Management’s portfolio posted a (1.37)% returnfor the quarter placing it in the 53 percentile of the CallanInternational Small Cap group for the quarter and in the 27percentile for the last year.
Wellington Management’s portfolio underperformed the S&PBMI EPAC <$2 B by 0.91% for the quarter andoutperformed the S&P BMI EPAC <$2 B for the year by1.17%.
Quarterly Asset Growth
Beginning Market Value $87,119,856
Net New Investment $-185,836
Investment Gains/(Losses) $-1,188,272
Ending Market Value $85,745,748
Performance vs Callan International Small Cap (Gross)
(10%)
(5%)
0%
5%
10%
15%
20%
Fiscal YTD Last Last 2 Years Last 3 Years Last 5 Years Last 10 Years Last 16-1/2Year Years
(53)(24)
(27)(35)
(29)
(75)
(22)(57)
(38)
(74)
(13)
(98)
(56)(98)
10th Percentile 0.55 7.92 15.78 14.99 11.46 13.21 14.1625th Percentile (0.48) 5.79 14.48 13.64 10.63 12.04 13.17
Median (1.35) 2.11 12.43 12.79 8.89 11.51 11.7875th Percentile (2.37) (0.29) 11.07 10.36 7.38 10.21 11.4690th Percentile (3.78) (3.59) 8.51 8.73 5.88 9.48 10.50
WellingtonManagement (1.37) 5.43 13.98 13.89 9.70 12.59 11.62
S&P BMIEPAC <$2 B (0.45) 4.26 11.00 11.91 7.49 8.62 9.84
Relative Return vs S&P BMI EPAC <$2 B
Rela
tive
Re
turn
s
(6%)
(4%)
(2%)
0%
2%
4%
6%
13 2014 2015 2016 2017 2018
Wellington Management
Callan International Small Cap (Gross)Annualized Five Year Risk vs Return
8 9 10 11 12 132%
4%
6%
8%
10%
12%
14%
16%
Wellington Management
S&P BMI EPAC <$2 B
Standard Deviation
Re
turn
s
79North Dakota State Investment Board Pension Funds
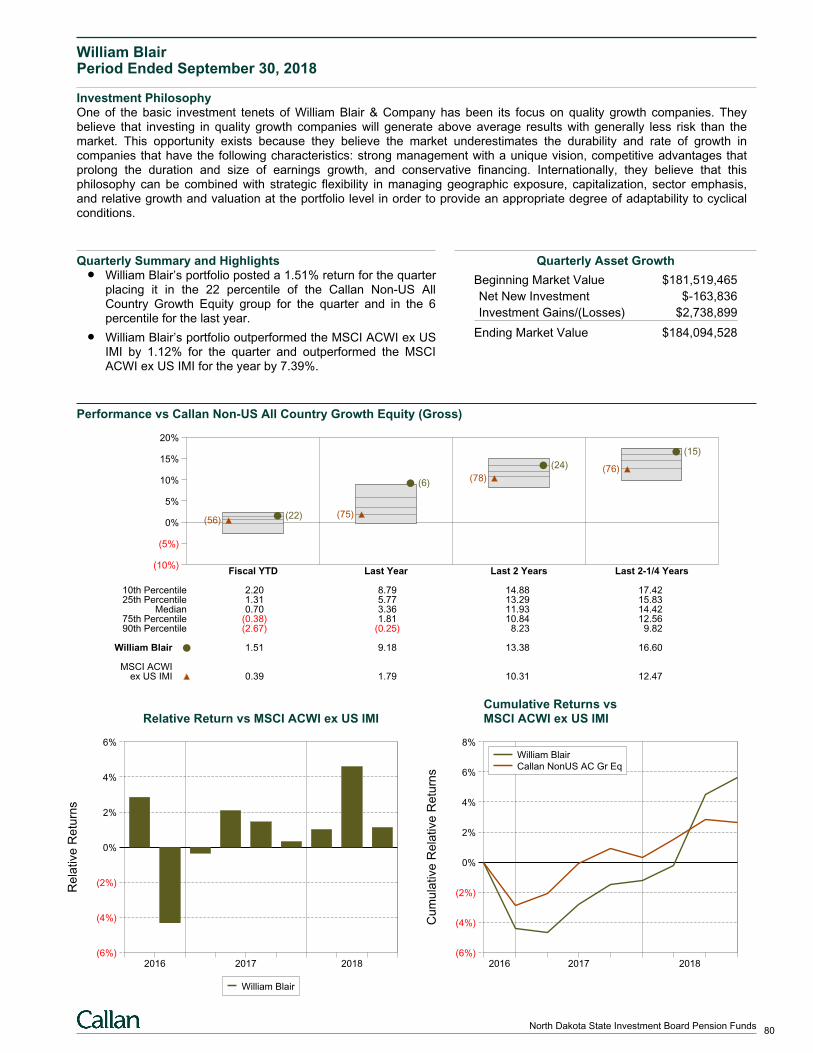
William BlairPeriod Ended September 30, 2018
Investment PhilosophyOne of the basic investment tenets of William Blair & Company has been its focus on quality growth companies. Theybelieve that investing in quality growth companies will generate above average results with generally less risk than themarket. This opportunity exists because they believe the market underestimates the durability and rate of growth incompanies that have the following characteristics: strong management with a unique vision, competitive advantages thatprolong the duration and size of earnings growth, and conservative financing. Internationally, they believe that thisphilosophy can be combined with strategic flexibility in managing geographic exposure, capitalization, sector emphasis,and relative growth and valuation at the portfolio level in order to provide an appropriate degree of adaptability to cyclicalconditions.
Quarterly Summary and HighlightsWilliam Blair’s portfolio posted a 1.51% return for the quarterplacing it in the 22 percentile of the Callan Non-US AllCountry Growth Equity group for the quarter and in the 6percentile for the last year.
William Blair’s portfolio outperformed the MSCI ACWI ex USIMI by 1.12% for the quarter and outperformed the MSCIACWI ex US IMI for the year by 7.39%.
Quarterly Asset Growth
Beginning Market Value $181,519,465
Net New Investment $-163,836
Investment Gains/(Losses) $2,738,899
Ending Market Value $184,094,528
Performance vs Callan Non-US All Country Growth Equity (Gross)
(10%)
(5%)
0%
5%
10%
15%
20%
Fiscal YTD Last Year Last 2 Years Last 2-1/4 Years
(22)(56)
(6)
(75)
(24)
(78)
(15)
(76)
10th Percentile 2.20 8.79 14.88 17.4225th Percentile 1.31 5.77 13.29 15.83
Median 0.70 3.36 11.93 14.4275th Percentile (0.38) 1.81 10.84 12.5690th Percentile (2.67) (0.25) 8.23 9.82
William Blair 1.51 9.18 13.38 16.60
MSCI ACWIex US IMI 0.39 1.79 10.31 12.47
Relative Return vs MSCI ACWI ex US IMI
Rela
tive
Re
turn
s
(6%)
(4%)
(2%)
0%
2%
4%
6%
2016 2017 2018
William Blair
Cumulative Returns vsMSCI ACWI ex US IMI
Cum
ula
tive
Re
lative
Re
turn
s
(6%)
(4%)
(2%)
0%
2%
4%
6%
8%
2016 2017 2018
William Blair
Callan NonUS AC Gr Eq
80North Dakota State Investment Board Pension Funds
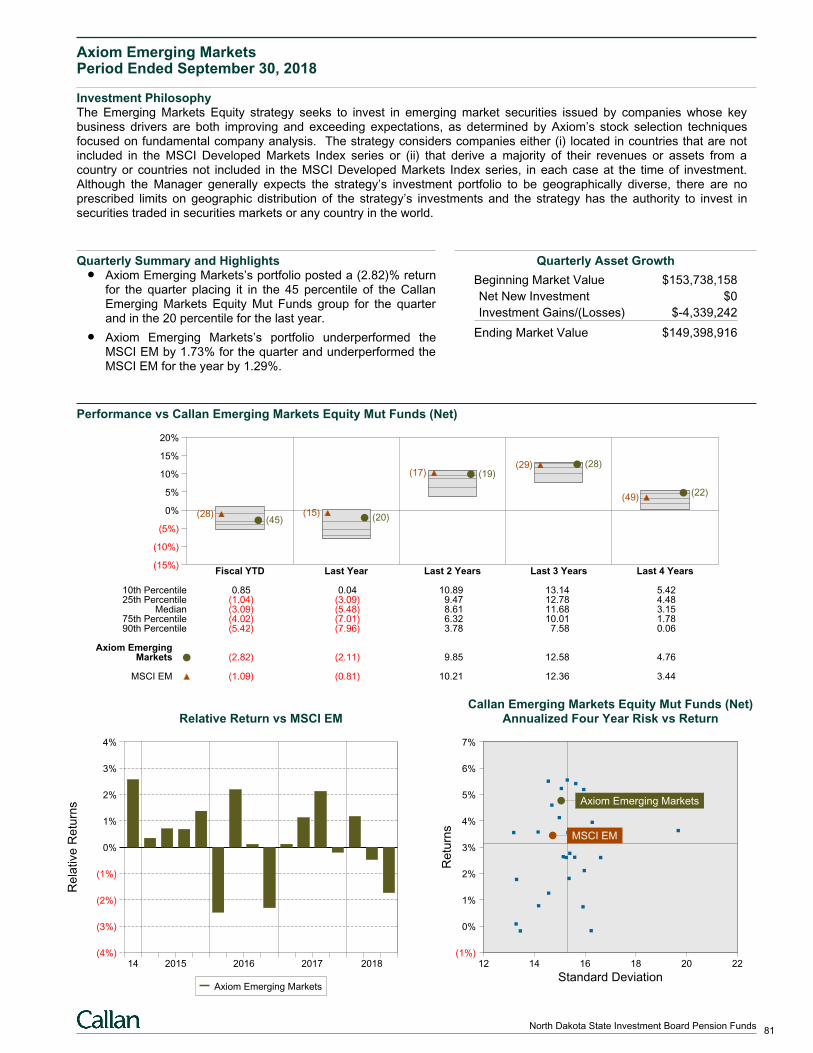
Axiom Emerging MarketsPeriod Ended September 30, 2018
Investment PhilosophyThe Emerging Markets Equity strategy seeks to invest in emerging market securities issued by companies whose keybusiness drivers are both improving and exceeding expectations, as determined by Axiom’s stock selection techniquesfocused on fundamental company analysis. The strategy considers companies either (i) located in countries that are notincluded in the MSCI Developed Markets Index series or (ii) that derive a majority of their revenues or assets from acountry or countries not included in the MSCI Developed Markets Index series, in each case at the time of investment.Although the Manager generally expects the strategy’s investment portfolio to be geographically diverse, there are noprescribed limits on geographic distribution of the strategy’s investments and the strategy has the authority to invest insecurities traded in securities markets or any country in the world.
Quarterly Summary and HighlightsAxiom Emerging Markets’s portfolio posted a (2.82)% returnfor the quarter placing it in the 45 percentile of the CallanEmerging Markets Equity Mut Funds group for the quarterand in the 20 percentile for the last year.
Axiom Emerging Markets’s portfolio underperformed theMSCI EM by 1.73% for the quarter and underperformed theMSCI EM for the year by 1.29%.
Quarterly Asset Growth
Beginning Market Value $153,738,158
Net New Investment $0
Investment Gains/(Losses) $-4,339,242
Ending Market Value $149,398,916
Performance vs Callan Emerging Markets Equity Mut Funds (Net)
(15%)
(10%)
(5%)
0%
5%
10%
15%
20%
Fiscal YTD Last Year Last 2 Years Last 3 Years Last 4 Years
(45)(28) (20)
(15)
(19)(17)(28)(29)
(22)(49)
10th Percentile 0.85 0.04 10.89 13.14 5.4225th Percentile (1.04) (3.09) 9.47 12.78 4.48
Median (3.09) (5.48) 8.61 11.68 3.1575th Percentile (4.02) (7.01) 6.32 10.01 1.7890th Percentile (5.42) (7.96) 3.78 7.58 0.06
Axiom EmergingMarkets (2.82) (2.11) 9.85 12.58 4.76
MSCI EM (1.09) (0.81) 10.21 12.36 3.44
Relative Return vs MSCI EM
Rela
tive
Re
turn
s
(4%)
(3%)
(2%)
(1%)
0%
1%
2%
3%
4%
14 2015 2016 2017 2018
Axiom Emerging Markets
Callan Emerging Markets Equity Mut Funds (Net)Annualized Four Year Risk vs Return
12 14 16 18 20 22(1%)
0%
1%
2%
3%
4%
5%
6%
7%
Axiom Emerging Markets
MSCI EM
Standard Deviation
Re
turn
s
81North Dakota State Investment Board Pension Funds
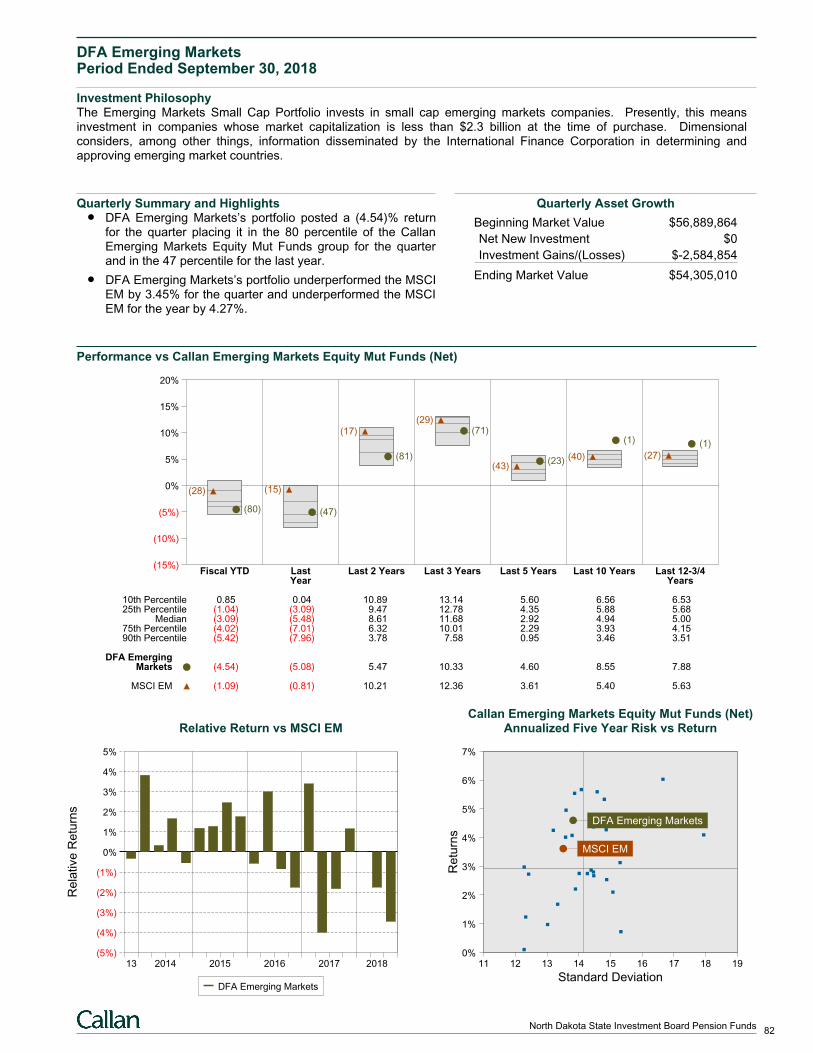
DFA Emerging MarketsPeriod Ended September 30, 2018
Investment PhilosophyThe Emerging Markets Small Cap Portfolio invests in small cap emerging markets companies. Presently, this meansinvestment in companies whose market capitalization is less than $2.3 billion at the time of purchase. Dimensionalconsiders, among other things, information disseminated by the International Finance Corporation in determining andapproving emerging market countries.
Quarterly Summary and HighlightsDFA Emerging Markets’s portfolio posted a (4.54)% returnfor the quarter placing it in the 80 percentile of the CallanEmerging Markets Equity Mut Funds group for the quarterand in the 47 percentile for the last year.
DFA Emerging Markets’s portfolio underperformed the MSCIEM by 3.45% for the quarter and underperformed the MSCIEM for the year by 4.27%.
Quarterly Asset Growth
Beginning Market Value $56,889,864
Net New Investment $0
Investment Gains/(Losses) $-2,584,854
Ending Market Value $54,305,010
Performance vs Callan Emerging Markets Equity Mut Funds (Net)
(15%)
(10%)
(5%)
0%
5%
10%
15%
20%
Fiscal YTD Last Last 2 Years Last 3 Years Last 5 Years Last 10 Years Last 12-3/4Year Years
(80)
(28)
(47)
(15)
(81)
(17) (71)(29)
(23)(43)
(1)
(40)
(1)
(27)
10th Percentile 0.85 0.04 10.89 13.14 5.60 6.56 6.5325th Percentile (1.04) (3.09) 9.47 12.78 4.35 5.88 5.68
Median (3.09) (5.48) 8.61 11.68 2.92 4.94 5.0075th Percentile (4.02) (7.01) 6.32 10.01 2.29 3.93 4.1590th Percentile (5.42) (7.96) 3.78 7.58 0.95 3.46 3.51
DFA EmergingMarkets (4.54) (5.08) 5.47 10.33 4.60 8.55 7.88
MSCI EM (1.09) (0.81) 10.21 12.36 3.61 5.40 5.63
Relative Return vs MSCI EM
Rela
tive
Re
turn
s
(5%)
(4%)
(3%)
(2%)
(1%)
0%
1%
2%
3%
4%
5%
13 2014 2015 2016 2017 2018
DFA Emerging Markets
Callan Emerging Markets Equity Mut Funds (Net)Annualized Five Year Risk vs Return
11 12 13 14 15 16 17 18 190%
1%
2%
3%
4%
5%
6%
7%
DFA Emerging Markets
MSCI EM
Standard Deviation
Re
turn
s
82North Dakota State Investment Board Pension Funds
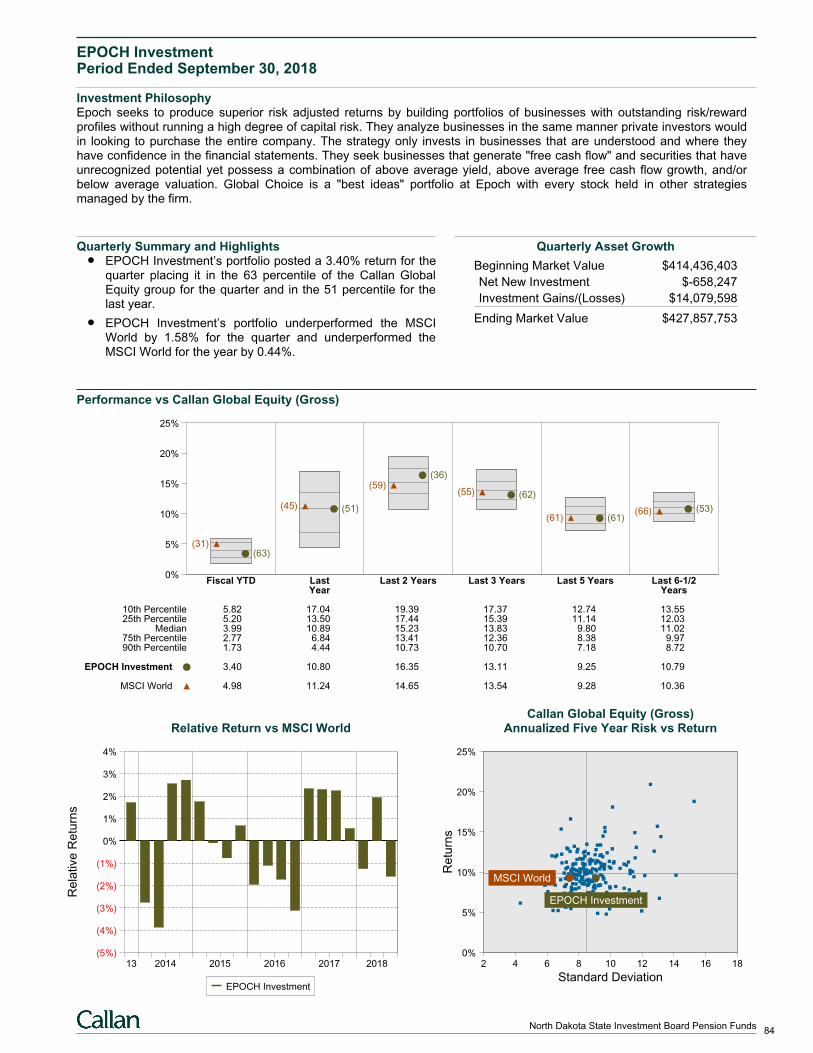
EPOCH InvestmentPeriod Ended September 30, 2018
Investment PhilosophyEpoch seeks to produce superior risk adjusted returns by building portfolios of businesses with outstanding risk/rewardprofiles without running a high degree of capital risk. They analyze businesses in the same manner private investors wouldin looking to purchase the entire company. The strategy only invests in businesses that are understood and where theyhave confidence in the financial statements. They seek businesses that generate "free cash flow" and securities that haveunrecognized potential yet possess a combination of above average yield, above average free cash flow growth, and/orbelow average valuation. Global Choice is a "best ideas" portfolio at Epoch with every stock held in other strategiesmanaged by the firm.
Quarterly Summary and HighlightsEPOCH Investment’s portfolio posted a 3.40% return for thequarter placing it in the 63 percentile of the Callan GlobalEquity group for the quarter and in the 51 percentile for thelast year.
EPOCH Investment’s portfolio underperformed the MSCIWorld by 1.58% for the quarter and underperformed theMSCI World for the year by 0.44%.
Quarterly Asset Growth
Beginning Market Value $414,436,403
Net New Investment $-658,247
Investment Gains/(Losses) $14,079,598
Ending Market Value $427,857,753
Performance vs Callan Global Equity (Gross)
0%
5%
10%
15%
20%
25%
Fiscal YTD Last Last 2 Years Last 3 Years Last 5 Years Last 6-1/2Year Years
(63)(31)
(51)(45)
(36)(59)
(62)(55)
(61)(61)(53)(66)
10th Percentile 5.82 17.04 19.39 17.37 12.74 13.5525th Percentile 5.20 13.50 17.44 15.39 11.14 12.03
Median 3.99 10.89 15.23 13.83 9.80 11.0275th Percentile 2.77 6.84 13.41 12.36 8.38 9.9790th Percentile 1.73 4.44 10.73 10.70 7.18 8.72
EPOCH Investment 3.40 10.80 16.35 13.11 9.25 10.79
MSCI World 4.98 11.24 14.65 13.54 9.28 10.36
Relative Return vs MSCI World
Rela
tive
Re
turn
s
(5%)
(4%)
(3%)
(2%)
(1%)
0%
1%
2%
3%
4%
13 2014 2015 2016 2017 2018
EPOCH Investment
Callan Global Equity (Gross)Annualized Five Year Risk vs Return
2 4 6 8 10 12 14 16 180%
5%
10%
15%
20%
25%
MSCI World
EPOCH Investment
Standard Deviation
Re
turn
s
84North Dakota State Investment Board Pension Funds
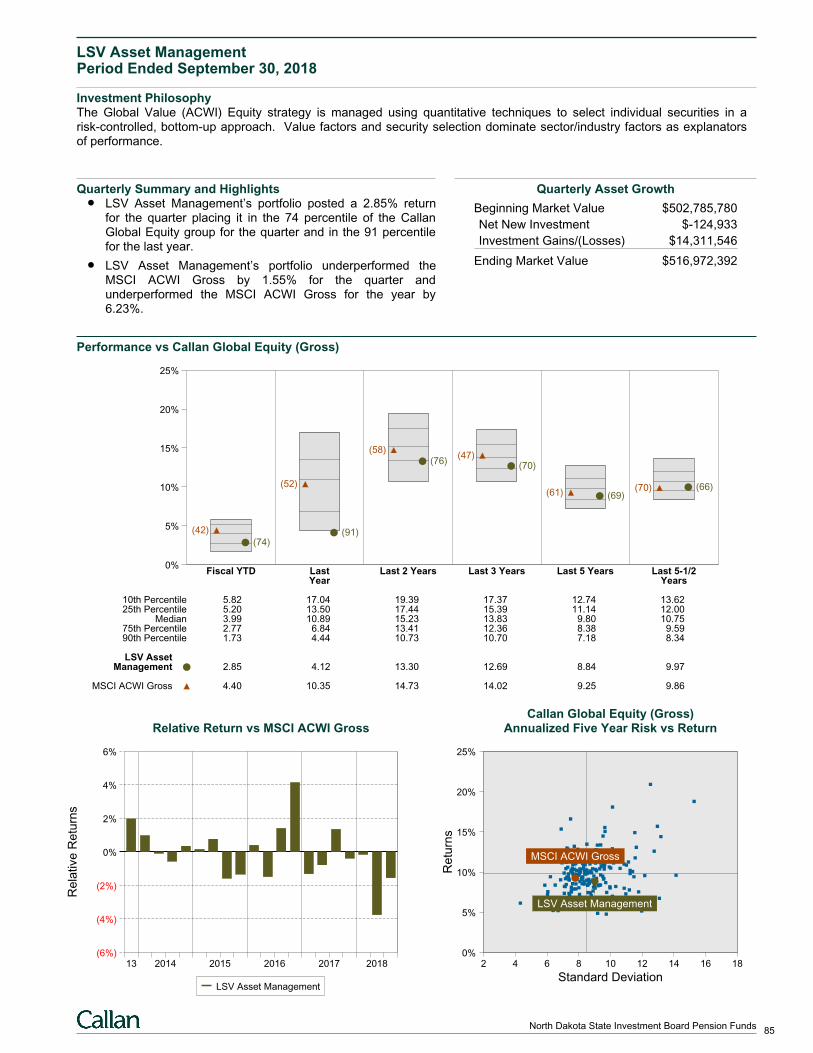
LSV Asset ManagementPeriod Ended September 30, 2018
Investment PhilosophyThe Global Value (ACWI) Equity strategy is managed using quantitative techniques to select individual securities in arisk-controlled, bottom-up approach. Value factors and security selection dominate sector/industry factors as explanatorsof performance.
Quarterly Summary and HighlightsLSV Asset Management’s portfolio posted a 2.85% returnfor the quarter placing it in the 74 percentile of the CallanGlobal Equity group for the quarter and in the 91 percentilefor the last year.
LSV Asset Management’s portfolio underperformed theMSCI ACWI Gross by 1.55% for the quarter andunderperformed the MSCI ACWI Gross for the year by6.23%.
Quarterly Asset Growth
Beginning Market Value $502,785,780
Net New Investment $-124,933
Investment Gains/(Losses) $14,311,546
Ending Market Value $516,972,392
Performance vs Callan Global Equity (Gross)
0%
5%
10%
15%
20%
25%
Fiscal YTD Last Last 2 Years Last 3 Years Last 5 Years Last 5-1/2Year Years
(74)
(42) (91)
(52)
(76)(58)
(70)(47)
(69)(61)(66)(70)
10th Percentile 5.82 17.04 19.39 17.37 12.74 13.6225th Percentile 5.20 13.50 17.44 15.39 11.14 12.00
Median 3.99 10.89 15.23 13.83 9.80 10.7575th Percentile 2.77 6.84 13.41 12.36 8.38 9.5990th Percentile 1.73 4.44 10.73 10.70 7.18 8.34
LSV AssetManagement 2.85 4.12 13.30 12.69 8.84 9.97
MSCI ACWI Gross 4.40 10.35 14.73 14.02 9.25 9.86
Relative Return vs MSCI ACWI Gross
Rela
tive
Re
turn
s
(6%)
(4%)
(2%)
0%
2%
4%
6%
13 2014 2015 2016 2017 2018
LSV Asset Management
Callan Global Equity (Gross)Annualized Five Year Risk vs Return
2 4 6 8 10 12 14 16 180%
5%
10%
15%
20%
25%
MSCI ACWI Gross
LSV Asset Management
Standard Deviation
Re
turn
s
85North Dakota State Investment Board Pension Funds
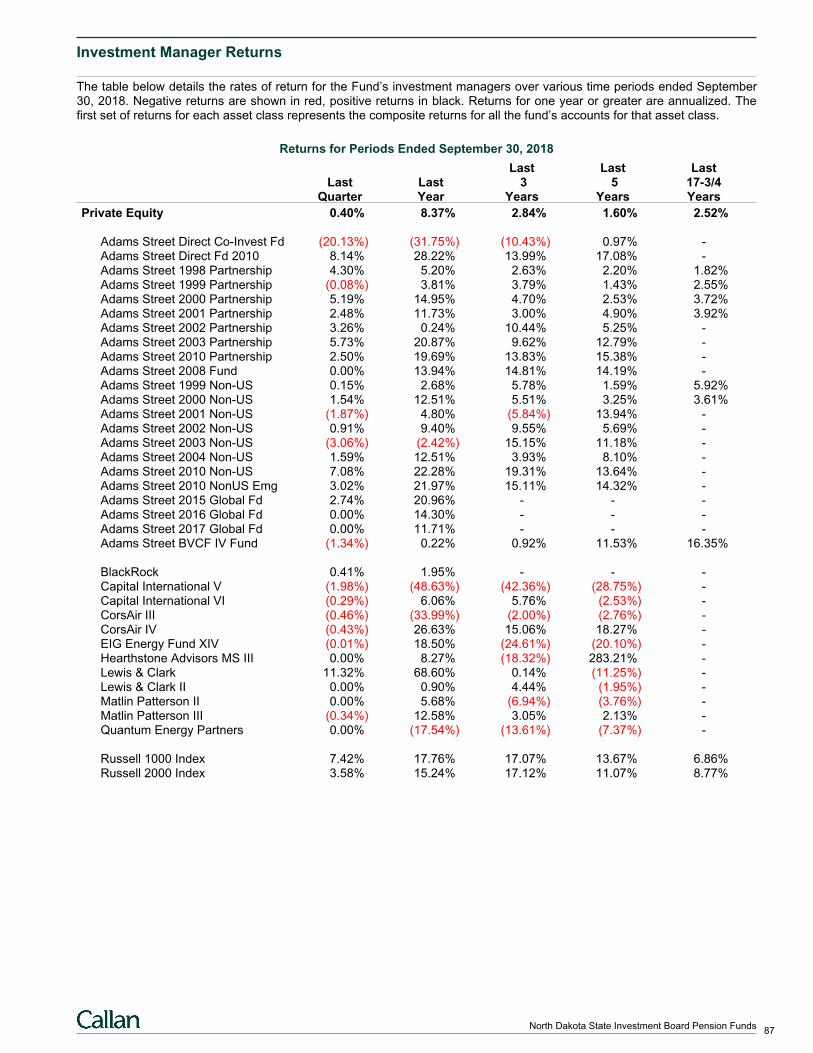
Investment Manager Returns
The table below details the rates of return for the Fund’s investment managers over various time periods ended September30, 2018. Negative returns are shown in red, positive returns in black. Returns for one year or greater are annualized. Thefirst set of returns for each asset class represents the composite returns for all the fund’s accounts for that asset class.
Returns for Periods Ended September 30, 2018
Last Last LastLast Last 3 5 17-3/4
Quarter Year Years Years Years
Private Equity 0.40% 8.37% 2.84% 1.60% 2.52%
Adams Street Direct Co-Invest Fd (20.13%) (31.75%) (10.43%) 0.97% -Adams Street Direct Fd 2010 8.14% 28.22% 13.99% 17.08% -Adams Street 1998 Partnership 4.30% 5.20% 2.63% 2.20% 1.82%Adams Street 1999 Partnership (0.08%) 3.81% 3.79% 1.43% 2.55%Adams Street 2000 Partnership 5.19% 14.95% 4.70% 2.53% 3.72%Adams Street 2001 Partnership 2.48% 11.73% 3.00% 4.90% 3.92%Adams Street 2002 Partnership 3.26% 0.24% 10.44% 5.25% -Adams Street 2003 Partnership 5.73% 20.87% 9.62% 12.79% -Adams Street 2010 Partnership 2.50% 19.69% 13.83% 15.38% -Adams Street 2008 Fund 0.00% 13.94% 14.81% 14.19% -Adams Street 1999 Non-US 0.15% 2.68% 5.78% 1.59% 5.92%Adams Street 2000 Non-US 1.54% 12.51% 5.51% 3.25% 3.61%Adams Street 2001 Non-US (1.87%) 4.80% (5.84%) 13.94% -Adams Street 2002 Non-US 0.91% 9.40% 9.55% 5.69% -Adams Street 2003 Non-US (3.06%) (2.42%) 15.15% 11.18% -Adams Street 2004 Non-US 1.59% 12.51% 3.93% 8.10% -Adams Street 2010 Non-US 7.08% 22.28% 19.31% 13.64% -Adams Street 2010 NonUS Emg 3.02% 21.97% 15.11% 14.32% -Adams Street 2015 Global Fd 2.74% 20.96% - - -Adams Street 2016 Global Fd 0.00% 14.30% - - -Adams Street 2017 Global Fd 0.00% 11.71% - - -Adams Street BVCF IV Fund (1.34%) 0.22% 0.92% 11.53% 16.35%
BlackRock 0.41% 1.95% - - -Capital International V (1.98%) (48.63%) (42.36%) (28.75%) -Capital International VI (0.29%) 6.06% 5.76% (2.53%) -CorsAir III (0.46%) (33.99%) (2.00%) (2.76%) -CorsAir IV (0.43%) 26.63% 15.06% 18.27% -EIG Energy Fund XIV (0.01%) 18.50% (24.61%) (20.10%) -Hearthstone Advisors MS III 0.00% 8.27% (18.32%) 283.21% -Lewis & Clark 11.32% 68.60% 0.14% (11.25%) -Lewis & Clark II 0.00% 0.90% 4.44% (1.95%) -Matlin Patterson II 0.00% 5.68% (6.94%) (3.76%) -Matlin Patterson III (0.34%) 12.58% 3.05% 2.13% -Quantum Energy Partners 0.00% (17.54%) (13.61%) (7.37%) -
Russell 1000 Index 7.42% 17.76% 17.07% 13.67% 6.86%Russell 2000 Index 3.58% 15.24% 17.12% 11.07% 8.77%
87North Dakota State Investment Board Pension Funds
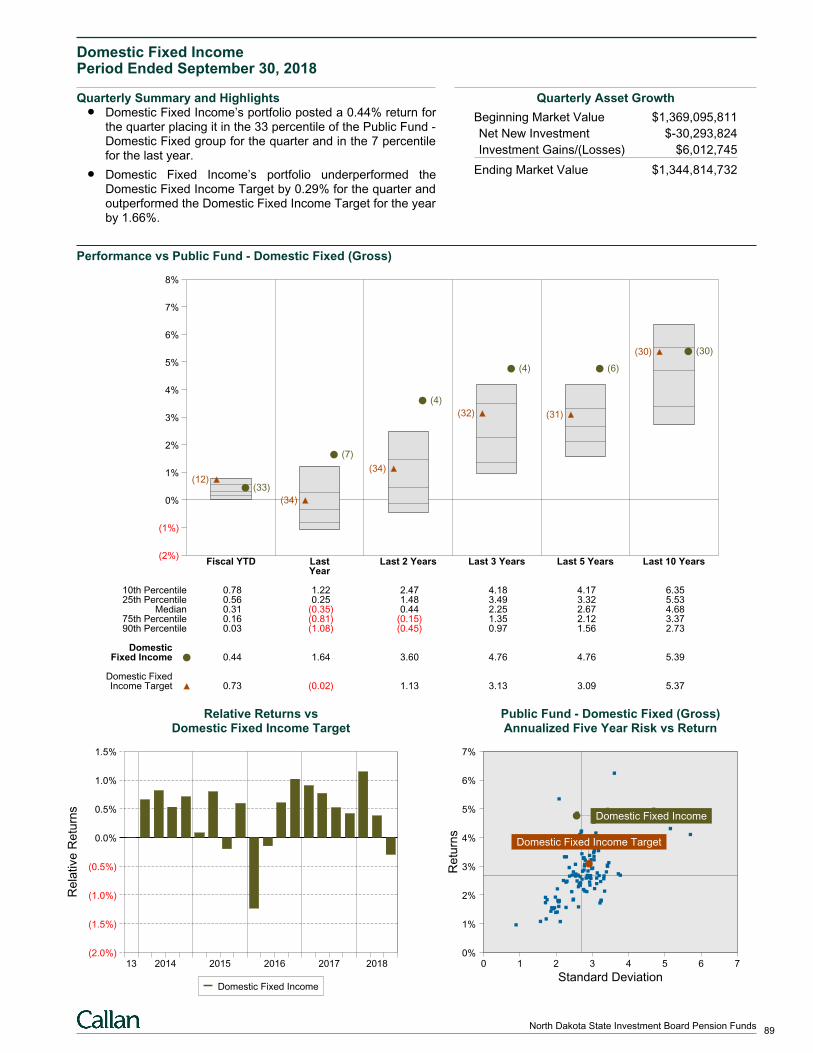
Domestic Fixed IncomePeriod Ended September 30, 2018
Quarterly Summary and HighlightsDomestic Fixed Income’s portfolio posted a 0.44% return forthe quarter placing it in the 33 percentile of the Public Fund -Domestic Fixed group for the quarter and in the 7 percentilefor the last year.
Domestic Fixed Income’s portfolio underperformed theDomestic Fixed Income Target by 0.29% for the quarter andoutperformed the Domestic Fixed Income Target for the yearby 1.66%.
Quarterly Asset Growth
Beginning Market Value $1,369,095,811
Net New Investment $-30,293,824
Investment Gains/(Losses) $6,012,745
Ending Market Value $1,344,814,732
Performance vs Public Fund - Domestic Fixed (Gross)
(2%)
(1%)
0%
1%
2%
3%
4%
5%
6%
7%
8%
Fiscal YTD Last Last 2 Years Last 3 Years Last 5 Years Last 10 YearsYear
(33)(12)
(7)
(34)
(4)
(34)
(4)
(32)
(6)
(31)
(30)(30)
10th Percentile 0.78 1.22 2.47 4.18 4.17 6.3525th Percentile 0.56 0.25 1.48 3.49 3.32 5.53
Median 0.31 (0.35) 0.44 2.25 2.67 4.6875th Percentile 0.16 (0.81) (0.15) 1.35 2.12 3.3790th Percentile 0.03 (1.08) (0.45) 0.97 1.56 2.73
DomesticFixed Income 0.44 1.64 3.60 4.76 4.76 5.39
Domestic FixedIncome Target 0.73 (0.02) 1.13 3.13 3.09 5.37
Relative Returns vsDomestic Fixed Income Target
Rela
tive
Re
turn
s
(2.0%)
(1.5%)
(1.0%)
(0.5%)
0.0%
0.5%
1.0%
1.5%
13 2014 2015 2016 2017 2018
Domestic Fixed Income
Public Fund - Domestic Fixed (Gross)Annualized Five Year Risk vs Return
0 1 2 3 4 5 6 70%
1%
2%
3%
4%
5%
6%
7%
Domestic Fixed Income Target
Domestic Fixed Income
Standard Deviation
Re
turn
s
89North Dakota State Investment Board Pension Funds
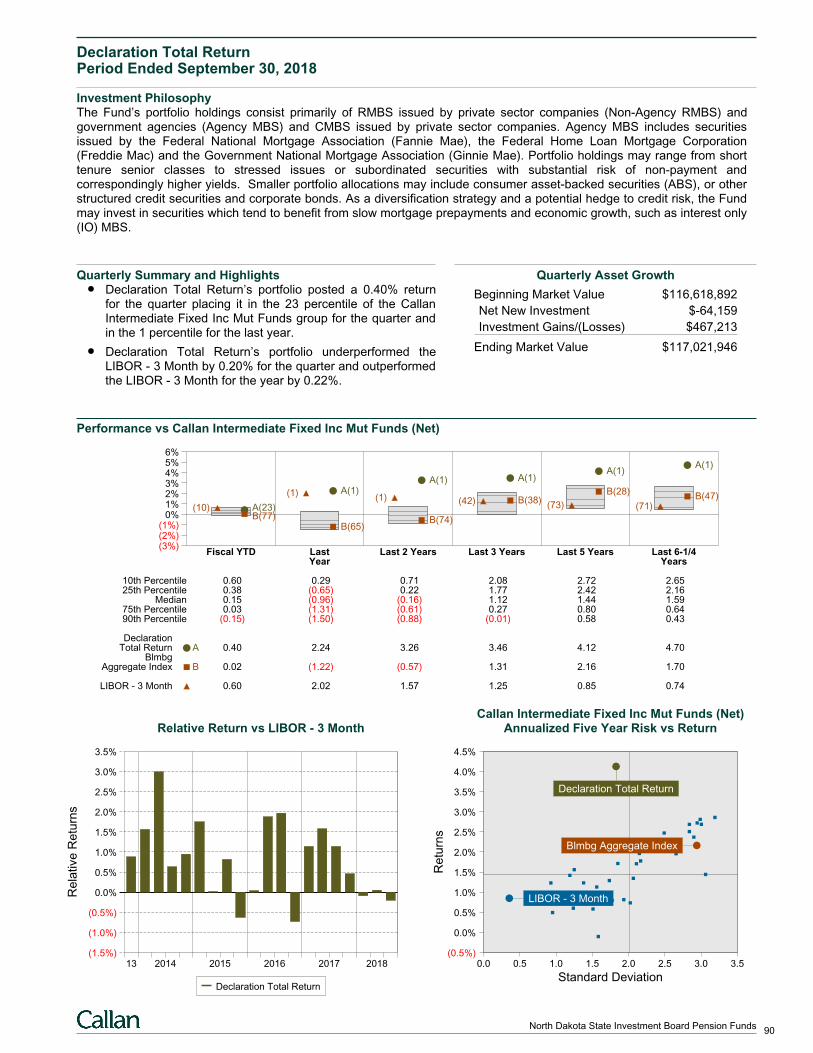
Declaration Total ReturnPeriod Ended September 30, 2018
Investment PhilosophyThe Fund’s portfolio holdings consist primarily of RMBS issued by private sector companies (Non-Agency RMBS) andgovernment agencies (Agency MBS) and CMBS issued by private sector companies. Agency MBS includes securitiesissued by the Federal National Mortgage Association (Fannie Mae), the Federal Home Loan Mortgage Corporation(Freddie Mac) and the Government National Mortgage Association (Ginnie Mae). Portfolio holdings may range from shorttenure senior classes to stressed issues or subordinated securities with substantial risk of non-payment andcorrespondingly higher yields. Smaller portfolio allocations may include consumer asset-backed securities (ABS), or otherstructured credit securities and corporate bonds. As a diversification strategy and a potential hedge to credit risk, the Fundmay invest in securities which tend to benefit from slow mortgage prepayments and economic growth, such as interest only(IO) MBS.
Quarterly Summary and HighlightsDeclaration Total Return’s portfolio posted a 0.40% returnfor the quarter placing it in the 23 percentile of the CallanIntermediate Fixed Inc Mut Funds group for the quarter andin the 1 percentile for the last year.
Declaration Total Return’s portfolio underperformed theLIBOR - 3 Month by 0.20% for the quarter and outperformedthe LIBOR - 3 Month for the year by 0.22%.
Quarterly Asset Growth
Beginning Market Value $116,618,892
Net New Investment $-64,159
Investment Gains/(Losses) $467,213
Ending Market Value $117,021,946
Performance vs Callan Intermediate Fixed Inc Mut Funds (Net)
(3%)(2%)(1%)
0%1%2%3%4%5%6%
Fiscal YTD Last Last 2 Years Last 3 Years Last 5 Years Last 6-1/4Year Years
A(23)B(77)
(10)
A(1)
B(65)
(1)
A(1)
B(74)
(1)
A(1)
B(38)(42)
A(1)
B(28)
(73)
A(1)
B(47)(71)
10th Percentile 0.60 0.29 0.71 2.08 2.72 2.6525th Percentile 0.38 (0.65) 0.22 1.77 2.42 2.16
Median 0.15 (0.96) (0.16) 1.12 1.44 1.5975th Percentile 0.03 (1.31) (0.61) 0.27 0.80 0.6490th Percentile (0.15) (1.50) (0.88) (0.01) 0.58 0.43
DeclarationTotal Return A 0.40 2.24 3.26 3.46 4.12 4.70
BlmbgAggregate Index B 0.02 (1.22) (0.57) 1.31 2.16 1.70
LIBOR - 3 Month 0.60 2.02 1.57 1.25 0.85 0.74
Relative Return vs LIBOR - 3 Month
Rela
tive
Re
turn
s
(1.5%)
(1.0%)
(0.5%)
0.0%
0.5%
1.0%
1.5%
2.0%
2.5%
3.0%
3.5%
13 2014 2015 2016 2017 2018
Declaration Total Return
Callan Intermediate Fixed Inc Mut Funds (Net)Annualized Five Year Risk vs Return
0.0 0.5 1.0 1.5 2.0 2.5 3.0 3.5(0.5%)
0.0%
0.5%
1.0%
1.5%
2.0%
2.5%
3.0%
3.5%
4.0%
4.5%
Declaration Total Return
Blmbg Aggregate Index
LIBOR - 3 Month
Standard Deviation
Re
turn
s
90North Dakota State Investment Board Pension Funds
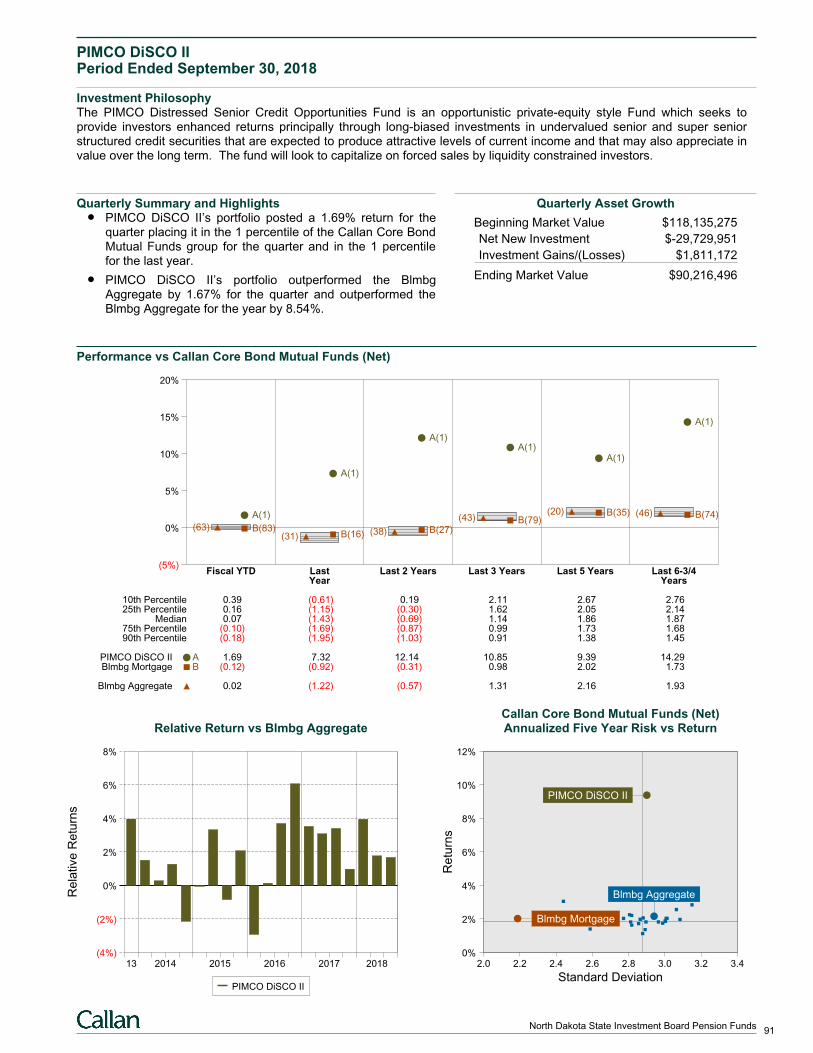
PIMCO DiSCO IIPeriod Ended September 30, 2018
Investment PhilosophyThe PIMCO Distressed Senior Credit Opportunities Fund is an opportunistic private-equity style Fund which seeks toprovide investors enhanced returns principally through long-biased investments in undervalued senior and super seniorstructured credit securities that are expected to produce attractive levels of current income and that may also appreciate invalue over the long term. The fund will look to capitalize on forced sales by liquidity constrained investors.
Quarterly Summary and HighlightsPIMCO DiSCO II’s portfolio posted a 1.69% return for thequarter placing it in the 1 percentile of the Callan Core BondMutual Funds group for the quarter and in the 1 percentilefor the last year.
PIMCO DiSCO II’s portfolio outperformed the BlmbgAggregate by 1.67% for the quarter and outperformed theBlmbg Aggregate for the year by 8.54%.
Quarterly Asset Growth
Beginning Market Value $118,135,275
Net New Investment $-29,729,951
Investment Gains/(Losses) $1,811,172
Ending Market Value $90,216,496
Performance vs Callan Core Bond Mutual Funds (Net)
(5%)
0%
5%
10%
15%
20%
Fiscal YTD Last Last 2 Years Last 3 Years Last 5 Years Last 6-3/4Year Years
A(1)
B(83)(63)
A(1)
B(16)(31)
A(1)
B(27)(38)
A(1)
B(79)(43)
A(1)
B(35)(20)
A(1)
B(74)(46)
10th Percentile 0.39 (0.61) 0.19 2.11 2.67 2.7625th Percentile 0.16 (1.15) (0.30) 1.62 2.05 2.14
Median 0.07 (1.43) (0.69) 1.14 1.86 1.8775th Percentile (0.10) (1.69) (0.87) 0.99 1.73 1.6890th Percentile (0.18) (1.95) (1.03) 0.91 1.38 1.45
PIMCO DiSCO II A 1.69 7.32 12.14 10.85 9.39 14.29Blmbg Mortgage B (0.12) (0.92) (0.31) 0.98 2.02 1.73
Blmbg Aggregate 0.02 (1.22) (0.57) 1.31 2.16 1.93
Relative Return vs Blmbg Aggregate
Rela
tive
Re
turn
s
(4%)
(2%)
0%
2%
4%
6%
8%
13 2014 2015 2016 2017 2018
PIMCO DiSCO II
Callan Core Bond Mutual Funds (Net)Annualized Five Year Risk vs Return
2.0 2.2 2.4 2.6 2.8 3.0 3.2 3.40%
2%
4%
6%
8%
10%
12%
Blmbg Aggregate
Blmbg Mortgage
PIMCO DiSCO II
Standard Deviation
Re
turn
s
91North Dakota State Investment Board Pension Funds
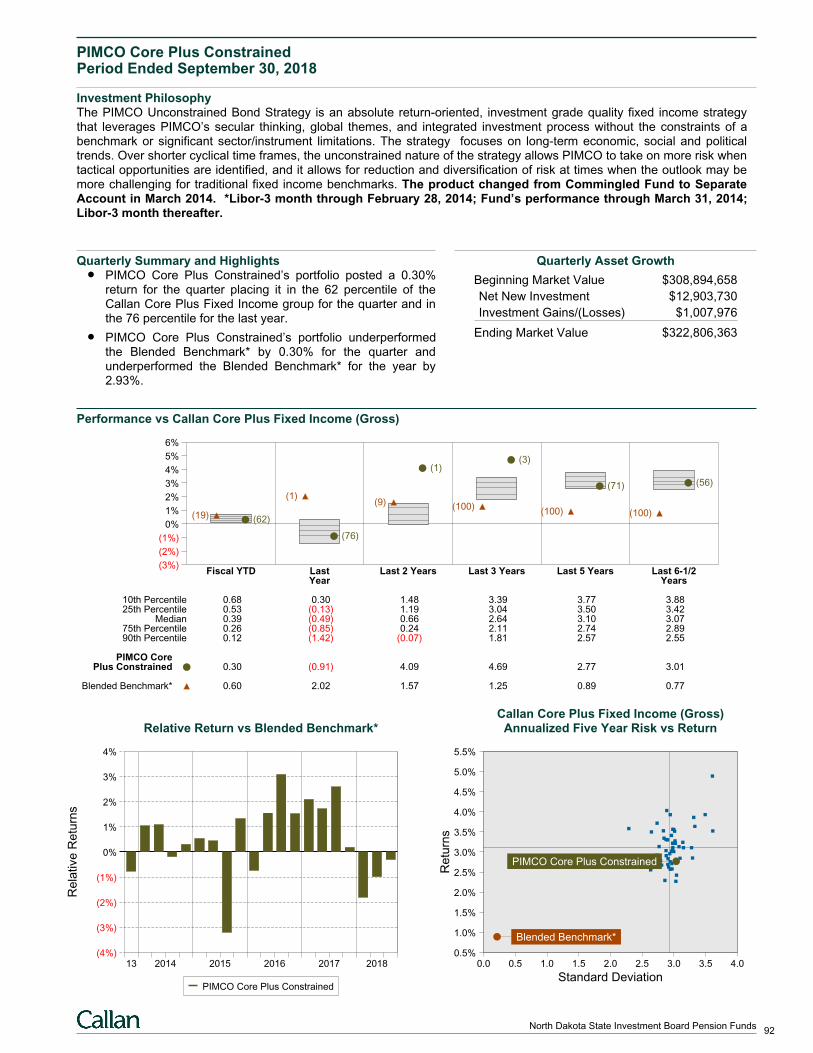
PIMCO Core Plus ConstrainedPeriod Ended September 30, 2018
Investment PhilosophyThe PIMCO Unconstrained Bond Strategy is an absolute return-oriented, investment grade quality fixed income strategythat leverages PIMCO’s secular thinking, global themes, and integrated investment process without the constraints of abenchmark or significant sector/instrument limitations. The strategy focuses on long-term economic, social and politicaltrends. Over shorter cyclical time frames, the unconstrained nature of the strategy allows PIMCO to take on more risk whentactical opportunities are identified, and it allows for reduction and diversification of risk at times when the outlook may bemore challenging for traditional fixed income benchmarks. The product changed from Commingled Fund to SeparateAccount in March 2014. *Libor-3 month through February 28, 2014; Fund’s performance through March 31, 2014;Libor-3 month thereafter.
Quarterly Summary and HighlightsPIMCO Core Plus Constrained’s portfolio posted a 0.30%return for the quarter placing it in the 62 percentile of theCallan Core Plus Fixed Income group for the quarter and inthe 76 percentile for the last year.
PIMCO Core Plus Constrained’s portfolio underperformedthe Blended Benchmark* by 0.30% for the quarter andunderperformed the Blended Benchmark* for the year by2.93%.
Quarterly Asset Growth
Beginning Market Value $308,894,658
Net New Investment $12,903,730
Investment Gains/(Losses) $1,007,976
Ending Market Value $322,806,363
Performance vs Callan Core Plus Fixed Income (Gross)
(3%)
(2%)
(1%)
0%
1%
2%
3%
4%
5%
6%
Fiscal YTD Last Last 2 Years Last 3 Years Last 5 Years Last 6-1/2Year Years
(62)(19)
(76)
(1)
(1)
(9)
(3)
(100)
(71)
(100)
(56)
(100)
10th Percentile 0.68 0.30 1.48 3.39 3.77 3.8825th Percentile 0.53 (0.13) 1.19 3.04 3.50 3.42
Median 0.39 (0.49) 0.66 2.64 3.10 3.0775th Percentile 0.26 (0.85) 0.24 2.11 2.74 2.8990th Percentile 0.12 (1.42) (0.07) 1.81 2.57 2.55
PIMCO CorePlus Constrained 0.30 (0.91) 4.09 4.69 2.77 3.01
Blended Benchmark* 0.60 2.02 1.57 1.25 0.89 0.77
Relative Return vs Blended Benchmark*
Rela
tive
Re
turn
s
(4%)
(3%)
(2%)
(1%)
0%
1%
2%
3%
4%
13 2014 2015 2016 2017 2018
PIMCO Core Plus Constrained
Callan Core Plus Fixed Income (Gross)Annualized Five Year Risk vs Return
0.0 0.5 1.0 1.5 2.0 2.5 3.0 3.5 4.00.5%
1.0%
1.5%
2.0%
2.5%
3.0%
3.5%
4.0%
4.5%
5.0%
5.5%
PIMCO Core Plus Constrained
Blended Benchmark*
Standard Deviation
Re
turn
s
92North Dakota State Investment Board Pension Funds
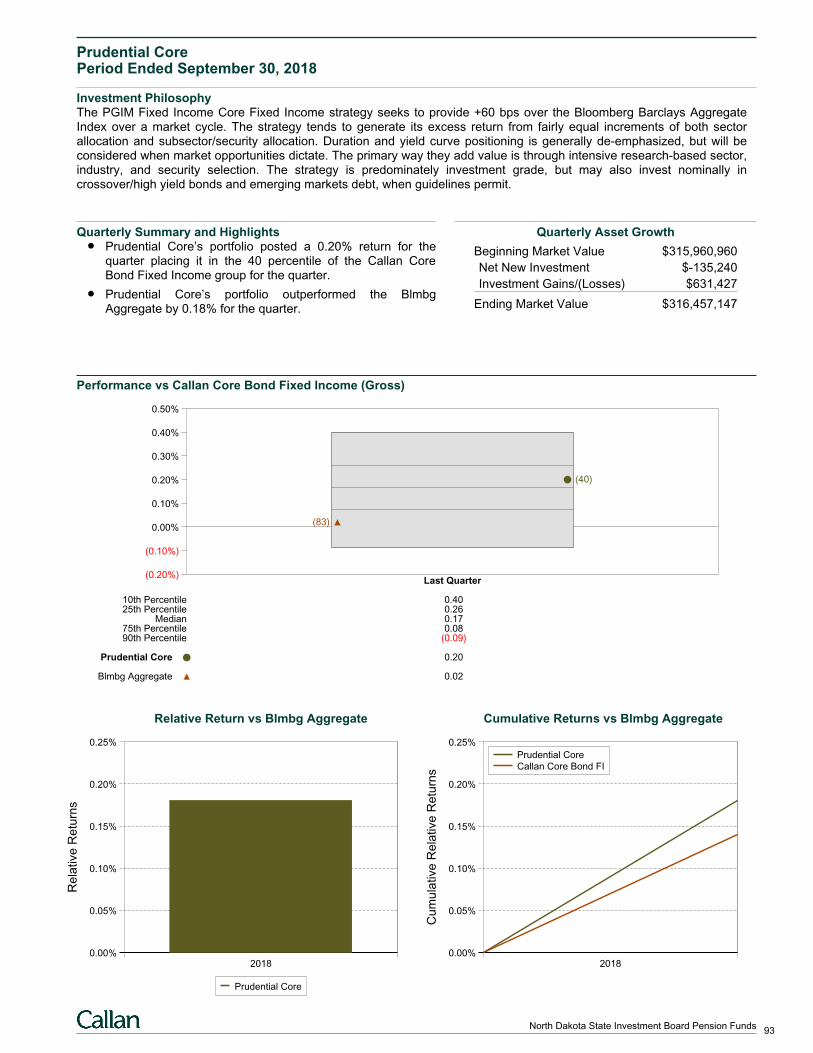
Prudential CorePeriod Ended September 30, 2018
Investment PhilosophyThe PGIM Fixed Income Core Fixed Income strategy seeks to provide +60 bps over the Bloomberg Barclays AggregateIndex over a market cycle. The strategy tends to generate its excess return from fairly equal increments of both sectorallocation and subsector/security allocation. Duration and yield curve positioning is generally de-emphasized, but will beconsidered when market opportunities dictate. The primary way they add value is through intensive research-based sector,industry, and security selection. The strategy is predominately investment grade, but may also invest nominally incrossover/high yield bonds and emerging markets debt, when guidelines permit.
Quarterly Summary and HighlightsPrudential Core’s portfolio posted a 0.20% return for thequarter placing it in the 40 percentile of the Callan CoreBond Fixed Income group for the quarter.
Prudential Core’s portfolio outperformed the BlmbgAggregate by 0.18% for the quarter.
Quarterly Asset Growth
Beginning Market Value $315,960,960
Net New Investment $-135,240
Investment Gains/(Losses) $631,427
Ending Market Value $316,457,147
Performance vs Callan Core Bond Fixed Income (Gross)
(0.20%)
(0.10%)
0.00%
0.10%
0.20%
0.30%
0.40%
0.50%
Last Quarter
(40)
(83)
10th Percentile 0.4025th Percentile 0.26
Median 0.1775th Percentile 0.0890th Percentile (0.09)
Prudential Core 0.20
Blmbg Aggregate 0.02
Relative Return vs Blmbg Aggregate
Rela
tive
Re
turn
s
0.00%
0.05%
0.10%
0.15%
0.20%
0.25%
2018
Prudential Core
Cumulative Returns vs Blmbg Aggregate
Cum
ula
tive
Re
lative
Re
turn
s
0.00%
0.05%
0.10%
0.15%
0.20%
0.25%
2018
Prudential Core
Callan Core Bond FI
93North Dakota State Investment Board Pension Funds
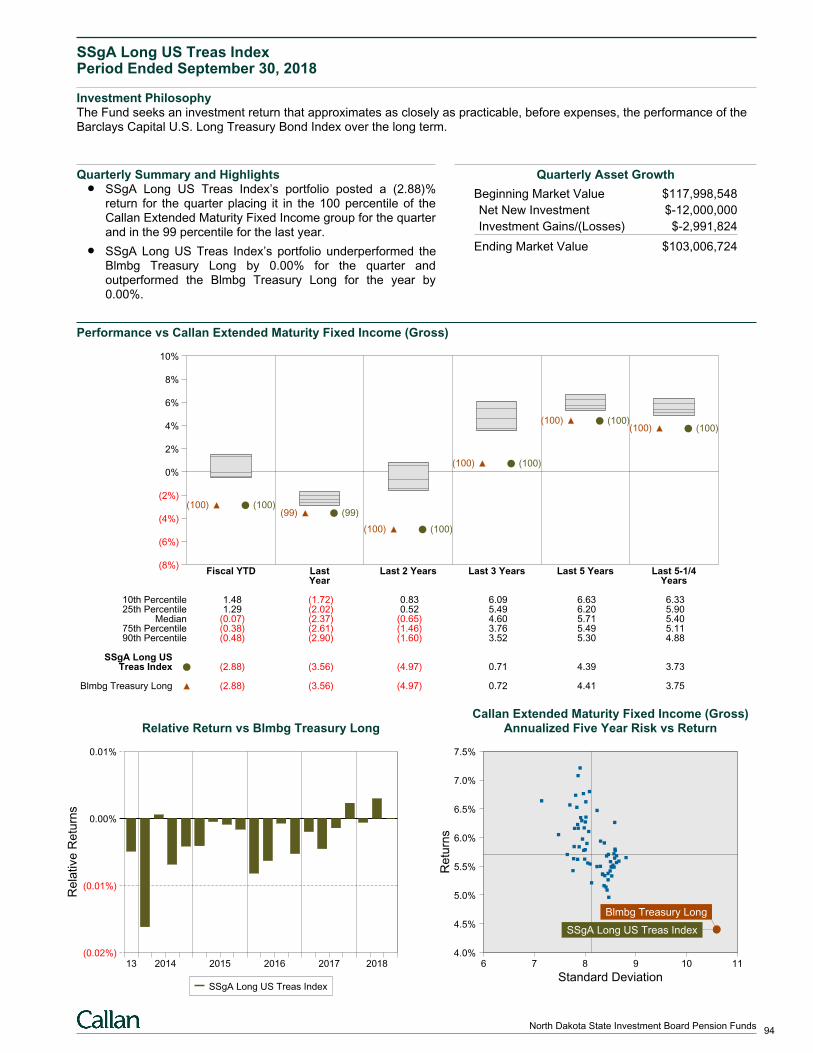
SSgA Long US Treas IndexPeriod Ended September 30, 2018
Investment PhilosophyThe Fund seeks an investment return that approximates as closely as practicable, before expenses, the performance of theBarclays Capital U.S. Long Treasury Bond Index over the long term.
Quarterly Summary and HighlightsSSgA Long US Treas Index’s portfolio posted a (2.88)%return for the quarter placing it in the 100 percentile of theCallan Extended Maturity Fixed Income group for the quarterand in the 99 percentile for the last year.
SSgA Long US Treas Index’s portfolio underperformed theBlmbg Treasury Long by 0.00% for the quarter andoutperformed the Blmbg Treasury Long for the year by0.00%.
Quarterly Asset Growth
Beginning Market Value $117,998,548
Net New Investment $-12,000,000
Investment Gains/(Losses) $-2,991,824
Ending Market Value $103,006,724
Performance vs Callan Extended Maturity Fixed Income (Gross)
(8%)
(6%)
(4%)
(2%)
0%
2%
4%
6%
8%
10%
Fiscal YTD Last Last 2 Years Last 3 Years Last 5 Years Last 5-1/4Year Years
(100)(100)(99)(99)
(100)(100)
(100)(100)
(100)(100)(100)(100)
10th Percentile 1.48 (1.72) 0.83 6.09 6.63 6.3325th Percentile 1.29 (2.02) 0.52 5.49 6.20 5.90
Median (0.07) (2.37) (0.65) 4.60 5.71 5.4075th Percentile (0.38) (2.61) (1.46) 3.76 5.49 5.1190th Percentile (0.48) (2.90) (1.60) 3.52 5.30 4.88
SSgA Long USTreas Index (2.88) (3.56) (4.97) 0.71 4.39 3.73
Blmbg Treasury Long (2.88) (3.56) (4.97) 0.72 4.41 3.75
Relative Return vs Blmbg Treasury Long
Rela
tive
Re
turn
s
(0.02%)
(0.01%)
0.00%
0.01%
13 2014 2015 2016 2017 2018
SSgA Long US Treas Index
Callan Extended Maturity Fixed Income (Gross)Annualized Five Year Risk vs Return
6 7 8 9 10 114.0%
4.5%
5.0%
5.5%
6.0%
6.5%
7.0%
7.5%
SSgA Long US Treas Index
Blmbg Treasury Long
Standard Deviation
Re
turn
s
94North Dakota State Investment Board Pension Funds
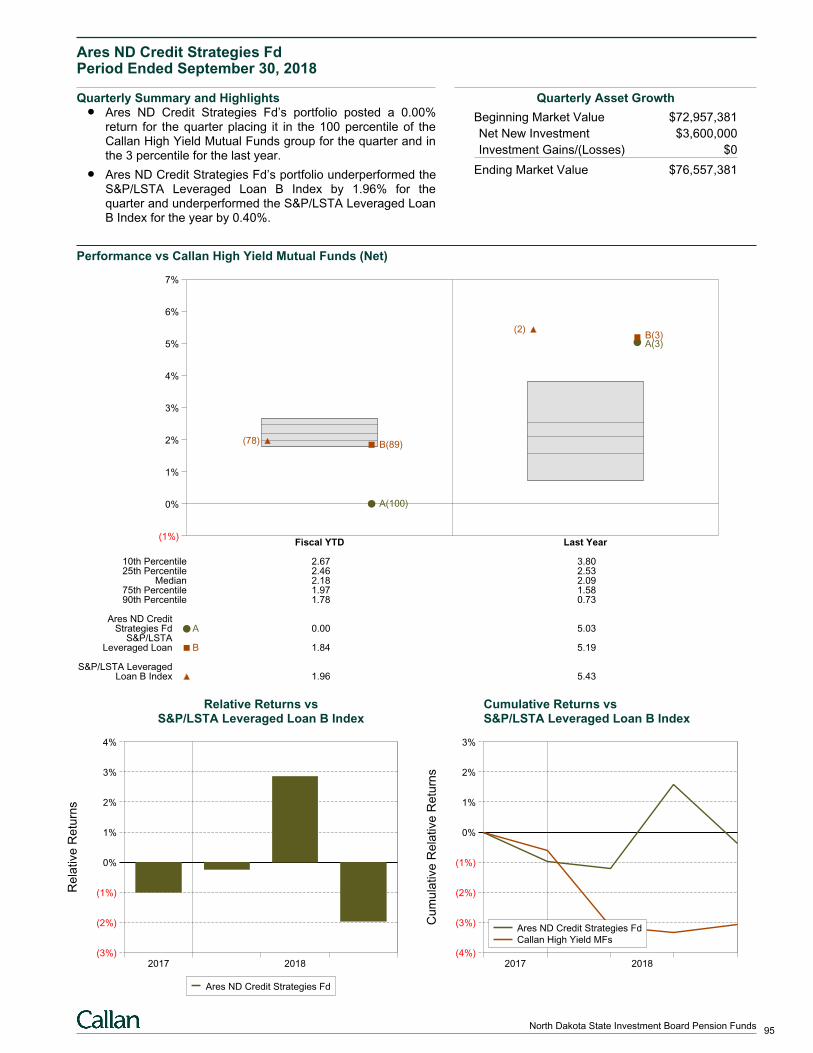
Ares ND Credit Strategies FdPeriod Ended September 30, 2018
Quarterly Summary and HighlightsAres ND Credit Strategies Fd’s portfolio posted a 0.00%return for the quarter placing it in the 100 percentile of theCallan High Yield Mutual Funds group for the quarter and inthe 3 percentile for the last year.
Ares ND Credit Strategies Fd’s portfolio underperformed theS&P/LSTA Leveraged Loan B Index by 1.96% for thequarter and underperformed the S&P/LSTA Leveraged LoanB Index for the year by 0.40%.
Quarterly Asset Growth
Beginning Market Value $72,957,381
Net New Investment $3,600,000
Investment Gains/(Losses) $0
Ending Market Value $76,557,381
Performance vs Callan High Yield Mutual Funds (Net)
(1%)
0%
1%
2%
3%
4%
5%
6%
7%
Fiscal YTD Last Year
B(89)
A(100)
(78)
B(3)A(3)
(2)
10th Percentile 2.67 3.8025th Percentile 2.46 2.53
Median 2.18 2.0975th Percentile 1.97 1.5890th Percentile 1.78 0.73
Ares ND CreditStrategies Fd A 0.00 5.03
S&P/LSTALeveraged Loan B 1.84 5.19
S&P/LSTA LeveragedLoan B Index 1.96 5.43
Relative Returns vsS&P/LSTA Leveraged Loan B Index
Rela
tive
Re
turn
s
(3%)
(2%)
(1%)
0%
1%
2%
3%
4%
2017 2018
Ares ND Credit Strategies Fd
Cumulative Returns vsS&P/LSTA Leveraged Loan B Index
Cum
ula
tive
Re
lative
Re
turn
s
(4%)
(3%)
(2%)
(1%)
0%
1%
2%
3%
2017 2018
Ares ND Credit Strategies Fd
Callan High Yield MFs
95North Dakota State Investment Board Pension Funds
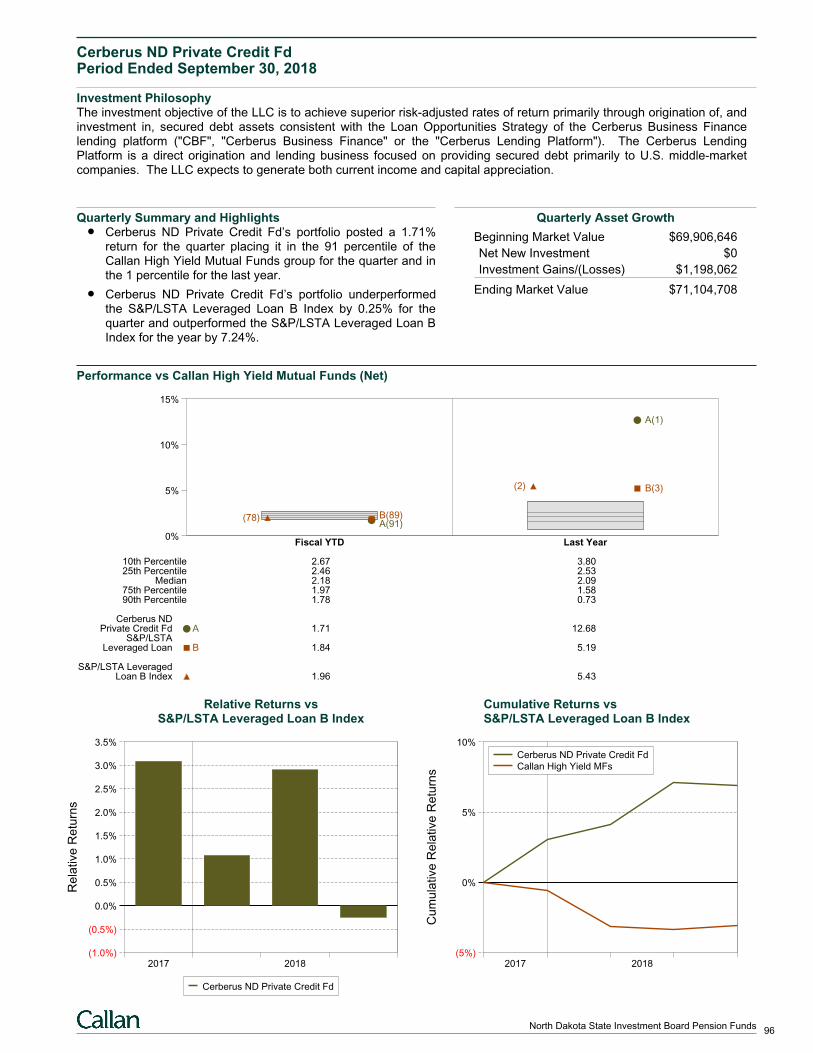
Cerberus ND Private Credit FdPeriod Ended September 30, 2018
Investment PhilosophyThe investment objective of the LLC is to achieve superior risk-adjusted rates of return primarily through origination of, andinvestment in, secured debt assets consistent with the Loan Opportunities Strategy of the Cerberus Business Financelending platform ("CBF", "Cerberus Business Finance" or the "Cerberus Lending Platform"). The Cerberus LendingPlatform is a direct origination and lending business focused on providing secured debt primarily to U.S. middle-marketcompanies. The LLC expects to generate both current income and capital appreciation.
Quarterly Summary and HighlightsCerberus ND Private Credit Fd’s portfolio posted a 1.71%return for the quarter placing it in the 91 percentile of theCallan High Yield Mutual Funds group for the quarter and inthe 1 percentile for the last year.
Cerberus ND Private Credit Fd’s portfolio underperformedthe S&P/LSTA Leveraged Loan B Index by 0.25% for thequarter and outperformed the S&P/LSTA Leveraged Loan BIndex for the year by 7.24%.
Quarterly Asset Growth
Beginning Market Value $69,906,646
Net New Investment $0
Investment Gains/(Losses) $1,198,062
Ending Market Value $71,104,708
Performance vs Callan High Yield Mutual Funds (Net)
0%
5%
10%
15%
Fiscal YTD Last Year
B(89)A(91)
(78)
A(1)
B(3)(2)
10th Percentile 2.67 3.8025th Percentile 2.46 2.53
Median 2.18 2.0975th Percentile 1.97 1.5890th Percentile 1.78 0.73
Cerberus NDPrivate Credit Fd A 1.71 12.68
S&P/LSTALeveraged Loan B 1.84 5.19
S&P/LSTA LeveragedLoan B Index 1.96 5.43
Relative Returns vsS&P/LSTA Leveraged Loan B Index
Rela
tive
Re
turn
s
(1.0%)
(0.5%)
0.0%
0.5%
1.0%
1.5%
2.0%
2.5%
3.0%
3.5%
2017 2018
Cerberus ND Private Credit Fd
Cumulative Returns vsS&P/LSTA Leveraged Loan B Index
Cum
ula
tive
Re
lative
Re
turn
s
(5%)
0%
5%
10%
2017 2018
Cerberus ND Private Credit Fd
Callan High Yield MFs
96North Dakota State Investment Board Pension Funds
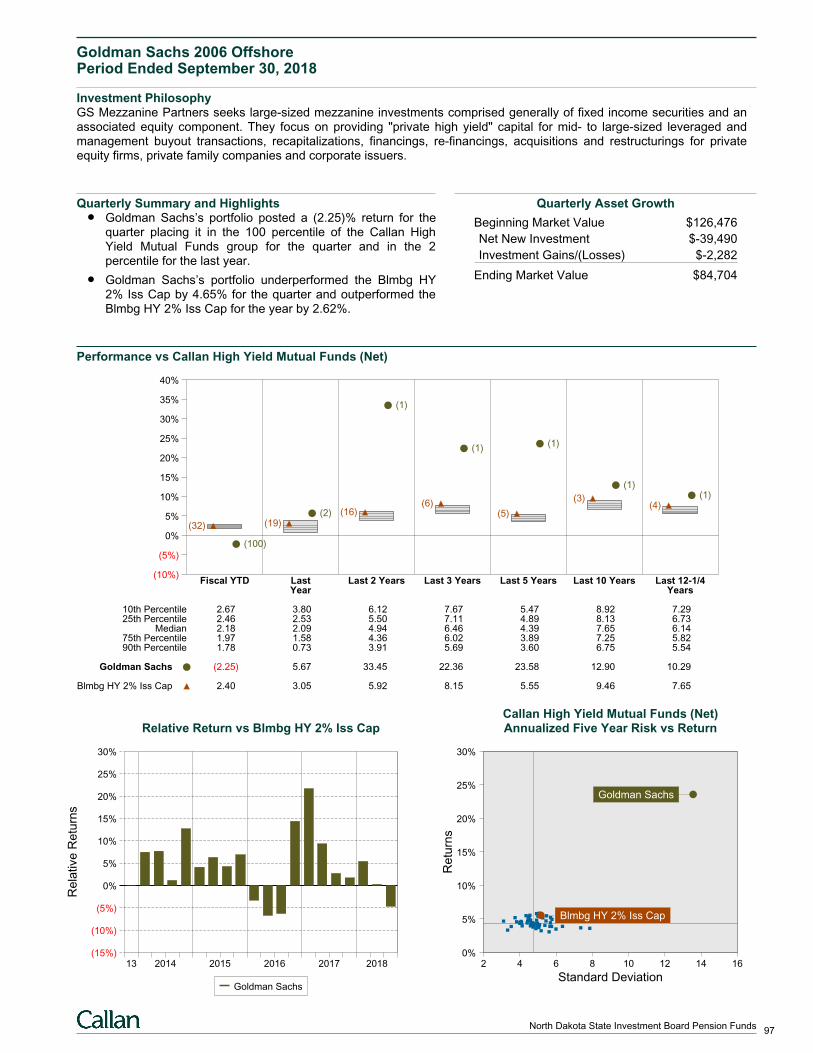
Goldman Sachs 2006 OffshorePeriod Ended September 30, 2018
Investment PhilosophyGS Mezzanine Partners seeks large-sized mezzanine investments comprised generally of fixed income securities and anassociated equity component. They focus on providing "private high yield" capital for mid- to large-sized leveraged andmanagement buyout transactions, recapitalizations, financings, re-financings, acquisitions and restructurings for privateequity firms, private family companies and corporate issuers.
Quarterly Summary and HighlightsGoldman Sachs’s portfolio posted a (2.25)% return for thequarter placing it in the 100 percentile of the Callan HighYield Mutual Funds group for the quarter and in the 2percentile for the last year.
Goldman Sachs’s portfolio underperformed the Blmbg HY2% Iss Cap by 4.65% for the quarter and outperformed theBlmbg HY 2% Iss Cap for the year by 2.62%.
Quarterly Asset Growth
Beginning Market Value $126,476
Net New Investment $-39,490
Investment Gains/(Losses) $-2,282
Ending Market Value $84,704
Performance vs Callan High Yield Mutual Funds (Net)
(10%)
(5%)
0%
5%
10%
15%
20%
25%
30%
35%
40%
Fiscal YTD Last Last 2 Years Last 3 Years Last 5 Years Last 10 Years Last 12-1/4Year Years
(100)
(32)
(2)(19)
(1)
(16)
(1)
(6)
(1)
(5)
(1)
(3) (1)(4)
10th Percentile 2.67 3.80 6.12 7.67 5.47 8.92 7.2925th Percentile 2.46 2.53 5.50 7.11 4.89 8.13 6.73
Median 2.18 2.09 4.94 6.46 4.39 7.65 6.1475th Percentile 1.97 1.58 4.36 6.02 3.89 7.25 5.8290th Percentile 1.78 0.73 3.91 5.69 3.60 6.75 5.54
Goldman Sachs (2.25) 5.67 33.45 22.36 23.58 12.90 10.29
Blmbg HY 2% Iss Cap 2.40 3.05 5.92 8.15 5.55 9.46 7.65
Relative Return vs Blmbg HY 2% Iss Cap
Rela
tive
Re
turn
s
(15%)
(10%)
(5%)
0%
5%
10%
15%
20%
25%
30%
13 2014 2015 2016 2017 2018
Goldman Sachs
Callan High Yield Mutual Funds (Net)Annualized Five Year Risk vs Return
2 4 6 8 10 12 14 160%
5%
10%
15%
20%
25%
30%
Goldman Sachs
Blmbg HY 2% Iss Cap
Standard Deviation
Re
turn
s
97North Dakota State Investment Board Pension Funds
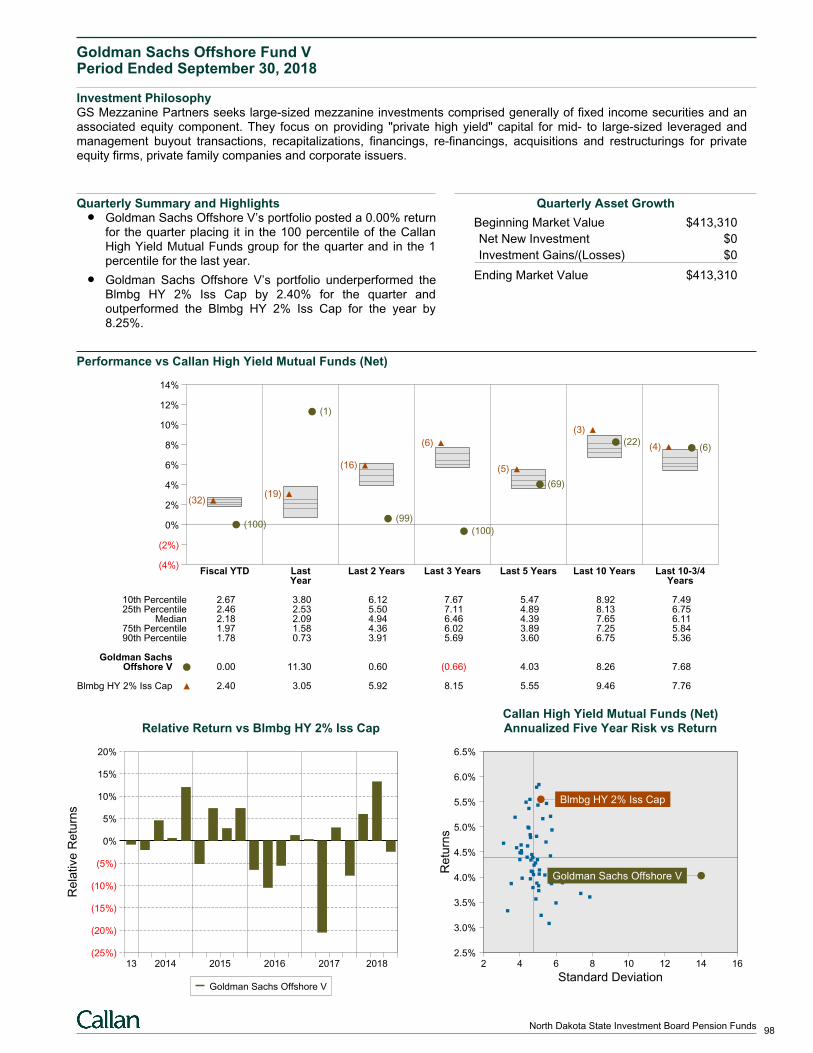
Goldman Sachs Offshore Fund VPeriod Ended September 30, 2018
Investment PhilosophyGS Mezzanine Partners seeks large-sized mezzanine investments comprised generally of fixed income securities and anassociated equity component. They focus on providing "private high yield" capital for mid- to large-sized leveraged andmanagement buyout transactions, recapitalizations, financings, re-financings, acquisitions and restructurings for privateequity firms, private family companies and corporate issuers.
Quarterly Summary and HighlightsGoldman Sachs Offshore V’s portfolio posted a 0.00% returnfor the quarter placing it in the 100 percentile of the CallanHigh Yield Mutual Funds group for the quarter and in the 1percentile for the last year.
Goldman Sachs Offshore V’s portfolio underperformed theBlmbg HY 2% Iss Cap by 2.40% for the quarter andoutperformed the Blmbg HY 2% Iss Cap for the year by8.25%.
Quarterly Asset Growth
Beginning Market Value $413,310
Net New Investment $0
Investment Gains/(Losses) $0
Ending Market Value $413,310
Performance vs Callan High Yield Mutual Funds (Net)
(4%)
(2%)
0%
2%
4%
6%
8%
10%
12%
14%
Fiscal YTD Last Last 2 Years Last 3 Years Last 5 Years Last 10 Years Last 10-3/4Year Years
(100)
(32)
(1)
(19)
(99)
(16)
(100)
(6)
(69)
(5)
(22)
(3)
(6)(4)
10th Percentile 2.67 3.80 6.12 7.67 5.47 8.92 7.4925th Percentile 2.46 2.53 5.50 7.11 4.89 8.13 6.75
Median 2.18 2.09 4.94 6.46 4.39 7.65 6.1175th Percentile 1.97 1.58 4.36 6.02 3.89 7.25 5.8490th Percentile 1.78 0.73 3.91 5.69 3.60 6.75 5.36
Goldman SachsOffshore V 0.00 11.30 0.60 (0.66) 4.03 8.26 7.68
Blmbg HY 2% Iss Cap 2.40 3.05 5.92 8.15 5.55 9.46 7.76
Relative Return vs Blmbg HY 2% Iss Cap
Rela
tive
Re
turn
s
(25%)
(20%)
(15%)
(10%)
(5%)
0%
5%
10%
15%
20%
13 2014 2015 2016 2017 2018
Goldman Sachs Offshore V
Callan High Yield Mutual Funds (Net)Annualized Five Year Risk vs Return
2 4 6 8 10 12 14 162.5%
3.0%
3.5%
4.0%
4.5%
5.0%
5.5%
6.0%
6.5%
Blmbg HY 2% Iss Cap
Goldman Sachs Offshore V
Standard Deviation
Re
turn
s
98North Dakota State Investment Board Pension Funds
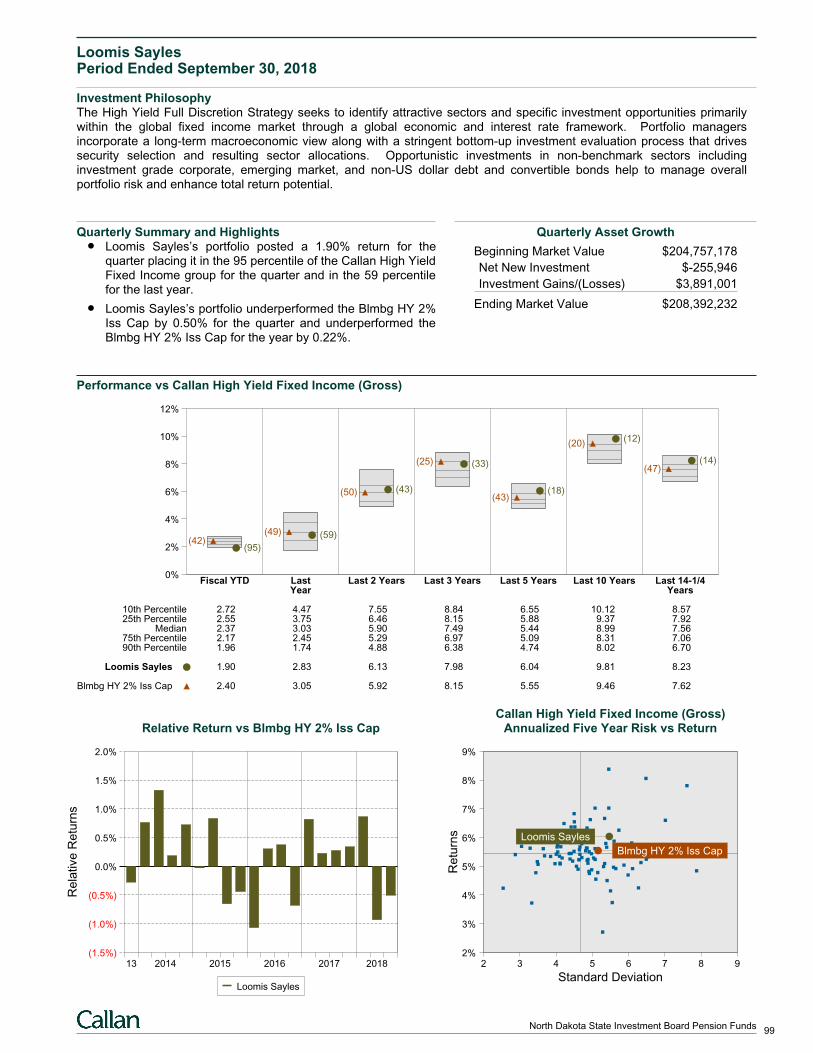
Loomis SaylesPeriod Ended September 30, 2018
Investment PhilosophyThe High Yield Full Discretion Strategy seeks to identify attractive sectors and specific investment opportunities primarilywithin the global fixed income market through a global economic and interest rate framework. Portfolio managersincorporate a long-term macroeconomic view along with a stringent bottom-up investment evaluation process that drivessecurity selection and resulting sector allocations. Opportunistic investments in non-benchmark sectors includinginvestment grade corporate, emerging market, and non-US dollar debt and convertible bonds help to manage overallportfolio risk and enhance total return potential.
Quarterly Summary and HighlightsLoomis Sayles’s portfolio posted a 1.90% return for thequarter placing it in the 95 percentile of the Callan High YieldFixed Income group for the quarter and in the 59 percentilefor the last year.
Loomis Sayles’s portfolio underperformed the Blmbg HY 2%Iss Cap by 0.50% for the quarter and underperformed theBlmbg HY 2% Iss Cap for the year by 0.22%.
Quarterly Asset Growth
Beginning Market Value $204,757,178
Net New Investment $-255,946
Investment Gains/(Losses) $3,891,001
Ending Market Value $208,392,232
Performance vs Callan High Yield Fixed Income (Gross)
0%
2%
4%
6%
8%
10%
12%
Fiscal YTD Last Last 2 Years Last 3 Years Last 5 Years Last 10 Years Last 14-1/4Year Years
(95)(42)
(59)(49)
(43)(50)
(33)(25)
(18)(43)
(12)(20)
(14)(47)
10th Percentile 2.72 4.47 7.55 8.84 6.55 10.12 8.5725th Percentile 2.55 3.75 6.46 8.15 5.88 9.37 7.92
Median 2.37 3.03 5.90 7.49 5.44 8.99 7.5675th Percentile 2.17 2.45 5.29 6.97 5.09 8.31 7.0690th Percentile 1.96 1.74 4.88 6.38 4.74 8.02 6.70
Loomis Sayles 1.90 2.83 6.13 7.98 6.04 9.81 8.23
Blmbg HY 2% Iss Cap 2.40 3.05 5.92 8.15 5.55 9.46 7.62
Relative Return vs Blmbg HY 2% Iss Cap
Rela
tive
Re
turn
s
(1.5%)
(1.0%)
(0.5%)
0.0%
0.5%
1.0%
1.5%
2.0%
13 2014 2015 2016 2017 2018
Loomis Sayles
Callan High Yield Fixed Income (Gross)Annualized Five Year Risk vs Return
2 3 4 5 6 7 8 92%
3%
4%
5%
6%
7%
8%
9%
Loomis Sayles
Blmbg HY 2% Iss Cap
Standard Deviation
Re
turn
s
99North Dakota State Investment Board Pension Funds
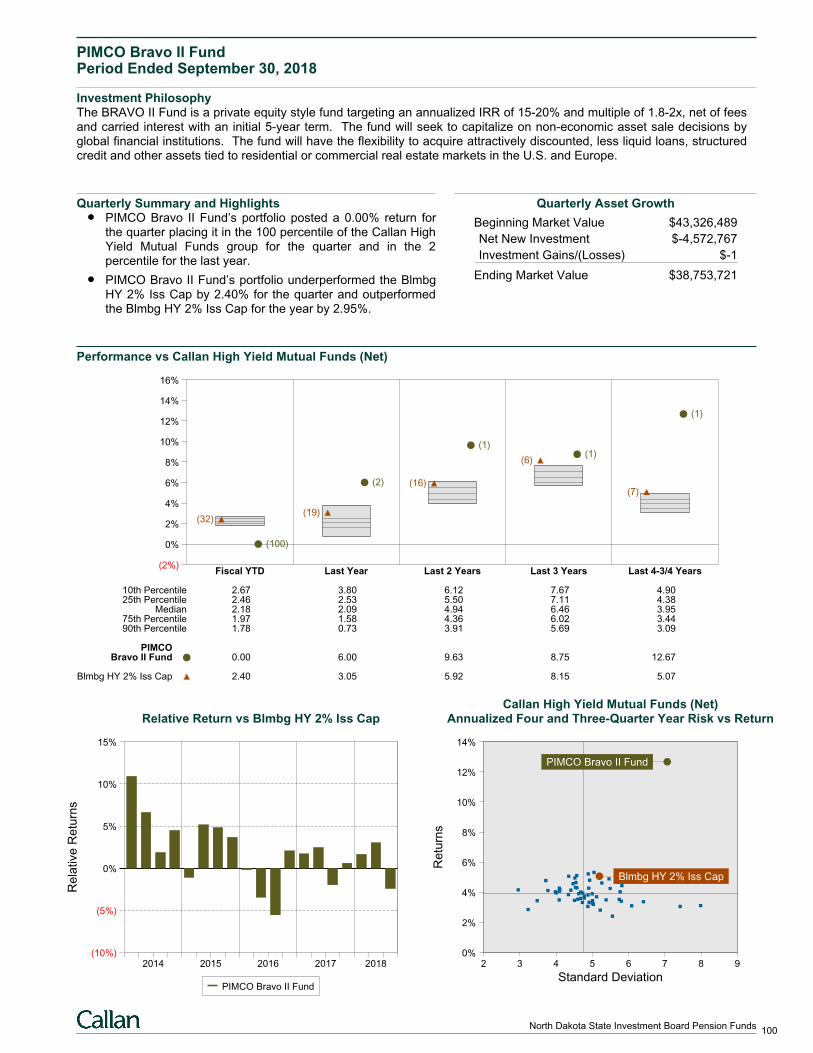
PIMCO Bravo II FundPeriod Ended September 30, 2018
Investment PhilosophyThe BRAVO II Fund is a private equity style fund targeting an annualized IRR of 15-20% and multiple of 1.8-2x, net of feesand carried interest with an initial 5-year term. The fund will seek to capitalize on non-economic asset sale decisions byglobal financial institutions. The fund will have the flexibility to acquire attractively discounted, less liquid loans, structuredcredit and other assets tied to residential or commercial real estate markets in the U.S. and Europe.
Quarterly Summary and HighlightsPIMCO Bravo II Fund’s portfolio posted a 0.00% return forthe quarter placing it in the 100 percentile of the Callan HighYield Mutual Funds group for the quarter and in the 2percentile for the last year.
PIMCO Bravo II Fund’s portfolio underperformed the BlmbgHY 2% Iss Cap by 2.40% for the quarter and outperformedthe Blmbg HY 2% Iss Cap for the year by 2.95%.
Quarterly Asset Growth
Beginning Market Value $43,326,489
Net New Investment $-4,572,767
Investment Gains/(Losses) $-1
Ending Market Value $38,753,721
Performance vs Callan High Yield Mutual Funds (Net)
(2%)
0%
2%
4%
6%
8%
10%
12%
14%
16%
Fiscal YTD Last Year Last 2 Years Last 3 Years Last 4-3/4 Years
(100)
(32)
(2)
(19)
(1)
(16)
(1)(6)
(1)
(7)
10th Percentile 2.67 3.80 6.12 7.67 4.9025th Percentile 2.46 2.53 5.50 7.11 4.38
Median 2.18 2.09 4.94 6.46 3.9575th Percentile 1.97 1.58 4.36 6.02 3.4490th Percentile 1.78 0.73 3.91 5.69 3.09
PIMCOBravo II Fund 0.00 6.00 9.63 8.75 12.67
Blmbg HY 2% Iss Cap 2.40 3.05 5.92 8.15 5.07
Relative Return vs Blmbg HY 2% Iss Cap
Rela
tive
Re
turn
s
(10%)
(5%)
0%
5%
10%
15%
2014 2015 2016 2017 2018
PIMCO Bravo II Fund
Callan High Yield Mutual Funds (Net)Annualized Four and Three-Quarter Year Risk vs Return
2 3 4 5 6 7 8 90%
2%
4%
6%
8%
10%
12%
14%
Blmbg HY 2% Iss Cap
PIMCO Bravo II Fund
Standard Deviation
Re
turn
s
100North Dakota State Investment Board Pension Funds
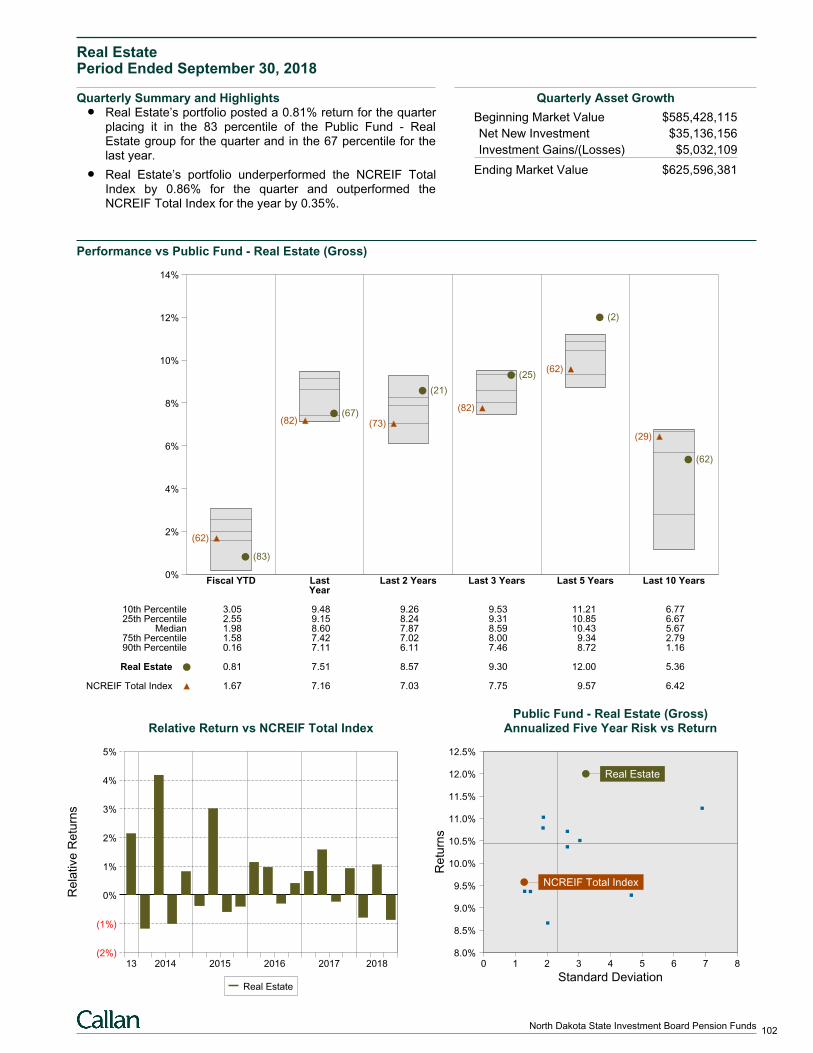
Real EstatePeriod Ended September 30, 2018
Quarterly Summary and HighlightsReal Estate’s portfolio posted a 0.81% return for the quarterplacing it in the 83 percentile of the Public Fund - RealEstate group for the quarter and in the 67 percentile for thelast year.
Real Estate’s portfolio underperformed the NCREIF TotalIndex by 0.86% for the quarter and outperformed theNCREIF Total Index for the year by 0.35%.
Quarterly Asset Growth
Beginning Market Value $585,428,115
Net New Investment $35,136,156
Investment Gains/(Losses) $5,032,109
Ending Market Value $625,596,381
Performance vs Public Fund - Real Estate (Gross)
0%
2%
4%
6%
8%
10%
12%
14%
Fiscal YTD Last Last 2 Years Last 3 Years Last 5 Years Last 10 YearsYear
(83)
(62)
(67)(82)
(21)
(73)
(25)
(82)
(2)
(62)
(62)
(29)
10th Percentile 3.05 9.48 9.26 9.53 11.21 6.7725th Percentile 2.55 9.15 8.24 9.31 10.85 6.67
Median 1.98 8.60 7.87 8.59 10.43 5.6775th Percentile 1.58 7.42 7.02 8.00 9.34 2.7990th Percentile 0.16 7.11 6.11 7.46 8.72 1.16
Real Estate 0.81 7.51 8.57 9.30 12.00 5.36
NCREIF Total Index 1.67 7.16 7.03 7.75 9.57 6.42
Relative Return vs NCREIF Total Index
Rela
tive
Re
turn
s
(2%)
(1%)
0%
1%
2%
3%
4%
5%
13 2014 2015 2016 2017 2018
Real Estate
Public Fund - Real Estate (Gross)Annualized Five Year Risk vs Return
0 1 2 3 4 5 6 7 88.0%
8.5%
9.0%
9.5%
10.0%
10.5%
11.0%
11.5%
12.0%
12.5%
Real Estate
NCREIF Total Index
Standard Deviation
Re
turn
s
102North Dakota State Investment Board Pension Funds
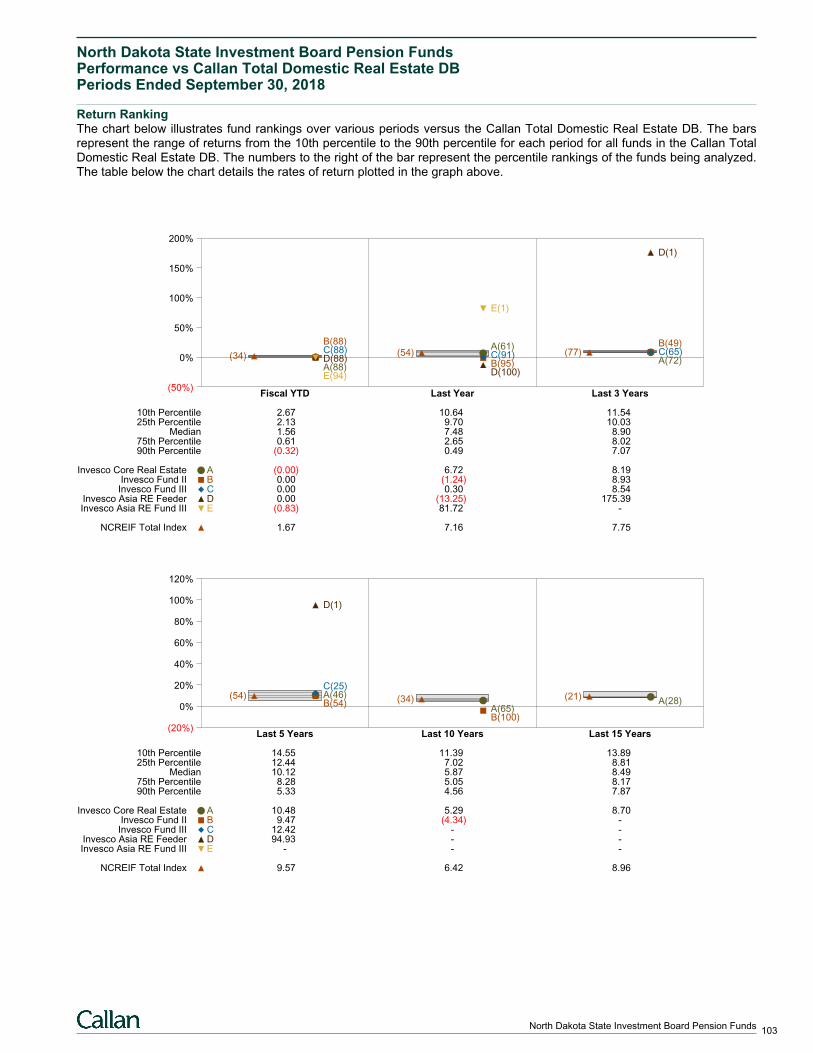
North Dakota State Investment Board Pension FundsPerformance vs Callan Total Domestic Real Estate DBPeriods Ended September 30, 2018
Return RankingThe chart below illustrates fund rankings over various periods versus the Callan Total Domestic Real Estate DB. The barsrepresent the range of returns from the 10th percentile to the 90th percentile for each period for all funds in the Callan TotalDomestic Real Estate DB. The numbers to the right of the bar represent the percentile rankings of the funds being analyzed.The table below the chart details the rates of return plotted in the graph above.
(50%)
0%
50%
100%
150%
200%
Fiscal YTD Last Year Last 3 Years
B(88)C(88)D(88)A(88)E(94)
(34)
E(1)
A(61)C(91)B(95)D(100)
(54)
D(1)
B(49)C(65)A(72)
(77)
10th Percentile 2.67 10.64 11.5425th Percentile 2.13 9.70 10.03
Median 1.56 7.48 8.9075th Percentile 0.61 2.65 8.0290th Percentile (0.32) 0.49 7.07
Invesco Core Real Estate A (0.00) 6.72 8.19Invesco Fund II B 0.00 (1.24) 8.93Invesco Fund III C 0.00 0.30 8.54
Invesco Asia RE Feeder D 0.00 (13.25) 175.39Invesco Asia RE Fund III E (0.83) 81.72 -
NCREIF Total Index 1.67 7.16 7.75
(20%)
0%
20%
40%
60%
80%
100%
120%
Last 5 Years Last 10 Years Last 15 Years
D(1)
C(25)A(46)B(54)
(54)
A(65)B(100)
(34) A(28)(21)
10th Percentile 14.55 11.39 13.8925th Percentile 12.44 7.02 8.81
Median 10.12 5.87 8.4975th Percentile 8.28 5.05 8.1790th Percentile 5.33 4.56 7.87
Invesco Core Real Estate A 10.48 5.29 8.70Invesco Fund II B 9.47 (4.34) -Invesco Fund III C 12.42 - -
Invesco Asia RE Feeder D 94.93 - -Invesco Asia RE Fund III E - - -
NCREIF Total Index 9.57 6.42 8.96
103North Dakota State Investment Board Pension Funds
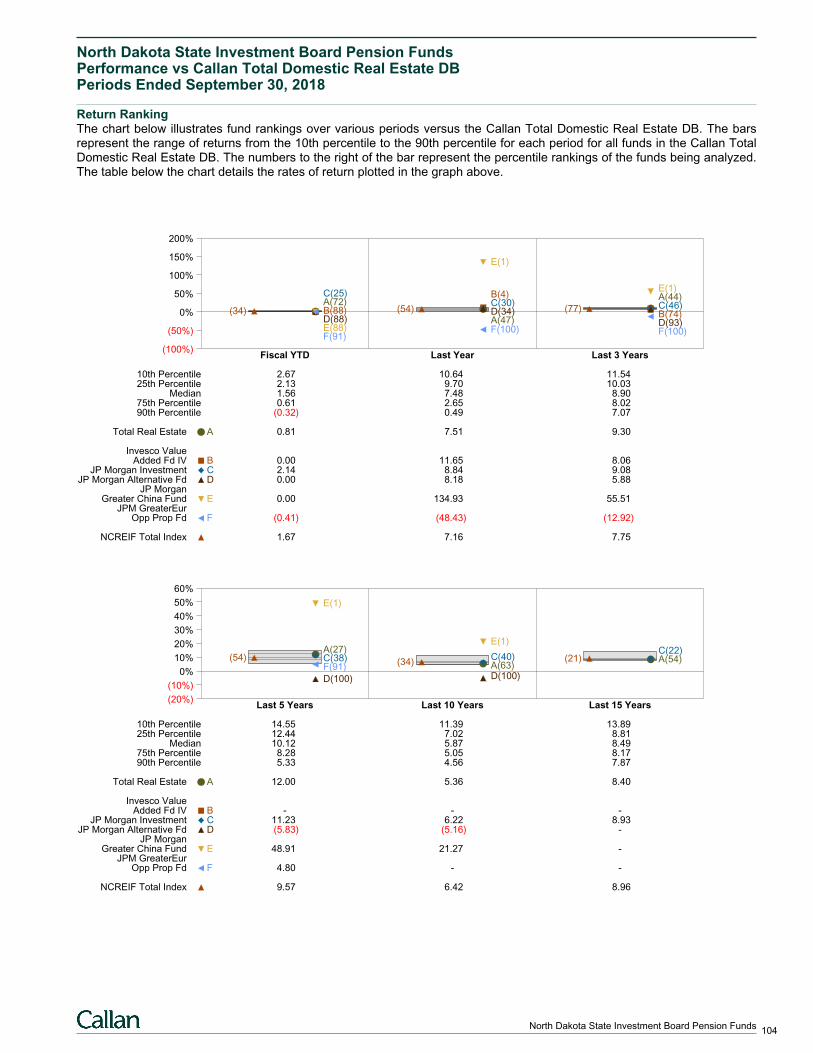
North Dakota State Investment Board Pension FundsPerformance vs Callan Total Domestic Real Estate DBPeriods Ended September 30, 2018
Return RankingThe chart below illustrates fund rankings over various periods versus the Callan Total Domestic Real Estate DB. The barsrepresent the range of returns from the 10th percentile to the 90th percentile for each period for all funds in the Callan TotalDomestic Real Estate DB. The numbers to the right of the bar represent the percentile rankings of the funds being analyzed.The table below the chart details the rates of return plotted in the graph above.
(100%)
(50%)
0%
50%
100%
150%
200%
Fiscal YTD Last Year Last 3 Years
C(25)A(72)B(88)D(88)E(88)F(91)
(34)
E(1)
B(4)C(30)D(34)A(47)F(100)
(54)
E(1)A(44)C(46)B(74)D(93)F(100)
(77)
10th Percentile 2.67 10.64 11.5425th Percentile 2.13 9.70 10.03
Median 1.56 7.48 8.9075th Percentile 0.61 2.65 8.0290th Percentile (0.32) 0.49 7.07
Total Real Estate A 0.81 7.51 9.30
Invesco ValueAdded Fd IV B 0.00 11.65 8.06
JP Morgan Investment C 2.14 8.84 9.08JP Morgan Alternative Fd D 0.00 8.18 5.88
JP MorganGreater China Fund E 0.00 134.93 55.51
JPM GreaterEurOpp Prop Fd F (0.41) (48.43) (12.92)
NCREIF Total Index 1.67 7.16 7.75
(20%)
(10%)
0%
10%
20%
30%
40%
50%
60%
Last 5 Years Last 10 Years Last 15 Years
E(1)
A(27)C(38)F(91)
D(100)
(54)
E(1)
C(40)A(63)D(100)
(34)
C(22)A(54)(21)
10th Percentile 14.55 11.39 13.8925th Percentile 12.44 7.02 8.81
Median 10.12 5.87 8.4975th Percentile 8.28 5.05 8.1790th Percentile 5.33 4.56 7.87
Total Real Estate A 12.00 5.36 8.40
Invesco ValueAdded Fd IV B - - -
JP Morgan Investment C 11.23 6.22 8.93JP Morgan Alternative Fd D (5.83) (5.16) -
JP MorganGreater China Fund E 48.91 21.27 -
JPM GreaterEurOpp Prop Fd F 4.80 - -
NCREIF Total Index 9.57 6.42 8.96
104North Dakota State Investment Board Pension Funds
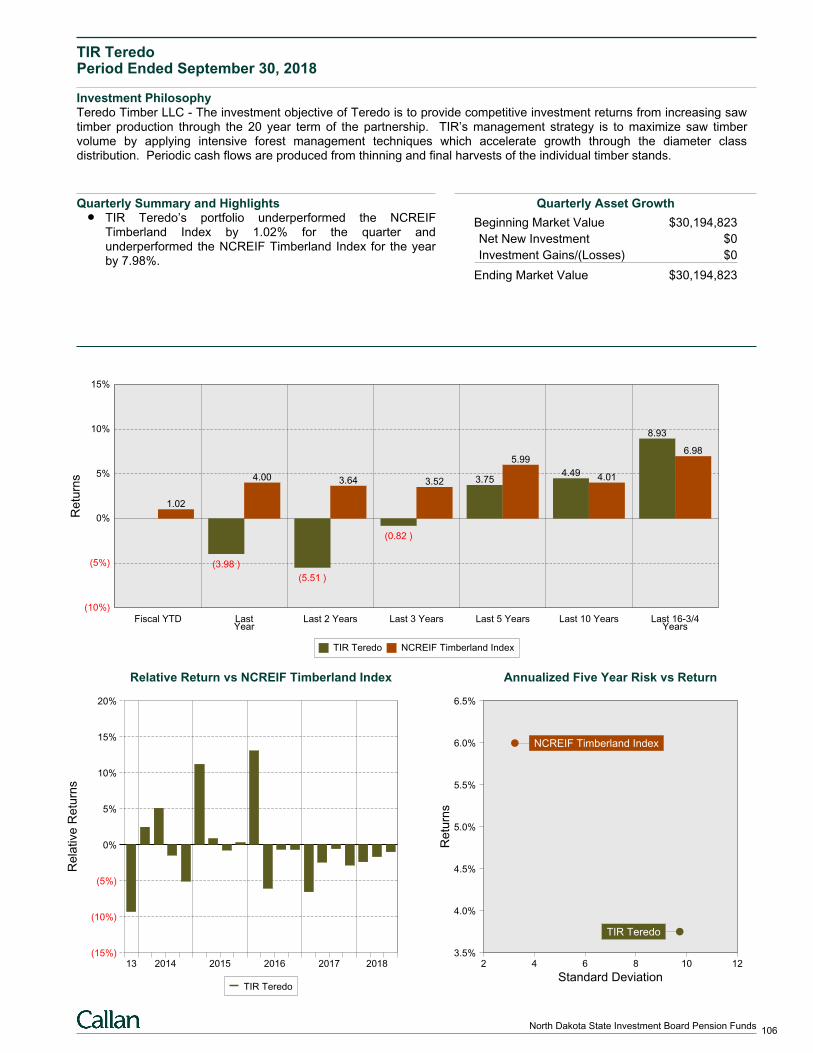
TIR TeredoPeriod Ended September 30, 2018
Investment PhilosophyTeredo Timber LLC - The investment objective of Teredo is to provide competitive investment returns from increasing sawtimber production through the 20 year term of the partnership. TIR’s management strategy is to maximize saw timbervolume by applying intensive forest management techniques which accelerate growth through the diameter classdistribution. Periodic cash flows are produced from thinning and final harvests of the individual timber stands.
Quarterly Summary and HighlightsTIR Teredo’s portfolio underperformed the NCREIFTimberland Index by 1.02% for the quarter andunderperformed the NCREIF Timberland Index for the yearby 7.98%.
Quarterly Asset Growth
Beginning Market Value $30,194,823
Net New Investment $0
Investment Gains/(Losses) $0
Ending Market Value $30,194,823
(10%)
(5%)
0%
5%
10%
15%
Fiscal YTD
1.02
LastYear
(3.98 )
4.00
Last 2 Years
(5.51 )
3.64
Last 3 Years
(0.82 )
3.52
Last 5 Years
3.75
5.99
Last 10 Years
4.49 4.01
Last 16-3/4Years
8.93
6.98
Re
turn
s
TIR Teredo NCREIF Timberland Index
Relative Return vs NCREIF Timberland Index
Re
lative
Re
turn
s
(15%)
(10%)
(5%)
0%
5%
10%
15%
20%
13 2014 2015 2016 2017 2018
TIR Teredo
Annualized Five Year Risk vs Return
2 4 6 8 10 123.5%
4.0%
4.5%
5.0%
5.5%
6.0%
6.5%
TIR Teredo
NCREIF Timberland Index
Standard Deviation
Re
turn
s
106North Dakota State Investment Board Pension Funds
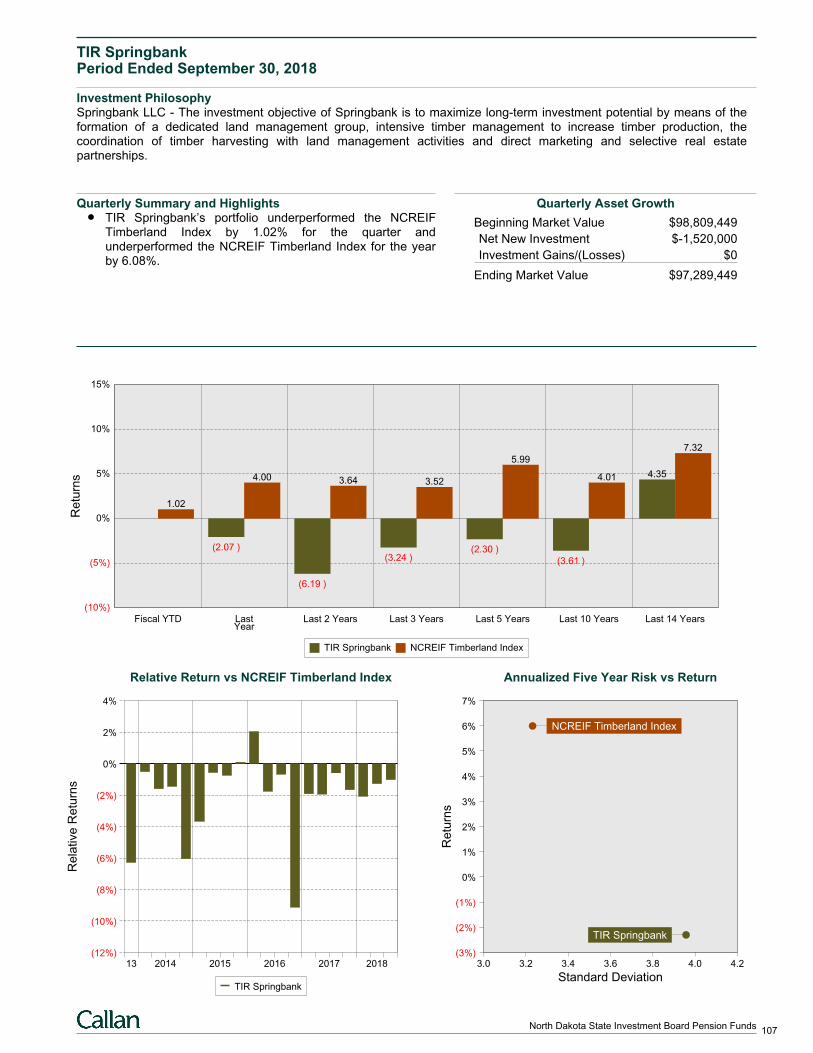
TIR SpringbankPeriod Ended September 30, 2018
Investment PhilosophySpringbank LLC - The investment objective of Springbank is to maximize long-term investment potential by means of theformation of a dedicated land management group, intensive timber management to increase timber production, thecoordination of timber harvesting with land management activities and direct marketing and selective real estatepartnerships.
Quarterly Summary and HighlightsTIR Springbank’s portfolio underperformed the NCREIFTimberland Index by 1.02% for the quarter andunderperformed the NCREIF Timberland Index for the yearby 6.08%.
Quarterly Asset Growth
Beginning Market Value $98,809,449
Net New Investment $-1,520,000
Investment Gains/(Losses) $0
Ending Market Value $97,289,449
(10%)
(5%)
0%
5%
10%
15%
Fiscal YTD
1.02
LastYear
(2.07 )
4.00
Last 2 Years
(6.19 )
3.64
Last 3 Years
(3.24 )
3.52
Last 5 Years
(2.30 )
5.99
Last 10 Years
(3.61 )
4.01
Last 14 Years
4.35
7.32
Re
turn
s
TIR Springbank NCREIF Timberland Index
Relative Return vs NCREIF Timberland Index
Re
lative
Re
turn
s
(12%)
(10%)
(8%)
(6%)
(4%)
(2%)
0%
2%
4%
13 2014 2015 2016 2017 2018
TIR Springbank
Annualized Five Year Risk vs Return
3.0 3.2 3.4 3.6 3.8 4.0 4.2(3%)
(2%)
(1%)
0%
1%
2%
3%
4%
5%
6%
7%
NCREIF Timberland Index
TIR Springbank
Standard Deviation
Re
turn
s
107North Dakota State Investment Board Pension Funds
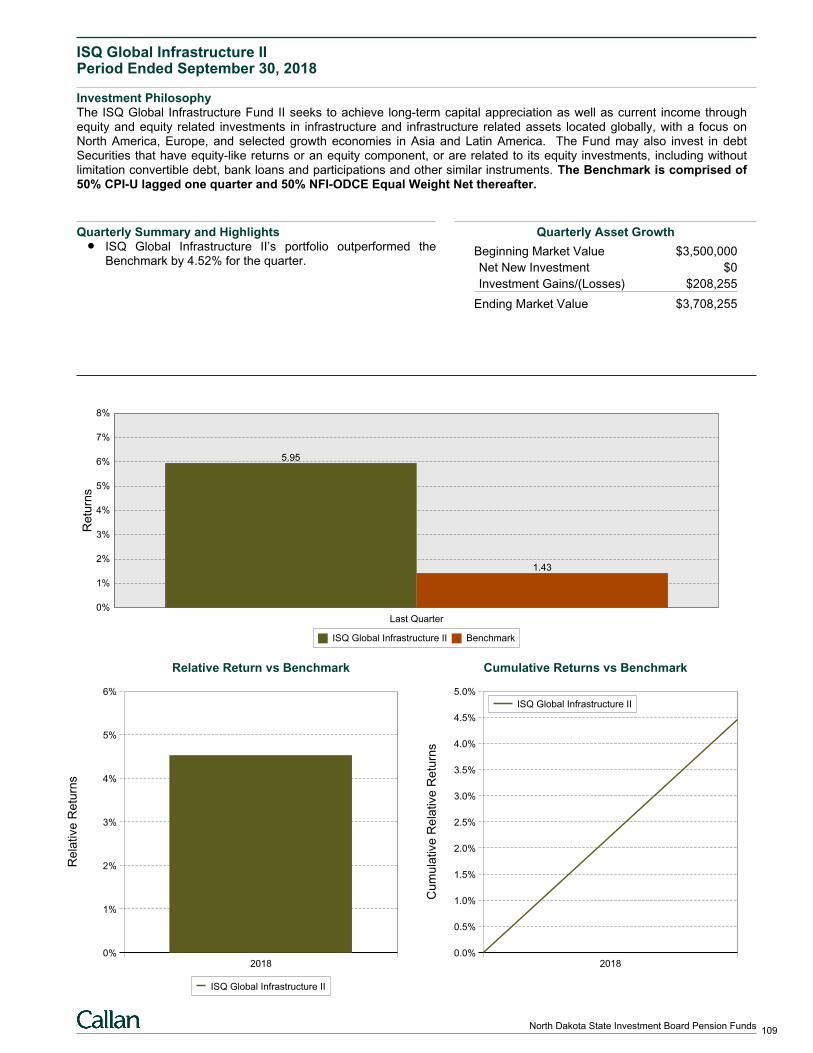
ISQ Global Infrastructure IIPeriod Ended September 30, 2018
Investment PhilosophyThe ISQ Global Infrastructure Fund II seeks to achieve long-term capital appreciation as well as current income throughequity and equity related investments in infrastructure and infrastructure related assets located globally, with a focus onNorth America, Europe, and selected growth economies in Asia and Latin America. The Fund may also invest in debtSecurities that have equity-like returns or an equity component, or are related to its equity investments, including withoutlimitation convertible debt, bank loans and participations and other similar instruments. The Benchmark is comprised of50% CPI-U lagged one quarter and 50% NFI-ODCE Equal Weight Net thereafter.
Quarterly Summary and HighlightsISQ Global Infrastructure II’s portfolio outperformed theBenchmark by 4.52% for the quarter.
Quarterly Asset Growth
Beginning Market Value $3,500,000
Net New Investment $0
Investment Gains/(Losses) $208,255
Ending Market Value $3,708,255
0%
1%
2%
3%
4%
5%
6%
7%
8%
Last Quarter
5.95
1.43
Re
turn
s
ISQ Global Infrastructure II Benchmark
Relative Return vs Benchmark
Re
lative
Re
turn
s
0%
1%
2%
3%
4%
5%
6%
2018
ISQ Global Infrastructure II
Cumulative Returns vs Benchmark
Cum
ula
tive
Re
lative
Re
turn
s
0.0%
0.5%
1.0%
1.5%
2.0%
2.5%
3.0%
3.5%
4.0%
4.5%
5.0%
2018
ISQ Global Infrastructure II
109North Dakota State Investment Board Pension Funds
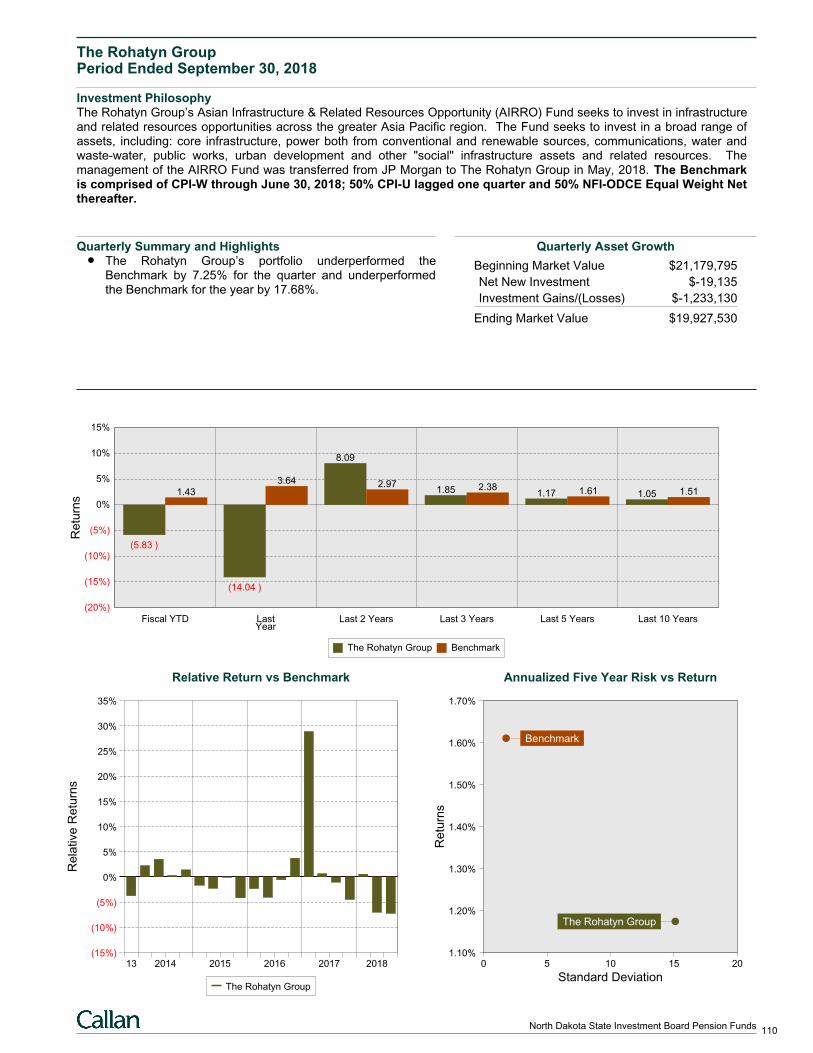
The Rohatyn GroupPeriod Ended September 30, 2018
Investment PhilosophyThe Rohatyn Group’s Asian Infrastructure & Related Resources Opportunity (AIRRO) Fund seeks to invest in infrastructureand related resources opportunities across the greater Asia Pacific region. The Fund seeks to invest in a broad range ofassets, including: core infrastructure, power both from conventional and renewable sources, communications, water andwaste-water, public works, urban development and other "social" infrastructure assets and related resources. Themanagement of the AIRRO Fund was transferred from JP Morgan to The Rohatyn Group in May, 2018. The Benchmarkis comprised of CPI-W through June 30, 2018; 50% CPI-U lagged one quarter and 50% NFI-ODCE Equal Weight Netthereafter.
Quarterly Summary and HighlightsThe Rohatyn Group’s portfolio underperformed theBenchmark by 7.25% for the quarter and underperformedthe Benchmark for the year by 17.68%.
Quarterly Asset Growth
Beginning Market Value $21,179,795
Net New Investment $-19,135
Investment Gains/(Losses) $-1,233,130
Ending Market Value $19,927,530
(20%)
(15%)
(10%)
(5%)
0%
5%
10%
15%
Fiscal YTD
(5.83 )
1.43
LastYear
(14.04 )
3.64
Last 2 Years
8.09
2.97
Last 3 Years
1.85 2.38
Last 5 Years
1.17 1.61
Last 10 Years
1.05 1.51
Re
turn
s
The Rohatyn Group Benchmark
Relative Return vs Benchmark
Re
lative
Re
turn
s
(15%)
(10%)
(5%)
0%
5%
10%
15%
20%
25%
30%
35%
13 2014 2015 2016 2017 2018
The Rohatyn Group
Annualized Five Year Risk vs Return
0 5 10 15 201.10%
1.20%
1.30%
1.40%
1.50%
1.60%
1.70%
Benchmark
The Rohatyn Group
Standard Deviation
Re
turn
s
110North Dakota State Investment Board Pension Funds
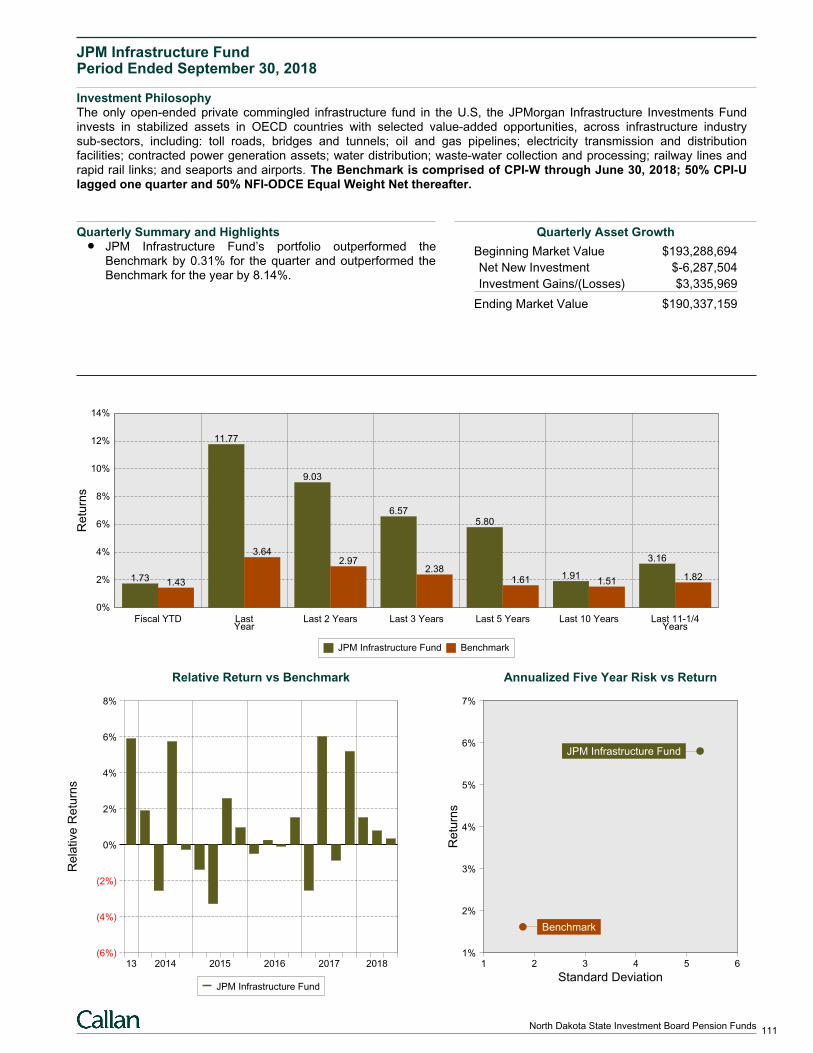
JPM Infrastructure FundPeriod Ended September 30, 2018
Investment PhilosophyThe only open-ended private commingled infrastructure fund in the U.S, the JPMorgan Infrastructure Investments Fundinvests in stabilized assets in OECD countries with selected value-added opportunities, across infrastructure industrysub-sectors, including: toll roads, bridges and tunnels; oil and gas pipelines; electricity transmission and distributionfacilities; contracted power generation assets; water distribution; waste-water collection and processing; railway lines andrapid rail links; and seaports and airports. The Benchmark is comprised of CPI-W through June 30, 2018; 50% CPI-Ulagged one quarter and 50% NFI-ODCE Equal Weight Net thereafter.
Quarterly Summary and HighlightsJPM Infrastructure Fund’s portfolio outperformed theBenchmark by 0.31% for the quarter and outperformed theBenchmark for the year by 8.14%.
Quarterly Asset Growth
Beginning Market Value $193,288,694
Net New Investment $-6,287,504
Investment Gains/(Losses) $3,335,969
Ending Market Value $190,337,159
0%
2%
4%
6%
8%
10%
12%
14%
Fiscal YTD
1.73 1.43
LastYear
11.77
3.64
Last 2 Years
9.03
2.97
Last 3 Years
6.57
2.38
Last 5 Years
5.80
1.61
Last 10 Years
1.911.51
Last 11-1/4Years
3.16
1.82
Re
turn
s
JPM Infrastructure Fund Benchmark
Relative Return vs Benchmark
Re
lative
Re
turn
s
(6%)
(4%)
(2%)
0%
2%
4%
6%
8%
13 2014 2015 2016 2017 2018
JPM Infrastructure Fund
Annualized Five Year Risk vs Return
1 2 3 4 5 61%
2%
3%
4%
5%
6%
7%
JPM Infrastructure Fund
Benchmark
Standard Deviation
Re
turn
s
111North Dakota State Investment Board Pension Funds
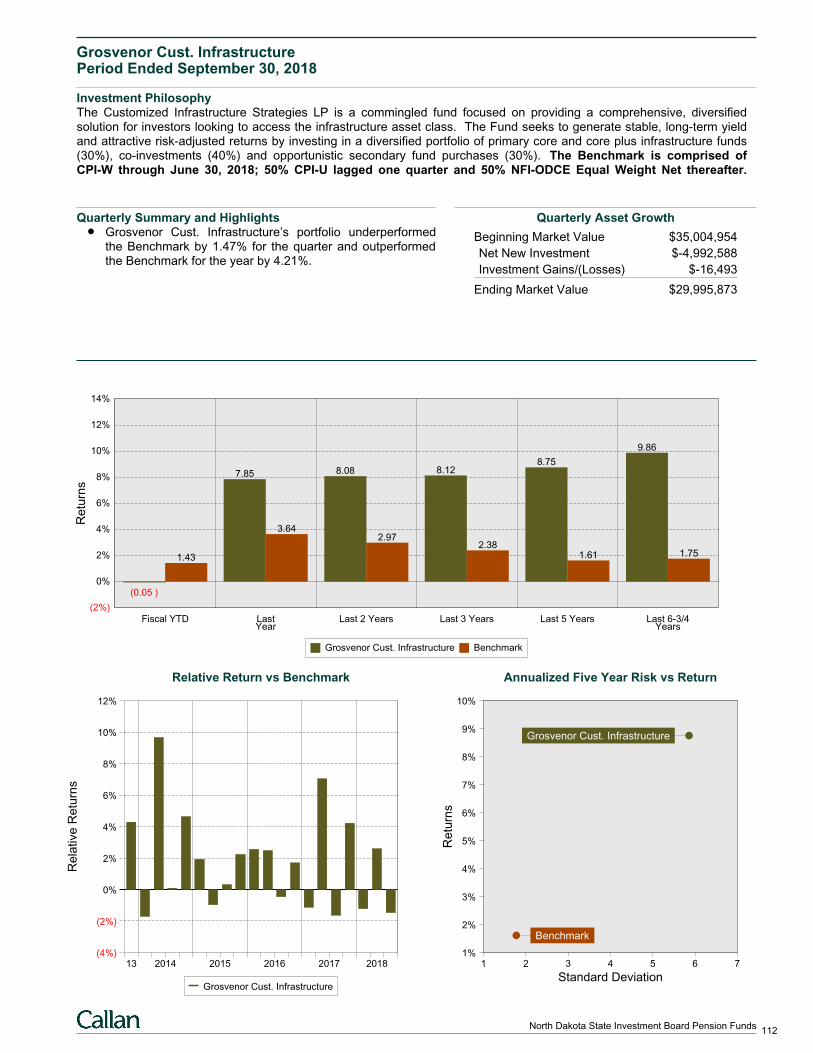
Grosvenor Cust. InfrastructurePeriod Ended September 30, 2018
Investment PhilosophyThe Customized Infrastructure Strategies LP is a commingled fund focused on providing a comprehensive, diversifiedsolution for investors looking to access the infrastructure asset class. The Fund seeks to generate stable, long-term yieldand attractive risk-adjusted returns by investing in a diversified portfolio of primary core and core plus infrastructure funds(30%), co-investments (40%) and opportunistic secondary fund purchases (30%). The Benchmark is comprised ofCPI-W through June 30, 2018; 50% CPI-U lagged one quarter and 50% NFI-ODCE Equal Weight Net thereafter.
Quarterly Summary and HighlightsGrosvenor Cust. Infrastructure’s portfolio underperformedthe Benchmark by 1.47% for the quarter and outperformedthe Benchmark for the year by 4.21%.
Quarterly Asset Growth
Beginning Market Value $35,004,954
Net New Investment $-4,992,588
Investment Gains/(Losses) $-16,493
Ending Market Value $29,995,873
(2%)
0%
2%
4%
6%
8%
10%
12%
14%
Fiscal YTD
(0.05 )
1.43
LastYear
7.85
3.64
Last 2 Years
8.08
2.97
Last 3 Years
8.12
2.38
Last 5 Years
8.75
1.61
Last 6-3/4Years
9.86
1.75
Re
turn
s
Grosvenor Cust. Infrastructure Benchmark
Relative Return vs Benchmark
Re
lative
Re
turn
s
(4%)
(2%)
0%
2%
4%
6%
8%
10%
12%
13 2014 2015 2016 2017 2018
Grosvenor Cust. Infrastructure
Annualized Five Year Risk vs Return
1 2 3 4 5 6 71%
2%
3%
4%
5%
6%
7%
8%
9%
10%
Grosvenor Cust. Infrastructure
Benchmark
Standard Deviation
Re
turn
s
112North Dakota State Investment Board Pension Funds
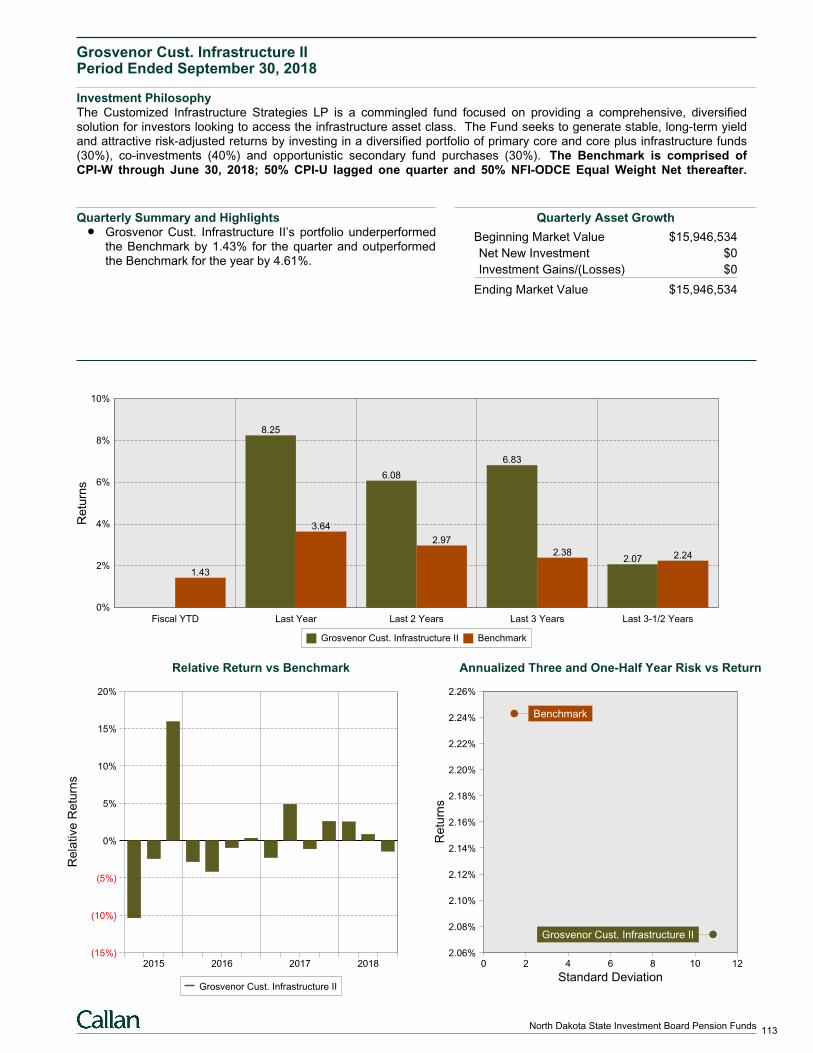
Grosvenor Cust. Infrastructure IIPeriod Ended September 30, 2018
Investment PhilosophyThe Customized Infrastructure Strategies LP is a commingled fund focused on providing a comprehensive, diversifiedsolution for investors looking to access the infrastructure asset class. The Fund seeks to generate stable, long-term yieldand attractive risk-adjusted returns by investing in a diversified portfolio of primary core and core plus infrastructure funds(30%), co-investments (40%) and opportunistic secondary fund purchases (30%). The Benchmark is comprised ofCPI-W through June 30, 2018; 50% CPI-U lagged one quarter and 50% NFI-ODCE Equal Weight Net thereafter.
Quarterly Summary and HighlightsGrosvenor Cust. Infrastructure II’s portfolio underperformedthe Benchmark by 1.43% for the quarter and outperformedthe Benchmark for the year by 4.61%.
Quarterly Asset Growth
Beginning Market Value $15,946,534
Net New Investment $0
Investment Gains/(Losses) $0
Ending Market Value $15,946,534
0%
2%
4%
6%
8%
10%
Fiscal YTD
1.43
Last Year
8.25
3.64
Last 2 Years
6.08
2.97
Last 3 Years
6.83
2.38
Last 3-1/2 Years
2.07 2.24
Re
turn
s
Grosvenor Cust. Infrastructure II Benchmark
Relative Return vs Benchmark
Re
lative
Re
turn
s
(15%)
(10%)
(5%)
0%
5%
10%
15%
20%
2015 2016 2017 2018
Grosvenor Cust. Infrastructure II
Annualized Three and One-Half Year Risk vs Return
0 2 4 6 8 10 122.06%
2.08%
2.10%
2.12%
2.14%
2.16%
2.18%
2.20%
2.22%
2.24%
2.26%
Grosvenor Cust. Infrastructure II
Benchmark
Standard Deviation
Re
turn
s
113North Dakota State Investment Board Pension Funds

Research and Educational Programs
The Callan Institute provides research to update clients on the latest industry trends and carefully structured educational programs
to enhance the knowledge of industry professionals. Visit www.callan.com/library to see all of our publications, and www.callan.com/blog
to view our blog “Perspectives.” For more information contact Corry Walsh at 312.346.3536 / [email protected].
New Research from Callan’s Experts
An Investor Framework for Addressing
Climate Change | Callan’s Anna West lays
out the top issues for investors about this
issue. We also identify solutions and areas
of progress for those seeking to address
climate-related risks as well as beneit from emerging opportunities.
Promoting Gender Diversity in the Investment Industry | Callan
Executive Chairman Ron Peyton offers his observations on what
has worked for gender inclusion at the irm over the last 45 years and what we have learned in the hope that it will inform others on
how to progress toward equality in senior roles industry-wide.
Helping DC Plan Participants in the
“Distribution” Phase | Callan’s Tom Shingler
and James Veneruso discuss our research on the
“distribution phase” of deined contribution plans, when participants are drawing down assets, and
the issues that plan sponsors should address.
Picking Through the Alpha Graveyard: Correcting for
Survivorship Bias in Investment Product Universes | In this
paper from the Journal of Investment Management, Callan’s Greg
Allen, Ivan Cliff, and Wally Meerschaert propose a technique to cor-
rect for survivorship bias in investment product universes. It uses
all available data for survivors and non-survivors, corrects for bias
across the full distribution (from 1st to 99th percentile), and can be
applied to other return-based statistics such as the Sharpe ratio.
Infrastructure: No Longer a Niche Option | Callan’s Jan Mende
discusses investing in infrastructure. Institutional investors are in-
creasing allocations, managers are creating more investment op-
tions, and benchmarks are being reined.
The Shape of Risk: Making Cents of the Irrational With Options
| In the third quarter’s Hedge Fund Monitor, Jim McKee discusses
the use of options as insurance for institutional portfolios.
2018 ESG Survey | Callan’s sixth annual survey on the status of
environmental, social, and governance (ESG) investing in the U.S.
institutional investment market reveals more than 40% of investors
are incorporating ESG factors into investment decisions.
Your Plan Will Face a Cyberattack; Here’s How to Prepare | The
third quarter’s edition of the DC Observer is designed to assist plan
sponsors with formulating and executing their cybersecurity strat-
egy to protect their information and their assets.
Quarterly Periodicals
Private Equity Trends | This newsletter offers the latest data on
private equity fundraising, buyouts, venture capital, and returns.
Market Pulse Flipbook | A quarterly market reference guide cover-
ing investment and fund sponsor trends in the U.S. economy, U.S.
and non-U.S. equities and ixed income, alternatives, and deined contribution.
Capital Market Review | This quarterly publication provides analy-
sis and a broad overview of the economy and public and private
market activity across a wide range of asset classes.
Real Estate Indicators: Too Hot to Touch or Cool Enough
to Handle? | Callan’s Real Assets Consulting group identi-
ies seven indicators—based on spreads in real estate and ixed income markets—that, combined with an understanding of prevail-ing market dynamics, have helped signal when the institutional real
estate market is overheated or cooled.
Education
3rd Quarter 2018
at Oxford University. In the context
8
These 17 goals were set in 2015 and target broad intergovernmental agree
ment around social and economic issues. Several of the 17 directly relate to
climate change; others indirectly touch on it. While the SDGs speciically relate
help to achieve the 17 goals. Likewise, index providers and asset managers are
investor market, as some expect more carbon pricing to occur in the next decade and want to avoid own
Research
August 2018
DC Plans Have Helped Participants Save. Now They Need to Help Them Spend.New Focus on the ‘Distribution Phase’
K E Y E L E M E N T S
Sponsorsaredevotingmoreattentiontothe“distributionphase”ofdeinedcontribution (DC) plans; that is, the period in which participants are drawing
down assets.
One key issue: whether to retain retiree assets in the plan. Sponsors should
address that question, and if the answer is yes, they need to make sure the
plan’s design and the recordkeeper’s capabilities support this choice.
The investing industry is also responding to the growing interest in the dis-
tribution phase with new retirement income products, but they can be quite
complex. Plan sponsors should evaluate the breadth of choices they wish to
offer retirees, as well as the level of fees and complexity.
Once operational considerations have been addressed, plans must focus
on the fund lineup and the overall communication efforts, which differ from
those needed for the “accumulation phase” when participants are building up
their wealth for retirement.
Knowledge. Experience. Integrity.
“Callan believes that plan sponsors should document their
philosophy on whether they wish to retain the assets of retired
and terminated participants. The issue of asset retention will
become increasingly important as demographics shift.”
James Veneruso and Tom Shingler
Fund Sponsor Consulting Group
INSTITUTE
INSTITUTE

Events
Miss out on a Callan conference or workshop? Event summa-
ries and speakers’ presentations are available on our website:
www.callan.com/library/
Callan’s 2019 National Conference will be held January 28-30,
2019. Mark your calendars for this upcoming event! And please
visit the Events page on our website (www.callan.com/events/) for
additional information as it becomes available.
For more information about events, please contact Barb
Gerraty: 415.274.3093 / [email protected]
The Center for Investment Training Educational Sessions
The Center for Investment Training, better known as the “Callan
College,” provides a foundation of knowledge for industry profes-
sionals who are involved in the investment decision-making pro-
cess. It was founded in 1994 to provide clients and non-clients alike
with basic- to intermediate-level instruction. Our next sessions are:
Introduction to Investments
San Francisco, April 16-17, 2019
San Francisco, July 16-17, 2019
Chicago, October 22-23, 2019
This program familiarizes fund sponsor trustees, staff, and asset
management advisers with basic investment theory, terminology,
and practices. It lasts one-and-a-half days and is designed for in-
dividuals who have less than two years of experience with asset-
management oversight and/or support responsibilities. Tuition for
the Introductory “Callan College” session is $2,350 per person.
Tuition includes instruction, all materials, breakfast and lunch on
each day, and dinner on the irst evening with the instructors.
Customized Sessions
The “Callan College” is equipped to customize a curriculum to
meet the training and educational needs of a speciic organization. These tailored sessions range from basic to advanced and can
take place anywhere—even at your ofice.
Learn more at www.callan.com/events/callan-college-intro or
contact Kathleen Cunnie: 415.274.3029 / [email protected]
Unique pieces of research the
Institute generates each year50+
Total attendees of the “Callan
College” since 19943,700 Year the Callan Institute
was founded1980
Attendees (on average) of the
Institute’s annual National Conference525
Education: By the Numbers
@CallanLLC Callan
“Research is the foundation of all we do at Callan, and sharing our
best thinking with the investment community is our way of helping
to foster dialog to raise the bar across the industry.”
Greg Allen, Chief Executive Oficer and Chief Research Oficer

List of Callan’s Investment Manager Clients
Confidential – For Callan Client Use Only Callan takes its fiduciary and disclosure responsibilities to clients very seriously. We recognize that there are numerous potential conflicts of interest encountered in the investment consulting industry and that it is our responsibility to manage those conflicts effectively and in the best interest of our clients. At Callan, we employ a robust process to identify, manage, monitor and disclose potential conflicts on an on-going basis. The list below is an important component of our conflicts management and disclosure process. It identifies those investment managers that pay Callan fees for educational, consulting, software, database or reporting products and services. We update the list quarterly because we believe that our fund sponsor clients should know the investment managers that do business with Callan, particularly those investment manager clients that the fund sponsor clients may be using or considering using. Please note that if an investment manager receives a product or service on a complimentary basis (e.g. attending and educational event), they are not included in the list below. Callan is committed to ensuring that we do not consider an investment manager’s business relationship with Callan, or lack thereof, in performing evaluations for or making suggestions or recommendations to its other clients. Please refer to Callan’s ADV Part 2A for a more detailed description of the services and products that Callan makes available to investment manager clients through our Institutional Consulting Group, Independent Adviser Group and Fund Sponsor Consulting Group. Due to the complex corporate and organizational ownership structures of many investment management firms, parent and affiliate firm relationships are not indicated on our list. Fund sponsor clients may request a copy of the most currently available list at any time. Fund sponsor clients may also request specific information regarding the fees paid to Callan by particular fund manager clients. Per company policy, information requests regarding fees are handled exclusively by Callan’s Compliance Department.
Quarterly List as of September 30, 2018
Knowledge. Experience. Integrity. Page 1 of 2
Manager Name Acadian Asset Management LLC AEGON USA Investment Management Aether Investment Partners AEW Capital Management Affiliated Managers Group, Inc. Alcentra AllianceBernstein Allianz Global Investors Allianz Life Insurance Company of North America American Century Investments Amundi Pioneer Asset Management Apollo Global Management AQR Capital Management Ares Management LLC Ariel Investments, LLC Atlanta Capital Management Co., LLC Aviva Investors Americas AXA Investment Managers Baillie Gifford International, LLC Baird Advisors Baron Capital Management, Inc. Barrow, Hanley, Mewhinney & Strauss, LLC Black Creek Investment Management, Inc. BlackRock BMO Global Asset Management BNP Paribas Asset Management BNY Mellon Asset Management Boston Partners Brandes Investment Partners, L.P. Brandywine Global Investment Management, LLC Breckinridge Capital Advisors, Inc. BrightSphere Investment Group (FKA Old Mutual Asset) Brown Brothers Harriman & Company Cambiar Investors, LLC
Manager Name Capital Group Carillon Tower Advisers CastleArk Management, LLC Causeway Capital Management CenterSquare Investment Management Chartwell Investment Partners Christian Brothers Investment Services CIM Group ClearBridge Investments, LLC Cohen & Steers Capital Management, Inc. Columbia Threadneedle Investments Columbus Circle Investors Credit Suisse Asset Management CS McKee, L.P. DePrince, Race & Zollo, Inc. D.E. Shaw Investment Management, L.L.C. Diamond Hill Capital Management, Inc. Dimensional Fund Advisors LP Doubleline Duff & Phelps Investment Management Co. DWS (Formerly Deutsche Asset Management) EARNEST Partners, LLC Eaton Vance Management Epoch Investment Partners, Inc. Fayez Sarofim & Company Federated Investors Fidelity Institutional Asset Management Fiera Capital Corporation First Eagle Investment Management, LLC First Hawaiian Bank Wealth Management Division Fisher Investments Franklin Templeton Fred Alger Management, Inc. GAM (USA) Inc.

Knowledge. Experience. Integrity. September 30, 2018 Page 2 of 2
Manager Name Gerding Edlen GlobeFlex Capital, L.P. GMO LLC Goldman Sachs Asset Management Green Square Capital LLC Greenwich Investment Management, Inc. Guggenheim Investments GW&K Investment Management Harbor Capital Group Trust Harding Loevner L.P. Hartford Funds Hartford Investment Management Co. Heitman LLC Hotchkis & Wiley Capital Management, LLC HSBC Global Asset Management Income Research + Management, Inc. Insight Investment Management Limited Intech Investment Management, LLC Invesco Investec Asset Management Ivy Investments J.P. Morgan Janus Jennison Associates LLC Jensen Investment Management Jobs Peak Advisors KeyCorp Lazard Asset Management Legal & General Investment Management America Lincoln National Corporation LMCG Investments, LLC Longview Partners Loomis, Sayles & Company, L.P. Lord Abbett & Company Los Angeles Capital Management LSV Asset Management MacKay Shields LLC Macquarie Investment Management (MIM) Manulife Asset Management McKinley Capital Management, LLC MFS Investment Management MidFirst Bank Mondrian Investment Partners Limited Montag & Caldwell, LLC Morgan Stanley Investment Management Mountain Lake Investment Management LLC MUFG Union Bank, N.A. Natixis Investment Managers Neuberger Berman Newton Investment Management Nikko Asset Management Co., Ltd. Northern Trust Asset Management Nuveen Investments, Inc. OFI Global Asset Management O’Shaughnessy Asset Management, LLC P/E Investments
Manager Name Pacific Investment Management Company Pathway Capital Management Peregrine Capital Management, Inc. Perkins Investment Management PGIM PGIM Fixed Income PineBridge Investments Pictet Asset Management Ltd.
PNC Capital Advisors, LLC
Principal Global Investors Private Advisors, LLC Putnam Investments, LLC QMA RBC Global Asset Management Reaves Asset Management Regions Financial Corporation Riverbridge Partners LLC Robeco Institutional Asset Management, US Inc. Rockefeller & Co., Inc. Rothschild Asset Management Inc. Russell Investments Santander Global Facilities Schroder Investment Management North America Inc. Smith Graham & Co. Investment Advisors, L.P. Smith Group Asset Management South Texas Money Management, Ltd. Sprucegrove Investment Management Ltd. Standard Life Investments Limited State Street Global Advisors Stone Harbor Investment Partners, L.P. Sun Life Investment Management T. Rowe Price Associates, Inc. The Boston Company Asset Management, LLC The London Company The TCW Group, Inc. Thompson, Siegel & Walmsley LLC Thornburg Investment Management, Inc. Tri-Star Trust Bank UBS Asset Management VanEck Velanne Asset Management Ltd. Versus Capital Group Victory Capital Management Inc. Virtus Investment Partners, Inc. Vontobel Asset Management, Inc. Voya WCM Investment Management WEDGE Capital Management Wedgewood Partners, Inc. Wellington Management Company, LLP Wells Capital Management Western Asset Management Company LLC Westfield Capital Management Company, LP William Blair & Company LLC
September 30, 2018
North Dakota State Investment
Board Insurance Trust
Investment Measurement Service
Quarterly Review
Information contained herein includes confidential, trade secret and proprietary information. Neither this Report nor any specific information contained herein is
to be used other than by the intended recipient for its intended purpose or disseminated to any other person without Callan’s permission. Certain information
herein has been compiled by Callan and is based on information provided by a variety of sources believed to be reliable for which Callan has not necessarily
verified the accuracy or completeness of or updated. This content may consist of statements of opinion, which are made as of the date they are expressed and
are not statements of fact. This content is for informational purposes only and should not be construed as legal or tax advice on any matter. Any decision you
make on the basis of this content is your sole responsibility. You should consult with legal and tax advisers before applying any of this information to your
particular situation. Past performance is no guarantee of future results. For further information, please see Appendix for Important Information and Disclosures.
Table of ContentsSeptember 30, 2018
Executive Summary
Active Management Overview 2
Capital Market Review 3
NDSIB - Consolidated
Insurance Trust
Actual vs Target Asset Allocation 19
Quarterly Total Fund Attribution 20
Cumulative Total Fund Attribution 21
Cumulative Performance 25
Historical Asset Allocation 26
Asset Class Risk and Return 27
Total Fund Ranking 28
Asset Class Rankings 29
Investment Manager Asset Allocation 30
Investment Manager Returns 31
NDSIB - Workforce Safety & Insurance
Actual vs Target Asset Allocation 35
Quarterly Total Fund Attribution 36
Cumulative Total Fund Attribution 37
Cumulative Performance 41
Historical Asset Allocation 42
Asset Class Rankings 43
Asset Class Allocation 44
Asset Class Returns 45
NDSIB - Budget Stabilization Fund
Actual vs Target Asset Allocation 47
Quarterly Total Fund Attribution 48
Cumulative Total Fund Attribution 49
Cumulative Performance 53
Historical Asset Allocation 54
Asset Class Allocation 55
Asset Class Returns 56
Table of ContentsSeptember 30, 2018
Domestic Equity
Large Cap Composite 58
Parametric Clifton Large Cap 59
L.A. Capital Large Cap Growth 60
L.A. Capital Enhanced 61
LSV Large Cap Value 62
Small Cap Composite 63
Parametric Clifton Small Cap 64
PIMCO RAE 65
International Equity
International Equity Composite 67
DFA International Small Cap Value 68
LSV Intl Value 69
Vanguard Intl Explorer Fund 70
William Blair 71
Domestic Fixed Income
Domestic Fixed Income Composite 73
Declaration Total Return 74
PIMCO DiSCO II 75
PIMCO Bravo II 76
Prudential Core Plus 77
SSgA US Government Credit Bond Index 78
Wells Capital 79
Western Asset Management Company 80
Real Estate
Real Estate Composite 82
Invesco Core Real Estate 83
JP Morgan 84
Diversified
Western Asset Management TIPS 86
Eastern Timber Opportunities 87
JP Morgan Infrastructure 88
Grosvenor Cust. Infrastructure 89
Short Term Fixed Income
Short Term Fixed Income Composite 91
JP Morgan Short Term Bonds - Budget Stabilization Fund 92
Callan Research/Education 93
Disclosures 96

Market OverviewActive Management vs Index Returns
Market OverviewThe charts below illustrate the range of returns across managers in Callan’s Separate Account database over the mostrecent one quarter and one year time periods. The database is broken down by asset class to illustrate the difference inreturns across those asset classes. An appropriate index is also shown for each asset class for comparison purposes. As anexample, the first bar in the upper chart illustrates the range of returns for domestic equity managers over the last quarter.The triangle represents the S&P 500 return. The number next to the triangle represents the ranking of the S&P 500 in theLarge Cap Equity manager database.
Range of Separate Account Manager Returns by Asset ClassOne Quarter Ended September 30, 2018
Retu
rns
(4%)
(2%)
0%
2%
4%
6%
8%
10%
12%
Large Cap Small Cap Non-US Domestic Non-US RealEquity Equity Equity Fixed Income Fixed Income Estate
vs vs vs vs vs vsS&P 500 Russell 2000 MSCI EAFE Blmbg Aggr Bd Citi Non-US Govt NCREIF Index
(42)
(57)
(34)
(83)
(100)
(53)
10th Percentile 9.13 9.62 2.54 0.40 (0.27) 2.7325th Percentile 8.41 7.36 1.64 0.26 (0.73) 2.33
Median 7.31 4.06 0.91 0.17 (1.40) 1.7175th Percentile 5.98 1.94 0.32 0.08 (1.61) 1.2990th Percentile 5.00 0.86 (0.46) (0.09) (1.71) 0.54
Index 7.71 3.58 1.35 0.02 (2.19) 1.67
Range of Separate Account Manager Returns by Asset ClassOne Year Ended September 30, 2018
Re
turn
s
(10%)
(5%)
0%
5%
10%
15%
20%
25%
30%
35%
40%
Large Cap Small Cap Non-US Domestic Non-US RealEquity Equity Equity Fixed Income Fixed Income Estate
vs vs vs vs vs vsS&P 500 Russell 2000 MSCI EAFE Blmbg Aggr Bd Citi Non-US Govt NCREIF Index
(51)(50)
(46)
(87) (29)
(60)
10th Percentile 29.14 33.60 8.26 (0.37) 0.17 11.2525th Percentile 24.32 24.92 4.96 (0.60) (1.17) 9.59
Median 18.07 15.34 2.53 (0.81) (2.19) 7.6275th Percentile 12.95 10.48 0.51 (1.06) (3.21) 6.1690th Percentile 9.60 7.08 (1.17) (1.26) (4.27) 1.90
Index 17.91 15.24 2.74 (1.22) (1.57) 7.16
2North Dakota State Investment Board - Insurance Trust

Boo! More Tricks
Than Treats
PRIVATE EQUITY
Private equity investment
and exit activity
showed a general
slowdown during the third quarter.
Company investments and exits
trended slightly down, fewer new
partnerships were closed, but dollar
commitments increased. Investors
are pursuing broad diversiication.
Active Traders Grind
Forward; MACs Falter
HEDGE FUNDS/MACs
Divergent economic
forces around the globe
created a modestly prof-
itable trading environment for most
hedge funds. Callan’s Multi-Asset
Class Peer Groups continued to
struggle in the third quarter, particu-
larly those overweighting bonds and
underweighting U.S. growth stocks.
DC Plans Rebound,
TDFs Struggle
DEFINED CONTRIBUTION
The Callan DC Index™
rose 1.8% in the second
quarter and outpaced
the 1.1% gain of the Age 45 Target
Date Fund (TDF). DC plan bal-
ances grew by 1.9%, driven primar-
ily by market performance. The sec-
ond quarter marked another all-time
high for TDFs’ share of DC assets.
Strong Market Both
Here and Abroad
REAL ESTATE
Supply and demand
fundamentals were bal-
anced but peaking.
The Industrial sector performed
the strongest. U.S. and non-U.S.
REITs were trading at discounts to
net asset value. European markets
(ex-U.K.) and Asian products saw
momentum.
Equity Risk Looms
Large for Plans
FUND SPONSOR
The median plan spon-
sor in Callan’s database
gained 2.7% in the quar-
ter, lagging the 4.6% gain of a 60%
S&P 500/40% Bloomberg Barclays
Aggregate benchmark. Sponsors
are focused on equity exposure,
market volatility, and mitigating risk
in the event of an equity correction.
Knowledge. Experience. Integrity.
Everything Is Going
Great! Right?
ECONOMY
The U.S. economy has
been iring on all cylin-
ders, and the accompa-
nying run-up in the equity market
in the irst three quarters buoyed conidence that all was not just well, but great! If only we knew in
September what Halloween fright
awaited us in October.
2P A G E
12P A G E
Markets Diverge, With
U.S. Staying Strong
EQUITY
U.S. stocks posted
broad-based gains,
fueled by strong eco-
nomic growth, robust corporate
earnings, and heightened stock buy-
backs. Several indices hit records.
Non-U.S. developed and emerging
markets faltered due to geopolitical
and economic uncertainties.
4P A G E
U.S. Returns Mostly
Flat; EM Debt Volatile
FIXED INCOME
The U.S. Treasury yield
curve rose across the
maturity spectrum on bet-
ter-than-expected corporate earn-
ings and solid U.S. economic data.
The JPM EMBI Global Diversiied Index (USD denominated) gained
2.3%, but the JPM GBI-EM Global
Diversiied Index fell 1.8%.
8P A G E
6P A G E
13P A G E
15P A G E
10P A G E
Broad Market Quarterly Returns
+0.7% 0.0%+7.1% -1.7%
U.S. EquityRussell 3000
U.S. Fixed IncomeBloomberg Barclays Agg
Non-U.S. EquityMSCI ACWI ex USA
Non-U.S. Fixed IncomeBloomberg Barclays Gbl ex US
Sources: Bloomberg Barclays, MSCI, FTSE Russell
CapitalMarket ReviewINSTITUTE
Third Quarter 2018

2
Everything Is Great! Right?
ECONOMY | Jay Kloepfer
02 0399 00 01 04 05 06 07 08 09 10 11 12 13 14 15 16 17
-10%
-8%
-6%
-4%
-2%
0%
2%
4%
6%
8%
18
Quarterly Real GDP Growth (20 Years)
-15%
-10%
-5%
0%
5%
10%
15%
20%
PPI (All Commodities)CPI (All Urban Consumers)
02 0399 00 01 04 05 06 07 08 09 10 11 12 13 14 15 16 17 18
Inlation Year-Over-Year
Source: Bureau of Labor Statistics
Source: Bureau of Economic Analysis
September 20 marked the capstone of a summer run-up in the
U.S. equity market. We saw a true market correction in February
(S&P 500 Index down 10.1%) and a drawdown of more than 7%
in March, but the memory of those experiences was obliterated
by a smooth, steady climb, with the S&P 500 gaining 12% in the
irst three quarters. Economic reports came in mixed for most economies outside the U.S. during 2018, but the U.S. economy
has been iring on all cylinders, with the job market, investment, and output all showing robust gains. GDP grew 3.5% in the third
quarter and 4.2% in the second. The accompanying run-up in
the equity market buoyed conidence that all was not just well, but great, and this economic expansion and bull market still had
fresh legs to keep going.
If only we knew in September what Halloween fright awaited us
in October.
Since the start of the year, investors had been growing increas-
ingly concerned that the expansion was getting long in the
tooth, and that both the economy and the stock market must
be nearing peaks. While elapsed time is not an economic vari-
able, the fact that the current expansion set a record for length
heightened fears of a downturn. Richly priced capital markets
across all asset classes and a new peak in the level of corpo-
rate earnings reported during the summer earnings season sug-
gested that a market correction was inevitable. Through the end
of September, such fears contrasted with the continuing stream
of good economic news, and the market roared. The unem-
ployment rate dropped to 3.7% in September, the lowest since
2000. Wages continue to inch up, with average hourly earnings
growth rising from 2% toward 3%. While potentially inlationary and certainly a cost to business, stronger wage growth kept
consumer spending robust, and boosted consumer (and busi-
ness) conidence.
Against this backdrop, the Fed raised rates three times in 2018,
bringing the Fed Funds rate to 2.0-2.25%. The Fed expects one
more rate hike this year and three in 2019. The Fed has now
raised rates 200 basis points over the past two years. Since
inlation has not changed over this period, real rates have essentially risen by 2 percentage points. Much of the growth
in the irst half of 2018 was attributed to the tax cut and spend-
ing, and trade activity in advance of tariffs imposed in July by
the U.S. and China. Monetary policy has incrementally become

3Knowledge. Experience. Integrity.
U.S. ECONOMY (Continued)
The Long-Term View
2018
3rd Qtr
Periods ended Dec. 31, 2017
Index Year 5 Yrs 10 Yrs 25 Yrs
U.S. Equity
Russell 3000 7.12 21.13 15.58 8.60 9.72
S&P 500 7.71 21.83 15.79 8.50 9.69
Russell 2000 3.58 14.65 14.12 8.71 9.54
Non-U.S. Equity
MSCI ACWI ex USA 0.71 27.19 6.80 1.84 --
MSCI Emerging Markets -1.09 37.28 4.35 1.68 --
MSCI ACWI ex USA Small Cap -1.51 31.65 10.03 4.69 --
Fixed Income
Bloomberg Barclays Agg 0.02 3.54 2.10 4.01 5.48
90-Day T-Bill 0.49 0.86 0.27 0.39 2.60
Bloomberg Barclays Long G/C -0.47 10.71 4.43 7.26 7.67
Bloomberg Barclays Gl Agg ex US -1.74 10.51 -0.20 2.40 5.02
Real Estate
NCREIF Property 1.67 6.96 10.19 6.08 9.12
FTSE NAREIT Equity 0.79 5.23 9.46 7.44 10.76
Alternatives
CS Hedge Fund 0.59 7.12 4.23 3.24 –
Cambridge PE* 4.51 19.48 13.97 9.14 15.65
Bloomberg Commodity -2.02 1.70 -8.45 -6.83 2.47
Gold Spot Price -4.65 13.68 -4.82 4.56 5.63
Inlation – CPI-U 0.18 2.11 1.43 1.61 2.23
*Data for most recent period lags by a quarter
Sources: Bloomberg Barclays, Bloomberg, Credit Suisse, FTSE, MSCI, NCREIF,
FTSE Russell, Standard & Poor’s, Thomson Reuters/Cambridge, Bureau of Economic
Analysis
Recent Quarterly Economic Indicators
3Q18 2Q18 1Q18 4Q17 3Q17 2Q17 1Q17 4Q16
Employment Cost–Total Compensation Growth 2.8% 2.8% 2.7% 2.6% 2.5% 2.4% 2.4% 2.2%
Nonfarm Business–Productivity Growth 2.2% 3.0% 0.3% -0.3% 2.3% 1.6% 0.4% 1.3%
GDP Growth 3.5% 4.2% 2.2% 2.3% 2.8% 3.0% 1.8% 1.8%
Manufacturing Capacity Utilization 75.8% 75.5% 75.3% 75.2% 74.4% 74.9% 74.6% 74.4%
Consumer Sentiment Index (1966=100) 98.1 98.3 98.9 98.4 95.1 96.4 97.2 93.2
Sources: Bureau of Economic Analysis, Bureau of Labor Statistics, Federal Reserve, IHS Economics, Reuters/University of Michigan
a more signiicant headwind, and it began showing up in the third quarter. While it is true that real rates are low relative to
history, the change in rates is important. Since the mid-1980s
real rates have risen by 2 percentage points four times; three of
those occurrences resulted in recessions. In a study by Capital
Economics, monetary policy tightening was a major contributing factor in 29 out of 45 recessions in G7 countries since 1960.
Higher interest rates are beginning to squeeze some of the most
rate-sensitive segments of the economy. Housing has been an
ongoing mystery; starts surged to an 11-year high in May, only
to stall during the summer. Home sales are also clearly feeling
the pressure of higher rates, and from the supply side, a short-
age of houses. Residential investment contracted by 4% in the
third quarter, following declines in each of the irst two quar-ters. Home prices rose substantially in certain markets through
the summer, but early indications are that rates began to crimp
prices and sales in September. Housing can often be the canary
in the coal mine: an early indicator of slowing economic activity
and lower conidence.
Inlation had been gradually trending up, reaching 2.9% in June, inally fulilling the expectations of many market observers, but the year-over-year gain in the CPI slowed to 2.3% in the third
quarter. Much of the rise in the irst half was attributable to a rebound in oil prices. Once oil prices stabilize as expected, the
increase in inlation will likely abate. One reason for the stability of inlation is the growing dominance of services in the inlation calculation. The services inlation rate has been much steadier than the goods rate and consistently positive near 2%. Goods
prices are more volatile and much more inluenced than ser-vices by factors such as trade, currency, supply and demand of
raw materials, and geopolitics.
Related to goods prices, the ISM manufacturing index had
reached a 14-year high earlier this year, but fell back in
September, as manufacturers and exporters face the triple
threat of a stronger dollar (up 8% since mid-April), the imposi-
tion of tariffs in July and anticipation of more in October, and
weakening of global growth.
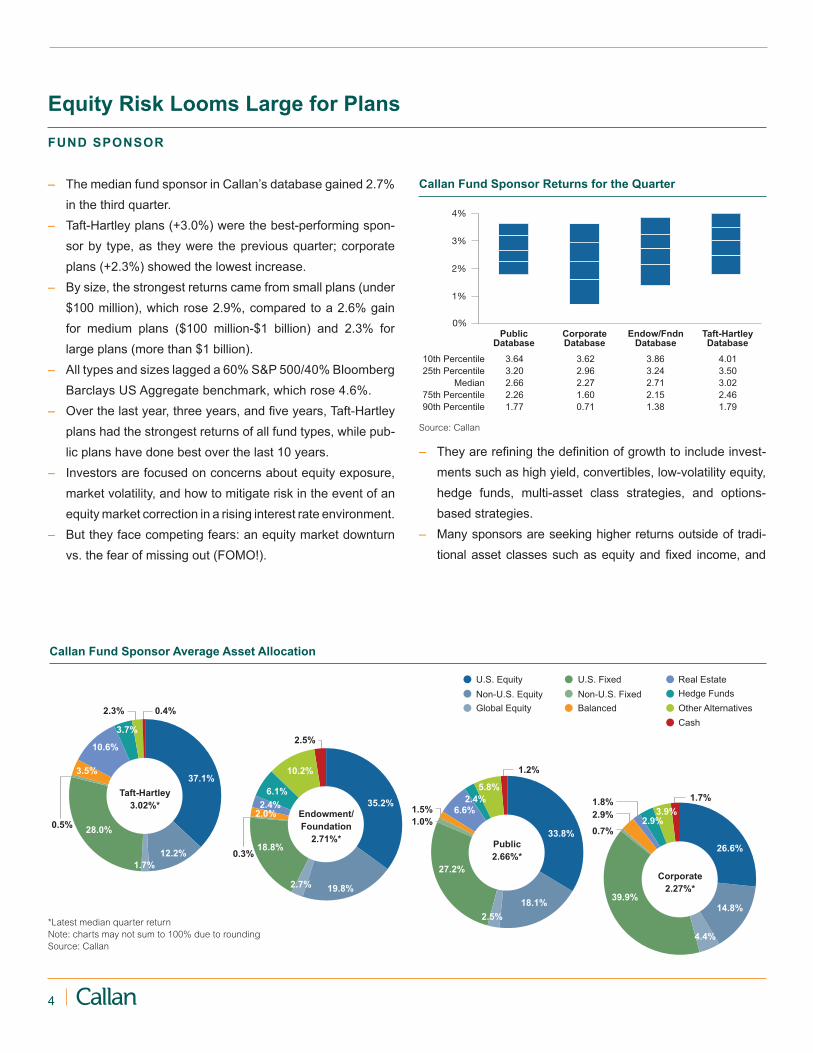
4
Equity Risk Looms Large for Plans
FUND SPONSOR
– The median fund sponsor in Callan’s database gained 2.7%
in the third quarter.
– Taft-Hartley plans (+3.0%) were the best-performing spon-
sor by type, as they were the previous quarter; corporate
plans (+2.3%) showed the lowest increase.
– By size, the strongest returns came from small plans (under
$100 million), which rose 2.9%, compared to a 2.6% gain
for medium plans ($100 million-$1 billion) and 2.3% for
large plans (more than $1 billion).
– All types and sizes lagged a 60% S&P 500/40% Bloomberg
Barclays US Aggregate benchmark, which rose 4.6%.
– Over the last year, three years, and ive years, Taft-Hartley plans had the strongest returns of all fund types, while pub-
lic plans have done best over the last 10 years.
– Investors are focused on concerns about equity exposure,
market volatility, and how to mitigate risk in the event of an
equity market correction in a rising interest rate environment.
– But they face competing fears: an equity market downturn
vs. the fear of missing out (FOMO!).
0%
1%
2%
3%
4%
Public Corporate Endow/Fndn Taft-Hartley Database Database Database Database
10th Percentile 3.64 3.62 3.86 4.01
25th Percentile 3.20 2.96 3.24 3.50
Median 2.66 2.27 2.71 3.02
75th Percentile 2.26 1.60 2.15 2.46
90th Percentile 1.77 0.71 1.38 1.79
Callan Fund Sponsor Returns for the Quarter
Source: Callan
U.S. Fixed
Non-U.S. Fixed
Real Estate
Hedge Funds
Other Alternatives
Cash
Balanced
U.S. Equity
Non-U.S. Equity
Global Equity
1.8%
Public
2.66%*
33.8%
18.1%
27.2%
2.4%
6.6%
1.0%
2.5%
5.8%
1.2%
Endowment/
Foundation
2.71%*
35.2%
19.8%
18.8%
2.0%
0.3%
6.1%
2.4%
10.2%
2.5%
Taft-Hartley
3.02%* 1.5%
Corporate
2.27%*
1.7%
2.3% 0.4%
37.1%
28.0%
12.2%
0.5%
3.5%
10.6%
3.7%
14.8%
1.7%
26.6%
39.9%
2.9%
0.7%
3.9%
4.4%
2.7%
2.9%
Callan Fund Sponsor Average Asset Allocation
*Latest median quarter return
Note: charts may not sum to 100% due to rounding
Source: Callan
– They are reining the deinition of growth to include invest-ments such as high yield, convertibles, low-volatility equity,
hedge funds, multi-asset class strategies, and options-
based strategies.
– Many sponsors are seeking higher returns outside of tradi-
tional asset classes such as equity and ixed income, and
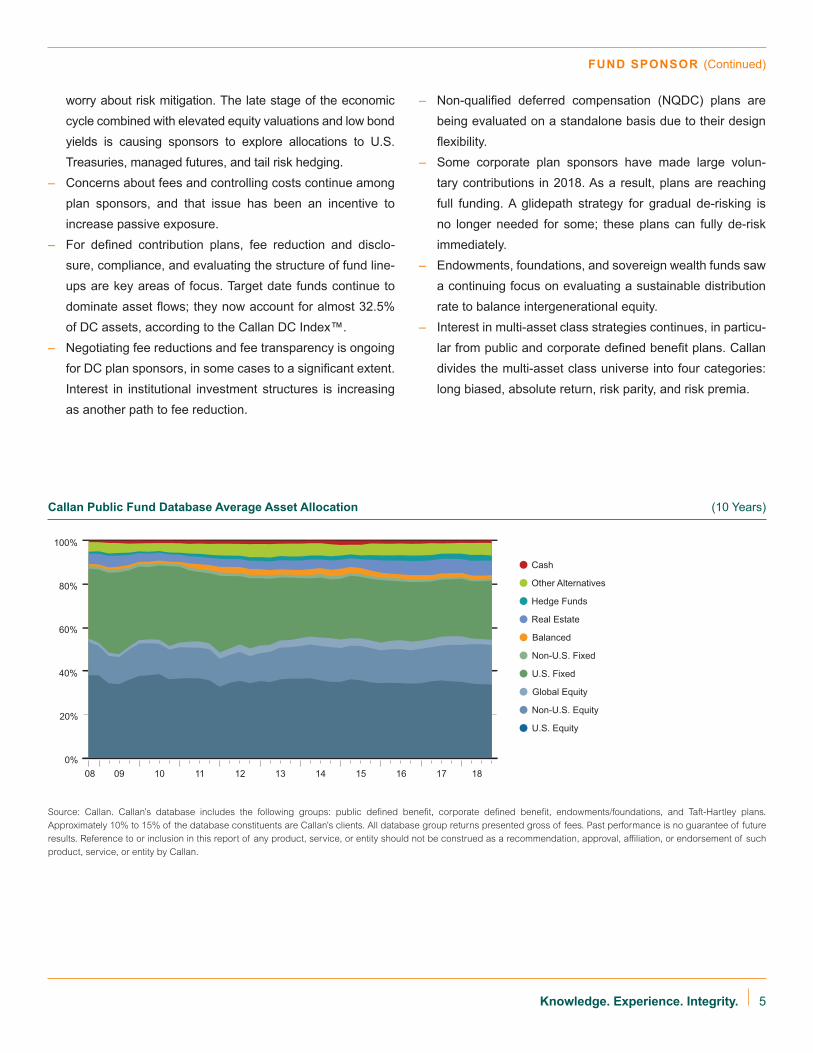
5Knowledge. Experience. Integrity.
FUND SPONSOR (Continued)
0%
20%
40%
60%
80%
100%
08 09 10 11 12 13
U.S. Fixed
Non-U.S. Fixed
Real Estate
Hedge Funds
Other Alternatives
Cash
Balanced
U.S. Equity
Non-U.S. Equity
Global Equity
14 15 16 17 18
Callan Public Fund Database Average Asset Allocation (10 Years)
Source: Callan. Callan’s database includes the following groups: public deined beneit, corporate deined beneit, endowments/foundations, and Taft-Hartley plans.
Approximately 10% to 15% of the database constituents are Callan’s clients. All database group returns presented gross of fees. Past performance is no guarantee of future
results. Reference to or inclusion in this report of any product, service, or entity should not be construed as a recommendation, approval, ailiation, or endorsement of such
product, service, or entity by Callan.
worry about risk mitigation. The late stage of the economic
cycle combined with elevated equity valuations and low bond
yields is causing sponsors to explore allocations to U.S.
Treasuries, managed futures, and tail risk hedging.
– Concerns about fees and controlling costs continue among
plan sponsors, and that issue has been an incentive to
increase passive exposure.
– For deined contribution plans, fee reduction and disclo-
sure, compliance, and evaluating the structure of fund line-
ups are key areas of focus. Target date funds continue to
dominate asset lows; they now account for almost 32.5% of DC assets, according to the Callan DC Index™.
– Negotiating fee reductions and fee transparency is ongoing
for DC plan sponsors, in some cases to a signiicant extent. Interest in institutional investment structures is increasing
as another path to fee reduction.
– Non-qualiied deferred compensation (NQDC) plans are being evaluated on a standalone basis due to their design
lexibility. – Some corporate plan sponsors have made large volun-
tary contributions in 2018. As a result, plans are reaching
full funding. A glidepath strategy for gradual de-risking is
no longer needed for some; these plans can fully de-risk
immediately.
– Endowments, foundations, and sovereign wealth funds saw
a continuing focus on evaluating a sustainable distribution
rate to balance intergenerational equity.
– Interest in multi-asset class strategies continues, in particu-
lar from public and corporate deined beneit plans. Callan divides the multi-asset class universe into four categories:
long biased, absolute return, risk parity, and risk premia.

6
U.S. Equities
U.S. stocks posted broad-based gains in the third quarter fueled
by strong economic growth, robust corporate earnings, and
heightened stock buybacks. Several major indices hit record levels during the quarter, and the 7.7% gain for the S&P 500
Index was its biggest since the fourth quarter of 2013. Volatility
was muted in spite of persistent headlines around threats of
trade wars and the ever-changing negotiations to avert them.
Large Cap Outpaces Small Cap
– Tax reform and U.S. prosperity contributed to an accelera-
tion in corporate earnings growth, and valuations remained
elevated as strong sentiment persisted given positive eco-
nomic data.
– Amazon (+17.8%), Apple (+22.4%), and Microsoft (+16.4%)
were strong contributors to large cap outperformance.
– FAANG stocks plus Microsoft had a more muted impact
than in previous quarters but still contributed nearly 25% of
the S&P 500’s quarterly return.
– All sectors landed in positive territory. The strongest per-
formers were Health Care (+14.5%), Industrials (+10%),
and Communication Services (+9.9%).
– The new Communication Services sector represents 10%
of the S&P 500 and includes several FAANG stocks such
as Alphabet, Facebook, and Netlix; Tech and Consumer Discretionary now represent lower weightings in the Index.
Global Equity
Growth Continues to Outperform Value
– The divergence between growth and value is approaching
a historical high; growth is outpacing value this year by the
widest margin in 15 years within large cap (Russell 1000
Growth YTD: +17.1% vs. Russell 1000 Value YTD: +3.9%)
due largely to ongoing euphoria over the FAANG stocks.
– Momentum continued as the leading factor for the quarter
and year-to-date; value has been the worst-performing
style for the last 18 months.
Non-U.S. / Global Equity
Market divergence has emerged after synchronized growth in
2017. The U.S. continues to post positive returns while non-
U.S. developed and emerging markets have lagged year-to-
date, dragged down by geopolitical and economic uncertainties.
Global/Non-U.S. Developed Markets See Slowing Growth
– The dollar rallied against the euro and yen given the fun-
damentals of the U.S. economy and the Fed’s contraction-
ary monetary policy; other central banks maintained the
status quo.
– Global trade tensions coupled with Brexit negotiations and
Italy’s populism concerns tempered the European market
despite solid earnings growth. In Japan, GDP growth and
the re-election of Prime Minister Shinzo Abe as head of his
party and sparked the market.
Russell 1000 Russell 2000
EnergyMaterials &
Processing
Communication
Services
UtilitiesFinancial
Services
Consumer
Staples
Consumer
Discretionary
TechnologyProducer
Durables
Health Care
14.2%
7.7%
9.8%
4.9%6.3% 6.8%
4.0%5.5%
-0.9%
4.7%0.6%
0.4%
6.2%
1.4%
12.9%
0.9% 1.0%
9.2%
-1.8%
0.9%4.4%
Quarterly Performance of Select Sectors
Source: FTSE Russell

7Knowledge. Experience. Integrity.
– Brazil and Russia were among the best performers due to
climbing oil prices.
– Supported by the oil price hike, Energy was the best per-
former; Consumer Discretionary was the worst sector per-
former, weighed down by China and India.
– Value and large cap factors were in favor as Energy gained
traction, and momentum struggled as market leadership
rotated away from Asian tech companies.
Non-U.S. Small Cap Underperforms
– Both non-U.S. developed and emerging market small cap
underperformed large cap as the appetite for risk waned due
to rising interest rates and the U.S. dollar, global trade ten-
sions, and geopolitical conlicts. – Value was favored in both non-U.S. developed and emerg-
ing market small cap as the Energy sector thrived.
– Top sector performers were Health Care, Telecommunication
Services, and Energy.
– Real Estate, Financials, and Consumer Staples were hurt by
rising interest rates and a lattening yield curve. – Style had a de minimis impact; however, growth moderately
outperformed value. Volatility and small cap factors were out
of favor given market uncertainties.
Emerging Markets Under Pressure
– Emerging markets were under pressure from a rising dollar,
U.S. interest rates, and U.S.-China trade frictions.
– Turkey was the worst-performing country within emerging
markets as the lira and local currency bonds crashed due to
the twin deicit, high level of dollar debt, and inlation. – The economic slowdown in China and trade tensions with
the U.S. weakened the market.
Russell 2000
Russell 2500
Russell Midcap
S&P 500
Russell 1000 Value
Russell 1000 Growth
Russell 1000
Russell 3000
9.5%
14.0%
17.7%
17.6%
17.9%
16.2%
26.3%
15.2%Russell 2000
Russell 2500
Russell Midcap
S&P 500
Russell 1000 Value
Russell 1000 Growth
Russell 1000
Russell 3000
5.7%
5.0%
7.4%
7.1%
7.7%
4.7%
9.1%
3.6%
U.S. Equity: Quarterly Returns U.S. Equity: One-Year Returns
Sources: FTSE Russell and Standard & Poor’s Sources: FTSE Russell and Standard & Poor’s
GLOBAL EQUITY (Continued)
2.2%
1.8%
1.9%
3.4%
2.7%
9.8%
2.9%
-1.5%
10.2%
-0.8%
-7.7%
4.3%
11.2%
-4.2%
MSCI Pacific ex Japan
MSCI ACWI ex USA Small Cap
MSCI ACWI
MSCI ACWI ex USA
MSCI World ex USA Small Cap
MSCI World ex USA
MSCI World
MSCI Europe ex UK
MSCI UK
MSCI Japan
MSCI Emerging Markets
MSCI China
MSCI Frontier Markets
MSCI Emerging Market Small Cap
MSCI Pacific ex Japan
-7.5%
0.7%
-1.5%
-0.9%
1.3%
4.3%
-1.7%
1.8%
3.7%
-1.1%
-2.0%
-0.6%
MSCI ACWI ex USA Small Cap
MSCI ACWI
MSCI ACWI ex USA
MSCI World ex USA Small Cap
MSCI World ex USA
MSCI World
MSCI Europe ex UK
MSCI UK
MSCI Japan
MSCI Emerging Markets
MSCI China
MSCI Frontier Markets
5.0%
MSCI Emerging Market Small Cap-4.2%
Non-U.S. Equity: Quarterly Returns (U.S. Dollar) Non-U.S. Equity: One-Year Returns (U.S. Dollar)
Source: MSCI Source: MSCI

8
Global Fixed Income
U.S. Fixed Income
Fixed income markets grappled with multiple issues, resulting
in continued volatility. Trade conlicts due to the imposition of tariffs, emerging market elections, and the rising U.S. dollar con-
tributed to the unstable environment. U.S. rates rose in the third
quarter and the yield curve continued lattening.
High Yield Tops the Quarter
– The Bloomberg Barclays US Aggregate Bond Index
was essentially lat, rising only 0.02% but gaining 1.6% year-to-date.
– The 10-year U.S. Treasury yield rose steadily, reaching a high
of 3.10% before settling at 3.06% as strong economic data
repriced investors’ inlation expectations and increased the probability of a December rate hike by the Federal Reserve.
– The yield curve lattened, with short-term interest rates rising more quickly than longer-term rates. The spread between
the 2-year and 10-year narrowed 9 basis points to 24 bps
from last quarter, the tightest in 10 years.
– Investment-grade (IG) corporates gained 1.0% in the third
quarter but dropped 2.3% YTD.
– New issuance remained strong with demand for new loans
oversubscribed by an average of two to three times through-
out the quarter.
– Spreads continued to narrow this quarter.
– Higher rates and weaker overall fundamentals caused the
IG sector to post negative results YTD.
– The Bloomberg Barclays US Corporate High Yield Index
gained 2.4% in the quarter and +2.6% YTD.
– Low new issuance volume and stable fundamentals com-
pressed spreads.
U.S. Treasury Yield Curves
0%
1%
2%
3%
4%
Maturity (Years)
September 30, 2018 June 30, 2018 September 30, 2017
302520151050
Source: Bloomberg
U.S. Fixed Income: Quarterly Returns U.S. Fixed Income: One-Year Returns
Bloomberg Barclays US TIPS
-0.5%
1.9%
0.2%
0.3%
0.3%
2.4%
-0.8%
0.0%
Bloomberg Barclays Gov/Credit 1-3 Yr
Bloomberg Barclays Interm Gov/Credit
Bloomberg Barclays Aggregate
Bloomberg Barclays Long Gov/Credit
Bloomberg Barclays Universal
CS Leveraged Loans
Bloomberg Barclays Corp. High Yield
-2.7%
5.6%
-1.0%
0.2%
-1.0%
3.0%
0.4%
-1.2%
Bloomberg Barclays Gov/Credit 1-3 Yr
Bloomberg Barclays Interm Gov/Credit
Bloomberg Barclays Aggregate
Bloomberg Barclays Long Gov/Credit
Bloomberg Barclays Universal
CS Leveraged Loans
Bloomberg Barclays Corp. High Yield
Bloomberg Barclays US TIPS
Sources: Bloomberg Barclays and Credit Suisse Sources: Bloomberg Barclays and Credit Suisse
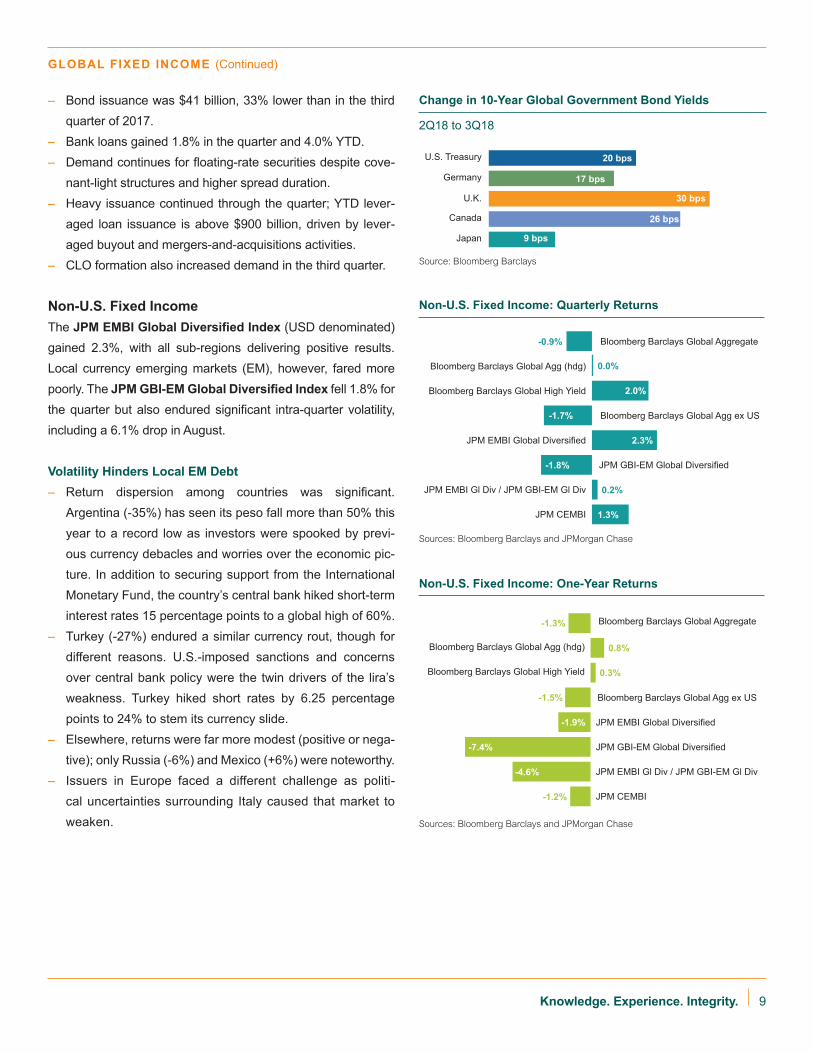
9Knowledge. Experience. Integrity.
– Bond issuance was $41 billion, 33% lower than in the third
quarter of 2017.
– Bank loans gained 1.8% in the quarter and 4.0% YTD.
– Demand continues for loating-rate securities despite cove-
nant-light structures and higher spread duration.
– Heavy issuance continued through the quarter; YTD lever-
aged loan issuance is above $900 billion, driven by lever-
aged buyout and mergers-and-acquisitions activities.
– CLO formation also increased demand in the third quarter.
Non-U.S. Fixed Income
The JPM EMBI Global Diversiied Index (USD denominated)
gained 2.3%, with all sub-regions delivering positive results.
Local currency emerging markets (EM), however, fared more
poorly. The JPM GBI-EM Global Diversiied Index fell 1.8% for
the quarter but also endured signiicant intra-quarter volatility, including a 6.1% drop in August.
Volatility Hinders Local EM Debt
– Return dispersion among countries was signiicant. Argentina (-35%) has seen its peso fall more than 50% this
year to a record low as investors were spooked by previ-
ous currency debacles and worries over the economic pic-
ture. In addition to securing support from the International
Monetary Fund, the country’s central bank hiked short-term
interest rates 15 percentage points to a global high of 60%.
– Turkey (-27%) endured a similar currency rout, though for
different reasons. U.S.-imposed sanctions and concerns
over central bank policy were the twin drivers of the lira’s
weakness. Turkey hiked short rates by 6.25 percentage
points to 24% to stem its currency slide.
– Elsewhere, returns were far more modest (positive or nega-
tive); only Russia (-6%) and Mexico (+6%) were noteworthy.
– Issuers in Europe faced a different challenge as politi-
cal uncertainties surrounding Italy caused that market to
weaken.
Non-U.S. Fixed Income: Quarterly Returns
Non-U.S. Fixed Income: One-Year Returns
JPM GBI-EM Global Diversified
JPM EMBI Global Diversified
-1.7%
-1.8%
0.0%
-0.9%
2.3%
0.2%
1.3%
2.0%
Bloomberg Barclays Global Aggregate
Bloomberg Barclays Global Agg (hdg)
Bloomberg Barclays Global High Yield
Bloomberg Barclays Global Agg ex US
JPM EMBI Gl Div / JPM GBI-EM Gl Div
JPM CEMBI
Bloomberg Barclays Global Aggregate
Bloomberg Barclays Global High Yield
JPM GBI-EM Global Diversified
Bloomberg Barclays Global Agg (hdg)
-7.4%
0.8%
-1.3%
-1.9%
-4.6%
-1.2%
0.3%
Bloomberg Barclays Global Agg ex US
JPM EMBI Global Diversified
JPM EMBI Gl Div / JPM GBI-EM Gl Div
JPM CEMBI
-1.5%
Sources: Bloomberg Barclays and JPMorgan Chase
Sources: Bloomberg Barclays and JPMorgan Chase
20 bps
17 bps
30 bps
26 bps
9 bps
Germany
U.S. Treasury
U.K.
Canada
Japan
Change in 10-Year Global Government Bond Yields
2Q18 to 3Q18
Source: Bloomberg Barclays
GLOBAL FIXED INCOME (Continued)

10
Market Robust With Private Valuations at Historic Highs
REAL ESTATE | Kevin Nagy, CAIA
– Supply and demand fundamentals are balanced but peak-
ing. Supply is in check and aided by strict commercial real
estate lending standards. Demand continues on the back of
strong U.S. growth.
– Transaction volumes took a step back from current cycle
peak levels but remain robust, supporting pricing, which
remains expensive.
– The Industrial sector is performing the strongest, beneit-ting from structural shifts in the economy, property markets,
and consumer habits, which continue to dampen demand
for traditional retail space. Ofice is performing as expected late in the cycle, and tenant improvements and other capi-
tal expenditures are increasingly eroding cash low. Multi-family remains strong except for very high-end properties
in some markets.
– U.S. core real estate returns continue to moderate and shift
toward income with limited appreciation. Appreciation that
occurs is coming from net operating income growth rather
than further cap rate compression.
– Spreads remain relatively tight between core and value-add
due to large amounts of capital in both strategies chasing
fewer available deals, combined with more core investors
chasing yield.
– Both U.S. and non-U.S. real estate investment trusts (REITs)
are trading at discounts to net asset value, indicating relative
value for public market securities compared to private real
estate valuations.
– European real estate markets (ex-U.K.) are gaining momen-
tum due to strong fundamentals in the major cities of Europe despite continued political noise across the region.
– Asian real estate products are seeing strong fundraising
momentum, with existing managers reaching target fund
sizes and Asia-focused open-end funds increasing.
– Farmland managers in the United States are concerned
more about the reworking of the North American Free Trade
Agreement than the trade war with China. Chinese tariffs on
soybeans are seen as a temporary dislocation as opposed
to a long-term headwind.
– As private real estate valuations continue to test historical
highs, investors are looking at other sectors, such as real
estate debt and REITs, to access the best risk-adjusted returns from real estate. This is resulting in the formation
of some products with very wide mandates that allow the
investment manager to place capital across real estate debt
and equity markets and up and down the capital stack based
on relative value.
Rolling One-Year Returns
-60%
-30%
0%
30%
60%
90%
120%
REIT Style Global REIT StylePrivate Real Estate Database
02 0399 00 01 04 05 06 07 08 09 10 11 12 13 14 15 16 17 18
Source: Callan
West
South
Midwest
East
2.2%
1.3%
1.7%
0.9%
Retail
Office
Industrial
Hotels
Apartments
0.6%
3.2%
1.7%
3.4%
1.6%
Sector Quarterly Returns by Property Type and Region
Source: NCREIF
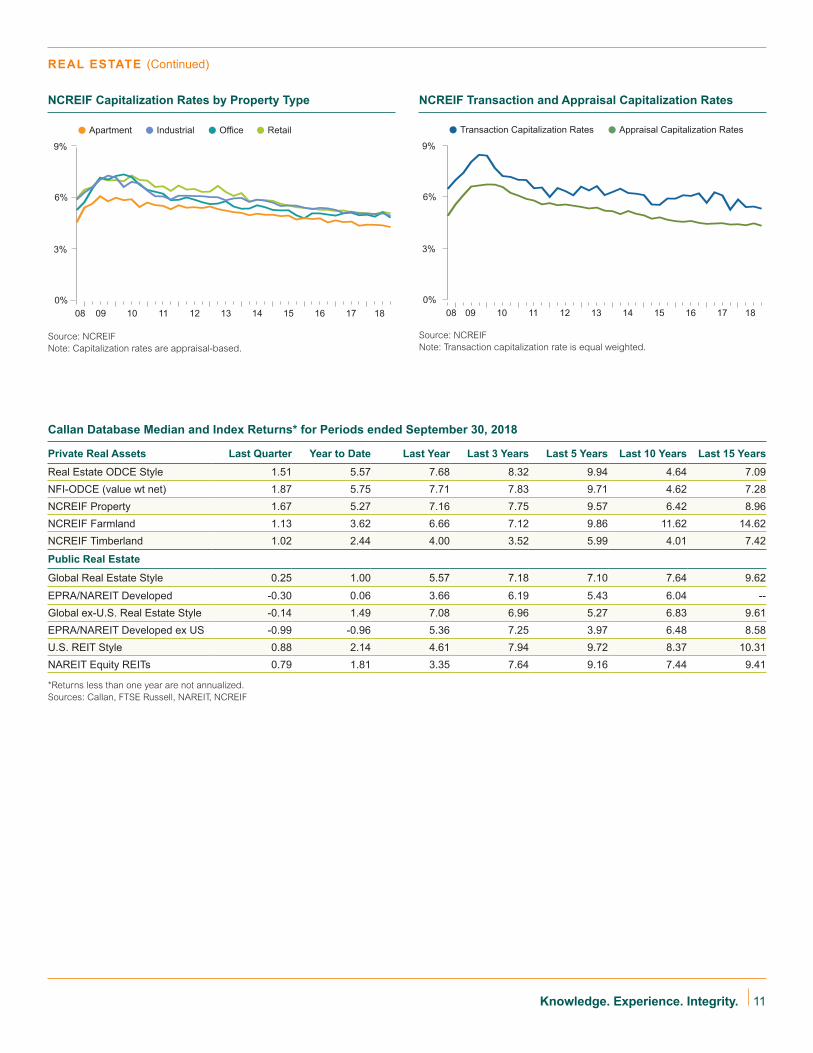
11Knowledge. Experience. Integrity.
REAL ESTATE (Continued)
NCREIF Transaction and Appraisal Capitalization Rates
Source: NCREIF
Note: Transaction capitalization rate is equal weighted.
NCREIF Capitalization Rates by Property Type
Source: NCREIF
Note: Capitalization rates are appraisal-based.
0%
3%
6%
9%
Appraisal Capitalization RatesTransaction Capitalization Rates
08 09 10 11 12 13 14 15 16 17 18
0%
3%
6%
9%
IndustrialApartment RetailOffice
08 09 10 11 12 13 14 15 16 17 18
Private Real Assets Last Quarter Year to Date Last Year Last 3 Years Last 5 Years Last 10 Years Last 15 Years
Real Estate ODCE Style 1.51 5.57 7.68 8.32 9.94 4.64 7.09
NFI-ODCE (value wt net) 1.87 5.75 7.71 7.83 9.71 4.62 7.28
NCREIF Property 1.67 5.27 7.16 7.75 9.57 6.42 8.96
NCREIF Farmland 1.13 3.62 6.66 7.12 9.86 11.62 14.62
NCREIF Timberland 1.02 2.44 4.00 3.52 5.99 4.01 7.42
Public Real Estate
Global Real Estate Style 0.25 1.00 5.57 7.18 7.10 7.64 9.62
EPRA/NAREIT Developed -0.30 0.06 3.66 6.19 5.43 6.04 --
Global ex-U.S. Real Estate Style -0.14 1.49 7.08 6.96 5.27 6.83 9.61
EPRA/NAREIT Developed ex US -0.99 -0.96 5.36 7.25 3.97 6.48 8.58
U.S. REIT Style 0.88 2.14 4.61 7.94 9.72 8.37 10.31
NAREIT Equity REITs 0.79 1.81 3.35 7.64 9.16 7.44 9.41
Callan Database Median and Index Returns* for Periods ended September 30, 2018
*Returns less than one year are not annualized.
Sources: Callan, FTSE Russell, NAREIT, NCREIF
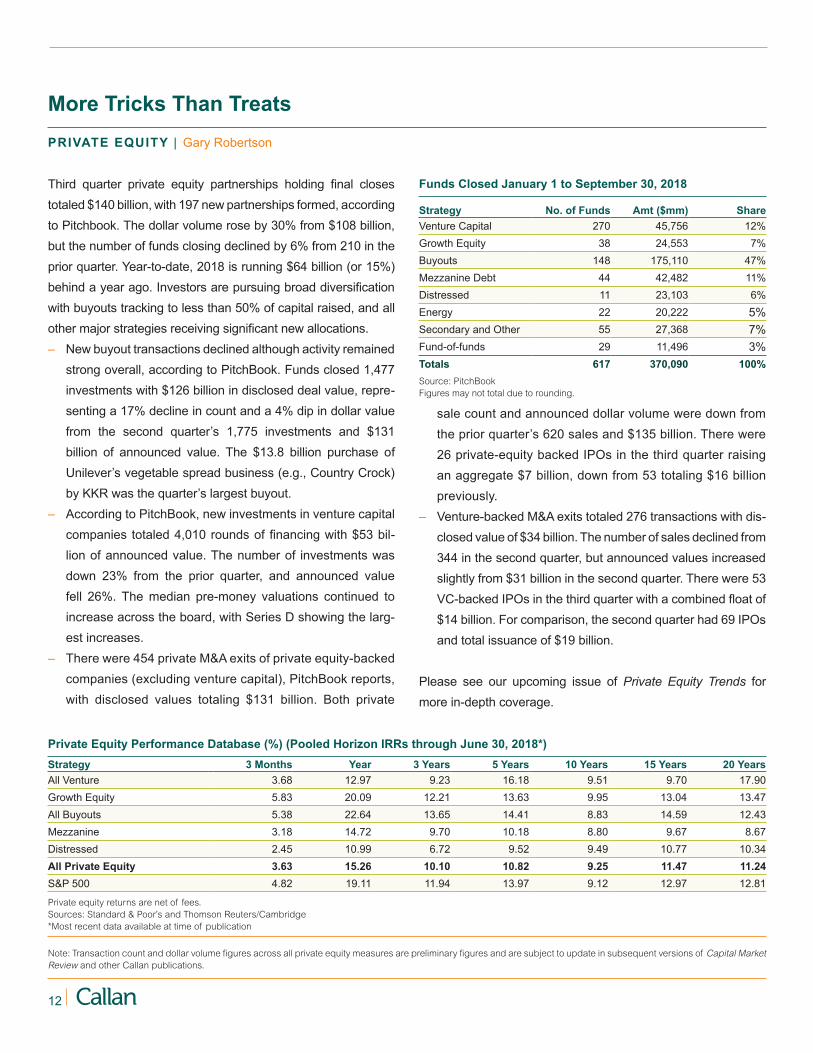
12
Private Equity Performance Database (%) (Pooled Horizon IRRs through June 30, 2018*)
Strategy 3 Months Year 3 Years 5 Years 10 Years 15 Years 20 Years
All Venture 3.68 12.97 9.23 16.18 9.51 9.70 17.90
Growth Equity 5.83 20.09 12.21 13.63 9.95 13.04 13.47
All Buyouts 5.38 22.64 13.65 14.41 8.83 14.59 12.43
Mezzanine 3.18 14.72 9.70 10.18 8.80 9.67 8.67
Distressed 2.45 10.99 6.72 9.52 9.49 10.77 10.34
All Private Equity 3.63 15.26 10.10 10.82 9.25 11.47 11.24
S&P 500 4.82 19.11 11.94 13.97 9.12 12.97 12.81
Private equity returns are net of fees.
Sources: Standard & Poor’s and Thomson Reuters/Cambridge
*Most recent data available at time of publication
More Tricks Than Treats
PRIVATE EQUITY | Gary Robertson
Funds Closed January 1 to September 30, 2018
Strategy No. of Funds Amt ($mm) Share
Venture Capital 270 45,756 12%
Growth Equity 38 24,553 7%
Buyouts 148 175,110 47%
Mezzanine Debt 44 42,482 11%
Distressed 11 23,103 6%
Energy 22 20,222 5%
Secondary and Other 55 27,368 7%
Fund-of-funds 29 11,496 3%
Totals 617 370,090 100%
Source: PitchBook
Figures may not total due to rounding.
Note: Transaction count and dollar volume igures across all private equity measures are preliminary igures and are subject to update in subsequent versions of Capital Market
Review and other Callan publications.
Third quarter private equity partnerships holding inal closes totaled $140 billion, with 197 new partnerships formed, according
to Pitchbook. The dollar volume rose by 30% from $108 billion,
but the number of funds closing declined by 6% from 210 in the
prior quarter. Year-to-date, 2018 is running $64 billion (or 15%)
behind a year ago. Investors are pursuing broad diversiication with buyouts tracking to less than 50% of capital raised, and all
other major strategies receiving signiicant new allocations. – New buyout transactions declined although activity remained
strong overall, according to PitchBook. Funds closed 1,477
investments with $126 billion in disclosed deal value, repre-
senting a 17% decline in count and a 4% dip in dollar value
from the second quarter’s 1,775 investments and $131
billion of announced value. The $13.8 billion purchase of
Unilever’s vegetable spread business (e.g., Country Crock)
by KKR was the quarter’s largest buyout.
– According to PitchBook, new investments in venture capital
companies totaled 4,010 rounds of inancing with $53 bil-lion of announced value. The number of investments was
down 23% from the prior quarter, and announced value
fell 26%. The median pre-money valuations continued to
increase across the board, with Series D showing the larg-
est increases.
– There were 454 private M&A exits of private equity-backed
companies (excluding venture capital), PitchBook reports,
with disclosed values totaling $131 billion. Both private
sale count and announced dollar volume were down from
the prior quarter’s 620 sales and $135 billion. There were
26 private-equity backed IPOs in the third quarter raising
an aggregate $7 billion, down from 53 totaling $16 billion
previously.
– Venture-backed M&A exits totaled 276 transactions with dis-
closed value of $34 billion. The number of sales declined from
344 in the second quarter, but announced values increased
slightly from $31 billion in the second quarter. There were 53
VC-backed IPOs in the third quarter with a combined loat of $14 billion. For comparison, the second quarter had 69 IPOs
and total issuance of $19 billion.
Please see our upcoming issue of Private Equity Trends for
more in-depth coverage.

13Knowledge. Experience. Integrity.
Callan Database Median and Index Returns* for Periods ended September 30, 2018
Hedge Fund Universe Quarter Year 3 Years 5 Years 10 Years 15 Years
Callan Fund-of-Funds Database 0.37 4.53 3.96 4.04 4.54 4.89
Callan Absolute Return FOF Style 0.42 4.60 3.73 3.88 4.33 4.45
Callan Core Diversiied FOF Style 0.68 3.37 3.76 3.61 4.36 5.07
Callan Long/Short Equity FOF Style -0.30 4.86 5.17 4.87 5.33 5.89
Credit Suisse Hedge Fund 0.59 3.49 3.09 3.39 4.43 5.39
CS Convertible Arbitrage 0.92 1.86 3.97 2.56 6.05 3.97
CS Distressed 0.79 3.36 4.46 3.44 5.00 6.36
CS Emerging Markets -4.08 -3.98 5.23 3.70 4.69 6.73
CS Equity Market Neutral -0.24 1.20 1.08 1.77 -3.18 0.20
CS Event-Driven Multi 1.14 4.27 2.37 1.70 3.98 5.72
CS Fixed Income Arb 0.93 4.71 4.41 3.88 5.22 4.06
CS Global Macro -0.19 3.56 2.66 2.68 4.75 6.36
CS Long/Short Equity 1.54 5.55 4.37 5.40 5.72 6.49
CS Managed Futures 0.63 3.29 -2.66 2.84 1.42 3.15
CS Multi-Strategy 0.98 3.05 4.84 5.67 6.59 6.36
CS Risk Arbitrage 0.82 1.13 4.50 2.54 3.33 3.95
HFRI Asset Wtd Composite 0.37 3.88 3.88 3.87 4.74 --
90-Day T-Bill + 5% 1.70 6.59 5.84 5.52 5.34 6.30
*Gross of fees. Sources: Bloomberg Barclays, Callan, Credit Suisse, Hedge Fund Research, Societe Generale, and Standard & Poor’s
Active Trading Grinds Forward Under Market Stress
HEDGE FUNDS/MACs | Jim McKee
Hedge Funds
A resilient U.S. economy stimulated by tax cuts and falling
unemployment pushed up U.S. stocks and the U.S. dollar in the
third quarter. The stronger dollar tied to rising short-term rates
undermined a slowing Chinese economy as well as markets
linked to it. Divergent economic forces around the globe created
a modestly proitable trading environment for most hedge funds. The Credit Suisse Hedge Fund Index gained 0.6%.
– Aided by climbing U.S. stock prices, Long/Short Equity
(+1.5%) topped CS hedge fund strategies.
– Supported by the strong U.S. corporate environment, event-
driven strategies (Event-Driven Multi, Distressed, Risk Arb)
made modest but steady gains.
– Emerging Markets (-4.1%) suffered the most, surrendering its
excess returns over passive benchmarks from prior quarters.
– Relecting live hedge fund portfolios, the HFRI FOF
Composite Index, net of all fees, inched forward 0.3%.
Absolute Core Long/Short
Return Diversified Equity
10th Percentile 5.9 5.2 6.4
25th Percentile 4.5 4.6 5.6
Median 3.9 3.6 4.9
75th Percentile 3.1 2.7 4.1
90th Percentile 2.6 1.9 1.5
CS Hedge Fund 0.6 0.6 0.6
90-Day T-Bill +5% 1.7 1.7 1.7
0%
2%
4%
6%
8%
Hedge Fund-of-Funds Style Group Returns
Sources: Callan, Credit Suisse, Federal Reserve
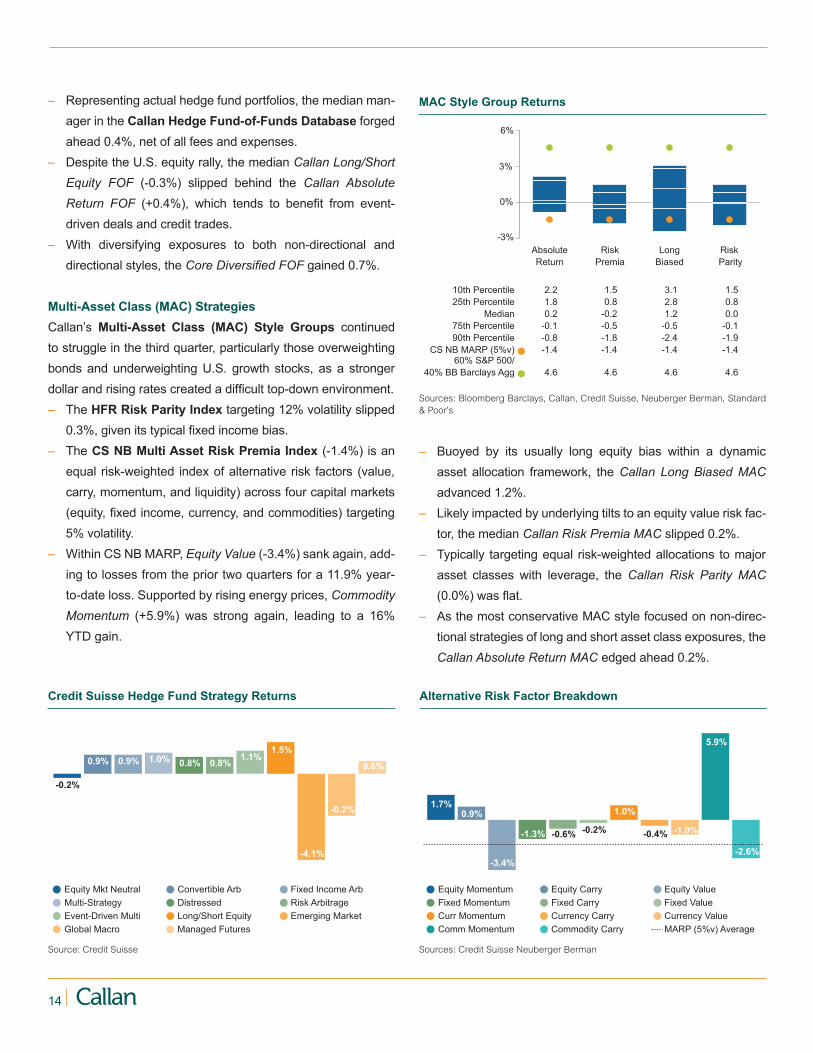
14
– Representing actual hedge fund portfolios, the median man-
ager in the Callan Hedge Fund-of-Funds Database forged
ahead 0.4%, net of all fees and expenses.
– Despite the U.S. equity rally, the median Callan Long/Short
Equity FOF (-0.3%) slipped behind the Callan Absolute
Return FOF (+0.4%), which tends to beneit from event-driven deals and credit trades.
– With diversifying exposures to both non-directional and
directional styles, the Core Diversiied FOF gained 0.7%.
Multi-Asset Class (MAC) Strategies
Callan’s Multi-Asset Class (MAC) Style Groups continued
to struggle in the third quarter, particularly those overweighting
bonds and underweighting U.S. growth stocks, as a stronger
dollar and rising rates created a dificult top-down environment. – The HFR Risk Parity Index targeting 12% volatility slipped
0.3%, given its typical ixed income bias. – The CS NB Multi Asset Risk Premia Index (-1.4%) is an
equal risk-weighted index of alternative risk factors (value,
carry, momentum, and liquidity) across four capital markets
(equity, ixed income, currency, and commodities) targeting 5% volatility.
– Within CS NB MARP, Equity Value (-3.4%) sank again, add-
ing to losses from the prior two quarters for a 11.9% year-
to-date loss. Supported by rising energy prices, Commodity
Momentum (+5.9%) was strong again, leading to a 16%
YTD gain.
Absolute Risk Long Risk
Return Premia Biased Parity
10th Percentile 2.2 1.5 3.1 1.5
25th Percentile 1.8 0.8 2.8 0.8
Median 0.2 -0.2 1.2 0.0
75th Percentile -0.1 -0.5 -0.5 -0.1
90th Percentile -0.8 -1.8 -2.4 -1.9
CS NB MARP (5%v) -1.4 -1.4 -1.4 -1.4 60% S&P 500/
40% BB Barclays Agg 4.6 4.6 4.6 4.6
-3%
0%
3%
6%
– Buoyed by its usually long equity bias within a dynamic
asset allocation framework, the Callan Long Biased MAC
advanced 1.2%.
– Likely impacted by underlying tilts to an equity value risk fac-
tor, the median Callan Risk Premia MAC slipped 0.2%.
– Typically targeting equal risk-weighted allocations to major asset classes with leverage, the Callan Risk Parity MAC
(0.0%) was lat. – As the most conservative MAC style focused on non-direc-
tional strategies of long and short asset class exposures, the
Callan Absolute Return MAC edged ahead 0.2%.
Convertible Arb
Distressed
Long/Short Equity
Managed Futures
1.0%
-0.2%
0.9%
-4.1%
0.8%0.9%
1.5%
0.6%
-0.2%
0.8%1.1%
Fixed Income Arb
Risk Arbitrage
Emerging Market
Equity Mkt Neutral
Multi-Strategy
Event-Driven Multi
Global Macro
Equity Carry
Fixed Carry
Currency Carry
Commodity Carry
-1.3%
1.7%0.9%
-1.0%-0.2%
-3.4%
-0.4%
-2.6%
5.9%
-0.6%
1.0%
Equity Value
Fixed Value
Currency Value
MARP (5%v) Average
Equity Momentum
Fixed Momentum
Curr Momentum
Comm Momentum
MAC Style Group Returns
Credit Suisse Hedge Fund Strategy Returns Alternative Risk Factor Breakdown
Sources: Bloomberg Barclays, Callan, Credit Suisse, Neuberger Berman, Standard
& Poor’s
Source: Credit Suisse Sources: Credit Suisse Neuberger Berman
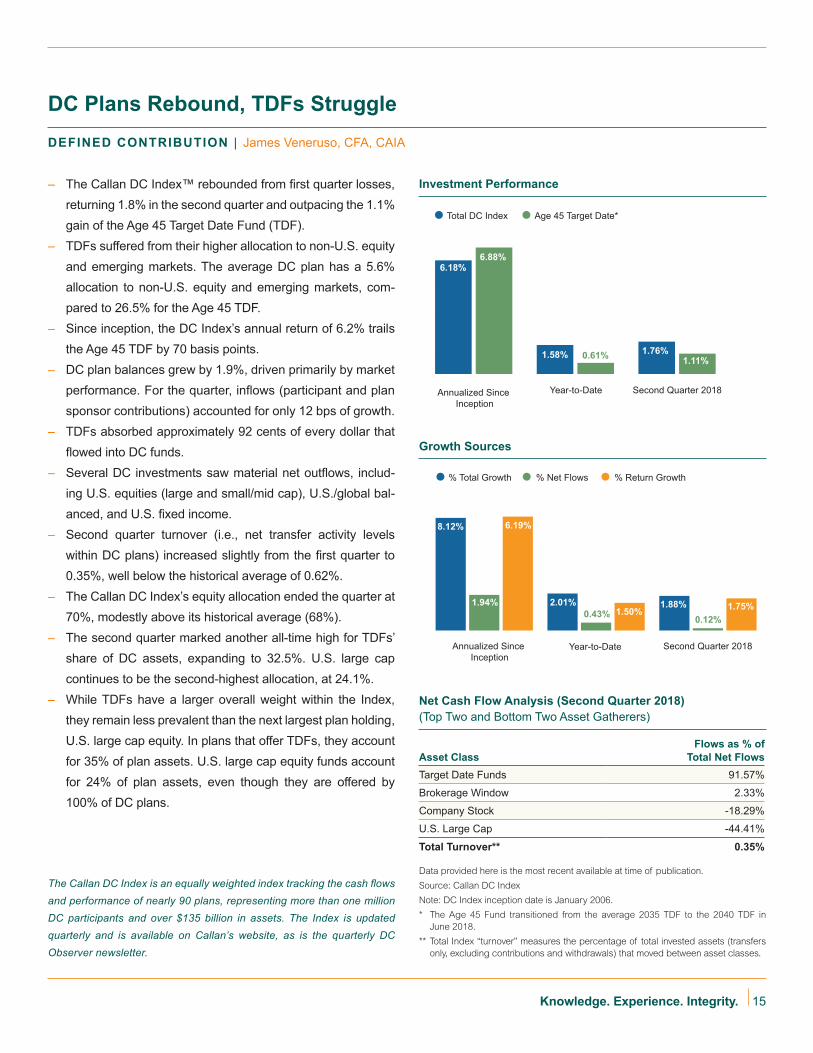
15Knowledge. Experience. Integrity.
The Callan DC Index is an equally weighted index tracking the cash lows and performance of nearly 90 plans, representing more than one million
DC participants and over $135 billion in assets. The Index is updated
quarterly and is available on Callan’s website, as is the quarterly DC
Observer newsletter.
– The Callan DC Index™ rebounded from irst quarter losses, returning 1.8% in the second quarter and outpacing the 1.1%
gain of the Age 45 Target Date Fund (TDF).
– TDFs suffered from their higher allocation to non-U.S. equity
and emerging markets. The average DC plan has a 5.6%
allocation to non-U.S. equity and emerging markets, com-
pared to 26.5% for the Age 45 TDF.
– Since inception, the DC Index’s annual return of 6.2% trails
the Age 45 TDF by 70 basis points.
– DC plan balances grew by 1.9%, driven primarily by market
performance. For the quarter, inlows (participant and plan sponsor contributions) accounted for only 12 bps of growth.
– TDFs absorbed approximately 92 cents of every dollar that
lowed into DC funds. – Several DC investments saw material net outlows, includ-
ing U.S. equities (large and small/mid cap), U.S./global bal-
anced, and U.S. ixed income. – Second quarter turnover (i.e., net transfer activity levels
within DC plans) increased slightly from the irst quarter to 0.35%, well below the historical average of 0.62%.
– The Callan DC Index’s equity allocation ended the quarter at
70%, modestly above its historical average (68%).
– The second quarter marked another all-time high for TDFs’
share of DC assets, expanding to 32.5%. U.S. large cap
continues to be the second-highest allocation, at 24.1%.
– While TDFs have a larger overall weight within the Index,
they remain less prevalent than the next largest plan holding,
U.S. large cap equity. In plans that offer TDFs, they account
for 35% of plan assets. U.S. large cap equity funds account
for 24% of plan assets, even though they are offered by
100% of DC plans.
DC Plans Rebound, TDFs Struggle
DEFINED CONTRIBUTION | James Veneruso, CFA, CAIA
Net Cash Flow Analysis (Second Quarter 2018)
(Top Two and Bottom Two Asset Gatherers)
Asset Class
Flows as % of
Total Net Flows
Target Date Funds 91.57%
Brokerage Window 2.33%
Company Stock -18.29%
U.S. Large Cap -44.41%
Total Turnover** 0.35%
Data provided here is the most recent available at time of publication.
Source: Callan DC Index
Note: DC Index inception date is January 2006.
* The Age 45 Fund transitioned from the average 2035 TDF to the 2040 TDF in
June 2018.
** Total Index “turnover” measures the percentage of total invested assets (transfers
only, excluding contributions and withdrawals) that moved between asset classes.
Investment Performance
Growth Sources
Second Quarter 2018
Age 45 Target Date* Total DC Index
1.76%1.11%
6.18%
Annualized Since
Inception
0.61%1.58%
6.88%
Year-to-Date
Second Quarter 2018
% Net Flows % Return Growth% Total Growth
8.12%
Annualized Since
Inception
1.94%
0.43%
6.19%
2.01%1.50%
0.12%
1.88% 1.75%
Year-to-Date
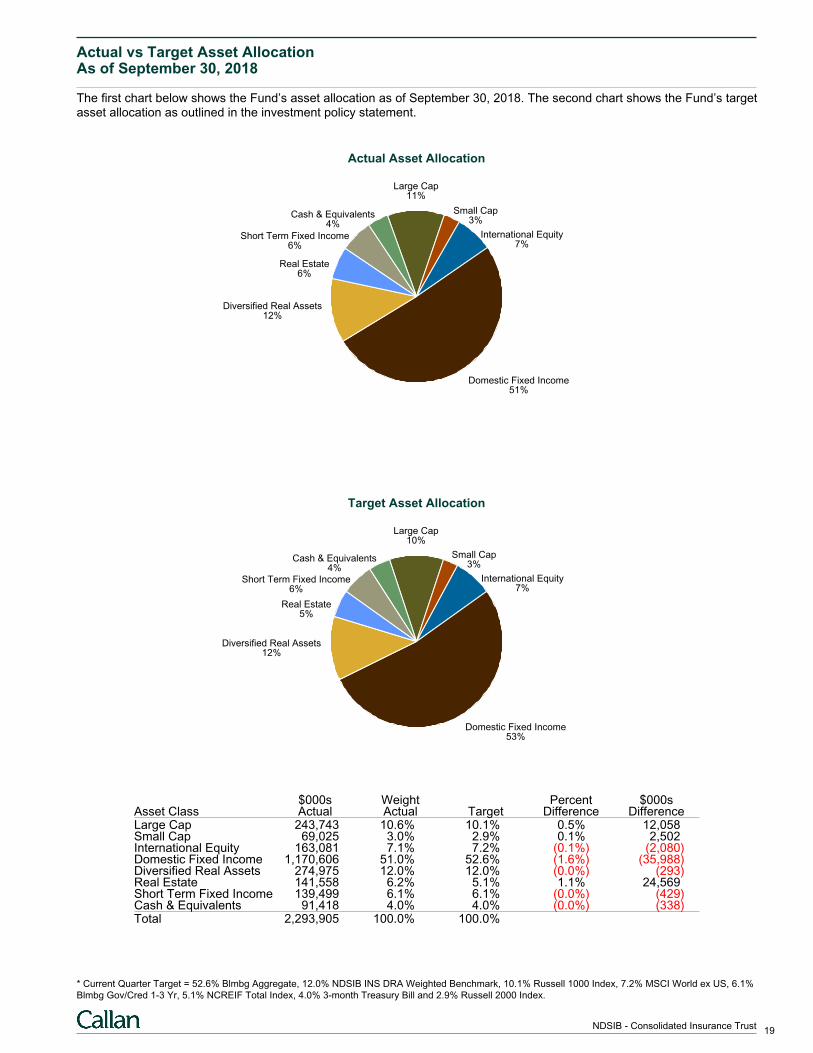
Actual vs Target Asset AllocationAs of September 30, 2018
The first chart below shows the Fund’s asset allocation as of September 30, 2018. The second chart shows the Fund’s targetasset allocation as outlined in the investment policy statement.
Actual Asset Allocation
Large Cap11%
Small Cap3%
International Equity7%
Domestic Fixed Income51%
Diversified Real Assets12%
Real Estate6%
Short Term Fixed Income6%
Cash & Equivalents4%
Target Asset Allocation
Large Cap10%
Small Cap3%
International Equity7%
Domestic Fixed Income53%
Diversified Real Assets12%
Real Estate5%
Short Term Fixed Income6%
Cash & Equivalents4%
$000s Weight Percent $000sAsset Class Actual Actual Target Difference DifferenceLarge Cap 243,743 10.6% 10.1% 0.5% 12,058Small Cap 69,025 3.0% 2.9% 0.1% 2,502International Equity 163,081 7.1% 7.2% (0.1%) (2,080)Domestic Fixed Income 1,170,606 51.0% 52.6% (1.6%) (35,988)Diversified Real Assets 274,975 12.0% 12.0% (0.0%) (293)Real Estate 141,558 6.2% 5.1% 1.1% 24,569Short Term Fixed Income 139,499 6.1% 6.1% (0.0%) (429)Cash & Equivalents 91,418 4.0% 4.0% (0.0%) (338)Total 2,293,905 100.0% 100.0%
* Current Quarter Target = 52.6% Blmbg Aggregate, 12.0% NDSIB INS DRA Weighted Benchmark, 10.1% Russell 1000 Index, 7.2% MSCI World ex US, 6.1%
Blmbg Gov/Cred 1-3 Yr, 5.1% NCREIF Total Index, 4.0% 3-month Treasury Bill and 2.9% Russell 2000 Index.
19NDSIB - Consolidated Insurance Trust
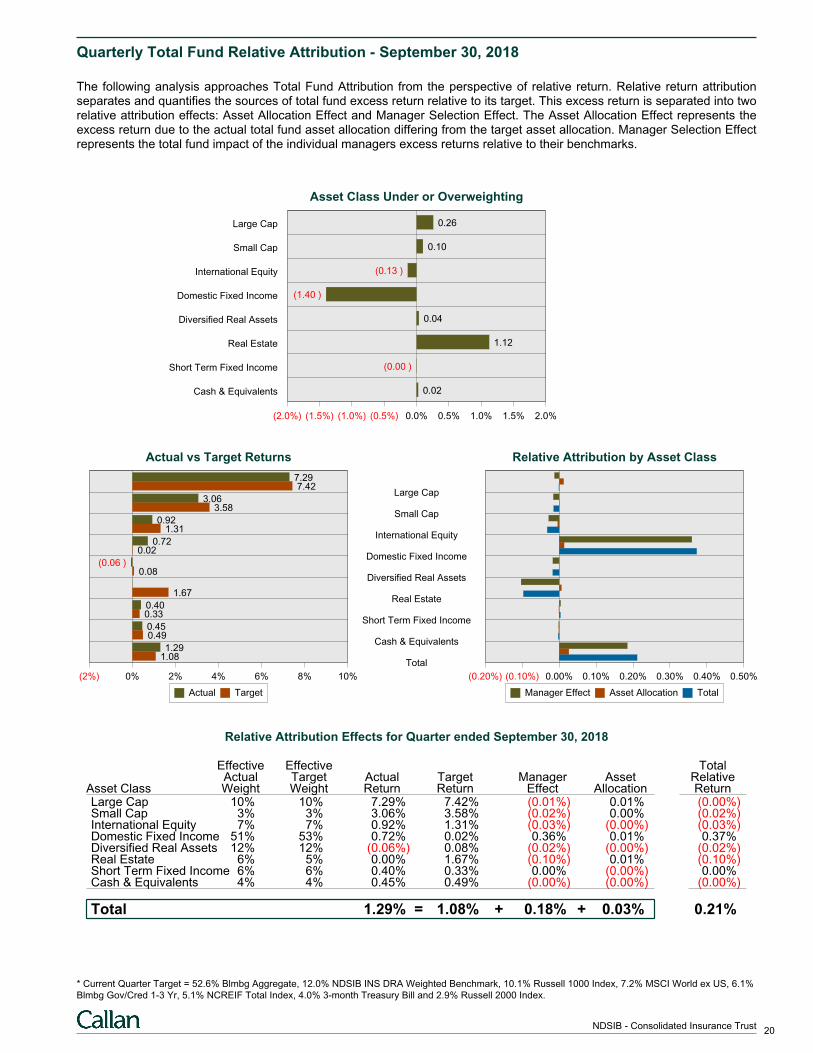
Quarterly Total Fund Relative Attribution - September 30, 2018
The following analysis approaches Total Fund Attribution from the perspective of relative return. Relative return attributionseparates and quantifies the sources of total fund excess return relative to its target. This excess return is separated into tworelative attribution effects: Asset Allocation Effect and Manager Selection Effect. The Asset Allocation Effect represents theexcess return due to the actual total fund asset allocation differing from the target asset allocation. Manager Selection Effectrepresents the total fund impact of the individual managers excess returns relative to their benchmarks.
Asset Class Under or Overweighting
(2.0%) (1.5%) (1.0%) (0.5%) 0.0% 0.5% 1.0% 1.5% 2.0%
Large Cap 0.26
Small Cap 0.10
International Equity (0.13 )
Domestic Fixed Income (1.40 )
Diversified Real Assets 0.04
Real Estate 1.12
Short Term Fixed Income (0.00 )
Cash & Equivalents 0.02
Large Cap
Small Cap
International Equity
Domestic Fixed Income
Diversified Real Assets
Real Estate
Short Term Fixed Income
Cash & Equivalents
Total
Actual vs Target Returns
(2%) 0% 2% 4% 6% 8% 10%
7.297.42
3.063.58
0.921.31
0.720.02
(0.06 )0.08
1.67
0.400.33
0.450.49
1.291.08
Actual Target
Relative Attribution by Asset Class
(0.20%) (0.10%) 0.00% 0.10% 0.20% 0.30% 0.40% 0.50%
Manager Effect Asset Allocation Total
Relative Attribution Effects for Quarter ended September 30, 2018
Effective Effective TotalActual Target Actual Target Manager Asset Relative
Asset Class Weight Weight Return Return Effect Allocation ReturnLarge Cap 10% 10% 7.29% 7.42% (0.01%) 0.01% (0.00%)Small Cap 3% 3% 3.06% 3.58% (0.02%) 0.00% (0.02%)International Equity 7% 7% 0.92% 1.31% (0.03%) (0.00%) (0.03%)Domestic Fixed Income 51% 53% 0.72% 0.02% 0.36% 0.01% 0.37%Diversified Real Assets 12% 12% (0.06%) 0.08% (0.02%) (0.00%) (0.02%)Real Estate 6% 5% 0.00% 1.67% (0.10%) 0.01% (0.10%)Short Term Fixed Income 6% 6% 0.40% 0.33% 0.00% (0.00%) 0.00%Cash & Equivalents 4% 4% 0.45% 0.49% (0.00%) (0.00%) (0.00%)
Total = + +1.29% 1.08% 0.18% 0.03% 0.21%
* Current Quarter Target = 52.6% Blmbg Aggregate, 12.0% NDSIB INS DRA Weighted Benchmark, 10.1% Russell 1000 Index, 7.2% MSCI World ex US, 6.1%
Blmbg Gov/Cred 1-3 Yr, 5.1% NCREIF Total Index, 4.0% 3-month Treasury Bill and 2.9% Russell 2000 Index.
20NDSIB - Consolidated Insurance Trust
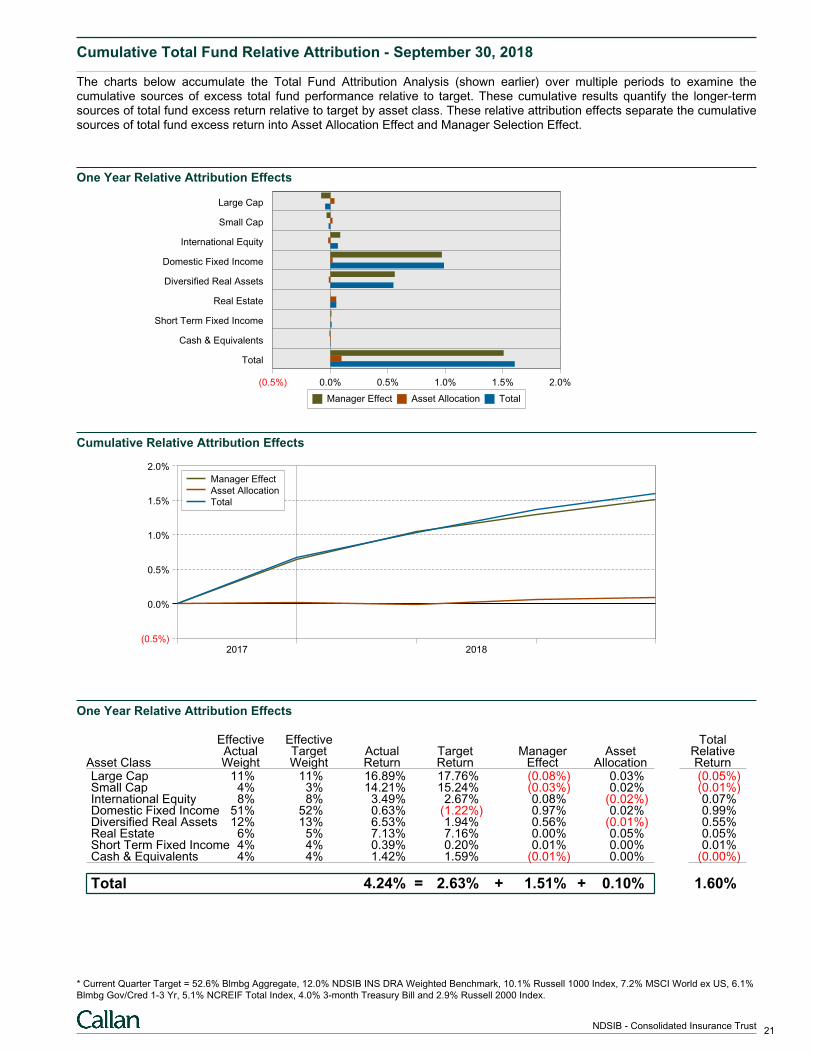
Cumulative Total Fund Relative Attribution - September 30, 2018
The charts below accumulate the Total Fund Attribution Analysis (shown earlier) over multiple periods to examine thecumulative sources of excess total fund performance relative to target. These cumulative results quantify the longer-termsources of total fund excess return relative to target by asset class. These relative attribution effects separate the cumulativesources of total fund excess return into Asset Allocation Effect and Manager Selection Effect.
One Year Relative Attribution Effects
(0.5%) 0.0% 0.5% 1.0% 1.5% 2.0%
Large Cap
Small Cap
International Equity
Domestic Fixed Income
Diversified Real Assets
Real Estate
Short Term Fixed Income
Cash & Equivalents
Total
Manager Effect Asset Allocation Total
Cumulative Relative Attribution Effects
(0.5%)
0.0%
0.5%
1.0%
1.5%
2.0%
2017 2018
Manager Effect
Asset Allocation
Total
One Year Relative Attribution Effects
Effective Effective TotalActual Target Actual Target Manager Asset Relative
Asset Class Weight Weight Return Return Effect Allocation ReturnLarge Cap 11% 11% 16.89% 17.76% (0.08%) 0.03% (0.05%)Small Cap 4% 3% 14.21% 15.24% (0.03%) 0.02% (0.01%)International Equity 8% 8% 3.49% 2.67% 0.08% (0.02%) 0.07%Domestic Fixed Income 51% 52% 0.63% (1.22%) 0.97% 0.02% 0.99%Diversified Real Assets 12% 13% 6.53% 1.94% 0.56% (0.01%) 0.55%Real Estate 6% 5% 7.13% 7.16% 0.00% 0.05% 0.05%Short Term Fixed Income 4% 4% 0.39% 0.20% 0.01% 0.00% 0.01%Cash & Equivalents 4% 4% 1.42% 1.59% (0.01%) 0.00% (0.00%)
Total = + +4.24% 2.63% 1.51% 0.10% 1.60%
* Current Quarter Target = 52.6% Blmbg Aggregate, 12.0% NDSIB INS DRA Weighted Benchmark, 10.1% Russell 1000 Index, 7.2% MSCI World ex US, 6.1%
Blmbg Gov/Cred 1-3 Yr, 5.1% NCREIF Total Index, 4.0% 3-month Treasury Bill and 2.9% Russell 2000 Index.
21NDSIB - Consolidated Insurance Trust
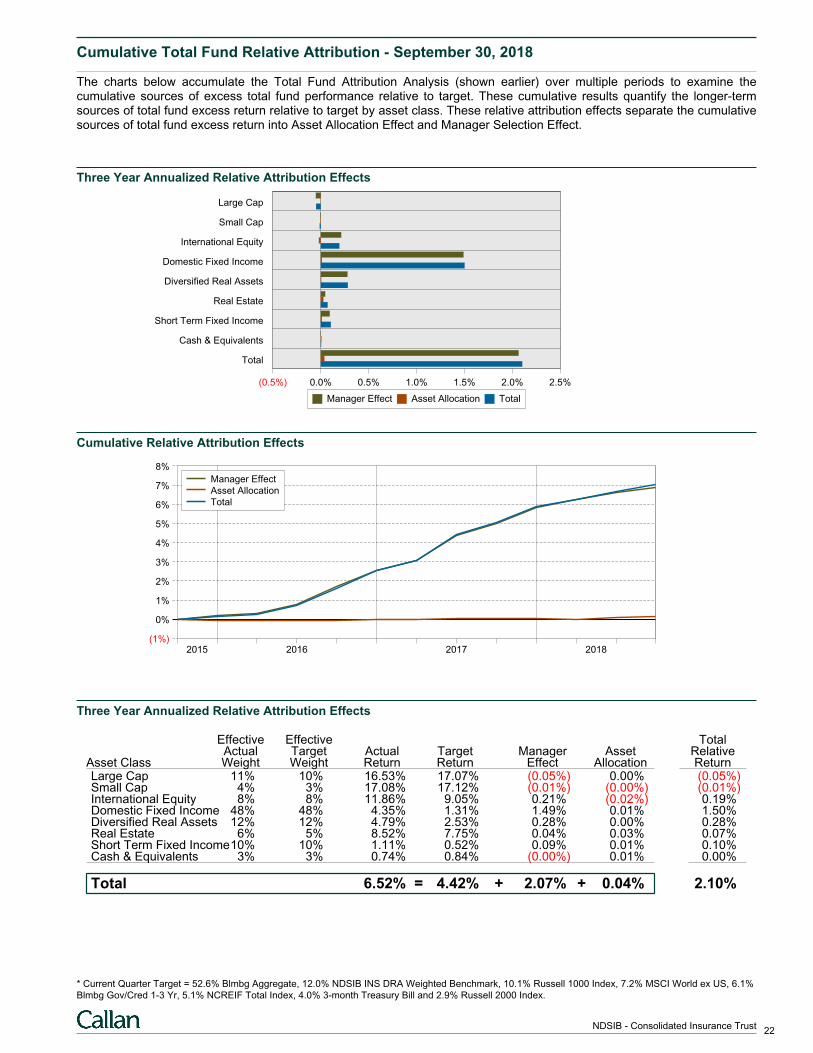
Cumulative Total Fund Relative Attribution - September 30, 2018
The charts below accumulate the Total Fund Attribution Analysis (shown earlier) over multiple periods to examine thecumulative sources of excess total fund performance relative to target. These cumulative results quantify the longer-termsources of total fund excess return relative to target by asset class. These relative attribution effects separate the cumulativesources of total fund excess return into Asset Allocation Effect and Manager Selection Effect.
Three Year Annualized Relative Attribution Effects
(0.5%) 0.0% 0.5% 1.0% 1.5% 2.0% 2.5%
Large Cap
Small Cap
International Equity
Domestic Fixed Income
Diversified Real Assets
Real Estate
Short Term Fixed Income
Cash & Equivalents
Total
Manager Effect Asset Allocation Total
Cumulative Relative Attribution Effects
(1%)
0%
1%
2%
3%
4%
5%
6%
7%
8%
2015 2016 2017 2018
Manager Effect
Asset Allocation
Total
Three Year Annualized Relative Attribution Effects
Effective Effective TotalActual Target Actual Target Manager Asset Relative
Asset Class Weight Weight Return Return Effect Allocation ReturnLarge Cap 11% 10% 16.53% 17.07% (0.05%) 0.00% (0.05%)Small Cap 4% 3% 17.08% 17.12% (0.01%) (0.00%) (0.01%)International Equity 8% 8% 11.86% 9.05% 0.21% (0.02%) 0.19%Domestic Fixed Income 48% 48% 4.35% 1.31% 1.49% 0.01% 1.50%Diversified Real Assets 12% 12% 4.79% 2.53% 0.28% 0.00% 0.28%Real Estate 6% 5% 8.52% 7.75% 0.04% 0.03% 0.07%Short Term Fixed Income10% 10% 1.11% 0.52% 0.09% 0.01% 0.10%Cash & Equivalents 3% 3% 0.74% 0.84% (0.00%) 0.01% 0.00%
Total = + +6.52% 4.42% 2.07% 0.04% 2.10%
* Current Quarter Target = 52.6% Blmbg Aggregate, 12.0% NDSIB INS DRA Weighted Benchmark, 10.1% Russell 1000 Index, 7.2% MSCI World ex US, 6.1%
Blmbg Gov/Cred 1-3 Yr, 5.1% NCREIF Total Index, 4.0% 3-month Treasury Bill and 2.9% Russell 2000 Index.
22NDSIB - Consolidated Insurance Trust
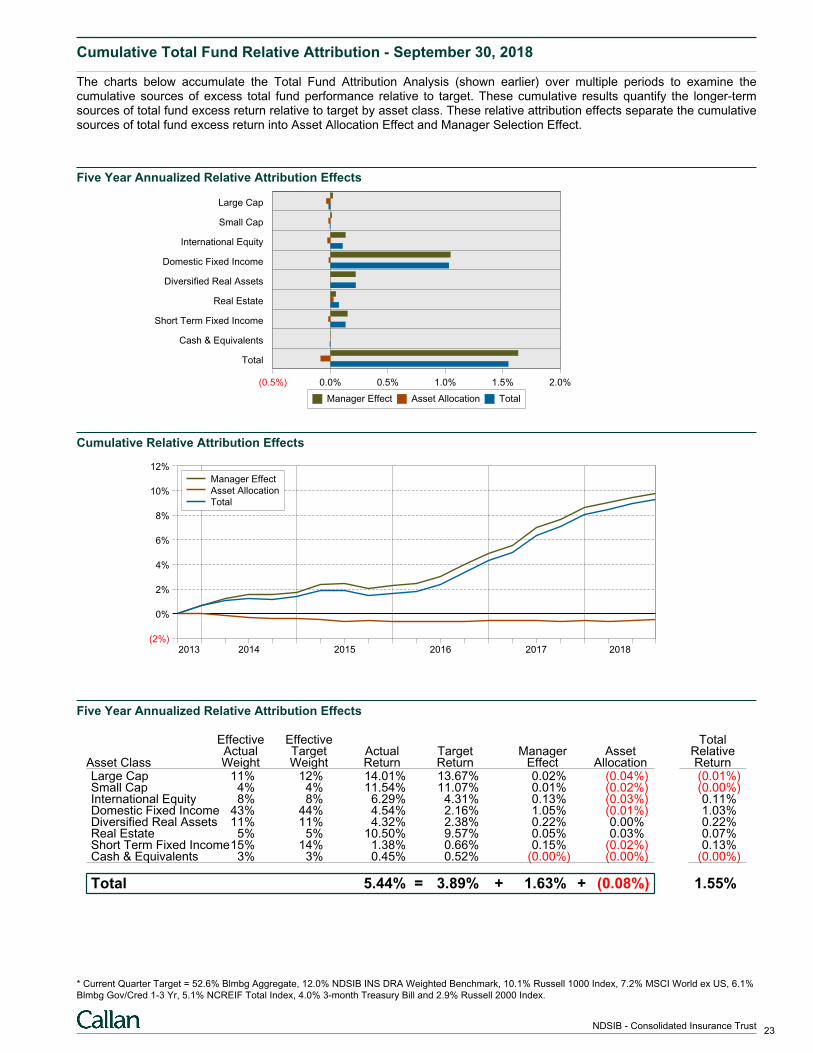
Cumulative Total Fund Relative Attribution - September 30, 2018
The charts below accumulate the Total Fund Attribution Analysis (shown earlier) over multiple periods to examine thecumulative sources of excess total fund performance relative to target. These cumulative results quantify the longer-termsources of total fund excess return relative to target by asset class. These relative attribution effects separate the cumulativesources of total fund excess return into Asset Allocation Effect and Manager Selection Effect.
Five Year Annualized Relative Attribution Effects
(0.5%) 0.0% 0.5% 1.0% 1.5% 2.0%
Large Cap
Small Cap
International Equity
Domestic Fixed Income
Diversified Real Assets
Real Estate
Short Term Fixed Income
Cash & Equivalents
Total
Manager Effect Asset Allocation Total
Cumulative Relative Attribution Effects
(2%)
0%
2%
4%
6%
8%
10%
12%
2013 2014 2015 2016 2017 2018
Manager Effect
Asset Allocation
Total
Five Year Annualized Relative Attribution Effects
Effective Effective TotalActual Target Actual Target Manager Asset Relative
Asset Class Weight Weight Return Return Effect Allocation ReturnLarge Cap 11% 12% 14.01% 13.67% 0.02% (0.04%) (0.01%)Small Cap 4% 4% 11.54% 11.07% 0.01% (0.02%) (0.00%)International Equity 8% 8% 6.29% 4.31% 0.13% (0.03%) 0.11%Domestic Fixed Income 43% 44% 4.54% 2.16% 1.05% (0.01%) 1.03%Diversified Real Assets 11% 11% 4.32% 2.38% 0.22% 0.00% 0.22%Real Estate 5% 5% 10.50% 9.57% 0.05% 0.03% 0.07%Short Term Fixed Income15% 14% 1.38% 0.66% 0.15% (0.02%) 0.13%Cash & Equivalents 3% 3% 0.45% 0.52% (0.00%) (0.00%) (0.00%)
Total = + +5.44% 3.89% 1.63% (0.08%) 1.55%
* Current Quarter Target = 52.6% Blmbg Aggregate, 12.0% NDSIB INS DRA Weighted Benchmark, 10.1% Russell 1000 Index, 7.2% MSCI World ex US, 6.1%
Blmbg Gov/Cred 1-3 Yr, 5.1% NCREIF Total Index, 4.0% 3-month Treasury Bill and 2.9% Russell 2000 Index.
23NDSIB - Consolidated Insurance Trust
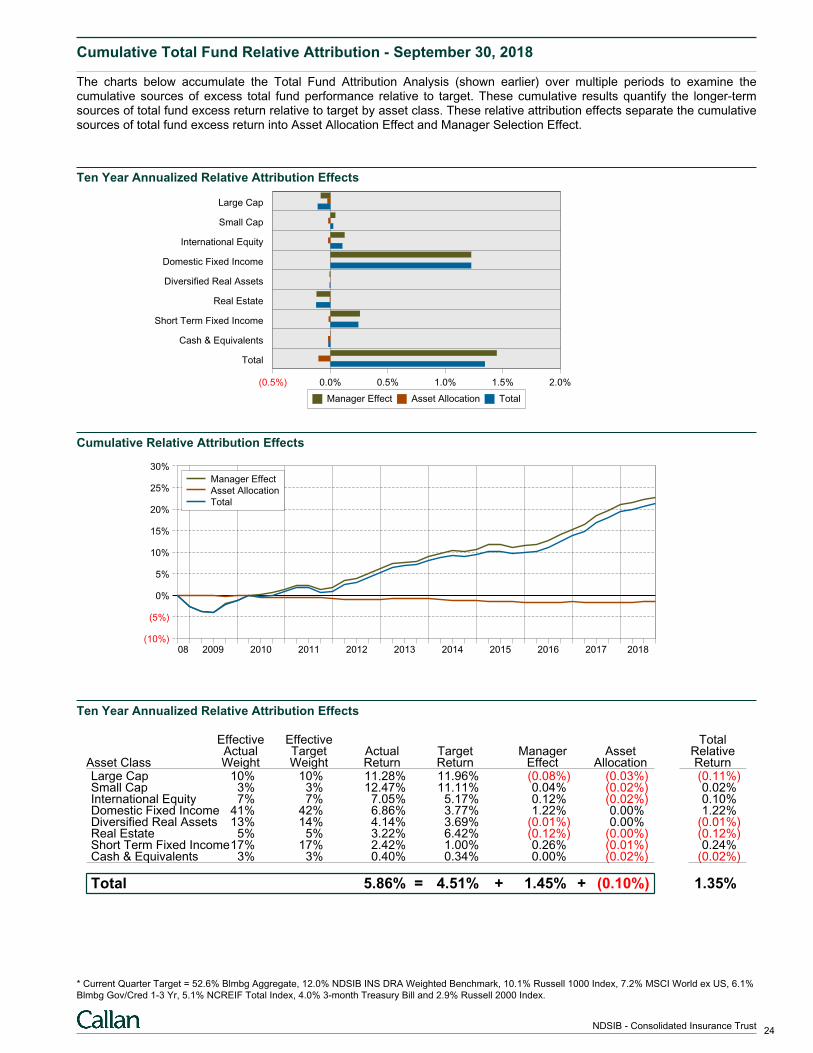
Cumulative Total Fund Relative Attribution - September 30, 2018
The charts below accumulate the Total Fund Attribution Analysis (shown earlier) over multiple periods to examine thecumulative sources of excess total fund performance relative to target. These cumulative results quantify the longer-termsources of total fund excess return relative to target by asset class. These relative attribution effects separate the cumulativesources of total fund excess return into Asset Allocation Effect and Manager Selection Effect.
Ten Year Annualized Relative Attribution Effects
(0.5%) 0.0% 0.5% 1.0% 1.5% 2.0%
Large Cap
Small Cap
International Equity
Domestic Fixed Income
Diversified Real Assets
Real Estate
Short Term Fixed Income
Cash & Equivalents
Total
Manager Effect Asset Allocation Total
Cumulative Relative Attribution Effects
(10%)
(5%)
0%
5%
10%
15%
20%
25%
30%
08 2009 2010 2011 2012 2013 2014 2015 2016 2017 2018
Manager Effect
Asset Allocation
Total
Ten Year Annualized Relative Attribution Effects
Effective Effective TotalActual Target Actual Target Manager Asset Relative
Asset Class Weight Weight Return Return Effect Allocation ReturnLarge Cap 10% 10% 11.28% 11.96% (0.08%) (0.03%) (0.11%)Small Cap 3% 3% 12.47% 11.11% 0.04% (0.02%) 0.02%International Equity 7% 7% 7.05% 5.17% 0.12% (0.02%) 0.10%Domestic Fixed Income 41% 42% 6.86% 3.77% 1.22% 0.00% 1.22%Diversified Real Assets 13% 14% 4.14% 3.69% (0.01%) 0.00% (0.01%)Real Estate 5% 5% 3.22% 6.42% (0.12%) (0.00%) (0.12%)Short Term Fixed Income17% 17% 2.42% 1.00% 0.26% (0.01%) 0.24%Cash & Equivalents 3% 3% 0.40% 0.34% 0.00% (0.02%) (0.02%)
Total = + +5.86% 4.51% 1.45% (0.10%) 1.35%
* Current Quarter Target = 52.6% Blmbg Aggregate, 12.0% NDSIB INS DRA Weighted Benchmark, 10.1% Russell 1000 Index, 7.2% MSCI World ex US, 6.1%
Blmbg Gov/Cred 1-3 Yr, 5.1% NCREIF Total Index, 4.0% 3-month Treasury Bill and 2.9% Russell 2000 Index.
24NDSIB - Consolidated Insurance Trust
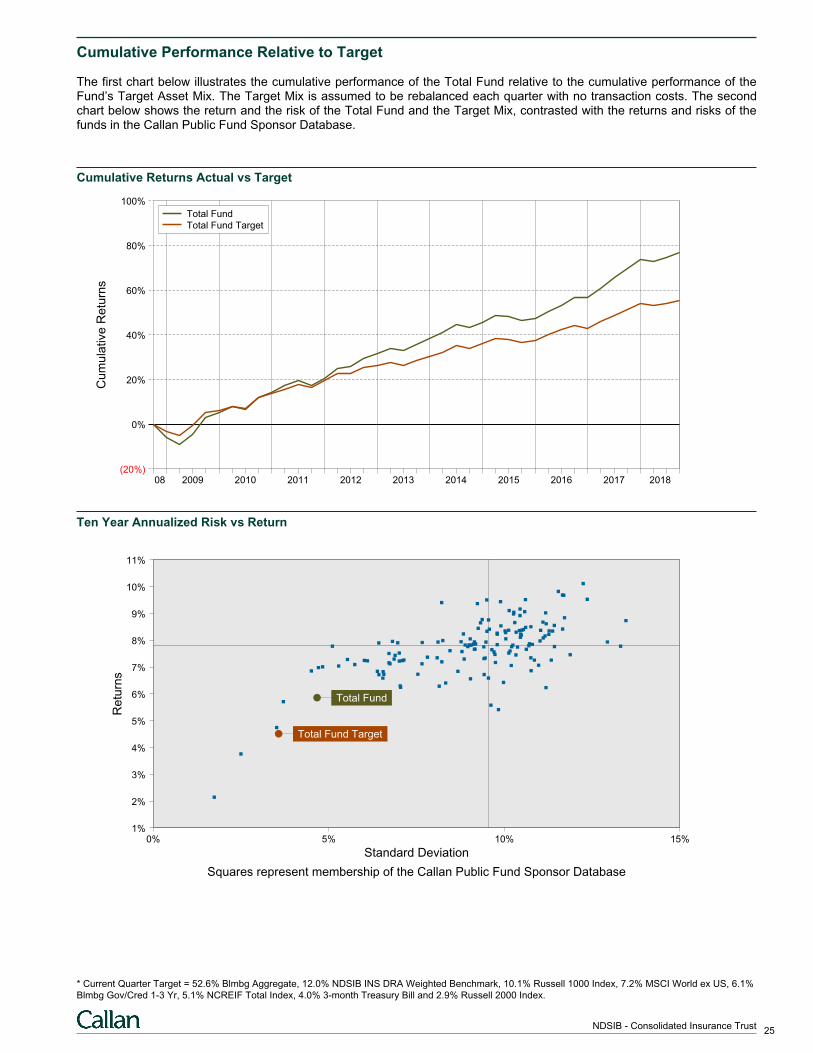
Cumulative Performance Relative to Target
The first chart below illustrates the cumulative performance of the Total Fund relative to the cumulative performance of theFund’s Target Asset Mix. The Target Mix is assumed to be rebalanced each quarter with no transaction costs. The secondchart below shows the return and the risk of the Total Fund and the Target Mix, contrasted with the returns and risks of thefunds in the Callan Public Fund Sponsor Database.
Cumulative Returns Actual vs Target
Cu
mu
lative
Re
turn
s
(20%)
0%
20%
40%
60%
80%
100%
08 2009 2010 2011 2012 2013 2014 2015 2016 2017 2018
Total Fund
Total Fund Target
Ten Year Annualized Risk vs Return
0% 5% 10% 15%1%
2%
3%
4%
5%
6%
7%
8%
9%
10%
11%
Total Fund
Total Fund Target
Standard Deviation
Re
turn
s
Squares represent membership of the Callan Public Fund Sponsor Database
* Current Quarter Target = 52.6% Blmbg Aggregate, 12.0% NDSIB INS DRA Weighted Benchmark, 10.1% Russell 1000 Index, 7.2% MSCI World ex US, 6.1%
Blmbg Gov/Cred 1-3 Yr, 5.1% NCREIF Total Index, 4.0% 3-month Treasury Bill and 2.9% Russell 2000 Index.
25NDSIB - Consolidated Insurance Trust
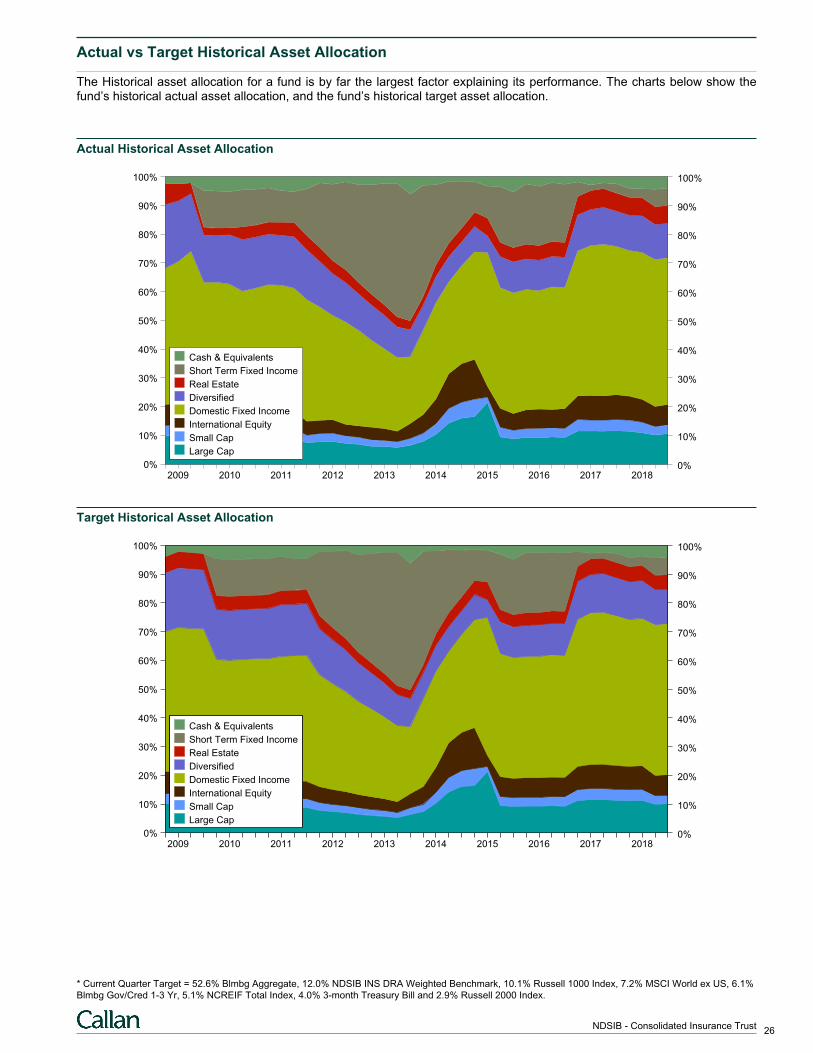
Actual vs Target Historical Asset Allocation
The Historical asset allocation for a fund is by far the largest factor explaining its performance. The charts below show thefund’s historical actual asset allocation, and the fund’s historical target asset allocation.
Actual Historical Asset Allocation
0% 0%
10% 10%
20% 20%
30% 30%
40% 40%
50% 50%
60% 60%
70% 70%
80% 80%
90% 90%
100% 100%
2009 2010 2011 2012 2013 2014 2015 2016 2017 2018
Cash & Equivalents
Short Term Fixed Income
Real Estate
Diversified
Domestic Fixed Income
International Equity
Small Cap
Large Cap
Target Historical Asset Allocation
0% 0%
10% 10%
20% 20%
30% 30%
40% 40%
50% 50%
60% 60%
70% 70%
80% 80%
90% 90%
100% 100%
2009 2010 2011 2012 2013 2014 2015 2016 2017 2018
Cash & Equivalents
Short Term Fixed Income
Real Estate
Diversified
Domestic Fixed Income
International Equity
Small Cap
Large Cap
* Current Quarter Target = 52.6% Blmbg Aggregate, 12.0% NDSIB INS DRA Weighted Benchmark, 10.1% Russell 1000 Index, 7.2% MSCI World ex US, 6.1%
Blmbg Gov/Cred 1-3 Yr, 5.1% NCREIF Total Index, 4.0% 3-month Treasury Bill and 2.9% Russell 2000 Index.
26NDSIB - Consolidated Insurance Trust
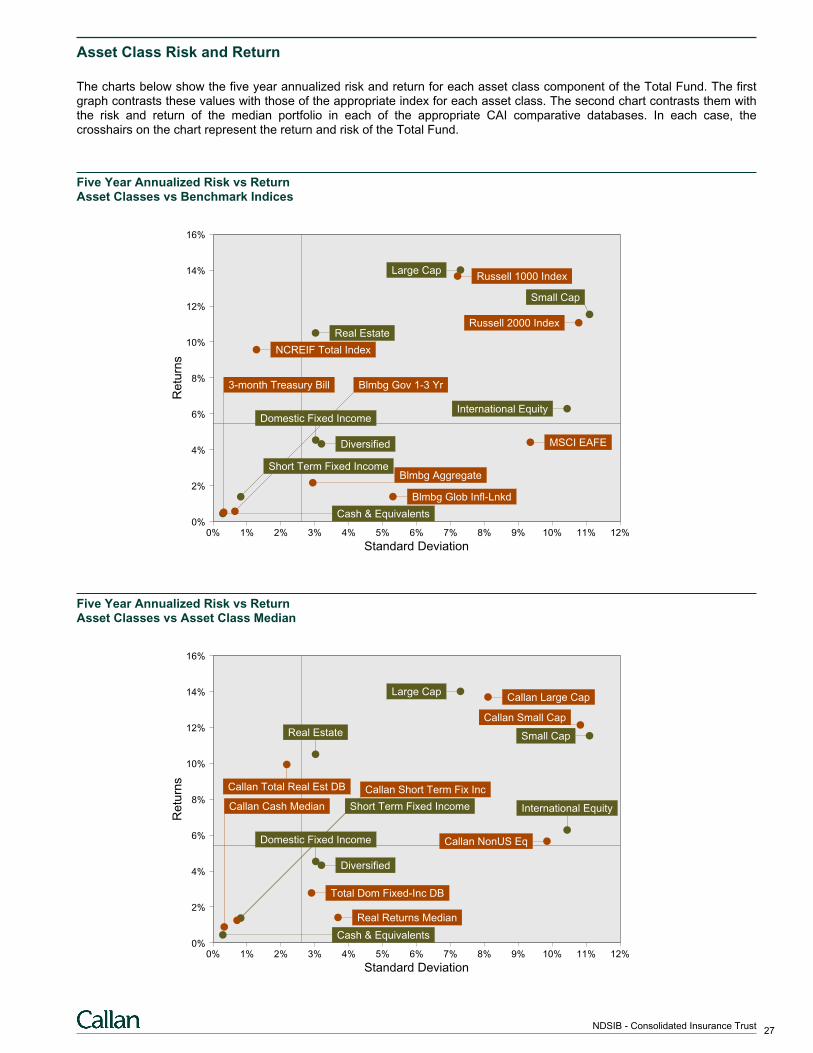
Asset Class Risk and Return
The charts below show the five year annualized risk and return for each asset class component of the Total Fund. The firstgraph contrasts these values with those of the appropriate index for each asset class. The second chart contrasts them withthe risk and return of the median portfolio in each of the appropriate CAI comparative databases. In each case, thecrosshairs on the chart represent the return and risk of the Total Fund.
Five Year Annualized Risk vs ReturnAsset Classes vs Benchmark Indices
0% 1% 2% 3% 4% 5% 6% 7% 8% 9% 10% 11% 12%0%
2%
4%
6%
8%
10%
12%
14%
16%
Blmbg Gov 1-3 Yr3-month Treasury Bill
Cash & Equivalents
Blmbg AggregateShort Term Fixed Income
Domestic Fixed Income
Large Cap
International Equity
Diversified
Real Estate
Russell 1000 Index
Russell 2000 Index
MSCI EAFE
NCREIF Total Index
Blmbg Glob Infl-Lnkd
Small Cap
Standard Deviation
Re
turn
s
Five Year Annualized Risk vs ReturnAsset Classes vs Asset Class Median
0% 1% 2% 3% 4% 5% 6% 7% 8% 9% 10% 11% 12%0%
2%
4%
6%
8%
10%
12%
14%
16%
Callan Short Term Fix Inc
Short Term Fixed IncomeCallan Cash Median
Cash & Equivalents
Domestic Fixed Income
International Equity
Diversified
Large Cap
Small Cap
Total Dom Fixed-Inc DB
Real Estate
Callan Large Cap
Real Returns Median
Callan Total Real Est DB
Callan NonUS Eq
Callan Small Cap
Standard Deviation
Re
turn
s
27NDSIB - Consolidated Insurance Trust
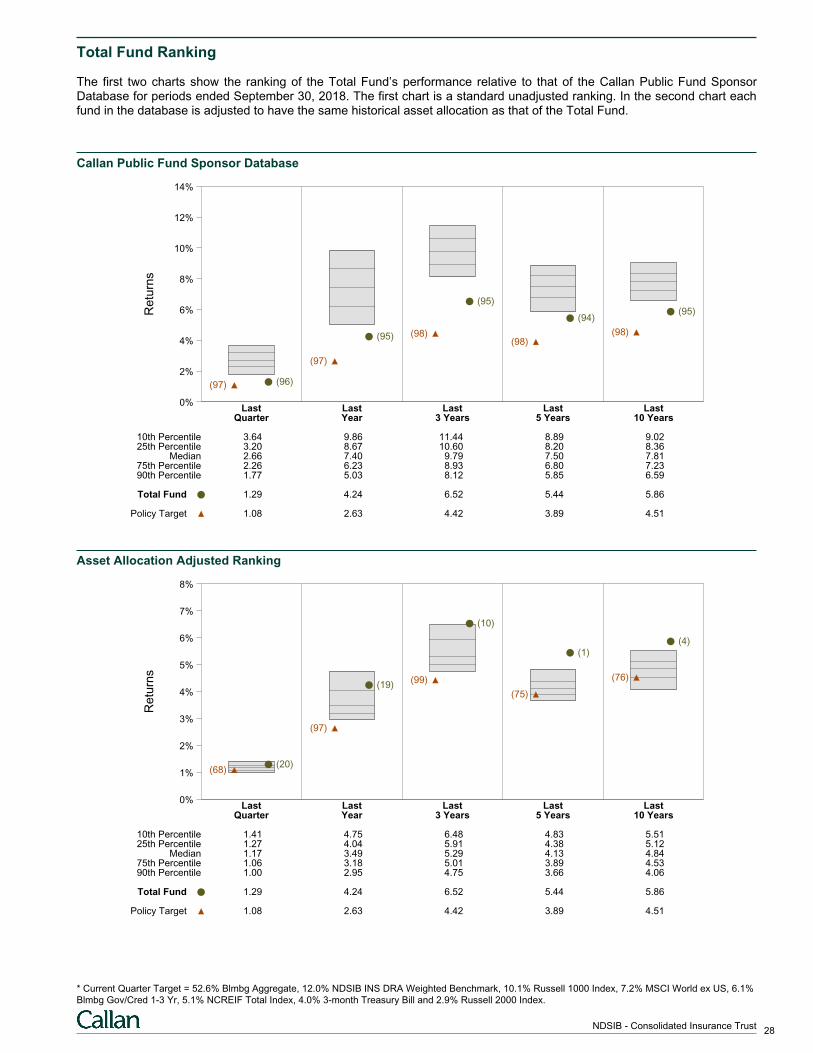
Total Fund Ranking
The first two charts show the ranking of the Total Fund’s performance relative to that of the Callan Public Fund SponsorDatabase for periods ended September 30, 2018. The first chart is a standard unadjusted ranking. In the second chart eachfund in the database is adjusted to have the same historical asset allocation as that of the Total Fund.
Callan Public Fund Sponsor DatabaseR
etu
rns
0%
2%
4%
6%
8%
10%
12%
14%
Last Last Last Last LastQuarter Year 3 Years 5 Years 10 Years
(96)(97)
(95)
(97)
(95)
(98)
(94)
(98)
(95)
(98)
10th Percentile 3.64 9.86 11.44 8.89 9.0225th Percentile 3.20 8.67 10.60 8.20 8.36
Median 2.66 7.40 9.79 7.50 7.8175th Percentile 2.26 6.23 8.93 6.80 7.2390th Percentile 1.77 5.03 8.12 5.85 6.59
Total Fund 1.29 4.24 6.52 5.44 5.86
Policy Target 1.08 2.63 4.42 3.89 4.51
Asset Allocation Adjusted Ranking
Re
turn
s
0%
1%
2%
3%
4%
5%
6%
7%
8%
Last Last Last Last LastQuarter Year 3 Years 5 Years 10 Years
(20)(68)
(19)
(97)
(10)
(99)
(1)
(75)
(4)
(76)
10th Percentile 1.41 4.75 6.48 4.83 5.5125th Percentile 1.27 4.04 5.91 4.38 5.12
Median 1.17 3.49 5.29 4.13 4.8475th Percentile 1.06 3.18 5.01 3.89 4.5390th Percentile 1.00 2.95 4.75 3.66 4.06
Total Fund 1.29 4.24 6.52 5.44 5.86
Policy Target 1.08 2.63 4.42 3.89 4.51
* Current Quarter Target = 52.6% Blmbg Aggregate, 12.0% NDSIB INS DRA Weighted Benchmark, 10.1% Russell 1000 Index, 7.2% MSCI World ex US, 6.1%
Blmbg Gov/Cred 1-3 Yr, 5.1% NCREIF Total Index, 4.0% 3-month Treasury Bill and 2.9% Russell 2000 Index.
28NDSIB - Consolidated Insurance Trust
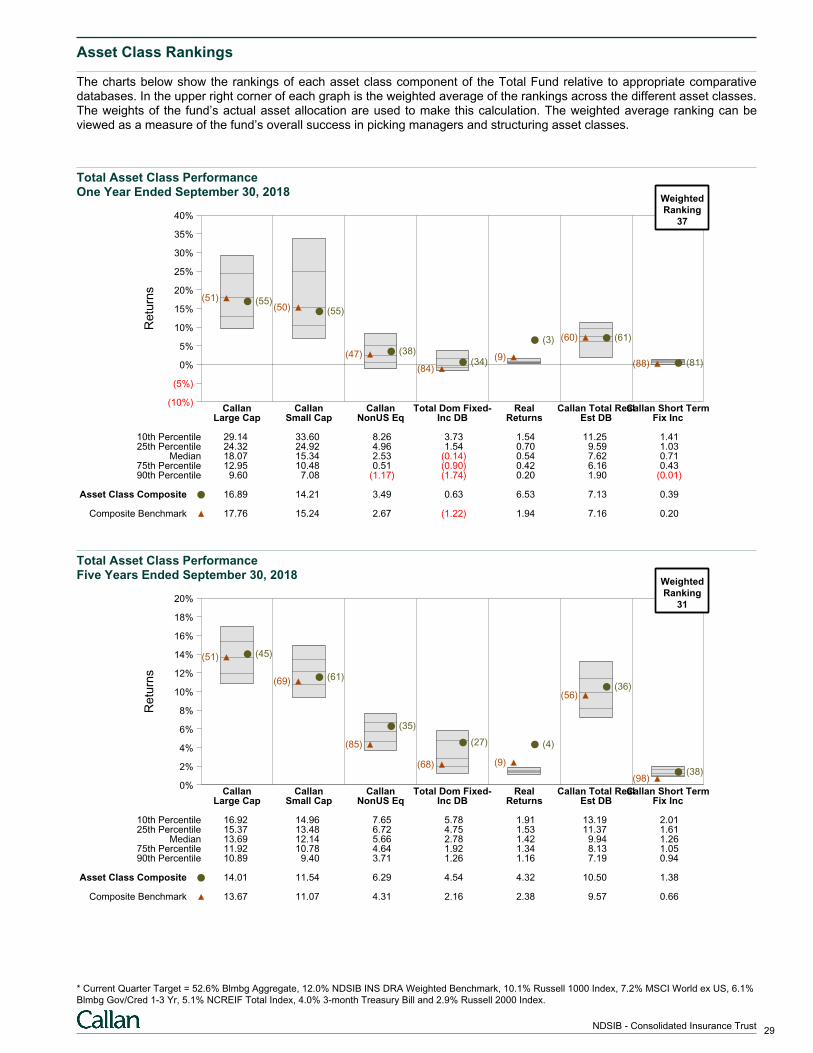
Asset Class Rankings
The charts below show the rankings of each asset class component of the Total Fund relative to appropriate comparativedatabases. In the upper right corner of each graph is the weighted average of the rankings across the different asset classes.The weights of the fund’s actual asset allocation are used to make this calculation. The weighted average ranking can beviewed as a measure of the fund’s overall success in picking managers and structuring asset classes.
Total Asset Class PerformanceOne Year Ended September 30, 2018
Re
turn
s
(10%)
(5%)
0%
5%
10%
15%
20%
25%
30%
35%
40%
Callan Callan Callan Total Dom Fixed- Real Callan Total RealCallan Short TermLarge Cap Small Cap NonUS Eq Inc DB Returns Est DB Fix Inc
(55)(51)
(55)(50)
(38)(47)(34)
(84)
(3)
(9)
(61)(60)
(81)(88)
10th Percentile 29.14 33.60 8.26 3.73 1.54 11.25 1.4125th Percentile 24.32 24.92 4.96 1.54 0.70 9.59 1.03
Median 18.07 15.34 2.53 (0.14) 0.54 7.62 0.7175th Percentile 12.95 10.48 0.51 (0.90) 0.42 6.16 0.4390th Percentile 9.60 7.08 (1.17) (1.74) 0.20 1.90 (0.01)
Asset Class Composite 16.89 14.21 3.49 0.63 6.53 7.13 0.39
Composite Benchmark 17.76 15.24 2.67 (1.22) 1.94 7.16 0.20
WeightedRanking
37
Total Asset Class PerformanceFive Years Ended September 30, 2018
Re
turn
s
0%
2%
4%
6%
8%
10%
12%
14%
16%
18%
20%
Callan Callan Callan Total Dom Fixed- Real Callan Total RealCallan Short TermLarge Cap Small Cap NonUS Eq Inc DB Returns Est DB Fix Inc
(45)(51)
(61)(69)
(35)
(85) (27)
(68)
(4)
(9)
(36)(56)
(38)(98)
10th Percentile 16.92 14.96 7.65 5.78 1.91 13.19 2.0125th Percentile 15.37 13.48 6.72 4.75 1.53 11.37 1.61
Median 13.69 12.14 5.66 2.78 1.42 9.94 1.2675th Percentile 11.92 10.78 4.64 1.92 1.34 8.13 1.0590th Percentile 10.89 9.40 3.71 1.26 1.16 7.19 0.94
Asset Class Composite 14.01 11.54 6.29 4.54 4.32 10.50 1.38
Composite Benchmark 13.67 11.07 4.31 2.16 2.38 9.57 0.66
WeightedRanking
31
* Current Quarter Target = 52.6% Blmbg Aggregate, 12.0% NDSIB INS DRA Weighted Benchmark, 10.1% Russell 1000 Index, 7.2% MSCI World ex US, 6.1%
Blmbg Gov/Cred 1-3 Yr, 5.1% NCREIF Total Index, 4.0% 3-month Treasury Bill and 2.9% Russell 2000 Index.
29NDSIB - Consolidated Insurance Trust
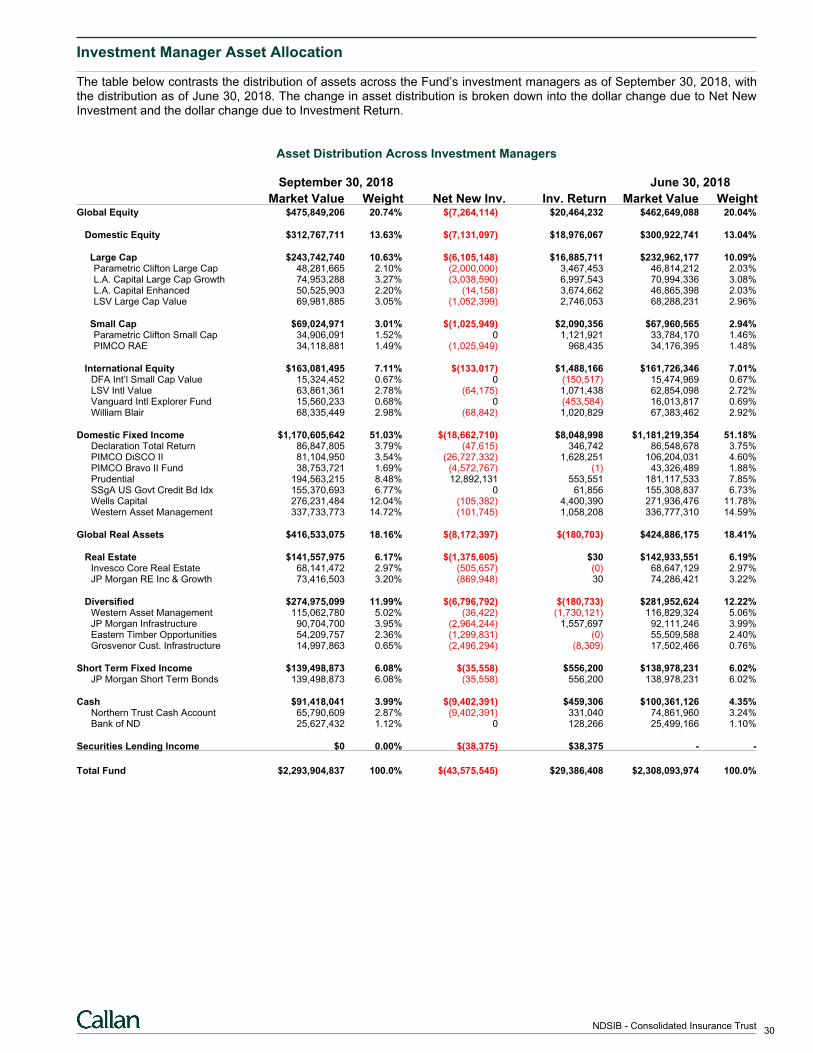
Investment Manager Asset Allocation
The table below contrasts the distribution of assets across the Fund’s investment managers as of September 30, 2018, withthe distribution as of June 30, 2018. The change in asset distribution is broken down into the dollar change due to Net NewInvestment and the dollar change due to Investment Return.
Asset Distribution Across Investment Managers
September 30, 2018 June 30, 2018
Market Value Weight Net New Inv. Inv. Return Market Value WeightGlobal Equity $475,849,206 20.74% $(7,264,114) $20,464,232 $462,649,088 20.04%
Domestic Equity $312,767,711 13.63% $(7,131,097) $18,976,067 $300,922,741 13.04%
Large Cap $243,742,740 10.63% $(6,105,148) $16,885,711 $232,962,177 10.09% Parametric Clifton Large Cap 48,281,665 2.10% (2,000,000) 3,467,453 46,814,212 2.03% L.A. Capital Large Cap Growth 74,953,288 3.27% (3,038,590) 6,997,543 70,994,336 3.08% L.A. Capital Enhanced 50,525,903 2.20% (14,158) 3,674,662 46,865,398 2.03% LSV Large Cap Value 69,981,885 3.05% (1,052,399) 2,746,053 68,288,231 2.96%
Small Cap $69,024,971 3.01% $(1,025,949) $2,090,356 $67,960,565 2.94% Parametric Clifton Small Cap 34,906,091 1.52% 0 1,121,921 33,784,170 1.46% PIMCO RAE 34,118,881 1.49% (1,025,949) 968,435 34,176,395 1.48%
International Equity $163,081,495 7.11% $(133,017) $1,488,166 $161,726,346 7.01%DFA Int’l Small Cap Value 15,324,452 0.67% 0 (150,517) 15,474,969 0.67%LSV Intl Value 63,861,361 2.78% (64,175) 1,071,438 62,854,098 2.72%Vanguard Intl Explorer Fund 15,560,233 0.68% 0 (453,584) 16,013,817 0.69%William Blair 68,335,449 2.98% (68,842) 1,020,829 67,383,462 2.92%
Domestic Fixed Income $1,170,605,642 51.03% $(18,662,710) $8,048,998 $1,181,219,354 51.18%Declaration Total Return 86,847,805 3.79% (47,615) 346,742 86,548,678 3.75%PIMCO DiSCO II 81,104,950 3.54% (26,727,332) 1,628,251 106,204,031 4.60%PIMCO Bravo II Fund 38,753,721 1.69% (4,572,767) (1) 43,326,489 1.88%Prudential 194,563,215 8.48% 12,892,131 553,551 181,117,533 7.85%SSgA US Govt Credit Bd Idx 155,370,693 6.77% 0 61,856 155,308,837 6.73%Wells Capital 276,231,484 12.04% (105,382) 4,400,390 271,936,476 11.78%Western Asset Management 337,733,773 14.72% (101,745) 1,058,208 336,777,310 14.59%
Global Real Assets $416,533,075 18.16% $(8,172,397) $(180,703) $424,886,175 18.41%
Real Estate $141,557,975 6.17% $(1,375,605) $30 $142,933,551 6.19%Invesco Core Real Estate 68,141,472 2.97% (505,657) (0) 68,647,129 2.97%JP Morgan RE Inc & Growth 73,416,503 3.20% (869,948) 30 74,286,421 3.22%
Diversified $274,975,099 11.99% $(6,796,792) $(180,733) $281,952,624 12.22%Western Asset Management 115,062,780 5.02% (36,422) (1,730,121) 116,829,324 5.06%JP Morgan Infrastructure 90,704,700 3.95% (2,964,244) 1,557,697 92,111,246 3.99%Eastern Timber Opportunities 54,209,757 2.36% (1,299,831) (0) 55,509,588 2.40%Grosvenor Cust. Infrastructure 14,997,863 0.65% (2,496,294) (8,309) 17,502,466 0.76%
Short Term Fixed Income $139,498,873 6.08% $(35,558) $556,200 $138,978,231 6.02%JP Morgan Short Term Bonds 139,498,873 6.08% (35,558) 556,200 138,978,231 6.02%
Cash $91,418,041 3.99% $(9,402,391) $459,306 $100,361,126 4.35%Northern Trust Cash Account 65,790,609 2.87% (9,402,391) 331,040 74,861,960 3.24%Bank of ND 25,627,432 1.12% 0 128,266 25,499,166 1.10%
Securities Lending Income $0 0.00% $(38,375) $38,375 - -
Total Fund $2,293,904,837 100.0% $(43,575,545) $29,386,408 $2,308,093,974 100.0%
30NDSIB - Consolidated Insurance Trust
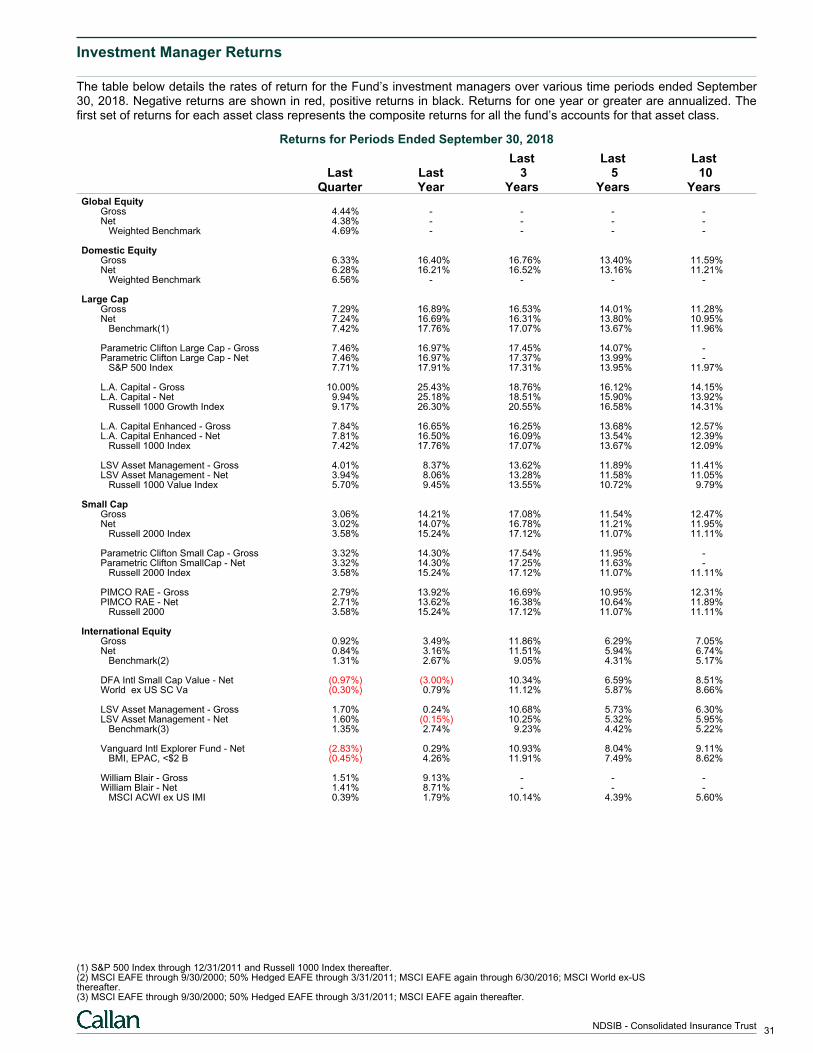
Investment Manager Returns
The table below details the rates of return for the Fund’s investment managers over various time periods ended September30, 2018. Negative returns are shown in red, positive returns in black. Returns for one year or greater are annualized. Thefirst set of returns for each asset class represents the composite returns for all the fund’s accounts for that asset class.
Returns for Periods Ended September 30, 2018
Last Last LastLast Last 3 5 10
Quarter Year Years Years YearsGlobal Equity
Gross 4.44% - - - -Net 4.38% - - - - Weighted Benchmark 4.69% - - - -
Domestic EquityGross 6.33% 16.40% 16.76% 13.40% 11.59%Net 6.28% 16.21% 16.52% 13.16% 11.21% Weighted Benchmark 6.56% - - - -
Large CapGross 7.29% 16.89% 16.53% 14.01% 11.28%Net 7.24% 16.69% 16.31% 13.80% 10.95% Benchmark(1) 7.42% 17.76% 17.07% 13.67% 11.96%
Parametric Clifton Large Cap - Gross 7.46% 16.97% 17.45% 14.07% -Parametric Clifton Large Cap - Net 7.46% 16.97% 17.37% 13.99% - S&P 500 Index 7.71% 17.91% 17.31% 13.95% 11.97%
L.A. Capital - Gross 10.00% 25.43% 18.76% 16.12% 14.15%L.A. Capital - Net 9.94% 25.18% 18.51% 15.90% 13.92% Russell 1000 Growth Index 9.17% 26.30% 20.55% 16.58% 14.31%
L.A. Capital Enhanced - Gross 7.84% 16.65% 16.25% 13.68% 12.57%L.A. Capital Enhanced - Net 7.81% 16.50% 16.09% 13.54% 12.39% Russell 1000 Index 7.42% 17.76% 17.07% 13.67% 12.09%
LSV Asset Management - Gross 4.01% 8.37% 13.62% 11.89% 11.41%LSV Asset Management - Net 3.94% 8.06% 13.28% 11.58% 11.05% Russell 1000 Value Index 5.70% 9.45% 13.55% 10.72% 9.79%
Small CapGross 3.06% 14.21% 17.08% 11.54% 12.47%Net 3.02% 14.07% 16.78% 11.21% 11.95% Russell 2000 Index 3.58% 15.24% 17.12% 11.07% 11.11%
Parametric Clifton Small Cap - Gross 3.32% 14.30% 17.54% 11.95% -Parametric Clifton SmallCap - Net 3.32% 14.30% 17.25% 11.63% - Russell 2000 Index 3.58% 15.24% 17.12% 11.07% 11.11%
PIMCO RAE - Gross 2.79% 13.92% 16.69% 10.95% 12.31%PIMCO RAE - Net 2.71% 13.62% 16.38% 10.64% 11.89% Russell 2000 3.58% 15.24% 17.12% 11.07% 11.11%
International EquityGross 0.92% 3.49% 11.86% 6.29% 7.05%Net 0.84% 3.16% 11.51% 5.94% 6.74% Benchmark(2) 1.31% 2.67% 9.05% 4.31% 5.17%
DFA Intl Small Cap Value - Net (0.97%) (3.00%) 10.34% 6.59% 8.51%World ex US SC Va (0.30%) 0.79% 11.12% 5.87% 8.66%
LSV Asset Management - Gross 1.70% 0.24% 10.68% 5.73% 6.30%LSV Asset Management - Net 1.60% (0.15%) 10.25% 5.32% 5.95% Benchmark(3) 1.35% 2.74% 9.23% 4.42% 5.22%
Vanguard Intl Explorer Fund - Net (2.83%) 0.29% 10.93% 8.04% 9.11% BMI, EPAC, <$2 B (0.45%) 4.26% 11.91% 7.49% 8.62%
William Blair - Gross 1.51% 9.13% - - -William Blair - Net 1.41% 8.71% - - - MSCI ACWI ex US IMI 0.39% 1.79% 10.14% 4.39% 5.60%
(1) S&P 500 Index through 12/31/2011 and Russell 1000 Index thereafter.(2) MSCI EAFE through 9/30/2000; 50% Hedged EAFE through 3/31/2011; MSCI EAFE again through 6/30/2016; MSCI World ex-USthereafter.(3) MSCI EAFE through 9/30/2000; 50% Hedged EAFE through 3/31/2011; MSCI EAFE again thereafter.
31NDSIB - Consolidated Insurance Trust
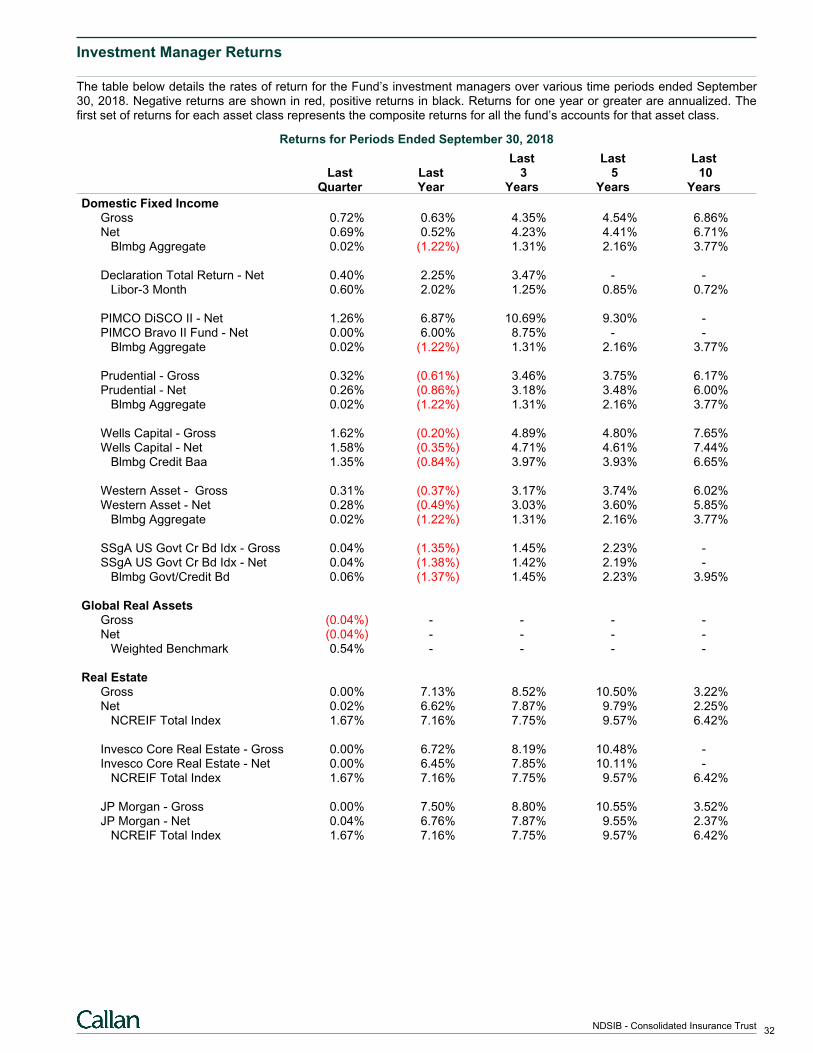
Investment Manager Returns
The table below details the rates of return for the Fund’s investment managers over various time periods ended September30, 2018. Negative returns are shown in red, positive returns in black. Returns for one year or greater are annualized. Thefirst set of returns for each asset class represents the composite returns for all the fund’s accounts for that asset class.
Returns for Periods Ended September 30, 2018
Last Last LastLast Last 3 5 10
Quarter Year Years Years Years
Domestic Fixed IncomeGross 0.72% 0.63% 4.35% 4.54% 6.86%Net 0.69% 0.52% 4.23% 4.41% 6.71% Blmbg Aggregate 0.02% (1.22%) 1.31% 2.16% 3.77%
Declaration Total Return - Net 0.40% 2.25% 3.47% - - Libor-3 Month 0.60% 2.02% 1.25% 0.85% 0.72%
PIMCO DiSCO II - Net 1.26% 6.87% 10.69% 9.30% -PIMCO Bravo II Fund - Net 0.00% 6.00% 8.75% - - Blmbg Aggregate 0.02% (1.22%) 1.31% 2.16% 3.77%
Prudential - Gross 0.32% (0.61%) 3.46% 3.75% 6.17%Prudential - Net 0.26% (0.86%) 3.18% 3.48% 6.00% Blmbg Aggregate 0.02% (1.22%) 1.31% 2.16% 3.77%
Wells Capital - Gross 1.62% (0.20%) 4.89% 4.80% 7.65%Wells Capital - Net 1.58% (0.35%) 4.71% 4.61% 7.44% Blmbg Credit Baa 1.35% (0.84%) 3.97% 3.93% 6.65%
Western Asset - Gross 0.31% (0.37%) 3.17% 3.74% 6.02%Western Asset - Net 0.28% (0.49%) 3.03% 3.60% 5.85% Blmbg Aggregate 0.02% (1.22%) 1.31% 2.16% 3.77%
SSgA US Govt Cr Bd Idx - Gross 0.04% (1.35%) 1.45% 2.23% -SSgA US Govt Cr Bd Idx - Net 0.04% (1.38%) 1.42% 2.19% - Blmbg Govt/Credit Bd 0.06% (1.37%) 1.45% 2.23% 3.95%
Global Real AssetsGross (0.04%) - - - -Net (0.04%) - - - - Weighted Benchmark 0.54% - - - -
Real EstateGross 0.00% 7.13% 8.52% 10.50% 3.22%Net 0.02% 6.62% 7.87% 9.79% 2.25% NCREIF Total Index 1.67% 7.16% 7.75% 9.57% 6.42%
Invesco Core Real Estate - Gross 0.00% 6.72% 8.19% 10.48% -Invesco Core Real Estate - Net 0.00% 6.45% 7.85% 10.11% - NCREIF Total Index 1.67% 7.16% 7.75% 9.57% 6.42%
JP Morgan - Gross 0.00% 7.50% 8.80% 10.55% 3.52%JP Morgan - Net 0.04% 6.76% 7.87% 9.55% 2.37% NCREIF Total Index 1.67% 7.16% 7.75% 9.57% 6.42%
32NDSIB - Consolidated Insurance Trust
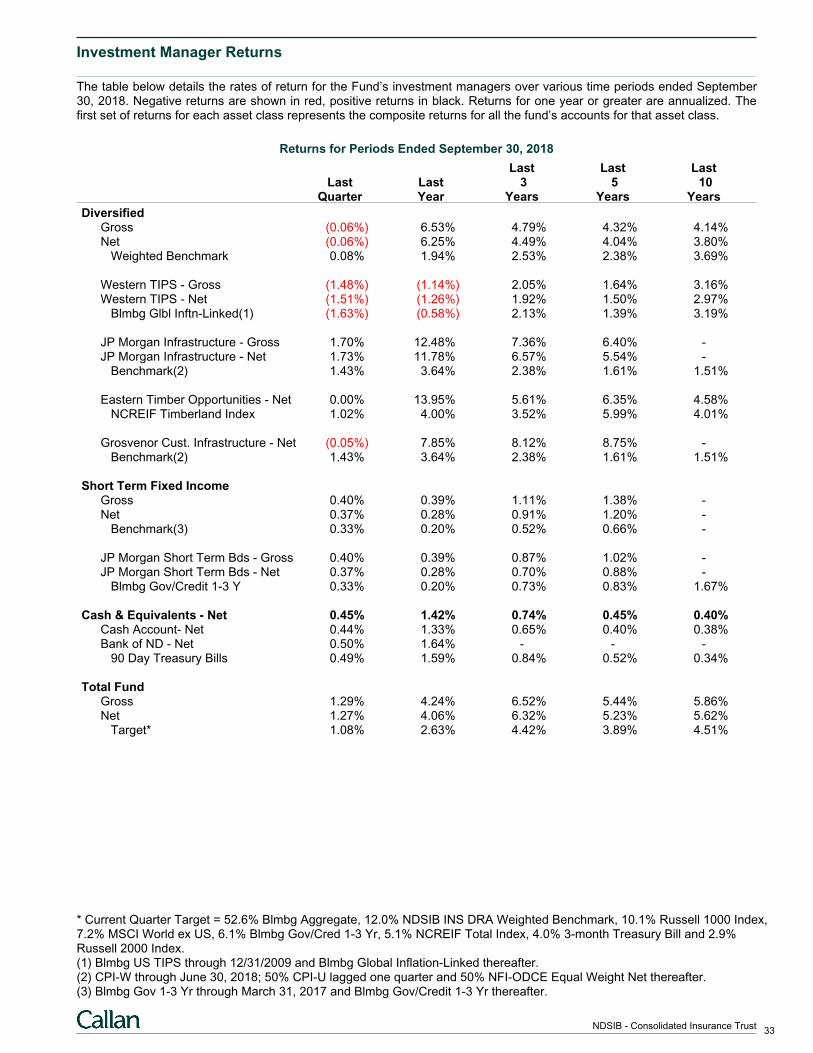
Investment Manager Returns
The table below details the rates of return for the Fund’s investment managers over various time periods ended September30, 2018. Negative returns are shown in red, positive returns in black. Returns for one year or greater are annualized. Thefirst set of returns for each asset class represents the composite returns for all the fund’s accounts for that asset class.
Returns for Periods Ended September 30, 2018
Last Last LastLast Last 3 5 10
Quarter Year Years Years Years
DiversifiedGross (0.06%) 6.53% 4.79% 4.32% 4.14%Net (0.06%) 6.25% 4.49% 4.04% 3.80% Weighted Benchmark 0.08% 1.94% 2.53% 2.38% 3.69%
Western TIPS - Gross (1.48%) (1.14%) 2.05% 1.64% 3.16%Western TIPS - Net (1.51%) (1.26%) 1.92% 1.50% 2.97% Blmbg Glbl Inftn-Linked(1) (1.63%) (0.58%) 2.13% 1.39% 3.19%
JP Morgan Infrastructure - Gross 1.70% 12.48% 7.36% 6.40% -JP Morgan Infrastructure - Net 1.73% 11.78% 6.57% 5.54% - Benchmark(2) 1.43% 3.64% 2.38% 1.61% 1.51%
Eastern Timber Opportunities - Net 0.00% 13.95% 5.61% 6.35% 4.58% NCREIF Timberland Index 1.02% 4.00% 3.52% 5.99% 4.01%
Grosvenor Cust. Infrastructure - Net (0.05%) 7.85% 8.12% 8.75% - Benchmark(2) 1.43% 3.64% 2.38% 1.61% 1.51%
Short Term Fixed IncomeGross 0.40% 0.39% 1.11% 1.38% -Net 0.37% 0.28% 0.91% 1.20% - Benchmark(3) 0.33% 0.20% 0.52% 0.66% -
JP Morgan Short Term Bds - Gross 0.40% 0.39% 0.87% 1.02% -JP Morgan Short Term Bds - Net 0.37% 0.28% 0.70% 0.88% - Blmbg Gov/Credit 1-3 Y 0.33% 0.20% 0.73% 0.83% 1.67%
Cash & Equivalents - Net 0.45% 1.42% 0.74% 0.45% 0.40%Cash Account- Net 0.44% 1.33% 0.65% 0.40% 0.38%Bank of ND - Net 0.50% 1.64% - - - 90 Day Treasury Bills 0.49% 1.59% 0.84% 0.52% 0.34%
Total FundGross 1.29% 4.24% 6.52% 5.44% 5.86%Net 1.27% 4.06% 6.32% 5.23% 5.62% Target* 1.08% 2.63% 4.42% 3.89% 4.51%
* Current Quarter Target = 52.6% Blmbg Aggregate, 12.0% NDSIB INS DRA Weighted Benchmark, 10.1% Russell 1000 Index,7.2% MSCI World ex US, 6.1% Blmbg Gov/Cred 1-3 Yr, 5.1% NCREIF Total Index, 4.0% 3-month Treasury Bill and 2.9%Russell 2000 Index.(1) Blmbg US TIPS through 12/31/2009 and Blmbg Global Inflation-Linked thereafter.(2) CPI-W through June 30, 2018; 50% CPI-U lagged one quarter and 50% NFI-ODCE Equal Weight Net thereafter.(3) Blmbg Gov 1-3 Yr through March 31, 2017 and Blmbg Gov/Credit 1-3 Yr thereafter.
33NDSIB - Consolidated Insurance Trust
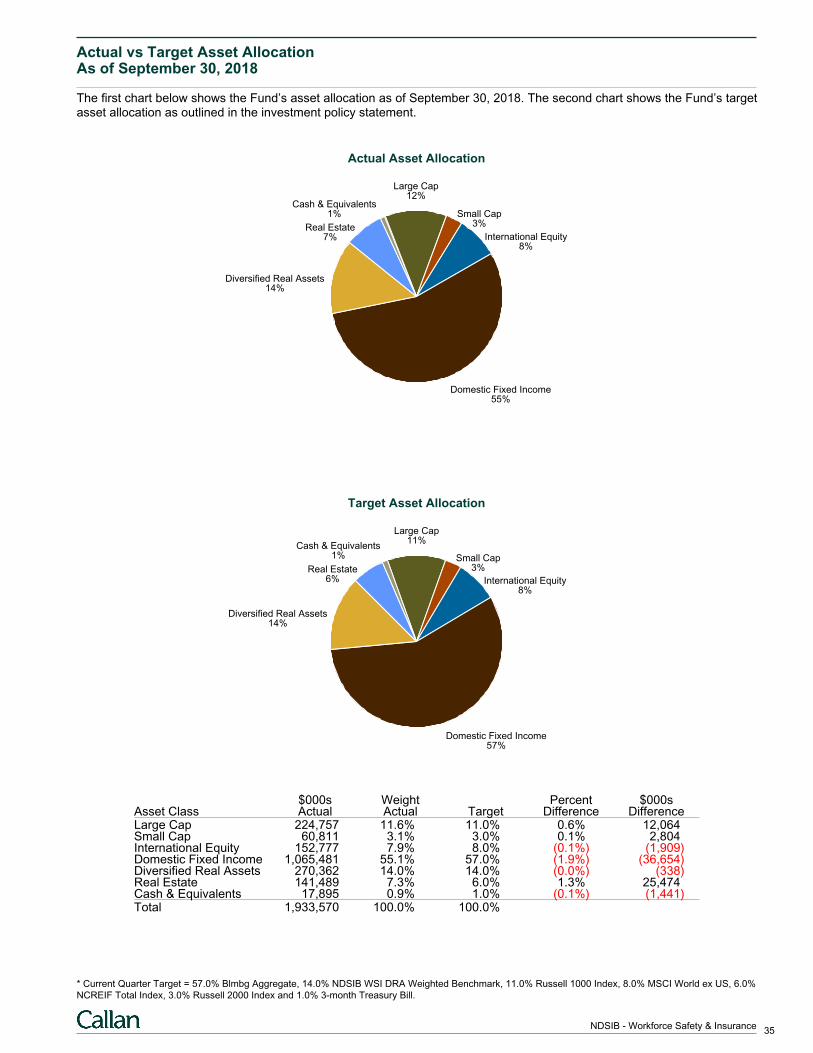
Actual vs Target Asset AllocationAs of September 30, 2018
The first chart below shows the Fund’s asset allocation as of September 30, 2018. The second chart shows the Fund’s targetasset allocation as outlined in the investment policy statement.
Actual Asset Allocation
Large Cap12%
Small Cap3%
International Equity8%
Domestic Fixed Income55%
Diversified Real Assets14%
Real Estate7%
Cash & Equivalents1%
Target Asset Allocation
Large Cap11%
Small Cap3%
International Equity8%
Domestic Fixed Income57%
Diversified Real Assets14%
Real Estate6%
Cash & Equivalents1%
$000s Weight Percent $000sAsset Class Actual Actual Target Difference DifferenceLarge Cap 224,757 11.6% 11.0% 0.6% 12,064Small Cap 60,811 3.1% 3.0% 0.1% 2,804International Equity 152,777 7.9% 8.0% (0.1%) (1,909)Domestic Fixed Income 1,065,481 55.1% 57.0% (1.9%) (36,654)Diversified Real Assets 270,362 14.0% 14.0% (0.0%) (338)Real Estate 141,489 7.3% 6.0% 1.3% 25,474Cash & Equivalents 17,895 0.9% 1.0% (0.1%) (1,441)Total 1,933,570 100.0% 100.0%
* Current Quarter Target = 57.0% Blmbg Aggregate, 14.0% NDSIB WSI DRA Weighted Benchmark, 11.0% Russell 1000 Index, 8.0% MSCI World ex US, 6.0%
NCREIF Total Index, 3.0% Russell 2000 Index and 1.0% 3-month Treasury Bill.
35NDSIB - Workforce Safety & Insurance
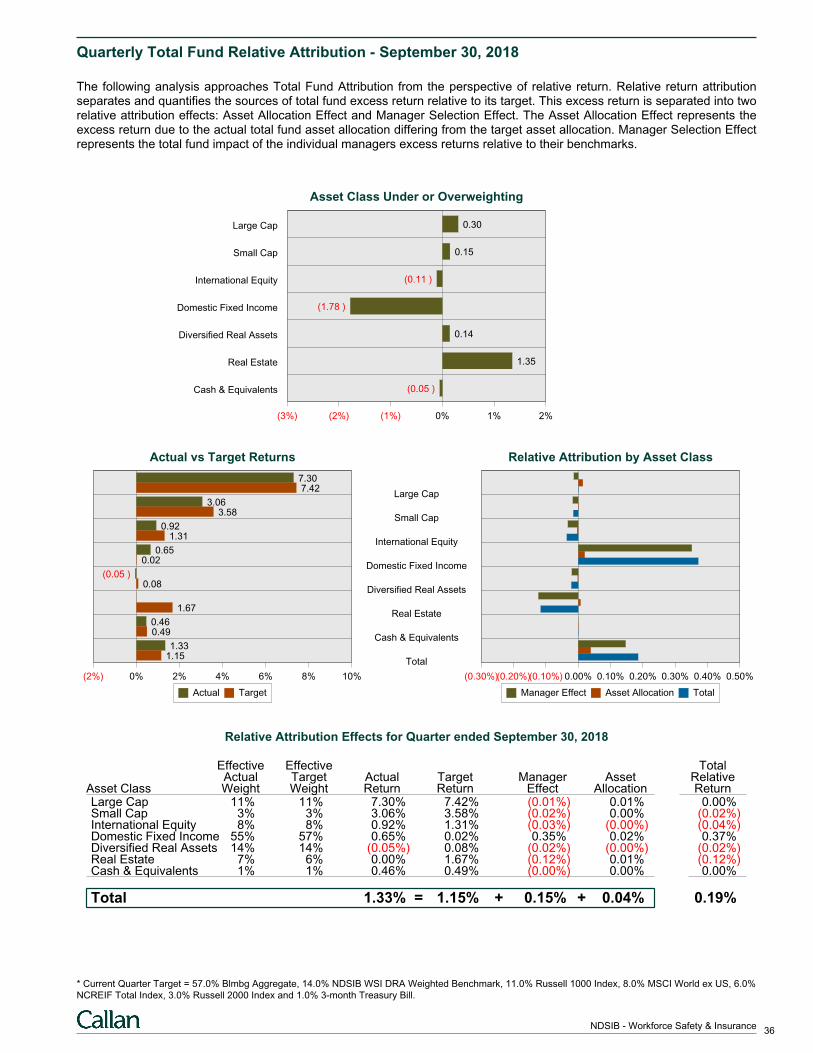
Quarterly Total Fund Relative Attribution - September 30, 2018
The following analysis approaches Total Fund Attribution from the perspective of relative return. Relative return attributionseparates and quantifies the sources of total fund excess return relative to its target. This excess return is separated into tworelative attribution effects: Asset Allocation Effect and Manager Selection Effect. The Asset Allocation Effect represents theexcess return due to the actual total fund asset allocation differing from the target asset allocation. Manager Selection Effectrepresents the total fund impact of the individual managers excess returns relative to their benchmarks.
Asset Class Under or Overweighting
(3%) (2%) (1%) 0% 1% 2%
Large Cap 0.30
Small Cap 0.15
International Equity (0.11 )
Domestic Fixed Income (1.78 )
Diversified Real Assets 0.14
Real Estate 1.35
Cash & Equivalents (0.05 )
Large Cap
Small Cap
International Equity
Domestic Fixed Income
Diversified Real Assets
Real Estate
Cash & Equivalents
Total
Actual vs Target Returns
(2%) 0% 2% 4% 6% 8% 10%
7.307.42
3.063.58
0.921.31
0.650.02
(0.05 )0.08
1.67
0.460.49
1.331.15
Actual Target
Relative Attribution by Asset Class
(0.30%)(0.20%)(0.10%) 0.00% 0.10% 0.20% 0.30% 0.40% 0.50%
Manager Effect Asset Allocation Total
Relative Attribution Effects for Quarter ended September 30, 2018
Effective Effective TotalActual Target Actual Target Manager Asset Relative
Asset Class Weight Weight Return Return Effect Allocation ReturnLarge Cap 11% 11% 7.30% 7.42% (0.01%) 0.01% 0.00%Small Cap 3% 3% 3.06% 3.58% (0.02%) 0.00% (0.02%)International Equity 8% 8% 0.92% 1.31% (0.03%) (0.00%) (0.04%)Domestic Fixed Income 55% 57% 0.65% 0.02% 0.35% 0.02% 0.37%Diversified Real Assets 14% 14% (0.05%) 0.08% (0.02%) (0.00%) (0.02%)Real Estate 7% 6% 0.00% 1.67% (0.12%) 0.01% (0.12%)Cash & Equivalents 1% 1% 0.46% 0.49% (0.00%) 0.00% 0.00%
Total = + +1.33% 1.15% 0.15% 0.04% 0.19%
* Current Quarter Target = 57.0% Blmbg Aggregate, 14.0% NDSIB WSI DRA Weighted Benchmark, 11.0% Russell 1000 Index, 8.0% MSCI World ex US, 6.0%
NCREIF Total Index, 3.0% Russell 2000 Index and 1.0% 3-month Treasury Bill.
36NDSIB - Workforce Safety & Insurance
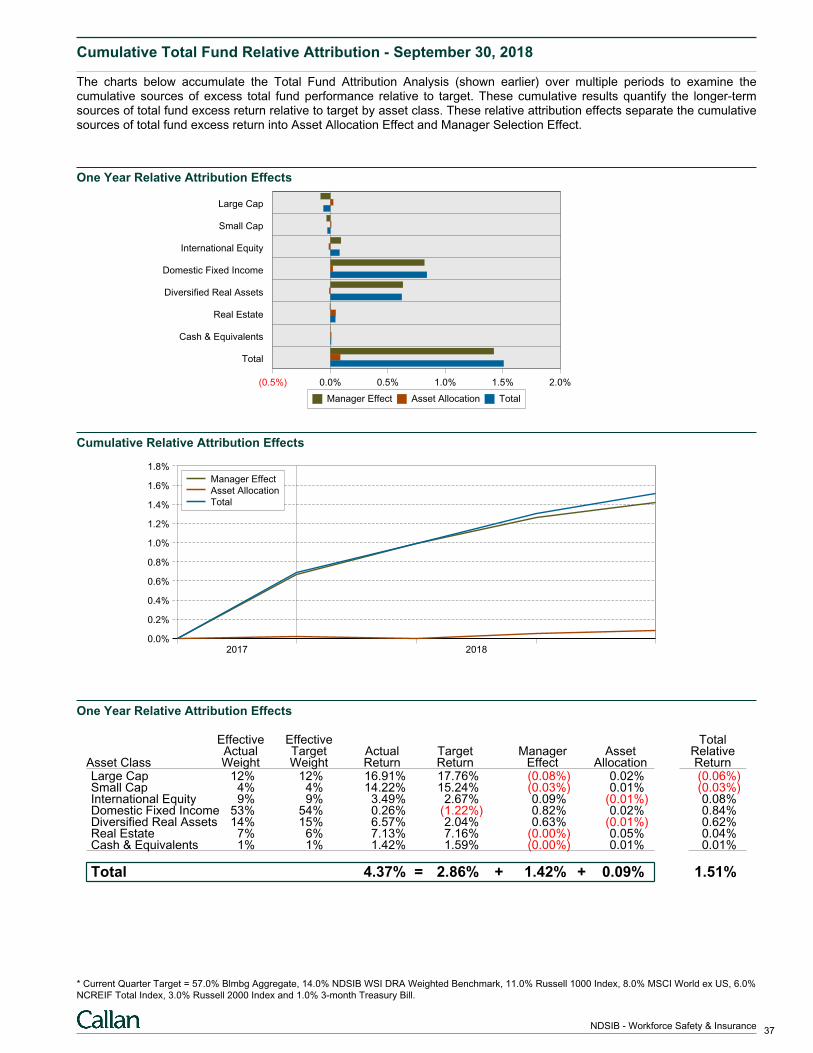
Cumulative Total Fund Relative Attribution - September 30, 2018
The charts below accumulate the Total Fund Attribution Analysis (shown earlier) over multiple periods to examine thecumulative sources of excess total fund performance relative to target. These cumulative results quantify the longer-termsources of total fund excess return relative to target by asset class. These relative attribution effects separate the cumulativesources of total fund excess return into Asset Allocation Effect and Manager Selection Effect.
One Year Relative Attribution Effects
(0.5%) 0.0% 0.5% 1.0% 1.5% 2.0%
Large Cap
Small Cap
International Equity
Domestic Fixed Income
Diversified Real Assets
Real Estate
Cash & Equivalents
Total
Manager Effect Asset Allocation Total
Cumulative Relative Attribution Effects
0.0%
0.2%
0.4%
0.6%
0.8%
1.0%
1.2%
1.4%
1.6%
1.8%
2017 2018
Manager Effect
Asset Allocation
Total
One Year Relative Attribution Effects
Effective Effective TotalActual Target Actual Target Manager Asset Relative
Asset Class Weight Weight Return Return Effect Allocation ReturnLarge Cap 12% 12% 16.91% 17.76% (0.08%) 0.02% (0.06%)Small Cap 4% 4% 14.22% 15.24% (0.03%) 0.01% (0.03%)International Equity 9% 9% 3.49% 2.67% 0.09% (0.01%) 0.08%Domestic Fixed Income 53% 54% 0.26% (1.22%) 0.82% 0.02% 0.84%Diversified Real Assets 14% 15% 6.57% 2.04% 0.63% (0.01%) 0.62%Real Estate 7% 6% 7.13% 7.16% (0.00%) 0.05% 0.04%Cash & Equivalents 1% 1% 1.42% 1.59% (0.00%) 0.01% 0.01%
Total = + +4.37% 2.86% 1.42% 0.09% 1.51%
* Current Quarter Target = 57.0% Blmbg Aggregate, 14.0% NDSIB WSI DRA Weighted Benchmark, 11.0% Russell 1000 Index, 8.0% MSCI World ex US, 6.0%
NCREIF Total Index, 3.0% Russell 2000 Index and 1.0% 3-month Treasury Bill.
37NDSIB - Workforce Safety & Insurance
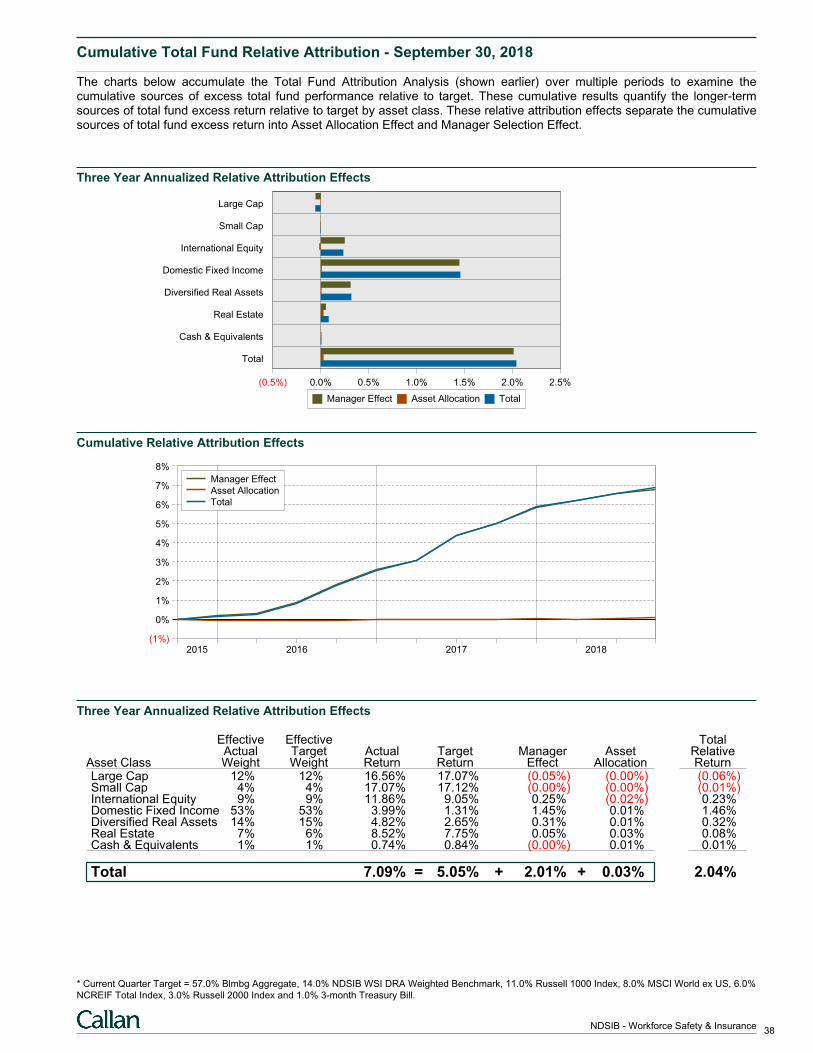
Cumulative Total Fund Relative Attribution - September 30, 2018
The charts below accumulate the Total Fund Attribution Analysis (shown earlier) over multiple periods to examine thecumulative sources of excess total fund performance relative to target. These cumulative results quantify the longer-termsources of total fund excess return relative to target by asset class. These relative attribution effects separate the cumulativesources of total fund excess return into Asset Allocation Effect and Manager Selection Effect.
Three Year Annualized Relative Attribution Effects
(0.5%) 0.0% 0.5% 1.0% 1.5% 2.0% 2.5%
Large Cap
Small Cap
International Equity
Domestic Fixed Income
Diversified Real Assets
Real Estate
Cash & Equivalents
Total
Manager Effect Asset Allocation Total
Cumulative Relative Attribution Effects
(1%)
0%
1%
2%
3%
4%
5%
6%
7%
8%
2015 2016 2017 2018
Manager Effect
Asset Allocation
Total
Three Year Annualized Relative Attribution Effects
Effective Effective TotalActual Target Actual Target Manager Asset Relative
Asset Class Weight Weight Return Return Effect Allocation ReturnLarge Cap 12% 12% 16.56% 17.07% (0.05%) (0.00%) (0.06%)Small Cap 4% 4% 17.07% 17.12% (0.00%) (0.00%) (0.01%)International Equity 9% 9% 11.86% 9.05% 0.25% (0.02%) 0.23%Domestic Fixed Income 53% 53% 3.99% 1.31% 1.45% 0.01% 1.46%Diversified Real Assets 14% 15% 4.82% 2.65% 0.31% 0.01% 0.32%Real Estate 7% 6% 8.52% 7.75% 0.05% 0.03% 0.08%Cash & Equivalents 1% 1% 0.74% 0.84% (0.00%) 0.01% 0.01%
Total = + +7.09% 5.05% 2.01% 0.03% 2.04%
* Current Quarter Target = 57.0% Blmbg Aggregate, 14.0% NDSIB WSI DRA Weighted Benchmark, 11.0% Russell 1000 Index, 8.0% MSCI World ex US, 6.0%
NCREIF Total Index, 3.0% Russell 2000 Index and 1.0% 3-month Treasury Bill.
38NDSIB - Workforce Safety & Insurance
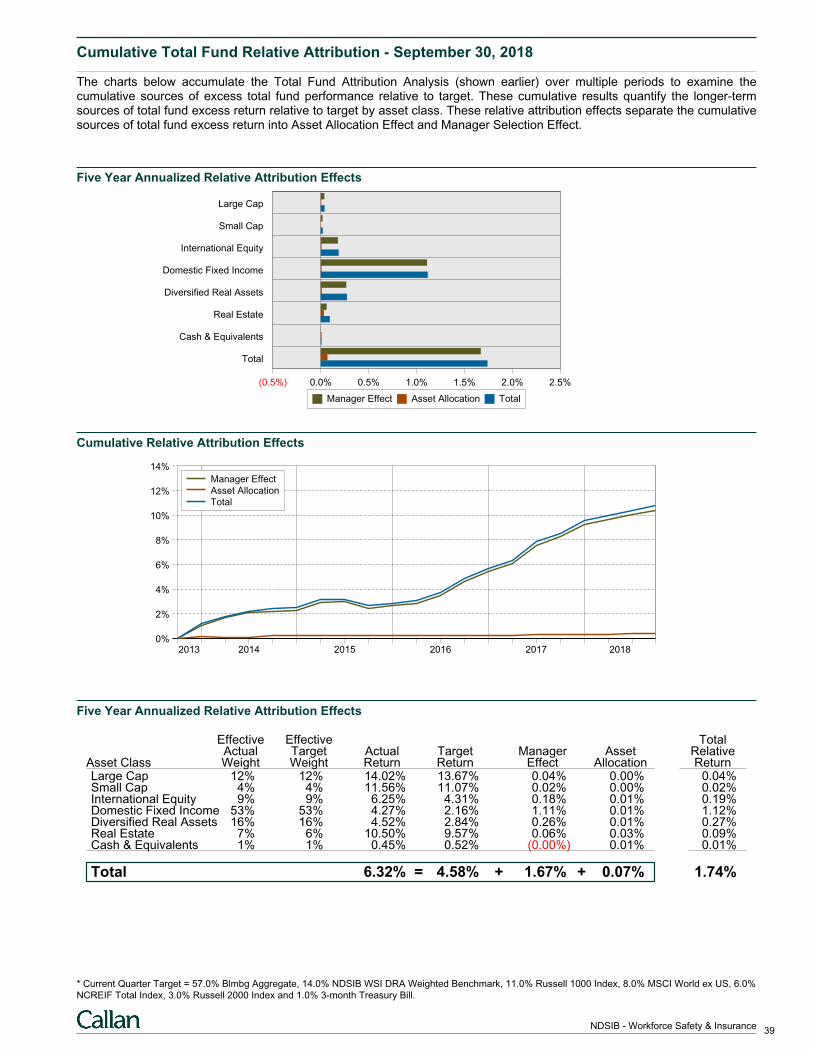
Cumulative Total Fund Relative Attribution - September 30, 2018
The charts below accumulate the Total Fund Attribution Analysis (shown earlier) over multiple periods to examine thecumulative sources of excess total fund performance relative to target. These cumulative results quantify the longer-termsources of total fund excess return relative to target by asset class. These relative attribution effects separate the cumulativesources of total fund excess return into Asset Allocation Effect and Manager Selection Effect.
Five Year Annualized Relative Attribution Effects
(0.5%) 0.0% 0.5% 1.0% 1.5% 2.0% 2.5%
Large Cap
Small Cap
International Equity
Domestic Fixed Income
Diversified Real Assets
Real Estate
Cash & Equivalents
Total
Manager Effect Asset Allocation Total
Cumulative Relative Attribution Effects
0%
2%
4%
6%
8%
10%
12%
14%
2013 2014 2015 2016 2017 2018
Manager Effect
Asset Allocation
Total
Five Year Annualized Relative Attribution Effects
Effective Effective TotalActual Target Actual Target Manager Asset Relative
Asset Class Weight Weight Return Return Effect Allocation ReturnLarge Cap 12% 12% 14.02% 13.67% 0.04% 0.00% 0.04%Small Cap 4% 4% 11.56% 11.07% 0.02% 0.00% 0.02%International Equity 9% 9% 6.25% 4.31% 0.18% 0.01% 0.19%Domestic Fixed Income 53% 53% 4.27% 2.16% 1.11% 0.01% 1.12%Diversified Real Assets 16% 16% 4.52% 2.84% 0.26% 0.01% 0.27%Real Estate 7% 6% 10.50% 9.57% 0.06% 0.03% 0.09%Cash & Equivalents 1% 1% 0.45% 0.52% (0.00%) 0.01% 0.01%
Total = + +6.32% 4.58% 1.67% 0.07% 1.74%
* Current Quarter Target = 57.0% Blmbg Aggregate, 14.0% NDSIB WSI DRA Weighted Benchmark, 11.0% Russell 1000 Index, 8.0% MSCI World ex US, 6.0%
NCREIF Total Index, 3.0% Russell 2000 Index and 1.0% 3-month Treasury Bill.
39NDSIB - Workforce Safety & Insurance
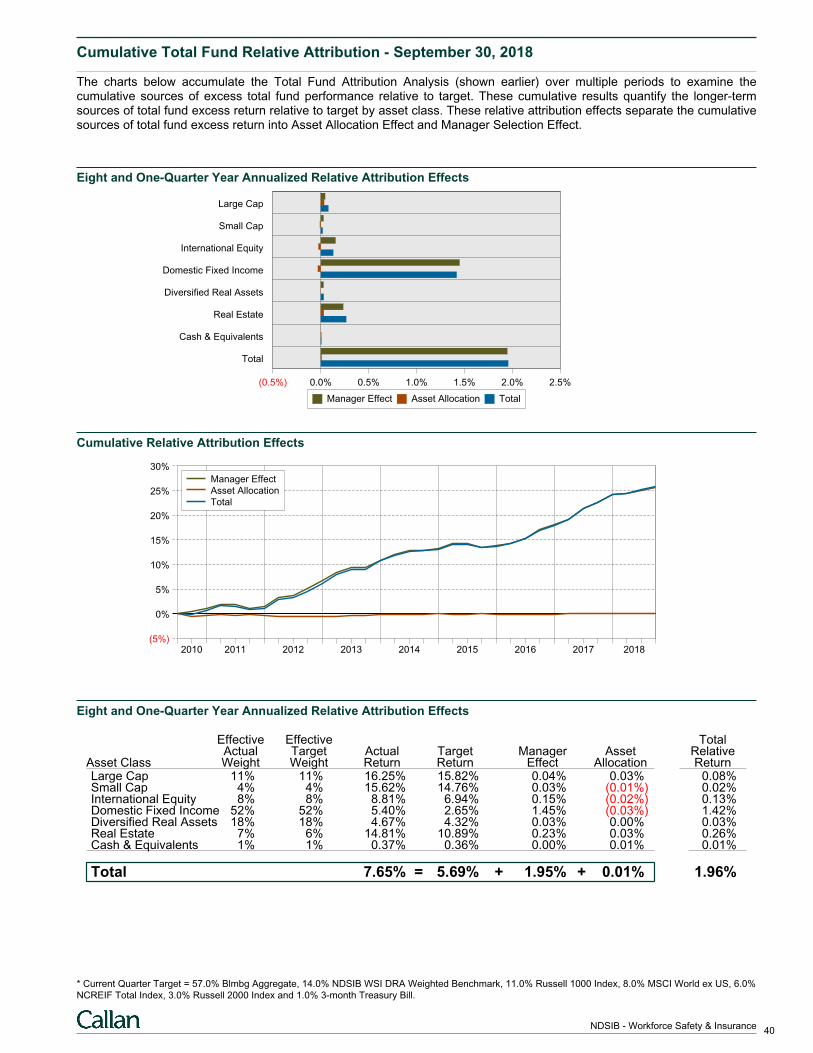
Cumulative Total Fund Relative Attribution - September 30, 2018
The charts below accumulate the Total Fund Attribution Analysis (shown earlier) over multiple periods to examine thecumulative sources of excess total fund performance relative to target. These cumulative results quantify the longer-termsources of total fund excess return relative to target by asset class. These relative attribution effects separate the cumulativesources of total fund excess return into Asset Allocation Effect and Manager Selection Effect.
Eight and One-Quarter Year Annualized Relative Attribution Effects
(0.5%) 0.0% 0.5% 1.0% 1.5% 2.0% 2.5%
Large Cap
Small Cap
International Equity
Domestic Fixed Income
Diversified Real Assets
Real Estate
Cash & Equivalents
Total
Manager Effect Asset Allocation Total
Cumulative Relative Attribution Effects
(5%)
0%
5%
10%
15%
20%
25%
30%
2010 2011 2012 2013 2014 2015 2016 2017 2018
Manager Effect
Asset Allocation
Total
Eight and One-Quarter Year Annualized Relative Attribution Effects
Effective Effective TotalActual Target Actual Target Manager Asset Relative
Asset Class Weight Weight Return Return Effect Allocation ReturnLarge Cap 11% 11% 16.25% 15.82% 0.04% 0.03% 0.08%Small Cap 4% 4% 15.62% 14.76% 0.03% (0.01%) 0.02%International Equity 8% 8% 8.81% 6.94% 0.15% (0.02%) 0.13%Domestic Fixed Income 52% 52% 5.40% 2.65% 1.45% (0.03%) 1.42%Diversified Real Assets 18% 18% 4.67% 4.32% 0.03% 0.00% 0.03%Real Estate 7% 6% 14.81% 10.89% 0.23% 0.03% 0.26%Cash & Equivalents 1% 1% 0.37% 0.36% 0.00% 0.01% 0.01%
Total = + +7.65% 5.69% 1.95% 0.01% 1.96%
* Current Quarter Target = 57.0% Blmbg Aggregate, 14.0% NDSIB WSI DRA Weighted Benchmark, 11.0% Russell 1000 Index, 8.0% MSCI World ex US, 6.0%
NCREIF Total Index, 3.0% Russell 2000 Index and 1.0% 3-month Treasury Bill.
40NDSIB - Workforce Safety & Insurance
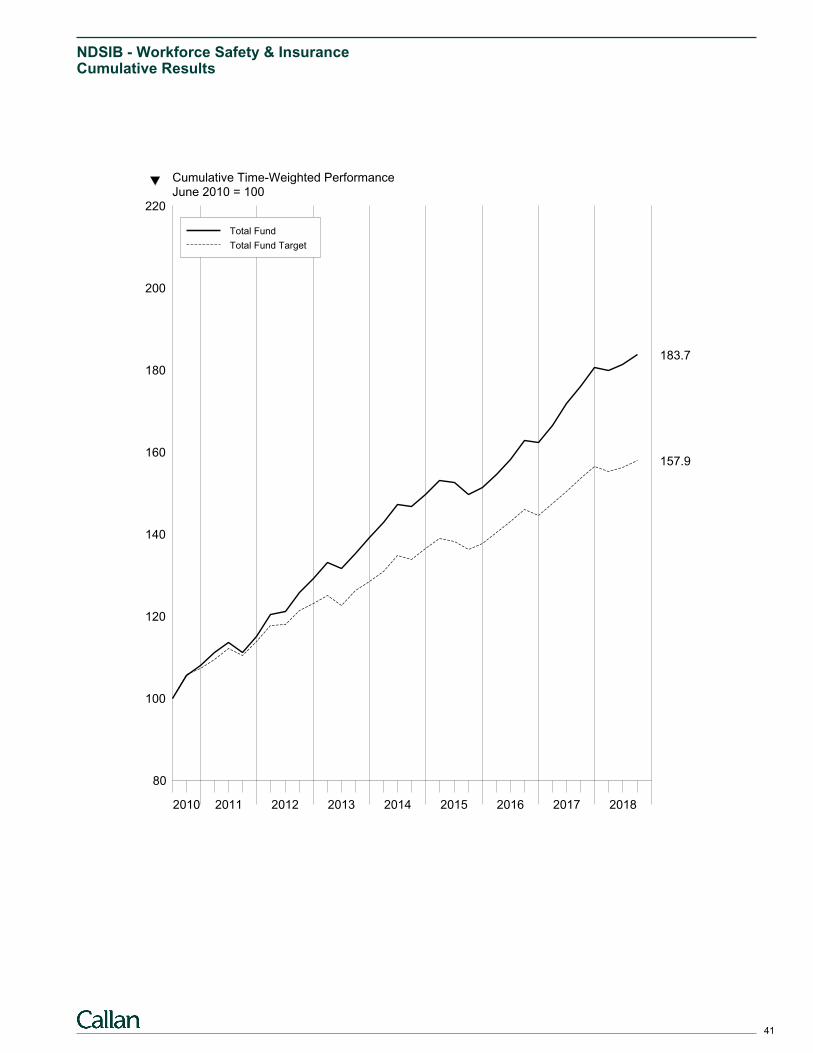
NDSIB - Workforce Safety & InsuranceCumulative Results
80
100
120
140
160
180
200
220
2010 2011 2012 2013 2014 2015 2016 2017 2018
183.7
157.9
Cumulative Time-Weighted PerformanceJune 2010 = 100
Total Fund
Total Fund Target
41
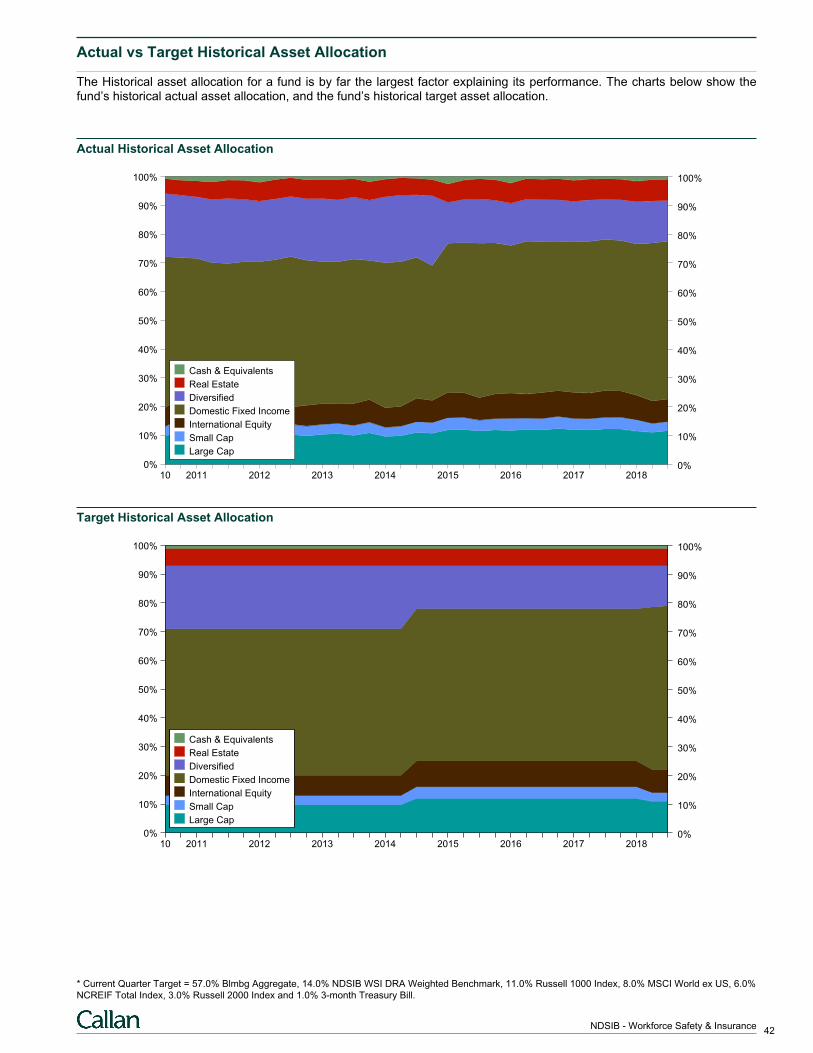
Actual vs Target Historical Asset Allocation
The Historical asset allocation for a fund is by far the largest factor explaining its performance. The charts below show thefund’s historical actual asset allocation, and the fund’s historical target asset allocation.
Actual Historical Asset Allocation
0% 0%
10% 10%
20% 20%
30% 30%
40% 40%
50% 50%
60% 60%
70% 70%
80% 80%
90% 90%
100% 100%
10 2011 2012 2013 2014 2015 2016 2017 2018
Cash & Equivalents
Real Estate
Diversified
Domestic Fixed Income
International Equity
Small Cap
Large Cap
Target Historical Asset Allocation
0% 0%
10% 10%
20% 20%
30% 30%
40% 40%
50% 50%
60% 60%
70% 70%
80% 80%
90% 90%
100% 100%
10 2011 2012 2013 2014 2015 2016 2017 2018
Cash & Equivalents
Real Estate
Diversified
Domestic Fixed Income
International Equity
Small Cap
Large Cap
* Current Quarter Target = 57.0% Blmbg Aggregate, 14.0% NDSIB WSI DRA Weighted Benchmark, 11.0% Russell 1000 Index, 8.0% MSCI World ex US, 6.0%
NCREIF Total Index, 3.0% Russell 2000 Index and 1.0% 3-month Treasury Bill.
42NDSIB - Workforce Safety & Insurance
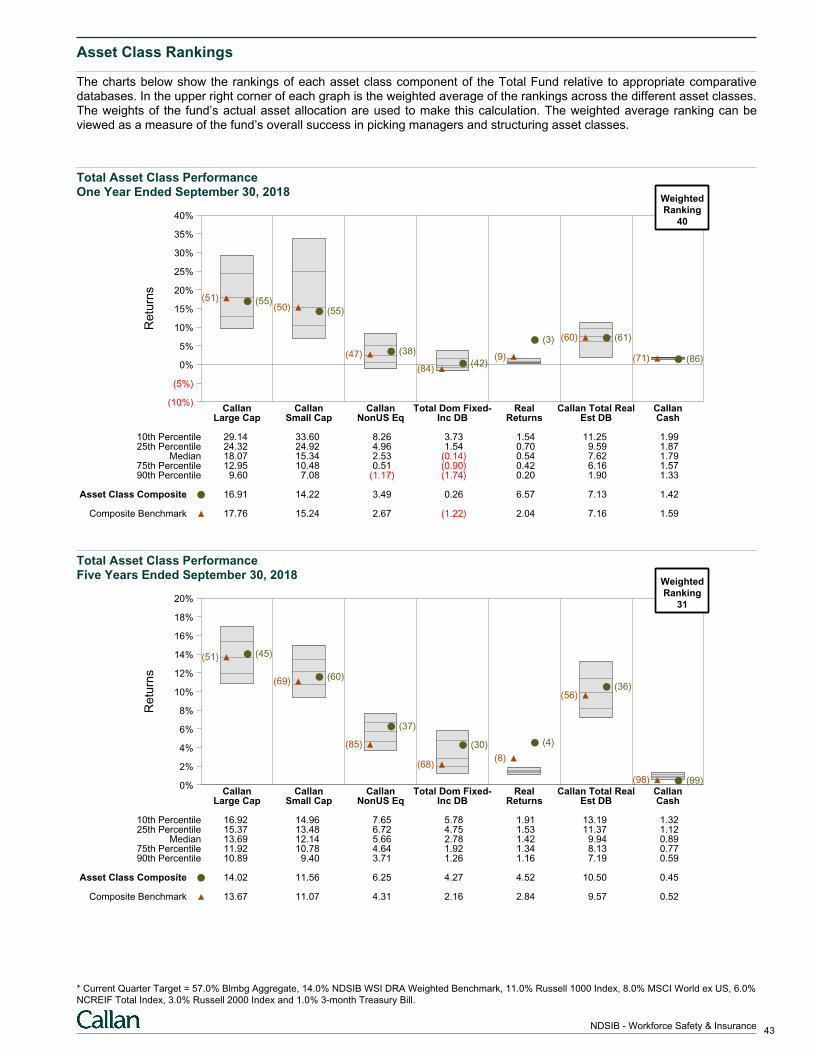
Asset Class Rankings
The charts below show the rankings of each asset class component of the Total Fund relative to appropriate comparativedatabases. In the upper right corner of each graph is the weighted average of the rankings across the different asset classes.The weights of the fund’s actual asset allocation are used to make this calculation. The weighted average ranking can beviewed as a measure of the fund’s overall success in picking managers and structuring asset classes.
Total Asset Class PerformanceOne Year Ended September 30, 2018
Re
turn
s
(10%)
(5%)
0%
5%
10%
15%
20%
25%
30%
35%
40%
Callan Callan Callan Total Dom Fixed- Real Callan Total Real CallanLarge Cap Small Cap NonUS Eq Inc DB Returns Est DB Cash
(55)(51)
(55)(50)
(38)(47)(42)
(84)
(3)
(9)
(61)(60)
(86)(71)
10th Percentile 29.14 33.60 8.26 3.73 1.54 11.25 1.9925th Percentile 24.32 24.92 4.96 1.54 0.70 9.59 1.87
Median 18.07 15.34 2.53 (0.14) 0.54 7.62 1.7975th Percentile 12.95 10.48 0.51 (0.90) 0.42 6.16 1.5790th Percentile 9.60 7.08 (1.17) (1.74) 0.20 1.90 1.33
Asset Class Composite 16.91 14.22 3.49 0.26 6.57 7.13 1.42
Composite Benchmark 17.76 15.24 2.67 (1.22) 2.04 7.16 1.59
WeightedRanking
40
Total Asset Class PerformanceFive Years Ended September 30, 2018
Re
turn
s
0%
2%
4%
6%
8%
10%
12%
14%
16%
18%
20%
Callan Callan Callan Total Dom Fixed- Real Callan Total Real CallanLarge Cap Small Cap NonUS Eq Inc DB Returns Est DB Cash
(45)(51)
(60)(69)
(37)
(85) (30)
(68)
(4)
(8)
(36)(56)
(99)(98)
10th Percentile 16.92 14.96 7.65 5.78 1.91 13.19 1.3225th Percentile 15.37 13.48 6.72 4.75 1.53 11.37 1.12
Median 13.69 12.14 5.66 2.78 1.42 9.94 0.8975th Percentile 11.92 10.78 4.64 1.92 1.34 8.13 0.7790th Percentile 10.89 9.40 3.71 1.26 1.16 7.19 0.59
Asset Class Composite 14.02 11.56 6.25 4.27 4.52 10.50 0.45
Composite Benchmark 13.67 11.07 4.31 2.16 2.84 9.57 0.52
WeightedRanking
31
* Current Quarter Target = 57.0% Blmbg Aggregate, 14.0% NDSIB WSI DRA Weighted Benchmark, 11.0% Russell 1000 Index, 8.0% MSCI World ex US, 6.0%
NCREIF Total Index, 3.0% Russell 2000 Index and 1.0% 3-month Treasury Bill.
43NDSIB - Workforce Safety & Insurance
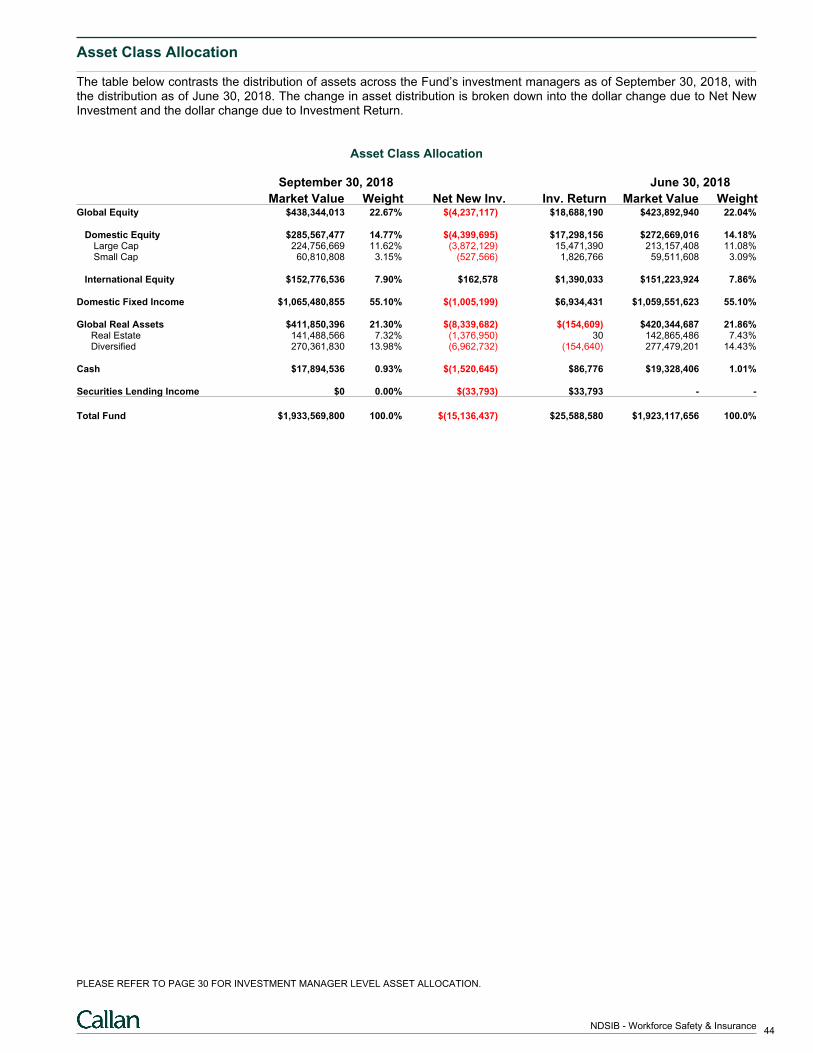
Asset Class Allocation
The table below contrasts the distribution of assets across the Fund’s investment managers as of September 30, 2018, withthe distribution as of June 30, 2018. The change in asset distribution is broken down into the dollar change due to Net NewInvestment and the dollar change due to Investment Return.
Asset Class Allocation
September 30, 2018 June 30, 2018
Market Value Weight Net New Inv. Inv. Return Market Value WeightGlobal Equity $438,344,013 22.67% $(4,237,117) $18,688,190 $423,892,940 22.04%
Domestic Equity $285,567,477 14.77% $(4,399,695) $17,298,156 $272,669,016 14.18% Large Cap 224,756,669 11.62% (3,872,129) 15,471,390 213,157,408 11.08% Small Cap 60,810,808 3.15% (527,566) 1,826,766 59,511,608 3.09%
International Equity $152,776,536 7.90% $162,578 $1,390,033 $151,223,924 7.86%
Domestic Fixed Income $1,065,480,855 55.10% $(1,005,199) $6,934,431 $1,059,551,623 55.10%
Global Real Assets $411,850,396 21.30% $(8,339,682) $(154,609) $420,344,687 21.86%Real Estate 141,488,566 7.32% (1,376,950) 30 142,865,486 7.43%Diversified 270,361,830 13.98% (6,962,732) (154,640) 277,479,201 14.43%
Cash $17,894,536 0.93% $(1,520,645) $86,776 $19,328,406 1.01%
Securities Lending Income $0 0.00% $(33,793) $33,793 - -
Total Fund $1,933,569,800 100.0% $(15,136,437) $25,588,580 $1,923,117,656 100.0%
PLEASE REFER TO PAGE 30 FOR INVESTMENT MANAGER LEVEL ASSET ALLOCATION.
44NDSIB - Workforce Safety & Insurance
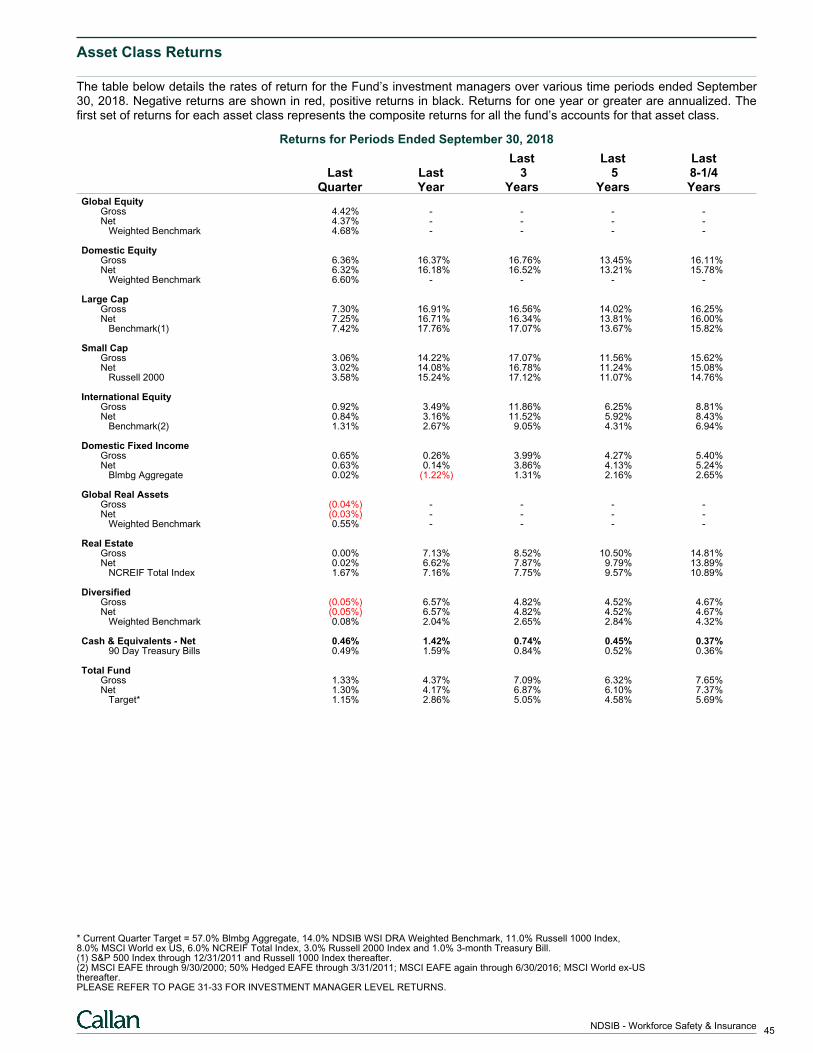
Asset Class Returns
The table below details the rates of return for the Fund’s investment managers over various time periods ended September30, 2018. Negative returns are shown in red, positive returns in black. Returns for one year or greater are annualized. Thefirst set of returns for each asset class represents the composite returns for all the fund’s accounts for that asset class.
Returns for Periods Ended September 30, 2018
Last Last LastLast Last 3 5 8-1/4
Quarter Year Years Years YearsGlobal Equity
Gross 4.42% - - - -Net 4.37% - - - - Weighted Benchmark 4.68% - - - -
Domestic EquityGross 6.36% 16.37% 16.76% 13.45% 16.11%Net 6.32% 16.18% 16.52% 13.21% 15.78% Weighted Benchmark 6.60% - - - -
Large CapGross 7.30% 16.91% 16.56% 14.02% 16.25%Net 7.25% 16.71% 16.34% 13.81% 16.00% Benchmark(1) 7.42% 17.76% 17.07% 13.67% 15.82%
Small CapGross 3.06% 14.22% 17.07% 11.56% 15.62%Net 3.02% 14.08% 16.78% 11.24% 15.08% Russell 2000 3.58% 15.24% 17.12% 11.07% 14.76%
International EquityGross 0.92% 3.49% 11.86% 6.25% 8.81%Net 0.84% 3.16% 11.52% 5.92% 8.43% Benchmark(2) 1.31% 2.67% 9.05% 4.31% 6.94%
Domestic Fixed IncomeGross 0.65% 0.26% 3.99% 4.27% 5.40%Net 0.63% 0.14% 3.86% 4.13% 5.24% Blmbg Aggregate 0.02% (1.22%) 1.31% 2.16% 2.65%
Global Real AssetsGross (0.04%) - - - -Net (0.03%) - - - - Weighted Benchmark 0.55% - - - -
Real EstateGross 0.00% 7.13% 8.52% 10.50% 14.81%Net 0.02% 6.62% 7.87% 9.79% 13.89% NCREIF Total Index 1.67% 7.16% 7.75% 9.57% 10.89%
DiversifiedGross (0.05%) 6.57% 4.82% 4.52% 4.67%Net (0.05%) 6.57% 4.82% 4.52% 4.67% Weighted Benchmark 0.08% 2.04% 2.65% 2.84% 4.32%
Cash & Equivalents - Net 0.46% 1.42% 0.74% 0.45% 0.37% 90 Day Treasury Bills 0.49% 1.59% 0.84% 0.52% 0.36%
Total FundGross 1.33% 4.37% 7.09% 6.32% 7.65%Net 1.30% 4.17% 6.87% 6.10% 7.37% Target* 1.15% 2.86% 5.05% 4.58% 5.69%
* Current Quarter Target = 57.0% Blmbg Aggregate, 14.0% NDSIB WSI DRA Weighted Benchmark, 11.0% Russell 1000 Index,8.0% MSCI World ex US, 6.0% NCREIF Total Index, 3.0% Russell 2000 Index and 1.0% 3-month Treasury Bill.(1) S&P 500 Index through 12/31/2011 and Russell 1000 Index thereafter.(2) MSCI EAFE through 9/30/2000; 50% Hedged EAFE through 3/31/2011; MSCI EAFE again through 6/30/2016; MSCI World ex-USthereafter.PLEASE REFER TO PAGE 31-33 FOR INVESTMENT MANAGER LEVEL RETURNS.
45NDSIB - Workforce Safety & Insurance
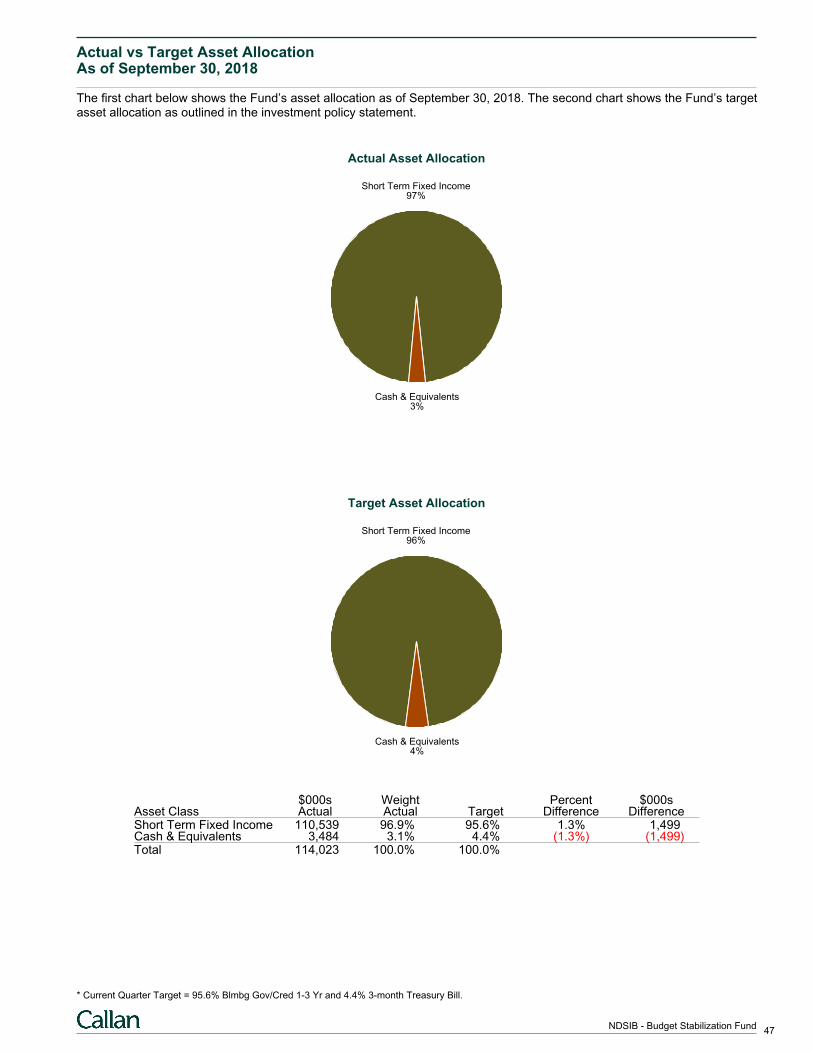
Actual vs Target Asset AllocationAs of September 30, 2018
The first chart below shows the Fund’s asset allocation as of September 30, 2018. The second chart shows the Fund’s targetasset allocation as outlined in the investment policy statement.
Actual Asset Allocation
Short Term Fixed Income97%
Cash & Equivalents3%
Target Asset Allocation
Short Term Fixed Income96%
Cash & Equivalents4%
$000s Weight Percent $000sAsset Class Actual Actual Target Difference DifferenceShort Term Fixed Income 110,539 96.9% 95.6% 1.3% 1,499Cash & Equivalents 3,484 3.1% 4.4% (1.3%) (1,499)Total 114,023 100.0% 100.0%
* Current Quarter Target = 95.6% Blmbg Gov/Cred 1-3 Yr and 4.4% 3-month Treasury Bill.
47NDSIB - Budget Stabilization Fund
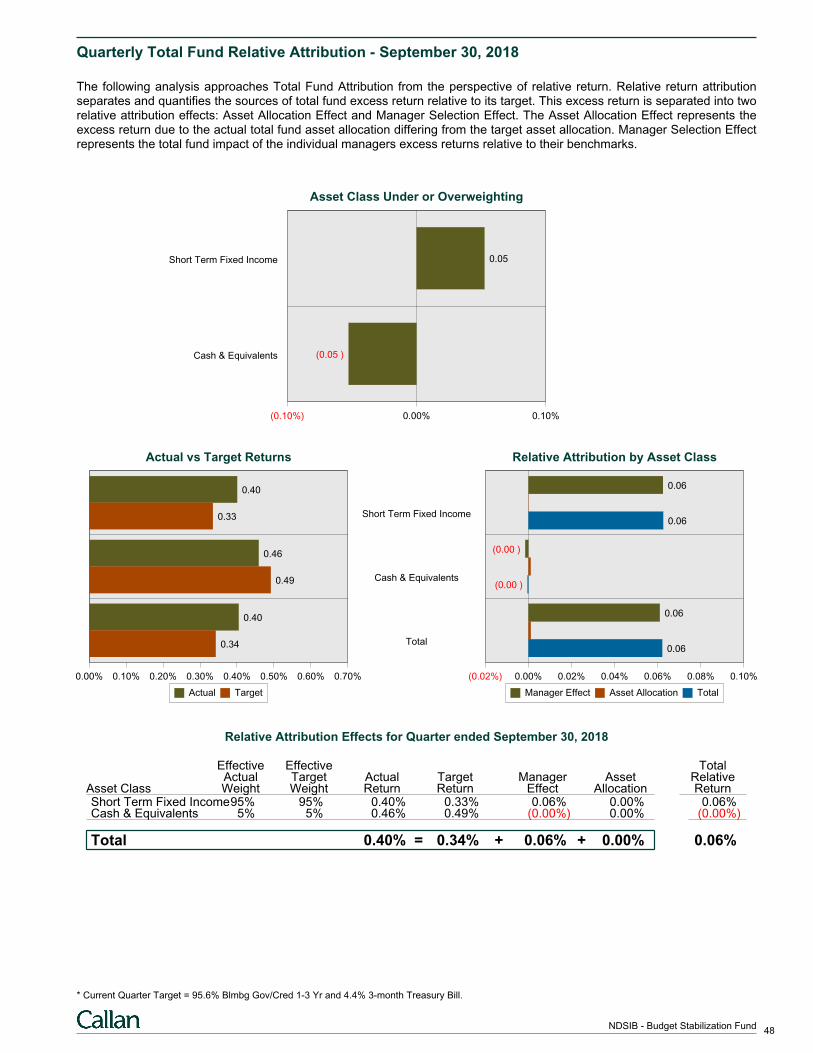
Quarterly Total Fund Relative Attribution - September 30, 2018
The following analysis approaches Total Fund Attribution from the perspective of relative return. Relative return attributionseparates and quantifies the sources of total fund excess return relative to its target. This excess return is separated into tworelative attribution effects: Asset Allocation Effect and Manager Selection Effect. The Asset Allocation Effect represents theexcess return due to the actual total fund asset allocation differing from the target asset allocation. Manager Selection Effectrepresents the total fund impact of the individual managers excess returns relative to their benchmarks.
Asset Class Under or Overweighting
(0.10%) 0.00% 0.10%
Short Term Fixed Income 0.05
Cash & Equivalents (0.05 )
Short Term Fixed Income
Cash & Equivalents
Total
Actual vs Target Returns
0.00% 0.10% 0.20% 0.30% 0.40% 0.50% 0.60% 0.70%
0.40
0.33
0.46
0.49
0.40
0.34
Actual Target
Relative Attribution by Asset Class
(0.02%) 0.00% 0.02% 0.04% 0.06% 0.08% 0.10%
0.06
0.06
(0.00 )
(0.00 )
0.06
0.06
Manager Effect Asset Allocation Total
Relative Attribution Effects for Quarter ended September 30, 2018
Effective Effective TotalActual Target Actual Target Manager Asset Relative
Asset Class Weight Weight Return Return Effect Allocation ReturnShort Term Fixed Income95% 95% 0.40% 0.33% 0.06% 0.00% 0.06%Cash & Equivalents 5% 5% 0.46% 0.49% (0.00%) 0.00% (0.00%)
Total = + +0.40% 0.34% 0.06% 0.00% 0.06%
* Current Quarter Target = 95.6% Blmbg Gov/Cred 1-3 Yr and 4.4% 3-month Treasury Bill.
48NDSIB - Budget Stabilization Fund
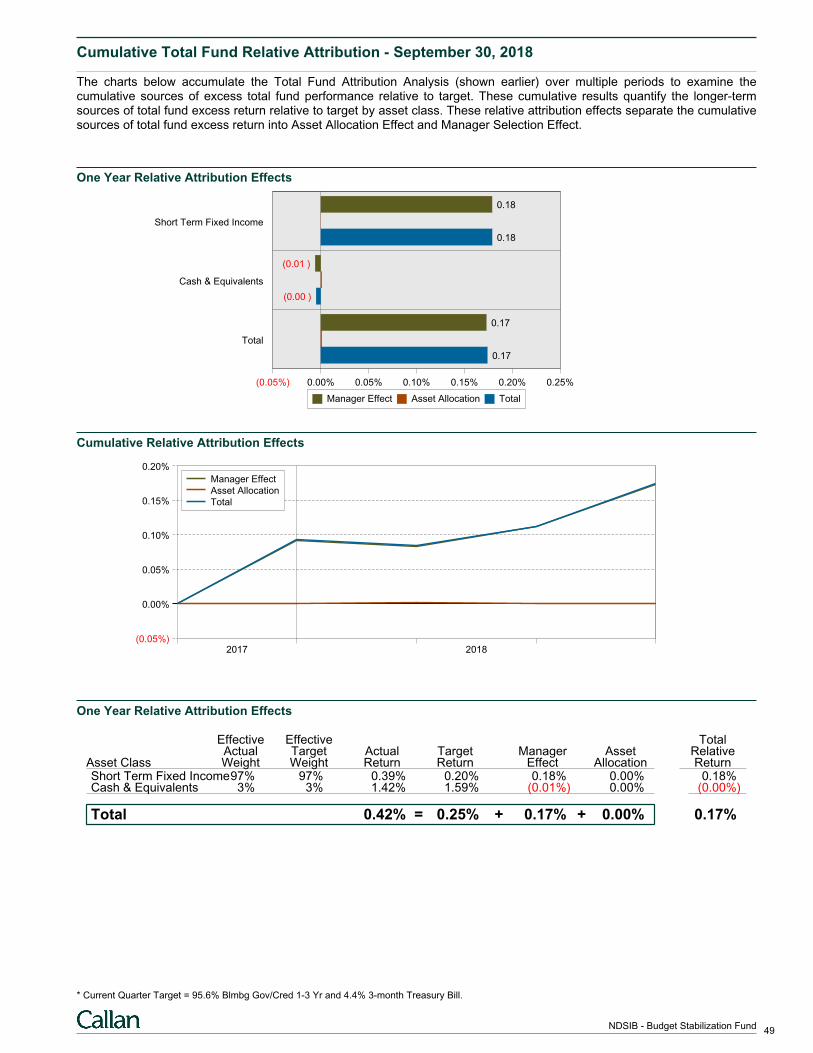
Cumulative Total Fund Relative Attribution - September 30, 2018
The charts below accumulate the Total Fund Attribution Analysis (shown earlier) over multiple periods to examine thecumulative sources of excess total fund performance relative to target. These cumulative results quantify the longer-termsources of total fund excess return relative to target by asset class. These relative attribution effects separate the cumulativesources of total fund excess return into Asset Allocation Effect and Manager Selection Effect.
One Year Relative Attribution Effects
(0.05%) 0.00% 0.05% 0.10% 0.15% 0.20% 0.25%
Short Term Fixed Income
0.18
0.18
Cash & Equivalents
(0.01 )
(0.00 )
Total
0.17
0.17
Manager Effect Asset Allocation Total
Cumulative Relative Attribution Effects
(0.05%)
0.00%
0.05%
0.10%
0.15%
0.20%
2017 2018
Manager Effect
Asset Allocation
Total
One Year Relative Attribution Effects
Effective Effective TotalActual Target Actual Target Manager Asset Relative
Asset Class Weight Weight Return Return Effect Allocation ReturnShort Term Fixed Income97% 97% 0.39% 0.20% 0.18% 0.00% 0.18%Cash & Equivalents 3% 3% 1.42% 1.59% (0.01%) 0.00% (0.00%)
Total = + +0.42% 0.25% 0.17% 0.00% 0.17%
* Current Quarter Target = 95.6% Blmbg Gov/Cred 1-3 Yr and 4.4% 3-month Treasury Bill.
49NDSIB - Budget Stabilization Fund
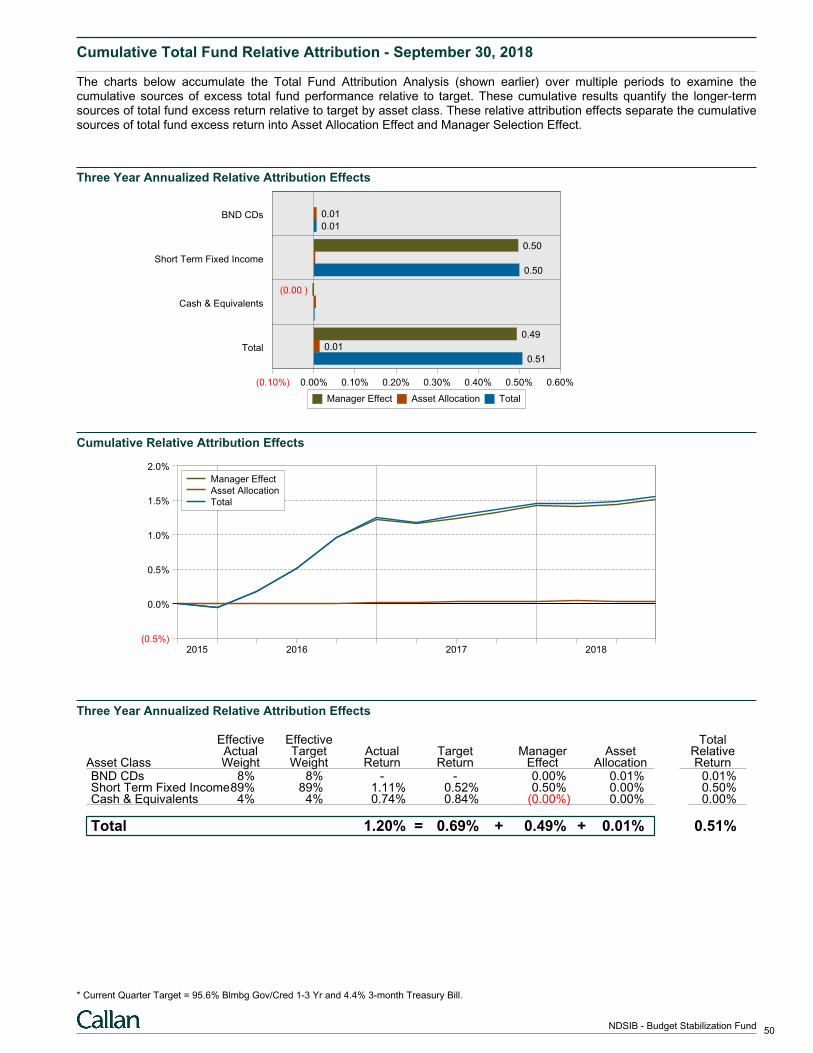
Cumulative Total Fund Relative Attribution - September 30, 2018
The charts below accumulate the Total Fund Attribution Analysis (shown earlier) over multiple periods to examine thecumulative sources of excess total fund performance relative to target. These cumulative results quantify the longer-termsources of total fund excess return relative to target by asset class. These relative attribution effects separate the cumulativesources of total fund excess return into Asset Allocation Effect and Manager Selection Effect.
Three Year Annualized Relative Attribution Effects
(0.10%) 0.00% 0.10% 0.20% 0.30% 0.40% 0.50% 0.60%
BND CDs 0.01
0.01
Short Term Fixed Income
0.50
0.50
Cash & Equivalents
(0.00 )
Total
0.49
0.01
0.51
Manager Effect Asset Allocation Total
Cumulative Relative Attribution Effects
(0.5%)
0.0%
0.5%
1.0%
1.5%
2.0%
2015 2016 2017 2018
Manager Effect
Asset Allocation
Total
Three Year Annualized Relative Attribution Effects
Effective Effective TotalActual Target Actual Target Manager Asset Relative
Asset Class Weight Weight Return Return Effect Allocation ReturnBND CDs 8% 8% - - 0.00% 0.01% 0.01%Short Term Fixed Income89% 89% 1.11% 0.52% 0.50% 0.00% 0.50%Cash & Equivalents 4% 4% 0.74% 0.84% (0.00%) 0.00% 0.00%
Total = + +1.20% 0.69% 0.49% 0.01% 0.51%
* Current Quarter Target = 95.6% Blmbg Gov/Cred 1-3 Yr and 4.4% 3-month Treasury Bill.
50NDSIB - Budget Stabilization Fund
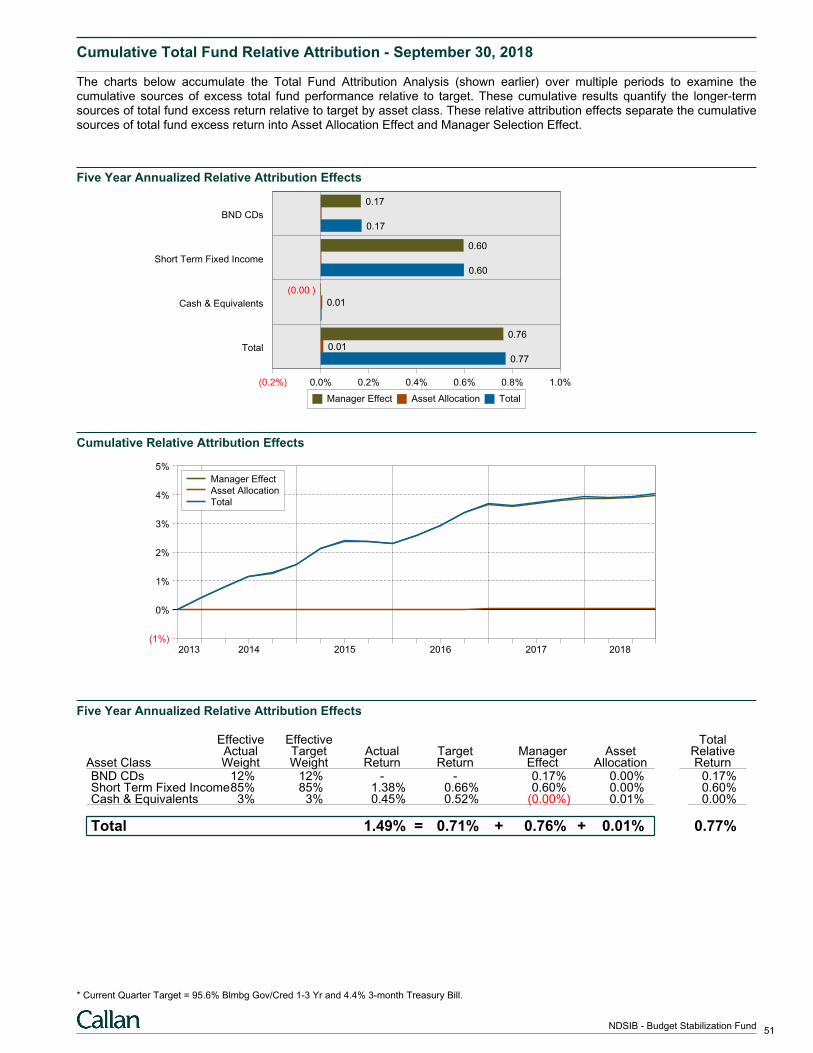
Cumulative Total Fund Relative Attribution - September 30, 2018
The charts below accumulate the Total Fund Attribution Analysis (shown earlier) over multiple periods to examine thecumulative sources of excess total fund performance relative to target. These cumulative results quantify the longer-termsources of total fund excess return relative to target by asset class. These relative attribution effects separate the cumulativesources of total fund excess return into Asset Allocation Effect and Manager Selection Effect.
Five Year Annualized Relative Attribution Effects
(0.2%) 0.0% 0.2% 0.4% 0.6% 0.8% 1.0%
BND CDs
0.17
0.17
Short Term Fixed Income
0.60
0.60
Cash & Equivalents
(0.00 )
0.01
Total
0.76
0.01
0.77
Manager Effect Asset Allocation Total
Cumulative Relative Attribution Effects
(1%)
0%
1%
2%
3%
4%
5%
2013 2014 2015 2016 2017 2018
Manager Effect
Asset Allocation
Total
Five Year Annualized Relative Attribution Effects
Effective Effective TotalActual Target Actual Target Manager Asset Relative
Asset Class Weight Weight Return Return Effect Allocation ReturnBND CDs 12% 12% - - 0.17% 0.00% 0.17%Short Term Fixed Income85% 85% 1.38% 0.66% 0.60% 0.00% 0.60%Cash & Equivalents 3% 3% 0.45% 0.52% (0.00%) 0.01% 0.00%
Total = + +1.49% 0.71% 0.76% 0.01% 0.77%
* Current Quarter Target = 95.6% Blmbg Gov/Cred 1-3 Yr and 4.4% 3-month Treasury Bill.
51NDSIB - Budget Stabilization Fund
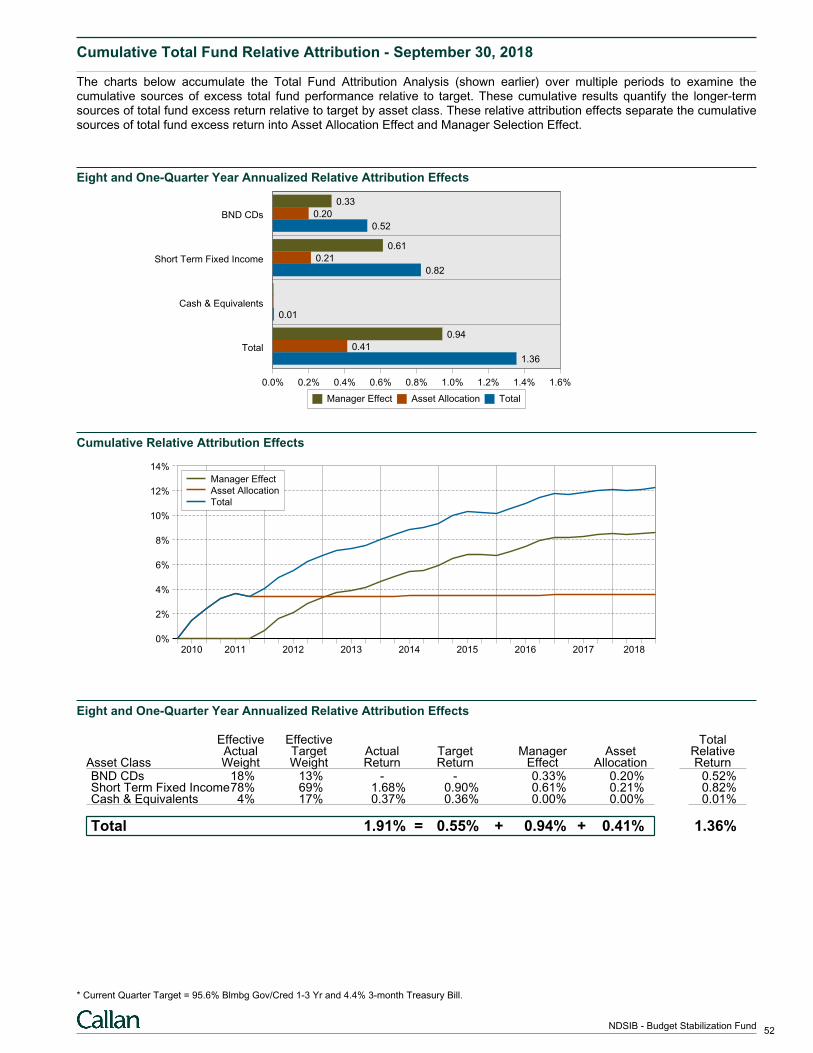
Cumulative Total Fund Relative Attribution - September 30, 2018
The charts below accumulate the Total Fund Attribution Analysis (shown earlier) over multiple periods to examine thecumulative sources of excess total fund performance relative to target. These cumulative results quantify the longer-termsources of total fund excess return relative to target by asset class. These relative attribution effects separate the cumulativesources of total fund excess return into Asset Allocation Effect and Manager Selection Effect.
Eight and One-Quarter Year Annualized Relative Attribution Effects
0.0% 0.2% 0.4% 0.6% 0.8% 1.0% 1.2% 1.4% 1.6%
BND CDs
0.33
0.20
0.52
Short Term Fixed Income
0.61
0.21
0.82
Cash & Equivalents
0.01
Total
0.94
0.41
1.36
Manager Effect Asset Allocation Total
Cumulative Relative Attribution Effects
0%
2%
4%
6%
8%
10%
12%
14%
2010 2011 2012 2013 2014 2015 2016 2017 2018
Manager Effect
Asset Allocation
Total
Eight and One-Quarter Year Annualized Relative Attribution Effects
Effective Effective TotalActual Target Actual Target Manager Asset Relative
Asset Class Weight Weight Return Return Effect Allocation ReturnBND CDs 18% 13% - - 0.33% 0.20% 0.52%Short Term Fixed Income78% 69% 1.68% 0.90% 0.61% 0.21% 0.82%Cash & Equivalents 4% 17% 0.37% 0.36% 0.00% 0.00% 0.01%
Total = + +1.91% 0.55% 0.94% 0.41% 1.36%
* Current Quarter Target = 95.6% Blmbg Gov/Cred 1-3 Yr and 4.4% 3-month Treasury Bill.
52NDSIB - Budget Stabilization Fund
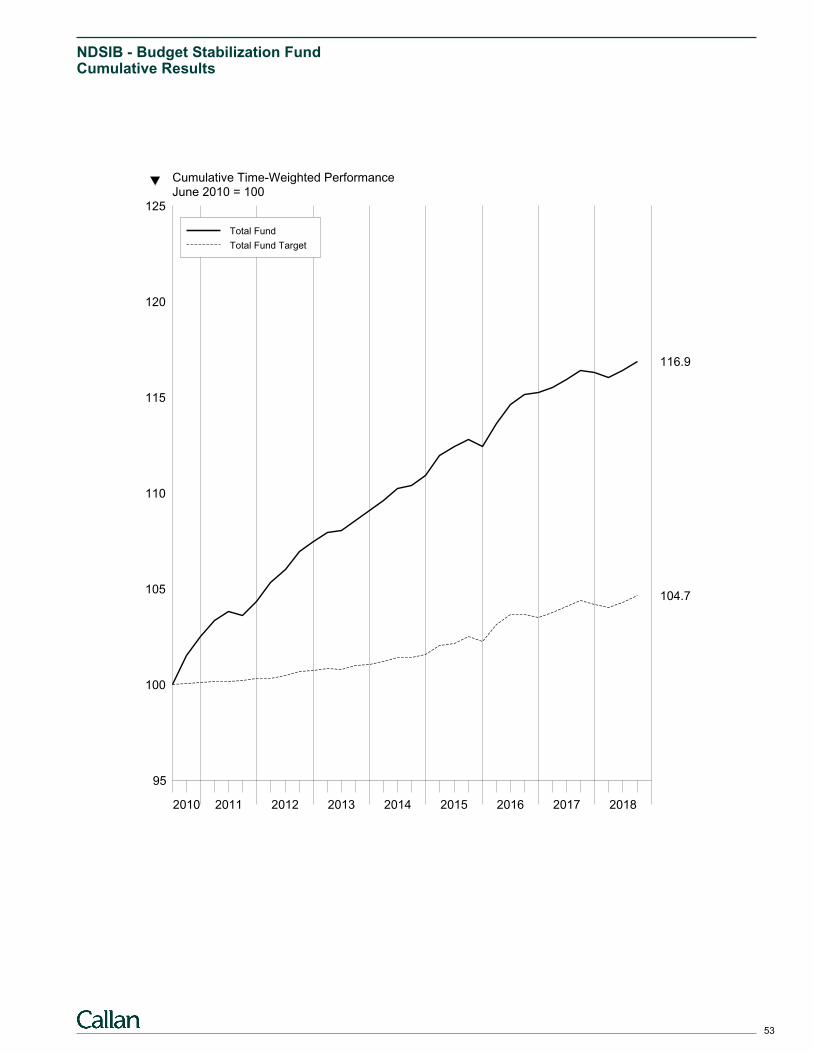
NDSIB - Budget Stabilization FundCumulative Results
95
100
105
110
115
120
125
2010 2011 2012 2013 2014 2015 2016 2017 2018
116.9
104.7
Cumulative Time-Weighted PerformanceJune 2010 = 100
Total Fund
Total Fund Target
53
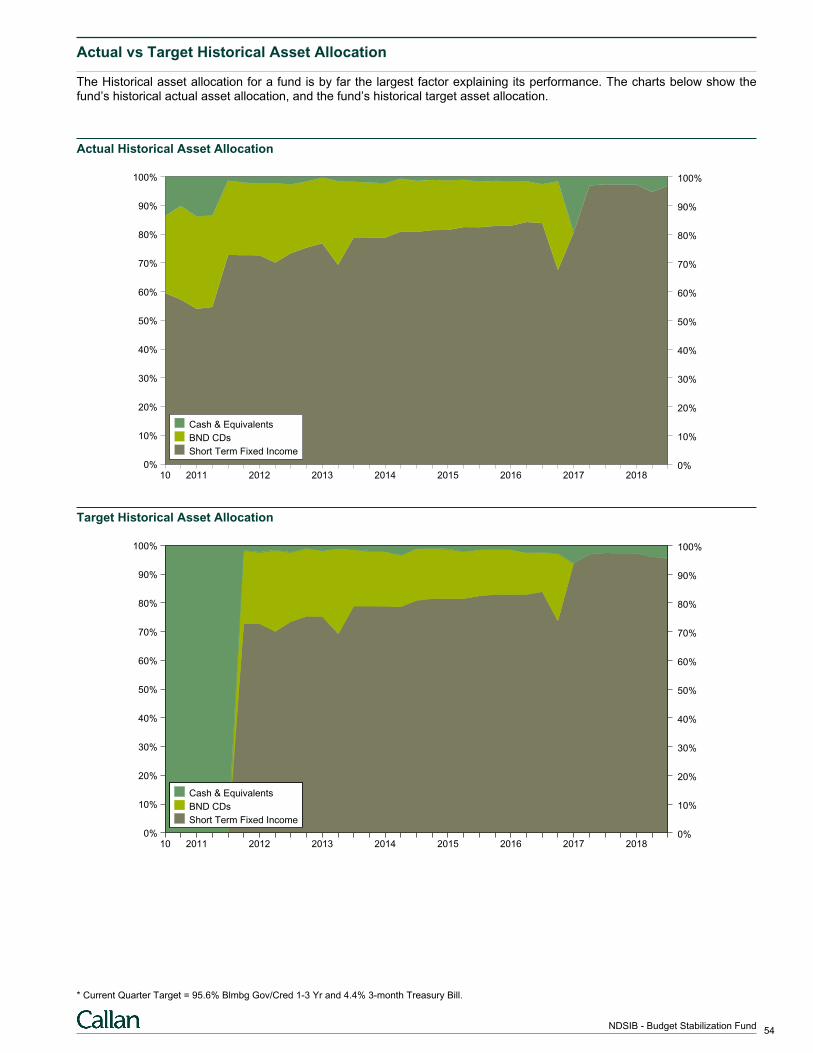
Actual vs Target Historical Asset Allocation
The Historical asset allocation for a fund is by far the largest factor explaining its performance. The charts below show thefund’s historical actual asset allocation, and the fund’s historical target asset allocation.
Actual Historical Asset Allocation
0% 0%
10% 10%
20% 20%
30% 30%
40% 40%
50% 50%
60% 60%
70% 70%
80% 80%
90% 90%
100% 100%
10 2011 2012 2013 2014 2015 2016 2017 2018
Cash & Equivalents
BND CDs
Short Term Fixed Income
Target Historical Asset Allocation
0% 0%
10% 10%
20% 20%
30% 30%
40% 40%
50% 50%
60% 60%
70% 70%
80% 80%
90% 90%
100% 100%
10 2011 2012 2013 2014 2015 2016 2017 2018
Cash & Equivalents
BND CDs
Short Term Fixed Income
* Current Quarter Target = 95.6% Blmbg Gov/Cred 1-3 Yr and 4.4% 3-month Treasury Bill.
54NDSIB - Budget Stabilization Fund
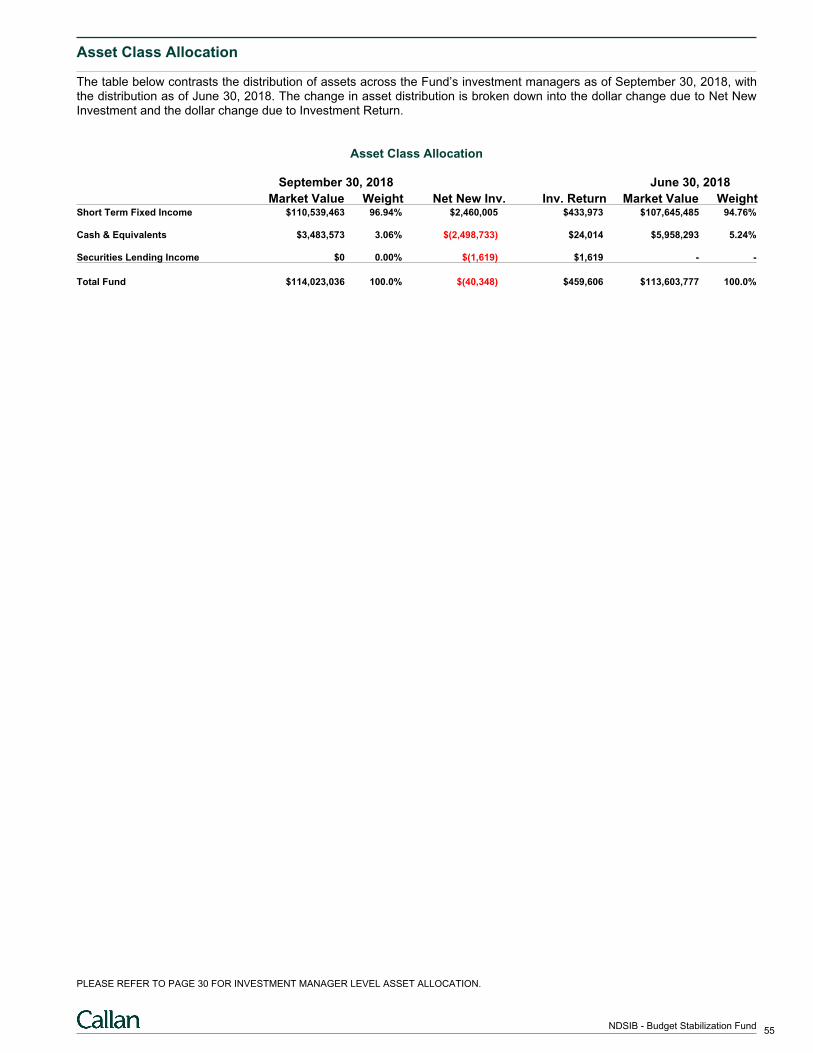
Asset Class Allocation
The table below contrasts the distribution of assets across the Fund’s investment managers as of September 30, 2018, withthe distribution as of June 30, 2018. The change in asset distribution is broken down into the dollar change due to Net NewInvestment and the dollar change due to Investment Return.
Asset Class Allocation
September 30, 2018 June 30, 2018
Market Value Weight Net New Inv. Inv. Return Market Value WeightShort Term Fixed Income $110,539,463 96.94% $2,460,005 $433,973 $107,645,485 94.76%
Cash & Equivalents $3,483,573 3.06% $(2,498,733) $24,014 $5,958,293 5.24%
Securities Lending Income $0 0.00% $(1,619) $1,619 - -
Total Fund $114,023,036 100.0% $(40,348) $459,606 $113,603,777 100.0%
PLEASE REFER TO PAGE 30 FOR INVESTMENT MANAGER LEVEL ASSET ALLOCATION.
55NDSIB - Budget Stabilization Fund
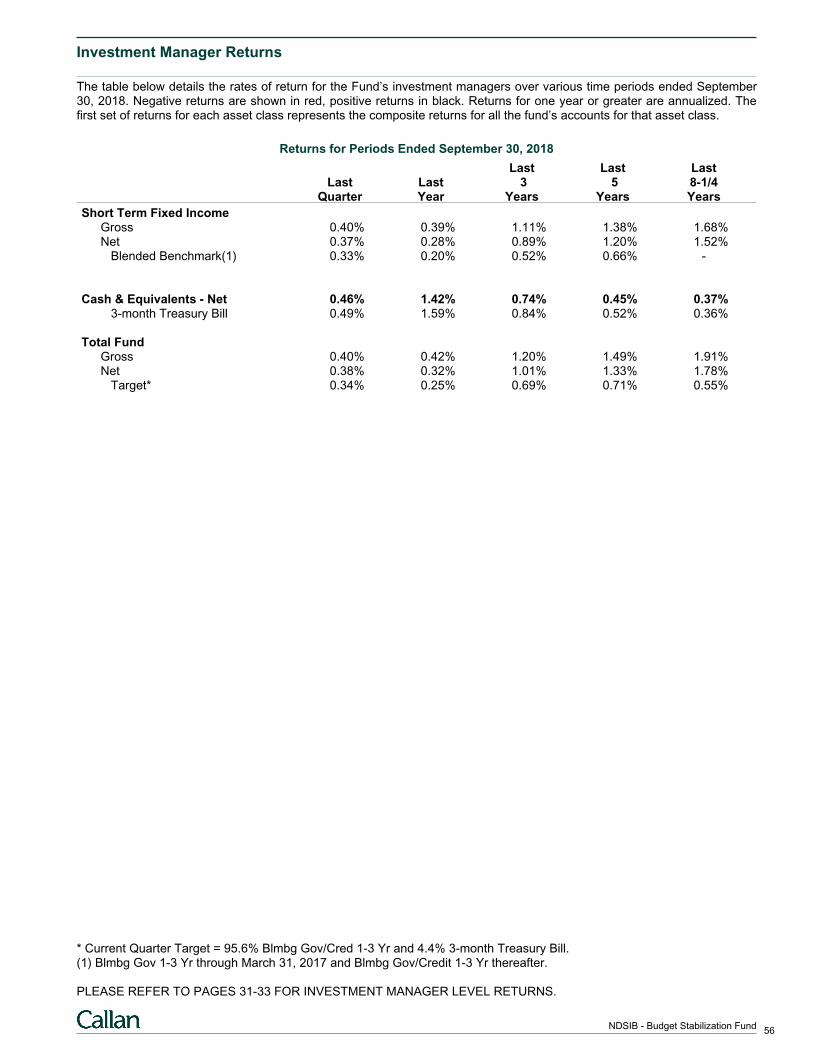
Investment Manager Returns
The table below details the rates of return for the Fund’s investment managers over various time periods ended September30, 2018. Negative returns are shown in red, positive returns in black. Returns for one year or greater are annualized. Thefirst set of returns for each asset class represents the composite returns for all the fund’s accounts for that asset class.
Returns for Periods Ended September 30, 2018
Last Last LastLast Last 3 5 8-1/4
Quarter Year Years Years Years
Short Term Fixed IncomeGross 0.40% 0.39% 1.11% 1.38% 1.68%Net 0.37% 0.28% 0.89% 1.20% 1.52% Blended Benchmark(1) 0.33% 0.20% 0.52% 0.66% -
Cash & Equivalents - Net 0.46% 1.42% 0.74% 0.45% 0.37% 3-month Treasury Bill 0.49% 1.59% 0.84% 0.52% 0.36%
Total FundGross 0.40% 0.42% 1.20% 1.49% 1.91%Net 0.38% 0.32% 1.01% 1.33% 1.78% Target* 0.34% 0.25% 0.69% 0.71% 0.55%
* Current Quarter Target = 95.6% Blmbg Gov/Cred 1-3 Yr and 4.4% 3-month Treasury Bill.(1) Blmbg Gov 1-3 Yr through March 31, 2017 and Blmbg Gov/Credit 1-3 Yr thereafter.
PLEASE REFER TO PAGES 31-33 FOR INVESTMENT MANAGER LEVEL RETURNS.
56NDSIB - Budget Stabilization Fund
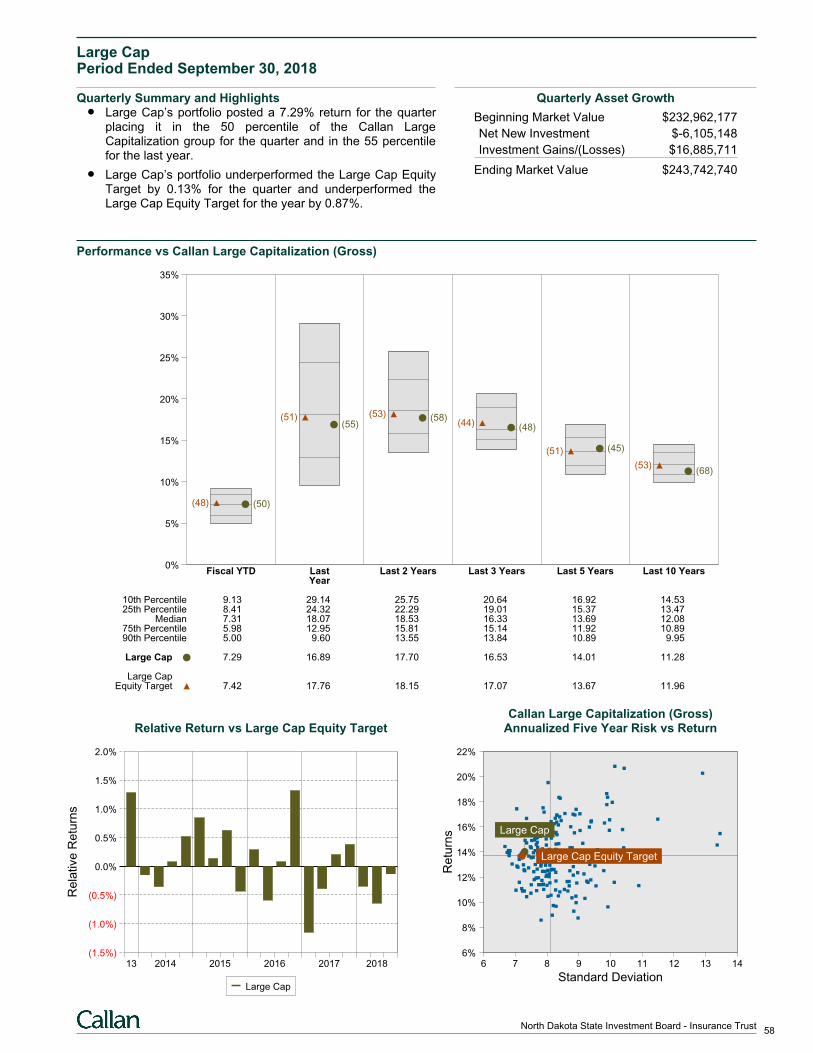
Large CapPeriod Ended September 30, 2018
Quarterly Summary and HighlightsLarge Cap’s portfolio posted a 7.29% return for the quarterplacing it in the 50 percentile of the Callan LargeCapitalization group for the quarter and in the 55 percentilefor the last year.
Large Cap’s portfolio underperformed the Large Cap EquityTarget by 0.13% for the quarter and underperformed theLarge Cap Equity Target for the year by 0.87%.
Quarterly Asset Growth
Beginning Market Value $232,962,177
Net New Investment $-6,105,148
Investment Gains/(Losses) $16,885,711
Ending Market Value $243,742,740
Performance vs Callan Large Capitalization (Gross)
0%
5%
10%
15%
20%
25%
30%
35%
Fiscal YTD Last Last 2 Years Last 3 Years Last 5 Years Last 10 YearsYear
(50)(48)
(55)(51) (58)(53)
(48)(44)
(45)(51)
(68)(53)
10th Percentile 9.13 29.14 25.75 20.64 16.92 14.5325th Percentile 8.41 24.32 22.29 19.01 15.37 13.47
Median 7.31 18.07 18.53 16.33 13.69 12.0875th Percentile 5.98 12.95 15.81 15.14 11.92 10.8990th Percentile 5.00 9.60 13.55 13.84 10.89 9.95
Large Cap 7.29 16.89 17.70 16.53 14.01 11.28
Large CapEquity Target 7.42 17.76 18.15 17.07 13.67 11.96
Relative Return vs Large Cap Equity Target
Rela
tive
Re
turn
s
(1.5%)
(1.0%)
(0.5%)
0.0%
0.5%
1.0%
1.5%
2.0%
13 2014 2015 2016 2017 2018
Large Cap
Callan Large Capitalization (Gross)Annualized Five Year Risk vs Return
6 7 8 9 10 11 12 13 146%
8%
10%
12%
14%
16%
18%
20%
22%
Large Cap
Large Cap Equity Target
Standard Deviation
Re
turn
s
58North Dakota State Investment Board - Insurance Trust
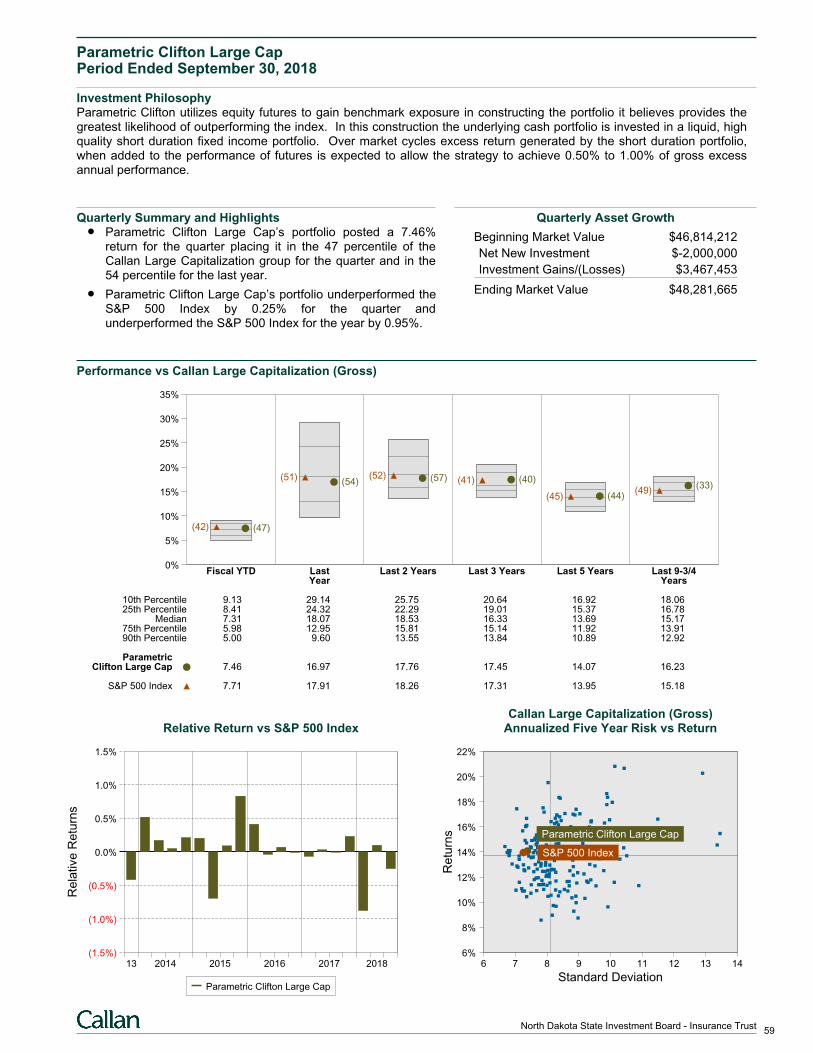
Parametric Clifton Large CapPeriod Ended September 30, 2018
Investment PhilosophyParametric Clifton utilizes equity futures to gain benchmark exposure in constructing the portfolio it believes provides thegreatest likelihood of outperforming the index. In this construction the underlying cash portfolio is invested in a liquid, highquality short duration fixed income portfolio. Over market cycles excess return generated by the short duration portfolio,when added to the performance of futures is expected to allow the strategy to achieve 0.50% to 1.00% of gross excessannual performance.
Quarterly Summary and HighlightsParametric Clifton Large Cap’s portfolio posted a 7.46%return for the quarter placing it in the 47 percentile of theCallan Large Capitalization group for the quarter and in the54 percentile for the last year.
Parametric Clifton Large Cap’s portfolio underperformed theS&P 500 Index by 0.25% for the quarter andunderperformed the S&P 500 Index for the year by 0.95%.
Quarterly Asset Growth
Beginning Market Value $46,814,212
Net New Investment $-2,000,000
Investment Gains/(Losses) $3,467,453
Ending Market Value $48,281,665
Performance vs Callan Large Capitalization (Gross)
0%
5%
10%
15%
20%
25%
30%
35%
Fiscal YTD Last Last 2 Years Last 3 Years Last 5 Years Last 9-3/4Year Years
(47)(42)
(54)(51) (57)(52) (40)(41)
(44)(45)(33)
(49)
10th Percentile 9.13 29.14 25.75 20.64 16.92 18.0625th Percentile 8.41 24.32 22.29 19.01 15.37 16.78
Median 7.31 18.07 18.53 16.33 13.69 15.1775th Percentile 5.98 12.95 15.81 15.14 11.92 13.9190th Percentile 5.00 9.60 13.55 13.84 10.89 12.92
ParametricClifton Large Cap 7.46 16.97 17.76 17.45 14.07 16.23
S&P 500 Index 7.71 17.91 18.26 17.31 13.95 15.18
Relative Return vs S&P 500 Index
Rela
tive
Re
turn
s
(1.5%)
(1.0%)
(0.5%)
0.0%
0.5%
1.0%
1.5%
13 2014 2015 2016 2017 2018
Parametric Clifton Large Cap
Callan Large Capitalization (Gross)Annualized Five Year Risk vs Return
6 7 8 9 10 11 12 13 146%
8%
10%
12%
14%
16%
18%
20%
22%
S&P 500 Index
Parametric Clifton Large Cap
Standard Deviation
Re
turn
s
59North Dakota State Investment Board - Insurance Trust
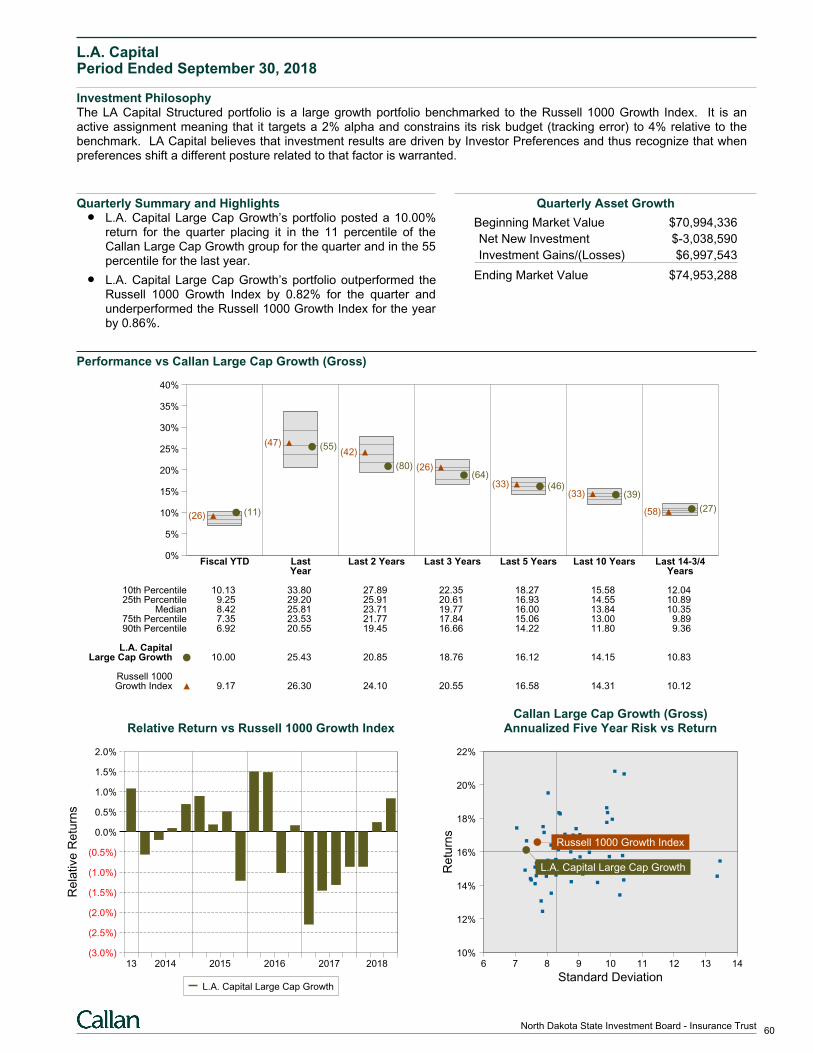
L.A. CapitalPeriod Ended September 30, 2018
Investment PhilosophyThe LA Capital Structured portfolio is a large growth portfolio benchmarked to the Russell 1000 Growth Index. It is anactive assignment meaning that it targets a 2% alpha and constrains its risk budget (tracking error) to 4% relative to thebenchmark. LA Capital believes that investment results are driven by Investor Preferences and thus recognize that whenpreferences shift a different posture related to that factor is warranted.
Quarterly Summary and HighlightsL.A. Capital Large Cap Growth’s portfolio posted a 10.00%return for the quarter placing it in the 11 percentile of theCallan Large Cap Growth group for the quarter and in the 55percentile for the last year.
L.A. Capital Large Cap Growth’s portfolio outperformed theRussell 1000 Growth Index by 0.82% for the quarter andunderperformed the Russell 1000 Growth Index for the yearby 0.86%.
Quarterly Asset Growth
Beginning Market Value $70,994,336
Net New Investment $-3,038,590
Investment Gains/(Losses) $6,997,543
Ending Market Value $74,953,288
Performance vs Callan Large Cap Growth (Gross)
0%
5%
10%
15%
20%
25%
30%
35%
40%
Fiscal YTD Last Last 2 Years Last 3 Years Last 5 Years Last 10 Years Last 14-3/4Year Years
(11)(26)
(55)(47)
(80)
(42)
(64)(26)
(46)(33)(39)(33)
(27)(58)
10th Percentile 10.13 33.80 27.89 22.35 18.27 15.58 12.0425th Percentile 9.25 29.20 25.91 20.61 16.93 14.55 10.89
Median 8.42 25.81 23.71 19.77 16.00 13.84 10.3575th Percentile 7.35 23.53 21.77 17.84 15.06 13.00 9.8990th Percentile 6.92 20.55 19.45 16.66 14.22 11.80 9.36
L.A. CapitalLarge Cap Growth 10.00 25.43 20.85 18.76 16.12 14.15 10.83
Russell 1000Growth Index 9.17 26.30 24.10 20.55 16.58 14.31 10.12
Relative Return vs Russell 1000 Growth Index
Rela
tive
Re
turn
s
(3.0%)
(2.5%)
(2.0%)
(1.5%)
(1.0%)
(0.5%)
0.0%
0.5%
1.0%
1.5%
2.0%
13 2014 2015 2016 2017 2018
L.A. Capital Large Cap Growth
Callan Large Cap Growth (Gross)Annualized Five Year Risk vs Return
6 7 8 9 10 11 12 13 1410%
12%
14%
16%
18%
20%
22%
Russell 1000 Growth Index
L.A. Capital Large Cap Growth
Standard Deviation
Re
turn
s
60North Dakota State Investment Board - Insurance Trust
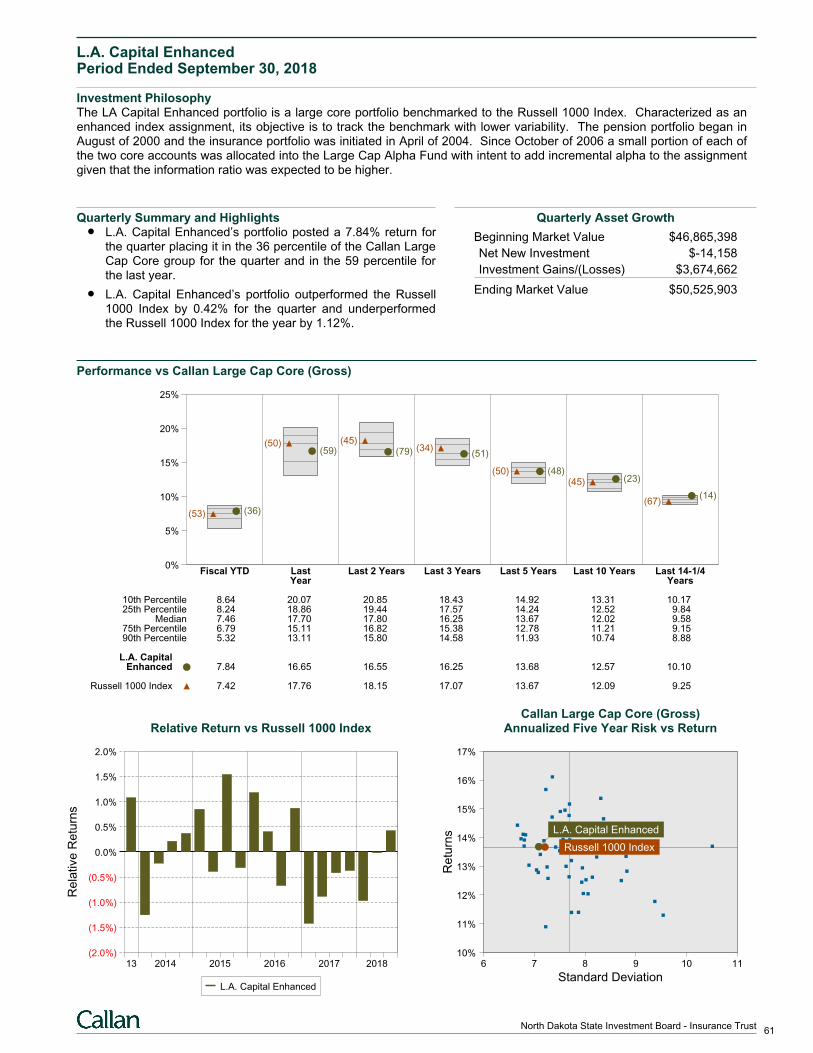
L.A. Capital EnhancedPeriod Ended September 30, 2018
Investment PhilosophyThe LA Capital Enhanced portfolio is a large core portfolio benchmarked to the Russell 1000 Index. Characterized as anenhanced index assignment, its objective is to track the benchmark with lower variability. The pension portfolio began inAugust of 2000 and the insurance portfolio was initiated in April of 2004. Since October of 2006 a small portion of each ofthe two core accounts was allocated into the Large Cap Alpha Fund with intent to add incremental alpha to the assignmentgiven that the information ratio was expected to be higher.
Quarterly Summary and HighlightsL.A. Capital Enhanced’s portfolio posted a 7.84% return forthe quarter placing it in the 36 percentile of the Callan LargeCap Core group for the quarter and in the 59 percentile forthe last year.
L.A. Capital Enhanced’s portfolio outperformed the Russell1000 Index by 0.42% for the quarter and underperformedthe Russell 1000 Index for the year by 1.12%.
Quarterly Asset Growth
Beginning Market Value $46,865,398
Net New Investment $-14,158
Investment Gains/(Losses) $3,674,662
Ending Market Value $50,525,903
Performance vs Callan Large Cap Core (Gross)
0%
5%
10%
15%
20%
25%
Fiscal YTD Last Last 2 Years Last 3 Years Last 5 Years Last 10 Years Last 14-1/4Year Years
(36)(53)
(59)(50)
(79)(45)
(51)(34)
(48)(50)(23)(45)
(14)(67)
10th Percentile 8.64 20.07 20.85 18.43 14.92 13.31 10.1725th Percentile 8.24 18.86 19.44 17.57 14.24 12.52 9.84
Median 7.46 17.70 17.80 16.25 13.67 12.02 9.5875th Percentile 6.79 15.11 16.82 15.38 12.78 11.21 9.1590th Percentile 5.32 13.11 15.80 14.58 11.93 10.74 8.88
L.A. CapitalEnhanced 7.84 16.65 16.55 16.25 13.68 12.57 10.10
Russell 1000 Index 7.42 17.76 18.15 17.07 13.67 12.09 9.25
Relative Return vs Russell 1000 Index
Rela
tive
Re
turn
s
(2.0%)
(1.5%)
(1.0%)
(0.5%)
0.0%
0.5%
1.0%
1.5%
2.0%
13 2014 2015 2016 2017 2018
L.A. Capital Enhanced
Callan Large Cap Core (Gross)Annualized Five Year Risk vs Return
6 7 8 9 10 1110%
11%
12%
13%
14%
15%
16%
17%
Russell 1000 Index
L.A. Capital Enhanced
Standard Deviation
Re
turn
s
61North Dakota State Investment Board - Insurance Trust
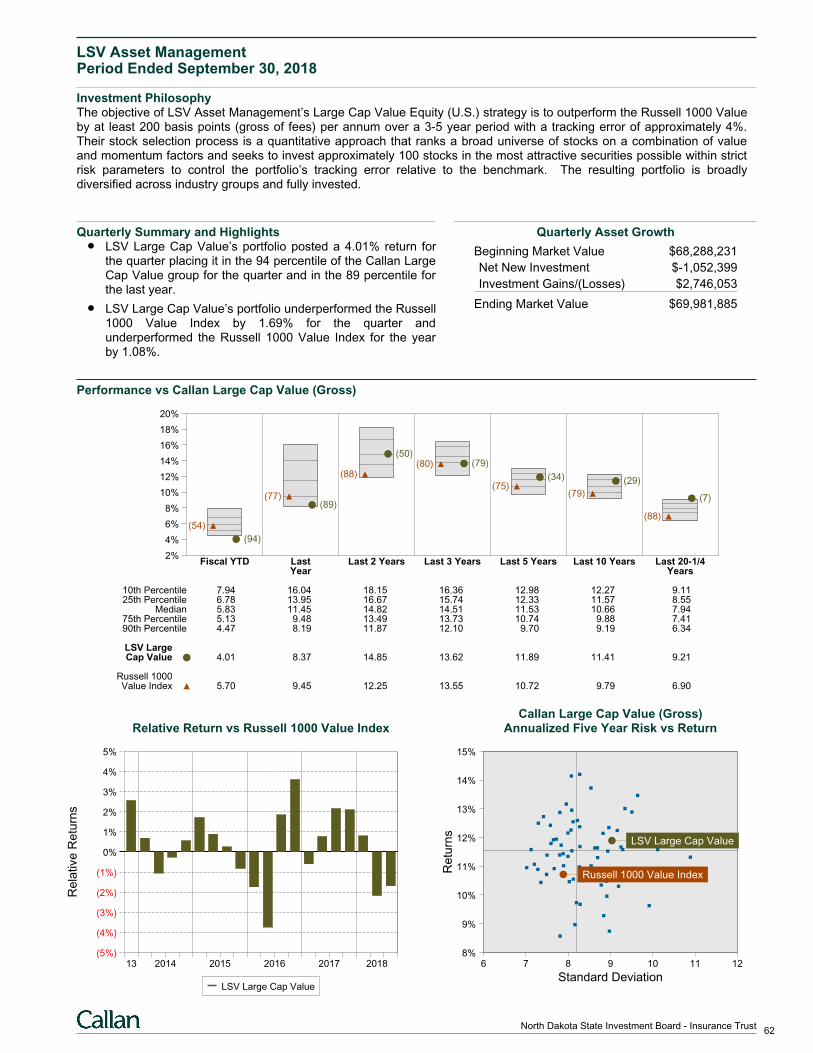
LSV Asset ManagementPeriod Ended September 30, 2018
Investment PhilosophyThe objective of LSV Asset Management’s Large Cap Value Equity (U.S.) strategy is to outperform the Russell 1000 Valueby at least 200 basis points (gross of fees) per annum over a 3-5 year period with a tracking error of approximately 4%.Their stock selection process is a quantitative approach that ranks a broad universe of stocks on a combination of valueand momentum factors and seeks to invest approximately 100 stocks in the most attractive securities possible within strictrisk parameters to control the portfolio’s tracking error relative to the benchmark. The resulting portfolio is broadlydiversified across industry groups and fully invested.
Quarterly Summary and HighlightsLSV Large Cap Value’s portfolio posted a 4.01% return forthe quarter placing it in the 94 percentile of the Callan LargeCap Value group for the quarter and in the 89 percentile forthe last year.
LSV Large Cap Value’s portfolio underperformed the Russell1000 Value Index by 1.69% for the quarter andunderperformed the Russell 1000 Value Index for the yearby 1.08%.
Quarterly Asset Growth
Beginning Market Value $68,288,231
Net New Investment $-1,052,399
Investment Gains/(Losses) $2,746,053
Ending Market Value $69,981,885
Performance vs Callan Large Cap Value (Gross)
2%
4%
6%
8%
10%
12%
14%
16%
18%
20%
Fiscal YTD Last Last 2 Years Last 3 Years Last 5 Years Last 10 Years Last 20-1/4Year Years
(94)
(54)
(89)(77)
(50)
(88)(79)(80)
(34)(75)
(29)
(79) (7)
(88)
10th Percentile 7.94 16.04 18.15 16.36 12.98 12.27 9.1125th Percentile 6.78 13.95 16.67 15.74 12.33 11.57 8.55
Median 5.83 11.45 14.82 14.51 11.53 10.66 7.9475th Percentile 5.13 9.48 13.49 13.73 10.74 9.88 7.4190th Percentile 4.47 8.19 11.87 12.10 9.70 9.19 6.34
LSV LargeCap Value 4.01 8.37 14.85 13.62 11.89 11.41 9.21
Russell 1000Value Index 5.70 9.45 12.25 13.55 10.72 9.79 6.90
Relative Return vs Russell 1000 Value Index
Rela
tive
Re
turn
s
(5%)
(4%)
(3%)
(2%)
(1%)
0%
1%
2%
3%
4%
5%
13 2014 2015 2016 2017 2018
LSV Large Cap Value
Callan Large Cap Value (Gross)Annualized Five Year Risk vs Return
6 7 8 9 10 11 128%
9%
10%
11%
12%
13%
14%
15%
LSV Large Cap Value
Russell 1000 Value Index
Standard Deviation
Re
turn
s
62North Dakota State Investment Board - Insurance Trust
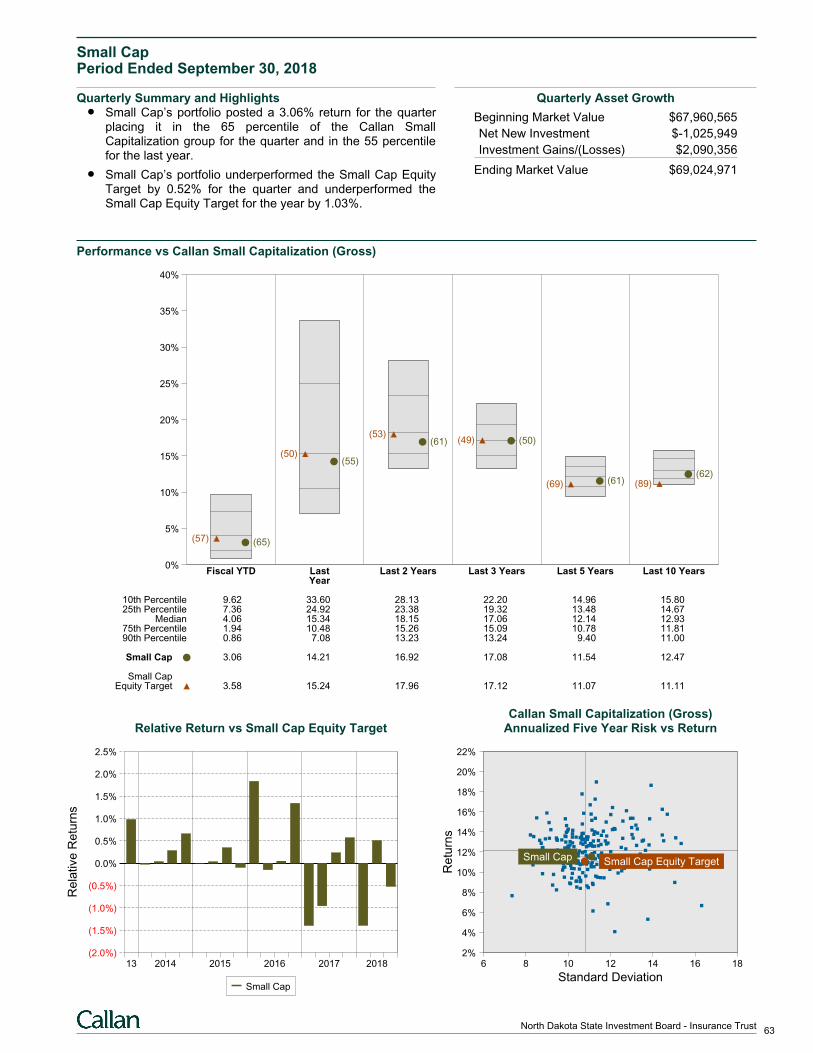
Small CapPeriod Ended September 30, 2018
Quarterly Summary and HighlightsSmall Cap’s portfolio posted a 3.06% return for the quarterplacing it in the 65 percentile of the Callan SmallCapitalization group for the quarter and in the 55 percentilefor the last year.
Small Cap’s portfolio underperformed the Small Cap EquityTarget by 0.52% for the quarter and underperformed theSmall Cap Equity Target for the year by 1.03%.
Quarterly Asset Growth
Beginning Market Value $67,960,565
Net New Investment $-1,025,949
Investment Gains/(Losses) $2,090,356
Ending Market Value $69,024,971
Performance vs Callan Small Capitalization (Gross)
0%
5%
10%
15%
20%
25%
30%
35%
40%
Fiscal YTD Last Last 2 Years Last 3 Years Last 5 Years Last 10 YearsYear
(65)(57)
(55)(50)
(61)(53)
(50)(49)
(61)(69)(62)
(89)
10th Percentile 9.62 33.60 28.13 22.20 14.96 15.8025th Percentile 7.36 24.92 23.38 19.32 13.48 14.67
Median 4.06 15.34 18.15 17.06 12.14 12.9375th Percentile 1.94 10.48 15.26 15.09 10.78 11.8190th Percentile 0.86 7.08 13.23 13.24 9.40 11.00
Small Cap 3.06 14.21 16.92 17.08 11.54 12.47
Small CapEquity Target 3.58 15.24 17.96 17.12 11.07 11.11
Relative Return vs Small Cap Equity Target
Rela
tive
Re
turn
s
(2.0%)
(1.5%)
(1.0%)
(0.5%)
0.0%
0.5%
1.0%
1.5%
2.0%
2.5%
13 2014 2015 2016 2017 2018
Small Cap
Callan Small Capitalization (Gross)Annualized Five Year Risk vs Return
6 8 10 12 14 16 182%
4%
6%
8%
10%
12%
14%
16%
18%
20%
22%
Small Cap Small Cap Equity Target
Standard Deviation
Re
turn
s
63North Dakota State Investment Board - Insurance Trust
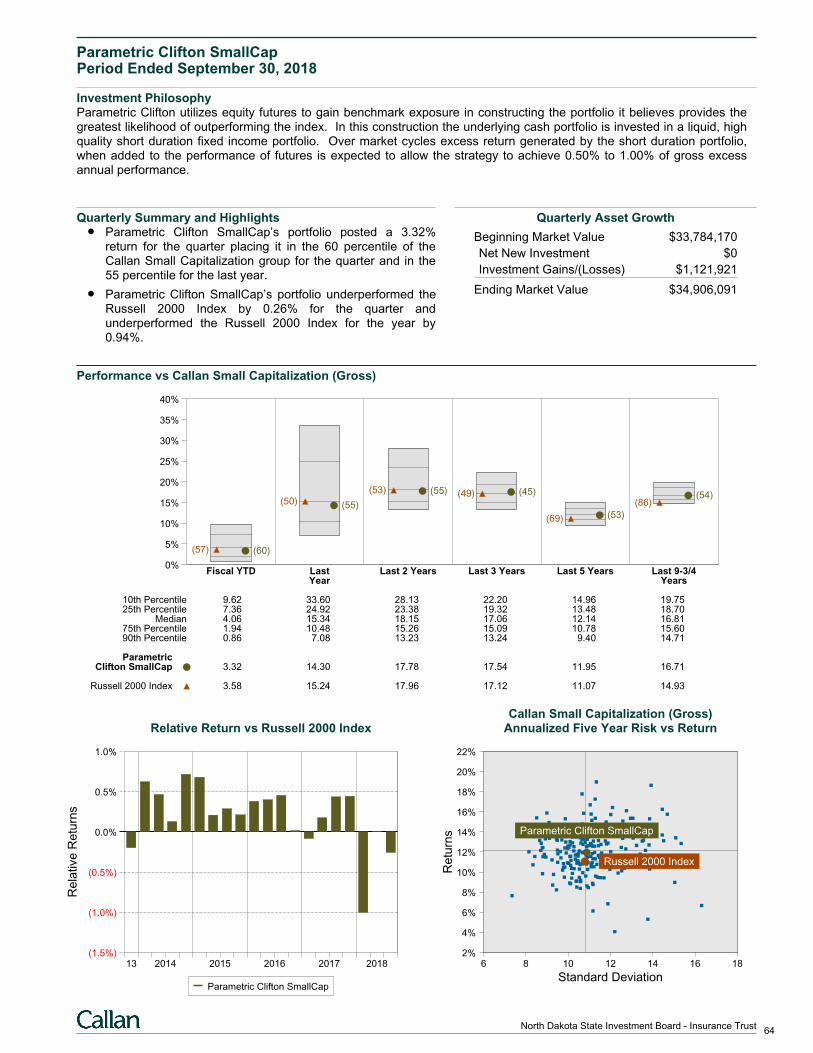
Parametric Clifton SmallCapPeriod Ended September 30, 2018
Investment PhilosophyParametric Clifton utilizes equity futures to gain benchmark exposure in constructing the portfolio it believes provides thegreatest likelihood of outperforming the index. In this construction the underlying cash portfolio is invested in a liquid, highquality short duration fixed income portfolio. Over market cycles excess return generated by the short duration portfolio,when added to the performance of futures is expected to allow the strategy to achieve 0.50% to 1.00% of gross excessannual performance.
Quarterly Summary and HighlightsParametric Clifton SmallCap’s portfolio posted a 3.32%return for the quarter placing it in the 60 percentile of theCallan Small Capitalization group for the quarter and in the55 percentile for the last year.
Parametric Clifton SmallCap’s portfolio underperformed theRussell 2000 Index by 0.26% for the quarter andunderperformed the Russell 2000 Index for the year by0.94%.
Quarterly Asset Growth
Beginning Market Value $33,784,170
Net New Investment $0
Investment Gains/(Losses) $1,121,921
Ending Market Value $34,906,091
Performance vs Callan Small Capitalization (Gross)
0%
5%
10%
15%
20%
25%
30%
35%
40%
Fiscal YTD Last Last 2 Years Last 3 Years Last 5 Years Last 9-3/4Year Years
(60)(57)
(55)(50)(55)(53) (45)(49)
(53)(69)
(54)(86)
10th Percentile 9.62 33.60 28.13 22.20 14.96 19.7525th Percentile 7.36 24.92 23.38 19.32 13.48 18.70
Median 4.06 15.34 18.15 17.06 12.14 16.8175th Percentile 1.94 10.48 15.26 15.09 10.78 15.6090th Percentile 0.86 7.08 13.23 13.24 9.40 14.71
ParametricClifton SmallCap 3.32 14.30 17.78 17.54 11.95 16.71
Russell 2000 Index 3.58 15.24 17.96 17.12 11.07 14.93
Relative Return vs Russell 2000 Index
Rela
tive
Re
turn
s
(1.5%)
(1.0%)
(0.5%)
0.0%
0.5%
1.0%
13 2014 2015 2016 2017 2018
Parametric Clifton SmallCap
Callan Small Capitalization (Gross)Annualized Five Year Risk vs Return
6 8 10 12 14 16 182%
4%
6%
8%
10%
12%
14%
16%
18%
20%
22%
Parametric Clifton SmallCap
Russell 2000 Index
Standard Deviation
Re
turn
s
64North Dakota State Investment Board - Insurance Trust
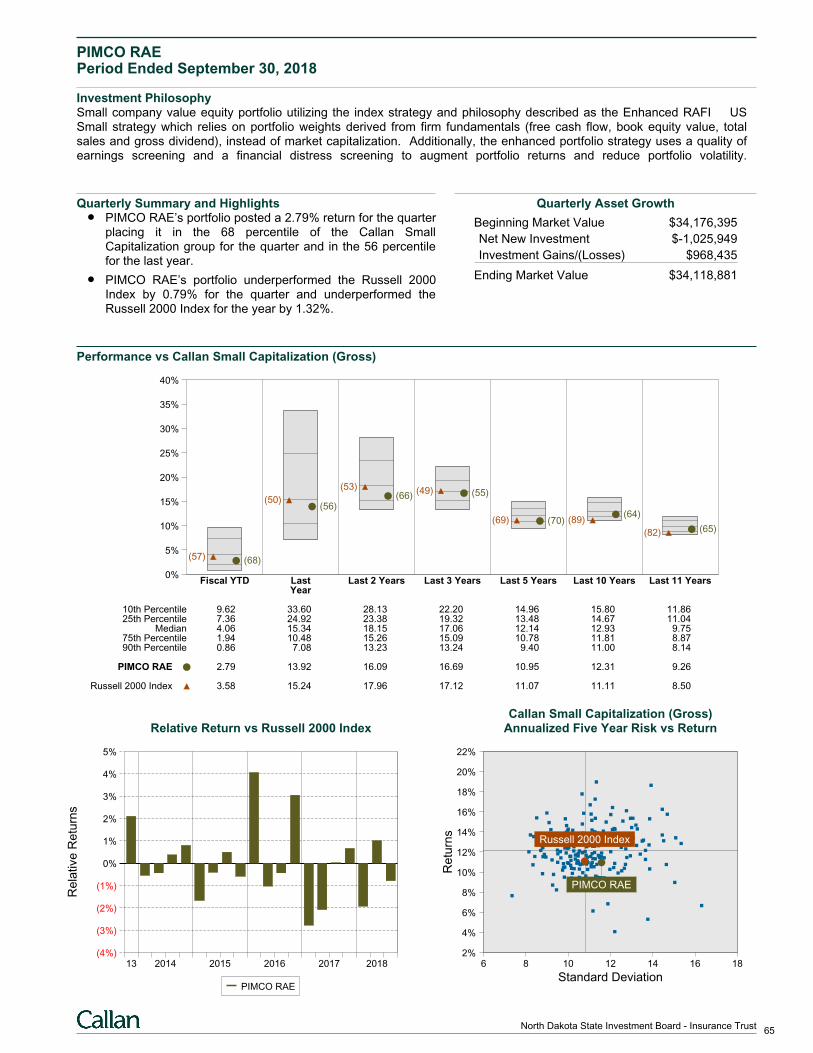
PIMCO RAEPeriod Ended September 30, 2018
Investment PhilosophySmall company value equity portfolio utilizing the index strategy and philosophy described as the Enhanced RAFI USSmall strategy which relies on portfolio weights derived from firm fundamentals (free cash flow, book equity value, totalsales and gross dividend), instead of market capitalization. Additionally, the enhanced portfolio strategy uses a quality ofearnings screening and a financial distress screening to augment portfolio returns and reduce portfolio volatility.
Quarterly Summary and HighlightsPIMCO RAE’s portfolio posted a 2.79% return for the quarterplacing it in the 68 percentile of the Callan SmallCapitalization group for the quarter and in the 56 percentilefor the last year.
PIMCO RAE’s portfolio underperformed the Russell 2000Index by 0.79% for the quarter and underperformed theRussell 2000 Index for the year by 1.32%.
Quarterly Asset Growth
Beginning Market Value $34,176,395
Net New Investment $-1,025,949
Investment Gains/(Losses) $968,435
Ending Market Value $34,118,881
Performance vs Callan Small Capitalization (Gross)
0%
5%
10%
15%
20%
25%
30%
35%
40%
Fiscal YTD Last Last 2 Years Last 3 Years Last 5 Years Last 10 Years Last 11 YearsYear
(68)(57)
(56)(50) (66)
(53)(55)(49)
(70)(69)(64)
(89)(65)(82)
10th Percentile 9.62 33.60 28.13 22.20 14.96 15.80 11.8625th Percentile 7.36 24.92 23.38 19.32 13.48 14.67 11.04
Median 4.06 15.34 18.15 17.06 12.14 12.93 9.7575th Percentile 1.94 10.48 15.26 15.09 10.78 11.81 8.8790th Percentile 0.86 7.08 13.23 13.24 9.40 11.00 8.14
PIMCO RAE 2.79 13.92 16.09 16.69 10.95 12.31 9.26
Russell 2000 Index 3.58 15.24 17.96 17.12 11.07 11.11 8.50
Relative Return vs Russell 2000 Index
Rela
tive
Re
turn
s
(4%)
(3%)
(2%)
(1%)
0%
1%
2%
3%
4%
5%
13 2014 2015 2016 2017 2018
PIMCO RAE
Callan Small Capitalization (Gross)Annualized Five Year Risk vs Return
6 8 10 12 14 16 182%
4%
6%
8%
10%
12%
14%
16%
18%
20%
22%
Russell 2000 Index
PIMCO RAE
Standard Deviation
Re
turn
s
65North Dakota State Investment Board - Insurance Trust
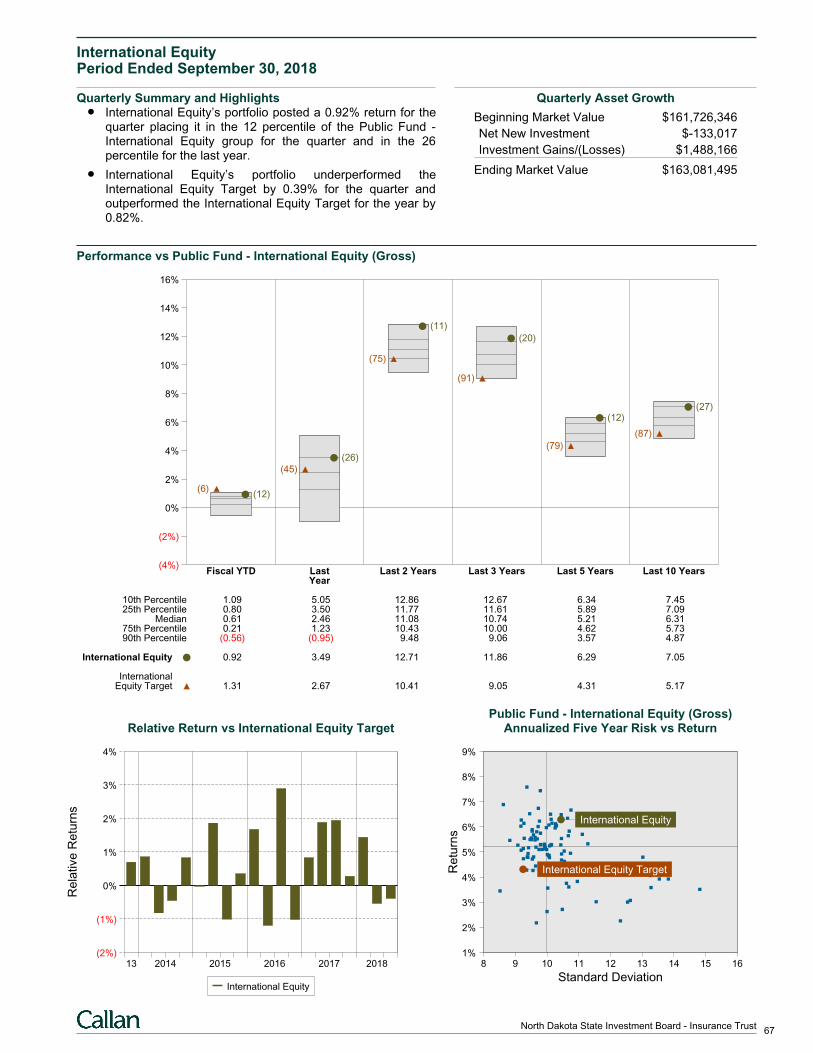
International EquityPeriod Ended September 30, 2018
Quarterly Summary and HighlightsInternational Equity’s portfolio posted a 0.92% return for thequarter placing it in the 12 percentile of the Public Fund -International Equity group for the quarter and in the 26percentile for the last year.
International Equity’s portfolio underperformed theInternational Equity Target by 0.39% for the quarter andoutperformed the International Equity Target for the year by0.82%.
Quarterly Asset Growth
Beginning Market Value $161,726,346
Net New Investment $-133,017
Investment Gains/(Losses) $1,488,166
Ending Market Value $163,081,495
Performance vs Public Fund - International Equity (Gross)
(4%)
(2%)
0%
2%
4%
6%
8%
10%
12%
14%
16%
Fiscal YTD Last Last 2 Years Last 3 Years Last 5 Years Last 10 YearsYear
(12)(6)
(26)
(45)
(11)
(75)
(20)
(91)
(12)
(79)
(27)
(87)
10th Percentile 1.09 5.05 12.86 12.67 6.34 7.4525th Percentile 0.80 3.50 11.77 11.61 5.89 7.09
Median 0.61 2.46 11.08 10.74 5.21 6.3175th Percentile 0.21 1.23 10.43 10.00 4.62 5.7390th Percentile (0.56) (0.95) 9.48 9.06 3.57 4.87
International Equity 0.92 3.49 12.71 11.86 6.29 7.05
InternationalEquity Target 1.31 2.67 10.41 9.05 4.31 5.17
Relative Return vs International Equity Target
Rela
tive
Re
turn
s
(2%)
(1%)
0%
1%
2%
3%
4%
13 2014 2015 2016 2017 2018
International Equity
Public Fund - International Equity (Gross)Annualized Five Year Risk vs Return
8 9 10 11 12 13 14 15 161%
2%
3%
4%
5%
6%
7%
8%
9%
International Equity
International Equity Target
Standard Deviation
Re
turn
s
67North Dakota State Investment Board - Insurance Trust
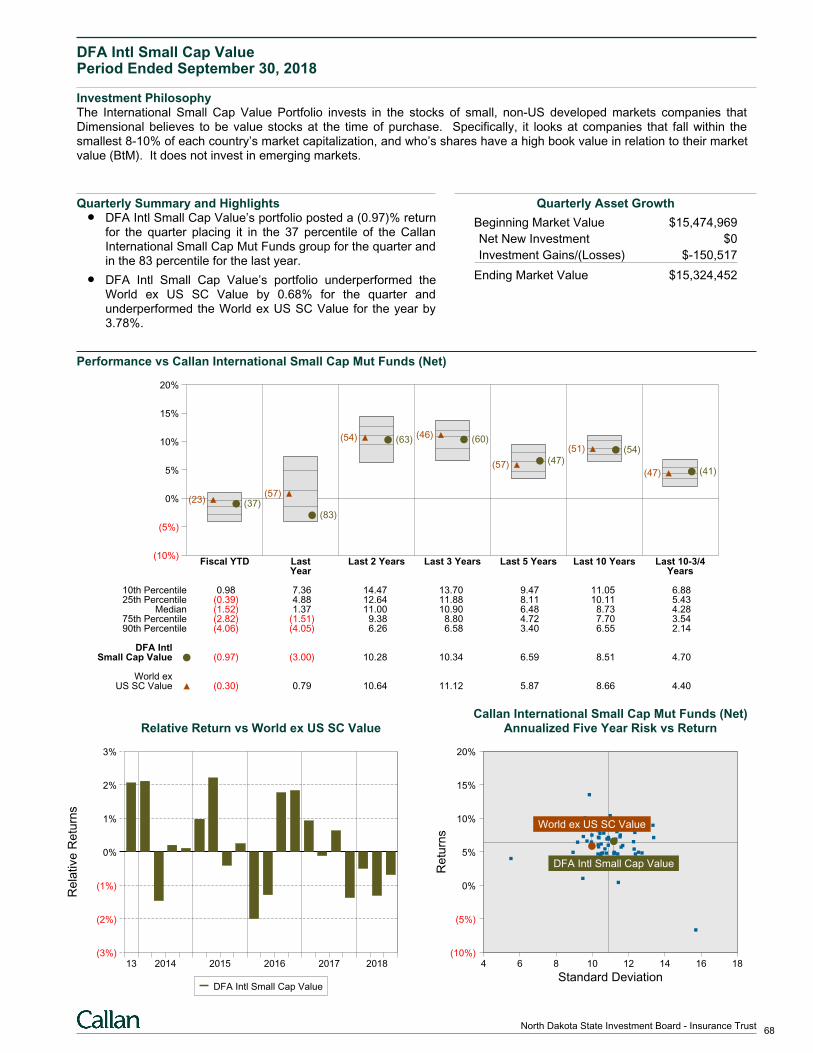
DFA Intl Small Cap ValuePeriod Ended September 30, 2018
Investment PhilosophyThe International Small Cap Value Portfolio invests in the stocks of small, non-US developed markets companies thatDimensional believes to be value stocks at the time of purchase. Specifically, it looks at companies that fall within thesmallest 8-10% of each country’s market capitalization, and who’s shares have a high book value in relation to their marketvalue (BtM). It does not invest in emerging markets.
Quarterly Summary and HighlightsDFA Intl Small Cap Value’s portfolio posted a (0.97)% returnfor the quarter placing it in the 37 percentile of the CallanInternational Small Cap Mut Funds group for the quarter andin the 83 percentile for the last year.
DFA Intl Small Cap Value’s portfolio underperformed theWorld ex US SC Value by 0.68% for the quarter andunderperformed the World ex US SC Value for the year by3.78%.
Quarterly Asset Growth
Beginning Market Value $15,474,969
Net New Investment $0
Investment Gains/(Losses) $-150,517
Ending Market Value $15,324,452
Performance vs Callan International Small Cap Mut Funds (Net)
(10%)
(5%)
0%
5%
10%
15%
20%
Fiscal YTD Last Last 2 Years Last 3 Years Last 5 Years Last 10 Years Last 10-3/4Year Years
(37)(23)
(83)
(57)
(63)(54) (60)(46)
(47)(57)
(54)(51)
(41)(47)
10th Percentile 0.98 7.36 14.47 13.70 9.47 11.05 6.8825th Percentile (0.39) 4.88 12.64 11.88 8.11 10.11 5.43
Median (1.52) 1.37 11.00 10.90 6.48 8.73 4.2875th Percentile (2.82) (1.51) 9.38 8.80 4.72 7.70 3.5490th Percentile (4.06) (4.05) 6.26 6.58 3.40 6.55 2.14
DFA IntlSmall Cap Value (0.97) (3.00) 10.28 10.34 6.59 8.51 4.70
World exUS SC Value (0.30) 0.79 10.64 11.12 5.87 8.66 4.40
Relative Return vs World ex US SC Value
Rela
tive
Re
turn
s
(3%)
(2%)
(1%)
0%
1%
2%
3%
13 2014 2015 2016 2017 2018
DFA Intl Small Cap Value
Callan International Small Cap Mut Funds (Net)Annualized Five Year Risk vs Return
4 6 8 10 12 14 16 18(10%)
(5%)
0%
5%
10%
15%
20%
World ex US SC Value
DFA Intl Small Cap Value
Standard Deviation
Re
turn
s
68North Dakota State Investment Board - Insurance Trust
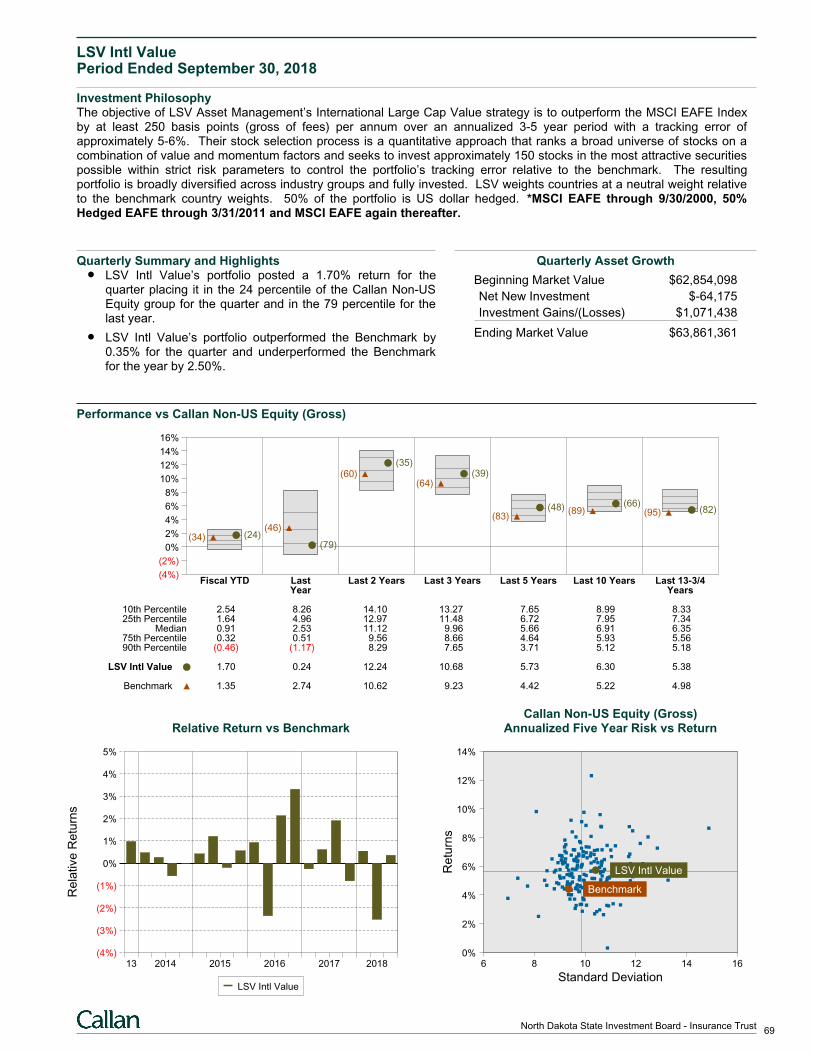
LSV Intl ValuePeriod Ended September 30, 2018
Investment PhilosophyThe objective of LSV Asset Management’s International Large Cap Value strategy is to outperform the MSCI EAFE Indexby at least 250 basis points (gross of fees) per annum over an annualized 3-5 year period with a tracking error ofapproximately 5-6%. Their stock selection process is a quantitative approach that ranks a broad universe of stocks on acombination of value and momentum factors and seeks to invest approximately 150 stocks in the most attractive securitiespossible within strict risk parameters to control the portfolio’s tracking error relative to the benchmark. The resultingportfolio is broadly diversified across industry groups and fully invested. LSV weights countries at a neutral weight relativeto the benchmark country weights. 50% of the portfolio is US dollar hedged. *MSCI EAFE through 9/30/2000, 50%Hedged EAFE through 3/31/2011 and MSCI EAFE again thereafter.
Quarterly Summary and HighlightsLSV Intl Value’s portfolio posted a 1.70% return for thequarter placing it in the 24 percentile of the Callan Non-USEquity group for the quarter and in the 79 percentile for thelast year.
LSV Intl Value’s portfolio outperformed the Benchmark by0.35% for the quarter and underperformed the Benchmarkfor the year by 2.50%.
Quarterly Asset Growth
Beginning Market Value $62,854,098
Net New Investment $-64,175
Investment Gains/(Losses) $1,071,438
Ending Market Value $63,861,361
Performance vs Callan Non-US Equity (Gross)
(4%)
(2%)
0%
2%
4%
6%
8%
10%
12%
14%
16%
Fiscal YTD Last Last 2 Years Last 3 Years Last 5 Years Last 10 Years Last 13-3/4Year Years
(24)(34)(79)
(46)
(35)(60) (39)
(64)
(48)(83)
(66)(89) (82)(95)
10th Percentile 2.54 8.26 14.10 13.27 7.65 8.99 8.3325th Percentile 1.64 4.96 12.97 11.48 6.72 7.95 7.34
Median 0.91 2.53 11.12 9.96 5.66 6.91 6.3575th Percentile 0.32 0.51 9.56 8.66 4.64 5.93 5.5690th Percentile (0.46) (1.17) 8.29 7.65 3.71 5.12 5.18
LSV Intl Value 1.70 0.24 12.24 10.68 5.73 6.30 5.38
Benchmark 1.35 2.74 10.62 9.23 4.42 5.22 4.98
Relative Return vs Benchmark
Rela
tive
Re
turn
s
(4%)
(3%)
(2%)
(1%)
0%
1%
2%
3%
4%
5%
13 2014 2015 2016 2017 2018
LSV Intl Value
Callan Non-US Equity (Gross)Annualized Five Year Risk vs Return
6 8 10 12 14 160%
2%
4%
6%
8%
10%
12%
14%
LSV Intl Value
Benchmark
Standard Deviation
Re
turn
s
69North Dakota State Investment Board - Insurance Trust
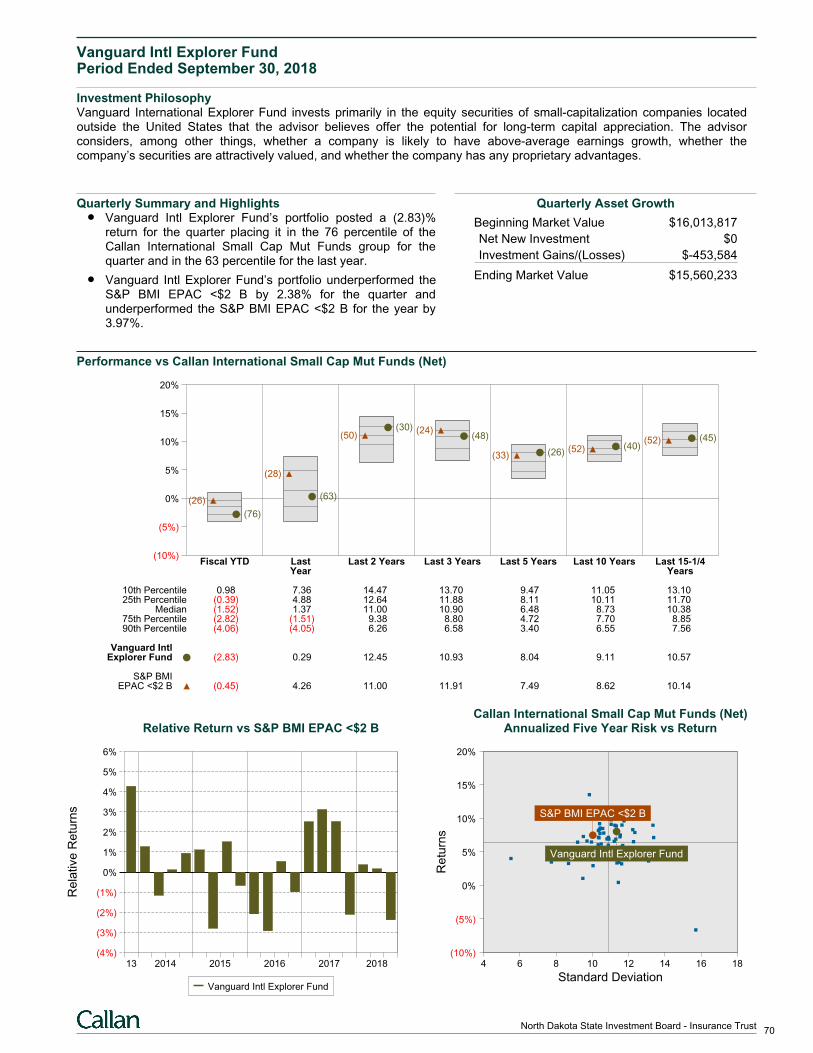
Vanguard Intl Explorer FundPeriod Ended September 30, 2018
Investment PhilosophyVanguard International Explorer Fund invests primarily in the equity securities of small-capitalization companies locatedoutside the United States that the advisor believes offer the potential for long-term capital appreciation. The advisorconsiders, among other things, whether a company is likely to have above-average earnings growth, whether thecompany’s securities are attractively valued, and whether the company has any proprietary advantages.
Quarterly Summary and HighlightsVanguard Intl Explorer Fund’s portfolio posted a (2.83)%return for the quarter placing it in the 76 percentile of theCallan International Small Cap Mut Funds group for thequarter and in the 63 percentile for the last year.
Vanguard Intl Explorer Fund’s portfolio underperformed theS&P BMI EPAC <$2 B by 2.38% for the quarter andunderperformed the S&P BMI EPAC <$2 B for the year by3.97%.
Quarterly Asset Growth
Beginning Market Value $16,013,817
Net New Investment $0
Investment Gains/(Losses) $-453,584
Ending Market Value $15,560,233
Performance vs Callan International Small Cap Mut Funds (Net)
(10%)
(5%)
0%
5%
10%
15%
20%
Fiscal YTD Last Last 2 Years Last 3 Years Last 5 Years Last 10 Years Last 15-1/4Year Years
(76)
(26) (63)
(28)
(30)(50) (48)
(24)
(26)(33)(40)(52)
(45)(52)
10th Percentile 0.98 7.36 14.47 13.70 9.47 11.05 13.1025th Percentile (0.39) 4.88 12.64 11.88 8.11 10.11 11.70
Median (1.52) 1.37 11.00 10.90 6.48 8.73 10.3875th Percentile (2.82) (1.51) 9.38 8.80 4.72 7.70 8.8590th Percentile (4.06) (4.05) 6.26 6.58 3.40 6.55 7.56
Vanguard IntlExplorer Fund (2.83) 0.29 12.45 10.93 8.04 9.11 10.57
S&P BMIEPAC <$2 B (0.45) 4.26 11.00 11.91 7.49 8.62 10.14
Relative Return vs S&P BMI EPAC <$2 B
Rela
tive
Re
turn
s
(4%)
(3%)
(2%)
(1%)
0%
1%
2%
3%
4%
5%
6%
13 2014 2015 2016 2017 2018
Vanguard Intl Explorer Fund
Callan International Small Cap Mut Funds (Net)Annualized Five Year Risk vs Return
4 6 8 10 12 14 16 18(10%)
(5%)
0%
5%
10%
15%
20%
S&P BMI EPAC <$2 B
Vanguard Intl Explorer Fund
Standard Deviation
Re
turn
s
70North Dakota State Investment Board - Insurance Trust
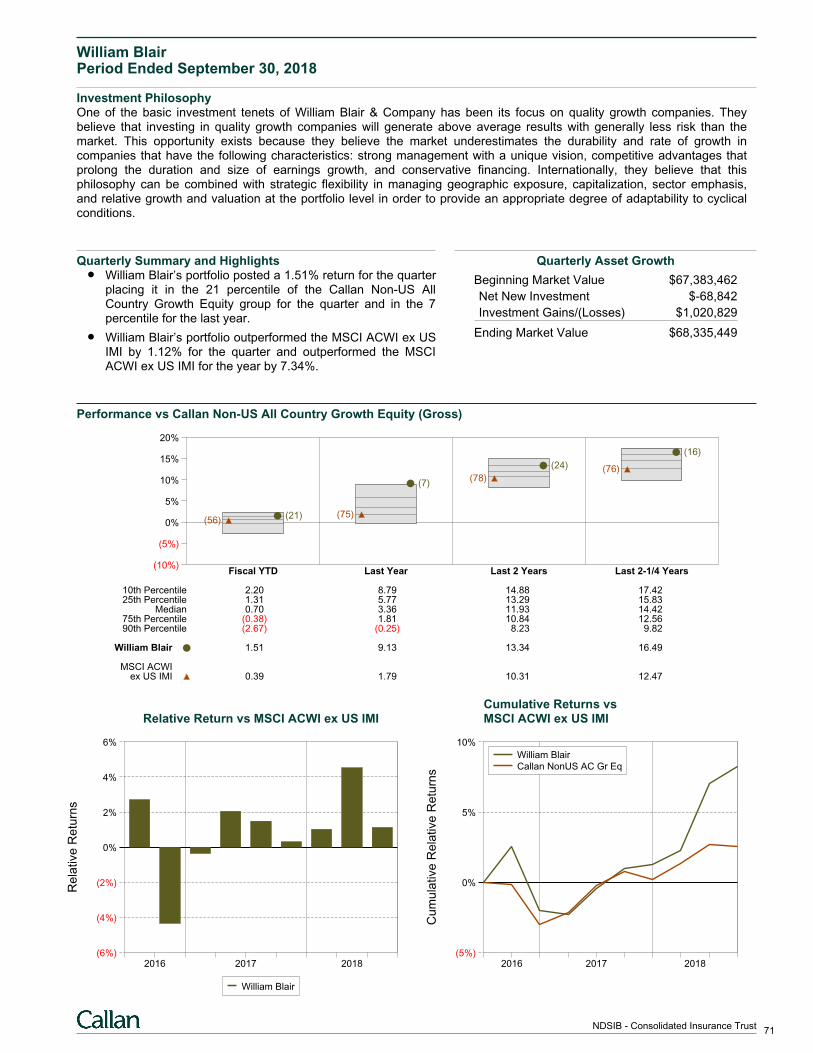
William BlairPeriod Ended September 30, 2018
Investment PhilosophyOne of the basic investment tenets of William Blair & Company has been its focus on quality growth companies. Theybelieve that investing in quality growth companies will generate above average results with generally less risk than themarket. This opportunity exists because they believe the market underestimates the durability and rate of growth incompanies that have the following characteristics: strong management with a unique vision, competitive advantages thatprolong the duration and size of earnings growth, and conservative financing. Internationally, they believe that thisphilosophy can be combined with strategic flexibility in managing geographic exposure, capitalization, sector emphasis,and relative growth and valuation at the portfolio level in order to provide an appropriate degree of adaptability to cyclicalconditions.
Quarterly Summary and HighlightsWilliam Blair’s portfolio posted a 1.51% return for the quarterplacing it in the 21 percentile of the Callan Non-US AllCountry Growth Equity group for the quarter and in the 7percentile for the last year.
William Blair’s portfolio outperformed the MSCI ACWI ex USIMI by 1.12% for the quarter and outperformed the MSCIACWI ex US IMI for the year by 7.34%.
Quarterly Asset Growth
Beginning Market Value $67,383,462
Net New Investment $-68,842
Investment Gains/(Losses) $1,020,829
Ending Market Value $68,335,449
Performance vs Callan Non-US All Country Growth Equity (Gross)
(10%)
(5%)
0%
5%
10%
15%
20%
Fiscal YTD Last Year Last 2 Years Last 2-1/4 Years
(21)(56)
(7)
(75)
(24)
(78)
(16)
(76)
10th Percentile 2.20 8.79 14.88 17.4225th Percentile 1.31 5.77 13.29 15.83
Median 0.70 3.36 11.93 14.4275th Percentile (0.38) 1.81 10.84 12.5690th Percentile (2.67) (0.25) 8.23 9.82
William Blair 1.51 9.13 13.34 16.49
MSCI ACWIex US IMI 0.39 1.79 10.31 12.47
Relative Return vs MSCI ACWI ex US IMI
Rela
tive
Re
turn
s
(6%)
(4%)
(2%)
0%
2%
4%
6%
2016 2017 2018
William Blair
Cumulative Returns vsMSCI ACWI ex US IMI
Cum
ula
tive
Re
lative
Re
turn
s
(5%)
0%
5%
10%
2016 2017 2018
William Blair
Callan NonUS AC Gr Eq
71NDSIB - Consolidated Insurance Trust
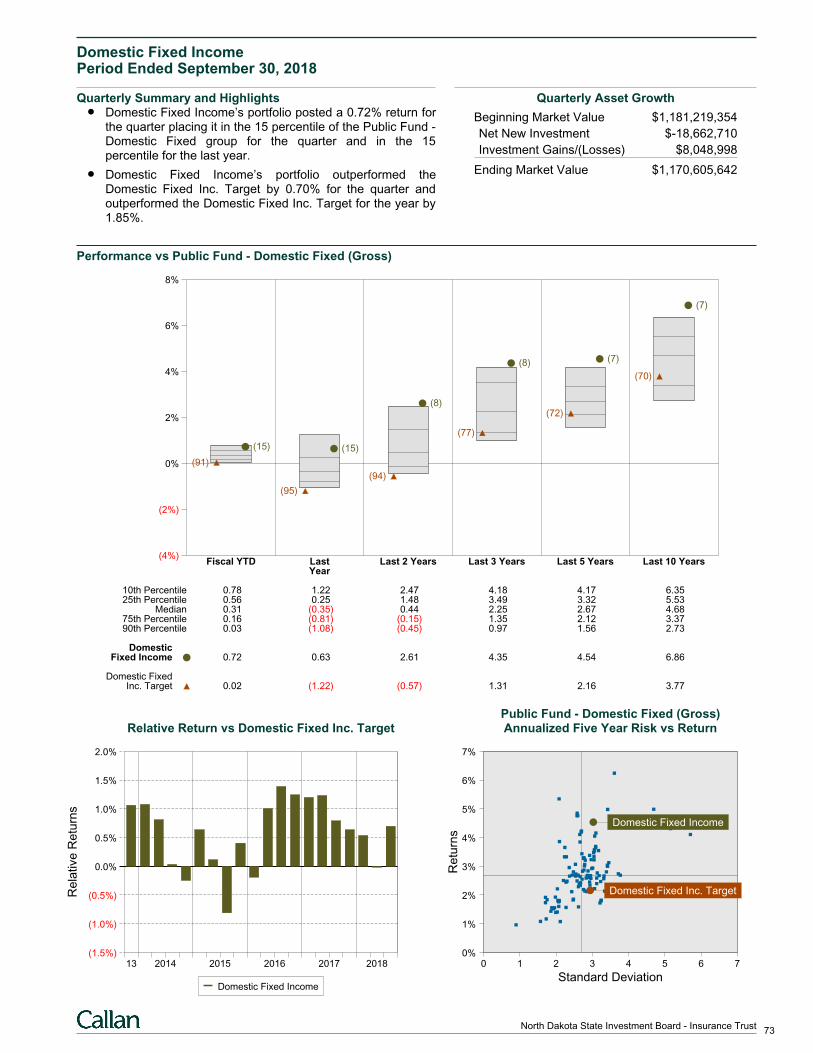
Domestic Fixed IncomePeriod Ended September 30, 2018
Quarterly Summary and HighlightsDomestic Fixed Income’s portfolio posted a 0.72% return forthe quarter placing it in the 15 percentile of the Public Fund -Domestic Fixed group for the quarter and in the 15percentile for the last year.
Domestic Fixed Income’s portfolio outperformed theDomestic Fixed Inc. Target by 0.70% for the quarter andoutperformed the Domestic Fixed Inc. Target for the year by1.85%.
Quarterly Asset Growth
Beginning Market Value $1,181,219,354
Net New Investment $-18,662,710
Investment Gains/(Losses) $8,048,998
Ending Market Value $1,170,605,642
Performance vs Public Fund - Domestic Fixed (Gross)
(4%)
(2%)
0%
2%
4%
6%
8%
Fiscal YTD Last Last 2 Years Last 3 Years Last 5 Years Last 10 YearsYear
(15)
(91)
(15)
(95)
(8)
(94)
(8)
(77)
(7)
(72)
(7)
(70)
10th Percentile 0.78 1.22 2.47 4.18 4.17 6.3525th Percentile 0.56 0.25 1.48 3.49 3.32 5.53
Median 0.31 (0.35) 0.44 2.25 2.67 4.6875th Percentile 0.16 (0.81) (0.15) 1.35 2.12 3.3790th Percentile 0.03 (1.08) (0.45) 0.97 1.56 2.73
DomesticFixed Income 0.72 0.63 2.61 4.35 4.54 6.86
Domestic FixedInc. Target 0.02 (1.22) (0.57) 1.31 2.16 3.77
Relative Return vs Domestic Fixed Inc. Target
Rela
tive
Re
turn
s
(1.5%)
(1.0%)
(0.5%)
0.0%
0.5%
1.0%
1.5%
2.0%
13 2014 2015 2016 2017 2018
Domestic Fixed Income
Public Fund - Domestic Fixed (Gross)Annualized Five Year Risk vs Return
0 1 2 3 4 5 6 70%
1%
2%
3%
4%
5%
6%
7%
Domestic Fixed Income
Domestic Fixed Inc. Target
Standard Deviation
Re
turn
s
73North Dakota State Investment Board - Insurance Trust
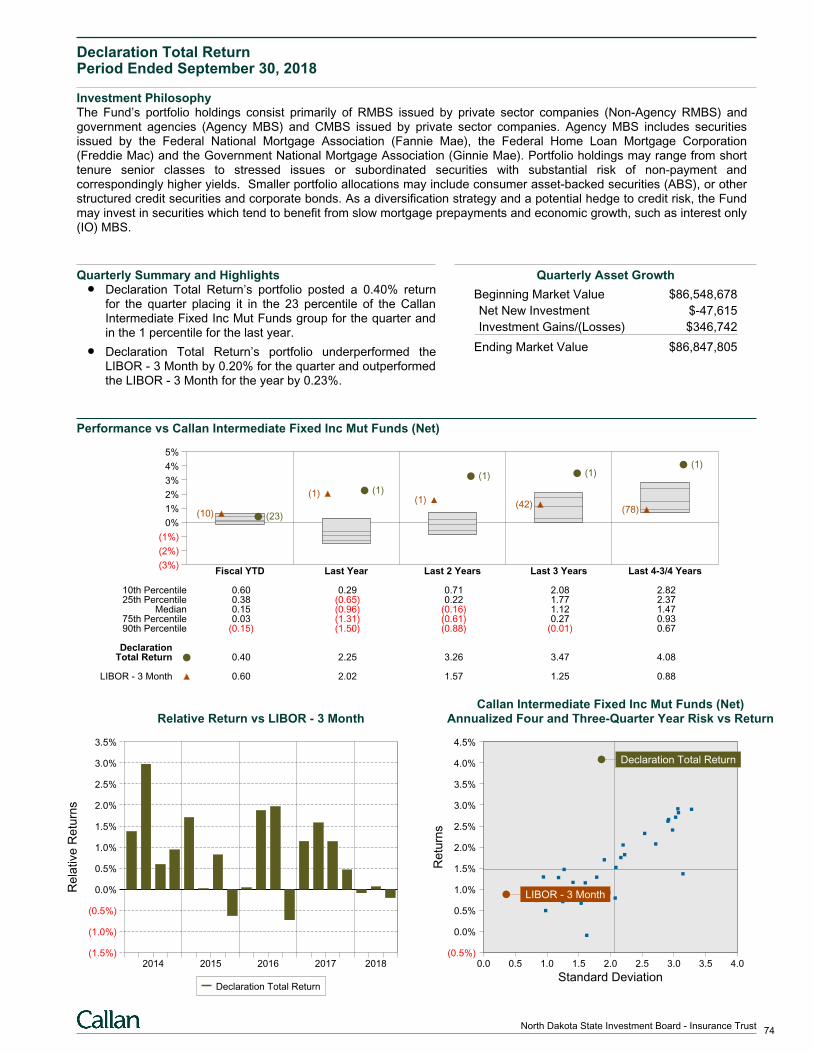
Declaration Total ReturnPeriod Ended September 30, 2018
Investment PhilosophyThe Fund’s portfolio holdings consist primarily of RMBS issued by private sector companies (Non-Agency RMBS) andgovernment agencies (Agency MBS) and CMBS issued by private sector companies. Agency MBS includes securitiesissued by the Federal National Mortgage Association (Fannie Mae), the Federal Home Loan Mortgage Corporation(Freddie Mac) and the Government National Mortgage Association (Ginnie Mae). Portfolio holdings may range from shorttenure senior classes to stressed issues or subordinated securities with substantial risk of non-payment andcorrespondingly higher yields. Smaller portfolio allocations may include consumer asset-backed securities (ABS), or otherstructured credit securities and corporate bonds. As a diversification strategy and a potential hedge to credit risk, the Fundmay invest in securities which tend to benefit from slow mortgage prepayments and economic growth, such as interest only(IO) MBS.
Quarterly Summary and HighlightsDeclaration Total Return’s portfolio posted a 0.40% returnfor the quarter placing it in the 23 percentile of the CallanIntermediate Fixed Inc Mut Funds group for the quarter andin the 1 percentile for the last year.
Declaration Total Return’s portfolio underperformed theLIBOR - 3 Month by 0.20% for the quarter and outperformedthe LIBOR - 3 Month for the year by 0.23%.
Quarterly Asset Growth
Beginning Market Value $86,548,678
Net New Investment $-47,615
Investment Gains/(Losses) $346,742
Ending Market Value $86,847,805
Performance vs Callan Intermediate Fixed Inc Mut Funds (Net)
(3%)
(2%)
(1%)
0%
1%
2%
3%
4%
5%
Fiscal YTD Last Year Last 2 Years Last 3 Years Last 4-3/4 Years
(23)(10)
(1)(1)
(1)
(1)
(1)
(42)
(1)
(78)
10th Percentile 0.60 0.29 0.71 2.08 2.8225th Percentile 0.38 (0.65) 0.22 1.77 2.37
Median 0.15 (0.96) (0.16) 1.12 1.4775th Percentile 0.03 (1.31) (0.61) 0.27 0.9390th Percentile (0.15) (1.50) (0.88) (0.01) 0.67
DeclarationTotal Return 0.40 2.25 3.26 3.47 4.08
LIBOR - 3 Month 0.60 2.02 1.57 1.25 0.88
Relative Return vs LIBOR - 3 Month
Rela
tive
Re
turn
s
(1.5%)
(1.0%)
(0.5%)
0.0%
0.5%
1.0%
1.5%
2.0%
2.5%
3.0%
3.5%
2014 2015 2016 2017 2018
Declaration Total Return
Callan Intermediate Fixed Inc Mut Funds (Net)Annualized Four and Three-Quarter Year Risk vs Return
0.0 0.5 1.0 1.5 2.0 2.5 3.0 3.5 4.0(0.5%)
0.0%
0.5%
1.0%
1.5%
2.0%
2.5%
3.0%
3.5%
4.0%
4.5%
Declaration Total Return
LIBOR - 3 Month
Standard Deviation
Re
turn
s
74North Dakota State Investment Board - Insurance Trust
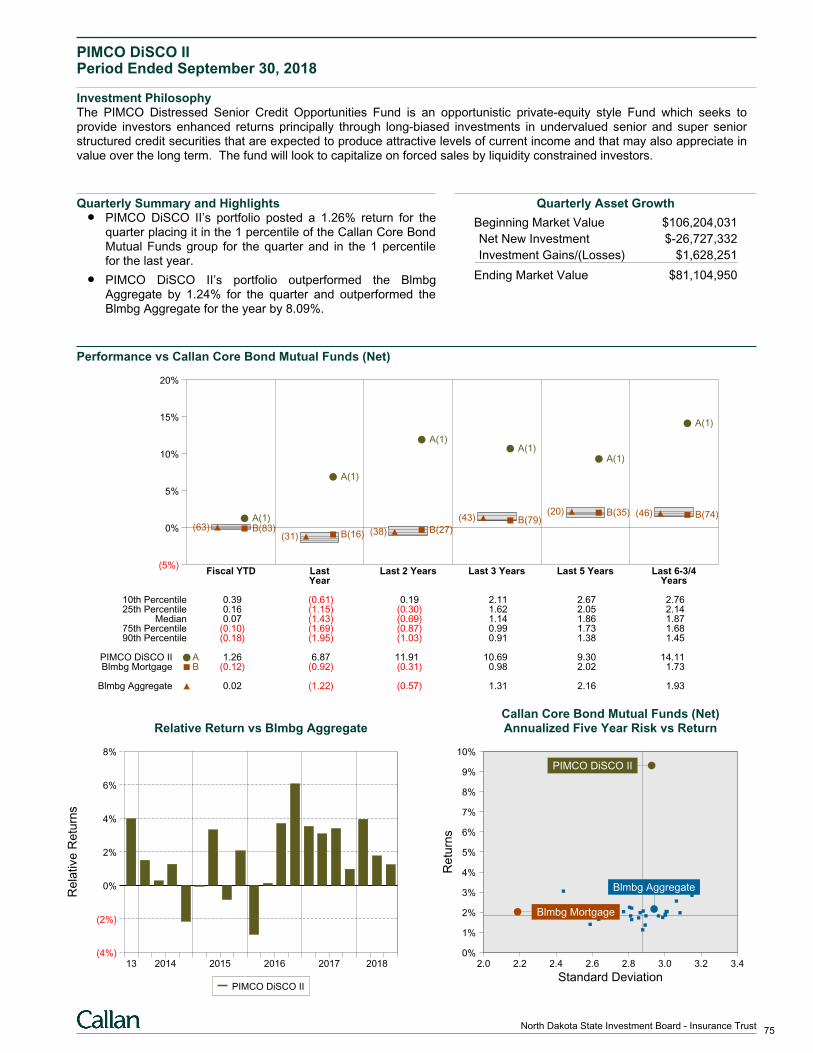
PIMCO DiSCO IIPeriod Ended September 30, 2018
Investment PhilosophyThe PIMCO Distressed Senior Credit Opportunities Fund is an opportunistic private-equity style Fund which seeks toprovide investors enhanced returns principally through long-biased investments in undervalued senior and super seniorstructured credit securities that are expected to produce attractive levels of current income and that may also appreciate invalue over the long term. The fund will look to capitalize on forced sales by liquidity constrained investors.
Quarterly Summary and HighlightsPIMCO DiSCO II’s portfolio posted a 1.26% return for thequarter placing it in the 1 percentile of the Callan Core BondMutual Funds group for the quarter and in the 1 percentilefor the last year.
PIMCO DiSCO II’s portfolio outperformed the BlmbgAggregate by 1.24% for the quarter and outperformed theBlmbg Aggregate for the year by 8.09%.
Quarterly Asset Growth
Beginning Market Value $106,204,031
Net New Investment $-26,727,332
Investment Gains/(Losses) $1,628,251
Ending Market Value $81,104,950
Performance vs Callan Core Bond Mutual Funds (Net)
(5%)
0%
5%
10%
15%
20%
Fiscal YTD Last Last 2 Years Last 3 Years Last 5 Years Last 6-3/4Year Years
A(1)B(83)(63)
A(1)
B(16)(31)
A(1)
B(27)(38)
A(1)
B(79)(43)
A(1)
B(35)(20)
A(1)
B(74)(46)
10th Percentile 0.39 (0.61) 0.19 2.11 2.67 2.7625th Percentile 0.16 (1.15) (0.30) 1.62 2.05 2.14
Median 0.07 (1.43) (0.69) 1.14 1.86 1.8775th Percentile (0.10) (1.69) (0.87) 0.99 1.73 1.6890th Percentile (0.18) (1.95) (1.03) 0.91 1.38 1.45
PIMCO DiSCO II A 1.26 6.87 11.91 10.69 9.30 14.11Blmbg Mortgage B (0.12) (0.92) (0.31) 0.98 2.02 1.73
Blmbg Aggregate 0.02 (1.22) (0.57) 1.31 2.16 1.93
Relative Return vs Blmbg Aggregate
Rela
tive
Re
turn
s
(4%)
(2%)
0%
2%
4%
6%
8%
13 2014 2015 2016 2017 2018
PIMCO DiSCO II
Callan Core Bond Mutual Funds (Net)Annualized Five Year Risk vs Return
2.0 2.2 2.4 2.6 2.8 3.0 3.2 3.40%
1%
2%
3%
4%
5%
6%
7%
8%
9%
10%
Blmbg Aggregate
Blmbg Mortgage
PIMCO DiSCO II
Standard Deviation
Re
turn
s
75North Dakota State Investment Board - Insurance Trust
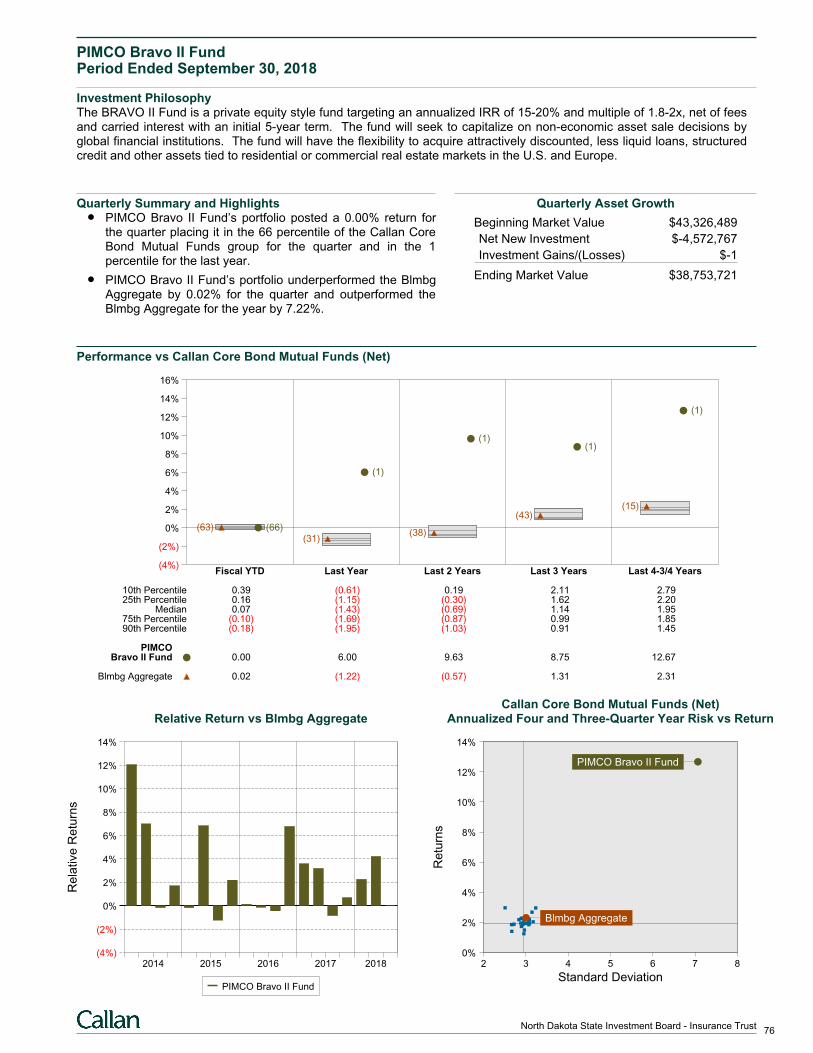
PIMCO Bravo II FundPeriod Ended September 30, 2018
Investment PhilosophyThe BRAVO II Fund is a private equity style fund targeting an annualized IRR of 15-20% and multiple of 1.8-2x, net of feesand carried interest with an initial 5-year term. The fund will seek to capitalize on non-economic asset sale decisions byglobal financial institutions. The fund will have the flexibility to acquire attractively discounted, less liquid loans, structuredcredit and other assets tied to residential or commercial real estate markets in the U.S. and Europe.
Quarterly Summary and HighlightsPIMCO Bravo II Fund’s portfolio posted a 0.00% return forthe quarter placing it in the 66 percentile of the Callan CoreBond Mutual Funds group for the quarter and in the 1percentile for the last year.
PIMCO Bravo II Fund’s portfolio underperformed the BlmbgAggregate by 0.02% for the quarter and outperformed theBlmbg Aggregate for the year by 7.22%.
Quarterly Asset Growth
Beginning Market Value $43,326,489
Net New Investment $-4,572,767
Investment Gains/(Losses) $-1
Ending Market Value $38,753,721
Performance vs Callan Core Bond Mutual Funds (Net)
(4%)
(2%)
0%
2%
4%
6%
8%
10%
12%
14%
16%
Fiscal YTD Last Year Last 2 Years Last 3 Years Last 4-3/4 Years
(66)(63)
(1)
(31)
(1)
(38)
(1)
(43)
(1)
(15)
10th Percentile 0.39 (0.61) 0.19 2.11 2.7925th Percentile 0.16 (1.15) (0.30) 1.62 2.20
Median 0.07 (1.43) (0.69) 1.14 1.9575th Percentile (0.10) (1.69) (0.87) 0.99 1.8590th Percentile (0.18) (1.95) (1.03) 0.91 1.45
PIMCOBravo II Fund 0.00 6.00 9.63 8.75 12.67
Blmbg Aggregate 0.02 (1.22) (0.57) 1.31 2.31
Relative Return vs Blmbg Aggregate
Rela
tive
Re
turn
s
(4%)
(2%)
0%
2%
4%
6%
8%
10%
12%
14%
2014 2015 2016 2017 2018
PIMCO Bravo II Fund
Callan Core Bond Mutual Funds (Net)Annualized Four and Three-Quarter Year Risk vs Return
2 3 4 5 6 7 80%
2%
4%
6%
8%
10%
12%
14%
PIMCO Bravo II Fund
Blmbg Aggregate
Standard Deviation
Re
turn
s
76North Dakota State Investment Board - Insurance Trust
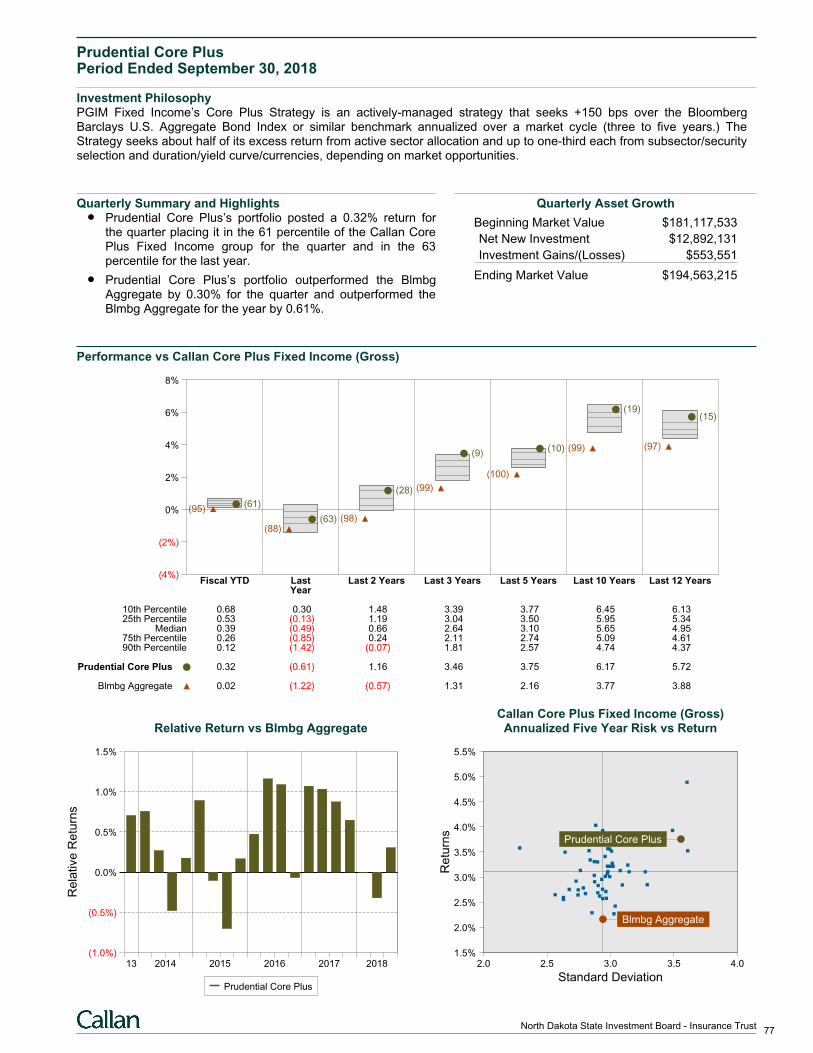
Prudential Core PlusPeriod Ended September 30, 2018
Investment PhilosophyPGIM Fixed Income’s Core Plus Strategy is an actively-managed strategy that seeks +150 bps over the BloombergBarclays U.S. Aggregate Bond Index or similar benchmark annualized over a market cycle (three to five years.) TheStrategy seeks about half of its excess return from active sector allocation and up to one-third each from subsector/securityselection and duration/yield curve/currencies, depending on market opportunities.
Quarterly Summary and HighlightsPrudential Core Plus’s portfolio posted a 0.32% return forthe quarter placing it in the 61 percentile of the Callan CorePlus Fixed Income group for the quarter and in the 63percentile for the last year.
Prudential Core Plus’s portfolio outperformed the BlmbgAggregate by 0.30% for the quarter and outperformed theBlmbg Aggregate for the year by 0.61%.
Quarterly Asset Growth
Beginning Market Value $181,117,533
Net New Investment $12,892,131
Investment Gains/(Losses) $553,551
Ending Market Value $194,563,215
Performance vs Callan Core Plus Fixed Income (Gross)
(4%)
(2%)
0%
2%
4%
6%
8%
Fiscal YTD Last Last 2 Years Last 3 Years Last 5 Years Last 10 Years Last 12 YearsYear
(61)(95)
(63)(88)
(28)
(98)
(9)
(99)
(10)
(100)
(19)
(99)
(15)
(97)
10th Percentile 0.68 0.30 1.48 3.39 3.77 6.45 6.1325th Percentile 0.53 (0.13) 1.19 3.04 3.50 5.95 5.34
Median 0.39 (0.49) 0.66 2.64 3.10 5.65 4.9575th Percentile 0.26 (0.85) 0.24 2.11 2.74 5.09 4.6190th Percentile 0.12 (1.42) (0.07) 1.81 2.57 4.74 4.37
Prudential Core Plus 0.32 (0.61) 1.16 3.46 3.75 6.17 5.72
Blmbg Aggregate 0.02 (1.22) (0.57) 1.31 2.16 3.77 3.88
Relative Return vs Blmbg Aggregate
Rela
tive
Re
turn
s
(1.0%)
(0.5%)
0.0%
0.5%
1.0%
1.5%
13 2014 2015 2016 2017 2018
Prudential Core Plus
Callan Core Plus Fixed Income (Gross)Annualized Five Year Risk vs Return
2.0 2.5 3.0 3.5 4.01.5%
2.0%
2.5%
3.0%
3.5%
4.0%
4.5%
5.0%
5.5%
Prudential Core Plus
Blmbg Aggregate
Standard Deviation
Re
turn
s
77North Dakota State Investment Board - Insurance Trust
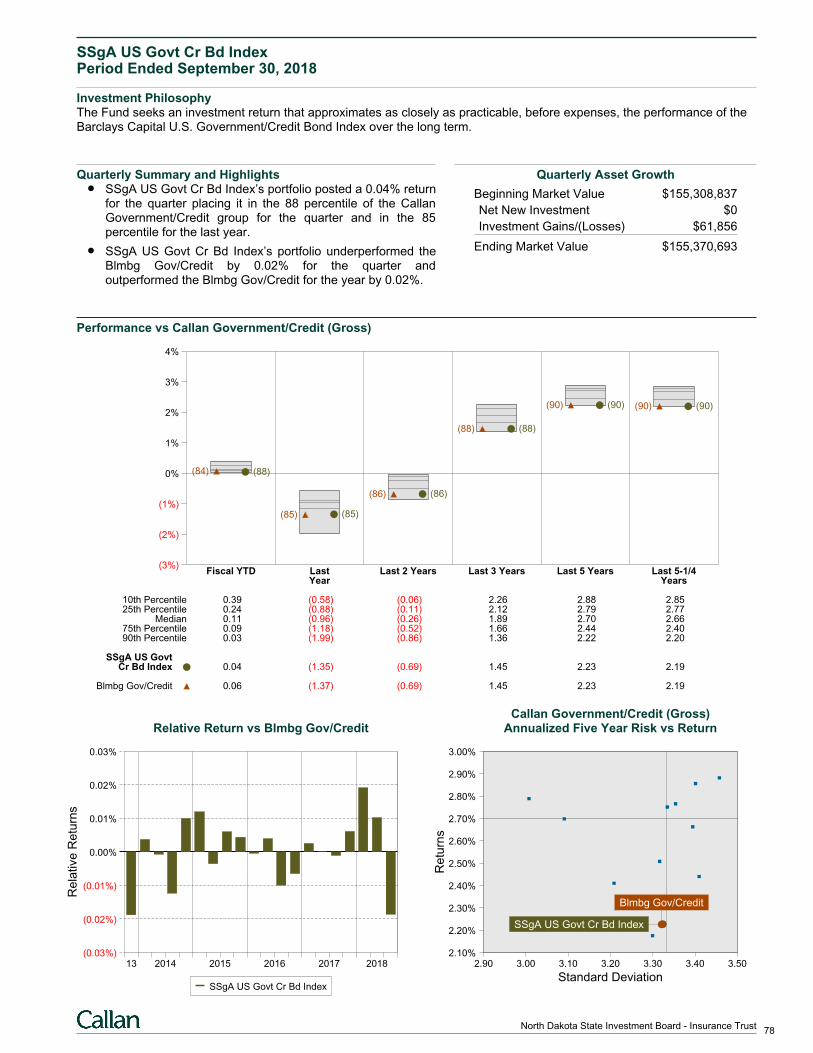
SSgA US Govt Cr Bd IndexPeriod Ended September 30, 2018
Investment PhilosophyThe Fund seeks an investment return that approximates as closely as practicable, before expenses, the performance of theBarclays Capital U.S. Government/Credit Bond Index over the long term.
Quarterly Summary and HighlightsSSgA US Govt Cr Bd Index’s portfolio posted a 0.04% returnfor the quarter placing it in the 88 percentile of the CallanGovernment/Credit group for the quarter and in the 85percentile for the last year.
SSgA US Govt Cr Bd Index’s portfolio underperformed theBlmbg Gov/Credit by 0.02% for the quarter andoutperformed the Blmbg Gov/Credit for the year by 0.02%.
Quarterly Asset Growth
Beginning Market Value $155,308,837
Net New Investment $0
Investment Gains/(Losses) $61,856
Ending Market Value $155,370,693
Performance vs Callan Government/Credit (Gross)
(3%)
(2%)
(1%)
0%
1%
2%
3%
4%
Fiscal YTD Last Last 2 Years Last 3 Years Last 5 Years Last 5-1/4Year Years
(88)(84)
(85)(85)
(86)(86)
(88)(88)
(90)(90) (90)(90)
10th Percentile 0.39 (0.58) (0.06) 2.26 2.88 2.8525th Percentile 0.24 (0.88) (0.11) 2.12 2.79 2.77
Median 0.11 (0.96) (0.26) 1.89 2.70 2.6675th Percentile 0.09 (1.18) (0.52) 1.66 2.44 2.4090th Percentile 0.03 (1.99) (0.86) 1.36 2.22 2.20
SSgA US GovtCr Bd Index 0.04 (1.35) (0.69) 1.45 2.23 2.19
Blmbg Gov/Credit 0.06 (1.37) (0.69) 1.45 2.23 2.19
Relative Return vs Blmbg Gov/Credit
Rela
tive
Re
turn
s
(0.03%)
(0.02%)
(0.01%)
0.00%
0.01%
0.02%
0.03%
13 2014 2015 2016 2017 2018
SSgA US Govt Cr Bd Index
Callan Government/Credit (Gross)Annualized Five Year Risk vs Return
2.90 3.00 3.10 3.20 3.30 3.40 3.502.10%
2.20%
2.30%
2.40%
2.50%
2.60%
2.70%
2.80%
2.90%
3.00%
Blmbg Gov/Credit
SSgA US Govt Cr Bd Index
Standard Deviation
Re
turn
s
78North Dakota State Investment Board - Insurance Trust
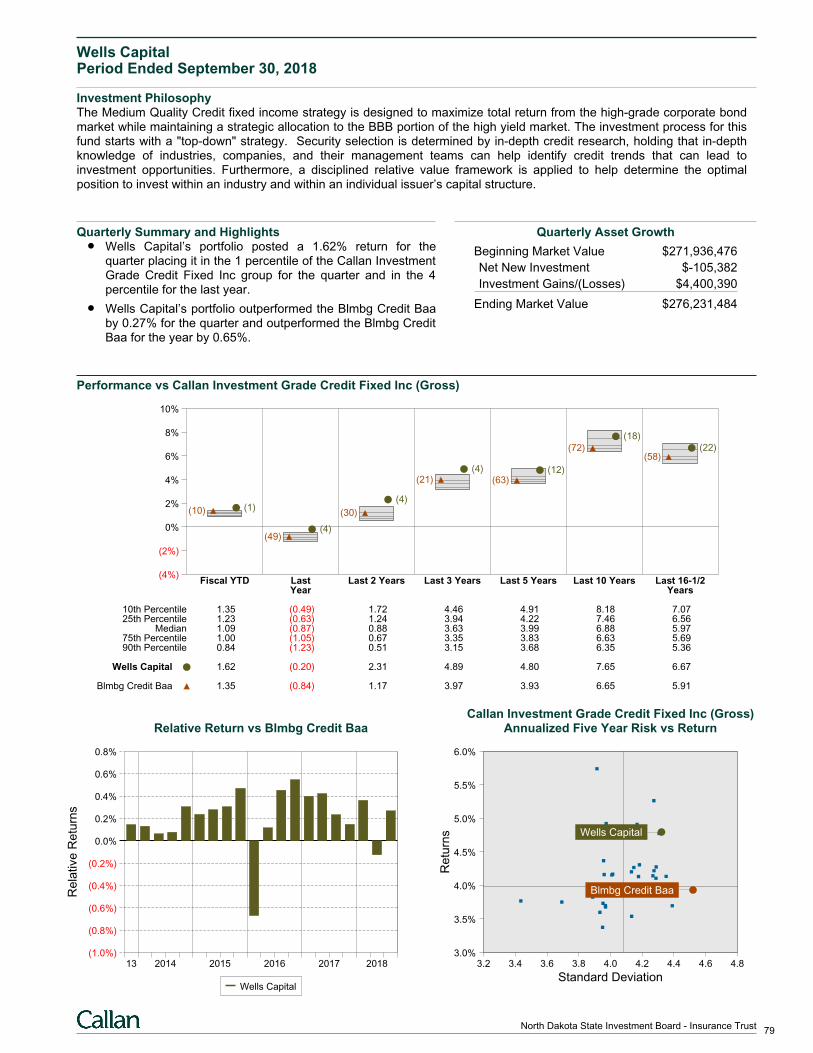
Wells CapitalPeriod Ended September 30, 2018
Investment PhilosophyThe Medium Quality Credit fixed income strategy is designed to maximize total return from the high-grade corporate bondmarket while maintaining a strategic allocation to the BBB portion of the high yield market. The investment process for thisfund starts with a "top-down" strategy. Security selection is determined by in-depth credit research, holding that in-depthknowledge of industries, companies, and their management teams can help identify credit trends that can lead toinvestment opportunities. Furthermore, a disciplined relative value framework is applied to help determine the optimalposition to invest within an industry and within an individual issuer’s capital structure.
Quarterly Summary and HighlightsWells Capital’s portfolio posted a 1.62% return for thequarter placing it in the 1 percentile of the Callan InvestmentGrade Credit Fixed Inc group for the quarter and in the 4percentile for the last year.
Wells Capital’s portfolio outperformed the Blmbg Credit Baaby 0.27% for the quarter and outperformed the Blmbg CreditBaa for the year by 0.65%.
Quarterly Asset Growth
Beginning Market Value $271,936,476
Net New Investment $-105,382
Investment Gains/(Losses) $4,400,390
Ending Market Value $276,231,484
Performance vs Callan Investment Grade Credit Fixed Inc (Gross)
(4%)
(2%)
0%
2%
4%
6%
8%
10%
Fiscal YTD Last Last 2 Years Last 3 Years Last 5 Years Last 10 Years Last 16-1/2Year Years
(1)(10)
(4)(49)
(4)
(30)
(4)(21)
(12)(63)
(18)
(72) (22)(58)
10th Percentile 1.35 (0.49) 1.72 4.46 4.91 8.18 7.0725th Percentile 1.23 (0.63) 1.24 3.94 4.22 7.46 6.56
Median 1.09 (0.87) 0.88 3.63 3.99 6.88 5.9775th Percentile 1.00 (1.05) 0.67 3.35 3.83 6.63 5.6990th Percentile 0.84 (1.23) 0.51 3.15 3.68 6.35 5.36
Wells Capital 1.62 (0.20) 2.31 4.89 4.80 7.65 6.67
Blmbg Credit Baa 1.35 (0.84) 1.17 3.97 3.93 6.65 5.91
Relative Return vs Blmbg Credit Baa
Rela
tive
Re
turn
s
(1.0%)
(0.8%)
(0.6%)
(0.4%)
(0.2%)
0.0%
0.2%
0.4%
0.6%
0.8%
13 2014 2015 2016 2017 2018
Wells Capital
Callan Investment Grade Credit Fixed Inc (Gross)Annualized Five Year Risk vs Return
3.2 3.4 3.6 3.8 4.0 4.2 4.4 4.6 4.83.0%
3.5%
4.0%
4.5%
5.0%
5.5%
6.0%
Wells Capital
Blmbg Credit Baa
Standard Deviation
Re
turn
s
79North Dakota State Investment Board - Insurance Trust
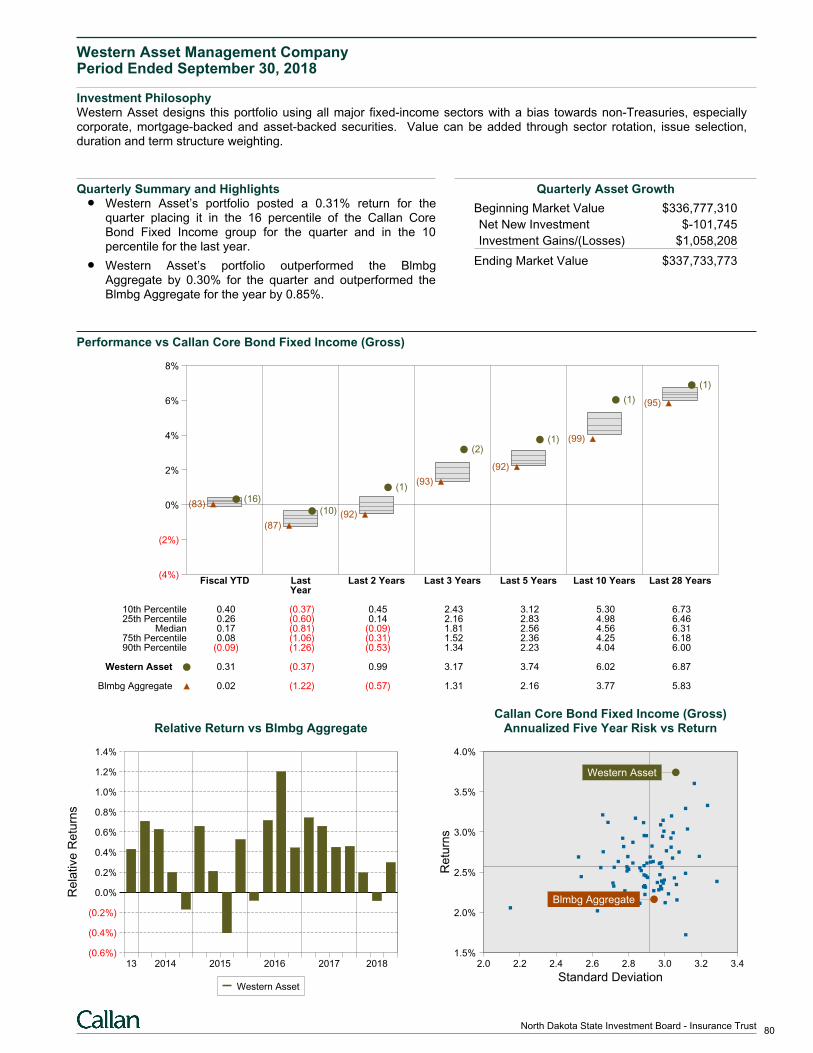
Western Asset Management CompanyPeriod Ended September 30, 2018
Investment PhilosophyWestern Asset designs this portfolio using all major fixed-income sectors with a bias towards non-Treasuries, especiallycorporate, mortgage-backed and asset-backed securities. Value can be added through sector rotation, issue selection,duration and term structure weighting.
Quarterly Summary and HighlightsWestern Asset’s portfolio posted a 0.31% return for thequarter placing it in the 16 percentile of the Callan CoreBond Fixed Income group for the quarter and in the 10percentile for the last year.
Western Asset’s portfolio outperformed the BlmbgAggregate by 0.30% for the quarter and outperformed theBlmbg Aggregate for the year by 0.85%.
Quarterly Asset Growth
Beginning Market Value $336,777,310
Net New Investment $-101,745
Investment Gains/(Losses) $1,058,208
Ending Market Value $337,733,773
Performance vs Callan Core Bond Fixed Income (Gross)
(4%)
(2%)
0%
2%
4%
6%
8%
Fiscal YTD Last Last 2 Years Last 3 Years Last 5 Years Last 10 Years Last 28 YearsYear
(16)(83)
(10)
(87)
(1)
(92)
(2)
(93)
(1)
(92)
(1)
(99)
(1)
(95)
10th Percentile 0.40 (0.37) 0.45 2.43 3.12 5.30 6.7325th Percentile 0.26 (0.60) 0.14 2.16 2.83 4.98 6.46
Median 0.17 (0.81) (0.09) 1.81 2.56 4.56 6.3175th Percentile 0.08 (1.06) (0.31) 1.52 2.36 4.25 6.1890th Percentile (0.09) (1.26) (0.53) 1.34 2.23 4.04 6.00
Western Asset 0.31 (0.37) 0.99 3.17 3.74 6.02 6.87
Blmbg Aggregate 0.02 (1.22) (0.57) 1.31 2.16 3.77 5.83
Relative Return vs Blmbg Aggregate
Rela
tive
Re
turn
s
(0.6%)
(0.4%)
(0.2%)
0.0%
0.2%
0.4%
0.6%
0.8%
1.0%
1.2%
1.4%
13 2014 2015 2016 2017 2018
Western Asset
Callan Core Bond Fixed Income (Gross)Annualized Five Year Risk vs Return
2.0 2.2 2.4 2.6 2.8 3.0 3.2 3.41.5%
2.0%
2.5%
3.0%
3.5%
4.0%
Western Asset
Blmbg Aggregate
Standard Deviation
Re
turn
s
80North Dakota State Investment Board - Insurance Trust
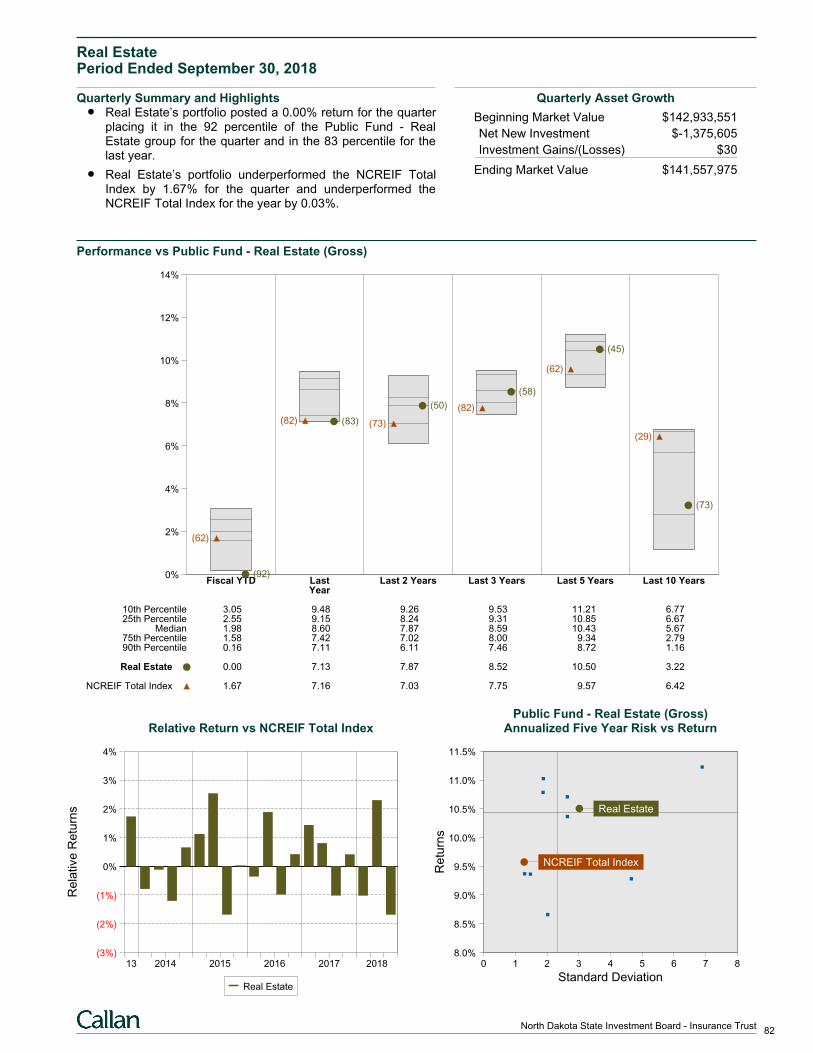
Real EstatePeriod Ended September 30, 2018
Quarterly Summary and HighlightsReal Estate’s portfolio posted a 0.00% return for the quarterplacing it in the 92 percentile of the Public Fund - RealEstate group for the quarter and in the 83 percentile for thelast year.
Real Estate’s portfolio underperformed the NCREIF TotalIndex by 1.67% for the quarter and underperformed theNCREIF Total Index for the year by 0.03%.
Quarterly Asset Growth
Beginning Market Value $142,933,551
Net New Investment $-1,375,605
Investment Gains/(Losses) $30
Ending Market Value $141,557,975
Performance vs Public Fund - Real Estate (Gross)
0%
2%
4%
6%
8%
10%
12%
14%
Fiscal YTD Last Last 2 Years Last 3 Years Last 5 Years Last 10 YearsYear
(92)
(62)
(83)(82)
(50)
(73)
(58)
(82)
(45)
(62)
(73)
(29)
10th Percentile 3.05 9.48 9.26 9.53 11.21 6.7725th Percentile 2.55 9.15 8.24 9.31 10.85 6.67
Median 1.98 8.60 7.87 8.59 10.43 5.6775th Percentile 1.58 7.42 7.02 8.00 9.34 2.7990th Percentile 0.16 7.11 6.11 7.46 8.72 1.16
Real Estate 0.00 7.13 7.87 8.52 10.50 3.22
NCREIF Total Index 1.67 7.16 7.03 7.75 9.57 6.42
Relative Return vs NCREIF Total Index
Rela
tive
Re
turn
s
(3%)
(2%)
(1%)
0%
1%
2%
3%
4%
13 2014 2015 2016 2017 2018
Real Estate
Public Fund - Real Estate (Gross)Annualized Five Year Risk vs Return
0 1 2 3 4 5 6 7 88.0%
8.5%
9.0%
9.5%
10.0%
10.5%
11.0%
11.5%
Real Estate
NCREIF Total Index
Standard Deviation
Re
turn
s
82North Dakota State Investment Board - Insurance Trust
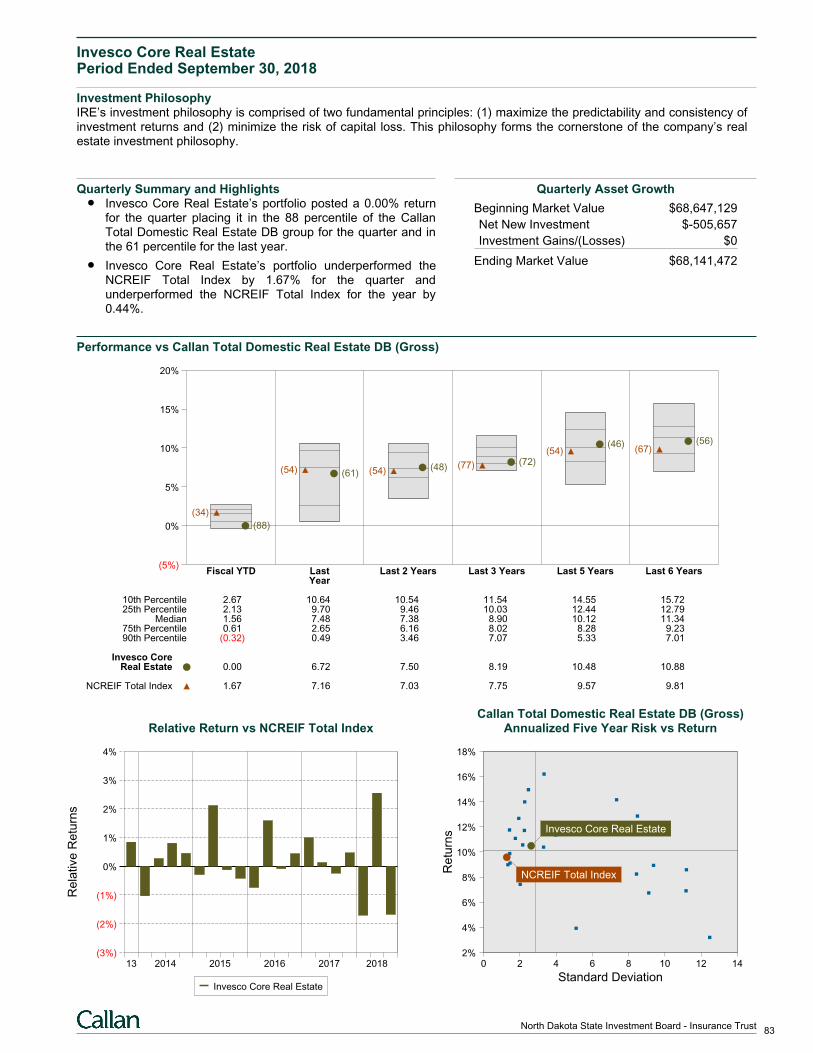
Invesco Core Real EstatePeriod Ended September 30, 2018
Investment PhilosophyIRE’s investment philosophy is comprised of two fundamental principles: (1) maximize the predictability and consistency ofinvestment returns and (2) minimize the risk of capital loss. This philosophy forms the cornerstone of the company’s realestate investment philosophy.
Quarterly Summary and HighlightsInvesco Core Real Estate’s portfolio posted a 0.00% returnfor the quarter placing it in the 88 percentile of the CallanTotal Domestic Real Estate DB group for the quarter and inthe 61 percentile for the last year.
Invesco Core Real Estate’s portfolio underperformed theNCREIF Total Index by 1.67% for the quarter andunderperformed the NCREIF Total Index for the year by0.44%.
Quarterly Asset Growth
Beginning Market Value $68,647,129
Net New Investment $-505,657
Investment Gains/(Losses) $0
Ending Market Value $68,141,472
Performance vs Callan Total Domestic Real Estate DB (Gross)
(5%)
0%
5%
10%
15%
20%
Fiscal YTD Last Last 2 Years Last 3 Years Last 5 Years Last 6 YearsYear
(88)
(34)
(61)(54) (48)(54)(72)(77)
(46)(54)
(56)(67)
10th Percentile 2.67 10.64 10.54 11.54 14.55 15.7225th Percentile 2.13 9.70 9.46 10.03 12.44 12.79
Median 1.56 7.48 7.38 8.90 10.12 11.3475th Percentile 0.61 2.65 6.16 8.02 8.28 9.2390th Percentile (0.32) 0.49 3.46 7.07 5.33 7.01
Invesco CoreReal Estate 0.00 6.72 7.50 8.19 10.48 10.88
NCREIF Total Index 1.67 7.16 7.03 7.75 9.57 9.81
Relative Return vs NCREIF Total Index
Rela
tive
Re
turn
s
(3%)
(2%)
(1%)
0%
1%
2%
3%
4%
13 2014 2015 2016 2017 2018
Invesco Core Real Estate
Callan Total Domestic Real Estate DB (Gross)Annualized Five Year Risk vs Return
0 2 4 6 8 10 12 142%
4%
6%
8%
10%
12%
14%
16%
18%
Invesco Core Real Estate
NCREIF Total Index
Standard Deviation
Re
turn
s
83North Dakota State Investment Board - Insurance Trust
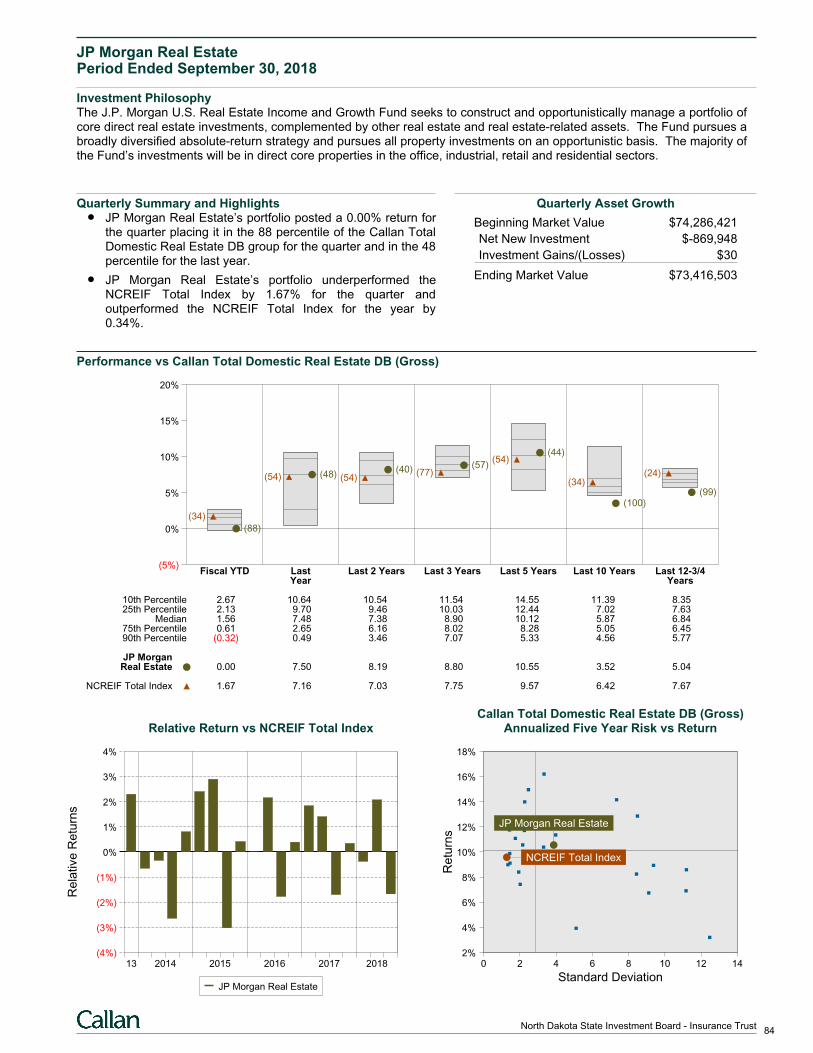
JP Morgan Real EstatePeriod Ended September 30, 2018
Investment PhilosophyThe J.P. Morgan U.S. Real Estate Income and Growth Fund seeks to construct and opportunistically manage a portfolio ofcore direct real estate investments, complemented by other real estate and real estate-related assets. The Fund pursues abroadly diversified absolute-return strategy and pursues all property investments on an opportunistic basis. The majority ofthe Fund’s investments will be in direct core properties in the office, industrial, retail and residential sectors.
Quarterly Summary and HighlightsJP Morgan Real Estate’s portfolio posted a 0.00% return forthe quarter placing it in the 88 percentile of the Callan TotalDomestic Real Estate DB group for the quarter and in the 48percentile for the last year.
JP Morgan Real Estate’s portfolio underperformed theNCREIF Total Index by 1.67% for the quarter andoutperformed the NCREIF Total Index for the year by0.34%.
Quarterly Asset Growth
Beginning Market Value $74,286,421
Net New Investment $-869,948
Investment Gains/(Losses) $30
Ending Market Value $73,416,503
Performance vs Callan Total Domestic Real Estate DB (Gross)
(5%)
0%
5%
10%
15%
20%
Fiscal YTD Last Last 2 Years Last 3 Years Last 5 Years Last 10 Years Last 12-3/4Year Years
(88)
(34)
(48)(54)(40)
(54)
(57)(77)
(44)(54)
(100)
(34)(99)
(24)
10th Percentile 2.67 10.64 10.54 11.54 14.55 11.39 8.3525th Percentile 2.13 9.70 9.46 10.03 12.44 7.02 7.63
Median 1.56 7.48 7.38 8.90 10.12 5.87 6.8475th Percentile 0.61 2.65 6.16 8.02 8.28 5.05 6.4590th Percentile (0.32) 0.49 3.46 7.07 5.33 4.56 5.77
JP MorganReal Estate 0.00 7.50 8.19 8.80 10.55 3.52 5.04
NCREIF Total Index 1.67 7.16 7.03 7.75 9.57 6.42 7.67
Relative Return vs NCREIF Total Index
Rela
tive
Re
turn
s
(4%)
(3%)
(2%)
(1%)
0%
1%
2%
3%
4%
13 2014 2015 2016 2017 2018
JP Morgan Real Estate
Callan Total Domestic Real Estate DB (Gross)Annualized Five Year Risk vs Return
0 2 4 6 8 10 12 142%
4%
6%
8%
10%
12%
14%
16%
18%
JP Morgan Real Estate
NCREIF Total Index
Standard Deviation
Re
turn
s
84North Dakota State Investment Board - Insurance Trust
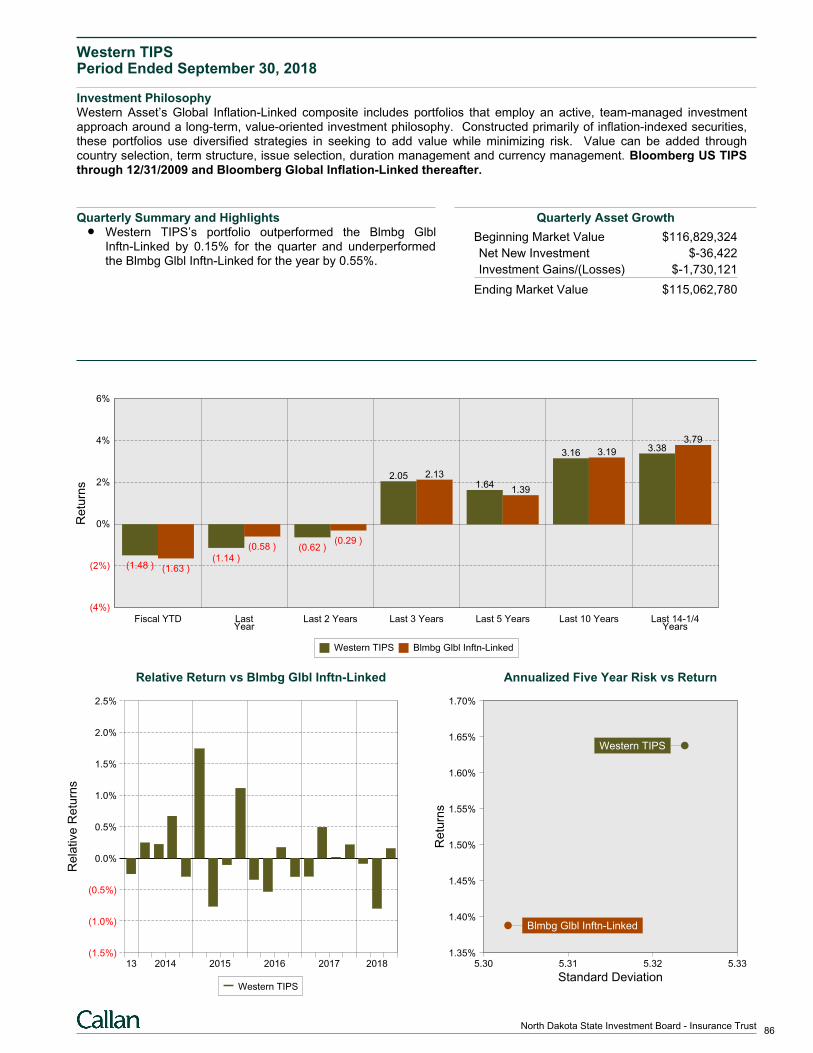
Western TIPSPeriod Ended September 30, 2018
Investment PhilosophyWestern Asset’s Global Inflation-Linked composite includes portfolios that employ an active, team-managed investmentapproach around a long-term, value-oriented investment philosophy. Constructed primarily of inflation-indexed securities,these portfolios use diversified strategies in seeking to add value while minimizing risk. Value can be added throughcountry selection, term structure, issue selection, duration management and currency management. Bloomberg US TIPSthrough 12/31/2009 and Bloomberg Global Inflation-Linked thereafter.
Quarterly Summary and HighlightsWestern TIPS’s portfolio outperformed the Blmbg GlblInftn-Linked by 0.15% for the quarter and underperformedthe Blmbg Glbl Inftn-Linked for the year by 0.55%.
Quarterly Asset Growth
Beginning Market Value $116,829,324
Net New Investment $-36,422
Investment Gains/(Losses) $-1,730,121
Ending Market Value $115,062,780
(4%)
(2%)
0%
2%
4%
6%
Fiscal YTD
(1.48 ) (1.63 )
LastYear
(1.14 )
(0.58 )
Last 2 Years
(0.62 )(0.29 )
Last 3 Years
2.05 2.13
Last 5 Years
1.641.39
Last 10 Years
3.16 3.19
Last 14-1/4Years
3.383.79
Re
turn
s
Western TIPS Blmbg Glbl Inftn-Linked
Relative Return vs Blmbg Glbl Inftn-Linked
Re
lative
Re
turn
s
(1.5%)
(1.0%)
(0.5%)
0.0%
0.5%
1.0%
1.5%
2.0%
2.5%
13 2014 2015 2016 2017 2018
Western TIPS
Annualized Five Year Risk vs Return
5.30 5.31 5.32 5.331.35%
1.40%
1.45%
1.50%
1.55%
1.60%
1.65%
1.70%
Western TIPS
Blmbg Glbl Inftn-Linked
Standard Deviation
Re
turn
s
86North Dakota State Investment Board - Insurance Trust
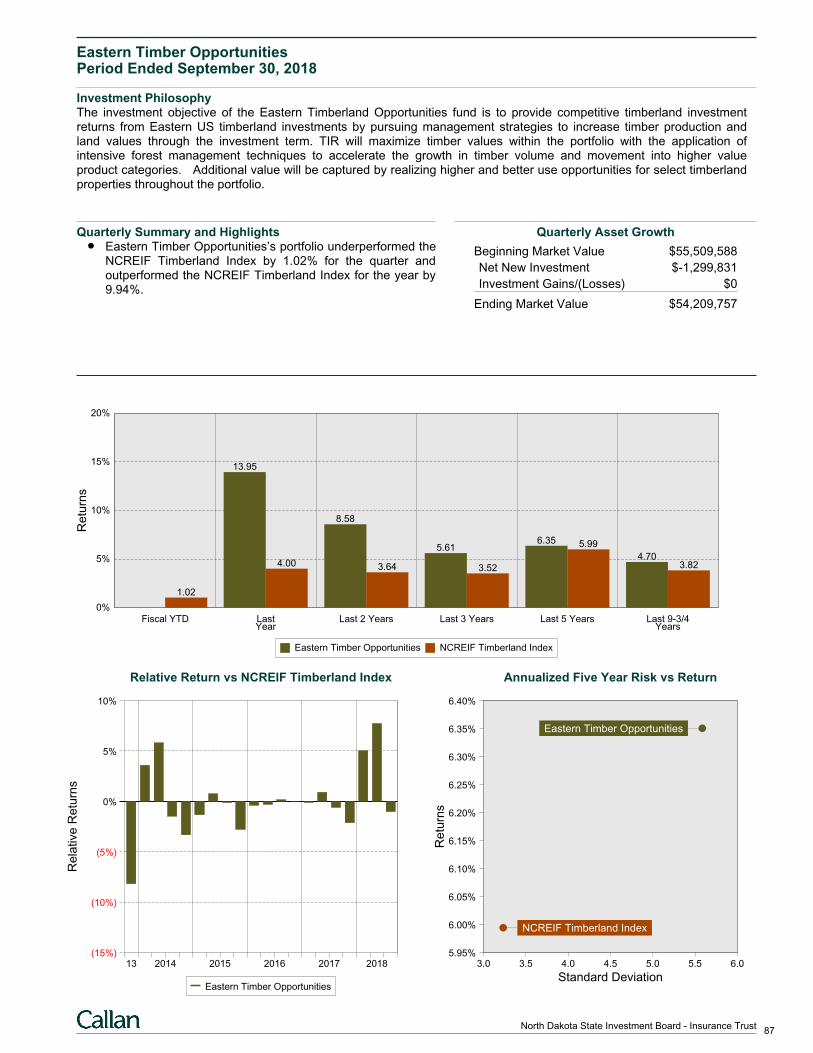
Eastern Timber OpportunitiesPeriod Ended September 30, 2018
Investment PhilosophyThe investment objective of the Eastern Timberland Opportunities fund is to provide competitive timberland investmentreturns from Eastern US timberland investments by pursuing management strategies to increase timber production andland values through the investment term. TIR will maximize timber values within the portfolio with the application ofintensive forest management techniques to accelerate the growth in timber volume and movement into higher valueproduct categories. Additional value will be captured by realizing higher and better use opportunities for select timberlandproperties throughout the portfolio.
Quarterly Summary and HighlightsEastern Timber Opportunities’s portfolio underperformed theNCREIF Timberland Index by 1.02% for the quarter andoutperformed the NCREIF Timberland Index for the year by9.94%.
Quarterly Asset Growth
Beginning Market Value $55,509,588
Net New Investment $-1,299,831
Investment Gains/(Losses) $0
Ending Market Value $54,209,757
0%
5%
10%
15%
20%
Fiscal YTD
1.02
LastYear
13.95
4.00
Last 2 Years
8.58
3.64
Last 3 Years
5.61
3.52
Last 5 Years
6.35 5.99
Last 9-3/4Years
4.703.82
Re
turn
s
Eastern Timber Opportunities NCREIF Timberland Index
Relative Return vs NCREIF Timberland Index
Re
lative
Re
turn
s
(15%)
(10%)
(5%)
0%
5%
10%
13 2014 2015 2016 2017 2018
Eastern Timber Opportunities
Annualized Five Year Risk vs Return
3.0 3.5 4.0 4.5 5.0 5.5 6.05.95%
6.00%
6.05%
6.10%
6.15%
6.20%
6.25%
6.30%
6.35%
6.40%
Eastern Timber Opportunities
NCREIF Timberland Index
Standard Deviation
Re
turn
s
87North Dakota State Investment Board - Insurance Trust
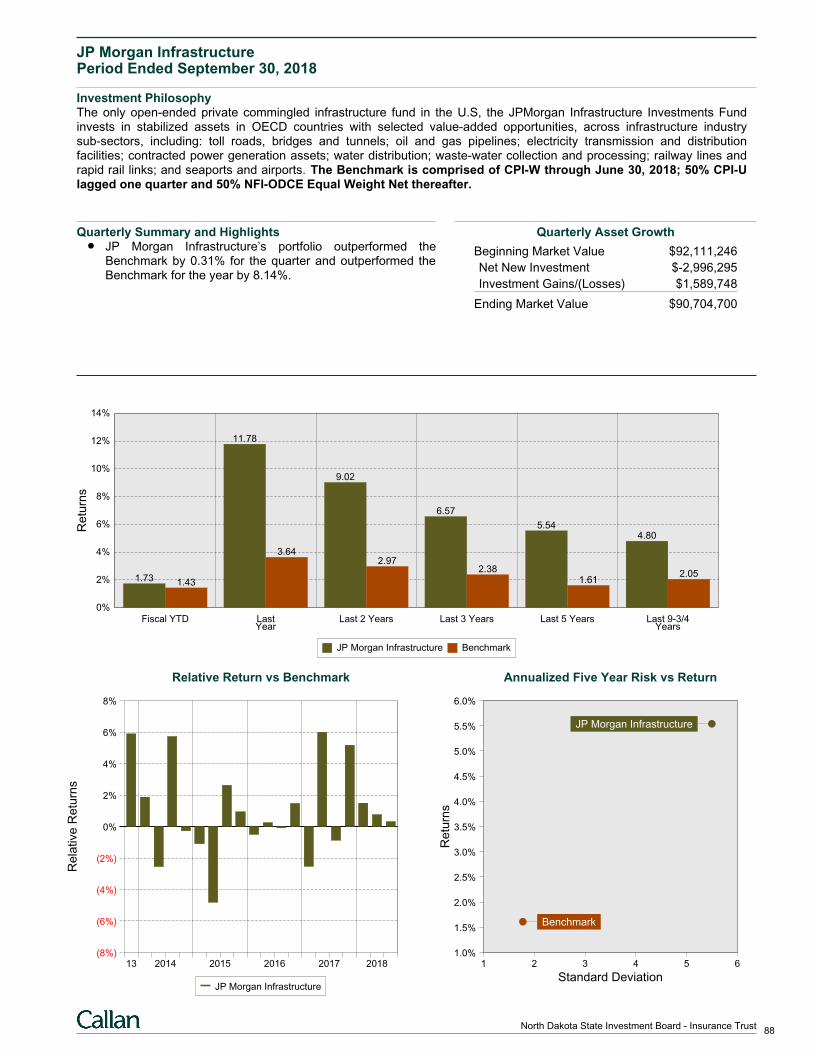
JP Morgan InfrastructurePeriod Ended September 30, 2018
Investment PhilosophyThe only open-ended private commingled infrastructure fund in the U.S, the JPMorgan Infrastructure Investments Fundinvests in stabilized assets in OECD countries with selected value-added opportunities, across infrastructure industrysub-sectors, including: toll roads, bridges and tunnels; oil and gas pipelines; electricity transmission and distributionfacilities; contracted power generation assets; water distribution; waste-water collection and processing; railway lines andrapid rail links; and seaports and airports. The Benchmark is comprised of CPI-W through June 30, 2018; 50% CPI-Ulagged one quarter and 50% NFI-ODCE Equal Weight Net thereafter.
Quarterly Summary and HighlightsJP Morgan Infrastructure’s portfolio outperformed theBenchmark by 0.31% for the quarter and outperformed theBenchmark for the year by 8.14%.
Quarterly Asset Growth
Beginning Market Value $92,111,246
Net New Investment $-2,996,295
Investment Gains/(Losses) $1,589,748
Ending Market Value $90,704,700
0%
2%
4%
6%
8%
10%
12%
14%
Fiscal YTD
1.73 1.43
LastYear
11.78
3.64
Last 2 Years
9.02
2.97
Last 3 Years
6.57
2.38
Last 5 Years
5.54
1.61
Last 9-3/4Years
4.80
2.05
Re
turn
s
JP Morgan Infrastructure Benchmark
Relative Return vs Benchmark
Re
lative
Re
turn
s
(8%)
(6%)
(4%)
(2%)
0%
2%
4%
6%
8%
13 2014 2015 2016 2017 2018
JP Morgan Infrastructure
Annualized Five Year Risk vs Return
1 2 3 4 5 61.0%
1.5%
2.0%
2.5%
3.0%
3.5%
4.0%
4.5%
5.0%
5.5%
6.0%
JP Morgan Infrastructure
Benchmark
Standard Deviation
Re
turn
s
88North Dakota State Investment Board - Insurance Trust
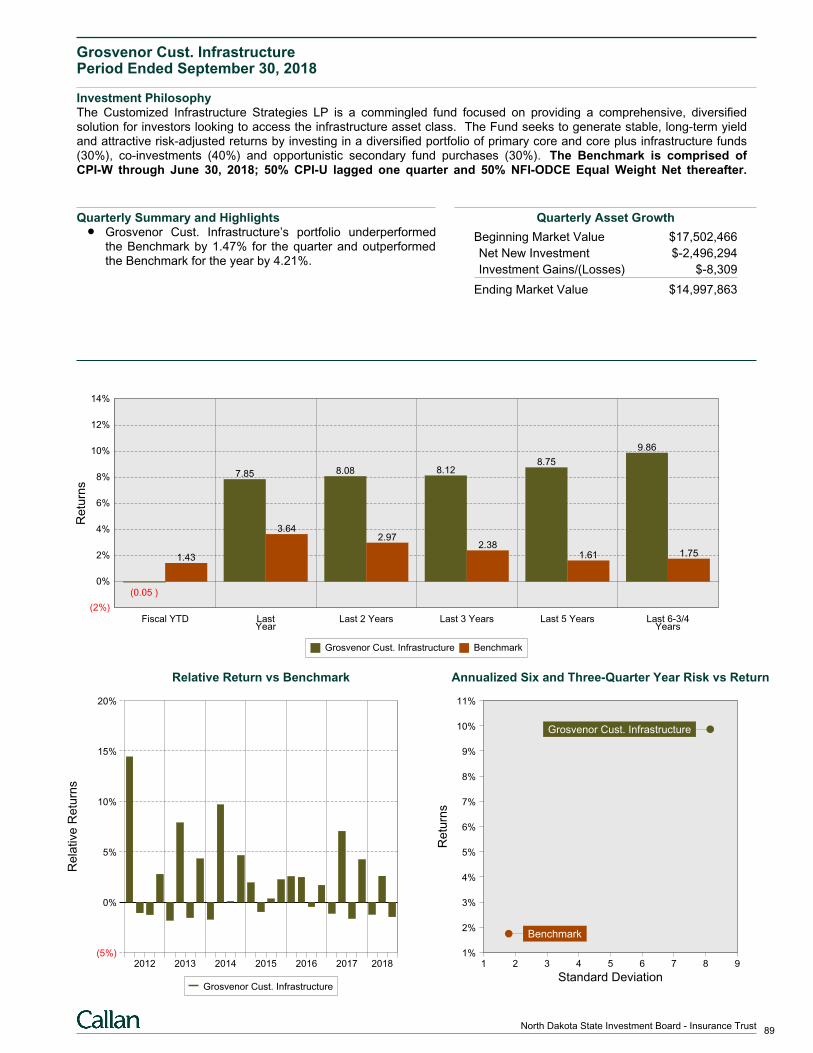
Grosvenor Cust. InfrastructurePeriod Ended September 30, 2018
Investment PhilosophyThe Customized Infrastructure Strategies LP is a commingled fund focused on providing a comprehensive, diversifiedsolution for investors looking to access the infrastructure asset class. The Fund seeks to generate stable, long-term yieldand attractive risk-adjusted returns by investing in a diversified portfolio of primary core and core plus infrastructure funds(30%), co-investments (40%) and opportunistic secondary fund purchases (30%). The Benchmark is comprised ofCPI-W through June 30, 2018; 50% CPI-U lagged one quarter and 50% NFI-ODCE Equal Weight Net thereafter.
Quarterly Summary and HighlightsGrosvenor Cust. Infrastructure’s portfolio underperformedthe Benchmark by 1.47% for the quarter and outperformedthe Benchmark for the year by 4.21%.
Quarterly Asset Growth
Beginning Market Value $17,502,466
Net New Investment $-2,496,294
Investment Gains/(Losses) $-8,309
Ending Market Value $14,997,863
(2%)
0%
2%
4%
6%
8%
10%
12%
14%
Fiscal YTD
(0.05 )
1.43
LastYear
7.85
3.64
Last 2 Years
8.08
2.97
Last 3 Years
8.12
2.38
Last 5 Years
8.75
1.61
Last 6-3/4Years
9.86
1.75
Re
turn
s
Grosvenor Cust. Infrastructure Benchmark
Relative Return vs Benchmark
Re
lative
Re
turn
s
(5%)
0%
5%
10%
15%
20%
2012 2013 2014 2015 2016 2017 2018
Grosvenor Cust. Infrastructure
Annualized Six and Three-Quarter Year Risk vs Return
1 2 3 4 5 6 7 8 91%
2%
3%
4%
5%
6%
7%
8%
9%
10%
11%
Benchmark
Grosvenor Cust. Infrastructure
Standard Deviation
Re
turn
s
89North Dakota State Investment Board - Insurance Trust
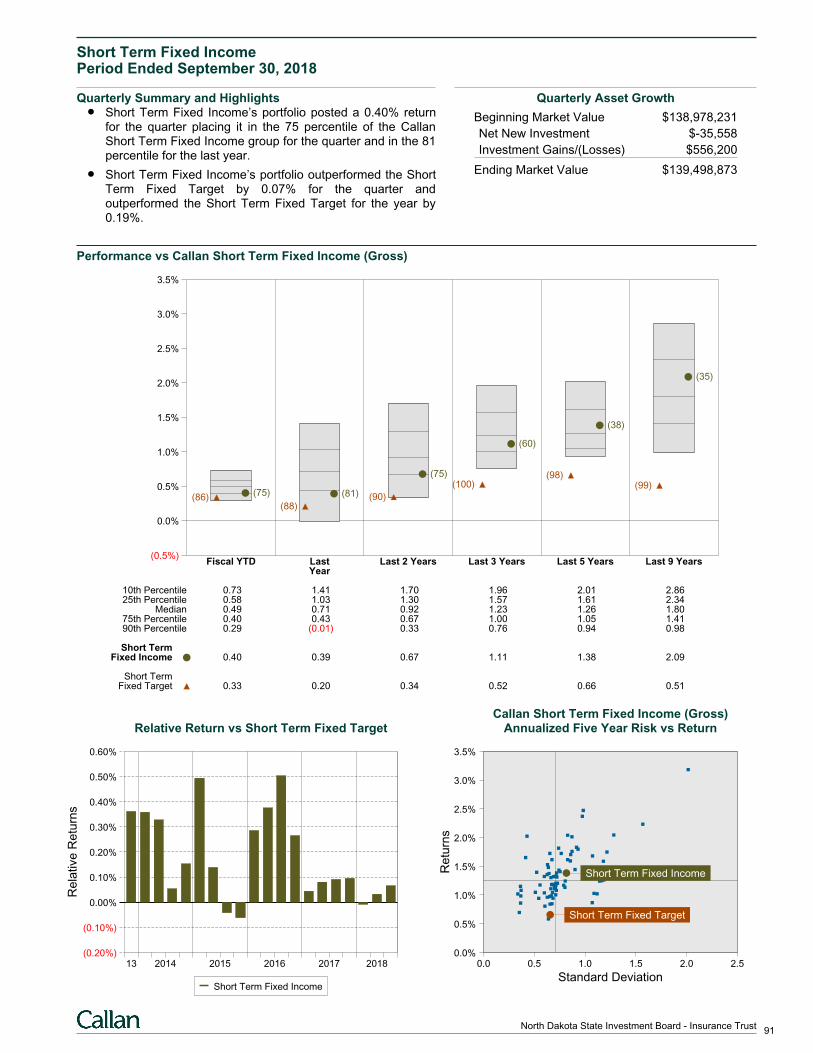
Short Term Fixed IncomePeriod Ended September 30, 2018
Quarterly Summary and HighlightsShort Term Fixed Income’s portfolio posted a 0.40% returnfor the quarter placing it in the 75 percentile of the CallanShort Term Fixed Income group for the quarter and in the 81percentile for the last year.
Short Term Fixed Income’s portfolio outperformed the ShortTerm Fixed Target by 0.07% for the quarter andoutperformed the Short Term Fixed Target for the year by0.19%.
Quarterly Asset Growth
Beginning Market Value $138,978,231
Net New Investment $-35,558
Investment Gains/(Losses) $556,200
Ending Market Value $139,498,873
Performance vs Callan Short Term Fixed Income (Gross)
(0.5%)
0.0%
0.5%
1.0%
1.5%
2.0%
2.5%
3.0%
3.5%
Fiscal YTD Last Last 2 Years Last 3 Years Last 5 Years Last 9 YearsYear
(75)(86) (81)
(88)
(75)
(90)
(60)
(100)
(38)
(98)
(35)
(99)
10th Percentile 0.73 1.41 1.70 1.96 2.01 2.8625th Percentile 0.58 1.03 1.30 1.57 1.61 2.34
Median 0.49 0.71 0.92 1.23 1.26 1.8075th Percentile 0.40 0.43 0.67 1.00 1.05 1.4190th Percentile 0.29 (0.01) 0.33 0.76 0.94 0.98
Short TermFixed Income 0.40 0.39 0.67 1.11 1.38 2.09
Short TermFixed Target 0.33 0.20 0.34 0.52 0.66 0.51
Relative Return vs Short Term Fixed Target
Rela
tive
Re
turn
s
(0.20%)
(0.10%)
0.00%
0.10%
0.20%
0.30%
0.40%
0.50%
0.60%
13 2014 2015 2016 2017 2018
Short Term Fixed Income
Callan Short Term Fixed Income (Gross)Annualized Five Year Risk vs Return
0.0 0.5 1.0 1.5 2.0 2.50.0%
0.5%
1.0%
1.5%
2.0%
2.5%
3.0%
3.5%
Short Term Fixed Income
Short Term Fixed Target
Standard Deviation
Re
turn
s
91North Dakota State Investment Board - Insurance Trust
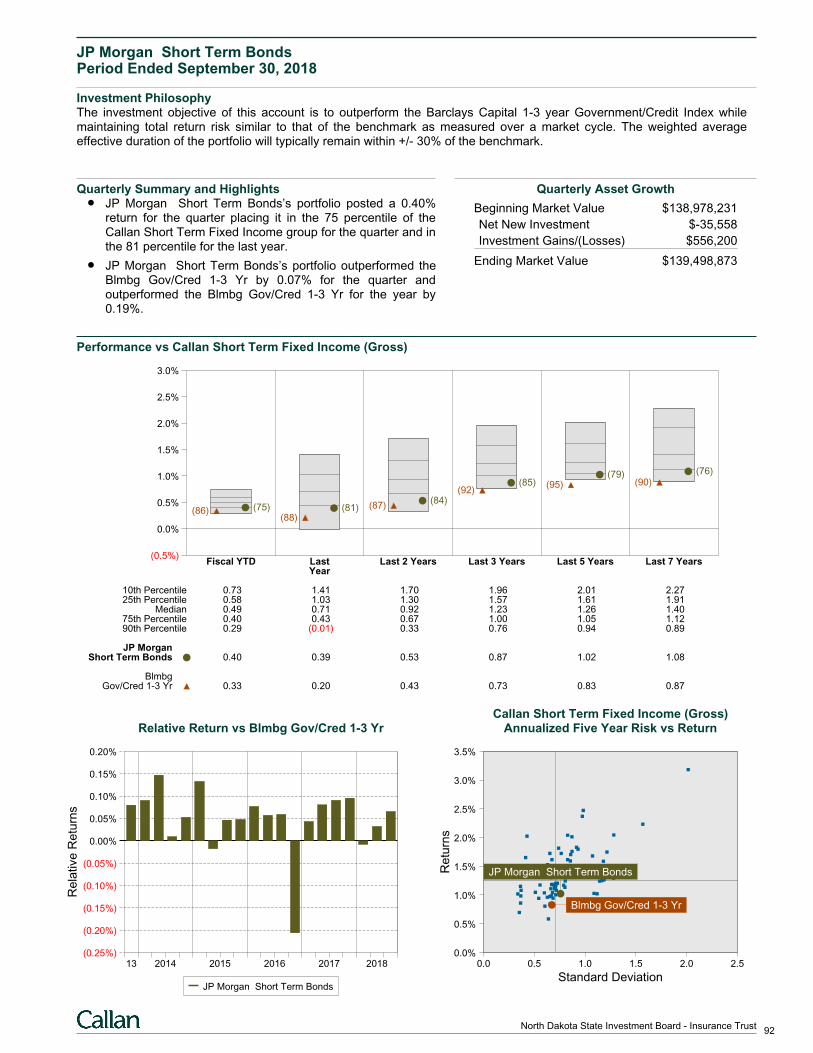
JP Morgan Short Term BondsPeriod Ended September 30, 2018
Investment PhilosophyThe investment objective of this account is to outperform the Barclays Capital 1-3 year Government/Credit Index whilemaintaining total return risk similar to that of the benchmark as measured over a market cycle. The weighted averageeffective duration of the portfolio will typically remain within +/- 30% of the benchmark.
Quarterly Summary and HighlightsJP Morgan Short Term Bonds’s portfolio posted a 0.40%return for the quarter placing it in the 75 percentile of theCallan Short Term Fixed Income group for the quarter and inthe 81 percentile for the last year.
JP Morgan Short Term Bonds’s portfolio outperformed theBlmbg Gov/Cred 1-3 Yr by 0.07% for the quarter andoutperformed the Blmbg Gov/Cred 1-3 Yr for the year by0.19%.
Quarterly Asset Growth
Beginning Market Value $138,978,231
Net New Investment $-35,558
Investment Gains/(Losses) $556,200
Ending Market Value $139,498,873
Performance vs Callan Short Term Fixed Income (Gross)
(0.5%)
0.0%
0.5%
1.0%
1.5%
2.0%
2.5%
3.0%
Fiscal YTD Last Last 2 Years Last 3 Years Last 5 Years Last 7 YearsYear
(75)(86) (81)(88)
(84)(87)
(85)(92)
(79)(95)
(76)(90)
10th Percentile 0.73 1.41 1.70 1.96 2.01 2.2725th Percentile 0.58 1.03 1.30 1.57 1.61 1.91
Median 0.49 0.71 0.92 1.23 1.26 1.4075th Percentile 0.40 0.43 0.67 1.00 1.05 1.1290th Percentile 0.29 (0.01) 0.33 0.76 0.94 0.89
JP MorganShort Term Bonds 0.40 0.39 0.53 0.87 1.02 1.08
BlmbgGov/Cred 1-3 Yr 0.33 0.20 0.43 0.73 0.83 0.87
Relative Return vs Blmbg Gov/Cred 1-3 Yr
Rela
tive
Re
turn
s
(0.25%)
(0.20%)
(0.15%)
(0.10%)
(0.05%)
0.00%
0.05%
0.10%
0.15%
0.20%
13 2014 2015 2016 2017 2018
JP Morgan Short Term Bonds
Callan Short Term Fixed Income (Gross)Annualized Five Year Risk vs Return
0.0 0.5 1.0 1.5 2.0 2.50.0%
0.5%
1.0%
1.5%
2.0%
2.5%
3.0%
3.5%
JP Morgan Short Term Bonds
Blmbg Gov/Cred 1-3 Yr
Standard Deviation
Re
turn
s
92North Dakota State Investment Board - Insurance Trust

Research and Educational Programs
The Callan Institute provides research to update clients on the latest industry trends and carefully structured educational programs
to enhance the knowledge of industry professionals. Visit www.callan.com/library to see all of our publications, and www.callan.com/blog
to view our blog “Perspectives.” For more information contact Corry Walsh at 312.346.3536 / [email protected].
New Research from Callan’s Experts
An Investor Framework for Addressing
Climate Change | Callan’s Anna West lays
out the top issues for investors about this
issue. We also identify solutions and areas
of progress for those seeking to address
climate-related risks as well as beneit from emerging opportunities.
Promoting Gender Diversity in the Investment Industry | Callan
Executive Chairman Ron Peyton offers his observations on what
has worked for gender inclusion at the irm over the last 45 years and what we have learned in the hope that it will inform others on
how to progress toward equality in senior roles industry-wide.
Helping DC Plan Participants in the
“Distribution” Phase | Callan’s Tom Shingler
and James Veneruso discuss our research on the
“distribution phase” of deined contribution plans, when participants are drawing down assets, and
the issues that plan sponsors should address.
Picking Through the Alpha Graveyard: Correcting for
Survivorship Bias in Investment Product Universes | In this
paper from the Journal of Investment Management, Callan’s Greg
Allen, Ivan Cliff, and Wally Meerschaert propose a technique to cor-
rect for survivorship bias in investment product universes. It uses
all available data for survivors and non-survivors, corrects for bias
across the full distribution (from 1st to 99th percentile), and can be
applied to other return-based statistics such as the Sharpe ratio.
Infrastructure: No Longer a Niche Option | Callan’s Jan Mende
discusses investing in infrastructure. Institutional investors are in-
creasing allocations, managers are creating more investment op-
tions, and benchmarks are being reined.
The Shape of Risk: Making Cents of the Irrational With Options
| In the third quarter’s Hedge Fund Monitor, Jim McKee discusses
the use of options as insurance for institutional portfolios.
2018 ESG Survey | Callan’s sixth annual survey on the status of
environmental, social, and governance (ESG) investing in the U.S.
institutional investment market reveals more than 40% of investors
are incorporating ESG factors into investment decisions.
Your Plan Will Face a Cyberattack; Here’s How to Prepare | The
third quarter’s edition of the DC Observer is designed to assist plan
sponsors with formulating and executing their cybersecurity strat-
egy to protect their information and their assets.
Quarterly Periodicals
Private Equity Trends | This newsletter offers the latest data on
private equity fundraising, buyouts, venture capital, and returns.
Market Pulse Flipbook | A quarterly market reference guide cover-
ing investment and fund sponsor trends in the U.S. economy, U.S.
and non-U.S. equities and ixed income, alternatives, and deined contribution.
Capital Market Review | This quarterly publication provides analy-
sis and a broad overview of the economy and public and private
market activity across a wide range of asset classes.
Real Estate Indicators: Too Hot to Touch or Cool Enough
to Handle? | Callan’s Real Assets Consulting group identi-
ies seven indicators—based on spreads in real estate and ixed income markets—that, combined with an understanding of prevail-ing market dynamics, have helped signal when the institutional real
estate market is overheated or cooled.
Education
3rd Quarter 2018
at Oxford University. In the context
8
These 17 goals were set in 2015 and target broad intergovernmental agree
ment around social and economic issues. Several of the 17 directly relate to
climate change; others indirectly touch on it. While the SDGs speciically relate
help to achieve the 17 goals. Likewise, index providers and asset managers are
investor market, as some expect more carbon pricing to occur in the next decade and want to avoid own
Research
August 2018
DC Plans Have Helped Participants Save. Now They Need to Help Them Spend.New Focus on the ‘Distribution Phase’
K E Y E L E M E N T S
Sponsorsaredevotingmoreattentiontothe“distributionphase”ofdeinedcontribution (DC) plans; that is, the period in which participants are drawing
down assets.
One key issue: whether to retain retiree assets in the plan. Sponsors should
address that question, and if the answer is yes, they need to make sure the
plan’s design and the recordkeeper’s capabilities support this choice.
The investing industry is also responding to the growing interest in the dis-
tribution phase with new retirement income products, but they can be quite
complex. Plan sponsors should evaluate the breadth of choices they wish to
offer retirees, as well as the level of fees and complexity.
Once operational considerations have been addressed, plans must focus
on the fund lineup and the overall communication efforts, which differ from
those needed for the “accumulation phase” when participants are building up
their wealth for retirement.
Knowledge. Experience. Integrity.
“Callan believes that plan sponsors should document their
philosophy on whether they wish to retain the assets of retired
and terminated participants. The issue of asset retention will
become increasingly important as demographics shift.”
James Veneruso and Tom Shingler
Fund Sponsor Consulting Group
INSTITUTE
INSTITUTE

Events
Miss out on a Callan conference or workshop? Event summa-
ries and speakers’ presentations are available on our website:
www.callan.com/library/
Callan’s 2019 National Conference will be held January 28-30,
2019. Mark your calendars for this upcoming event! And please
visit the Events page on our website (www.callan.com/events/) for
additional information as it becomes available.
For more information about events, please contact Barb
Gerraty: 415.274.3093 / [email protected]
The Center for Investment Training Educational Sessions
The Center for Investment Training, better known as the “Callan
College,” provides a foundation of knowledge for industry profes-
sionals who are involved in the investment decision-making pro-
cess. It was founded in 1994 to provide clients and non-clients alike
with basic- to intermediate-level instruction. Our next sessions are:
Introduction to Investments
San Francisco, April 16-17, 2019
San Francisco, July 16-17, 2019
Chicago, October 22-23, 2019
This program familiarizes fund sponsor trustees, staff, and asset
management advisers with basic investment theory, terminology,
and practices. It lasts one-and-a-half days and is designed for in-
dividuals who have less than two years of experience with asset-
management oversight and/or support responsibilities. Tuition for
the Introductory “Callan College” session is $2,350 per person.
Tuition includes instruction, all materials, breakfast and lunch on
each day, and dinner on the irst evening with the instructors.
Customized Sessions
The “Callan College” is equipped to customize a curriculum to
meet the training and educational needs of a speciic organization. These tailored sessions range from basic to advanced and can
take place anywhere—even at your ofice.
Learn more at www.callan.com/events/callan-college-intro or
contact Kathleen Cunnie: 415.274.3029 / [email protected]
Unique pieces of research the
Institute generates each year50+
Total attendees of the “Callan
College” since 19943,700 Year the Callan Institute
was founded1980
Attendees (on average) of the
Institute’s annual National Conference525
Education: By the Numbers
@CallanLLC Callan
“Research is the foundation of all we do at Callan, and sharing our
best thinking with the investment community is our way of helping
to foster dialog to raise the bar across the industry.”
Greg Allen, Chief Executive Oficer and Chief Research Oficer

List of Callan’s Investment Manager Clients
Confidential – For Callan Client Use Only Callan takes its fiduciary and disclosure responsibilities to clients very seriously. We recognize that there are numerous potential conflicts of interest encountered in the investment consulting industry and that it is our responsibility to manage those conflicts effectively and in the best interest of our clients. At Callan, we employ a robust process to identify, manage, monitor and disclose potential conflicts on an on-going basis. The list below is an important component of our conflicts management and disclosure process. It identifies those investment managers that pay Callan fees for educational, consulting, software, database or reporting products and services. We update the list quarterly because we believe that our fund sponsor clients should know the investment managers that do business with Callan, particularly those investment manager clients that the fund sponsor clients may be using or considering using. Please note that if an investment manager receives a product or service on a complimentary basis (e.g. attending and educational event), they are not included in the list below. Callan is committed to ensuring that we do not consider an investment manager’s business relationship with Callan, or lack thereof, in performing evaluations for or making suggestions or recommendations to its other clients. Please refer to Callan’s ADV Part 2A for a more detailed description of the services and products that Callan makes available to investment manager clients through our Institutional Consulting Group, Independent Adviser Group and Fund Sponsor Consulting Group. Due to the complex corporate and organizational ownership structures of many investment management firms, parent and affiliate firm relationships are not indicated on our list. Fund sponsor clients may request a copy of the most currently available list at any time. Fund sponsor clients may also request specific information regarding the fees paid to Callan by particular fund manager clients. Per company policy, information requests regarding fees are handled exclusively by Callan’s Compliance Department.
Quarterly List as of September 30, 2018
Knowledge. Experience. Integrity. Page 1 of 2
Manager Name Acadian Asset Management LLC AEGON USA Investment Management Aether Investment Partners AEW Capital Management Affiliated Managers Group, Inc. Alcentra AllianceBernstein Allianz Global Investors Allianz Life Insurance Company of North America American Century Investments Amundi Pioneer Asset Management Apollo Global Management AQR Capital Management Ares Management LLC Ariel Investments, LLC Atlanta Capital Management Co., LLC Aviva Investors Americas AXA Investment Managers Baillie Gifford International, LLC Baird Advisors Baron Capital Management, Inc. Barrow, Hanley, Mewhinney & Strauss, LLC Black Creek Investment Management, Inc. BlackRock BMO Global Asset Management BNP Paribas Asset Management BNY Mellon Asset Management Boston Partners Brandes Investment Partners, L.P. Brandywine Global Investment Management, LLC Breckinridge Capital Advisors, Inc. BrightSphere Investment Group (FKA Old Mutual Asset) Brown Brothers Harriman & Company Cambiar Investors, LLC
Manager Name Capital Group Carillon Tower Advisers CastleArk Management, LLC Causeway Capital Management CenterSquare Investment Management Chartwell Investment Partners Christian Brothers Investment Services CIM Group ClearBridge Investments, LLC Cohen & Steers Capital Management, Inc. Columbia Threadneedle Investments Columbus Circle Investors Credit Suisse Asset Management CS McKee, L.P. DePrince, Race & Zollo, Inc. D.E. Shaw Investment Management, L.L.C. Diamond Hill Capital Management, Inc. Dimensional Fund Advisors LP Doubleline Duff & Phelps Investment Management Co. DWS (Formerly Deutsche Asset Management) EARNEST Partners, LLC Eaton Vance Management Epoch Investment Partners, Inc. Fayez Sarofim & Company Federated Investors Fidelity Institutional Asset Management Fiera Capital Corporation First Eagle Investment Management, LLC First Hawaiian Bank Wealth Management Division Fisher Investments Franklin Templeton Fred Alger Management, Inc. GAM (USA) Inc.
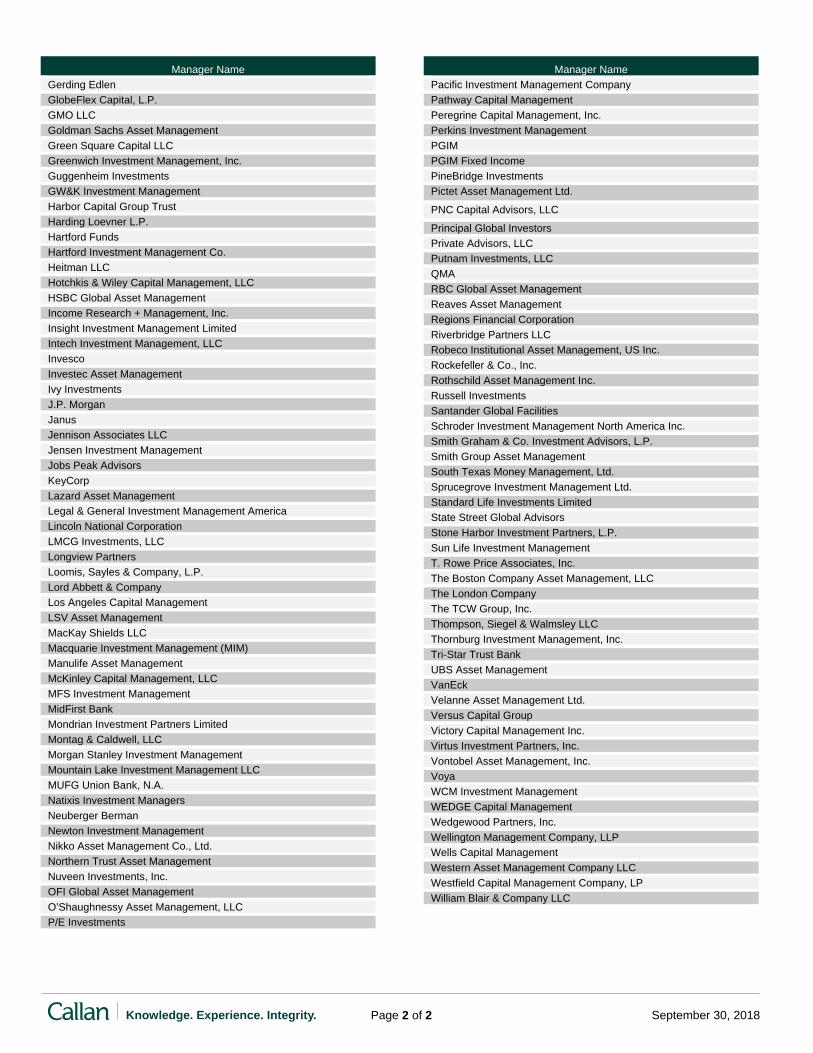
Knowledge. Experience. Integrity. September 30, 2018 Page 2 of 2
Manager Name Gerding Edlen GlobeFlex Capital, L.P. GMO LLC Goldman Sachs Asset Management Green Square Capital LLC Greenwich Investment Management, Inc. Guggenheim Investments GW&K Investment Management Harbor Capital Group Trust Harding Loevner L.P. Hartford Funds Hartford Investment Management Co. Heitman LLC Hotchkis & Wiley Capital Management, LLC HSBC Global Asset Management Income Research + Management, Inc. Insight Investment Management Limited Intech Investment Management, LLC Invesco Investec Asset Management Ivy Investments J.P. Morgan Janus Jennison Associates LLC Jensen Investment Management Jobs Peak Advisors KeyCorp Lazard Asset Management Legal & General Investment Management America Lincoln National Corporation LMCG Investments, LLC Longview Partners Loomis, Sayles & Company, L.P. Lord Abbett & Company Los Angeles Capital Management LSV Asset Management MacKay Shields LLC Macquarie Investment Management (MIM) Manulife Asset Management McKinley Capital Management, LLC MFS Investment Management MidFirst Bank Mondrian Investment Partners Limited Montag & Caldwell, LLC Morgan Stanley Investment Management Mountain Lake Investment Management LLC MUFG Union Bank, N.A. Natixis Investment Managers Neuberger Berman Newton Investment Management Nikko Asset Management Co., Ltd. Northern Trust Asset Management Nuveen Investments, Inc. OFI Global Asset Management O’Shaughnessy Asset Management, LLC P/E Investments
Manager Name Pacific Investment Management Company Pathway Capital Management Peregrine Capital Management, Inc. Perkins Investment Management PGIM PGIM Fixed Income PineBridge Investments Pictet Asset Management Ltd.
PNC Capital Advisors, LLC
Principal Global Investors Private Advisors, LLC Putnam Investments, LLC QMA RBC Global Asset Management Reaves Asset Management Regions Financial Corporation Riverbridge Partners LLC Robeco Institutional Asset Management, US Inc. Rockefeller & Co., Inc. Rothschild Asset Management Inc. Russell Investments Santander Global Facilities Schroder Investment Management North America Inc. Smith Graham & Co. Investment Advisors, L.P. Smith Group Asset Management South Texas Money Management, Ltd. Sprucegrove Investment Management Ltd. Standard Life Investments Limited State Street Global Advisors Stone Harbor Investment Partners, L.P. Sun Life Investment Management T. Rowe Price Associates, Inc. The Boston Company Asset Management, LLC The London Company The TCW Group, Inc. Thompson, Siegel & Walmsley LLC Thornburg Investment Management, Inc. Tri-Star Trust Bank UBS Asset Management VanEck Velanne Asset Management Ltd. Versus Capital Group Victory Capital Management Inc. Virtus Investment Partners, Inc. Vontobel Asset Management, Inc. Voya WCM Investment Management WEDGE Capital Management Wedgewood Partners, Inc. Wellington Management Company, LLP Wells Capital Management Western Asset Management Company LLC Westfield Capital Management Company, LP William Blair & Company LLC

September 30, 2018
North Dakota State Investment
Board Legacy Fund
Investment Measurement Service
Quarterly Review
Information contained herein includes confidential, trade secret and proprietary information. Neither this Report nor any specific information contained herein is
to be used other than by the intended recipient for its intended purpose or disseminated to any other person without Callan’s permission. Certain information
herein has been compiled by Callan and is based on information provided by a variety of sources believed to be reliable for which Callan has not necessarily
verified the accuracy or completeness of or updated. This content may consist of statements of opinion, which are made as of the date they are expressed and
are not statements of fact. This content is for informational purposes only and should not be construed as legal or tax advice on any matter. Any decision you
make on the basis of this content is your sole responsibility. You should consult with legal and tax advisers before applying any of this information to your
particular situation. Past performance is no guarantee of future results. For further information, please see Appendix for Important Information and Disclosures.
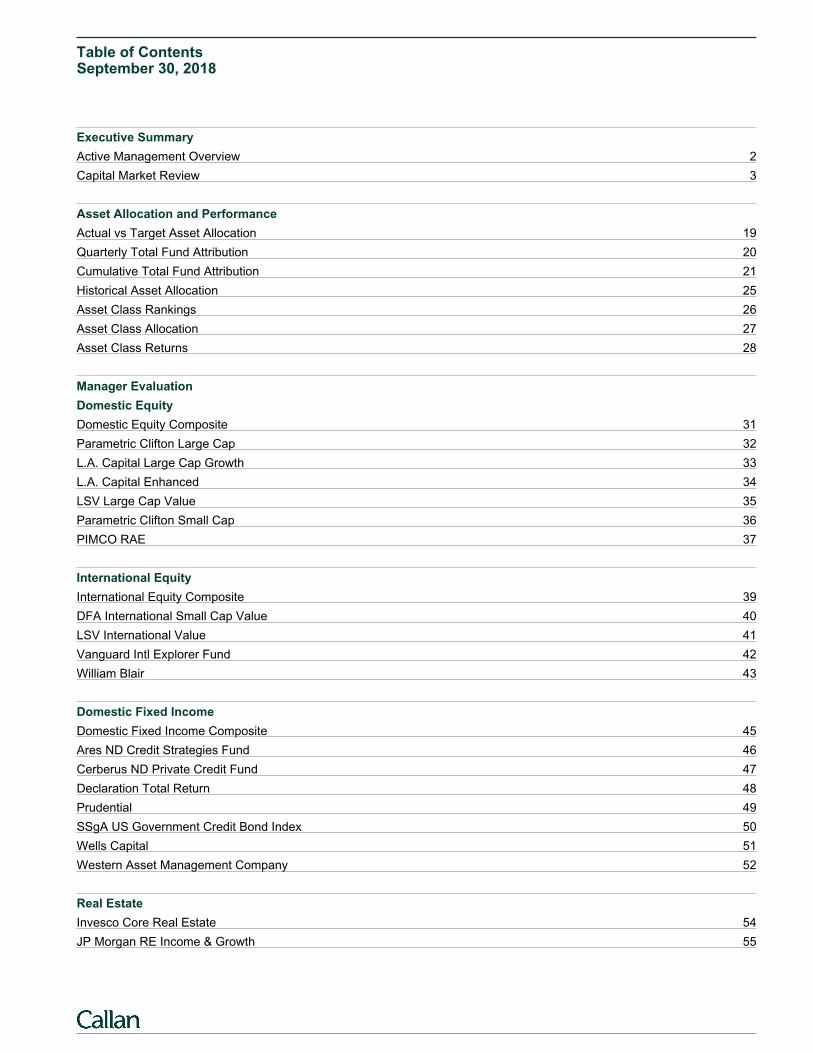
Table of ContentsSeptember 30, 2018
Executive Summary
Active Management Overview 2
Capital Market Review 3
Asset Allocation and Performance
Actual vs Target Asset Allocation 19
Quarterly Total Fund Attribution 20
Cumulative Total Fund Attribution 21
Historical Asset Allocation 25
Asset Class Rankings 26
Asset Class Allocation 27
Asset Class Returns 28
Manager Evaluation
Domestic Equity
Domestic Equity Composite 31
Parametric Clifton Large Cap 32
L.A. Capital Large Cap Growth 33
L.A. Capital Enhanced 34
LSV Large Cap Value 35
Parametric Clifton Small Cap 36
PIMCO RAE 37
International Equity
International Equity Composite 39
DFA International Small Cap Value 40
LSV International Value 41
Vanguard Intl Explorer Fund 42
William Blair 43
Domestic Fixed Income
Domestic Fixed Income Composite 45
Ares ND Credit Strategies Fund 46
Cerberus ND Private Credit Fund 47
Declaration Total Return 48
Prudential 49
SSgA US Government Credit Bond Index 50
Wells Capital 51
Western Asset Management Company 52
Real Estate
Invesco Core Real Estate 54
JP Morgan RE Income & Growth 55
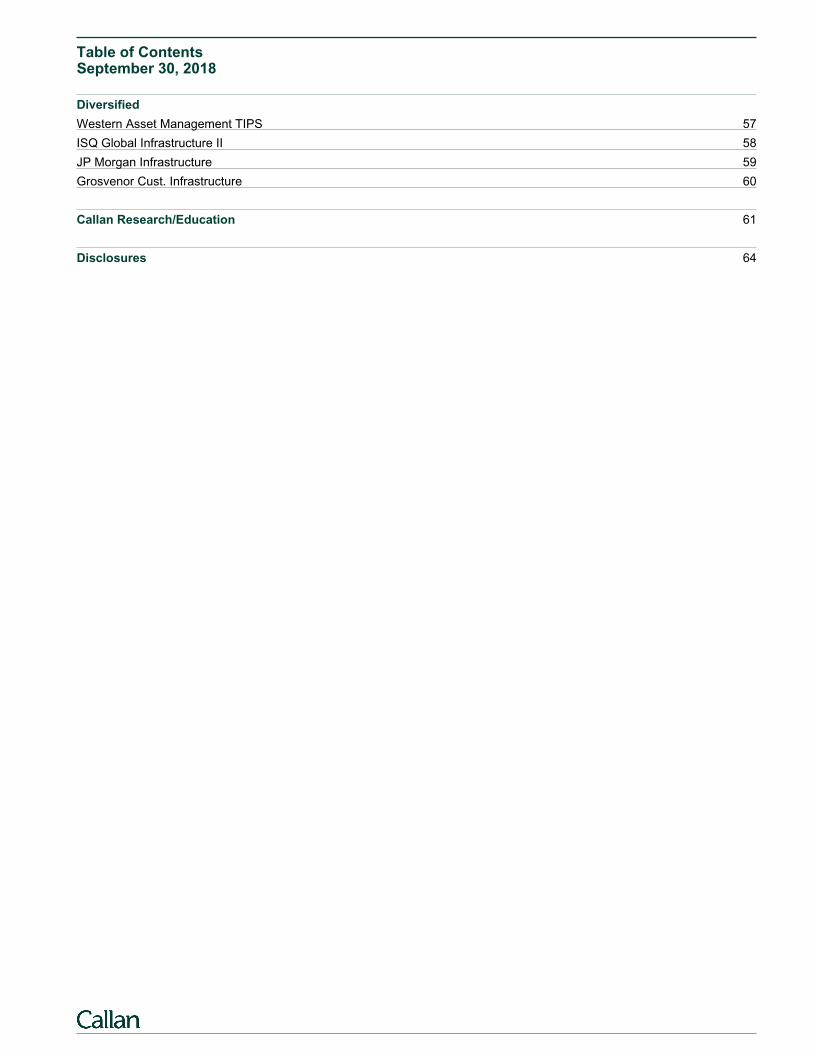
Table of ContentsSeptember 30, 2018
Diversified
Western Asset Management TIPS 57
ISQ Global Infrastructure II 58
JP Morgan Infrastructure 59
Grosvenor Cust. Infrastructure 60
Callan Research/Education 61
Disclosures 64
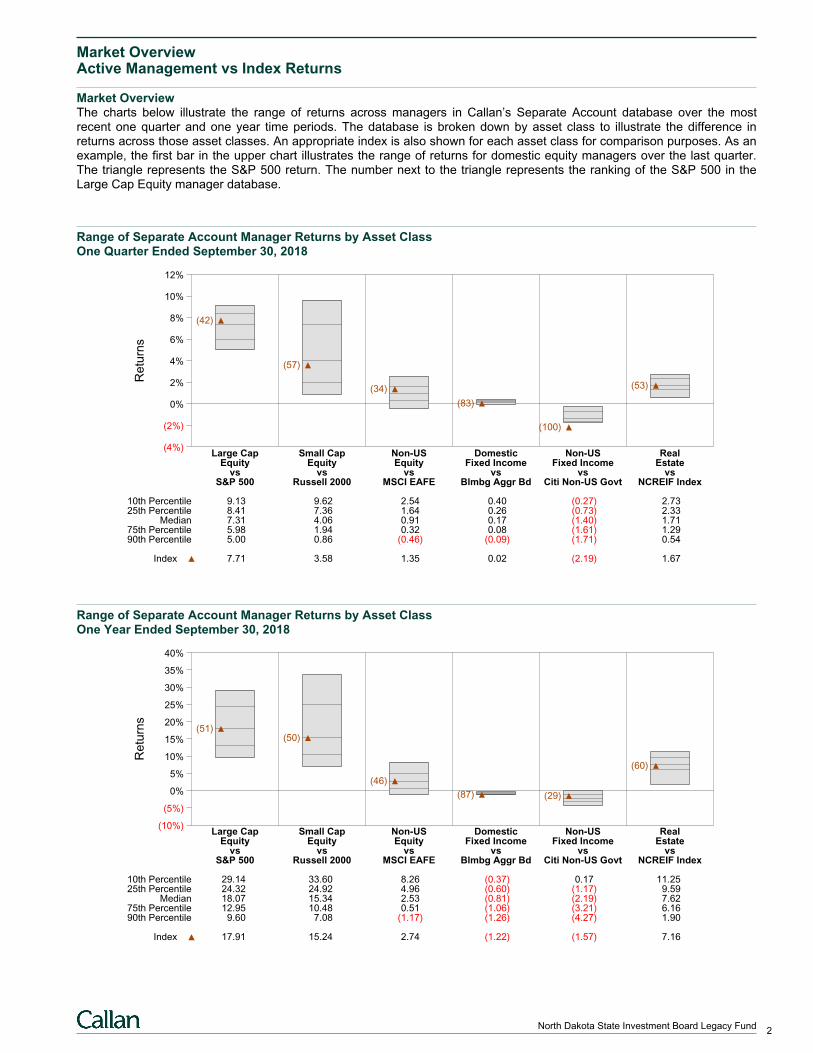
Market OverviewActive Management vs Index Returns
Market OverviewThe charts below illustrate the range of returns across managers in Callan’s Separate Account database over the mostrecent one quarter and one year time periods. The database is broken down by asset class to illustrate the difference inreturns across those asset classes. An appropriate index is also shown for each asset class for comparison purposes. As anexample, the first bar in the upper chart illustrates the range of returns for domestic equity managers over the last quarter.The triangle represents the S&P 500 return. The number next to the triangle represents the ranking of the S&P 500 in theLarge Cap Equity manager database.
Range of Separate Account Manager Returns by Asset ClassOne Quarter Ended September 30, 2018
Retu
rns
(4%)
(2%)
0%
2%
4%
6%
8%
10%
12%
Large Cap Small Cap Non-US Domestic Non-US RealEquity Equity Equity Fixed Income Fixed Income Estate
vs vs vs vs vs vsS&P 500 Russell 2000 MSCI EAFE Blmbg Aggr Bd Citi Non-US Govt NCREIF Index
(42)
(57)
(34)
(83)
(100)
(53)
10th Percentile 9.13 9.62 2.54 0.40 (0.27) 2.7325th Percentile 8.41 7.36 1.64 0.26 (0.73) 2.33
Median 7.31 4.06 0.91 0.17 (1.40) 1.7175th Percentile 5.98 1.94 0.32 0.08 (1.61) 1.2990th Percentile 5.00 0.86 (0.46) (0.09) (1.71) 0.54
Index 7.71 3.58 1.35 0.02 (2.19) 1.67
Range of Separate Account Manager Returns by Asset ClassOne Year Ended September 30, 2018
Re
turn
s
(10%)
(5%)
0%
5%
10%
15%
20%
25%
30%
35%
40%
Large Cap Small Cap Non-US Domestic Non-US RealEquity Equity Equity Fixed Income Fixed Income Estate
vs vs vs vs vs vsS&P 500 Russell 2000 MSCI EAFE Blmbg Aggr Bd Citi Non-US Govt NCREIF Index
(51)(50)
(46)
(87) (29)
(60)
10th Percentile 29.14 33.60 8.26 (0.37) 0.17 11.2525th Percentile 24.32 24.92 4.96 (0.60) (1.17) 9.59
Median 18.07 15.34 2.53 (0.81) (2.19) 7.6275th Percentile 12.95 10.48 0.51 (1.06) (3.21) 6.1690th Percentile 9.60 7.08 (1.17) (1.26) (4.27) 1.90
Index 17.91 15.24 2.74 (1.22) (1.57) 7.16
2North Dakota State Investment Board Legacy Fund
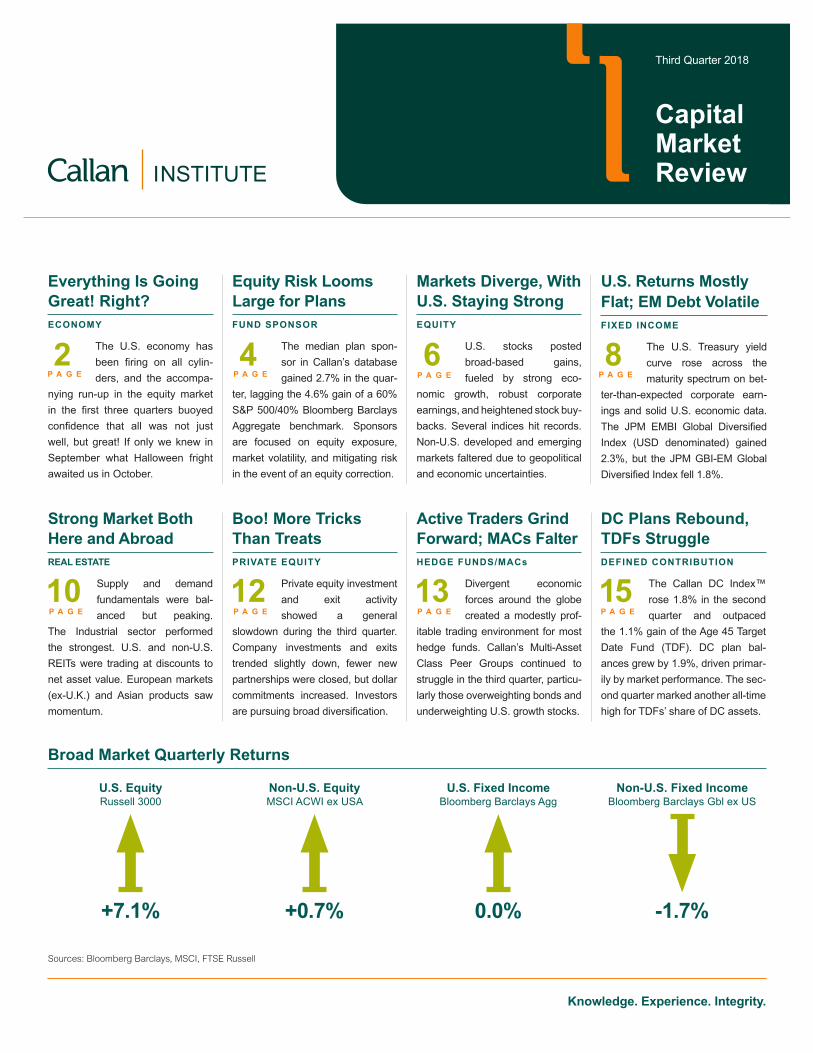
Boo! More Tricks
Than Treats
PRIVATE EQUITY
Private equity investment
and exit activity
showed a general
slowdown during the third quarter.
Company investments and exits
trended slightly down, fewer new
partnerships were closed, but dollar
commitments increased. Investors
are pursuing broad diversiication.
Active Traders Grind
Forward; MACs Falter
HEDGE FUNDS/MACs
Divergent economic
forces around the globe
created a modestly prof-
itable trading environment for most
hedge funds. Callan’s Multi-Asset
Class Peer Groups continued to
struggle in the third quarter, particu-
larly those overweighting bonds and
underweighting U.S. growth stocks.
DC Plans Rebound,
TDFs Struggle
DEFINED CONTRIBUTION
The Callan DC Index™
rose 1.8% in the second
quarter and outpaced
the 1.1% gain of the Age 45 Target
Date Fund (TDF). DC plan bal-
ances grew by 1.9%, driven primar-
ily by market performance. The sec-
ond quarter marked another all-time
high for TDFs’ share of DC assets.
Strong Market Both
Here and Abroad
REAL ESTATE
Supply and demand
fundamentals were bal-
anced but peaking.
The Industrial sector performed
the strongest. U.S. and non-U.S.
REITs were trading at discounts to
net asset value. European markets
(ex-U.K.) and Asian products saw
momentum.
Equity Risk Looms
Large for Plans
FUND SPONSOR
The median plan spon-
sor in Callan’s database
gained 2.7% in the quar-
ter, lagging the 4.6% gain of a 60%
S&P 500/40% Bloomberg Barclays
Aggregate benchmark. Sponsors
are focused on equity exposure,
market volatility, and mitigating risk
in the event of an equity correction.
Knowledge. Experience. Integrity.
Everything Is Going
Great! Right?
ECONOMY
The U.S. economy has
been iring on all cylin-
ders, and the accompa-
nying run-up in the equity market
in the irst three quarters buoyed conidence that all was not just well, but great! If only we knew in
September what Halloween fright
awaited us in October.
2P A G E
12P A G E
Markets Diverge, With
U.S. Staying Strong
EQUITY
U.S. stocks posted
broad-based gains,
fueled by strong eco-
nomic growth, robust corporate
earnings, and heightened stock buy-
backs. Several indices hit records.
Non-U.S. developed and emerging
markets faltered due to geopolitical
and economic uncertainties.
4P A G E
U.S. Returns Mostly
Flat; EM Debt Volatile
FIXED INCOME
The U.S. Treasury yield
curve rose across the
maturity spectrum on bet-
ter-than-expected corporate earn-
ings and solid U.S. economic data.
The JPM EMBI Global Diversiied Index (USD denominated) gained
2.3%, but the JPM GBI-EM Global
Diversiied Index fell 1.8%.
8P A G E
6P A G E
13P A G E
15P A G E
10P A G E
Broad Market Quarterly Returns
+0.7% 0.0%+7.1% -1.7%
U.S. EquityRussell 3000
U.S. Fixed IncomeBloomberg Barclays Agg
Non-U.S. EquityMSCI ACWI ex USA
Non-U.S. Fixed IncomeBloomberg Barclays Gbl ex US
Sources: Bloomberg Barclays, MSCI, FTSE Russell
CapitalMarket ReviewINSTITUTE
Third Quarter 2018

2
Everything Is Great! Right?
ECONOMY | Jay Kloepfer
02 0399 00 01 04 05 06 07 08 09 10 11 12 13 14 15 16 17
-10%
-8%
-6%
-4%
-2%
0%
2%
4%
6%
8%
18
Quarterly Real GDP Growth (20 Years)
-15%
-10%
-5%
0%
5%
10%
15%
20%
PPI (All Commodities)CPI (All Urban Consumers)
02 0399 00 01 04 05 06 07 08 09 10 11 12 13 14 15 16 17 18
Inlation Year-Over-Year
Source: Bureau of Labor Statistics
Source: Bureau of Economic Analysis
September 20 marked the capstone of a summer run-up in the
U.S. equity market. We saw a true market correction in February
(S&P 500 Index down 10.1%) and a drawdown of more than 7%
in March, but the memory of those experiences was obliterated
by a smooth, steady climb, with the S&P 500 gaining 12% in the
irst three quarters. Economic reports came in mixed for most economies outside the U.S. during 2018, but the U.S. economy
has been iring on all cylinders, with the job market, investment, and output all showing robust gains. GDP grew 3.5% in the third
quarter and 4.2% in the second. The accompanying run-up in
the equity market buoyed conidence that all was not just well, but great, and this economic expansion and bull market still had
fresh legs to keep going.
If only we knew in September what Halloween fright awaited us
in October.
Since the start of the year, investors had been growing increas-
ingly concerned that the expansion was getting long in the
tooth, and that both the economy and the stock market must
be nearing peaks. While elapsed time is not an economic vari-
able, the fact that the current expansion set a record for length
heightened fears of a downturn. Richly priced capital markets
across all asset classes and a new peak in the level of corpo-
rate earnings reported during the summer earnings season sug-
gested that a market correction was inevitable. Through the end
of September, such fears contrasted with the continuing stream
of good economic news, and the market roared. The unem-
ployment rate dropped to 3.7% in September, the lowest since
2000. Wages continue to inch up, with average hourly earnings
growth rising from 2% toward 3%. While potentially inlationary and certainly a cost to business, stronger wage growth kept
consumer spending robust, and boosted consumer (and busi-
ness) conidence.
Against this backdrop, the Fed raised rates three times in 2018,
bringing the Fed Funds rate to 2.0-2.25%. The Fed expects one
more rate hike this year and three in 2019. The Fed has now
raised rates 200 basis points over the past two years. Since
inlation has not changed over this period, real rates have essentially risen by 2 percentage points. Much of the growth
in the irst half of 2018 was attributed to the tax cut and spend-
ing, and trade activity in advance of tariffs imposed in July by
the U.S. and China. Monetary policy has incrementally become

3Knowledge. Experience. Integrity.
U.S. ECONOMY (Continued)
The Long-Term View
2018
3rd Qtr
Periods ended Dec. 31, 2017
Index Year 5 Yrs 10 Yrs 25 Yrs
U.S. Equity
Russell 3000 7.12 21.13 15.58 8.60 9.72
S&P 500 7.71 21.83 15.79 8.50 9.69
Russell 2000 3.58 14.65 14.12 8.71 9.54
Non-U.S. Equity
MSCI ACWI ex USA 0.71 27.19 6.80 1.84 --
MSCI Emerging Markets -1.09 37.28 4.35 1.68 --
MSCI ACWI ex USA Small Cap -1.51 31.65 10.03 4.69 --
Fixed Income
Bloomberg Barclays Agg 0.02 3.54 2.10 4.01 5.48
90-Day T-Bill 0.49 0.86 0.27 0.39 2.60
Bloomberg Barclays Long G/C -0.47 10.71 4.43 7.26 7.67
Bloomberg Barclays Gl Agg ex US -1.74 10.51 -0.20 2.40 5.02
Real Estate
NCREIF Property 1.67 6.96 10.19 6.08 9.12
FTSE NAREIT Equity 0.79 5.23 9.46 7.44 10.76
Alternatives
CS Hedge Fund 0.59 7.12 4.23 3.24 –
Cambridge PE* 4.51 19.48 13.97 9.14 15.65
Bloomberg Commodity -2.02 1.70 -8.45 -6.83 2.47
Gold Spot Price -4.65 13.68 -4.82 4.56 5.63
Inlation – CPI-U 0.18 2.11 1.43 1.61 2.23
*Data for most recent period lags by a quarter
Sources: Bloomberg Barclays, Bloomberg, Credit Suisse, FTSE, MSCI, NCREIF,
FTSE Russell, Standard & Poor’s, Thomson Reuters/Cambridge, Bureau of Economic
Analysis
Recent Quarterly Economic Indicators
3Q18 2Q18 1Q18 4Q17 3Q17 2Q17 1Q17 4Q16
Employment Cost–Total Compensation Growth 2.8% 2.8% 2.7% 2.6% 2.5% 2.4% 2.4% 2.2%
Nonfarm Business–Productivity Growth 2.2% 3.0% 0.3% -0.3% 2.3% 1.6% 0.4% 1.3%
GDP Growth 3.5% 4.2% 2.2% 2.3% 2.8% 3.0% 1.8% 1.8%
Manufacturing Capacity Utilization 75.8% 75.5% 75.3% 75.2% 74.4% 74.9% 74.6% 74.4%
Consumer Sentiment Index (1966=100) 98.1 98.3 98.9 98.4 95.1 96.4 97.2 93.2
Sources: Bureau of Economic Analysis, Bureau of Labor Statistics, Federal Reserve, IHS Economics, Reuters/University of Michigan
a more signiicant headwind, and it began showing up in the third quarter. While it is true that real rates are low relative to
history, the change in rates is important. Since the mid-1980s
real rates have risen by 2 percentage points four times; three of
those occurrences resulted in recessions. In a study by Capital
Economics, monetary policy tightening was a major contributing factor in 29 out of 45 recessions in G7 countries since 1960.
Higher interest rates are beginning to squeeze some of the most
rate-sensitive segments of the economy. Housing has been an
ongoing mystery; starts surged to an 11-year high in May, only
to stall during the summer. Home sales are also clearly feeling
the pressure of higher rates, and from the supply side, a short-
age of houses. Residential investment contracted by 4% in the
third quarter, following declines in each of the irst two quar-ters. Home prices rose substantially in certain markets through
the summer, but early indications are that rates began to crimp
prices and sales in September. Housing can often be the canary
in the coal mine: an early indicator of slowing economic activity
and lower conidence.
Inlation had been gradually trending up, reaching 2.9% in June, inally fulilling the expectations of many market observers, but the year-over-year gain in the CPI slowed to 2.3% in the third
quarter. Much of the rise in the irst half was attributable to a rebound in oil prices. Once oil prices stabilize as expected, the
increase in inlation will likely abate. One reason for the stability of inlation is the growing dominance of services in the inlation calculation. The services inlation rate has been much steadier than the goods rate and consistently positive near 2%. Goods
prices are more volatile and much more inluenced than ser-vices by factors such as trade, currency, supply and demand of
raw materials, and geopolitics.
Related to goods prices, the ISM manufacturing index had
reached a 14-year high earlier this year, but fell back in
September, as manufacturers and exporters face the triple
threat of a stronger dollar (up 8% since mid-April), the imposi-
tion of tariffs in July and anticipation of more in October, and
weakening of global growth.

4
Equity Risk Looms Large for Plans
FUND SPONSOR
– The median fund sponsor in Callan’s database gained 2.7%
in the third quarter.
– Taft-Hartley plans (+3.0%) were the best-performing spon-
sor by type, as they were the previous quarter; corporate
plans (+2.3%) showed the lowest increase.
– By size, the strongest returns came from small plans (under
$100 million), which rose 2.9%, compared to a 2.6% gain
for medium plans ($100 million-$1 billion) and 2.3% for
large plans (more than $1 billion).
– All types and sizes lagged a 60% S&P 500/40% Bloomberg
Barclays US Aggregate benchmark, which rose 4.6%.
– Over the last year, three years, and ive years, Taft-Hartley plans had the strongest returns of all fund types, while pub-
lic plans have done best over the last 10 years.
– Investors are focused on concerns about equity exposure,
market volatility, and how to mitigate risk in the event of an
equity market correction in a rising interest rate environment.
– But they face competing fears: an equity market downturn
vs. the fear of missing out (FOMO!).
0%
1%
2%
3%
4%
Public Corporate Endow/Fndn Taft-Hartley Database Database Database Database
10th Percentile 3.64 3.62 3.86 4.01
25th Percentile 3.20 2.96 3.24 3.50
Median 2.66 2.27 2.71 3.02
75th Percentile 2.26 1.60 2.15 2.46
90th Percentile 1.77 0.71 1.38 1.79
Callan Fund Sponsor Returns for the Quarter
Source: Callan
U.S. Fixed
Non-U.S. Fixed
Real Estate
Hedge Funds
Other Alternatives
Cash
Balanced
U.S. Equity
Non-U.S. Equity
Global Equity
1.8%
Public
2.66%*
33.8%
18.1%
27.2%
2.4%
6.6%
1.0%
2.5%
5.8%
1.2%
Endowment/
Foundation
2.71%*
35.2%
19.8%
18.8%
2.0%
0.3%
6.1%
2.4%
10.2%
2.5%
Taft-Hartley
3.02%* 1.5%
Corporate
2.27%*
1.7%
2.3% 0.4%
37.1%
28.0%
12.2%
0.5%
3.5%
10.6%
3.7%
14.8%
1.7%
26.6%
39.9%
2.9%
0.7%
3.9%
4.4%
2.7%
2.9%
Callan Fund Sponsor Average Asset Allocation
*Latest median quarter return
Note: charts may not sum to 100% due to rounding
Source: Callan
– They are reining the deinition of growth to include invest-ments such as high yield, convertibles, low-volatility equity,
hedge funds, multi-asset class strategies, and options-
based strategies.
– Many sponsors are seeking higher returns outside of tradi-
tional asset classes such as equity and ixed income, and

5Knowledge. Experience. Integrity.
FUND SPONSOR (Continued)
0%
20%
40%
60%
80%
100%
08 09 10 11 12 13
U.S. Fixed
Non-U.S. Fixed
Real Estate
Hedge Funds
Other Alternatives
Cash
Balanced
U.S. Equity
Non-U.S. Equity
Global Equity
14 15 16 17 18
Callan Public Fund Database Average Asset Allocation (10 Years)
Source: Callan. Callan’s database includes the following groups: public deined beneit, corporate deined beneit, endowments/foundations, and Taft-Hartley plans.
Approximately 10% to 15% of the database constituents are Callan’s clients. All database group returns presented gross of fees. Past performance is no guarantee of future
results. Reference to or inclusion in this report of any product, service, or entity should not be construed as a recommendation, approval, ailiation, or endorsement of such
product, service, or entity by Callan.
worry about risk mitigation. The late stage of the economic
cycle combined with elevated equity valuations and low bond
yields is causing sponsors to explore allocations to U.S.
Treasuries, managed futures, and tail risk hedging.
– Concerns about fees and controlling costs continue among
plan sponsors, and that issue has been an incentive to
increase passive exposure.
– For deined contribution plans, fee reduction and disclo-
sure, compliance, and evaluating the structure of fund line-
ups are key areas of focus. Target date funds continue to
dominate asset lows; they now account for almost 32.5% of DC assets, according to the Callan DC Index™.
– Negotiating fee reductions and fee transparency is ongoing
for DC plan sponsors, in some cases to a signiicant extent. Interest in institutional investment structures is increasing
as another path to fee reduction.
– Non-qualiied deferred compensation (NQDC) plans are being evaluated on a standalone basis due to their design
lexibility. – Some corporate plan sponsors have made large volun-
tary contributions in 2018. As a result, plans are reaching
full funding. A glidepath strategy for gradual de-risking is
no longer needed for some; these plans can fully de-risk
immediately.
– Endowments, foundations, and sovereign wealth funds saw
a continuing focus on evaluating a sustainable distribution
rate to balance intergenerational equity.
– Interest in multi-asset class strategies continues, in particu-
lar from public and corporate deined beneit plans. Callan divides the multi-asset class universe into four categories:
long biased, absolute return, risk parity, and risk premia.

6
U.S. Equities
U.S. stocks posted broad-based gains in the third quarter fueled
by strong economic growth, robust corporate earnings, and
heightened stock buybacks. Several major indices hit record levels during the quarter, and the 7.7% gain for the S&P 500
Index was its biggest since the fourth quarter of 2013. Volatility
was muted in spite of persistent headlines around threats of
trade wars and the ever-changing negotiations to avert them.
Large Cap Outpaces Small Cap
– Tax reform and U.S. prosperity contributed to an accelera-
tion in corporate earnings growth, and valuations remained
elevated as strong sentiment persisted given positive eco-
nomic data.
– Amazon (+17.8%), Apple (+22.4%), and Microsoft (+16.4%)
were strong contributors to large cap outperformance.
– FAANG stocks plus Microsoft had a more muted impact
than in previous quarters but still contributed nearly 25% of
the S&P 500’s quarterly return.
– All sectors landed in positive territory. The strongest per-
formers were Health Care (+14.5%), Industrials (+10%),
and Communication Services (+9.9%).
– The new Communication Services sector represents 10%
of the S&P 500 and includes several FAANG stocks such
as Alphabet, Facebook, and Netlix; Tech and Consumer Discretionary now represent lower weightings in the Index.
Global Equity
Growth Continues to Outperform Value
– The divergence between growth and value is approaching
a historical high; growth is outpacing value this year by the
widest margin in 15 years within large cap (Russell 1000
Growth YTD: +17.1% vs. Russell 1000 Value YTD: +3.9%)
due largely to ongoing euphoria over the FAANG stocks.
– Momentum continued as the leading factor for the quarter
and year-to-date; value has been the worst-performing
style for the last 18 months.
Non-U.S. / Global Equity
Market divergence has emerged after synchronized growth in
2017. The U.S. continues to post positive returns while non-
U.S. developed and emerging markets have lagged year-to-
date, dragged down by geopolitical and economic uncertainties.
Global/Non-U.S. Developed Markets See Slowing Growth
– The dollar rallied against the euro and yen given the fun-
damentals of the U.S. economy and the Fed’s contraction-
ary monetary policy; other central banks maintained the
status quo.
– Global trade tensions coupled with Brexit negotiations and
Italy’s populism concerns tempered the European market
despite solid earnings growth. In Japan, GDP growth and
the re-election of Prime Minister Shinzo Abe as head of his
party and sparked the market.
Russell 1000 Russell 2000
EnergyMaterials &
Processing
Communication
Services
UtilitiesFinancial
Services
Consumer
Staples
Consumer
Discretionary
TechnologyProducer
Durables
Health Care
14.2%
7.7%
9.8%
4.9%6.3% 6.8%
4.0%5.5%
-0.9%
4.7%0.6%
0.4%
6.2%
1.4%
12.9%
0.9% 1.0%
9.2%
-1.8%
0.9%4.4%
Quarterly Performance of Select Sectors
Source: FTSE Russell

7Knowledge. Experience. Integrity.
– Brazil and Russia were among the best performers due to
climbing oil prices.
– Supported by the oil price hike, Energy was the best per-
former; Consumer Discretionary was the worst sector per-
former, weighed down by China and India.
– Value and large cap factors were in favor as Energy gained
traction, and momentum struggled as market leadership
rotated away from Asian tech companies.
Non-U.S. Small Cap Underperforms
– Both non-U.S. developed and emerging market small cap
underperformed large cap as the appetite for risk waned due
to rising interest rates and the U.S. dollar, global trade ten-
sions, and geopolitical conlicts. – Value was favored in both non-U.S. developed and emerg-
ing market small cap as the Energy sector thrived.
– Top sector performers were Health Care, Telecommunication
Services, and Energy.
– Real Estate, Financials, and Consumer Staples were hurt by
rising interest rates and a lattening yield curve. – Style had a de minimis impact; however, growth moderately
outperformed value. Volatility and small cap factors were out
of favor given market uncertainties.
Emerging Markets Under Pressure
– Emerging markets were under pressure from a rising dollar,
U.S. interest rates, and U.S.-China trade frictions.
– Turkey was the worst-performing country within emerging
markets as the lira and local currency bonds crashed due to
the twin deicit, high level of dollar debt, and inlation. – The economic slowdown in China and trade tensions with
the U.S. weakened the market.
Russell 2000
Russell 2500
Russell Midcap
S&P 500
Russell 1000 Value
Russell 1000 Growth
Russell 1000
Russell 3000
9.5%
14.0%
17.7%
17.6%
17.9%
16.2%
26.3%
15.2%Russell 2000
Russell 2500
Russell Midcap
S&P 500
Russell 1000 Value
Russell 1000 Growth
Russell 1000
Russell 3000
5.7%
5.0%
7.4%
7.1%
7.7%
4.7%
9.1%
3.6%
U.S. Equity: Quarterly Returns U.S. Equity: One-Year Returns
Sources: FTSE Russell and Standard & Poor’s Sources: FTSE Russell and Standard & Poor’s
GLOBAL EQUITY (Continued)
2.2%
1.8%
1.9%
3.4%
2.7%
9.8%
2.9%
-1.5%
10.2%
-0.8%
-7.7%
4.3%
11.2%
-4.2%
MSCI Pacific ex Japan
MSCI ACWI ex USA Small Cap
MSCI ACWI
MSCI ACWI ex USA
MSCI World ex USA Small Cap
MSCI World ex USA
MSCI World
MSCI Europe ex UK
MSCI UK
MSCI Japan
MSCI Emerging Markets
MSCI China
MSCI Frontier Markets
MSCI Emerging Market Small Cap
MSCI Pacific ex Japan
-7.5%
0.7%
-1.5%
-0.9%
1.3%
4.3%
-1.7%
1.8%
3.7%
-1.1%
-2.0%
-0.6%
MSCI ACWI ex USA Small Cap
MSCI ACWI
MSCI ACWI ex USA
MSCI World ex USA Small Cap
MSCI World ex USA
MSCI World
MSCI Europe ex UK
MSCI UK
MSCI Japan
MSCI Emerging Markets
MSCI China
MSCI Frontier Markets
5.0%
MSCI Emerging Market Small Cap-4.2%
Non-U.S. Equity: Quarterly Returns (U.S. Dollar) Non-U.S. Equity: One-Year Returns (U.S. Dollar)
Source: MSCI Source: MSCI

8
Global Fixed Income
U.S. Fixed Income
Fixed income markets grappled with multiple issues, resulting
in continued volatility. Trade conlicts due to the imposition of tariffs, emerging market elections, and the rising U.S. dollar con-
tributed to the unstable environment. U.S. rates rose in the third
quarter and the yield curve continued lattening.
High Yield Tops the Quarter
– The Bloomberg Barclays US Aggregate Bond Index
was essentially lat, rising only 0.02% but gaining 1.6% year-to-date.
– The 10-year U.S. Treasury yield rose steadily, reaching a high
of 3.10% before settling at 3.06% as strong economic data
repriced investors’ inlation expectations and increased the probability of a December rate hike by the Federal Reserve.
– The yield curve lattened, with short-term interest rates rising more quickly than longer-term rates. The spread between
the 2-year and 10-year narrowed 9 basis points to 24 bps
from last quarter, the tightest in 10 years.
– Investment-grade (IG) corporates gained 1.0% in the third
quarter but dropped 2.3% YTD.
– New issuance remained strong with demand for new loans
oversubscribed by an average of two to three times through-
out the quarter.
– Spreads continued to narrow this quarter.
– Higher rates and weaker overall fundamentals caused the
IG sector to post negative results YTD.
– The Bloomberg Barclays US Corporate High Yield Index
gained 2.4% in the quarter and +2.6% YTD.
– Low new issuance volume and stable fundamentals com-
pressed spreads.
U.S. Treasury Yield Curves
0%
1%
2%
3%
4%
Maturity (Years)
September 30, 2018 June 30, 2018 September 30, 2017
302520151050
Source: Bloomberg
U.S. Fixed Income: Quarterly Returns U.S. Fixed Income: One-Year Returns
Bloomberg Barclays US TIPS
-0.5%
1.9%
0.2%
0.3%
0.3%
2.4%
-0.8%
0.0%
Bloomberg Barclays Gov/Credit 1-3 Yr
Bloomberg Barclays Interm Gov/Credit
Bloomberg Barclays Aggregate
Bloomberg Barclays Long Gov/Credit
Bloomberg Barclays Universal
CS Leveraged Loans
Bloomberg Barclays Corp. High Yield
-2.7%
5.6%
-1.0%
0.2%
-1.0%
3.0%
0.4%
-1.2%
Bloomberg Barclays Gov/Credit 1-3 Yr
Bloomberg Barclays Interm Gov/Credit
Bloomberg Barclays Aggregate
Bloomberg Barclays Long Gov/Credit
Bloomberg Barclays Universal
CS Leveraged Loans
Bloomberg Barclays Corp. High Yield
Bloomberg Barclays US TIPS
Sources: Bloomberg Barclays and Credit Suisse Sources: Bloomberg Barclays and Credit Suisse

9Knowledge. Experience. Integrity.
– Bond issuance was $41 billion, 33% lower than in the third
quarter of 2017.
– Bank loans gained 1.8% in the quarter and 4.0% YTD.
– Demand continues for loating-rate securities despite cove-
nant-light structures and higher spread duration.
– Heavy issuance continued through the quarter; YTD lever-
aged loan issuance is above $900 billion, driven by lever-
aged buyout and mergers-and-acquisitions activities.
– CLO formation also increased demand in the third quarter.
Non-U.S. Fixed Income
The JPM EMBI Global Diversiied Index (USD denominated)
gained 2.3%, with all sub-regions delivering positive results.
Local currency emerging markets (EM), however, fared more
poorly. The JPM GBI-EM Global Diversiied Index fell 1.8% for
the quarter but also endured signiicant intra-quarter volatility, including a 6.1% drop in August.
Volatility Hinders Local EM Debt
– Return dispersion among countries was signiicant. Argentina (-35%) has seen its peso fall more than 50% this
year to a record low as investors were spooked by previ-
ous currency debacles and worries over the economic pic-
ture. In addition to securing support from the International
Monetary Fund, the country’s central bank hiked short-term
interest rates 15 percentage points to a global high of 60%.
– Turkey (-27%) endured a similar currency rout, though for
different reasons. U.S.-imposed sanctions and concerns
over central bank policy were the twin drivers of the lira’s
weakness. Turkey hiked short rates by 6.25 percentage
points to 24% to stem its currency slide.
– Elsewhere, returns were far more modest (positive or nega-
tive); only Russia (-6%) and Mexico (+6%) were noteworthy.
– Issuers in Europe faced a different challenge as politi-
cal uncertainties surrounding Italy caused that market to
weaken.
Non-U.S. Fixed Income: Quarterly Returns
Non-U.S. Fixed Income: One-Year Returns
JPM GBI-EM Global Diversified
JPM EMBI Global Diversified
-1.7%
-1.8%
0.0%
-0.9%
2.3%
0.2%
1.3%
2.0%
Bloomberg Barclays Global Aggregate
Bloomberg Barclays Global Agg (hdg)
Bloomberg Barclays Global High Yield
Bloomberg Barclays Global Agg ex US
JPM EMBI Gl Div / JPM GBI-EM Gl Div
JPM CEMBI
Bloomberg Barclays Global Aggregate
Bloomberg Barclays Global High Yield
JPM GBI-EM Global Diversified
Bloomberg Barclays Global Agg (hdg)
-7.4%
0.8%
-1.3%
-1.9%
-4.6%
-1.2%
0.3%
Bloomberg Barclays Global Agg ex US
JPM EMBI Global Diversified
JPM EMBI Gl Div / JPM GBI-EM Gl Div
JPM CEMBI
-1.5%
Sources: Bloomberg Barclays and JPMorgan Chase
Sources: Bloomberg Barclays and JPMorgan Chase
20 bps
17 bps
30 bps
26 bps
9 bps
Germany
U.S. Treasury
U.K.
Canada
Japan
Change in 10-Year Global Government Bond Yields
2Q18 to 3Q18
Source: Bloomberg Barclays
GLOBAL FIXED INCOME (Continued)
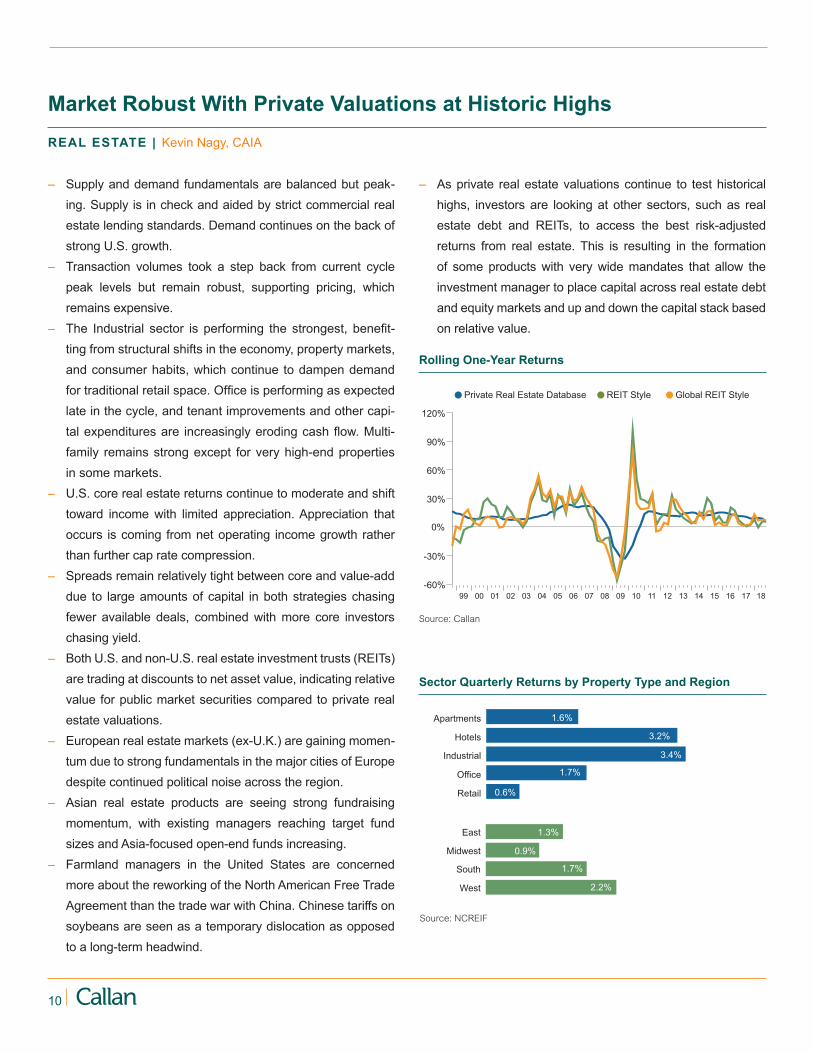
10
Market Robust With Private Valuations at Historic Highs
REAL ESTATE | Kevin Nagy, CAIA
– Supply and demand fundamentals are balanced but peak-
ing. Supply is in check and aided by strict commercial real
estate lending standards. Demand continues on the back of
strong U.S. growth.
– Transaction volumes took a step back from current cycle
peak levels but remain robust, supporting pricing, which
remains expensive.
– The Industrial sector is performing the strongest, beneit-ting from structural shifts in the economy, property markets,
and consumer habits, which continue to dampen demand
for traditional retail space. Ofice is performing as expected late in the cycle, and tenant improvements and other capi-
tal expenditures are increasingly eroding cash low. Multi-family remains strong except for very high-end properties
in some markets.
– U.S. core real estate returns continue to moderate and shift
toward income with limited appreciation. Appreciation that
occurs is coming from net operating income growth rather
than further cap rate compression.
– Spreads remain relatively tight between core and value-add
due to large amounts of capital in both strategies chasing
fewer available deals, combined with more core investors
chasing yield.
– Both U.S. and non-U.S. real estate investment trusts (REITs)
are trading at discounts to net asset value, indicating relative
value for public market securities compared to private real
estate valuations.
– European real estate markets (ex-U.K.) are gaining momen-
tum due to strong fundamentals in the major cities of Europe despite continued political noise across the region.
– Asian real estate products are seeing strong fundraising
momentum, with existing managers reaching target fund
sizes and Asia-focused open-end funds increasing.
– Farmland managers in the United States are concerned
more about the reworking of the North American Free Trade
Agreement than the trade war with China. Chinese tariffs on
soybeans are seen as a temporary dislocation as opposed
to a long-term headwind.
– As private real estate valuations continue to test historical
highs, investors are looking at other sectors, such as real
estate debt and REITs, to access the best risk-adjusted returns from real estate. This is resulting in the formation
of some products with very wide mandates that allow the
investment manager to place capital across real estate debt
and equity markets and up and down the capital stack based
on relative value.
Rolling One-Year Returns
-60%
-30%
0%
30%
60%
90%
120%
REIT Style Global REIT StylePrivate Real Estate Database
02 0399 00 01 04 05 06 07 08 09 10 11 12 13 14 15 16 17 18
Source: Callan
West
South
Midwest
East
2.2%
1.3%
1.7%
0.9%
Retail
Office
Industrial
Hotels
Apartments
0.6%
3.2%
1.7%
3.4%
1.6%
Sector Quarterly Returns by Property Type and Region
Source: NCREIF

11Knowledge. Experience. Integrity.
REAL ESTATE (Continued)
NCREIF Transaction and Appraisal Capitalization Rates
Source: NCREIF
Note: Transaction capitalization rate is equal weighted.
NCREIF Capitalization Rates by Property Type
Source: NCREIF
Note: Capitalization rates are appraisal-based.
0%
3%
6%
9%
Appraisal Capitalization RatesTransaction Capitalization Rates
08 09 10 11 12 13 14 15 16 17 18
0%
3%
6%
9%
IndustrialApartment RetailOffice
08 09 10 11 12 13 14 15 16 17 18
Private Real Assets Last Quarter Year to Date Last Year Last 3 Years Last 5 Years Last 10 Years Last 15 Years
Real Estate ODCE Style 1.51 5.57 7.68 8.32 9.94 4.64 7.09
NFI-ODCE (value wt net) 1.87 5.75 7.71 7.83 9.71 4.62 7.28
NCREIF Property 1.67 5.27 7.16 7.75 9.57 6.42 8.96
NCREIF Farmland 1.13 3.62 6.66 7.12 9.86 11.62 14.62
NCREIF Timberland 1.02 2.44 4.00 3.52 5.99 4.01 7.42
Public Real Estate
Global Real Estate Style 0.25 1.00 5.57 7.18 7.10 7.64 9.62
EPRA/NAREIT Developed -0.30 0.06 3.66 6.19 5.43 6.04 --
Global ex-U.S. Real Estate Style -0.14 1.49 7.08 6.96 5.27 6.83 9.61
EPRA/NAREIT Developed ex US -0.99 -0.96 5.36 7.25 3.97 6.48 8.58
U.S. REIT Style 0.88 2.14 4.61 7.94 9.72 8.37 10.31
NAREIT Equity REITs 0.79 1.81 3.35 7.64 9.16 7.44 9.41
Callan Database Median and Index Returns* for Periods ended September 30, 2018
*Returns less than one year are not annualized.
Sources: Callan, FTSE Russell, NAREIT, NCREIF

12
Private Equity Performance Database (%) (Pooled Horizon IRRs through June 30, 2018*)
Strategy 3 Months Year 3 Years 5 Years 10 Years 15 Years 20 Years
All Venture 3.68 12.97 9.23 16.18 9.51 9.70 17.90
Growth Equity 5.83 20.09 12.21 13.63 9.95 13.04 13.47
All Buyouts 5.38 22.64 13.65 14.41 8.83 14.59 12.43
Mezzanine 3.18 14.72 9.70 10.18 8.80 9.67 8.67
Distressed 2.45 10.99 6.72 9.52 9.49 10.77 10.34
All Private Equity 3.63 15.26 10.10 10.82 9.25 11.47 11.24
S&P 500 4.82 19.11 11.94 13.97 9.12 12.97 12.81
Private equity returns are net of fees.
Sources: Standard & Poor’s and Thomson Reuters/Cambridge
*Most recent data available at time of publication
More Tricks Than Treats
PRIVATE EQUITY | Gary Robertson
Funds Closed January 1 to September 30, 2018
Strategy No. of Funds Amt ($mm) Share
Venture Capital 270 45,756 12%
Growth Equity 38 24,553 7%
Buyouts 148 175,110 47%
Mezzanine Debt 44 42,482 11%
Distressed 11 23,103 6%
Energy 22 20,222 5%
Secondary and Other 55 27,368 7%
Fund-of-funds 29 11,496 3%
Totals 617 370,090 100%
Source: PitchBook
Figures may not total due to rounding.
Note: Transaction count and dollar volume igures across all private equity measures are preliminary igures and are subject to update in subsequent versions of Capital Market
Review and other Callan publications.
Third quarter private equity partnerships holding inal closes totaled $140 billion, with 197 new partnerships formed, according
to Pitchbook. The dollar volume rose by 30% from $108 billion,
but the number of funds closing declined by 6% from 210 in the
prior quarter. Year-to-date, 2018 is running $64 billion (or 15%)
behind a year ago. Investors are pursuing broad diversiication with buyouts tracking to less than 50% of capital raised, and all
other major strategies receiving signiicant new allocations. – New buyout transactions declined although activity remained
strong overall, according to PitchBook. Funds closed 1,477
investments with $126 billion in disclosed deal value, repre-
senting a 17% decline in count and a 4% dip in dollar value
from the second quarter’s 1,775 investments and $131
billion of announced value. The $13.8 billion purchase of
Unilever’s vegetable spread business (e.g., Country Crock)
by KKR was the quarter’s largest buyout.
– According to PitchBook, new investments in venture capital
companies totaled 4,010 rounds of inancing with $53 bil-lion of announced value. The number of investments was
down 23% from the prior quarter, and announced value
fell 26%. The median pre-money valuations continued to
increase across the board, with Series D showing the larg-
est increases.
– There were 454 private M&A exits of private equity-backed
companies (excluding venture capital), PitchBook reports,
with disclosed values totaling $131 billion. Both private
sale count and announced dollar volume were down from
the prior quarter’s 620 sales and $135 billion. There were
26 private-equity backed IPOs in the third quarter raising
an aggregate $7 billion, down from 53 totaling $16 billion
previously.
– Venture-backed M&A exits totaled 276 transactions with dis-
closed value of $34 billion. The number of sales declined from
344 in the second quarter, but announced values increased
slightly from $31 billion in the second quarter. There were 53
VC-backed IPOs in the third quarter with a combined loat of $14 billion. For comparison, the second quarter had 69 IPOs
and total issuance of $19 billion.
Please see our upcoming issue of Private Equity Trends for
more in-depth coverage.
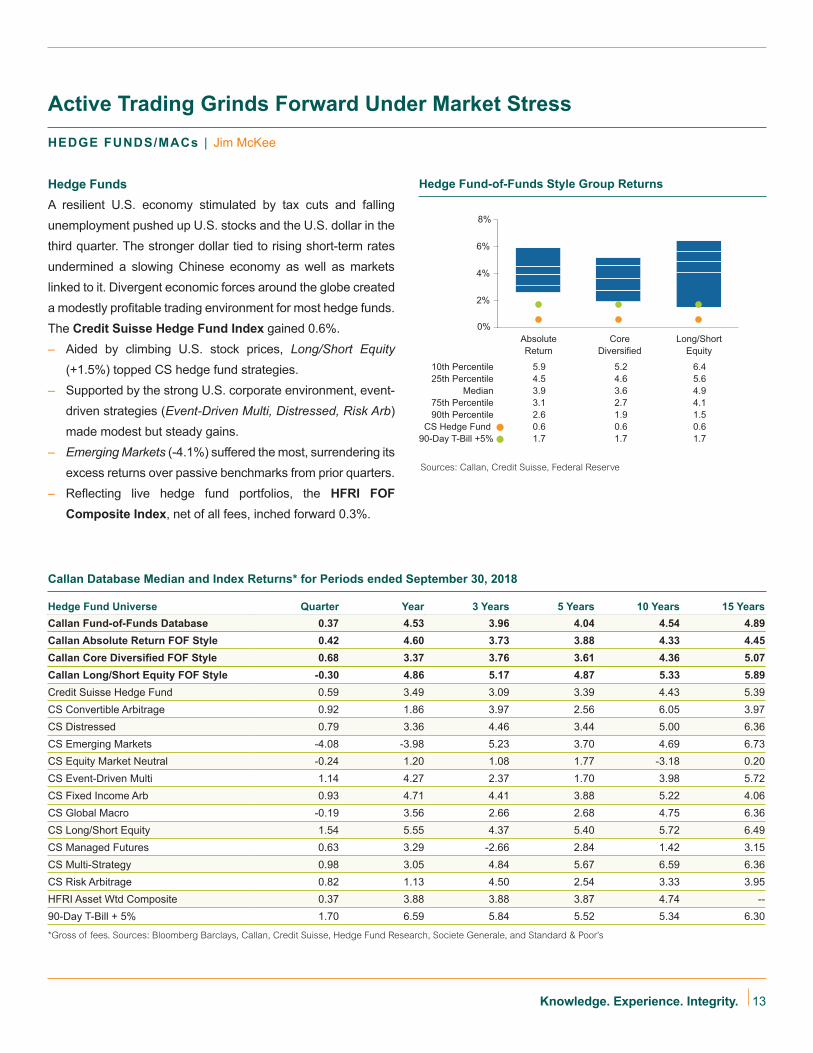
13Knowledge. Experience. Integrity.
Callan Database Median and Index Returns* for Periods ended September 30, 2018
Hedge Fund Universe Quarter Year 3 Years 5 Years 10 Years 15 Years
Callan Fund-of-Funds Database 0.37 4.53 3.96 4.04 4.54 4.89
Callan Absolute Return FOF Style 0.42 4.60 3.73 3.88 4.33 4.45
Callan Core Diversiied FOF Style 0.68 3.37 3.76 3.61 4.36 5.07
Callan Long/Short Equity FOF Style -0.30 4.86 5.17 4.87 5.33 5.89
Credit Suisse Hedge Fund 0.59 3.49 3.09 3.39 4.43 5.39
CS Convertible Arbitrage 0.92 1.86 3.97 2.56 6.05 3.97
CS Distressed 0.79 3.36 4.46 3.44 5.00 6.36
CS Emerging Markets -4.08 -3.98 5.23 3.70 4.69 6.73
CS Equity Market Neutral -0.24 1.20 1.08 1.77 -3.18 0.20
CS Event-Driven Multi 1.14 4.27 2.37 1.70 3.98 5.72
CS Fixed Income Arb 0.93 4.71 4.41 3.88 5.22 4.06
CS Global Macro -0.19 3.56 2.66 2.68 4.75 6.36
CS Long/Short Equity 1.54 5.55 4.37 5.40 5.72 6.49
CS Managed Futures 0.63 3.29 -2.66 2.84 1.42 3.15
CS Multi-Strategy 0.98 3.05 4.84 5.67 6.59 6.36
CS Risk Arbitrage 0.82 1.13 4.50 2.54 3.33 3.95
HFRI Asset Wtd Composite 0.37 3.88 3.88 3.87 4.74 --
90-Day T-Bill + 5% 1.70 6.59 5.84 5.52 5.34 6.30
*Gross of fees. Sources: Bloomberg Barclays, Callan, Credit Suisse, Hedge Fund Research, Societe Generale, and Standard & Poor’s
Active Trading Grinds Forward Under Market Stress
HEDGE FUNDS/MACs | Jim McKee
Hedge Funds
A resilient U.S. economy stimulated by tax cuts and falling
unemployment pushed up U.S. stocks and the U.S. dollar in the
third quarter. The stronger dollar tied to rising short-term rates
undermined a slowing Chinese economy as well as markets
linked to it. Divergent economic forces around the globe created
a modestly proitable trading environment for most hedge funds. The Credit Suisse Hedge Fund Index gained 0.6%.
– Aided by climbing U.S. stock prices, Long/Short Equity
(+1.5%) topped CS hedge fund strategies.
– Supported by the strong U.S. corporate environment, event-
driven strategies (Event-Driven Multi, Distressed, Risk Arb)
made modest but steady gains.
– Emerging Markets (-4.1%) suffered the most, surrendering its
excess returns over passive benchmarks from prior quarters.
– Relecting live hedge fund portfolios, the HFRI FOF
Composite Index, net of all fees, inched forward 0.3%.
Absolute Core Long/Short
Return Diversified Equity
10th Percentile 5.9 5.2 6.4
25th Percentile 4.5 4.6 5.6
Median 3.9 3.6 4.9
75th Percentile 3.1 2.7 4.1
90th Percentile 2.6 1.9 1.5
CS Hedge Fund 0.6 0.6 0.6
90-Day T-Bill +5% 1.7 1.7 1.7
0%
2%
4%
6%
8%
Hedge Fund-of-Funds Style Group Returns
Sources: Callan, Credit Suisse, Federal Reserve

14
– Representing actual hedge fund portfolios, the median man-
ager in the Callan Hedge Fund-of-Funds Database forged
ahead 0.4%, net of all fees and expenses.
– Despite the U.S. equity rally, the median Callan Long/Short
Equity FOF (-0.3%) slipped behind the Callan Absolute
Return FOF (+0.4%), which tends to beneit from event-driven deals and credit trades.
– With diversifying exposures to both non-directional and
directional styles, the Core Diversiied FOF gained 0.7%.
Multi-Asset Class (MAC) Strategies
Callan’s Multi-Asset Class (MAC) Style Groups continued
to struggle in the third quarter, particularly those overweighting
bonds and underweighting U.S. growth stocks, as a stronger
dollar and rising rates created a dificult top-down environment. – The HFR Risk Parity Index targeting 12% volatility slipped
0.3%, given its typical ixed income bias. – The CS NB Multi Asset Risk Premia Index (-1.4%) is an
equal risk-weighted index of alternative risk factors (value,
carry, momentum, and liquidity) across four capital markets
(equity, ixed income, currency, and commodities) targeting 5% volatility.
– Within CS NB MARP, Equity Value (-3.4%) sank again, add-
ing to losses from the prior two quarters for a 11.9% year-
to-date loss. Supported by rising energy prices, Commodity
Momentum (+5.9%) was strong again, leading to a 16%
YTD gain.
Absolute Risk Long Risk
Return Premia Biased Parity
10th Percentile 2.2 1.5 3.1 1.5
25th Percentile 1.8 0.8 2.8 0.8
Median 0.2 -0.2 1.2 0.0
75th Percentile -0.1 -0.5 -0.5 -0.1
90th Percentile -0.8 -1.8 -2.4 -1.9
CS NB MARP (5%v) -1.4 -1.4 -1.4 -1.4 60% S&P 500/
40% BB Barclays Agg 4.6 4.6 4.6 4.6
-3%
0%
3%
6%
– Buoyed by its usually long equity bias within a dynamic
asset allocation framework, the Callan Long Biased MAC
advanced 1.2%.
– Likely impacted by underlying tilts to an equity value risk fac-
tor, the median Callan Risk Premia MAC slipped 0.2%.
– Typically targeting equal risk-weighted allocations to major asset classes with leverage, the Callan Risk Parity MAC
(0.0%) was lat. – As the most conservative MAC style focused on non-direc-
tional strategies of long and short asset class exposures, the
Callan Absolute Return MAC edged ahead 0.2%.
Convertible Arb
Distressed
Long/Short Equity
Managed Futures
1.0%
-0.2%
0.9%
-4.1%
0.8%0.9%
1.5%
0.6%
-0.2%
0.8%1.1%
Fixed Income Arb
Risk Arbitrage
Emerging Market
Equity Mkt Neutral
Multi-Strategy
Event-Driven Multi
Global Macro
Equity Carry
Fixed Carry
Currency Carry
Commodity Carry
-1.3%
1.7%0.9%
-1.0%-0.2%
-3.4%
-0.4%
-2.6%
5.9%
-0.6%
1.0%
Equity Value
Fixed Value
Currency Value
MARP (5%v) Average
Equity Momentum
Fixed Momentum
Curr Momentum
Comm Momentum
MAC Style Group Returns
Credit Suisse Hedge Fund Strategy Returns Alternative Risk Factor Breakdown
Sources: Bloomberg Barclays, Callan, Credit Suisse, Neuberger Berman, Standard
& Poor’s
Source: Credit Suisse Sources: Credit Suisse Neuberger Berman

15Knowledge. Experience. Integrity.
The Callan DC Index is an equally weighted index tracking the cash lows and performance of nearly 90 plans, representing more than one million
DC participants and over $135 billion in assets. The Index is updated
quarterly and is available on Callan’s website, as is the quarterly DC
Observer newsletter.
– The Callan DC Index™ rebounded from irst quarter losses, returning 1.8% in the second quarter and outpacing the 1.1%
gain of the Age 45 Target Date Fund (TDF).
– TDFs suffered from their higher allocation to non-U.S. equity
and emerging markets. The average DC plan has a 5.6%
allocation to non-U.S. equity and emerging markets, com-
pared to 26.5% for the Age 45 TDF.
– Since inception, the DC Index’s annual return of 6.2% trails
the Age 45 TDF by 70 basis points.
– DC plan balances grew by 1.9%, driven primarily by market
performance. For the quarter, inlows (participant and plan sponsor contributions) accounted for only 12 bps of growth.
– TDFs absorbed approximately 92 cents of every dollar that
lowed into DC funds. – Several DC investments saw material net outlows, includ-
ing U.S. equities (large and small/mid cap), U.S./global bal-
anced, and U.S. ixed income. – Second quarter turnover (i.e., net transfer activity levels
within DC plans) increased slightly from the irst quarter to 0.35%, well below the historical average of 0.62%.
– The Callan DC Index’s equity allocation ended the quarter at
70%, modestly above its historical average (68%).
– The second quarter marked another all-time high for TDFs’
share of DC assets, expanding to 32.5%. U.S. large cap
continues to be the second-highest allocation, at 24.1%.
– While TDFs have a larger overall weight within the Index,
they remain less prevalent than the next largest plan holding,
U.S. large cap equity. In plans that offer TDFs, they account
for 35% of plan assets. U.S. large cap equity funds account
for 24% of plan assets, even though they are offered by
100% of DC plans.
DC Plans Rebound, TDFs Struggle
DEFINED CONTRIBUTION | James Veneruso, CFA, CAIA
Net Cash Flow Analysis (Second Quarter 2018)
(Top Two and Bottom Two Asset Gatherers)
Asset Class
Flows as % of
Total Net Flows
Target Date Funds 91.57%
Brokerage Window 2.33%
Company Stock -18.29%
U.S. Large Cap -44.41%
Total Turnover** 0.35%
Data provided here is the most recent available at time of publication.
Source: Callan DC Index
Note: DC Index inception date is January 2006.
* The Age 45 Fund transitioned from the average 2035 TDF to the 2040 TDF in
June 2018.
** Total Index “turnover” measures the percentage of total invested assets (transfers
only, excluding contributions and withdrawals) that moved between asset classes.
Investment Performance
Growth Sources
Second Quarter 2018
Age 45 Target Date* Total DC Index
1.76%1.11%
6.18%
Annualized Since
Inception
0.61%1.58%
6.88%
Year-to-Date
Second Quarter 2018
% Net Flows % Return Growth% Total Growth
8.12%
Annualized Since
Inception
1.94%
0.43%
6.19%
2.01%1.50%
0.12%
1.88% 1.75%
Year-to-Date
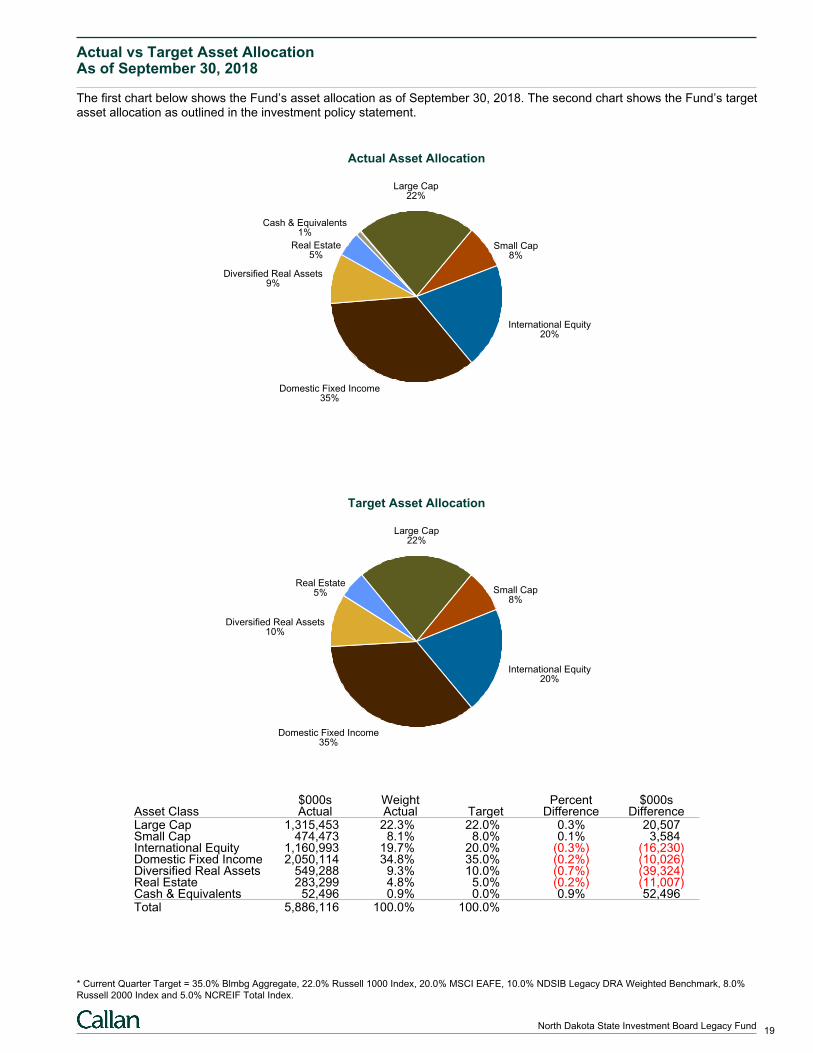
Actual vs Target Asset AllocationAs of September 30, 2018
The first chart below shows the Fund’s asset allocation as of September 30, 2018. The second chart shows the Fund’s targetasset allocation as outlined in the investment policy statement.
Actual Asset Allocation
Large Cap22%
Small Cap8%
International Equity20%
Domestic Fixed Income35%
Diversified Real Assets9%
Real Estate5%
Cash & Equivalents1%
Target Asset Allocation
Large Cap22%
Small Cap8%
International Equity20%
Domestic Fixed Income35%
Diversified Real Assets10%
Real Estate5%
$000s Weight Percent $000sAsset Class Actual Actual Target Difference DifferenceLarge Cap 1,315,453 22.3% 22.0% 0.3% 20,507Small Cap 474,473 8.1% 8.0% 0.1% 3,584International Equity 1,160,993 19.7% 20.0% (0.3%) (16,230)Domestic Fixed Income 2,050,114 34.8% 35.0% (0.2%) (10,026)Diversified Real Assets 549,288 9.3% 10.0% (0.7%) (39,324)Real Estate 283,299 4.8% 5.0% (0.2%) (11,007)Cash & Equivalents 52,496 0.9% 0.0% 0.9% 52,496Total 5,886,116 100.0% 100.0%
* Current Quarter Target = 35.0% Blmbg Aggregate, 22.0% Russell 1000 Index, 20.0% MSCI EAFE, 10.0% NDSIB Legacy DRA Weighted Benchmark, 8.0%
Russell 2000 Index and 5.0% NCREIF Total Index.
19North Dakota State Investment Board Legacy Fund
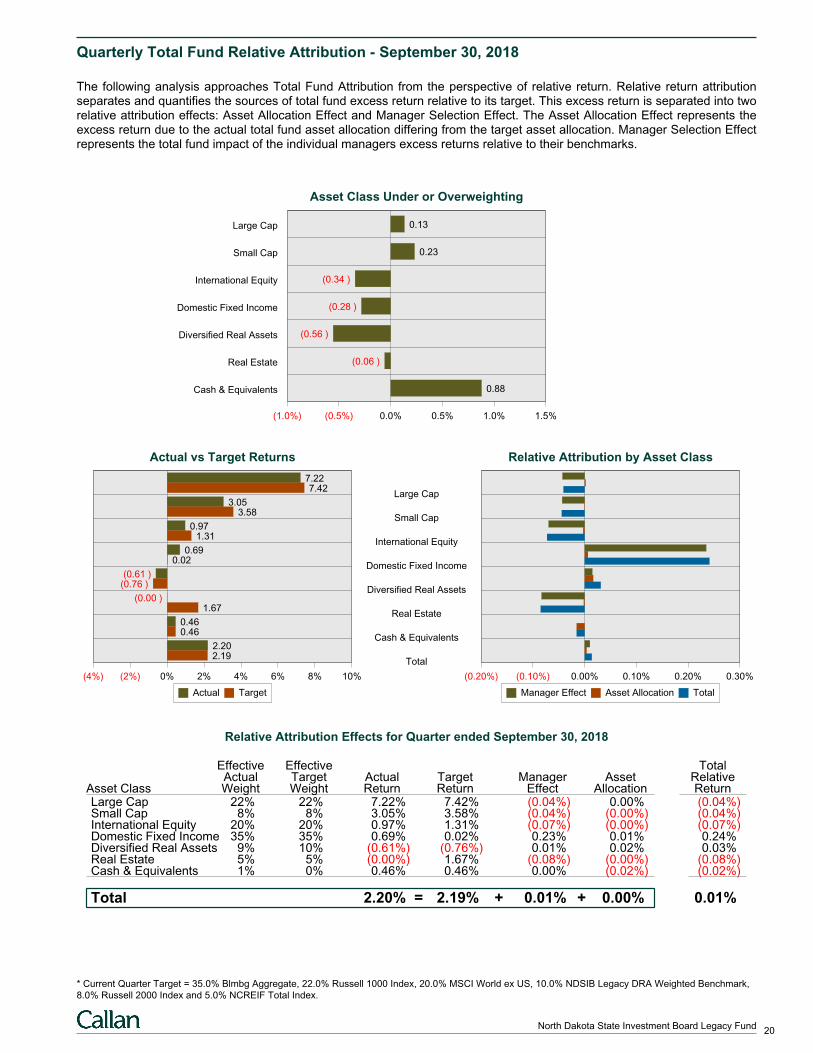
Quarterly Total Fund Relative Attribution - September 30, 2018
The following analysis approaches Total Fund Attribution from the perspective of relative return. Relative return attributionseparates and quantifies the sources of total fund excess return relative to its target. This excess return is separated into tworelative attribution effects: Asset Allocation Effect and Manager Selection Effect. The Asset Allocation Effect represents theexcess return due to the actual total fund asset allocation differing from the target asset allocation. Manager Selection Effectrepresents the total fund impact of the individual managers excess returns relative to their benchmarks.
Asset Class Under or Overweighting
(1.0%) (0.5%) 0.0% 0.5% 1.0% 1.5%
Large Cap 0.13
Small Cap 0.23
International Equity (0.34 )
Domestic Fixed Income (0.28 )
Diversified Real Assets (0.56 )
Real Estate (0.06 )
Cash & Equivalents 0.88
Large Cap
Small Cap
International Equity
Domestic Fixed Income
Diversified Real Assets
Real Estate
Cash & Equivalents
Total
Actual vs Target Returns
(4%) (2%) 0% 2% 4% 6% 8% 10%
7.227.42
3.053.58
0.971.31
0.690.02
(0.61 )(0.76 )
(0.00 )1.67
0.460.46
2.202.19
Actual Target
Relative Attribution by Asset Class
(0.20%) (0.10%) 0.00% 0.10% 0.20% 0.30%
Manager Effect Asset Allocation Total
Relative Attribution Effects for Quarter ended September 30, 2018
Effective Effective TotalActual Target Actual Target Manager Asset Relative
Asset Class Weight Weight Return Return Effect Allocation ReturnLarge Cap 22% 22% 7.22% 7.42% (0.04%) 0.00% (0.04%)Small Cap 8% 8% 3.05% 3.58% (0.04%) (0.00%) (0.04%)International Equity 20% 20% 0.97% 1.31% (0.07%) (0.00%) (0.07%)Domestic Fixed Income 35% 35% 0.69% 0.02% 0.23% 0.01% 0.24%Diversified Real Assets 9% 10% (0.61%) (0.76%) 0.01% 0.02% 0.03%Real Estate 5% 5% (0.00%) 1.67% (0.08%) (0.00%) (0.08%)Cash & Equivalents 1% 0% 0.46% 0.46% 0.00% (0.02%) (0.02%)
Total = + +2.20% 2.19% 0.01% 0.00% 0.01%
* Current Quarter Target = 35.0% Blmbg Aggregate, 22.0% Russell 1000 Index, 20.0% MSCI World ex US, 10.0% NDSIB Legacy DRA Weighted Benchmark,
8.0% Russell 2000 Index and 5.0% NCREIF Total Index.
20North Dakota State Investment Board Legacy Fund
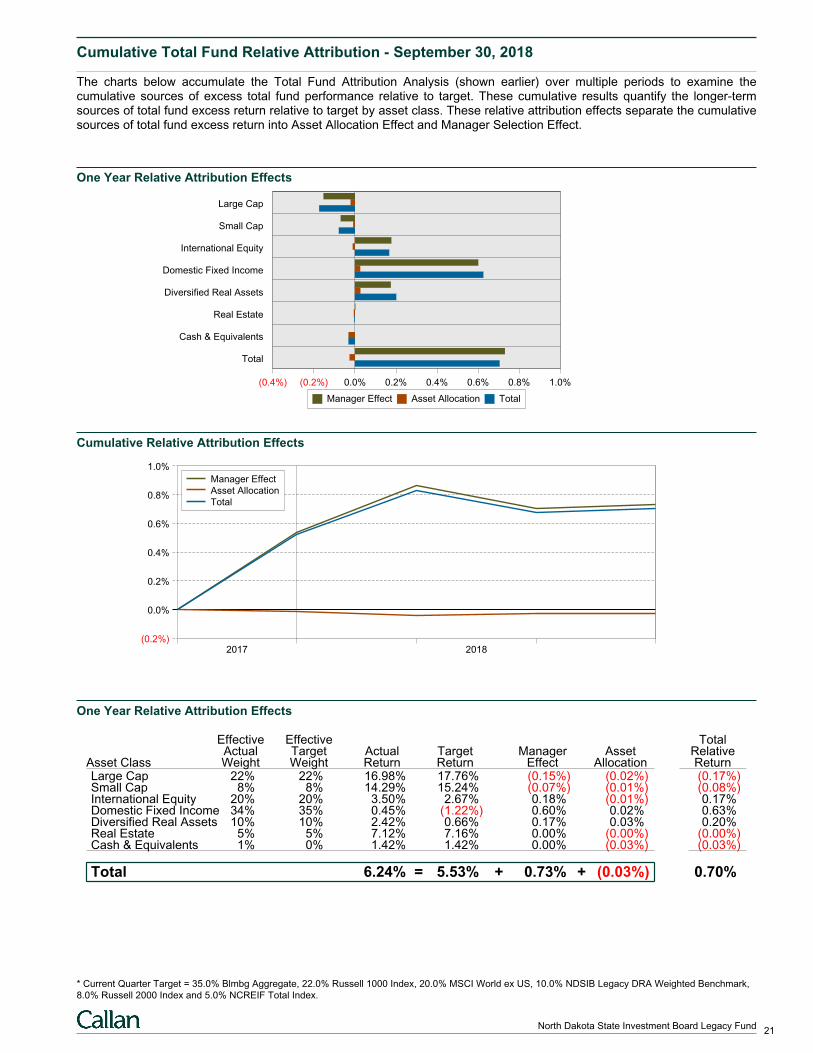
Cumulative Total Fund Relative Attribution - September 30, 2018
The charts below accumulate the Total Fund Attribution Analysis (shown earlier) over multiple periods to examine thecumulative sources of excess total fund performance relative to target. These cumulative results quantify the longer-termsources of total fund excess return relative to target by asset class. These relative attribution effects separate the cumulativesources of total fund excess return into Asset Allocation Effect and Manager Selection Effect.
One Year Relative Attribution Effects
(0.4%) (0.2%) 0.0% 0.2% 0.4% 0.6% 0.8% 1.0%
Large Cap
Small Cap
International Equity
Domestic Fixed Income
Diversified Real Assets
Real Estate
Cash & Equivalents
Total
Manager Effect Asset Allocation Total
Cumulative Relative Attribution Effects
(0.2%)
0.0%
0.2%
0.4%
0.6%
0.8%
1.0%
2017 2018
Manager Effect
Asset Allocation
Total
One Year Relative Attribution Effects
Effective Effective TotalActual Target Actual Target Manager Asset Relative
Asset Class Weight Weight Return Return Effect Allocation ReturnLarge Cap 22% 22% 16.98% 17.76% (0.15%) (0.02%) (0.17%)Small Cap 8% 8% 14.29% 15.24% (0.07%) (0.01%) (0.08%)International Equity 20% 20% 3.50% 2.67% 0.18% (0.01%) 0.17%Domestic Fixed Income 34% 35% 0.45% (1.22%) 0.60% 0.02% 0.63%Diversified Real Assets 10% 10% 2.42% 0.66% 0.17% 0.03% 0.20%Real Estate 5% 5% 7.12% 7.16% 0.00% (0.00%) (0.00%)Cash & Equivalents 1% 0% 1.42% 1.42% 0.00% (0.03%) (0.03%)
Total = + +6.24% 5.53% 0.73% (0.03%) 0.70%
* Current Quarter Target = 35.0% Blmbg Aggregate, 22.0% Russell 1000 Index, 20.0% MSCI World ex US, 10.0% NDSIB Legacy DRA Weighted Benchmark,
8.0% Russell 2000 Index and 5.0% NCREIF Total Index.
21North Dakota State Investment Board Legacy Fund
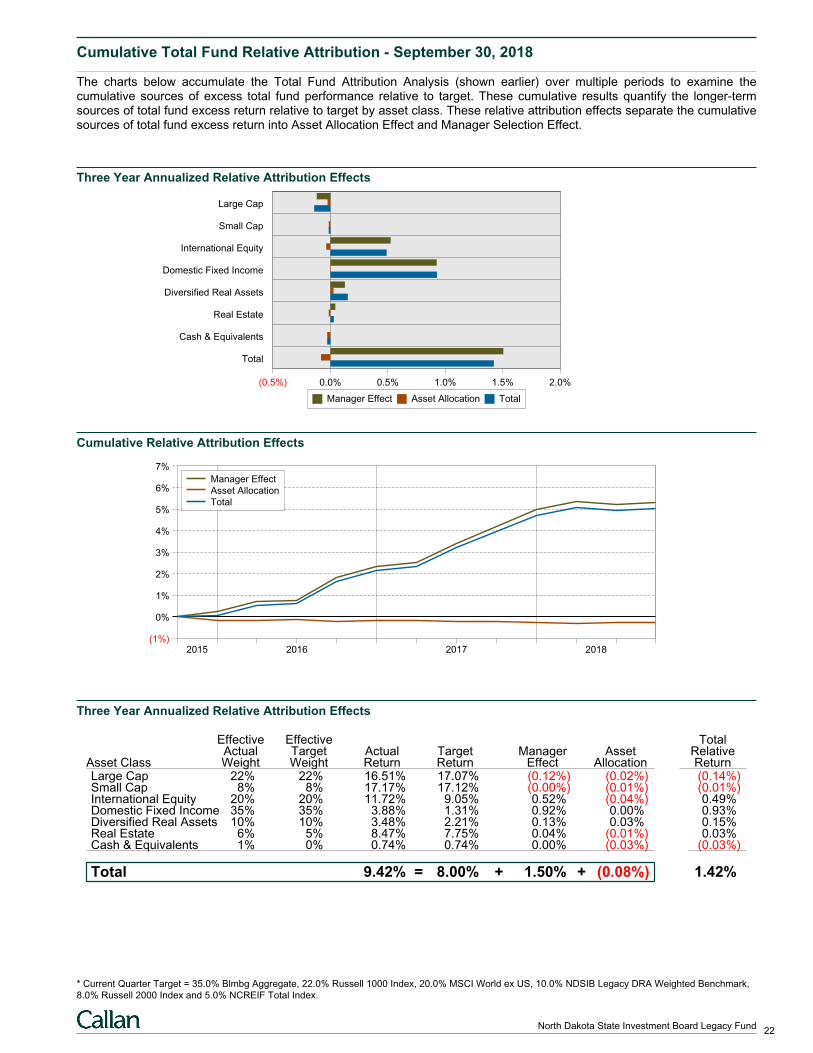
Cumulative Total Fund Relative Attribution - September 30, 2018
The charts below accumulate the Total Fund Attribution Analysis (shown earlier) over multiple periods to examine thecumulative sources of excess total fund performance relative to target. These cumulative results quantify the longer-termsources of total fund excess return relative to target by asset class. These relative attribution effects separate the cumulativesources of total fund excess return into Asset Allocation Effect and Manager Selection Effect.
Three Year Annualized Relative Attribution Effects
(0.5%) 0.0% 0.5% 1.0% 1.5% 2.0%
Large Cap
Small Cap
International Equity
Domestic Fixed Income
Diversified Real Assets
Real Estate
Cash & Equivalents
Total
Manager Effect Asset Allocation Total
Cumulative Relative Attribution Effects
(1%)
0%
1%
2%
3%
4%
5%
6%
7%
2015 2016 2017 2018
Manager Effect
Asset Allocation
Total
Three Year Annualized Relative Attribution Effects
Effective Effective TotalActual Target Actual Target Manager Asset Relative
Asset Class Weight Weight Return Return Effect Allocation ReturnLarge Cap 22% 22% 16.51% 17.07% (0.12%) (0.02%) (0.14%)Small Cap 8% 8% 17.17% 17.12% (0.00%) (0.01%) (0.01%)International Equity 20% 20% 11.72% 9.05% 0.52% (0.04%) 0.49%Domestic Fixed Income 35% 35% 3.88% 1.31% 0.92% 0.00% 0.93%Diversified Real Assets 10% 10% 3.48% 2.21% 0.13% 0.03% 0.15%Real Estate 6% 5% 8.47% 7.75% 0.04% (0.01%) 0.03%Cash & Equivalents 1% 0% 0.74% 0.74% 0.00% (0.03%) (0.03%)
Total = + +9.42% 8.00% 1.50% (0.08%) 1.42%
* Current Quarter Target = 35.0% Blmbg Aggregate, 22.0% Russell 1000 Index, 20.0% MSCI World ex US, 10.0% NDSIB Legacy DRA Weighted Benchmark,
8.0% Russell 2000 Index and 5.0% NCREIF Total Index.
22North Dakota State Investment Board Legacy Fund
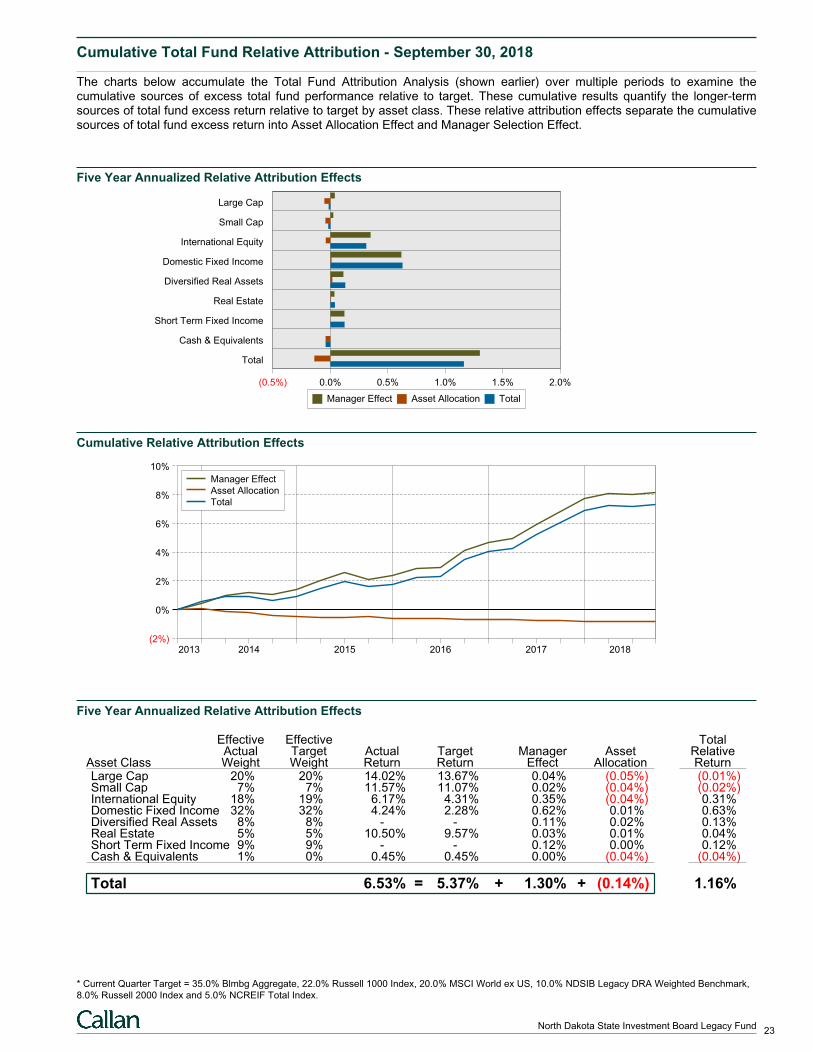
Cumulative Total Fund Relative Attribution - September 30, 2018
The charts below accumulate the Total Fund Attribution Analysis (shown earlier) over multiple periods to examine thecumulative sources of excess total fund performance relative to target. These cumulative results quantify the longer-termsources of total fund excess return relative to target by asset class. These relative attribution effects separate the cumulativesources of total fund excess return into Asset Allocation Effect and Manager Selection Effect.
Five Year Annualized Relative Attribution Effects
(0.5%) 0.0% 0.5% 1.0% 1.5% 2.0%
Large Cap
Small Cap
International Equity
Domestic Fixed Income
Diversified Real Assets
Real Estate
Short Term Fixed Income
Cash & Equivalents
Total
Manager Effect Asset Allocation Total
Cumulative Relative Attribution Effects
(2%)
0%
2%
4%
6%
8%
10%
2013 2014 2015 2016 2017 2018
Manager Effect
Asset Allocation
Total
Five Year Annualized Relative Attribution Effects
Effective Effective TotalActual Target Actual Target Manager Asset Relative
Asset Class Weight Weight Return Return Effect Allocation ReturnLarge Cap 20% 20% 14.02% 13.67% 0.04% (0.05%) (0.01%)Small Cap 7% 7% 11.57% 11.07% 0.02% (0.04%) (0.02%)International Equity 18% 19% 6.17% 4.31% 0.35% (0.04%) 0.31%Domestic Fixed Income 32% 32% 4.24% 2.28% 0.62% 0.01% 0.63%Diversified Real Assets 8% 8% - - 0.11% 0.02% 0.13%Real Estate 5% 5% 10.50% 9.57% 0.03% 0.01% 0.04%Short Term Fixed Income 9% 9% - - 0.12% 0.00% 0.12%Cash & Equivalents 1% 0% 0.45% 0.45% 0.00% (0.04%) (0.04%)
Total = + +6.53% 5.37% 1.30% (0.14%) 1.16%
* Current Quarter Target = 35.0% Blmbg Aggregate, 22.0% Russell 1000 Index, 20.0% MSCI World ex US, 10.0% NDSIB Legacy DRA Weighted Benchmark,
8.0% Russell 2000 Index and 5.0% NCREIF Total Index.
23North Dakota State Investment Board Legacy Fund
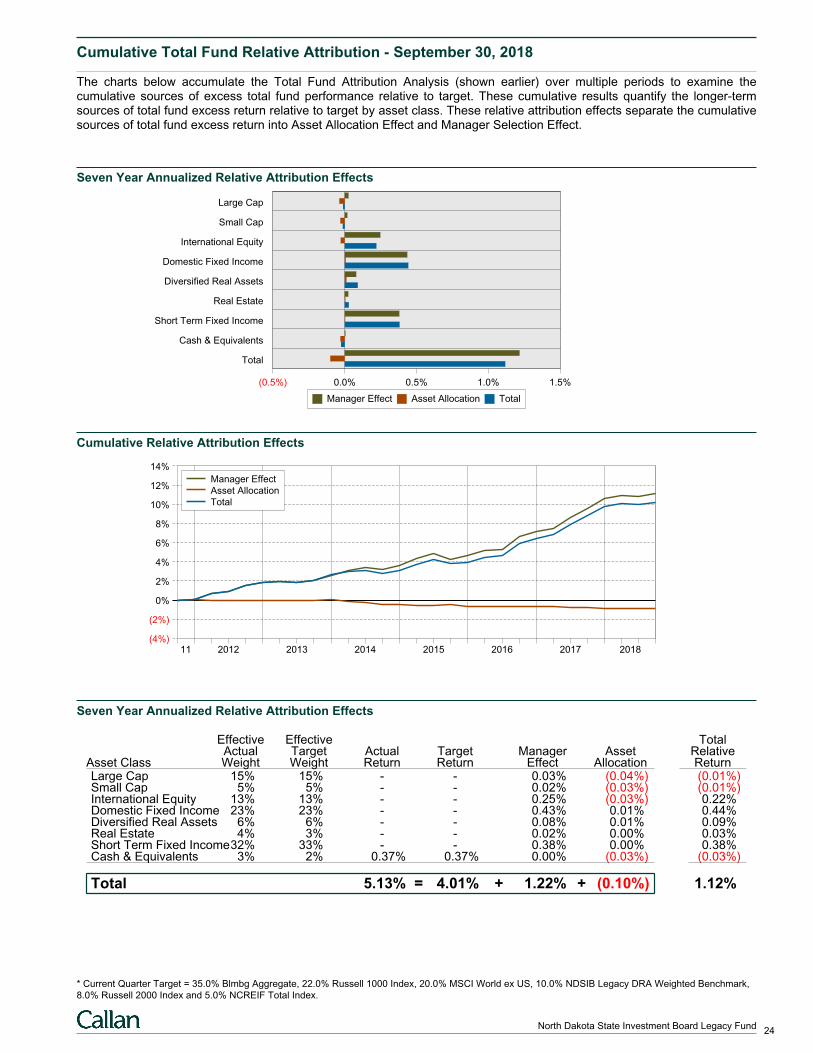
Cumulative Total Fund Relative Attribution - September 30, 2018
The charts below accumulate the Total Fund Attribution Analysis (shown earlier) over multiple periods to examine thecumulative sources of excess total fund performance relative to target. These cumulative results quantify the longer-termsources of total fund excess return relative to target by asset class. These relative attribution effects separate the cumulativesources of total fund excess return into Asset Allocation Effect and Manager Selection Effect.
Seven Year Annualized Relative Attribution Effects
(0.5%) 0.0% 0.5% 1.0% 1.5%
Large Cap
Small Cap
International Equity
Domestic Fixed Income
Diversified Real Assets
Real Estate
Short Term Fixed Income
Cash & Equivalents
Total
Manager Effect Asset Allocation Total
Cumulative Relative Attribution Effects
(4%)
(2%)
0%
2%
4%
6%
8%
10%
12%
14%
11 2012 2013 2014 2015 2016 2017 2018
Manager Effect
Asset Allocation
Total
Seven Year Annualized Relative Attribution Effects
Effective Effective TotalActual Target Actual Target Manager Asset Relative
Asset Class Weight Weight Return Return Effect Allocation ReturnLarge Cap 15% 15% - - 0.03% (0.04%) (0.01%)Small Cap 5% 5% - - 0.02% (0.03%) (0.01%)International Equity 13% 13% - - 0.25% (0.03%) 0.22%Domestic Fixed Income 23% 23% - - 0.43% 0.01% 0.44%Diversified Real Assets 6% 6% - - 0.08% 0.01% 0.09%Real Estate 4% 3% - - 0.02% 0.00% 0.03%Short Term Fixed Income32% 33% - - 0.38% 0.00% 0.38%Cash & Equivalents 3% 2% 0.37% 0.37% 0.00% (0.03%) (0.03%)
Total = + +5.13% 4.01% 1.22% (0.10%) 1.12%
* Current Quarter Target = 35.0% Blmbg Aggregate, 22.0% Russell 1000 Index, 20.0% MSCI World ex US, 10.0% NDSIB Legacy DRA Weighted Benchmark,
8.0% Russell 2000 Index and 5.0% NCREIF Total Index.
24North Dakota State Investment Board Legacy Fund
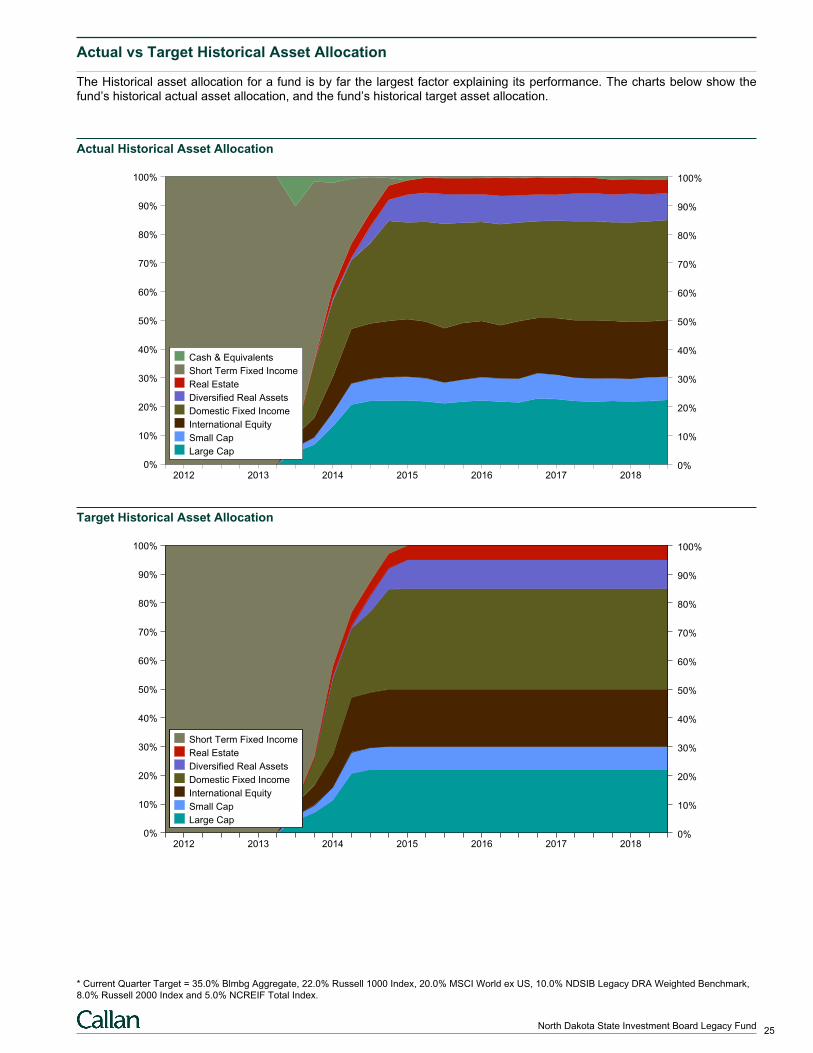
Actual vs Target Historical Asset Allocation
The Historical asset allocation for a fund is by far the largest factor explaining its performance. The charts below show thefund’s historical actual asset allocation, and the fund’s historical target asset allocation.
Actual Historical Asset Allocation
0% 0%
10% 10%
20% 20%
30% 30%
40% 40%
50% 50%
60% 60%
70% 70%
80% 80%
90% 90%
100% 100%
2012 2013 2014 2015 2016 2017 2018
Cash & Equivalents
Short Term Fixed Income
Real Estate
Diversified Real Assets
Domestic Fixed Income
International Equity
Small Cap
Large Cap
Target Historical Asset Allocation
0% 0%
10% 10%
20% 20%
30% 30%
40% 40%
50% 50%
60% 60%
70% 70%
80% 80%
90% 90%
100% 100%
2012 2013 2014 2015 2016 2017 2018
Short Term Fixed Income
Real Estate
Diversified Real Assets
Domestic Fixed Income
International Equity
Small Cap
Large Cap
* Current Quarter Target = 35.0% Blmbg Aggregate, 22.0% Russell 1000 Index, 20.0% MSCI World ex US, 10.0% NDSIB Legacy DRA Weighted Benchmark,
8.0% Russell 2000 Index and 5.0% NCREIF Total Index.
25North Dakota State Investment Board Legacy Fund
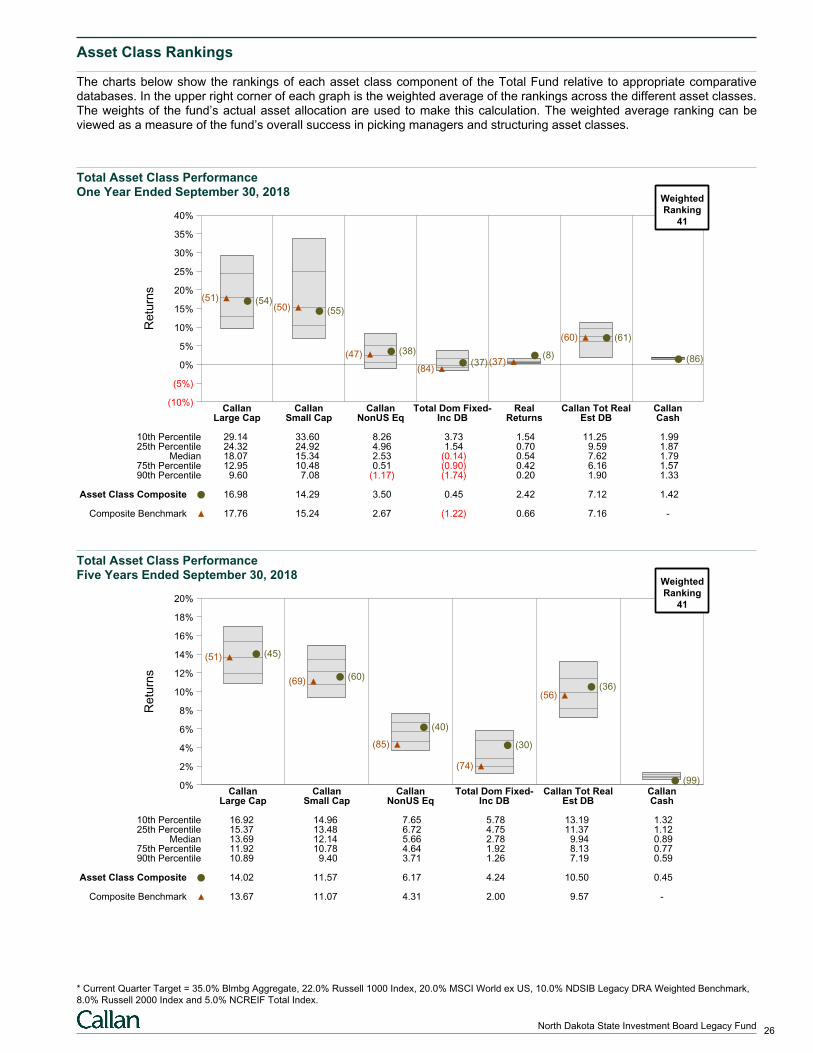
Asset Class Rankings
The charts below show the rankings of each asset class component of the Total Fund relative to appropriate comparativedatabases. In the upper right corner of each graph is the weighted average of the rankings across the different asset classes.The weights of the fund’s actual asset allocation are used to make this calculation. The weighted average ranking can beviewed as a measure of the fund’s overall success in picking managers and structuring asset classes.
Total Asset Class PerformanceOne Year Ended September 30, 2018
Re
turn
s
(10%)
(5%)
0%
5%
10%
15%
20%
25%
30%
35%
40%
Callan Callan Callan Total Dom Fixed- Real Callan Tot Real CallanLarge Cap Small Cap NonUS Eq Inc DB Returns Est DB Cash
(54)(51)
(55)(50)
(38)(47)(37)
(84)
(8)(37)
(61)(60)
(86)
10th Percentile 29.14 33.60 8.26 3.73 1.54 11.25 1.9925th Percentile 24.32 24.92 4.96 1.54 0.70 9.59 1.87
Median 18.07 15.34 2.53 (0.14) 0.54 7.62 1.7975th Percentile 12.95 10.48 0.51 (0.90) 0.42 6.16 1.5790th Percentile 9.60 7.08 (1.17) (1.74) 0.20 1.90 1.33
Asset Class Composite 16.98 14.29 3.50 0.45 2.42 7.12 1.42
Composite Benchmark 17.76 15.24 2.67 (1.22) 0.66 7.16 -
WeightedRanking
41
Total Asset Class PerformanceFive Years Ended September 30, 2018
Re
turn
s
0%
2%
4%
6%
8%
10%
12%
14%
16%
18%
20%
Callan Callan Callan Total Dom Fixed- Callan Tot Real CallanLarge Cap Small Cap NonUS Eq Inc DB Est DB Cash
(45)(51)
(60)(69)
(40)
(85) (30)
(74)
(36)(56)
(99)
10th Percentile 16.92 14.96 7.65 5.78 13.19 1.3225th Percentile 15.37 13.48 6.72 4.75 11.37 1.12
Median 13.69 12.14 5.66 2.78 9.94 0.8975th Percentile 11.92 10.78 4.64 1.92 8.13 0.7790th Percentile 10.89 9.40 3.71 1.26 7.19 0.59
Asset Class Composite 14.02 11.57 6.17 4.24 10.50 0.45
Composite Benchmark 13.67 11.07 4.31 2.00 9.57 -
WeightedRanking
41
* Current Quarter Target = 35.0% Blmbg Aggregate, 22.0% Russell 1000 Index, 20.0% MSCI World ex US, 10.0% NDSIB Legacy DRA Weighted Benchmark,
8.0% Russell 2000 Index and 5.0% NCREIF Total Index.
26North Dakota State Investment Board Legacy Fund
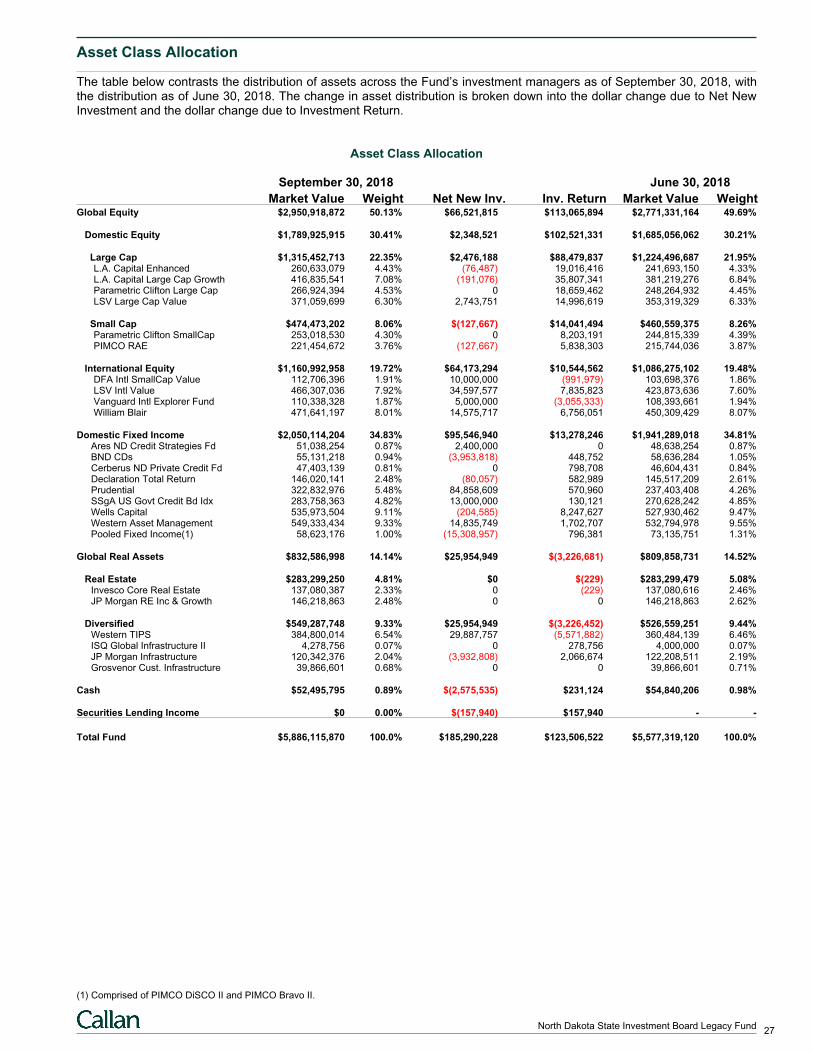
Asset Class Allocation
The table below contrasts the distribution of assets across the Fund’s investment managers as of September 30, 2018, withthe distribution as of June 30, 2018. The change in asset distribution is broken down into the dollar change due to Net NewInvestment and the dollar change due to Investment Return.
Asset Class Allocation
September 30, 2018 June 30, 2018
Market Value Weight Net New Inv. Inv. Return Market Value WeightGlobal Equity $2,950,918,872 50.13% $66,521,815 $113,065,894 $2,771,331,164 49.69%
Domestic Equity $1,789,925,915 30.41% $2,348,521 $102,521,331 $1,685,056,062 30.21%
Large Cap $1,315,452,713 22.35% $2,476,188 $88,479,837 $1,224,496,687 21.95% L.A. Capital Enhanced 260,633,079 4.43% (76,487) 19,016,416 241,693,150 4.33% L.A. Capital Large Cap Growth 416,835,541 7.08% (191,076) 35,807,341 381,219,276 6.84% Parametric Clifton Large Cap 266,924,394 4.53% 0 18,659,462 248,264,932 4.45% LSV Large Cap Value 371,059,699 6.30% 2,743,751 14,996,619 353,319,329 6.33%
Small Cap $474,473,202 8.06% $(127,667) $14,041,494 $460,559,375 8.26% Parametric Clifton SmallCap 253,018,530 4.30% 0 8,203,191 244,815,339 4.39% PIMCO RAE 221,454,672 3.76% (127,667) 5,838,303 215,744,036 3.87%
International Equity $1,160,992,958 19.72% $64,173,294 $10,544,562 $1,086,275,102 19.48% DFA Intl SmallCap Value 112,706,396 1.91% 10,000,000 (991,979) 103,698,376 1.86% LSV Intl Value 466,307,036 7.92% 34,597,577 7,835,823 423,873,636 7.60% Vanguard Intl Explorer Fund 110,338,328 1.87% 5,000,000 (3,055,333) 108,393,661 1.94% William Blair 471,641,197 8.01% 14,575,717 6,756,051 450,309,429 8.07%
Domestic Fixed Income $2,050,114,204 34.83% $95,546,940 $13,278,246 $1,941,289,018 34.81%Ares ND Credit Strategies Fd 51,038,254 0.87% 2,400,000 0 48,638,254 0.87%BND CDs 55,131,218 0.94% (3,953,818) 448,752 58,636,284 1.05%Cerberus ND Private Credit Fd 47,403,139 0.81% 0 798,708 46,604,431 0.84%Declaration Total Return 146,020,141 2.48% (80,057) 582,989 145,517,209 2.61%Prudential 322,832,976 5.48% 84,858,609 570,960 237,403,408 4.26%SSgA US Govt Credit Bd Idx 283,758,363 4.82% 13,000,000 130,121 270,628,242 4.85%Wells Capital 535,973,504 9.11% (204,585) 8,247,627 527,930,462 9.47%Western Asset Management 549,333,434 9.33% 14,835,749 1,702,707 532,794,978 9.55%Pooled Fixed Income(1) 58,623,176 1.00% (15,308,957) 796,381 73,135,751 1.31%
Global Real Assets $832,586,998 14.14% $25,954,949 $(3,226,681) $809,858,731 14.52%
Real Estate $283,299,250 4.81% $0 $(229) $283,299,479 5.08%Invesco Core Real Estate 137,080,387 2.33% 0 (229) 137,080,616 2.46%JP Morgan RE Inc & Growth 146,218,863 2.48% 0 0 146,218,863 2.62%
Diversified $549,287,748 9.33% $25,954,949 $(3,226,452) $526,559,251 9.44%Western TIPS 384,800,014 6.54% 29,887,757 (5,571,882) 360,484,139 6.46%ISQ Global Infrastructure II 4,278,756 0.07% 0 278,756 4,000,000 0.07%JP Morgan Infrastructure 120,342,376 2.04% (3,932,808) 2,066,674 122,208,511 2.19%Grosvenor Cust. Infrastructure 39,866,601 0.68% 0 0 39,866,601 0.71%
Cash $52,495,795 0.89% $(2,575,535) $231,124 $54,840,206 0.98%
Securities Lending Income $0 0.00% $(157,940) $157,940 - -
Total Fund $5,886,115,870 100.0% $185,290,228 $123,506,522 $5,577,319,120 100.0%
(1) Comprised of PIMCO DiSCO II and PIMCO Bravo II.
27North Dakota State Investment Board Legacy Fund
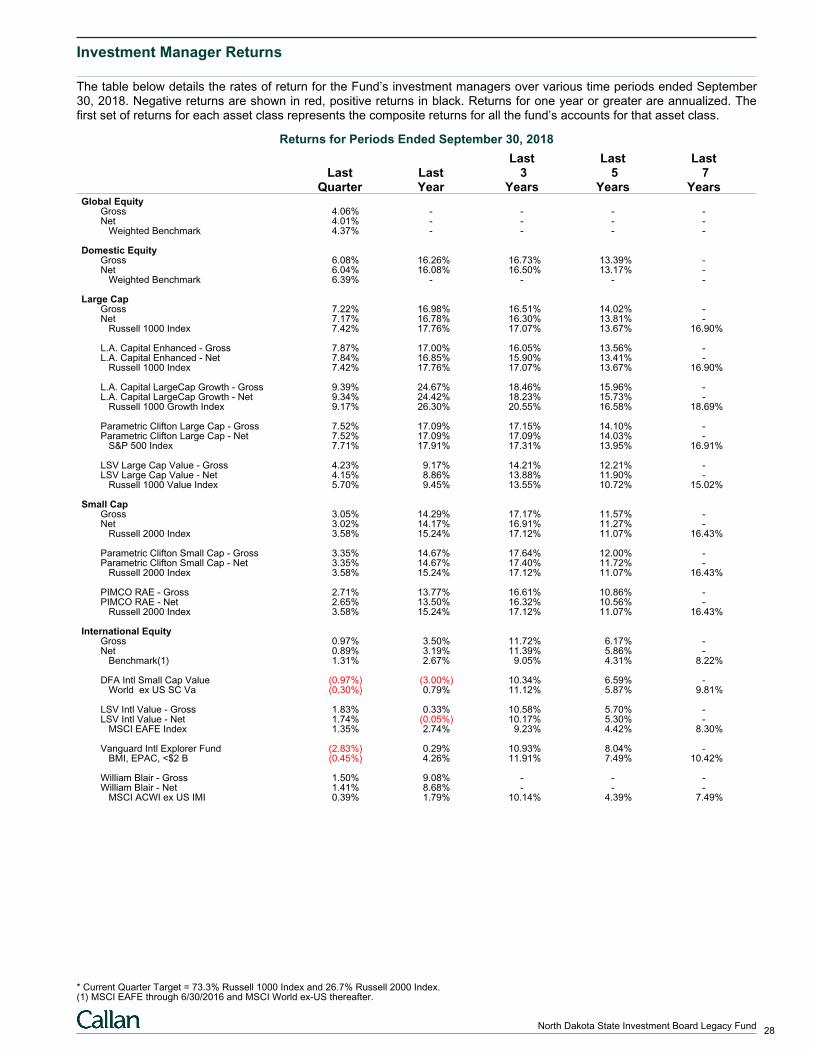
Investment Manager Returns
The table below details the rates of return for the Fund’s investment managers over various time periods ended September30, 2018. Negative returns are shown in red, positive returns in black. Returns for one year or greater are annualized. Thefirst set of returns for each asset class represents the composite returns for all the fund’s accounts for that asset class.
Returns for Periods Ended September 30, 2018
Last Last LastLast Last 3 5 7
Quarter Year Years Years YearsGlobal Equity
Gross 4.06% - - - -Net 4.01% - - - - Weighted Benchmark 4.37% - - - -
Domestic EquityGross 6.08% 16.26% 16.73% 13.39% -Net 6.04% 16.08% 16.50% 13.17% - Weighted Benchmark 6.39% - - - -
Large CapGross 7.22% 16.98% 16.51% 14.02% -Net 7.17% 16.78% 16.30% 13.81% - Russell 1000 Index 7.42% 17.76% 17.07% 13.67% 16.90%
L.A. Capital Enhanced - Gross 7.87% 17.00% 16.05% 13.56% -L.A. Capital Enhanced - Net 7.84% 16.85% 15.90% 13.41% - Russell 1000 Index 7.42% 17.76% 17.07% 13.67% 16.90%
L.A. Capital LargeCap Growth - Gross 9.39% 24.67% 18.46% 15.96% -L.A. Capital LargeCap Growth - Net 9.34% 24.42% 18.23% 15.73% - Russell 1000 Growth Index 9.17% 26.30% 20.55% 16.58% 18.69%
Parametric Clifton Large Cap - Gross 7.52% 17.09% 17.15% 14.10% -Parametric Clifton Large Cap - Net 7.52% 17.09% 17.09% 14.03% - S&P 500 Index 7.71% 17.91% 17.31% 13.95% 16.91%
LSV Large Cap Value - Gross 4.23% 9.17% 14.21% 12.21% -LSV Large Cap Value - Net 4.15% 8.86% 13.88% 11.90% - Russell 1000 Value Index 5.70% 9.45% 13.55% 10.72% 15.02%
Small CapGross 3.05% 14.29% 17.17% 11.57% -Net 3.02% 14.17% 16.91% 11.27% - Russell 2000 Index 3.58% 15.24% 17.12% 11.07% 16.43%
Parametric Clifton Small Cap - Gross 3.35% 14.67% 17.64% 12.00% -Parametric Clifton Small Cap - Net 3.35% 14.67% 17.40% 11.72% - Russell 2000 Index 3.58% 15.24% 17.12% 11.07% 16.43%
PIMCO RAE - Gross 2.71% 13.77% 16.61% 10.86% -PIMCO RAE - Net 2.65% 13.50% 16.32% 10.56% - Russell 2000 Index 3.58% 15.24% 17.12% 11.07% 16.43%
International EquityGross 0.97% 3.50% 11.72% 6.17% -Net 0.89% 3.19% 11.39% 5.86% - Benchmark(1) 1.31% 2.67% 9.05% 4.31% 8.22%
DFA Intl Small Cap Value (0.97%) (3.00%) 10.34% 6.59% - World ex US SC Va (0.30%) 0.79% 11.12% 5.87% 9.81%
LSV Intl Value - Gross 1.83% 0.33% 10.58% 5.70% -LSV Intl Value - Net 1.74% (0.05%) 10.17% 5.30% - MSCI EAFE Index 1.35% 2.74% 9.23% 4.42% 8.30%
Vanguard Intl Explorer Fund (2.83%) 0.29% 10.93% 8.04% - BMI, EPAC, <$2 B (0.45%) 4.26% 11.91% 7.49% 10.42%
William Blair - Gross 1.50% 9.08% - - -William Blair - Net 1.41% 8.68% - - - MSCI ACWI ex US IMI 0.39% 1.79% 10.14% 4.39% 7.49%
* Current Quarter Target = 73.3% Russell 1000 Index and 26.7% Russell 2000 Index.(1) MSCI EAFE through 6/30/2016 and MSCI World ex-US thereafter.
28North Dakota State Investment Board Legacy Fund
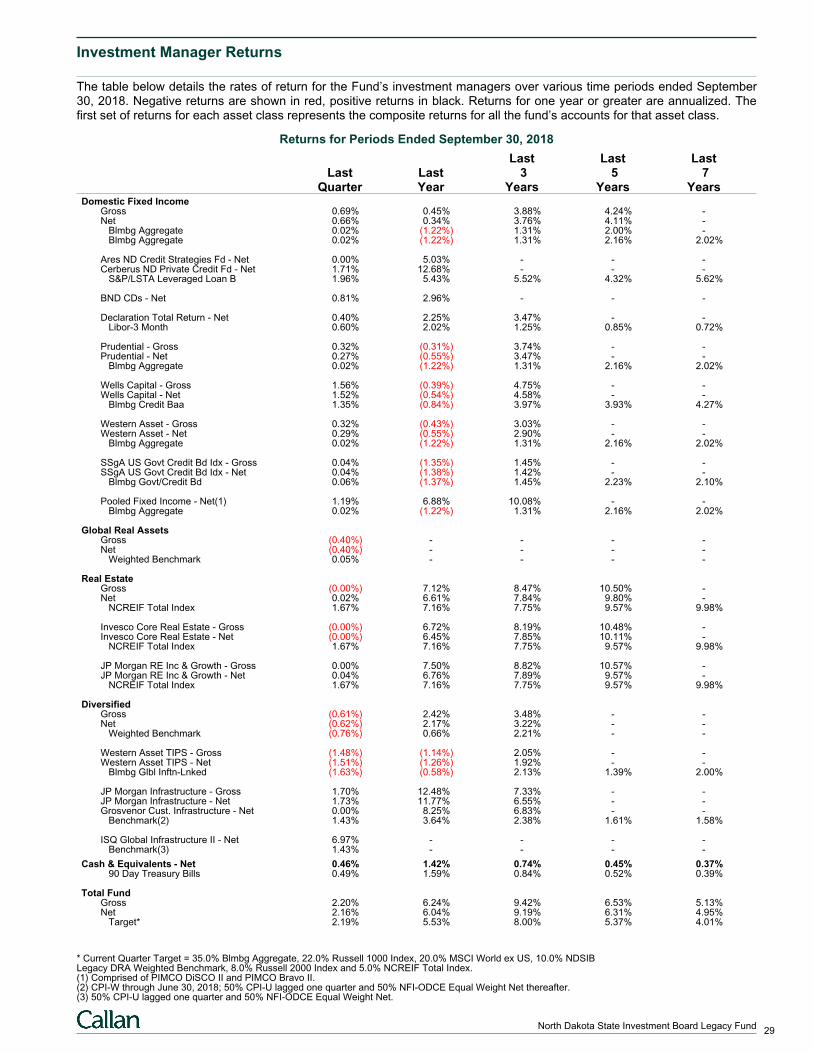
Investment Manager Returns
The table below details the rates of return for the Fund’s investment managers over various time periods ended September30, 2018. Negative returns are shown in red, positive returns in black. Returns for one year or greater are annualized. Thefirst set of returns for each asset class represents the composite returns for all the fund’s accounts for that asset class.
Returns for Periods Ended September 30, 2018
Last Last LastLast Last 3 5 7
Quarter Year Years Years YearsDomestic Fixed Income
Gross 0.69% 0.45% 3.88% 4.24% -Net 0.66% 0.34% 3.76% 4.11% - Blmbg Aggregate 0.02% (1.22%) 1.31% 2.00% - Blmbg Aggregate 0.02% (1.22%) 1.31% 2.16% 2.02%
Ares ND Credit Strategies Fd - Net 0.00% 5.03% - - -Cerberus ND Private Credit Fd - Net 1.71% 12.68% - - - S&P/LSTA Leveraged Loan B 1.96% 5.43% 5.52% 4.32% 5.62%
BND CDs - Net 0.81% 2.96% - - -
Declaration Total Return - Net 0.40% 2.25% 3.47% - - Libor-3 Month 0.60% 2.02% 1.25% 0.85% 0.72%
Prudential - Gross 0.32% (0.31%) 3.74% - -Prudential - Net 0.27% (0.55%) 3.47% - - Blmbg Aggregate 0.02% (1.22%) 1.31% 2.16% 2.02%
Wells Capital - Gross 1.56% (0.39%) 4.75% - -Wells Capital - Net 1.52% (0.54%) 4.58% - - Blmbg Credit Baa 1.35% (0.84%) 3.97% 3.93% 4.27%
Western Asset - Gross 0.32% (0.43%) 3.03% - -Western Asset - Net 0.29% (0.55%) 2.90% - - Blmbg Aggregate 0.02% (1.22%) 1.31% 2.16% 2.02%
SSgA US Govt Credit Bd Idx - Gross 0.04% (1.35%) 1.45% - -SSgA US Govt Credit Bd Idx - Net 0.04% (1.38%) 1.42% - - Blmbg Govt/Credit Bd 0.06% (1.37%) 1.45% 2.23% 2.10%
Pooled Fixed Income - Net(1) 1.19% 6.88% 10.08% - - Blmbg Aggregate 0.02% (1.22%) 1.31% 2.16% 2.02%
Global Real AssetsGross (0.40%) - - - -Net (0.40%) - - - - Weighted Benchmark 0.05% - - - -
Real EstateGross (0.00%) 7.12% 8.47% 10.50% -Net 0.02% 6.61% 7.84% 9.80% - NCREIF Total Index 1.67% 7.16% 7.75% 9.57% 9.98%
Invesco Core Real Estate - Gross (0.00%) 6.72% 8.19% 10.48% -Invesco Core Real Estate - Net (0.00%) 6.45% 7.85% 10.11% - NCREIF Total Index 1.67% 7.16% 7.75% 9.57% 9.98%
JP Morgan RE Inc & Growth - Gross 0.00% 7.50% 8.82% 10.57% -JP Morgan RE Inc & Growth - Net 0.04% 6.76% 7.89% 9.57% - NCREIF Total Index 1.67% 7.16% 7.75% 9.57% 9.98%
DiversifiedGross (0.61%) 2.42% 3.48% - -Net (0.62%) 2.17% 3.22% - - Weighted Benchmark (0.76%) 0.66% 2.21% - -
Western Asset TIPS - Gross (1.48%) (1.14%) 2.05% - -Western Asset TIPS - Net (1.51%) (1.26%) 1.92% - - Blmbg Glbl Inftn-Lnked (1.63%) (0.58%) 2.13% 1.39% 2.00%
JP Morgan Infrastructure - Gross 1.70% 12.48% 7.33% - -JP Morgan Infrastructure - Net 1.73% 11.77% 6.55% - -Grosvenor Cust. Infrastructure - Net 0.00% 8.25% 6.83% - - Benchmark(2) 1.43% 3.64% 2.38% 1.61% 1.58%
ISQ Global Infrastructure II - Net 6.97% - - - - Benchmark(3) 1.43% - - - -
Cash & Equivalents - Net 0.46% 1.42% 0.74% 0.45% 0.37% 90 Day Treasury Bills 0.49% 1.59% 0.84% 0.52% 0.39%
Total FundGross 2.20% 6.24% 9.42% 6.53% 5.13%Net 2.16% 6.04% 9.19% 6.31% 4.95% Target* 2.19% 5.53% 8.00% 5.37% 4.01%
* Current Quarter Target = 35.0% Blmbg Aggregate, 22.0% Russell 1000 Index, 20.0% MSCI World ex US, 10.0% NDSIBLegacy DRA Weighted Benchmark, 8.0% Russell 2000 Index and 5.0% NCREIF Total Index.(1) Comprised of PIMCO DiSCO II and PIMCO Bravo II.(2) CPI-W through June 30, 2018; 50% CPI-U lagged one quarter and 50% NFI-ODCE Equal Weight Net thereafter.(3) 50% CPI-U lagged one quarter and 50% NFI-ODCE Equal Weight Net.
29North Dakota State Investment Board Legacy Fund
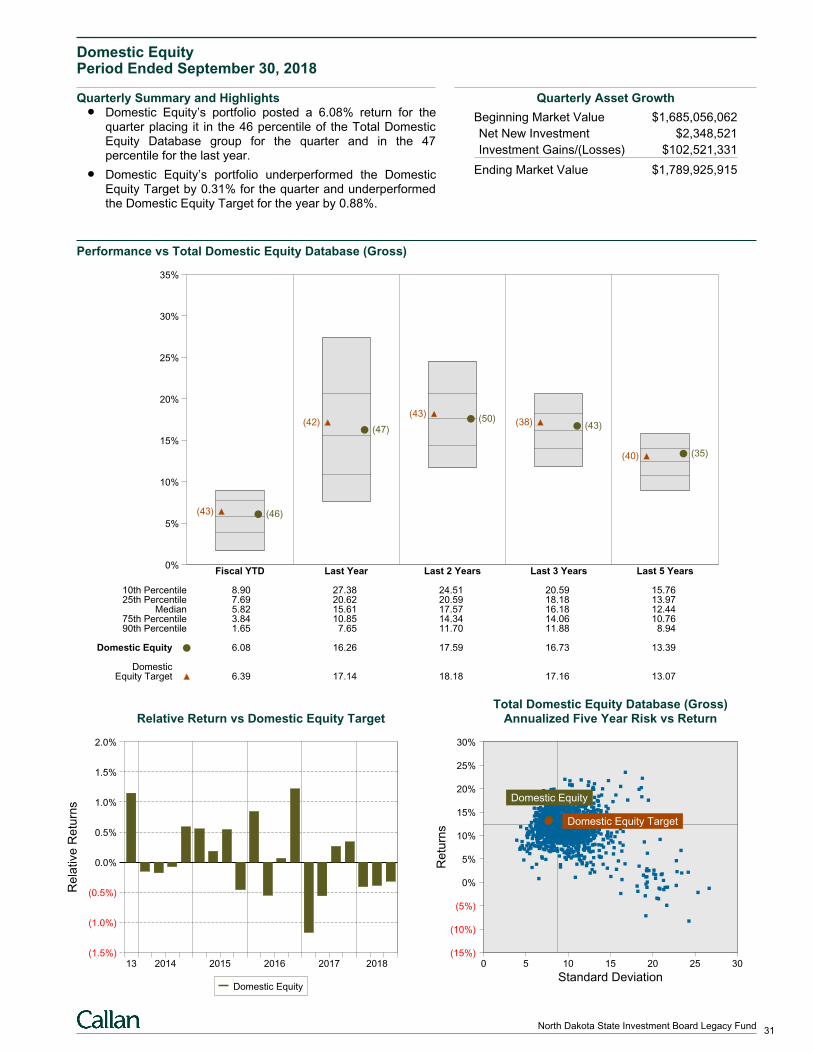
Domestic EquityPeriod Ended September 30, 2018
Quarterly Summary and HighlightsDomestic Equity’s portfolio posted a 6.08% return for thequarter placing it in the 46 percentile of the Total DomesticEquity Database group for the quarter and in the 47percentile for the last year.
Domestic Equity’s portfolio underperformed the DomesticEquity Target by 0.31% for the quarter and underperformedthe Domestic Equity Target for the year by 0.88%.
Quarterly Asset Growth
Beginning Market Value $1,685,056,062
Net New Investment $2,348,521
Investment Gains/(Losses) $102,521,331
Ending Market Value $1,789,925,915
Performance vs Total Domestic Equity Database (Gross)
0%
5%
10%
15%
20%
25%
30%
35%
Fiscal YTD Last Year Last 2 Years Last 3 Years Last 5 Years
(46)(43)
(47)(42) (50)
(43)
(43)(38)
(35)(40)
10th Percentile 8.90 27.38 24.51 20.59 15.7625th Percentile 7.69 20.62 20.59 18.18 13.97
Median 5.82 15.61 17.57 16.18 12.4475th Percentile 3.84 10.85 14.34 14.06 10.7690th Percentile 1.65 7.65 11.70 11.88 8.94
Domestic Equity 6.08 16.26 17.59 16.73 13.39
DomesticEquity Target 6.39 17.14 18.18 17.16 13.07
Relative Return vs Domestic Equity Target
Rela
tive
Re
turn
s
(1.5%)
(1.0%)
(0.5%)
0.0%
0.5%
1.0%
1.5%
2.0%
13 2014 2015 2016 2017 2018
Domestic Equity
Total Domestic Equity Database (Gross)Annualized Five Year Risk vs Return
0 5 10 15 20 25 30(15%)
(10%)
(5%)
0%
5%
10%
15%
20%
25%
30%
Domestic Equity
Domestic Equity Target
Standard Deviation
Re
turn
s
31North Dakota State Investment Board Legacy Fund
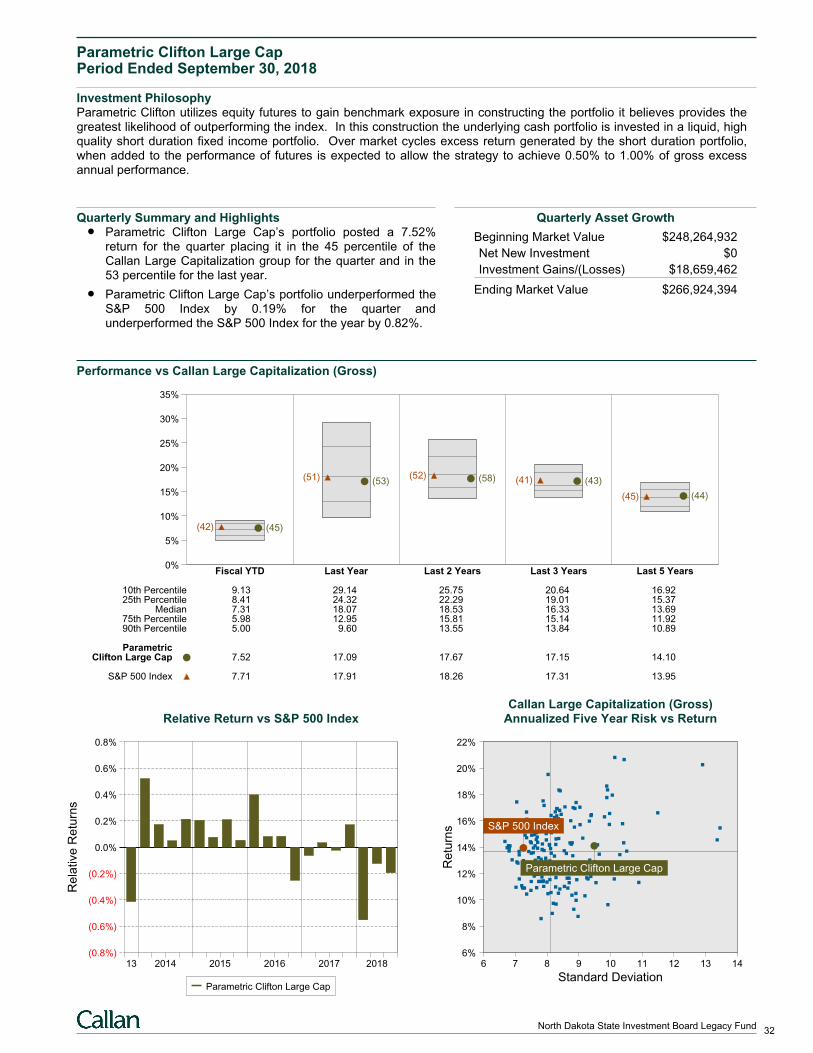
Parametric Clifton Large CapPeriod Ended September 30, 2018
Investment PhilosophyParametric Clifton utilizes equity futures to gain benchmark exposure in constructing the portfolio it believes provides thegreatest likelihood of outperforming the index. In this construction the underlying cash portfolio is invested in a liquid, highquality short duration fixed income portfolio. Over market cycles excess return generated by the short duration portfolio,when added to the performance of futures is expected to allow the strategy to achieve 0.50% to 1.00% of gross excessannual performance.
Quarterly Summary and HighlightsParametric Clifton Large Cap’s portfolio posted a 7.52%return for the quarter placing it in the 45 percentile of theCallan Large Capitalization group for the quarter and in the53 percentile for the last year.
Parametric Clifton Large Cap’s portfolio underperformed theS&P 500 Index by 0.19% for the quarter andunderperformed the S&P 500 Index for the year by 0.82%.
Quarterly Asset Growth
Beginning Market Value $248,264,932
Net New Investment $0
Investment Gains/(Losses) $18,659,462
Ending Market Value $266,924,394
Performance vs Callan Large Capitalization (Gross)
0%
5%
10%
15%
20%
25%
30%
35%
Fiscal YTD Last Year Last 2 Years Last 3 Years Last 5 Years
(45)(42)
(53)(51) (58)(52)(43)(41)
(44)(45)
10th Percentile 9.13 29.14 25.75 20.64 16.9225th Percentile 8.41 24.32 22.29 19.01 15.37
Median 7.31 18.07 18.53 16.33 13.6975th Percentile 5.98 12.95 15.81 15.14 11.9290th Percentile 5.00 9.60 13.55 13.84 10.89
ParametricClifton Large Cap 7.52 17.09 17.67 17.15 14.10
S&P 500 Index 7.71 17.91 18.26 17.31 13.95
Relative Return vs S&P 500 Index
Rela
tive
Re
turn
s
(0.8%)
(0.6%)
(0.4%)
(0.2%)
0.0%
0.2%
0.4%
0.6%
0.8%
13 2014 2015 2016 2017 2018
Parametric Clifton Large Cap
Callan Large Capitalization (Gross)Annualized Five Year Risk vs Return
6 7 8 9 10 11 12 13 146%
8%
10%
12%
14%
16%
18%
20%
22%
S&P 500 Index
Parametric Clifton Large Cap
Standard Deviation
Re
turn
s
32North Dakota State Investment Board Legacy Fund
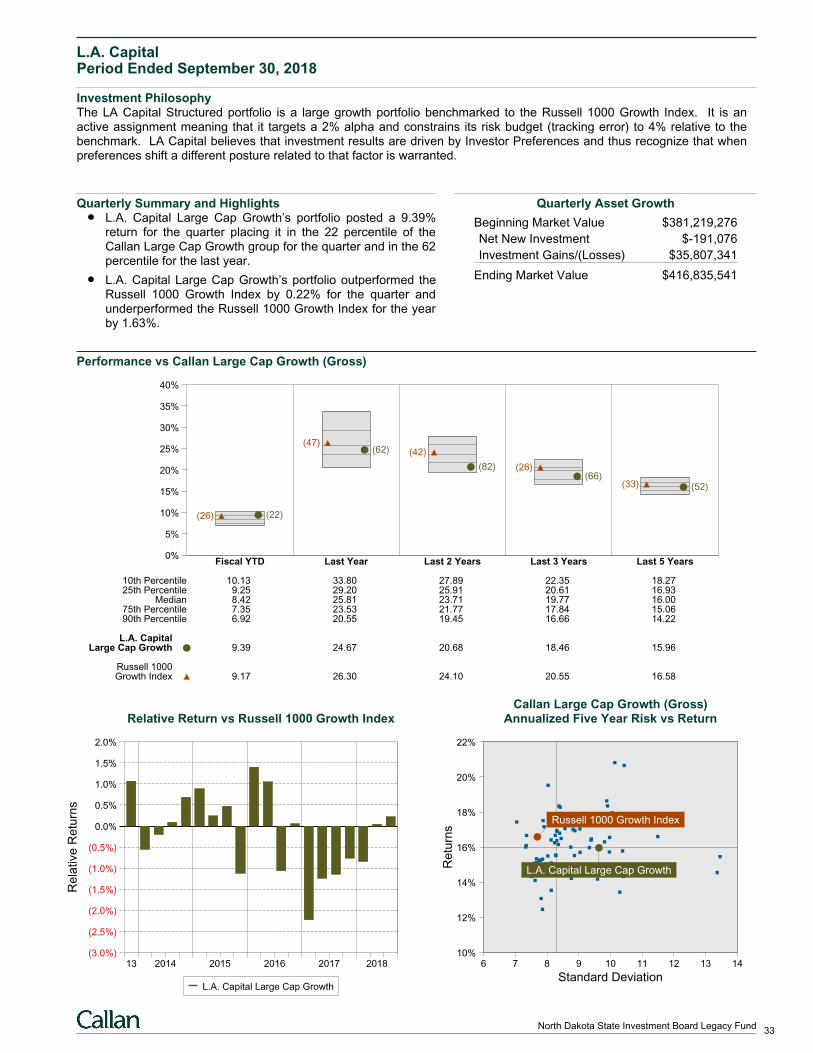
L.A. CapitalPeriod Ended September 30, 2018
Investment PhilosophyThe LA Capital Structured portfolio is a large growth portfolio benchmarked to the Russell 1000 Growth Index. It is anactive assignment meaning that it targets a 2% alpha and constrains its risk budget (tracking error) to 4% relative to thebenchmark. LA Capital believes that investment results are driven by Investor Preferences and thus recognize that whenpreferences shift a different posture related to that factor is warranted.
Quarterly Summary and HighlightsL.A. Capital Large Cap Growth’s portfolio posted a 9.39%return for the quarter placing it in the 22 percentile of theCallan Large Cap Growth group for the quarter and in the 62percentile for the last year.
L.A. Capital Large Cap Growth’s portfolio outperformed theRussell 1000 Growth Index by 0.22% for the quarter andunderperformed the Russell 1000 Growth Index for the yearby 1.63%.
Quarterly Asset Growth
Beginning Market Value $381,219,276
Net New Investment $-191,076
Investment Gains/(Losses) $35,807,341
Ending Market Value $416,835,541
Performance vs Callan Large Cap Growth (Gross)
0%
5%
10%
15%
20%
25%
30%
35%
40%
Fiscal YTD Last Year Last 2 Years Last 3 Years Last 5 Years
(22)(26)
(62)(47)
(82)
(42)
(66)(26)
(52)(33)
10th Percentile 10.13 33.80 27.89 22.35 18.2725th Percentile 9.25 29.20 25.91 20.61 16.93
Median 8.42 25.81 23.71 19.77 16.0075th Percentile 7.35 23.53 21.77 17.84 15.0690th Percentile 6.92 20.55 19.45 16.66 14.22
L.A. CapitalLarge Cap Growth 9.39 24.67 20.68 18.46 15.96
Russell 1000Growth Index 9.17 26.30 24.10 20.55 16.58
Relative Return vs Russell 1000 Growth Index
Rela
tive
Re
turn
s
(3.0%)
(2.5%)
(2.0%)
(1.5%)
(1.0%)
(0.5%)
0.0%
0.5%
1.0%
1.5%
2.0%
13 2014 2015 2016 2017 2018
L.A. Capital Large Cap Growth
Callan Large Cap Growth (Gross)Annualized Five Year Risk vs Return
6 7 8 9 10 11 12 13 1410%
12%
14%
16%
18%
20%
22%
L.A. Capital Large Cap Growth
Russell 1000 Growth Index
Standard Deviation
Re
turn
s
33North Dakota State Investment Board Legacy Fund
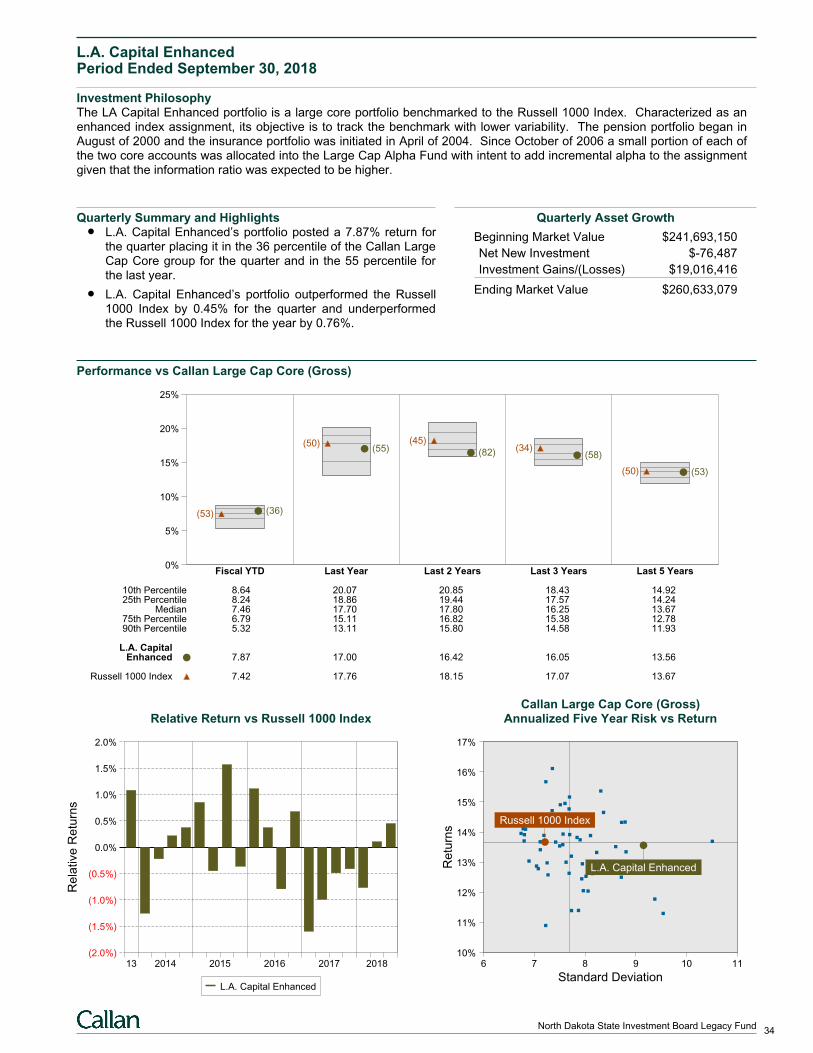
L.A. Capital EnhancedPeriod Ended September 30, 2018
Investment PhilosophyThe LA Capital Enhanced portfolio is a large core portfolio benchmarked to the Russell 1000 Index. Characterized as anenhanced index assignment, its objective is to track the benchmark with lower variability. The pension portfolio began inAugust of 2000 and the insurance portfolio was initiated in April of 2004. Since October of 2006 a small portion of each ofthe two core accounts was allocated into the Large Cap Alpha Fund with intent to add incremental alpha to the assignmentgiven that the information ratio was expected to be higher.
Quarterly Summary and HighlightsL.A. Capital Enhanced’s portfolio posted a 7.87% return forthe quarter placing it in the 36 percentile of the Callan LargeCap Core group for the quarter and in the 55 percentile forthe last year.
L.A. Capital Enhanced’s portfolio outperformed the Russell1000 Index by 0.45% for the quarter and underperformedthe Russell 1000 Index for the year by 0.76%.
Quarterly Asset Growth
Beginning Market Value $241,693,150
Net New Investment $-76,487
Investment Gains/(Losses) $19,016,416
Ending Market Value $260,633,079
Performance vs Callan Large Cap Core (Gross)
0%
5%
10%
15%
20%
25%
Fiscal YTD Last Year Last 2 Years Last 3 Years Last 5 Years
(36)(53)
(55)(50)
(82)
(45)
(58)(34)
(53)(50)
10th Percentile 8.64 20.07 20.85 18.43 14.9225th Percentile 8.24 18.86 19.44 17.57 14.24
Median 7.46 17.70 17.80 16.25 13.6775th Percentile 6.79 15.11 16.82 15.38 12.7890th Percentile 5.32 13.11 15.80 14.58 11.93
L.A. CapitalEnhanced 7.87 17.00 16.42 16.05 13.56
Russell 1000 Index 7.42 17.76 18.15 17.07 13.67
Relative Return vs Russell 1000 Index
Rela
tive
Re
turn
s
(2.0%)
(1.5%)
(1.0%)
(0.5%)
0.0%
0.5%
1.0%
1.5%
2.0%
13 2014 2015 2016 2017 2018
L.A. Capital Enhanced
Callan Large Cap Core (Gross)Annualized Five Year Risk vs Return
6 7 8 9 10 1110%
11%
12%
13%
14%
15%
16%
17%
Russell 1000 Index
L.A. Capital Enhanced
Standard Deviation
Re
turn
s
34North Dakota State Investment Board Legacy Fund
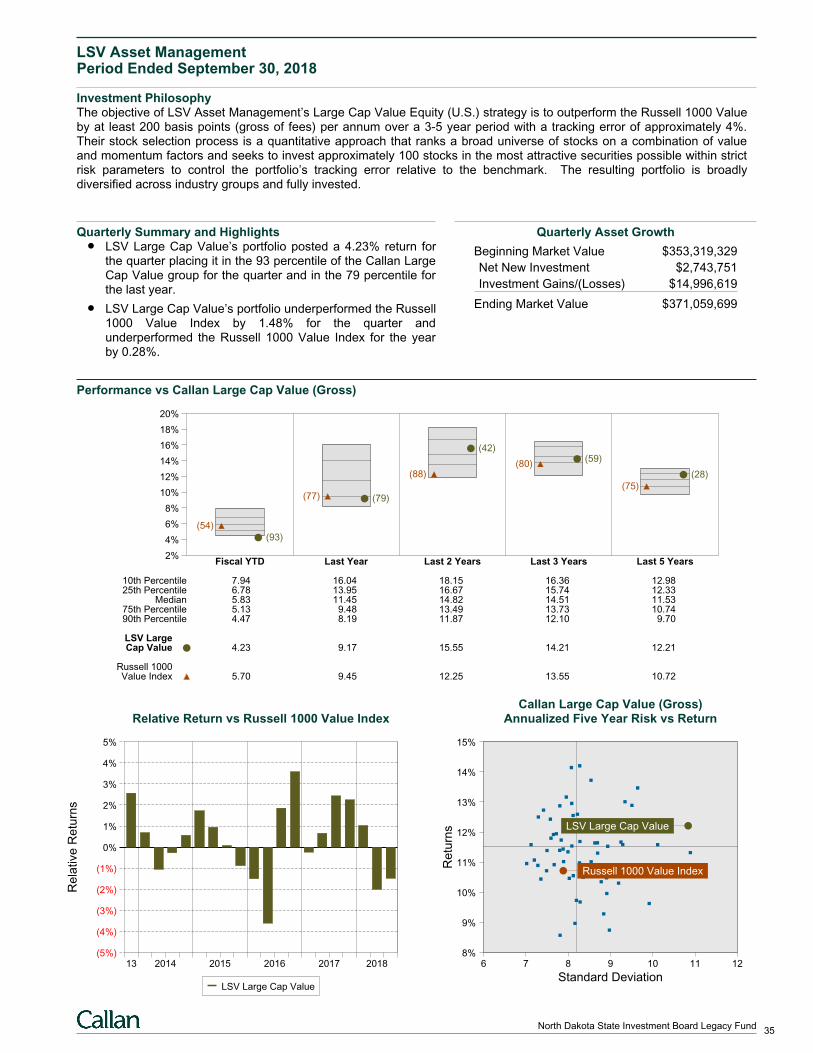
LSV Asset ManagementPeriod Ended September 30, 2018
Investment PhilosophyThe objective of LSV Asset Management’s Large Cap Value Equity (U.S.) strategy is to outperform the Russell 1000 Valueby at least 200 basis points (gross of fees) per annum over a 3-5 year period with a tracking error of approximately 4%.Their stock selection process is a quantitative approach that ranks a broad universe of stocks on a combination of valueand momentum factors and seeks to invest approximately 100 stocks in the most attractive securities possible within strictrisk parameters to control the portfolio’s tracking error relative to the benchmark. The resulting portfolio is broadlydiversified across industry groups and fully invested.
Quarterly Summary and HighlightsLSV Large Cap Value’s portfolio posted a 4.23% return forthe quarter placing it in the 93 percentile of the Callan LargeCap Value group for the quarter and in the 79 percentile forthe last year.
LSV Large Cap Value’s portfolio underperformed the Russell1000 Value Index by 1.48% for the quarter andunderperformed the Russell 1000 Value Index for the yearby 0.28%.
Quarterly Asset Growth
Beginning Market Value $353,319,329
Net New Investment $2,743,751
Investment Gains/(Losses) $14,996,619
Ending Market Value $371,059,699
Performance vs Callan Large Cap Value (Gross)
2%
4%
6%
8%
10%
12%
14%
16%
18%
20%
Fiscal YTD Last Year Last 2 Years Last 3 Years Last 5 Years
(93)
(54)
(79)(77)
(42)
(88)
(59)(80)
(28)
(75)
10th Percentile 7.94 16.04 18.15 16.36 12.9825th Percentile 6.78 13.95 16.67 15.74 12.33
Median 5.83 11.45 14.82 14.51 11.5375th Percentile 5.13 9.48 13.49 13.73 10.7490th Percentile 4.47 8.19 11.87 12.10 9.70
LSV LargeCap Value 4.23 9.17 15.55 14.21 12.21
Russell 1000Value Index 5.70 9.45 12.25 13.55 10.72
Relative Return vs Russell 1000 Value Index
Rela
tive
Re
turn
s
(5%)
(4%)
(3%)
(2%)
(1%)
0%
1%
2%
3%
4%
5%
13 2014 2015 2016 2017 2018
LSV Large Cap Value
Callan Large Cap Value (Gross)Annualized Five Year Risk vs Return
6 7 8 9 10 11 128%
9%
10%
11%
12%
13%
14%
15%
LSV Large Cap Value
Russell 1000 Value Index
Standard Deviation
Re
turn
s
35North Dakota State Investment Board Legacy Fund
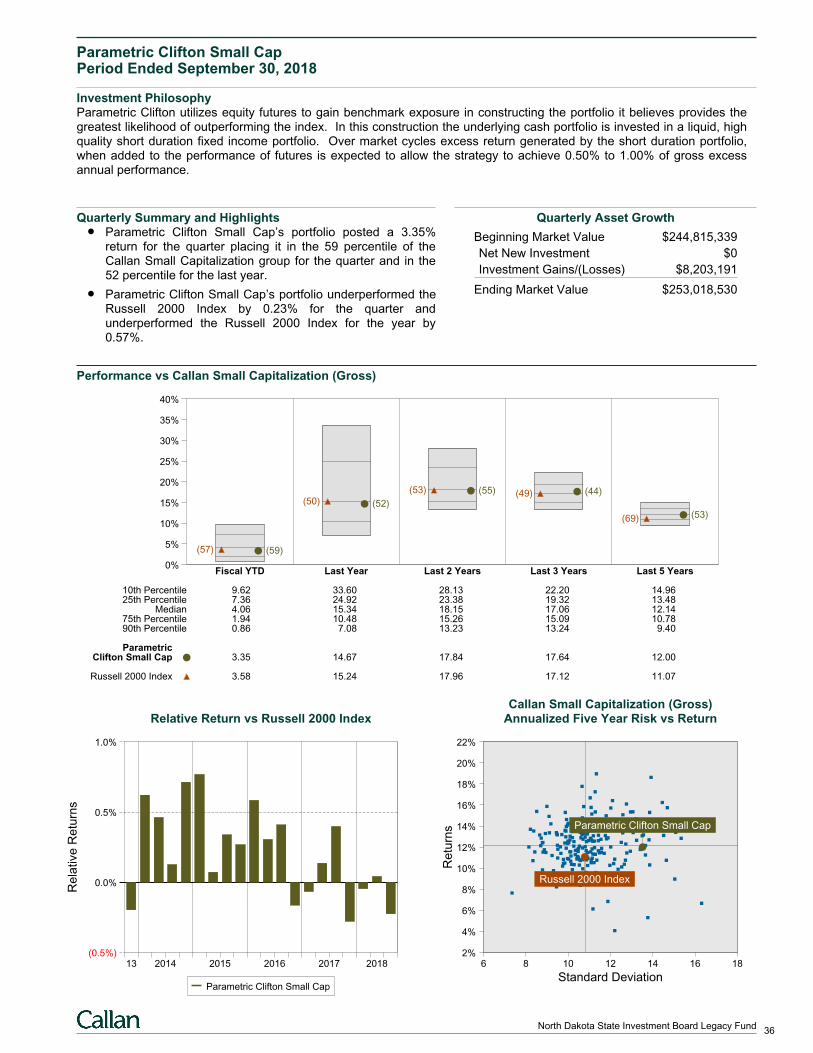
Parametric Clifton Small CapPeriod Ended September 30, 2018
Investment PhilosophyParametric Clifton utilizes equity futures to gain benchmark exposure in constructing the portfolio it believes provides thegreatest likelihood of outperforming the index. In this construction the underlying cash portfolio is invested in a liquid, highquality short duration fixed income portfolio. Over market cycles excess return generated by the short duration portfolio,when added to the performance of futures is expected to allow the strategy to achieve 0.50% to 1.00% of gross excessannual performance.
Quarterly Summary and HighlightsParametric Clifton Small Cap’s portfolio posted a 3.35%return for the quarter placing it in the 59 percentile of theCallan Small Capitalization group for the quarter and in the52 percentile for the last year.
Parametric Clifton Small Cap’s portfolio underperformed theRussell 2000 Index by 0.23% for the quarter andunderperformed the Russell 2000 Index for the year by0.57%.
Quarterly Asset Growth
Beginning Market Value $244,815,339
Net New Investment $0
Investment Gains/(Losses) $8,203,191
Ending Market Value $253,018,530
Performance vs Callan Small Capitalization (Gross)
0%
5%
10%
15%
20%
25%
30%
35%
40%
Fiscal YTD Last Year Last 2 Years Last 3 Years Last 5 Years
(59)(57)
(52)(50)(55)(53) (44)(49)
(53)(69)
10th Percentile 9.62 33.60 28.13 22.20 14.9625th Percentile 7.36 24.92 23.38 19.32 13.48
Median 4.06 15.34 18.15 17.06 12.1475th Percentile 1.94 10.48 15.26 15.09 10.7890th Percentile 0.86 7.08 13.23 13.24 9.40
ParametricClifton Small Cap 3.35 14.67 17.84 17.64 12.00
Russell 2000 Index 3.58 15.24 17.96 17.12 11.07
Relative Return vs Russell 2000 Index
Rela
tive
Re
turn
s
(0.5%)
0.0%
0.5%
1.0%
13 2014 2015 2016 2017 2018
Parametric Clifton Small Cap
Callan Small Capitalization (Gross)Annualized Five Year Risk vs Return
6 8 10 12 14 16 182%
4%
6%
8%
10%
12%
14%
16%
18%
20%
22%
Parametric Clifton Small Cap
Russell 2000 Index
Standard Deviation
Re
turn
s
36North Dakota State Investment Board Legacy Fund
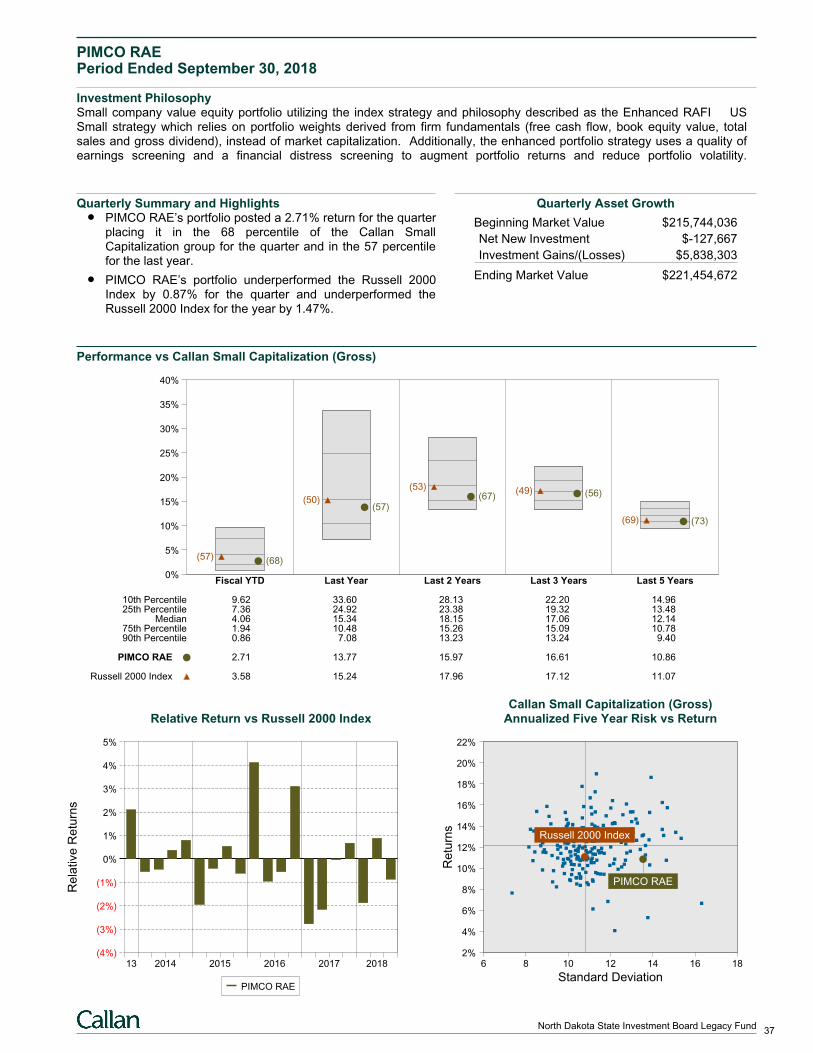
PIMCO RAEPeriod Ended September 30, 2018
Investment PhilosophySmall company value equity portfolio utilizing the index strategy and philosophy described as the Enhanced RAFI USSmall strategy which relies on portfolio weights derived from firm fundamentals (free cash flow, book equity value, totalsales and gross dividend), instead of market capitalization. Additionally, the enhanced portfolio strategy uses a quality ofearnings screening and a financial distress screening to augment portfolio returns and reduce portfolio volatility.
Quarterly Summary and HighlightsPIMCO RAE’s portfolio posted a 2.71% return for the quarterplacing it in the 68 percentile of the Callan SmallCapitalization group for the quarter and in the 57 percentilefor the last year.
PIMCO RAE’s portfolio underperformed the Russell 2000Index by 0.87% for the quarter and underperformed theRussell 2000 Index for the year by 1.47%.
Quarterly Asset Growth
Beginning Market Value $215,744,036
Net New Investment $-127,667
Investment Gains/(Losses) $5,838,303
Ending Market Value $221,454,672
Performance vs Callan Small Capitalization (Gross)
0%
5%
10%
15%
20%
25%
30%
35%
40%
Fiscal YTD Last Year Last 2 Years Last 3 Years Last 5 Years
(68)(57)
(57)(50) (67)
(53)(56)(49)
(73)(69)
10th Percentile 9.62 33.60 28.13 22.20 14.9625th Percentile 7.36 24.92 23.38 19.32 13.48
Median 4.06 15.34 18.15 17.06 12.1475th Percentile 1.94 10.48 15.26 15.09 10.7890th Percentile 0.86 7.08 13.23 13.24 9.40
PIMCO RAE 2.71 13.77 15.97 16.61 10.86
Russell 2000 Index 3.58 15.24 17.96 17.12 11.07
Relative Return vs Russell 2000 Index
Rela
tive
Re
turn
s
(4%)
(3%)
(2%)
(1%)
0%
1%
2%
3%
4%
5%
13 2014 2015 2016 2017 2018
PIMCO RAE
Callan Small Capitalization (Gross)Annualized Five Year Risk vs Return
6 8 10 12 14 16 182%
4%
6%
8%
10%
12%
14%
16%
18%
20%
22%
Russell 2000 Index
PIMCO RAE
Standard Deviation
Re
turn
s
37North Dakota State Investment Board Legacy Fund
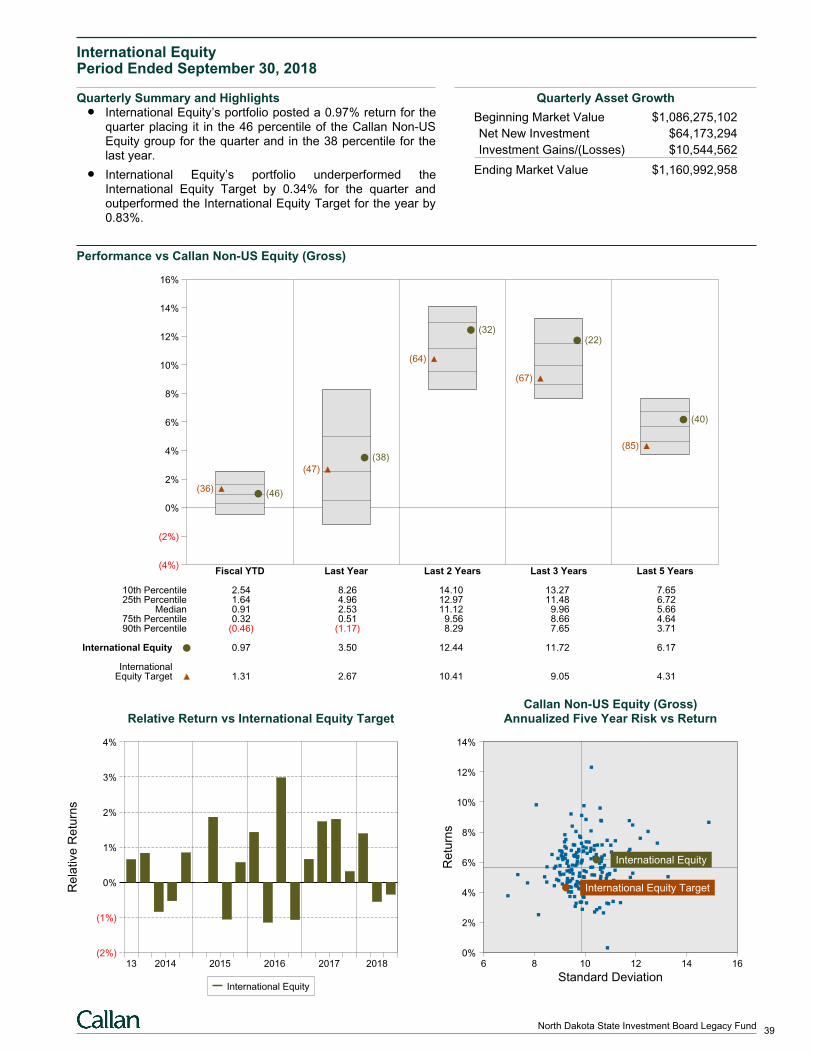
International EquityPeriod Ended September 30, 2018
Quarterly Summary and HighlightsInternational Equity’s portfolio posted a 0.97% return for thequarter placing it in the 46 percentile of the Callan Non-USEquity group for the quarter and in the 38 percentile for thelast year.
International Equity’s portfolio underperformed theInternational Equity Target by 0.34% for the quarter andoutperformed the International Equity Target for the year by0.83%.
Quarterly Asset Growth
Beginning Market Value $1,086,275,102
Net New Investment $64,173,294
Investment Gains/(Losses) $10,544,562
Ending Market Value $1,160,992,958
Performance vs Callan Non-US Equity (Gross)
(4%)
(2%)
0%
2%
4%
6%
8%
10%
12%
14%
16%
Fiscal YTD Last Year Last 2 Years Last 3 Years Last 5 Years
(46)(36)
(38)
(47)
(32)
(64)
(22)
(67)
(40)
(85)
10th Percentile 2.54 8.26 14.10 13.27 7.6525th Percentile 1.64 4.96 12.97 11.48 6.72
Median 0.91 2.53 11.12 9.96 5.6675th Percentile 0.32 0.51 9.56 8.66 4.6490th Percentile (0.46) (1.17) 8.29 7.65 3.71
International Equity 0.97 3.50 12.44 11.72 6.17
InternationalEquity Target 1.31 2.67 10.41 9.05 4.31
Relative Return vs International Equity Target
Rela
tive
Re
turn
s
(2%)
(1%)
0%
1%
2%
3%
4%
13 2014 2015 2016 2017 2018
International Equity
Callan Non-US Equity (Gross)Annualized Five Year Risk vs Return
6 8 10 12 14 160%
2%
4%
6%
8%
10%
12%
14%
International Equity
International Equity Target
Standard Deviation
Re
turn
s
39North Dakota State Investment Board Legacy Fund
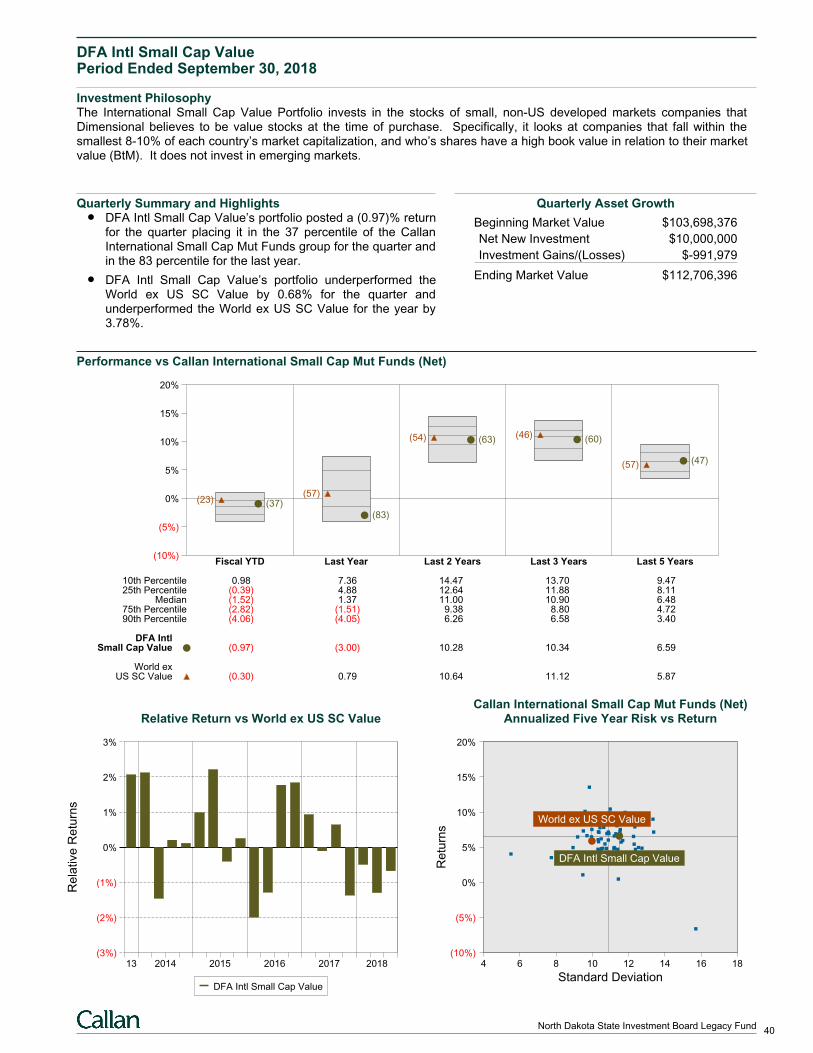
DFA Intl Small Cap ValuePeriod Ended September 30, 2018
Investment PhilosophyThe International Small Cap Value Portfolio invests in the stocks of small, non-US developed markets companies thatDimensional believes to be value stocks at the time of purchase. Specifically, it looks at companies that fall within thesmallest 8-10% of each country’s market capitalization, and who’s shares have a high book value in relation to their marketvalue (BtM). It does not invest in emerging markets.
Quarterly Summary and HighlightsDFA Intl Small Cap Value’s portfolio posted a (0.97)% returnfor the quarter placing it in the 37 percentile of the CallanInternational Small Cap Mut Funds group for the quarter andin the 83 percentile for the last year.
DFA Intl Small Cap Value’s portfolio underperformed theWorld ex US SC Value by 0.68% for the quarter andunderperformed the World ex US SC Value for the year by3.78%.
Quarterly Asset Growth
Beginning Market Value $103,698,376
Net New Investment $10,000,000
Investment Gains/(Losses) $-991,979
Ending Market Value $112,706,396
Performance vs Callan International Small Cap Mut Funds (Net)
(10%)
(5%)
0%
5%
10%
15%
20%
Fiscal YTD Last Year Last 2 Years Last 3 Years Last 5 Years
(37)(23)
(83)
(57)
(63)(54) (60)(46)
(47)(57)
10th Percentile 0.98 7.36 14.47 13.70 9.4725th Percentile (0.39) 4.88 12.64 11.88 8.11
Median (1.52) 1.37 11.00 10.90 6.4875th Percentile (2.82) (1.51) 9.38 8.80 4.7290th Percentile (4.06) (4.05) 6.26 6.58 3.40
DFA IntlSmall Cap Value (0.97) (3.00) 10.28 10.34 6.59
World exUS SC Value (0.30) 0.79 10.64 11.12 5.87
Relative Return vs World ex US SC Value
Rela
tive
Re
turn
s
(3%)
(2%)
(1%)
0%
1%
2%
3%
13 2014 2015 2016 2017 2018
DFA Intl Small Cap Value
Callan International Small Cap Mut Funds (Net)Annualized Five Year Risk vs Return
4 6 8 10 12 14 16 18(10%)
(5%)
0%
5%
10%
15%
20%
World ex US SC Value
DFA Intl Small Cap Value
Standard Deviation
Re
turn
s
40North Dakota State Investment Board Legacy Fund
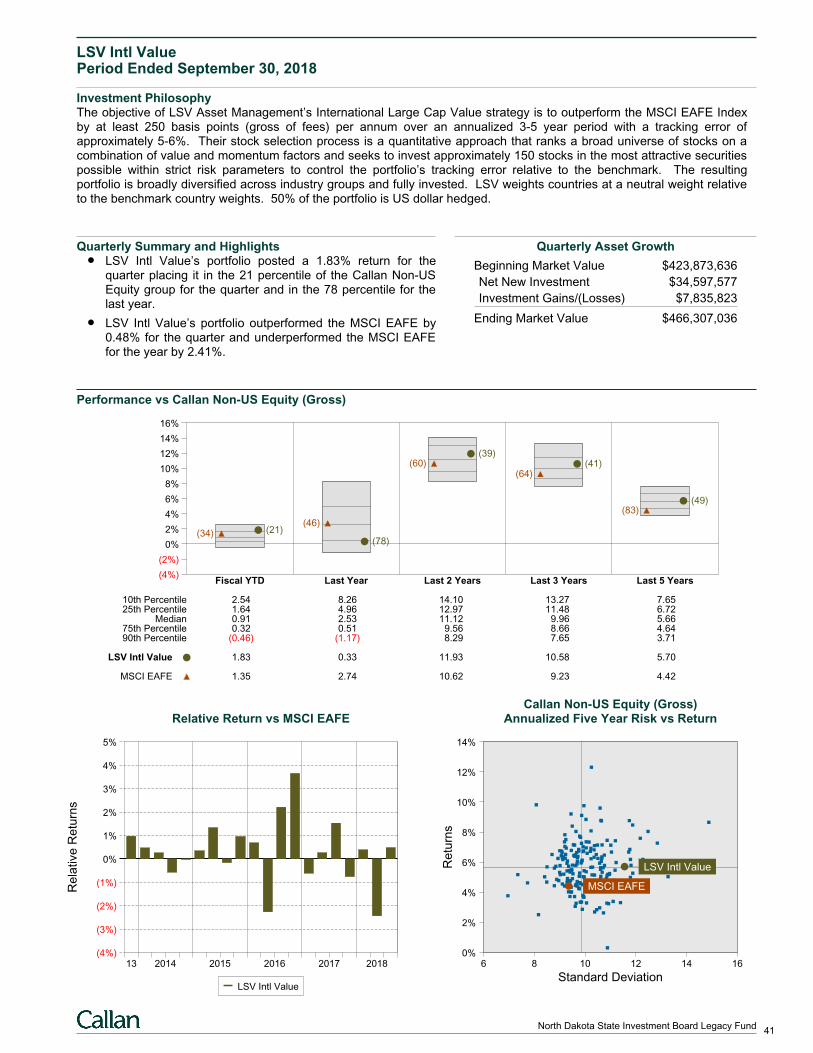
LSV Intl ValuePeriod Ended September 30, 2018
Investment PhilosophyThe objective of LSV Asset Management’s International Large Cap Value strategy is to outperform the MSCI EAFE Indexby at least 250 basis points (gross of fees) per annum over an annualized 3-5 year period with a tracking error ofapproximately 5-6%. Their stock selection process is a quantitative approach that ranks a broad universe of stocks on acombination of value and momentum factors and seeks to invest approximately 150 stocks in the most attractive securitiespossible within strict risk parameters to control the portfolio’s tracking error relative to the benchmark. The resultingportfolio is broadly diversified across industry groups and fully invested. LSV weights countries at a neutral weight relativeto the benchmark country weights. 50% of the portfolio is US dollar hedged.
Quarterly Summary and HighlightsLSV Intl Value’s portfolio posted a 1.83% return for thequarter placing it in the 21 percentile of the Callan Non-USEquity group for the quarter and in the 78 percentile for thelast year.
LSV Intl Value’s portfolio outperformed the MSCI EAFE by0.48% for the quarter and underperformed the MSCI EAFEfor the year by 2.41%.
Quarterly Asset Growth
Beginning Market Value $423,873,636
Net New Investment $34,597,577
Investment Gains/(Losses) $7,835,823
Ending Market Value $466,307,036
Performance vs Callan Non-US Equity (Gross)
(4%)
(2%)
0%
2%
4%
6%
8%
10%
12%
14%
16%
Fiscal YTD Last Year Last 2 Years Last 3 Years Last 5 Years
(21)(34)(78)
(46)
(39)(60) (41)
(64)
(49)(83)
10th Percentile 2.54 8.26 14.10 13.27 7.6525th Percentile 1.64 4.96 12.97 11.48 6.72
Median 0.91 2.53 11.12 9.96 5.6675th Percentile 0.32 0.51 9.56 8.66 4.6490th Percentile (0.46) (1.17) 8.29 7.65 3.71
LSV Intl Value 1.83 0.33 11.93 10.58 5.70
MSCI EAFE 1.35 2.74 10.62 9.23 4.42
Relative Return vs MSCI EAFE
Rela
tive
Re
turn
s
(4%)
(3%)
(2%)
(1%)
0%
1%
2%
3%
4%
5%
13 2014 2015 2016 2017 2018
LSV Intl Value
Callan Non-US Equity (Gross)Annualized Five Year Risk vs Return
6 8 10 12 14 160%
2%
4%
6%
8%
10%
12%
14%
LSV Intl Value
MSCI EAFE
Standard Deviation
Re
turn
s
41North Dakota State Investment Board Legacy Fund
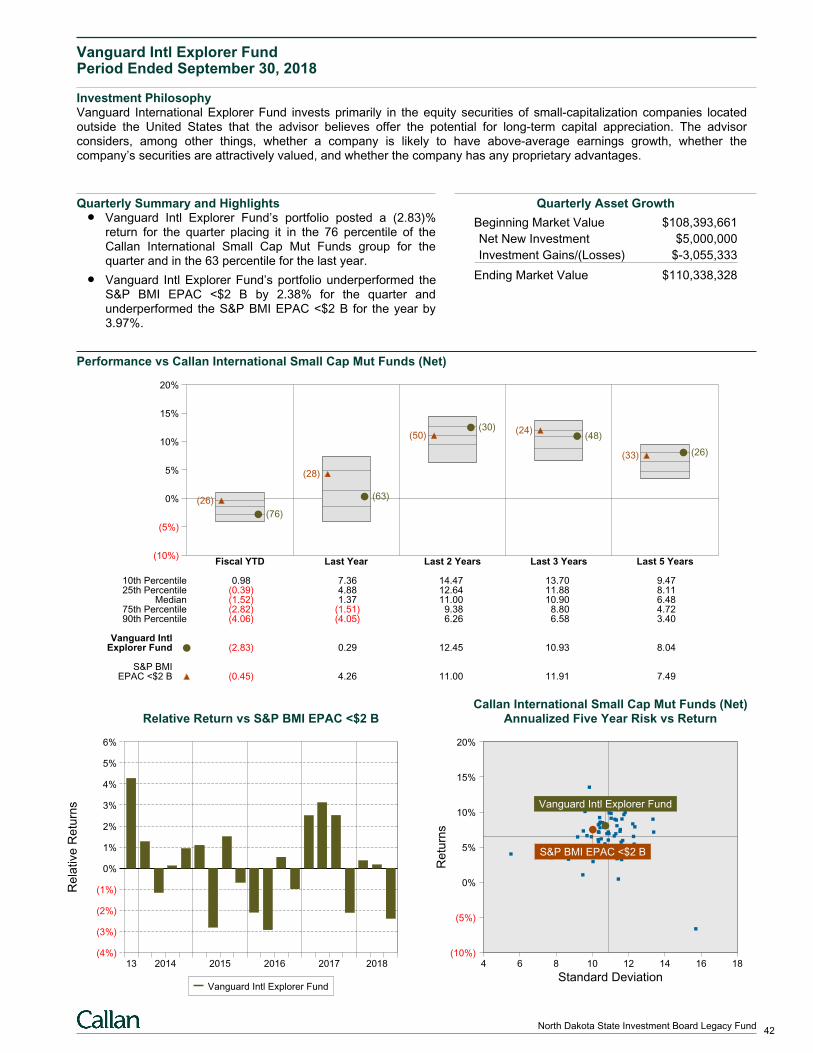
Vanguard Intl Explorer FundPeriod Ended September 30, 2018
Investment PhilosophyVanguard International Explorer Fund invests primarily in the equity securities of small-capitalization companies locatedoutside the United States that the advisor believes offer the potential for long-term capital appreciation. The advisorconsiders, among other things, whether a company is likely to have above-average earnings growth, whether thecompany’s securities are attractively valued, and whether the company has any proprietary advantages.
Quarterly Summary and HighlightsVanguard Intl Explorer Fund’s portfolio posted a (2.83)%return for the quarter placing it in the 76 percentile of theCallan International Small Cap Mut Funds group for thequarter and in the 63 percentile for the last year.
Vanguard Intl Explorer Fund’s portfolio underperformed theS&P BMI EPAC <$2 B by 2.38% for the quarter andunderperformed the S&P BMI EPAC <$2 B for the year by3.97%.
Quarterly Asset Growth
Beginning Market Value $108,393,661
Net New Investment $5,000,000
Investment Gains/(Losses) $-3,055,333
Ending Market Value $110,338,328
Performance vs Callan International Small Cap Mut Funds (Net)
(10%)
(5%)
0%
5%
10%
15%
20%
Fiscal YTD Last Year Last 2 Years Last 3 Years Last 5 Years
(76)
(26) (63)
(28)
(30)(50) (48)
(24)
(26)(33)
10th Percentile 0.98 7.36 14.47 13.70 9.4725th Percentile (0.39) 4.88 12.64 11.88 8.11
Median (1.52) 1.37 11.00 10.90 6.4875th Percentile (2.82) (1.51) 9.38 8.80 4.7290th Percentile (4.06) (4.05) 6.26 6.58 3.40
Vanguard IntlExplorer Fund (2.83) 0.29 12.45 10.93 8.04
S&P BMIEPAC <$2 B (0.45) 4.26 11.00 11.91 7.49
Relative Return vs S&P BMI EPAC <$2 B
Rela
tive
Re
turn
s
(4%)
(3%)
(2%)
(1%)
0%
1%
2%
3%
4%
5%
6%
13 2014 2015 2016 2017 2018
Vanguard Intl Explorer Fund
Callan International Small Cap Mut Funds (Net)Annualized Five Year Risk vs Return
4 6 8 10 12 14 16 18(10%)
(5%)
0%
5%
10%
15%
20%
Vanguard Intl Explorer Fund
S&P BMI EPAC <$2 B
Standard Deviation
Re
turn
s
42North Dakota State Investment Board Legacy Fund
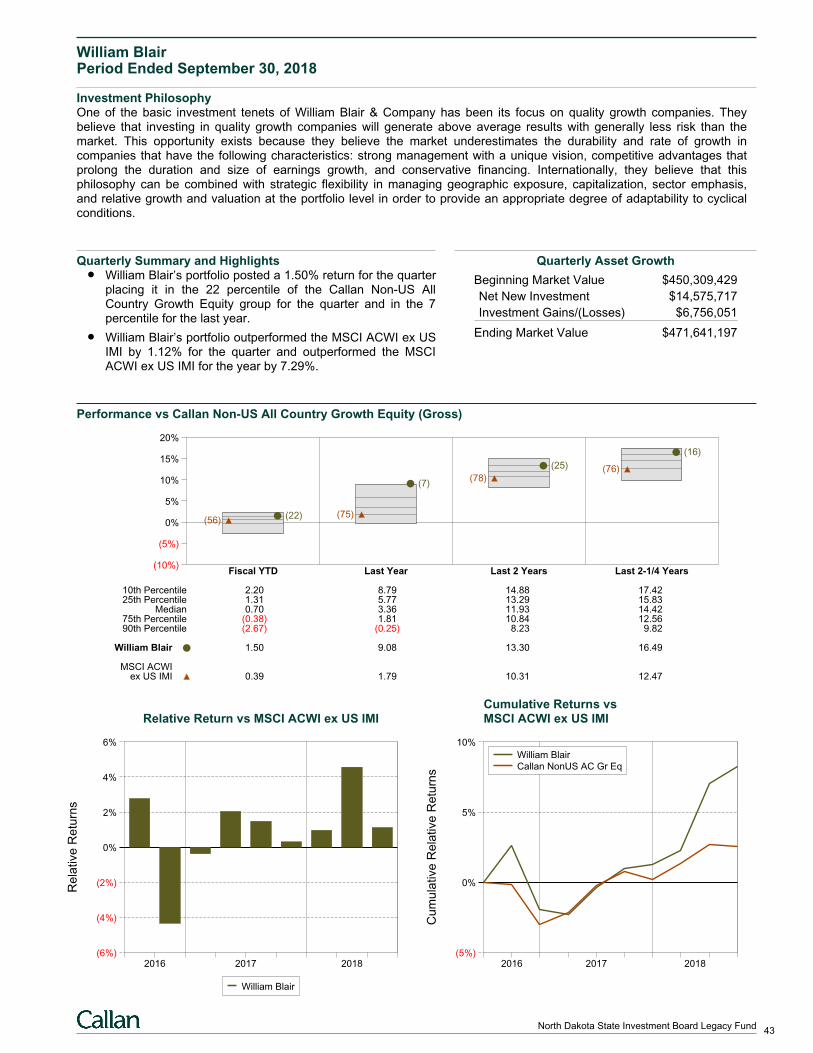
William BlairPeriod Ended September 30, 2018
Investment PhilosophyOne of the basic investment tenets of William Blair & Company has been its focus on quality growth companies. Theybelieve that investing in quality growth companies will generate above average results with generally less risk than themarket. This opportunity exists because they believe the market underestimates the durability and rate of growth incompanies that have the following characteristics: strong management with a unique vision, competitive advantages thatprolong the duration and size of earnings growth, and conservative financing. Internationally, they believe that thisphilosophy can be combined with strategic flexibility in managing geographic exposure, capitalization, sector emphasis,and relative growth and valuation at the portfolio level in order to provide an appropriate degree of adaptability to cyclicalconditions.
Quarterly Summary and HighlightsWilliam Blair’s portfolio posted a 1.50% return for the quarterplacing it in the 22 percentile of the Callan Non-US AllCountry Growth Equity group for the quarter and in the 7percentile for the last year.
William Blair’s portfolio outperformed the MSCI ACWI ex USIMI by 1.12% for the quarter and outperformed the MSCIACWI ex US IMI for the year by 7.29%.
Quarterly Asset Growth
Beginning Market Value $450,309,429
Net New Investment $14,575,717
Investment Gains/(Losses) $6,756,051
Ending Market Value $471,641,197
Performance vs Callan Non-US All Country Growth Equity (Gross)
(10%)
(5%)
0%
5%
10%
15%
20%
Fiscal YTD Last Year Last 2 Years Last 2-1/4 Years
(22)(56)
(7)
(75)
(25)
(78)
(16)
(76)
10th Percentile 2.20 8.79 14.88 17.4225th Percentile 1.31 5.77 13.29 15.83
Median 0.70 3.36 11.93 14.4275th Percentile (0.38) 1.81 10.84 12.5690th Percentile (2.67) (0.25) 8.23 9.82
William Blair 1.50 9.08 13.30 16.49
MSCI ACWIex US IMI 0.39 1.79 10.31 12.47
Relative Return vs MSCI ACWI ex US IMI
Rela
tive
Re
turn
s
(6%)
(4%)
(2%)
0%
2%
4%
6%
2016 2017 2018
William Blair
Cumulative Returns vsMSCI ACWI ex US IMI
Cum
ula
tive
Re
lative
Re
turn
s
(5%)
0%
5%
10%
2016 2017 2018
William Blair
Callan NonUS AC Gr Eq
43North Dakota State Investment Board Legacy Fund
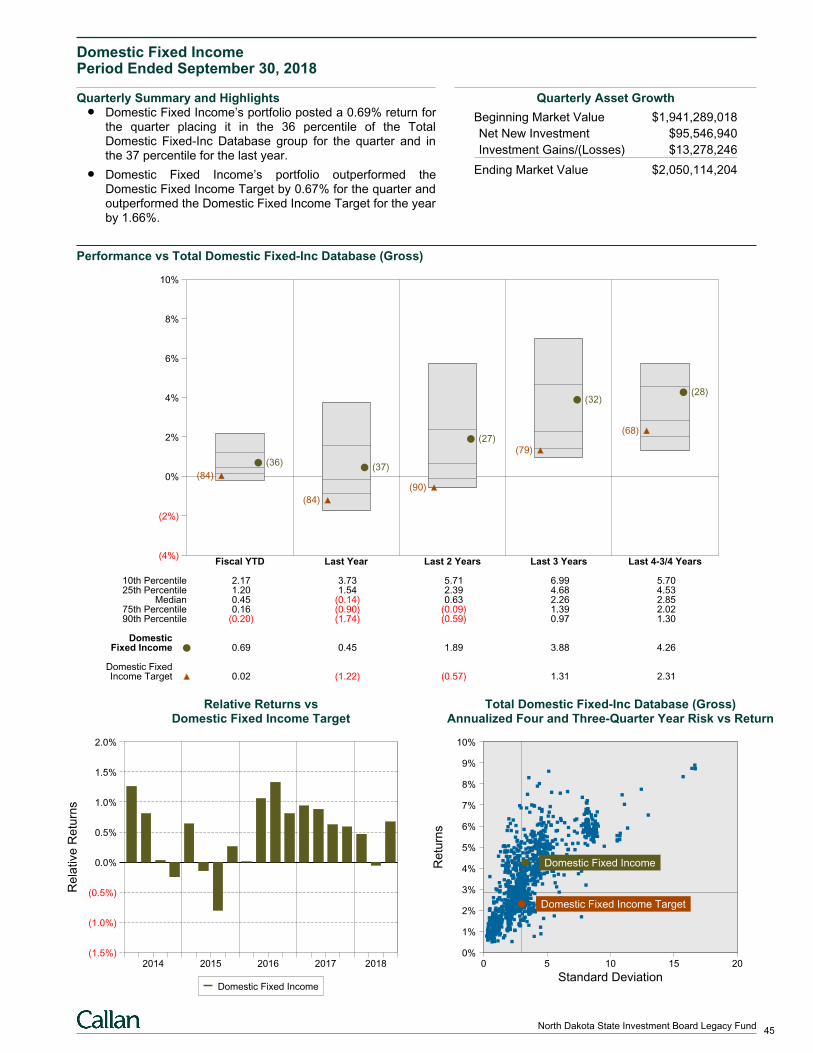
Domestic Fixed IncomePeriod Ended September 30, 2018
Quarterly Summary and HighlightsDomestic Fixed Income’s portfolio posted a 0.69% return forthe quarter placing it in the 36 percentile of the TotalDomestic Fixed-Inc Database group for the quarter and inthe 37 percentile for the last year.
Domestic Fixed Income’s portfolio outperformed theDomestic Fixed Income Target by 0.67% for the quarter andoutperformed the Domestic Fixed Income Target for the yearby 1.66%.
Quarterly Asset Growth
Beginning Market Value $1,941,289,018
Net New Investment $95,546,940
Investment Gains/(Losses) $13,278,246
Ending Market Value $2,050,114,204
Performance vs Total Domestic Fixed-Inc Database (Gross)
(4%)
(2%)
0%
2%
4%
6%
8%
10%
Fiscal YTD Last Year Last 2 Years Last 3 Years Last 4-3/4 Years
(36)
(84)(37)
(84)
(27)
(90)
(32)
(79)
(28)
(68)
10th Percentile 2.17 3.73 5.71 6.99 5.7025th Percentile 1.20 1.54 2.39 4.68 4.53
Median 0.45 (0.14) 0.63 2.26 2.8575th Percentile 0.16 (0.90) (0.09) 1.39 2.0290th Percentile (0.20) (1.74) (0.59) 0.97 1.30
DomesticFixed Income 0.69 0.45 1.89 3.88 4.26
Domestic FixedIncome Target 0.02 (1.22) (0.57) 1.31 2.31
Relative Returns vsDomestic Fixed Income Target
Rela
tive
Re
turn
s
(1.5%)
(1.0%)
(0.5%)
0.0%
0.5%
1.0%
1.5%
2.0%
2014 2015 2016 2017 2018
Domestic Fixed Income
Total Domestic Fixed-Inc Database (Gross)Annualized Four and Three-Quarter Year Risk vs Return
0 5 10 15 200%
1%
2%
3%
4%
5%
6%
7%
8%
9%
10%
Domestic Fixed Income
Domestic Fixed Income Target
Standard Deviation
Re
turn
s
45North Dakota State Investment Board Legacy Fund

Ares ND Credit Strategies FdPeriod Ended September 30, 2018
Quarterly Summary and HighlightsAres ND Credit Strategies Fd’s portfolio posted a 0.00%return for the quarter placing it in the 100 percentile of theCallan High Yield Mutual Funds group for the quarter and inthe 3 percentile for the last year.
Ares ND Credit Strategies Fd’s portfolio underperformed theS&P/LSTA Leveraged Loan B Index by 1.96% for thequarter and underperformed the S&P/LSTA Leveraged LoanB Index for the year by 0.40%.
Quarterly Asset Growth
Beginning Market Value $48,638,254
Net New Investment $2,400,000
Investment Gains/(Losses) $0
Ending Market Value $51,038,254
Performance vs Callan High Yield Mutual Funds (Net)
(1%)
0%
1%
2%
3%
4%
5%
6%
7%
Fiscal YTD Last Year
B(89)
A(100)
(78)
B(3)A(3)
(2)
10th Percentile 2.67 3.8025th Percentile 2.46 2.53
Median 2.18 2.0975th Percentile 1.97 1.5890th Percentile 1.78 0.73
Ares ND CreditStrategies Fd A 0.00 5.03
S&P/LSTALeveraged Loan B 1.84 5.19
S&P/LSTA LeveragedLoan B Index 1.96 5.43
Relative Returns vsS&P/LSTA Leveraged Loan B Index
Rela
tive
Re
turn
s
(3%)
(2%)
(1%)
0%
1%
2%
3%
4%
2017 2018
Ares ND Credit Strategies Fd
Cumulative Returns vsS&P/LSTA Leveraged Loan B Index
Cum
ula
tive
Re
lative
Re
turn
s
(4%)
(3%)
(2%)
(1%)
0%
1%
2%
3%
2017 2018
Ares ND Credit Strategies Fd
Callan High Yield MFs
46North Dakota State Investment Board Legacy Fund
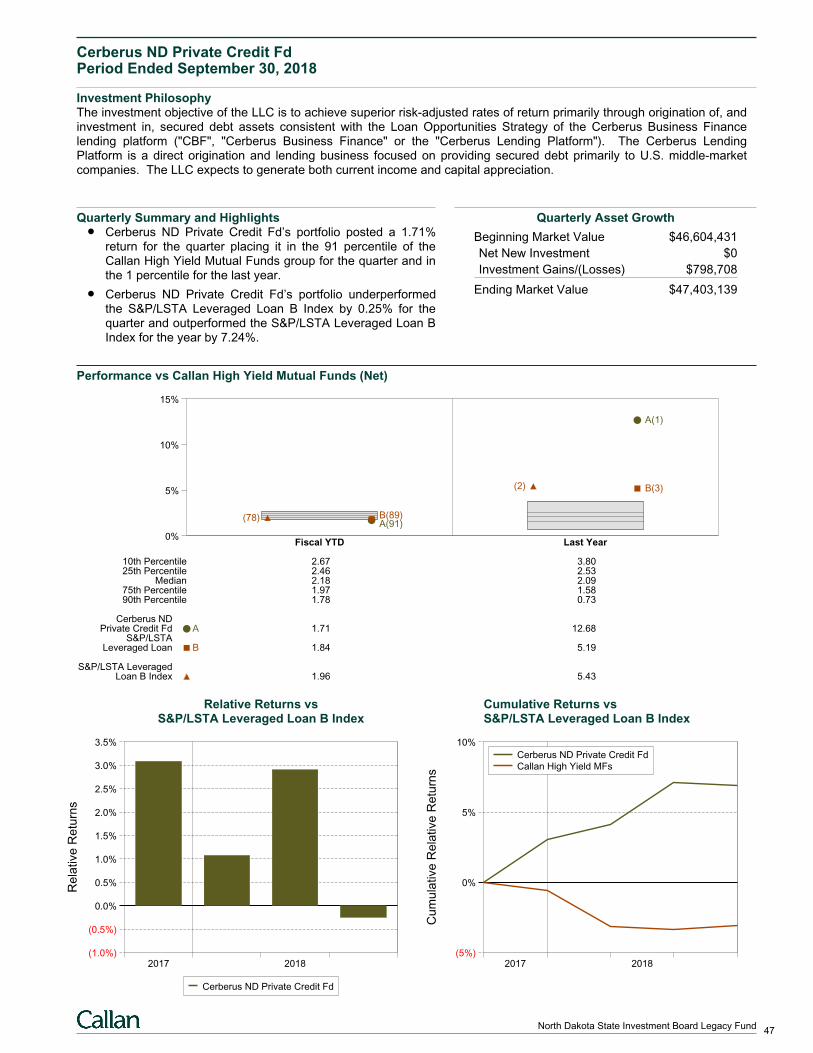
Cerberus ND Private Credit FdPeriod Ended September 30, 2018
Investment PhilosophyThe investment objective of the LLC is to achieve superior risk-adjusted rates of return primarily through origination of, andinvestment in, secured debt assets consistent with the Loan Opportunities Strategy of the Cerberus Business Financelending platform ("CBF", "Cerberus Business Finance" or the "Cerberus Lending Platform"). The Cerberus LendingPlatform is a direct origination and lending business focused on providing secured debt primarily to U.S. middle-marketcompanies. The LLC expects to generate both current income and capital appreciation.
Quarterly Summary and HighlightsCerberus ND Private Credit Fd’s portfolio posted a 1.71%return for the quarter placing it in the 91 percentile of theCallan High Yield Mutual Funds group for the quarter and inthe 1 percentile for the last year.
Cerberus ND Private Credit Fd’s portfolio underperformedthe S&P/LSTA Leveraged Loan B Index by 0.25% for thequarter and outperformed the S&P/LSTA Leveraged Loan BIndex for the year by 7.24%.
Quarterly Asset Growth
Beginning Market Value $46,604,431
Net New Investment $0
Investment Gains/(Losses) $798,708
Ending Market Value $47,403,139
Performance vs Callan High Yield Mutual Funds (Net)
0%
5%
10%
15%
Fiscal YTD Last Year
B(89)A(91)
(78)
A(1)
B(3)(2)
10th Percentile 2.67 3.8025th Percentile 2.46 2.53
Median 2.18 2.0975th Percentile 1.97 1.5890th Percentile 1.78 0.73
Cerberus NDPrivate Credit Fd A 1.71 12.68
S&P/LSTALeveraged Loan B 1.84 5.19
S&P/LSTA LeveragedLoan B Index 1.96 5.43
Relative Returns vsS&P/LSTA Leveraged Loan B Index
Rela
tive
Re
turn
s
(1.0%)
(0.5%)
0.0%
0.5%
1.0%
1.5%
2.0%
2.5%
3.0%
3.5%
2017 2018
Cerberus ND Private Credit Fd
Cumulative Returns vsS&P/LSTA Leveraged Loan B Index
Cum
ula
tive
Re
lative
Re
turn
s
(5%)
0%
5%
10%
2017 2018
Cerberus ND Private Credit Fd
Callan High Yield MFs
47North Dakota State Investment Board Legacy Fund
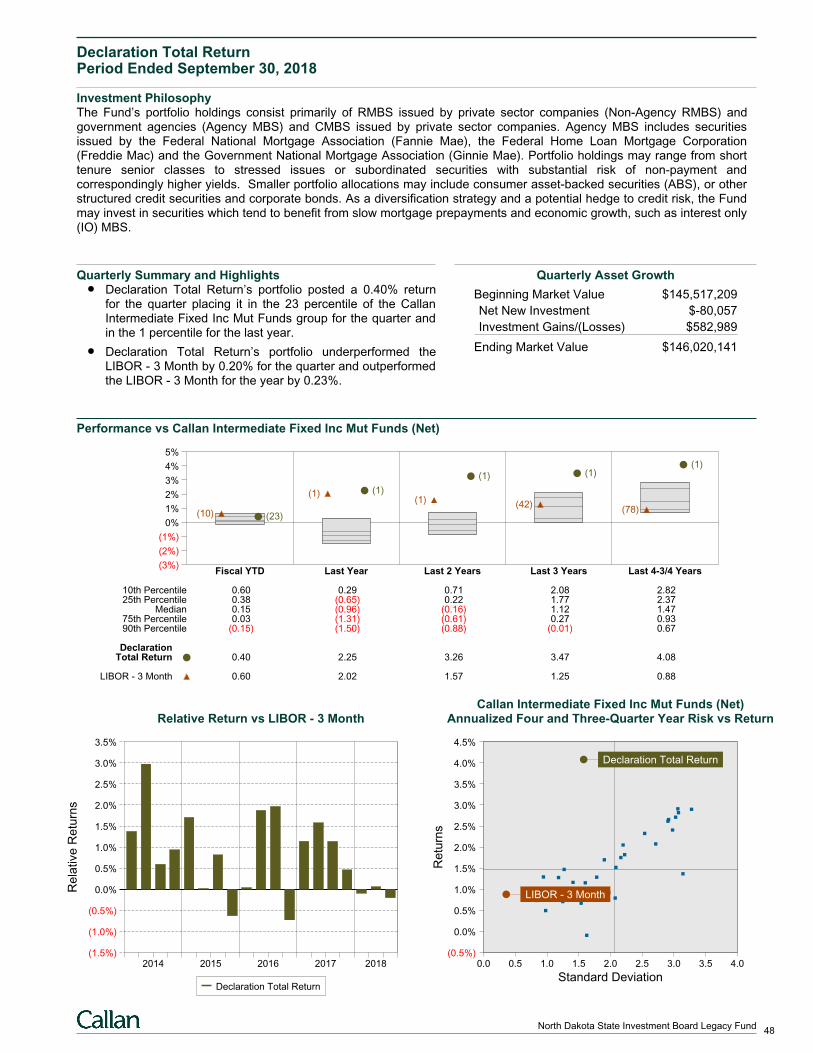
Declaration Total ReturnPeriod Ended September 30, 2018
Investment PhilosophyThe Fund’s portfolio holdings consist primarily of RMBS issued by private sector companies (Non-Agency RMBS) andgovernment agencies (Agency MBS) and CMBS issued by private sector companies. Agency MBS includes securitiesissued by the Federal National Mortgage Association (Fannie Mae), the Federal Home Loan Mortgage Corporation(Freddie Mac) and the Government National Mortgage Association (Ginnie Mae). Portfolio holdings may range from shorttenure senior classes to stressed issues or subordinated securities with substantial risk of non-payment andcorrespondingly higher yields. Smaller portfolio allocations may include consumer asset-backed securities (ABS), or otherstructured credit securities and corporate bonds. As a diversification strategy and a potential hedge to credit risk, the Fundmay invest in securities which tend to benefit from slow mortgage prepayments and economic growth, such as interest only(IO) MBS.
Quarterly Summary and HighlightsDeclaration Total Return’s portfolio posted a 0.40% returnfor the quarter placing it in the 23 percentile of the CallanIntermediate Fixed Inc Mut Funds group for the quarter andin the 1 percentile for the last year.
Declaration Total Return’s portfolio underperformed theLIBOR - 3 Month by 0.20% for the quarter and outperformedthe LIBOR - 3 Month for the year by 0.23%.
Quarterly Asset Growth
Beginning Market Value $145,517,209
Net New Investment $-80,057
Investment Gains/(Losses) $582,989
Ending Market Value $146,020,141
Performance vs Callan Intermediate Fixed Inc Mut Funds (Net)
(3%)
(2%)
(1%)
0%
1%
2%
3%
4%
5%
Fiscal YTD Last Year Last 2 Years Last 3 Years Last 4-3/4 Years
(23)(10)
(1)(1)
(1)
(1)
(1)
(42)
(1)
(78)
10th Percentile 0.60 0.29 0.71 2.08 2.8225th Percentile 0.38 (0.65) 0.22 1.77 2.37
Median 0.15 (0.96) (0.16) 1.12 1.4775th Percentile 0.03 (1.31) (0.61) 0.27 0.9390th Percentile (0.15) (1.50) (0.88) (0.01) 0.67
DeclarationTotal Return 0.40 2.25 3.26 3.47 4.08
LIBOR - 3 Month 0.60 2.02 1.57 1.25 0.88
Relative Return vs LIBOR - 3 Month
Rela
tive
Re
turn
s
(1.5%)
(1.0%)
(0.5%)
0.0%
0.5%
1.0%
1.5%
2.0%
2.5%
3.0%
3.5%
2014 2015 2016 2017 2018
Declaration Total Return
Callan Intermediate Fixed Inc Mut Funds (Net)Annualized Four and Three-Quarter Year Risk vs Return
0.0 0.5 1.0 1.5 2.0 2.5 3.0 3.5 4.0(0.5%)
0.0%
0.5%
1.0%
1.5%
2.0%
2.5%
3.0%
3.5%
4.0%
4.5%
Declaration Total Return
LIBOR - 3 Month
Standard Deviation
Re
turn
s
48North Dakota State Investment Board Legacy Fund
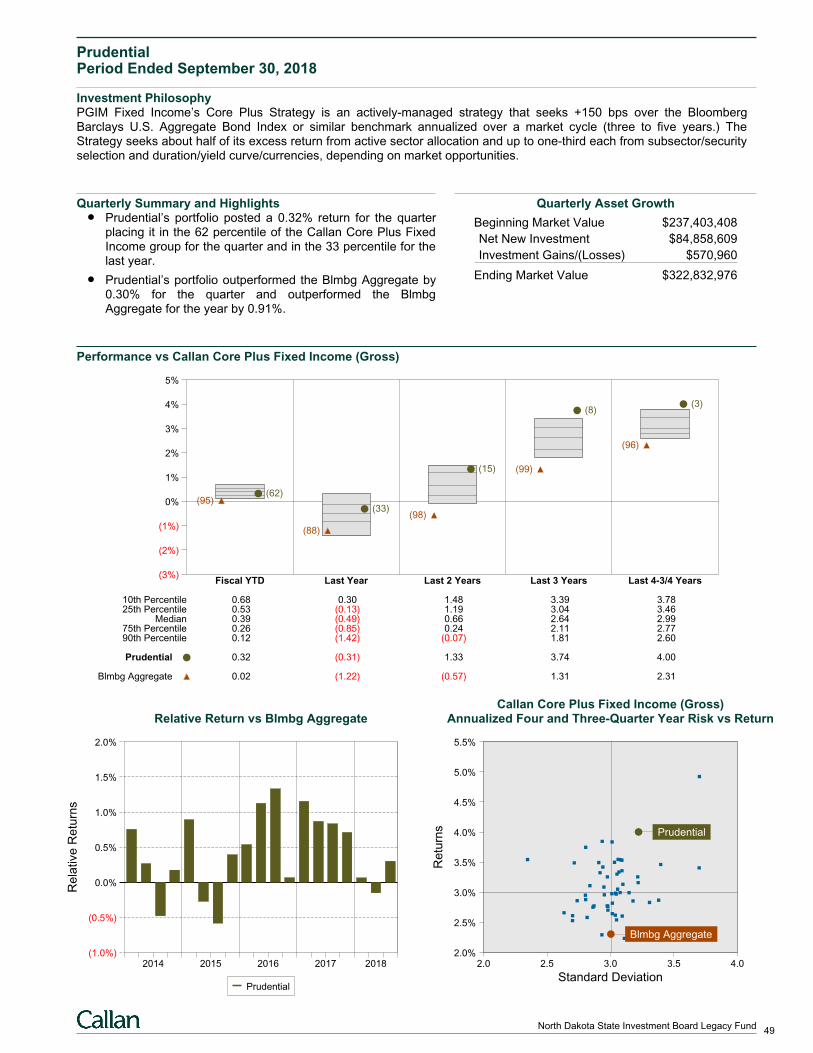
PrudentialPeriod Ended September 30, 2018
Investment PhilosophyPGIM Fixed Income’s Core Plus Strategy is an actively-managed strategy that seeks +150 bps over the BloombergBarclays U.S. Aggregate Bond Index or similar benchmark annualized over a market cycle (three to five years.) TheStrategy seeks about half of its excess return from active sector allocation and up to one-third each from subsector/securityselection and duration/yield curve/currencies, depending on market opportunities.
Quarterly Summary and HighlightsPrudential’s portfolio posted a 0.32% return for the quarterplacing it in the 62 percentile of the Callan Core Plus FixedIncome group for the quarter and in the 33 percentile for thelast year.
Prudential’s portfolio outperformed the Blmbg Aggregate by0.30% for the quarter and outperformed the BlmbgAggregate for the year by 0.91%.
Quarterly Asset Growth
Beginning Market Value $237,403,408
Net New Investment $84,858,609
Investment Gains/(Losses) $570,960
Ending Market Value $322,832,976
Performance vs Callan Core Plus Fixed Income (Gross)
(3%)
(2%)
(1%)
0%
1%
2%
3%
4%
5%
Fiscal YTD Last Year Last 2 Years Last 3 Years Last 4-3/4 Years
(62)(95)
(33)
(88)
(15)
(98)
(8)
(99)
(3)
(96)
10th Percentile 0.68 0.30 1.48 3.39 3.7825th Percentile 0.53 (0.13) 1.19 3.04 3.46
Median 0.39 (0.49) 0.66 2.64 2.9975th Percentile 0.26 (0.85) 0.24 2.11 2.7790th Percentile 0.12 (1.42) (0.07) 1.81 2.60
Prudential 0.32 (0.31) 1.33 3.74 4.00
Blmbg Aggregate 0.02 (1.22) (0.57) 1.31 2.31
Relative Return vs Blmbg Aggregate
Rela
tive
Re
turn
s
(1.0%)
(0.5%)
0.0%
0.5%
1.0%
1.5%
2.0%
2014 2015 2016 2017 2018
Prudential
Callan Core Plus Fixed Income (Gross)Annualized Four and Three-Quarter Year Risk vs Return
2.0 2.5 3.0 3.5 4.02.0%
2.5%
3.0%
3.5%
4.0%
4.5%
5.0%
5.5%
Prudential
Blmbg Aggregate
Standard Deviation
Re
turn
s
49North Dakota State Investment Board Legacy Fund
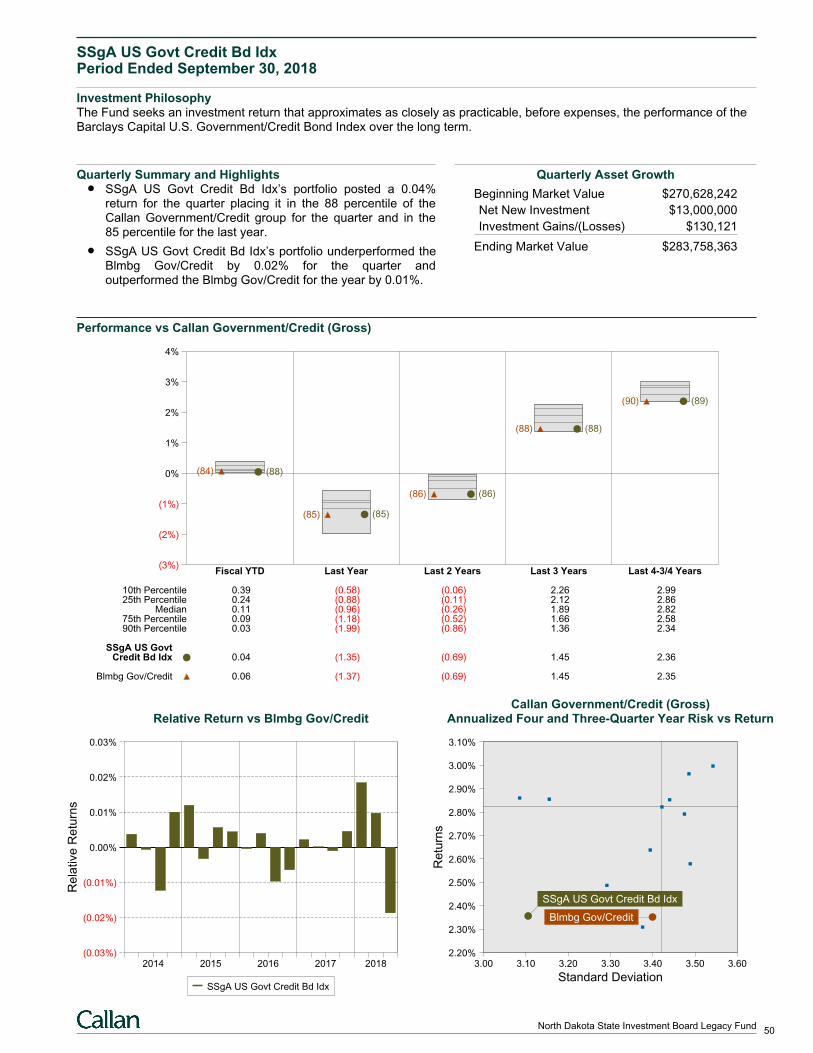
SSgA US Govt Credit Bd IdxPeriod Ended September 30, 2018
Investment PhilosophyThe Fund seeks an investment return that approximates as closely as practicable, before expenses, the performance of theBarclays Capital U.S. Government/Credit Bond Index over the long term.
Quarterly Summary and HighlightsSSgA US Govt Credit Bd Idx’s portfolio posted a 0.04%return for the quarter placing it in the 88 percentile of theCallan Government/Credit group for the quarter and in the85 percentile for the last year.
SSgA US Govt Credit Bd Idx’s portfolio underperformed theBlmbg Gov/Credit by 0.02% for the quarter andoutperformed the Blmbg Gov/Credit for the year by 0.01%.
Quarterly Asset Growth
Beginning Market Value $270,628,242
Net New Investment $13,000,000
Investment Gains/(Losses) $130,121
Ending Market Value $283,758,363
Performance vs Callan Government/Credit (Gross)
(3%)
(2%)
(1%)
0%
1%
2%
3%
4%
Fiscal YTD Last Year Last 2 Years Last 3 Years Last 4-3/4 Years
(88)(84)
(85)(85)
(86)(86)
(88)(88)
(89)(90)
10th Percentile 0.39 (0.58) (0.06) 2.26 2.9925th Percentile 0.24 (0.88) (0.11) 2.12 2.86
Median 0.11 (0.96) (0.26) 1.89 2.8275th Percentile 0.09 (1.18) (0.52) 1.66 2.5890th Percentile 0.03 (1.99) (0.86) 1.36 2.34
SSgA US GovtCredit Bd Idx 0.04 (1.35) (0.69) 1.45 2.36
Blmbg Gov/Credit 0.06 (1.37) (0.69) 1.45 2.35
Relative Return vs Blmbg Gov/Credit
Rela
tive
Re
turn
s
(0.03%)
(0.02%)
(0.01%)
0.00%
0.01%
0.02%
0.03%
2014 2015 2016 2017 2018
SSgA US Govt Credit Bd Idx
Callan Government/Credit (Gross)Annualized Four and Three-Quarter Year Risk vs Return
3.00 3.10 3.20 3.30 3.40 3.50 3.602.20%
2.30%
2.40%
2.50%
2.60%
2.70%
2.80%
2.90%
3.00%
3.10%
Blmbg Gov/Credit
SSgA US Govt Credit Bd Idx
Standard Deviation
Re
turn
s
50North Dakota State Investment Board Legacy Fund
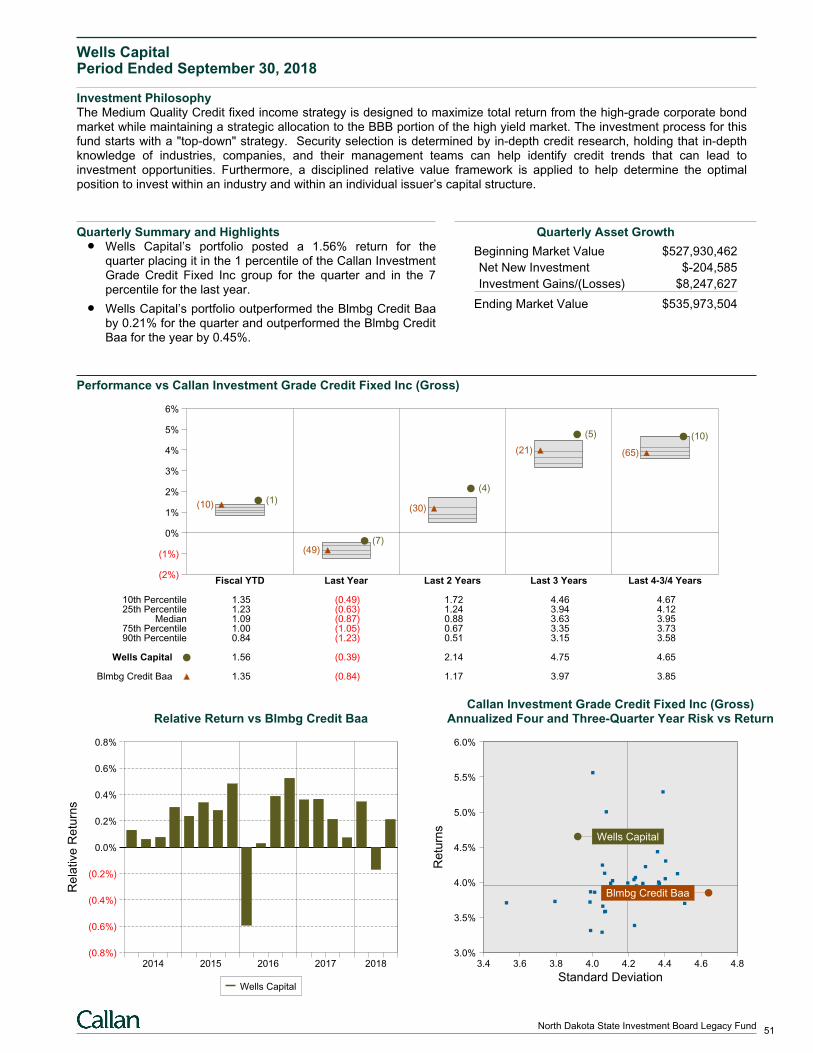
Wells CapitalPeriod Ended September 30, 2018
Investment PhilosophyThe Medium Quality Credit fixed income strategy is designed to maximize total return from the high-grade corporate bondmarket while maintaining a strategic allocation to the BBB portion of the high yield market. The investment process for thisfund starts with a "top-down" strategy. Security selection is determined by in-depth credit research, holding that in-depthknowledge of industries, companies, and their management teams can help identify credit trends that can lead toinvestment opportunities. Furthermore, a disciplined relative value framework is applied to help determine the optimalposition to invest within an industry and within an individual issuer’s capital structure.
Quarterly Summary and HighlightsWells Capital’s portfolio posted a 1.56% return for thequarter placing it in the 1 percentile of the Callan InvestmentGrade Credit Fixed Inc group for the quarter and in the 7percentile for the last year.
Wells Capital’s portfolio outperformed the Blmbg Credit Baaby 0.21% for the quarter and outperformed the Blmbg CreditBaa for the year by 0.45%.
Quarterly Asset Growth
Beginning Market Value $527,930,462
Net New Investment $-204,585
Investment Gains/(Losses) $8,247,627
Ending Market Value $535,973,504
Performance vs Callan Investment Grade Credit Fixed Inc (Gross)
(2%)
(1%)
0%
1%
2%
3%
4%
5%
6%
Fiscal YTD Last Year Last 2 Years Last 3 Years Last 4-3/4 Years
(1)(10)
(7)(49)
(4)
(30)
(5)
(21)
(10)
(65)
10th Percentile 1.35 (0.49) 1.72 4.46 4.6725th Percentile 1.23 (0.63) 1.24 3.94 4.12
Median 1.09 (0.87) 0.88 3.63 3.9575th Percentile 1.00 (1.05) 0.67 3.35 3.7390th Percentile 0.84 (1.23) 0.51 3.15 3.58
Wells Capital 1.56 (0.39) 2.14 4.75 4.65
Blmbg Credit Baa 1.35 (0.84) 1.17 3.97 3.85
Relative Return vs Blmbg Credit Baa
Rela
tive
Re
turn
s
(0.8%)
(0.6%)
(0.4%)
(0.2%)
0.0%
0.2%
0.4%
0.6%
0.8%
2014 2015 2016 2017 2018
Wells Capital
Callan Investment Grade Credit Fixed Inc (Gross)Annualized Four and Three-Quarter Year Risk vs Return
3.4 3.6 3.8 4.0 4.2 4.4 4.6 4.83.0%
3.5%
4.0%
4.5%
5.0%
5.5%
6.0%
Wells Capital
Blmbg Credit Baa
Standard Deviation
Re
turn
s
51North Dakota State Investment Board Legacy Fund
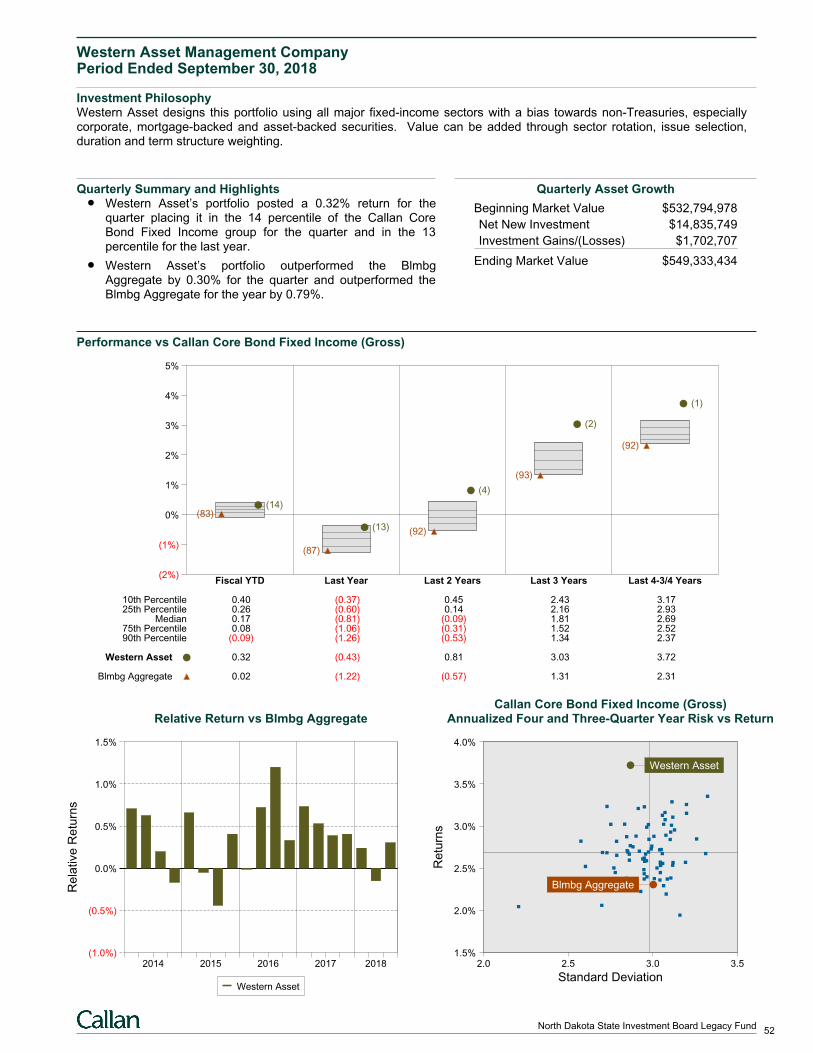
Western Asset Management CompanyPeriod Ended September 30, 2018
Investment PhilosophyWestern Asset designs this portfolio using all major fixed-income sectors with a bias towards non-Treasuries, especiallycorporate, mortgage-backed and asset-backed securities. Value can be added through sector rotation, issue selection,duration and term structure weighting.
Quarterly Summary and HighlightsWestern Asset’s portfolio posted a 0.32% return for thequarter placing it in the 14 percentile of the Callan CoreBond Fixed Income group for the quarter and in the 13percentile for the last year.
Western Asset’s portfolio outperformed the BlmbgAggregate by 0.30% for the quarter and outperformed theBlmbg Aggregate for the year by 0.79%.
Quarterly Asset Growth
Beginning Market Value $532,794,978
Net New Investment $14,835,749
Investment Gains/(Losses) $1,702,707
Ending Market Value $549,333,434
Performance vs Callan Core Bond Fixed Income (Gross)
(2%)
(1%)
0%
1%
2%
3%
4%
5%
Fiscal YTD Last Year Last 2 Years Last 3 Years Last 4-3/4 Years
(14)(83)
(13)
(87)
(4)
(92)
(2)
(93)
(1)
(92)
10th Percentile 0.40 (0.37) 0.45 2.43 3.1725th Percentile 0.26 (0.60) 0.14 2.16 2.93
Median 0.17 (0.81) (0.09) 1.81 2.6975th Percentile 0.08 (1.06) (0.31) 1.52 2.5290th Percentile (0.09) (1.26) (0.53) 1.34 2.37
Western Asset 0.32 (0.43) 0.81 3.03 3.72
Blmbg Aggregate 0.02 (1.22) (0.57) 1.31 2.31
Relative Return vs Blmbg Aggregate
Rela
tive
Re
turn
s
(1.0%)
(0.5%)
0.0%
0.5%
1.0%
1.5%
2014 2015 2016 2017 2018
Western Asset
Callan Core Bond Fixed Income (Gross)Annualized Four and Three-Quarter Year Risk vs Return
2.0 2.5 3.0 3.51.5%
2.0%
2.5%
3.0%
3.5%
4.0%
Western Asset
Blmbg Aggregate
Standard Deviation
Re
turn
s
52North Dakota State Investment Board Legacy Fund
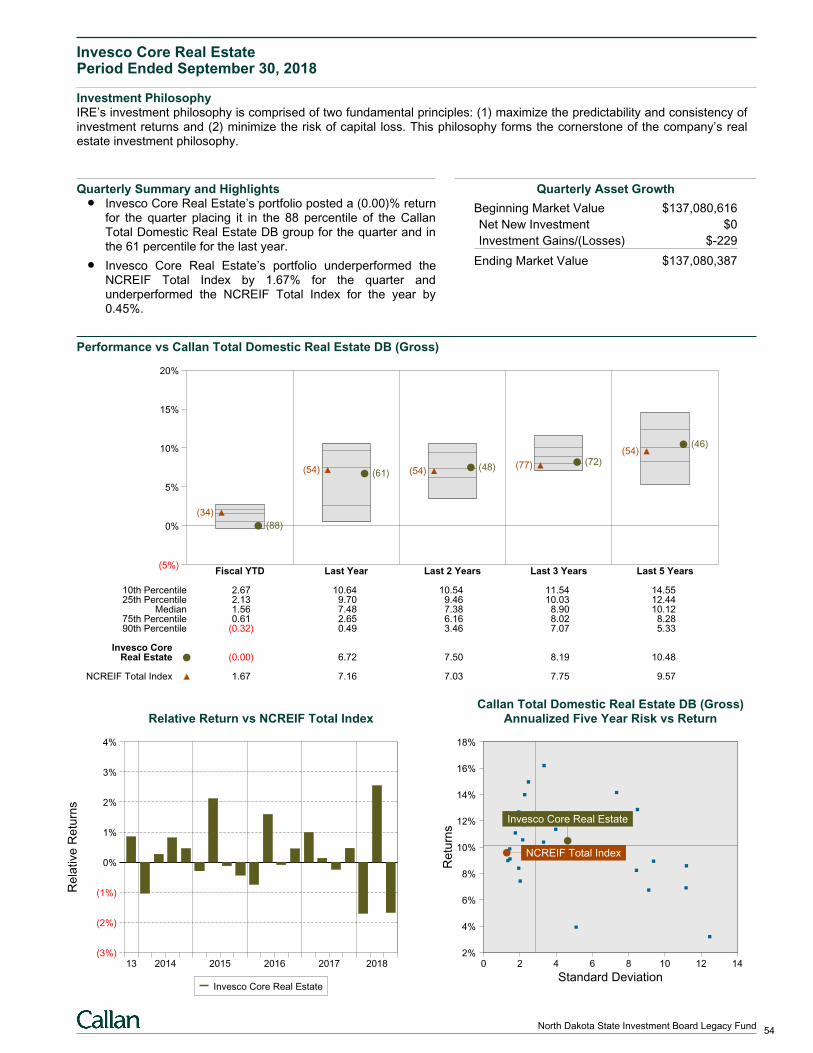
Invesco Core Real EstatePeriod Ended September 30, 2018
Investment PhilosophyIRE’s investment philosophy is comprised of two fundamental principles: (1) maximize the predictability and consistency ofinvestment returns and (2) minimize the risk of capital loss. This philosophy forms the cornerstone of the company’s realestate investment philosophy.
Quarterly Summary and HighlightsInvesco Core Real Estate’s portfolio posted a (0.00)% returnfor the quarter placing it in the 88 percentile of the CallanTotal Domestic Real Estate DB group for the quarter and inthe 61 percentile for the last year.
Invesco Core Real Estate’s portfolio underperformed theNCREIF Total Index by 1.67% for the quarter andunderperformed the NCREIF Total Index for the year by0.45%.
Quarterly Asset Growth
Beginning Market Value $137,080,616
Net New Investment $0
Investment Gains/(Losses) $-229
Ending Market Value $137,080,387
Performance vs Callan Total Domestic Real Estate DB (Gross)
(5%)
0%
5%
10%
15%
20%
Fiscal YTD Last Year Last 2 Years Last 3 Years Last 5 Years
(88)
(34)
(61)(54) (48)(54)(72)(77)
(46)(54)
10th Percentile 2.67 10.64 10.54 11.54 14.5525th Percentile 2.13 9.70 9.46 10.03 12.44
Median 1.56 7.48 7.38 8.90 10.1275th Percentile 0.61 2.65 6.16 8.02 8.2890th Percentile (0.32) 0.49 3.46 7.07 5.33
Invesco CoreReal Estate (0.00) 6.72 7.50 8.19 10.48
NCREIF Total Index 1.67 7.16 7.03 7.75 9.57
Relative Return vs NCREIF Total Index
Rela
tive
Re
turn
s
(3%)
(2%)
(1%)
0%
1%
2%
3%
4%
13 2014 2015 2016 2017 2018
Invesco Core Real Estate
Callan Total Domestic Real Estate DB (Gross)Annualized Five Year Risk vs Return
0 2 4 6 8 10 12 142%
4%
6%
8%
10%
12%
14%
16%
18%
Invesco Core Real Estate
NCREIF Total Index
Standard Deviation
Re
turn
s
54North Dakota State Investment Board Legacy Fund
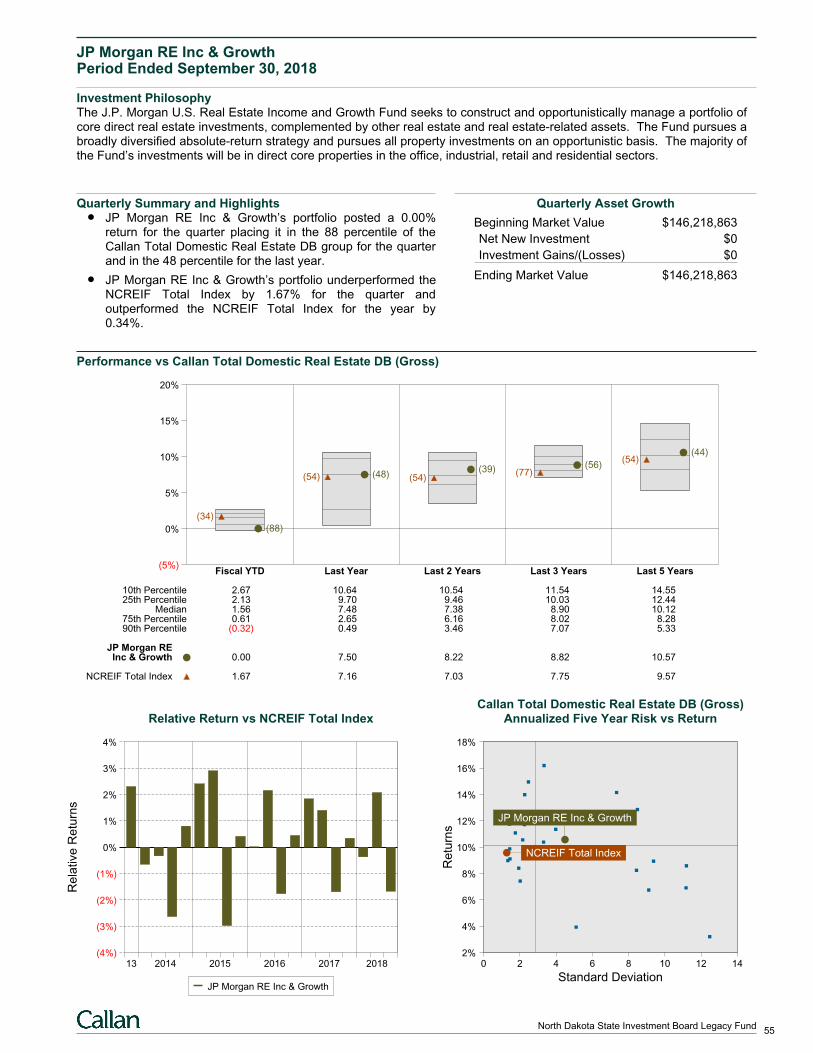
JP Morgan RE Inc & GrowthPeriod Ended September 30, 2018
Investment PhilosophyThe J.P. Morgan U.S. Real Estate Income and Growth Fund seeks to construct and opportunistically manage a portfolio ofcore direct real estate investments, complemented by other real estate and real estate-related assets. The Fund pursues abroadly diversified absolute-return strategy and pursues all property investments on an opportunistic basis. The majority ofthe Fund’s investments will be in direct core properties in the office, industrial, retail and residential sectors.
Quarterly Summary and HighlightsJP Morgan RE Inc & Growth’s portfolio posted a 0.00%return for the quarter placing it in the 88 percentile of theCallan Total Domestic Real Estate DB group for the quarterand in the 48 percentile for the last year.
JP Morgan RE Inc & Growth’s portfolio underperformed theNCREIF Total Index by 1.67% for the quarter andoutperformed the NCREIF Total Index for the year by0.34%.
Quarterly Asset Growth
Beginning Market Value $146,218,863
Net New Investment $0
Investment Gains/(Losses) $0
Ending Market Value $146,218,863
Performance vs Callan Total Domestic Real Estate DB (Gross)
(5%)
0%
5%
10%
15%
20%
Fiscal YTD Last Year Last 2 Years Last 3 Years Last 5 Years
(88)
(34)
(48)(54)(39)
(54)
(56)(77)
(44)(54)
10th Percentile 2.67 10.64 10.54 11.54 14.5525th Percentile 2.13 9.70 9.46 10.03 12.44
Median 1.56 7.48 7.38 8.90 10.1275th Percentile 0.61 2.65 6.16 8.02 8.2890th Percentile (0.32) 0.49 3.46 7.07 5.33
JP Morgan REInc & Growth 0.00 7.50 8.22 8.82 10.57
NCREIF Total Index 1.67 7.16 7.03 7.75 9.57
Relative Return vs NCREIF Total Index
Rela
tive
Re
turn
s
(4%)
(3%)
(2%)
(1%)
0%
1%
2%
3%
4%
13 2014 2015 2016 2017 2018
JP Morgan RE Inc & Growth
Callan Total Domestic Real Estate DB (Gross)Annualized Five Year Risk vs Return
0 2 4 6 8 10 12 142%
4%
6%
8%
10%
12%
14%
16%
18%
JP Morgan RE Inc & Growth
NCREIF Total Index
Standard Deviation
Re
turn
s
55North Dakota State Investment Board Legacy Fund
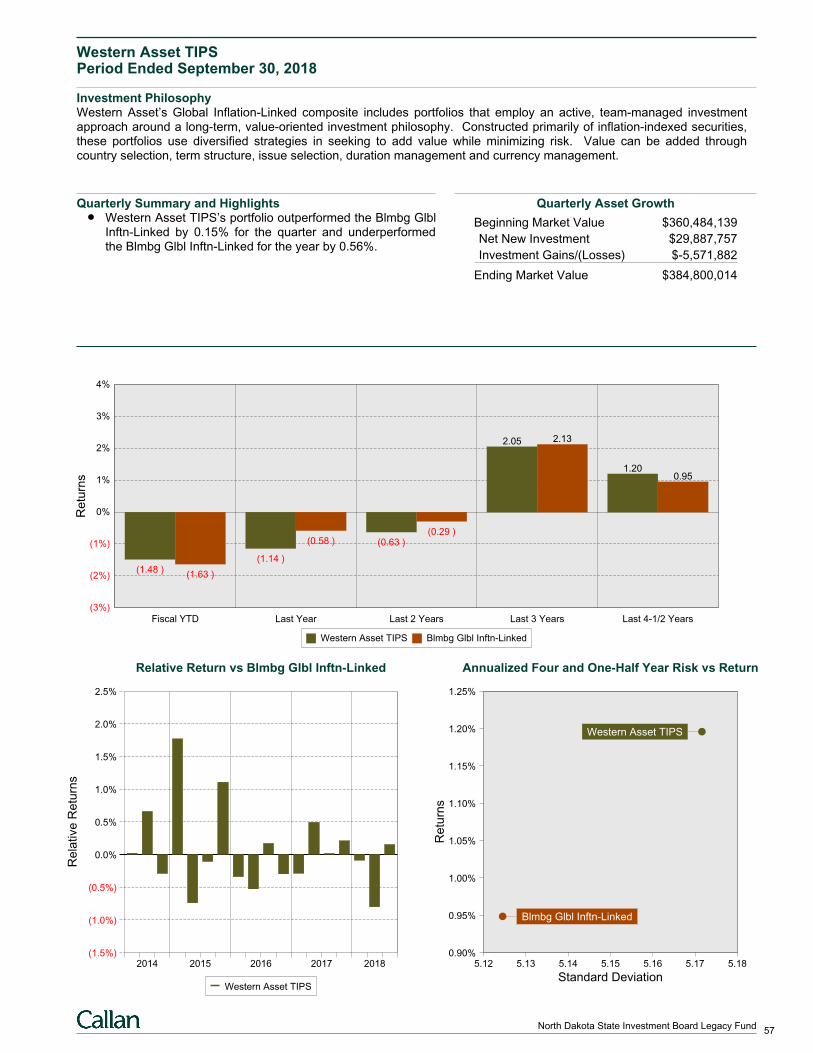
Western Asset TIPSPeriod Ended September 30, 2018
Investment PhilosophyWestern Asset’s Global Inflation-Linked composite includes portfolios that employ an active, team-managed investmentapproach around a long-term, value-oriented investment philosophy. Constructed primarily of inflation-indexed securities,these portfolios use diversified strategies in seeking to add value while minimizing risk. Value can be added throughcountry selection, term structure, issue selection, duration management and currency management.
Quarterly Summary and HighlightsWestern Asset TIPS’s portfolio outperformed the Blmbg GlblInftn-Linked by 0.15% for the quarter and underperformedthe Blmbg Glbl Inftn-Linked for the year by 0.56%.
Quarterly Asset Growth
Beginning Market Value $360,484,139
Net New Investment $29,887,757
Investment Gains/(Losses) $-5,571,882
Ending Market Value $384,800,014
(3%)
(2%)
(1%)
0%
1%
2%
3%
4%
Fiscal YTD
(1.48 )(1.63 )
Last Year
(1.14 )
(0.58 )
Last 2 Years
(0.63 )(0.29 )
Last 3 Years
2.05 2.13
Last 4-1/2 Years
1.200.95
Re
turn
s
Western Asset TIPS Blmbg Glbl Inftn-Linked
Relative Return vs Blmbg Glbl Inftn-Linked
Re
lative
Re
turn
s
(1.5%)
(1.0%)
(0.5%)
0.0%
0.5%
1.0%
1.5%
2.0%
2.5%
2014 2015 2016 2017 2018
Western Asset TIPS
Annualized Four and One-Half Year Risk vs Return
5.12 5.13 5.14 5.15 5.16 5.17 5.180.90%
0.95%
1.00%
1.05%
1.10%
1.15%
1.20%
1.25%
Western Asset TIPS
Blmbg Glbl Inftn-Linked
Standard Deviation
Re
turn
s
57North Dakota State Investment Board Legacy Fund
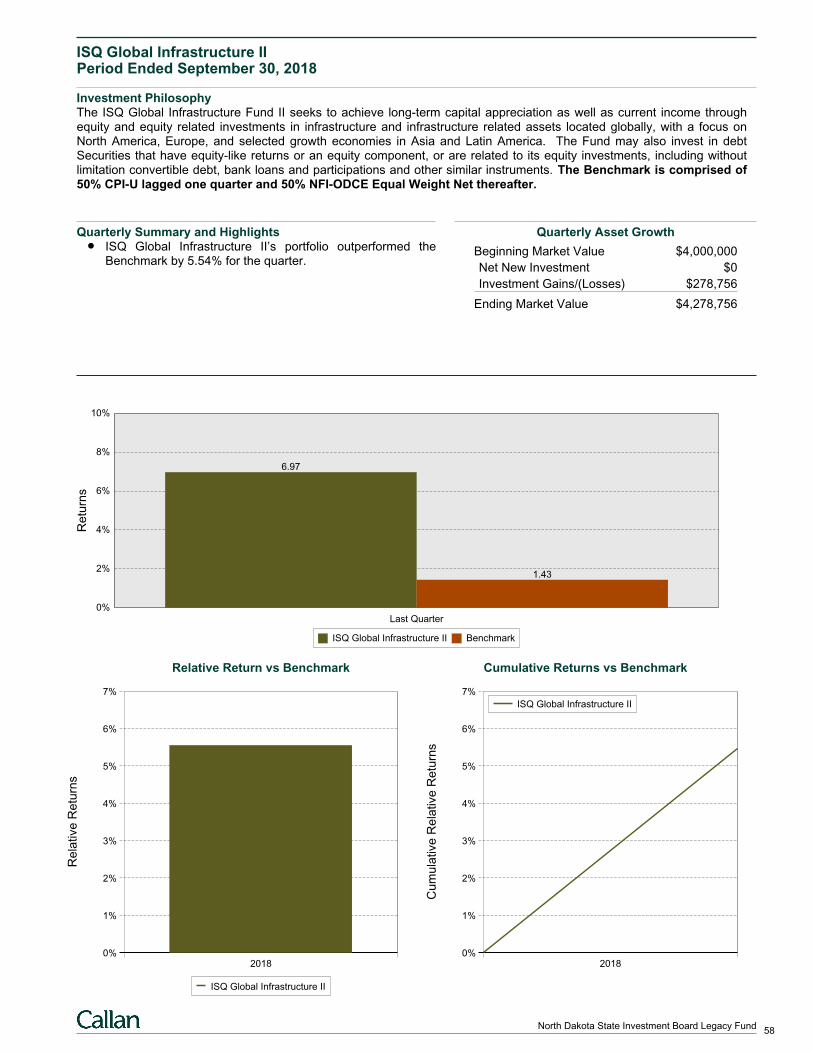
ISQ Global Infrastructure IIPeriod Ended September 30, 2018
Investment PhilosophyThe ISQ Global Infrastructure Fund II seeks to achieve long-term capital appreciation as well as current income throughequity and equity related investments in infrastructure and infrastructure related assets located globally, with a focus onNorth America, Europe, and selected growth economies in Asia and Latin America. The Fund may also invest in debtSecurities that have equity-like returns or an equity component, or are related to its equity investments, including withoutlimitation convertible debt, bank loans and participations and other similar instruments. The Benchmark is comprised of50% CPI-U lagged one quarter and 50% NFI-ODCE Equal Weight Net thereafter.
Quarterly Summary and HighlightsISQ Global Infrastructure II’s portfolio outperformed theBenchmark by 5.54% for the quarter.
Quarterly Asset Growth
Beginning Market Value $4,000,000
Net New Investment $0
Investment Gains/(Losses) $278,756
Ending Market Value $4,278,756
0%
2%
4%
6%
8%
10%
Last Quarter
6.97
1.43
Re
turn
s
ISQ Global Infrastructure II Benchmark
Relative Return vs Benchmark
Re
lative
Re
turn
s
0%
1%
2%
3%
4%
5%
6%
7%
2018
ISQ Global Infrastructure II
Cumulative Returns vs Benchmark
Cum
ula
tive
Re
lative
Re
turn
s
0%
1%
2%
3%
4%
5%
6%
7%
2018
ISQ Global Infrastructure II
58North Dakota State Investment Board Legacy Fund
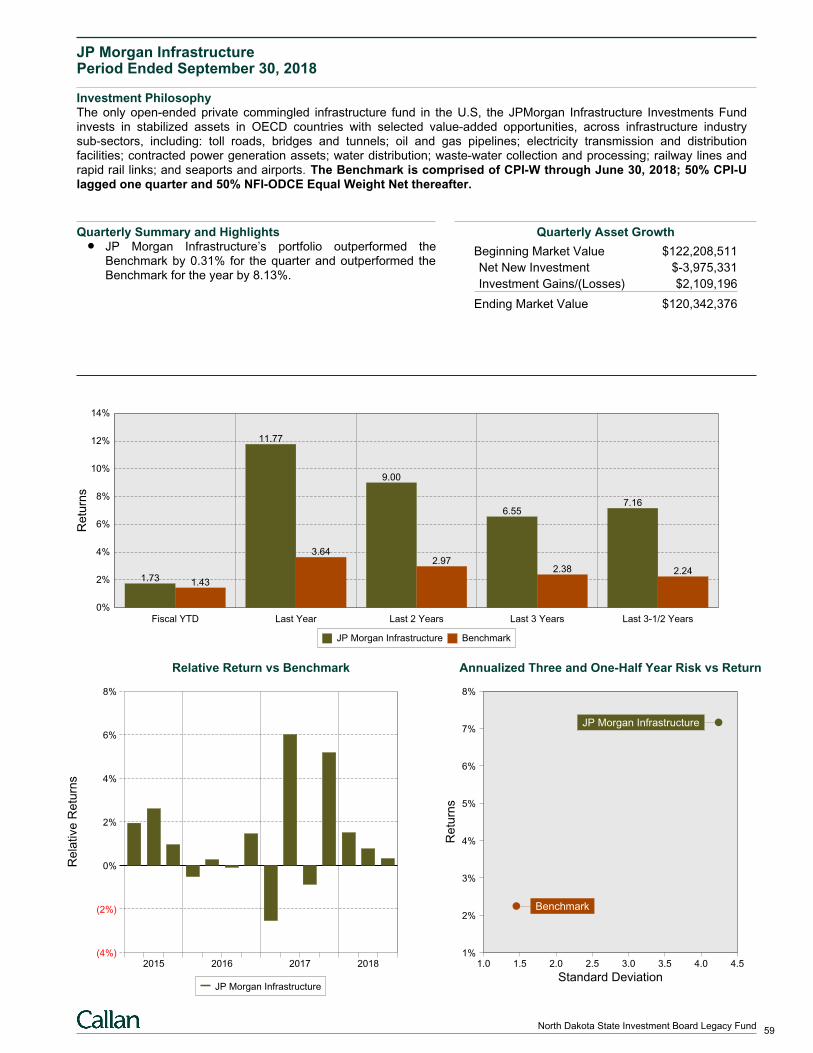
JP Morgan InfrastructurePeriod Ended September 30, 2018
Investment PhilosophyThe only open-ended private commingled infrastructure fund in the U.S, the JPMorgan Infrastructure Investments Fundinvests in stabilized assets in OECD countries with selected value-added opportunities, across infrastructure industrysub-sectors, including: toll roads, bridges and tunnels; oil and gas pipelines; electricity transmission and distributionfacilities; contracted power generation assets; water distribution; waste-water collection and processing; railway lines andrapid rail links; and seaports and airports. The Benchmark is comprised of CPI-W through June 30, 2018; 50% CPI-Ulagged one quarter and 50% NFI-ODCE Equal Weight Net thereafter.
Quarterly Summary and HighlightsJP Morgan Infrastructure’s portfolio outperformed theBenchmark by 0.31% for the quarter and outperformed theBenchmark for the year by 8.13%.
Quarterly Asset Growth
Beginning Market Value $122,208,511
Net New Investment $-3,975,331
Investment Gains/(Losses) $2,109,196
Ending Market Value $120,342,376
0%
2%
4%
6%
8%
10%
12%
14%
Fiscal YTD
1.73 1.43
Last Year
11.77
3.64
Last 2 Years
9.00
2.97
Last 3 Years
6.55
2.38
Last 3-1/2 Years
7.16
2.24
Re
turn
s
JP Morgan Infrastructure Benchmark
Relative Return vs Benchmark
Re
lative
Re
turn
s
(4%)
(2%)
0%
2%
4%
6%
8%
2015 2016 2017 2018
JP Morgan Infrastructure
Annualized Three and One-Half Year Risk vs Return
1.0 1.5 2.0 2.5 3.0 3.5 4.0 4.51%
2%
3%
4%
5%
6%
7%
8%
JP Morgan Infrastructure
Benchmark
Standard Deviation
Re
turn
s
59North Dakota State Investment Board Legacy Fund

Grosvenor Cust. InfrastructurePeriod Ended September 30, 2018
Investment PhilosophyThe Customized Infrastructure Strategies LP is a commingled fund focused on providing a comprehensive, diversifiedsolution for investors looking to access the infrastructure asset class. The Fund seeks to generate stable, long-term yieldand attractive risk-adjusted returns by investing in a diversified portfolio of primary core and core plus infrastructure funds(30%), co-investments (40%) and opportunistic secondary fund purchases (30%). The Benchmark is comprised ofCPI-W through June 30, 2018; 50% CPI-U lagged one quarter and 50% NFI-ODCE Equal Weight Net thereafter.
Quarterly Summary and HighlightsGrosvenor Cust. Infrastructure’s portfolio underperformedthe Benchmark by 1.43% for the quarter and outperformedthe Benchmark for the year by 4.61%.
Quarterly Asset Growth
Beginning Market Value $39,866,601
Net New Investment $0
Investment Gains/(Losses) $0
Ending Market Value $39,866,601
0%
2%
4%
6%
8%
10%
Fiscal YTD
1.43
Last Year
8.25
3.64
Last 2 Years
6.08
2.97
Last 3 Years
6.83
2.38
Last 3-1/2 Years
2.07 2.24
Re
turn
s
Grosvenor Cust. Infrastructure Benchmark
Relative Return vs Benchmark
Re
lative
Re
turn
s
(15%)
(10%)
(5%)
0%
5%
10%
15%
20%
2015 2016 2017 2018
Grosvenor Cust. Infrastructure
Annualized Three and One-Half Year Risk vs Return
0 2 4 6 8 10 122.06%
2.08%
2.10%
2.12%
2.14%
2.16%
2.18%
2.20%
2.22%
2.24%
2.26%
Benchmark
Grosvenor Cust. Infrastructure
Standard Deviation
Re
turn
s
60North Dakota State Investment Board Legacy Fund

Research and Educational Programs
The Callan Institute provides research to update clients on the latest industry trends and carefully structured educational programs
to enhance the knowledge of industry professionals. Visit www.callan.com/library to see all of our publications, and www.callan.com/blog
to view our blog “Perspectives.” For more information contact Corry Walsh at 312.346.3536 / [email protected].
New Research from Callan’s Experts
An Investor Framework for Addressing
Climate Change | Callan’s Anna West lays
out the top issues for investors about this
issue. We also identify solutions and areas
of progress for those seeking to address
climate-related risks as well as beneit from emerging opportunities.
Promoting Gender Diversity in the Investment Industry | Callan
Executive Chairman Ron Peyton offers his observations on what
has worked for gender inclusion at the irm over the last 45 years and what we have learned in the hope that it will inform others on
how to progress toward equality in senior roles industry-wide.
Helping DC Plan Participants in the
“Distribution” Phase | Callan’s Tom Shingler
and James Veneruso discuss our research on the
“distribution phase” of deined contribution plans, when participants are drawing down assets, and
the issues that plan sponsors should address.
Picking Through the Alpha Graveyard: Correcting for
Survivorship Bias in Investment Product Universes | In this
paper from the Journal of Investment Management, Callan’s Greg
Allen, Ivan Cliff, and Wally Meerschaert propose a technique to cor-
rect for survivorship bias in investment product universes. It uses
all available data for survivors and non-survivors, corrects for bias
across the full distribution (from 1st to 99th percentile), and can be
applied to other return-based statistics such as the Sharpe ratio.
Infrastructure: No Longer a Niche Option | Callan’s Jan Mende
discusses investing in infrastructure. Institutional investors are in-
creasing allocations, managers are creating more investment op-
tions, and benchmarks are being reined.
The Shape of Risk: Making Cents of the Irrational With Options
| In the third quarter’s Hedge Fund Monitor, Jim McKee discusses
the use of options as insurance for institutional portfolios.
2018 ESG Survey | Callan’s sixth annual survey on the status of
environmental, social, and governance (ESG) investing in the U.S.
institutional investment market reveals more than 40% of investors
are incorporating ESG factors into investment decisions.
Your Plan Will Face a Cyberattack; Here’s How to Prepare | The
third quarter’s edition of the DC Observer is designed to assist plan
sponsors with formulating and executing their cybersecurity strat-
egy to protect their information and their assets.
Quarterly Periodicals
Private Equity Trends | This newsletter offers the latest data on
private equity fundraising, buyouts, venture capital, and returns.
Market Pulse Flipbook | A quarterly market reference guide cover-
ing investment and fund sponsor trends in the U.S. economy, U.S.
and non-U.S. equities and ixed income, alternatives, and deined contribution.
Capital Market Review | This quarterly publication provides analy-
sis and a broad overview of the economy and public and private
market activity across a wide range of asset classes.
Real Estate Indicators: Too Hot to Touch or Cool Enough
to Handle? | Callan’s Real Assets Consulting group identi-
ies seven indicators—based on spreads in real estate and ixed income markets—that, combined with an understanding of prevail-ing market dynamics, have helped signal when the institutional real
estate market is overheated or cooled.
Education
3rd Quarter 2018
at Oxford University. In the context
8
These 17 goals were set in 2015 and target broad intergovernmental agree
ment around social and economic issues. Several of the 17 directly relate to
climate change; others indirectly touch on it. While the SDGs speciically relate
help to achieve the 17 goals. Likewise, index providers and asset managers are
investor market, as some expect more carbon pricing to occur in the next decade and want to avoid own
Research
August 2018
DC Plans Have Helped Participants Save. Now They Need to Help Them Spend.New Focus on the ‘Distribution Phase’
K E Y E L E M E N T S
Sponsorsaredevotingmoreattentiontothe“distributionphase”ofdeinedcontribution (DC) plans; that is, the period in which participants are drawing
down assets.
One key issue: whether to retain retiree assets in the plan. Sponsors should
address that question, and if the answer is yes, they need to make sure the
plan’s design and the recordkeeper’s capabilities support this choice.
The investing industry is also responding to the growing interest in the dis-
tribution phase with new retirement income products, but they can be quite
complex. Plan sponsors should evaluate the breadth of choices they wish to
offer retirees, as well as the level of fees and complexity.
Once operational considerations have been addressed, plans must focus
on the fund lineup and the overall communication efforts, which differ from
those needed for the “accumulation phase” when participants are building up
their wealth for retirement.
Knowledge. Experience. Integrity.
“Callan believes that plan sponsors should document their
philosophy on whether they wish to retain the assets of retired
and terminated participants. The issue of asset retention will
become increasingly important as demographics shift.”
James Veneruso and Tom Shingler
Fund Sponsor Consulting Group
INSTITUTE
INSTITUTE

Events
Miss out on a Callan conference or workshop? Event summa-
ries and speakers’ presentations are available on our website:
www.callan.com/library/
Callan’s 2019 National Conference will be held January 28-30,
2019. Mark your calendars for this upcoming event! And please
visit the Events page on our website (www.callan.com/events/) for
additional information as it becomes available.
For more information about events, please contact Barb
Gerraty: 415.274.3093 / [email protected]
The Center for Investment Training Educational Sessions
The Center for Investment Training, better known as the “Callan
College,” provides a foundation of knowledge for industry profes-
sionals who are involved in the investment decision-making pro-
cess. It was founded in 1994 to provide clients and non-clients alike
with basic- to intermediate-level instruction. Our next sessions are:
Introduction to Investments
San Francisco, April 16-17, 2019
San Francisco, July 16-17, 2019
Chicago, October 22-23, 2019
This program familiarizes fund sponsor trustees, staff, and asset
management advisers with basic investment theory, terminology,
and practices. It lasts one-and-a-half days and is designed for in-
dividuals who have less than two years of experience with asset-
management oversight and/or support responsibilities. Tuition for
the Introductory “Callan College” session is $2,350 per person.
Tuition includes instruction, all materials, breakfast and lunch on
each day, and dinner on the irst evening with the instructors.
Customized Sessions
The “Callan College” is equipped to customize a curriculum to
meet the training and educational needs of a speciic organization. These tailored sessions range from basic to advanced and can
take place anywhere—even at your ofice.
Learn more at www.callan.com/events/callan-college-intro or
contact Kathleen Cunnie: 415.274.3029 / [email protected]
Unique pieces of research the
Institute generates each year50+
Total attendees of the “Callan
College” since 19943,700 Year the Callan Institute
was founded1980
Attendees (on average) of the
Institute’s annual National Conference525
Education: By the Numbers
@CallanLLC Callan
“Research is the foundation of all we do at Callan, and sharing our
best thinking with the investment community is our way of helping
to foster dialog to raise the bar across the industry.”
Greg Allen, Chief Executive Oficer and Chief Research Oficer
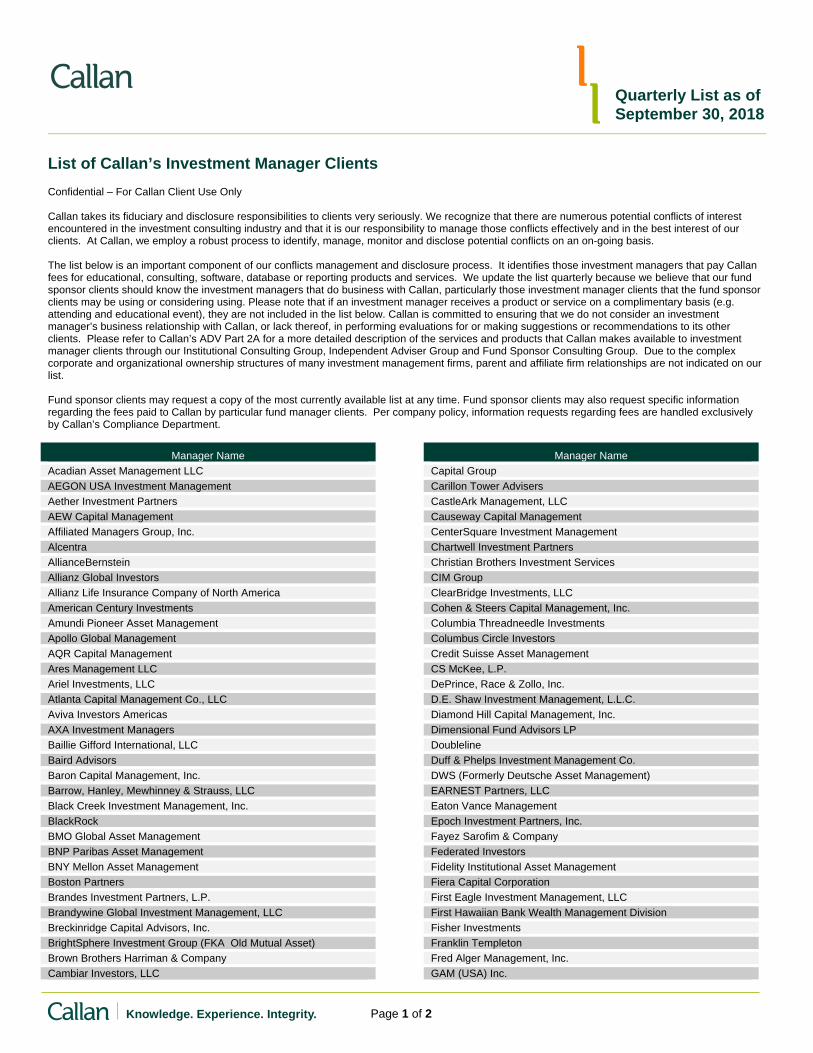
List of Callan’s Investment Manager Clients
Confidential – For Callan Client Use Only Callan takes its fiduciary and disclosure responsibilities to clients very seriously. We recognize that there are numerous potential conflicts of interest encountered in the investment consulting industry and that it is our responsibility to manage those conflicts effectively and in the best interest of our clients. At Callan, we employ a robust process to identify, manage, monitor and disclose potential conflicts on an on-going basis. The list below is an important component of our conflicts management and disclosure process. It identifies those investment managers that pay Callan fees for educational, consulting, software, database or reporting products and services. We update the list quarterly because we believe that our fund sponsor clients should know the investment managers that do business with Callan, particularly those investment manager clients that the fund sponsor clients may be using or considering using. Please note that if an investment manager receives a product or service on a complimentary basis (e.g. attending and educational event), they are not included in the list below. Callan is committed to ensuring that we do not consider an investment manager’s business relationship with Callan, or lack thereof, in performing evaluations for or making suggestions or recommendations to its other clients. Please refer to Callan’s ADV Part 2A for a more detailed description of the services and products that Callan makes available to investment manager clients through our Institutional Consulting Group, Independent Adviser Group and Fund Sponsor Consulting Group. Due to the complex corporate and organizational ownership structures of many investment management firms, parent and affiliate firm relationships are not indicated on our list. Fund sponsor clients may request a copy of the most currently available list at any time. Fund sponsor clients may also request specific information regarding the fees paid to Callan by particular fund manager clients. Per company policy, information requests regarding fees are handled exclusively by Callan’s Compliance Department.
Quarterly List as of September 30, 2018
Knowledge. Experience. Integrity. Page 1 of 2
Manager Name Acadian Asset Management LLC AEGON USA Investment Management Aether Investment Partners AEW Capital Management Affiliated Managers Group, Inc. Alcentra AllianceBernstein Allianz Global Investors Allianz Life Insurance Company of North America American Century Investments Amundi Pioneer Asset Management Apollo Global Management AQR Capital Management Ares Management LLC Ariel Investments, LLC Atlanta Capital Management Co., LLC Aviva Investors Americas AXA Investment Managers Baillie Gifford International, LLC Baird Advisors Baron Capital Management, Inc. Barrow, Hanley, Mewhinney & Strauss, LLC Black Creek Investment Management, Inc. BlackRock BMO Global Asset Management BNP Paribas Asset Management BNY Mellon Asset Management Boston Partners Brandes Investment Partners, L.P. Brandywine Global Investment Management, LLC Breckinridge Capital Advisors, Inc. BrightSphere Investment Group (FKA Old Mutual Asset) Brown Brothers Harriman & Company Cambiar Investors, LLC
Manager Name Capital Group Carillon Tower Advisers CastleArk Management, LLC Causeway Capital Management CenterSquare Investment Management Chartwell Investment Partners Christian Brothers Investment Services CIM Group ClearBridge Investments, LLC Cohen & Steers Capital Management, Inc. Columbia Threadneedle Investments Columbus Circle Investors Credit Suisse Asset Management CS McKee, L.P. DePrince, Race & Zollo, Inc. D.E. Shaw Investment Management, L.L.C. Diamond Hill Capital Management, Inc. Dimensional Fund Advisors LP Doubleline Duff & Phelps Investment Management Co. DWS (Formerly Deutsche Asset Management) EARNEST Partners, LLC Eaton Vance Management Epoch Investment Partners, Inc. Fayez Sarofim & Company Federated Investors Fidelity Institutional Asset Management Fiera Capital Corporation First Eagle Investment Management, LLC First Hawaiian Bank Wealth Management Division Fisher Investments Franklin Templeton Fred Alger Management, Inc. GAM (USA) Inc.

Knowledge. Experience. Integrity. September 30, 2018 Page 2 of 2
Manager Name Gerding Edlen GlobeFlex Capital, L.P. GMO LLC Goldman Sachs Asset Management Green Square Capital LLC Greenwich Investment Management, Inc. Guggenheim Investments GW&K Investment Management Harbor Capital Group Trust Harding Loevner L.P. Hartford Funds Hartford Investment Management Co. Heitman LLC Hotchkis & Wiley Capital Management, LLC HSBC Global Asset Management Income Research + Management, Inc. Insight Investment Management Limited Intech Investment Management, LLC Invesco Investec Asset Management Ivy Investments J.P. Morgan Janus Jennison Associates LLC Jensen Investment Management Jobs Peak Advisors KeyCorp Lazard Asset Management Legal & General Investment Management America Lincoln National Corporation LMCG Investments, LLC Longview Partners Loomis, Sayles & Company, L.P. Lord Abbett & Company Los Angeles Capital Management LSV Asset Management MacKay Shields LLC Macquarie Investment Management (MIM) Manulife Asset Management McKinley Capital Management, LLC MFS Investment Management MidFirst Bank Mondrian Investment Partners Limited Montag & Caldwell, LLC Morgan Stanley Investment Management Mountain Lake Investment Management LLC MUFG Union Bank, N.A. Natixis Investment Managers Neuberger Berman Newton Investment Management Nikko Asset Management Co., Ltd. Northern Trust Asset Management Nuveen Investments, Inc. OFI Global Asset Management O’Shaughnessy Asset Management, LLC P/E Investments
Manager Name Pacific Investment Management Company Pathway Capital Management Peregrine Capital Management, Inc. Perkins Investment Management PGIM PGIM Fixed Income PineBridge Investments Pictet Asset Management Ltd.
PNC Capital Advisors, LLC
Principal Global Investors Private Advisors, LLC Putnam Investments, LLC QMA RBC Global Asset Management Reaves Asset Management Regions Financial Corporation Riverbridge Partners LLC Robeco Institutional Asset Management, US Inc. Rockefeller & Co., Inc. Rothschild Asset Management Inc. Russell Investments Santander Global Facilities Schroder Investment Management North America Inc. Smith Graham & Co. Investment Advisors, L.P. Smith Group Asset Management South Texas Money Management, Ltd. Sprucegrove Investment Management Ltd. Standard Life Investments Limited State Street Global Advisors Stone Harbor Investment Partners, L.P. Sun Life Investment Management T. Rowe Price Associates, Inc. The Boston Company Asset Management, LLC The London Company The TCW Group, Inc. Thompson, Siegel & Walmsley LLC Thornburg Investment Management, Inc. Tri-Star Trust Bank UBS Asset Management VanEck Velanne Asset Management Ltd. Versus Capital Group Victory Capital Management Inc. Virtus Investment Partners, Inc. Vontobel Asset Management, Inc. Voya WCM Investment Management WEDGE Capital Management Wedgewood Partners, Inc. Wellington Management Company, LLP Wells Capital Management Western Asset Management Company LLC Westfield Capital Management Company, LP William Blair & Company LLC
AGENDA ITEM IV.D.
INFORMATIONAL
TO: State Investment Board (“SIB”) FROM: Dave Hunter DATE: November 9, 2018 SUBJECT: Investment Fee Reviews – Summary Memo
Background:
SIB Governance Policy D-1 on Ends states that “SIB clients receive investment returns … in a cost effective manner …” and Policy E-1 on Fiduciary Duties states that “investment expenses must be controlled”. As consistent with prior years, the SIB approved RIO’s recommendation to engage Callan to conduct a review of investment fee levels. (RIO notes the Callan contract includes two projects per fiscal year and the fee study represents one of the two projects for the current fiscal year.) RIO will continue to work with our existing managers on various fee reduction initiatives. Most recently, this includes SIB approval to engage XTP to perform a comprehensive review of our investment fee structures and underlying expenses in 2019 (noting that Novarca was previously engaged to perform a similar contingent fee review in November of 2014). Summary:
The following page summarizes the fee ranking of each asset class within the Pension Trust, Insurance Trust and Legacy Fund. The lowest fee level is highlighted in blue, the second lowest fee level is green, median pricing is brown, above average pricing is orange and the highest fee level is yellow. Based on this quartile ranking system for “All-In Pricing”, most of the asset classes are ranked in the two best quartiles (e.g. blue is best and green is good) and generally include our equity allocations. In contrast, some of the asset classes are ranked in the two worst quartiles (e.g. orange or yellow) and generally includes fixed income and real assets. Although fixed income and real assets are often ranked in the two worst quartiles from a fee perspective, it is important to note that these sectors have generated above average levels of excess return (as highlighted in the RIO Commentary section on the next page). As such, RIO firmly believes this significant level of outperformance justifies the above median fee levels within these sectors. RIO believes that investment expenses are reasonable overall noting that management fees have been trending downward on a % basis since fiscal 2013. More importantly, RIO notes the return on investment fees has been meaningfully positive and exceeded 50 bps per annum (or $300 million in aggregate) over the last five years. As such, the SIB has been successful in prudently using active management to generate positive risk adjusted rates of return while significantly reducing fee levels for nearly all of our clients.
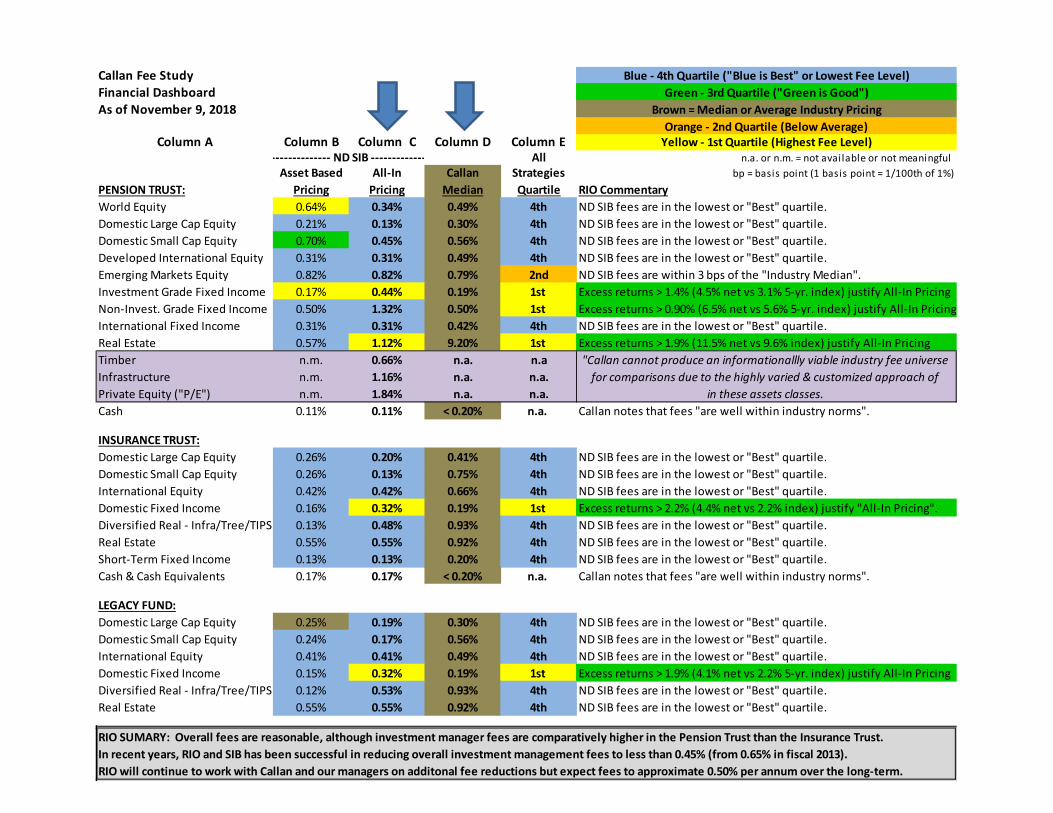
Callan Fee Study Blue - 4th Quartile ("Blue is Best" or Lowest Fee Level)Financial Dashboard Green - 3rd Quartile ("Green is Good")As of November 9, 2018 Brown = Median or Average Industry Pricing
Orange - 2nd Quartile (Below Average)Column A Column B Column C Column D Column E Yellow - 1st Quartile (Highest Fee Level)
All n.a. or n.m. = not available or not meaningful Asset Based All-In Callan Strategies bp = basis point (1 basis point = 1/100th of 1%)
PENSION TRUST: Pricing Pricing Median Quartile RIO CommentaryWorld Equity 0.64% 0.34% 0.49% 4th ND SIB fees are in the lowest or "Best" quartile.Domestic Large Cap Equity 0.21% 0.13% 0.30% 4th ND SIB fees are in the lowest or "Best" quartile.Domestic Small Cap Equity 0.70% 0.45% 0.56% 4th ND SIB fees are in the lowest or "Best" quartile.Developed International Equity 0.31% 0.31% 0.49% 4th ND SIB fees are in the lowest or "Best" quartile.Emerging Markets Equity 0.82% 0.82% 0.79% 2nd ND SIB fees are within 3 bps of the "Industry Median".Investment Grade Fixed Income 0.17% 0.44% 0.19% 1st Excess returns > 1.4% (4.5% net vs 3.1% 5-yr. index) justify All-In PricingNon-Invest. Grade Fixed Income 0.50% 1.32% 0.50% 1st Excess returns > 0.90% (6.5% net vs 5.6% 5-yr. index) justify All-In PricingInternational Fixed Income 0.31% 0.31% 0.42% 4th ND SIB fees are in the lowest or "Best" quartile.Real Estate 0.57% 1.12% 9.20% 1st Excess returns > 1.9% (11.5% net vs 9.6% index) justify All-In PricingTimber n.m. 0.66% n.a. n.aInfrastructure n.m. 1.16% n.a. n.a.Private Equity ("P/E") n.m. 1.84% n.a. n.a. in these assets classes.Cash 0.11% 0.11% < 0.20% n.a. Callan notes that fees "are well within industry norms".
INSURANCE TRUST:Domestic Large Cap Equity 0.26% 0.20% 0.41% 4th ND SIB fees are in the lowest or "Best" quartile.Domestic Small Cap Equity 0.26% 0.13% 0.75% 4th ND SIB fees are in the lowest or "Best" quartile.International Equity 0.42% 0.42% 0.66% 4th ND SIB fees are in the lowest or "Best" quartile.Domestic Fixed Income 0.16% 0.32% 0.19% 1st Excess returns > 2.2% (4.4% net vs 2.2% index) justify "All-In Pricing".Diversified Real - Infra/Tree/TIPS 0.13% 0.48% 0.93% 4th ND SIB fees are in the lowest or "Best" quartile.Real Estate 0.55% 0.55% 0.92% 4th ND SIB fees are in the lowest or "Best" quartile.Short-Term Fixed Income 0.13% 0.13% 0.20% 4th ND SIB fees are in the lowest or "Best" quartile.Cash & Cash Equivalents 0.17% 0.17% < 0.20% n.a. Callan notes that fees "are well within industry norms".
LEGACY FUND:Domestic Large Cap Equity 0.25% 0.19% 0.30% 4th ND SIB fees are in the lowest or "Best" quartile.Domestic Small Cap Equity 0.24% 0.17% 0.56% 4th ND SIB fees are in the lowest or "Best" quartile.International Equity 0.41% 0.41% 0.49% 4th ND SIB fees are in the lowest or "Best" quartile.Domestic Fixed Income 0.15% 0.32% 0.19% 1st Excess returns > 1.9% (4.1% net vs 2.2% 5-yr. index) justify All-In PricingDiversified Real - Infra/Tree/TIPS 0.12% 0.53% 0.93% 4th ND SIB fees are in the lowest or "Best" quartile.Real Estate 0.55% 0.55% 0.92% 4th ND SIB fees are in the lowest or "Best" quartile.
RIO SUMARY: Overall fees are reasonable, although investment manager fees are comparatively higher in the Pension Trust than the Insurance Trust.In recent years, RIO and SIB has been successful in reducing overall investment management fees to less than 0.45% (from 0.65% in fiscal 2013).RIO will continue to work with Callan and our managers on additonal fee reductions but expect fees to approximate 0.50% per annum over the long-term.
-------------- ND SIB -------------
"Callan cannot produce an informationallly viable industry fee universe for comparisons due to the highly varied & customized approach of
NDSIB Fee Study:
Fiscal Year 2018
Pension Trust, Insurance Trust,
and Legacy Fund
November 16, 2018
Paul Erlendson
Senior Vice President
Alex Browning
Senior Vice President
Perry Hopper
Assistant Vice President
1 Knowledge. Experience. Integrity. North Dakota State Investment Board Fee Study
Summary Notes and Comments on 2018 Fee Study
●All market values and fee data are as of the fiscal year ending June 30, 2018.
● Investment managers employ three primary fee calculation methods to charge for their services;
– Asset-Based Fees: fees are calculated as a percentage of assets under management
– Performance-Based Fees: fees are calculated on outperformance relative to a pre-specified benchmark during a contracted measurement period
– Hybrid Fees: A combination of an asset-based fee and a performance-based fee schedule
●Fees are calculated as weighted averages in three different ways within the asset classes:
– Weighted Average Asset-based Fee: calculated using only managers that employ an asset-based fee schedule
– Weighted Average Performance / Hybrid Fee: calculated using only managers that employ a performance or hybrid fee schedule
– Total Weighted Average Fee: calculated across all managers in the asset class
●Regardless of the method used by a particular manager, Callan calculated fees as a percentage of assets under management for each manager for the purposes of comparison.
● In many instances, fees paid by the individual trusts benefit from fee schedules that account for the aggregate level of assets invested with a particular manager or in a specific strategy.
●Fee universes used in the study reflect either:
– Actual Fees paid by Callan survey respondents who invest in similar mandates,
– Published Fees calculated using a universe of manager fee schedules for similar mandates, or;
– An Average of Actual and Published Fee universes. This method was employed where the Actual Fee universe was smaller than 30.
●All fee universes are explicitly noted beneath each chart where “n=” will denote the applicable sample size.
●Greater detail on fee measurements and data are available on the last page of the report.
NDSIB – Pension Trust, Insurance Trust, and Legacy Fund
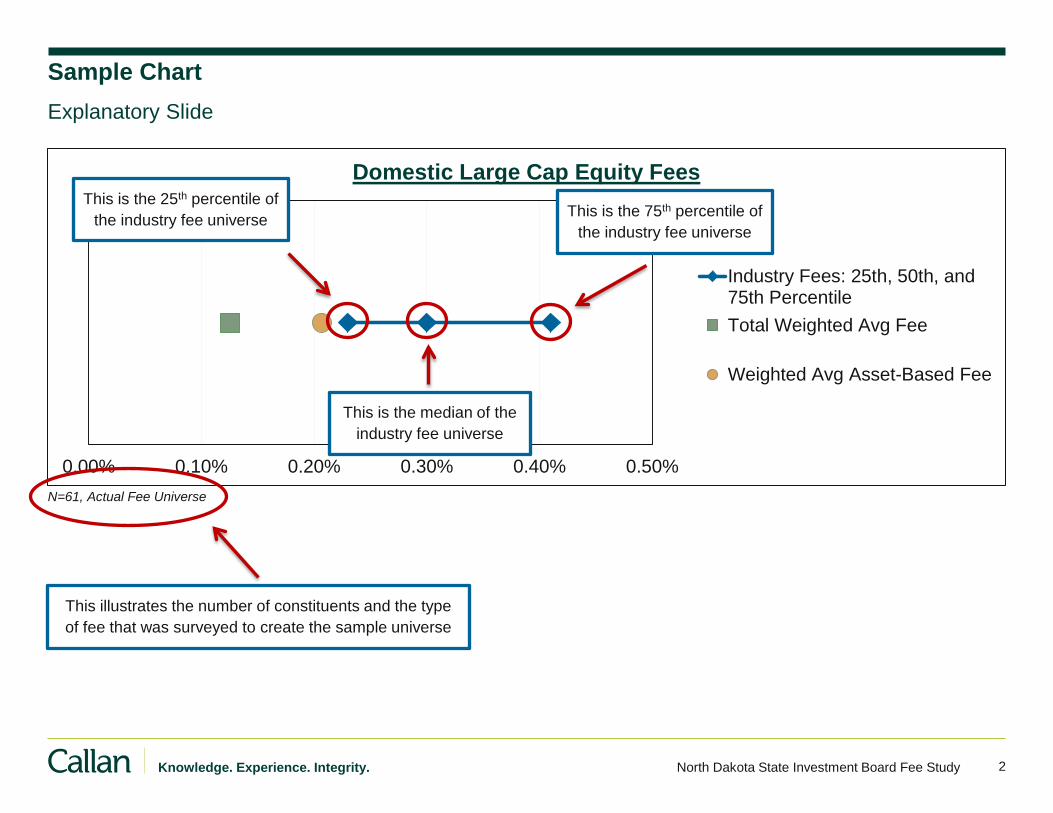
2 Knowledge. Experience. Integrity. North Dakota State Investment Board Fee Study
0.00% 0.10% 0.20% 0.30% 0.40% 0.50%
Domestic Large Cap Equity Fees
Industry Fees: 25th, 50th, and75th Percentile
Total Weighted Avg Fee
Weighted Avg Asset-Based Fee
Sample Chart
Explanatory Slide
N=61, Actual Fee Universe
This illustrates the number of constituents and the type
of fee that was surveyed to create the sample universe
This is the 25th percentile of
the industry fee universe
This is the median of the
industry fee universe
This is the 75th percentile of
the industry fee universe
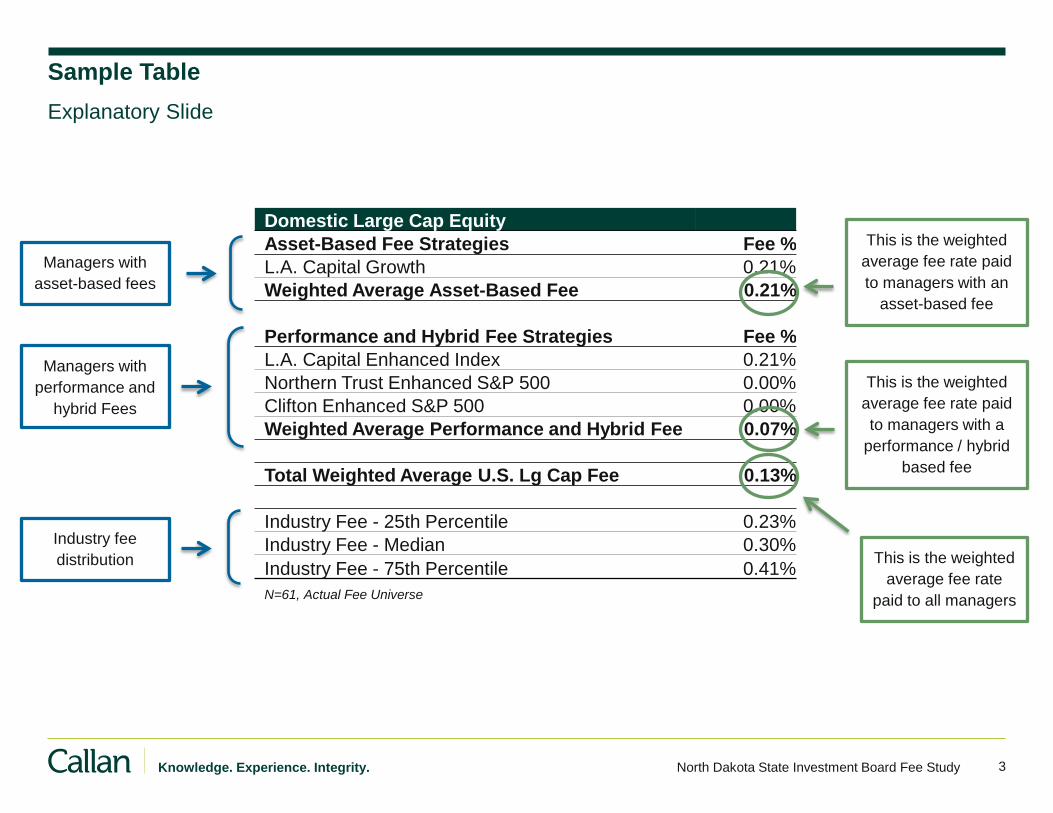
3 Knowledge. Experience. Integrity. North Dakota State Investment Board Fee Study
Domestic Large Cap Equity
Asset-Based Fee Strategies Fee %
L.A. Capital Growth 0.21%
Weighted Average Asset-Based Fee 0.21%
Performance and Hybrid Fee Strategies Fee %
L.A. Capital Enhanced Index 0.21%
Northern Trust Enhanced S&P 500 0.00%
Clifton Enhanced S&P 500 0.00%
Weighted Average Performance and Hybrid Fee 0.07%
Total Weighted Average U.S. Lg Cap Fee 0.13%
Industry Fee - 25th Percentile 0.23%
Industry Fee - Median 0.30%
Industry Fee - 75th Percentile 0.41%
N=61, Actual Fee Universe
Sample Table
Explanatory Slide
Industry fee
distribution
Managers with
performance and
hybrid Fees
Managers with
asset-based fees
This is the weighted
average fee rate
paid to all managers
This is the weighted
average fee rate paid
to managers with an
asset-based fee
This is the weighted
average fee rate paid
to managers with a
performance / hybrid
based fee

Pension Trust
5 Knowledge. Experience. Integrity. North Dakota State Investment Board Fee Study
Pension Trust
● Total Equity manager fees paid represented a mix of asset-based and performance/hybrid fee strategies.
– Total Global Equity fees fell below the 25th percentile of the industry universe, helped in part by performance/hybrid fee based strategies
– Total Domestic Large Cap Equity asset-based and performance/hybrid fee strategies were below the 25th percentile of the industry universe
– Total Small Cap Equity fees were close to the 25th percentile with asset-based fees falling above the 75th percentile
– Developed International Equity fees were below the 25th percentile and represented only asset-based fee strategies
– Emerging Market Equity fees fell just above median and represented only asset-based fee strategies
● Total Fixed Income manager fees paid represented a mix of asset-based and performance/hybrid fee strategies.
– Total Investment Grade Fixed Income fees paid were above the 75th percentile, driven largely by performance/hybrid fee based strategies
– Total Below Investment Grade Fixed Income fees paid were above the 75th percentile, driven largely by performance/hybrid fee based
strategies
– Total International Fixed Income fees paid were below the 25th percentile of industry averages and represented only asset-based fee strategies
● Total Real Estate manager fees paid represented a mix of asset-based and performance/hybrid fee strategies. Asset based fee
strategies fell well below the 25th percentile with performance/hybrid fee strategies pushing the total fees paid just above the 75th
percentile.
● Total Real Assets represents a variety of inflation-sensitive strategies including Timber and Infrastructure. Due to the custom nature of
these strategies, no applicable manager fee distribution is available.
– Fee structures do however appear to follow industry norms and standards
● Private Equity represents a variety of strategies and investment vehicles that cannot produce a reasonable industry fee universe for
comparison.
– Fee structures do however appear to follow industry norms and standards
NDSIB Fee Study Fiscal Year 2018 Executive Summary
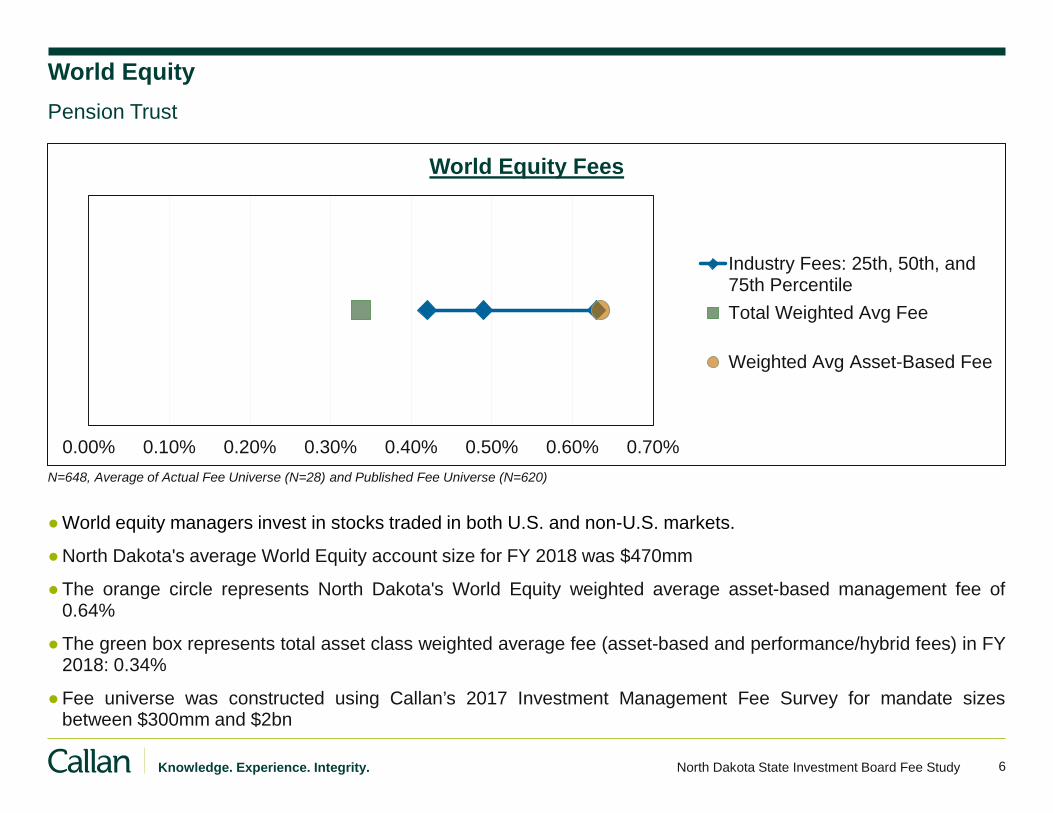
6 Knowledge. Experience. Integrity. North Dakota State Investment Board Fee Study
World Equity
●World equity managers invest in stocks traded in both U.S. and non-U.S. markets.
●North Dakota's average World Equity account size for FY 2018 was $470mm
●The orange circle represents North Dakota's World Equity weighted average asset-based management fee of 0.64%
●The green box represents total asset class weighted average fee (asset-based and performance/hybrid fees) in FY 2018: 0.34%
●Fee universe was constructed using Callan’s 2017 Investment Management Fee Survey for mandate sizes between $300mm and $2bn
Pension Trust
N=648, Average of Actual Fee Universe (N=28) and Published Fee Universe (N=620)
0.00% 0.10% 0.20% 0.30% 0.40% 0.50% 0.60% 0.70%
World Equity Fees
Industry Fees: 25th, 50th, and75th Percentile
Total Weighted Avg Fee
Weighted Avg Asset-Based Fee
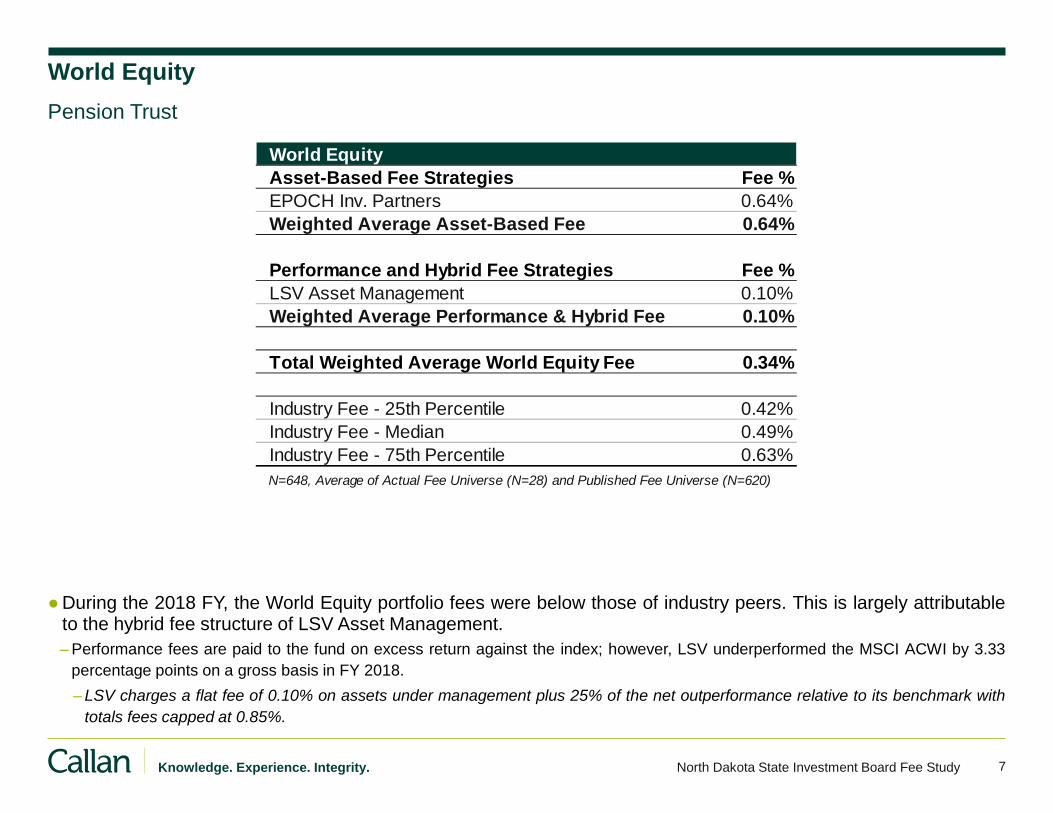
7 Knowledge. Experience. Integrity. North Dakota State Investment Board Fee Study
World Equity
●During the 2018 FY, the World Equity portfolio fees were below those of industry peers. This is largely attributable to the hybrid fee structure of LSV Asset Management.
– Performance fees are paid to the fund on excess return against the index; however, LSV underperformed the MSCI ACWI by 3.33
percentage points on a gross basis in FY 2018.
– LSV charges a flat fee of 0.10% on assets under management plus 25% of the net outperformance relative to its benchmark with totals fees capped at 0.85%.
Pension Trust
World Equity
Asset-Based Fee Strategies Fee %
EPOCH Inv. Partners 0.64%
Weighted Average Asset-Based Fee 0.64%
Performance and Hybrid Fee Strategies Fee %
LSV Asset Management 0.10%
Weighted Average Performance & Hybrid Fee 0.10%
Total Weighted Average World Equity Fee 0.34%
Industry Fee - 25th Percentile 0.42%
Industry Fee - Median 0.49%
Industry Fee - 75th Percentile 0.63%
N=648, Average of Actual Fee Universe (N=28) and Published Fee Universe (N=620)
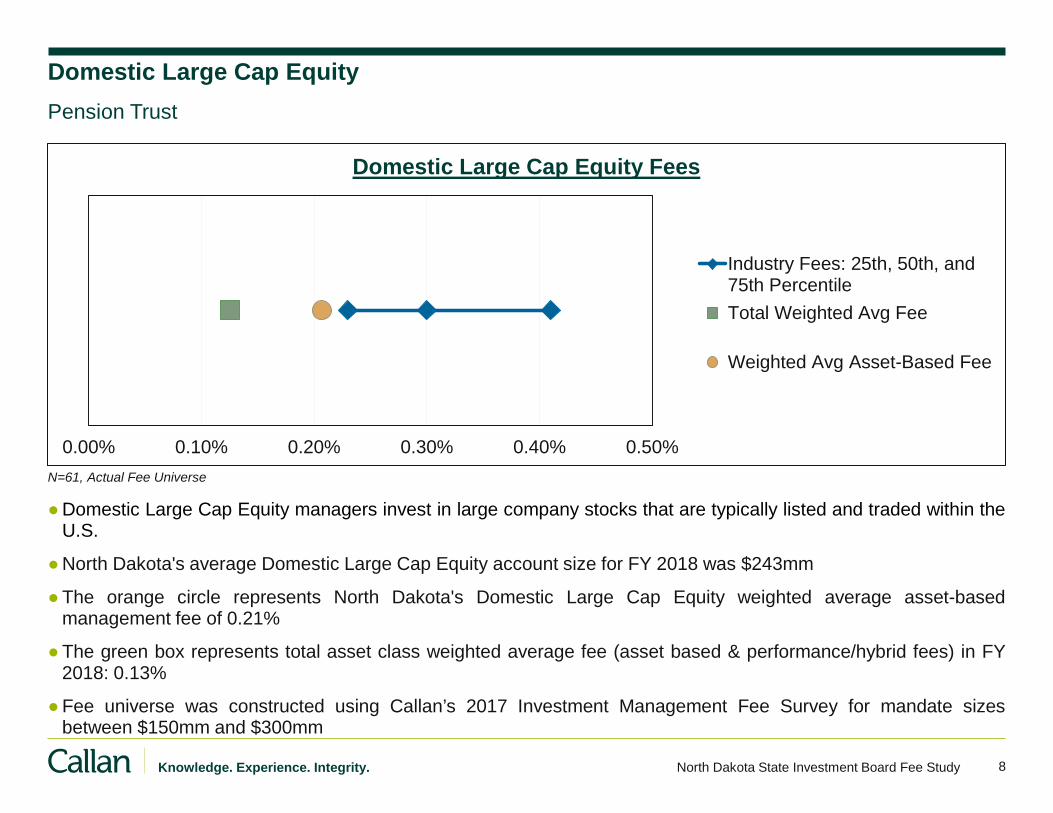
8 Knowledge. Experience. Integrity. North Dakota State Investment Board Fee Study
Domestic Large Cap Equity
●Domestic Large Cap Equity managers invest in large company stocks that are typically listed and traded within the U.S.
●North Dakota's average Domestic Large Cap Equity account size for FY 2018 was $243mm
●The orange circle represents North Dakota's Domestic Large Cap Equity weighted average asset-based management fee of 0.21%
●The green box represents total asset class weighted average fee (asset based & performance/hybrid fees) in FY 2018: 0.13%
●Fee universe was constructed using Callan’s 2017 Investment Management Fee Survey for mandate sizes between $150mm and $300mm
Pension Trust
N=61, Actual Fee Universe
0.00% 0.10% 0.20% 0.30% 0.40% 0.50%
Domestic Large Cap Equity Fees
Industry Fees: 25th, 50th, and75th Percentile
Total Weighted Avg Fee
Weighted Avg Asset-Based Fee
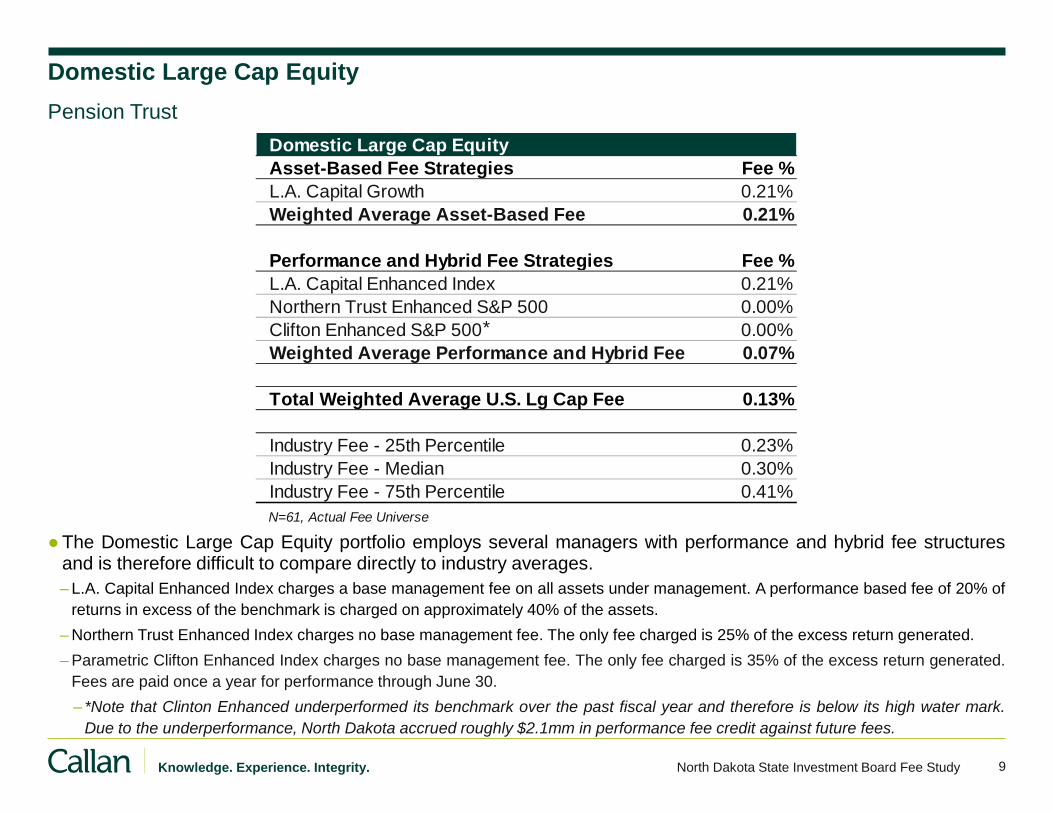
9 Knowledge. Experience. Integrity. North Dakota State Investment Board Fee Study
Domestic Large Cap Equity
●The Domestic Large Cap Equity portfolio employs several managers with performance and hybrid fee structures and is therefore difficult to compare directly to industry averages.
– L.A. Capital Enhanced Index charges a base management fee on all assets under management. A performance based fee of 20% of
returns in excess of the benchmark is charged on approximately 40% of the assets.
– Northern Trust Enhanced Index charges no base management fee. The only fee charged is 25% of the excess return generated.
– Parametric Clifton Enhanced Index charges no base management fee. The only fee charged is 35% of the excess return generated.
Fees are paid once a year for performance through June 30.
– *Note that Clinton Enhanced underperformed its benchmark over the past fiscal year and therefore is below its high water mark. Due to the underperformance, North Dakota accrued roughly $2.1mm in performance fee credit against future fees.
Pension Trust
Domestic Large Cap Equity
Asset-Based Fee Strategies Fee %
L.A. Capital Growth 0.21%
Weighted Average Asset-Based Fee 0.21%
Performance and Hybrid Fee Strategies Fee %
L.A. Capital Enhanced Index 0.21%
Northern Trust Enhanced S&P 500 0.00%
Clifton Enhanced S&P 500 0.00%
Weighted Average Performance and Hybrid Fee 0.07%
Total Weighted Average U.S. Lg Cap Fee 0.13%
Industry Fee - 25th Percentile 0.23%
Industry Fee - Median 0.30%
Industry Fee - 75th Percentile 0.41%
N=61, Actual Fee Universe
*
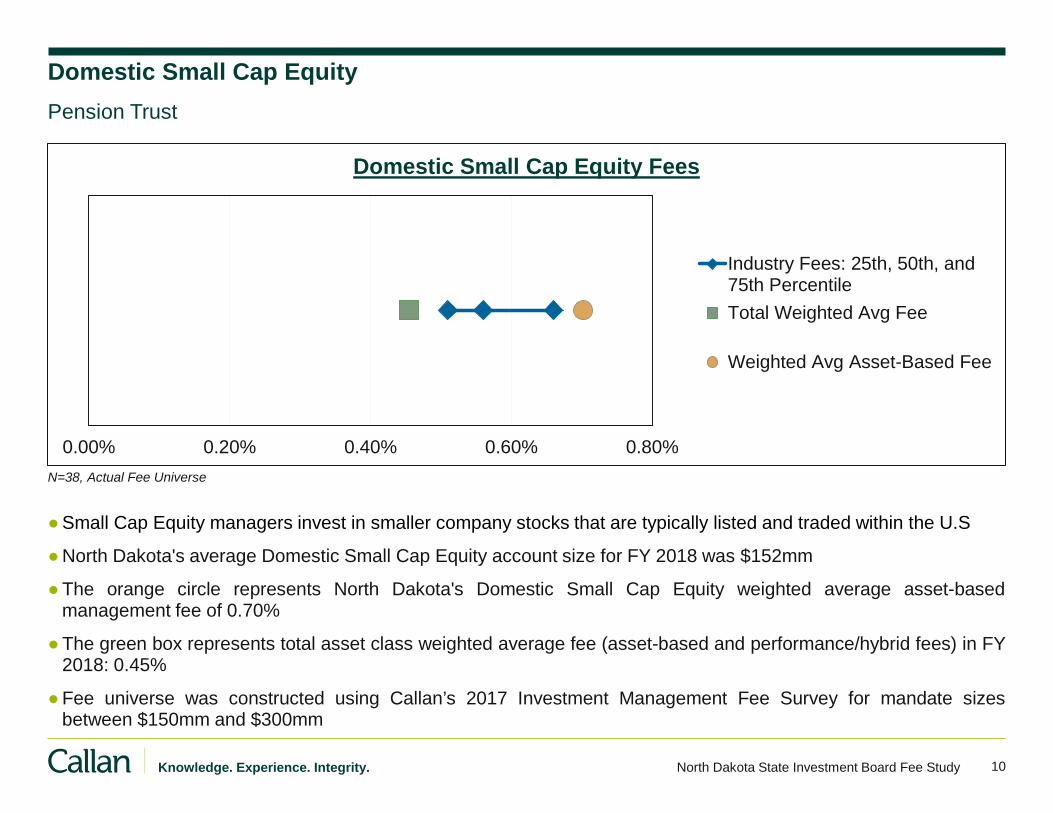
10 Knowledge. Experience. Integrity. North Dakota State Investment Board Fee Study
Domestic Small Cap Equity
●Small Cap Equity managers invest in smaller company stocks that are typically listed and traded within the U.S
●North Dakota's average Domestic Small Cap Equity account size for FY 2018 was $152mm
●The orange circle represents North Dakota's Domestic Small Cap Equity weighted average asset-based management fee of 0.70%
●The green box represents total asset class weighted average fee (asset-based and performance/hybrid fees) in FY 2018: 0.45%
●Fee universe was constructed using Callan’s 2017 Investment Management Fee Survey for mandate sizes between $150mm and $300mm
Pension Trust
N=38, Actual Fee Universe
0.00% 0.20% 0.40% 0.60% 0.80%
Domestic Small Cap Equity Fees
Industry Fees: 25th, 50th, and75th Percentile
Total Weighted Avg Fee
Weighted Avg Asset-Based Fee
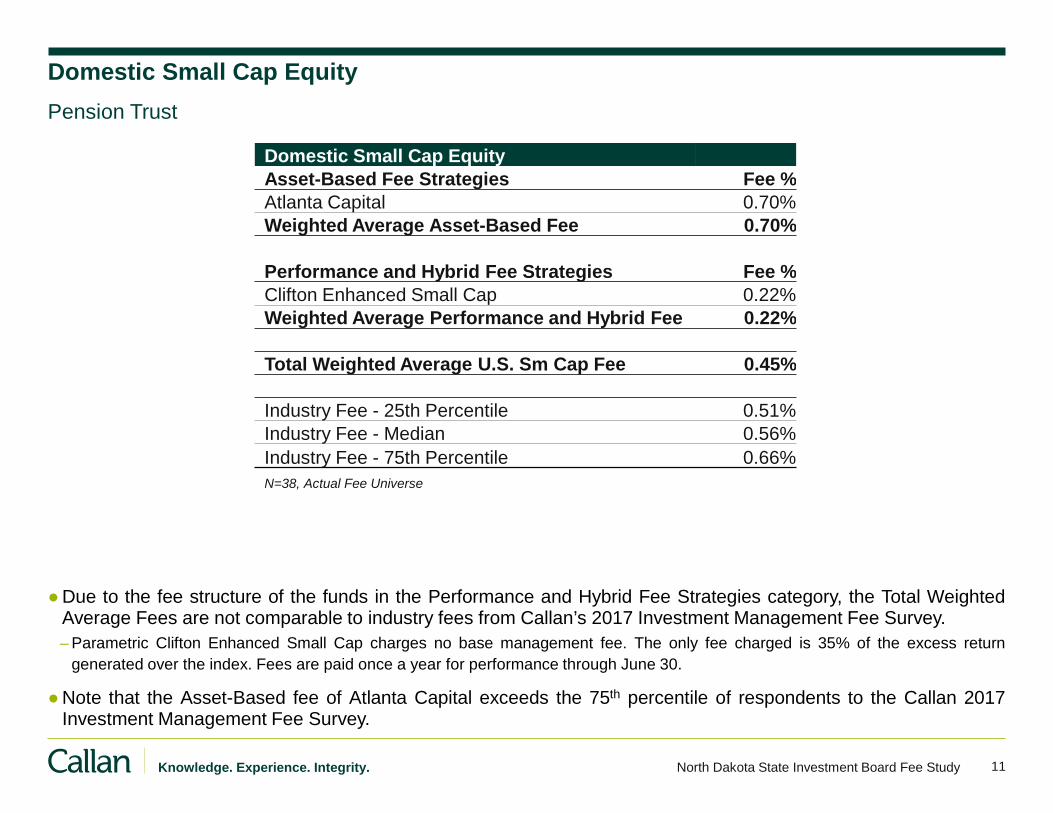
11 Knowledge. Experience. Integrity. North Dakota State Investment Board Fee Study
Domestic Small Cap Equity
●Due to the fee structure of the funds in the Performance and Hybrid Fee Strategies category, the Total Weighted Average Fees are not comparable to industry fees from Callan’s 2017 Investment Management Fee Survey.
– Parametric Clifton Enhanced Small Cap charges no base management fee. The only fee charged is 35% of the excess return
generated over the index. Fees are paid once a year for performance through June 30.
●Note that the Asset-Based fee of Atlanta Capital exceeds the 75th percentile of respondents to the Callan 2017 Investment Management Fee Survey.
Pension Trust
Domestic Small Cap Equity
Asset-Based Fee Strategies Fee %
Atlanta Capital 0.70%
Weighted Average Asset-Based Fee 0.70%
Performance and Hybrid Fee Strategies Fee %
Clifton Enhanced Small Cap 0.22%
Weighted Average Performance and Hybrid Fee 0.22%
Total Weighted Average U.S. Sm Cap Fee 0.45%
Industry Fee - 25th Percentile 0.51%
Industry Fee - Median 0.56%
Industry Fee - 75th Percentile 0.66%
N=38, Actual Fee Universe
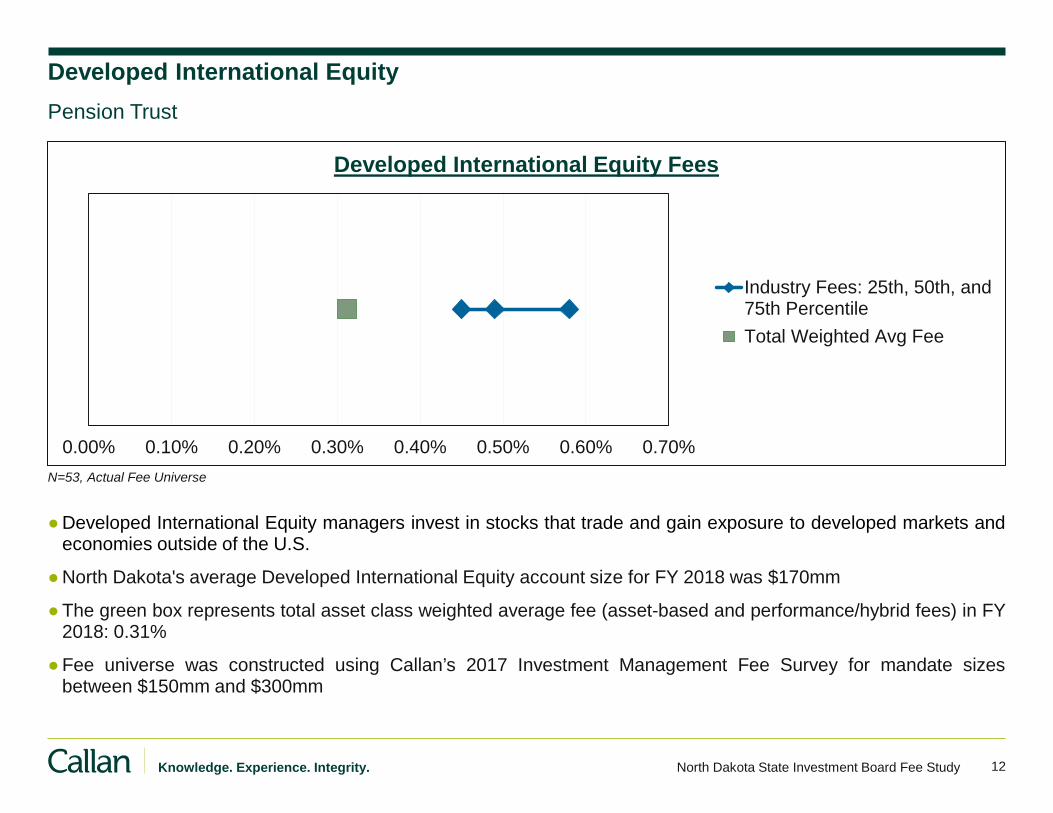
12 Knowledge. Experience. Integrity. North Dakota State Investment Board Fee Study
Developed International Equity
●Developed International Equity managers invest in stocks that trade and gain exposure to developed markets and economies outside of the U.S.
●North Dakota's average Developed International Equity account size for FY 2018 was $170mm
●The green box represents total asset class weighted average fee (asset-based and performance/hybrid fees) in FY 2018: 0.31%
●Fee universe was constructed using Callan’s 2017 Investment Management Fee Survey for mandate sizes between $150mm and $300mm
Pension Trust
N=53, Actual Fee Universe
0.00% 0.10% 0.20% 0.30% 0.40% 0.50% 0.60% 0.70%
Developed International Equity Fees
Industry Fees: 25th, 50th, and75th Percentile
Total Weighted Avg Fee
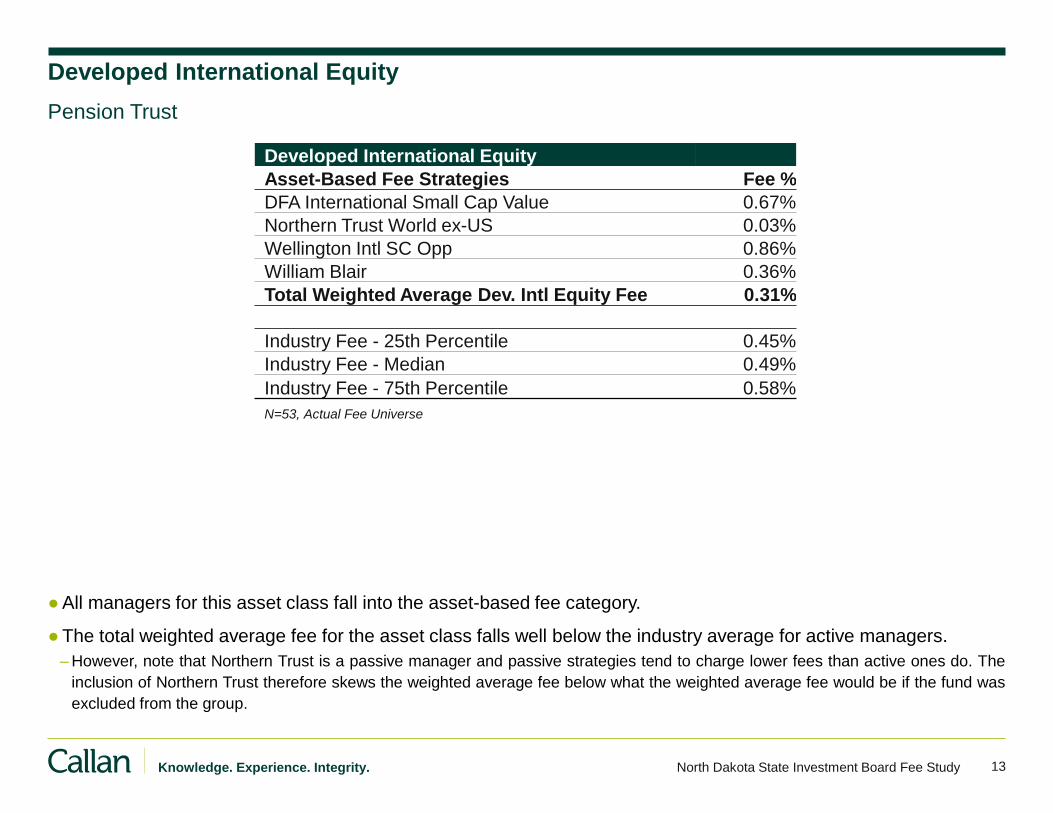
13 Knowledge. Experience. Integrity. North Dakota State Investment Board Fee Study
Developed International Equity
●All managers for this asset class fall into the asset-based fee category.
●The total weighted average fee for the asset class falls well below the industry average for active managers.
– However, note that Northern Trust is a passive manager and passive strategies tend to charge lower fees than active ones do. The
inclusion of Northern Trust therefore skews the weighted average fee below what the weighted average fee would be if the fund was
excluded from the group.
Pension Trust
Developed International Equity
Asset-Based Fee Strategies Fee %
DFA International Small Cap Value 0.67%
Northern Trust World ex-US 0.03%
Wellington Intl SC Opp 0.86%
William Blair 0.36%
Total Weighted Average Dev. Intl Equity Fee 0.31%
Industry Fee - 25th Percentile 0.45%
Industry Fee - Median 0.49%
Industry Fee - 75th Percentile 0.58%
N=53, Actual Fee Universe
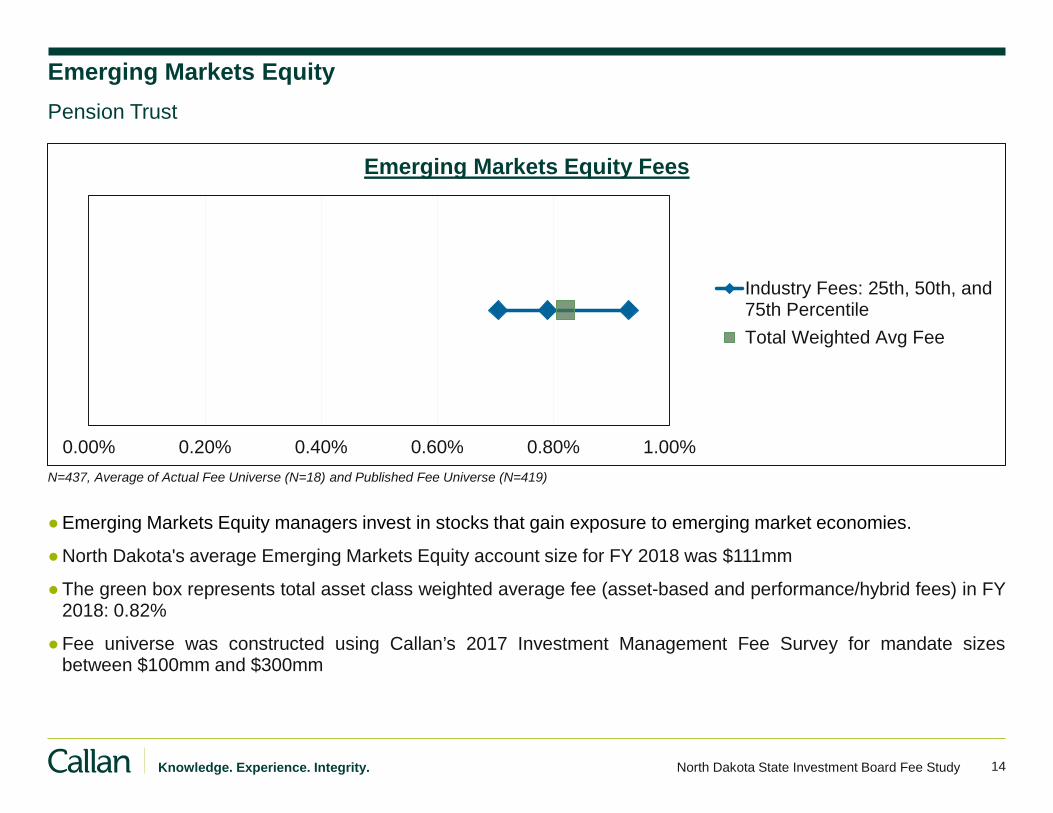
14 Knowledge. Experience. Integrity. North Dakota State Investment Board Fee Study
Emerging Markets Equity
●Emerging Markets Equity managers invest in stocks that gain exposure to emerging market economies.
●North Dakota's average Emerging Markets Equity account size for FY 2018 was $111mm
●The green box represents total asset class weighted average fee (asset-based and performance/hybrid fees) in FY 2018: 0.82%
●Fee universe was constructed using Callan’s 2017 Investment Management Fee Survey for mandate sizes between $100mm and $300mm
Pension Trust
N=437, Average of Actual Fee Universe (N=18) and Published Fee Universe (N=419)
0.00% 0.20% 0.40% 0.60% 0.80% 1.00%
Emerging Markets Equity Fees
Industry Fees: 25th, 50th, and75th Percentile
Total Weighted Avg Fee
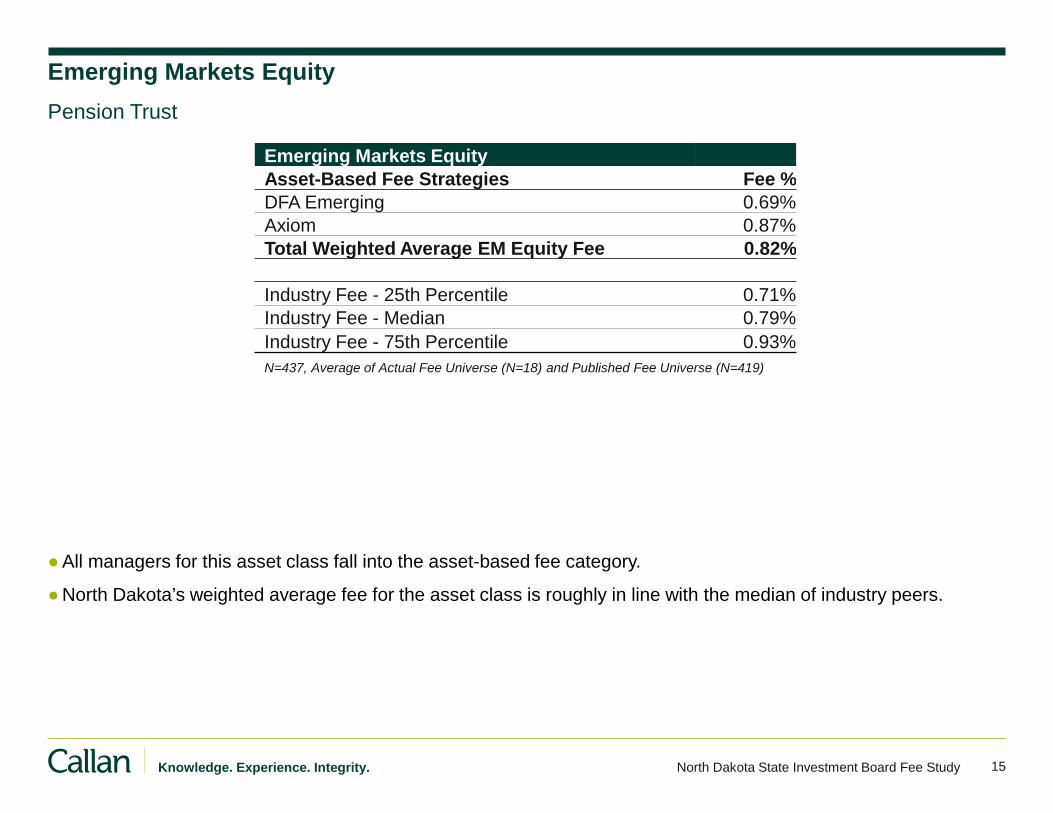
15 Knowledge. Experience. Integrity. North Dakota State Investment Board Fee Study
Emerging Markets Equity
●All managers for this asset class fall into the asset-based fee category.
●North Dakota’s weighted average fee for the asset class is roughly in line with the median of industry peers.
Pension Trust
Emerging Markets Equity
Asset-Based Fee Strategies Fee %
DFA Emerging 0.69%
Axiom 0.87%
Total Weighted Average EM Equity Fee 0.82%
Industry Fee - 25th Percentile 0.71%
Industry Fee - Median 0.79%
Industry Fee - 75th Percentile 0.93%
N=437, Average of Actual Fee Universe (N=18) and Published Fee Universe (N=419)
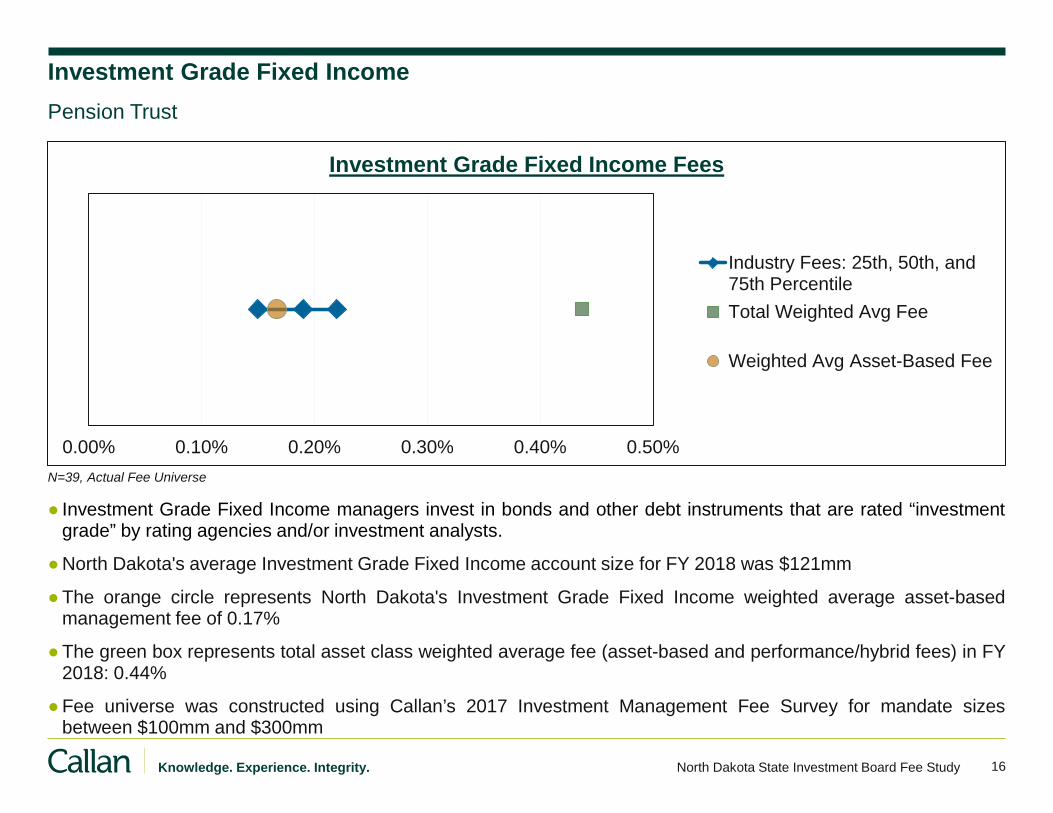
16 Knowledge. Experience. Integrity. North Dakota State Investment Board Fee Study
Investment Grade Fixed Income
● Investment Grade Fixed Income managers invest in bonds and other debt instruments that are rated “investment grade” by rating agencies and/or investment analysts.
●North Dakota's average Investment Grade Fixed Income account size for FY 2018 was $121mm
●The orange circle represents North Dakota's Investment Grade Fixed Income weighted average asset-based management fee of 0.17%
●The green box represents total asset class weighted average fee (asset-based and performance/hybrid fees) in FY 2018: 0.44%
●Fee universe was constructed using Callan’s 2017 Investment Management Fee Survey for mandate sizes between $100mm and $300mm
Pension Trust
N=39, Actual Fee Universe
0.00% 0.10% 0.20% 0.30% 0.40% 0.50%
Investment Grade Fixed Income Fees
Industry Fees: 25th, 50th, and75th Percentile
Total Weighted Avg Fee
Weighted Avg Asset-Based Fee
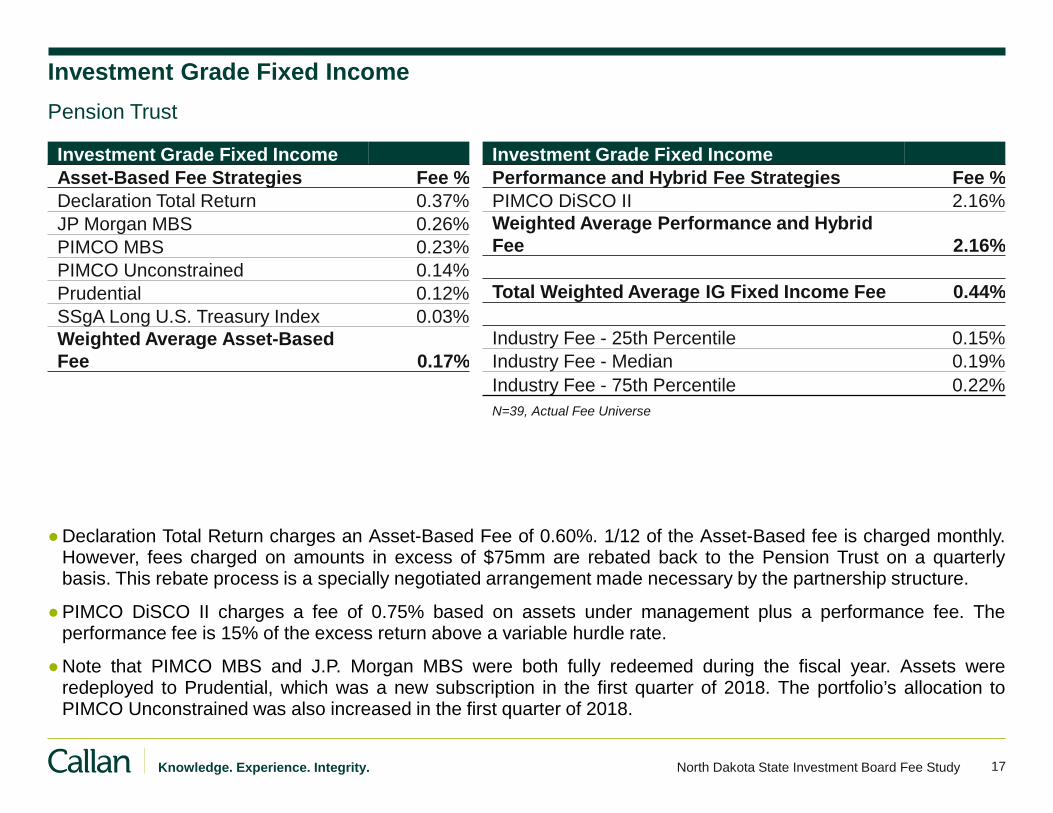
17 Knowledge. Experience. Integrity. North Dakota State Investment Board Fee Study
Investment Grade Fixed Income
●Declaration Total Return charges an Asset-Based Fee of 0.60%. 1/12 of the Asset-Based fee is charged monthly. However, fees charged on amounts in excess of $75mm are rebated back to the Pension Trust on a quarterly basis. This rebate process is a specially negotiated arrangement made necessary by the partnership structure.
●PIMCO DiSCO II charges a fee of 0.75% based on assets under management plus a performance fee. The performance fee is 15% of the excess return above a variable hurdle rate.
●Note that PIMCO MBS and J.P. Morgan MBS were both fully redeemed during the fiscal year. Assets were redeployed to Prudential, which was a new subscription in the first quarter of 2018. The portfolio’s allocation to PIMCO Unconstrained was also increased in the first quarter of 2018.
Pension Trust
Investment Grade Fixed Income
Asset-Based Fee Strategies Fee %
Declaration Total Return 0.37%
JP Morgan MBS 0.26%
PIMCO MBS 0.23%
PIMCO Unconstrained 0.14%
Prudential 0.12%
SSgA Long U.S. Treasury Index 0.03%
Weighted Average Asset-Based
Fee 0.17%
Investment Grade Fixed Income
Performance and Hybrid Fee Strategies Fee %
PIMCO DiSCO II 2.16%
Weighted Average Performance and Hybrid
Fee 2.16%
Total Weighted Average IG Fixed Income Fee 0.44%
Industry Fee - 25th Percentile 0.15%
Industry Fee - Median 0.19%
Industry Fee - 75th Percentile 0.22%
N=39, Actual Fee Universe
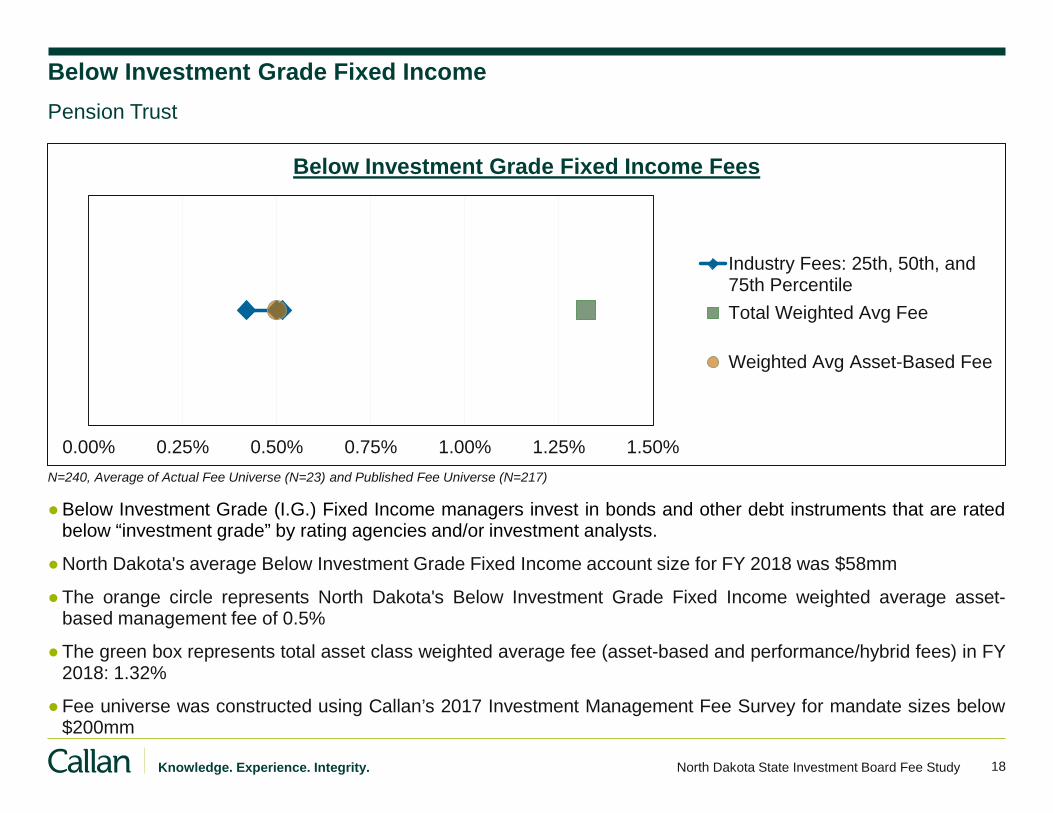
18 Knowledge. Experience. Integrity. North Dakota State Investment Board Fee Study
Below Investment Grade Fixed Income
●Below Investment Grade (I.G.) Fixed Income managers invest in bonds and other debt instruments that are rated below “investment grade” by rating agencies and/or investment analysts.
●North Dakota's average Below Investment Grade Fixed Income account size for FY 2018 was $58mm
●The orange circle represents North Dakota's Below Investment Grade Fixed Income weighted average asset-based management fee of 0.5%
●The green box represents total asset class weighted average fee (asset-based and performance/hybrid fees) in FY 2018: 1.32%
●Fee universe was constructed using Callan’s 2017 Investment Management Fee Survey for mandate sizes below $200mm
Pension Trust
N=240, Average of Actual Fee Universe (N=23) and Published Fee Universe (N=217)
0.00% 0.25% 0.50% 0.75% 1.00% 1.25% 1.50%
Below Investment Grade Fixed Income Fees
Industry Fees: 25th, 50th, and75th Percentile
Total Weighted Avg Fee
Weighted Avg Asset-Based Fee
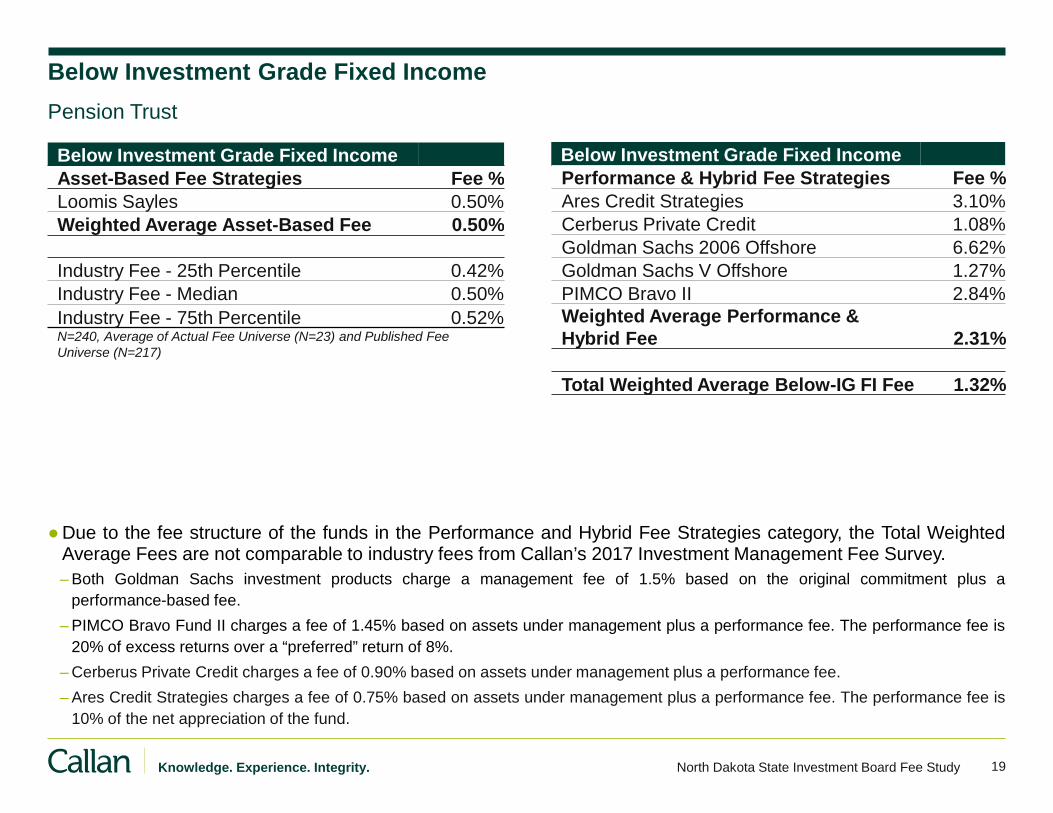
19 Knowledge. Experience. Integrity. North Dakota State Investment Board Fee Study
Below Investment Grade Fixed Income
●Due to the fee structure of the funds in the Performance and Hybrid Fee Strategies category, the Total Weighted Average Fees are not comparable to industry fees from Callan’s 2017 Investment Management Fee Survey.
– Both Goldman Sachs investment products charge a management fee of 1.5% based on the original commitment plus a
performance-based fee.
– PIMCO Bravo Fund II charges a fee of 1.45% based on assets under management plus a performance fee. The performance fee is
20% of excess returns over a “preferred” return of 8%.
– Cerberus Private Credit charges a fee of 0.90% based on assets under management plus a performance fee.
– Ares Credit Strategies charges a fee of 0.75% based on assets under management plus a performance fee. The performance fee is
10% of the net appreciation of the fund.
Pension Trust
Below Investment Grade Fixed Income
Asset-Based Fee Strategies Fee %
Loomis Sayles 0.50%
Weighted Average Asset-Based Fee 0.50%
Industry Fee - 25th Percentile 0.42%
Industry Fee - Median 0.50%
Industry Fee - 75th Percentile 0.52% N=240, Average of Actual Fee Universe (N=23) and Published Fee Universe (N=217)
Below Investment Grade Fixed Income
Performance & Hybrid Fee Strategies Fee %
Ares Credit Strategies 3.10%
Cerberus Private Credit 1.08%
Goldman Sachs 2006 Offshore 6.62%
Goldman Sachs V Offshore 1.27%
PIMCO Bravo II 2.84%
Weighted Average Performance &
Hybrid Fee 2.31%
Total Weighted Average Below-IG FI Fee 1.32%
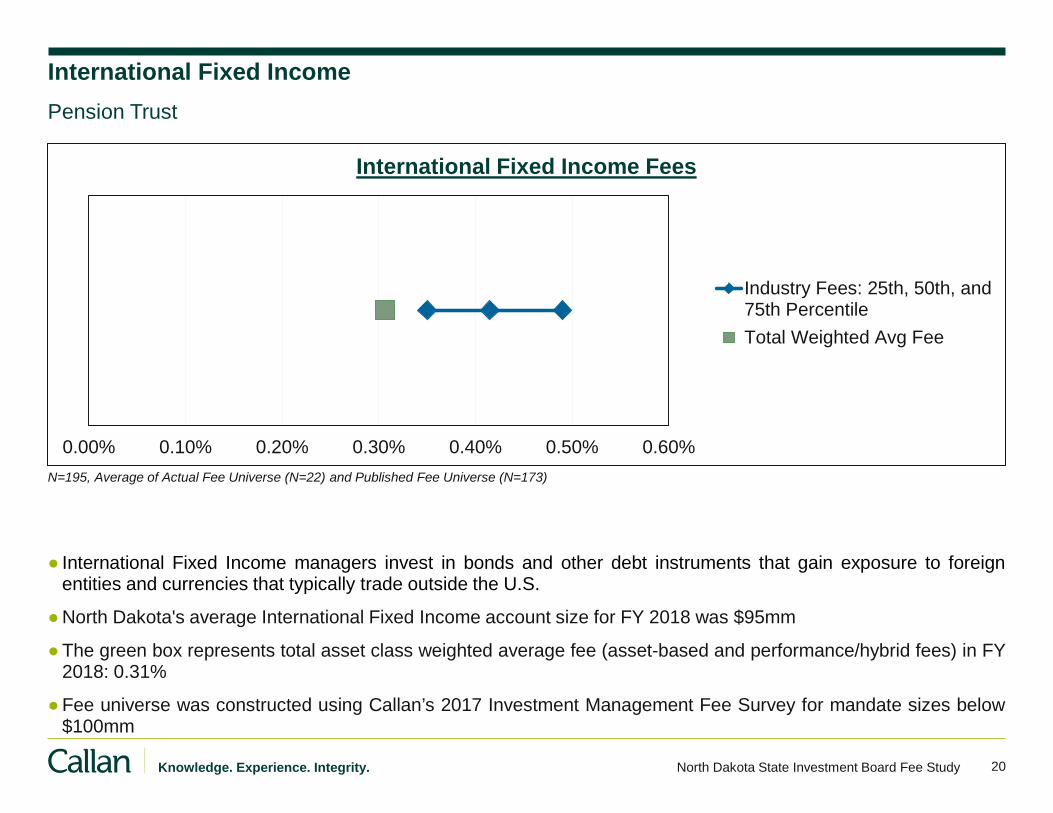
20 Knowledge. Experience. Integrity. North Dakota State Investment Board Fee Study
International Fixed Income
● International Fixed Income managers invest in bonds and other debt instruments that gain exposure to foreign entities and currencies that typically trade outside the U.S.
●North Dakota's average International Fixed Income account size for FY 2018 was $95mm
●The green box represents total asset class weighted average fee (asset-based and performance/hybrid fees) in FY 2018: 0.31%
●Fee universe was constructed using Callan’s 2017 Investment Management Fee Survey for mandate sizes below $100mm
Pension Trust
N=195, Average of Actual Fee Universe (N=22) and Published Fee Universe (N=173)
0.00% 0.10% 0.20% 0.30% 0.40% 0.50% 0.60%
International Fixed Income Fees
Industry Fees: 25th, 50th, and75th Percentile
Total Weighted Avg Fee
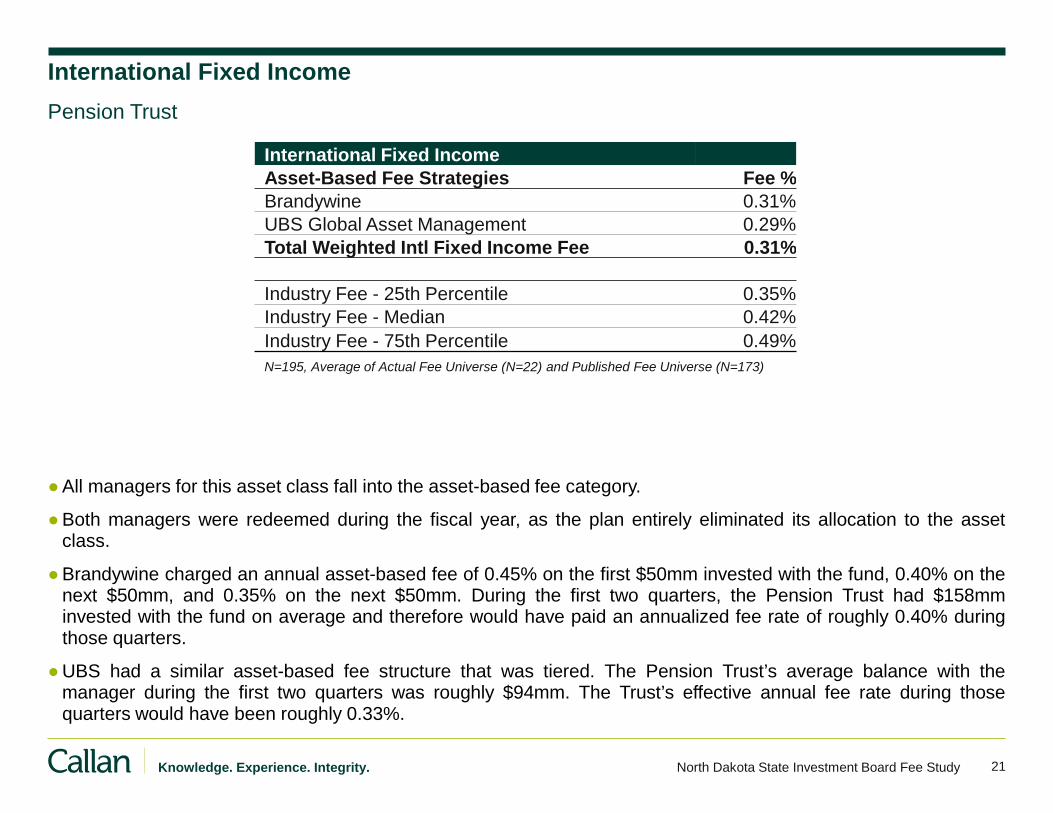
21 Knowledge. Experience. Integrity. North Dakota State Investment Board Fee Study
International Fixed Income
Asset-Based Fee Strategies Fee %
Brandywine 0.31%
UBS Global Asset Management 0.29%
Total Weighted Intl Fixed Income Fee 0.31%
Industry Fee - 25th Percentile 0.35%
Industry Fee - Median 0.42%
Industry Fee - 75th Percentile 0.49%
N=195, Average of Actual Fee Universe (N=22) and Published Fee Universe (N=173)
International Fixed Income
●All managers for this asset class fall into the asset-based fee category.
●Both managers were redeemed during the fiscal year, as the plan entirely eliminated its allocation to the asset class.
●Brandywine charged an annual asset-based fee of 0.45% on the first $50mm invested with the fund, 0.40% on the next $50mm, and 0.35% on the next $50mm. During the first two quarters, the Pension Trust had $158mm invested with the fund on average and therefore would have paid an annualized fee rate of roughly 0.40% during those quarters.
●UBS had a similar asset-based fee structure that was tiered. The Pension Trust’s average balance with the manager during the first two quarters was roughly $94mm. The Trust’s effective annual fee rate during those quarters would have been roughly 0.33%.
Pension Trust
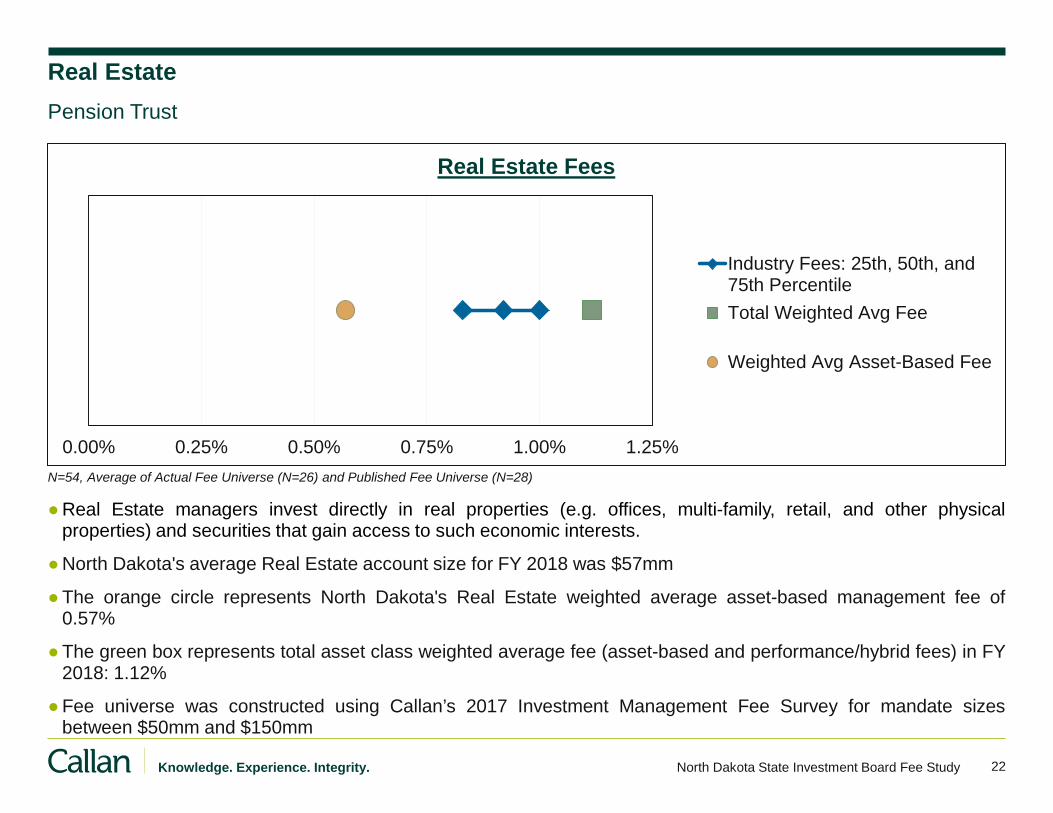
22 Knowledge. Experience. Integrity. North Dakota State Investment Board Fee Study
Real Estate
●Real Estate managers invest directly in real properties (e.g. offices, multi-family, retail, and other physical properties) and securities that gain access to such economic interests.
●North Dakota's average Real Estate account size for FY 2018 was $57mm
●The orange circle represents North Dakota's Real Estate weighted average asset-based management fee of 0.57%
●The green box represents total asset class weighted average fee (asset-based and performance/hybrid fees) in FY 2018: 1.12%
●Fee universe was constructed using Callan’s 2017 Investment Management Fee Survey for mandate sizes between $50mm and $150mm
Pension Trust
N=54, Average of Actual Fee Universe (N=26) and Published Fee Universe (N=28)
0.00% 0.25% 0.50% 0.75% 1.00% 1.25%
Real Estate Fees
Industry Fees: 25th, 50th, and75th Percentile
Total Weighted Avg Fee
Weighted Avg Asset-Based Fee
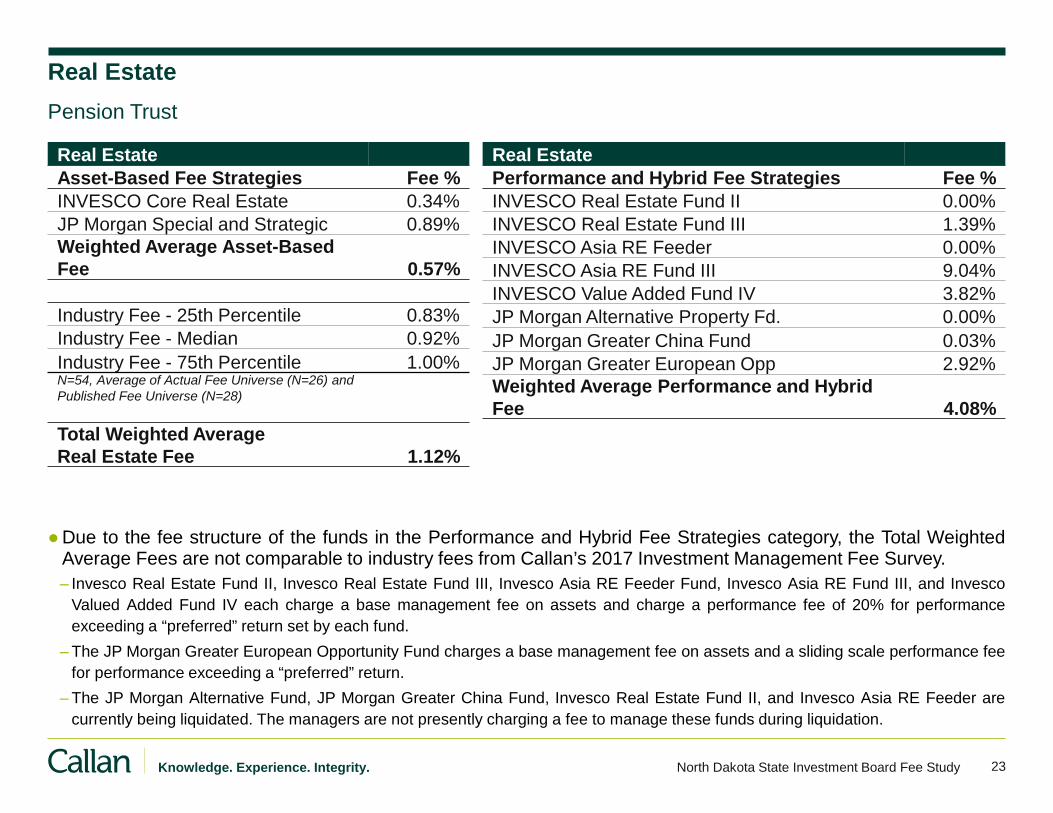
23 Knowledge. Experience. Integrity. North Dakota State Investment Board Fee Study
Real Estate
●Due to the fee structure of the funds in the Performance and Hybrid Fee Strategies category, the Total Weighted Average Fees are not comparable to industry fees from Callan’s 2017 Investment Management Fee Survey.
– Invesco Real Estate Fund II, Invesco Real Estate Fund III, Invesco Asia RE Feeder Fund, Invesco Asia RE Fund III, and Invesco
Valued Added Fund IV each charge a base management fee on assets and charge a performance fee of 20% for performance
exceeding a “preferred” return set by each fund.
– The JP Morgan Greater European Opportunity Fund charges a base management fee on assets and a sliding scale performance fee
for performance exceeding a “preferred” return.
– The JP Morgan Alternative Fund, JP Morgan Greater China Fund, Invesco Real Estate Fund II, and Invesco Asia RE Feeder are
currently being liquidated. The managers are not presently charging a fee to manage these funds during liquidation.
Pension Trust
Real Estate
Performance and Hybrid Fee Strategies Fee %
INVESCO Real Estate Fund II 0.00%
INVESCO Real Estate Fund III 1.39%
INVESCO Asia RE Feeder 0.00%
INVESCO Asia RE Fund III 9.04%
INVESCO Value Added Fund IV 3.82%
JP Morgan Alternative Property Fd. 0.00%
JP Morgan Greater China Fund 0.03%
JP Morgan Greater European Opp 2.92%
Weighted Average Performance and Hybrid
Fee 4.08%
Real Estate
Asset-Based Fee Strategies Fee %
INVESCO Core Real Estate 0.34%
JP Morgan Special and Strategic 0.89%
Weighted Average Asset-Based
Fee 0.57%
Industry Fee - 25th Percentile 0.83%
Industry Fee - Median 0.92%
Industry Fee - 75th Percentile 1.00% N=54, Average of Actual Fee Universe (N=26) and Published Fee Universe (N=28)
Total Weighted Average
Real Estate Fee 1.12%
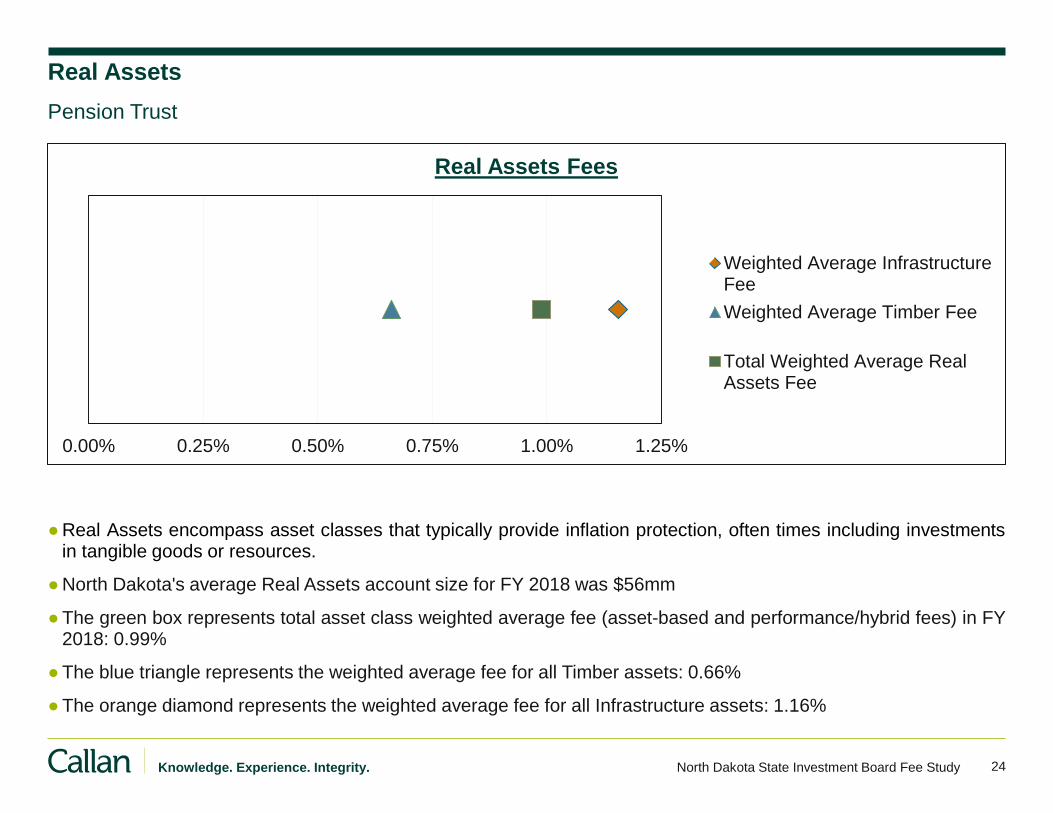
24 Knowledge. Experience. Integrity. North Dakota State Investment Board Fee Study
Real Assets
●Real Assets encompass asset classes that typically provide inflation protection, often times including investments in tangible goods or resources.
●North Dakota's average Real Assets account size for FY 2018 was $56mm
●The green box represents total asset class weighted average fee (asset-based and performance/hybrid fees) in FY 2018: 0.99%
●The blue triangle represents the weighted average fee for all Timber assets: 0.66%
●The orange diamond represents the weighted average fee for all Infrastructure assets: 1.16%
Pension Trust
0.00% 0.25% 0.50% 0.75% 1.00% 1.25%
Real Assets Fees
Weighted Average InfrastructureFee
Weighted Average Timber Fee
Total Weighted Average RealAssets Fee
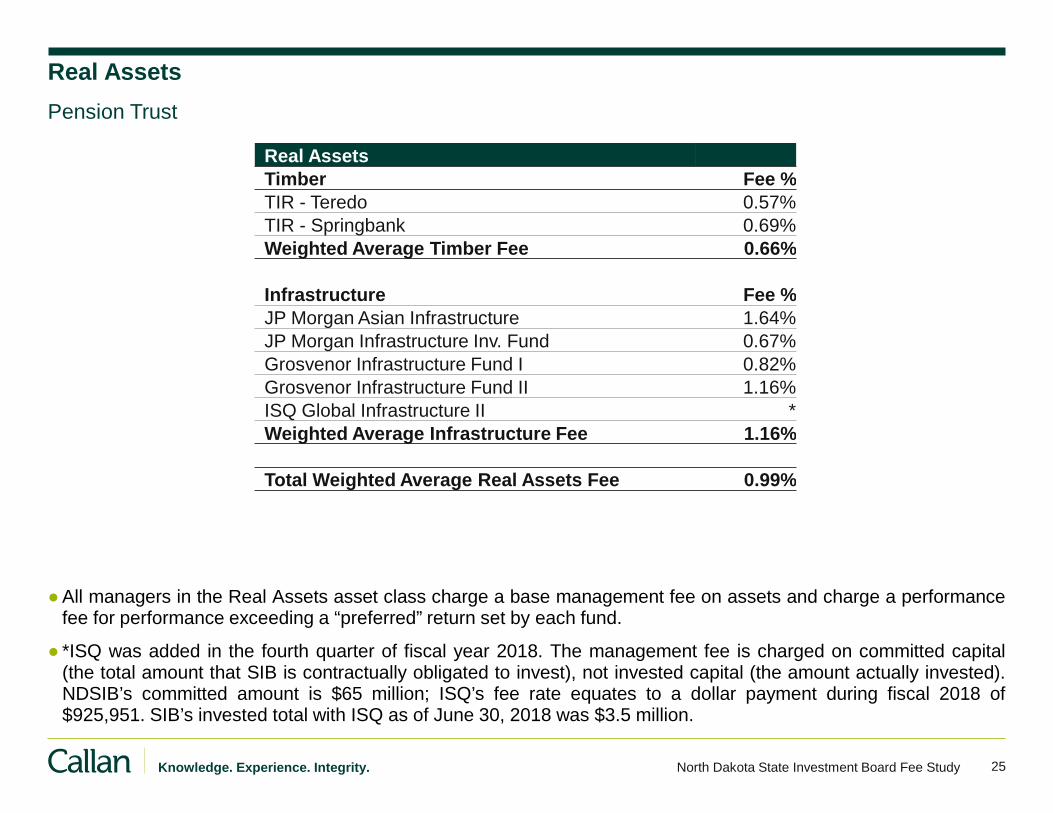
25 Knowledge. Experience. Integrity. North Dakota State Investment Board Fee Study
Real Assets
Timber Fee %
TIR - Teredo 0.57%
TIR - Springbank 0.69%
Weighted Average Timber Fee 0.66%
Infrastructure Fee %
JP Morgan Asian Infrastructure 1.64%
JP Morgan Infrastructure Inv. Fund 0.67%
Grosvenor Infrastructure Fund I 0.82%
Grosvenor Infrastructure Fund II 1.16%
ISQ Global Infrastructure II *
Weighted Average Infrastructure Fee 1.16%
Total Weighted Average Real Assets Fee 0.99%
Real Assets
●All managers in the Real Assets asset class charge a base management fee on assets and charge a performance fee for performance exceeding a “preferred” return set by each fund.
● *ISQ was added in the fourth quarter of fiscal year 2018. The management fee is charged on committed capital (the total amount that SIB is contractually obligated to invest), not invested capital (the amount actually invested). NDSIB’s committed amount is $65 million; ISQ’s fee rate equates to a dollar payment during fiscal 2018 of $925,951. SIB’s invested total with ISQ as of June 30, 2018 was $3.5 million.
Pension Trust
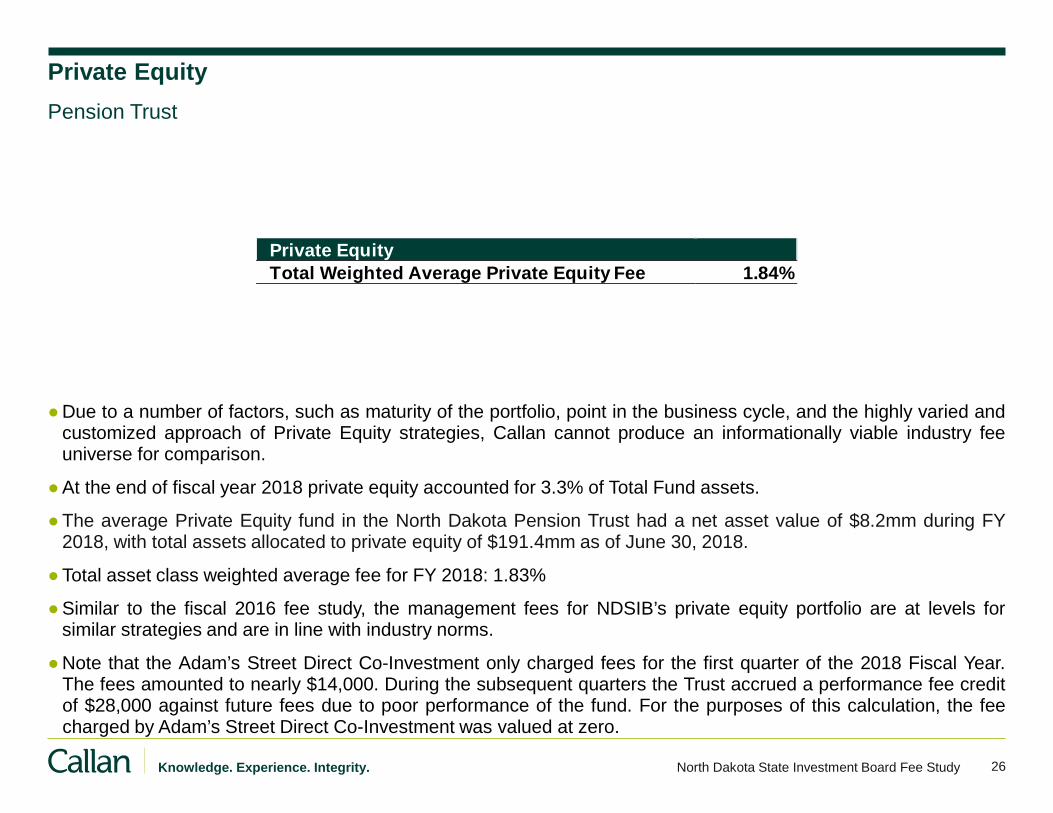
26 Knowledge. Experience. Integrity. North Dakota State Investment Board Fee Study
Private Equity
Total Weighted Average Private Equity Fee 1.84%
Private Equity
●Due to a number of factors, such as maturity of the portfolio, point in the business cycle, and the highly varied and customized approach of Private Equity strategies, Callan cannot produce an informationally viable industry fee universe for comparison.
●At the end of fiscal year 2018 private equity accounted for 3.3% of Total Fund assets.
●The average Private Equity fund in the North Dakota Pension Trust had a net asset value of $8.2mm during FY 2018, with total assets allocated to private equity of $191.4mm as of June 30, 2018.
●Total asset class weighted average fee for FY 2018: 1.83%
●Similar to the fiscal 2016 fee study, the management fees for NDSIB’s private equity portfolio are at levels for similar strategies and are in line with industry norms.
●Note that the Adam’s Street Direct Co-Investment only charged fees for the first quarter of the 2018 Fiscal Year. The fees amounted to nearly $14,000. During the subsequent quarters the Trust accrued a performance fee credit of $28,000 against future fees due to poor performance of the fund. For the purposes of this calculation, the fee charged by Adam’s Street Direct Co-Investment was valued at zero.
Pension Trust
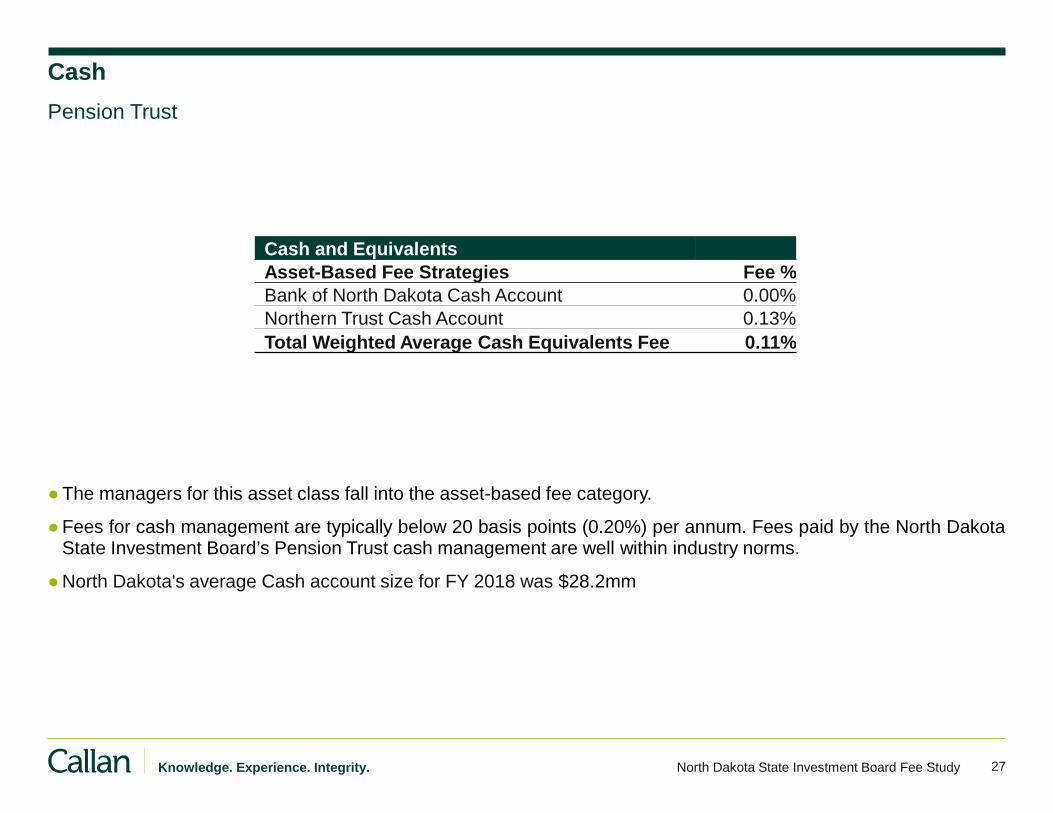
27 Knowledge. Experience. Integrity. North Dakota State Investment Board Fee Study
Cash and Equivalents
Asset-Based Fee Strategies Fee %
Bank of North Dakota Cash Account 0.00%
Northern Trust Cash Account 0.13%
Total Weighted Average Cash Equivalents Fee 0.11%
Cash
●The managers for this asset class fall into the asset-based fee category.
●Fees for cash management are typically below 20 basis points (0.20%) per annum. Fees paid by the North Dakota State Investment Board’s Pension Trust cash management are well within industry norms.
●North Dakota's average Cash account size for FY 2018 was $28.2mm
Pension Trust

Insurance Trust
29 Knowledge. Experience. Integrity. North Dakota State Investment Board Fee Study
Insurance Trust
●Total Equity Manager fees paid represented a mix of asset-based and performance/hybrid fee strategies. In aggregate all equity strategy composites had fees below their respective 25th percentiles.
– Total Domestic Large Cap Equity fees were well below the 25th percentile of the industry fee universe
– Total Small Cap Equity fees were well below the 25th percentile, with the Trust having paid no performance based fees during the fiscal year
– Total Developed International Equity fees were below the 25th percentile and represented only asset-based fee strategies
●Total Domestic Fixed Income Manager fees paid represented a mix of asset-based and performance/hybrid fee strategies.
– Total Domestic Fixed Income fees paid were above the 75th percentile, driven largely by performance/hybrid fee based strategies, while total
asset-based fee strategies were below the median
●Diversified Real Assets Manager fees paid represented a mix of asset-based and performance/hybrid fee strategies spanning public and private markets. asset-based fee strategies fell below the 25th percentile with performance/hybrid fee strategies pushing the total fees rate paid higher, but still below the 25th percentile.
– Due to the custom nature of non-core public strategies and their closed-end fund structures, there is no applicable manager fee distribution and
so it presents a skew to the asset-based fee universe for the comparison
●Total Real Estate manager fees paid represented asset-based fee strategies only.
– Total Real Estate manager fees paid were well below the 25th percentile
●Short-term Fixed Income manager fees paid represented asset-based fee strategies only.
– Fees paid fell below the 25th percentile of the strategy universe
NDSIB Fee Study Fiscal Year 2018 Executive Summary
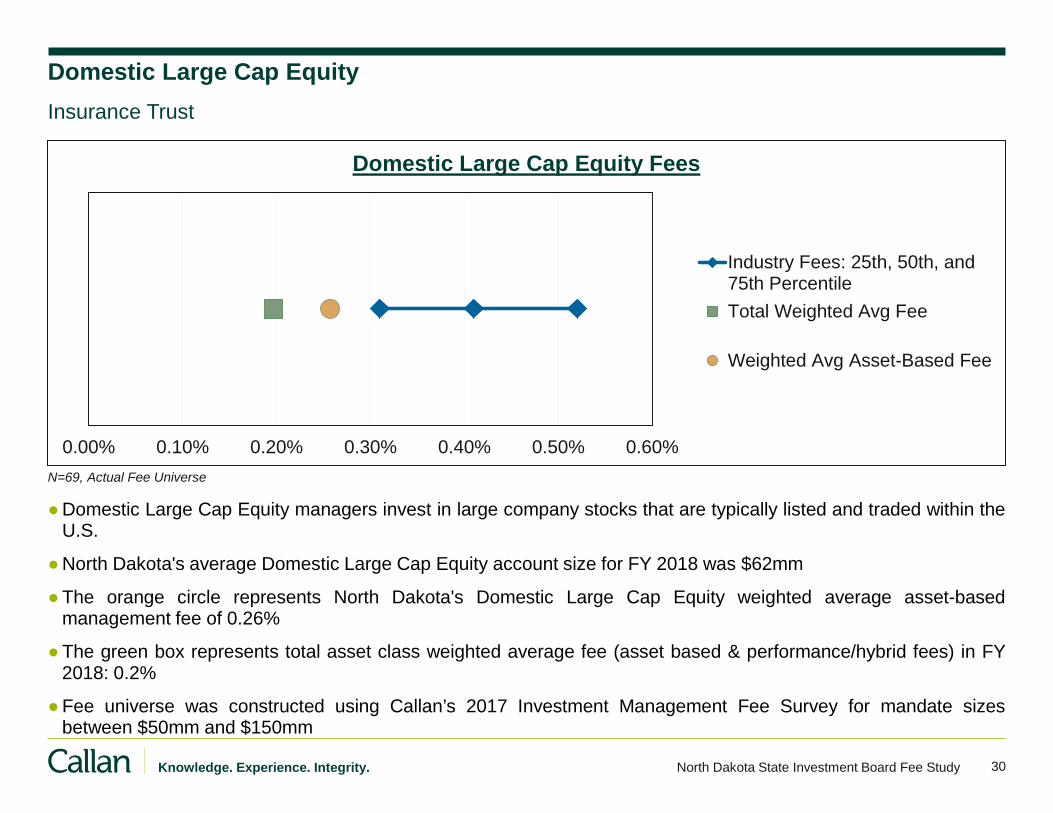
30 Knowledge. Experience. Integrity. North Dakota State Investment Board Fee Study
Domestic Large Cap Equity
●Domestic Large Cap Equity managers invest in large company stocks that are typically listed and traded within the U.S.
●North Dakota's average Domestic Large Cap Equity account size for FY 2018 was $62mm
●The orange circle represents North Dakota's Domestic Large Cap Equity weighted average asset-based management fee of 0.26%
●The green box represents total asset class weighted average fee (asset based & performance/hybrid fees) in FY 2018: 0.2%
●Fee universe was constructed using Callan’s 2017 Investment Management Fee Survey for mandate sizes between $50mm and $150mm
Insurance Trust
N=69, Actual Fee Universe
0.00% 0.10% 0.20% 0.30% 0.40% 0.50% 0.60%
Domestic Large Cap Equity Fees
Industry Fees: 25th, 50th, and75th Percentile
Total Weighted Avg Fee
Weighted Avg Asset-Based Fee
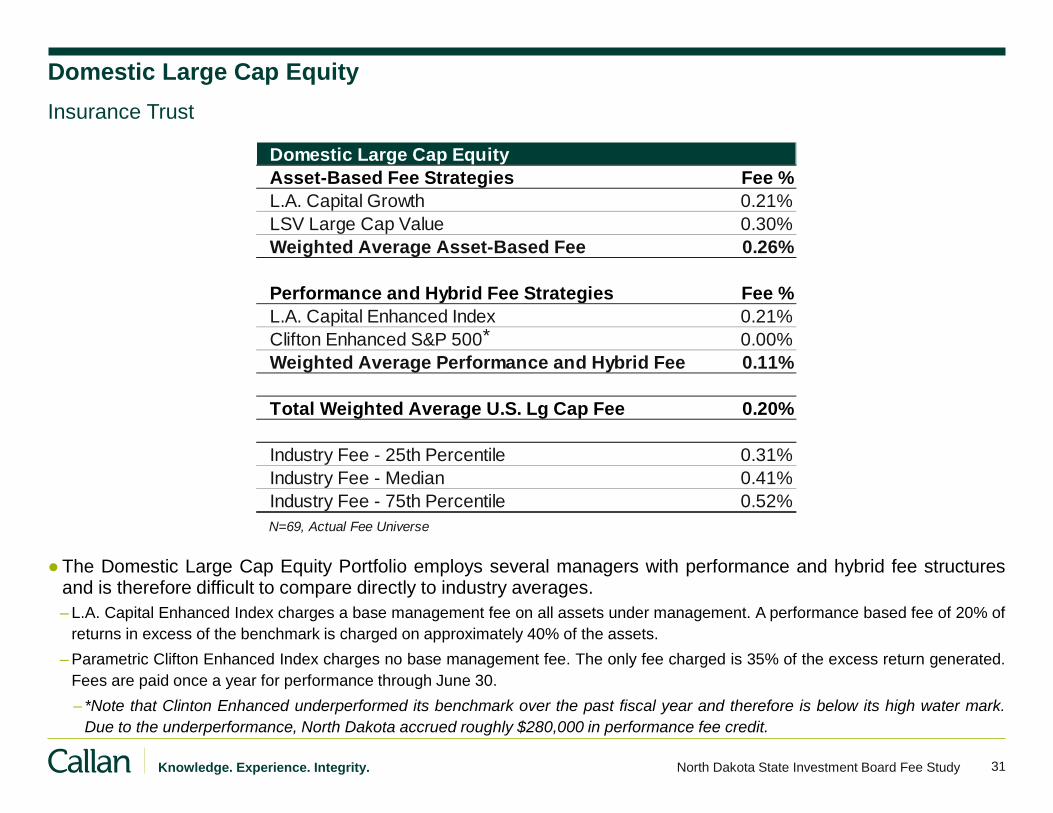
31 Knowledge. Experience. Integrity. North Dakota State Investment Board Fee Study
Domestic Large Cap Equity
●The Domestic Large Cap Equity Portfolio employs several managers with performance and hybrid fee structures and is therefore difficult to compare directly to industry averages.
– L.A. Capital Enhanced Index charges a base management fee on all assets under management. A performance based fee of 20% of
returns in excess of the benchmark is charged on approximately 40% of the assets.
– Parametric Clifton Enhanced Index charges no base management fee. The only fee charged is 35% of the excess return generated.
Fees are paid once a year for performance through June 30.
– *Note that Clinton Enhanced underperformed its benchmark over the past fiscal year and therefore is below its high water mark. Due to the underperformance, North Dakota accrued roughly $280,000 in performance fee credit.
Insurance Trust
Domestic Large Cap Equity
Asset-Based Fee Strategies Fee %
L.A. Capital Growth 0.21%
LSV Large Cap Value 0.30%
Weighted Average Asset-Based Fee 0.26%
Performance and Hybrid Fee Strategies Fee %
L.A. Capital Enhanced Index 0.21%
Clifton Enhanced S&P 500 0.00%
Weighted Average Performance and Hybrid Fee 0.11%
Total Weighted Average U.S. Lg Cap Fee 0.20%
Industry Fee - 25th Percentile 0.31%
Industry Fee - Median 0.41%
Industry Fee - 75th Percentile 0.52%
N=69, Actual Fee Universe
*
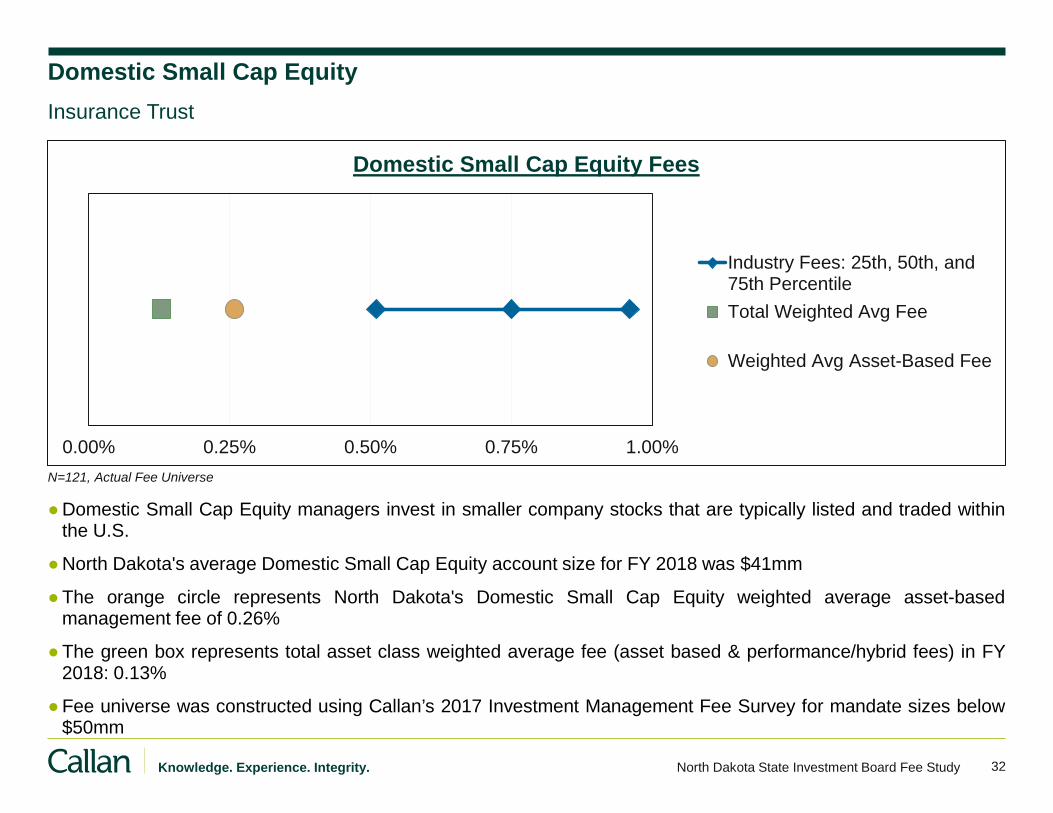
32 Knowledge. Experience. Integrity. North Dakota State Investment Board Fee Study
Domestic Small Cap Equity
●Domestic Small Cap Equity managers invest in smaller company stocks that are typically listed and traded within the U.S.
●North Dakota's average Domestic Small Cap Equity account size for FY 2018 was $41mm
●The orange circle represents North Dakota's Domestic Small Cap Equity weighted average asset-based management fee of 0.26%
●The green box represents total asset class weighted average fee (asset based & performance/hybrid fees) in FY 2018: 0.13%
●Fee universe was constructed using Callan’s 2017 Investment Management Fee Survey for mandate sizes below $50mm
Insurance Trust
N=121, Actual Fee Universe
0.00% 0.25% 0.50% 0.75% 1.00%
Domestic Small Cap Equity Fees
Industry Fees: 25th, 50th, and75th Percentile
Total Weighted Avg Fee
Weighted Avg Asset-Based Fee
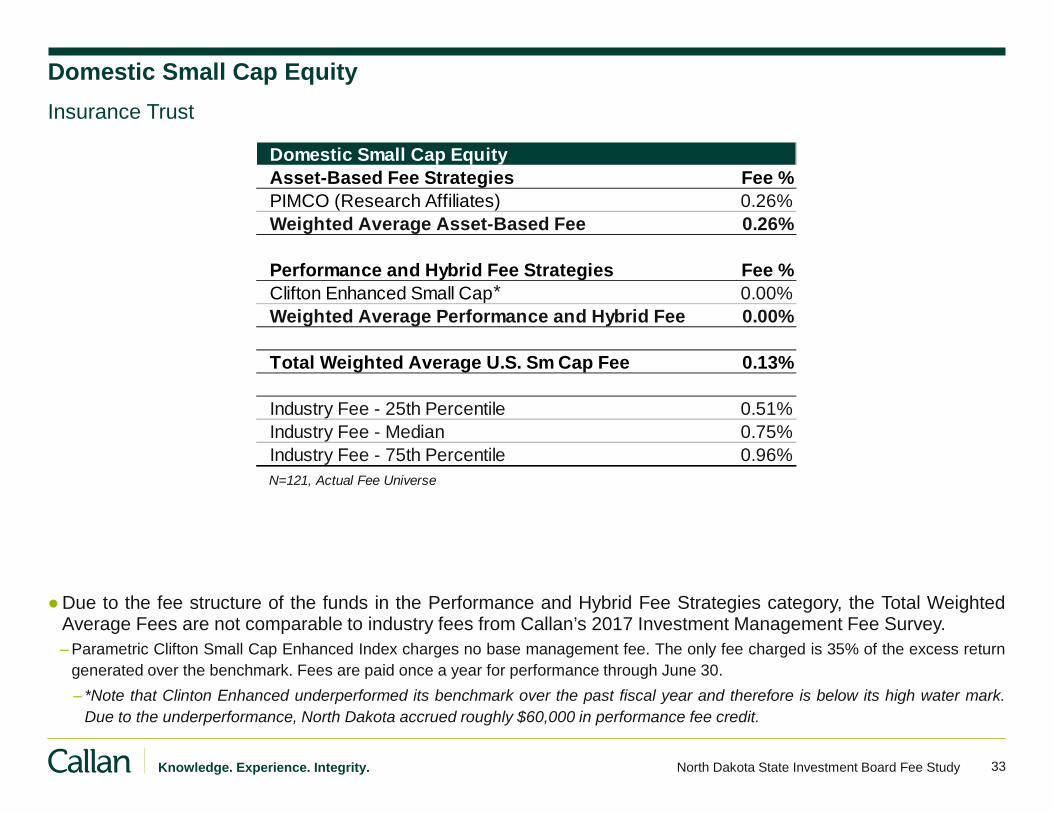
33 Knowledge. Experience. Integrity. North Dakota State Investment Board Fee Study
Domestic Small Cap Equity
●Due to the fee structure of the funds in the Performance and Hybrid Fee Strategies category, the Total Weighted Average Fees are not comparable to industry fees from Callan’s 2017 Investment Management Fee Survey.
– Parametric Clifton Small Cap Enhanced Index charges no base management fee. The only fee charged is 35% of the excess return
generated over the benchmark. Fees are paid once a year for performance through June 30.
– *Note that Clinton Enhanced underperformed its benchmark over the past fiscal year and therefore is below its high water mark. Due to the underperformance, North Dakota accrued roughly $60,000 in performance fee credit.
Insurance Trust
Domestic Small Cap Equity
Asset-Based Fee Strategies Fee %
PIMCO (Research Affiliates) 0.26%
Weighted Average Asset-Based Fee 0.26%
Performance and Hybrid Fee Strategies Fee %
Clifton Enhanced Small Cap 0.00%
Weighted Average Performance and Hybrid Fee 0.00%
Total Weighted Average U.S. Sm Cap Fee 0.13%
Industry Fee - 25th Percentile 0.51%
Industry Fee - Median 0.75%
Industry Fee - 75th Percentile 0.96%
N=121, Actual Fee Universe
*
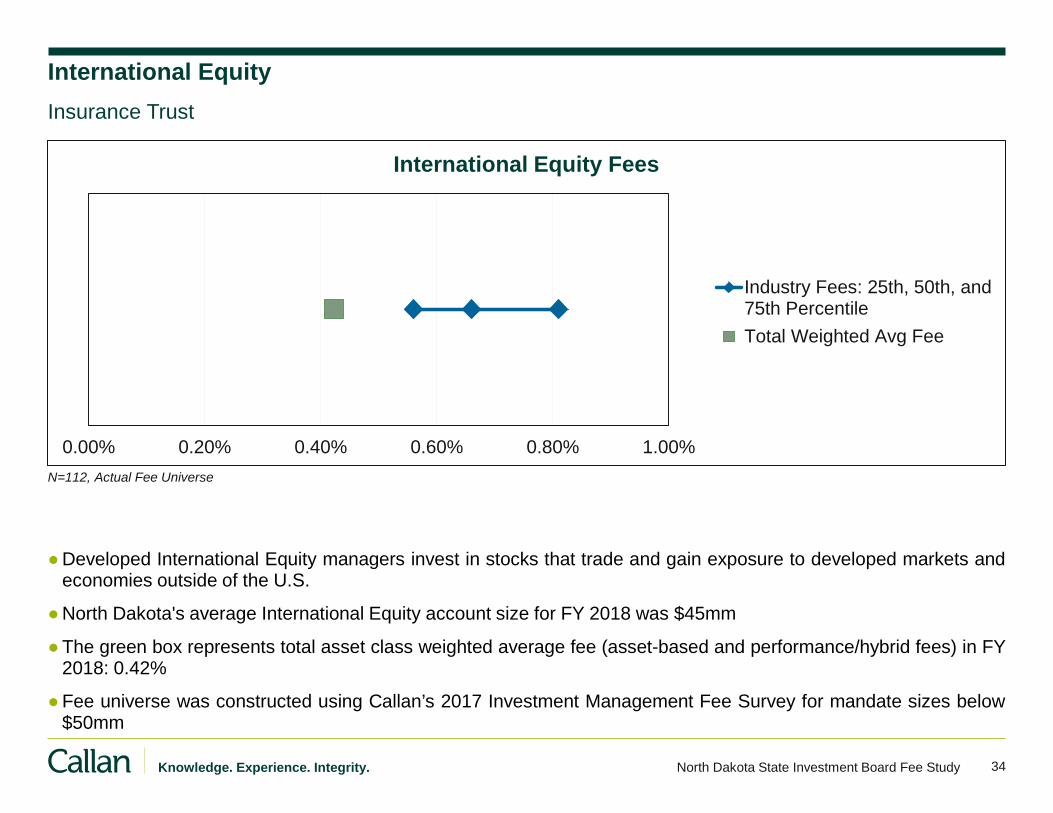
34 Knowledge. Experience. Integrity. North Dakota State Investment Board Fee Study
International Equity
●Developed International Equity managers invest in stocks that trade and gain exposure to developed markets and economies outside of the U.S.
●North Dakota's average International Equity account size for FY 2018 was $45mm
●The green box represents total asset class weighted average fee (asset-based and performance/hybrid fees) in FY 2018: 0.42%
●Fee universe was constructed using Callan’s 2017 Investment Management Fee Survey for mandate sizes below $50mm
Insurance Trust
N=112, Actual Fee Universe
0.00% 0.20% 0.40% 0.60% 0.80% 1.00%
International Equity Fees
Industry Fees: 25th, 50th, and75th Percentile
Total Weighted Avg Fee

35 Knowledge. Experience. Integrity. North Dakota State Investment Board Fee Study
International Equity
●All managers for this asset class fall into the asset-based fee category.
Insurance Trust
International Equity
Asset-Based Fee Strategies Fee %
LSV International Value 0.40%
DFA Int'l Small Cap 0.69%
William Blair 0.39%
Vanguard Int'l Explorer Fund 0.38%
Total Weighted Average Intl Equity Fee 0.42%
Industry Fee - 25th Percentile 0.56%
Industry Fee - Median 0.66%
Industry Fee - 75th Percentile 0.81%
N=112, Actual Fee Universe
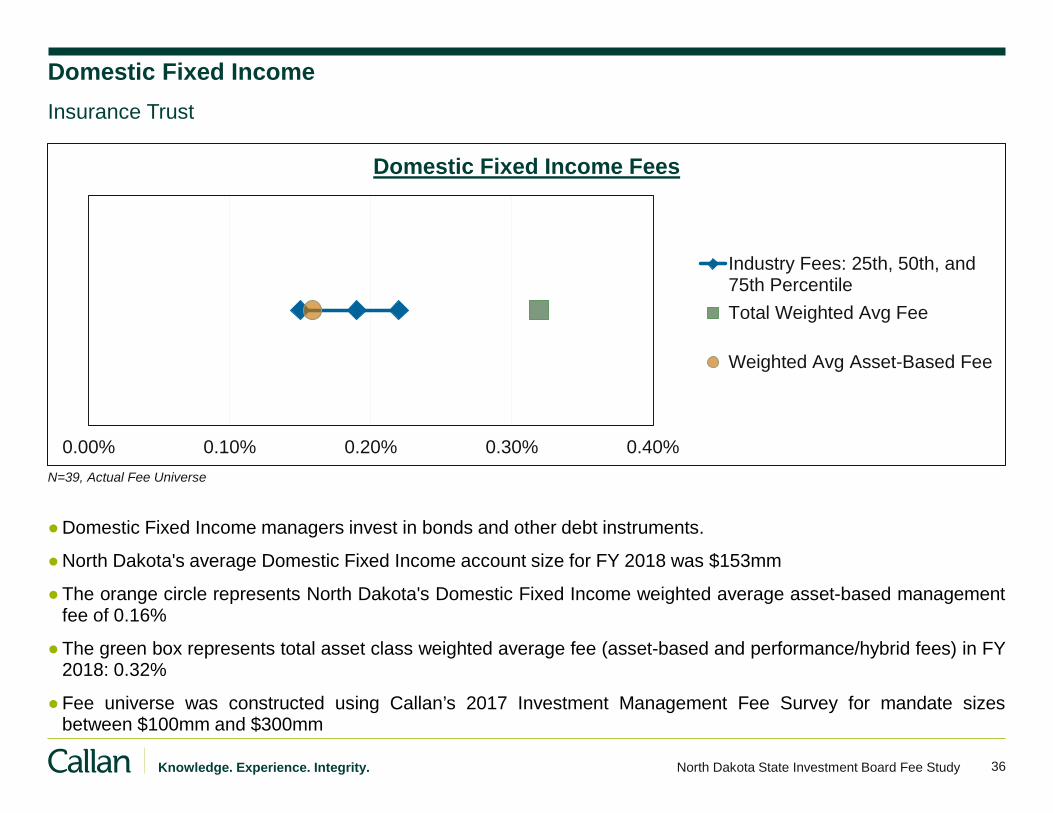
36 Knowledge. Experience. Integrity. North Dakota State Investment Board Fee Study
Domestic Fixed Income
●Domestic Fixed Income managers invest in bonds and other debt instruments.
●North Dakota's average Domestic Fixed Income account size for FY 2018 was $153mm
●The orange circle represents North Dakota's Domestic Fixed Income weighted average asset-based management fee of 0.16%
●The green box represents total asset class weighted average fee (asset-based and performance/hybrid fees) in FY 2018: 0.32%
●Fee universe was constructed using Callan’s 2017 Investment Management Fee Survey for mandate sizes between $100mm and $300mm
Insurance Trust
N=39, Actual Fee Universe
0.00% 0.10% 0.20% 0.30% 0.40%
Domestic Fixed Income Fees
Industry Fees: 25th, 50th, and75th Percentile
Total Weighted Avg Fee
Weighted Avg Asset-Based Fee
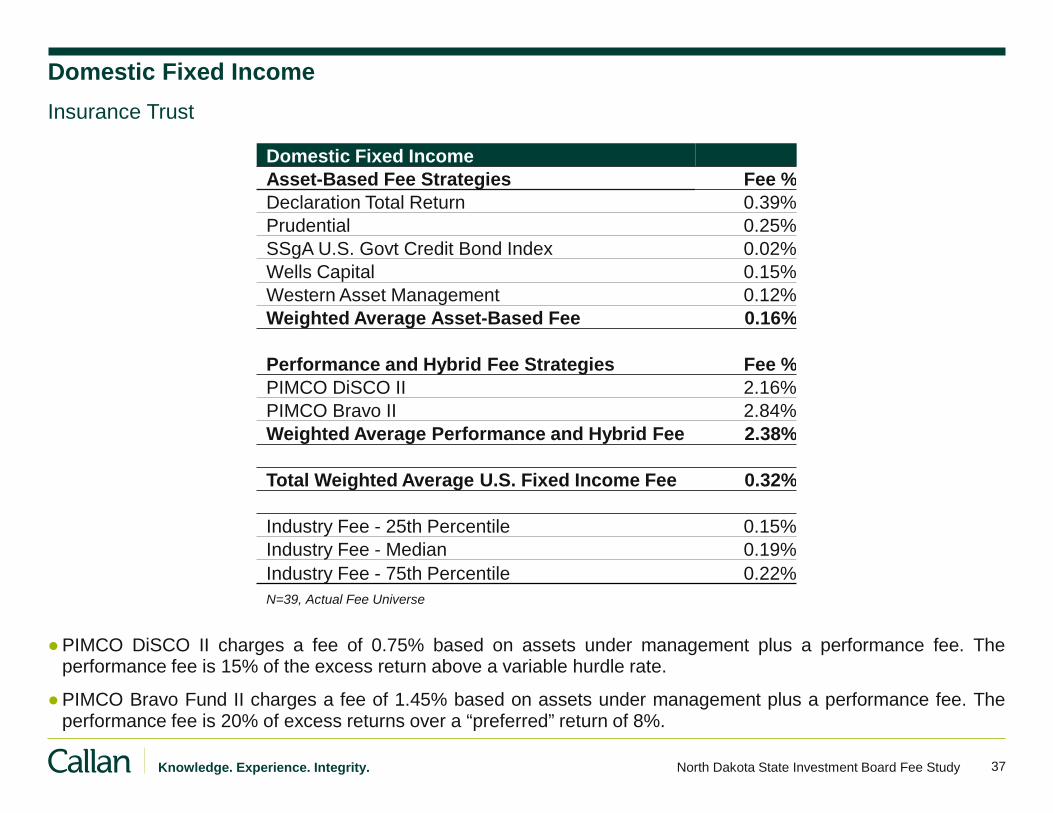
37 Knowledge. Experience. Integrity. North Dakota State Investment Board Fee Study
Domestic Fixed Income
Asset-Based Fee Strategies Fee %
Declaration Total Return 0.39%
Prudential 0.25%
SSgA U.S. Govt Credit Bond Index 0.02%
Wells Capital 0.15%
Western Asset Management 0.12%
Weighted Average Asset-Based Fee 0.16%
Performance and Hybrid Fee Strategies Fee %
PIMCO DiSCO II 2.16%
PIMCO Bravo II 2.84%
Weighted Average Performance and Hybrid Fee 2.38%
Total Weighted Average U.S. Fixed Income Fee 0.32%
Industry Fee - 25th Percentile 0.15%
Industry Fee - Median 0.19%
Industry Fee - 75th Percentile 0.22%
N=39, Actual Fee Universe
Domestic Fixed Income
●PIMCO DiSCO II charges a fee of 0.75% based on assets under management plus a performance fee. The performance fee is 15% of the excess return above a variable hurdle rate.
●PIMCO Bravo Fund II charges a fee of 1.45% based on assets under management plus a performance fee. The performance fee is 20% of excess returns over a “preferred” return of 8%.
Insurance Trust
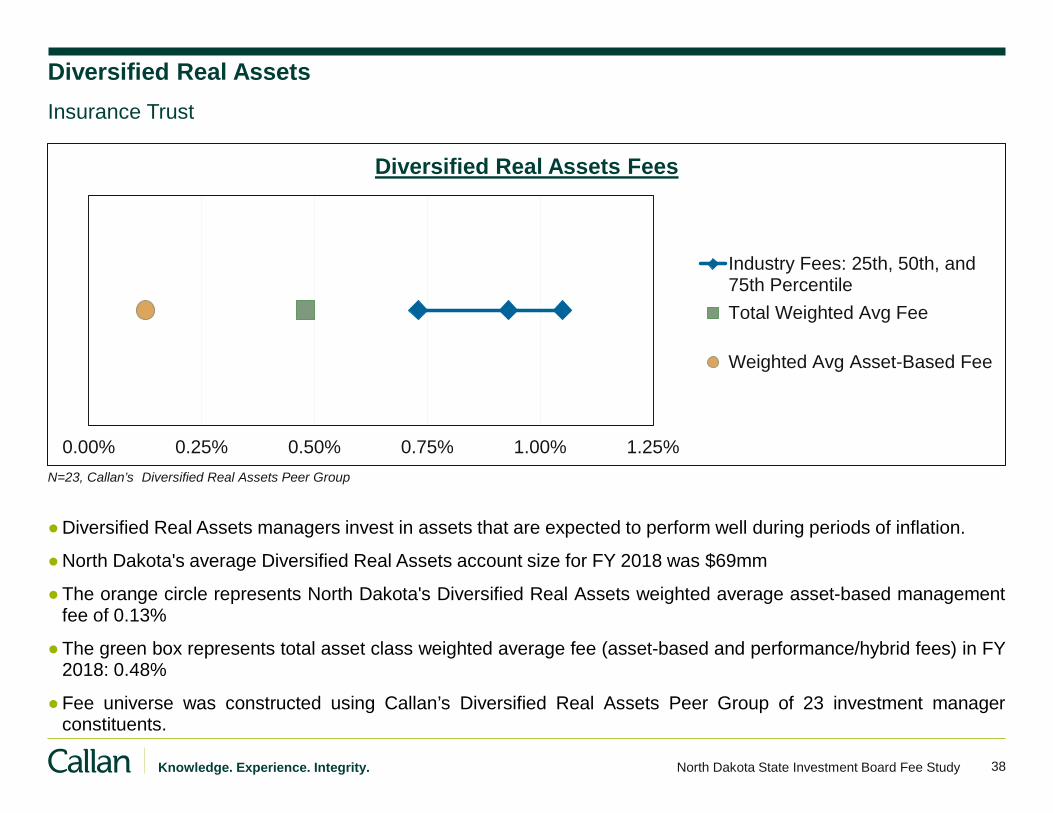
38 Knowledge. Experience. Integrity. North Dakota State Investment Board Fee Study
Diversified Real Assets
●Diversified Real Assets managers invest in assets that are expected to perform well during periods of inflation.
●North Dakota's average Diversified Real Assets account size for FY 2018 was $69mm
●The orange circle represents North Dakota's Diversified Real Assets weighted average asset-based management fee of 0.13%
●The green box represents total asset class weighted average fee (asset-based and performance/hybrid fees) in FY 2018: 0.48%
●Fee universe was constructed using Callan’s Diversified Real Assets Peer Group of 23 investment manager constituents.
Insurance Trust
N=23, Callan’s Diversified Real Assets Peer Group
0.00% 0.25% 0.50% 0.75% 1.00% 1.25%
Diversified Real Assets Fees
Industry Fees: 25th, 50th, and75th Percentile
Total Weighted Avg Fee
Weighted Avg Asset-Based Fee
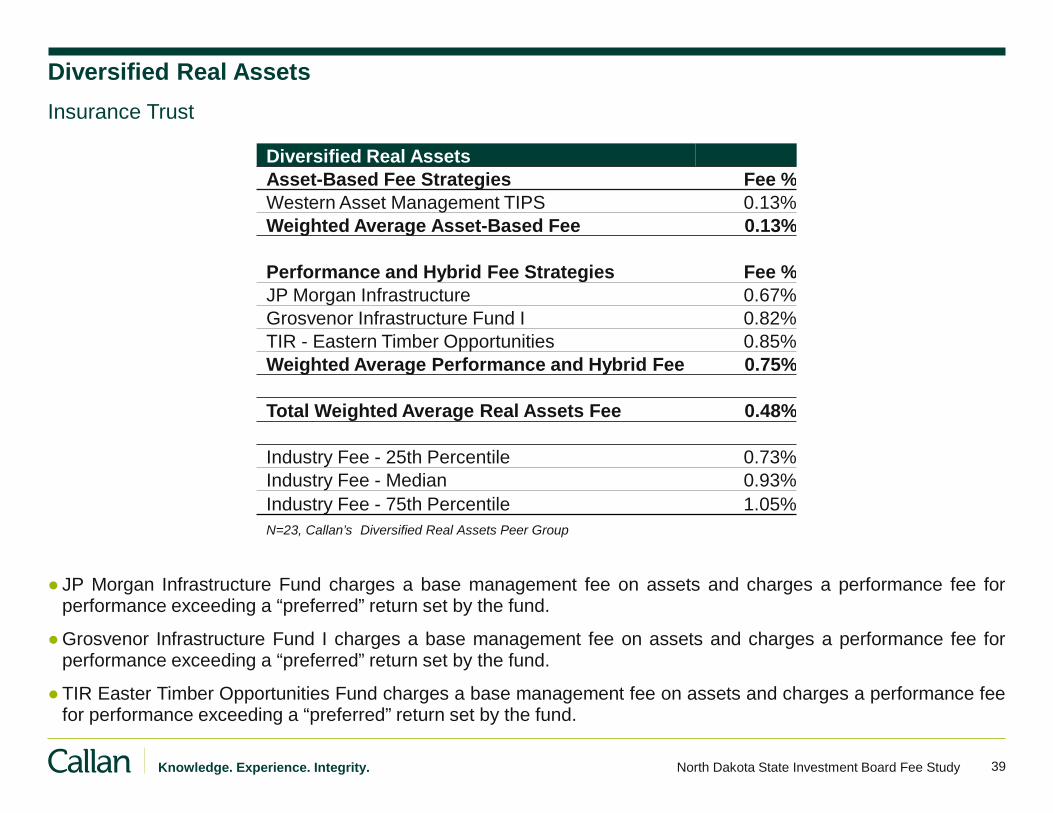
39 Knowledge. Experience. Integrity. North Dakota State Investment Board Fee Study
Diversified Real Assets
● JP Morgan Infrastructure Fund charges a base management fee on assets and charges a performance fee for performance exceeding a “preferred” return set by the fund.
●Grosvenor Infrastructure Fund I charges a base management fee on assets and charges a performance fee for performance exceeding a “preferred” return set by the fund.
●TIR Easter Timber Opportunities Fund charges a base management fee on assets and charges a performance fee for performance exceeding a “preferred” return set by the fund.
Insurance Trust
Diversified Real Assets
Asset-Based Fee Strategies Fee %
Western Asset Management TIPS 0.13%
Weighted Average Asset-Based Fee 0.13%
Performance and Hybrid Fee Strategies Fee %
JP Morgan Infrastructure 0.67%
Grosvenor Infrastructure Fund I 0.82%
TIR - Eastern Timber Opportunities 0.85%
Weighted Average Performance and Hybrid Fee 0.75%
Total Weighted Average Real Assets Fee 0.48%
Industry Fee - 25th Percentile 0.73%
Industry Fee - Median 0.93%
Industry Fee - 75th Percentile 1.05%
N=23, Callan’s Diversified Real Assets Peer Group
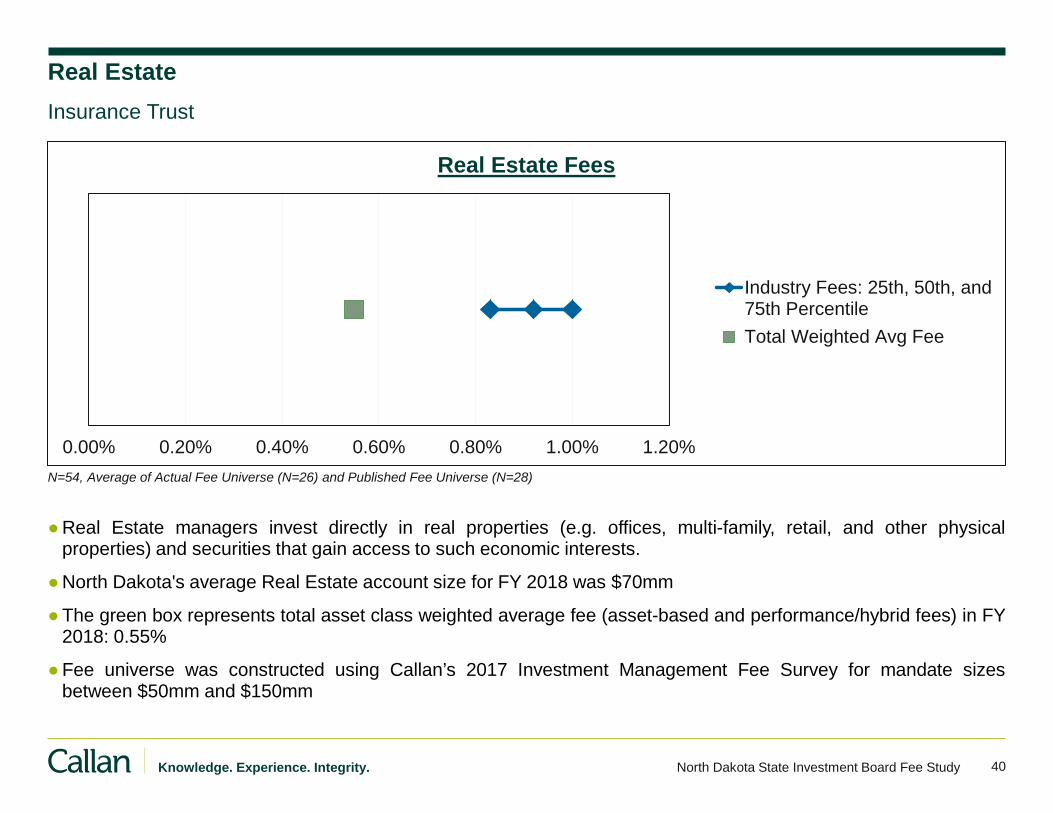
40 Knowledge. Experience. Integrity. North Dakota State Investment Board Fee Study
Real Estate
●Real Estate managers invest directly in real properties (e.g. offices, multi-family, retail, and other physical properties) and securities that gain access to such economic interests.
●North Dakota's average Real Estate account size for FY 2018 was $70mm
●The green box represents total asset class weighted average fee (asset-based and performance/hybrid fees) in FY 2018: 0.55%
●Fee universe was constructed using Callan’s 2017 Investment Management Fee Survey for mandate sizes between $50mm and $150mm
Insurance Trust
N=54, Average of Actual Fee Universe (N=26) and Published Fee Universe (N=28)
0.00% 0.20% 0.40% 0.60% 0.80% 1.00% 1.20%
Real Estate Fees
Industry Fees: 25th, 50th, and75th Percentile
Total Weighted Avg Fee
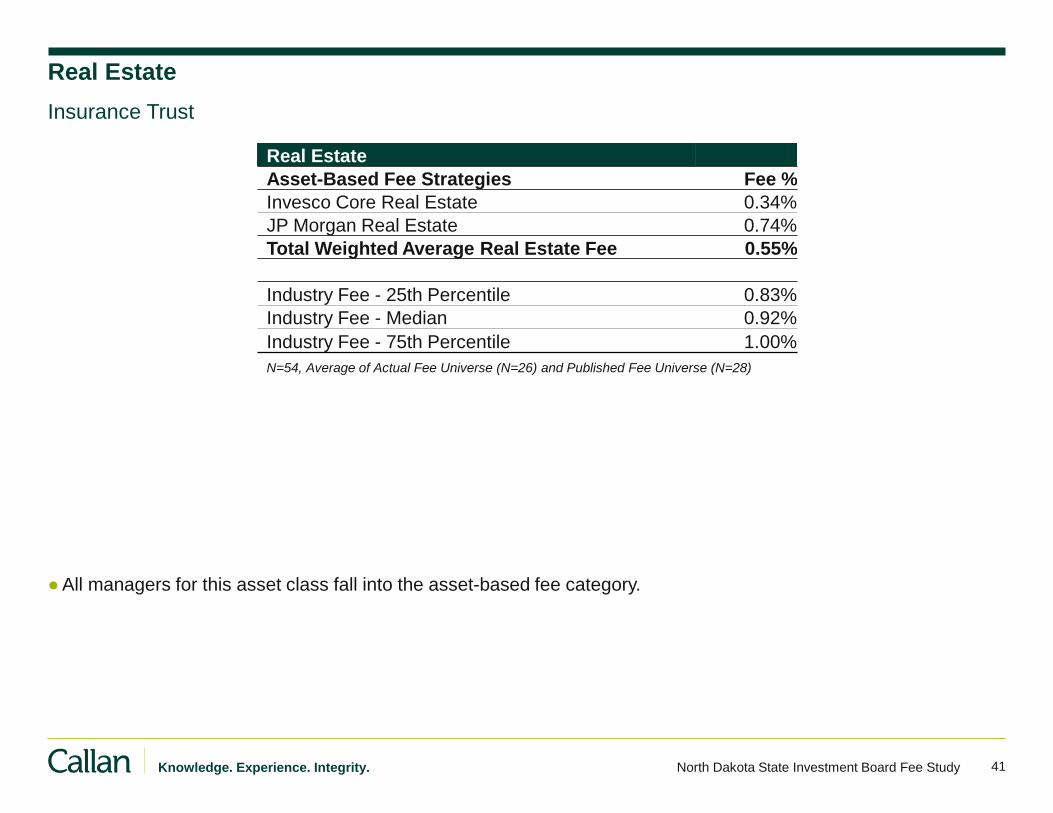
41 Knowledge. Experience. Integrity. North Dakota State Investment Board Fee Study
Real Estate
●All managers for this asset class fall into the asset-based fee category.
Insurance Trust
Real Estate
Asset-Based Fee Strategies Fee %
Invesco Core Real Estate 0.34%
JP Morgan Real Estate 0.74%
Total Weighted Average Real Estate Fee 0.55%
Industry Fee - 25th Percentile 0.83%
Industry Fee - Median 0.92%
Industry Fee - 75th Percentile 1.00%
N=54, Average of Actual Fee Universe (N=26) and Published Fee Universe (N=28)
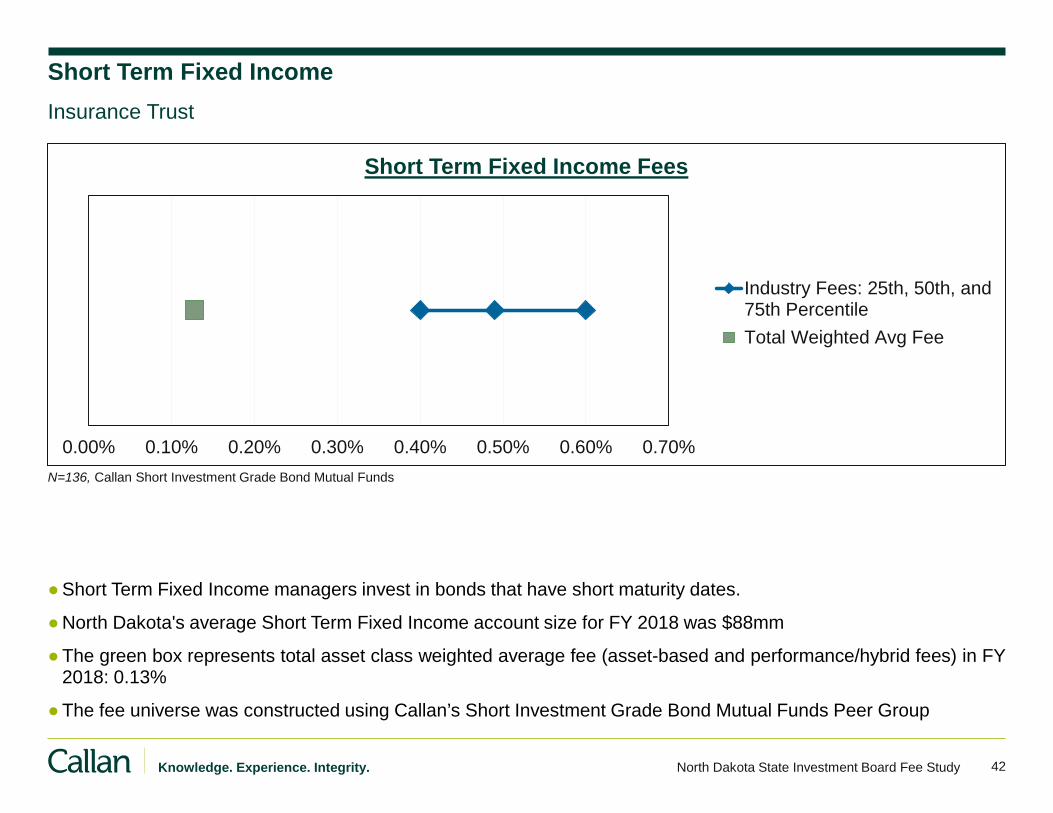
42 Knowledge. Experience. Integrity. North Dakota State Investment Board Fee Study
Short Term Fixed Income
●Short Term Fixed Income managers invest in bonds that have short maturity dates.
●North Dakota's average Short Term Fixed Income account size for FY 2018 was $88mm
●The green box represents total asset class weighted average fee (asset-based and performance/hybrid fees) in FY 2018: 0.13%
●The fee universe was constructed using Callan’s Short Investment Grade Bond Mutual Funds Peer Group
Insurance Trust
N=136, Callan Short Investment Grade Bond Mutual Funds
0.00% 0.10% 0.20% 0.30% 0.40% 0.50% 0.60% 0.70%
Short Term Fixed Income Fees
Industry Fees: 25th, 50th, and75th Percentile
Total Weighted Avg Fee
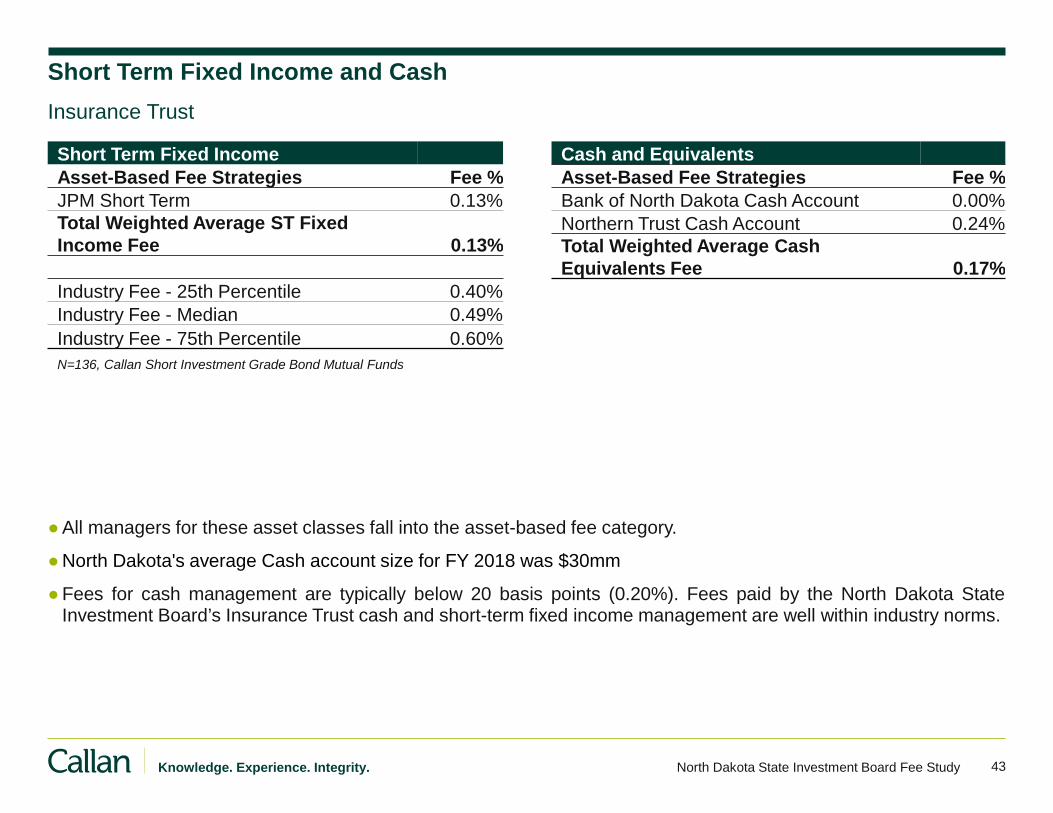
43 Knowledge. Experience. Integrity. North Dakota State Investment Board Fee Study
Short Term Fixed Income and Cash
●All managers for these asset classes fall into the asset-based fee category.
●North Dakota's average Cash account size for FY 2018 was $30mm
●Fees for cash management are typically below 20 basis points (0.20%). Fees paid by the North Dakota State Investment Board’s Insurance Trust cash and short-term fixed income management are well within industry norms.
Insurance Trust
Short Term Fixed Income
Asset-Based Fee Strategies Fee %
JPM Short Term 0.13%
Total Weighted Average ST Fixed
Income Fee 0.13%
Industry Fee - 25th Percentile 0.40%
Industry Fee - Median 0.49%
Industry Fee - 75th Percentile 0.60%
N=136, Callan Short Investment Grade Bond Mutual Funds
Cash and Equivalents
Asset-Based Fee Strategies Fee %
Bank of North Dakota Cash Account 0.00%
Northern Trust Cash Account 0.24%
Total Weighted Average Cash
Equivalents Fee 0.17%
Legacy Trust
45 Knowledge. Experience. Integrity. North Dakota State Investment Board Fee Study
Legacy Trust
●Total Equity Manager fees paid represented a mix of asset-based and performance/hybrid fee strategies.
– Total Domestic Large Cap Equity fees were below the 25th percentile of industry fees. The average fees paid by the Trust were pressed lower
by performance based fee structures.
– Total Small Cap Equity fees were well below the 25th percentile with performance based fee strategies lower than asset-based fee strategies.
– Developed International Equity fees were slightly below the 25th percentile and represented only asset-based fee strategies.
●Total Domestic Fixed Income Manager fees paid represented both asset-based and performance/hybrid fee strategies.
– Total Domestic Fixed Income fees paid were above the 75th percentile of industry fees. This was largely due to the impact of performance-based
fee schedules. Asset based fees paid by the trust were on par with the 25th percentile of industry fees.
●Diversified Real Assets Manager fees paid represented a mix of asset-based and performance/hybrid fee strategies spanning public and private markets. Asset based fee strategies fell well below the 25th percentile, with performance/hybrid fee strategies pushing the total fees paid higher, but still below the 25th percentile.
– Due to the custom nature of the private strategies and their closed-end fund structures, there is no applicable manager fee distribution and so it
presents a skew to the asset-based fee universe for the comparison
●Total Real Estate manager fees paid represented asset-based fee strategies only.
– Total Real Estate manager fees paid were well below the 25th percentile
NDSIB Fee Study Fiscal Year 2018 Executive Summary
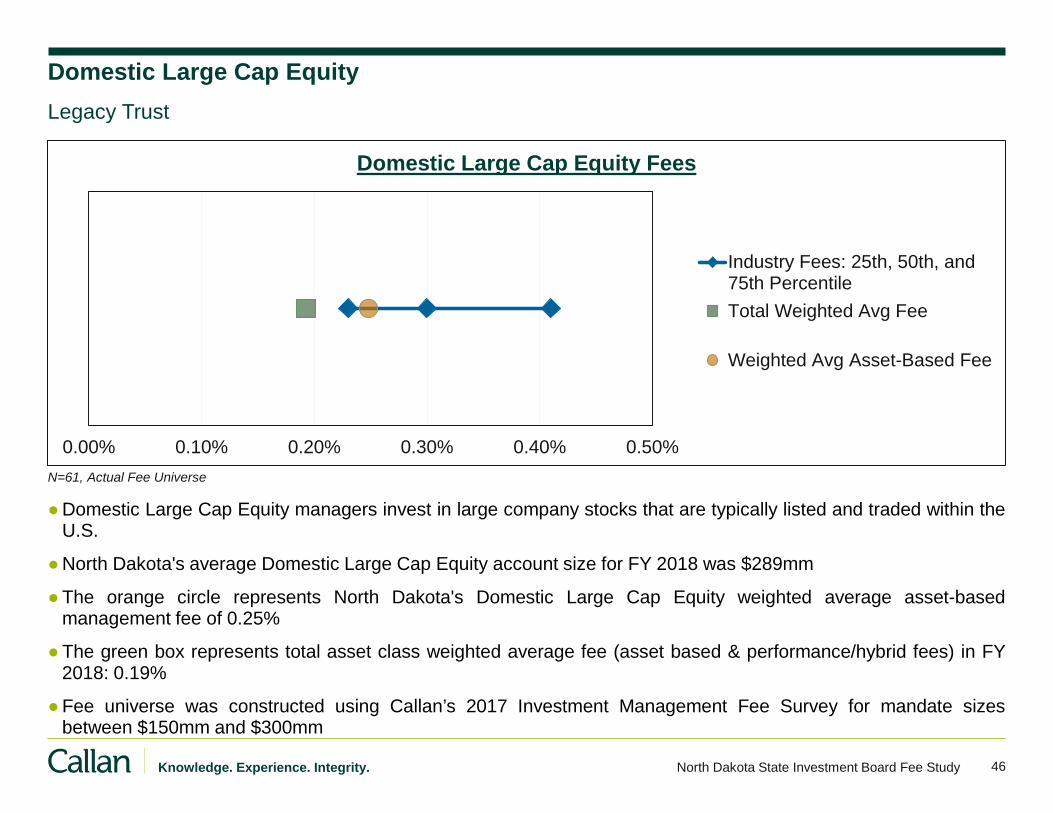
46 Knowledge. Experience. Integrity. North Dakota State Investment Board Fee Study
Domestic Large Cap Equity
●Domestic Large Cap Equity managers invest in large company stocks that are typically listed and traded within the U.S.
●North Dakota's average Domestic Large Cap Equity account size for FY 2018 was $289mm
●The orange circle represents North Dakota's Domestic Large Cap Equity weighted average asset-based management fee of 0.25%
●The green box represents total asset class weighted average fee (asset based & performance/hybrid fees) in FY 2018: 0.19%
●Fee universe was constructed using Callan’s 2017 Investment Management Fee Survey for mandate sizes between $150mm and $300mm
Legacy Trust
N=61, Actual Fee Universe
0.00% 0.10% 0.20% 0.30% 0.40% 0.50%
Domestic Large Cap Equity Fees
Industry Fees: 25th, 50th, and75th Percentile
Total Weighted Avg Fee
Weighted Avg Asset-Based Fee

47 Knowledge. Experience. Integrity. North Dakota State Investment Board Fee Study
Domestic Large Cap Equity
●The Domestic Large Cap Equity Portfolio employs several managers with performance and hybrid fee structures and is therefore difficult to compare directly to industry averages.
– L.A. Capital Enhanced Index charges a base management fee on all assets under management. A performance based fee of 20% of
returns in excess of the benchmark is charged on approximately 40% of the assets.
– Parametric Clifton Enhanced Index charges no base management fee. The only fee charged is 35% of the excess return generated.
Fees are paid once a year for performance through June 30.
– *Note that Clinton Enhanced underperformed its benchmark over the past fiscal year and therefore is below its high water mark. Due to the underperformance, North Dakota accrued roughly $1.3mm in performance fee credit.
Legacy Trust
Domestic Large Cap Equity
Asset-Based Fee Strategies Fee %
L.A. Capital Growth 0.21%
LSV Large Cap Value 0.29%
Weighted Average Asset-Based Fee 0.25%
Performance and Hybrid Fee Strategies Fee %
L.A. Capital Enhanced Index 0.22%
Clifton Enhanced S&P 500 0.00%
Weighted Average Performance and Hybrid Fee 0.11%
Total Weighted Average U.S. Lg Cap Fee 0.19%
Industry Fee - 25th Percentile 0.23%
Industry Fee - Median 0.30%
Industry Fee - 75th Percentile 0.41%
N=61, Actual Fee Universe
*
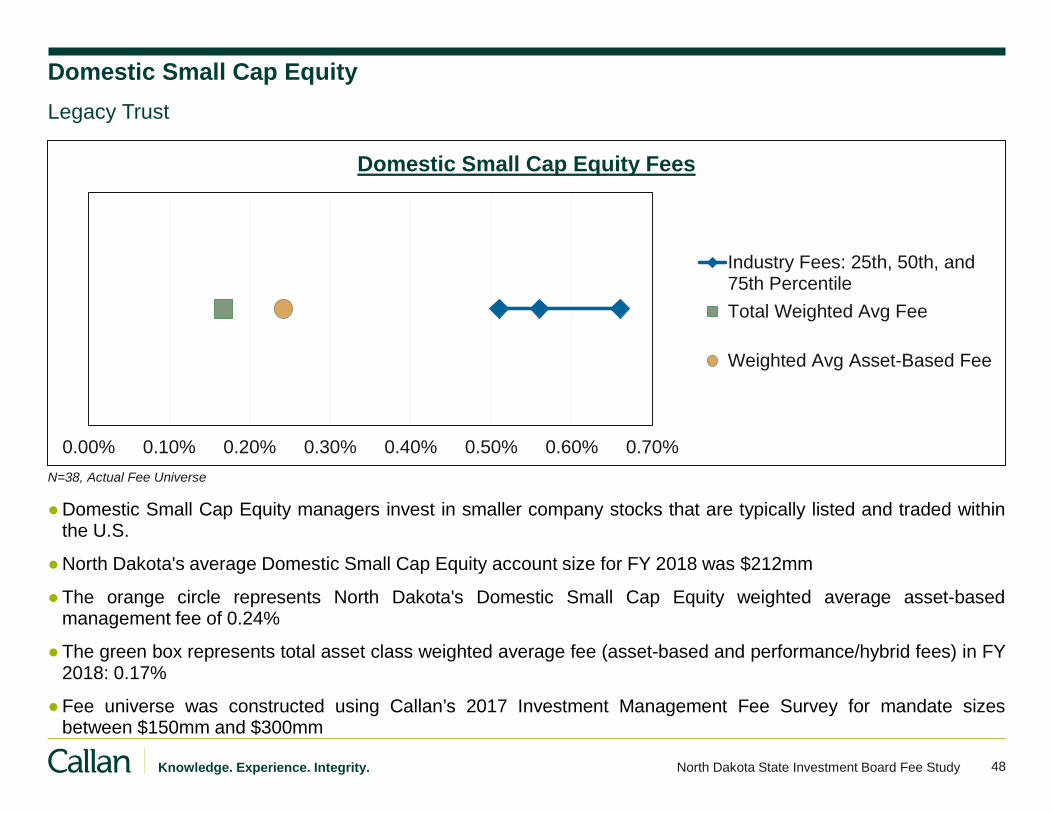
48 Knowledge. Experience. Integrity. North Dakota State Investment Board Fee Study
Domestic Small Cap Equity
●Domestic Small Cap Equity managers invest in smaller company stocks that are typically listed and traded within the U.S.
●North Dakota's average Domestic Small Cap Equity account size for FY 2018 was $212mm
●The orange circle represents North Dakota's Domestic Small Cap Equity weighted average asset-based management fee of 0.24%
●The green box represents total asset class weighted average fee (asset-based and performance/hybrid fees) in FY 2018: 0.17%
●Fee universe was constructed using Callan’s 2017 Investment Management Fee Survey for mandate sizes between $150mm and $300mm
Legacy Trust
N=38, Actual Fee Universe
0.00% 0.10% 0.20% 0.30% 0.40% 0.50% 0.60% 0.70%
Domestic Small Cap Equity Fees
Industry Fees: 25th, 50th, and75th Percentile
Total Weighted Avg Fee
Weighted Avg Asset-Based Fee
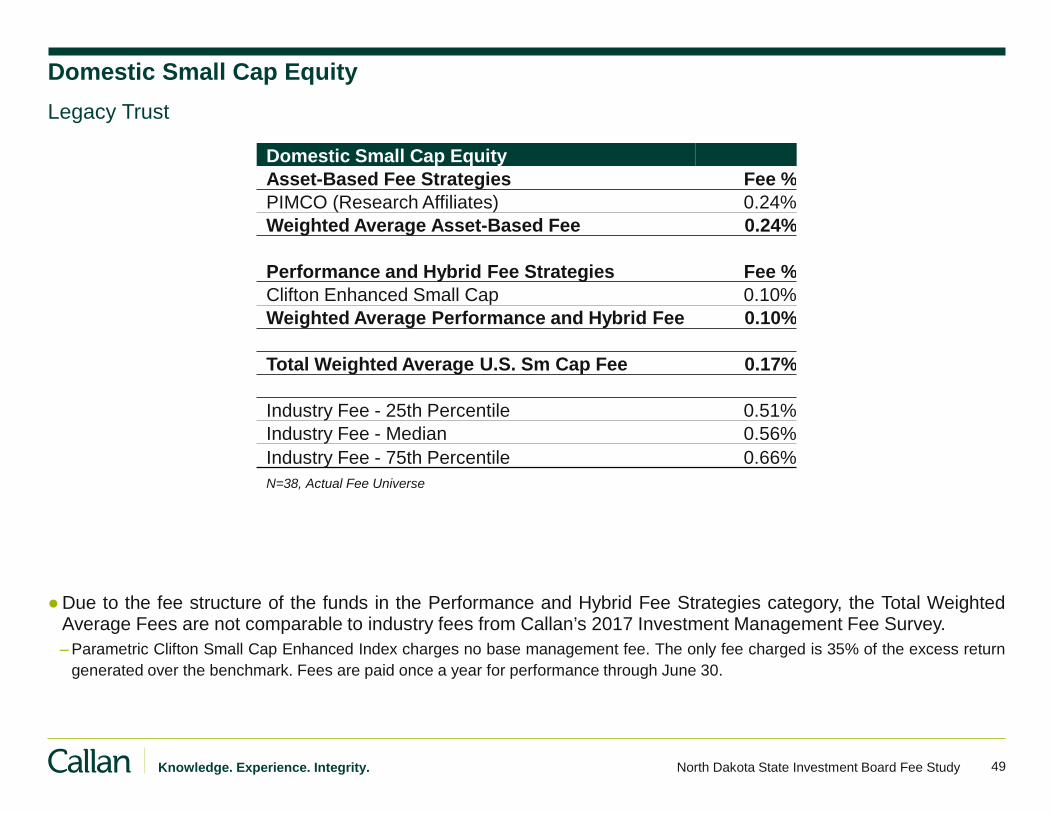
49 Knowledge. Experience. Integrity. North Dakota State Investment Board Fee Study
Domestic Small Cap Equity
Asset-Based Fee Strategies Fee %
PIMCO (Research Affiliates) 0.24%
Weighted Average Asset-Based Fee 0.24%
Performance and Hybrid Fee Strategies Fee %
Clifton Enhanced Small Cap 0.10%
Weighted Average Performance and Hybrid Fee 0.10%
Total Weighted Average U.S. Sm Cap Fee 0.17%
Industry Fee - 25th Percentile 0.51%
Industry Fee - Median 0.56%
Industry Fee - 75th Percentile 0.66%
N=38, Actual Fee Universe
Domestic Small Cap Equity
●Due to the fee structure of the funds in the Performance and Hybrid Fee Strategies category, the Total Weighted Average Fees are not comparable to industry fees from Callan’s 2017 Investment Management Fee Survey.
– Parametric Clifton Small Cap Enhanced Index charges no base management fee. The only fee charged is 35% of the excess return
generated over the benchmark. Fees are paid once a year for performance through June 30.
Legacy Trust
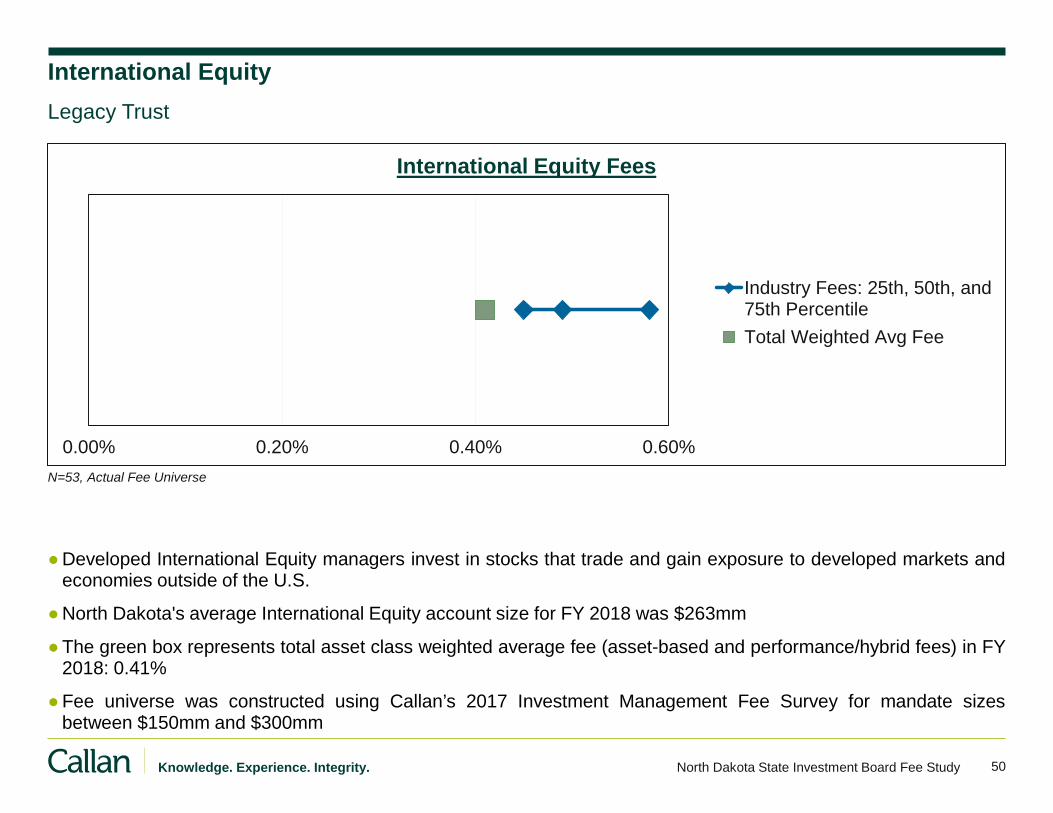
50 Knowledge. Experience. Integrity. North Dakota State Investment Board Fee Study
International Equity
●Developed International Equity managers invest in stocks that trade and gain exposure to developed markets and economies outside of the U.S.
●North Dakota's average International Equity account size for FY 2018 was $263mm
●The green box represents total asset class weighted average fee (asset-based and performance/hybrid fees) in FY 2018: 0.41%
●Fee universe was constructed using Callan’s 2017 Investment Management Fee Survey for mandate sizes between $150mm and $300mm
Legacy Trust
N=53, Actual Fee Universe
0.00% 0.20% 0.40% 0.60%
International Equity Fees
Industry Fees: 25th, 50th, and75th Percentile
Total Weighted Avg Fee
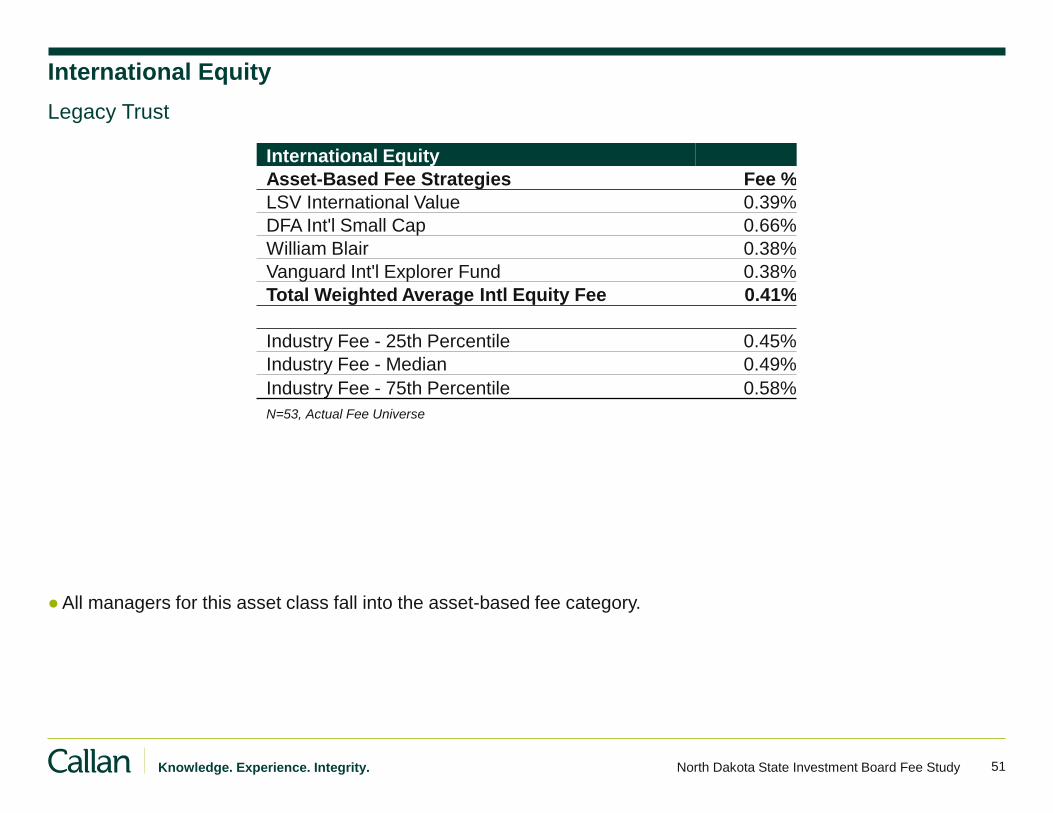
51 Knowledge. Experience. Integrity. North Dakota State Investment Board Fee Study
International Equity
Asset-Based Fee Strategies Fee %
LSV International Value 0.39%
DFA Int'l Small Cap 0.66%
William Blair 0.38%
Vanguard Int'l Explorer Fund 0.38%
Total Weighted Average Intl Equity Fee 0.41%
Industry Fee - 25th Percentile 0.45%
Industry Fee - Median 0.49%
Industry Fee - 75th Percentile 0.58%
N=53, Actual Fee Universe
International Equity
●All managers for this asset class fall into the asset-based fee category.
Legacy Trust
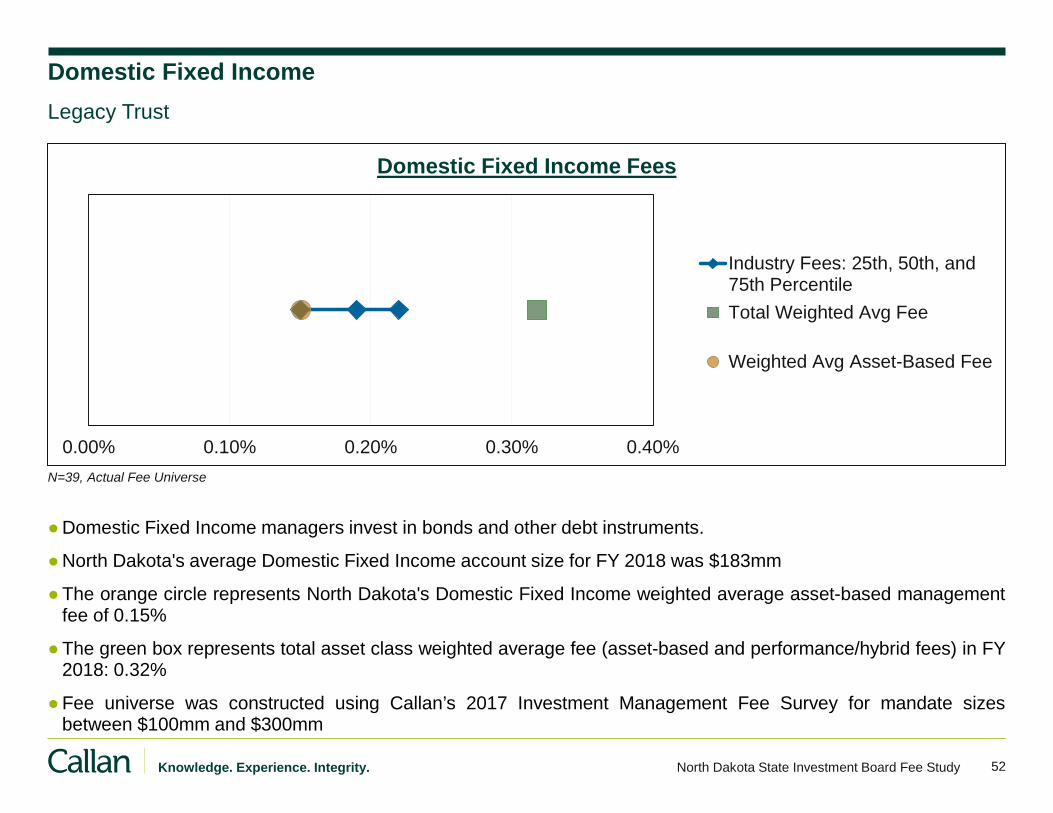
52 Knowledge. Experience. Integrity. North Dakota State Investment Board Fee Study
Domestic Fixed Income
●Domestic Fixed Income managers invest in bonds and other debt instruments.
●North Dakota's average Domestic Fixed Income account size for FY 2018 was $183mm
●The orange circle represents North Dakota's Domestic Fixed Income weighted average asset-based management fee of 0.15%
●The green box represents total asset class weighted average fee (asset-based and performance/hybrid fees) in FY 2018: 0.32%
●Fee universe was constructed using Callan’s 2017 Investment Management Fee Survey for mandate sizes between $100mm and $300mm
Legacy Trust
N=39, Actual Fee Universe
0.00% 0.10% 0.20% 0.30% 0.40%
Domestic Fixed Income Fees
Industry Fees: 25th, 50th, and75th Percentile
Total Weighted Avg Fee
Weighted Avg Asset-Based Fee
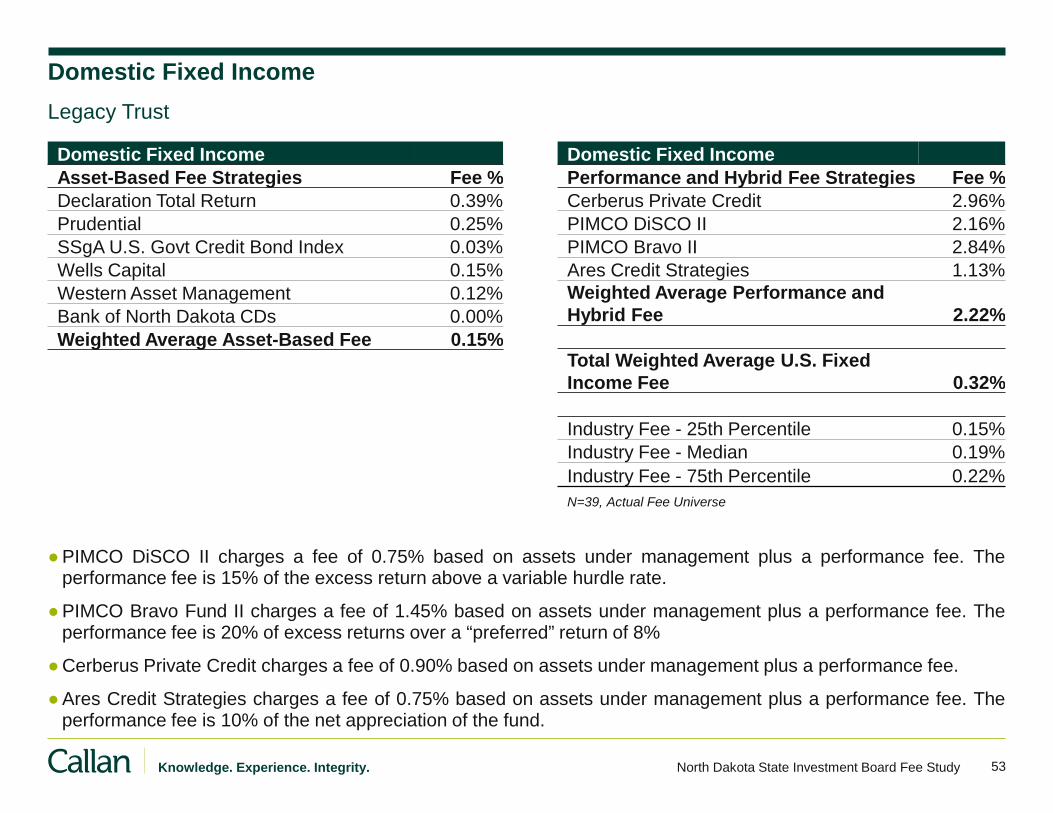
53 Knowledge. Experience. Integrity. North Dakota State Investment Board Fee Study
Domestic Fixed Income
●PIMCO DiSCO II charges a fee of 0.75% based on assets under management plus a performance fee. The performance fee is 15% of the excess return above a variable hurdle rate.
●PIMCO Bravo Fund II charges a fee of 1.45% based on assets under management plus a performance fee. The performance fee is 20% of excess returns over a “preferred” return of 8%
●Cerberus Private Credit charges a fee of 0.90% based on assets under management plus a performance fee.
●Ares Credit Strategies charges a fee of 0.75% based on assets under management plus a performance fee. The performance fee is 10% of the net appreciation of the fund.
Legacy Trust
Domestic Fixed Income
Asset-Based Fee Strategies Fee %
Declaration Total Return 0.39%
Prudential 0.25%
SSgA U.S. Govt Credit Bond Index 0.03%
Wells Capital 0.15%
Western Asset Management 0.12%
Bank of North Dakota CDs 0.00%
Weighted Average Asset-Based Fee 0.15%
Domestic Fixed Income
Performance and Hybrid Fee Strategies Fee %
Cerberus Private Credit 2.96%
PIMCO DiSCO II 2.16%
PIMCO Bravo II 2.84%
Ares Credit Strategies 1.13%
Weighted Average Performance and
Hybrid Fee 2.22%
Total Weighted Average U.S. Fixed
Income Fee 0.32%
Industry Fee - 25th Percentile 0.15%
Industry Fee - Median 0.19%
Industry Fee - 75th Percentile 0.22%
N=39, Actual Fee Universe

54 Knowledge. Experience. Integrity. North Dakota State Investment Board Fee Study
Diversified Real Assets
●Diversified Real Assets managers invest in assets that are expected to perform well during periods of inflation.
●North Dakota's average Diversified Real Assets account size for FY 2018 was $128mm
●The orange circle represents North Dakota's Diversified Real Assets weighted average asset-based management fee of 0.12%
●The green box represents total asset class weighted average fee (asset-based and performance/hybrid fees) in FY 2018: 0.53%
●Fee universe was constructed using Callan’s Diversified Real Assets Peer Group of 23 investment manager constituents.
Legacy Trust
N=23, Callan’s Diversified Real Assets Peer Group
0.00% 0.20% 0.40% 0.60% 0.80% 1.00% 1.20%
Diversified Real Assets Fees
Industry Fees: 25th, 50th, and75th Percentile
Total Weighted Avg Fee
Weighted Avg Asset-Based Fee
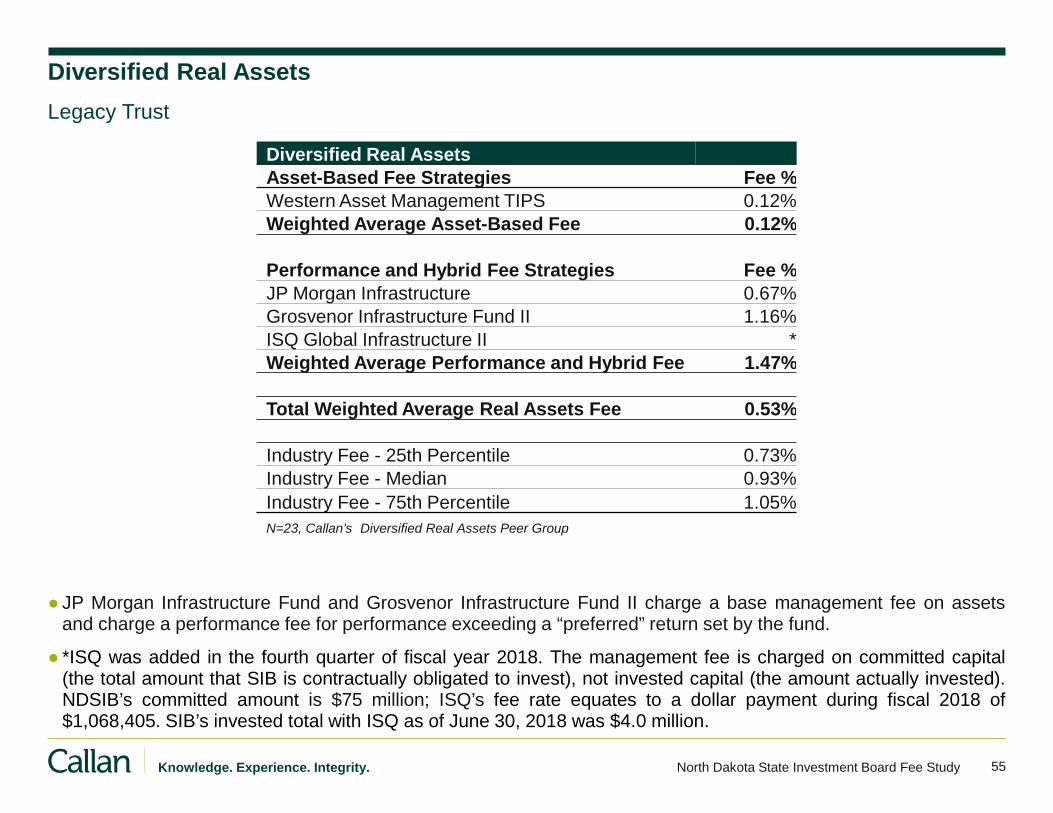
55 Knowledge. Experience. Integrity. North Dakota State Investment Board Fee Study
Diversified Real Assets
Asset-Based Fee Strategies Fee %
Western Asset Management TIPS 0.12%
Weighted Average Asset-Based Fee 0.12%
Performance and Hybrid Fee Strategies Fee %
JP Morgan Infrastructure 0.67%
Grosvenor Infrastructure Fund II 1.16%
ISQ Global Infrastructure II *
Weighted Average Performance and Hybrid Fee 1.47%
Total Weighted Average Real Assets Fee 0.53%
Industry Fee - 25th Percentile 0.73%
Industry Fee - Median 0.93%
Industry Fee - 75th Percentile 1.05%
N=23, Callan’s Diversified Real Assets Peer Group
Diversified Real Assets
● JP Morgan Infrastructure Fund and Grosvenor Infrastructure Fund II charge a base management fee on assets and charge a performance fee for performance exceeding a “preferred” return set by the fund.
● *ISQ was added in the fourth quarter of fiscal year 2018. The management fee is charged on committed capital (the total amount that SIB is contractually obligated to invest), not invested capital (the amount actually invested). NDSIB’s committed amount is $75 million; ISQ’s fee rate equates to a dollar payment during fiscal 2018 of $1,068,405. SIB’s invested total with ISQ as of June 30, 2018 was $4.0 million.
Legacy Trust
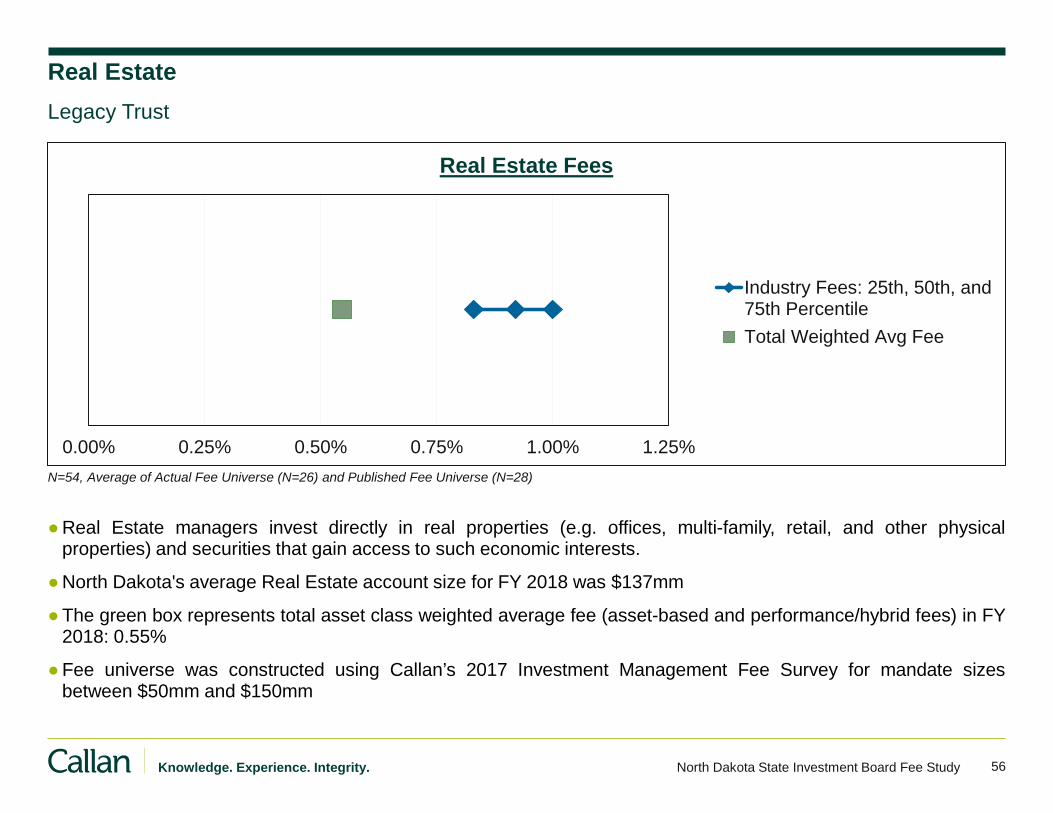
56 Knowledge. Experience. Integrity. North Dakota State Investment Board Fee Study
Real Estate
●Real Estate managers invest directly in real properties (e.g. offices, multi-family, retail, and other physical properties) and securities that gain access to such economic interests.
●North Dakota's average Real Estate account size for FY 2018 was $137mm
●The green box represents total asset class weighted average fee (asset-based and performance/hybrid fees) in FY 2018: 0.55%
●Fee universe was constructed using Callan’s 2017 Investment Management Fee Survey for mandate sizes between $50mm and $150mm
Legacy Trust
N=54, Average of Actual Fee Universe (N=26) and Published Fee Universe (N=28)
0.00% 0.25% 0.50% 0.75% 1.00% 1.25%
Real Estate Fees
Industry Fees: 25th, 50th, and75th Percentile
Total Weighted Avg Fee
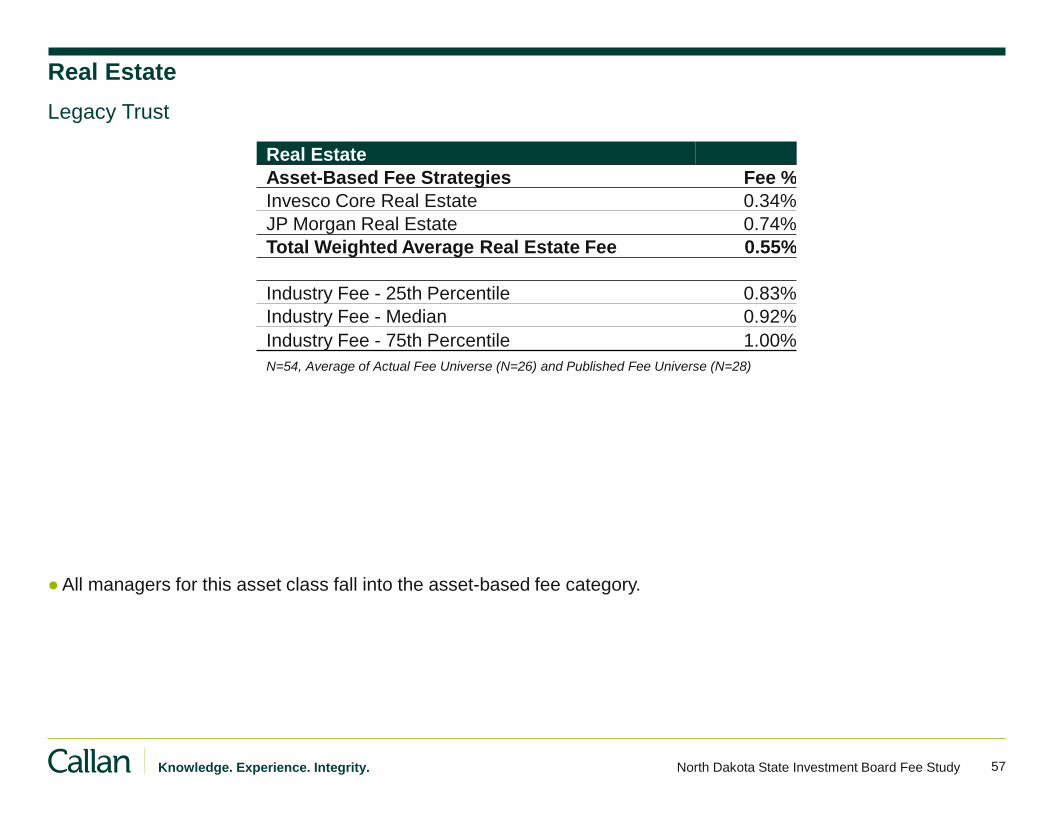
57 Knowledge. Experience. Integrity. North Dakota State Investment Board Fee Study
Real Estate
Asset-Based Fee Strategies Fee %
Invesco Core Real Estate 0.34%
JP Morgan Real Estate 0.74%
Total Weighted Average Real Estate Fee 0.55%
Industry Fee - 25th Percentile 0.83%
Industry Fee - Median 0.92%
Industry Fee - 75th Percentile 1.00%
N=54, Average of Actual Fee Universe (N=26) and Published Fee Universe (N=28)
Real Estate
●All managers for this asset class fall into the asset-based fee category.
Legacy Trust
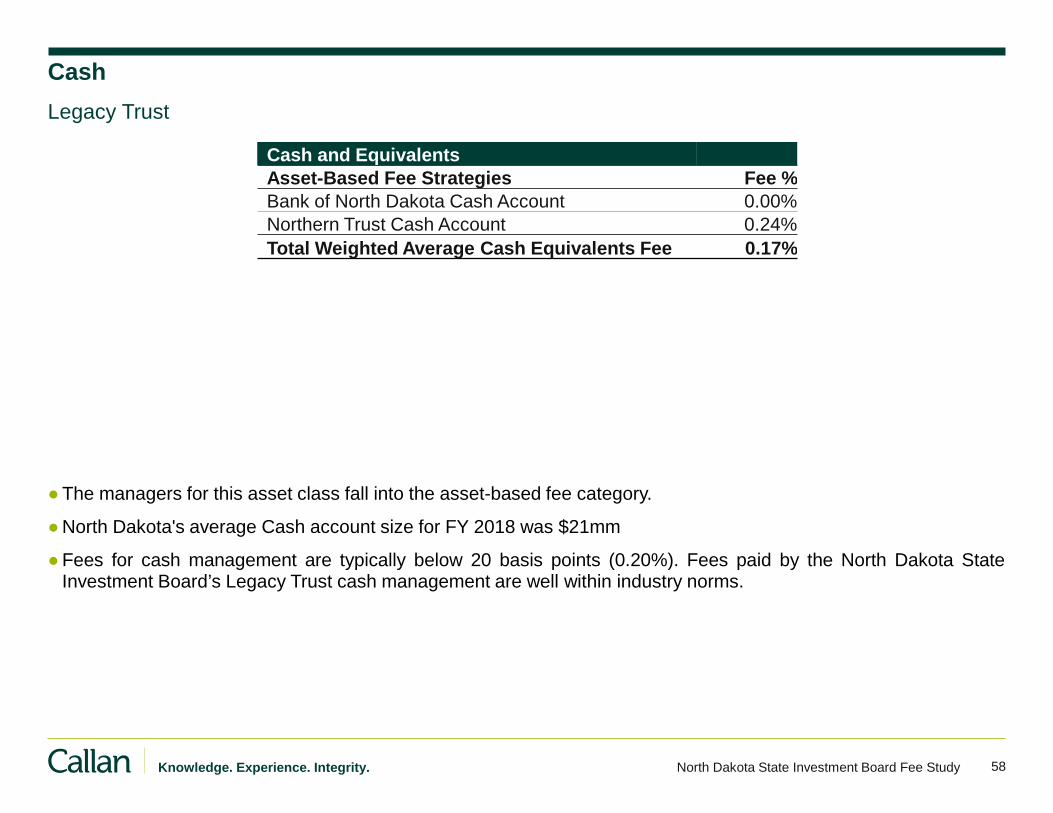
58 Knowledge. Experience. Integrity. North Dakota State Investment Board Fee Study
Cash and Equivalents
Asset-Based Fee Strategies Fee %
Bank of North Dakota Cash Account 0.00%
Northern Trust Cash Account 0.24%
Total Weighted Average Cash Equivalents Fee 0.17%
Cash
●The managers for this asset class fall into the asset-based fee category.
●North Dakota's average Cash account size for FY 2018 was $21mm
●Fees for cash management are typically below 20 basis points (0.20%). Fees paid by the North Dakota State Investment Board’s Legacy Trust cash management are well within industry norms.
Legacy Trust
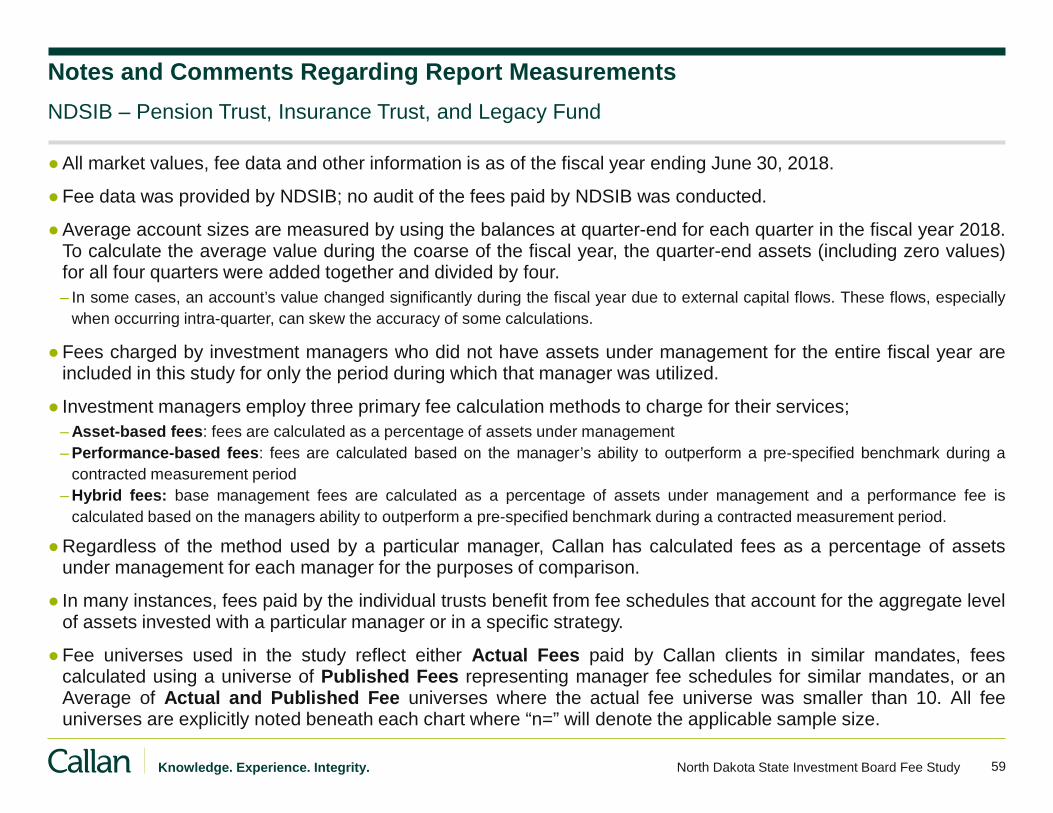
59 Knowledge. Experience. Integrity. North Dakota State Investment Board Fee Study
Notes and Comments Regarding Report Measurements
●All market values, fee data and other information is as of the fiscal year ending June 30, 2018.
●Fee data was provided by NDSIB; no audit of the fees paid by NDSIB was conducted.
●Average account sizes are measured by using the balances at quarter-end for each quarter in the fiscal year 2018. To calculate the average value during the coarse of the fiscal year, the quarter-end assets (including zero values) for all four quarters were added together and divided by four.
– In some cases, an account’s value changed significantly during the fiscal year due to external capital flows. These flows, especially
when occurring intra-quarter, can skew the accuracy of some calculations.
●Fees charged by investment managers who did not have assets under management for the entire fiscal year are included in this study for only the period during which that manager was utilized.
● Investment managers employ three primary fee calculation methods to charge for their services;
– Asset-based fees: fees are calculated as a percentage of assets under management
– Performance-based fees: fees are calculated based on the manager’s ability to outperform a pre-specified benchmark during a
contracted measurement period
– Hybrid fees: base management fees are calculated as a percentage of assets under management and a performance fee is
calculated based on the managers ability to outperform a pre-specified benchmark during a contracted measurement period.
●Regardless of the method used by a particular manager, Callan has calculated fees as a percentage of assets under management for each manager for the purposes of comparison.
● In many instances, fees paid by the individual trusts benefit from fee schedules that account for the aggregate level of assets invested with a particular manager or in a specific strategy.
●Fee universes used in the study reflect either Actual Fees paid by Callan clients in similar mandates, fees calculated using a universe of Published Fees representing manager fee schedules for similar mandates, or an Average of Actual and Published Fee universes where the actual fee universe was smaller than 10. All fee universes are explicitly noted beneath each chart where “n=” will denote the applicable sample size.
NDSIB – Pension Trust, Insurance Trust, and Legacy Fund
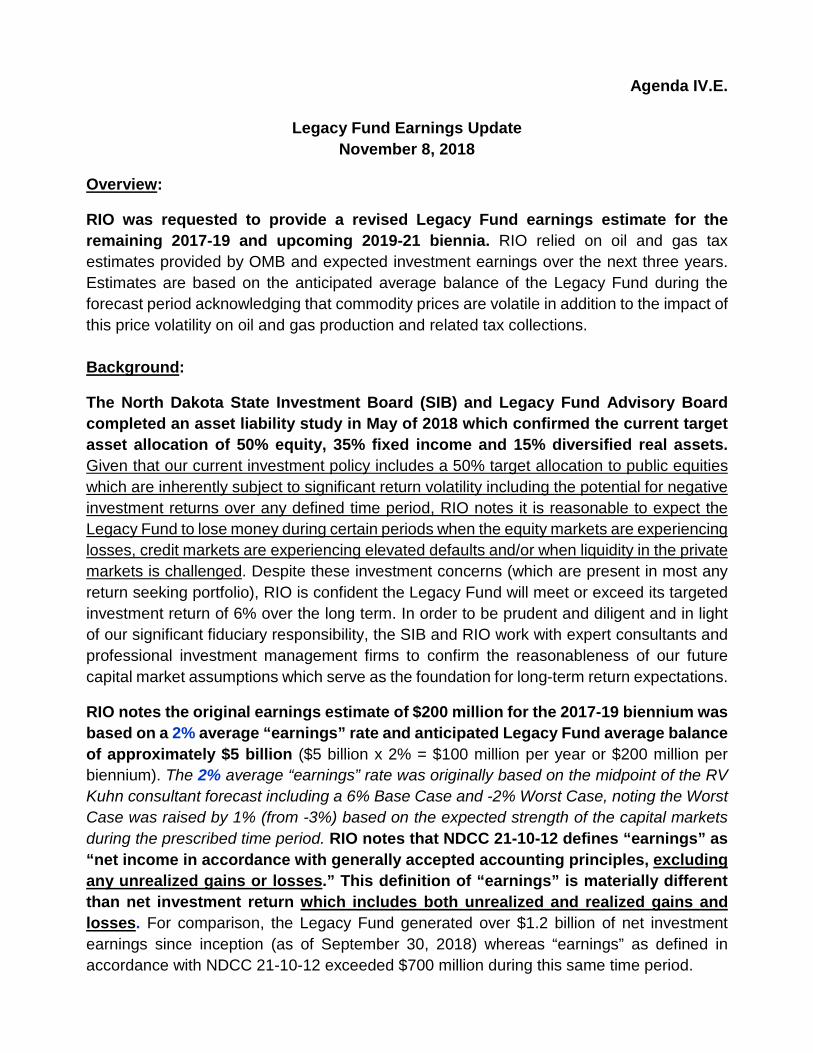
Agenda IV.E.
Legacy Fund Earnings Update
November 8, 2018
Overview:
RIO was requested to provide a revised Legacy Fund earnings estimate for the
remaining 2017-19 and upcoming 2019-21 biennia. RIO relied on oil and gas tax
estimates provided by OMB and expected investment earnings over the next three years.
Estimates are based on the anticipated average balance of the Legacy Fund during the
forecast period acknowledging that commodity prices are volatile in addition to the impact of
this price volatility on oil and gas production and related tax collections.
Background:
The North Dakota State Investment Board (SIB) and Legacy Fund Advisory Board
completed an asset liability study in May of 2018 which confirmed the current target
asset allocation of 50% equity, 35% fixed income and 15% diversified real assets.
Given that our current investment policy includes a 50% target allocation to public equities
which are inherently subject to significant return volatility including the potential for negative
investment returns over any defined time period, RIO notes it is reasonable to expect the
Legacy Fund to lose money during certain periods when the equity markets are experiencing
losses, credit markets are experiencing elevated defaults and/or when liquidity in the private
markets is challenged. Despite these investment concerns (which are present in most any
return seeking portfolio), RIO is confident the Legacy Fund will meet or exceed its targeted
investment return of 6% over the long term. In order to be prudent and diligent and in light
of our significant fiduciary responsibility, the SIB and RIO work with expert consultants and
professional investment management firms to confirm the reasonableness of our future
capital market assumptions which serve as the foundation for long-term return expectations.
RIO notes the original earnings estimate of $200 million for the 2017-19 biennium was
based on a 2% average “earnings” rate and anticipated Legacy Fund average balance
of approximately $5 billion ($5 billion x 2% = $100 million per year or $200 million per
biennium). The 2% average “earnings” rate was originally based on the midpoint of the RV Kuhn consultant forecast including a 6% Base Case and -2% Worst Case, noting the Worst Case was raised by 1% (from -3%) based on the expected strength of the capital markets during the prescribed time period. RIO notes that NDCC 21-10-12 defines “earnings” as
“net income in accordance with generally accepted accounting principles, excluding
any unrealized gains or losses.” This definition of “earnings” is materially different
than net investment return which includes both unrealized and realized gains and
losses. For comparison, the Legacy Fund generated over $1.2 billion of net investment
earnings since inception (as of September 30, 2018) whereas “earnings” as defined in
accordance with NDCC 21-10-12 exceeded $700 million during this same time period.
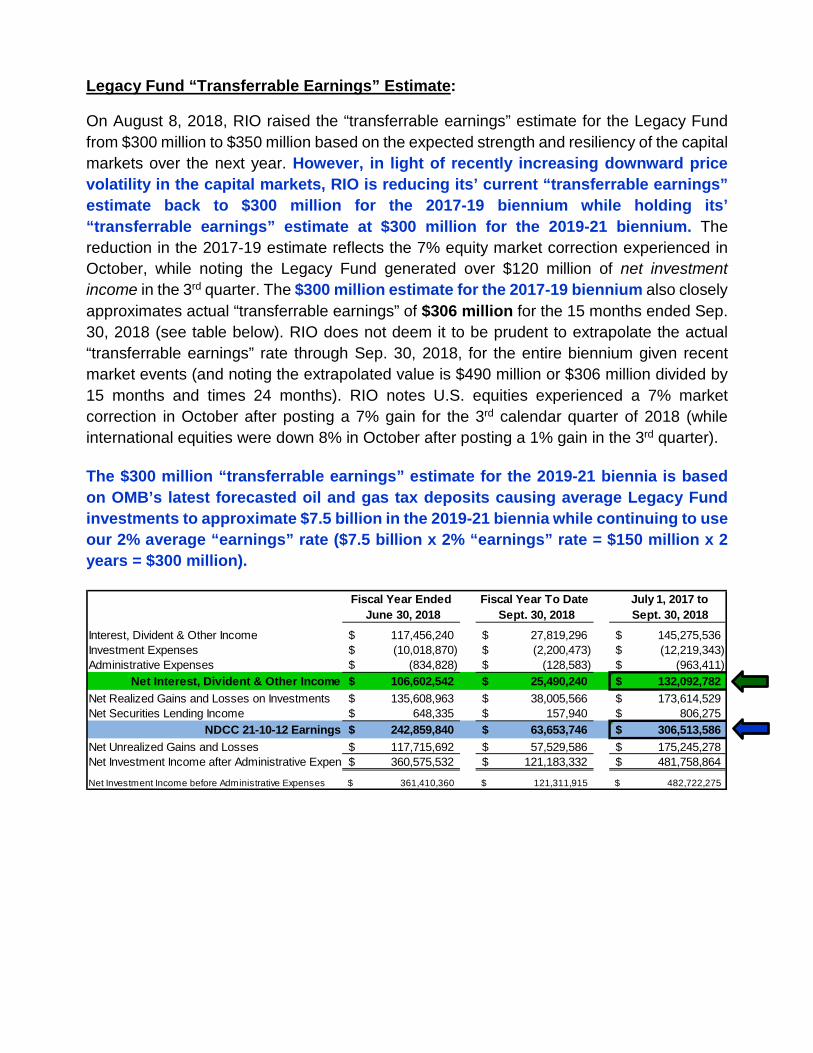
Legacy Fund “Transferrable Earnings” Estimate:
On August 8, 2018, RIO raised the “transferrable earnings” estimate for the Legacy Fund
from $300 million to $350 million based on the expected strength and resiliency of the capital
markets over the next year. However, in light of recently increasing downward price
volatility in the capital markets, RIO is reducing its’ current “transferrable earnings”
estimate back to $300 million for the 2017-19 biennium while holding its’
“transferrable earnings” estimate at $300 million for the 2019-21 biennium. The
reduction in the 2017-19 estimate reflects the 7% equity market correction experienced in
October, while noting the Legacy Fund generated over $120 million of net investment income in the 3rd quarter. The $300 million estimate for the 2017-19 biennium also closely
approximates actual “transferrable earnings” of $306 million for the 15 months ended Sep.
30, 2018 (see table below). RIO does not deem it to be prudent to extrapolate the actual
“transferrable earnings” rate through Sep. 30, 2018, for the entire biennium given recent
market events (and noting the extrapolated value is $490 million or $306 million divided by
15 months and times 24 months). RIO notes U.S. equities experienced a 7% market
correction in October after posting a 7% gain for the 3rd calendar quarter of 2018 (while
international equities were down 8% in October after posting a 1% gain in the 3rd quarter).
The $300 million “transferrable earnings” estimate for the 2019-21 biennia is based
on OMB’s latest forecasted oil and gas tax deposits causing average Legacy Fund
investments to approximate $7.5 billion in the 2019-21 biennia while continuing to use
our 2% average “earnings” rate ($7.5 billion x 2% “earnings” rate = $150 million x 2
years = $300 million).
Fiscal Year Ended Fiscal Year To Date July 1, 2017 to
June 30, 2018 Sept. 30, 2018 Sept. 30, 2018
Interest, Divident & Other Income 117,456,240$ 27,819,296$ 145,275,536$
Investment Expenses (10,018,870)$ (2,200,473)$ (12,219,343)$
Administrative Expenses (834,828)$ (128,583)$ (963,411)$
Net Interest, Divident & Other Income 106,602,542$ 25,490,240$ 132,092,782$
Net Realized Gains and Losses on Investments 135,608,963$ 38,005,566$ 173,614,529$
Net Securities Lending Income 648,335$ 157,940$ 806,275$
NDCC 21-10-12 Earnings 242,859,840$ 63,653,746$ 306,513,586$
Net Unrealized Gains and Losses 117,715,692$ 57,529,586$ 175,245,278$
Net Investment Income after Administrative Expens 360,575,532$ 121,183,332$ 481,758,864$
Net Investment Income before Administrative Expenses 361,410,360$ 121,311,915$ 482,722,275$
Appendix
Review of Legacy Fund “Transferrable Earnings” definition:
Although there is a reasonable belief that the long-term “transferrable earnings” rate will
trend upwards towards 3% to 4% in the next decade, it is important to acknowledge that
“realized earnings” will likely be negative in some future 2-year time frame.
Given the risk of a moderate market correction in the foreseeable future, RIO notes
the definition of “transferrable earnings” could be revised to exclude both realized
and unrealized gains and losses to minimize volatility and the potential adverse
impact on our State’s budgeting process. If “transferrable earnings” were revised to
only include “net investment income without any realized or unrealized gains or
losses”, the impact of a market correction would be significantly reduced.
Example:
RIO notes that “net investment income without realized and unrealized gains or
losses” approximated $132 million for the 15 months ended September 30, 2018 (see
table on prior page). Based on this current earnings rate, net investment income
without realized and unrealized gains or losses is forecasted to exceed $200 million
for 2017-19. In contrast, “transferrable earnings as currently defined under NDCC 21-
10-12 approximated $306 million for the 15 months ended September 30, 2018.
Board Acceptance
To: State Investment Board
From: RIO Staff
Date: November 15, 2018
RE: State Historical Society Endowment Funds
In late September of 2018, RIO staff was approached by the State Historical Society of North Dakota (SHS) inquiring about investment management services for their Endowment Funds (Funds). The Funds include five (5) separate trust accounts ranging in size from $5,000 to $400,000 and totaling over $640,000. RIO understands all of trust funds have the same relatively simple and straight forward investment guidelines (and believe they are currently invested in Certificates of Deposit issued by the Bank of North Dakota). RIO understands the Funds are to be used for a variety of purposes including special projects, designated building maintenance, and to fund staff salary. RIO also understands the SHS receives a biennial appropriation to fund annual operating expenses. SHS representatives are exploring the opportunity to increase annual returns if investment oversight was contractually transferred to the SIB.
As per SIB Governance Policy E-13 “Accepting New Clients”, the following steps have been taken by staff.
1. Staff has conducted initial discussions with SHS representatives regarding the Fund and services to be provided by the SIB. The Fund would likely be invested with other short-term, high quality, and liquid debt strategies. RIO does not believe the SHS will seek to change their investment guidelines in the near term which should prevent this potential new client from becoming an administrative burden.
2. Due to the relatively small size of the Fund, staff feels a formal asset/liability study is not necessary
and will assist the Fund in determining the proper asset allocation for the Fund. Initial discussions have contemplated a 100% high quality, short term debt asset allocation (similar to the Budget Stabilization Fund), which would need to be consistent with existing trust investment guidelines.
3. An initial review by RIO legal counsel concluded that the Fund would be eligible under NDCC to be
invested by the SIB as a contractual investment client. Based on the initial discussions, SHS has expressed interest in pursuing this strategy to contract with the SIB for investment management services. They are awaiting preliminary approval of the SIB before taking further action.
Per Policy E-13, the SIB should take the following into consideration in determining if a new investor request will be accepted.
a. Internal staff administrative capacity – RIO staff has recently been able to better automate some
if its monthly accounting processes which has freed up staff time. Based on that, the relatively small size of the Fund, and the fact that staff would recommend pooling the Fund with the existing Insurance Trust, staff capacity should be sufficient to absorb this fund.
b. Compatibility of new investor’s goals and risk tolerances with the existing SIB program structure
would also suggest pooling the Funds within the Insurance Trust would not be problematic.
c. Whatever other factors the SIB determines to be appropriate to the decision – the SIB program offers a very cost effective solution for state agencies and political subdivisions to invest public funds. Funds of this size do not have institutional investment options available at the fee levels offered in these pooled accounts. A minimum administrative fee of $1,000 per year will apply to this fund. The administrative contract fees collected are then used to offset the administrative fees charged to the statutory funds.
If the SIB concurs, RIO staff will work with SHS representatives in the upcoming months to further consider the appropriateness of this client for the SIB based on RIO’s current staffing levels. Per SIB Governance Policy E-13, RIO will bring the final documentation, including an Investment Policy Statement, to the SIB for further consideration and/or final acceptance at a future meeting.