Embed Size (px)
Citation preview
ADVERTIMENT. Lʼaccés als continguts dʼaquesta tesi queda condicionat a lʼacceptació de les condicions dʼúsestablertes per la següent llicència Creative Commons: http://cat.creativecommons.org/?page_id=184
ADVERTENCIA. El acceso a los contenidos de esta tesis queda condicionado a la aceptación de las condiciones de usoestablecidas por la siguiente licencia Creative Commons: http://es.creativecommons.org/blog/licencias/
WARNING. The access to the contents of this doctoral thesis it is limited to the acceptance of the use conditions setby the following Creative Commons license: https://creativecommons.org/licenses/?lang=en

Enelia Cristina Peláez Gutiérrez Directors: Prof. Laura M. Lechuga Dr. M. Carmen Estévez Institut Catalá de Nanociència i Nanotecnologia (ICN2) Universitat Autónoma de Barcelona (UAB)
Tutor: Prof. Julián Alonso Chamarro

Doctorat en Química Departament de Química - Facultat de Ciències
Nanoplasmonic biosensors for clinical diagnosis, drug monitoring and therapeutic follow-up
Doctoral Thesis – 2020
Enelia Cristina Peláez Gutiérrez Author
Dr. M. Carmen Estévez Prof. Laura M. Lechuga Directors
Prof. Julián Alonso Chamarro
Tutor

i
Abstract This Doctoral Thesis aims to the development of several label-free biosensing analytical strategies integrated within optical plasmonic devices for the direct detection of drugs or biomarkers related to different diseases in biological samples such as plasma, serum, urine, and sputum. These biosensor devices offer several benefits like their high sensitivity, ease of operation, quantitative data, label-free operation, and real-time detection, and commonly require a small sample volume. All this turn plasmonic biosensors into well-suited analytical tools for diagnosing diseases, monitoring medication, or for personalized therapies follow-up. Our research group has extensively demonstrated the successful conjunction of novel in-house optical biosensor configurations (like plasmonic and photonic-based designs) with the full demonstrations of bioapplications, which has paved the way for their potential technological transfer as Point-of-Care devices (POC) for clinical diagnostics. The biosensor assays here implemented, which include their full optimization and validation with real samples, exemplify clinical challenges where such biosensors can overcome limitations of current conventional analytical techniques. The results show the potential and versatility that plasmonic biosensors can offer as future POC devices placed in primary healthcare units or even in the household environment for patients’ self-monitoring. This thesis is organized into six chapters. Chapter 1 is the introductory one, which explains the basic concepts and the state of the art of the current advances in diagnosis and monitoring techniques of diseases and/or therapies and the role of biosensors to improve them. Chapter 2 includes a detailed description of the biosensor platforms employed and a general description of the methodological processes. Chapter 3 is related to the development of a nanoplasmonic device for the therapeutic monitoring of the drug acenocoumarol, a commonly administered anticoagulant, directly in human plasma. Chapter 4 focuses on the implementation of a plasmonic biosensor that monitors the gluten-free diet in urine in celiac patients. Chapter 5 describes the biosensing strategies developed for the detection of two biomarkers for the early diagnosis of tuberculosis in sputum samples. Finally, Chapter 6 explores the detection of four specific autoantibodies associated with the tumor onset directly in human serum as potential biomarkers for the early detection of colorectal cancer.

ii
iii
Resumen
Esta Tesis Doctoral tiene como objetivo el desarrollo de diversos biosensores que operan sin necesidad de marcaje adicional basados en dispositivos plasmónicos ópticos para la detección directa de medicamentos o biomarcadores relacionados con diferentes enfermedades y que son analizados directamente en muestras humanas como plasma, suero, orina o esputo. Estos dispositivos biosensores ofrecen un sinnúmero de beneficios como es su alta sensibilidad, facilidad de operación, la obtención de datos cuantitativos, detección sin marcaje en tiempo real, y comúnmente sólo necesitan de un pequeño volumen de muestra. Todo esto convierte a los biosensores plasmónicos en herramientas analíticas muy adecuadas para el diagnóstico de enfermedades, el control de la medicación o el seguimiento de terapias personalizadas. Nuestro grupo de investigación ha demostrado exitosamente la implementación de biosensores ópticos basados en plasmónica y en fotónica de silicio, incluido el desarrollo completo de bioaplicaciones, lo que ha allanado el camino de su futura transferencia tecnológica para su implementación como dispositivos Point-of-Care (POC). Los biosensores desarrollados en esta Tesis incluyen su optimización y validación completa con muestras reales, ejemplificando algunos desafíos clínicos en los que dichos biosensores plasmónicos pueden superar importantes limitaciones de las técnicas de análisis convencionales actuales, mostrando su potencial y versatilidad como futuros dispositivos POC para ser usados en las unidades de atención primaria en salud o incluso en el entorno doméstico para el propio autocontrol por parte de los pacientes. La tesis está organizada en seis capítulos. El Capítulo 1 contiene la introducción de los conceptos básicos y el estado del arte sobre los avances actuales en las técnicas de diagnóstico y control de enfermedades y/o terapias y el papel que desempeñan los biosensores para mejorarlos. El Capítulo 2 incluye una descripción detallada de las plataformas biosensoras empleadas y una descripción general de los procesos metodológicos. El Capítulo 3 describe el desarrollo de un dispositivo nanoplasmónico para el control terapéutico del medicamento acenocumarol, un anticoagulante comúnmente administrado directamente en plasma humano. El Capítulo 4 se centra en el desarrollo de un biosensor plasmónico que sirva como control de la dieta libre de gluten que deben llevar los pacientes celíacos. El Capítulo 5 describe las estrategias desarrolladas para la detección de dos biomarcadores para el diagnóstico temprano de tuberculosis en muestras de esputo. Finalmente, el Capítulo 6 explora la detección de cuatro autoanticuerpos específicos asociados con la aparición del tumor directamente en el suero humano como biomarcadores potenciales para el diagnóstico temprano del cáncer colorrectal.

iv
v
Acknowledgements I would like to first express my gratitude to my directors Laura M. Lechuga and M-Carmen Estévez for their educative guidance, confidence, and helpful attitude during all my Ph.D. study. The highly competitive scientific environment of the NanoB2A group along with the excellence institute ICN2 have constantly fed me with my inspiration and motivation. I want to thank all those researchers who have collaborated in the development of each project of this thesis: the Nanobiotechnology for Diagnostics Group (Nb4D) from the Institute for Advanced Chemistry of Catalonia (IQAC), especially to Dr. J. Pablo Salvador and Dr. M. Pilar Marco; Protein Alternatives S.L. mainly to Dr. M. Carmen García and Dr. J. Ignacio Imbaud; the company Biomedal S.L, to Dr. Angel Cebolla, and Dr. Remedios Domínguez; the Sevilla University, to Dr. Carolina Sousa; the Colombian research centers: CIDEI, Corpogen, CIB, NBIC of the Central University and the National University of Colombia, for being the permanent support in my path towards research, for believing in me and helping me fulfill this long-awaited goal. Especially Dr. Oscar Herrera, Dr. Patricia del Portillo, Dr. Maria Mercedes Zambrano, and Dr. Luis Fernando Niño, you are an inspiration in my professional career. In addition, to Dr. M. Jesús García from the Autonomous University of Madrid, for her advice, teachings, and motivation. Also, I want to thank to the group of A4Cell Company for believing in me and being pioneers of the future that is just beginning. A big thank-you to the NanoB2a group, all my labmates of my generation whom I miss and remember with all my heart: my Mexican brothers: Chatico, Jesús, Sam, and Gerardo. They will always be in my heart along with the most beautiful memories of companionship, affection, and friendship. Jonatthan my Colombian brother, thanks for your teachings, your love and brotherhood gave me the strength to continue with my dreams. Santitos, the best of the best, the boy with a heart as big as you!!, thanks for a transparent friendship, my little Spanish brother. Jens (Jovic Jova, cada día te quiero más hahaha) thank you for keeping in touch and always with the same affection. You know I'm always there for you. Crispin thank you buddy, for your simplicity for your many invitations to dinners and beer, you are the best host and I hope to see you again. Cesar, “doctorcito corazón”, how I miss you… see you dance, sing, draw, your jokes, your joy, all this was essential to fill my days with happiness in the lab. Melissa my Mexican girl, beautiful inside and out, the first person I met from the group from Bogotá. Thank you for your friendship even in the distance. Blancaaa the Catalan and Pamplonesa, your simplicity, your charisma, and companionship will be unforgettable. Nuria, someone should give you an award for being the kindest girl I've ever met, thanks for so many shared moments, for your smile in difficult times. Bertito, the most special canary of the ICN2, and Roger (Chuziiii), thank you for your friendship. You know the beer is missing! Olalla, thank you for giving me your smile and sympathy every day. And my little

vi
Patty, my Catalan and Colombian Andalusian hehehe thanks my little sister. Thank all of you for unforgettable moments in the lab, singing all the songs of the moment. Thank you because you impregnated me with that joy every day. To the new generation whom I appreciate very much: Miquel, David, Xavi, Denise, Meritxell, Oscar, Albert, Jesús and Camille. Also, the postdocs: Ana Belén, David Fariñas, Astu (the unforgettable Adriiii), Priyanka, Sonia, Cris Kurachi, Alejandro, Jess and Maria, because all of you have given me your generosity and kindness to that this thesis goes ahead. Also, thanks to the technicians Rafa, Raúl and my office colleagues: Civan, Najmeh, Farnoosh, and Yunhui. Thanks guys, really. I would like to thank my ICN2-friends: Jose Fran, Amadeo, Dani Quesada, Enric and Rus (the guys from Merkoçi always ready to help me and make me smile), Javi and Luis Garzón (mis rolitos del alma), Adrianita and Roberto, Francisco, Emigdio, Omar, Alois, Zwedu, Iván, Regina, Antonio, Rocio, Dr. Will, Mattias and Debby, Andrea Prada, Roque, Alba, and Anabel (the best of the ICN2 definitely). Also, to my friends: Liss my beautiful girl, Augusto (I hope you visit me again with Linis), Nancy (my always special flatmate), Victor and Clara (el sabor caleño hahaha siempre pendientes de esta paisa). Claire, Thibault, Taianne and Fábio (merci beaucoup mes amis pour les moments partagés et j'espère qu'il y en aura beaucoup plus), and my favorite spanish, Adri (Manchi: I hope we continue to fill our lives with unforgettable moments, you are the best has happened to me this year). Barcelona without you guys would not have been so fun and full of friendship and love. The social activities, trips, dinners, drinks, the wonderful moments full of laughter and experiences I will never forget. My friends of my soul: Viviana, Pily, Claudina, Greys, and Juan Ramírez, fundamental pillars at every moment of my life, always supporting me, filling me with the strength to keep going. To you, my friends, my deepest thanks. Finalmente, dedico esta tesis doctoral a mis cuatro padres encantadores, que siempre han estado para mí en todo momento, de quienes vivo enamorada. A mis abuelos, primos, tíos y tías, especialmente a mi tía Argenis y abuelitas, que han sido mis ángeles. Familia: este es un logro por y para ustedes. Gracias por entregarme tanto amor sin condiciones. Gracias por darme la fuerza de tomar decisiones y apoyarme en cada una, no saben cuanto los amo, extraño y pienso. Son la más grande bendición de mi vida.
vii
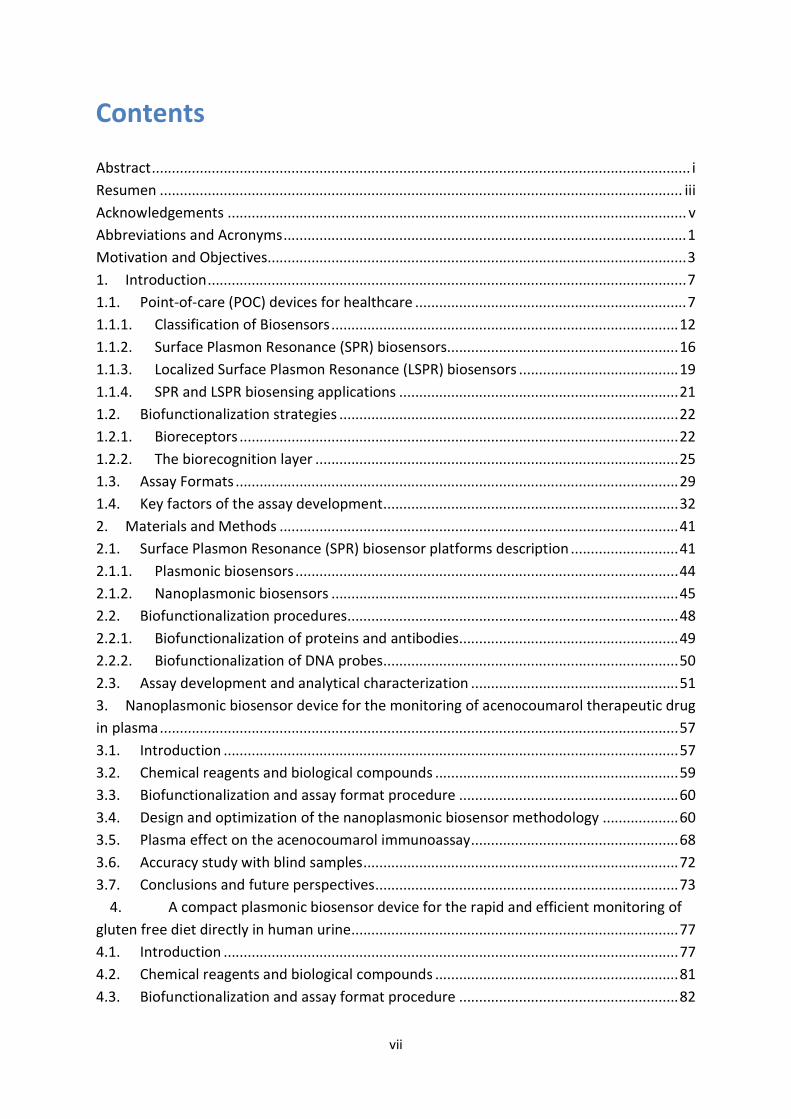
Contents Abstract ....................................................................................................................................... i Resumen ................................................................................................................................... iii Acknowledgements ................................................................................................................... v Abbreviations and Acronyms ..................................................................................................... 1 Motivation and Objectives......................................................................................................... 3 1. Introduction ........................................................................................................................ 7 1.1. Point-of-care (POC) devices for healthcare .................................................................... 7 1.1.1. Classification of Biosensors ....................................................................................... 12 1.1.2. Surface Plasmon Resonance (SPR) biosensors .......................................................... 16 1.1.3. Localized Surface Plasmon Resonance (LSPR) biosensors ........................................ 19 1.1.4. SPR and LSPR biosensing applications ...................................................................... 21 1.2. Biofunctionalization strategies ..................................................................................... 22 1.2.1. Bioreceptors .............................................................................................................. 22 1.2.2. The biorecognition layer ........................................................................................... 25 1.3. Assay Formats ............................................................................................................... 29 1.4. Key factors of the assay development .......................................................................... 32 2. Materials and Methods .................................................................................................... 41 2.1. Surface Plasmon Resonance (SPR) biosensor platforms description ........................... 41 2.1.1. Plasmonic biosensors ................................................................................................ 44 2.1.2. Nanoplasmonic biosensors ....................................................................................... 45 2.2. Biofunctionalization procedures ................................................................................... 48 2.2.1. Biofunctionalization of proteins and antibodies ....................................................... 49 2.2.2. Biofunctionalization of DNA probes .......................................................................... 50 2.3. Assay development and analytical characterization .................................................... 51 3. Nanoplasmonic biosensor device for the monitoring of acenocoumarol therapeutic drug in plasma .................................................................................................................................. 57 3.1. Introduction .................................................................................................................. 57 3.2. Chemical reagents and biological compounds ............................................................. 59 3.3. Biofunctionalization and assay format procedure ....................................................... 60 3.4. Design and optimization of the nanoplasmonic biosensor methodology ................... 60 3.5. Plasma effect on the acenocoumarol immunoassay .................................................... 68 3.6. Accuracy study with blind samples ............................................................................... 72 3.7. Conclusions and future perspectives ............................................................................ 73
4. A compact plasmonic biosensor device for the rapid and efficient monitoring of gluten free diet directly in human urine .................................................................................. 77 4.1. Introduction .................................................................................................................. 77 4.2. Chemical reagents and biological compounds ............................................................. 81 4.3. Biofunctionalization and assay format procedure ....................................................... 82
viii
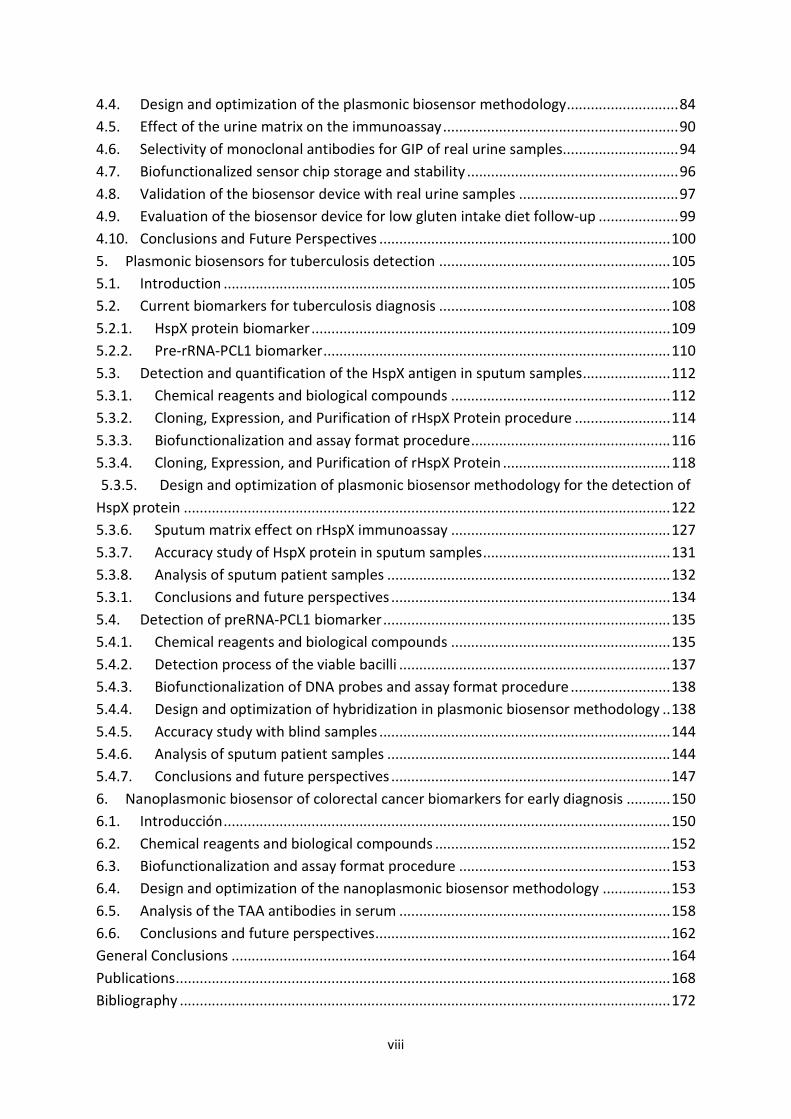
4.4. Design and optimization of the plasmonic biosensor methodology ............................ 84 4.5. Effect of the urine matrix on the immunoassay ........................................................... 90 4.6. Selectivity of monoclonal antibodies for GIP of real urine samples ............................. 94 4.7. Biofunctionalized sensor chip storage and stability ..................................................... 96 4.8. Validation of the biosensor device with real urine samples ........................................ 97 4.9. Evaluation of the biosensor device for low gluten intake diet follow-up .................... 99 4.10. Conclusions and Future Perspectives ......................................................................... 100 5. Plasmonic biosensors for tuberculosis detection .......................................................... 105 5.1. Introduction ................................................................................................................ 105 5.2. Current biomarkers for tuberculosis diagnosis .......................................................... 108 5.2.1. HspX protein biomarker .......................................................................................... 109 5.2.2. Pre-rRNA-PCL1 biomarker ....................................................................................... 110 5.3. Detection and quantification of the HspX antigen in sputum samples ...................... 112 5.3.1. Chemical reagents and biological compounds ....................................................... 112 5.3.2. Cloning, Expression, and Purification of rHspX Protein procedure ........................ 114 5.3.3. Biofunctionalization and assay format procedure .................................................. 116 5.3.4. Cloning, Expression, and Purification of rHspX Protein .......................................... 118 5.3.5. Design and optimization of plasmonic biosensor methodology for the detection of
HspX protein .......................................................................................................................... 122 5.3.6. Sputum matrix effect on rHspX immunoassay ....................................................... 127 5.3.7. Accuracy study of HspX protein in sputum samples ............................................... 131 5.3.8. Analysis of sputum patient samples ....................................................................... 132 5.3.1. Conclusions and future perspectives ...................................................................... 134 5.4. Detection of preRNA-PCL1 biomarker ........................................................................ 135 5.4.1. Chemical reagents and biological compounds ....................................................... 135 5.4.2. Detection process of the viable bacilli .................................................................... 137 5.4.3. Biofunctionalization of DNA probes and assay format procedure ......................... 138 5.4.4. Design and optimization of hybridization in plasmonic biosensor methodology .. 138 5.4.5. Accuracy study with blind samples ......................................................................... 144 5.4.6. Analysis of sputum patient samples ....................................................................... 144 5.4.7. Conclusions and future perspectives ...................................................................... 147 6. Nanoplasmonic biosensor of colorectal cancer biomarkers for early diagnosis ........... 150 6.1. Introducción ................................................................................................................ 150 6.2. Chemical reagents and biological compounds ........................................................... 152 6.3. Biofunctionalization and assay format procedure ..................................................... 153 6.4. Design and optimization of the nanoplasmonic biosensor methodology ................. 153 6.5. Analysis of the TAA antibodies in serum .................................................................... 158 6.6. Conclusions and future perspectives .......................................................................... 162 General Conclusions .............................................................................................................. 164 Publications ............................................................................................................................ 168 Bibliography ........................................................................................................................... 172
Nanoplasmonic biosensors for clinical diagnosis, drug monitoring and therapeutic follow-up

1
Abbreviations and Acronyms Ab Antibody AFM APC ATR
Atomic force microscopy Antigen-presenting cells Attenuated total reflection
BiMW Bimodal waveguide interferometer BSA Bovine serum albumin CD CV
Celiac disease Coefficient of variability
CRC Colorectal cancer DNA Deoxyribonucleic acid dNTB Deoxyribonucleotides triphosphates DEPC Diethyl pyrocarbonate DS Dextrane sulfate EDC N-(3-Dimethylaminopropyl)-N’-ethylcarbodiimide hydrochloride EDIL3 EGF-like repeats and sicoidin I-like domains 3 EDTA Ethylendiaminetetraacetic acid ELISA Enzyme-linked immunosorbent assay Fab Fragment antigen-binding FDA FDTD FOM FWHM
Food and Drug Administration Finite-Difference Time-Domain method Figure of merit Full width at half maximum
GFD GIP
Gluten-free diet Gluten immunogenic peptides
GTF2B HCL
General Transcription Factor IIb Hole-mask colloidal lithography
HEPES 4-(2-hydroxyethyl)-1-piperazineethanesulfonic acid IC50 Half inhibitory concentration Ig INR IPTG ISI
Immunoglobulin International normalized ratio Isopropyl-β-D-1-thiogalactopyranoside International sensitivity index
IUPAC LFT
International Union of Pure and Applied Chemistry Lateral flow immunochromatography test
LOC Lab on a chip LOD Limit of detection LOQ Limit of quantification LSPR Localised surface plasmon resonance mAb Monoclonal antibody MCH 6-Mercapto-1-hexanol MES 2-N-morpholino ethanesulfonic acid MHDA Mercaptohexadecanoic acid
2
miRNA Micro RNA MUOH 11-Mercaptoundecanol NHS N-Hydroxysulfosuccinimide sodium Ni-NTA Nitrilotriacetic acid and nickel pAb Polyclonal antibody PBS Phosphate buffered saline PBST Tween 20-containing PBS PCR Polymerase chain reaction PDDA Poly(diallyldimethylammonium) chloride PEG Polyethyleneglycol PLL-PEG Copolymer poly-(L-lysine) graft-PEG PMMA Poly(methyl methacrylate) POC PSL PT PVP PWG
Point-of-care Polystyrene sulfate latex Prothrombin time Polyvinylpyrrolidone Prolamin Working Group
RCD Refractory celiac disease RI Refractive index RIU Refractive index unit RNA Ribonucleic acid RT Room temperature SAM Self-assembled monolayer SD Standard deviation SDS SERS
Sodium dodecyl sulfate Surface enhanced raman spectroscopy
SP Surface plasmon SPP Surface plasmon polariton SPR Surface plasmon resonance SSC Saline sodium citrate ssDNA Single-stranded DNA TAA Tumor-associated antigen TCEP Tris(2-carboxyethyl)phosphine hydrochloride TE Transverse-electric TIR Total internal reflection TM tTG
Transverse-magnetic Tissue Transglutaminase enzyme
UV Ultraviolet
3
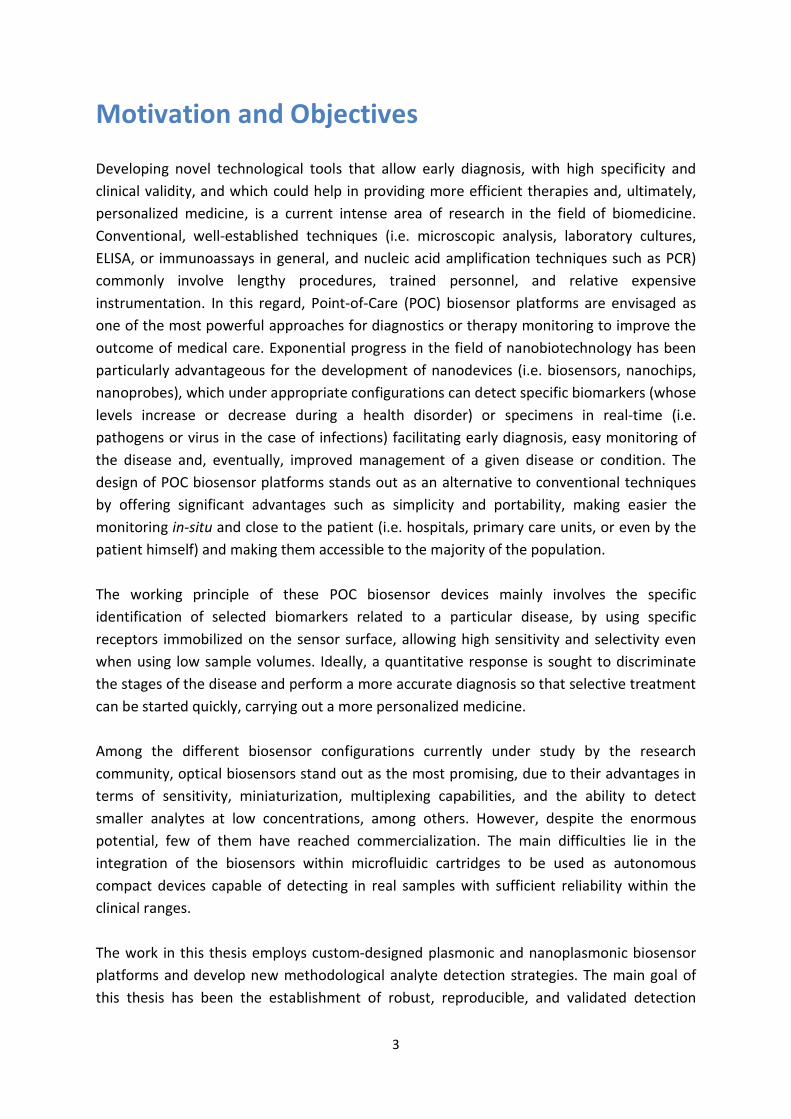
Motivation and Objectives Developing novel technological tools that allow early diagnosis, with high specificity and clinical validity, and which could help in providing more efficient therapies and, ultimately, personalized medicine, is a current intense area of research in the field of biomedicine. Conventional, well-established techniques (i.e. microscopic analysis, laboratory cultures, ELISA, or immunoassays in general, and nucleic acid amplification techniques such as PCR) commonly involve lengthy procedures, trained personnel, and relative expensive instrumentation. In this regard, Point-of-Care (POC) biosensor platforms are envisaged as one of the most powerful approaches for diagnostics or therapy monitoring to improve the outcome of medical care. Exponential progress in the field of nanobiotechnology has been particularly advantageous for the development of nanodevices (i.e. biosensors, nanochips, nanoprobes), which under appropriate configurations can detect specific biomarkers (whose levels increase or decrease during a health disorder) or specimens in real-time (i.e. pathogens or virus in the case of infections) facilitating early diagnosis, easy monitoring of the disease and, eventually, improved management of a given disease or condition. The design of POC biosensor platforms stands out as an alternative to conventional techniques by offering significant advantages such as simplicity and portability, making easier the monitoring in-situ and close to the patient (i.e. hospitals, primary care units, or even by the patient himself) and making them accessible to the majority of the population. The working principle of these POC biosensor devices mainly involves the specific identification of selected biomarkers related to a particular disease, by using specific receptors immobilized on the sensor surface, allowing high sensitivity and selectivity even when using low sample volumes. Ideally, a quantitative response is sought to discriminate the stages of the disease and perform a more accurate diagnosis so that selective treatment can be started quickly, carrying out a more personalized medicine. Among the different biosensor configurations currently under study by the research community, optical biosensors stand out as the most promising, due to their advantages in terms of sensitivity, miniaturization, multiplexing capabilities, and the ability to detect smaller analytes at low concentrations, among others. However, despite the enormous potential, few of them have reached commercialization. The main difficulties lie in the integration of the biosensors within microfluidic cartridges to be used as autonomous compact devices capable of detecting in real samples with sufficient reliability within the clinical ranges. The work in this thesis employs custom-designed plasmonic and nanoplasmonic biosensor platforms and develop new methodological analyte detection strategies. The main goal of this thesis has been the establishment of robust, reproducible, and validated detection
4
assays with real samples, which can eventually be used as POC biosensor devices in four relevant clinical scenarios. One of the applications focuses on the drug monitoring of acenocoumarol, an anticoagulant widely employed, and which is evaluated in human plasma. The second one centers on monitoring the intake of intolerant substances like gluten by the detection of gluten immunogenic peptides derived from gluten digestion and found in the urine of celiac patients. The third one relates to the detection of autoantibodies in blood serum to support the early diagnosis of colorectal cancer. Finally, we evaluate the bisoensors in the detection of specific biomarkers, such as proteins or single DNA sequences found in human sputum, for the fast diagnosis of tuberculosis. The implementation of novel biosensor strategies will aim at designing and evaluating routes for improving the performance of plasmonic and nanoplasmonic biosensors in the field of clinical diagnosis or therapy monitoring for the aforementioned diseases or conditions. The specific objectives derived from this main goal are the following: 1. Assessment and optimization of biofunctionalization strategies that enhance the analytical parameters of the detection assay in terms of sensitivity, selectivity, and reproducibility. 2. Design of methodologies for prevention and minimization of interferences coming from complex biological matrices such as urine, plasma, serum, and sputum. 3. Analysis of the accuracy and reliability of the proposed strategies with the nanoplasmonic biosensors employing real clinical samples.
5
Chapter 1 Introduction
This chapter provides a general introduction to optical biosensors, their working principle, and the main features that have positioned them as valuable analytical tools in the clinical and biomedical field. The relevant application scenarios are described, as drug monitoring, therapeutic follow-up, and early diagnosis or prognosis of infectious diseases and cancer, which could permit more efficient therapies and personalized medicine. Also, we describe their advantages and limitations for their real use in the clinical practice. Additionally, we describe the set of biorecognition elements, the biofunctionalization strategies, and the physicochemical parameters needed to obtain an optimal biosensor surface.

6
Introduction
7
1. Introduction
1.1. Point-of-care (POC) devices for healthcare Successful prevention and disease therapies can only be achieved with an adequate diagnosis. Habitually, laboratory tests identify the causes of deterioration of health status accurately. Collecting human samples using invasive methods such as biopsies involves a highly specialized process1. The detection and identification of the pathology will finally serve the doctor as a basis to select the most appropriate medical therapy or treatment. Subsequently, the symptomatology of the patients should be monitored to verify their evolution during therapy and evaluate their health improvement2. Conventional methods for pathogen identification for example (i.e. microbiological laboratory cultures, staining, and microscopic analysis) require instrumental infrastructure, personnel trained in the identification of the microorganism, and significant time to obtain a result (hours or weeks depending on the growth rate of the microorganism)3. These techniques are reliable for decision-making at the beginning of anti-infective therapy, in addition to the necessary epidemiological control measures. However, they are not convenient when the pathogen causing the infection cannot be grown in the laboratory4. Common standard tehcniques well established in clinical laboratories for the identification of diseases biomarkers, such as the Enzyme-Linked Immunosorbent Assay (ELISA)5, chromatography (i.e. Liquid-Liquid Extraction (LLE), Solid Phase Extraction (SPE), Solid Phase Microextraction (SPME), and High-Performance Liquid Chromatography (HPLC)), Flow Cytometry (FCM) and Mass Spectrometry (MS) are frequently used for the precise and sensitive quantification of multiple analytes. However, they require advanced infrastructure manage by trained personnel and can be relatively expensive and complex. In addition, molecular diagnostic methods have been successfully implemented in clinical laboratories and have had a great impact on health systems due to their efficiency and high sensitivity and specificity, allowing the detection of multiple analytes or pathogens that have been difficult to detect by conventional methods. Detection methods based on nucleic acids mainly rely on Real-Time Polymerase Chain Reaction (RT-PCR) techniques which, despite being highly effective, involve several complex preliminary steps to obtain a pure sample before analysis, which is necessary to obtain reliable results. The analysis takes a few hours (between 2-5 h), and require specialized personnel, safe environments for handling the samples to avoid contamination and equipment with a significant commercial cost. Consequently, these types of equipment cannot be always be provided in areas with limited resources6.
Introduction
8
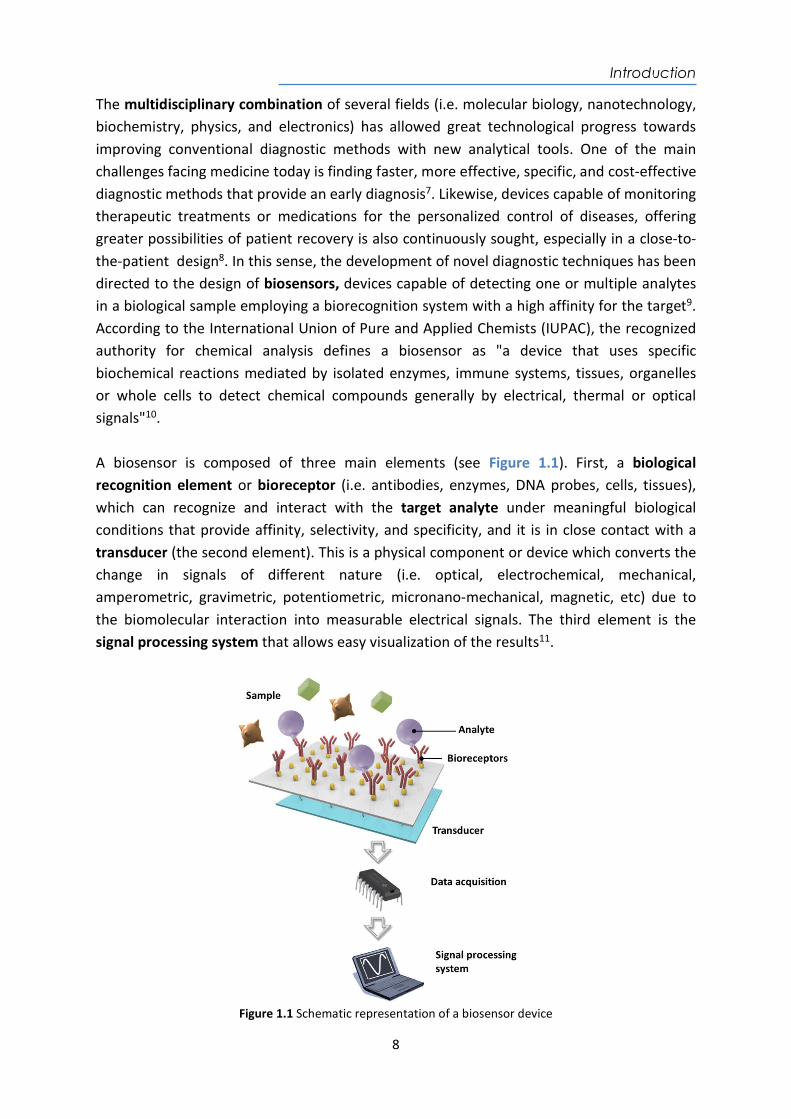
The multidisciplinary combination of several fields (i.e. molecular biology, nanotechnology, biochemistry, physics, and electronics) has allowed great technological progress towards improving conventional diagnostic methods with new analytical tools. One of the main challenges facing medicine today is finding faster, more effective, specific, and cost-effective diagnostic methods that provide an early diagnosis7. Likewise, devices capable of monitoring therapeutic treatments or medications for the personalized control of diseases, offering greater possibilities of patient recovery is also continuously sought, especially in a close-to-the-patient design8. In this sense, the development of novel diagnostic techniques has been directed to the design of biosensors, devices capable of detecting one or multiple analytes in a biological sample employing a biorecognition system with a high affinity for the target9. According to the International Union of Pure and Applied Chemists (IUPAC), the recognized authority for chemical analysis defines a biosensor as "a device that uses specific biochemical reactions mediated by isolated enzymes, immune systems, tissues, organelles or whole cells to detect chemical compounds generally by electrical, thermal or optical signals"10. A biosensor is composed of three main elements (see Figure 1.1). First, a biological recognition element or bioreceptor (i.e. antibodies, enzymes, DNA probes, cells, tissues), which can recognize and interact with the target analyte under meaningful biological conditions that provide affinity, selectivity, and specificity, and it is in close contact with a transducer (the second element). This is a physical component or device which converts the change in signals of different nature (i.e. optical, electrochemical, mechanical, amperometric, gravimetric, potentiometric, micronano-mechanical, magnetic, etc) due to the biomolecular interaction into measurable electrical signals. The third element is the signal processing system that allows easy visualization of the results11.
Figure 1.1 Schematic representation of a biosensor device
Introduction
9
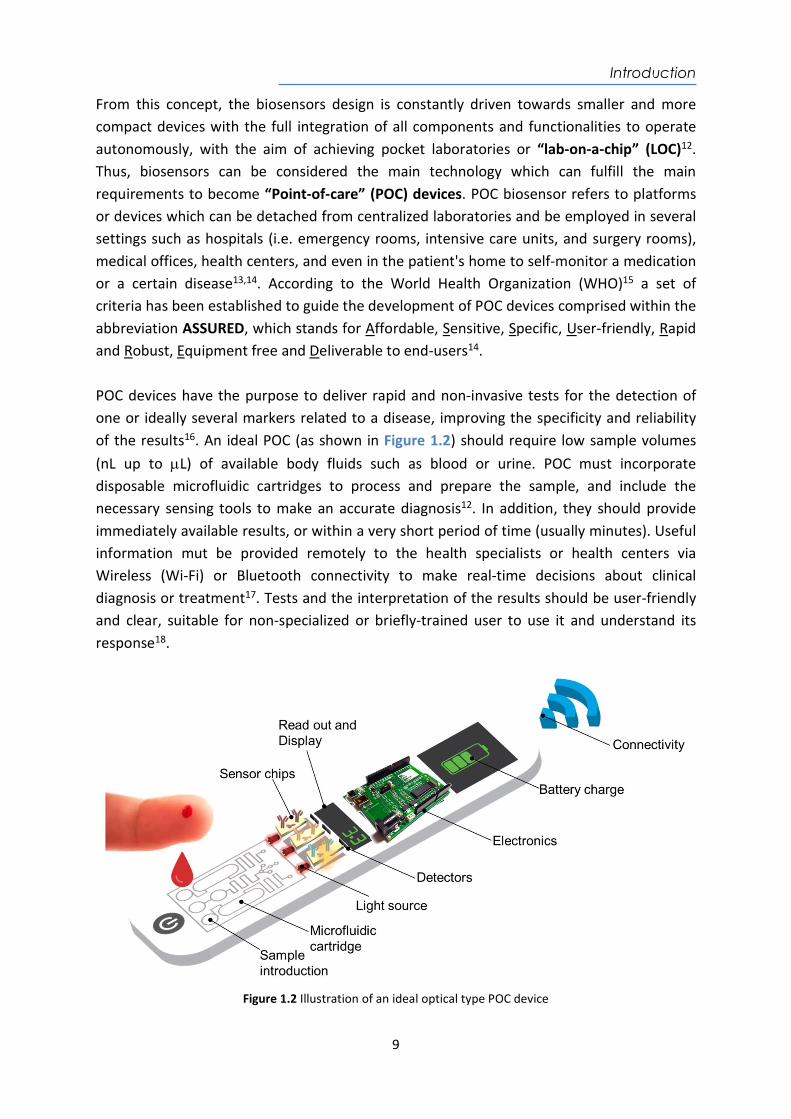
From this concept, the biosensors design is constantly driven towards smaller and more compact devices with the full integration of all components and functionalities to operate autonomously, with the aim of achieving pocket laboratories or “lab-on-a-chip” (LOC)12. Thus, biosensors can be considered the main technology which can fulfill the main requirements to become “Point-of-care” (POC) devices. POC biosensor refers to platforms or devices which can be detached from centralized laboratories and be employed in several settings such as hospitals (i.e. emergency rooms, intensive care units, and surgery rooms), medical offices, health centers, and even in the patient's home to self-monitor a medication or a certain disease13,14. According to the World Health Organization (WHO)15 a set of criteria has been established to guide the development of POC devices comprised within the abbreviation ASSURED, which stands for Affordable, Sensitive, Specific, User-friendly, Rapid and Robust, Equipment free and Deliverable to end-users14. POC devices have the purpose to deliver rapid and non-invasive tests for the detection of one or ideally several markers related to a disease, improving the specificity and reliability of the results16. An ideal POC (as shown in Figure 1.2) should require low sample volumes (nL up to L) of available body fluids such as blood or urine. POC must incorporate disposable microfluidic cartridges to process and prepare the sample, and include the necessary sensing tools to make an accurate diagnosis12. In addition, they should provide immediately available results, or within a very short period of time (usually minutes). Useful information mut be provided remotely to the health specialists or health centers via Wireless (Wi-Fi) or Bluetooth connectivity to make real-time decisions about clinical diagnosis or treatment17. Tests and the interpretation of the results should be user-friendly and clear, suitable for non-specialized or briefly-trained user to use it and understand its response18.
Figure 1.2 Illustration of an ideal optical type POC device
Introduction
10
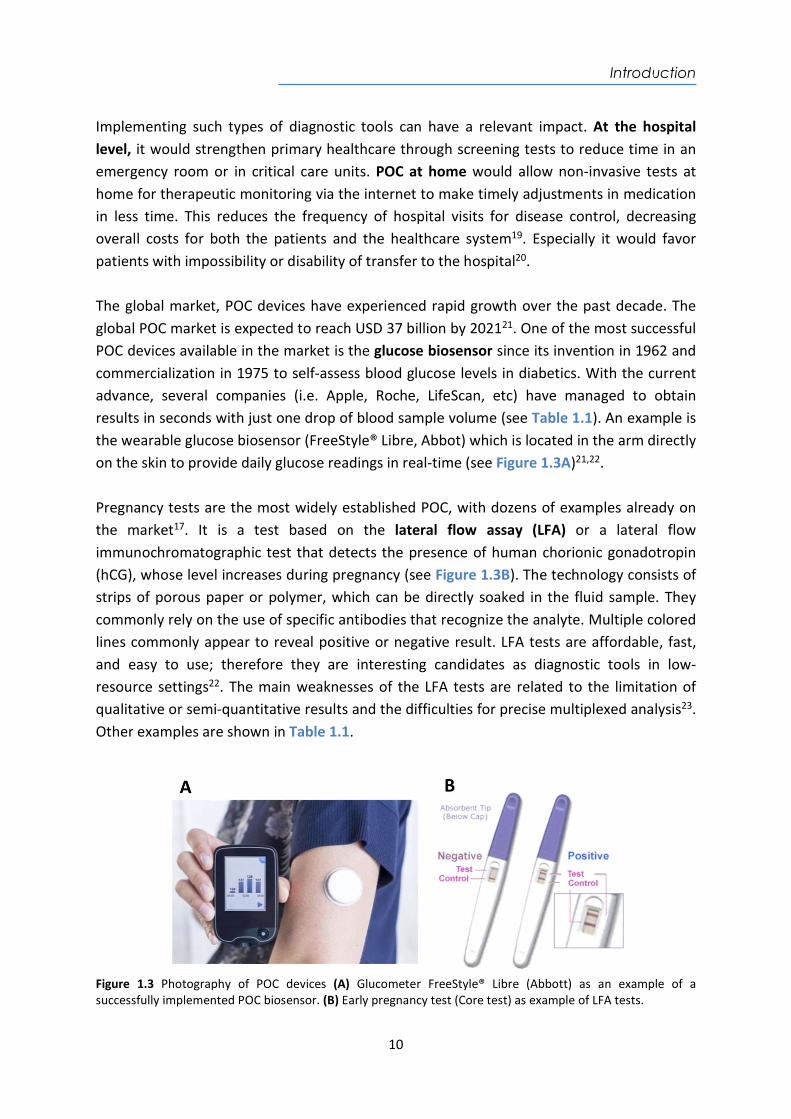
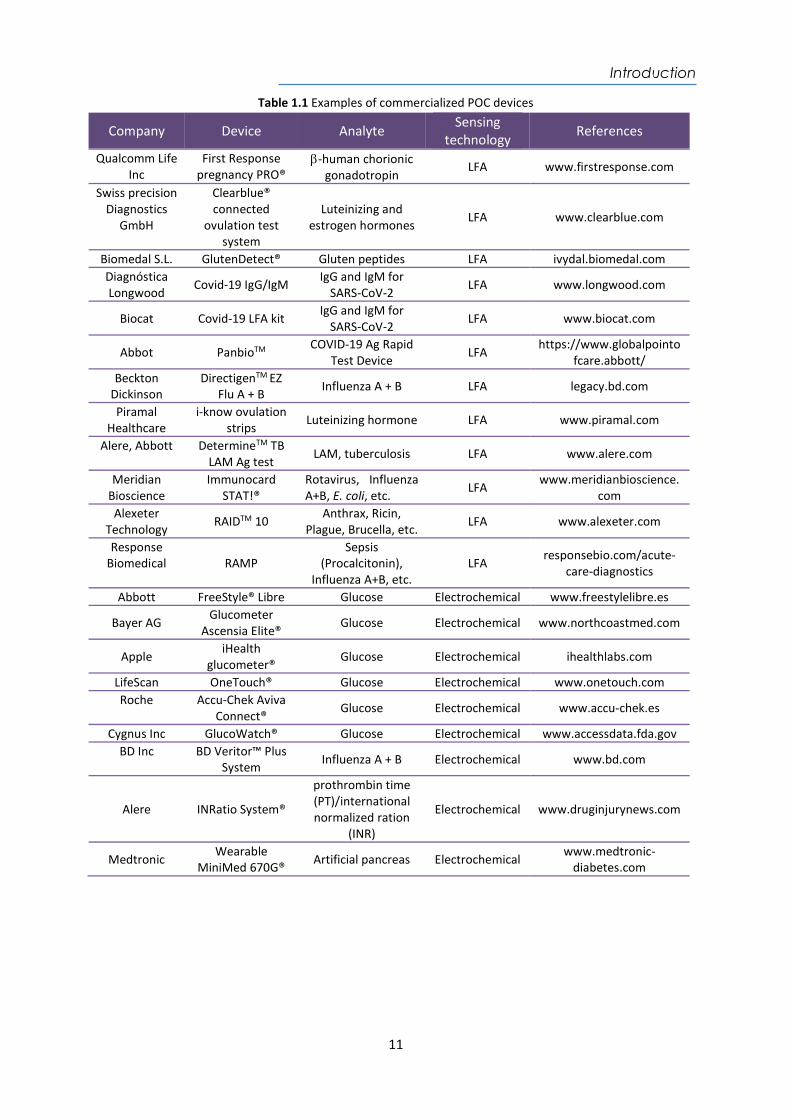
Implementing such types of diagnostic tools can have a relevant impact. At the hospital level, it would strengthen primary healthcare through screening tests to reduce time in an emergency room or in critical care units. POC at home would allow non-invasive tests at home for therapeutic monitoring via the internet to make timely adjustments in medication in less time. This reduces the frequency of hospital visits for disease control, decreasing overall costs for both the patients and the healthcare system19. Especially it would favor patients with impossibility or disability of transfer to the hospital20. The global market, POC devices have experienced rapid growth over the past decade. The global POC market is expected to reach USD 37 billion by 202121. One of the most successful POC devices available in the market is the glucose biosensor since its invention in 1962 and commercialization in 1975 to self-assess blood glucose levels in diabetics. With the current advance, several companies (i.e. Apple, Roche, LifeScan, etc) have managed to obtain results in seconds with just one drop of blood sample volume (see Table 1.1). An example is the wearable glucose biosensor (FreeStyle® Libre, Abbot) which is located in the arm directly on the skin to provide daily glucose readings in real-time (see Figure 1.3A)21,22. Pregnancy tests are the most widely established POC, with dozens of examples already on the market17. It is a test based on the lateral flow assay (LFA) or a lateral flow immunochromatographic test that detects the presence of human chorionic gonadotropin (hCG), whose level increases during pregnancy (see Figure 1.3B). The technology consists of strips of porous paper or polymer, which can be directly soaked in the fluid sample. They commonly rely on the use of specific antibodies that recognize the analyte. Multiple colored lines commonly appear to reveal positive or negative result. LFA tests are affordable, fast, and easy to use; therefore they are interesting candidates as diagnostic tools in low-resource settings22. The main weaknesses of the LFA tests are related to the limitation of qualitative or semi-quantitative results and the difficulties for precise multiplexed analysis23. Other examples are shown in Table 1.1.
Figure 1.3 Photography of POC devices (A) Glucometer FreeStyle® Libre (Abbott) as an example of a successfully implemented POC biosensor. (B) Early pregnancy test (Core test) as example of LFA tests.
Introduction
11
Table 1.1 Examples of commercialized POC devices
Company Device Analyte Sensing technology References
Qualcomm Life Inc
First Response pregnancy PRO®
-human chorionic gonadotropin
LFA www.firstresponse.com
Swiss precision Diagnostics
GmbH
Clearblue® connected
ovulation test system
Luteinizing and estrogen hormones
LFA www.clearblue.com
Biomedal S.L. GlutenDetect® Gluten peptides LFA ivydal.biomedal.com Diagnóstica Longwood
Covid-19 IgG/IgM IgG and IgM for
SARS-CoV-2 LFA www.longwood.com
Biocat Covid-19 LFA kit IgG and IgM for
SARS-CoV-2 LFA www.biocat.com
Abbot PanbioTM COVID-19 Ag Rapid
Test Device LFA
https://www.globalpointofcare.abbott/
Beckton Dickinson
DirectigenTM EZ Flu A + B Influenza A + B LFA legacy.bd.com
Piramal Healthcare
i-know ovulation strips
Luteinizing hormone LFA www.piramal.com
Alere, Abbott DetermineTM TB LAM Ag test
LAM, tuberculosis LFA www.alere.com
Meridian Bioscience
Immunocard STAT!®
Rotavirus, Influenza A+B, E. coli, etc.
LFA www.meridianbioscience.
com Alexeter
Technology RAIDTM 10
Anthrax, Ricin, Plague, Brucella, etc.
LFA www.alexeter.com
Response Biomedical RAMP
Sepsis (Procalcitonin),
Influenza A+B, etc. LFA
responsebio.com/acute-care-diagnostics
Abbott FreeStyle® Libre Glucose Electrochemical www.freestylelibre.es
Bayer AG Glucometer
Ascensia Elite® Glucose Electrochemical www.northcoastmed.com
Apple iHealth
glucometer® Glucose Electrochemical ihealthlabs.com
LifeScan OneTouch® Glucose Electrochemical www.onetouch.com Roche Accu-Chek Aviva
Connect® Glucose Electrochemical www.accu-chek.es
Cygnus Inc GlucoWatch® Glucose Electrochemical www.accessdata.fda.gov BD Inc BD Veritor™ Plus
System Influenza A + B Electrochemical www.bd.com
Alere INRatio System®
prothrombin time (PT)/international normalized ration
(INR)
Electrochemical www.druginjurynews.com
Medtronic Wearable
MiniMed 670G® Artificial pancreas Electrochemical www.medtronic-
diabetes.com
Introduction
12
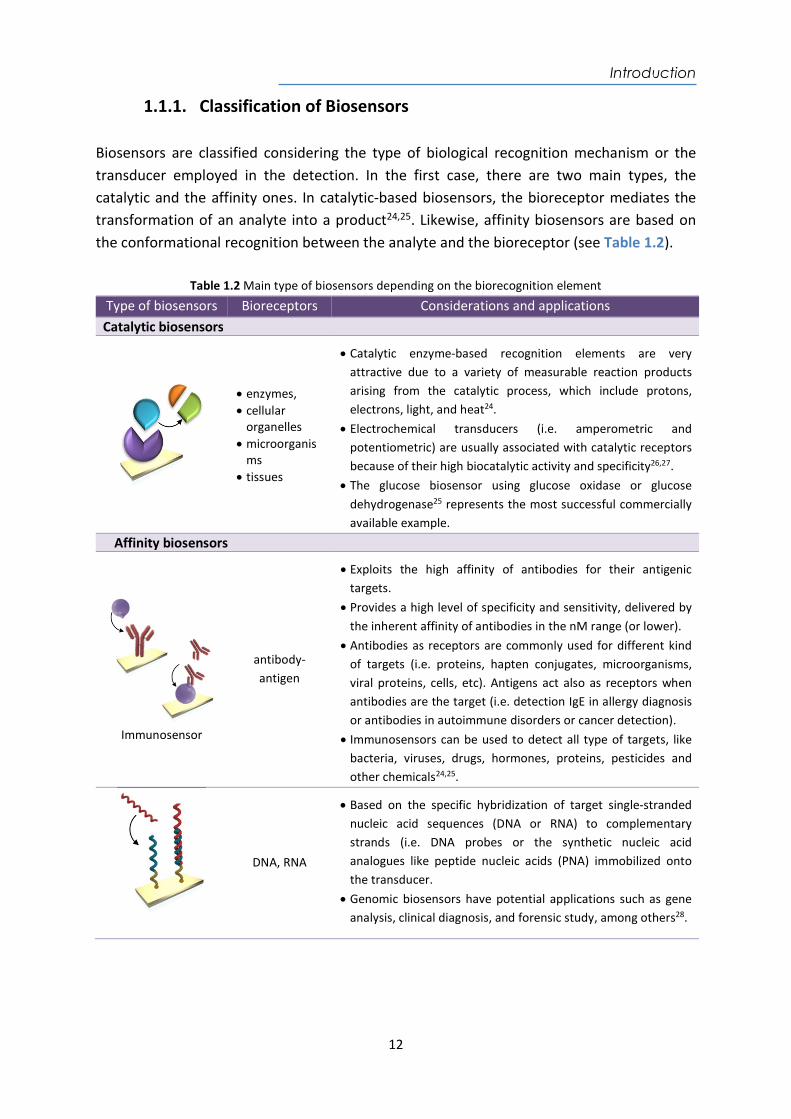
1.1.1. Classification of Biosensors Biosensors are classified considering the type of biological recognition mechanism or the transducer employed in the detection. In the first case, there are two main types, the catalytic and the affinity ones. In catalytic-based biosensors, the bioreceptor mediates the transformation of an analyte into a product24,25. Likewise, affinity biosensors are based on the conformational recognition between the analyte and the bioreceptor (see Table 1.2).
Table 1.2 Main type of biosensors depending on the biorecognition element
Type of biosensors Bioreceptors Considerations and applications Catalytic biosensors
enzymes, cellular
organelles microorganis
ms tissues
Catalytic enzyme-based recognition elements are very attractive due to a variety of measurable reaction products arising from the catalytic process, which include protons, electrons, light, and heat24.
Electrochemical transducers (i.e. amperometric and potentiometric) are usually associated with catalytic receptors because of their high biocatalytic activity and specificity26,27.
The glucose biosensor using glucose oxidase or glucose dehydrogenase25 represents the most successful commercially available example.
Affinity biosensors
Immunosensor
antibody-antigen
Exploits the high affinity of antibodies for their antigenic targets.
Provides a high level of specificity and sensitivity, delivered by the inherent affinity of antibodies in the nM range (or lower).
Antibodies as receptors are commonly used for different kind of targets (i.e. proteins, hapten conjugates, microorganisms, viral proteins, cells, etc). Antigens act also as receptors when antibodies are the target (i.e. detection IgE in allergy diagnosis or antibodies in autoimmune disorders or cancer detection).
Immunosensors can be used to detect all type of targets, like bacteria, viruses, drugs, hormones, proteins, pesticides and other chemicals24,25.
DNA, RNA
Based on the specific hybridization of target single-stranded nucleic acid sequences (DNA or RNA) to complementary strands (i.e. DNA probes or the synthetic nucleic acid analogues like peptide nucleic acids (PNA) immobilized onto the transducer.
Genomic biosensors have potential applications such as gene analysis, clinical diagnosis, and forensic study, among others28.
Introduction
13
Aptamers
Aptamers (single stranded nucleic acids ) can be produced for virtually any type of analyte through the SELEX (Systematic Evolution of Ligand by Exponential Enrichment) process29. The affinity for its target can vary against a large number of factors (i.e. temperature, pH or ionic strength).
MIPs
A molecular imprinting polymer (MIP) is a polymer that has been processed using the molecular imprinting technique that leaves cavities in the polymer matrix with affinity for a chosen "template" molecule. However, they have lower specificity, the manufacturing method is complicated, and they have poor compatibility with aqueous solutions11.
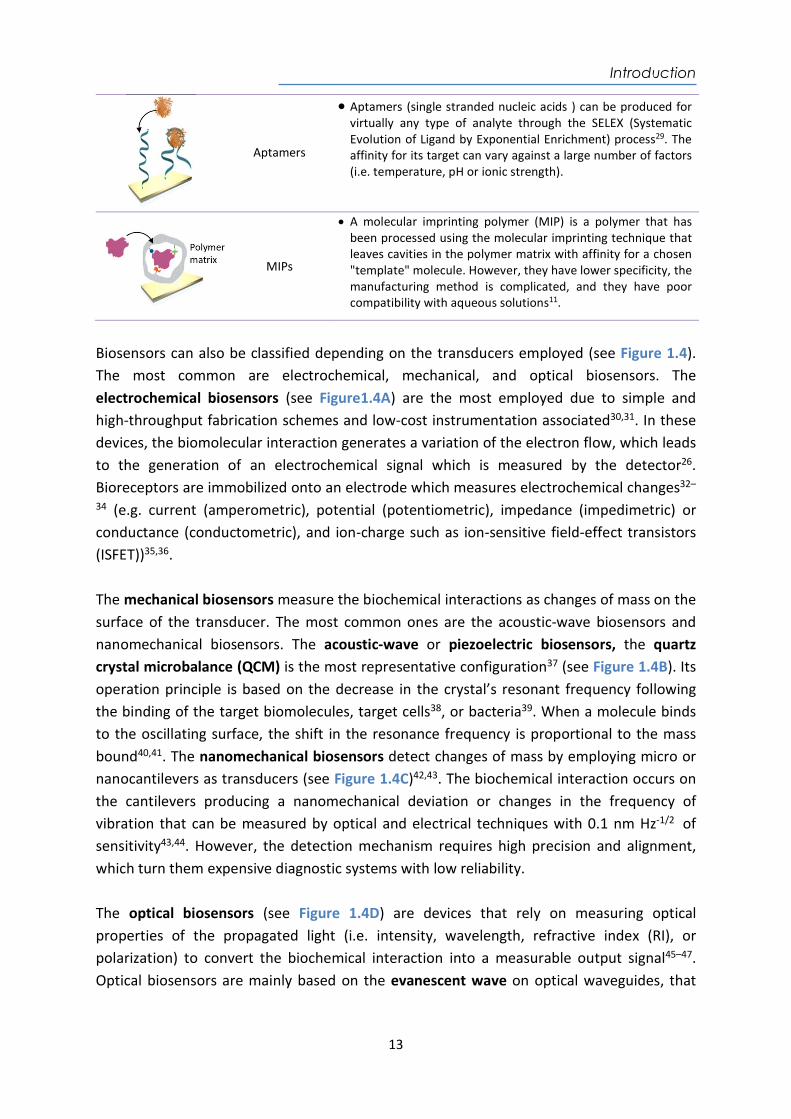
Biosensors can also be classified depending on the transducers employed (see Figure 1.4). The most common are electrochemical, mechanical, and optical biosensors. The electrochemical biosensors (see Figure1.4A) are the most employed due to simple and high-throughput fabrication schemes and low-cost instrumentation associated30,31. In these devices, the biomolecular interaction generates a variation of the electron flow, which leads to the generation of an electrochemical signal which is measured by the detector26. Bioreceptors are immobilized onto an electrode which measures electrochemical changes32–
34 (e.g. current (amperometric), potential (potentiometric), impedance (impedimetric) or conductance (conductometric), and ion-charge such as ion-sensitive field-effect transistors (ISFET))35,36. The mechanical biosensors measure the biochemical interactions as changes of mass on the surface of the transducer. The most common ones are the acoustic-wave biosensors and nanomechanical biosensors. The acoustic-wave or piezoelectric biosensors, the quartz crystal microbalance (QCM) is the most representative configuration37 (see Figure 1.4B). Its operation principle is based on the decrease in the crystal’s resonant frequency following the binding of the target biomolecules, target cells38, or bacteria39. When a molecule binds to the oscillating surface, the shift in the resonance frequency is proportional to the mass bound40,41. The nanomechanical biosensors detect changes of mass by employing micro or nanocantilevers as transducers (see Figure 1.4C)42,43. The biochemical interaction occurs on the cantilevers producing a nanomechanical deviation or changes in the frequency of vibration that can be measured by optical and electrical techniques with 0.1 nm Hz-1/2 of sensitivity43,44. However, the detection mechanism requires high precision and alignment, which turn them expensive diagnostic systems with low reliability. The optical biosensors (see Figure 1.4D) are devices that rely on measuring optical properties of the propagated light (i.e. intensity, wavelength, refractive index (RI), or polarization) to convert the biochemical interaction into a measurable output signal45–47. Optical biosensors are mainly based on the evanescent wave on optical waveguides, that
Introduction
14
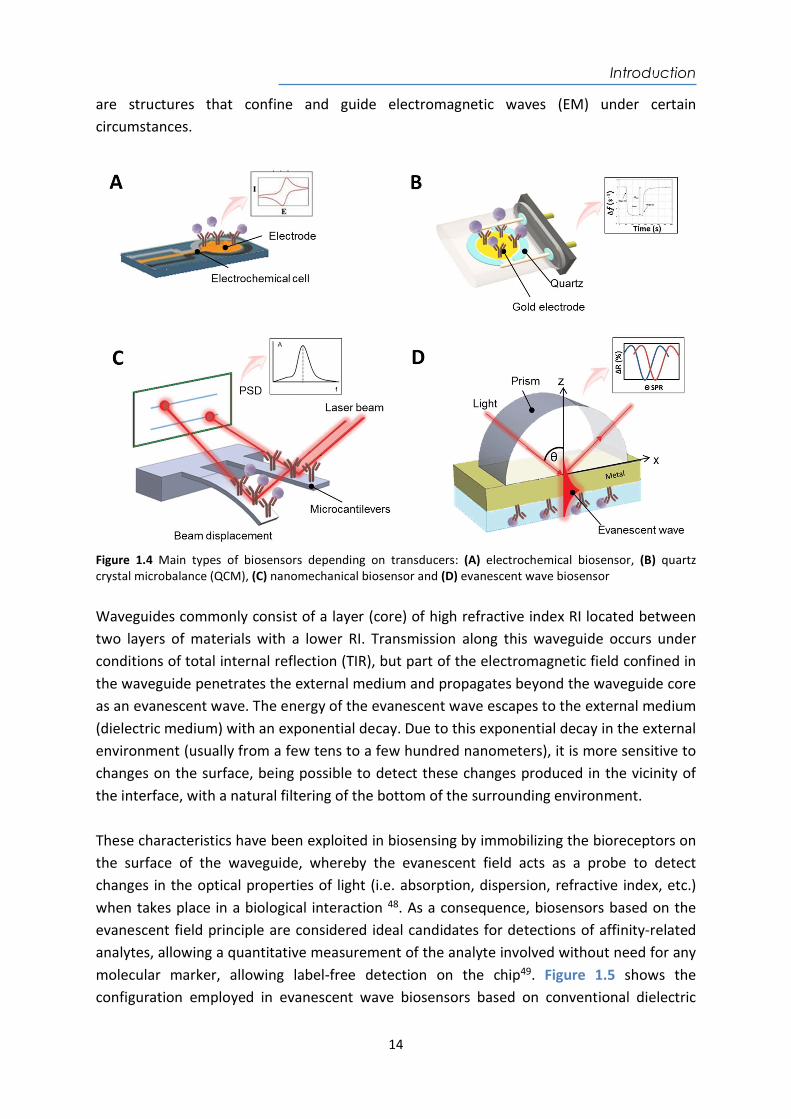
are structures that confine and guide electromagnetic waves (EM) under certain circumstances.
Figure 1.4 Main types of biosensors depending on transducers: (A) electrochemical biosensor, (B) quartz crystal microbalance (QCM), (C) nanomechanical biosensor and (D) evanescent wave biosensor Waveguides commonly consist of a layer (core) of high refractive index RI located between two layers of materials with a lower RI. Transmission along this waveguide occurs under conditions of total internal reflection (TIR), but part of the electromagnetic field confined in the waveguide penetrates the external medium and propagates beyond the waveguide core as an evanescent wave. The energy of the evanescent wave escapes to the external medium (dielectric medium) with an exponential decay. Due to this exponential decay in the external environment (usually from a few tens to a few hundred nanometers), it is more sensitive to changes on the surface, being possible to detect these changes produced in the vicinity of the interface, with a natural filtering of the bottom of the surrounding environment. These characteristics have been exploited in biosensing by immobilizing the bioreceptors on the surface of the waveguide, whereby the evanescent field acts as a probe to detect changes in the optical properties of light (i.e. absorption, dispersion, refractive index, etc.) when takes place in a biological interaction 48. As a consequence, biosensors based on the evanescent field principle are considered ideal candidates for detections of affinity-related analytes, allowing a quantitative measurement of the analyte involved without need for any molecular marker, allowing label-free detection on the chip49. Figure 1.5 shows the configuration employed in evanescent wave biosensors based on conventional dielectric
Introduction
15
waveguides. Therefore, biosensors based on this detection principle do not need any molecular marker, which allows label-free detection45,50.
Figure 1.5 Schematic depicting the sensing principle of evanescent wave biosensors
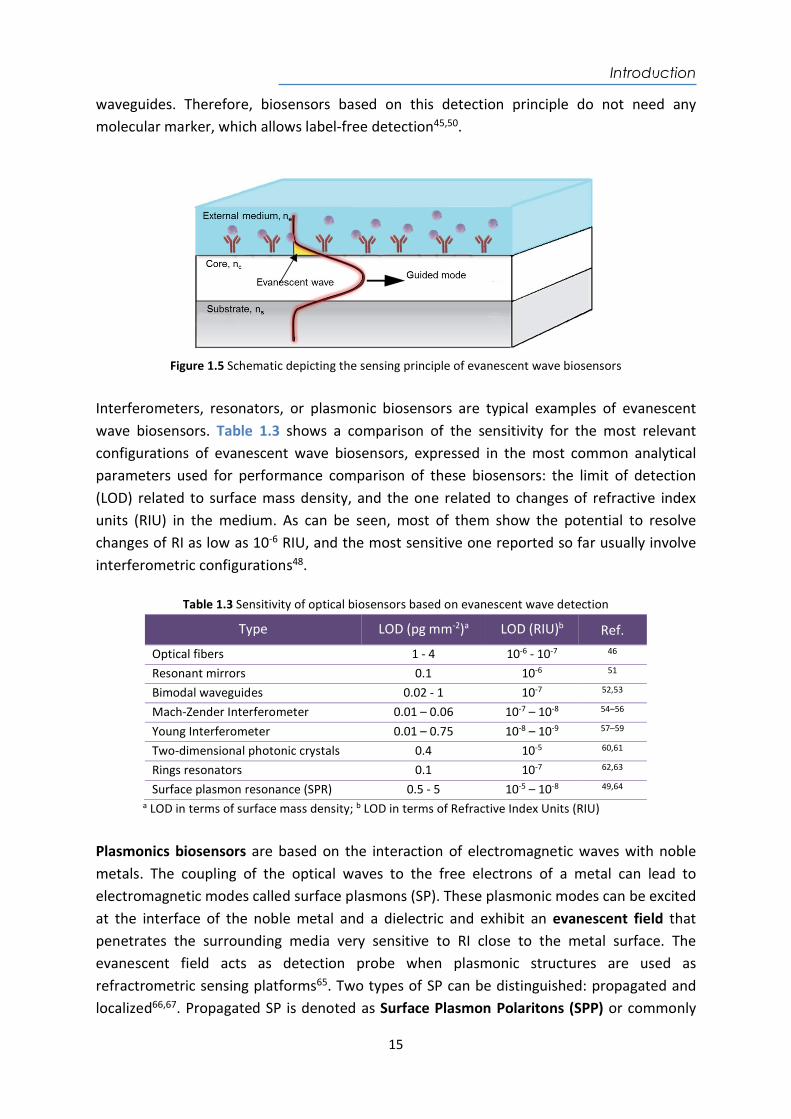
Interferometers, resonators, or plasmonic biosensors are typical examples of evanescent wave biosensors. Table 1.3 shows a comparison of the sensitivity for the most relevant configurations of evanescent wave biosensors, expressed in the most common analytical parameters used for performance comparison of these biosensors: the limit of detection (LOD) related to surface mass density, and the one related to changes of refractive index units (RIU) in the medium. As can be seen, most of them show the potential to resolve changes of RI as low as 10-6 RIU, and the most sensitive one reported so far usually involve interferometric configurations48.
Table 1.3 Sensitivity of optical biosensors based on evanescent wave detection
Type LOD (pg mm-2)a LOD (RIU)b Ref.
Optical fibers 1 - 4 10-6 - 10-7 46 Resonant mirrors 0.1 10-6 51 Bimodal waveguides 0.02 - 1 10-7 52,53 Mach-Zender Interferometer 0.01 – 0.06 10-7 – 10-8 54–56 Young Interferometer 0.01 – 0.75 10-8 – 10-9 57–59 Two-dimensional photonic crystals 0.4 10-5 60,61 Rings resonators 0.1 10-7 62,63 Surface plasmon resonance (SPR) 0.5 - 5 10-5 – 10-8 49,64
a LOD in terms of surface mass density; b LOD in terms of Refractive Index Units (RIU)
Plasmonics biosensors are based on the interaction of electromagnetic waves with noble metals. The coupling of the optical waves to the free electrons of a metal can lead to electromagnetic modes called surface plasmons (SP). These plasmonic modes can be excited at the interface of the noble metal and a dielectric and exhibit an evanescent field that penetrates the surrounding media very sensitive to RI close to the metal surface. The evanescent field acts as detection probe when plasmonic structures are used as refractrometric sensing platforms65. Two types of SP can be distinguished: propagated and localized66,67. Propagated SP is denoted as Surface Plasmon Polaritons (SPP) or commonly
Introduction
16
known as Surface Plasmon Resonance (SPR) and Localized SP as Localized Surface Plasmon Resonance (LSPR) excited on sub-wavelength-sized metal nanostructures. In this case the localized plasmons are highly confined on the surface of the nanostructure, which under excitation can also be used as a probe for sensing68,69.
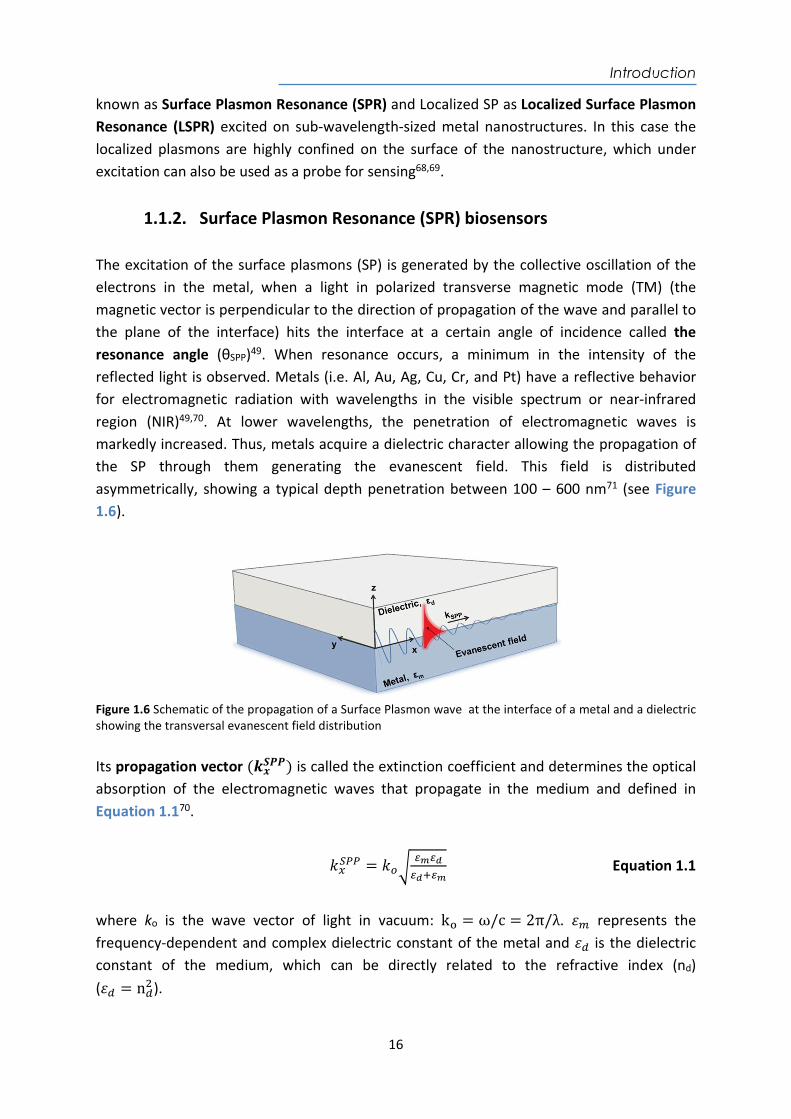
1.1.2. Surface Plasmon Resonance (SPR) biosensors The excitation of the surface plasmons (SP) is generated by the collective oscillation of the electrons in the metal, when a light in polarized transverse magnetic mode (TM) (the magnetic vector is perpendicular to the direction of propagation of the wave and parallel to the plane of the interface) hits the interface at a certain angle of incidence called the resonance angle (θSPP)49. When resonance occurs, a minimum in the intensity of the reflected light is observed. Metals (i.e. Al, Au, Ag, Cu, Cr, and Pt) have a reflective behavior for electromagnetic radiation with wavelengths in the visible spectrum or near-infrared region (NIR)49,70. At lower wavelengths, the penetration of electromagnetic waves is markedly increased. Thus, metals acquire a dielectric character allowing the propagation of the SP through them generating the evanescent field. This field is distributed asymmetrically, showing a typical depth penetration between 100 – 600 nm71 (see Figure 1.6).
Figure 1.6 Schematic of the propagation of a Surface Plasmon wave at the interface of a metal and a dielectric showing the transversal evanescent field distribution Its propagation vector (𝒌𝒙
𝑺𝑷𝑷) is called the extinction coefficient and determines the optical absorption of the electromagnetic waves that propagate in the medium and defined in Equation 1.170.
𝑘 = 𝑘 Equation 1.1
where ko is the wave vector of light in vacuum: k = ω/c = 2π/λ. 𝜀 represents the frequency-dependent and complex dielectric constant of the metal and 𝜀 is the dielectric constant of the medium, which can be directly related to the refractive index (nd) (𝜀 = n ).
Introduction
17
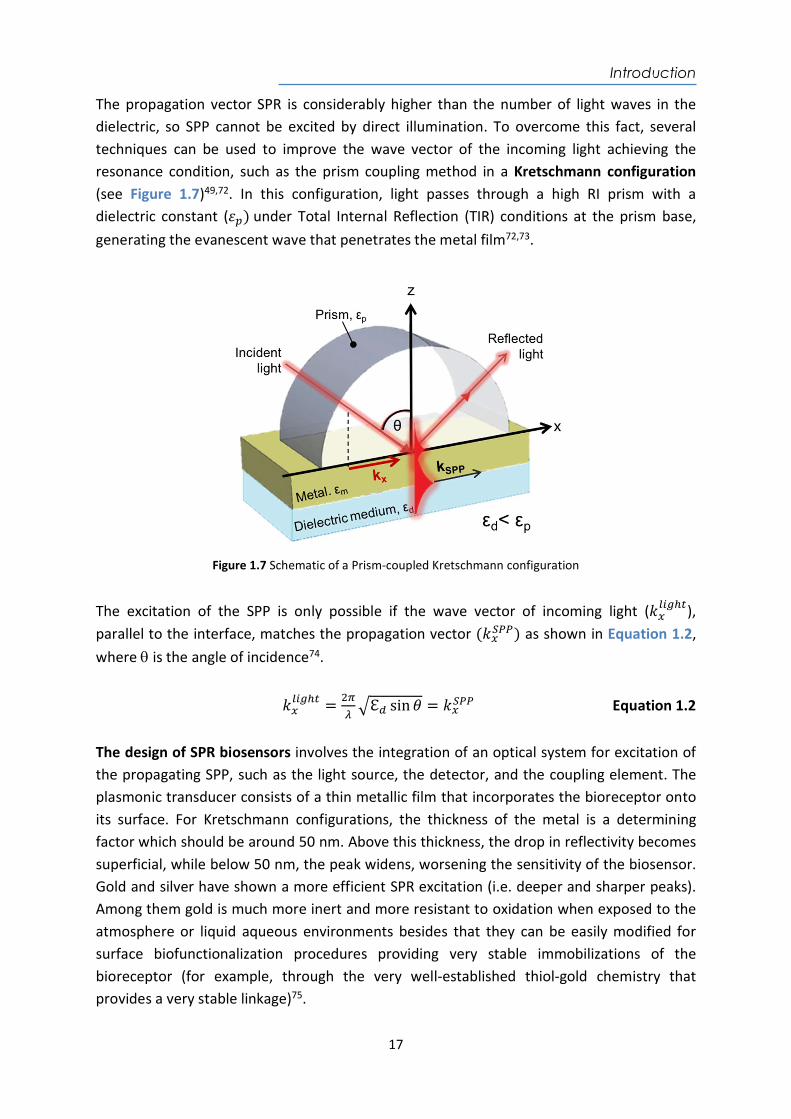
The propagation vector SPR is considerably higher than the number of light waves in the dielectric, so SPP cannot be excited by direct illumination. To overcome this fact, several techniques can be used to improve the wave vector of the incoming light achieving the resonance condition, such as the prism coupling method in a Kretschmann configuration (see Figure 1.7)49,72. In this configuration, light passes through a high RI prism with a dielectric constant (𝜀 ) under Total Internal Reflection (TIR) conditions at the prism base, generating the evanescent wave that penetrates the metal film72,73.
Figure 1.7 Schematic of a Prism-coupled Kretschmann configuration
The excitation of the SPP is only possible if the wave vector of incoming light (𝑘 ), parallel to the interface, matches the propagation vector (𝑘 ) as shown in Equation 1.2, where is the angle of incidence74.
𝑘 = ℇ sin 𝜃 = 𝑘 Equation 1.2
The design of SPR biosensors involves the integration of an optical system for excitation of the propagating SPP, such as the light source, the detector, and the coupling element. The plasmonic transducer consists of a thin metallic film that incorporates the bioreceptor onto its surface. For Kretschmann configurations, the thickness of the metal is a determining factor which should be around 50 nm. Above this thickness, the drop in reflectivity becomes superficial, while below 50 nm, the peak widens, worsening the sensitivity of the biosensor. Gold and silver have shown a more efficient SPR excitation (i.e. deeper and sharper peaks). Among them gold is much more inert and more resistant to oxidation when exposed to the atmosphere or liquid aqueous environments besides that they can be easily modified for surface biofunctionalization procedures providing very stable immobilizations of the bioreceptor (for example, through the very well-established thiol-gold chemistry that provides a very stable linkage)75.
Introduction
18
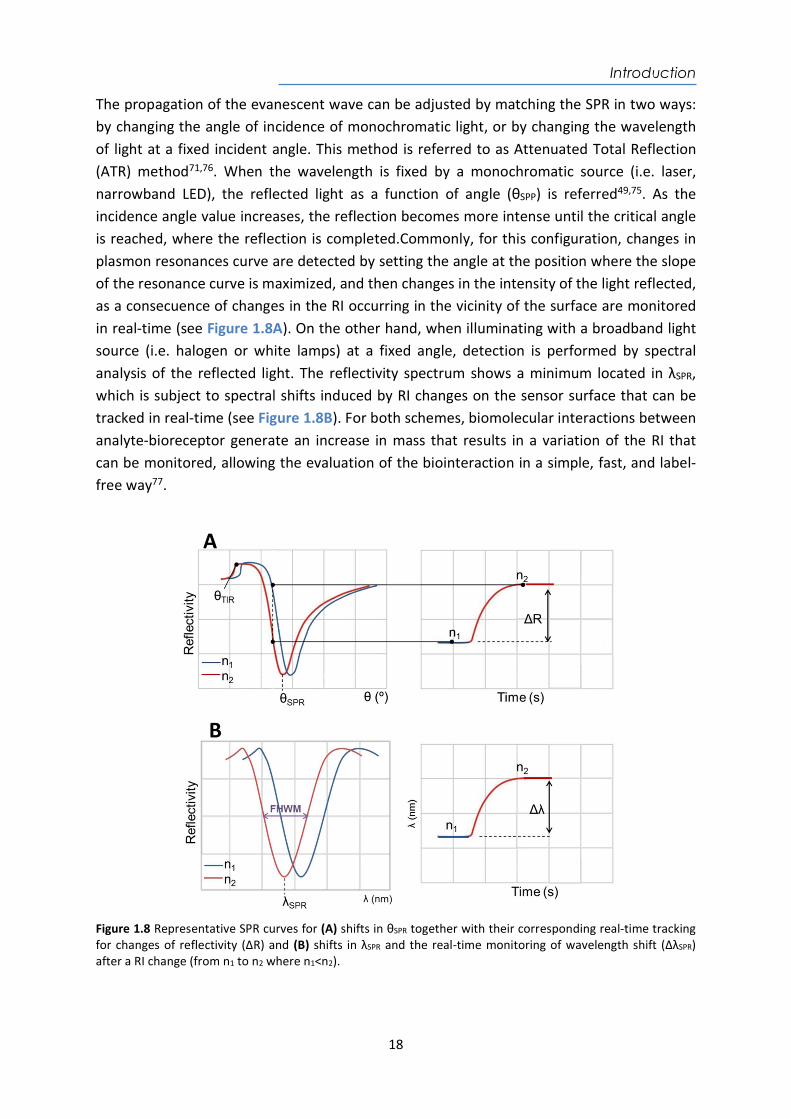
The propagation of the evanescent wave can be adjusted by matching the SPR in two ways: by changing the angle of incidence of monochromatic light, or by changing the wavelength of light at a fixed incident angle. This method is referred to as Attenuated Total Reflection (ATR) method71,76. When the wavelength is fixed by a monochromatic source (i.e. laser, narrowband LED), the reflected light as a function of angle (θSPP) is referred49,75. As the incidence angle value increases, the reflection becomes more intense until the critical angle is reached, where the reflection is completed.Commonly, for this configuration, changes in plasmon resonances curve are detected by setting the angle at the position where the slope of the resonance curve is maximized, and then changes in the intensity of the light reflected, as a consecuence of changes in the RI occurring in the vicinity of the surface are monitored in real-time (see Figure 1.8A). On the other hand, when illuminating with a broadband light source (i.e. halogen or white lamps) at a fixed angle, detection is performed by spectral analysis of the reflected light. The reflectivity spectrum shows a minimum located in λSPR, which is subject to spectral shifts induced by RI changes on the sensor surface that can be tracked in real-time (see Figure 1.8B). For both schemes, biomolecular interactions between analyte-bioreceptor generate an increase in mass that results in a variation of the RI that can be monitored, allowing the evaluation of the biointeraction in a simple, fast, and label-free way77.
Figure 1.8 Representative SPR curves for (A) shifts in θSPR together with their corresponding real-time tracking for changes of reflectivity (ΔR) and (B) shifts in λSPR and the real-time monitoring of wavelength shift (ΔλSPR) after a RI change (from n1 to n2 where n1<n2).
Introduction
19
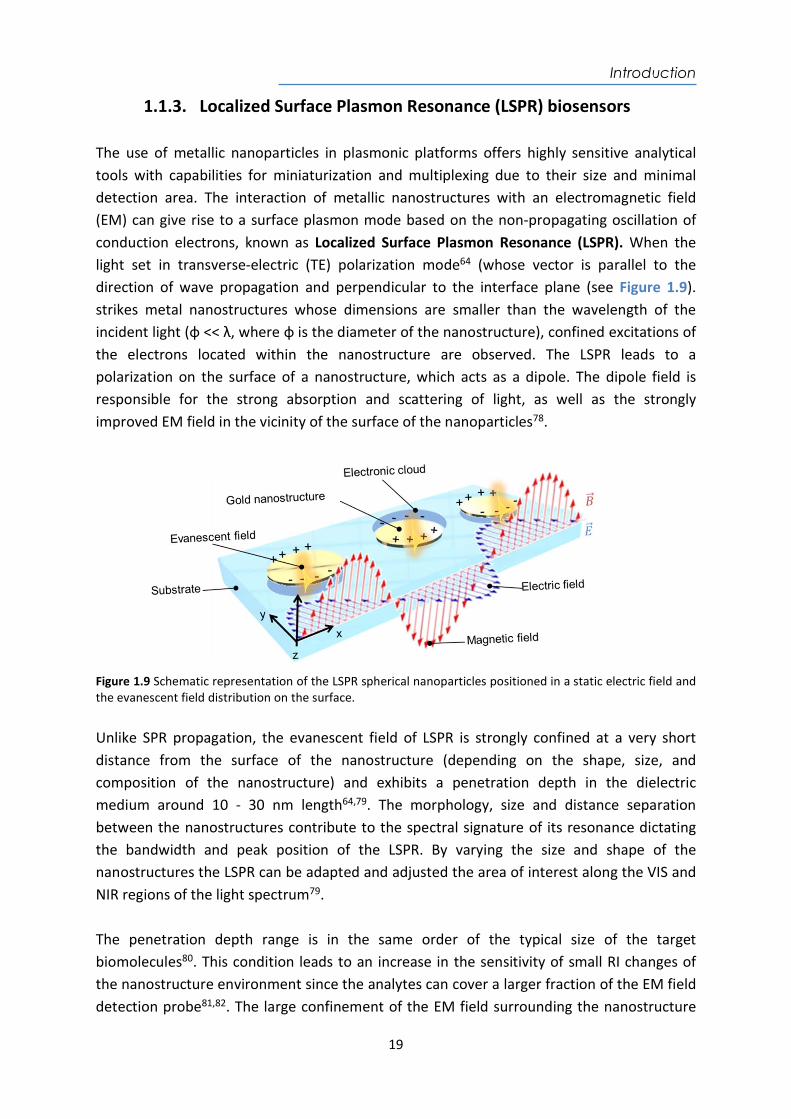
1.1.3. Localized Surface Plasmon Resonance (LSPR) biosensors The use of metallic nanoparticles in plasmonic platforms offers highly sensitive analytical tools with capabilities for miniaturization and multiplexing due to their size and minimal detection area. The interaction of metallic nanostructures with an electromagnetic field (EM) can give rise to a surface plasmon mode based on the non-propagating oscillation of conduction electrons, known as Localized Surface Plasmon Resonance (LSPR). When the light set in transverse-electric (TE) polarization mode64 (whose vector is parallel to the direction of wave propagation and perpendicular to the interface plane (see Figure 1.9). strikes metal nanostructures whose dimensions are smaller than the wavelength of the incident light (φ << λ, where φ is the diameter of the nanostructure), confined excitations of the electrons located within the nanostructure are observed. The LSPR leads to a polarization on the surface of a nanostructure, which acts as a dipole. The dipole field is responsible for the strong absorption and scattering of light, as well as the strongly improved EM field in the vicinity of the surface of the nanoparticles78.
Figure 1.9 Schematic representation of the LSPR spherical nanoparticles positioned in a static electric field and the evanescent field distribution on the surface. Unlike SPR propagation, the evanescent field of LSPR is strongly confined at a very short distance from the surface of the nanostructure (depending on the shape, size, and composition of the nanostructure) and exhibits a penetration depth in the dielectric medium around 10 - 30 nm length64,79. The morphology, size and distance separation between the nanostructures contribute to the spectral signature of its resonance dictating the bandwidth and peak position of the LSPR. By varying the size and shape of the nanostructures the LSPR can be adapted and adjusted the area of interest along the VIS and NIR regions of the light spectrum79. The penetration depth range is in the same order of the typical size of the target biomolecules80. This condition leads to an increase in the sensitivity of small RI changes of the nanostructure environment since the analytes can cover a larger fraction of the EM field detection probe81,82. The large confinement of the EM field surrounding the nanostructure
Introduction
20
provides sufficient sensitivity for direct and label-free detection of small biomolecules and even at the level of single molecule82,83. In addition, the confinement of the EM field turns LSPR configuration into less susceptible to massive changes that occur in the environment, such as temperature fluctuations84. As for all the evanescence wave-based biosensors, the performance of a plasmonic sensor is mainly evaluated through its ability to detect changes in RI. As both detection schemes (θ or λ) are generally characterized by a peak response (as can be seen in Figure 1.8), changes in RI (Δn) will generate changes in the position of the resonance wavelength (ΔλSPR) or resonance angle (ΔθSPR)75. Since the sensitivity of SPR sensors is due to exponentially decaying evanescent fields, it is important to distinguish the surface sensitivity at the nanometric vicinity of the metal layer from the bulk sensitivity in the surrounding medium. Depending on the spatial distribution of the refractive index change, sensitivity can be defined as the bulk sensitivity (Sbulk) which occur homogeneously in the whole surrounding medium and is defined as the relation between changes in the position of the resonance wavelength (ΔλSPR) or resonance angle (ΔθSPR) and the changes in RI of the medium (Δn) expressed in nmRIU-1 as shown in Equation 1.3.
𝑆 =∆ ,
Equation 1.3
Surface sensitivity (Ssurface) is defined as sensitivity to refractive index changes occurring within a layer at the surface of the metal, where Δ𝑛 denotes the RI of the thin layer and can be expressed in Equation 1.4.
𝑆 =∆ ,
Equation 1.4
Another important parameter used to characterize the biosensor performance is the resolution to detect the RI changes, which is related to the full-width-at-half-maximum (FWHM) of the resonance peak. FWHM is the width of a spectral curve between points on the y-axis that are half the maximum amplitude85. A narrow peak (i.e. low FWHM) facilitates discrimination of small changes (i.e. small shifts) in the curve. Therefore, when considering the performance of a sensor both bulk sensitivity and resolution are crucial parameters. In order to compare different configurations and evaluate biosensor performance, a Figure of Merit (FOM) including both parameters is defined (see Equation 1.5)86,87.
𝐹𝑂𝑀 = Equation 1.5
Introduction
21
Finally, the limit of detection (LOD) is the lowest RI change (nmin) that can be distinguished from the baseline noise and is expressed in RIU75. It is defined as the RI change corresponding to the quotient of three times the standard deviation of a baseline or a blank (3σ) and the Sbulk (see Equation 1.6). Currently, SPR biosensors reach a LOD between 10-5 - 10-7 RIU49,64.
𝐿𝑂𝐷 (𝑅𝐼𝑈) = Equation 1.6
1.1.4. SPR and LSPR biosensing applications Nowadays, research in SPR and LSPR biosensors has been aimed to develop fast, cost-effective, and easy-to-use analytical biosensors platforms, mainly motivated by the urgent demand for ultrasensitive and reliable POC biosensor devices. Due to its simplicity and versatility, the scope has been extended to a wide range of applications. This type of biosensors offers excellent levels of sensitivity, immunity to electromagnetic interference, miniaturization, and integration capabilities and portability, among others. Therefore, they are excellent analytical tools to move the analysis of centralized laboratories to the POC concept81. Furthermore, the label-free detection and the real-time monitoring of biochemical interactions allow the determination of any target analyte and the affinity or kinetic studies of the reaction in a simple and reliable way. Often, their design offers rapid results, easy to handle features, and in some cases, multiplexed analysis capability88,89. There is a wide variety of SPR and LSPR-based biosensor platforms and more than 20 different companies are currently commercializing them, mainly at research laboratory level. Because of their high versatility to detect any type of analyte, these platforms have an increasing number of applications in areas such as the food industry90, the pharmaceutical industry73, the environmental field91, clinical diagnostics92, or the military industry78,93, homeland security94, among others65. In terms of biomedical applications, numerous proofs of concept and real samples tests have proven to be a useful tool especially at the clinical level for the diagnosis of diseases and monitoring of drugs or therapies. The implementation of this powerful technology necessarily requires a research effort focused on surface biofunctionalization and optimized assay methodologies to improve biosensor performance and ensure reliable and accurate clinical and biomedical analysis. Some of the recent bioapplications have focused on the diagnosis of neurodegenerative diseases95 96, early cancer diagnosis (i.e. biomarkers detection for liver cancer97, breast cancer98, prostate cancer99, or for more genomic biomarkers such as DNA methylation studies100 or miRNA detection101), or infectious diseases detection102, among others.
Introduction
22
1.2. Biofunctionalization strategies To fully exploit the potential of these devices, it becomes crucial the development of adequate surface biofunctionalization to ensure optimium performance and reliable and accurate analysis. Proper surface chemistry is key for highly specific bioreceptors to interact with targets at very low concentrations and especially in complex matrices, where a large number of potential intererences (other concomitant susbtances can be present).
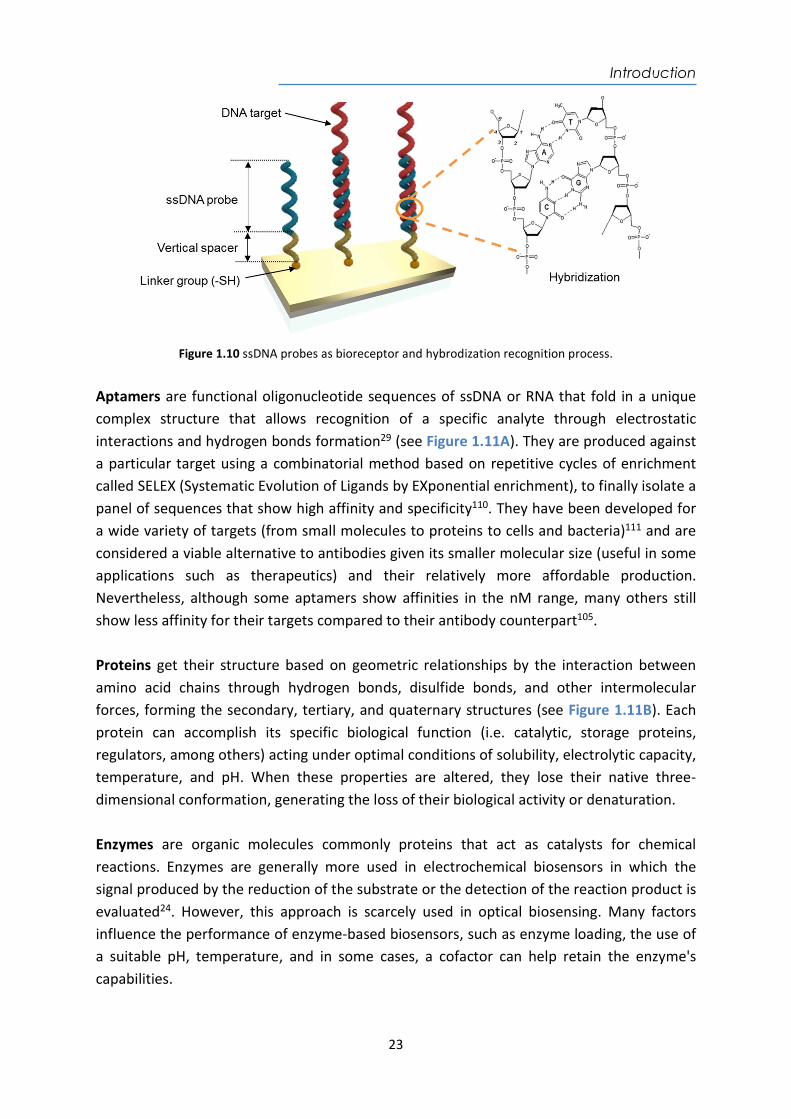
1.2.1. Bioreceptors Knowing and controlling the physicochemical features of the bioreceptor that is immobilized on the sensor surface and the surrounding environment where the interaction takes place (i.e. buffer, complex biological sample) are key elements to favor the capture of the analyte with high sensitivity and selectivity. Many biomolecules can be used as bioreceptors to for the specific recognition of target molecules, such as the antigen-antibody system103, DNA or RNA hybridizations93,104, and aptamer-target105,106, among others. The nucleic acids (NA) (both DNA and RNA) take advantage of the high specificity and affinity provided by the base complementarity. Commonly the designed probe is immobilized on the sensor surface for selective capture of the target molecule. The capture probe is often a single-stranded DNA (ssDNA) which contains a specific complementary sequence to be hybridized with the nucleotide sequences of the target into a double helix according to Watson-Crick base pairing (adenine-thymine/adenine-uracil (A-T/A-U) for DNA/RNA and cytosine-guanine (C-G)). The capture probe is designed with functional groups in the 5’ or 3’-end that allows the attachment of the probe to the sensor surface (i.e. thiol groups to be attached with Au sensor surface) in well-oriented and accessible positions using vertical spacers (i.e. hydrocarbon sequences or a tail of thymines, for example) as shown in Figure 1.10. The high specificity avoids hybridization of other NA present in the sample even in the case of single mismatched sequences, homologous sequences, or cross-hybridizations as long as the hybridization conditions are carefully selected107,108. DNA is a biological element easily synthesizable, compatible with the introduction in the same production process of different modifications at the 5 'and 3'-ends to generate probes with different characteristics according to their application at a very low manufacturing cost109.
Introduction
23
Figure 1.10 ssDNA probes as bioreceptor and hybrodization recognition process.
Aptamers are functional oligonucleotide sequences of ssDNA or RNA that fold in a unique complex structure that allows recognition of a specific analyte through electrostatic interactions and hydrogen bonds formation29 (see Figure 1.11A). They are produced against a particular target using a combinatorial method based on repetitive cycles of enrichment called SELEX (Systematic Evolution of Ligands by EXponential enrichment), to finally isolate a panel of sequences that show high affinity and specificity110. They have been developed for a wide variety of targets (from small molecules to proteins to cells and bacteria)111 and are considered a viable alternative to antibodies given its smaller molecular size (useful in some applications such as therapeutics) and their relatively more affordable production. Nevertheless, although some aptamers show affinities in the nM range, many others still show less affinity for their targets compared to their antibody counterpart105. Proteins get their structure based on geometric relationships by the interaction between amino acid chains through hydrogen bonds, disulfide bonds, and other intermolecular forces, forming the secondary, tertiary, and quaternary structures (see Figure 1.11B). Each protein can accomplish its specific biological function (i.e. catalytic, storage proteins, regulators, among others) acting under optimal conditions of solubility, electrolytic capacity, temperature, and pH. When these properties are altered, they lose their native three-dimensional conformation, generating the loss of their biological activity or denaturation. Enzymes are organic molecules commonly proteins that act as catalysts for chemical reactions. Enzymes are generally more used in electrochemical biosensors in which the signal produced by the reduction of the substrate or the detection of the reaction product is evaluated24. However, this approach is scarcely used in optical biosensing. Many factors influence the performance of enzyme-based biosensors, such as enzyme loading, the use of a suitable pH, temperature, and in some cases, a cofactor can help retain the enzyme's capabilities.
Introduction
24
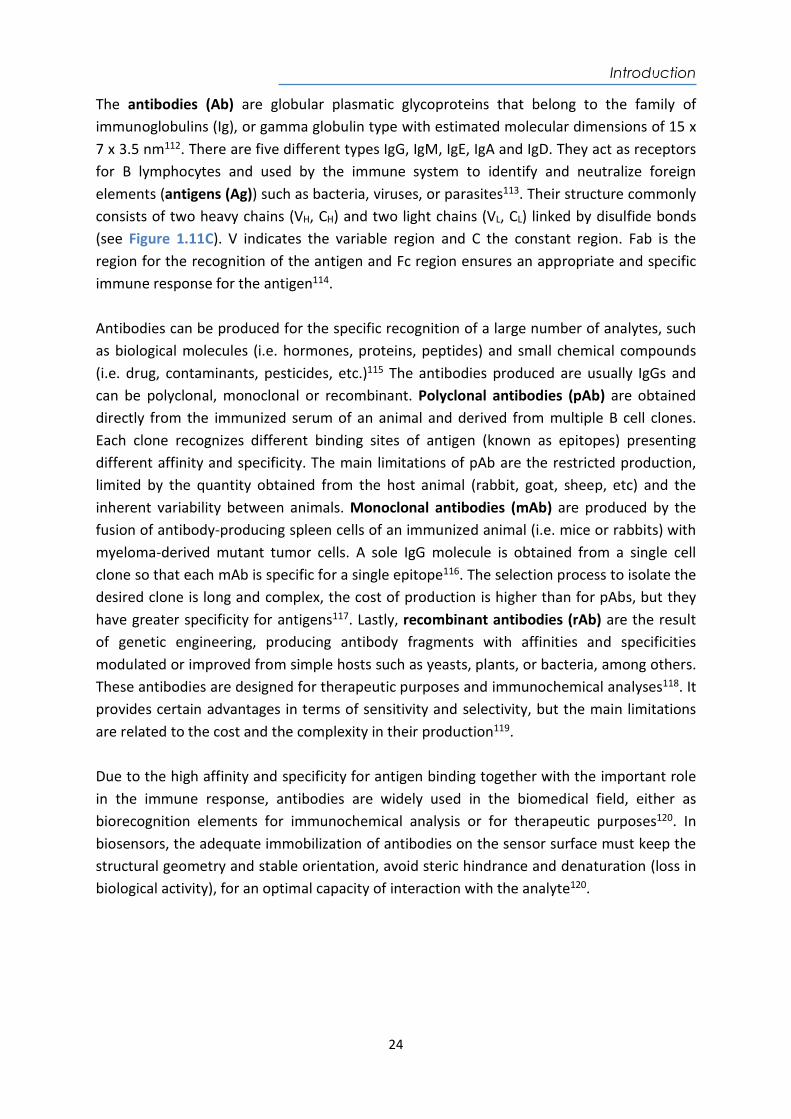
The antibodies (Ab) are globular plasmatic glycoproteins that belong to the family of immunoglobulins (Ig), or gamma globulin type with estimated molecular dimensions of 15 x 7 x 3.5 nm112. There are five different types IgG, IgM, IgE, IgA and IgD. They act as receptors for B lymphocytes and used by the immune system to identify and neutralize foreign elements (antigens (Ag)) such as bacteria, viruses, or parasites113. Their structure commonly consists of two heavy chains (VH, CH) and two light chains (VL, CL) linked by disulfide bonds (see Figure 1.11C). V indicates the variable region and C the constant region. Fab is the region for the recognition of the antigen and Fc region ensures an appropriate and specific immune response for the antigen114. Antibodies can be produced for the specific recognition of a large number of analytes, such as biological molecules (i.e. hormones, proteins, peptides) and small chemical compounds (i.e. drug, contaminants, pesticides, etc.)115 The antibodies produced are usually IgGs and can be polyclonal, monoclonal or recombinant. Polyclonal antibodies (pAb) are obtained directly from the immunized serum of an animal and derived from multiple B cell clones. Each clone recognizes different binding sites of antigen (known as epitopes) presenting different affinity and specificity. The main limitations of pAb are the restricted production, limited by the quantity obtained from the host animal (rabbit, goat, sheep, etc) and the inherent variability between animals. Monoclonal antibodies (mAb) are produced by the fusion of antibody-producing spleen cells of an immunized animal (i.e. mice or rabbits) with myeloma-derived mutant tumor cells. A sole IgG molecule is obtained from a single cell clone so that each mAb is specific for a single epitope116. The selection process to isolate the desired clone is long and complex, the cost of production is higher than for pAbs, but they have greater specificity for antigens117. Lastly, recombinant antibodies (rAb) are the result of genetic engineering, producing antibody fragments with affinities and specificities modulated or improved from simple hosts such as yeasts, plants, or bacteria, among others. These antibodies are designed for therapeutic purposes and immunochemical analyses118. It provides certain advantages in terms of sensitivity and selectivity, but the main limitations are related to the cost and the complexity in their production119. Due to the high affinity and specificity for antigen binding together with the important role in the immune response, antibodies are widely used in the biomedical field, either as biorecognition elements for immunochemical analysis or for therapeutic purposes120. In biosensors, the adequate immobilization of antibodies on the sensor surface must keep the structural geometry and stable orientation, avoid steric hindrance and denaturation (loss in biological activity), for an optimal capacity of interaction with the analyte120.
Introduction
25
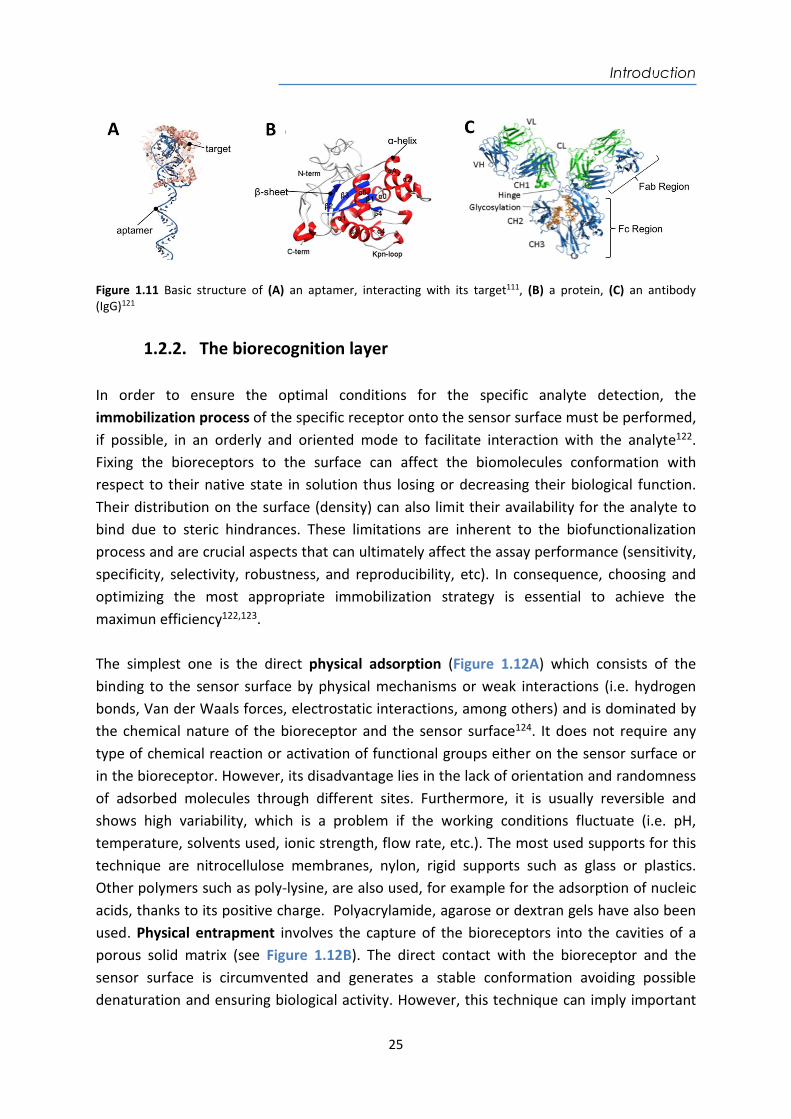
Figure 1.11 Basic structure of (A) an aptamer, interacting with its target111, (B) a protein, (C) an antibody (IgG)121
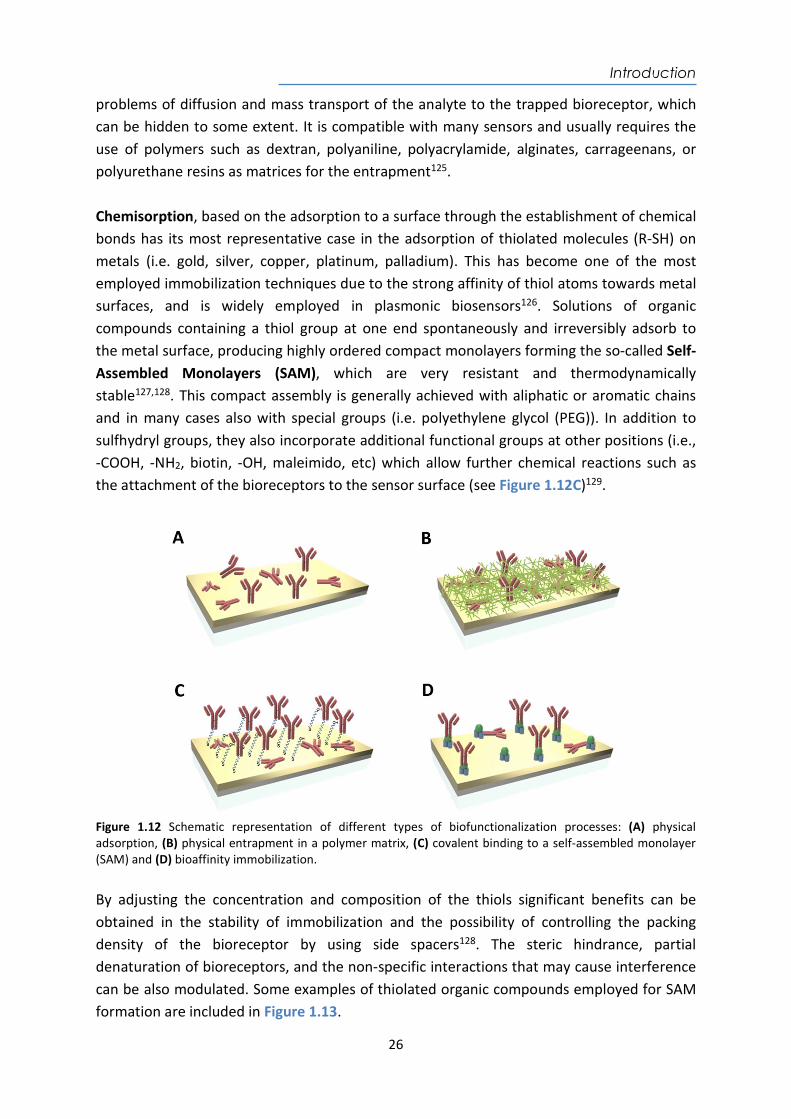
1.2.2. The biorecognition layer In order to ensure the optimal conditions for the specific analyte detection, the immobilization process of the specific receptor onto the sensor surface must be performed, if possible, in an orderly and oriented mode to facilitate interaction with the analyte122. Fixing the bioreceptors to the surface can affect the biomolecules conformation with respect to their native state in solution thus losing or decreasing their biological function. Their distribution on the surface (density) can also limit their availability for the analyte to bind due to steric hindrances. These limitations are inherent to the biofunctionalization process and are crucial aspects that can ultimately affect the assay performance (sensitivity, specificity, selectivity, robustness, and reproducibility, etc). In consequence, choosing and optimizing the most appropriate immobilization strategy is essential to achieve the maximun efficiency122,123. The simplest one is the direct physical adsorption (Figure 1.12A) which consists of the binding to the sensor surface by physical mechanisms or weak interactions (i.e. hydrogen bonds, Van der Waals forces, electrostatic interactions, among others) and is dominated by the chemical nature of the bioreceptor and the sensor surface124. It does not require any type of chemical reaction or activation of functional groups either on the sensor surface or in the bioreceptor. However, its disadvantage lies in the lack of orientation and randomness of adsorbed molecules through different sites. Furthermore, it is usually reversible and shows high variability, which is a problem if the working conditions fluctuate (i.e. pH, temperature, solvents used, ionic strength, flow rate, etc.). The most used supports for this technique are nitrocellulose membranes, nylon, rigid supports such as glass or plastics. Other polymers such as poly-lysine, are also used, for example for the adsorption of nucleic acids, thanks to its positive charge. Polyacrylamide, agarose or dextran gels have also been used. Physical entrapment involves the capture of the bioreceptors into the cavities of a porous solid matrix (see Figure 1.12B). The direct contact with the bioreceptor and the sensor surface is circumvented and generates a stable conformation avoiding possible denaturation and ensuring biological activity. However, this technique can imply important
Introduction
26
problems of diffusion and mass transport of the analyte to the trapped bioreceptor, which can be hidden to some extent. It is compatible with many sensors and usually requires the use of polymers such as dextran, polyaniline, polyacrylamide, alginates, carrageenans, or polyurethane resins as matrices for the entrapment125. Chemisorption, based on the adsorption to a surface through the establishment of chemical bonds has its most representative case in the adsorption of thiolated molecules (R-SH) on metals (i.e. gold, silver, copper, platinum, palladium). This has become one of the most employed immobilization techniques due to the strong affinity of thiol atoms towards metal surfaces, and is widely employed in plasmonic biosensors126. Solutions of organic compounds containing a thiol group at one end spontaneously and irreversibly adsorb to the metal surface, producing highly ordered compact monolayers forming the so-called Self-Assembled Monolayers (SAM), which are very resistant and thermodynamically stable127,128. This compact assembly is generally achieved with aliphatic or aromatic chains and in many cases also with special groups (i.e. polyethylene glycol (PEG)). In addition to sulfhydryl groups, they also incorporate additional functional groups at other positions (i.e., -COOH, -NH2, biotin, -OH, maleimido, etc) which allow further chemical reactions such as the attachment of the bioreceptors to the sensor surface (see Figure 1.12C)129.
Figure 1.12 Schematic representation of different types of biofunctionalization processes: (A) physical adsorption, (B) physical entrapment in a polymer matrix, (C) covalent binding to a self-assembled monolayer (SAM) and (D) bioaffinity immobilization. By adjusting the concentration and composition of the thiols significant benefits can be obtained in the stability of immobilization and the possibility of controlling the packing density of the bioreceptor by using side spacers128. The steric hindrance, partial denaturation of bioreceptors, and the non-specific interactions that may cause interference can be also modulated. Some examples of thiolated organic compounds employed for SAM formation are included in Figure 1.13.
Introduction
27
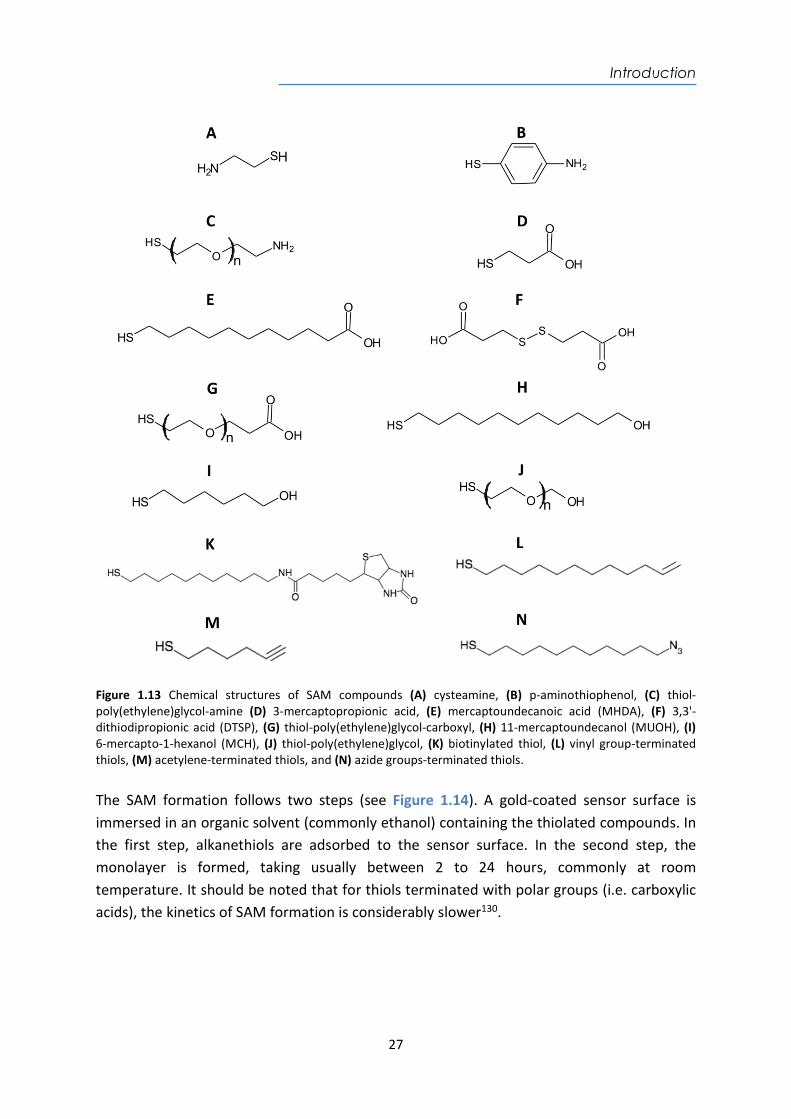
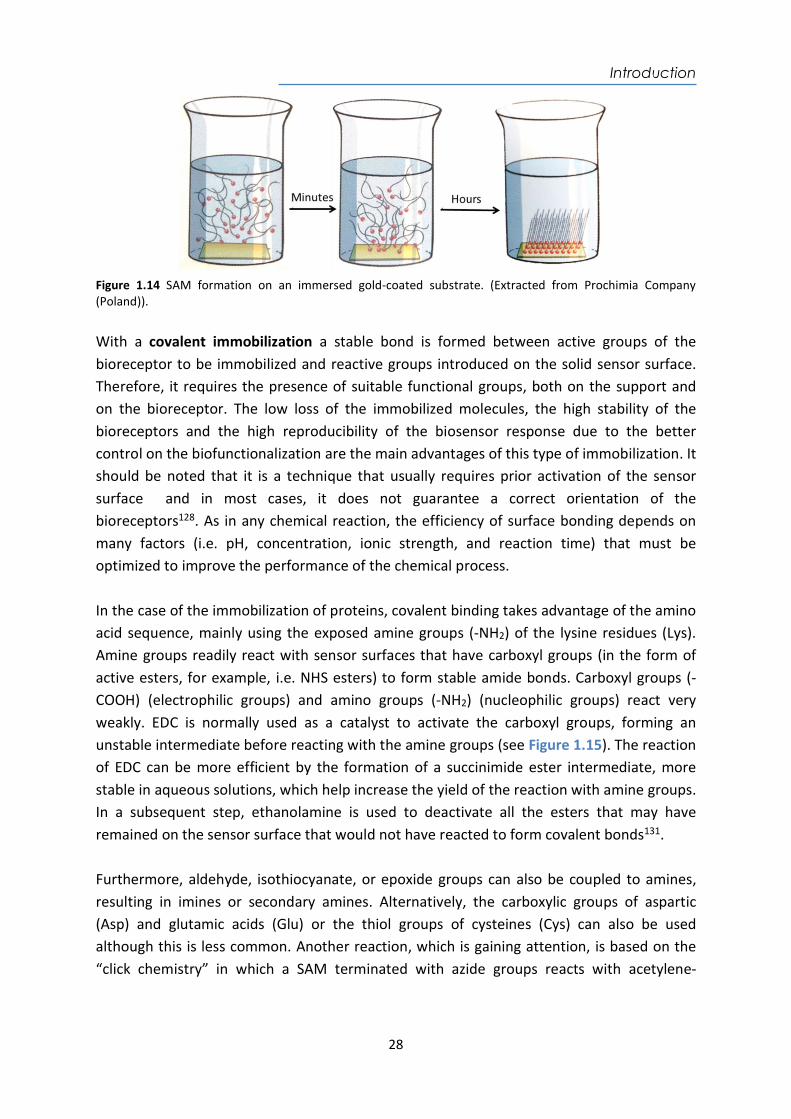
Figure 1.13 Chemical structures of SAM compounds (A) cysteamine, (B) p-aminothiophenol, (C) thiol-poly(ethylene)glycol-amine (D) 3-mercaptopropionic acid, (E) mercaptoundecanoic acid (MHDA), (F) 3,3'-dithiodipropionic acid (DTSP), (G) thiol-poly(ethylene)glycol-carboxyl, (H) 11-mercaptoundecanol (MUOH), (I) 6-mercapto-1-hexanol (MCH), (J) thiol-poly(ethylene)glycol, (K) biotinylated thiol, (L) vinyl group-terminated thiols, (M) acetylene-terminated thiols, and (N) azide groups-terminated thiols. The SAM formation follows two steps (see Figure 1.14). A gold-coated sensor surface is immersed in an organic solvent (commonly ethanol) containing the thiolated compounds. In the first step, alkanethiols are adsorbed to the sensor surface. In the second step, the monolayer is formed, taking usually between 2 to 24 hours, commonly at room temperature. It should be noted that for thiols terminated with polar groups (i.e. carboxylic acids), the kinetics of SAM formation is considerably slower130.
Introduction
28
Figure 1.14 SAM formation on an immersed gold-coated substrate. (Extracted from Prochimia Company (Poland)). With a covalent immobilization a stable bond is formed between active groups of the bioreceptor to be immobilized and reactive groups introduced on the solid sensor surface. Therefore, it requires the presence of suitable functional groups, both on the support and on the bioreceptor. The low loss of the immobilized molecules, the high stability of the bioreceptors and the high reproducibility of the biosensor response due to the better control on the biofunctionalization are the main advantages of this type of immobilization. It should be noted that it is a technique that usually requires prior activation of the sensor surface and in most cases, it does not guarantee a correct orientation of the bioreceptors128. As in any chemical reaction, the efficiency of surface bonding depends on many factors (i.e. pH, concentration, ionic strength, and reaction time) that must be optimized to improve the performance of the chemical process. In the case of the immobilization of proteins, covalent binding takes advantage of the amino acid sequence, mainly using the exposed amine groups (-NH2) of the lysine residues (Lys). Amine groups readily react with sensor surfaces that have carboxyl groups (in the form of active esters, for example, i.e. NHS esters) to form stable amide bonds. Carboxyl groups (-COOH) (electrophilic groups) and amino groups (-NH2) (nucleophilic groups) react very weakly. EDC is normally used as a catalyst to activate the carboxyl groups, forming an unstable intermediate before reacting with the amine groups (see Figure 1.15). The reaction of EDC can be more efficient by the formation of a succinimide ester intermediate, more stable in aqueous solutions, which help increase the yield of the reaction with amine groups. In a subsequent step, ethanolamine is used to deactivate all the esters that may have remained on the sensor surface that would not have reacted to form covalent bonds131. Furthermore, aldehyde, isothiocyanate, or epoxide groups can also be coupled to amines, resulting in imines or secondary amines. Alternatively, the carboxylic groups of aspartic (Asp) and glutamic acids (Glu) or the thiol groups of cysteines (Cys) can also be used although this is less common. Another reaction, which is gaining attention, is based on the “click chemistry” in which a SAM terminated with azide groups reacts with acetylene-
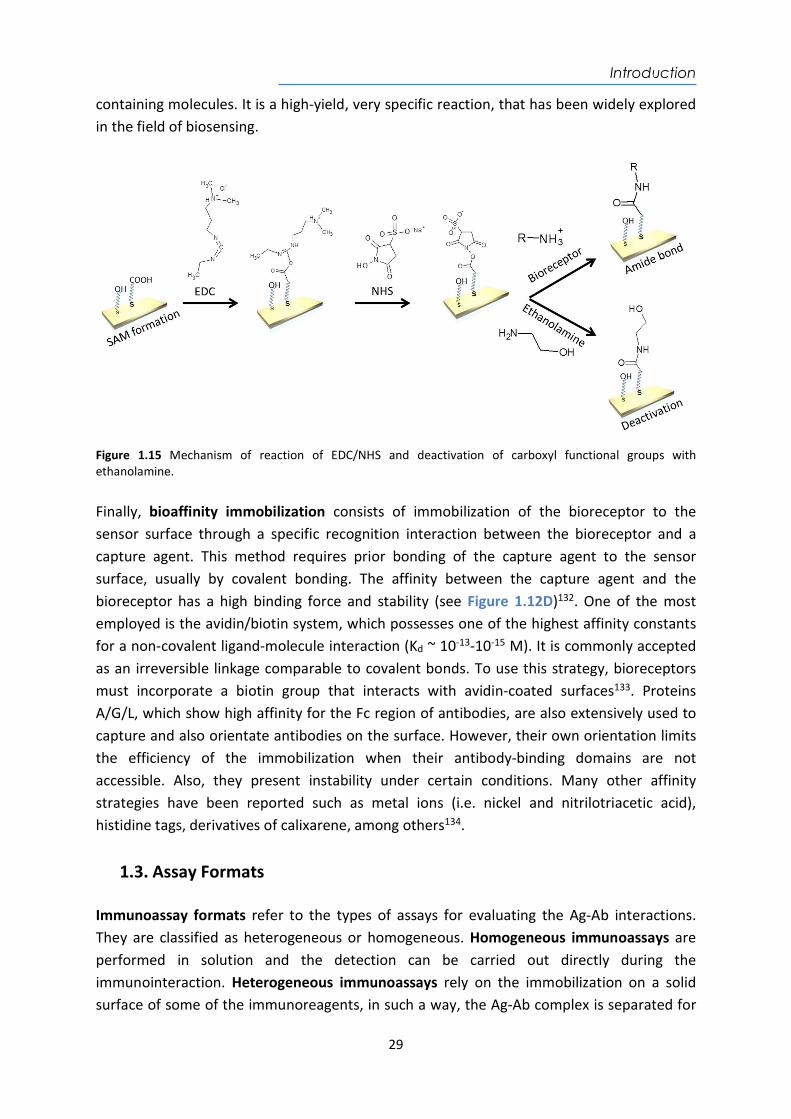
Introduction
29
containing molecules. It is a high-yield, very specific reaction, that has been widely explored in the field of biosensing.
Figure 1.15 Mechanism of reaction of EDC/NHS and deactivation of carboxyl functional groups with ethanolamine. Finally, bioaffinity immobilization consists of immobilization of the bioreceptor to the sensor surface through a specific recognition interaction between the bioreceptor and a capture agent. This method requires prior bonding of the capture agent to the sensor surface, usually by covalent bonding. The affinity between the capture agent and the bioreceptor has a high binding force and stability (see Figure 1.12D)132. One of the most employed is the avidin/biotin system, which possesses one of the highest affinity constants for a non-covalent ligand-molecule interaction (Kd ~ 10-13-10-15 M). It is commonly accepted as an irreversible linkage comparable to covalent bonds. To use this strategy, bioreceptors must incorporate a biotin group that interacts with avidin-coated surfaces133. Proteins A/G/L, which show high affinity for the Fc region of antibodies, are also extensively used to capture and also orientate antibodies on the surface. However, their own orientation limits the efficiency of the immobilization when their antibody-binding domains are not accessible. Also, they present instability under certain conditions. Many other affinity strategies have been reported such as metal ions (i.e. nickel and nitrilotriacetic acid), histidine tags, derivatives of calixarene, among others134.
1.3. Assay Formats Immunoassay formats refer to the types of assays for evaluating the Ag-Ab interactions. They are classified as heterogeneous or homogeneous. Homogeneous immunoassays are performed in solution and the detection can be carried out directly during the immunointeraction. Heterogeneous immunoassays rely on the immobilization on a solid surface of some of the immunoreagents, in such a way, the Ag-Ab complex is separated for
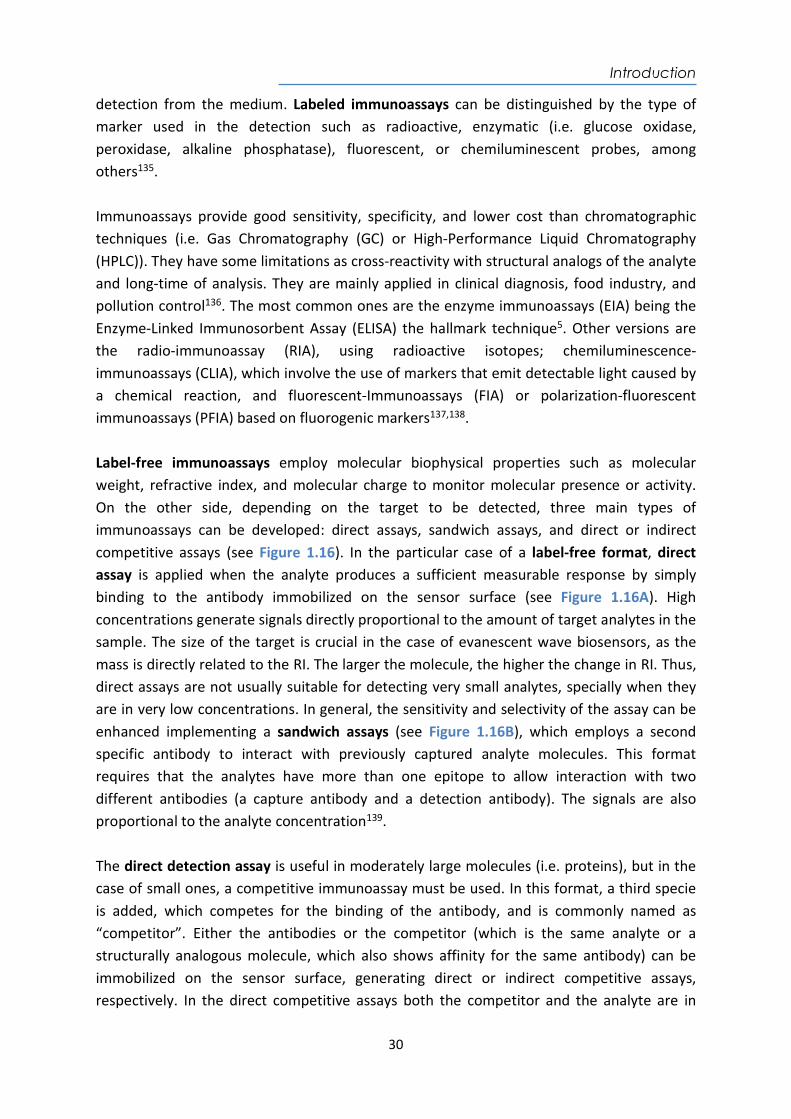
Introduction
30
detection from the medium. Labeled immunoassays can be distinguished by the type of marker used in the detection such as radioactive, enzymatic (i.e. glucose oxidase, peroxidase, alkaline phosphatase), fluorescent, or chemiluminescent probes, among others135. Immunoassays provide good sensitivity, specificity, and lower cost than chromatographic techniques (i.e. Gas Chromatography (GC) or High-Performance Liquid Chromatography (HPLC)). They have some limitations as cross-reactivity with structural analogs of the analyte and long-time of analysis. They are mainly applied in clinical diagnosis, food industry, and pollution control136. The most common ones are the enzyme immunoassays (EIA) being the Enzyme-Linked Immunosorbent Assay (ELISA) the hallmark technique5. Other versions are the radio-immunoassay (RIA), using radioactive isotopes; chemiluminescence-immunoassays (CLIA), which involve the use of markers that emit detectable light caused by a chemical reaction, and fluorescent-Immunoassays (FIA) or polarization-fluorescent immunoassays (PFIA) based on fluorogenic markers137,138. Label-free immunoassays employ molecular biophysical properties such as molecular weight, refractive index, and molecular charge to monitor molecular presence or activity. On the other side, depending on the target to be detected, three main types of immunoassays can be developed: direct assays, sandwich assays, and direct or indirect competitive assays (see Figure 1.16). In the particular case of a label-free format, direct assay is applied when the analyte produces a sufficient measurable response by simply binding to the antibody immobilized on the sensor surface (see Figure 1.16A). High concentrations generate signals directly proportional to the amount of target analytes in the sample. The size of the target is crucial in the case of evanescent wave biosensors, as the mass is directly related to the RI. The larger the molecule, the higher the change in RI. Thus, direct assays are not usually suitable for detecting very small analytes, specially when they are in very low concentrations. In general, the sensitivity and selectivity of the assay can be enhanced implementing a sandwich assays (see Figure 1.16B), which employs a second specific antibody to interact with previously captured analyte molecules. This format requires that the analytes have more than one epitope to allow interaction with two different antibodies (a capture antibody and a detection antibody). The signals are also proportional to the analyte concentration139. The direct detection assay is useful in moderately large molecules (i.e. proteins), but in the case of small ones, a competitive immunoassay must be used. In this format, a third specie is added, which competes for the binding of the antibody, and is commonly named as “competitor”. Either the antibodies or the competitor (which is the same analyte or a structurally analogous molecule, which also shows affinity for the same antibody) can be immobilized on the sensor surface, generating direct or indirect competitive assays, respectively. In the direct competitive assays both the competitor and the analyte are in
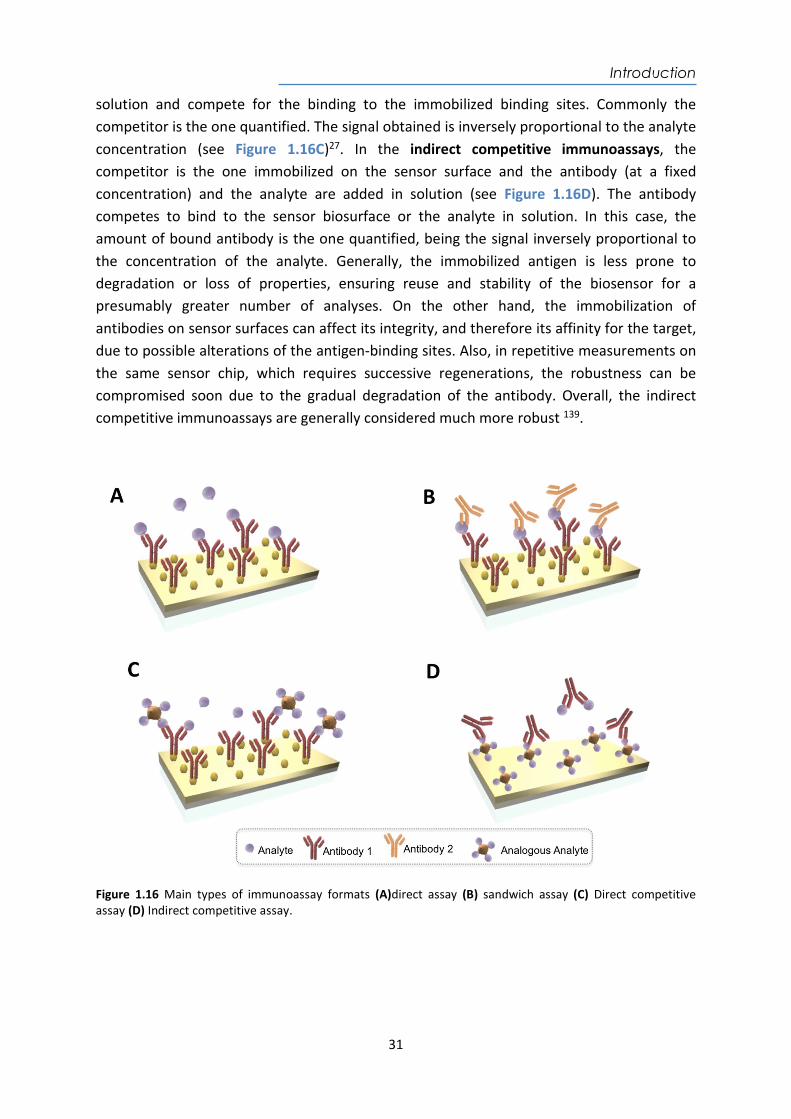
Introduction
31
solution and compete for the binding to the immobilized binding sites. Commonly the competitor is the one quantified. The signal obtained is inversely proportional to the analyte concentration (see Figure 1.16C)27. In the indirect competitive immunoassays, the competitor is the one immobilized on the sensor surface and the antibody (at a fixed concentration) and the analyte are added in solution (see Figure 1.16D). The antibody competes to bind to the sensor biosurface or the analyte in solution. In this case, the amount of bound antibody is the one quantified, being the signal inversely proportional to the concentration of the analyte. Generally, the immobilized antigen is less prone to degradation or loss of properties, ensuring reuse and stability of the biosensor for a presumably greater number of analyses. On the other hand, the immobilization of antibodies on sensor surfaces can affect its integrity, and therefore its affinity for the target, due to possible alterations of the antigen-binding sites. Also, in repetitive measurements on the same sensor chip, which requires successive regenerations, the robustness can be compromised soon due to the gradual degradation of the antibody. Overall, the indirect competitive immunoassays are generally considered much more robust 139.
Figure 1.16 Main types of immunoassay formats (A)direct assay (B) sandwich assay (C) Direct competitive assay (D) Indirect competitive assay.
Introduction
32
1.4. Key factors of the assay development The immobilization of the bioreceptor should be performed in the optimal conditions to guarantee the affinity, stability, and reproducibility for the interaction analyte-bioreceptor. An important aspect of biofunctionalization is related to surface regeneration, that is, the removal of the target analyte after the detection stage without altering the immobilized bioreceptor, allowing the reusability of the biosensor surface for subsequent analyses (see Figure 1.17). Although not always needed for commercial purposes, as disposable kits are the preferred option in clinical field, at the laboratory level, it is usually necessary to during the development and optimization of the assay. An effective regeneration is also useful to evaluate the stability and robustness of the sensor biosurface. Low or high pH (i.e. HCl, NaOH, glycine, among others), ionic strength (i.e. salt buffers), and destabilizing chemicals (i.e. formamide, urea for DNA dehybridization)140 can disrupt the biochemical interaction between the target analyte and the bioreceptor141 and are commonly used for this purpose. Commonly the conditions are chosen so that the least aggressive donditions are used that at the same time guarantees a complete regeneration without affecting the bioactive surface.
Figure 1.17 Schematic representation a covalent immobilization of bioreceptor, the specific detection of analyte and surface regeneration. Another crucial factor in biosensor functionalization is related to the selectivity and antifouling properties of the biorecognition layer. Label-free optical biosensors allow real-time monitoring of interactions between biomolecules based on changes in the RI caused by the binding of the target analyte to the immobilized-bioreceptor on the sensor surface. These changes are translated to mass changes on the surface. Thus, matrix components of biological samples not related to the target analyte can also produce changes in the RI142 if they adsorb non-specifically on the sensor surface. This is mainly due to electrostatic, van der Waals, and hydrophobic interactions between the sensor surface and the matrix components143,144. These non-specific interferences and adsorptions generate changes that translate in sensor signals that can alter the real value of the specific binding. Also, as in many other assays configurations, the presence of these substances can inhibit the analyte-bioreceptor interaction or mask the analyte143. These fouling effects can be crucial for the development of biosensor devices for direct detection in real samples, which are intended to be applied in real clinical scenarios145. Therefore, once the bioreceptors are immobilized, it is advisable to use blocking agents. Knowing the composition of the biological fluids to be
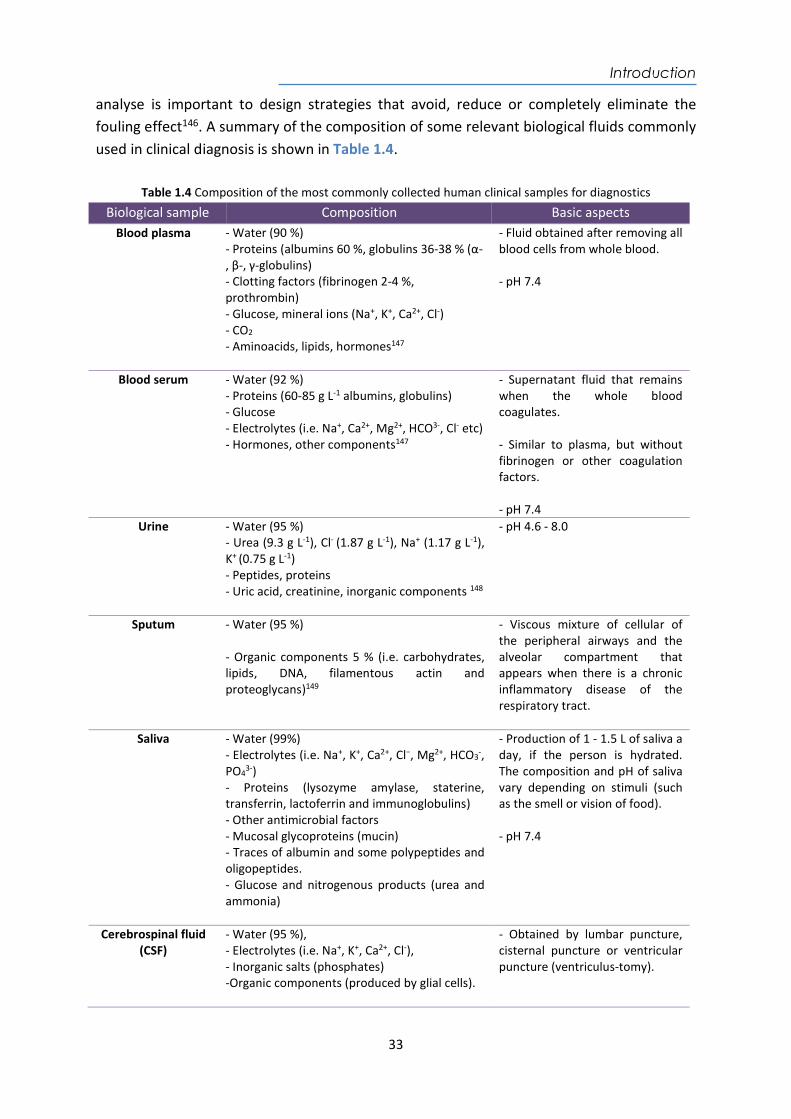
Introduction
33
analyse is important to design strategies that avoid, reduce or completely eliminate the fouling effect146. A summary of the composition of some relevant biological fluids commonly used in clinical diagnosis is shown in Table 1.4.
Table 1.4 Composition of the most commonly collected human clinical samples for diagnostics
Biological sample Composition Basic aspects Blood plasma - Water (90 %)
- Proteins (albumins 60 %, globulins 36-38 % (α-, β-, γ-globulins) - Clotting factors (fibrinogen 2-4 %, prothrombin) - Glucose, mineral ions (Na+, K+, Ca2+, Cl-) - CO2 - Aminoacids, lipids, hormones147
- Fluid obtained after removing all blood cells from whole blood. - pH 7.4
Blood serum - Water (92 %) - Proteins (60-85 g L-1 albumins, globulins) - Glucose - Electrolytes (i.e. Na+, Ca2+, Mg2+, HCO3-, Cl- etc) - Hormones, other components147
- Supernatant fluid that remains when the whole blood coagulates. - Similar to plasma, but without fibrinogen or other coagulation factors. - pH 7.4
Urine - Water (95 %) - Urea (9.3 g L-1), Cl- (1.87 g L-1), Na+ (1.17 g L-1), K+ (0.75 g L-1) - Peptides, proteins - Uric acid, creatinine, inorganic components 148
- pH 4.6 - 8.0
Sputum - Water (95 %) - Organic components 5 % (i.e. carbohydrates, lipids, DNA, filamentous actin and proteoglycans)149
- Viscous mixture of cellular of the peripheral airways and the alveolar compartment that appears when there is a chronic inflammatory disease of the respiratory tract.
Saliva - Water (99%) - Electrolytes (i.e. Na+, K+, Ca2+, Cl−, Mg2+, HCO3
-, PO4
3-) - Proteins (lysozyme amylase, staterine, transferrin, lactoferrin and immunoglobulins) - Other antimicrobial factors - Mucosal glycoproteins (mucin) - Traces of albumin and some polypeptides and oligopeptides. - Glucose and nitrogenous products (urea and ammonia)
- Production of 1 - 1.5 L of saliva a day, if the person is hydrated. The composition and pH of saliva vary depending on stimuli (such as the smell or vision of food). - pH 7.4
Cerebrospinal fluid (CSF)
- Water (95 %), - Electrolytes (i.e. Na+, K+, Ca2+, Cl-), - Inorganic salts (phosphates) -Organic components (produced by glial cells).
- Obtained by lumbar puncture, cisternal puncture or ventricular puncture (ventriculus-tomy).
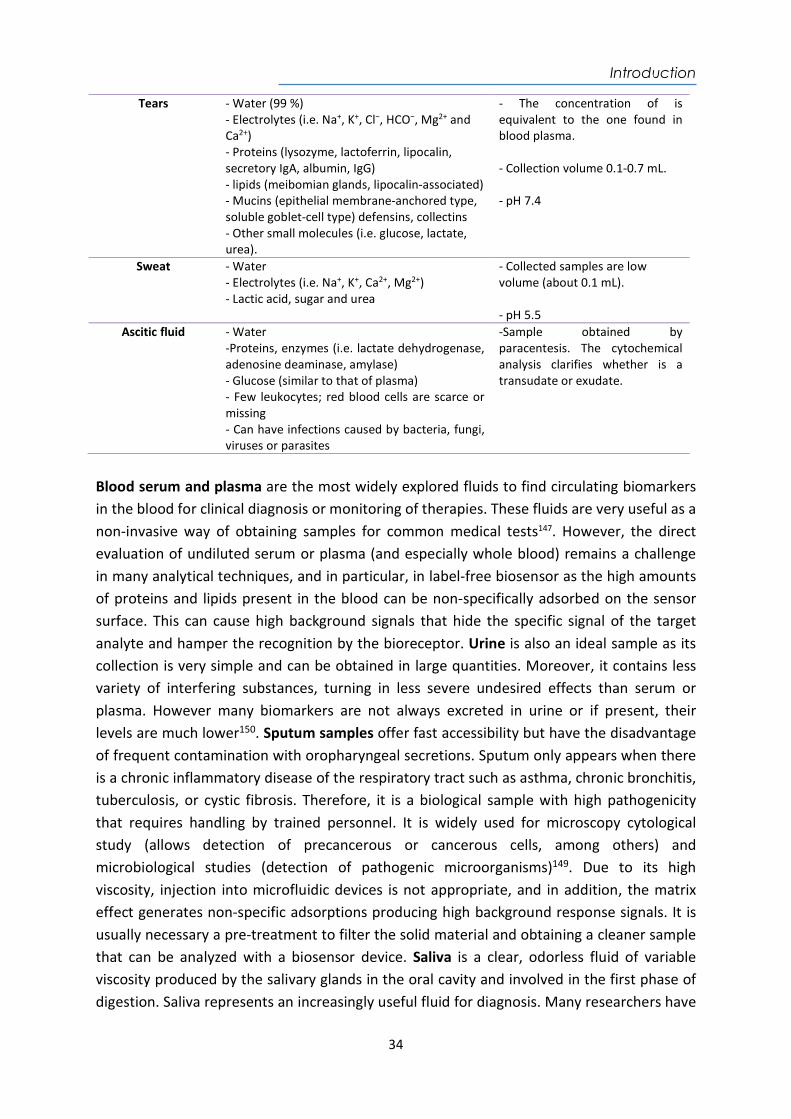
Introduction
34
Tears - Water (99 %) - Electrolytes (i.e. Na+, K+, Cl−, HCO−, Mg2+ and Ca2+) - Proteins (lysozyme, lactoferrin, lipocalin, secretory IgA, albumin, IgG) - lipids (meibomian glands, lipocalin-associated) - Mucins (epithelial membrane-anchored type, soluble goblet-cell type) defensins, collectins - Other small molecules (i.e. glucose, lactate, urea).
- The concentration of is equivalent to the one found in blood plasma. - Collection volume 0.1-0.7 mL. - pH 7.4
Sweat - Water - Electrolytes (i.e. Na+, K+, Ca2+, Mg2+) - Lactic acid, sugar and urea
- Collected samples are low volume (about 0.1 mL). - pH 5.5
Ascitic fluid - Water -Proteins, enzymes (i.e. lactate dehydrogenase, adenosine deaminase, amylase) - Glucose (similar to that of plasma) - Few leukocytes; red blood cells are scarce or missing - Can have infections caused by bacteria, fungi, viruses or parasites
-Sample obtained by paracentesis. The cytochemical analysis clarifies whether is a transudate or exudate.
Blood serum and plasma are the most widely explored fluids to find circulating biomarkers in the blood for clinical diagnosis or monitoring of therapies. These fluids are very useful as a non-invasive way of obtaining samples for common medical tests147. However, the direct evaluation of undiluted serum or plasma (and especially whole blood) remains a challenge in many analytical techniques, and in particular, in label-free biosensor as the high amounts of proteins and lipids present in the blood can be non-specifically adsorbed on the sensor surface. This can cause high background signals that hide the specific signal of the target analyte and hamper the recognition by the bioreceptor. Urine is also an ideal sample as its collection is very simple and can be obtained in large quantities. Moreover, it contains less variety of interfering substances, turning in less severe undesired effects than serum or plasma. However many biomarkers are not always excreted in urine or if present, their levels are much lower150. Sputum samples offer fast accessibility but have the disadvantage of frequent contamination with oropharyngeal secretions. Sputum only appears when there is a chronic inflammatory disease of the respiratory tract such as asthma, chronic bronchitis, tuberculosis, or cystic fibrosis. Therefore, it is a biological sample with high pathogenicity that requires handling by trained personnel. It is widely used for microscopy cytological study (allows detection of precancerous or cancerous cells, among others) and microbiological studies (detection of pathogenic microorganisms)149. Due to its high viscosity, injection into microfluidic devices is not appropriate, and in addition, the matrix effect generates non-specific adsorptions producing high background response signals. It is usually necessary a pre-treatment to filter the solid material and obtaining a cleaner sample that can be analyzed with a biosensor device. Saliva is a clear, odorless fluid of variable viscosity produced by the salivary glands in the oral cavity and involved in the first phase of digestion. Saliva represents an increasingly useful fluid for diagnosis. Many researchers have
Introduction
35
made use of sialometry and sialochemistry to diagnose systemic illnesses, monitoring general health, and as an indicator of risk for diseases, creating a close relation between oral and systemic health151. Therefore, saliva provides a useful and non-invasive alternative to blood for many biomedical diagnostic assays152. Other biological fluids collected for diagnostics include the cerebrospinal fluid (CSF), which is a colorless fluid that bathes the brain and spinal cord. It circulates through the subarachnoid space, the cerebral ventricles, and the ependymal canal, adding a volume between 100 - 150 mL, under normal conditions. It is produced in 70 % in the choroid plexuses of the four cerebral ventricles, especially the lateral ones, and 30 % in the ependyma at a rate of 0.35 mL min-1 or 500 mL day-1. It can be clouded by the presence of leukocytes or the presence of bile pigments. It is widely used to determine meningeal infections, carcinomatosis, hemorrhages and demyelinating diseases of the central, or peripheral nervous system153. Tears are produced by the body's lacrimation process to clean and lubricate the eye. They are fundamentally involved in ocular optics and in the operation of the eyeball and its structures. Additional substances appear in the tears when there is an eye disease (i.e. inflammatory mediators, growth factors, invasive white cells, remodeling enzymes such as collagenase, plasmin or plasminogen activator, etc). The sweat is a liquid secreted by the sweat glands, generally as a means of thermal regulation known as perspiration and medically as diaphoresis, when it is excessive. Sweat can also be caused by high temperature, intense physical exercise, excess body weight, eating spicy food, even feelings such as fear, as these stimuli increase the excitement that the sympathetic nervous system exerts on the sweat glands154. The ascitic fluid is a liquid that can be up to several liters that accumulate in the peritoneal cavity, making the patient's abdomen significantly distend. It can be transudated or exuded. The transudate is the accumulation of sterile liquid, without inflammation or infection or significant changes in its composition. The exudates modify the composition and present infectious and inflammatory processes, infiltration, or necrosis. Infections can be caused by bacteria, fungi, viruses, or parasites. The ascitic fluid is usually a consequence of liver disease, especially alcoholic liver cirrhosis, cirrhosis due to chronic viral hepatitis (i.e. hepatitis B, hepatitis C), neoplastic processes, congestive heart failure, tuberculous peritonitis, pancreatitis, nephrosis, among others, and is diagnosed clinically with the sign of shifting dullness and abdominal ultrasound155. When using for diagnostics with biosensors, each of these biological fluids requires antifouling compounds that provide different physicochemical features to the sensor biosurface to prevent undesired interactions146. Among the different strategies to reduce or eliminate non-specific adsorptions from the matrix, we can mention the following: (i) introduction of a surface blocking step with different antifouling compounds; (ii) dilution of the biological fluid until the background signal is minimized, and (iii) addition of additives in the buffer employed to dilute the biological sample (if it is unavoidable). The fouling effect of the biological samples is evaluated on the biofunctionalized sensor surface before and
Introduction
36
after the blocking step. Common additives to the assay buffer are Tween 20, often used in immunoassays for this purpose (Figure 1.18A) or zwitterionic detergent 3-[(3-cholamidopropyl) dimethylammonium]-1-propanesulfonate (CHAPS) (Figure 1.18B) used to solubilize biological macromolecules, preventing undesirable hydrophobic interactions. It also minimizes any hydrophobic or electrostatic attraction between the complex matrix and the functionalized sensor surfaces144,156. Proteins-based additives such as BSA, casein, or gelatin also help to reduce the adsorption of other proteins of the biological fluid in the sensor surface157. BSA is the most employed as has a slightly hydrophobic behavior. Milk is the most cost-effective but cannot be employed when using phosphospecific antibodies or in biotin detection methods due to the presence of biotin in the phosphoproteins. Some designed peptide sequences, which are zwitterionic molecules with inherent high biocompatibility, have become promising potential candidates for preventing biofouling. The outstanding antifouling capacity of peptide sequences benefits from their predominant hydrophilicity and charge neutrality due to the functional groups of the side chain (R group) (carboxyl or amino groups), such as negatively charged glutamic acid (E), aspartic acid (D) and positively charged lysine (K)158. Polymers as blocking agents such as polyvinylpyrrolidone (PVP) (Figure 1.18C), dextran (Figure 1.18D) and derivatives (i.e. CM-dextran (Figure 1.18E), amino-dextran (Figure 1.18F), sulfate-dextran (Figure 1.18G)) are widely used in biomedicine due to their high hydrophilicity, which confers extraordinary resistance to protein adsorption and biomimetic properties159. Copolymers such as polyethylene glycol (PEG) has interesting properties due to its biocompatibility to produce low-fouling or even non-fouling protein resistant biomaterial surfaces (i.e. diamine-PEG (Figure 1.18H) and poly-L-Lysine-graft-PEG (PLL-PEG) (Figure 1.18I)). In the case of PLL-PEG, its higher molecular weight and the relatively high ratio of amine groups present in the poly-lysine chains can efficiently cover the molecules and, at the same time, confer high hydrophilicity to the bioactive layer160,161. Another effective strategy is introducing the biocompatibility of PEG-groups directly in thiolated compounds (for plasmonic biosensors for example) that include different functional groups (as shown in Figure 1.13)159 so that it provides a more biocompatible but still reactive layer to attach the bioreceptors132. In addition, mixed thiols-PEG can form a hybrid ion surface that improves the antifouling properties of the monolayer avoiding hydrophobic interactions of the complex biofluid with the sensor surface162. The combination of one or more antifouling compounds for the surface blocking may result in a reduction of non-specific binding compared to standard conditions. However, these changes in the buffer can also affect the bioreceptor, the target analyte, and/or the interaction between them103,163 so its global effect has to be studied for each particular application.
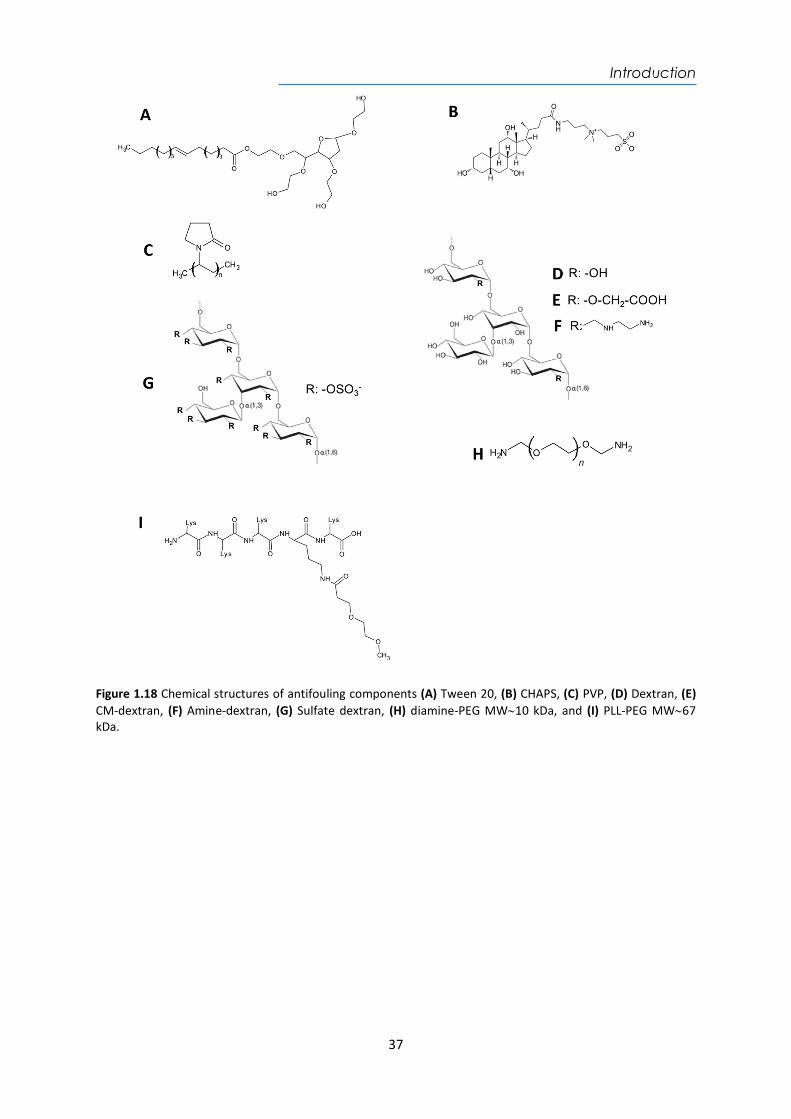
Introduction
37
Figure 1.18 Chemical structures of antifouling components (A) Tween 20, (B) CHAPS, (C) PVP, (D) Dextran, (E) CM-dextran, (F) Amine-dextran, (G) Sulfate dextran, (H) diamine-PEG MW10 kDa, and (I) PLL-PEG MW67 kDa.

Introduction
38
39
Chapter 2
Materials and Methods
This chapter includes a description of the SPR and LSPR-based biosensor schemes, followed by the fabrication of sensor chips based on gold layers and gold nanostructures. The plasmonic sensor platforms employed, the biofunctionalization strategies selected for the development of the assays, and the assays formats are also detailed. Finally, the strategies to minimize nonspecific adsorptions of biological fluids, such as plasma, serum, urine, and sputum are also described.

40
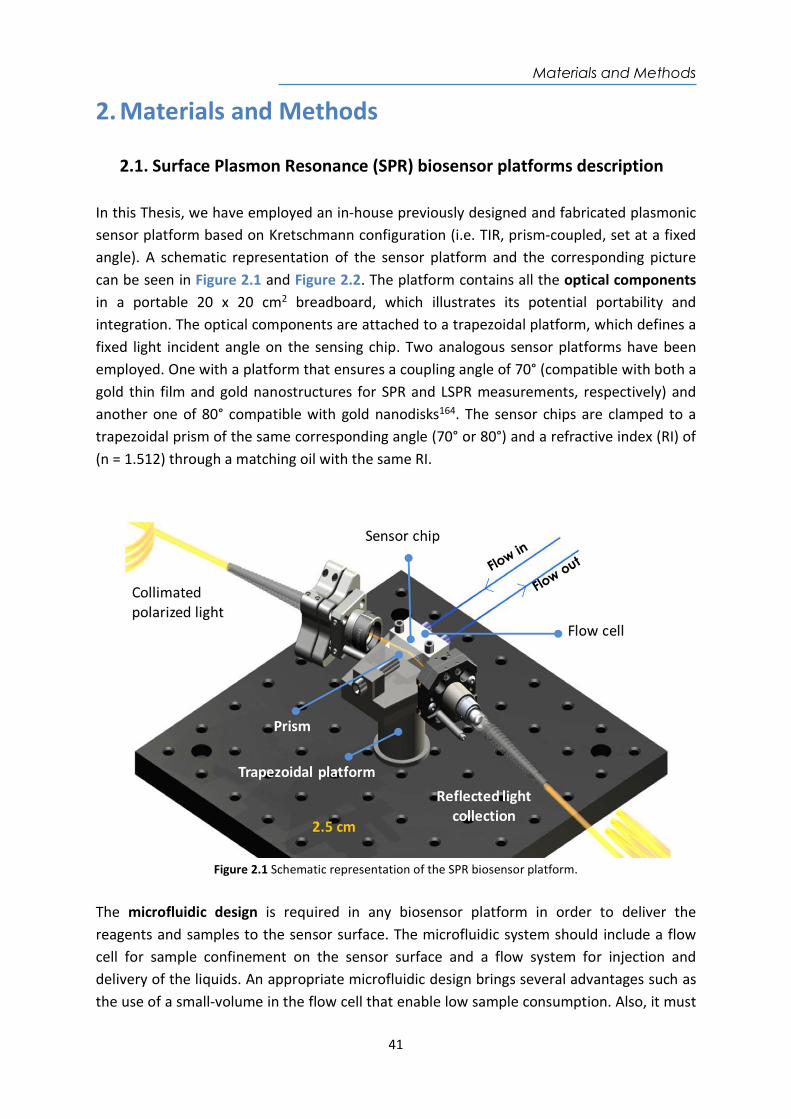
Materials and Methods
41
2. Materials and Methods
2.1. Surface Plasmon Resonance (SPR) biosensor platforms description In this Thesis, we have employed an in-house previously designed and fabricated plasmonic sensor platform based on Kretschmann configuration (i.e. TIR, prism-coupled, set at a fixed angle). A schematic representation of the sensor platform and the corresponding picture can be seen in Figure 2.1 and Figure 2.2. The platform contains all the optical components in a portable 20 x 20 cm2 breadboard, which illustrates its potential portability and integration. The optical components are attached to a trapezoidal platform, which defines a fixed light incident angle on the sensing chip. Two analogous sensor platforms have been employed. One with a platform that ensures a coupling angle of 70° (compatible with both a gold thin film and gold nanostructures for SPR and LSPR measurements, respectively) and another one of 80° compatible with gold nanodisks164. The sensor chips are clamped to a trapezoidal prism of the same corresponding angle (70° or 80°) and a refractive index (RI) of (n = 1.512) through a matching oil with the same RI.
Figure 2.1 Schematic representation of the SPR biosensor platform.
The microfluidic design is required in any biosensor platform in order to deliver the reagents and samples to the sensor surface. The microfluidic system should include a flow cell for sample confinement on the sensor surface and a flow system for injection and delivery of the liquids. An appropriate microfluidic design brings several advantages such as the use of a small-volume in the flow cell that enable low sample consumption. Also, it must
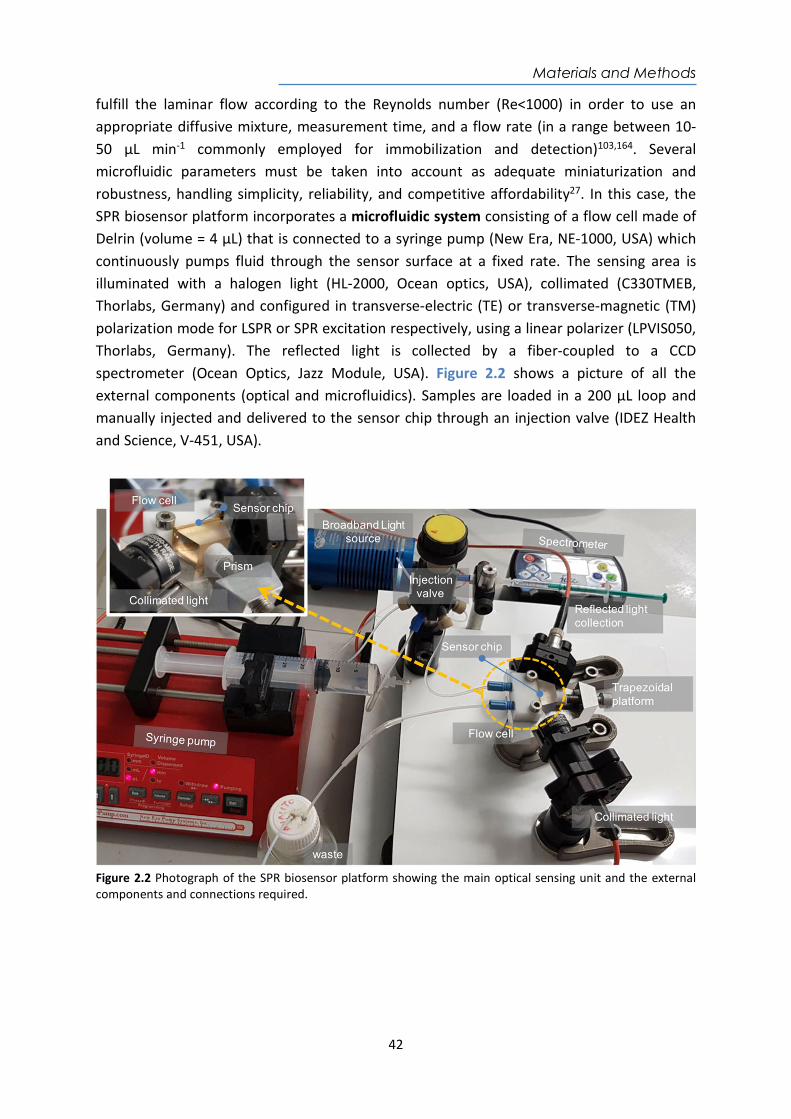
Materials and Methods
42
fulfill the laminar flow according to the Reynolds number (Re<1000) in order to use an appropriate diffusive mixture, measurement time, and a flow rate (in a range between 10-50 µL min-1 commonly employed for immobilization and detection)103,164. Several microfluidic parameters must be taken into account as adequate miniaturization and robustness, handling simplicity, reliability, and competitive affordability27. In this case, the SPR biosensor platform incorporates a microfluidic system consisting of a flow cell made of Delrin (volume = 4 µL) that is connected to a syringe pump (New Era, NE-1000, USA) which continuously pumps fluid through the sensor surface at a fixed rate. The sensing area is illuminated with a halogen light (HL-2000, Ocean optics, USA), collimated (C330TMEB, Thorlabs, Germany) and configured in transverse-electric (TE) or transverse-magnetic (TM) polarization mode for LSPR or SPR excitation respectively, using a linear polarizer (LPVIS050, Thorlabs, Germany). The reflected light is collected by a fiber-coupled to a CCD spectrometer (Ocean Optics, Jazz Module, USA). Figure 2.2 shows a picture of all the external components (optical and microfluidics). Samples are loaded in a 200 µL loop and manually injected and delivered to the sensor chip through an injection valve (IDEZ Health and Science, V-451, USA).
Figure 2.2 Photograph of the SPR biosensor platform showing the main optical sensing unit and the external components and connections required.
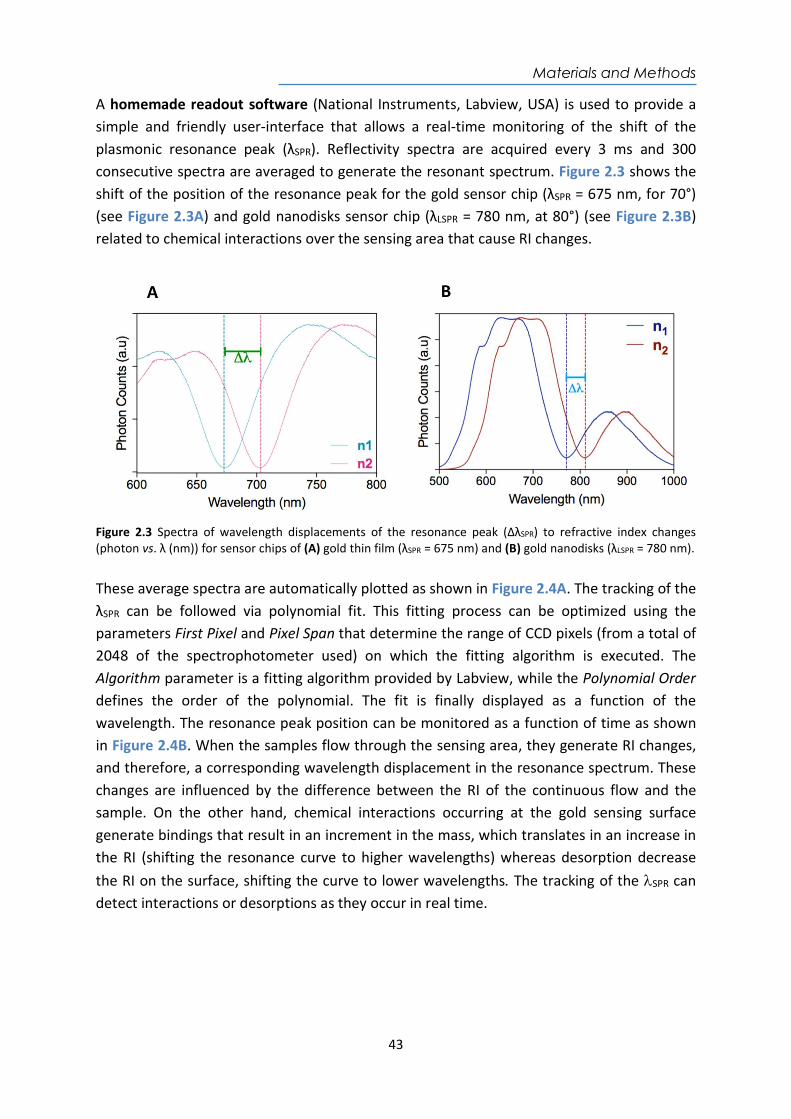
Materials and Methods
43
A homemade readout software (National Instruments, Labview, USA) is used to provide a simple and friendly user-interface that allows a real-time monitoring of the shift of the plasmonic resonance peak (λSPR). Reflectivity spectra are acquired every 3 ms and 300 consecutive spectra are averaged to generate the resonant spectrum. Figure 2.3 shows the shift of the position of the resonance peak for the gold sensor chip (λSPR = 675 nm, for 70°) (see Figure 2.3A) and gold nanodisks sensor chip (λLSPR = 780 nm, at 80°) (see Figure 2.3B) related to chemical interactions over the sensing area that cause RI changes.
Figure 2.3 Spectra of wavelength displacements of the resonance peak (ΔλSPR) to refractive index changes (photon vs. λ (nm)) for sensor chips of (A) gold thin film (λSPR = 675 nm) and (B) gold nanodisks (λLSPR = 780 nm). These average spectra are automatically plotted as shown in Figure 2.4A. The tracking of the λSPR can be followed via polynomial fit. This fitting process can be optimized using the parameters First Pixel and Pixel Span that determine the range of CCD pixels (from a total of 2048 of the spectrophotometer used) on which the fitting algorithm is executed. The Algorithm parameter is a fitting algorithm provided by Labview, while the Polynomial Order defines the order of the polynomial. The fit is finally displayed as a function of the wavelength. The resonance peak position can be monitored as a function of time as shown in Figure 2.4B. When the samples flow through the sensing area, they generate RI changes, and therefore, a corresponding wavelength displacement in the resonance spectrum. These changes are influenced by the difference between the RI of the continuous flow and the sample. On the other hand, chemical interactions occurring at the gold sensing surface generate bindings that result in an increment in the mass, which translates in an increase in the RI (shifting the resonance curve to higher wavelengths) whereas desorption decrease the RI on the surface, shifting the curve to lower wavelengths. The tracking of the SPR can detect interactions or desorptions as they occur in real time.
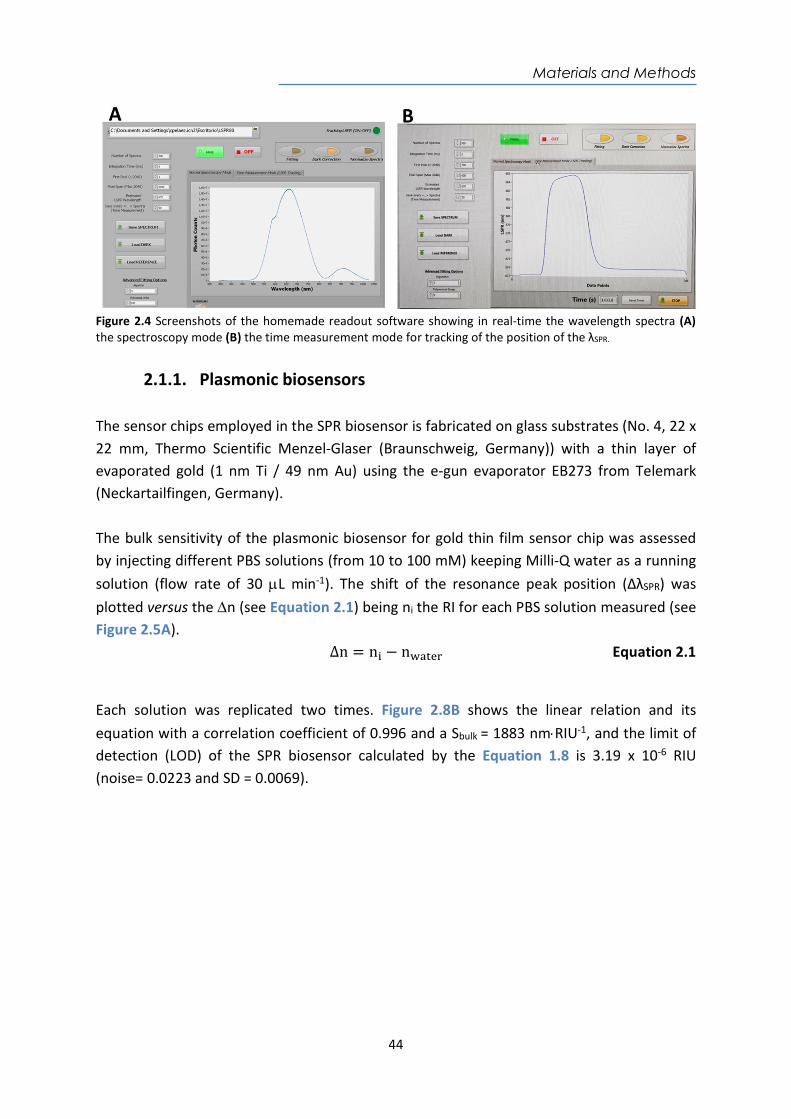
Materials and Methods
44
Figure 2.4 Screenshots of the homemade readout software showing in real-time the wavelength spectra (A) the spectroscopy mode (B) the time measurement mode for tracking of the position of the λSPR.
2.1.1. Plasmonic biosensors The sensor chips employed in the SPR biosensor is fabricated on glass substrates (No. 4, 22 x 22 mm, Thermo Scientific Menzel-Glaser (Braunschweig, Germany)) with a thin layer of evaporated gold (1 nm Ti / 49 nm Au) using the e-gun evaporator EB273 from Telemark (Neckartailfingen, Germany). The bulk sensitivity of the plasmonic biosensor for gold thin film sensor chip was assessed by injecting different PBS solutions (from 10 to 100 mM) keeping Milli-Q water as a running solution (flow rate of 30 L min-1). The shift of the resonance peak position (ΔλSPR) was plotted versus the n (see Equation 2.1) being ni the RI for each PBS solution measured (see Figure 2.5A).
∆n = n − n Equation 2.1
Each solution was replicated two times. Figure 2.8B shows the linear relation and its equation with a correlation coefficient of 0.996 and a Sbulk = 1883 nmRIU-1, and the limit of detection (LOD) of the SPR biosensor calculated by the Equation 1.8 is 3.19 x 10⁻⁶ RIU (noise= 0.0223 and SD = 0.0069).
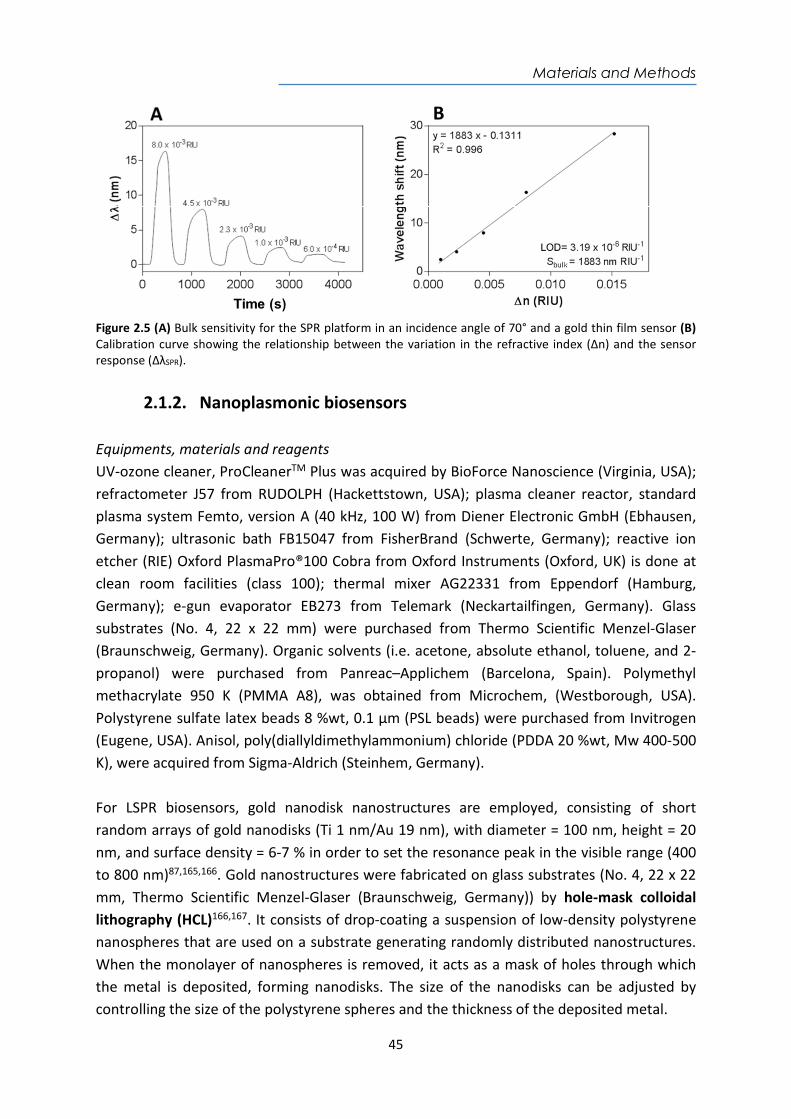
Materials and Methods
45
Figure 2.5 (A) Bulk sensitivity for the SPR platform in an incidence angle of 70° and a gold thin film sensor (B) Calibration curve showing the relationship between the variation in the refractive index (Δn) and the sensor response (ΔλSPR).
2.1.2. Nanoplasmonic biosensors Equipments, materials and reagents UV-ozone cleaner, ProCleanerTM Plus was acquired by BioForce Nanoscience (Virginia, USA); refractometer J57 from RUDOLPH (Hackettstown, USA); plasma cleaner reactor, standard plasma system Femto, version A (40 kHz, 100 W) from Diener Electronic GmbH (Ebhausen, Germany); ultrasonic bath FB15047 from FisherBrand (Schwerte, Germany); reactive ion etcher (RIE) Oxford PlasmaPro®100 Cobra from Oxford Instruments (Oxford, UK) is done at clean room facilities (class 100); thermal mixer AG22331 from Eppendorf (Hamburg, Germany); e-gun evaporator EB273 from Telemark (Neckartailfingen, Germany). Glass substrates (No. 4, 22 x 22 mm) were purchased from Thermo Scientific Menzel-Glaser (Braunschweig, Germany). Organic solvents (i.e. acetone, absolute ethanol, toluene, and 2-propanol) were purchased from Panreac–Applichem (Barcelona, Spain). Polymethyl methacrylate 950 K (PMMA A8), was obtained from Microchem, (Westborough, USA). Polystyrene sulfate latex beads 8 %wt, 0.1 µm (PSL beads) were purchased from Invitrogen (Eugene, USA). Anisol, poly(diallyldimethylammonium) chloride (PDDA 20 %wt, Mw 400-500 K), were acquired from Sigma-Aldrich (Steinhem, Germany). For LSPR biosensors, gold nanodisk nanostructures are employed, consisting of short random arrays of gold nanodisks (Ti 1 nm/Au 19 nm), with diameter = 100 nm, height = 20 nm, and surface density = 6-7 % in order to set the resonance peak in the visible range (400 to 800 nm)87,165,166. Gold nanostructures were fabricated on glass substrates (No. 4, 22 x 22 mm, Thermo Scientific Menzel-Glaser (Braunschweig, Germany)) by hole-mask colloidal lithography (HCL)166,167. It consists of drop-coating a suspension of low-density polystyrene nanospheres that are used on a substrate generating randomly distributed nanostructures. When the monolayer of nanospheres is removed, it acts as a mask of holes through which the metal is deposited, forming nanodisks. The size of the nanodisks can be adjusted by controlling the size of the polystyrene spheres and the thickness of the deposited metal.
Materials and Methods
46
Nanofabrication process that was carried out following a modified protocol as described below. A schematic representation of the fabrication process is shown in the Figure 2.6. Standard cleaning process (not shown) of the glass slides was performed using SDS, HCl and Milli-Q water prior drying with flow of N2 stream. Sonication of the glass substrates in the ultrasonic bath during 5 min at 50 ºC first in acetone and then in isopropanol was followed by drying under N2 flow. The fabrication process involves the following six steps: Step 1. Glass substrates are rinsed using isopropanol and lastly dried under N2 flow. A deposition of a PMMA (4 % in anisole) of approximately 210 nm layer is obtained by spin coating process (4000 rpm, 1500 r/s2). Immediately, the sample is baked at 165 °C during 5 min. The chips are exposed to O2 plasma treatment (10 s, 75 W, 75 mTorr) to increase the hydrophilicity of the PMMA layer. A cationic solution of PDDA (0.2 %wt) suspended in water was coated and incubated one minute onto the PMMA layer. The sample is rinsed using water and dried under N2 flow. The polystyrene sulfate latex (PSL) beads are diluted in water (0.01 %wt) and sonicated for 10 min prior coating (1 min) on the substrate. The sample is rinsed and sank water (95 °C, 3 min) to fix the nanoparticles on the PMMA layer to create the hole mask, which will define the short-ordered particle array.
Step 2. A sacrificial layer of titanium (Ti) 15 nm, which can withstand an O2 plasma treatment, is deposited to create the hole-mask template. Step 3. Polystyrene beads are removed by tape-stripping to create a perforated Ti hole-mask on top. Step 4. The selective etching of the exposed PMMA is performed by a reactive ion etcher (RIE, Oxford PlasmaPro®100 Cobra from Oxford Instruments (Oxford, UK)) process using oxygen plasma (5 min, 400W, 75 mTorr, 50 sccm O2-flux) in a clean room facility to create a cavity underneath the holes left by the PSL nanoparticles on the Ti layer. Step 5. A nanodisks array is generated by evaporation of Ti/Au layer (1 nm Ti/19 nm Au) using the electron-beam evaporation e-gun evaporator EB273 from Telemark (Neckartailfingen, Germany). Step 6. A lift-off process to remove the hole-mask and expose the gold nanodisks array is done by thoroughly rinsing and sinking the substrates for 1 hour in acetone. Lastly, the sensor chip is rinsed with isopropanol and dried with N2 flow.
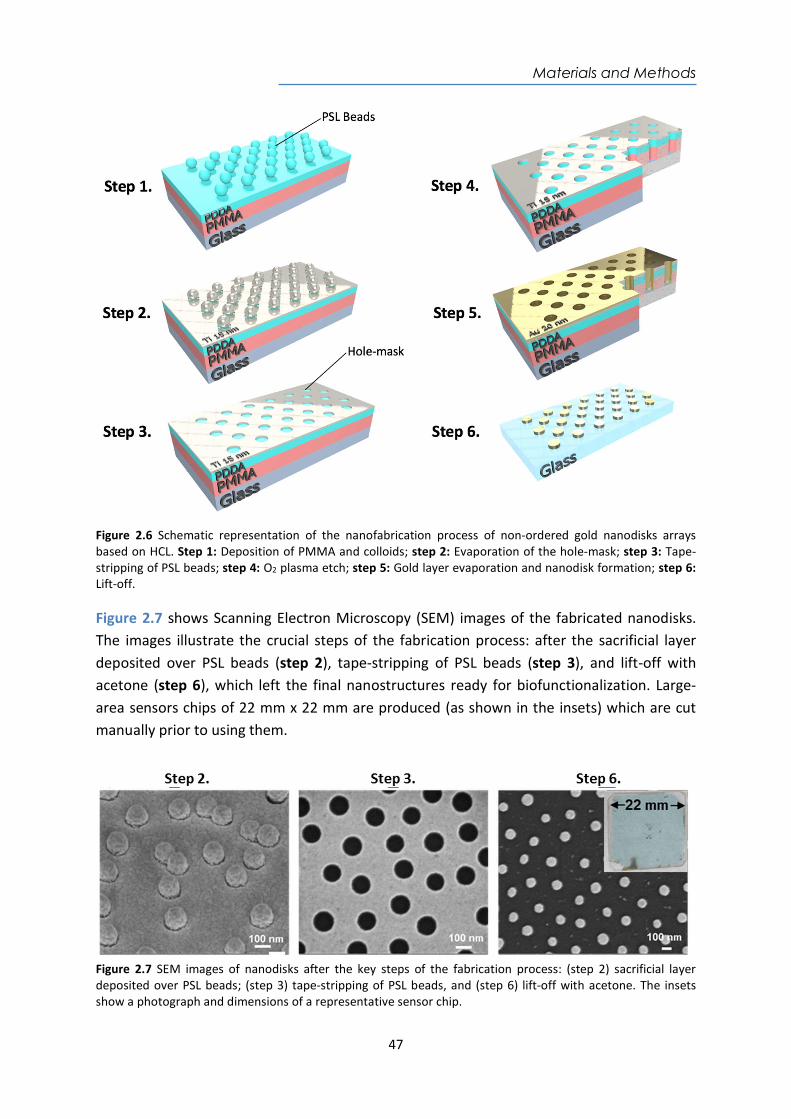
Materials and Methods
47
Figure 2.6 Schematic representation of the nanofabrication process of non-ordered gold nanodisks arrays based on HCL. Step 1: Deposition of PMMA and colloids; step 2: Evaporation of the hole-mask; step 3: Tape-stripping of PSL beads; step 4: O2 plasma etch; step 5: Gold layer evaporation and nanodisk formation; step 6: Lift-off. Figure 2.7 shows Scanning Electron Microscopy (SEM) images of the fabricated nanodisks. The images illustrate the crucial steps of the fabrication process: after the sacrificial layer deposited over PSL beads (step 2), tape-stripping of PSL beads (step 3), and lift-off with acetone (step 6), which left the final nanostructures ready for biofunctionalization. Large-area sensors chips of 22 mm x 22 mm are produced (as shown in the insets) which are cut manually prior to using them.
Figure 2.7 SEM images of nanodisks after the key steps of the fabrication process: (step 2) sacrificial layer deposited over PSL beads; (step 3) tape-stripping of PSL beads, and (step 6) lift-off with acetone. The insets show a photograph and dimensions of a representative sensor chip.
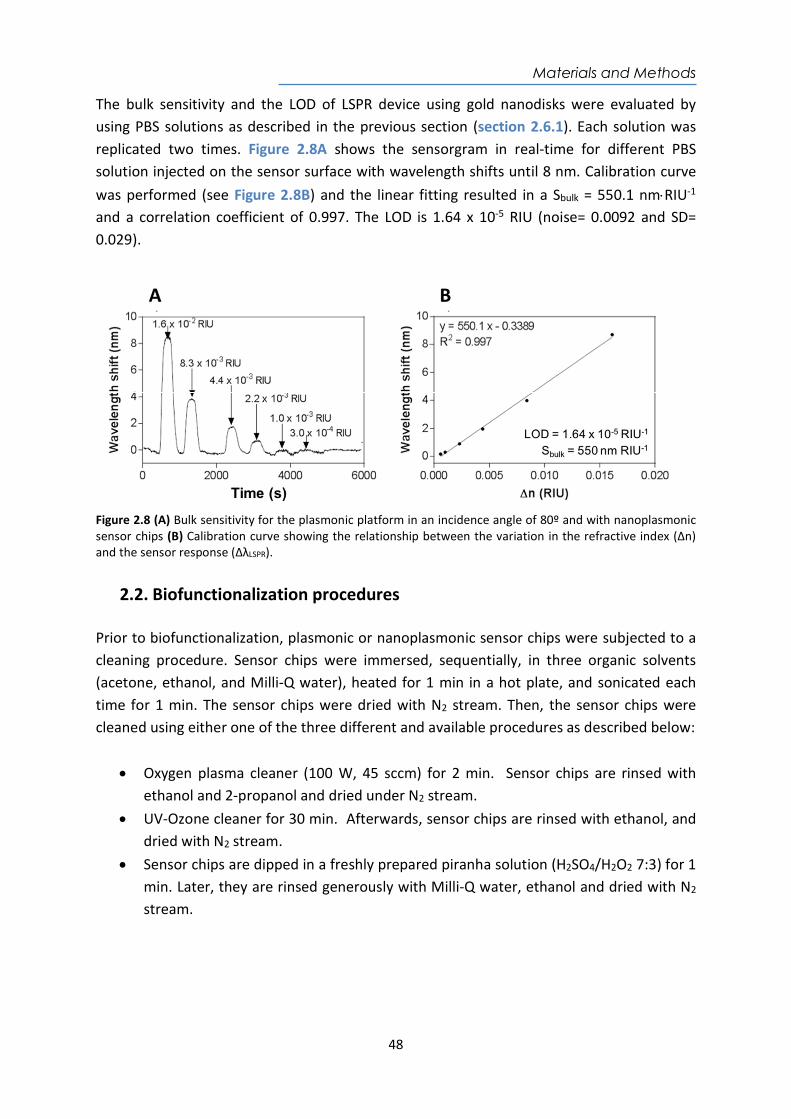
Materials and Methods
48
The bulk sensitivity and the LOD of LSPR device using gold nanodisks were evaluated by using PBS solutions as described in the previous section (section 2.6.1). Each solution was replicated two times. Figure 2.8A shows the sensorgram in real-time for different PBS solution injected on the sensor surface with wavelength shifts until 8 nm. Calibration curve was performed (see Figure 2.8B) and the linear fitting resulted in a Sbulk = 550.1 nmRIU-1 and a correlation coefficient of 0.997. The LOD is 1.64 x 10⁻⁵ RIU (noise= 0.0092 and SD= 0.029).
Figure 2.8 (A) Bulk sensitivity for the plasmonic platform in an incidence angle of 80º and with nanoplasmonic sensor chips (B) Calibration curve showing the relationship between the variation in the refractive index (Δn) and the sensor response (ΔλLSPR).
2.2. Biofunctionalization procedures Prior to biofunctionalization, plasmonic or nanoplasmonic sensor chips were subjected to a cleaning procedure. Sensor chips were immersed, sequentially, in three organic solvents (acetone, ethanol, and Milli-Q water), heated for 1 min in a hot plate, and sonicated each time for 1 min. The sensor chips were dried with N2 stream. Then, the sensor chips were cleaned using either one of the three different and available procedures as described below:
Oxygen plasma cleaner (100 W, 45 sccm) for 2 min. Sensor chips are rinsed with ethanol and 2-propanol and dried under N2 stream.
UV-Ozone cleaner for 30 min. Afterwards, sensor chips are rinsed with ethanol, and dried with N2 stream.
Sensor chips are dipped in a freshly prepared piranha solution (H2SO4/H2O2 7:3) for 1 min. Later, they are rinsed generously with Milli-Q water, ethanol and dried with N2 stream.
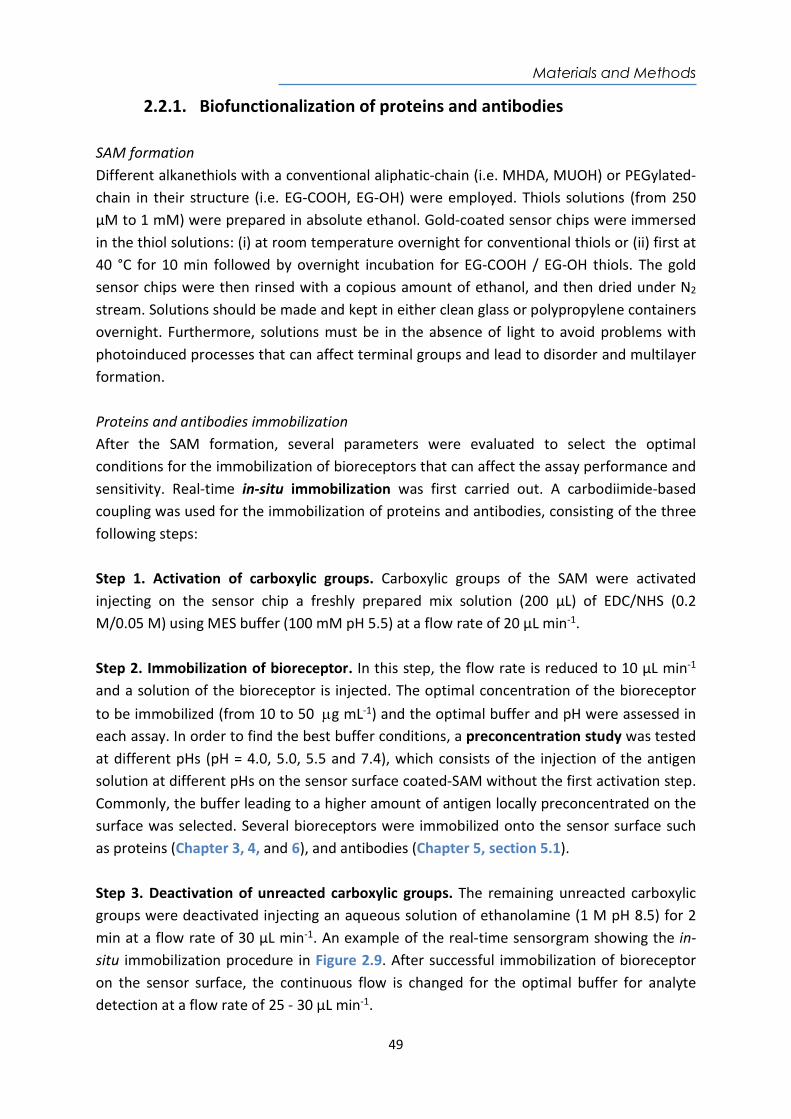
Materials and Methods
49
2.2.1. Biofunctionalization of proteins and antibodies SAM formation Different alkanethiols with a conventional aliphatic-chain (i.e. MHDA, MUOH) or PEGylated-chain in their structure (i.e. EG-COOH, EG-OH) were employed. Thiols solutions (from 250 µM to 1 mM) were prepared in absolute ethanol. Gold-coated sensor chips were immersed in the thiol solutions: (i) at room temperature overnight for conventional thiols or (ii) first at 40 °C for 10 min followed by overnight incubation for EG-COOH / EG-OH thiols. The gold sensor chips were then rinsed with a copious amount of ethanol, and then dried under N2 stream. Solutions should be made and kept in either clean glass or polypropylene containers overnight. Furthermore, solutions must be in the absence of light to avoid problems with photoinduced processes that can affect terminal groups and lead to disorder and multilayer formation. Proteins and antibodies immobilization After the SAM formation, several parameters were evaluated to select the optimal conditions for the immobilization of bioreceptors that can affect the assay performance and sensitivity. Real-time in-situ immobilization was first carried out. A carbodiimide-based coupling was used for the immobilization of proteins and antibodies, consisting of the three following steps: Step 1. Activation of carboxylic groups. Carboxylic groups of the SAM were activated injecting on the sensor chip a freshly prepared mix solution (200 µL) of EDC/NHS (0.2 M/0.05 M) using MES buffer (100 mM pH 5.5) at a flow rate of 20 µL min-1. Step 2. Immobilization of bioreceptor. In this step, the flow rate is reduced to 10 µL min-1 and a solution of the bioreceptor is injected. The optimal concentration of the bioreceptor to be immobilized (from 10 to 50 g mL-1) and the optimal buffer and pH were assessed in each assay. In order to find the best buffer conditions, a preconcentration study was tested at different pHs (pH = 4.0, 5.0, 5.5 and 7.4), which consists of the injection of the antigen solution at different pHs on the sensor surface coated-SAM without the first activation step. Commonly, the buffer leading to a higher amount of antigen locally preconcentrated on the surface was selected. Several bioreceptors were immobilized onto the sensor surface such as proteins (Chapter 3, 4, and 6), and antibodies (Chapter 5, section 5.1). Step 3. Deactivation of unreacted carboxylic groups. The remaining unreacted carboxylic groups were deactivated injecting an aqueous solution of ethanolamine (1 M pH 8.5) for 2 min at a flow rate of 30 µL min-1. An example of the real-time sensorgram showing the in-situ immobilization procedure in Figure 2.9. After successful immobilization of bioreceptor on the sensor surface, the continuous flow is changed for the optimal buffer for analyte detection at a flow rate of 25 - 30 µL min-1.
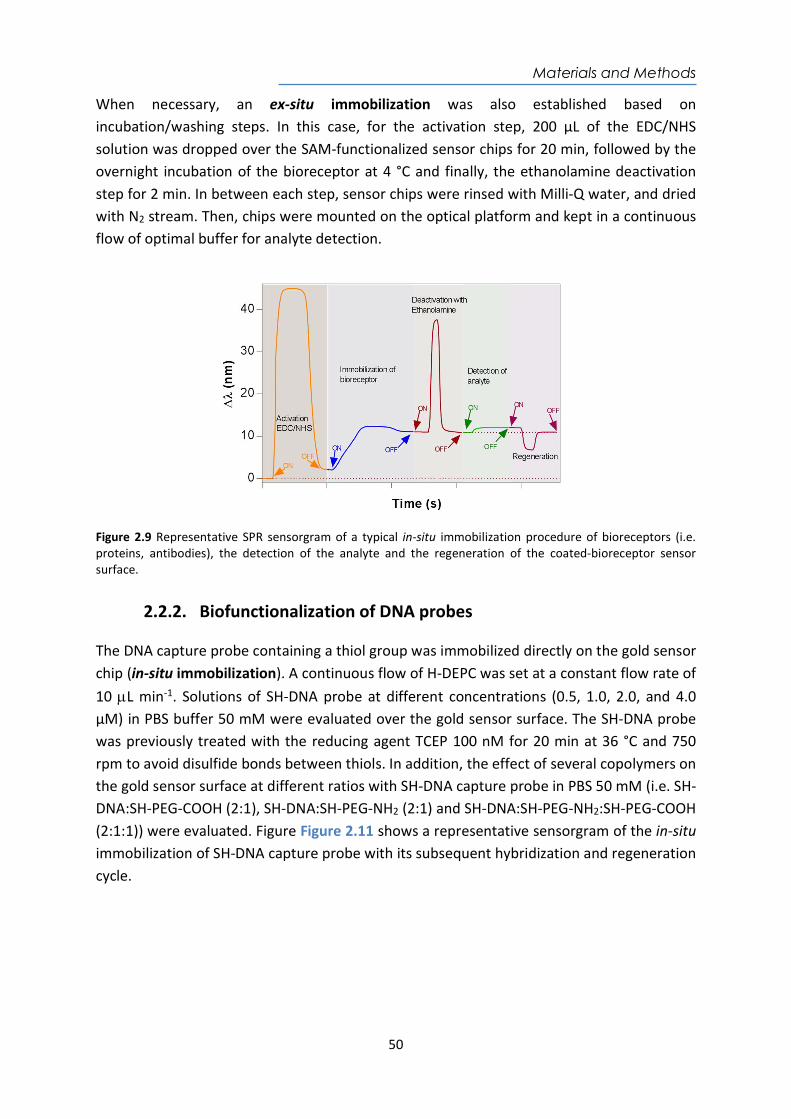
Materials and Methods
50
When necessary, an ex-situ immobilization was also established based on incubation/washing steps. In this case, for the activation step, 200 µL of the EDC/NHS solution was dropped over the SAM-functionalized sensor chips for 20 min, followed by the overnight incubation of the bioreceptor at 4 °C and finally, the ethanolamine deactivation step for 2 min. In between each step, sensor chips were rinsed with Milli-Q water, and dried with N2 stream. Then, chips were mounted on the optical platform and kept in a continuous flow of optimal buffer for analyte detection.
Figure 2.9 Representative SPR sensorgram of a typical in-situ immobilization procedure of bioreceptors (i.e. proteins, antibodies), the detection of the analyte and the regeneration of the coated-bioreceptor sensor surface.
2.2.2. Biofunctionalization of DNA probes The DNA capture probe containing a thiol group was immobilized directly on the gold sensor chip (in-situ immobilization). A continuous flow of H-DEPC was set at a constant flow rate of 10 L min-1. Solutions of SH-DNA probe at different concentrations (0.5, 1.0, 2.0, and 4.0 µM) in PBS buffer 50 mM were evaluated over the gold sensor surface. The SH-DNA probe was previously treated with the reducing agent TCEP 100 nM for 20 min at 36 °C and 750 rpm to avoid disulfide bonds between thiols. In addition, the effect of several copolymers on the gold sensor surface at different ratios with SH-DNA capture probe in PBS 50 mM (i.e. SH-DNA:SH-PEG-COOH (2:1), SH-DNA:SH-PEG-NH2 (2:1) and SH-DNA:SH-PEG-NH2:SH-PEG-COOH (2:1:1)) were evaluated. Figure Figure 2.11 shows a representative sensorgram of the in-situ immobilization of SH-DNA capture probe with its subsequent hybridization and regeneration cycle.
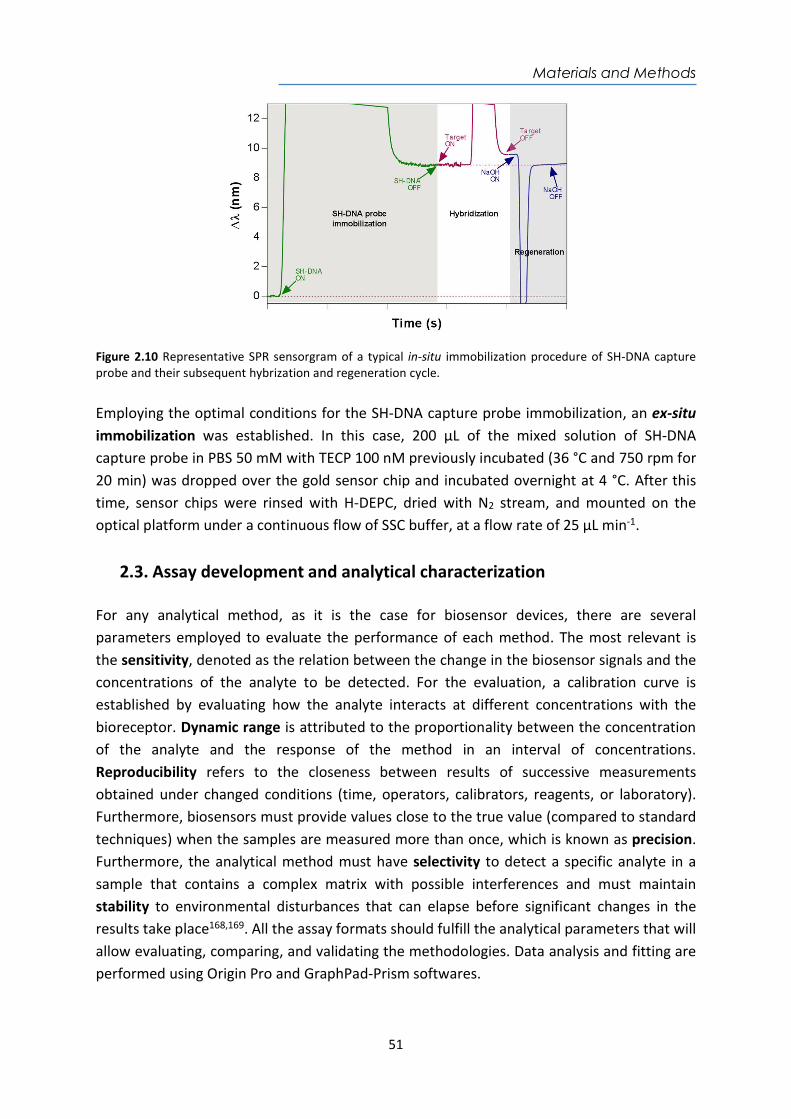
Materials and Methods
51
Figure 2.10 Representative SPR sensorgram of a typical in-situ immobilization procedure of SH-DNA capture probe and their subsequent hybrization and regeneration cycle. Employing the optimal conditions for the SH-DNA capture probe immobilization, an ex-situ immobilization was established. In this case, 200 µL of the mixed solution of SH-DNA capture probe in PBS 50 mM with TECP 100 nM previously incubated (36 °C and 750 rpm for 20 min) was dropped over the gold sensor chip and incubated overnight at 4 °C. After this time, sensor chips were rinsed with H-DEPC, dried with N2 stream, and mounted on the optical platform under a continuous flow of SSC buffer, at a flow rate of 25 µL min-1.
2.3. Assay development and analytical characterization For any analytical method, as it is the case for biosensor devices, there are several parameters employed to evaluate the performance of each method. The most relevant is the sensitivity, denoted as the relation between the change in the biosensor signals and the concentrations of the analyte to be detected. For the evaluation, a calibration curve is established by evaluating how the analyte interacts at different concentrations with the bioreceptor. Dynamic range is attributed to the proportionality between the concentration of the analyte and the response of the method in an interval of concentrations. Reproducibility refers to the closeness between results of successive measurements obtained under changed conditions (time, operators, calibrators, reagents, or laboratory). Furthermore, biosensors must provide values close to the true value (compared to standard techniques) when the samples are measured more than once, which is known as precision. Furthermore, the analytical method must have selectivity to detect a specific analyte in a sample that contains a complex matrix with possible interferences and must maintain stability to environmental disturbances that can elapse before significant changes in the results take place168,169. All the assay formats should fulfill the analytical parameters that will allow evaluating, comparing, and validating the methodologies. Data analysis and fitting are performed using Origin Pro and GraphPad-Prism softwares.
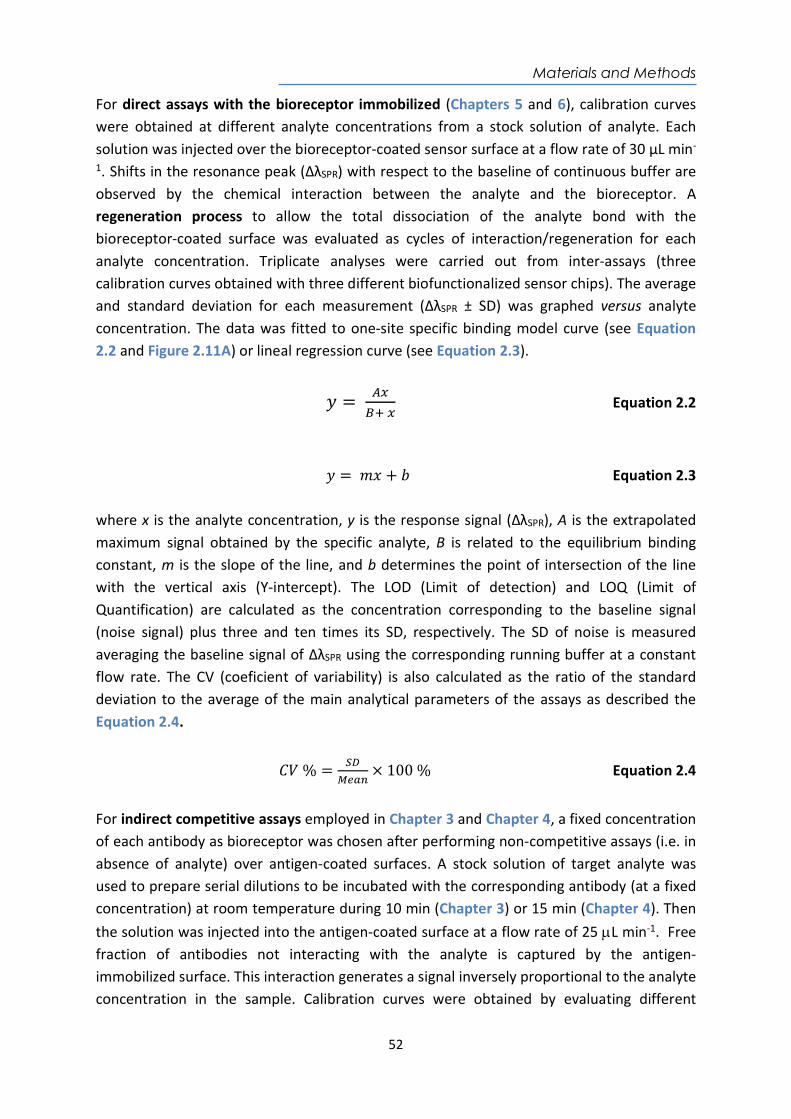
Materials and Methods
52
For direct assays with the bioreceptor immobilized (Chapters 5 and 6), calibration curves were obtained at different analyte concentrations from a stock solution of analyte. Each solution was injected over the bioreceptor-coated sensor surface at a flow rate of 30 µL min-
1. Shifts in the resonance peak (ΔλSPR) with respect to the baseline of continuous buffer are observed by the chemical interaction between the analyte and the bioreceptor. A regeneration process to allow the total dissociation of the analyte bond with the bioreceptor-coated surface was evaluated as cycles of interaction/regeneration for each analyte concentration. Triplicate analyses were carried out from inter-assays (three calibration curves obtained with three different biofunctionalized sensor chips). The average and standard deviation for each measurement (ΔλSPR ± SD) was graphed versus analyte concentration. The data was fitted to one-site specific binding model curve (see Equation 2.2 and Figure 2.11A) or lineal regression curve (see Equation 2.3).
𝑦 =
Equation 2.2
𝑦 = 𝑚𝑥 + 𝑏 Equation 2.3 where x is the analyte concentration, y is the response signal (ΔλSPR), A is the extrapolated maximum signal obtained by the specific analyte, B is related to the equilibrium binding constant, m is the slope of the line, and b determines the point of intersection of the line with the vertical axis (Y-intercept). The LOD (Limit of detection) and LOQ (Limit of Quantification) are calculated as the concentration corresponding to the baseline signal (noise signal) plus three and ten times its SD, respectively. The SD of noise is measured averaging the baseline signal of ΔλSPR using the corresponding running buffer at a constant flow rate. The CV (coeficient of variability) is also calculated as the ratio of the standard deviation to the average of the main analytical parameters of the assays as described the Equation 2.4.
𝐶𝑉 % = × 100 % Equation 2.4
For indirect competitive assays employed in Chapter 3 and Chapter 4, a fixed concentration of each antibody as bioreceptor was chosen after performing non-competitive assays (i.e. in absence of analyte) over antigen-coated surfaces. A stock solution of target analyte was used to prepare serial dilutions to be incubated with the corresponding antibody (at a fixed concentration) at room temperature during 10 min (Chapter 3) or 15 min (Chapter 4). Then the solution was injected into the antigen-coated surface at a flow rate of 25 L min-1. Free fraction of antibodies not interacting with the analyte is captured by the antigen-immobilized surface. This interaction generates a signal inversely proportional to the analyte concentration in the sample. Calibration curves were obtained by evaluating different
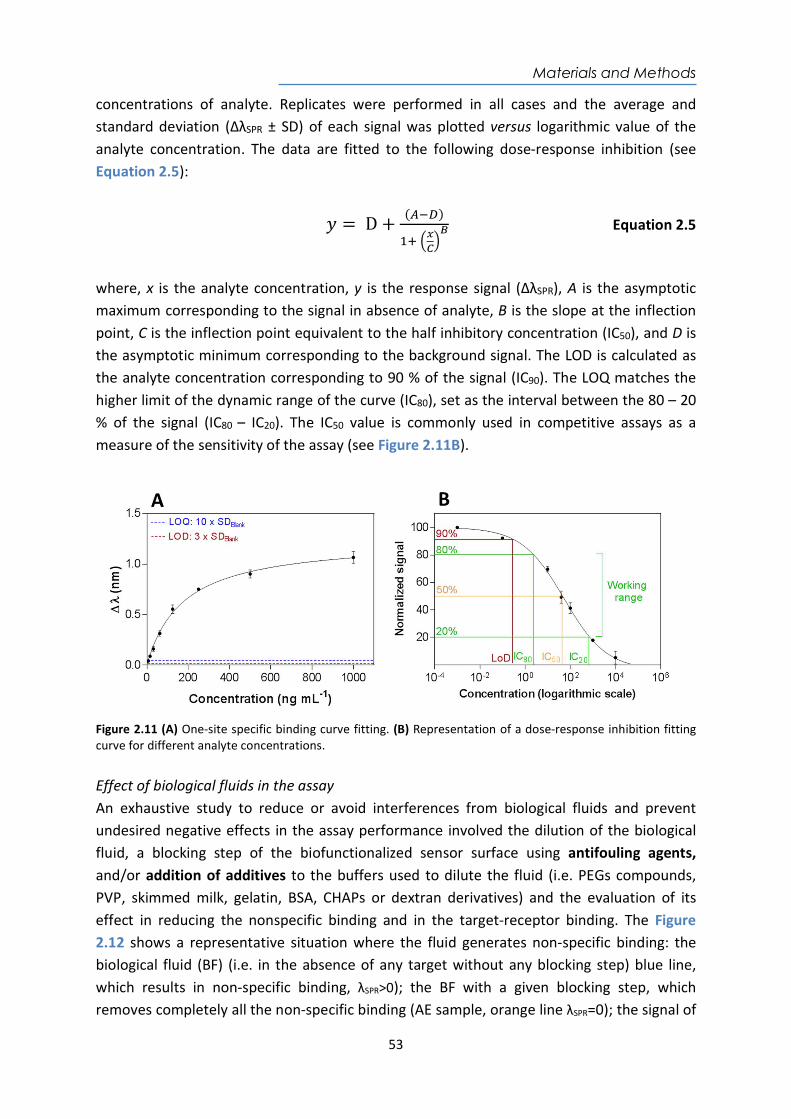
Materials and Methods
53
concentrations of analyte. Replicates were performed in all cases and the average and standard deviation (ΔλSPR ± SD) of each signal was plotted versus logarithmic value of the analyte concentration. The data are fitted to the following dose-response inhibition (see Equation 2.5):
𝑦 = D +( )
Equation 2.5
where, x is the analyte concentration, y is the response signal (ΔλSPR), A is the asymptotic maximum corresponding to the signal in absence of analyte, B is the slope at the inflection point, C is the inflection point equivalent to the half inhibitory concentration (IC50), and D is the asymptotic minimum corresponding to the background signal. The LOD is calculated as the analyte concentration corresponding to 90 % of the signal (IC90). The LOQ matches the higher limit of the dynamic range of the curve (IC80), set as the interval between the 80 – 20 % of the signal (IC80 – IC20). The IC50 value is commonly used in competitive assays as a measure of the sensitivity of the assay (see Figure 2.11B).
Figure 2.11 (A) One-site specific binding curve fitting. (B) Representation of a dose-response inhibition fitting curve for different analyte concentrations. Effect of biological fluids in the assay An exhaustive study to reduce or avoid interferences from biological fluids and prevent undesired negative effects in the assay performance involved the dilution of the biological fluid, a blocking step of the biofunctionalized sensor surface using antifouling agents, and/or addition of additives to the buffers used to dilute the fluid (i.e. PEGs compounds, PVP, skimmed milk, gelatin, BSA, CHAPs or dextran derivatives) and the evaluation of its effect in reducing the nonspecific binding and in the target-receptor binding. The Figure 2.12 shows a representative situation where the fluid generates non-specific binding: the biological fluid (BF) (i.e. in the absence of any target without any blocking step) blue line, which results in non-specific binding, λSPR>0); the BF with a given blocking step, which removes completely all the non-specific binding (AE sample, orange line λSPR=0); the signal of
Materials and Methods
54
a spiked sample with the target analyte under these blocking conditions (red line) and in normal standard conditions for comparison (i.e. in buffer, green line). The final goal is to achieve complete removal of the non-specific adsorption (orange line) while keeping the analyte-bioreceptor interaction unaltered (red line). Calibration curves with the best conditions for each biological fluid (and discussed in each chapter) were performed and compared with the analytical parameters of the standard conditions.
Figure 2.12 Antifouling effect (AE) in biological fluid (BF) to minimize non-specific binding and comparison of ΔλSPR signal of analyte detection using reference buffer and the biological sample. Accuracy studies and validation The accuracy and reliability of the biosensor devices have been evaluated first with blind samples (analyte-spiked at a known concentration in the biological fluid) and finally with real samples. Each measurement was repeated at least three times. Signals were interpolated in the calibration curve performed with the biological sample and measured in triplicate. The average value, SD, and CV were calculated for each one. The results were compared with the real concentration (if known) and the accuracy was calculated as follows (see Equation 2.6).
Accuracy % =[ ]
[ ]× 100 % Equation 2.6
Acenocoumarol Therapeutic Drug
55
Chapter 3
Nanoplasmonic biosensor device for the monitoring of acenocoumarol
therapeutic drug in plasma
We have implemented a nanoplasmonic biosensor based on LSPR of gold nanodisks for the therapeutic drug monitoring of Acenocoumarol (Sintrom®), an oral anticoagulant prescribed for the treatment of a variety of thromboembolic disorders. A label-free indirect competitive immunoassay was developed by using highly specific polyclonal antibodies produced against this drug. Several experimental conditions have been optimized to reach a detection level and a working range within the required clinical values for acenocoumarol testing. This POC device would have an added value to facilitate on-site monitoring (i.e. hospitals or primary care doctor) aiding in dosage management.

Acenocoumarol Therapeutic Drug
56
Acenocoumarol Therapeutic Drug
57
3. Nanoplasmonic biosensor device for the monitoring of acenocoumarol therapeutic drug in plasma
3.1. Introduction The nitrophenyl acetyl-4-oxycoumarin or acenocoumarol (commercialized by Novartis as Sintrom®) is a prescribed oral anticoagulant that belongs to the group of vitamin K antagonists (see Figure 3.1). Acenocoumarol is orally administered as a racemic mixture of R (+) and S (-) optical enantiomers that are rapidly absorbed in the gastrointestinal tract and bind to plasma proteins (>99 %)170. It exerts its anticoagulant effect by inhibiting the synthesis of the subunit 1 enzyme complex of Epoxide Reduction Vitamin K (VKORC1). It also inhibits the gamma-carboxylation of certain glutamic acid molecules found at various sites near the amino terminal end of coagulation factors II (prothrombin formation). Likewise, the drug interferes with the production of coagulation factors VII, IX, X, as well as with protein C. Consequently, acenocoumarol decreases the blood's ability to coagulate, inhibits the formation of fibrin proteins that together with platelets forms blood clots171. For this reason, acenocoumarol is used for the prevention and treatment of an extensive variety of thromboembolic disorders such as arterial fibrillation, deep venous thrombosis, and pulmonary embolism172–174.
Figure 3.1 Chemical structure of acenocoumarol (Mw: 353 Da)
To ensure the effectiveness and safety of acenocoumarol drug, the dosage must be accurately adjusted because the sensitivity to this anticoagulant is variable according to each individual and throughout the treatment. This implies that the drug has a narrow therapeutic range and requires regular medical checkups to avoid risks of hemorrhage which can cause death in the case of late medical intervention175. According to the World Health Organization (WHO), patients under treatment with anticoagulants are commonly monitored by determining the International Normalized Ratio (INR), a coagulation parameter resulting from the quotient between the prothrombin time of the patient's plasma and the average normal prothrombin time (PT) raised to the power of the International Sensitivity Index (ISI)171,176,177. Patients with INR between 2.0 and 4.5 have no recurrence of serious bleeding complications. If the patient's dose is insufficient,
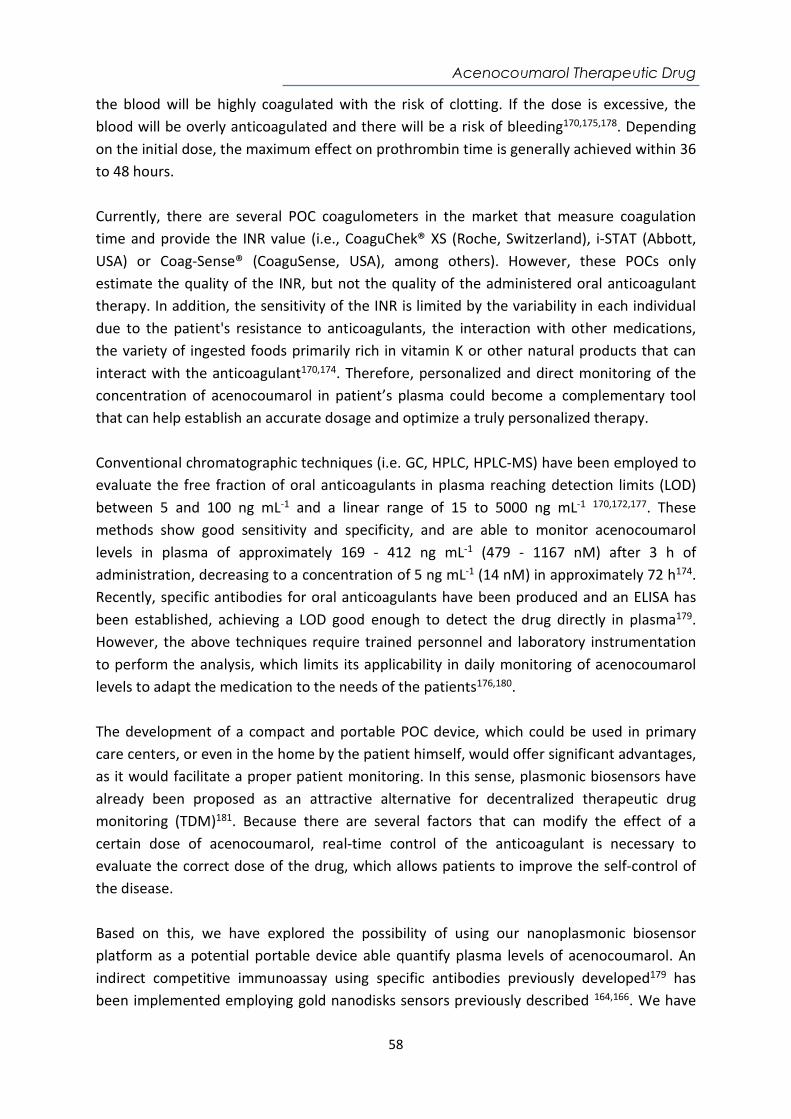
Acenocoumarol Therapeutic Drug
58
the blood will be highly coagulated with the risk of clotting. If the dose is excessive, the blood will be overly anticoagulated and there will be a risk of bleeding170,175,178. Depending on the initial dose, the maximum effect on prothrombin time is generally achieved within 36 to 48 hours. Currently, there are several POC coagulometers in the market that measure coagulation time and provide the INR value (i.e., CoaguChek® XS (Roche, Switzerland), i-STAT (Abbott, USA) or Coag-Sense® (CoaguSense, USA), among others). However, these POCs only estimate the quality of the INR, but not the quality of the administered oral anticoagulant therapy. In addition, the sensitivity of the INR is limited by the variability in each individual due to the patient's resistance to anticoagulants, the interaction with other medications, the variety of ingested foods primarily rich in vitamin K or other natural products that can interact with the anticoagulant170,174. Therefore, personalized and direct monitoring of the concentration of acenocoumarol in patient’s plasma could become a complementary tool that can help establish an accurate dosage and optimize a truly personalized therapy. Conventional chromatographic techniques (i.e. GC, HPLC, HPLC-MS) have been employed to evaluate the free fraction of oral anticoagulants in plasma reaching detection limits (LOD) between 5 and 100 ng mL-1 and a linear range of 15 to 5000 ng mL-1 170,172,177. These methods show good sensitivity and specificity, and are able to monitor acenocoumarol levels in plasma of approximately 169 - 412 ng mL-1 (479 - 1167 nM) after 3 h of administration, decreasing to a concentration of 5 ng mL-1 (14 nM) in approximately 72 h174. Recently, specific antibodies for oral anticoagulants have been produced and an ELISA has been established, achieving a LOD good enough to detect the drug directly in plasma179. However, the above techniques require trained personnel and laboratory instrumentation to perform the analysis, which limits its applicability in daily monitoring of acenocoumarol levels to adapt the medication to the needs of the patients176,180. The development of a compact and portable POC device, which could be used in primary care centers, or even in the home by the patient himself, would offer significant advantages, as it would facilitate a proper patient monitoring. In this sense, plasmonic biosensors have already been proposed as an attractive alternative for decentralized therapeutic drug monitoring (TDM)181. Because there are several factors that can modify the effect of a certain dose of acenocoumarol, real-time control of the anticoagulant is necessary to evaluate the correct dose of the drug, which allows patients to improve the self-control of the disease. Based on this, we have explored the possibility of using our nanoplasmonic biosensor platform as a potential portable device able quantify plasma levels of acenocoumarol. An indirect competitive immunoassay using specific antibodies previously developed179 has been implemented employing gold nanodisks sensors previously described 164,166. We have
Acenocoumarol Therapeutic Drug
59
assessed the feasibility of directly detecting the drug in plasma, paying special attention to the minimization of the matrix effect of this biological fluid.
3.2. Chemical reagents and biological compounds Reagents Organic solvents (i.e. acetone, absolute ethanol, toluene, 2-propanol and dimethyl sulfoxide (DMSO)), H2SO4 and hydrochloric acid 37 % were purchased from Panreac–Applichem (Barcelona, Spain). Tween 20, ethanolamine hydrochloride, 1-ethyl-3-(3-dimethyl-aminopropyl)carbodiimide hydrochloride (EDC), N-hydroxysulfosuccinimide (NHS), dextran sulfate sodium salt (DS, MW 40000 g mol-1), polyvinylpyrrolidone (PVP, MW 40000 g mol-1), NaOH, gelatin from cold water fish skin, chicken serum, bovine serum albumin (BSA), CM-dextran, and all reagents used for the preparation of buffers were acquired from Sigma-Aldrich (Steinhem, Germany). Acenocoumarol (Sintrom®) was provided by Ipochem Ltd. (Warszawa, Poland). Amine-dextran and CHAPS were purchased from Fisher Scientific (Madrid, Spain). Dextran and skim milk powder were purchased from Fluka (Munich, Germany). Alkanethiols used for the preparation of the SAM like 16-mercaptohexadecanoic acid (MHDA) and 11-mercaptoundecanol (MUOH) and 6-mercapto-1-hexanol (MCH) were acquired from Sigma-Aldrich (Steinhem, Germany). Copolymer Poly-L-Lysine-graft-PEG (PLL-PEG MW 70000 g mol-1) was purchased from SuSoS (Dübendorf, Switzerland); diamine-PEG (NH2-PEG-NH2, MW 10000 g mol-1) was obtained from Laysan Bio (Arab, USA). Buffers The buffers were prepared with Milli-Q water (deionized water from a Milli-DI® Water Purification System, Merck Millipore, USA) and are the following: PBS-1X (10 mM phosphate, 137 mM NaCl, 2.7 mM KCl, pH 7.5); PBST-0.05 (PBS with 0.05 % Tween 20); PBST-0.5 (PBS with 0.5 % Tween 20); PBST-DS (PBST-0.5 with DS, 2 mg mL-1); acetate buffer (10 - 20 mM pH from 4.0 to 5.5); MES buffer (2-(-N-morpholino)ethanesulfonic acid 100 mM, 500 mM NaCl, pH 5.5); HEPES buffer (N-(2-Hydroxyethyl)piperazine-N’-(2-ethanesulfonic acid 10 mM pH 7.4). Biological compounds Antigen (hACL-BSA) and polyclonal antibody As236 specific for acenocoumarol179 were provided by Prof. Mª Pilar Marco from the Nanobiotechnology for Diagnostics group (Nb4D, Department of Chemical and Biomolecular Nanotechnology, Institute for Advanced Chemistry of Catalonia (IQAC-CSIC)). Pooled normal human plasma was purchased from Innovative Research (Novi, USA) and stored at -20 °C until further use. The ICTS “NANOBIOSIS”, and particularly the Custom Antibody Service (CAbS, IQAC-CSIC, CIBER-BBN), is acknowledged for the assistance and support related to the immunoreagents used in this work.
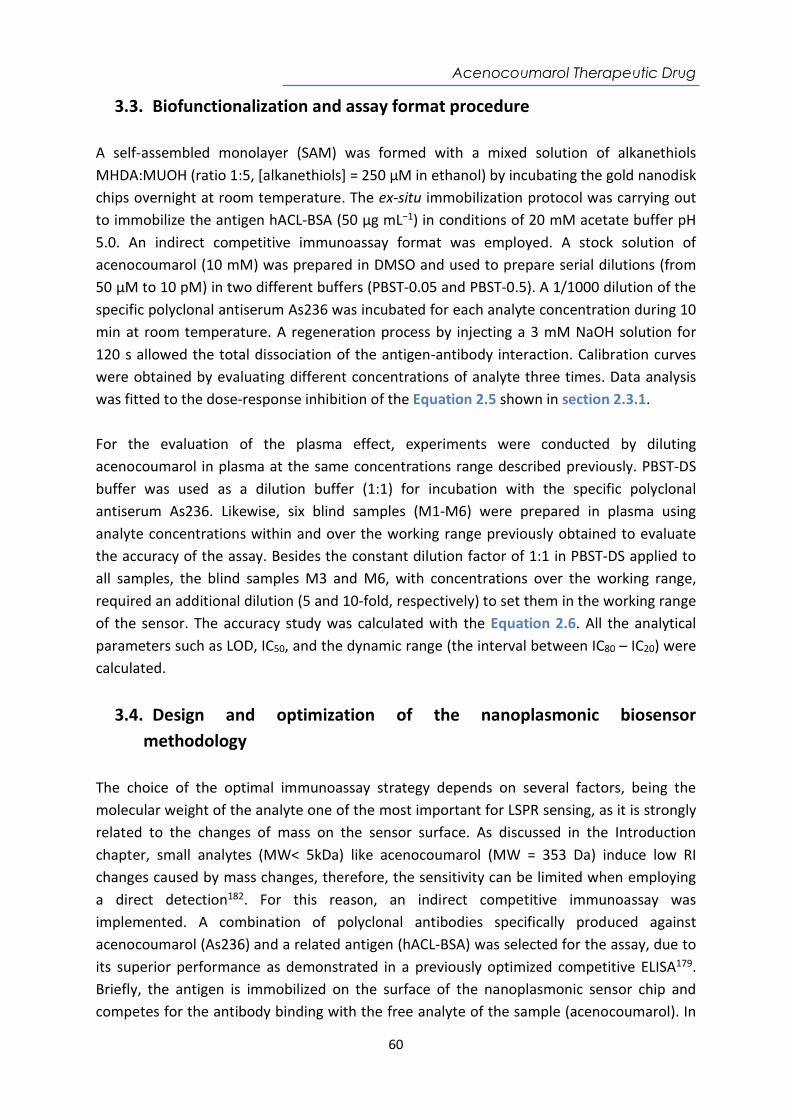
Acenocoumarol Therapeutic Drug
60
3.3. Biofunctionalization and assay format procedure A self-assembled monolayer (SAM) was formed with a mixed solution of alkanethiols MHDA:MUOH (ratio 1:5, [alkanethiols] = 250 μM in ethanol) by incubating the gold nanodisk chips overnight at room temperature. The ex-situ immobilization protocol was carrying out to immobilize the antigen hACL-BSA (50 μg mL−1) in conditions of 20 mM acetate buffer pH 5.0. An indirect competitive immunoassay format was employed. A stock solution of acenocoumarol (10 mM) was prepared in DMSO and used to prepare serial dilutions (from 50 μM to 10 pM) in two different buffers (PBST-0.05 and PBST-0.5). A 1/1000 dilution of the specific polyclonal antiserum As236 was incubated for each analyte concentration during 10 min at room temperature. A regeneration process by injecting a 3 mM NaOH solution for 120 s allowed the total dissociation of the antigen-antibody interaction. Calibration curves were obtained by evaluating different concentrations of analyte three times. Data analysis was fitted to the dose-response inhibition of the Equation 2.5 shown in section 2.3.1. For the evaluation of the plasma effect, experiments were conducted by diluting acenocoumarol in plasma at the same concentrations range described previously. PBST-DS buffer was used as a dilution buffer (1:1) for incubation with the specific polyclonal antiserum As236. Likewise, six blind samples (M1-M6) were prepared in plasma using analyte concentrations within and over the working range previously obtained to evaluate the accuracy of the assay. Besides the constant dilution factor of 1:1 in PBST-DS applied to all samples, the blind samples M3 and M6, with concentrations over the working range, required an additional dilution (5 and 10-fold, respectively) to set them in the working range of the sensor. The accuracy study was calculated with the Equation 2.6. All the analytical parameters such as LOD, IC50, and the dynamic range (the interval between IC80 – IC20) were calculated.
3.4. Design and optimization of the nanoplasmonic biosensor methodology
The choice of the optimal immunoassay strategy depends on several factors, being the molecular weight of the analyte one of the most important for LSPR sensing, as it is strongly related to the changes of mass on the sensor surface. As discussed in the Introduction chapter, small analytes (MW< 5kDa) like acenocoumarol (MW = 353 Da) induce low RI changes caused by mass changes, therefore, the sensitivity can be limited when employing a direct detection182. For this reason, an indirect competitive immunoassay was implemented. A combination of polyclonal antibodies specifically produced against acenocoumarol (As236) and a related antigen (hACL-BSA) was selected for the assay, due to its superior performance as demonstrated in a previously optimized competitive ELISA179. Briefly, the antigen is immobilized on the surface of the nanoplasmonic sensor chip and competes for the antibody binding with the free analyte of the sample (acenocoumarol). In
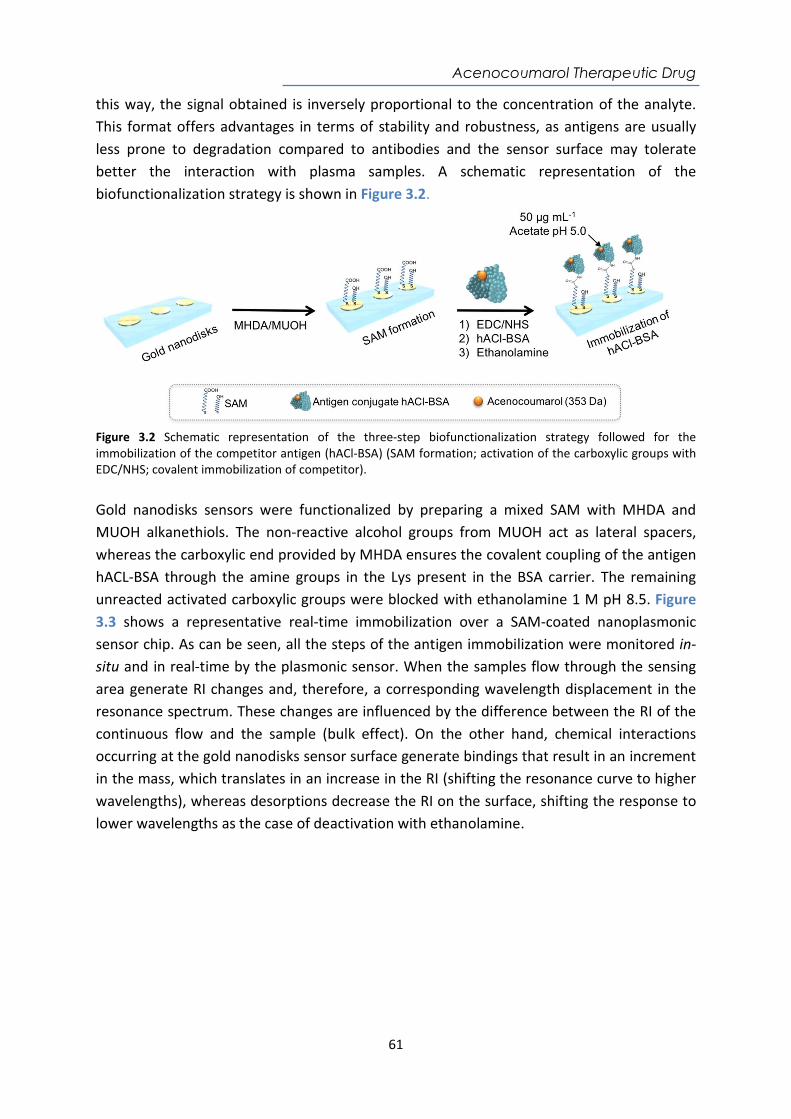
Acenocoumarol Therapeutic Drug
61
this way, the signal obtained is inversely proportional to the concentration of the analyte. This format offers advantages in terms of stability and robustness, as antigens are usually less prone to degradation compared to antibodies and the sensor surface may tolerate better the interaction with plasma samples. A schematic representation of the biofunctionalization strategy is shown in Figure 3.2.
Figure 3.2 Schematic representation of the three-step biofunctionalization strategy followed for the immobilization of the competitor antigen (hACl-BSA) (SAM formation; activation of the carboxylic groups with EDC/NHS; covalent immobilization of competitor). Gold nanodisks sensors were functionalized by preparing a mixed SAM with MHDA and MUOH alkanethiols. The non-reactive alcohol groups from MUOH act as lateral spacers, whereas the carboxylic end provided by MHDA ensures the covalent coupling of the antigen hACL-BSA through the amine groups in the Lys present in the BSA carrier. The remaining unreacted activated carboxylic groups were blocked with ethanolamine 1 M pH 8.5. Figure 3.3 shows a representative real-time immobilization over a SAM-coated nanoplasmonic sensor chip. As can be seen, all the steps of the antigen immobilization were monitored in-situ and in real-time by the plasmonic sensor. When the samples flow through the sensing area generate RI changes and, therefore, a corresponding wavelength displacement in the resonance spectrum. These changes are influenced by the difference between the RI of the continuous flow and the sample (bulk effect). On the other hand, chemical interactions occurring at the gold nanodisks sensor surface generate bindings that result in an increment in the mass, which translates in an increase in the RI (shifting the resonance curve to higher wavelengths), whereas desorptions decrease the RI on the surface, shifting the response to lower wavelengths as the case of deactivation with ethanolamine.
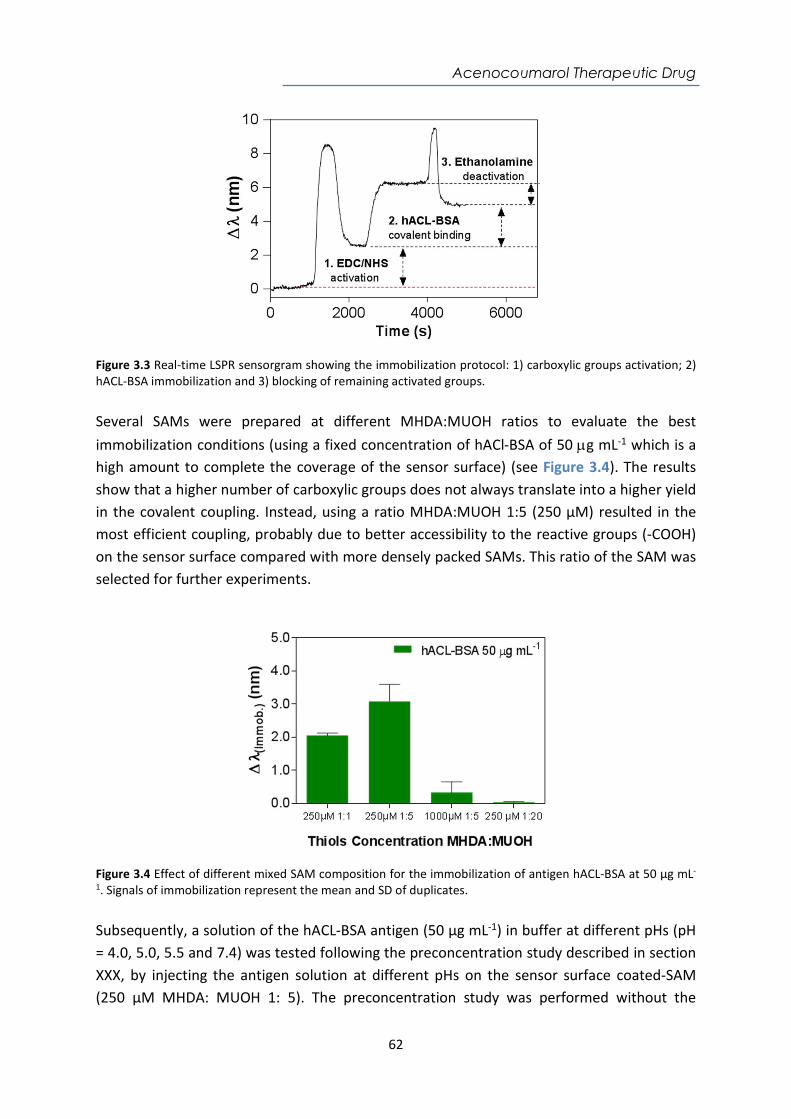
Acenocoumarol Therapeutic Drug
62
Figure 3.3 Real-time LSPR sensorgram showing the immobilization protocol: 1) carboxylic groups activation; 2) hACL-BSA immobilization and 3) blocking of remaining activated groups. Several SAMs were prepared at different MHDA:MUOH ratios to evaluate the best immobilization conditions (using a fixed concentration of hACl-BSA of 50 g mL-1 which is a high amount to complete the coverage of the sensor surface) (see Figure 3.4). The results show that a higher number of carboxylic groups does not always translate into a higher yield in the covalent coupling. Instead, using a ratio MHDA:MUOH 1:5 (250 µM) resulted in the most efficient coupling, probably due to better accessibility to the reactive groups (-COOH) on the sensor surface compared with more densely packed SAMs. This ratio of the SAM was selected for further experiments.
Figure 3.4 Effect of different mixed SAM composition for the immobilization of antigen hACL-BSA at 50 µg mL-
1. Signals of immobilization represent the mean and SD of duplicates. Subsequently, a solution of the hACL-BSA antigen (50 µg mL-1) in buffer at different pHs (pH = 4.0, 5.0, 5.5 and 7.4) was tested following the preconcentration study described in section XXX, by injecting the antigen solution at different pHs on the sensor surface coated-SAM (250 µM MHDA: MUOH 1: 5). The preconcentration study was performed without the
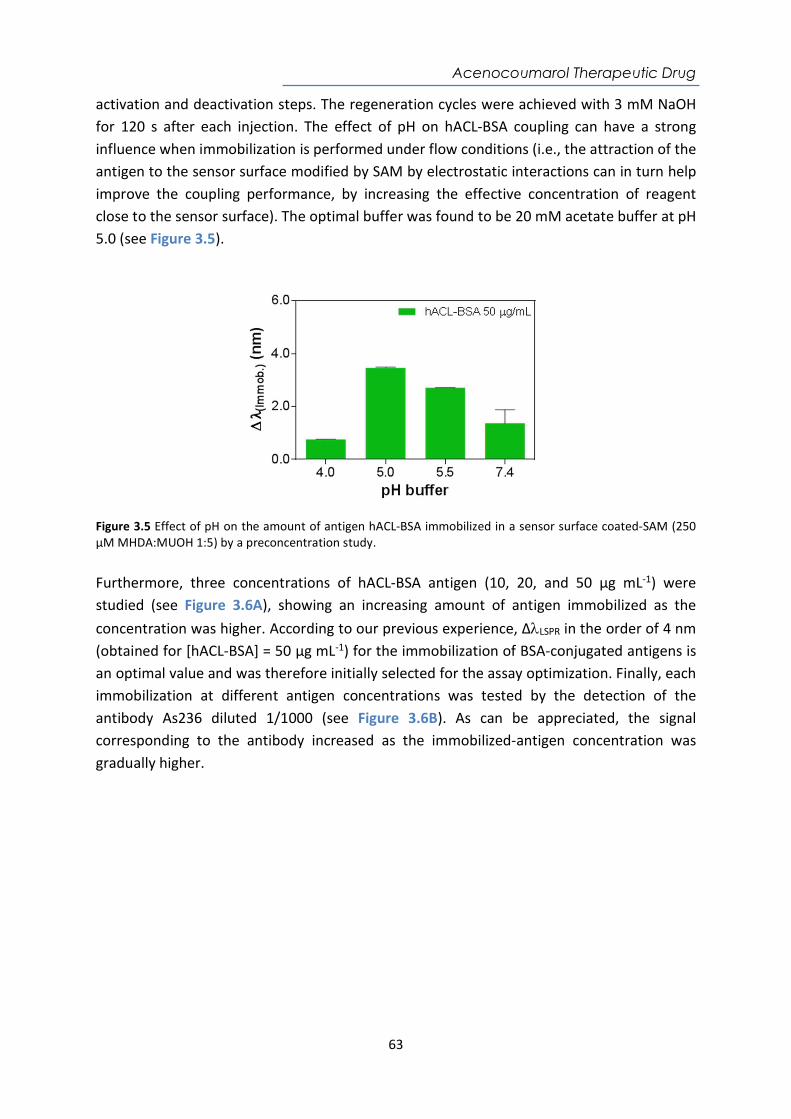
Acenocoumarol Therapeutic Drug
63
activation and deactivation steps. The regeneration cycles were achieved with 3 mM NaOH for 120 s after each injection. The effect of pH on hACL-BSA coupling can have a strong influence when immobilization is performed under flow conditions (i.e., the attraction of the antigen to the sensor surface modified by SAM by electrostatic interactions can in turn help improve the coupling performance, by increasing the effective concentration of reagent close to the sensor surface). The optimal buffer was found to be 20 mM acetate buffer at pH 5.0 (see Figure 3.5).
Figure 3.5 Effect of pH on the amount of antigen hACL-BSA immobilized in a sensor surface coated-SAM (250 µM MHDA:MUOH 1:5) by a preconcentration study. Furthermore, three concentrations of hACL-BSA antigen (10, 20, and 50 μg mL-1) were studied (see Figure 3.6A), showing an increasing amount of antigen immobilized as the concentration was higher. According to our previous experience, ΔLSPR in the order of 4 nm (obtained for [hACL-BSA] = 50 µg mL-1) for the immobilization of BSA-conjugated antigens is an optimal value and was therefore initially selected for the assay optimization. Finally, each immobilization at different antigen concentrations was tested by the detection of the antibody As236 diluted 1/1000 (see Figure 3.6B). As can be appreciated, the signal corresponding to the antibody increased as the immobilized-antigen concentration was gradually higher.
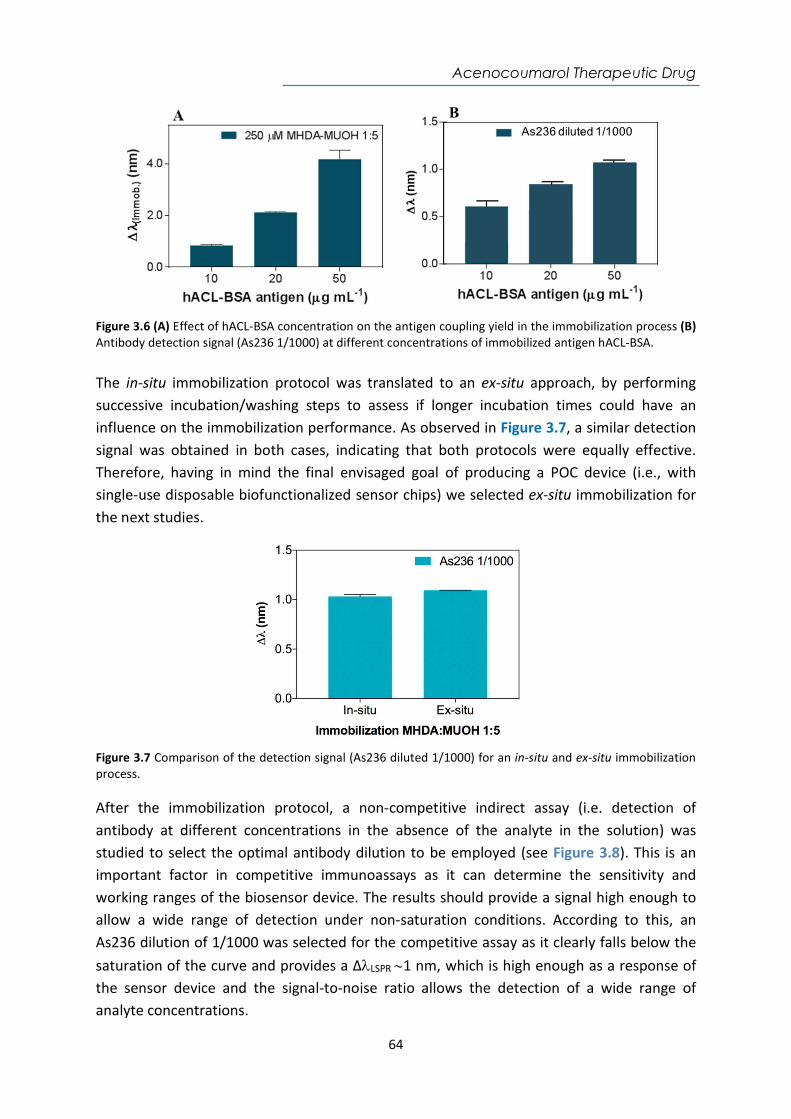
Acenocoumarol Therapeutic Drug
64
Figure 3.6 (A) Effect of hACL-BSA concentration on the antigen coupling yield in the immobilization process (B) Antibody detection signal (As236 1/1000) at different concentrations of immobilized antigen hACL-BSA. The in-situ immobilization protocol was translated to an ex-situ approach, by performing successive incubation/washing steps to assess if longer incubation times could have an influence on the immobilization performance. As observed in Figure 3.7, a similar detection signal was obtained in both cases, indicating that both protocols were equally effective. Therefore, having in mind the final envisaged goal of producing a POC device (i.e., with single-use disposable biofunctionalized sensor chips) we selected ex-situ immobilization for the next studies.
Figure 3.7 Comparison of the detection signal (As236 diluted 1/1000) for an in-situ and ex-situ immobilization process. After the immobilization protocol, a non-competitive indirect assay (i.e. detection of antibody at different concentrations in the absence of the analyte in the solution) was studied to select the optimal antibody dilution to be employed (see Figure 3.8). This is an important factor in competitive immunoassays as it can determine the sensitivity and working ranges of the biosensor device. The results should provide a signal high enough to allow a wide range of detection under non-saturation conditions. According to this, an As236 dilution of 1/1000 was selected for the competitive assay as it clearly falls below the saturation of the curve and provides a ΔLSPR 1 nm, which is high enough as a response of the sensor device and the signal-to-noise ratio allows the detection of a wide range of analyte concentrations.
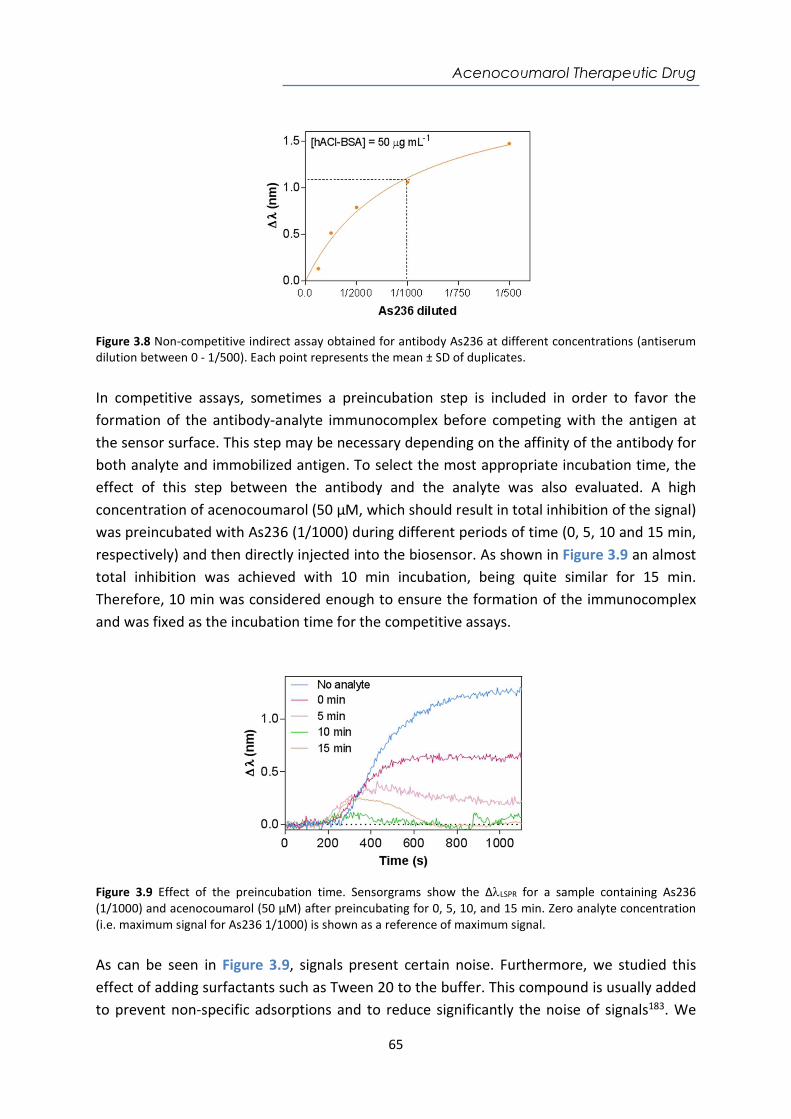
Acenocoumarol Therapeutic Drug
65
Figure 3.8 Non-competitive indirect assay obtained for antibody As236 at different concentrations (antiserum dilution between 0 - 1/500). Each point represents the mean ± SD of duplicates. In competitive assays, sometimes a preincubation step is included in order to favor the formation of the antibody-analyte immunocomplex before competing with the antigen at the sensor surface. This step may be necessary depending on the affinity of the antibody for both analyte and immobilized antigen. To select the most appropriate incubation time, the effect of this step between the antibody and the analyte was also evaluated. A high concentration of acenocoumarol (50 µM, which should result in total inhibition of the signal) was preincubated with As236 (1/1000) during different periods of time (0, 5, 10 and 15 min, respectively) and then directly injected into the biosensor. As shown in Figure 3.9 an almost total inhibition was achieved with 10 min incubation, being quite similar for 15 min. Therefore, 10 min was considered enough to ensure the formation of the immunocomplex and was fixed as the incubation time for the competitive assays.
Figure 3.9 Effect of the preincubation time. Sensorgrams show the ΔLSPR for a sample containing As236 (1/1000) and acenocoumarol (50 µM) after preincubating for 0, 5, 10, and 15 min. Zero analyte concentration (i.e. maximum signal for As236 1/1000) is shown as a reference of maximum signal. As can be seen in Figure 3.9, signals present certain noise. Furthermore, we studied this effect of adding surfactants such as Tween 20 to the buffer. This compound is usually added to prevent non-specific adsorptions and to reduce significantly the noise of signals183. We
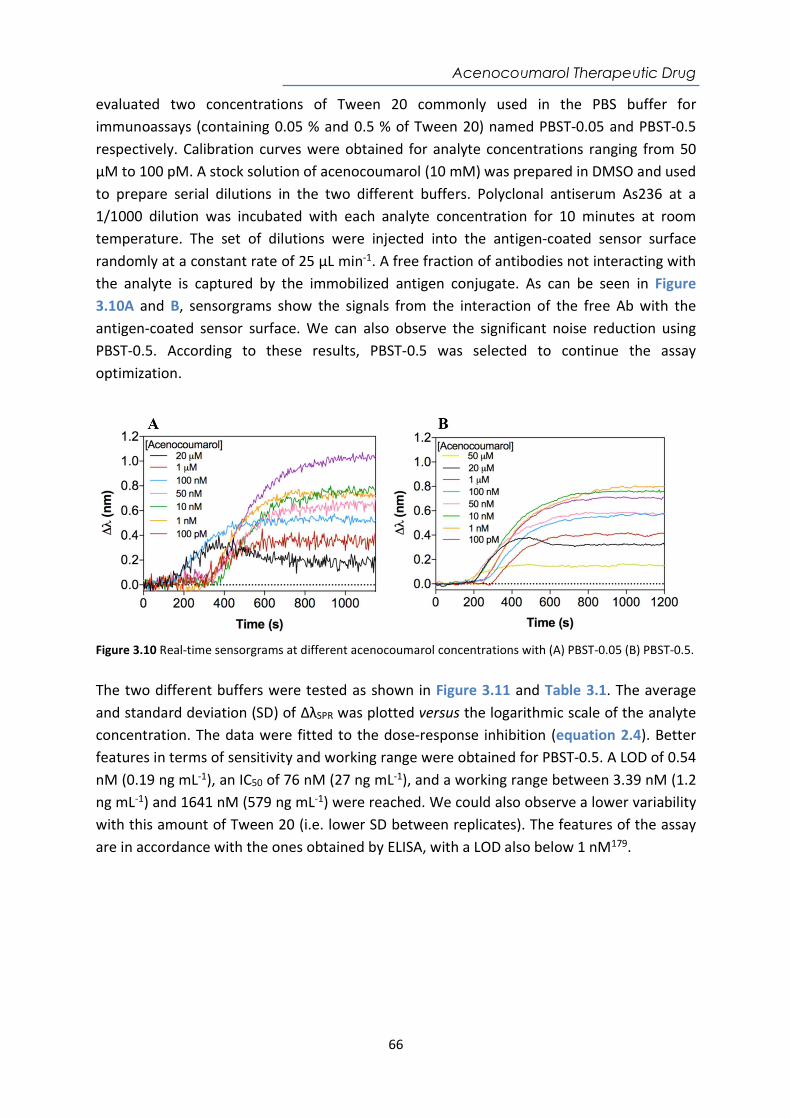
Acenocoumarol Therapeutic Drug
66
evaluated two concentrations of Tween 20 commonly used in the PBS buffer for immunoassays (containing 0.05 % and 0.5 % of Tween 20) named PBST-0.05 and PBST-0.5 respectively. Calibration curves were obtained for analyte concentrations ranging from 50 µM to 100 pM. A stock solution of acenocoumarol (10 mM) was prepared in DMSO and used to prepare serial dilutions in the two different buffers. Polyclonal antiserum As236 at a 1/1000 dilution was incubated with each analyte concentration for 10 minutes at room temperature. The set of dilutions were injected into the antigen-coated sensor surface randomly at a constant rate of 25 µL min-1. A free fraction of antibodies not interacting with the analyte is captured by the immobilized antigen conjugate. As can be seen in Figure 3.10A and B, sensorgrams show the signals from the interaction of the free Ab with the antigen-coated sensor surface. We can also observe the significant noise reduction using PBST-0.5. According to these results, PBST-0.5 was selected to continue the assay optimization.
Figure 3.10 Real-time sensorgrams at different acenocoumarol concentrations with (A) PBST-0.05 (B) PBST-0.5. The two different buffers were tested as shown in Figure 3.11 and Table 3.1. The average and standard deviation (SD) of ΔλSPR was plotted versus the logarithmic scale of the analyte concentration. The data were fitted to the dose-response inhibition (equation 2.4). Better features in terms of sensitivity and working range were obtained for PBST-0.5. A LOD of 0.54 nM (0.19 ng mL-1), an IC50 of 76 nM (27 ng mL-1), and a working range between 3.39 nM (1.2 ng mL-1) and 1641 nM (579 ng mL-1) were reached. We could also observe a lower variability with this amount of Tween 20 (i.e. lower SD between replicates). The features of the assay are in accordance with the ones obtained by ELISA, with a LOD also below 1 nM179.
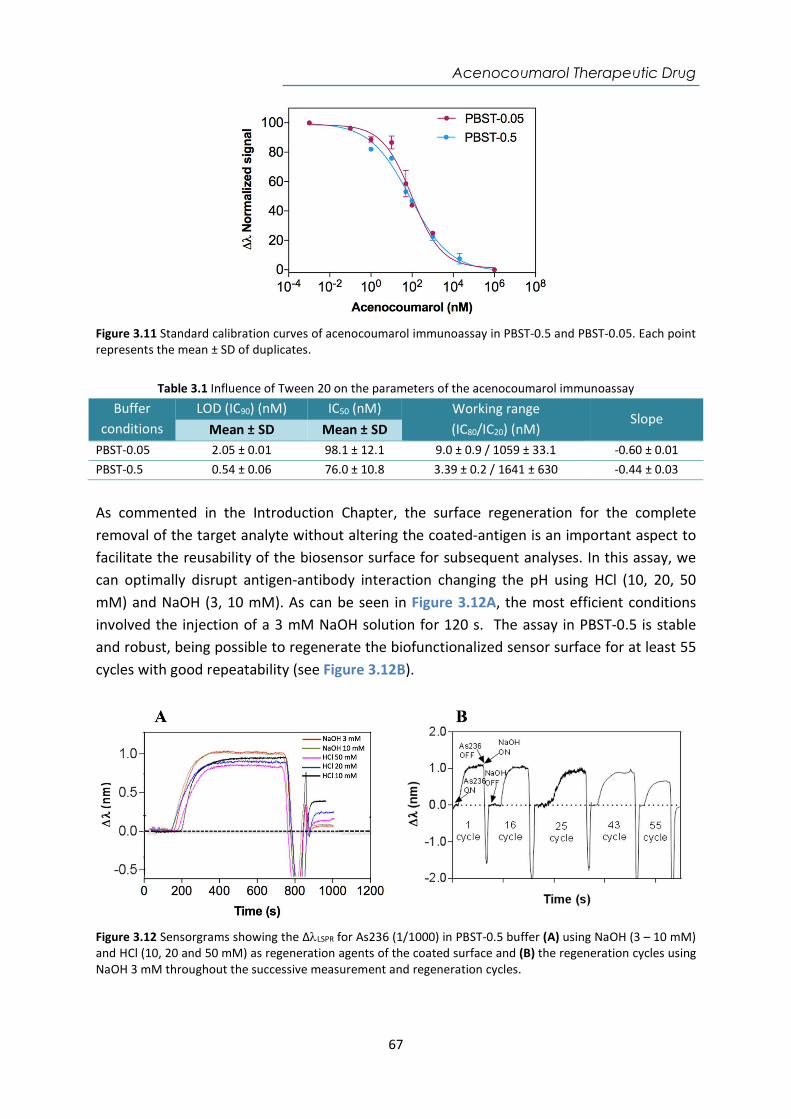
Acenocoumarol Therapeutic Drug
67
Figure 3.11 Standard calibration curves of acenocoumarol immunoassay in PBST-0.5 and PBST-0.05. Each point represents the mean ± SD of duplicates.
Table 3.1 Influence of Tween 20 on the parameters of the acenocoumarol immunoassay
Buffer conditions
LOD (IC90) (nM) IC50 (nM) Working range (IC80/IC20) (nM)
Slope Mean ± SD Mean ± SD
PBST-0.05 2.05 ± 0.01 98.1 ± 12.1 9.0 ± 0.9 / 1059 ± 33.1 -0.60 ± 0.01 PBST-0.5 0.54 ± 0.06 76.0 ± 10.8 3.39 ± 0.2 / 1641 ± 630 -0.44 ± 0.03
As commented in the Introduction Chapter, the surface regeneration for the complete removal of the target analyte without altering the coated-antigen is an important aspect to facilitate the reusability of the biosensor surface for subsequent analyses. In this assay, we can optimally disrupt antigen-antibody interaction changing the pH using HCl (10, 20, 50 mM) and NaOH (3, 10 mM). As can be seen in Figure 3.12A, the most efficient conditions involved the injection of a 3 mM NaOH solution for 120 s. The assay in PBST-0.5 is stable and robust, being possible to regenerate the biofunctionalized sensor surface for at least 55 cycles with good repeatability (see Figure 3.12B).
Figure 3.12 Sensorgrams showing the ΔLSPR for As236 (1/1000) in PBST-0.5 buffer (A) using NaOH (3 – 10 mM) and HCl (10, 20 and 50 mM) as regeneration agents of the coated surface and (B) the regeneration cycles using NaOH 3 mM throughout the successive measurement and regeneration cycles.
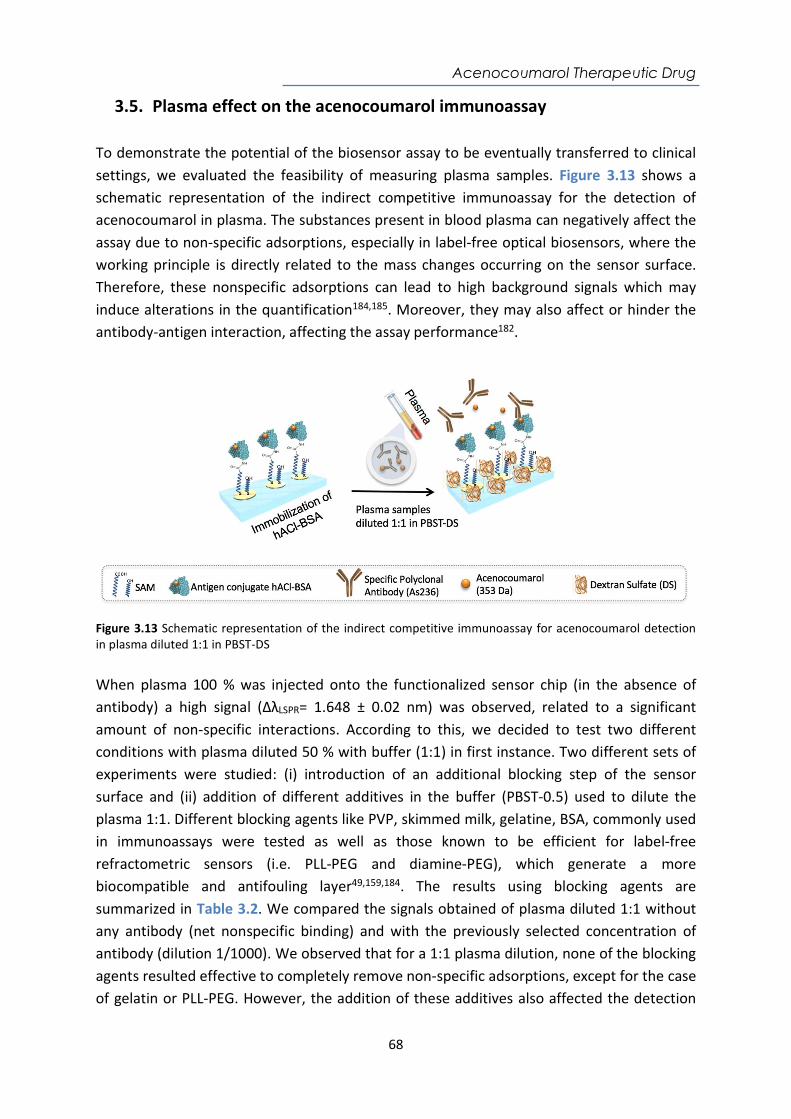
Acenocoumarol Therapeutic Drug
68
3.5. Plasma effect on the acenocoumarol immunoassay To demonstrate the potential of the biosensor assay to be eventually transferred to clinical settings, we evaluated the feasibility of measuring plasma samples. Figure 3.13 shows a schematic representation of the indirect competitive immunoassay for the detection of acenocoumarol in plasma. The substances present in blood plasma can negatively affect the assay due to non-specific adsorptions, especially in label-free optical biosensors, where the working principle is directly related to the mass changes occurring on the sensor surface. Therefore, these nonspecific adsorptions can lead to high background signals which may induce alterations in the quantification184,185. Moreover, they may also affect or hinder the antibody-antigen interaction, affecting the assay performance182.
Figure 3.13 Schematic representation of the indirect competitive immunoassay for acenocoumarol detection in plasma diluted 1:1 in PBST-DS When plasma 100 % was injected onto the functionalized sensor chip (in the absence of antibody) a high signal (ΔλLSPR= 1.648 ± 0.02 nm) was observed, related to a significant amount of non-specific interactions. According to this, we decided to test two different conditions with plasma diluted 50 % with buffer (1:1) in first instance. Two different sets of experiments were studied: (i) introduction of an additional blocking step of the sensor surface and (ii) addition of different additives in the buffer (PBST-0.5) used to dilute the plasma 1:1. Different blocking agents like PVP, skimmed milk, gelatine, BSA, commonly used in immunoassays were tested as well as those known to be efficient for label-free refractometric sensors (i.e. PLL-PEG and diamine-PEG), which generate a more biocompatible and antifouling layer49,159,184. The results using blocking agents are summarized in Table 3.2. We compared the signals obtained of plasma diluted 1:1 without any antibody (net nonspecific binding) and with the previously selected concentration of antibody (dilution 1/1000). We observed that for a 1:1 plasma dilution, none of the blocking agents resulted effective to completely remove non-specific adsorptions, except for the case of gelatin or PLL-PEG. However, the addition of these additives also affected the detection
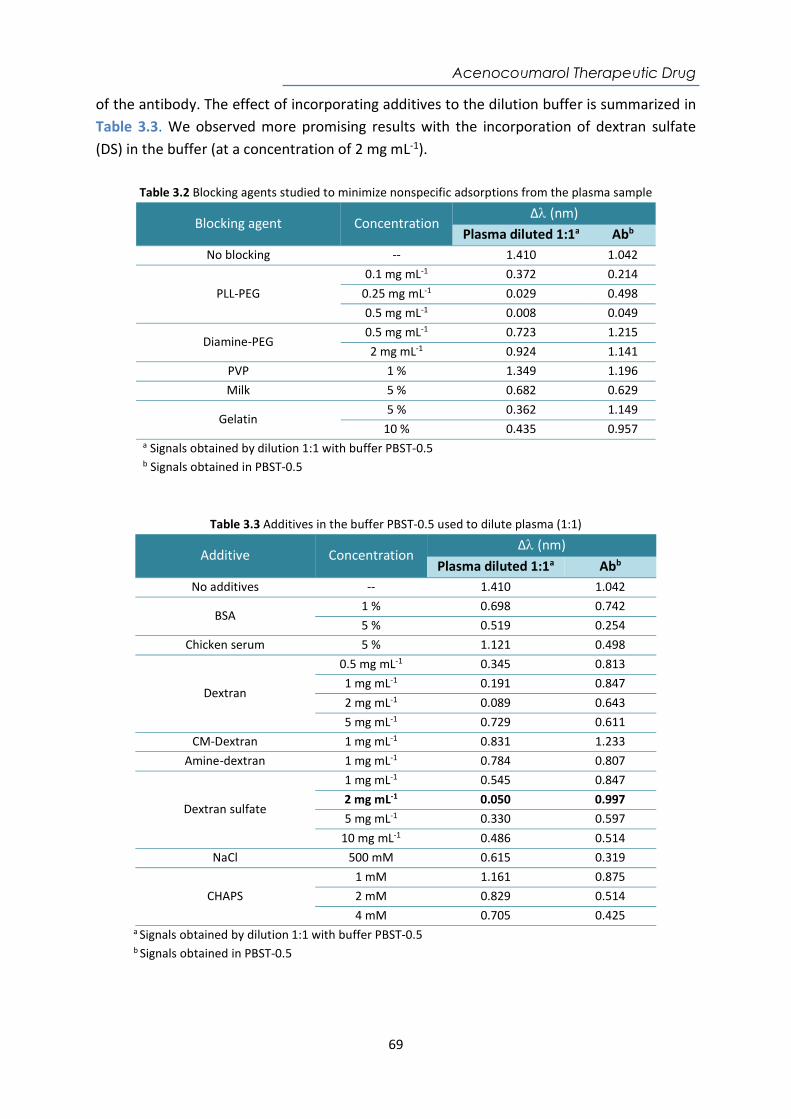
Acenocoumarol Therapeutic Drug
69
of the antibody. The effect of incorporating additives to the dilution buffer is summarized in Table 3.3. We observed more promising results with the incorporation of dextran sulfate (DS) in the buffer (at a concentration of 2 mg mL-1).
Table 3.2 Blocking agents studied to minimize nonspecific adsorptions from the plasma sample
Blocking agent Concentration Δ (nm)
Plasma diluted 1:1a Abb No blocking -- 1.410 1.042
PLL-PEG 0.1 mg mL-1 0.372 0.214
0.25 mg mL-1 0.029 0.498 0.5 mg mL-1 0.008 0.049
Diamine-PEG 0.5 mg mL-1 0.723 1.215 2 mg mL-1 0.924 1.141
PVP 1 % 1.349 1.196 Milk 5 % 0.682 0.629
Gelatin 5 % 0.362 1.149
10 % 0.435 0.957 a Signals obtained by dilution 1:1 with buffer PBST-0.5 b Signals obtained in PBST-0.5
Table 3.3 Additives in the buffer PBST-0.5 used to dilute plasma (1:1)
Additive Concentration Δ (nm)
Plasma diluted 1:1a Abb No additives -- 1.410 1.042
BSA 1 % 0.698 0.742 5 % 0.519 0.254
Chicken serum 5 % 1.121 0.498
Dextran
0.5 mg mL-1 0.345 0.813 1 mg mL-1 0.191 0.847 2 mg mL-1 0.089 0.643 5 mg mL-1 0.729 0.611
CM-Dextran 1 mg mL-1 0.831 1.233 Amine-dextran 1 mg mL-1 0.784 0.807
Dextran sulfate
1 mg mL-1 0.545 0.847 2 mg mL-1 0.050 0.997 5 mg mL-1 0.330 0.597
10 mg mL-1 0.486 0.514 NaCl 500 mM 0.615 0.319
CHAPS 1 mM 1.161 0.875 2 mM 0.829 0.514 4 mM 0.705 0.425
a Signals obtained by dilution 1:1 with buffer PBST-0.5
b Signals obtained in PBST-0.5
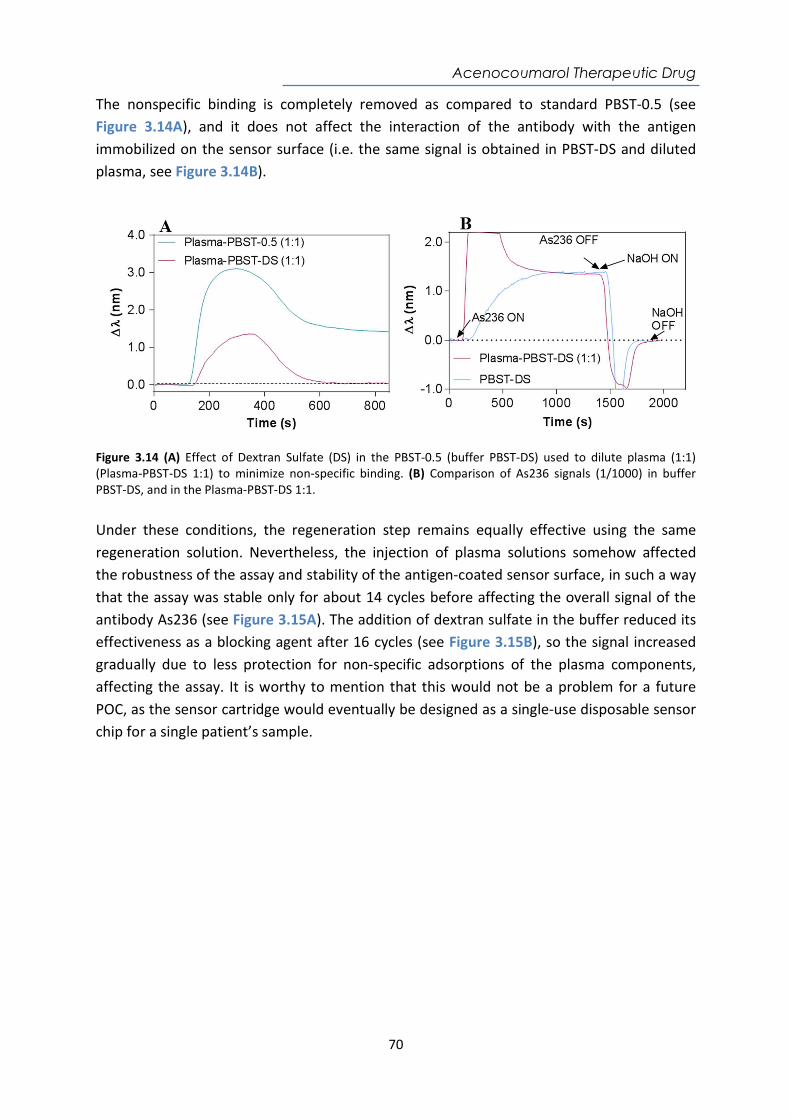
Acenocoumarol Therapeutic Drug
70
The nonspecific binding is completely removed as compared to standard PBST-0.5 (see Figure 3.14A), and it does not affect the interaction of the antibody with the antigen immobilized on the sensor surface (i.e. the same signal is obtained in PBST-DS and diluted plasma, see Figure 3.14B).
Figure 3.14 (A) Effect of Dextran Sulfate (DS) in the PBST-0.5 (buffer PBST-DS) used to dilute plasma (1:1) (Plasma-PBST-DS 1:1) to minimize non-specific binding. (B) Comparison of As236 signals (1/1000) in buffer PBST-DS, and in the Plasma-PBST-DS 1:1. Under these conditions, the regeneration step remains equally effective using the same regeneration solution. Nevertheless, the injection of plasma solutions somehow affected the robustness of the assay and stability of the antigen-coated sensor surface, in such a way that the assay was stable only for about 14 cycles before affecting the overall signal of the antibody As236 (see Figure 3.15A). The addition of dextran sulfate in the buffer reduced its effectiveness as a blocking agent after 16 cycles (see Figure 3.15B), so the signal increased gradually due to less protection for non-specific adsorptions of the plasma components, affecting the assay. It is worthy to mention that this would not be a problem for a future POC, as the sensor cartridge would eventually be designed as a single-use disposable sensor chip for a single patient’s sample.
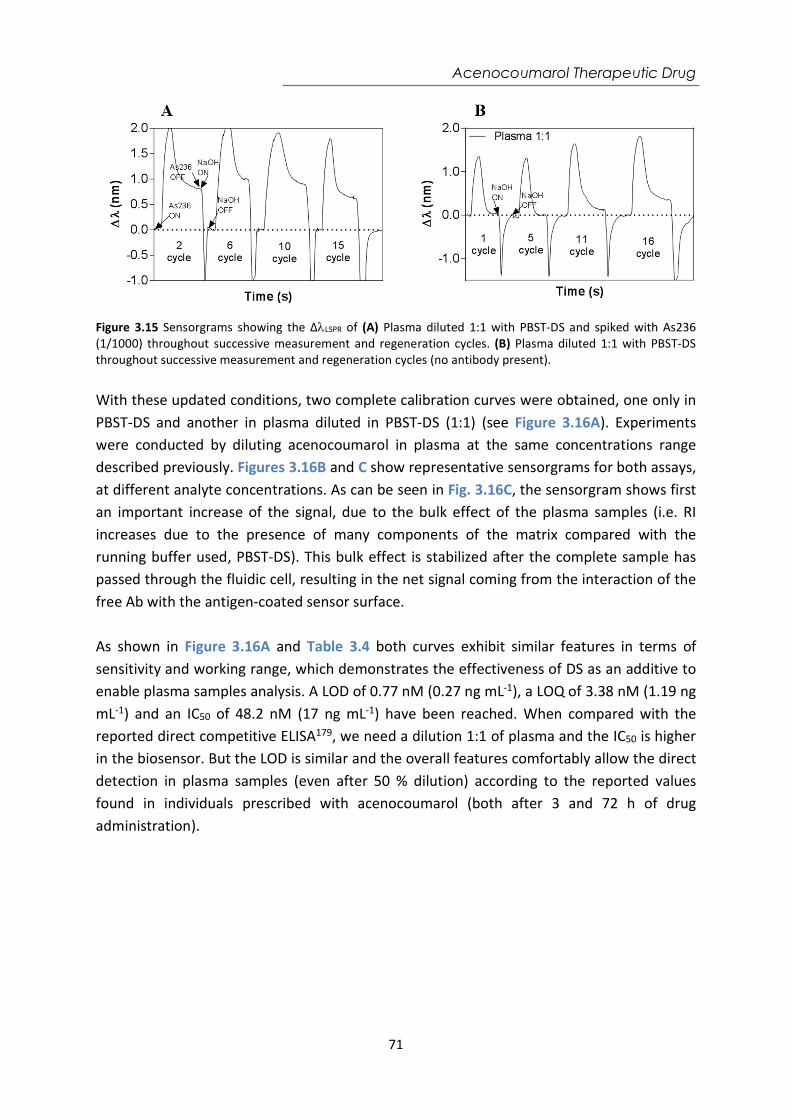
Acenocoumarol Therapeutic Drug
71
Figure 3.15 Sensorgrams showing the ΔLSPR of (A) Plasma diluted 1:1 with PBST-DS and spiked with As236 (1/1000) throughout successive measurement and regeneration cycles. (B) Plasma diluted 1:1 with PBST-DS throughout successive measurement and regeneration cycles (no antibody present). With these updated conditions, two complete calibration curves were obtained, one only in PBST-DS and another in plasma diluted in PBST-DS (1:1) (see Figure 3.16A). Experiments were conducted by diluting acenocoumarol in plasma at the same concentrations range described previously. Figures 3.16B and C show representative sensorgrams for both assays, at different analyte concentrations. As can be seen in Fig. 3.16C, the sensorgram shows first an important increase of the signal, due to the bulk effect of the plasma samples (i.e. RI increases due to the presence of many components of the matrix compared with the running buffer used, PBST-DS). This bulk effect is stabilized after the complete sample has passed through the fluidic cell, resulting in the net signal coming from the interaction of the free Ab with the antigen-coated sensor surface. As shown in Figure 3.16A and Table 3.4 both curves exhibit similar features in terms of sensitivity and working range, which demonstrates the effectiveness of DS as an additive to enable plasma samples analysis. A LOD of 0.77 nM (0.27 ng mL-1), a LOQ of 3.38 nM (1.19 ng mL-1) and an IC50 of 48.2 nM (17 ng mL-1) have been reached. When compared with the reported direct competitive ELISA179, we need a dilution 1:1 of plasma and the IC50 is higher in the biosensor. But the LOD is similar and the overall features comfortably allow the direct detection in plasma samples (even after 50 % dilution) according to the reported values found in individuals prescribed with acenocoumarol (both after 3 and 72 h of drug administration).
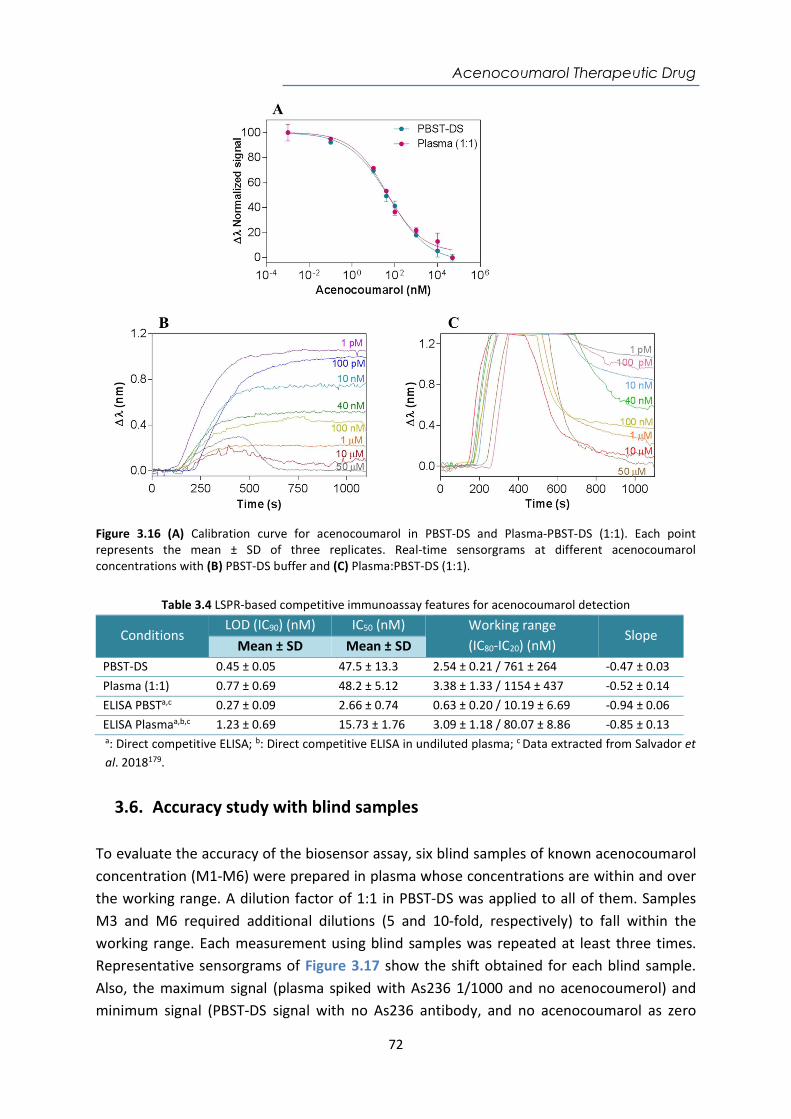
Acenocoumarol Therapeutic Drug
72
Figure 3.16 (A) Calibration curve for acenocoumarol in PBST-DS and Plasma-PBST-DS (1:1). Each point represents the mean ± SD of three replicates. Real-time sensorgrams at different acenocoumarol concentrations with (B) PBST-DS buffer and (C) Plasma:PBST-DS (1:1).
Table 3.4 LSPR-based competitive immunoassay features for acenocoumarol detection
Conditions LOD (IC90) (nM) IC50 (nM) Working range
(IC80-IC20) (nM) Slope
Mean ± SD Mean ± SD PBST-DS 0.45 ± 0.05 47.5 ± 13.3 2.54 ± 0.21 / 761 ± 264 -0.47 ± 0.03 Plasma (1:1) 0.77 ± 0.69 48.2 ± 5.12 3.38 ± 1.33 / 1154 ± 437 -0.52 ± 0.14 ELISA PBSTa,c 0.27 ± 0.09 2.66 ± 0.74 0.63 ± 0.20 / 10.19 ± 6.69 -0.94 ± 0.06 ELISA Plasmaa,b,c 1.23 ± 0.69 15.73 ± 1.76 3.09 ± 1.18 / 80.07 ± 8.86 -0.85 ± 0.13 a: Direct competitive ELISA; b: Direct competitive ELISA in undiluted plasma; c Data extracted from Salvador et al. 2018179.
3.6. Accuracy study with blind samples To evaluate the accuracy of the biosensor assay, six blind samples of known acenocoumarol concentration (M1-M6) were prepared in plasma whose concentrations are within and over the working range. A dilution factor of 1:1 in PBST-DS was applied to all of them. Samples M3 and M6 required additional dilutions (5 and 10-fold, respectively) to fall within the working range. Each measurement using blind samples was repeated at least three times. Representative sensorgrams of Figure 3.17 show the shift obtained for each blind sample. Also, the maximum signal (plasma spiked with As236 1/1000 and no acenocoumerol) and minimum signal (PBST-DS signal with no As236 antibody, and no acenocoumarol as zero
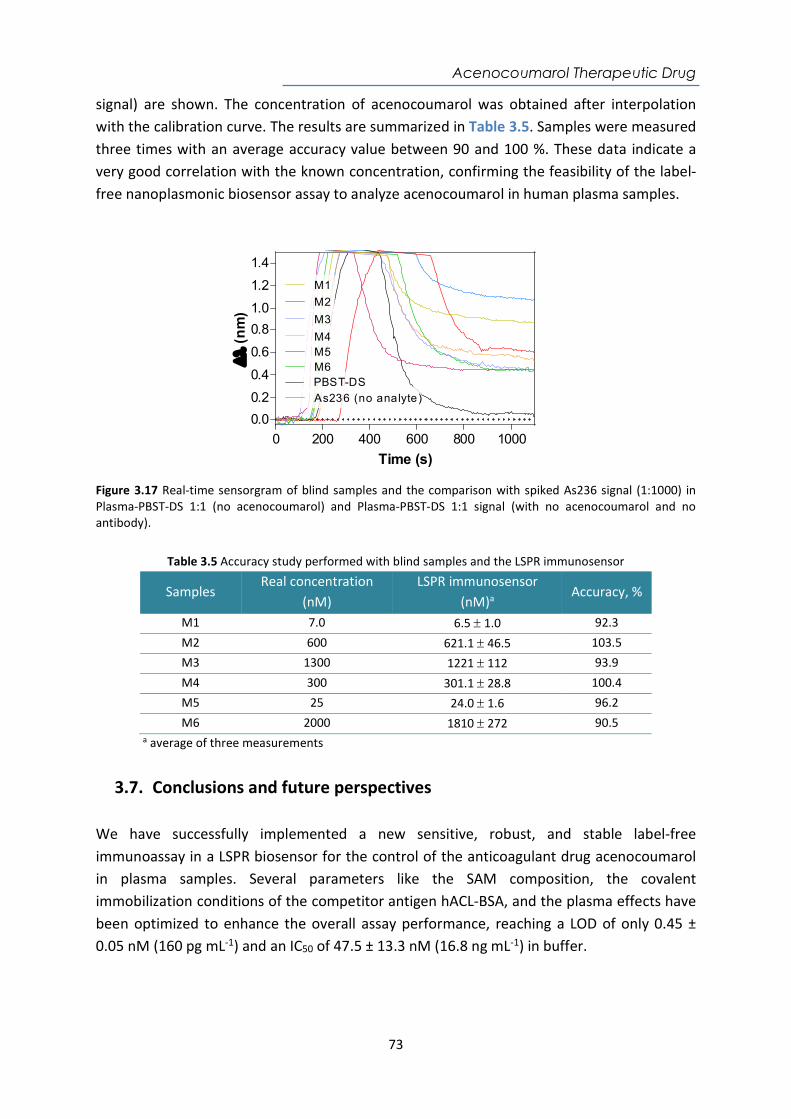
Acenocoumarol Therapeutic Drug
73
signal) are shown. The concentration of acenocoumarol was obtained after interpolation with the calibration curve. The results are summarized in Table 3.5. Samples were measured three times with an average accuracy value between 90 and 100 %. These data indicate a very good correlation with the known concentration, confirming the feasibility of the label-free nanoplasmonic biosensor assay to analyze acenocoumarol in human plasma samples.
Figure 3.17 Real-time sensorgram of blind samples and the comparison with spiked As236 signal (1:1000) in Plasma-PBST-DS 1:1 (no acenocoumarol) and Plasma-PBST-DS 1:1 signal (with no acenocoumarol and no antibody).
Table 3.5 Accuracy study performed with blind samples and the LSPR immunosensor
Samples Real concentration
(nM) LSPR immunosensor
(nM)a Accuracy, %
M1 7.0 6.5 1.0 92.3 M2 600 621.1 46.5 103.5 M3 1300 1221 112 93.9 M4 300 301.1 28.8 100.4 M5 25 24.0 1.6 96.2 M6 2000 1810 272 90.5
a average of three measurements
3.7. Conclusions and future perspectives We have successfully implemented a new sensitive, robust, and stable label-free immunoassay in a LSPR biosensor for the control of the anticoagulant drug acenocoumarol in plasma samples. Several parameters like the SAM composition, the covalent immobilization conditions of the competitor antigen hACL-BSA, and the plasma effects have been optimized to enhance the overall assay performance, reaching a LOD of only 0.45 ± 0.05 nM (160 pg mL-1) and an IC50 of 47.5 ± 13.3 nM (16.8 ng mL-1) in buffer.
0 200 400 600 800 1000
0.0
0.2
0.4
0.6
0.8
1.0
1.2
1.4
Time (s)
(nm
) M3
M4
M1
M2
PBST-DSM6M5
As236 (no analyte)
Acenocoumarol Therapeutic Drug
74
The incorporation of dextran sulfate (DS) in the buffer for plasma dilution 1:1 has allowed to completely remove non-specific binding, without affecting the interaction of the antibody with the antigen immobilized on the sensor surface. The analytical parameters demonstrate the effectiveness of DS as an additive in order to maintain the same features compared with standard PBST-0.5, a LOD of 0.77 ± 0.69 nM (272.5 pg mL-1) and an IC50 of 48.19 ± 5.12 nM (17.0 ng mL-1). Blind samples confirmed the excellent feasibility and accuracy levels to analyze acenocoumarol in plasma samples, achieving an average accuracy value between 90 and 100 %. The obtained results confirm the usefulness of our approach to monitor acenocoumarol in real samples and demonstrate the feasibility of the LSPR biosensor device to perform fast and reliable analysis. This biosensor could be implemented as a POC as a complementary and useful tool for achieving a personalized therapy follow-up of the acenocoumarol dosage as it allows a rapid and direct quantification requiring a low sample volume. It has to be noted that plasma can be easily obtained from blood by using commercially available centrifugation and filtering tools in a short time of only a couple of minutes. It is estimated that only a few microliters of patient’s samples will be sufficient for the analysis. Further integration of disposable cartridges incorporating the biofunctionalized sensor chip and highly efficient microfluidics for rapid delivery of the patient´s plasma to the sensing area will facilitate the implementation of such device in decentralized settings such as primary healthcare units, or even in the household environment where patients could make their self-control of the medication.

Gluten-free diet monitoring
75
Chapter 4
A compact plasmonic biosensor device for the rapid and efficient monitoring of gluten free diet directly in human urine
A careful follow-up of the diet in celiac disease patients is necessary to avoid health complications associated with long-term gluten intake. A promising type of biomarker to monitor gluten intake is the detection of peptides derived from the digestion of the gluten, which are excreted in the urine and feces. We have implemented a simple and extremely sensitive label-free POC device based on SPR biosensor for the direct detection of peptides derived from the digestion of the gluten excreted in urine. The assay is based on the use of specific monoclonal antibodies and has been optimized for the detection of the 33-mer α2-gliadin, which is known as the main immunogenic peptide of wheat gluten, and for the detection of GIP (gluten immunogenic peptides) found in urine. Excellent analytical parameters have been reached, which enables the direct detection of gluten peptides even when the gluten intake is around the maximum tolerable amount in the digestive tract (< 50 mg) for celiac individuals. All these features pave the way towards an end-user easy–to-handle biosensor device for the rapid monitoring of gluten-free diet (GFD) as well as for the follow-up of the health status in celiac patients.

Gluten-free diet monitoring
76
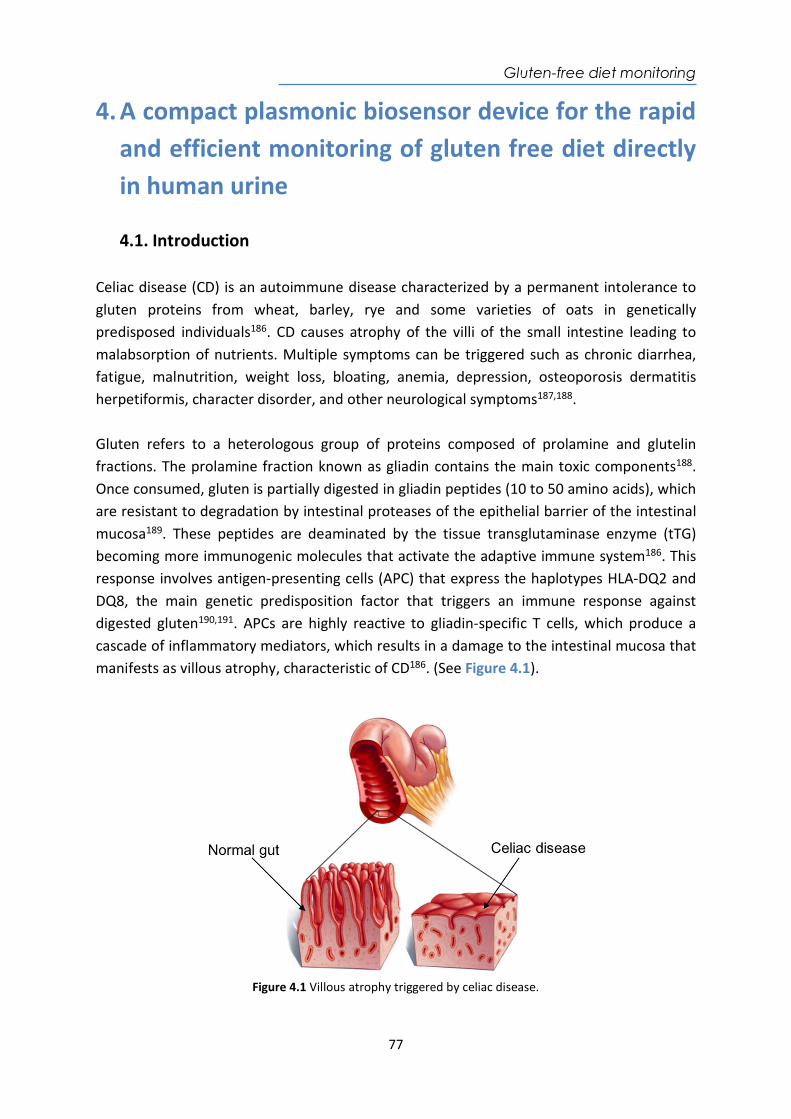
Gluten-free diet monitoring
77
4. A compact plasmonic biosensor device for the rapid and efficient monitoring of gluten free diet directly in human urine
4.1. Introduction Celiac disease (CD) is an autoimmune disease characterized by a permanent intolerance to gluten proteins from wheat, barley, rye and some varieties of oats in genetically predisposed individuals186. CD causes atrophy of the villi of the small intestine leading to malabsorption of nutrients. Multiple symptoms can be triggered such as chronic diarrhea, fatigue, malnutrition, weight loss, bloating, anemia, depression, osteoporosis dermatitis herpetiformis, character disorder, and other neurological symptoms187,188. Gluten refers to a heterologous group of proteins composed of prolamine and glutelin fractions. The prolamine fraction known as gliadin contains the main toxic components188. Once consumed, gluten is partially digested in gliadin peptides (10 to 50 amino acids), which are resistant to degradation by intestinal proteases of the epithelial barrier of the intestinal mucosa189. These peptides are deaminated by the tissue transglutaminase enzyme (tTG) becoming more immunogenic molecules that activate the adaptive immune system186. This response involves antigen-presenting cells (APC) that express the haplotypes HLA-DQ2 and DQ8, the main genetic predisposition factor that triggers an immune response against digested gluten190,191. APCs are highly reactive to gliadin-specific T cells, which produce a cascade of inflammatory mediators, which results in a damage to the intestinal mucosa that manifests as villous atrophy, characteristic of CD186. (See Figure 4.1).
Figure 4.1 Villous atrophy triggered by celiac disease.
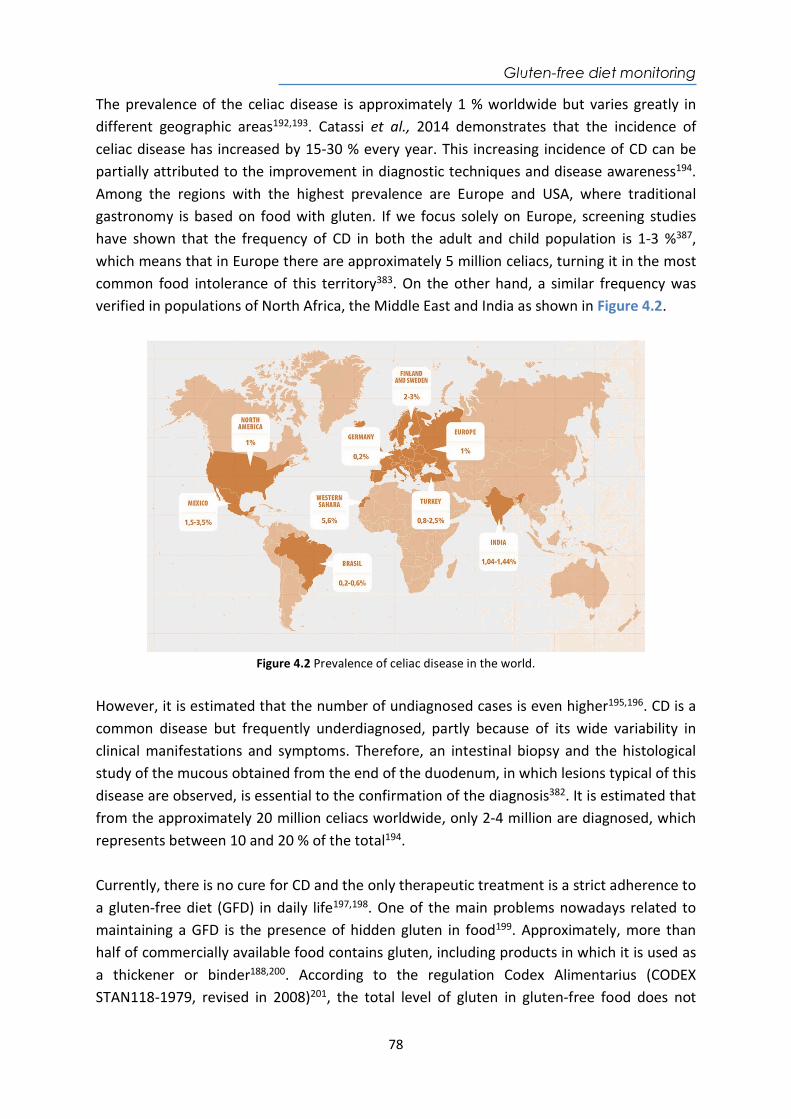
Gluten-free diet monitoring
78
The prevalence of the celiac disease is approximately 1 % worldwide but varies greatly in different geographic areas192,193. Catassi et al., 2014 demonstrates that the incidence of celiac disease has increased by 15-30 % every year. This increasing incidence of CD can be partially attributed to the improvement in diagnostic techniques and disease awareness194. Among the regions with the highest prevalence are Europe and USA, where traditional gastronomy is based on food with gluten. If we focus solely on Europe, screening studies have shown that the frequency of CD in both the adult and child population is 1-3 %387, which means that in Europe there are approximately 5 million celiacs, turning it in the most common food intolerance of this territory383. On the other hand, a similar frequency was verified in populations of North Africa, the Middle East and India as shown in Figure 4.2.
Figure 4.2 Prevalence of celiac disease in the world.
However, it is estimated that the number of undiagnosed cases is even higher195,196. CD is a common disease but frequently underdiagnosed, partly because of its wide variability in clinical manifestations and symptoms. Therefore, an intestinal biopsy and the histological study of the mucous obtained from the end of the duodenum, in which lesions typical of this disease are observed, is essential to the confirmation of the diagnosis382. It is estimated that from the approximately 20 million celiacs worldwide, only 2-4 million are diagnosed, which represents between 10 and 20 % of the total194. Currently, there is no cure for CD and the only therapeutic treatment is a strict adherence to a gluten-free diet (GFD) in daily life197,198. One of the main problems nowadays related to maintaining a GFD is the presence of hidden gluten in food199. Approximately, more than half of commercially available food contains gluten, including products in which it is used as a thickener or binder188,200. According to the regulation Codex Alimentarius (CODEX STAN118-1979, revised in 2008)201, the total level of gluten in gluten-free food does not
Gluten-free diet monitoring
79
exceed 20 mg Kg-1. Therefore, constant vigilance is always required as the adhesion to a strict diet with zero gluten intakes is almost impossible given its ubiquity, cross-contamination, or inadequate food labeling regulations197,202,203. As a result, persistent symptoms and enteropathy are common among celiac patients who are trying to follow a GFD. Specifically, research shows that 25 - 40 % of adults with celiac disease have persistent enteropathy after two years on a GFD396. In addition, more than half of the patients do not adhere fully to the GFD186. 60 % of patients keep experiencing persistence of symptoms even after starting GFD382. At least 43 % of celiacs with more than one year in GFD maintain atrophy of intestinal villi186. Children are thought to recover more quickly, and data suggests that 5 - 19 % of celiac children on a GFD may have persistent enteropathy despite treatment with a GFD for at least one year. In addition, the amount of gluten that celiac patients can tolerate has not yet been established due to the variability among individuals203. However, the effects of low gluten intake in celiac patients have suggested that daily consumption of up to 50 mg can cause significant damage in the small intestine204. Hence, a daily intake of gluten less than 10 mg is recommended to be safe and unlikely to cause significant abnormalities or to trigger symptoms195. The strict adherence to a GFD is essential to resolve symptoms and nutritional deficiencies, and to avoid clinical complications associated with long-term gluten intake in celiac patients, such as osteoporosis, anemia or malignancy382. The adherence to GFD leads to an improvement in symptoms approximately two weeks after the start of the diet with significant variations between patients204. They need to have gluten-free dietary control and careful monitoring of the therapy. Extensive clinical guidelines have been reported on the importance of long-term monitoring of patients with CD398. There are several companies commercializing detection assays designed to diagnose celiac disease such as Quanta Flash® Celiac (Werfen Company, Spain), Alegria® (Orgentec Diagnostika, Germany), EliA™ Celikey (tTG) and EliA™ Gliadin (Thermo Scientific Phadia, USA) Anti-Gliadin GAF-3X ELISA and Anti-tTG ELISA (Euroimmun, Germany), while other assays are developed to monitor the adherence to a GFD, like the iVYLISA GIP™ (Biomedal, Spain). These assays are commonly based on solid-phase immunoassays (i.e. ELISA, chemiluminescence, and immunofluorescence) performed with bench-top, high throughput instruments. They are sensitive and specific, although they are also considerably expensive. Their handling requires specialized skills and commonly these analyses are done in central laboratories and research centers. However, their location in primary healthcare settings is more limited and definitely less accessible to the patients themselves203,205–207. The development of portable, compact, and easy-to-handle diagnostic tool entails significant advantages for its self-use by patients, as it allows personalized monitoring of therapies or detection usually with a small amount of a biological sample. Such is the case of the qualitative tests based on lateral flow immunochromatography (LFT) Sintomax® (Augurix
Gluten-free diet monitoring
80
SA, Switzerland), Xeliac® Test (Eurospital, Italy) and BiocardTM celiac test (AniBiotech®, Vantaa, Finland)17,207–209. These companies have developed qualitative, direct, rapid, and easy tests that support the monitoring or the diagnosis of the disease by the end-user. However, the limitation of these tests is mainly related to the lack of quantification of the analyte concentration to know the evolution of the response to treatment. In other instances (i.e. GlutenDetect®, Biomedal, Spain), the sensitivity might not be enough to detect small intakes of gluten, and the need of additional cocktails for dilution and pretreatment of samples, which complicate the steps required to be done by the user and restrict its continuous use at home. Previous studies have allowed the characterization and development of two highly specific monoclonal antibodies (G12 and A1 mAb) that detect gluten immunogenic peptides (GIP), originating after the degradation of gliadin in urine samples. These antibodies have a high affinity for GIP, especially for the 2-gliadin 33-mer peptide (LQLQPFPQPQLPYPQPQLPYPQPQLPYPQPQPF, MW 3.9 kDa), a small, digestion-resistant peptide, which is the most immunodominant toxic peptide for celiac patients395,396. This peptide persists in the intestine where it can interact with antigen-presenting cells (APC) through the specific recognition of HLA-DQ2 and HLA-DQ8. Part of the 33-mer peptide of gliadin is excreted from the human body; therefore, the detection of this compound in feces or urine may be an indicator of gluten intake203,207. These highly specific mAb for 33-mer peptide are the key element in gluten-free systems and products marketed by Biomedal (Spain) as the iVYLISA GIPTM (ELISA test for detection in stool, which it has to be performed necessarily in the lab) and the iVYCHECK GIPTM, which allows the GIP detection in feces and urine samples. This last test, which is based on LFA, still requires sample pretreatment before measurement. Moreover, it can be combined with an external reader to provide quantitative and more reliable data. Overall, these features limit their use to laboratory settings and restrict the final implementation as point of care instruments. The development of a simple and affordable biosensor device allowing direct monitoring of the intake of gluten in the urine as well as the adherence of celiac patients to a strict GFD would itself represent a diagnostic tool with high potential. It could be implemented not only in clinical and/or hospital settings, but also in more decentralized ones, such as the doctor's office in the Primary Care Center and, ultimately, at the patient's home. In this regard, we have designed a compact, portable and easy-to-use SPR biosensor device to overcome the limitations that current testing have, to specifically and quantitatively monitor gluten intake levels from a simple urine test. Our group previously demonstrated a SPR-based biosensor methodology which allowed the label-free detection of GIP in diluted urine 1:1210. The biosensor reaches sensitivity levels sufficiently good to enable the detection of digested gluten peptides. It has been possible to discriminate samples from
Gluten-free diet monitoring
81
individuals with a gluten-free diet (celiac patients) or with low or normal consumption of gluten. However, the influence of urine as a matrix was not fully resolved, requiring a dilution before the evaluation to remove undesired effects. From these preliminary results, we have studied methodological alternatives in order to improve the assay performance210. We have established a new biofunctionalization strategy to successfully provide the direct and quantitative analysis in urine 100 %, without prior extraction, pretreatment, or even dilution. In addition to using the G12 mAb, another antibody was included (A1 mAb), which shows a broader pattern of recognition of different epitopes (i.e. different GIP) within overall higher affinity than for exclusively the 33-mer peptide. This plamonic biosensor prototype has been implemented to improve the levels of detection and dynamic ranges with both specific antibodies that allow detecting minimum concentrations of GIP for a strict GFD or low gluten intake.
4.2. Chemical reagents and biological compounds Reagents Organic solvents (i.e. acetone, absolute ethanol, toluene, and 2-propanol) and hydrochloric acid 37 % were purchased from Panreac–Applichem (Barcelona, Spain). Tween 20, ethanolamine hydrochloride, EDC, NHS, NaOH, BSA, centrifugal filters Amicon Ultra 10 kDa (0.5 mL Ultracel membrane of regenerated cellulose 10000 MWCO Millipore) and all reagents used for the preparation of buffers were acquired from Sigma-Aldrich (Steinhem, Germany). Alkanethiols HS-C11-(EG)6-O-CH2-COOH (EG-COOH MW: 526.73 g mol-1) and HS-C11-(EG)4-OH (EG-OH MW: 380.48 g mol-1) were acquired from Prochimia (Sopot, Poland). Buffers The buffers were prepared with Milli-Q water (deionized water from a Milli-DI® Water Purification System, Merck Millipore, USA) and are the following: PBS-1X (10 mM phosphate, 137 mM NaCl, 2.7 mM KCl, pH 7.5); PBST-0.5 (PBS with 0.5 % Tween 20); PBST-BSA (PBST-0.5 with BSA 10 mg mL-1); acetate buffer (10-20 mM pH from 4.0 to 5.5); MES buffer (100 mM, 500 mM NaCl, pH 5.5). Biological compounds Monoclonal antibodies G12 and A1; prolamin working group (PWG) gliadin, and α2-gliadin 33-mer peptide (33-mer) were provided by Biomedal S.L. (Seville, Spain). Urine sample collection Two different types of urine samples were collected according to the donor’s gluten-containing diet. Group 1 samples were obtained from celiac disease patients and healthy volunteers on strict gluten-free diet (GFD) (with no 33-mer peptide present) and were used during the optimization and assessment of immunoassays. Group 2 samples are collected from healthy individuals following an unrestricted normal gluten-containing diet. All
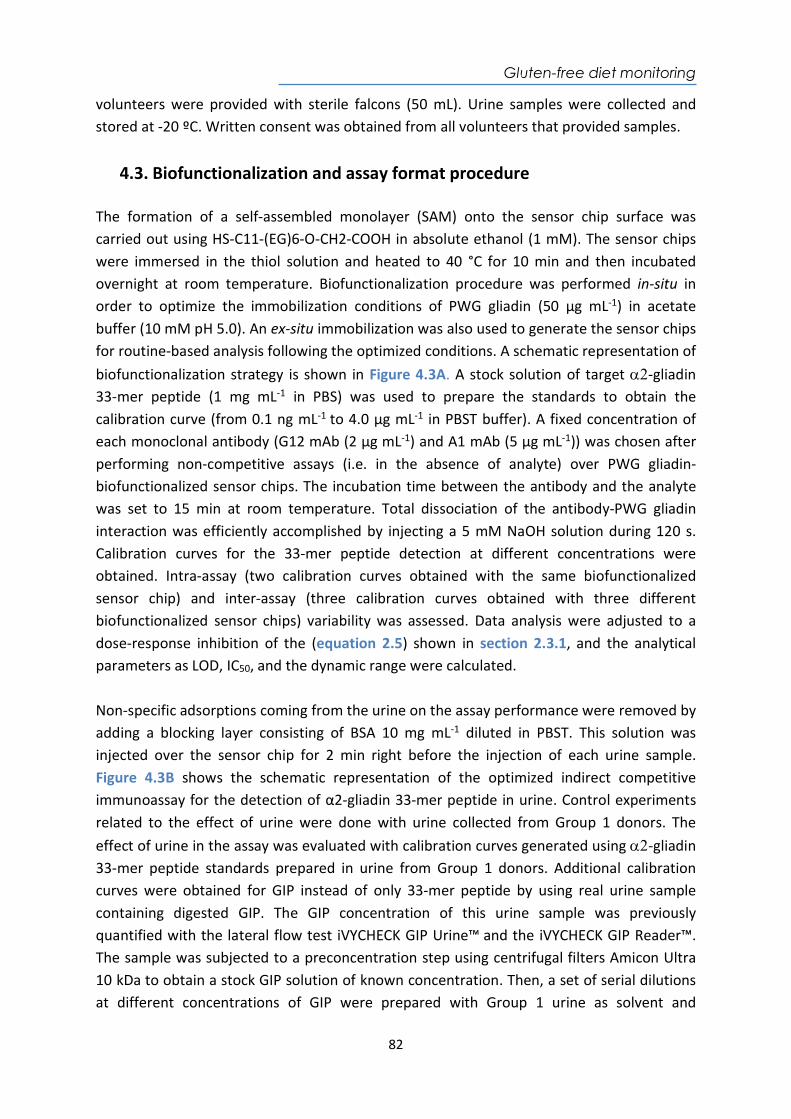
Gluten-free diet monitoring
82
volunteers were provided with sterile falcons (50 mL). Urine samples were collected and stored at -20 ºC. Written consent was obtained from all volunteers that provided samples.
4.3. Biofunctionalization and assay format procedure The formation of a self-assembled monolayer (SAM) onto the sensor chip surface was carried out using HS-C11-(EG)6-O-CH2-COOH in absolute ethanol (1 mM). The sensor chips were immersed in the thiol solution and heated to 40 °C for 10 min and then incubated overnight at room temperature. Biofunctionalization procedure was performed in-situ in order to optimize the immobilization conditions of PWG gliadin (50 µg mL-1) in acetate buffer (10 mM pH 5.0). An ex-situ immobilization was also used to generate the sensor chips for routine-based analysis following the optimized conditions. A schematic representation of biofunctionalization strategy is shown in Figure 4.3A. A stock solution of target -gliadin 33-mer peptide (1 mg mL-1 in PBS) was used to prepare the standards to obtain the calibration curve (from 0.1 ng mL-1 to 4.0 µg mL-1 in PBST buffer). A fixed concentration of each monoclonal antibody (G12 mAb (2 µg mL-1) and A1 mAb (5 µg mL-1)) was chosen after performing non-competitive assays (i.e. in the absence of analyte) over PWG gliadin-biofunctionalized sensor chips. The incubation time between the antibody and the analyte was set to 15 min at room temperature. Total dissociation of the antibody-PWG gliadin interaction was efficiently accomplished by injecting a 5 mM NaOH solution during 120 s. Calibration curves for the 33-mer peptide detection at different concentrations were obtained. Intra-assay (two calibration curves obtained with the same biofunctionalized sensor chip) and inter-assay (three calibration curves obtained with three different biofunctionalized sensor chips) variability was assessed. Data analysis were adjusted to a dose-response inhibition of the (equation 2.5) shown in section 2.3.1, and the analytical parameters as LOD, IC50, and the dynamic range were calculated. Non-specific adsorptions coming from the urine on the assay performance were removed by adding a blocking layer consisting of BSA 10 mg mL-1 diluted in PBST. This solution was injected over the sensor chip for 2 min right before the injection of each urine sample. Figure 4.3B shows the schematic representation of the optimized indirect competitive immunoassay for the detection of α2-gliadin 33-mer peptide in urine. Control experiments related to the effect of urine were done with urine collected from Group 1 donors. The effect of urine in the assay was evaluated with calibration curves generated using-gliadin 33-mer peptide standards prepared in urine from Group 1 donors. Additional calibration curves were obtained for GIP instead of only 33-mer peptide by using real urine sample containing digested GIP. The GIP concentration of this urine sample was previously quantified with the lateral flow test iVYCHECK GIP Urine™ and the iVYCHECK GIP Reader™. The sample was subjected to a preconcentration step using centrifugal filters Amicon Ultra 10 kDa to obtain a stock GIP solution of known concentration. Then, a set of serial dilutions at different concentrations of GIP were prepared with Group 1 urine as solvent and
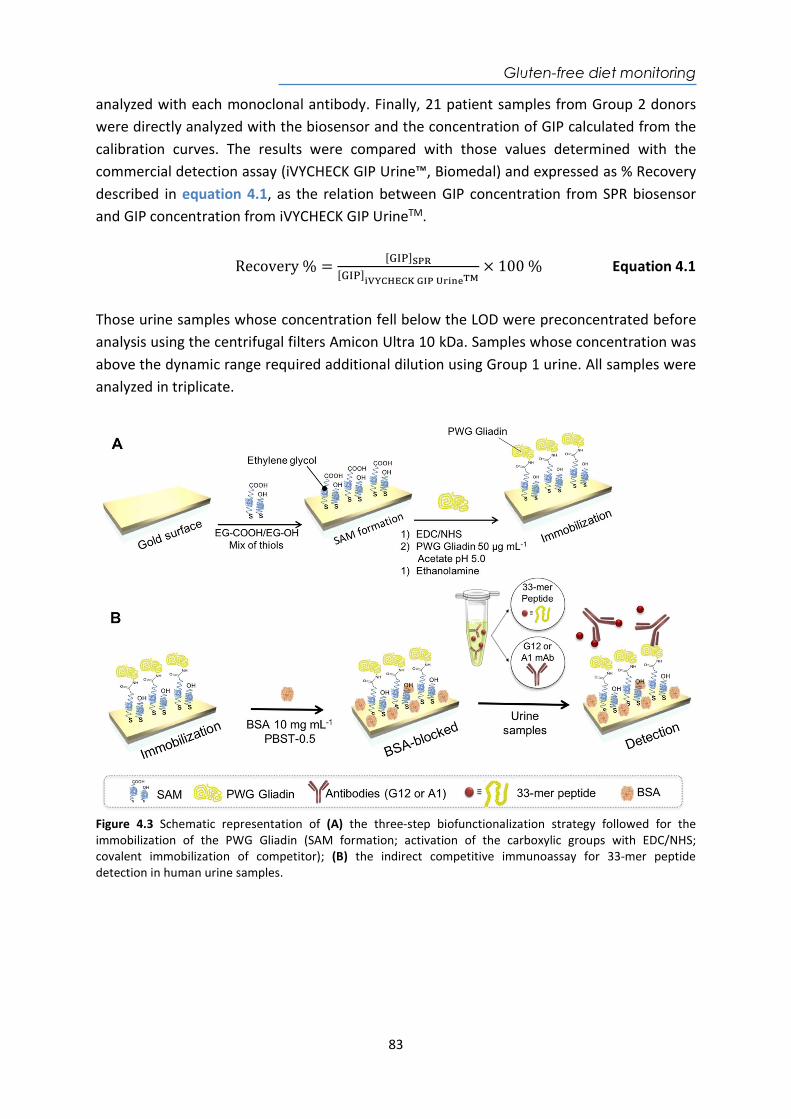
Gluten-free diet monitoring
83
analyzed with each monoclonal antibody. Finally, 21 patient samples from Group 2 donors were directly analyzed with the biosensor and the concentration of GIP calculated from the calibration curves. The results were compared with those values determined with the commercial detection assay (iVYCHECK GIP Urine™, Biomedal) and expressed as % Recovery described in equation 4.1, as the relation between GIP concentration from SPR biosensor and GIP concentration from iVYCHECK GIP UrineTM.
Recovery % =[ ]
[ ]
× 100 % Equation 4.1
Those urine samples whose concentration fell below the LOD were preconcentrated before analysis using the centrifugal filters Amicon Ultra 10 kDa. Samples whose concentration was above the dynamic range required additional dilution using Group 1 urine. All samples were analyzed in triplicate.
Figure 4.3 Schematic representation of (A) the three-step biofunctionalization strategy followed for the immobilization of the PWG Gliadin (SAM formation; activation of the carboxylic groups with EDC/NHS; covalent immobilization of competitor); (B) the indirect competitive immunoassay for 33-mer peptide detection in human urine samples.
Gluten-free diet monitoring
84
4.4. Design and optimization of the plasmonic biosensor methodology We have implemented a label-free indirect competitive immunoassay based on the SPR biosensor using a gold thin layer as the sensor chips. For all details of the description of the biosensor device and working principle, please refer to section 2.3. The indirect competitive immunoassay was chosen over direct immunoassay because of the relatively small size of GIP, especially for the 2-gliadin 33-mer peptide (MW 3.9 kDa). Low molecular weight analytes induce low RI changes, therefore, hindering the direct detection at low concentrations. Instead, the indirect competitive immunoassay allows the analysis of small compounds usually with high sensitivity, since we monitor the changes in RI resulting from the binding of the antibodies, which have a considerably larger molecular weight. The prolamine working group (PWG) gliadin (MW 33–45 kDa) is considered an international reference reagent in the gluten analysis obtained from the extraction of different wheat cultivars. It has a high content of gliadins and has good solubility, homogeneity, and stability. Thus, the PWG gliadin was considered as a good competitor antigen for the assay development. Previously, our group had performed assays with the monoclonal antibody (mAb) G12 having high affinity for the 33-mer peptide. Now, in addition to using the G12 mAb, we have also employed the A1 mAb for the assay development. They show reactivity to different prolamin epitopes from wheat, barley, rye and some oat varieties. The G12 mAb recognizes QPQ-(L/Q)-P-(Y/F) and A1 mAb reacts against the epitopes Q-(Q/L)-P(Y/F)-PQP. Both antibodies are currently used in research, food analysis and clinical monitoring of CD and implemented in commercial assays such as ELISA and LFT for the detection of GIP excreted in human feces and urine211–214. To facilitate the attachment of PWG gliadin, a SAM with reactive groups (-COOH group) was added to the gold sensor chip. Instead of conventional alkanelthiols as MHDA or MUOH previously tested on other assays, including the first approach for GIP detection in urine210 and that probably provide a compact and more hydrophobic SAM, we opted in this case for thiolated compounds containing ethylene glycol units in their structure. This chemical group may provide a more compatible, hydrophilic environment, thus help improving or preventing non-specific adsorptions from the urine matrix215,216. To initially mimic the immobilization protocol previously established, based on the covalent attachment of PWG gliadin to the sensor chip surface, we likewise selected a reactive compound HS-C11-(EG)6-O-CH2-COOH (EG-COOH) and an inert one HS-C11-(EG)4-OH (EG-OH) used as a lateral spacer, to spread the PWG gliadin on the sensor chip surface. Different parameters were studied in order to optimize the SAM formation and the subsequent coupling of gliadin. Several EG-COOH:EG-OH molar ratios 1 mM were tested (3:7, 1:1, 7:3 and 1:0) and for each of them, the best pH for coupling was assessed by a preconcentration study, using solutions of PWG gliadin (50 µg mL-1) at different pHs (see Figure 4.4). Each solution was injected on the
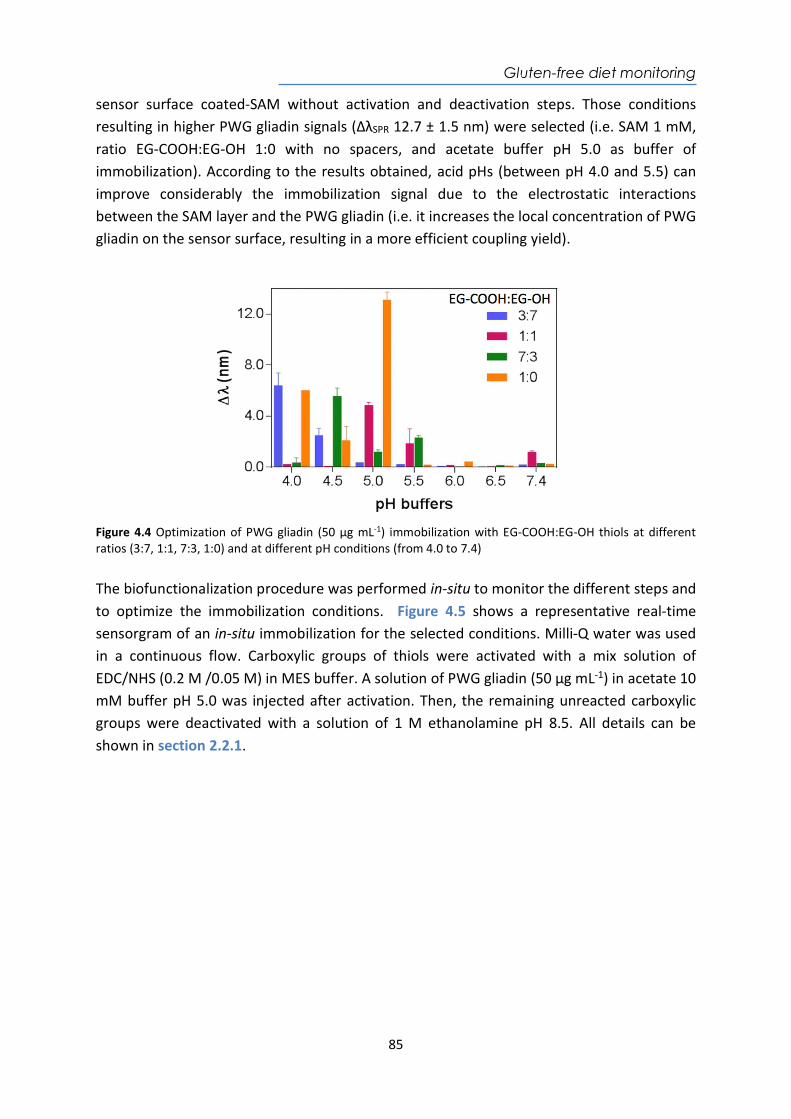
Gluten-free diet monitoring
85
sensor surface coated-SAM without activation and deactivation steps. Those conditions resulting in higher PWG gliadin signals (ΔλSPR 12.7 ± 1.5 nm) were selected (i.e. SAM 1 mM, ratio EG-COOH:EG-OH 1:0 with no spacers, and acetate buffer pH 5.0 as buffer of immobilization). According to the results obtained, acid pHs (between pH 4.0 and 5.5) can improve considerably the immobilization signal due to the electrostatic interactions between the SAM layer and the PWG gliadin (i.e. it increases the local concentration of PWG gliadin on the sensor surface, resulting in a more efficient coupling yield).
Figure 4.4 Optimization of PWG gliadin (50 µg mL-1) immobilization with EG-COOH:EG-OH thiols at different ratios (3:7, 1:1, 7:3, 1:0) and at different pH conditions (from 4.0 to 7.4) The biofunctionalization procedure was performed in-situ to monitor the different steps and to optimize the immobilization conditions. Figure 4.5 shows a representative real-time sensorgram of an in-situ immobilization for the selected conditions. Milli-Q water was used in a continuous flow. Carboxylic groups of thiols were activated with a mix solution of EDC/NHS (0.2 M /0.05 M) in MES buffer. A solution of PWG gliadin (50 µg mL-1) in acetate 10 mM buffer pH 5.0 was injected after activation. Then, the remaining unreacted carboxylic groups were deactivated with a solution of 1 M ethanolamine pH 8.5. All details can be shown in section 2.2.1.
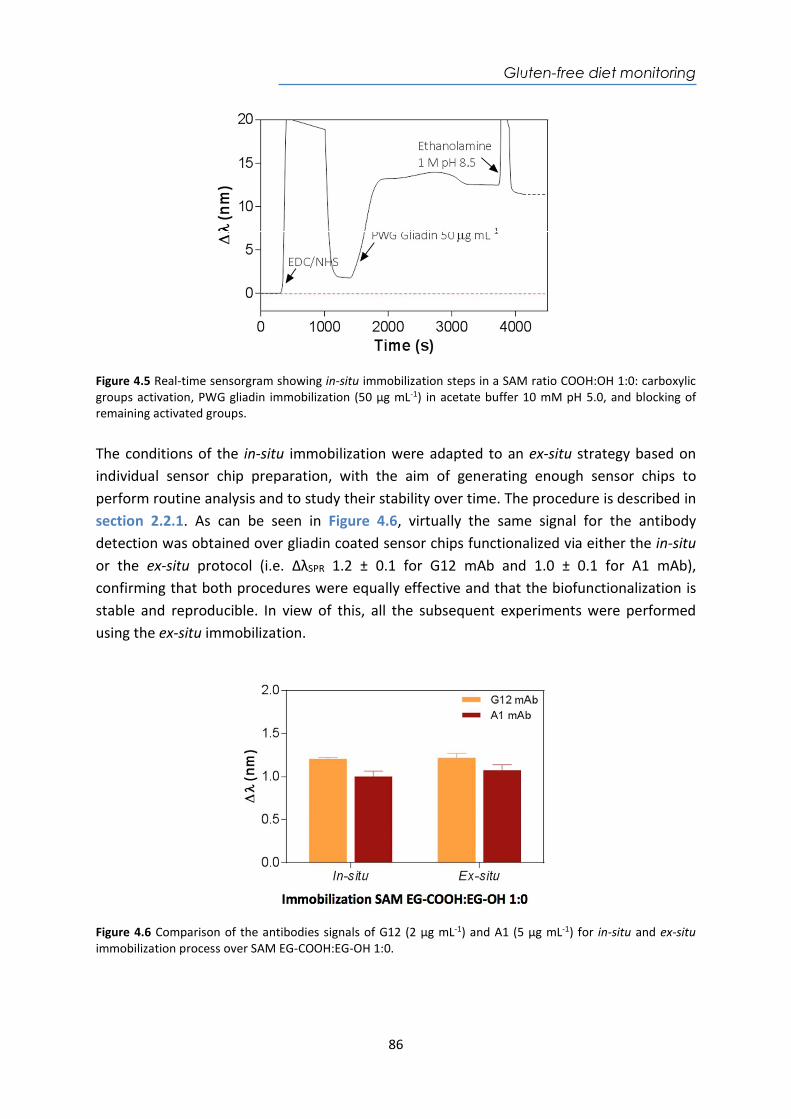
Gluten-free diet monitoring
86
Figure 4.5 Real-time sensorgram showing in-situ immobilization steps in a SAM ratio COOH:OH 1:0: carboxylic groups activation, PWG gliadin immobilization (50 µg mL-1) in acetate buffer 10 mM pH 5.0, and blocking of remaining activated groups. The conditions of the in-situ immobilization were adapted to an ex-situ strategy based on individual sensor chip preparation, with the aim of generating enough sensor chips to perform routine analysis and to study their stability over time. The procedure is described in section 2.2.1. As can be seen in Figure 4.6, virtually the same signal for the antibody detection was obtained over gliadin coated sensor chips functionalized via either the in-situ or the ex-situ protocol (i.e. ΔλSPR 1.2 ± 0.1 for G12 mAb and 1.0 ± 0.1 for A1 mAb), confirming that both procedures were equally effective and that the biofunctionalization is stable and reproducible. In view of this, all the subsequent experiments were performed using the ex-situ immobilization.
Figure 4.6 Comparison of the antibodies signals of G12 (2 µg mL-1) and A1 (5 µg mL-1) for in-situ and ex-situ immobilization process over SAM EG-COOH:EG-OH 1:0.
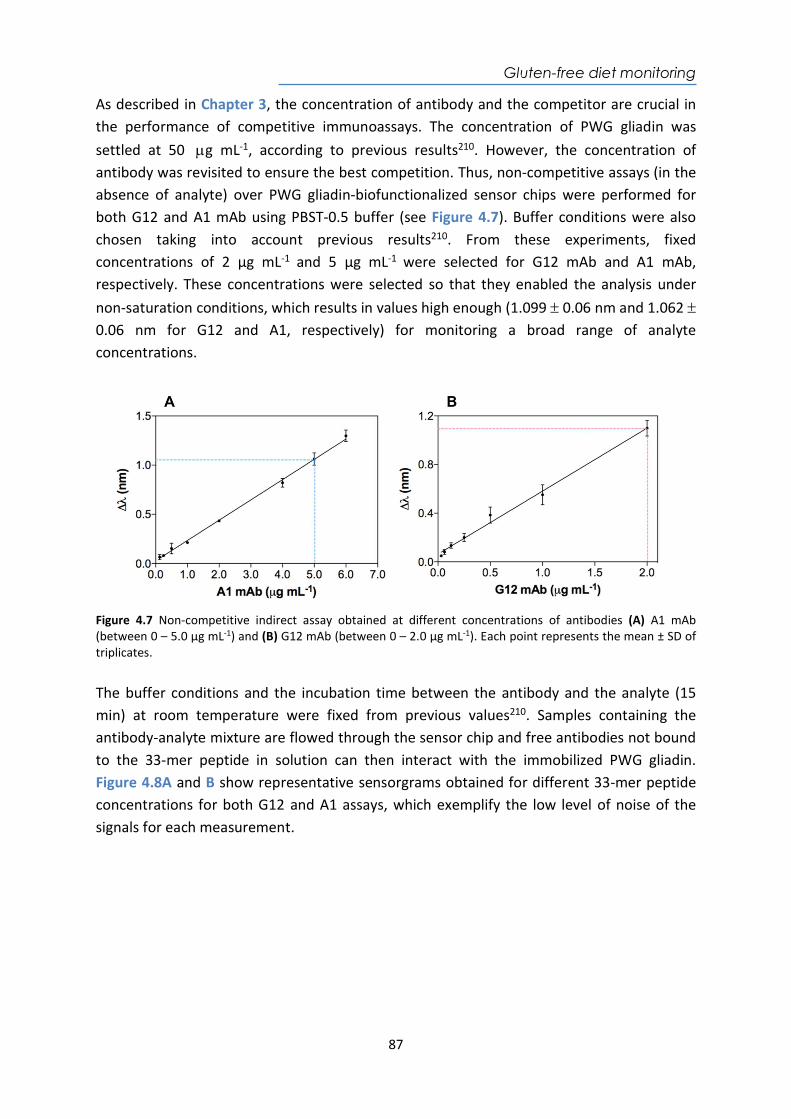
Gluten-free diet monitoring
87
As described in Chapter 3, the concentration of antibody and the competitor are crucial in the performance of competitive immunoassays. The concentration of PWG gliadin was settled at 50 g mL-1, according to previous results210. However, the concentration of antibody was revisited to ensure the best competition. Thus, non-competitive assays (in the absence of analyte) over PWG gliadin-biofunctionalized sensor chips were performed for both G12 and A1 mAb using PBST-0.5 buffer (see Figure 4.7). Buffer conditions were also chosen taking into account previous results210. From these experiments, fixed concentrations of 2 µg mL-1 and 5 µg mL-1 were selected for G12 mAb and A1 mAb, respectively. These concentrations were selected so that they enabled the analysis under non-saturation conditions, which results in values high enough (1.099 0.06 nm and 1.062 0.06 nm for G12 and A1, respectively) for monitoring a broad range of analyte concentrations.
Figure 4.7 Non-competitive indirect assay obtained at different concentrations of antibodies (A) A1 mAb (between 0 – 5.0 µg mL-1) and (B) G12 mAb (between 0 – 2.0 µg mL-1). Each point represents the mean ± SD of triplicates. The buffer conditions and the incubation time between the antibody and the analyte (15 min) at room temperature were fixed from previous values210. Samples containing the antibody-analyte mixture are flowed through the sensor chip and free antibodies not bound to the 33-mer peptide in solution can then interact with the immobilized PWG gliadin. Figure 4.8A and B show representative sensorgrams obtained for different 33-mer peptide concentrations for both G12 and A1 assays, which exemplify the low level of noise of the signals for each measurement.
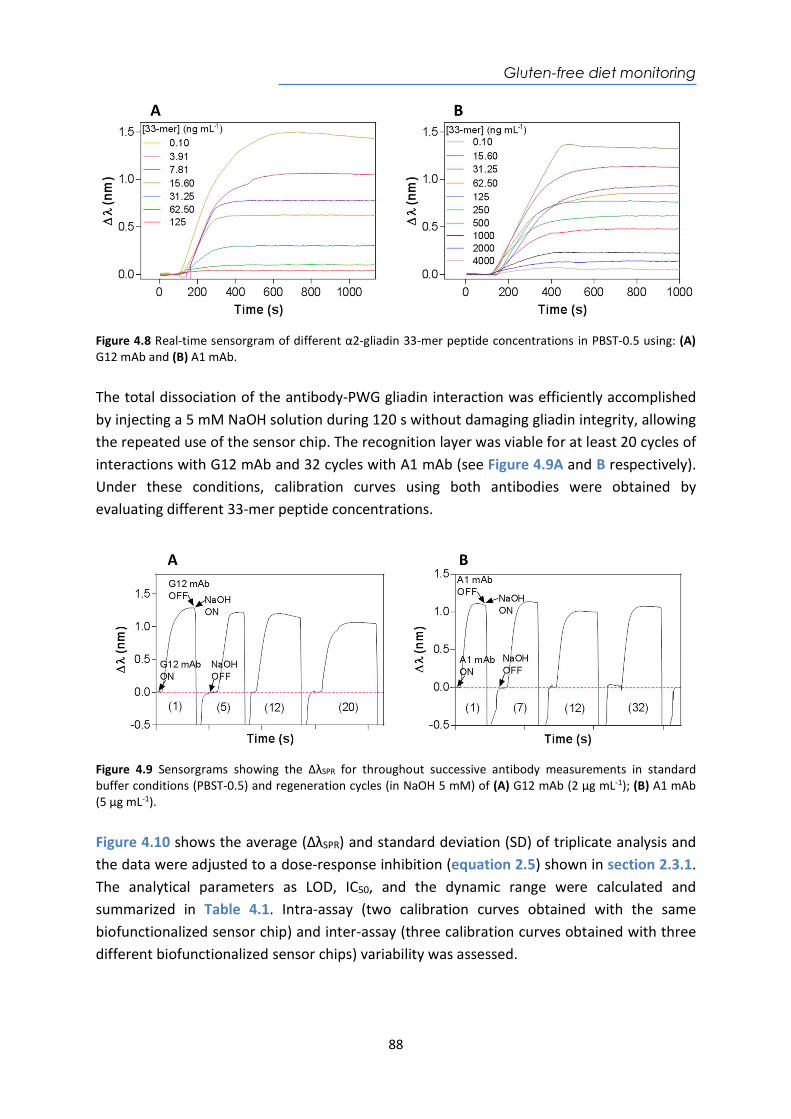
Gluten-free diet monitoring
88
Figure 4.8 Real-time sensorgram of different α2-gliadin 33-mer peptide concentrations in PBST-0.5 using: (A) G12 mAb and (B) A1 mAb. The total dissociation of the antibody-PWG gliadin interaction was efficiently accomplished by injecting a 5 mM NaOH solution during 120 s without damaging gliadin integrity, allowing the repeated use of the sensor chip. The recognition layer was viable for at least 20 cycles of interactions with G12 mAb and 32 cycles with A1 mAb (see Figure 4.9A and B respectively). Under these conditions, calibration curves using both antibodies were obtained by evaluating different 33-mer peptide concentrations.
Figure 4.9 Sensorgrams showing the ΔλSPR for throughout successive antibody measurements in standard buffer conditions (PBST-0.5) and regeneration cycles (in NaOH 5 mM) of (A) G12 mAb (2 µg mL-1); (B) A1 mAb (5 µg mL-1). Figure 4.10 shows the average (ΔλSPR) and standard deviation (SD) of triplicate analysis and the data were adjusted to a dose-response inhibition (equation 2.5) shown in section 2.3.1. The analytical parameters as LOD, IC50, and the dynamic range were calculated and summarized in Table 4.1. Intra-assay (two calibration curves obtained with the same biofunctionalized sensor chip) and inter-assay (three calibration curves obtained with three different biofunctionalized sensor chips) variability was assessed.
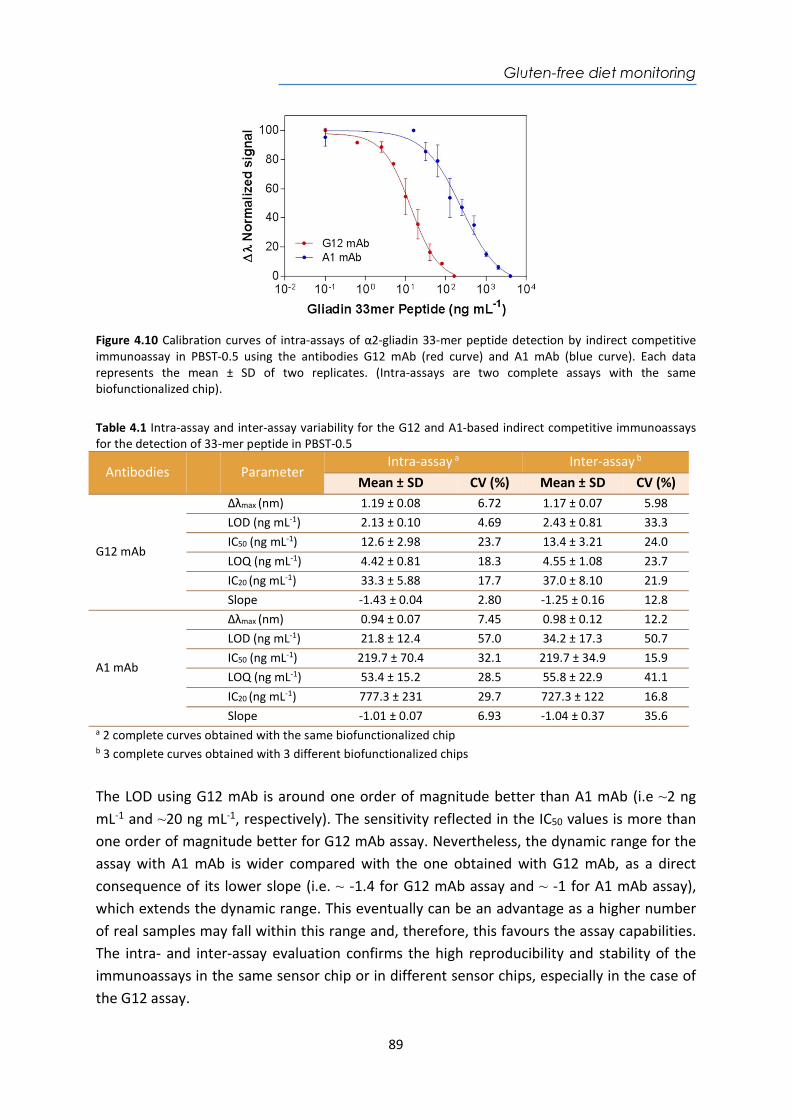
Gluten-free diet monitoring
89
Figure 4.10 Calibration curves of intra-assays of α2-gliadin 33-mer peptide detection by indirect competitive immunoassay in PBST-0.5 using the antibodies G12 mAb (red curve) and A1 mAb (blue curve). Each data represents the mean ± SD of two replicates. (Intra-assays are two complete assays with the same biofunctionalized chip). Table 4.1 Intra-assay and inter-assay variability for the G12 and A1-based indirect competitive immunoassays for the detection of 33-mer peptide in PBST-0.5
Antibodies
Parameter Intra-assay a Inter-assay b
Mean ± SD CV (%) Mean ± SD CV (%)
G12 mAb
Δλmax (nm) 1.19 ± 0.08 6.72 1.17 ± 0.07 5.98 LOD (ng mL-1) 2.13 ± 0.10 4.69 2.43 ± 0.81 33.3 IC50 (ng mL-1) 12.6 ± 2.98 23.7 13.4 ± 3.21 24.0 LOQ (ng mL-1) 4.42 ± 0.81 18.3 4.55 ± 1.08 23.7 IC20 (ng mL-1) 33.3 ± 5.88 17.7 37.0 ± 8.10 21.9 Slope -1.43 ± 0.04 2.80 -1.25 ± 0.16 12.8
A1 mAb
Δλmax (nm) 0.94 ± 0.07 7.45 0.98 ± 0.12 12.2 LOD (ng mL-1) 21.8 ± 12.4 57.0 34.2 ± 17.3 50.7 IC50 (ng mL-1) 219.7 ± 70.4 32.1 219.7 ± 34.9 15.9 LOQ (ng mL-1) 53.4 ± 15.2 28.5 55.8 ± 22.9 41.1 IC20 (ng mL-1) 777.3 ± 231 29.7 727.3 ± 122 16.8 Slope -1.01 ± 0.07 6.93 -1.04 ± 0.37 35.6
a 2 complete curves obtained with the same biofunctionalized chip b 3 complete curves obtained with 3 different biofunctionalized chips
The LOD using G12 mAb is around one order of magnitude better than A1 mAb (i.e ~2 ng mL-1 and ~20 ng mL-1, respectively). The sensitivity reflected in the IC50 values is more than one order of magnitude better for G12 mAb assay. Nevertheless, the dynamic range for the assay with A1 mAb is wider compared with the one obtained with G12 mAb, as a direct consequence of its lower slope (i.e. ~ -1.4 for G12 mAb assay and ~ -1 for A1 mAb assay), which extends the dynamic range. This eventually can be an advantage as a higher number of real samples may fall within this range and, therefore, this favours the assay capabilities. The intra- and inter-assay evaluation confirms the high reproducibility and stability of the immunoassays in the same sensor chip or in different sensor chips, especially in the case of the G12 assay.
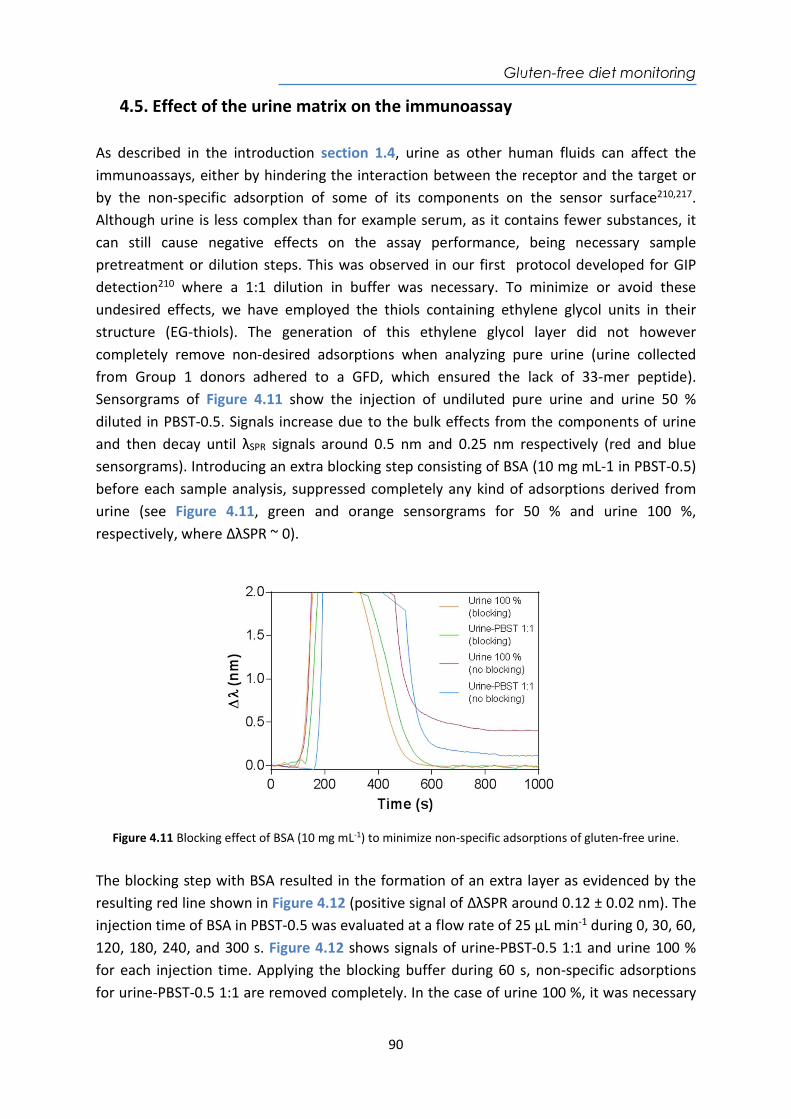
Gluten-free diet monitoring
90
4.5. Effect of the urine matrix on the immunoassay As described in the introduction section 1.4, urine as other human fluids can affect the immunoassays, either by hindering the interaction between the receptor and the target or by the non-specific adsorption of some of its components on the sensor surface210,217. Although urine is less complex than for example serum, as it contains fewer substances, it can still cause negative effects on the assay performance, being necessary sample pretreatment or dilution steps. This was observed in our first protocol developed for GIP detection210 where a 1:1 dilution in buffer was necessary. To minimize or avoid these undesired effects, we have employed the thiols containing ethylene glycol units in their structure (EG-thiols). The generation of this ethylene glycol layer did not however completely remove non-desired adsorptions when analyzing pure urine (urine collected from Group 1 donors adhered to a GFD, which ensured the lack of 33-mer peptide). Sensorgrams of Figure 4.11 show the injection of undiluted pure urine and urine 50 % diluted in PBST-0.5. Signals increase due to the bulk effects from the components of urine and then decay until λSPR signals around 0.5 nm and 0.25 nm respectively (red and blue sensorgrams). Introducing an extra blocking step consisting of BSA (10 mg mL-1 in PBST-0.5) before each sample analysis, suppressed completely any kind of adsorptions derived from urine (see Figure 4.11, green and orange sensorgrams for 50 % and urine 100 %, respectively, where ΔλSPR ~ 0).
Figure 4.11 Blocking effect of BSA (10 mg mL-1) to minimize non-specific adsorptions of gluten-free urine.
The blocking step with BSA resulted in the formation of an extra layer as evidenced by the resulting red line shown in Figure 4.12 (positive signal of ΔλSPR around 0.12 ± 0.02 nm). The injection time of BSA in PBST-0.5 was evaluated at a flow rate of 25 μL min-1 during 0, 30, 60, 120, 180, 240, and 300 s. Figure 4.12 shows signals of urine-PBST-0.5 1:1 and urine 100 % for each injection time. Applying the blocking buffer during 60 s, non-specific adsorptions for urine-PBST-0.5 1:1 are removed completely. In the case of urine 100 %, it was necessary
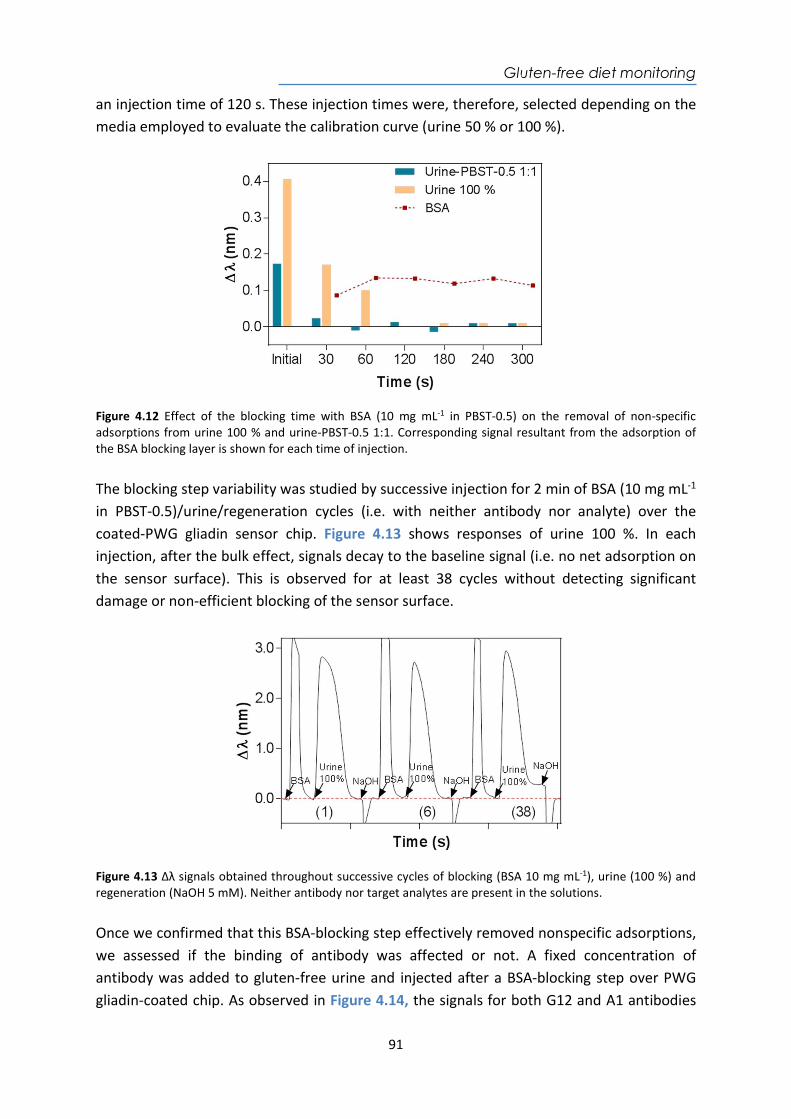
Gluten-free diet monitoring
91
an injection time of 120 s. These injection times were, therefore, selected depending on the media employed to evaluate the calibration curve (urine 50 % or 100 %).
Figure 4.12 Effect of the blocking time with BSA (10 mg mL-1 in PBST-0.5) on the removal of non-specific adsorptions from urine 100 % and urine-PBST-0.5 1:1. Corresponding signal resultant from the adsorption of the BSA blocking layer is shown for each time of injection. The blocking step variability was studied by successive injection for 2 min of BSA (10 mg mL-1 in PBST-0.5)/urine/regeneration cycles (i.e. with neither antibody nor analyte) over the coated-PWG gliadin sensor chip. Figure 4.13 shows responses of urine 100 %. In each injection, after the bulk effect, signals decay to the baseline signal (i.e. no net adsorption on the sensor surface). This is observed for at least 38 cycles without detecting significant damage or non-efficient blocking of the sensor surface.
Figure 4.13 Δλ signals obtained throughout successive cycles of blocking (BSA 10 mg mL-1), urine (100 %) and regeneration (NaOH 5 mM). Neither antibody nor target analytes are present in the solutions. Once we confirmed that this BSA-blocking step effectively removed nonspecific adsorptions, we assessed if the binding of antibody was affected or not. A fixed concentration of antibody was added to gluten-free urine and injected after a BSA-blocking step over PWG gliadin-coated chip. As observed in Figure 4.14, the signals for both G12 and A1 antibodies
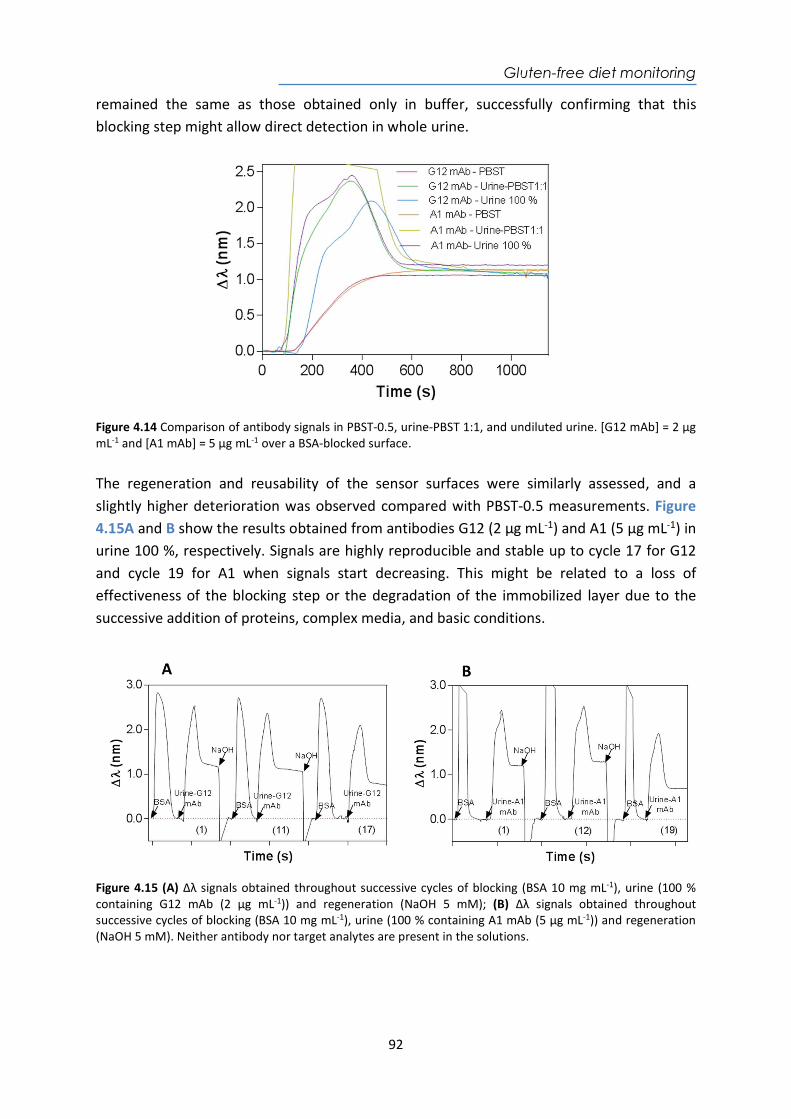
Gluten-free diet monitoring
92
remained the same as those obtained only in buffer, successfully confirming that this blocking step might allow direct detection in whole urine.
Figure 4.14 Comparison of antibody signals in PBST-0.5, urine-PBST 1:1, and undiluted urine. [G12 mAb] = 2 µg mL-1 and [A1 mAb] = 5 µg mL-1 over a BSA-blocked surface. The regeneration and reusability of the sensor surfaces were similarly assessed, and a slightly higher deterioration was observed compared with PBST-0.5 measurements. Figure 4.15A and B show the results obtained from antibodies G12 (2 µg mL-1) and A1 (5 µg mL-1) in urine 100 %, respectively. Signals are highly reproducible and stable up to cycle 17 for G12 and cycle 19 for A1 when signals start decreasing. This might be related to a loss of effectiveness of the blocking step or the degradation of the immobilized layer due to the successive addition of proteins, complex media, and basic conditions.
Figure 4.15 (A) Δλ signals obtained throughout successive cycles of blocking (BSA 10 mg mL-1), urine (100 % containing G12 mAb (2 µg mL-1)) and regeneration (NaOH 5 mM); (B) Δλ signals obtained throughout successive cycles of blocking (BSA 10 mg mL-1), urine (100 % containing A1 mAb (5 µg mL-1)) and regeneration (NaOH 5 mM). Neither antibody nor target analytes are present in the solutions.
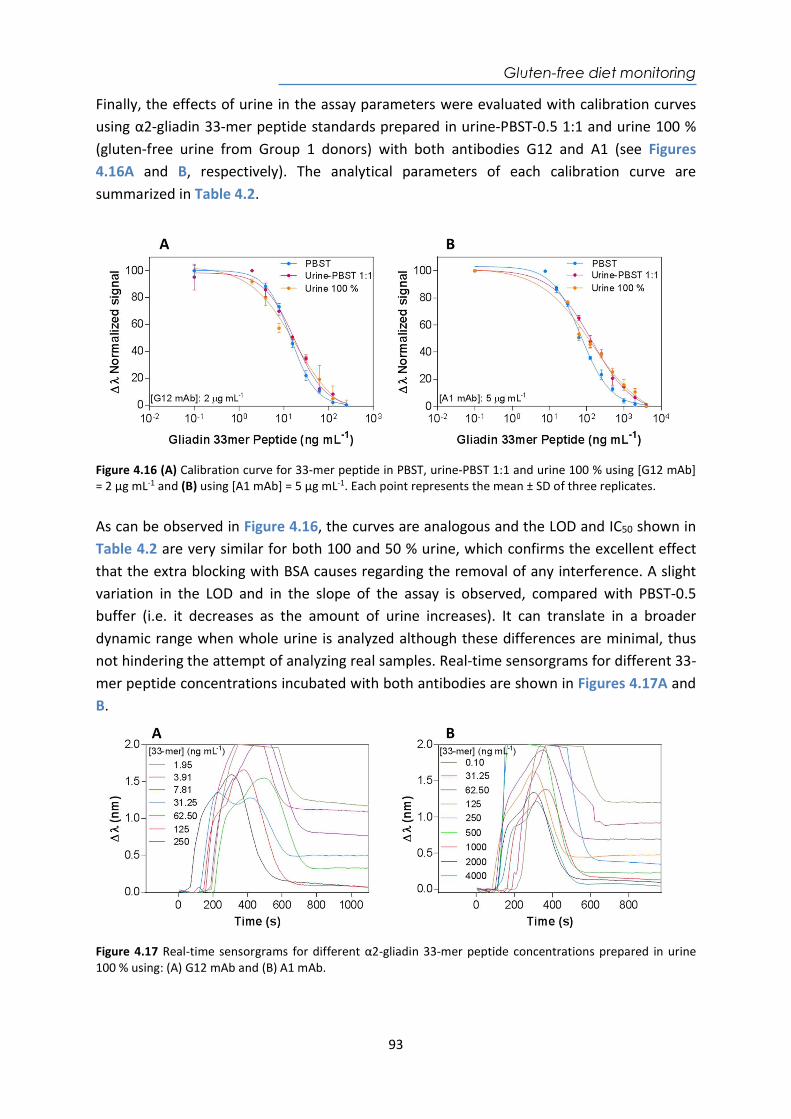
Gluten-free diet monitoring
93
Finally, the effects of urine in the assay parameters were evaluated with calibration curves using α2-gliadin 33-mer peptide standards prepared in urine-PBST-0.5 1:1 and urine 100 % (gluten-free urine from Group 1 donors) with both antibodies G12 and A1 (see Figures 4.16A and B, respectively). The analytical parameters of each calibration curve are summarized in Table 4.2.
Figure 4.16 (A) Calibration curve for 33-mer peptide in PBST, urine-PBST 1:1 and urine 100 % using [G12 mAb] = 2 µg mL-1 and (B) using [A1 mAb] = 5 µg mL-1. Each point represents the mean ± SD of three replicates. As can be observed in Figure 4.16, the curves are analogous and the LOD and IC50 shown in Table 4.2 are very similar for both 100 and 50 % urine, which confirms the excellent effect that the extra blocking with BSA causes regarding the removal of any interference. A slight variation in the LOD and in the slope of the assay is observed, compared with PBST-0.5 buffer (i.e. it decreases as the amount of urine increases). It can translate in a broader dynamic range when whole urine is analyzed although these differences are minimal, thus not hindering the attempt of analyzing real samples. Real-time sensorgrams for different 33-mer peptide concentrations incubated with both antibodies are shown in Figures 4.17A and B.
Figure 4.17 Real-time sensorgrams for different α2-gliadin 33-mer peptide concentrations prepared in urine 100 % using: (A) G12 mAb and (B) A1 mAb.
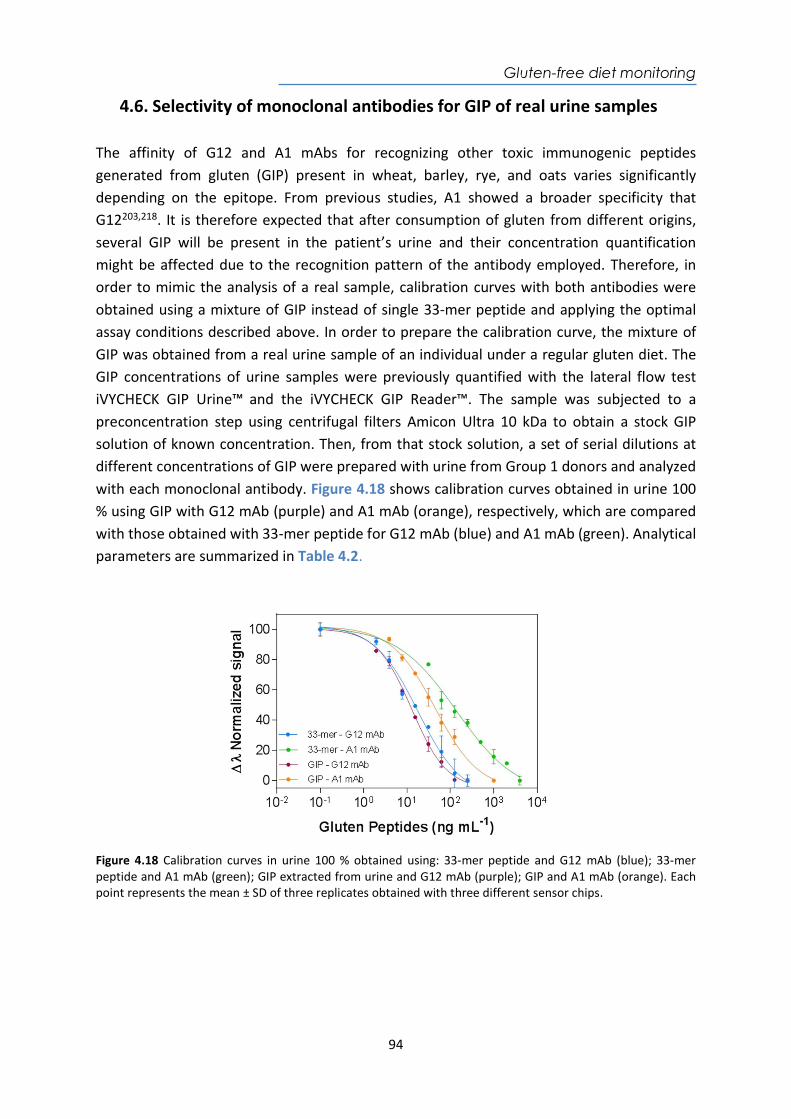
Gluten-free diet monitoring
94
4.6. Selectivity of monoclonal antibodies for GIP of real urine samples The affinity of G12 and A1 mAbs for recognizing other toxic immunogenic peptides generated from gluten (GIP) present in wheat, barley, rye, and oats varies significantly depending on the epitope. From previous studies, A1 showed a broader specificity that G12203,218. It is therefore expected that after consumption of gluten from different origins, several GIP will be present in the patient’s urine and their concentration quantification might be affected due to the recognition pattern of the antibody employed. Therefore, in order to mimic the analysis of a real sample, calibration curves with both antibodies were obtained using a mixture of GIP instead of single 33-mer peptide and applying the optimal assay conditions described above. In order to prepare the calibration curve, the mixture of GIP was obtained from a real urine sample of an individual under a regular gluten diet. The GIP concentrations of urine samples were previously quantified with the lateral flow test iVYCHECK GIP Urine™ and the iVYCHECK GIP Reader™. The sample was subjected to a preconcentration step using centrifugal filters Amicon Ultra 10 kDa to obtain a stock GIP solution of known concentration. Then, from that stock solution, a set of serial dilutions at different concentrations of GIP were prepared with urine from Group 1 donors and analyzed with each monoclonal antibody. Figure 4.18 shows calibration curves obtained in urine 100 % using GIP with G12 mAb (purple) and A1 mAb (orange), respectively, which are compared with those obtained with 33-mer peptide for G12 mAb (blue) and A1 mAb (green). Analytical parameters are summarized in Table 4.2.
Figure 4.18 Calibration curves in urine 100 % obtained using: 33-mer peptide and G12 mAb (blue); 33-mer peptide and A1 mAb (green); GIP extracted from urine and G12 mAb (purple); GIP and A1 mAb (orange). Each point represents the mean ± SD of three replicates obtained with three different sensor chips.
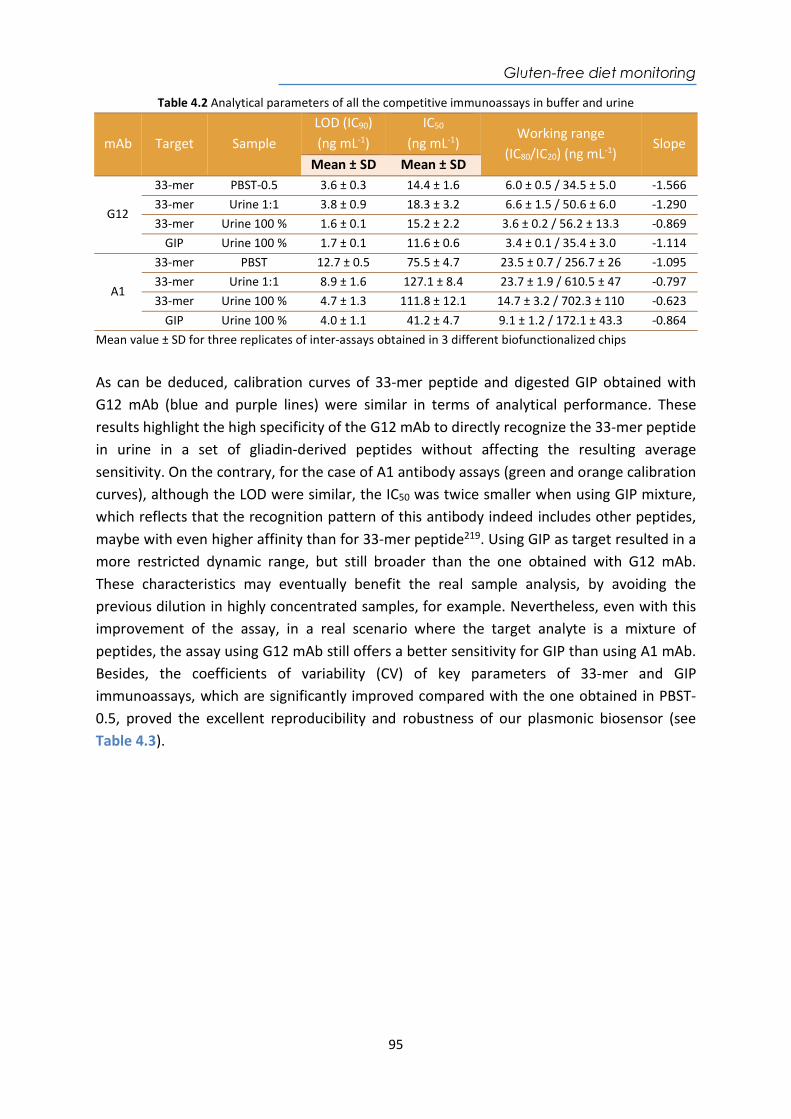
Gluten-free diet monitoring
95
Table 4.2 Analytical parameters of all the competitive immunoassays in buffer and urine
mAb Target Sample LOD (IC90) (ng mL-1)
IC50 (ng mL-1)
Working range (IC80/IC20) (ng mL-1)
Slope Mean ± SD Mean ± SD
G12
33-mer PBST-0.5 3.6 ± 0.3 14.4 ± 1.6 6.0 ± 0.5 / 34.5 ± 5.0 -1.566 33-mer Urine 1:1 3.8 ± 0.9 18.3 ± 3.2 6.6 ± 1.5 / 50.6 ± 6.0 -1.290 33-mer Urine 100 % 1.6 ± 0.1 15.2 ± 2.2 3.6 ± 0.2 / 56.2 ± 13.3 -0.869
GIP Urine 100 % 1.7 ± 0.1 11.6 ± 0.6 3.4 ± 0.1 / 35.4 ± 3.0 -1.114
A1
33-mer PBST 12.7 ± 0.5 75.5 ± 4.7 23.5 ± 0.7 / 256.7 ± 26 -1.095 33-mer Urine 1:1 8.9 ± 1.6 127.1 ± 8.4 23.7 ± 1.9 / 610.5 ± 47 -0.797 33-mer Urine 100 % 4.7 ± 1.3 111.8 ± 12.1 14.7 ± 3.2 / 702.3 ± 110 -0.623
GIP Urine 100 % 4.0 ± 1.1 41.2 ± 4.7 9.1 ± 1.2 / 172.1 ± 43.3 -0.864 Mean value ± SD for three replicates of inter-assays obtained in 3 different biofunctionalized chips
As can be deduced, calibration curves of 33-mer peptide and digested GIP obtained with G12 mAb (blue and purple lines) were similar in terms of analytical performance. These results highlight the high specificity of the G12 mAb to directly recognize the 33-mer peptide in urine in a set of gliadin-derived peptides without affecting the resulting average sensitivity. On the contrary, for the case of A1 antibody assays (green and orange calibration curves), although the LOD were similar, the IC50 was twice smaller when using GIP mixture, which reflects that the recognition pattern of this antibody indeed includes other peptides, maybe with even higher affinity than for 33-mer peptide219. Using GIP as target resulted in a more restricted dynamic range, but still broader than the one obtained with G12 mAb. These characteristics may eventually benefit the real sample analysis, by avoiding the previous dilution in highly concentrated samples, for example. Nevertheless, even with this improvement of the assay, in a real scenario where the target analyte is a mixture of peptides, the assay using G12 mAb still offers a better sensitivity for GIP than using A1 mAb. Besides, the coefficients of variability (CV) of key parameters of 33-mer and GIP immunoassays, which are significantly improved compared with the one obtained in PBST-0.5, proved the excellent reproducibility and robustness of our plasmonic biosensor (see Table 4.3).
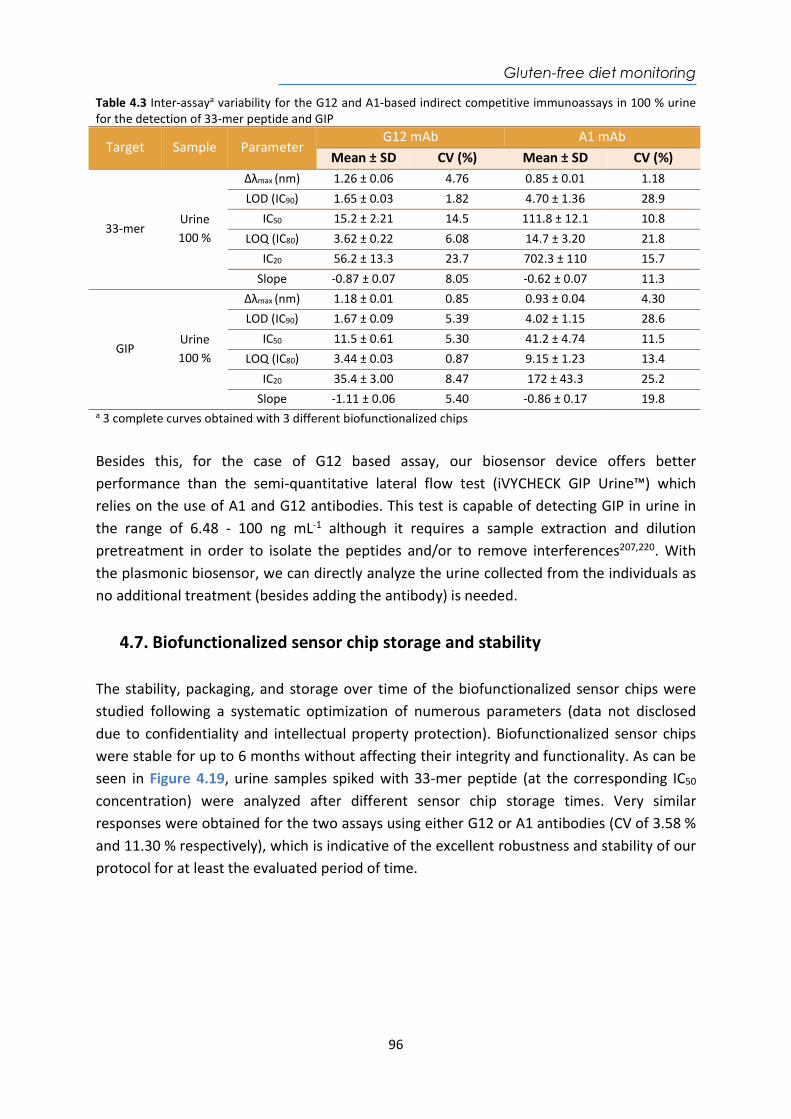
Gluten-free diet monitoring
96
Table 4.3 Inter-assaya variability for the G12 and A1-based indirect competitive immunoassays in 100 % urine for the detection of 33-mer peptide and GIP
Target Sample Parameter G12 mAb A1 mAb
Mean ± SD CV (%) Mean ± SD CV (%)
33-mer Urine 100 %
Δλmax (nm) 1.26 ± 0.06 4.76 0.85 ± 0.01 1.18 LOD (IC90) 1.65 ± 0.03 1.82 4.70 ± 1.36 28.9
IC50 15.2 ± 2.21 14.5 111.8 ± 12.1 10.8 LOQ (IC80) 3.62 ± 0.22 6.08 14.7 ± 3.20 21.8
IC20 56.2 ± 13.3 23.7 702.3 ± 110 15.7 Slope -0.87 ± 0.07 8.05 -0.62 ± 0.07 11.3
GIP Urine 100 %
Δλmax (nm) 1.18 ± 0.01 0.85 0.93 ± 0.04 4.30 LOD (IC90) 1.67 ± 0.09 5.39 4.02 ± 1.15 28.6
IC50 11.5 ± 0.61 5.30 41.2 ± 4.74 11.5 LOQ (IC80) 3.44 ± 0.03 0.87 9.15 ± 1.23 13.4
IC20 35.4 ± 3.00 8.47 172 ± 43.3 25.2 Slope -1.11 ± 0.06 5.40 -0.86 ± 0.17 19.8
a 3 complete curves obtained with 3 different biofunctionalized chips
Besides this, for the case of G12 based assay, our biosensor device offers better performance than the semi-quantitative lateral flow test (iVYCHECK GIP Urine™) which relies on the use of A1 and G12 antibodies. This test is capable of detecting GIP in urine in the range of 6.48 - 100 ng mL-1 although it requires a sample extraction and dilution pretreatment in order to isolate the peptides and/or to remove interferences207,220. With the plasmonic biosensor, we can directly analyze the urine collected from the individuals as no additional treatment (besides adding the antibody) is needed.
4.7. Biofunctionalized sensor chip storage and stability The stability, packaging, and storage over time of the biofunctionalized sensor chips were studied following a systematic optimization of numerous parameters (data not disclosed due to confidentiality and intellectual property protection). Biofunctionalized sensor chips were stable for up to 6 months without affecting their integrity and functionality. As can be seen in Figure 4.19, urine samples spiked with 33-mer peptide (at the corresponding IC50 concentration) were analyzed after different sensor chip storage times. Very similar responses were obtained for the two assays using either G12 or A1 antibodies (CV of 3.58 % and 11.30 % respectively), which is indicative of the excellent robustness and stability of our protocol for at least the evaluated period of time.
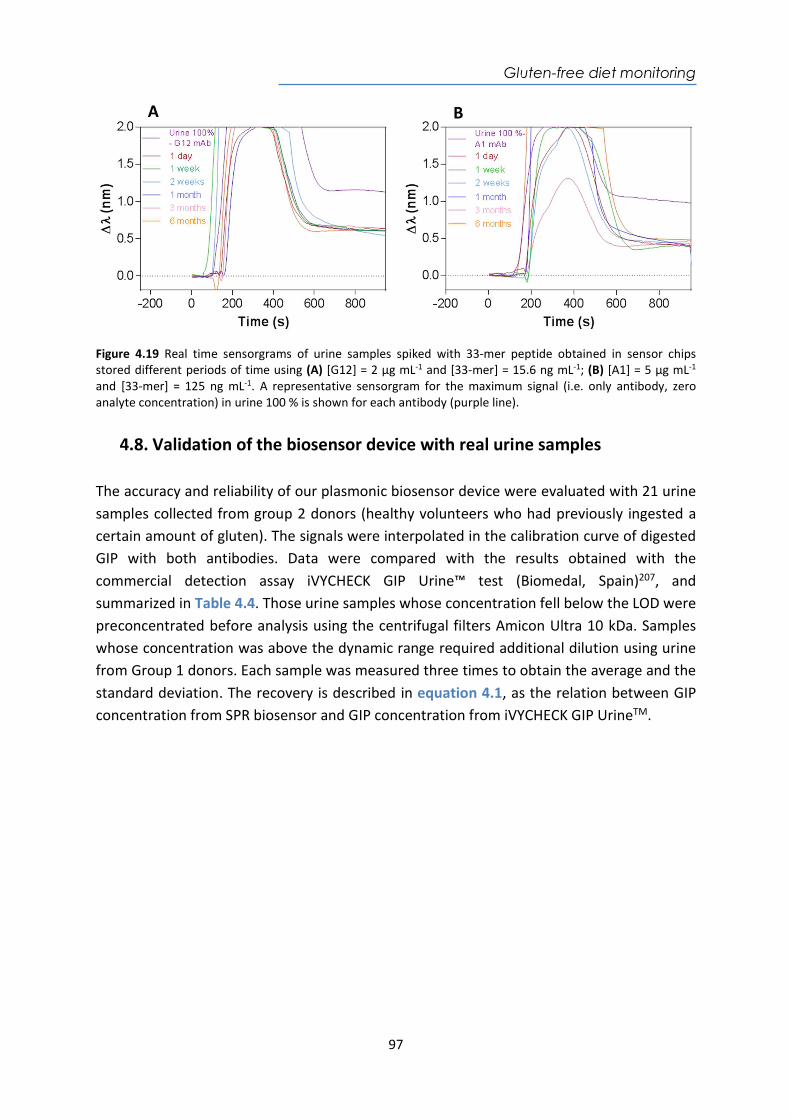
Gluten-free diet monitoring
97
Figure 4.19 Real time sensorgrams of urine samples spiked with 33-mer peptide obtained in sensor chips stored different periods of time using (A) [G12] = 2 µg mL-1 and [33-mer] = 15.6 ng mL-1; (B) [A1] = 5 µg mL-1 and [33-mer] = 125 ng mL-1. A representative sensorgram for the maximum signal (i.e. only antibody, zero analyte concentration) in urine 100 % is shown for each antibody (purple line).
4.8. Validation of the biosensor device with real urine samples The accuracy and reliability of our plasmonic biosensor device were evaluated with 21 urine samples collected from group 2 donors (healthy volunteers who had previously ingested a certain amount of gluten). The signals were interpolated in the calibration curve of digested GIP with both antibodies. Data were compared with the results obtained with the commercial detection assay iVYCHECK GIP Urine™ test (Biomedal, Spain)207, and summarized in Table 4.4. Those urine samples whose concentration fell below the LOD were preconcentrated before analysis using the centrifugal filters Amicon Ultra 10 kDa. Samples whose concentration was above the dynamic range required additional dilution using urine from Group 1 donors. Each sample was measured three times to obtain the average and the standard deviation. The recovery is described in equation 4.1, as the relation between GIP concentration from SPR biosensor and GIP concentration from iVYCHECK GIP UrineTM.
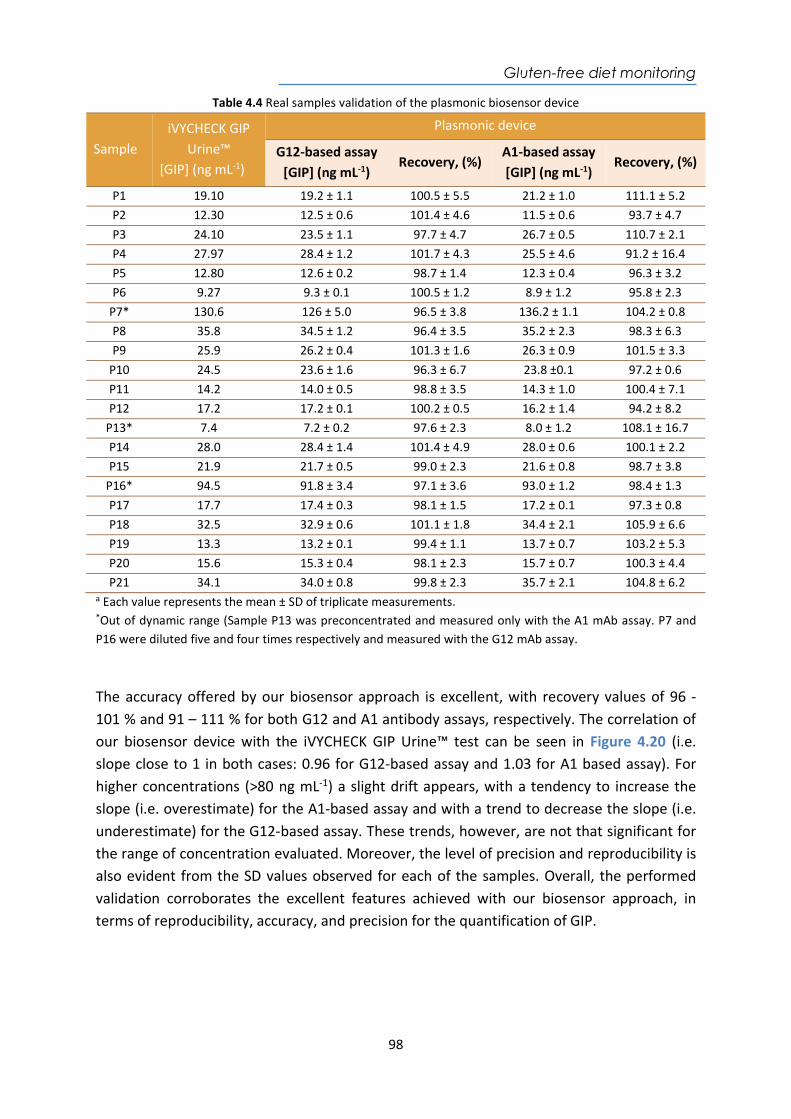
Gluten-free diet monitoring
98
Table 4.4 Real samples validation of the plasmonic biosensor device
Sample iVYCHECK GIP
Urine™ [GIP] (ng mL-1)
Plasmonic device
G12-based assay [GIP] (ng mL-1)
Recovery, (%) A1-based assay [GIP] (ng mL-1)
Recovery, (%)
P1 19.10 19.2 ± 1.1 100.5 ± 5.5 21.2 ± 1.0 111.1 ± 5.2 P2 12.30 12.5 ± 0.6 101.4 ± 4.6 11.5 ± 0.6 93.7 ± 4.7 P3 24.10 23.5 ± 1.1 97.7 ± 4.7 26.7 ± 0.5 110.7 ± 2.1 P4 27.97 28.4 ± 1.2 101.7 ± 4.3 25.5 ± 4.6 91.2 ± 16.4 P5 12.80 12.6 ± 0.2 98.7 ± 1.4 12.3 ± 0.4 96.3 ± 3.2 P6 9.27 9.3 ± 0.1 100.5 ± 1.2 8.9 ± 1.2 95.8 ± 2.3
P7* 130.6 126 ± 5.0 96.5 ± 3.8 136.2 ± 1.1 104.2 ± 0.8 P8 35.8 34.5 ± 1.2 96.4 ± 3.5 35.2 ± 2.3 98.3 ± 6.3 P9 25.9 26.2 ± 0.4 101.3 ± 1.6 26.3 ± 0.9 101.5 ± 3.3
P10 24.5 23.6 ± 1.6 96.3 ± 6.7 23.8 ±0.1 97.2 ± 0.6 P11 14.2 14.0 ± 0.5 98.8 ± 3.5 14.3 ± 1.0 100.4 ± 7.1 P12 17.2 17.2 ± 0.1 100.2 ± 0.5 16.2 ± 1.4 94.2 ± 8.2
P13* 7.4 7.2 ± 0.2 97.6 ± 2.3 8.0 ± 1.2 108.1 ± 16.7 P14 28.0 28.4 ± 1.4 101.4 ± 4.9 28.0 ± 0.6 100.1 ± 2.2 P15 21.9 21.7 ± 0.5 99.0 ± 2.3 21.6 ± 0.8 98.7 ± 3.8
P16* 94.5 91.8 ± 3.4 97.1 ± 3.6 93.0 ± 1.2 98.4 ± 1.3 P17 17.7 17.4 ± 0.3 98.1 ± 1.5 17.2 ± 0.1 97.3 ± 0.8 P18 32.5 32.9 ± 0.6 101.1 ± 1.8 34.4 ± 2.1 105.9 ± 6.6 P19 13.3 13.2 ± 0.1 99.4 ± 1.1 13.7 ± 0.7 103.2 ± 5.3 P20 15.6 15.3 ± 0.4 98.1 ± 2.3 15.7 ± 0.7 100.3 ± 4.4 P21 34.1 34.0 ± 0.8 99.8 ± 2.3 35.7 ± 2.1 104.8 ± 6.2
a Each value represents the mean ± SD of triplicate measurements. *Out of dynamic range (Sample P13 was preconcentrated and measured only with the A1 mAb assay. P7 and P16 were diluted five and four times respectively and measured with the G12 mAb assay.
The accuracy offered by our biosensor approach is excellent, with recovery values of 96 - 101 % and 91 – 111 % for both G12 and A1 antibody assays, respectively. The correlation of our biosensor device with the iVYCHECK GIP Urine™ test can be seen in Figure 4.20 (i.e. slope close to 1 in both cases: 0.96 for G12-based assay and 1.03 for A1 based assay). For higher concentrations (>80 ng mL-1) a slight drift appears, with a tendency to increase the slope (i.e. overestimate) for the A1-based assay and with a trend to decrease the slope (i.e. underestimate) for the G12-based assay. These trends, however, are not that significant for the range of concentration evaluated. Moreover, the level of precision and reproducibility is also evident from the SD values observed for each of the samples. Overall, the performed validation corroborates the excellent features achieved with our biosensor approach, in terms of reproducibility, accuracy, and precision for the quantification of GIP.
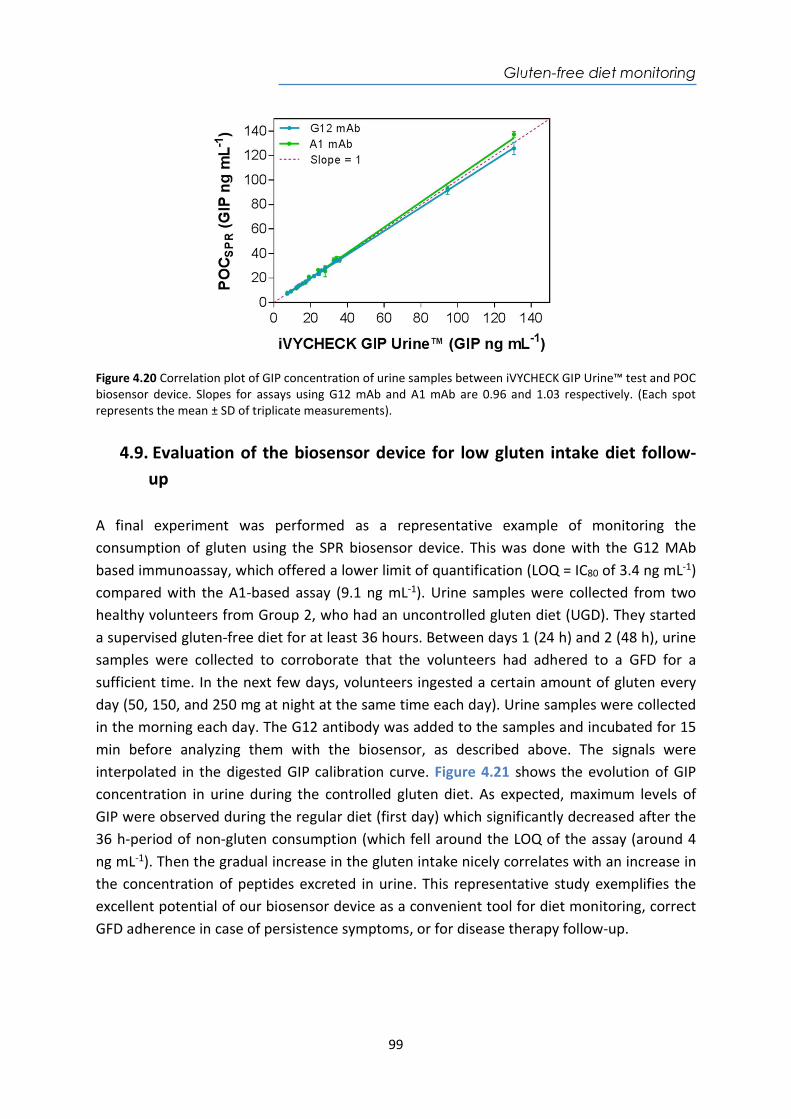
Gluten-free diet monitoring
99
Figure 4.20 Correlation plot of GIP concentration of urine samples between iVYCHECK GIP Urine™ test and POC biosensor device. Slopes for assays using G12 mAb and A1 mAb are 0.96 and 1.03 respectively. (Each spot represents the mean ± SD of triplicate measurements).
4.9. Evaluation of the biosensor device for low gluten intake diet follow-up
A final experiment was performed as a representative example of monitoring the consumption of gluten using the SPR biosensor device. This was done with the G12 MAb based immunoassay, which offered a lower limit of quantification (LOQ = IC80 of 3.4 ng mL-1) compared with the A1-based assay (9.1 ng mL-1). Urine samples were collected from two healthy volunteers from Group 2, who had an uncontrolled gluten diet (UGD). They started a supervised gluten-free diet for at least 36 hours. Between days 1 (24 h) and 2 (48 h), urine samples were collected to corroborate that the volunteers had adhered to a GFD for a sufficient time. In the next few days, volunteers ingested a certain amount of gluten every day (50, 150, and 250 mg at night at the same time each day). Urine samples were collected in the morning each day. The G12 antibody was added to the samples and incubated for 15 min before analyzing them with the biosensor, as described above. The signals were interpolated in the digested GIP calibration curve. Figure 4.21 shows the evolution of GIP concentration in urine during the controlled gluten diet. As expected, maximum levels of GIP were observed during the regular diet (first day) which significantly decreased after the 36 h-period of non-gluten consumption (which fell around the LOQ of the assay (around 4 ng mL-1). Then the gradual increase in the gluten intake nicely correlates with an increase in the concentration of peptides excreted in urine. This representative study exemplifies the excellent potential of our biosensor device as a convenient tool for diet monitoring, correct GFD adherence in case of persistence symptoms, or for disease therapy follow-up.
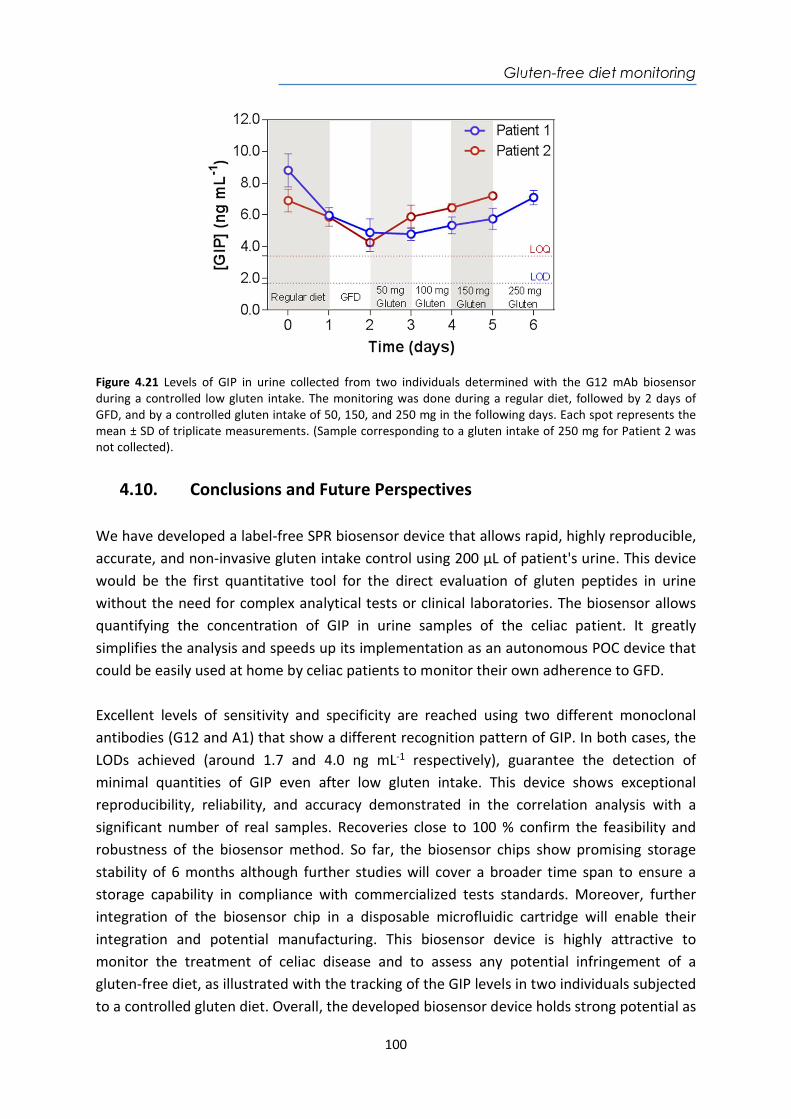
Gluten-free diet monitoring
100
Figure 4.21 Levels of GIP in urine collected from two individuals determined with the G12 mAb biosensor during a controlled low gluten intake. The monitoring was done during a regular diet, followed by 2 days of GFD, and by a controlled gluten intake of 50, 150, and 250 mg in the following days. Each spot represents the mean ± SD of triplicate measurements. (Sample corresponding to a gluten intake of 250 mg for Patient 2 was not collected).
4.10. Conclusions and Future Perspectives We have developed a label-free SPR biosensor device that allows rapid, highly reproducible, accurate, and non-invasive gluten intake control using 200 µL of patient's urine. This device would be the first quantitative tool for the direct evaluation of gluten peptides in urine without the need for complex analytical tests or clinical laboratories. The biosensor allows quantifying the concentration of GIP in urine samples of the celiac patient. It greatly simplifies the analysis and speeds up its implementation as an autonomous POC device that could be easily used at home by celiac patients to monitor their own adherence to GFD. Excellent levels of sensitivity and specificity are reached using two different monoclonal antibodies (G12 and A1) that show a different recognition pattern of GIP. In both cases, the LODs achieved (around 1.7 and 4.0 ng mL-1 respectively), guarantee the detection of minimal quantities of GIP even after low gluten intake. This device shows exceptional reproducibility, reliability, and accuracy demonstrated in the correlation analysis with a significant number of real samples. Recoveries close to 100 % confirm the feasibility and robustness of the biosensor method. So far, the biosensor chips show promising storage stability of 6 months although further studies will cover a broader time span to ensure a storage capability in compliance with commercialized tests standards. Moreover, further integration of the biosensor chip in a disposable microfluidic cartridge will enable their integration and potential manufacturing. This biosensor device is highly attractive to monitor the treatment of celiac disease and to assess any potential infringement of a gluten-free diet, as illustrated with the tracking of the GIP levels in two individuals subjected to a controlled gluten diet. Overall, the developed biosensor device holds strong potential as
Gluten-free diet monitoring
101
a convenient sensing tool for disease follow-up from different perspectives: it may provide useful timely data to the clinician about the degree of adherence to GFD and about the patient's health status both in the home environment and in the primary care health centers and specialists. Transgressions can be detected to guide the patient to avoid exposure to involuntary gluten and to rectify erroneous dietary habits. Moreover, it would help promote self-monitoring by celiac patients in daily life and reduce the need for additional invasive investigations on follow-up.

Gluten-free diet monitoring
102
Tuberculosis detection
103
Chapter 5
Plasmonic biosensors for tuberculosis detection
Improving the diagnosis of Mycobacterium tuberculosis (MTb), the causative agent of tuberculosis disease, has led to an increase in patient survival rates. There are still limitations related to the inefficiency of early detection: techniques and laboratory methods have low specificity, instruments are expensive, and highly trained staff are still needed. In order to contribute to a faster and more effective diagnosis of tuberculosis, we have investigated the use of a SPR biosensor device for early tuberculosis diagnosis with two different strategies: through the detection and quantification of Heat shock protein (HspX), in a direct immunoassay, and through the detection of the non-coding sequence preRNA-pCL1, by a direct hybridization-based assay, both in sputum samples. Both of them are relevant biomarkers of this disease and are present in MTb. The potential of measuring pre-treated sputum of tuberculosis patients has also been demonstrated.

Tuberculosis detection
104
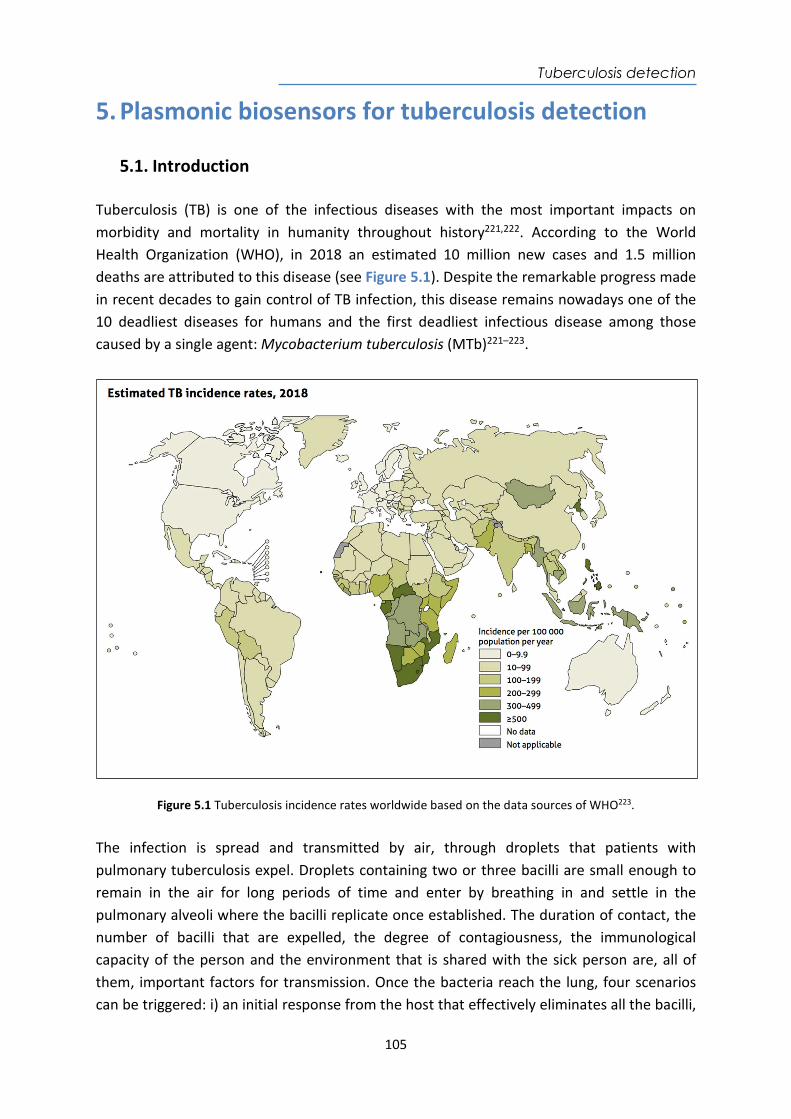
Tuberculosis detection
105
5. Plasmonic biosensors for tuberculosis detection
5.1. Introduction
Tuberculosis (TB) is one of the infectious diseases with the most important impacts on morbidity and mortality in humanity throughout history221,222. According to the World Health Organization (WHO), in 2018 an estimated 10 million new cases and 1.5 million deaths are attributed to this disease (see Figure 5.1). Despite the remarkable progress made in recent decades to gain control of TB infection, this disease remains nowadays one of the 10 deadliest diseases for humans and the first deadliest infectious disease among those caused by a single agent: Mycobacterium tuberculosis (MTb)221–223.
Figure 5.1 Tuberculosis incidence rates worldwide based on the data sources of WHO223.
The infection is spread and transmitted by air, through droplets that patients with pulmonary tuberculosis expel. Droplets containing two or three bacilli are small enough to remain in the air for long periods of time and enter by breathing in and settle in the pulmonary alveoli where the bacilli replicate once established. The duration of contact, the number of bacilli that are expelled, the degree of contagiousness, the immunological capacity of the person and the environment that is shared with the sick person are, all of them, important factors for transmission. Once the bacteria reach the lung, four scenarios can be triggered: i) an initial response from the host that effectively eliminates all the bacilli,
Tuberculosis detection
106
therefore the person does not develop tuberculosis; ii) the microorganism begins to multiply immediately after infection, causing active tuberculosis; iii) the bacillus arrives and remains in the organism but does not cause disease reaching a balance with the host. The patient is considered asymptomatic and the bacillus resides in the tissues for years and even decades as latent disease; iv) these latent microorganisms can eventually grow and cause reactive tuberculosis when that balance is broken. As reported by WHO one-third of the world’s population is latently infected in an asymptomatic and non-transmissible state with the bacilli causing Latent TB Infection (LTBI)224. The bacillus takes advantage of any weakness of the immune system to be activated such as the appearance of the human immunodeficiency virus and Acquired Immune Deficiency Syndrome (HIV/AIDS), malnutrition and immune system diseases, which compromise the immune system as enhancers of the disease224–226. In general, it is assumed that a significant percentage of cases of active tuberculosis is the result of the reactivation of a latent infection. WHO also estimated that 13 % of TB patients have HIV226 and 480.000 cases per year are multidrug-resistant (MDR) owing to inadequate use of antibiotics, poor adherence to anti-TB drugs and insufficient monitoring of drugs resistance222,227. Among the main factors that contribute to the high incidence of TB are the 3 million people who are not diagnosed every year, becoming a source of dissemination of MTb225. The development of novel diagnostic methods that can be used as a triage in the TB identification in a remote population, that overcome the low sensitivity of microscopy-based identification and the delayed diagnosis from the sample culture (which can take between two and six weeks) are crucial for TB control222,228. During this period, patients without treatment can transmit the bacillus to other people, which guarantees the bacteria survival229,230. The genus Mycobacterium, described by Lehman and Neuman in 1896, is one of the most widely studied taxa worldwide. Its traditional identification is based on characteristics such as the shape of the colonies, growth rate and biochemical tests. TB is caused by a group of bacteria belonging to the M. tuberculosis complex (MTBC) that include MTb, the causative pathogen agent of human TB231. The bacillus is an aerobic, non-sporogenic, cylindrical bacterium, which measures 0.5 x 3 µm, can be detected by optical microscopy with a modified Ziehl-Neelsen (ZN) or Kinyoun stain in sputum of a patient with active TB (see Figure 5.2). In staining, a thin red to pink bacillus can be observed, while the rest of the material is dyed with a blue color232. In 1998, the complete genomic sequence of MTb was obtained, which comprises 4043 genes encoding 3993 proteins and 50 genes encoded in RNA and a high content of guanine-cytosine (65.6 %). A large proportion of genes encode enzymes that are involved in cell wall metabolism233.
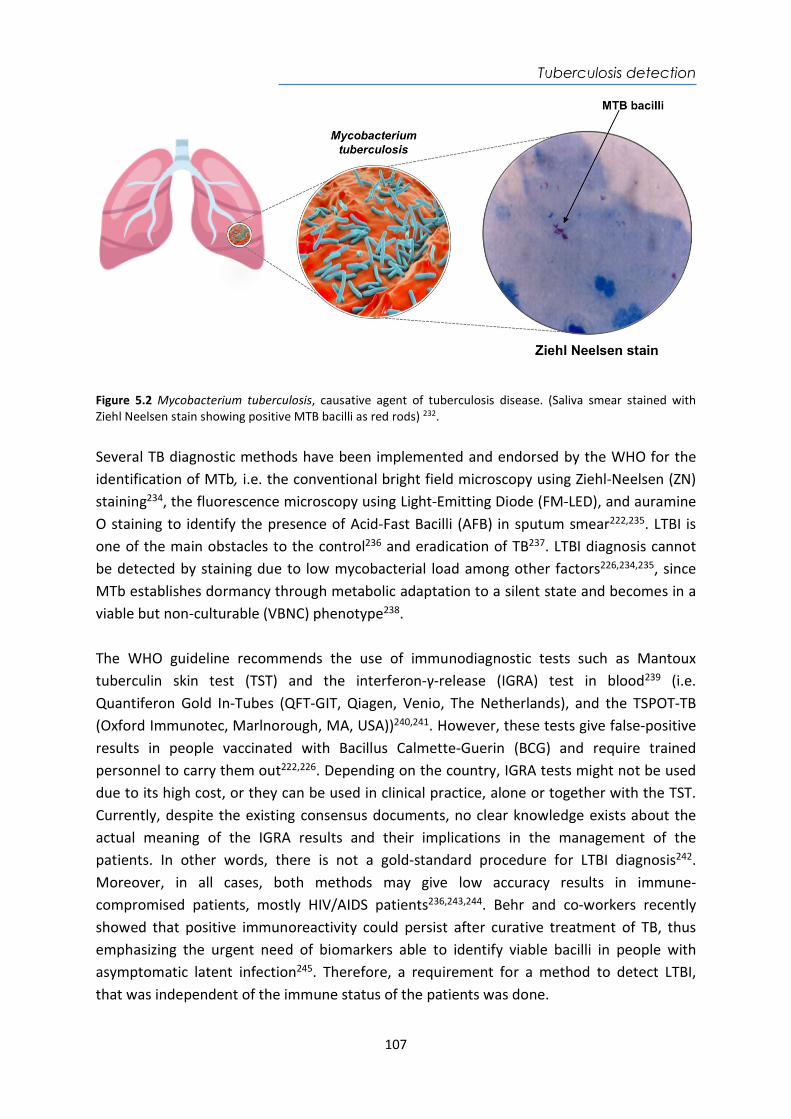
Tuberculosis detection
107
Figure 5.2 Mycobacterium tuberculosis, causative agent of tuberculosis disease. (Saliva smear stained with Ziehl Neelsen stain showing positive MTB bacilli as red rods) 232. Several TB diagnostic methods have been implemented and endorsed by the WHO for the identification of MTb, i.e. the conventional bright field microscopy using Ziehl-Neelsen (ZN) staining234, the fluorescence microscopy using Light-Emitting Diode (FM-LED), and auramine O staining to identify the presence of Acid-Fast Bacilli (AFB) in sputum smear222,235. LTBI is one of the main obstacles to the control236 and eradication of TB237. LTBI diagnosis cannot be detected by staining due to low mycobacterial load among other factors226,234,235, since MTb establishes dormancy through metabolic adaptation to a silent state and becomes in a viable but non-culturable (VBNC) phenotype238. The WHO guideline recommends the use of immunodiagnostic tests such as Mantoux tuberculin skin test (TST) and the interferon-γ-release (IGRA) test in blood239 (i.e. Quantiferon Gold In-Tubes (QFT-GIT, Qiagen, Venio, The Netherlands), and the TSPOT-TB (Oxford Immunotec, Marlnorough, MA, USA))240,241. However, these tests give false-positive results in people vaccinated with Bacillus Calmette-Guerin (BCG) and require trained personnel to carry them out222,226. Depending on the country, IGRA tests might not be used due to its high cost, or they can be used in clinical practice, alone or together with the TST. Currently, despite the existing consensus documents, no clear knowledge exists about the actual meaning of the IGRA results and their implications in the management of the patients. In other words, there is not a gold-standard procedure for LTBI diagnosis242. Moreover, in all cases, both methods may give low accuracy results in immune-compromised patients, mostly HIV/AIDS patients236,243,244. Behr and co-workers recently showed that positive immunoreactivity could persist after curative treatment of TB, thus emphasizing the urgent need of biomarkers able to identify viable bacilli in people with asymptomatic latent infection245. Therefore, a requirement for a method to detect LTBI, that was independent of the immune status of the patients was done.
Tuberculosis detection
108
In 2015, the "End TB" strategy was launched as part of the Sustainable Development Goals. This strategy has the control of LTBI and the control of resistance emergence as key components to the real control of TB246. To accomplish those aims, new tools that provide new biomarkers for TB detection, that improve diagnostic quality, increase treatment efficiency and avoid the risk of developing active disease, are still being sought. In order to improve the efficiency, specificity and accuracy of diagnosis, WHO recommended nucleic acid amplification test (NAAT) which uses PCR to amplify and detect mycobacterial rRNA or DNA directly in blood, sputum, among others (i.e. Loop-mediated Isothermal Amplification PCR PURE-TB-LAMP, from Eiken Chemical (Japan) and GeneXpert MTB/RIF®, from Cepheid (USA)247). Furthermore, WHO recognizes the need for more sensitive and specific strategies to improve the early TB diagnosis, such as the design of portable POC devices, which stand out as an alternative to the conventional techniques. The features of POC devices can eventually make them accessible to the majority of population, thus helping to reduce the global infection rate225,248.
5.2. Current biomarkers for tuberculosis diagnosis A critical point in developing a new POC test for TB diagnosis is the selection of the appropriate biomarkers to be detected. Promising biomarkers of MTb such as lipoarabinomannan (LAM)249,250, ESAT-6251, CFP-10252, Ag85B224, GlcB253, and MPT-51254 in serum, sputum and CSF have been studying by ELISA248,255,256. Nevertheless, this technique still requires sophisticated equipment, trained personnel, and controlled environments, hindering the TB diagnosis in low-resource settings255,256. Several POC devices based on the detection of MTb biomarkers have been reported. For example, a lateral flow immunochromatography for the detection of LAM in urine is currently commercialized (i.e. Alere Determine™ TB LAM). This biomarker has also been detected in urine using a nanophotonic POC biosensor in a label-free configuration249 or in a planar waveguide based biosensors using fluorescent-labeled antibodies250. Nevertheless, this lipopolysaccharide is not only found in MTb, but also in other mycobacteria257. Other examples are based on the use of SPR biosensor for the detection of the CFP-10 antigen in urine258,259, Ag85 in sputum260, and DNA fragments in plasma253. The use of a mobile-phone mediated plasmonic ELISA to detect ESAT-6 and CFP-10261, or the use of electrochemical devices for the detection of volatile organic compounds (VOC) of MTb (i.e. cyclohexane and benzene derivatives) are other described POC techniques. Those results are promising, however, they still show variable and inconsistent sensitivity (14 – 86 %) and low specificity (47 - 89 %)120,262–264. Table 5.1 summarizes some of the biosensor methods reported so far for tuberculosis detection.
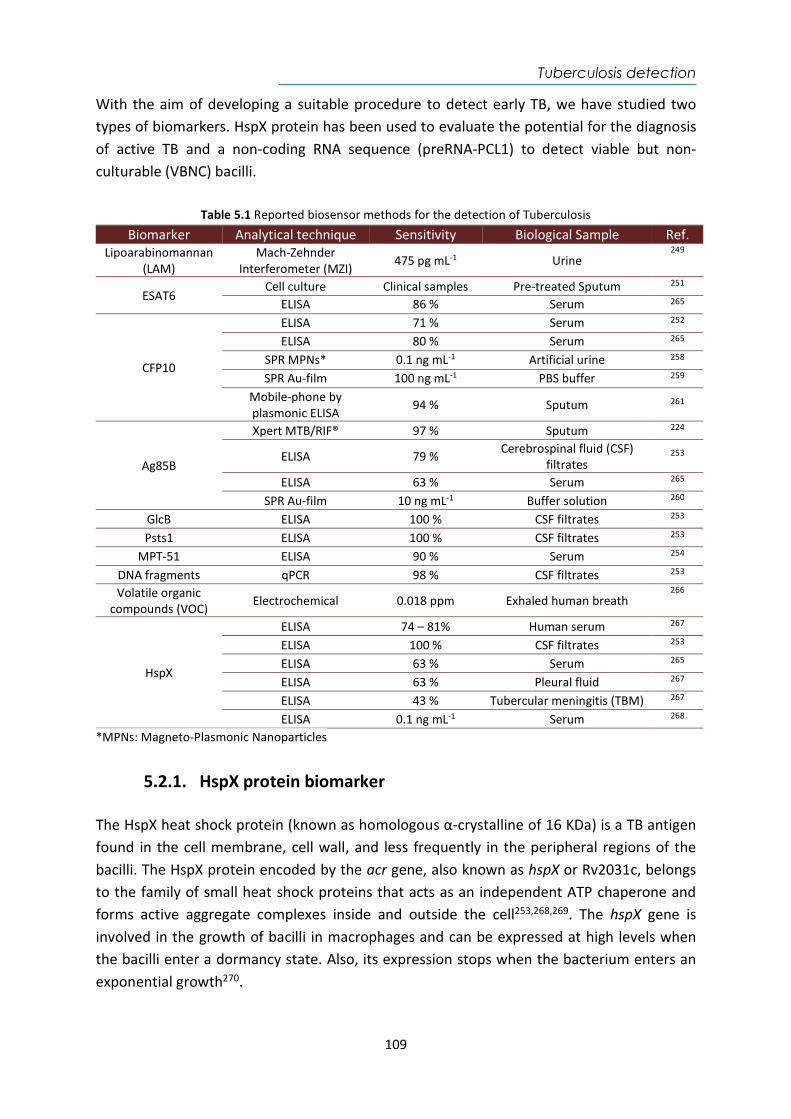
Tuberculosis detection
109
With the aim of developing a suitable procedure to detect early TB, we have studied two types of biomarkers. HspX protein has been used to evaluate the potential for the diagnosis of active TB and a non-coding RNA sequence (preRNA-PCL1) to detect viable but non-culturable (VBNC) bacilli.
Table 5.1 Reported biosensor methods for the detection of Tuberculosis
Biomarker Analytical technique Sensitivity Biological Sample Ref. Lipoarabinomannan
(LAM) Mach-Zehnder
Interferometer (MZI) 475 pg mL-1 Urine
249
ESAT6 Cell culture Clinical samples Pre-treated Sputum 251
ELISA 86 % Serum 265
CFP10
ELISA 71 % Serum 252 ELISA 80 % Serum 265
SPR MPNs* 0.1 ng mL-1 Artificial urine 258 SPR Au-film 100 ng mL-1 PBS buffer 259
Mobile-phone by plasmonic ELISA
94 % Sputum 261
Ag85B
Xpert MTB/RIF® 97 % Sputum 224
ELISA 79 % Cerebrospinal fluid (CSF) filtrates
253
ELISA 63 % Serum 265 SPR Au-film 10 ng mL-1 Buffer solution 260
GlcB ELISA 100 % CSF filtrates 253 Psts1 ELISA 100 % CSF filtrates 253
MPT-51 ELISA 90 % Serum 254 DNA fragments qPCR 98 % CSF filtrates 253 Volatile organic
compounds (VOC) Electrochemical 0.018 ppm Exhaled human breath
266
HspX
ELISA 74 – 81% Human serum 267 ELISA 100 % CSF filtrates 253 ELISA 63 % Serum 265 ELISA 63 % Pleural fluid 267 ELISA 43 % Tubercular meningitis (TBM) 267 ELISA 0.1 ng mL-1 Serum 268
*MPNs: Magneto-Plasmonic Nanoparticles
5.2.1. HspX protein biomarker The HspX heat shock protein (known as homologous α-crystalline of 16 KDa) is a TB antigen found in the cell membrane, cell wall, and less frequently in the peripheral regions of the bacilli. The HspX protein encoded by the acr gene, also known as hspX or Rv2031c, belongs to the family of small heat shock proteins that acts as an independent ATP chaperone and forms active aggregate complexes inside and outside the cell253,268,269. The hspX gene is involved in the growth of bacilli in macrophages and can be expressed at high levels when the bacilli enter a dormancy state. Also, its expression stops when the bacterium enters an exponential growth270.
Tuberculosis detection
110
The expression of the HspX protein is controlled by the DosR transcription factor, which in turn is regulated by a histidine-linked kinase route. The transcription factor induces the production of the HspX protein271. Its function is to help the bacilli maintain long-term survival in adverse hypoxic conditions268,272, low pH, high levels of hydrolytic enzymes, reactive oxygen, and presence of nitric oxide in granulomas or macrophages271. In addition, it helps prevent aggregation of denatured proteins and facilitates reassembly by other chaperone proteins. Therefore, its function is particularly important in MTb because it must withstand extreme environments once it enters the alveolar macrophages and in turn forms granulomas in the lungs273. Under these extreme conditions, the expression of HspX protein could reach up to 25 % of the total bacterial protein expression274. Consequently, HspX stabilizes proteins and cellular structures to survive in this hostile environment, providing to the bacilli a high degree of resistance and escaping the host's innate immune system during the latent phase of infection269. In addition, it causes the slow growth of bacteria within macrophages and the non-replicative persistence of the bacteria, since overexpression of the protein inhibits the growth of the bacteria253,268,269. Therefore, this protein is considered as one of the main immunologically active mycobacterial antigens after infection and it is expressed at high levels by bacterial pathogens during adaptation for intracellular survival, which makes it a promising biomarker for the early, rapid and direct detection of MTb253,265,268,275. The detection of HspX for active TB has been evaluated mainly by ELISA in human serum254,265,267, pleural fluid267,276, sputum254, and CSF253,267. For latent TB detection has only be tested by ELISA in serum265,268. According to this, we have developed a quantitative detection assay of HspX in pre-treated sputum to demonstrate its potential as biomarker for early diagnosis of tuberculosis using a portable label-free SPR biosensor. A direct immunoassay using specific monoclonal antibodies has been implemented and, evaluated directly in pre-treated sputum from clinical samples, providing rapid and simple tests for the quantification of the HspX protein concentration in sputum.
5.2.2. Pre-rRNA-PCL1 biomarker The mechanisms that bacteria and other microorganisms switch-on in order to survive in adverse conditions are extremely variable. One of them, which has still not been solved, refers to the observation that the number of microbial cells that can be seen with a microscope is generally greater than the number of colonies that grow in the laboratory277. This finding is explained by the existence of some microorganisms in a sample that develops a viable but non-culturable (VBNC) phenotype278. The existence of these phenotypes in environmental samples is well known, but evidence of this in human samples was only apparent with the first studies on the human microbiome279. Moreover, it is also known that microbiota culturable bacteria, as well as important pathogens, could establish a VBNC phenotype as a suitable strategy to survive inside their host280. A well-known example is the
Tuberculosis detection
111
latent infection caused by MTb. Other examples of microbial survival with lack of growth are the occurrence of bacterial persistence and tolerance in the presence of antibiotics, with the possibility of further resistance appearance as a consequence. A subpopulation of bacteria is considered persistent when being genetically identical to the sensitive bacteria, it does not die in the presence of antibiotics at levels higher than the Minimum Inhibitory Concentrations (MICs), remaining VBNC instead281. Bacterial tolerance is considered when a similar situation occurs in the whole population282. Particularly important in this context would be the detection of viable bacteria in a negative culture during treatment with antibiotics. It was recently shown that tolerant bacteria in vitro could lead to the development of resistance, due to the adaptative advantage that tolerance represents for the bacteria283. According to this, we have used a biomarker of viability to detect live and non-cultivable bacilli in culture-negative clinical samples. The selected target is the promoter region called PCL1, the main promoter leading the ribosomal RNA operon synthesis (rRNA)284. Through this promoter, the complete ribosomal operon (in the sequence 16S + 23S + 5S) is transcribed to an immature ribosomal RNA (pre-rRNA) with stability similar to standard mRNAs285. After transcription, the pre-rRNA is processed by RNases to give mature rRNAs 16S, 23S and 5S286 losing the promoter region. Thus, this promoter transitory region can be used as a marker of viability because not viable bacilli would lack in pre-rRNA synthesis and that target would not be detected, as it has been shown by reverse transcription PCR (RT-PCR) 285–287. With the aim of developing a suitable procedure to detect viable bacilli, we have designed a portable Surface Plasmon Resonance (SPR) biosensor as a tool to detect the pre-rRNA-PCL1 in sputum samples. Samples from patients diagnosed of active TB were used to determine the suitability of the procedure. To this end, total nucleic acids (DNA plus RNA) were extracted from the bacillus and the PCL1 sequence was detected by a thiolated oligonucleotides probe coated-sensor surface. The strategy has been developed and the rapid detection of viable bacilli in real-time by analysis of the DNA hybridization in a single step has been established.
Tuberculosis detection
112
5.3. Detection and quantification of the HspX antigen in sputum samples
5.3.1. Chemical reagents and biological compounds Reagents Organic solvents (i.e. acetone, absolute ethanol, toluene, and 2-propanol), H2SO4 and hydrochloric acid 37 % were purchased from Panreac–Applichem (Barcelona, Spain). H2O2 from Merck (Darmstadt, Germany). Tween 20, ethanolamine hydrochloride, EDC, NHS, NaOH, and all reagents used for the preparation of buffers were acquired from Sigma-Aldrich (Steinhem, Germany). Alkanethiols like 16-mercaptohexadecanoic acid (MHDA) and 11-mercaptoundecanol (MUOH) were acquired from Sigma-Aldrich (Steinhem, Germany) whereas HS-C11-(EG)6-O-CH2-COOH (EG-COOH MW: 526.73 g mol-1) and HS-C11-(EG)4-OH (EG-OH MW: 380.48 g mol-1) were acquired from Prochimia (Sopot, Poland). Copolymer Poly-L-Lysine-graft-PEG (PLL-PEG MW 70000 g mol-1) was purchased from SuSoS (Dübendorf, Switzerland). Buffers The buffers were prepared with Milli-Q water (deionized water from a Milli-DI® Water Purification System, Merck Millipore, USA) and are the following: PBS-1X (10 mM phosphate, 137 mM NaCl, 2.7 mM KCl, pH 7.5); PBST-0.05 (PBS with 0.05 % Tween 20); acetate buffer (10-20 mM pH from 4.0 to 5.5); MES buffer (100 mM, 500 mM NaCl, pH 5.5); HEPES buffer (10 mM pH 7.4). Protein expression reagents Kits QIAprep Spin Miniprep; Silica columns; QIAquick PCR Purification; buffer Gu-HCl (5 M Gu-HCl and 30 % isopropanol) and buffer Tris-HCl (10 mM Tris-HCl pH 7.5 and 80 % ethanol) were purchased from QIAGEN (Hilden, Germany). Sodium dodecyl sulfate (SDS); potassium acetate and Triton X-100 were acquired from Promega (Madison, USA). EDTA; guanidine hydrochloride; calcium chloride; ammonium persulfate; urea; lysozyme; phenylmethylsulfonyl fluoride (PMFS); resin nitrilotriacetic acid and nickel (Ni-NTA) 50 % and imidazole were purchased from Sigma Aldrich (Steinhem, Germany). RNase A and isopropyl-β-D-1-thiogalactopyranoside (IPTG) were purchased from Invitrogen (California, USA). Agarose gel and Coomassie blue staining were acquired from Gibco (Massachusetts, USA). SYBR Safe; Vector pET100/D-TOPO; cathode and anode buffer for analysis of rHspX based on electrophoresis SDS-PAGE and western blot were purchased from Thermo Fisher Scientific (Massachusetts, USA). Tris Acetate-EDTA (TAE) buffer (10X: 0.4 M Tris acetate pH 8.3 and 0.01 M EDTA); Red cresol (charge marker); molecular weight marker (100 bp and 1 kb) and PCR reagents (deoxyribonucleotides triphosphates (dNTB) and DNA polymerase) were obtained from Corpogen (Bogotá, Colombia). Magnesium chloride from Mol Labs (Bogotá, Colombia). Acrylbis-acrylamide 30 % and (Tetramethylethylenediamine) TEMED
Tuberculosis detection
113
were acquired from Biorad (USA). Extran; Nitrocellulose membrane – Immobilon pore size 0.2 µm were obtained from Merck (Darmstadt, Germany). Biological compounds Mouse monoclonal antibody anti-Mycobacterium tuberculosis 16 kDa (mAb anti-HspX) and rabbit polyclonal antibody anti-Mycobacterium tuberculosis (pAb anti-HspX) were supplied by Abcam (Cambridge, UK). The reference DNA H37Rv of M. tuberculosis was obtained from Corporation for Biological Research (CIB) (Medellín, Colombia). Conservation strain E. coli TOP10 and competent strain E. coli BL21 (DE3) were acquired from Thermo Fisher (Massachusetts, USA). Strains were grown in Luria-Bertani broth (LB) (10 g L-1 Triptone, 5 g L-
1 yeast extract, 10 g L-1 NaCl) and maintained on LB agar plates (LB and agar bacteriological 15 g L-1). All reagents were purchased by Oxoid (Basingstoke, England). Ampicillin 100 µg mL-
1 from Bayer was added to the media when was required. The frozen cells were cultured in LB medium with ampicillin for 16 hours, shaking at 200 rpm and 37 °C. Then, they were resuspended in LB medium with 20 % glycerol from Promega (Madison, USA) and stored at -80 °C. Sputum samples collection For the assay validation study, a total of 12 pre-treated tuberculous sputum samples (PTSS, S1 - S12) from five patients were included in the study, and 22 pre-treated non-tuberculous sputum samples (PNTSS) from 22 patients (S13 - S34) suffering respiratory illnesses other than TB, were evaluated and employed during the optimization of the immunoassays. In addition, two samples of untreated non-tuberculous sputum sample (UNTSS) were used as a control of sputum matrix. All samples (pre-treated or untreated samples) were collected in sterile containers for diagnostic purposes by the Service of Clinical Microbiology from La Paz University Hospital Madrid (Spain). The local Ethics Committee Hospital La Paz approved the study protocol. Standard diagnostic procedures were performed to test the presence of Mtb bacilli in the samples, including fluorescent acid-fast staining and growth in liquid medium BACTEC MGIT 960 (Becton Dickinson) as well as in solid medium Löwenstein-Jensen. The GenoType Mycobacterium CM (Bruker) or Xpert MTB/Rif® (Cepheid) were used for Mtb confirmation. Pretreatment for decontamination of samples has followed standard procedure by Cubero et al., 2013 at Departamento de Medicina Preventiva, Salud Publica y Microbiología, Facultad de Medicina, Universidad Autonoma de Madrid. In brief, a mixture of N-acetyl-L-cysteine, sodium citrate and NaOH was added to the sample until complete dilution and then it was neutralized with PBS buffer pH 6.8 (BBL™ MycoPrep™, BD). Finally, samples were centrifuged at 4 ºC, 3000 g for 15 min. The supernatant was discarded in a bottle with sodium hypochlorite (5 g L-1) leaving a sediment of 500 µL. These pretreated samples were stored at -20 ºC until analysis. Aliquots of these pre-treated samples (PTSS) were placed in Eppendorf tubes containing a guanidine chloride buffer (preservative agent that halts the bacterial metabolism) and glass beads. The untreated non-tuberculous sample (UNTSS) was placed only in the guanidine chloride buffer. In order to lyse the bacteria, the
Tuberculosis detection
114
aliquots were subjected to 7 pulses of lysis with a speed of 5.0 m s-1 during 60 s, in a fastprep-24, and maintaining the samples in ice between pulses. The supernatant was collected by centrifugation at 4 ºC, 12000 rpm during 5 min and stored at -70 ºC until analysis286. The obtained lysate supernatants were evaluated with the SPR biosensor.
5.3.2. Cloning, Expression, and Purification of rHspX Protein procedure
Amplification of the encoding hspX gene (436 base pairs (pb)) was carried out by PCR using as template the genomic DNA of Mtb H37Rv. The following upstream and downstream primers were used for the PCR: 5'-CAC CGC CAC CAC CCT TCC-3' (18 bp) and 5'-TCA GTT GGT GGA CCG GAT CT-3' (20 bp). The amplification products were verified by electrophoresis with 1.2 % agarose gel and SYBR Green staining in TAE buffer 1X at 120 V for 50 minutes. A weight marker of 100 bp and a PCR product as negative control lacking DNA were included. DNA concentration was determined by the Nanodrop device of 58.7 ng µL-1 (Mw of 134209 g mol-1). The PCR product was purified and ligated into the vector pET100/D-TOPO (5760 bp) (Thermo Fisher Scientific, Massachusetts, USA). The Figure 5.3 shows the design of plasmid map of pET100/D-TOPO vector with gene hspX and cells of E. coli TOP10 were transformed. Incubation was carried out at 200 rpm and 37 °C for one hour. The sense orientation of the sequence into the vector were evaluated by PCR amplification with T7 promoter primers (Forward 5’ TAA TAC GAC TCA CTA TAG GG 3’ of 20 bp and Reverse 3’ GCT AGT TAT TGC TCA GCG G 5’ of 19 bp). Moreover, ligated plasmids were purified by QIAprep Spin Miniprep kit and digested using two restriction enzymes: EcoRI and BgLII at 37 °C for 2 h. Cut sites are observed in Figure 5.3. Finally, the digestion was stopped at 60 °C during 2 min and verified by electrophoresis with agarose gel with SYBR Green. The clone containing the hspX gene was verified by sequence (Macrogen, Inc, Korea).
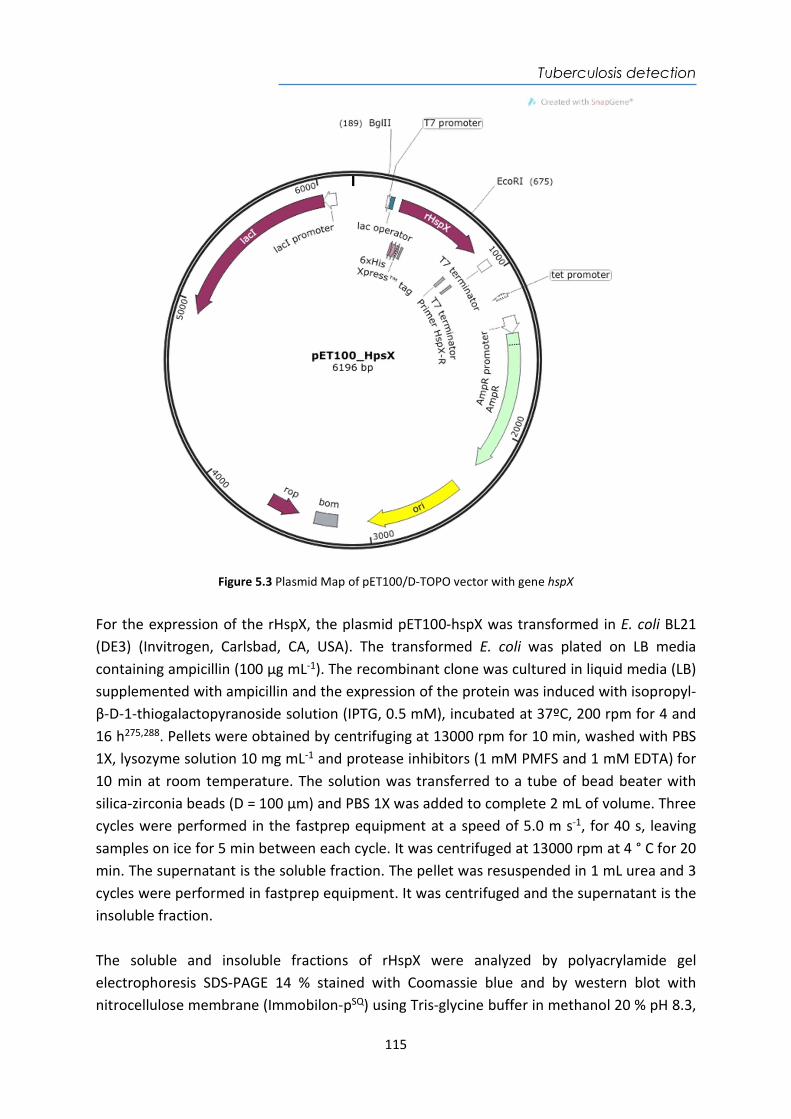
Tuberculosis detection
115
Figure 5.3 Plasmid Map of pET100/D-TOPO vector with gene hspX
For the expression of the rHspX, the plasmid pET100-hspX was transformed in E. coli BL21 (DE3) (Invitrogen, Carlsbad, CA, USA). The transformed E. coli was plated on LB media containing ampicillin (100 µg mL-1). The recombinant clone was cultured in liquid media (LB) supplemented with ampicillin and the expression of the protein was induced with isopropyl-β-D-1-thiogalactopyranoside solution (IPTG, 0.5 mM), incubated at 37ºC, 200 rpm for 4 and 16 h275,288. Pellets were obtained by centrifuging at 13000 rpm for 10 min, washed with PBS 1X, lysozyme solution 10 mg mL-1 and protease inhibitors (1 mM PMFS and 1 mM EDTA) for 10 min at room temperature. The solution was transferred to a tube of bead beater with silica-zirconia beads (D = 100 µm) and PBS 1X was added to complete 2 mL of volume. Three cycles were performed in the fastprep equipment at a speed of 5.0 m s-1, for 40 s, leaving samples on ice for 5 min between each cycle. It was centrifuged at 13000 rpm at 4 ° C for 20 min. The supernatant is the soluble fraction. The pellet was resuspended in 1 mL urea and 3 cycles were performed in fastprep equipment. It was centrifuged and the supernatant is the insoluble fraction. The soluble and insoluble fractions of rHspX were analyzed by polyacrylamide gel electrophoresis SDS-PAGE 14 % stained with Coomassie blue and by western blot with nitrocellulose membrane (Immobilon-pSQ) using Tris-glycine buffer in methanol 20 % pH 8.3,
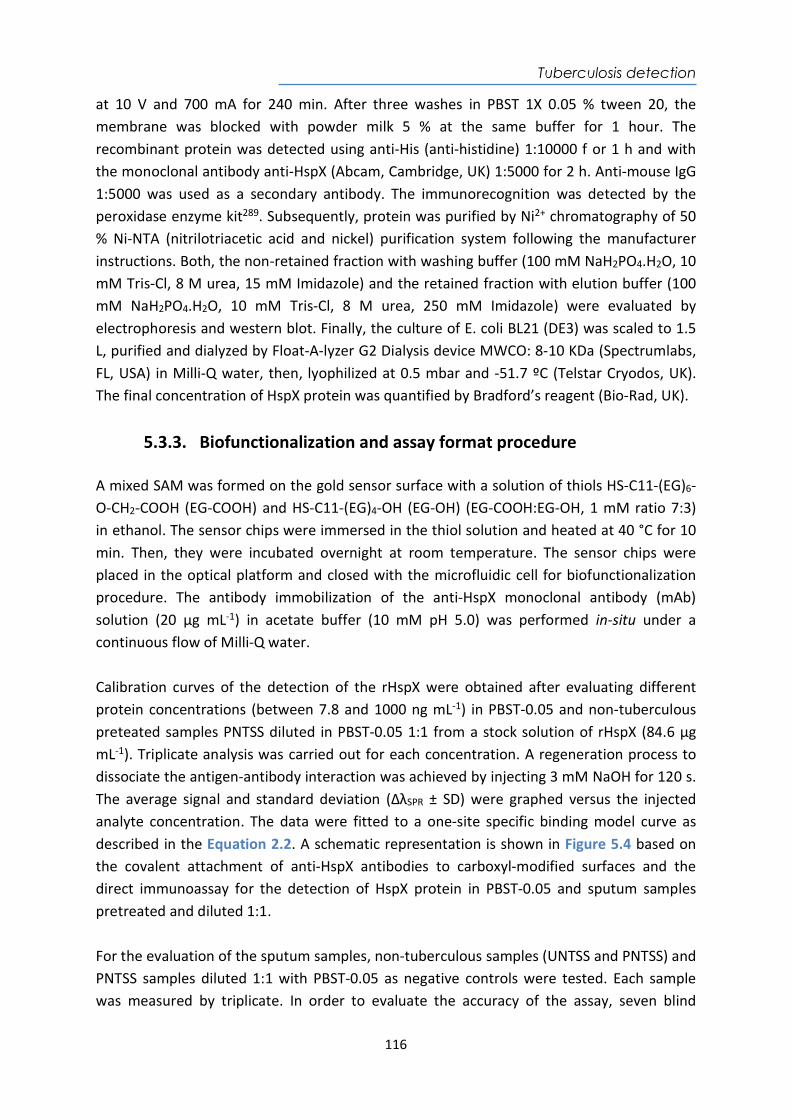
Tuberculosis detection
116
at 10 V and 700 mA for 240 min. After three washes in PBST 1X 0.05 % tween 20, the membrane was blocked with powder milk 5 % at the same buffer for 1 hour. The recombinant protein was detected using anti-His (anti-histidine) 1:10000 f or 1 h and with the monoclonal antibody anti-HspX (Abcam, Cambridge, UK) 1:5000 for 2 h. Anti-mouse IgG 1:5000 was used as a secondary antibody. The immunorecognition was detected by the peroxidase enzyme kit289. Subsequently, protein was purified by Ni2+ chromatography of 50 % Ni-NTA (nitrilotriacetic acid and nickel) purification system following the manufacturer instructions. Both, the non-retained fraction with washing buffer (100 mM NaH2PO4.H2O, 10 mM Tris-Cl, 8 M urea, 15 mM Imidazole) and the retained fraction with elution buffer (100 mM NaH2PO4.H2O, 10 mM Tris-Cl, 8 M urea, 250 mM Imidazole) were evaluated by electrophoresis and western blot. Finally, the culture of E. coli BL21 (DE3) was scaled to 1.5 L, purified and dialyzed by Float-A-lyzer G2 Dialysis device MWCO: 8-10 KDa (Spectrumlabs, FL, USA) in Milli-Q water, then, lyophilized at 0.5 mbar and -51.7 ºC (Telstar Cryodos, UK). The final concentration of HspX protein was quantified by Bradford’s reagent (Bio-Rad, UK).
5.3.3. Biofunctionalization and assay format procedure A mixed SAM was formed on the gold sensor surface with a solution of thiols HS-C11-(EG)6-O-CH2-COOH (EG-COOH) and HS-C11-(EG)4-OH (EG-OH) (EG-COOH:EG-OH, 1 mM ratio 7:3) in ethanol. The sensor chips were immersed in the thiol solution and heated at 40 °C for 10 min. Then, they were incubated overnight at room temperature. The sensor chips were placed in the optical platform and closed with the microfluidic cell for biofunctionalization procedure. The antibody immobilization of the anti-HspX monoclonal antibody (mAb) solution (20 µg mL-1) in acetate buffer (10 mM pH 5.0) was performed in-situ under a continuous flow of Milli-Q water. Calibration curves of the detection of the rHspX were obtained after evaluating different protein concentrations (between 7.8 and 1000 ng mL-1) in PBST-0.05 and non-tuberculous preteated samples PNTSS diluted in PBST-0.05 1:1 from a stock solution of rHspX (84.6 µg mL-1). Triplicate analysis was carried out for each concentration. A regeneration process to dissociate the antigen-antibody interaction was achieved by injecting 3 mM NaOH for 120 s. The average signal and standard deviation (ΔλSPR ± SD) were graphed versus the injected analyte concentration. The data were fitted to a one-site specific binding model curve as described in the Equation 2.2. A schematic representation is shown in Figure 5.4 based on the covalent attachment of anti-HspX antibodies to carboxyl-modified surfaces and the direct immunoassay for the detection of HspX protein in PBST-0.05 and sputum samples pretreated and diluted 1:1. For the evaluation of the sputum samples, non-tuberculous samples (UNTSS and PNTSS) and PNTSS samples diluted 1:1 with PBST-0.05 as negative controls were tested. Each sample was measured by triplicate. In order to evaluate the accuracy of the assay, seven blind
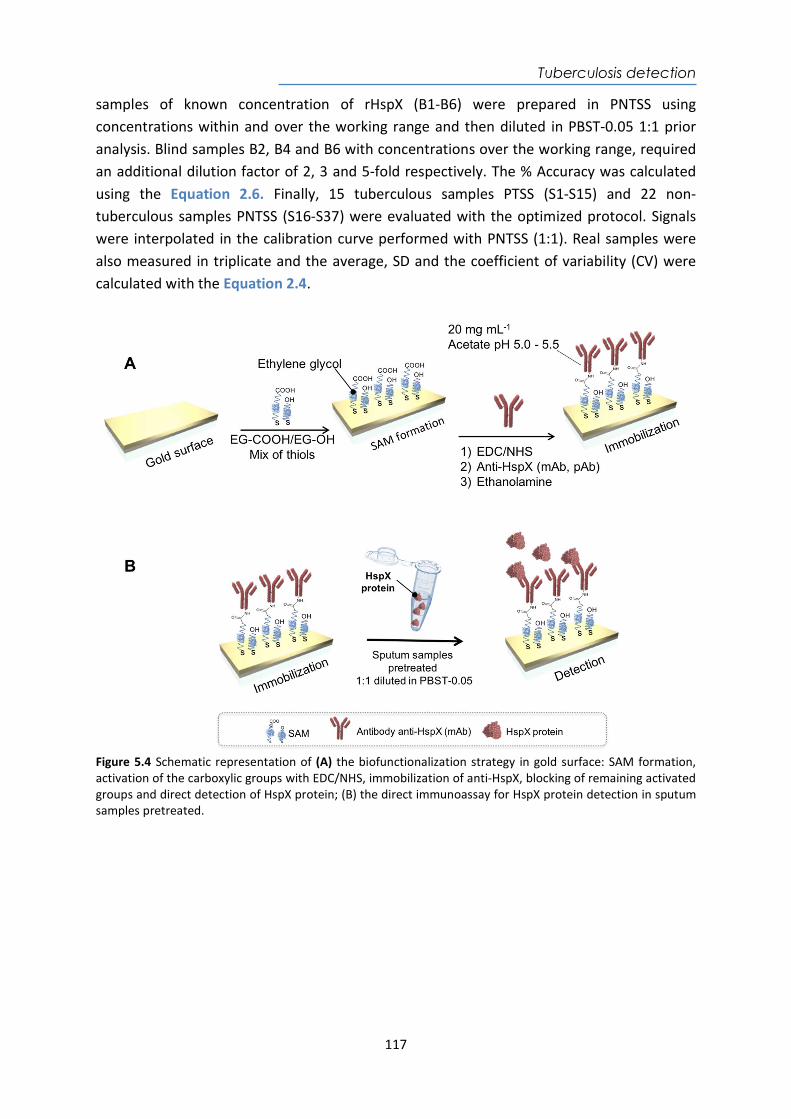
Tuberculosis detection
117
samples of known concentration of rHspX (B1-B6) were prepared in PNTSS using concentrations within and over the working range and then diluted in PBST-0.05 1:1 prior analysis. Blind samples B2, B4 and B6 with concentrations over the working range, required an additional dilution factor of 2, 3 and 5-fold respectively. The % Accuracy was calculated using the Equation 2.6. Finally, 15 tuberculous samples PTSS (S1-S15) and 22 non-tuberculous samples PNTSS (S16-S37) were evaluated with the optimized protocol. Signals were interpolated in the calibration curve performed with PNTSS (1:1). Real samples were also measured in triplicate and the average, SD and the coefficient of variability (CV) were calculated with the Equation 2.4.
Figure 5.4 Schematic representation of (A) the biofunctionalization strategy in gold surface: SAM formation, activation of the carboxylic groups with EDC/NHS, immobilization of anti-HspX, blocking of remaining activated groups and direct detection of HspX protein; (B) the direct immunoassay for HspX protein detection in sputum samples pretreated.
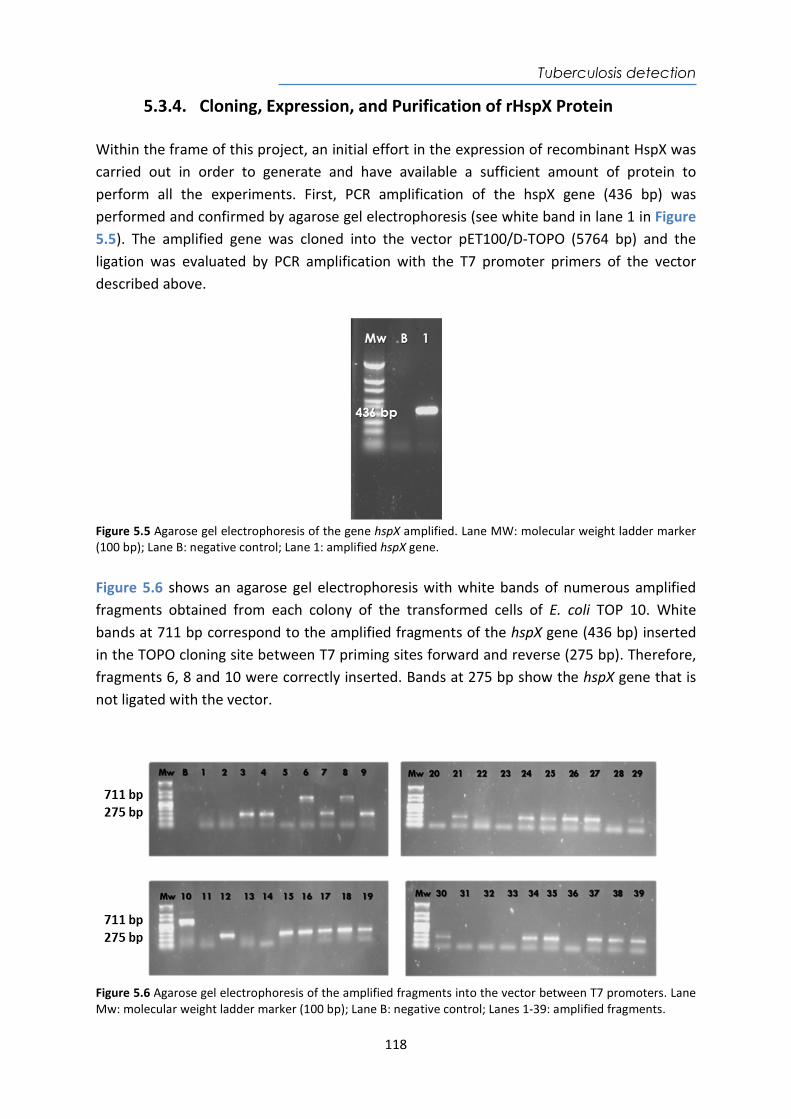
Tuberculosis detection
118
5.3.4. Cloning, Expression, and Purification of rHspX Protein Within the frame of this project, an initial effort in the expression of recombinant HspX was carried out in order to generate and have available a sufficient amount of protein to perform all the experiments. First, PCR amplification of the hspX gene (436 bp) was performed and confirmed by agarose gel electrophoresis (see white band in lane 1 in Figure 5.5). The amplified gene was cloned into the vector pET100/D-TOPO (5764 bp) and the ligation was evaluated by PCR amplification with the T7 promoter primers of the vector described above.
Figure 5.5 Agarose gel electrophoresis of the gene hspX amplified. Lane MW: molecular weight ladder marker (100 bp); Lane B: negative control; Lane 1: amplified hspX gene. Figure 5.6 shows an agarose gel electrophoresis with white bands of numerous amplified fragments obtained from each colony of the transformed cells of E. coli TOP 10. White bands at 711 bp correspond to the amplified fragments of the hspX gene (436 bp) inserted in the TOPO cloning site between T7 priming sites forward and reverse (275 bp). Therefore, fragments 6, 8 and 10 were correctly inserted. Bands at 275 bp show the hspX gene that is not ligated with the vector.
Figure 5.6 Agarose gel electrophoresis of the amplified fragments into the vector between T7 promoters. Lane Mw: molecular weight ladder marker (100 bp); Lane B: negative control; Lanes 1-39: amplified fragments.
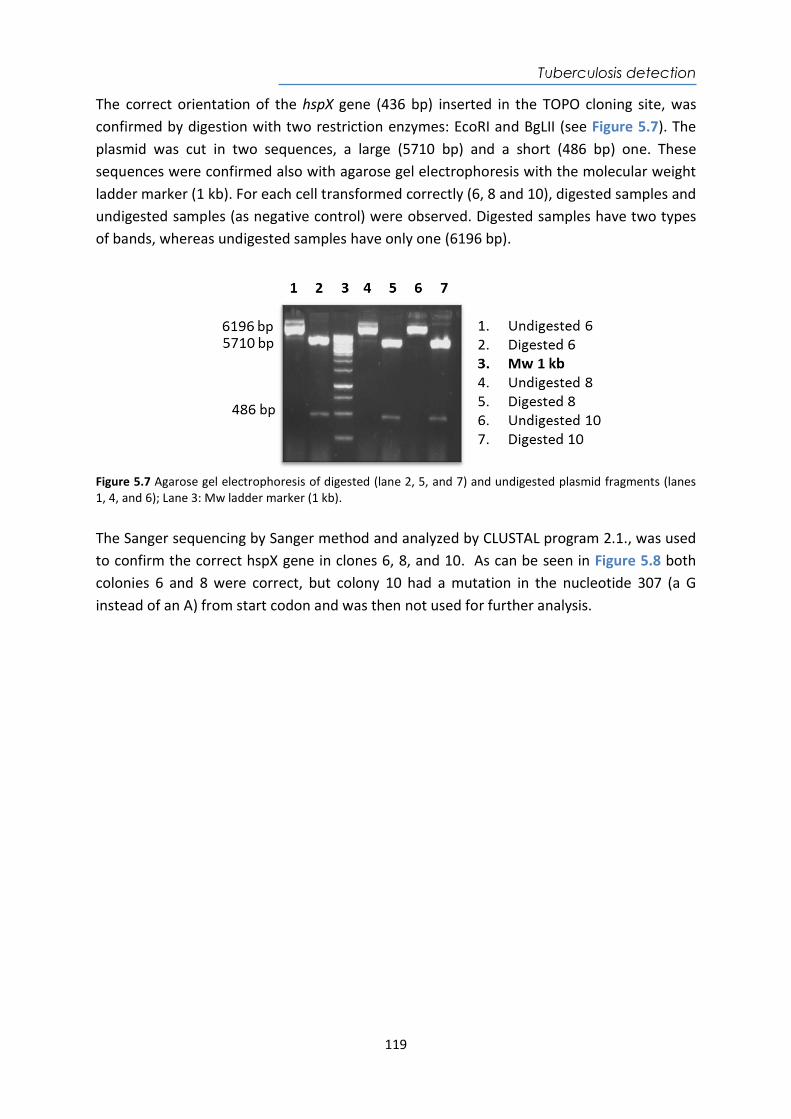
Tuberculosis detection
119
The correct orientation of the hspX gene (436 bp) inserted in the TOPO cloning site, was confirmed by digestion with two restriction enzymes: EcoRI and BgLII (see Figure 5.7). The plasmid was cut in two sequences, a large (5710 bp) and a short (486 bp) one. These sequences were confirmed also with agarose gel electrophoresis with the molecular weight ladder marker (1 kb). For each cell transformed correctly (6, 8 and 10), digested samples and undigested samples (as negative control) were observed. Digested samples have two types of bands, whereas undigested samples have only one (6196 bp).
Figure 5.7 Agarose gel electrophoresis of digested (lane 2, 5, and 7) and undigested plasmid fragments (lanes 1, 4, and 6); Lane 3: Mw ladder marker (1 kb). The Sanger sequencing by Sanger method and analyzed by CLUSTAL program 2.1., was used to confirm the correct hspX gene in clones 6, 8, and 10. As can be seen in Figure 5.8 both colonies 6 and 8 were correct, but colony 10 had a mutation in the nucleotide 307 (a G instead of an A) from start codon and was then not used for further analysis.
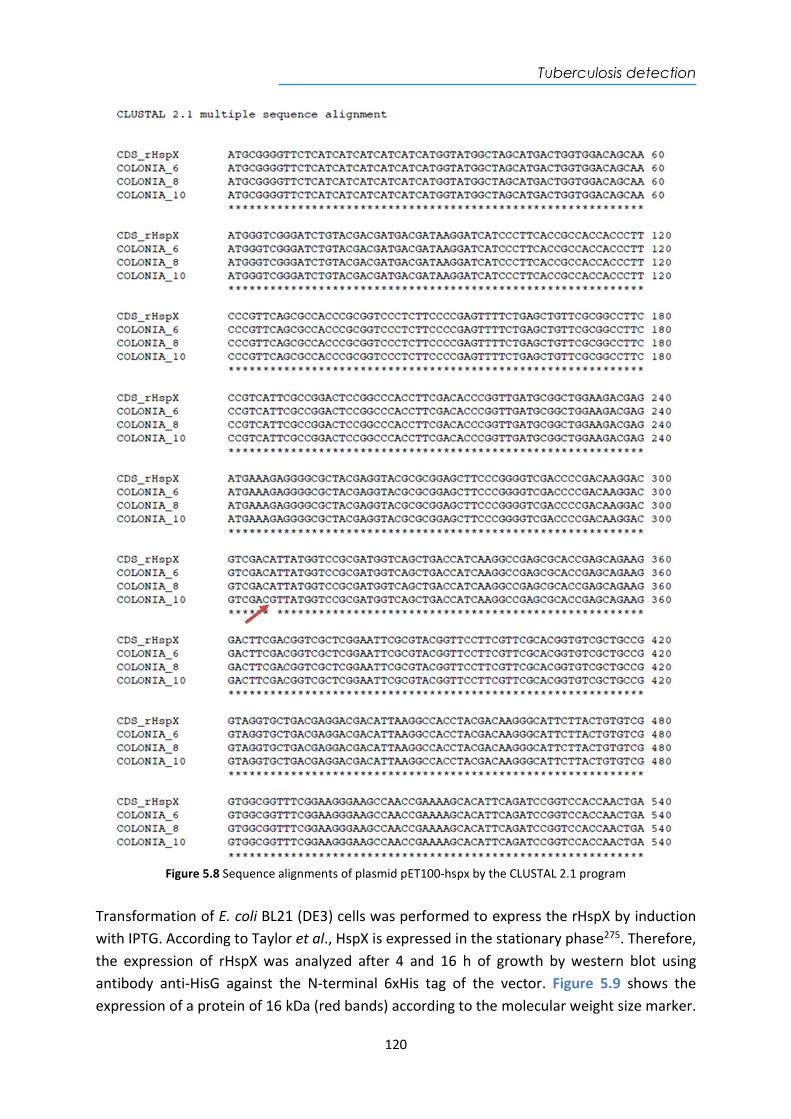
Tuberculosis detection
120
Figure 5.8 Sequence alignments of plasmid pET100-hspx by the CLUSTAL 2.1 program
Transformation of E. coli BL21 (DE3) cells was performed to express the rHspX by induction with IPTG. According to Taylor et al., HspX is expressed in the stationary phase275. Therefore, the expression of rHspX was analyzed after 4 and 16 h of growth by western blot using antibody anti-HisG against the N-terminal 6xHis tag of the vector. Figure 5.9 shows the expression of a protein of 16 kDa (red bands) according to the molecular weight size marker.
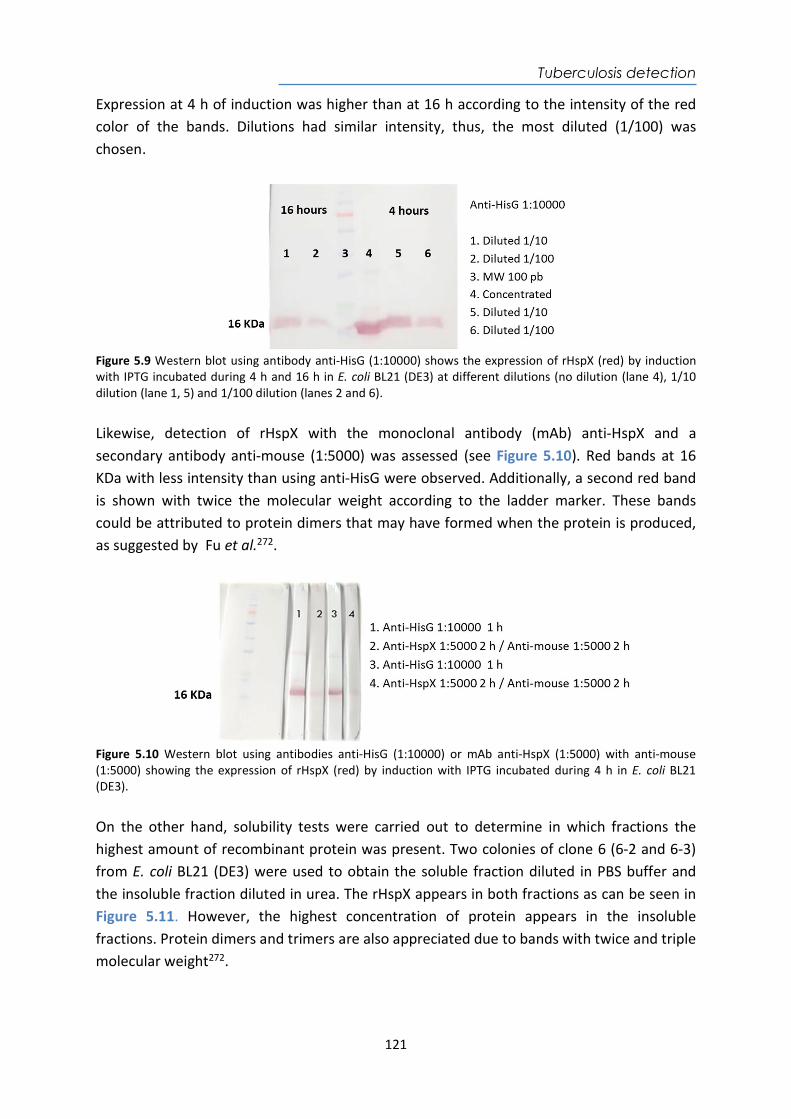
Tuberculosis detection
121
Expression at 4 h of induction was higher than at 16 h according to the intensity of the red color of the bands. Dilutions had similar intensity, thus, the most diluted (1/100) was chosen.
Figure 5.9 Western blot using antibody anti-HisG (1:10000) shows the expression of rHspX (red) by induction with IPTG incubated during 4 h and 16 h in E. coli BL21 (DE3) at different dilutions (no dilution (lane 4), 1/10 dilution (lane 1, 5) and 1/100 dilution (lanes 2 and 6). Likewise, detection of rHspX with the monoclonal antibody (mAb) anti-HspX and a secondary antibody anti-mouse (1:5000) was assessed (see Figure 5.10). Red bands at 16 KDa with less intensity than using anti-HisG were observed. Additionally, a second red band is shown with twice the molecular weight according to the ladder marker. These bands could be attributed to protein dimers that may have formed when the protein is produced, as suggested by Fu et al.272.
Figure 5.10 Western blot using antibodies anti-HisG (1:10000) or mAb anti-HspX (1:5000) with anti-mouse (1:5000) showing the expression of rHspX (red) by induction with IPTG incubated during 4 h in E. coli BL21 (DE3). On the other hand, solubility tests were carried out to determine in which fractions the highest amount of recombinant protein was present. Two colonies of clone 6 (6-2 and 6-3) from E. coli BL21 (DE3) were used to obtain the soluble fraction diluted in PBS buffer and the insoluble fraction diluted in urea. The rHspX appears in both fractions as can be seen in Figure 5.11. However, the highest concentration of protein appears in the insoluble fractions. Protein dimers and trimers are also appreciated due to bands with twice and triple molecular weight272.
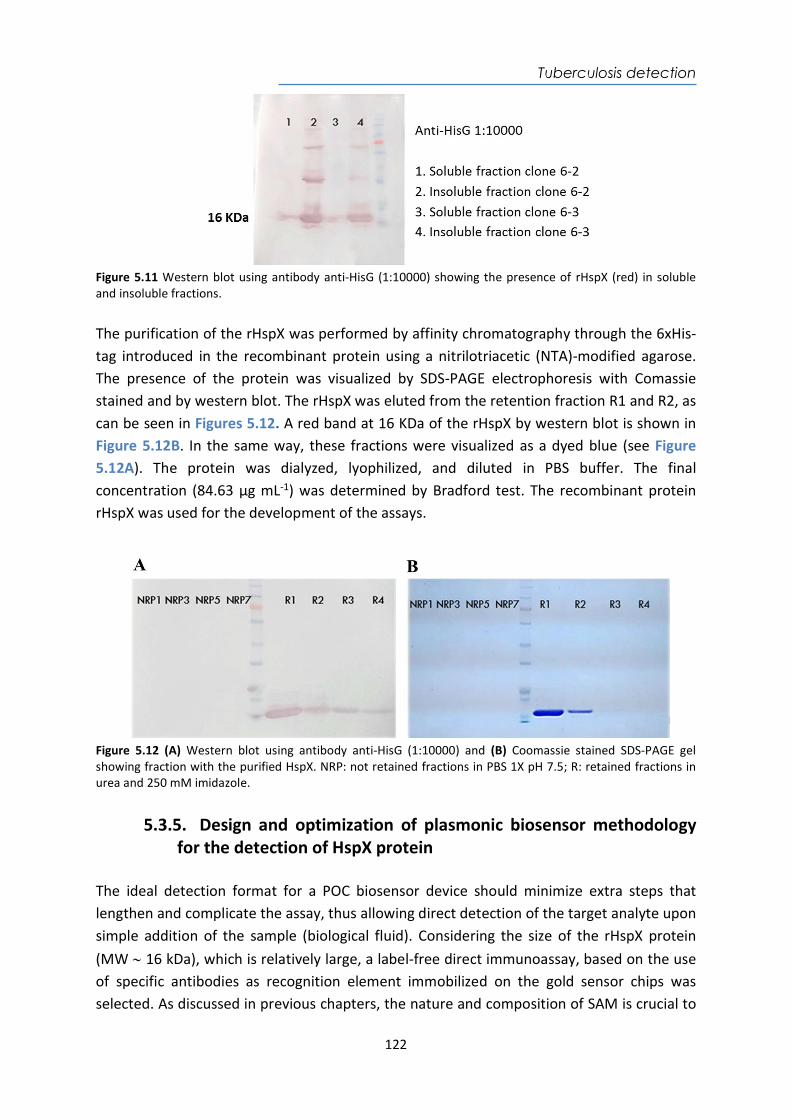
Tuberculosis detection
122
Figure 5.11 Western blot using antibody anti-HisG (1:10000) showing the presence of rHspX (red) in soluble and insoluble fractions. The purification of the rHspX was performed by affinity chromatography through the 6xHis-tag introduced in the recombinant protein using a nitrilotriacetic (NTA)-modified agarose. The presence of the protein was visualized by SDS-PAGE electrophoresis with Comassie stained and by western blot. The rHspX was eluted from the retention fraction R1 and R2, as can be seen in Figures 5.12. A red band at 16 KDa of the rHspX by western blot is shown in Figure 5.12B. In the same way, these fractions were visualized as a dyed blue (see Figure 5.12A). The protein was dialyzed, lyophilized, and diluted in PBS buffer. The final concentration (84.63 µg mL-1) was determined by Bradford test. The recombinant protein rHspX was used for the development of the assays.
Figure 5.12 (A) Western blot using antibody anti-HisG (1:10000) and (B) Coomassie stained SDS-PAGE gel showing fraction with the purified HspX. NRP: not retained fractions in PBS 1X pH 7.5; R: retained fractions in urea and 250 mM imidazole.
5.3.5. Design and optimization of plasmonic biosensor methodology for the detection of HspX protein
The ideal detection format for a POC biosensor device should minimize extra steps that lengthen and complicate the assay, thus allowing direct detection of the target analyte upon simple addition of the sample (biological fluid). Considering the size of the rHspX protein (MW 16 kDa), which is relatively large, a label-free direct immunoassay, based on the use of specific antibodies as recognition element immobilized on the gold sensor chips was selected. As discussed in previous chapters, the nature and composition of SAM is crucial to
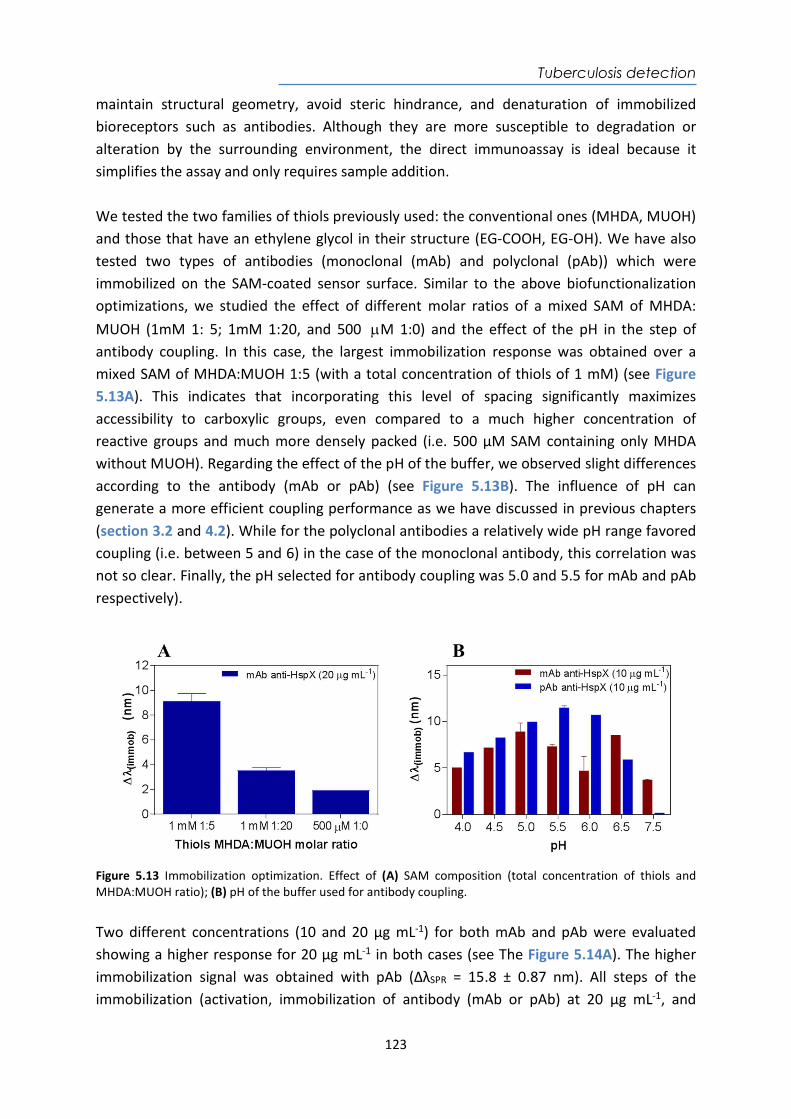
Tuberculosis detection
123
maintain structural geometry, avoid steric hindrance, and denaturation of immobilized bioreceptors such as antibodies. Although they are more susceptible to degradation or alteration by the surrounding environment, the direct immunoassay is ideal because it simplifies the assay and only requires sample addition. We tested the two families of thiols previously used: the conventional ones (MHDA, MUOH) and those that have an ethylene glycol in their structure (EG-COOH, EG-OH). We have also tested two types of antibodies (monoclonal (mAb) and polyclonal (pAb)) which were immobilized on the SAM-coated sensor surface. Similar to the above biofunctionalization optimizations, we studied the effect of different molar ratios of a mixed SAM of MHDA: MUOH (1mM 1: 5; 1mM 1:20, and 500 M 1:0) and the effect of the pH in the step of antibody coupling. In this case, the largest immobilization response was obtained over a mixed SAM of MHDA:MUOH 1:5 (with a total concentration of thiols of 1 mM) (see Figure 5.13A). This indicates that incorporating this level of spacing significantly maximizes accessibility to carboxylic groups, even compared to a much higher concentration of reactive groups and much more densely packed (i.e. 500 µM SAM containing only MHDA without MUOH). Regarding the effect of the pH of the buffer, we observed slight differences according to the antibody (mAb or pAb) (see Figure 5.13B). The influence of pH can generate a more efficient coupling performance as we have discussed in previous chapters (section 3.2 and 4.2). While for the polyclonal antibodies a relatively wide pH range favored coupling (i.e. between 5 and 6) in the case of the monoclonal antibody, this correlation was not so clear. Finally, the pH selected for antibody coupling was 5.0 and 5.5 for mAb and pAb respectively).
Figure 5.13 Immobilization optimization. Effect of (A) SAM composition (total concentration of thiols and MHDA:MUOH ratio); (B) pH of the buffer used for antibody coupling. Two different concentrations (10 and 20 µg mL-1) for both mAb and pAb were evaluated showing a higher response for 20 µg mL-1 in both cases (see The Figure 5.14A). The higher immobilization signal was obtained with pAb (ΔλSPR = 15.8 ± 0.87 nm). All steps of the immobilization (activation, immobilization of antibody (mAb or pAb) at 20 µg mL-1, and
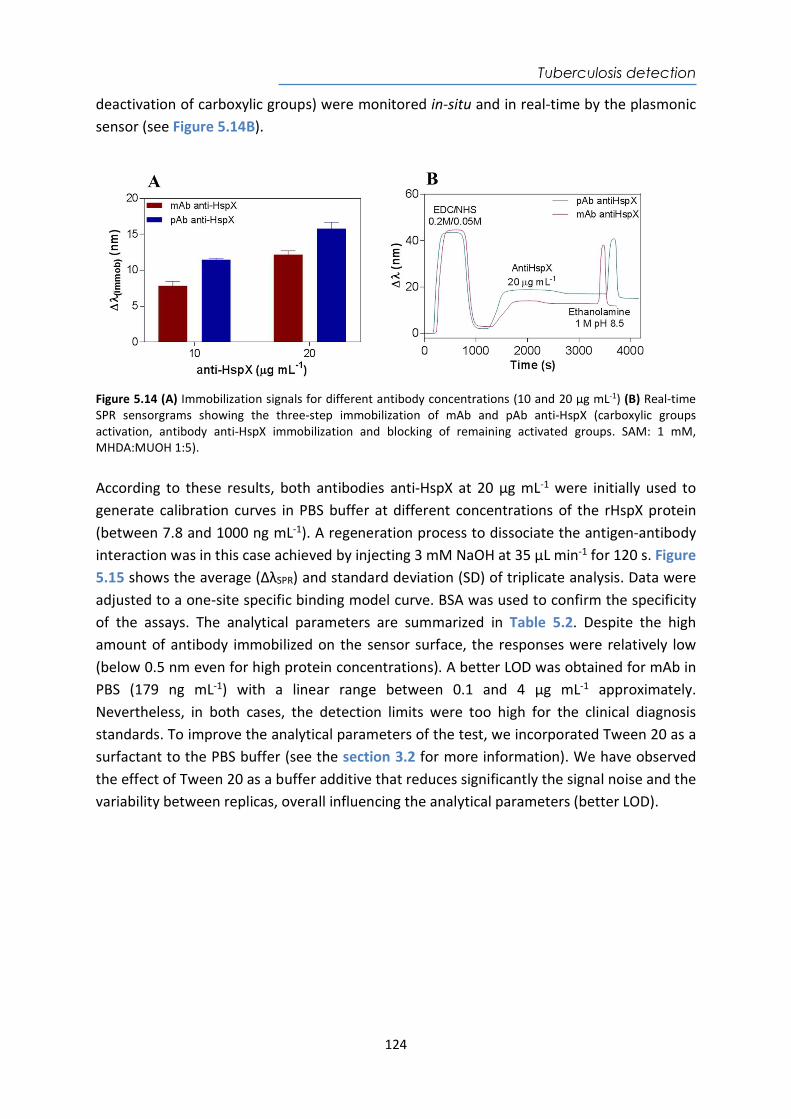
Tuberculosis detection
124
deactivation of carboxylic groups) were monitored in-situ and in real-time by the plasmonic sensor (see Figure 5.14B).
Figure 5.14 (A) Immobilization signals for different antibody concentrations (10 and 20 µg mL-1) (B) Real-time SPR sensorgrams showing the three-step immobilization of mAb and pAb anti-HspX (carboxylic groups activation, antibody anti-HspX immobilization and blocking of remaining activated groups. SAM: 1 mM, MHDA:MUOH 1:5). According to these results, both antibodies anti-HspX at 20 µg mL-1 were initially used to generate calibration curves in PBS buffer at different concentrations of the rHspX protein (between 7.8 and 1000 ng mL-1). A regeneration process to dissociate the antigen-antibody interaction was in this case achieved by injecting 3 mM NaOH at 35 µL min-1 for 120 s. Figure 5.15 shows the average (ΔλSPR) and standard deviation (SD) of triplicate analysis. Data were adjusted to a one-site specific binding model curve. BSA was used to confirm the specificity of the assays. The analytical parameters are summarized in Table 5.2. Despite the high amount of antibody immobilized on the sensor surface, the responses were relatively low (below 0.5 nm even for high protein concentrations). A better LOD was obtained for mAb in PBS (179 ng mL-1) with a linear range between 0.1 and 4 µg mL-1 approximately. Nevertheless, in both cases, the detection limits were too high for the clinical diagnosis standards. To improve the analytical parameters of the test, we incorporated Tween 20 as a surfactant to the PBS buffer (see the section 3.2 for more information). We have observed the effect of Tween 20 as a buffer additive that reduces significantly the signal noise and the variability between replicas, overall influencing the analytical parameters (better LOD).
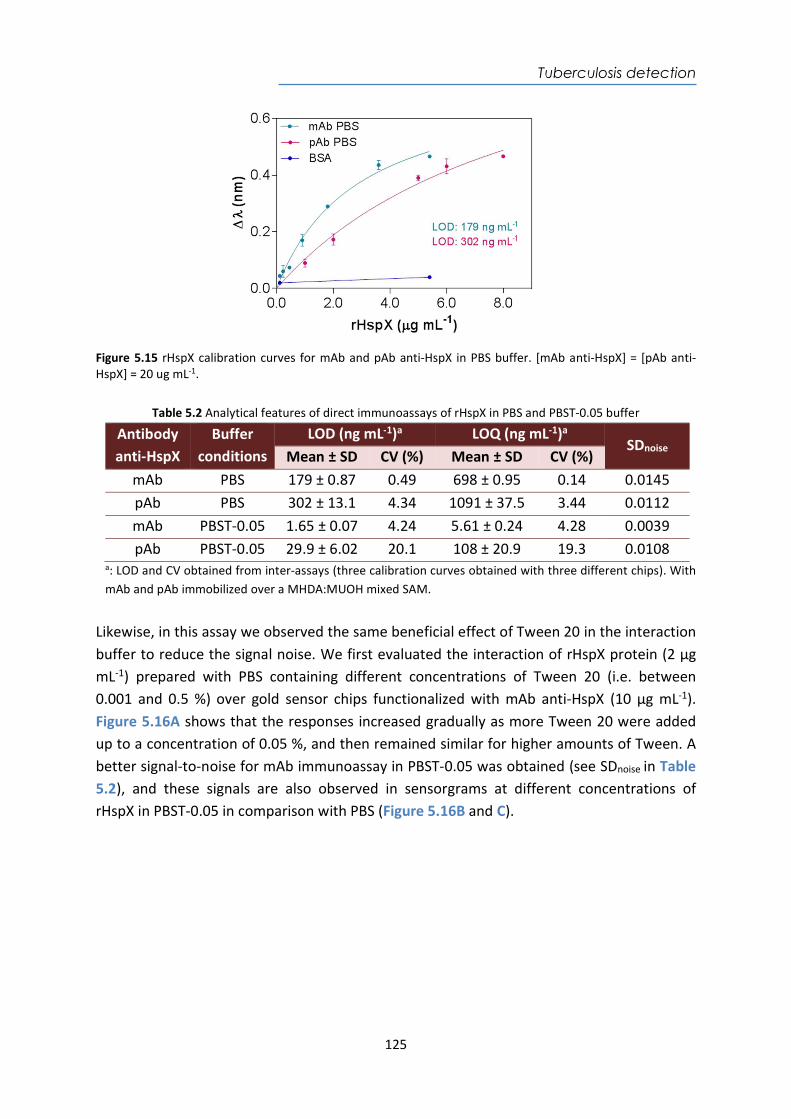
Tuberculosis detection
125
Figure 5.15 rHspX calibration curves for mAb and pAb anti-HspX in PBS buffer. [mAb anti-HspX] = [pAb anti-HspX] = 20 ug mL-1.
Table 5.2 Analytical features of direct immunoassays of rHspX in PBS and PBST-0.05 buffer
Antibody anti-HspX
Buffer conditions
LOD (ng mL-1)a LOQ (ng mL-1)a SDnoise
Mean ± SD CV (%) Mean ± SD CV (%) mAb PBS 179 ± 0.87 0.49 698 ± 0.95 0.14 0.0145 pAb PBS 302 ± 13.1 4.34 1091 ± 37.5 3.44 0.0112 mAb PBST-0.05 1.65 ± 0.07 4.24 5.61 ± 0.24 4.28 0.0039 pAb PBST-0.05 29.9 ± 6.02 20.1 108 ± 20.9 19.3 0.0108
a: LOD and CV obtained from inter-assays (three calibration curves obtained with three different chips). With mAb and pAb immobilized over a MHDA:MUOH mixed SAM.
Likewise, in this assay we observed the same beneficial effect of Tween 20 in the interaction buffer to reduce the signal noise. We first evaluated the interaction of rHspX protein (2 µg mL-1) prepared with PBS containing different concentrations of Tween 20 (i.e. between 0.001 and 0.5 %) over gold sensor chips functionalized with mAb anti-HspX (10 µg mL-1). Figure 5.16A shows that the responses increased gradually as more Tween 20 were added up to a concentration of 0.05 %, and then remained similar for higher amounts of Tween. A better signal-to-noise for mAb immunoassay in PBST-0.05 was obtained (see SDnoise in Table 5.2), and these signals are also observed in sensorgrams at different concentrations of rHspX in PBST-0.05 in comparison with PBS (Figure 5.16B and C).
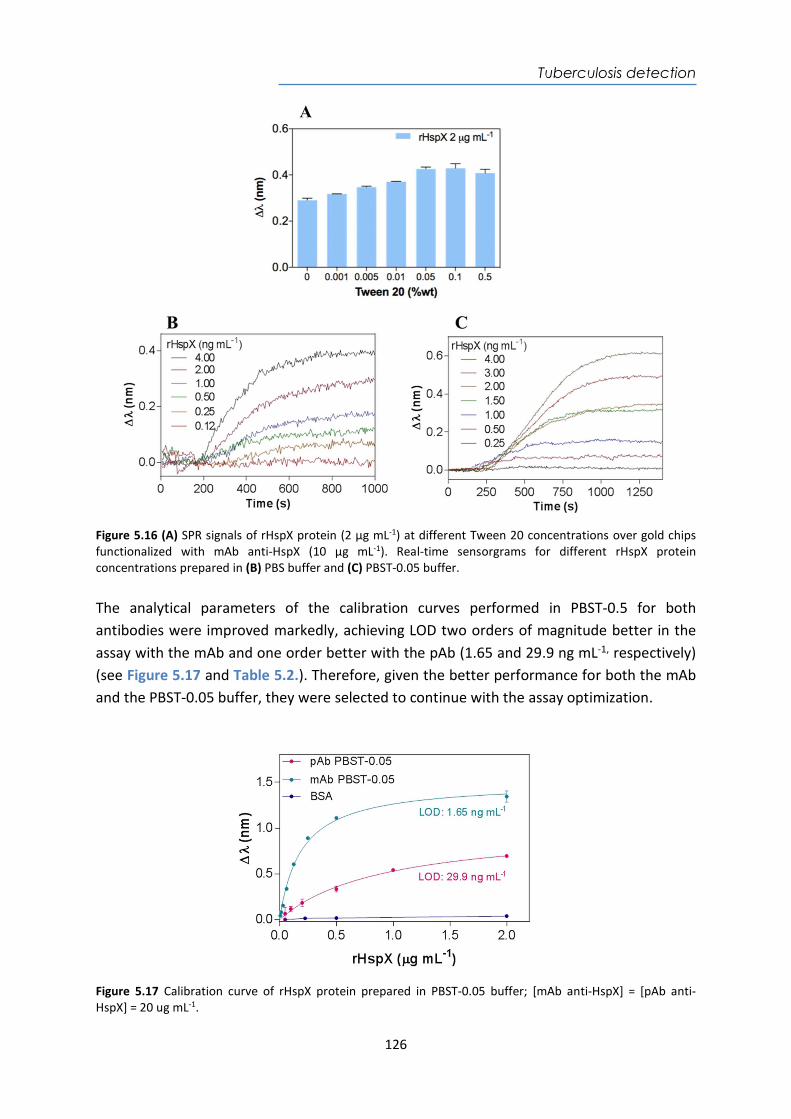
Tuberculosis detection
126
Figure 5.16 (A) SPR signals of rHspX protein (2 µg mL-1) at different Tween 20 concentrations over gold chips functionalized with mAb anti-HspX (10 µg mL-1). Real-time sensorgrams for different rHspX protein concentrations prepared in (B) PBS buffer and (C) PBST-0.05 buffer. The analytical parameters of the calibration curves performed in PBST-0.5 for both antibodies were improved markedly, achieving LOD two orders of magnitude better in the assay with the mAb and one order better with the pAb (1.65 and 29.9 ng mL-1, respectively) (see Figure 5.17 and Table 5.2.). Therefore, given the better performance for both the mAb and the PBST-0.05 buffer, they were selected to continue with the assay optimization.
Figure 5.17 Calibration curve of rHspX protein prepared in PBST-0.05 buffer; [mAb anti-HspX] = [pAb anti-HspX] = 20 ug mL-1.
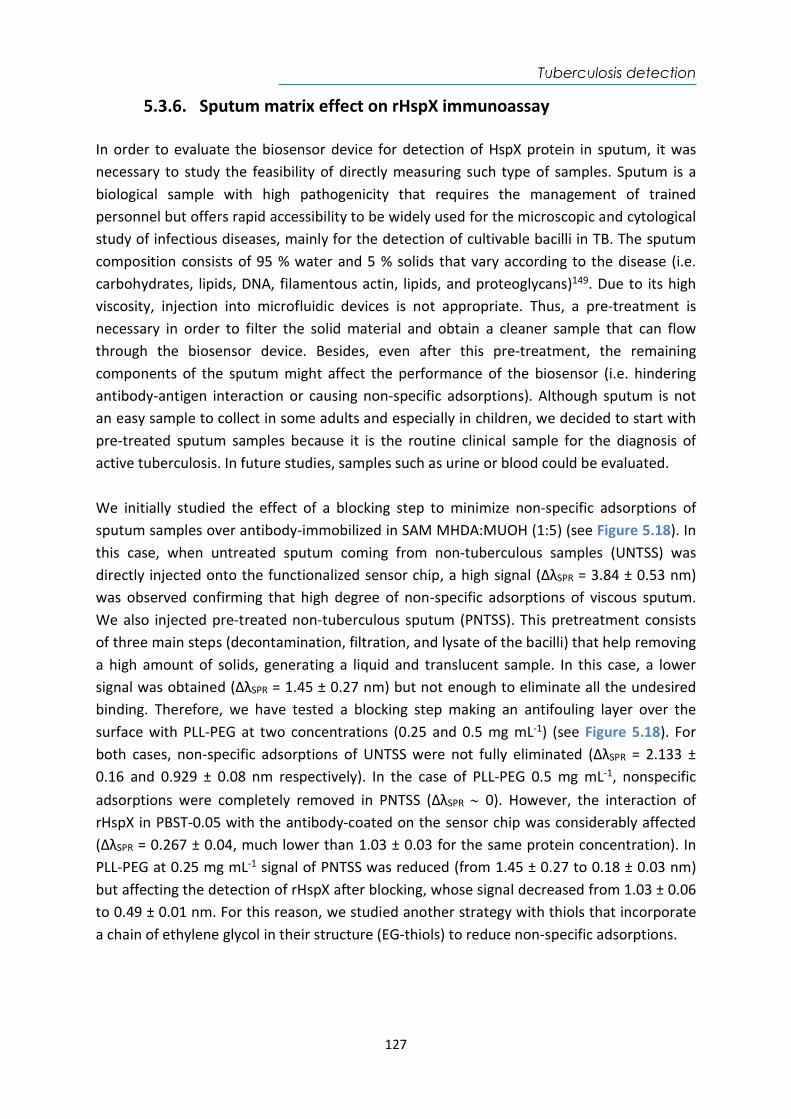
Tuberculosis detection
127
5.3.6. Sputum matrix effect on rHspX immunoassay In order to evaluate the biosensor device for detection of HspX protein in sputum, it was necessary to study the feasibility of directly measuring such type of samples. Sputum is a biological sample with high pathogenicity that requires the management of trained personnel but offers rapid accessibility to be widely used for the microscopic and cytological study of infectious diseases, mainly for the detection of cultivable bacilli in TB. The sputum composition consists of 95 % water and 5 % solids that vary according to the disease (i.e. carbohydrates, lipids, DNA, filamentous actin, lipids, and proteoglycans)149. Due to its high viscosity, injection into microfluidic devices is not appropriate. Thus, a pre-treatment is necessary in order to filter the solid material and obtain a cleaner sample that can flow through the biosensor device. Besides, even after this pre-treatment, the remaining components of the sputum might affect the performance of the biosensor (i.e. hindering antibody-antigen interaction or causing non-specific adsorptions). Although sputum is not an easy sample to collect in some adults and especially in children, we decided to start with pre-treated sputum samples because it is the routine clinical sample for the diagnosis of active tuberculosis. In future studies, samples such as urine or blood could be evaluated. We initially studied the effect of a blocking step to minimize non-specific adsorptions of sputum samples over antibody-immobilized in SAM MHDA:MUOH (1:5) (see Figure 5.18). In this case, when untreated sputum coming from non-tuberculous samples (UNTSS) was directly injected onto the functionalized sensor chip, a high signal (ΔλSPR = 3.84 ± 0.53 nm) was observed confirming that high degree of non-specific adsorptions of viscous sputum. We also injected pre-treated non-tuberculous sputum (PNTSS). This pretreatment consists of three main steps (decontamination, filtration, and lysate of the bacilli) that help removing a high amount of solids, generating a liquid and translucent sample. In this case, a lower signal was obtained (ΔλSPR = 1.45 ± 0.27 nm) but not enough to eliminate all the undesired binding. Therefore, we have tested a blocking step making an antifouling layer over the surface with PLL-PEG at two concentrations (0.25 and 0.5 mg mL-1) (see Figure 5.18). For both cases, non-specific adsorptions of UNTSS were not fully eliminated (ΔλSPR = 2.133 ± 0.16 and 0.929 ± 0.08 nm respectively). In the case of PLL-PEG 0.5 mg mL-1, nonspecific adsorptions were completely removed in PNTSS (ΔλSPR 0). However, the interaction of rHspX in PBST-0.05 with the antibody-coated on the sensor chip was considerably affected (ΔλSPR = 0.267 ± 0.04, much lower than 1.03 ± 0.03 for the same protein concentration). In PLL-PEG at 0.25 mg mL-1 signal of PNTSS was reduced (from 1.45 ± 0.27 to 0.18 ± 0.03 nm) but affecting the detection of rHspX after blocking, whose signal decreased from 1.03 ± 0.06 to 0.49 ± 0.01 nm. For this reason, we studied another strategy with thiols that incorporate a chain of ethylene glycol in their structure (EG-thiols) to reduce non-specific adsorptions.
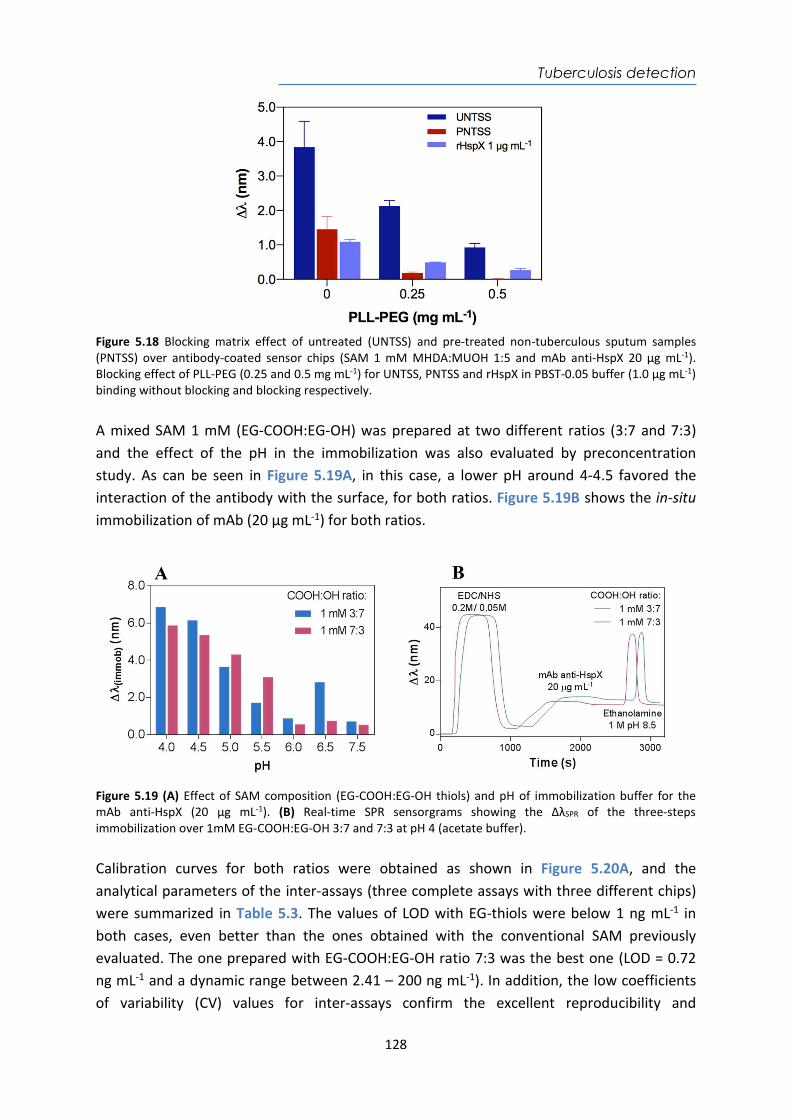
Tuberculosis detection
128
Figure 5.18 Blocking matrix effect of untreated (UNTSS) and pre-treated non-tuberculous sputum samples (PNTSS) over antibody-coated sensor chips (SAM 1 mM MHDA:MUOH 1:5 and mAb anti-HspX 20 µg mL-1). Blocking effect of PLL-PEG (0.25 and 0.5 mg mL-1) for UNTSS, PNTSS and rHspX in PBST-0.05 buffer (1.0 µg mL-1) binding without blocking and blocking respectively. A mixed SAM 1 mM (EG-COOH:EG-OH) was prepared at two different ratios (3:7 and 7:3) and the effect of the pH in the immobilization was also evaluated by preconcentration study. As can be seen in Figure 5.19A, in this case, a lower pH around 4-4.5 favored the interaction of the antibody with the surface, for both ratios. Figure 5.19B shows the in-situ immobilization of mAb (20 µg mL-1) for both ratios.
Figure 5.19 (A) Effect of SAM composition (EG-COOH:EG-OH thiols) and pH of immobilization buffer for the mAb anti-HspX (20 µg mL-1). (B) Real-time SPR sensorgrams showing the ΔλSPR of the three-steps immobilization over 1mM EG-COOH:EG-OH 3:7 and 7:3 at pH 4 (acetate buffer). Calibration curves for both ratios were obtained as shown in Figure 5.20A, and the analytical parameters of the inter-assays (three complete assays with three different chips) were summarized in Table 5.3. The values of LOD with EG-thiols were below 1 ng mL-1 in both cases, even better than the ones obtained with the conventional SAM previously evaluated. The one prepared with EG-COOH:EG-OH ratio 7:3 was the best one (LOD = 0.72 ng mL-1 and a dynamic range between 2.41 – 200 ng mL-1). In addition, the low coefficients of variability (CV) values for inter-assays confirm the excellent reproducibility and
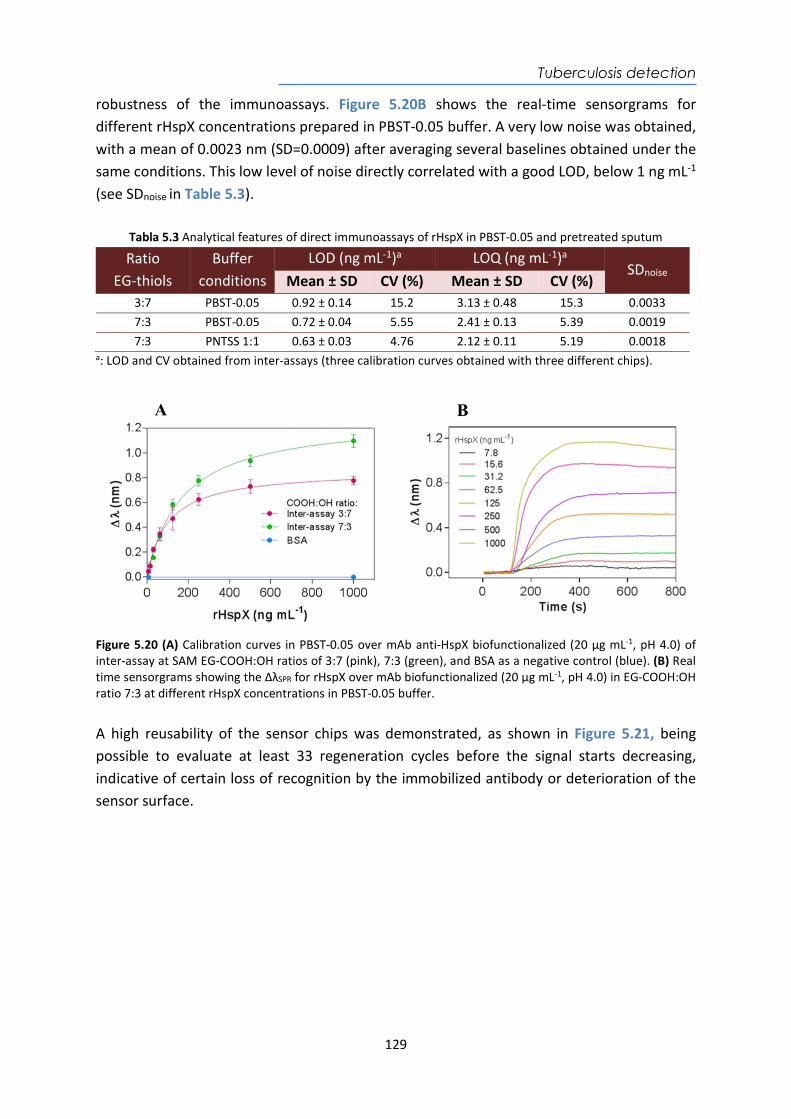
Tuberculosis detection
129
robustness of the immunoassays. Figure 5.20B shows the real-time sensorgrams for different rHspX concentrations prepared in PBST-0.05 buffer. A very low noise was obtained, with a mean of 0.0023 nm (SD=0.0009) after averaging several baselines obtained under the same conditions. This low level of noise directly correlated with a good LOD, below 1 ng mL-1 (see SDnoise in Table 5.3).
Tabla 5.3 Analytical features of direct immunoassays of rHspX in PBST-0.05 and pretreated sputum
Ratio EG-thiols
Buffer conditions
LOD (ng mL-1)a LOQ (ng mL-1)a SDnoise
Mean ± SD CV (%) Mean ± SD CV (%) 3:7 PBST-0.05 0.92 ± 0.14 15.2 3.13 ± 0.48 15.3 0.0033 7:3 PBST-0.05 0.72 ± 0.04 5.55 2.41 ± 0.13 5.39 0.0019 7:3 PNTSS 1:1 0.63 ± 0.03 4.76 2.12 ± 0.11 5.19 0.0018
a: LOD and CV obtained from inter-assays (three calibration curves obtained with three different chips).
Figure 5.20 (A) Calibration curves in PBST-0.05 over mAb anti-HspX biofunctionalized (20 µg mL-1, pH 4.0) of inter-assay at SAM EG-COOH:OH ratios of 3:7 (pink), 7:3 (green), and BSA as a negative control (blue). (B) Real time sensorgrams showing the ΔλSPR for rHspX over mAb biofunctionalized (20 µg mL-1, pH 4.0) in EG-COOH:OH ratio 7:3 at different rHspX concentrations in PBST-0.05 buffer. A high reusability of the sensor chips was demonstrated, as shown in Figure 5.21, being possible to evaluate at least 33 regeneration cycles before the signal starts decreasing, indicative of certain loss of recognition by the immobilized antibody or deterioration of the sensor surface.
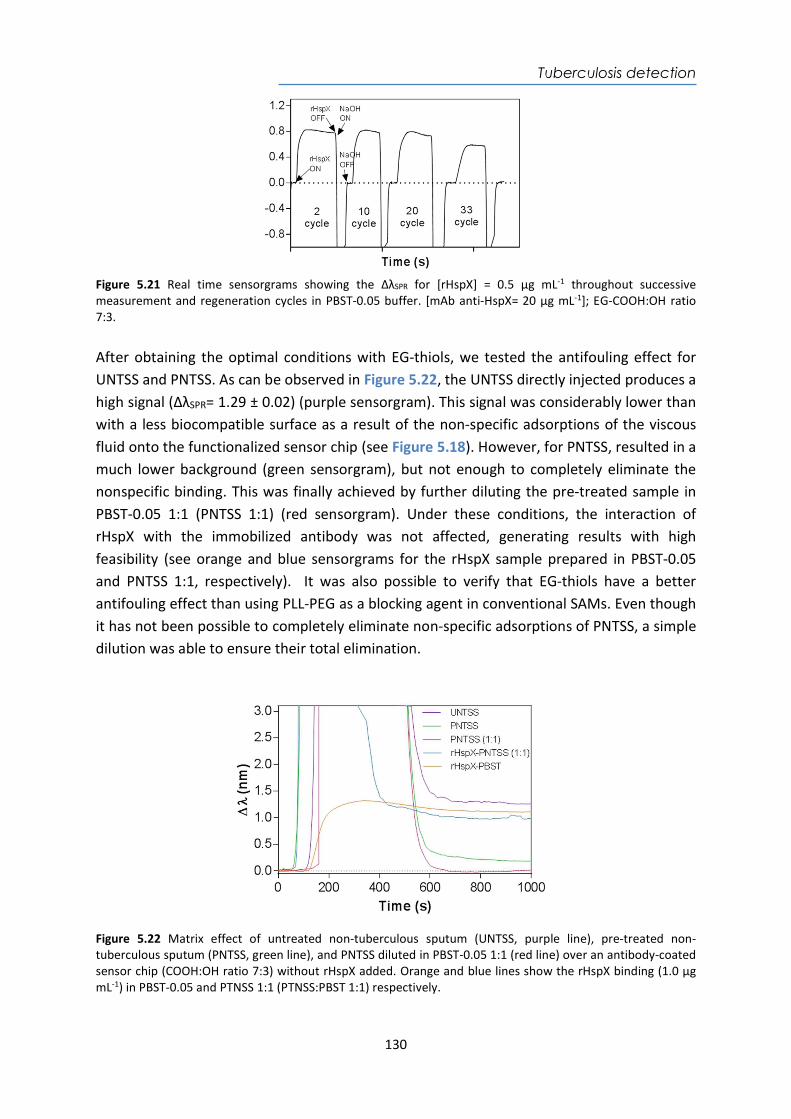
Tuberculosis detection
130
Figure 5.21 Real time sensorgrams showing the ΔλSPR for [rHspX] = 0.5 µg mL-1 throughout successive measurement and regeneration cycles in PBST-0.05 buffer. [mAb anti-HspX= 20 µg mL-1]; EG-COOH:OH ratio 7:3. After obtaining the optimal conditions with EG-thiols, we tested the antifouling effect for UNTSS and PNTSS. As can be observed in Figure 5.22, the UNTSS directly injected produces a high signal (ΔλSPR= 1.29 ± 0.02) (purple sensorgram). This signal was considerably lower than with a less biocompatible surface as a result of the non-specific adsorptions of the viscous fluid onto the functionalized sensor chip (see Figure 5.18). However, for PNTSS, resulted in a much lower background (green sensorgram), but not enough to completely eliminate the nonspecific binding. This was finally achieved by further diluting the pre-treated sample in PBST-0.05 1:1 (PNTSS 1:1) (red sensorgram). Under these conditions, the interaction of rHspX with the immobilized antibody was not affected, generating results with high feasibility (see orange and blue sensorgrams for the rHspX sample prepared in PBST-0.05 and PNTSS 1:1, respectively). It was also possible to verify that EG-thiols have a better antifouling effect than using PLL-PEG as a blocking agent in conventional SAMs. Even though it has not been possible to completely eliminate non-specific adsorptions of PNTSS, a simple dilution was able to ensure their total elimination.
Figure 5.22 Matrix effect of untreated non-tuberculous sputum (UNTSS, purple line), pre-treated non-tuberculous sputum (PNTSS, green line), and PNTSS diluted in PBST-0.05 1:1 (red line) over an antibody-coated sensor chip (COOH:OH ratio 7:3) without rHspX added. Orange and blue lines show the rHspX binding (1.0 µg mL-1) in PBST-0.05 and PTNSS 1:1 (PTNSS:PBST 1:1) respectively.
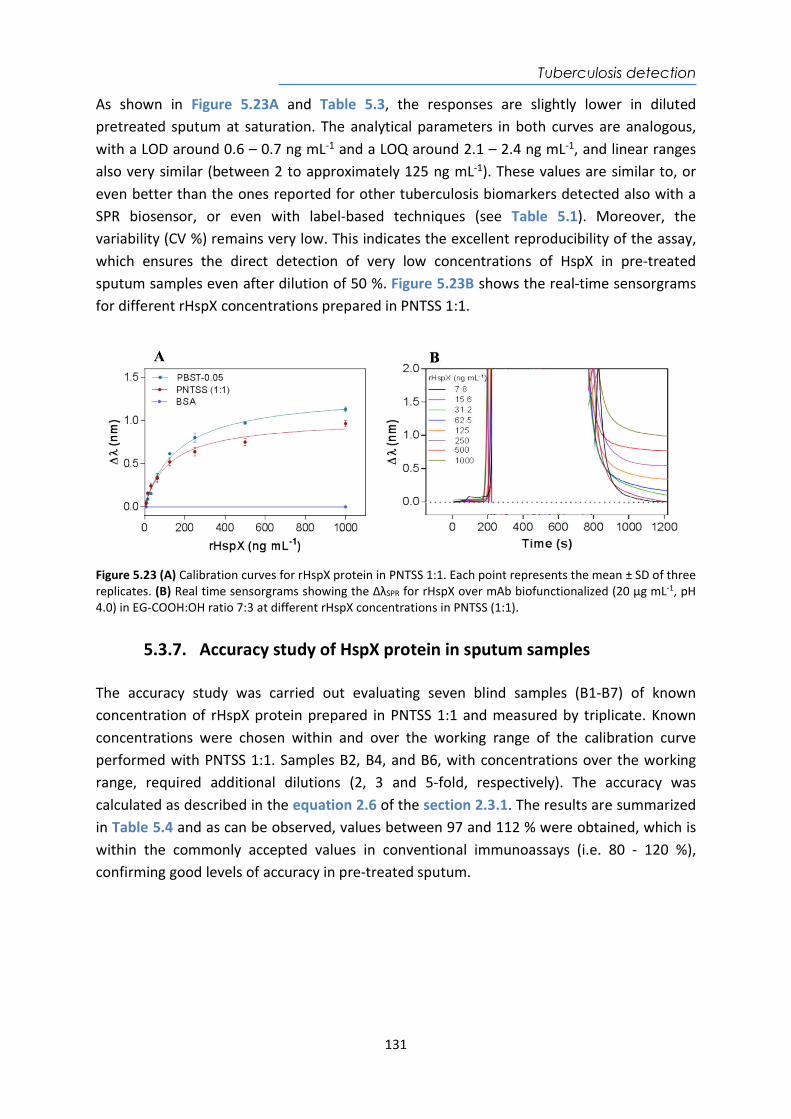
Tuberculosis detection
131
As shown in Figure 5.23A and Table 5.3, the responses are slightly lower in diluted pretreated sputum at saturation. The analytical parameters in both curves are analogous, with a LOD around 0.6 – 0.7 ng mL-1 and a LOQ around 2.1 – 2.4 ng mL-1, and linear ranges also very similar (between 2 to approximately 125 ng mL-1). These values are similar to, or even better than the ones reported for other tuberculosis biomarkers detected also with a SPR biosensor, or even with label-based techniques (see Table 5.1). Moreover, the variability (CV %) remains very low. This indicates the excellent reproducibility of the assay, which ensures the direct detection of very low concentrations of HspX in pre-treated sputum samples even after dilution of 50 %. Figure 5.23B shows the real-time sensorgrams for different rHspX concentrations prepared in PNTSS 1:1.
Figure 5.23 (A) Calibration curves for rHspX protein in PNTSS 1:1. Each point represents the mean ± SD of three replicates. (B) Real time sensorgrams showing the ΔλSPR for rHspX over mAb biofunctionalized (20 µg mL-1, pH 4.0) in EG-COOH:OH ratio 7:3 at different rHspX concentrations in PNTSS (1:1).
5.3.7. Accuracy study of HspX protein in sputum samples The accuracy study was carried out evaluating seven blind samples (B1-B7) of known concentration of rHspX protein prepared in PNTSS 1:1 and measured by triplicate. Known concentrations were chosen within and over the working range of the calibration curve performed with PNTSS 1:1. Samples B2, B4, and B6, with concentrations over the working range, required additional dilutions (2, 3 and 5-fold, respectively). The accuracy was calculated as described in the equation 2.6 of the section 2.3.1. The results are summarized in Table 5.4 and as can be observed, values between 97 and 112 % were obtained, which is within the commonly accepted values in conventional immunoassays (i.e. 80 - 120 %), confirming good levels of accuracy in pre-treated sputum.
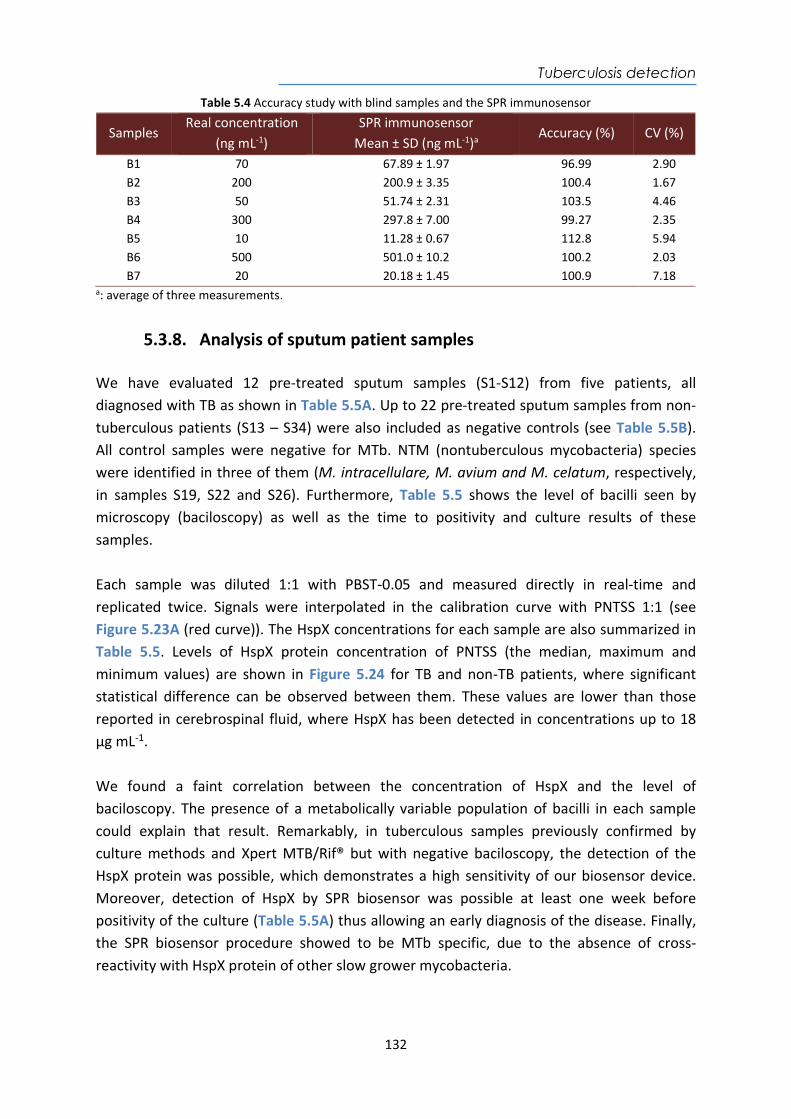
Tuberculosis detection
132
Table 5.4 Accuracy study with blind samples and the SPR immunosensor
Samples Real concentration
(ng mL-1) SPR immunosensor
Mean ± SD (ng mL-1)a Accuracy (%) CV (%)
B1 70 67.89 ± 1.97 96.99 2.90 B2 200 200.9 ± 3.35 100.4 1.67 B3 50 51.74 ± 2.31 103.5 4.46 B4 300 297.8 ± 7.00 99.27 2.35 B5 10 11.28 ± 0.67 112.8 5.94 B6 500 501.0 ± 10.2 100.2 2.03 B7 20 20.18 ± 1.45 100.9 7.18
a: average of three measurements.
5.3.8. Analysis of sputum patient samples We have evaluated 12 pre-treated sputum samples (S1-S12) from five patients, all diagnosed with TB as shown in Table 5.5A. Up to 22 pre-treated sputum samples from non-tuberculous patients (S13 – S34) were also included as negative controls (see Table 5.5B). All control samples were negative for MTb. NTM (nontuberculous mycobacteria) species were identified in three of them (M. intracellulare, M. avium and M. celatum, respectively, in samples S19, S22 and S26). Furthermore, Table 5.5 shows the level of bacilli seen by microscopy (baciloscopy) as well as the time to positivity and culture results of these samples. Each sample was diluted 1:1 with PBST-0.05 and measured directly in real-time and replicated twice. Signals were interpolated in the calibration curve with PNTSS 1:1 (see Figure 5.23A (red curve)). The HspX concentrations for each sample are also summarized in Table 5.5. Levels of HspX protein concentration of PNTSS (the median, maximum and minimum values) are shown in Figure 5.24 for TB and non-TB patients, where significant statistical difference can be observed between them. These values are lower than those reported in cerebrospinal fluid, where HspX has been detected in concentrations up to 18 μg mL-1.
We found a faint correlation between the concentration of HspX and the level of baciloscopy. The presence of a metabolically variable population of bacilli in each sample could explain that result. Remarkably, in tuberculous samples previously confirmed by culture methods and Xpert MTB/Rif® but with negative baciloscopy, the detection of the HspX protein was possible, which demonstrates a high sensitivity of our biosensor device. Moreover, detection of HspX by SPR biosensor was possible at least one week before positivity of the culture (Table 5.5A) thus allowing an early diagnosis of the disease. Finally, the SPR biosensor procedure showed to be MTb specific, due to the absence of cross-reactivity with HspX protein of other slow grower mycobacteria.
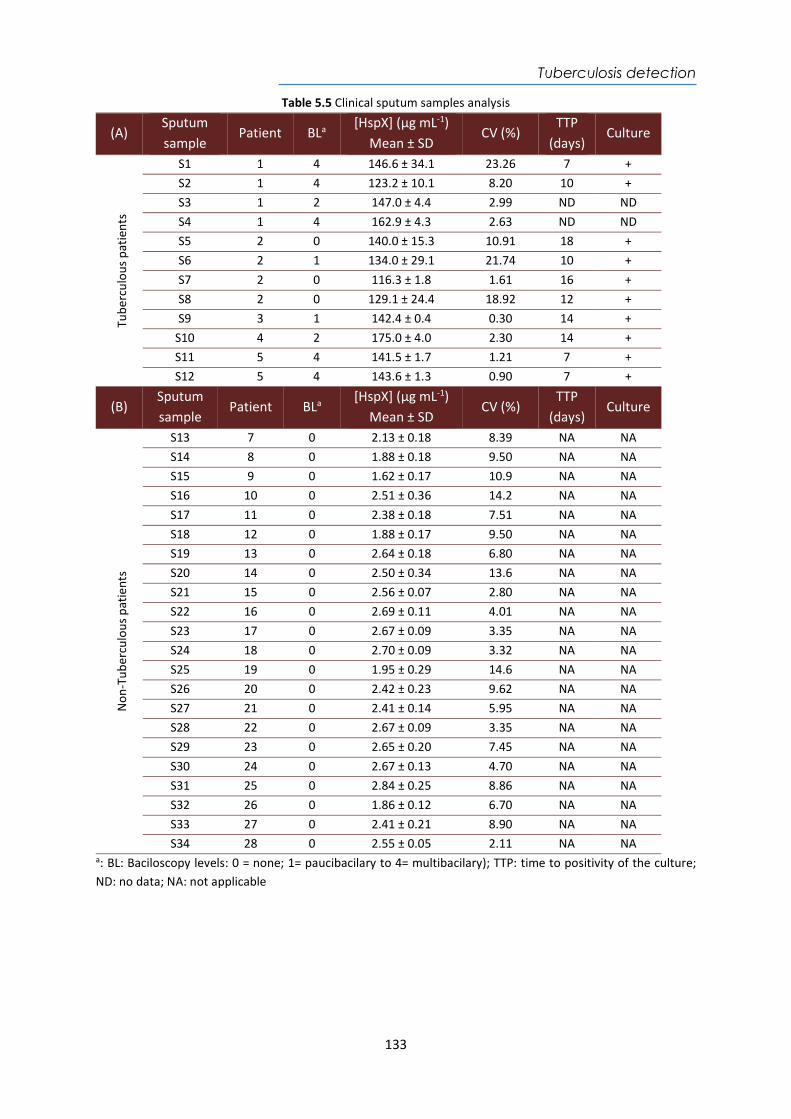
Tuberculosis detection
133
Table 5.5 Clinical sputum samples analysis
(A) Sputum sample
Patient BLa [HspX] (µg mL-1)
Mean ± SD CV (%)
TTP (days)
Culture Tu
berc
ulou
s pa
tient
s
S1 1 4 146.6 ± 34.1 23.26 7 + S2 1 4 123.2 ± 10.1 8.20 10 + S3 1 2 147.0 ± 4.4 2.99 ND ND S4 1 4 162.9 ± 4.3 2.63 ND ND S5 2 0 140.0 ± 15.3 10.91 18 + S6 2 1 134.0 ± 29.1 21.74 10 + S7 2 0 116.3 ± 1.8 1.61 16 + S8 2 0 129.1 ± 24.4 18.92 12 + S9 3 1 142.4 ± 0.4 0.30 14 +
S10 4 2 175.0 ± 4.0 2.30 14 + S11 5 4 141.5 ± 1.7 1.21 7 + S12 5 4 143.6 ± 1.3 0.90 7 +
(B) Sputum sample
Patient BLa [HspX] (µg mL-1)
Mean ± SD CV (%)
TTP (days)
Culture
Non
-Tub
ercu
lous
pat
ient
s
S13 7 0 2.13 ± 0.18 8.39 NA NA S14 8 0 1.88 ± 0.18 9.50 NA NA S15 9 0 1.62 ± 0.17 10.9 NA NA S16 10 0 2.51 ± 0.36 14.2 NA NA S17 11 0 2.38 ± 0.18 7.51 NA NA S18 12 0 1.88 ± 0.17 9.50 NA NA S19 13 0 2.64 ± 0.18 6.80 NA NA S20 14 0 2.50 ± 0.34 13.6 NA NA S21 15 0 2.56 ± 0.07 2.80 NA NA S22 16 0 2.69 ± 0.11 4.01 NA NA S23 17 0 2.67 ± 0.09 3.35 NA NA S24 18 0 2.70 ± 0.09 3.32 NA NA S25 19 0 1.95 ± 0.29 14.6 NA NA S26 20 0 2.42 ± 0.23 9.62 NA NA S27 21 0 2.41 ± 0.14 5.95 NA NA S28 22 0 2.67 ± 0.09 3.35 NA NA S29 23 0 2.65 ± 0.20 7.45 NA NA S30 24 0 2.67 ± 0.13 4.70 NA NA S31 25 0 2.84 ± 0.25 8.86 NA NA S32 26 0 1.86 ± 0.12 6.70 NA NA S33 27 0 2.41 ± 0.21 8.90 NA NA S34 28 0 2.55 ± 0.05 2.11 NA NA
a: BL: Baciloscopy levels: 0 = none; 1= paucibacilary to 4= multibacilary); TTP: time to positivity of the culture; ND: no data; NA: not applicable
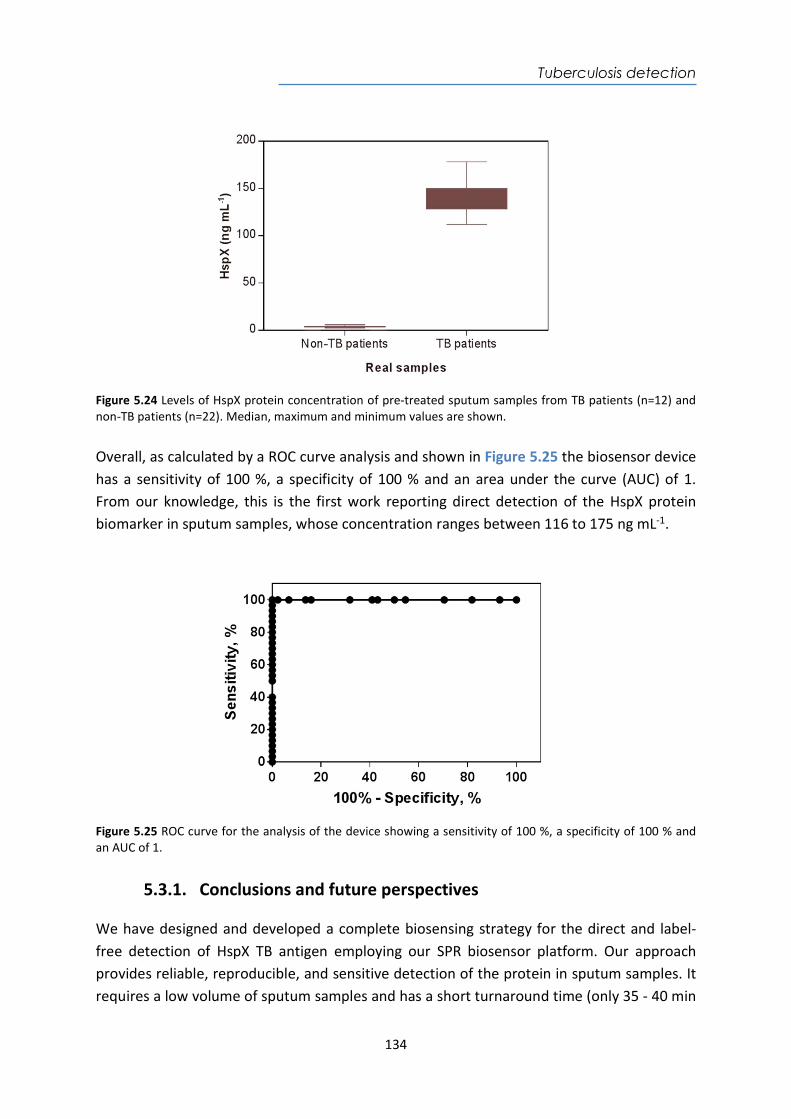
Tuberculosis detection
134
Figure 5.24 Levels of HspX protein concentration of pre-treated sputum samples from TB patients (n=12) and non-TB patients (n=22). Median, maximum and minimum values are shown. Overall, as calculated by a ROC curve analysis and shown in Figure 5.25 the biosensor device has a sensitivity of 100 %, a specificity of 100 % and an area under the curve (AUC) of 1. From our knowledge, this is the first work reporting direct detection of the HspX protein biomarker in sputum samples, whose concentration ranges between 116 to 175 ng mL-1.
Figure 5.25 ROC curve for the analysis of the device showing a sensitivity of 100 %, a specificity of 100 % and an AUC of 1.
5.3.1. Conclusions and future perspectives We have designed and developed a complete biosensing strategy for the direct and label-free detection of HspX TB antigen employing our SPR biosensor platform. Our approach provides reliable, reproducible, and sensitive detection of the protein in sputum samples. It requires a low volume of sputum samples and has a short turnaround time (only 35 - 40 min
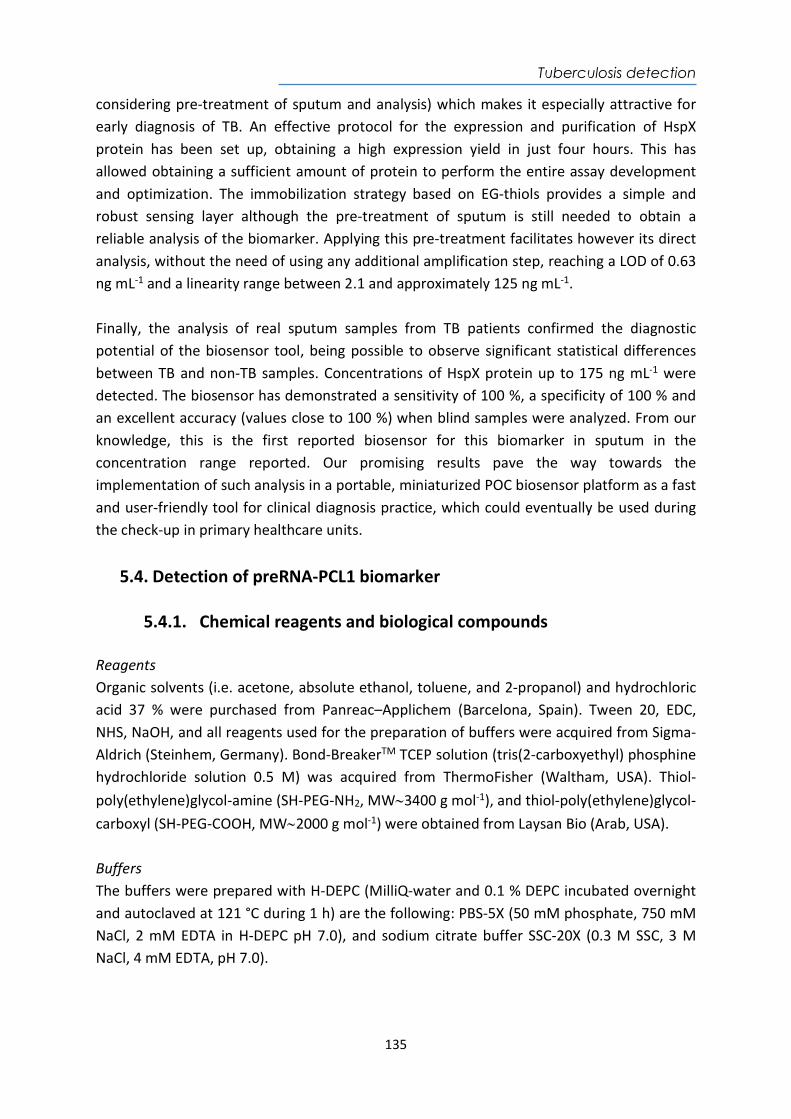
Tuberculosis detection
135
considering pre-treatment of sputum and analysis) which makes it especially attractive for early diagnosis of TB. An effective protocol for the expression and purification of HspX protein has been set up, obtaining a high expression yield in just four hours. This has allowed obtaining a sufficient amount of protein to perform the entire assay development and optimization. The immobilization strategy based on EG-thiols provides a simple and robust sensing layer although the pre-treatment of sputum is still needed to obtain a reliable analysis of the biomarker. Applying this pre-treatment facilitates however its direct analysis, without the need of using any additional amplification step, reaching a LOD of 0.63 ng mL-1 and a linearity range between 2.1 and approximately 125 ng mL-1. Finally, the analysis of real sputum samples from TB patients confirmed the diagnostic potential of the biosensor tool, being possible to observe significant statistical differences between TB and non-TB samples. Concentrations of HspX protein up to 175 ng mL-1 were detected. The biosensor has demonstrated a sensitivity of 100 %, a specificity of 100 % and an excellent accuracy (values close to 100 %) when blind samples were analyzed. From our knowledge, this is the first reported biosensor for this biomarker in sputum in the concentration range reported. Our promising results pave the way towards the implementation of such analysis in a portable, miniaturized POC biosensor platform as a fast and user-friendly tool for clinical diagnosis practice, which could eventually be used during the check-up in primary healthcare units.
5.4. Detection of preRNA-PCL1 biomarker
5.4.1. Chemical reagents and biological compounds Reagents Organic solvents (i.e. acetone, absolute ethanol, toluene, and 2-propanol) and hydrochloric acid 37 % were purchased from Panreac–Applichem (Barcelona, Spain). Tween 20, EDC, NHS, NaOH, and all reagents used for the preparation of buffers were acquired from Sigma-Aldrich (Steinhem, Germany). Bond-BreakerTM TCEP solution (tris(2-carboxyethyl) phosphine hydrochloride solution 0.5 M) was acquired from ThermoFisher (Waltham, USA). Thiol-poly(ethylene)glycol-amine (SH-PEG-NH2, MW3400 g mol-1), and thiol-poly(ethylene)glycol-carboxyl (SH-PEG-COOH, MW2000 g mol-1) were obtained from Laysan Bio (Arab, USA). Buffers The buffers were prepared with H-DEPC (MilliQ-water and 0.1 % DEPC incubated overnight and autoclaved at 121 °C during 1 h) are the following: PBS-5X (50 mM phosphate, 750 mM NaCl, 2 mM EDTA in H-DEPC pH 7.0), and sodium citrate buffer SSC-20X (0.3 M SSC, 3 M NaCl, 4 mM EDTA, pH 7.0).
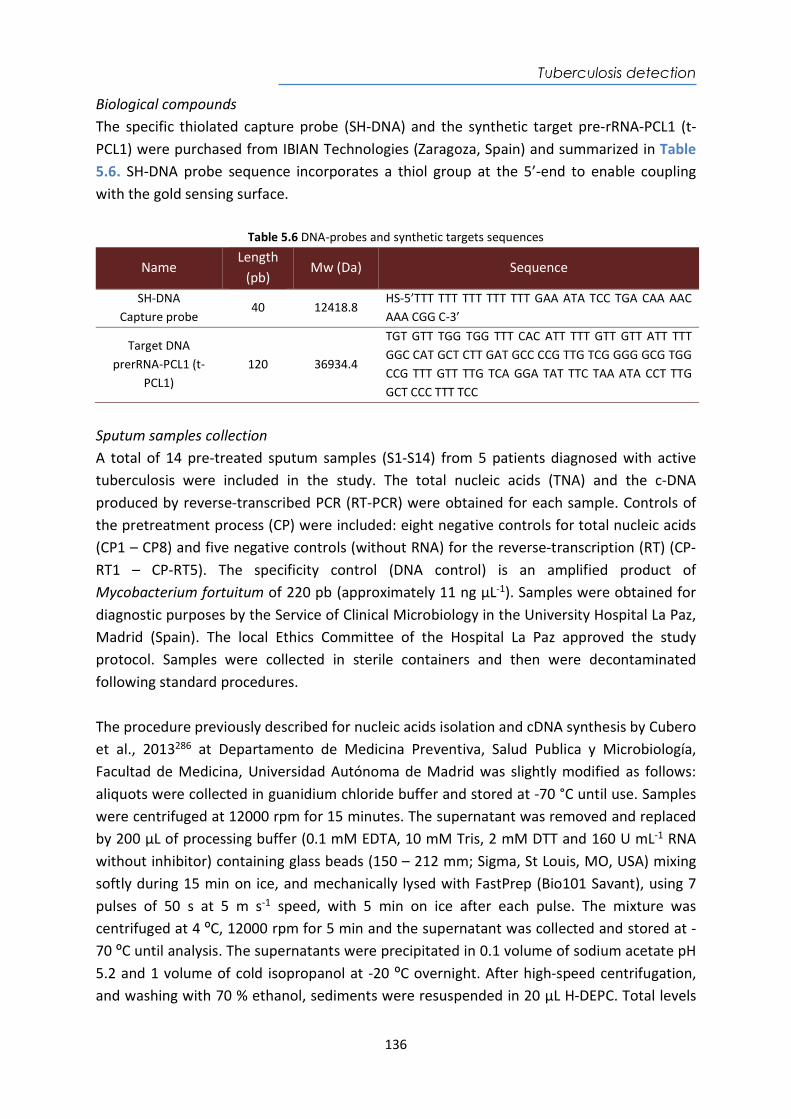
Tuberculosis detection
136
Biological compounds The specific thiolated capture probe (SH-DNA) and the synthetic target pre-rRNA-PCL1 (t-PCL1) were purchased from IBIAN Technologies (Zaragoza, Spain) and summarized in Table 5.6. SH-DNA probe sequence incorporates a thiol group at the 5’-end to enable coupling with the gold sensing surface.
Table 5.6 DNA-probes and synthetic targets sequences
Name Length
(pb) Mw (Da) Sequence
SH-DNA Capture probe
40 12418.8 HS-5’TTT TTT TTT TTT TTT GAA ATA TCC TGA CAA AAC AAA CGG C-3’
Target DNA prerRNA-PCL1 (t-
PCL1) 120 36934.4
TGT GTT TGG TGG TTT CAC ATT TTT GTT GTT ATT TTT GGC CAT GCT CTT GAT GCC CCG TTG TCG GGG GCG TGG CCG TTT GTT TTG TCA GGA TAT TTC TAA ATA CCT TTG GCT CCC TTT TCC
Sputum samples collection A total of 14 pre-treated sputum samples (S1-S14) from 5 patients diagnosed with active tuberculosis were included in the study. The total nucleic acids (TNA) and the c-DNA produced by reverse-transcribed PCR (RT-PCR) were obtained for each sample. Controls of the pretreatment process (CP) were included: eight negative controls for total nucleic acids (CP1 – CP8) and five negative controls (without RNA) for the reverse-transcription (RT) (CP-RT1 – CP-RT5). The specificity control (DNA control) is an amplified product of Mycobacterium fortuitum of 220 pb (approximately 11 ng µL-1). Samples were obtained for diagnostic purposes by the Service of Clinical Microbiology in the University Hospital La Paz, Madrid (Spain). The local Ethics Committee of the Hospital La Paz approved the study protocol. Samples were collected in sterile containers and then were decontaminated following standard procedures. The procedure previously described for nucleic acids isolation and cDNA synthesis by Cubero et al., 2013286 at Departamento de Medicina Preventiva, Salud Publica y Microbiología, Facultad de Medicina, Universidad Autónoma de Madrid was slightly modified as follows: aliquots were collected in guanidium chloride buffer and stored at -70 °C until use. Samples were centrifuged at 12000 rpm for 15 minutes. The supernatant was removed and replaced by 200 µL of processing buffer (0.1 mM EDTA, 10 mM Tris, 2 mM DTT and 160 U mL-1 RNA without inhibitor) containing glass beads (150 – 212 mm; Sigma, St Louis, MO, USA) mixing softly during 15 min on ice, and mechanically lysed with FastPrep (Bio101 Savant), using 7 pulses of 50 s at 5 m s-1 speed, with 5 min on ice after each pulse. The mixture was centrifuged at 4 ºC, 12000 rpm for 5 min and the supernatant was collected and stored at -70 ºC until analysis. The supernatants were precipitated in 0.1 volume of sodium acetate pH 5.2 and 1 volume of cold isopropanol at -20 ºC overnight. After high-speed centrifugation, and washing with 70 % ethanol, sediments were resuspended in 20 µL H-DEPC. Total levels
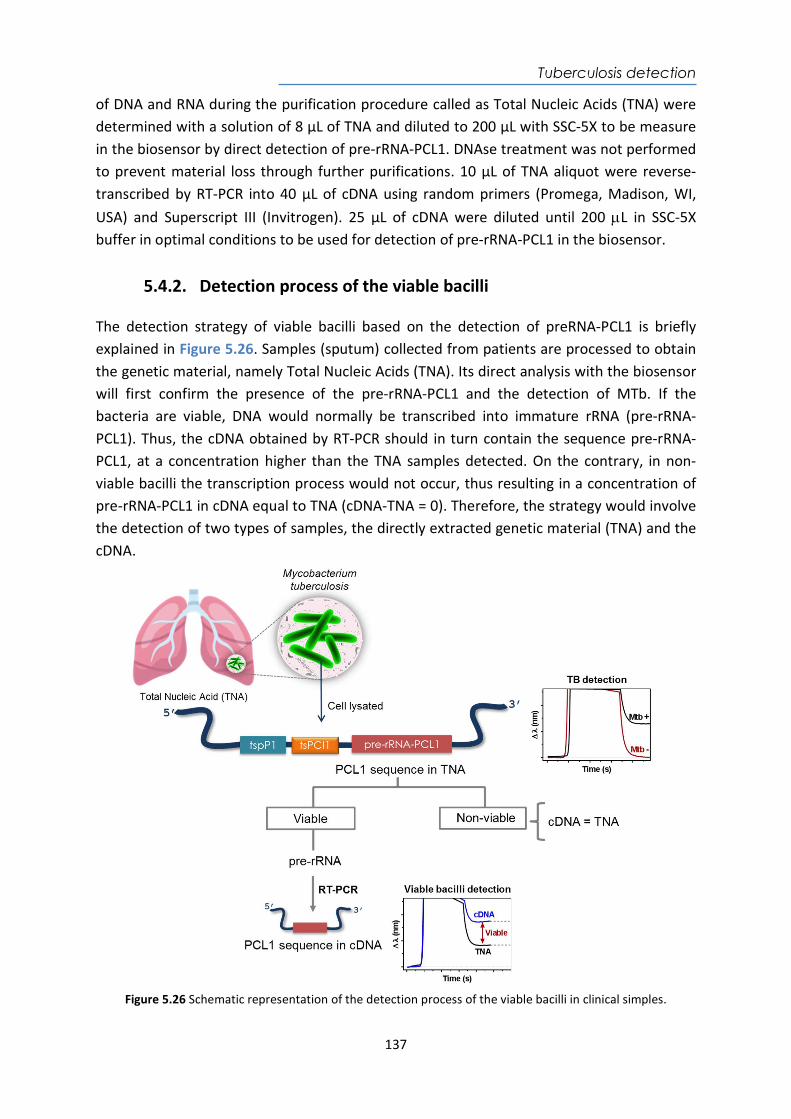
Tuberculosis detection
137
of DNA and RNA during the purification procedure called as Total Nucleic Acids (TNA) were determined with a solution of 8 µL of TNA and diluted to 200 µL with SSC-5X to be measure in the biosensor by direct detection of pre-rRNA-PCL1. DNAse treatment was not performed to prevent material loss through further purifications. 10 µL of TNA aliquot were reverse-transcribed by RT-PCR into 40 µL of cDNA using random primers (Promega, Madison, WI, USA) and Superscript III (Invitrogen). 25 µL of cDNA were diluted until 200 L in SSC-5X buffer in optimal conditions to be used for detection of pre-rRNA-PCL1 in the biosensor.
5.4.2. Detection process of the viable bacilli The detection strategy of viable bacilli based on the detection of preRNA-PCL1 is briefly explained in Figure 5.26. Samples (sputum) collected from patients are processed to obtain the genetic material, namely Total Nucleic Acids (TNA). Its direct analysis with the biosensor will first confirm the presence of the pre-rRNA-PCL1 and the detection of MTb. If the bacteria are viable, DNA would normally be transcribed into immature rRNA (pre-rRNA-PCL1). Thus, the cDNA obtained by RT-PCR should in turn contain the sequence pre-rRNA-PCL1, at a concentration higher than the TNA samples detected. On the contrary, in non-viable bacilli the transcription process would not occur, thus resulting in a concentration of pre-rRNA-PCL1 in cDNA equal to TNA (cDNA-TNA = 0). Therefore, the strategy would involve the detection of two types of samples, the directly extracted genetic material (TNA) and the cDNA.
Figure 5.26 Schematic representation of the detection process of the viable bacilli in clinical simples.
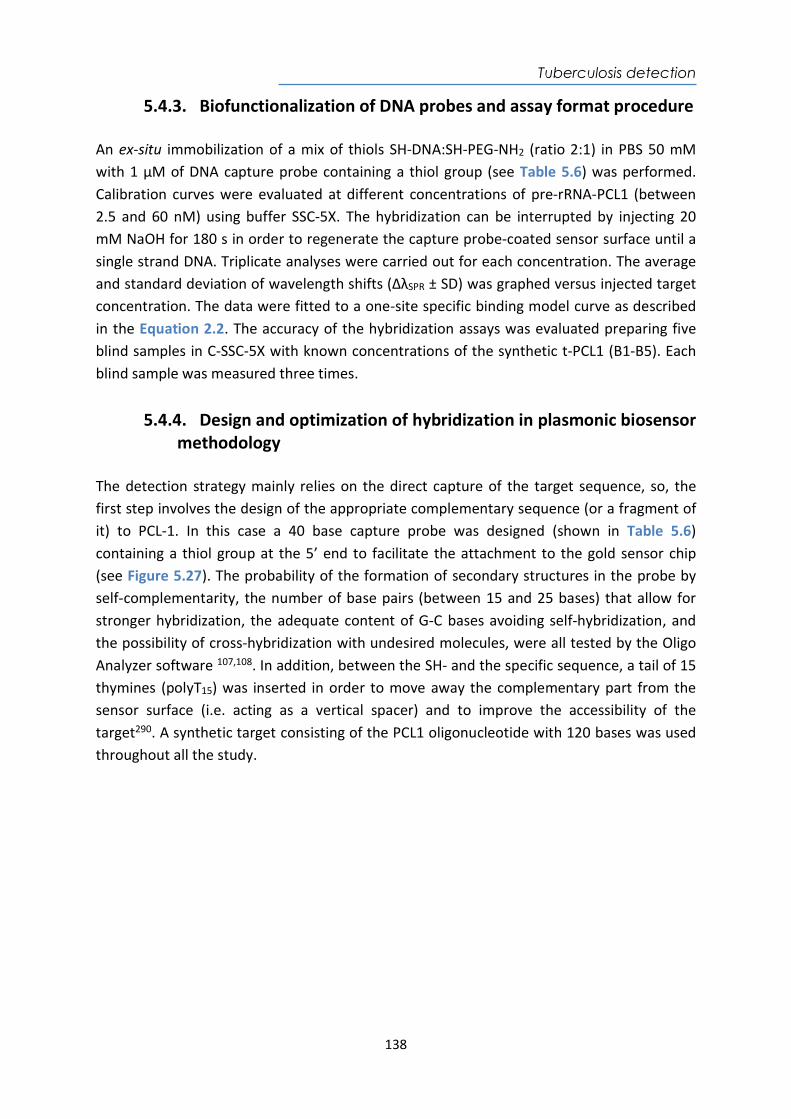
Tuberculosis detection
138
5.4.3. Biofunctionalization of DNA probes and assay format procedure An ex-situ immobilization of a mix of thiols SH-DNA:SH-PEG-NH2 (ratio 2:1) in PBS 50 mM with 1 µM of DNA capture probe containing a thiol group (see Table 5.6) was performed. Calibration curves were evaluated at different concentrations of pre-rRNA-PCL1 (between 2.5 and 60 nM) using buffer SSC-5X. The hybridization can be interrupted by injecting 20 mM NaOH for 180 s in order to regenerate the capture probe-coated sensor surface until a single strand DNA. Triplicate analyses were carried out for each concentration. The average and standard deviation of wavelength shifts (ΔλSPR ± SD) was graphed versus injected target concentration. The data were fitted to a one-site specific binding model curve as described in the Equation 2.2. The accuracy of the hybridization assays was evaluated preparing five blind samples in C-SSC-5X with known concentrations of the synthetic t-PCL1 (B1-B5). Each blind sample was measured three times.
5.4.4. Design and optimization of hybridization in plasmonic biosensor methodology
The detection strategy mainly relies on the direct capture of the target sequence, so, the first step involves the design of the appropriate complementary sequence (or a fragment of it) to PCL-1. In this case a 40 base capture probe was designed (shown in Table 5.6) containing a thiol group at the 5’ end to facilitate the attachment to the gold sensor chip (see Figure 5.27). The probability of the formation of secondary structures in the probe by self-complementarity, the number of base pairs (between 15 and 25 bases) that allow for stronger hybridization, the adequate content of G-C bases avoiding self-hybridization, and the possibility of cross-hybridization with undesired molecules, were all tested by the Oligo Analyzer software 107,108. In addition, between the SH- and the specific sequence, a tail of 15 thymines (polyT15) was inserted in order to move away the complementary part from the sensor surface (i.e. acting as a vertical spacer) and to improve the accessibility of the target290. A synthetic target consisting of the PCL1 oligonucleotide with 120 bases was used throughout all the study.
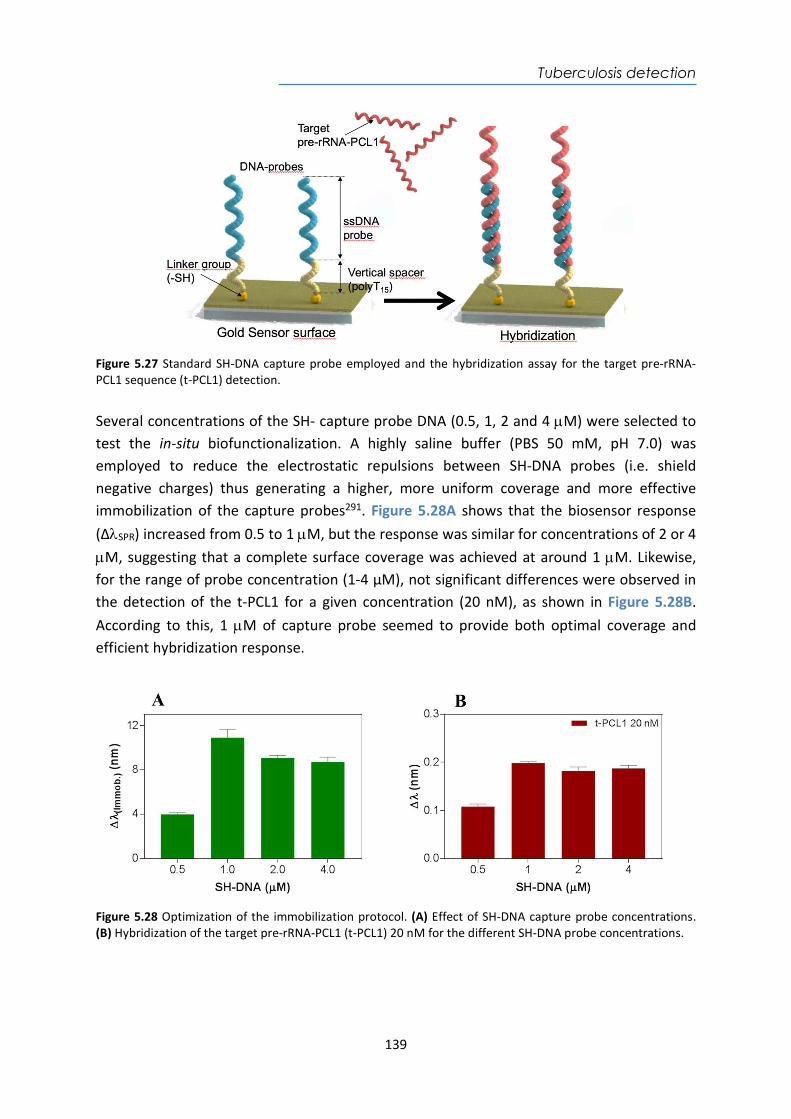
Tuberculosis detection
139
Figure 5.27 Standard SH-DNA capture probe employed and the hybridization assay for the target pre-rRNA-PCL1 sequence (t-PCL1) detection. Several concentrations of the SH- capture probe DNA (0.5, 1, 2 and 4 M) were selected to test the in-situ biofunctionalization. A highly saline buffer (PBS 50 mM, pH 7.0) was employed to reduce the electrostatic repulsions between SH-DNA probes (i.e. shield negative charges) thus generating a higher, more uniform coverage and more effective immobilization of the capture probes291. Figure 5.28A shows that the biosensor response (ΔSPR) increased from 0.5 to 1 M, but the response was similar for concentrations of 2 or 4 M, suggesting that a complete surface coverage was achieved at around 1 M. Likewise, for the range of probe concentration (1-4 µM), not significant differences were observed in the detection of the t-PCL1 for a given concentration (20 nM), as shown in Figure 5.28B. According to this, 1 M of capture probe seemed to provide both optimal coverage and efficient hybridization response.
Figure 5.28 Optimization of the immobilization protocol. (A) Effect of SH-DNA capture probe concentrations. (B) Hybridization of the target pre-rRNA-PCL1 (t-PCL1) 20 nM for the different SH-DNA probe concentrations.
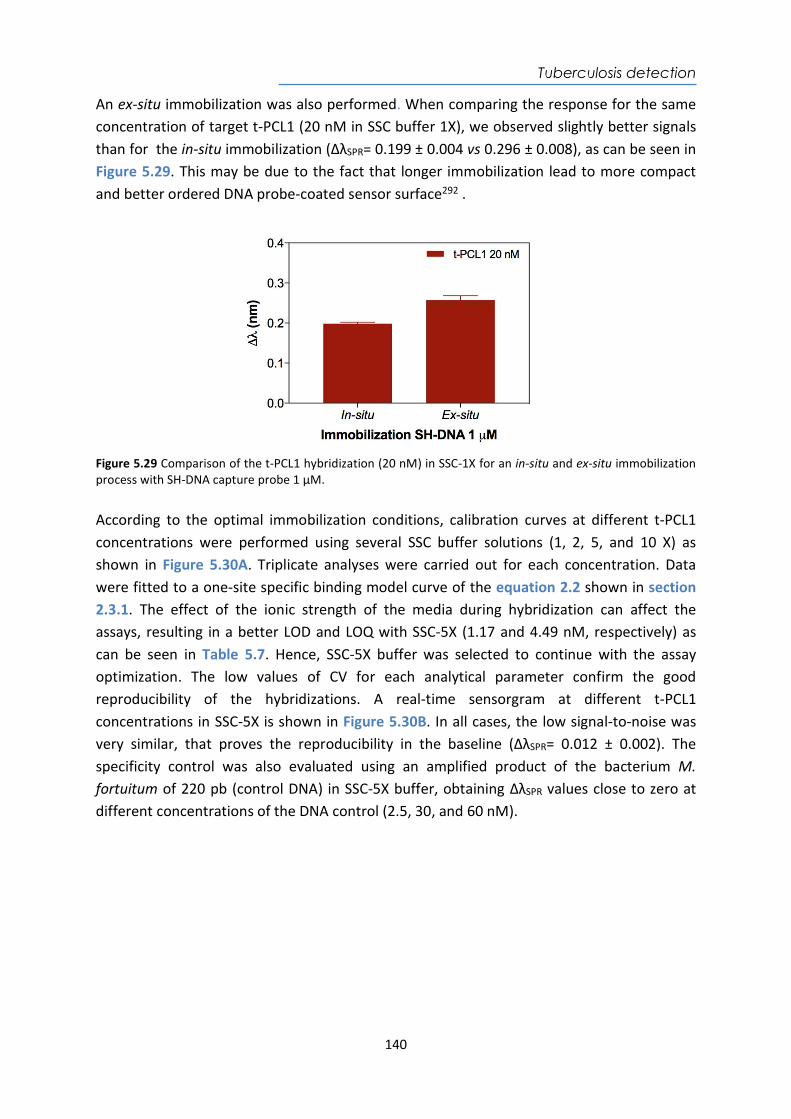
Tuberculosis detection
140
An ex-situ immobilization was also performed. When comparing the response for the same concentration of target t-PCL1 (20 nM in SSC buffer 1X), we observed slightly better signals than for the in-situ immobilization (ΔλSPR= 0.199 ± 0.004 vs 0.296 ± 0.008), as can be seen in Figure 5.29. This may be due to the fact that longer immobilization lead to more compact and better ordered DNA probe-coated sensor surface292 .
Figure 5.29 Comparison of the t-PCL1 hybridization (20 nM) in SSC-1X for an in-situ and ex-situ immobilization process with SH-DNA capture probe 1 µM. According to the optimal immobilization conditions, calibration curves at different t-PCL1 concentrations were performed using several SSC buffer solutions (1, 2, 5, and 10 X) as shown in Figure 5.30A. Triplicate analyses were carried out for each concentration. Data were fitted to a one-site specific binding model curve of the equation 2.2 shown in section 2.3.1. The effect of the ionic strength of the media during hybridization can affect the assays, resulting in a better LOD and LOQ with SSC-5X (1.17 and 4.49 nM, respectively) as can be seen in Table 5.7. Hence, SSC-5X buffer was selected to continue with the assay optimization. The low values of CV for each analytical parameter confirm the good reproducibility of the hybridizations. A real-time sensorgram at different t-PCL1 concentrations in SSC-5X is shown in Figure 5.30B. In all cases, the low signal-to-noise was very similar, that proves the reproducibility in the baseline (ΔλSPR= 0.012 ± 0.002). The specificity control was also evaluated using an amplified product of the bacterium M. fortuitum of 220 pb (control DNA) in SSC-5X buffer, obtaining ΔλSPR values close to zero at different concentrations of the DNA control (2.5, 30, and 60 nM).
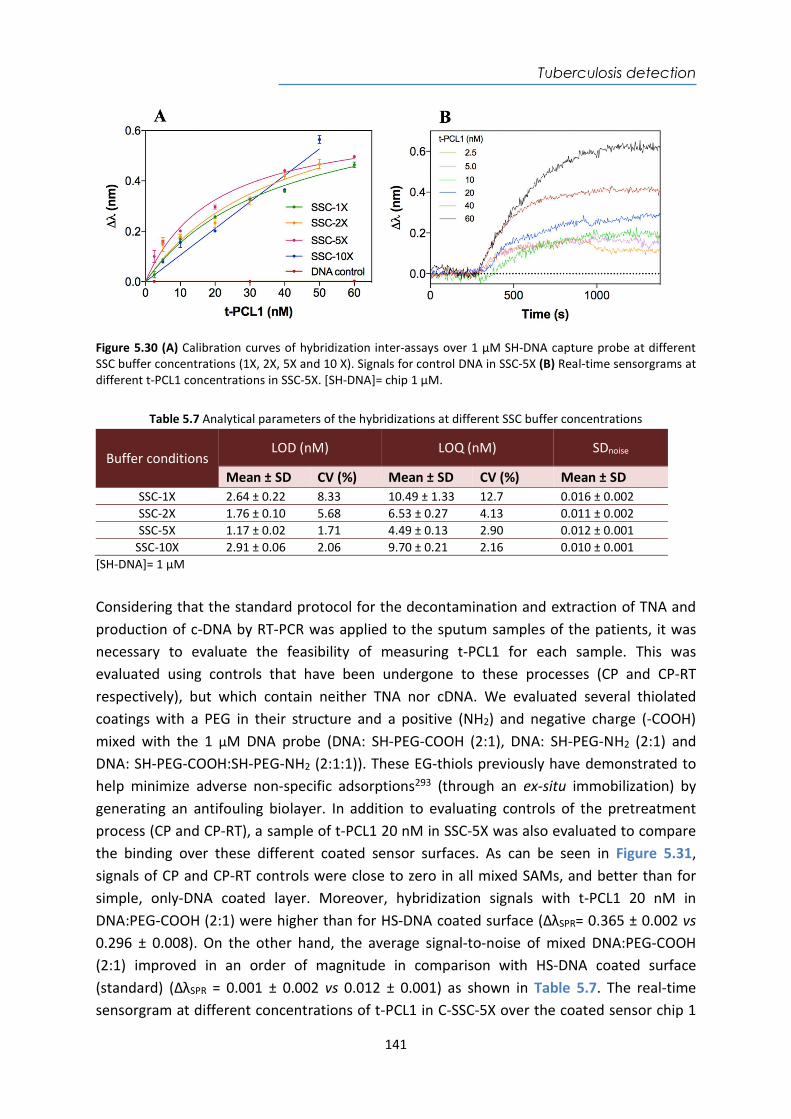
Tuberculosis detection
141
Figure 5.30 (A) Calibration curves of hybridization inter-assays over 1 µM SH-DNA capture probe at different SSC buffer concentrations (1X, 2X, 5X and 10 X). Signals for control DNA in SSC-5X (B) Real-time sensorgrams at different t-PCL1 concentrations in SSC-5X. [SH-DNA]= chip 1 µM.
Table 5.7 Analytical parameters of the hybridizations at different SSC buffer concentrations
Buffer conditions LOD (nM) LOQ (nM) SDnoise
Mean ± SD CV (%) Mean ± SD CV (%) Mean ± SD SSC-1X 2.64 ± 0.22 8.33 10.49 ± 1.33 12.7 0.016 ± 0.002 SSC-2X 1.76 ± 0.10 5.68 6.53 ± 0.27 4.13 0.011 ± 0.002 SSC-5X 1.17 ± 0.02 1.71 4.49 ± 0.13 2.90 0.012 ± 0.001
SSC-10X 2.91 ± 0.06 2.06 9.70 ± 0.21 2.16 0.010 ± 0.001 [SH-DNA]= 1 µM
Considering that the standard protocol for the decontamination and extraction of TNA and production of c-DNA by RT-PCR was applied to the sputum samples of the patients, it was necessary to evaluate the feasibility of measuring t-PCL1 for each sample. This was evaluated using controls that have been undergone to these processes (CP and CP-RT respectively), but which contain neither TNA nor cDNA. We evaluated several thiolated coatings with a PEG in their structure and a positive (NH2) and negative charge (-COOH) mixed with the 1 µM DNA probe (DNA: SH-PEG-COOH (2:1), DNA: SH-PEG-NH2 (2:1) and DNA: SH-PEG-COOH:SH-PEG-NH2 (2:1:1)). These EG-thiols previously have demonstrated to help minimize adverse non-specific adsorptions293 (through an ex-situ immobilization) by generating an antifouling biolayer. In addition to evaluating controls of the pretreatment process (CP and CP-RT), a sample of t-PCL1 20 nM in SSC-5X was also evaluated to compare the binding over these different coated sensor surfaces. As can be seen in Figure 5.31, signals of CP and CP-RT controls were close to zero in all mixed SAMs, and better than for simple, only-DNA coated layer. Moreover, hybridization signals with t-PCL1 20 nM in DNA:PEG-COOH (2:1) were higher than for HS-DNA coated surface (ΔλSPR= 0.365 ± 0.002 vs 0.296 ± 0.008). On the other hand, the average signal-to-noise of mixed DNA:PEG-COOH (2:1) improved in an order of magnitude in comparison with HS-DNA coated surface (standard) (ΔλSPR = 0.001 ± 0.002 vs 0.012 ± 0.001) as shown in Table 5.7. The real-time sensorgram at different concentrations of t-PCL1 in C-SSC-5X over the coated sensor chip 1
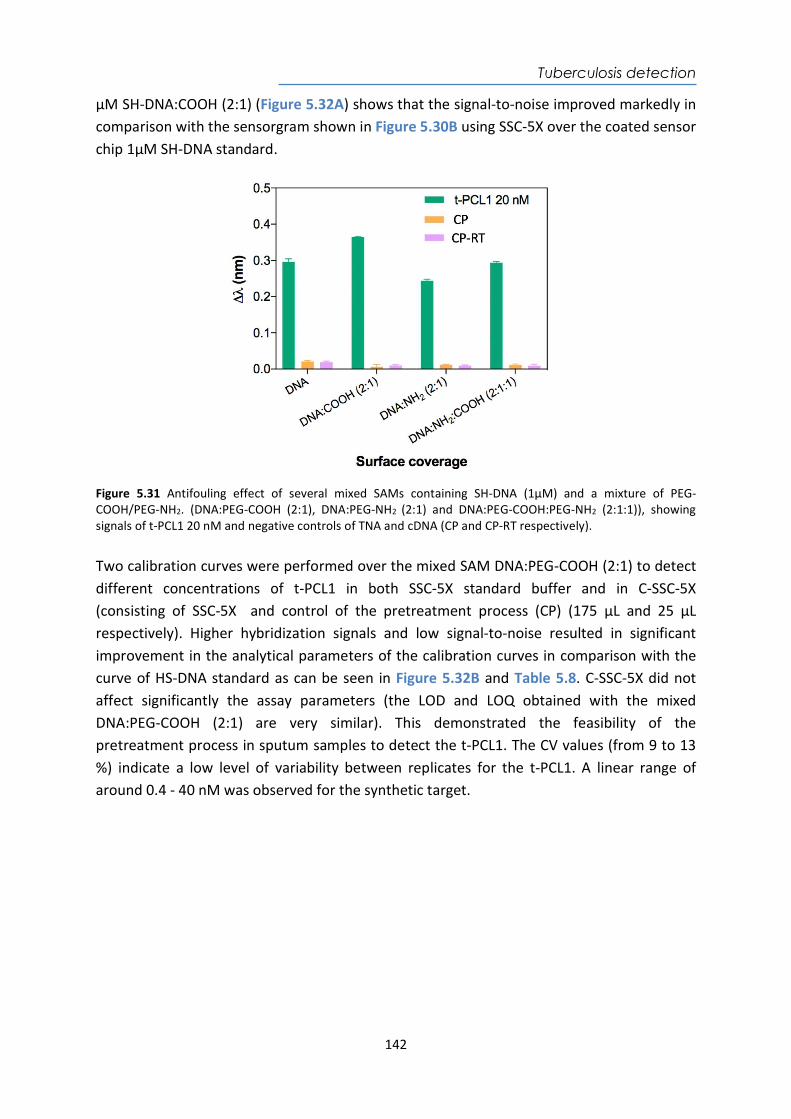
Tuberculosis detection
142
µM SH-DNA:COOH (2:1) (Figure 5.32A) shows that the signal-to-noise improved markedly in comparison with the sensorgram shown in Figure 5.30B using SSC-5X over the coated sensor chip 1µM SH-DNA standard.
Figure 5.31 Antifouling effect of several mixed SAMs containing SH-DNA (1µM) and a mixture of PEG-COOH/PEG-NH2. (DNA:PEG-COOH (2:1), DNA:PEG-NH2 (2:1) and DNA:PEG-COOH:PEG-NH2 (2:1:1)), showing signals of t-PCL1 20 nM and negative controls of TNA and cDNA (CP and CP-RT respectively). Two calibration curves were performed over the mixed SAM DNA:PEG-COOH (2:1) to detect different concentrations of t-PCL1 in both SSC-5X standard buffer and in C-SSC-5X (consisting of SSC-5X and control of the pretreatment process (CP) (175 µL and 25 µL respectively). Higher hybridization signals and low signal-to-noise resulted in significant improvement in the analytical parameters of the calibration curves in comparison with the curve of HS-DNA standard as can be seen in Figure 5.32B and Table 5.8. C-SSC-5X did not affect significantly the assay parameters (the LOD and LOQ obtained with the mixed DNA:PEG-COOH (2:1) are very similar). This demonstrated the feasibility of the pretreatment process in sputum samples to detect the t-PCL1. The CV values (from 9 to 13 %) indicate a low level of variability between replicates for the t-PCL1. A linear range of around 0.4 - 40 nM was observed for the synthetic target.
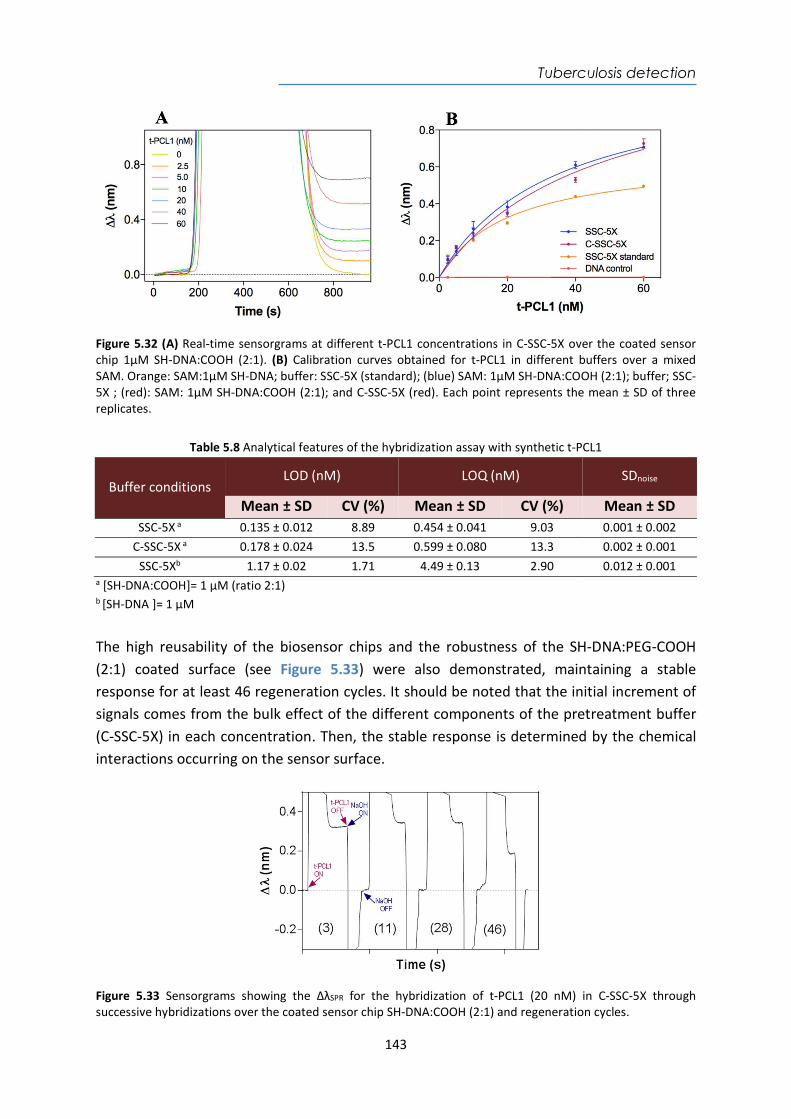
Tuberculosis detection
143
Figure 5.32 (A) Real-time sensorgrams at different t-PCL1 concentrations in C-SSC-5X over the coated sensor chip 1µM SH-DNA:COOH (2:1). (B) Calibration curves obtained for t-PCL1 in different buffers over a mixed SAM. Orange: SAM:1µM SH-DNA; buffer: SSC-5X (standard); (blue) SAM: 1µM SH-DNA:COOH (2:1); buffer; SSC-5X ; (red): SAM: 1µM SH-DNA:COOH (2:1); and C-SSC-5X (red). Each point represents the mean ± SD of three replicates.
Table 5.8 Analytical features of the hybridization assay with synthetic t-PCL1
Buffer conditions LOD (nM) LOQ (nM) SDnoise
Mean ± SD CV (%) Mean ± SD CV (%) Mean ± SD SSC-5X a 0.135 ± 0.012 8.89 0.454 ± 0.041 9.03 0.001 ± 0.002
C-SSC-5X a 0.178 ± 0.024 13.5 0.599 ± 0.080 13.3 0.002 ± 0.001 SSC-5Xb 1.17 ± 0.02 1.71 4.49 ± 0.13 2.90 0.012 ± 0.001
a [SH-DNA:COOH]= 1 µM (ratio 2:1) b [SH-DNA ]= 1 µM
The high reusability of the biosensor chips and the robustness of the SH-DNA:PEG-COOH (2:1) coated surface (see Figure 5.33) were also demonstrated, maintaining a stable response for at least 46 regeneration cycles. It should be noted that the initial increment of signals comes from the bulk effect of the different components of the pretreatment buffer (C-SSC-5X) in each concentration. Then, the stable response is determined by the chemical interactions occurring on the sensor surface.
Figure 5.33 Sensorgrams showing the ΔλSPR for the hybridization of t-PCL1 (20 nM) in C-SSC-5X through successive hybridizations over the coated sensor chip SH-DNA:COOH (2:1) and regeneration cycles.
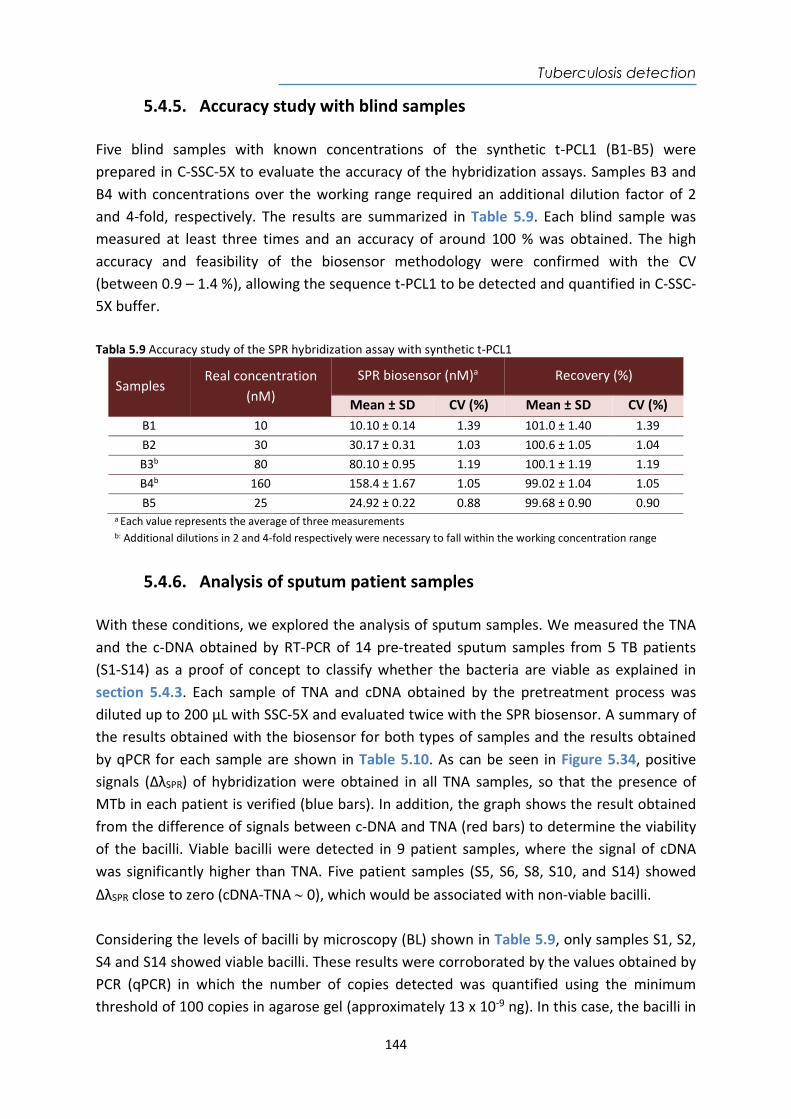
Tuberculosis detection
144
5.4.5. Accuracy study with blind samples Five blind samples with known concentrations of the synthetic t-PCL1 (B1-B5) were prepared in C-SSC-5X to evaluate the accuracy of the hybridization assays. Samples B3 and B4 with concentrations over the working range required an additional dilution factor of 2 and 4-fold, respectively. The results are summarized in Table 5.9. Each blind sample was measured at least three times and an accuracy of around 100 % was obtained. The high accuracy and feasibility of the biosensor methodology were confirmed with the CV (between 0.9 – 1.4 %), allowing the sequence t-PCL1 to be detected and quantified in C-SSC-5X buffer. Tabla 5.9 Accuracy study of the SPR hybridization assay with synthetic t-PCL1
Samples Real concentration
(nM) SPR biosensor (nM)a Recovery (%)
Mean ± SD CV (%) Mean ± SD CV (%) B1 10 10.10 ± 0.14 1.39 101.0 ± 1.40 1.39 B2 30 30.17 ± 0.31 1.03 100.6 ± 1.05 1.04 B3b 80 80.10 ± 0.95 1.19 100.1 ± 1.19 1.19 B4b 160 158.4 ± 1.67 1.05 99.02 ± 1.04 1.05 B5 25 24.92 ± 0.22 0.88 99.68 ± 0.90 0.90
a Each value represents the average of three measurements b: Additional dilutions in 2 and 4-fold respectively were necessary to fall within the working concentration range
5.4.6. Analysis of sputum patient samples With these conditions, we explored the analysis of sputum samples. We measured the TNA and the c-DNA obtained by RT-PCR of 14 pre-treated sputum samples from 5 TB patients (S1-S14) as a proof of concept to classify whether the bacteria are viable as explained in section 5.4.3. Each sample of TNA and cDNA obtained by the pretreatment process was diluted up to 200 µL with SSC-5X and evaluated twice with the SPR biosensor. A summary of the results obtained with the biosensor for both types of samples and the results obtained by qPCR for each sample are shown in Table 5.10. As can be seen in Figure 5.34, positive signals (ΔλSPR) of hybridization were obtained in all TNA samples, so that the presence of MTb in each patient is verified (blue bars). In addition, the graph shows the result obtained from the difference of signals between c-DNA and TNA (red bars) to determine the viability of the bacilli. Viable bacilli were detected in 9 patient samples, where the signal of cDNA was significantly higher than TNA. Five patient samples (S5, S6, S8, S10, and S14) showed ΔλSPR close to zero (cDNA-TNA 0), which would be associated with non-viable bacilli. Considering the levels of bacilli by microscopy (BL) shown in Table 5.9, only samples S1, S2, S4 and S14 showed viable bacilli. These results were corroborated by the values obtained by PCR (qPCR) in which the number of copies detected was quantified using the minimum threshold of 100 copies in agarose gel (approximately 13 x 10-9 ng). In this case, the bacilli in
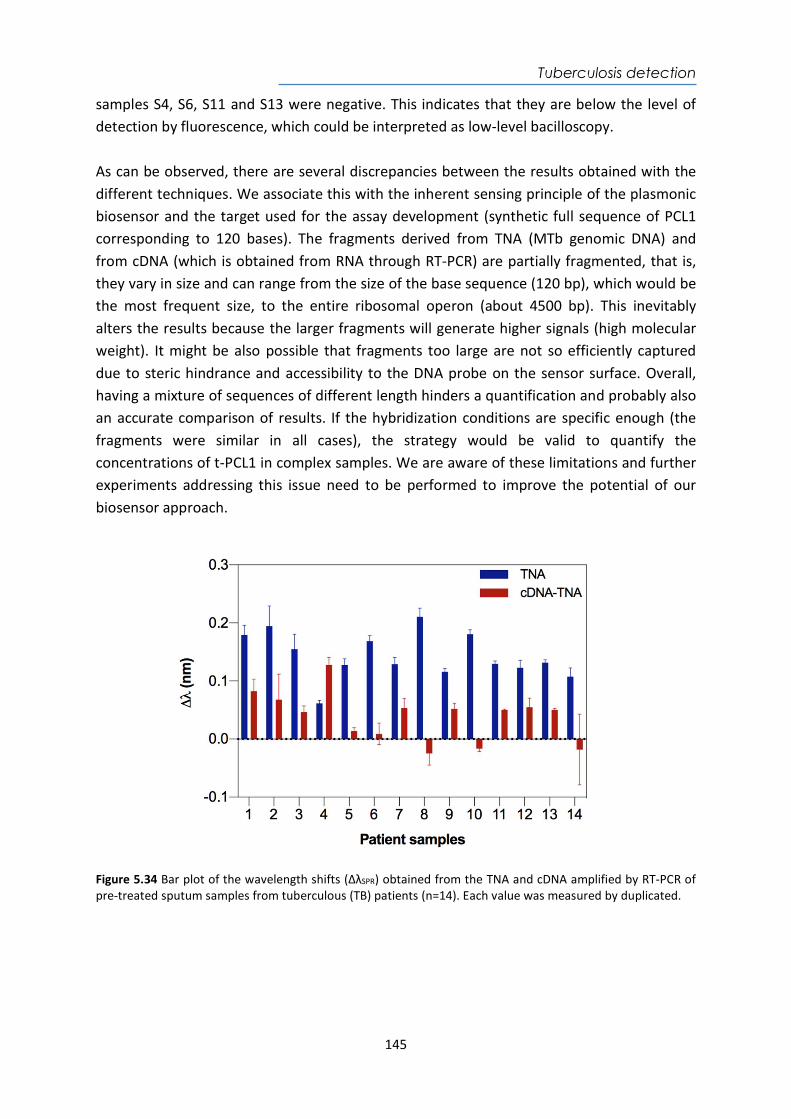
Tuberculosis detection
145
samples S4, S6, S11 and S13 were negative. This indicates that they are below the level of detection by fluorescence, which could be interpreted as low-level bacilloscopy. As can be observed, there are several discrepancies between the results obtained with the different techniques. We associate this with the inherent sensing principle of the plasmonic biosensor and the target used for the assay development (synthetic full sequence of PCL1 corresponding to 120 bases). The fragments derived from TNA (MTb genomic DNA) and from cDNA (which is obtained from RNA through RT-PCR) are partially fragmented, that is, they vary in size and can range from the size of the base sequence (120 bp), which would be the most frequent size, to the entire ribosomal operon (about 4500 bp). This inevitably alters the results because the larger fragments will generate higher signals (high molecular weight). It might be also possible that fragments too large are not so efficiently captured due to steric hindrance and accessibility to the DNA probe on the sensor surface. Overall, having a mixture of sequences of different length hinders a quantification and probably also an accurate comparison of results. If the hybridization conditions are specific enough (the fragments were similar in all cases), the strategy would be valid to quantify the concentrations of t-PCL1 in complex samples. We are aware of these limitations and further experiments addressing this issue need to be performed to improve the potential of our biosensor approach.
Figure 5.34 Bar plot of the wavelength shifts (ΔλSPR) obtained from the TNA and cDNA amplified by RT-PCR of pre-treated sputum samples from tuberculous (TB) patients (n=14). Each value was measured by duplicated.
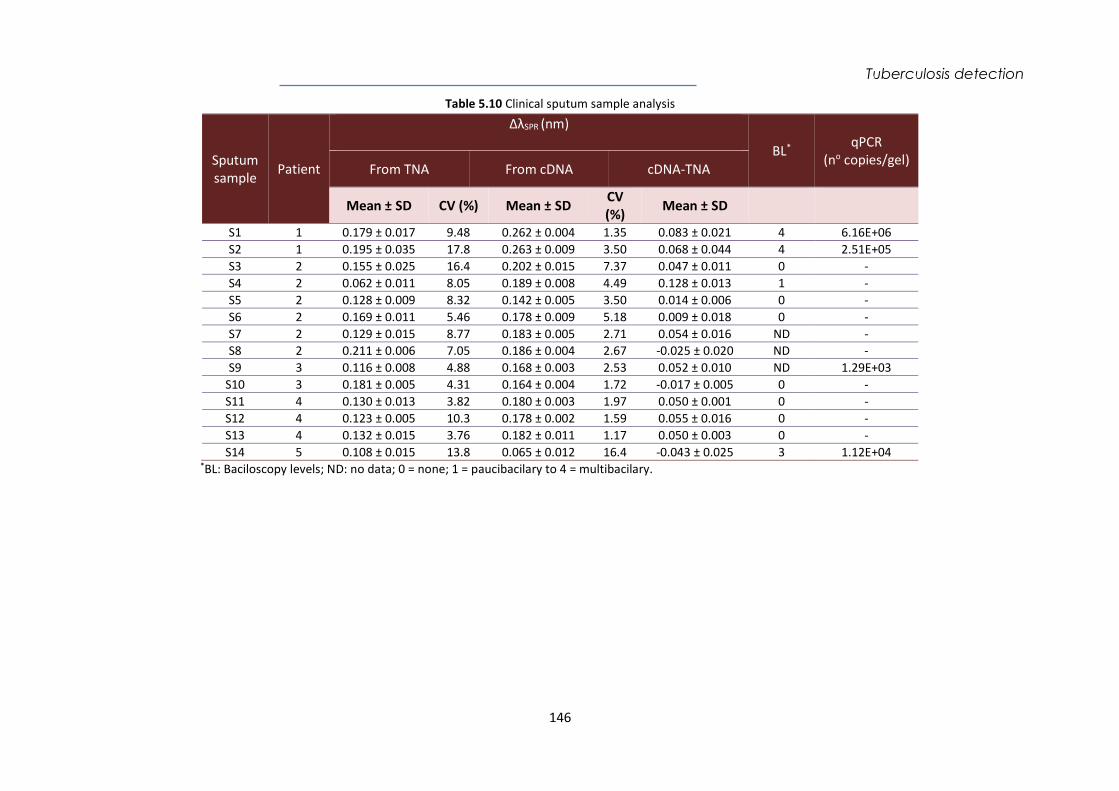
Tuberculosis detection
146
Table 5.10 Clinical sputum sample analysis
Sputum sample Patient
ΔλSPR (nm)
BL* qPCR (no copies/gel)
From TNA From cDNA cDNA-TNA
Mean ± SD CV (%) Mean ± SD CV (%) Mean ± SD
S1 1 0.179 ± 0.017 9.48 0.262 ± 0.004 1.35 0.083 ± 0.021 4 6.16E+06 S2 1 0.195 ± 0.035 17.8 0.263 ± 0.009 3.50 0.068 ± 0.044 4 2.51E+05 S3 2 0.155 ± 0.025 16.4 0.202 ± 0.015 7.37 0.047 ± 0.011 0 - S4 2 0.062 ± 0.011 8.05 0.189 ± 0.008 4.49 0.128 ± 0.013 1 - S5 2 0.128 ± 0.009 8.32 0.142 ± 0.005 3.50 0.014 ± 0.006 0 - S6 2 0.169 ± 0.011 5.46 0.178 ± 0.009 5.18 0.009 ± 0.018 0 - S7 2 0.129 ± 0.015 8.77 0.183 ± 0.005 2.71 0.054 ± 0.016 ND - S8 2 0.211 ± 0.006 7.05 0.186 ± 0.004 2.67 -0.025 ± 0.020 ND - S9 3 0.116 ± 0.008 4.88 0.168 ± 0.003 2.53 0.052 ± 0.010 ND 1.29E+03
S10 3 0.181 ± 0.005 4.31 0.164 ± 0.004 1.72 -0.017 ± 0.005 0 - S11 4 0.130 ± 0.013 3.82 0.180 ± 0.003 1.97 0.050 ± 0.001 0 - S12 4 0.123 ± 0.005 10.3 0.178 ± 0.002 1.59 0.055 ± 0.016 0 - S13 4 0.132 ± 0.015 3.76 0.182 ± 0.011 1.17 0.050 ± 0.003 0 - S14 5 0.108 ± 0.015 13.8 0.065 ± 0.012 16.4 -0.043 ± 0.025 3 1.12E+04
*BL: Baciloscopy levels; ND: no data; 0 = none; 1 = paucibacilary to 4 = multibacilary.
Tuberculosis detection
147
5.4.7. Conclusions and future perspectives We have developed a methodology for the detection of live and non-cultivable bacilli in sputum samples employing the non-coding sequence of DNA pre-rRNA-PCL1 (t-PCL1) as a potential TB biomarker in a label-free SPR biosensor device. The biofunctionalization strategy based on SH-DNA probe mixed with a polyethylene glycol incorporated-thiols provided the prevention of non-specific adsorptions of sputum samples, an enhancement of the signal-to-noise and as a consequence better parameter analysis with a mix of thiols of DNA:COOH (2:1). The SPR biosensor device achieved a high sensitivity using the synthetic target t-PCL1 with a LOD of 0.135 nM and a LOQ of 0.454 nM in SSC-5X with a high reproducibility. The biosensor showed excellent levels of accuracy for the pure target and it was demonstrated with the analysis of blind samples with recovery values close to 100 % and low CV up to 1.39 %. In addition, the high reusability of the biosensor chips and the robustness of the coated sensor surface to maintain stable responses for at least 46 cycles, were demonstrated. This biosensor assay has demonstrated a preliminary exploration of its potential for analyzing sputum samples and detecting the biomarker sequence, demonstrating the ability to discriminate between viable and VBNC bacilli. However, in order to provide accurate data further experiments are needed, for example, performing controlled fragmentation of genetic material before the analysis, to ensure samples with homogeneous and comparable fragments. Another option would involve the use of real processed samples (both TNA and cDNA), with known concentration (determined by other techniques) as standards for the assay development (instead of a pure 120 bases PCL1 sequence). All these aspects are currently under study for further implementation.

Colorectal cancer detection
148
Chapter 6
Nanoplasmonic biosensor of colorectal cancer biomarkers for early diagnosis
Colorectal cancer is the third most common cancer in the world. It can be treatable and curable when detected in early stages. The study of specific autoantibodies associated with tumors expressed in the early stages of colorectal cancer would facilitate their early detection and pave the way towards achieving a sensitive diagnostic tool. In this chapter, we present a biosensor methodology that allows the detection of four autoantibodies linked to colorectal cancer directly in serum using a label-free nanoplasmonic biosensor. Our nanoplasmonic biosensor device offers their sensitive and real-time quantification with excellent selectivity and reproducibility.

Colorectal cancer detection
149
Colorectal cancer detection
150
6. Nanoplasmonic biosensor of colorectal cancer biomarkers for early diagnosis
6.1. Introducción Colorectal cancer (CRC) is the third most frequent cancer worldwide, with an incidence of more than 1.8 million new cases diagnosed every year294. It is also the second type of cancer in terms of mortality, with about 881.000 deaths per year295. Several factors strongly associated with the development of CRC have been established, such as genetic and epigenetic parameters, inflammatory diseases, age, lifestyle and environmental conditions. Much of the research done in the last years has been focused on prevention, on establishing better diagnostic techniques for early diagnosis, as well as on new therapies, which has substantially increased survival rates. CRC produces polyps resulting from abnormal growth of epithelial cells in the internal lining of the colon or rectum. Generally, small polyps (hyperplastic polyps) are practically benign and have no risk of developing cancer. In contrast, large adenomatous polyps are considered highly precancerous due to a failure in one or more steps of the normal process of cell proliferation and maturation. Genetic alterations or suppressor genes of inactivated tumors can cause the progression of adenoma to carcinoma. It is estimated that only 30 - 40 % of polyps are diagnosed in early stages, when the disease is highly treatable and curable, involving surgery, chemotherapy, or complementary radiotherapy. A late diagnosis correlates worse prognoses. In 5 years, the survival rate of patients who are diagnosed with CRC in the early stages is between 95 - 100 %, while those diagnosed in intermediate stages have a survival rate between 48 - 60 %. Those diagnosed in advanced stages have only a 3 % chance of survival. Implementation of early detection programs would have a significant impact to reduce mortality296,297. Currently, available tools for the diagnosis of CRC are invasive techniques such as colonoscopy (or sigmoidoscopy) for the distal colon and rectum, barium enema, magnetic resonance imaging or computed tomography. These methods offer good detection capabilities, but some have side effects, are complex and are highly costly. These limitations restrict their possible use as methods for mass population screening. There are non-invasive tests of low complexity such as a fecal occult blood test based on guaiac (gFOBT)298. This test has some limitations, such as the limited specificity (some patients not suffering from CRC are misdiagnosed) and low sensitivity (some patients are not correctly detected). This requires the performance of additional complementary tests to avoid both false negatives and false positives299.
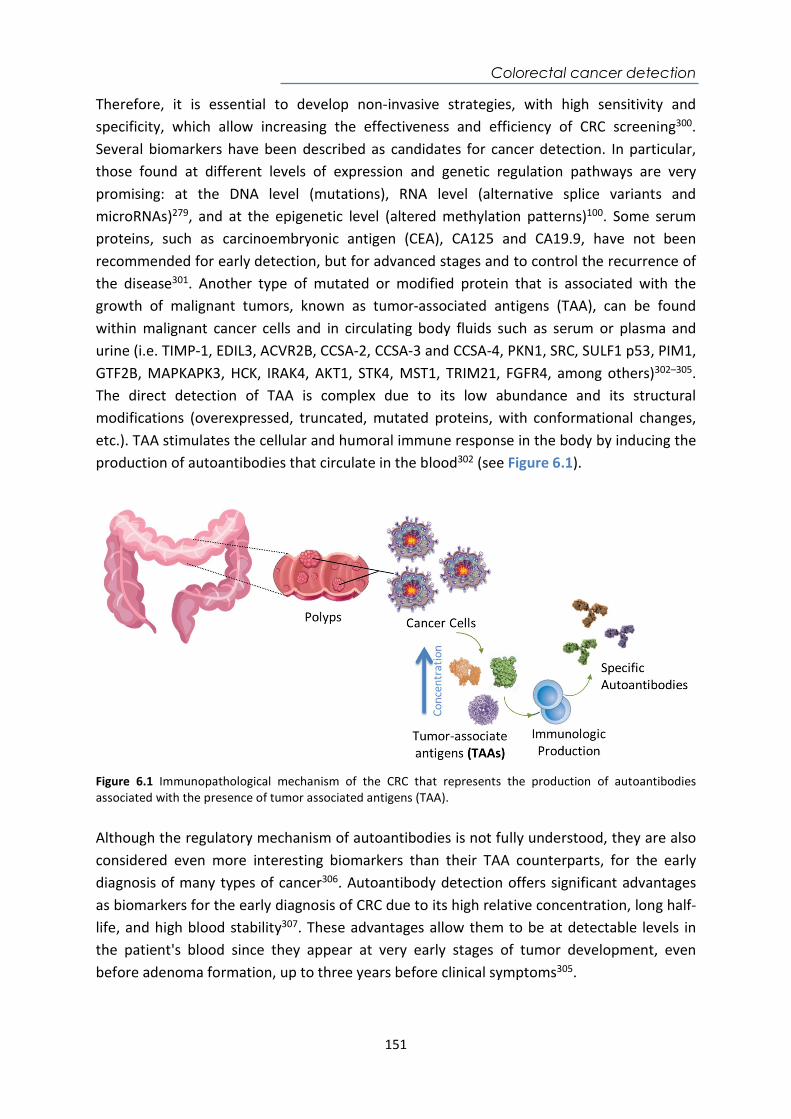
Colorectal cancer detection
151
Therefore, it is essential to develop non-invasive strategies, with high sensitivity and specificity, which allow increasing the effectiveness and efficiency of CRC screening300. Several biomarkers have been described as candidates for cancer detection. In particular, those found at different levels of expression and genetic regulation pathways are very promising: at the DNA level (mutations), RNA level (alternative splice variants and microRNAs)279, and at the epigenetic level (altered methylation patterns)100. Some serum proteins, such as carcinoembryonic antigen (CEA), CA125 and CA19.9, have not been recommended for early detection, but for advanced stages and to control the recurrence of the disease301. Another type of mutated or modified protein that is associated with the growth of malignant tumors, known as tumor-associated antigens (TAA), can be found within malignant cancer cells and in circulating body fluids such as serum or plasma and urine (i.e. TIMP-1, EDIL3, ACVR2B, CCSA-2, CCSA-3 and CCSA-4, PKN1, SRC, SULF1 p53, PIM1, GTF2B, MAPKAPK3, HCK, IRAK4, AKT1, STK4, MST1, TRIM21, FGFR4, among others)302–305. The direct detection of TAA is complex due to its low abundance and its structural modifications (overexpressed, truncated, mutated proteins, with conformational changes, etc.). TAA stimulates the cellular and humoral immune response in the body by inducing the production of autoantibodies that circulate in the blood302 (see Figure 6.1).
Figure 6.1 Immunopathological mechanism of the CRC that represents the production of autoantibodies associated with the presence of tumor associated antigens (TAA). Although the regulatory mechanism of autoantibodies is not fully understood, they are also considered even more interesting biomarkers than their TAA counterparts, for the early diagnosis of many types of cancer306. Autoantibody detection offers significant advantages as biomarkers for the early diagnosis of CRC due to its high relative concentration, long half-life, and high blood stability307. These advantages allow them to be at detectable levels in the patient's blood since they appear at very early stages of tumor development, even before adenoma formation, up to three years before clinical symptoms305.
Colorectal cancer detection
152
In the particular case of CRC, numerous TAA autoantibodies305,308 have a potential diagnostic value to detect complete proteins, peptides, phage peptides or glycopeptides.309 These autoantibodies have been identified by ELISA or protein microarrays which generally provide qualitative or semi-quantitative results310,311. For instance, an electrochemical immunosensor has demonstrated an average sensitivity of 72 % and a specificity of 92 % for a panel of eight TAA (i.e. GTF2B, MAPKAPK3, PIM1, PKN1, SRC, STK4, SULF1, and p53)303. Another study was able to detect TAA autoantibodies by protein microarrays and by ELISA based on the combination of MAPKAPK3 and ACVR2B proteins, showing specificity and sensitivity values of 73.9 and 83.3%. respectively306. A label-free electrochemical immunosensor based on gold nanoparticles (AuNPs) for detecting p53 specific autoantibodies exhibited a LOD of 0.088 pg mL-1. Currently, the implementation of multiplexed approaches in the same device capable of simultaneously and directly detecting a specific panel of autoantibodies with optimal precision and reliability would be highly valuable. Our group has worked on the design and optimization of a nanoplasmonic biosensor for the direct detection and quantification of two TAA autoantibodies related to specific CRC: anti-GTF2B and anti-EDIL3. Rapid and simple quantitative analysis of these autoantibodies in 1/10 diluted serum and plasma samples has generated LODs between 16 and 12 ng mL-1, respectively. The possibility of quantifying the concentration of autoantibodies in serum samples, in addition to allow the early diagnosis of CRC, may allow a better understanding of the humoral response triggered by the tumor and can improve the prognosis of the disease312. This biosensor methodology has been a first approach for the future development of a highly sensitive multiplexed biosensor platform, capable of simultaneously detecting a specific panel of TAA autoantibodies. The implementation of several TAA biomarkers could allow enhancing diagnostic specificity and sensitivity compared to the traditional methods (occult blood in faeces) and at an affordable cost. Therefore, in this Thesis, we have expanded the panel previously initiated to three additional TAA tumor antigens (MAPKAPK3, PIM-1, STK4) with views of eventually integrate them into a multiplexed version of the biosensor platform. Recombinant TAA were employed as recognition elements immobilized on gold nanodisks in the nanoplasmonic biosensor to evaluate autoantibodies directly in serum and in real-time.
6.2. Chemical reagents and biological compounds Reagents Organic solvents (i.e. acetone, absolute ethanol, toluene, 2-propanol and dimethyl sulfoxide (DMSO)), and hydrochloric acid 37 % were purchased from Panreac–Applichem (Barcelona, Spain). H2O2 from Merck (Darmstadt, Germany). Tween 20, ethanolamine hydrochloride, EDC, NHS, and all reagents used for the preparation of buffers were acquired from Sigma-
Colorectal cancer detection
153
Aldrich (Steinhem, Germany). Alkanethiols 16-mercaptohexadecanoic acid (MHDA) and 11-mercaptoundecanol (MUOH) were acquired from Sigma-Aldrich (Steinhem, Germany). Copolymer Poly-L-Lysine-graft-PEG (PLL-PEG MW 70000 g mol-1) was purchased from SuSoS (Dübendorf, Switzerland). Buffers The buffers were prepared with Milli-Q water (deionized water from a Milli-DI® Water Purification System, Merck Millipore, USA) and are the following: PBS-1X (10 mM phosphate, 137 mM NaCl, 2.7 mM KCl, pH 7.5); PBST-0.5 (PBS with 0.5 % Tween 20); MES buffer (2-(-N-morpholino)ethanesulfonic acid 100 mM, 500 mM NaCl, pH 5.5); HEPES buffer (N-(2-Hydroxyethyl)piperazine-N’-(2-ethanesulfonic acid 10 mM pH 7.4). Biological compounds Recombinant proteins of tumor associated antigens (TAAs) (GTF2b, MAPKAPK3, PIM-1, STK4, EDIL-3) were produced and provided by Protein Alternatives S.L. (Madrid, Spain). Antibodies anti-GTF2b (D-3 (Sc-225) and c-18 (sc271736)) and anti-PIM-1 (Ab117518MAb) were purchased from Santa Cruz Biotechnology (Santa Cruz, USA); antibodies anti-MAPKAPK3 (3F4MAb), anti-STK4 (1D6-8A10MAb), and anti-EDIL-3 (Ab67573 PAb) were purchased from Abnova (Heidelberg, Germany). Commercial serum was obtained from Sigma– Aldrich (Germany).
6.3. Biofunctionalization and assay format procedure A mixed self-assembled monolayer (SAM) on the gold nanodisks surface was formed with a solution of thiols 500 M MHDA in ethanol. The sensor chips were placed in the optical platform for an in-situ immobilization procedure under a continuous flow of Milli-Q water. The antibody immobilization concentration for recombinant proteins TAA (50 µg mL-1) were diluted in PBS 1X. Calibration curves of the detection of the TAA antibodies were obtained at different concentrations (between 0.5 and 6 g mL-1) in PBST-0.05 buffer. Triplicate analysis was carried out for each concentration. A regeneration process to dissociate the antigen-antibody interaction was achieved by injecting 20 mM NaOH for 120 s. The average signal and standard deviation (ΔλSPR ± SD) were graphed versus the injected analyte concentration. The data were fitted to a lineal regression curve as described in the Equation 2.3. the coefficient of variability (CV) for each parameter was also calculated with the Equation 2.4.
6.4. Design and optimization of the nanoplasmonic biosensor methodology
In order to develop a multiplexed biosensor platform for the simultaneous detection of a panel of specific CRC autoantibodies, we took advantage of the biofunctionalization and immobilization strategies of the previous work for the detection of anti-GTF2B and anti-
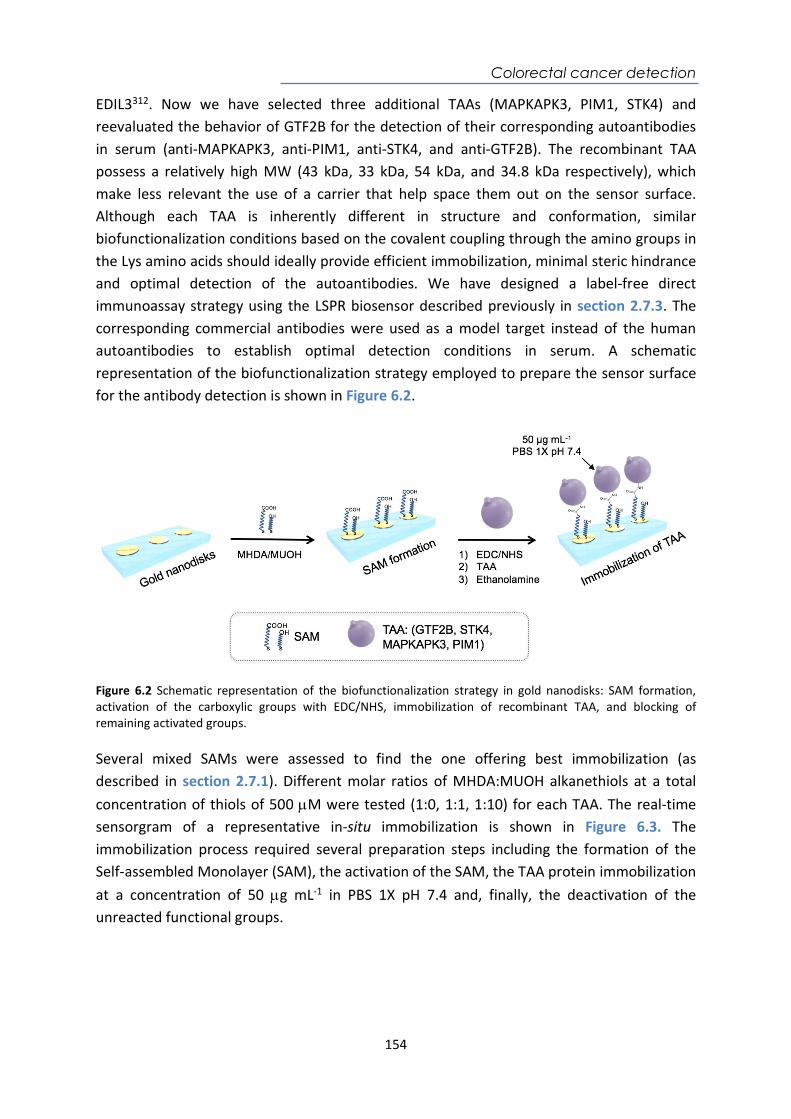
Colorectal cancer detection
154
EDIL3312. Now we have selected three additional TAAs (MAPKAPK3, PIM1, STK4) and reevaluated the behavior of GTF2B for the detection of their corresponding autoantibodies in serum (anti-MAPKAPK3, anti-PIM1, anti-STK4, and anti-GTF2B). The recombinant TAA possess a relatively high MW (43 kDa, 33 kDa, 54 kDa, and 34.8 kDa respectively), which make less relevant the use of a carrier that help space them out on the sensor surface. Although each TAA is inherently different in structure and conformation, similar biofunctionalization conditions based on the covalent coupling through the amino groups in the Lys amino acids should ideally provide efficient immobilization, minimal steric hindrance and optimal detection of the autoantibodies. We have designed a label-free direct immunoassay strategy using the LSPR biosensor described previously in section 2.7.3. The corresponding commercial antibodies were used as a model target instead of the human autoantibodies to establish optimal detection conditions in serum. A schematic representation of the biofunctionalization strategy employed to prepare the sensor surface for the antibody detection is shown in Figure 6.2.
Figure 6.2 Schematic representation of the biofunctionalization strategy in gold nanodisks: SAM formation, activation of the carboxylic groups with EDC/NHS, immobilization of recombinant TAA, and blocking of remaining activated groups. Several mixed SAMs were assessed to find the one offering best immobilization (as described in section 2.7.1). Different molar ratios of MHDA:MUOH alkanethiols at a total concentration of thiols of 500 M were tested (1:0, 1:1, 1:10) for each TAA. The real-time sensorgram of a representative in-situ immobilization is shown in Figure 6.3. The immobilization process required several preparation steps including the formation of the Self-assembled Monolayer (SAM), the activation of the SAM, the TAA protein immobilization at a concentration of 50 g mL-1 in PBS 1X pH 7.4 and, finally, the deactivation of the unreacted functional groups.
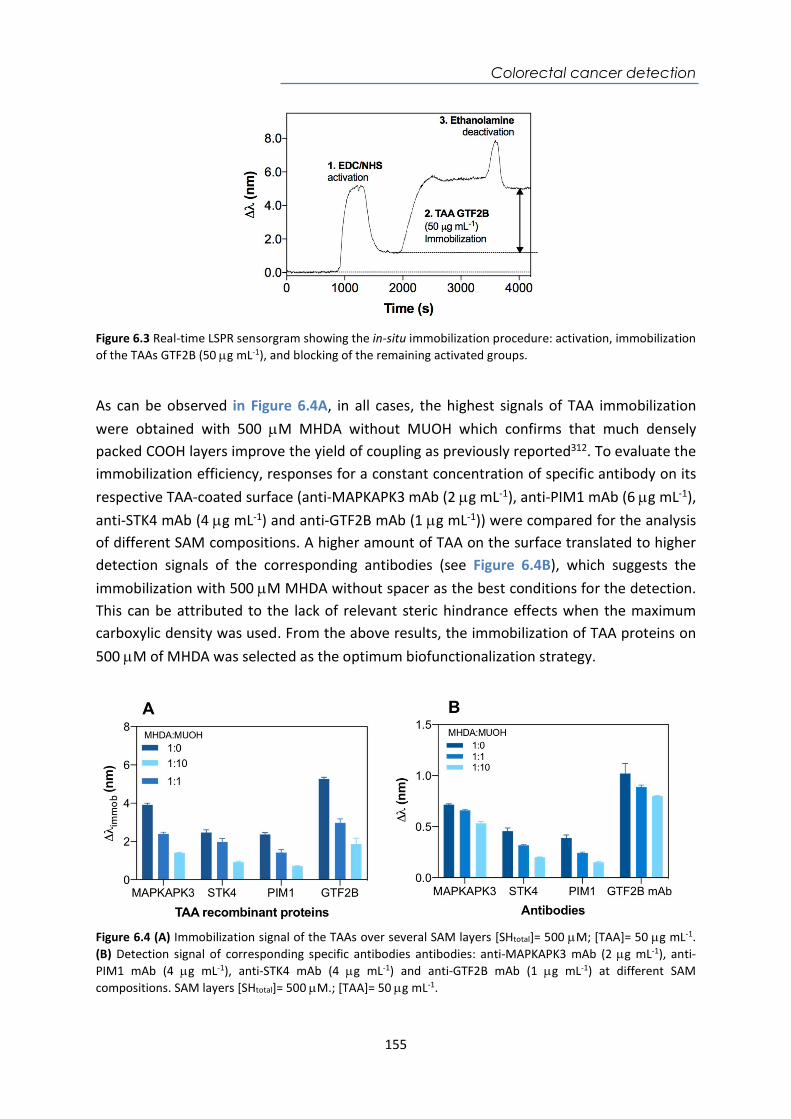
Colorectal cancer detection
155
Figure 6.3 Real-time LSPR sensorgram showing the in-situ immobilization procedure: activation, immobilization of the TAAs GTF2B (50 g mL-1), and blocking of the remaining activated groups. As can be observed in Figure 6.4A, in all cases, the highest signals of TAA immobilization were obtained with 500 M MHDA without MUOH which confirms that much densely packed COOH layers improve the yield of coupling as previously reported312. To evaluate the immobilization efficiency, responses for a constant concentration of specific antibody on its respective TAA-coated surface (anti-MAPKAPK3 mAb (2 g mL-1), anti-PIM1 mAb (6 g mL-1), anti-STK4 mAb (4 g mL-1) and anti-GTF2B mAb (1 g mL-1)) were compared for the analysis of different SAM compositions. A higher amount of TAA on the surface translated to higher detection signals of the corresponding antibodies (see Figure 6.4B), which suggests the immobilization with 500 M MHDA without spacer as the best conditions for the detection. This can be attributed to the lack of relevant steric hindrance effects when the maximum carboxylic density was used. From the above results, the immobilization of TAA proteins on 500 M of MHDA was selected as the optimum biofunctionalization strategy.
Figure 6.4 (A) Immobilization signal of the TAAs over several SAM layers [SHtotal]= 500 M; [TAA]= 50 g mL-1. (B) Detection signal of corresponding specific antibodies antibodies: anti-MAPKAPK3 mAb (2 g mL-1), anti-PIM1 mAb (4 g mL-1), anti-STK4 mAb (4 g mL-1) and anti-GTF2B mAb (1 g mL-1) at different SAM compositions. SAM layers [SHtotal]= 500 M.; [TAA]= 50 g mL-1.
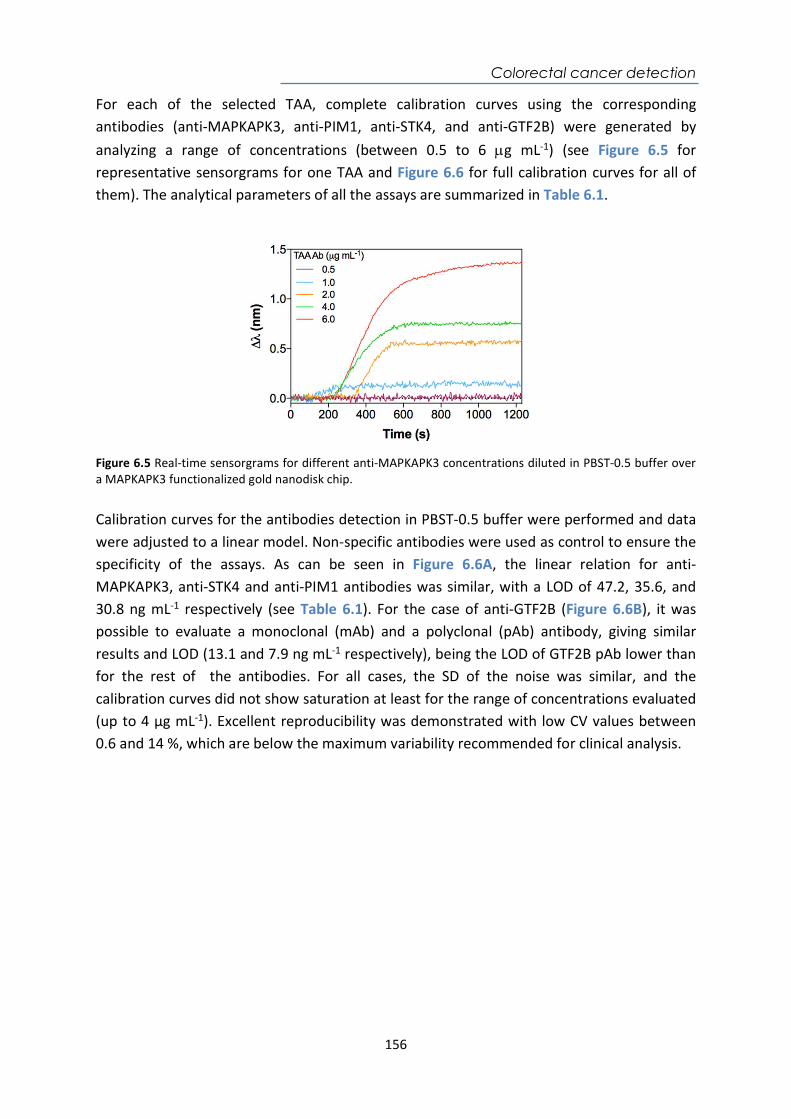
Colorectal cancer detection
156
For each of the selected TAA, complete calibration curves using the corresponding antibodies (anti-MAPKAPK3, anti-PIM1, anti-STK4, and anti-GTF2B) were generated by analyzing a range of concentrations (between 0.5 to 6 g mL-1) (see Figure 6.5 for representative sensorgrams for one TAA and Figure 6.6 for full calibration curves for all of them). The analytical parameters of all the assays are summarized in Table 6.1.
Figure 6.5 Real-time sensorgrams for different anti-MAPKAPK3 concentrations diluted in PBST-0.5 buffer over a MAPKAPK3 functionalized gold nanodisk chip. Calibration curves for the antibodies detection in PBST-0.5 buffer were performed and data were adjusted to a linear model. Non-specific antibodies were used as control to ensure the specificity of the assays. As can be seen in Figure 6.6A, the linear relation for anti-MAPKAPK3, anti-STK4 and anti-PIM1 antibodies was similar, with a LOD of 47.2, 35.6, and 30.8 ng mL-1 respectively (see Table 6.1). For the case of anti-GTF2B (Figure 6.6B), it was possible to evaluate a monoclonal (mAb) and a polyclonal (pAb) antibody, giving similar results and LOD (13.1 and 7.9 ng mL-1 respectively), being the LOD of GTF2B pAb lower than for the rest of the antibodies. For all cases, the SD of the noise was similar, and the calibration curves did not show saturation at least for the range of concentrations evaluated (up to 4 µg mL-1). Excellent reproducibility was demonstrated with low CV values between 0.6 and 14 %, which are below the maximum variability recommended for clinical analysis.
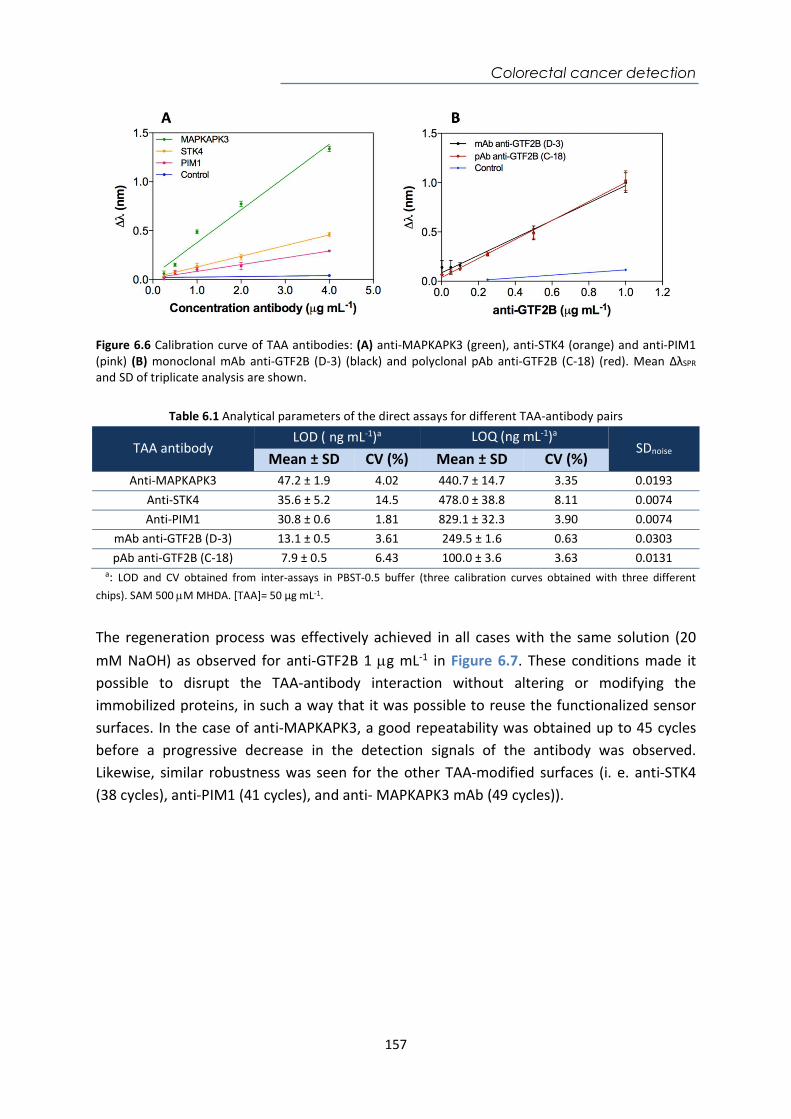
Colorectal cancer detection
157
Figure 6.6 Calibration curve of TAA antibodies: (A) anti-MAPKAPK3 (green), anti-STK4 (orange) and anti-PIM1 (pink) (B) monoclonal mAb anti-GTF2B (D-3) (black) and polyclonal pAb anti-GTF2B (C-18) (red). Mean ΔλSPR and SD of triplicate analysis are shown.
Table 6.1 Analytical parameters of the direct assays for different TAA-antibody pairs
TAA antibody LOD (ng mL-1)a LOQ (ng mL-1)a
SDnoise Mean ± SD CV (%) Mean ± SD CV (%)
Anti-MAPKAPK3 47.2 ± 1.9 4.02 440.7 ± 14.7 3.35 0.0193 Anti-STK4 35.6 ± 5.2 14.5 478.0 ± 38.8 8.11 0.0074 Anti-PIM1 30.8 ± 0.6 1.81 829.1 ± 32.3 3.90 0.0074
mAb anti-GTF2B (D-3) 13.1 ± 0.5 3.61 249.5 ± 1.6 0.63 0.0303 pAb anti-GTF2B (C-18) 7.9 ± 0.5 6.43 100.0 ± 3.6 3.63 0.0131
a: LOD and CV obtained from inter-assays in PBST-0.5 buffer (three calibration curves obtained with three different chips). SAM 500 M MHDA. [TAA]= 50 µg mL-1.
The regeneration process was effectively achieved in all cases with the same solution (20 mM NaOH) as observed for anti-GTF2B 1 g mL-1 in Figure 6.7. These conditions made it possible to disrupt the TAA-antibody interaction without altering or modifying the immobilized proteins, in such a way that it was possible to reuse the functionalized sensor surfaces. In the case of anti-MAPKAPK3, a good repeatability was obtained up to 45 cycles before a progressive decrease in the detection signals of the antibody was observed. Likewise, similar robustness was seen for the other TAA-modified surfaces (i. e. anti-STK4 (38 cycles), anti-PIM1 (41 cycles), and anti- MAPKAPK3 mAb (49 cycles)).
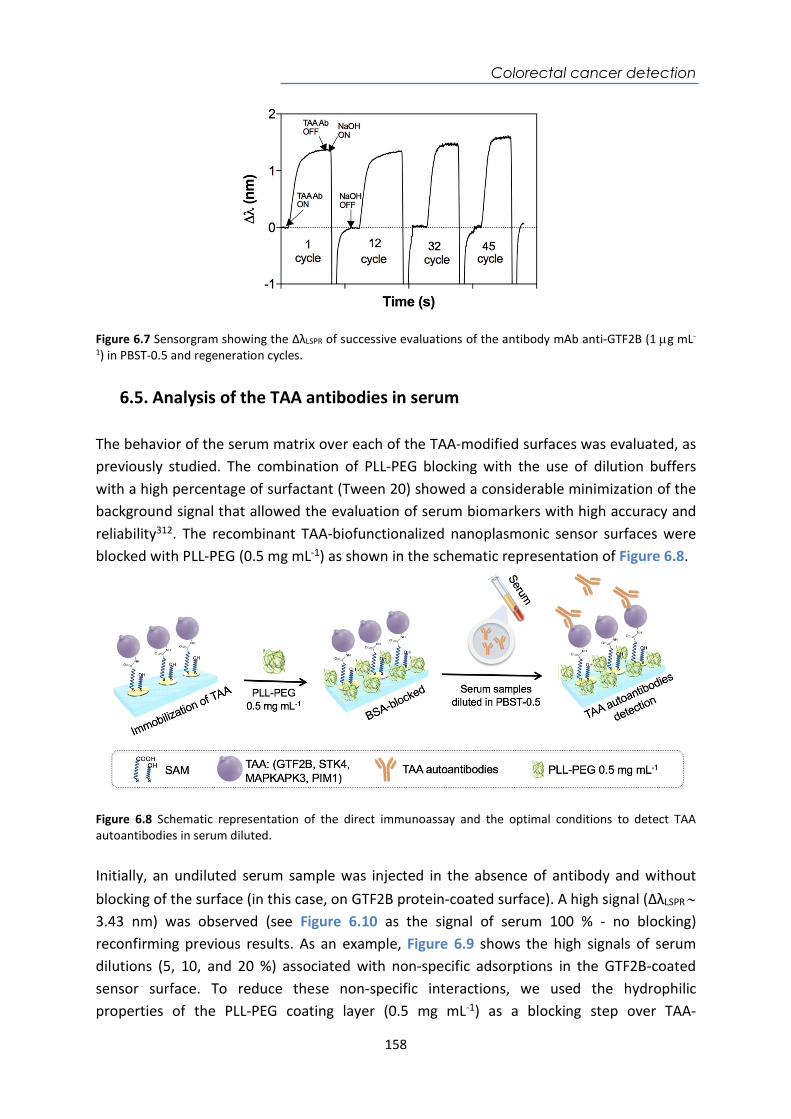
Colorectal cancer detection
158
Figure 6.7 Sensorgram showing the ΔλLSPR of successive evaluations of the antibody mAb anti-GTF2B (1 g mL-
1) in PBST-0.5 and regeneration cycles.
6.5. Analysis of the TAA antibodies in serum The behavior of the serum matrix over each of the TAA-modified surfaces was evaluated, as previously studied. The combination of PLL-PEG blocking with the use of dilution buffers with a high percentage of surfactant (Tween 20) showed a considerable minimization of the background signal that allowed the evaluation of serum biomarkers with high accuracy and reliability312. The recombinant TAA-biofunctionalized nanoplasmonic sensor surfaces were blocked with PLL-PEG (0.5 mg mL-1) as shown in the schematic representation of Figure 6.8.
Figure 6.8 Schematic representation of the direct immunoassay and the optimal conditions to detect TAA autoantibodies in serum diluted. Initially, an undiluted serum sample was injected in the absence of antibody and without blocking of the surface (in this case, on GTF2B protein-coated surface). A high signal (ΔλLSPR 3.43 nm) was observed (see Figure 6.10 as the signal of serum 100 % - no blocking) reconfirming previous results. As an example, Figure 6.9 shows the high signals of serum dilutions (5, 10, and 20 %) associated with non-specific adsorptions in the GTF2B-coated sensor surface. To reduce these non-specific interactions, we used the hydrophilic properties of the PLL-PEG coating layer (0.5 mg mL-1) as a blocking step over TAA-
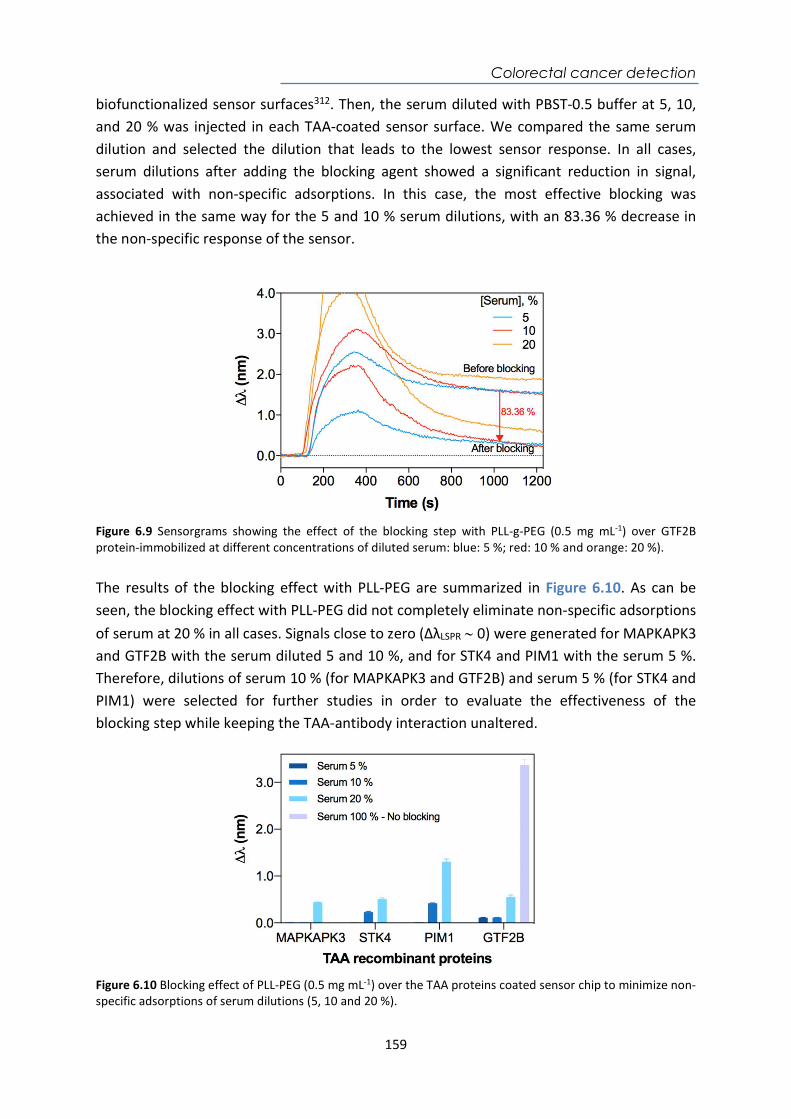
Colorectal cancer detection
159
biofunctionalized sensor surfaces312. Then, the serum diluted with PBST-0.5 buffer at 5, 10, and 20 % was injected in each TAA-coated sensor surface. We compared the same serum dilution and selected the dilution that leads to the lowest sensor response. In all cases, serum dilutions after adding the blocking agent showed a significant reduction in signal, associated with non-specific adsorptions. In this case, the most effective blocking was achieved in the same way for the 5 and 10 % serum dilutions, with an 83.36 % decrease in the non-specific response of the sensor.
Figure 6.9 Sensorgrams showing the effect of the blocking step with PLL-g-PEG (0.5 mg mL-1) over GTF2B protein-immobilized at different concentrations of diluted serum: blue: 5 %; red: 10 % and orange: 20 %). The results of the blocking effect with PLL-PEG are summarized in Figure 6.10. As can be seen, the blocking effect with PLL-PEG did not completely eliminate non-specific adsorptions of serum at 20 % in all cases. Signals close to zero (ΔλLSPR 0) were generated for MAPKAPK3 and GTF2B with the serum diluted 5 and 10 %, and for STK4 and PIM1 with the serum 5 %. Therefore, dilutions of serum 10 % (for MAPKAPK3 and GTF2B) and serum 5 % (for STK4 and PIM1) were selected for further studies in order to evaluate the effectiveness of the blocking step while keeping the TAA-antibody interaction unaltered.
Figure 6.10 Blocking effect of PLL-PEG (0.5 mg mL-1) over the TAA proteins coated sensor chip to minimize non-specific adsorptions of serum dilutions (5, 10 and 20 %).
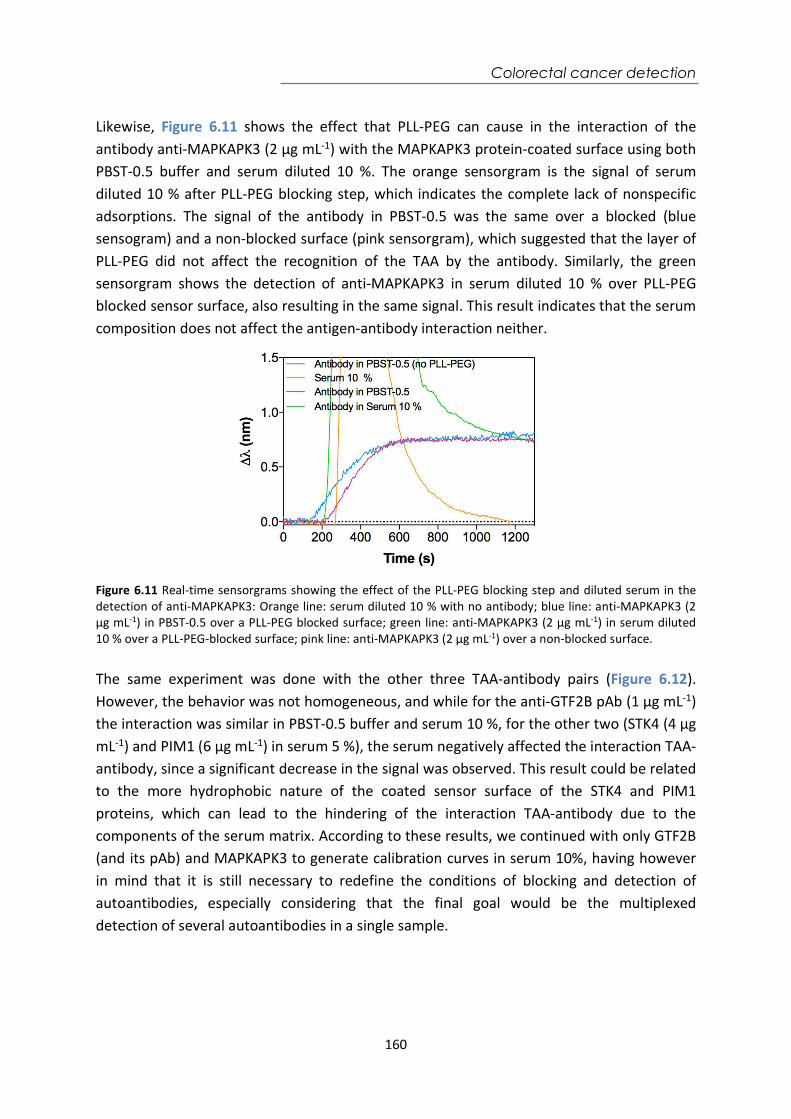
Colorectal cancer detection
160
Likewise, Figure 6.11 shows the effect that PLL-PEG can cause in the interaction of the antibody anti-MAPKAPK3 (2 µg mL-1) with the MAPKAPK3 protein-coated surface using both PBST-0.5 buffer and serum diluted 10 %. The orange sensorgram is the signal of serum diluted 10 % after PLL-PEG blocking step, which indicates the complete lack of nonspecific adsorptions. The signal of the antibody in PBST-0.5 was the same over a blocked (blue sensogram) and a non-blocked surface (pink sensorgram), which suggested that the layer of PLL-PEG did not affect the recognition of the TAA by the antibody. Similarly, the green sensorgram shows the detection of anti-MAPKAPK3 in serum diluted 10 % over PLL-PEG blocked sensor surface, also resulting in the same signal. This result indicates that the serum composition does not affect the antigen-antibody interaction neither.
Figure 6.11 Real-time sensorgrams showing the effect of the PLL-PEG blocking step and diluted serum in the detection of anti-MAPKAPK3: Orange line: serum diluted 10 % with no antibody; blue line: anti-MAPKAPK3 (2 µg mL-1) in PBST-0.5 over a PLL-PEG blocked surface; green line: anti-MAPKAPK3 (2 µg mL-1) in serum diluted 10 % over a PLL-PEG-blocked surface; pink line: anti-MAPKAPK3 (2 µg mL-1) over a non-blocked surface. The same experiment was done with the other three TAA-antibody pairs (Figure 6.12). However, the behavior was not homogeneous, and while for the anti-GTF2B pAb (1 µg mL-1) the interaction was similar in PBST-0.5 buffer and serum 10 %, for the other two (STK4 (4 µg mL-1) and PIM1 (6 µg mL-1) in serum 5 %), the serum negatively affected the interaction TAA-antibody, since a significant decrease in the signal was observed. This result could be related to the more hydrophobic nature of the coated sensor surface of the STK4 and PIM1 proteins, which can lead to the hindering of the interaction TAA-antibody due to the components of the serum matrix. According to these results, we continued with only GTF2B (and its pAb) and MAPKAPK3 to generate calibration curves in serum 10%, having however in mind that it is still necessary to redefine the conditions of blocking and detection of autoantibodies, especially considering that the final goal would be the multiplexed detection of several autoantibodies in a single sample.
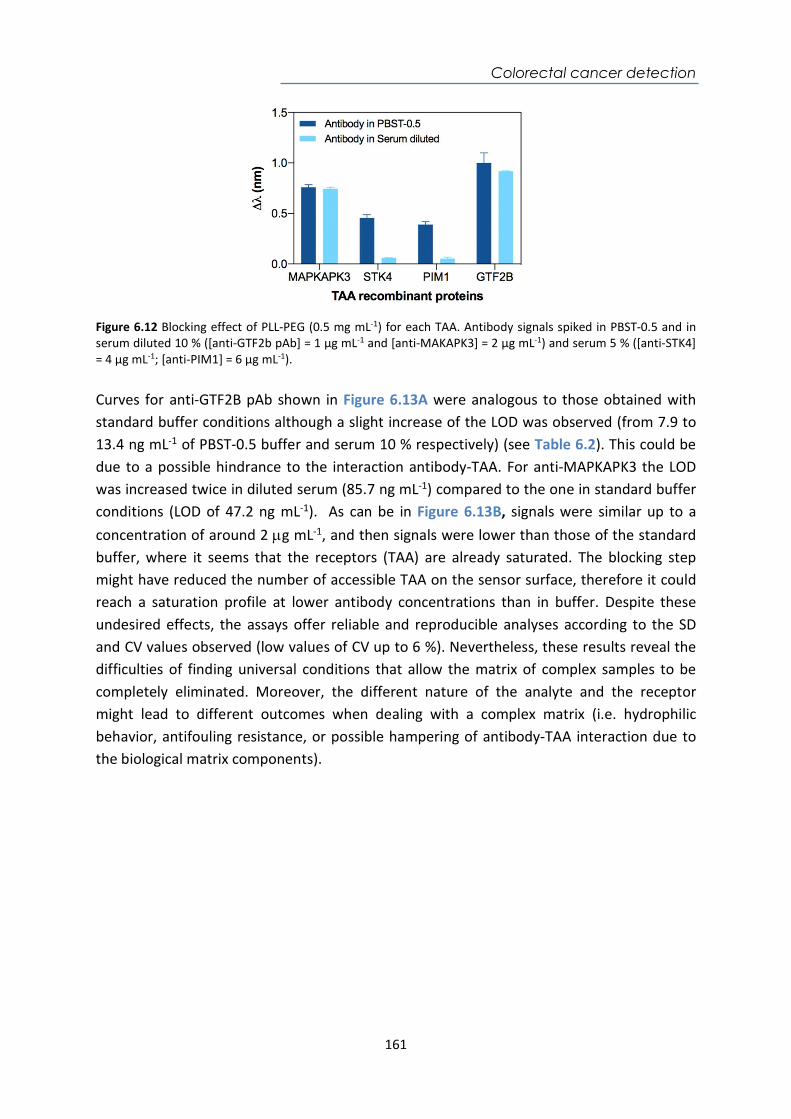
Colorectal cancer detection
161
Figure 6.12 Blocking effect of PLL-PEG (0.5 mg mL-1) for each TAA. Antibody signals spiked in PBST-0.5 and in serum diluted 10 % ([anti-GTF2b pAb] = 1 µg mL-1 and [anti-MAKAPK3] = 2 µg mL-1) and serum 5 % ([anti-STK4] = 4 µg mL-1; [anti-PIM1] = 6 µg mL-1). Curves for anti-GTF2B pAb shown in Figure 6.13A were analogous to those obtained with standard buffer conditions although a slight increase of the LOD was observed (from 7.9 to 13.4 ng mL-1 of PBST-0.5 buffer and serum 10 % respectively) (see Table 6.2). This could be due to a possible hindrance to the interaction antibody-TAA. For anti-MAPKAPK3 the LOD was increased twice in diluted serum (85.7 ng mL-1) compared to the one in standard buffer conditions (LOD of 47.2 ng mL-1). As can be in Figure 6.13B, signals were similar up to a concentration of around 2 g mL-1, and then signals were lower than those of the standard buffer, where it seems that the receptors (TAA) are already saturated. The blocking step might have reduced the number of accessible TAA on the sensor surface, therefore it could reach a saturation profile at lower antibody concentrations than in buffer. Despite these undesired effects, the assays offer reliable and reproducible analyses according to the SD and CV values observed (low values of CV up to 6 %). Nevertheless, these results reveal the difficulties of finding universal conditions that allow the matrix of complex samples to be completely eliminated. Moreover, the different nature of the analyte and the receptor might lead to different outcomes when dealing with a complex matrix (i.e. hydrophilic behavior, antifouling resistance, or possible hampering of antibody-TAA interaction due to the biological matrix components).
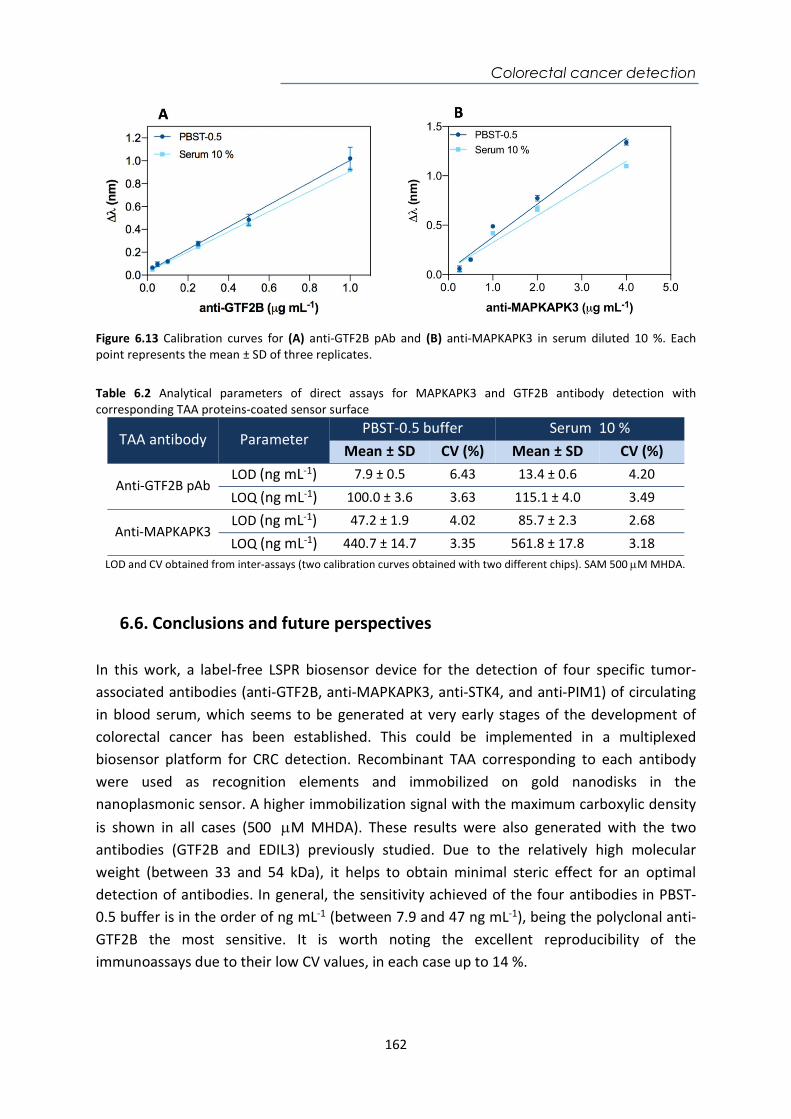
Colorectal cancer detection
162
Figure 6.13 Calibration curves for (A) anti-GTF2B pAb and (B) anti-MAPKAPK3 in serum diluted 10 %. Each point represents the mean ± SD of three replicates. Table 6.2 Analytical parameters of direct assays for MAPKAPK3 and GTF2B antibody detection with corresponding TAA proteins-coated sensor surface
TAA antibody Parameter PBST-0.5 buffer Serum 10 %
Mean ± SD CV (%) Mean ± SD CV (%)
Anti-GTF2B pAb LOD (ng mL-1) 7.9 ± 0.5 6.43 13.4 ± 0.6 4.20
LOQ (ng mL-1) 100.0 ± 3.6 3.63 115.1 ± 4.0 3.49
Anti-MAPKAPK3 LOD (ng mL-1) 47.2 ± 1.9 4.02 85.7 ± 2.3 2.68
LOQ (ng mL-1) 440.7 ± 14.7 3.35 561.8 ± 17.8 3.18 LOD and CV obtained from inter-assays (two calibration curves obtained with two different chips). SAM 500 M MHDA.
6.6. Conclusions and future perspectives In this work, a label-free LSPR biosensor device for the detection of four specific tumor-associated antibodies (anti-GTF2B, anti-MAPKAPK3, anti-STK4, and anti-PIM1) of circulating in blood serum, which seems to be generated at very early stages of the development of colorectal cancer has been established. This could be implemented in a multiplexed biosensor platform for CRC detection. Recombinant TAA corresponding to each antibody were used as recognition elements and immobilized on gold nanodisks in the nanoplasmonic sensor. A higher immobilization signal with the maximum carboxylic density is shown in all cases (500 M MHDA). These results were also generated with the two antibodies (GTF2B and EDIL3) previously studied. Due to the relatively high molecular weight (between 33 and 54 kDa), it helps to obtain minimal steric effect for an optimal detection of antibodies. In general, the sensitivity achieved of the four antibodies in PBST-0.5 buffer is in the order of ng mL-1 (between 7.9 and 47 ng mL-1), being the polyclonal anti-GTF2B the most sensitive. It is worth noting the excellent reproducibility of the immunoassays due to their low CV values, in each case up to 14 %.
Colorectal cancer detection
163
Evaluation of the immunoassays in serum was performed including a blocking step with PLL-PEG and a dilution of serum with PBST-0.5 (i.e serum 5 % for anti-STK4 and anti-PIM1 and serum 10 % for anti-GTF2B and anti-MAPKAPK3). Although it was possible to remove non-specific binding, the four detection assays have been affected differently. The study of the influence of serum shows that probably the nature of the TAA and the type of interaction they have with their corresponding antibodies may influence the effect of the serum differently, which can limit their simultaneous detection in a multiplexed biosensor platform. This has been observed especially with the anti-STK4 and anti-PIM1, making it impossible to obtain calibration curves in diluted serum. On the other hand, reliable and reproducible calibration curves were obtained for both anti-GTF2B and anti-MAPKAPK3 for serum dilution 10 %. This dilution factor inevitably worsens the LOD, increasing in the case of the MAPKAPK3 immunoassay to 85.7 ng mL-1, and in the case of GTF2B to 13.4 ng mL-1. Nevertheless, the parameters resulting from the calibration curves in diluted serum offer a highly reliable analysis method to quantify TAA antibodies with high selectivity and reproducibility with CV values of less than 6 %. Therefore, these results demonstrate the need to seek improvements in immobilization and especially in blocking conditions to prevent non-specific adsorptions in each of the immunoassays. As the fundamental goal is the simultaneous detection of a panel of TAA antibodies in a single multiplexed biosensor platform, it must involve the uniformity of the samples to be measured. This includes the same biofunctionalization and sensor surface pretreatment (i.e. same blocking step, if necessary, with the same beneficial effect for all the TAAs) and the same treatment for the real sample (i.e. same serum dilution factor). Once these have been achieved, accuracy studies and clinical validation will be further attempted to explore the detection of such autoantibodies in real samples from patients with colorectal cancer.
General Conclusions
164
General Conclusions This doctoral thesis represents a significant contribution to the development of plasmonic and nanoplasmonic biosensors as potential tools to be used as point-of-care devices in clinical diagnosis and therapy monitoring. Several analytical methodologies have been developed, targeting representative and relevant clinical conditions and diseases (i.e celiac disease, infections, drug monitoring, and cancer) whose early detection or continuous monitoring can be improved by means of these rapid, sensitive, and easy-to-use biosensor platforms. The different detection strategies have been carefully designed and optimized to eventually perform the analysis in complex biological fluids. In each assay, we have selected specific antibodies, proteins, or DNA probes as biorecognition elements for the detection of analytes of interest (i.e. drugs, peptides, proteins, antibodies, and DNA sequences) found in biological fluids such as serum, plasma, urine, and sputum. The rigorous optimization and evaluation of the biofunctionalization and biodetection processes have demonstrated a reliable monitoring at levels of sensitivity, selectivity, and reproducibility comparable to current standard analytical methodologies. The implementation of antifouling strategies such as blocking agents or additives added to the buffer have shown an efficient reduction of the non-specific adsorptions of the biological matrices. The adequate selection of these strategies in each assay preserves the biological activity of the bioreceptors, providing even slight improvements in the analytical parameters while resolving the issues related to the analysis of complex body fluids. Each of the proposed methodologies has shown accuracy levels between 90 and 100 %, which confirms the viability of the biosensor assays on biological samples. The concentrations that could be detected and the quantification limits obtained are adjusted within the clinical ranges reported for the diseases studied, which represents a promising future as efficient analytical tools for diagnosis and therapy follow-up. Furthermore, the analysis of clinical samples has demonstrated the complete feasibility of the proposed biosensor methodologies for their implementation in the biomedical and clinical fields. The main general conclusions that can be drawn from the work done during this thesis are the following:
A label-free based methodology has been developed for the therapeutic drug monitoring of the anticoagulant acenocoumarol in plasma samples. All the analytical parameters have been optimized in such a way that the detection biosensor assay can be performed in plasma applying a simple 1:1 dilution. The inclusion of a blocking step consisting of adding dextran sulfate (2 mg mL-1) in PBST-0.5 buffer as
General Conclusions
165
an additive has been crucial to achieve a LOD of 272.5 pg mL-1 and an IC50 of 17 ng mL-1 with excellent reproducibility and precision. This biosensor methodology reaches detection levels and a working range within the clinical values required for acenocoumarol monitoring in plasma. Accuracy levels around 90-100 % reveal a high degree of reliability. Compared to its ELISA counterpart, our biosensor approach offers a simpler and faster approach to convenient monitoring of drug levels, with great potential to be implemented at the point-of-care.
A label-free SPR biosensor device that allows rapid, highly reproducible, accurate,
and non-invasive gluten intake control has been established. The methodology is based on a label-free indirect competitive immunoassay that enables the quantification of the gliadin 33-mer peptide and GIP directly into the urine without requiring any purification, treatment, or dilution procedures. The use of ethylene glycol-containing alkanethiols in its structure and an additional blocking step consisting of BSA (10 mg mL-1 in PBST-0.5 buffer) before each sample analysis completely suppressed any type of urine-derived adsorptions. Excellent analytical parameters have been achieved using two monoclonal antibodies (G12 and A1) with LODs of 1.7 and 4.0 ng mL-1 respectively, guaranteeing the minimum detection of GIP even around the maximum tolerable amount in the digestive tract (<50 mg) for celiac individuals. This biosensor device shows exceptional reproducibility, reliability and accuracy demonstrated in the correlation analysis with a significant number of real samples, achieving recoveries close to 100 % that confirm the viability and robustness of the method.
We have developed a direct biosensor immunoassay for the detection and quantification of heat shock protein (HspX) as a biomarker of Mtb in pre-treated sputum samples. The method is based on the use of highly specific monoclonal antibodies immobilized on the sensor surface to allow biomarker detection without the need to use amplification steps. With the EG-thiol-based strategy, it provides a simple and robust detection layer, although the pretreatment of the sputum is still necessary in order to obtain a reliable biomarker analysis. However, the application of this pretreatment facilitates its direct analysis, achieving a LOD of 0.63 ng mL-1, and a working range between 2.1 - 125 ng mL-1. The biosensor assay shows excellent reproducibility (with CV values of the main parameters below 15 %) and high accuracy, with values close to 100 % when evaluated with blind samples. The assay has been validated with real samples from patients with Tuberculosis. To our knowledge, this has been the first work reporting quantifiable data regarding levels of HspX protein in sputum of infected patients. The biosensor demonstrated a sensitivity and specificity of 100 %, with the real samples from TB and non-TB patients, confirming the potential of this biosensor as a simple tool for the diagnosis of TB.
General Conclusions
166
We have set the basis for the detection of the non-coding sequence of DNA pre-rRNA-PCL1, considered a potential biomarker in tuberculosis diagnosis, to detect live and non-cultivable bacilli in sputum samples. DNA probes functionalized with a thiol group mixed with polyethylene glycol incorporated-thiols have been used to improve the noise signal and to avoid non-specific adsorptions from the sputum samples. The SPR biosensor has demonstrated high sensitivity using synthetic targets of the pre-rRNA-PCL1 sequence with a LOD of 0.13 nM and a LOQ of 0.45 nM in SSC-5X buffer. In addition, it has demonstrated excellent levels of reproducibility with low CV of up to 1.39 % and an accuracy performed with blind samples obtaining values close to 100 %. The qualitative assay of real samples seems to be promising for the detection of viable and non-cultivable bacilli as a future tool for the early detection of Tuberculosis. However, further studies are required to confirm the feasibility of the assay for DNA sequence quantification in real sputum samples.
A label-free LSPR biosensor device for the early diagnosis of colorectal cancer by the
determination of specific tumor-associated autoantibodies circulating in blood serum has been established. The detection strategy is based on the direct detection of these antibodies through their corresponding tumor-associated antigens (TAA) immobilized on the sensor chip surface. The biosensor has been evaluated with four different TAAs: MAPKAPK3, STK4, PIM1, and GTF2B, using commercial specific antibodies as model target of the human autoantibodies (anti-MAPKAPK3, anti-STK4, anti-PIM1, and anti-GTF2B pAb). Calibration curves using PBST-0.5 buffer have allowed the direct quantification of these antibodies achieving LOD values between 7.9 and 47 ng mL-1 depending on the antibody. The assays were highly reproducible with CV values of up to 14 %. The combination of a blocking step using PLL-PEG with a dilution of serum in PBST-0.5 buffer and with a high percentage of surfactant (Tween 20) was sufficient to eliminate nonspecific binding to TAA-modified sensor surfaces. Diluting the serum was enough to remove the nonspecific binding to the TAA modified sensor surfaces (5 % in the case of anti-STK4 and anti-PIM1 antibodies) and 10 % (for anti-GTF2B pAb and anti-MAPKAPK3). However, the detection of the antibodies under these conditions are not fully resolved in all the cases as it affected the antibody-TAA interaction in two out of the four assays (STK4 and PIM1), thus preventing their effective detection. In the other two assays, only a slight worsening of the LOD was observed (from 7.9 to 13.4 ng mL-1 for anti-GTF2B and from 47.2 to 85.7 ng mL-1 for anti-MAPKAPK3). Further work is needed to homogenize the assay conditions to make feasible the detection of the panel of autoantibodies under the same conditions (i.e. same sample pretreatment, same sample dilution) to pursue their multiplexed biosensing detection as an advanced tool for CRC diagnosis.
General Conclusions
167
Considerations and Future Perspectives There are countless benefits that (nano)plasmonics can offer in the development of biosensors such as new nanostructures and sensing configurations which provide enhanced features in terms of analytical performance, device integration, and miniaturization, and multiplexing opportunities. The use of nanoplasmonic biosensors as commercial POC biodetection platforms has not been accomplished yet. This thesis shows the paramount importance that the biofunctionalization and full assay development has in this goal and demonstrates that these devices can fully compete and even improve current analytical techniques. However, the transfer of fully integrated devices to clinical settings has not yet been completely overcome and the gap between the laboratory and the market still remains. To accelerate this process of technology transfer, the incorporation of advanced software, microfluidic and photonic designs that allow complete integration without the minimum support of additional equipment is needed. A further integration into disposable cartridges incorporating biofunctionalized sensor chips that allows sample injection without any additional pretreatment or dilution steps is a crucial step. Achieving these improvements will benefit to rapid delivery of the patient's biological sample to the detection area and will facilitate the deployment of such biosensor devices in decentralized settings, such as primary health care units, or even in the home setting where patients can self-monitor the medication or the diet.
Publications
168
Publications
Journal articles: 1. López-Muñoz G.A., Estévez M.C., Peláez E.C., Homs-Corbera A., García-Hernández M.C., Imbaud J.I., and Lechuga L.M. (2017). A label-free nanostructured plasmonic biosensor based on Blu-ray discs with integrated microfluidics for sensitive biodetection. Biosensors and Bioelectronics 96, 260-267. 2. Peláez E.C., Estévez M.C., Portela A., Salvador J.P., Marco M.P., Lechuga L.M. (2018). Nanoplasmonic biosensor device for the monitoring of acenocoumarol therapeutic drug in plasma. Biosensors and Bioelectronics 119(5), 149-155. 3. Peláez E.C., Estévez M.C., Domínguez R., Sousa C., Cebolla A., Lechuga L.M. (2020). A compact SPR biosensor device for the rapid and efficient monitoring of gluten-free diet directly in human urine. Analytical and Bioanalytical Chemistry 412, 6407–6417. 4. Peláez E.C., Estévez M.C., Mongui A., Menéndez M.C., García M.J., Toro C., Herrera-Sandoval O.L., Del-Portillo P., Robledo J., Lechuga L.M. (2020). Detection and quantification of the HspX antigen in sputum samples using plasmonic biosensing: toward a real POC for tuberculosis diagnosis. ACS Infectious Diseases 6(5), 1110-1120. Book Chapter 1. Portela A., Peláez E.C., Calvo-Lozano O., Estévez M.C., Lechuga L.M. (2019). Label-free Nanoplasmonic Biosensing of Cancer Biomarkers for Clinical Diagnosis. In: Biomimetic Sensing. Methods and Protocols in Molecular Biology. Editorial Humana Press, vol. 2027. Chapter 10. pp. 115-140.
Publications
169
Oral presentations: 1. Peláez E.C., Estevez, M.-C., Sousa, C., Moreno, M.L., Cebolla, A., Lechuga, L.M. Label-free SPR monitoring of Gluten Immunogenic Peptides in Urine for Celiac Disease Follow-up. 11th Ibero-American Congress on Sensors. IBERSENSOR 2018. September 17th – 20th 2018. Barcelona (Spain). 2. Peláez E.C., Estévez M.-C., Mongui A., Menéndez M.C., García M.J., Toro C., Herrera O.L., Del Portillo, P., Robledo J., Lechuga L.M. “HspX protein tuberculosis biomarker evaluated in sputum samples by plasmonic biosensing”. Doctoral Seminars. Autonomous University of Barcelona. May 30th – June 1st 2018. Barcelona, Spain. 3. Peláez E.C., Estévez M.-C., Mongui A., Menéndez M.C., García M.J., Toro C., Herrera O.L., Del Portillo, P., Robledo J., Lechuga L.M. Development of a nanosensor for Tuberculosis detection. International Workshop: Biomarkers of infectious diseases for diagnosis. December 6th – 7th 2017. Barranquilla, Atlántico (Colombia). 4. Peláez E.C., Estévez M.-C., Mongui A., Menéndez M.C., García M.J., Toro C., Herrera O.L., Del Portillo, P., Robledo J., Lechuga L.M. “Development of a biosensor for early tuberculosis diagnosis”. 4th Consortium Network Nucleosensor Corporation Corpogen, Centre for Research and Technological Development of the Electro Electronics Industry (CIDEI), National University of Colombia, Corporation for biological Research (CIB), Central University. December 6th -12th 2017. Barranquilla, Atlántico (Colombia). 5. Peláez E.C., Estévez M.-C., Lechuga L.M. “Photonic nanobiosensors for clinical applications – NanoB2A, ICN2”. Central University. December 3rd, 2017. Bogotá, Colombia. 6. Peláez E.C., Estévez M.-C., Mongui A., Menéndez M.C., García M.J., Toro C., Herrera O.L., Del Portillo, P., Robledo J., Lechuga L.M. "Label free optical biosensors for specific detection of tuberculosis" 3rd Consortium Network Nucleosensor Corporation Corpogen, Centre for Research and Technological Development of the Electro Electronics Industry (CIDEI), National University of Colombia, Corporation for biological Research (CIB), Central University. October 11th – 13th, 2016. Villavicencio (Colombia). 7. Peláez E.C., Estévez M.-C., Mongui A., Menéndez M.C., García M.J., Toro C., Herrera O.L., Del Portillo, P., Robledo J., Lechuga L.M. “Search for a new biosensing system based on nanotechnology for the detection of markers for tuberculosis, through use of layer-by-layer deposition techniques”. 2nd Consortium Network Nucleosensor Corporation Corpogen, Centre for Research and Technological Development of the Electro Electronics Industry (CIDEI), National University of Colombia, Corporation for biological Research (CIB), Central University. November 10th – 12th, 2015. Medellín (Colombia).
Publications
170
Posters: 1. Peláez E.C., Estévez M.C., Mongui A., Menéndez M.C., García M.J., Toro C., Herrera O.L., Del Portillo, P., Robledo J., Lechuga L.M. “HspX protein tuberculosis biomarker evaluated in sputum samples by plasmonic biosensing”. 11th Ibero-Amercian Congress on Sensors. IBERSENSOR 2018. September 17th – 20th, 2018. Barcelona (Spain). 2. Peláez E.C., Estévez M.-C., Del Portillo P., Herrera O.L., Robledo J., Lechuga L. “LSPR-based immunoassay for the specific detection of HspX protein biomarker related to Tuberculosis disease”. Doctoral Seminars. Autonomous University of Barcelona. May 30th – June 1st, 2018. Barcelona, Spain. 3. Peláez E.C., Estevez, M.-C, Sousa, C., Moreno, M.L., Cebolla, A., Lechuga. L.M. “Label-free SPR Monitoring of Gluten Immunogenic Peptide in Urine for Celiac Disease Follow-up”. EUROPT(R)ODE XIV. March 25th-28th, 2018. Naples, Italy. 4. Peláez E.C., Estévez M.C., Salvador J.P., Marco M.P., Lechuga L.M. “Localised Surface Plasmon Resonance Biosensor for the monitoring of Sintrom® therapeutic drug in plasma”. VIII International Congress on Analytical Nanoscience and Nanotechnology. NyNA2017. July 3rd – 5th, 2017. Barcelona, Spain. 5. Peláez E.C., Estévez M.C., Del Portillo P., Herrera O.L., Robledo J., Lechuga L.M. “LSPR-based immunoassay for the specific detection of HspX protein biomarker related to Tuberculosis disease”. The 3rd Institut Pasteur International Network Symposium, November 29th – December 2nd, 2016. París (France). 6. Peláez E.C., Estévez M.C., Salvador J.P., Marco M.P., Lechuga L. M."SPR-based immunoassay for quantification of Sintrom® in serum”. The 2nd Scientific Meeting of BNC-b Students. Autonomous University of Barcelona, June 29th – 30th, 2016. Barcelona (Spain). 7. García M.A., Pazos J., Carvajal L.A., Peláez E.C., Herrera O.L. "Resonator of quartz crystal as a low-cost nanobiosensor for the detection of Mycobacterium Tuberculosis". NanoAndes 2016. November 8th – 11th 2016. Bogotá (Colombia).

Publications
171
Bibliography
172
Bibliography 1. Sandbhor Gaikwad, P. & Banerjee, R. Advances in point-of-care diagnostic devices in
cancers. Analyst 143, 1326–1348 (2018).
2. Soler, M., Huertas, C. S. & Lechuga, L. M. Label-free plasmonic biosensors for point-of-care diagnostics: a review. Expert Rev. Mol. Diagn. 19, 71–81 (2019).
3. Tumbarello, M. et al. Bloodstream infections caused by extended-spectrum-β-lactamase- producing Escherichia coli: Risk factors for inadequate initial antimicrobial therapy. Antimicrob. Agents Chemother. 52, 3244–3252 (2008).
4. Ramamurthy, T., Ghosh, A., Pazhani, G. P. & Shinoda, S. Current perspectives on viable but non-culturable (VBNC) pathogenic bacteria. Front. Public Heal. 2, 1–9 (2014).
5. Tighe, P. J., Ryder, R. R., Todd, I. & Fairclough, L. C. ELISA in the multiplex era: Potentials and pitfalls. Proteomics - Clin. Appl. 9, 406–422 (2015).
6. Zarei, M. Advances in point-of-care technologies for molecular diagnostics. Biosens. Bioelectron. 98, 494–506 (2017).
7. Murday, J. S., Siegel, R. W., Stein, J. & Wright, J. F. Translational nanomedicine : status assessment and opportunities. Nanomedicine Nanotechnology, Biol. Med. 5, 251–273 (2009).
8. Vashist, S. K. Point-of-care diagnostics: Recent advances and trends. Biosensors 7, 10–13 (2017).
9. Liu, D. et al. Trends in miniaturized biosensors for point-of-care testing. TrAC - Trends Anal. Chem. 122, 115701 (2020).
10. Baldini, F. & Minunni, M. New developments in biosensors. Anal. Bioanal. Chem. 411, 7605–7606 (2019).
11. Davis, F. & Altintas, Z. Section 1 Introduction to Biosensors , Recognition Elements , General Introduction to Biosensors and Recognition Receptors. in Biosensors and Nanotechnology: Applications in Heath Care Diagnosis (ed. John Wiley & Sons, I.) 13–15 (2017).
12. Mukherji, S. & Mondal, D. Lab-on-chip (LOC) devices for point of care (POC) applications. Medical Biosensors for Point of Care (POC) Applications (Elsevier Ltd, 2017).
13. Larsson, A., Greig-Pylypczuk, R. & Huisman, A. The state of point-of-care testing: A european perspective. Ups. J. Med. Sci. 120, 1–10 (2015).
14. Panpradist, N. & Lai, J. J. 4.1 - Point-of-Care Diagnostics. in Biomaterials Nanoarchitectonics 139–156 (Elsevier Inc., 2016).
15. Kosack, C. S., Page, A. L. & Klatser, P. R. A guide to aid the selection of diagnostic tests. Bull. World Health Organ. 95, 639–645 (2017).
16. Song, Y. et al. Point-of-care technologies for molecular diagnostics using a drop of
Bibliography
173
blood. Trends Biotechnol. 32, 132–139 (2014).
17. Wu, H., Wallach, M. & Shimoni, O. Challenges with Point-Of-Care Tests (POCT) for Celiac Disease. Celiac Dis. - From Bench to Clin. 1–12 (2019).
18. Quesada-González, D. & Merkoçi, A. Nanomaterial-based devices for point-of-care diagnostic applications. Chem. Soc. Rev. 47, 4697–4709 (2018).
19. Misra, S., Huddy, J., Hanna, G. & Oliver, N. Validation and regulation of point of care devices for medical applications. in Medical Biosensors for Point of Care (POC) Applications 27–44 (Elsevier, 2017).
20. Kozel, T. R. & Burnham-marusich, A. R. Point-of-Care testing for Infectious Diseases: Past , Present , and Future. J. Clin. Microbiol. 55, 2313–2320 (2017).
21. Vashist, S. K. & Luong, J. H. T. Point-of-Care Technologies Enabling Next-Generation Healthcare Monitoring and Management. Point-of-Care Technol. Enabling Next-Generation Healthc. Monit. Manag. (2019).
22. Wang, P. & Kricka, L. J. Current and emerging trends in point-of-care technology and strategies for clinical validation and implementation. Clin. Chem. 64, 1439–1452 (2018).
23. Wang, K., Qin, W., Hou, Y., Xiao, K. & Yan, W. The application of lateral flow immunoassay in point of care testing: A review. Nano Biomed. Eng. 8, 172–183 (2016).
24. Chambers, J. P., Arulanandam, B. P., Matta, L. L., Weis, A. & Valdes, J. J. Biosensor Recognition elements. Curr. Issues Mol. biol. 10, 1–12 (2008).
25. Monošík, R., Streďanský, M. & Šturdík, E. Biosensors - classification, characterization and new trends. Acta Chim. Slovaca 5, 109–120 (2012).
26. Ronkainen, N. J., Halsall, H. B. & Heineman, W. R. Electrochemical biosensors. Chem. Soc. Rev. 39, 1747 (2010).
27. Farré, M., Kantiani, L. & Barceló, D. Microfluidic Devices: Biosensors. Chemical Analysis of Food: Techniques and Applications (2012).
28. Karunakaran, C., Rajkumar, R. & Bhargava, K. Chapter 1. Introduction to Biosensors. in Biosensors and Bioelectronics 1–68 (Elsevier Inc., 2015).
29. Hasegawa, H., Savory, N., Abe, K. & Ikebukuro, K. Methods for improving aptamer binding affinity. Molecules 21, (2016).
30. Huang, A., Li, H. & Xu, D. An on-chip electrochemical sensor by integrating ITO three-electrode with low-volume cell for on-line determination of trace Hg(II). J. Electroanal. Chem. 848, 113189 (2019).
31. Xu, Y. & Wang, E. Electrochemical biosensors based on magnetic micro/nano particles. Electrochim. Acta 84, 62–73 (2012).
32. Budnikov, H. C., Evtugyn, G. a & Porfireva, A. V. Electrochemical DNA sensors based on electropolymerized materials. Talanta 102, 137–55 (2012).
33. Liu, Y., Tuleouva, N., Ramanculov, E. & Revzin, A. Aptamer-based electrochemical
Bibliography
174
biosensor for interferon gamma detection. Anal. Chem. 82, 8131–8136 (2010).
34. Meini, N. et al. Label-free electrochemical monitoring of protein addressing through electroactivated ‘click’ chemistry on gold electrodes. Mater. Sci. Eng. C. Mater. Biol. Appl. 38, 286–91 (2014).
35. Thevenot, D. ., Toth, K., Durst, R. . & Wilson, G. . Electrochemical biosensors: recommended definitions and classification. Biosens. Bioelectron. 16, 121–131 (2001).
36. Grieshaber, D., MacKenzie, R., Vörös, J. & Reimhult, E. Electrochemical Biosensors - Sensor principles and architectures. Sensors 8, 1400–1458 (2008).
37. Dubiel, E. A., Martin, B., Vigier, S. & Vermette, P. Real-time label-free detection and kinetic analysis of Etanercept—Protein A interactions using quartz crystal microbalance. Colloids Surfaces B Biointerfaces 149, 312–321 (2017).
38. Atay, S. et al. Quartz crystal microbalance based biosensors for detecting highly metastatic breast cancer cells via their transferrin receptors. Anal. Methods 8, 153–161 (2016).
39. Shen, Z. et al. Non Labeled QCM Lectin sensor. Anal. Chem. 79, 2312–2319 (2007).
40. Deng, X. et al. A Highly Sensitive Immunosorbent Assay Based on Biotinylated Graphene Oxide and the Quartz Crystal Microbalance. ACS Appl. Mater. Interfaces 8, 1893–1902 (2016).
41. Vashist, S. K. & Vashist, P. Recent Advances in Quartz Crystal Microbalance-Based Sensors. J. Sensors ID571405, 1–13 (2011).
42. Arlett, J. L., Myers, E. B. & Roukes, M. L. Comparative advantages of mechanical biosensors. Nat. Nanotechnol. 6, 203–215 (2011).
43. Tamayo, J., Kosaka, P. M., Ruz, J. J., San Paulo, Á. & Calleja, M. Biosensors based on nanomechanical systems. Chem. Soc. Rev. 42, 1287–1311 (2013).
44. Alvarez, M. & Lechuga, L. M. Microcantilever-based platforms as biosensing tools. Analyst 135, 827–836 (2010).
45. Fan, X. et al. Sensitive optical biosensors for unlabeled targets: A review. Anal. Chim. Acta 620, 8–26 (2008).
46. Peltomaa, R., Glahn-Martínez, B., Benito-Peña, E. & Moreno-Bondi, M. C. Optical Biosensors for Label-Free Detection of Small Molecules. Sensors (Basel). 18, (2018).
47. Zanchetta, G., Lanfranco, R., Giavazzi, F., Bellini, T. & Buscaglia, M. Emerging applications of label-free optical biosensors. Nanophotonics 6, 627–645 (2017).
48. Soler, M., Estevez, M.-C., Calvo-Lozano, O. & Lechuga, L. M. Nanophotonic Biosensors, driving personalized medicine. Opt. Photonics News 24–31 (2020).
49. Homola, J. Surface plasmon resonance sensors for detection of chemical and biological species. Chem. Rev. 108, 462–93 (2008).
50. Vollmer, F. & Arnold, S. Whispering-gallery-mode biosensing: Label-free detection down to single molecules. Nat. Methods 5, 591–596 (2008).
51. Daghestani, H. N. & Day, B. W. Theory and applications of surface plasmon resonance,
Bibliography
175
resonant mirror, resonant waveguide grating, and dual polarization interferometry biosensors. Sensors 10, 9630–9646 (2010).
52. González-Guerrero, A. B., Maldonado, J., Herranz, S. & Lechuga, L. M. Trends in photonic lab-on-chip interferometric biosensors for point-of-care diagnostics. Anal. Methods 8, 8380–8394 (2016).
53. Duval, D., González-Guerrero, A. B., Dante, S., Domínguez, C. & Lechuga, L. M. Interferometric waveguide biosensors based on Si-technology for point-of-care diagnostic. Silicon Photonics Photonic Integr. Circuits III 8431, 84310P (2012).
54. Lambeck, P. V. Integrated optical sensors for the chemical domain. Meas. Sci. Technol. 17, (2006).
55. Zinoviev, K. et al. Silicon photonic biosensors for lab-on-a-chip applications. Adv. Opt. Technol. 2008, (2008).
56. Heideman, R. G. & Lambeck, P. V. Remote opto-chemical sensing with extreme sensitivity: Design, fabrication and performance of a pigtailed integrated optical phase-modulated Mach-Zehnder interferometer system. Sensors Actuators, B Chem. 61, 100–127 (1999).
57. Schmitt, K., Schirmer, B., Hoffmann, C., Brandenburg, A. & Meyrueis, P. Interferometric biosensor based on planar optical waveguide sensor chips for label-free detection of surface bound bioreactions. Biosens. Bioelectron. 22, 2591–2597 (2007).
58. Ymeti, A. et al. Fast, ultrasensitive virus detection using a young interferometer sensor. Nano Lett. 7, 394–397 (2007).
59. Mulder, H. K. P., Blum, C., Subramaniam, V. & Kanger, J. S. Size-selective analyte detection with a Young interferometer sensor using multiple wavelengths. Opt. Express 24, 8594 (2016).
60. Zhang, Y. N., Zhao, Y. & Lv, R. Q. A review for optical sensors based on photonic crystal cavities. Sensors Actuators, A Phys. 233, 374–389 (2015).
61. Baker, J. E., Sriram, R. & Miller, B. L. Two-dimensional photonic crystals for sensitive microscale chemical and biochemical sensing. Lab Chip 15, 971–990 (2015).
62. Baaske, M. & Vollmer, F. Optical resonator biosensors: Molecular diagnostic and nanoparticle detection on an integrated platform. ChemPhysChem 13, 427–436 (2012).
63. Bogaerts, W. et al. Silicon microring resonators. Laser Photonics Rev. 6, 47–73 (2012).
64. Estevez, M. C., Otte, M. A., Sepulveda, B. & Lechuga, L. M. Trends and challenges of refractometric nanoplasmonic biosensors: A review. Anal. Chim. Acta 806, 55–73 (2014).
65. Hill, R. T. Plasmonic biosensors. Wiley Interdiscip. Rev. Nanomedicine Nanobiotechnology 7, 152–168 (2015).
66. Svedendahl, M., Chen, S., Dmitriev, A. & Käll, M. Refractometric Sensing Using Propagating versus LSPR: A Direct Comparison. Nano Lett. 9, 4428–4433 (2009).
Bibliography
176
67. Anker, J. N. et al. Biosensing with plasmonic nanosensors. Nat. Mater. 7, 442–453 (2008).
68. Jain, P. K. & El-Sayed, M. A. Plasmonic coupling in noble metal nanostructures. Chem. Phys. Lett. 487, 153–164 (2010).
69. Sepúlveda, B., Angelomé, P. C., Lechuga, L. M. & Liz-Marzán, L. M. LSPR-based nanobiosensors. Nano Today 4, 244–251 (2009).
70. Hausler, P. et al. Miniaturized Surface Plasmon Resonance based Sensor System. 63–66 (2018).
71. Homola, J. Springer Series on Chemical Sensors and Biosensors: Method and Applications. Springer 4, (2006).
72. Vinogradov, A. P., Dorofeenko, A. V., Pukhov, A. A. & Lisyansky, A. A. Exciting surface plasmon polaritons in the Kretschmann configuration by a light beam. Phys. Rev. B 97, 1–9 (2018).
73. Olaru, A., Bala, C., Jaffrezic-Renault, N. & Aboul-Enein, H. Y. Surface Plasmon Resonance (SPR) Biosensors in Pharmaceutical Analysis. Crit. Rev. Anal. Chem. 45, 97–105 (2015).
74. Li, M., Cushing, S. K. & Wu, N. Plasmon-enhanced optical sensors: A review. Analyst 140, 386–406 (2015).
75. Piliarik, M. & Homola, J. Surface plasmon resonance (SPR) sensors: approaching their limits? Opt. Express 17, 16505 (2009).
76. Tudos, A. & Schasfoort, R. B. . Handbook of Surface Plasmon Resonance. Handbook of surface Plasmon resonance (2008).
77. Nguyen, H. H., Park, J., Kang, S. & Kim, M. Surface plasmon resonance: A versatile technique for biosensor applications. Sensors (Switzerland) 15, 10481–10510 (2015).
78. Lopez, G. A., Estevez, M.-C., Soler, M. & Lechuga, L. M. Recent advances in nanoplasmonic biosensors: applications and lab-on-a-chip integration. Nanophotonics 6, 1–14 (2016).
79. Mazzotta, F. et al. Influence of the evanescent field decay length on the sensitivity of plasmonic nanodisks and nanoholes. ACS Photonics 2, 256–262 (2015).
80. Haes, A. J., Zou, S., Schatz, G. C. & Van Duyne, R. P. Nanoscale optical biosensor: Short range distance dependence of the localized surface plasmon resonance of noble metal nanoparticles. J. Phys. Chem. B 108, 6961–6968 (2004).
81. Unser, S., Bruzas, I., He, J. & Sagle, L. Localized surface plasmon resonance biosensing: Current challenges and approaches. Sensors (Switzerland) 15, 15684–15716 (2015).
82. Tokel, O., Inci, F. & Demirci, U. Advances in Plasmonic Technologies for Point of Care Applications. Chem. Rev. 114, 5728–5752 (2014).
83. Dahlin, A. B., Wittenberg, N. J., Höök, F. & Oh, S. H. Promises and Challenges of Nanoplasmonics Devices for Refractometric Biosensing. Nanophotonics 2, 83–101 (2013).
Bibliography
177
84. Piliarik, M. et al. High-resolution biosensor based on localized surface plasmons. Opt. Express 20, 672–80 (2012).
85. Li, J., Chen, C., Lagae, L. & Van Dorpe, P. Nanoplasmonic Sensors with Various Photonic Coupling Effects for Detecting Different Targets. J. Phys. Chem. C 119, 29116–29122 (2015).
86. Cao, J., Sun, Y., Kong, Y. & Qian, W. The sensitivity of grating-based SPR sensors with wavelength interrogation. Sensors (Switzerland) 19, (2019).
87. Otte, M. A. et al. Identification of the optimal spectral region for plasmonic and nanoplasmonic sensing. ACS Nano 4, 349–357 (2010).
88. Špačková, B., Wrobel, P., Bocková, M. & Homola, J. Optical Biosensors Based on Plasmonic Nanostructures: A Review. Proc. IEEE 104, 2380–2408 (2016).
89. Sepúlveda, B. et al. Identification of the Optimal Spectral Region for Plasmonic and Nanoplasmonic Sensing. ACS Nano 4, 349–357 (2009).
90. Pechprasarn, S., Ittipornnuson, K., Jungpanich, T., Pensupa, N. & Albutt, N. Surface Plasmon Biosensor Platform for Food Industry. Appl. Mech. Mater. 891, 103–108 (2019).
91. Brulé, T. et al. A field-deployed surface plasmon resonance (SPR) sensor for RDX quantification in environmental waters. Analyst 142, 2161–2168 (2017).
92. Masson, J. F. Surface Plasmon Resonance Clinical Biosensors for Medical Diagnostics. ACS Sensors 2, 16–30 (2017).
93. Huertas, C. S., Carrascosa, L. G., Bonnal, S., Valc??rcel, J. & Lechuga, L. M. Quantitative evaluation of alternatively spliced mRNA isoforms by label-free real-time plasmonic sensing. Biosens. Bioelectron. 78, 118–125 (2016).
94. Bai, X., Xu, S., Hu, G. & Wang, L. Surface plasmon resonance-enhanced photothermal nanosensor for sensitive and selective visual detection of 2,4,6-trinitrotoluene. Sensors Actuators, B Chem. 237, 224–229 (2016).
95. Kim, H., Lee, J. U., Song, S., Kim, S. & Sim, S. J. A shape-code nanoplasmonic biosensor for multiplex detection of Alzheimer’s disease biomarkers. Biosens. Bioelectron. 101, 96–102 (2018).
96. Lee, Y. K., Lee, K. S., Kim, W. M. & Sohn, Y. S. Detection of amyloid-β42 using a waveguide-coupled bimetallic surface plasmon resonance sensor chip in the intensity measurement mode. PLoS One 9, 1–7 (2014).
97. Li, W., Jiang, X., Xue, J., Zhou, Z. & Zhou, J. Antibody modified gold nano-mushroom arrays for rapid detection of alpha-fetoprotein. Biosens. Bioelectron. 68, 468–474 (2015).
98. Aubé, A., Campbell, S., Schmitzer, A. R., Claing, A. & Masson, J. F. Ultra-low fouling methylimidazolium modified surfaces for the detection of HER2 in breast cancer cell lysates. Analyst 142, 2343–2353 (2017).
99. Khan, Y., Li, A., Chang, L., Li, L. & Guo, L. Gold nano disks arrays for localized surface plasmon resonance based detection of PSA cancer marker. Sensors Actuators, B
Bibliography
178
Chem. 255, 1298–1307 (2018).
100. Huertas, C. S. et al. Label-free DNA-methylation detection by direct ds-DNA fragment screening using poly-purine hairpins. Biosens. Bioelectron. 120, 47–54 (2018).
101. Zhang, L. et al. Individual Au-Nanocube Based Plasmonic Nanoprobe for Cancer Relevant MicroRNA Biomarker Detection. ACS Sensors 2, 1435–1440 (2017).
102. Li, Z. et al. Plasmonic-based platforms for diagnosis of infectious diseases at the point-of-care. Biotechnol. Adv. 37, 107440 (2019).
103. Soler, M. et al. Direct detection of protein biomarkers in human fluids using site-specific antibody immobilization strategies. Sensors (Basel). 14, 2239–2258 (2014).
104. Carrascosa, L. G., Huertas, C. S. & Lechuga, L. M. Prospects of optical biosensors for emerging label-free RNA analysis. TrAC - Trends Anal. Chem. 80, 177–189 (2016).
105. Paniel, N., Baudart, J., Hayat, a & Barthelmebs, L. Aptasensor and genosensor methods for detection of microbes in real world samples. Methods 64, 229–40 (2013).
106. Zhou, J., Battig, M. R. & Wang, Y. Aptamer-based molecular recognition for biosensor development. Anal. Bioanal. Chem. 398, 2471–2480 (2010).
107. Ermini, M. L. et al. A rational approach in probe design for nucleic acid-based biosensing. Biosens. Bioelectron. 26, 4785–4790 (2011).
108. Hormeño, S. et al. Mechanical properties of high-G·C content DNA with A-type base-stacking. Biophys. J. 100, 1996–2005 (2011).
109. Teles, F. & Fonseca, L. Trends in DNA biosensors. Talanta 77, 606–623 (2008).
110. Zhou, W., Jimmy Huang, P. J., Ding, J. & Liu, J. Aptamer-based biosensors for biomedical diagnostics. Analyst 139, 2627–2640 (2014).
111. Joseph, D. F. et al. DNA aptamers for the recognition of HMGB1 from Plasmodium falciparum. PLoS One 14, 1–20 (2019).
112. Saphire, E. O. et al. Contrasting IgG structures reveal extreme asymmetry and flexibility. J. Mol. Biol. 319, 9–18 (2002).
113. Woof, J. M. & Burton, D. R. Human antibody-Fc receptor interactions illuminated by crystal structures. Nat. Rev. Immunol. 4, 89–99 (2004).
114. Rodrigo, G., Gruvegård, M. & Van Alstine, J. Antibody Fragments and Their Purification by Protein L Affinity Chromatography. Antibodies 4, 259–277 (2015).
115. Lipman, N. S., Jackson, L. R., Trudel, L. J. & Weis-Garcia, F. Monoclonal Versus Polyclonal Antibodies: Distinguishing Characteristics, Applications, and Information Resources. ILAR J. 46, 258–268 (2005).
116. Yokoyama, W. M. et al. Production of monoclonal antibodies. Curr. Protoc. Immunol. 1–29 (2013) doi:10.1002/0471142735.im0205s102.
117. Birch, J. R. & Racher, A. J. Antibody production. Adv. Drug Deliv. Rev. 58, 671–685 (2006).
Bibliography
179
118. Zeng, X., Shen, Z. & Mernaugh, R. Recombinant antibodies and their use in biosensors. Anal. Bioanal. Chem. 402, 3027–3038 (2012).
119. Jager, V. et al. High level transient production of recombinant antibodies and antibody fusion proteins in HEK293 cells. BMC Biotechnol. 13, 1–20 (2013).
120. Thanyani, S. T., Roberts, V., Siko, D. G. R., Vrey, P. & Verschoor, J. a. A novel application of affinity biosensor technology to detect antibodies to mycolic acid in tuberculosis patients. J. Immunol. Methods 332, 61–72 (2008).
121. Absolute antibody. Antibody Structure. https://absoluteantibody.com/antibody-resources/antibody-overview/antibody-structure/ (2019).
122. Mauriz, E., García-Fernández, M. C. & Lechuga, L. M. Towards the design of universal immunosurfaces for SPR-based assays: A review. TrAC - Trends Anal. Chem. 79, 191–198 (2016).
123. Wijaya, E. et al. Surface plasmon resonance-based biosensors: From the development of different SPR structures to novel surface functionalization strategies. Curr. Opin. Solid State Mater. Sci. 15, 208–224 (2011).
124. Rabe, M., Verdes, D. & Seeger, S. Understanding protein adsorption phenomena at solid surfaces. Adv. Colloid Interface Sci. 162, 87–106 (2011).
125. Liu, Y. & Chen, J. Y. Enzyme immobilization on cellulose matrixes. J. Bioact. Compat. Polym. 31, 553–567 (2016).
126. Mohamad, N. R., Marzuki, N. H. C., Buang, N. A., Huyop, F. & Wahab, R. A. An overview of technologies for immobilization of enzymes and surface analysis techniques for immobilized enzymes. Biotechnol. Biotechnol. Equip. 29, 205–220 (2015).
127. Górecka, E. & Jastrzębska, M. Review article: Immobilization techniques and biopolymer carriers. Biotechnol. Food Sci. 75, 65–86 (2011).
128. Sassolas, A., Blum, L. J. & Leca-Bouvier, B. D. Immobilization strategies to develop enzymatic biosensors. Biotechnol. Adv. 30, 489–511 (2012).
129. Ulman, A. Formation and structure of self-assembled monolayers. Chem. Rev. 96, 1533–1554 (1996).
130. Vericat, C., Vela, M. E., Benitez, G., Carro, P. & Salvarezza, R. C. Self-assembled monolayers of thiols and dithiols on gold: New challenges for a well-known system. Chem. Soc. Rev. 39, 1805–1834 (2010).
131. Sam, S. et al. Semiquantitative study of the EDC/NHS activation of acid terminal groups at modified porous silicon surfaces. Langmuir 26, 809–814 (2010).
132. Camarero, J. A. Recent developments in the site-specific immobilization of proteins onto solid supports. Biopolym. - Pept. Sci. Sect. 90, 450–458 (2008).
133. Jonkheijm, P., Weinrich, D., Schröder, H., Niemeyer, C. M. & Waldmann, H. Chemical strategies for generating protein biochips. Angew. Chemie - Int. Ed. 47, 9618–9647 (2008).
Bibliography
180
134. Makaraviciute, A. & Ramanaviciene, A. Site-directed antibody immobilization techniques for immunosensors. Biosens. Bioelectron. 50, 460–471 (2013).
135. O’Kennedy, R. & Murphy, C. Immunoassays: Development, Applications and Future Trends. (2017).
136. Chan, C. P., Cheung, Y., Renneberg, R. & Seydack, M. New trends in immunoassays. Adv. Biochem. Eng. Biotechnol. 109, 123–54 (2008).
137. Cinquanta, L., Fontana, D. E. & Bizzaro, N. Chemiluminescent immunoassay technology: what does it change in autoantibody detection? Autoimmun. Highlights 8, (2017).
138. Kolosova, A. et al. Fluorescence polarisation immunoassays for strobilurin fungicides kresoxim-methyl, trifloxystrobin and picoxystrobin. Talanta 162, 495–504 (2017).
139. Gomez-Morte, T. et al. Immunoassay for food quality evaluation. Evaluation Technologies for Food Quality (2019). doi:10.1016/b978-0-12-814217-2.00026-3.
140. Fuchs, J. et al. Effects of formamide on the thermal stability of DNA duplexes on biochips. Anal. Biochem. 397, 132–134 (2010).
141. Andersson, K., Hamalainen, M., Malmqvist, M. & Roos, H. E. United States Patent. Surface regeneration of biosensors and characterization of biomolecules associated therewith. (2001).
142. Vaisocherová, H. et al. Functionalizable surface platform with reduced nonspecific protein adsorption from full blood plasma-Material selection and protein immobilization optimization. Biosens. Bioelectron. 24, 1924–1930 (2009).
143. Vaisocherová, H., Brynda, E. & Homola, J. Functionalizable low-fouling coatings for label-free biosensing in complex biological media: advances and applications. Anal. Bioanal. Chem. 407, 3927–3953 (2015).
144. Vaisocherová, H. & Homola, J. Functionalized ultra-low fouling surface platforms for biosensing in real-world media. Opt. Sensors, 2014 3–4 (2014).
145. Vaisocherová, H. et al. Functionalized ultra-low fouling carboxy- and hydroxy-functional surface platforms: Functionalization capacity, biorecognition capability and resistance to fouling from undiluted biological media. Biosens. Bioelectron. 51, 150–157 (2014).
146. Mckeating, K. S., Hinman, S. S., Rais, N. A., Zhou, Z. & Cheng, Q. Antifouling lipid membranes over protein a for orientation-controlled immunosensing in undiluted serum and plasma. ACS Sensors 4, 1774–1782 (2019).
147. Wang, X. et al. Gold nanorod-based localized surface plasmon resonance biosensor for sensitive detection of hepatitis B virus in buffer, blood serum and plasma. Biosens. Bioelectron. 26, 404–410 (2010).
148. Adachi, J., Kumar, C., Zhang, Y., Olsen, J. V. & Mann, M. The human urinary proteome contains more than 1500 proteins, including a large proportion of membrane proteins. Genome Biol. 7, (2006).
149. Holz, O., Kips, J. & Magnussen, H. Update on sputum methodology. Eur. Respir. J. 16,
Bibliography
181
355–359 (2000).
150. Karak, T. & Bhattacharyya, P. Human urine as a source of alternative natural fertilizer in agriculture: A flight of fancy or an achievable reality. Resour. Conserv. Recycl. 55, 400–408 (2011).
151. de Almeida, P., Grégio, A., Machado, M. & de Lima AAS, A. L. Saliva Composition and Functions : 9, 72–80 (2008).
152. Stevens, R. C., Soelberg, S. D., Near, S. & Furlong, C. E. Detection of cortisol in saliva with a flow-filtered, portable surface plasmon resonance biosensor system. Anal. Chem. 80, 6747–6751 (2008).
153. Sakka, L., Coll, G. & Chazal, J. Anatomy and physiology of cerebrospinal fluid. Eur. Ann. Otorhinolaryngol. Head Neck Dis. 128, 309–316 (2011).
154. Patterson, M. J., Galloway, S. D. R. & Nimmo, M. A. Variations in regional sweat composition in normal human males. Exp. Physiol. 85, 869–875 (2000).
155. Fernández, J. & Gustot, T. Management of bacterial infections in cirrhosis. J. Hepatol. 56, 1–12 (2012).
156. Vaisocherová, H. et al. Ultralow fouling and functionalizable surface chemistry based on a zwitterionic polymer enabling sensitive and specific protein detection in undiluted blood plasma. Anal. Chem. 80, 7894–7901 (2008).
157. Feng, M., Morales, A. B., Poot, A., Beugeling, T. & Bantjes, A. Effects of Tween 20 on the desorption of proteins from polymer surfaces. J. Biomater. Sci. Polym. Ed. 7, 415–424 (1995).
158. Cui, M., Wang, Y., Wang, H., Wu, Y. & Luo, X. A label-free electrochemical DNA biosensor for breast cancer marker BRCA1 based on self-assembled antifouling peptide monolayer. Sensors Actuators, B Chem. 244, 742–749 (2017).
159. Krishnan, S., Weinman, C. J. & Ober, C. K. Advances in polymers for anti-biofouling surfaces. J. Mater. Chem. 18, 3405–3413 (2008).
160. Bergstrand, A., Rahmani-Monfared, G., Östlund, Å., Nydén, M. & Holmberg, K. Comparison of PEI-PEG and PLL-PEG copolymer coatings on the prevention of protein fouling. J. Biomed. Mater. Res. - Part A 88, 608–615 (2009).
161. Blättler, T. M., Pasche, S., Textor, M. & Griesser, H. J. High salt stability and protein resistance of poly(L-lysine)-g- poly(ethylene glycol) copolymers covalently immobilized via aldehyde plasma polymer interlayers on inorganic and polymeric substrates. Langmuir 22, 5760–5769 (2006).
162. Goddard, J. M. & Hotchkiss, J. H. Polymer surface modification for the attachment of bioactive compounds. Prog. Polym. Sci. 32, 698–725 (2007).
163. Rodriguez-Emmenegger, C. et al. Polymer brushes showing non-fouling in blood plasma challenge the currently accepted design of protein resistant surfaces. Macromol. Rapid Commun. 32, 952–957 (2011).
164. Soler, M. et al. Highly sensitive dendrimer-based nanoplasmonic biosensor for drug allergy diagnosis. Biosens. Bioelectron. 66, 115–123 (2015).
Bibliography
182
165. Otte, M. A. et al. Improved biosensing capability with novel suspended nanodisks. J. Phys. Chem. C 115, 5344–5351 (2011).
166. Otte, M. A., Estevez, M. ., Regatos, D., Lechuga, L. M. & Sepúlveda, B. Guiding Light in Monolayers of Sparse and Random Plasmonic Meta-atoms. ACS Nano 5, 9179–9186 (2011).
167. Fredriksson, H. et al. Hole-mask colloidal lithography. Adv. Mater. 19, 4297–4302 (2007).
168. Bhalla, N., Jolly, P., Formisano, N. & Estrela, P. Introduction to Biosensors. Essays Biochem. 60, 1–8 (2016).
169. Andreasson, U. et al. A practical guide to immunoassay method validation. Front. Neurol. 6, 1–8 (2015).
170. Vecchione, G., Casetta, B., Tomaiuolo, M., Grandone, E. & Margaglione, M. A rapid method for the quantification of the enantiomers of Warfarin, Phenprocoumon and Acenocoumarol by two-dimensional-enantioselective liquid chromatography/electrospray tandem mass spectrometry. J. Chromatogr. B Anal. Technol. Biomed. Life Sci. (2007).
171. Hou, J., Zheng, J. & Shamsi, S. A. Separation and determination of warfarin enantiomers in human plasma using a novel polymeric surfactant for micellar electrokinetic chromatography–mass spectrometry. J. Chromatogr. A 1159, 208–216 (2007).
172. Hadjmohammadi, M. & Ghambari, H. Three-phase hollow fiber liquid phase microextraction of warfarin from human plasma and its determination by high-performance liquid chromatography. J. Pharm. Biomed. Anal. 61, 44–49 (2012).
173. Lombardi, R., Chantarangkul, V., Cattaneo, M. & Tripodi, A. Measurement of warfarin in plasma by high performance liquid chromatography (HPLC) and its correlation with the international normalized ratio. Thromb. Res. (2003).
174. Schroecksnadel, S. et al. Immunomodulatory effects in vitro of vitamin K antagonist acenocoumarol. Thromb. Res. (2013).
175. Denooz, R., Douamba, Z. & Charlier, C. Fatal intoxications by acenocoumarol, phenprocoumon and warfarin: Method validation in blood using the total error approach. J. Chromatogr. B Anal. Technol. Biomed. Life Sci. (2009).
176. Locatelli, I., Kmetec, V., Mrhar, A. & Grabnar, I. Determination of warfarin enantiomers and hydroxylated metabolites in human blood plasma by liquid chromatography with achiral and chiral separation. J. Chromatogr. B Anal. Technol. Biomed. Life Sci. (2005).
177. Sun, S. et al. Study on warfarin plasma concentration and its correlation with international normalized ratio. J. Pharm. Biomed. Anal. (2006).
178. Rentsch, K. M., Gutteck-Amsler, U., Bührer, R., Fattinger, K. E. & Vonderschmitt, D. J. Sensitive stereospecific determination of acenocoumarol and phenprocoumon in plasma by high-performance liquid chromatography. J. Chromatogr. B Biomed. Sci. Appl. (2000).
Bibliography
183
179. Salvador, J. P., Tassies, D., Reverter, J. C. & Marco, M. P. Enzyme-linked immunosorbent assays for therapeutic drug monitoring coumarin oral anticoagulants in plasma. Anal. Chim. Acta 1028, 59–65 (2018).
180. Huang, C., Yang, J., Du, Y. & Miao, L. Measurement of free concentrations of highly protein-bound warfarin in plasma by ultra performance liquid chromatography-tandem mass spectrometry and its correlation with the international normalized ratio. Clin. Chim. Acta (2008).
181. Garzón, V., Pinacho, D. G., Bustos, R.-H., Garzón, G. & Bustamante, S. Optical Biosensors for Therapeutic Drug Monitoring. Biosensors 9, 132 (2019).
182. Estevez, M. C., Alvarez, M. & Lechuga, L. M. Integrated optical devices for lab-on-a-chip biosensing applications. Laser Photon. Rev. 6, 463–487 (2012).
183. Estevez, M. C. et al. Indirect competitive immunoassay for the detection of fungicide Thiabendazole in whole orange samples by Surface Plasmon Resonance. Analyst 137, 5659–5665 (2012).
184. Marie, R., Dahlin, A. B., Tegenfeldt, J. O. & Höök, F. Generic surface modification strategy for sensing applications based on AuSiO2 nanostructures. Biointerphases 2, 49–55 (2007).
185. Johansson, M. A. & Hellenäs, K. E. Matrix effects in immunobiosensor determination of clenbuterol in urine and serum. Analyst 129, 438–442 (2004).
186. Green, P. H. R., Lebwohl, B. & Greywoode, R. Celiac Disease. Allergy Clin. Immunol. 134, 1099–1106 (2015).
187. Comino, I. et al. Diversity in oat potential immunogenicity: Basis for the selection of oat varieties with no toxicity in coeliac disease. Gut 60, 915–922 (2011).
188. Sharma, G. M., Pereira, M. & Williams, K. M. Gluten detection in foods available in the United States - A market survey. Food Chem. 169, 120–126 (2015).
189. Garnier-Lengliné, H., Cerf-Bensussan, N. & Ruemmele, F. M. Celiac disease in children. Clin. Res. Hepatol. Gastroenterol. 39, 544–551 (2015).
190. Harris, L. A., Park, J. Y., Voltaggio, L. & Lam-Himlin, D. Celiac disease: clinical, endoscopic, and histopathologic review. Gastrointest. Endosc. 76, 625–640 (2012).
191. Meresse, B., Malamut, G. & Cerf-Bensussan, N. Celiac Disease: An Immunological Jigsaw. Immunity 36, 907–919 (2012).
192. Bernardo, D. & Peña, A. S. Developing strategies to improve the quality of life of patients with gluten intolerance in patients with and without coeliac disease. Eur. J. Intern. Med. 23, 6–8 (2012).
193. Valenti, S., Corica, D., Ricciardi, L. & Romano, C. Gluten-related disorders: certainties, questions and doubts. Ann. Med. 49, 569–581 (2017).
194. Polanco, I., Koester Weber, T., Martínez-Ojinaga, E., Molina, M. & Sarria, J. Efficacy of a point-of-care test based on deamidated gliadin peptides for the detection of celiac disease in pediatric patients. Rev. Esp. Enfermedades Dig. 109, 743–748 (2017).
Bibliography
184
195. Castillo, N. E., Theethira, T. G. & Leffler, D. A. The present and the future in the diagnosis and management of celiac disease. Gastroenterol. Rep. 3, 3–11 (2015).
196. Esteve, M. et al. Case-finding in primary care for coeliac disease: Accuracy and cost-effectiveness of a rapid point-of-care test. United Eur. Gastroenterol. J. 6, 855–865 (2018).
197. Jnawali, P., Kumar, V. & Tanwar, B. Celiac disease: Overview and considerations for development of gluten-free foods. Food Sci. Hum. Wellness 5, 169–176 (2016).
198. Jabri, B. & Sollid, L. M. T Cells in Celiac Disease. J. Immunol. 198, 3005–3014 (2017).
199. Stamnaes, J. & Sollid, L. M. Celiac disease: Autoimmunity in response to food antigen. Semin. Immunol. 27, 343–352 (2015).
200. Moreno, M. de L., Rodríguez-Herrera, A., Sousa, C. & Comino, I. Biomarkers to monitor gluten-free diet compliance in celiac patients. Nutrients 9, 1–14 (2017).
201. Codex Alimentarius, I. F. S. Standard for Foods for Special dietary Use for Persons Intolerant to Gluten CODEX STAN118-1979. http://www.codexalimentarius.net http://www.codexalimentarius.net (2019).
202. Moreno, M. D. L. et al. Detection of gluten immunogenic peptides in the urine of patients with coeliac disease reveals transgressions in the gluten-free diet and incomplete mucosal healing. Gut 66, 250–257 (2017).
203. Comino, I. et al. Immunological determination of gliadin 33-mer equivalent peptides in beers as a specific and practical analytical method to assess safety for celiac patients. J. Sci. Food Agric. 93, 933–943 (2013).
204. Tommasini, A., Not, T. & Ventura, A. Ages of celiac disease: From changing environment to improved diagnostics. World J. Gastroenterol. 17, 3665–3671 (2011).
205. Leja, M. et al. Changing patterns of serological testing for celiac disease in Latvia. J. Gastrointest. Liver Dis. 20, 121–126 (2011).
206. Mubarak, A., Wolters, V. M., Gmelig-Meyling, F. H. J., ten Kate, F. J. W. & Houwen, R. H. J. Tissue transglutaminase levels above 100 U/mL and celiac disease: A prospective study. World J. Gastroenterol. 18, 4399–4403 (2012).
207. Moreno, M. L., Sousa, C., Rodriguez, A. & Cebolla, A. Detecting gluten peptides in human fluids. Patent No. WO 2016/005643 Al. (2016).
208. Bienvenu, F. et al. Bienvenu F, Anghel SI, Besson Duvanel C, Guillemaud J, Garnier L, Renosi F, et al. Early diagnosis of celiac disease in IgA deficient children: contribution of a point-of-care test. BMC Gastroenterol. 2014;14:186. BMC Gastroenterol. 14, 186 (2014).
209. Benkebil, F., Combescure, C., Anghel, S. I., Besson Duvanel, C. & Schäppi, M. G. Diagnostic accuracy of a new point-of-care screening assay for celiac disease. World J. Gastroenterol. 19, 5111–5117 (2013).
210. Soler, M., Estevez, M. C., Moreno, M. de L., Cebolla, A. & Lechuga, L. M. Label-free SPR detection of gluten peptides in urine for non-invasive celiac disease follow-up. Biosens. Bioelectron. 79, 158–164 (2016).
Bibliography
185
211. Moreno, M. D. L. et al. Detection of gluten immunogenic peptides in the urine of patients with coeliac disease reveals transgressions in the gluten-free diet and incomplete mucosal healing. Gut 0, 1–8 (2015).
212. Morón, B. et al. Toward the assessment of food toxicity for celiac patients: Characterization of monoclonal antibodies to a main immunogenic gluten peptide. PLoS One 3, 1–13 (2008).
213. Real, A. et al. Identification and in Vitro reactivity of celiac immunoactive peptides in an apparent gluten-free beer. PLoS One 9, 12–14 (2014).
214. Comino, I. et al. Monitoring of gluten-free diet compliance in celiac patients by assessment of gliadin 33-mer equivalent epitopes in feces. Am. J. Clin. Nutr. 95, 670–677 (2012).
215. De Vos, K. et al. SOI optical microring resonator with poly(ethylene glycol) polymer brush for label-free biosensor applications. Biosens. Bioelectron. 24, 2528–2533 (2009).
216. Schilp, S. et al. Physicochemical properties of (ethylene glycol)-containing self-assembled monolayers relevant for protein and algal cell resistance. Langmuir 25, 10077–10082 (2009).
217. Vega, B. et al. Real-time detection of the chemokine CXCL12 in urine samples by surface plasmon resonance. Talanta 109, 209–215 (2013).
218. Comino, I. et al. Significant differences in coeliac immunotoxicity of barley varieties. Mol. Nutr. Food Res. 56, 1697–1707 (2012).
219. Cebolla, Á., Moreno, M. de L., Coto, L. & Sousa, C. Gluten immunogenic peptides as standard for the evaluation of potential harmful prolamin content in food and human specimen. Nutrients 10, 1–16 (2018).
220. Sousa, C., Comino, I., Real, A., Vivas, S. & Cebolla, A. Determination of levels of immunogenic gluten peptides in human samples. European Patent application (2013).
221. Magana-Arachchi, D., Medagedara, D. & Thevanesam, V. Molecular characterization of Mycobacterium tuberculosis isolates from Kandy, Sri Lanka. Asian Pacific J. Trop. Dis. 1, 181–186 (2011).
222. Cheon, S. A. et al. Recent tuberculosis diagnosis toward the end TB strategy. J. Microbiol. Methods 123, 51–61 (2016).
223. World Health Organization (WHO). Global Tuberculosis Report. (2019).
224. Goletti, D., Petruccioli, E., Joosten, S. A. & Ottenhoff, T. H. M. Tuberculosis biomarkers: From diagnosis to protection. Infect. Dis. Rep. 8, 24–32 (2016).
225. World Health Organisation. Global Health TB Report. (2018).
226. Dheda, K., Barry, C. E. & Maartens, G. Tuberculosis. Lancet 387, 1211–1226 (2016).
227. Wallis, R. S. et al. Tuberculosis-advances in development of new drugs, treatment regimens, host-directed therapies, and biomarkers. Lancet Infect. Dis. 16, e34–e46 (2016).
Bibliography
186
228. Yon Ju Ryu, M. D. Diagnosis of pulmonary tuberculosis: Recent advances and diagnostic algorithms. Tuberc. Respir. Dis. (Seoul). 78 (2), 64–71 (2015).
229. Hong, S. C. et al. Clinical immunosensing of tuberculosis CFP-10 in patient urine by surface plasmon resonance spectroscopy. Sensors Actuators, B Chem. 160, 1434–1438 (2011).
230. Viñuelas-Bayón, J., Vitoria, M. A. & Samper, S. Rapid diagnosis of tuberculosis. Detection of drug resistance mechanisms. Enferm. Infecc. Microbiol. Clin. 35, 520–528 (2017).
231. Godreuil, S., Tazi, L. & Bañuls, A.-L. Pulmonary Tuberculosis and Mycobacterium Tuberculosis: Modern Molecular Epidemiology and Perspectives. in Encyclopedia of Inectious Diseases. Modern Methodologies. (ed. Tibayrenc, M.) 1–22 (2007).
232. Holani, A. G. et al. Demonstration of Mycobacterium Tuberculosis in sputum and saliva smears of tuberculosis patients using Ziehl Neelsen and flurochrome staining - A comparative study. J. Clin. Diagnostic Res. 8, 42–45 (2014).
233. Cole, S. T. et al. Deciphering the biology of Mycobacterium tuberculosis from the complete genome sequence. Nature 396, 190–190 (1998).
234. Bansal, R., Sharma, P. K., Jaryal, S. C., Gupta, P. K. & Kumar, D. Comparison of Sensitivity and Specificity of ZN and Fluorescent Stain Microscopy with Culture as Gold Standard. J. Tuberc. Res. 05, 118–128 (2017).
235. Ismail, N. A. et al. Performance of a novel algorithm using automated digital microscopy for diagnosing tuberculosis. Am. J. Respir. Crit. Care Med. 191, 1443–1449 (2015).
236. Demissie, A. et al. Recognition of Stage-Specific Mycobacterial Antigens Differentiates between Acute and Latent Infections with Mycobacterium tuberculosis. Clin. Vaccine Immunol. 13, 179–186 (2006).
237. Gengenbacher, M. & Kaufmann, S. H. E. Mycobacterium tuberculosis: Success through dormancy. FEMS Microbiol. Rev. 36, 514–532 (2012).
238. Warner, D. F. & Mizrahi, V. The survival kit of Mycobacterium tuberculosis. Nat. Med. 13, 282–284 (2007).
239. Dorman, S. E. et al. Interferon-γ release assays and tuberculin skin testing for diagnosis of latent tuberculosis infection in healthcare workers in the united states. Am. J. Respir. Crit. Care Med. 189, 77–87 (2014).
240. Mori, T. et al. Specific Detection of Tuberculosis Infection. Am. J. Respir. Crit. Care Med. 170, 59–64 (2004).
241. Ruhwald, M. et al. Safety and efficacy of the C-Tb skin test to diagnose Mycobacterium tuberculosis infection, compared with an interferon γ release assay and the tuberculin skin test: a phase 3, double-blind, randomised, controlled trial. Lancet Respir. Med. 5, 259–268 (2017).
242. Getahun, H. et al. Management of latent Mycobacterium tuberculosis infection: WHO guidelines for low tuberculosis burden countries. Eur. Respir. J. 46, 1563–1576 (2015).
Bibliography
187
243. Sester, M. et al. Risk assessment of tuberculosis in immunocompromised patients: A TBNET study. Am. J. Respir. Crit. Care Med. 190, 1168–1176 (2014).
244. Froeschle, J. E., Ruben, F. L. & Bloh, A. M. Immediate Hypersensitivity Reactions after Use of Tuberculin Skin Testing. Clin. Infect. Dis. 34, e12–e13 (2002).
245. Behr, M. A., Edelstein, P. H. & Ramakrishnan, L. Is Mycobacterium tuberculosis infection life long ? 5770, 1–7 (2019).
246. WHO. World Health Organization. WHO “Global tuberculosis report 2017”. http://www.who.int/tb/publications/global_report/ gtbr2017_main_text.pdf (2017).
247. Chakravorty, S. et al. The New Xpert MTB/RIF Ultra: Improving Detection of Mycobacterium tuberculosis and Resistance to Rifampin in an Assay Suitable for Point-of-Care Testing . MBio 8, 1–12 (2017).
248. Srivastava, S. K., van Rijn, C. J. M. & Jongsma, M. A. Biosensor-based detection of tuberculosis. RSC Adv. 6, 17759–17771 (2016).
249. Ramirez-Priego, P. et al. Label-Free and Real-Time Detection of Tuberculosis in Human Urine Samples Using a Nanophotonic Point-of-Care Platform. ACS Sensors 3, 2079–2086 (2018).
250. Mukundan, H. et al. Rapid detection of Mycobacterium tuberculosis biomarkers in a sandwich immunoassay format using a waveguide-based optical biosensor. Tuberculosis 92, 407–416 (2012).
251. Poulakis, N. et al. Intracellular ESAT-6: A new biomarker for Mycobacterium tuberculosis infection. Cytom. Part B - Clin. Cytom. 90, 312–314 (2016).
252. Ren, N. et al. Identification of new diagnostic biomarkers for Mycobacterium tuberculosis and the potential application in the serodiagnosis of human tuberculosis. Microb. Biotechnol. 11, 893–904 (2018).
253. Haldar, S. et al. Detection of Mycobacterium tuberculosis GlcB or HspX Antigens or devR DNA Impacts the Rapid Diagnosis of Tuberculous Meningitis in Children. PLoS One 7, (2012).
254. de Sousa, E. M. et al. Immunogenicity of a Fusion Protein Containing Immunodominant Epitopes of Ag85C, MPT51, and HspX from Mycobacterium tuberculosis in Mice and Active TB Infection. PLoS One 7, 1–11 (2012).
255. Nagai, K. et al. Diagnostic test accuracy of loop-mediated isothermal amplification assay for Mycobacterium tuberculosis: Systematic review and meta-analysis. Sci. Rep. 6, 3–9 (2016).
256. Pai, M. et al. Tuberculosis. Lancet 2, 1–23 (2016).
257. Shah, M. et al. Lateral flow urine lipoarabinomannan assay for detecting active tuberculosis in HIV-positive adults ( Review ). (2016).
258. Zou, F. et al. Magneto-plamonic nanoparticles enhanced surface plasmon resonance TB sensor based on recombinant gold binding antibody. Sensors Actuators, B Chem. 250, 356–363 (2017).
Bibliography
188
259. Hong, S. C. et al. Ultrasensitive immunosensing of tuberculosis CFP-10 based on SPR spectroscopy. Sensors Actuators B Chem. 156, 271–275 (2011).
260. Trzaskowski, M., Napiórkowska, A., Augustynowicz-Kopeć, E. & Ciach, T. Detection of tuberculosis in patients with the use of portable SPR device. Sensors Actuators, B Chem. 260, 786–792 (2018).
261. Shabut, A. M. et al. An intelligent mobile-enabled expert system for tuberculosis disease diagnosis in real time. Expert Syst. Appl. 114, 65–77 (2018).
262. Hsieh, S. C. et al. Rapid identification of Mycobacterium tuberculosis infection by a new array format-based surface plasmon resonance method. Nanoscale Res. Lett. 7, 1–6 (2012).
263. Steingart, K. R. et al. Commercial serological antibody detection tests for the diagnosis of pulmonary tuberculosis: A systematic review. PLoS Med. 4, 1041–1060 (2007).
264. Wallis, R. S. et al. Biomarkers and diagnostics for tuberculosis: progress, needs, and translation into practice. Lancet 375, 1920–1937 (2010).
265. Zhang, C. et al. Mycobacterium tuberculosis Secreted Proteins As Potential Biomarkers for the Diagnosis of Active Tuberculosis and Latent Tuberculosis Infection. J. Clin. Lab. Anal. 29, 375–382 (2015).
266. Bhattacharyya, D., Smith, Y. R., Mohanty, S. K. & Misra, M. Titania Nanotube Array Sensor for Electrochemical Detection of Four Predominate Tuberculosis Volatile Biomarkers. J. Electrochem. Soc. 163, B206–B214 (2016).
267. A. Kaushik et al. Diagnostic potential of 16 kDa (HspX, alpha-crystalline) antigen for serodiagnosis of tuberculosis. Indian J. Med. Res. 135, 771–777 (2012).
268. Castro-Garza, J. et al. Detection of anti-HspX antibodies and HspX protein in patient sera for the identification of recent latent infection by Mycobacterium tuberculosis. PLoS One 12, e0181714 (2017).
269. SK, R. & SW, S. Mycobacterium Tuberculosis Heat Shock Protein 16 as a Potential Marker for Latent TB: A Preliminary Findings. J. Clin. Cell. Immunol. 2, (2011).
270. Doherty, T. Separating Latent and Acute Disease in the Diagnosis of Tuberculosis. National Institute of Allergy and Infectious Diseases. NIH. (2008).
271. Gideon, H. P. & Flynn, J. L. Latent tuberculosis: What the host ‘sees’? Immunol. Res. 50, 202–212 (2011).
272. Fu, X. et al. A dual role for the N-terminal region of Mycobacterium tuberculosis Hsp16.3 in self-oligomerization and binding denaturing substrate proteins. J. Biol. Chem. 280, 6337–6348 (2005).
273. Kennaway, C. K. et al. Dodecameric structure of the small heat shock protein Acr1 from Mycobacterium tuberculosis. J. Biol. Chem. 280, 33419–33425 (2005).
274. Yousefi-Avarvand, A., Tafaghodi, M., Soleimanpour, S. & Khademi, F. HspX protein as a candidate vaccine against Mycobacterium tuberculosis: an overview. Front. Biol. (Beijing). 13, 293–296 (2018).
Bibliography
189
275. Taylor, J. L. et al. HspX-mediated protection against tuberculosis depends on its chaperoning of a mycobacterial molecule. Immunol. Cell Biol. 00, 1–10 (2012).
276. Limongi, A., Olival, L., Conde, M. B. & Junqueira-Kipnis, A. P. Determination of levels of specific IgA to the HspX recombinant antigen of Mycobacterium tuberculosis for the diagnosis of pleural tuberculosis. 37, 302–307 (2011).
277. Rappé, M. S. & Giovannoni, S. J. The Uncultured Microbial Majority. Annu. Rev. Microbiol. 57, 369–394 (2003).
278. Jöers, A., Putrins, M., Kaldalu, N., Luidalepp, H. & Tenson, T. Persister Resuscitation. in Persister cells, dormancy and infectious disease (ed. Lewis, K.) 203–216 (2019). doi:10.1038/nrmicro1557.
279. Huttenhower, C. et al. Structure, function and diversity of the healthy human microbiome. Nature 486, 207–214 (2012).
280. Oliver, J. D. The viable but nonculturable state in bacteria. J. Microbiol. 43, 93–100 (2005).
281. Lewis, K. Persister Cells. Annu. Rev. Microbiol. 64, 357–372 (2010).
282. Maisonneuve, E. & Gerdes, K. Molecular mechanisms underlying bacterial persisters. Cell 157, 539–548 (2014).
283. Levin-Reisman, I. et al. Antibiotic tolerance facilitates the evolution of resistance. Science (80-. ). 355, 826–830 (2017).
284. Menéndez, M. D. C., Rebollo, M. J., Núñez, M. D. C., Cox, R. A. & García, M. J. Analysis of the precursor rRNA fractions of rapidly growing mycobacteria: Quantification by methods that include the use of a promoter (rrnA P1) as a novel standard. J. Bacteriol. 187, 534–543 (2005).
285. Hellyer, T. J. et al. Detection of viable Mycobacterium tuberculosis by reverse transcriptase- strand displacement amplification of mRNA. J. Clin. Microbiol. 37, 518–523 (1999).
286. Cubero, N., Esteban, J., Palenque, E., Rosell, A. & Garcia, M. J. Evaluation of the detection of Mycobacterium tuberculosis with metabolic activity in culture-negative human clinical samples. Clin. Microbiol. Infect. 19, 273–278 (2013).
287. Manina, G., Dhar, N. & McKinney, J. D. Stress and host immunity amplify mycobacterium tuberculosis phenotypic heterogeneity and induce nongrowing metabolically active forms. Cell Host Microbe 17, 32–46 (2015).
288. Chen, J. et al. Novel recombinant RD2- and RD11-encoded Mycobacterium tuberculosis antigens are potential candidates for diagnosis of tuberculosis infections in BCG-vaccinated individuals. Microbes Infect. 11, 876–885 (2009).
289. Bannantine, J. P. & Stabel, J. R. HspX is present within Mycobacterium paratuberculosis-infected macrophages and is recognized by sera from some infected cattle. Vet. Microbiol. 76, 343–58 (2000).
290. Steel, A. B., Levicky, R. L., Herne, T. M. & Tarlov, M. J. Immobilization of nucleic acids at solid surfaces: Effect of oligonucleotide length on layer assembly. Biophys. J. 79,
Bibliography
190
975–981 (2000).
291. Peterson, A. W. The effect of surface probe density on DNA hybridization. Nucleic Acids Res. 29, 5163–5168 (2001).
292. Huertas, C. S., Domínguez-Zotes, S. & Lechuga, L. M. Analysis of alternative splicing events for cancer diagnosis using a multiplexing nanophotonic biosensor. Sci. Rep. 7, 41368 (2017).
293. Huertas, C. S., Calvo-Lozano, O., Mitchell, A. & Lechuga, L. M. Advanced Evanescent-Wave Optical Biosensors for the Detection of Nucleic Acids: An Analytic Perspective. Front. Chem. 7, 1–25 (2019).
294. Wong, M. C. et al. Differences in Incidence and Mortality Trends of Colorectal Cancer, Worldwide, Based on Sex, Age, and Anatomic Location. Clin. Gastroenterol. Hepatol. (2020).
295. Siegel, R. L. et al. Global patterns and trends in colorectal cancer incidence in young adults. Gut 68, 2179–2185 (2019).
296. Wang, Y. et al. A tree ensemble-based two-stage model for advanced-stage colorectal cancer survival prediction. Inf. Sci. (Ny). 474, 106–124 (2019).
297. Angelis, N. De, Di Saverio, N. & Brunetti, F. Emergency Surgical Management of colorectal cancer. (Springer, Cham, 2019).
298. Taylor, S. A. Is CT Colonography Better Tolerated than Flexible Sigmoidoscopy for Colorectal Cancer Screening ? 1. 286, 884–886 (2018).
299. Shapiro, J. A. et al. HHS Public Access. 2017, 1728–1735 (2018).
300. Goede, S. L. et al. Harms, benefits and costs of fecal immunochemical testing versus guaiac fecal occult blood testing for colorectal cancer screening. PLoS One 12, 1–15 (2017).
301. Duffy, M. J. et al. Tumour markers in colorectal cancer: European Group on Tumour Markers (EGTM) guidelines for clinical use. Eur. J. Cancer 43, 1348–1360 (2007).
302. Hiwasa, T. & Shimada, H. Autoantibody in cancer. in Biomarkers in Cancer Therapy (ed. Shimada, H.) 25–40 (2019).
303. Garranzo-Asensio, M. et al. Multiplexed monitoring of a novel autoantibody diagnostic signature of colorectal cancer using HaloTag technology-based electrochemical immunosensing platform. Theranostics 10, 3022–3034 (2020).
304. Barderas, R., Villar-Vázquez, R. & Casal, J. I. Biomarkers in Cancer. Biomarkers in Disease: Methods, Discoveries and Applications. in Colorectal Cancer Circulating Biomarkers. (eds. Preedy, V. & Patel, V.) (2015).
305. Villar-Vázquez, R. et al. Development of a novel multiplex beads-based assay for autoantibody detection for colorectal cancer diagnosis. Proteomics 16, 1280–1290 (2016).
306. Babel, I. et al. Identification of tumor-associated autoantigens for the diagnosis of colorectal cancer in serum using high density protein microarrays. Mol. Cell.
Bibliography
191
Proteomics 8, 2382–2395 (2009).
307. Yadav, S. et al. Autoantibodies as diagnostic and prognostic cancer biomarker: Detection techniques and approaches. Biosens. Bioelectron. 139, 111315 (2019).
308. Ushigome, M. et al. Multi-panel assay of serum autoantibodies in colorectal cancer. Int. J. Clin. Oncol. 23, 917–923 (2018).
309. Chen, H., Werner, S., Tao, S., Zörnig, I. & Brenner, H. Blood autoantibodies against tumor-associated antigens as biomarkers in early detection of colorectal cancer. Cancer Lett. 346, 178–187 (2014).
310. Negm, O. H. et al. Human blood autoantibodies in the detection of colorectal cancer. PLoS One 11, 1–14 (2016).
311. Fan, C. W. et al. Development of a multiplexed tumor-associated autoantibody-based blood test for the detection of colorectal cancer. Clin. Chim. Acta 475, 157–163 (2017).
312. Soler, M., Estevez, M. C., Villar-Vazquez, R., Casal, J. I. & Lechuga, L. M. Label-free nanoplasmonic sensing of tumor-associate autoantibodies for early diagnosis of colorectal cancer. Anal. Chim. Acta 930, 31–38 (2016).