Embed Size (px)
Citation preview

Author's personal copy
Na2O solubility in CaO–MgO–SiO2 melts
R. Mathieu a,⇑, G. Libourel a,b, E. Deloule a, L. Tissandier a, C. Rapin c, R. Podor c,d
aCentre de Recherches Petrographiques et Geochimiques, CNRS-UPR 2300, Nancy Universite, BP 20, 54501 Vandoeuvre les Nancy, FrancebEcole Nationale Superieure de Geologie, INPL, Nancy Universite, BP 40, 54501 Vandoeuvre les Nancy, France
c Institut Jean Lamour, CNRS-UMR 7198, Departement CP2S, Nancy Universite, BP 239, 54506 Vandoeuvre les Nancy, Franced Institut de Chimie Separative de Marcoule, UMR 5257, CEA-CNRS-UM2-ENSCM Site de Marcoule, BP 17171,
F-30207 Bagnols sur Ceze Cedex, France
Received 2 February 2010; accepted in revised form 1 November 2010; available online 9 November 2010
Abstract
The sodium solubility in silicate melts in the CaO–MgO–SiO2 (CMS) system at 1400 °C has been measured by using aclosed thermochemical reactor designed to control alkali metal activity. In this reactor, Na(g) evaporation from a Na2O–xSiO2
melt imposes an alkali metal vapor pressure in equilibrium with the molten silicate samples. Because of equilibrium conditionsin the reactor, the activity of sodium-metal oxide in the molten samples is the same as that of the source, i.e., aNa2O(sample) =aNa2O(source). This design also allows to determine the sodium oxide activity coefficient in the samples. Thirty-three differentCMS compositions were studied. The results show that the amount of sodium entering from the gas phase (i.e., Na2O solu-bility) is strongly sensitive to silica content of the melt and, to a lesser extent, the relative amounts of CaO and MgO. Despitethe large range of tested melt compositions (0 < CaO and MgO < 40; 40 < SiO2 < 100; in wt%), we found that Na2O solubilityis conveniently modeled as a linear function of the optical basicity (K) calculated on a Na-free basis melt composition. In ourexperiments, cNa2O(sample) ranges from 7 � 10ÿ7 to 5 � 10ÿ6, indicating a strongly non-ideal behavior of Na2O solubility inthe studied CMS melts (cNa2O(sample) � 1). In addition to showing the effect of sodium on phase relationships in the CMSsystem, this Na2O solubility study brings valuable new constraints on how melt structure controls the solubility of Na in theCMS silicate melts. Our results suggest that Na2O addition causes depolymerization of the melt by preferential breaking of Si–O–Si bonds of the most polymerized tetrahedral sites, mainly Q4.Ó 2010 Elsevier Ltd. All rights reserved.
1. INTRODUCTION
On Earth, the alkali metals Na and K occur as minor tomajor constituents in many common rock-forming miner-als. Due to their incompatible element behavior, the alumi-no-silicate magmas produced by partial melting aresignificantly enriched in sodium and potassium, with upto Na2O + K2O � 15 wt% (Le Bas et al., 1986). High alkaliconcentrations have been also documented in extra-terres-
trial materials, for instance in the mesostasis of chondrulesof some primitive meteorites (Hewins, 1991; Libourel et al.,2006). Numerous experimental works have demonstratedthat, even at minor concentration levels, alkalis significantlyaffect the physicochemical properties of silicate melts(Mysen and Richet, 2005; see references therein), includingmelting temperature, diffusion, viscosity, crystallization,etc. These features are well explained in term of changesoccurring in the melt structure in response to the dual roleof alkalis in molten silicates, acting either as network-modifying cations and/or as charge compensating cations,depending on the melt composition. Because of their effecton the physicochemical properties of melts, alkalis are alsofrequently used in industry, as for instance the use ofsodium as “fluxes” in blast-furnace smelting. Otherwise,alkalis are heavily used in the glass industry to manipulate
0016-7037/$ - see front matter Ó 2010 Elsevier Ltd. All rights reserved.
doi:10.1016/j.gca.2010.11.001
⇑ Corresponding author. Present address: Universitat Gottingen,
Geowissenschaftliches Zentrum, Goldschmidtstrasse 1, D-37077
Gottingen, Germany. Tel.: +49 551 393980; mobile: +49 151
52119655; fax: +49 551 3910452.E-mail addresses: [email protected], rom
[email protected] (R. Mathieu).
www.elsevier.com/locate/gca
Available online at www.sciencedirect.com
Geochimica et Cosmochimica Acta 75 (2011) 608–628
Author's personal copy
glass properties and for the same reason in the ceramicsindustry in producing glazes. Understanding alkali behav-ior in molten silicates is thus of key importance in bothMaterial and Earth Sciences.
Despite their ubiquitous occurrence in molten silicatesand their prominent role on melt structure, thermodynamicproperties of Na and K in molten silicates are poorly doc-umented; even if several studies deal with alkali-bearing liq-uids and/or phases (Nekvasil and Lindsley, 1990; Powelland Holland, 1990; as example). By comparison with othermajor silicate melt components (i.e., Si, Ca, Fe), alkali me-tal oxide activity–composition models are only partly athand to describe complex molten silicates belonging to nat-ural or anthropogenic systems, although great efforts havebeen made in the thermodynamic modeling of alkali-bearing liquids (Ghiorso and Sack, 1995; Pelton and Wu,1999; Gaye et al., 2001; Romero-Serrano et al., 2005). Amain reason for this dichotomy is the difficulty of perform-ing experiments with alkali-bearing systems since alkalis arehighly volatile at high temperature and/or reducing condi-tions (Tsuchiyama et al., 1981; Tissandier et al., 1998;Hewins et al., 2005). According to a generalized reactionof the form of:
Me2OðmeltÞ $ 2MeðgasÞ þ 1=2O2ðgasÞ ð1Þ
with
Keq ¼ aMe2ðgasÞ � aO21=2
ðgasÞ=aMe2OðmeltÞ ð2Þ
assuming that: aMe = fMe/f°Me = PMe and aO2 = fO2/f°O2 = PO2; with f the fugacity and P the partial pressure,at 1 atm, the control of the alkali metal (Me) partial pres-sures, i.e., PMe(gas), or in situ measurements of the alkalimetal oxide activity, i.e., aMe2O(melt), are needed to deter-mine the alkali metal oxide activity–composition relation-ships in molten silicates.
Several experimental approaches have been used to mea-sure alkali metal oxide activities in molten silicates at lowpressure, including EMF measurements in galvanic cells(Neudorf and Elliott, 1980; Yamaguchi et al., 1983; Paket al., 1989; Kim et al., 2004; Abdelouhab et al., 2008) orvaporization processes such as Knudsen effusion cell massspectrometry (Zaitsev et al., 1999; Mueller et al., 2004;Willenborg et al., 2006) and gravimetric method (Steiler,1976; Kawahara, 1984). These techniques can be veryaccurate but they require considerable effort for eachcomposition, making it difficult to study a large range ofcompositions. Other methods consist to control the alkalipartial pressure by equilibrating molten silicates at hightemperature with alkali metal vapor pressure establishedby a reference system composed of simple alkali-silica bin-ary melts or salts. For instance, Lewis et al. (1993) usedNaCl as a carrier to produce Na-bearing vapors, Georgeset al. (2000) fixed constant PK(gas) by using a mixture ofK2CO3 and graphite, and van Limpt et al. (2006) used theevaporation of NaOH from molten sodium disilicateglasses. The use of highly volatile carriers greatly limitsthe region of composition space that can be explored andyields correlative high alkali metal partial pressures in theirdevices (Lewis et al., 1993; Georges et al., 2000; van Limptet al., 2006). In contrast, Karsrud (1984), Rego et al. (1985,
1988), O’Neill (2005), Borisov (2008, 2009), Borisov et al.(2006, 2008), and Grant and Wood (2008, 2010) usedNa2O–xSiO2, K2O–xSiO2, Li2O–xSiO2 or Rb2O–yNa2O–zK2O–xSiO2 melt to impose a specific Na, K, Li or Rb me-tal vapor pressure over their samples. These methods forcontrolling alkali metal oxide activity in molten samplesare very simple, can be used to reduce alkali losses fromexperimental charges in high-temperature experiments,and to determine relative values for activity coefficients insilicate melts. By comparison, the closed system design ofKarsrud (1984) or Rego et al. (1985, 1988) is very likelythe most reliable in controlling the sodium-metal oxideactivity in molten silicates over relative long periods of timeat low partial pressure. Rego et al. (1988) have, however,applied their protocol only to simple binary (e.g., Na2O–SiO2) or ternary (e.g., Na2O–CaO–SiO2, Na2O–MgO–SiO2) systems.
In order to document the behavior of alkali elements inmore complex liquids, we developed a new device to controlsodium-metal oxide activity (aNa2O) by equilibrating themelts with gaseous environment of known Na partial pres-sure (PNa) at high temperature and fixed oxygen fugacity(fO2) (Khedim et al., 2008, 2009; Mathieu et al., 2008;Mathieu, 2009). In this paper, we establish an internallyconsistent experimental database of Na2O solubility and so-dium-metal oxide activity coefficient (cNa2O) for a largerange of CaO–MgO–SiO2 (CMS) + Na2O silicate melts ata magmatic temperature of 1400 °C, and show that thesenew results help to understand how melt composition andmelt structure control the solubility of sodium in moltensilicates.
2. EXPERIMENTAL PROCEDURE
2.1. Experimental strategy
Our experimental strategy was motivated by the need fora method of controlling alkali metal oxide activities in mol-ten silicates that was easy to implement and allowed theindependent variation of multiple parameters includingsample melt composition, PNa, PO2 and temperature (T).This method (Khedim et al., 2008, 2009; Mathieu et al.,2008; Mathieu, 2009) consists of imposing a specific Na-metal vapor pressure in a closed system (sealed silica tube,see below) by controlled evaporation of a Na2O–xSiO2 meltreservoir (source), where x refers to mol% of SiO2:
Na2OðsourceÞ $ 2NaðgasÞ þ 1=2O2ðgasÞ ð3Þ
and equilibrating this vapor with the molten silicate sam-ples of interest:
2NaðgasÞ þ 1=2O2ðgasÞ $ Na2OðsampleÞ ð4Þ
At equilibrium, and for the same temperature, the sodium-metal oxide activity (O’Neill, 2005; Mathieu et al., 2008;Mathieu, 2009) in molten samples is fixed by the source, i.e.:
aNa2OðsampleÞ ¼ aNa2OðsourceÞ ð5Þ
By comparison of experiments carried out in regular fur-naces, the drastic reduction of the working volume allowsto minimize efficiently the gradients (temperature, oxygen
Sodium solubility in molten CMS system 609

Author's personal copy
fugacity, etc.), ensuring better control of alkali metal oxideactivity and a greater stability of the thermochemical cellfor long duration runs.
2.2. Experimental protocol
The cell (Fig. 1) is a sealed silica tube of 25–30 cm3
(Øext = 22 mm,h � 120 mm,Quartz-ILMASIL-PN-MatelÒ)containing the various components that fix the thermochem-ical parameters of the system. A loosely capped Pt crucible(Øext = 16 mm, h = 20 mm) hosts the source melt with sam-ples suspended on Pt wire loops (e.g., Donaldson, 1979) fromthe crucible lid. The Na vapor partial pressure is imposed bytwo grams of Na2O–xSiO2 source melt (with 1 6 x 6 3.5) ofknown aNa2O. Up to six glass samples of 15–20 mg each(Øext = 1–2 mm) can be suspended simultaneously abovethe Na source melt. The oxygen fugacity over the samples
is controlled by a solid Ni/NiO buffer placed below the Ptcrucible in a silica tube to avoid alloying between the solidbuffer and the platinum crucible (Fig. 1). Around 5 g ofNi/NiO solid buffer is used per experiment with amolar ratioof five Ni for one NiO. Once loaded, the outer silica tube isevacuated and sealed under vacuum. Direct measurementsshow that the residual pressures inside the thermochemicalcell never exceed Ptotal < 10ÿ6 bar. Note that the tube wasplaced in a furnace (T = 120 °C), and pumping was madeassociated with active charcoal and liquid nitrogen, in orderto eliminate residualwater (PNaOH is thus negligible).Whenprepared, the silica tube is introduced in a muffle furnace atthe dwell temperature on an alumina support formaintainingthe cell vertical. Preliminary temperature measurements inthe device near the reactor reveals that despite the existenceof a thermal gradient across the cell (�3 °C cmÿ1), gradientsinside the reactor (20 mmhigh) are relatively small due to theability of the alumina of the support and the platinum of thecrucible to homogenize the temperature. Temperature uncer-tainty does not exceed ±5 °C.
At the end of the run, the silica tube is removed from thefurnace and directly quenched into cold water. After eachexperiment, the Na2O–xSiO2 melt reservoir and the samplemelt droplets were recovered and polished mounts preparedfor each. Finally, the presence of both metal and oxidephases in the solid buffer after each run is confirmed byoptical microscopy observation and/or X-ray diffraction,to check that the metallic buffer was not exhausted.
2.3. Source and samples
2.3.1. Preparation
Na2O–xSiO2 glass sources, starting silicate glasses andEDiAn reference glass (see below) were obtained by mixingreagent grade oxides (SiO2, Al2O3, and MgO) and carbon-ates (CaCO3, Na2CO3) in the appropriate proportions andfinely grinding them, dryly, in an agate mortar by hand.After decarbonation (slowly heating from 600 °C), the mix-tures were fused for 2 h in a muffle furnace, and quenched.The resulting glasses were finely ground and powder ali-quots were used as the starting material for experimentalruns. To avoid hydration, which can occur in some of theseglasses even under ambient conditions, the Na2O–xSiO2
glasses were stored in a desiccator at 20 °C.
2.3.2. Samples composition
Thirty-three different starting compositions (Fig. 2) wereproduced for this study. They encompass a large range ofcompositions (0 < CaO and MgO < 40; 40 < SiO2 < 100;in wt%) with the degree of polymerization as expressed bythe number of non-bridging to tetrahedral oxygens(NBO/T), ranging from 0 to 3. Because large portions ofthe CMS diagram have liquidus temperatures exceeding1400 °C, Na2O-enriched CMS compositions (Mathieuet al., 2008; Mathieu, 2009) were also used as starting com-positions (Table 1).
2.3.3. Chemical analyses
The determination of the compositions was performedby flame atomic adsorption spectrometry (AAS) at the
Fig. 1. Scheme of the thermochemical cell (Øext = 22 mm,
h � 120 mm) with glass samples to be studied, suspended beneath
the platinum lid of the reactor using Pt wire loop; semi-closed Pt
crucible containing 2 g of Na2O–2SiO2 reference melt (source) and
constituting the reactor; open silica crucible containing �5 g of
solid Ni/NiO oxygen buffer. See text for further explanations.
610 R. Mathieu et al. /Geochimica et Cosmochimica Acta 75 (2011) 608–628

Author's personal copy
SARM (CNRS, Nancy, France), for crystalline startingsamples; or using a CAMECA SX100 electron microprobe,for glassy compositions (starting or final samples) and finalcrystallized phases, at the Universite Henri Poincare,Nancy Universite (France). Compositions of the final crys-talline phases were determined at 15 kV voltage, 10 nA cur-rent and 10 s peaks and backgrounds counting time (Nameasured first), with the beam focused at 1–2 lm. The maindifficulty (EPMA analyses), when analyzing glasses withhigh alkali metal contents (and especially Na), is to deter-mine the sodium content with accuracy and with limited so-dium volatilization during measurement (Morgan andLondon, 2005; Borisov, 2009). In order to probe Na-richglasses, from our own experience, the optimized conditionsfor the analysis of homogeneous glasses are an accelerationvoltage of 25 kV, a beam intensity of 8 nA, an electronbeam size of 10 lm. The counting times on peaks and back-grounds are (6 s, 3 s) and (10 s, 5 s) for Na and Ca, Mg, Al,Si, respectively. Natural and synthetic mineral standardswere used for calibration: orthoclase (Si, K), albite (Na,Al), wollastonite (Ca), olivine (Mg). Each composition
(Tables 1–5) is determined by a mean of 5–10 individualanalyses. Analyses obtained with these two methods arecomparable with analyses of: (i) major elements (i.e.,>1 wt%) with a relative errors of 1% for AAS analysesand 0.5–1% for EPMA analyses; and minor elements (i.e.,<1 wt%) with relative errors of 8% and 5–8%, respectively.Data were reduced using the ISOPLOTÒ software and arepresented with two standard deviations.
2.4. Attainment of equilibrium and equilibrium value
To determine the Na2O equilibrium values, the reactorhas been tested at 1400 °C using a CaO–MgO–Al2O3–SiO2
(CMAS) glass composition and a Na2O–2SiO2 melt forthe Na source (see also Mathieu et al., 2008). The selectedCMAS composition (Table 1) is the 1 atm anorthite–diop-side eutectic composition (EDiAn), frequently used in theliterature as a proxy of basaltic magmas (see also Libourelet al., 1989; O’Neill, 2005; Borisov, 2008, 2009). To ascer-tain the time scale for equilibrium, experiments were per-formed at 1400 °C for durations varying from 1 to 100 h.
Fig. 2. Composition of the starting materials (filled circles) superimposed on simplified CaO–MgO–SiO2 liquidus phase diagram (Bowen,
1928, 1945; Slag Atlas, 1995). Dashed lines represent the degree of bulk polymerization of the Na-free CMS melts as indicated by NBO/T (see
Mysen and Richet, 2005).
Sodium solubility in molten CMS system 611

Author's personal copy
For these specific sets of experiments, 1–3 samples of20 mg each (Ø = 1–2 mm) were suspended simultaneouslyabove the Na2O–2SiO2 source melt. Results show thatNa2O contents of the EDiAn melt increase rapidly withthe exposure time (Table 2) reaching a steady state at avalue of Na2O � 12.5 wt% (Fig. 3). Even at short runduration (i.e., few hours), Na2O contents display no vari-ation from rim to core, consistent with the fast diffusivityof Na in molten silicates (Tsuchiyama et al., 1981). Afterexperiments, Si/Mg and Ca/Al ratios (Table 2) remainconstant in the studied glass samples indicating that (i)Na entering the melt from the gas phase simply dilutesthe original Na-free composition, (ii) SiO(gas) enteringfrom the gas phase, is negligible (this is consistent withthe calculation of a PSiO < 10ÿ22 atm with the softwareHSC ChemistryÒ 5.1, and (iii) no direct contamination
from the Na2O–2SiO2 melt source has occurred. It isimportant to notice that the sodium contents of theNa2O–2SiO2 melt source remain constant within uncer-tainty in all runs (Table 3 and Fig. 3), whatever the expo-sure time, indicating that the source buffers the reactorefficiently even for the longest runs. As such, we can con-clude that EDiAn melt is equilibrated, at 1400 °C, after60 h. In the light of these results, run durations for allexperiments were set between 72 and 120 h (Table 3), toensure as much as possible attainment of equilibrium be-tween the sources and the experimented CMS melts(Mathieu et al., 2008). Otherwise, knowing that no Nawas measured in the silica tube after experiments, massbalance calculations show that �2% of the original Nais in the samples after equilibration, �0.1% in the vaporand �97.9% remaining in the source.
Table 1
Starting compositions (in wt%).
Compositiona Na2O MgO SiO2 Al2O3 CaO
EDiAn 0.11 (0.01) 10.62 (0.24) 51.59 (0.95) 16.11 (0.28) 21.57 (0.66)
EDiAn12.5 12.51 (0.20) 9.36 (0.31) 44.98 (0.21) 14.36 (0.18) 18.78 (0.14)
CMS1b — 0.15 (0.02) 54.63 (0.27) 0.08 (0.03) 45.13 (0.13)
CMS3c 0.07 (0.01) 27 (0.27) 67.17 (0.67) — 5.6 (0.06)
CMS5c 0.04 (0) 23.26 (0.23) 43.83 (0.44) 0.06 (0) 32.81 (0.33)
CMS8b 0.04 (0.02) 4.54 (0.18) 52.74 (0.37) 0.25 (0.17) 42.43 (0.18)
CMS9b 0.06 (0.02) 9.57 (0.33) 57.94 (0.66) 0.14 (0.005) 32.29 (0.49)
CMS10c 0.03 (0) 10.27 (0.10) 67.58 (0.68) — 22.08 (0.22)
CMS11b 0.04 (0.02) 14.03 (0.08) 47.90 (0.24) 0.36 (0.22) 37.66 (0.31)
CMS12b 0.07 (0.02) 13.05 (0.24) 55.85 (0.31) 0.20 (0.07) 30.84 (0.03)
CMS13b 0.03 (0.02) 10.13 (0.10) 67.96 (0.39) 0.06 (0.04) 21.82 (0.17)
CMS15b 0.06 (0.01) 18.40 (0.11) 46.25 (0.14) 0.12 (0.04) 35.16 (0.19)
CMS16b 0.10 (0.02) 20.32 (0.11) 51.33 (0.35) 0.11 (0.04) 28.13 (0.20)
CMS17b 0.08 (0.03) 22.15 (0.27) 56.11 (0.25) 0.12 (0.01) 21.55 (0.20)
CMS18b 0.10 (0.03) 24.43 (0.16) 62.23 (0.30) 0.15 (0.03) 13.08 (0.05)
CMS19b 0.09 (0.02) 25.44 (0.27) 48.26 (0.11) 0.13 (0.05) 26.08 (0.03)
CMS20b 0.10 (0.02) 27.95 (0.13) 52.15 (0.13) 0.13 (0.05) 19.66 (0.15)
CMS21b 0.10 (0.01) 30.69 (0.09) 57.01 (0.14) 0.11 (0.03) 12.10 (0.07)
CMS22c 0.22 (0.02) — 70.93 (0.71) — 28.80 (0.29)
CMS23c 0.30 (0.02) 3.9 (0.04) 59.74 (0.60) — 36.04 (0.36)
CMS24c 0.25 (0.02) 4.43 (0.04) 67.26 (0.67) — 28.02 (0.28)
CMS25c 0.17 (0.01) 8.76 (0.09) 64.66 (0.65) — 26.37 (0.26)
CMS26c 0.11 (0.01) 17.68 (0.18) 67.89 (0.68) — 14.29 (0.14)
CMS27c 0.40 (0.03) — 50.04 (0.50) — 49.51 (0.50)
CMS28c — 37.10 (0.37) 62.39 (0.62) 0.26 (0.02) 0.26 (0)
CMS30b — 9.61 (0.10) 44.76 (0.41) — 45.63 (0.30)
CMS31b — 9.98 (0.16) 50.04 (0.27) — 39.98 (0.34)
CMS32b — 10.03 (0.14) 54.58 (0.33) — 35.39 (0.10)
CMS33b — 9.56 (0.04) 61.01 (0.37) — 29.44 (0.28)
CMS34b 0.21 (0.02) 9.78 (0.08) 46.88 (0.18) — 43.11 (0.09)
CMS35b 0.25 (0.02) — 68.71 (0.69) — 30.95 (0.31)
CMS36b 0.27 (0.02) 12.10 (0.18) 60.61 (0.12) — 26.98 (0.10)
NCMS3b 20.23 (0.43) — 60.81 (0.24) — 18.96 (0.44)
NCMS4b 17.54 (0.51) — 67.09 (0.39) — 15.37 (0.30)
NCMS7b 12.92 (0.38) — 74.25 (0) — 12.83 (0.38)
NSb 45.45 (0.50) — 54.55 (0.23) — —
NS2b 32.60 (0.30) — 67.40 (0.35) — —
NS3.5b 22.22 (0.30) — 77.78 (0.25) — —
Dashed entries correspond to not analyzed element. Values in parentheses correspond to two standard deviations.a EDiAn stands for the diopside–anorthite eutectic in the CaO–MgO–Al2O3–SiO2 system; CMSx stands for composition in the CaO–MgO–
SiO2 system; NCMSx stands for composition in the Na2O–CaO–MgO–SiO2 system; NSx stands for composition in the Na2O–xSiO2 system.b Analyses by electron microprobe.c Analyses by AAS.
612 R. Mathieu et al. /Geochimica et Cosmochimica Acta 75 (2011) 608–628

Author's personal copy
In each run (Table 3), a glass of anorthite–diopside eu-tectic composition (EDiAn) was systematically includedto serve as an internal and external reference. Despite con-ditions close to equilibrium, the Na2O content of theEDiAn reference melt (Table 3) varies slightly from onerun to another around a mean value of Na2OEDiAn =12.44 ± 0.27 wt% (n = 16; Tables 2 and 3), suggesting vari-ations of the Na partial pressure (PNa) in the reactordepending on the runs. Rego et al. (1988) and Mathieuet al. (2008) have shown that these variations can be ex-plained by small compositional differences among thesources, and/or differences in the residual pressure insidethe silica tube after sealing of the reactor. Even if thesevariations in Na partial pressure and their effects on
Na2O solubility in CMS melts remain small, we show inthe following how we normalized them.
2.5. Determination of Na partial pressure in the reactor, and
corrections
For thedeterminationofNapartial pressure in the reactorin a given experiment, we proceed as follow. According toreactions (1) and (3), and Eq. (2), the equilibrium constant is:
Keq ¼ PNa2 � PO21=2=aNa2O ð6Þ
Keq can be assessed from appropriate thermodynamic dat-abases, here Keq = 1.14 � 10ÿ04 and PO2 is equal to2.11 � 10ÿ06 (from HSC ChemistryÒ version 5.1, with ther-modynamic data from Barin (1989), NASA Report (1993),Knacke et al. (1991), and Landolt-Bornstein (1999)).
At equilibrium, the sodium-metal oxide activity in theEDiAn melt is being fixed by the source according to Eq.(5), so that, if aNa2O in the source is known so is aNa2Oin an EDiAn melt droplet or any other sample. Fig. 4 showson a logarithmic scale a compilation of the Na2O activitiesin the binary system Na2O–xSiO2 at 1400 °C, as determinedby EMF measurements in galvanic cells (Yamaguchi et al.,1983; Pak et al., 1989), Knudsen effusion cells mass spec-trometry measurements (Zaitsev et al., 1999), gravimetricmeasurements (Kawahara, 1984) and transpiration mea-surements (Rego et al., 1985). The results derived fromCharles’ (1967) calculations after correction by Regoet al. (1985) are also shown together with those of Witthohnet al. (1998) as calculated by FACTÒ, and those obtainedusing the software FactSageÒ. Based on the above, we pro-pose the following relation to calculate the sodium oxideactivity of Na2O–SiO2 binary melts at 1400 °C for compo-sitions ranging from 0.21 < xNa2O < 0.5, with xNa2O is themolar fraction of Na2O:
logðaNa2OsourceÞ ¼ logðaNa2OEDiAnÞ
¼ 11:23 ð�0:80Þ � xNa2O
ÿ 10:42 ð�0:28Þ ð7Þ
To quantify the relationship between PNa and aNa2Ofor our EDiAn reference melt composition, we have testedthe influence of the composition of the Na2O–xSiO2 melt
Table 2
Run conditions and glass compositions for experiments designed to test the attainment of equilibrium for Na2O solubility in molten EDiAn
reference glasses, at 1400 °C. EDiAn glass compositions are expressed in wt%. Also provided are the sodium contents of the Na2O–2SiO2
source in wt% after each experiments. Notice that all experiments were run at oxygen fugacity conditions imposed by the NNO solid buffer.
Run Duration (h) EDiAn Sourcea
Na2O MgO SiO2 Al2O3 CaO Ca/Al Mg/Si Na2O (final)
ACMA16S-19 1 1.88 (0.09) 10.33 (0.14) 49.95 (0.50) 15.75 (0.21) 22.08 (0.05) 1.27 0.3 31.86 (0.29)
ACMA16S-20 2 3.60 (0.14) 10.04 (0.02) 49.15 (0.42) 15.54 (0.26) 21.67 (0.20) 1.27 0.3 32.41 (0.66)
ACMA16S-21 6 6.00 (0.08) 9.97 (0.17) 47.87 (0.46) 15.16 (0.20) 21.00 (0.17) 1.26 0.31 32.52 (0.24)
ACMA16S-26 24 11.16 (0.30) 9.46 (0.10) 45.32 (0.13) 14.17 (0.10) 19.88 (0.12) 1.28 0.31 32.06 (0.22)
ACMA16S-27 48 12.27 (0.24) 9.15 (0.12) 44.70 (0.28) 14.27 (0.23) 19.62 (0.03) 1.25 0.31 31.61 (0.42)
AEDiAn45 67 13.23 (0.21) 8.95 (0.16) 44.17 (0.25) 14.26 (0.13) 19.39 (0.10) 1.26 0.31 33.33 (0.50)
AEDiAn68 71 12.95 (0.20) 9.43 (0.16) 43.21 (0.17) 14.70 (0.09) 19.72 (0.18) 1.26 0.3 33.85 (0.42)
AEDiAn67 111 13.21 (0.16) 9.39 (0.14) 43.07 (0.13) 14.62 (0.10) 19.71 (0.08) 1.27 0.3 33.63 (0.44)
a Final Na2O content in sodium source melt (Na2O–2SiO2). Values in parentheses correspond to two standard deviations.
Fig. 3. Mean Na2O (wt%) contents versus time (in h) (i) for EDiAn
glass samples (triangle, Table 2) exposed to a Na2O–2SiO2
reference melt at 1400 °C and NNO buffer, and (ii) for the Na2O-
2SiO2 source (circles, Table 2). Error bars indicate one standard
deviation of 5–10 analyses. For all experiments, error bars are less
than the size of the symbols. It is worth noticing that the Na2O–
2SiO2 reference melt shows within errors bars a constant compo-
sition for all run durations. See text for detailed comments.
Sodium solubility in molten CMS system 613
Author's personal copy
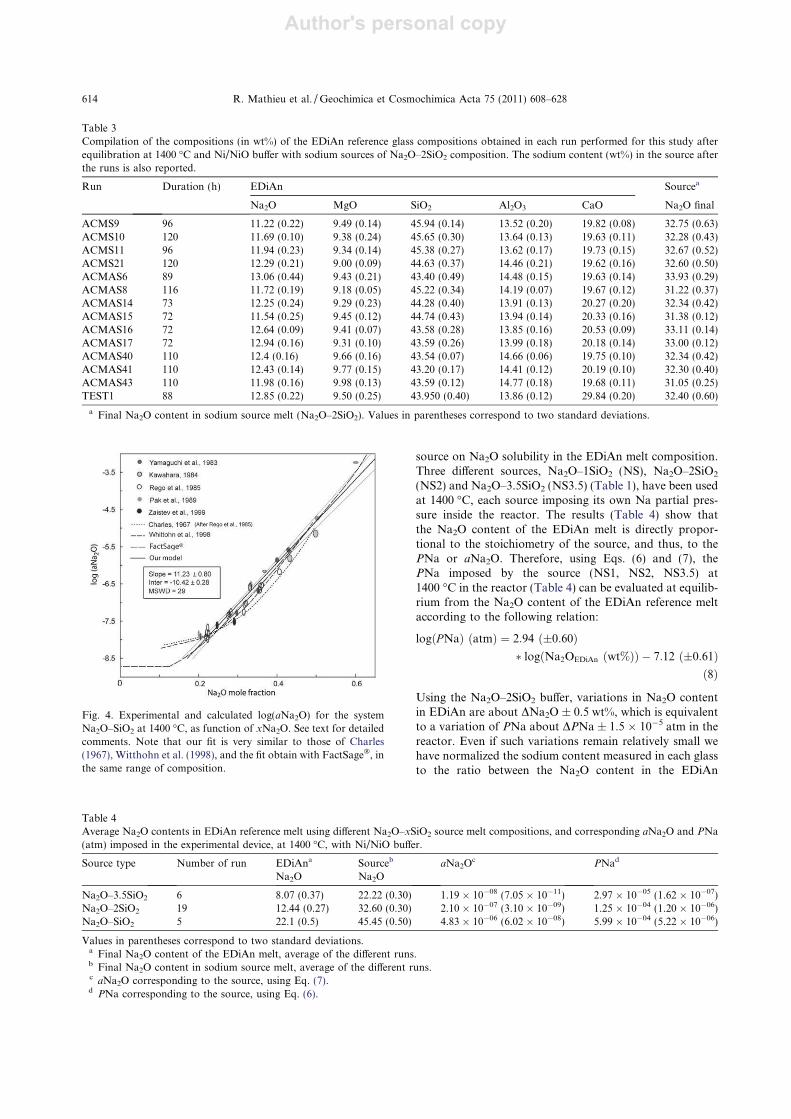
source on Na2O solubility in the EDiAn melt composition.Three different sources, Na2O–1SiO2 (NS), Na2O–2SiO2
(NS2) and Na2O–3.5SiO2 (NS3.5) (Table 1), have been usedat 1400 °C, each source imposing its own Na partial pres-sure inside the reactor. The results (Table 4) show thatthe Na2O content of the EDiAn melt is directly propor-tional to the stoichiometry of the source, and thus, to thePNa or aNa2O. Therefore, using Eqs. (6) and (7), thePNa imposed by the source (NS1, NS2, NS3.5) at1400 °C in the reactor (Table 4) can be evaluated at equilib-rium from the Na2O content of the EDiAn reference meltaccording to the following relation:
logðPNaÞ ðatmÞ ¼ 2:94 ð�0:60Þ
� logðNa2OEDiAn ðwt%ÞÞ ÿ 7:12 ð�0:61Þ
ð8Þ
Using the Na2O–2SiO2 buffer, variations in Na2O contentin EDiAn are about DNa2O ± 0.5 wt%, which is equivalentto a variation of PNa about DPNa ± 1.5 � 10ÿ5 atm in thereactor. Even if such variations remain relatively small wehave normalized the sodium content measured in each glassto the ratio between the Na2O content in the EDiAn
Table 3
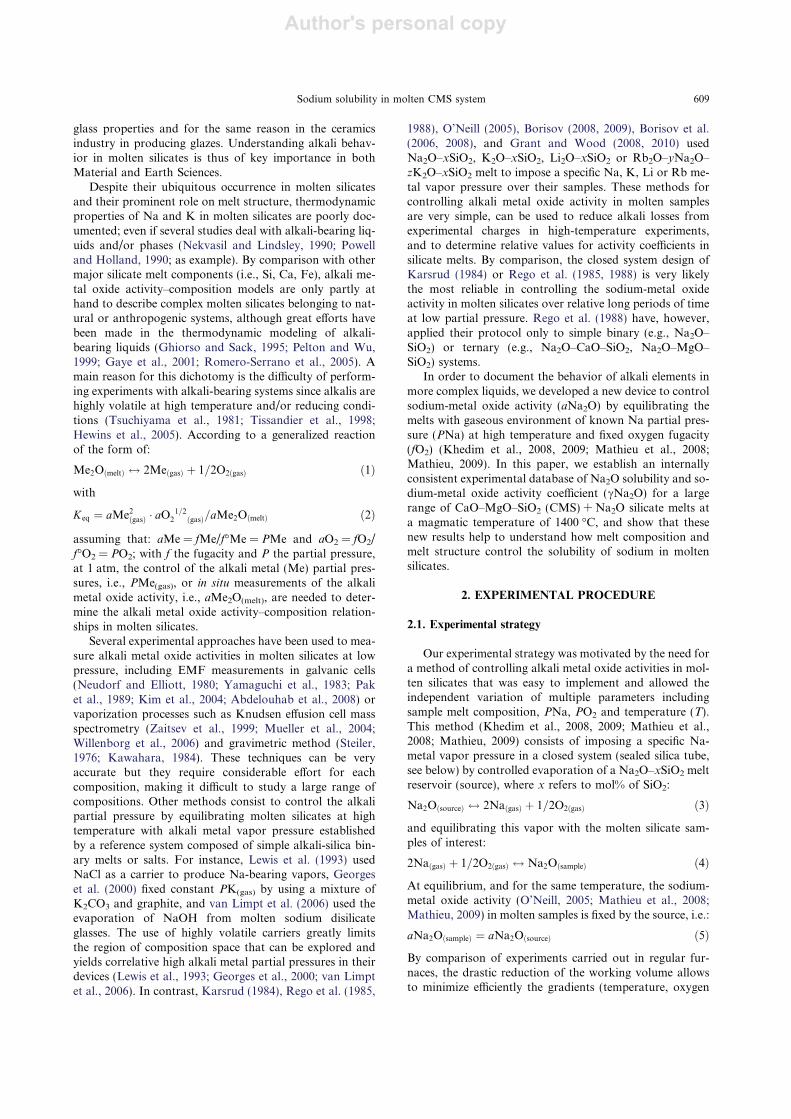
Compilation of the compositions (in wt%) of the EDiAn reference glass compositions obtained in each run performed for this study after
equilibration at 1400 °C and Ni/NiO buffer with sodium sources of Na2O–2SiO2 composition. The sodium content (wt%) in the source after
the runs is also reported.
Run Duration (h) EDiAn Sourcea
Na2O MgO SiO2 Al2O3 CaO Na2O final
ACMS9 96 11.22 (0.22) 9.49 (0.14) 45.94 (0.14) 13.52 (0.20) 19.82 (0.08) 32.75 (0.63)
ACMS10 120 11.69 (0.10) 9.38 (0.24) 45.65 (0.30) 13.64 (0.13) 19.63 (0.11) 32.28 (0.43)
ACMS11 96 11.94 (0.23) 9.34 (0.14) 45.38 (0.27) 13.62 (0.17) 19.73 (0.15) 32.67 (0.52)
ACMS21 120 12.29 (0.21) 9.00 (0.09) 44.63 (0.37) 14.46 (0.21) 19.62 (0.16) 32.60 (0.50)
ACMAS6 89 13.06 (0.44) 9.43 (0.21) 43.40 (0.49) 14.48 (0.15) 19.63 (0.14) 33.93 (0.29)
ACMAS8 116 11.72 (0.19) 9.18 (0.05) 45.22 (0.34) 14.19 (0.07) 19.67 (0.12) 31.22 (0.37)
ACMAS14 73 12.25 (0.24) 9.29 (0.23) 44.28 (0.40) 13.91 (0.13) 20.27 (0.20) 32.34 (0.42)
ACMAS15 72 11.54 (0.25) 9.45 (0.12) 44.74 (0.43) 13.94 (0.14) 20.33 (0.16) 31.38 (0.12)
ACMAS16 72 12.64 (0.09) 9.41 (0.07) 43.58 (0.28) 13.85 (0.16) 20.53 (0.09) 33.11 (0.14)
ACMAS17 72 12.94 (0.16) 9.31 (0.10) 43.59 (0.26) 13.99 (0.18) 20.18 (0.14) 33.00 (0.12)
ACMAS40 110 12.4 (0.16) 9.66 (0.16) 43.54 (0.07) 14.66 (0.06) 19.75 (0.10) 32.34 (0.42)
ACMAS41 110 12.43 (0.14) 9.77 (0.15) 43.20 (0.17) 14.41 (0.12) 20.19 (0.10) 32.30 (0.40)
ACMAS43 110 11.98 (0.16) 9.98 (0.13) 43.59 (0.12) 14.77 (0.18) 19.68 (0.11) 31.05 (0.25)
TEST1 88 12.85 (0.22) 9.50 (0.25) 43.950 (0.40) 13.86 (0.12) 29.84 (0.20) 32.40 (0.60)
a Final Na2O content in sodium source melt (Na2O–2SiO2). Values in parentheses correspond to two standard deviations.
Fig. 4. Experimental and calculated log(aNa2O) for the system
Na2O–SiO2 at 1400 °C, as function of xNa2O. See text for detailed
comments. Note that our fit is very similar to those of Charles
(1967), Witthohn et al. (1998), and the fit obtain with FactSageÒ, in
the same range of composition.
Table 4
Average Na2O contents in EDiAn reference melt using different Na2O–xSiO2 source melt compositions, and corresponding aNa2O and PNa
(atm) imposed in the experimental device, at 1400 °C, with Ni/NiO buffer.
Source type Number of run EDiAna Sourceb aNa2Oc PNad
Na2O Na2O
Na2O–3.5SiO2 6 8.07 (0.37) 22.22 (0.30) 1.19 � 10ÿ08 (7.05 � 10ÿ11) 2.97 � 10ÿ05 (1.62 � 10ÿ07)
Na2O–2SiO2 19 12.44 (0.27) 32.60 (0.30) 2.10 � 10ÿ07 (3.10 � 10ÿ09) 1.25 � 10ÿ04 (1.20 � 10ÿ06)
Na2O–SiO2 5 22.1 (0.5) 45.45 (0.50) 4.83 � 10ÿ06 (6.02 � 10ÿ08) 5.99 � 10ÿ04 (5.22 � 10ÿ06)
Values in parentheses correspond to two standard deviations.a Final Na2O content of the EDiAn melt, average of the different runs.b Final Na2O content in sodium source melt, average of the different runs.c aNa2O corresponding to the source, using Eq. (7).d PNa corresponding to the source, using Eq. (6).
614 R. Mathieu et al. /Geochimica et Cosmochimica Acta 75 (2011) 608–628

Author's personal copy
reference melt and in the EDiAn obtained in Section 2.4 un-der Na2O–2SiO2 buffer, according to:
Na2O ðwt%Þsample;NS2 ¼ Na2O ðwt%Þsample;run
� ðNa2O ðwt%ÞEDiAn;NS2=
Na2O ðwt%ÞEDiAn;runÞ ð9Þ
with Na2O (wt%)EDiAn,NS2 = 12.44 (Section 2.4; Table 4).Equivalent to a correction on PNa or aNa2O, this
normalization allows rigorous comparison of the resultsobtained on different runs.
2.6. Verification of aNa2O by electrochemical measurements
An electrochemical device was used to determine inde-pendently the Na2O activity (aNa2OEDiAn) of the EDiAncomposition doped with 12.5 wt% of Na2O (Table 1). Itwas previously determined that this composition in theEDiAn system has the same Na2O activity as that of theNa2O–2SiO2 melt at 1400 °C (see above).
The EMF cell design used in this study is the same thatused by Abdelouhab (2005) and Abdelouhab et al. (2008).It consists of a Na–b00-alumina electrolyte (Na+ conductor),and platinum electrodes in both half-cells containing the ref-erence and working melts. Air was used as the reference gas(PO2 = 0.21 atm). The Na2O activities were determinedusing this galvanic cell shown in Fig. 5a (see also Yamaguchiet al., 1983). The cell was placed in a Nabertherm furnace(maximum temperature 1600 °C), the glass bath temperaturebeing directly controlled by a Pt/PtRh (10%) thermocoupleimmersed in the working melt. The EMF of the cell(expressed in mV) was recorded using a M263A Princetonpotentiostat driven by the EG&G Perkin-Elmer M352corrosion software.
The anodic reaction of this cell is
Na2OðRÞ $ 2Naþb þ 1=2O2;R þ 2eÿ ð10Þ
and the cathodic reaction is
2Naþb þ 1=2O2;T þ 2eÿ $ Na2OðTÞ ð11Þ
The overall reaction can be written as
Na2OðRÞ þ 1=2O2;T $ Na2OðTÞ þ 1=2O2;R ð12Þ
where Na2O(R) designates sodium oxide in the referencemelt and Na2O(T) designates sodium oxide in the workingmelt.
Because the oxygen partial pressure is the same in bothcompartments, the activity of sodium oxide in the workingmelt, a(Na2O(T)), can be calculated from the Nernst equa-tion as follows:
logðaNa2OðTÞÞ ¼ logðaNa2OðRÞÞ ÿ ð2 � F � DEÞ=ð2:303RT Þ
ð13Þ
where DE is the EMF (V) of the cell, R is the universal gasconstant and F is the Faraday constant.
During this experiment, the reference melt was theNa2O–2SiO2 melt and the working melt was the “EDiAnmelt with 12.5 wt% Na2O”. The data for the “EDiAn meltwith 12.5 wt% Na2O” were recorded in the temperaturerange of 1200–1325 °C (upper limit for temperature dueto Na evaporation). The experiment duration was between1 and 4 h for each temperature in order to ensure the DE
stability (Fig. 5b). To confirm the reproducibility and thereversibility of the cell, the measurements at a given temper-ature were performed during both heating and cooling cy-cles (two series, Fig. 5b).
The glass compositions were systematically determinedby EPMA after the experiments in order to check that nosignificant changes in composition had occurred duringthe experiment (due to the dissolution of the Na-b-aluminacrucible and of electrode alumina cement in the workingmelt, and evaporation of Na(g)). An enrichment of less than1 wt% of Al2O3 was measured in glass after electrochemical
Fig. 5. (a) Illustration of the experimental electrochemical cell, including: (i) the Pt wires (electrodes) from which DE is measured; (ii) the
working melt and the reference melt separated by a Na-b-crucible used as ionic conductor; (iii) the galvanic cell used, where (Na2O)Rdesignates sodium oxide in the Na2O–2SiO2 reference melt, and (Na2O)T designates sodium oxide in the working melt. (b) Illustration of the
temperature sequences (two series: (i) 1225 < T (°C) < 1325 for 10 h; (ii) 1225 < T (°C) < 1325 for 17 h) for EMF recordings in melts, imposed
on the sample during electrochemical experiments.
Sodium solubility in molten CMS system 615

Author's personal copy
experiments. Moreover, no significant variation of Na/Siratio was observed.
The log(aNa2O) values in the “EDiAn melt with12.5 wt% Na2O” are directly calculated using the data re-corded in the temperature domain ranging from 1200 to1325 °C and the Na2O activities in the Na2O–2SiO2 meltdetermined by Abdelouhab (2005) and Abdelouhab et al.(2008), for each temperature. The obtained data relativeto the “EDiAn melt with 12.5 wt% Na2O” are reported inFig. 6. From this data series, the following Arrhenian fitis obtained:
logðaNa2OEDiAnÞ ¼ ÿð0:75 � 10; 000=T Þ ÿ 2:48 ðR2 ¼ 0:82Þ
ð14Þ
with T in Kelvin.The log(aNa2O) values determined by different methods
during previous studies for the Na2O–2SiO2 melt are alsoreported in Fig. 6 for comparison (EMF measurements ingalvanic cells: Neudorf and Elliott, 1980; Yamaguchiet al., 1983; Pak et al., 1989; Kim et al., 2004; Abdelouhabet al., 2008; Knudsen effusion cells mass spectrometry:Zaitsev et al., 1999; gravimetric method: Kawahara, 1984;Ion–Molecule equilibria method: Rudnyi et al., 1988; gasphase equilibration technique: Rego et al., 1985; van Limptet al., 2006; and chemical equilibration method: Tsukihashiand Sano, 1985; Ivanov et al., 2004).
From these two data sets, it can be concluded that thelog(aNa2O) series in the “EDiAn melt with 12.5 wt%Na2O” intercepts the log(aNa2O) series in the Na2O–2SiO2 melt at T = 1400 °C. The log(aNa2O) calculatedfrom relation (14) (relative to the “EDiAn melt with12.5 wt% Na2O”) is equal to ÿ6.96 ± 0.2 while the log(a-Na2O) calculated from relation (7) (relative to the“Na2O–2SiO2 melt”) is equal to ÿ6.68 ± 0.2. Both valuesbeing within the confidence interval, consistent with the fact
that the Na2O activities in both Na2O–2SiO2 melt and“EDiAn melt with 12.5 wt% Na2O” are equal within uncer-tainty at T = 1400 °C. These electrochemical measurementsvalidate the use of the silica tube reactor method which willbe used for all the experiments reported in this work.
3. RESULTS
3.1. Na2O solubility in silicates melts
Compositions of the 33 studied CMS glasses equili-brated with a Na2O–2SiO2 (NS2) source melt at 1400 °Cand Ni/NiO buffer are reported in Table 5, together withthe anorthite–diopside eutectic reference composition(EDiAn) obtained for each run (Table 3). As indicated bythe small 2r errors (Table 5), glass samples are homoge-neous and no Na zonation has been observed.
The normalized Na2O (wt%) or Na2O (mol%) values(Table 6) show a very large range of variation, from 4 upto 30 mol%, of the sodium solubility in initially Na-freeCMS melts. Iso-solubility curves have been drawn in thecorresponding part of the CMS system (Fig. 7) by triangu-lation. Within uncertainties, these iso-solubility curves aresub-parallel and equidistant to each other, suggesting linearrelationships between the Na2O solubility and the composi-tion of the CMS melt. Accordingly, two main effects can beoutlined. The increase of the SiO2 content of the melt causesa drastic increase of the Na2O solubility in the CMS melt,by almost an order of magnitude, from 4.2 mol% for ourmost silica-poor melts up to a maximum value of�30 mol% for pure SiO2 melt. A secondary effect is linkedto the nature of the alkaline earth element. Na2O iso-solu-bility curves are oblique to lines of constant SiO2/(CaO +MgO) (Fig. 7), implying that the substitution ofCa by Mg increases the solubility of Na2O. For instance,the full substitution of Ca by Mg along metasilicate meltcompositions (i.e., NBO/T = 2) results in a change of theNa2O content by almost 10 mol% (Fig. 7).
3.2. Na2O-activity coefficients in silicate melts
At equilibrium conditions in the reactor, the activity ofsoda in the samples can be calculated from that of thesource (Karsrud, 1984; Rego et al., 1985; O’Neill, 2005;Mathieu et al., 2008) according to:
aNa2OðsampleÞ ¼ xNa2OðsampleÞ � cNa2OðsampleÞ ð15Þ
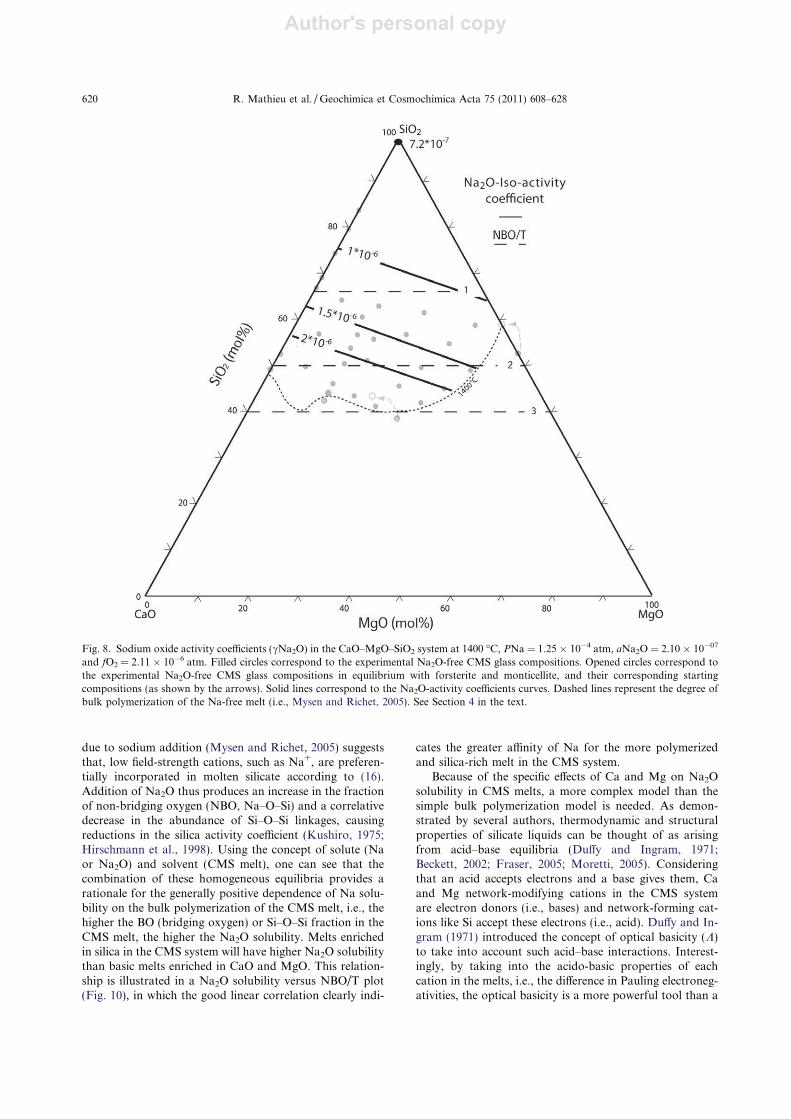
With a value of aNa2O(sample) = aNa2O(source) = 2.10 �10ÿ07 (±3.10 � 10ÿ09) determined via Eq. (7) for theNa2O–2SiO2 reference melt at T = 1400 °C, the sodiumoxide activity coefficient in the sample (cNa2O(sample)) canbe calculated from glass compositions using Eq. (15). Re-sults are given in Table 6. These results show that Na2Ois extremely non-ideal in these CMS melts. Large variationsoccur in the cNa2O(sample) from 7.1 � 10ÿ07 for the silicaend-member up to 5 � 10ÿ06 for the silica-poor composi-tion (CMS34) but all are �1. Iso-activity coefficient curvesdrawn in the CMS system follow (Fig. 8) the same trend de-picted for Na2O solubility curves with a significant decreaseof cNa2O(sample) as function of SiO2 content and NBO/T.
Fig. 6. Na2O activities in the EDiAn-12.5 wt%Na2O doped com-
position (data obtained in this work) and Na2O activities in the
Na2O–2SiO2 system (from bibliographic data) reported as a
function of the reciprocal temperature.
616 R. Mathieu et al. /Geochimica et Cosmochimica Acta 75 (2011) 608–628

Author's personal copy
cNa2O(sample) curves are also sensitive to Ca–Mg exchangein the melt with a decrease of cNa2O(sample) values as Mg issubstituted for Ca.
3.3. Isothermal and iso-activity phase diagrams
The effect of sodium on phase relationship can be as-sessed by comparing the 1400 °C isothermal section of theCaO–MgO–SiO2 system (Bowen, 1928, 1945; Slag Atlas,1995; Fig. 9a), with data obtained with our design(Table 5) at the same temperature but with a fixedaNa2O = 2.10 � 10ÿ07 (Fig. 9b). As shown in Fig. 9a andb, the sodium effect is prominent with a large expansionof the molten domain towards the silica-rich part of theternary diagram. Note also the significant expansion ofliquidus field of forsterite, and the retraction of the enstatiteand wollastonite fields. These features are in agreementwith previous phase diagrams; i.e.: (i) Shahid and Glasser(1971) for Na2O–CaO–SiO2, (ii) Schairer et al. (1954) for
Na2O–MgO–SiO2, (iii) Shahid and Glasser (1972) forNa2O–MgO–CaO–SiO2 at low MgO content. This1400 °C section in the quaternary system Na2O–CaO–MgO–SiO2 (Fig. 9b) has to be considered as a new typeof isothermal and iso-aNa2O (or iso-PNa) phase diagram(see below).
4. DISCUSSION
4.1. Na2O solubility in CMS silicate melts and its implication
on phase relationships
Comparing phase diagrams drawn from melt composi-tions prior to or after exposure to Na-bearing vapors(Fig. 9a and b) shows that sodium strongly affects the phaserelationships at high temperature in the Na2O–CaO–MgO–SiO2 quaternary system. Indeed, when CMS melts are ex-posed to a PNaNS2 = 1.25 � 10ÿ04 ± 1.20 � 10ÿ06 atm, at1400 °C, as in this study, three significant effects can be
Table 5
Final compositions (wt%) after equilibration at 1400 °C and Ni/NiO buffer with sodium sources of Na2O–2SiO2 composition.
Run Composition Phase Na2O MgO SiO2 CaO
ACMS9 CMS8 Gl 7.25 (0.14) 4.67 (0.08) 49.44 (0.30) 38.58 (0.20)
ACMS10 CMS9 Gl 10.98 (0.19) 8.81 (0.11) 52.18 (0.21) 28.00 (0.10)
ACMS10 CMS10 Gl 16.10 (0.25) 8.87 (0.13) 56.78 (0.17) 18.20 (0.07)
ACMS10 CMS12 Gl 10.24 (0.09) 11.96 (0.10) 50.70 (0.27) 27.08 (0.18)
ACMS10 CMS13 Gl 14.07 (0.15) 14.68 (0.09) 53.82 (0.26) 17.39 (0.09)
ACMS11 CMS3 Gl 17.33 (0.12) 21.93 (0.17) 56.07 (0.21) 4.63 (0.05)
ACMS11 CMS17 Gl 10.79 (0.18) 19.79 (0.22) 50.74 (0.25) 18.64 (0.03)
ACMS11 CMS18 Gl 14.53 (0.25) 20.92 (0.20) 53.17 (0.18) 11.33 (0.07)
ACMS11 CMS19 Gl 6.79 (0.37) 20.54 (0.82) 46.81 (0.77) 26.32 (0.40)
ACMS11 CMS20 Gl 9.80 (0.24) 22.67 (0.57) 48.77 (0.36) 18.73 (0.45)
ACMS21 CMS23 Gl 11.61 (0.20) 3.46 (0.05) 52.98 (0.17) 31.92 (0.05)
ACMS21 CMS24 Gl 15.37 (0.11) 3.83 (0.06) 57.24 (0.23) 23.53 (0.06)
ACMS21 CMS25 Gl 13.83 (0.08) 5.96 (0.14) 57.23 (0.17) 22.97 (0.07)
ACMS21 CMS26 Gl 17.39 (0.20) 14.42 (0.08) 56.76 (0.24) 11.39 (0.09)
ACMAS6 CMS11 Gl 7.11 (0.14) 13.35 (0.27) 44.22 (0.78) 35.23 (0.29)
ACMAS6 CMS15 Gl 5.77 (0.09) 17.68 (0.17) 43.10 (0.31) 33.41 (0.14)
ACMAS6 CMS27 Gl 7.10 (0.20) — 46.14 (0.22) 46.72 (0.17)
ACMAS8 CMS1 Gl 8.96 (0.30) 0.18 (0.02) 50.40 (0.16) 40.40 (0.15)
ACMAS14 CMS5 Gl 6.95 (0.62) 14.63 (0.50) 47.19 (0.45) 31.15 (0.20)
ACMAS14 CMS5 Mo 0.02 (0.01) 29.43 (0.34) 39.47 (0.48) 32.28 (0.34)
ACMAS14 CMS31 Gl 6.71 (0.03) 9.33 (0.26) 46.13 (1.14) 37.79 (0.83)
ACMAS14 CMS32 Gl 9.80 (0.20) 8.98 (0.20) 48.80 (0.39) 32.40 (0.13)
ACMAS14 CMS33 Gl 12.54 (0.28) 8.72 (0.22) 51.76 (0.25) 26.95 (0.17)
ACMAS15 CMS16 Gl 7.58 (0.15) 19.04 (0.22) 46.83 (0.38) 26.54 (0.18)
ACMAS16 CMS21 Gl 13.56 (0.25) 24.65 (0.12) 50.06 (0.30) 11.71 (0.04)
ACMAS16 CMS22 Gl 18.06 (0.21) — 57.80 (0.10) 24.08 (0.12)
ACMAS16 CMS28 Gl 19.23 (0.14) 25.18 (0.26) 54.90 (0.20) 0.42 (0.02)
ACMAS16 CMS28 Fo 0.02 (0.01) 58.14 (0.20) 43.67 (0.19) 0.03 (0.01)
ACMAS17 NCS3 Gl 21.12 (0.14) 0.16 (0.03) 59.64 (0.30) 18.99 (0.11)
ACMAS17 NCS4 Gl 23.53 (0.42) — 61.35 (1.28) 14.98 (0.08)
ACMAS17 NCS7 Gl 25.58 (0.25) — 65.24 (0.34) 8.96 (0.19)
ACMAS40 CMS35 Gl 16.62 (0.09) — 56.62 (0.27) 26.69 (0.11)
ACMAS41 CMS36 Gl 13.20 (0.12) 11.10 (0.19) 51.94 (0.11) 23.73 (0.22)
ACMAS41 CMS34 Gl 4.51 (0.12) 9.93 (0.13) 43.92 (0.22) 41.61 (0.17)
TEST1 NS2 Gl 30.12 (0.55) — 69.38 (0.25) —
TEST1 NS3.5 Gl 29.91 (0.60) — 69.38 (0.25) —
TEST1 NS1 Gl 29.85 (0.38) — 70.09 (0.60) —
Mo, monticellite; Fo, forsterite; Gl, glasses. Values in parentheses correspond to two standard deviations.
Sodium solubility in molten CMS system 617
Author's personal copy
distinguished. First, the molten domain increases signifi-cantly in the silica-rich part of the CMS system, with theassociated disappearance of the domains saturated by a sil-ica phase (cristobalite and tridymite), or by wollastonite ororthopyroxene. This efficient role of Na2O for lowering thefreezing point of minerals crystallizing from multicompo-nent melts can be related to the direct effect of sodium onthe lowering of both the aSiO2(melt) and cSiO2(melt) in theseisothermal experiments. Secondly, addition of Na causesthe liquidus fields of less polymerized minerals (forsterite)to expand relative to those of the more polymerized miner-als (Kushiro, 1975) like the low-Ca pyroxenes and the silicapolymorphs (Fig. 9a and b), by inhibition of the polymeri-zation of [SiO4]
4ÿ tetrahedra in the melt. Addition of Na byreducing the abundance of Si–O–Si linkages in the CMSmelt (as described by changes in cSiO2(melt)) causes impor-tant structural changes in the melt that in turn have a direct
control on the stability of silicate phases. Third, the liquiddomain shows a significant asymmetry towards the MgO–SiO2 binary suggesting that Na bearing MgO-rich composi-tions are more refractory than their calcic equivalents.
Petrologists have long used simple synthetic systems asuseful analogs for more complex natural magmas (Bowen,1928, 1945; Yoder and Tilley, 1962). Although it is under-stood that the alkalis can have a significant effect on thecompositional evolution of natural magmas, Na2O-bearingsystems are still poorly documented (Donaldson, 1979; Panand Longhi, 1989; Soulard et al., 1992). Here, we show thatour design can be used to obtain: (i) a new type ofisothermal iso-activity phase diagram useful for acquiringthermochemical data on complex silicate melts and (ii)experimental samples suited for disentangling composi-tional and thermal effect on crystal liquid equilibrium insodium bearing igneous systems (e.g., partition coefficients).
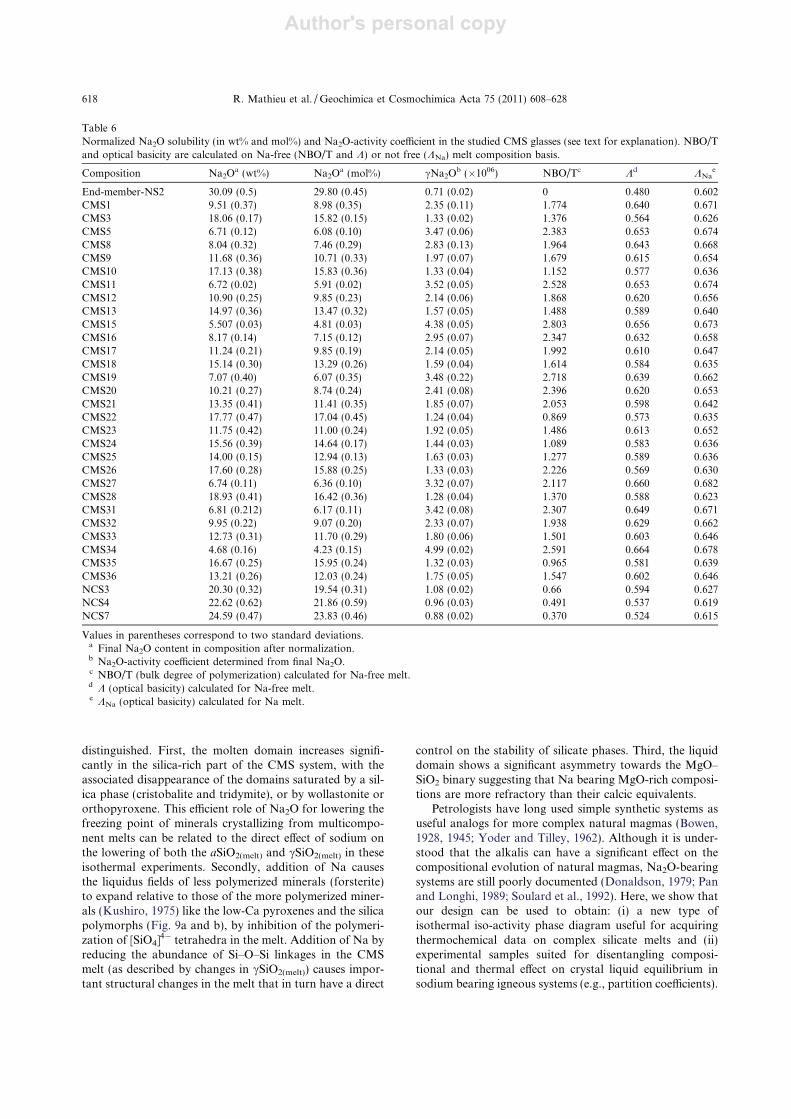
Table 6
Normalized Na2O solubility (in wt% and mol%) and Na2O-activity coefficient in the studied CMS glasses (see text for explanation). NBO/T
and optical basicity are calculated on Na-free (NBO/T and K) or not free (KNa) melt composition basis.
Composition Na2Oa (wt%) Na2O
a (mol%) cNa2Ob (�1006) NBO/Tc Kd KNa
e
End-member-NS2 30.09 (0.5) 29.80 (0.45) 0.71 (0.02) 0 0.480 0.602
CMS1 9.51 (0.37) 8.98 (0.35) 2.35 (0.11) 1.774 0.640 0.671
CMS3 18.06 (0.17) 15.82 (0.15) 1.33 (0.02) 1.376 0.564 0.626
CMS5 6.71 (0.12) 6.08 (0.10) 3.47 (0.06) 2.383 0.653 0.674
CMS8 8.04 (0.32) 7.46 (0.29) 2.83 (0.13) 1.964 0.643 0.668
CMS9 11.68 (0.36) 10.71 (0.33) 1.97 (0.07) 1.679 0.615 0.654
CMS10 17.13 (0.38) 15.83 (0.36) 1.33 (0.04) 1.152 0.577 0.636
CMS11 6.72 (0.02) 5.91 (0.02) 3.52 (0.05) 2.528 0.653 0.674
CMS12 10.90 (0.25) 9.85 (0.23) 2.14 (0.06) 1.868 0.620 0.656
CMS13 14.97 (0.36) 13.47 (0.32) 1.57 (0.05) 1.488 0.589 0.640
CMS15 5.507 (0.03) 4.81 (0.03) 4.38 (0.05) 2.803 0.656 0.673
CMS16 8.17 (0.14) 7.15 (0.12) 2.95 (0.07) 2.347 0.632 0.658
CMS17 11.24 (0.21) 9.85 (0.19) 2.14 (0.05) 1.992 0.610 0.647
CMS18 15.14 (0.30) 13.29 (0.26) 1.59 (0.04) 1.614 0.584 0.635
CMS19 7.07 (0.40) 6.07 (0.35) 3.48 (0.22) 2.718 0.639 0.662
CMS20 10.21 (0.27) 8.74 (0.24) 2.41 (0.08) 2.396 0.620 0.653
CMS21 13.35 (0.41) 11.41 (0.35) 1.85 (0.07) 2.053 0.598 0.642
CMS22 17.77 (0.47) 17.04 (0.45) 1.24 (0.04) 0.869 0.573 0.635
CMS23 11.75 (0.42) 11.00 (0.24) 1.92 (0.05) 1.486 0.613 0.652
CMS24 15.56 (0.39) 14.64 (0.17) 1.44 (0.03) 1.089 0.583 0.636
CMS25 14.00 (0.15) 12.94 (0.13) 1.63 (0.03) 1.277 0.589 0.636
CMS26 17.60 (0.28) 15.88 (0.25) 1.33 (0.03) 2.226 0.569 0.630
CMS27 6.74 (0.11) 6.36 (0.10) 3.32 (0.07) 2.117 0.660 0.682
CMS28 18.93 (0.41) 16.42 (0.36) 1.28 (0.04) 1.370 0.588 0.623
CMS31 6.81 (0.212) 6.17 (0.11) 3.42 (0.08) 2.307 0.649 0.671
CMS32 9.95 (0.22) 9.07 (0.20) 2.33 (0.07) 1.938 0.629 0.662
CMS33 12.73 (0.31) 11.70 (0.29) 1.80 (0.06) 1.501 0.603 0.646
CMS34 4.68 (0.16) 4.23 (0.15) 4.99 (0.02) 2.591 0.664 0.678
CMS35 16.67 (0.25) 15.95 (0.24) 1.32 (0.03) 0.965 0.581 0.639
CMS36 13.21 (0.26) 12.03 (0.24) 1.75 (0.05) 1.547 0.602 0.646
NCS3 20.30 (0.32) 19.54 (0.31) 1.08 (0.02) 0.66 0.594 0.627
NCS4 22.62 (0.62) 21.86 (0.59) 0.96 (0.03) 0.491 0.537 0.619
NCS7 24.59 (0.47) 23.83 (0.46) 0.88 (0.02) 0.370 0.524 0.615
Values in parentheses correspond to two standard deviations.a Final Na2O content in composition after normalization.b Na2O-activity coefficient determined from final Na2O.c NBO/T (bulk degree of polymerization) calculated for Na-free melt.dK (optical basicity) calculated for Na-free melt.
eKNa (optical basicity) calculated for Na melt.
618 R. Mathieu et al. /Geochimica et Cosmochimica Acta 75 (2011) 608–628

Author's personal copy
4.2. Influence of melt composition on Na2O solubility
The large systematic variations in Na2O solubility ob-served in our experiments provide valuable constraints onthe interplay between melt composition and melt structurein CMS liquid. The strong positive correlation between theNa2O solubility and the silica content of the melt (Fig. 7)suggest that the degree of polymerization of melts is oneof the key parameters controlling the Na2O solubility inCMS melt, with increasing solubility associated with an in-crease of melt polymerization. This agrees with the greateraffinity of alkalis for silica-rich melts shown by studies ofsilicate liquid immiscibility (Watson, 1976; Hess and Wood,1980; Ryerson and Hess, 1980). Similarly, experimentalstudies on Na2O solubility (O’Neill, 2005; Borisov, 2008),K2O solubility (Karsrud, 1984; Amatatsu et al., 1985;Georges et al., 2000; Borisov, 2008, 2009) or Rb2O solubil-
ity (Borisov, 2009) revealed the same affinity of alkalis forsilica-rich melts. Furthermore, Knudsen cell measurements(Mueller et al., 2004; Willenborg et al., 2006) have alsoshown that an addition of SiO2 is associated with a decreaseof alkali oxide activity in the slag.
A qualitative idea of the influence of Na and other ele-ments on Si-linkages in otherwise CMS melts can be ob-tained using a bond species notation. Consider first:
1=2Si–O–Siþ 1=2M–O–M ¼ M–O–Si ð16Þ
Si–O–SiþN–O ¼ Si–O–N–O–Si ð17Þ
where M refers to monovalent cations (Na, K, . . .) and N todivalent cations (Ca, Mg, . . .). Increasing M or N in themelt causes depolymerization (NBO increases), shiftingreactions (16) and (17) to the right-hand side. Similarly,the prominent decrease in the viscosity of silicate melts
Fig. 7. Na2O solubility (in mol%) in the CaO–MgO–SiO2 system at 1400 °C, PNa = 1.25 � 10ÿ4 atm, aNa2O = 2.10 � 10ÿ07 and
fO2 = 2.11 � 10ÿ6 atm. Filled circles correspond to the experimental Na2O-free CMS glass compositions. Opened circles correspond to the
experimental Na2O-free CMS glass compositions in equilibrium with forsterite and monticellite (see Table 5), and their corresponding starting
compositions (as shown by the arrows). The dotted line represents the 1400 °C liquidus curve. Solid lines correspond to the iso-Na2O
solubility curves interpolated from our data set (Tables 5 and 6). Dashed lines represent the degree of bulk polymerization of the Na2O-free
CMS melt (i.e., NBO/T, see Mysen and Richet, 2005). NBO/T = 2 corresponds for instance to the metasilicate line composition.
Sodium solubility in molten CMS system 619
Author's personal copy
due to sodium addition (Mysen and Richet, 2005) suggeststhat, low field-strength cations, such as Na+, are preferen-tially incorporated in molten silicate according to (16).Addition of Na2O thus produces an increase in the fractionof non-bridging oxygen (NBO, Na–O–Si) and a correlativedecrease in the abundance of Si–O–Si linkages, causingreductions in the silica activity coefficient (Kushiro, 1975;Hirschmann et al., 1998). Using the concept of solute (Naor Na2O) and solvent (CMS melt), one can see that thecombination of these homogeneous equilibria provides arationale for the generally positive dependence of Na solu-bility on the bulk polymerization of the CMS melt, i.e., thehigher the BO (bridging oxygen) or Si–O–Si fraction in theCMS melt, the higher the Na2O solubility. Melts enrichedin silica in the CMS system will have higher Na2O solubilitythan basic melts enriched in CaO and MgO. This relation-ship is illustrated in a Na2O solubility versus NBO/T plot(Fig. 10), in which the good linear correlation clearly indi-
cates the greater affinity of Na for the more polymerizedand silica-rich melt in the CMS system.
Because of the specific effects of Ca and Mg on Na2Osolubility in CMS melts, a more complex model than thesimple bulk polymerization model is needed. As demon-strated by several authors, thermodynamic and structuralproperties of silicate liquids can be thought of as arisingfrom acid–base equilibria (Duffy and Ingram, 1971;Beckett, 2002; Fraser, 2005; Moretti, 2005). Consideringthat an acid accepts electrons and a base gives them, Caand Mg network-modifying cations in the CMS systemare electron donors (i.e., bases) and network-forming cat-ions like Si accept these electrons (i.e., acid). Duffy and In-gram (1971) introduced the concept of optical basicity (K)to take into account such acid–base interactions. Interest-ingly, by taking into the acido-basic properties of eachcation in the melts, i.e., the difference in Pauling electroneg-ativities, the optical basicity is a more powerful tool than a
Fig. 8. Sodium oxide activity coefficients (cNa2O) in the CaO–MgO–SiO2 system at 1400 °C, PNa = 1.25 � 10ÿ4 atm, aNa2O = 2.10 � 10ÿ07
and fO2 = 2.11 � 10ÿ6 atm. Filled circles correspond to the experimental Na2O-free CMS glass compositions. Opened circles correspond to
the experimental Na2O-free CMS glass compositions in equilibrium with forsterite and monticellite, and their corresponding starting
compositions (as shown by the arrows). Solid lines correspond to the Na2O-activity coefficients curves. Dashed lines represent the degree of
bulk polymerization of the Na-free melt (i.e., Mysen and Richet, 2005). See Section 4 in the text.
620 R. Mathieu et al. /Geochimica et Cosmochimica Acta 75 (2011) 608–628

Author's personal copy
Fig. 9. (a) Isothermal section for the CMS system (i.e., Na-free), at 1400 °C and P = 1 atm showing a narrow liquid domain. See text for
detailed comments. (b) Isothermal section at 1400 °C under iso-Na partial pressure (PNa = 1.25 � 10ÿ4 atm), iso-sodium oxide activity
(aNa2O = 2.10 � 10ÿ07) and at fixed fO2 = 2.11 � 10ÿ6 atm. Comparison with 1400 °C isothermal section (a) shows the tremendous changes
in the phase relationship due to the imposed sodium partial pressure. Qz, quartz; Wo, wollastonite; Ra, rankinite; Ak, ankermanite; La,
larnite; C3S, 3CaO–SiO2; Me, merwinite; Mo, monticellite; Fo, forsterite; En, enstatite; Liq, liquid. See text for further comments.
Sodium solubility in molten CMS system 621
Author's personal copy
simple bulk polymerization parameter, in which Ca isequivalent to Mg, Si to Al and so on. The optical basicity(K) is calculated using the following equation (Duffy andIngram, 1971):
K¼ðxNa2O�1:15þ xCaO�1:00þ xMgO�0:78
þ2�SiO2 �0:48Þ=ðxNa2Oþ xCaOþ xMgOþ2�xSiO2Þ
ð18Þ
where K: optical basicity of the silicate melt and xi: molefraction of oxide “i” in the melt.
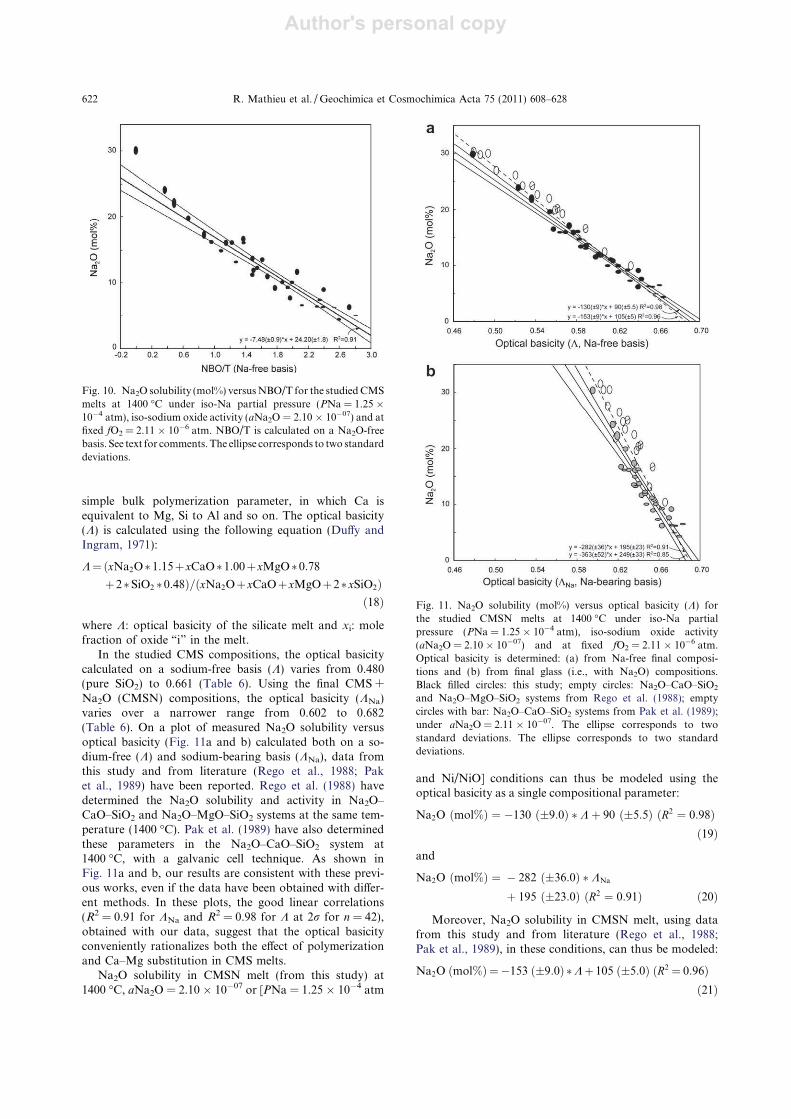
In the studied CMS compositions, the optical basicitycalculated on a sodium-free basis (K) varies from 0.480(pure SiO2) to 0.661 (Table 6). Using the final CMS +Na2O (CMSN) compositions, the optical basicity (KNa)varies over a narrower range from 0.602 to 0.682(Table 6). On a plot of measured Na2O solubility versusoptical basicity (Fig. 11a and b) calculated both on a so-dium-free (K) and sodium-bearing basis (KNa), data fromthis study and from literature (Rego et al., 1988; Paket al., 1989) have been reported. Rego et al. (1988) havedetermined the Na2O solubility and activity in Na2O–CaO–SiO2 and Na2O–MgO–SiO2 systems at the same tem-perature (1400 °C). Pak et al. (1989) have also determinedthese parameters in the Na2O–CaO–SiO2 system at1400 °C, with a galvanic cell technique. As shown inFig. 11a and b, our results are consistent with these previ-ous works, even if the data have been obtained with differ-ent methods. In these plots, the good linear correlations(R2 = 0.91 for KNa and R2 = 0.98 for K at 2r for n = 42),obtained with our data, suggest that the optical basicityconveniently rationalizes both the effect of polymerizationand Ca–Mg substitution in CMS melts.
Na2O solubility in CMSN melt (from this study) at1400 °C, aNa2O = 2.10 � 10ÿ07 or [PNa = 1.25 � 10ÿ4 atm
and Ni/NiO] conditions can thus be modeled using theoptical basicity as a single compositional parameter:
Na2O ðmol%Þ ¼ ÿ130 ð�9:0Þ � Kþ 90 ð�5:5Þ ðR2 ¼ 0:98Þ
ð19Þ
and
Na2O ðmol%Þ ¼ ÿ 282 ð�36:0Þ � KNa
þ 195 ð�23:0Þ ðR2 ¼ 0:91Þ ð20Þ
Moreover, Na2O solubility in CMSN melt, using datafrom this study and from literature (Rego et al., 1988;Pak et al., 1989), in these conditions, can thus be modeled:
Na2O ðmol%Þ ¼ÿ153 ð�9:0Þ �Kþ 105 ð�5:0Þ ðR2 ¼ 0:96Þ
ð21Þ
Fig. 10. Na2O solubility (mol%) versusNBO/T for the studiedCMS
melts at 1400 °C under iso-Na partial pressure (PNa = 1.25 �
10ÿ4 atm), iso-sodium oxide activity (aNa2O = 2.10 � 10ÿ07) and at
fixed fO2 = 2.11 � 10ÿ6 atm. NBO/T is calculated on a Na2O-free
basis. See text for comments.The ellipse corresponds to two standard
deviations.
Fig. 11. Na2O solubility (mol%) versus optical basicity (K) for
the studied CMSN melts at 1400 °C under iso-Na partial
pressure (PNa = 1.25 � 10ÿ4 atm), iso-sodium oxide activity
(aNa2O = 2.10 � 10ÿ07) and at fixed fO2 = 2.11 � 10ÿ6 atm.
Optical basicity is determined: (a) from Na-free final composi-
tions and (b) from final glass (i.e., with Na2O) compositions.
Black filled circles: this study; empty circles: Na2O–CaO–SiO2
and Na2O–MgO–SiO2 systems from Rego et al. (1988); empty
circles with bar: Na2O–CaO–SiO2 systems from Pak et al. (1989);
under aNa2O = 2.11 � 10ÿ07. The ellipse corresponds to two
standard deviations. The ellipse corresponds to two standard
deviations.
622 R. Mathieu et al. /Geochimica et Cosmochimica Acta 75 (2011) 608–628

Author's personal copy
and
Na2O ðmol%Þ ¼ ÿ 363 ð�52Þ � KNa
þ 249 ð�33:0Þ ðR2 ¼ 0:85Þ ð22Þ
It is of note, however, that Na2O solubility calculated ona CMS sodium-free basis (Eqs. (19) and (21)) reproducesthe experimental data (Fig. 11a) better than the model usingthe final CMSN glass compositions (Eqs. (20) and (22),Fig. 11b) suggesting that the “solvent” of Na or Na2Oatoms is more likely a Na-free local environment than aNa-bearing one (see below).
Similar linear relationships have been already docu-mented in the literature for Na2O and/or K2O solubility(Amatatsu et al., 1985; Bergman, 1989a,b; Gaskell, 1989;Yang et al., 2000), but these studies consider much more re-stricted ranges of compositions. More generally, such linearfits exist for other physicochemical melt properties, such asMgO solubility (Bergman, 1989a,b; Jung et al., 2009), sul-fide/phosphorus capacities (Sosinsky and Sommerville,1986; Young et al., 1992; Slag Atlas, 1995), and viscosity(Choudhury et al., 2006). Beckett (2002) shows that formost CMAS liquids at 1600 °C, ln(cCaO) increases linearlywith optical basicity. Finally, Duffy and Ingram (1976) andBaucke and Duffy (1993), among others, have demon-strated that the ratio of reduced to oxidized cations of amultivalent element (e.g., Fe or Cr) tends to decrease withincreasing optical basicity.
For the same conditions (1400 °C, PNa = 1.25 �10ÿ4 atm or aNa2O = 2.10 � 10ÿ07 and Ni/NiO), a goodcorrelation also exists between log(cNa2O) obtained in thisstudy and from the literature (Rego et al., 1988; Pak et al.,1989), and the optical basicity of compositions (Fig. 12)and is expressed by the following exponential relation:
logðcNa2OÞ ¼ 0:038 � exp½5:30 � K� ÿ 6:68 ðR2 ¼ 0:96Þ
ð23Þ
and
logðcNa2OÞ ¼ 0:0007 � exp½11:07 � KNa� ÿ 6:68 ðR2 ¼ 0:92Þ
ð24Þ
The activity coefficient of Na2O confirms the non-idealbehavior of the Na2O solubility in CMS melts; the non-lin-earity of this relationship suggesting a complex influence ofliquid composition on Na2O-activity coefficient (see alsoRego et al., 1988; Pak et al., 1989; Allendorf and Spear,2001; Lee and Stebbins, 2009).
In silicate melts, the strong Na–Si interaction can be as-sessed in the light of the anti-correlation between the Na2O-activity coefficient and the silica content of the melt. Thisextremely large negative deviation from Raoult’s law fordissolution of sodium in CMS silicate melts has alreadybeen observed in alkali-silicate binary or ternary systems(Hirschmann et al., 1998; Allendorf and Spear, 2001;Willenborg et al., 2006). Other modifying-cations such asCa2+ or Mg2+ (Beckett, 2002) also show a non-ideal behav-ior in silicate melts. Beckett (2002) has computed cMgOand cCaO (relative to a solid oxide standard state) in sev-eral silicate melts. At equivalent optical basicity and tem-perature, log(cMgO) is 4–5 orders of magnitude higherthan log(cCaO). To a first approximation, log(cCaO) is5–6 orders of magnitude higher than log(cNa2O) (thisstudy; Beckett, 2002), suggesting that silicon complexespreferentially in melts according the following inequality:Na � Ca > Mg.
4.3. Implication for melt structure
In the same way that a shear stress applied to molten sil-icates provides information on the ease with which atomicbonds may be broken, and the link with specific melt struc-tural configurations (Mysen and Richet, 2005), Na2O solu-bility in the molten CMS system (at fixed PNa or aNa2O)provides indications on how the entry of Na2O atoms(Eq. (4)) affects the structure and properties of the CMShost melts, and can be used as an in situ probe of meltstructure.
From a structural point of view, melt polymerizationcan be described by the Qn nomenclature for silicate net-works (Mysen et al., 1980; Schramm et al., 1984), whereQ denotes the tetrahedral symmetry of the SiO4 unit andn the number of bridging oxygens per Q unit to neighboringsilicate tetrahedra. Several spectroscopic studies (e.g.,Mysen et al., 1980; Maekawa et al., 1991; Jones et al.,2001; Malfait et al., 2008) have shown a preponderanceof Q4 species in SiO2-rich liquids. Furthermore, the moreopen structure of acidic melts (Watson, 1976) is wellknown, correlated with lower density for silica-rich liquids(Lange, 1997). Therefore, in a similar way to rare gases(Nuccio and Paonita, 2000), Na2O solubility is highly sen-sitive to a steric effect, in which Na atoms seem to have ahigh preference for the free space between interconnectedtetrahedra as the number of network-forming cations (i.e.,Si) increase in the silicate melt lattice. On the other hand,
Fig. 12. Log(cNa2O) versus optical basicity (K) for the studied
CMSN melts at 1400 °C under iso-Na partial pressure
(PNa = 1.25 � 10ÿ4 atm), iso-sodium oxide activity (aNa2-O = 2.10 � 10ÿ07) and at fixed fO2 = 2.11 � 10ÿ6 atm. Optical
basicity is determined from Na-free final compositions. Black filled
circles: this study; empty circles: Na2O–CaO–SiO2 and Na2O–
MgO–SiO2 systems from Rego et al. (1988); empty circles with bar:
Na2O–CaO–SiO2 systems from Pak et al. (1989); under aNa2-O = 2.11 � 10ÿ07. The ellipse corresponds to two standard devia-
tions. The ellipse corresponds to two standard deviations.
Sodium solubility in molten CMS system 623

Author's personal copy
in contrast to rare gases or nitrogen, which dissolve ideally,having little impact on the melt structure (Kesson andHolloway, 1974; Lux, 1987; Nuccio and Paonita, 2000;Libourel et al., 2003; Marrocchi and Toplis, 2005), Nainteracts with the structure. Thus it seems that the moreopen structure of silica-rich melt, associated with the highdensity of Si–O–Si linkages of Q4 species, strongly favorsan increase of Na2O solubility. Indeed, at constant bulkNBO/T, we have seen that the substitution of CaO byMgO causes a significant increase in the Na2O solubilityin CMS melt (Fig. 7). Mg2+ having a higher electrostaticfield than Ca2+, several spectroscopic studies (Murdochet al., 1985; Maekawa et al., 1991; Libourel et al., 1992;Jones et al., 2001; Schneider et al., 2003; Lin et al., 2007;Kelsey et al., 2008) have shown that the stoichiometric sub-stitution of Ca by Mg leads to an increase in the proportionof the different structural units in the melt, notably siteswith high density of Si–O–Si bonds, according to a dispro-portionation reaction of the type:
2Q3 ¼ Q2 þQ4 ð25Þ
Therefore, the significant increase of Na2O solubility inCMS melts with increasing Mg-content at fixed polymeriza-tion can be thus related to an increase in the fraction ofhighly polymerized sites (Q4) caused by such a kind of dis-proportionation reaction. NMR and Raman spectrometrymeasurements (Jones et al., 2001; Schneider et al., 2003;Lin et al., 2007) on Na2O–CaO–SiO2 (NCS) and Na2O–MgO–SiO2 (NMS) systems also show that for equivalent li-quid (in terms of Ca or Mg molar contents) the Mg-liquidsare more enriched in Q4 species than Ca-liquids, even in thepresence of Na. For example, at equivalent Na2O-concen-tration and same bulk polymerization (NBO/T = 1), theproportion of Q4 is evaluated between 0% and 6% inNCS glasses (Jones et al., 2001; Schneider et al., 2003) whilein NMS glasses, the proportion of Q4 species is up to 30–40% (Lin et al., 2007). This relation between Na2O solubil-ity and an increase in local disorder in Mg-rich melts (i.e.,increase of Q2 and Q4 species; Eq. (25)) is also in agreementwith configurational entropy data (Sconf) obtained onCaSiO3, MgSiO3 and CaMgSi2O6 glass compositions(Neuville and Richet, 1991; Richet et al., 1993) indicatingthat the Sconf in Mg-rich glasses is higher than in Ca-coun-terparts. Finally, these results are also consistent with theSiO2 iso-activity contours in CaO–MgO–SiO2 system at1873 K (Rein and Chipman 1965; Morita et al., 2000)showing that substitution of Ca by Mg increases activityof SiO2 in silicate melts, possibly in response to the coordi-nation number of Mg that may be significantly less thanthat of Ca (Brown et al., 1995; Kroeker and Stebbins,2000; Allwardt and Stebbins, 2004; Shimoda et al., 2007,2008).
Interestingly, comparison with physicochemical proper-ties suggest interestingly, that the viscosity of CMS melts(Giordano et al., 2008) and their density (Lange andCarmichael, 1987; Lange, 1997) show similar compositionaldependences, i.e., magnitudes of all three of these propertiesare correlated with SiO2 content and CaO/MgO ratio of themelts. Using the concept of solute (Na) and solvent (CMS
melt), it is possible that the non-ideal behavior of Na solu-bility is intrinsically linked to the Qn species distribution inthe CMS melts. To a first approximation, CMS + Na2Omelts can be modeled by two end-members, i.e., a polymer-ized end-member favoring Na2O solubility and a depoly-merized end-member rejecting the sodium (see also Fig. 11).
These data are consistent with the interpretation ofGreaves et al. (1981) who proposed that a silicate meltcan be modeled as two continuous interpenetrating net-works, one presenting a high connectivity between theframework cations, and another enriched in network-modifying cations (modified random-network (MRN)models; Greaves et al., 1981; Gaskell et al., 1991). In thesemodels, the non-bridging oxygens (NBO) ensure the linkbetween the two networks, and the Na atoms are preferen-tially bound to the NBO. If the Na concentration is suffi-cient, Na atoms organize themselves to form channelsthrough the most depolymerized network. Recently Leeand Stebbins (2003, 2009) with NMR studies and Jundet al. (2001) with molecular dynamic simulations in binarysodium silicate glasses challenged this view by placing somelimits on the extent of segregation of alkali channels fromsilica-enriched regions as suggested by MRN models. Thesestudies suggest that Na+ can sample various oxygen envi-ronments such as Na surrounded by NBO and BO depend-ing on the composition.
Our results obtained on the more complex CMS systemshow that Na2O entering the melt breaks preferentially theSi–O–Si linkages of Q4 species (Eq. (25)). However, ourinterpretation does not agree with MRN types of modelsfor the Na behavior. If Na2O interacts preferentially withthe BO of Q4 species, Na atoms entering the melt cannotbe located in the “ion channels” with the other modifier cat-ions (Ca and Mg) but instead have to be positioned in thepolymerized sub lattice. If correct, this means that additionof sodium to CMS melt will favor the depolymerization ofthe polymerized network (Q4) by the formation of Na-richion channels, probably different from the existing Ca–Mg-rich ones. Such high affinity of Na2O for highly polymer-ized sites as indicated by preferential Na–NBO interactionsin Q4 sites may be a plausible explanation for the significantnon-ideal behavior of Na in CMS melts. Similarly, the exis-tence of sub-network rich in Na–O–Si bonds is also consis-tent with the high diffusivity of Na in silicate liquids and thelower viscosity of Na melts compared to their non-sodicequivalents (Brady, 1995).
Finally, it is interesting to note that Na2O solubility mea-sured for the eutectic diopside–anorthite (EDiAn) alumina-bearing composition (Na2OEDiAn = 12.44 ± 0.27 wt%;n = 16; Tables 2 and 3) is within uncertainty the same asthat predicted by the present CMS model if the EDiAncomposition is recalculated on an alumina-free basis(K = 0.599; Na2OEDiAn-CMS = 12.13 wt%; Eq. (20)). Thismeans that addition of around 10 mol% of Al2O3 to aCMS melt do not significantly affect the solubility ofNa2O. In agreement with the recent studies of O’Neill(2005), Grant and Wood (2008) and Borisov (2009), thisfinding clearly suggests that more work needs to be doneto evaluate the role of Al on Na2O solubility.
624 R. Mathieu et al. /Geochimica et Cosmochimica Acta 75 (2011) 608–628

Author's personal copy
5. CONCLUSIONS
The proposed thermochemical cell method allows to im-pose a sodium-metal oxide activity in molten silicates andto determine the sodium solubility up to 1400 °C in com-plex silicate melts, and their Na2O-activity coefficients:cNa2O(melt). The method consists in imposing an alkali me-tal vapor pressure in a closed system by Na(g) evaporationfrom Na2O–2SiO2 melt and equilibrating this vapor withmolten silicates samples.
Using this apparatus, we have documented Na2O solubil-ity in CaO–MgO–SiO2 molten silicates over a large range ofcompositions, i.e., 0 < CaOandMgO < 40; 40 < SiO2 < 100;in wt%) at 1400 °C, aNa2O = 2.10 � 10ÿ07 or [PNa =1.25 � 10ÿ4 atm] and Ni/NiO. Our results show that Na2Osolubility is strongly sensitive to silica content of the meltand, to a lesser extent, the relative amounts of CaO andMgO. The higher the SiO2 content and the MgO/CaO ratio,the higher the Na2O solubility in the CMSmelts. Despite thelarge range of tested melt compositions, Na2O solubility isconveniently modeled by a linear function of the optical ba-sicity (K) calculated on aNa-free basismelt composition. Thedetermined Na2O-activity coefficients cNa2O(sample) indicatea strong non-ideal behavior of Na2O solubility in the studiedCMS melts ranging from 7 � 10ÿ7 to 5 � 10ÿ6.
A general feature that emerges from the above results isthe strong link between the Na2O solubility and the meltcomposition in the CaO–MgO–SiO2 system. The natureof connectivity among framework cations and non-networkcations in CMS molten silicates (including Qn species distri-bution) is the key factor that affects the Na2O solubility,suggesting that this solubility in CMS melts is above allcontrolled by entropic effects. Our results show that themore opened structure of silica-rich melts, associated witha high density of Si–O–Si linkages of Q4 species, stronglyfavors an increase of Na2O solubility. In a similar manner,the significant increase of Na2O solubility in CMS meltswith Mg-content at fixed polymerization is also related tothe increase in fraction of highly polymerized sites (Q4)caused by the substitution of Ca by the higher electrostaticfield of Mg. Such high affinity of Na2O for highly polymer-ized sites as indicated by preferential Na–NBO interactionsin Q4 sites may be a plausible explanation for the significantnon-ideal behavior of Na in CMS melts.
Finally, addition of Na by reducing the abundance of Si–O–Si linkages in the CMS melt (as described by changes incSiO2(melt)) causes important changes in the melt that in turnhave a direct control on the stability of silicate phases. Priorto any application to natural systems or to model physicaland chemical properties of silicate melts of industrial andgeological importance (ceramics, steel-making slags, basicto acidicmagmas, . . .), morework is needed to provide struc-tural information on the nature of the interactions betweenNa atoms and the CMS (±Na2O) silicate lattice and to eval-uate the effect of Al2O3 on tNa2O solubility.
ACKNOWLEDGMENTS
The authors would like particularly to thank F. Faure and H.
Khedim for their pertinent advice. We would also like to thank
J. Ravaux and S. Mathieu for technical assistance with electron
microprobe at the Service d’Analyse of the Universite Henri Poin-
care, Nancy; L. Marin and collaborators for AAS measurements at
SARM (CRPG-CNRS), and A. Pisch for data from FactSageÒ.
This work was financially supported by the ANR grant: ActiMelt
Project No. BLAN06-3_134633. We thank M.J. Beckett, A. Bori-
sov and Associate Editor M. Toplis for constructive comments that
improve the quality of the manuscript. This is CRPG Contribution
No. 2083.
REFERENCES
Abdelouhab S. (2005) Determination de Grandeurs Physico-
Chimiques dans les Verres Fondus—Relation avec le Com-
portement en Corrosion du Chrome et d’Alliages Chromine-
Formeurs. Ph.D. thesis, Universite Henri Poincare, Nancy,
France.
Abdelouhab S., Podor R., Rapin C., Toplis M. J., Berthod P. and
Vilasi M. (2008) Determination of Na2O activity in silicate
melts by EMF measurements. J. Non-Cryst. Solids 354(26),
3001–3011.
Allendorf M. D. and Spear K. E. (2001) Thermodynamic analysis
of silica refractory corrosion in glass-melting furnaces. J.
Electrochem. Soc. 148(2), B59–B67.
Allwardt J. R. and Stebbins J. F. (2004) Ca–Mg and K–Mg mixing
around non-bridging O atoms in silicate glasses: an investiga-
tion using 17O MAS and 3QMAS NMR. Am. Mineral. 89(5–6),
777–784.
Amatatsu M., Stuts V. and Gudenau H. W. (1985) Evaporation
and absorption rate of potassium through blast-furnace slag.
Trans. ISIJ 25, 949–952.
Barin I. (1989) Thermochemical Data of Pure Substances. VCH
Verlags Gesellschaft, Weinheim.
Baucke F. G. K. and Duffy J. A. (1993) Redox reactions between
cations of different polyvalent elements in glass melts: an optical
basicity study. Phys. Chem. Glasses 34, 158–163.
Beckett J. R. (2002) Role of basicity and tetrahedral speciation in
controlling the thermodynamic properties of silicate liquids:
Part 1. The system CaO–MgO–Al2O3–SiO2. Geochim. Cosmo-
chim. Acta 66(1), 93–107.
Bergman A. (1989a) New model on K2O solubility in blast-furnace
slags. Steel Res. 60(9), 383–386.
Bergman A. (1989b) Some aspects on MgO solubility in complex
slags. Steel Res. 60(5), 191–195.
Borisov A. (2008) Experimental investigation of K and Na
partitioning between miscible liquids. Petrology 16(6), 552–564.
Borisov A. (2009) Influence of SiO2 and Al2O3 on the activity
coefficients of alkalis in melts: an experimental study. Petrology
17(6), 579–590.
Borisov A., Lahaye Y. and Palme H. (2006) The effect of sodium
on the solubilities of metals in silicate melts. Am. Mineral. 91(5–
6), 762–771.
Borisov A., Pack A., Kropf A. and Palme H. (2008) Partitioning of
Na between olivine and melt: an experimental study with
application to the formation of meteoritic Na2O-rich chondrule
glass and refractory forsterite grains. Geochim. Cosmochim.
Acta 72(22), 5558–5573.
Bowen N. L. (1928) The Evolution of Igneous Rocks. Princeton
University Press, Princeton, New Jersey.
Bowen N. L. (1945) Phase equilibria bearing on the origin and
differentiation of alkaline rocks. Am. J. Sci. 243(A), 75–89.
Brady J. B. (1995) Diffusion Data for silicate minerals, glasses, and
liquids; Mineral Physics and Crystallography, a Handbook of
Physical Constants. AGU Reference Shelf 2, 269–290.
Sodium solubility in molten CMS system 625

Author's personal copy
Brown, Jr., G. E., Farges F. and Calas G. (1995) X-ray scattering
and X-ray spectroscopy studies of silicate melts. In Structure,
Dynamics and Properties of Silicate Melts (eds. J. F. Stebbins, P.
F. McMillan and D. B. Dingwell). Mineralogical Society of
America, Washington, DC, pp. 317–410.
Charles R. J. (1967) Activities in Li2O–, Na2O–, K2O–SiO2
solutions. J. Am. Chem. Soc. 50(12), 631–641.
Choudhury P., Pal S. K. and Ray H. S. (2006) On the prediction of
viscosity of glasses from optical basicity. J. Appl. Phys. 100,
113502-1–113502-5.
Donaldson C. H. (1979) Composition changes in basalt melt
contained in a wire loop of Pt80Rh20: effects of temperature,
time, and oxygen fugacity. Mineral. Mag. 43, 115–119.
Duffy J. A. and Ingram M. D. (1971) Establishment of an optical
scale for Lewis basicity in inorganic oxyacids, molten salts and
glasses. J. Am. Chem. Soc. 93(24), 6448–6454.
Duffy J. A. and Ingram M. D. (1976) An interpretation of glass
chemistry in terms of the optical basicity concept. J. Non-Cryst.
Solids 21, 373–410.
Fraser D. G. (2005) Acid–base properties and structure: towards a
structural model for predicting the thermodynamic properties
of silicate melts. Ann. Geophys. 48(4–5), 549–559.
Gaskell D. R. (1989) Optical basicity and the thermodynamic
properties of slags. Metall. Trans. B 20(1), 113–118.
Gaskell P. H., Eckersley M. C., Barnes A. C. and Chieux P. (1991)
Medium-range order in the cation distribution of a calcium
silicate glass. Nature 350, 675–677.
Gaye H., Lehmann J., Rocabois P. and Ruby-Meyer F. (2001)
Computational thermodynamics and slag modelling applied to
stell elaboration. Steel Res. 72(11–12), 446–451.
Georges P., Libourel G. and Deloule E. (2000) Experimental
constraints on alkali condensation in chondrule formation.
Meteorit. Planet. Sci. 35(6), 1183–1188.
Ghiorso M. S. and Sack R. O. (1995) Chemical mass-transfer in
magmatic processes. A revised and internally consistent ther-
modynamic model for the interpolation and extrapolation of
liquid–solid equilibria in magmatic systems at elevated-temper-
atures and pressures. Contrib. Mineral. Petrol. 119, 197–212.
Giordano D., Russell J. K. and Dingwell D. B. (2008) Viscosity of
magmatic liquids: a model. Earth Planet. Sci. Lett. 271, 123–
134.
Grant K. J. and Wood B. J. (2008) Alkali activities in silicate melt.
Geochim. Cosmochim. Acta 72(12, Supp. 1), A323.
Grant K. J. and Wood B. J. (2010) Experimental study of the
incorporation of Li, Sc, Al and other trace elements into
olivine. Geochim. Cosmochim. Acta 74, 2412–2428.
Greaves G. N., Fontaine A., Lagarde P., Raoux D. and Gurman S.
J. (1981) Local structure of silicate glasses. Nature 293(5834),
611–616.
Hess P. C. and Wood M. I. (1980) Aluminium coordination in
metaaluminous and peralkaline silicate melts. Contrib. Mineral.
Petrol. 81, 103–112.
Hewins R. H. (1991) Retention of sodium during chondrule
melting. Geochim. Cosmochim. Acta 55(4), 935–942.
Hewins R. H., Connolly Jr., H. C., Logfren G. E. and Libourel G.
(2005) Experimental constraints on chondrule formation. In
Chondrites and the Protoplanetary Disk, vol. 341 (eds. A. N.
Krot, D. Scott and B. Reipurth). ASP Conference Series, pp.
286–316.
Hirschmann M. M., Baker M. B. and Stolper E. M. (1998) The
effect of alkalis on the silica content of mantle-derived melts.
Geochim. Cosmochim. Acta 62, 883–902.
Ivanov O., Savov L. and Janke D. (2004) Experimental studies of
the alkali behaviour in blast furnace type slags. Steel Res. Int.
75, 442–448.
Jones A. R., Winter R., Greaves G. N. and Smith I. H. (2001) MAS
NMR study of soda-lime-silicate glasses with variable degree of
polymerisation. J. Non-Cryst. Solids 293–295(1), 87–92.
Jund P., Kob W. and Jullien R. (2001) Channel diffusion of sodium
in a silicate glass. Phys. Rev. B 64, 4303–4308.
Jung S. M., Rhee C. H. and Min D. J. (2009) Solubility of MgO in
CaO-based slags. In International Conference on Molten Slags
and Fluxes, Molten2009, Chili, Santiago, pp. 133–142.
Karsrud K. (1984) Alkali capacities of synthetic blast furnace slags
at 1500 °C. Scand. J. Metall. 13, 98–106.
Kawahara T. (1984) Etude experimentale de l’activite de Na2O
dans le systeme Na2O–SiO2. IRSID. PCM.84-RP.209, p. 22.
Kelsey K. E., Allwardt J. R. and Stebbins J. F. (2008) Ca–Mg
mixing in aluminosilicate glasses: an investigation using 17O
MAS and 3QMAS and 27Al MAS NMR. J. Non-Cryst. Solids
354, 4644–4653.
Kesson S. E. and Holloway J. R. (1974) The generation of N2–
CO2–H2O fluids for use in hydrothermal experimentation: II.
Melting of albite in a multispecies fluid. Am. Mineral. 59(5–6),
598–603.
Khedim H., Podor R., Rapin C. and Vilasi M. (2008) Redox-
control solubility of chromium oxide in soda-silicate melts. J.
Am. Chem. Soc. 91(11), 3571–3579.
Khedim H., Katrina T., Podor R., Panteix P. J., Rapin C. and
Vilasi M. (2009) Solubility of Cr2O3 and speciation of
chromium in soda-lime-silicate melts. J. Am. Chem. Soc.
93(5), 1347–1354.
KimW. S., Cho D. H. and Lim S. K. (2004) The activity of sodium
oxide in molten float glass by EMF measurements. Thermo-
chim. Acta 414(2), 191–195.
Knacke O., Kubaschewski O. and Hesselman K. (1991) Thermo-
chemical Properties of Inorganic Substances, second ed. Spring-
er-Verlag, Berlin, pp. 1–1113.
Kroeker S. and Stebbins J. F. (2000) Magnesium coordination
environments in glasses and minerals: new insight from high-
field magnesium-25 MAS NMR. Am. Mineral. 85(10), 1459–
1464.
Kushiro I. (1975) Nature of silicate melt and its significance in
magma genesis: regularities in shift of liquidus boundaries
involving olivine, pyroxene, and silica minerals. Am. J. Sci. 275,
411–431.
Landolt-Bornstein (1999) Thermodynamic Properties of Inorganic
Material, Scientific Group Thermodata Europe (SGTE). Spring-
er-Verlag, Berlin/Heidelberg.
Lange R. A. (1997) A revised model for the density and thermal
expansivity of K2O–Na2O–CaO–MgO–Al2O3–SiO2 liquids
from 700 to 1900 K: extension to crustal magmatic tempera-
tures. Contrib. Mineral. Petrol. 130, 1–11.
Lange R. A. and Carmichael I. S. E. (1987) Densities of Na2O–
K2O–CaO–MgO–FeO–Fe2O3–Al2O3–TiO2–SiO2 liquids: new
measurements and derived partial molar properties. Geochim.
Cosmochim. Acta 51, 2931–2946.
Le Bas M. J., Le Maitre R. W., Streckeisen A. and Zanettin B.
(1986) A chemical classification of volcanic rocks based on the
total alkali-silica diagram. J. Petrol. 27(3), 745–750.
Lee S. K. and Stebbins J. F. (2003) The distribution of sodium ions
in aluminosilicate glasses: a high-field 23Na MAS and 3QMAS
NMR study. Geochim. Cosmochim. Acta 67, 1699–1709.
Lee S. K. and Stebbins J. F. (2009) Effects of the degree of
polymerization on the structure of sodium silicate and alumi-
nosilicate glasses and melts: an 17O NMR study. Geochim.
Cosmochim. Acta 73(4), 1109–1119.
Lewis R. D., Lofgren G. E., Franzen H. F. and Windom K. E.
(1993) The effect of Na vapor on the Na content of chondrules.
Meteoritics 28(5), 622–628.
626 R. Mathieu et al. /Geochimica et Cosmochimica Acta 75 (2011) 608–628

Author's personal copy
Libourel G., Boivin P. and Biggar G. M. (1989) The univariant
curve liquid = forsterite + anorthite + diopside in the system
CMAS at 1 bar: solid solutions and melt structure. Contrib.
Mineral. Petrol. 102, 406–421.
Libourel G., Geiger C. A., Merwin L. and Sebald A. (1992) 29Si
and 27Al MAS-NMR spectroscopy of glasses in the system
CaSiO3–MgSiO3–Al2O3. Chem. Geol. 96(3–4), 387–397.
Libourel G., Marty B. and Humbert F. (2003) Nitrogen solubility
in basaltic melt: Part I. Effect of oxygen fugacity. Geochim.
Cosmochim. Acta 67, 4123–4135.
Libourel G., Krot A. N. and Tissandier L. (2006) Role of gas–melt
interaction during chondrule formation. Earth Planet. Sci. Lett.
251(3–4), 232–240.
Lin C. C., Chen S. F., Liu L. G. and Li C. C. (2007) Anionic
structure and elasticity of Na2O–MgO–SiO2 glasses. J. Non-
Cryst. Solids 353(4), 413–425.
Lux G. (1987) The behavior of noble gases in silicate liquids:
solution, diffusion, bubbles and surface effects, with applica-
tions to natural samples. Geochim. Cosmochim. Acta 51(6),
1549–1560.
Maekawa H., Maekawa T., Kawamura K. and Yokokawa T.
(1991) The structural groups of alkali silicate glasses determined
from 29Si MAS-NMR. J. Non-Cryst. Solids 127, 53–64.
Malfait W. J., Zakaznova-Herzog V. P. and Halter W. E. (2008)
Quantitative Raman spectroscopy: speciation of Na-silicate
glasses and melts. Am. Mineral. 93, 1505–1518.
Marrocchi Y. and Toplis M. J. (2005) Experimental determination
of argon solubility in silicate melts: an assessment of the effects
of liquid composition and temperature. Geochim. Cosmochim.
Acta 69, 5765–5776.
Mathieu R. (2009) Sodium solubility in silicate melts. PhD thesis,
Institut National Polytechnique de Lorraine, Nancy, France.
Mathieu R., Khedim H., Libourel G., Podor R., Tissandier L.,
Deloule E., Faure F., Rapin C. and Vilasi M. (2008) Control of
alkali-metal oxide activity in molten silicates. J. Non-Cryst.
Solids 354(45–46), 5079–5083.
Moretti R. (2005) Polymerisation, basicity, oxidation state, and
their role in ionic modeling of silicates melts. Ann. Geophys.
48(4–5), 583–608.
Morgan G. B. and London D. (2005) Effect of current density on
the electron microprobe analysis of alkali aluminosilicate
glasses. Am. Mineral. 90, 1131–1138.
Morita K., Kume K. and Sano N. (2000) A newly
developed method for determining SiO2 activity of the
silicate slags equilibrated with molten silicon alloys. ISIJ
Int. 40(6), 554–560.
Mueller M., Willenborg W., Hilpert K. and Singheiser L. (2004)
Structural dependence of alkali oxide activity in coal ash slags,
In VIIth International Conference on Molten Slags, Fluxes &
Salts, Molten2004. The South Africa Institute of Mining an
Metallurgy, pp. 615–618.
Murdoch J. B., Stebbins J. F. and Carmichael I. S. E. (1985) High
resolution 29Si NMR study of silicate and aluminosilicate
glasses: the effect of network modifying cations. Am. Mineral.
70, 332–343.
Mysen B. and Richet P. (2005) Silicate glasses and melts, properties
and structure. In Developments in Geochemistry. Elsevier, p.
544.
Mysen B. O., Virgo D. and Scarfe C. M. (1980) Relations between
the anionic structure and viscosity of silicate melts, a Raman
spectroscopic study. Am. Mineral. 65, 690–710.
NASA Report (1993) Thermodynamic Data for Fifty Reference
Elements, NASA-TP-3287, N93-19977, 240p.
Nekvasil H. and Lindsley D. H. (1990) Termination of the 2-
feldspar + liquid curve in the system An–Or–An–H2O at low
H2O contents. Am. Mineral. 75(9–10), 1071–1079.
Neudorf D. A. and Elliott J. F. (1980) Thermodynamic properties
of Na2O–SiO2–CaO melts at 1000 °C to 1100 °C.Metall. Trans.
B 4, 607–614.
Neuville D. R. and Richet P. (1991) Viscosity and mixing in molten
(Ca, Mg) pyroxenes and garnets. Geochim. Cosmochim. Acta
55, 1011–1019.
Nuccio P. M. and Paonita A. (2000) Investigation of the noble gas
solubility in H2O–CO2 bearing silicate liquids at moderate
pressure: II. The extended ionic porosity (EIP) model. Earth
Planet. Sci. Lett. 183(3–4), 499–512.
O’Neill H. S. C. (2005) A method for controlling alkali-metal oxide
activities in one-atmosphere experiments and its application to
measuring the relative activity coefficients of NaO0.5 in silicate
melts. Am. Mineral. 90(2–3), 497–501.
Pak J. J., Ito K. and Fruehan F. J. (1989) Activities of Na2O in
CaO-based slags used for dephosphorization of steel. ISIJ Int.
29(4), 318–323.
Pan V. and Longhi J. (1989) Low pressure liquidus relations in the
system Mg2SiO4–Ca2SiO4–NaAlSiO4–SiO2. Am. J. Sci. 289,
116.
Pelton A. D. and Wu P. (1999) Thermodynamic modeling in glass-
forming melts. J. Non-Cryst. Solids 253(1–3).
Powell R. and Holland T. (1990) Calculated mineral equilibria in
the pelite system, KFMASH (K2O–FeO–MgO–Al2O3–SiO2–
H2O). Am. Mineral. 75(3–4), 367–380.
Rego D. N., Sigworth G. K. and Philbrook W. O. (1985)
Thermodynamic Study of Na2O–SiO2 melts at 1300 °C and
1400 °C. Metall. Trans. B 16, 313–323.
Rego D. N., Sigworth G. K. and Philbrook W. O. (1988)
Thermodynamic activity of Na2O–CaO–SiO2, Na2O–MgO–
SiO2, and Na2O–CaO–SiO2–Al2O3 melts at 1400 °C. Metall.
Trans. B 19(4), 655–661.
Rein R. H. and Chipman J. (1965) Activities in liquid solution
SiO2–CaO–MgO–Al2O3 at 1600 °C. Trans. Metall. Soc. AIME
233(2), 415–425.
Richet P., Robie R. A. and Hemingway B. S. (1993) Entropy and
structure of silicate glasses and melts. Geochim. Cosmochim.
Acta 57(12), 2751–2766.
Roine A. (2002) HSC Chemistry 5.11, Outotec Research Oy,
Finland. Available from: <http://www.hsc-chemistry.net/>.
Romero-Serrano A., Gomez-Yanez C., Hallen-Lopez M. and
Araujo-Osorio J. (2005) Thermodynamic modeling of alkali
metal oxide-silica binary melts. J. Am. Ceram. Soc. 88(1), 141–
145.
Rudnyi E. B., Vovk O. M., Sidorov L. N., Stolyarov V. L.,
Shakhmatkin B. A. and Rakhimov V. I. (1988) Use of the ion–
molecule equilibria method for determining the activity of alkali
oxide in sodium silicate melts. Sov. J. Glass Phys. Chem. 14(2),
119–125.
Ryerson F. J. and Hess P. C. (1980) The role of P2O5 in silicate
melts. Geochim. Cosmochim. Acta 44, 611–624.
Schairer J. F., Yoder H. S. and Keene A. G. (1954) The System
Na2O–MgO–SiO2 and Na2O–FeO–SiO2, vol. 60. Carnegie
Institution, Washington Year Book, pp. 141–144.
Schneider J., Mastelaro V. R., Zanotto E. D., Shakhmatkin B. A.,
Vedishcheva N. M., Wright A. C. and Panepucci H. (2003) Qn
distribution in stoichiometric silicate glasses: thermodynamic
calculations and 29Si high resolution NMR measurements. J.
Non-Cryst. Solids 325(1–3), 164–178.
Schramm C. M., De Jong B. H. and Parziale V. E. (1984) 29Si
magic angle spinning NMR study on local silicon environments
in amorphous and crystalline lithium silicates. J. Am. Chem.
Soc. 106(16), 4396–4402.
Shahid K. A. and Glasser F. P. (1971) Phase equilibria in glass
forming region forming region of Na2O–CaO–SiO2. Phys.
Chem. Glasses 12, 50–57.
Sodium solubility in molten CMS system 627

Author's personal copy
Shahid K. A. and Glasser F. P. (1972) Phase equilibria in glass
forming region forming region of Na2O–MgO–CaO–SiO2.
Phys. Chem. Glasses 13, 27.
Shimoda K., Tobu Y., Shimoikeda Y., Nemoto T. and Saito
K. (2007) Multiple Ca2+ environments in silicate glasses
by high-resolution Ca-43 MQMAS NMR technique at
high and ultra-high (21.8 T) magnetic fields. J. Magn.
Reson. 186(1), 156–159.
Shimoda K., Nemoto T. and Saito K. (2008) Local structure of
magnesium in silicate glasses: a Mg-25 3QMAS NMR study. J.
Phys. Chem. B 112(22), 6747–6752.
Slag Atlas (1995) VDEh, second ed. Verlag Stahleisen GmbH,
Dusseldorf, p. 616.
Sosinsky D. J. and Sommerville I. D. (1986) The composition and
temperature dependence of sulphide capacity of metallurgical
slags. Metall. Trans. B 17, 331–337.
Soulard H., Provost A. and Boivin P. (1992) CaO–MgO–Al2O3–
SiO2–Na2O (CMASN) at 1 bar from low to high Na2O
contents: topology of an analogue for alkaline basic rocks.
Chem. Geol. 96, 459–477.
Steiler J. M. (1976) Etude thermodynamique des laitiers du systeme
K2O–SiO2, IRSID. PCM.76-RP.110, p. 31.
Tissandier L., Libourel G., Toplis M. J. and Chaussidon M. (1998)
Alkali volatilization at high temperature in silicate melts.
Meteorit. Soc. 33(4), A154–A155.
Tsuchiyama A., Nagahara H. and Kushiro I. (1981) Volatilization
of sodium from silicate melt spheres and its application to the
formation of chondrules. Geochim. Cosmochim. Acta 45(8),
1357–1367.
Tsukihashi F. and Sano N. (1985) Measurement of the activity of
Na2O in Na2O–SiO2 melts by chemical equilibration method.
Tetsu to Hagane/J. Iron Steel Inst. Jpn. 71, 815–822.
van Limpt H., Beerkens R. and Verheijen O. (2006) Models and
experiments for sodium evaporation from sodium containing
silicate melts. J. Am. Ceram. Soc. 89(11), 3446–3455.
Watson E. B. (1976) Two-liquid partition coefficients: experimental
data and geochemical implications. Contrib. Mineral. Petrol. 56,
119–134.
Willenborg W., Mueller M. and Hilpert K. (2006) Alkali removal
at about 1400 °C for the pressurized pulverized coal combus-
tion combined cycle: 1. Thermodynamics and concept. Energy
Fuels 20(6), 2593–2598.
Witthohn A., Oeltjen L. and Hilpert K. (1998) Release and
sorption of alkali metals in coal conversion. Am. Soc. Mech.
Eng., Fuels Combust. Technol. Div. (Publ.) 22, 161–168.
Yamaguchi S., Imai A. and Goto K. S. (1983) Measurement of
activity of Na2O in Na2O–SiO2 binary melt using beta-alumina
as a solid electrolyte. J. Jpn. Inst. Metals 47(9), 736–742.
Yang Y. D., McLean A., Sommerville I. D. and Poveromo J. J.
(2000) The correlation of alkali capacity with optical basicity of
blast furnace slags. Iron Steelmaker 27(10), 103–111.
Yoder H. S. and Tilley C. E. (1962) Origin of basaltic magmas: an
experimental study of natural and synthetic systems. J. Petrol.
3, 342–532.
Young R. W., Duffy J. A., Hassal G. J. and Xu Z. (1992) Use of
optical basicity concept for determining phosphorous and
sulphur slag-metal partitions. Ironmaking Steelmaking 19,
201–219.
Zaitsev A. I., Shelkova N. E., Lyakishev N. P. andMogutnov B. M.
(1999) Thermodynamic properties and phase equilibria in the
Na2O–SiO2 system. Phys. Chem. Chem. Phys. 1(8), 1899–1907.
Associate editor: Michael Toplis
628 R. Mathieu et al. /Geochimica et Cosmochimica Acta 75 (2011) 608–628


