Embed Size (px)
Citation preview
Multiple Nucleation and Crystal Growth of Barium TitanateHongquan Zhan,†,§ Xianfeng Yang,† Chaomin Wang,† Jian Chen,† Yuping Wen,† Chaolun Liang,†
Heather F. Greer,‡ Mingmei Wu,*,† and Wuzong Zhou*,‡
†MOE Key Laboratory of Bioinorganic and Synthetic Chemistry, State Key Laboratory of Optoelectronic Materials andTechnologies, School of Chemistry and Chemical Engineering, Instrumental Analysis and Research Centre, Sun Yat-Sen University,Guangzhou, 510275, P. R. China‡EAStCHEM, School of Chemistry, University of St Andrews, St Andrews, Fife KY16 9ST, United Kingdom§Department of Material Science and Engineering, Jingdezhen Ceramic Institute, Jingdezhen 333001, P. R. China
*S Supporting Information
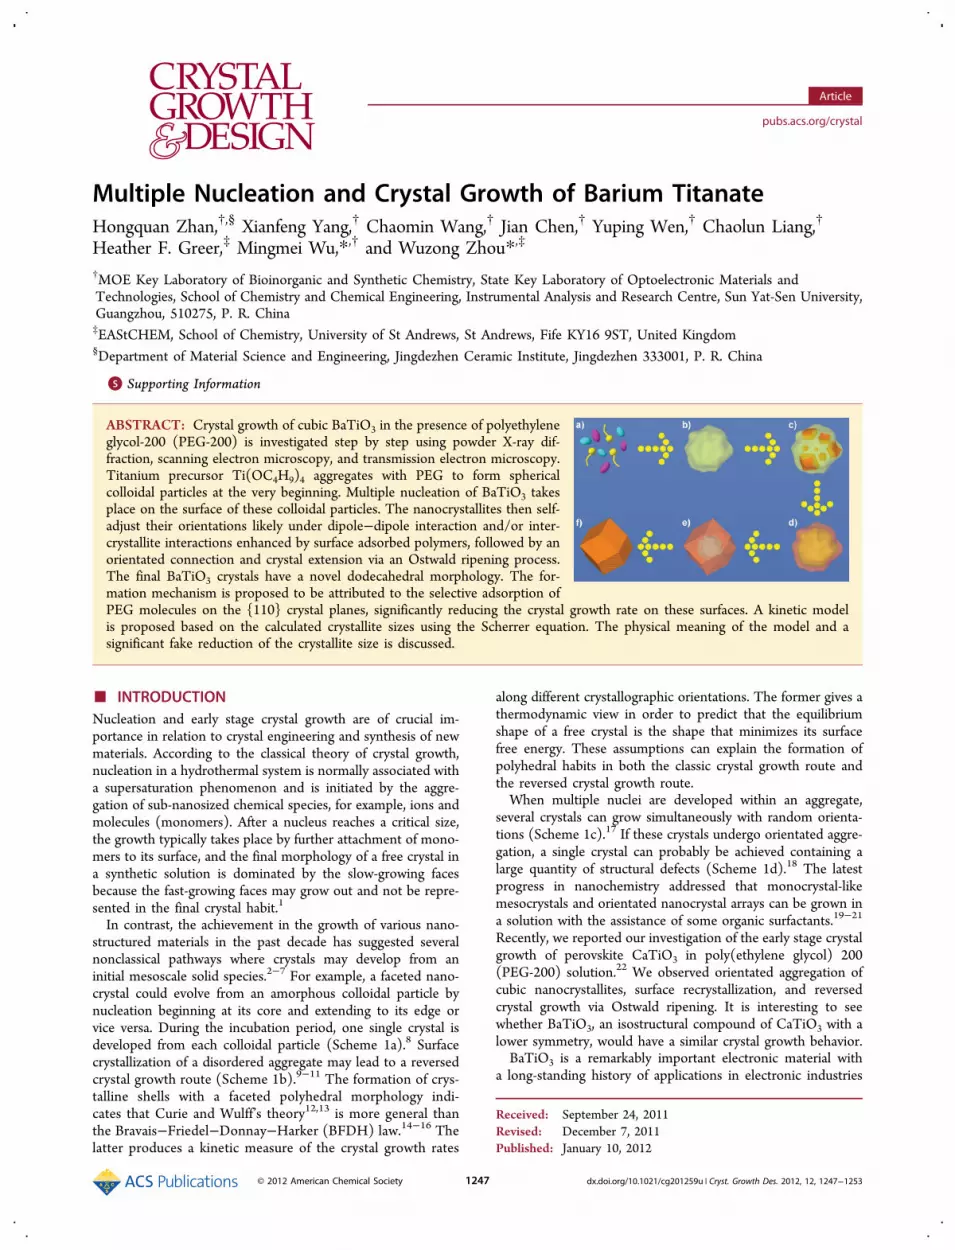
ABSTRACT: Crystal growth of cubic BaTiO3 in the presence of polyethyleneglycol-200 (PEG-200) is investigated step by step using powder X-ray dif-fraction, scanning electron microscopy, and transmission electron microscopy.Titanium precursor Ti(OC4H9)4 aggregates with PEG to form sphericalcolloidal particles at the very beginning. Multiple nucleation of BaTiO3 takesplace on the surface of these colloidal particles. The nanocrystallites then self-adjust their orientations likely under dipole−dipole interaction and/or inter-crystallite interactions enhanced by surface adsorbed polymers, followed by anorientated connection and crystal extension via an Ostwald ripening process.The final BaTiO3 crystals have a novel dodecahedral morphology. The for-mation mechanism is proposed to be attributed to the selective adsorption ofPEG molecules on the {110} crystal planes, significantly reducing the crystal growth rate on these surfaces. A kinetic modelis proposed based on the calculated crystallite sizes using the Scherrer equation. The physical meaning of the model and asignificant fake reduction of the crystallite size is discussed.
■ INTRODUCTIONNucleation and early stage crystal growth are of crucial im-portance in relation to crystal engineering and synthesis of newmaterials. According to the classical theory of crystal growth,nucleation in a hydrothermal system is normally associated witha supersaturation phenomenon and is initiated by the aggre-gation of sub-nanosized chemical species, for example, ions andmolecules (monomers). After a nucleus reaches a critical size,the growth typically takes place by further attachment of mono-mers to its surface, and the final morphology of a free crystal ina synthetic solution is dominated by the slow-growing facesbecause the fast-growing faces may grow out and not be repre-sented in the final crystal habit.1
In contrast, the achievement in the growth of various nano-structured materials in the past decade has suggested severalnonclassical pathways where crystals may develop from aninitial mesoscale solid species.2−7 For example, a faceted nano-crystal could evolve from an amorphous colloidal particle bynucleation beginning at its core and extending to its edge orvice versa. During the incubation period, one single crystal isdeveloped from each colloidal particle (Scheme 1a).8 Surfacecrystallization of a disordered aggregate may lead to a reversedcrystal growth route (Scheme 1b).9−11 The formation of crys-talline shells with a faceted polyhedral morphology indi-cates that Curie and Wulff’s theory12,13 is more general thanthe Bravais−Friedel−Donnay−Harker (BFDH) law.14−16 Thelatter produces a kinetic measure of the crystal growth rates
along different crystallographic orientations. The former gives athermodynamic view in order to predict that the equilibriumshape of a free crystal is the shape that minimizes its surfacefree energy. These assumptions can explain the formation ofpolyhedral habits in both the classic crystal growth route andthe reversed crystal growth route.When multiple nuclei are developed within an aggregate,
several crystals can grow simultaneously with random orienta-tions (Scheme 1c).17 If these crystals undergo orientated aggre-gation, a single crystal can probably be achieved containing alarge quantity of structural defects (Scheme 1d).18 The latestprogress in nanochemistry addressed that monocrystal-likemesocrystals and orientated nanocrystal arrays can be grown ina solution with the assistance of some organic surfactants.19−21
Recently, we reported our investigation of the early stage crystalgrowth of perovskite CaTiO3 in poly(ethylene glycol) 200(PEG-200) solution.22 We observed orientated aggregation ofcubic nanocrystallites, surface recrystallization, and reversedcrystal growth via Ostwald ripening. It is interesting to seewhether BaTiO3, an isostructural compound of CaTiO3 with alower symmetry, would have a similar crystal growth behavior.BaTiO3 is a remarkably important electronic material with
a long-standing history of applications in electronic industries
Received: September 24, 2011Revised: December 7, 2011Published: January 10, 2012
Article
pubs.acs.org/crystal
© 2012 American Chemical Society 1247 dx.doi.org/10.1021/cg201259u | Cryst. Growth Des. 2012, 12, 1247−1253
due to its unique and microstructure-dependent di- and ferro-electric properties.23−26 Detailed crystal growth processes andmorphology control may have significant influences on itsphysicochemical properties. In addition, the improved knowl-edge of the crystal growth of BaTiO3, a member of the hugeperovskite family, is expected to have a large impact on thestudy of other perovskite materials. Among a variety of fabri-cation processes of barium titanate, the one-step hydrothermalsynthesis method has attracted the most interest whereby thegrowth mechanism has been proposed by several groups.27,28
Typically, it can be classified into two approaches. One is theso-called dissolution−precipitation approach and the other is anin situ heterogeneous transformation. Disagreement regardingthe formation mechanism of BaTiO3 has often been raised.More detailed studies of the early stage crystal growth aretherefore required for a better understanding. The studies ofthe early crystal growth stages of BaTiO3 without the presenceof surfactant were reported by Testino et al.29,30 It was ob-served that irregular BaTiO3 polycrystalline particles formed viaprimary and secondary nucleation processes. Further, moreinteresting results could be attained if a correlation could bemade between structural domains and the development of theparticle morphology.Herein, we present our recent investigation of early stage
crystal growth of perovskite-type BaTiO3 from barium hy-droxide and tetrabutyl titanate when polyethylene glycol-200(PEG-200) is present. A new crystallization process is pro-posed, that is, “aggregation” − “multiple nucleation” − “surfacerecrystallization” − “single crystal”. Bearing in mind thatBaTiO3 crystals usually have a cubic shape,31,32 the formationof dodecahedral crystals of BaTiO3 with 12 {110} facets in the
present work is of interest and the possible explanation of itsformation is discussed.
■ EXPERIMENTAL SECTIONSynthesis. To grow BaTiO3 crystals, tetrabutyl titanate [titanium
n-butoxide, Ti(OC4H9)4, TNB] (analytical grade) was slowly addedto the polymer PEG-200 (5.0 mL), achieving final concentrationsof 0.05 M and 2.81 M of [Ti] and PEG, respectively. 188 mg ofBa(OH)2·8H2O (analytical grade) was dissolved in 3.83 mL of double-distilled water, which had been preboiled for 15 min to remove anydissolved CO2. The TNB/PEG solution was slowly added into theBa(OH)2·8H2O solution under stirring. The Ba:Ti ratio of the mixturewas 1.2 in order to ensure a complete conversion of the titanium pre-cursor into BaTiO3. NaOH solution was then added to keep the batchat a designated pH value of ca. 11. The final volume ratio of PEG towater is 1:1. The suspension was then transferred to a 20-mL Teflon-lined autoclave, which was immediately sealed.
The hydrothermal reaction was conducted at 180 °C in an oven fortimes ranging from 15 min to 20 days. After the reaction, the autoclavewas removed from the oven and cooled down to room temperature.Soluble impurities were removed by repeatedly washing the precipitatewith hot double-distilled water. The final powder specimens wererecovered via filtration and washed extensively, first with water, fol-lowed by dilute acetic acid, and finally with ethanol, in an attempt toremove any adsorbed impurities such as the excess barium compo-nents. The powder specimens were ultimately placed into a desiccatorfor overnight drying at 60 °C.
Characterization. Initial specimen characterization was performedusing X-ray diffraction (XRD) on a Rigaku D/MAX 2200 VPC dif-fractometer, operating at 40 kV and 20 mA, with steps of 0.02° at10° min−1 in a 2θ range from 20° to 80°. Scanning electron micro-scopic (SEM) images were recorded on a FEI Quanta 400 Thermal FEenvironment scanning electron microscope. Samples for transmissionelectron microscopic (TEM) examination were prepared by dispersingspecimen powder on a carbon film supported on a copper grid. TEMand high resolution TEM (HRTEM) images were recorded on aJEOL JEM-2010HR electron microscope equipped with a Gatan GIFTridiem system. The Ba:Ti ratios of the produced particles were exam-ined by energy dispersive X-ray spectroscopy (EDS) using an OxfordInca system. Although the commonly used XRD peaks for the cal-culation of the elemental ratio of Ba:Ti, Ba Lα, and Ti Kα are heavilyoverlapped, the system can separate them according to their differentshapes. The Brunauer−Emmett−Teller (BET) nitrogen physisorptionexperiments were carried out on a Micromeritics ASAP 2010 system.The pore size distributions of the materials were determined by usingthe Barrett−Joyner−Halenda (BJH) algorithm according to thedesorption data of the N2 isotherms. Fourier transform infrared(FT-IR) spectra, in a range of 400−4000 cm−1 with a resolution of0.4 cm−1, were obtained from an FTIR-Avatar 350 spectrometer.Thermogravimetric analysis (TGA) was performed in N2 atmospherewith a flow rate of 20 mL/min and with a temperature control fromroom temperature to 800 °C at a rate of 20 °C/min.
■ RESULTS AND DISCUSSION
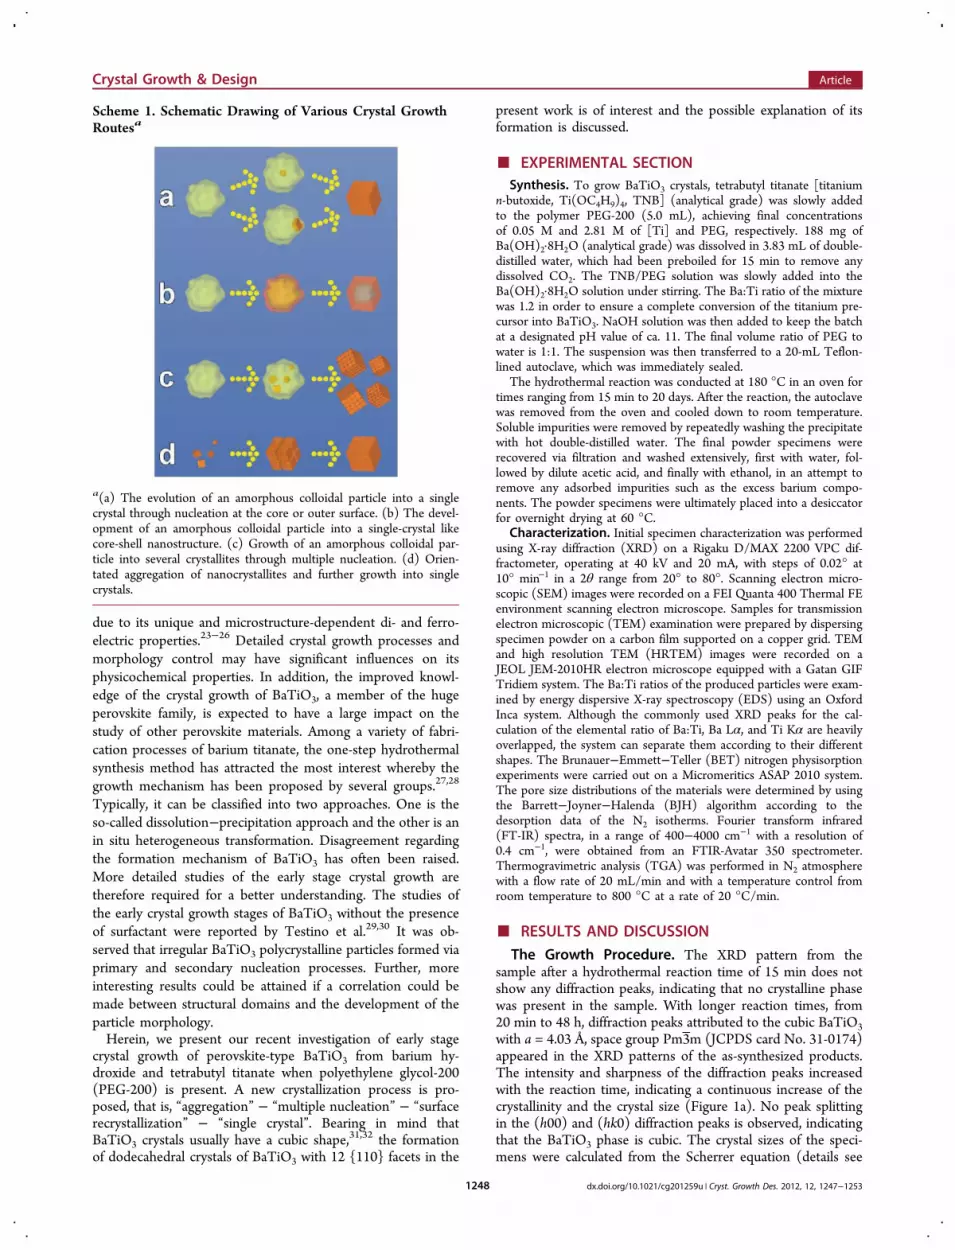
The Growth Procedure. The XRD pattern from thesample after a hydrothermal reaction time of 15 min does notshow any diffraction peaks, indicating that no crystalline phasewas present in the sample. With longer reaction times, from20 min to 48 h, diffraction peaks attributed to the cubic BaTiO3with a = 4.03 Å, space group Pm3m (JCPDS card No. 31-0174)appeared in the XRD patterns of the as-synthesized products.The intensity and sharpness of the diffraction peaks increasedwith the reaction time, indicating a continuous increase of thecrystallinity and the crystal size (Figure 1a). No peak splittingin the (h00) and (hk0) diffraction peaks is observed, indicatingthat the BaTiO3 phase is cubic. The crystal sizes of the speci-mens were calculated from the Scherrer equation (details see
Scheme 1. Schematic Drawing of Various Crystal GrowthRoutesa
a(a) The evolution of an amorphous colloidal particle into a singlecrystal through nucleation at the core or outer surface. (b) The devel-opment of an amorphous colloidal particle into a single-crystal likecore-shell nanostructure. (c) Growth of an amorphous colloidal par-ticle into several crystallites through multiple nucleation. (d) Orien-tated aggregation of nanocrystallites and further growth into singlecrystals.
Crystal Growth & Design Article
dx.doi.org/10.1021/cg201259u | Cryst. Growth Des. 2012, 12, 1247−12531248
Supporting Information Part 1). As shown in Figure 1b, thecalculated crystal sizes rapidly increase between the reactiontimes of 20 min and 12 h, a significant decrease from 12 to 48 h,followed by a slow increase. A possible kinetic model corres-ponding to this novel curve is discussed below.SEM and TEM images from the specimen with a reaction time
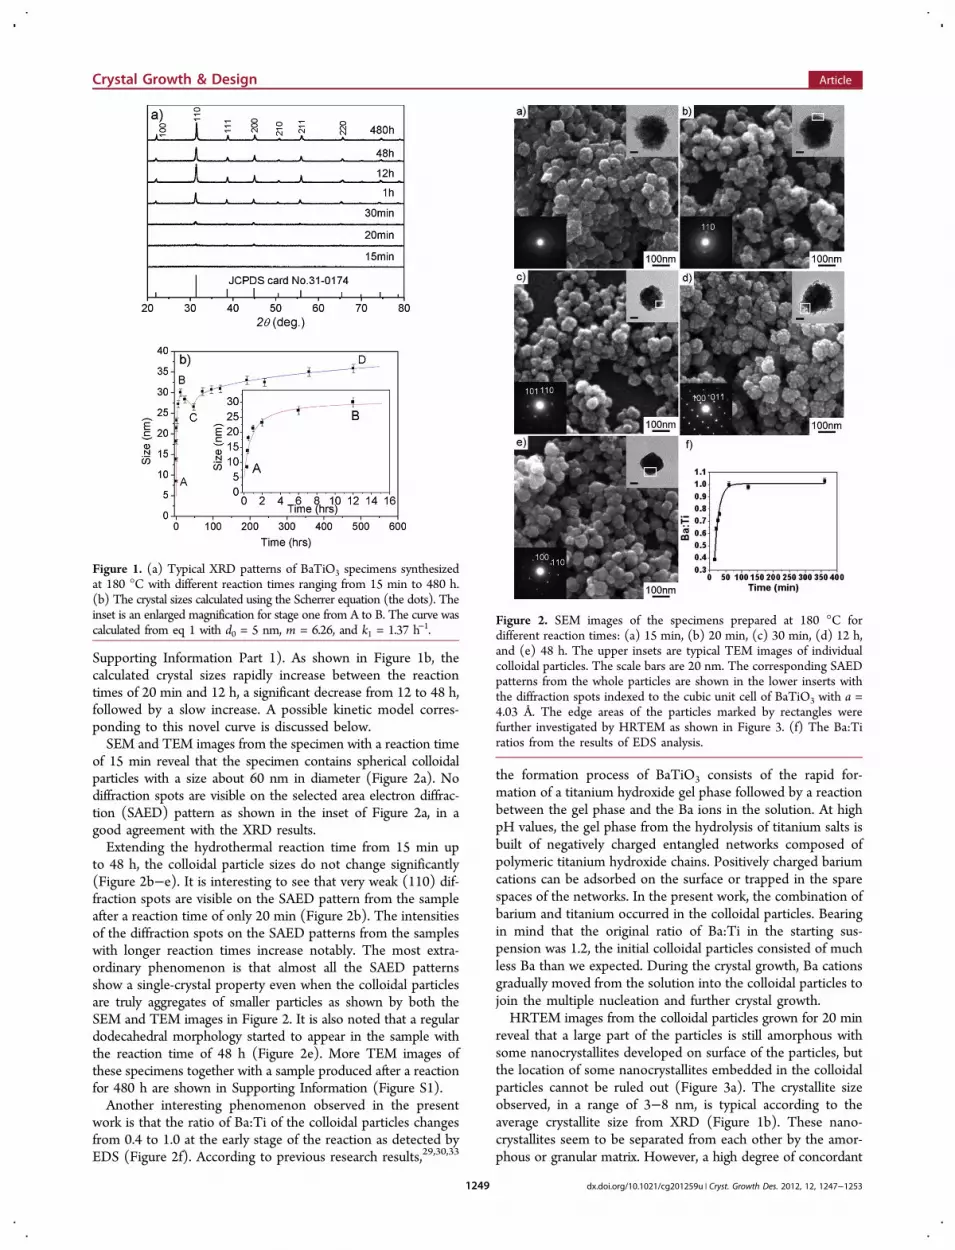
of 15 min reveal that the specimen contains spherical colloidalparticles with a size about 60 nm in diameter (Figure 2a). Nodiffraction spots are visible on the selected area electron diffrac-tion (SAED) pattern as shown in the inset of Figure 2a, in agood agreement with the XRD results.Extending the hydrothermal reaction time from 15 min up
to 48 h, the colloidal particle sizes do not change significantly(Figure 2b−e). It is interesting to see that very weak (110) dif-fraction spots are visible on the SAED pattern from the sampleafter a reaction time of only 20 min (Figure 2b). The intensitiesof the diffraction spots on the SAED patterns from the sampleswith longer reaction times increase notably. The most extra-ordinary phenomenon is that almost all the SAED patternsshow a single-crystal property even when the colloidal particlesare truly aggregates of smaller particles as shown by both theSEM and TEM images in Figure 2. It is also noted that a regulardodecahedral morphology started to appear in the sample withthe reaction time of 48 h (Figure 2e). More TEM images ofthese specimens together with a sample produced after a reactionfor 480 h are shown in Supporting Information (Figure S1).Another interesting phenomenon observed in the present
work is that the ratio of Ba:Ti of the colloidal particles changesfrom 0.4 to 1.0 at the early stage of the reaction as detected byEDS (Figure 2f). According to previous research results,29,30,33
the formation process of BaTiO3 consists of the rapid for-mation of a titanium hydroxide gel phase followed by a reactionbetween the gel phase and the Ba ions in the solution. At highpH values, the gel phase from the hydrolysis of titanium salts isbuilt of negatively charged entangled networks composed ofpolymeric titanium hydroxide chains. Positively charged bariumcations can be adsorbed on the surface or trapped in the sparespaces of the networks. In the present work, the combination ofbarium and titanium occurred in the colloidal particles. Bearingin mind that the original ratio of Ba:Ti in the starting sus-pension was 1.2, the initial colloidal particles consisted of muchless Ba than we expected. During the crystal growth, Ba cationsgradually moved from the solution into the colloidal particles tojoin the multiple nucleation and further crystal growth.HRTEM images from the colloidal particles grown for 20 min
reveal that a large part of the particles is still amorphous withsome nanocrystallites developed on surface of the particles, butthe location of some nanocrystallites embedded in the colloidalparticles cannot be ruled out (Figure 3a). The crystallite sizeobserved, in a range of 3−8 nm, is typical according to theaverage crystallite size from XRD (Figure 1b). These nano-crystallites seem to be separated from each other by the amor-phous or granular matrix. However, a high degree of concordant
Figure 1. (a) Typical XRD patterns of BaTiO3 specimens synthesizedat 180 °C with different reaction times ranging from 15 min to 480 h.(b) The crystal sizes calculated using the Scherrer equation (the dots). Theinset is an enlarged magnification for stage one from A to B. The curve wascalculated from eq 1 with d0 = 5 nm, m = 6.26, and k1 = 1.37 h−1.
Figure 2. SEM images of the specimens prepared at 180 °C fordifferent reaction times: (a) 15 min, (b) 20 min, (c) 30 min, (d) 12 h,and (e) 48 h. The upper insets are typical TEM images of individualcolloidal particles. The scale bars are 20 nm. The corresponding SAEDpatterns from the whole particles are shown in the lower inserts withthe diffraction spots indexed to the cubic unit cell of BaTiO3 with a =4.03 Å. The edge areas of the particles marked by rectangles werefurther investigated by HRTEM as shown in Figure 3. (f) The Ba:Tiratios from the results of EDS analysis.
Crystal Growth & Design Article
dx.doi.org/10.1021/cg201259u | Cryst. Growth Des. 2012, 12, 1247−12531249
crystal orientations of these nanocrystallites implies that theyhave already undergone some type of interaction and self-adjusted their orientations. It is much easier for such a processto happen on the surface of the colloidal particles. A similarphenomenon of surface crystallization was observed during thereversed crystal growth of zeolite analcime and zeolite A.9,10
With longer hydrothermal treatment times, the nanocrys-tallites tend to join together. Consequently, the single-crystalareas become larger, although a large number of defects can bedetected. In specimens with a reaction time of 30 min, HRTEMimages revealed such a connection of nanocrystallites. Theoverall structure of the particles looks like mesoporous crystals(Figure 3b).34 The pores were filled by further crystallization ofthe samples with longer reaction times (Figure 3c,d).Dodecahedral Crystals of BaTiO3. When the crystals are
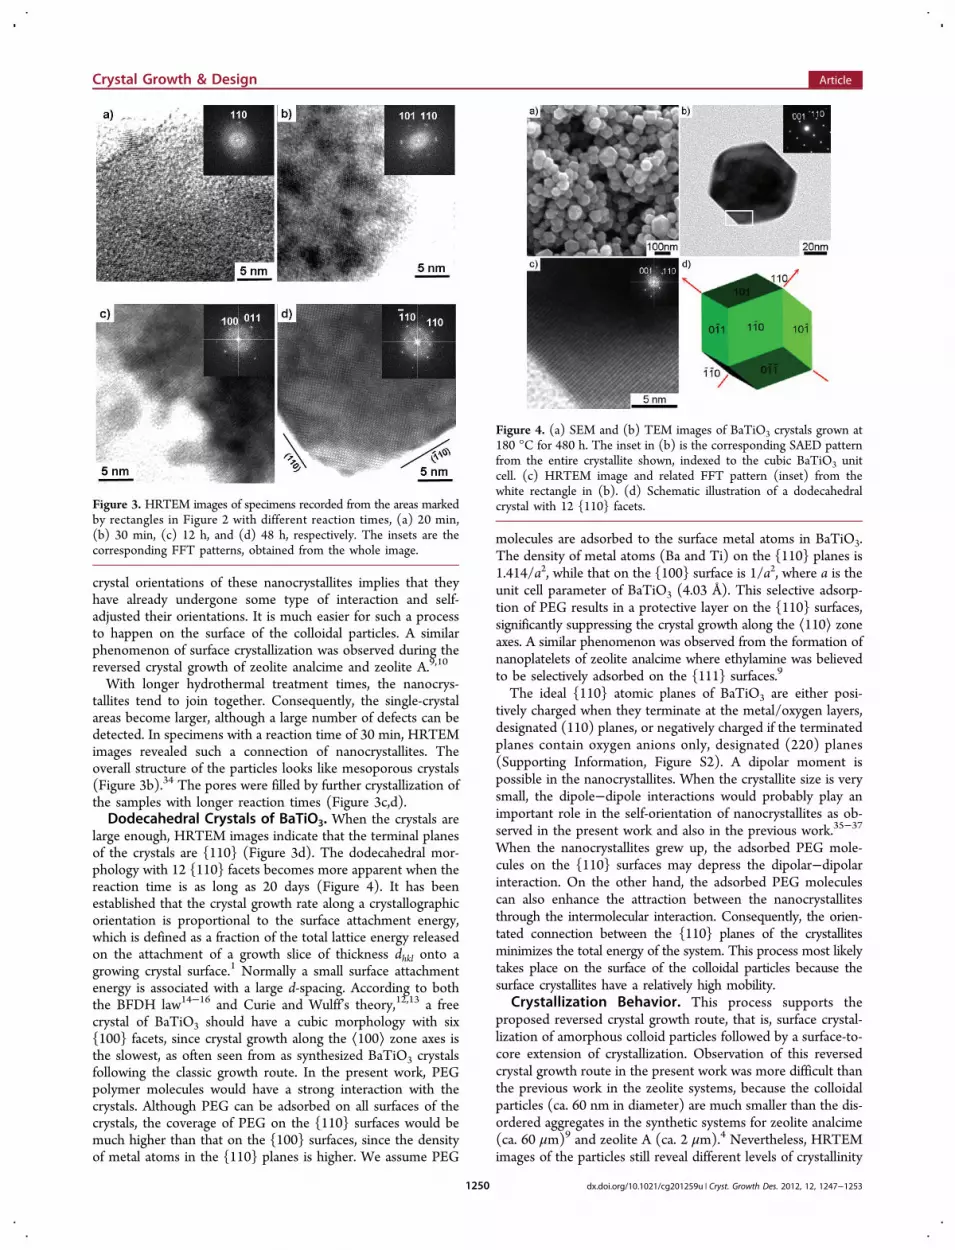
large enough, HRTEM images indicate that the terminal planesof the crystals are {110} (Figure 3d). The dodecahedral mor-phology with 12 {110} facets becomes more apparent when thereaction time is as long as 20 days (Figure 4). It has beenestablished that the crystal growth rate along a crystallographicorientation is proportional to the surface attachment energy,which is defined as a fraction of the total lattice energy releasedon the attachment of a growth slice of thickness dhkl onto agrowing crystal surface.1 Normally a small surface attachmentenergy is associated with a large d-spacing. According to boththe BFDH law14−16 and Curie and Wulff’s theory,12,13 a freecrystal of BaTiO3 should have a cubic morphology with six{100} facets, since crystal growth along the ⟨100⟩ zone axes isthe slowest, as often seen from as synthesized BaTiO3 crystalsfollowing the classic growth route. In the present work, PEGpolymer molecules would have a strong interaction with thecrystals. Although PEG can be adsorbed on all surfaces of thecrystals, the coverage of PEG on the {110} surfaces would bemuch higher than that on the {100} surfaces, since the densityof metal atoms in the {110} planes is higher. We assume PEG
molecules are adsorbed to the surface metal atoms in BaTiO3.The density of metal atoms (Ba and Ti) on the {110} planes is1.414/a2, while that on the {100} surface is 1/a2, where a is theunit cell parameter of BaTiO3 (4.03 Å). This selective adsorp-tion of PEG results in a protective layer on the {110} surfaces,significantly suppressing the crystal growth along the ⟨110⟩ zoneaxes. A similar phenomenon was observed from the formation ofnanoplatelets of zeolite analcime where ethylamine was believedto be selectively adsorbed on the {111} surfaces.9
The ideal {110} atomic planes of BaTiO3 are either posi-tively charged when they terminate at the metal/oxygen layers,designated (110) planes, or negatively charged if the terminatedplanes contain oxygen anions only, designated (220) planes(Supporting Information, Figure S2). A dipolar moment ispossible in the nanocrystallites. When the crystallite size is verysmall, the dipole−dipole interactions would probably play animportant role in the self-orientation of nanocrystallites as ob-served in the present work and also in the previous work.35−37
When the nanocrystallites grew up, the adsorbed PEG mole-cules on the {110} surfaces may depress the dipolar−dipolarinteraction. On the other hand, the adsorbed PEG moleculescan also enhance the attraction between the nanocrystallitesthrough the intermolecular interaction. Consequently, the orien-tated connection between the {110} planes of the crystallitesminimizes the total energy of the system. This process most likelytakes place on the surface of the colloidal particles because thesurface crystallites have a relatively high mobility.
Crystallization Behavior. This process supports theproposed reversed crystal growth route, that is, surface crystal-lization of amorphous colloid particles followed by a surface-to-core extension of crystallization. Observation of this reversedcrystal growth route in the present work was more difficult thanthe previous work in the zeolite systems, because the colloidalparticles (ca. 60 nm in diameter) are much smaller than the dis-ordered aggregates in the synthetic systems for zeolite analcime(ca. 60 μm)9 and zeolite A (ca. 2 μm).4 Nevertheless, HRTEMimages of the particles still reveal different levels of crystallinity
Figure 3. HRTEM images of specimens recorded from the areas markedby rectangles in Figure 2 with different reaction times, (a) 20 min,(b) 30 min, (c) 12 h, and (d) 48 h, respectively. The insets are thecorresponding FFT patterns, obtained from the whole image.
Figure 4. (a) SEM and (b) TEM images of BaTiO3 crystals grown at180 °C for 480 h. The inset in (b) is the corresponding SAED patternfrom the entire crystallite shown, indexed to the cubic BaTiO3 unitcell. (c) HRTEM image and related FFT pattern (inset) from thewhite rectangle in (b). (d) Schematic illustration of a dodecahedralcrystal with 12 {110} facets.
Crystal Growth & Design Article
dx.doi.org/10.1021/cg201259u | Cryst. Growth Des. 2012, 12, 1247−12531250
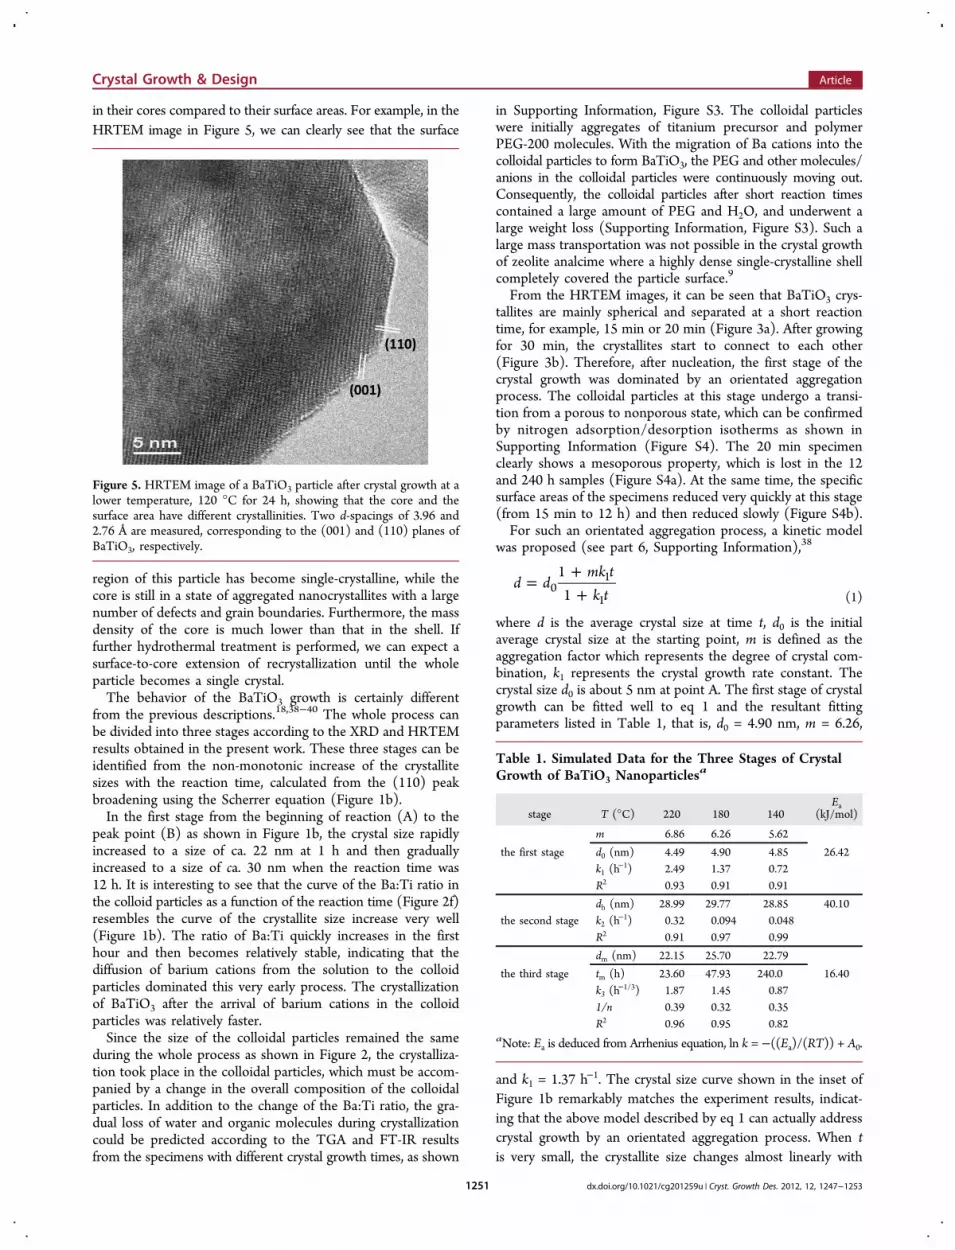
in their cores compared to their surface areas. For example, in theHRTEM image in Figure 5, we can clearly see that the surface
region of this particle has become single-crystalline, while thecore is still in a state of aggregated nanocrystallites with a largenumber of defects and grain boundaries. Furthermore, the massdensity of the core is much lower than that in the shell. Iffurther hydrothermal treatment is performed, we can expect asurface-to-core extension of recrystallization until the wholeparticle becomes a single crystal.The behavior of the BaTiO3 growth is certainly different
from the previous descriptions.18,38−40 The whole process canbe divided into three stages according to the XRD and HRTEMresults obtained in the present work. These three stages can beidentified from the non-monotonic increase of the crystallitesizes with the reaction time, calculated from the (110) peakbroadening using the Scherrer equation (Figure 1b).In the first stage from the beginning of reaction (A) to the
peak point (B) as shown in Figure 1b, the crystal size rapidlyincreased to a size of ca. 22 nm at 1 h and then graduallyincreased to a size of ca. 30 nm when the reaction time was12 h. It is interesting to see that the curve of the Ba:Ti ratio inthe colloid particles as a function of the reaction time (Figure 2f)resembles the curve of the crystallite size increase very well(Figure 1b). The ratio of Ba:Ti quickly increases in the firsthour and then becomes relatively stable, indicating that thediffusion of barium cations from the solution to the colloidparticles dominated this very early process. The crystallizationof BaTiO3 after the arrival of barium cations in the colloidparticles was relatively faster.Since the size of the colloidal particles remained the same
during the whole process as shown in Figure 2, the crystalliza-tion took place in the colloidal particles, which must be accom-panied by a change in the overall composition of the colloidalparticles. In addition to the change of the Ba:Ti ratio, the gra-dual loss of water and organic molecules during crystallizationcould be predicted according to the TGA and FT-IR resultsfrom the specimens with different crystal growth times, as shown
in Supporting Information, Figure S3. The colloidal particleswere initially aggregates of titanium precursor and polymerPEG-200 molecules. With the migration of Ba cations into thecolloidal particles to form BaTiO3, the PEG and other molecules/anions in the colloidal particles were continuously moving out.Consequently, the colloidal particles after short reaction timescontained a large amount of PEG and H2O, and underwent alarge weight loss (Supporting Information, Figure S3). Such alarge mass transportation was not possible in the crystal growthof zeolite analcime where a highly dense single-crystalline shellcompletely covered the particle surface.9
From the HRTEM images, it can be seen that BaTiO3 crys-tallites are mainly spherical and separated at a short reactiontime, for example, 15 min or 20 min (Figure 3a). After growingfor 30 min, the crystallites start to connect to each other(Figure 3b). Therefore, after nucleation, the first stage of thecrystal growth was dominated by an orientated aggregationprocess. The colloidal particles at this stage undergo a transi-tion from a porous to nonporous state, which can be confirmedby nitrogen adsorption/desorption isotherms as shown inSupporting Information (Figure S4). The 20 min specimenclearly shows a mesoporous property, which is lost in the 12and 240 h samples (Figure S4a). At the same time, the specificsurface areas of the specimens reduced very quickly at this stage(from 15 min to 12 h) and then reduced slowly (Figure S4b).For such an orientated aggregation process, a kinetic model
was proposed (see part 6, Supporting Information),38
=++
d dmk tk t
110
1
1 (1)
where d is the average crystal size at time t, d0 is the initialaverage crystal size at the starting point, m is defined as theaggregation factor which represents the degree of crystal com-bination, k1 represents the crystal growth rate constant. Thecrystal size d0 is about 5 nm at point A. The first stage of crystalgrowth can be fitted well to eq 1 and the resultant fittingparameters listed in Table 1, that is, d0 = 4.90 nm, m = 6.26,
and k1 = 1.37 h−1. The crystal size curve shown in the inset ofFigure 1b remarkably matches the experiment results, indicat-ing that the above model described by eq 1 can actually addresscrystal growth by an orientated aggregation process. When tis very small, the crystallite size changes almost linearly with
Figure 5. HRTEM image of a BaTiO3 particle after crystal growth at alower temperature, 120 °C for 24 h, showing that the core and thesurface area have different crystallinities. Two d-spacings of 3.96 and2.76 Å are measured, corresponding to the (001) and (110) planes ofBaTiO3, respectively.
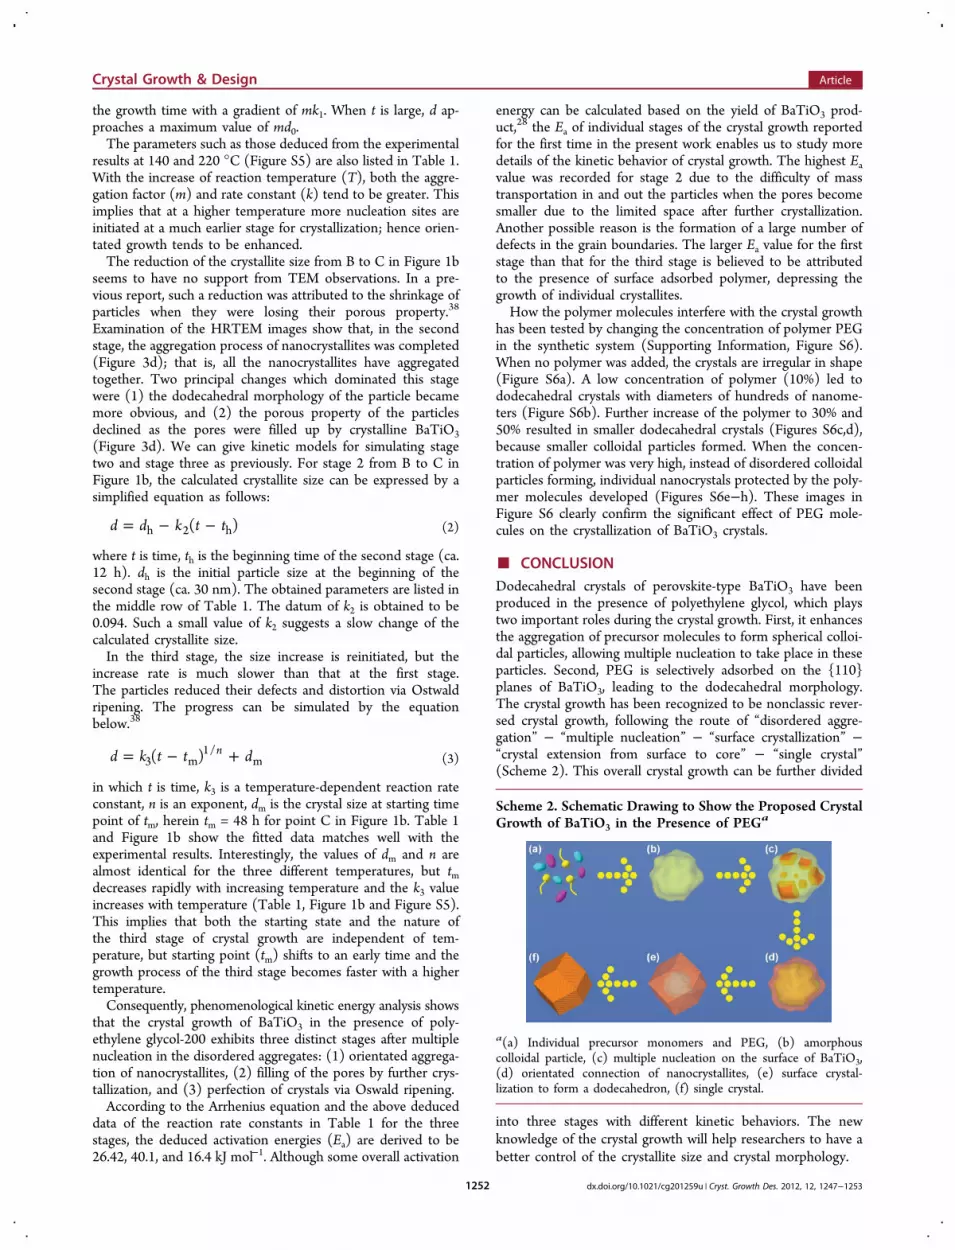
Table 1. Simulated Data for the Three Stages of CrystalGrowth of BaTiO3 Nanoparticles
a
stage T (°C) 220 180 140Ea
(kJ/mol)
m 6.86 6.26 5.62
the first stage d0 (nm) 4.49 4.90 4.85 26.42k1 (h
−1) 2.49 1.37 0.72R2 0.93 0.91 0.91
dh (nm) 28.99 29.77 28.85 40.10the second stage k2 (h
−1) 0.32 0.094 0.048R2 0.91 0.97 0.99
dm (nm) 22.15 25.70 22.79
the third stage tm (h) 23.60 47.93 240.0 16.40k3 (h
−1/3) 1.87 1.45 0.871/n 0.39 0.32 0.35R2 0.96 0.95 0.82
aNote: Ea is deduced from Arrhenius equation, ln k = −((Ea)/(RT)) + A0.
Crystal Growth & Design Article
dx.doi.org/10.1021/cg201259u | Cryst. Growth Des. 2012, 12, 1247−12531251
the growth time with a gradient of mk1. When t is large, d ap-proaches a maximum value of md0.The parameters such as those deduced from the experimental
results at 140 and 220 °C (Figure S5) are also listed in Table 1.With the increase of reaction temperature (T), both the aggre-gation factor (m) and rate constant (k) tend to be greater. Thisimplies that at a higher temperature more nucleation sites areinitiated at a much earlier stage for crystallization; hence orien-tated growth tends to be enhanced.The reduction of the crystallite size from B to C in Figure 1b
seems to have no support from TEM observations. In a pre-vious report, such a reduction was attributed to the shrinkage ofparticles when they were losing their porous property.38
Examination of the HRTEM images show that, in the secondstage, the aggregation process of nanocrystallites was completed(Figure 3d); that is, all the nanocrystallites have aggregatedtogether. Two principal changes which dominated this stagewere (1) the dodecahedral morphology of the particle becamemore obvious, and (2) the porous property of the particlesdeclined as the pores were filled up by crystalline BaTiO3(Figure 3d). We can give kinetic models for simulating stagetwo and stage three as previously. For stage 2 from B to C inFigure 1b, the calculated crystallite size can be expressed by asimplified equation as follows:
= − −d d k t t( )h 2 h (2)
where t is time, th is the beginning time of the second stage (ca.12 h). dh is the initial particle size at the beginning of thesecond stage (ca. 30 nm). The obtained parameters are listed inthe middle row of Table 1. The datum of k2 is obtained to be0.094. Such a small value of k2 suggests a slow change of thecalculated crystallite size.In the third stage, the size increase is reinitiated, but the
increase rate is much slower than that at the first stage.The particles reduced their defects and distortion via Ostwaldripening. The progress can be simulated by the equationbelow.38
= − +d k t t d( ) n3 m
1/m (3)
in which t is time, k3 is a temperature-dependent reaction rateconstant, n is an exponent, dm is the crystal size at starting timepoint of tm, herein tm = 48 h for point C in Figure 1b. Table 1and Figure 1b show the fitted data matches well with theexperimental results. Interestingly, the values of dm and n arealmost identical for the three different temperatures, but tmdecreases rapidly with increasing temperature and the k3 valueincreases with temperature (Table 1, Figure 1b and Figure S5).This implies that both the starting state and the nature ofthe third stage of crystal growth are independent of tem-perature, but starting point (tm) shifts to an early time and thegrowth process of the third stage becomes faster with a highertemperature.Consequently, phenomenological kinetic energy analysis shows
that the crystal growth of BaTiO3 in the presence of poly-ethylene glycol-200 exhibits three distinct stages after multiplenucleation in the disordered aggregates: (1) orientated aggrega-tion of nanocrystallites, (2) filling of the pores by further crys-tallization, and (3) perfection of crystals via Oswald ripening.According to the Arrhenius equation and the above deduced
data of the reaction rate constants in Table 1 for the threestages, the deduced activation energies (Ea) are derived to be26.42, 40.1, and 16.4 kJ mol−1. Although some overall activation
energy can be calculated based on the yield of BaTiO3 prod-uct,28 the Ea of individual stages of the crystal growth reportedfor the first time in the present work enables us to study moredetails of the kinetic behavior of crystal growth. The highest Eavalue was recorded for stage 2 due to the difficulty of masstransportation in and out the particles when the pores becomesmaller due to the limited space after further crystallization.Another possible reason is the formation of a large number ofdefects in the grain boundaries. The larger Ea value for the firststage than that for the third stage is believed to be attributedto the presence of surface adsorbed polymer, depressing thegrowth of individual crystallites.How the polymer molecules interfere with the crystal growth
has been tested by changing the concentration of polymer PEGin the synthetic system (Supporting Information, Figure S6).When no polymer was added, the crystals are irregular in shape(Figure S6a). A low concentration of polymer (10%) led tododecahedral crystals with diameters of hundreds of nanome-ters (Figure S6b). Further increase of the polymer to 30% and50% resulted in smaller dodecahedral crystals (Figures S6c,d),because smaller colloidal particles formed. When the concen-tration of polymer was very high, instead of disordered colloidalparticles forming, individual nanocrystals protected by the poly-mer molecules developed (Figures S6e−h). These images inFigure S6 clearly confirm the significant effect of PEG mole-cules on the crystallization of BaTiO3 crystals.
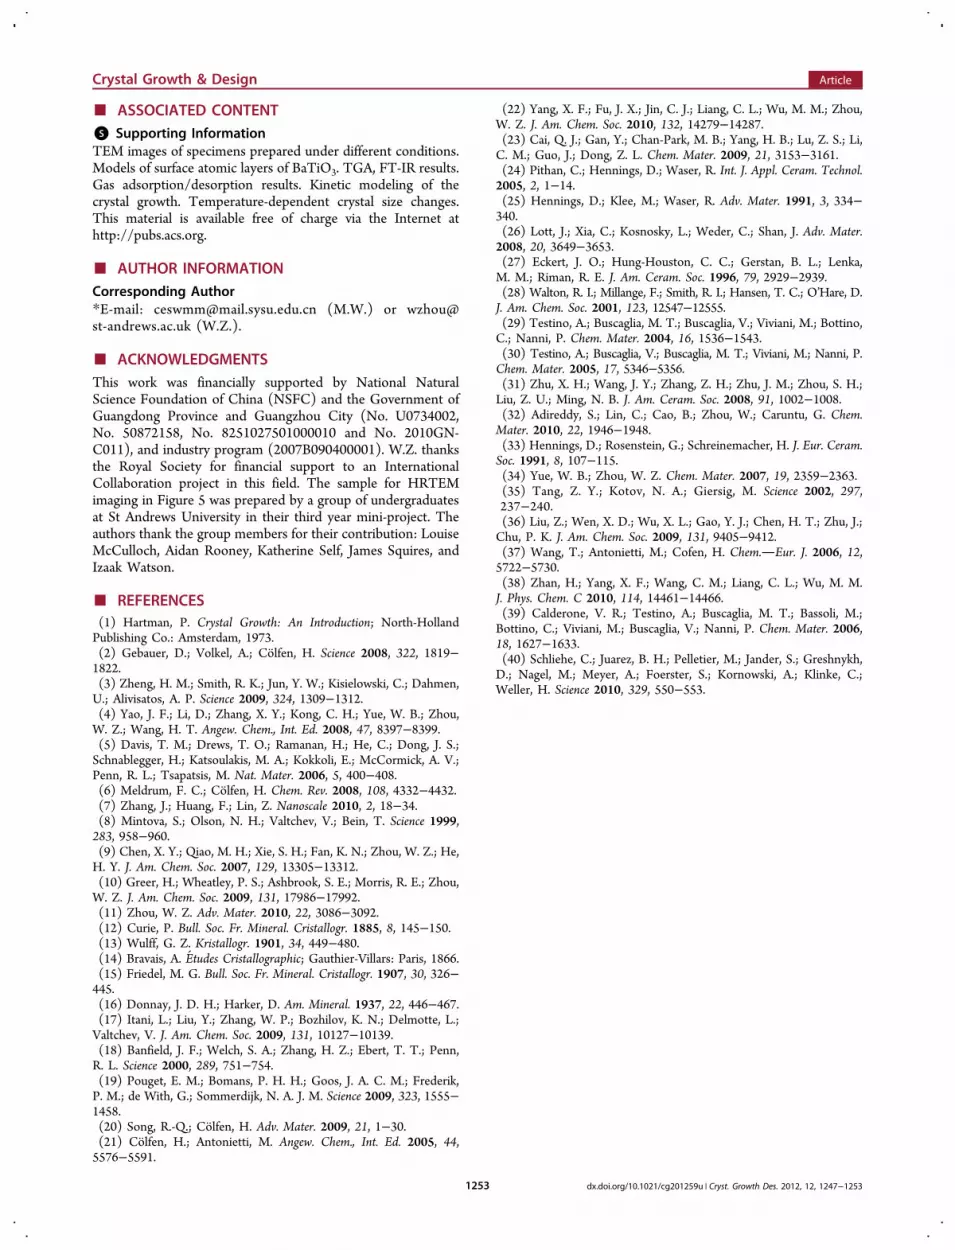
■ CONCLUSIONDodecahedral crystals of perovskite-type BaTiO3 have beenproduced in the presence of polyethylene glycol, which playstwo important roles during the crystal growth. First, it enhancesthe aggregation of precursor molecules to form spherical colloi-dal particles, allowing multiple nucleation to take place in theseparticles. Second, PEG is selectively adsorbed on the {110}planes of BaTiO3, leading to the dodecahedral morphology.The crystal growth has been recognized to be nonclassic rever-sed crystal growth, following the route of “disordered aggre-gation” − “multiple nucleation” − “surface crystallization” −“crystal extension from surface to core” − “single crystal”(Scheme 2). This overall crystal growth can be further divided
into three stages with different kinetic behaviors. The newknowledge of the crystal growth will help researchers to have abetter control of the crystallite size and crystal morphology.
Scheme 2. Schematic Drawing to Show the Proposed CrystalGrowth of BaTiO3 in the Presence of PEGa
a(a) Individual precursor monomers and PEG, (b) amorphouscolloidal particle, (c) multiple nucleation on the surface of BaTiO3,(d) orientated connection of nanocrystallites, (e) surface crystal-lization to form a dodecahedron, (f) single crystal.
Crystal Growth & Design Article
dx.doi.org/10.1021/cg201259u | Cryst. Growth Des. 2012, 12, 1247−12531252
■ ASSOCIATED CONTENT*S Supporting InformationTEM images of specimens prepared under different conditions.Models of surface atomic layers of BaTiO3. TGA, FT-IR results.Gas adsorption/desorption results. Kinetic modeling of thecrystal growth. Temperature-dependent crystal size changes.This material is available free of charge via the Internet athttp://pubs.acs.org.
■ AUTHOR INFORMATIONCorresponding Author*E-mail: [email protected] (M.W.) or [email protected] (W.Z.).
■ ACKNOWLEDGMENTSThis work was financially supported by National NaturalScience Foundation of China (NSFC) and the Government ofGuangdong Province and Guangzhou City (No. U0734002,No. 50872158, No. 8251027501000010 and No. 2010GN-C011), and industry program (2007B090400001). W.Z. thanksthe Royal Society for financial support to an InternationalCollaboration project in this field. The sample for HRTEMimaging in Figure 5 was prepared by a group of undergraduatesat St Andrews University in their third year mini-project. Theauthors thank the group members for their contribution: LouiseMcCulloch, Aidan Rooney, Katherine Self, James Squires, andIzaak Watson.
■ REFERENCES(1) Hartman, P. Crystal Growth: An Introduction; North-HollandPublishing Co.: Amsterdam, 1973.(2) Gebauer, D.; Volkel, A.; Colfen, H. Science 2008, 322, 1819−1822.(3) Zheng, H. M.; Smith, R. K.; Jun, Y. W.; Kisielowski, C.; Dahmen,U.; Alivisatos, A. P. Science 2009, 324, 1309−1312.(4) Yao, J. F.; Li, D.; Zhang, X. Y.; Kong, C. H.; Yue, W. B.; Zhou,W. Z.; Wang, H. T. Angew. Chem., Int. Ed. 2008, 47, 8397−8399.(5) Davis, T. M.; Drews, T. O.; Ramanan, H.; He, C.; Dong, J. S.;Schnablegger, H.; Katsoulakis, M. A.; Kokkoli, E.; McCormick, A. V.;Penn, R. L.; Tsapatsis, M. Nat. Mater. 2006, 5, 400−408.(6) Meldrum, F. C.; Colfen, H. Chem. Rev. 2008, 108, 4332−4432.(7) Zhang, J.; Huang, F.; Lin, Z. Nanoscale 2010, 2, 18−34.(8) Mintova, S.; Olson, N. H.; Valtchev, V.; Bein, T. Science 1999,283, 958−960.(9) Chen, X. Y.; Qiao, M. H.; Xie, S. H.; Fan, K. N.; Zhou, W. Z.; He,H. Y. J. Am. Chem. Soc. 2007, 129, 13305−13312.(10) Greer, H.; Wheatley, P. S.; Ashbrook, S. E.; Morris, R. E.; Zhou,W. Z. J. Am. Chem. Soc. 2009, 131, 17986−17992.(11) Zhou, W. Z. Adv. Mater. 2010, 22, 3086−3092.(12) Curie, P. Bull. Soc. Fr. Mineral. Cristallogr. 1885, 8, 145−150.(13) Wulff, G. Z. Kristallogr. 1901, 34, 449−480.(14) Bravais, A. Etudes Cristallographic; Gauthier-Villars: Paris, 1866.(15) Friedel, M. G. Bull. Soc. Fr. Mineral. Cristallogr. 1907, 30, 326−445.(16) Donnay, J. D. H.; Harker, D. Am. Mineral. 1937, 22, 446−467.(17) Itani, L.; Liu, Y.; Zhang, W. P.; Bozhilov, K. N.; Delmotte, L.;Valtchev, V. J. Am. Chem. Soc. 2009, 131, 10127−10139.(18) Banfield, J. F.; Welch, S. A.; Zhang, H. Z.; Ebert, T. T.; Penn,R. L. Science 2000, 289, 751−754.(19) Pouget, E. M.; Bomans, P. H. H.; Goos, J. A. C. M.; Frederik,P. M.; de With, G.; Sommerdijk, N. A. J. M. Science 2009, 323, 1555−1458.(20) Song, R.-Q.; Colfen, H. Adv. Mater. 2009, 21, 1−30.(21) Colfen, H.; Antonietti, M. Angew. Chem., Int. Ed. 2005, 44,5576−5591.
(22) Yang, X. F.; Fu, J. X.; Jin, C. J.; Liang, C. L.; Wu, M. M.; Zhou,W. Z. J. Am. Chem. Soc. 2010, 132, 14279−14287.(23) Cai, Q. J.; Gan, Y.; Chan-Park, M. B.; Yang, H. B.; Lu, Z. S.; Li,C. M.; Guo, J.; Dong, Z. L. Chem. Mater. 2009, 21, 3153−3161.(24) Pithan, C.; Hennings, D.; Waser, R. Int. J. Appl. Ceram. Technol.2005, 2, 1−14.(25) Hennings, D.; Klee, M.; Waser, R. Adv. Mater. 1991, 3, 334−340.(26) Lott, J.; Xia, C.; Kosnosky, L.; Weder, C.; Shan, J. Adv. Mater.2008, 20, 3649−3653.(27) Eckert, J. O.; Hung-Houston, C. C.; Gerstan, B. L.; Lenka,M. M.; Riman, R. E. J. Am. Ceram. Soc. 1996, 79, 2929−2939.(28) Walton, R. I.; Millange, F.; Smith, R. I.; Hansen, T. C.; O’Hare, D.J. Am. Chem. Soc. 2001, 123, 12547−12555.(29) Testino, A.; Buscaglia, M. T.; Buscaglia, V.; Viviani, M.; Bottino,C.; Nanni, P. Chem. Mater. 2004, 16, 1536−1543.(30) Testino, A.; Buscaglia, V.; Buscaglia, M. T.; Viviani, M.; Nanni, P.Chem. Mater. 2005, 17, 5346−5356.(31) Zhu, X. H.; Wang, J. Y.; Zhang, Z. H.; Zhu, J. M.; Zhou, S. H.;Liu, Z. U.; Ming, N. B. J. Am. Ceram. Soc. 2008, 91, 1002−1008.(32) Adireddy, S.; Lin, C.; Cao, B.; Zhou, W.; Caruntu, G. Chem.Mater. 2010, 22, 1946−1948.(33) Hennings, D.; Rosenstein, G.; Schreinemacher, H. J. Eur. Ceram.Soc. 1991, 8, 107−115.(34) Yue, W. B.; Zhou, W. Z. Chem. Mater. 2007, 19, 2359−2363.(35) Tang, Z. Y.; Kotov, N. A.; Giersig, M. Science 2002, 297,237−240.(36) Liu, Z.; Wen, X. D.; Wu, X. L.; Gao, Y. J.; Chen, H. T.; Zhu, J.;Chu, P. K. J. Am. Chem. Soc. 2009, 131, 9405−9412.(37) Wang, T.; Antonietti, M.; Cofen, H. Chem.Eur. J. 2006, 12,5722−5730.(38) Zhan, H.; Yang, X. F.; Wang, C. M.; Liang, C. L.; Wu, M. M.J. Phys. Chem. C 2010, 114, 14461−14466.(39) Calderone, V. R.; Testino, A.; Buscaglia, M. T.; Bassoli, M.;Bottino, C.; Viviani, M.; Buscaglia, V.; Nanni, P. Chem. Mater. 2006,18, 1627−1633.(40) Schliehe, C.; Juarez, B. H.; Pelletier, M.; Jander, S.; Greshnykh,D.; Nagel, M.; Meyer, A.; Foerster, S.; Kornowski, A.; Klinke, C.;Weller, H. Science 2010, 329, 550−553.
Crystal Growth & Design Article
dx.doi.org/10.1021/cg201259u | Cryst. Growth Des. 2012, 12, 1247−12531253


