Embed Size (px)
Citation preview
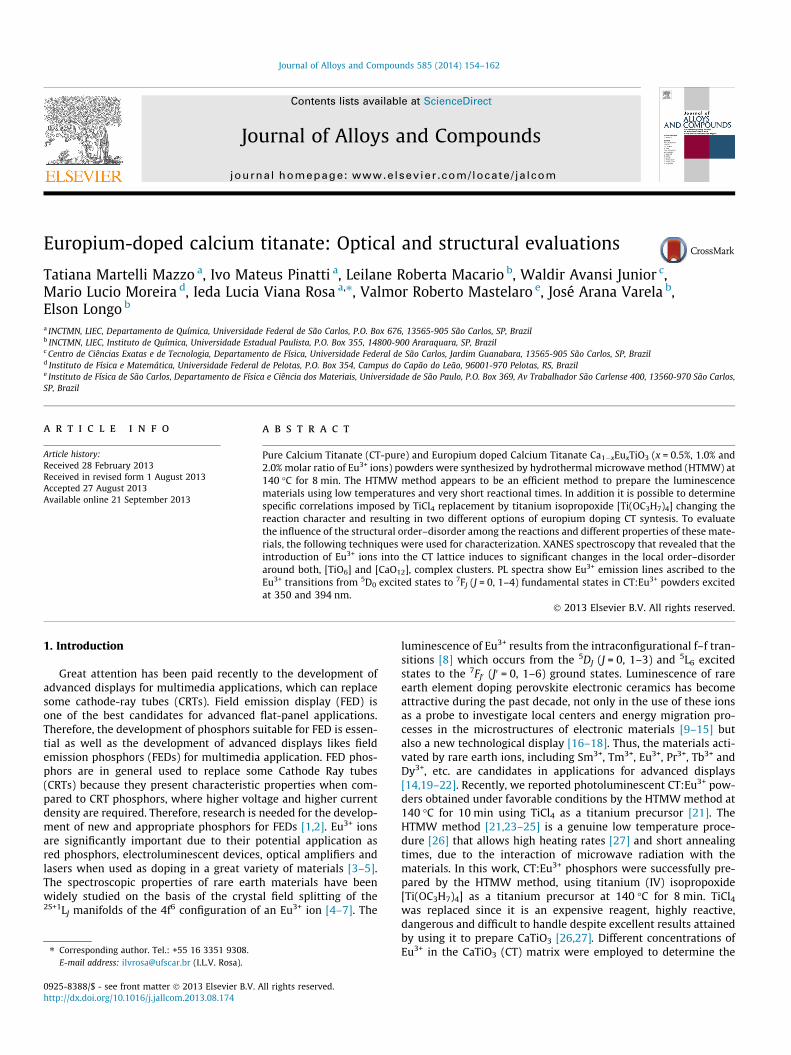
Journal of Alloys and Compounds 585 (2014) 154–162
Contents lists available at ScienceDirect
Journal of Alloys and Compounds
journal homepage: www.elsevier .com/locate / ja lcom
Europium-doped calcium titanate: Optical and structural evaluations
0925-8388/$ - see front matter � 2013 Elsevier B.V. All rights reserved.http://dx.doi.org/10.1016/j.jallcom.2013.08.174
⇑ Corresponding author. Tel.: +55 16 3351 9308.E-mail address: [email protected] (I.L.V. Rosa).
Tatiana Martelli Mazzo a, Ivo Mateus Pinatti a, Leilane Roberta Macario b, Waldir Avansi Junior c,Mario Lucio Moreira d, Ieda Lucia Viana Rosa a,⇑, Valmor Roberto Mastelaro e, José Arana Varela b,Elson Longo b
a INCTMN, LIEC, Departamento de Química, Universidade Federal de São Carlos, P.O. Box 676, 13565-905 São Carlos, SP, Brazilb INCTMN, LIEC, Instituto de Química, Universidade Estadual Paulista, P.O. Box 355, 14800-900 Araraquara, SP, Brazilc Centro de Ciências Exatas e de Tecnologia, Departamento de Física, Universidade Federal de São Carlos, Jardim Guanabara, 13565-905 São Carlos, SP, Brazild Instituto de Física e Matemática, Universidade Federal de Pelotas, P.O. Box 354, Campus do Capão do Leão, 96001-970 Pelotas, RS, Brazile Instituto de Física de São Carlos, Departamento de Física e Ciência dos Materiais, Universidade de São Paulo, P.O. Box 369, Av Trabalhador São Carlense 400, 13560-970 São Carlos,SP, Brazil
a r t i c l e i n f o
Article history:Received 28 February 2013Received in revised form 1 August 2013Accepted 27 August 2013Available online 21 September 2013
a b s t r a c t
Pure Calcium Titanate (CT-pure) and Europium doped Calcium Titanate Ca1�xEuxTiO3 (x = 0.5%, 1.0% and2.0% molar ratio of Eu3+ ions) powders were synthesized by hydrothermal microwave method (HTMW) at140 �C for 8 min. The HTMW method appears to be an efficient method to prepare the luminescencematerials using low temperatures and very short reactional times. In addition it is possible to determinespecific correlations imposed by TiCl4 replacement by titanium isopropoxide [Ti(OC3H7)4] changing thereaction character and resulting in two different options of europium doping CT syntesis. To evaluatethe influence of the structural order–disorder among the reactions and different properties of these mate-rials, the following techniques were used for characterization. XANES spectroscopy that revealed that theintroduction of Eu3+ ions into the CT lattice induces to significant changes in the local order–disorderaround both, [TiO6] and [CaO12], complex clusters. PL spectra show Eu3+ emission lines ascribed to theEu3+ transitions from 5D0 excited states to 7FJ (J = 0, 1–4) fundamental states in CT:Eu3+ powders excitedat 350 and 394 nm.
� 2013 Elsevier B.V. All rights reserved.
1. Introduction
Great attention has been paid recently to the development ofadvanced displays for multimedia applications, which can replacesome cathode-ray tubes (CRTs). Field emission display (FED) isone of the best candidates for advanced flat-panel applications.Therefore, the development of phosphors suitable for FED is essen-tial as well as the development of advanced displays likes fieldemission phosphors (FEDs) for multimedia application. FED phos-phors are in general used to replace some Cathode Ray tubes(CRTs) because they present characteristic properties when com-pared to CRT phosphors, where higher voltage and higher currentdensity are required. Therefore, research is needed for the develop-ment of new and appropriate phosphors for FEDs [1,2]. Eu3+ ionsare significantly important due to their potential application asred phosphors, electroluminescent devices, optical amplifiers andlasers when used as doping in a great variety of materials [3–5].The spectroscopic properties of rare earth materials have beenwidely studied on the basis of the crystal field splitting of the2S+1LJ manifolds of the 4f6 configuration of an Eu3+ ion [4–7]. The
luminescence of Eu3+ results from the intraconfigurational f–f tran-sitions [8] which occurs from the 5DJ (J = 0, 1–3) and 5L6 excitedstates to the 7FJ0 (J0 = 0, 1–6) ground states. Luminescence of rareearth element doping perovskite electronic ceramics has becomeattractive during the past decade, not only in the use of these ionsas a probe to investigate local centers and energy migration pro-cesses in the microstructures of electronic materials [9–15] butalso a new technological display [16–18]. Thus, the materials acti-vated by rare earth ions, including Sm3+, Tm3+, Eu3+, Pr3+, Tb3+ andDy3+, etc. are candidates in applications for advanced displays[14,19–22]. Recently, we reported photoluminescent CT:Eu3+ pow-ders obtained under favorable conditions by the HTMW method at140 �C for 10 min using TiCl4 as a titanium precursor [21]. TheHTMW method [21,23–25] is a genuine low temperature proce-dure [26] that allows high heating rates [27] and short annealingtimes, due to the interaction of microwave radiation with thematerials. In this work, CT:Eu3+ phosphors were successfully pre-pared by the HTMW method, using titanium (IV) isopropoxide[Ti(OC3H7)4] as a titanium precursor at 140 �C for 8 min. TiCl4
was replaced since it is an expensive reagent, highly reactive,dangerous and difficult to handle despite excellent results attainedby using it to prepare CaTiO3 [26,27]. Different concentrations ofEu3+ in the CaTiO3 (CT) matrix were employed to determine the
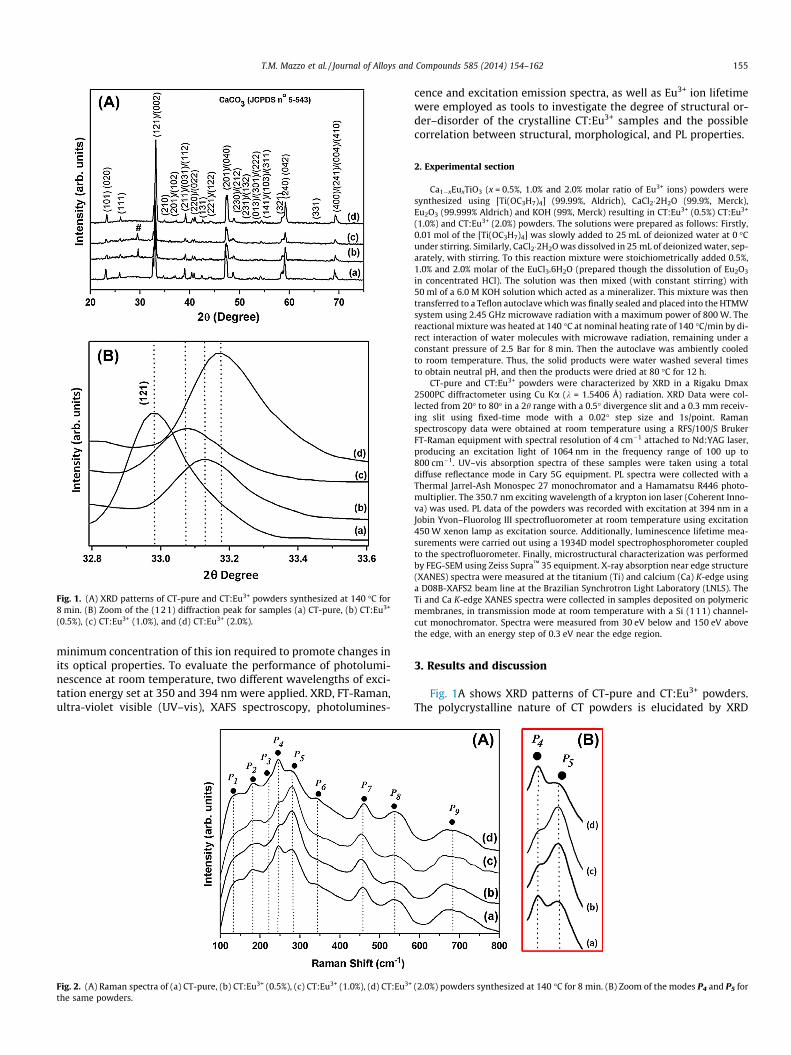
Fig. 1. (A) XRD patterns of CT-pure and CT:Eu3+ powders synthesized at 140 �C for8 min. (B) Zoom of the (121) diffraction peak for samples (a) CT-pure, (b) CT:Eu3+
(0.5%), (c) CT:Eu3+ (1.0%), and (d) CT:Eu3+ (2.0%).
T.M. Mazzo et al. / Journal of Alloys and Compounds 585 (2014) 154–162 155
minimum concentration of this ion required to promote changes inits optical properties. To evaluate the performance of photolumi-nescence at room temperature, two different wavelengths of exci-tation energy set at 350 and 394 nm were applied. XRD, FT-Raman,ultra-violet visible (UV–vis), XAFS spectroscopy, photolumines-
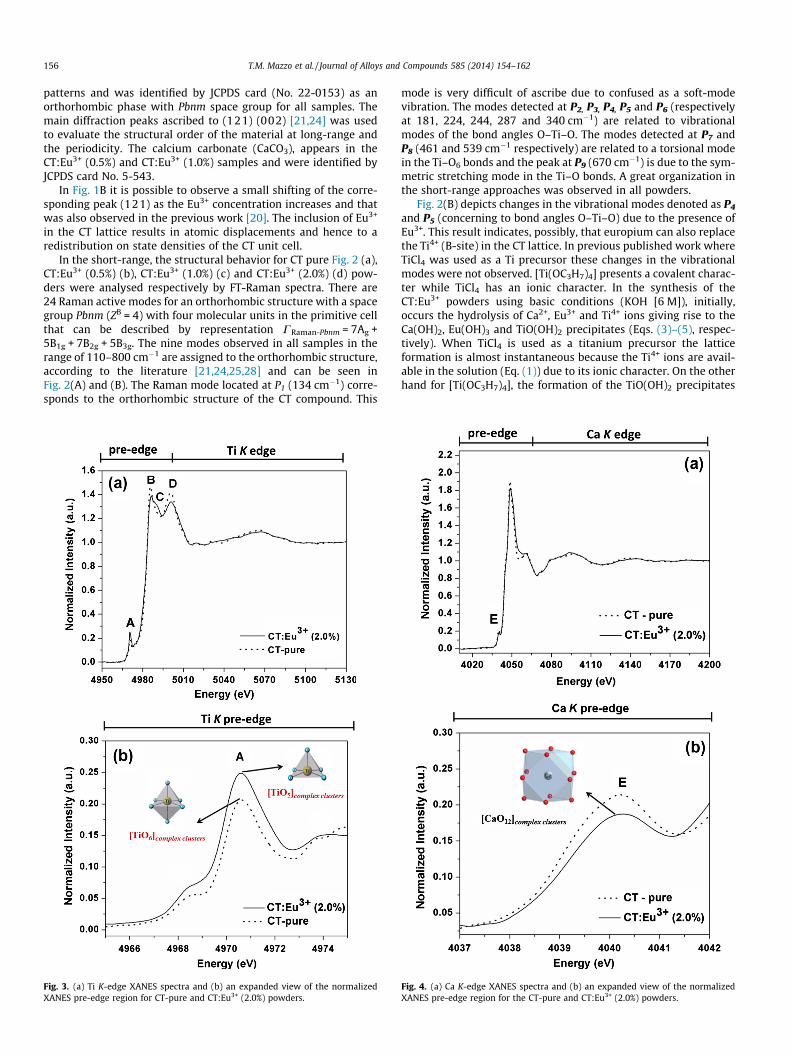
Fig. 2. (A) Raman spectra of (a) CT-pure, (b) CT:Eu3+ (0.5%), (c) CT:Eu3+ (1.0%), (d) CT:Eu3+
the same powders.
cence and excitation emission spectra, as well as Eu3+ ion lifetimewere employed as tools to investigate the degree of structural or-der–disorder of the crystalline CT:Eu3+ samples and the possiblecorrelation between structural, morphological, and PL properties.
2. Experimental section
Ca1�xEuxTiO3 (x = 0.5%, 1.0% and 2.0% molar ratio of Eu3+ ions) powders weresynthesized using [Ti(OC3H7)4] (99.99%, Aldrich), CaCl2�2H2O (99.9%, Merck),Eu2O3 (99.999% Aldrich) and KOH (99%, Merck) resulting in CT:Eu3+ (0.5%) CT:Eu3+
(1.0%) and CT:Eu3+ (2.0%) powders. The solutions were prepared as follows: Firstly,0.01 mol of the [Ti(OC3H7)4] was slowly added to 25 mL of deionized water at 0 �Cunder stirring. Similarly, CaCl2�2H2O was dissolved in 25 mL of deionized water, sep-arately, with stirring. To this reaction mixture were stoichiometrically added 0.5%,1.0% and 2.0% molar of the EuCl3.6H2O (prepared though the dissolution of Eu2O3
in concentrated HCl). The solution was then mixed (with constant stirring) with50 ml of a 6.0 M KOH solution which acted as a mineralizer. This mixture was thentransferred to a Teflon autoclave which was finally sealed and placed into the HTMWsystem using 2.45 GHz microwave radiation with a maximum power of 800 W. Thereactional mixture was heated at 140 �C at nominal heating rate of 140 �C/min by di-rect interaction of water molecules with microwave radiation, remaining under aconstant pressure of 2.5 Bar for 8 min. Then the autoclave was ambiently cooledto room temperature. Thus, the solid products were water washed several timesto obtain neutral pH, and then the products were dried at 80 �C for 12 h.
CT-pure and CT:Eu3+ powders were characterized by XRD in a Rigaku Dmax2500PC diffractometer using Cu Ka (k = 1.5406 Å) radiation. XRD Data were col-lected from 20� to 80� in a 2h range with a 0.5� divergence slit and a 0.3 mm receiv-ing slit using fixed-time mode with a 0.02� step size and 1s/point. Ramanspectroscopy data were obtained at room temperature using a RFS/100/S BrukerFT-Raman equipment with spectral resolution of 4 cm�1 attached to Nd:YAG laser,producing an excitation light of 1064 nm in the frequency range of 100 up to800 cm�1. UV–vis absorption spectra of these samples were taken using a totaldiffuse reflectance mode in Cary 5G equipment. PL spectra were collected with aThermal Jarrel-Ash Monospec 27 monochromator and a Hamamatsu R446 photo-multiplier. The 350.7 nm exciting wavelength of a krypton ion laser (Coherent Inno-va) was used. PL data of the powders was recorded with excitation at 394 nm in aJobin Yvon–Fluorolog III spectrofluorometer at room temperature using excitation450 W xenon lamp as excitation source. Additionally, luminescence lifetime mea-surements were carried out using a 1934D model spectrophosphorometer coupledto the spectrofluorometer. Finally, microstructural characterization was performedby FEG-SEM using Zeiss Supra™ 35 equipment. X-ray absorption near edge structure(XANES) spectra were measured at the titanium (Ti) and calcium (Ca) K-edge usinga D08B-XAFS2 beam line at the Brazilian Synchrotron Light Laboratory (LNLS). TheTi and Ca K-edge XANES spectra were collected in samples deposited on polymericmembranes, in transmission mode at room temperature with a Si (111) channel-cut monochromator. Spectra were measured from 30 eV below and 150 eV abovethe edge, with an energy step of 0.3 eV near the edge region.
3. Results and discussion
Fig. 1A shows XRD patterns of CT-pure and CT:Eu3+ powders.The polycrystalline nature of CT powders is elucidated by XRD
(2.0%) powders synthesized at 140 �C for 8 min. (B) Zoom of the modes P4 and P5 for
156 T.M. Mazzo et al. / Journal of Alloys and Compounds 585 (2014) 154–162
patterns and was identified by JCPDS card (No. 22-0153) as anorthorhombic phase with Pbnm space group for all samples. Themain diffraction peaks ascribed to (121) (002) [21,24] was usedto evaluate the structural order of the material at long-range andthe periodicity. The calcium carbonate (CaCO3), appears in theCT:Eu3+ (0.5%) and CT:Eu3+ (1.0%) samples and were identified byJCPDS card No. 5-543.
In Fig. 1B it is possible to observe a small shifting of the corre-sponding peak (121) as the Eu3+ concentration increases and thatwas also observed in the previous work [20]. The inclusion of Eu3+
in the CT lattice results in atomic displacements and hence to aredistribution on state densities of the CT unit cell.
In the short-range, the structural behavior for CT pure Fig. 2 (a),CT:Eu3+ (0.5%) (b), CT:Eu3+ (1.0%) (c) and CT:Eu3+ (2.0%) (d) pow-ders were analysed respectively by FT-Raman spectra. There are24 Raman active modes for an orthorhombic structure with a spacegroup Pbnm (ZB = 4) with four molecular units in the primitive cellthat can be described by representation CRaman-Pbnm = 7Ag +5B1g + 7B2g + 5B3g. The nine modes observed in all samples in therange of 110–800 cm�1 are assigned to the orthorhombic structure,according to the literature [21,24,25,28] and can be seen inFig. 2(A) and (B). The Raman mode located at P1 (134 cm�1) corre-sponds to the orthorhombic structure of the CT compound. This
Fig. 3. (a) Ti K-edge XANES spectra and (b) an expanded view of the normalizedXANES pre-edge region for CT-pure and CT:Eu3+ (2.0%) powders.
mode is very difficult of ascribe due to confused as a soft-modevibration. The modes detected at P2, P3, P4, P5 and P6 (respectivelyat 181, 224, 244, 287 and 340 cm�1) are related to vibrationalmodes of the bond angles O–Ti–O. The modes detected at P7 andP8 (461 and 539 cm�1 respectively) are related to a torsional modein the Ti–O6 bonds and the peak at P9 (670 cm�1) is due to the sym-metric stretching mode in the Ti–O bonds. A great organization inthe short-range approaches was observed in all powders.
Fig. 2(B) depicts changes in the vibrational modes denoted as P4
and P5 (concerning to bond angles O–Ti–O) due to the presence ofEu3+. This result indicates, possibly, that europium can also replacethe Ti4+ (B-site) in the CT lattice. In previous published work whereTiCl4 was used as a Ti precursor these changes in the vibrationalmodes were not observed. [Ti(OC3H7)4] presents a covalent charac-ter while TiCl4 has an ionic character. In the synthesis of theCT:Eu3+ powders using basic conditions (KOH [6 M]), initially,occurs the hydrolysis of Ca2+, Eu3+ and Ti4+ ions giving rise to theCa(OH)2, Eu(OH)3 and TiO(OH)2 precipitates (Eqs. (3)–(5), respec-tively). When TiCl4 is used as a titanium precursor the latticeformation is almost instantaneous because the Ti4+ ions are avail-able in the solution (Eq. (1)) due to its ionic character. On the otherhand for [Ti(OC3H7)4], the formation of the TiO(OH)2 precipitates
Fig. 4. (a) Ca K-edge XANES spectra and (b) an expanded view of the normalizedXANES pre-edge region for the CT-pure and CT:Eu3+ (2.0%) powders.
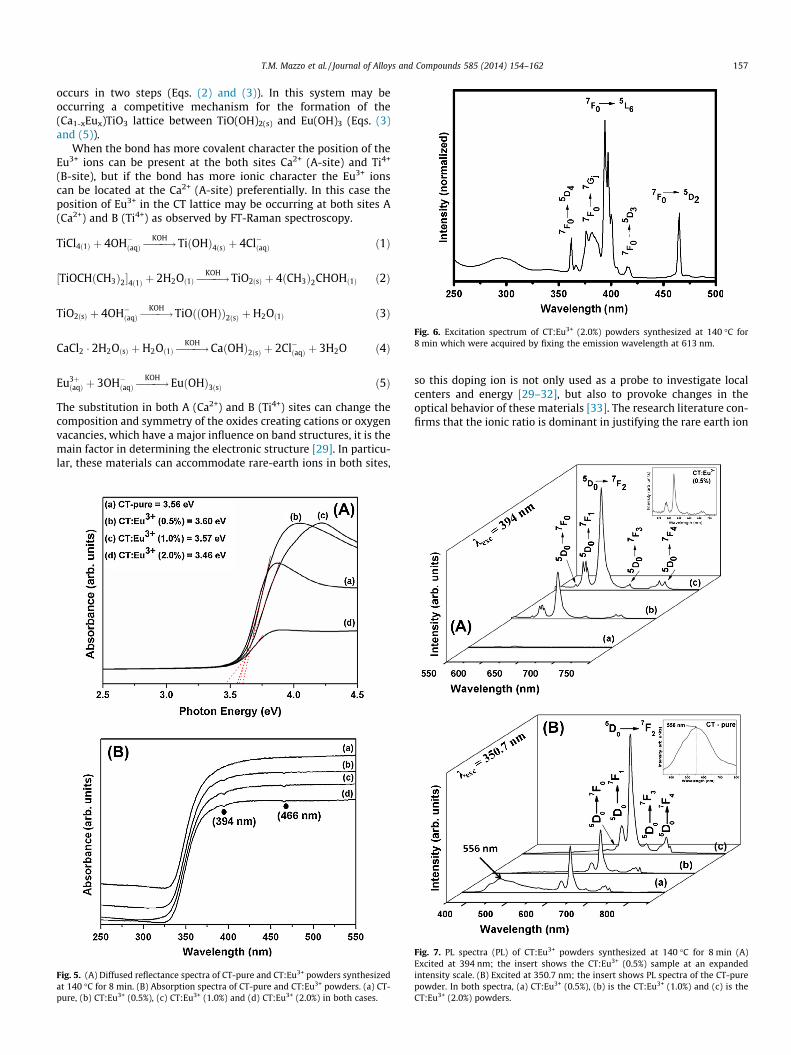
Fig. 6. Excitation spectrum of CT:Eu3+ (2.0%) powders synthesized at 140 �C for8 min which were acquired by fixing the emission wavelength at 613 nm.
T.M. Mazzo et al. / Journal of Alloys and Compounds 585 (2014) 154–162 157
occurs in two steps (Eqs. (2) and (3)). In this system may beoccurring a competitive mechanism for the formation of the(Ca1-xEux)TiO3 lattice between TiO(OH)2(s) and Eu(OH)3 (Eqs. (3)and (5)).
When the bond has more covalent character the position of theEu3+ ions can be present at the both sites Ca2+ (A-site) and Ti4+
(B-site), but if the bond has more ionic character the Eu3+ ionscan be located at the Ca2+ (A-site) preferentially. In this case theposition of Eu3+ in the CT lattice may be occurring at both sites A(Ca2+) and B (Ti4+) as observed by FT-Raman spectroscopy.
TiCl4ð1Þ þ 4OH�ðaqÞ ����!KOH TiðOHÞ4ðsÞ þ 4Cl�ðaqÞ ð1Þ
½TiOCHðCH3Þ2�4ð1Þ þ 2H2Oð1Þ ����!KOH TiO2ðsÞ þ 4ðCH3Þ2CHOHð1Þ ð2Þ
TiO2ðsÞ þ 4OH�ðaqÞ ����!KOH TiOððOHÞÞ2ðsÞ þH2Oð1Þ ð3Þ
CaCl2 � 2H2OðsÞ þH2Oð1Þ ����!KOH CaðOHÞ2ðsÞ þ 2Cl�ðaqÞ þ 3H2O ð4Þ
Eu3þðaqÞ þ 3OH�ðaqÞ ����!
KOH EuðOHÞ3ðsÞ ð5Þ
The substitution in both A (Ca2+) and B (Ti4+) sites can change thecomposition and symmetry of the oxides creating cations or oxygenvacancies, which have a major influence on band structures, it is themain factor in determining the electronic structure [29]. In particu-lar, these materials can accommodate rare-earth ions in both sites,
Fig. 5. (A) Diffused reflectance spectra of CT-pure and CT:Eu3+ powders synthesizedat 140 �C for 8 min. (B) Absorption spectra of CT-pure and CT:Eu3+ powders. (a) CT-pure, (b) CT:Eu3+ (0.5%), (c) CT:Eu3+ (1.0%) and (d) CT:Eu3+ (2.0%) in both cases.
so this doping ion is not only used as a probe to investigate localcenters and energy [29–32], but also to provoke changes in theoptical behavior of these materials [33]. The research literature con-firms that the ionic ratio is dominant in justifying the rare earth ion
Fig. 7. PL spectra (PL) of CT:Eu3+ powders synthesized at 140 �C for 8 min (A)Excited at 394 nm; the insert shows the CT:Eu3+ (0.5%) sample at an expandedintensity scale. (B) Excited at 350.7 nm; the insert shows PL spectra of the CT-purepowder. In both spectra, (a) CT:Eu3+ (0.5%), (b) is the CT:Eu3+ (1.0%) and (c) is theCT:Eu3+ (2.0%) powders.
158 T.M. Mazzo et al. / Journal of Alloys and Compounds 585 (2014) 154–162
localization in perovskites and conclude that the substitution is inthe A2+ position [34,35,36]. However, previous Rietveld refinementresults of BaTiO3 containing Sm3+ indicated that it is soluble in boththe A and B sites [36]. Similarly, Araujo et al. [37] reported that thelattice location of Er3+ in a SrTiO3 single crystal can be found in bothA (Sr2+) and B (Ti4+) substitutional lattice sites. Using a Rietveldanalysis of a nanocrystalline powder of SrTiO3 containing Sm3+ an-nealed at 750 �C, Longo et al. [38] concluded that the Sm3+ wasprobably inserted in the B-site position. Zhang et al. [16] reportedthat Ca2+ and Ti4+ in the CaTiO3 matrix can be substituted by Ln3+
ions.Fig. 3(a) presents a normalized Ti K-edge XANES spectra of
CT-pure and CT:Eu3+ (2.0%) powders, which reports the mainimportant distortions around the Ca and Ti K-edges. XANES spectrarevealed some differences in the pre- and post-edge regions. In thepost-edge region it is clear that the presence of Eu3+ leads to achange in the peak intensities denoted as B and D, and an
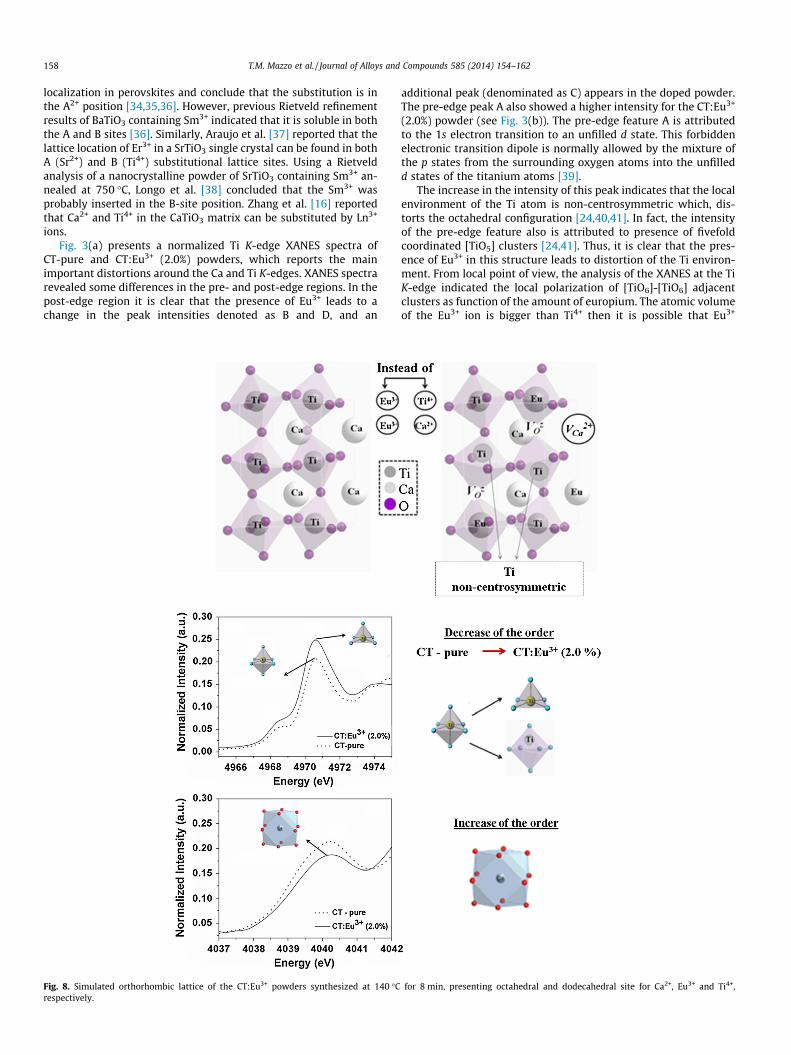
Fig. 8. Simulated orthorhombic lattice of the CT:Eu3+ powders synthesized at 140 �Crespectively.
additional peak (denominated as C) appears in the doped powder.The pre-edge peak A also showed a higher intensity for the CT:Eu3+
(2.0%) powder (see Fig. 3(b)). The pre-edge feature A is attributedto the 1s electron transition to an unfilled d state. This forbiddenelectronic transition dipole is normally allowed by the mixture ofthe p states from the surrounding oxygen atoms into the unfilledd states of the titanium atoms [39].
The increase in the intensity of this peak indicates that the localenvironment of the Ti atom is non-centrosymmetric which, dis-torts the octahedral configuration [24,40,41]. In fact, the intensityof the pre-edge feature also is attributed to presence of fivefoldcoordinated [TiO5] clusters [24,41]. Thus, it is clear that the pres-ence of Eu3+ in this structure leads to distortion of the Ti environ-ment. From local point of view, the analysis of the XANES at the TiK-edge indicated the local polarization of [TiO6]-[TiO6] adjacentclusters as function of the amount of europium. The atomic volumeof the Eu3+ ion is bigger than Ti4+ then it is possible that Eu3+
for 8 min, presenting octahedral and dodecahedral site for Ca2+, Eu3+ and Ti4+,
T.M. Mazzo et al. / Journal of Alloys and Compounds 585 (2014) 154–162 159
replaces the B-site (Ti4+) increasing the structural disorder around[TiO6] octahedral cluster related to the formation of ½EuO6��c�½TiO6�jc complex clusters [19]. Thus, the distortion between thesecomplex clusters causes a polarization and/or difference in chargedensity in the structure which is able to promote a charge transferbetween the ½EuO6��c � ½TiO6�jc and the charge compensation occursaccording to Eq. (6):
½EuO6��c � ½TiO6�jc ! ½EuO6�xc þ ½TiO6�xc ; ð6Þ
where c is the complex clusters.According to de Lazaro et al. [40], the PL emission can be related
to the order–disorder in the calcium coordination which indicatesthat the lattice modifier affects the PL emission intensity.
To show the calcium local order, Fig. 4(a) presents the Ca KedgeXANES spectra of CT-pure and CT:Eu3+ (2.0%) powders. The pre-edge feature E is commonly attributed to transitions of Ca 1s statesto the Ca 3d or O 2p molecular orbital [24]. Peak E is attributed tothe pre-edge feature which is related to the number of holes and isemployed to evaluate the degree of disorder around Ca2+ ions [40].As Fig. 4(b) indicates, significant changes in these features occurdue to the presence of Eu3+.
The decrease in the intensity of the pre-edge feature E alsocould be related to a increase of the order in the arrangement ofnearest neighbor oxygen atoms around Ca2+ ions. The atomic vol-ume of the Eu3+ ion is similar of the Ca2+ and when it replacesthe A-site (Ca2+) the structural order increase around the [CaO12]cube-octahedral cluster [19] and this fact causes the contractionin the unitary cell as observed by XRD data. In summary, the anal-ysis of the XANES spectra collected at the Ti and Ca K-edges showsthat the introduction of Eu3+ ions into the CT network induces sig-nificant changes in the local order–disorder around both Ti and Caatoms.
Table 1Relative area of the (5D0 ? 7F2)/(5D0 ? 7F1) CT:Eu3+ powders transition synthesized140 �C for 8 min.
Samples (5D0 ?7F2)/(5D0 ?
7F1)
CT: Eu3+ (0.5%) 2.34CT: Eu3+ (1.0%) 3.28CT: Eu3+ (2.0%) 3.53
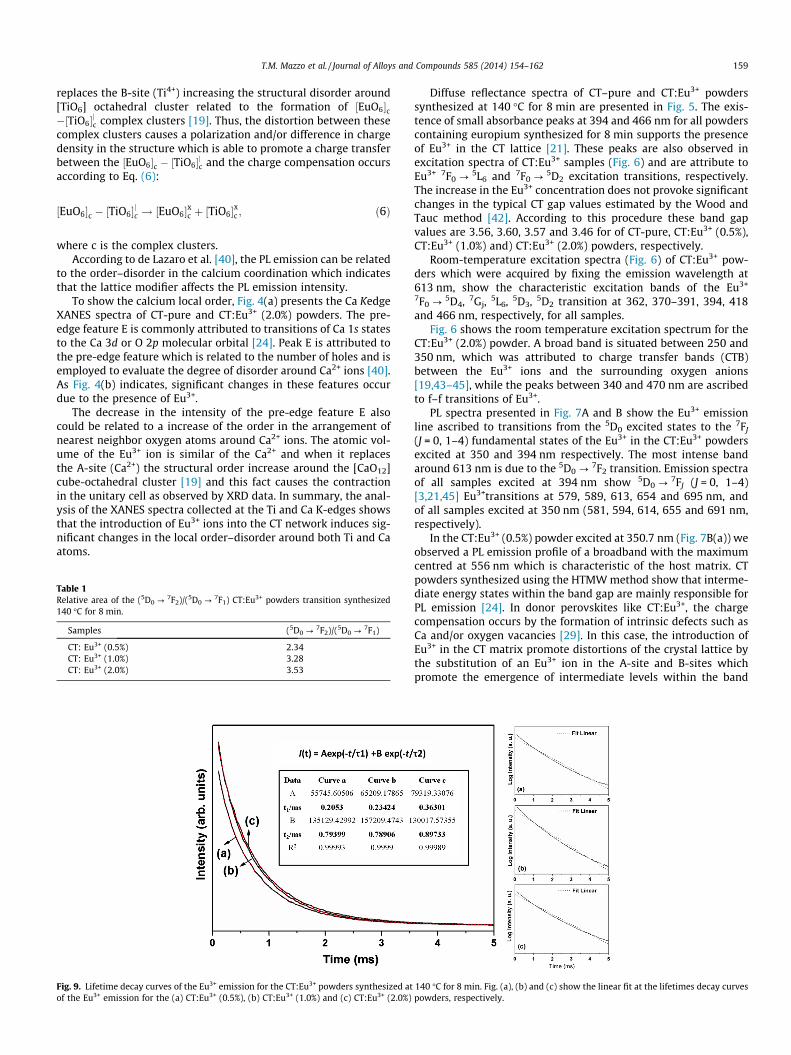
Fig. 9. Lifetime decay curves of the Eu3+ emission for the CT:Eu3+ powders synthesized atof the Eu3+ emission for the (a) CT:Eu3+ (0.5%), (b) CT:Eu3+ (1.0%) and (c) CT:Eu3+ (2.0%)
Diffuse reflectance spectra of CT–pure and CT:Eu3+ powderssynthesized at 140 �C for 8 min are presented in Fig. 5. The exis-tence of small absorbance peaks at 394 and 466 nm for all powderscontaining europium synthesized for 8 min supports the presenceof Eu3+ in the CT lattice [21]. These peaks are also observed inexcitation spectra of CT:Eu3+ samples (Fig. 6) and are attribute toEu3+ 7F0 ?
5L6 and 7F0 ?5D2 excitation transitions, respectively.
The increase in the Eu3+ concentration does not provoke significantchanges in the typical CT gap values estimated by the Wood andTauc method [42]. According to this procedure these band gapvalues are 3.56, 3.60, 3.57 and 3.46 for of CT-pure, CT:Eu3+ (0.5%),CT:Eu3+ (1.0%) and) CT:Eu3+ (2.0%) powders, respectively.
Room-temperature excitation spectra (Fig. 6) of CT:Eu3+ pow-ders which were acquired by fixing the emission wavelength at613 nm, show the characteristic excitation bands of the Eu3+
7F0 ?5D4, 7Gj, 5L6, 5D3, 5D2 transition at 362, 370–391, 394, 418
and 466 nm, respectively, for all samples.Fig. 6 shows the room temperature excitation spectrum for the
CT:Eu3+ (2.0%) powder. A broad band is situated between 250 and350 nm, which was attributed to charge transfer bands (CTB)between the Eu3+ ions and the surrounding oxygen anions[19,43–45], while the peaks between 340 and 470 nm are ascribedto f–f transitions of Eu3+.
PL spectra presented in Fig. 7A and B show the Eu3+ emissionline ascribed to transitions from the 5D0 excited states to the 7FJ
(J = 0, 1–4) fundamental states of the Eu3+ in the CT:Eu3+ powdersexcited at 350 and 394 nm respectively. The most intense bandaround 613 nm is due to the 5D0 ?
7F2 transition. Emission spectraof all samples excited at 394 nm show 5D0 ?
7FJ (J = 0, 1–4)[3,21,45] Eu3+transitions at 579, 589, 613, 654 and 695 nm, andof all samples excited at 350 nm (581, 594, 614, 655 and 691 nm,respectively).
In the CT:Eu3+ (0.5%) powder excited at 350.7 nm (Fig. 7B(a)) weobserved a PL emission profile of a broadband with the maximumcentred at 556 nm which is characteristic of the host matrix. CTpowders synthesized using the HTMW method show that interme-diate energy states within the band gap are mainly responsible forPL emission [24]. In donor perovskites like CT:Eu3+, the chargecompensation occurs by the formation of intrinsic defects such asCa and/or oxygen vacancies [29]. In this case, the introduction ofEu3+ in the CT matrix promote distortions of the crystal lattice bythe substitution of an Eu3+ ion in the A-site and B-sites whichpromote the emergence of intermediate levels within the band
140 �C for 8 min. Fig. (a), (b) and (c) show the linear fit at the lifetimes decay curvespowders, respectively.
160 T.M. Mazzo et al. / Journal of Alloys and Compounds 585 (2014) 154–162
gap, possibly due to the presence of oxygen vacancies that can beeither (Vx
o), ðV �oÞ and ðV ��oÞ between the clusters [BO6] and/or Cavacancies that can be either [V jjCa], [V jCa] and between the clusters[AO12] [21]. The optical performance of Eu-doped calcium titanatesdepends critically of the charge compensation according to Eqs.(7)–(10):
2½EuO12��c þ ½VjjcaO12�c ! 2½EuO12�xc þ ½V
xcaO12�c; ð7Þ
½TiO6�xc þ ½TiOS � Vx0�c ! ½TiO6�jc � ½TiOS � V �0�c; ð8Þ
2½EuO6��c½TiOS � Vx0�c ! 2½EuO6�xc � ½TiOS � V �0�c; ð9Þ
½EuO6��c þ ½TiO6�jc ! ½EuO6�xc þ ½TiO6�xc ð10Þ
where c is the complex clusters.
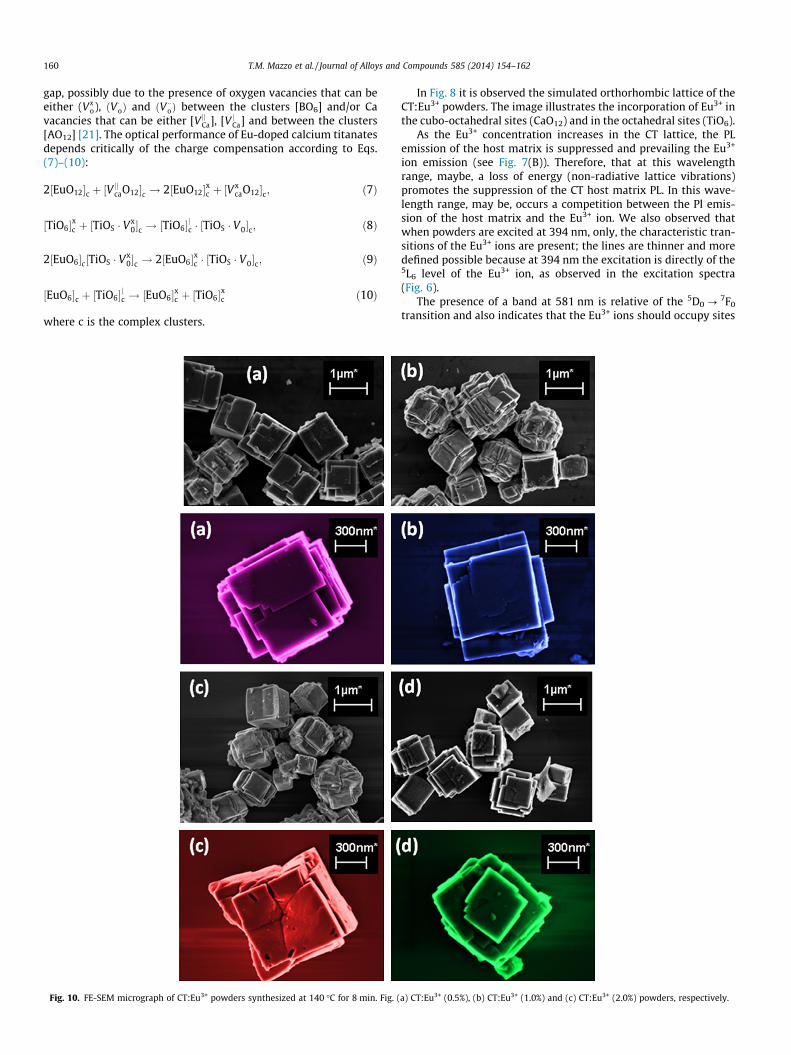
Fig. 10. FE-SEM micrograph of CT:Eu3+ powders synthesized at 140 �C for 8 min. Fig. (
In Fig. 8 it is observed the simulated orthorhombic lattice of theCT:Eu3+ powders. The image illustrates the incorporation of Eu3+ inthe cubo-octahedral sites (CaO12) and in the octahedral sites (TiO6).
As the Eu3+ concentration increases in the CT lattice, the PLemission of the host matrix is suppressed and prevailing the Eu3+
ion emission (see Fig. 7(B)). Therefore, that at this wavelengthrange, maybe, a loss of energy (non-radiative lattice vibrations)promotes the suppression of the CT host matrix PL. In this wave-length range, may be, occurs a competition between the Pl emis-sion of the host matrix and the Eu3+ ion. We also observed thatwhen powders are excited at 394 nm, only, the characteristic tran-sitions of the Eu3+ ions are present; the lines are thinner and moredefined possible because at 394 nm the excitation is directly of the5L6 level of the Eu3+ ion, as observed in the excitation spectra(Fig. 6).
The presence of a band at 581 nm is relative of the 5D0 ?7F0
transition and also indicates that the Eu3+ ions should occupy sites
a) CT:Eu3+ (0.5%), (b) CT:Eu3+ (1.0%) and (c) CT:Eu3+ (2.0%) powders, respectively.
T.M. Mazzo et al. / Journal of Alloys and Compounds 585 (2014) 154–162 161
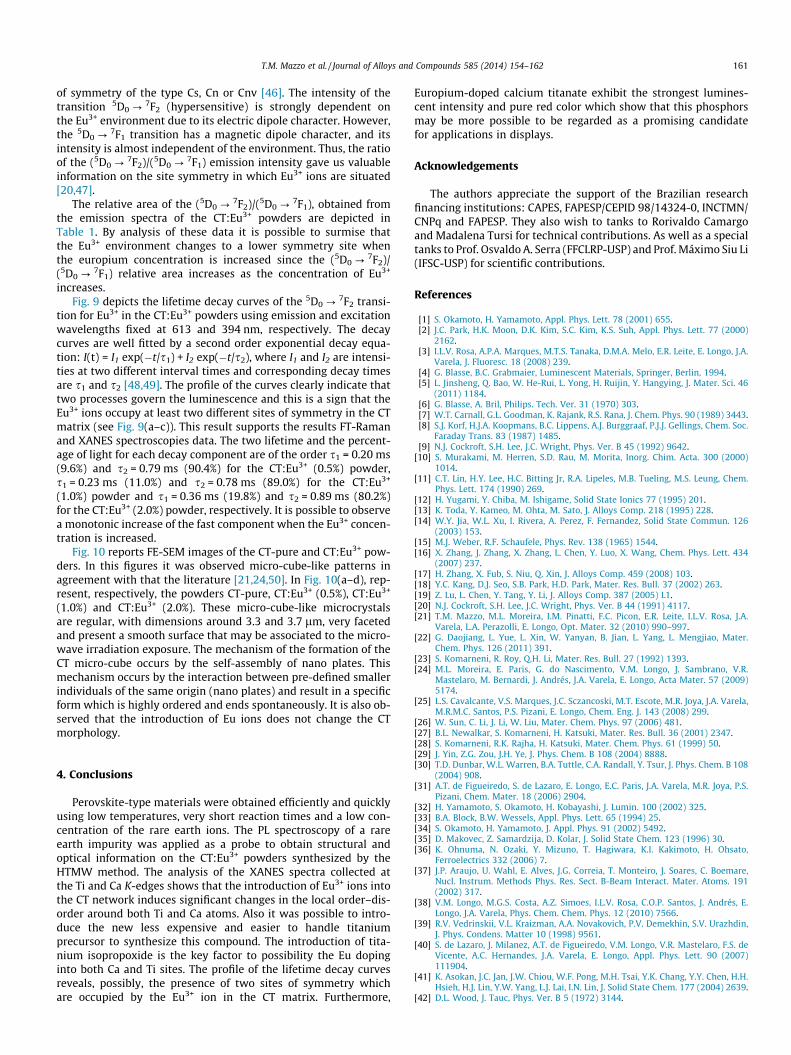
of symmetry of the type Cs, Cn or Cnv [46]. The intensity of thetransition 5D0 ?
7F2 (hypersensitive) is strongly dependent onthe Eu3+ environment due to its electric dipole character. However,the 5D0 ?
7F1 transition has a magnetic dipole character, and itsintensity is almost independent of the environment. Thus, the ratioof the (5D0 ?
7F2)/(5D0 ?7F1) emission intensity gave us valuable
information on the site symmetry in which Eu3+ ions are situated[20,47].
The relative area of the (5D0 ?7F2)/(5D0 ?
7F1), obtained fromthe emission spectra of the CT:Eu3+ powders are depicted inTable 1. By analysis of these data it is possible to surmise thatthe Eu3+ environment changes to a lower symmetry site whenthe europium concentration is increased since the (5D0 ?
7F2)/(5D0 ?
7F1) relative area increases as the concentration of Eu3+
increases.Fig. 9 depicts the lifetime decay curves of the 5D0 ?
7F2 transi-tion for Eu3+ in the CT:Eu3+ powders using emission and excitationwavelengths fixed at 613 and 394 nm, respectively. The decaycurves are well fitted by a second order exponential decay equa-tion: I(t) = I1 exp(�t/s1) + I2 exp(�t/s2), where I1 and I2 are intensi-ties at two different interval times and corresponding decay timesare s1 and s2 [48,49]. The profile of the curves clearly indicate thattwo processes govern the luminescence and this is a sign that theEu3+ ions occupy at least two different sites of symmetry in the CTmatrix (see Fig. 9(a–c)). This result supports the results FT-Ramanand XANES spectroscopies data. The two lifetime and the percent-age of light for each decay component are of the order s1 = 0.20 ms(9.6%) and s2 = 0.79 ms (90.4%) for the CT:Eu3+ (0.5%) powder,s1 = 0.23 ms (11.0%) and s2 = 0.78 ms (89.0%) for the CT:Eu3+
(1.0%) powder and s1 = 0.36 ms (19.8%) and s2 = 0.89 ms (80.2%)for the CT:Eu3+ (2.0%) powder, respectively. It is possible to observea monotonic increase of the fast component when the Eu3+ concen-tration is increased.
Fig. 10 reports FE-SEM images of the CT-pure and CT:Eu3+ pow-ders. In this figures it was observed micro-cube-like patterns inagreement with that the literature [21,24,50]. In Fig. 10(a–d), rep-resent, respectively, the powders CT-pure, CT:Eu3+ (0.5%), CT:Eu3+
(1.0%) and CT:Eu3+ (2.0%). These micro-cube-like microcrystalsare regular, with dimensions around 3.3 and 3.7 lm, very facetedand present a smooth surface that may be associated to the micro-wave irradiation exposure. The mechanism of the formation of theCT micro-cube occurs by the self-assembly of nano plates. Thismechanism occurs by the interaction between pre-defined smallerindividuals of the same origin (nano plates) and result in a specificform which is highly ordered and ends spontaneously. It is also ob-served that the introduction of Eu ions does not change the CTmorphology.
4. Conclusions
Perovskite-type materials were obtained efficiently and quicklyusing low temperatures, very short reaction times and a low con-centration of the rare earth ions. The PL spectroscopy of a rareearth impurity was applied as a probe to obtain structural andoptical information on the CT:Eu3+ powders synthesized by theHTMW method. The analysis of the XANES spectra collected atthe Ti and Ca K-edges shows that the introduction of Eu3+ ions intothe CT network induces significant changes in the local order–dis-order around both Ti and Ca atoms. Also it was possible to intro-duce the new less expensive and easier to handle titaniumprecursor to synthesize this compound. The introduction of tita-nium isopropoxide is the key factor to possibility the Eu dopinginto both Ca and Ti sites. The profile of the lifetime decay curvesreveals, possibly, the presence of two sites of symmetry whichare occupied by the Eu3+ ion in the CT matrix. Furthermore,
Europium-doped calcium titanate exhibit the strongest lumines-cent intensity and pure red color which show that this phosphorsmay be more possible to be regarded as a promising candidatefor applications in displays.
Acknowledgements
The authors appreciate the support of the Brazilian researchfinancing institutions: CAPES, FAPESP/CEPID 98/14324-0, INCTMN/CNPq and FAPESP. They also wish to tanks to Rorivaldo Camargoand Madalena Tursi for technical contributions. As well as a specialtanks to Prof. Osvaldo A. Serra (FFCLRP-USP) and Prof. Máximo Siu Li(IFSC-USP) for scientific contributions.
References
[1] S. Okamoto, H. Yamamoto, Appl. Phys. Lett. 78 (2001) 655.[2] J.C. Park, H.K. Moon, D.K. Kim, S.C. Kim, K.S. Suh, Appl. Phys. Lett. 77 (2000)
2162.[3] I.L.V. Rosa, A.P.A. Marques, M.T.S. Tanaka, D.M.A. Melo, E.R. Leite, E. Longo, J.A.
Varela, J. Fluoresc. 18 (2008) 239.[4] G. Blasse, B.C. Grabmaier, Luminescent Materials, Springer, Berlin, 1994.[5] L. Jinsheng, Q. Bao, W. He-Rui, L. Yong, H. Ruijin, Y. Hangying, J. Mater. Sci. 46
(2011) 1184.[6] G. Blasse, A. Bril, Philips. Tech. Ver. 31 (1970) 303.[7] W.T. Carnall, G.L. Goodman, K. Rajank, R.S. Rana, J. Chem. Phys. 90 (1989) 3443.[8] S.J. Korf, H.J.A. Koopmans, B.C. Lippens, A.J. Burggraaf, P.J.J. Gellings, Chem. Soc.
Faraday Trans. 83 (1987) 1485.[9] N.J. Cockroft, S.H. Lee, J.C. Wright, Phys. Ver. B 45 (1992) 9642.
[10] S. Murakami, M. Herren, S.D. Rau, M. Morita, Inorg. Chim. Acta. 300 (2000)1014.
[11] C.T. Lin, H.Y. Lee, H.C. Bitting Jr, R.A. Lipeles, M.B. Tueling, M.S. Leung, Chem.Phys. Lett. 174 (1990) 269.
[12] H. Yugami, Y. Chiba, M. Ishigame, Solid State Ionics 77 (1995) 201.[13] K. Toda, Y. Kameo, M. Ohta, M. Sato, J. Alloys Comp. 218 (1995) 228.[14] W.Y. Jia, W.L. Xu, I. Rivera, A. Perez, F. Fernandez, Solid State Commun. 126
(2003) 153.[15] M.J. Weber, R.F. Schaufele, Phys. Rev. 138 (1965) 1544.[16] X. Zhang, J. Zhang, X. Zhang, L. Chen, Y. Luo, X. Wang, Chem. Phys. Lett. 434
(2007) 237.[17] H. Zhang, X. Fub, S. Niu, Q. Xin, J. Alloys Comp. 459 (2008) 103.[18] Y.C. Kang, D.J. Seo, S.B. Park, H.D. Park, Mater. Res. Bull. 37 (2002) 263.[19] Z. Lu, L. Chen, Y. Tang, Y. Li, J. Alloys Comp. 387 (2005) L1.[20] N.J. Cockroft, S.H. Lee, J.C. Wright, Phys. Ver. B 44 (1991) 4117.[21] T.M. Mazzo, M.L. Moreira, I.M. Pinatti, F.C. Picon, E.R. Leite, I.L.V. Rosa, J.A.
Varela, L.A. Perazolli, E. Longo, Opt. Mater. 32 (2010) 990–997.[22] G. Daojiang, L. Yue, L. Xin, W. Yanyan, B. Jian, L. Yang, L. Mengjiao, Mater.
Chem. Phys. 126 (2011) 391.[23] S. Komarneni, R. Roy, Q.H. Li, Mater. Res. Bull. 27 (1992) 1393.[24] M.L. Moreira, E. Paris, G. do Nascimento, V.M. Longo, J. Sambrano, V.R.
Mastelaro, M. Bernardi, J. Andrés, J.A. Varela, E. Longo, Acta Mater. 57 (2009)5174.
[25] L.S. Cavalcante, V.S. Marques, J.C. Sczancoski, M.T. Escote, M.R. Joya, J.A. Varela,M.R.M.C. Santos, P.S. Pizani, E. Longo, Chem. Eng. J. 143 (2008) 299.
[26] W. Sun, C. Li, J. Li, W. Liu, Mater. Chem. Phys. 97 (2006) 481.[27] B.L. Newalkar, S. Komarneni, H. Katsuki, Mater. Res. Bull. 36 (2001) 2347.[28] S. Komarneni, R.K. Rajha, H. Katsuki, Mater. Chem. Phys. 61 (1999) 50.[29] J. Yin, Z.G. Zou, J.H. Ye, J. Phys. Chem. B 108 (2004) 8888.[30] T.D. Dunbar, W.L. Warren, B.A. Tuttle, C.A. Randall, Y. Tsur, J. Phys. Chem. B 108
(2004) 908.[31] A.T. de Figueiredo, S. de Lazaro, E. Longo, E.C. Paris, J.A. Varela, M.R. Joya, P.S.
Pizani, Chem. Mater. 18 (2006) 2904.[32] H. Yamamoto, S. Okamoto, H. Kobayashi, J. Lumin. 100 (2002) 325.[33] B.A. Block, B.W. Wessels, Appl. Phys. Lett. 65 (1994) 25.[34] S. Okamoto, H. Yamamoto, J. Appl. Phys. 91 (2002) 5492.[35] D. Makovec, Z. Samardzija, D. Kolar, J. Solid State Chem. 123 (1996) 30.[36] K. Ohnuma, N. Ozaki, Y. Mizuno, T. Hagiwara, K.I. Kakimoto, H. Ohsato,
Ferroelectrics 332 (2006) 7.[37] J.P. Araujo, U. Wahl, E. Alves, J.G. Correia, T. Monteiro, J. Soares, C. Boemare,
Nucl. Instrum. Methods Phys. Res. Sect. B-Beam Interact. Mater. Atoms. 191(2002) 317.
[38] V.M. Longo, M.G.S. Costa, A.Z. Simoes, I.L.V. Rosa, C.O.P. Santos, J. Andrés, E.Longo, J.A. Varela, Phys. Chem. Chem. Phys. 12 (2010) 7566.
[39] R.V. Vedrinskii, V.L. Kraizman, A.A. Novakovich, P.V. Demekhin, S.V. Urazhdin,J. Phys. Condens. Matter 10 (1998) 9561.
[40] S. de Lazaro, J. Milanez, A.T. de Figueiredo, V.M. Longo, V.R. Mastelaro, F.S. deVicente, A.C. Hernandes, J.A. Varela, E. Longo, Appl. Phys. Lett. 90 (2007)111904.
[41] K. Asokan, J.C. Jan, J.W. Chiou, W.F. Pong, M.H. Tsai, Y.K. Chang, Y.Y. Chen, H.H.Hsieh, H.J. Lin, Y.W. Yang, L.J. Lai, I.N. Lin, J. Solid State Chem. 177 (2004) 2639.
[42] D.L. Wood, J. Tauc, Phys. Ver. B 5 (1972) 3144.

162 T.M. Mazzo et al. / Journal of Alloys and Compounds 585 (2014) 154–162
[43] L. Jingbao, S. Xudong, L. Xiaodong, Mater. Chem. Phys. 125 (2011) 479.[44] Z. Pei, Q. Su, S. Li, J. Lumin. 50 (1991) 123.[45] H.W. Zheng, X.Y. Liu, W.C. Wang, H.R. Zhang, Y.X. Wang, G.S. Yin, Y.Z. Gu, W.F.
Zhang, J. Sol-Gel Sci. Technol. 58 (2011) 539.[46] M.A. Bizeto, V.R.L. Constantino, H.F. Brito, J. Alloys Comp. 311 (2000) 159.[47] D.P. Volanti, I.L.V. Rosa, E.C. Paris, C.A. Paskocimas, P.S. Pizani, J.A. Varela, E.
Longo, Opt. Mater. 31 (2009) 995.
[48] J.C. Zhang, X. Wang, X. Yao, J. Alloys Comp. 498 (2010) 152.[49] C. Peng, Z. Hou, C. Zhang, G. Li, H. Lian, Z. Cheng, J. Lin, Opt. Express. 18 (2010)
7543.[50] L.H. Oliveira, A.P. de Moura, T.M. Mazzo, M.A. Ramírez, L.S. Cavalcante, S.G.
Antonio, W. Avansi, V.R. Mastelaro, E. Longo, J.A. Varela, Mater. Chem. Phys.(2012). http://dx.doi.org/10.1016/j.matchemphys.2012.06.042.


