Embed Size (px)
Citation preview

A compact multifunctional microfluidic platformfor exploring cellular dynamics in real-time usingelectrochemical detection
K. Zor,†a A. Heiskanen,†a C. Caviglia,a M. Vergani,b E. Landini,c F. Shah,a M. Carminati,b
A. Martınez-Serrano,d T. Ramos Moreno,de M. Kokaia,e D. Benayahu,f Zs. Keresztes,g
D. Papkovsky,h U. Wollenberger,i W. E. Svendsen,a M. Dimaki,a G. Ferrari,b R. Raiteri,c
M. Sampietro,b M. Dufvaa and J. Emneus*a
Downscaling of microfluidic cell culture and detection devices for electrochemical monitoring has mostly
focused on miniaturization of the microfluidic chips which are often designed for specific applications and
therefore lack functional flexibility. We present a compact microfluidic cell culture and electrochemical
analysis platform with in-built fluid handling and detection, enabling complete cell based assays
comprising on-line electrode cleaning, sterilization, surface functionalization, cell seeding, cultivation
and electrochemical real-time monitoring of cellular dynamics. To demonstrate the versatility and
multifunctionality of the platform, we explored amperometric monitoring of intracellular redox activity in
yeast (Saccharomyces cerevisiae) and detection of exocytotically released dopamine from rat
pheochromocytoma cells (PC12). Electrochemical impedance spectroscopy was used in both
applications for monitoring cell sedimentation and adhesion as well as proliferation in the case of PC12
cells. The influence of flow rate on the signal amplitude in the detection of redox metabolism as well as
the effect of mechanical stimulation on dopamine release were demonstrated using the programmable
fluid handling capability. The here presented platform is aimed at applications utilizing cell based assays,
ranging from e.g. monitoring of drug effects in pharmacological studies, characterization of neural stem
cell differentiation, and screening of genetically modified microorganisms to environmental monitoring.
Introduction
When designing a microuidic device for cell-based analysis,
specic requirements for a biological problem need to be
carefully taken into consideration. This leads to construction of
tailor-made devices to primarily address one biological
function; operational exibility and multifunctionality of the
devices is rarely realized.1 Moreover, since the main focus is on
development of specialized microuidic cell culture chips,
miniaturization of ‘in-built’ liquid handling and detection units
is oen overlooked;2 hence, bulky off-chip instrumentation is
still required for uidic operations and detection.
Monitoring of cellular dynamic processes (e.g. detection of
messenger molecules, neurotransmitters, intracellular redox
changes) can provide valuable information about cellular
functions and evolution of various diseases, opening up possi-
bilities for their treatment. Imbalance in production and release
of neurotransmitters as well as intracellular redox metabolism
have important implications for development and evolution of
neurodegenerative disorders.3–5 Only for the treatment of these
pathological conditions, almost 700 drugs are under develop-
ment.6 Although well-established cell based in vitro assays have
a signicant role in drug discovery7 and toxicity assessement,8
there is a need for tools enabling cellular investigations on
microscale allowing low sample consumption combined with
fast and high-content analysis. Combination of in vitro cell
based assays with in situ real-time monitoring, while keeping
the cells intact, can provide a powerful analysis tool for cell
based assays.
aDepartment of Micro- and Nanotechnology, Technical University of Denmark,
Produktionstorvet 423, DK-2800 Kgs. Lyngby, Denmark. E-mail: Jenny.Emneus@
nanotech.dtu.dk; Tel: +45-45256867bDipartimento di Elettronica, Informazione e Bioingegneria, Politecnico di Milano,
Milan, ItalycDepartment of Informatics, Bioengineering, Robotics, and System Engineering,
University of Genova, Genova, ItalydDepartment of Molecular Biology and Center of Molecular Biology “Severo Ochoa”,
University Autonoma de Madrid, Madrid, SpaineWallenberg Neuroscience Center, Lund University, Lund, SwedenfDepartment of Cell and Developmental Biology, Tel Aviv University, Ramat Aviv, IsraelgResearch Center for Natural Sciences, Hungarian Academy of Sciences, Budapest,
HungaryhDepartment of Biochemistry and Cell Biology, University College Cork, Cork, IrelandiDepartment of Molecular Enzymology, University of Potsdam, Potsdam (Golm),
Germany
† These authors contributed equally to this study.
Cite this: RSC Adv., 2014, 4, 63761
Received 17th October 2014Accepted 13th November 2014
DOI: 10.1039/c4ra12632g
www.rsc.org/advances
This journal is © The Royal Society of Chemistry 2014 RSC Adv., 2014, 4, 63761–63771 | 63761
RSC Advances
PAPER
Publ
ishe
d on
14
Nov
embe
r 20
14. D
ownl
oade
d by
DT
U L
ibra
ry o
n 26
/11/
2014
13:
55:1
6.
View Article OnlineView Journal | View Issue

In comparison with static cell cultures, microuidic cell
culture devices can provide a more stable environment during
long-term cell culturing, eliminating uctuations in medium
content and removal of metabolic waste products, as well as
providing continuous nutrient and oxygen supply while mini-
mizing risk for contamination.9 Microuidic cell culture devices
have been used in studies on drug metabolism and toxicity,10 as
a diagnostic tool for neurological disorder,11 and for evaluating
the inuence of different factors on cancer development and
stem cell differentiation.12,13
Electrochemical detection techniques, on the other hand,
enable real-time measurements without destroying cellular
integrity14,15 and can be miniaturized, multiplexed, and auto-
mated without losing their performance.16,17 Moreover, they can
easily be integrated with microuidics17,18 and have therefore
been applied for a range of biological applications, e.g., detec-
tion of cancer markers,19 drug screening,20 monitoring of
enzyme kinetics,21 drug metabolism studies,22 as well as for
detection of biologically important molecules such as nitric
oxide and peroxynitrite.23
Here, we present the design and development of a compact
multifunctional microuidic platform for monitoring of
cellular dynamics, from here on referred to as EXCELL platform
(EXploring CELLular Dynamics at Nanoscale) as the outcome of
EU funded project, facilitating both cell culturing and electro-
chemical real-time cell analysis combined with microscopic
observations while maintaining cellular integrity. The platform
comprises all the necessary units for uidic operations and
electrochemical detection: (i) microuidic motherboard with
integrated programmable peristaltic micropumps,24 as well as
reagent- and waste reservoirs, (ii) exchangeable microuidic cell
culture and analysis chip with an integrated 12-microelectrode
array chip,25,26 and (iii) a miniaturized tailor-made 12-channel
bipotentiostat realized on a printed circuit board operated by a
tailor-made acquisition and analysis soware27 that also
enables control of the micropumps. The multifunctionality of
the EXCELL platform is characterized by its ability to facilitate
different cell based assays. As examples, two established cell
based assays, (i) amperometric monitoring of intracellular
redox activity in yeast (Saccharomyces cerevisiae) and (ii) detec-
tion of the exocytotically released dopamine (DA) from rat
pheochromocytoma cells (PC12), were performed following
changes in cellular dynamics.
The intracellular redox metabolism in yeast (Saccharomyces
cerevisiae) has been monitored amperometrically under static
conditions in immobilized cells using soluble double mediator
system menadione/potassium hexacyanoferrate III (ferricya-
nide),28 and the applicability of the assay in a microuidic
environment was preliminarily evaluated.29 Recently, intracel-
lular redox activity of yeast cells was achieved by ‘wiring’ the
cells to the electrode surface with a polymeric mediator (redox
active osmium polymer) applied in a microuidic environ-
ment.30 However, this microuidic adaptation is only suitable
for analyzing cells that have been prepared in advance and then
introduced into a microuidic platform. For a wider applica-
bility of the technique in a microuidic environment, for
instance, by combining perfusion culture and analysis of
genetically modied cells, “wiring” and immobilization of cells
is not suitable. Here, we performed an assay on redox metabo-
lism using the soluble mediators, menadione (intracellular
accessibility) and ferricyanide (extracellular secondary medi-
ator) directly aer electrochemical impedance spectroscopic
(EIS) monitoring of cell sedimentation and evaluated the effect
of ow rate on signal intensity.
DA is a neurotransmitter involved in several neurodegener-
ative disorders.25 Electrochemical detection of single vesicle
exocytotic DA release has been pioneered by Wightman and co-
workers using carbon bre microelectrodes.31,32 The develop-
ment of microfabrication techniques has opened possibilities
for constructing novel electrodes and electroanalytical systems,
giving rise to various technical developments for single cell
neurotransmitter detection.33,34 Measurements at single cell
level provide valuable information about the mechanism of
exocytosis and effect of drugs. However, the experimental
procedures are labour intensive, limiting the available infor-
mation. On the other hand, monitoring of exocytosis on cell
population level can provide facile screening of drug effects35
and characterization of neural stem cells developed for cell
replacement therapy of neurodegenerative diseases.36 The
development of electrochemical methods and analysis plat-
forms for population based neurotransmitter detection,
specically for DA, is a new emerging eld25,35–38 with scarce
applications in microuidic environment.29,39–43 We measured
DA release from PC12 cells induced by both chemical and
mechanical (increased ow rate) stimulation in the microuidic
environment aer EIS monitoring of cell adhesion and growth.
Results and discussionAssessment of the on-line cleaning of the electrodes
Cleaning of electrode surfaces represents a crucial step in order
to assure reproducibility and stability of electrochemical
detection. The optimized cleaning procedure for Au electrodes,
as previously presented elsewhere, comprises both a chemical
and electrochemical step.44,45 The complete cleaning, as evalu-
ated in an electrochemical batch cell, renders electrodes with a
highly reproducible behaviour.25,26 During system assembly (as
described in the Experimental section), each microelectrode
chip undergoes chemical cleaning prior to integration with
microuidics, since it is not amenable for a closed microuidic
system due to strong gas evolution during the process. The
electrochemical cleaning, which can instead be easily per-
formed on-line aer complete assembly of the platform,
removes possible contaminations due to the attachment of the
silicon adhesive gasket.
Based on our tests, the combination of chemical cleaning of
microelectrode chips prior to integration and on-line electro-
chemical cleaning aer integration (detailed description in the
Experimental section) provides optimal electrode reproduc-
ibility. Moreover, electrodes that have been used for a cell based
assay can be re-cleaned aerwards using the on-line electro-
chemical procedure.
Table 1 presents a summary of electrode characterization
comparing the cyclic voltammetric behaviour (probed using
63762 | RSC Adv., 2014, 4, 63761–63771 This journal is © The Royal Society of Chemistry 2014
RSC Advances Paper
Publ
ishe
d on
14
Nov
embe
r 20
14. D
ownl
oade
d by
DT
U L
ibra
ry o
n 26
/11/
2014
13:
55:1
6.
View Article Online

10 mM ferricyanide/ferrocyanide) of already used working
electrodes (WEs) before recleaning has been performed and the
same electrodes aer the electrochemical on-line cleaning fol-
lowed by Cys modication. The results indicate that all the
aspects dening optimal electrode behaviour for electro-
chemical assays, i.e. peak separation, peak current and repro-
ducibility of the obtained current response, are re-established
and signicantly improved.
The results in Table 1 show that the platform allows, aside
from carrying out and monitoring the electrochemical cleaning
aer integration, reusability of the integrated electrodes. All the
re-cleaning and re-functionalization steps can be performed on-
line by introducing different solutions in the chambers and
applying a required potential to the electrodes without dis-
assembling the platform.
Monitoring of yeast cell sedimentation and intracellular redox
metabolism
When seeding yeast cells into miniaturized devices in prep-
aration for experiments involving electrochemical moni-
toring, a sufficient time has to be allocated for cell
sedimentation.30,44 We have previously shown the suitability
of EIS for monitoring the progress of yeast cell sedimenta-
tion44 as a means to evaluate when the cell seeding is
complete allowing initiation of the assay. Aer yeast sedi-
mentation was achieved, the amperometric monitoring of the
intracellular redox metabolism was performed under micro-
uidic conditions by using the menadione/ferricyanide
double mediator system.29
EIS monitoring of yeast cell seeding
Aer loading the microuidic chambers with yeast suspension,
the progress of cell seeding was rst monitored over time (every
5 min) unto the Cys modied electrodes,44 by acquiring
impedance spectra in PBS containing an equimolar amount of
ferri/ferrocyanide. Fig. 1A shows the recorded spectra as
Nyquist plots, which show the characteristic electrode–elec-
trolyte interface behaviour under a faradaic process, i.e.
kinetic and mass transfer limitation represented by charge
transfer resistance (Rct) and Warburg impedance (ZW),
respectively. Generally, at solid electrodes such interfaces can
be modelled using the Randles equivalent circuit46 modied
Table 1 Peak separation and peak current (oxidation and reduction)for Cys modified WEs of a microelectrode chip probed by 10 mMferricyanide/ferrocyanide in PBS. Each side of the 8 IDEs was char-acterized separately. (n ¼ 16)
Determined parameterBeforerecleaning
Aer recleaning/Cysmodication
Peak separation (mV) 709 90.8Peak separation variability(RSD%)
17% 7.2%
Oxidation peak current (mA) 1.58 3.23Oxidation peak currentvariability (RSD%)
8.2 2.4
Reduction peak current (mA) �1.57 �3.18Reduction peak currentvariability (RSD%)
9.5 4.9
Fig. 1 EIS monitoring of Saccharomyces cerevisiae seeding with time:(A) Nyquist plots acquired during cell sedimentation (ZIM and ZRIrepresent the imaginary and real part of the impedance, respectively);(B) normalized impedance spectra (CI) of cell sedimentation; (C)variation of CI at 57 Hz in three chambers with 1250 � 228 cells permm2 and three control chambers in the absence of cells. Error barsrepresent SD (n ¼ 3). Impedance spectra were recorded in thefrequency range 1 Hz to 100 kHz every 5 minutes in PBS containing 10mM ferri/ferrocyanide.
This journal is © The Royal Society of Chemistry 2014 RSC Adv., 2014, 4, 63761–63771 | 63763
Paper RSC Advances
Publ
ishe
d on
14
Nov
embe
r 20
14. D
ownl
oade
d by
DT
U L
ibra
ry o
n 26
/11/
2014
13:
55:1
6.
View Article Online

by replacing the double layer capacitance by the constant
phase element (CPE).47
This general behaviour is represented by the rst Nyquist
plot recorded immediately aer cell loading (t ¼ 0) when only a
fraction of the cells had sedimented onto the electrodes. The
subsequent spectra, acquired during the continued deposition
of yeast cells at the bottom of the chamber, show an increase in
the Rct due to the decreasing free electrode area. However, an
increasing deviation can be observed from the behaviour
described by the modied Randles equivalent circuit, charac-
terized by the low-frequency bending of the ZW line. To model
such spectral behaviour, a more detailed equivalent circuit is
required.44 To simplify data analysis, instead of using curve
tting to an equivalent circuit, quantitative progress of cell
sedimentation can be determined by normalizing impedance
spectra (presented in Fig. 1B as Cell Index, CI, with detailed
description in the Experimental section). The average CI values
for three microuidic chambers vs. time presented in Fig. 1C
were calculated from the normalized spectra (Fig. 1B) at 57 Hz.
Although the average CI for three control chambers without
cells shows a positive dri, the trend is linear in contrast with
the one for the cell loaded chambers which is levelling off.
Flow rate dependent signal intensity of yeast redox
metabolism
In microuidic applications on monitoring of cellular redox
metabolism,29,30 the magnitude of the recorded current is
dependent on a quantitative transfer of the electrons vested
from the cellular redox metabolism to the electrode. In our
previous application using cell “wiring” with the polymeric
mediator (redox active osmium polymer), the electrons were
shuttled effectively (by the formed menadiol) from the cellular
redox metabolism to the electrode through the redox centres of
the polymer where the cells were anchored.30 Hence, the
maximal current response was not signicantly dependent on
the applied ow rate. However, when the secondary mediator
(ferricyanide) is soluble,29 it may be partially ushed away
before it can be detected at the electrode surface. This can result
in a response that does not accurately reect the cellular redox
metabolism.
We monitored yeast redox metabolism, demonstrating
specically the inuence of ow rate on the recorded current
response. Fig. 2A shows the dynamics of recorded current in
four different chambers. One chamber without cells was used as
control (red line) and the three other chambers were loaded
with the same amount of cells (1250 � 228 cells per mm2). The
black line shows the average of the response recorded in the
three chambers, while the grey band represents the standard
deviation between the measurements. A stable baseline was
obtained when PBS was perfused through the system at
10 mL min�1ow rate with no signicant differences observed
between the chambers (control or those loaded with cells).
When 2 mM ferricyanide was introduced into the chambers
(indicated as F), the current in the presence of yeast cells
reached a rather small but stable level, indicating the redox
activity related to membrane bound redox enzymes since
ferricyanide is not able to diffuse through the plasma
membrane into the intracellular environment. Introduction of
buffer also containing 100 mM menadione (indicated as F + M)
increased the current response now reecting the involvement
of the intracellular redox metabolism which was further
increased upon gradually decreasing the ow rate from 10 to 0.4
mL min�1. The inset of Fig. 2A shows a comparison of the current
responses at steady-state for each of the ow rates. Although
decreasing the ow rate by a factor of 25 (from 10 to 0.4 mLmin�1)
only corresponds to approximately 2.5-time increase in the
current response, the achieved effect is, nevertheless, signicant
for experiments where even a marginal enhancement in the
observed dynamics can help distinguish between biological
effects.
At the beginning of the measurement shown in Fig. 2B, the
chambers were perfused at a ow rate of 10 mL min�1 with PBS
containing 2 mM ferricyanide followed by the same buffer
having 100 mM menadione. When the ow rate was decreased
Fig. 2 (A) An averaged current–time recording for three S. cerevisiae
populations each monitored in a different chamber (black line). Thegrey band represents the SD. The control current–time trace wasrecorded in a microfluidic chamber without cells (red line). Inset: thesignal variation with changing flow rate in the presence of F and M. (B)Current response of a S. cerevisiae population in the presence of F, M,andG at different flow rates (F, ferricyanide; M,menadione; G, glucose;F + M: basal level of redox activity; F + M + G: redox activity uponaccelerated metabolism). Each arrow marks the period of a specificflow rate. The signal intensity is dynamically changing with the flowrate. WEs were biased at +350 mV vs. on-chip Au RE.
63764 | RSC Adv., 2014, 4, 63761–63771 This journal is © The Royal Society of Chemistry 2014
RSC Advances Paper
Publ
ishe
d on
14
Nov
embe
r 20
14. D
ownl
oade
d by
DT
U L
ibra
ry o
n 26
/11/
2014
13:
55:1
6.
View Article Online

from 10 to 2 and further to 0.4 mL min�1, analogously as for the
response curve in Fig. 2A, a gradual increase in the current
could be observed. Upon returning back to the 10 mL min�1
ow rate the current is decreased, reaching the same level
previously obtained for that ow rate. This indicates that the
mapped basal level of redox activity is under steady state
control, the variation in current being only dependent on the
applied ow rate. Aer 16 min, a 10 mM glucose solution was
perfused through the system, resulting in an acceleration of
redox metabolism due to increased availability of NAD(P)H
indicated by the further increase in current. As observed for
the basal level of redox metabolism when only menadione and
ferricyanide were present, the administered glucose leads to a
steady state of redox metabolism, the current level being
inuenced only by the applied ow rate.
Detection is only possible if menadione is reduced intracel-
lularly and reoxidized forming ferrocyanide that can reach the
electrode surface to be oxidized. Our previous study using
polymeric mediator showed that a high current response is
obtained even at a higher ow rate, such as 10 mL min�1. This
means that the observed current dynamics, i.e. a low current
response at a higher ow rate is not caused by the cellular
metabolism. Hence, the increased current response at a
decreased ow rate can be explained by the fact that the removal
of the mediators is slower, i.e. a greater fraction of the formed
ferrocyanide is reoxidized at the electrode surface resulting in
the higher current.
This experiment further highlights the necessary aspects of
redox metabolism assays in relation to the functional features
of the platform: (1) a fast ow rate is initially needed to
promptly deliver a solution (an additional mediator or cellular
effector) to the microuidic chamber and equilibrate the
concentration to have a well-dened response. (2) A change in
the ow rate is required to enhance the current. Such ow
conditions with prompt and precise changes in ow rate,
without interrupting the ow, are readily achieved using the
LabView programmable micropumps integrated on the plat-
form (presented in the Experimental section).
Monitoring of PC12 cell growth and detection of DA exocytosis
In neurotransmitter detection assays in microuidics, the effect
of possible mechanical perturbations is usually not taken into
consideration. Therefore, we performed and compared the
effect of both chemical and mechanical stimulation of PC12
cells and quantied the released DA. Prior to and aer the DA
detection, the adhesion and proliferation of PC12 cells was
monitored in real-time for evaluating the condition of the cell
population.
EIS monitoring of PC12 cell growth
Preparation of cell based electrochemical experiments to be
conducted in a microuidic environment requires optimization
of cell coverage on the electrodes. Aside from diverse applica-
tions, such as toxicological evaluation,15,48 EIS monitoring
functions as a tool to assess cell adherence15 on electrodes in
preparation for further bioassays, such as exocytosis detection
from cell populations.
PC12 cells were seeded using suspensions with different cell
densities (from 1.5 to 3 million cells per mL) in order to nd an
optimal density, which gives uniform cell coverage on the WEs.
We found a correlation between the initial cell density in the
seeding suspension and the number of cells on the WEs in the
microuidic chambers (Fig. 3A). The optimal density of seeded
PC12 cells was 3 million cells per mL, resulting in uniform
coverage on the WEs (270 � 34 cells per WE area; average � SD,
n ¼ 3). This cell density was similar to the one used earlier by
Sasso et al.25 when measuring DA release from populations of
PC12 cells in a batch system using the same electrode design.
Aer cell seeding, PC12 cells were kept at stopped ow
condition to facilitate adhesion. The EIS monitoring was per-
formed at 250 nL min�1ow rate, which does not have any
inuence on EIS recordings as indicated by the overlapping
Bode plots in Fig. 3B. Impedance spectra were recorded once an
hour by applying a 200 mV sinusoidal potential. Fig. 3D shows a
characteristic growth curve presented as CI vs. time. The
adhesion and migration of the PC12 cells was observed during
the rst 5–10 h of the EIS monitoring followed by an increase in
CI until 25 h before reaching a plateau. Aer having reached the
steady-state in the growth curve at 25 h, an exocytosis
measurement could have already been initiated. In this case,
the EIS monitoring was, however, continued until 45 h, where a
typical decreasing trend could be seen until 32 h, indicating the
low adhesion and clustering/partial detachment of PC12 cells,49
followed by a steady-state up to 45 h. Aer a conducted exocy-
tosis measurement (discussed below), the impedance recording
was continued. Now, the starting CI level was clearly below the
value that had been reached at 45 h, showing only a slow
increase in CI (Fig. 3D).
This drastic effect in the CI level could be due to the changes
during exocytosis measurements in the biological condition
(e.g., exposure of the cell population to room temperature and
lack of serum proteins in the assay buffers that further deteri-
orates cell adhesion) affecting the subsequent impedance
measurements. The presented study illustrates signicant
points when using EIS as a tool in preparation for cell based
experiments: it provides a possibility to assess in real-time the
condition of cell cultures to (1) ensure the best timing for
continued experiments, and (2) evaluate the effect of experi-
mental conditions on the cell population.
Amperometric monitoring of DA exocytosis
Based on previous studies on collagen coated electrodes,35 the
extracellular matrix protein coating was considered to decrease
the efficiency of DA detection. We found that the electro-
chemical detection of DA on laminin coated electrodes is
improved compared to bare electrodes (Fig. 3C). The applied
potential for DA detection (Eapp ¼ 400 mV vs. on-chip Au RE)
was chosen based on the cyclic voltammogram on laminin
modied electrode (Fig. 3C) in order to have sufficient over-
potential for DA oxidation. Detection of DA release from the
PC12 cell population (Fig. 3D) was performed aer 45 h of cell
This journal is © The Royal Society of Chemistry 2014 RSC Adv., 2014, 4, 63761–63771 | 63765
Paper RSC Advances
Publ
ishe
d on
14
Nov
embe
r 20
14. D
ownl
oade
d by
DT
U L
ibra
ry o
n 26
/11/
2014
13:
55:1
6.
View Article Online

growth by introducing buffer containing elevated K+ concen-
tration (1 mL min�1ow rate) into the cell culture chamber. The
current response due to oxidation of the released DA (Fig. 3D
inset) starts when the elevated K+ buffer enters the cell culture
chamber in the vicinity of the WE and lasts for approximately
the period corresponding to the passage of the buffer over the
WE area at the given ow rate (1 mL min�1).
Aside from DA exocytosis induced by elevated K+, we also
recorded current–time traces related to DA release induced
mechanically by increasing the ow rate from 1 mL min�1 to
10 mL min�1 for 10 s (Fig. 4A). The ow rates were chosen based
on calculations performed to evaluate the effect of shear stress
at different ow rates indicating that 1 mL min�1 does not cause
any adversary effect on the cells13,50,51 while 10 mL min�1
generates a shear stress level of 12 mPa. When comparing the
current responses from K+ and mechanically induced DA
release, we observed that both the charge (Fig. 4B) calculated by
integrating the area of the current peak25 and duration of DA
release (Fig. 4C) are much lower in the case of mechanical
induction while the peak heights are similar (Fig. 4D). The
quantity (charge) of released DA is much lower in the case of
mechanical induction as reported earlier in the case of single
cell exocytotic events.31,52
The used ow rate for neurotransmitter detection from
populations of PC12 cells in a microuidic environment varies
depending on the structure of the microuidic chamber/
channel where the cells reside.39–43 Our results indicate that
when chemical stimulation is to be used it is signicant to
optimise the ow conditions in order to avoid mechanical
stimulation, however, this aspect is not commonly addressed
in publications.
To further explore the experimental possibilities of the
platform, wemonitored DA depletion from the same population
of PC12 cells (Fig. 4E). There is a drastic decrease in both peak
height and charge between the rst and second K+ induced DA
release, followed by a gradually decreasing signal when the cells
were mechanically stimulated using high-K+ buffer showing the
DA depletion of the cells.
ExperimentalThe EXCELL platform
The fully integrated EXCELL platform is shown in Fig. 5 with (A)
and without (B) the EXCELL potentiostat attached. The EXCELL
platform is equipped with: (1) a base plate to accommodate all
the necessary components, (2) four 8-channel peristaltic
micropumps24 operated with Lego® Interactive servo motors
connected to NXT Intelligent Brick units (Lego Systems A/S,
Billund, Denmark) under control of the custom-made
LabView-based EXCELL soware, (3) four 8-channel pump
ribbons in poly(dimethylsiloxane) (PDMS),24 (4) four different
sample and/or waste reservoirs and (5) a ‘plug-in’ microuidic
chip with integrated 12-microelectrode array chip (Fig. 5C) with
the capability to electrochemically address 12 separate cell
culture chambers (Fig. 5D) individually, monitoring 12 different
cell populations. The EXCELL potentiostat was operated by the
custom-made EXCELL acquisition and analysis soware that
enables different electrochemical techniques (e.g., cyclic
Fig. 3 (A) Correlation between the number of PC12 cells in suspension and number of cells on the WEs. The error bars represent SD (n ¼ 3). (B)Impedance spectra recorded under stopped flow condition and at 250 nL min�1
flow rate. (C) Cyclic voltammograms of 100 mM DA in PBSrecorded before and after lamininmodification. (D) Impedancemonitoring of PC12 cell adhesion and growth. Inserts: (i) representative images ofPC12 cells on theWE; (ii) detection of DA release from the cell population induced by elevated K+ perfused at 1 mLmin�1
flow rate (Eapp¼ 400mVvs. on-chip Au RE).
63766 | RSC Adv., 2014, 4, 63761–63771 This journal is © The Royal Society of Chemistry 2014
RSC Advances Paper
Publ
ishe
d on
14
Nov
embe
r 20
14. D
ownl
oade
d by
DT
U L
ibra
ry o
n 26
/11/
2014
13:
55:1
6.
View Article Online
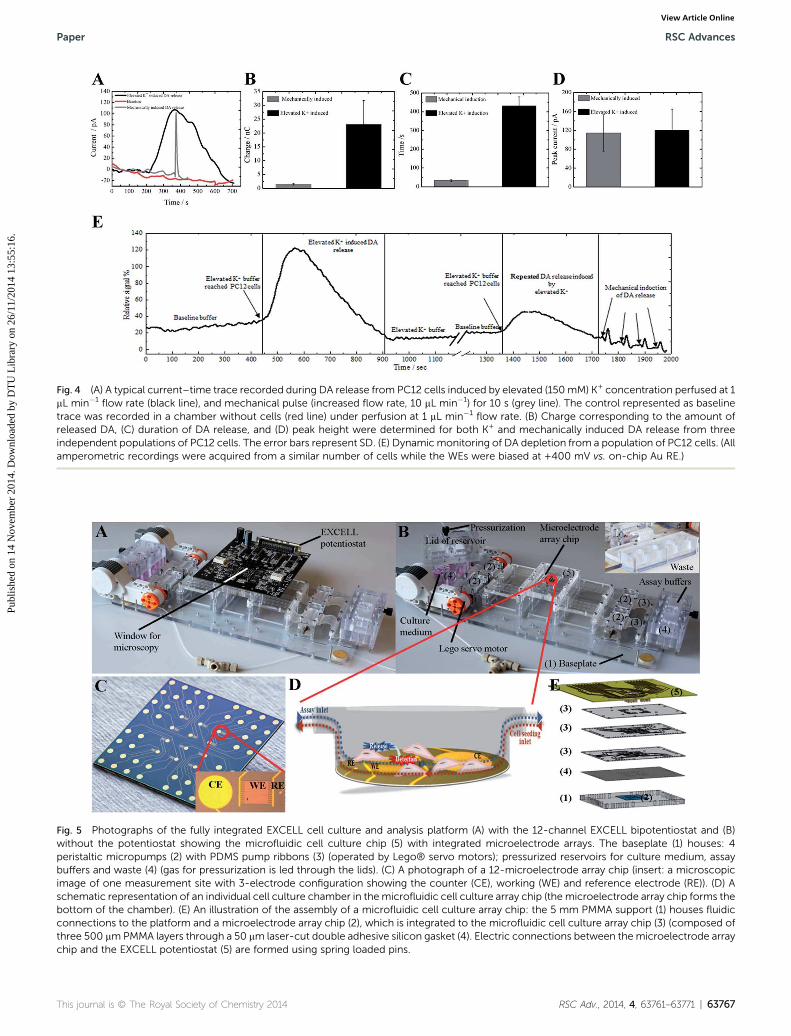
Fig. 5 Photographs of the fully integrated EXCELL cell culture and analysis platform (A) with the 12-channel EXCELL bipotentiostat and (B)without the potentiostat showing the microfluidic cell culture chip (5) with integrated microelectrode arrays. The baseplate (1) houses: 4peristaltic micropumps (2) with PDMS pump ribbons (3) (operated by Lego® servo motors); pressurized reservoirs for culture medium, assaybuffers and waste (4) (gas for pressurization is led through the lids). (C) A photograph of a 12-microelectrode array chip (insert: a microscopicimage of one measurement site with 3-electrode configuration showing the counter (CE), working (WE) and reference electrode (RE)). (D) Aschematic representation of an individual cell culture chamber in themicrofluidic cell culture array chip (the microelectrode array chip forms thebottom of the chamber). (E) An illustration of the assembly of a microfluidic cell culture array chip: the 5 mm PMMA support (1) houses fluidicconnections to the platform and a microelectrode array chip (2), which is integrated to the microfluidic cell culture array chip (3) (composed ofthree 500 mmPMMA layers through a 50 mm laser-cut double adhesive silicon gasket (4). Electric connections between the microelectrode arraychip and the EXCELL potentiostat (5) are formed using spring loaded pins.
Fig. 4 (A) A typical current–time trace recorded during DA release from PC12 cells induced by elevated (150mM) K+ concentration perfused at 1mL min�1
flow rate (black line), and mechanical pulse (increased flow rate, 10 mL min�1) for 10 s (grey line). The control represented as baselinetrace was recorded in a chamber without cells (red line) under perfusion at 1 mL min�1
flow rate. (B) Charge corresponding to the amount ofreleased DA, (C) duration of DA release, and (D) peak height were determined for both K+ and mechanically induced DA release from threeindependent populations of PC12 cells. The error bars represent SD. (E) Dynamic monitoring of DA depletion from a population of PC12 cells. (Allamperometric recordings were acquired from a similar number of cells while the WEs were biased at +400 mV vs. on-chip Au RE.)
This journal is © The Royal Society of Chemistry 2014 RSC Adv., 2014, 4, 63761–63771 | 63767
Paper RSC Advances
Publ
ishe
d on
14
Nov
embe
r 20
14. D
ownl
oade
d by
DT
U L
ibra
ry o
n 26
/11/
2014
13:
55:1
6.
View Article Online

voltammetry, amperometry and electrochemical impedance
spectroscopy (EIS)).27 Data acquisition was done through a
portable NI-6259 USB system (National Instruments Corpora-
tion, Austin, TX, USA).
To avoid bubble formation, the platform was pressurised
(Fig. 5B) through connections integrated in the lid of each
reservoir (0.4 bar overpressure provided by a gas mixture
composed of 5% CO2/20% oxygen/75% nitrogen supplied by
AGA A/S, Copenhagen, Denmark). Each gas connection was
established using a 6 mmHPLC connector and equipped with a
0.5 mm cut-off lter unit (all components from IDEX Health &
Science SA, Glattbrugg, Switzerland) to avoid contamination
and infection during perfusion culture. The connection
between sample/waste reservoirs, and the plug-in microuidic
array chip was achieved through the peristaltic pumps via the
PDMS multichannel ribbons.24
All the polymeric components of the platform were designed
using AutoCAD 2013 (Autodesk, Inc., San Rafael, CA, USA),
machined by micromilling using a Mini-Mill/3PRO system
(Minitech Machinery Corporation, Norcross, GA, USA)
executing G-code generated by EZ-CAM17 Express soware
(EZCAM Solutions, Inc., New York, NY, USA) and thermally
bonded (20 min at 85 �C/4.4 MPa using a PW20 hydraulic press
from Paul-Otto Weber GmbH, Remshalden, Germany) aer
1 min UV activation (5000-EC Series UV Curing Flood Lamp
System from Dymax Corporation, Torrington, CT, USA).
Microuidic cell culture chip with integrated microelectrode
array
The microuidic cell culture chips, composed of three 500 mm
thick poly(methyl methacrylate) (PMMA) layers with micro-
uidic channels, were micromilled and bonded as described
above (schematically shown in Fig. 5E). The chips with 12
microelectrode arrays (Fig. 5C), each consisting of a working
(WE), counter (CE) and reference (RE) electrode, were fabricated
on a wet oxidized 4-inch Si wafer (one side polished) using UV
lithography with a li-off process as previously described.26 The
Au WEs are interdigitated electrodes (IDE) with twelve 500 mm
long and 10 mm wide digits (gap: 10 mm). Both the CEs and REs
are Au disks with 700 mm and 50 mm diameter, respectively.
Prior to integration, the microelectrode array chip was
chemically cleaned in a mixture of 25% H2O2 and 50 mM
KOH.44,45 The integration (Fig. 5E) was done by placing the
microelectrode array chip in a 5 mm PMMA holder and
attaching it to the microuidic cell culture chip using a silicon
adhesive gasket (INT TA106) (Intertronics, Oxfordshire, UK) cut
with laser ablation (48-5S Duo Lase carbon dioxide laser, Synrad
Inc., Mukilteo, WA, USA) in order to form the cell culture/
detection chambers (Fig. 5D) facilitating cell seeding and
assays.
Chemicals
Potassium hydroxide (semiconductor grade), sodium
hydroxide, potassium chloride, potassium hexacyanoferrate(II)
(ferrocyanide), potassium hexacyanoferrate(III) (ferricyanide),
and glucose (all BioXtra grade), sodium chloride, magnesium
chloride hexahydrate, calcium chloride dihydrate, hydrochloric
acid, and 4-(2-hydroxyethyl)piperazine-1-ethanesulfonic acid
(HEPES; 1 M solution) (all BioReagent grade), hydrogen
peroxide (30% solution in water), cysteamine hydrochloride
(Cys), menadione, 2-(3,4-dihydroxyphenyl)ethylamine hydro-
chloride (dopamine), 3-(3,4-dihydroxyphenyl)-L-alanine
(L-DOPA), laminin from Engelbreth-Holm-Swarm murine
sarcoma basement membrane, polyethylenimine (PEI,
branched, averageMw � 25 000), horse serum (HS), fetal bovine
serum (FBS), cell culture tested phosphate buffered saline (PBS)
and water were all purchased from Sigma Aldrich Corporation
(St. Louis, MO, USA). Dulbecco's Modied EagleMedium/Ham's
Nutrient Mixture F12 with GlutaMAX (DMEM/F12), trypsin–
EDTA (0.05%), and penicillin/streptomycin (P/S) were
purchased from Life Technologies Ltd (Paisley, UK). The
aqueous solutions used in experiments on PC12 cells were
prepared in cell culture tested water. All other aqueous solu-
tions were prepared in ultrapure water (resistivity
18.2 Mohm cm) obtained from a Milli-Q® water purication
system (Millipore Corporation, Billerica, MA, USA).
On-line electrode cleaning, functionalization and sterilization
Aer integration of a microelectrode chip with a microuidic
cell culture chip and assembly of the platform, an on-line
electrochemical cleaning (potential sweep from �200 mV
to �1200 mV vs. on-chip Au RE at a 50 mV s�1 scan rate in
50 mM KOH44,45) was performed to ensure optimal function of
the electrode arrays. The cleaning procedure was followed by
on-line functionalization step necessary to ensure optimum
conditions for the experiments. Yeast redox metabolism was
monitored on electrodes functionalized with a self-assembled
monolayer (SAM) of Cys (200 mM, 2 h, stopped-ow) shown to
enhance the interaction between electrodes and yeast cells.44 In
preparation for PC12 cell culturing and detection of DA exocy-
tosis, the microuidic cell culture platform was cleaned and
sterilized using 500 mM NaOH introduced at 30 mL min�1 fol-
lowed by 20 min perfusion at 5 mL min�1ow rate. Aer ster-
ilization, the NaOH solution was removed from the platform
followed by introduction of PBS (30 mL min�1) and rinsing
(15 mL min�1) for 30 min. All the subsequent steps were per-
formed under sterile conditions. For enhanced cell adhesion,
the microelectrode arrays were coated with laminin (20 mg mL�1
in PBS, 2 h at 37 �C in an incubator) at a constant ow rate of
250 nL min�1 under pressurization. The excess laminin solu-
tion was removed followed by rinsing with PBS (15 mL min�1,
20 min). All the on-line cleaning and functionalization steps
were performed using aqueous solutions that are compatible
with PMMA. The microuidic chips with integrated electrode
chip were used once aer re-cleaning.
Yeast sedimentation and intracellular redox activity assay
Saccharomyces cerevisiae cells (baker's yeast from Jastbolaget AB,
Sweden) were suspended at a density of 10 mg mL�1 in PBS
containing 10 mM ferricyanide and ferrocyanide. The cell
suspension was placed in the outlet reservoirs of the platform.
Cell loading was performed under continuous microscopic
63768 | RSC Adv., 2014, 4, 63761–63771 This journal is © The Royal Society of Chemistry 2014
RSC Advances Paper
Publ
ishe
d on
14
Nov
embe
r 20
14. D
ownl
oade
d by
DT
U L
ibra
ry o
n 26
/11/
2014
13:
55:1
6.
View Article Online

monitoring (Zeiss Axio Imager M1mmicroscope from Carl Zeiss
AG, Gottingen, Germany) using reverse ow (7 mL min�1,
15 min) from the outlet reservoirs (Fig. 5B). Aer cell loading,
the progress of cell seeding (sedimentation on the electrodes)
was monitored with EIS for 50 min at 5 min measurement
interval using the EXCELL potentiostat/soware (1 mV sinu-
soidal potential applied in the frequency range 1 Hz to 100 kHz,
10 data points per decade) based on a protocol developed for
static conditions.44 The amperometric monitoring of intracel-
lular redox activity was based on a method previously developed
by Heiskanen et al. using the menadione/ferricyanide double
mediator system.53 This assay monitors the dynamics in the
NAD(P)+/NAD(P)H pool via the lipophilic mediator (menadione)
that freely diffuses into the intracellular environment, where it
is reduced to menadiol by menadione reducing enzymes. The
lipophilic menadiol can diffuse back into the extracellular
environment, where it is reoxidized by the secondary hydro-
philic mediator, ferricyanide. The current recorded at the elec-
trode surface due to oxidation of the formed ferrocyanide is an
indicator of the cellular reducing capacity related to the avail-
ability of NAD(P)H.28 In the assay, the microuidic chambers
were initially lled with PBS followed by sequential addition of
PBS containing 2 mM ferricyanide, 100 mM menadione and
10 mM glucose. The amperometric measurements were per-
formed at +350 mV vs. the on-chip Au RE.
PC12 cell seeding, proliferation and DA exocytosis
PC12 cells (Deutsche Sammlung von Microorganismen und
Zellkulturen GmbH, Braunschweig, Gemany) were subcultured
in PEI coated (50 mg mL�1 in PBS, 2 h at room temperature) T25
culture asks (Nunc A/S, Roskilde, Denmark) using growth
medium (DMEM supplemented with 15%HS, 2.5% FBS, 1% P/S
and 0.5% HEPES). In preparation for microuidic experiments,
the cells were trypsinized from the culture asks using trypsin–
EDTA, counted using a standard hemocytometer and sus-
pended in culture medium to obtain a desired cell density. Cell
seeding in the platform was done as described above for yeast
experiments. Aer seeding, the cells were le to adhere at
stopped ow condition for 2 h and thereaer cultured under
perfusion at a ow rate of 250 nL min�1 for at least 24 h before
detection of DA exocytosis. Cell culturing was performed at
37 �C in a humidied incubator at an atmosphere of 5% CO2/
95% air.
Aer cell seeding, the progress of cell adhesion, spreading
and proliferation was monitored for at least 24 h at 1 h
measurement interval using EIS (200 mV sinusoidal potential
applied in the frequency range 100 Hz to 100 kHz, 10 data
points per decade). Prior to exocytosis experiments, PC12 cells
were incubated in medium containing 100 mM of the dopamine
precursor L-DOPA (2 h at 250 nL min�1ow rate) to increase the
vesicular dopamine content.25 The L-DOPA containing medium
was exchanged for low-K+ buffer (10 mM HEPES, 5 mM glucose,
1.2 mMMgCl2, 2 mM CaCl2, 150 mM NaCl and 5 mM KCl) used
for baseline recording. The baseline buffer was exchanged for
high-K+ stimulation buffer (the same composition as in the
baseline buffer except for 150 mM KCl and 5 mM NaCl).
Baseline recording and K+-induction of DA release were con-
ducted at a ow rate of 1 mL min�1, whereas mechanical
induction was achieved by applying a 10 s ow pulse (10 mL
min�1 using baseline buffer). DA release was detected by
oxidation on the WEs at 400 mV vs. on-chip Au RE. To facilitate
recording of pA range currents CHI potentiostat (Model 1010A,
CH Instrument Inc., Austin, TX, USA) was connected to the
platform through a printed circuit board and used for all
exocytosis measurements with shielded cables to minimize the
random environmental noise.
Microscopic imaging during experiments was done using a
Zeiss Axio Imager M1m microscope (Carl Zeiss AG, Gottingen,
Germany) equipped with a Neo 5.5 sCMOS camera under
control of Solis (i) soware (version 4.22.30007.0) from Andor
Technology Ltd. (Belfast, UK).
Analysis of impedance data
Impedance spectra acquired during experiments involving yeast
and PC12 cells were expressed using the dimensionless
parameter Cell Index (CI),48 which represents the maximum
value of normalized impedance based on eqn (1).
CI(t) ¼ maxi¼1,.,N{[|Z(t,fi)| � |Z(0,fi)|]/|Z(0,fi)|} (1)
where |Z(t,fi)| is the magnitude of impedance at a given
frequency and time point and |Z(0,fi)| is the magnitude of
impedance at the same frequency at the beginning of the
experiment recorded in the absence of cells. For each time
point, the CI was calculated by analysing the entire spectrum
(10 points per decade).
Conclusions
Commonly used electrochemical microuidic cell culture and
detection devises are tailored for a specic application without
providing operational exibility for different cell based assays.
The miniaturization of these devices is specically targeting the
cell culture unit/chip without considering the necessary func-
tional parts, such as uid handling and detection. Here, we
have presented a microuidic platform that represents a major
step towards self-contained, robust analysis tools with inte-
grated programmable uid handling and electrochemical
detection enabling automated long-term cell culturing and
monitoring.
The presented biological work conrms the multi-
functionality of the platform and forms the basis for further
biological applications, such as drug-toxicity assays, study of
stem cell differentiation combined with detection of signaling
molecules, toxicological evaluation in environmental moni-
toring and screening of genetically modied microorganisms in
strain engineering. Both the microuidic chip and the inte-
grated electrode chip can be redesigned to increase throughput
in analysis and adaptation to a specic cell based assay, while
maintaining the uid handling and detection unit. Further-
more, using the presented prototyping the platform can be
further miniaturized if needed for a specic application. Addi-
tionally, the in-built pressurization of the platform allows
This journal is © The Royal Society of Chemistry 2014 RSC Adv., 2014, 4, 63761–63771 | 63769
Paper RSC Advances
Publ
ishe
d on
14
Nov
embe
r 20
14. D
ownl
oade
d by
DT
U L
ibra
ry o
n 26
/11/
2014
13:
55:1
6.
View Article Online

control of the gas composition (CO2 level) to which cells are
exposed in the microuidic environment, providing incubator-
free culture conditions once a temperature control unit is
incorporated.
Acknowledgements
This work was supported by the EU FP7 project EXCELL
(“Exploring Cellular Dynamics at Nanoscale” NMP4-SL-2008-
214706). Additionally, the following agencies are acknowl-
edged for nancial support: Danish Council for Independent
Research Natural Sciences (K.Z.), Lundbeck Foundation grant
R69-A6408 (A.H.), and PhD scholarship from Department of
Micro- and Nanotechnology, Technical University of Denmark
(C.C. and F.S.). Haseena B. Muhammad is acknowledged for
providing the illustration of the assembly of a microuidic cell
culture array chip and for sheer stress related calculations.
Nanna Bild and Jesper Scheel are acknowledged for the graph-
ical illustrations and photography.
Notes and references
1 D. Sabourin, P. Skae-Pedersen, M. J. Søe, M. Hemmingsen,
M. Alberti, V. Coman, J. Petersen, J. Emneus, J. P. Kutter,
D. Snakenborg, F. Jørgensen, C. Clausen, K. Holmstrøm
and M. Dufva, J. Lab. Autom., 2013, 18, 212.
2 B. Li, L. Li, A. Guan, Q. Dong, K. Ruan, R. Hu and Z. Li, Lab
Chip, 2014, 14, 4085.
3 D. Berg, in Oxidative Stress and Neurodegenerative Disorders,
ed. G. A. Qureshi and S. H. Parvez, Elsevier, Amsterdam,
2007, p. 183.
4 K. Sas, H. Robotka, J. Toldi and L. Vecsei, J. Neurol. Sci., 2007,
257, 221.
5 M. F. Beal, Curr. Opin. Neurobiol., 1996, 6, 661.
6 V. P. Kramp, Neurodegener. Dis., 2012, 9, 210.
7 E. Michelini, L. Cevenini, L. Mezzanotte, A. Coppa and
A. Roda, Anal. Bioanal. Chem., 2010, 398, 227.
8 K. Slater, Curr. Opin. Biotechnol., 2001, 12, 70.
9 M.-H. Wu, S.-B. Huang and G.-B. Lee, Lab Chip, 2010, 10, 939.
10 P. M. van Midwoud, E. Verpoorte and G. M. M. Groothuis,
Integr. Biol., 2011, 3, 509.
11 J. P. Devadhasan, S. Kim and J. An, J. Biomed. Sci., 2011, 18,
33.
12 J. Y. Park, S. Takayama and S.-H. Lee, Integr. Biol., 2010, 2,
229.
13 R. Gomez-Sjoberg, A. A. Leyrat, D. M. Pirone, C. S. Chen and
S. R. Quake, Anal. Chem., 2007, 79, 8557.
14 N. V. Kostesha, J. R. M. Almeida, A. R. Heiskanen,
M. F. Gorwa-Grauslund, B. Hahn-Hagerdal and J. Emneus,
Anal. Chem., 2009, 81, 9896.
15 C. Caviglia, K. Zor, S. Canepa, M. Carminati,
B. H. Muhammad, R. Raiteri, T. L. Andresen, A. Heiskanen
and J. Emneus, PLoS One, 2014, in review.
16 L. Nyholm, Analyst, 2005, 130, 599.
17 X. Xu, S. Zhang, H. Chen and J. Kong, Talanta, 2009, 80, 8.
18 F. Sassa, K. Morimoto, W. Satoh and H. Suzuki,
Electrophoresis, 2008, 29, 1787.
19 O. Y. Henry, A. Fragoso, V. Beni, N. Laboria, J. L. A. Sanchez,
D. Latta, F. Von Germar, K. Drese, I. Katakis and
C. K. O'Sullivan, Electrophoresis, 2009, 30, 3398.
20 Y. Chen, H. Cui, J. Ye, S. Chong, T. Lim, F. Sheu and W. Hui,
J. Phys.: Conf. Ser., 2006, 34, 198.
21 Z. Han, W. Li, Y. Huang and B. Zheng, Anal. Chem., 2009, 81,
5840.
22 M. Odijk, A. Baumann, W. Olthuis, A. van den Berg and
U. Karst, Biosens. Bioelectron., 2010, 26, 1521.
23 D. Quinton, A. Girard, L. T. Thi Kim, V. Raimbault,
L. Griscom, F. Razan, S. Griveau and F. Bedioui, Lab Chip,
2011, 11, 1342.
24 P. Skae-Pedersen, M. Hemmingsen, D. Sabourin,
F. S. Blaga, H. Bruus and M. Dufva, Biomed. Microdevices,
2012, 14, 385.
25 L. Sasso, A. Heiskanen, F. Diazzi, M. Dimaki, J. Castillo-
Leon, M. Vergani, E. Landini, R. Raiteri, G. Ferrari,
M. Carminati, M. Sampietro, W. E. Svendsen and
J. Emneus, Analyst, 2013, 138, 3651.
26 M. Dimaki, M. Vergani, A. Heiskanen, D. Kwasny, L. Sasso,
M. Carminati, J. a. Gerrard, J. Emneus and W. E. Svendsen,
Sensors, 2014, 14, 9505.
27 M. Vergani, M. Carminati, G. Ferrari, E. Landini, C. Caviglia,
A. Heiskanen, C. Comminges, K. Zor, D. Sabourin, M. Dufva,
M. Dimaki, R. Raiteri, U. Wollenberger, J. Emneus and
M. Sampietro, IEEE Trans. Biomed. Circuits Syst., 2012, 6, 498.
28 N. Kostesha, A. Heiskanen, C. Spegel, B. Hahn-Hagerdal,
M.-F. Gorwa-Grauslund and J. Emneus, Bioelectrochemistry,
2009, 76, 180.
29 K. Zor, M. Vergani, A. Heiskanen, E. Landini, M. Carminati,
V. Coman, I. Vedarethinam, M. Skolimowski, A. M. Serrano,
M. Kokaia, T. R. Moreno, A. Ghio, W. E. Svendsen, M.
Dimaki, M. Adamovski, U. Wollenberger, D. Sabourin, G.
Ferrari, R. Raiteri, M. Sampietro, M. Dufva, and J. Emneus,
Proc. mTAS 2011, Seattle, 2011, 1532.
30 A. Heiskanen, V. Coman, N. Kostesha, D. Sabourin,
N. Haslett, K. Baronian, L. Gorton, M. Dufva and
J. Emneus, Anal. Bioanal. Chem., 2013, 405, 3847.
31 D. J. Leszczyszyn, J. A. Jankowski, H. Viveross, E. J. Diliberto,
J. A. Nears and R. M. Wightman, J. Biol. Chem., 1990, 265,
14736.
32 K. L. Adams, M. Puchades and A. G. Ewing, Annu. Rev. Anal.
Chem., 2008, 1, 329.
33 C. Spegel, A. Heiskanen, L. H. D. Skjolding and J. Emneus,
Electroanalysis, 2008, 20, 680.
34 F. Lemaıtre, M. Guille Collignon and C. Amatore,
Electrochim. Acta, 2014, 140, 457.
35 H.-F. Cui, J.-S. Ye, Y. Chen, S.-C. Chong and F.-S. Sheu, Anal.
Chem., 2006, 78, 6347.
36 L. Amato, A. Heiskanen, C. Caviglia, F. Shah, K. Zor,
M. Skolimowski, M. Madou, L. Gammelgaard, R. Hansen,
E. G. Seiz, M. Ramos, T. R. Moreno, A. Martınez-Serrano,
S. S. Keller and J. Emneus, Adv. Funct. Mater., 2014, DOI:
10.1002/adfm.201400812.
37 A. Heiskanen, C. Spegel, J. Tønnesen, Z. Fohlerova, L.
Goulart, J. Hansen, M. Kokaia, T. Ruzgas, M. Dufva and
J. Emneus, Proc. mTAS 2008, San Diego, 2008, 1168.
63770 | RSC Adv., 2014, 4, 63761–63771 This journal is © The Royal Society of Chemistry 2014
RSC Advances Paper
Publ
ishe
d on
14
Nov
embe
r 20
14. D
ownl
oade
d by
DT
U L
ibra
ry o
n 26
/11/
2014
13:
55:1
6.
View Article Online

38 M. B. Taskin, L. Sasso, M. Dimaki, W. E. Svendsen and
J. Castillo-Leon, ACS Appl. Mater. Interfaces, 2013, 5, 3323.
39 K. B. Anderson, S. T. Halpin, A. S. Johnson, R. S. Martin and
D. M. Spence, Analyst, 2013, 138, 137.
40 I. A. Ges, R. L. Brindley, K. P. M. Currie and
F. J. Baudenbacher, Lab Chip, 2013, 13, 4663.
41 S. T. Larsen and R. Taboryski, Analyst, 2012, 137, 5057.
42 M. W. Li, D. M. Spence and R. S. Martin, Electroanalysis,
2005, 17, 1171.
43 Y. Chen, C. Guo, L. Lim, S. Cheong, Q. Zhang, K. Tang and
J. Reboud, Anal. Chem., 2008, 80, 1133.
44 A. R. Heiskanen, C. F. Spegel, N. Kostesha, T. Ruzgas and
J. Emneus, Langmuir, 2008, 9066.
45 L. M. Fischer, M. Tenje, A. R. Heiskanen, N. Masuda,
J. Castillo, A. Bentien, J. Emneus, M. H. Jakobsen and
A. Boisen, Microelectron. Eng., 2009, 86, 1282.
46 J. E. B. Randles, Discuss. Faraday Soc., 1947, 1, 11.
47 G. J. Brug, A. L. G. Van den Eeden, M. Sluyters-Rehbach and
J. H. Sluyters, J. Electroanal. Chem., 1984, 176, 275.
48 K. Solly, X. Wang, X. Xu, B. Strulovici and W. Zheng, Assay
Drug Dev. Technol., 2004, 2, 363.
49 A. Heiskanen and J. Emneus, Applications of Electrochemistry
and Nanotechnology in Biology and Medicine I, Springer New
York, New York, NY, 2011, vol. 52.
50 G. Kretzmer and K. Schugerl, Appl. Microbiol. Biotechnol.,
1991, 34, 613.
51 A. Ludwig, G. Kretzmer and K. Schugerl, Enzyme Microb.
Technol., 1992, 14, 209.
52 T. K. Chen, G. Luo and A. G. Ewing, Anal. Chem., 1994, 66,
3031.
53 A. Heiskanen, J. Yakovleva, C. Spegel, R. Taboryski,
M. Koudelka-Hep, J. Emneus and T. Ruzgas, Electrochem.
Commun., 2004, 6, 219.
This journal is © The Royal Society of Chemistry 2014 RSC Adv., 2014, 4, 63761–63771 | 63771
Paper RSC Advances
Publ
ishe
d on
14
Nov
embe
r 20
14. D
ownl
oade
d by
DT
U L
ibra
ry o
n 26
/11/
2014
13:
55:1
6.
View Article Online


