Embed Size (px)
Citation preview
ORI GIN AL PA PER
Multi-criteria evaluation approach to GIS-based land-suitability classification for tilapia farming in Bangladesh
M. Shahadat Hossain Æ Sayedur Rahman Chowdhury ÆNani Gopal Das Æ M. Moshiur Rahaman
Received: 4 February 2007 / Accepted: 13 April 2007 / Published online: 25 May 2007� Springer Science+Business Media B.V. 2007
Abstract Site selection is a key factor in any aquaculture operation, because it affects
both success and sustainability. It can, moreover, solve conflicts between different activ-
ities, making rational use of the land. This study was conducted to identify suitable sites for
development of Nile tilapia (Oreochromis niloticus) farming in Sitakunda Upazila (sub-
district), Bangladesh, using GIS-based multi-criteria evaluation of water and soil quality,
topography, infrastructure and socio-economic factors. ASTER image and eighteen the-
matic layers were analyzed using ENVI and ArcView software to identify the suitable
areas for tilapia farm development. A constraint layer was used to exclude areas from
suitability maps that cannot be allowed to implement tilapia farming. A series of GIS
models were developed to identify and prioritize the most suitable areas for tilapia farming.
The output of the model clearly indicates the location and extent of tilapia farming areas on
different suitability scales, i.e. most suitable (7,744 ha), moderately suitable (2,479 ha), and
not suitable (838 ha). Model outputs were assessed against field verification data, and were
consistent. Because existing aquaculture covers only 1,540 ha of land in the study area, the
potential for expanding tilapia farms should take into consideration socio-political and
environmental issues. The results are encouraging in terms of tilapia culture development
and suggest that grassland–agriculture areas could be used for sustainable development of
tilapia farming to diversify the economic activities of rural communities.
Keywords Analytical hierarchy process � GIS � Land suitability � Multi-criteria
evaluation � Tilapia farming
M. S. Hossain (&) � S. R. Chowdhury � N. G. Das � M. M. RahamanInstitute of Marine Sciences and Fisheries, University of Chittagong, Chittagong 4331, Bangladeshe-mail: [email protected]
S. R. Chowdhurye-mail: [email protected]
N. G. Dase-mail: [email protected]
123
Aquacult Int (2007) 15:425–443DOI 10.1007/s10499-007-9109-y
Introduction
A suitability study is a preliminary step when assessing whether land or any other area is
likely to be practical and successful for sustainable development of an intended venture. In
many instances aquaculture has been promoted in regions which are unsuitable in terms of
climatic conditions, water and soil quality, and other facilities. A suitable site is a pre-
requisite for successful aquaculture. Fish have traditionally been cultured in the Sitakunda
region without adopting any scientific and systematic inputs. In recent years horizontal
expansion of fish farming (Nile tilapia, carp, and catfish) has been increasing in the Si-
takunda area without consideration of the suitability of the locations. To ensure sustainable
aquaculture development there is, therefore, a great need to allocate aquaculture to suitable
locations to resolve competing demands for land, avoid undesirable effects on the envi-
ronment, and ensure the profitability of the operation (Kapetsky 1987; GESAMP 1997).
Satellite remote sensing data are useful for updating an existing map or generating new
thematic maps. During observations many earth features of interest have already been
identified, mapped, and studied on the basis of their spectral characteristics (Lillisand and
Kiefer 2000). GIS and remote sensing are essential tools for planning of aquaculture
development (Burrough 1986). GIS also serve as an analytical and predicting tools for
aquaculture development and to test the consequence of various development decisions
before their use in the landscape (Aguilar-Manjarrez and Ross 1995). Other uses of GIS
include efficient storage, management, and analysis of spatial and non-spatial data
(Kapetsky et al. 1987; Burrough and McDonnel 1998). Similar observations were made by
Vibulsresth et al. (1993), Venkataratnam et al. (1997), Perez et al. (2003), Giap et al.
(2005), and Rajitha et al. (2007). In recent years, significant advances have been made in
remote sensing in Bangladesh, especially in shrimp-farming development in the coastal
zone (Hossain et al. 2001), detection of changes in Sunderbans mangrove forest (Islam
et al. 1997), mapping shrimp farming and agricultural areas (Shahid et al. 1992), mapping
suitable areas for saltpan development (Hossain et al. 2003a), mangrove afforestation
(Hossain et al. 2003b), and assessing suitable carp-farming areas (Salam et al. 2005).
The main problem in selecting suitable sites for tilapia farming is the lack of baseline
information about physicochemical and topographic conditions, and existing land-use
patterns. In Sitakunda the land area used for Nile tilapia farming has increased in recent
years, because of steadily increasing demand in local and city markets. Expansion of Nile
tilapia culture in traditional carp farming areas, grassland, and agriculture fields may,
however, change ecological and environmental conditions and affect aquatic biodiversity.
Thus, site selection incorporating water quality, soil characteristics, topography, infra-
structure and socio-economic factors that affect suitability for the intended purpose is
essential for Nile tilapia farming development. Inappropriate land use for tilapia farming
without considering these factors can lead to misuse of natural resources and degradation
of the environment, breeding poverty, and other social conflicts. The failure of shrimp
farms in Ecuador, Taiwan, Thailand, Bangladesh, Vietnam, and elsewhere has been
attributed to the deterioration of environmental conditions (Hossain et al. 2004). Farms in
some areas are located on unsuitable sites and some are also constructed too densely for the
carrying capacity of the environment. Site selection is rarely based on thorough assessment
of the natural or men-made environment, however, and limited consideration is often given
to technical, economic, logistic, and socio-political factors (Fegan 1994). To alleviate these
potential problems, land evaluation can be used to predict land performance on the basis of
its attributes by using a variety of analytical models. The structures of these models range
426 M. S. Hossain et al.
123
from qualitative to quantitative, functional to mechanistic, or specific to general (Rossiter
1996). The objective of this study was to evaluate, using GIS-based models, quantitative
land suitability for Nile tilapia farming development in Sitakunda Upazila, Bangladesh.
Study area
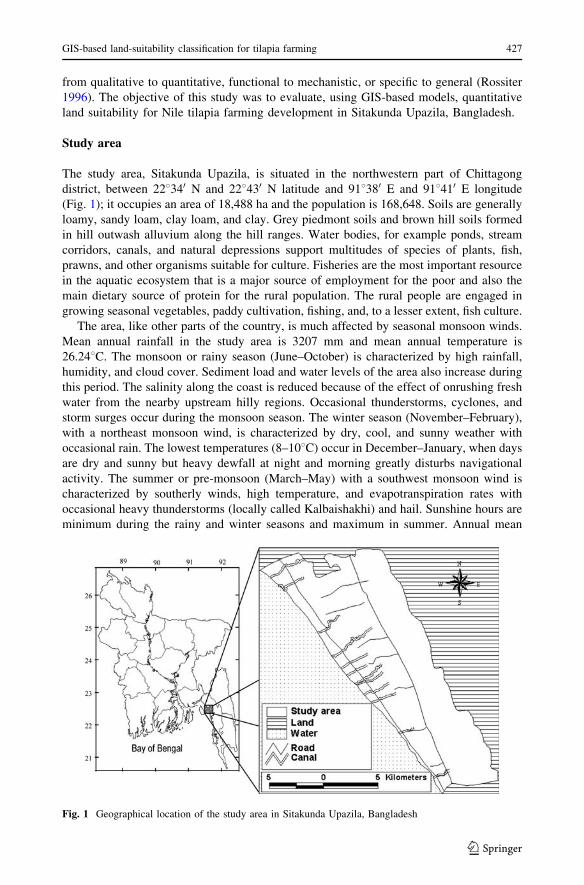
The study area, Sitakunda Upazila, is situated in the northwestern part of Chittagong
district, between 228340 N and 228430 N latitude and 918380 E and 918410 E longitude
(Fig. 1); it occupies an area of 18,488 ha and the population is 168,648. Soils are generally
loamy, sandy loam, clay loam, and clay. Grey piedmont soils and brown hill soils formed
in hill outwash alluvium along the hill ranges. Water bodies, for example ponds, stream
corridors, canals, and natural depressions support multitudes of species of plants, fish,
prawns, and other organisms suitable for culture. Fisheries are the most important resource
in the aquatic ecosystem that is a major source of employment for the poor and also the
main dietary source of protein for the rural population. The rural people are engaged in
growing seasonal vegetables, paddy cultivation, fishing, and, to a lesser extent, fish culture.
The area, like other parts of the country, is much affected by seasonal monsoon winds.
Mean annual rainfall in the study area is 3207 mm and mean annual temperature is
26.248C. The monsoon or rainy season (June–October) is characterized by high rainfall,
humidity, and cloud cover. Sediment load and water levels of the area also increase during
this period. The salinity along the coast is reduced because of the effect of onrushing fresh
water from the nearby upstream hilly regions. Occasional thunderstorms, cyclones, and
storm surges occur during the monsoon season. The winter season (November–February),
with a northeast monsoon wind, is characterized by dry, cool, and sunny weather with
occasional rain. The lowest temperatures (8–108C) occur in December–January, when days
are dry and sunny but heavy dewfall at night and morning greatly disturbs navigational
activity. The summer or pre-monsoon (March–May) with a southwest monsoon wind is
characterized by southerly winds, high temperature, and evapotranspiration rates with
occasional heavy thunderstorms (locally called Kalbaishakhi) and hail. Sunshine hours are
minimum during the rainy and winter seasons and maximum in summer. Annual mean
Fig. 1 Geographical location of the study area in Sitakunda Upazila, Bangladesh
GIS-based land-suitability classification for tilapia farming 427
123
sunshine is approximately 5 h per day and the mean annual wind speed recorded for the
years 1991–2001 in Sitakunda was 1.8 knots (Khan et al. 2003).
Materials and methods
Data
An ASTER (advanced spaceborne thermal emission and reflection radiometer) image
acquired on 29 November 2003 was used for this study. Topographic maps, soil maps, and
land-use maps of 1:10000, 1:50000, and 1:50000 scale, published by the Survey of
Bangladesh in 1999, SRDI in 1990, and LGED in 1998, respectively, were used for
geometric correction. Geometric correction was performed with a fourth-order polynomial
(Research Systems 2000a) and the monitored error (0.47) was less than one pixel (15 m)
for 35 ground control points (GCP). Road junctions, crossing points of roads and railways,
historical hard infrastructure, and prominent features were selected as most of the GCPs in
the image. The image processor for the analysis was ENVI (the environment for visual-
izing image; Research Systems, USA). Ground data were obtained by field investigation of
approximately 55 plots, some of which were permanent. Other ancillary data, for example
water quality, soil quality, slope, elevation, land use, and infrastructure and socio-eco-
nomic data are also important for the analysis.
Classification procedure
ISODATA unsupervised classification (use of information from the image itself to identify
spectral clusters, which are interpreted as classes) was performed by considering minimum
and maximum classes of 5–10, 10–15, and 15–20, among which the 10–15 classes were
found to be useful. Supervised classification was performed on the basis of regions of
interest (ROIs), in which the ground truth, or so-called training areas (collected during field
investigation), were regions of terrain with known properties or characteristics (Research
Systems 2000b). Maximum likelihood classification strategy was applied and found to be
most useful for discriminating the category of interest.
Water and soil quality conditions, topography, road networks, markets, sources of fish
fry, electricity, and population density were weighted and scored in terms of significance
for tilapia farming. After image processing, reference points were chosen for ground
verification. All the reference points were surveyed for the ground truthing of Sitakunda
Upazila and compared on the preliminary map with real position. ArcView (Environmental
Systems Research Institute, USA) and MS Office (Microsoft, USA) software were used to
digitize and analyze all the classified and other necessary maps.
Weight and score
Within the framework of a GIS system (ArcView), a procedure was set up to attribute
suitability classes to individual land units and to present the results of the classification on
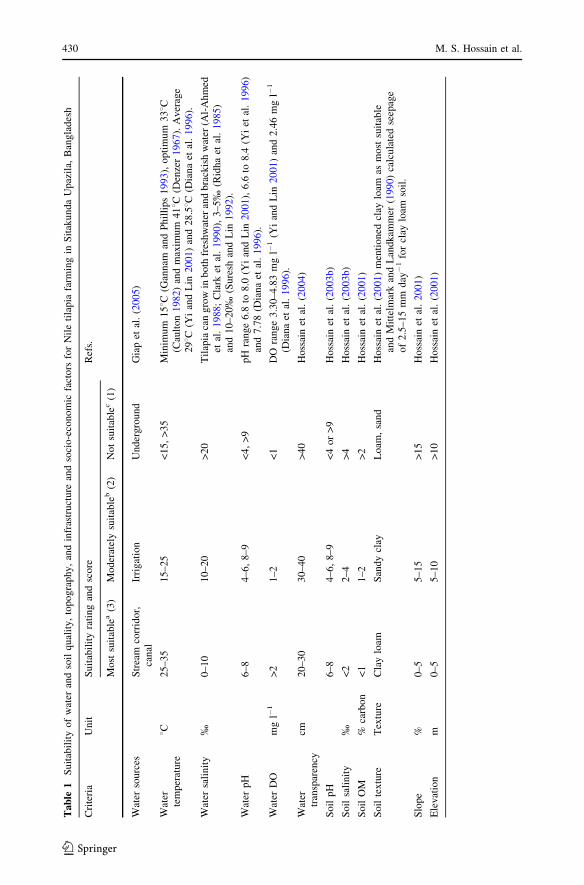
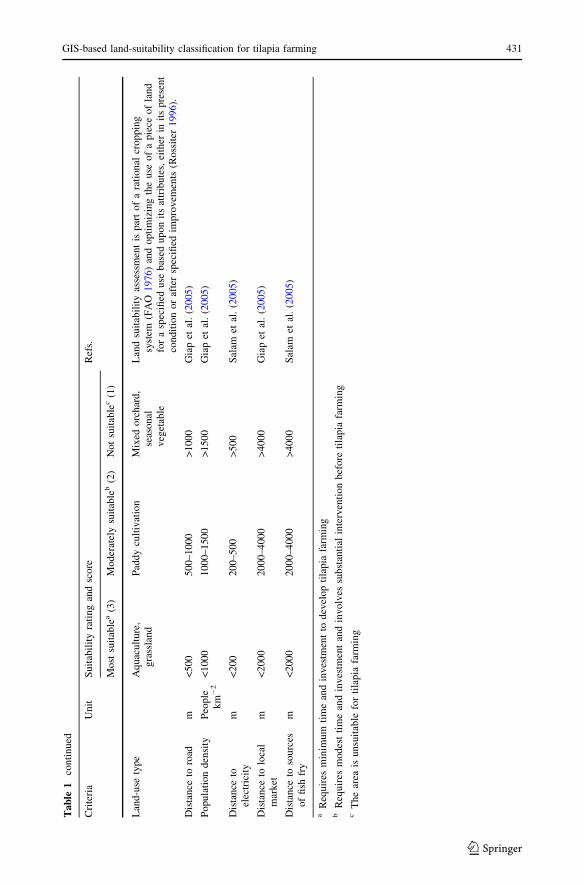
maps. The range of land characteristics was divided into three classes—most suitable,
moderately suitable, and not suitable (FAO 1993)—on the basis of requirements for tilapia
farm development. This study focused on basic factors, for example, eighteen base layers
(thematic maps) were developed for tilapia farming, namely water source and quality
428 M. S. Hossain et al.
123
(temperature, salinity, pH, dissolved oxygen, transparency), soil quality (pH, salinity, or-
ganic matter, texture), topography (slope, elevation, land-use type), infrastructure and
socio-economic factors (road network, markets, sources of fish fry, electricity, population
density). Weight was given according to the effectiveness of the criteria. Each class was
also given a score according to suitability, i.e. most suitable scored 3, moderately suitable
scored 2, and not suitable scored 1 (FAO 1976; Hossain et al. 2003a, b) (Table 1).
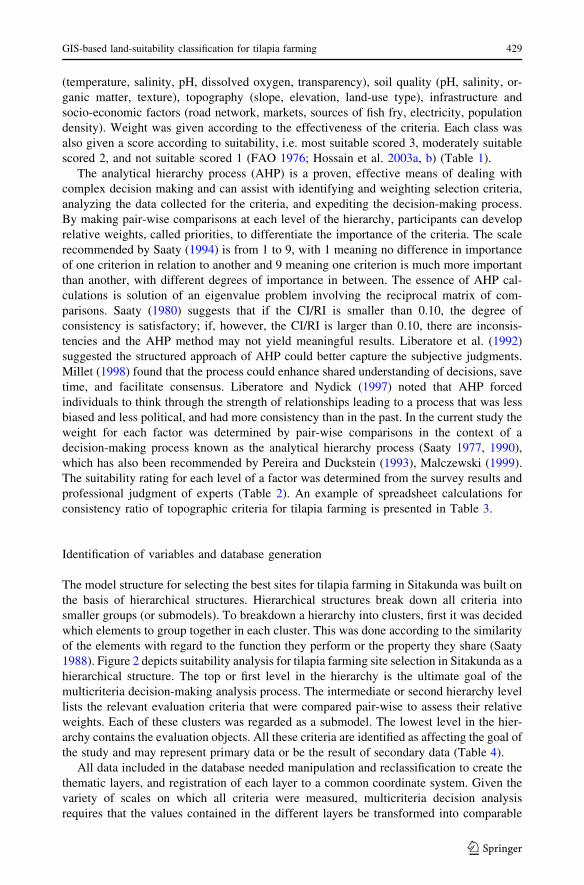
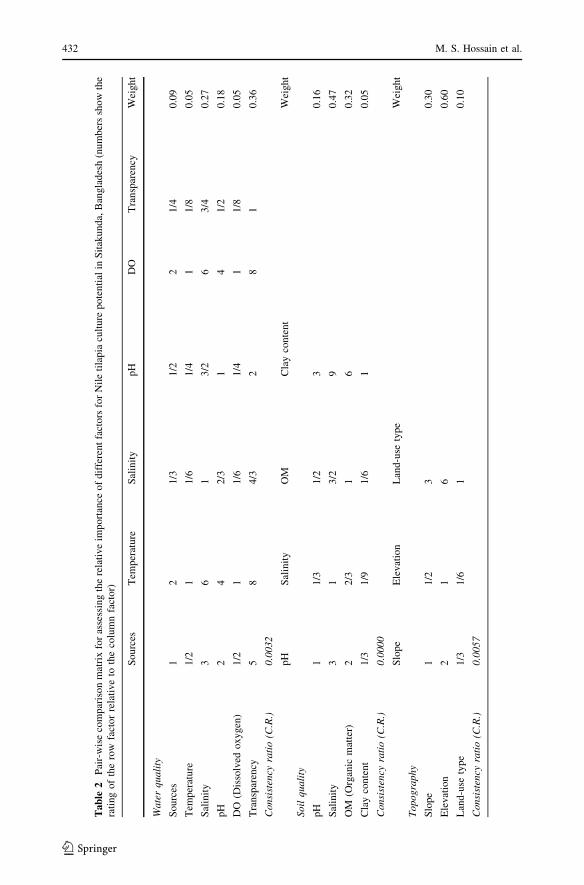
The analytical hierarchy process (AHP) is a proven, effective means of dealing with
complex decision making and can assist with identifying and weighting selection criteria,
analyzing the data collected for the criteria, and expediting the decision-making process.
By making pair-wise comparisons at each level of the hierarchy, participants can develop
relative weights, called priorities, to differentiate the importance of the criteria. The scale
recommended by Saaty (1994) is from 1 to 9, with 1 meaning no difference in importance
of one criterion in relation to another and 9 meaning one criterion is much more important
than another, with different degrees of importance in between. The essence of AHP cal-
culations is solution of an eigenvalue problem involving the reciprocal matrix of com-
parisons. Saaty (1980) suggests that if the CI/RI is smaller than 0.10, the degree of
consistency is satisfactory; if, however, the CI/RI is larger than 0.10, there are inconsis-
tencies and the AHP method may not yield meaningful results. Liberatore et al. (1992)
suggested the structured approach of AHP could better capture the subjective judgments.
Millet (1998) found that the process could enhance shared understanding of decisions, save
time, and facilitate consensus. Liberatore and Nydick (1997) noted that AHP forced
individuals to think through the strength of relationships leading to a process that was less
biased and less political, and had more consistency than in the past. In the current study the
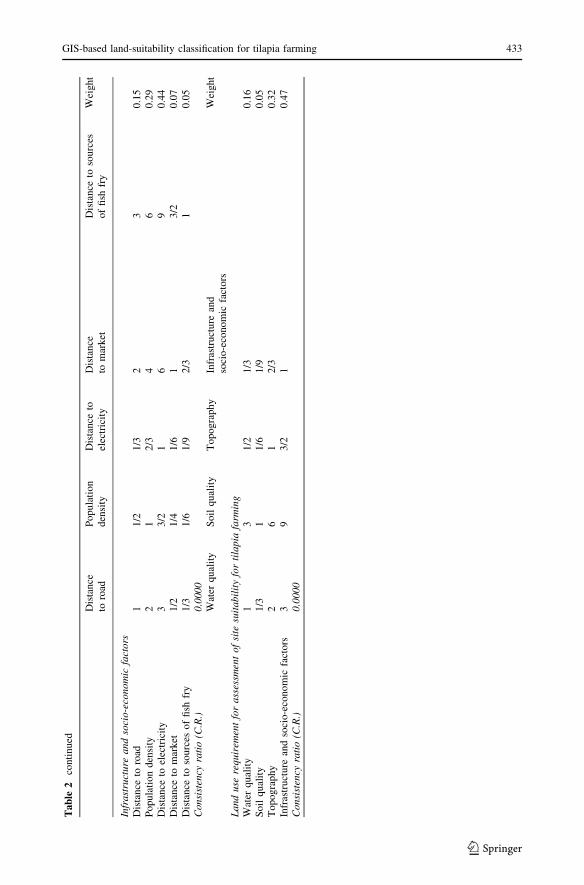
weight for each factor was determined by pair-wise comparisons in the context of a
decision-making process known as the analytical hierarchy process (Saaty 1977, 1990),
which has also been recommended by Pereira and Duckstein (1993), Malczewski (1999).
The suitability rating for each level of a factor was determined from the survey results and
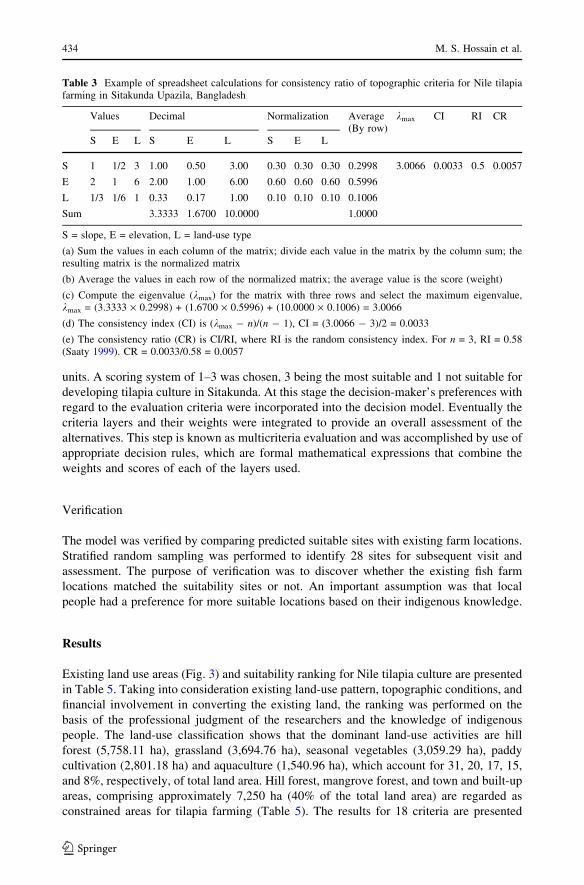
professional judgment of experts (Table 2). An example of spreadsheet calculations for
consistency ratio of topographic criteria for tilapia farming is presented in Table 3.
Identification of variables and database generation
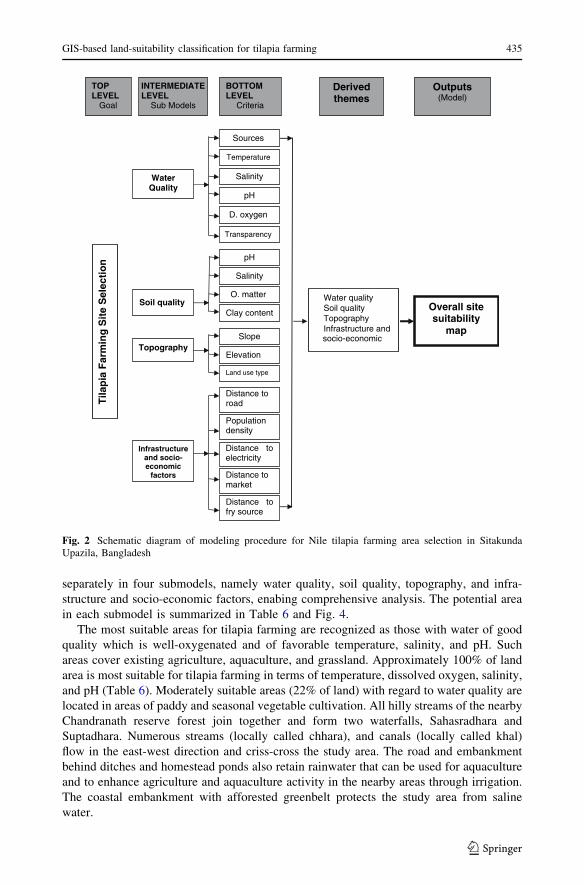
The model structure for selecting the best sites for tilapia farming in Sitakunda was built on
the basis of hierarchical structures. Hierarchical structures break down all criteria into
smaller groups (or submodels). To breakdown a hierarchy into clusters, first it was decided
which elements to group together in each cluster. This was done according to the similarity
of the elements with regard to the function they perform or the property they share (Saaty
1988). Figure 2 depicts suitability analysis for tilapia farming site selection in Sitakunda as a
hierarchical structure. The top or first level in the hierarchy is the ultimate goal of the
multicriteria decision-making analysis process. The intermediate or second hierarchy level
lists the relevant evaluation criteria that were compared pair-wise to assess their relative
weights. Each of these clusters was regarded as a submodel. The lowest level in the hier-
archy contains the evaluation objects. All these criteria are identified as affecting the goal of
the study and may represent primary data or be the result of secondary data (Table 4).
All data included in the database needed manipulation and reclassification to create the
thematic layers, and registration of each layer to a common coordinate system. Given the
variety of scales on which all criteria were measured, multicriteria decision analysis
requires that the values contained in the different layers be transformed into comparable
GIS-based land-suitability classification for tilapia farming 429
123
Tab
le1
Su
itab
ilit
yo
fw
ater
and
soil
qu
alit
y,
top
og
rap
hy
,an
din
fras
tru
ctu
rean
dso
cio
-eco
no
mic
fact
ors
for
Nil
eti
lap
iafa
rmin
gin
Sit
aku
nd
aU
paz
ila,
Ban
gla
des
h
Cri
teri
aU
nit
Su
itab
ilit
yra
tin
gan
dsc
ore
Ref
s.
Mo
stsu
itab
lea
(3)
Mo
der
atel
ysu
itab
leb
(2)
No
tsu
itab
lec
(1)
Wat
erso
urc
esS
trea
mco
rrid
or,
can
alIr
rig
atio
nU
nd
erg
rou
nd
Gia
pet
al.
(20
05)
Wat
erte
mp
erat
ure
8C2
5–
35
15
–25
<1
5,
>3
5M
inim
um
158C
(Gan
nam
and
Ph
illi
ps
19
93),
op
tim
um
338C
(Cau
lto
n1
98
2)
and
max
imu
m4
18C
(Den
zer
19
67).
Av
erag
e2
98C
(Yi
and
Lin
20
01)
and
28
.58C
(Dia
na
etal
.1
99
6).
Wat
ersa
lin
ity
%0
–1
01
0–
20
>2
0T
ilap
iaca
ng
row
inb
oth
fres
hw
ater
and
bra
ckis
hw
ater
(Al-
Ah
med
etal
.1
98
8;
Cla
rket
al.
19
90),
3–
5%
(Rid
ha
etal
.1
98
5)
and
10
–20%
(Su
resh
and
Lin
19
92).
Wat
erp
H6
–8
4–
6,
8–
9<
4,
>9
pH
ran
ge
6.8
to8
.0(Y
ian
dL
in2
00
1),
6.6
to8
.4(Y
iet
al.
19
96)
and
7.7
8(D
ian
aet
al.
19
96).
Wat
erD
Om
gl�
1>
21
–2
<1
DO
rang
e3
.30–
4.8
3m
gl�
1(Y
ian
dL
in2
00
1)
and
2.4
6m
gl�
1
(Dia
na
etal
.1
99
6).
Wat
ertr
ansp
aren
cycm
20
–30
30
–40
>4
0H
oss
ain
etal
.(2
00
4)
So
ilp
H6
–8
4–
6,
8–
9<
4o
r>
9H
oss
ain
etal
.(2
00
3b)
So
ilsa
lin
ity
%<
22
–4
>4
Ho
ssai
net
al.
(20
03
b)
So
ilO
M%
carb
on
<1
1–
2>
2H
oss
ain
etal
.(2
00
1)
So
ilte
xtu
reT
extu
reC
lay
loam
San
dy
clay
Lo
am,
san
dH
oss
ain
etal
.(2
00
1)
men
tio
ned
clay
loam
asm
ost
suit
able
and
Mit
telm
ark
and
Lan
dkam
mer
(19
90)
calc
ula
ted
seep
age
of
2.5
–1
5m
md
ay�
1fo
rcl
aylo
amso
il.
Slo
pe
%0
–5
5–
15
>1
5H
oss
ain
etal
.2
00
1)
Ele
vat
ion
m0
–5
5–
10
>1
0H
oss
ain
etal
.(2
00
1)
430 M. S. Hossain et al.
123
Tab
le1
con
tin
ued
Cri
teri
aU
nit
Su
itab
ilit
yra
tin
gan
dsc
ore
Ref
s.
Mo
stsu
itab
lea
(3)
Mo
der
atel
ysu
itab
leb
(2)
No
tsu
itab
lec
(1)
Lan
d-u
sety
pe
Aq
uac
ult
ure
,g
rass
lan
dP
add
ycu
ltiv
atio
nM
ixed
orc
har
d,
seas
on
alv
eget
able
Lan
dsu
itab
ilit
yas
sess
men
tis
par
to
fa
rati
on
alcr
op
pin
gsy
stem
(FA
O1
97
6)
and
op
tim
izin
gth
eu
seo
fa
pie
ceo
fla
nd
for
asp
ecifi
edu
seb
ased
up
on
its
attr
ibute
s,ei
ther
init
sp
rese
nt
con
dit
ion
or
afte
rsp
ecifi
edim
pro
vem
ents
(Ro
ssit
er1
99
6).
Dis
tan
ceto
road
m<
50
05
00
–1
000
>1
00
0G
iap
etal
.(2
00
5)
Po
pu
lati
on
den
sity
Peo
ple
km�
2<
10
00
10
00
–1
50
0>
15
00
Gia
pet
al.
(20
05)
Dis
tan
ceto
elec
tric
ity
m<
20
02
00
–5
00
>5
00
Sal
amet
al.
(20
05)
Dis
tan
ceto
loca
lm
ark
etm
<2
00
02
00
0–
400
0>
40
00
Gia
pet
al.
(20
05)
Dis
tan
ceto
sou
rces
of
fish
fry
m<
20
00
20
00
–4
00
0>
40
00
Sal
amet
al.
(20
05)
aR
equir
esm
inim
um
tim
ean
din
ves
tmen
tto
dev
elo
pti
lap
iafa
rmin
gb
Req
uir
esm
od
est
tim
ean
din
ves
tmen
tan
din
vo
lves
sub
stan
tial
inte
rven
tio
nb
efo
reti
lap
iafa
rmin
gc
Th
ear
eais
un
suit
able
for
tila
pia
farm
ing
GIS-based land-suitability classification for tilapia farming 431
123
Tab
le2
Pai
r-w
ise
com
par
iso
nm
atri
xfo
ras
sess
ing
the
rela
tiv
eim
po
rtan
ceo
fd
iffe
ren
tfa
cto
rsfo
rN
ile
tila
pia
cult
ure
po
ten
tial
inS
itak
un
da,
Ban
gla
des
h(n
um
ber
ssh
ow
the
rati
ng
of
the
row
fact
or
rela
tiv
eto
the
colu
mn
fact
or)
So
urc
esT
emp
erat
ure
Sal
init
yp
HD
OT
ran
spar
ency
Wei
gh
t
Wa
ter
qu
ali
ty
So
urc
es1
21
/31
/22
1/4
0.0
9
Tem
per
atu
re1
/21
1/6
1/4
11
/80
.05
Sal
init
y3
61
3/2
63
/40
.27
pH
24
2/3
14
1/2
0.1
8
DO
(Dis
solv
edo
xy
gen
)1
/21
1/6
1/4
11
/80
.05
Tra
nsp
aren
cy5
84/3
28
10.3
6
Con
sist
ency
rati
o(C
.R.)
0.0
032
pH
Sal
init
yO
MC
lay
con
ten
tW
eig
ht
So
ilq
ua
lity
pH
11
/31
/23
0.1
6
Sal
init
y3
13
/29
0.4
7
OM
(Org
anic
mat
ter)
22
/31
60
.32
Cla
yco
nte
nt
1/3
1/9
1/6
10
.05
Con
sist
ency
rati
o(C
.R.)
0.0
000
Slo
pe
Ele
vat
ion
Lan
d-u
sety
pe
Wei
gh
t
To
pog
rap
hy
Slo
pe
11
/23
0.3
0
Ele
vat
ion
21
60
.60
Lan
d-u
sety
pe
1/3
1/6
10
.10
Con
sist
ency
rati
o(C
.R.)
0.0
057
432 M. S. Hossain et al.
123
Tab
le2
con
tin
ued
Dis
tan
ceto
road
Po
pu
lati
on
den
sity
Dis
tan
ceto
elec
tric
ity
Dis
tan
ceto
mar
ket
Dis
tan
ceto
sou
rces
of
fish
fry
Wei
gh
t
Infr
astr
uct
ure
and
soci
o-ec
onom
icfa
ctors
Dis
tan
ceto
road
11
/21
/32
30
.15
Po
pu
lati
on
den
sity
21
2/3
46
0.2
9D
ista
nce
toel
ectr
icit
y3
3/2
16
90.4
4D
ista
nce
tom
ark
et1
/21
/41
/61
3/2
0.0
7D
ista
nce
toso
urc
eso
ffi
shfr
y1
/31
/61
/92
/31
0.0
5C
onsi
sten
cyra
tio
(C.R
.)0.0
000
Wat
erq
ual
ity
So
ilq
ual
ity
To
pog
rap
hy
Infr
astr
uct
ure
and
soci
o-e
con
om
icfa
cto
rsW
eigh
t
La
ndu
sere
qu
irem
ent
for
ass
essm
ent
of
site
suit
ab
ilit
yfo
rti
lap
iafa
rmin
gW
ater
qu
alit
y1
31
/21
/30
.16
So
ilq
ual
ity
1/3
11
/61
/90
.05
To
pog
rap
hy
26
12
/30
.32
Infr
astr
uct
ure
and
soci
o-e
con
om
icfa
cto
rs3
93
/21
0.4
7C
onsi
sten
cyra
tio
(C.R
.)0.0
000
GIS-based land-suitability classification for tilapia farming 433
123
units. A scoring system of 1–3 was chosen, 3 being the most suitable and 1 not suitable for
developing tilapia culture in Sitakunda. At this stage the decision-maker’s preferences with
regard to the evaluation criteria were incorporated into the decision model. Eventually the
criteria layers and their weights were integrated to provide an overall assessment of the
alternatives. This step is known as multicriteria evaluation and was accomplished by use of
appropriate decision rules, which are formal mathematical expressions that combine the
weights and scores of each of the layers used.
Verification
The model was verified by comparing predicted suitable sites with existing farm locations.
Stratified random sampling was performed to identify 28 sites for subsequent visit and
assessment. The purpose of verification was to discover whether the existing fish farm
locations matched the suitability sites or not. An important assumption was that local
people had a preference for more suitable locations based on their indigenous knowledge.
Results
Existing land use areas (Fig. 3) and suitability ranking for Nile tilapia culture are presented
in Table 5. Taking into consideration existing land-use pattern, topographic conditions, and
financial involvement in converting the existing land, the ranking was performed on the
basis of the professional judgment of the researchers and the knowledge of indigenous
people. The land-use classification shows that the dominant land-use activities are hill
forest (5,758.11 ha), grassland (3,694.76 ha), seasonal vegetables (3,059.29 ha), paddy
cultivation (2,801.18 ha) and aquaculture (1,540.96 ha), which account for 31, 20, 17, 15,
and 8%, respectively, of total land area. Hill forest, mangrove forest, and town and built-up
areas, comprising approximately 7,250 ha (40% of the total land area) are regarded as
constrained areas for tilapia farming (Table 5). The results for 18 criteria are presented
Table 3 Example of spreadsheet calculations for consistency ratio of topographic criteria for Nile tilapiafarming in Sitakunda Upazila, Bangladesh
Values Decimal Normalization Average(By row)
kmax CI RI CR
S E L S E L S E L
S 1 1/2 3 1.00 0.50 3.00 0.30 0.30 0.30 0.2998 3.0066 0.0033 0.5 0.0057
E 2 1 6 2.00 1.00 6.00 0.60 0.60 0.60 0.5996
L 1/3 1/6 1 0.33 0.17 1.00 0.10 0.10 0.10 0.1006
Sum 3.3333 1.6700 10.0000 1.0000
S = slope, E = elevation, L = land-use type
(a) Sum the values in each column of the matrix; divide each value in the matrix by the column sum; theresulting matrix is the normalized matrix
(b) Average the values in each row of the normalized matrix; the average value is the score (weight)
(c) Compute the eigenvalue (kmax) for the matrix with three rows and select the maximum eigenvalue,kmax = (3.3333 · 0.2998) + (1.6700 · 0.5996) + (10.0000 · 0.1006) = 3.0066
(d) The consistency index (CI) is (kmax � n)/(n � 1), CI = (3.0066 � 3)/2 = 0.0033
(e) The consistency ratio (CR) is CI/RI, where RI is the random consistency index. For n = 3, RI = 0.58(Saaty 1999). CR = 0.0033/0.58 = 0.0057
434 M. S. Hossain et al.
123
separately in four submodels, namely water quality, soil quality, topography, and infra-
structure and socio-economic factors, enabing comprehensive analysis. The potential area
in each submodel is summarized in Table 6 and Fig. 4.
The most suitable areas for tilapia farming are recognized as those with water of good
quality which is well-oxygenated and of favorable temperature, salinity, and pH. Such
areas cover existing agriculture, aquaculture, and grassland. Approximately 100% of land
area is most suitable for tilapia farming in terms of temperature, dissolved oxygen, salinity,
and pH (Table 6). Moderately suitable areas (22% of land) with regard to water quality are
located in areas of paddy and seasonal vegetable cultivation. All hilly streams of the nearby
Chandranath reserve forest join together and form two waterfalls, Sahasradhara and
Suptadhara. Numerous streams (locally called chhara), and canals (locally called khal)
flow in the east-west direction and criss-cross the study area. The road and embankment
behind ditches and homestead ponds also retain rainwater that can be used for aquaculture
and to enhance agriculture and aquaculture activity in the nearby areas through irrigation.
The coastal embankment with afforested greenbelt protects the study area from saline
water.
Water Quality
Temperature
Salinity
D. oxygen
pH
Sources
Transparency
Clay content
O. matter
Salinity
pH
Soil quality
Topography Slope
Elevation
Land use type
Infrastructureand socio-economic
factors
Distance to road
Populationdensity
Distance to fry source
Distance to market
Distance to electricity
noitcele
Seti
Sg
nimra
Fai
paliT
TOPLEVEL
Goal
INTERMEDIATELEVEL
Sub Models
BOTTOM LEVEL
Criteria
Derivedthemes
Outputs(Model)
Water quality Soil quality Topography Infrastructure and socio-economic
Overall site suitability
map
Fig. 2 Schematic diagram of modeling procedure for Nile tilapia farming area selection in SitakundaUpazila, Bangladesh
GIS-based land-suitability classification for tilapia farming 435
123
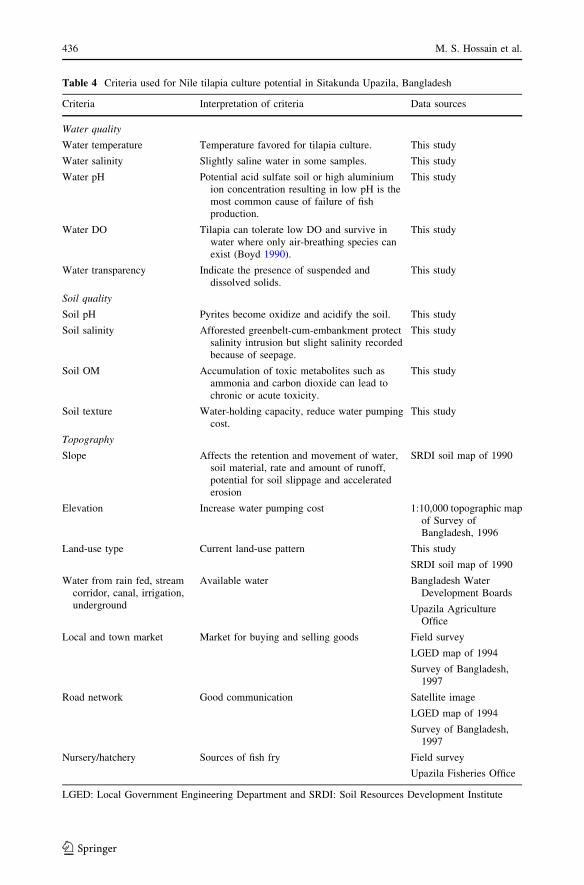
Table 4 Criteria used for Nile tilapia culture potential in Sitakunda Upazila, Bangladesh
Criteria Interpretation of criteria Data sources
Water quality
Water temperature Temperature favored for tilapia culture. This study
Water salinity Slightly saline water in some samples. This study
Water pH Potential acid sulfate soil or high aluminiumion concentration resulting in low pH is themost common cause of failure of fishproduction.
This study
Water DO Tilapia can tolerate low DO and survive inwater where only air-breathing species canexist (Boyd 1990).
This study
Water transparency Indicate the presence of suspended anddissolved solids.
This study
Soil quality
Soil pH Pyrites become oxidize and acidify the soil. This study
Soil salinity Afforested greenbelt-cum-embankment protectsalinity intrusion but slight salinity recordedbecause of seepage.
This study
Soil OM Accumulation of toxic metabolites such asammonia and carbon dioxide can lead tochronic or acute toxicity.
This study
Soil texture Water-holding capacity, reduce water pumpingcost.
This study
Topography
Slope Affects the retention and movement of water,soil material, rate and amount of runoff,potential for soil slippage and acceleratederosion
SRDI soil map of 1990
Elevation Increase water pumping cost 1:10,000 topographic mapof Survey ofBangladesh, 1996
Land-use type Current land-use pattern This study
SRDI soil map of 1990
Water from rain fed, streamcorridor, canal, irrigation,underground
Available water Bangladesh WaterDevelopment Boards
Upazila AgricultureOffice
Local and town market Market for buying and selling goods Field survey
LGED map of 1994
Survey of Bangladesh,1997
Road network Good communication Satellite image
LGED map of 1994
Survey of Bangladesh,1997
Nursery/hatchery Sources of fish fry Field survey
Upazila Fisheries Office
LGED: Local Government Engineering Department and SRDI: Soil Resources Development Institute
436 M. S. Hossain et al.
123
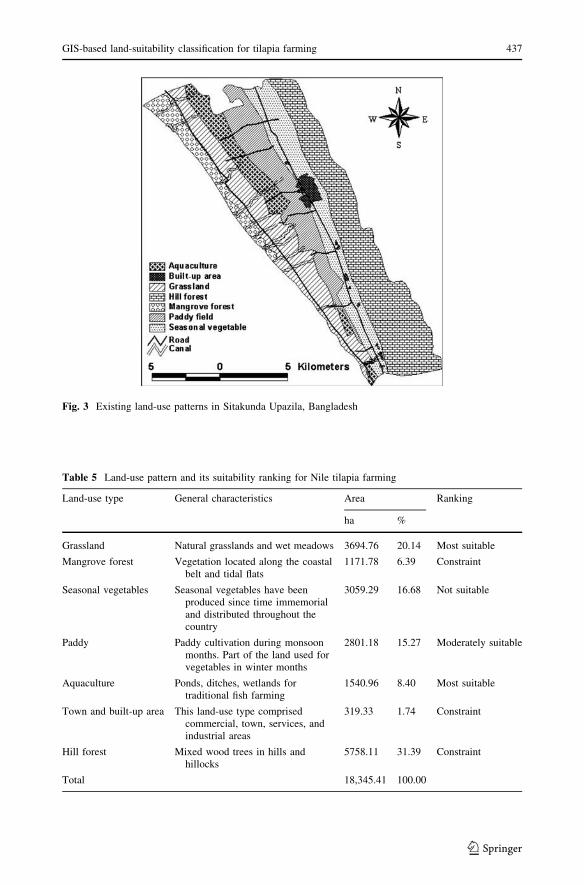
Table 5 Land-use pattern and its suitability ranking for Nile tilapia farming
Land-use type General characteristics Area Ranking
ha %
Grassland Natural grasslands and wet meadows 3694.76 20.14 Most suitable
Mangrove forest Vegetation located along the coastalbelt and tidal flats
1171.78 6.39 Constraint
Seasonal vegetables Seasonal vegetables have beenproduced since time immemorialand distributed throughout thecountry
3059.29 16.68 Not suitable
Paddy Paddy cultivation during monsoonmonths. Part of the land used forvegetables in winter months
2801.18 15.27 Moderately suitable
Aquaculture Ponds, ditches, wetlands fortraditional fish farming
1540.96 8.40 Most suitable
Town and built-up area This land-use type comprisedcommercial, town, services, andindustrial areas
319.33 1.74 Constraint
Hill forest Mixed wood trees in hills andhillocks
5758.11 31.39 Constraint
Total 18,345.41 100.00
Fig. 3 Existing land-use patterns in Sitakunda Upazila, Bangladesh
GIS-based land-suitability classification for tilapia farming 437
123
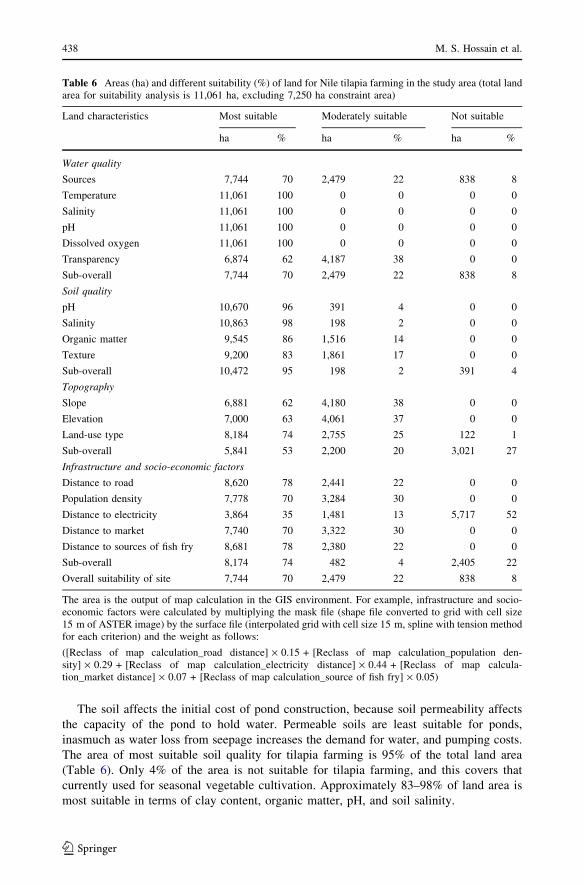
The soil affects the initial cost of pond construction, because soil permeability affects
the capacity of the pond to hold water. Permeable soils are least suitable for ponds,
inasmuch as water loss from seepage increases the demand for water, and pumping costs.
The area of most suitable soil quality for tilapia farming is 95% of the total land area
(Table 6). Only 4% of the area is not suitable for tilapia farming, and this covers that
currently used for seasonal vegetable cultivation. Approximately 83–98% of land area is
most suitable in terms of clay content, organic matter, pH, and soil salinity.
Table 6 Areas (ha) and different suitability (%) of land for Nile tilapia farming in the study area (total landarea for suitability analysis is 11,061 ha, excluding 7,250 ha constraint area)
Land characteristics Most suitable Moderately suitable Not suitable
ha % ha % ha %
Water quality
Sources 7,744 70 2,479 22 838 8
Temperature 11,061 100 0 0 0 0
Salinity 11,061 100 0 0 0 0
pH 11,061 100 0 0 0 0
Dissolved oxygen 11,061 100 0 0 0 0
Transparency 6,874 62 4,187 38 0 0
Sub-overall 7,744 70 2,479 22 838 8
Soil quality
pH 10,670 96 391 4 0 0
Salinity 10,863 98 198 2 0 0
Organic matter 9,545 86 1,516 14 0 0
Texture 9,200 83 1,861 17 0 0
Sub-overall 10,472 95 198 2 391 4
Topography
Slope 6,881 62 4,180 38 0 0
Elevation 7,000 63 4,061 37 0 0
Land-use type 8,184 74 2,755 25 122 1
Sub-overall 5,841 53 2,200 20 3,021 27
Infrastructure and socio-economic factors
Distance to road 8,620 78 2,441 22 0 0
Population density 7,778 70 3,284 30 0 0
Distance to electricity 3,864 35 1,481 13 5,717 52
Distance to market 7,740 70 3,322 30 0 0
Distance to sources of fish fry 8,681 78 2,380 22 0 0
Sub-overall 8,174 74 482 4 2,405 22
Overall suitability of site 7,744 70 2,479 22 838 8
The area is the output of map calculation in the GIS environment. For example, infrastructure and socio-economic factors were calculated by multiplying the mask file (shape file converted to grid with cell size15 m of ASTER image) by the surface file (interpolated grid with cell size 15 m, spline with tension methodfor each criterion) and the weight as follows:
([Reclass of map calculation_road distance] · 0.15 + [Reclass of map calculation_population den-sity] · 0.29 + [Reclass of map calculation_electricity distance] · 0.44 + [Reclass of map calcula-tion_market distance] · 0.07 + [Reclass of map calculation_source of fish fry] · 0.05)
438 M. S. Hossain et al.
123
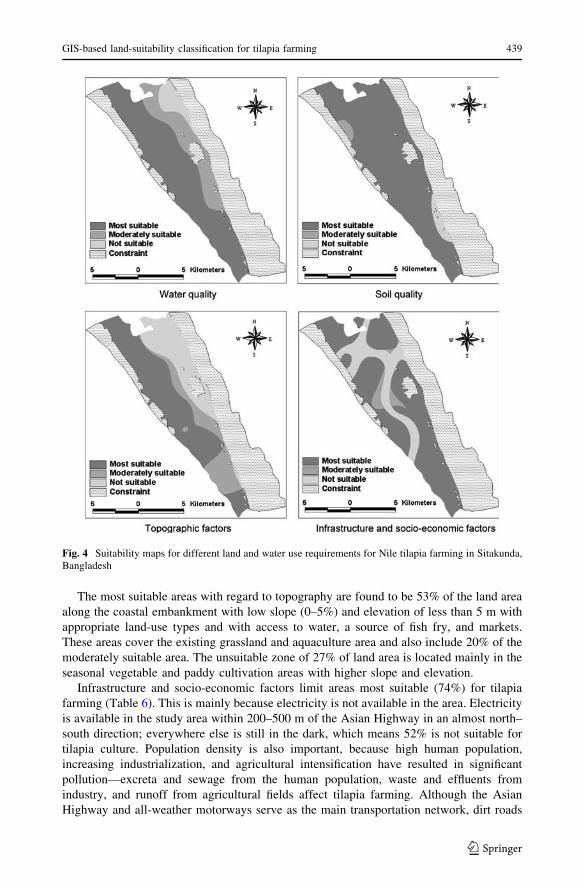
The most suitable areas with regard to topography are found to be 53% of the land area
along the coastal embankment with low slope (0–5%) and elevation of less than 5 m with
appropriate land-use types and with access to water, a source of fish fry, and markets.
These areas cover the existing grassland and aquaculture area and also include 20% of the
moderately suitable area. The unsuitable zone of 27% of land area is located mainly in the
seasonal vegetable and paddy cultivation areas with higher slope and elevation.
Infrastructure and socio-economic factors limit areas most suitable (74%) for tilapia
farming (Table 6). This is mainly because electricity is not available in the area. Electricity
is available in the study area within 200–500 m of the Asian Highway in an almost north–
south direction; everywhere else is still in the dark, which means 52% is not suitable for
tilapia culture. Population density is also important, because high human population,
increasing industrialization, and agricultural intensification have resulted in significant
pollution—excreta and sewage from the human population, waste and effluents from
industry, and runoff from agricultural fields affect tilapia farming. Although the Asian
Highway and all-weather motorways serve as the main transportation network, dirt roads
Fig. 4 Suitability maps for different land and water use requirements for Nile tilapia farming in Sitakunda,Bangladesh
GIS-based land-suitability classification for tilapia farming 439
123
are also significant to the local community for developing a network among the forward
and backward-linked industries of tilapia farming. Availability of sources of fish fry and
easily accessible well-established marketing facilities favor tilapia farming development in
the study area. Approximately three-fourths of the total area (74%) is classified as suitable
for tilapia farming in terms of infrastructure and socio-economic factors.
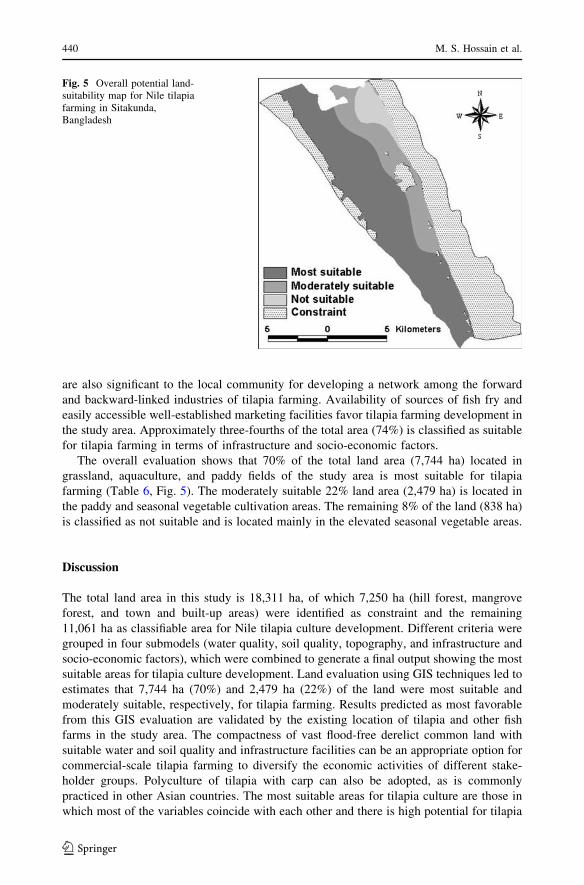
The overall evaluation shows that 70% of the total land area (7,744 ha) located in
grassland, aquaculture, and paddy fields of the study area is most suitable for tilapia
farming (Table 6, Fig. 5). The moderately suitable 22% land area (2,479 ha) is located in
the paddy and seasonal vegetable cultivation areas. The remaining 8% of the land (838 ha)
is classified as not suitable and is located mainly in the elevated seasonal vegetable areas.
Discussion
The total land area in this study is 18,311 ha, of which 7,250 ha (hill forest, mangrove
forest, and town and built-up areas) were identified as constraint and the remaining
11,061 ha as classifiable area for Nile tilapia culture development. Different criteria were
grouped in four submodels (water quality, soil quality, topography, and infrastructure and
socio-economic factors), which were combined to generate a final output showing the most
suitable areas for tilapia culture development. Land evaluation using GIS techniques led to
estimates that 7,744 ha (70%) and 2,479 ha (22%) of the land were most suitable and
moderately suitable, respectively, for tilapia farming. Results predicted as most favorable
from this GIS evaluation are validated by the existing location of tilapia and other fish
farms in the study area. The compactness of vast flood-free derelict common land with
suitable water and soil quality and infrastructure facilities can be an appropriate option for
commercial-scale tilapia farming to diversify the economic activities of different stake-
holder groups. Polyculture of tilapia with carp can also be adopted, as is commonly
practiced in other Asian countries. The most suitable areas for tilapia culture are those in
which most of the variables coincide with each other and there is high potential for tilapia
Fig. 5 Overall potential land-suitability map for Nile tilapiafarming in Sitakunda,Bangladesh
440 M. S. Hossain et al.
123
production. Farmers in these areas can easily obtain support services and sell their product
in good time to earn more profit than in other areas. In contrast, moderately suitable areas
can enable moderate tilapia production, although costs may be higher than in the most
suitable areas because of the time required to obtain support services, transport require-
ments, and sell the product.
This study suggests that the land should be divided into different zones on the basis of
suitability for tilapia farming, i.e. most suitable, moderately suitable, and not suitable
zones. The zoning approach can provide important information enabling potential devel-
opers/investors to identify suitable zones that meet requirements ensuring maximum
benefit for a long period (Hossain and Lin 2001). Zoning of land and water for tilapia farm
development can help in the control of environmental deterioration at the farm level and in
the avoidance of adverse social and environmental interactions. Local people prefer more
suitable locations on the basis of their indigenous knowledge, which justifies the well
known expression ‘‘farmers are the real scientists’’; thus the present land-suitability
evaluation identified the most favorable areas that were also validated by the current
location of fish farms in the study area. Grassland and wet meadows are currently used
solely for buffalo and cow grazing, although this derelict land can be converted for
commercial-scale tilapia farming with added economic benefits and no environmental loss.
A fragmented culture system, without any management practice, has occupied only
1,540 ha of the land in the study area, however. The most notable approach consists of
stocking fish in water bodies followed by recapture after a period of several months or even
a year. These results are very encouraging in terms of tilapia culture development and
suggest that the grassland–agriculture areas could be used for Nile tilapia farming to
diversify economic activity. After completion of the harvest the pond bottom effluent can
be lifted up on to the dike and dried in the sun to produce manure for cultivation of dike-
based vegetables. The decision to convert agriculture and wet-meadow grassland to fish
ponds is often related to food security and social aspects. To maintain a balance between
social and economic aspects, integrated farming systems, for example rice–fish culture
(Gregory and Guttman 2002) or garden–pond–livestock and garden–pond–livestock–forest
(Luu et al. 2002) may be examined. Other important factors, for example detailed envi-
ronmental, climatic, economic, and political issues should be considered in the decision-
making process. These factors are not considered, because of little variation within the
study area and difficulties in spatial surface modeling from a small number of collected
samples. These factors may be useful for land evaluation in larger areas.
Members of the local community reported there is a strong bond and social harmony
among the religious groups (Muslims 75% and Hindus 25%). Most members of the
community extend a helping hand to neighbors during crises or problems. The local
community invites their neighbors to religious and social festivals. Women are quite
conservative and feel shy about meeting outsiders, for example this research team. No
social conflict, poaching, or robbery have been reported in the study area. Incorporating
key socio-economic and environmental factors into land evaluation for Nile tilapia farming
will enable planners and policy makers to develop better land use policies and make
decisions based on objective characteristics and requirements or the overall potential of the
land. This study shows that GIS databases of different format and from different sources
can be used effectively to establish spatial models in land evaluation for tilapia farming. It
is expected that land-evaluation modeling will be useful for identifying areas suitable for
tilapia farming in terms of efficient income generation, effective conservation, and sus-
tainable land management. The results of this study could be improved by use of site-
specific data for tilapia culture. An important advantage of GIS is the ability to update
GIS-based land-suitability classification for tilapia farming 441
123
current ratings easily when new or better information becomes available (Rajitha et al.
2007) and the ability to obtain output from the improved model ‘‘on-the-fly’’. A new map
can be generated in a relatively short time with less effort and lower cost than for additions
to files on paper, manual planimetry, and conventional map updating (Kapetsky 1994;
William 1994).
References
Aguilar-Manjarrez J, Ross LG (1995) Geographical Information System (GIS), environmental models foraquaculture development in Sinaloa state, Mexico. Aquacult Int 3(2):103–115
Al-Ahmad T, Ridha M, Al-Ahmad AA (1988) Production and feed ratio of the tilapia Oreochromis spilurusin seawater. Aquaculture 73:111–118
Boyd CE (1990) Water quality in ponds for aquaculture. Auburn University, Auburn, ALBurrough PA (1986) Principles of Geographic Information System for land resources assessment. Oxford
University Press, New YorkBurrough PA, McDonnell RA (1998) Principles of Geographical Information Systems. Oxford University
Press, New York, p 333Caulton MS (1982) Feeding, metabolism and growth of tilapias: some quantitative considerations. In: Pullin
RVS, Lower-McConnell RH (eds) The biology and culture of tilapias. ICLARM Conference Pro-ceedings 7, 2–5 September 1980, Bellagio, Italy. International Center for Living Aquatic ResourcesManagement, Manila, Phillippines, pp 157–180
Clark JH, Wantanabe WO, Ernst DH, Wicklund RI (1990) Effect of feeding rate on growth and feedconversion of Florida red tilapia reared in floating marine cages. J World Aquacult Soc 20:16–24
Denzer HW (1967) Studies on the physiology of young tilapia. FAO Fish Rep 44:358–366Diana JS, Lin CK, Yi Y (1996) Timing of supplemental feeding for tilapia production. J World Aquacult
Soc 27:410–419FAO (1993) Guidelines for land use planning. FAO Development Series 1. Food and Agriculture Organi-
zation of the United Nations, Rome, ItalyFAO (1976) A framework for land evaluation. Soils Bulletin, vol. 32. Food and Agriculture Organization of
the United Nations, Rome, ItalyFegan DF (1994) Environmental assessment and management of aquaculture development: an industry
perspective. Workshop on environmental assessment and management of aquaculture. Third meetingof the Technical Advisory Committee (TAC 3) of the Network of Aquaculture Centres of Asia-Pacific,Hanoi, S. R. Vietnam, 27–30 September 1994, pp 18–29
Gannam A, Phillips H (1993) Effects of temperature on growth of Oreochromis niloticus. In: Egna HS,McNamara M, Bowan J, Astin N (eds) Tenth annual administrative report. Pond Dynamics/Aqua-culture CRSP, Oregon State University, Corvallis, OR, pp 136–142
GESAMP (IMO/FAO/UNESCO/WMO/WHO/IAEA/UN/UNEP Joint Group of Experts on the ScientificAspects of Marine Pollution) (1997) Towards safe and effective use of chemicals in coastal aqua-culture. Rep Stud GESAMP 65, p 40
Giap DH, Yi Y, Yakupitiyage A (2005) GIS for land evaluation for shrimp farming in Haiphong of Vietnam.Ocean Coast Manage 48:51–63
Gregory G, Guttman H (2002) Developing appropriate interventions for rice-fish cultures, In: Edwards P,Little DC, Demaine H (eds) Rural aquaculture, CABI Publishing, Wallingford, UK, pp 15–28
Hossain MS, Alam SMN, Lin CK, Demaine H, Khan YSA, Das NG, Rouf MA (2004) integrated man-agement approach for shrimp culture development in the coastal environment of Bangladesh. WorldAquacult 35(1):35–45
Hossain MS, Lin CK, Demaine H, Tokunaga M, Hussain MZ (2003a) Land use zoning for solar saltproduction in Cox’s Bazar coast of Bangladesh: A Remote Sensing and GIS analysis. Asian J Geo-informatics 3(4):69–77
Hossain MS, Lin CK, Tokunaga M, Hussain MZ (2003b) Remote Sensing and GIS application for suitablemangrove afforestation area selection in the coastal zone of Bangladesh. Geocarto Int 18(1):61–65
Hossain MS, Lin CK (2001) Land use zoning for integrated coastal zone management: Remote Sensing, GISand RRA approach in Cox’s Bazar coast, Bangladesh. ITCZM Publication Series, No.3, Asian Instituteof Technology, Bangkok, Thailand, p 25
Hossain MS, Lin CK, Demaine H, Tokunaga M, Hussain MZ (2001) Integrated GIS and Remote Sensingapproaches for suitable shrimp farming area selection in the coastal zone of Bangladesh. Asia-PacificRem Sens GIS J 14:33–39
442 M. S. Hossain et al.
123
Islam MJ, Alam MS, Elahi KM (1997) Remote sensing for change detection in the Sunderbans, Bangladesh.Geocarto Int 12(3):91–100
Kapetsky JM (1994) A strategic assessment of warm-water fish farming potential in Africa. CIFA TechnicalPaper, vol. 27. Food and Agriculture Organization, Rome, Italy
Kapetsky JM (1987) Satellite remote sensing to locate and inventory small water bodies for fisheries man-agement and aquaculture development in Zimbabwe. CIFA Occasional Paper (14). FAO, Rome, Italy.
Kapetsky JM, McGregor L, Nanne LH (1987) A geographical information system and satellite remotesensing to plan for aquaculture development: A FAO-UNESCO/GRID cooperative study in CostaRica. FAO Fisheries Technical Paper (287), p 51
Khan YSA, Hossain MS, Chowdhury MAT (2003) Resource inventory and land use mapping for integratedcoastal environment management: remote sensing, GIS and RRA approach in greater Chittagong coast.Ministry of science and information & communication technology, Government of the People’sRepublic of Bangladesh, Dhaka, p 59
Liberatore MJ, Nydick RL (1997) Group decision making in higher education using the analytic hierarchyprocess. Res High Educ 38(5):593–614
Liberatore MJ, Nydick RL, Sanchez PM (1992) The evaluation of research papers (or how to get anacademic committee to agree on something). Interfaces 22(2):92–100
Lillisand TM, Kiefer RW (2000) Remote sensing and image interpretation, 4th edition. John Wiley & Sons,Inc., New York, p 724
Luu LT, Trang PV, Cuong NX, Demaine H, Edwards P, Pant J (2002) Promotion of small-scale pondaquaculture in the Red River Delta, Vietnam, In: Edwards P, Little DC, Demaine H (eds) Ruralaquaculture, CABI Publishing, Wallingford, UK, pp 55–76
Malczewski J (1999) GIS and multicriteria decision analysis. New York: Wiley, p 392Millet I (1998) Ethical decision making using the analytic hierarchy process. J Bus Ethics 17:1197–1204Mittelmark J, Landkammer D (1990) Design and construction of diversion ponds for aquaculture.
Department of Fisheries and Wildlife, University of Minnesota, St. Paul, Minnesota USAPereira JMC, Duckstein L (1993) A multiple criteria decision-making approach to GIS-based land suitability
evaluation. Int J Geogr Inf Syst 7:407–424Perez OM, Telfer TC, Ross LG (2003) Use of GIS-based models for integrating and developing marine fish
cages within the tourism industry in Tenerife (Canary Islands). Coast Manag 31:355–366Rajitha K, Mukherjee R, Chandran V (2007) Applications of remote sensing and GIS for sustainable
management of shrimp culture in India. Aquacult Eng 36:1–17Research Systems Inc (2000a) ENVI user’s guide. ENVI version 3.4. Research Systems Inc., USAResearch Systems Inc (2000b) Exploring ENVI, training course manual. Better Solutions Consulting
Limited, Liability Company, USARidha M, Al-Ahmad T, Al-Ahmad AA (1985) Tilapia culture in Kuwait: spawning experiments. Kuwait
Institute for Scientific Research. Report KISR 1875, Kuwait, p 19Rossiter DG (1996) A theoretical framework for land evaluation (with discussion). Geoderma 72:165–202Saaty TL (1977) A scaling method for priorities in hierarchical structure. J Math Physiol 15:234–281Saaty TL (1980) The Analytic Hierarchy Process. McGraw–Hill, New York, NYSaaty TL (1988) The analytic hierarchy process. Typesetters Ltd, Beccles, SuffolkSaaty TL (1990) The analytic hierarchy process: planning, priority setting, resource allocation. RWS
Publications, Pittsburgh, p 287Saaty TL (1994) How to make a decision: the analytic hierarchy process. Interfaces 24(6):19–43Saaty TL (1999) Decision making for leaders (3rd ed.). RWS Publications, Pittsburgh, PASalam MA, Khatun NA, Ali MM (2005) Carp farming potential in Barhatta Upazilla, Bangladesh: a GIS
methodological perspective. Aquaculture 245:75–87Shahid MA, Pramanik MAH, Jabbar MA, Ali S (1992) Remote sensing application to study the coastal
shrimp farming area in Bangladesh. Geocarto Int 2:5–13Suresh AV, Lin CK (1992) Tilapia culture in saline waters: a review. Aquaculture 106:201–226Venkataratnam L, Thammappa SS, Sankar TR, Anis S (1997) Mapping and monitoring prawn farming areas
through remote sensing techniques. Geocarto Int 12(2):23–29Vibulsresth S, Ratanasermpong S, Dowreang D, Silapathong C (1993) Mangrove monitoring using satellite
data. TRSC Newsl 10(1):1–2William RG (1994) A role for comprehensive planning, Geographical Information System (GIS) technol-
ogies and program evaluation in aquatic habitat development. Bull Mar Sci 55(2–3):995–1013Yi Y, Lin CK (2001) Effects of biomass of caged Nile tilapia (Oreochromis niloticus) and aeration on the
growth and yields in an integrated cage-cum-pond system. Aquaculture 195:253–267Yi Y, Lin CK, Diana J (1996) Influence of Nile tilapia (Oreochromis niloticus) stocking density in cages on
their growth and yield in cages and in ponds containing the cages. Aquaculture 146:205–215
GIS-based land-suitability classification for tilapia farming 443
123


