Embed Size (px)
Citation preview

138
MODELLING OF LAND USE AND LAND COVER CHANGE IN IBADAN NORTH-WEST LOCAL
GOVERNMENT AREA (LGA), NIGERIA USING SATELLITE IMAGERIES AND GIS TECHNIQUES
Abiodun Olufemi Adebola1, Suleiman Abdul-azeez Adegboyega.1, Ayo Emmanuel Olajuyigbe2, & Sunday Olu Oladejo1
1Department of Remote Sensing & GIS, Federal University of Technology, Akure.
2Department of Urban & Regional Planning, Federal University of Technology, Akure.
ABSTRACT
This study examines urban spatial change in land use and land cover of Ibadan Northwest Local Government Area (LGA)
in Oyo State. The general patterns of land use/cover as they were recorded in remotely sensed data were analysed. Multi-
date satellite imageries (Landsat ETM+ 2000, Landsat ETM+ 2014 of 30m spatial resolution respectively were obtained
and used for the study. These images were enhanced, geo-referenced and classified using IDRISI software. The result of
ground truthing was combined with visual image interpretation as training sites for supervised classification. To predict
land use land cover change of the area in the next 7 years, CA-Markov chain analysis, a land cover prediction procedure
was introduced. The results showed that the natural environments (vegetation, wetland, water bodies, forest, grassland and
built-up) were being threatened, as they reduced continually in the area extent over time and space while the social
environment (built up area) expanded and this may likely be the trend between 2000 and 2021 as projected. The study
discovered that urbanization processes is majorly responsible for land-use/land-cover change in Ibadan North-west. In
conclusion, the study advanced our frontier of knowledge on land use/cover study by providing information on the status
of natural and social environment in Ibadan North-west, between 2000 and 2021 using remotely sensed images and
Geographic Information Systems (GIS) technology.
Keywords: Urban, Land-Use, Land-Cover, Predictive Modeling, CA Markov Chain Analysis, Satellite Imageries
Journal of Sustainable Development in Africa (Volume 17, No.7, 2015)
ISSN: 1520-5509
Clarion University of Pennsylvania, Clarion, Pennsylvania

139
INTRODUCTION
In recent times, the dynamics of Land use Land cover and particularly settlement expansion in the area requires a more
powerful and sophisticated system such as remote sensing and geographic information system (GIS), which provides a
general coverage of large areas than the method employed in the past. In the past two centuries the impact of human
activities on the land has grown enormously, altering entire landscapes, and ultimately impacting the earth's nutrient and
hydrological cycles as well as climate (De Sherbin, 2002). Significant population increase, migration, accelerated socio-
economic activities, increased demands on the landscapes for food and shelter and an increased number of products of
man’s living environment have led to un-parallel changes in land use and modification of rural and urban environment,
these changes have made sustainability of the environment difficult. Information about the earth and our environment can
be extracted from imagery obtained by various sensors carried in aircraft and satellites (Paul and Charles, 2002). The advent
of geographic information system (GIS) has made it possible to integrate multisource andmulti-date data for the generation
of landuse and landcover changes involving suchinformation as the trend, rate, nature, location and magnitude of the
changes Adeniyi et al (1999). This has been very useful to various relevant authorities in ensuring sustainable development.
Remotely sensed data have been applied in many fields like forestry, geology, agriculture, conservation and planning etc.
(Paul et al, 2002).The role of planning agencies, for example, is becoming increasingly more complex and is extending to
a wider range of activities. Consequently, there is an increased need for these agencies to have timely, accurate and cost-
effective sources of data of various forms. Several of these data are well served by visual and digital image interpretation.
A key example is land use land cover mapping (Lillesand, Kiefer and Chipman, 2008). Major consequences of the globally
recognized rapid land use and land cover changes are; land degradation, loss of biodiversity, agricultural yield depletion
and ecosystem functioning. Due to poorly planned human interference, many African countries have experience untold
environmental degradation and ecological deterioration in the past century, with little or no real solution to alleviate many
of these concerns. Adequate information and appropriate technology are limited factors for effective environmental
management.
In situations of rapid and often unrecorded land use change, viewing the earth from space provides objective information
of human utilization of the earth. Remote Sensing and Geographic Information System (GIS) are now providing new tools
for advanced ecosystem management. The collection of remotely sensed data facilitates the analyses of Earth - system
function, patterning, and change at local, regional and global scales over time; such data also provide an important link
between intensive, localized ecological research and regional, national and international conservation and management of
biological diversity (Wilkie and Finn, 1996). Therefore, an attempt was made in this study to map out the status of land
use land cover of Ibadan Northwest between 2000 - 2014 with a view to detecting the land consumption rate and the
changes that have taken place particularly in the built-up and vegetated areas so as to predict possible changes that might
take place in the next 20 years using both Geographic Information System and Remote Sensing tools.
Urbanization in Nigeria is not a recent phenomenon, thus the growth and development of cities in Nigeria is very similar
to the urbanization process in other African countries. The south western part of Nigeria has the highest urbanization level
(Aloba, 2004). It is generally believed that urbanization has both direct and indirect impacts on land use transformation.
Abubakar, et al. (2000) in their study on assessment of environmental degradation using satellite remote sensing
technologies, they examine landuse/landcover changes in TalataMafara area of Zamfara state, Nigeria. Their results
showed that changes among six land use / land cover classes between 1986 and 1995, Agricultural land increased from

140
117.00 km2 to 158.50 km2, while grass, shrub and thicket Land cover decreased from 20.13km2 to 12.50 km2. There was a
drastic increase in bare surfaces from 5.38 km2 to 27.13 km2. Settlement showed a slight decrease from 1.25 km2 to 1.13
km2 rather than the expected growth. Uncultivated vegetated wetland also showed a decrease from 14.63 to 8.25 km2 and
Water bodies increased from 3.88 km2 to 5.00 km2.
Bhaduri, et al. (2000) used L-THIA to assess long-term hydrologic impacts of land use change with special attention given
to small and low-frequency storms in the Little Eagle Creek in Indianapolis, Indiana (70.5 km2). Daily precipitation from
1966 to 1995, with 1973, 1984, and 1991 land use data were used for the simulations. The study determined that an 18%
increase in urban and impervious areas resulted in approximately 80% increase in annual average runoff volume, more
than 50% increase in heavy metal loads (lead, copper, and zinc), and 15% increase in nutrient loads (phosphorus and
nitrogen. Adetunji and Adegboyega (2011) examined the spatio-temporal pattern of city development and travel
characteristics of urban resident of Ilesa. Satellite imagery of ilesa taken in 1986, 1998, 2002, and 2008 were used as source
of primary data to compliment the administrative map of 1948, 1965, nd1977. The study reveals that the expansion ofIlesa
was alarming between 1948 and 2008 at 57.4%, when the built-up area of Ilesa attained a net increase of 52km2 to reach
62.7km2 in 2008.The Earth Summit, United Nations Conference on Environment and Development (UNCED), which took
place in Rio-De-Janeiro in 1992, recognized the pressing environment and development problems of the world and through
the adoption of Agenda 21, produced a global programme of action for sustainable development in the 21st century. Agenda
21 stresses the importance of partnership in improving social, economic and environmental quality in urban areas. It
suggests renewed focus on effective land use planning to include adequate environmental infrastructure, water, sanitation,
drainage, transportation, and solid waste in addition to a sound social infrastructure capable of alleviating hunger. However,
the urban expansion in Ibadan mostly occur in an unguided, unplanned, uncoordinated and unsystematic manner thereby
paving way for sprawling development due to unprecedented urban pressures. Therefore, modeling the land use in the
study area will go a long way to predict future development and assist to check urban development to appropriate area
thereby ensuring a sustained urban growth.
MATERIALS AND METHODS
Research locale
Ibadan Northwest is located within longitude 3.80E and3.90E, latitude 7.30N and 7.40.N. The study area has an aerial extent
of about 26km2. It’s headquarter is at Dugbe/Onireke and it has a population of 152,834 at the 2006 census. Population
increase is about +3.46% per year (2006- 2011). Estimated population as at 2010 is 173,359. The climate of the region is
tropically wet and dry with a lengthy wet season and relatively constant temperature throughout the course of the year. The
wet season runs from march through October, also there are two peaks for rainfall, which are; June and September. The
mean temperature is 26.46oc, and minimum is 21.42oc, while the relative humidity is about 74.55mmHg.
141
1.0 FIG 2: Map of the study area.
2.0 The change process in Ibadan North West is heavily dependent on the land holdings and the socio economic capacities of
urban residents. The study seeks to provide explanation to change process in Ibadan North-west.
3.0 Socio-economic factors
4.0 Population characteristics: Ibadan North-west has a population of 147,918 people in
5.0
6.0
7.0
8.0
Fig 1: Map of Study Area
Nature of Data
Satellite Image
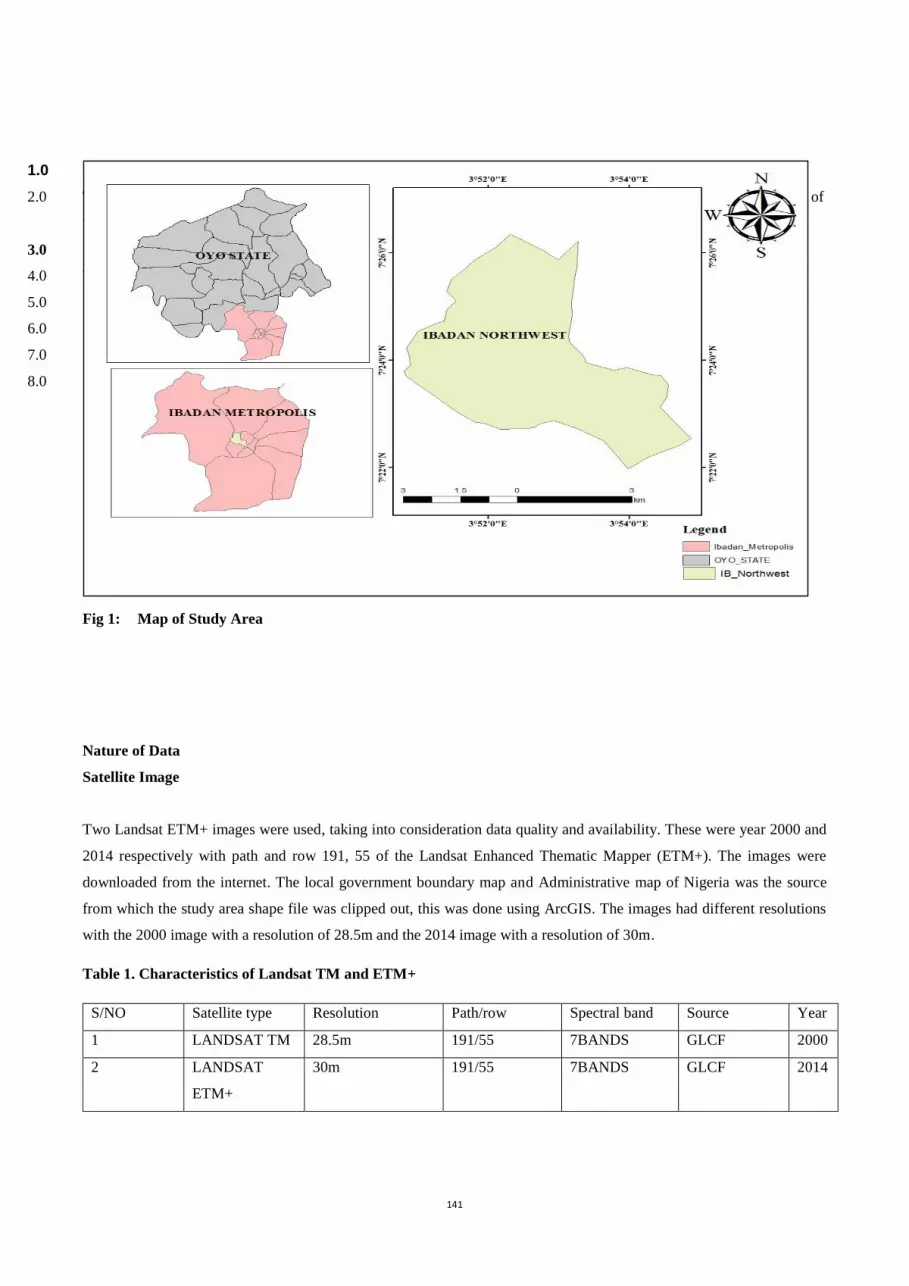
Two Landsat ETM+ images were used, taking into consideration data quality and availability. These were year 2000 and
2014 respectively with path and row 191, 55 of the Landsat Enhanced Thematic Mapper (ETM+). The images were
downloaded from the internet. The local government boundary map and Administrative map of Nigeria was the source
from which the study area shape file was clipped out, this was done using ArcGIS. The images had different resolutions
with the 2000 image with a resolution of 28.5m and the 2014 image with a resolution of 30m.
Table 1. Characteristics of Landsat TM and ETM+
S/NO Satellite type Resolution Path/row Spectral band Source Year
1 LANDSAT TM 28.5m 191/55 7BANDS GLCF 2000
2 LANDSAT
ETM+
30m 191/55 7BANDS GLCF 2014
142
FIG 2: Band 432 composite in 2000.
FIG 3: Band 432 composite in 2014.
Development of a Classification Scheme
Multi-date satellite imageries (Landsat ETM+ 2000, Landsat ETM+ 2014 of 30m spatial resolution respectively) were
obtained and used for the study. The images were obtained in the same season. All the images were enhanced, geo-
referenced and classified for the assessment of spatio-temporal pattern of land use/cover change in the study area. The band
combination used for this study is 4, 3 and 2 (RGB) and band 5, 4, 3(RGB). In this study, the satellite images were classified
using supervised classification method. The combine process of visual image interpretation of tones/colours, patterns,
shape, size, and texture of the imageries and digital image processing were used to identify homogeneous groups of pixels,
which represent various land use classes of interest. To validate the tonal values recorded on the satellite images with the
features obtained on the ground and also to know what type of land use/cover was actually present,Quickbird map of the
study area was printed and was used as guide to locate and identify features both on ground and on the image data. The
geographical locations of the identified features on the ground were clearly defined. These were used as training samples
for supervised classification of the remotely sensed images. Based on this, a classification scheme was developed for the
study area.

143
Table 2: Land Use Land Cover Classification Scheme
Change Detection and Prediction
Percentage change to determine the trend of change can be calculated by dividing observed change by sum ofchanges
multiplied by 100
(Trend)percentage change =observed change
sum of changes𝑥 100 (1)
Change detection involves the prediction of landuselandcover changes to a later period by estimating the percentage change
of the area over a period of time. The algorithms in predicting change is; Stochiastic, and Cellular Automata (CA) _Markov.
Markov chain is a convenient tool for modelling landuselandcover change when changes and the process of change are
difficult to explain. It is achieved by developing a transition probability matrix of landuselandcover change from time to
time, which shows the nature of change while at same time serving as the basis for projecting to a later period. CA_Markov
uses the output from the Markov chain analysis to grow out landuse from time to time.
Predictive Modelling for Future Land use and Land cover Changes in Ibadan North-West
For this study two different techniques are used in the predictive modeling of the landuse/landcover change, they include
the Markov Chain Analysis and the Cellular Automa (CA) Markov.
Markov Chain Analysis for Future Land Cover Change Prediction
Markovian model was used to create such a transition probability matrix.Conditional probability maps for each of the land
cover type is shown below:
Code Land-use/Land cover categories
1 Built-up Land
2 Derived savanna/Farmland
3 Water Body
4 Bare Land
5 Wet Land
6 Thick vegetation
7 Light vegetation

144
Figure 4 : Transition map from all other landcover classes to built-up landuse class
Figure 5: Transition map from all other landcover classes to bare surface landcover

145
Figure 6: Transition map from all other landcover classes to dense vegetation
146
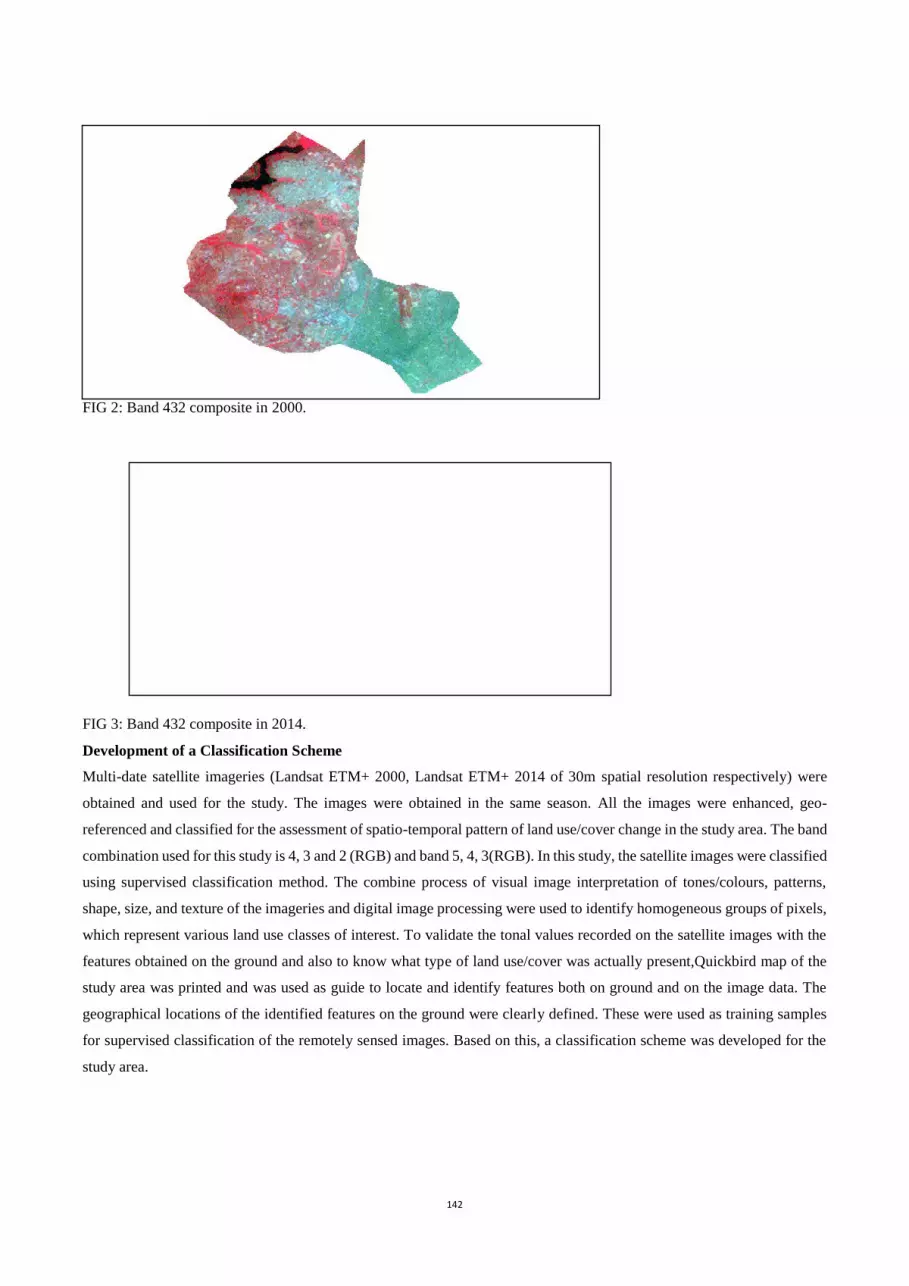
Figure 7: Transition map from all other landcover classes to water body
Figure 8: Transition map from all other landcover classes to riparian
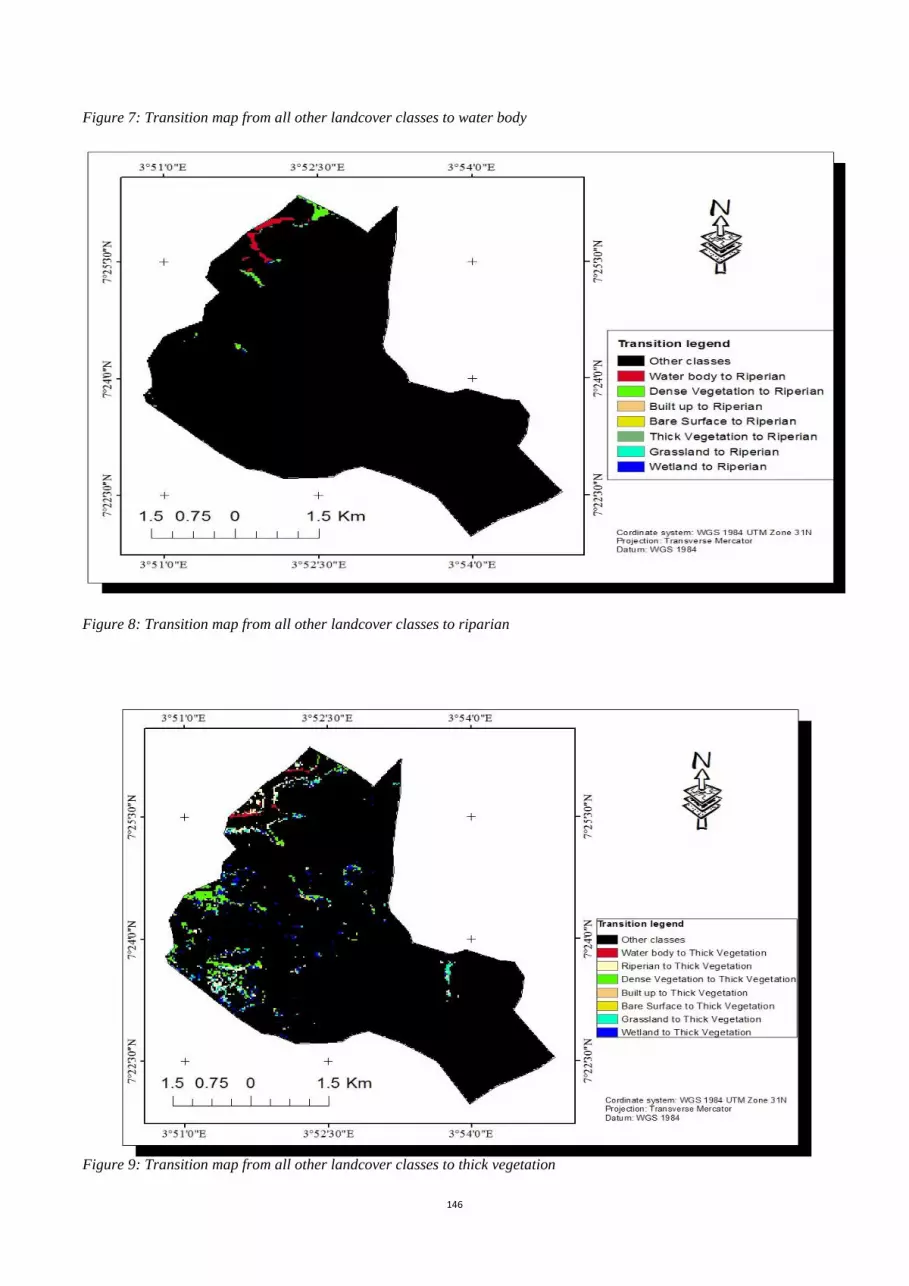
Figure 9: Transition map from all other landcover classes to thick vegetation

147
Figure 10: Transition map from all other landcover classes to grassland
Figure 11: Transition map from all other landcover classes to wetland

148
Table 3: Landuse/landcover transition probability matrix
Year 2014
2000 Classes Water
body
Riparian Dense
vegetation
Built
up
Bare
surfaces
Thick
Vegetation
Grassland Wetland
Water
body
0.5529 0.3180 0.0971 0.0000 0.0000 0.0313 0.0000 0.0000
Riparian 0.0544 0.0746 0.1064 0.0000 0.2142 0.4364 0.1139 0.0000
Dense
vegetation
0.0094 0.0944 0.1744 0.0234 0.1821 0.3047 0.1065 0.1051
Built up 0.0000 0.0000 0.0187 0.9259 0.0274 0.0000 0.0022 0.0258
Bare
surfaces
0.0000 0.0000 0.1385 0.1640 0.5026 0.0000 0.1026 0.0924
Thick
vegetation
0.0000 0.0131 0.1758 0.0000 0.2319 0.3779 0.1554 0.0458
Grassland 0.0021 0.00087 0.1339 0.0735 0.2853 0.1912 0.2183 0.0870
Wetland 0.0000 0.0000 0.1777 0.1624 0.2995 0.0187 0.1771 0.1644
Table 4: Transition Area Matrix
Year 2014
2000 Classes Water
body
Riparian Dense
vegetation
Built up Bare
surfaces
Thick
Vegetation
Grassland Wetland Total
Water body 18.81 14.85 6.93 0 3.06 7.20 0.27 0 51.12
Riparian 3.96 5.31 13.05 3.33 25.47 32.13 12.33 3.15 98.73
Dense
vegetation
1.80 11.43 31.05 19.89 45.09 46.26 22.68 17.91 196.11
Built up 0 0.09 44.73 1218.15 78.84 4.68 18.90 49.32 1414.71
Bare
surfaces
0 0.18 27.90 56.88 82.17 4.77 21.78 18.99 212.67
Thick
vegetation
0.27 2.34 23.67 9.00 38.34 38.97 20.97 9.27 142.83
Grassland 0.45 1.89 21.33 25.74 45.09 25.38 26.91 13.41 160.20
Wetland 0 1.17 86.85 144.09 162.81 31.68 82.17 71.19 579.96
Total 25.29 37.26 255.21 1477.08 480.89 191.07 206.01 183.24 2874.33

149
The above land cover transition probability matrix explains the probability of a land cover class changing to another land
cover class within the period of 14 years. It shows maximum transition probability from riparian to thick vegetation and
the lowest transition is seen to occur from grassland to water body, while no change is seen to be occurring from water
body to built-up and wetland, within the period of 14 years from 2000 to 2014.It is also observed that built up area is the
most consistent land cover type because it has the highest probability value of 0.93.
The landuse/landcover area (change) matrix shown in the table above explains the total area of land transferred from one
class to another within the period of 14 years. The matrix shows that maximum change occurred from wetland to bare
surfaces and minimum change from thick vegetation to water body.
Cellular Automata (CA) Markov Future Land-cover Change Prediction
A cellular automaton is an agent or object that has the ability to change its state based upon the application of a rule that
relates the new state to its previous state and those of its neighbor. One of the basic spatial elements that under lies the
dynamics of many change events is proximity, areas will have a higher tendency to change to a land cover class when they
are near existing area of the same class. This is similar to that of the Markovian chain process with the only difference been
the application of a transition rule that depends not only upon the previous state but also upon the state of local
neighborhood. The predicted landuse/landcover map for this study was done for year 2020.
Figure 12: Predicted map for year 2020

150
Figure 13: Area distribution of each of the landcover classes for year 2020
Figure 14: Nature of change to be expected in the year 2020.
From the figure above, it can be predicted that come year 2020, built up area, bare surfaces, thick vegetation and riparian
will experience an increase in area of 0.72%, 0.46%, 0.66% and 0.09% respectively; while water body, dense vegetation,
grassland and wetland would experience reduction in their covered area extent by 0.25%, 0.66%, 0.5% and 0.6%
respectively.
151
Results and Discussion
Land Use Land Cover Distribution
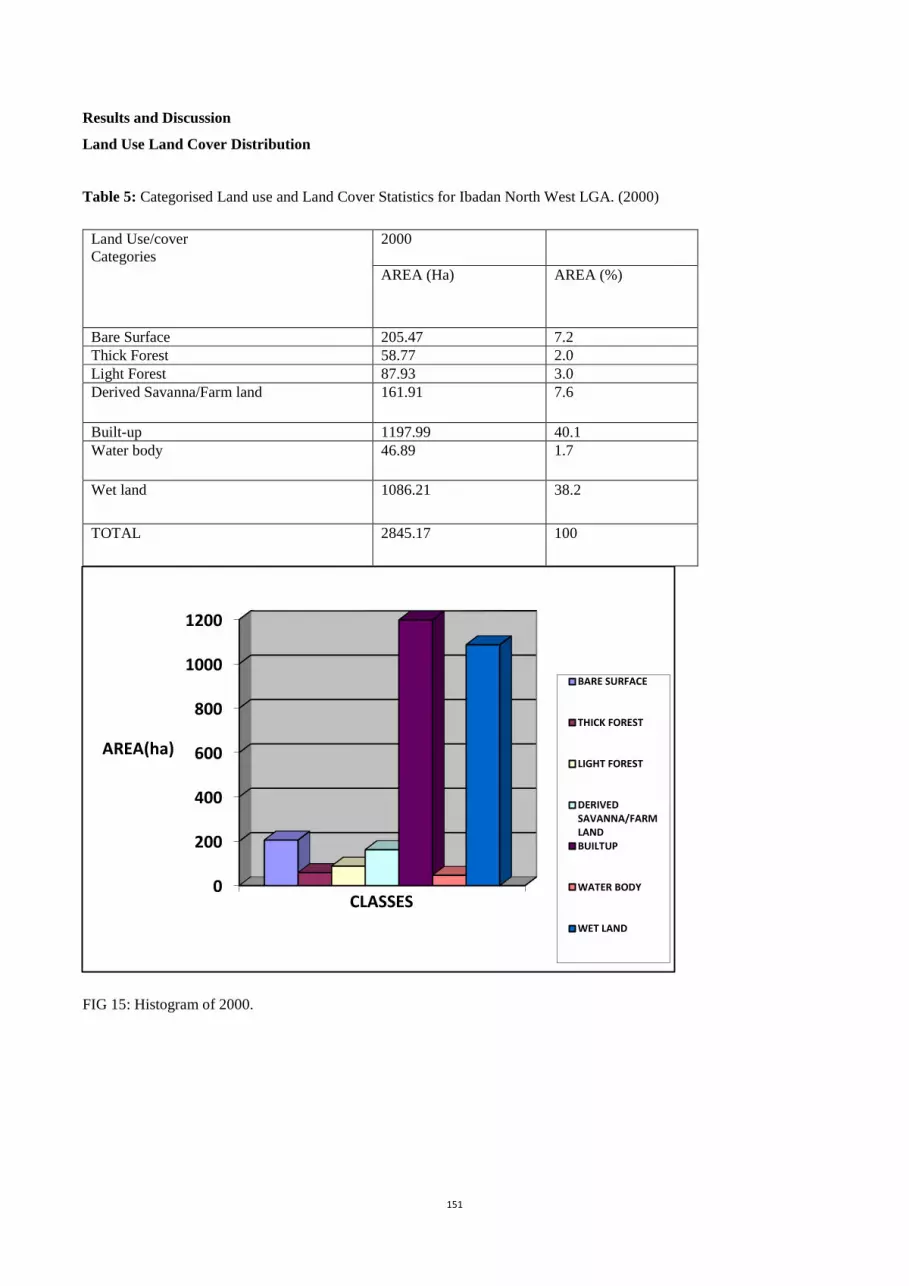
Table 5: Categorised Land use and Land Cover Statistics for Ibadan North West LGA. (2000)
Land Use/cover
Categories
2000
AREA (Ha) AREA (%)
Bare Surface 205.47 7.2
Thick Forest 58.77 2.0
Light Forest 87.93 3.0
Derived Savanna/Farm land 161.91 7.6
Built-up 1197.99 40.1
Water body 46.89 1.7
Wet land 1086.21 38.2
TOTAL 2845.17 100
FIG 15: Histogram of 2000.
0
200
400
600
800
1000
1200
AREA(ha)
CLASSES
BARE SURFACE
THICK FOREST
LIGHT FOREST
DERIVEDSAVANNA/FARMLANDBUILTUP
WATER BODY
WET LAND

152
Table 6: Categorised Land use/ and Land Cover Statistics for Ibadan North West LGA. (2014)
FIG 16: Histogram of 2014.
0
200
400
600
800
1000
1200
1400
AREA(ha)
CLASSES
BARE SURFACE
THICK FOREST
LIGHT FOREST
DERIVEDSAVANNA/FARM LAND
BUILTUP
WATER BODY
WET LAND
Land Use/cover
Categories
2014 AREA (HA) AREA (%)
Bare Surface 341.91 11.90
Thick Forest 91.80 3.20
Light forest 55.26 1.90
Derived savanna/farmland 280.53 9.80
Built up area 1211.22 42.40
Water body 21.33 0.75
Wet land 854.19 29.90
TOTAL 2856.24 100

153
Table 7: Land use and Land Cover Statistics for Ibadan North West LGA. (2021)
FIG 17: Histogram of 2021.
0
200
400
600
800
1000
1200
1400
AREA(ha)
CLASSES
BARE SURFACE
THICK FOREST
LIGHT FOREST
DERIVED SAVANNA/FARMLAND
BUILTUP
WATER BODY
WET LAND
Land Use/cover
Categories
2021 AREA
(HA)
AREA
(%)
Bare surface 361.26 12.70
Thick forest 46.62 1.64
Light forest 89.50 3.15
Derived savanna/farmland 289.08 10.16
Built up 1213.29 42.64
Water body 15.30 0.54
Wet land 830.16 29.18
TOTAL 2845.17 100

154
Table 8: Land use and Land Cover Statistics for Ibadan North West LGA. (From 2000 to 2021)
Categories
2000 2014 2021
AREA(HA) AREA (%) AREA
(HA)
AREA
(%)
AREA
(HA)
AREA
(%)
Bare surface 205.47 7.2 341.91 11.90 361.26 12.70
Thick forest 58.77 2.0 91.80 3.20 46.62 1.64
Light forest 87.93 3.0 55.26 1.90 89.50 3.15
Derived savanna/farm
land
161.91 7.6 280.53 9.80 289.08 10.16
Built up area 1197.99 40.1 1211.22 42.40 1213.29 42.64
Water body 46.89 1.7 21.33 0.75 15.30 0.54
Wetland 1086.21 38.2 854.19 29.90 830.16 29.18
TOTAL 2845.17 100 2856.24 100 2845.17 100
FIG 18: Trend of Classes between 2000, 2014, and 2020
The figures presented in fig 15 above represent the static area of each land use land cover category for each study year.
Built-up was the dominant land use landcover class in 2000, taking about 40.1% of the total area followed by wetland
0
200
400
600
800
1000
1200
1400
AR
EA(h
a)
YEARS
BARE SURFACE
THICK FOREST
LIGHT FOREST
DERIVEDSAVANNA/FARMLAND
BUILTUP
WATER BODY
WET LAND

155
which covers an area of about 38.2% of the study area. This may not be unconnected to the fact that Ibadan has long been
regarded as one of the cities in the world with highest slums and with few industries.
In table 8, built-up covered the largest area with 42.4% of the total area followed by wetland that has 29.9%.
Change Analysis
The period of change analysis was from 2000 to 2014 based on the data available. Through image analysis and change
detection analysis in IDRIS GIS, using image differencing the changes were measured and converted to vector GIS data
for precise area measurements. The results of the changes are presented below.The table 8 equally reveals that the increase
in built- up area from 40.1% to 42.4% in 2000 and 2014 respectively may be as a result of urban rural-urban drift and
renewal policy of government of the State in recent times. From the maps derived from the Landsat images, it is observed
that growth tilts towards the Eleyele dam.
For the projected change as shown in Table 9, the wetland seems to have decreased and this therefore suggests that
encroachment on wetland will occur provided all this parameters are kept constant.Again, the water body is shrinking and
there is a probability of it being covered with buildings if development is not monitored or controlled. It is therefore
suggested that while people should be encouraged to build towards the suburbs to reduce compactness in the city by creating
pulling factors, which are capable of pushing them away from the city Centre, and activities of man in the fringes should
properly be monitored.

156
FIG 19: Supervised Classification of 2000.

157
Fig 20: Supervised Classification 2014
Transition Probability Matrix
The TPM records the probability that each landuselandcover category will change to the other category. The matrix is
produced by multiplication of each column in the transition probability matrix by the number of cell of corresponding
landuse in the later image. For the 7 by 7 matrix in table 9, the rows represent the older landuselandcover category (2000),
while column represent newer category.

158
Table 9: Probability Matrix
CLASSES Built up Wetland Water
body
Thick forest Light forest Farmland Bare surface
Built up 0.9358 0.0000 0.0000 0.0000 0.0000 0.0542 0.0101
Wetland 0.0000 0.2694 0.0793 0.3788 0.2211 0.0514 0.0000
Water body 0.0000 0.0275 0.5472 0.0467 0.1313 0.0000 0.0000
Thick forest 0.0489 0.0056 0.0013 0.2839 0.0588 0.5498 0.0516
Light forest 0.0333 0.0304 0.0039 0.2835 0.1593 0.4392 0.0504
Farm land 0.1782 0.0065 0.0000 0.1248 0.0231 0.5982 0.0692
Bare surface 0.1785 0.0000 0.0000 0.0189 0.0242 0.5346 0.2438
FIG 21: Prediction in 2021

159
Fig 22: Contribution to Bare Surface.
Fig 23: Contribution to Built-up.

160
Fig 24: Contribution to Farmland.
Fig 25: Contribution to Lightforest
161
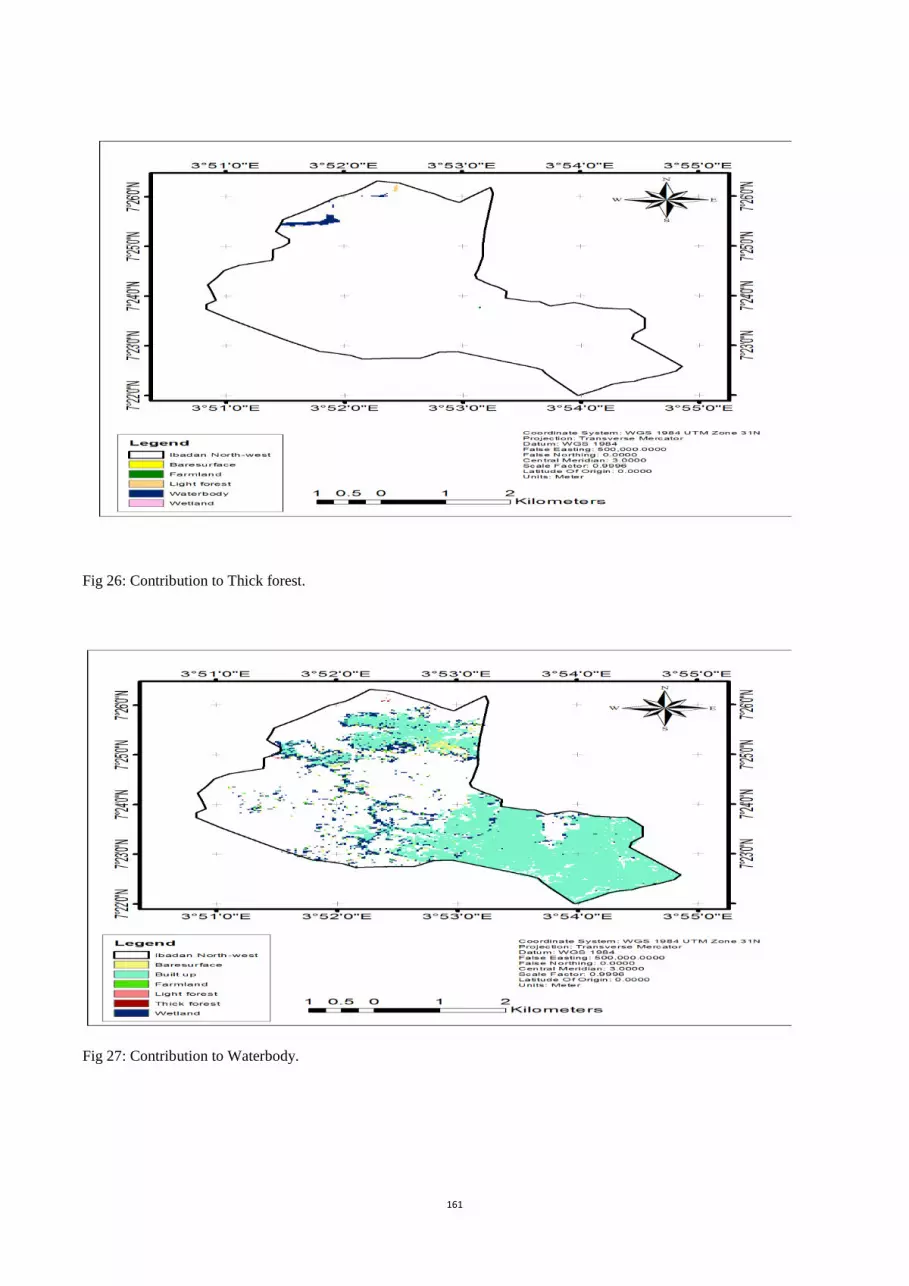
Fig 26: Contribution to Thick forest.
Fig 27: Contribution to Waterbody.

162
Fig 28: contribution to built up area
Fig 29: Contribution to Wetland.
Fig 30: Contribution to change in Farmland.

163
Fig 31: Contribution to change in Baresurface.
Fig 32: Contribution to change in Lightforest.

164
Fig 33: Contribution to change in Thickforest.
Fig 34: Contribution to change in bare surface
Conclusion
This study has shown that information gotten from satellite remote sensing and integrating it with GIS can play an important
role in understanding the nature and extent of changes in land use and landcover where these changes are occurring and
are been monitored in local scale. The change detection analysis integrated with the transition matrix and Cellular Automata
Markov performed in the study allowed for the monitoring of landuse/landcover changes overtime and space. The analysis
provided valuable insight into the nature and extent of changes that have taken place in Ibadan Northwest LGA from 2000
to 2014 and lays foundation for further study to be conducted that aims at modelling and predicting future changes.
Changes in landuse/landcover pattern have been identified by analyzing the multi- temporal Landsat images of 2000 and
2014 in a GIS platform. The quantitative evidences of landuse/landcover changes revealed the dynamic growth of Built –
up areas. Conversion of riparian to thick forest represent the most prominent land cover change, the change difference was
as high.
The trend and extent of urban change is likely to continue with the rapid development of infrastructure due to increasing
population.
In order to alleviate the dramatic landuse/landcover change and adverse environmental impacts of urban expansion and
increasing built up surfaces, which negates the principle of sustainable development, the current growth pattern needs to

165
be managed through effective landuse/landcover planning and management. This would be useful to protect the fragile and
important wetland and water body in the area and further reduce environmental degradation in the form of soil erosion and
water stress.
In conclusion, present study of Ibadan Northwest LGA in Oyo State Nigeria from 2000 to 2014 shows change in the
landscape as there is high growth in the built up area only within (14) fourteen years. Water bodies have been covered by
riparian while wetland has reduced marginally and other classes are showing little or almost stagnant condition over time.
REFERENCES
Abubakar, S.M., KudanmiyaY.R., and Eyong, P.N., (2000); "Assessment of Environmental Degradation Using Satellite
Remote Sensing Technologies in Talata-Mafara Area, Northern Nigeria," Environmental Review,vol. 4, pp. 577-586.
Adetunji G. D., and Adegboyega, S. A., (2011), Urban Sprawl Measurement in Egbeda Local Government Area, Ibadan,
Nigeria.
Aloba, H.G., (20004). Land Cover Change Prediction of Dhaka City: A Markov Cellular Automata Approach:
Geospatial World Publication, 2011, Pp. 7
Bhaduri, I., Wolf, Charles &Ghilani, D., (2000). An Introduction to Geomatics, Pp.787 and 822.
De. Sherbin, S. (2002). Modelling Tropical Deforestation in the Southern YucatanPeninsular Region: Comparing Survey
and Satellite Data. Agriculture, Ecosystems and Environment, 85, 25-46.
Lillesand, K. and Chipman, (2008).Remote Sensing and Image Interpretation, Pp 259.
Paul O. A. and Ademola O. (2002); Land use land cover change evaluation in Sokoto-Rima Basin of N.W. Nigeria
based on archival remote sensing and G.I.S. techniques: Geoinformation Technology Applications for Resource and
Environmental Management in Africa (Ed: Peter O. A).
Paul, T., and Charles, O., (1999). Association of Remote Sensing of the Environment, University of Lagos: Pp.143-
172.
Wilkie D.S and Finn J.T, (1996). Remote Sensing Imagery for Natural Resource Monitoring, Columbia University Press, New York, Pp.295
ABOUT THE AUTHORS
Dr. Abiodun Olufemi Adebola
166
Department of Remote Sensing and GIS,
Federal University of Technology, Akure,
Ondo State.
Dr. Suleiman Abdulazeez Adegboyega,
Department of Remote Sensing and GIS,
Federal University of Technology, Akure,
Ondo State
Dr. Ayo Emmanuel Olajuyigbe
Department of Urban and Regional Planning,
Federal University of Technology, Akure,
Ondo State.
Mr. Sunday Olu Oladejo
Department of Remote Sensing and GIS,
Federal University of Technology, Akure,
Ondo State