Embed Size (px)
Citation preview
ORIGINAL PAPER
Molecular docking and 3D-QSAR studiesof HIV-1 protease inhibitors
Vijay M. Khedkar & Premlata K. Ambre &
Jitender Verma & Mushtaque S. Shaikh &
Raghuvir R. S. Pissurlenkar & Evans C. Coutinho
Received: 11 June 2009 /Accepted: 23 November 2009 /Published online: 13 January 2010# Springer-Verlag 2010
Abstract HIV-1 protease is an obligatory enzyme in thereplication process of the HIV virus. The abundance ofstructural information on HIV-1PR has made the enzyme anattractive target for computer-aided drug design strategies.The daunting ability of the virus to rapidly generateresistant mutants suggests that there is an ongoing needfor new HIV-1PR inhibitors with better efficacy profilesand reduced toxicity. In the present investigation, molecularmodeling studies were performed on a series of 54 cyclicurea analogs with symmetric P2/P2′ substituents. Thebinding modes of these inhibitors were determined bydocking. The docking results also provided a reliableconformational superimposition scheme for the 3D-QSARstudies. To gain insight into the steric, electrostatic,hydrophobic and hydrogen-bonding properties of thesemolecules and their influence on the inhibitory activity,comparative molecular field analysis (CoMFA) and com-parative molecular similarity indices analysis (CoMSIA)were performed. Two different alignment schemes viz.receptor-based and atom-fit alignment, were used in thisstudy to build the QSAR models. The derived 3D-QSARmodels were found to be robust with statistically significantr2 and r2pred values and have led to the identification ofregions important for steric, hydrophobic and electronicinteractions. The predictive ability of the models was
assessed on a set of molecules that were not included inthe training set. Superimposition of the 3D-contour mapsgenerated from these models onto the active site of enzymeprovided additional insight into the structural requirementsof these inhibitors. The CoMFA and CoMSIA models wereused to design some new inhibitors with improved bindingaffinity. Pharmacokinetic and toxicity predictions were alsocarried out for these molecules to gauge their ADME andsafety profile. The computational results may open up newavenues for synthesis of potent HIV-1 protease inhibitors.
Keywords ADMET. Atom-fit alignment . CoMFA .
CoMSIA . Docking . HIV-1PR inhibitors . Receptor-basedalignment
Introduction
HIV-1 protease (HIV-1PR) is probably the most extensivelyinvestigated enzyme for therapeutic intervention in theshort history of structure-based drug design. The develop-ment of HIV protease inhibitors is regarded as one of themost successful examples of structure-based drug designefforts to date. This enzyme is a critical component in thereplicative cycle of the human immunodeficiency virus(HIV) that cleaves the polyproteins transcribed from thegag and pol genes into enzymes and structural proteinsessential for the assembly and maturation of infectiousvirions [1, 2]. The finding that inactivation of this viralencoded aspartyl protease produces a progeny of virionsthat are immature and noninfectious, elicited intense effortsin the development of specific and potent inhibitorstargeted against this enzyme, as a novel therapy for AIDS.
V. M. Khedkar : P. K. Ambre : J. Verma :M. S. Shaikh :R. R. S. Pissurlenkar : E. C. Coutinho (*)Department of Pharmaceutical Chemistry,Bombay College of Pharmacy,Kalina, Santacruz (E),Mumbai 400098, Indiae-mail: [email protected]
J Mol Model (2010) 16:1251–1268DOI 10.1007/s00894-009-0636-5
Since then, HIV-1PR has become a prime target fortherapeutic intervention in this disease. Moreover, avail-ability of several X-ray crystal structures of HIV-1 proteasehas guided structure-based searches for specific inhibitors.
The ability of the virus to circumvent the inhibitors viamutation clearly signifies the need for improved therapeuticagents. To facilitate the design of more specific and potentHIV-1 protease inhibitors, we must improve our under-standing of the principles of molecular recognition for thisenzyme. Two distinct characteristics of HIV-1 proteasehave been identified to date that distinguish it from thehuman aspartyl proteases - renin and pepsin: first, the activeform of the enzyme is a homodimer, where each monomercontributes equally to the active site; and second, thepresence of a structural water molecule that bridges theinhibitor molecule to the flap of the protein via hydrogenbonds. While hydroxyethylene isosteres and phosphinatesare known to be the first C2 symmetric molecules able torecognize the HIV-1PR [3, 4], C2 symmetric cyclic urea(CU) based inhibitors are one of the first molecules thatdisplace the structural water molecule involved in ligand-receptor interaction [5]. Since then, the CU scaffold hasbeen extensively explored by medicinal chemists. Althoughsome molecular modification and structure-activity relation-ships have been reported [6, 7], more quantitative insightinto structure-activity relationship is needed for rationaldevelopment of improved CU inhibitors in the future. ACoMFA study to understand the structure activity relation-ship for the CU class of HIV-1 protease inhibitors has beenreported [8]. The authors used an approach where theligands were built in the active pocket and further subjectedto constrained minimization to identify the bioactive confor-mation for structural alignment in CoMFA. Due to suchstructural constraints, it is unlikely that a complete explorationof the active site would have been possible. This limitationcan be addressed using molecular docking by which it ispossible to search the active site more thoroughly. In an effortto gain deeper insight into the ligand-receptor interaction forthe CU scaffold, we present here a 3D-QSAR study usingboth CoMFA and CoMSIA techniques on the series of CUanalogs containing symmetric P2/P2′ substituents with HIV-1PR inhibitory activity [6]. Molecular docking was carriedout to identify the probable binding conformation of theseCU analogs; this also served as a guideline for the structuralalignment. The advantage of using docking-based alignmentover constrained minimization within the active site is thatdocking explores the binding pocket more extensively whileconstrained minimization may limit the conformationalsearch to local minima. In addition, atom-fit alignment wasalso carried out to compare against the results obtainedfrom docking-based alignment. The objective of using theCoMSIA approach was to understand the role of H-bondingand hydrophobic interactions which cannot be envisaged by
CoMFA alone. These additional fields provide bettervisualization and interpretation of the derived correlation interms of field contribution to the activity of the compounds.The results obtained from 3D-QSAR analysis were furtherutilized to design new molecules whose activities werepredicted to be manifold better than existing CU analogs. Insilico prediction of pharmacokinetics and toxicity wascarried out for the designed molecules to assess theirmetabolic stability and therapeutic safety.
Computational details
The molecular modeling packages Sybyl (v7.1, Tripos Inc.,USA) [9] running on a Pentium IV computer under theLinux RedHat Enterprise WS 4 and the GOLD Suite(CCDC, UK) [10] running on a Pentium IV computer underthe Windows OS were used in this modeling study.
Ligand preparation
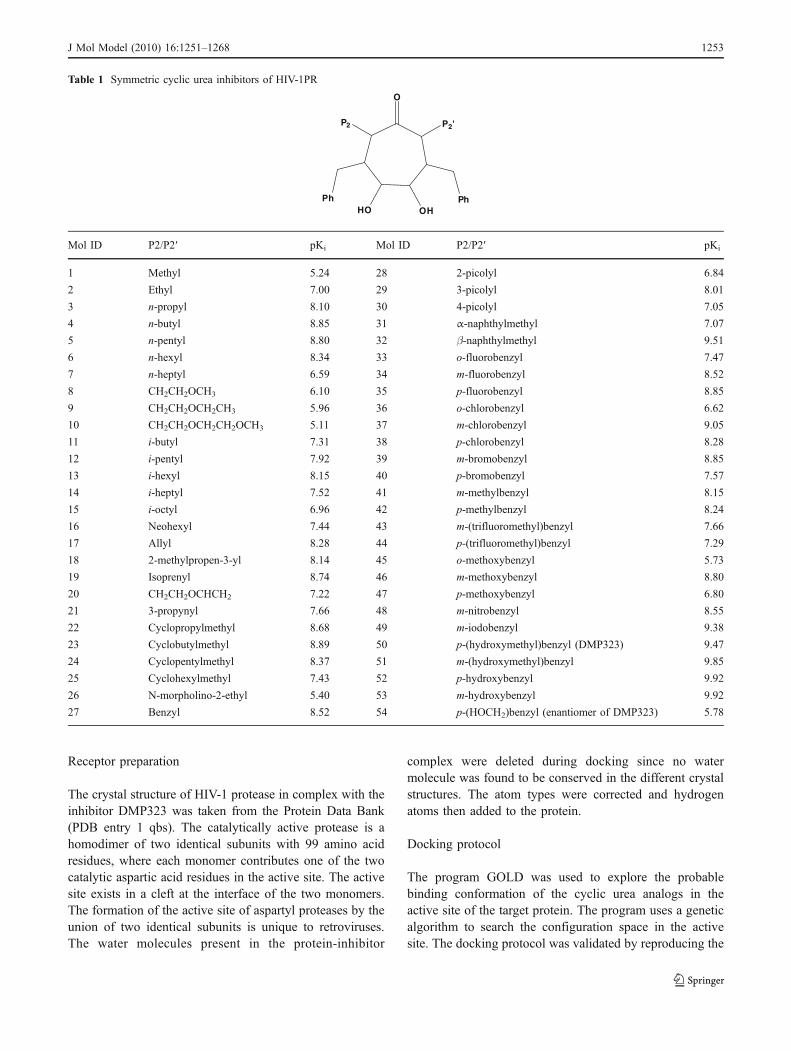
The set of HIV-1PR inhibitors used in the molecularmodeling study was taken from literature [6]. The chemicalstructures of the 54 cyclic urea analogs and their experi-mental pKi values are given in Table 1. The molecules spana 5 log unit activity range and molecular field descriptorshave a good distribution across the range of values. Thus,the dataset was found to be appropriate for the purpose of3D-QSAR analysis. In this study, the negative log of Ki
(pKi) was used, as it gives numerically a larger value for theactive compound than that for the inactive compound.These pKi values were used as the dependent variable in the3D-QSAR calculations.
The 3D-structures of the molecules were sketched withthe Builder module of Sybyl. Generally, the globalminimum energy structure, assumed to be the bioactiveconformation, is used in 3D-QSAR studies. Since in thepresent case, a crystal structure of HIV-1PR in complexwith one of the inhibitors in the dataset (DMP323) isavailable, the 3D structures of the remaining molecules inthe dataset were built using DMP323 as the template. Theligand geometries were then optimized by energy minimi-zation using the Powel gradient method, the Tripos forcefield, Gasteiger Hückel charges and a distance dependentdielectric, till a gradient of 0.01 kcal mol−1 Å−1 was reached.
To derive statistically significant QSAR models, thedataset was split into training and test sets on the basis ofstructural, chemical and biological diversity using similaritysearch techniques [11] viz. D-Optimal design, Tanimotosimilarity coefficient and the Euclidian distance matrixcriteria defined in Cerius2 (Accelrys Inc., USA) [12]. Theselection technique searches for diverse molecules bycomparing their chemical nature in 2D space.
1252 J Mol Model (2010) 16:1251–1268
Receptor preparation
The crystal structure of HIV-1 protease in complex with theinhibitor DMP323 was taken from the Protein Data Bank(PDB entry 1 qbs). The catalytically active protease is ahomodimer of two identical subunits with 99 amino acidresidues, where each monomer contributes one of the twocatalytic aspartic acid residues in the active site. The activesite exists in a cleft at the interface of the two monomers.The formation of the active site of aspartyl proteases by theunion of two identical subunits is unique to retroviruses.The water molecules present in the protein-inhibitor
complex were deleted during docking since no watermolecule was found to be conserved in the different crystalstructures. The atom types were corrected and hydrogenatoms then added to the protein.
Docking protocol
The program GOLD was used to explore the probablebinding conformation of the cyclic urea analogs in theactive site of the target protein. The program uses a geneticalgorithm to search the configuration space in the activesite. The docking protocol was validated by reproducing the
Table 1 Symmetric cyclic urea inhibitors of HIV-1PR
P2 P2'
PhPhHO
O
OH
Mol ID P2/P2′ pKi Mol ID P2/P2′ pKi
1 Methyl 5.24 28 2-picolyl 6.84
2 Ethyl 7.00 29 3-picolyl 8.01
3 n-propyl 8.10 30 4-picolyl 7.05
4 n-butyl 8.85 31 α-naphthylmethyl 7.07
5 n-pentyl 8.80 32 β-naphthylmethyl 9.51
6 n-hexyl 8.34 33 o-fluorobenzyl 7.47
7 n-heptyl 6.59 34 m-fluorobenzyl 8.52
8 CH2CH2OCH3 6.10 35 p-fluorobenzyl 8.85
9 CH2CH2OCH2CH3 5.96 36 o-chlorobenzyl 6.62
10 CH2CH2OCH2CH2OCH3 5.11 37 m-chlorobenzyl 9.05
11 i-butyl 7.31 38 p-chlorobenzyl 8.28
12 i-pentyl 7.92 39 m-bromobenzyl 8.85
13 i-hexyl 8.15 40 p-bromobenzyl 7.57
14 i-heptyl 7.52 41 m-methylbenzyl 8.15
15 i-octyl 6.96 42 p-methylbenzyl 8.24
16 Neohexyl 7.44 43 m-(trifluoromethyl)benzyl 7.66
17 Allyl 8.28 44 p-(trifluoromethyl)benzyl 7.29
18 2-methylpropen-3-yl 8.14 45 o-methoxybenzyl 5.73
19 Isoprenyl 8.74 46 m-methoxybenzyl 8.80
20 CH2CH2OCHCH2 7.22 47 p-methoxybenzyl 6.80
21 3-propynyl 7.66 48 m-nitrobenzyl 8.55
22 Cyclopropylmethyl 8.68 49 m-iodobenzyl 9.38
23 Cyclobutylmethyl 8.89 50 p-(hydroxymethyl)benzyl (DMP323) 9.47
24 Cyclopentylmethyl 8.37 51 m-(hydroxymethyl)benzyl 9.85
25 Cyclohexylmethyl 7.43 52 p-hydroxybenzyl 9.92
26 N-morpholino-2-ethyl 5.40 53 m-hydroxybenzyl 9.92
27 Benzyl 8.52 54 p-(HOCH2)benzyl (enantiomer of DMP323) 5.78
J Mol Model (2010) 16:1251–1268 1253
pose of the CU analog DMP323 in its crystal structure(PDB entry 1 qbs) [13]. GOLD parameters optimized forthe docking protocol were: (a) the dihedral angles of therotatable bonds in the ligand; (b) geometries of the ligandring (flipping ring corners); (c) the dihedral angles ofprotein OH and NH3
+ groups; and (d) mapping of the H-bond fitting points. All these variables were randomized atthe start of a docking run.
The docking protocol was then implemented on theremaining molecules in the dataset. The study was carriedfor 20 GA runs, which was found to be optimum toreproduce the pose of DMP323 in its crystal. The other GAparameters viz. the population size and the genetic operatorswere kept at their default values. All molecules in thedataset were docked into the receptor active site shaped byresidues in a 7.0 Å vicinity of the ligand. This active sitecomprised of Arg8, Leu23, Asp25, Thr26, Gly27, Ala28,Asp29, Asp30, Thr31, Val32, Lys45, Met46, Ile47, Gly48,Gly49, Ile50, Gly51, Phe53, Leu76, Thr80, Pro81, Val82,Asn83, Ile84, and Gly86 residues from chains A and B thusforming a symmetric binding site.
CoMFA and CoMSIA studies
In the present study, two 3D-QSAR methodologies,CoMFA and CoMSIA, were adopted to understand thelocal physicochemical properties involved in the ligand-receptor interaction. Since its advent in 1988, comparativemolecular field analysis (CoMFA) [14] has been cherishedas one of the most valuable 3D-QSAR methods. A 3Dcubic lattice with a grid spacing of 1 Å and extending 4 Åbeyond the aligned molecules in all directions was createdto encompass the aligned molecules. CoMFA fields weregenerated using the sp3 carbon probe with a +1 charge tocalculate steric (Lennard–Jones 6–12 potential) field ener-gies and electrostatic (Coulombic potential) fields with adistance-dependent dielectric at each lattice point. Thefields were scaled by the CoMFA-Standard method avail-able in Sybyl. The default cut-off for energy greater than30 kcal mol−1 was applied; the electrostatic values werealso dropped for each row where the steric cut-off wasreached. No smoothing functions were employed.
Comparative Molecular similarity indices analysis(CoMSIA) [15] calculates similarity indices in the spacesurrounding each of the molecules in the dataset, that havepreviously been aligned by some methodology. TheCoMSIA approach circumvents some of the inherentdeficiencies arising from the functional form of theLennard-Jones and Coulombic potentials used in CoMFA.CoMSIA employs a Gaussian type distance dependencefunction between the probe and the atoms of the molecules;this avoids singularities at the atomic positions and thedramatic changes in the potential energy for threshold grids
in the proximity of the surface. This functional formrequires no arbitrary definition of cut-off limits, and thesimilarity indices can be calculated at all grid points insideand outside the molecule. The CoMSIA technique calcu-lates five different similarity index fields (steric, electro-static, hydrophobic, hydrogen bond donor, and hydrogenbond acceptor) with a similar probe atom as CoMFA. Theobjective of using these additional fields is not to improvethe predictive power of the 3D-QSAR models but topartition the various properties into spatial locations wherethey play a vital role in determining the binding affinity.The major advantage of CoMSIA lies in better visualizationand interpretation of the correlations that have beenobtained in terms of field contributions. Strictly speak-ing, the contours obtained from regression analysisindicate those lattice points in space where a particularproperty contributes significantly to the variance inbinding affinity.
The contour maps derived from both the CoMFA andCoMSIA models permit an understanding of the steric,electrostatic, hydrophobic, and hydrogen bonding require-ments for ligand binding. Some information about thebinding domain of the receptor can also be gleaned fromthe contour map.
Structural alignment
The most critical step in the CoMFA and CoMSIA proceduresis the relative alignment of all ligands, such that they havecomparable conformations and orientations in space. Bothreceptor-based and atom-fit molecular alignment strategieswere applied to derive the 3D-QSAR models.
Receptor-based alignment
An underlying postulate in 3D-QSAR analyses is that allmolecules in the dataset bind to the receptor in a similarway. The docking solutions with the best scores, andconformations similar to the ligand in the crystal structurewere overlaid to derive the receptor-based molecularalignment. This approach is also termed as the docking-based alignment [16, 17]. The alignment based on thisstrategy is shown in Fig. 1(a).
Atom-fit alignment
The atom-fit alignment procedure is based on the bestmatching of preselected atoms. The cyclic urea ringatoms were used as the basis for the alignment of allcompounds in the series. The molecules in the datasetwere aligned using the “Database Align” option availablein Sybyl. The alignment based on atom-fit strategy isshown in Fig. 1(b).
1254 J Mol Model (2010) 16:1251–1268
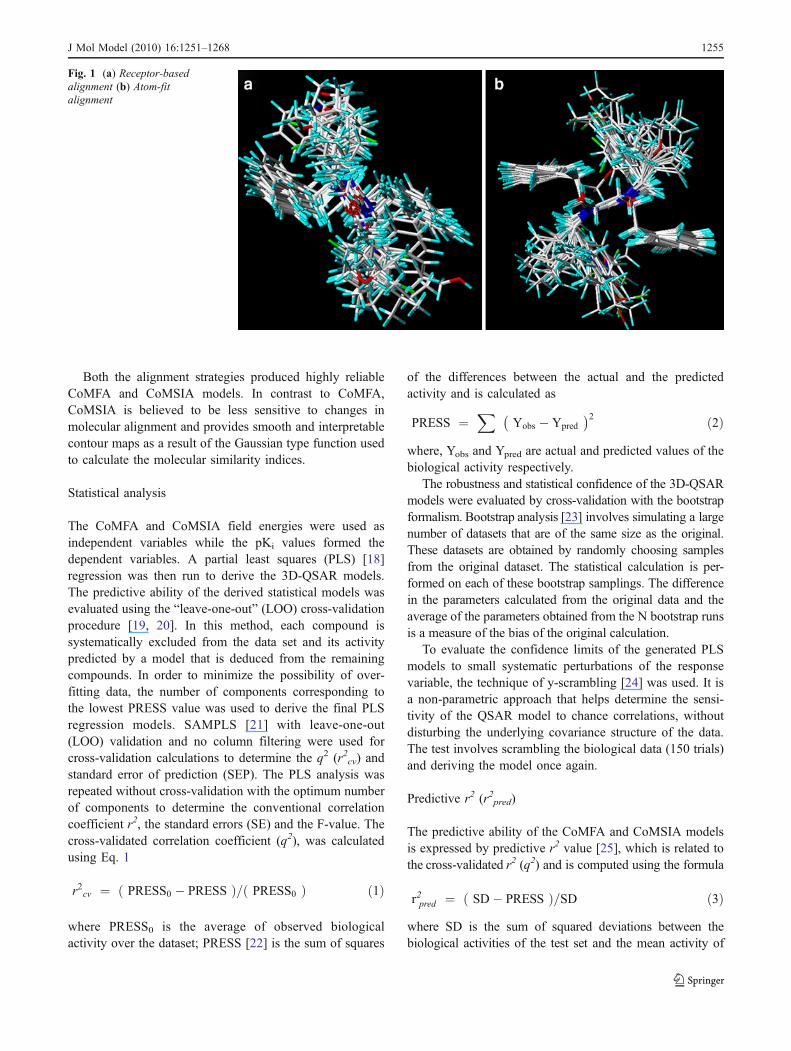
Both the alignment strategies produced highly reliableCoMFA and CoMSIA models. In contrast to CoMFA,CoMSIA is believed to be less sensitive to changes inmolecular alignment and provides smooth and interpretablecontour maps as a result of the Gaussian type function usedto calculate the molecular similarity indices.
Statistical analysis
The CoMFA and CoMSIA field energies were used asindependent variables while the pKi values formed thedependent variables. A partial least squares (PLS) [18]regression was then run to derive the 3D-QSAR models.The predictive ability of the derived statistical models wasevaluated using the “leave-one-out” (LOO) cross-validationprocedure [19, 20]. In this method, each compound issystematically excluded from the data set and its activitypredicted by a model that is deduced from the remainingcompounds. In order to minimize the possibility of over-fitting data, the number of components corresponding tothe lowest PRESS value was used to derive the final PLSregression models. SAMPLS [21] with leave-one-out(LOO) validation and no column filtering were used forcross-validation calculations to determine the q2 (r2cv) andstandard error of prediction (SEP). The PLS analysis wasrepeated without cross-validation with the optimum numberof components to determine the conventional correlationcoefficient r2, the standard errors (SE) and the F-value. Thecross-validated correlation coefficient (q2), was calculatedusing Eq. 1
r2cv ¼ PRESS0 � PRESSð Þ= PRESS0ð Þ ð1Þ
where PRESS0 is the average of observed biologicalactivity over the dataset; PRESS [22] is the sum of squares
of the differences between the actual and the predictedactivity and is calculated as
PRESS ¼X
Yobs � Ypred
� �2 ð2Þwhere, Yobs and Ypred are actual and predicted values of thebiological activity respectively.
The robustness and statistical confidence of the 3D-QSARmodels were evaluated by cross-validation with the bootstrapformalism. Bootstrap analysis [23] involves simulating a largenumber of datasets that are of the same size as the original.These datasets are obtained by randomly choosing samplesfrom the original dataset. The statistical calculation is per-formed on each of these bootstrap samplings. The differencein the parameters calculated from the original data and theaverage of the parameters obtained from the N bootstrap runsis a measure of the bias of the original calculation.
To evaluate the confidence limits of the generated PLSmodels to small systematic perturbations of the responsevariable, the technique of y-scrambling [24] was used. It isa non-parametric approach that helps determine the sensi-tivity of the QSAR model to chance correlations, withoutdisturbing the underlying covariance structure of the data.The test involves scrambling the biological data (150 trials)and deriving the model once again.
Predictive r2 (r2pred)
The predictive ability of the CoMFA and CoMSIA modelsis expressed by predictive r2 value [25], which is related tothe cross-validated r2 (q2) and is computed using the formula
r2pred ¼ SD� PRESSð Þ=SD ð3Þwhere SD is the sum of squared deviations between thebiological activities of the test set and the mean activity of
Fig. 1 (a) Receptor-basedalignment (b) Atom-fitalignment
J Mol Model (2010) 16:1251–1268 1255
the training set; while PRESS is the sum of squareddeviations between the actual and the predicted activitiesof the test set molecules. The r2pred is based solely onmolecules included in the test set.
Results and discussion
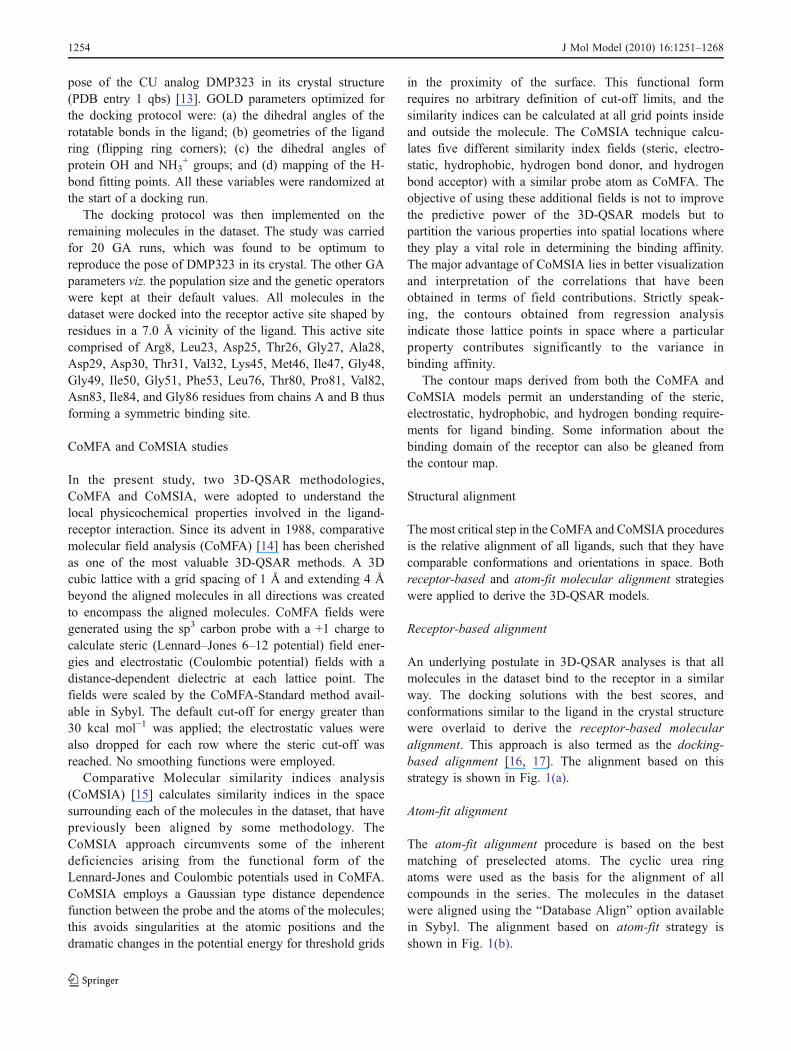
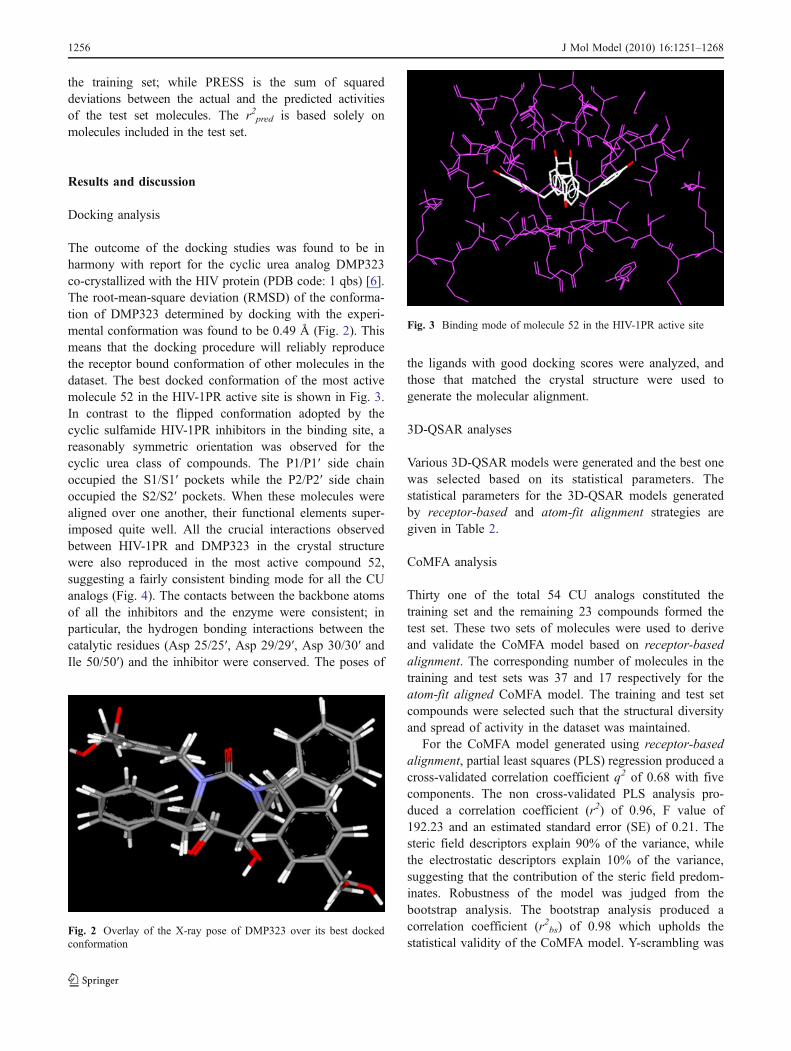
Docking analysis
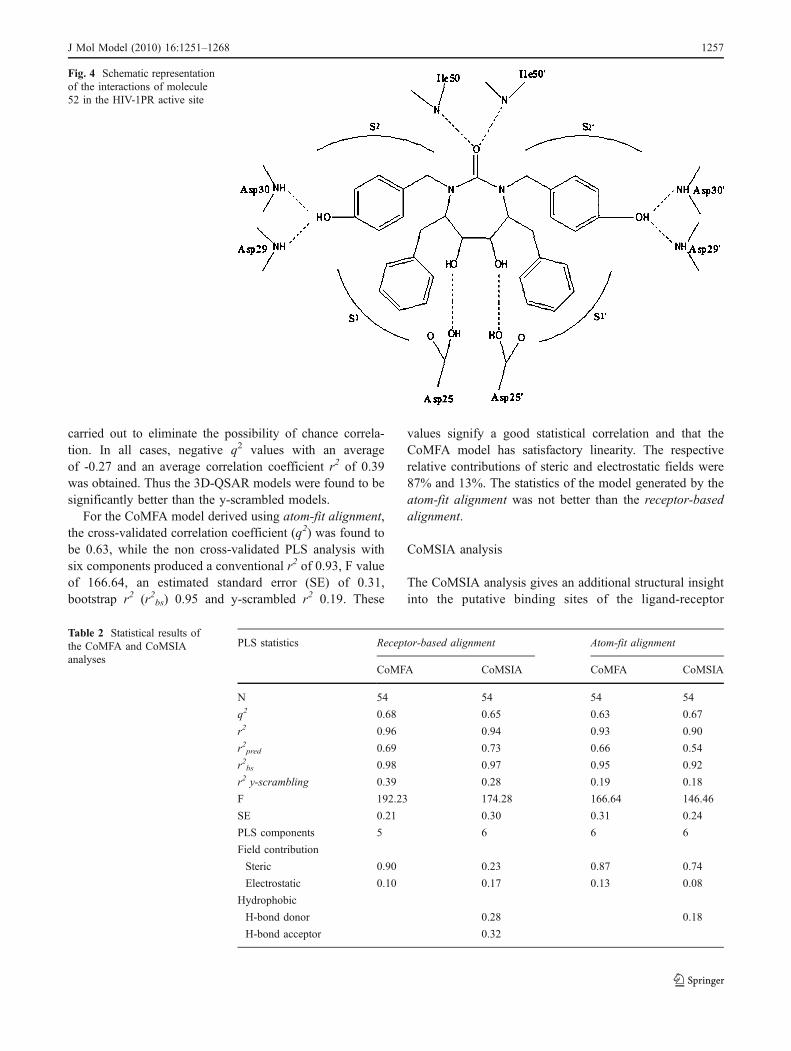
The outcome of the docking studies was found to be inharmony with report for the cyclic urea analog DMP323co-crystallized with the HIV protein (PDB code: 1 qbs) [6].The root-mean-square deviation (RMSD) of the conforma-tion of DMP323 determined by docking with the experi-mental conformation was found to be 0.49 Å (Fig. 2). Thismeans that the docking procedure will reliably reproducethe receptor bound conformation of other molecules in thedataset. The best docked conformation of the most activemolecule 52 in the HIV-1PR active site is shown in Fig. 3.In contrast to the flipped conformation adopted by thecyclic sulfamide HIV-1PR inhibitors in the binding site, areasonably symmetric orientation was observed for thecyclic urea class of compounds. The P1/P1′ side chainoccupied the S1/S1′ pockets while the P2/P2′ side chainoccupied the S2/S2′ pockets. When these molecules werealigned over one another, their functional elements super-imposed quite well. All the crucial interactions observedbetween HIV-1PR and DMP323 in the crystal structurewere also reproduced in the most active compound 52,suggesting a fairly consistent binding mode for all the CUanalogs (Fig. 4). The contacts between the backbone atomsof all the inhibitors and the enzyme were consistent; inparticular, the hydrogen bonding interactions between thecatalytic residues (Asp 25/25′, Asp 29/29′, Asp 30/30′ andIle 50/50′) and the inhibitor were conserved. The poses of
the ligands with good docking scores were analyzed, andthose that matched the crystal structure were used togenerate the molecular alignment.
3D-QSAR analyses
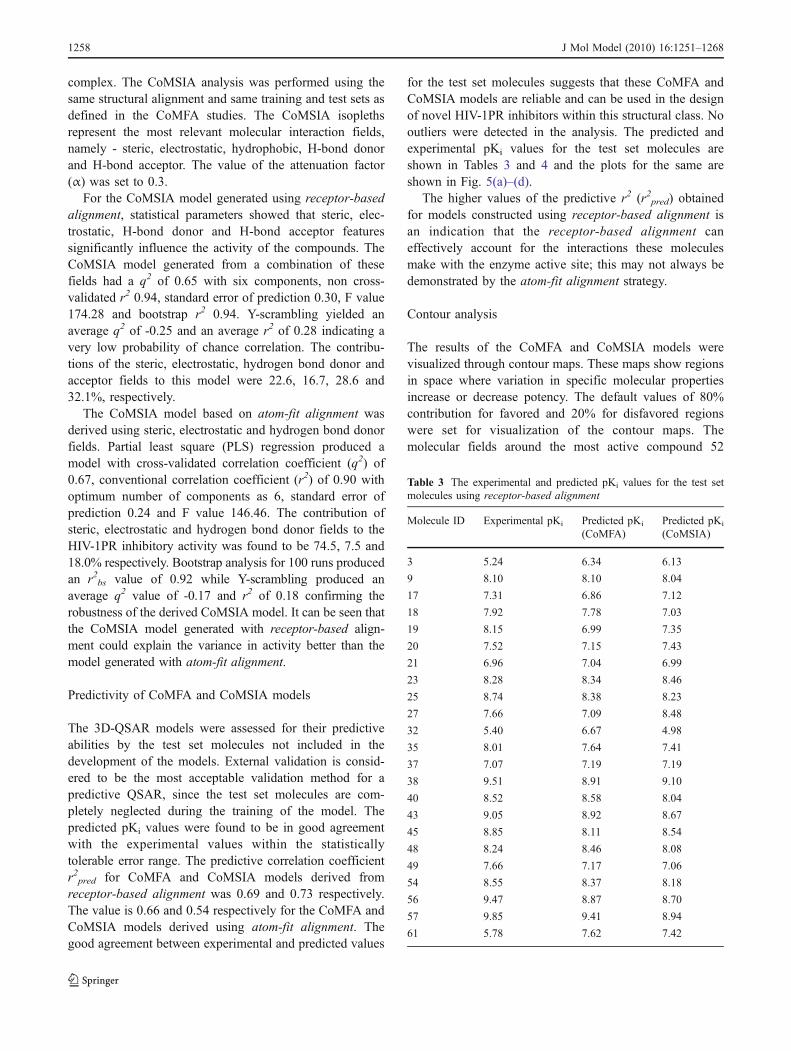
Various 3D-QSAR models were generated and the best onewas selected based on its statistical parameters. Thestatistical parameters for the 3D-QSAR models generatedby receptor-based and atom-fit alignment strategies aregiven in Table 2.
CoMFA analysis
Thirty one of the total 54 CU analogs constituted thetraining set and the remaining 23 compounds formed thetest set. These two sets of molecules were used to deriveand validate the CoMFA model based on receptor-basedalignment. The corresponding number of molecules in thetraining and test sets was 37 and 17 respectively for theatom-fit aligned CoMFA model. The training and test setcompounds were selected such that the structural diversityand spread of activity in the dataset was maintained.
For the CoMFA model generated using receptor-basedalignment, partial least squares (PLS) regression produced across-validated correlation coefficient q2 of 0.68 with fivecomponents. The non cross-validated PLS analysis pro-duced a correlation coefficient (r2) of 0.96, F value of192.23 and an estimated standard error (SE) of 0.21. Thesteric field descriptors explain 90% of the variance, whilethe electrostatic descriptors explain 10% of the variance,suggesting that the contribution of the steric field predom-inates. Robustness of the model was judged from thebootstrap analysis. The bootstrap analysis produced acorrelation coefficient (r2bs) of 0.98 which upholds thestatistical validity of the CoMFA model. Y-scrambling was
Fig. 3 Binding mode of molecule 52 in the HIV-1PR active site
Fig. 2 Overlay of the X-ray pose of DMP323 over its best dockedconformation
1256 J Mol Model (2010) 16:1251–1268
carried out to eliminate the possibility of chance correla-tion. In all cases, negative q2 values with an averageof -0.27 and an average correlation coefficient r2 of 0.39was obtained. Thus the 3D-QSAR models were found to besignificantly better than the y-scrambled models.
For the CoMFA model derived using atom-fit alignment,the cross-validated correlation coefficient (q2) was found tobe 0.63, while the non cross-validated PLS analysis withsix components produced a conventional r2 of 0.93, F valueof 166.64, an estimated standard error (SE) of 0.31,bootstrap r2 (r2bs) 0.95 and y-scrambled r2 0.19. These
values signify a good statistical correlation and that theCoMFA model has satisfactory linearity. The respectiverelative contributions of steric and electrostatic fields were87% and 13%. The statistics of the model generated by theatom-fit alignment was not better than the receptor-basedalignment.
CoMSIA analysis
The CoMSIA analysis gives an additional structural insightinto the putative binding sites of the ligand-receptor
Fig. 4 Schematic representationof the interactions of molecule52 in the HIV-1PR active site
PLS statistics Receptor-based alignment Atom-fit alignment
CoMFA CoMSIA CoMFA CoMSIA
N 54 54 54 54
q2 0.68 0.65 0.63 0.67
r2 0.96 0.94 0.93 0.90
r2pred 0.69 0.73 0.66 0.54
r2bs 0.98 0.97 0.95 0.92
r2 y-scrambling 0.39 0.28 0.19 0.18
F 192.23 174.28 166.64 146.46
SE 0.21 0.30 0.31 0.24
PLS components 5 6 6 6
Field contribution
Steric 0.90 0.23 0.87 0.74
Electrostatic 0.10 0.17 0.13 0.08
Hydrophobic
H-bond donor 0.28 0.18
H-bond acceptor 0.32
Table 2 Statistical results ofthe CoMFA and CoMSIAanalyses
J Mol Model (2010) 16:1251–1268 1257
complex. The CoMSIA analysis was performed using thesame structural alignment and same training and test sets asdefined in the CoMFA studies. The CoMSIA isoplethsrepresent the most relevant molecular interaction fields,namely - steric, electrostatic, hydrophobic, H-bond donorand H-bond acceptor. The value of the attenuation factor(α) was set to 0.3.
For the CoMSIA model generated using receptor-basedalignment, statistical parameters showed that steric, elec-trostatic, H-bond donor and H-bond acceptor featuressignificantly influence the activity of the compounds. TheCoMSIA model generated from a combination of thesefields had a q2 of 0.65 with six components, non cross-validated r2 0.94, standard error of prediction 0.30, F value174.28 and bootstrap r2 0.94. Y-scrambling yielded anaverage q2 of -0.25 and an average r2 of 0.28 indicating avery low probability of chance correlation. The contribu-tions of the steric, electrostatic, hydrogen bond donor andacceptor fields to this model were 22.6, 16.7, 28.6 and32.1%, respectively.
The CoMSIA model based on atom-fit alignment wasderived using steric, electrostatic and hydrogen bond donorfields. Partial least square (PLS) regression produced amodel with cross-validated correlation coefficient (q2) of0.67, conventional correlation coefficient (r2) of 0.90 withoptimum number of components as 6, standard error ofprediction 0.24 and F value 146.46. The contribution ofsteric, electrostatic and hydrogen bond donor fields to theHIV-1PR inhibitory activity was found to be 74.5, 7.5 and18.0% respectively. Bootstrap analysis for 100 runs producedan r2bs value of 0.92 while Y-scrambling produced anaverage q2 value of -0.17 and r2 of 0.18 confirming therobustness of the derived CoMSIA model. It can be seen thatthe CoMSIA model generated with receptor-based align-ment could explain the variance in activity better than themodel generated with atom-fit alignment.
Predictivity of CoMFA and CoMSIA models
The 3D-QSAR models were assessed for their predictiveabilities by the test set molecules not included in thedevelopment of the models. External validation is consid-ered to be the most acceptable validation method for apredictive QSAR, since the test set molecules are com-pletely neglected during the training of the model. Thepredicted pKi values were found to be in good agreementwith the experimental values within the statisticallytolerable error range. The predictive correlation coefficientr2pred for CoMFA and CoMSIA models derived fromreceptor-based alignment was 0.69 and 0.73 respectively.The value is 0.66 and 0.54 respectively for the CoMFA andCoMSIA models derived using atom-fit alignment. Thegood agreement between experimental and predicted values
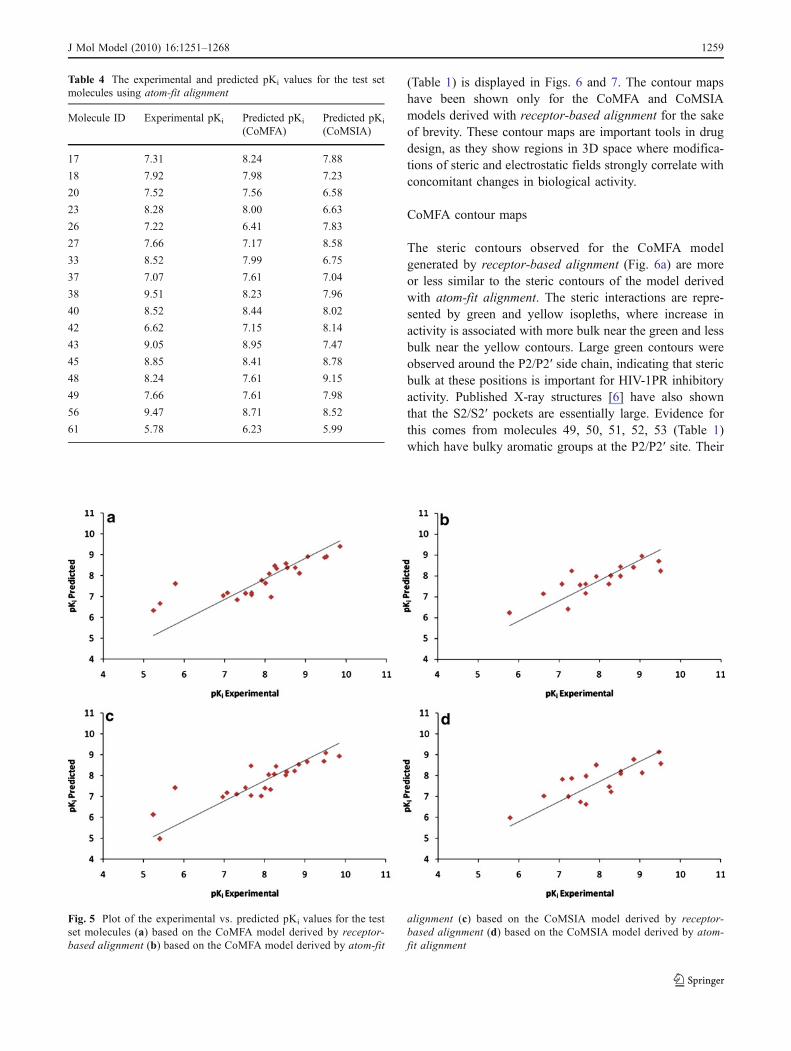
for the test set molecules suggests that these CoMFA andCoMSIA models are reliable and can be used in the designof novel HIV-1PR inhibitors within this structural class. Nooutliers were detected in the analysis. The predicted andexperimental pKi values for the test set molecules areshown in Tables 3 and 4 and the plots for the same areshown in Fig. 5(a)–(d).
The higher values of the predictive r2 (r2pred) obtainedfor models constructed using receptor-based alignment isan indication that the receptor-based alignment caneffectively account for the interactions these moleculesmake with the enzyme active site; this may not always bedemonstrated by the atom-fit alignment strategy.
Contour analysis
The results of the CoMFA and CoMSIA models werevisualized through contour maps. These maps show regionsin space where variation in specific molecular propertiesincrease or decrease potency. The default values of 80%contribution for favored and 20% for disfavored regionswere set for visualization of the contour maps. Themolecular fields around the most active compound 52
Table 3 The experimental and predicted pKi values for the test setmolecules using receptor-based alignment
Molecule ID Experimental pKi Predicted pKi
(CoMFA)Predicted pKi
(CoMSIA)
3 5.24 6.34 6.13
9 8.10 8.10 8.04
17 7.31 6.86 7.12
18 7.92 7.78 7.03
19 8.15 6.99 7.35
20 7.52 7.15 7.43
21 6.96 7.04 6.99
23 8.28 8.34 8.46
25 8.74 8.38 8.23
27 7.66 7.09 8.48
32 5.40 6.67 4.98
35 8.01 7.64 7.41
37 7.07 7.19 7.19
38 9.51 8.91 9.10
40 8.52 8.58 8.04
43 9.05 8.92 8.67
45 8.85 8.11 8.54
48 8.24 8.46 8.08
49 7.66 7.17 7.06
54 8.55 8.37 8.18
56 9.47 8.87 8.70
57 9.85 9.41 8.94
61 5.78 7.62 7.42
1258 J Mol Model (2010) 16:1251–1268
(Table 1) is displayed in Figs. 6 and 7. The contour mapshave been shown only for the CoMFA and CoMSIAmodels derived with receptor-based alignment for the sakeof brevity. These contour maps are important tools in drugdesign, as they show regions in 3D space where modifica-tions of steric and electrostatic fields strongly correlate withconcomitant changes in biological activity.
CoMFA contour maps
The steric contours observed for the CoMFA modelgenerated by receptor-based alignment (Fig. 6a) are moreor less similar to the steric contours of the model derivedwith atom-fit alignment. The steric interactions are repre-sented by green and yellow isopleths, where increase inactivity is associated with more bulk near the green and lessbulk near the yellow contours. Large green contours wereobserved around the P2/P2′ side chain, indicating that stericbulk at these positions is important for HIV-1PR inhibitoryactivity. Published X-ray structures [6] have also shownthat the S2/S2′ pockets are essentially large. Evidence forthis comes from molecules 49, 50, 51, 52, 53 (Table 1)which have bulky aromatic groups at the P2/P2′ site. Their
Table 4 The experimental and predicted pKi values for the test setmolecules using atom-fit alignment
Molecule ID Experimental pKi Predicted pKi
(CoMFA)Predicted pKi
(CoMSIA)
17 7.31 8.24 7.88
18 7.92 7.98 7.23
20 7.52 7.56 6.58
23 8.28 8.00 6.63
26 7.22 6.41 7.83
27 7.66 7.17 8.58
33 8.52 7.99 6.75
37 7.07 7.61 7.04
38 9.51 8.23 7.96
40 8.52 8.44 8.02
42 6.62 7.15 8.14
43 9.05 8.95 7.47
45 8.85 8.41 8.78
48 8.24 7.61 9.15
49 7.66 7.61 7.98
56 9.47 8.71 8.52
61 5.78 6.23 5.99
Fig. 5 Plot of the experimental vs. predicted pKi values for the testset molecules (a) based on the CoMFA model derived by receptor-based alignment (b) based on the CoMFA model derived by atom-fit
alignment (c) based on the CoMSIA model derived by receptor-based alignment (d) based on the CoMSIA model derived by atom-fit alignment
J Mol Model (2010) 16:1251–1268 1259
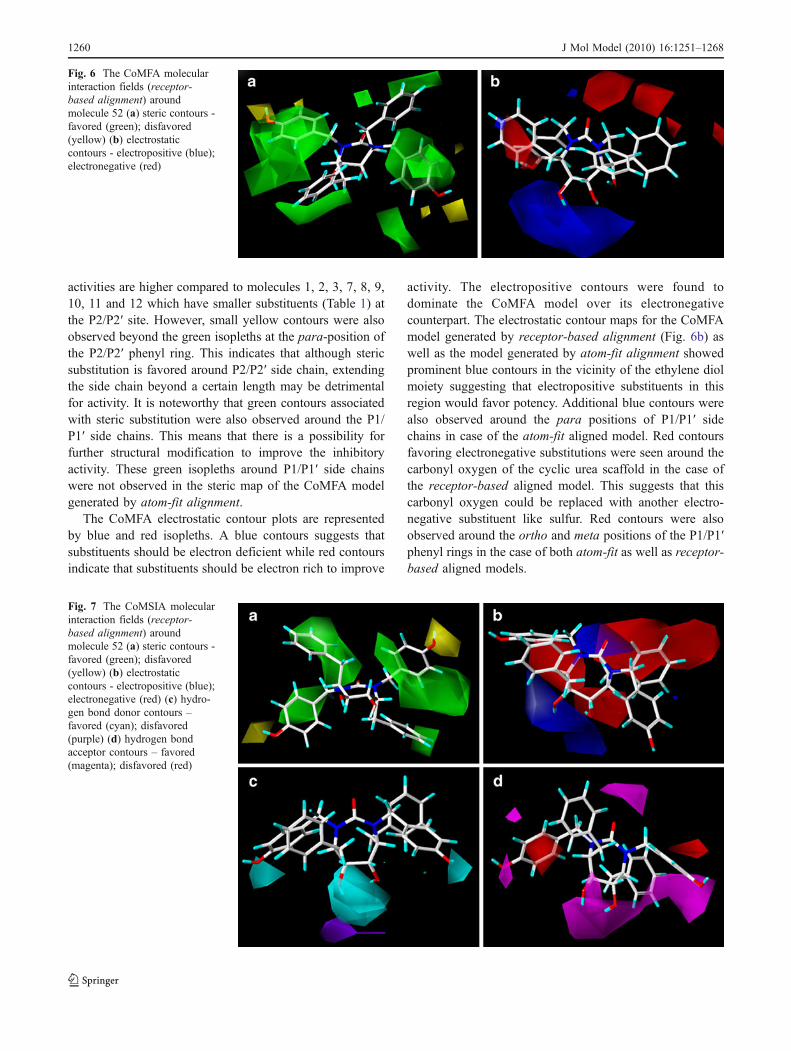
activities are higher compared to molecules 1, 2, 3, 7, 8, 9,10, 11 and 12 which have smaller substituents (Table 1) atthe P2/P2′ site. However, small yellow contours were alsoobserved beyond the green isopleths at the para-position ofthe P2/P2′ phenyl ring. This indicates that although stericsubstitution is favored around P2/P2′ side chain, extendingthe side chain beyond a certain length may be detrimentalfor activity. It is noteworthy that green contours associatedwith steric substitution were also observed around the P1/P1′ side chains. This means that there is a possibility forfurther structural modification to improve the inhibitoryactivity. These green isopleths around P1/P1′ side chainswere not observed in the steric map of the CoMFA modelgenerated by atom-fit alignment.
The CoMFA electrostatic contour plots are representedby blue and red isopleths. A blue contours suggests thatsubstituents should be electron deficient while red contoursindicate that substituents should be electron rich to improve
activity. The electropositive contours were found todominate the CoMFA model over its electronegativecounterpart. The electrostatic contour maps for the CoMFAmodel generated by receptor-based alignment (Fig. 6b) aswell as the model generated by atom-fit alignment showedprominent blue contours in the vicinity of the ethylene diolmoiety suggesting that electropositive substituents in thisregion would favor potency. Additional blue contours werealso observed around the para positions of P1/P1′ sidechains in case of the atom-fit aligned model. Red contoursfavoring electronegative substitutions were seen around thecarbonyl oxygen of the cyclic urea scaffold in the case ofthe receptor-based aligned model. This suggests that thiscarbonyl oxygen could be replaced with another electro-negative substituent like sulfur. Red contours were alsoobserved around the ortho and meta positions of the P1/P1′phenyl rings in the case of both atom-fit as well as receptor-based aligned models.
Fig. 6 The CoMFA molecularinteraction fields (receptor-based alignment) aroundmolecule 52 (a) steric contours -favored (green); disfavored(yellow) (b) electrostaticcontours - electropositive (blue);electronegative (red)
Fig. 7 The CoMSIA molecularinteraction fields (receptor-based alignment) aroundmolecule 52 (a) steric contours -favored (green); disfavored(yellow) (b) electrostaticcontours - electropositive (blue);electronegative (red) (c) hydro-gen bond donor contours –favored (cyan); disfavored(purple) (d) hydrogen bondacceptor contours – favored(magenta); disfavored (red)
1260 J Mol Model (2010) 16:1251–1268
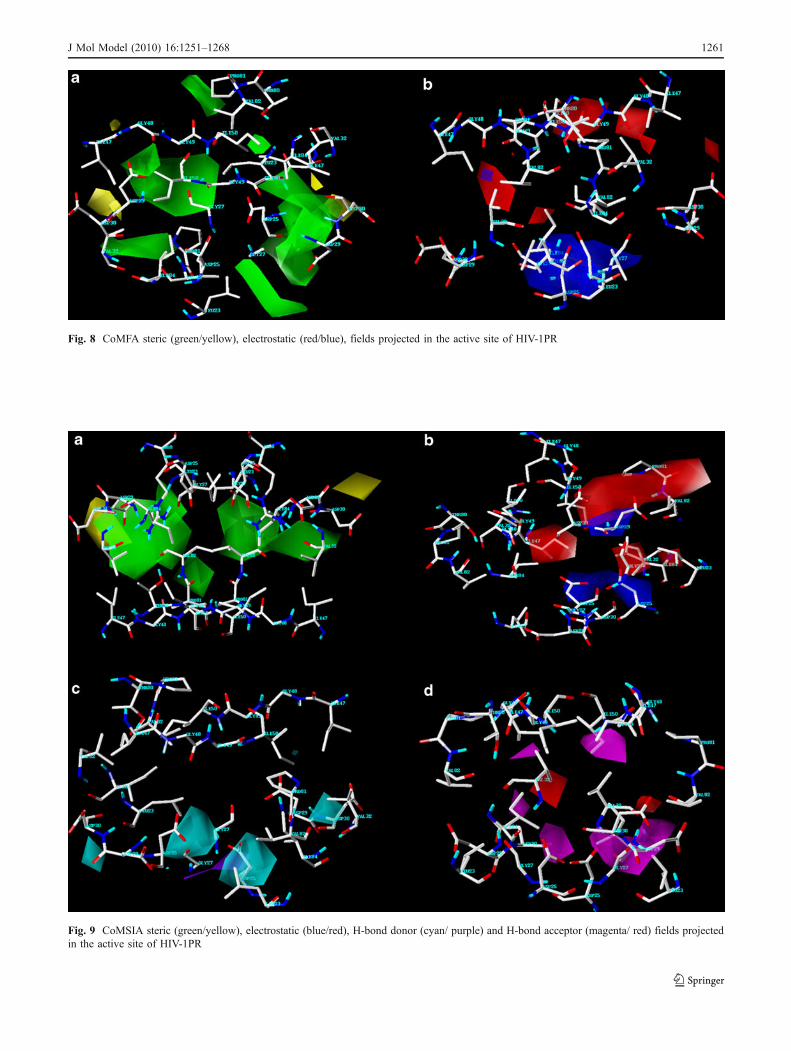
Fig. 8 CoMFA steric (green/yellow), electrostatic (red/blue), fields projected in the active site of HIV-1PR
Fig. 9 CoMSIA steric (green/yellow), electrostatic (blue/red), H-bond donor (cyan/ purple) and H-bond acceptor (magenta/ red) fields projectedin the active site of HIV-1PR
J Mol Model (2010) 16:1251–1268 1261
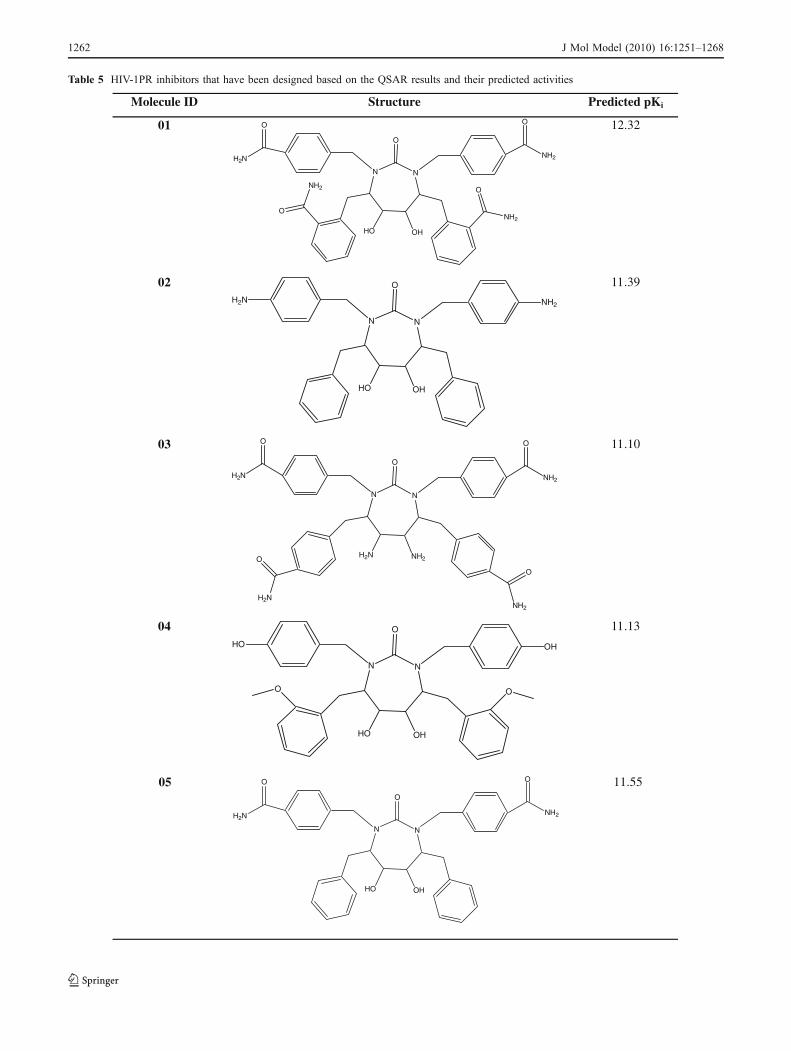
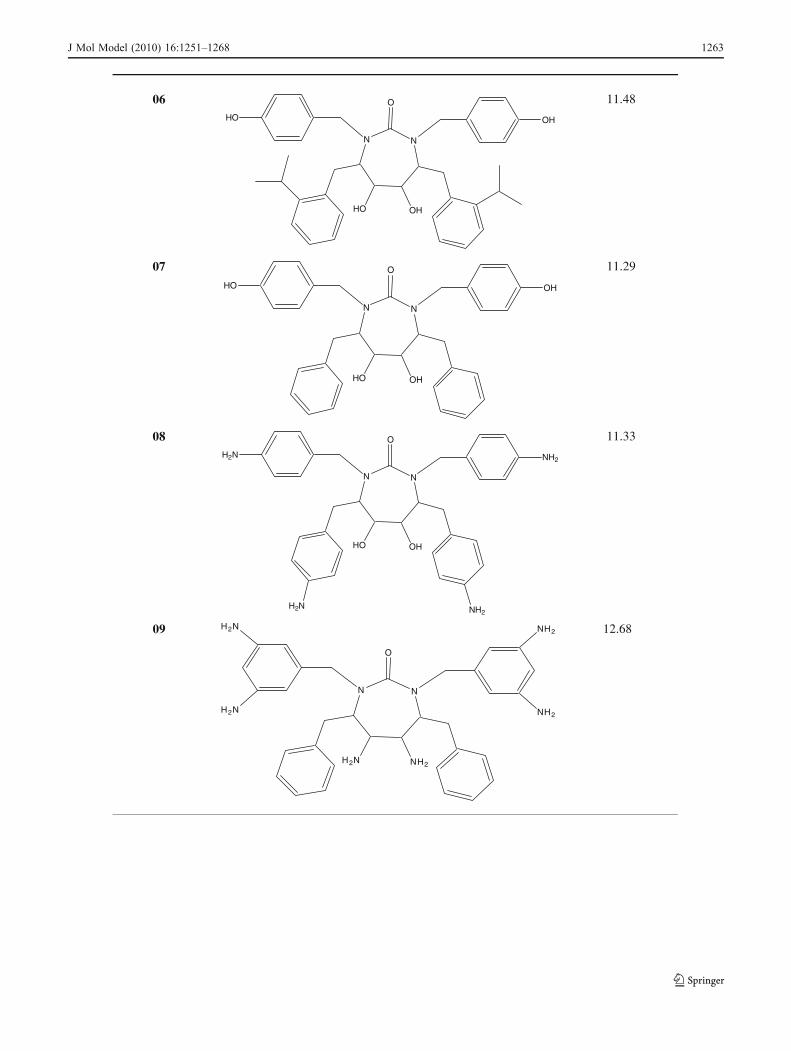
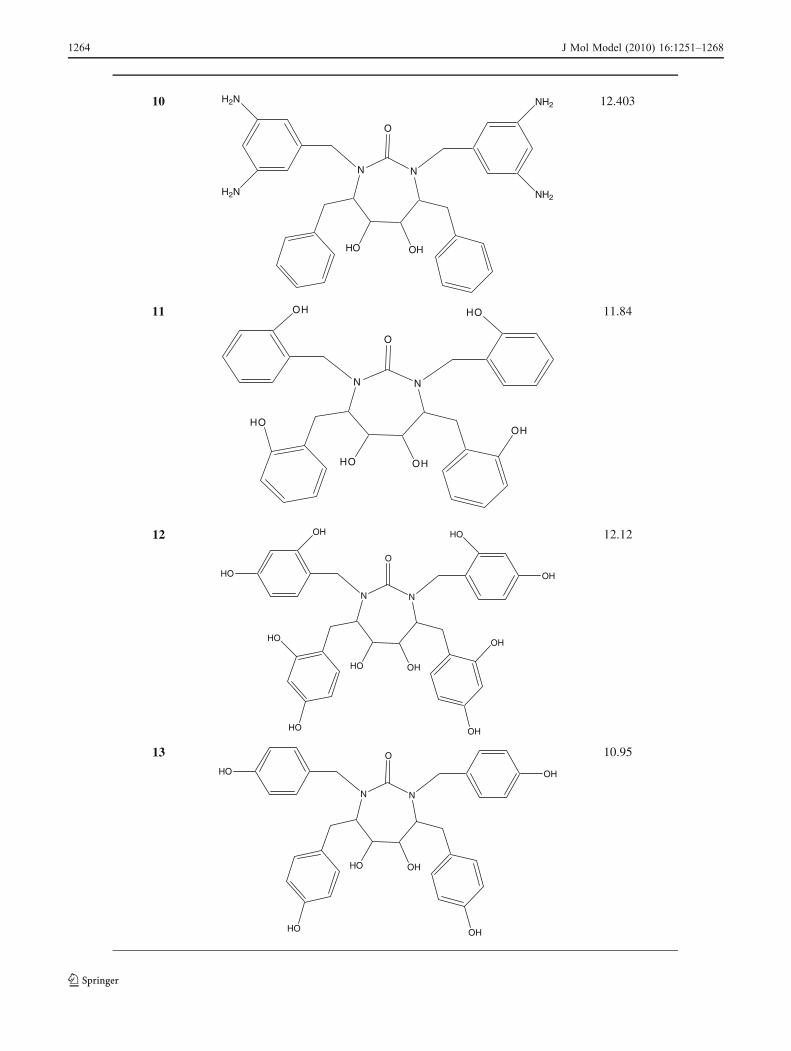
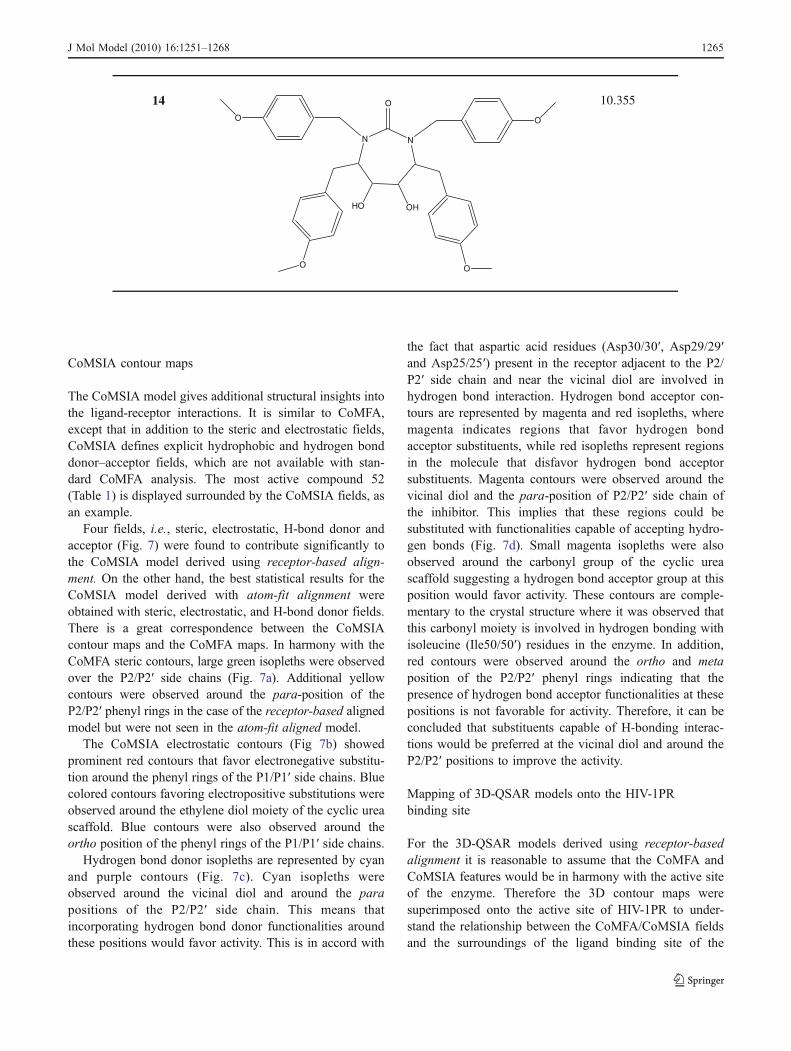
Table 5 HIV-1PR inhibitors that have been designed based on the QSAR results and their predicted activities
05
N N
O
HO OH
NH2H2N
O O 11.55
Kp detciderP erutcurtS DI eluceloM i
01
N N
O
HO OH
O
NH2
NH2
O
NH2H2N
O O 12.32
02
N N
O
HO OH
H2N NH2
11.39
03
N N
O
H2N NH2
H2N NH2
H2NNH2
O O
O
O
11.10
04
N N
O
HO OH
HO OH
O O
11.13
1262 J Mol Model (2010) 16:1251–1268
09
N N
O
H2N NH2
H2N
H2N
NH2
NH2
12.68
06
N N
O
HO OH
HO OH
11.48
07
N N
O
HO OH
HO OH
11.29
08
N N
O
HO OH
H2N NH2
H2N NH2
11.33
J Mol Model (2010) 16:1251–1268 1263
12
N N
O
HO OH
OH HO
HO OH
HO OH
HO OH
12.12
13
N N
O
HO OH
HO OH
HO OH
10.95
10
N N
O
HO OH
H2N
H2N
NH2
NH2
12.403
11
N N
O
HO OH
OH HO
HOOH
11.84
1264 J Mol Model (2010) 16:1251–1268
CoMSIA contour maps
The CoMSIA model gives additional structural insights intothe ligand-receptor interactions. It is similar to CoMFA,except that in addition to the steric and electrostatic fields,CoMSIA defines explicit hydrophobic and hydrogen bonddonor–acceptor fields, which are not available with stan-dard CoMFA analysis. The most active compound 52(Table 1) is displayed surrounded by the CoMSIA fields, asan example.
Four fields, i.e., steric, electrostatic, H-bond donor andacceptor (Fig. 7) were found to contribute significantly tothe CoMSIA model derived using receptor-based align-ment. On the other hand, the best statistical results for theCoMSIA model derived with atom-fit alignment wereobtained with steric, electrostatic, and H-bond donor fields.There is a great correspondence between the CoMSIAcontour maps and the CoMFA maps. In harmony with theCoMFA steric contours, large green isopleths were observedover the P2/P2′ side chains (Fig. 7a). Additional yellowcontours were observed around the para-position of theP2/P2′ phenyl rings in the case of the receptor-based alignedmodel but were not seen in the atom-fit aligned model.
The CoMSIA electrostatic contours (Fig 7b) showedprominent red contours that favor electronegative substitu-tion around the phenyl rings of the P1/P1′ side chains. Bluecolored contours favoring electropositive substitutions wereobserved around the ethylene diol moiety of the cyclic ureascaffold. Blue contours were also observed around theortho position of the phenyl rings of the P1/P1′ side chains.
Hydrogen bond donor isopleths are represented by cyanand purple contours (Fig. 7c). Cyan isopleths wereobserved around the vicinal diol and around the parapositions of the P2/P2′ side chain. This means thatincorporating hydrogen bond donor functionalities aroundthese positions would favor activity. This is in accord with
the fact that aspartic acid residues (Asp30/30′, Asp29/29′and Asp25/25′) present in the receptor adjacent to the P2/P2′ side chain and near the vicinal diol are involved inhydrogen bond interaction. Hydrogen bond acceptor con-tours are represented by magenta and red isopleths, wheremagenta indicates regions that favor hydrogen bondacceptor substituents, while red isopleths represent regionsin the molecule that disfavor hydrogen bond acceptorsubstituents. Magenta contours were observed around thevicinal diol and the para-position of P2/P2′ side chain ofthe inhibitor. This implies that these regions could besubstituted with functionalities capable of accepting hydro-gen bonds (Fig. 7d). Small magenta isopleths were alsoobserved around the carbonyl group of the cyclic ureascaffold suggesting a hydrogen bond acceptor group at thisposition would favor activity. These contours are comple-mentary to the crystal structure where it was observed thatthis carbonyl moiety is involved in hydrogen bonding withisoleucine (Ile50/50′) residues in the enzyme. In addition,red contours were observed around the ortho and metaposition of the P2/P2′ phenyl rings indicating that thepresence of hydrogen bond acceptor functionalities at thesepositions is not favorable for activity. Therefore, it can beconcluded that substituents capable of H-bonding interac-tions would be preferred at the vicinal diol and around theP2/P2′ positions to improve the activity.
Mapping of 3D-QSAR models onto the HIV-1PRbinding site
For the 3D-QSAR models derived using receptor-basedalignment it is reasonable to assume that the CoMFA andCoMSIA features would be in harmony with the active siteof the enzyme. Therefore the 3D contour maps weresuperimposed onto the active site of HIV-1PR to under-stand the relationship between the CoMFA/CoMSIA fieldsand the surroundings of the ligand binding site of the
14
N N
O
HO OH
O O
O O
10.355
J Mol Model (2010) 16:1251–1268 1265
enzyme (Figs. 8 and 9). The sterically favorable regions liein the S1/S1′ and S2/S2′ catalytic binding pocket, whichharbor the hydrophobic residues Val 32/32′, Val82/82′, Gly48/48′, Ile 50/50′, and Ile 84/84′. The diol functionalityassociated with cyclic urea scaffold is involved in hydrogenbonding with Asp 25/25′. The P2/P2′ substituents also takepart in hydrogen bonding interaction with Asp 30/30′ andAsp 29/29′. The urea oxygen accepts two hydrogen bondsfrom the Ile 50/50′. These observations are consistent withthe electrostatic and the hydrogen bond donor/acceptorisopleths. Thus the field contour maps correlate wellwith the environmental characteristics of the active site ofHIV-PR.
Design of new CU analogs
The structural requirements identified in the present studycan be utilized strategically in the design of novel, potentand selective molecules with improved binding affinity. Forthe inactivation of HIV-1PR by cyclic urea analogs, theCoMFA and CoMSIA studies suggested that increasing thebulk at the P1/P1′ and P2/P2′ side chains of the cyclic ureascaffold would favor affinity and efficacy. The results alsosuggested that electropositive substituents capable ofhydrogen bonding with key aspartic acid residues in thereceptor are favored around the diol , the P1/P1′ and P2/P2′side chains. Therefore, based on 3D-QSAR analysis presentedhere, we have designed some potential candidates (Table 5).
In silico pharmacokinetic/ toxicity predictions
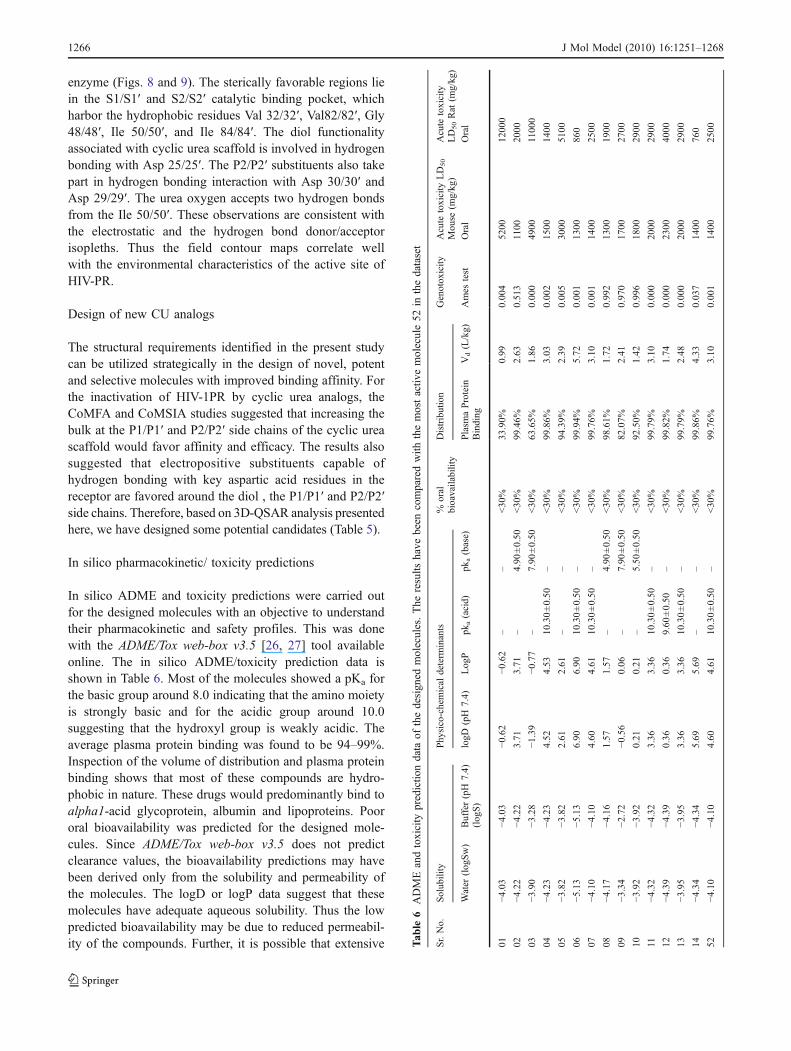
In silico ADME and toxicity predictions were carried outfor the designed molecules with an objective to understandtheir pharmacokinetic and safety profiles. This was donewith the ADME/Tox web-box v3.5 [26, 27] tool availableonline. The in silico ADME/toxicity prediction data isshown in Table 6. Most of the molecules showed a pKa forthe basic group around 8.0 indicating that the amino moietyis strongly basic and for the acidic group around 10.0suggesting that the hydroxyl group is weakly acidic. Theaverage plasma protein binding was found to be 94–99%.Inspection of the volume of distribution and plasma proteinbinding shows that most of these compounds are hydro-phobic in nature. These drugs would predominantly bind toalpha1-acid glycoprotein, albumin and lipoproteins. Poororal bioavailability was predicted for the designed mole-cules. Since ADME/Tox web-box v3.5 does not predictclearance values, the bioavailability predictions may havebeen derived only from the solubility and permeability ofthe molecules. The logD or logP data suggest that thesemolecules have adequate aqueous solubility. Thus the lowpredicted bioavailability may be due to reduced permeabil-ity of the compounds. Further, it is possible that extensive T
able
6ADMEandtoxicity
predictio
ndata
ofthedesign
edmolecules.The
results
have
been
comparedwith
themostactiv
emolecule52
inthedataset
Sr.No.
Solubility
Physico-chemical
determ
inants
%oral
bioavailability
Distribution
Genotoxicity
Acute
toxicity
LD50
Mouse
(mg/kg)
Acute
toxicity
LD50Rat
(mg/kg)
Water
(logSw)
Buffer(pH
7.4)
(logS)
logD
(pH
7.4)
LogP
pka(acid)
pka(base)
Plasm
aProtein
Binding
Vd(L/kg)
Ames
test
Oral
Oral
01−4
.03
−4.03
−0.62
−0.62
––
<30%
33.90%
0.99
0.004
5200
12000
02−4
.22
−4.22
3.71
3.71
–4.90
±0.50
<30%
99.46%
2.63
0.513
1100
2000
03−3
.90
−3.28
−1.39
−0.77
–7.90
±0.50
<30%
63.65%
1.86
0.000
4900
11000
04−4
.23
−4.23
4.52
4.53
10.30±0.50
–<30%
99.86%
3.03
0.002
1500
1400
05−3
.82
−3.82
2.61
2.61
––
<30%
94.39%
2.39
0.005
3000
5100
06−5
.13
−5.13
6.90
6.90
10.30±0.50
–<30%
99.94%
5.72
0.001
1300
860
07−4
.10
−4.10
4.60
4.61
10.30±0.50
–<30%
99.76%
3.10
0.001
1400
2500
08−4
.17
−4.16
1.57
1.57
–4.90
±0.50
<30%
98.61%
1.72
0.992
1300
1900
09−3
.34
−2.72
−0.56
0.06
–7.90
±0.50
<30%
82.07%
2.41
0.970
1700
2700
10−3
.92
−3.92
0.21
0.21
–5.50
±0.50
<30%
92.50%
1.42
0.996
1800
2900
11−4
.32
−4.32
3.36
3.36
10.30±0.50
–<30%
99.79%
3.10
0.000
2000
2900
12−4
.39
−4.39
0.36
0.36
9.60
±0.50
–<30%
99.82%
1.74
0.000
2300
4000
13−3
.95
−3.95
3.36
3.36
10.30±0.50
–<30%
99.79%
2.48
0.000
2000
2900
14−4
.34
−4.34
5.69
5.69
––
<30%
99.86%
4.33
0.037
1400
760
52−4
.10
−4.10
4.60
4.61
10.30±0.50
–<30%
99.76%
3.10
0.001
1400
2500
1266 J Mol Model (2010) 16:1251–1268
first pass metabolism may also be the reason for lowbioavailability. High oral as well as i.v. LD50 dose meansthat these molecules are reasonably safe. Also the designedmolecules showed a low potential for genotoxicity as depictedby the Ames test. To conclude, the predicted pharmacokineticand toxicity profile for the designed molecules appeared to befavorable for hit/lead optimization.
Conclusions
The 3D-QSAR models presented in this investigationestablishes the molecular basis for inhibition of HIV-1PR.The 3D-QSAR models described herein possesses goodinternal and external consistency. The predictive ability ofthese models is manifested in the good correlation betweenexperimental and predicted pKi values for the test mole-cules. The CoMFA and CoMSIA contour plots provided afruitful insight into the different field contributions towardthe overall activity. The contour maps as well as thedocking studies were used for designing new moleculeswhose predicted activities were found to be better than theparent molecules. The ADMET/toxicity predictions forthe designed molecules were also found to be withintolerance limits. Overall, the results described in thispaper provide a better understanding of ligand HIV-1PRinteractions and thus offer guidelines for ligand design plus apredictive model for scoring novel synthetic candidatesagainst HIV-1PR.
Acknowledgments The computational facilities were jointly providedby the All India Council of Technical Education through grant (F. No.8022/RID/NPROJ/RPS-5/2003–04), the Department of Science andTechnology through their FIST program (SR/FST/LSI-163/2003) andthe Council of Scientific and Industrial Research (01(1986)/05/EMR-II).Vijay M. Khedkar thanks the Amrut Mody Research Foundation(AMRF) and Jitender Verma, the CSIR, New Delhi for the financialsupport. The authors are also grateful to Dr. Krishna Iyer, Professor,Bombay College of Pharmacy for the ADME-Toxicity profiling of thedesigned molecules.
References
1. Henderson LE, Benveniste RE, Sowder R, Copeland TD, SchultzAM, Oroszlan S (1988) Molecular characterization of gag proteinsfrom simian immunodeficiency virus (SIVMne). J Virol 62:2587–2595
2. Loeb DD, Hutchison CA 3rd, Edgell MH, Farmerie WG,Swanstrom R (1989) Mutational analysis of human immunodefi-ciency virus type 1 protease suggests functional homology withaspartic proteinases. J Virol 63:111–121
3. Erickson J, Neidhart DJ, VanDrie J, Kempf DJ, Wang XC,Norbeck DW, Plattner JJ, Rittenhouse JW, Turon M, Wideburg Net al. (1990) Design, activity, and 2.8 A crystal structure of a C2
symmetric inhibitor complexed to HIV-1 protease. Science249:527–533
4. Dreyer GB, Boehm JC, Chenera B, DesJarlais RL, Hassell AM,Meek TD, Tomaszek TA, Lewis M (1993) A symmetric inhibitorbinds HIV-1 protease asymmetrically. Biochemistry 32:937–947
5. Lam PY, Jadhav PK, Eyermann CJ, Hodge CN, Ru Y, BachelerLT, Meek JL, Otto MJ, Rayner MM, Wong YN et al. (1994)Rational design of potent, bioavailable, nonpeptide cyclic ureas asHIV protease inhibitors. Science 263:380–384
6. Lam PY, Ru Y, Jadhav PK, Aldrich PE, DeLucca GV, EyermannCJ, Chang CH, Emmett G, Holler ER, Daneker WF, Li L,Confalone PN, McHugh RJ, Han Q, Li R, Markwalder JA, SeitzSP, Sharpe TR, Bacheler LT, Rayner MM, Klabe RM, Shum L,Winslow DL, Kornhauser DM, Hodge CN et al. (1996) CyclicHIV protease inhibitors: synthesis, conformational analysis, P2/P2′ structure-activity relationship, and molecular recognition ofcyclic ureas. J Med Chem 39:3514–3525
7. Schaal W, Karlsson A, Ahlsen G, Lindberg J, Andersson HO,Danielson UH, Classon B, Unge T, Samuelsson B, Hulten J,Hallberg A, Karlen A (2001) Synthesis and comparative molec-ular field analysis (CoMFA) of symmetric and nonsymmetriccyclic sulfamide HIV-1 protease inhibitors. J Med Chem 44:155–169
8. Debnath AK (1999) Three-dimensional quantitative structure-activity relationship study on cyclic urea derivatives as HIV-1protease inhibitors: application of comparative molecular fieldanalysis. J Med Chem 42:249–259
9. Sybyl. Sybyl, version 7.1; Tripos Associates Inc: 1699S HanleyRd, St. Louis, MO 631444, USA, 2005
10. Gold. GOLD, version 3.1; Cambridge Crystallographic DataCentre (CCDC), UK, 2005
11. Nayyar A, Malde A, Jain R, Coutinho E (2006) 3D-QSAR studyof ring-substituted quinoline class of anti-tuberculosis agents.Bioorg Med Chem 14:847–856
12. Accelrys I. Cerius2, version 4.8; San Diego, CA, USA, 199813. Berman HM, Westbrook J, Feng Z, Gilliland G, Bhat TN, Weissig
H, Shindyalov IN, Bourne PE (2000) The protein data bank.Nucleic Acids Res 28:235–242
14. Cramer RD, Patterson DE, Bunce JD (1988) Comparativemolecular field analysis (CoMFA). 1. Effect of shape on bindingof steroids to carrier proteins. J Am Chem Soc 110:5959–5967
15. Klebe G, Abraham U, Mietzner T (1994) Molecular similarityindices in a comparative analysis (CoMSIA) of drug molecules tocorrelate and predict their biological activity. J Med Chem37:4130–4146
16. Datar PA, Coutinho EC (2004) A CoMFA study of COX-2inhibitors with receptor based alignment. J Mol Graph Model23:239–251
17. Pissurlenkar RR, Shaikh MS, Coutinho EC (2007) 3D-QSARstudies of Dipeptidyl peptidase IV inhibitors using a dockingbased alignment. J Mol Model 13:1047–1071
18. Wold S, Johansson E, Cocchi M (1993) PLS: partial least squaresprojections to latent structures. In: Kubinyi H (ed) 3D QSAR indrug design: theory, methods and applications. ESCOM Science,Leiden, pp 523–550
19. Stone M (1974) Cross-validatory choice and assessment ofstatistical predictions. J Roy Stat Soc B 36:111–147
20. Richard D, Cramer RD III, Bunce JD, Patterson DE, Frank IE(1988) Crossvalidation, bootstrapping, and partial least squarescompared with multiple regression in conventional QSAR studies.Quant Struct-Act Relat 7:18–25
21. Bush BL, Nachbar RB (1993) Sample-distance partial leastsquares: PLS optimized for many variables, with application toCoMFA. J Comput Aided Mol Des 7:587–619
22. Deep R (2006) Regression. In: Deep R (ed) Probability andstatistics. Academic, London, UK, pp 455–515
J Mol Model (2010) 16:1251–1268 1267
23. Shao J (1996) Bootstrap model selection. J Am Stat Assoc91:655–665
24. Rucker C, Rucker G, Meringer M (2007) y-Randomization and itsvariants in QSPR/QSAR. J Chem Inf Model 47:2345–2357
25. Marshall GR (1998) Binding-site modeling of unknown receptors.In: Kubinyi H,Martin YC, Folkers G (eds) 3DQSAR in drug design:Theory methods and applications. Springer, London, pp 80–116
26. Didziapetris R, Reynolds DP, Japertas P, Zmuidinavicius D,Petrauskas A (2006) In silico technology for identification ofpotentially toxic compounds in drug discovery. Curr Comput-Aided Drug Des 2:95–103
27. Zmuidinavicius D, Japertas P, Petrauskas A, Didziapetris R (2003)Progress in toxinformatics: the challenge of predicting acutetoxicity. Curr Top Med Chem 3:1301–1314
1268 J Mol Model (2010) 16:1251–1268