Embed Size (px)
Citation preview
Received for publication: 28 October, 2014. Accepted for publication: 27 November, 2014. Doi: 10.15446/agron.colomb.v32n3.46879
1 Faculty of Agricultural Sciences and Natural Resources, Universidad de los Llanos. Villavicencio (Colombia).2 Faculty of Agricultural Sciences, Universidad Pedagogica y Tecnologica de Colombia (UPTC). Tunja (Colombia).3 Faculty of Agricultural Sciences, Universidad Nacional de Colombia. Palmira (Colombia).4 Faculty of Agricultural Sciences, Universidad de Nariño. Pasto (Colombia).5 Tibaitata Research Center, Corporacion Colombiana de Investigacion Agropecuaria (Corpoica). Bogota (Colombia). [email protected]
Agronomía Colombiana 32(3), 315-325, 2014
Molecular characterization of 93 genotypes of cocoa (Theobroma cacao L.) with random amplified microsatellites RAMsCaracterización molecular con microsatélites amplificados al azar
(RAMs) de 93 genotipos de cacao (Theobroma cacao L.)
Yacenia Morillo C.1, Ana Cruz Morillo C.2, Jaime Eduardo Muñoz F.3, William Ballesteros P.4, and Alonso González5
ABSTRACT RESUMEN
Random amplified microsatellite (RAMs) markers six were used to characterize 93 genotypes of cocoa in Tumaco (Co-lombia). Hundred twenty seven bands were generated. The number of polymorphic loci varied between 11 and 25 for the AG and TG primers, respectively. This study differentiated the 93 genotypes into six groups with a 0.53 similarity, 0.28 mean heterozygosity (He) for the population, and 0.12±0.02 genetic differentiation coefficient or Fst. A significant level of genetic diversity was evident in the T. cacao genotypes. This resource would benefit selection programs of individual trees or plant breeding programs. The genotypes clustered in a large propor-tion in accordance with the collection zone. This characteristic was associated with collection zones and along the rivers in the municipality of Tumaco. The RAM technique proved to be a useful tool for the determination of genetic diversity in Theobroma species.
Seis marcadores microsatélites (RAMs) fueron utilizados para caracterizar 93 genotipos de cacao de las zonas productoras del municipio de Tumaco (Colombia). Se generaron 127 bandas. El número de loci polimórfico varió entre 11 y 25 para los cebadores AG y TG, respectivamente. Este estudio diferenció los 93 genotipos en seis grupos con una similaridad de 0,53, una heterocigosidad promedio (He) para la población de 0,28, y un coeficiente de diferenciación genética o Fst de 0,12±0,02. Se evidenció un nivel importante de diversidad genética en los genotipos de T. cacao. Este recurso beneficiaría los programas de selección de árboles individuales o un programa de fitome-joramiento. Los genotipos se agruparon en clusters en gran proporción de acuerdo a su lugar de colecta. Esta característica fue asociada con zonas localizadas en las veredas ubicadas a lo largo de los ríos del municipio de Tumaco. La técnica RAMs demostró ser una herramienta útil para la determinación de la diversidad genética en especies de Theobroma.
Key words: Malvaceae, molecular markers, heterozygosity, clonal multiplication, genetic diversity.
Palabras clave: Malvaceae, marcadores moleculares, heterocigosidad, multiplicación clonal, diversidad genética.
Introduction
The exact origin of Theobroma cacao L. remains shrouded in mystery and it is hard to define, due to the vastness of its geographical distribution and the bio-diverse landscape (Pound, 1945; Bartley, 2005; Motamayor et al., 2008). It is thought to have originated in the lowland rainforests of northeastern South America and in the southeast of Mexico (Dias, 2001). However, although the origin and domestication are controversial and widely debated, the Upper Amazon Basin is the most accepted origin given its large morphological (Pound, 1945; Bartley, 2005) and allelic diversity (Zhang et al., 2012). The borders between Brazil, Peru and the Southern of southern Colombia encompass
the highest genetic diversity of this tree species (Thomas et al., 2012).
Climatic models indicate that, 21,000 years ago, at the peak of the last ice age, tropical zones provided a refuge for spe-cies, including T. cacao. It is assumed that, from these zones, humans carried T. cacao to Mexico, where the selection of grains started. A better understanding about the spatial and temporal distribution of the genetic diversity of T. cacao (Zhang et al., 2006) and the adaptability of this species to environmental changes (Pautasso, 2009) is fundamental to the development of a set of protocols to face the challenges of markets and future climates.

316 Agron. Colomb. 32(3) 2014
Molecular studies have confirmed the broad genetic di-versity of the species, placing the Nacional cocoa variety in a group separate from the other three (Crouzillat et al., 2000). Recent studies suggest the existence of 10 genetic groups, providing a better understanding of the amplitude and structure of T. cacao genetic diversity in the current populations. Motamayor et al. (2008) found little genetic diversity in the accessions of Central America and broad diversity in the Upper Amazon. This finding coincides with theories on the central origin of T. cacao (Chessman, 1944). The confirmation of these theories would bring beneficial implications for the genetic improvement and conservation of T. cacao.
Theobroma cacao has been characterized with different molecular markers (Lanaud et al., 1999). The genetic diver-sity distribution of the 936 T. cacao genotypes was analyzed with 96 microsatellites in Latin America (Thomas et al., 2012). The results confirm the high diversity of T. cacao in the Upper Amazon. These areas encompasses encompass the south of Peru to the Ecuadorian Amazon and the bor-ders between Colombia, Peru and Brazil. They suggested that T. cacao was already widely distributed in the western Amazon before glaciation started.
Recent studies have reported high genetic diversity on farms in Honduras and Nicaragua (Ji et al., 2012). This research was based on 70 polymorphic markers of only one nucleotide (SNP) and analyzed 84 traditional varieties and 31 clones from international collections. The results indicated a high genetic diversity in the traditional varieties with an appealing potential for further studies on intra-population variation.
The genetic diversity of 77 accessions of the ‘Criollo’ cocoa, collected in the Mayas Mountains of Belize, was analyzed using microsatellite markers (Motilal et al., 2010). They identified 11 distinctive genotypes, which positioned the ‘Criollo’ cocoa within the germplasm of Belize. On the Ec-uadorian Coast, 332 T. cacao accessions were characterized with 60 microsatellite molecular markers (AKA Simple Sequence Repeat, SSRs) (Loor, 2007). The results showed different heterozygosity levels. The genotypes with more homozygosity were genetically closer to the native Ecuador-ian cocoa, which is known as ‘Nacional’ cocoa.
Restriction fragment length polymorphism (RFLPs) and random amplified polymorphic DNA (RAPDs) molecular markers were used by Lerceteau et al. (1997) in INIAP, Ecuador. Their results indicated high variability in the
degree of heterozygosity, which included genotypes with low levels for this characteristic.
Marcano et al. (2009) used genetic mapping to analyze characteristics important for T. cacao cultivation and also detected a degree of variation or polymorphism in the phenotypically distinct samples, as in the formation of two genetic groups. The first included ‘Trinitarian’ a Trinitarian origin and the second ‘Trinitarian’ included Trinitarian and ‘Forastero’ clones.
Amplified fragment length polymorphism (AFLPs) mo-lecular markers were used by Palacio (2007) to evaluate 13 clones in Colombia. His results showed 250 developed markers.
The molecular markers known as RAMs are efficient for measuring the genetic diversity in plants and animals and differences between families, between species and within a species, allowing for the selection of fixed regions within the DNA molecule for different studies (Muñoz et al., 2008). The number of detectable polymorphisms is theoretically unlimited and allows for the analysis of the information that is both expressed and unexpressed (Mahuku et al., 2002). This methodology is feasible for small laboratories at a low cost and with simple equipment, with no requirement for previous sequence knowledge, radioactive isotope use, or population studies (Hantula et al., 1996).
Farmers from Tumaco have traditionally grown different cocoa genotypes without technological management. De-spite the fact that these genotypes have an aromatic profile with floral notes, highly appreciated in the cocoa market; its yields are very low. For this reason, their persistence is at risk because of cultivars with high productivity (CCN clone for Ecuador) but with lower quality. To face these challenges, this study aimed to obtain the first approxima-tion of the genetic diversity of T. cacao in the municipality of Tumaco, in southern Colombia, using random amplified microsatellites (RAMs).
Materials and methods
Collection of T. cacao genotypesThe collection of T. cacao genotypes was carried out in the municipality of Tumaco (Colombia) on farms located in San Luis Robles, Rio Rosario, Rio Mejicano, Rio Cha-güi and Mascarey (Municipio de Tumaco, 2006) (Fig. 1). The gathering was based on the morphologically charac-terization study of the elite T. cacao trees by Ballesteros (2011). According to Vallejo and Peña (2006), the zone

317Morillo C., Morillo C., Muñoz F., Ballesteros P., and González: Molecular characterization of 93 genotypes of cocoa (Theobroma cacao L.)...
encompasses rain forests (RF) and very rainy tropical fo-rests (VRTF), altitudes ranging from 10 to 300 m a.s.l., an annual precipitation of 2,800 mm, a temperature of 26ºC, relative humidity of 88%, and sunshine of 1,000 h year-1.
A total of 93 T. cacao trees were collected, 54 of them cor-responded to Ballesteros’ (2011) dataset, 35 were suggested by the farmers and five were commercial clones from the Cocoa Germplasm Bank of Corpoica-Tumaco. These
commercial clones included CCN 51 (Castro Naranjal Colection), ICS 60 (Imperial College Selection), ICS 95 (Imperial College Selection), IMC 67 (Iquitos Marañon Colection) and TSH561 (Trinidad Selected Hybrid). The plant sample consisted of three to four healthy young leaves from each selected tree. These leaves were stored with silica gel and transported to the Molecular Biology Laboratory of the Universidad Nacional de Colombia, Palmira campus (Tab. 1).
FIGURE 1. Cacao production zones and collection sites in the municipality of Tumaco (Colombia). Source: Ballesteros (2011).

318 Agron. Colomb. 32(3) 2014
TABLE 1. Theobroma cacao genotypes used for the molecular characterization with RAM molecular markers from Tumaco (Colombia).
Genotype Location Collection point Latitude Longitude Genotype Location Collection point Latitude Longitude
1 Isla Grande Rosario 1.67626 -78.6466 105 Iscuande Rosario 1.688694 -78.658806
3 Isla Grande Rosario 1.65943 -78.63496 109 Iscuande Rosario 1.687472 -78.655833
4 Isla Grande Rosario 1.65933 -78.63499 110 Isla Grande Rosario 1.6665 -78.640722
5 Isla Grande Rosario 1.65922 -78.63515 111 Quebrada Arriba San Luis Robles 1.678389 -78.688972
6 Isla Grande Rosario 1.663694 -78.640944 112 Quebrada Arriba San Luis Robles 1.67825 -78.689194
7 Isla Grande Rosario 1.66387 -78.64067 113 Quebrada Arriba San Luis Robles 1.678194 -78.689111
8 Carretera Rosario San Luis Robles 1.6652 -78.67163 114 Pacora Chagüi 1.7805 -78.485306
9 Carretera Rosario San Luis Robles 1.66534 -78.67111 2CN51 Piñal Dulce San Luis Robles 1.675503 -78.71379
10 Carretera Rosario San Luis Robles 1.66544 -78.67094 CCN 51 Corpoica Tumaco 1.8166 -78.7666
13 Monte Bonito San Luis Robles 1.67275 -78.70705 CR01 La Lomita San Luis Robles 1.696267 -78.6813
14 Piñal Dulce San Luis Robles 1.6681 -78.7163 CR02 La Lomita San Luis Robles 1.696233 -78.68125
21 La Sirena Chagüi 1.732639 -78.485583 CR04 Nerete San Luis Robles 1.707867 -78.6672
22 La Sirena Chagüi 1.732583 -78.4855 CR05 Nerete San Luis Robles 1.707867 -78.667217
23 La Sirena Chagüi 1.73625 -78.477583 CR06 Nerete San Luis Robles 1.707867 -78.667217
24 La Sirena Chagüi 1.7365 -78.477444 CR08 Nerete San Luis Robles 1.709033 -78.666733
30 Pacora Chagüi 1.780778 -78.484861 CR09 Nerete San Luis Robles 1.709067 -78.66675
31 Pacora Chagüi 1.782833 -78.481778 CR10 Nerete San Luis Robles 1.709167 -78.666833
32 Pacora Chagüi 1.782111 -78.489111 CR11 Nerete San Luis Robles 1.708478 -78.666992
33 Pacora Chagüi 1.780944 -78.48925 CR12 Nerete San Luis Robles 1.709433 -78.666917
35 Pacora Chagüi 1.782139 -78.468328 CR13 Nerete San Luis Robles 1.709433 -78.666917
42 La Ceiba Chagüi 1.717833 -78.470528 CR14 Zona Carretera San Luis Robles 1.689089 -78.673292
47 Bella Vista Mejicano 1.683917 -78.540917 CR15 Piñal Dulce San Luis Robles 1.698217 -78.719167
54 Guayabo Mejicano 1.686806 -78.573389 CR16 Piñal Dulce San Luis Robles 1.69825 -78.719233
60 Isla Grande Rosario 1.66871 -78.66996 CR17 Zona Carretera San Luis Robles 1.68905 -78.673517
61 Isla Grande Rosario 1.6664 -78.64068 CR18 Zona Carretera San Luis Robles 1.688883 -78.673283
62 Isla Grande Rosario 1.67286 -78.64368 CR19 Zona Carretera San Luis Robles 1.688867 -78.673267
63 Isla Grande Rosario 1.67286 -78.64368 CR20 Zona Carretera San Luis Robles 1.688867 -78.6732
69 Monte Bonito San Luis Robles 1.67817 -78.68923 CR21 Zona Carretera San Luis Robles 1.689467 -78.673283
70 Monte Bonito San Luis Robles 1.67287 -78.70601 CR22 Zona Carretera San Luis Robles 1.6894 -78.6732
71 Monte Bonito San Luis Robles 1.67256 -78.70628 CR23 Isla Grande Rosario 1.6946 -78.643333
73 Quebrada Arriba San Luis Robles 1.67816 -78.68919 CR24 Isla Grande Rosario 1.6969 -78.64545
74 Nerete San Luis Robles 1.687556 -78.667944 CR25 La Ceiba Chagüi 1.739267 -78.470533
75 Nerete San Luis Robles 1.687389 -78.667528 CR26 La Ceiba Chagüi 1.739917 -78.470283
76 Nerete San Luis Robles 1.686917 -78.666917 CR27 La Ceiba Chagüi 1.636535 -78.407402
77 Nerete San Luis Robles 1.686639 -78.666333 CR28 La Ceiba Chagüi 1.758617 -78.47745
78 Nerete San Luis Robles 1.686167 -78.665667 CR29 Palambi Chagüi 1.780933 -78.47955
82 Quebrada Arriba San Luis Robles 1.670472 -78.69625 CR3 Quebrada Arriba San Luis Robles 1.692633 -78.696033
85 Isla Grande Rosario 1.6593 -78.63534 CR30 Pacora Chagüi 1.8025 -78.488767
89 Isla Grande Rosario 1.666 -78.639917 CR31 Guayabo Mejicano 1.41125 -78.34242
91 La Lomita San Luis Robles 1.675611 -78.681972 CR32 Bella Vista Mejicano 1.41021 -78.32273
92 La Lomita San Luis Robles 1.674972 -78.681806 ICS 60 Corpoica Tumaco 1.817 -78.767
93 La Lomita San Luis Robles 1.674833 -78.681528 ICS 95 Corpoica Tumaco 1.818 -78.768
95 Carretera Rosario San Luis Robles 1.658417 -78.72975 IMC 67 Corpoica Tumaco 1.819 -78.769
96 Piñal Dulce San Luis Robles 1.67797 -78.7137 Regional Monte Bonito San Luis Robles 1.672727 -78.706447
97 Piñal Dulce San Luis Robles 1.67797 -78.71387 TSH561 Quebrada Arriba San Luis Robles 1.514877 -78.470276
98 Piñal Dulce San Luis Robles 1.67797 -78.71129 TSH561 Corpoica Tumaco 1.82 -78.77
99 Mascarey San Luis Robles 1.655444 -78.720444
319Morillo C., Morillo C., Muñoz F., Ballesteros P., and González: Molecular characterization of 93 genotypes of cocoa (Theobroma cacao L.)...
Molecular characterizationThe protocol of Dellaporta et al. (1983) was used for the extraction of the DNA. A 0.8% agarose gel was used to visualize the DNA, dyed with ethidium bromide in a Maxi-cell Primo EC-340 Electrophoresis Gel System chamber (Thermo EC, Holbrook, AZ) and visualized with UV light. The DNA concentration of each sample was determined for comparison with known DNA concentrations of Lambda bacteriophage. The quantified DNA was diluted in HPLC water at a volume of 100 µL to 10 ng µL-1 and stored at -20ºC.
For the RAM analysis, six polymorphic primers were used (Technologies Inc., Alameda, CA) (Espinosa et al., 2004; Mahuku et al., 2002; Álvarez et al., 2003) (Tab. 2).
TABLE 2. RAM primers used to determine the genetic diversity of T. cacao.
Primer (repeat unit) Sequence (5’a 3’)
CCA DDB(CCA)5
CGA DHB(CGA)5
AG HBH(AG)7ACT DYD(CT)7CTG HVH(TG)7TCA DBDA(CA)7
The following designations were used for degenerated sites: H (A/T/C); B (G/T/C); V (G/A/C) and D (G/A/T).
The amplification reaction was prepared with a final volume of 25 µL. The reaction mixture included buffer 1X, MgCl2-1.5 mM, dNTPs-0.2 mM, Taq Polymerase-1U, primer-2 µmM and genomic DNA-10 ng.
The amplification was carried out in a PTC 100 Program-mable Thermal Controller (MJ Research, Inc., Waltham, MA). The initial denaturation was at 95ºC for 5 min, with denaturation at 95ºC for 30 s, hybridization at 50ºC (AG and CA primers), 55ºC (CCA-TG-CT primers) and 58ºC (GT-CGA primers) for 45 s, an extension at 72ºC for 2 min, 37 cycles from the denaturation to the extension and, finally, an extension at 72ºC for 7 min.
The amplified products were separated by electrophoresis in 7% polyacrylamide gel (37:1 acrylamide-bis-acrylamide) at 159 V for 1 h in a small DNA Sequencing System FB-SEQ-3545 chamber (Fisher Biotech, Pittsburg, PA). The coloring was done with ethidium bromide with subsequent treatment with silver salts.
Statistical analysisA binary matrix was generated which was coded as absence (zero) and presence (one). The genetic similarity between
the individuals was calculated using the similarity co-efficient of Nei and Li (1979), AKA Dice (1945) (Sneath and Sokal, 1973). A cluster analysis was carried out by the UPGMA method. A dendrogram was generated using Nu-merical Taxonomy System (NTSYS) version 2.02 (Applied Biostastics, New York, NY). To evaluate the genetic diver-sity, the unbiased heterozygosity and the polymorphic loci percentage were estimated using the Tools for Population Genetic Analyses (TFPGA), version 1.3 (Northern Arizona University, Flagstaff, AZ). An F statistic test was enough for the genetic differentiation with a confidence interval of 95%.
Results and discussion
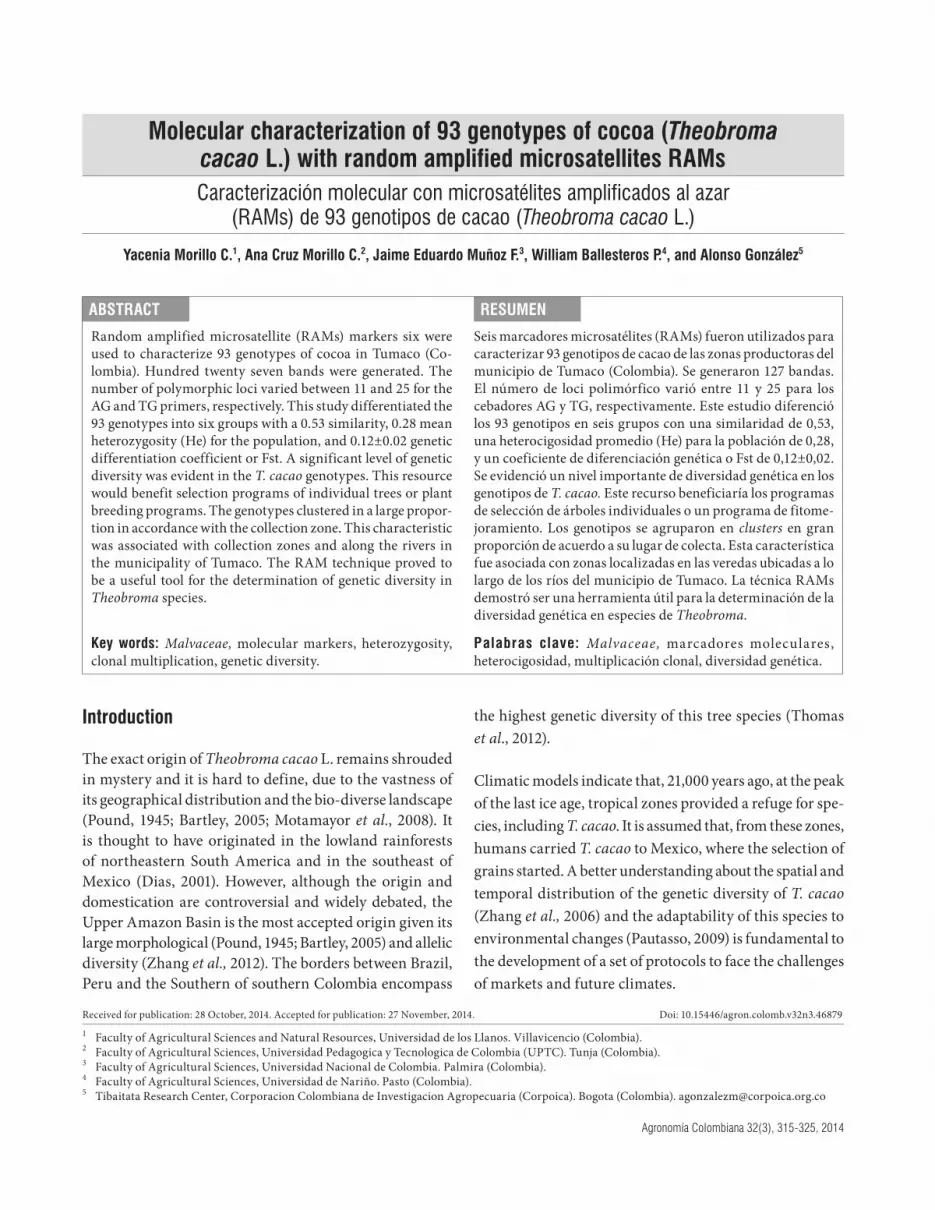
The six RAM primers used for the molecular characteriza-tion of the T. cacao generated 127 bands that fluctuated between 12, for the AG primer, and 33, for the TG primer. The number of polymorphic loci varied between 11 and 25 for the AG and TG primers, respectively (Tab. 3).
TABLE 3. Average estimated heterozygosity and polymorphic loci per-centage for the six evaluated RAM primers in 93 genotypes of T. cacao.
Cebador*No.
polymorphic loci
He estimated
Porcentaje polymorphic loci (95%)
Fst SD
CGA 19 0.30 82.6 0.11 0.02TG 25 0.34 91.7 0.16 0.05
CCA 13 0.30 92.9 0.09 0.02CA 20 0.23 76.9 0.12 0.03CT 16 0.35 84.2 0.13 0.04AG 11 0.22 75.8 0.07 0.02
Total population 0.28 84.0 0.12 0.02
*See Tab. 2 for the primer sequence.
The average heterozygosity (He) for the population was 0.28, which revealed an intermediate degree of genetic diversity considering that RAMs were used as the markers. These results suggest that, in general, a significant level of genetic diversity exists in the T. cacao genotypes collected in Tumaco. This diversity must be valued to characterize its potential, which in turn, will be valuable for selection and breeding programs.
The highest value, for the percentage of polymorphic loci, was seen with the CCA primer (92.9%) and the lowest with the AG primer (75.8%). The highest values for polymor-phism (91.7 and 92.9%) and for He (0.34 and 0.30) were seen with the TG and CCA primers, respectively. These results indicate that these primers allowed for the evaluation of the diversity and could be appropriate for use in future

320 Agron. Colomb. 32(3) 2014
research on the evaluation of the population structure and genetic diversity of T. cacao.
The expected heterozygosity of 0.28 was due to, despite being a small geographic region, the fact that the origin of the materials is diverse and multiplication by botanical seed and cross-pollination of the species have contributed to maintaining the genetic diversity between the evaluated materials. Duplicates were not detected in the analyzed samples, which suggests that there has been little clonal multiplication in the propagation of the material sown by the farmers. This condition of intermediate genetic diver-sity potentializes the opportunity of implementing suitable selection and evaluation of local materials for characteris-tics of quality, disease response, and productivity, which, in the future, could indentify genotypes with productive potential and possible use as parentals in breeding pro-grams for this species.
Analogous values of genetic diversity have been reported by Loor et al. (2009), who analyzed 322 plants of ‘Nacio-nal’ cocoa collected in different geographic zones along the Ecuadorian coast. These authors determined that the genetic structure of modern populations of the ‘Nacional’ cocoa is characterized by high levels of heterozygosity and genetic diversity.
Chumacero de Schawe et al. (2013) studied the flow of pollen and genetic diversity between cultivated and wild populations of T. cacao, and genotypified 143 wild plants and 86 adult cultivated plants and 374 plantlets from 19 wild trees and 25 cultivated trees with nine microsatellite loci. The principal components analysis differentiated the cultivated trees from the wild trees, supporting the idea that Bolivia holds populations of truly wild T. cacao. The cultivated T. cacao had a higher level of genetic diversity than the wild T. cacao, which reflected the diverse origin of the cultivated trees. The relatively high exchange of pollen from the cultivated T. cacao to the wild T. cacao compromised the genetic diversity of the wild populations, making it necessary to protect vast areas of natural forests where wild T. cacao thrives.
The heterozygosity values fluctuated between 0.27, for San Luis Robles and Rio Rosario, and 0.15, for the Rio Mejicano. The high heterozigosity levels (He=0.27) and percentage of polymorphic loci (83.5) found in San Luis Robles were due to the high number of genotypes (50) included in this study and their high number of sampled locations: Monte Bonito, Quebrada Arriba, Nerete, Piñal Dulce, Zona Car-retera, Carretera Rosario, La Lomita and Mascarey.
The high He values found in the watersheds of the Rio Chagüi (He=0.25) and Rio Rosario (He=0.27) were ac-companied by equally high polymorphic loci values with 72.4 and 73.2%, respectively. These results indicate that, although only a few trees were sampled (17), these two re-gions hold high genetic variability. As a result, it is essential to implement management, conservation and strategies for the phytogenetic resources in these regions.
The low He (0.15) and polymorphism (36.2%) values ob-tained in Rio Mejicano could be affected by the low number of genotypes and T. cacao farms. For this reason, more sample sites and a higher number of genotypes are needed to represent the diversity in this region.
The obtained genetic dif ferentiat ion coef f icient (Fst=0.12±0.02) suggests that an intermediate genetic differentiation exits. This result confirms that there is a moderate relationship between the geographic location and the genetic group (Tab. 3).
Studies carried out by Motamayor et al. (2002) on the genetic diversity of the ‘Criollo’, with respect to that of the ‘Forastero’ and ‘Trinitario’ have demonstrated that the genetic basis of the ‘Criollo’ is very narrow, despite its broad geographic distribution, because the study included a high number from our collections from the south of Mexico to the north of Colombia and Venezuela. Addi-tionally, this study also demonstrated that the ‘Forastero’ presented high genetic variability, which corresponded to provenance of these genotypes. In another study, Motamayor et al. (2002) reported that the ‘Trinitario’ presented high variability for the genotypes, similar to that of ‘Criollo’ and ‘Forastero’, and a high number of genotypes that presented intermediate characteristics between both groups.
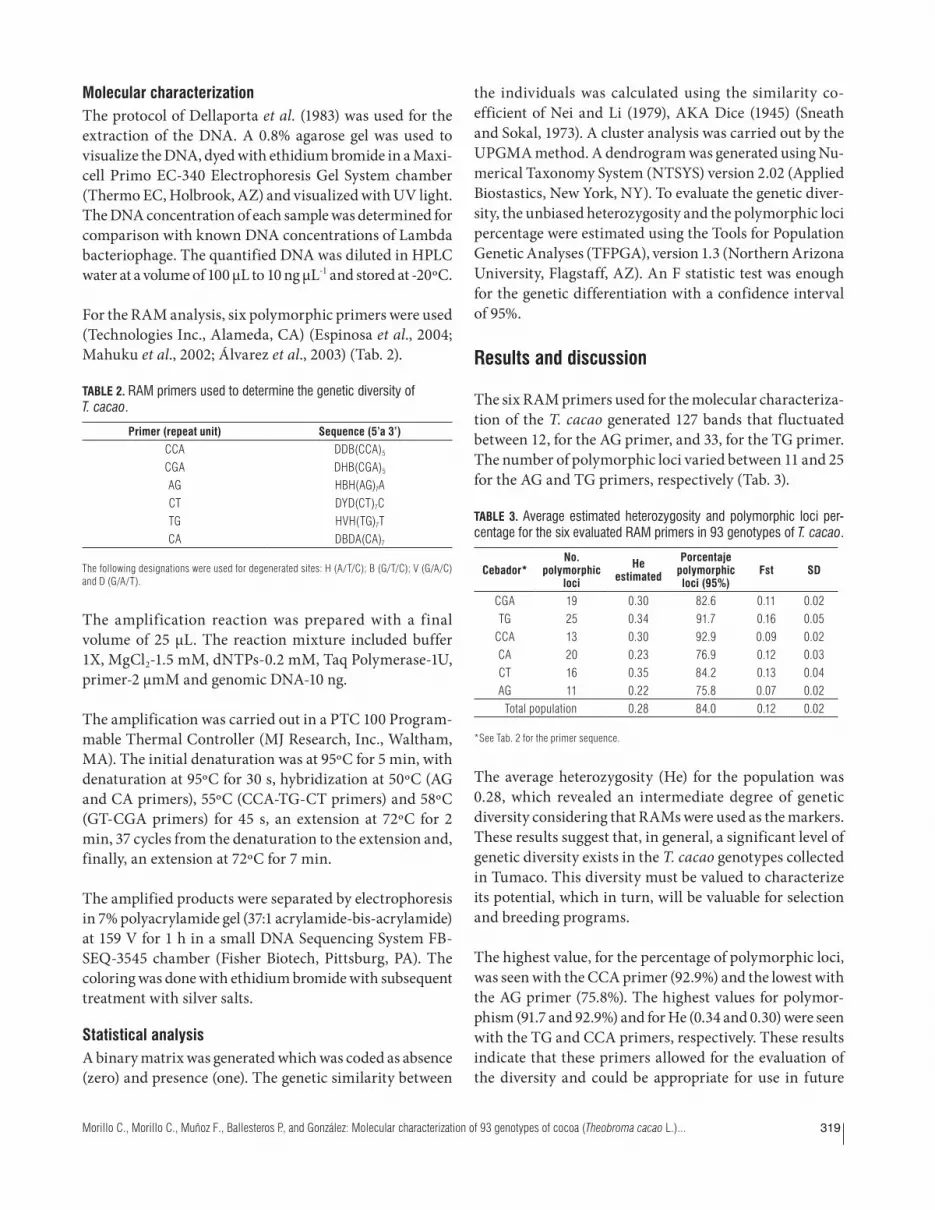
The TG primer allowed for the identification of the highest polymorphism between the samples (Fst=0.16). This result indicates that it can be used for obtaining higher differen-tiation between T. cacao genotypes (Fig. 2).
Similar results have been reported by Sereno et al. (2006) and Zhang et al. (2006), who analyzed the genetic diver-sity of ‘Forastero’ populations from Brazil and Peru with microsatellite markers. They determined that the genetic differentiation between the studied groups was very low, with values ranging from 0.018 to 0.234 for Brazil and Peru, respectively. These values confirm the hypothesis that “individuals from distinct ‘Forastero’ populations present high polymorphism levels”.
321Morillo C., Morillo C., Muñoz F., Ballesteros P., and González: Molecular characterization of 93 genotypes of cocoa (Theobroma cacao L.)...
FIGURE 2. Band pattern in T. cacao generated by RAM microsatellite primer (TG)n.
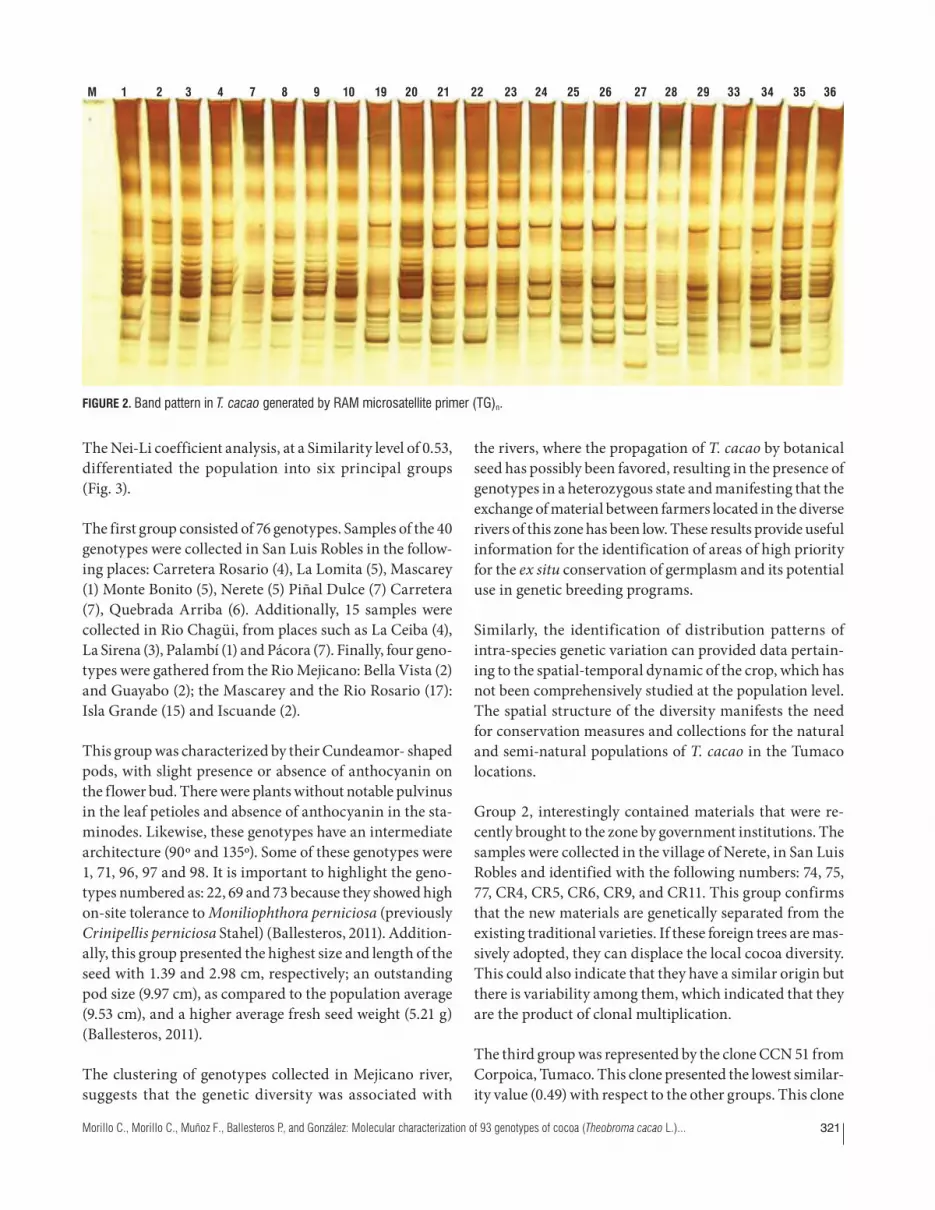
The Nei-Li coefficient analysis, at a Similarity level of 0.53, differentiated the population into six principal groups (Fig. 3).
The first group consisted of 76 genotypes. Samples of the 40 genotypes were collected in San Luis Robles in the follow-ing places: Carretera Rosario (4), La Lomita (5), Mascarey (1) Monte Bonito (5), Nerete (5) Piñal Dulce (7) Carretera (7), Quebrada Arriba (6). Additionally, 15 samples were collected in Rio Chagüi, from places such as La Ceiba (4), La Sirena (3), Palambí (1) and Pácora (7). Finally, four geno-types were gathered from the Rio Mejicano: Bella Vista (2) and Guayabo (2); the Mascarey and the Rio Rosario (17): Isla Grande (15) and Iscuande (2).
This group was characterized by their Cundeamor- shaped pods, with slight presence or absence of anthocyanin on the flower bud. There were plants without notable pulvinus in the leaf petioles and absence of anthocyanin in the sta-minodes. Likewise, these genotypes have an intermediate architecture (90º and 135º). Some of these genotypes were 1, 71, 96, 97 and 98. It is important to highlight the geno-types numbered as: 22, 69 and 73 because they showed high on-site tolerance to Moniliophthora perniciosa (previously Crinipellis perniciosa Stahel) (Ballesteros, 2011). Addition-ally, this group presented the highest size and length of the seed with 1.39 and 2.98 cm, respectively; an outstanding pod size (9.97 cm), as compared to the population average (9.53 cm), and a higher average fresh seed weight (5.21 g) (Ballesteros, 2011).
The clustering of genotypes collected in Mejicano river, suggests that the genetic diversity was associated with
the rivers, where the propagation of T. cacao by botanical seed has possibly been favored, resulting in the presence of genotypes in a heterozygous state and manifesting that the exchange of material between farmers located in the diverse rivers of this zone has been low. These results provide useful information for the identification of areas of high priority for the ex situ conservation of germplasm and its potential use in genetic breeding programs.
Similarly, the identification of distribution patterns of intra-species genetic variation can provided data pertain-ing to the spatial-temporal dynamic of the crop, which has not been comprehensively studied at the population level. The spatial structure of the diversity manifests the need for conservation measures and collections for the natural and semi-natural populations of T. cacao in the Tumaco locations.
Group 2, interestingly contained materials that were re-cently brought to the zone by government institutions. The samples were collected in the village of Nerete, in San Luis Robles and identified with the following numbers: 74, 75, 77, CR4, CR5, CR6, CR9, and CR11. This group confirms that the new materials are genetically separated from the existing traditional varieties. If these foreign trees are mas-sively adopted, they can displace the local cocoa diversity. This could also indicate that they have a similar origin but there is variability among them, which indicated that they are the product of clonal multiplication.
The third group was represented by the clone CCN 51 from Corpoica, Tumaco. This clone presented the lowest similar-ity value (0.49) with respect to the other groups. This clone
M 1 2 3 4 7 8 9 10 19 20 21 22 23 24 25 26 27 28 29 33 34 35 36

322 Agron. Colomb. 32(3) 2014
13967114107098RegionalCR10CR12CR1378CR82CN51CR2797CR15CR1692CR14CR20CR17CR18CR19899599915CR21CR22CR252193CR1CR2CR26CR2822243031114CR30333513234611106601051096389CR2378562CR246973CR38211111211347CR3254CR31CR29747577CR11CR4CR5CR6CR9CCN51ISH561764223ICS60ISH561ICS95IMC67
89%
San
Lui
s Ro
bles
Hybr
ids
100%
Rio
Mej
ican
o
100%
Car
rete
ra A
rriba
100%
Ner
ete
100%
Rio
Ros
ario
85%
Rio
Cha
güí
Coefficient0.750.500.25 1.00
1
6
5
43
2
FIGURE 3. Dendrogram of the genetic structure of 93 T. cacao genotypes based on the Nei-Li coefficient and calculated from the combined data of the six RAM microsatellite primers.

323Morillo C., Morillo C., Muñoz F., Ballesteros P., and González: Molecular characterization of 93 genotypes of cocoa (Theobroma cacao L.)...
is the result of the double hybridization of ‘Trinitario’ and ‘Forastero’ genetic material of an Amazon origin and is rec-ognized as having a yield potential and carrying resistance to common fungal diseases (Amores et al., 2009). This clone was grouped with the recently introduced materials of the Tumaco zone, suggesting that these materials could have a hybrid origin, like CCN 51 and TSH 561. At the time of sampling, these materials did not present production and the genetic origin was not known.
The fourth group contained the genotypes TSH 561 and 76. The latter is characterized by few flowers, leaves and small grains, and presents high on-site tolerance to Mo-niliophthora perniciosa.
In group five, the cocoa genotypes with the numbers 42 and 23 were found, collected in the Rio Chagüi, at the locations of La Ceiba and La Sirena, respectively. These genotypes are characterized by their Cundeamor- shaped pods and absence of anthocyanin on the flower bud. According to Ballesteros (2011), they were grouped with those that pre-sented the highest size and length of the seed with 1.39 and 2.98 cm, respectively; an outstanding pod size (9.97 cm), when compared to the population average (9.53 cm), and a higher average fresh seed weight (5.21 g).
The sixth group showed a similarity level of 0.48. This cluster encompassed clones that came from the Corpoica Germplasm Bank in Tumaco. These trees corresponded to ‘Trinitario’ type, identified as follows: ICS 60, ICS 90, and TSH 561, and the ‘Forastero’ labeled IMC 67. These genotypes were clearly separated from the traditional cocoa varieties cultivated by the local cocoa growers and those dispersed throughout the sampled zones.
The genetic distances seen in this study were smaller than those reported by Quiroz (2002), who morphologi-cally and molecularly characterized 63 “Nacional” cocoa genotypes from Ecuador with three reference genotypes of the ‘Trinitario’ (UF-676), ‘Forastero Amazónico’ (Matina) and ‘Criollo’ (Criollo-36), through the use of AFLPs with seven primer combinations. His results indicated a genetic distance of 0.83, a very high value for individuals of the same species. However, this distance can be explained by the hybrid nature of the materials and the ample genetic diversity introduced to the zone since 1920. Likewise, these materials have a broad relationship with the ‘Refractario’ group (Zhang et al., 2008).
The results found in the present study suggest that, despite being treated as materials that are located in relatively close
areas and that are being used commercially, a significant level of genetic diversity exists in the collected T. cacao material.
The RAM technique allowed for the grouping of the differ-ent T. cacao genotypes by their collection site, suggesting that these materials have been propagated from a common plant, which could be a molecular tool for the evaluation of the genetic diversity in the Theobroma genus.
In Colombia, studies of genetic diversity in T. cacao using microsatellite molecular markers are lacking, with only two studies for this species (Londoño et al., 2011). Therefore, it is important to carry out studies on genetic diversity, germplasm characterization, phylogenetics, and so on, to contribute to a better understanding of the origin and genetic variability of T. cacao in Tumaco.
The T. cacao from Tumaco evidenced genetic diversity with no uniformity among the genotypes. This is an appealing characteristic for carrying out studies that aim to gener-ate flavor profiles, phytosanitary management, genotype conservation, and sustainability of these phytogenetic resources.
AcknowledgementsThis research was sponsored by the MIDAS A-01652 -11-C-921 contract between CIAT and ARD, carried out in the Molecular Biology Laboratory of the Universidad Nacional de Colombia, Palmira and supported by the Consejos Comunitarios of the Afrocolombians in Tumaco.
Literature cited
Amores, F., J. Agama, F. Mite, J. Jiménez, G. Loor, and J. Quiroz. 2009. EET 544 y EET 558, nuevos clones de cacao nacional para la producción bajo riego en la Península de Santa Elena. Technical Bulletin No. 134. Estación experimental Tropical Pichilingue, Instituto Nacional Autonomo de Investigaciones Agropecuarias (INIAP), Quevedo, Ecuador.
Álvarez, E., J.F. Mejía, and T.L. Valle. 2003. Molecular and patho-genicity characterization of Sphaceloma manihoticola isolates from south-central Brazil. Plant Dis. 87, 1322-1328. Doi: 10.1094/PDIS.2003.87.11.1322
Ballesteros P., W. 2011. Caracterización morfológica de árboles élite de cacao (Theobroma cacao L.) en el municipio de Tumaco, Nariño, Colombia. MSc thesis. Faculty of Agricultural Sci-ences, Universidad de Nariño, Pasto, Colombia.
Bartley, B.G.D. 2005. The genetic diversity of cacao and its utiliza-tion. CABI Publishing, London, UK.
Chessman, E.E. 1944. Notes on the nomenclature, classification and possible relationships of cocoa populations. Trop. Agr. 21, 144-159. Doi: 10.1038/hdy.1994.166

324 Agron. Colomb. 32(3) 2014
Chumacero de Schawe, C., W. Durka, T. Tscharntke, I. Hensen, and M. Kessler. 2013. Gene flow and genetic diversity in cultivated and wild cacao (Theobroma cacao) in Bolivia. Am. J. Bot. 100: 2271-2279. Doi: 10.3732/ajb.1300025
Crouzillat, D., L. Bellanger, M. Rigoreau, P. Bucheli, and V. Pétiard. 2000. Genetic structure, characterization and selection of national cocoa compared to other genetic groups. pp. 47-64. In: Proceedings of the International Workshop on New Tech-nologies and Cocoa Breeding. International Group for Genetic Improvement of Cocoa - Ingenic. Kota Kinabalu, Malaysia.
Dellaporta, S.L., J. Wood, and J.B. Hicks. 1983. A plant DNA mini-preparation: Version II. Plant Mol. Biol. Rep. 1, 19-21.
Dias, L.A.S. 2001. Origin and distribution of Theobroma cacao L: a new scenario. In: Dias, L.A.S. (ed.). Genetic improvement of cacao. FAO, http://ecoport.org/ep?SearchType=earticleView&earticleId=197&page=-2; consulted: November, 2014.
Dice, L.R. 1945. Measures of the amount of ecological association between species. Ecology 26, 297-302. Doi: 10.2307/1932409
Espinosa, K., M.L. Bonilla, J.E. Muñoz, A.M. Posso, and H.D. Vásquez. 2004. Colección, caracterización fenotípica y molecu-lar de poblaciones de uchuva Physallis peruviana. Biotecnol. Sector Agropec. Agroind. 2, 72-78.
Hantula, J., M. Dusabenyagasani, and R.C. Hamelin. 1996. Random amplified microsatellites (RAMs) - a novel method for char-acterizing genetic variation within fungi. Eur. J. For. Path. 26, 159-166. Doi: 10.1111/j.1439-0329.1996.tb00720.x
Ji, K., D. Zhang, L.A. Motilal, M. Boccara, P. Lachenaud, and L.W. Meinhardt. 2012. Genetic diversity and parentage in farmer varieties of cacao (Theobroma cacao L.) from Honduras and Nicaragua as revealed by single nucleotide polymorphism (SNP) markers. Genet. Resour. Crop Evol. 60, 441-453. Doi: 10.1007/s10722-012-9847-1
Lanaud, C., A.M. Risterucci, I. Pieretti, M. Falque, A. Bouet, and P.J.L. Lagoda. 1999. Isolation and characterization of micro-satellites in Theobroma cacao L. Mol. Ecol. 8, 2141-2152. Doi: 10.1046/j.1365-294x.1999.00802.x
Lerceteau, E., J. Quiroz, J. Soria, S. Flipo, V. Pétiard, and D. Crouzilat. 1997. Genetic differentiation among Ecuadorian Theobroma cacao L. accessions using DNA and morphological analyses. Euphytica 95, 77-87. Doi: 10.1023/A:1002993415875
Londoño M., J., D.M. Gil V., S.B. Aguilar M., F.A. Rivera P., and G.A. López G. 2011. Caracterización molecular de clones de Theobroma cacao L., por medio de marcadores moleculares mi-crosatélites. Luna Azul 32, 52-60. Doi: 10.17151/luaz.2011.32.6
Loor, R.G. 2007. Contribution à l’étude de la domestication de la variété de cacaoyer Nacional d’Équateur: recherche de la variété native et de ses ancêtres sauvages. PhD thesis. Ecole Nationale Superieure d’Agronomie (ENSAM), Montpellier, France.
Loor, R.G., A.M. Risterucci, B. Courtois, O. Fouet, M. Jeanneau, E. Rosenquist, F. Amores, A. Vasco, M. Medina, and C. Lanaud. 2009. Tracing the native ancestors of the modern Theobroma cacao L. population in Ecuador. Tree Genet. Genomes 5, 421-433. Doi: 10.1007/s11295-008-0196-3
Mahuku, G.S., M.A. Henríquez, J. Muñoz, and R.A. Buruchara. 2002. Molecular markers dispute the existence of the Afro-Andean group of the bean angular leaf spot pathogen,
Phaeoisariopsis griseola. Phytopathology 92, 580-589. Doi: 10.1094/PHYTO.2002.92.6.580
Marcano, M., S. Morales, M.T. Hoyer, B. Courtois, A.M. Risterucci, O. Fouet, T. Pugh, E. Cros, V. Gonzalez, M. Dagert, and C. Lanaud. 2009. A genomewide admixture mapping study for yield factors and morphological traits in a cultivated cocoa (Theobroma cacao L.) population. Tree Genet. Genomes 5, 329-337. Doi: 10.1007/s11295-008-0185-6
Motamayor, J.C., A.M. Risterucci, P.A. Lopez, C.F. Ortiz, A. Moreno, and C. Lanaud. 2002. Cacao domestication I: the origin of the cacao cultivated by the Mayas. Heredity 89, 380-386. Doi: 10.1038/sj.hdy.6800156
Motamayor, J.C., P. Lachenaud, J.W. da Silva e Mota, R. Loor, D.N. Kuhn, J.S. Brown, and R.J. Schnell. 2008. Geographic and ge-netic population differentiation of the Amazonian chocolate tree (Theobroma cacao L). PloS One 3, e3311. DOI: 10.1371/journal.pone.0003311
Motilal, L.A., D. Zhang, P. Umaharan, S. Mischke, V. Mooleed-har, and L.W. Meinhardt. 2010. The relic Criollo cacao in Belize - genetic diversity and relationship with Trinitario and other cacao clones held in the International Cocoa Gene-bank, Trinidad. Plant Genet. Resour. 8, 106-115. Doi: 10.1017/S1479262109990232
Municipio de Tumaco. 2006. Plan de Ordenamiento Territorial (POT). Tumaco, Colombia. pp. 25-26.
Muñoz F., J.E., A.C. Morillo C., and Y. Morillo C. 2008. Microsa-télites amplificados al azar (RAM) en estudios de diversidad genética vegetal. Acta Agron. 57, 219-226.
Nei, M., and W.H. Li. 1979. Mathematical model for studying genetic variation in terms of restriction endonucleases. Proc. Natl. Acad Sci. USA 76, 5269-5273. Doi: 10.1073/pnas.76.10.5269
Palacio G., D. 2007. Caracterización (fingerprinting) de clones de Theobroma cacao L., de interés comercial de la zona cafetera marginal baja (ZCMB) utilizando marcadores tipo fAFLP. MSc thesis. Faculty of Sciences, Universidad de Los Andes, Bogota.
Pautasso, M. 2009. Geographical genetics and the conservation of forest trees. Perspect. Plant Ecol. Evol. Syst. 11, 157-189. Doi: doi:10.1016/j.ppees.2009.01.003
Pound, F.J. 1945. A note on the cocoa population of South America. In: Rep. Proc. Cocoa Res. Conf. London. Colonial 192, 95-97. Reprinted 1982 in Arch. Cacao Res. 1, 93-97.
Quiroz V., J.G. 2002. Caracterización molecular y morfológica de genotipos superiores de cacao nacional (Theobroma cacao L.) de Ecuador. MSc thesis. Tropical Agricultural Research and Higher Education Center (CATIE). Turrialba, Costa Rica.
Sereno, M.L., P.S.B. Albuquerque, R. Vencovsky, and A. Figueira. 2006. Genetic diversity and natural population structure of cacao (Theobroma cacao L.) from the Brazilian Amazon evalu-ated by microsatellite markers. Conserv. Genet. 7, 13-24. Doi: 10.1007/s10592-005-7568-0
Sneath, P.H.A. and R.R. Sokal. 1973. Numerical taxonomy: the prin-ciples and practice of numerical classification. W.H. Freeman and Co., San Francisco, CA.
Thomas, E., M. Van Zonneveld, J. Loo, T. Hodgkin, G. Galluzzi, and J. Van Etten. 2012. Present spatial diversity patterns of Theo-broma cacao L. in the neotropics reflect genetic differentiation

325Morillo C., Morillo C., Muñoz F., Ballesteros P., and González: Molecular characterization of 93 genotypes of cocoa (Theobroma cacao L.)...
in Pleistocene refugia followed by human-influenced dispersal. PLoS ONE 7, e47676. Doi:10.1371/journal.pone.0047676
Vallejo, G. and E. Peña. 2006. Centro Regional de Investigación el Mira. Brochure No. 47 Corpoica, Tumaco, Colombia.
Zhang, D., E. Arevalo-Gardini, S. Mischke, L. Zúñiga-Cernades, A. Barreto-Chavez, and J. Adriazola del Aguila. 2006. Genetic diversity and structure of managed and semi-natural popu-lations of cocoa (Theobroma cacao L.) in the Huallaga and Ucayali Valleys of Peru. Ann. Bot. 98, 647-655. Doi: 10.1093/aob/mcl146
Zhang, D., M. Boccara, L.A. Motilal, D.R. Butler, P. Umaharan, S. Mischke, and L.W. Meinhardt. 2008. Microsatellite variation and population structure in the “Refractario” cacao of Ecuador. Conserv. Genet. 9, 327-337. Doi: 10.1007/s10592-007-9345-8
Zhang, D., W.J. Martínez, E.S. Johnson, E. Somarriba, W. Phillips-Mora, C. Astorga, S. Mischke, and L.W. Meinhardt. 2012. Genetic diversity and spatial structure in a new distinct Theo-broma cacao L. population in Bolivia. Genet. Res. Crop Evol. 59, 239 - 252. Doi: 10.1007/s10722-011-9680-y