Embed Size (px)
Citation preview
Mon. Not. R. Astron. Soc. 000, 1–15 (0000) Printed 17 January 2014 (MN LATEX style file v2.2)
Models of Stephan’s Quintet: Hydrodynamic Constraints on theGroup’s Evolution
Jeong-Sun Hwang ?1,2, Curtis Struck1, Florent Renaud3,4, and Philip Appleton51Department of Physics and Astronomy, Iowa State University, Ames, IA 50011, USA2School of Physics, Korea Institute for Advanced Study, Seoul 130-722, Republic of Korea3Observatoire Astronomique and CNRS UMR 7550, Universite de Strasbourg, 11 rue de l’Universite, F-67000 Strasbourg, France4Laboratoire AIM Paris-Saclay, CEA/IRFU/SAp, Universite Paris Diderot, F-91191 Gif-sur-Yvette Cedex, France5NASA Herschel Science Center (NHSC), California Institute of Technology, Mail code 100-22, Pasadena, CA 91125, USA
17 January 2014
ABSTRACTWe present smoothed particle hydrodynamic models of the interactions in the compact galaxygroup, Stephan’s Quintet. This work is extension of the earlier collisionless N-body simula-tions of Renaud et al. in which the large-scale stellar morphology of the group was modeledwith a series of galaxy-galaxy interactions in the simulations. Including thermohydrodynamiceffects in this work, we further investigate the dynamical interaction history and evolutionof the intergalactic gas of Stephan’s Quintet. The major features of the group, such as the ex-tended tidal features and the group-wide shock, enabled us to constrain the models reasonablywell, while trying to reproduce multiple features of the system. We found that reconstructingthe two long tails extending from NGC 7319 toward NGC 7320c one after the other in twoseparate encounters is very difficult and unlikely, because the second encounter usually de-stroys or distorts the already-generated tidal structure. Our models suggest the two long tailsmay be formed simultaneously from a single encounter between NGC 7319 and 7320c, result-ing in a thinner and denser inner tail than the outer one. The tails then also run parallel to eachother as observed. The model results support the ideas that the group-wide shock detected inmulti-wavelength observations between NGC 7319 and 7318b and the starburst region northof NGC 7318b are triggered by the high-speed collision between NGC 7318b and the inter-galactic gas. Our models show that a gas bridge is formed by the high-speed collision andclouds in the bridge continue to interact for some tens of millions of years after the impact.This produces many small shocks in that region, resulting a much longer cooling time thanthat of a single impact shock.
Key words: galaxies: evolution – galaxies: individual: NGC 7318a, NGC 7318b, NGC 7319,NGC 7320c – galaxies: interactions – intergalactic medium – shock waves – methods: numer-ical.
1 INTRODUCTION
In investigating the evolution of an interacting galaxy system,multi-wavelength observations and dynamical modeling are com-plementary. On the one hand, high-resolution observations in dif-ferent wave bands reveal important physical quantities and infor-mation about various physical processes occurring in the system.By interpreting these quantities and the possible causes of the pro-cesses, we can learn about the dynamical state and deduce a plau-sible interaction history of the system. On the other hand, a well-constrained numerical model not only provide the direct testing ofthe plausible interactions and help to interpret observational results,
? E-mail: [email protected] (J-SH); [email protected] (CS); [email protected] (FR); [email protected] (PA)
but it also may yield additional constraints or information suchas the halo profiles of the system. Ever since Toomre & Toomre(1972) successfully simulated the stellar morphologies of severalinteracting galaxy pairs, explaining the formation of their peculiarstructures, numerical simulations have become more popular andimportant means in studying interacting systems.
Compact groups (compact and relatively isolated systems ofseveral galaxies) often show highly distorted features of interac-tions. Due to the dense environment, galaxy interactions would oc-cur more frequently in more complex ways in compact groups thanbinary systems. These groups are thus important environments forstudying various interaction and merger effects and also the evo-lution of galaxies at higher redshifts where interactions are morefrequent (e.g., Gottlober, Klypin & Kravtsov 2001).
However, unlike binary systems where computer simulations
c© 0000 RAS
arX
iv:1
109.
4161
v1 [
astr
o-ph
.CO
] 1
9 Se
p 20
11
2 J.-S. Hwang et al.
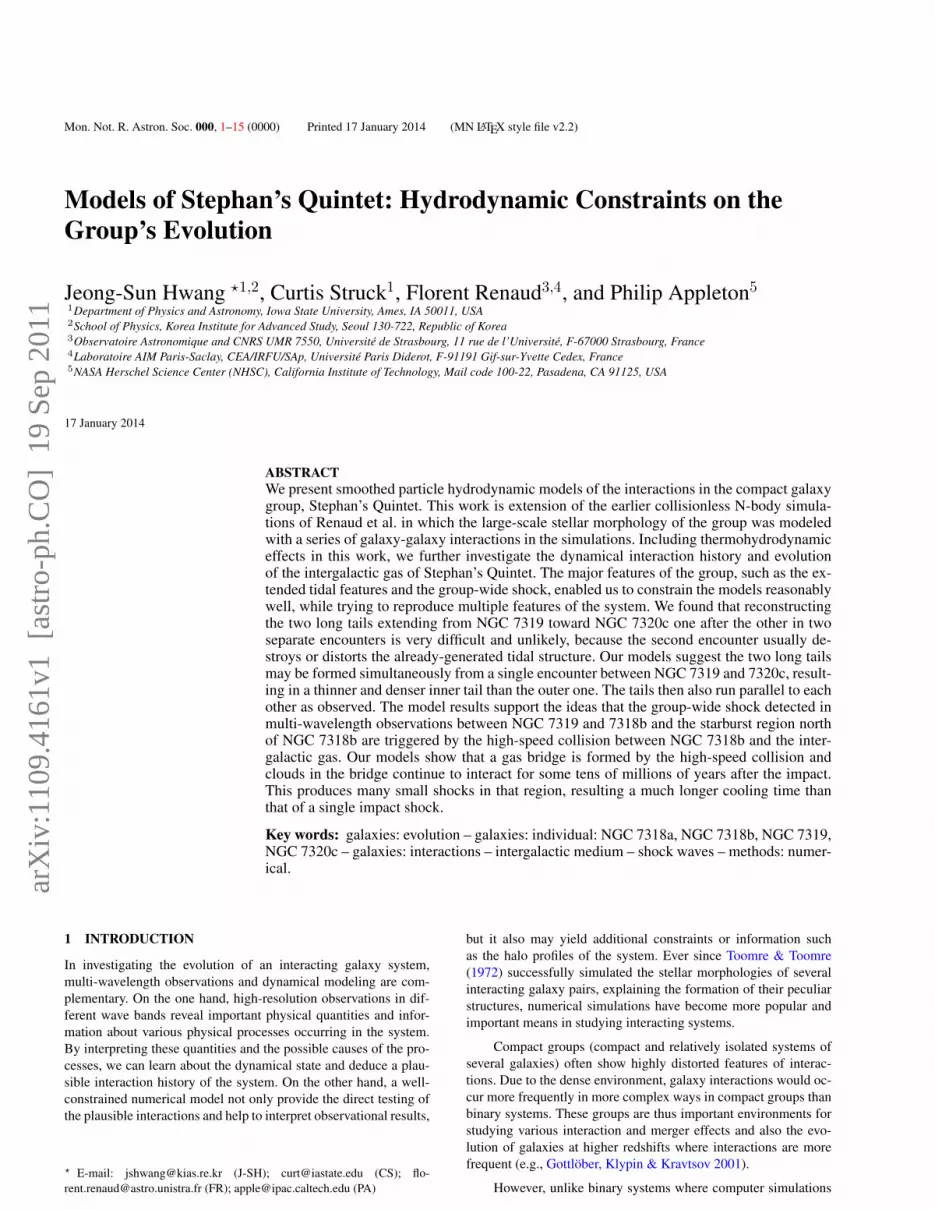
Figure 1. Top: the optical morphology of Stephan’s Quintet. The members and major large-scale features are marked: the inner and outer tails (the two longparallel tails; the outer tail is hard to see as it is diffuse and passes behind NGC 7320), the star-forming regions SQ-A and SQ-B, and the tail-like SW-armfeature (see text for more descriptions of the features). NGC 7320 (to the lower middle in the image) is only a foreground projection. North is up and east tothe left. (Credit: NOAO/AURA/NSF) Bottom: an unsharped-masked version of the above optical image to show the outer tail better. The extended outer tailruns parallel with the inner tail.
have often been used to interpret observations, simulations forcompact groups have not been frequently attempted, especially tomodel specific groups. Constraining models is much more difficultor sometimes not doable if the system has experienced multiplestrong interactions involving multiple members and the structuralor kinematical evidence of interactions has been largely erased.
For some special compact groups, however, numerical mod-eling is feasible. For example, if a system maintains characteris-tic tidal features or collisional ring structures then it is possibleto limit the plausible interactions to a few cases. The presence ofrecent interaction is also helpful, since there can be unique ev-idence preserved from the ‘young’ interaction. In addition, even
though a group appears to have experienced multiple interactions,if each interaction involved mainly two galaxies rather than threeor more members (i.e., a sequence of ‘two-at-a-time’ interactions),then modeling interpretations could be more tractable.
Stephan’s Quintet (hereafter SQ; also known as HCG 92, Arp319, and VV 288; see Fig. 1), one of the first compact galaxy groupsidentified (Hickson 1982), has many of these properties. It showsstrongly disturbed structural and kinematical features, such as ex-tended tidal tails, disturbed arms and ring-like features, and richintergalactic medium (IGM) with little gas remaining in the centralregion of every member galaxy (e.g., Sulentic et al. 2001; Williams,Yun & Verdes-Montenegro 2002; see Fig. 2). Moreover, the group
c© 0000 RAS, MNRAS 000, 1–15
Models of Stephan’s Quintet 3
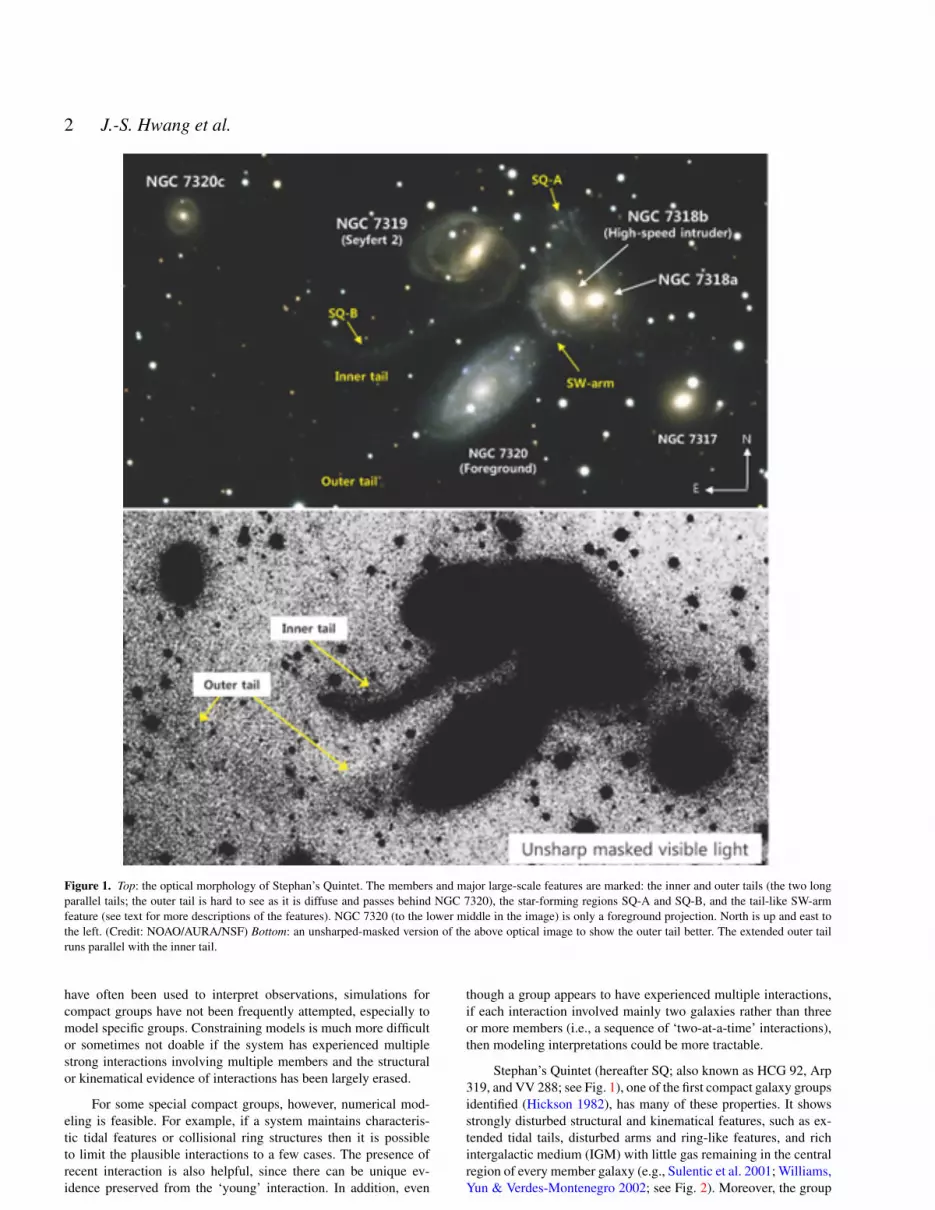
Figure 2. H I gas observed in Stephan’s Quintet (from Williams, Yun &Verdes-Montenegro 2002). Most of the gas is found outside of the galaxies,within five physically distinct components and in three discrete radial veloc-ity bands: Three H I clouds, ‘Arc-N’, ‘Arc-S’, and ‘NW-HV’, are detectedin the highest radial velocity band, 6475−6755 km s−1. An H I cloud ‘NW-LV’ is found in the intermediate velocity band 5939−6068 km s−1, and adiffuse H I feature ‘SW’ is detected in the low velocity band 5597−5789km s−1.
is thought to be experiencing a high-speed collision between amember (NGC 7318b) and its IGM; multi-wavelength observa-tions, including radio continuum (e.g., Allen & Hartsuiker 1972;Xu et al. 2003) and X-rays (e.g., Trinchieri et al. 2003, 2005; seeFig. 3(a)), have consistently shown a huge elongated feature (∼30kpc) in the IGM which has been widely interpreted as a shock fronttriggered by an ongoing or very recent collision.
More recently, Appleton et al. (2006) discovered strong almostpure-rotational H2 line emission along the X-ray-emitting shockfront. In follow-up observations (Cluver et al. 2010; see Fig. 3(b)),the line emission at the main shock region was detected over ∼480kpc2 with a luminosity exceeding that of the X-rays from the shock.Guillard et al. (2009) modeled the H2 excitation in a multi-phasedmedium overrun by a high-speed shock caused by the intruder.These models, which dealt with H2 formation and destruction, X-ray emission and the survival of dust grains in the shock, showedthat the H2 power seen in the Spitzer observations could be ex-plained in terms of the dissipation of mechanical energy throughturbulence. Although these models involve a sophisticated treat-ment of the micro-physics, our current paper attempts to place thiswork in the context of the group dynamics as a whole. This cou-pling between the large-scale gas dynamics and the detailed astro-physics of the shocked regions provides a strong motivation for thisstudy.
Given all of those interesting features and observational con-straints available from the literature, we have performed smoothedparticle hydrodynamics (SPH) simulations of SQ, taking up to fourstrongly interacting members into account. Previously, two of usstarted modeling of this system with a purely gravitational N-bodycode and examined interaction history and large-scale stellar mor-phology (Renaud, Appleton & Xu 2010). (Hereafter we distinguishthe previous work (code, models, etc) with the term ‘N-body’; ifnot specified, the reference is to the current SPH code, models, etc).In this paper, we extend the N-body work adding thermohydrody-namic effects to model the shocks. With new models, we further
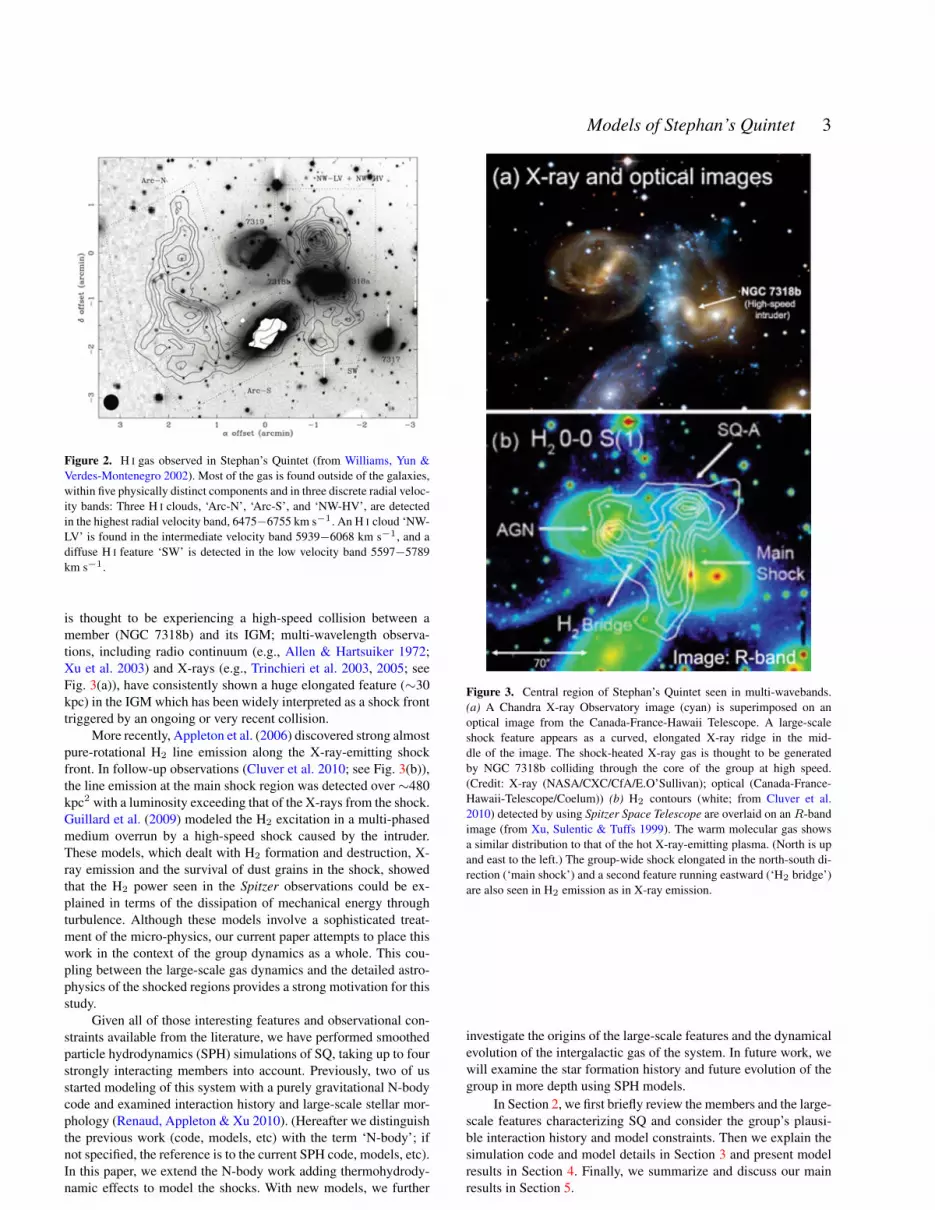
Figure 3. Central region of Stephan’s Quintet seen in multi-wavebands.(a) A Chandra X-ray Observatory image (cyan) is superimposed on anoptical image from the Canada-France-Hawaii Telescope. A large-scaleshock feature appears as a curved, elongated X-ray ridge in the mid-dle of the image. The shock-heated X-ray gas is thought to be generatedby NGC 7318b colliding through the core of the group at high speed.(Credit: X-ray (NASA/CXC/CfA/E.O’Sullivan); optical (Canada-France-Hawaii-Telescope/Coelum)) (b) H2 contours (white; from Cluver et al.2010) detected by using Spitzer Space Telescope are overlaid on an R-bandimage (from Xu, Sulentic & Tuffs 1999). The warm molecular gas showsa similar distribution to that of the hot X-ray-emitting plasma. (North is upand east to the left.) The group-wide shock elongated in the north-south di-rection (‘main shock’) and a second feature running eastward (‘H2 bridge’)are also seen in H2 emission as in X-ray emission.
investigate the origins of the large-scale features and the dynamicalevolution of the intergalactic gas of the system. In future work, wewill examine the star formation history and future evolution of thegroup in more depth using SPH models.
In Section 2, we first briefly review the members and the large-scale features characterizing SQ and consider the group’s plausi-ble interaction history and model constraints. Then we explain thesimulation code and model details in Section 3 and present modelresults in Section 4. Finally, we summarize and discuss our mainresults in Section 5.
c© 0000 RAS, MNRAS 000, 1–15
4 J.-S. Hwang et al.
2 OVERVIEW OF SQ PROPERTIES AND MODELCONSTRAINTS
2.1 The members and the large-scale features
The optical morphology of SQ is presented in Fig. 1. By appar-ent proximity, SQ traditionally denotes the group of five galaxies,NGC 7317, NGC 7318a, NGC 7318b, NGC 7319, and NGC 7320.However, NGC 7320 is a foreground galaxy which has a consider-ably smaller redshift than others (Burbidge & Burbidge 1961) with-out any indications of interactions with the group. Actually, NGC7320c, located far east of NGC 7319, is considered to be linkedto the group, particularly to NGC 7319. As we conduct numericalmodeling of SQ, we treat the five physically related galaxies, ex-cluding NGC 7320 and adding NGC 7320c, as the members of thequintet.
SQ is a relatively close (∼94 Mpc away, assuming a Hubbleconstant of 70 km s−1 Mpc−1 and a systemic velocity of 6600km s−1 for the group; Appleton et al. 2006) and isolated sys-tem among the Hickson Compact Groups (HCGs). Four members,NGC 7317, 7318a, 7319, and 7320c, have a similar recession ve-locity of ∼6600 km s−1. In contrast, NGC 7318b has a lower reces-sion velocity than the others by ∼900 km s−1; this galaxy (‘high-speed intruder’) is thought to be coming toward us with the largerelative velocity, having collided with the material placed betweenNGC 7319 and 7318a and triggered the group-wide shock shownin Fig. 3.
The large spiral galaxy NGC 7319, whose nucleus is knownto be a Seyfert 2 (Durret 1994), has a strong central bar, disturbedarms, and two long tails (hereafter the parallel tails, or the innerand outer tails; see Fig. 1). Both inner and outer tails appear inthe optical to extend from NGC 7319 toward NGC 7320c, a smallspiral or ringed galaxy. The outer tail is seen at the south of theinner tail, although the outer one is harder to see as it is more dif-fuse and passes behind the foreground galaxy NGC 7320, runningnearly parallel with the inner one. The inner tail, which is opticallybrighter than the outer one, is active in star formation. Many tidaldwarf galaxy candidates have been found along the inner tail (e.g.,Hunsberger, Charlton & Zaritsky 1996), including ‘SQ-B’ markedin the figure. Star formation activity in the outer tail has not beenwell studied because the foreground galaxy blocks a large portionof the tail. In ultraviolet (UV), the inner tail is far more extendedtoward north than in optical and shows a loop-like structure (Xu etal. 2005).
To the west of NGC 7319, a pair of galaxies NGC 7318a/bis seen with complex features around them, including ‘SQ-A’,and ‘SW-arm’ (Fig. 1). NGC 7318b, the high-speed intruder, hasweakly barred spiral morphology and its optical core looks rela-tively intact (on the contrary, its interstellar medium (ISM) has beenwell removed as shown in Fig. 2). NGC 7318a is the most difficultmember for type determination. Even whether it is an elliptical ora spiral is unclear, due to the complex features around the pair.Most of the features are thought to be related to NGC 7318b, how-ever, some of the arm-like structures might be associated with NGC7318a (e.g. Shostak, Allen & Sullivan 1984). On the other hand, thephotometric data of NGC 7318a show a smooth light distributionlike an elliptical (Moles, Marquez & Sulentic 1998). The galaxyis listed as an E.2.P. in the Third Reference Catalogue of BrightGalaxies (RC3; de Vaucouleurs et al. 1991). It was also classifiedas Sc (Hickson, Kindl & Auman 1989) and SB0 (Hickson 1994).Features in the north of the pair appear to cross each other, and nearthe apparent crossing a starburst region SQ-A has been found (Xu,Sulentic & Tuffs 1999), together with many young (<10 Myr) star
cluster candidates (SCCs) over a large area (Fedotov et al. 2011).The feature SW-arm looks like a tidal tail, and some Hα clumpsbetween NGC 7318a and 7317 (e.g., Xu, Sulentic & Tuffs 1999)might be related to SW-arm.
The fifth galaxy NGC 7317 is located to the southwest of thepair NGC 7318a/b. This elliptical member does not show directsigns of interaction with others (thus we do not include the galaxyin the models). However, the diffuse optical and X-ray haloes ly-ing over the regions of NGC 7318a/b and NGC 7317 (e.g., Moles,Marquez & Sulentic 1998) indicate that the galaxy is a member ofthe group.
The neutral hydrogen distribution of the system is very inter-esting. As shown in Fig. 2, an VLA H I observation (Williams, Yun& Verdes-Montenegro 2002) found most of the gas outside of op-tical boundaries of the members, within five distinct components(‘Arc-N’, ‘Arc-S’, ‘NW-HV’, ‘NW-LV’, and ‘SW’) and in threediscrete radial velocity bands (6475−6755 km s−1, 5939−6068km s−1, and 5597−5789 km s−1; with a Hubble constant of 75km s−1 Mpc−1 and a recessional motion of 6480 km s−1 for thecenter of mass of the quartet NGC 7317, 7318a/b, and 7319). Thegas with the highest radial velocity (6475−6755 km s−1) is de-tected in two large arc-like clouds (Arc-N and Arc-S) tracing theoptical inner and outer tails (see fig. 6 of Williams, Yun & Verdes-Montenegro 2002 for the view of each arc-like cloud separately)and in a relatively compact cloud (NW-HV) centred near SQ-A.Another kinematically distinct cloud (NW-LV) centred near SQ-Ais observed in the intermediate velocity band (5939−6068 km s−1);this cloud coincides with the high velocity one but is more ex-tended (see figs 8 and 9 of Williams, Yun & Verdes-Montenegro2002 to see NW-HV and NW-LV separately). The low velocity(5597−5789 km s−1) gas is found between NGC 7318a/b andNGC 7317 in a diffuse feature (SW).
The shock seen in X-rays in the central region of SQ is shownin Fig. 3(a) (cyan), as a narrow elongated feature in the IGM be-tween NGC 7319 and 7318b. As noted earlier, it is widely acceptedthat the hot X-ray-emitting gas in the elongated feature has resultedfrom the shock-heating triggered by the present-day high-speedcollision between NGC 7318b and the IGM. The fact that the mainshock occurs in a region where the cold neutral hydrogen is missingalso supports this idea.
The white contours in Fig. 3(b) represent the 0-0 S(1) 17µmrotational H2 line emission detected in the central area of the group(see also figs 2 and 3 of Cluver et al. 2010). The strong line emis-sion in north-south direction (‘main shock’) follows the X-ray emit-ting shock shown in Fig. 3(a); strong line emission also comesfrom the starburst region SQ-A and from the region associated withthe active galaxy NGC 7319. There is another H2 structure (‘H2
bridge’) which runs eastward from the main shock. The structure isalso discernable in the X-ray emission. Overall, the warm molecu-lar gas shows a similar distribution to that of the hot X-ray emittinggas. The line luminosity of the H2 in the main shock was measuredto be about three times stronger than the X-ray luminosity from thehot shocked gas, implying that H2 lines are a stronger coolant thanX-ray emission (Cluver et al. 2010).
Hα emission in the central region of the group has also beendetected, with two different components of the emission, ∼5700km s−1 (which is in the velocity range of the high-speed intruder)and ∼6600 km s−1(Xu, Sulentic & Tuffs 1999; see also Xu et al.2003). It is shown that the shock feature appears in the 6600 km s−1
component, but not in the 5700 km s−1 component; this indicatesthe shock front is associated with the 6600 km s−1 component.
c© 0000 RAS, MNRAS 000, 1–15
Models of Stephan’s Quintet 5
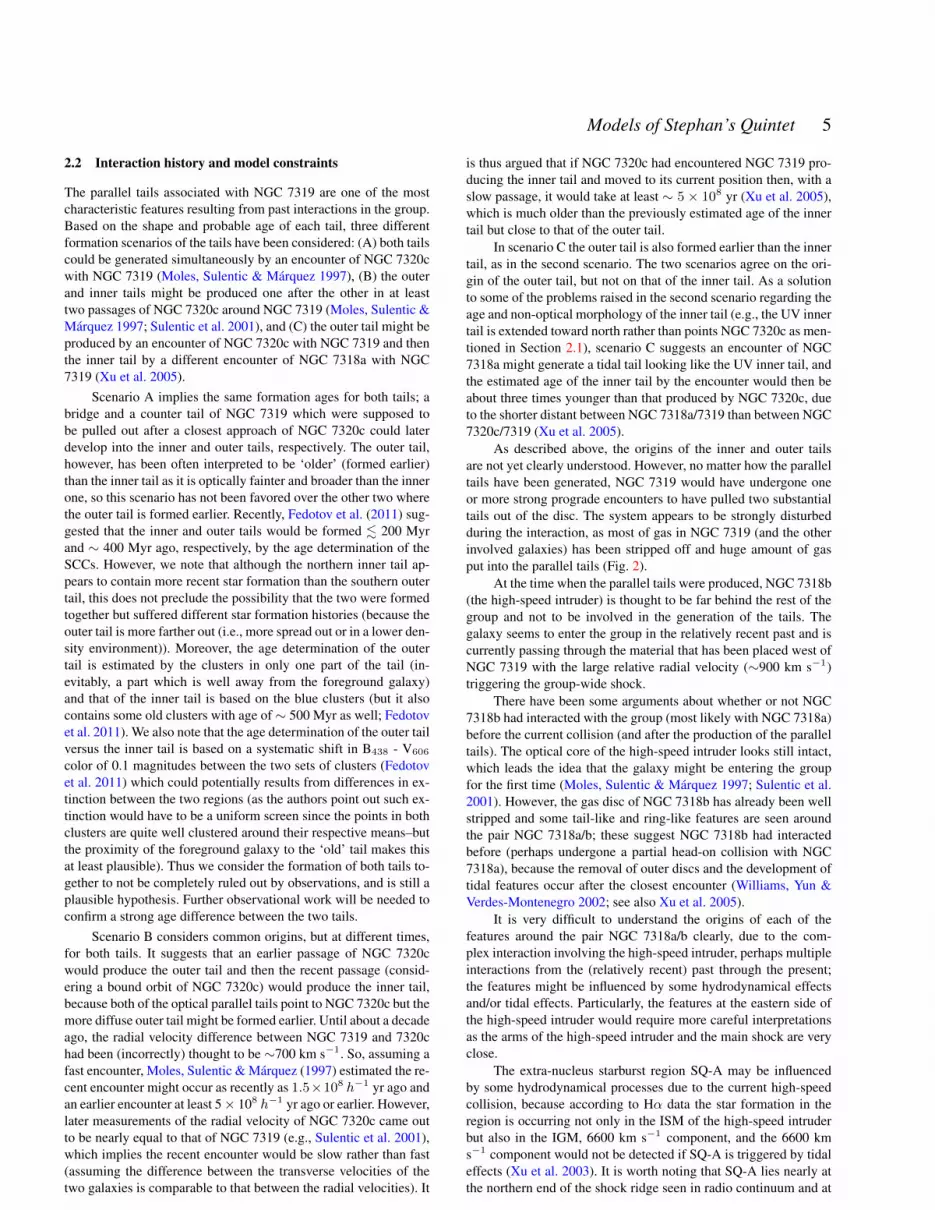
2.2 Interaction history and model constraints
The parallel tails associated with NGC 7319 are one of the mostcharacteristic features resulting from past interactions in the group.Based on the shape and probable age of each tail, three differentformation scenarios of the tails have been considered: (A) both tailscould be generated simultaneously by an encounter of NGC 7320cwith NGC 7319 (Moles, Sulentic & Marquez 1997), (B) the outerand inner tails might be produced one after the other in at leasttwo passages of NGC 7320c around NGC 7319 (Moles, Sulentic &Marquez 1997; Sulentic et al. 2001), and (C) the outer tail might beproduced by an encounter of NGC 7320c with NGC 7319 and thenthe inner tail by a different encounter of NGC 7318a with NGC7319 (Xu et al. 2005).
Scenario A implies the same formation ages for both tails; abridge and a counter tail of NGC 7319 which were supposed tobe pulled out after a closest approach of NGC 7320c could laterdevelop into the inner and outer tails, respectively. The outer tail,however, has been often interpreted to be ‘older’ (formed earlier)than the inner tail as it is optically fainter and broader than the innerone, so this scenario has not been favored over the other two wherethe outer tail is formed earlier. Recently, Fedotov et al. (2011) sug-gested that the inner and outer tails would be formed . 200 Myrand ∼ 400 Myr ago, respectively, by the age determination of theSCCs. However, we note that although the northern inner tail ap-pears to contain more recent star formation than the southern outertail, this does not preclude the possibility that the two were formedtogether but suffered different star formation histories (because theouter tail is more farther out (i.e., more spread out or in a lower den-sity environment)). Moreover, the age determination of the outertail is estimated by the clusters in only one part of the tail (in-evitably, a part which is well away from the foreground galaxy)and that of the inner tail is based on the blue clusters (but it alsocontains some old clusters with age of ∼ 500 Myr as well; Fedotovet al. 2011). We also note that the age determination of the outer tailversus the inner tail is based on a systematic shift in B438 - V606
color of 0.1 magnitudes between the two sets of clusters (Fedotovet al. 2011) which could potentially results from differences in ex-tinction between the two regions (as the authors point out such ex-tinction would have to be a uniform screen since the points in bothclusters are quite well clustered around their respective means–butthe proximity of the foreground galaxy to the ‘old’ tail makes thisat least plausible). Thus we consider the formation of both tails to-gether to not be completely ruled out by observations, and is still aplausible hypothesis. Further observational work will be needed toconfirm a strong age difference between the two tails.
Scenario B considers common origins, but at different times,for both tails. It suggests that an earlier passage of NGC 7320cwould produce the outer tail and then the recent passage (consid-ering a bound orbit of NGC 7320c) would produce the inner tail,because both of the optical parallel tails point to NGC 7320c but themore diffuse outer tail might be formed earlier. Until about a decadeago, the radial velocity difference between NGC 7319 and 7320chad been (incorrectly) thought to be ∼700 km s−1. So, assuming afast encounter, Moles, Sulentic & Marquez (1997) estimated the re-cent encounter might occur as recently as 1.5×10⁸ h−1 yr ago andan earlier encounter at least 5 × 10⁸ h−1 yr ago or earlier. However,later measurements of the radial velocity of NGC 7320c came outto be nearly equal to that of NGC 7319 (e.g., Sulentic et al. 2001),which implies the recent encounter would be slow rather than fast(assuming the difference between the transverse velocities of thetwo galaxies is comparable to that between the radial velocities). It
is thus argued that if NGC 7320c had encountered NGC 7319 pro-ducing the inner tail and moved to its current position then, with aslow passage, it would take at least ∼ 5× 10⁸ yr (Xu et al. 2005),which is much older than the previously estimated age of the innertail but close to that of the outer tail.
In scenario C the outer tail is also formed earlier than the innertail, as in the second scenario. The two scenarios agree on the ori-gin of the outer tail, but not on that of the inner tail. As a solutionto some of the problems raised in the second scenario regarding theage and non-optical morphology of the inner tail (e.g., the UV innertail is extended toward north rather than points NGC 7320c as men-tioned in Section 2.1), scenario C suggests an encounter of NGC7318a might generate a tidal tail looking like the UV inner tail, andthe estimated age of the inner tail by the encounter would then beabout three times younger than that produced by NGC 7320c, dueto the shorter distant between NGC 7318a/7319 than between NGC7320c/7319 (Xu et al. 2005).
As described above, the origins of the inner and outer tailsare not yet clearly understood. However, no matter how the paralleltails have been generated, NGC 7319 would have undergone oneor more strong prograde encounters to have pulled two substantialtails out of the disc. The system appears to be strongly disturbedduring the interaction, as most of gas in NGC 7319 (and the otherinvolved galaxies) has been stripped off and huge amount of gasput into the parallel tails (Fig. 2).
At the time when the parallel tails were produced, NGC 7318b(the high-speed intruder) is thought to be far behind the rest of thegroup and not to be involved in the generation of the tails. Thegalaxy seems to enter the group in the relatively recent past and iscurrently passing through the material that has been placed west ofNGC 7319 with the large relative radial velocity (∼900 km s−1)triggering the group-wide shock.
There have been some arguments about whether or not NGC7318b had interacted with the group (most likely with NGC 7318a)before the current collision (and after the production of the paralleltails). The optical core of the high-speed intruder looks still intact,which leads the idea that the galaxy might be entering the groupfor the first time (Moles, Sulentic & Marquez 1997; Sulentic et al.2001). However, the gas disc of NGC 7318b has already been wellstripped and some tail-like and ring-like features are seen aroundthe pair NGC 7318a/b; these suggest NGC 7318b had interactedbefore (perhaps undergone a partial head-on collision with NGC7318a), because the removal of outer discs and the development oftidal features occur after the closest encounter (Williams, Yun &Verdes-Montenegro 2002; see also Xu et al. 2005).
It is very difficult to understand the origins of each of thefeatures around the pair NGC 7318a/b clearly, due to the com-plex interaction involving the high-speed intruder, perhaps multipleinteractions from the (relatively recent) past through the present;the features might be influenced by some hydrodynamical effectsand/or tidal effects. Particularly, the features at the eastern side ofthe high-speed intruder would require more careful interpretationsas the arms of the high-speed intruder and the main shock are veryclose.
The extra-nucleus starburst region SQ-A may be influencedby some hydrodynamical processes due to the current high-speedcollision, because according to Hα data the star formation in theregion is occurring not only in the ISM of the high-speed intruderbut also in the IGM, 6600 km s−1 component, and the 6600 kms−1 component would not be detected if SQ-A is triggered by tidaleffects (Xu et al. 2003). It is worth noting that SQ-A lies nearly atthe northern end of the shock ridge seen in radio continuum and at
c© 0000 RAS, MNRAS 000, 1–15
6 J.-S. Hwang et al.
the southern end there is also a star-forming region (i.e., ‘7318b-south’ in Cluver et al. 2010) but in the ridge itself shows little star-formation (e.g., Xu et al. 2003; Cluver et al. 2010). Our models can,in principal, address the question of whether the existence of twomajor star formation complexes at either end of the shock structureis a coincidence, or whether they are regions which, unlike the mainshock, have less turbulent conditions more conducive to the onsetof star formation.
3 NUMERICAL MODELS
We have constructed an SPH code for numerical simulations of SQ.As mentioned earlier, before this hydrodynamic modeling two ofus used an N-body code, based on primarily NEMO stellar dynam-ics toolbox (Teuben 1995), and performed about 3000 exploratoryruns to test various interaction hypotheses and examined the gravi-tational aspects of the group (see Renaud, Appleton & Xu 2010 fordetails). In this new SPH modeling, all of the relatively successfulN-body models have been re-tested and some additional ideas ofinteractions have been tried. We ran about 170 simulations with theSPH code. In this section, we first explain the SPH code details andthen describe our models including the modeling strategies and thedifferences among the models.
3.1 The SPH code
The SPH code used in this work has been produced by modifyingthe SPH code of Struck (1997) which was originally designed forstudying collisions between two disc galaxies (see Struck 1997 fordetails), so that the code can be applied to systems with more thantwo galaxies. In the SPH code for SQ, four strongly interactingmembers NGC 7318a/b, NGC 7319, and NGC 7320c have beenconsidered, excluding NGC 7317 (and the unrelated foregroundgalaxy NGC 7320), since we simulate the group from the gener-ation of the parallel tails to the near future, and during the time theeffect of NGC 7317 on the group is considered to be small (e.g.,Moles, Sulentic & Marquez 1997; Fedotov et al. 2011). It is alsobecause we do not have observational constraints to include thegalaxy into the simulations.
Each model galaxy consists of discs containing gas and col-lisionless star particles and a rigid dark matter halo. The ellipticallooking member NGC 7318a is also initialized with discs, but weadjust some initial parameters (such as decreasing the angular andincreasing the random velocities of its test particles) to model it asan elliptical galaxy.
In the SPH code, hydrodynamical forces are calculated with aspline kernel on a grid. A constant smoothing length and fixed unitcells in a grid are used. Local self-gravity is calculated betweengas particles in adjacent cells. A standard artificial viscosity for-mulation and a simple leapfrog integration method are used. Thelarge-scale dynamics of interactions are simulated with a restrictedthree-body approximation. The specific form of the halo accelera-tion of a particle is
a =GMh
ε2r/ε
(1 + r2/ε2)nh, (1)
where Mh is a halo mass-scale, ε is a core radius, and the index nh
specifies the compactness of the halo.Simple treatments of heating and cooling are included for gas
particles using an adiabatic equation of state. (For pressure calcula-tion, adiabatic equation of state was assumed. Heating and cooling
were calculated separately. Constant cooling time-scales were usedin three temperature ranges as described in Struck 1997.) Star for-mation is assumed to occur when the local gas density exceeds aconstant threshold density and the gas temperature goes below an-other constant threshold temperature. The density and temperaturethresholds are arbitrary and can be normalized to give realistic starformation rate for the system. Dynamical friction is not included forthe current models. We will add the effects of dynamical friction inthe future runs; with which we will study SQ’s future evolution.
The code uses the non-inertial reference frame of a ‘primary’galaxy. (The model galaxy for NGC 7319 has been chosen to be theprimary.) All masses and lengths in the code are scaled to the halomass-scale (Mh in Equation 1) and the core radius (ε in Equation1) in the halo potential of the primary galaxy. There is a charac-teristic sound speed in the code; which is used as a unit velocity.These code units are dimensionless and have been converted to thephysical units after simulations.
There are fixed spatial boundaries imposed in the code. Theboundaries are large enough to include almost all particles but nottoo big for efficient computing performance. A few distant particlesreach the boundaries and are excluded from the simulations in mostruns.
3.2 Model differences and initial conditions
Most of our simulations run from just before the production of theparallel tails to shortly after the current high-speed collision. Wedivided the modeling efforts into three major stages, each with aspecific goal: (1) to reproduce the inner and outer tails accurately,stripping much of gas off the involved members, (2) to test the oc-currence of any intermediate interaction before the present, espe-cially between the high-speed intruder and NGC 7318a, and (3)to make a high-speed present-day collision between NGC 7318band the IGM of the group. (These three stages do not have strictboundaries and can overlap; they are more like conceptual cate-gories, though several interactions in the group do indeed seem tooccur sequentially.) We will henceforth refer to the model galaxiesfor NGC 7319, 7318a, 7318b (the high-speed intruder), and 7320cas G1, G2, G3, and G4, respectively (from the most massive modelgalaxy to the least massive one) to avoid confusion between themodel galaxies and the real ones.
Various interactions have been attempted at each stage. In par-ticular, we spent more time at the first stage, trying many differentmodels, than the other two, in order to generate the two tidal tails(which are supposed to develop as the parallel tails) in the correctconfiguration out of the disc of G1. The parallel tails are one of themost distinctive features resulting from the past interactions in thegroup, so a good model of SQ should be able to reproduce them,and the outcome of the first stage would directly affect the inter-actions at the later stages. The models attempting to reproduce theparallel tails at the first stage were evaluated depending on howreasonably they reproduced the two tails, and those models thatsuccessfully generated the tails were evolved further. Once we hadany complete model that reproduced the overall morphology of thesystem relatively well throughout the entire stages, we then madeseveral similar models changing the values of a few model param-eters and ran them again to determine how the models are affectedby particular parameter values.
We tried many models to produce the parallel tails as sug-gested in both scenarios A (with one encounter of G4) and C (withan encounter of G4 and then an encounter of G2), but not in sce-nario B (with at least two encounters of G4) as the previous N-body
c© 0000 RAS, MNRAS 000, 1–15
Models of Stephan’s Quintet 7
simulations (which included the effects of dynamical friction; Re-naud, Appleton & Xu 2010) already found that scenario B doesnot work properly. (We will hereafter describe complete models as‘models A’ or ‘models C’ depending on which model scenario isreferred to for the production of the inner and outer tails.) The rea-son why the N-body models with scenario B failed was: after onetail (the outer tail) had been produced by the earlier encounter, G4had to encounter G1 again very closely to be able to generate an-other tail (the inner tail), but then G4 could not leave G1 far enoughtoward its current position (actually, G4 collapsed into the largermember G1 in most cases) due to the strong gravitational attractionand the dynamical friction.
In the N-body simulations, one of models C was chosen as thebest model in reproducing the general stellar morphology of SQ. Inthe SPH simulations, however, models A came out generally betterthan models C. The differences between the N-body and the SPHmodeling are primarily due to the different halo potentials used ineach simulation code and besides, our models are evaluated notonly on the basis of the stellar, but also the gas features. We willexplain more about models A and C, including the advantages anddisadvantages of each type, in the next section when we present themodel results.
We finish this subsection by stating initial parameters used inone of our best model A runs (the fiducial model). Many detailsof the fiducial model are summarized in Table 1. The values inthe table were derived from observational data or modeling expe-riences with many trials. Those values are presented in physicalunits. To scale the SPH code, the length and velocity code unitshave been converted to 1.0 kpc and 5.0 km s−1 in all models, thenthe time code unit becomes 200 Myr. The mass code unit, which isthe halo mass-scaleMh for G1 (see Equation 1), has been scaled to4.7 × 1010 M� in most models including the fiducial model; Mh
for G2, G3, and G4 relative to that of G1 have been chosen to be0.78, 0.62, and 0.22, respectively. ε and nh in Equation 1 for allmembers have been set to 1.0 kpc and 1.4 in the fiducial model.There has been a halo cut-off radius assigned for each member inthe fiducial model as 135 kpc (G1), 55 kpc (G2), 80 kpc (G3), and45 kpc (G4); which is five times larger than either the gas disc ra-dius (for G1, G3, and G4) or star disc radius (for G2, which hasbeen set with a smaller gas disc than its star disc). The halo mass,with the given potential (Equation 1), for each member out to thecut-off radius, in the unit of 1010 M�, is 12.6 (G1), 8.2 (G2), 7.1(G3), and 2.4 (G4). No group halo has been assigned. The initialgas disc of each member in the model, from G1 through G4 in or-der, were set to 27 kpc, 8 kpc, 16 kpc, and 9 kpc, and the initialstellar disc to 18 kpc, 11 kpc, 11 kpc, and 7 kpc. So, the stellar andgas disc sizes of the least massive member G4 were chosen to beabout one third of those of the most massive member G1. G2 andG3 were selected to be comparable in mass and stellar disc size,but not in gas disc size. G2 was set to have smaller gas disc with alot fewer gas particles compared to G3. In all models, all galaxieswere initialized in the x-y plane (which was chosen to be equiv-alent to the plane of the sky) with disc spins in either clockwiseor counter-clockwise directions, and then rotated around any of thethree orthogonal axes as necessary. In the fiducial model, G1 andG4 were set with counter-clockwise directional spins, while G2 andG3 with clockwise directional spins. All members in the fiducialmodel were not tilted in any direction. (The members may not beall exactly face-on, but tilts were ignored in the fiducial model; dif-ferent tilts particularly for G3, the high-speed intruder, were testedin several similar models to the fiducial model for comparison).
4 SIMULATION RESULTS
In this section we present the results of our models. We first de-scribe the general evolution of the fiducial model, as a representa-tive for models A, focusing on the generations of the large-scalestructural features in the system. Then we compare our models Ato models C, discussing the advantages and disadvantages of themodels. Finally, we analyse the gas properties in the fiducial modeland compare to observations.
4.1 Evolution of the fiducial model
The fiducial model is designed firstly to generate the inner and outertails simultaneously by a close encounter of G4 with G1 (as sug-gested in scenario A in Section 2.2), then at the second stage tohave a collision between G2 and G3 relatively far behind the planeof G1, and finally at the third stage to make a high-speed colli-sion between G3 and the material found west of G1 (see Section3.2 for the description of the modeling stages). The initial parame-ters and the subsequent orbits of the model galaxies are presentedin Table 1 (and also in Section 3.2) and Fig. 4, respectively. Thedistributions of star and gas particles of the model galaxies at fourtimes are shown in Figs 5 and 6, respectively. (See also Fig. 7 for abetter view of the gas distribution from the model near the present,displaying it in three discrete velocity bands separately.)
As mentioned earlier, we use the coordinate system that moveswith the halo centre of G1 (the most massive and largest memberin the model) so the galaxy appears fixed at the origin throughoutthe simulations and set the x-y plane as the plane of the sky. Thediscs in the fiducial model are initialized with star and gas particlesas described in Table 1. The adopted scaling is 1 kpc for the lengthunit, 5 km s−1 for the velocity unit, and 200 Myr for the time unitin all models. Note, however, that this (representative) scaling isnot unique; can be scaled, e.g., with the total system mass.
The fiducial simulation starts shortly before G4 makes its clos-est approach to G1. As shown in Fig. 4, G4 starts southwest vicinityof G1 seen in the sky plane, swings closely around G1 in a counter-clockwise direction, and moves toward east. Seen from the sides,G4 starts a little bit above G1, turns quickly around G1 (penetratingG1) going downward, and then slows in the vertical (z) direction asit moves toward east. On the other hand, G2 starts far from G1 andmoves toward west going deeper behind G1. (This orbit of G2 hasbeen chosen in such a way that G2 has little to no effect to thedevelopment of the parallel tails, which were supposed to be gen-erated by an encounter of G4 with G1, staying relatively far fromboth tails until they grow well, and then G2 can encounter with G3well below the plane of G1). G3, the high-speed intruder, has beenstarted far below all the others, set to move nearly vertically (in z-axis) toward the rest of the group, meet with G2 on its way up, andthen pass through between G1 and G2 at a high speed.
The top rows of Figs 5 and 6 show the early development ofthe inner and outer tails, in the x-y view (left panels) and the x-z view (right panels), at about t = 1.95 units or 390 Myr (in therepresentative scaling) after the closest encounter of G4 with G1.(We measure time from the instant of the closest approach betweenG1 and G4 throughout this paper for convenience; the start of themodel is at about −1.0 in code time units. As we noted earlier, thescaling is not unique; there could be up to a factor of two or sochange possible in the scaling.) By this time, G4 has swung aroundG1 in a counter-clockwise direction passing through the large discof G1 from front to behind and has pulled two massive arms (abridge and a counter-arm) out of the disc of G1. Since the initial
c© 0000 RAS, MNRAS 000, 1–15
8 J.-S. Hwang et al.
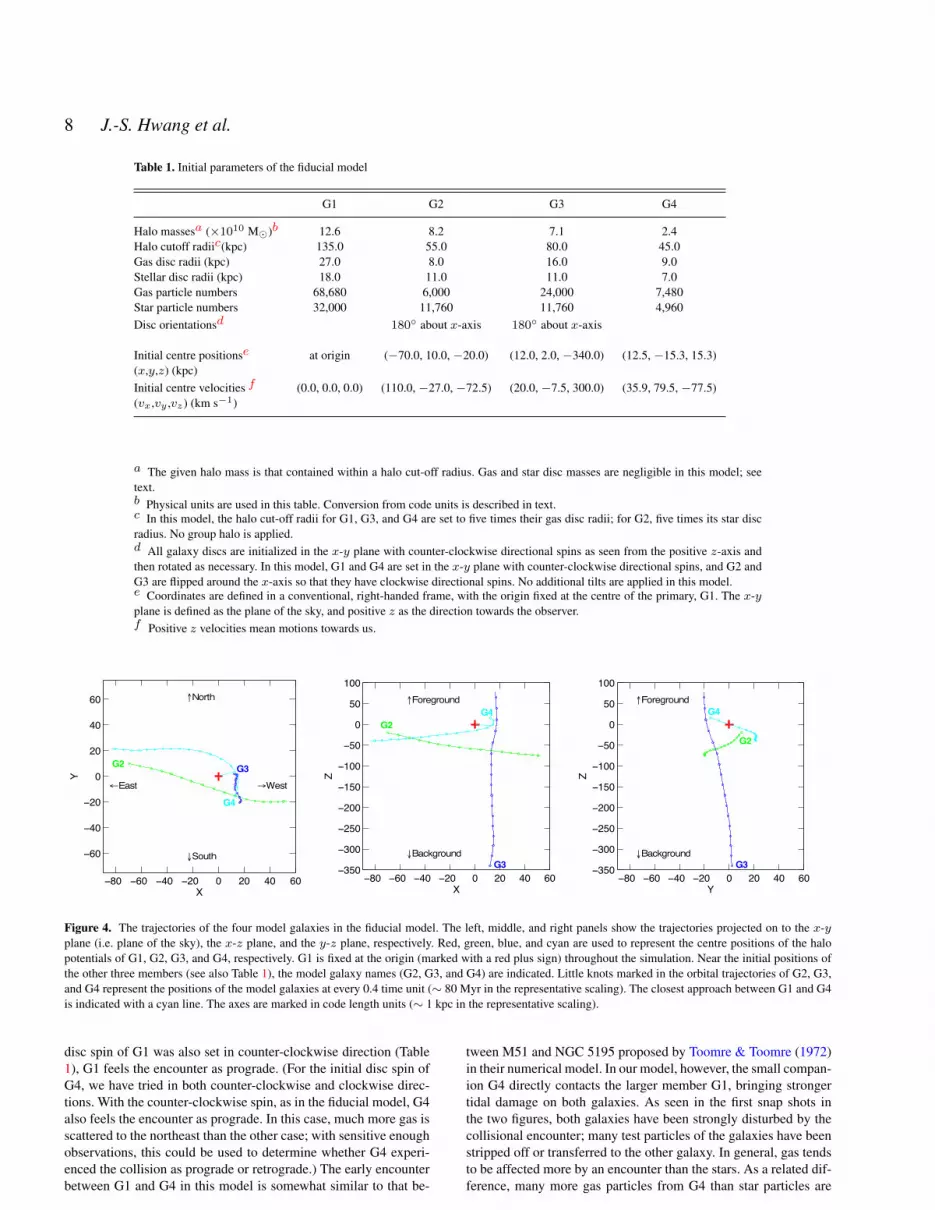
Table 1. Initial parameters of the fiducial model
G1 G2 G3 G4
Halo massesa (×1010 M�)b 12.6 8.2 7.1 2.4Halo cutoff radiic(kpc) 135.0 55.0 80.0 45.0Gas disc radii (kpc) 27.0 8.0 16.0 9.0Stellar disc radii (kpc) 18.0 11.0 11.0 7.0Gas particle numbers 68,680 6,000 24,000 7,480Star particle numbers 32,000 11,760 11,760 4,960Disc orientationsd 180◦ about x-axis 180◦ about x-axis
Initial centre positionse at origin (−70.0, 10.0, −20.0) (12.0, 2.0, −340.0) (12.5, −15.3, 15.3)(x,y,z) (kpc)Initial centre velocities f (0.0, 0.0, 0.0) (110.0, −27.0, −72.5) (20.0, −7.5, 300.0) (35.9, 79.5, −77.5)(vx,vy ,vz) (km s−1)
a The given halo mass is that contained within a halo cut-off radius. Gas and star disc masses are negligible in this model; seetext.b Physical units are used in this table. Conversion from code units is described in text.c In this model, the halo cut-off radii for G1, G3, and G4 are set to five times their gas disc radii; for G2, five times its star discradius. No group halo is applied.d All galaxy discs are initialized in the x-y plane with counter-clockwise directional spins as seen from the positive z-axis andthen rotated as necessary. In this model, G1 and G4 are set in the x-y plane with counter-clockwise directional spins, and G2 andG3 are flipped around the x-axis so that they have clockwise directional spins. No additional tilts are applied in this model.e Coordinates are defined in a conventional, right-handed frame, with the origin fixed at the centre of the primary, G1. The x-yplane is defined as the plane of the sky, and positive z as the direction towards the observer.f Positive z velocities mean motions towards us.
!80 !60 !40 !20 0 20 40 60
!60
!40
!20
0
20
40
60
G2 G3
G4
!North
"South
#East $West
X
Y
!80 !60 !40 !20 0 20 40 60!350
!300
!250
!200
!150
!100
!50
0
50
100
G2
G3
G4!Foreground
"Background
X
Z
!80 !60 !40 !20 0 20 40 60!350
!300
!250
!200
!150
!100
!50
0
50
100
G2
G3
G4!Foreground
"Background
Y
Z
Figure 4. The trajectories of the four model galaxies in the fiducial model. The left, middle, and right panels show the trajectories projected on to the x-yplane (i.e. plane of the sky), the x-z plane, and the y-z plane, respectively. Red, green, blue, and cyan are used to represent the centre positions of the halopotentials of G1, G2, G3, and G4, respectively. G1 is fixed at the origin (marked with a red plus sign) throughout the simulation. Near the initial positions ofthe other three members (see also Table 1), the model galaxy names (G2, G3, and G4) are indicated. Little knots marked in the orbital trajectories of G2, G3,and G4 represent the positions of the model galaxies at every 0.4 time unit (∼ 80 Myr in the representative scaling). The closest approach between G1 and G4is indicated with a cyan line. The axes are marked in code length units (∼ 1 kpc in the representative scaling).
disc spin of G1 was also set in counter-clockwise direction (Table1), G1 feels the encounter as prograde. (For the initial disc spin ofG4, we have tried in both counter-clockwise and clockwise direc-tions. With the counter-clockwise spin, as in the fiducial model, G4also feels the encounter as prograde. In this case, much more gas isscattered to the northeast than the other case; with sensitive enoughobservations, this could be used to determine whether G4 experi-enced the collision as prograde or retrograde.) The early encounterbetween G1 and G4 in this model is somewhat similar to that be-
tween M51 and NGC 5195 proposed by Toomre & Toomre (1972)in their numerical model. In our model, however, the small compan-ion G4 directly contacts the larger member G1, bringing strongertidal damage on both galaxies. As seen in the first snap shots inthe two figures, both galaxies have been strongly disturbed by thecollisional encounter; many test particles of the galaxies have beenstripped off or transferred to the other galaxy. In general, gas tendsto be affected more by an encounter than the stars. As a related dif-ference, many more gas particles from G4 than star particles are
c© 0000 RAS, MNRAS 000, 1–15
Models of Stephan’s Quintet 9
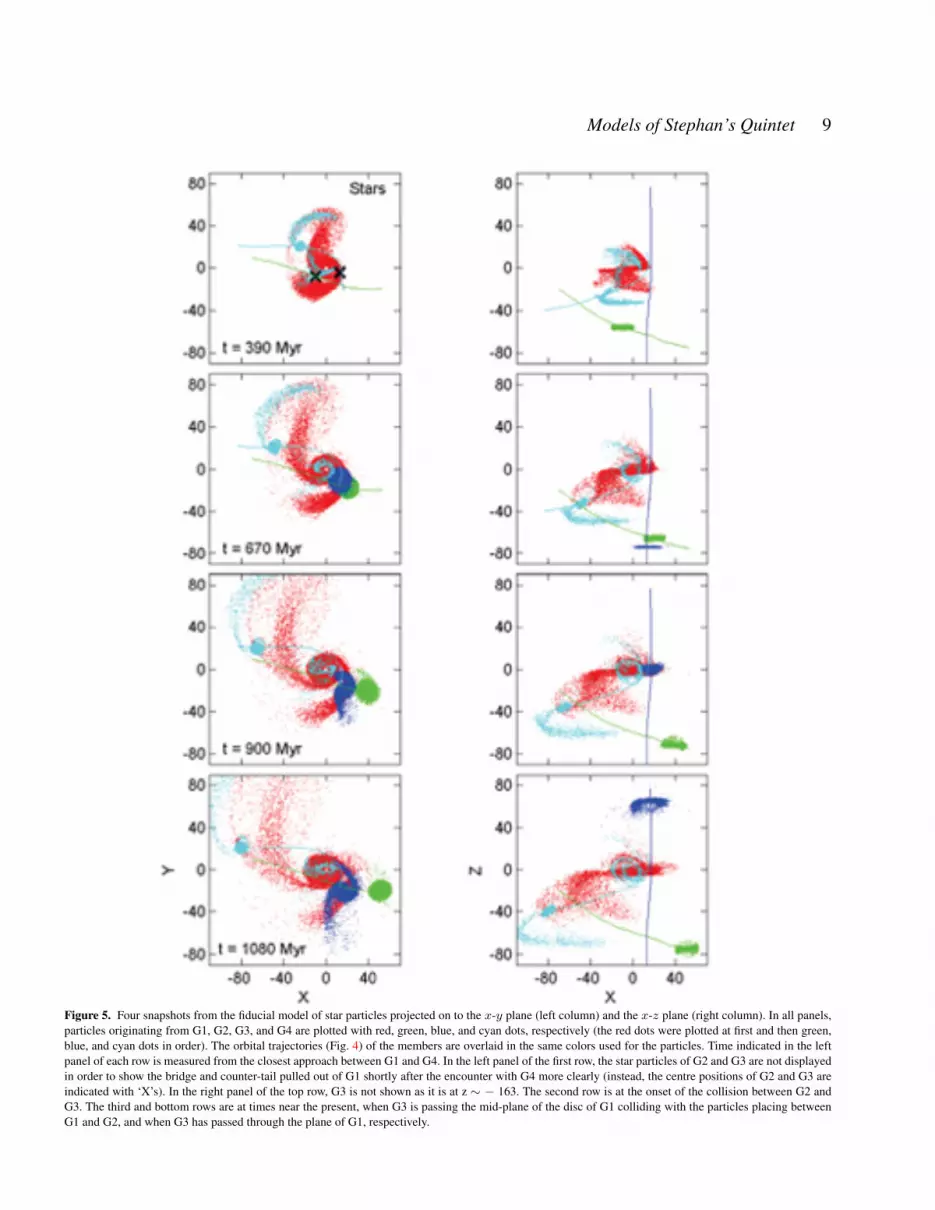
Figure 5. Four snapshots from the fiducial model of star particles projected on to the x-y plane (left column) and the x-z plane (right column). In all panels,particles originating from G1, G2, G3, and G4 are plotted with red, green, blue, and cyan dots, respectively (the red dots were plotted at first and then green,blue, and cyan dots in order). The orbital trajectories (Fig. 4) of the members are overlaid in the same colors used for the particles. Time indicated in the leftpanel of each row is measured from the closest approach between G1 and G4. In the left panel of the first row, the star particles of G2 and G3 are not displayedin order to show the bridge and counter-tail pulled out of G1 shortly after the encounter with G4 more clearly (instead, the centre positions of G2 and G3 areindicated with ‘X’s). In the right panel of the top row, G3 is not shown as it is at z ∼ − 163. The second row is at the onset of the collision between G2 andG3. The third and bottom rows are at times near the present, when G3 is passing the mid-plane of the disc of G1 colliding with the particles placing betweenG1 and G2, and when G3 has passed through the plane of G1, respectively.
c© 0000 RAS, MNRAS 000, 1–15
10 J.-S. Hwang et al.
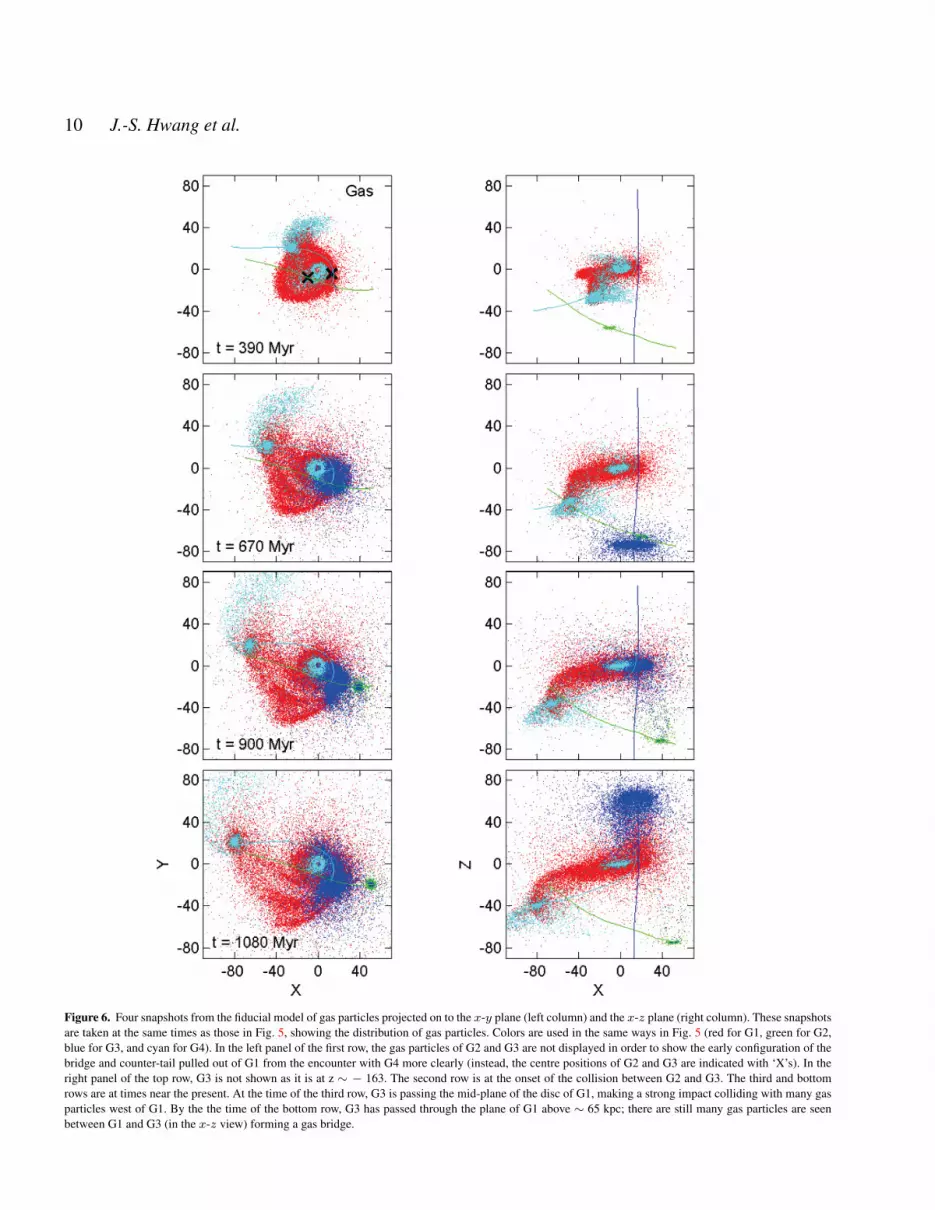
Figure 6. Four snapshots from the fiducial model of gas particles projected on to the x-y plane (left column) and the x-z plane (right column). These snapshotsare taken at the same times as those in Fig. 5, showing the distribution of gas particles. Colors are used in the same ways in Fig. 5 (red for G1, green for G2,blue for G3, and cyan for G4). In the left panel of the first row, the gas particles of G2 and G3 are not displayed in order to show the early configuration of thebridge and counter-tail pulled out of G1 from the encounter with G4 more clearly (instead, the centre positions of G2 and G3 are indicated with ‘X’s). In theright panel of the top row, G3 is not shown as it is at z ∼ − 163. The second row is at the onset of the collision between G2 and G3. The third and bottomrows are at times near the present. At the time of the third row, G3 is passing the mid-plane of the disc of G1, making a strong impact colliding with many gasparticles west of G1. By the the time of the bottom row, G3 has passed through the plane of G1 above ∼ 65 kpc; there are still many gas particles are seenbetween G1 and G3 (in the x-z view) forming a gas bridge.
c© 0000 RAS, MNRAS 000, 1–15
Models of Stephan’s Quintet 11
seen to be captured by G1 (compare the top row of Fig. 5 to thatof Fig. 6). The accreted gas at the central region of G1 during theencounter might play a role to the development in G1 as an activegalaxy (as NGC 7319 has been found to have a type 2 Seyfert nu-cleus).
The two arms drawn out of G1 continue to grow through thetime shown in the second rows of the two figures (t = 670 Myr),forming a parallel configuration. As intended in this model, G2does not distort the tails while they develop since it stays far fromthem; meanwhile, G3 continues to approach the group. At the in-stant of the second snapshots, G3 is about to collide with G2 atz ∼ −70 kpc in the adopted scaling. Here G2 is placed slightly tothe west (the positive x direction) of G3 at the onset of the collision.This is intended to make a partial head-on collision between G2 andG3, and to stabilize the orbit of G3 between G1 and G2, keeping G3from being attracted too much toward G1 afterward, even thoughthe effect would be small due to the high z-speed of G3. Note thatwe are not completely certain whether this collision between G2and G3 does in fact occur (and in the manner described in themodel). We attempt the collision at the second stage in the modelbased on the interpretation (described in Section 2.2) that some ofthe disturbed features observed around the pair NGC 7318a/b couldbe the result of the earlier interaction between the two galaxies. Itis thought that some features, such as SW-arm and stripped gas ofG3, might have tidal origin that require some time (a few 100 Myr)to develop to the presently observed state.
The third and bottom rows of the two figures (Figs 5 and 6)show the model system at the times near present, when the high-speed intruder is passing the mid-plane of G1 colliding with mainlythe outer tail and some other particles placed west of G1 (t = 900Myr ≡ t3; between shortly before the present and the present) andwhen the intruder has passed the mid-plane of G1 after the strongimpact (t = 1080 Myr ≡ t4; between the present and shortly afterthe present), respectively. Since G3 collided with G2 earlier it hasbeen evolving tidal structures. G3 in this model develops moderatetidal tails by the onset of the current collision, so the disc and theeastern tidal arm pulled out of it both hit the IGM at a high-speed(the z-velocities of the model galaxies will be discussed in Section4.3).
The morphology of the model at t3−t4 looks generally similarto that of SQ. First of all, the positions of the four model galaxiesprojected on to the x-y plane are close to those observed. The par-allel tails look similar to the observed features as well. It should beemphasized that even though the inner and outer tails in the modelwere generated simultaneously, the inner tail appears stronger thanthe outer tail in stellar features. Some of the features around NGC7318a/b were generated very roughly in the model: The two tailsdrawn out of G3 (by the collision with G2) in stars do not matchwith the real optical features very well. However, the one extractedfrom the eastern side of the disc looks similar to the feature SW-arm, although the curvature and orientation are not quite right. Afeature like SQ-A is produced at the north of G3; the feature be-gan to be formed right after the impact and has grown with time(it is quite small at t3, but larger at t4; see also Fig. 7). Note thata gas bridge is formed (seen in the bottom right panel of Fig. 6)after the strong impact of G3 with the IGM. (We use the term ‘gasbridge’ for the gas feature running manly in the north-south di-rection formed in the shock region between G1 and G3 and distin-guish it from ‘H2 bridge’ which indicates specifically the thin dustybridge running in the east-west direction shown in Fig. 3(b).) Wewill discuss and compare the gas structure more in Section 4.3.
4.2 Models A versus models C
The fiducial model described above is one of the models of type A(which are designed to generate the inner and outer tails simulta-neously by an encounter of G4 with G1 as suggested in scenarioA in Section 2.2). The observations of the inner and outer tails inSQ suggest a younger age of the inner tail than the outer tail (e.g.,Fedotov et al. 2011). We thought at the beginning of this work thatmodels C (which intend to generate the outer tail first by an ear-lier encounter of G4 with G1 and then the inner tail by the recentencounter of G2 with G1 as suggested in scenario C) would bemore appropriate for the system. However, as we proceeded withthe simulations, we found difficulties with models of type C.
First of all, reconstructing two long tails one after one in agood configuration following scenario C was much more compli-cated than we expected. In such models, producing the outer tailfirst from G1 by an encounter of G4 and letting G4 leave towardeast (to its current position) are easy, however, because the scenarioassumes the inner tail is formed sufficiently later than the outer tail,G2 has to encounter G1 closely (to produce the inner tail) afterthe previously generated outer tail has already been grown. Then,even though G2 could manage to pull the inner tail out of (the al-ready disturbed) G1, creating a relatively good configuration withthe outer tail, G2 at the same time strongly distorts the outer tail.This ‘dilemma’ (G2 has to pass G1 closely to produce the innertail but then it also destroys the outer tail) occurred in the earlierN-body models as well, so a very inclined orbit of G2 with whichG2 would not disturb the outer tail was used (see Renaud, Apple-ton & Xu 2010 for details). We applied the similar orbits for G2 inmodels C, but the effect of G2 on the outer tail was still too strongdue to the extended halo potentials used in the SPH code (Equation1). To decrease the effect of G2 on the outer tail, we tried particu-larly smaller cutoffs for the halo potentials of the model galaxies;the effect was still not eliminated. (We cut off each halo potentialat 2−3 times the maximum initial disc extent for models C, and 5or more times that for models A.)
Another disadvantage of models C is that it is hard to adjustthe orbit of G2 after it encounters G1 to best fit later developments.We prefer to place G2 relatively far below at the second stage soit collides with G3 (like in the fiducial model) and so G3 has timeto develop tidal features (assuming some features of NGC 7318bhave tidal origins). However, when G2 is placed on an inclined orbitto make the inner tail without destroying the outer tail at the firststage, it is difficult to put G2 sufficiently far down at the secondstage and then let G2 slow down in its vertical motion (in z-axis) atthe third stage (as it should have a small z-speed relative to G1 nearthe present). In addition, apart from the possibility of the collisionbetween G2 and G3 well below the plane of G1, it is difficult toevolve sufficiently many particles to the western side of G1 to behit and shocked by G3 at the third stage in these models.
Models of type C do have some advantages. One is that theobserved gas distribution near the parallel tails could also gener-ally be well reproduced. Another is that a transient feature like theobserved H2-bridge could be relatively well generated by the en-counter of G2 with G1 in models C. We, however, have not tried tooptimize models C as thoroughly as with models A. Thus, althoughthey do not look promising, we cannot entirely rule out the modelsof scenario C.
c© 0000 RAS, MNRAS 000, 1–15
12 J.-S. Hwang et al.
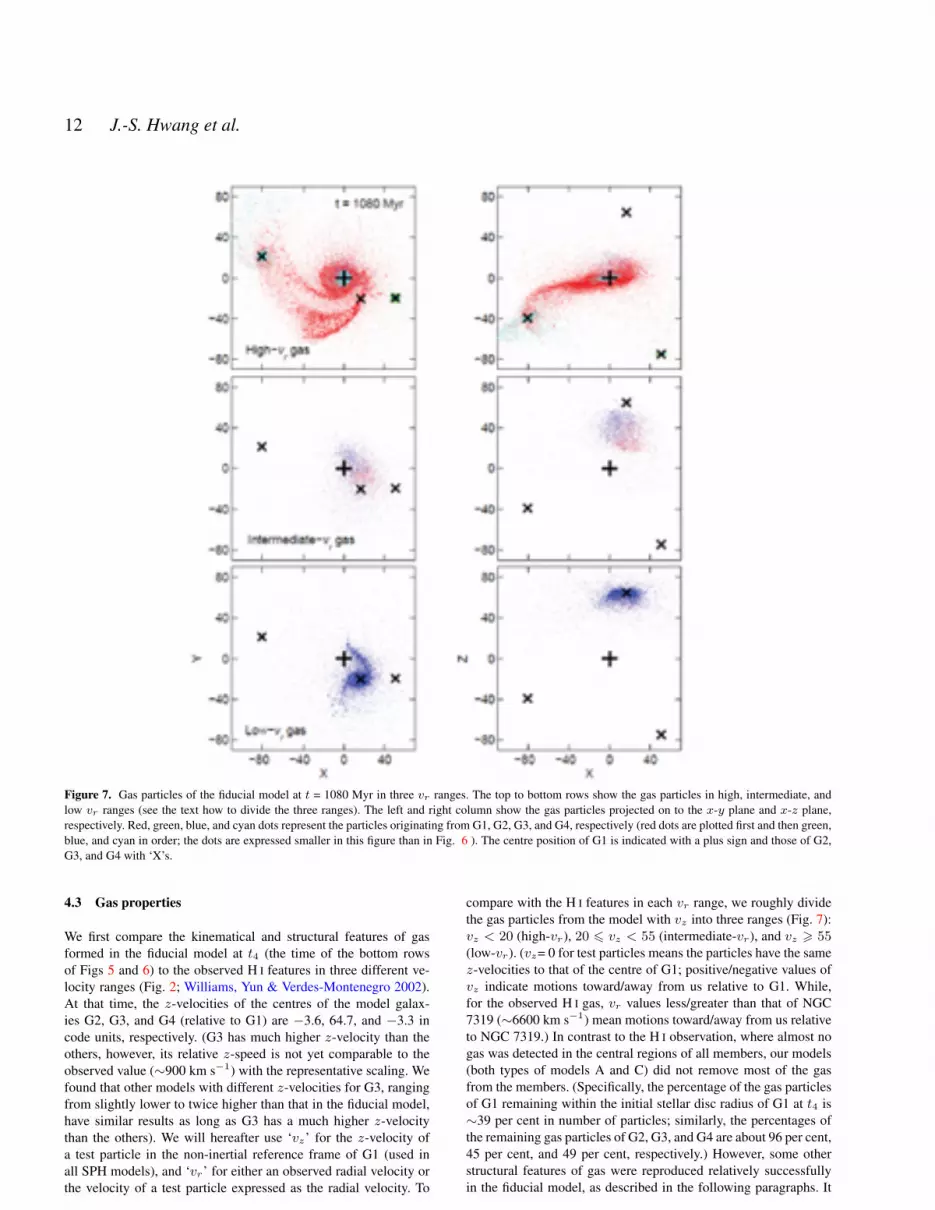
Figure 7. Gas particles of the fiducial model at t = 1080 Myr in three vr ranges. The top to bottom rows show the gas particles in high, intermediate, andlow vr ranges (see the text how to divide the three ranges). The left and right column show the gas particles projected on to the x-y plane and x-z plane,respectively. Red, green, blue, and cyan dots represent the particles originating from G1, G2, G3, and G4, respectively (red dots are plotted first and then green,blue, and cyan in order; the dots are expressed smaller in this figure than in Fig. 6 ). The centre position of G1 is indicated with a plus sign and those of G2,G3, and G4 with ‘X’s.
4.3 Gas properties
We first compare the kinematical and structural features of gasformed in the fiducial model at t4 (the time of the bottom rowsof Figs 5 and 6) to the observed H I features in three different ve-locity ranges (Fig. 2; Williams, Yun & Verdes-Montenegro 2002).At that time, the z-velocities of the centres of the model galax-ies G2, G3, and G4 (relative to G1) are −3.6, 64.7, and −3.3 incode units, respectively. (G3 has much higher z-velocity than theothers, however, its relative z-speed is not yet comparable to theobserved value (∼900 km s−1) with the representative scaling. Wefound that other models with different z-velocities for G3, rangingfrom slightly lower to twice higher than that in the fiducial model,have similar results as long as G3 has a much higher z-velocitythan the others). We will hereafter use ‘vz’ for the z-velocity ofa test particle in the non-inertial reference frame of G1 (used inall SPH models), and ‘vr’ for either an observed radial velocity orthe velocity of a test particle expressed as the radial velocity. To
compare with the H I features in each vr range, we roughly dividethe gas particles from the model with vz into three ranges (Fig. 7):vz < 20 (high-vr), 20 6 vz < 55 (intermediate-vr), and vz > 55(low-vr). (vz= 0 for test particles means the particles have the samez-velocities to that of the centre of G1; positive/negative values ofvz indicate motions toward/away from us relative to G1. While,for the observed H I gas, vr values less/greater than that of NGC7319 (∼6600 km s−1) mean motions toward/away from us relativeto NGC 7319.) In contrast to the H I observation, where almost nogas was detected in the central regions of all members, our models(both types of models A and C) did not remove most of the gasfrom the members. (Specifically, the percentage of the gas particlesof G1 remaining within the initial stellar disc radius of G1 at t4 is∼39 per cent in number of particles; similarly, the percentages ofthe remaining gas particles of G2, G3, and G4 are about 96 per cent,45 per cent, and 49 per cent, respectively.) However, some otherstructural features of gas were reproduced relatively successfullyin the fiducial model, as described in the following paragraphs. It
c© 0000 RAS, MNRAS 000, 1–15
Models of Stephan’s Quintet 13
is yet unclear why the galaxies contain no H I within them. Somemembers appear to be of quite early type, and might lost their gaslong before the recent encounters. The case of NGC 7319 is moremysterious. Perhaps the bar has funneled much gas to the centre.Unveiling the origins of the H I deficiency in the members is one ofthe problems that we need to keep investigating.
As shown in the top row of Fig. 7, the gas corresponding tothe high-vr range consists of particles originating from mostly G1,G2, and G4 (which have a similar high radial velocity themselves)as expected (note that G2 was initially set with the smallest numberof gas particles as indicated in Table 1). A few particles originatingfrom the high-speed intruder G3 (3.5 per cent of G3 gas particles)which are captured by the others or scattered into the intergalacticspace are in this vr range. Many high-vr gas particles are found be-tween G1 and G4, tracing the stellar parallel tails (shown in the bot-tom row of Fig. 5). These groups of gas particles in the model lookquite similar to the two huge arc-like H I clouds observed along theoptical inner and outer tails in high-vr range (Arc-N and Arc-S inFig. 2, respectively). Arc-S extends well beyond the southern tip ofthe optical outer tail, and the gas feature formed in the model alongthe outer tail extends further than the corresponding stellar feature.Arc-N curves toward north (as the UV inner tail; see Section 2)rather than toward NGC 7320c. In the model many gas particlesdistributed along the inner tail seem to be curved toward G4; how-ever, there is a trail of gas curved far to the north like the observedcloud Arc-N. Another notable high-vr gas feature is seen in the top-left panel of the figure, at west of G1 and north of G3. We interpretthis gas as the compact high-vr H I cloud (NW-HV) detected nearSQ-A, although the model feature should be separated more fromboth G1 and G3. (We tried to refine the feature in some similarmodels by using different values of vz and/or tilt for G3. Howeverwith the limited resolution, the feature did not come out noticeablydifferently.)
Gas particles in the intermediate-vr range (middle row ofFig. 7) appear mostly at north of G3 (left panel). Most of these gashave come from either G1(35 per cent) or G3 (63 per cent) (notethat the percentages vary depending on the criteria for dividing thevr ranges; it is also affected by the number of gas particles set ineach member). The observed intermediate-vr H I cloud (NW-LV)coincides with the high-vr cloud (NW-HV) near SQ-A, but moreextended. The intermediate-vr gas particles in the model are dis-tributed over a larger area than the high-vr gas particles at north ofG3.
The gas particles in the low-vr range are presented in the bot-tom row of the figure. Almost all (99 per cent) of the particles orig-inate from G3 (87 per cent of G3 gas particles are in this range).The H I observation found low-vr gas in south of NGC 7318a/bdiffusely distributed (the feature SW in Fig. 2), and no gas at thecentral area of NGC 7318b. As pointed out earlier, in contrast toobservation, many gas particles in the model remain in the disc ofG3 and the spiral features look somewhat different. However, someof the particles found south of G3 appear more or less similar to thediffuse H I gas.
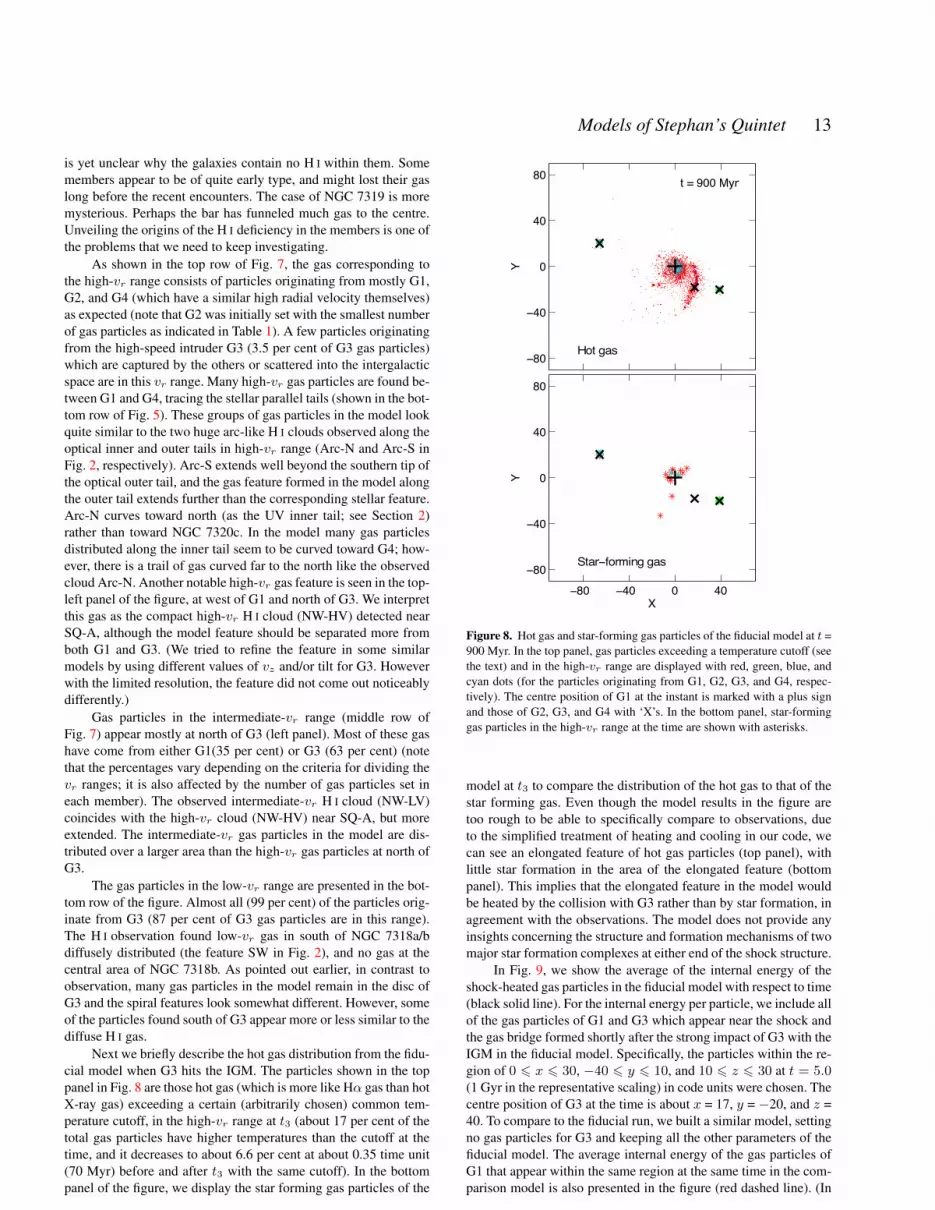
Next we briefly describe the hot gas distribution from the fidu-cial model when G3 hits the IGM. The particles shown in the toppanel in Fig. 8 are those hot gas (which is more like Hα gas than hotX-ray gas) exceeding a certain (arbitrarily chosen) common tem-perature cutoff, in the high-vr range at t3 (about 17 per cent of thetotal gas particles have higher temperatures than the cutoff at thetime, and it decreases to about 6.6 per cent at about 0.35 time unit(70 Myr) before and after t3 with the same cutoff). In the bottompanel of the figure, we display the star forming gas particles of the
!80
!40
0
40
80
Y
Hot gas
t = 900 Myr
!80 !40 0 40
!80
!40
0
40
80
X
Y
Star!forming gas
Figure 8. Hot gas and star-forming gas particles of the fiducial model at t =900 Myr. In the top panel, gas particles exceeding a temperature cutoff (seethe text) and in the high-vr range are displayed with red, green, blue, andcyan dots (for the particles originating from G1, G2, G3, and G4, respec-tively). The centre position of G1 at the instant is marked with a plus signand those of G2, G3, and G4 with ‘X’s. In the bottom panel, star-forminggas particles in the high-vr range at the time are shown with asterisks.
model at t3 to compare the distribution of the hot gas to that of thestar forming gas. Even though the model results in the figure aretoo rough to be able to specifically compare to observations, dueto the simplified treatment of heating and cooling in our code, wecan see an elongated feature of hot gas particles (top panel), withlittle star formation in the area of the elongated feature (bottompanel). This implies that the elongated feature in the model wouldbe heated by the collision with G3 rather than by star formation, inagreement with the observations. The model does not provide anyinsights concerning the structure and formation mechanisms of twomajor star formation complexes at either end of the shock structure.
In Fig. 9, we show the average of the internal energy of theshock-heated gas particles in the fiducial model with respect to time(black solid line). For the internal energy per particle, we include allof the gas particles of G1 and G3 which appear near the shock andthe gas bridge formed shortly after the strong impact of G3 with theIGM in the fiducial model. Specifically, the particles within the re-gion of 0 6 x 6 30, −40 6 y 6 10, and 10 6 z 6 30 at t = 5.0(1 Gyr in the representative scaling) in code units were chosen. Thecentre position of G3 at the time is about x = 17, y = −20, and z =40. To compare to the fiducial run, we built a similar model, settingno gas particles for G3 and keeping all the other parameters of thefiducial model. The average internal energy of the gas particles ofG1 that appear within the same region at the same time in the com-parison model is also presented in the figure (red dashed line). (In
c© 0000 RAS, MNRAS 000, 1–15

14 J.-S. Hwang et al.
800 900 1000 110010!1
100
101
102
t (Myr)
log
U
Figure 9. The change of the average internal energy of the gas particlesin the shock region in the fiducial model with respect to time (black solidline). The change in a comparison model, in which no gas particles of G3have been set, is also presented (red dashed). (See text for the selection cri-teria of the gas particles considered for the internal energies per particle inboth models.) The time on the x-axis is converted with the representativescaling (1 time unit = 200 Myr). G3, the high-speed intruder, passes themid-plane of the disc of G1 in both models at about t = 890 Myr in theadopted scaling. The average internal energy of the gas particles in the fidu-cial model decreases rather slowly after the strong impact, having a nearlypower-law form, for some tens of millions of years. Not the absolute valuesbut the relative values of the y-axis are meaningful. The horizontal dottedline is drawn at the y value of the fiducial model at t = 730 Myr, as a repre-sentative value of the average internal energy before the strong impact; thevertical dotted line is drawn at t = 955 Myr when the average value starts togo below the representative value again after the strong impact.
the fiducial model, total 2779 gas particles, 1447 from G1 + 1332from G3, met the above selection-criteria. While, in the compari-son model, 170 gas particles of G1 met the same criteria. For theinternal energies per particle represented in the y-axis in the fig-ure, these 2779 and 170 gas particles are considered in the fiducialand comparison models, respectively.) In both models, G3 collideswith the IGM at about t = 4.45, which corresponds to 890 Myr inthe adopted scaling. (G3 in these models collides first with G2 atabout t = 3.38, 700 Myr.) As expected, a strong peak occurs in thefiducial model but not in the comparison one at about the impact,when G3 hits the outer tail and some other stripped materials westof G1. In the fiducial model, the average internal energy of the gasparticles in the shock region decreases rather slowly after the im-pact, showing a nearly power-law form as might be expected fromdecaying turbulence in the interacting flows. We checked the tra-jectories of some of the gas particles (clouds) and found that manyof the particles’ trajectories in the gas bridge in the fiducial modelwere redirected by collisions with other particles, after G3 has al-ready passed through the plane of G1, for some tens of millionsof years. This amounts to decaying turbulence with many smallshocks of various strengths in that region and we think it can ac-count for the observed emission without much star formation. Thetime-scale is much longer than the cooling time of a single impactshock (e.g., Guillard et al. 2009), and so makes it easier to under-stand how we happen to see a phenomena that would otherwise beextremely short-lived.
5 SUMMARY AND DISCUSSION
Motivated by the disturbed structure of SQ, including the remark-able group-wide shock seen at the IGM between NGC 7319 and7318b, and using published high quality observations for the sys-tem in various wavebands, we have attempted to model the inter-action history and the evolution of the large-scale structure of thegroup.
Despite the complex interactions expected in the compactgroup, some of its major features allow us to constrain the modelsreasonably well. First, the appearance of the parallel tails providesimportant clues to track how they were formed, narrowing down thepossibilities to encounters of NGC 7320c and/or NGC 7318a withNGC 7319. In addition, the fact that such delicate tidal features ex-tend large distances outward justifies the supposition that membersmight not pass close to the tails after they were produced, otherwisethey would have been destroyed or greatly modified. Some of theother complex disturbed features around the pair NGC 7318a/b,such as the tail-like feature SW-arm and the stripped gas disc ofthe high-speed intruder, suggest NGC 7318b might have interactedwith NGC 7318a before. At the current time, it is known from manyobservations that the high-speed intruder, NGC 7318b, has hit theIGM giving rise to the large-scale shock.
The interactions described above seem to take place one afteranother, involving mainly two members at a time; which simplifiesthe modeling. Thus we divided each of our models in three majorstages and simulated a series of plausible interactions in order: Atthe first stage, we tried a collision between NGC 7319 and 7320c toproduce both of the parallel tails simultaneously in models (modelsA), or via an encounter between NGC 7319 and 7320c to generatethe outer tail first and then an encounter between NGC 7319 and7318a to pull out the inner tail later (models C). Then we attemptedat the second stage an interaction between NGC 7318a and 7318bof varying intensity, and at the final stage a collision between NGC7318b with the IGM.
Models A were generally more successful than models C.Even though generating the parallel tails one by one from two dif-ferent interactions seems to be conceptually reasonable, in modelsC it turned out to be very difficult to pull another substantial tail(the inner tail) in a second close encounter, while at the same timepreserving the outer tail. This later encounter usually destroyed theouter tail in models with extended halo potentials, and with verylimited haloes it still disturbed the outer tail, yielding a poor tailmorphology. On the other hand, a single strong encounter, as inmodels A, could generate two substantial tails nicely with differ-ent stellar intensity. We note that the fact that the two tails don’thave the same star formation history doesn’t have to mean thatthey weren’t born in the same tidal event.
In the fiducial model (one of the best models of type A), theinner and outer tails are generated simultaneously by an encounterof NGC 7320c, and the high-speed intruder experiences an earliercollision with NGC 7318a, the galaxy slightly to the west of it,below the plane of NGC 7319. This early collision induces spiralwaves in the intruder; one of which later collides with the outer tailand the IGM.
We think that the fiducial model is generally successful atreproducing the large-scale morphology and kinematics of SQ.Specifically, the current relative positions (projected on to the skyplane) and relative radial velocities of the members, the long par-allel tails with thinner and brighter inner tail in stellar feature, thehuge amount of high-vr gas along both of the parallel tails, the fea-tures looking like SW-arm and SQ-A, the high and intermediate-vr
c© 0000 RAS, MNRAS 000, 1–15
Models of Stephan’s Quintet 15
gas at north of the high-speed intruder and some scattered low-vrgas at southwest of the high-speed intruder that were produced inthe model resemble more or less the real features. However, the de-tailed inner structures of the spiral members, the many disturbedstructural features around NGC 7318a/b, and the gas removal fromeach disc (which may also resulted from the earlier interactionsthan our simulations start) were not reproduced in our models. Thelocation of SQ-A and the orientation of SW-arm in the model do notmatch the observations well either. The gas temperature and star-formation history of our models are not accurate enough for de-tailed comparison to observations. The shortcomings of the modelsare the result of limited resolution and the approximate treatmentsof heating and cooling in the current code. Nonetheless, the modelshows the shock-heated gas, by the impact of the high-speed in-truder with the IGM, in an elongated feature with little star forma-tion. A gas bridge is formed in the shock region and particles in thebridge continue to interact for some tens of millions of years af-ter the impact. Dynamical friction has been neglected in this work.Though the effect would not change our main results, it becomesparticularly significant for modeling the future of the system.
Finally, we note some general implications from this work.Constructing numerical models of a compact group could be verydifficult as the system might have experienced multiple interac-tions. However, if a group possesses very extended features, themodel could be relatively well constrained. This is because notonly do the rich features themselves provide important clues to theformation, developing and maintaining those delicate extended fea-tures also could eliminate the possibilities of strong interactions oc-curring in the vicinity of the features after the production. We founda very interesting result in SQ, with collisions occurring mostlytwo-at-a-time. This result may be general (although it is not neces-sarily so), because flyby or the final merger together time would beshort compared to the total orbital time.
SQ appears to be unusual in the population of compact groupsin that the system possesses prominent, extended features and theintruder seems to be actively colliding with previously known tidalmaterial. This might be due to the unique interaction history of thesystem, or result from the short time-scale during which such fea-tures can be observed. SQ seems to exhibit a wide variety of galaxyinteraction indicators, ranging from clear stellar and gaseous tidalfeatures to group-wide shock structures. This kind of diversity maybe special to the compact group environment, but SQ may be asnapshot in time of what many compact groups may go throughif we wait long enough. The question of how commonly power-ful shocks are found in the compact group environment is beingexplored by a major Spitzer survey of HCGs by Cluver el al. (inpreparation). We expect that our major result can be extended toother similar groups in studying the evolutionary histories or find-ing initial conditions of collisions. Detailed numerical studies onmore compact groups would also help to better understand the evo-lution of high-redshift galaxies.
ACKNOWLEDGMENTS
J.-S.H. thanks Korea Institute for Advanced Study for providingcomputing resources (KIAS Center for Advanced ComputationAbacus System) for the part of this work.
REFERENCES
Allen R. J., Hartsuiker J. W., 1972, Nat, 239, 324Appleton P. N. et al., 2006, ApJ, 639, L51Burbidge E. M., Burbidge G. R., 1961, ApJ, 134, 244Cluver M. E. et al., 2010, ApJ, 710, 248de Vaucouleurs G., de Vaucouleurs A., Corwin H. G., Buta R. J.,
Paturel G., Fouqu P., 1991, Third Reference Catalogue of BrightGalaxies, Springer-Verlag, New York
Durret F., 1994, A&AS, 105, 57Fedotov K., Gallagher S. C., Konstantopoulos I. S., Chandar R.,
Bastian N., Charlton J. C., Whitmore B., Trancho G., 2011, AJ,142, 42
Gottlober S., Klypin A., Kravtsov, A. V., 2001, ApJ, 546, 223Guillard P., Boulanger F., Pineau des Forets G., Appleton P. N.,
2009, A&A, 502, 515Hickson P., 1982, ApJ, 255, 382Hickson P., 1994, Atlas of Compact Groups of Galaxies, Gordon
and Breach, SwitzerlandHickson P., Kindl E., Auman J. R., 1989, ApJS, 70, 687Hunsberger S. D., Charlton J. C., Zaritsky D., 1996, ApJ, 462, 50Moles M., Marquez I., Sulentic J. W., 1998, A&A, 334, 473Moles M., Sulentic J. W., Marquez I., 1997, ApJ, 485, L69Renaud F., Appleton P. N., Xu C. K., 2010, ApJ, 724, 80Shostak G. S., Allen R. J., Sullivan W. T., III, 1984, A&A, 139,
15Struck C., 1997, ApJS, 113, 269Sulentic J. W., Rosado M., Dultzin-Hacyan D., Verdes-
Montenegro L., Trinchieri G., Xu C., Pietsch W., 2001, AJ, 122,2993
Teuben P., 1995, in Shaw R. A., Payne H. E., Hayes J. J. E., eds,ASP Conf. Ser. Vol. 77, Astronomical Data Analysis Softwareand Systems IV. Astron. Soc. Pac., San Francisco, p. 398
Toomre A., Toomre J. 1972, ApJ, 178, 623Trinchieri G., Sulentic J., Breitschwerdt D., Pietsch, W., 2003,
A&A, 401, 173Trinchieri G., Sulentic J., Pietsch W., Breitschwerdt D., 2005,
A&A, 444, 697Allen R. J., Hartsuiker J. W., 1972, Nat, 239, 324Williams B. A., Yun M. S., Verdes-Montenegro L., 2002, AJ, 123,
2417Xu C. K., Lu N., Condon J. J., Dopita M., Tuffs R. J., 2003, ApJ,
595, 665Xu C. K., Sulentic J. W., Tuffs R., 1999, ApJ, 512, 178Xu C. K. et al., 2005, ApJ, 619, L95
This paper has been typeset from a TEX/ LATEX file prepared by theauthor.
c© 0000 RAS, MNRAS 000, 1–15


