Embed Size (px)
Citation preview

HAL Id: tel-00672978https://tel.archives-ouvertes.fr/tel-00672978v1
Submitted on 22 Feb 2012 (v1), last revised 6 Sep 2013 (v2)
HAL is a multi-disciplinary open accessarchive for the deposit and dissemination of sci-entific research documents, whether they are pub-lished or not. The documents may come fromteaching and research institutions in France orabroad, or from public or private research centers.
L’archive ouverte pluridisciplinaire HAL, estdestinée au dépôt et à la diffusion de documentsscientifiques de niveau recherche, publiés ou non,émanant des établissements d’enseignement et derecherche français ou étrangers, des laboratoirespublics ou privés.
Hydrodynamic interactions and diffusion in vesicle andred blood cell suspensions
Aparna Srivastav
To cite this version:Aparna Srivastav. Hydrodynamic interactions and diffusion in vesicle and red blood cell suspensions.Fluids mechanics [physics.class-ph]. Université de Grenoble, 2012. English. �tel-00672978v1�
THESEPour obtenir le grade de
DOCTEUR DE L’UNIVERSITE DE GRENOBLESpecialite : Physique pour les sciences du vivant
Arrete ministerial : 7 aout 2006
Presentee par
Aparna Srivastav
These dirigee par Chaouqi Misbahet codirigee par Thomas Podgorski
preparee au sein du Laboratoire Interdisciplinaire de Physiqueet de l’Ecole Doctorale de Physique
Interaction et diffusion hydrody-namiques dans une suspension devesicules et globules rouges
These soutenue publiquement le (26 Janvier, 2012),devant le jury compose de :
Mme. Miglena AngelovaLaboratoire MSC, RapporteurM. Marc LeonettiIRPHE , RapporteurM. Francois CatonLaboratoire de rheologie, ExaminateurM. Bernard ZappoliCNES, ExaminateurM. Chaouqi MisbahLIPhy, Directeur de theseM. Thomas PodgorskiLIPhy, Co-Directeur de these

Hydrodynamic interactionsand diffusion in vesicle and red
blood cell suspensions
Aparna Srivastav
Ph.D thesis
Grenoble, January 26th 2012
Ph.D thesis supervised by Chaouqi Misbah, Thomas PodgorskiPrepared at Laboratoire interdisciplinaire de Physique
Universite Joseph Fourier CNRS/CNESGrenoble, France

Acknowledgement
The present thesis has been prepared with the help and support of many people, whomI would like to thank with my humble acknowledgement.
First and foremost, I want to express my sincere gratitude to Dr. Gwennou Coupierfor his guidance, encouragement, patience, enthusiasm and great technical support fromthe initial to the final level which enabled me to develop an understanding of the subject.He was always accessible and willing to help his students with their research.
I wish to express my warm and sincere thanks to my co-supervisor Dr. Thomas Pod-gorski, for enlightening and guiding me with his knowledge. His help and his advices werevery fruitful for shaping up my research and thesis. The way they train student is excel-lent, I will always been indebted for this. I was delighted to interact with my supervisorProf. Chaouqi Misbah for his detailed review, constructive criticism and excellent advicesduring the preparation of this thesis.
I have been lucky to have an opportunity to work with Prof. Victoria Vitkova to studyrheological property of blood. She has taught me, both consciously and unconsciously, howgood experimental physics is done. The joy and enthusiasm she has for her research wascontagious and motivated me especially during tough times in the Ph.D. pursuit. I amalso thankful for the excellent example she has provided as a successful scientist womanand professor. Thanks to Xavier who recently joined the group in a post-doc position forhis support in completing the last set of experiments of my thesis.
In my daily work I have been blessed with a friendly and cheerful group of fellowlab mates, Valentina, Edith, Darja, Michael, Giovanni, Kalpana and Levan for all theemotional support, friendship, entertainment, and caring they provided and for their helpthey gave me to surmount the difficult times. In particular, Vincent helped me get onthe road to LaTeX and provided support to solve problems I had as a beginner in LaTeXpractice for writing the thesis. Outside of the lab, plenty of people kept me sane and happyin Grenoble. Among many others, I thank Bernard and Dr. Subodh for their insightfulsuggestions to look at the problem from different angle and happily overcome it. Theirunconditional help and encouragement throughout the thesis were appreciable.
For this dissertation I would like to thank my reading committee members Prof.Miglena Anguelova and Dr. Marc Leonetti for gracefully accepting to be my reporterand contributing to improve my work with their time, interest, and helpful comments. I
gratefully acknowledge the French government and my funding sources, the CNRS/CNESthat made my Ph.D. work possible. Lastly, I would like to thank my family for all theirlove and encouragement.
My elder brothers and younger sister were particularly supportive. The love and firmconfidence my parents have for me added enormous energy to work cheerfully. Most im-portant, I express my heartily gratitude to my defunct father who had supported mydecision for coming so far from home to prepare a Ph.D. work, I dedicate this thesis tohim, he has always been my most enthusiast support. Finally, I would like to thank allthe people who contributed to the success of this thesis, and express my apology to thoseI could not mention personally.
6


8
Contents
1 Introduction 131.1 Some generic features of blood flow in the microcirculation . . 131.2 The dynamics of blood cells . . . . . . . . . . . . . . . . . . . 161.3 Objectives and contribution of the present work . . . . . . . . 16
1.3.1 Dynamics of deflated vesicles . . . . . . . . . . . . . . 171.3.2 Hydrodynamic interaction between two vesicles . . . . 171.3.3 Shear induced diffusion of red blood cells in Pois-euille
flow . . . . . . . . . . . . . . . . . . . . . . . . . . . . 181.3.4 A separation technique for size-sorting of vesicles . . . 18
1.4 Organisation of the manuscript . . . . . . . . . . . . . . . . . 18
2 Introduction (francais) 212.1 Quelques generalites sur les ecoulements sanguins dans la mi-
crocirculation . . . . . . . . . . . . . . . . . . . . . . . . . . . 212.2 La dynamique des cellules sanguines . . . . . . . . . . . . . . 242.3 Objectifs et contribution de ce travail . . . . . . . . . . . . . . 25
2.3.1 Dynamique de vesicules degonflees . . . . . . . . . . . 252.3.2 Interaction hydrodynamique entre deux vesicules . . . 262.3.3 Diffusion induite par cisaillement de globules rou-ges
en ecoulement de Poiseuille . . . . . . . . . . . . . . . 262.3.4 Une technique de separation pour le tri en taille de
vesicules . . . . . . . . . . . . . . . . . . . . . . . . . . 272.4 Organisation du manuscrit . . . . . . . . . . . . . . . . . . . . 27
3 Vesicles & Red Blood Cells 293.1 Vesicles . . . . . . . . . . . . . . . . . . . . . . . . . . . . . . 29
3.1.1 Structure of membrane . . . . . . . . . . . . . . . . . . 303.1.2 Mechanical properties of the membrane . . . . . . . . . 34
3.2 Red Blood Cell . . . . . . . . . . . . . . . . . . . . . . . . . . 403.2.1 Blood composition . . . . . . . . . . . . . . . . . . . . 403.2.2 Structure and composition of a red blood cell . . . . . 423.2.3 Mechanical properties of the red blood cell . . . . . . . 42
9
CONTENTS
3.3 Parameter under study . . . . . . . . . . . . . . . . . . . . . . 443.4 Visualization of vesicles and red blood cell . . . . . . . . . . . 46
3.4.1 The bright-field microscopy . . . . . . . . . . . . . . . 463.4.2 Phase contrast microscopy . . . . . . . . . . . . . . . . 473.4.3 Camera . . . . . . . . . . . . . . . . . . . . . . . . . . 493.4.4 Image analysis . . . . . . . . . . . . . . . . . . . . . . . 50
3.5 Experimental Techniques . . . . . . . . . . . . . . . . . . . . . 503.5.1 Microfluidics . . . . . . . . . . . . . . . . . . . . . . . . 50
4 Preparation and sorting method of vesicles 554.1 Preparation method of vesicles . . . . . . . . . . . . . . . . . . 55
4.1.1 Lipid Solutions . . . . . . . . . . . . . . . . . . . . . . 574.1.2 Electroformation chamber . . . . . . . . . . . . . . . . 574.1.3 Deposition of lipids & filling of chambers . . . . . . . . 584.1.4 Electroformation . . . . . . . . . . . . . . . . . . . . . 59
4.2 Description of sorting method . . . . . . . . . . . . . . . . . . 604.2.1 Motivation . . . . . . . . . . . . . . . . . . . . . . . . . 604.2.2 Technical details of sorting device . . . . . . . . . . . . 624.2.3 Performance of the sorting method . . . . . . . . . . . 63
5 Dynamics of a deflated vesicle 675.1 Theoretical Background . . . . . . . . . . . . . . . . . . . . . 67
5.1.1 Keller & Skalak’s model . . . . . . . . . . . . . . . . . 685.1.2 Few numerical & experimental results . . . . . . . . . . 71
5.2 Deflated vesicles in shear flow . . . . . . . . . . . . . . . . . . 745.2.1 Theoretical background . . . . . . . . . . . . . . . . . . 745.2.2 Experimental set-up . . . . . . . . . . . . . . . . . . . 795.2.3 Result and discussion . . . . . . . . . . . . . . . . . . . 83
6 Hydrodynamic interaction between two vesicles in shear flow 876.1 Introduction . . . . . . . . . . . . . . . . . . . . . . . . . . . . 88
6.1.1 Statement and review of the problem . . . . . . . . . . 886.2 Preparation and experimental set-up . . . . . . . . . . . . . . 91
6.2.1 Microfluidic flow focusing system . . . . . . . . . . . . 926.2.2 Flow set-up : . . . . . . . . . . . . . . . . . . . . . . . 936.2.3 Sample preparation : . . . . . . . . . . . . . . . . . . . 94
6.3 Results and discussions . . . . . . . . . . . . . . . . . . . . . . 95
7 Shear induced diffusion of RBCs in Poiseuille flow 1057.1 Introduction . . . . . . . . . . . . . . . . . . . . . . . . . . . . 1067.2 Theoretical background . . . . . . . . . . . . . . . . . . . . . . 1067.3 The advection-diffusion equation . . . . . . . . . . . . . . . . 1077.4 Thermal diffusion . . . . . . . . . . . . . . . . . . . . . . . . . 107
10
CONTENTS
7.5 Shear-induced diffusion . . . . . . . . . . . . . . . . . . . . . . 1087.5.1 One particular case . . . . . . . . . . . . . . . . . . . . 1107.5.2 More general case . . . . . . . . . . . . . . . . . . . . . 1117.5.3 Detailed solutions for shear-induced diffusion under Poiseuille
flow . . . . . . . . . . . . . . . . . . . . . . . . . . . . 1127.5.4 Contribution of in-plane shear . . . . . . . . . . . . . . 1137.5.5 Contribution of out-of-plane shear or of in-plane shear
on off-centered cluster . . . . . . . . . . . . . . . . . . 1177.6 Arrangement of the work . . . . . . . . . . . . . . . . . . . . . 120
7.6.1 Sample preparation . . . . . . . . . . . . . . . . . . . . 1207.6.2 Device and flow set-up : . . . . . . . . . . . . . . . . . 120
7.7 Results and discussions: . . . . . . . . . . . . . . . . . . . . . 121
8 Conclusion & Perspective 1298.1 Conclusion & major outcomes . . . . . . . . . . . . . . . . . . 1298.2 Perspective . . . . . . . . . . . . . . . . . . . . . . . . . . . . 131
9 Conclusion & Perspectives (francais) 1339.1 Conclusion & apports principaux . . . . . . . . . . . . . . . . 1339.2 Perspectives . . . . . . . . . . . . . . . . . . . . . . . . . . . . 135
11

CONTENTS
12
Chapter 1
Introduction
Blood is a complex fluid whose features lead to unique behavior in flow. Theobjective of this thesis is to contribute to the understanding of fundamentalaspects of blood flow by focusing on particular aspects of red blood cellsmotion. The model system is briefly introduced. Contributions in under-standing fundamental of physics impaired with organisation of the work aredetailed.
1.1 Some generic features of blood flow in the
microcirculation
Blood is a non-homogeneous dense suspension of red blood cells, leucocytesand platelets (which account for less than 1% of total volume fraction). Thesecells perform many important biological functions with the help of a trans-port medium, plasma. In early studies on blood flow, Poiseuille [1] alreadynoticed that in flow these cells are inhomogeneously distributed throughoutthe cross section of vessels. This non-uniform distribution of red blood cellsis influenced by many factors such as hydrodynamic interactions with thevessel walls and interactions between red blood cells. Blood also exhibitsNon-Newtonian rheology (shear-thinning) due to the elasticity of cells andtheir interactions. This complex and Non-Newtonian behaviour of bloodhas been a fascinating subject that has attracted the attention of many sci-entists, including biologists, physicists or mathematicians for several decades.
A homogeneous Newtonian fluid is characterized by a constant viscosity,which is an intrinsic material property of the fluid, independent of the con-ditions or geometry of the flow. Blood is not a homogeneous fluid, it is asuspension. As noticed by Poiseuille, the apparent viscosity of blood depends
13
CHAPTER 1. INTRODUCTION
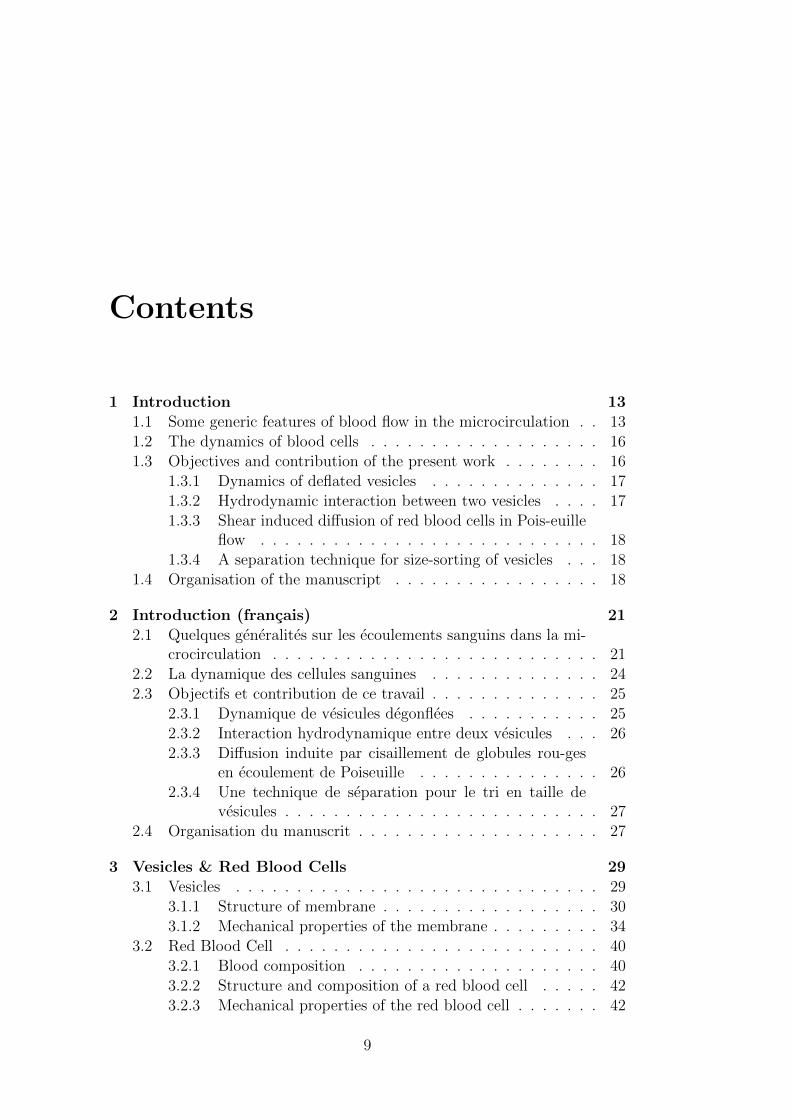
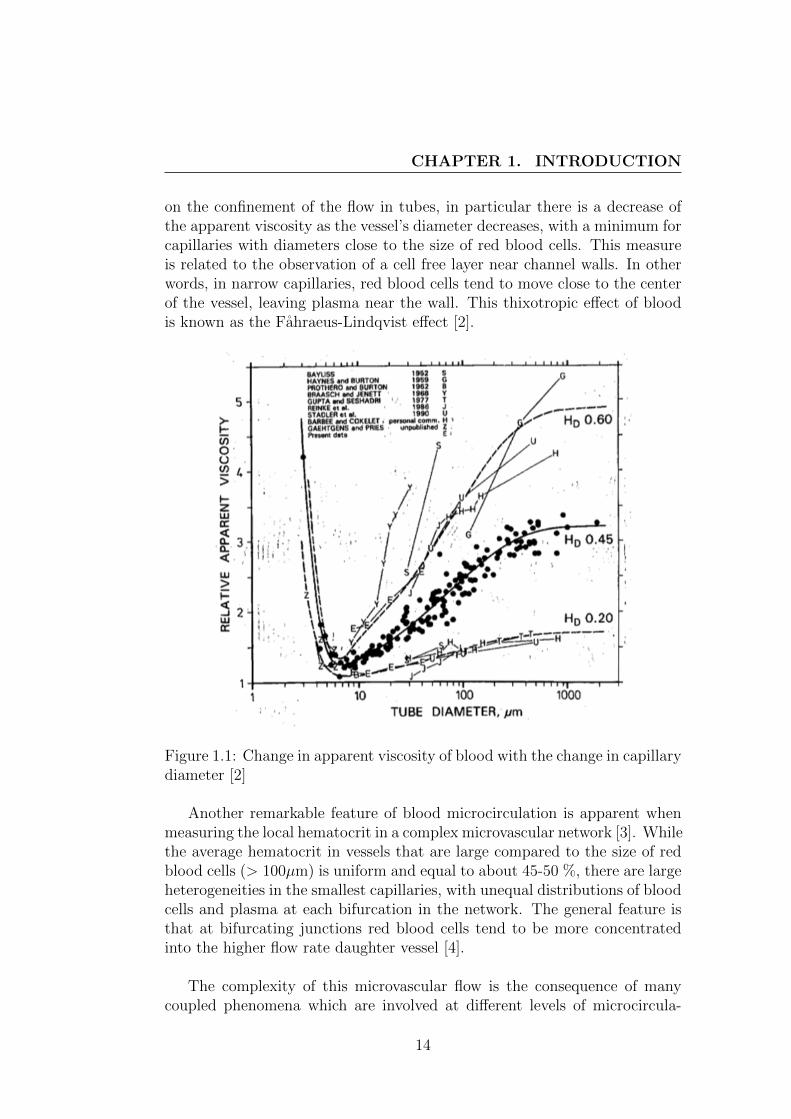
on the confinement of the flow in tubes, in particular there is a decrease ofthe apparent viscosity as the vessel’s diameter decreases, with a minimum forcapillaries with diameters close to the size of red blood cells. This measureis related to the observation of a cell free layer near channel walls. In otherwords, in narrow capillaries, red blood cells tend to move close to the centerof the vessel, leaving plasma near the wall. This thixotropic effect of bloodis known as the Fahraeus-Lindqvist effect [2].
Figure 1.1: Change in apparent viscosity of blood with the change in capillarydiameter [2]
Another remarkable feature of blood microcirculation is apparent whenmeasuring the local hematocrit in a complex microvascular network [3]. Whilethe average hematocrit in vessels that are large compared to the size of redblood cells (> 100µm) is uniform and equal to about 45-50 %, there are largeheterogeneities in the smallest capillaries, with unequal distributions of bloodcells and plasma at each bifurcation in the network. The general feature isthat at bifurcating junctions red blood cells tend to be more concentratedinto the higher flow rate daughter vessel [4].
The complexity of this microvascular flow is the consequence of manycoupled phenomena which are involved at different levels of microcircula-
14
1.1. SOME GENERIC FEATURES OF BLOOD FLOW IN THEMICROCIRCULATION
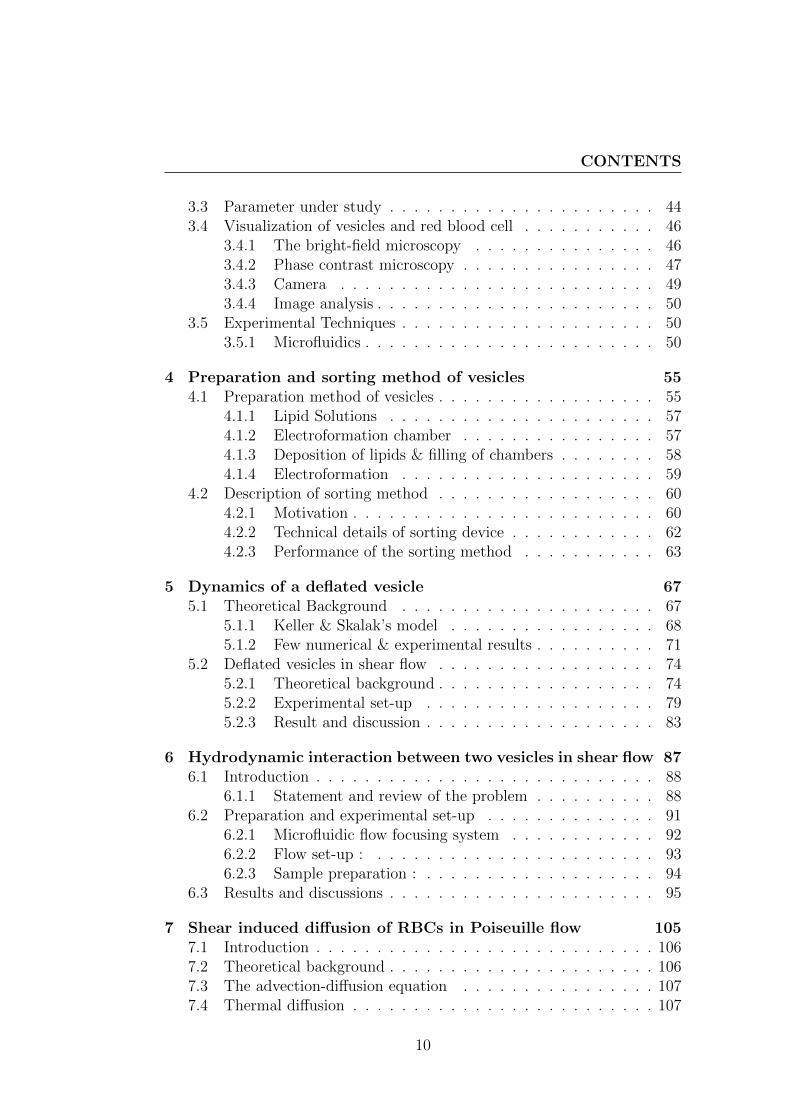
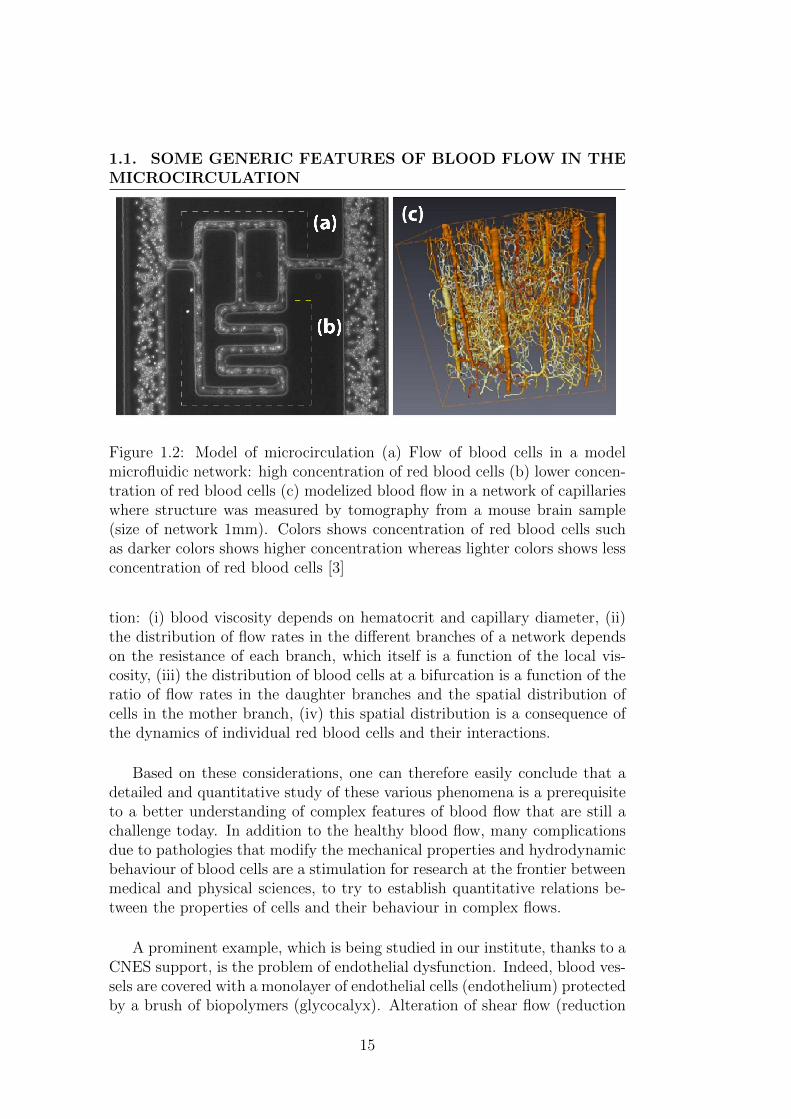
Figure 1.2: Model of microcirculation (a) Flow of blood cells in a modelmicrofluidic network: high concentration of red blood cells (b) lower concen-tration of red blood cells (c) modelized blood flow in a network of capillarieswhere structure was measured by tomography from a mouse brain sample(size of network 1mm). Colors shows concentration of red blood cells suchas darker colors shows higher concentration whereas lighter colors shows lessconcentration of red blood cells [3]
tion: (i) blood viscosity depends on hematocrit and capillary diameter, (ii)the distribution of flow rates in the different branches of a network dependson the resistance of each branch, which itself is a function of the local vis-cosity, (iii) the distribution of blood cells at a bifurcation is a function of theratio of flow rates in the daughter branches and the spatial distribution ofcells in the mother branch, (iv) this spatial distribution is a consequence ofthe dynamics of individual red blood cells and their interactions.
Based on these considerations, one can therefore easily conclude that adetailed and quantitative study of these various phenomena is a prerequisiteto a better understanding of complex features of blood flow that are still achallenge today. In addition to the healthy blood flow, many complicationsdue to pathologies that modify the mechanical properties and hydrodynamicbehaviour of blood cells are a stimulation for research at the frontier betweenmedical and physical sciences, to try to establish quantitative relations be-tween the properties of cells and their behaviour in complex flows.
A prominent example, which is being studied in our institute, thanks to aCNES support, is the problem of endothelial dysfunction. Indeed, blood ves-sels are covered with a monolayer of endothelial cells (endothelium) protectedby a brush of biopolymers (glycocalyx). Alteration of shear flow (reduction
15
CHAPTER 1. INTRODUCTION
of shear stress, as happens in microgravity), as well as flow recirculation(occurring at blood vessel bifurcations), are both known to be favorableterrain for endothelial dysfunction. As a consequence of flow alteration acascade of events takes place, including platelet activation, lipid (LDL=lowdensity lipoproteins and glycoproteins) deposition on vessel walls, mechan-otransduction (such as gene activation, etc...), all have potential impact oncardiovascular diseases.
1.2 The dynamics of blood cells
At a scale smaller than the global blood flow, individual red blood cells ex-hibit a very rich and unique behaviour due to peculiar membrane properties.Rich scenarios in shape transitions and dynamics in different types of simpleflows have been observed, which confer to blood amazing and nontrivial flowproperties at larger scales. Under inflammatory and oxidative stress states(mainly cardiovascular) red blood cells aggregability, rigidity and adherenceare enhanced, resulting in flow hindrance. Under shear flow it exhibits pe-culiar dynamics like tank-treading motion consisting in a stationary shapewhile the membrane undergoes a rotational motion [5, 6], or tumbling andswinging motions ([7, 8]). This rich picture already has an impact on bloodrheology: the apparent viscosity of a blood cell suspension shows a macro-scopic signature of the microscopic dynamic regime ([9]).
In small capillaries whose diameter is of the same order of magnitude asblood cells, they can exhibit a variety of shapes (axisymmetric parachuteshapes or asymmetric slipper-like shapes) [10] [11]. These details naturallyhave an impact on energy dissipation due to viscous friction and therefore onblood rheology in confined channels, as well as on the ability of red blood cellsto interact hydrodynamically with walls or between them to form aggregates.
Indeed, at very low shear rate, RBCs tend to aggregate due to depletionforces promoted by plasma proteins and form structures called rouleaux.These structures are responsible for the shear-thinning behaviour observedat low shear rates [12], [13].
1.3 Objectives and contribution of the present
work
The main objective of this thesis is to focus on a few aspects of the behaviourof red blood cells in flow at the microscopic level and relate this dynamics to
16
1.3. OBJECTIVES AND CONTRIBUTION OF THEPRESENT WORK
properties at a meso and macroscopic level such as the structure of suspen-sions and their rheology.
In order to study the fundamental phenomena of individual and collectivedynamics of red blood cells, we have used, besides real red blood cells, asimplified model of cell: the phospholipid vesicle. Vesicles are closed lipidmembranes, encapsulating an internal fluid and are usually suspended inanother external aqueous solution. They are similar to red blood cell whichare envelopes containing a viscous fluid (haemoglobin solution) dispersedin another fluid (plasma). The membrane of vesicles possesses mechanicalproperties which are related to those of red blood cells. They are easy toproduce with sizes close to the size of red blood cells, are easy to handleand do not need special physiological conditions unlike red blood cells. Itallows the experimentalist to play with physical parameters such as viscositycontrast (difference in internal and external viscosity), deflation of the shape.In the present study we explored the situations described below with the helpof microfluidic devices reproducing flow conditions similar to micro-vesselsin some respect.
1.3.1 Dynamics of deflated vesicles
The dynamics of individual vesicles has been studied experimentally, theo-retically and numerically by several authors, for quasi-spherical vesicles orvesicle with moderated deflation. From former works four kinds of dynami-cal regimes have been found: tank-treading, tumbling, vacillating breathingand kayaking. In the absence of a reliable experimental method for produc-ing stable significantly deflated vesicles, no systematic dynamical study hasbeen reported about vesicles with shapes similar to red blood cells.
We initiated an experimental study on the dynamics of deflation vesicles.The motivation is that former studies revealed that the regime of tumblingof vesicles can only exist in the presence of a viscosity difference between theinternal and external fluids. The first results of our study reveal a tumbling-like motion in absence of viscosity contrast. This could shed light on thedynamics of deflated red blood cells and suggest that the shape itself issufficient to produce such a motion.
1.3.2 Hydrodynamic interaction between two vesicles
The interaction between two objects in suspension in a fluid has been stud-ied since 1970’s for drops, bubbles, rigid particles and elastic capsules. Theyshowed trajectory displacements and effective repulsion between objects dur-ing the collision or interaction in shear flow, which lead to shear induceddiffusion at the scale of the suspension. To understand quantitatively these
17
CHAPTER 1. INTRODUCTION
phenomena in blood and their consequences on the structure of blood cellsuspensions, we performed an experimental study on the interaction betweentwo vesicles of identical size. This study on interactions leads to results inqualitative agreement with the former studies on other systems and providesa way to derive macroscopic diffusion coefficients from microscopic consid-erations. It should prove to be helpful for a better understanding of thestructure of blood and vesicle suspensions in channel flow where shear in-duced diffusion is balanced by other effets.
1.3.3 Shear induced diffusion of red blood cells in Pois-euille flow
During the circulation of blood in the micro-vascular network, the suspen-sion viscosity depends on the distribution of cells in the cross section of thechannels. As a complementary approach to the computation of shear induceddiffusion coefficients from the analysis of pair-interactions in suspensions, itis also important to find simple ways to measure the effect of this diffusionin more complex and more concentrated situations. We investigated thediffusion in a focused jet of a red blood cell suspension in a channel fromwhich the coefficient of shear induced diffusion is estimated, this diffusionbeing a non-linear phenomena where the diffusivity is a function of the localconcentration and shear rate.
1.3.4 A separation technique for size-sorting of vesicles
Many studies on vesicles have been performed with polydisperse samples.In specific situations, including some of those we have studied, concentratedsamples of monodisperse vesicles are a requisite: for instance diffusion orhydrodynamic interactions in pairs of vesicles.
By following an established principle of pinched-flow fractionation, wehave developped and optimized a sorting device dedicated to the sorting ofvesicle by size and provide a characterization of its performance. Such adevice could also be useful in rheological studies of concentrated suspensionof monodisperse vesicle which could be compared to the rheology of realblood to have a better idea of the quantitative effects of the cytoskeleton onrheology.
1.4 Organisation of the manuscript
The core of this manuscript is divided into five distinct chapters, as follows:
18
1.4. ORGANISATION OF THE MANUSCRIPT
• Chapter 3 is dedicated to an introduction on the structural and mechan-ical properties of vesicles and red blood cell and physics of the systemunder study. We present briefly the general materials and methods usedduring our experiments. The technics of microscopy, the use of highspeed cameras and experimental set-up are introduced. The differentfabrication steps of the microfluidic systems we used are detailed.
• Chapter 4 presents our experimental methodology for producing vesi-cles. Since, from electroformation we get polydisperse sample of vesi-cles, a device dedicated to sort the vesicles according to their size hasbeen developed. Finally, the characteristics and performance of thesorting device are described in details.
• In Chapter 5 we propose a detailed but non-exhaustive presentation ofthe state of the art concerning the behaviour of vesicles and red bloodcells (in a dilute suspension) in response to external flow field throughvarious theoretical and experimental work. In the second section ofthis chapter, we present the experimental method chosen to producedeflated vesicles. Finally the first observations of the dynamical be-haviour of deflated vesicle is discussed.
• In Chapter 6, the phenomenon of hydrodynamic interaction betweentwo vesicles in shear flow is described. To produce interactions betweentwo vesicles in convenient conditions, an interaction device has been cre-ated to establish a confined flow with a focused vesicle suspension. Thegeometry of the device is explained. Results on the interaction betweenvesicles of an isolated pair are presented and discussed in comparisonwith theoretical results. A derivation of the shear induced diffusioncoefficient from these results is proposed.
• In Chapter 7 we focus on the determination of the diffusion coefficientof Red Blood Cells in Poiseuille flow and on the properties of thisnon-linear diffusion phenomenon. Experimental results as well as atheoretical study are presented.
19

CHAPTER 1. INTRODUCTION
20
Chapter 2
Introduction (francais)
Le sang est un fluide complexe dont les proprietes entraınent des comporte-ments uniques en ecoulement. L’objectif de cette these est de contribuera la comprehension d’aspects fondamentaux des ecoulement sanguins en seconcentrant sur certains aspects de la dynamique de globules rouges. Unsysteme modele est presente. Les contributions a la comprehension fonda-mentale des phenomenes physiques mis en jeu ainsi que l’organisation de cetravail sont le preesentes ci-dessous.
2.1 Quelques generalites sur les ecoulements
sanguins dans la microcirculation
Le sang est uns suspension dense non-homogene de globules rouges, leuco-cytes et plaquettes (qui representent moins de 1% de la fraction volumique to-tale). Ces cellules remplissent d’importantes fonctions biologiques avec l’aided’un milieu porteur, le plasma. Dans ses etudes pionnieres sur l’ecoulementdu sang, Poiseuille [1] avait deja remarque qu’en ecoulement ces cellules sontdistribuees de facon inhomogene dans la section des vaisseaux. Cette dis-tribution non-uniforme des globules rouges est influencee par de nombreuxfacteurs tels que les interactions hydrodynamiques avec les parois des vais-seuax et les interactions entres globules rouges. Le sang a aussi une rheologienon newtonienne (rheofluidifiante) due a l’elasticite des cellules et leurs in-teractions. Ce comportement complexe et non newtonien du sang est unsujet fascinant qui a attire l’attention de nombreux chercheurs, biologistes,physiciens ou mathematiciens, depuis des decennies.
Un fluide newtonien homogene est caracterise par une viscosite constante,propriete materielle intrinseque du fluide, independante des conditions et de
21
CHAPTER 2. INTRODUCTION (FRANCAIS)
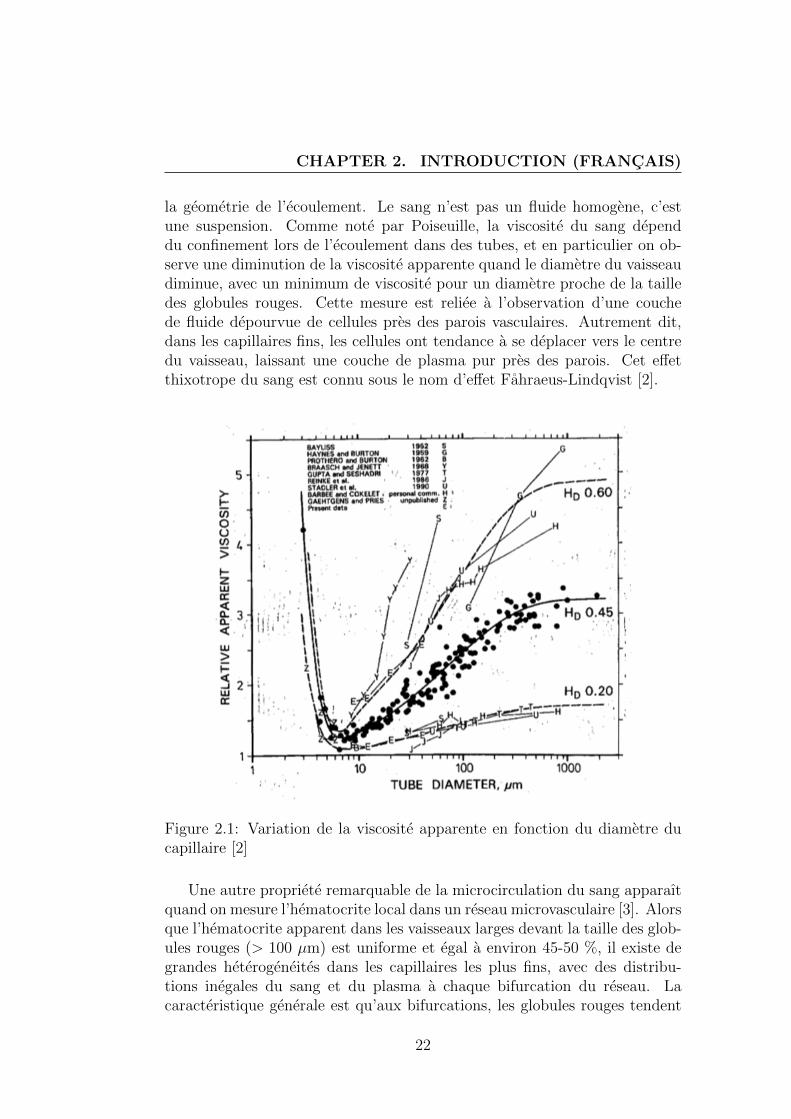
la geometrie de l’ecoulement. Le sang n’est pas un fluide homogene, c’estune suspension. Comme note par Poiseuille, la viscosite du sang dependdu confinement lors de l’ecoulement dans des tubes, et en particulier on ob-serve une diminution de la viscosite apparente quand le diametre du vaisseaudiminue, avec un minimum de viscosite pour un diametre proche de la tailledes globules rouges. Cette mesure est reliee a l’observation d’une couchede fluide depourvue de cellules pres des parois vasculaires. Autrement dit,dans les capillaires fins, les cellules ont tendance a se deplacer vers le centredu vaisseau, laissant une couche de plasma pur pres des parois. Cet effetthixotrope du sang est connu sous le nom d’effet Fahraeus-Lindqvist [2].
Figure 2.1: Variation de la viscosite apparente en fonction du diametre ducapillaire [2]
Une autre propriete remarquable de la microcirculation du sang apparaıtquand on mesure l’hematocrite local dans un reseau microvasculaire [3]. Alorsque l’hematocrite apparent dans les vaisseaux larges devant la taille des glob-ules rouges (> 100 µm) est uniforme et egal a environ 45-50 %, il existe degrandes heterogeneites dans les capillaires les plus fins, avec des distribu-tions inegales du sang et du plasma a chaque bifurcation du reseau. Lacaracteristique generale est qu’aux bifurcations, les globules rouges tendent
22
2.1. QUELQUES GENERALITES SUR LES ECOULEMENTSSANGUINS DANS LA MICROCIRCULATION
a eter plus concentres dans la branche fille de plus haut debit [4].
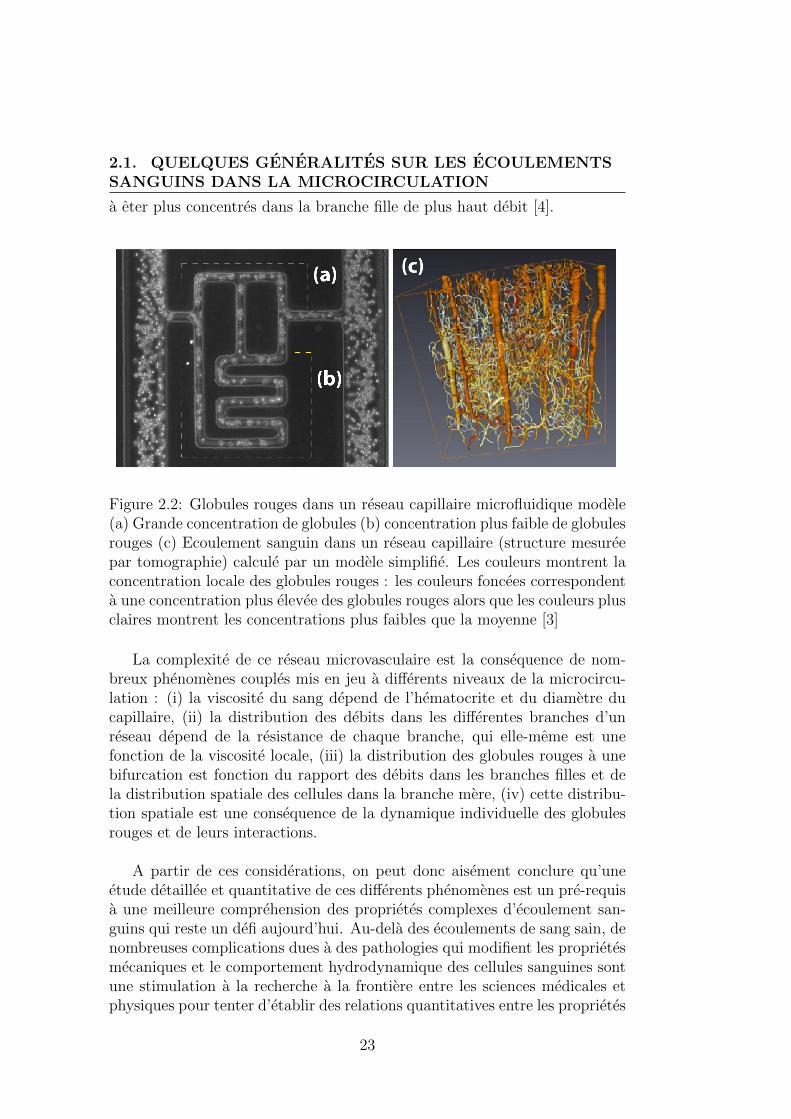
Figure 2.2: Globules rouges dans un reseau capillaire microfluidique modele(a) Grande concentration de globules (b) concentration plus faible de globulesrouges (c) Ecoulement sanguin dans un reseau capillaire (structure mesureepar tomographie) calcule par un modele simplifie. Les couleurs montrent laconcentration locale des globules rouges : les couleurs foncees correspondenta une concentration plus elevee des globules rouges alors que les couleurs plusclaires montrent les concentrations plus faibles que la moyenne [3]
La complexite de ce reseau microvasculaire est la consequence de nom-breux phenomenes couples mis en jeu a differents niveaux de la microcircu-lation : (i) la viscosite du sang depend de l’hematocrite et du diametre ducapillaire, (ii) la distribution des debits dans les differentes branches d’unreseau depend de la resistance de chaque branche, qui elle-meme est unefonction de la viscosite locale, (iii) la distribution des globules rouges a unebifurcation est fonction du rapport des debits dans les branches filles et dela distribution spatiale des cellules dans la branche mere, (iv) cette distribu-tion spatiale est une consequence de la dynamique individuelle des globulesrouges et de leurs interactions.
A partir de ces considerations, on peut donc aisement conclure qu’uneetude detaillee et quantitative de ces differents phenomenes est un pre-requisa une meilleure comprehension des proprietes complexes d’ecoulement san-guins qui reste un defi aujourd’hui. Au-dela des ecoulements de sang sain, denombreuses complications dues a des pathologies qui modifient les proprietesmecaniques et le comportement hydrodynamique des cellules sanguines sontune stimulation a la recherche a la frontiere entre les sciences medicales etphysiques pour tenter d’etablir des relations quantitatives entre les proprietes
23
CHAPTER 2. INTRODUCTION (FRANCAIS)
des cellules et leur comportement dans des ecoulements complexes.
Un exemple saillant, etudie dans notre laboratoire grace au support duCNES, est le probleme de la dysfonction endotheliale. En effet, les vais-seaux sanguins sont recouverts d’une monocouche de cellules endotheliales(endothelium) protegee par une brosse de biopolymeres (glycocalyx). Lesmodifications de l’ecoulement (reduction des contraintes de cisaillement quise produit notamment en microgravite), de meme que les ecoulements derecirculation (qui se produisent aux bifurcations entre vaisseaux sanguins),sont connus pour etre un terrain favorable a la dysfonction endotheliale. Enconsequence de la modification de l’ecoulement, une cascade d’evenements semet en place, comprenant l’activation des plaquettes, le depot de lipides surles parois vasculaires (LDL = faible densite lipoproteins et glycoproteines),la mecanotransduction (activation de genes etc...), ayant tous un impact po-tentiel sur les maladies cardiovasculaires.
2.2 La dynamique des cellules sanguines
A une echelle plus petite que l’ecoulement sanguin global, les globules rougesindividuels montrent une richesse de comportements uniques lies a leursproprietes membranaires particulieres. De riches scenarios de transitionsde forme et de dynamique dans differents types d’ecoulements simples ontete observes, qui conferent au sang des proprietes d’ecoulement etonnanteset non-triviales a plus grande echelle. En presence d’etats inflammatoireset oxydatifes (principalement cardiovasculaires), l’aggregabilite des globulesrouge, leur rigidite et leur adherence sont augmentees, ce qui represente unfrein a l’ecoulement. En ecoulement de cisaillement, ils presentent des mouve-ments particuliers, comme le mouvement de chenille de char (tank-treading)consistant en une forme stationnaire accompagnee d’un mouvement de rota-tion de la membrane [5, 6], ou les mouvements de bascule (tumbling) et de bal-ancier (swinging) [7, 8]. Ce schema riche a deja un impact sur la rheologie dusang : la viscosite effective d’une suspension de globules rouges presente unesignature macroscopique du comportement microscopique dynamique([9].
Dans les petits capillaires dont le diametre est du meme ordre de grandeurque celui des cellules sanguines, celles-ci peuvent presenter une variete deformes (formes de parachute axisymetriques ou formes asymetriques de pan-toufles) [10, 11]. Ces details ont naturellement un impact sur la dissipationd’energie liee a la friction visqueuse et donc sur la rheologie du sang en sit-uation confinee, de meme que sur la capacite des globules rouges a interagirhydrodynamiquement avec les parois ou entre eux pour former des aggregats.
24
2.3. OBJECTIFS ET CONTRIBUTION DE CE TRAVAIL
En effet, a tres petit taux de cisaillement, les globules rouges tendent as’aggreger a cause de forces de depletion favorisees par les proteines du plasmaet forment des structures appelees rouleaux. Ces structures sont responsablesdu comportement rheo-fluidifiant observe a petit taux de cisaillement [12, 13].
2.3 Objectifs et contribution de ce travail
Le principal objectif de cette these est de focaliser sur quelques aspects ducomportement de globules rouges en ecoulement a l’echelle microscopique etde relier cette dynamique aux proprietes aux echelles meso et macroscopiquestelles que la structure de suspensions et leur rheologie.
Afin d’etudier les phenomenes fondamentaux de dynamique individu-elle et collective de globules rouges, nous avons utilise, en plus de globulesrouges reels, un modele simplifie de cellule: la vesicule de phospholipides.Les vesicules sont des membranes lipidique fermees, encapsulant un fluidle interne et generalement en suspension dans une autre solution externe,de maniere analogue aux globules rouges qui sont des enveloppes contenantun fluide visqueux (solution d’hemoglobine) dispersees dans un autre fluide(le plasma). La membrane des vesicules possede des proprietes mecaniquesvoisines de celles des globules rouges. Elles sont faciles a produire, avecdes tailles voisines de celle des globules rouges, sont faciles a manipuleret ne necessitent pas de conditions physiologiques speciales contrairementaux globules rouges. Elles permettent a l’experimentateur de jouer avec desparametres physiques tels que le contraste de viscosite (difference entre lesviscosites interne et externe), le degonflement de la forme. Dans l’etudepresente, nous avons expore des situations decrites ci-dessous avec l’aidede dispositifs microfluidiques reproduisant des conditions d’ecoulement sim-ilaires aux micro-capillaires par certains aspects.
2.3.1 Dynamique de vesicules degonflees
La dynamique de vesicules individuelles a ete etudiee experimentallementpar plusieurs auteurs, theoriquement et numeriquement, pour des vesiculesquasi-spheriques ou moderement degonflees. Dans ces travaux precedents,quatre types de regime dynamique ont ete identifies: tank-treading, tum-bling, vacillating breathing et kayaking. En l’absence de methode fiable pourproduire des vesicules stables significativement degonflees, aucune etude n’aete rapportee sur des vesicules avec des formes similaires aux globules rouges.
25
CHAPTER 2. INTRODUCTION (FRANCAIS)
Nous avons debute une etude experimentale sur la dynamique de vesiculesdegonflees. La motivation est que les etudes precedents ont revele que leregime de tumbling des vesicules ne peut exister qu’en presence d’une differencede viscosite entre les fluides interne et externe. Les premiers resultats de notreetude revelent un mouvement de type tumbling en absence de contraste deviscosite. Ceci pourrait eclairer d’un jour nouveau la dynamique de globulesrouges degonfles et suggerer que la forme en elle-meme est suffisante pourproduire un tel mouvement.
2.3.2 Interaction hydrodynamique entre deux vesicules
L’interaction entre deux objets en suspension dans un fluide a ete etudieesdepuis les annees 1970 pour des gouttes, bulles, particules rigides et cap-sules elastiques. Elles ont montre des deplacements de trajectoires et unerepulsion effective entre les objets pendant les collisions ou interactions enecoulement de cisaillement, ce qui conduit a une diffusion induite par ci-saillement a l’echelle de la suspension. Pour comprendre quantitativementces phenomenes dans le sang et leurs consequences sur la structure de sus-pensions de globules rouges, nous avons realise une etude experiementale del’interaction entre deux vesicules de taille identique. Cette etude sur les inter-actions conduit a des resultats en accord qualitatif avec les etudes precedentessur d’autres systemes et fournit un moyend de deriver des coefficients de diffu-sion macroscopiques a partir de considerations microscopiques. Ceci devraitse montrer utile pour une meilleure comprehension de la structure du sanget de suspensions de vesicules en ecoulement en canal ou la diffusion induitepar cisaillement est en competition avec d’autres effets.
2.3.3 Diffusion induite par cisaillement de globules rou-ges en ecoulement de Poiseuille
Pendant la circulation du sang dans le reseau microvasculaire, la viscositede la suspension depend de la distribution des cellules dans la section descanaux. Dans une approche complementaire au calcul de coefficients de dif-fusion induite par cisaillement a partir de l’analyse d’interactions de paires ensuspension, il est aussi important de trouver des moyens simples de mesurerles effets de cette diffusion dans des situations plus complexes et plus con-centrees. Nous avons etudie la diffusion dans un jet de suspension de globulesrouges dans un canal, a partir de quoi le coefficient de diffusion est estime,cette diffusion etant un phenomene non-lineaire ou la diffusivite est fonctionde la concentration locale et du taux de cisaillement.
26

2.4. ORGANISATION DU MANUSCRIT
2.3.4 Une technique de separation pour le tri en taillede vesicules
De nombreuses etudes sur les vesicules ont ete realisees avec des echantillonspolydisperses. Dans des situations specifiques, y compris certaines de cellesque nous avons etudiees, des echantillons concentres de vesicules monodis-perses sont necessaires: par exemple pour la diffusion ou les interactions depaires de vesicules.
En suivant un principe bien etabli de pinched-flow fractionation, nousavons developpe et optimise un dispositif de tri dedie au tri de vesicules entaille et presentons une caracterisation de ses performances. Un tel dispositifpeut aussi etre utile dans des etudes de rheologie de suspensions concentreesde vesicules monodisperses qui pourraient etre comparees a la rheologie decellules sanguines reelles pour avoir une meilleure idee d’effets quantitatifsdu cytosquelette sur la rheologie.
2.4 Organisation du manuscrit
Le coeur de ce manuscrit est divise en cinq chapitres distincts, de la faconsuivante:
• le chapitre 3 est dedie a une introduction sur les proprietes structurelleset mecaniques des vesicules et globules rouges, et a la physique dusysteme etudie. Nous presentons brievement les methodes et materiauxutilises dans nos experiences. Les techniques de microscopie, l’utilisationde cameras rapides et les dispositifs experimentaux sont introduits.Les differentes etapes de fabrication de dispositifs microfluidiques sontdetailles.
• le chapitre 4 presente notre methodologie experimentale pour produiredes vesicules. Comme par electroformation on obtient des echantillonspolydisperses de vesicules, un dispositif dedie au tri de vesicules enfonction de leur taille a ete developpe. Finalement, les performances etcaracteristiques du dispositif de tri sont decrites en detail.
• dans le chapitre 5, nous proposons une etude detaillee, mais non ex-haustive de l’etat de l’art concernant le comportement de vesicules etglobules rouges (en suspension diluee) en reponse a un ecoulement ex-terne a travers differentes etudes theoriques et experimentales. Dans ladeuxieme section de ce chapitre, nous presentons la methode experime-ntale choisie pour produire des vesicules degonflees. Finalement, lespremieres observations de la dynamique de vesicules degonflees sontdiscutees.
27
CHAPTER 2. INTRODUCTION (FRANCAIS)
• dans le chapitre 6, le phenomene d’interaction hydrodynamique entredeux vesicules en ecoulement de cisaillement est decrit. Pour produiredes interactions entre vesicules dans des conditions convenables, undispositif d’interaction a ete concu pour realiser un ecoulement confined’une suspension de vesicules. La geometrie du dispositif est expliquee.Les resultats sur l’interaction entre vesicules d’une paire isolee sontpresentes et discutes en comparaison avec les resultats theoriques. Unederivation d’un coefficient de diffusion induite par cisaillement a partirde ces premiers resultats est proposee.
• dans le chapitre 7, nous nous focalisons sur la determination du coeffi-cient de diffusion pour des globules rouges en ecoulement de Poiseuilleet sur les proprietes de ce phenomene de diffusion non-lineaire. Desresultats experimentaux ainsi qu’une etude theorique sont presentes.
28
Chapter 3
Vesicles & Red Blood Cells
Ce chapitre introduit les proprietes structurelles et mecaniques de vesiculeset globules rouges. Une breve explication des quelques parametres physiquesresponsables de la dynamique de vesicules est presentee. Finalement lesmethodes experimentales sont decrites.
This chapter introduces the structural and mechanical properties of vesi-cles and red blood cells. A brief explanation of few physical parametersresponsible for dynamics of vesicles is presented. Finally, an overview of ourexperimental approach is described.
3.1 Vesicles
A vesicle is a closed lipid membrane encapsulating an internal fluid andsuspended in an external aqueous environment. Its size varies from a fewnanometers to hundreds of micrometers in diameter. The cell membrane isselectively permeable to ions and organic molecules. Due to this property itcontrols the movement of substances in and out of cell. Vesicle exhibits ma-jor physical and mechanical properties similar to most biological cells. Theyare easy to produce and their properties such as size, structure and capa-bility to influence internal and external fluid component can be controlled,hence they can be use to mimic certain aspects of biomembranes. Thereforeit is essential to know how their membrane structure plays an importantrole in understanding many physical phenomena like deformation and theirdynamics.
29
CHAPTER 3. VESICLES & RED BLOOD CELLS
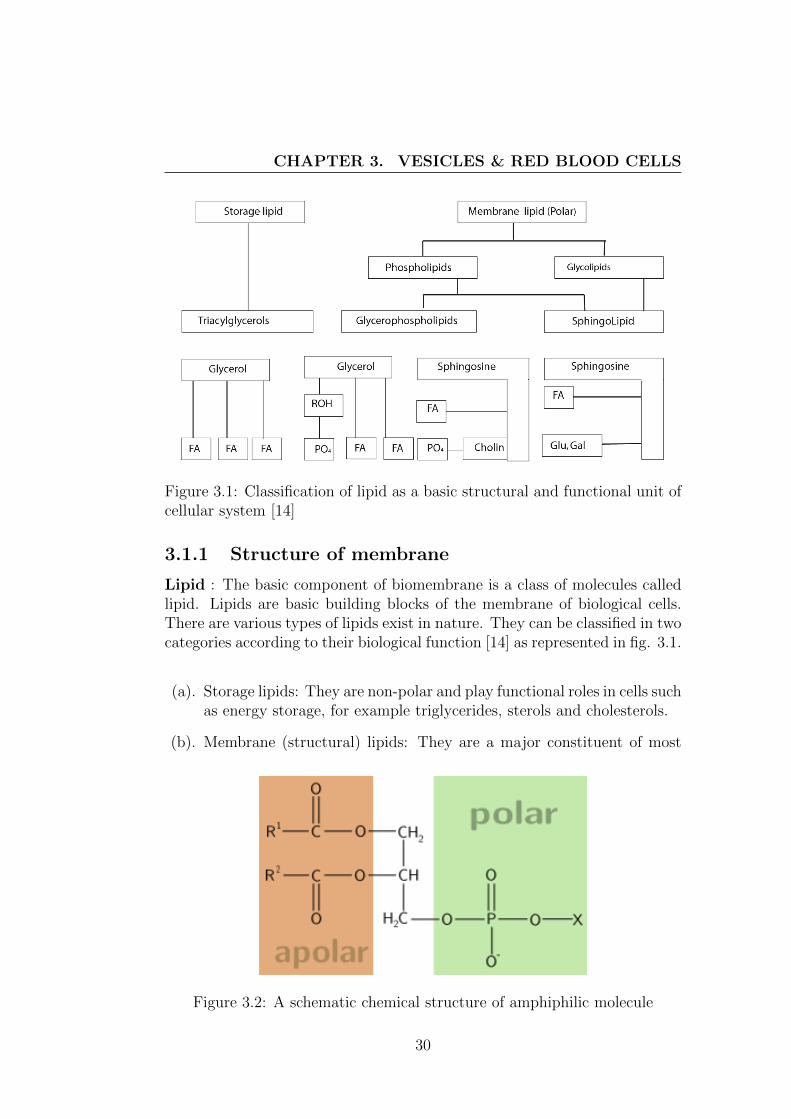
Figure 3.1: Classification of lipid as a basic structural and functional unit ofcellular system [14]
3.1.1 Structure of membrane
Lipid : The basic component of biomembrane is a class of molecules calledlipid. Lipids are basic building blocks of the membrane of biological cells.There are various types of lipids exist in nature. They can be classified in twocategories according to their biological function [14] as represented in fig. 3.1.
(a). Storage lipids: They are non-polar and play functional roles in cells suchas energy storage, for example triglycerides, sterols and cholesterols.
(b). Membrane (structural) lipids: They are a major constituent of most
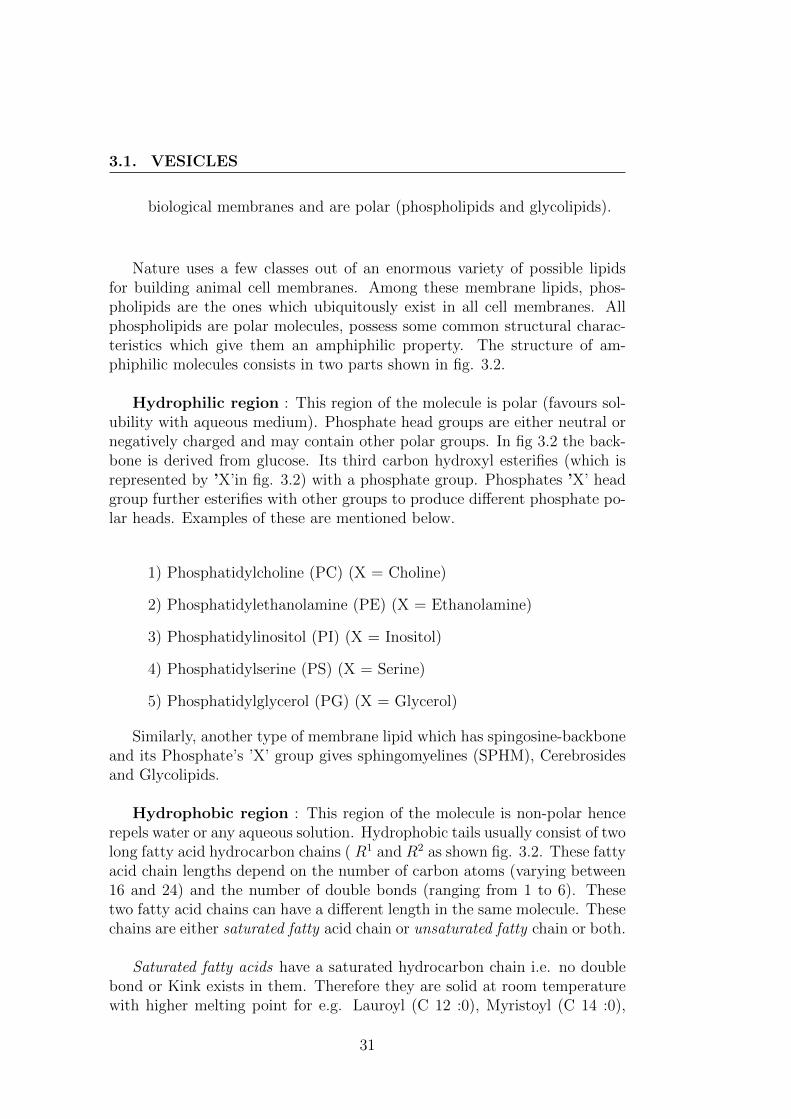
Figure 3.2: A schematic chemical structure of amphiphilic molecule
30
3.1. VESICLES
biological membranes and are polar (phospholipids and glycolipids).
Nature uses a few classes out of an enormous variety of possible lipidsfor building animal cell membranes. Among these membrane lipids, phos-pholipids are the ones which ubiquitously exist in all cell membranes. Allphospholipids are polar molecules, possess some common structural charac-teristics which give them an amphiphilic property. The structure of am-phiphilic molecules consists in two parts shown in fig. 3.2.
Hydrophilic region : This region of the molecule is polar (favours sol-ubility with aqueous medium). Phosphate head groups are either neutral ornegatively charged and may contain other polar groups. In fig 3.2 the back-bone is derived from glucose. Its third carbon hydroxyl esterifies (which isrepresented by ’X’in fig. 3.2) with a phosphate group. Phosphates ’X’ headgroup further esterifies with other groups to produce different phosphate po-lar heads. Examples of these are mentioned below.
1) Phosphatidylcholine (PC) (X = Choline)
2) Phosphatidylethanolamine (PE) (X = Ethanolamine)
3) Phosphatidylinositol (PI) (X = Inositol)
4) Phosphatidylserine (PS) (X = Serine)
5) Phosphatidylglycerol (PG) (X = Glycerol)
Similarly, another type of membrane lipid which has spingosine-backboneand its Phosphate’s ’X’ group gives sphingomyelines (SPHM), Cerebrosidesand Glycolipids.
Hydrophobic region : This region of the molecule is non-polar hencerepels water or any aqueous solution. Hydrophobic tails usually consist of twolong fatty acid hydrocarbon chains ( R1 and R2 as shown fig. 3.2. These fattyacid chain lengths depend on the number of carbon atoms (varying between16 and 24) and the number of double bonds (ranging from 1 to 6). Thesetwo fatty acid chains can have a different length in the same molecule. Thesechains are either saturated fatty acid chain or unsaturated fatty chain or both.
Saturated fatty acids have a saturated hydrocarbon chain i.e. no doublebond or Kink exists in them. Therefore they are solid at room temperaturewith higher melting point for e.g. Lauroyl (C 12 :0), Myristoyl (C 14 :0),
31
CHAPTER 3. VESICLES & RED BLOOD CELLS
Palmitoyl (C 16 :0), Stearoyl (C 18 : 0) and Arachidoyl (C 20 :0).
Unsaturated fatty acids have cis or trans double bond which disrupts in-termolecular packing and therefore have a lower melting point (melting pointdecreases when the number of unsaturated hydrocarbons or double bond in-creases) for e.g. Palmitoleoyl (C 16 :1) and Oleoyl (C 18 :1). In addition,chain lengths and their unsaturation have an impact on membrane deforma-tion
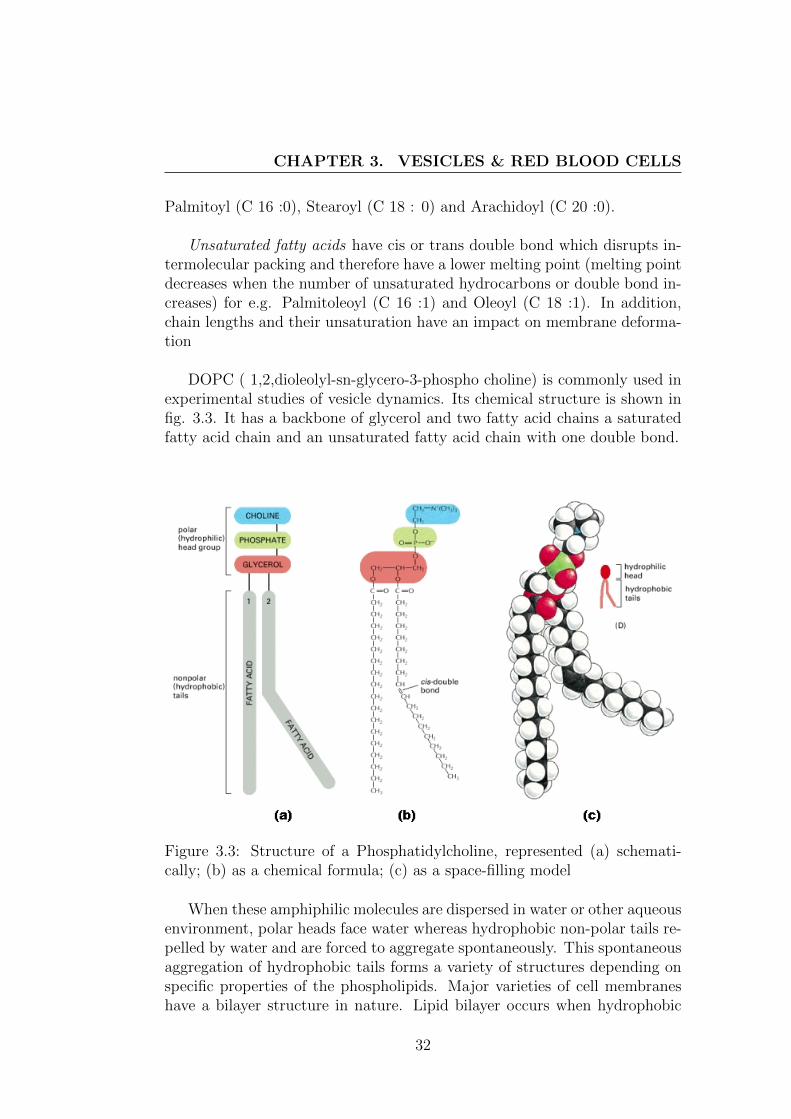
DOPC ( 1,2,dioleolyl-sn-glycero-3-phospho choline) is commonly used inexperimental studies of vesicle dynamics. Its chemical structure is shown infig. 3.3. It has a backbone of glycerol and two fatty acid chains a saturatedfatty acid chain and an unsaturated fatty acid chain with one double bond.
Figure 3.3: Structure of a Phosphatidylcholine, represented (a) schemati-cally; (b) as a chemical formula; (c) as a space-filling model
When these amphiphilic molecules are dispersed in water or other aqueousenvironment, polar heads face water whereas hydrophobic non-polar tails re-pelled by water and are forced to aggregate spontaneously. This spontaneousaggregation of hydrophobic tails forms a variety of structures depending onspecific properties of the phospholipids. Major varieties of cell membraneshave a bilayer structure in nature. Lipid bilayer occurs when hydrophobic
32
3.1. VESICLES
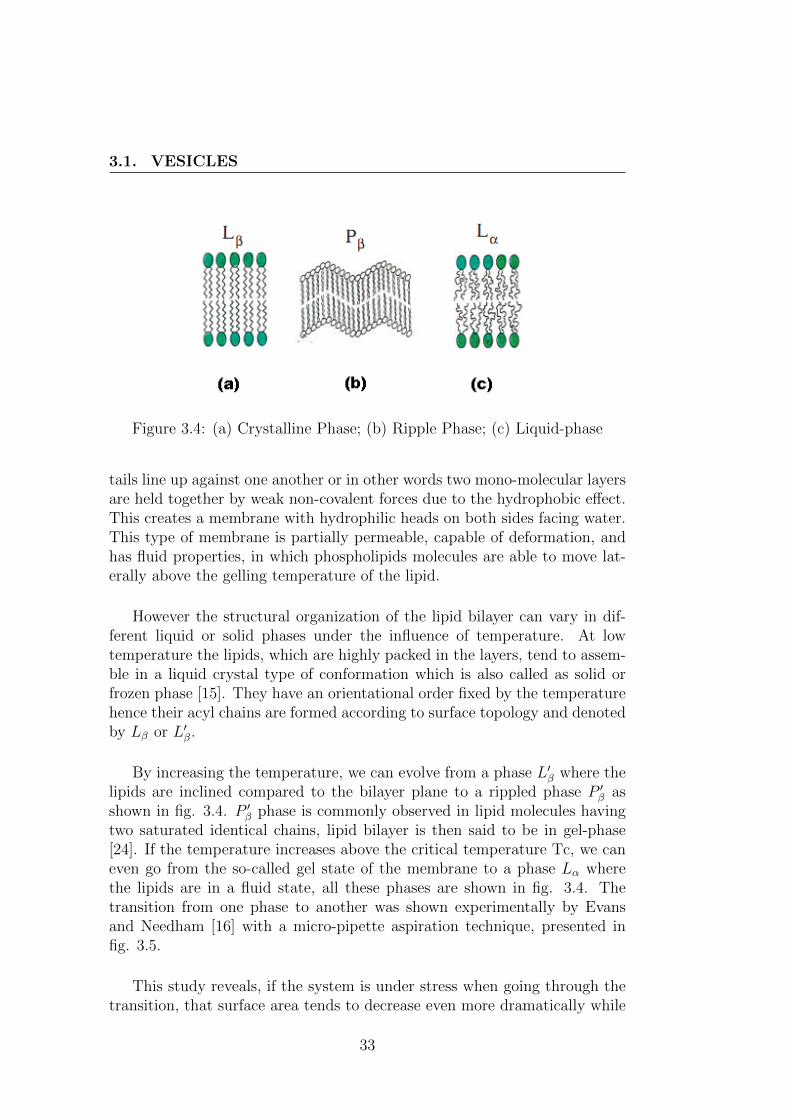
Figure 3.4: (a) Crystalline Phase; (b) Ripple Phase; (c) Liquid-phase
tails line up against one another or in other words two mono-molecular layersare held together by weak non-covalent forces due to the hydrophobic effect.This creates a membrane with hydrophilic heads on both sides facing water.This type of membrane is partially permeable, capable of deformation, andhas fluid properties, in which phospholipids molecules are able to move lat-erally above the gelling temperature of the lipid.
However the structural organization of the lipid bilayer can vary in dif-ferent liquid or solid phases under the influence of temperature. At lowtemperature the lipids, which are highly packed in the layers, tend to assem-ble in a liquid crystal type of conformation which is also called as solid orfrozen phase [15]. They have an orientational order fixed by the temperaturehence their acyl chains are formed according to surface topology and denotedby Lβ or L′β.
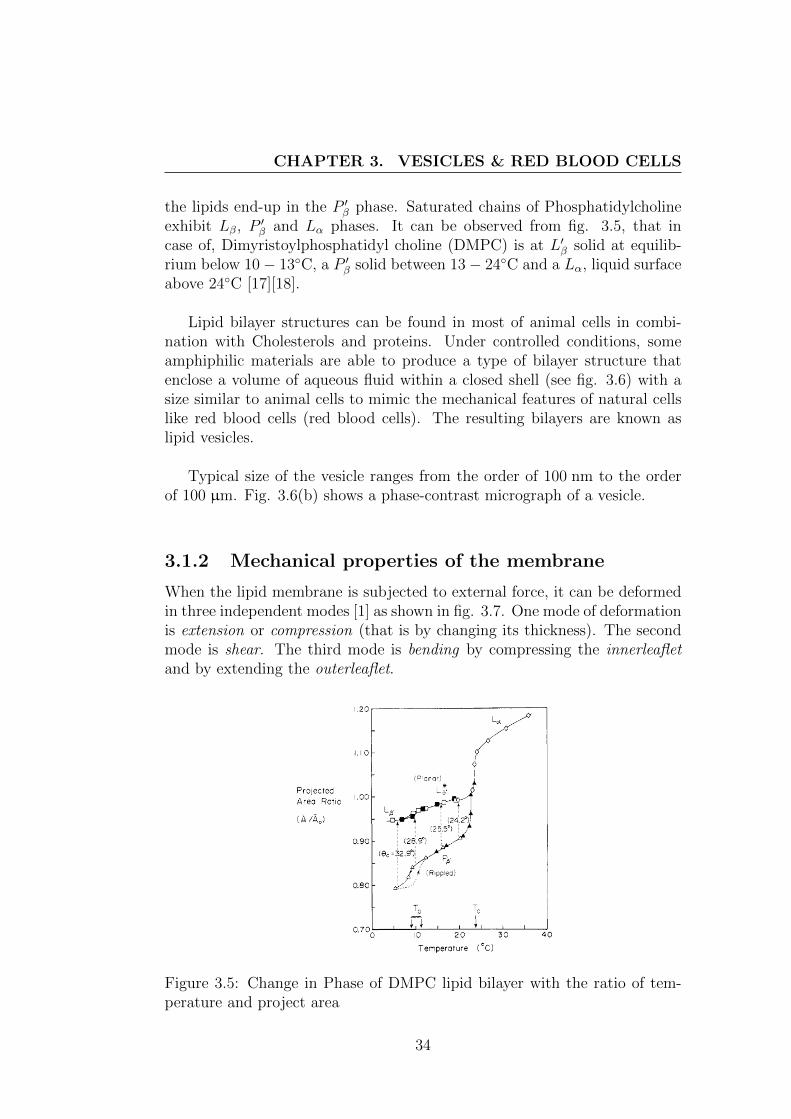
By increasing the temperature, we can evolve from a phase L′β where thelipids are inclined compared to the bilayer plane to a rippled phase P ′β asshown in fig. 3.4. P ′β phase is commonly observed in lipid molecules havingtwo saturated identical chains, lipid bilayer is then said to be in gel-phase[24]. If the temperature increases above the critical temperature Tc, we caneven go from the so-called gel state of the membrane to a phase Lα wherethe lipids are in a fluid state, all these phases are shown in fig. 3.4. Thetransition from one phase to another was shown experimentally by Evansand Needham [16] with a micro-pipette aspiration technique, presented infig. 3.5.
This study reveals, if the system is under stress when going through thetransition, that surface area tends to decrease even more dramatically while
33
CHAPTER 3. VESICLES & RED BLOOD CELLS
the lipids end-up in the P ′β phase. Saturated chains of Phosphatidylcholineexhibit Lβ, P ′β and Lα phases. It can be observed from fig. 3.5, that incase of, Dimyristoylphosphatidyl choline (DMPC) is at L′β solid at equilib-rium below 10− 13◦C, a P ′β solid between 13− 24◦C and a Lα, liquid surfaceabove 24◦C [17][18].
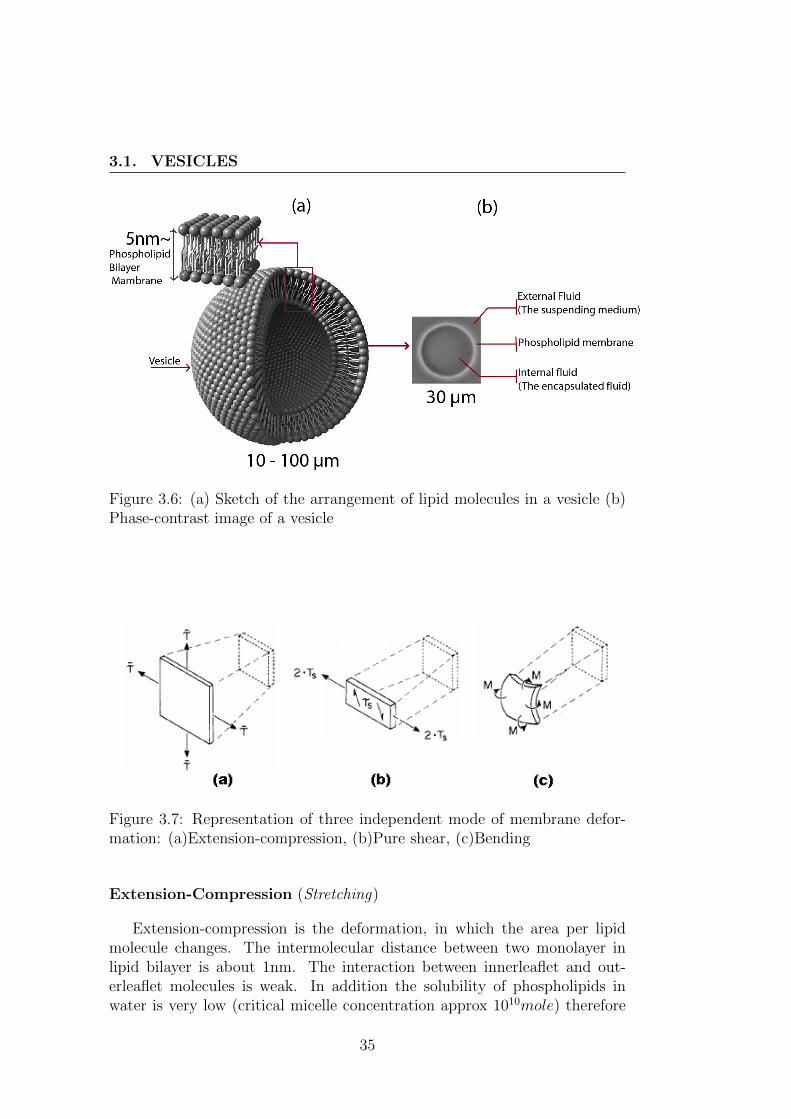
Lipid bilayer structures can be found in most of animal cells in combi-nation with Cholesterols and proteins. Under controlled conditions, someamphiphilic materials are able to produce a type of bilayer structure thatenclose a volume of aqueous fluid within a closed shell (see fig. 3.6) with asize similar to animal cells to mimic the mechanical features of natural cellslike red blood cells (red blood cells). The resulting bilayers are known aslipid vesicles.
Typical size of the vesicle ranges from the order of 100 nm to the orderof 100 µm. Fig. 3.6(b) shows a phase-contrast micrograph of a vesicle.
3.1.2 Mechanical properties of the membrane
When the lipid membrane is subjected to external force, it can be deformedin three independent modes [1] as shown in fig. 3.7. One mode of deformationis extension or compression (that is by changing its thickness). The secondmode is shear. The third mode is bending by compressing the innerleafletand by extending the outerleaflet.
Figure 3.5: Change in Phase of DMPC lipid bilayer with the ratio of tem-perature and project area
34
3.1. VESICLES
Figure 3.6: (a) Sketch of the arrangement of lipid molecules in a vesicle (b)Phase-contrast image of a vesicle
Figure 3.7: Representation of three independent mode of membrane defor-mation: (a)Extension-compression, (b)Pure shear, (c)Bending
Extension-Compression (Stretching)
Extension-compression is the deformation, in which the area per lipidmolecule changes. The intermolecular distance between two monolayer inlipid bilayer is about 1nm. The interaction between innerleaflet and out-erleaflet molecules is weak. In addition the solubility of phospholipids inwater is very low (critical micelle concentration approx 1010mole) therefore
35
CHAPTER 3. VESICLES & RED BLOOD CELLS
to balance this energy there can not be any exchange between the bilayerand the external environment. In other words the extension or stretching isa measure of the energy necessary to change a unit area of the membraneand maintain the cohesion between the lipids of the membrane [19]. Theextension/compression energy Eextension is given by,
Eextension =1
2χ
(∆A
A0
)(3.1)
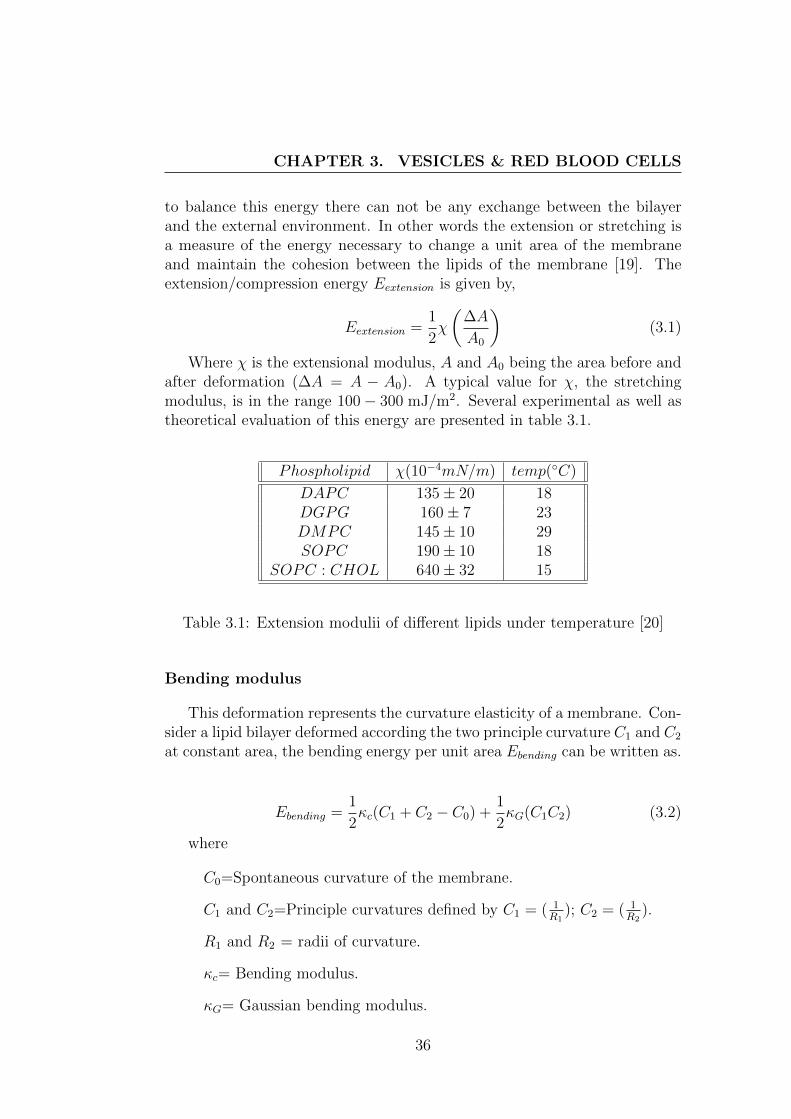
Where χ is the extensional modulus, A and A0 being the area before andafter deformation (∆A = A − A0). A typical value for χ, the stretchingmodulus, is in the range 100− 300 mJ/m2. Several experimental as well astheoretical evaluation of this energy are presented in table 3.1.
Phospholipid χ(10−4mN/m) temp(◦C)
DAPC 135± 20 18DGPG 160± 7 23DMPC 145± 10 29SOPC 190± 10 18
SOPC : CHOL 640± 32 15
Table 3.1: Extension modulii of different lipids under temperature [20]
Bending modulus
This deformation represents the curvature elasticity of a membrane. Con-sider a lipid bilayer deformed according the two principle curvature C1 and C2
at constant area, the bending energy per unit area Ebending can be written as.
Ebending =1
2κc(C1 + C2 − C0) +
1
2κG(C1C2) (3.2)
where
C0=Spontaneous curvature of the membrane.
C1 and C2=Principle curvatures defined by C1 = ( 1R1
); C2 = ( 1R2
).
R1 and R2 = radii of curvature.
κc= Bending modulus.
κG= Gaussian bending modulus.
36
3.1. VESICLES
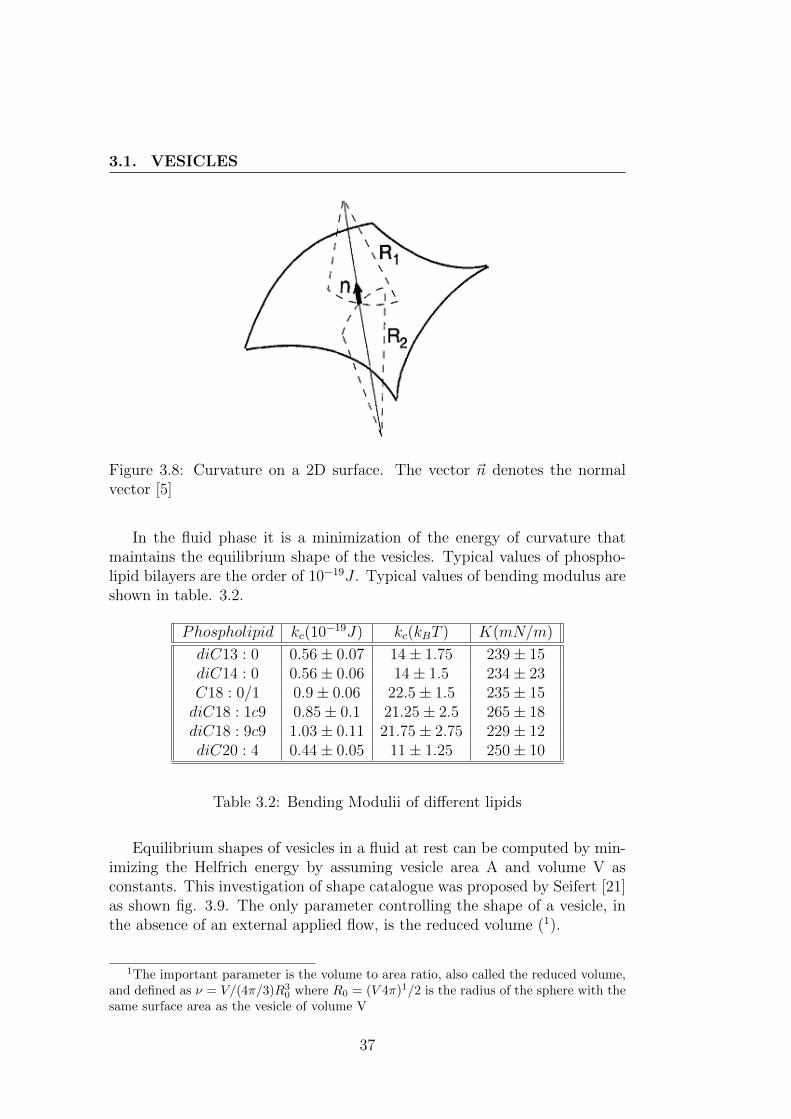
Figure 3.8: Curvature on a 2D surface. The vector ~n denotes the normalvector [5]
In the fluid phase it is a minimization of the energy of curvature thatmaintains the equilibrium shape of the vesicles. Typical values of phospho-lipid bilayers are the order of 10−19J . Typical values of bending modulus areshown in table. 3.2.
Phospholipid kc(10−19J) kc(kBT ) K(mN/m)
diC13 : 0 0.56± 0.07 14± 1.75 239± 15diC14 : 0 0.56± 0.06 14± 1.5 234± 23C18 : 0/1 0.9± 0.06 22.5± 1.5 235± 15diC18 : 1c9 0.85± 0.1 21.25± 2.5 265± 18diC18 : 9c9 1.03± 0.11 21.75± 2.75 229± 12diC20 : 4 0.44± 0.05 11± 1.25 250± 10
Table 3.2: Bending Modulii of different lipids
Equilibrium shapes of vesicles in a fluid at rest can be computed by min-imizing the Helfrich energy by assuming vesicle area A and volume V asconstants. This investigation of shape catalogue was proposed by Seifert [21]as shown fig. 3.9. The only parameter controlling the shape of a vesicle, inthe absence of an external applied flow, is the reduced volume (1).
1The important parameter is the volume to area ratio, also called the reduced volume,and defined as ν = V/(4π/3)R3
0 where R0 = (V 4π)1/2 is the radius of the sphere with thesame surface area as the vesicle of volume V
37
CHAPTER 3. VESICLES & RED BLOOD CELLS
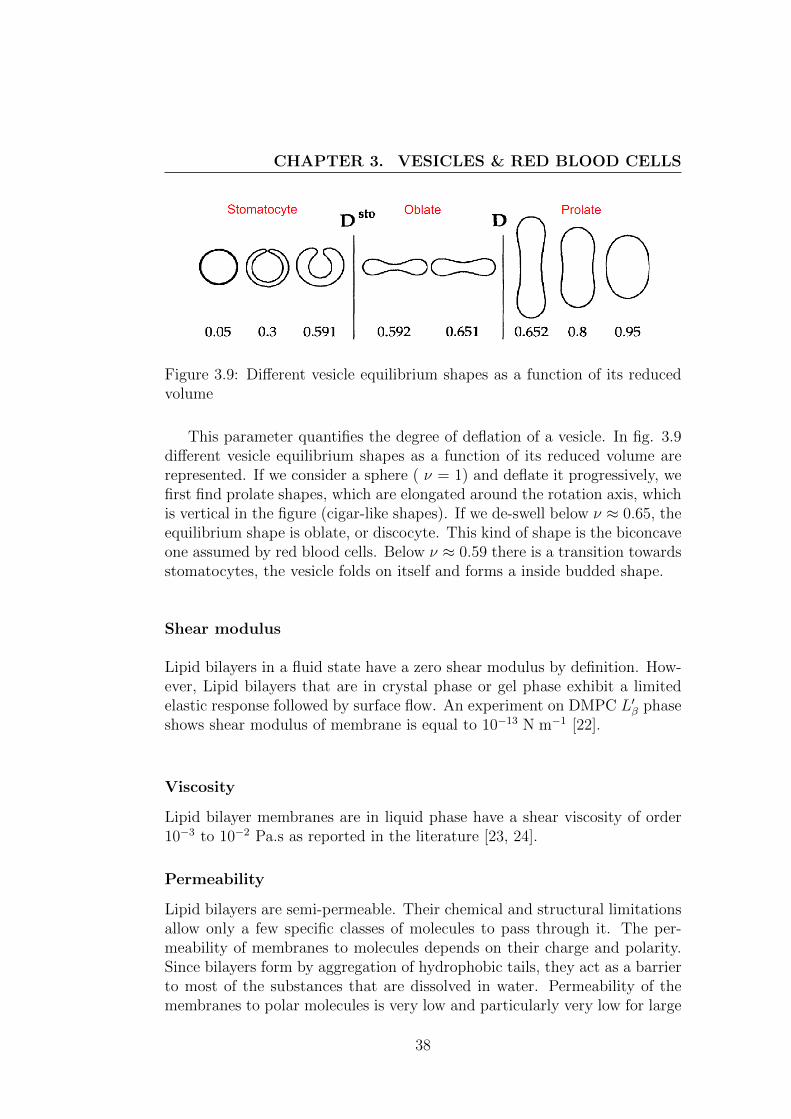
Figure 3.9: Different vesicle equilibrium shapes as a function of its reducedvolume
This parameter quantifies the degree of deflation of a vesicle. In fig. 3.9different vesicle equilibrium shapes as a function of its reduced volume arerepresented. If we consider a sphere ( ν = 1) and deflate it progressively, wefirst find prolate shapes, which are elongated around the rotation axis, whichis vertical in the figure (cigar-like shapes). If we de-swell below ν ≈ 0.65, theequilibrium shape is oblate, or discocyte. This kind of shape is the biconcaveone assumed by red blood cells. Below ν ≈ 0.59 there is a transition towardsstomatocytes, the vesicle folds on itself and forms a inside budded shape.
Shear modulus
Lipid bilayers in a fluid state have a zero shear modulus by definition. How-ever, Lipid bilayers that are in crystal phase or gel phase exhibit a limitedelastic response followed by surface flow. An experiment on DMPC L′β phaseshows shear modulus of membrane is equal to 10−13 N m−1 [22].
Viscosity
Lipid bilayer membranes are in liquid phase have a shear viscosity of order10−3 to 10−2 Pa.s as reported in the literature [23, 24].
Permeability
Lipid bilayers are semi-permeable. Their chemical and structural limitationsallow only a few specific classes of molecules to pass through it. The per-meability of membranes to molecules depends on their charge and polarity.Since bilayers form by aggregation of hydrophobic tails, they act as a barrierto most of the substances that are dissolved in water. Permeability of themembranes to polar molecules is very low and particularly very low for large
38
3.1. VESICLES
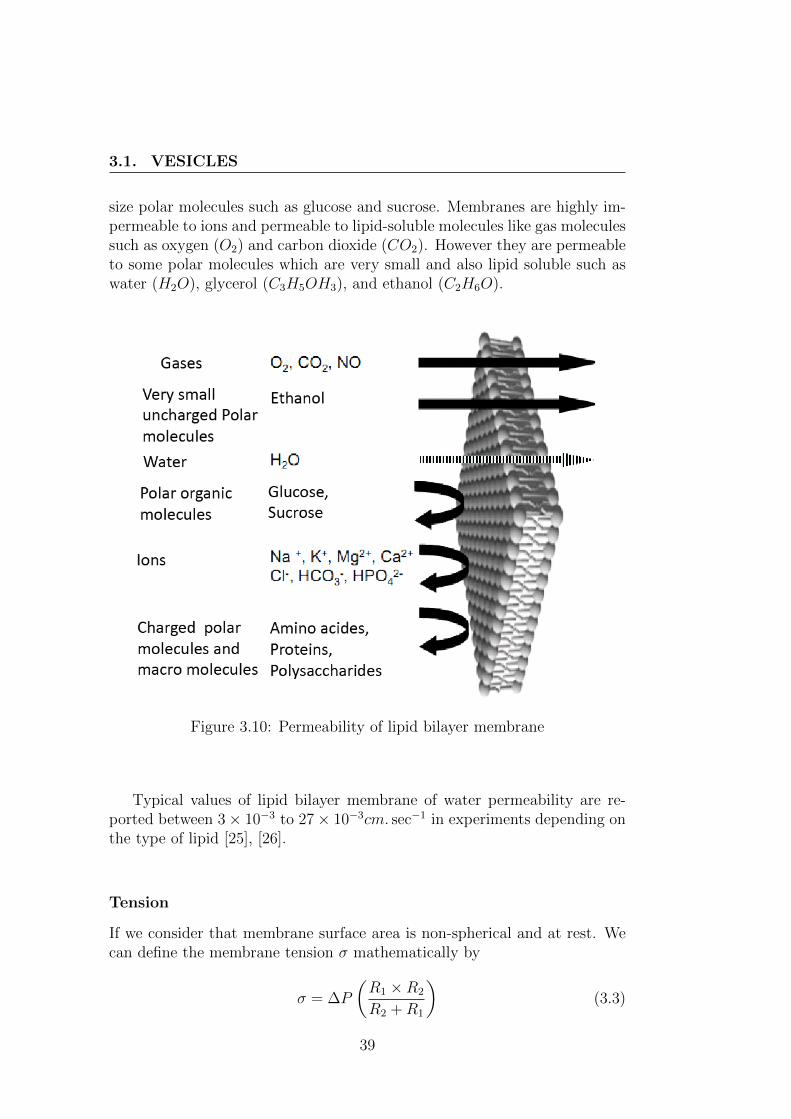
size polar molecules such as glucose and sucrose. Membranes are highly im-permeable to ions and permeable to lipid-soluble molecules like gas moleculessuch as oxygen (O2) and carbon dioxide (CO2). However they are permeableto some polar molecules which are very small and also lipid soluble such aswater (H2O), glycerol (C3H5OH3), and ethanol (C2H6O).
Figure 3.10: Permeability of lipid bilayer membrane
Typical values of lipid bilayer membrane of water permeability are re-ported between 3× 10⁻³ to 27× 10−3cm. sec−1 in experiments depending onthe type of lipid [25], [26].
Tension
If we consider that membrane surface area is non-spherical and at rest. Wecan define the membrane tension σ mathematically by
σ = ∆P
(R1 ×R2
R2 +R1
)(3.3)
39
CHAPTER 3. VESICLES & RED BLOOD CELLS
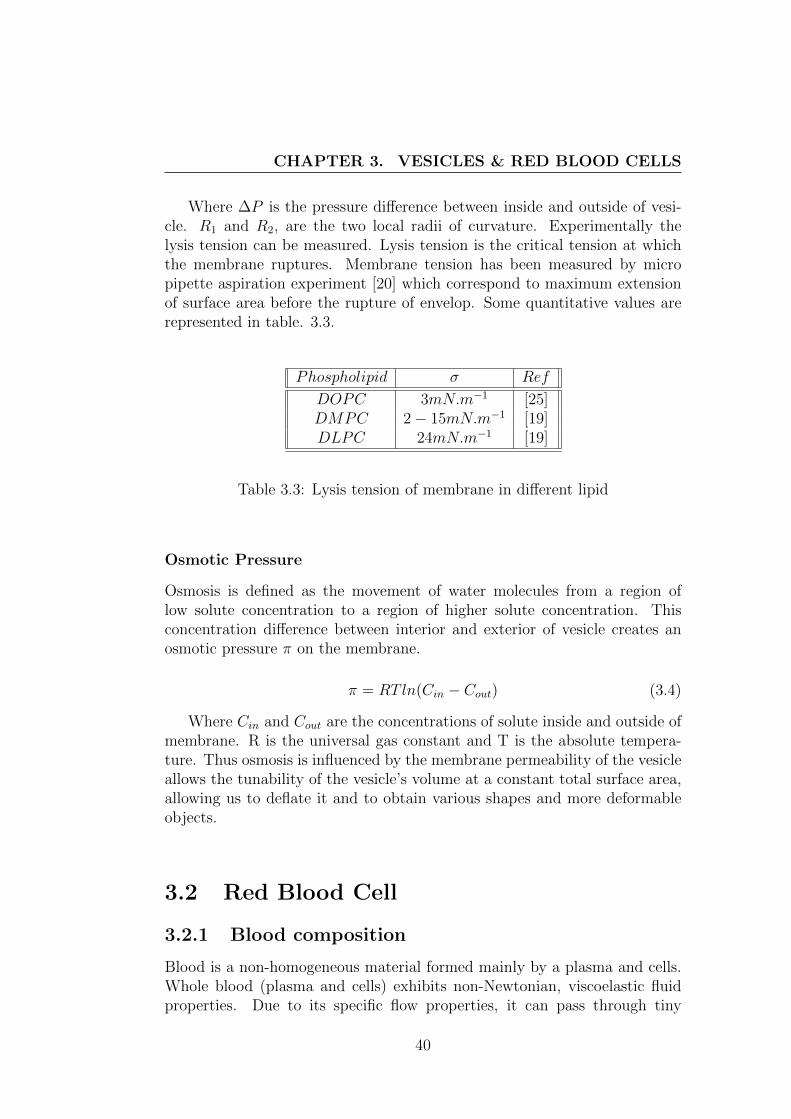
Where ∆P is the pressure difference between inside and outside of vesi-cle. R1 and R2, are the two local radii of curvature. Experimentally thelysis tension can be measured. Lysis tension is the critical tension at whichthe membrane ruptures. Membrane tension has been measured by micropipette aspiration experiment [20] which correspond to maximum extensionof surface area before the rupture of envelop. Some quantitative values arerepresented in table. 3.3.
Phospholipid σ Ref
DOPC 3mN.m−1 [25]DMPC 2− 15mN.m−1 [19]DLPC 24mN.m−1 [19]
Table 3.3: Lysis tension of membrane in different lipid
Osmotic Pressure
Osmosis is defined as the movement of water molecules from a region oflow solute concentration to a region of higher solute concentration. Thisconcentration difference between interior and exterior of vesicle creates anosmotic pressure π on the membrane.
π = RTln(Cin − Cout) (3.4)
Where Cin and Cout are the concentrations of solute inside and outside ofmembrane. R is the universal gas constant and T is the absolute tempera-ture. Thus osmosis is influenced by the membrane permeability of the vesicleallows the tunability of the vesicle’s volume at a constant total surface area,allowing us to deflate it and to obtain various shapes and more deformableobjects.
3.2 Red Blood Cell
3.2.1 Blood composition
Blood is a non-homogeneous material formed mainly by a plasma and cells.Whole blood (plasma and cells) exhibits non-Newtonian, viscoelastic fluidproperties. Due to its specific flow properties, it can pass through tiny
40
3.2. RED BLOOD CELL
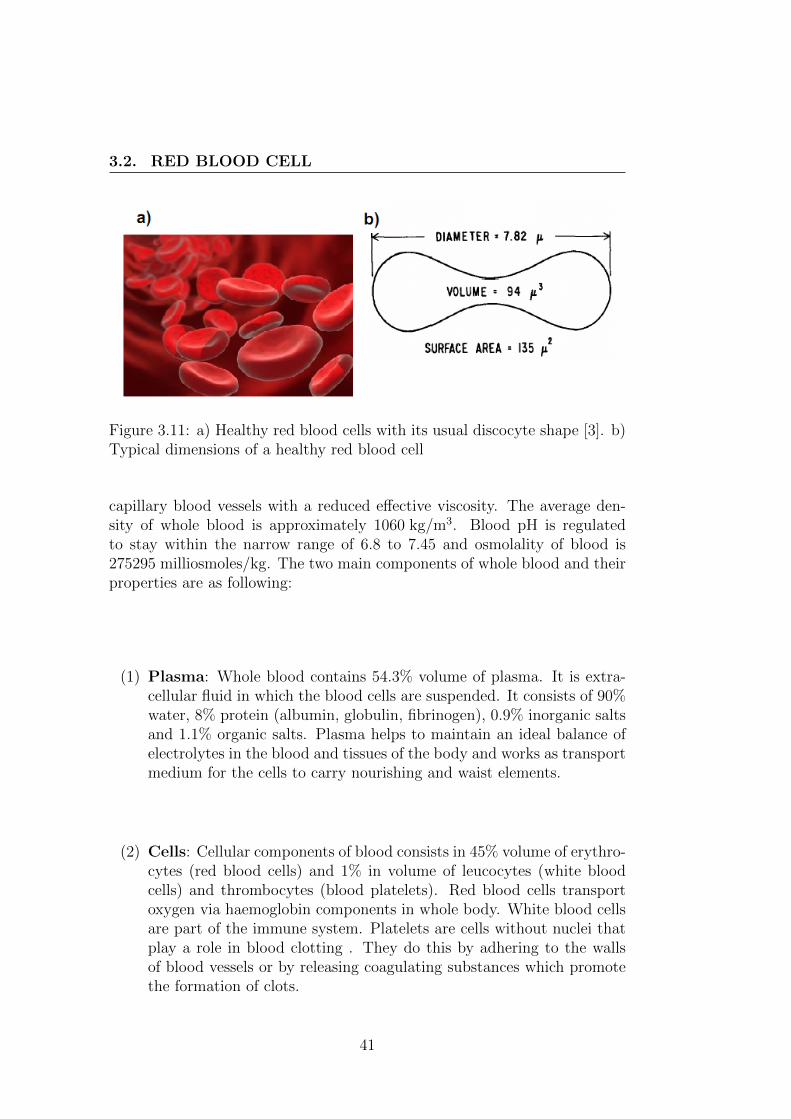
Figure 3.11: a) Healthy red blood cells with its usual discocyte shape [3]. b)Typical dimensions of a healthy red blood cell
capillary blood vessels with a reduced effective viscosity. The average den-sity of whole blood is approximately 1060 kg/m3. Blood pH is regulatedto stay within the narrow range of 6.8 to 7.45 and osmolality of blood is275295 milliosmoles/kg. The two main components of whole blood and theirproperties are as following:
(1) Plasma: Whole blood contains 54.3% volume of plasma. It is extra-cellular fluid in which the blood cells are suspended. It consists of 90%water, 8% protein (albumin, globulin, fibrinogen), 0.9% inorganic saltsand 1.1% organic salts. Plasma helps to maintain an ideal balance ofelectrolytes in the blood and tissues of the body and works as transportmedium for the cells to carry nourishing and waist elements.
(2) Cells: Cellular components of blood consists in 45% volume of erythro-cytes (red blood cells) and 1% in volume of leucocytes (white bloodcells) and thrombocytes (blood platelets). Red blood cells transportoxygen via haemoglobin components in whole body. White blood cellsare part of the immune system. Platelets are cells without nuclei thatplay a role in blood clotting . They do this by adhering to the wallsof blood vessels or by releasing coagulating substances which promotethe formation of clots.
41
CHAPTER 3. VESICLES & RED BLOOD CELLS
3.2.2 Structure and composition of a red blood cell
The shape of a red blood cell is a biconcave disc as shown in fig. 3.11. A redblood cell measures about 6 to 8 micrometers in diameter (average = 7.8 µm)with an average thickness of 2 micrometers (2.5 µm) at the thickest point andless than 1 µm at the center. Although a red blood cell is wider than somecapillaries, its flexibility allows it to become distorted as it squeezes throughnarrow passages and then restores to its original shape. red blood cell cansqueeze to pass through a small capillary of diameter 5 µm. In contrast withother living cells, red blood cells do not have a nucleus and organelles andcontains a hemoglobin solution. Except external shape and size it possessessome important structural complexities which separate it from other livingcells.
3.2.3 Mechanical properties of the red blood cell
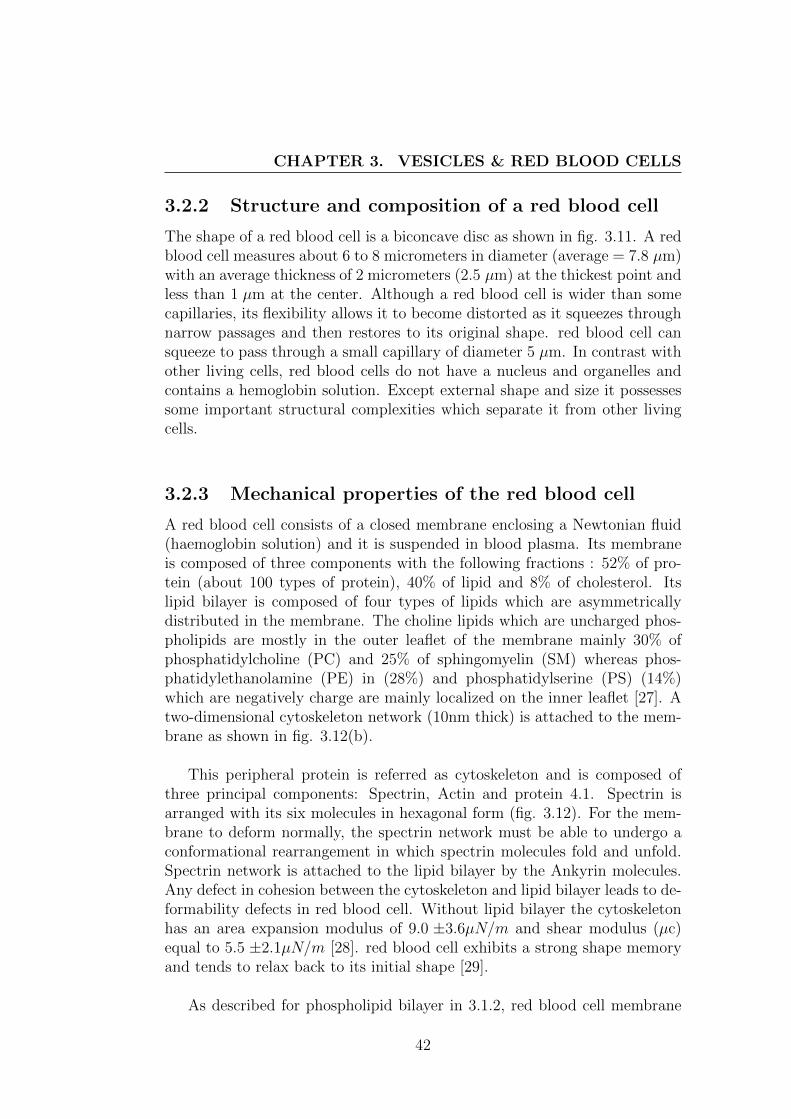
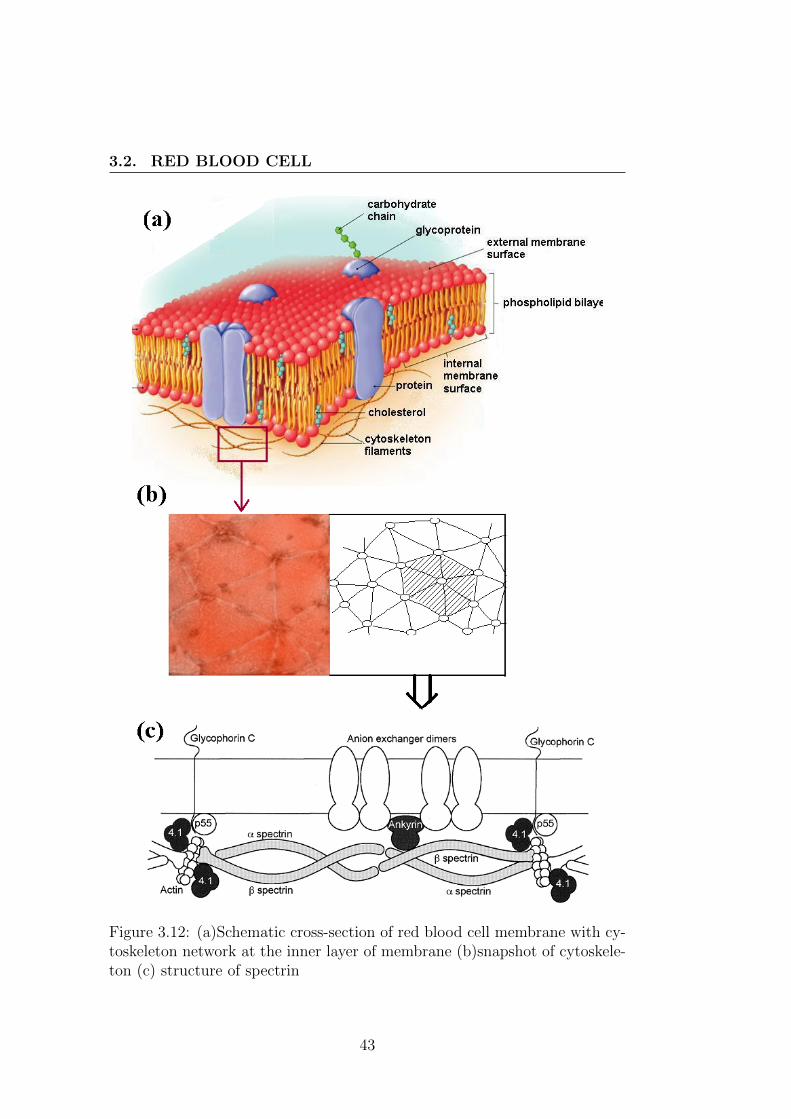
A red blood cell consists of a closed membrane enclosing a Newtonian fluid(haemoglobin solution) and it is suspended in blood plasma. Its membraneis composed of three components with the following fractions : 52% of pro-tein (about 100 types of protein), 40% of lipid and 8% of cholesterol. Itslipid bilayer is composed of four types of lipids which are asymmetricallydistributed in the membrane. The choline lipids which are uncharged phos-pholipids are mostly in the outer leaflet of the membrane mainly 30% ofphosphatidylcholine (PC) and 25% of sphingomyelin (SM) whereas phos-phatidylethanolamine (PE) in (28%) and phosphatidylserine (PS) (14%)which are negatively charge are mainly localized on the inner leaflet [27]. Atwo-dimensional cytoskeleton network (10nm thick) is attached to the mem-brane as shown in fig. 3.12(b).
This peripheral protein is referred as cytoskeleton and is composed ofthree principal components: Spectrin, Actin and protein 4.1. Spectrin isarranged with its six molecules in hexagonal form (fig. 3.12). For the mem-brane to deform normally, the spectrin network must be able to undergo aconformational rearrangement in which spectrin molecules fold and unfold.Spectrin network is attached to the lipid bilayer by the Ankyrin molecules.Any defect in cohesion between the cytoskeleton and lipid bilayer leads to de-formability defects in red blood cell. Without lipid bilayer the cytoskeletonhas an area expansion modulus of 9.0 ±3.6µN/m and shear modulus (µc)equal to 5.5 ±2.1µN/m [28]. red blood cell exhibits a strong shape memoryand tends to relax back to its initial shape [29].
As described for phospholipid bilayer in 3.1.2, red blood cell membrane
42
3.2. RED BLOOD CELL
Figure 3.12: (a)Schematic cross-section of red blood cell membrane with cy-toskeleton network at the inner layer of membrane (b)snapshot of cytoskele-ton (c) structure of spectrin
43
CHAPTER 3. VESICLES & RED BLOOD CELLS
also exhibits deformations in three independent modes. A ”shear” of themembrane without either increasing the surface area or bending at roomtemperature, µ = 6− 9 ×10⁻³mN/m [30]. A dilation (isotropic expansion)of the membrane surface without either shearing or bending it, results inarea expansion with a modulus K = 450 mN/m at room temperature with astandard deviation of about ±15− 20% [31]. Erythrocyte’s membrane showsbending deformation of order 10−19mN/m [30].
An experimental evidence has shown viscoelasticity (η) of red blood cellsof the order of 10−3mNs/m [32]. The membrane of erythrocytes shows highpermeability to water [33] and small molecules [34] similarly lipid bilayers.
3.3 Parameter under study
In the context of the study of hydrodynamic properties of vesicles and redblood cells, few dimensionless parameters are commonly used in many theo-retical and experimental studies. These parameters are presented below:
1)Viscosity contrast, (λ):The viscosity contrast is the ratio between the internal viscosity (ηin)
and the external viscosity (ηout) :
λ =ηinηout
(3.5)
2)Capillary number, (Ca):
Ca =τshapeτflow
=ηextR
30
κγ (3.6)
The capillary number, is defined as the ratio between two characteristictime scales, the shearing time, τflow = 1/γ, where γ is the shear rate,and the typical time needed for a vesicle to reach its equilibrium shapeafter cessation of the flow, τshape = ηextR
30/κ where κ is the membrane
bending rigidity. Typical values from experimental investigations ofvesicles lie roughly in the range of Ca∼ 1− 103.
3)Excess area, (∆):
∆ =A− 4πR2
0
R20
(3.7)
44
3.3. PARAMETER UNDER STUDY
where A is the vesicle area and R0 is the radius of a sphere having thesame volume as the vesicle. ∆ = 0 for a sphere, and ∆ > 0 for deflatedenvelopes like human red blood cells, where ∆ = 5. The deflation of avesicle can also be characterized by the reduced volume, ν:
ν =Volume
Volume of sphere of same surface=
3V
4πR30
≤ 1 (3.8)
where
R0 =√
A/4π (3.9)
The relation between reduced volume (ν) and excess area (∆) is
∆ = 4π(ν−2/3 − 1) (3.10)
For a two-dimensional vesicle (a model often used in theoretical works)the reduced volume is defined as the ratio of the area of the vesicle Ato the area of a circle having the same perimeter P as the vesicle:
τ2D =4πA
P 2(3.11)
4)Reynolds number, (Re):
This dimensionless number represents the relative importance of iner-tial and viscous effects in flow, and is defined as:
Re =ρLυ
η
where ρ and η are the density and the viscosity of the fluid in motion,respectively, L is the characteristic length of the system and υ the speedof the object. In most situations that are involve in flow at moderatevelocities and small scales, the Reynold number is low ((10−5− 10−3)).
45
CHAPTER 3. VESICLES & RED BLOOD CELLS
3.4 Visualization of vesicles and red blood
cell
Since the objects that we are studying are micron-size (from 5 to 200 µm indiameter), the observations during our experiments require the use of a mi-croscope. We used an inverted basic microscope model IX71/IX51. Severaltechniques have been used preferentially to fit with the observational needswith the used of bright-field and phase contrast microscopy which are brieflydescribed in this section.
3.4.1 The bright-field microscopy
With a conventional bright-field microscope, light from an incandescencesource is directed towards the condenser and passes through the specimen.This light waves project on an object lens, and to the eye through the binoc-ular. Objects are visible only when difference in absorption occurs.
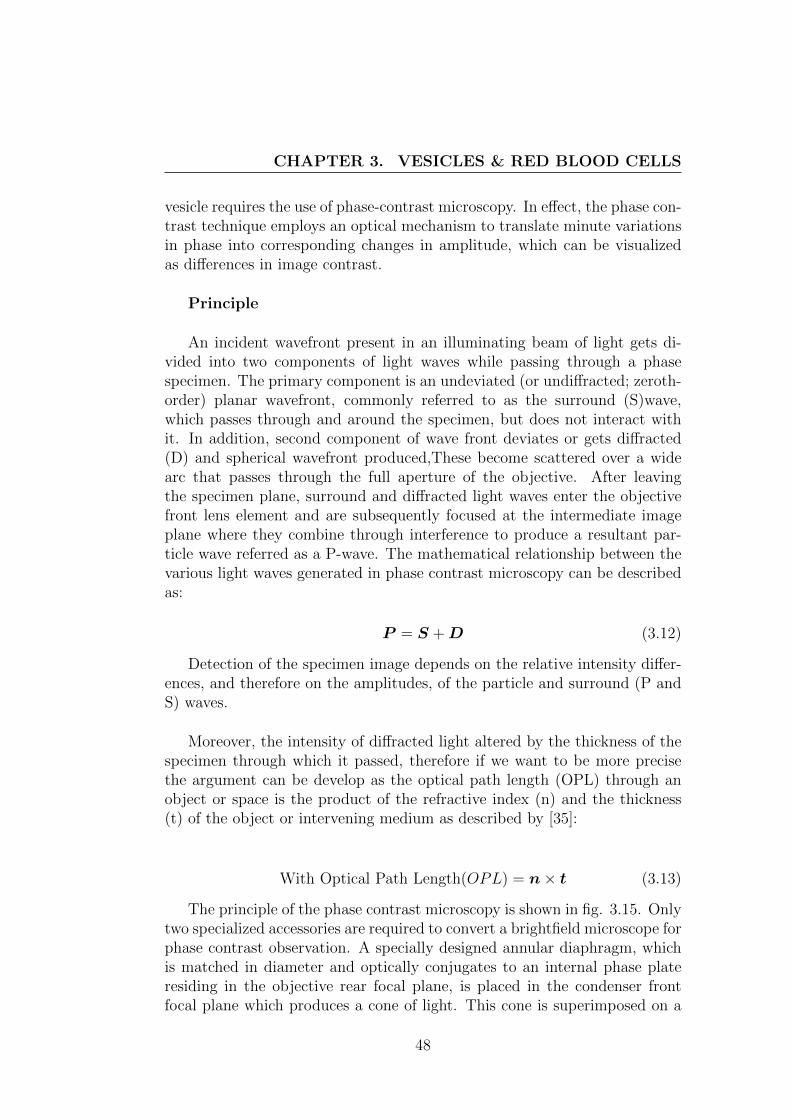
Phase relationships between the surround, diffracted, and particle (S, D,and P) waves in the region of the specimen at the image plane for bright-field microscopy (in the absence of phase contrast optical accessories) arepresented in fig. 3.13. The surround and particle waves, whose relative am-plitudes determine the amount of specimen contrast, are illustrated as redand green lines (respectively). The wave produced by diffraction from thespecimen, which is never directly observed, is depicted as a blue wave oflower amplitude. The surround and diffracted waves recombine through in-terference to generate the resultant particle wave in the image plane of themicroscope. The amplitude of each wave illustrated in fig. 3.13 representsthe sum of the electric vectors of the individual component waves.
Relative to the surround wave, the diffracted wave has lower amplitude(because there are fewer diffracted than surround photons at the image point)and is retarded in phase by approximately 90 degrees (a quarter wavelength)through interaction with the specimen. The slight phase shift of 1/20th wave-length exhibited by the resultant particle wave (which arises from interferencebetween the diffracted and surround waves) is typically observed for minutedetails in a cell, and is related to the optical path length difference. Becausethe amplitudes of the surround and particle waves are nearly the same, thetransparent specimen completely lacks contrast and is almost invisible whensuperimposed against the bright background.Therefore we need contrast en-hancing accessories which is coupled in phase contrast system described insec. 3.4.2. Different appearance of a cell specimen under two system i.e.
46

3.4. VISUALIZATION OF VESICLES AND RED BLOODCELL
Figure 3.13: Bright field microscope wave phase relationships
bright field and phase contrast is shown in fig. 3.14.
Figure 3.14: Cell specimen in (a)Bright field (b)Phase contrast
3.4.2 Phase contrast microscopy
Phase contrast is contrast-enhancing optical techniques that can be utilizedto produce high contrast images of transparent specimens, such as livingcells, micro-organisms, thin tissue slices, lithographic patterns, fibres, latexdispersions, glass fragments, and sub cellular particles. Generally, red bloodcells are easy to observe in classic transmission microscopy but the study of
47
CHAPTER 3. VESICLES & RED BLOOD CELLS
vesicle requires the use of phase-contrast microscopy. In effect, the phase con-trast technique employs an optical mechanism to translate minute variationsin phase into corresponding changes in amplitude, which can be visualizedas differences in image contrast.
Principle
An incident wavefront present in an illuminating beam of light gets di-vided into two components of light waves while passing through a phasespecimen. The primary component is an undeviated (or undiffracted; zeroth-order) planar wavefront, commonly referred to as the surround (S)wave,which passes through and around the specimen, but does not interact withit. In addition, second component of wave front deviates or gets diffracted(D) and spherical wavefront produced,These become scattered over a widearc that passes through the full aperture of the objective. After leavingthe specimen plane, surround and diffracted light waves enter the objectivefront lens element and are subsequently focused at the intermediate imageplane where they combine through interference to produce a resultant par-ticle wave referred as a P-wave. The mathematical relationship between thevarious light waves generated in phase contrast microscopy can be describedas:
P = S + D (3.12)
Detection of the specimen image depends on the relative intensity differ-ences, and therefore on the amplitudes, of the particle and surround (P andS) waves.
Moreover, the intensity of diffracted light altered by the thickness of thespecimen through which it passed, therefore if we want to be more precisethe argument can be develop as the optical path length (OPL) through anobject or space is the product of the refractive index (n) and the thickness(t) of the object or intervening medium as described by [35]:
With Optical Path Length(OPL) = n× t (3.13)
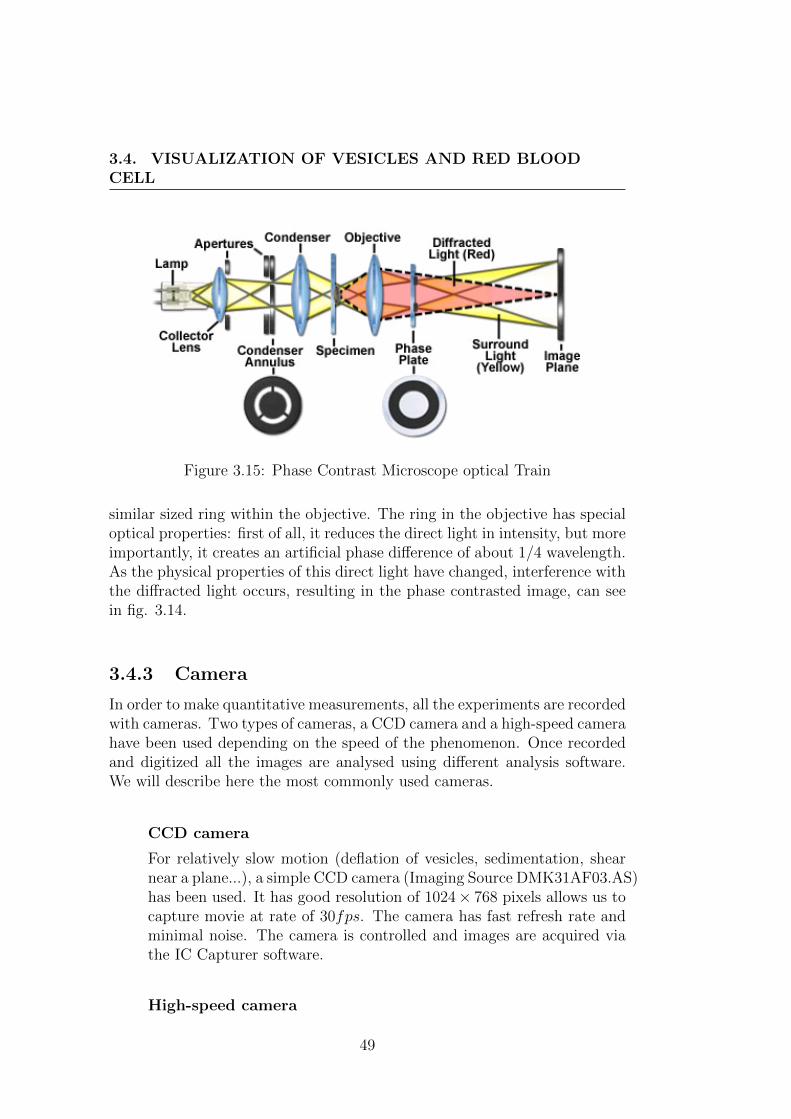
The principle of the phase contrast microscopy is shown in fig. 3.15. Onlytwo specialized accessories are required to convert a brightfield microscope forphase contrast observation. A specially designed annular diaphragm, whichis matched in diameter and optically conjugates to an internal phase plateresiding in the objective rear focal plane, is placed in the condenser frontfocal plane which produces a cone of light. This cone is superimposed on a
48
3.4. VISUALIZATION OF VESICLES AND RED BLOODCELL
Figure 3.15: Phase Contrast Microscope optical Train
similar sized ring within the objective. The ring in the objective has specialoptical properties: first of all, it reduces the direct light in intensity, but moreimportantly, it creates an artificial phase difference of about 1/4 wavelength.As the physical properties of this direct light have changed, interference withthe diffracted light occurs, resulting in the phase contrasted image, can seein fig. 3.14.
3.4.3 Camera
In order to make quantitative measurements, all the experiments are recordedwith cameras. Two types of cameras, a CCD camera and a high-speed camerahave been used depending on the speed of the phenomenon. Once recordedand digitized all the images are analysed using different analysis software.We will describe here the most commonly used cameras.
CCD camera
For relatively slow motion (deflation of vesicles, sedimentation, shearnear a plane...), a simple CCD camera (Imaging Source DMK31AF03.AS)has been used. It has good resolution of 1024× 768 pixels allows us tocapture movie at rate of 30fps. The camera has fast refresh rate andminimal noise. The camera is controlled and images are acquired viathe IC Capturer software.
High-speed camera
49
CHAPTER 3. VESICLES & RED BLOOD CELLS
When using microfluidic devices, the objects flow at typical velocitiesof the order of magnitude of a centimeter per second. The observationof such fast motion requires the use of a high-speed camera. We haveused Phantom cameras capable of recording with frame rates up to10000 fps.
3.4.4 Image analysis
Most of the experimental images require image processing and analysis. Thetwo software were used, Image J, a free software developed by NIH reg-istered and a commercial software and IDL. With the help of ImageJ wecan edit, analyse, process and print up to 32bit images. It can read manygraphical formats and convert them in another format if needed. It supports”stack”, a series of images that shares a single window and multithreaded,hence time consuming operations can be performed in parallel. IDL is scien-tific programming language used for data analysis. By programming IDL wecan analyse several parameters such as speed of particle, their volume, typ-ical dimensions like radius and axis in case of deformed objects, orientationof cells or deflation of an object.
3.5 Experimental Techniques
The size of our object is a few microns hence to study their dynamics in con-fined situation we need microchannel with the dimensions of the order of fewmicron. The system must have some flexibility similar human arteries andveins, reliable and economical too. Therefore we used microfludic devices. Abrief introduction about microfludic devices and their manufacturing processis described in the following section.
3.5.1 Microfluidics
Microfluidics are component system of micro to nano scale which allows tomanipulate gases, liquid and cells in flow. The system should be capa-ble of manipulating suspensions within cross sectional dimension of order10− 100 µm. Their advantages are manifold: the volumes of fluids withinmicrofluidic channels are generally in the nano-liter to micro-liter in range,fabrication is inexpensive and allows to miniaturize multiplexed devices. Re-cently, there has been advancement in microfluidic technology which enablesto fabricate highly integrated devices that can perform several different func-
50

3.5. EXPERIMENTAL TECHNIQUES
tions on the same substrate chip [36, 37].
Fabrication of microfluidics devices
To fabricate a microfluidic device we need a material which must be easyto fabricate, optically transparent and allow an easy control of the flow. Tomeet these requirements, we use a reticulated polymer named PDMS (Poly-dimethylsiloxane). The fabrication of microfluidic devices in (Polydimethyl-siloxane) PDMS is based on the techniques of soft lithography, and replicamolding [38].
PDMS is cheaper than silicon, it is more flexible and it bonds more easilyto other material than silicon or glass do. PDMS conforms to the surfaceof the substrate over a large area and can adjust to surfaces that are nonplanar, waterproof and permeable to gases. The surface properties of PDMScan easily be changed by exposure of the surface in oxygen plasma. This wayPDMS can bond to other materials that have a wide range of free energies.
However, before making a PDMS channel by soft lithography we mustfirst create a master. The master is used to cast the PDMS stamp mold andit is often fabricated with photolithography. To create a master the patternis drawn with a CAD software. The pattern is then printed on a transparentsheet with a high resolution printer (sufficient to produce structures between10 and 200 µm) or engraved in a chrome mask (for a better resolution below10 µm) produced by suppliers of photomasks for contact photolithography.
The first step of soft lithography consists in spin-coating photoresist SU-8with a homogeneous thickness on a silicon wafer. The speed of the spin-coatersets the homogeneous thickness of this layer of photoresist, controlling theheight of the channels. Then, we pre-bake the wafer for several minutes at65◦C and 95◦C (the exact time depends on the type of photoresist and thedesired thickness) in order to initiate the polymerization of the SU-8. AUV source is used to expose the silicon wafer which is covered with the pho-tomask. Another baking step finishes to cure the photoresist (polymerizationof the exposed area). Dissolving away the unilluminated - and so unpoly-merized - photoresist leaves a positive relief that serves as a master. Thedeveloped pattern can be used as a mold to create the PDMS microfluidicchip.
The PDMS channels are formed by replica molding (ridges on the masterappear as valleys in the replica). We mix a solution of silicone elastomer with
51
CHAPTER 3. VESICLES & RED BLOOD CELLS
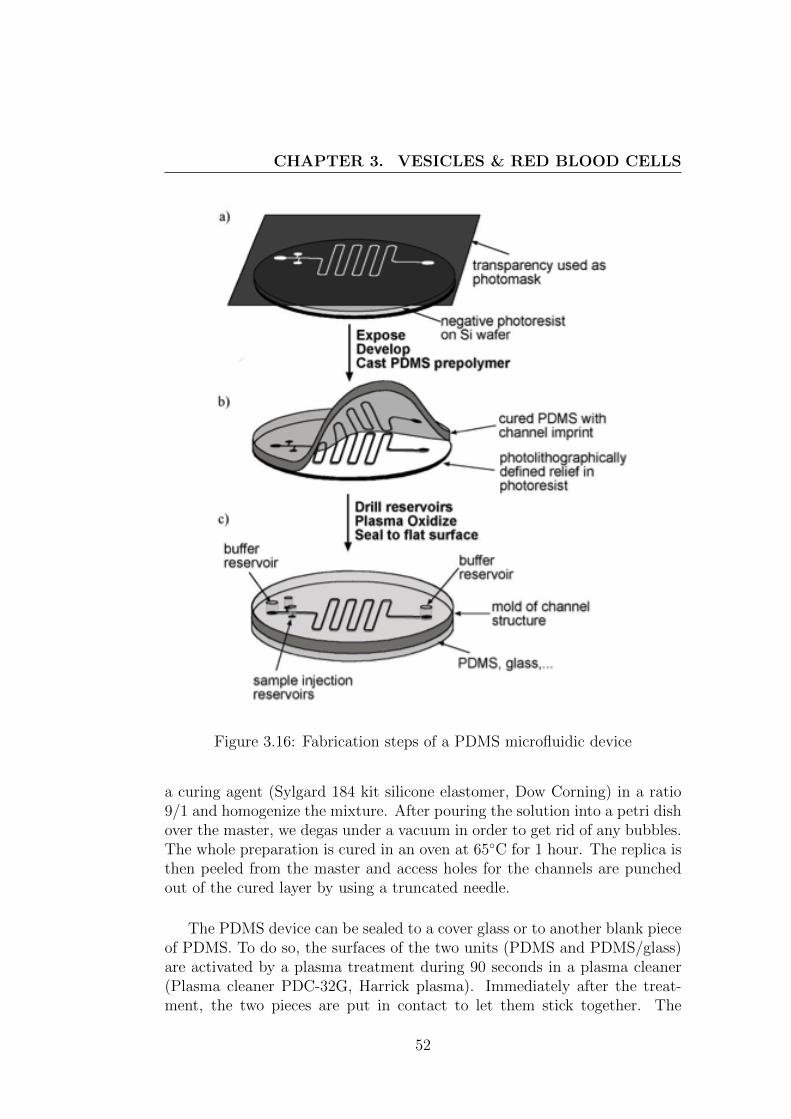
Figure 3.16: Fabrication steps of a PDMS microfluidic device
a curing agent (Sylgard 184 kit silicone elastomer, Dow Corning) in a ratio9/1 and homogenize the mixture. After pouring the solution into a petri dishover the master, we degas under a vacuum in order to get rid of any bubbles.The whole preparation is cured in an oven at 65◦C for 1 hour. The replica isthen peeled from the master and access holes for the channels are punchedout of the cured layer by using a truncated needle.
The PDMS device can be sealed to a cover glass or to another blank pieceof PDMS. To do so, the surfaces of the two units (PDMS and PDMS/glass)are activated by a plasma treatment during 90 seconds in a plasma cleaner(Plasma cleaner PDC-32G, Harrick plasma). Immediately after the treat-ment, the two pieces are put in contact to let them stick together. The
52

3.5. EXPERIMENTAL TECHNIQUES
device is then stored at 65◦C over night to allow the strengthening of bond-ing between the two blocks. 2
2Note:In the case of a PDMS/PDMS device, the preparation of the PDMS is madewith an excess space of the curating agent (ratio 5/1) to allow the crosslinking to takeplace between the two blocks of PDMS.
53

CHAPTER 3. VESICLES & RED BLOOD CELLS
54
Chapter 4
Preparation and sortingmethod of vesicles
Ce chapitre presente notre methodologie experimentale pour produire desvesicules. Du fait que l’electroformation produit des echantillons polydis-perses, un dispositif dedie au tri de vesicules en fonction de leur taille a etedeveloppe pour les etudes ou la monodispersite est requise. Finalement, lesperformances du dispositif de tri sont caracterisees.
This chapter presents our experimental methodology for producing vesi-cles. Since electroformation produces polydisperse samples, a device dedi-cated to the sorting of vesicles according to their size has been developedfor studies where monodispersity are required. Finally, the performance ofsorting device is characterized.
4.1 Preparation method of vesicles
Since vesicles have many uses, from the modelling of bio-membrane to drugdelivery, and other industrial applications, many methods have been devel-oped to produce vesicles with sizes ranging from 30nm to 100µm. Accordingto their size and structure vesicles are classified in the following way:
Multilamellar vesicles (MLV): These vesicles have several layers of lipidbilayers. They have a low trapped volume and unequal distribution of
55
CHAPTER 4. PREPARATION AND SORTING METHOD OFVESICLES
solutes.
Unilamellar vesicles, with a single lipid bilayer, among which :
Small Unilamellar vesicle (SUV): Typical diameters are within therange 30 to 100nm. They can get by Sonication or Extrusion [39]of aqueous dispersions. Since their diameter is very small, these struc-tures are not appropriate to model cell membrane.
Large Unilamellar vesicle (LUV): Their diameter ranges from 100nmto 1µm. There are two methods to obtain LUVs vesicles. One isExtrusion which was developed by Szoka et al [39] using the methodof reverse phase evaporation. Another technique of preparing LUVs islipid film hydration with liposome breaking in fusion followed by freeze-and-thraw cycle in order to obtain unilamellar structure [39][40].
Giant Unilamellar vesicle (GUV): Their typical diameter ranges from1 to 100 µm. These GUVs are in the same range of size as biologicalcells. They are easier to visualize and allow us to play with internal andexternal solvent concentrations therefore we choose GUVs as model tostudy hydrodynamic properties of biological membrane. There are twoconventional methods to produce GUVs.
The first method is spontaneous swelling by gentle hydration introducedby Reeves and Dowben [41]. In this method lipids are hydrated by deionisedwater and kept for many hours or even days for automatic swelling of driedlipid and form GUVs. In this method GUV size is not larger than 10µm andtheir suspension is not stable. In addition it produces also negligible amountof multilamellar vesicles. Thus it is not reliable to get the expected range ofsize and stability.
The second method is the formation of vesicles under an electric fieldor electroformation. This method was introduced by M.I. Angelova [42] andfurther improved to take into account surface effects under electric fields [43].We have followed this method of electroformation which is more reliable andproduces vesicles of size range 1−100µm in large quantities. Vesicles obtainedwith this method are of reasonably good size to visualize and allows to varythe concentration of the aqueous internal as well as external medium. Thedifferent steps in producing vesicles is briefly described here.
56
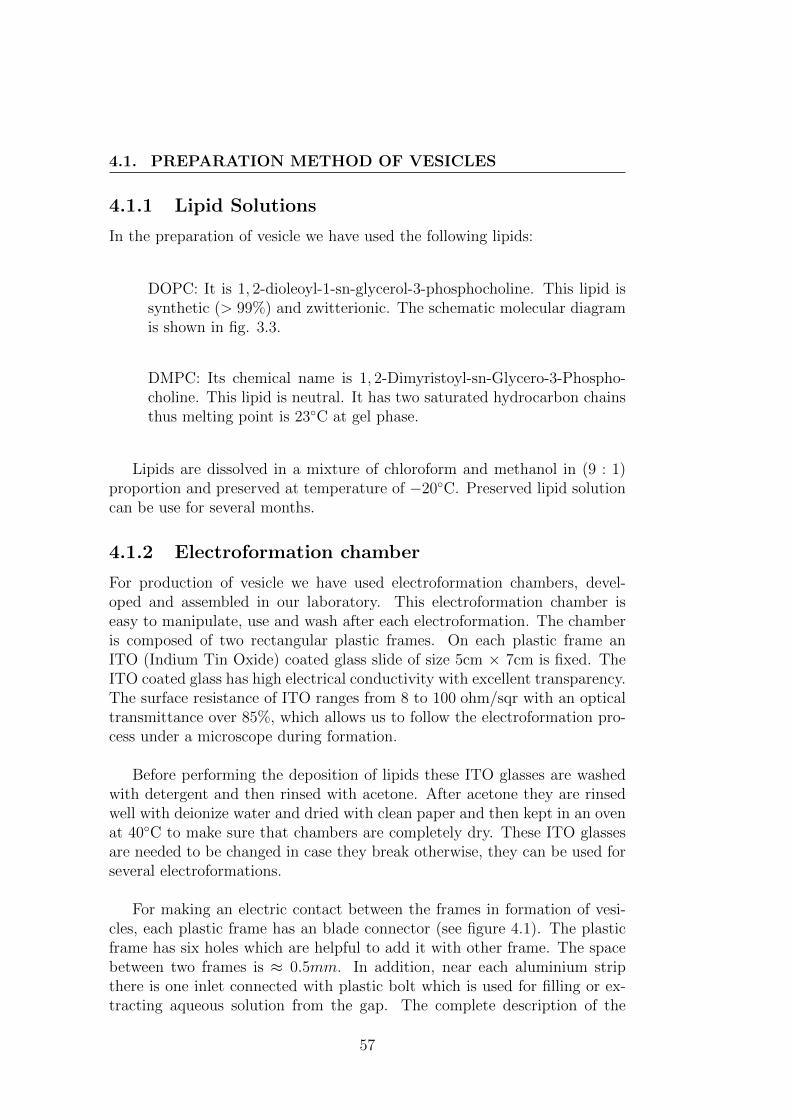
4.1. PREPARATION METHOD OF VESICLES
4.1.1 Lipid Solutions
In the preparation of vesicle we have used the following lipids:
DOPC: It is 1, 2-dioleoyl-1-sn-glycerol-3-phosphocholine. This lipid issynthetic (> 99%) and zwitterionic. The schematic molecular diagramis shown in fig. 3.3.
DMPC: Its chemical name is 1, 2-Dimyristoyl-sn-Glycero-3-Phospho-choline. This lipid is neutral. It has two saturated hydrocarbon chainsthus melting point is 23◦C at gel phase.
Lipids are dissolved in a mixture of chloroform and methanol in (9 : 1)proportion and preserved at temperature of −20◦C. Preserved lipid solutioncan be use for several months.
4.1.2 Electroformation chamber
For production of vesicle we have used electroformation chambers, devel-oped and assembled in our laboratory. This electroformation chamber iseasy to manipulate, use and wash after each electroformation. The chamberis composed of two rectangular plastic frames. On each plastic frame anITO (Indium Tin Oxide) coated glass slide of size 5cm × 7cm is fixed. TheITO coated glass has high electrical conductivity with excellent transparency.The surface resistance of ITO ranges from 8 to 100 ohm/sqr with an opticaltransmittance over 85%, which allows us to follow the electroformation pro-cess under a microscope during formation.
Before performing the deposition of lipids these ITO glasses are washedwith detergent and then rinsed with acetone. After acetone they are rinsedwell with deionize water and dried with clean paper and then kept in an ovenat 40◦C to make sure that chambers are completely dry. These ITO glassesare needed to be changed in case they break otherwise, they can be used forseveral electroformations.
For making an electric contact between the frames in formation of vesi-cles, each plastic frame has an blade connector (see figure 4.1). The plasticframe has six holes which are helpful to add it with other frame. The spacebetween two frames is ≈ 0.5mm. In addition, near each aluminium stripthere is one inlet connected with plastic bolt which is used for filling or ex-tracting aqueous solution from the gap. The complete description of the
57
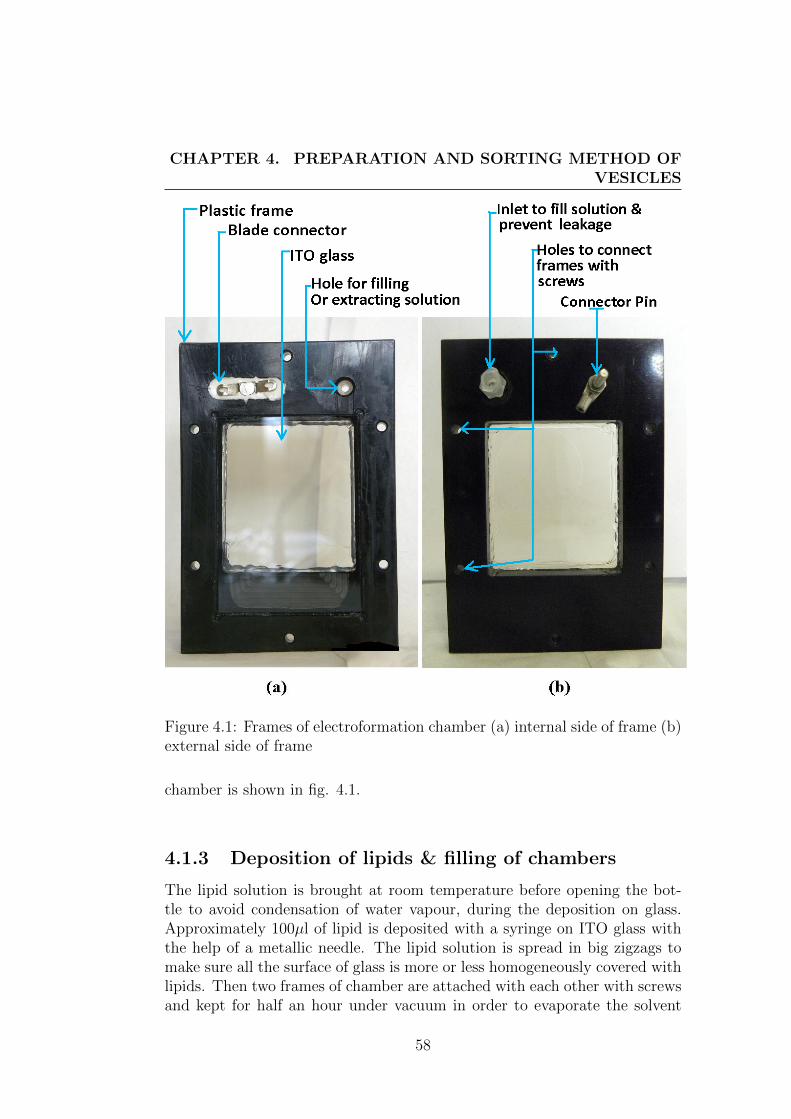
CHAPTER 4. PREPARATION AND SORTING METHOD OFVESICLES
Figure 4.1: Frames of electroformation chamber (a) internal side of frame (b)external side of frame
chamber is shown in fig. 4.1.
4.1.3 Deposition of lipids & filling of chambers
The lipid solution is brought at room temperature before opening the bot-tle to avoid condensation of water vapour, during the deposition on glass.Approximately 100µl of lipid is deposited with a syringe on ITO glass withthe help of a metallic needle. The lipid solution is spread in big zigzags tomake sure all the surface of glass is more or less homogeneously covered withlipids. Then two frames of chamber are attached with each other with screwsand kept for half an hour under vacuum in order to evaporate the solvent
58
4.1. PREPARATION METHOD OF VESICLES
Figure 4.2: Complete chamber when formation of vesicles takes place
completely.
After deposition of lipids and evaporation of the solvent, the lipid is hy-drated by an aqueous solution. In our case we hydrate lipids with sucrosesolutions in order to easily generate osmotic pressure in the GUVs by con-trolling internal and external solute concentrations. The hydrating solutionis filled through inlet in the frame (as shown in fig. 4.1). There are two inletsin the electroformation chamber, opposite to each other to fill the hydratingsolution. After filling the gap between frames by hydrating solution, theseinlets are closed with the help of clamps to prevent leakage. After the endof electroformation, the vesicles samples are extracted from the same inletswith a syringe.
4.1.4 Electroformation
Once the chambers is filled with internal solution, electroformation can belaunched by applying tension of few tenths of volt with frequency ≈ 10Hz forfew hours. The optimal protocol depends on the viscosity of encapsulatingfluid. We can change the tension and frequency within a certain range toslightly control the size of vesicles.
59
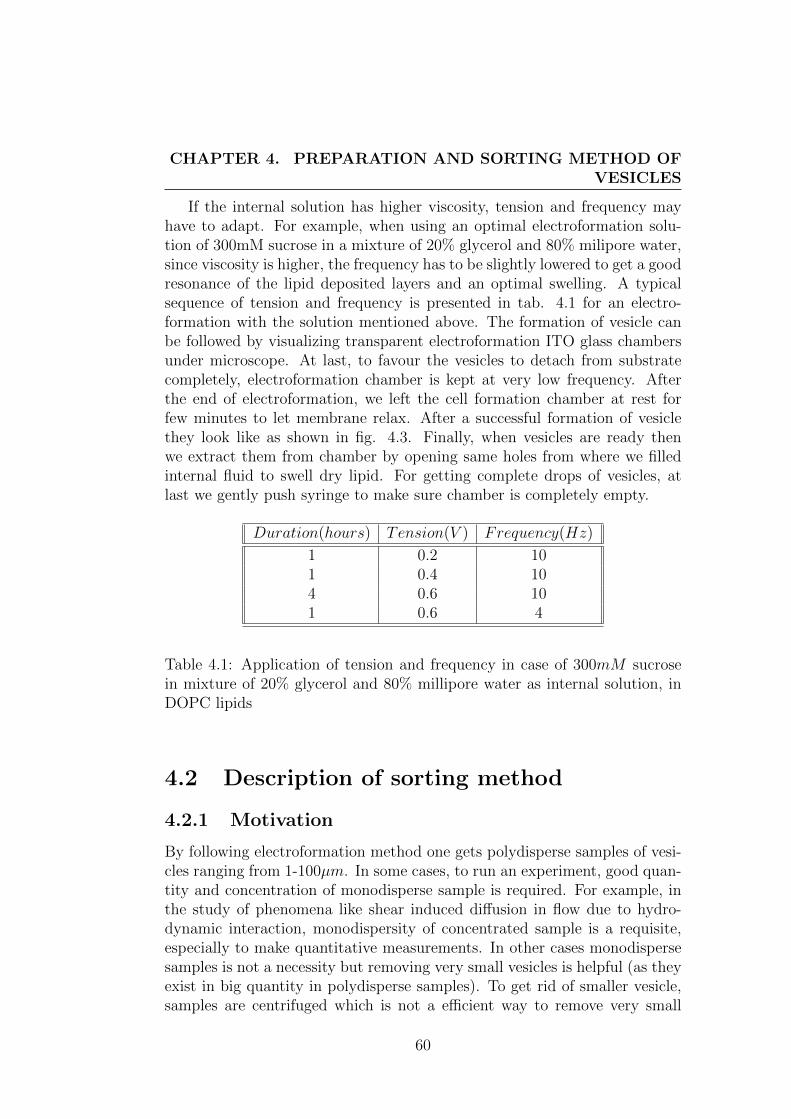
CHAPTER 4. PREPARATION AND SORTING METHOD OFVESICLES
If the internal solution has higher viscosity, tension and frequency mayhave to adapt. For example, when using an optimal electroformation solu-tion of 300mM sucrose in a mixture of 20% glycerol and 80% milipore water,since viscosity is higher, the frequency has to be slightly lowered to get a goodresonance of the lipid deposited layers and an optimal swelling. A typicalsequence of tension and frequency is presented in tab. 4.1 for an electro-formation with the solution mentioned above. The formation of vesicle canbe followed by visualizing transparent electroformation ITO glass chambersunder microscope. At last, to favour the vesicles to detach from substratecompletely, electroformation chamber is kept at very low frequency. Afterthe end of electroformation, we left the cell formation chamber at rest forfew minutes to let membrane relax. After a successful formation of vesiclethey look like as shown in fig. 4.3. Finally, when vesicles are ready thenwe extract them from chamber by opening same holes from where we filledinternal fluid to swell dry lipid. For getting complete drops of vesicles, atlast we gently push syringe to make sure chamber is completely empty.
Duration(hours) Tension(V ) Frequency(Hz)
1 0.2 101 0.4 104 0.6 101 0.6 4
Table 4.1: Application of tension and frequency in case of 300mM sucrosein mixture of 20% glycerol and 80% millipore water as internal solution, inDOPC lipids
4.2 Description of sorting method
4.2.1 Motivation
By following electroformation method one gets polydisperse samples of vesi-cles ranging from 1-100µm. In some cases, to run an experiment, good quan-tity and concentration of monodisperse sample is required. For example, inthe study of phenomena like shear induced diffusion in flow due to hydro-dynamic interaction, monodispersity of concentrated sample is a requisite,especially to make quantitative measurements. In other cases monodispersesamples is not a necessity but removing very small vesicles is helpful (as theyexist in big quantity in polydisperse samples). To get rid of smaller vesicle,samples are centrifuged which is not a efficient way to remove very small
60
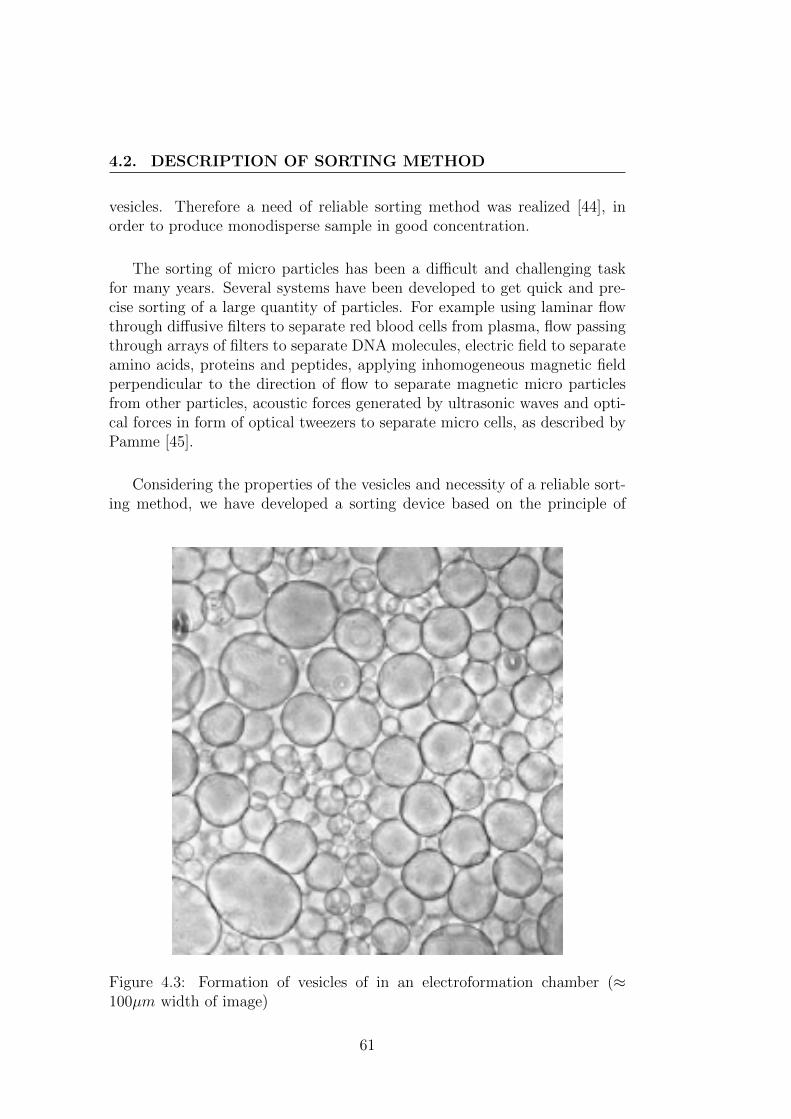
4.2. DESCRIPTION OF SORTING METHOD
vesicles. Therefore a need of reliable sorting method was realized [44], inorder to produce monodisperse sample in good concentration.
The sorting of micro particles has been a difficult and challenging taskfor many years. Several systems have been developed to get quick and pre-cise sorting of a large quantity of particles. For example using laminar flowthrough diffusive filters to separate red blood cells from plasma, flow passingthrough arrays of filters to separate DNA molecules, electric field to separateamino acids, proteins and peptides, applying inhomogeneous magnetic fieldperpendicular to the direction of flow to separate magnetic micro particlesfrom other particles, acoustic forces generated by ultrasonic waves and opti-cal forces in form of optical tweezers to separate micro cells, as described byPamme [45].
Considering the properties of the vesicles and necessity of a reliable sort-ing method, we have developed a sorting device based on the principle of
Figure 4.3: Formation of vesicles of in an electroformation chamber (≈100µm width of image)
61
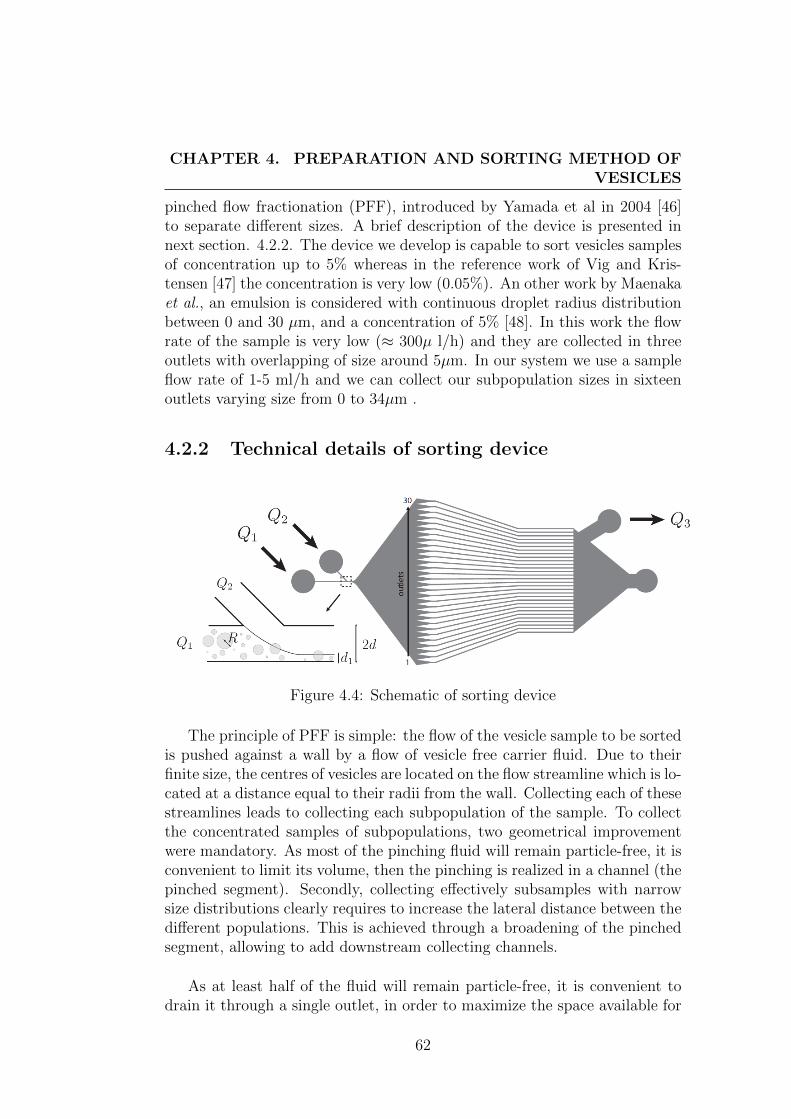
CHAPTER 4. PREPARATION AND SORTING METHOD OFVESICLES
pinched flow fractionation (PFF), introduced by Yamada et al in 2004 [46]to separate different sizes. A brief description of the device is presented innext section. 4.2.2. The device we develop is capable to sort vesicles samplesof concentration up to 5% whereas in the reference work of Vig and Kris-tensen [47] the concentration is very low (0.05%). An other work by Maenakaet al., an emulsion is considered with continuous droplet radius distributionbetween 0 and 30 µm, and a concentration of 5% [48]. In this work the flowrate of the sample is very low (≈ 300µ l/h) and they are collected in threeoutlets with overlapping of size around 5µm. In our system we use a sampleflow rate of 1-5 ml/h and we can collect our subpopulation sizes in sixteenoutlets varying size from 0 to 34µm .
4.2.2 Technical details of sorting device
Figure 4.4: Schematic of sorting device
The principle of PFF is simple: the flow of the vesicle sample to be sortedis pushed against a wall by a flow of vesicle free carrier fluid. Due to theirfinite size, the centres of vesicles are located on the flow streamline which is lo-cated at a distance equal to their radii from the wall. Collecting each of thesestreamlines leads to collecting each subpopulation of the sample. To collectthe concentrated samples of subpopulations, two geometrical improvementwere mandatory. As most of the pinching fluid will remain particle-free, it isconvenient to limit its volume, then the pinching is realized in a channel (thepinched segment). Secondly, collecting effectively subsamples with narrowsize distributions clearly requires to increase the lateral distance between thedifferent populations. This is achieved through a broadening of the pinchedsegment, allowing to add downstream collecting channels.
As at least half of the fluid will remain particle-free, it is convenient todrain it through a single outlet, in order to maximize the space available for
62
4.2. DESCRIPTION OF SORTING METHOD
the expansion of particle-charged streamlines [49, 47, 48]. In order to con-trol the destination of sorted particles, they were extracted with the help ofmicrovalves, joined at the outlets of the channel [50]. To improve sorting ofmicro particles, different geometrical variations were also studied to compareseparation efficiency to the expected one [46, 51, 48]. It is also found thatthe small variations observed are mainly due to channel imperfections, 3Deffects or optical errors [52].
The vesicles sample is injected with flow rateQ1 and pinched by a particle-free fluid with flow rate Q2 in a segment of width 2d. The pinched segmentwhose width 2d can be similar to the diameter 2Rmax of the largest particleto be sorted as shown in fig. 4.4. The typical width of pinching segmentis 2d = 70µm and thickness of the channel is 99µm. The suspension entersthen into broad segment where streamlines splits into 30 outlets accordingto radius of vesicles. By altering flow rate ratio in Q1/Q2 we can follow theefficiency of sorting by visualizing under microscope. We were focused onefficiency of sorting rather collecting sorted sample therefore all 30 outletconverged to unique outlet at atmospheric pressure.
Sorted vesicles are collected in the 16 first channels whereas the last 14channels are vesicle free because of the high flow rate of particle free fluid.The extraction of particle free fluid through a sucking outlet with a flow rateQ3 = 0.9(Q1 + Q2) was considered in order to increase the number of chan-nels containing vesicles. The best place for drainage is a complex issue thatdepends on geometry of channels.
In each outlet channel the mean radius < R >i of the vesicles and thestandard deviation is measured. The flow rate Q2 was kept constant to 10mL/h, and Q1 was varied between 0.2 ml/h and 10 ml/h. We wish to findthe optimum ratio Q1/Q2 but this parameter would depend on the chosenwidth 2d (larger d would require larger Q2 for the same pinching efficiency),which depends itself on the maximum size of the vesicles to be sorted. Amore appropriate parameter is the width d1 occupied in the pinched-segmentby the fluid coming from flow rate Q1. A rough estimation would tell us thatd1 must be of the order of the radius of the smallest vesicle to be sorted.Finally, we used d as the lengthscale of the problem, and the values for d1
and R are evaluated in d unit.
4.2.3 Performance of the sorting method
In order to study the efficiency of the sorting device, we studied the size dis-tribution of vesicles in different outlet channels by varying width d1 of vesicle
63
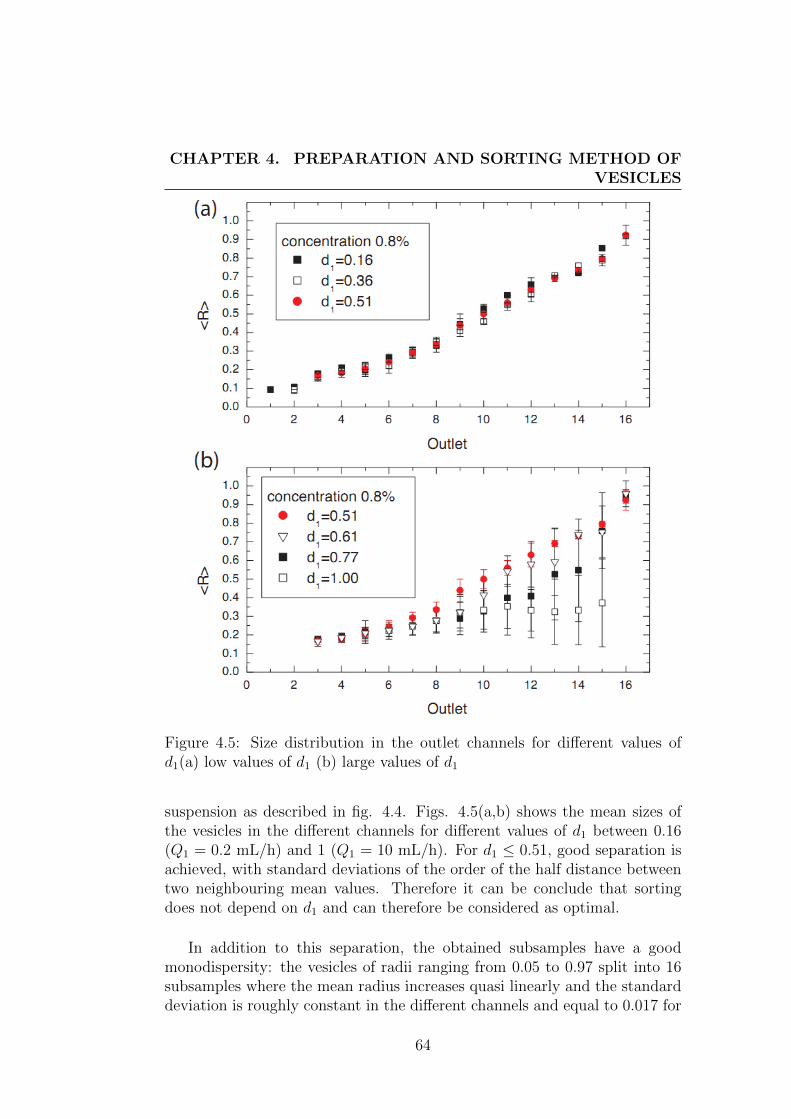
CHAPTER 4. PREPARATION AND SORTING METHOD OFVESICLES
Figure 4.5: Size distribution in the outlet channels for different values ofd1(a) low values of d1 (b) large values of d1
suspension as described in fig. 4.4. Figs. 4.5(a,b) shows the mean sizes ofthe vesicles in the different channels for different values of d1 between 0.16(Q1 = 0.2 mL/h) and 1 (Q1 = 10 mL/h). For d1 ≤ 0.51, good separation isachieved, with standard deviations of the order of the half distance betweentwo neighbouring mean values. Therefore it can be conclude that sortingdoes not depend on d1 and can therefore be considered as optimal.
In addition to this separation, the obtained subsamples have a goodmonodispersity: the vesicles of radii ranging from 0.05 to 0.97 split into 16subsamples where the mean radius increases quasi linearly and the standarddeviation is roughly constant in the different channels and equal to 0.017 for
64
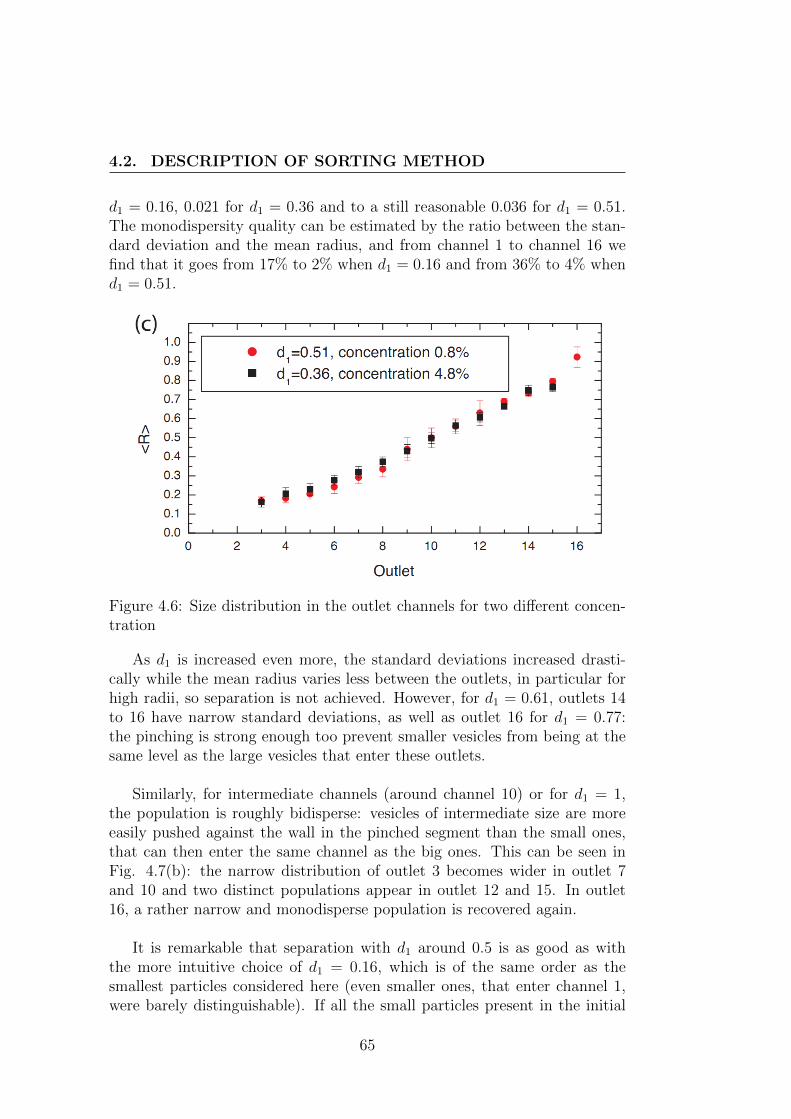
4.2. DESCRIPTION OF SORTING METHOD
d1 = 0.16, 0.021 for d1 = 0.36 and to a still reasonable 0.036 for d1 = 0.51.The monodispersity quality can be estimated by the ratio between the stan-dard deviation and the mean radius, and from channel 1 to channel 16 wefind that it goes from 17% to 2% when d1 = 0.16 and from 36% to 4% whend1 = 0.51.
Figure 4.6: Size distribution in the outlet channels for two different concen-tration
As d1 is increased even more, the standard deviations increased drasti-cally while the mean radius varies less between the outlets, in particular forhigh radii, so separation is not achieved. However, for d1 = 0.61, outlets 14to 16 have narrow standard deviations, as well as outlet 16 for d1 = 0.77:the pinching is strong enough too prevent smaller vesicles from being at thesame level as the large vesicles that enter these outlets.
Similarly, for intermediate channels (around channel 10) or for d1 = 1,the population is roughly bidisperse: vesicles of intermediate size are moreeasily pushed against the wall in the pinched segment than the small ones,that can then enter the same channel as the big ones. This can be seen inFig. 4.7(b): the narrow distribution of outlet 3 becomes wider in outlet 7and 10 and two distinct populations appear in outlet 12 and 15. In outlet16, a rather narrow and monodisperse population is recovered again.
It is remarkable that separation with d1 around 0.5 is as good as withthe more intuitive choice of d1 = 0.16, which is of the same order as thesmallest particles considered here (even smaller ones, that enter channel 1,were barely distinguishable). If all the small particles present in the initial
65
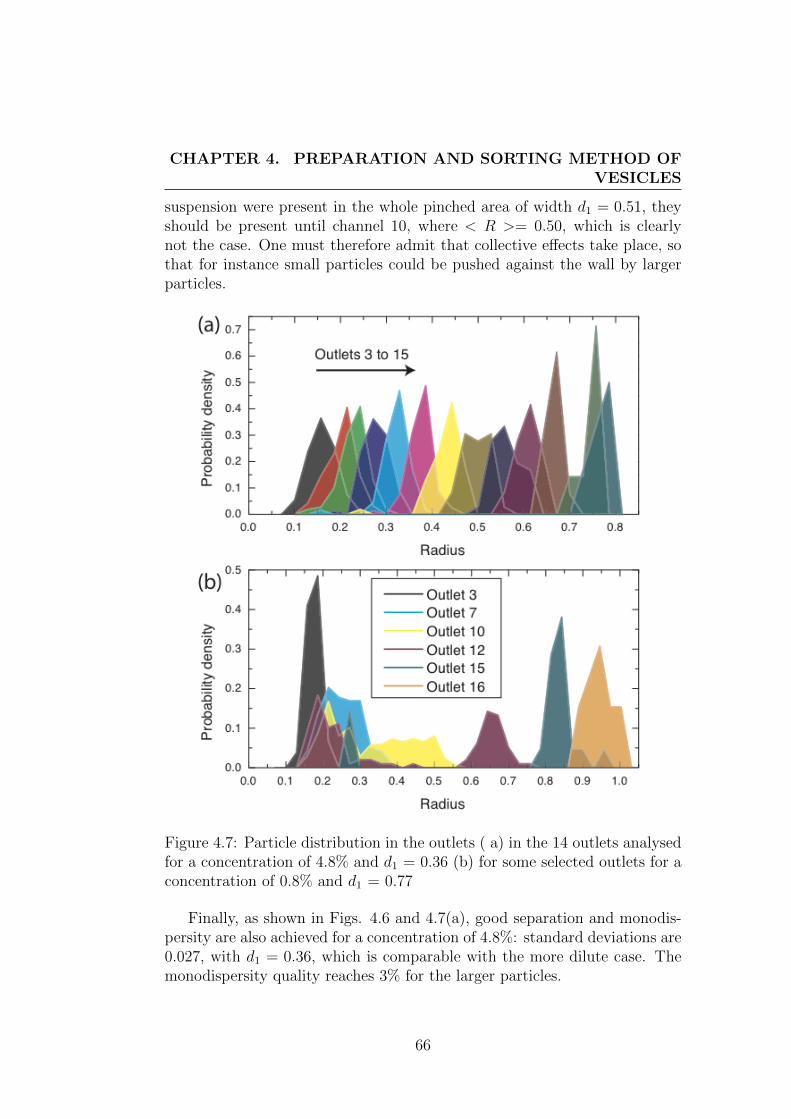
CHAPTER 4. PREPARATION AND SORTING METHOD OFVESICLES
suspension were present in the whole pinched area of width d1 = 0.51, theyshould be present until channel 10, where < R >= 0.50, which is clearlynot the case. One must therefore admit that collective effects take place, sothat for instance small particles could be pushed against the wall by largerparticles.
Figure 4.7: Particle distribution in the outlets ( a) in the 14 outlets analysedfor a concentration of 4.8% and d1 = 0.36 (b) for some selected outlets for aconcentration of 0.8% and d1 = 0.77
Finally, as shown in Figs. 4.6 and 4.7(a), good separation and monodis-persity are also achieved for a concentration of 4.8%: standard deviations are0.027, with d1 = 0.36, which is comparable with the more dilute case. Themonodispersity quality reaches 3% for the larger particles.
66
Chapter 5
Dynamics of a deflated vesicle
Ce chapitre presente l’etat de l’art sur le comportement de vesicules et glob-ules rouges (en suspension diluee) en reponse a un champ d’ecoulement ex-terne. Tout d’abord, nous resumons les faits theoriques et experimentaux quisont les fondations de notre travail afin d’avoir une meilleure comprehensiondu sujet. Puis notre methodologie experimentale pour produire des vesiculesde forme degonflee et un exemple de leur reponse en ecoulement de cisaille-ment simple impose sont presentes en detail.
This section deals with the state of art concerning the behaviour of vesicleand red blood cell (in a dilute suspension) in response to external flow field.First, we summarise briefly theoretical work and experimental evidences thatare foundations of our work in order to make better understanding of thesubject. Then our experimental methodology in producing deflation shapesof vesicles and an example of their response in imposed simple shear flow ispresented in detail.
5.1 Theoretical Background
In most available experimental data on vesicles and red blood cells, and inparticular in our experiments Re is small as compared to unity, and the Stokesapproximation (i.e. neglecting inertia) constitutes a good approximation.Hence, if v denotes the vector velocity field of the fluid, it obeys
η∆v −5P + fext = 0 (5.1)
67
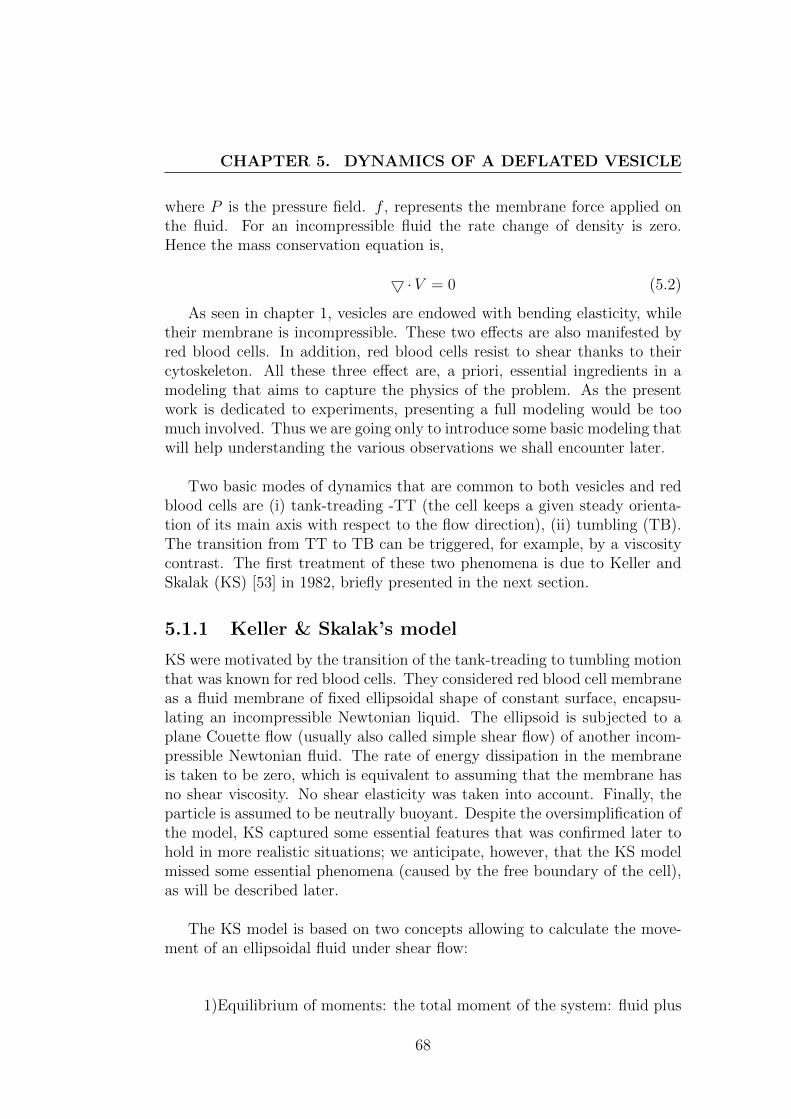
CHAPTER 5. DYNAMICS OF A DEFLATED VESICLE
where P is the pressure field. f , represents the membrane force applied onthe fluid. For an incompressible fluid the rate change of density is zero.Hence the mass conservation equation is,
5·V = 0 (5.2)
As seen in chapter 1, vesicles are endowed with bending elasticity, whiletheir membrane is incompressible. These two effects are also manifested byred blood cells. In addition, red blood cells resist to shear thanks to theircytoskeleton. All these three effect are, a priori, essential ingredients in amodeling that aims to capture the physics of the problem. As the presentwork is dedicated to experiments, presenting a full modeling would be toomuch involved. Thus we are going only to introduce some basic modeling thatwill help understanding the various observations we shall encounter later.
Two basic modes of dynamics that are common to both vesicles and redblood cells are (i) tank-treading -TT (the cell keeps a given steady orienta-tion of its main axis with respect to the flow direction), (ii) tumbling (TB).The transition from TT to TB can be triggered, for example, by a viscositycontrast. The first treatment of these two phenomena is due to Keller andSkalak (KS) [53] in 1982, briefly presented in the next section.
5.1.1 Keller & Skalak’s model
KS were motivated by the transition of the tank-treading to tumbling motionthat was known for red blood cells. They considered red blood cell membraneas a fluid membrane of fixed ellipsoidal shape of constant surface, encapsu-lating an incompressible Newtonian liquid. The ellipsoid is subjected to aplane Couette flow (usually also called simple shear flow) of another incom-pressible Newtonian fluid. The rate of energy dissipation in the membraneis taken to be zero, which is equivalent to assuming that the membrane hasno shear viscosity. No shear elasticity was taken into account. Finally, theparticle is assumed to be neutrally buoyant. Despite the oversimplification ofthe model, KS captured some essential features that was confirmed later tohold in more realistic situations; we anticipate, however, that the KS modelmissed some essential phenomena (caused by the free boundary of the cell),as will be described later.
The KS model is based on two concepts allowing to calculate the move-ment of an ellipsoidal fluid under shear flow:
1)Equilibrium of moments: the total moment of the system: fluid plus
68
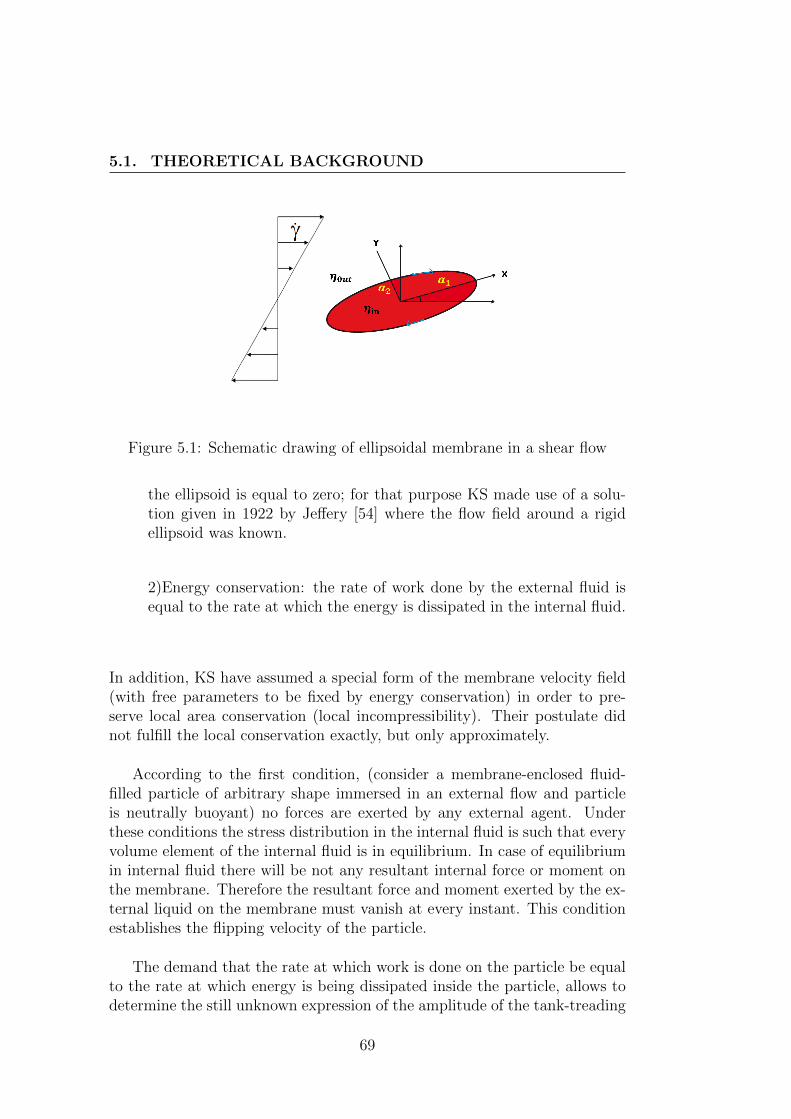
5.1. THEORETICAL BACKGROUND
Figure 5.1: Schematic drawing of ellipsoidal membrane in a shear flow
the ellipsoid is equal to zero; for that purpose KS made use of a solu-tion given in 1922 by Jeffery [54] where the flow field around a rigidellipsoid was known.
2)Energy conservation: the rate of work done by the external fluid isequal to the rate at which the energy is dissipated in the internal fluid.
In addition, KS have assumed a special form of the membrane velocity field(with free parameters to be fixed by energy conservation) in order to pre-serve local area conservation (local incompressibility). Their postulate didnot fulfill the local conservation exactly, but only approximately.
According to the first condition, (consider a membrane-enclosed fluid-filled particle of arbitrary shape immersed in an external flow and particleis neutrally buoyant) no forces are exerted by any external agent. Underthese conditions the stress distribution in the internal fluid is such that everyvolume element of the internal fluid is in equilibrium. In case of equilibriumin internal fluid there will be not any resultant internal force or moment onthe membrane. Therefore the resultant force and moment exerted by the ex-ternal liquid on the membrane must vanish at every instant. This conditionestablishes the flipping velocity of the particle.
The demand that the rate at which work is done on the particle be equalto the rate at which energy is being dissipated inside the particle, allows todetermine the still unknown expression of the amplitude of the tank-treading
69
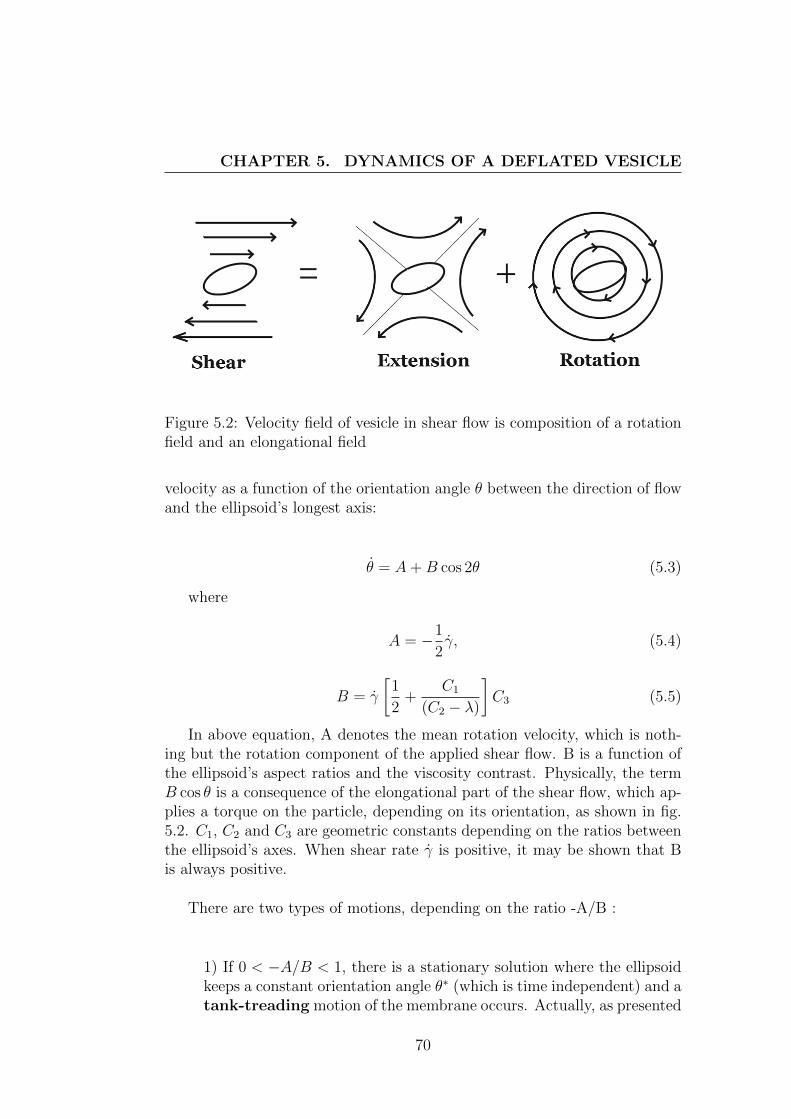
CHAPTER 5. DYNAMICS OF A DEFLATED VESICLE
Figure 5.2: Velocity field of vesicle in shear flow is composition of a rotationfield and an elongational field
velocity as a function of the orientation angle θ between the direction of flowand the ellipsoid’s longest axis:
θ = A+B cos 2θ (5.3)
where
A = −1
2γ, (5.4)
B = γ
[1
2+
C1
(C2 − λ)
]C3 (5.5)
In above equation, A denotes the mean rotation velocity, which is noth-ing but the rotation component of the applied shear flow. B is a function ofthe ellipsoid’s aspect ratios and the viscosity contrast. Physically, the termB cos θ is a consequence of the elongational part of the shear flow, which ap-plies a torque on the particle, depending on its orientation, as shown in fig.5.2. C1, C2 and C3 are geometric constants depending on the ratios betweenthe ellipsoid’s axes. When shear rate γ is positive, it may be shown that Bis always positive.
There are two types of motions, depending on the ratio -A/B :
1) If 0 < −A/B < 1, there is a stationary solution where the ellipsoidkeeps a constant orientation angle θ∗ (which is time independent) and atank-treading motion of the membrane occurs. Actually, as presented
70
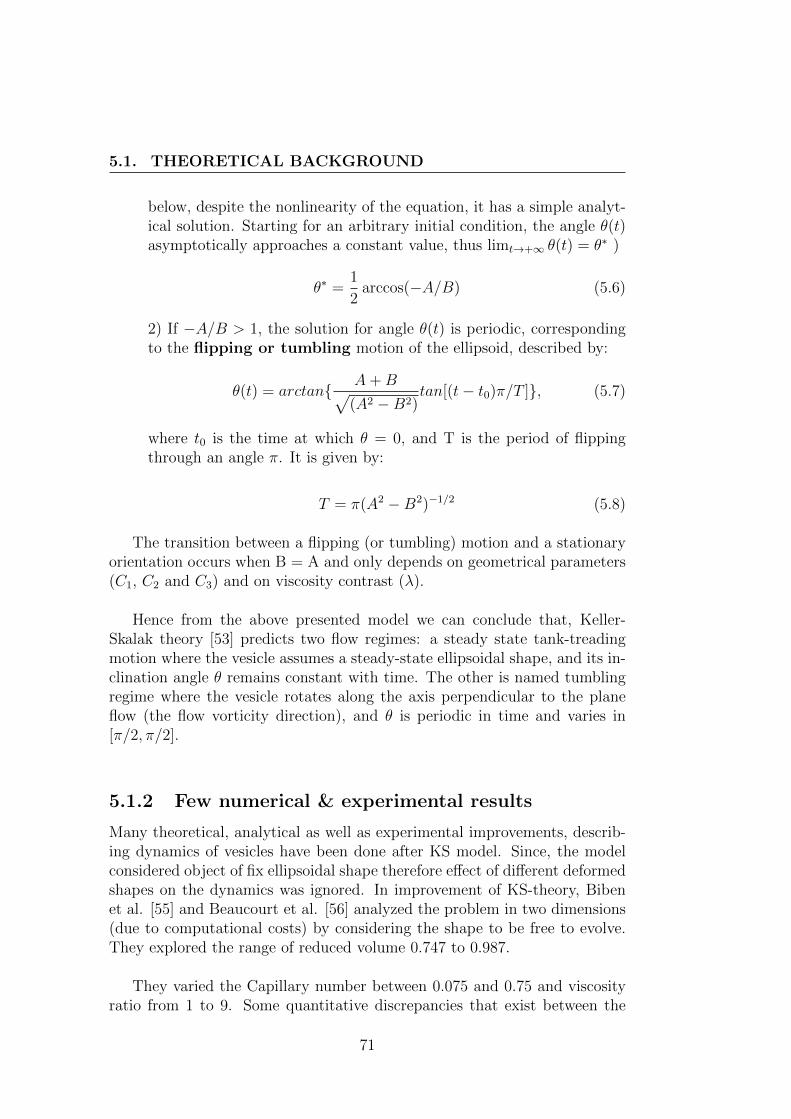
5.1. THEORETICAL BACKGROUND
below, despite the nonlinearity of the equation, it has a simple analyt-ical solution. Starting for an arbitrary initial condition, the angle θ(t)asymptotically approaches a constant value, thus limt→+∞ θ(t) = θ∗ )
θ∗ =1
2arccos(−A/B) (5.6)
2) If −A/B > 1, the solution for angle θ(t) is periodic, correspondingto the flipping or tumbling motion of the ellipsoid, described by:
θ(t) = arctan{ A+B√(A2 −B2)
tan[(t− t0)π/T ]}, (5.7)
where t0 is the time at which θ = 0, and T is the period of flippingthrough an angle π. It is given by:
T = π(A2 −B2)−1/2 (5.8)
The transition between a flipping (or tumbling) motion and a stationaryorientation occurs when B = A and only depends on geometrical parameters(C1, C2 and C3) and on viscosity contrast (λ).
Hence from the above presented model we can conclude that, Keller-Skalak theory [53] predicts two flow regimes: a steady state tank-treadingmotion where the vesicle assumes a steady-state ellipsoidal shape, and its in-clination angle θ remains constant with time. The other is named tumblingregime where the vesicle rotates along the axis perpendicular to the planeflow (the flow vorticity direction), and θ is periodic in time and varies in[π/2, π/2].
5.1.2 Few numerical & experimental results
Many theoretical, analytical as well as experimental improvements, describ-ing dynamics of vesicles have been done after KS model. Since, the modelconsidered object of fix ellipsoidal shape therefore effect of different deformedshapes on the dynamics was ignored. In improvement of KS-theory, Bibenet al. [55] and Beaucourt et al. [56] analyzed the problem in two dimensions(due to computational costs) by considering the shape to be free to evolve.They explored the range of reduced volume 0.747 to 0.987.
They varied the Capillary number between 0.075 and 0.75 and viscosityratio from 1 to 9. Some quantitative discrepancies that exist between the
71
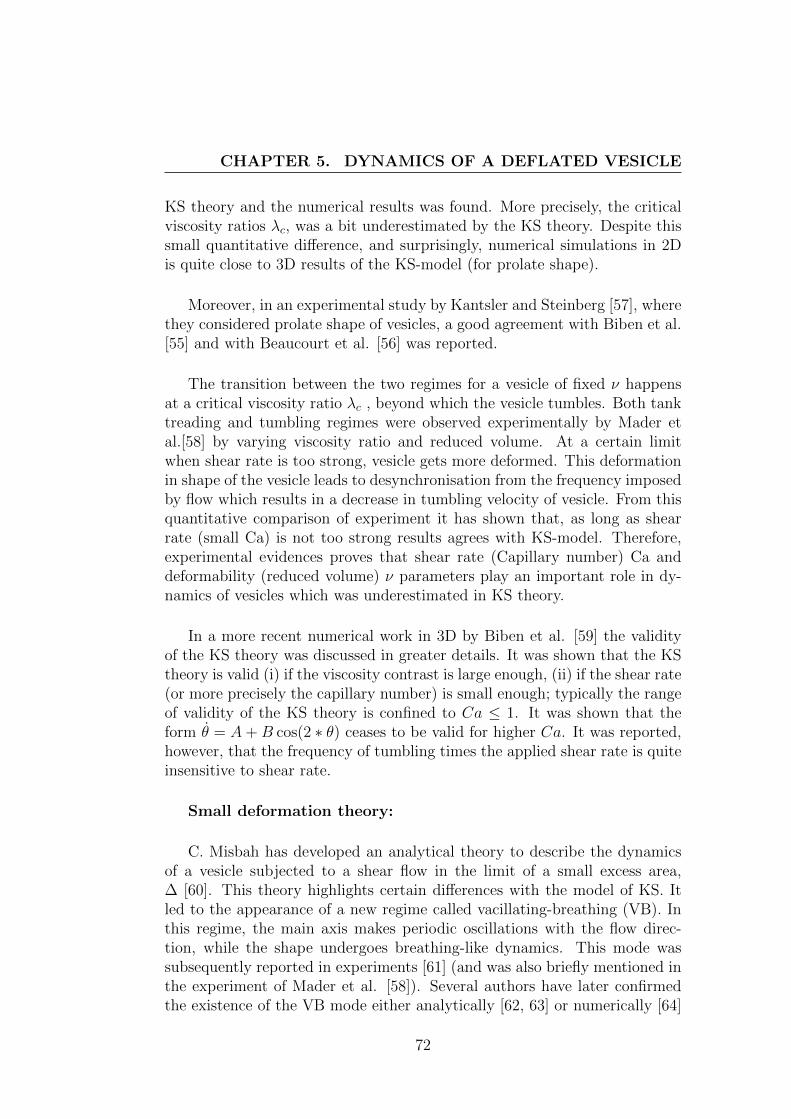
CHAPTER 5. DYNAMICS OF A DEFLATED VESICLE
KS theory and the numerical results was found. More precisely, the criticalviscosity ratios λc, was a bit underestimated by the KS theory. Despite thissmall quantitative difference, and surprisingly, numerical simulations in 2Dis quite close to 3D results of the KS-model (for prolate shape).
Moreover, in an experimental study by Kantsler and Steinberg [57], wherethey considered prolate shape of vesicles, a good agreement with Biben et al.[55] and with Beaucourt et al. [56] was reported.
The transition between the two regimes for a vesicle of fixed ν happensat a critical viscosity ratio λc , beyond which the vesicle tumbles. Both tanktreading and tumbling regimes were observed experimentally by Mader etal.[58] by varying viscosity ratio and reduced volume. At a certain limitwhen shear rate is too strong, vesicle gets more deformed. This deformationin shape of the vesicle leads to desynchronisation from the frequency imposedby flow which results in a decrease in tumbling velocity of vesicle. From thisquantitative comparison of experiment it has shown that, as long as shearrate (small Ca) is not too strong results agrees with KS-model. Therefore,experimental evidences proves that shear rate (Capillary number) Ca anddeformability (reduced volume) ν parameters play an important role in dy-namics of vesicles which was underestimated in KS theory.
In a more recent numerical work in 3D by Biben et al. [59] the validityof the KS theory was discussed in greater details. It was shown that the KStheory is valid (i) if the viscosity contrast is large enough, (ii) if the shear rate(or more precisely the capillary number) is small enough; typically the rangeof validity of the KS theory is confined to Ca ≤ 1. It was shown that theform θ = A+ B cos(2 ∗ θ) ceases to be valid for higher Ca. It was reported,however, that the frequency of tumbling times the applied shear rate is quiteinsensitive to shear rate.
Small deformation theory:
C. Misbah has developed an analytical theory to describe the dynamicsof a vesicle subjected to a shear flow in the limit of a small excess area,∆ [60]. This theory highlights certain differences with the model of KS. Itled to the appearance of a new regime called vacillating-breathing (VB). Inthis regime, the main axis makes periodic oscillations with the flow direc-tion, while the shape undergoes breathing-like dynamics. This mode wassubsequently reported in experiments [61] (and was also briefly mentioned inthe experiment of Mader et al. [58]). Several authors have later confirmedthe existence of the VB mode either analytically [62, 63] or numerically [64]
72
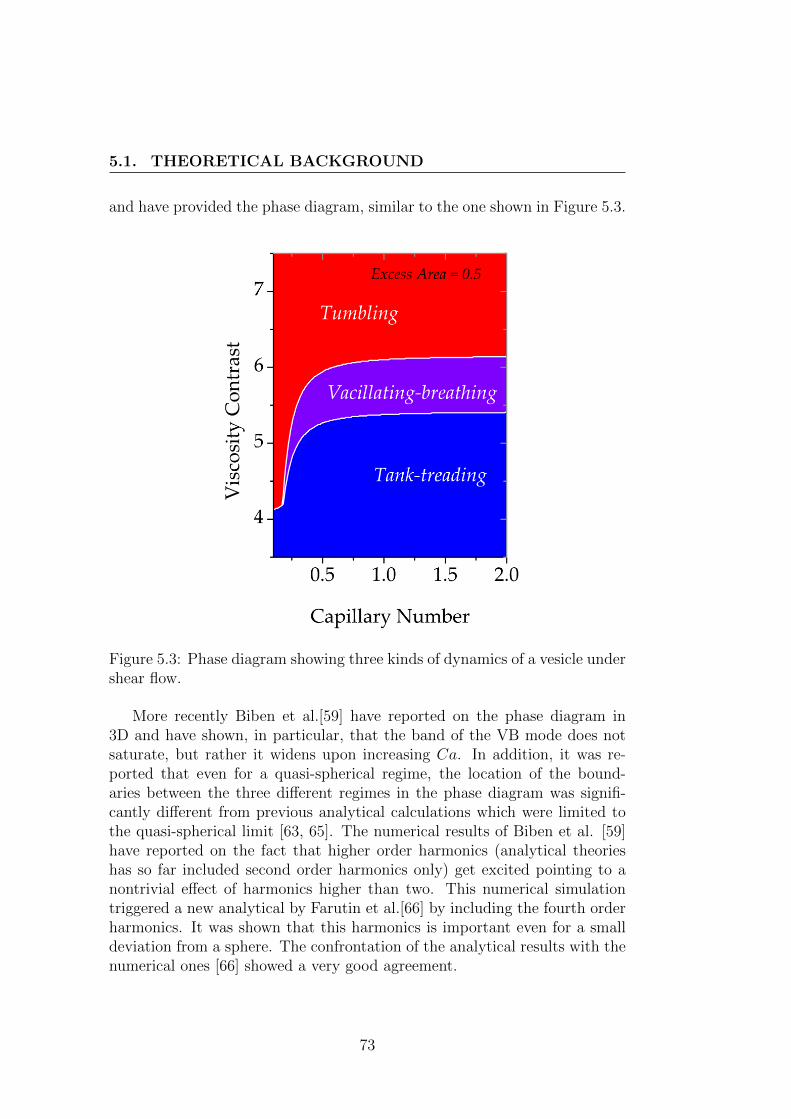
5.1. THEORETICAL BACKGROUND
and have provided the phase diagram, similar to the one shown in Figure 5.3.
Figure 5.3: Phase diagram showing three kinds of dynamics of a vesicle undershear flow.
More recently Biben et al.[59] have reported on the phase diagram in3D and have shown, in particular, that the band of the VB mode does notsaturate, but rather it widens upon increasing Ca. In addition, it was re-ported that even for a quasi-spherical regime, the location of the bound-aries between the three different regimes in the phase diagram was signifi-cantly different from previous analytical calculations which were limited tothe quasi-spherical limit [63, 65]. The numerical results of Biben et al. [59]have reported on the fact that higher order harmonics (analytical theorieshas so far included second order harmonics only) get excited pointing to anontrivial effect of harmonics higher than two. This numerical simulationtriggered a new analytical by Farutin et al.[66] by including the fourth orderharmonics. It was shown that this harmonics is important even for a smalldeviation from a sphere. The confrontation of the analytical results with thenumerical ones [66] showed a very good agreement.
73

CHAPTER 5. DYNAMICS OF A DEFLATED VESICLE
5.2 Deflated vesicles in shear flow
Variety in vesicles shapes and transition from one shape to another shapehave always been a subject of study for membrane physicists to measurephysical parameters of the membrane (energy of curvature, tension, cou-pling with a gel, adsorption of proteins, etc). Due to the absence of reliablemethod in producing deflated shapes of vesicles, so far no experimental studyon their dynamics has been reported. To compare the dynamical behaviourof deflated shapes with existing regimes such as tank-treading, tumbling andvacillating-breathing (for quasi spherical vesicle ), we have put first effort toproduce deflated shapes. The dynamical behaviour of deflated shapes canbe useful to understand the microscopic properties of the red blood cells inflow, and linking their rheological properties in overall blood flow.
5.2.1 Theoretical background
Dynamics of deflated object :
The first study on dynamics of very deflated shape of 2D vesicle imposed inlinear shear flow has been done by Ghigliotti et al. [67], considering viscosityratio λ (no viscosity difference in internal and external medium) and capil-lary number Ca, set to unity. Reduced area, τ2D, (corresponding to the 2Dmodel) of vesicle, varied from range of 0.32 to 1 (1 = circle) is shown in fig.5.4.
Figure 5.4: Equilibrium shapes for different reduced area
The study shows (fig. 5.5.a) that of a 2D vesicle when reduced area tendsto be unity i.e almost spherical (circular in 2D), inclination angle (θ) in tanktrading regime tends to be 45◦. This is consistent with earlier theoreticalpredictions. Surprisingly, inclination angle goes to zero for a finite reducedarea which is 0.32, even though there is no viscosity contrast.
In addition, tank-treading velocity (vtt) decreases for smaller reduced areaof the vesicle, as shown in fig. 5.5.b. This is expected due to fact that asreduced area decreases the vesicle aligns further with the flow. Then torque
74
5.2. DEFLATED VESICLES IN SHEAR FLOW
due to the imposed flow transfers more to inclination than the tank-treading.The interesting fact is that the vesicles can tumble even without viscosity con-trast. The idea is that due to deflation the vesicles assumes a pronouncedbiconcave-like shape, such that the membrane shows a neck. Upon shear-ing (with small shear rate), there is a competition between dissipation atthe neck (which prevents tank-treading) and the imposed flow that tends totransfer tank-treding to membrane. As a result the vesicle tumbles, up to acertain critical shear where transition to tank-treading is observed. We shallsee some preliminary results on deflated vesicles later in this chapter.
Figure 5.5: (a) Inclination angle (in degrees) of a tank - treading vesicle ina shear flow for Ca = 1 as a function of reduced area τ2D(b)Tank - treadingvelocity measured in unit of γ as a function of the reduced area τ2D
Formation of deflated Vesicle:
For producing very deflated vesicles, we chose DMPC lipid, which possessa rich scenario of shape and shape transition with variation of temperature[68][17] due to the difference of area and volume dilatability. Despite thehigh cholesterol content and the bilayer-cytoskeleton coupling, the bendingstiffness of the erythrocyte membrane is equal to about that of DMPC-bilayer[69, 70]. Many experiments on DOPC, DLPC and mixture of these lipids weredone to test the reliability of formation of deflated shapes. A few importantmechanical properties have already been described in chapter 3 (section:3.1.2)about DMPC and other lipids.
75
CHAPTER 5. DYNAMICS OF A DEFLATED VESICLE
Bilayer coupling model:
When vesicle membrane is a 2D liquid (absence of shear elasticity), and itsshape is dictated by the membrane bending energy (see 3.1.2). Under theconstraints of constant area and constant enclosed volume, the shape adoptedby a vesicle is given the minimum bending energy. In the case where there isno spontaneous curvature (and no area difference between the internal andexternal monolayer) the shape depends only on the reduced volume (definedin 3.3). For a human red blood cell the reduced volume is of about 0.65. Mi-minisation of the bending energy under the afore mentioned constraints leadsto a discocyte shape [71], which is very reminiscent of that of a red blood cell.
Various experiments (see review [15] for more details) on vesicles haveconcluded that the above model is not sufficient to account for all the varietyof shapes. The first additional ingredient consisted in taking into account aspontaneous curvature (taken to be constant) in the model. Duling and Hel-frich [72] took into account the effect of a spontaneous curvature. The modelhas now two dimensionless parameters: the spontaneous curvature (rescaledby the typical vesicle curvature) and the reduced volume. A catalogue ofvarious shapes in this 2D parameter space has been calculated, as alreadyshown in fig. 3.9 (chapter 3).
Another fact is that when vesicle undergoes deformation, two leafletsof membrane bilayer may respond differently [73]. Later other ingredientswere taken into account. Owing from the fact that any change in monolayermay lead different shapes, experimentally it is very complicated to createany difference between monolayers of membrane. Though, in spite of thesecomplications, few deflated shapes have been produced by changing osmoticconditions, the composition of lipid or additional solute in external solu-tion. Indeed, reliable method in formation of controlled shapes could notattempted. Therefore a hypothesis, considering coupling between two mono-layer by constancy of the difference between the areas of the two bilayerleaflets has been proposed by Svetina and Zeks [74, 75] which represents aLegendre transformation of the spontaneous curvature model of Helfrich [72].
Due to the fact that lipid exchange (flip-flop) between the inner and outermonolayer is so slow that area difference between two monolayers ∆A =Aex−Ain is fixed. Thus, two constraints, the enclosed volume, V, and the areaof the inner monolayer, Ain are considered as constant. The basic bendingenergy reads as
Gel = 1/2Kc
∫(c1 + c2)2dAin (5.9)
76
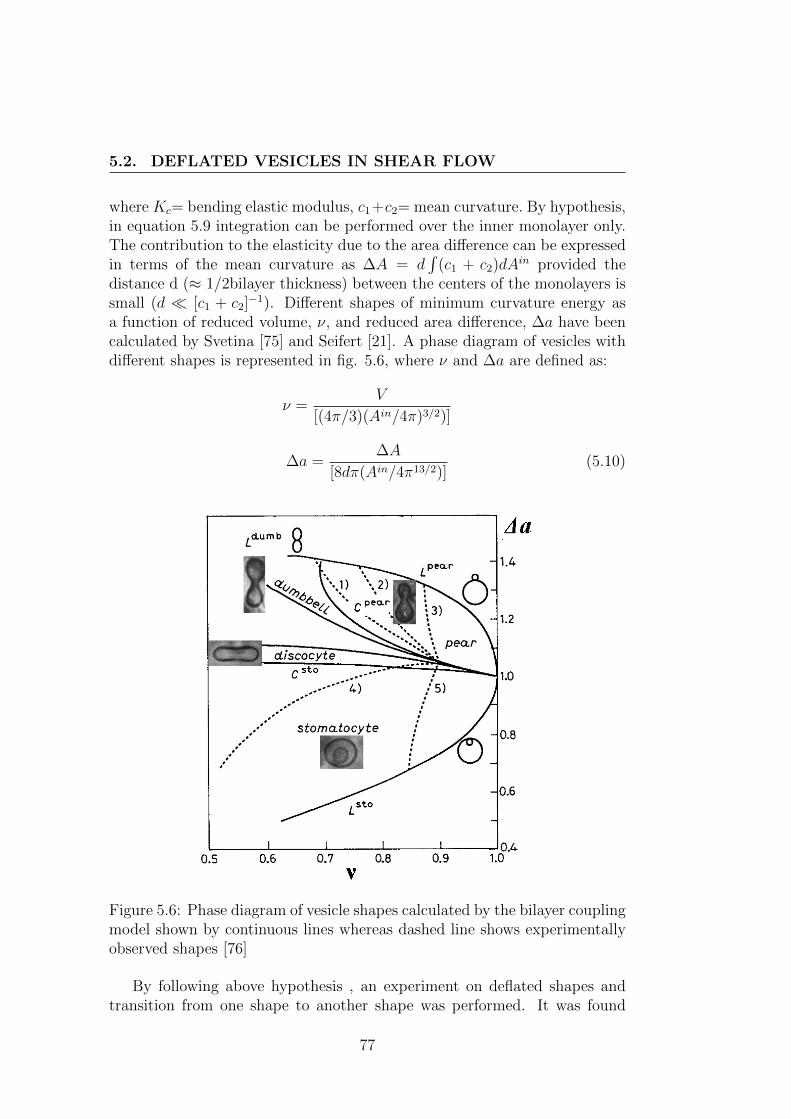
5.2. DEFLATED VESICLES IN SHEAR FLOW
where Kc= bending elastic modulus, c1+c2= mean curvature. By hypothesis,in equation 5.9 integration can be performed over the inner monolayer only.The contribution to the elasticity due to the area difference can be expressedin terms of the mean curvature as ∆A = d
∫(c1 + c2)dAin provided the
distance d (≈ 1/2bilayer thickness) between the centers of the monolayers issmall (d � [c1 + c2]−1). Different shapes of minimum curvature energy asa function of reduced volume, ν, and reduced area difference, ∆a have beencalculated by Svetina [75] and Seifert [21]. A phase diagram of vesicles withdifferent shapes is represented in fig. 5.6, where ν and ∆a are defined as:
ν =V
[(4π/3)(Ain/4π)3/2)]
∆a =∆A
[8dπ(Ain/4π13/2)](5.10)
Figure 5.6: Phase diagram of vesicle shapes calculated by the bilayer couplingmodel shown by continuous lines whereas dashed line shows experimentallyobserved shapes [76]
By following above hypothesis , an experiment on deflated shapes andtransition from one shape to another shape was performed. It was found
77

CHAPTER 5. DYNAMICS OF A DEFLATED VESICLE
that, even a variation of 0.1K/min in temperature resulted in a big trans-formation in shape [76]. On the basis of temperature effect , to comparetheoretical and experimental shapes, Berndl et al proposed a calculation ofthermal expansivities between leaflets [76, 68].
Shape change by thermal expansivity:
For explaining shape transition, it is assumed that the thermal expansivi-ties of the inner monolayer, αin, and outer monolayer, αex, exhibit a smalldifference, which is denoted by Υ. where αin,αex are defined by,
αin ≡ 1
AindAin
dT(5.11)
and
αex ≡ 1
AexdAex
dT
with
αex = (1 + Υ)αin
By neglecting the small thermal expansivity of the enclosed water volumeand assuming that the volume of the bilayer given by Aind is temperatureindependent, then ν and ∆a will depend on the temperature as follows:
∆a(T ) =Aex(To)exp[Υα
ex(T − To)]− Ain(To)
8dπ(To)(Ain(To)/4π)1/2.exp[(−3/2)αin]
andν(T ) = ν(To)exp[(−3/2)αin(T − To)] (5.12)
where ν(To) and ∆a(T ) are the parameters of the initial shape at tem-perature T = To. By eliminating (T −To) from these equations the change ofthe reduced area difference can be expressed as a function of ν i.e. νo ≡ ν(To)and ∆ao ≡ ∆ao(To) at T = To,
∆a(ν) =(νoν
)[∆ao + b
((νoν
)2Υ/3
− 1
)](5.13)
with
b ≡ Aex(To)
8dπ(To)(Ain(To)/4π)1/2(5.14)
78
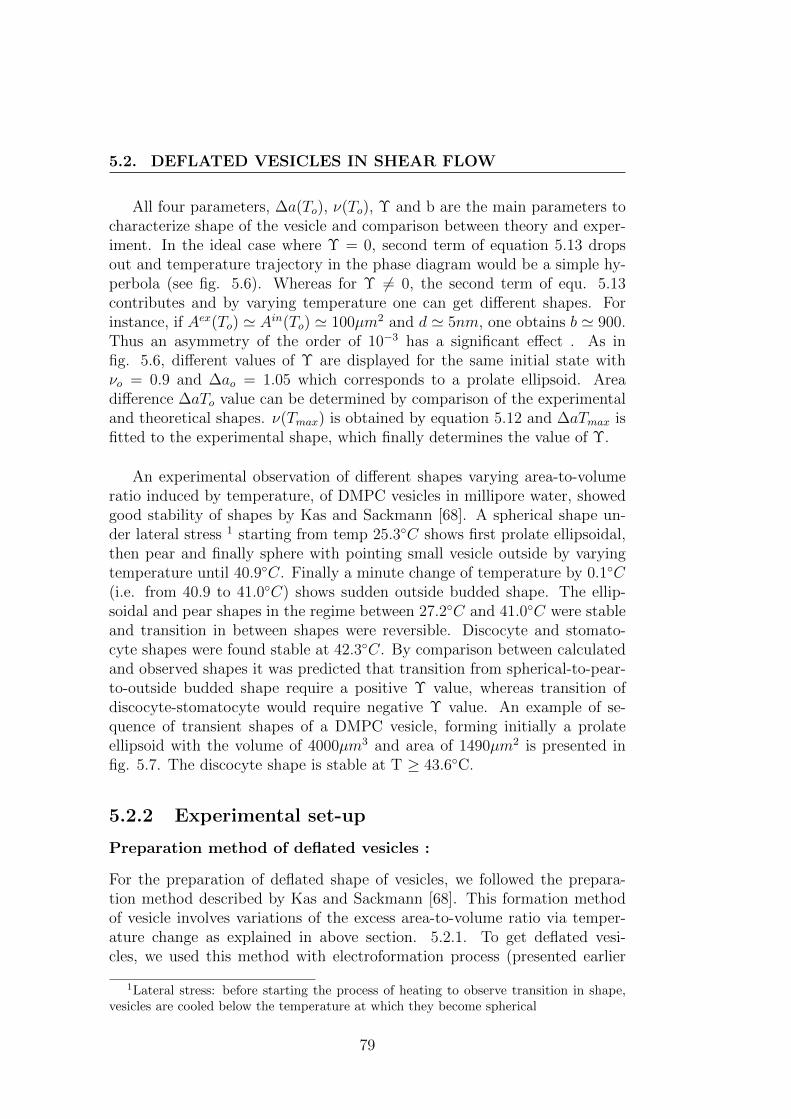
5.2. DEFLATED VESICLES IN SHEAR FLOW
All four parameters, ∆a(To), ν(To), Υ and b are the main parameters tocharacterize shape of the vesicle and comparison between theory and exper-iment. In the ideal case where Υ = 0, second term of equation 5.13 dropsout and temperature trajectory in the phase diagram would be a simple hy-perbola (see fig. 5.6). Whereas for Υ 6= 0, the second term of equ. 5.13contributes and by varying temperature one can get different shapes. Forinstance, if Aex(To) ' Ain(To) ' 100µm2 and d ' 5nm, one obtains b ' 900.Thus an asymmetry of the order of 10−3 has a significant effect . As infig. 5.6, different values of Υ are displayed for the same initial state withνo = 0.9 and ∆ao = 1.05 which corresponds to a prolate ellipsoid. Areadifference ∆aTo value can be determined by comparison of the experimentaland theoretical shapes. ν(Tmax) is obtained by equation 5.12 and ∆aTmax isfitted to the experimental shape, which finally determines the value of Υ.
An experimental observation of different shapes varying area-to-volumeratio induced by temperature, of DMPC vesicles in millipore water, showedgood stability of shapes by Kas and Sackmann [68]. A spherical shape un-der lateral stress 1 starting from temp 25.3◦C shows first prolate ellipsoidal,then pear and finally sphere with pointing small vesicle outside by varyingtemperature until 40.9◦C. Finally a minute change of temperature by 0.1◦C(i.e. from 40.9 to 41.0◦C) shows sudden outside budded shape. The ellip-soidal and pear shapes in the regime between 27.2◦C and 41.0◦C were stableand transition in between shapes were reversible. Discocyte and stomato-cyte shapes were found stable at 42.3◦C. By comparison between calculatedand observed shapes it was predicted that transition from spherical-to-pear-to-outside budded shape require a positive Υ value, whereas transition ofdiscocyte-stomatocyte would require negative Υ value. An example of se-quence of transient shapes of a DMPC vesicle, forming initially a prolateellipsoid with the volume of 4000µm3 and area of 1490µm2 is presented infig. 5.7. The discocyte shape is stable at T ≥ 43.6◦C.
5.2.2 Experimental set-up
Preparation method of deflated vesicles :
For the preparation of deflated shape of vesicles, we followed the prepara-tion method described by Kas and Sackmann [68]. This formation methodof vesicle involves variations of the excess area-to-volume ratio via temper-ature change as explained in above section. 5.2.1. To get deflated vesi-cles, we used this method with electroformation process (presented earlier
1Lateral stress: before starting the process of heating to observe transition in shape,vesicles are cooled below the temperature at which they become spherical
79
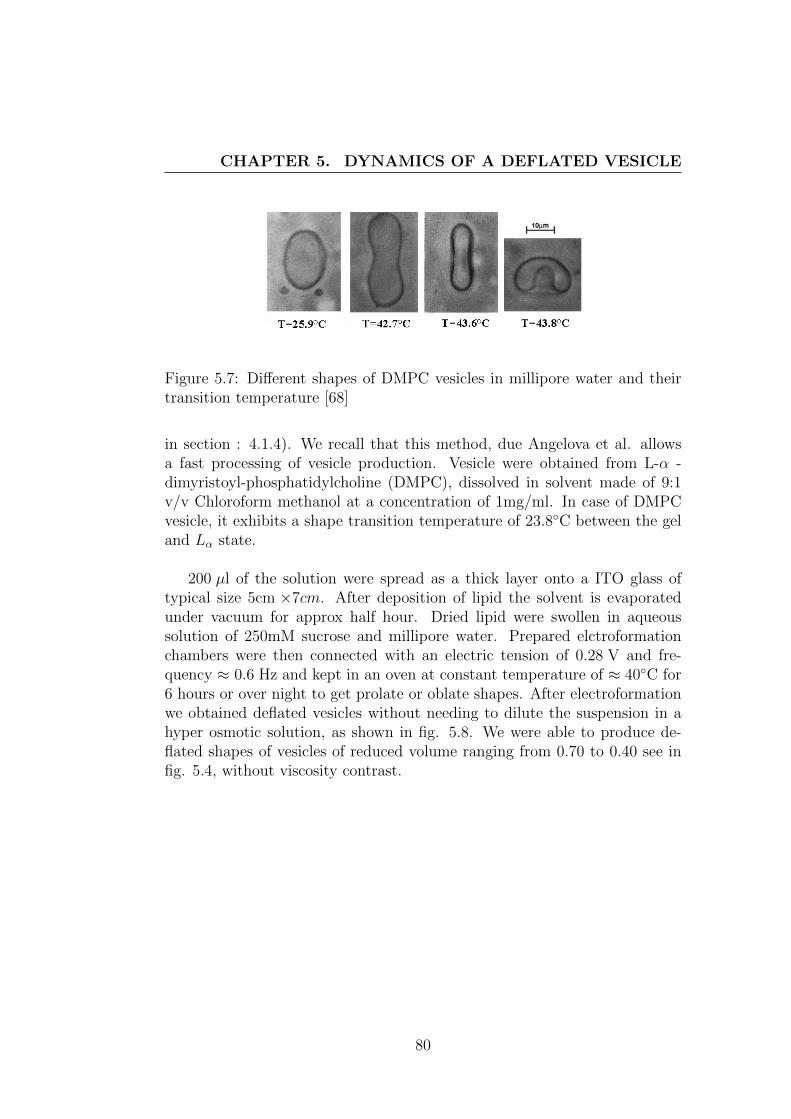
CHAPTER 5. DYNAMICS OF A DEFLATED VESICLE
Figure 5.7: Different shapes of DMPC vesicles in millipore water and theirtransition temperature [68]
in section : 4.1.4). We recall that this method, due Angelova et al. allowsa fast processing of vesicle production. Vesicle were obtained from L-α -dimyristoyl-phosphatidylcholine (DMPC), dissolved in solvent made of 9:1v/v Chloroform methanol at a concentration of 1mg/ml. In case of DMPCvesicle, it exhibits a shape transition temperature of 23.8◦C between the geland Lα state.
200 µl of the solution were spread as a thick layer onto a ITO glass oftypical size 5cm ×7cm. After deposition of lipid the solvent is evaporatedunder vacuum for approx half hour. Dried lipid were swollen in aqueoussolution of 250mM sucrose and millipore water. Prepared elctroformationchambers were then connected with an electric tension of 0.28 V and fre-quency ≈ 0.6 Hz and kept in an oven at constant temperature of ≈ 40◦C for6 hours or over night to get prolate or oblate shapes. After electroformationwe obtained deflated vesicles without needing to dilute the suspension in ahyper osmotic solution, as shown in fig. 5.8. We were able to produce de-flated shapes of vesicles of reduced volume ranging from 0.70 to 0.40 see infig. 5.4, without viscosity contrast.
80
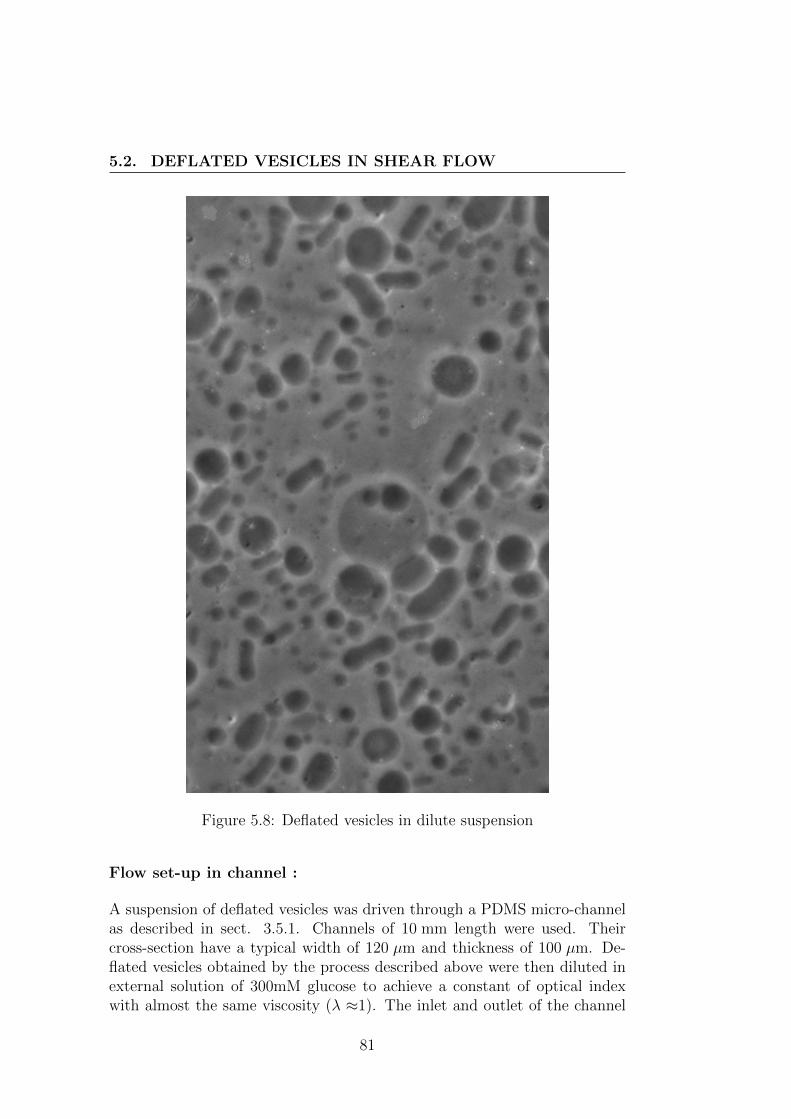
5.2. DEFLATED VESICLES IN SHEAR FLOW
Figure 5.8: Deflated vesicles in dilute suspension
Flow set-up in channel :
A suspension of deflated vesicles was driven through a PDMS micro-channelas described in sect. 3.5.1. Channels of 10 mm length were used. Theircross-section have a typical width of 120 µm and thickness of 100 µm. De-flated vesicles obtained by the process described above were then diluted inexternal solution of 300mM glucose to achieve a constant of optical indexwith almost the same viscosity (λ ≈1). The inlet and outlet of the channel
81
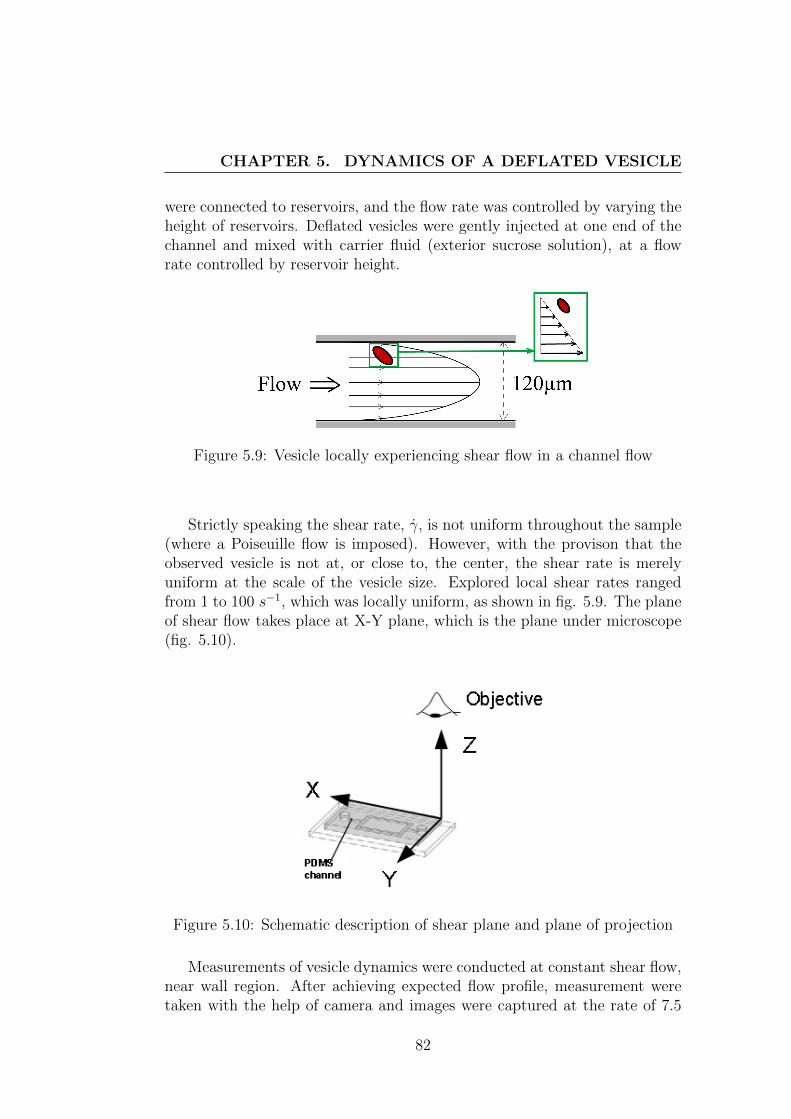
CHAPTER 5. DYNAMICS OF A DEFLATED VESICLE
were connected to reservoirs, and the flow rate was controlled by varying theheight of reservoirs. Deflated vesicles were gently injected at one end of thechannel and mixed with carrier fluid (exterior sucrose solution), at a flowrate controlled by reservoir height.
Figure 5.9: Vesicle locally experiencing shear flow in a channel flow
Strictly speaking the shear rate, γ, is not uniform throughout the sample(where a Poiseuille flow is imposed). However, with the provison that theobserved vesicle is not at, or close to, the center, the shear rate is merelyuniform at the scale of the vesicle size. Explored local shear rates rangedfrom 1 to 100 s−1, which was locally uniform, as shown in fig. 5.9. The planeof shear flow takes place at X-Y plane, which is the plane under microscope(fig. 5.10).
Figure 5.10: Schematic description of shear plane and plane of projection
Measurements of vesicle dynamics were conducted at constant shear flow,near wall region. After achieving expected flow profile, measurement weretaken with the help of camera and images were captured at the rate of 7.5
82
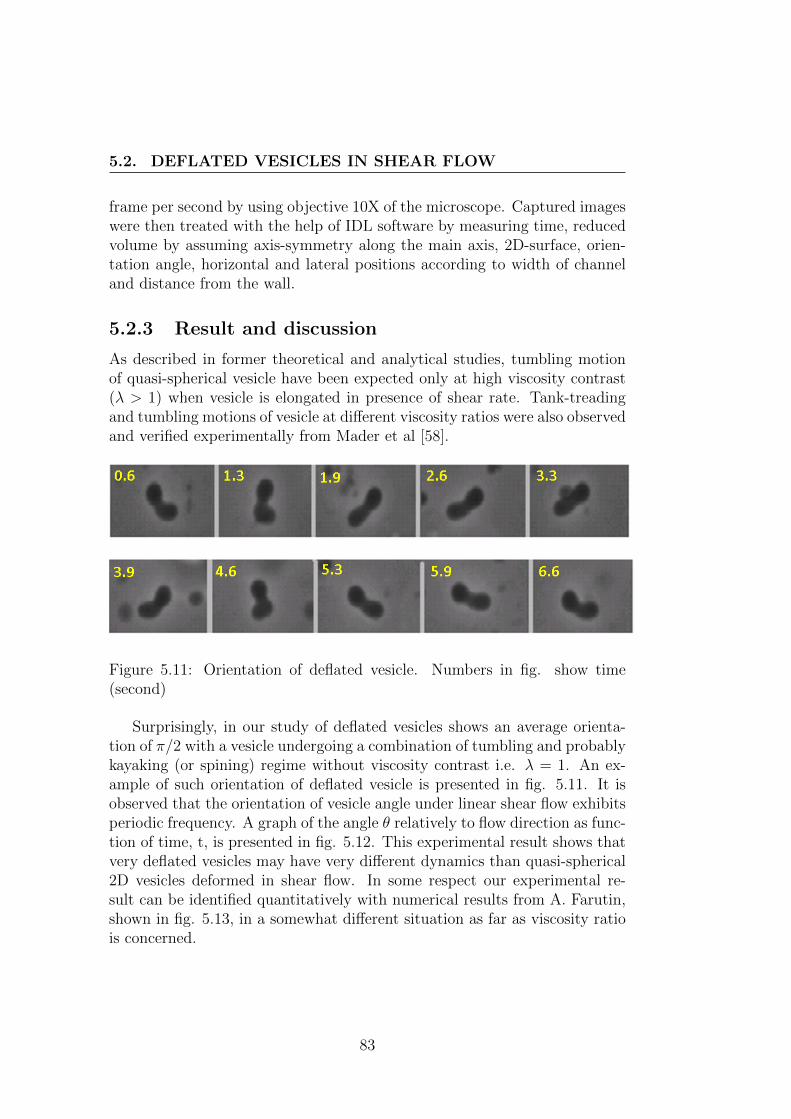
5.2. DEFLATED VESICLES IN SHEAR FLOW
frame per second by using objective 10X of the microscope. Captured imageswere then treated with the help of IDL software by measuring time, reducedvolume by assuming axis-symmetry along the main axis, 2D-surface, orien-tation angle, horizontal and lateral positions according to width of channeland distance from the wall.
5.2.3 Result and discussion
As described in former theoretical and analytical studies, tumbling motionof quasi-spherical vesicle have been expected only at high viscosity contrast(λ > 1) when vesicle is elongated in presence of shear rate. Tank-treadingand tumbling motions of vesicle at different viscosity ratios were also observedand verified experimentally from Mader et al [58].
Figure 5.11: Orientation of deflated vesicle. Numbers in fig. show time(second)
Surprisingly, in our study of deflated vesicles shows an average orienta-tion of π/2 with a vesicle undergoing a combination of tumbling and probablykayaking (or spining) regime without viscosity contrast i.e. λ = 1. An ex-ample of such orientation of deflated vesicle is presented in fig. 5.11. It isobserved that the orientation of vesicle angle under linear shear flow exhibitsperiodic frequency. A graph of the angle θ relatively to flow direction as func-tion of time, t, is presented in fig. 5.12. This experimental result shows thatvery deflated vesicles may have very different dynamics than quasi-spherical2D vesicles deformed in shear flow. In some respect our experimental re-sult can be identified quantitatively with numerical results from A. Farutin,shown in fig. 5.13, in a somewhat different situation as far as viscosity ratiois concerned.
83
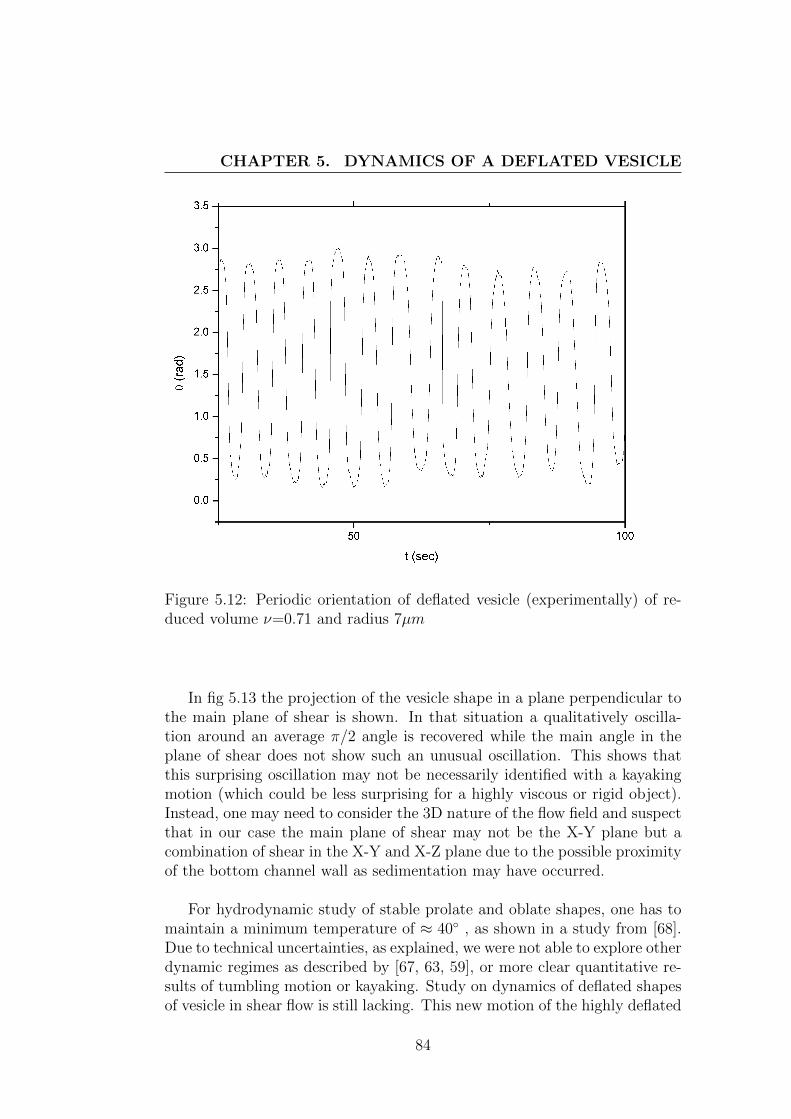
CHAPTER 5. DYNAMICS OF A DEFLATED VESICLE
Figure 5.12: Periodic orientation of deflated vesicle (experimentally) of re-duced volume ν=0.71 and radius 7µm
In fig 5.13 the projection of the vesicle shape in a plane perpendicular tothe main plane of shear is shown. In that situation a qualitatively oscilla-tion around an average π/2 angle is recovered while the main angle in theplane of shear does not show such an unusual oscillation. This shows thatthis surprising oscillation may not be necessarily identified with a kayakingmotion (which could be less surprising for a highly viscous or rigid object).Instead, one may need to consider the 3D nature of the flow field and suspectthat in our case the main plane of shear may not be the X-Y plane but acombination of shear in the X-Y and X-Z plane due to the possible proximityof the bottom channel wall as sedimentation may have occurred.
For hydrodynamic study of stable prolate and oblate shapes, one has tomaintain a minimum temperature of ≈ 40◦ , as shown in a study from [68].Due to technical uncertainties, as explained, we were not able to explore otherdynamic regimes as described by [67, 63, 59], or more clear quantitative re-sults of tumbling motion or kayaking. Study on dynamics of deflated shapesof vesicle in shear flow is still lacking. This new motion of the highly deflated
84
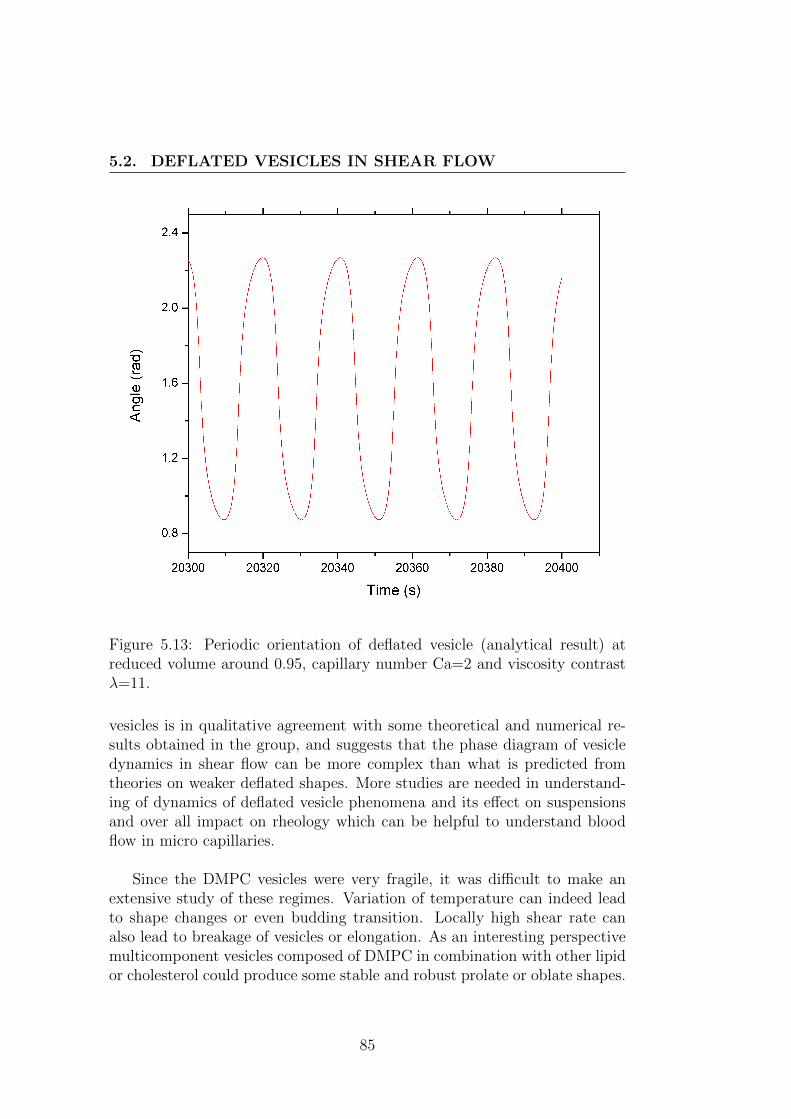
5.2. DEFLATED VESICLES IN SHEAR FLOW
Figure 5.13: Periodic orientation of deflated vesicle (analytical result) atreduced volume around 0.95, capillary number Ca=2 and viscosity contrastλ=11.
vesicles is in qualitative agreement with some theoretical and numerical re-sults obtained in the group, and suggests that the phase diagram of vesicledynamics in shear flow can be more complex than what is predicted fromtheories on weaker deflated shapes. More studies are needed in understand-ing of dynamics of deflated vesicle phenomena and its effect on suspensionsand over all impact on rheology which can be helpful to understand bloodflow in micro capillaries.
Since the DMPC vesicles were very fragile, it was difficult to make anextensive study of these regimes. Variation of temperature can indeed leadto shape changes or even budding transition. Locally high shear rate canalso lead to breakage of vesicles or elongation. As an interesting perspectivemulticomponent vesicles composed of DMPC in combination with other lipidor cholesterol could produce some stable and robust prolate or oblate shapes.
85
CHAPTER 5. DYNAMICS OF A DEFLATED VESICLE
86
Chapter 6
Hydrodynamic interactionbetween two vesicles in shearflow
Dans ce chapitre, le phenomene dinteraction hydrodynamique entre deuxvesicules dans un ecoulement de cisaillement est decrit. Un dispositif expe-rimental microfluidique a ete concu pour produire des conditions favorablesa l’observation des interactions de paires de vesicules, a savoir un jet con-centre de la suspension de vesicules dans un canal plus large. Pendant lin-teraction, une repulsion hydrodynamique a lieu, ce qui augmente la distancelaterale (transverse a la direction de l’ecoulement) de vesicules. Lintensitede cette repulsion depend du volume reduit de la vesicule (les spheres ne sontpas deplacees), du contraste de viscosite, et est une fonction decroissante deleur distance initiale dans la direction transverse. Nous mesurons quantita-tivement cette repulsion et comparons les resultats aux resultats theoriquesobtenus dans le groupe. Ces resultats fournissent une base quantitative pourla derivation des coefficients de diffusion induite par cisaillement dans lessuspensions de vesicules.
In this chapter, the phenomenon of hydrodynamic interaction betweentwo vesicles in a shear flow is described. An experimental microfluidic de-vice has been designed to produce favourable conditions to observe pair-interactions of vesicles, namely a focused jet of the vesicle suspension in widerchannel. During the interaction, a hydrodynamic repulsion takes place, whichincreases the lateral (cross-streamwise) distance of vesicles. The intensity ofthis repulsion depends on vesicle reduced volume (spheres are not displaced),viscosity contrast and is a decreasing function of their initial cross-streamwise
87
CHAPTER 6. HYDRODYNAMIC INTERACTION BETWEENTWO VESICLES IN SHEAR FLOW
distance. We quantitatively measured this repulsion and compared the re-sults to theoretical results obtained in the group. These results provide aquantitative basis for the derivation of shear-induced diffusion coefficients insheared vesicle suspensions.
6.1 Introduction
Since the early 70’s the interactions between two bodies in flow such as spher-ical particles, bubbles, drops, or capsules have been the subject of manyworks. [77, 78]. The effects of hydrodynamic interactions on the motion ofbubbles [79, 80], bulk stress and sedimentation velocity [81] have been stud-ied. Even in dilute suspensions, interactions between micro particles affectthe rheological behaviour [82]. The phenomenon of interaction in varioussystems is described below
6.1.1 Statement and review of the problem
We consider two particles of identical size in shear flow. The centers of massof the two particles are in same plane of shear. The two interacting particlesare on different streamlines moving with different velocities. For simplicitywe herein assume one vesicle is at the origin of the reference frame (X = 0,Y = 0) at constant position and an another vesicle follows a trajectory fromits initial position Xin and Yin (| Xin |� R0 where R0 is the effective radiusof the particle).
After travelling a distance Xin, the particle meets the other one whichis located at the origin and crosses it. During the crossing it is displacedin the Y direction from its initial lateral position and after crossing relaxestowards its final lateral position. Studies on drops and capsules showed thatin the limit of dilute suspension spherical objects came back to their initial Ycoordinate and initial streamline. In the general case, the particle does notrelax to Yin and a net lateral displacement is observed with a final coordinateYfin, as shown in fig. 6.1.
For spheres, cross-stream lateral displacement is expected to be negligiblefrom symmetry arguments by considering the linearity of the Stokes equa-tion [83]. To break the symmetry of the problem three body interactions arenecessary, which are negligible in dilute suspensions.
In other cases when roughness with a relative amplitude of ≈ 4.7× 10⁻⁵
is considered, interacting spheres are shifted from their initial streamline and
88
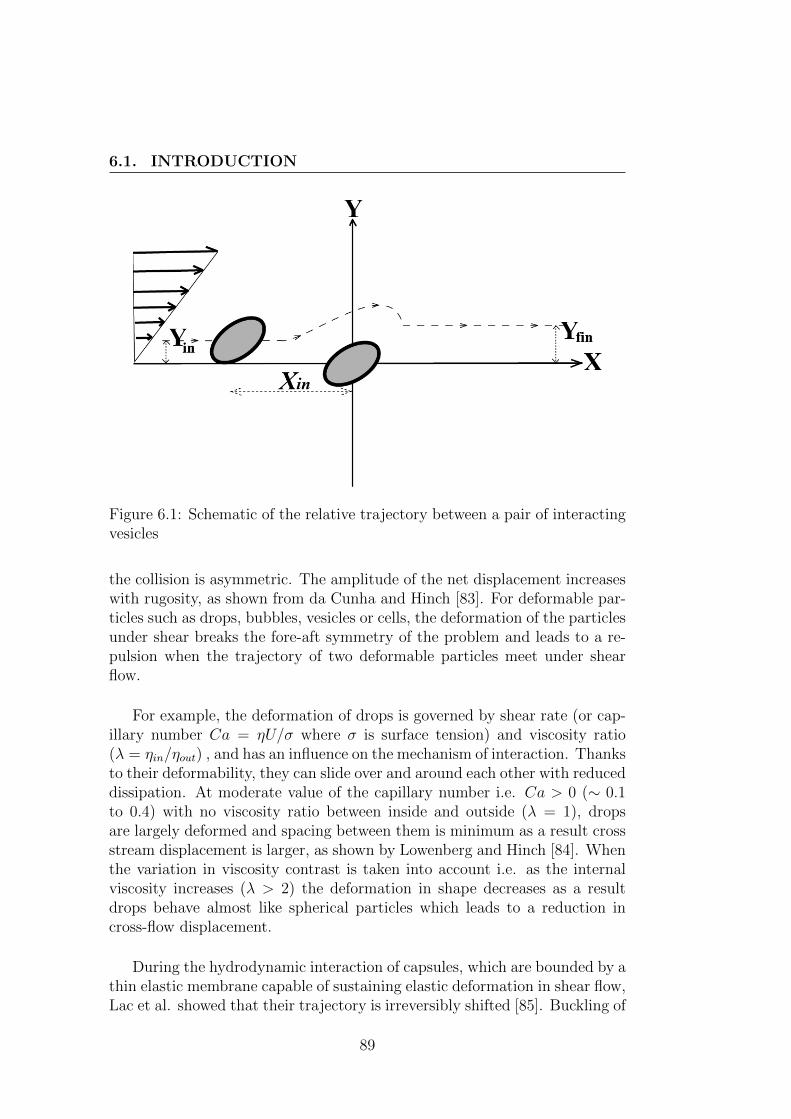
6.1. INTRODUCTION
Figure 6.1: Schematic of the relative trajectory between a pair of interactingvesicles
the collision is asymmetric. The amplitude of the net displacement increaseswith rugosity, as shown from da Cunha and Hinch [83]. For deformable par-ticles such as drops, bubbles, vesicles or cells, the deformation of the particlesunder shear breaks the fore-aft symmetry of the problem and leads to a re-pulsion when the trajectory of two deformable particles meet under shearflow.
For example, the deformation of drops is governed by shear rate (or cap-illary number Ca = ηU/σ where σ is surface tension) and viscosity ratio(λ = ηin/ηout) , and has an influence on the mechanism of interaction. Thanksto their deformability, they can slide over and around each other with reduceddissipation. At moderate value of the capillary number i.e. Ca > 0 (∼ 0.1to 0.4) with no viscosity ratio between inside and outside (λ = 1), dropsare largely deformed and spacing between them is minimum as a result crossstream displacement is larger, as shown by Lowenberg and Hinch [84]. Whenthe variation in viscosity contrast is taken into account i.e. as the internalviscosity increases (λ > 2) the deformation in shape decreases as a resultdrops behave almost like spherical particles which leads to a reduction incross-flow displacement.
During the hydrodynamic interaction of capsules, which are bounded by athin elastic membrane capable of sustaining elastic deformation in shear flow,Lac et al. showed that their trajectory is irreversibly shifted [85]. Buckling of
89
CHAPTER 6. HYDRODYNAMIC INTERACTION BETWEENTWO VESICLES IN SHEAR FLOW
membranes were also observed during the separation phase of capsules. Thistheoretical prediction shows qualitative agreement with Loewenberg’s dropmodel but shows membrane mechanics plays a specific role. It was foundthat the trajectory displacement of a drop was about 30% higher than thatof capsules.
Theoretically, it is challenging to study more than two deformable shapesin interaction. Wang, Mauri and Acrivos [86], [87] have shown an effecton cross stream diffusivity by considering the interaction of three sphereswhereas Acrivos calculated far field streamline interactions by consideringfour spheres as two pairs [88].
While there have been many studies on pair interactions of particles, bub-bles, drops or capsules, there are actually very few studies reported relatedto the quantitative study of the objects with membranes having mechanicalproperties similar to those of living cells.
Apart from the few experimental results reported by Kantsler [89] on thedisplacement of vesicles during their interaction in shear flow, no quantita-tive study of this phenomenon and the influence of parameters such as initialrelative position and vesicle properties has been performed and many ques-tions remain unanswered.
However, at the scale of a whole suspension in shear flow, direct conse-quences of hydrodynamic interactions have been observed and quantified :in a shear flow between plates, it has been observed that a vesicle suspen-sion reaches a steady non-uniform distribution due to a balance between liftforce that repels vesicles away from walls, and shear-induced diffusion due torepulsion between vesicles during random interactions [90]. Interestingly, apoly-disperse suspension of vesicle is sheared between two plates, the smallvesicles interact with large vesicles and are pushed towards the wall: the pop-ulation of large vesicles is concentrated around the center of the flow whilesmaller vesicles show a dissipation in their distribution near the center, asshown in fig. 6.2.
As shown by Da Cunha and Hinch [83], in a suspension of deformableparticles of size R in a shear flow, a shear-induced diffusion coefficient dueto pair interactions can be computed as:
D = fiR2γΦ (6.1)
where γ is the shear rate, Φ the volume fraction of particles in the sus-
90

6.2. PREPARATION AND EXPERIMENTAL SET-UP
Figure 6.2: Steady distribution of (a) small and (b) large vesicles with noviscosity contrast. z is the distance between two plates that are separatedby 180µm, R is the radius of vesicle and a1/a2 aspect ratio [90]
pension and fi is a dimensionless diffusion coefficient which is proportional tothe mean square displacement of particles during interactions averaged overall possible initial relative positions, fi = f2 or f3 for cross-flow self-diffusionin the direction of velocity gradient or vorticity.
In order to derive the shear induced diffusion coefficient from microscopicinteractions, it is therefore necessary to make quantitative measurements ofthe repulsion of vesicles during pair interactions by varying the initial relativepositions, and quantify the effect of parameters such as vesicle size, reducedvolume and viscosity ratio.
Ideally, for a complete understanding of the effects measured at the scaleof the suspension [90], it would be useful not only to study interactions be-tween identical vesicles, but also between vesicles of different sizes, whichcould shed light on phenomena such as possible segregation effects in poly-disperse suspensions. Such effects are biologically relevant (a segregation be-tween blood cells and platelets is sometimes observed in blood flow in smallvessels) and could also be interesting for microfluidic manipulation and sep-aration of cells.
6.2 Preparation and experimental set-up
To achieve a good probability of interaction between vesicles in experiments,an experimental set-up has been designed to produce a narrow layer of con-centrated vesicles in a larger shear flow. This set-up is described in section6.2.1.
91
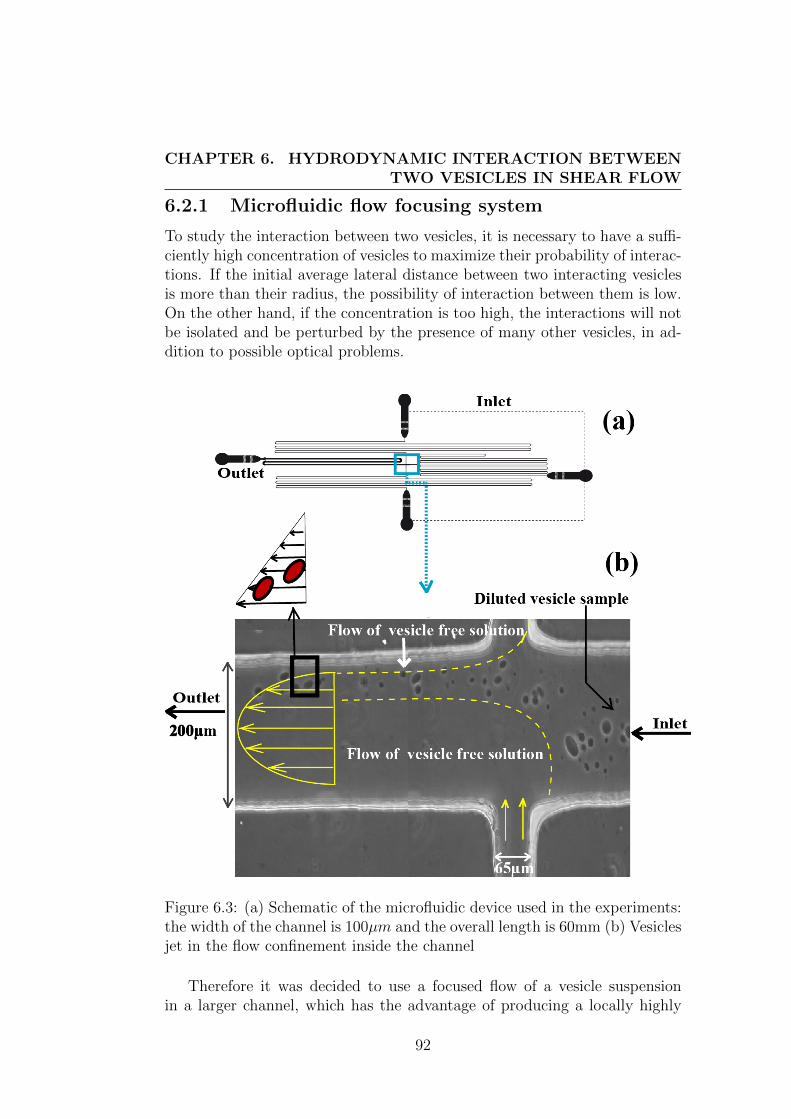
CHAPTER 6. HYDRODYNAMIC INTERACTION BETWEENTWO VESICLES IN SHEAR FLOW
6.2.1 Microfluidic flow focusing system
To study the interaction between two vesicles, it is necessary to have a suffi-ciently high concentration of vesicles to maximize their probability of interac-tions. If the initial average lateral distance between two interacting vesiclesis more than their radius, the possibility of interaction between them is low.On the other hand, if the concentration is too high, the interactions will notbe isolated and be perturbed by the presence of many other vesicles, in ad-dition to possible optical problems.
Figure 6.3: (a) Schematic of the microfluidic device used in the experiments:the width of the channel is 100µm and the overall length is 60mm (b) Vesiclesjet in the flow confinement inside the channel
Therefore it was decided to use a focused flow of a vesicle suspensionin a larger channel, which has the advantage of producing a locally highly
92
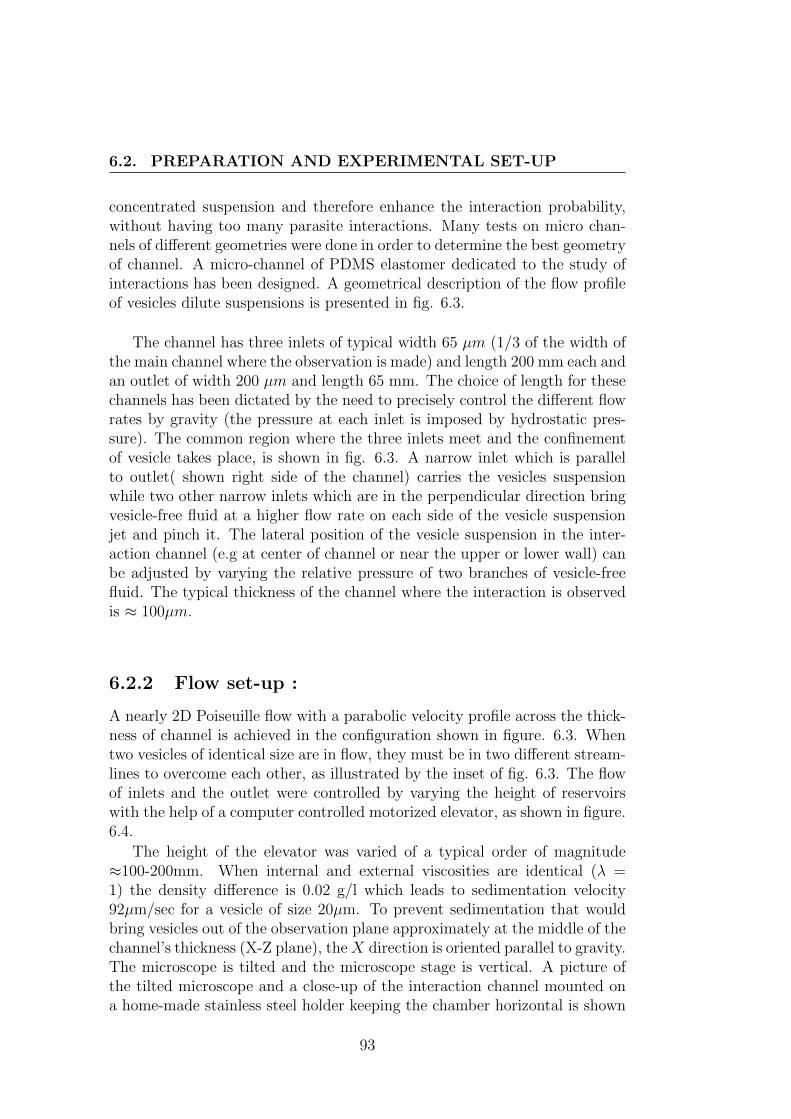
6.2. PREPARATION AND EXPERIMENTAL SET-UP
concentrated suspension and therefore enhance the interaction probability,without having too many parasite interactions. Many tests on micro chan-nels of different geometries were done in order to determine the best geometryof channel. A micro-channel of PDMS elastomer dedicated to the study ofinteractions has been designed. A geometrical description of the flow profileof vesicles dilute suspensions is presented in fig. 6.3.
The channel has three inlets of typical width 65 µm (1/3 of the width ofthe main channel where the observation is made) and length 200 mm each andan outlet of width 200 µm and length 65 mm. The choice of length for thesechannels has been dictated by the need to precisely control the different flowrates by gravity (the pressure at each inlet is imposed by hydrostatic pres-sure). The common region where the three inlets meet and the confinementof vesicle takes place, is shown in fig. 6.3. A narrow inlet which is parallelto outlet( shown right side of the channel) carries the vesicles suspensionwhile two other narrow inlets which are in the perpendicular direction bringvesicle-free fluid at a higher flow rate on each side of the vesicle suspensionjet and pinch it. The lateral position of the vesicle suspension in the inter-action channel (e.g at center of channel or near the upper or lower wall) canbe adjusted by varying the relative pressure of two branches of vesicle-freefluid. The typical thickness of the channel where the interaction is observedis ≈ 100µm.
6.2.2 Flow set-up :
A nearly 2D Poiseuille flow with a parabolic velocity profile across the thick-ness of channel is achieved in the configuration shown in figure. 6.3. Whentwo vesicles of identical size are in flow, they must be in two different stream-lines to overcome each other, as illustrated by the inset of fig. 6.3. The flowof inlets and the outlet were controlled by varying the height of reservoirswith the help of a computer controlled motorized elevator, as shown in figure.6.4.
The height of the elevator was varied of a typical order of magnitude≈100-200mm. When internal and external viscosities are identical (λ =1) the density difference is 0.02 g/l which leads to sedimentation velocity92µm/sec for a vesicle of size 20µm. To prevent sedimentation that wouldbring vesicles out of the observation plane approximately at the middle of thechannel’s thickness (X-Z plane), theX direction is oriented parallel to gravity.The microscope is tilted and the microscope stage is vertical. A picture ofthe tilted microscope and a close-up of the interaction channel mounted ona home-made stainless steel holder keeping the chamber horizontal is shown
93
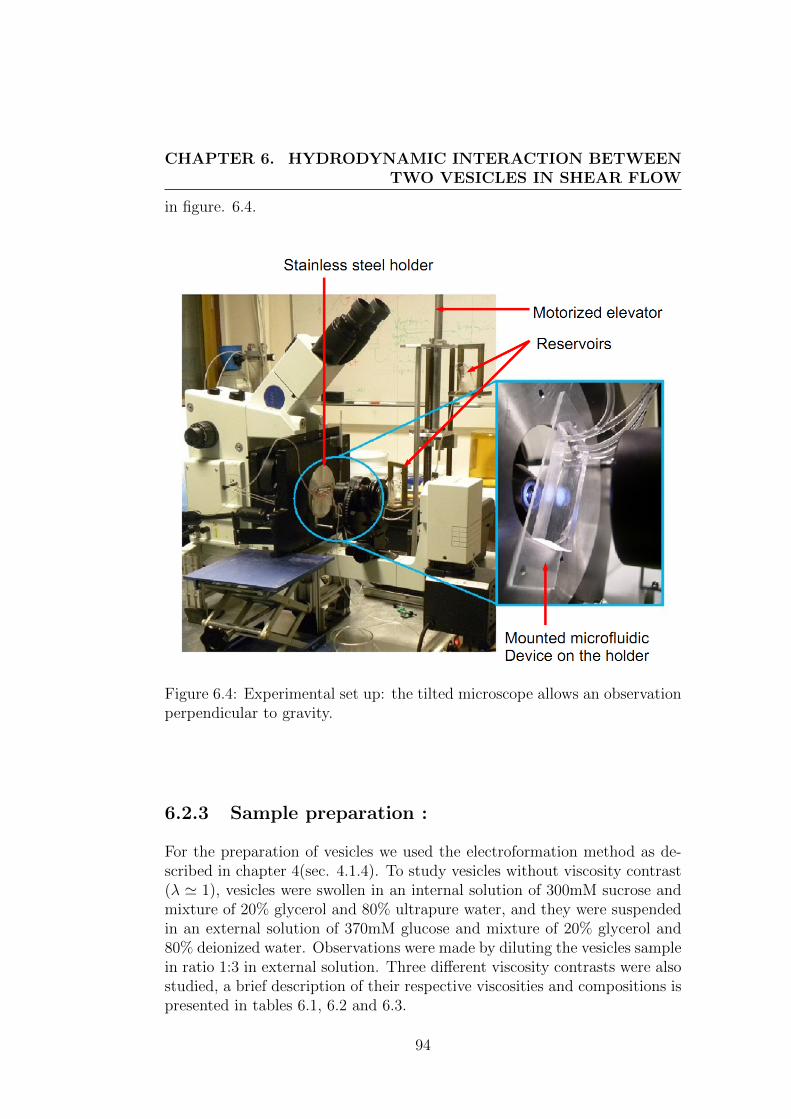
CHAPTER 6. HYDRODYNAMIC INTERACTION BETWEENTWO VESICLES IN SHEAR FLOW
in figure. 6.4.
Figure 6.4: Experimental set up: the tilted microscope allows an observationperpendicular to gravity.
6.2.3 Sample preparation :
For the preparation of vesicles we used the electroformation method as de-scribed in chapter 4(sec. 4.1.4). To study vesicles without viscosity contrast(λ ' 1), vesicles were swollen in an internal solution of 300mM sucrose andmixture of 20% glycerol and 80% ultrapure water, and they were suspendedin an external solution of 370mM glucose and mixture of 20% glycerol and80% deionized water. Observations were made by diluting the vesicles samplein ratio 1:3 in external solution. Three different viscosity contrasts were alsostudied, a brief description of their respective viscosities and compositions ispresented in tables 6.1, 6.2 and 6.3.
94
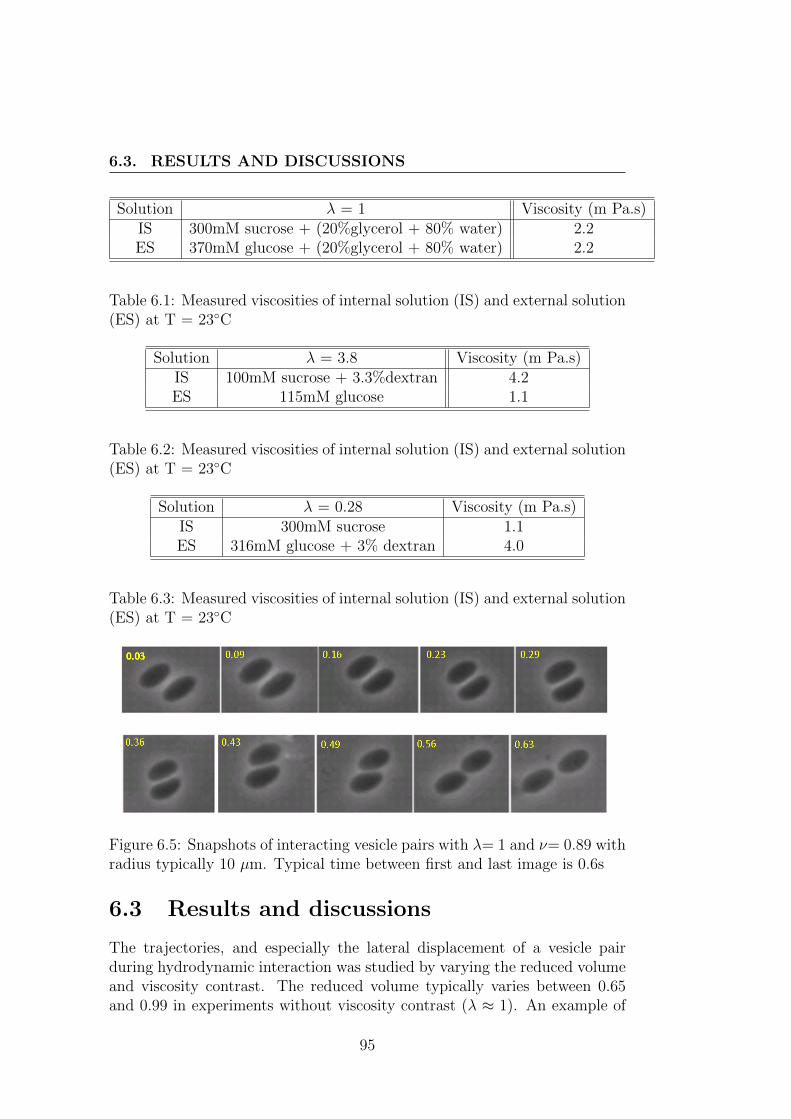
6.3. RESULTS AND DISCUSSIONS
Solution λ = 1 Viscosity (m Pa.s)IS 300mM sucrose + (20%glycerol + 80% water) 2.2ES 370mM glucose + (20%glycerol + 80% water) 2.2
Table 6.1: Measured viscosities of internal solution (IS) and external solution(ES) at T = 23◦C
Solution λ = 3.8 Viscosity (m Pa.s)IS 100mM sucrose + 3.3%dextran 4.2ES 115mM glucose 1.1
Table 6.2: Measured viscosities of internal solution (IS) and external solution(ES) at T = 23◦C
Solution λ = 0.28 Viscosity (m Pa.s)IS 300mM sucrose 1.1ES 316mM glucose + 3% dextran 4.0
Table 6.3: Measured viscosities of internal solution (IS) and external solution(ES) at T = 23◦C
Figure 6.5: Snapshots of interacting vesicle pairs with λ= 1 and ν= 0.89 withradius typically 10 µm. Typical time between first and last image is 0.6s
6.3 Results and discussions
The trajectories, and especially the lateral displacement of a vesicle pairduring hydrodynamic interaction was studied by varying the reduced volumeand viscosity contrast. The reduced volume typically varies between 0.65and 0.99 in experiments without viscosity contrast (λ ≈ 1). An example of
95
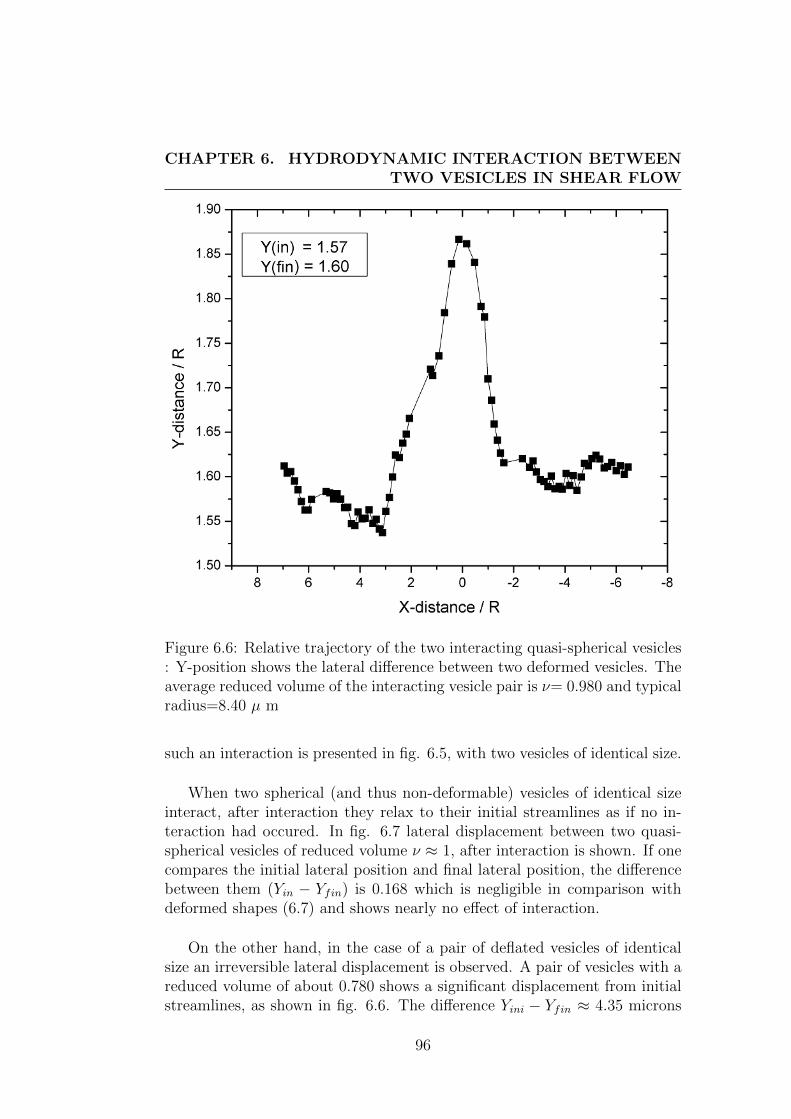
CHAPTER 6. HYDRODYNAMIC INTERACTION BETWEENTWO VESICLES IN SHEAR FLOW
Figure 6.6: Relative trajectory of the two interacting quasi-spherical vesicles: Y-position shows the lateral difference between two deformed vesicles. Theaverage reduced volume of the interacting vesicle pair is ν= 0.980 and typicalradius=8.40 µ m
such an interaction is presented in fig. 6.5, with two vesicles of identical size.
When two spherical (and thus non-deformable) vesicles of identical sizeinteract, after interaction they relax to their initial streamlines as if no in-teraction had occured. In fig. 6.7 lateral displacement between two quasi-spherical vesicles of reduced volume ν ≈ 1, after interaction is shown. If onecompares the initial lateral position and final lateral position, the differencebetween them (Yin − Yfin) is 0.168 which is negligible in comparison withdeformed shapes (6.7) and shows nearly no effect of interaction.
On the other hand, in the case of a pair of deflated vesicles of identicalsize an irreversible lateral displacement is observed. A pair of vesicles with areduced volume of about 0.780 shows a significant displacement from initialstreamlines, as shown in fig. 6.6. The difference Yini − Yfin ≈ 4.35 microns
96
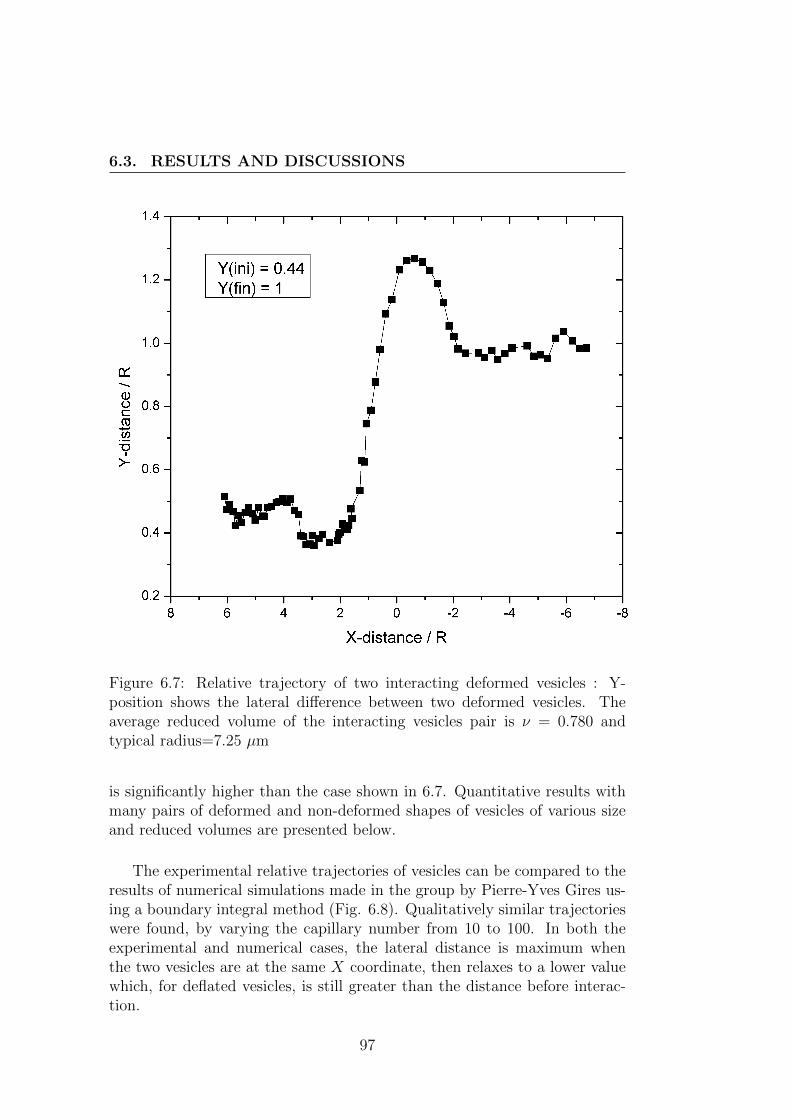
6.3. RESULTS AND DISCUSSIONS
Figure 6.7: Relative trajectory of two interacting deformed vesicles : Y-position shows the lateral difference between two deformed vesicles. Theaverage reduced volume of the interacting vesicles pair is ν = 0.780 andtypical radius=7.25 µm
is significantly higher than the case shown in 6.7. Quantitative results withmany pairs of deformed and non-deformed shapes of vesicles of various sizeand reduced volumes are presented below.
The experimental relative trajectories of vesicles can be compared to theresults of numerical simulations made in the group by Pierre-Yves Gires us-ing a boundary integral method (Fig. 6.8). Qualitatively similar trajectorieswere found, by varying the capillary number from 10 to 100. In both theexperimental and numerical cases, the lateral distance is maximum whenthe two vesicles are at the same X coordinate, then relaxes to a lower valuewhich, for deflated vesicles, is still greater than the distance before interac-tion.
97
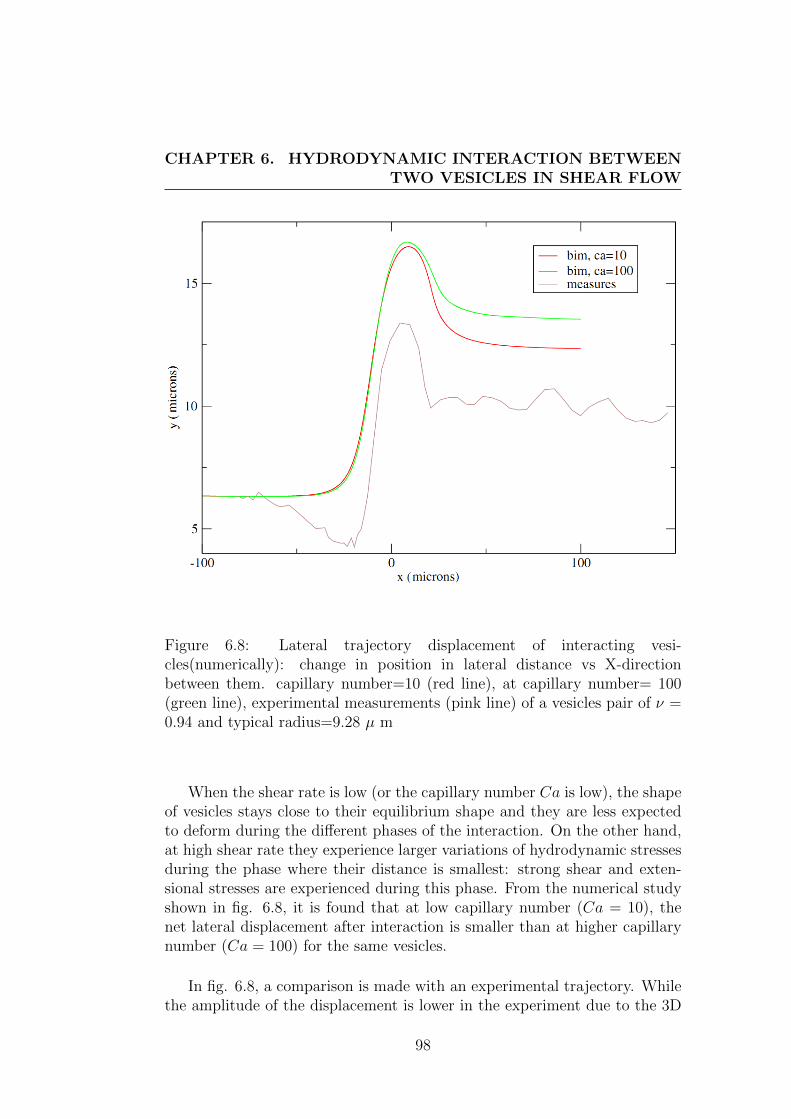
CHAPTER 6. HYDRODYNAMIC INTERACTION BETWEENTWO VESICLES IN SHEAR FLOW
Figure 6.8: Lateral trajectory displacement of interacting vesi-cles(numerically): change in position in lateral distance vs X-directionbetween them. capillary number=10 (red line), at capillary number= 100(green line), experimental measurements (pink line) of a vesicles pair of ν =0.94 and typical radius=9.28 µ m
When the shear rate is low (or the capillary number Ca is low), the shapeof vesicles stays close to their equilibrium shape and they are less expectedto deform during the different phases of the interaction. On the other hand,at high shear rate they experience larger variations of hydrodynamic stressesduring the phase where their distance is smallest: strong shear and exten-sional stresses are experienced during this phase. From the numerical studyshown in fig. 6.8, it is found that at low capillary number (Ca = 10), thenet lateral displacement after interaction is smaller than at higher capillarynumber (Ca = 100) for the same vesicles.
In fig. 6.8, a comparison is made with an experimental trajectory. Whilethe amplitude of the displacement is lower in the experiment due to the 3D
98
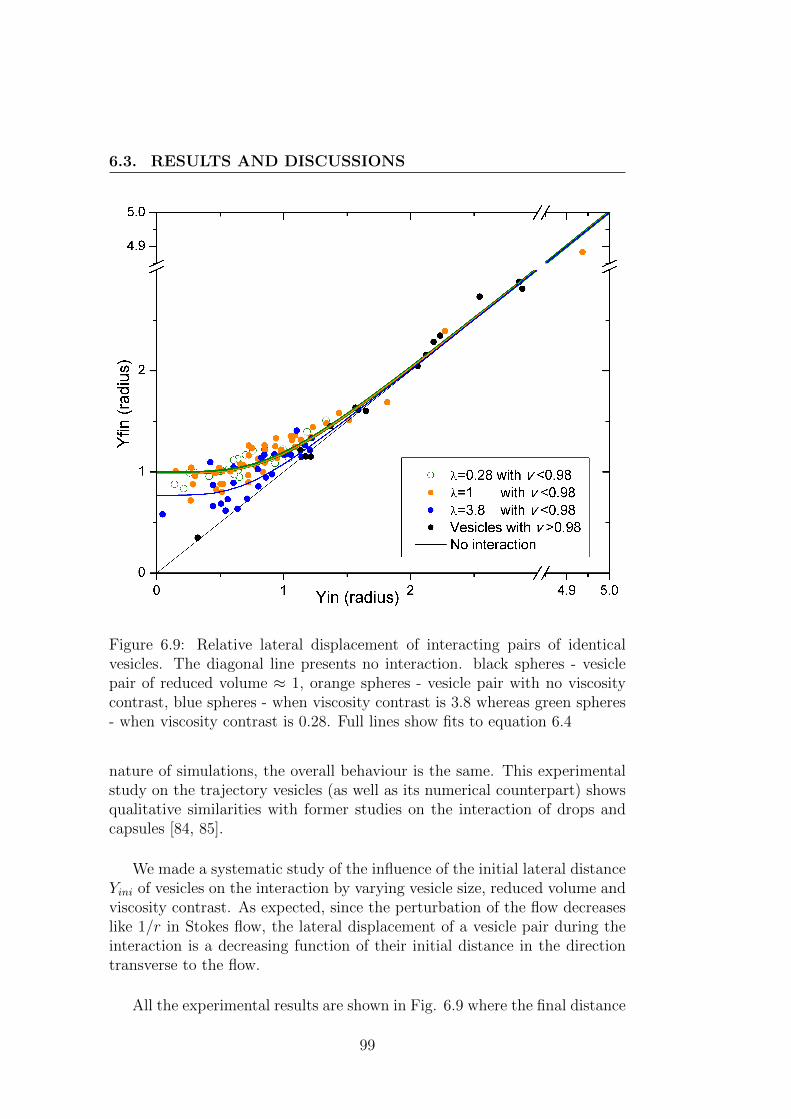
6.3. RESULTS AND DISCUSSIONS
Figure 6.9: Relative lateral displacement of interacting pairs of identicalvesicles. The diagonal line presents no interaction. black spheres - vesiclepair of reduced volume ≈ 1, orange spheres - vesicle pair with no viscositycontrast, blue spheres - when viscosity contrast is 3.8 whereas green spheres- when viscosity contrast is 0.28. Full lines show fits to equation 6.4
nature of simulations, the overall behaviour is the same. This experimentalstudy on the trajectory vesicles (as well as its numerical counterpart) showsqualitative similarities with former studies on the interaction of drops andcapsules [84, 85].
We made a systematic study of the influence of the initial lateral distanceYini of vesicles on the interaction by varying vesicle size, reduced volume andviscosity contrast. As expected, since the perturbation of the flow decreaseslike 1/r in Stokes flow, the lateral displacement of a vesicle pair during theinteraction is a decreasing function of their initial distance in the directiontransverse to the flow.
All the experimental results are shown in Fig. 6.9 where the final distance
99
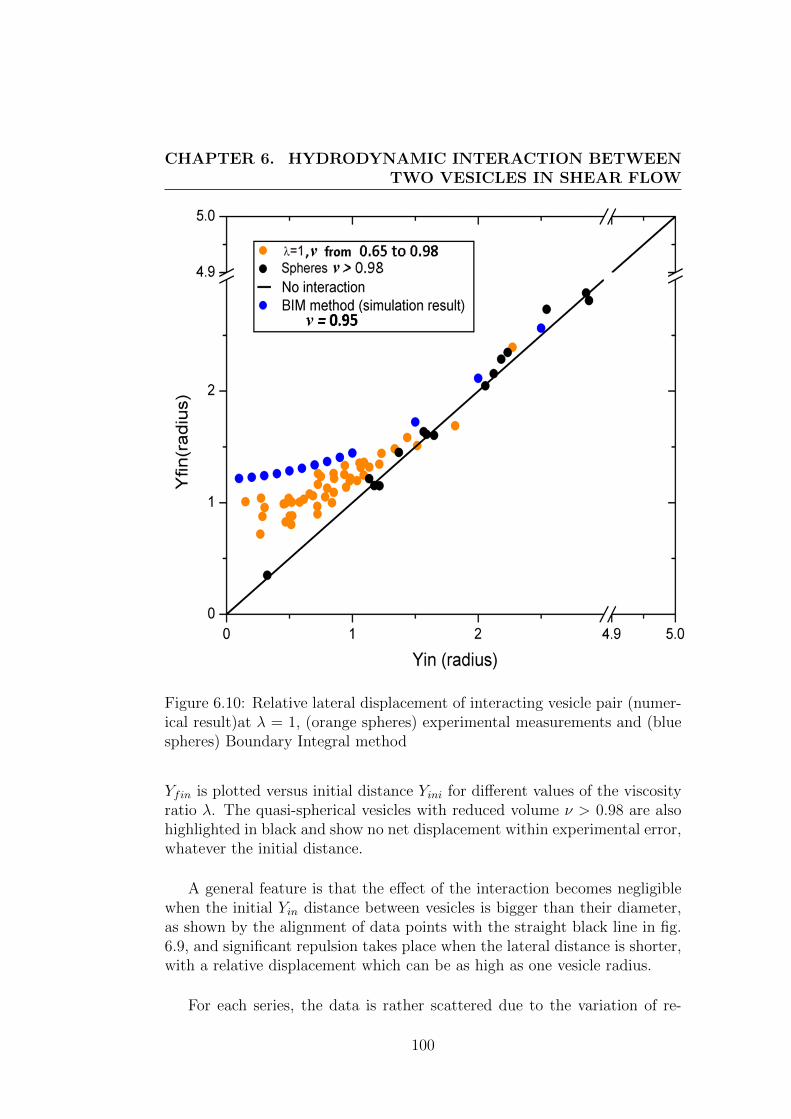
CHAPTER 6. HYDRODYNAMIC INTERACTION BETWEENTWO VESICLES IN SHEAR FLOW
Figure 6.10: Relative lateral displacement of interacting vesicle pair (numer-ical result)at λ = 1, (orange spheres) experimental measurements and (bluespheres) Boundary Integral method
Yfin is plotted versus initial distance Yini for different values of the viscosityratio λ. The quasi-spherical vesicles with reduced volume ν > 0.98 are alsohighlighted in black and show no net displacement within experimental error,whatever the initial distance.
A general feature is that the effect of the interaction becomes negligiblewhen the initial Yin distance between vesicles is bigger than their diameter,as shown by the alignment of data points with the straight black line in fig.6.9, and significant repulsion takes place when the lateral distance is shorter,with a relative displacement which can be as high as one vesicle radius.
For each series, the data is rather scattered due to the variation of re-
100
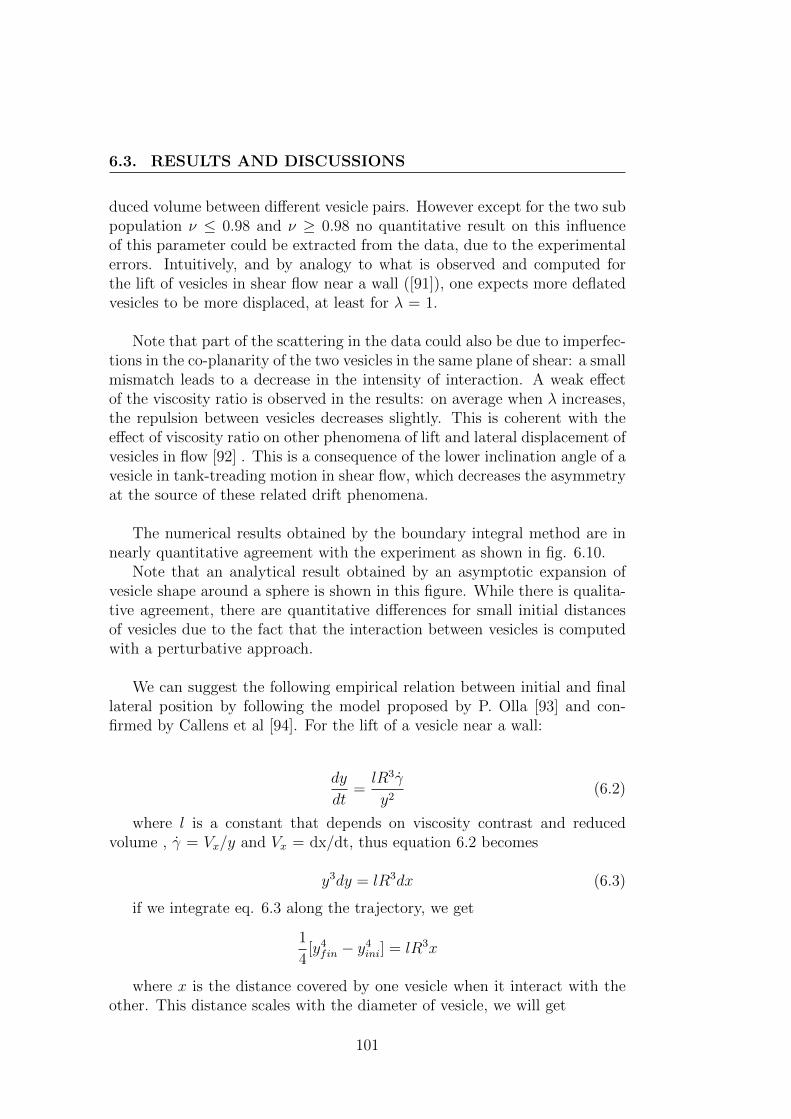
6.3. RESULTS AND DISCUSSIONS
duced volume between different vesicle pairs. However except for the two subpopulation ν ≤ 0.98 and ν ≥ 0.98 no quantitative result on this influenceof this parameter could be extracted from the data, due to the experimentalerrors. Intuitively, and by analogy to what is observed and computed forthe lift of vesicles in shear flow near a wall ([91]), one expects more deflatedvesicles to be more displaced, at least for λ = 1.
Note that part of the scattering in the data could also be due to imperfec-tions in the co-planarity of the two vesicles in the same plane of shear: a smallmismatch leads to a decrease in the intensity of interaction. A weak effectof the viscosity ratio is observed in the results: on average when λ increases,the repulsion between vesicles decreases slightly. This is coherent with theeffect of viscosity ratio on other phenomena of lift and lateral displacement ofvesicles in flow [92] . This is a consequence of the lower inclination angle of avesicle in tank-treading motion in shear flow, which decreases the asymmetryat the source of these related drift phenomena.
The numerical results obtained by the boundary integral method are innearly quantitative agreement with the experiment as shown in fig. 6.10.
Note that an analytical result obtained by an asymptotic expansion ofvesicle shape around a sphere is shown in this figure. While there is qualita-tive agreement, there are quantitative differences for small initial distancesof vesicles due to the fact that the interaction between vesicles is computedwith a perturbative approach.
We can suggest the following empirical relation between initial and finallateral position by following the model proposed by P. Olla [93] and con-firmed by Callens et al [94]. For the lift of a vesicle near a wall:
dy
dt=lR3γ
y2(6.2)
where l is a constant that depends on viscosity contrast and reducedvolume , γ = Vx/y and Vx = dx/dt, thus equation 6.2 becomes
y3dy = lR3dx (6.3)
if we integrate eq. 6.3 along the trajectory, we get
1
4[y4fin − y4
ini] = lR3x
where x is the distance covered by one vesicle when it interact with theother. This distance scales with the diameter of vesicle, we will get
101
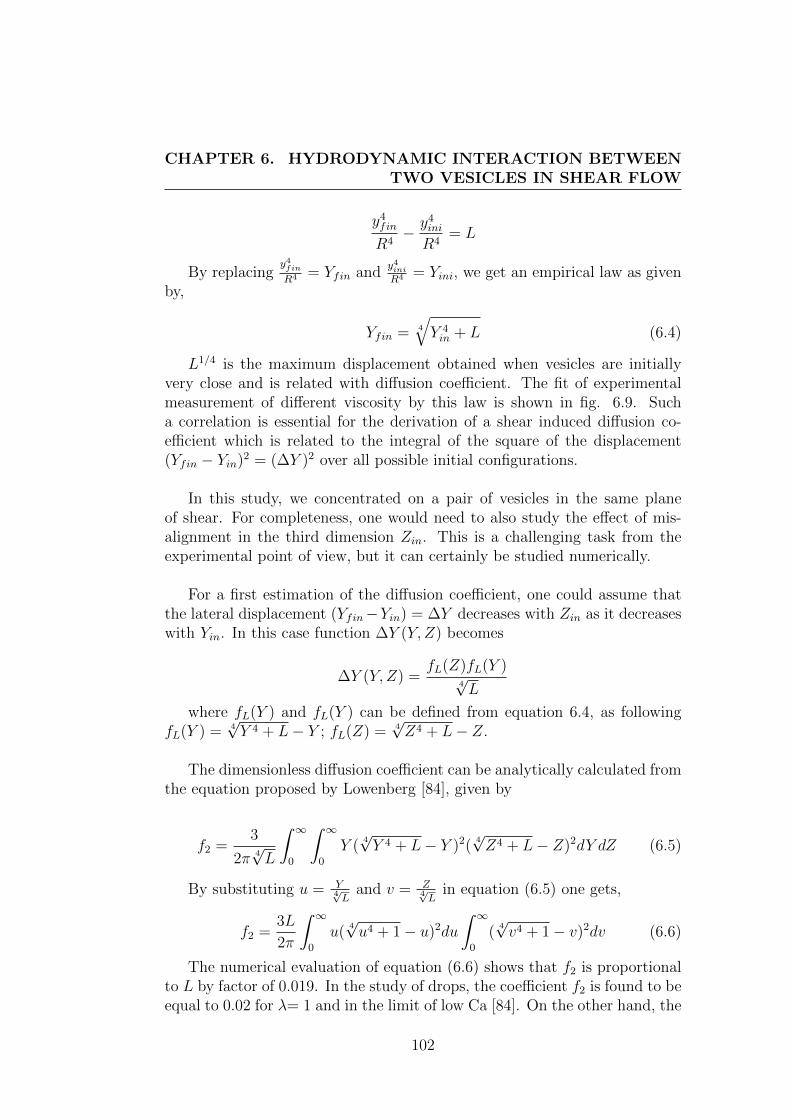
CHAPTER 6. HYDRODYNAMIC INTERACTION BETWEENTWO VESICLES IN SHEAR FLOW
y4fin
R4− y4
ini
R4= L
By replacingy4finR4 = Yfin and
y4ini
R4 = Yini, we get an empirical law as givenby,
Yfin = 4
√Y 4in + L (6.4)
L1/4 is the maximum displacement obtained when vesicles are initiallyvery close and is related with diffusion coefficient. The fit of experimentalmeasurement of different viscosity by this law is shown in fig. 6.9. Sucha correlation is essential for the derivation of a shear induced diffusion co-efficient which is related to the integral of the square of the displacement(Yfin − Yin)2 = (∆Y )2 over all possible initial configurations.
In this study, we concentrated on a pair of vesicles in the same planeof shear. For completeness, one would need to also study the effect of mis-alignment in the third dimension Zin. This is a challenging task from theexperimental point of view, but it can certainly be studied numerically.
For a first estimation of the diffusion coefficient, one could assume thatthe lateral displacement (Yfin−Yin) = ∆Y decreases with Zin as it decreaseswith Yin. In this case function ∆Y (Y, Z) becomes
∆Y (Y, Z) =fL(Z)fL(Y )
4√L
where fL(Y ) and fL(Y ) can be defined from equation 6.4, as followingfL(Y ) = 4
√Y 4 + L− Y ; fL(Z) = 4
√Z4 + L− Z.
The dimensionless diffusion coefficient can be analytically calculated fromthe equation proposed by Lowenberg [84], given by
f2 =3
2π 4√L
∫ ∞0
∫ ∞0
Y (4√Y 4 + L− Y )2(
4√Z4 + L− Z)2dY dZ (6.5)
By substituting u = Y4√L
and v = Z4√L
in equation (6.5) one gets,
f2 =3L
2π
∫ ∞0
u(4√u4 + 1− u)2du
∫ ∞0
(4√v4 + 1− v)2dv (6.6)
The numerical evaluation of equation (6.6) shows that f2 is proportionalto L by factor of 0.019. In the study of drops, the coefficient f2 is found to beequal to 0.02 for λ= 1 and in the limit of low Ca [84]. On the other hand, the
102
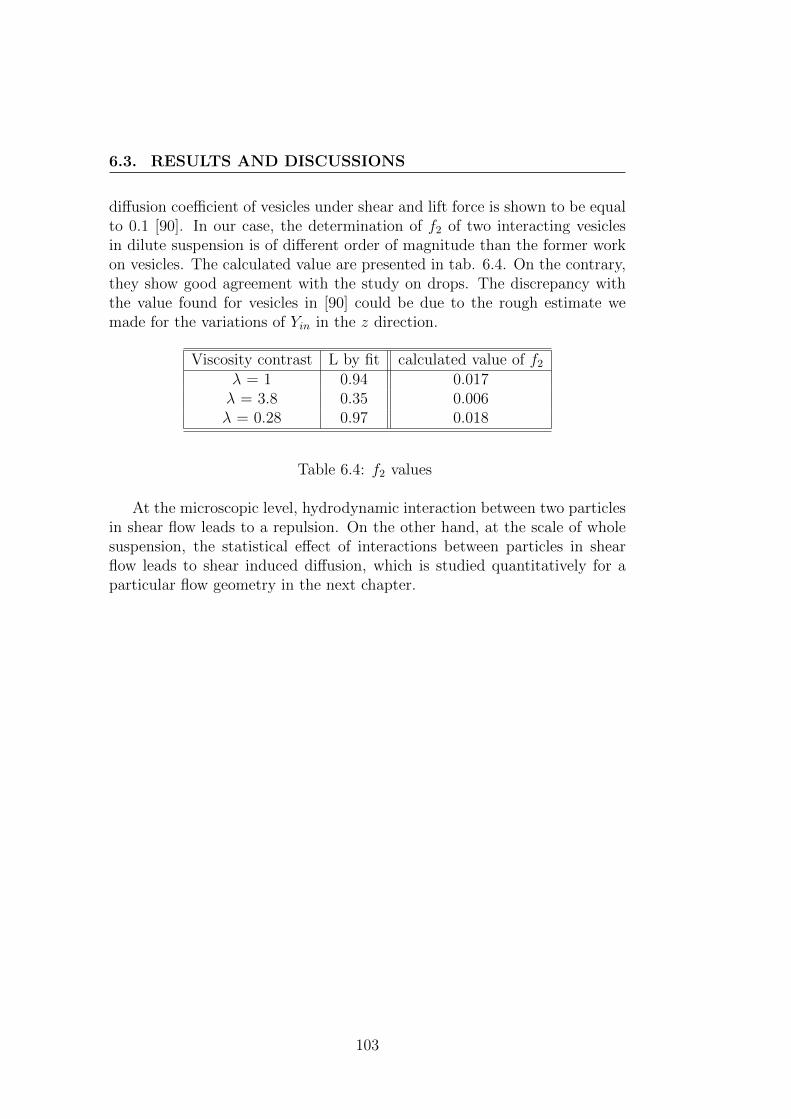
6.3. RESULTS AND DISCUSSIONS
diffusion coefficient of vesicles under shear and lift force is shown to be equalto 0.1 [90]. In our case, the determination of f2 of two interacting vesiclesin dilute suspension is of different order of magnitude than the former workon vesicles. The calculated value are presented in tab. 6.4. On the contrary,they show good agreement with the study on drops. The discrepancy withthe value found for vesicles in [90] could be due to the rough estimate wemade for the variations of Yin in the z direction.
Viscosity contrast L by fit calculated value of f2
λ = 1 0.94 0.017λ = 3.8 0.35 0.006λ = 0.28 0.97 0.018
Table 6.4: f2 values
At the microscopic level, hydrodynamic interaction between two particlesin shear flow leads to a repulsion. On the other hand, at the scale of wholesuspension, the statistical effect of interactions between particles in shearflow leads to shear induced diffusion, which is studied quantitatively for aparticular flow geometry in the next chapter.
103
CHAPTER 6. HYDRODYNAMIC INTERACTION BETWEENTWO VESICLES IN SHEAR FLOW
104
Chapter 7
Shear induced diffusion ofRBCs in Poiseuille flow
Nous etudions la diffusion induite par cisaillement d’un nuage de globulesrouges injecte dans un ecoulement en canal. L’equation d’advection-diffusionnon lineaire est etablie pour ce probleme, et une analyse theorique de quelquescas limites est presentee. Nous montrons qu’en fonction des conditions, lalongueur caracteristique de diffusion peut varier comme x1/3 ou x1/2 ou x estla distance parcourue. Une etude experimentale est realisee, et alors qu’uneloi de puissance pour la dependance spatiale est generalement trouvee, unegrande gamme d’exposants apparaıt, ce qui suggere une superposition d’effetsde la diffusion dans differ ents plans de l’ecoulement et eventuellement unrole des interactions a 3 corps dans les situations localement concentrees. Fi-nalement, ceci devrait conduire a un moyen simple de mesurer les coefficientsde diffusion induite par cisaillement.
We study the shear induced diffusion of a focused cloud of red blood cellsinjected in a channel flow. The non-linear advection-diffusion for this prob-lem is establish and a theoretical analysis of a few limit cases is presented. Weshow that depending on the conditions, the characteristic diffusion lengthscan vary like x1/3 or x1/2 where x is downstream distance. An experimen-tal study is performed, and while a power-law for the space-dependency isgenerally found, a wide range of exponents is found, suggesting an interplaybetween diffusions in different planes and possibly an influence of 3-bodyinteractions for locally concentrated suspensions. Ultimately, this shouldprovide a way to measure shear induced diffusion coefficients in a simpleway.
105
CHAPTER 7. SHEAR INDUCED DIFFUSION OF RBCS INPOISEUILLE FLOW
7.1 Introduction
In blood, the distribution of cells is non-uniform due to several phenomenafor example the formation of clots or thrombi caused by the displacementof platelets towards the wall. The non-uniform distribution of cells (mainlyvesicles) in shear flow is due to the interactions among neighbouring cellsand lift forces exerted from walls as shown in microgravity experiment byPodgorski et al [90] for vesicles. In this study it is found that a steady dis-tribution takes place with a well defined concentration profile that dependson vesicle properties (size, reduced volume and viscosity ratio). The distri-bution of large vesicles are concentrated at center of flow while small vesiclesare pushed away from the center due to interaction with large vesicles.
The effect of interactions between vesicles in dilute suspension, is de-scribed in detail in chapter 6. Motivated by the fact that the difference in sizeof vesicles affects the distribution in overall suspension, it is therefore of greatimportance to study the diffusive behaviour of red blood cells or monodis-perse suspensions of vesicles, induced by interactions. To obtain monodis-perse and concentrated sample of vesicles is hard task and self-diffusivity ofred blood cells in flow has rarely been studied, so far. It is also motivatingto study the phenomena in geometries and flows that are different from theone studied on microgravity experiments [90]. Indeed this kind of diffusion isnon-linear and therefore its quantitative features should strongly depend ondetail of the flow. For all these reasons, we chose to investigate the diffusivityof a jet of red blood cells initially confined in a Poiseuille flow in a channelby measuring the widening of the red blood cells suspension when travellingdownstream.
7.2 Theoretical background
The dispersion of RBCs in the blood flow can be studied by the determinationof the diffusion coefficient. According to Fick’s law, diffusion flux is given by:
~J = −D~∇Φ,
where, ~J is the flux per unit area, ~∇Φ is the rate of change of concentra-tion and D is the diffusion coefficient depending on nature of the substance.
106
7.3. THE ADVECTION-DIFFUSION EQUATION
As we concentrated our study to determine the diffusion coefficient of parti-cles under flow, we explain few examples of diffusion in order to make betterunderstanding of the subject.
7.3 The advection-diffusion equation
In case of 2D flows of diffusing particles, we consider that, the particles ofvolume fraction Φ(x, y, t) are flowing in x direction which is also the flowdirection. Suppose the suspension velocity is v(y) and particles are flowingwith the same velocity. Then x-component of particle diffusion is negligi-ble as compared to the advection. Due to the advection x-direction, theamount of particles in a small volume around (x, y), the volume in particlesΦ(x, y, t)dxdydz varies whereas the diffusion occurs in a perpendicular direc-tion of the flow. We get the following conservation equation.
∂Φ
∂tdxdydz = v(y)dydzΦ(x, y, t)− v(y)dydzΦ(x+ dx, y, t) (advection)
+[−D(x, y, t)
∂Φ(x, y, t)
∂ydxdz
−(−D(x, y + dy, t)
∂Φ(x, y + dy, t)
∂ydxdz
)](diffusion), (7.1)
which simplifies into
∂Φ(x, y, t)
∂t= −v(y)
∂Φ(x, y, t)
∂x+
∂
∂y
(D(x, y, t)
∂Φ(x, y, t)
∂y
). (7.2)
The above solution cannot be further simplified. In the general case afew approaches have been attempted to calculate the diffusion coefficients ofconcentrated suspension in flow for different limit case, which are describedin the following section.
Note that the equation above is already a simplified one, as we do nottaken into account effects due to gradients of shear rate. We expect con-centration gradients to be the main motivation for diffusion, because of thepeculiar experiment we consider.
7.4 Thermal diffusion
In thermal diffusion, D is constant. Let us consider an experiment, for in-stance, a rectangular channel of high aspect ratio. At the inlet of the channel
107
CHAPTER 7. SHEAR INDUCED DIFFUSION OF RBCS INPOISEUILLE FLOW
constant initial condition is imposed in such a way that fluid velocity v doesnot depend on y. If one observes evolution of the stationary distribution ofparticles along the channel, the corresponding equation can be written as :
v∂Φ
∂x= D
∂2Φ
∂y2(7.3)
The above equation can be solved with Fourier series depending on initialcondition. For instance, the following solution describes the widening of aGaussian particle distribution,
Φ(x, y) =Φ0√
4πDx/vexp
[− vy2/(4Dx)
]We can see from the solution that the width scales as x1/2 and amplitude
scales as x−1/2. From the scaling of the width one can identify the relevantparameter as yx−1/2. Therefore in order to work with dimensionless parame-ters, we define η = y(Dx/v)−1/2 where, D/v has the dimension of a distanceand is the typical length-scale of the problem. A similar solution was shownby Taylor [95], in a Poiseuille flow when velocity profile v was not homo-geneous. In his study, determination of the diffusion coefficient depends onother parameters of the problem.
7.5 Shear-induced diffusion
Shear-induced diffusion has been studied at two different levels: self-diffusionof individual particles and collective process of gradient diffusion. The presentwork is particularly concerned with shear-induced diffusion due to hydrody-namic interactions on the particle level.
The diffusion of RBCs from the flow of concentrated suspension is influ-enced by microscopic interaction among them as described by the followingexample. When a concentrated suspension of particles is subjected to shearflow, individual particles tend to follow the flow of their streamlines. Ontheir way they encounter particles of neighbouring streamlines with differentvelocities.
In fig 7.1 a concentrated suspension of particles in simple shear flow is de-picted. A marked particle which is following its trajectory (shown with dottedline in fig. 7.1 ), meets the neighbouring particles. The neighbouring parti-cles bounce on the marked particle and divert it from its initial trajectory.Consecutive interactions with particles leads to irreversible displacement. At
108
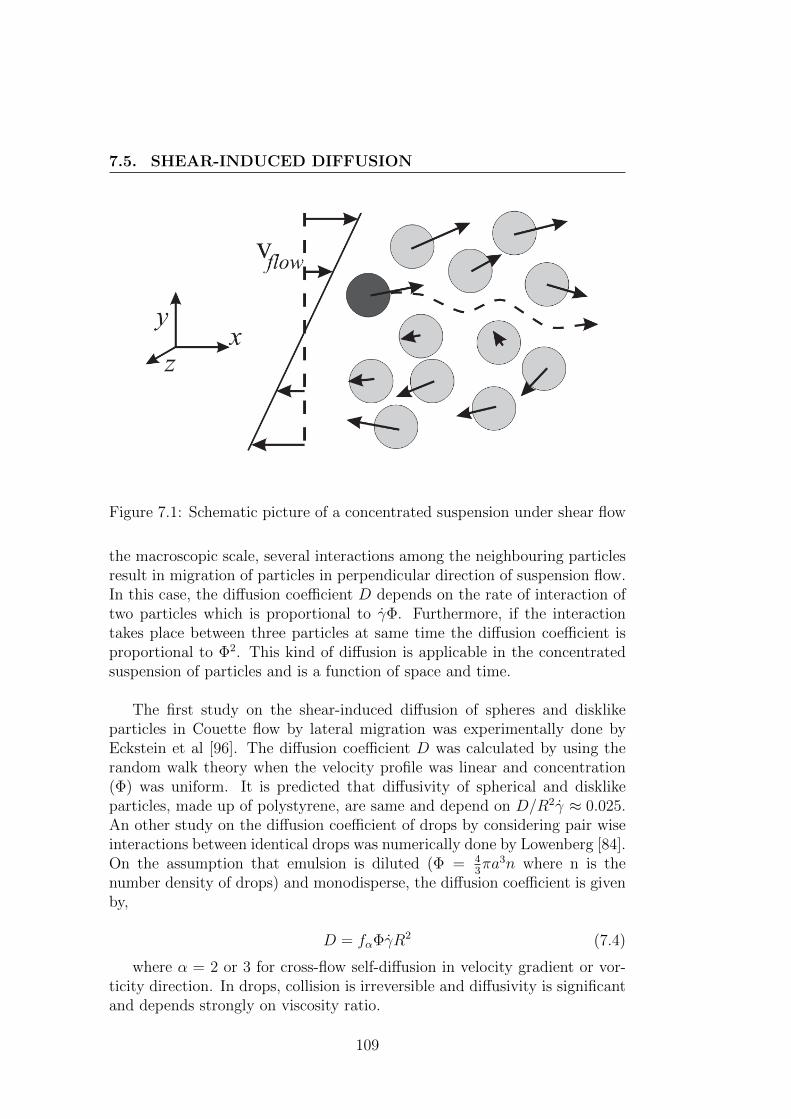
7.5. SHEAR-INDUCED DIFFUSION
Figure 7.1: Schematic picture of a concentrated suspension under shear flow
the macroscopic scale, several interactions among the neighbouring particlesresult in migration of particles in perpendicular direction of suspension flow.In this case, the diffusion coefficient D depends on the rate of interaction oftwo particles which is proportional to γΦ. Furthermore, if the interactiontakes place between three particles at same time the diffusion coefficient isproportional to Φ2. This kind of diffusion is applicable in the concentratedsuspension of particles and is a function of space and time.
The first study on the shear-induced diffusion of spheres and disklikeparticles in Couette flow by lateral migration was experimentally done byEckstein et al [96]. The diffusion coefficient D was calculated by using therandom walk theory when the velocity profile was linear and concentration(Φ) was uniform. It is predicted that diffusivity of spherical and disklikeparticles, made up of polystyrene, are same and depend on D/R2γ ≈ 0.025.An other study on the diffusion coefficient of drops by considering pair wiseinteractions between identical drops was numerically done by Lowenberg [84].On the assumption that emulsion is diluted (Φ = 4
3πa3n where n is the
number density of drops) and monodisperse, the diffusion coefficient is givenby,
D = fαΦγR2 (7.4)
where α = 2 or 3 for cross-flow self-diffusion in velocity gradient or vor-ticity direction. In drops, collision is irreversible and diffusivity is significantand depends strongly on viscosity ratio.
109
CHAPTER 7. SHEAR INDUCED DIFFUSION OF RBCS INPOISEUILLE FLOW
7.5.1 One particular case
Collisions between two spherical particles result in no net displacement butdiffusion can occur when three spherical particles meet. A comparison be-tween spherical particles and platelike clay particles by Rusconi and Stone[97] shows that diffusion is significant in platelike clay particles even at verylow volume fraction Φ. The shear flow observation was made in a chan-nel of large length (y-direction) and reduced thickness (z-direction). Underthis condition the velocity v of flow does not depend on y and shear planetakes place in xz-direction, thus diffusion occurs in perpendicular directionof xz-plane i.e. in y-direction. At the inlets of the channel, constant initialconditions are imposed which leads to the time-independent equation, givenby,
∂Φ
∂x= Kγ
∂
∂y
(Φ∂Φ
∂y
), (7.5)
where K is defined by D = vKγΦ. Here KγΦ has the dimension of adistance, and thus can be associated with x and y. In addition, this parameteris also function of an unknown volume fraction Φ. In the experiment ofRusconi and Stone, the main channel has two inlets, of which one is injectedby particles of concentration Φ0 and the other is being injected with particlefree fluid. The spreading of the particles in the direction transverse to the flowdirection give rise to shear induced diffusivity. To modelize the experiment,Rusconi and Stone suggested that the concentration was constant at thewall (implicitly meaning that it is a sourse of particles). The concentrationof particles spreading with Φ = Φ0 at one side and Φ = 0 on the other side, byvarying x. In this case, one can consider A = KγΦ0 and build dimensionlessparameter η = y(Ax)−1/2. Hence the solution can be found in the form ofΦ(x, y) = Ψ(η). We have,
∂Φ
∂x=∂Ψ
∂η
∂η
∂x= −ηx
−1
2
∂Ψ
∂η(7.6)
∂
∂y
(Φ∂Φ
∂y
)=
∂
∂y
(Ψ∂Ψ
∂η
∂η
∂y
)= ... = (Ax)−1 ∂
∂η
(Ψ∂Ψ
∂η
). (7.7)
In equation 7.5, the x−1 terms disappear, and one gets an equation forΨ as a function of η: −Φ0ηΨ′ = 2
(ΨΨ′
)′. This indicates the possibility
for self-similar solution for Φ with a typical width scaling as x−1/2, which isconfirmed by the experiments [97].
110
7.5. SHEAR-INDUCED DIFFUSION
7.5.2 More general case
We consider the case of time-independent distribution. This case also indi-rectly includes the one of the time-evolution of an initially x independentdistribution. It is typically the case for a suspension under shear (either in aplane-plane shear chamber or in a Couette apparatus), where one can startwith an initially homogeneous suspension or with a sedimented suspensionon the bottom plate of the plate-plate shear chamber. In that case ∂Φ
∂x= 0
and equation 7.2 is the same as the time-independent equation 7.2 with con-stant v.
We consider now the general case where v can be written under the formv ∝ yν , and D scales as γΦm, where m = 0, 1, 2 and γ ∝ yδ. As we wantto focus only on exponents here, we will not take into account here the factthat |γ| must be considered instead of γ. We also neglect any wall effect.Equation 7.2 becomes
yν∂Φ
∂x= A
∂
∂y
(yδΦm∂Φ
∂y
), (7.8)
where A is a constant. We wish to find self-similar solutions of this equationand will therefore consider the variable η = yx−α , which means that weexpect the typical width to increase as xα.
Rusconi and Stone looked for solutions under the form Φ(x, y) = Ψ(η).However, this kind of solution will lead to a solution with fixed amplitudeΦ0, which is relevant in the case of the presence of a source, as they assumed,but not in the more common case of the spreading of an initial given amountof particles. In which case, if the width increases as xα, particles volumeconservation implies that the amplitude should decrease as x−α. We shalltherefore look for solutions under the form Φ(x, y) = x−αΨ(η).
Equation 7.8 becomes:
−αxνα−α−1 ην(Ψ + ηΨ′) = x−mα−3α+δα(δηδ−1ΨmΨ′ + ηδ(ΨmΨ′)′
), (7.9)
which leads to an equation for Ψ as a function of η if:
α =1
ν +m− δ + 2. (7.10)
For thermal diffusion in a flow of homogeneous velocity v, one has ν =m = δ = 0, therefore α = 1/2 is the good choice, which corresponds indeed
111
CHAPTER 7. SHEAR INDUCED DIFFUSION OF RBCS INPOISEUILLE FLOW
to the Gaussian solution already evoked. Note that, in this particular case, ifone looks for solutions under the form Φ(x, y) = Ψ(η) (spreading of a source),one finds also α = 1/2.
On the contrary, in the case of the experiment by Rusconi and Stone,we find a different solutions according to the form chosen for Φ. In theirexperiment, we have ν = δ = 0 and m = 1, so α = 1/3. The x1/3 widening istherefore the expected behaviour once the finiteness of the available amountof particles is felt, in particular, for large x. One sees here that the necessityto have particle collision to get diffusion leads to slower diffusion (subdiffu-sion) by comparison with the thermal case.
In the case of the time-evolution of a suspension in a shear chamber, it isequivalent to consider the stationary equation with homogeneous v, so onehas ν = δ = 0 and m = 1, so α = 1/3. This was observed in parabolic flightexperiments, when considering the cloud of lifting vesicles [90].
In the present study, we are concerned with the diffusive behaviour ofthe concentrated suspension of RBCs. Such a suspension will be introducedcontinuously in a microfluidic channel of section 2d× 2h in the yz plane andflow in the x direction. The initial cluster will have a given initial widthand initial position in the y direction, while it will be invariant in the thirddirection (across the channel thickness). We shall restrict ourselves to caseswhere the RBCs will not touch the walls, so that the above theoretical con-siderations are valid. As v scales as 1-(y/d)2, there are two powers of y so theproposed scalings do not work. We shall then make simulations of equation7.9 in order to seek for possible simplifications.
7.5.3 Detailed solutions for shear-induced diffusion un-der Poiseuille flow
We re-introduce the physical constants in the problem. Equation 7.2 be-comes, in the stationnary case:
v0(1− y2/d2)∂Φ
∂x= fR2 ∂
∂y
(|γ|Φ∂Φ
∂y
). (7.11)
f is a dimensionless factor which depends on the details of the pair inter-action, R is the typical particle size.
Considering the dimensionless y position y∗ = y/d and concentrationΦ∗ = Φ/Φ0, we get:
112
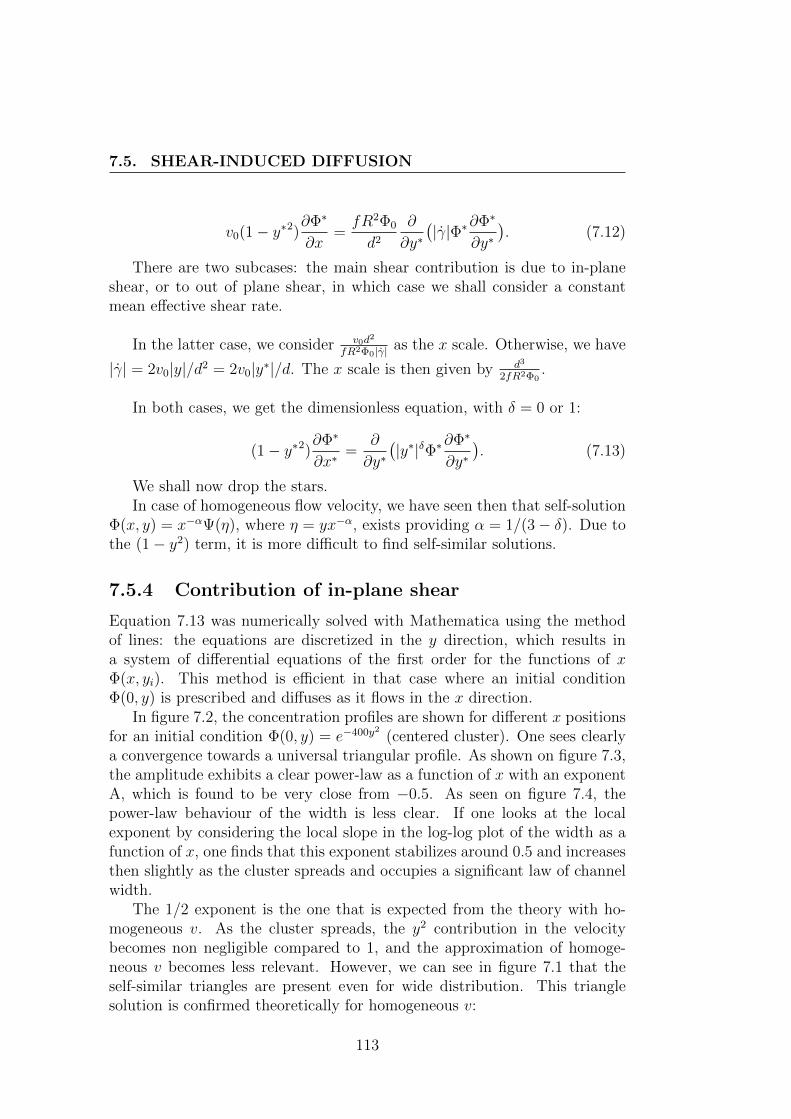
7.5. SHEAR-INDUCED DIFFUSION
v0(1− y∗2)∂Φ∗
∂x=fR2Φ0
d2
∂
∂y∗(|γ|Φ∗∂Φ∗
∂y∗). (7.12)
There are two subcases: the main shear contribution is due to in-planeshear, or to out of plane shear, in which case we shall consider a constantmean effective shear rate.
In the latter case, we consider v0d2
fR2Φ0|γ| as the x scale. Otherwise, we have
|γ| = 2v0|y|/d2 = 2v0|y∗|/d. The x scale is then given by d3
2fR2Φ0.
In both cases, we get the dimensionless equation, with δ = 0 or 1:
(1− y∗2)∂Φ∗
∂x∗=
∂
∂y∗(|y∗|δΦ∗∂Φ∗
∂y∗). (7.13)
We shall now drop the stars.In case of homogeneous flow velocity, we have seen then that self-solution
Φ(x, y) = x−αΨ(η), where η = yx−α, exists providing α = 1/(3− δ). Due tothe (1− y2) term, it is more difficult to find self-similar solutions.
7.5.4 Contribution of in-plane shear
Equation 7.13 was numerically solved with Mathematica using the methodof lines: the equations are discretized in the y direction, which results ina system of differential equations of the first order for the functions of xΦ(x, yi). This method is efficient in that case where an initial conditionΦ(0, y) is prescribed and diffuses as it flows in the x direction.
In figure 7.2, the concentration profiles are shown for different x positionsfor an initial condition Φ(0, y) = e−400y2 (centered cluster). One sees clearlya convergence towards a universal triangular profile. As shown on figure 7.3,the amplitude exhibits a clear power-law as a function of x with an exponentA, which is found to be very close from −0.5. As seen on figure 7.4, thepower-law behaviour of the width is less clear. If one looks at the localexponent by considering the local slope in the log-log plot of the width as afunction of x, one finds that this exponent stabilizes around 0.5 and increasesthen slightly as the cluster spreads and occupies a significant law of channelwidth.
The 1/2 exponent is the one that is expected from the theory with ho-mogeneous v. As the cluster spreads, the y2 contribution in the velocitybecomes non negligible compared to 1, and the approximation of homoge-neous v becomes less relevant. However, we can see in figure 7.1 that theself-similar triangles are present even for wide distribution. This trianglesolution is confirmed theoretically for homogeneous v:
113

CHAPTER 7. SHEAR INDUCED DIFFUSION OF RBCS INPOISEUILLE FLOW
Figure 7.2: Concentration profiles from the numerical resolution of equation7.13, for x = 0 to 2 by 0.2 steps, with centered initial condition.
Figure 7.3: Log-log plot of distribution amplitudes as a function of x. Thedistributions are those of fig. 7.2. A fit gives Φ(0, x) = 0.21(x+ 0.03)−0.494.
114
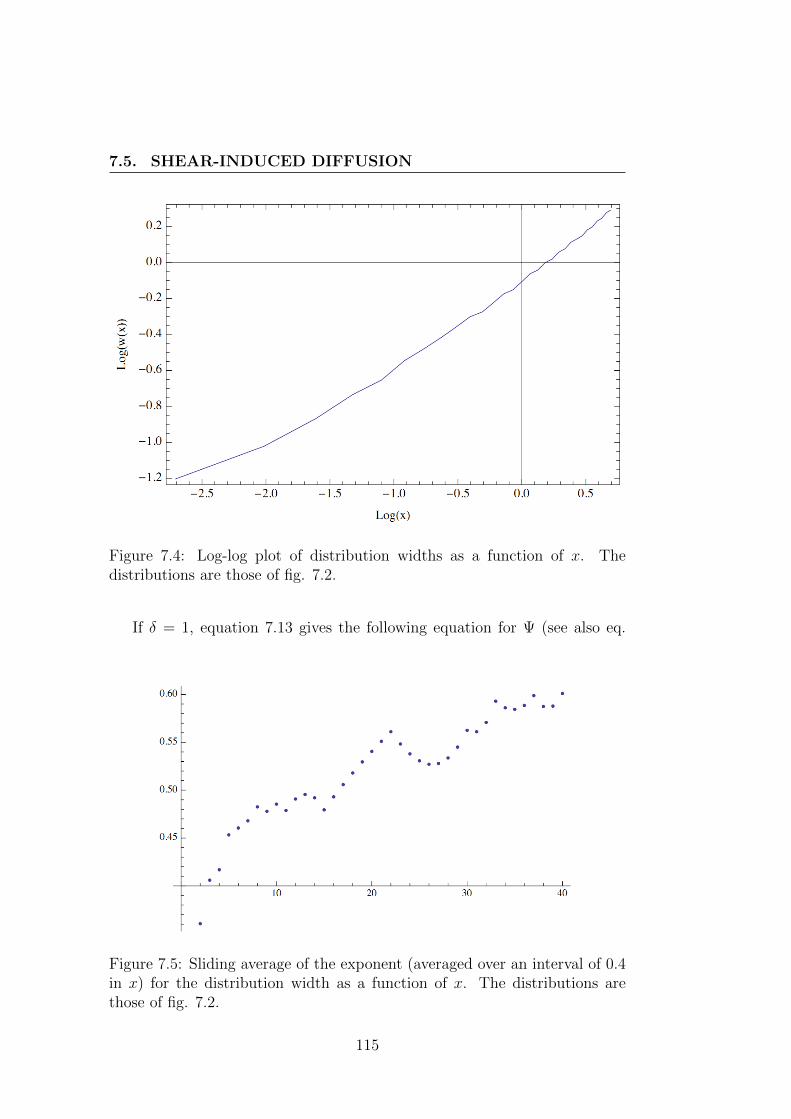
7.5. SHEAR-INDUCED DIFFUSION
Figure 7.4: Log-log plot of distribution widths as a function of x. Thedistributions are those of fig. 7.2.
If δ = 1, equation 7.13 gives the following equation for Ψ (see also eq.
Figure 7.5: Sliding average of the exponent (averaged over an interval of 0.4in x) for the distribution width as a function of x. The distributions arethose of fig. 7.2.
115
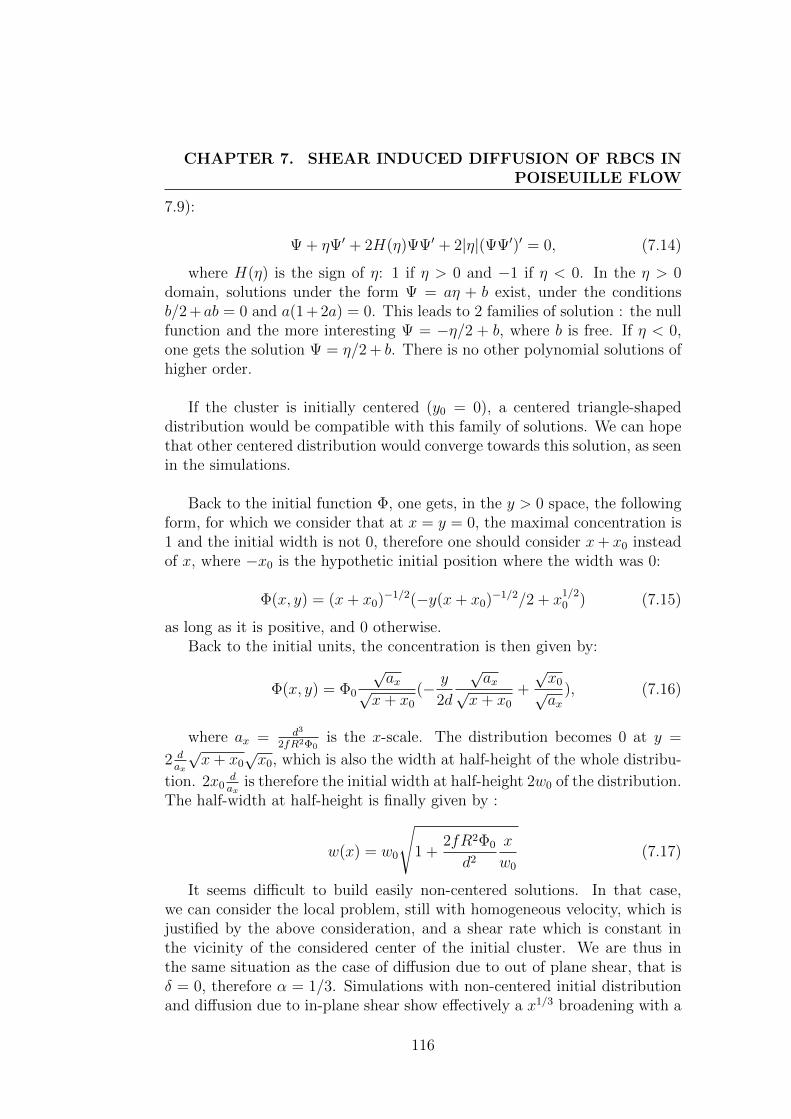
CHAPTER 7. SHEAR INDUCED DIFFUSION OF RBCS INPOISEUILLE FLOW
7.9):
Ψ + ηΨ′ + 2H(η)ΨΨ′ + 2|η|(ΨΨ′)′ = 0, (7.14)
where H(η) is the sign of η: 1 if η > 0 and −1 if η < 0. In the η > 0domain, solutions under the form Ψ = aη + b exist, under the conditionsb/2 +ab = 0 and a(1 + 2a) = 0. This leads to 2 families of solution : the nullfunction and the more interesting Ψ = −η/2 + b, where b is free. If η < 0,one gets the solution Ψ = η/2 + b. There is no other polynomial solutions ofhigher order.
If the cluster is initially centered (y0 = 0), a centered triangle-shapeddistribution would be compatible with this family of solutions. We can hopethat other centered distribution would converge towards this solution, as seenin the simulations.
Back to the initial function Φ, one gets, in the y > 0 space, the followingform, for which we consider that at x = y = 0, the maximal concentration is1 and the initial width is not 0, therefore one should consider x+ x0 insteadof x, where −x0 is the hypothetic initial position where the width was 0:
Φ(x, y) = (x+ x0)−1/2(−y(x+ x0)−1/2/2 + x1/20 ) (7.15)
as long as it is positive, and 0 otherwise.Back to the initial units, the concentration is then given by:
Φ(x, y) = Φ0
√ax√
x+ x0
(− y
2d
√ax√
x+ x0
+
√x0√ax
), (7.16)
where ax = d3
2fR2Φ0is the x-scale. The distribution becomes 0 at y =
2 dax
√x+ x0
√x0, which is also the width at half-height of the whole distribu-
tion. 2x0dax
is therefore the initial width at half-height 2w0 of the distribution.The half-width at half-height is finally given by :
w(x) = w0
√1 +
2fR2Φ0
d2
x
w0
(7.17)
It seems difficult to build easily non-centered solutions. In that case,we can consider the local problem, still with homogeneous velocity, which isjustified by the above consideration, and a shear rate which is constant inthe vicinity of the considered center of the initial cluster. We are thus inthe same situation as the case of diffusion due to out of plane shear, that isδ = 0, therefore α = 1/3. Simulations with non-centered initial distributionand diffusion due to in-plane shear show effectively a x1/3 broadening with a
116
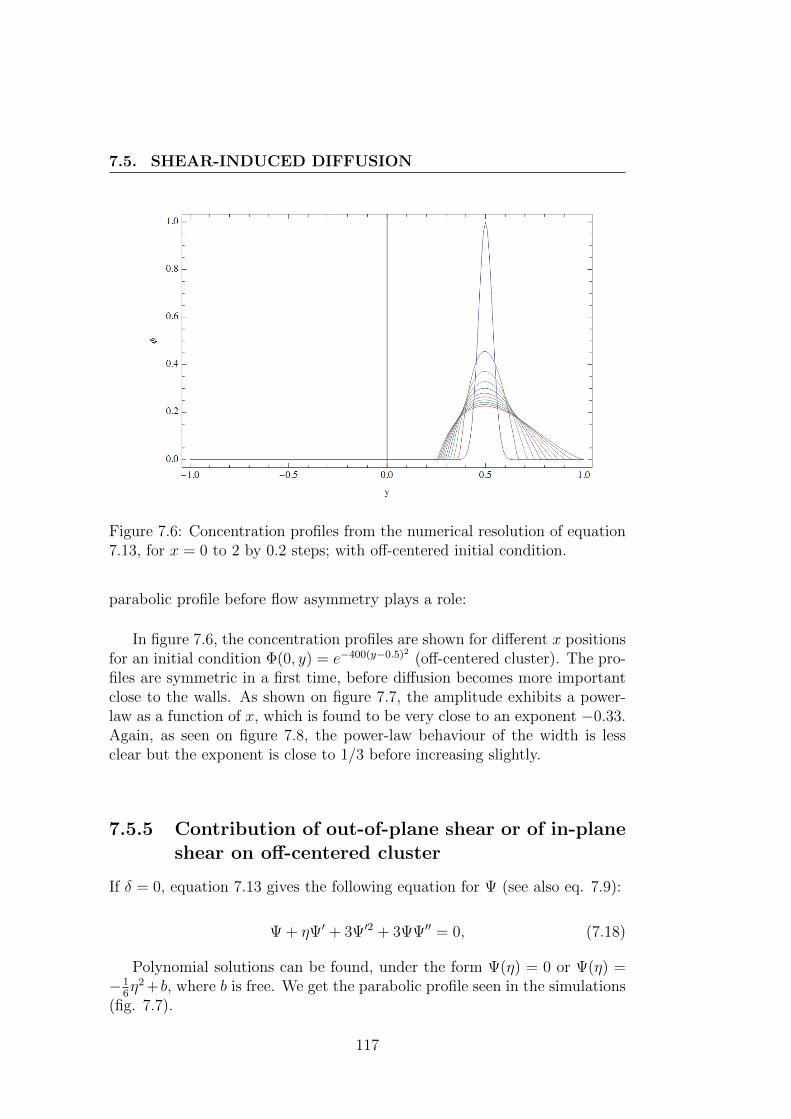
7.5. SHEAR-INDUCED DIFFUSION
Figure 7.6: Concentration profiles from the numerical resolution of equation7.13, for x = 0 to 2 by 0.2 steps; with off-centered initial condition.
parabolic profile before flow asymmetry plays a role:
In figure 7.6, the concentration profiles are shown for different x positionsfor an initial condition Φ(0, y) = e−400(y−0.5)2 (off-centered cluster). The pro-files are symmetric in a first time, before diffusion becomes more importantclose to the walls. As shown on figure 7.7, the amplitude exhibits a power-law as a function of x, which is found to be very close to an exponent −0.33.Again, as seen on figure 7.8, the power-law behaviour of the width is lessclear but the exponent is close to 1/3 before increasing slightly.
7.5.5 Contribution of out-of-plane shear or of in-planeshear on off-centered cluster
If δ = 0, equation 7.13 gives the following equation for Ψ (see also eq. 7.9):
Ψ + ηΨ′ + 3Ψ′2 + 3ΨΨ′′ = 0, (7.18)
Polynomial solutions can be found, under the form Ψ(η) = 0 or Ψ(η) =−1
6η2 +b, where b is free. We get the parabolic profile seen in the simulations
(fig. 7.7).
117
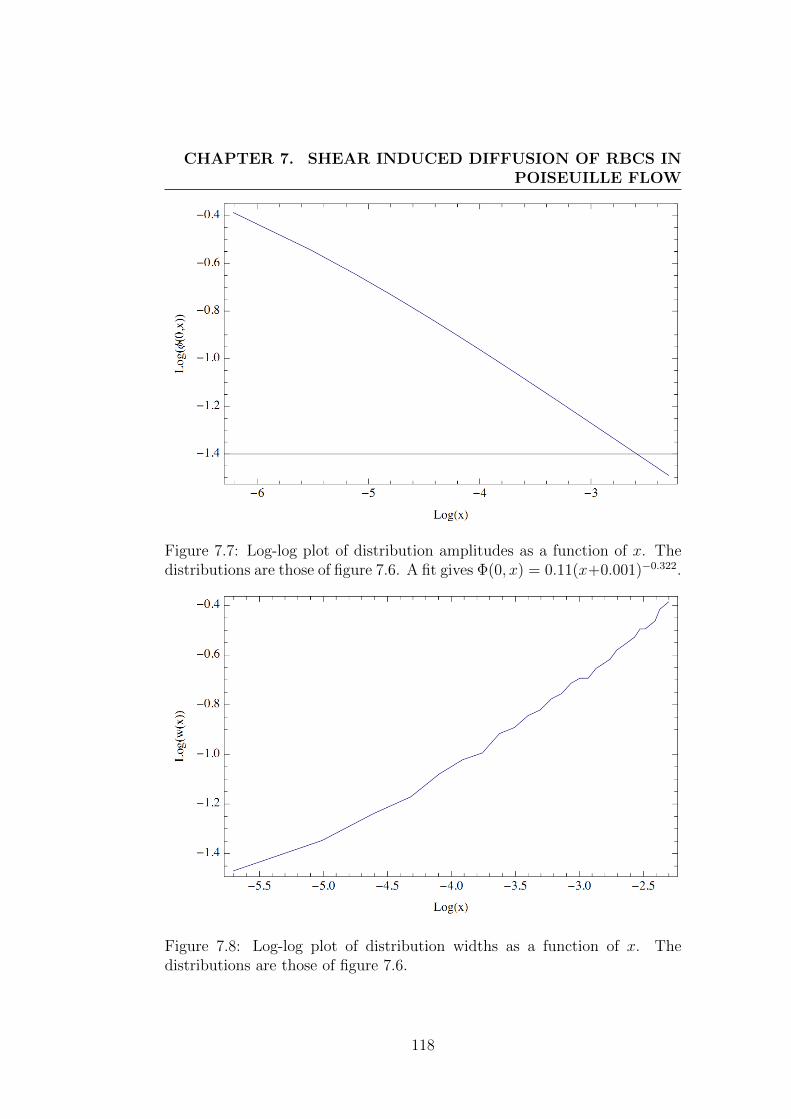
CHAPTER 7. SHEAR INDUCED DIFFUSION OF RBCS INPOISEUILLE FLOW
Figure 7.7: Log-log plot of distribution amplitudes as a function of x. Thedistributions are those of figure 7.6. A fit gives Φ(0, x) = 0.11(x+0.001)−0.322.
Figure 7.8: Log-log plot of distribution widths as a function of x. Thedistributions are those of figure 7.6.
118
7.5. SHEAR-INDUCED DIFFUSION
We get for Φ: Φ(x, y) = (x+x0)−1/3(−y2(x+x0)−2/3/6+x1/30 ) if positive,
and 0 otherwise. Back to the initial units, we find
Φ(x, y) = Φ0ax
1/3
(x+ x0)1/3(− y2
6d2
a2/3x
(x+ x0)2/3+
x1/30
ax1/3), (7.19)
where ax = v0d2
fR2Φ0|γ| is the x-scale.
Solving Φ(x, y) = Φ(x, 0)/2 , we find that the half-width at half-height isgiven by :
w(x) =√
3d(x+ x0)1/3 x
1/60
a1/2x
= w0
(1 +
3fR2Φ0|γ|v0
x
w20
)1/3(7.20)
Note that |γ| is proportional to v0, so the result is v0-independent in re-ality. In case we consider the diffusion due to in-plane shear, and if y0 isthe location of the center of the distribution, we have v0 = vmax(1− y2
0/d2),
where vmax is the fluid maximum velocity, and |γ| = 2vmax|y0|/d2.
If the diffusion is due to out-of-plane shear, if the velocity profile in the xzplane of thickness 2h is the parabolic, |γ| is the mean value (2h)−1|
∫ h−h 2v0z/h
2
dz = v0/h. In particular, w(x) will not depend on the lateral position y0 ofthe diffusing cluster.
Conclusion
In the two subcases considered in the preceding subsections, the half-widthcan finally be written as
w(x) = w0(1 + ax)α, (7.21)
with the following values for a and α:
a =
2f2R
2Φ01
w0d2for centered cluster due to in-plane shear
6f2R2Φ0
|y0|w2
0(d2−y20)for off-centered cluster due to in-plane shear
3f3R2Φ0
1w2
0hfor cluster at any location due to out-of-plane shear
(7.22)
α =
1/2 for centered cluster due to in-plane shear
1/3 for off-centered cluster due to in-plane shear
1/3 for cluster at any location due to out-of-plane shear
(7.23)
119
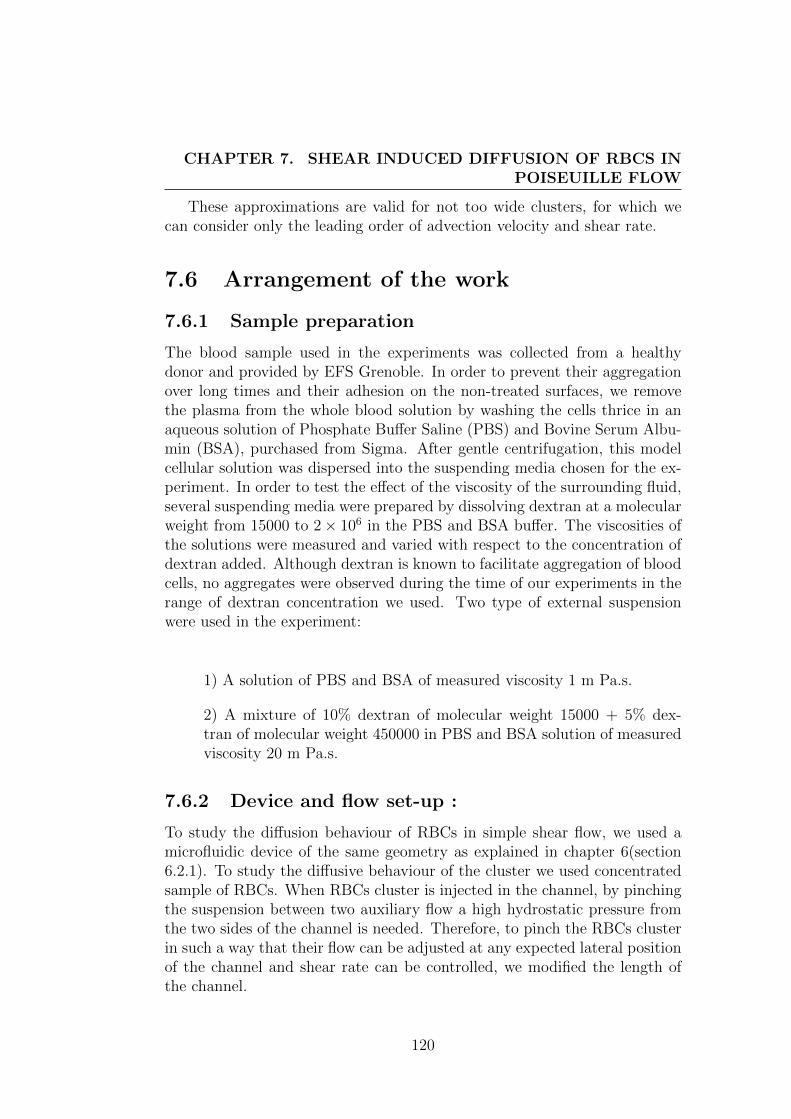
CHAPTER 7. SHEAR INDUCED DIFFUSION OF RBCS INPOISEUILLE FLOW
These approximations are valid for not too wide clusters, for which wecan consider only the leading order of advection velocity and shear rate.
7.6 Arrangement of the work
7.6.1 Sample preparation
The blood sample used in the experiments was collected from a healthydonor and provided by EFS Grenoble. In order to prevent their aggregationover long times and their adhesion on the non-treated surfaces, we removethe plasma from the whole blood solution by washing the cells thrice in anaqueous solution of Phosphate Buffer Saline (PBS) and Bovine Serum Albu-min (BSA), purchased from Sigma. After gentle centrifugation, this modelcellular solution was dispersed into the suspending media chosen for the ex-periment. In order to test the effect of the viscosity of the surrounding fluid,several suspending media were prepared by dissolving dextran at a molecularweight from 15000 to 2× 10⁶ in the PBS and BSA buffer. The viscosities ofthe solutions were measured and varied with respect to the concentration ofdextran added. Although dextran is known to facilitate aggregation of bloodcells, no aggregates were observed during the time of our experiments in therange of dextran concentration we used. Two type of external suspensionwere used in the experiment:
1) A solution of PBS and BSA of measured viscosity 1 m Pa.s.
2) A mixture of 10% dextran of molecular weight 15000 + 5% dex-tran of molecular weight 450000 in PBS and BSA solution of measuredviscosity 20 m Pa.s.
7.6.2 Device and flow set-up :
To study the diffusion behaviour of RBCs in simple shear flow, we used amicrofluidic device of the same geometry as explained in chapter 6(section6.2.1). To study the diffusive behaviour of the cluster we used concentratedsample of RBCs. When RBCs cluster is injected in the channel, by pinchingthe suspension between two auxiliary flow a high hydrostatic pressure fromthe two sides of the channel is needed. Therefore, to pinch the RBCs clusterin such a way that their flow can be adjusted at any expected lateral positionof the channel and shear rate can be controlled, we modified the length ofthe channel.
120
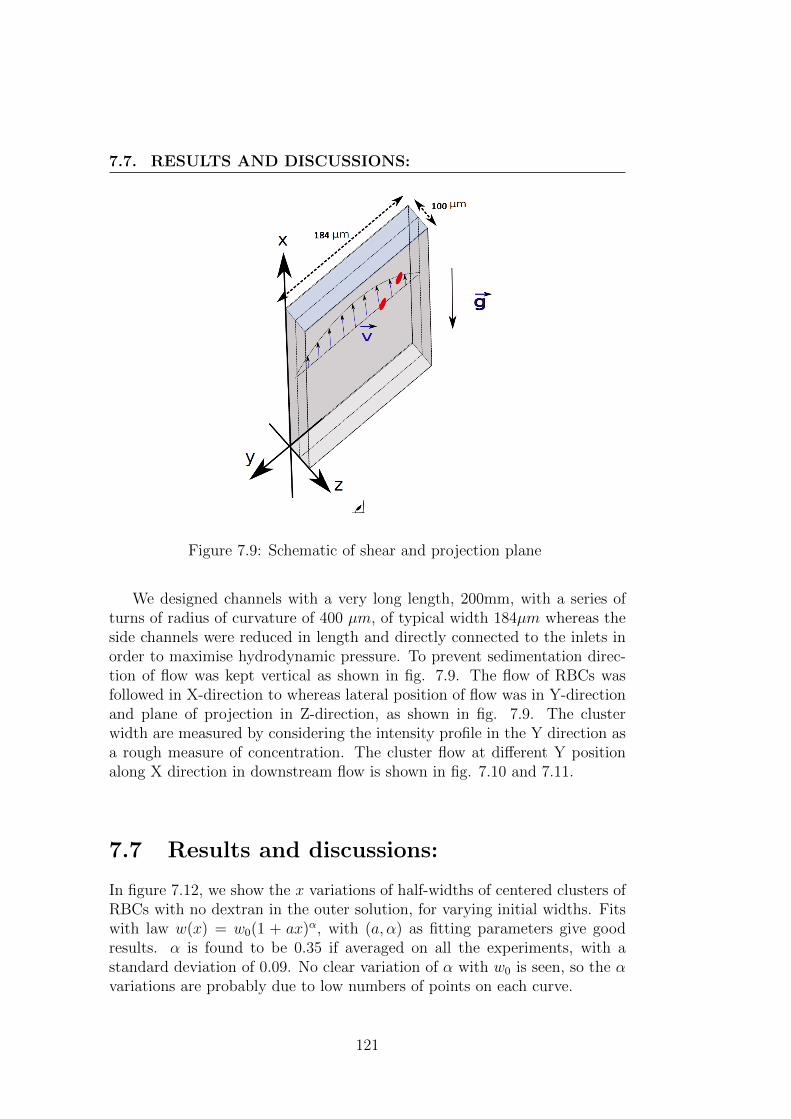
7.7. RESULTS AND DISCUSSIONS:
Figure 7.9: Schematic of shear and projection plane
We designed channels with a very long length, 200mm, with a series ofturns of radius of curvature of 400 µm, of typical width 184µm whereas theside channels were reduced in length and directly connected to the inlets inorder to maximise hydrodynamic pressure. To prevent sedimentation direc-tion of flow was kept vertical as shown in fig. 7.9. The flow of RBCs wasfollowed in X-direction to whereas lateral position of flow was in Y-directionand plane of projection in Z-direction, as shown in fig. 7.9. The clusterwidth are measured by considering the intensity profile in the Y direction asa rough measure of concentration. The cluster flow at different Y positionalong X direction in downstream flow is shown in fig. 7.10 and 7.11.
7.7 Results and discussions:
In figure 7.12, we show the x variations of half-widths of centered clusters ofRBCs with no dextran in the outer solution, for varying initial widths. Fitswith law w(x) = w0(1 + ax)α, with (a, α) as fitting parameters give goodresults. α is found to be 0.35 if averaged on all the experiments, with astandard deviation of 0.09. No clear variation of α with w0 is seen, so the αvariations are probably due to low numbers of points on each curve.
121
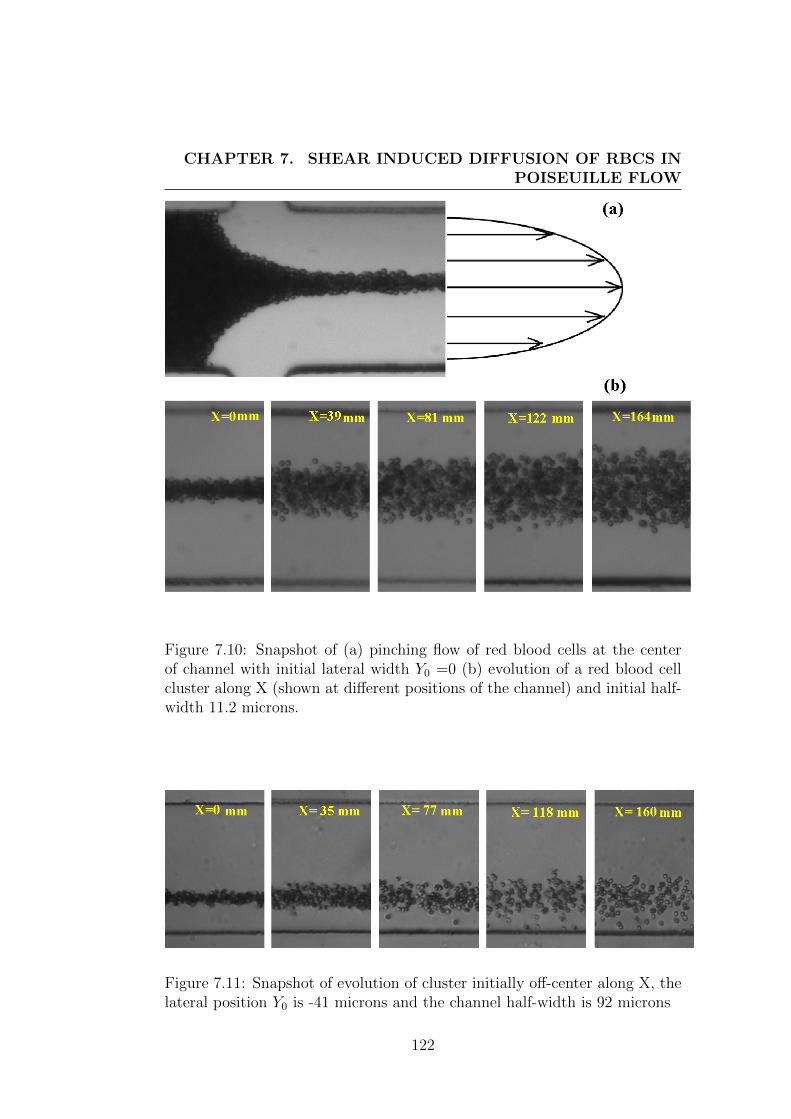
CHAPTER 7. SHEAR INDUCED DIFFUSION OF RBCS INPOISEUILLE FLOW
Figure 7.10: Snapshot of (a) pinching flow of red blood cells at the centerof channel with initial lateral width Y0 =0 (b) evolution of a red blood cellcluster along X (shown at different positions of the channel) and initial half-width 11.2 microns.
Figure 7.11: Snapshot of evolution of cluster initially off-center along X, thelateral position Y0 is -41 microns and the channel half-width is 92 microns
122
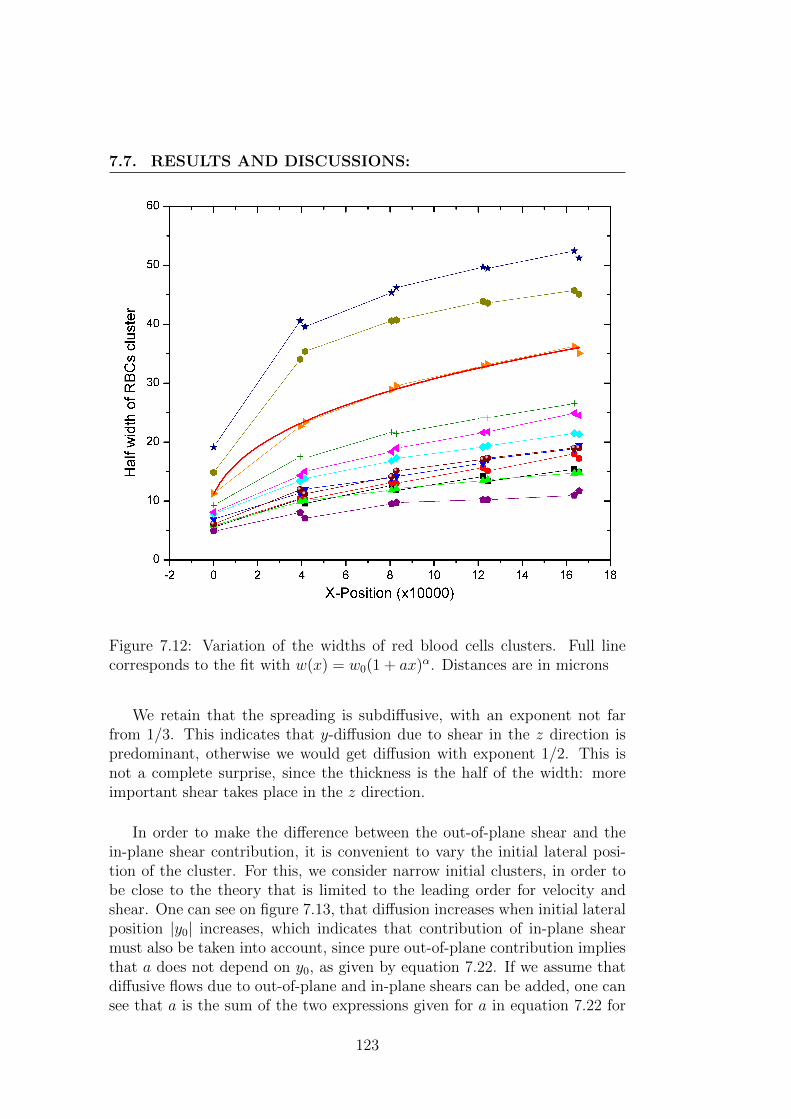
7.7. RESULTS AND DISCUSSIONS:
Figure 7.12: Variation of the widths of red blood cells clusters. Full linecorresponds to the fit with w(x) = w0(1 + ax)α. Distances are in microns
We retain that the spreading is subdiffusive, with an exponent not farfrom 1/3. This indicates that y-diffusion due to shear in the z direction ispredominant, otherwise we would get diffusion with exponent 1/2. This isnot a complete surprise, since the thickness is the half of the width: moreimportant shear takes place in the z direction.
In order to make the difference between the out-of-plane shear and thein-plane shear contribution, it is convenient to vary the initial lateral posi-tion of the cluster. For this, we consider narrow initial clusters, in order tobe close to the theory that is limited to the leading order for velocity andshear. One can see on figure 7.13, that diffusion increases when initial lateralposition |y0| increases, which indicates that contribution of in-plane shearmust also be taken into account, since pure out-of-plane contribution impliesthat a does not depend on y0, as given by equation 7.22. If we assume thatdiffusive flows due to out-of-plane and in-plane shears can be added, one cansee that a is the sum of the two expressions given for a in equation 7.22 for
123
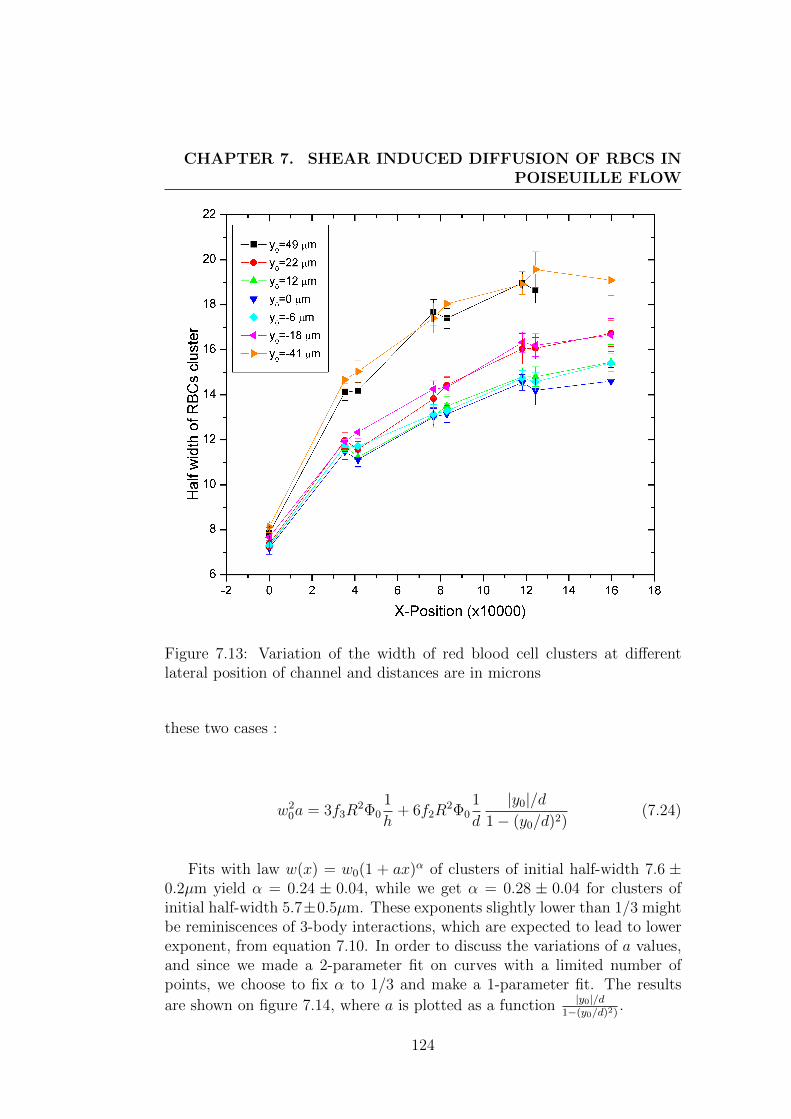
CHAPTER 7. SHEAR INDUCED DIFFUSION OF RBCS INPOISEUILLE FLOW
Figure 7.13: Variation of the width of red blood cell clusters at differentlateral position of channel and distances are in microns
these two cases :
w20a = 3f3R
2Φ01
h+ 6f2R
2Φ01
d
|y0|/d1− (y0/d)2)
(7.24)
Fits with law w(x) = w0(1 + ax)α of clusters of initial half-width 7.6 ±0.2µm yield α = 0.24 ± 0.04, while we get α = 0.28 ± 0.04 for clusters ofinitial half-width 5.7±0.5µm. These exponents slightly lower than 1/3 mightbe reminiscences of 3-body interactions, which are expected to lead to lowerexponent, from equation 7.10. In order to discuss the variations of a values,and since we made a 2-parameter fit on curves with a limited number ofpoints, we choose to fix α to 1/3 and make a 1-parameter fit. The results
are shown on figure 7.14, where a is plotted as a function |y0|/d1−(y0/d)2)
.
124

7.7. RESULTS AND DISCUSSIONS:
Figure 7.14: Evaluation of a for two different widths of red blood cells cluster,corresponding to fig 7.13
In agreement with equation , we find an affine dependency
a = a0 + a1|y0|/d
1− (y0/d)2), (7.25)
the slope giving a1 the in-plane contribution and the value at origin giv-ing the out-of-plane contribution.
In order to compute f2 and f3, we consider the mean volume of RBCsV ' 90µ m and find R = 3
√3V/(4π) ' 2.8µm. Φ0 is estimated around 0.5,
which leads to f2 = da16R2Φ0
' 0.002 and f3 = ha03R2Φ0
' 0.001 for w0 = 7.6. Forw0 = 5.7, we find f2 ' 0.001 and f3 ' 0.0005. The variations between thetwo experiments can be due to uncontrolled dilution in the initial cluster asit is pinched, or to subtle interplay with the 3-body effect. However, the ratiof2/f3, which should be Φ0 independent, is the same in the two experiments,and the values for f2 of f3 are in the good order of magnitude. Note thatthey are rather important even though the RBCs are in tumbling and not
125

CHAPTER 7. SHEAR INDUCED DIFFUSION OF RBCS INPOISEUILLE FLOW
Figure 7.15: Variation of RBCs cluster width at different lateral position ofchannel with viscosity of outer fluid 20 m Pa.s. Distances are in microns
tank-treading regime.
To our knowledge, there have been only one determination of f3 in theliterature and none of f2 for red blood cells. In [98], the diffusion coeffi-cient D is determined from the random walk of a red blood cell in a channelmuch larger than thick. D is found to be proportional to the flow velocityv0 : D ' 0.6v0, where D is given in µm2.s−1 and v0 in µm.s−1. We foundthat the diffusion coefficient D due to out-of-plane shear can be written asD = f3Φ0R
2v0/h = a0/3v0, which gives, in the same units, D = 0.08v0 forthe experiment where w0 = 7.6µm. We thus find a diffusion coefficient oneorder of magnitude lower.
When considering an outer solution with dextran, the results are lessclear. On figure 7.15 are shown some w(x) variations for three initial lateralpositions. In this case, we find that centered clusters diffuse with an expo-
126
7.7. RESULTS AND DISCUSSIONS:
nent α = 0.38± 0.04 while superdiffusive behaviour is found for off-centeredclusters with α = 0.62 ± 0.08. Even though the dynamics of RBCs is closeto tank-treading in that case, we don’t expect this to be the main reason forthis unexpected behavious, since the general scalings for diffusive flows donot depend on the microscopic dynamics but through a multiplicative con-stant.
In summary, we have found a variety of regimes due to a subtle interplaybetween several effects : shear in the y and z directions and probably threebody effects. A natural extension of this work should probably be a sys-tematic explanation of the influence of the expectation of the channel’s crosssection (to vary relative importance of the shear in the two planes), and tomake reliable measurements of the local concentration of blood cells in thecluster.
127

CHAPTER 7. SHEAR INDUCED DIFFUSION OF RBCS INPOISEUILLE FLOW
128
Chapter 8
Conclusion & Perspective
In this section, the obtained results are summarized and some concludingremarks are outlined.
8.1 Conclusion & major outcomes
Along the present thesis we explored the dynamics of red blood cells andlipid vesicles hydrodynamically interacting with each other.
As a preliminary study, in order to make comparisons between both sys-tems, we first tried to study the dynamics of highly deflated vesicles havingshapes similar to the one of red blood cells. These vesicles were produced byusing DMPC as membrane lipids in an electroformation process run at a tem-perature higher than the one of the gel-liquid transition. Concave oblate andprolate shapes of vesicles were produced. Finally, the first study on highlydeflated vesicles under flow was performed. It showed different dynamicsthan the one of quasi-spherical vesicles. In particular, tumbling-like motionwas exhibited despite the absence of viscosity contrast. However, stabilityunder flow of these vesicles appeared to be a crucial issue, which preventedus from running an exhaustive set of experiments.
When two deformable particles cross each other under flow, their trajec-tories are generally such that their final lateral distance is larger than theinitial one. As a consequence, shearing a suspension of such particles willlead to their diffusion transversally to the flow direction. The correspondingdiffusion coefficient can be derived from the knowledge of the trajectories ofthe particles as they interact.
We measured the net cross-flow displacement due to the collision betweentwo identical vesicles under shear flow. This displacement was found to be a
129
CHAPTER 8. CONCLUSION & PERSPECTIVE
decreasing function of the initial lateral separation, with a maximum value ofthe order of the vesicles radius for vesicles lying on almost the same stream-line. On the contrary, vesicles separated by more than two radii showed noimportant deviation from their unperturbed trajectories. In addition, thedisplacement was shown to decrease slightly with increasing viscosity con-trast. On the contrary, we found no significant dependency on the reducedvolume, except for quasi-spherical vesicles, for which no important drift wasfound, as expected. We proposed an empirical model to describe the varia-tions of the displacement with the initial lateral position and calculated thediffusion coefficient resulting from this interaction, which was found to be ofthe same order of magnitude as the one found in the literature for drops.
The next step was to measure diffusion of a vesicle suspension under shearflow, in order to check the accuracy of our experiments and calculations basedon the basic event of pair interaction. To do so, we optimized a sorting tech-nique named Pinched Flow Fractionation in order to produce a monodispersepopulation of vesicles. We showed that, in comparison with other techniquesproposed in the literature, this technique is a fast, simple and efficient wayto create subpopulations of similar sizes out of a very polydisperse sample.Such sorted samples will be studied under simple shear flow in micrograv-ity conditions in order to prevent screening by sedimentation effects. Theseconditions will be obtained by setting the experiment in a sounding rocket,whose launching is scheduled for February 2012.
For this thesis, we focused on a second experimental set-up allowing toget rid of such undesired sedimentation effects, namely a microfluidic channelparallel to the gravity direction. As this set-up requires a continuous supplyof concentrated enough vesicles, it appeared to be unadapted to the study ofour monodisperse samples, which are highly diluted as they are produced.
Therefore, we chose to study the diffusion of red blood cells, which areavailable in large quantities and of same sizes. Jets of these cells were focusedat the inlet of a channel and their broadening was studied as a function oftheir initial width and lateral position. As transverse movement only oc-curs when two particles meet, the corresponding diffusion coefficient is pro-portional to the concentration, which leads to non-linear advection-diffusionequations. Self-similar solutions of these equations were found under somehypothesis that were validated by numerical resolution of the full equations.Subdiffusion with exponent 1/3 instead of the classical 1/2 was predictedand confirmed by the experiments, which allowed us, in addition, to makethe first estimate of the diffusion coefficient of red blood cells under shearflow, be it shear in the diffusion plane or orthogonal to it.
130
8.2. PERSPECTIVE
8.2 Perspective
The perspectives opened by our work are the following:
The new motions observed for highly deflated vesicles suggest that thephase diagram of vesicle dynamics in shear flow can be more complex thanwhat is predicted from theories on weakly deflated shapes. More studies areneeded to understand such a dynamics and its effect on the rheology of asuspension. The ultimate goal is to allow quantitative comparisons betweenred blood cells and vesicles of similar shapes, in order to characterize the roleof the cytoskeleton. It is thus of the great importance in the future to find astable and reliable method for producing highly deflated vesicles.
As already mentioned, sorted vesicles will be used to determine the diffu-sion coefficients under simple shear flow, which will allow direct comparisonswith the value tabulated from the study of pair interaction. The latter shouldbe enriched in a very near future by numerical simulations based on bound-ary integral method (thesis of Pierre-Yves Gires). When vesicles are placedin the same shear plane, the simulations showed quantitative agreement withthe experiments. Varying the initial distance in the third direction, thus ex-ploring the whole initial position space, will allow us to compute directly thediffusion coefficient without any simplifying hypothesis.
In a second time, diffusion experiments with red blood cells will allow todetermine more precisely the ideal conditions for a reliable study, and willwill make it possible to run experiments with sorted samples in an efficientand time-saving manner.
The diffusion experiments with red blood cells were run in a channelof fixed aspect ratio, where effects due to in-plane and out-of-plane shearwere superimposed. The next step is to vary this aspect ratio, in order tostudy separately both effects and measure them with more accuracy. In asecond time, the parameters governing the dynamics of red blood cells, suchas viscosity contrast and capillary number, could be varied in order to studytheir effect on diffusion. In addition, studying pair interaction of red bloodcells could support these diffusion measurements.
In a channel, this diffusion will be counterbalanced by wall effects, thattend to push cells towards the center. Unlike for vesicles, there have beenvery few studies aiming at quantifying that lift forces due to walls and theirconsequences on the spatial distribution of cells across the channel, althoughthis non-homogeneous distribution is commonly identified as the cause of thedependency of blood effective viscosity on channel diameter.
131
CHAPTER 8. CONCLUSION & PERSPECTIVE
Another perspective is to focus more precisely on situations of biologicaland medical interest, such as the platelet-RBC segregation, or the diffusionof cells in the presence of plasma proteins, that promote cell aggregation.Diffusion and lift forces are also influenced by cell mechanical properties:pathological cells will then have different behaviour, with possible conse-quences on their distribution and on blood viscosity, which remain widelyunexplored.
132
Chapter 9
Conclusion & Perspectives(francais)
Dans cette section, nous resumons nos principaux resultats et dressons lesperspectives de notre travail.
9.1 Conclusion & apports principaux
Dans cette these, nous avons etudie la dynamique de globules rouges et devesicules lipidiques en interaction hydrodynamique.
Afin de pouvoir mieux comparer ces deux systemes, nous avons dans unpremier temps essaye d’etudier la dynamique de vesicules tres degonflees,aux formes semblables a celles des globules. Ces vesicules ont ete obtenuesa partir de DMPC comme constituant de la membrane et electroformees aune temperature superieure a la temperature de transition gel-liquide. Nousavons pu ainsi obtenir des formes oblates et prolates concaves. La premiereetude experimentale sur des vesicules fortement degonflees soumises a unecoulement de cisaillement a alors pu etre initiee, ce qui a permis de mettreen valeur un comportement dynamique bien different de celui prevu pourdes vesicules quasi-spheriques. En particulier, un mouvement semblable aun mouvement de bascule a ete observe, malgre l’absence de contraste deviscosite. Toutefois, la faible stabilite mecanique de ces vesicules lorsqu’ellessont soumises ! a une contrainte ne nous a pas permis de poursuivre vers uneetude plus exhaustive.
Quand deux particules deformables se rencontrent sous ecoulement, il enresulte generalement un deplacement accroissant leur separation laterale. Enconsequence, cisailler une suspension constituee de telles particules conduira
133
CHAPTER 9. CONCLUSION & PERSPECTIVES(FRANCAIS)
a leur diffusion transversalement a l’ecoulement. Les coefficients de diffusionassocies peuvent etre directement calcules a partir de l’information sur lestrajectoires des particules lors de l’interaction.
Nous avons mesure le deplacement transverse de deux vesicules iden-tiques sous cisaillement du a leur collision. Ce deplacement est une fonctiondecroissante de la distance laterale initiale, avec une valeur maximale del’ordre d’une rayon pour des vesicules situees quasiment sur la meme lignede courant. Au contraire, des vesicules situees a une distance superieure adeux rayons ne sont pas deviees de manieres significative lors de la collli-sion. Par ailleurs, nous avons montre que le deplacement decroıt legerementlorsque le contraste de viscosite augmente. En revanche, nous n’avons pastrouve de dependance significative de ce deplacement avec le degonflementdes vesicules, a l’exception des vesicules presque spheriques, pour lesquellesaucun deplacement n’est attendu ni observe. Nous avons propose une loiempirique permettant de decrire l’evolution du deplacement final en fonctionde la position laterale initiale et avons calcule le coefficient decrivant la dif-fusion resultant de cette interaction. Il est du meme ordre de grandeur quecelui propose dans la litterature pour des gouttes.
L’etape suivante etait de mesurer effectivement la diffusion dans unesuspension cisaillee, afin de verifier l’exactitude de notre calcul base surl’evenement elementaire que constitue l’interaction entre vesicules. A ceteffet, nous avons optimise une technique de tri basee sur le confinement hy-drodynamique de la suspension a trier afin de produire une suspension devesicules monodisperse en tailles. Nous avons montre que, en compara-ison d’autres techniques proposees dans la litterature, celle-ci est partic-ulierement simple, rapide, et efficace. Les echantillons produits seront enparticulier etudies sous cisaillement simple en condition de microgravite afinde s’affranchir de la sedimentation, qui ecrante les effets hydrodynamiques.Ces conditions seront obtenues grace a l’installation de l’experience dans unefusee sonde, dont le lancement est programme pour fevrier 2012.
Pour cette these, nous nous sommes focalises sur un second dispositifexperimental, qui permet egalement de ne pas etre derange par les effets dela gravite, a savoir un canal microfluidique vertical. Cependant, l’utilisationde ce dispositif necessite une alimentation continue en vesicules raisonnable-ment concentrees, et nous a paru dans un premier temps inadapte pouretudier nos echantillons tries, qui sont relativement dilues une fois produits.
Par consequent, nous avons choisi d’etudier la diffusion de globules rouges,objets disponibles en grandes quantites et de tailles similaires. Des jets de
134

9.2. PERSPECTIVES
cellules ont ete focalises a l’entree d’un canal et leur elargissement a eteetudie en fonction de leur largeur initiale et de leur positition laterale. Lesdeplacements lateraux n’ayant lieu que grace a la rencontre de deux cellules,le coefficient de diffusion est proportionnel a la concentration, ce qui con-duit a des equations d’advection-diffusion non lineaires. Des solutions auto-similaires de ces equations ont ete trouvees sous certains hypotheses simpli-ficatrices qui ont ete validees par des resolutions numeriques des equationscompletes. Une sous-diffusion caracterisee par un exposant 1/3 (et non 1/2comme en diffusion classique) a pu etre mise en valeur et confirmee par lesexperiences. De plus, nous avons pu estimer pour la premi! ere fois les coef-ficients de diffusion de globules rouges sous cisaillement, que ce soit pour uncisaillement dans le plan de diffusion ou hors du plan.
9.2 Perspectives
Les perspectives que nous pouvons tirer de notre travail sont les suivantes :Les nouveaux mouvements que nous avons pu observer pour des vesicules
tres degonflees suggerent que le diagramme de phase de la dynamique devesicule sous ecoulement est sans doute plus complexe que celui connu pourles vesicules faiblement degonflees. Des etudes supplementaires seraient neces-saires pour aller plus loin et comprendre l’effet de ces regimes sur la rheologied’une suspension. Le but final d’une telle etude pourrait etre de faire unecomparaison quantitative entre globules rouges et vesicules de meme forme,afin de mesurer le role du cytosquelette. Il serait donc important de trouverune methode fiable permettant de produire des vesicules fortement degonfleeset mecaniquement stables sous ecoulement.
Ainsi que nous l’avons deja signale, les vesicules triees seront bientotutilisees pour determiner les coefficients de diffusion sous cisaillement simple,ce qui nous permettra de realiser une comparaison avec nos calculs directs.Ces derniers pourront, dans un futur proche, etre affines grace aux simula-tions numeriques basees sur la methode integrale realisees par Pierre-YvesGires dans le cadre de sa these. Lorsque les vesicules sont placees dans lememe plan de cisaillement, les simulations sont en accord avec les experiences.En variant la distance intiiale dans la troiseme direction, et en explorant ainsila totalite de l’espace des positions initiales, nous pourrons alors calculer plusprecisement le coefficient de diffusion, sans hypothese simplificatrice.
Dans un second temps, les experiences de diffusion sur globules vont nouspermettre de determiner les conditions ideales permettant d’obtenir rapide-ment des resultats a partir de l’experience en canal, ce qui nous permettra
135
CHAPTER 9. CONCLUSION & PERSPECTIVES(FRANCAIS)
alors de mener efficacement des experiences avec ces echantillons tries.
Les experiences de diffusion de globules rouges ont ete menees dans uncanal de rapport d’aspect donne, ou les effets du cisaillement dans le plan etdu cisaillement hors du plan de diffusion se combinaient. La prochaine etapeest naturellement de varier ce rapport d’aspect, afin de decoupler ces deuxphenomenes et mesurer de maniere plus precise les coefficients associes. Dansun second temps, les parametres controlant la dynamique des globules, telsle rapport de viscosite ou le nombre capillaire, pourront etre modifies afin dequantifier leur effet sur la diffusion. En complement, une etude directe del’interaction de paire entre globules pourraient enrichir ces mesures.
Dans un canal, cette diffusion sera equilibree par les effets de paroi, quitendent a faire migrer les vesicules vers le centre. Contrairement au cas desvesicules, il y a a ce jour tres peu d’etudes quantifiant ces forces de portanceet leurs consequences sur la distribution finale des cellules dans le canal, bienque cette distribution inhomogene soit identifiee depuis longtemps comme lacause principale de la dependance de la viscosite effective du sang envers lediametre d’un canal.
Une autre perspective de ce travail est de s’interesser a des situationsd’interet biological ou medical, comme la segregation entre globules et pla-quettes, ou la diffusion de cellules en presence de proteines du plasma, quiont tendance a favoriser l’aggregation des cellules. La diffusion comme leseffets de paroi sont egalement influences par les proprietes mecaniques descellules : les cellules pathologiques auront ainsi un comportement different,avec des consequences possibles sur leur distribution et sur la viscosite dusang. Tout ceci reste un sujet largement inexplore par la physique.
136
Bibliography
[1] J. L.M. Poiseuille. ”recherches sur les causes du mouvement du sangdans les vaisseaux capillaires.”. Ann. Sci. Nat., Series 2 (Zool. Biol.Animale), 5:111–115., 1836.
[2] R. Fahræus and T. Linqvist. The viscosity of the blood in narrow cap-illary tube. Am. J. Physiol., 96:562–568, 1931.
[3] R. Guibert, C. Fonta, and F. Plouraboue. A New Approach to ModelConfined Suspensions Flows in Complex Networks: Application toBlood Flow. Transport Porous Med., 83:171–194, 2010.
[4] K. Svanes and B. W. Zweifach. Variations in small blood vessel hema-tocrits produced in hypothermic rats by micro-occlusion. Microvasc.Res., 1:210–220, 1968.
[5] T. M. Fischer, M. Stohr-Lissen, and H. Schmid-Schonbein. The redcell as a fluid droplet: tank tread-like motion of the human erythrocytemembrane in shear flow. Science, 202:894–896, 1978.
[6] A. R. Pries, T. W. Secomb, and P. Gaethgens. Biophysical aspects ofblood flow in the microvasculature. Cardiovasc. Res., 32:654–667, 1996.
[7] M. Abkarian, M. Faivre, and H. A. Stone. High-speed microfluidic dif-ferential manometer for cellular-scale hydrodynamics. PNAS, 103:538,2006.
[8] M. Abkarian, M. Faivre, and A. Viallat. Swinging of red blood cellsunder shear flow. Phys. Rev. Lett., 98:188302, 2007.
[9] V. Vitkova, M.-A. Mader, B. Polack, C. Misbah, and T. Podgorski.Micro-macro link in rheology of erythrocyte and vesicle suspensions.Biophys. J., 95:33, 2008.
[10] Badr Kaoui, George Biros, and Chaouqi Misbah. Why do red blood cellshave asymmetric shapes even in a symmetric flow? Phys. Rev. Lett.,103:188101, 2009.
137
BIBLIOGRAPHY
[11] M. Abkarian, M. Faivre, R. Horton, K. Smistrup, C. A. Best-Popescu,and H. A. Stone. Cellular-scale hydrodynamics. Biomed. Mater.,3:034011, 2008.
[12] Duc Bach Nguyen Jue Wang Lisa Wagner-Britz Achim Jung ChristianWagner Ingolf Bernhardt Lars Kaestner, Patrick Steffen. Lysophospha-tidic acid induced red blood cell aggregation in vitro. Bioelectrochem-istry, Under press, 2011.
[13] Pries A.R. Gaehtgens P Alonso, C. Time-dependent rheological behaviorof blood at low shear in narrow vertical tubes. American Journal ofPhysiology - Heart and Circulatory Physiology, Volume 265, Issue 2 34-2, ,1993:1993, 1993.
[14] Albert L. Lehninger et al. Principlesl of Biochemistry: The MolecularBasis of Cell Structure and Function. Worth Pub, July 1, 1978.
[15] Udo Seifert. Configurations of fluid membranes and vesicles. Advancesin Physics, 46(1):13–137, 1997.
[16] Evan. Evans and David. Needham. Physical properties of surfactantbilayer membranes: thermal transitions, elasticity, rigidity, cohesion andcolloidal interactions. The Journal of Physical Chemistry, 91(16):4219–4228, 1987.
[17] Needham Evans. Structure and mechanical properties of giant lipid(dmpc) vesicle bilayers from 20 ”c below to 10 ”c above the liquid crystal-crystalline phase transition at 24 c. 27 (21),:pp 82618269, 1988.
[18] Meleard et al. Bending elasticities of model membranes: Influences oftemperature and sterol content. Biophysical Journal, Volume 72, Issue6,:Pages 2616–2629, 1997.
[19] P. Meleard, C. Gerbeaud, P. Bardusco, N. Jeandaine, M. D. Mitov,and L. Fernandez-Puente. Mechanical properties of model membranesstudied from shape transformations of giant vesicles. Biochimie, 80(5-6):401 – 413, 1998.
[20] E. Evans and W. Rawicz. Entropy-driven tension and bending elastic-ity in condensed-fluid membranes. Phys. Rev. Lett., 64:2094–2097, Apr1990.
[21] U. Seifert, K. Berndl, and R. Lipowsky. Shape transformations of vesi-cles: Phase diagram for spontaneous- curvature and bilayer-couplingmodels. Phys. Rev. A, 44(2):1182–1202, Jul 1991.
138
BIBLIOGRAPHY
[22] R. Dimova, B. Pouligny, and C. Dietrich. Pretransitional effects indimyristoylphosphatidylcholine vesicle membranes: Optical dynamom-etry study. Biophys J, 79:340–356, 2000.
[23] K. Velikov, C. Dietrich, A. Hadjiisky, K. Danov, and B. Pouligny. Motionof a massive microsphere bound to a spherical vesicle. EPL (EurophysicsLetters), 40(4):405, 1997.
[24] R. Dimova, C. Dietrich, A. Hadjiisky, K. Danov, and B. Pouligny. Fallingball viscosimetry of giant vesicle membranes: Finite-size effects. TheEuropean Physical Journal B - Condensed Matter and Complex Systems,12:589–598, 1999. 10.1007/s100510051042.
[25] K. Olbrich, W. Rawicz, D. Needham, and E. Evans. Water permeabilityand mechanical strength of polyunsaturated lipid bilayers. Biophys. J.,79:321, 2000.
[26] John F. Nagle. Theory of passive permeability through lipid bilayers.The Rockefeller University Press, 2008.
[27] Narla Mohandas. Mechanical properties of the red cell membrane inrelation to molecular structure and genetic defects. Annu. Rev. Biophys.Biomol. Struet., 23:787–818, 1994.
[28] Guillaume Lenormand. Direct measurement of the area expansion andshear moduli of the human red blood cell membrane skeleton. Biophys-ical Journal, 81:43–56, 2001.
[29] Thomas M Fischer. Shape memory of human red blood cells. BiophysicalJournal, 86(5):3304–3313, 2004.
[30] R. M. Hochmuth. Erythrocyte membrane elasticity and viscosity. Ann.Rev. Physiol., 49:209–19, 1987.
[31] John Sleep. Elasticity of the red cell membrane and its relation tohemolytic disorders: An optical tweezers study. Biophysical Journal,Volume 77, Issue 6,:Pages 3085–3095, 1999.
[32] Worthy P. R. Evans E. A. Hochmuth, R. M. Red cell extensional recov-ery and the determination of membrane viscosity. Biophys. J., 26:101–14, 1979.
[33] T C Terwilliger and A K Solomon. Osmotic water permeability of humanred cells. The Journal of General Physiology, 77(5):549–570, 1981.
139
BIBLIOGRAPHY
[34] Victor W. Sidel and A. K. Solomon. Entrance of water into humanred cells under an osmotic pressure gradient. The Journal of GeneralPhysiology, 41(2):243–257, 1957.
[35] http://www.microscopyu.com/articles/phasecontrast/phasemicroscopy.html.
[36] Dongqing Li David Erickson. Integrated microfluidic devices. Microflu-idics and Lab - On - a - Chip, Volume 507, Issue 1:Pages 11–26, 2003.
[37] Jongin Hong. Micro- and nanofluidic systems for high-throughput bi-ological screening. Drug Discover y Today, Volume 14,:Pages 134–146,2009.
[38] J. K. Chang. Fabrication of the pdms microchip for serially diluting sam-ple with buffer. Microsystem Technologies Springer, Volume 9,:Number8, 555–558, 2003.
[39] F Szoka and D Papahadjopoulos. Procedure for preparation of lipo-somes with large internal aqueous space and high capture by reverse-phase evaporation. Proceedings of the National Academy of Sciences,75(9):4194–4198, 1978.
[40] L.D. Mayer, M.J. Hope, and P.R. Cullis. Vesicles of variable sizes pro-duced by a rapid extrusion procedure. Biochimica et Biophysica Acta(BBA) - Biomembranes, 858(1):161 – 168, 1986.
[41] John P. Reeves and Robert M. Dowben. Formation and propertiesof thin-walled phospholipid vesicles. Journal of Cellular Physiology,73(1):49–60, 1969.
[42] Dimitrov Angelova M., Dimiter S. Liposome electro formation. FaradayDiscuss. Chem. Soc., 81:303–311, 1986.
[43] D.S. Dimitrov and M.I. Angelova. Lipid swelling and liposome formationmediated by electric fields. Journal of Electroanalytical Chemistry andInterfacial Electrochemistry, 253(2):323 – 336, 1988.
[44] A. Srivastav, T. Podgorski, and G. Coupier. Efficiency of size-dependentseparation by pinched flow fractionation. Submited to Microfluidics andnanofluidics, 2012.
[45] N. Pamme. Continuous flow separations in microfluidic devices. Lab ona chip, 7:1644–1659, 2007.
[46] M. Yamada, M. Nakashima, and M. Seki. Pinched flow fractionation:Continuous size separation of particles utilizing a laminar flow profile ina pinched microchannel. Anal. Chem., 76:5465, 2004.
140
BIBLIOGRAPHY
[47] A. L. Vig and A. Kristensen. Separation enhancement in pinched flowfractionation. Appl. Phys. Lett., 93:203507, 2008.
[48] H. Maenaka, M. Yamada, M. Yasuda, and M. Seki. Continuous and size-dependent sorting of emulsion droplets using hydrodynamics in pinchedmicrochannels. Langmuir, 24:4405–4410, 2008.
[49] J. Takagi, M. Yamada, M. Yasuda, and M. Seki. Continuous particleseparation in a microchannel having asymmetrically arranged multiplebranches. Lab Chip, 5:778–784, 2005.
[50] Y. Sai, M. Yamada, M. Yasuda, and M. Seki. Continuous separationof particles using a microfluidic device equipped with flow rate controlvalves. J. Chrom. A, 1127:214, 2006.
[51] X. Zhang, J. M. Cooper, P. B. Monaghan, and S. J. Haswell. Continuousflow separation of particles within an asymmetric microfluidic device.Lab Chip, 6:561–566, 2006.
[52] A. Jain and J. D. Posner. Particle dispersion and separation resolutionof pinched flow fractionation. Anal. Chem., 80:1641–1648, 2008.
[53] J. R. Keller and R. Skalak. Motion of a tank-treading ellipsoidal particlein a shear flow. J. Fluid. Mech., 120:27, 1982.
[54] G. Jeffery. The motion of ellipsoidal particles immersed in a viscousfluid. Proc. R. Soc. Lond. Ser. A, 102:161–179, 1922.
[55] T. Biben, C. Misbah, A. Leyrat, and C. Verdier. An advected-fieldapproach to the dynamics of fluid interfaces. Europhys. Lett., 63:623–629, 2003.
[56] J. Beaucourt, F. Rioual, T. Seon, T. Biben, and C. Misbah. Steady tounsteady dynamics of a vesicle in a flow. Phys. Rev. E, 69:011906, 2004.
[57] Vasiliy Kantsler and Victor Steinberg. Orientation and dynamics ofa vesicle in tank-treading motion in shear flow. Phys. Rev. Lett.,95:258101, 2005.
[58] M. Mader, V. Vitkova, M. Abkarian, A. Viallat, and T. Podgorski. Dy-namics of viscous vesicles in shear flow. The European Physical JournalE: Soft Matter and Biological Physics, 19:389–397, 2006.
[59] Thierry Biben, Alexander Farutin, and Chaouqi Misbah. Three-dimensional vesicles under shear flow: Numerical study of dynamicsand phase diagram. Phys. Rev. E, 83:031921, Mar 2011.
141
BIBLIOGRAPHY
[60] C. Misbah. Vacillating breathing and tumbling of vesicles under shearflow. Phys. Rev. Lett., 96:028104, 2006.
[61] V. Kantsler and V. Steinberg. Transition to tumbling and two regimes oftumbling motion of a vesicle in shear flow. Phys. Rev. Lett., 96:036001,2006.
[62] P. M. Vlahovska and R. Serral Gracia. Dynamics of a viscous vesicle inlinear flows. Phys. Rev. E, 75:016313, 2007.
[63] V. V. Lebedev, K. S. Turitsyn, and S. S. Vergeles. Dynamics of nearlyspherical vesicles in an external flow. Phys.Rev. Lett., 99:218101, 2007.
[64] H. Noguchi and G. Gompper. Swinging and tumbling of fluid vesiclesin shear flow. Phys. Rev. Lett., 98:128103, 2007.
[65] Gerrit Danker, Thierry Biben, Thomas Podgorski, Claude Verdier, andChaouqi Misbah. Dynamics and rheology of a dilute suspension of vesi-cles: Higher-order theory. Phys. Rev. E, 76:041905, 2007.
[66] A. Farutin, T. Biben, and C. Misbah. Analytical progress in the theoryof vesicles under linear flow. Phys. Rev. E, 81:061904, 2010.
[67] Ghigliotti, Giovanni, Selmi, Hassib, Kaoui, Badr, Biros, George, andMisbah, Chaouqi. Dynamics and rheology of highly deflated vesicles.ESAIM: Proc., 28:211–226, 2009.
[68] J. Kas and E. Sackmann. Shape transitions and shape stability of giantphospholipid vesicles in pure water induced by area-to-volume changes.Biophysical Journal, 60(4):825 – 844, 1991.
[69] E. Sackmann. Membrane bending energy concept of vesicle- and cell-shapes and shape-transitions. Elsevier Science Publisher, Volume 346,Issue 1,:Pages 3–16, 1994.
[70] Kitty de Jong and Peter Ott. Membrane phospholipid asymmetry indmpc-induced human red cell vesicles. FEBS Letters, 334(2):183 – 188,1993.
[71] P.B. and Canham. The minimum energy of bending as a possible ex-planation of the biconcave shape of the human red blood cell. Journalof Theoretical Biology, 26(1):61 – 81, 1970.
[72] W.Helfrich H.J.Deuling. The curvature elasticity of fluid membranes :A catalogue of vesicle shapes. Le Journal de Physique, 37:1335–1345,1976.
142
BIBLIOGRAPHY
[73] Michael P. Sheetz and S. J. Singer. Biological membranes as bilayercouples. a molecular mechanism of drug-erythrocyte interactions. Pro-ceedings of the National Academy of Sciences, 71(11):4457–4461, 1974.
[74] S. Svetina, Angela Ottova-Leitmannov, and R. Glaser. Membrane bend-ing energy in relation to bilayer couples concept of red blood cell shapetransformations. Journal of Theoretical Biology, 94(1):13 – 23, 1982.
[75] S.Svetina and B. Zek. Membrane bending energy and shape determina-tion of phospholipid vesicles and red blood cells. European biophysicsjournal, Feb-1989.
[76] K. Berndl, J. Ks, R. Lipowsky, E. Sackmann, and U. Seifert. Shapetransformations of giant vesicles: Extreme sensitivity to bilayer asym-metry. EPL (Europhysics Letters), 13(7):659, 1990.
[77] G. K. Batchelor. The stress generated in a non-dilute suspension of elon-gated particles by pure straining motion. Journal of Fluid Mechanics,46(04):813–829, 1971.
[78] G. K. Batchelor and J. T. Green. The hydrodynamic interaction oftwo small freely-moving spheres in a linear flow field. Journal of FluidMechanics, 56(02):375–400, 1972.
[79] L. Van Wijngaarden and D. J. Jeffrey. Hydrodynamic interaction be-tween gas bubbles in liquid. Journal of Fluid Mechanics, 77(01):27–44,1976.
[80] A. Biesheuvel and L. Wijngaarden. The motion of pairs of gas bubblesin a perfect liquid. Journal of Engineering Mathematics, 16:349–365,1982.
[81] E. J. Hinch. An averaged-equation approach to particle interactions ina fluid suspension. Journal of Fluid Mechanics, 83(04):695–720, 1977.
[82] A.Z. Zinchenko. Effect of hydrodynamic interactions between the parti-cles on the rheological properties of dilute emulsions. Journal of AppliedMathematics and Mechanics, 48(2):198 – 206, 1984.
[83] F. R. Da Cunha and E. J. Hinch. Shear-induced dispersion in a dilutesuspension of rough spheres. Journal of Fluid Mechanics, 309:211–223,1996.
[84] M. Loewenberg and E.J. Hinch. Collision of two deformable drops inshear flow. J. Fluid Mech., 338:299, 1997.
143
BIBLIOGRAPHY
[85] E. Lac, A. Morel, and D. Barthes-Biesel. Hydrodynamic interactionbetween two identical capsules in simple shear flow. J. Fluid. Mech.,573:149, 2007.
[86] Y. Wang, R. Mauri, and A. Acrivos. The transverse shear-induced liquidand particle tracer diffusivities of a dilute suspension of spheres under-going a simple shear flow. Journal of Fluid Mechanics, 327:255–272,1996.
[87] Y. Wang, R. Mauri, and Acrivos.A. Transverse shear-induced gradientdiffusion in a dilute suspension of spheres. Journal of Fluid Mechanics,357:279–287, 1998.
[88] A. Acrivos, G. K. Batchelor, E. J. Hinch, D. L. Koch, and R. Mauri.Longitudinal shear-induced diffusion of spheres in a dilute suspension.Journal of Fluid Mechanics, 240:651–657, 1992.
[89] V. Kantsler, E. Segre, and V. Steinberg. Dynamics of interacting vesi-cles and rheology of vesicle suspension in shear flow. Europhys. Lett.,82:58005, 2008.
[90] Thomas Podgorski, Natacha Callens, Christophe Minetti, GwennouCoupier, Frank Dubois, and Chaouqi Misbah. Dynamics of VesicleSuspensions in Shear Flow Between Walls. MICROGRAVITY SCI-ENCE AND TECHNOLOGY, 23(2):263–270, FEB 2011. Biennial Sym-posium of the European-Low-Gravity-Research-Association (ELGRA),Bonn, GERMANY, SEP 01-04, 2009.
[91] N. Callens, C. Minetti, G. Coupier, M.-A. Mader, F. Dubois, C. Misbah,and T. Podgorski. Hydrodynamic lift of vesicles under shear flow inmicrogravity. Europhys. Lett., 83:24002, 2008.
[92] G. Coupier, B. Kaoui, T. Podgorski, and C. Misbah. Noninertial lateralmigration of vesicles in bounded Poiseuille flow. Phys. Fluids, 20:111702,2008.
[93] P. Olla. The lift on a tank-treading ellipsoidal cell in a shear flow. J.Phys. II France, 7:1533–1540, 1997.
[94] N. Callens, C. Minetti, G. Coupier, M.-A. Mader, F. Dubois, C. Misbah,and T. Podgorski. Hydrodynamic lift of vesicles under shear flow inmicrogravity. EPL (Europhysics Letters), 83(2):24002, 2008.
[95] Geoffrey Taylor. Dispersion of soluble matter in solvent flowing slowlythrough a tube. Proceedings of the Royal Society of London. Series A.Mathematical and Physical Sciences, 219(1137):186–203, 1953.
144
BIBLIOGRAPHY
[96] Eugene C. Eckstein, Douglas G. Bailey, and Ascher H. Shapiro. Self-diffusion of particles in shear flow of a suspension. Journal of FluidMechanics, 79(01):191–208, 1977.
[97] Roberto Rusconi and Howard A. Stone. Shear-induced diffusion of plate-like particles in microchannels. Phys. Rev. Lett., 101:254502, Dec 2008.
[98] John M. Higgins, David T. Eddington, Sangeeta N. Bhatia, and L. Ma-hadevan. Statistical dynamics of flowing red blood cells by morphologicalimage processing. PLoS Comput Biol, 5(2):e1000288, 02 2009.
145

BIBLIOGRAPHY
146
List of Figures
1.1 Change in apparent viscosity of blood with the change in cap-illary diameter [2] . . . . . . . . . . . . . . . . . . . . . . . . . 14
1.2 Model of microcirculation (a) Flow of blood cells in a modelmicrofluidic network: high concentration of red blood cells (b)lower concentration of red blood cells (c) modelized blood flowin a network of capillaries where structure was measured bytomography from a mouse brain sample (size of network 1mm).Colors shows concentration of red blood cells such as darkercolors shows higher concentration whereas lighter colors showsless concentration of red blood cells [3] . . . . . . . . . . . . . 15
2.1 Variation de la viscosite apparente en fonction du diametre ducapillaire [2] . . . . . . . . . . . . . . . . . . . . . . . . . . . . 22
2.2 Globules rouges dans un reseau capillaire microfluidique modele(a) Grande concentration de globules (b) concentration plusfaible de globules rouges (c) Ecoulement sanguin dans un reseaucapillaire (structure mesuree par tomographie) calcule par unmodele simplifie. Les couleurs montrent la concentration lo-cale des globules rouges : les couleurs foncees correspondent aune concentration plus elevee des globules rouges alors que lescouleurs plus claires montrent les concentrations plus faiblesque la moyenne [3] . . . . . . . . . . . . . . . . . . . . . . . . 23
3.1 Classification of lipid as a basic structural and functional unitof cellular system [14] . . . . . . . . . . . . . . . . . . . . . . . 30
3.2 A schematic chemical structure of amphiphilic molecule . . . . 303.3 Structure of a Phosphatidylcholine, represented (a) schemati-
cally; (b) as a chemical formula; (c) as a space-filling model . . 323.4 (a) Crystalline Phase; (b) Ripple Phase; (c) Liquid-phase . . . 333.5 Change in Phase of DMPC lipid bilayer with the ratio of tem-
perature and project area . . . . . . . . . . . . . . . . . . . . 343.6 (a) Sketch of the arrangement of lipid molecules in a vesicle
(b) Phase-contrast image of a vesicle . . . . . . . . . . . . . . 35
147
LIST OF FIGURES
3.7 Representation of three independent mode of membrane defor-mation: (a)Extension-compression, (b)Pure shear, (c)Bending 35
3.8 Curvature on a 2D surface. The vector ~n denotes the normalvector [5] . . . . . . . . . . . . . . . . . . . . . . . . . . . . . . 37
3.9 Different vesicle equilibrium shapes as a function of its reducedvolume . . . . . . . . . . . . . . . . . . . . . . . . . . . . . . . 38
3.10 Permeability of lipid bilayer membrane . . . . . . . . . . . . . 39
3.11 a) Healthy red blood cells with its usual discocyte shape [3].b) Typical dimensions of a healthy red blood cell . . . . . . . 41
3.12 (a)Schematic cross-section of red blood cell membrane with cy-toskeleton network at the inner layer of membrane (b)snapshotof cytoskeleton (c) structure of spectrin . . . . . . . . . . . . . 43
3.13 Bright field microscope wave phase relationships . . . . . . . . 47
3.14 Cell specimen in (a)Bright field (b)Phase contrast . . . . . . . 47
3.15 Phase Contrast Microscope optical Train . . . . . . . . . . . . 49
3.16 Fabrication steps of a PDMS microfluidic device . . . . . . . . 52
4.1 Frames of electroformation chamber (a) internal side of frame(b) external side of frame . . . . . . . . . . . . . . . . . . . . . 58
4.2 Complete chamber when formation of vesicles takes place . . . 59
4.3 Formation of vesicles of in an electroformation chamber (≈100µm width of image) . . . . . . . . . . . . . . . . . . . . . . 61
4.4 Schematic of sorting device . . . . . . . . . . . . . . . . . . . . 62
4.5 Size distribution in the outlet channels for different values ofd1(a) low values of d1 (b) large values of d1 . . . . . . . . . . 64
4.6 Size distribution in the outlet channels for two different con-centration . . . . . . . . . . . . . . . . . . . . . . . . . . . . . 65
4.7 Particle distribution in the outlets ( a) in the 14 outlets anal-ysed for a concentration of 4.8% and d1 = 0.36 (b) for someselected outlets for a concentration of 0.8% and d1 = 0.77 . . . 66
5.1 Schematic drawing of ellipsoidal membrane in a shear flow . . 69
5.2 Velocity field of vesicle in shear flow is composition of a rota-tion field and an elongational field . . . . . . . . . . . . . . . . 70
5.3 Phase diagram showing three kinds of dynamics of a vesicleunder shear flow. . . . . . . . . . . . . . . . . . . . . . . . . . 73
5.4 Equilibrium shapes for different reduced area . . . . . . . . . . 74
5.5 (a) Inclination angle (in degrees) of a tank - treading vesi-cle in a shear flow for Ca = 1 as a function of reduced areaτ2D(b)Tank - treading velocity measured in unit of γ as a func-tion of the reduced area τ2D . . . . . . . . . . . . . . . . . . . 75
148
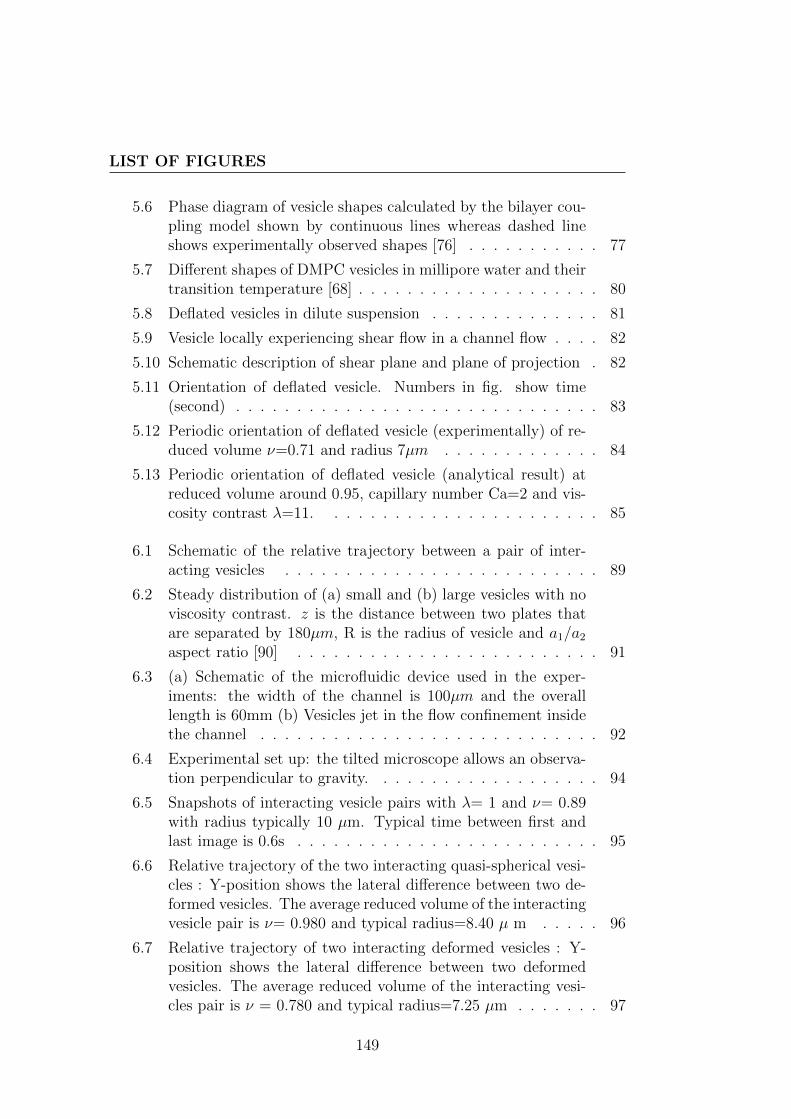
LIST OF FIGURES
5.6 Phase diagram of vesicle shapes calculated by the bilayer cou-pling model shown by continuous lines whereas dashed lineshows experimentally observed shapes [76] . . . . . . . . . . . 77
5.7 Different shapes of DMPC vesicles in millipore water and theirtransition temperature [68] . . . . . . . . . . . . . . . . . . . . 80
5.8 Deflated vesicles in dilute suspension . . . . . . . . . . . . . . 81
5.9 Vesicle locally experiencing shear flow in a channel flow . . . . 82
5.10 Schematic description of shear plane and plane of projection . 82
5.11 Orientation of deflated vesicle. Numbers in fig. show time(second) . . . . . . . . . . . . . . . . . . . . . . . . . . . . . . 83
5.12 Periodic orientation of deflated vesicle (experimentally) of re-duced volume ν=0.71 and radius 7µm . . . . . . . . . . . . . 84
5.13 Periodic orientation of deflated vesicle (analytical result) atreduced volume around 0.95, capillary number Ca=2 and vis-cosity contrast λ=11. . . . . . . . . . . . . . . . . . . . . . . 85
6.1 Schematic of the relative trajectory between a pair of inter-acting vesicles . . . . . . . . . . . . . . . . . . . . . . . . . . 89
6.2 Steady distribution of (a) small and (b) large vesicles with noviscosity contrast. z is the distance between two plates thatare separated by 180µm, R is the radius of vesicle and a1/a2
aspect ratio [90] . . . . . . . . . . . . . . . . . . . . . . . . . 91
6.3 (a) Schematic of the microfluidic device used in the exper-iments: the width of the channel is 100µm and the overalllength is 60mm (b) Vesicles jet in the flow confinement insidethe channel . . . . . . . . . . . . . . . . . . . . . . . . . . . . 92
6.4 Experimental set up: the tilted microscope allows an observa-tion perpendicular to gravity. . . . . . . . . . . . . . . . . . . 94
6.5 Snapshots of interacting vesicle pairs with λ= 1 and ν= 0.89with radius typically 10 µm. Typical time between first andlast image is 0.6s . . . . . . . . . . . . . . . . . . . . . . . . . 95
6.6 Relative trajectory of the two interacting quasi-spherical vesi-cles : Y-position shows the lateral difference between two de-formed vesicles. The average reduced volume of the interactingvesicle pair is ν= 0.980 and typical radius=8.40 µ m . . . . . 96
6.7 Relative trajectory of two interacting deformed vesicles : Y-position shows the lateral difference between two deformedvesicles. The average reduced volume of the interacting vesi-cles pair is ν = 0.780 and typical radius=7.25 µm . . . . . . . 97
149
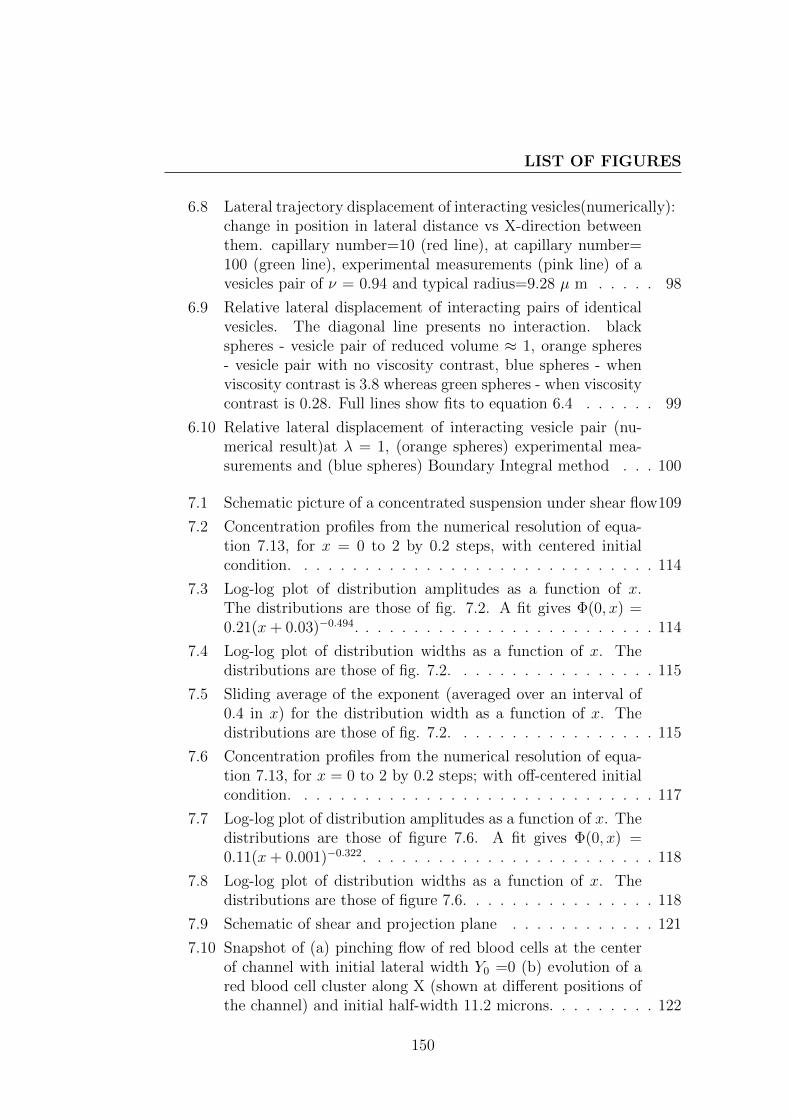
LIST OF FIGURES
6.8 Lateral trajectory displacement of interacting vesicles(numerically):change in position in lateral distance vs X-direction betweenthem. capillary number=10 (red line), at capillary number=100 (green line), experimental measurements (pink line) of avesicles pair of ν = 0.94 and typical radius=9.28 µ m . . . . . 98
6.9 Relative lateral displacement of interacting pairs of identicalvesicles. The diagonal line presents no interaction. blackspheres - vesicle pair of reduced volume ≈ 1, orange spheres- vesicle pair with no viscosity contrast, blue spheres - whenviscosity contrast is 3.8 whereas green spheres - when viscositycontrast is 0.28. Full lines show fits to equation 6.4 . . . . . . 99
6.10 Relative lateral displacement of interacting vesicle pair (nu-merical result)at λ = 1, (orange spheres) experimental mea-surements and (blue spheres) Boundary Integral method . . . 100
7.1 Schematic picture of a concentrated suspension under shear flow109
7.2 Concentration profiles from the numerical resolution of equa-tion 7.13, for x = 0 to 2 by 0.2 steps, with centered initialcondition. . . . . . . . . . . . . . . . . . . . . . . . . . . . . . 114
7.3 Log-log plot of distribution amplitudes as a function of x.The distributions are those of fig. 7.2. A fit gives Φ(0, x) =0.21(x+ 0.03)−0.494. . . . . . . . . . . . . . . . . . . . . . . . . 114
7.4 Log-log plot of distribution widths as a function of x. Thedistributions are those of fig. 7.2. . . . . . . . . . . . . . . . . 115
7.5 Sliding average of the exponent (averaged over an interval of0.4 in x) for the distribution width as a function of x. Thedistributions are those of fig. 7.2. . . . . . . . . . . . . . . . . 115
7.6 Concentration profiles from the numerical resolution of equa-tion 7.13, for x = 0 to 2 by 0.2 steps; with off-centered initialcondition. . . . . . . . . . . . . . . . . . . . . . . . . . . . . . 117
7.7 Log-log plot of distribution amplitudes as a function of x. Thedistributions are those of figure 7.6. A fit gives Φ(0, x) =0.11(x+ 0.001)−0.322. . . . . . . . . . . . . . . . . . . . . . . . 118
7.8 Log-log plot of distribution widths as a function of x. Thedistributions are those of figure 7.6. . . . . . . . . . . . . . . . 118
7.9 Schematic of shear and projection plane . . . . . . . . . . . . 121
7.10 Snapshot of (a) pinching flow of red blood cells at the centerof channel with initial lateral width Y0 =0 (b) evolution of ared blood cell cluster along X (shown at different positions ofthe channel) and initial half-width 11.2 microns. . . . . . . . . 122
150
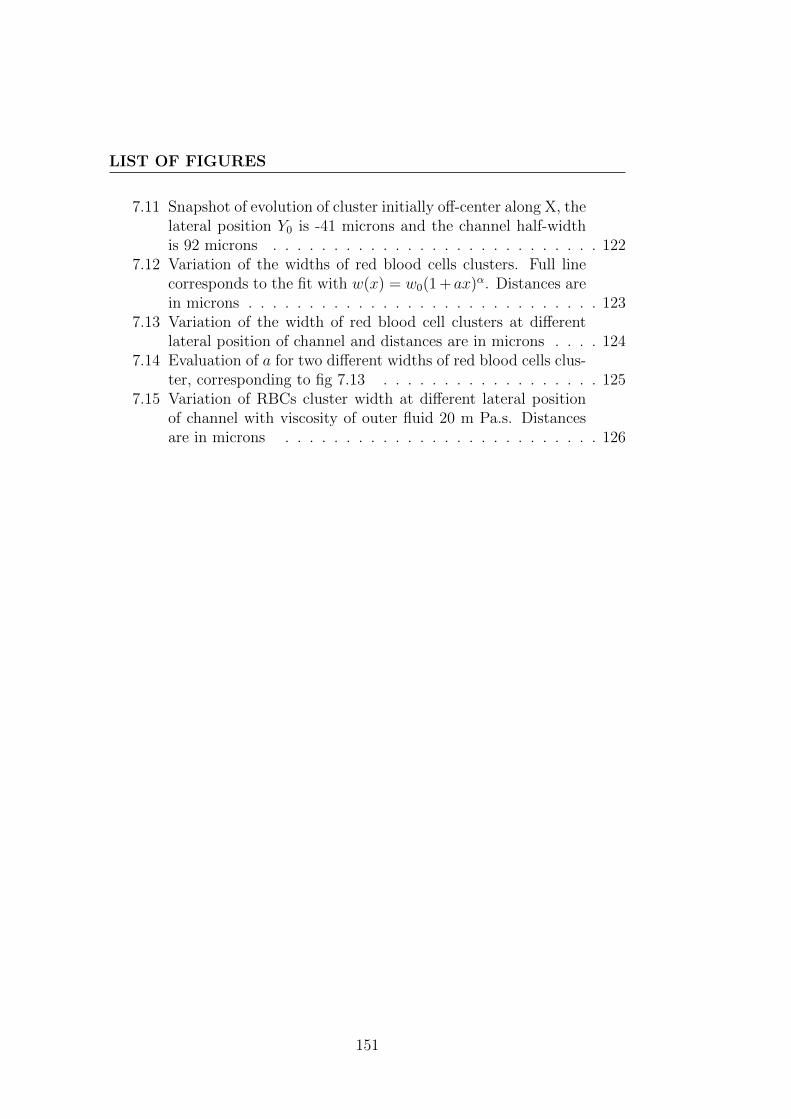
LIST OF FIGURES
7.11 Snapshot of evolution of cluster initially off-center along X, thelateral position Y0 is -41 microns and the channel half-widthis 92 microns . . . . . . . . . . . . . . . . . . . . . . . . . . . 122
7.12 Variation of the widths of red blood cells clusters. Full linecorresponds to the fit with w(x) = w0(1 +ax)α. Distances arein microns . . . . . . . . . . . . . . . . . . . . . . . . . . . . . 123
7.13 Variation of the width of red blood cell clusters at differentlateral position of channel and distances are in microns . . . . 124
7.14 Evaluation of a for two different widths of red blood cells clus-ter, corresponding to fig 7.13 . . . . . . . . . . . . . . . . . . 125
7.15 Variation of RBCs cluster width at different lateral positionof channel with viscosity of outer fluid 20 m Pa.s. Distancesare in microns . . . . . . . . . . . . . . . . . . . . . . . . . . 126
151

LIST OF FIGURES
152
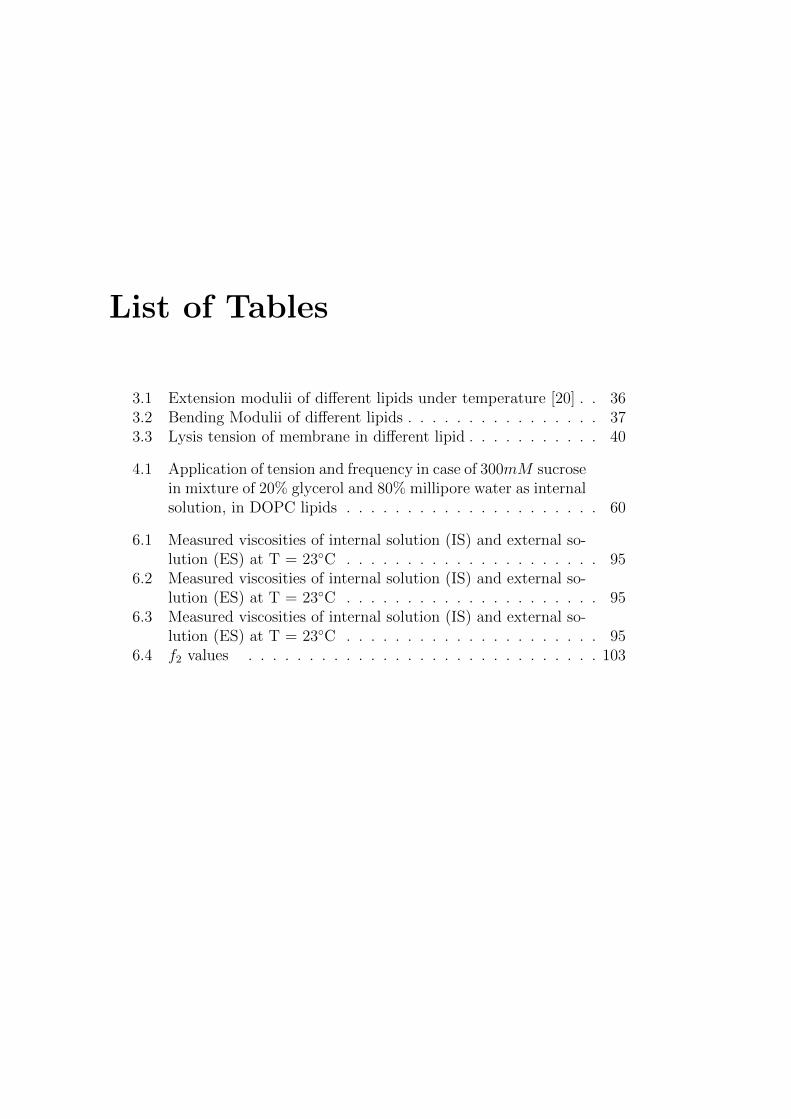
List of Tables
3.1 Extension modulii of different lipids under temperature [20] . . 363.2 Bending Modulii of different lipids . . . . . . . . . . . . . . . . 373.3 Lysis tension of membrane in different lipid . . . . . . . . . . . 40
4.1 Application of tension and frequency in case of 300mM sucrosein mixture of 20% glycerol and 80% millipore water as internalsolution, in DOPC lipids . . . . . . . . . . . . . . . . . . . . . 60
6.1 Measured viscosities of internal solution (IS) and external so-lution (ES) at T = 23◦C . . . . . . . . . . . . . . . . . . . . . 95
6.2 Measured viscosities of internal solution (IS) and external so-lution (ES) at T = 23◦C . . . . . . . . . . . . . . . . . . . . . 95
6.3 Measured viscosities of internal solution (IS) and external so-lution (ES) at T = 23◦C . . . . . . . . . . . . . . . . . . . . . 95
6.4 f2 values . . . . . . . . . . . . . . . . . . . . . . . . . . . . . 103


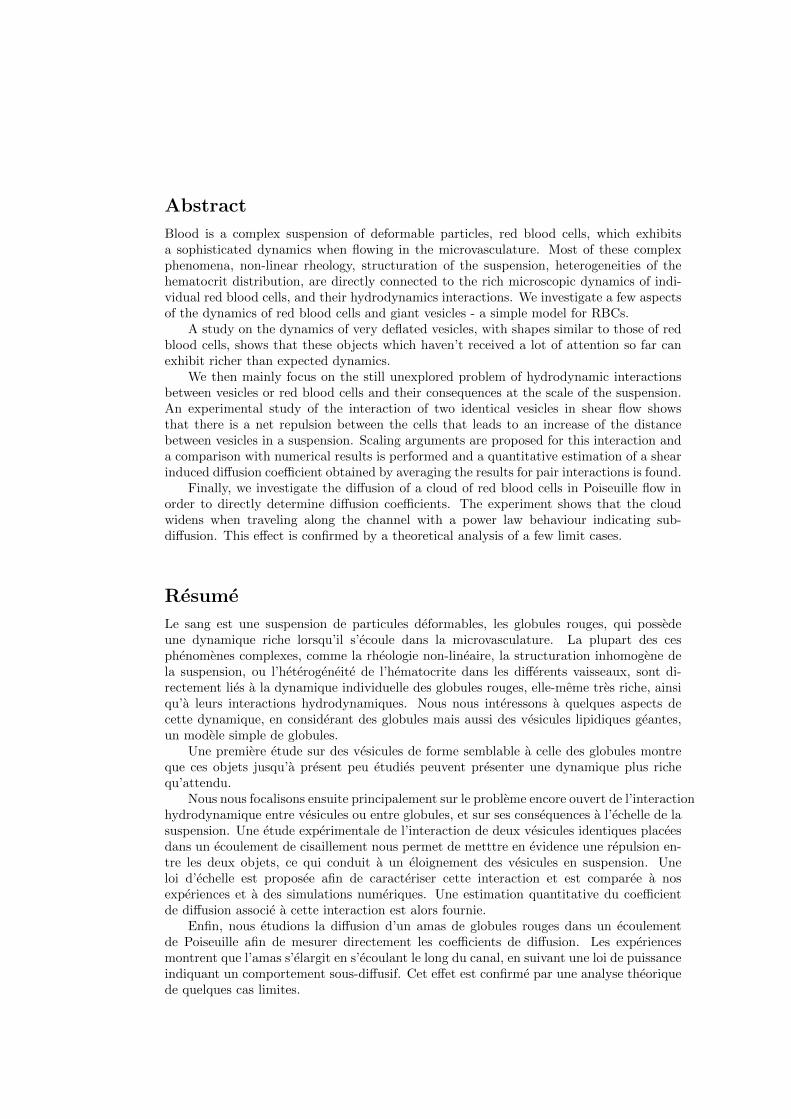
Abstract
Blood is a complex suspension of deformable particles, red blood cells, which exhibitsa sophisticated dynamics when flowing in the microvasculature. Most of these complexphenomena, non-linear rheology, structuration of the suspension, heterogeneities of thehematocrit distribution, are directly connected to the rich microscopic dynamics of indi-vidual red blood cells, and their hydrodynamics interactions. We investigate a few aspectsof the dynamics of red blood cells and giant vesicles - a simple model for RBCs.
A study on the dynamics of very deflated vesicles, with shapes similar to those of redblood cells, shows that these objects which haven’t received a lot of attention so far canexhibit richer than expected dynamics.
We then mainly focus on the still unexplored problem of hydrodynamic interactionsbetween vesicles or red blood cells and their consequences at the scale of the suspension.An experimental study of the interaction of two identical vesicles in shear flow showsthat there is a net repulsion between the cells that leads to an increase of the distancebetween vesicles in a suspension. Scaling arguments are proposed for this interaction anda comparison with numerical results is performed and a quantitative estimation of a shearinduced diffusion coefficient obtained by averaging the results for pair interactions is found.
Finally, we investigate the diffusion of a cloud of red blood cells in Poiseuille flow inorder to directly determine diffusion coefficients. The experiment shows that the cloudwidens when traveling along the channel with a power law behaviour indicating sub-diffusion. This effect is confirmed by a theoretical analysis of a few limit cases.
Resume
Le sang est une suspension de particules deformables, les globules rouges, qui possedeune dynamique riche lorsqu’il s’ecoule dans la microvasculature. La plupart des cesphenomenes complexes, comme la rheologie non-lineaire, la structuration inhomogene dela suspension, ou l’heterogeneite de l’hematocrite dans les differents vaisseaux, sont di-rectement lies a la dynamique individuelle des globules rouges, elle-meme tres riche, ainsiqu’a leurs interactions hydrodynamiques. Nous nous interessons a quelques aspects decette dynamique, en considerant des globules mais aussi des vesicules lipidiques geantes,un modele simple de globules.
Une premiere etude sur des vesicules de forme semblable a celle des globules montreque ces objets jusqu’a present peu etudies peuvent presenter une dynamique plus richequ’attendu.
Nous nous focalisons ensuite principalement sur le probleme encore ouvert de l’interactionhydrodynamique entre vesicules ou entre globules, et sur ses consequences a l’echelle de lasuspension. Une etude experimentale de l’interaction de deux vesicules identiques placeesdans un ecoulement de cisaillement nous permet de metttre en evidence une repulsion en-tre les deux objets, ce qui conduit a un eloignement des vesicules en suspension. Uneloi d’echelle est proposee afin de caracteriser cette interaction et est comparee a nosexperiences et a des simulations numeriques. Une estimation quantitative du coefficientde diffusion associe a cette interaction est alors fournie.
Enfin, nous etudions la diffusion d’un amas de globules rouges dans un ecoulementde Poiseuille afin de mesurer directement les coefficients de diffusion. Les experiencesmontrent que l’amas s’elargit en s’ecoulant le long du canal, en suivant une loi de puissanceindiquant un comportement sous-diffusif. Cet effet est confirme par une analyse theoriquede quelques cas limites.


