Embed Size (px)
Citation preview

Diffusion dynamics Microeconomics of Technical Change -‐ 20153 EMIT
Agnese Centineo 1468875 August Majer 1659085
2
Table of Content
Introduction ........................................................................................................................ 3
# Diffusion ............................................................................................................................ 4
## Modeling diffusion ...................................................................................................... 5 ### What affects the diffusion? .................................................................................... 6
#### Diffusion speed ....................................................................................................... 9
##### Variations in speed .......................................................................................... 11 ###### Final remarks .................................................................................................. 13
References ........................................................................................................................ 14
3
Diffusion dynamics “And it ought to be remembered that there is nothing more difficult to take in hand, more perilous to conduct, or more uncertain in its success, than to take the lead in the introduction of a new order of things. Because the innovator has for enemies all those who have done well under the old conditions, and lukewarm defenders in those who may do well under the new. This coolness arises partly from fear of the opponents, who have the laws on their side, and partly from the incredulity of men, who do not readily believe in new things until they have had a long experience of them.” – Niccolò Machiavelli
Introduction
History of innovation shows how usually it takes far too long for attested products and processes to become part of our practice. Innovation is a risky and complicated process, that grows up from market gaps or radical new ideas followed by creation of new markets; it widely contributes to economic development and growth. The value an innovation is capable to give to a socio economic system mostly depends, on the rate by which is it adopted by individuals and on the nature of that spread within a population. In essence it’s a way on which diffusion process takes its shape. Innovation diffusion has a detrimental effect on social and economic evolution of cultures and populations.
The impact an innovation is meant to have on social habits and conditions and,
above all, on social welfare, has a big potential strength which every government and institution has to consider in addressing their development activities and actions. Trough diffusion, an innovation acquires its proper social meaning and becomes a relevant tool to be exploited. As long as is adopted by individuals and societies, it becomes useful and it is utilized in order to satisfy a specific need and accomplish a function by a new technology product or process application.
Since diffusion of innovation is socially critical and also transversal to many
different disciplines and humanistic and scientific fields of knowledge, one cannot disregard to mention the multidimensional and variegate factors that interfere with the diffusion process, its fundamental characteristics, the main theories developed so far and some empirical evidences. The point this work wants to start from, and expand its focus on, has its origin in Nathan Rosenberg’s quote “in the history of diffusion of many innovations, one cannot help being struck by two characteristics of the diffusion process: its apparent overall slowness on the one hand, and the wide variations in the rates of acceptance of different inventions, on the other”.
4
# Diffusion
The noun diffusion, in the innovation of technology field, is used to describe a process by which a cultural practice or skill spreads within a community. In the 1950’s first serious attempts to explain innovation diffusion were taken. Pivotal work comes from mentioned Rogers M. Everett who published work on diffusion of innovation (1962) in which he defined innovation as “an idea, practice, or object that is perceived as new by individual or other unit of adoption” (Rogers, 1985, p.11) and diffusion as “the process by which an innovation is communicated through certain channels over time among the members of a social system”. Earlier Rogers points out that diffusion is “a special type of communication, in that the massages are concerned with new ideas” and “communication is a process in which participants create and share information with one another in other to reach a mutual understanding” (Rogers, 1983). Such approach is known as a communication based theory. Diffusion is assumed, according to Rogers as a social process in which information is spread and shared among the members of a society, and, as part of a social system, the diffusion evolution of an invention is influenced by the communication channel, the characteristics and culture of the members of the society and the time. Indeed, is to consider diffusion of innovation does not consist in a mare technical switch, a research and development goal or an industry key source, but is also the springboard for an economic turn and a social change. This phenomenon is visible and it is verified every time an innovation adopted by a society of individuals and institutions demonstrates to be capable to mutate the structure of the social system and influence its main functions and uses.
Rogers of course is not the only one to research this topic, in 1961, Mansfield
proposed that the rate of diffusion is a “function of the extend of economic advantage of innovation, the amount of investment required to adopt the innovation and the degree of uncertainty associated with the innovation” (Mahajan V. and Peterson R.A., 1985). Learning perspective of innovation diffusion was proposed by Casetti and Semple (1969) and again by Sahal (1981). Prominent work done by Blackman (1974) and Sharif and Kabir (1976) used a technological substitution frame to describe innovation diffusion.
5
## Modeling diffusion Rogers’s model looks at diffusion dynamics under a social environment
framework and investigates over different elements of this framework that affect the rate of adoption. The centrality of diffusion matter lays on the concept of rate of adoption, the relative speed at which an innovation is adopted by the members of a social system, the determinant of the slope of the adoption curve for an innovation. Wondering the causes behind the rate of adoption and diffusion dynamics, Rogers individuates five major types of variables decisive for the determination of the rate of adoption. These variables are the perceived attributes of innovation; the communication channels used to search the information about an innovation, that can be interpersonal and private or mass media; the type of innovation decision, if collective, individual or social, namely made by a govern organization or another authority; the nature of the social system, its habits, its laws, the degree of interconnectedness and the extent of the change agent’s efforts in promoting the innovation.
In particular, the characteristics of the innovation perceived by the adopters are
the most relevant and affective for the adoption decision process. These are constituted by the relative advantage which a consumer can gain from an innovation compared with the previous benefits of the extant technology which fulfill the same functions; the compatibility with the uses and habits of the potential adopters, their need and the values, needs and past experience framework; the degree of complexity of the innovation, namely the difficulty perceived for the necessary efforts to learn the know how due to the use of the innovation, which constitute a cost and it is negatively correlated with the rate of adoption; the trialability whereas the possibility to find an easy way to try the innovation before the decision making; the observability, the availability and the opportunity to find visible results of an invention, easy to measure.
The adoption process, considering the percentage of adoptions in a length of
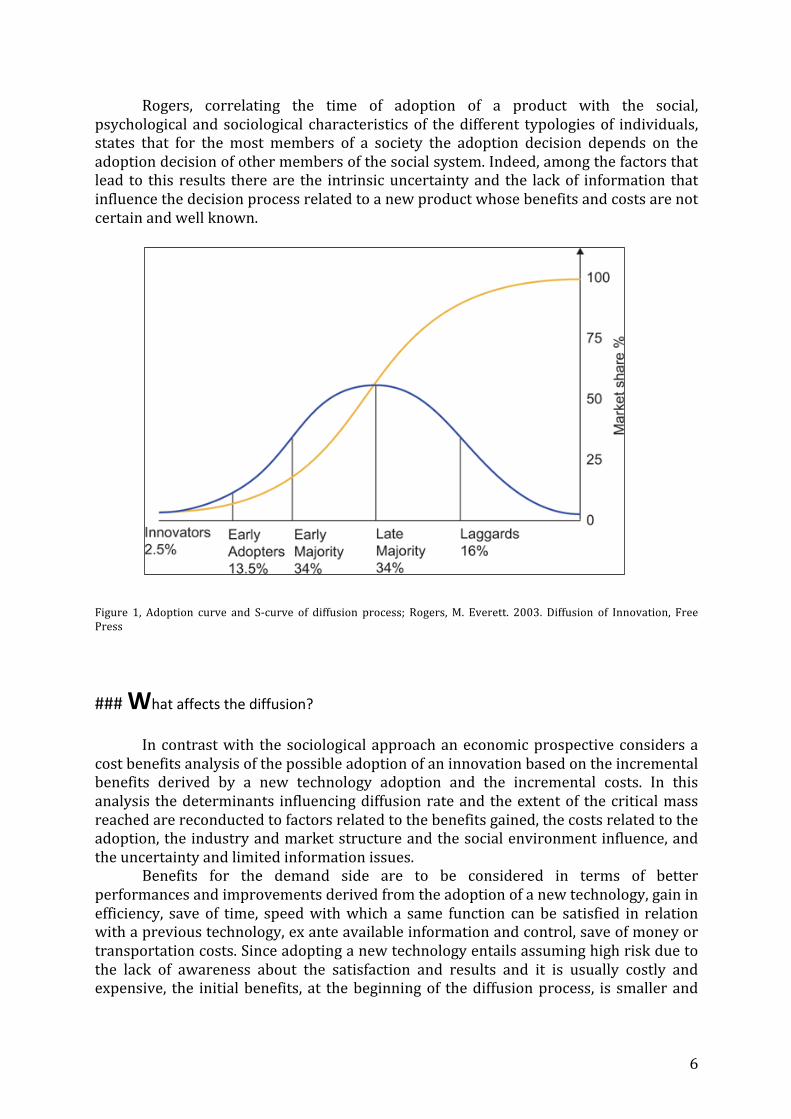
time, follows an S shaped curve, in which the slope and the shape it is affected by the social environment and the mentioned characteristic of a specific technology. Rogers diffusion model categorizes the adopters’ typologies displaying the distribution of the different types in a time axis. The bell shaped adoption curve with the frequency of the adopters is correlated with the S shaped diffusion curve (cumulative). When the S curve rises slowly we find an uncertainty stage where the adopters are few and classified as innovators, with a great interest in innovations, low risk adversity and low price sensibility. Then the early majority that constitutes a higher percentage made up of individuals with a great influence on the other potential part of the demand. Next comes the biggest interval, which includes the mean of the normal distribution, and the early and the late majority occupy it. The individual’s part of the early majority has more resistance to adopt the innovations than the early adopters and more price sensitiveness too. The late majority is composed of individuals that adopt the innovation after the most of the society have adopted it; they are skeptical about innovation and very price sensitive. The last category is the laggards one; these are individuals that decide to adopt an innovation very late, when it is almost outdated, very price sensitive and not really interested into the technological innovation characteristics.
6
Rogers, correlating the time of adoption of a product with the social, psychological and sociological characteristics of the different typologies of individuals, states that for the most members of a society the adoption decision depends on the adoption decision of other members of the social system. Indeed, among the factors that lead to this results there are the intrinsic uncertainty and the lack of information that influence the decision process related to a new product whose benefits and costs are not certain and well known.
Figure 1, Adoption curve and S-‐curve of diffusion process; Rogers, M. Everett. 2003. Diffusion of Innovation, Free Press
### What affects the diffusion?
In contrast with the sociological approach an economic prospective considers a cost benefits analysis of the possible adoption of an innovation based on the incremental benefits derived by a new technology adoption and the incremental costs. In this analysis the determinants influencing diffusion rate and the extent of the critical mass reached are reconducted to factors related to the benefits gained, the costs related to the adoption, the industry and market structure and the social environment influence, and the uncertainty and limited information issues.
Benefits for the demand side are to be considered in terms of better performances and improvements derived from the adoption of a new technology, gain in efficiency, save of time, speed with which a same function can be satisfied in relation with a previous technology, ex ante available information and control, save of money or transportation costs. Since adopting a new technology entails assuming high risk due to the lack of awareness about the satisfaction and results and it is usually costly and expensive, the initial benefits, at the beginning of the diffusion process, is smaller and
7
diffusion process manifests its intrinsic slowness. As diffusion proceeds, the technology spreads and the learning process takes place among the members of the social system.
In this perspective, according to Rosenberg’s view, diffusion is evolving as the
learning by using or doing and expanding trough out the demand, shaping in accordance to the specific socio economic environment in which the invention is introduced. Thus, as the new technologies become even more and more attractive, the related benefits grow over time until they increase at a rate higher than the costs. Consequently, the number of the adopters rises over time until the critical mass is reached, in correspondence of the highest rate of adoption. The extension adoption base, for some new technologies, is proportional to the benefits an individual receives from the adoption. The more the customer’s base, the more the value a user can gain from the adoption of a product. These types of technologies innovation are those network goods that foster the diffusion process often accelerating it. A wider network, made of a high number of consumers, leads to a higher diffusion rate, namely to a faster diffusion curve.
The strength of network lays on the element of standard. When a standard is
affirmed and the same technology is chosen from the most of the customers, it is easier for the network phenomenon to raise and for the adopted product to reach sooner the critical mass in the diffusion process, eventually leading the point at which the market is saturated. New technology, in particular social networks and communication tools industries, are the ones where network benefits related to diffusion process are more relevant and evident. Firms and consumers of these technologies benefit from the adoption of the same product by others consumers and firms. Studies investigating the effects existent in the speed of diffusion for a product when there are network externalities highlighted that the value of a technology to a consumer increases with the number of network participants. These issues can be exploited promoting the standardization of different technologies among them and enhancing the positive externalities trough complementarities. In a network, when complementary products are standardized, benefits from network externalities increase and the spread of a product within a community is broader.
Nathan Rosenberg looked at the diffusion of innovation also trough a supply
determinants considerations. He considered the industrial production process correlating it to the diffusion process of an item in the market. According to Rosenberg view behind the slowness of the adoption there is the relative weak performance of the innovative technology at the initial stage. Assuming such prospective, is to be enhanced the role of suppliers in improving and bettering the innovation, therefore first in the comprehension of the focal points and in the research of feedbacks about the performance of the new technologies from the potential demand or the early adopters. Rosenberg defined important factors determinant for the supply side of the market: alternative uses of new technologies, improvements in the technologies performances and applications after the first launch, invention of complementary products, promotion and development of complementary skills by the users. A further critical factor pointed out is the negative effect of the improvements on affirmed technologies on the speed of the diffusion process related to a new technology.
The adoption process slowly at first, accelerates as the innovation spreads
through the potential customer base and then, eventually reached the market saturation,
8
slows down. As a consequence, the S shape curve implicates that adoption is an absorbing state, namely it stressed the common attested fact that there is no point in abandoning a technology in favor of an older one. Two different models explain the S adoption curve dispersion.
The Heterogeneity model states that different individuals have different
preferences and give different value to a product. Assuming normal the distribution of the benefits from the adoption over the consumers, the cost of adoption is constant, declining over time, due to the fact that the net benefit from adoption is increasing over time, the diffusion curve has the s shape. Net benefit is said to increase because of scale economies, decreasing of initial costs, learning by doing process. Another model, the epidemic model, also called learning model, is based on the opposite assumption. Consumers have the same tastes and preferences, so the same expected benefits and the costs are constant, but they are not homogeneous in the degree information about the product. The individual user learns from his close environment, from his proper neighbor over the time. An incremental number of people become informed and adopt the new technology over the time. Consequently the rate of adoption increases and the market is capable to become saturated. After the saturation point the rate starts decreasing again.
The relevance of diffusion of innovation theories is still very important to our
understanding of markets and it is adopted in a huge number of different fields. Not to forget mentioning organizational applications of methods enhancing diffusion of some organizational tools and practice. Overall, we can currently observe diffusion also just in population every day consumptions choices, purchases and transactions, which let us measure in a empirical manner, how fast and why a product takes its space in the markets all over the world.
This is just a fraction of the research done in the field, however all have manage
to isolate and verify that variables from various sets most of all economic and social ones are important to explain an innovation diffusion process.
9
#### Diffusion speed
Lets take a more closely look at the observation of different diffusion rates for different products.
As has been confirmed by numerous empirical research innovation diffusion
speed varies, it might grow or suddenly pause, with latter due to a technical discontinuities. Technical discontinuities and radical technological change, emergence of new innovations, a number of different approaches were provided by innovation management theorists such as Schumpeter’s creative destruction (Schumpeter, 1942), very prominently by the incremental – radical innovation model (Abernathy and Utterback, 1978).
The speed of diffusion and the wide range of variation the rate of adoption
presents, have been studied from several perspectives since a long time. These key points have been correlated with the characteristics of the different technological innovative inventions, with the demand structure and the differences within the typologies of potential adopters and their preferences, in order to better understand the diffusion dynamics and investigate on the reasons behind the differential in the speed among different innovations and among different societies.
Speed in physics is define as the rate or a measure of the rate of motion,
especially: distance traveled divided by the time of travel, the first derivative of distance with respect to time, the magnitude of a velocity (The American Heritage® Dictionary of the English Language, 2009). In the context of diffusion, the relevant measure is the difference between two penetration levels. Having above in mind the diffusion speed can be define as the amount of time it takes to go from one penetration level to a higher level (Fisher and Pry, 1971). Accepted practice by researches in the field of diffusion modeling and diffusion speed measurement is to first estimate a specific diffusion model and then use one or more of the estimated parameters as an indicator of diffusion speed. Typically in situations in which an innovation diffuses though a population a simplest model is used: the logistic model. The model results the familiar “S” curve in which period of rapid acceleration is followed by deceleration and finally, saturation (Richard, 2002). The model is presented with the following mathematical expression:
𝑥 𝑡 = 𝛽 𝐹(𝑡 − 1) 𝑀 − 𝑋(𝑡 − 1) (1) Let the number of adopters of innovation at time t be x(t) and the total number of adopters by time t be X(t). M the number of eventual adopters and F(t)=X(t)/M. The β parameter in presented model has a direct relationship with diffusion speed the time it takes to go from one penetration level p1 to penetration level p2 which equals to: 𝑝! = 𝛽!!𝑙𝑛 1− 𝑝! 𝑝!/ (1− 𝑝!)𝑝! (2)
By this, we can show that the time it would take to go from 10% to 90% of the max M, (t90% -‐ t 10%) would be equal to 4.93/β in the logistic diffusion process (Fisher and Pry, 1971). Continuing, 1/β also equals the Gini coefficient in logistic model,
10
showing the expected waiting time of random potential adopter at a random point in time (Trajtenberg and Yitzhaki, 1989).
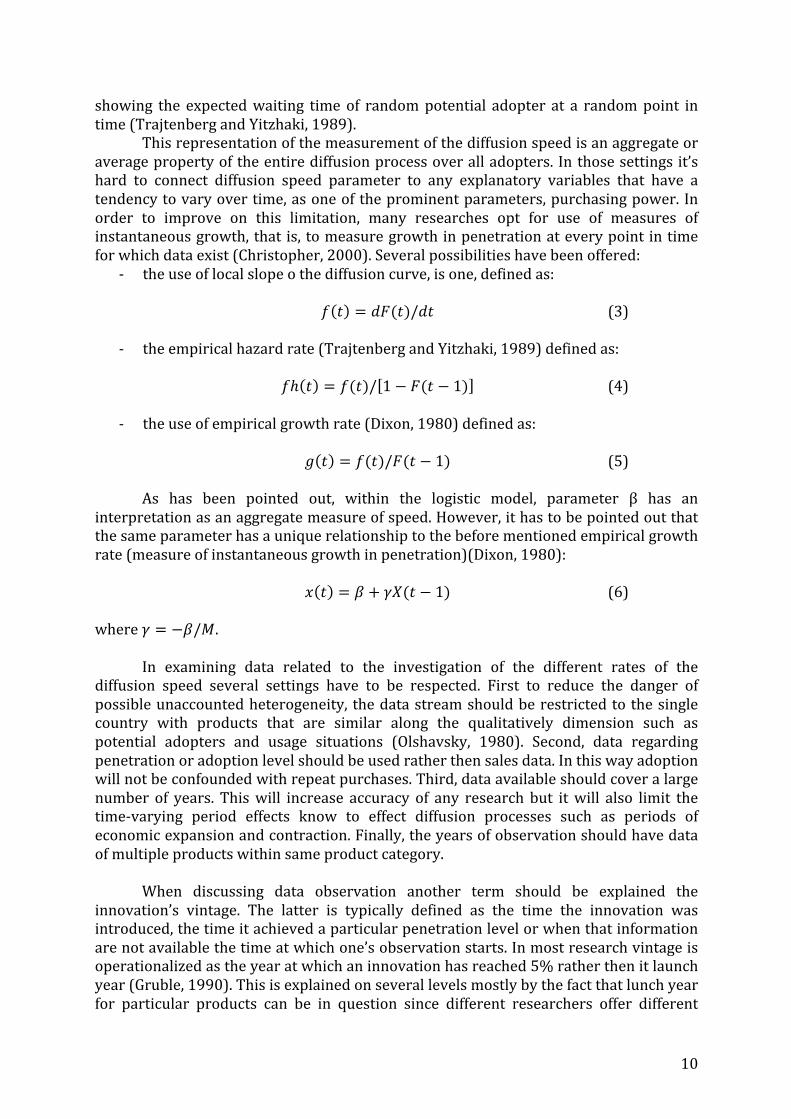
This representation of the measurement of the diffusion speed is an aggregate or average property of the entire diffusion process over all adopters. In those settings it’s hard to connect diffusion speed parameter to any explanatory variables that have a tendency to vary over time, as one of the prominent parameters, purchasing power. In order to improve on this limitation, many researches opt for use of measures of instantaneous growth, that is, to measure growth in penetration at every point in time for which data exist (Christopher, 2000). Several possibilities have been offered:
-‐ the use of local slope o the diffusion curve, is one, defined as: 𝑓 𝑡 = 𝑑𝐹(𝑡)/𝑑𝑡 (3)
-‐ the empirical hazard rate (Trajtenberg and Yitzhaki, 1989) defined as:
𝑓ℎ 𝑡 = 𝑓(𝑡)/ 1− 𝐹(𝑡 − 1) (4)
-‐ the use of empirical growth rate (Dixon, 1980) defined as:
𝑔 𝑡 = 𝑓(𝑡)/𝐹(𝑡 − 1)
(5)
As has been pointed out, within the logistic model, parameter β has an interpretation as an aggregate measure of speed. However, it has to be pointed out that the same parameter has a unique relationship to the before mentioned empirical growth rate (measure of instantaneous growth in penetration)(Dixon, 1980):
𝑥 𝑡 = 𝛽 + 𝛾𝑋(𝑡 − 1)
(6)
where 𝛾 = −𝛽/𝑀.
In examining data related to the investigation of the different rates of the diffusion speed several settings have to be respected. First to reduce the danger of possible unaccounted heterogeneity, the data stream should be restricted to the single country with products that are similar along the qualitatively dimension such as potential adopters and usage situations (Olshavsky, 1980). Second, data regarding penetration or adoption level should be used rather then sales data. In this way adoption will not be confounded with repeat purchases. Third, data available should cover a large number of years. This will increase accuracy of any research but it will also limit the time-‐varying period effects know to effect diffusion processes such as periods of economic expansion and contraction. Finally, the years of observation should have data of multiple products within same product category.
When discussing data observation another term should be explained the
innovation’s vintage. The latter is typically defined as the time the innovation was introduced, the time it achieved a particular penetration level or when that information are not available the time at which one’s observation starts. In most research vintage is operationalized as the year at which an innovation has reached 5% rather then it launch year (Gruble, 1990). This is explained on several levels mostly by the fact that lunch year for particular products can be in question since different researchers offer different
11
dates, further more the level of 5% is know for the most of the products. Following table displays such data for consumer durables.
##### Variations in speed
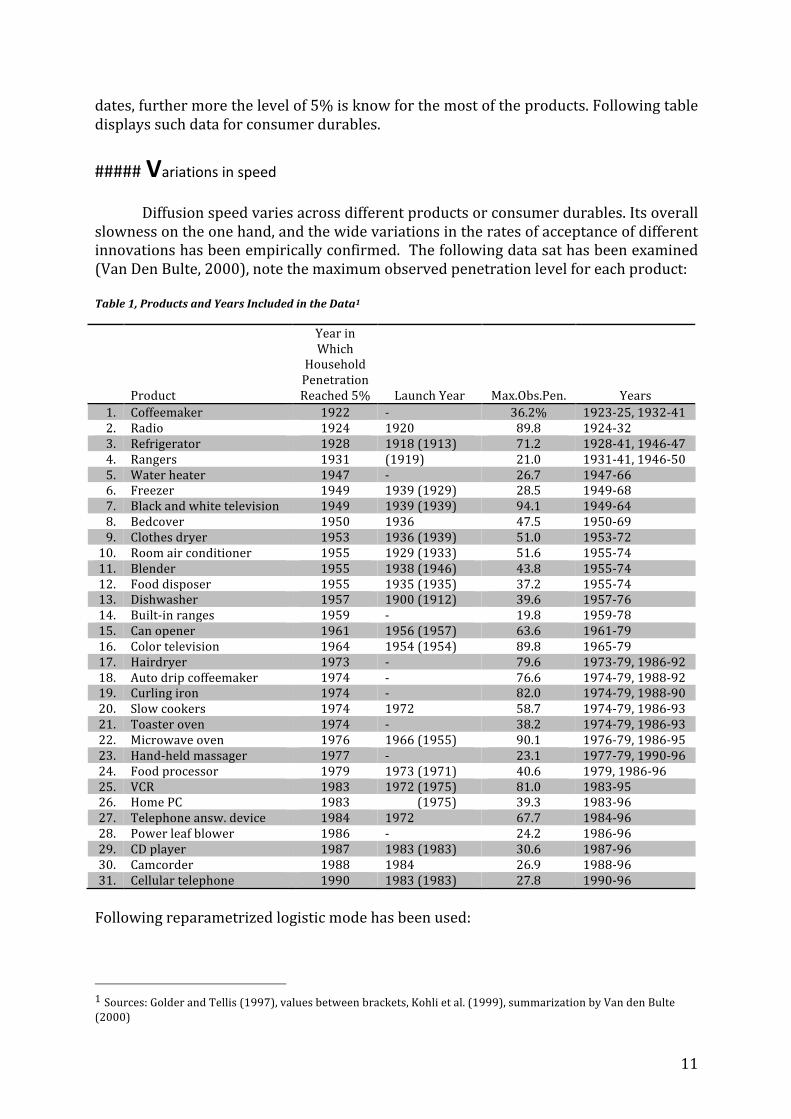
Diffusion speed varies across different products or consumer durables. Its overall slowness on the one hand, and the wide variations in the rates of acceptance of different innovations has been empirically confirmed. The following data sat has been examined (Van Den Bulte, 2000), note the maximum observed penetration level for each product: Table 1, Products and Years Included in the Data1
Product
Year in Which
Household Penetration Reached 5% Launch Year Max.Obs.Pen. Years
1. Coffeemaker 1922 -‐ 36.2% 1923-‐25, 1932-‐41 2. Radio 1924 1920 89.8 1924-‐32 3. Refrigerator 1928 1918 (1913) 71.2 1928-‐41, 1946-‐47 4. Rangers 1931 (1919) 21.0 1931-‐41, 1946-‐50 5. Water heater 1947 -‐ 26.7 1947-‐66 6. Freezer 1949 1939 (1929) 28.5 1949-‐68 7. Black and white television 1949 1939 (1939) 94.1 1949-‐64 8. Bedcover 1950 1936 47.5 1950-‐69 9. Clothes dryer 1953 1936 (1939) 51.0 1953-‐72 10. Room air conditioner 1955 1929 (1933) 51.6 1955-‐74 11. Blender 1955 1938 (1946) 43.8 1955-‐74 12. Food disposer 1955 1935 (1935) 37.2 1955-‐74 13. Dishwasher 1957 1900 (1912) 39.6 1957-‐76 14. Built-‐in ranges 1959 -‐ 19.8 1959-‐78 15. Can opener 1961 1956 (1957) 63.6 1961-‐79 16. Color television 1964 1954 (1954) 89.8 1965-‐79 17. Hairdryer 1973 -‐ 79.6 1973-‐79, 1986-‐92 18. Auto drip coffeemaker 1974 -‐ 76.6 1974-‐79, 1988-‐92 19. Curling iron 1974 -‐ 82.0 1974-‐79, 1988-‐90 20. Slow cookers 1974 1972 58.7 1974-‐79, 1986-‐93 21. Toaster oven 1974 -‐ 38.2 1974-‐79, 1986-‐93 22. Microwave oven 1976 1966 (1955) 90.1 1976-‐79, 1986-‐95 23. Hand-‐held massager 1977 -‐ 23.1 1977-‐79, 1990-‐96 24. Food processor 1979 1973 (1971) 40.6 1979, 1986-‐96 25. VCR 1983 1972 (1975) 81.0 1983-‐95 26. Home PC 1983 (1975) 39.3 1983-‐96 27. Telephone answ. device 1984 1972 67.7 1984-‐96 28. Power leaf blower 1986 -‐ 24.2 1986-‐96 29. CD player 1987 1983 (1983) 30.6 1987-‐96 30. Camcorder 1988 1984 26.9 1988-‐96 31. Cellular telephone 1990 1983 (1983) 27.8 1990-‐96 Following reparametrized logistic mode has been used:
1 Sources: Golder and Tellis (1997), values between brackets, Kohli et al. (1999), summarization by Van den Bulte (2000)
12
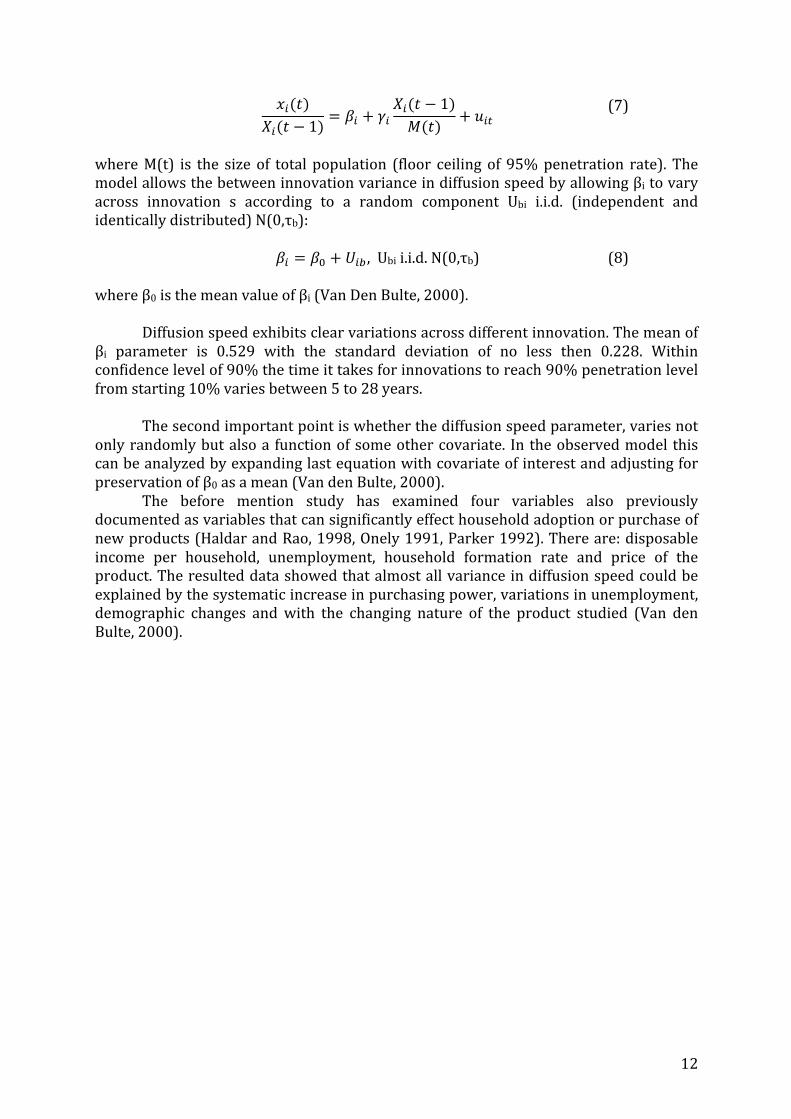
𝑥!(𝑡)𝑋!(𝑡 − 1)
= 𝛽! + 𝛾!𝑋!(𝑡 − 1)𝑀(𝑡) + 𝑢!"
(7)
where M(t) is the size of total population (floor ceiling of 95% penetration rate). The model allows the between innovation variance in diffusion speed by allowing βi to vary across innovation s according to a random component Ubi i.i.d. (independent and identically distributed) N(0,τb): 𝛽! = 𝛽! + 𝑈!" , Ubi i.i.d. N(0,τb)
(8)
where β0 is the mean value of βi (Van Den Bulte, 2000).
Diffusion speed exhibits clear variations across different innovation. The mean of βi parameter is 0.529 with the standard deviation of no less then 0.228. Within confidence level of 90% the time it takes for innovations to reach 90% penetration level from starting 10% varies between 5 to 28 years.
The second important point is whether the diffusion speed parameter, varies not
only randomly but also a function of some other covariate. In the observed model this can be analyzed by expanding last equation with covariate of interest and adjusting for preservation of β0 as a mean (Van den Bulte, 2000).
The before mention study has examined four variables also previously documented as variables that can significantly effect household adoption or purchase of new products (Haldar and Rao, 1998, Onely 1991, Parker 1992). There are: disposable income per household, unemployment, household formation rate and price of the product. The resulted data showed that almost all variance in diffusion speed could be explained by the systematic increase in purchasing power, variations in unemployment, demographic changes and with the changing nature of the product studied (Van den Bulte, 2000).
13
###### Final remarks
Invention, innovation, adoption and diffusion of a product are the building blocks on which economy is based. Diffusion, as a form of communication by which it is possible for an innovation to become part of the market and trough the market be part of the society. Within the society able to foster a technological shift that sometimes has such relevance to cause a social turn, could be interpreted as fundamental link and a central feature for an innovation to assume a social meaning. Central to this work was the examination of the variation in speed of diffusion for different categories of products and product its self trough empirical evidences and meaningful data. It is suggested that the starting point of this work, namely Rosenberg’s statement “in the history of diffusion of many innovations, one cannot help being struck by two characteristics of the diffusion process: its apparent overall slowness on the one hand, and the wide variations in the rates of acceptance of different inventions, on the other”, is to consider as valid and verified by empirical evidence.
However, further research should be taken. In accordance to the maximal posed length on this work, several issues have been ignored. In particular the extended analysis of the variables and the linkage between the same, that influences the variation of the diffusion speed among products. Also examination of the variation in speed among different countries should be examined if qualified date could be located. Final point is the new arising issue of possible increase of diffusion speed observed with in the new product groups. The main question been posed here is: are the products launch today diffuse faster then products launched in the past?
14
References Fisher, J.C., R.H.Pry. 1971. A simple sustition model of technology change. Tech. Forcasting Soc. Change 3 (1) 75-‐88. Gatignon, Hubert, Jehoshua Eliashberg, Thomas S. Robertson. 1989. Modeling multinational diffusion patterns: An efficient methodology. Marketing Sci. 8 (Summer) 231-‐247. Golder, Peter N., Gerald J. Tellis. 1997. Will it ever fly? Modeling the takeoff of really new consumer durables. Marketing Sci. 16 (3) 256-‐270. Grubler, Arnulf. 1990. The Rise and Fall of Infrastructures: Dynamics of Evolution and Technological Change in Transport. Physica-‐Verlag, Heidelberg, Germany. Halder, Sudeep, Vithala Rao. 1998. A micro-‐analytic threshold model for the timing of the first purchase of durable goods. Appl. Econom. 30 959-‐974. Kohli, Rajeev, Donald R. Lehman, Jae Pae. 1999. Extent and impact of incubation time in new product diffusion. J. Product Innovation Management 16 (March) 134-‐144. Mansfield, Edwin. 1961. Technical change and the rate of imitation. Econometrica 29 (October) 741-‐766. Olney, Martha L. 1991. Buy Now, Pay Later: Advertising, Credit, and Consumer Durables in the 1920s. University of North Carolina Press, Chapel Hill, NC. Olshavsky, Richard W. 1980. Time and the rate of adoption of innovations J. Consumer Res. 6 (March) 425-‐428. Parket, Philip M. 1992. Price elasticity dynamics over the adoption life cycle. J. Marketing Res. 29 (August) 358-‐367. Rogers, M. Everett. 2003. Diffusion of Innovations, 5th Edition. Free Press. Trajtenberg, Manuel, Shlomo Yitzhaki. 1989. The diffusion of innovations: A methodology reappraisal. J. Bus. Economic Statist. 7 (January) 35-‐47 Van den Bulte, Christophe, Gary L. Lilien. 1997. Bias and systematic change in the parameter estimates of the macro-‐level diffusion models. Marketing Sci. 16 (4) 338-‐353 Van den Bulte, 2000. New Prodact Diffusion Acceleration: Measurement and Analysis. Marketing Sci. Vol. 19. No. 4 (Fall). 366-‐380.


