Embed Size (px)
Citation preview
Biexponential Diffusion Tensor Analysis of Human BrainDiffusion Data
Stephan E. Maier,1* Sridhar Vajapeyam,2 Hatsuho Mamata,1 Carl-Fredrik Westin,1
Ferenc A. Jolesz,1 and Robert V. Mulkern2
Several studies have shown that in tissues over an extendedrange of b-factors, the signal decay deviates significantly fromthe basic monoexponential model. The true nature of this de-parture has to date not been identified. For the current study,line scan diffusion images of brain suitable for biexponentialdiffusion tensor analysis were acquired in normal subjects on aclinical MR system. For each of six noncollinear directions, 32images with b-factors ranging from 5 to 5000 s/mm2 werecollected. Biexponential fits yielded parameter maps for a fastand a slow diffusion component. A subset of the diffusion data,consisting of the images obtained at the conventional range ofb-factors between 5 and 972 s/mm2, was used for monoexpo-nential diffusion tensor analysis. Fractional anisotropy (FA) ofthe fast-diffusion component and the monoexponential fit ex-hibited no significant difference. FA of the slow-diffusion biex-ponential component was significantly higher, particularly inareas of lower fiber density. The principal diffusion directionsfor the two biexponential components and the monoexponen-tial solution were largely the same and in agreement withknown fiber tracts. The second and third diffusion eigenvectordirections also appeared to be aligned, but they exhibited sig-nificant deviations in localized areas. Magn Reson Med 51:321–330, 2004. © 2004 Wiley-Liss, Inc.
Key words: diffusion tensor imaging; line scan; high-b diffusionimaging; white matter; biexponential signal decay
Routine diffusion imaging of the brain generally utilizesb-factors within a range of 0–1000 s/mm2. Apparent dif-fusion coefficient (ADC) maps are then generated assum-ing that the relationship between the MR signal and theb-factor is monoexponential. However, it has been shownthat for rat brain the signal decay with b-factors over anextended range of up to 10000 s/mm2 is better describedwith a biexponential curve (1). Similar findings were madefor normal human brain, using multiple b-factors of up to6000 s/mm2 (2–4).
For the conventional range of b-factors, the sensitivity ofthe ADC value to the direction of the diffusion sensitiza-tion gradient in some parts of the brain is well recognizedand attributed to anisotropic diffusion along myelinated
axons in the white matter. With this well-establishedmodel, measurement of the ADC value for six noncollineardirections suffices to yield a theoretically complete de-scription of the full diffusion tensor for each voxel sam-pled (5). One might expect that the biexponential model isreadily extended to include the diffusion tensor formal-ism. Earlier in vivo studies, which were based on theanalysis of only two or three orthogonal diffusion direc-tions, indeed revealed that directional dependence alsoapplies to each component in the biexponential model (3,6, 7). The limited number of directions sampled, however,did not permit computation of anisotropy or eigenvectordirection. To date, only estimates have been published forthe biexponential diffusion tensor in normal human brain(8). Integral biexponential diffusion tensor data analysishas been employed in animal experiments conducted atvery high magnetic field strengths [9– 11]. It can be ex-pected that the findings are strongly influenced by tissueviability and temperature, and field-strength-dependentrelaxation times, as well as by the diffusion encoding andecho times (TEs) that can be attained with a particulargradient hardware. Since diffusion tensor imaging (DTI) ismost widely employed in the human brain and on clinicalMR systems, exploration of the biexponential diffusiontensor properties under comparable experimental condi-tions is important in order to put the findings into a widerclinical context.
In the present study (12), human brain image data suit-able for biexponential diffusion tensor analysis were ac-quired in normal subjects on a clinical MR system. Foreach diffusion component, maps of anisotropy and eigen-vectors were computed. For reference purposes, a subset ofthe data was used for a conventional, monoexponentialdiffusion tensor analysis.
MATERIALS AND METHODS
MR Diffusion Imaging
Diffusion-weighted images for a wide range of b-factorswere obtained with a line scan diffusion imaging (LSDI)sequence. Details about this single-shot column samplingtechnique, which is distinguished by minimal motion sen-sitivity and reduced artifacts in areas exhibiting large vari-ations in susceptibility, have been published previously[13–15]. The LSDI sequence was implemented on a 1.5Tesla LX Echospeed whole-body system (General ElectricMedical Systems, Milwaukee, WI) with version 8.2.5 soft-ware release. This system permits a maximum gradientstrength of up to 40 mT/m. The standard birdcage headcoil was used, and neither cardiac gating nor head re-straints were employed. Four healthy male volunteers(mean age 36 years) were scanned after they provided
1Department of Radiology, Brigham and Women’s Hospital, Boston, Massa-chusetts.2Department of Radiology, Children’s Hospital, Harvard Medical School, Bos-ton, Massachusetts.Presented in part at the 9th annual meeting of ISMRM, Glasgow, Scotland,2001.Grant sponsor: NIH; Grant number: 1R01 NS39335; Grant sponsor: NATO;Grant number: LST CLG 976686.*Correspondence to: Stephan E. Maier, M.D., Ph.D., Radiology (MRI),Brigham and Women’s Hospital, Harvard Medical School, 75 Francis St.,Boston, MA 02115. E-mail: [email protected] 27 March 2003; revised 29 August 2003; accepted 30 August 2003.DOI 10.1002/mrm.10685Published online in Wiley InterScience (www.interscience.wiley.com).
Magnetic Resonance in Medicine 51:321–330 (2004)
© 2004 Wiley-Liss, Inc. 321
informed consent. All studies were conducted within theguidelines of the institutional internal review board (IRB).
Thirty-two images with linearly increasing diffusionweighting between 5 and 5000 s/mm2 were acquired foreach of six noncollinear diffusion directions ((1,1,0),(0,1,1), (1,0,1), (0,1,� 1), (1,�1,0), (�1,0,1)). The diffusion-encoding times � and � were held constant at 35 ms and47 ms, respectively. In each subject a single axial section atthe level of the lateral ventricles was scanned. Image ge-ometry was given by an effective (13) section thickness of6 mm, a rectangular field of view (FOV) of 220 � 165 mm,and a matrix size of 64 � 48 columns, interpolated to afinal image matrix of 256 � 192 with zero-filling in thefrequency domain along the frequency-encode direction,and with spline interpolation between lines. During pre-liminary experiments, it was found that for the tissues ofinterest, this image geometry together with a receiverbandwidth of �2.23 kHz produced unaveraged signalswell above the noise threshold for all combinations ofdiffusion-encoding directions and b-factors used.
The TE was 94 ms and the time interval between columnexcitations was 155 ms. This timing permitted an effective(13) repetition time (TR) of 2635 ms and a total scan timeof 27 min for a single slice and one excitation. It should beemphasized that the diffusion gradient amplitudes usedexploited only 70% of the maximal permissible gradientamplitude. Due to gradient heating limitations, the re-duced gradient amplitude permitted a considerablyshorter interval between column excitations, and ulti-mately a reduced scan time with only a modest increase inTE. With further reduction, the TR would not have beenduty cycle limited, but rather determined by the TEneeded to accommodate the imaging and diffusion-encod-ing gradients.
Data Analysis
Data analysis was performed offline on a Linux personalcomputer using software written by the authors in C pro-gramming language. A nonlinear least-squares Levenberg-Marquardt algorithm was employed for each pixel to fitbrain signal intensity decay S with diffusion-weighting bto a biexponential function of the form
S � Af exp� � Dfb� � As exp� � Dsb� [1]
where Df and Ds are the ADCs of a fast and a slow diffusioncomponent, respectively, and Af and As are their respec-tive sizes. It was assumed that both Df and Ds vary with thediffusion-encoding direction and, as in the case of mono-exponential diffusion-related signal loss, can be repre-sented as tensor components. For the component sizes Af
and As, the diffusion direction dependence is not obvious.Therefore, two fitting strategies were studied: one with andone without diffusion direction dependence of Af and As.For the approach with diffusion direction dependence, Af
and As, together with Df and Ds, were assumed to be tensorcomponents and were assessed by independent fits foreach diffusion direction. For the second approach, Af andAs were treated as constants and were obtained by a fit ofa composite decay curve generated by the geometric aver-age of the measures along the different diffusion-encoding
directions, i.e., �6S1S2S3S4S5S6 for the six directions of thetensor configuration. These were then used to determineDf and Ds in separate fits for each of the different diffusion-encoding directions. The two fitting approaches to thesignal decay Sk for each gradient direction with unit vectorgk, can be differentiated on a mathematical basis with thefollowing two equations:
Sk � gkTAfgk exp� � b�gk
TDfgk)]gkTAsgk exp[�b(gk
TDsgk)]
(unconstrained fit) [2]
Sk � Af exp� � b�gkTDfgk)]As exp� � b�gk
TDsgk)]
(constrained fit) [3]
Subsequent diagonalization produced respective eigenval-ues (1, 2, 3) and eigenvectors of each tensor. The threediffusion eigenvalues were used to compute trace ADCand the dimensionless fractional anisotropy (FA) (16) ofthe fast- and slow-diffusion components:
FA ���1 � 2�
2 � �2 � 3�2 � �1 � 3�
2
�2�12 � 2
2 � 32 [4]
Data points were only included in the fit if their signalexceeded three times the noise baseline. As already indi-cated, MRI parameters were chosen so that independentlyof the diffusion-encoding direction, the signal of all tissuesof interest was above this threshold for the entire range ofb-factors applied. The quality of the fit was judged on thebasis of the �2 error, i.e., the sum of the unweightedsquared differences between the input data points and thefunction values, evaluated at the same b-factors. The �2
error merit function may contain several local minima. Toimprove the chances of finding the global optimum of thefit function, starting values for Df and Ds were variedincrementally over a relatively wide range. Processingtime for a complete data set was on the order of minutes.
A subset of the diffusion data, consisting of the imagesobtained at the conventional range of b-factors between 5and 972 s/mm2 (i.e., seven images for each diffusion-en-coding direction) was fitted monoexponentially with thesame nonlinear least-squares Levenberg-Marquardtmethod. The resulting diffusion tensor was also diagonal-ized in order to obtain eigenvectors, eigenvalues, and theassociated FA as reliable measures of reference.
To compare directions of the principal axes of diffusionamong the two components of the biexponential fit and thesingle component of the monoexponential fit, the devia-tion angle � was determined from the eigenvectors ofinterest a and b with the expression
� � arccos�a�b) [5]
which produces � values in the range of 0–180°. Thedistribution of these deviation angles was then deter-mined. One distribution included data from all pixelswhere the FA of the diffusion determined with a monoex-ponential fit was 0.4 (i.e., mostly very dense fiber tracts,such as the corpus callosum and internal capsule). A sec-
322 Maier et al.
ond distribution included data from all pixels where themonoexponential FA was � 0.4, but than 0.2 (i.e., itincluded more peripheral white matter tracts but no graymatter). Tissues outside the brain were excluded from thedistribution by a manually drawn region of interest (ROI).
In order to describe the distribution of � analytically, apolar coordinate system is considered, where the latitudeangle follows a normal distribution and the longitude an-gle is evenly distributed. The distribution can conse-quently be described by a normal probability density func-tion adjusted by a sine function. Accordingly, the equation
f��� � sin��� � ���s
��2�exp� �
�� � ��2
2�2 � [6]
where � is the standard deviation (SD) of the normaldistribution, � is a potentially present angle bias, and s isa scaling factor that normalizes the distribution, was fittedfor a range of 0°–30° with the Levenberg-Marquardt algo-rithm to the histogram of the angle deviations.
Maps of the various parameters (i.e., trace ADC, FA, fastdiffusion component signal fraction Af/(Af As), �, and�2) were used for ROI analysis. It was confirmed thatspatial interpolation of the diffusion data, which was per-formed to facilitate the placement of ROIs, did not intro-duce any systematic errors. ROIs were manually drawnwithin the medial portion of the posterior corpus callo-sum, the left internal capsule, and the left thalamus. Thesize of the manually drawn ROIs at original scan resolu-tion was 3–5 pixels. This rather small size (in comparisonto the structures measured) was used to minimize partialvolume effects due to low resolution and possible headdisplacement during the long scan. For each particularROI, the same contour was used for all of the subjects, withrepositioning as needed. A two-sided Student’s t-test wasapplied to confirm statistically significant differences,whereby a P value of � 0.05 was considered significant.
RESULTS
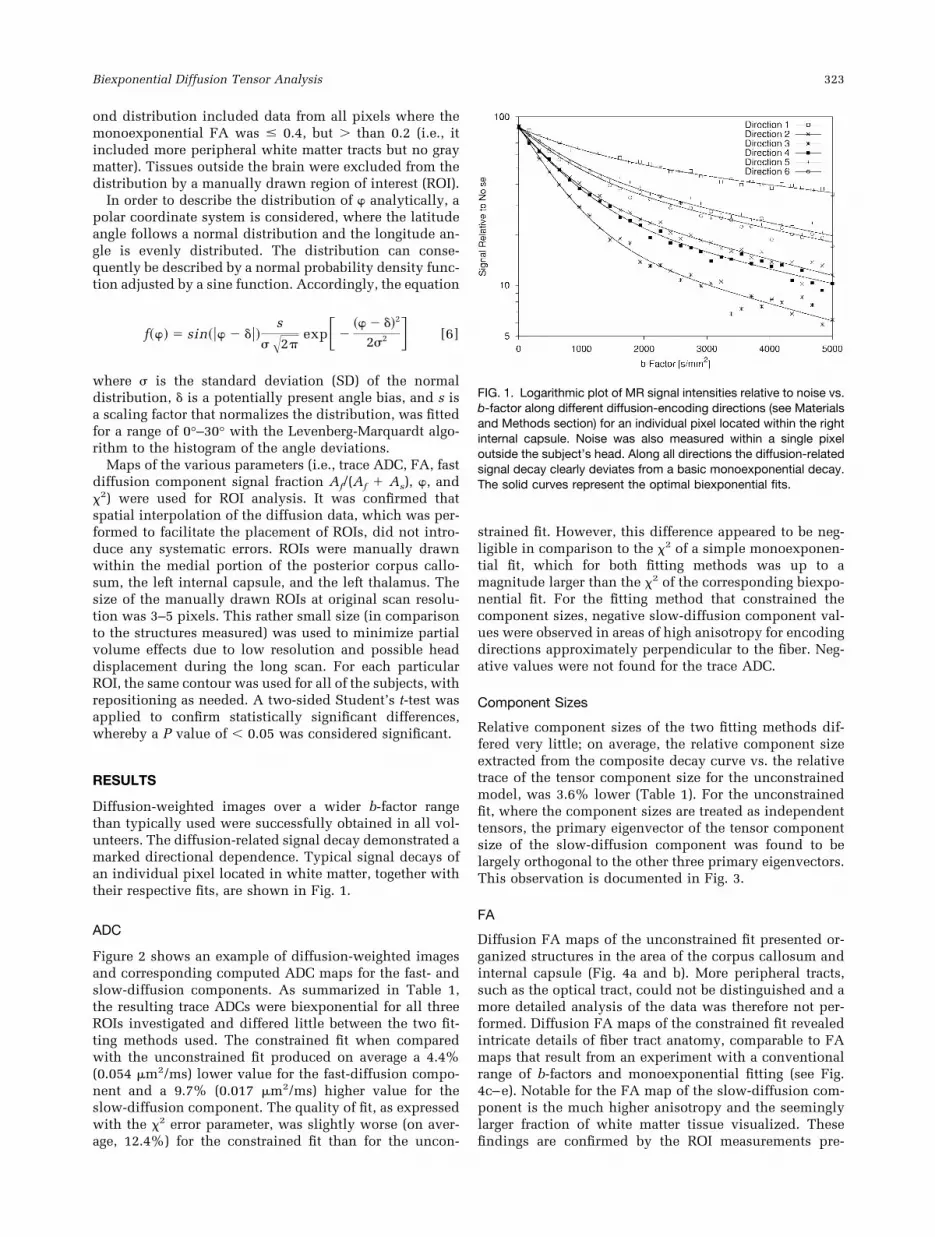
Diffusion-weighted images over a wider b-factor rangethan typically used were successfully obtained in all vol-unteers. The diffusion-related signal decay demonstrated amarked directional dependence. Typical signal decays ofan individual pixel located in white matter, together withtheir respective fits, are shown in Fig. 1.
ADC
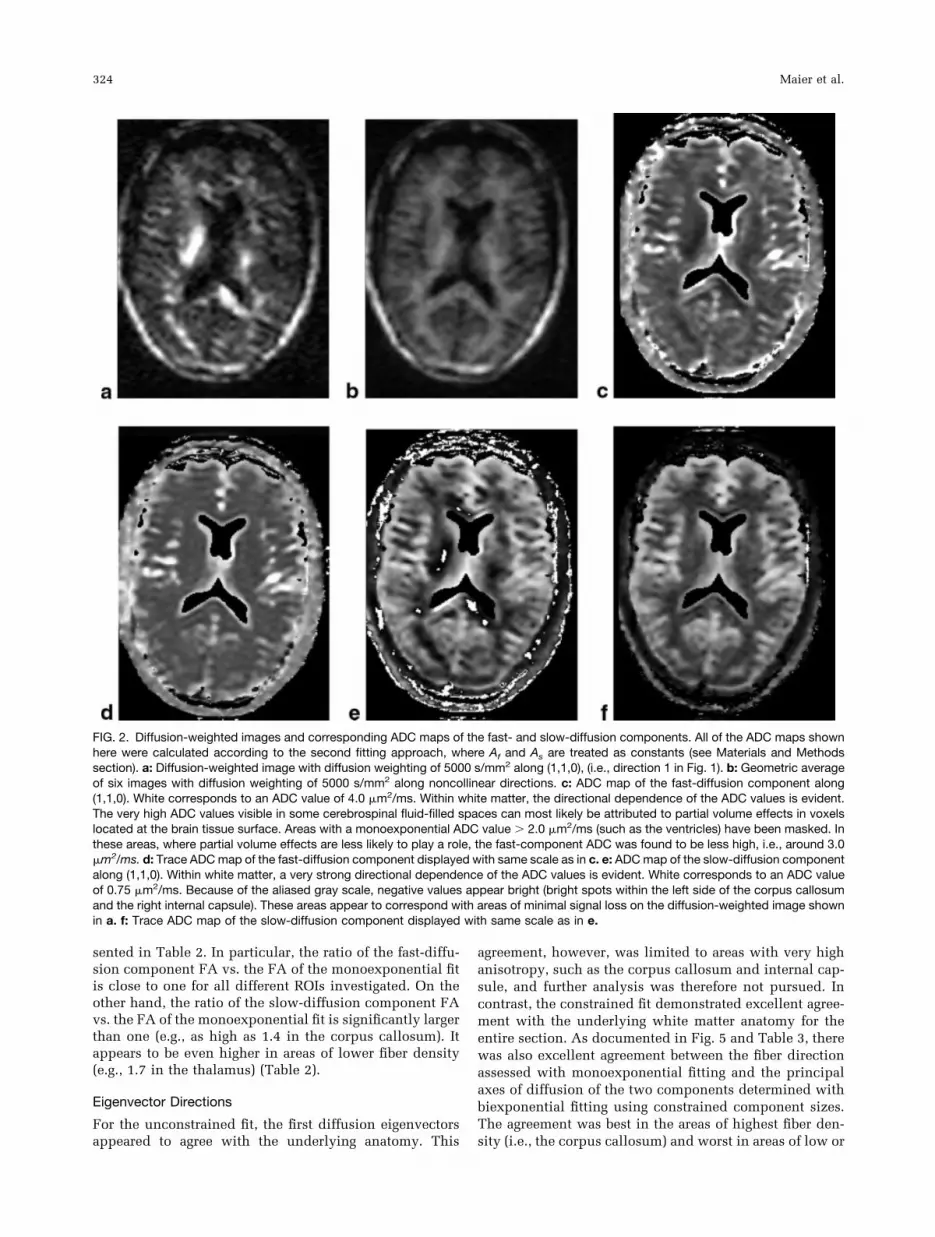
Figure 2 shows an example of diffusion-weighted imagesand corresponding computed ADC maps for the fast- andslow-diffusion components. As summarized in Table 1,the resulting trace ADCs were biexponential for all threeROIs investigated and differed little between the two fit-ting methods used. The constrained fit when comparedwith the unconstrained fit produced on average a 4.4%(0.054 �m2/ms) lower value for the fast-diffusion compo-nent and a 9.7% (0.017 �m2/ms) higher value for theslow-diffusion component. The quality of fit, as expressedwith the �2 error parameter, was slightly worse (on aver-age, 12.4%) for the constrained fit than for the uncon-
strained fit. However, this difference appeared to be neg-ligible in comparison to the �2 of a simple monoexponen-tial fit, which for both fitting methods was up to amagnitude larger than the �2 of the corresponding biexpo-nential fit. For the fitting method that constrained thecomponent sizes, negative slow-diffusion component val-ues were observed in areas of high anisotropy for encodingdirections approximately perpendicular to the fiber. Neg-ative values were not found for the trace ADC.
Component Sizes
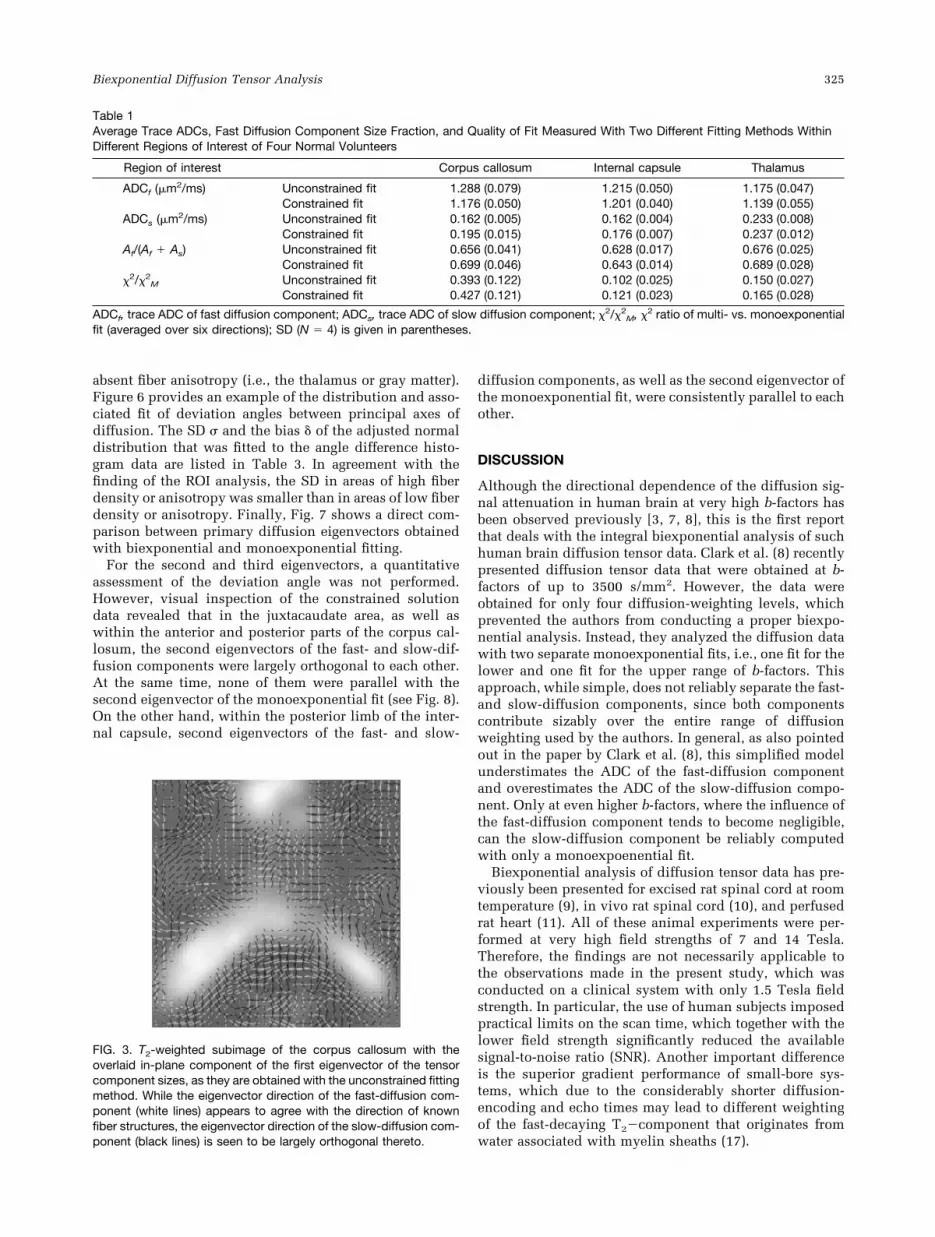
Relative component sizes of the two fitting methods dif-fered very little; on average, the relative component sizeextracted from the composite decay curve vs. the relativetrace of the tensor component size for the unconstrainedmodel, was 3.6% lower (Table 1). For the unconstrainedfit, where the component sizes are treated as independenttensors, the primary eigenvector of the tensor componentsize of the slow-diffusion component was found to belargely orthogonal to the other three primary eigenvectors.This observation is documented in Fig. 3.
FA
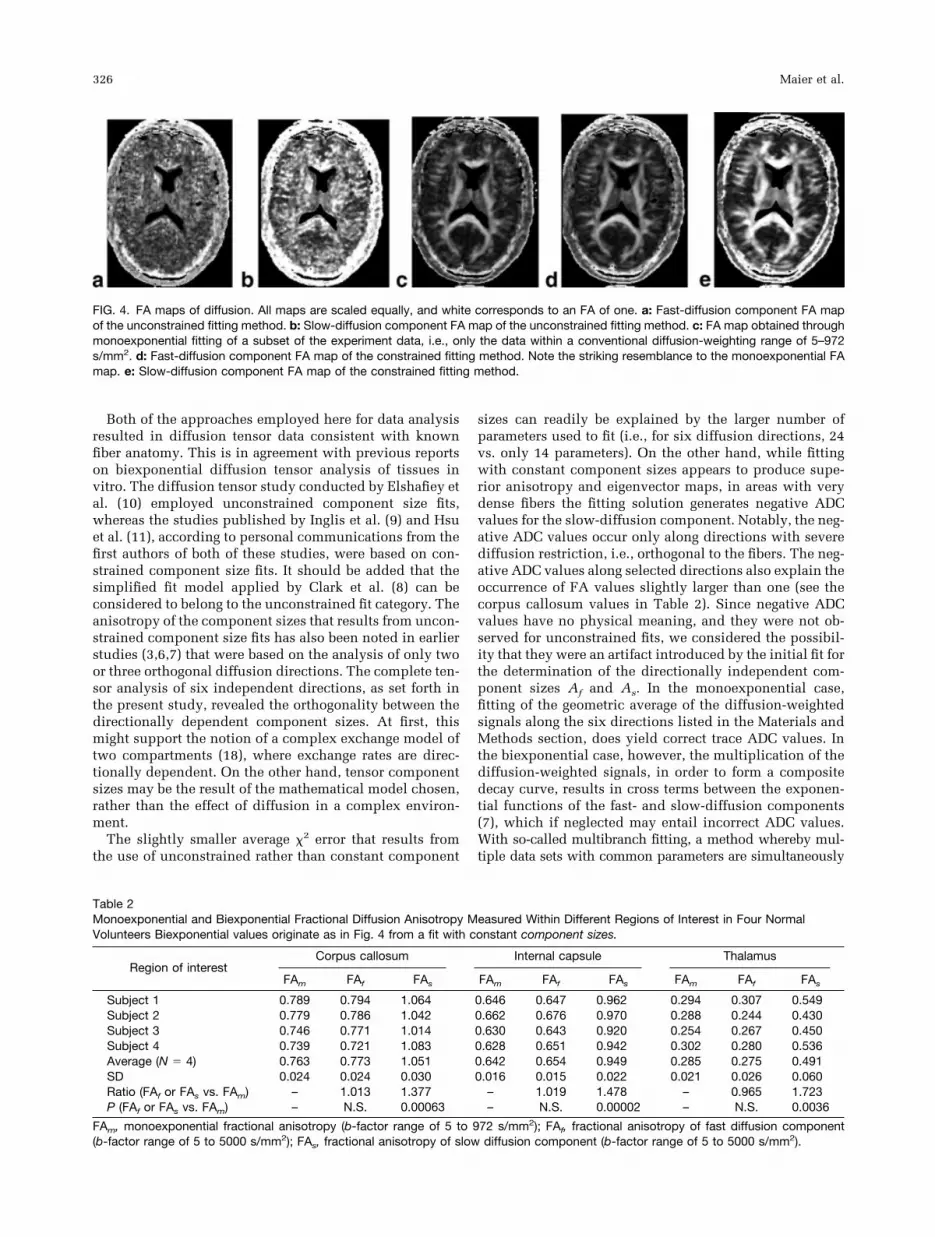
Diffusion FA maps of the unconstrained fit presented or-ganized structures in the area of the corpus callosum andinternal capsule (Fig. 4a and b). More peripheral tracts,such as the optical tract, could not be distinguished and amore detailed analysis of the data was therefore not per-formed. Diffusion FA maps of the constrained fit revealedintricate details of fiber tract anatomy, comparable to FAmaps that result from an experiment with a conventionalrange of b-factors and monoexponential fitting (see Fig.4c–e). Notable for the FA map of the slow-diffusion com-ponent is the much higher anisotropy and the seeminglylarger fraction of white matter tissue visualized. Thesefindings are confirmed by the ROI measurements pre-
FIG. 1. Logarithmic plot of MR signal intensities relative to noise vs.b-factor along different diffusion-encoding directions (see Materialsand Methods section) for an individual pixel located within the rightinternal capsule. Noise was also measured within a single pixeloutside the subject’s head. Along all directions the diffusion-relatedsignal decay clearly deviates from a basic monoexponential decay.The solid curves represent the optimal biexponential fits.
Biexponential Diffusion Tensor Analysis 323
sented in Table 2. In particular, the ratio of the fast-diffu-sion component FA vs. the FA of the monoexponential fitis close to one for all different ROIs investigated. On theother hand, the ratio of the slow-diffusion component FAvs. the FA of the monoexponential fit is significantly largerthan one (e.g., as high as 1.4 in the corpus callosum). Itappears to be even higher in areas of lower fiber density(e.g., 1.7 in the thalamus) (Table 2).
Eigenvector Directions
For the unconstrained fit, the first diffusion eigenvectorsappeared to agree with the underlying anatomy. This
agreement, however, was limited to areas with very highanisotropy, such as the corpus callosum and internal cap-sule, and further analysis was therefore not pursued. Incontrast, the constrained fit demonstrated excellent agree-ment with the underlying white matter anatomy for theentire section. As documented in Fig. 5 and Table 3, therewas also excellent agreement between the fiber directionassessed with monoexponential fitting and the principalaxes of diffusion of the two components determined withbiexponential fitting using constrained component sizes.The agreement was best in the areas of highest fiber den-sity (i.e., the corpus callosum) and worst in areas of low or
FIG. 2. Diffusion-weighted images and corresponding ADC maps of the fast- and slow-diffusion components. All of the ADC maps shownhere were calculated according to the second fitting approach, where Af and As are treated as constants (see Materials and Methodssection). a: Diffusion-weighted image with diffusion weighting of 5000 s/mm2 along (1,1,0), (i.e., direction 1 in Fig. 1). b: Geometric averageof six images with diffusion weighting of 5000 s/mm2 along noncollinear directions. c: ADC map of the fast-diffusion component along(1,1,0). White corresponds to an ADC value of 4.0 �m2/ms. Within white matter, the directional dependence of the ADC values is evident.The very high ADC values visible in some cerebrospinal fluid-filled spaces can most likely be attributed to partial volume effects in voxelslocated at the brain tissue surface. Areas with a monoexponential ADC value 2.0 �m2/ms (such as the ventricles) have been masked. Inthese areas, where partial volume effects are less likely to play a role, the fast-component ADC was found to be less high, i.e., around 3.0�m2/ms. d: Trace ADC map of the fast-diffusion component displayed with same scale as in c. e: ADC map of the slow-diffusion componentalong (1,1,0). Within white matter, a very strong directional dependence of the ADC values is evident. White corresponds to an ADC valueof 0.75 �m2/ms. Because of the aliased gray scale, negative values appear bright (bright spots within the left side of the corpus callosumand the right internal capsule). These areas appear to correspond with areas of minimal signal loss on the diffusion-weighted image shownin a. f: Trace ADC map of the slow-diffusion component displayed with same scale as in e.
324 Maier et al.
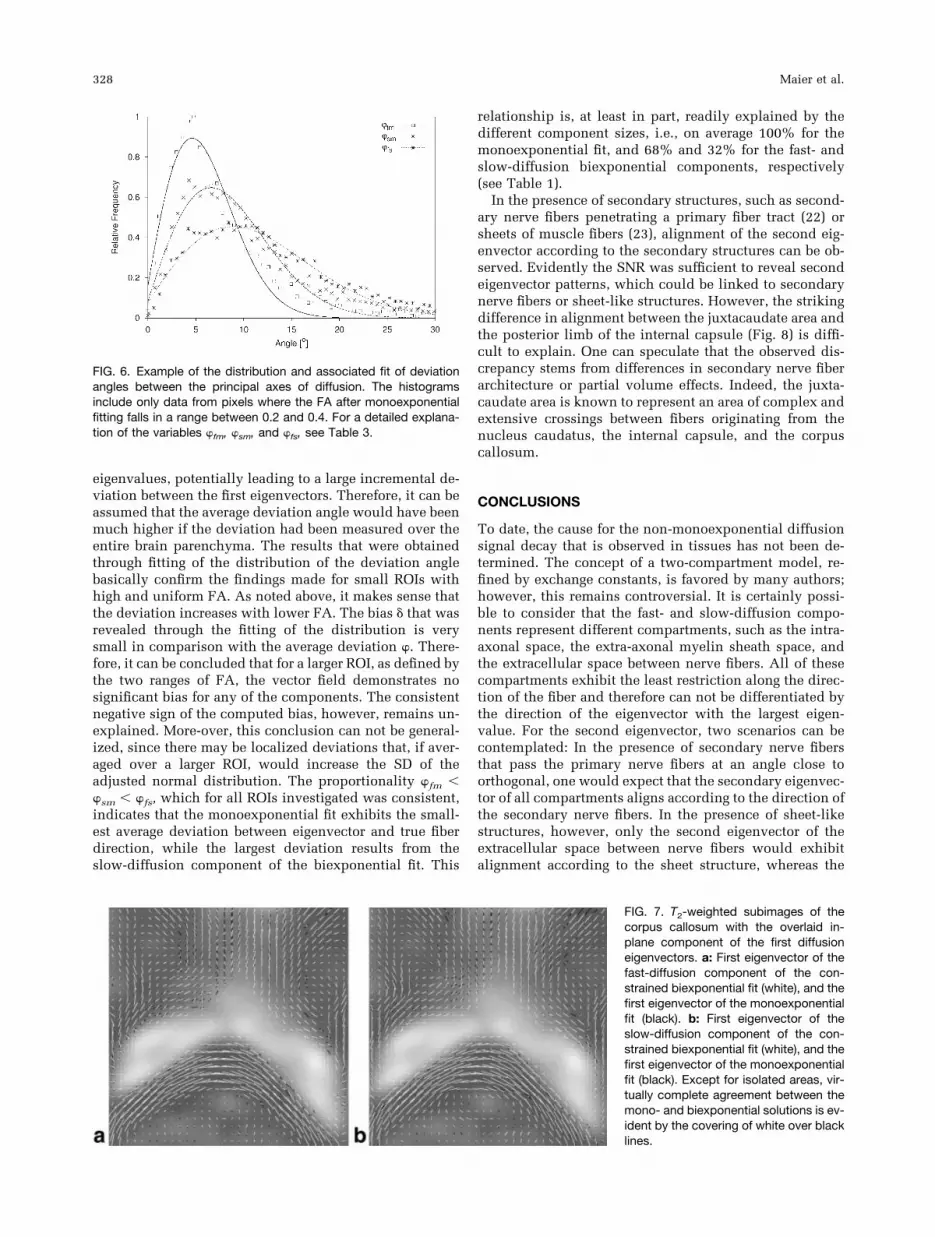
absent fiber anisotropy (i.e., the thalamus or gray matter).Figure 6 provides an example of the distribution and asso-ciated fit of deviation angles between principal axes ofdiffusion. The SD � and the bias � of the adjusted normaldistribution that was fitted to the angle difference histo-gram data are listed in Table 3. In agreement with thefinding of the ROI analysis, the SD in areas of high fiberdensity or anisotropy was smaller than in areas of low fiberdensity or anisotropy. Finally, Fig. 7 shows a direct com-parison between primary diffusion eigenvectors obtainedwith biexponential and monoexponential fitting.
For the second and third eigenvectors, a quantitativeassessment of the deviation angle was not performed.However, visual inspection of the constrained solutiondata revealed that in the juxtacaudate area, as well aswithin the anterior and posterior parts of the corpus cal-losum, the second eigenvectors of the fast- and slow-dif-fusion components were largely orthogonal to each other.At the same time, none of them were parallel with thesecond eigenvector of the monoexponential fit (see Fig. 8).On the other hand, within the posterior limb of the inter-nal capsule, second eigenvectors of the fast- and slow-
diffusion components, as well as the second eigenvector ofthe monoexponential fit, were consistently parallel to eachother.
DISCUSSION
Although the directional dependence of the diffusion sig-nal attenuation in human brain at very high b-factors hasbeen observed previously [3, 7, 8], this is the first reportthat deals with the integral biexponential analysis of suchhuman brain diffusion tensor data. Clark et al. (8) recentlypresented diffusion tensor data that were obtained at b-factors of up to 3500 s/mm2. However, the data wereobtained for only four diffusion-weighting levels, whichprevented the authors from conducting a proper biexpo-nential analysis. Instead, they analyzed the diffusion datawith two separate monoexponential fits, i.e., one fit for thelower and one fit for the upper range of b-factors. Thisapproach, while simple, does not reliably separate the fast-and slow-diffusion components, since both componentscontribute sizably over the entire range of diffusionweighting used by the authors. In general, as also pointedout in the paper by Clark et al. (8), this simplified modelunderstimates the ADC of the fast-diffusion componentand overestimates the ADC of the slow-diffusion compo-nent. Only at even higher b-factors, where the influence ofthe fast-diffusion component tends to become negligible,can the slow-diffusion component be reliably computedwith only a monoexpoenential fit.
Biexponential analysis of diffusion tensor data has pre-viously been presented for excised rat spinal cord at roomtemperature (9), in vivo rat spinal cord (10), and perfusedrat heart (11). All of these animal experiments were per-formed at very high field strengths of 7 and 14 Tesla.Therefore, the findings are not necessarily applicable tothe observations made in the present study, which wasconducted on a clinical system with only 1.5 Tesla fieldstrength. In particular, the use of human subjects imposedpractical limits on the scan time, which together with thelower field strength significantly reduced the availablesignal-to-noise ratio (SNR). Another important differenceis the superior gradient performance of small-bore sys-tems, which due to the considerably shorter diffusion-encoding and echo times may lead to different weightingof the fast-decaying T2�component that originates fromwater associated with myelin sheaths (17).
FIG. 3. T2-weighted subimage of the corpus callosum with theoverlaid in-plane component of the first eigenvector of the tensorcomponent sizes, as they are obtained with the unconstrained fittingmethod. While the eigenvector direction of the fast-diffusion com-ponent (white lines) appears to agree with the direction of knownfiber structures, the eigenvector direction of the slow-diffusion com-ponent (black lines) is seen to be largely orthogonal thereto.
Table 1Average Trace ADCs, Fast Diffusion Component Size Fraction, and Quality of Fit Measured With Two Different Fitting Methods WithinDifferent Regions of Interest of Four Normal Volunteers
Region of interest Corpus callosum Internal capsule Thalamus
ADCf (�m2/ms) Unconstrained fit 1.288 (0.079) 1.215 (0.050) 1.175 (0.047)Constrained fit 1.176 (0.050) 1.201 (0.040) 1.139 (0.055)
ADCs (�m2/ms) Unconstrained fit 0.162 (0.005) 0.162 (0.004) 0.233 (0.008)Constrained fit 0.195 (0.015) 0.176 (0.007) 0.237 (0.012)
Af/(Af As) Unconstrained fit 0.656 (0.041) 0.628 (0.017) 0.676 (0.025)Constrained fit 0.699 (0.046) 0.643 (0.014) 0.689 (0.028)
�2/�2M Unconstrained fit 0.393 (0.122) 0.102 (0.025) 0.150 (0.027)
Constrained fit 0.427 (0.121) 0.121 (0.023) 0.165 (0.028)
ADCf, trace ADC of fast diffusion component; ADCs, trace ADC of slow diffusion component; �2/�2M, �2 ratio of multi- vs. monoexponential
fit (averaged over six directions); SD (N � 4) is given in parentheses.
Biexponential Diffusion Tensor Analysis 325
Both of the approaches employed here for data analysisresulted in diffusion tensor data consistent with knownfiber anatomy. This is in agreement with previous reportson biexponential diffusion tensor analysis of tissues invitro. The diffusion tensor study conducted by Elshafiey etal. (10) employed unconstrained component size fits,whereas the studies published by Inglis et al. (9) and Hsuet al. (11), according to personal communications from thefirst authors of both of these studies, were based on con-strained component size fits. It should be added that thesimplified fit model applied by Clark et al. (8) can beconsidered to belong to the unconstrained fit category. Theanisotropy of the component sizes that results from uncon-strained component size fits has also been noted in earlierstudies (3,6,7) that were based on the analysis of only twoor three orthogonal diffusion directions. The complete ten-sor analysis of six independent directions, as set forth inthe present study, revealed the orthogonality between thedirectionally dependent component sizes. At first, thismight support the notion of a complex exchange model oftwo compartments (18), where exchange rates are direc-tionally dependent. On the other hand, tensor componentsizes may be the result of the mathematical model chosen,rather than the effect of diffusion in a complex environ-ment.
The slightly smaller average �2 error that results fromthe use of unconstrained rather than constant component
sizes can readily be explained by the larger number ofparameters used to fit (i.e., for six diffusion directions, 24vs. only 14 parameters). On the other hand, while fittingwith constant component sizes appears to produce supe-rior anisotropy and eigenvector maps, in areas with verydense fibers the fitting solution generates negative ADCvalues for the slow-diffusion component. Notably, the neg-ative ADC values occur only along directions with severediffusion restriction, i.e., orthogonal to the fibers. The neg-ative ADC values along selected directions also explain theoccurrence of FA values slightly larger than one (see thecorpus callosum values in Table 2). Since negative ADCvalues have no physical meaning, and they were not ob-served for unconstrained fits, we considered the possibil-ity that they were an artifact introduced by the initial fit forthe determination of the directionally independent com-ponent sizes Af and As. In the monoexponential case,fitting of the geometric average of the diffusion-weightedsignals along the six directions listed in the Materials andMethods section, does yield correct trace ADC values. Inthe biexponential case, however, the multiplication of thediffusion-weighted signals, in order to form a compositedecay curve, results in cross terms between the exponen-tial functions of the fast- and slow-diffusion components(7), which if neglected may entail incorrect ADC values.With so-called multibranch fitting, a method whereby mul-tiple data sets with common parameters are simultaneously
Table 2Monoexponential and Biexponential Fractional Diffusion Anisotropy Measured Within Different Regions of Interest in Four NormalVolunteers Biexponential values originate as in Fig. 4 from a fit with constant component sizes.
Region of interestCorpus callosum Internal capsule Thalamus
FAm FAf FAs FAm FAf FAs FAm FAf FAs
Subject 1 0.789 0.794 1.064 0.646 0.647 0.962 0.294 0.307 0.549Subject 2 0.779 0.786 1.042 0.662 0.676 0.970 0.288 0.244 0.430Subject 3 0.746 0.771 1.014 0.630 0.643 0.920 0.254 0.267 0.450Subject 4 0.739 0.721 1.083 0.628 0.651 0.942 0.302 0.280 0.536Average (N � 4) 0.763 0.773 1.051 0.642 0.654 0.949 0.285 0.275 0.491SD 0.024 0.024 0.030 0.016 0.015 0.022 0.021 0.026 0.060Ratio (FAf or FAs vs. FAm) – 1.013 1.377 – 1.019 1.478 – 0.965 1.723P (FAf or FAs vs. FAm) – N.S. 0.00063 – N.S. 0.00002 – N.S. 0.0036
FAm, monoexponential fractional anisotropy (b-factor range of 5 to 972 s/mm2); FAf, fractional anisotropy of fast diffusion component(b-factor range of 5 to 5000 s/mm2); FAs, fractional anisotropy of slow diffusion component (b-factor range of 5 to 5000 s/mm2).
FIG. 4. FA maps of diffusion. All maps are scaled equally, and white corresponds to an FA of one. a: Fast-diffusion component FA mapof the unconstrained fitting method. b: Slow-diffusion component FA map of the unconstrained fitting method. c: FA map obtained throughmonoexponential fitting of a subset of the experiment data, i.e., only the data within a conventional diffusion-weighting range of 5–972s/mm2. d: Fast-diffusion component FA map of the constrained fitting method. Note the striking resemblance to the monoexponential FAmap. e: Slow-diffusion component FA map of the constrained fitting method.
326 Maier et al.

fitted by minimizing the total �2 error, all parameters can beobtained within a single fit. To verify the validity of theapproach used in this study, multibranch fitting was con-ducted with the Gnuplot software (http://www.gnuplot.info)for average signals of an ROI, located in the corpus callo-sum, where ADC values appeared to be negative. For thediffusion-encoding direction that produced negative val-ues, the average ADC of the slow-diffusion component was�0.078 �m2/ms when component sizes and ADCs werefitted separately, but it was �0.074 �m2/ms when compo-nent sizes and ADCs were fitted jointly in a multibranchfit. The differences for the other parameters were equallyminor, which seems to support the validity of the ap-proach with separate fitting of component sizes and ADCs.
An interesting finding is the agreement of the FA of thefast-diffusion component and the FA of a monoexponen-tial fit of data obtained within the conventional b-factorrange below 1000 s/mm2. Also remarkable is the higher FAof the slow-diffusion component. The fact that in moreperipheral regions with lower FA, the ratio of FAs/FAf
increases indicates that the first eigenvector of the slow-diffusion component may permit more detailed and accu-rate fiber tracking in areas where FA is low, such as insubcortical areas or deep gray matter.
This is the first study to quantitatively compare thedirections of the biexponential diffusion eigenvectors innormal human brain. In contrast, to a previous study inheart muscle by Hsu et al. (11), we found that the firsteigenvectors of the fast- and slow-diffusion componentsshare the same direction. In addition, we confirmed thatthis common direction coincides with the direction of thefirst eigenvector that results from a monoexponential fit ofdata obtained within the conventional b-factor range be-low 1000 s/mm2. Earlier studies of canine (19) and rabbit(20) heart myocardium, and rat optical tract (21), whichused histology or direct tract visualization on MR images,validated the agreement between fiber course and primarydiffusion direction derived from a monoexponential fit.The study by Hsu et al. (11) measured the average angledeviation between the first eigenvectors of the two com-ponents for the entire heart section, whereas in the currentstudy the average angle deviation was only assessed forsmall ROIs with high FA or for pixels where the mo-noexponential FA fell within a certain range. The FAvalues 0.2 and 0.4 used to define the range limits wouldconstitute cylindric diffusion with eigenvalue ratios of1.4/1.0/1.0 and 2.0/1.0/1.0, respectively. Obviously, atlower FA values, noise begins to dominate the sorting of
FIG. 5. Angle difference maps of the principal axes of diffusion among the two diffusion components of the biexponential fit, and the singlecomponent of the monoexponential fit. The eigenvectors for the fast- and slow-diffusion components are derived from a biexponential fit withdirectionally independent component sizes. For the monoexponential fit, a subset of data, obtained within a limited b-factor range of 5–972s/mm2, was employed. For improved visualization, deviation angles � of 90°–180° were set to the value 180° - �, and consequently images arescaled from 0° (black) to 90° (white). a: Difference between fast and monoexponential components. b: Difference between slow and monoex-ponential components. c: Difference between fast- and slow-diffusion components.
Table 3Angle Differences of the Principal Axes of Diffusion Among the Fast and Slow Components of the Biexponential Fit With ConstrainedComponent Sizes and the Single Component of the Monoexponential Fit
Region of interest �fm (°) �sm (°) �fs (°)
Corpus callosum 1.9 (0.2) 3.0 (0.7) 3.7 (1.0)Internal capsule 1.9 (0.6) 3.2 (0.3) 4.2 (0.6)Thalamus 8.9 (1.0) 12.3 (2.8) 16.3 (4.3)� (0.4 � FAm) 2.5 (0.2) 4.1 (0.4) 4.9 (0.6)� (0.2 � FAm � � 0.4) 5.6 (0.6) 7.6 (0.7) 9.2 (1.0)� (0.4 � FAm) �0.3 (0.1) �0.4 (0.3) �0.7 (0.3)� (0.2 � FAm � � 0.4) �0.7 (0.2) �0.7 (0.3) �0.8 (0.3)
�fm, angle between fast and monoexponential component; �sm, angle between slow and monoexponential component; �fs, angle betweenfast and slow component; �, SD of adjusted normal distribution; �, bias of adjusted normal distribution; FAm, monoexponential fractionalanisotropy (b-factor range of 5 to 972 s/mm2); SD (N � 4) is given in parentheses.
Biexponential Diffusion Tensor Analysis 327
eigenvalues, potentially leading to a large incremental de-viation between the first eigenvectors. Therefore, it can beassumed that the average deviation angle would have beenmuch higher if the deviation had been measured over theentire brain parenchyma. The results that were obtainedthrough fitting of the distribution of the deviation anglebasically confirm the findings made for small ROIs withhigh and uniform FA. As noted above, it makes sense thatthe deviation increases with lower FA. The bias � that wasrevealed through the fitting of the distribution is verysmall in comparison with the average deviation �. There-fore, it can be concluded that for a larger ROI, as defined bythe two ranges of FA, the vector field demonstrates nosignificant bias for any of the components. The consistentnegative sign of the computed bias, however, remains un-explained. More-over, this conclusion can not be general-ized, since there may be localized deviations that, if aver-aged over a larger ROI, would increase the SD of theadjusted normal distribution. The proportionality �fm ��sm � �fs, which for all ROIs investigated was consistent,indicates that the monoexponential fit exhibits the small-est average deviation between eigenvector and true fiberdirection, while the largest deviation results from theslow-diffusion component of the biexponential fit. This
relationship is, at least in part, readily explained by thedifferent component sizes, i.e., on average 100% for themonoexponential fit, and 68% and 32% for the fast- andslow-diffusion biexponential components, respectively(see Table 1).
In the presence of secondary structures, such as second-ary nerve fibers penetrating a primary fiber tract (22) orsheets of muscle fibers (23), alignment of the second eig-envector according to the secondary structures can be ob-served. Evidently the SNR was sufficient to reveal secondeigenvector patterns, which could be linked to secondarynerve fibers or sheet-like structures. However, the strikingdifference in alignment between the juxtacaudate area andthe posterior limb of the internal capsule (Fig. 8) is diffi-cult to explain. One can speculate that the observed dis-crepancy stems from differences in secondary nerve fiberarchitecture or partial volume effects. Indeed, the juxta-caudate area is known to represent an area of complex andextensive crossings between fibers originating from thenucleus caudatus, the internal capsule, and the corpuscallosum.
CONCLUSIONS
To date, the cause for the non-monoexponential diffusionsignal decay that is observed in tissues has not been de-termined. The concept of a two-compartment model, re-fined by exchange constants, is favored by many authors;however, this remains controversial. It is certainly possi-ble to consider that the fast- and slow-diffusion compo-nents represent different compartments, such as the intra-axonal space, the extra-axonal myelin sheath space, andthe extracellular space between nerve fibers. All of thesecompartments exhibit the least restriction along the direc-tion of the fiber and therefore can not be differentiated bythe direction of the eigenvector with the largest eigen-value. For the second eigenvector, two scenarios can becontemplated: In the presence of secondary nerve fibersthat pass the primary nerve fibers at an angle close toorthogonal, one would expect that the secondary eigenvec-tor of all compartments aligns according to the direction ofthe secondary nerve fibers. In the presence of sheet-likestructures, however, only the second eigenvector of theextracellular space between nerve fibers would exhibitalignment according to the sheet structure, whereas the
FIG. 6. Example of the distribution and associated fit of deviationangles between the principal axes of diffusion. The histogramsinclude only data from pixels where the FA after monoexponentialfitting falls in a range between 0.2 and 0.4. For a detailed explana-tion of the variables �fm, �sm, and �fs, see Table 3.
FIG. 7. T2-weighted subimages of thecorpus callosum with the overlaid in-plane component of the first diffusioneigenvectors. a: First eigenvector of thefast-diffusion component of the con-strained biexponential fit (white), and thefirst eigenvector of the monoexponentialfit (black). b: First eigenvector of theslow-diffusion component of the con-strained biexponential fit (white), and thefirst eigenvector of the monoexponentialfit (black). Except for isolated areas, vir-tually complete agreement between themono- and biexponential solutions is ev-ident by the covering of white over blacklines.
328 Maier et al.

second eigenvector of the extra-axonal myelin sheathspace and the intra-axonal space, in accordance with thecylindrical symmetry of the restriction, would point inrandom directions. The alignment of the first eigenvectorsis well corroborated by the present results. In itself, how-ever, it is not sufficient to prove a connection betweenobserved diffusion components and different compart-ments at the cellular level. An assessment of the secondeigenvector direction was not among the initial aims of thepresent study, and the findings made at this point must beconsidered preliminary.
In the first study on biexponential analysis of high b-factor diffusion-weighted signals (1), it was pointed outthat the assignment of the components to the extra-andintracellular space based on their diffusion constants leadsto relative component sizes that are inconsistent with therespective compartment sizes. Moreover, other studieshave found that the two magnetization pools can not bedifferentiated by T1 relaxation (24), T2 relaxation (3), ormagnetization transfer (25). These findings do not supportthe notion of a multicompartment model, unless moderateexchange between the two magnetization pools is assumed(2, 24). A theoretical paper by Sukstanskii and Yablonskiy(26) proposed that the deviation from a pure monoexpo-nential signal decay may be due to restricted diffusionwithin a single compartment. However, findings derivedfrom simplified mathematical models may not neccessar-ily be suitable for describing the diffusion tensor in a nervefiber tract.
The potential clinical value of high-b diffusion-weighted imaging has already been demonstrated in tu-mors (27–29) and multiple sclerosis (30). While applica-tions for other pathologies are likely to follow, a betterunderstanding and modeling of the underlying biophysicsof multiexponential diffusion signal decay will be criticalshould the technique begin to play a significant role indiagnosis and therapy monitoring. This will also be im-portant in order to define a mathematical model that is freeof inconsistencies, some of which were revealed in thisstudy.
ACKNOWLEDGMENT
S.E.M. greatly appreciates the valuable discussions withSpyros Kollias about human brain nerve fiber anatomy.
REFERENCES
1. Niendorf T, Dijkhuizen RM, Norris DG, van Lookeren Campagne M,Nicolay K. Biexponential diffusion attenuation in various states ofbrain tissue: implications for diffusion-weighted imaging. Magn ResonMed 1996;36:847–857.
2. Mulkern RV, Gudbjartsson H, Westin CF, Zengingonul HP, Gartner W,Guttmann CR, Robertson R, Kyriakos W, Schwartz R, Holtzman D,Jolesz FA, Maier SE. Multi-component apparent diffusion coefficientsin human brain. NMR Biomed 1999;12:51–62.
3. Clark CA, Le Bihan D. Water diffusion compartmentation and anisot-ropy at high b values in the human brain. Magn Reson Med 2000;44:852–859.
4. Maier SE, Mamata H, Mulkern RV. Biexponential analysis of diffusionrelated signal decay in human cortical grey matter. In: Proceedings ofthe 11th Annual Meeting of ISMRM, Toronto, Canada, 2003.
5. Basser P, Mattiello J, Le Bihan D. MR diffusion tensor spectroscopy andimaging. Biophys J 1994;66:259–267.
6. Assaf Y, Cohen Y. Assignment of the water slow-diffusing componentin the central nervous system using q-space diffusion MRS: implica-tions for fiber tract imaging. Magn Reson Med 2000;43:191–199.
7. Mulkern RV, Vajapeyam S, Robertson RL, Caruso PA, Rivkin MJ, MaierSE. Biexponential apparent diffusion coefficient parametrization inadult vs newborn brain. Magn Reson Imaging 2001;19:659–668.
8. Clark CA, Hedehus M, Moseley ME. In vivo mapping of the fast andslow diffusion tensors in human brain. Magn Reson Med 2002;47:623–628.
9. Inglis BA, Bossart EL, Buckley DL, Wirth ED 3rd, Mareci TH. Visual-ization of neural tissue water compartments using biexponential diffu-sion tensor MRI. Magn Reson Med 2001;45:580–587.
10. Elshafiey I, Bilgen M, He R, Narayana PA. In vivo diffusion tensorimaging of rat spinal cord at 7 T. Magn Reson Imaging 2002;20:243–247.
11. Hsu EW, Buckley DL, Bui JD, Blackband SJ, Forder JR. Two-componentdiffusion tensor MRI of isolated perfused hearts. Magn Reson Med2001;45:1039–1045.
12. Maier S, Vajapeyam S, Mamata H, Westin CF, Jolesz FA, Mulkern RV.Diffusion tensor imaging of the fast and slow diffusion coefficientcomponents in human brain. In: Proceedings of the 9th Annual Meet-ing of ISMRM, Glasgow, Scotland, 2001.
13. Gudbjartsson H, Maier SE, Mulkern RV, Morocz IA, Patz S, Jolesz FA.Line scan diffusion imaging. Magn Reson Med 1996;36:509–519.
14. Maier SE, Gudbjartsson H, Patz S, Hsu L, Lovblad KO, Edelman RR,Warach S, Jolesz FA. Line scan diffusion imaging: characterization inhealthy subjects and stroke patients. AJR Am J Roentgenol 1998;17:85–93.
15. Mamata H, Mamata Y, Westin CF, Shenton ME, Kikinis R, Jolesz FA,Maier SE. High-resolution line scan diffusion tensor MRI of whitematter fiber tract anatomy. AJNR Am J Neuroradiol 2002;23:67–75.
16. Papadakis NG, Xing D, Houston GC, Smith JM, Smith MI, James MF,Parsons AA, Huang CL, Hall LD, Carpenter TA. A study of rotationallyinvariant and symmetric indices of diffusion anisotropy. Magn ResonImaging 1999;17:881–892.
FIG. 8. T2-weighted subimages of deep brain structuressurrounding the ventricles overlaid with the second diffusioneigenvectors scaled in length by the monoexponential FAvalue. The in-plane component of the second diffusion eig-envector is represented by black lines, and the out-of-planecomponent is indicated by white discs that are scaled in sizeaccording to the length of the out-of-plane component. Theopen arrowheads point to the left and right juxtacaudateareas, where fibers originating from the nucleus caudatus,the internal capsule, and the corpus callosum cross. Thefilled arrowheads designate the left and right posterior limbsof the internal capsule. a: Second eigenvector of the fast-diffusion component. b: Second eigenvector of the slow-diffusion component. Note the agreement between the fast-and slow-diffusion eigenvector directions in the posteriorlimb of the internal capsule, and the profound deviation inthe anterior limb of the internal capsule.
Biexponential Diffusion Tensor Analysis 329

17. MacKay A, Whittall K, Adler J, Li D, Paty D, Graeb D. In vivo visual-ization of myelin water in brain by magnetic resonance. Magn ResonMed 1994;31:673–677.
18. Karger J, Pfeiffer H, Heink W. Principles and applications of self-diffusion measurements by NMR. Adv Magn Reson 1988;12:1–89.
19. Hsu EW, Muzikant AL, Matulevicius SA, Penland RC, Henriquez CS.Magnetic resonance myocardial fiber-orientation mapping with directhistological correlation. Am J Physiol 1998;274(5 Pt 2):H1627–H1634.
20. Scollan DF, Holmes A, Winslow R, Forder J. Histological validation ofmyocardial microstructure obtained from diffusion tensor magneticresonance imaging. Am J Physiol 1998;275(6 Pt 2):H2308–H2318.
21. Lin CP, Tseng WY, Cheng HC, Chen JH. Validation of diffusion tensormagnetic resonance axonal fiber imaging with registered manganese-enhanced optic tracts. Neuroimage 2001;14:1035–1047.
22. Mamata H, Westin CF, De Girolami U, Jolesz FA, Maier SE. Visualiza-tion of collateral nerve fibers of human cervical spinal cord: directhistologic validation of diffusion tensor imaging. In: Proceedings of the10th Annual Meeting of ISMRM, Honolulu, 2002.
23. Tseng WY, Wedeen VJ, Reese TG, Smith RN, Halpern EF. Diffusiontensor MRI of myocardial fibers and sheets: correspondence with visi-ble cut-face texture. J Magn Reson Imaging 2003;17:31–42.
24. Mulkern RV, Zengingonul HP, Robertson RL, Bogner P, GudbjartssonH, Guttmann CR, Holtzman D, Kyriakos W, Jolesz FA, Maier SE. Multi-
component apparent diffusion coefficients in human brain: relation-ship to spin-lattice relaxation. Magn Reson Med 2000;44:292–300.
25. Mulkern RV, Vajapeyam S, Maier SE. Magnetization transfer studies ofthe fast and slow apparent diffusion coefficient (ADC) components inthe human brain. In: Proceedings of the 9th Annual Meeting of ISMRM,Glasgow, Scotland, 2001.
26. Sukstanskii A, Yablonskiy D. Effects of restricted diffusion on MRsignal formation. J Magn Reson 2002;157:92–105.
27. Maier SE, Bogner P, Bajzik G, Mamata H, Mamata Y, Repa I, Jolesz FA,Mulkern RV. Normal brain and brain tumor: multicomponent apparentdiffusion coefficient line scan imaging. Radiology 2001;219:842–849.
28. Maier SE, Mamata H, Mulkern RV. Characterization of normal brainand brain tumor pathology by chi squares parameter maps of diffusion-weighted image data. Eur J Radiol 2003;45:199–207.
29. Mardor Y, Pfeffer R, Spiegelmann R, Roth Y, Maier SE, Nissim O,Berger R, Glicksman A, Baram J, Orenstein A, Cohen JS, Tichler T.Early detection of response to radiation therapy in patients with brainmalignancies using conventional and high b-value diffusion weightedMRI. J Clin Oncol 2003;21:1094–1100.
30. Assaf Y, Ben-Bashat D, Chapman J, Peled S, Biton IE, Kafri M, Segev Y,Hendler T, Korczyn AD, Graif M, Cohen Y. High b-value q-spaceanalyzed diffusion-weighted MRI: application to multiple sclerosis.Magn Reson Med 2002;47:115–126.
330 Maier et al.


