Embed Size (px)
Citation preview

j o u r n a l o f MEMBRANE
SCIENCE
E L S E V I E R Journal of Membrane Science 99 (1995) 77-88
Modelling the effects of particle polydispersity in crossflow filtration
Greg Foley 1,*, Dermot M. Malone, Frank MacLoughlin Department of Chemical Engineering, University College, Dublin, Belfield, Dublin 4, Ireland
Received 24 May 1994; accepted in revised form 6 September 1994
Abstract
A mathematical model of crossflow filtration which accounts for particle polydispersity is developed. The model combines classical filtration theory with the concept of the cut-off particle diameter (i.e., the diameter below which particles will deposit on the membrane), to yield a single differential equation for the filter cake thickness as a function of time. Using an analysis of the hydrodynamic forces acting on a depositing particle, the cut-off diameter is expressed as a function of cake thickness. The differential equation is then solved numerically by considering the cake to be incompressible and to be composed of discrete layers of different average particle size, the average particle size being greatest in the layer adjacent to the membrane, and lowest in the outermost layer. Steady state is shown to be attained when the fraction of suspension particles which are below the cut- off diameter, approaches zero. It is demonstrated that the steady state filtrate flux increases with transmembrane pressure and crossflow velocity, and decreases with increasing membrane resistance. The average specific cake resistance is found to increase with membrane resistance and crossflow velocity (due to deposition of smaller particles), but to decrease with increasing transmembrane pressure (due to deposition of larger particles). Thus, the particle polydispersity effects modelled here cannot explain experimental observations of fluxes which decrease with increasing crossflow velocity, because the decrease in cake- height more than compensates for the increase in specific cake resistance.
Keywords: Microfiltration; Modelling; Cake formation; Polydispersity; Specific resistance
1. Introduction
Particle polydispersi ty is generally assumed to be responsible for a number of anomalous effects in cross- flow filtration. Examples of these include the tendency for the specific cake resistance to increase with increas- ing crossflow velocity [1,2] , to exhibit a minimum with respect to transmembrane pressure [ 1,3 ] and to increase with increasing membrane resistance [3] . Another, more dramatic effect, is the phenomenon
* Corresponding author. I Current address: School of Biological Sciences, Dublin City
University, Dublin 9, Ireland.
0376-7388/95/$09.50 © 1995 Elsevier Science B.V. All rights reserved SSDIO376-7388(94)OO207-X
whereby the transmembrane flux can decrease as the crossflow velocity is increased [4 -6 ] .
Previous theoretical work [ 1,2,7] has suggested that these effects may be due to preferential deposition of the smaller particles in a polydisperse suspension. By analysing the forces acting on a depositing particle, it has been shown that for given operating conditions, there exists a cut-off particle diameter below which particles will deposit on the membrane. Since it is well established that the specific resistance of a filter cake increases with decreasing particle size, the concept of a cut-off diameter can be shown to provide a qualitative explanation for the anomalous effects described in the
78 G. Foley et al. / Journal of Membrane Science 99 (1995) 77-88
previous paragraph. Experimental support for the exis- tence of the cut-off diameter can be found in a number of studies which confirm that the average particle size in crossflow filter cakes is less than the bulk suspension average [ 1,2,4,6,8].
The model of Dharmappa et al. [9] is the most detailed description of crossflow filtration which explicitly takes account of the effects of particle poly- dispersity. However, their work is semi-empirical in that the cake thickness is assumed to increase with time in an exponential manner. In this paper, a new model is developed which does not make this arbitrary assumption. The model differs from that of Dharmappa et al. [9] in a number of other respects. Firstly, they assumed that cake accumulation is limited by size- dependent transport of particles normal to, and away from, the membrane. The mechanism of this transport is assumed to be a combination of inertial lift, Brownian motion and shear-induced diffusion. In the model pre- sented in this paper, it is the tangential force acting on depositing particles which is assumed to limit cake formation. This is consistent with the flow visualisation observations of Yung et al. [ 10] and Mackley and Sherman [5]. Secondly, Dharmappaet al. [9] treat the filter cake as being well-mixed, its properties being determined by the average concentration of particles of different sizes within the cake. This approach is in contrast to the model presented below where the cake is assumed to have a stratified structure, with the aver- age particle size highest at the membrane and lowest at the cake surface.
The new approach to modelling size-dependent par- ticle deposition is developed in the next section. In subsequent sections, the effects of various process par- ameters on the cake thickness, flux and average specific resistance are examined. Of particular interest is whether particle polydispersity alone can explain data in which the transmembrane flux is found to decrease with increasing crossflow velocity.
2. Theory
The basic approach used in this analysis employs a combination of classical filtration theory and an anal- ysis of the forces acting on a single particle as it deposits on a layer of previously deposited particles.
The mass balance for the process of particle depo- sition can be written, for 4'0 << 4'c, in the form [5]
d6 4'0 - - = - - J f (1) dt 4'~
where 8 is the length-averaged cake thickness at time, t, J is the length-averaged flux at time, t, 4'0 is the bulk particle volume fraction and 4'c is the particle volume fraction in the cake. Throughout this analysis, 4'c is taken to be constant and uniform throughout the cake, i.e., the cake is assumed to be incompressible. The parameter,f, is the fraction (on a volume basis) of bulk suspension particles which have a diameter less than or equal to the cut-off value. Calculation of the cut-off diameter (and hence f) requires consideration of the forces acting on a particle as it deposits on the membrane (or cake). In this paper, hydrodynamic forces only will be considered. Other forces such as those of an adhesive nature (which are present with flocculating strains of yeast or bacteria) would obvi- ously need to be considered in a more general formu- lation of the problem.
Sherwood [ 11 ] has considered the case of a particle in contact with a 'clean' membrane whose thickness is much greater than the particle diameter. It was shown that the normal fluid drag, FN, 'pulling' the particle towards the membrane is given by
FN = kp.Jdp/3 - 2/5 ( 2 )
where k is a numerical constant,/~ is the filtrate viscos- ity, dp is the particle diameter and/3 is defined by the expression
/3= ~la~p (3)
The membrane permeability, K, is defined by the equa- tion
KAP J = - - (4) uZM
where LM is the membrane thickness and Ap is the average transmembrane pressure. It is assumed throughout this paper that the membrane permeability is constant. This may be incorrect in biological systems where molecular components in the suspension can cause membrane fouling.
A particle which has been deposited on the membrane will also be subjected to a tangential drag force, Ft, given by

G. Foley et al. / Journal of Membrane Science 99 (1995) 77--88 79
Ft= ~'d 2 (5)
where ris the average hydrodynamic shear stress acting on the particle.
The critical force balance for a particle which has deposited on the membrane is written
Ft = p-fFN (6)
where/~f is the coefficient of friction between the par- ticle and the membrane. Writing Eq. (6) in full gives
rd 2 = ktzlxeldpfl - 2/5 (7)
Before Eq. (7) can be solved for the cut-off diameter, dp, it must be generalised somewhat in order to be applicable to typical filtration processes, where most particles in the suspension will deposit on a filter cake, rather than on a clean membrane.
Using the filtration equation
Ap J - (8)
~(RM + KhS)
where RM is the membrane resistance and Kh is the specific cake resistance, it can be shown that the effec- tive permeability, K, based on the sum of the membrane and cake thicknesses, is given by [ 12]
K = R~ (.11++ Kh6/RM ]6/LM "I (9)
The tangential shear stress acting on a particle at the cake surface is given, for laminar flow in a rectangular channel of half-height, H (where dp/H<< 1), by the expression
TW ~'= (1 - 8/H) z (10)
~'w is the wall shear stress in the absence of a cake, and is given by
3/~u ~-w = (11)
H
where u is the mean crossflow velocity based on the cake-free channel height, and the bulk suspension is assumed to be sufficiently dilute that its viscosity is identical to that of the filtrate (i.e. 4) < 0.01 ).
Substituting Eqs. (8) to ( 11 ) into Eq. (7) and rear- ranging gives the following expression for the cut-off diameter
dl/5= kbtfHAP(1 - 6/H)2(~) 2/5 P /ZU
+ Kh6> - ' (12) X \ 1 + 6/L M ]
Eq. ( 1 ) and Eq. (12) constitute the basic model equa- tions. However, before they can be solved, a particle size distribution must be specified from which the frac- tion, f, can be calculated. It must also be recognised that the specific resistance, Kh, of a cake of thickness, 6, is a function of the sizes of all previously deposited particles. Hence, the steady state parameters can only be evaluated once the full dynamic solution to the prob- lem has been obtained. The details as to how dp, Kh, and 8 are calculated, are described in the next section.
3. Solution method
Throughout the following analysis, it is assumed that the feed concentration is constant and that the filter is operating at constant pressure, Ap. Consider the filter cake to be composed of discrete layers of thickness A 8i. Let the cut-off diameter at a distance, 6i, from the membrane be dp; and the mean diameter in each layer be dpi (Fig. 1 ). Thus, each layer of thickness A 6 i con- tains only those particles in the distribution whose diameter is less than dpi. The specific resistance of the
dpl dp2 dp3 dim dpn
MEMBRANE dpl dp2 dp3
A81 A8 2 A8 3
81 8 2 8 3 8 4 8 n
CAKE
Fig. 1. Simplified view of cake structure.

80 G. Foley et al. / Journal of Membrane Science 99 (1995) 77~8
layer can then be computed from the Blake-Kozeny equation
180 ~ Khi d~i (1--@¢)3 (13)
where the Kozeny constant has been taken to be equal to 5 [ 13,14]. It should be noted that the appropriate average diameter to use in the Blake-Kozeny equation is the volume-to-surface mean diameter. Therefore, if the particle size distribution function for the bulk sus- pension is given by p ( x ) , with minimum particle size, drain, and maximum particle size, dmax, the mean particle diameter within the layer is given by
dpi dpi
dmin dmin
(14)
For a cake of thickness, 6,, the mean specific resistance, Kh, which appears in Eq. (12) can be approximated by
n - I
G= ~ K.;a6;la. (15) i = 1
Thus, dp, can be calculated from Eq. (12) and the fraction,f, calculated from the expression
dpn dmax
i= fx3 x x, f dmin dmin
(16)
Implementation of these equations is straightforward since at t= 0, the cake thickness is zero and dpi can be calculated directly. Therefore, f can be calculated and the next value of 8, (i.e., 62) computed by numerical solution of Eq. ( 1 ). Once 62 is known, Kh can be cal- culated as can dp2 and the calculation procedure repeated. This algorithm was implemented with a FOR- TRAN computer programme, utilising the IMSL ordi- nary differential equation solver DIVPAG, and the numerical integration routine DQ2AGS. The average specific resistance was calculated from Eq. (15) at five second intervals and the program was allowed to run until t= 400 s, at which time the cake thickness and flux were generally constant.
All calculations were performed using the following function to represent the particle size distribution [ 15 ] :
d,~xX_X2+a 1 exp -
p ( x ) =dm~
d , ~ x - x 2 + a l ~ \ a3 / / 0
(17)
where the a; are constants. The structure of this function is such that it can represent symmetric and skewed distributions for particle sizes between zero (dm~,) and dmax. The function provides a computationally conven- ient method for examining the effect of not only aver- age particle size, but also the shape of the size distribution, on the filter performance.
The model equations were solved initially for the symmetric distribution shown graphically in Fig. 2. Particles of this average size are typical of yeast sus- pensions [ 14]. In addition, it was assumed, in all cal- culations, that the particle volume fraction in the cake, 4'c, was constant and equal to 0.73. This value is taken from the work of Ofsthun [ 16] who found yeast sus- pensions to have a specific resistance which was only weakly dependent on pressure, at least in the range of pressures covered by the simulations reported here.
Calculations were performed for set values of the dimensionless parameter dpo, where dpo is the ratio of the initial cut-off diameter to the maximum particle size. Using Eq. (12) with 6=0, dpo is given by the expression
dpo = (k txfHAPR~3/5L~elS]5/dma~ (18) /zu ]
Once dpo and the size distribution is specified, the initial cut-off diameter, dpl, is also specified and the initial value of f can be computed. The computation can then proceed as outlined above.
It should be noted that it was assumed throughout, that the coefficient of friction of the membrane was identical to that of the filter cake and thus enters the calculations only through dpo which is specified ini- tially. As a result, the problem of an apparently abrupt transition from particle deposition on the membrane, to deposition on a layer of particles, was not addressed. As mentioned previously, it is assumed throughout the analysis that membrane fouling is negligible, i.e., that the membrane resistance, RM, remains constant.

G. Foley et al. / Journal of Membrane Science 99 (1995) 77--88 81
0.05
0.00 0.0 10.0
I I I I [ I I I I 1.0 2.0 3.0 4.0 5.0 6.0 7.0 8.0 9.0
0.40
0.35
l - x
0.30 i
E
.~, 0.25
© • ~ 0.20
:~ o.15
o ~" 0.10
Particle diamem (gin)
Fig. 2. Particle size distribution for model calculations, dmax = 10 I~m, al = 1 × 10- to m 2, a 2 = 5 i~m, a3 = 2 l~m.
c- O
©
O >
2.0
1.8
1.6
1.4
1.2
1.0
0.8
0.6
0.4
0.2
0.0 0
. . . >
< . . .
I I I I I [
25 50 75 ~00 125 lso
Time (s)
6.0 =L
5.0
4.0
0
3.0 ~ 0
2.0
1.0 o
i 0 . 0 < 175 200
Fig. 3. Fraction of particles which deposit (f) and the average particle diameter in the outermost cake layer versus time. H = 300 I~m, dpo = 10,
A P = 5 0 kPa, 0bo=0.001, RM= 0.5 × l 0 II m - k

82 G. Foley et al. / Journal of Membrane Science 99 (1995) 77-88
0
o
-d
o Z
1.00
0.95
0.90
0.85
0.80
0.75
0.70 I F I I I r I 75 100 125 150 175
Time (s)
0 25 50
50
40
30
20
10
0 200
o
Fig. 4. Reduced flux and cake thickness versus time. (Model parameters as Fig. 3.)
v
a; t9
C9
O
O
<
4.0
3.5
3.0
2.5
2.0
1.5
1.0
1
0
100
I I I I I I r 50 100 150 200 250 300 350 400
Time (s)
Fig. 5. Average specific resistance versus time at various values of the initial dimensionless cut-off diameter, dvo. (Other model parameters as Fig. 3.)

G. Foley et al. / Journal of Membrane Science 99 (1995) 77-88 83
4. Results and discussion
4.1. Dynamic behaviour
The attainment of steady state during crossflow fil- tration of a polydisperse suspension is illustrated in Fig.
1.00
0.95
O 0.90
d o.85
'~ 0.80
0.75
O Z 0.70
0.65
0.60 I 10
3. Initially, the cut-offdiameter is greater than dmax, the fraction of suspension particles which deposit, f, remains equal to one, and the filter behaves in an iden- tical manner to a dead-end filter. However, when the cut-off diameter declines to dm~, (due to an increase in
140
120
i I I I I I I I
Fig. 6. Steady
20 30 40 50 60 70 80 90 100
Pressure (kPa)
100
8o
6o
40 ~9
20
state cake thickness and reduced flux versus transmembrane pressure. (Other model parameters as Fig. 3.)
4.0
E 3.5
e~
3.0 d
~ 2.5
• - 2.0
e~
© 1.5
©
< 1.0 I I I I I I I
20 30 40 50 60 70 80 90 100
Pressure (kPa) Fig. 7. Steady state specific cake resistance versus transmembrane pressure. (Model parameters as Fig. 6. )

84 G. Foley et al. / Journal of Membrane Science 99 (1995) 77-88
8 and a reduction in J) , this fraction begins to drop rapidly towards zero and the system approaches a steady state. Fig. 3 also illustrates the parallel reduction in the average particle diameter in the outermost cake layer. This reduction in average diameter has clear con- sequences for the average specific resistance of the cake, as will be discussed later.
The variation (with respect to time) in cake thick- ness and reduced flux (J/Jo, where Jo is the initial flux) is demonstrated in Fig. 4. The predictions are largely as expected, the small reductions in flux being a com- bination of the low particle concentrations and the rel- atively low specific resistance of the yeast-like particles simulated. The major point to be noted is the very rapid transition (less than one minute) from a growing cake to one of nearly constant thickness. The rapidity of this transition is probably a reflection of the idealised view of the deposition process used in this model. In reality, the deposition of a particle will depend on factors other than its size relative to the cut-off diameter. The pres- ence of other depositing particles, surface topology, axial position, adhesive forces and membrane fouling will all be significant.
The time dependence of the average specific cake resistance is shown in Fig. 5. The three curves corre- spond to three different values ofdpo. Clearly, when all other model parameters are constant, increasing the value of doo corresponds to reducing the crossflow velocity. When the cut-off diameter is greater than dmax., Kh remains constant, whereas when it becomes smaller than dmax, Kh begins to rise as a direct conse- quence of the decreasing average particle size in the cake. Furthermore, as the crossflow velocity increases, Kh also increases, in agreement with experimental data for weakly compressible cakes [1,2]. It should be noted that the data of Riesmeier et al. [3,17], which showed that the specific resistance was essentially con- stant over a substantial range of crossflow velocities, is not necessarily inconsistent with Fig. 5, since those authors used suspensions of Escherichia coli which form highly compressible cakes. A complicating fea- ture of compressible cakes is that when the crossflow velocity is increased, the pressure drop across the filter cake decreases, resulting in a reduction in specific cake resistance [ 12 ]. This tendency could compete with the effect of reducing particle size and may lead to a veloc- ity-independent specific cake resistance.
While Fig. 5 shows that Kh increases with crossflow velocity, it is not clear whether this effect can compen- sate for the reduction in cake height at higher crossflow velocities (due to the lower initial cut-offparticle diam- eter), leading to a parallel reduction in flux [ 1,3]. This problem is explored in detail in the following section.
4.2. Steady state behaviour
The effect of transmembrane pressure on the steady state reduced flux and cake thickness is demonstrated in Fig. 6. The calculations were performed for dpo = 20 at Ap = 50 kPa, with dpo at other pressures adjusted according to the scaling in Eq. (18). The predictions are largely as expected. Interestingly, Fig. 7 shows that the specific resistance decreases with Ap, approaching a constant value at high pressures. As discussed earlier, a specific resistance which decreases with pressure has been observed at low pressures by Baker et al. [ 1 ] and Riesmeier et al. [ 3 ]. However, those authors used sus- pensions which formed compressible cakes, and found Kh tO exhibit a minimum with respect to pressure. It would obviously be desirable to extend the current model to take account of cake compressibility and to reproduce the observed behaviour for compressible cakes over the full pressure range.
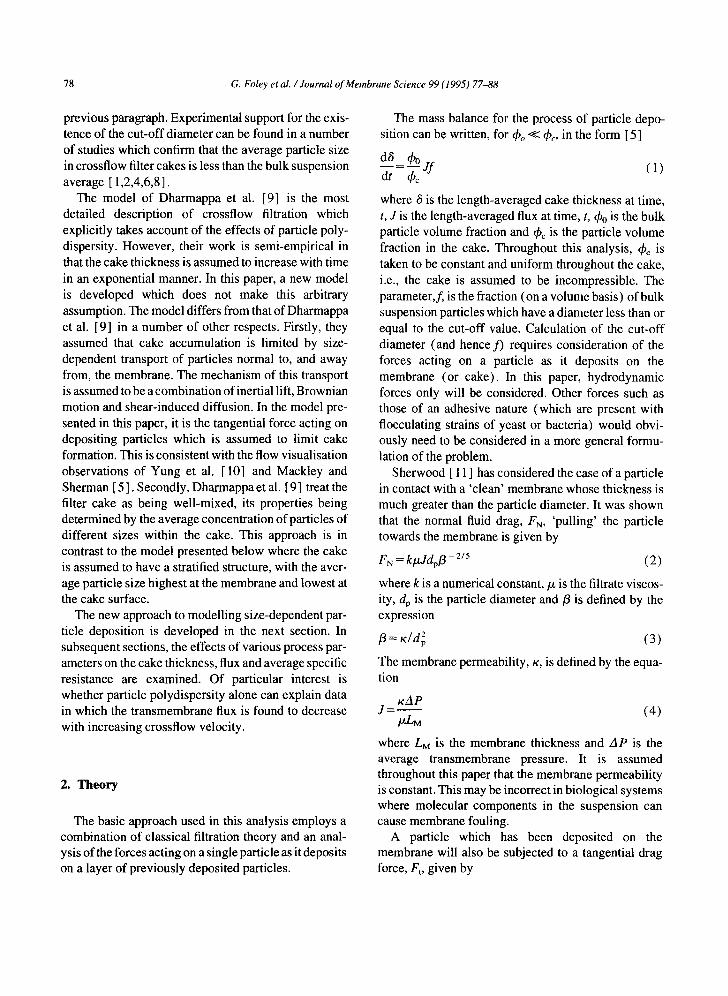
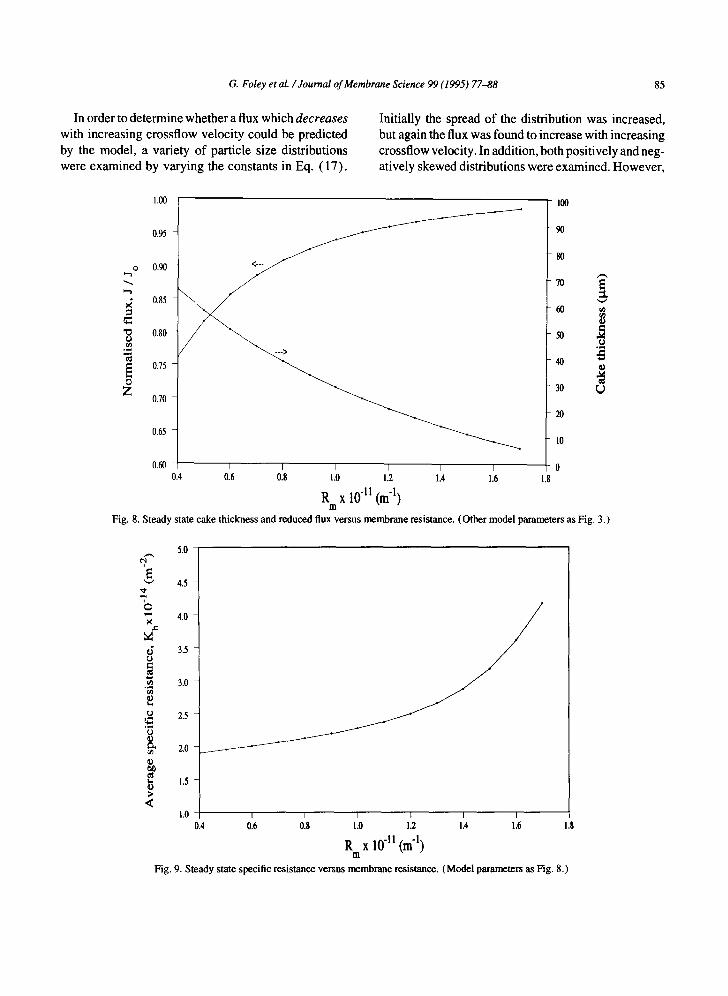
The dependence of the reduced flux and cake thick- ness on the membrane resistance is shown in Fig. 8. The calculations were performed for ttpO=20 at RM=0.5 × 10 H m - j , with dpo at other values of RM again adjusted according to the scaling in Eq. (18). Again the results are as expected, with greater values Of RM providing for less particle deposition and smaller percentage reductions in flux. Fig. 9 shows that Kh increases with RM in qualitative agreement with the yeast data of Riesmeier et al. [ 3 ].
Figs. 10 and 11 show the effect of dpo (and hence crossflow velocity) on the specific resistance and reduced flux at various bulk particle volume fractions. It is clear that while the specific resistance increases with increasing crossflow velocity, the flux also increases because of reduced cake thickness. The ten- dency for the reduced flux to decrease with increasing 4)0 is as expected. Interestingly, the specific resistance is found to increase slightly with particle concentration. This is in good agreement with experimental data obtained for bacterial suspensions [ 3,17 ].
G. Foley et al. / Journal of Membrane Science 99 (1995) 77--88 85
In order to determine whether a flux which decreases with increasing crossflow velocity could be predicted by the model, a variety of particle size distributions were examined by varying the constants in Eq. (17).
Initially the spread of the distribution was increased, but again the flux was found to increase with increasing crossflow velocity. In addition, both positively and neg- atively skewed distributions were examined. However,
O
o Z
1.00
0.95
0.90
0.85
0.80
0.75
0.70
0.65
0.60
/
--. . . . .
100
90
70
60 r~ o
.o
o
30 ~)
20
10
I I I 4 I I 0 0.4 0.6 0.8 1.0 1.2 1.4 1.6 1.8
R x 10 11 (m "l) m
Fig. 8. Steady state cake thickness and reduced flux versus membrane resistance. (Other model parameters as Fig. 3.)
5.0
E " " 4.5
4.0 e,
~d ~; 3.5 ¢2
3.0
t~ 2.5
0
~ 2.0 ©
~ 1.5
< 1.0
/
I I I [ I I
0.4 0.6 0.8 1.0 1.2 1.4 1.6 1.8
R x 10 "11 (m "1) m
Fig. 9. Steady state specific resistance versus membrane resistance. (Model parameters as Fig. 8.)

86 G. Foley et al. / Journal o f Membrane Science 99 (1995) 77-88
.7" v
o
(J
o ~o
o
<
o .0005
+ .001
• .002
I I r I I I I I I I I
2 10 50
Initial dimensionless cut-off diameter
i , - ~ °
"d
o Z
Fig. 10. Steady state specific resistance versus dpo at various bulk particle volume fractions. (Other model parameters as Fig. 3.)
0.0005 0.g
0.7
+ .001
o . 0 0 2
I t I I I r i
10
Initial dimensionless cut-off diameter
I
50
Fig. 11. Steady state reduced flux versus dpo at various bulk particle volume fractions. (Other model parameters as Fig. 3.)
in no instance was an anomalous velocity dependence predicted for the flux. This suggests that other phenom- ena, and not particle polydispersity, may be the cause of fluxes which decrease with increasing crossflow velocity. One obvious possibility is that qb~ increases
with crossflow velocity. Given the strong dependence of Kh on ~b c in Eq. (13), even a weak dependence of qSc on crossflow velocity could produce large changes in Kn and offset the natural tendency for the cake thick- ness to decrease with increasing crossflow velocity.

G. Foley et al. / Journal of Membrane Science 99 (1995) 77-88 87
This explanation has been offered by Mackley and Sherman [5] and Sherman and Sherwood [ 18].
4.3. Conclusions
The model presented in this paper provides a con- venient framework for investigating the role of the par- ticle size distribution in crossflow filtration. The simulations reported here show that the model predic- tions are qualitatively consistent with a number of key experiments in crossflow filtration. In particular, the model is successful in predicting not only the observed behaviour of the flux and cake thickness, but also the behaviour of the average specific cake resistance. Future modifications to the model might involve incor- porating the effects of adhesive forces, membrane foul- ing or cake compressibility. In addition, the mechanism by which the flux can decrease as the crossflow velocity is increased needs to be elucidated. The incorporation of a shear rate dependence of ~b C in the above model might contribute to a better understanding of this anom- alous behaviour. However, a formal relationship between cake structure and flow conditions remains to be established.
5. Symbols list
a~ particle size distribution parameter (m 2) a2 particle size distribution parameter (m) a3 particle size distribution parameter (m) dm,x maximum particle diameter (m) dn~, minimum particle diameter (m) dp cut-off particle diameter (m) dpi cut-off diameter at distance, 8, from
membrane (m) dp~ volume-to-surface mean diameter of ith cake
layer (m) dvo initial dimensionless cut-off diameter ( - ) FN normal fluid drag force (N) Ft tangential fluid drag force (N) f volume fraction of particles which deposit ( - ) H channel half height (m) J transmembrane flux (m/ s ) k constant ( - ) Kh specific cake resistance (m -2) Khg specific resistance of ith layer ( m - 2) LM membrane thickness (m)
p(x ) probability density function ( m - ~) R~t membrane resistance ( m - 1 ) t time (s) u crossflow velocity (m/s ) /3 dimensionless fluid drag parameter ( - ) 8 cake thickness (m) A 6i thickness of ith cake layer (m) a p transmembrane pressure ( N / m 2) q~o bulk suspension particle volume fraction ( - ) ~b~ particle volume fraction in cake ( - ) K membrane permeability (m 2) /z filtrate viscosity (kg /ms) /zf coefficient of friction ( - ) ~- shear stress at cake-suspension interface (N/
m 2 )
~'w wall shear stress ( N / m 2)
References
[ 1 ] R.J. Baker, A.G. Fane, C.J.D. Fell and B.H. Yoo, Factors affecting flux in crossflow filtration, Desalination, 53 (1985) 81-93.
[2] W.-M. Lu and S.-C. Ju, Selective particle deposition in crossflow filtration, Sep. Sci. Technol., 24 (1989) 517-540.
[3] B. Riesmeier, K.H. Kroner and M.-R. Kula, Tangential filtration of microbial suspensions: filtration resistances and model development, J. Biotechnol., 12 (1989) 153-172.
[4] E. Fischer and J. Raasch, Crossflow filtration, Ger. Chem. Eng., 8 (1985) 211-216.
[5] M.R. Mackley and N.E. Sherman, Crossflow filtration mechanisms and kinetics, Chem. Eng. Sci., 47 (1992) 3067- 3085.
[6] R.J. Wakeman and E.S. Tarleton, Colloidal fouling of microfiltration membranes during the treatment of aqueous feed streams, Desalination, 83 ( 1991 ) 35-52.
[7] N.J. Blake, I.W. Cumming and M. Streat, Prediction of steady state crossflow filtration using a force balance model, J. Membrane Sci., 68 (1992) 205-216,
18l G. Foley, P.F. MacLoughlin and D.M. Malone, Preferential deposition of smaller cells during crossflow microfiltration of a yeast suspension, Biotechnol. Tech., 2 (1992) 115-120.
[9] H.B. Dharmappa, J. Verink, R. Ben Aim, K. Yamamoto and S. Vigneswaran, A comprehensive model for crossflow filtration incorporating polydispersity of the influent, J. Membrane Sci., 65 (1992) 173-185. B.P.K. Yung, H. Merry and T.R. Bott, The role of turbulent bursts in particle re-entrainment in aqueous systems, Chem. Eng. Sci., 44 (1989) 873-882. J.D. Sherwood, The force on a sphere pulled away from a permeable half space, PhysicoChem. Hydrodyn., 10 (1988) 3-12.
[101
[111

88 G. Foley et al. / Journal of Membrane Science 99 (1995) 77-88
[ 12] G. Foley, Experimental and theoretical studies of factors affecting cake formation and membrane fouling in crossflow microfiltration, PhD Thesis, University College, Dublin, 1993.
[ 13 ] C.J. Geankoplis, Transport processes and unit operations, 2nd ed., Allyn and Bacon, Newton, MA, 1983.
[14] G.E. Ogden and R.H. Davis, Experimental determination of the permeability and relative viscosity for fine latexes and yeast suspensions, Chem. Eng. Commun., 91 (1990) 11-28.
[15] M. Peleg, M.D. Normand and J.R. Rosenau, A distribution function for particle populations having a finite size range and a mode independent of the spread, Powder Technol., 46 (1986) 209-214.
[16] N.J. Ofsthun, Crossflow membrane filtration of cell suspensions, PhD Thesis, MIT, 1989.
[17] B. Riesmeier, K.H. Kroner and M.-R. Kula, Studies on secondary layer formation and its characterisation during crossflow filtration of microbial cells, J. Membrane Sci., 34 (1987) 245-266.
[ 18] N.E. Sherman and J.D. Sherwood, Crossflow filtration: cakes with variable resistance and capture efficiency, Chem. Eng. Sci., 48 (1993) 2913-2918.