Embed Size (px)
Citation preview
ARID ZONE JOURNAL OF ENGINEERING, TECHNOLOGY & ENVIRONMENTAZOJETE - CIGR Section VI Special Issue:
Innovation & Technologies for Sustainable Agricultural Production & Food SufficiencyAZOJETE, December, 2018. Vol. 14(SP.i4): 8-19
Published by the Faculty of Engineering, University of Maidiguri, Maidiguri, Nigeria.
Print ISSN: 1596-2490, Electronic ISSN: 2545-5818www.azojete.com.ng
Corresponding author’s e-mail address: [email protected] 8
ORIGINAL RESEARCH ARTICLEMODELLING OF TRACTOR FUEL CONSUMPTION FOR HARROWING OPERATION IN A
SANDY LOAM SOILO. A. Oyelade1* and K. C. Oni2
1*Farm Power and Machinery Department, National Centre for Agricultural Mechanization (NCAM), Ilorin, Kwara State,Nigeria.
2Agricultural and Biosystems Engineering Department, University of Ilorin, Ilorin, Kwara State, Nigeria.
ARTICLE INFORMATION
Received October, 2018Accepted December, 2018
Keywords:FuelHarrowingEvaluationpredictionTractorconsumption
ABSTRACTIn the study of agricultural machinery management, fuelconsumption is considered as a very important factor that plays asignificant role in the selection and management of tractors andequipment. In Nigeria, there are no tractor fuel consumptionmodels developed for harrowing operation. Considering theimportance of harrowing operation to tillage practice in Nigerianagriculture, it became necessary to embark on the study on themodelling of tractor fuel consumption in litres per hectare (L/ha)during harrowing operation in a sandy loam soil using availableinformation gathered from the National Centre for AgriculturalMechanization (NCAM) Tractor Test Reports. A multiple linearregression method was used to develop the model. A 10-repeated10-fold cross-validation method was used to validate the model.The study revealed that the model developed for harrowingoperation had a R2-value of 0.477 showing tractor power rating asthe only operation parameter contributing to the model developed.Cross-validation revealed that the harrowing operation model had atest error value of 0.986 L/ha. The study also identified othercontributing factors to tractor fuel consumption during harrowingoperation in a sandy loam soil. The model developed for tractor fuelconsumption during harrowing operation in a sandy loam soil isrecommended for use in budgeting for diesel consumption.© 2018 Faculty of Engineering, University of Maiduguri, Nigeria. All rights reserved.
1.0 IntroductionTillage of soil is considered to be one of the biggest farm operations (Al-Suhaibani and Ghaly,2010). It is also a conventional farming system involving the use of the tractors which results inhigh energy costs. The sustainability of such a system requires a well-controlled resourcemanagement leading to a significant reduction in crop production costs derived from savings infuel consumption (Serrano et al., 2009). Agricultural machinery has become increasinglyimportant in carrying out farm work. The application of machines to agricultural production hasbeen one of the outstanding developments in agriculture. Machinery contributes a major capitalinput cost in most farm businesses.In agriculture, the tractor remains a very important machine due to its ability to providemechanical power to farm implements both on and off the farm. The choice of a tractor basedon field performance can be very challenging due to limited information with regards toperformance on the field. According to Sirelkatim, et al. (2001), land preparation is one of themost energy demanding operations in agriculture, it involves soil cutting, turning andpulverizing and thus demands high energy, hence there is need to optimize tractor performance
Arid Zone Journal of Engineering, Technology and Environment, December, 2018; Vol. 14(sp.i4): 8-19. ISSN 1596-2490;e-ISSN 2545-5818; www.azojete.com.ng
Corresponding author’s e-mail address: [email protected] 9
in order to utilize the available energy. This energy utilization depends on many factors such assoil type and condition, operating depth and speed, and hitch geometry.
The use of models for budgeting of tractor fuel consumption has been of great use to farmers indeveloped nations. Most studies on model development for tractor fuel consumption centresmainly on ploughing operation which is the first tillage operation carried out on the soil.Harrowing operation has been considered as a very important tillage operation that needs to becarried out during land preparation in Nigerian agriculture.
Considering the importance of harrowing operation to tillage practice in Nigerian agriculture,there is a need to develop a simple model equation for predicting tractor fuel consumption inlitres per hectare (L/ha) during harrowing operation. The study is aimed at developing astatistical model for predicting tractor fuel consumption during harrowing operation in a sandyloam soil.
2.0 Materials and Methods2.1 Experimental procedureThe study involves the use of information gathered from the National Centre for AgriculturalMechanization (NCAM) Tractor Test Reports on 41 agricultural tractors compiled by Oyelade(2016) which were tested during harrowing operation on a sandy loam soil. Each tractor wastested on an area of 0.25 hectare (25 m x 100 m) in a randomized complete block design (RCBD).The implement used for the trials was tractor mounted off-set disc harrow. Parameters measuredduring harrowing operation include speed of operation, fuel consumption, field capacity, fieldefficiency, wheel slip, duration of operation, draught force, the width of cut, depth of cut, soilcone index, soil moisture content, and soil bulk density. The three soil properties, namely, soilcone index, soil moisture content and soil bulk density were all measured at depths 0 – 7 cm, 7 –14 cm and 14 – 21 cm. The resulting average values of these three soil properties were part ofthe data collated. All the parameters of the tractor-implement performance were measured andrecorded in line with the recommendations of RNAM test codes and procedures for farmmachinery technical series (1983). Out of the 41 tractor test data, 37 tractor test data termedmodel development data-set was used to generate multiple regression for use in futurepredictions of tractor fuel consumption in litres per hectare during harrowing operation on asandy loam soil. The remaining four tractor test data termed model validating data-set wereused to validate the model developed.
2.2 Description of the Study AreaThe study was carried out at the National Centre for Agricultural Mechanization (NCAM), Ilorin,Kwara State which is located at 370 m above sea level in the Southern Guinea Savannaecological zone of Nigeria by Longitude 4o 30′ E and Latitude 8o 26′ N. The various testlocations where these tractors were tested fall under the sandy loam soil textural class with thefollowing fractions: sand - 56.79% to 69.92%, silt - 15.33% to 28.64% and clay - 6.44% to 18.33%.The soil in the various test locations of the study area were classified as Alfisols (Soil Survey Staff,1975) under the USDA soil order.
2.3 Particle Size AnalysisParticle size analysis was carried out using the hydrometer method described by Gee and Or(2002). Sodium hexametaphosphate (calgon) was used as the dispersant. The textural class of thesoil was determined using the USDA Textural Triangle.
Oyelade and Oni. Modelling of tractor fuel consumption for harrowing operation in a sandy loam soil.AZOJETE, 14(sp.i4): 8-19. ISSN 1596-2490; e-ISSN 2545-5818, www.azojete.com.ng
Corresponding author’s e-mail address: [email protected] 10
2.4 Test Parameters2.4.1 Speed of OperationThe speed of operation was determined by placing two poles 20 m a part in-between thelongest distance of the test plot. On the opposite side of the test plot, two poles were placed ina similar position 20 m apart. The speed of operation for each tractor evaluated duringharrowing operation was mathematically expressed as:
1
206.3t
VS (1)
where,Vs = Speed of operation (km/h)t1 = Time taken to cover 20 m (sec)
2.4.2 Depth and Width of cutThe depth and width of cut during field operation were measured using a steel rule andmeasuring tape, respectively.
2.4.3 Draught of the ImplementThe draught of implement was measured using the trace tractor technique described by Oyelade(2016).
2.4.4 Theoretical Field CapacityTheoretical field capacity measured in ha/h was expressed mathematically as:
T3600
a
EG(2)
where,G = Theoretical field capacity (ha/h),E = Area of field (ha)Ta = Actual time taken in doing the main tillage work (sec)
2.4.5 Effective Field CapacityEffective field capacity measured in ha/h was expressed mathematically as:
T t
EX )3600(5
(3)where,
X5 = Effective field capacity (ha/h)E = Area of field (ha)Tt = Total time taken in completing the whole tillage operation (sec)
2.4.6 Field EfficiencyField efficiency, according to ASAE (2000), is the ratio of effective field capacity to theoreticalfield capacity, expressed in percent. It was expressed mathematically as:
%100G
5 xXH (4)
where,H = Field efficiency (%)X5 = Effective field capacity (ha/h)G = Theoretical field capacity (ha/h)
Arid Zone Journal of Engineering, Technology and Environment, December, 2018; Vol. 14(sp.i4): 8-19. ISSN 1596-2490;e-ISSN 2545-5818; www.azojete.com.ng
Corresponding author’s e-mail address: [email protected] 11
2.4.7 Fuel ConsumptionThe fuel required for each tillage operation was determined by filling the tank to full capacitybefore and after the test. Amount of refueling after each test is the fuel consumption for the test.The filling of fuel tank before the operation and then refilling after completing the operation indetermining the amount of fuel consumed during operation is a common method used in thefield for determining tractor fuel consumption in litres per hectare. This same method was asreported by (Ajav and Adewoyin, 2011; Ikpo and Ifem, 2005; Kudabo and Gbadamosi, 2012;Meshack-Hart, 1997; Sirelkatim et al., 2001; Udo and Akubuo, 2004) in determining tractor fuelconsumption in litres per hectare.
Fuel consumption measured in either L/ha or L/h was expressed mathematically as:
EJI
(5)IxK 5X (6)
where,I = Fuel consumption (L/ha)J = Volume of fuel consumed (L)E = Area of field (ha)K = Fuel consumption (L/h)X5 = Effective field capacity (ha/h)
2.4.8 Travel Reduction (Wheel slip)In determining the wheel slip (travel reduction), a mark was made on the tractor drive wheel withcoloured tapes. This was used to measure the distance covered by the tractor drive wheel atevery 10 revolutions under no load and the same revolution with a load on the same surface.The travel reduction (wheel slip) measured in % was expressed mathematically as:
%100M
M - M
2
12 L(7)
where,L = Travel reduction (wheel slip) (%)M2 = Distance covered at every 10 revs of the wheel at no-load condition (m)M1 = Distance covered at every 10 revs of the wheel at load condition (m)
2.4.9 Tractive EfficiencyTractive efficiency measured in % is the ratio of drawbar power to wheel power and wasexpressed mathematically according to (Macmillan, 2002) as:
%100w
pt Q
DQ
(8)where,
Qt = Tractive efficiency (%)Dp = Drawbar power (kW)
Qw = Wheel power (kW), power losses in the transmission from engine to thewheels of, say 10% is assumed, it can be written as:
%1009.0
e
pt Q
DQ
(9)where, Qe = Engine power (kW)
Oyelade and Oni. Modelling of tractor fuel consumption for harrowing operation in a sandy loam soil.AZOJETE, 14(sp.i4): 8-19. ISSN 1596-2490; e-ISSN 2545-5818, www.azojete.com.ng
Corresponding author’s e-mail address: [email protected] 12
2.4.10 Duration of OperationThe duration of operation measured in h/ha which is the time spent in completing the wholeoperation was mathematically expressed as:
59
1X
X (10)
where,X9 = Duration of operation (h/ha)X5 = Effective field capacity (ha/h)
2.5 Soil Parameters2.5.1 Soil Bulk DensitySoil bulk density (ρb ) is a measure of the mass of soil per unit volume and is usually reported onan oven-dry basis. The soil bulk density was determined by the core method described byAnwanane (2014). The core samples were oven dried at a temperature of 1050C to a constantweight.
ρb =MsVT
(11)where,
ρb = Soil bulk density (g/cm3)Ms = Mass of dry soil (g)VT = Total volume of soil (cm3)
2.5.2 Soil MoistureKlenin et al. (1985) defined soil moisture content as the amount of liquid, usually water that ispresent in the soil. It is expressed as a percentage of the mass of water in the soil to the mass ofthe dried soil (for dry weight classification). The soil moisture content (in dry basis) measured in%, can be expressed mathematically as:
%100s
wc W
WM
(12)where,
Mc = Soil moisture content (%)Ws = Mass of oven dried soil (g)Ww = Mass of water present in soil (g)
2.5.3 Soil Cone IndexThe soil cone index (CI) is the soil resistance to penetration and was measured using a conepenetrometer.
2.6 Statistical Tool2.6.1 Regression AnalysisMultiple linear regression method which is a form of regression analysis was used forestablishing the relationship that existed between fuel consumption (the model responsevariable) and other factors (or predictors of fuel consumption) identified to be factorsinfluencing tractor fuel consumption in litres per hectare during harrowing operation. Multipleregression is when there is one dependent variable but more than one independent variables. Inthis study, tractor fuel consumption in litres per hectare was the dependent variable while otherfactors identified as factors influencing tractor fuel consumption in litres per hectare stands asthe independent variables.
Arid Zone Journal of Engineering, Technology and Environment, December, 2018; Vol. 14(sp.i4): 8-19. ISSN 1596-2490;e-ISSN 2545-5818; www.azojete.com.ng
Corresponding author’s e-mail address: [email protected] 13
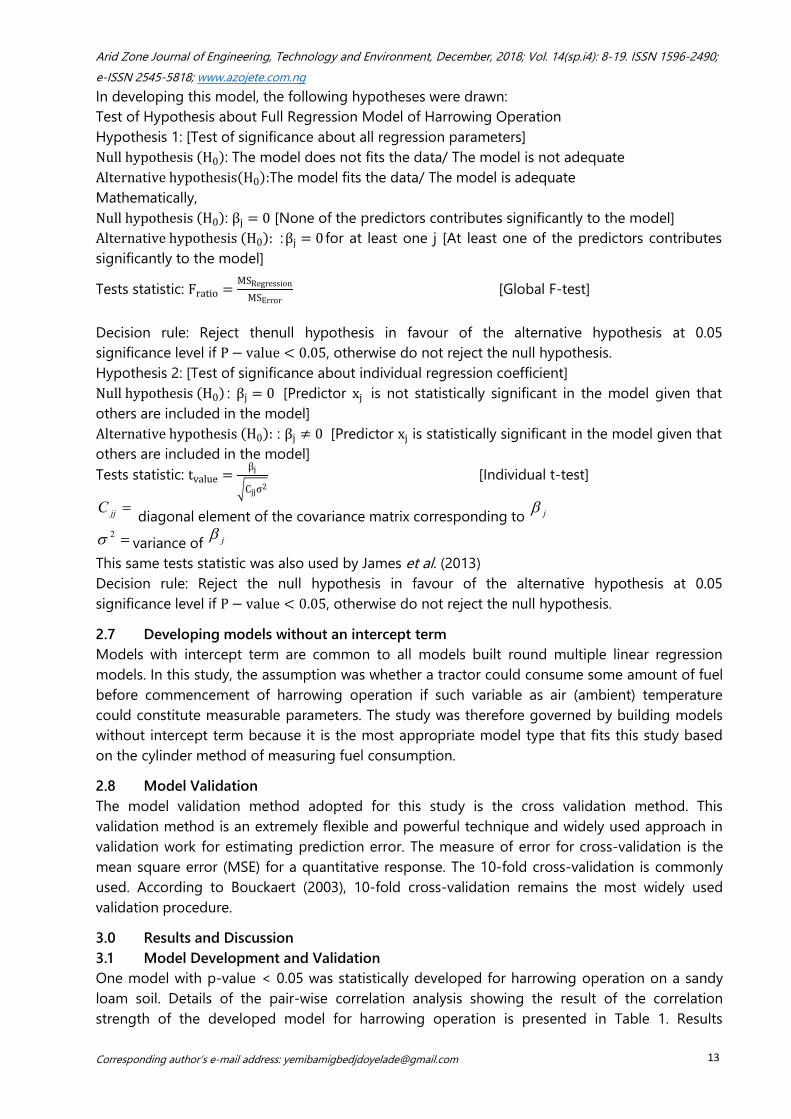
In developing this model, the following hypotheses were drawn:Test of Hypothesis about Full Regression Model of Harrowing OperationHypothesis 1: [Test of significance about all regression parameters]Null hypothesis H0 : The model does not fits the data/ The model is not adequateAlternative hypothesis H0 :The model fits the data/ The model is adequateMathematically,Null hypothesis H0 : βj = 0 [None of the predictors contributes significantly to the model]Alternative hypothesis H0 : :βj = 0 for at least one j [At least one of the predictors contributessignificantly to the model]
Tests statistic: Fratio =MSRegressionMSError
[Global F-test]
Decision rule: Reject thenull hypothesis in favour of the alternative hypothesis at 0.05significance level if P − value < 0.05, otherwise do not reject the null hypothesis.Hypothesis 2: [Test of significance about individual regression coefficient]Null hypothesis H0 : βj = 0 [Predictor xj is not statistically significant in the model given thatothers are included in the model]Alternative hypothesis H0 : : βj ≠ 0 [Predictor xj is statistically significant in the model given thatothers are included in the model]Tests statistic: tvalue =
βj
Cjjσ2[Individual t-test]
jjC diagonal element of the covariance matrix corresponding to j
2 variance of j
This same tests statistic was also used by James et al. (2013)Decision rule: Reject the null hypothesis in favour of the alternative hypothesis at 0.05significance level if P − value < 0.05, otherwise do not reject the null hypothesis.
2.7 Developing models without an intercept termModels with intercept term are common to all models built round multiple linear regressionmodels. In this study, the assumption was whether a tractor could consume some amount of fuelbefore commencement of harrowing operation if such variable as air (ambient) temperaturecould constitute measurable parameters. The study was therefore governed by building modelswithout intercept term because it is the most appropriate model type that fits this study basedon the cylinder method of measuring fuel consumption.
2.8 Model ValidationThe model validation method adopted for this study is the cross validation method. Thisvalidation method is an extremely flexible and powerful technique and widely used approach invalidation work for estimating prediction error. The measure of error for cross-validation is themean square error (MSE) for a quantitative response. The 10-fold cross-validation is commonlyused. According to Bouckaert (2003), 10-fold cross-validation remains the most widely usedvalidation procedure.
3.0 Results and Discussion3.1 Model Development and ValidationOne model with p-value < 0.05 was statistically developed for harrowing operation on a sandyloam soil. Details of the pair-wise correlation analysis showing the result of the correlationstrength of the developed model for harrowing operation is presented in Table 1. Results
Oyelade and Oni. Modelling of tractor fuel consumption for harrowing operation in a sandy loam soil.AZOJETE, 14(sp.i4): 8-19. ISSN 1596-2490; e-ISSN 2545-5818, www.azojete.com.ng
Corresponding author’s e-mail address: [email protected] 14
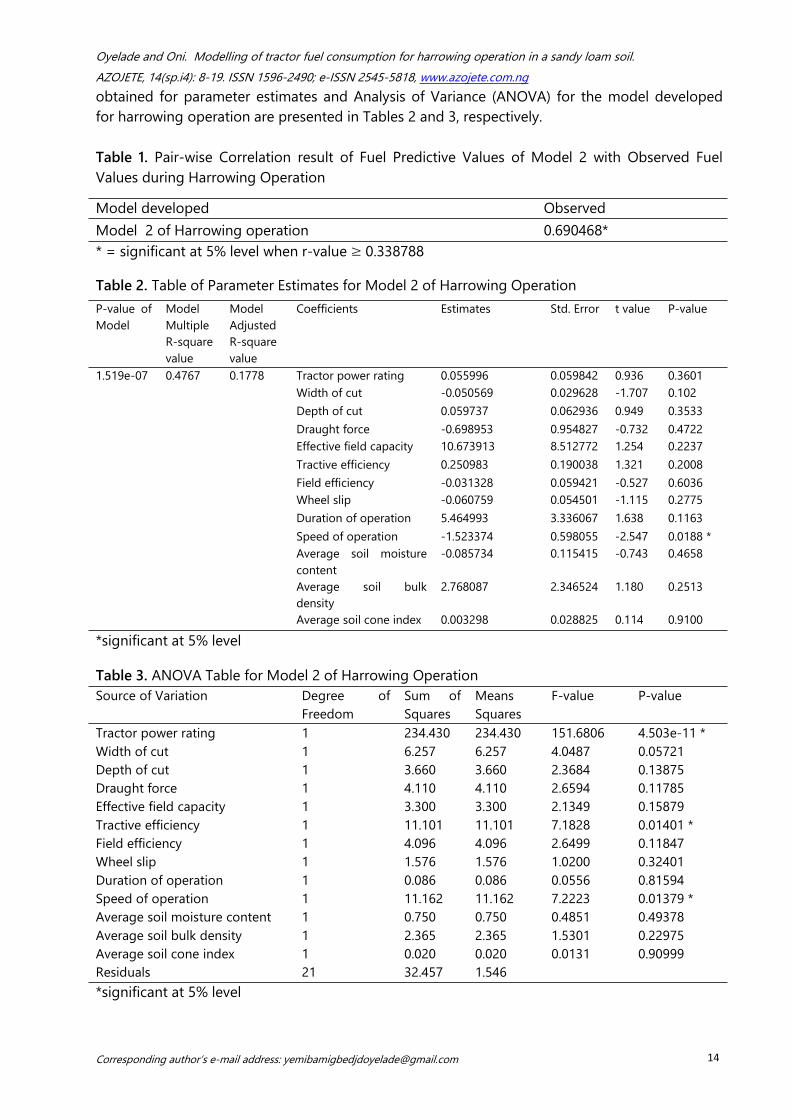
obtained for parameter estimates and Analysis of Variance (ANOVA) for the model developedfor harrowing operation are presented in Tables 2 and 3, respectively.
Table 1. Pair-wise Correlation result of Fuel Predictive Values of Model 2 with Observed FuelValues during Harrowing Operation
* = significant at 5% level when r-value ≥ 0.338788
Table 2. Table of Parameter Estimates for Model 2 of Harrowing Operation
*significant at 5% level
Table 3. ANOVA Table for Model 2 of Harrowing OperationSource of Variation Degree of
FreedomSum ofSquares
MeansSquares
F-value P-value
Tractor power rating 1 234.430 234.430 151.6806 4.503e-11 *Width of cut 1 6.257 6.257 4.0487 0.05721Depth of cut 1 3.660 3.660 2.3684 0.13875Draught force 1 4.110 4.110 2.6594 0.11785Effective field capacity 1 3.300 3.300 2.1349 0.15879Tractive efficiency 1 11.101 11.101 7.1828 0.01401 *Field efficiency 1 4.096 4.096 2.6499 0.11847Wheel slip 1 1.576 1.576 1.0200 0.32401Duration of operation 1 0.086 0.086 0.0556 0.81594Speed of operation 1 11.162 11.162 7.2223 0.01379 *Average soil moisture content 1 0.750 0.750 0.4851 0.49378Average soil bulk density 1 2.365 2.365 1.5301 0.22975Average soil cone index 1 0.020 0.020 0.0131 0.90999Residuals 21 32.457 1.546*significant at 5% level
Model developed ObservedModel 2 of Harrowing operation 0.690468*
P-value ofModel
ModelMultipleR-squarevalue
ModelAdjustedR-squarevalue
Coefficients Estimates Std. Error t value P-value
1.519e-07 0.4767 0.1778 Tractor power rating 0.055996 0.059842 0.936 0.3601Width of cut -0.050569 0.029628 -1.707 0.102Depth of cut 0.059737 0.062936 0.949 0.3533Draught force -0.698953 0.954827 -0.732 0.4722Effective field capacity 10.673913 8.512772 1.254 0.2237Tractive efficiency 0.250983 0.190038 1.321 0.2008Field efficiency -0.031328 0.059421 -0.527 0.6036Wheel slip -0.060759 0.054501 -1.115 0.2775Duration of operation 5.464993 3.336067 1.638 0.1163Speed of operation -1.523374 0.598055 -2.547 0.0188 *Average soil moisturecontent
-0.085734 0.115415 -0.743 0.4658
Average soil bulkdensity
2.768087 2.346524 1.180 0.2513
Average soil cone index 0.003298 0.028825 0.114 0.9100
Arid Zone Journal of Engineering, Technology and Environment, December, 2018; Vol. 14(sp.i4): 8-19. ISSN 1596-2490;e-ISSN 2545-5818; www.azojete.com.ng
Corresponding author’s e-mail address: [email protected] 15
Model 2 of harrowing operation with p-value < 0.05 recorded a R-squared value of 0.4767. Themodel explains 48% of the proportion of variance in the mean squared errors of tractor fuelconsumption for harrowing operation with only speed of operation showing statisticalsignificance with a p-value of 0.0188 in the model. In terms of marginal (individual) significanceof the predictor variables, results in Table 4 reveal that we reject the null hypothesis about onlytractor power rating, tractive efficiency and speed of operation with corresponding p-values of4.503e-11, 0.01401 and 0.01379, respectively. This means that each of these variables isstatistically significant in the model provided others are included in the model. It also impliesthat they cannot be removed from the model.
The equation used for expressing Model 2 of harrowing operation as contained in Table 2 wasgiven as:
The equation used for expressing Model 2 of harrowing operation as contained in Table 2 was given as:�� = 0.055996X1 − 0.050569 X2 + 0.059737X3 − 0.698953X4 + 10.673913X5 + 0.250983X6 −0.031328X7 − 0.060759X8 + 5.464993X9 − 1.523374X10 − 0.085734X11 + 2.768087X12 +0.003298X13
where,Y� = Tractor fuel consumption (L/ha),X1 = Tractor power rating (hp),X2 = Width of cut (cm),X3 = Depth of cut (cm),X4 = Draught force (kN),X5 = Effective field capacity (ha/h),X6 = Tractive efficiency (%),
X7 = Field efficiency (%),X8 = Wheel slip (%),X9 = Duration of operation (h/ha),X10 = Speed of operation (km/h),X11 = Average soil moisture content (%),X12 = Average soil bulk density (g/cm3) andX13 = Average soil cone index (N/cm2).
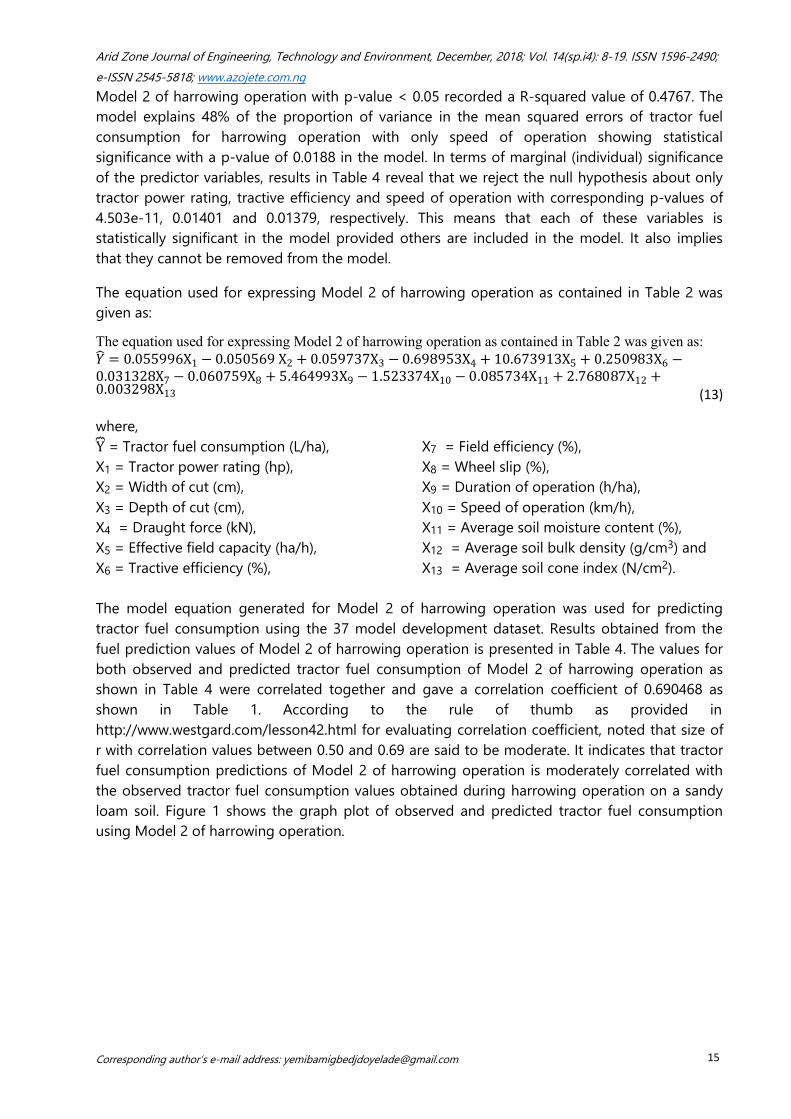
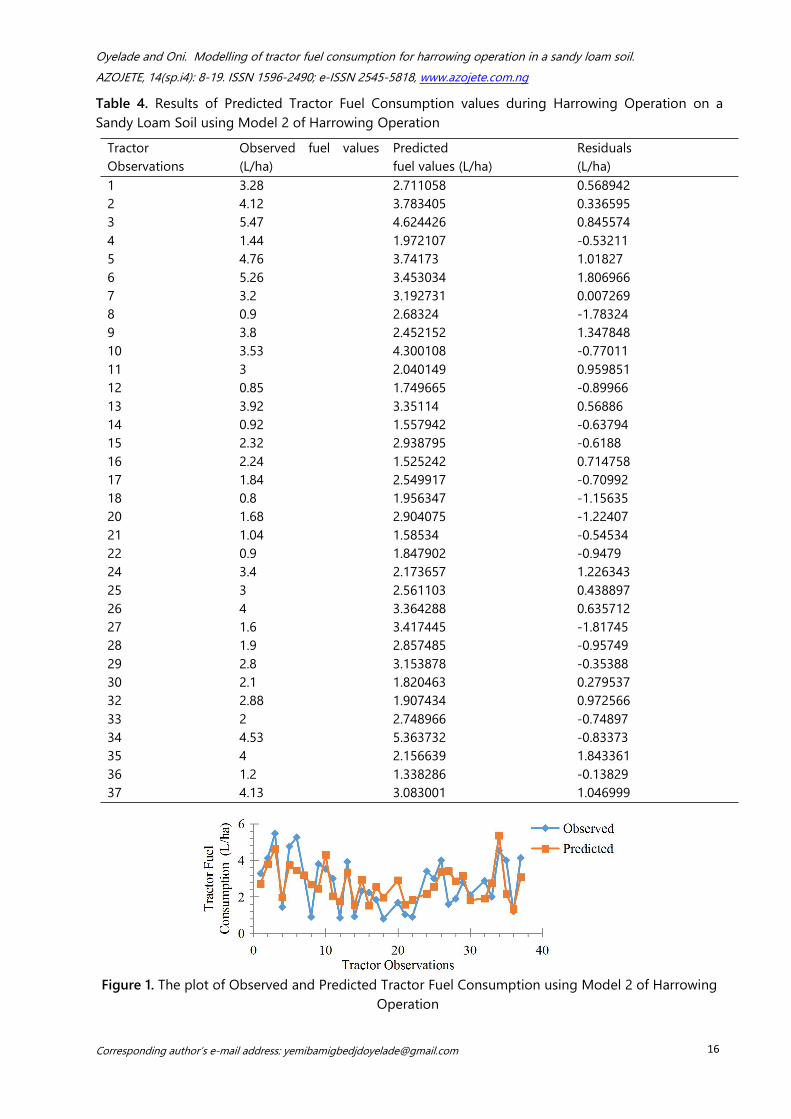
The model equation generated for Model 2 of harrowing operation was used for predictingtractor fuel consumption using the 37 model development dataset. Results obtained from thefuel prediction values of Model 2 of harrowing operation is presented in Table 4. The values forboth observed and predicted tractor fuel consumption of Model 2 of harrowing operation asshown in Table 4 were correlated together and gave a correlation coefficient of 0.690468 asshown in Table 1. According to the rule of thumb as provided inhttp://www.westgard.com/lesson42.html for evaluating correlation coefficient, noted that size ofr with correlation values between 0.50 and 0.69 are said to be moderate. It indicates that tractorfuel consumption predictions of Model 2 of harrowing operation is moderately correlated withthe observed tractor fuel consumption values obtained during harrowing operation on a sandyloam soil. Figure 1 shows the graph plot of observed and predicted tractor fuel consumptionusing Model 2 of harrowing operation.
(13)
Oyelade and Oni. Modelling of tractor fuel consumption for harrowing operation in a sandy loam soil.AZOJETE, 14(sp.i4): 8-19. ISSN 1596-2490; e-ISSN 2545-5818, www.azojete.com.ng
Corresponding author’s e-mail address: [email protected] 16
Table 4. Results of Predicted Tractor Fuel Consumption values during Harrowing Operation on aSandy Loam Soil using Model 2 of Harrowing Operation
Figure 1. The plot of Observed and Predicted Tractor Fuel Consumption using Model 2 of HarrowingOperation
TractorObservations
Observed fuel values(L/ha)
Predictedfuel values (L/ha)
Residuals(L/ha)
1 3.28 2.711058 0.5689422 4.12 3.783405 0.3365953 5.47 4.624426 0.8455744 1.44 1.972107 -0.532115 4.76 3.74173 1.018276 5.26 3.453034 1.8069667 3.2 3.192731 0.0072698 0.9 2.68324 -1.783249 3.8 2.452152 1.34784810 3.53 4.300108 -0.7701111 3 2.040149 0.95985112 0.85 1.749665 -0.8996613 3.92 3.35114 0.5688614 0.92 1.557942 -0.6379415 2.32 2.938795 -0.618816 2.24 1.525242 0.71475817 1.84 2.549917 -0.7099218 0.8 1.956347 -1.1563520 1.68 2.904075 -1.2240721 1.04 1.58534 -0.5453422 0.9 1.847902 -0.947924 3.4 2.173657 1.22634325 3 2.561103 0.43889726 4 3.364288 0.63571227 1.6 3.417445 -1.8174528 1.9 2.857485 -0.9574929 2.8 3.153878 -0.3538830 2.1 1.820463 0.27953732 2.88 1.907434 0.97256633 2 2.748966 -0.7489734 4.53 5.363732 -0.8337335 4 2.156639 1.84336136 1.2 1.338286 -0.1382937 4.13 3.083001 1.046999
Arid Zone Journal of Engineering, Technology and Environment, December, 2018; Vol. 14(sp.i4): 8-19. ISSN 1596-2490;e-ISSN 2545-5818; www.azojete.com.ng
Corresponding author’s e-mail address: [email protected] 17
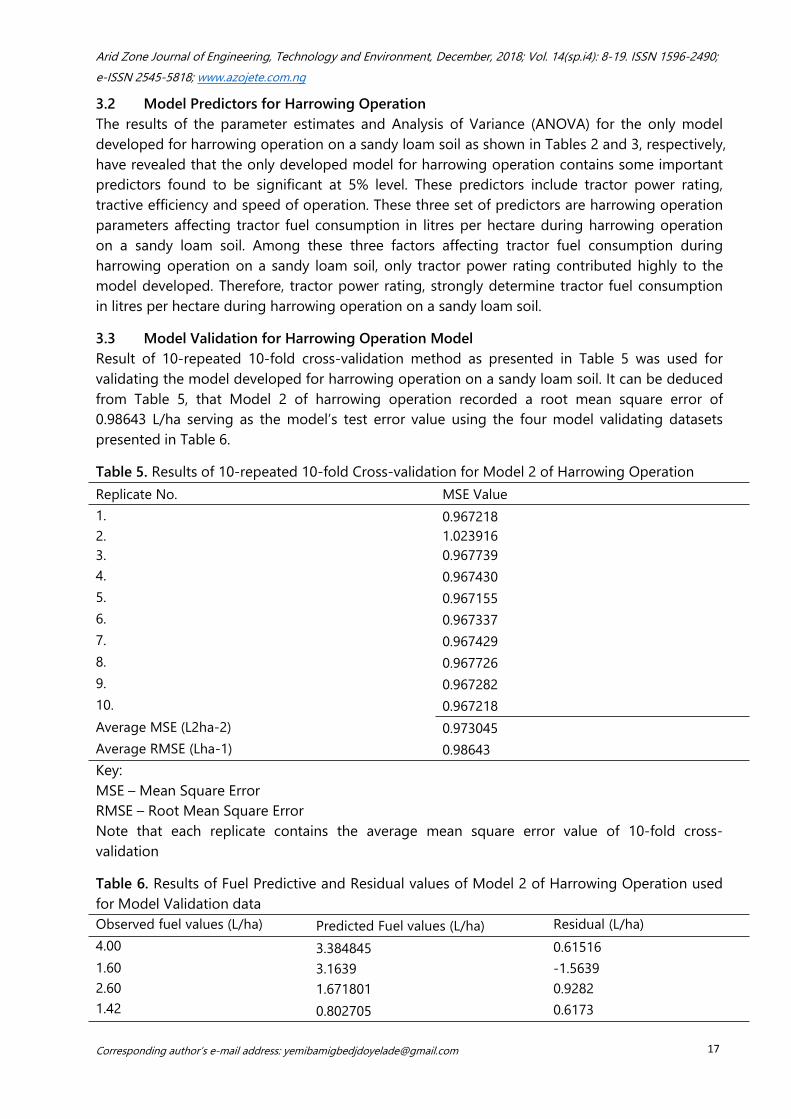
3.2 Model Predictors for Harrowing OperationThe results of the parameter estimates and Analysis of Variance (ANOVA) for the only modeldeveloped for harrowing operation on a sandy loam soil as shown in Tables 2 and 3, respectively,have revealed that the only developed model for harrowing operation contains some importantpredictors found to be significant at 5% level. These predictors include tractor power rating,tractive efficiency and speed of operation. These three set of predictors are harrowing operationparameters affecting tractor fuel consumption in litres per hectare during harrowing operationon a sandy loam soil. Among these three factors affecting tractor fuel consumption duringharrowing operation on a sandy loam soil, only tractor power rating contributed highly to themodel developed. Therefore, tractor power rating, strongly determine tractor fuel consumptionin litres per hectare during harrowing operation on a sandy loam soil.
3.3 Model Validation for Harrowing Operation ModelResult of 10-repeated 10-fold cross-validation method as presented in Table 5 was used forvalidating the model developed for harrowing operation on a sandy loam soil. It can be deducedfrom Table 5, that Model 2 of harrowing operation recorded a root mean square error of0.98643 L/ha serving as the model’s test error value using the four model validating datasetspresented in Table 6.
Table 5. Results of 10-repeated 10-fold Cross-validation for Model 2 of Harrowing OperationReplicate No. MSE Value1. 0.9672182. 1.0239163. 0.9677394. 0.9674305. 0.9671556. 0.9673377. 0.9674298. 0.9677269. 0.96728210. 0.967218Average MSE (L2ha-2) 0.973045Average RMSE (Lha-1) 0.98643Key:MSE – Mean Square ErrorRMSE – Root Mean Square ErrorNote that each replicate contains the average mean square error value of 10-fold cross-validation
Table 6. Results of Fuel Predictive and Residual values of Model 2 of Harrowing Operation usedfor Model Validation dataObserved fuel values (L/ha) Predicted Fuel values (L/ha) Residual (L/ha)4.00 3.384845 0.615161.60 3.1639 -1.56392.60 1.671801 0.92821.42 0.802705 0.6173
Oyelade and Oni. Modelling of tractor fuel consumption for harrowing operation in a sandy loam soil.AZOJETE, 14(sp.i4): 8-19. ISSN 1596-2490; e-ISSN 2545-5818, www.azojete.com.ng
Corresponding author’s e-mail address: [email protected] 18
4.0 ConclusionA study was carried out to develop a model for future prediction of tractor fuel consumptionduring harrowing operation in a sandy loam soil using information gathered from NCAM TractorTest Reports. From the outcome of this study, it can be concluded that:
One effective model with p-value < 0.05 was developed for harrowing operation. Model 2 ofharrowing operation developed for future prediction of tractor fuel consumption in litres perhectare during harrowing operation on a sandy loam soil recorded a coefficient of multipledetermination (R-squared) value of 0.4767.
Harrowing operation parameters such as tractor power rating, the speed of operation andtractive efficiency were found to be statistically significant at 5% level in Model 2 of harrowingoperation with only tractor power rating contributing highly to the model developed.
The model for harrowing operation based on cross-validation result had a test error of 0.98643L/ha.
AcknowledgementWe want to thank members of NCAM tractor testing team for the tremendous work they havebeen doing over the years in the testing of agricultural tractors imported into the country for usein Nigerian agriculture.
ReferenceAjav, EA. and Adewoyin, AO. 2011. The effects of ploughing depth and speed on the fuel
consumption of some commonly used farm tractors in selected states of south westernNigeria. Proceedings of the Nigerian Institution of Agricultural Engineers (NIAE), 32: 114 –122.
Al-Suhaibani, SA. and Ghaly, AE. 2010. Effect of plowing depth of tillage and forward speed onthe performance of a medium size chisel plough operating in a sandy soil. American Journalof Agricultural and Biological Engineers, 5(3):247 – 255.
Anwanane, NB. 2014. Modeling of soil water retention characteristics (SWRCs) from basicproperties on a typical Alfisols in Unilorin Teaching and Research Farm. Unpublished M.Sc.Report of the Department of Agronomy, University of Ilorin, Ilorin, Nigeria.
ASAE Standards. 2000. Uniform terminology for agricultural machinery management. ASAE S495DEC99. pp. 342.
Bouckaert, RR. 2003. Choosing between two learning algorithms based on calibrated tests. Inproceedings of 20th International Conference on Machine Learning. pp. 51 – 58.
Gee, GW. and Or, D. 2002. “Particle size analysis,” In: Dane, J. H., Toop, G. C. (Eds.), Methods ofSoil Analysis Part 4, SSSA. Book Series No.5. Soil Sci. Society of Am., Madison, Wi, USA pp.255-293.http://www.westgard.com/lesson42.html. Accessed 02/12/2015.
Ikpo, C. and Ifem, JLC. 2005. Fuel consumption of tractors – Steyr 768 & 8075 during tillageoperations in Makurdi, Benue State. Proceedings of the Nigerian Institution ofAgricultural Engineers, 27: 60 – 63.
James, G., Witten, D. Hastie, T. and Tibshirani, R. 2013. An introduction to statistical learning withR application. Springer Texts in Statistics 103, DOI 10.1007/978-1-4614-7138-7_1, ©Springer Science + Business Media, New York.
Arid Zone Journal of Engineering, Technology and Environment, December, 2018; Vol. 14(sp.i4): 8-19. ISSN 1596-2490;e-ISSN 2545-5818; www.azojete.com.ng
Corresponding author’s e-mail address: [email protected] 19
Klenin, NI., Popov, IF. and Sakun, VA. 1985. Agricultural machines: theory of operation,computation of controlling parameters and condition of operation. America Publication.New Delhi. pp 15 – 18; 54 – 58.
Kudabo, EA. and Gbadamosi, L. 2012. Effects of forward speed on the performance of a discplough. Journal of Science and Multidisciplinary Research, 4: 25 – 32.
Macmillan, RH. 2002. The mechanics of tractor-implement performance: Theory and WorkedExamples. A Textbook for Students and Engineers. Printed from:http://www.eprints.unimelb.edu.au.
Meshack-Hart, ET. 1997. Selection of tractors for tillage operations in Rivers/Bayelsa State ofNigeria. Proceedings of the Nigerian Society of Agricultural Engineers (NSAE), 19: 28 – 32.
Oyelade, OA. 2016. Modelling of Tractor Fuel Consumption for Tillage Operations in a SandyLoam Soil. Unpublished Ph.D. Report of the Department of Agricultural and BiosystemsEngineering, University of Ilorin, Ilorin, Nigeria.
RNAM. 1983. Regional network for agricultural machinery test codes and procedures for farmmachinery. Technical Series No. 12. General Guidelines in the use of Test Codes.
Serrano, JM., Peca, JO., Silva, JR. and Luis, M. 2009. The Effect of Liquid Ballast and Tyre InflationPressure on Tractor Performance. Biosystems Engineering 102(1):51-62.
Sirelkatim, KA., ALHashem, HA. and Saeed, MO. 2001. The effect of some operating parameterson field performance of a 2WD tractor. Scientific Journal of King Faisal University (Basic andApplied Science), 2 (1): 153 – 166.
Soil Survey Staff. 1975. Soil Taxonomy, A Basic System of Soil Classification for Making andInterpreting Soils. Handbook No. 436, USDA, US Government Printing Office, WashingtonDC.
Udo, DC. and Akubuo, CO. 2004. Fuel consumption in tillage operation for sandy loam soil.Proceedings of the Nigerian Institution of Agricultural Engineers (NIAE), 26: 74 – 83.


