Embed Size (px)
Citation preview

Antibiotics 2021, 10, 222. https://doi.org/10.3390/antibiotics10020222 www.mdpi.com/journal/antibiotics
Article
Modeling the Growth and Death of Staphylococcus aureus
against Melaleuca armillaris Essential Oil at Different
pH Conditions
Daniel Buldain 1,2,*, Lihuel Gortari Castillo 1,2, María Laura Marchetti 1, Karen Julca Lozano 1, Arnaldo Bandoni 3,4
and Nora Mestorino 1
1 Laboratorio de Estudios Farmacológicos y Toxicológicos (LEFyT), Facultad de Ciencias Veterinarias,
Universidad Nacional de La Plata, La Plata B1900, Argentina; [email protected] (L.G.C.);
[email protected] (M.L.M.); [email protected] (K.J.L.); [email protected] (N.M.) 2 Consejo Nacional de Investigaciones Científicas y Técnicas (CONICET), La Plata B1900, Argentina 3 Facultad de Farmacia y Bioquímica, Cátedra de Farmacognosia, Universidad de Buenos Aires,
C.A. de Buenos Aires C1113AAD, Argentina; [email protected] 4 Instituto de Química y Metabolismo del Fármaco (IQUIMEFA), CONICET‐Universidad de Buenos Aires,
C.A. de Buenos Aires C1113AAD, Argentina
* Correspondence: [email protected]
Abstract: Essential oils (EO) are a great antimicrobial resource against bacterial resistance in public
health. Math models are useful in describing the growth, survival, and inactivation of microorgan‐
isms against antimicrobials. We evaluated the antimicrobial activity of Melaleuca armillaris EO ob‐
tained from plants placed in the province of Buenos Aires (Argentina) against Staphylococcus aureus.
The minimum inhibitory and bactericidal concentrations were close and decreased, slightly acidi‐
fying the medium from pH 7.4 to 6.5 and 5.0. This result was also evidenced by applying a sigmoid
model, where the time and EO concentration necessaries to achieve 50% of the maximum effect
decreased when the medium was acidified. Moreover, at pH 7.4, applying the Gompertz model, we
found that subinhibitory concentrations of EO decreased the growth rate and the maximum popu‐
lation density and increased the latency period concerning the control. Additionally, we established
physicochemical parameters for quality control and standardization of M. armillaris EO. Mathemat‐
ical modeling allowed us to estimate key parameters in the behavior of S. aureus and Melaleuca ar‐
millaris EO at different pH. This is interesting in situations where the pH changes are relevant, such
as the control of intracellular infections in public health or the development of preservatives for the
food industry.
Keywords: Staphylococcus aureus; Melaleuca armillaris; essential oil; Gompertz model; Sigmoid
model; antibacterial
1. Introduction
Antimicrobial resistance is a critical problem with a high prevalence in both human
and animal medicine [1]. Essential oils (EO) are a great resource as an alternative therapy,
providing a lot of antimicrobials (ATMs) compounds produced by aromatic plants. In
addition to their usefulness in medicine, essential oils are of great importance in the food
industry to guarantee food preservation and safety [2]. These can act as bacteriostatics or
bactericides in several ways by responding to different action mechanisms and having a
wide variety of target sites, which generally lead to destabilization of the phospholipid
bilayer, destruction of the function and composition of the plasma membrane, loss of vital
intracellular components, and inactivation of enzyme mechanisms [3]. The genus Mela‐
leuca belongs to the Myrtaceae family, which contains a lot of species of plants producing
Citation: Buldain, D.; Gortari
Castillo, L.; Marchetti, M.L.; Julca
Lozano, K.; Bandoni, A.; Mestorino,
N. Modelling the Growth and Death
of Staphylococcus aureus against
Melaleuca armillaris Essential Oil at
Different pH Conditions.
Antibiotics 2021, 10, 222.
https://doi.org/10.3390/
antibiotics10020222
Academic Editor: Carla Sabia
Received: 29 January 2021
Accepted: 19 February 2021
Published: 23 February 2021
Publisher’s Note: MDPI stays neu‐
tral with regard to jurisdictional
claims in published maps and insti‐
tutional affiliations.
Copyright: © 2021 by the authors.
Licensee MDPI, Basel, Switzerland.
This article is an open access article
distributed under the terms and con‐
ditions of the Creative Commons At‐
tribution (CC BY) license (http://cre‐
ativecommons.org/licenses/by/4.0/).

Antibiotics 2021, 10, 222 2 of 14
EO. Among the species of Melaleuca genus, Melaleuca armillaris Sm. is one of the most
widely cultivated. It is commonly known as Honey bracelet myrtle and grows as a small
tree or as a large bush. Investigations by GC‐MS (gas chromatography coupled to mass
spectrometry) of its essential oil revealed the presence of 1.8 cineole as the main compo‐
nent [4–7]. Several authors evaluated the biological activities for this essential oil. For in‐
stance, Rizk et al. (2012) obtained good results in vivo using it for the treatment of the
parasite Schistosoma mansoni, responding to the oxidative activity generated by this path‐
ogen [8]. In vitro inhibitory activity was also found against Staphylococcus aureus [4] and
other bacterial species such as Bacillus subtilis, Staphylococcus epidermidis, Escherichia coli,
and Pseudomonas aeruginosa [9]. Reports about this plant EO are scarce, but these have
potential as antimicrobials, and more studies must be conducted to exploit them. Antibac‐
terial agents from plants can act as important sources of new antibiotics, efflux pump in‐
hibitors, compounds that target bacterial virulence, or can be used in combination with
existing drugs [10].
S. aureus is recognized worldwide as a causative pathogen of different types of infec‐
tions in humans and animals. Moreover, it is commonly found in animals that are in‐
tended for food production such as dairy cows, sheep, and goats, particularly when they
are affected by subclinical mastitis [11], and represent a high risk for human consumption
[12]. This microorganism can express a wide spectrum of pathogenic factors used to colo‐
nize, invade, and infect the host [13]. This pathogen can survive intracellularly contrib‐
uting to the recurrence of infections like mastitis in cows. Despite several ATMs showing
good in vitro activity, the cure rates are low, because the bacteria do not fade to adequate
concentrations and exposure times sufficient to eradicate them [14]. This may be related
to the low intracellular penetration of some ATMs or their loss of activity at the acidic pH
of lysosomes, the low diffusion of acidic ATMs through the lysosomal membrane due to
their high ionization at neutral extracellular or cytoplasmic pH, and the poor retention of
ATMs inside that enter freely [15]. Ideally, the ATMs needed to treat these infections
should penetrate the phagocytic cells in adequate concentrations and time, not be metab‐
olized in the cells, and be active at acidic pH [16].
The change of pH can influence the antimicrobial activity of the different molecules.
For example, β‐lactams increase their potency by acidifying the media [17], while macro‐
lides lose their antibacterial activity with a decrease in pH [18]. This is interesting for the
treatment of intracellular pathogens causing infection such as S. aureus, which can inter‐
nalize in the phagolysosome where the pH is close to 5 [19]. The susceptibility of micro‐
organisms to EO seemed to be higher at lower pH; the hydrophobicity of EO is higher at
low pH, and this favors their dissolution in the lipids of the cell membrane [20].
There are different methods to evaluate antimicrobial activity. A microdilution in
broth is the most common technique, standardized by the Clinical & Laboratory Stand‐
ards Institute (CLSI). This provides very useful parameters like a minimum inhibitory
concentration (MIC) and minimum bactericidal concentration (MBC). The problem with
these parameters is that they give us static information. On the other hand, the time‐kill
assay is a very useful method that describes the antimicrobial activity of a compound dy‐
namically, allowing the analysis of the bacterial behavior in the presence of antimicrobial
along the time [21]. The curves (bacterial concentrations vs. time) obtained by this last
kind of technic can be analyzed by mathematical models. Kinetic models can explain the
behavior of a bacterial inoculum in the time because of the presence of an antimicrobial
or the change of environmental variables [22]. There exist several kinetic models like Gom‐
pertz and square root models that can provide the growth rate (μ), lag period duration
(LPD), and the maximum population density (MPD) [23]. There also exist models to de‐
scribe the survival or the destruction of bacteria over the time, like the sigmoid minus the
base model [24], which is similar to Emax models [25].
Modeling the antimicrobial activity of natural products like EO is mainly associated
to the research of food preservatives [22]. There are no studies on models applied to nat‐
ural products with antimicrobial activity in veterinary medicine. This is a powerful tool

Antibiotics 2021, 10, 222 3 of 14
to understand the behavior of bacteria against new therapeutic alternatives molecules to
control infections.
Our work aimed to describe by mathematical models the behavior of S. aureus against
M. armillaris EO at different pH, emulating extra‐ and intracellular conditions.
2. Results
We obtained 550 mL of EO representing a yield of 1.22% v/w (volume/100 g of fresh
material). In Table 1 is shown the composition of the EO extracted. The M. armillaris EO
isolated for this work presented a liquid consistency with a pale‐yellow color and a pene‐
trating and fresh odor. The other parameters analyzed were the refractive index; density;
pH; solubility in mineral oil, ethanol 70%, and water; acid value; and esterification index
(Table 2).
Table 1. Composition of Melaleuca armillaris essential oil analyzed by gas chromatography‐mass
spectrometry and flame ionization detector (GC‐MS)‐FID. RI: retention index. The polar column
was connected to an FID, whereas the nonpolar column was connected to a MS detector.
Compound RI Nonpolar RI Polar AREA %
1,8‐Cineole 1022 1234 72.3
Limonene 1024 1221 7.8
α‐Pinene 935 1043 6.0
Myrcene 974 1170 2.2
β‐Pinene 979 1133 2.2
α‐Thujene 926 1036 1.5
p‐Cymene 1018 1286 1.4
Terpinen‐4‐ol 1164 1614 1.4
α‐Terpineol 1172 1705 1.4
Sabinene 968 1138 1.0
γ‐Terpinene 1047 1264 0.5
β‐Caryophyllene 1417 1614 0.5
α‐Terpinene 1012 1206 0.2
trans‐β‐Ocimene 1032 1260 0.2
Geranyl acetate 1359 1760 0.2
α‐Phellandrene 1005 1191 0.1
Terpinolene 1082 1305 0.1
δ‐Terpineol 1150 1674 0.1
Aromandendrene 1437 1622 0.1
Geranyl isobutyrate 1496 1794 0.1
cis‐Calamenene 1508 1841 0.1
Oxi‐Caryophyllene 1565 1989 0.1
Table 2. Physicochemical parameters of M. armillaris essential oil.
Parameter Value Obtained
Appearance at 20 °C Oily and transparent liquid
Odor Penetrating, very fresh
Taste Bitter, astringent
Color Pale‐yellow
Density (using pycnometer) 0.89197–0.93013 g/mL
Solubility in mineral oil (1:1) Soluble
Solubility in water (1:10) Partially soluble
Solubility in ethanol 70% (1: 1) Soluble
Refractive index at 20 °C 1.4698 ‐1.4703
Acid value 0.7824
Esterification index 32.8526
Antibiotics 2021, 10, 222 4 of 14
For the MIC determination assay, erythromycin was used for the quality check of the
microdilution method. The MIC of this antibiotic was 0.5 μg/mL for S. aureus ATCC 29213
at pH 7.4 (it must range between 0.25 and 1 μg/mL, according to the CLSI (2013) [26]). The
MIC of M. armillaris EO necessary to inhibit S. aureus ATCC 29213 was 25 μL/mL at pH
7.4 and 6.5 but decreased twofold at pH 5.0. Concerning wild‐type strains, the MIC was
12.5 μL/mL at pH 7.4 for all strains, without a change at pH 6.5 for three strains (SA13,
SA96, and SA139) and decreasing by half for the other strains at pH 6.5 (SA78A, SA79A,
and SA86B). Variations may be due to the existence of bacterial subpopulations with dif‐
ferent sensitivities. At pH 5.0, the MIC decreased by half from that obtained at pH 6.5 (6.25
and 3.1 μL/mL, respectively). Something similar occurred when evaluating the MBC,
since this parameter decreased between 2 and 4 times depending on the strain, comparing
what happened at pH 7.4 and 5.0. The inhibitory and bactericidal concentrations of EO
against the reference strain and the six wild‐type strains are shown in Table 3.
Table 3. The MIC (minimum inhibitory concentration) and MBC (minimum bactericidal concen‐
tration) in μL/mL of each strain analyzed at pH 7.4, 6.5, and 5.0.
Strain pH 7.4 pH 6.5 pH 5.0
MIC MBC MIC MBC MIC MBC
ATCC 29213 25 50 25 50 12.5 25
SA 13 12.5 25 12.5 25 6.25 25
SA 96 12.5 50 12.5 25 6.25 12.5
SA 139 12.5 25 12.5 25 6.25 12.5
SA 78A 12.5 12.5 6.25 6.25 3.1 3.1
SA 79A 12.5 12.5 6.25 6.25 3.1 3.1
SA 86B 12.5 12.5 6.25 6.25 3.1 3.1
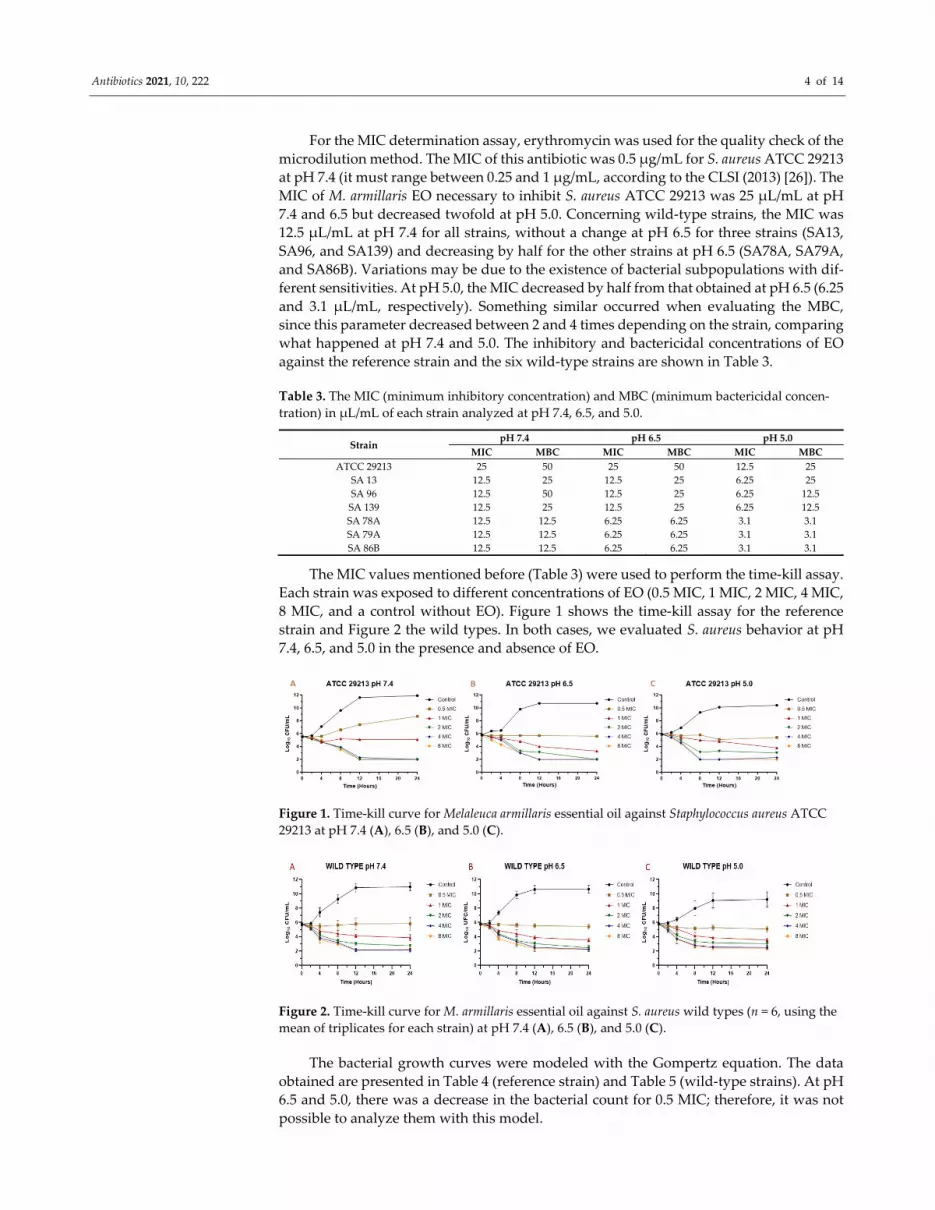
The MIC values mentioned before (Table 3) were used to perform the time‐kill assay.
Each strain was exposed to different concentrations of EO (0.5 MIC, 1 MIC, 2 MIC, 4 MIC,
8 MIC, and a control without EO). Figure 1 shows the time‐kill assay for the reference
strain and Figure 2 the wild types. In both cases, we evaluated S. aureus behavior at pH
7.4, 6.5, and 5.0 in the presence and absence of EO.
Figure 1. Time‐kill curve for Melaleuca armillaris essential oil against Staphylococcus aureus ATCC
29213 at pH 7.4 (A), 6.5 (B), and 5.0 (C).
Figure 2. Time‐kill curve for M. armillaris essential oil against S. aureus wild types (n = 6, using the
mean of triplicates for each strain) at pH 7.4 (A), 6.5 (B), and 5.0 (C).
The bacterial growth curves were modeled with the Gompertz equation. The data
obtained are presented in Table 4 (reference strain) and Table 5 (wild‐type strains). At pH
6.5 and 5.0, there was a decrease in the bacterial count for 0.5 MIC; therefore, it was not
possible to analyze them with this model.

Antibiotics 2021, 10, 222 5 of 14
Table 4. Parameters estimated by the Gompertz model for the ATCC 29213 strain at pH 7.4, 6.5,
and 5.0.
Parameter pH 7.4 pH 6.5 pH 5.0
Control 0.5 MIC Control 0.5 MIC Control 0.5 MIC
R2 0.988 0.908 0.996 ‐ 1.000 ‐
μ (Log10 CFU/mL*hours) 0.74 0.72 0.70 ‐ 0.67 ‐
LPD (hours) 1.80 9.96 2.48 ‐ 2.54 ‐
MPD (Log10 CFU/mL) 12.20 8.66 10.84 ‐ 10.40 ‐
R2: coefficient of determination, μ: growth rate, LPD: latency period duration, MPD: maximum
population density, and CFU: colony‐forming units.
Table 5. Mean of the parameters estimated by the Gompertz model for the wild‐type strains at pH
7.4, 6.5, and 5.0.
Parameter pH 7.4 pH 6.5 pH 5.0
Control 0.5 MIC* Control 0.5 MIC Control 0.5 MIC
R2 0.990 0.972 0.994 ‐ 0.992 ‐
μ (Log10 CFU/mL*hours) 0.72 0.52 0.71 ‐ 0.49 ‐
LPD (hours) 1.86 6.81 1.93 ‐ 2.92 ‐
MPD (Log10 CFU/mL) 12.06 6.86 10.91 ‐ 9.27 ‐
R2: coefficient of determination, μ: growth rate, LPD: latency period duration, and MPD: maxi‐
mum population density. The 0.5 MIC* strain 78A was excluded, because it could not be analyzed
by Gompertz.
Those curves where the bacterial inoculum decreased were analyzed with the sig‐
moid model minus the base, and the parameters obtained are observed in Table 6 (refer‐
ence strain) and Table 7 (wild‐type strains).
Table 6. Parameters estimated by the sigmoid model minus the base for the ATCC 29213 strain at
pH 7.4, 6.5, and 5.0.
Parameter 0.5 MIC 1 MIC 2 MIC 4 MIC 8 MIC
pH 7.4
R2 ‐ 0.925 1.000 1.000 1.000
Nmax (CFU/mL) ‐ 297,000 375,000 371,000 420,000
ϒ ‐ 29.33 1.91 1.70 1.92
TI50 (hours) ‐ 1.96 1.53 1.36 1.36
N0 (CFU/mL) ‐ 410,000 370,000 365,000 415,000
pH 6.5
R2 0.949 0.998 0.990 0.998 1.000
Nmax (CFU/mL) 162,000 679,000 716,000 786,000 591,000
ϒ 5.62 1.48 1.49 1.85 2.68
TI50 (hours) 11.53 2.30 1.94 1.54 1.16
N0 (CFU/mL) 540,000 649,000 679,000 770,000 59,000
pH 5.0
R2 0.776 0.998 1.000 1.000 1.000
Nmax 782,000 897,000 680,000 782,000 821,000
ϒ 1.30 2.48 4.60 3.31 3.35
TI50 (hours) 6.40 2.82 2.54 1.68 1.59
N0 (CFU/mL) 877,000 922,000 680,000 780,000 820,000
R2 is the coefficient of determination, N0 is the initial inoculum concentration, Nmax is the maxi‐
mum drop in the bacterial count, TI50 is the time necessary to reach 50% of the maximum bacterial
inhibition, and ϒ is the sigmoidicity coefficient.

Antibiotics 2021, 10, 222 6 of 14
Table 7. Mean of the parameters estimated by the sigmoid minus the base model for the wild‐type
strains at pH 7.4, 6.5, and 5.0.
Parameter 0.5 MIC 1 MIC 2 MIC 4 MIC 8 MIC
pH 7.4
R2 ‐ 0.968 0.994 0.998 1.000
Nmax (CFU/mL) ‐ 714,000 649,000 657,000 646,000
ϒ ‐ 17.16 3.93 4.02 4.32
TI50 (hours) ‐ 7.62 2.38 2.23 1.87
N0 (CFU/mL) ‐ 673,000 702,000 654,000 640,000
pH 6.5
R2 0.943 0.996 1.000 1.000 1.000
Nmax (CFU/mL) 322,000 633,000 640,000 651,000 595,000
ϒ 23.58 9.67 6.02 4.94 6469.42
TI50 (hours) 5.62 2.83 2.28 1.95 1.65
N0 (CFU/mL) 671,000 604,000 643,000 653,000 595,000
pH 5.0
R2 0.962 0.998 1.000 1.000 1.000
Nmax (CFU/mL) 490,000 667,000 564,000 646,000 634,000
ϒ 6.85 3.44 4.46 4.52 4.50
TI50 (hours) 3.25 2.37 1.71 1.34 1.28
N0 (CFU/mL) 631,000 669,000 563,000 645,000 633,000
R2 is the coefficient of determination, N0 is the initial inoculum concentration, Nmax is the maxi‐
mum drop in the bacterial count, TI50 is the time necessary to reach 50% of the maximum bacterial
inhibition, and ϒ is the sigmoidicity coefficient.
The data obtained in the time‐kill assay allowed us to obtain index E (antibacterial
effect) of the antibacterial activity. In Figure 3, index E vs. the EO concentration is plotted
at the three different pH evaluated. In this way, it is possible to observe the incidence of
pH in the drop of the bacterial count added to the effect of the EO. Table 8 shows the
parameters obtained after modeling this data with the sigmoid model.
Figure 3. Graphic representation of the antibacterial effect (antibacterial effect (E): ΔLog colony‐
forming units (CFU)/mL 24–0 h) of essential oil (EO) against S. aureus ATCC 29213 (A); wild type
(n = 3: SA13, SA96, and SA139, using the mean of triplicates for each strain) (B); and wild type (n =
3: SA78A, SA79A, and SA86B, using the mean of triplicates for each strain) (C). In the three cases
are plotted the E vs. EO concentration at pH 7.4, 6.5, and 5.0.
Table 8. Parameters obtained by the sigmoid model applied to curves of the Index E (antibacterial
effect) (CFU/mL) vs. EO concentration (μL/mL) at pH 7.4, 6.5, and 5.0.
Strain Parameter pH 7.4 pH 6.5 pH 5.0
ATCC 29213
R2 0.996 0.998 0.998
Emax (Log10 CFU/mL) 10.20 8.85 8.63
ϒ 2.42 2.14 1.12
C50 (μL/mL) 17.56 11.13 4.56
E0 (Log10 CFU/mL) 6.36 4.90 4.50
WT (13–96‐139) R2 0.998 1.000 0.998
Emax (Log10 CFU/mL) 9.11 8.46 8.85

Antibiotics 2021, 10, 222 7 of 14
ϒ 2.71 2.51 1.01
C50 (μL/mL) 6.52 5.15 1.50
E0 (Log10CFU/mL) 5.73 5.10 4.90
WT (78A‐79A‐86B)
R2 0.996 0.994 0.978
Emax (Log10 CFU/mL) 9.35 8.56 5.48
ϒ 0.75 1.41 1.68
C50 (μL/mL) 3.13 2.28 1.86
E0 (Log10CFU/mL) 4.70 4.63 1.92
R2 is the coefficient of determination, E0 is the index E (antibacterial index) in the absence of an
antimicrobial, Emax is the maximum reduction in Log10 of E0, C50 is the concentration that causes
50% of the reduction of the Emax, ϒ is the coefficient of sigmoidicity, and WT stands for wild type.
3. Discussion
Physicochemical characterization is important to assess the quality of essential oils.
It is very important for the standardization and design of commercial products, especially
if they are destined for food and healthcare in both animal and human medicines. There
is no information in the literature to compare the physicochemical parameters we ob‐
tained. These represent a starting point for the standardization of M. armillaris EO and
consider them for quality control. The chromatographic analysis of this EO revealed the
presence of 1.8 cineol as the main component (72.3%) and limonene (7.8%) and α‐pinene
(6.0%). These are commonly present in essential oils with high antimicrobial activity. The
1.8 cineole is a monocyclic monoterpene with an important antimicrobial activity and was
found as the main component in M. armillaris EO in other works [5–7]. This compound is,
in general, also the major compound in the essential oil of Eucalyptus species [27].
Falci et al. (2015) studied the composition and the antimicrobial activity of the essen‐
tial oil of a Melaleuca species (not specified) cultivated in Brazil [28]. This essential oil had
70.8% of 1.8 cineole, 8.95% of terpineol, and 8.25% of limonene. The amount of 1.8 cineole,
limonene, and myrcene (1.99%) was similar to the essential oil of M. armillaris obtained in
this work. Although the specie of Melaleuca is not specified, parallelism can be made with
the composition of the mentioned essential oil. These authors demonstrated an important
antimicrobial activity against S. aureus strains with MIC values between 1 and 2 μL/mL
and MBC between 2 and 4 μL/mL. Li et al. (2014) found that the MIC of 1.8 cineol against
S. aureus ATCC 25923 was 6.25 μL/mL [29]. Those value reported were lower than the
obtained in the present study. This can be attributed to a greater sensitivity of the S. aureus
strains used by the authors and/or incidences in the antimicrobial activity of the rest of
the minority components.
The high content of 1.8 cineol may be one of the factors that contribute to the antibac‐
terial activity of the EO, to which the permeabilization of the membranes of microorgan‐
isms such as S. aureus has been attributed as an antimicrobial action mechanism due to its
great hydrophobicity [30,31]. This compound is usually the most abundant in Eucalyptus
globulus essential oil. Yáñez Rueda and Cuadro Mogollón (2012) found an important ac‐
tivity for this species against S. aureus ATCC 29213 (MIC of 12.4 μg/mL), in which its com‐
position was similar to the M. armillaris EO evaluated in this work: 1.8 cineol (82.27%),
limonene (3.70%), α‐pinene (3.16%), terpinen‐4‐ol (1.4%), α‐terpineol (1.2%), β‐myrcene
(1.12%), and α‐terpinene (1.1%), among others [32]. This could indicate a synergism be‐
tween these components particularly effective against strains of S. aureus.
According to the ratio of MIC/MBC, an antimicrobial may be considered bactericidal
or bacteriostatic. A compound is bacteriostatic if the MBC/MIC ratio is greater than 4 [33].
Analyzing the MIC and MBC of the EO, we found that, for strains SA13, SA96, and SA139,
these parameters were the same, and this coincidence was maintained even when the pH
conditions were modified. For the other strains, the MBC/MIC ratio was between 2 and 4,

Antibiotics 2021, 10, 222 8 of 14
maintaining the ratio when acidifying the culture medium. Therefore, it could be consid‐
ered that the EO of M. armillaris has bactericidal activity against S. aureus, which is inde‐
pendent of the pH.
The M. armillaris EO mechanism of action has not yet been investigated against S.
aureus. Hayouni et al. (2008) studied the antimicrobial activity of this species against dif‐
ferent Lactobacillus species [6]. As 1.8 cineole was the main component found (68.92%),
these authors hypothesized that this compound could have destabilized the cytoplasmic
membrane of these bacteria, as was demonstrated by Li et al. (2014) [29]. However, the
way of action postulated for M. armillaris by Hayouni et al. (2008) also involved the mi‐
nority components found (α‐pinene, terpinen‐4‐ol, sabinene, β‐myrcene, and α‐terpinene,
among others) [6]. According to these authors, these molecules interact with the cell mem‐
brane, where they dissolve in the phospholipid bilayer, aligning themselves between the
fatty acid chains. This distortion of the physical structure would cause the expansion and
destabilization of the membrane, increasing the fluidity of the membrane, which, in turn,
would increase the passive permeability.
The MIC and MBC are the parameters most used to quantify the antibacterial activity
of a drug against an infectious pathogen. However, the temporal evaluation of different
concentrations of the antimicrobial against a microorganism allows a better description of
the magnitude of its antibacterial effect [34]. For this reason, it is also important to analyze
what occurs over time through the construction of bacterial death curves. In the time‐kill
assay for the EO against S. aureus (Figures 1 and 2), it is possible to observe a decrease in
the bacterial count after being exposed to the EO. In general, a slight drop in the slope of
the curve was observed with a concentration equivalent to the MIC of the essential oil
against each strain and isolate. However, for concentrations of 0.5 MIC, a relevant rate of
growth was not perceived, and in many cases, there was a decrease in the initial inoculum.
For concentrations of two, four, and eight times the MIC, a drop in the bacterial cell count
was evidenced at two hours, continuing the decrease exponentially until 8–12 h and then
maintaining the bacterial count until 24 h after assay started. This pattern was generally
maintained for all strains, even changing the pH of the medium.
In the case of the reference strain (ATCC 29213) at pH 7.4, it was possible to achieve
a decrease of 2.6 Log10 (colony‐forming units (CFU)/mL) of the initial inoculum for con‐
centrations of two, four, and eight times the MIC. At pH 6.5, the decrease for these con‐
centrations was 2.8 Log10 (CFU/mL). At pH 5.0, the decrease in inoculum was 2.8 for two
MIC, 3.6 for four MIC, and 3.9 Log10 (CFU/mL) for eight MIC. With these results, we can
observe that, at higher concentrations and higher acidity, the antibacterial activity of the
essential oil is higher, being similar for concentrations of four and eight MIC. For strains
SA13, SA96, and SA139, the decrease in the initial inoculum for two MIC at 24 h is 2.7–3.0
Log10 (CFU/mL) at pH 7.4, 3.0–3.2 at pH 6.5, and 2.9–3.2 at pH 5.0. As for four and eight
MIC, the decrease is 2.5–3.5 Log10 (CFU/mL) at pH 7.4, from 3.1–3.7 at pH 6.5, and 3.2–3.9
at pH 5.0. Regarding strains SA78A, SA79A, and SA86B, a fall of 3.1–3.8 Log10 (CFU/mL)
was observed for the three pH values at concentrations of four and eight MIC. In the case
of the two MIC for these strains, the drop in inoculum was between 2.5 and 3.4 Log10
(CFU/mL). The strains analyzed had slight differences in susceptibility against the EO but
the antimicrobial activity improvement by increasing the acidity and EO concentration
was common.
The mathematical modeling of a microorganism response at different conditions or
with an inhibitor compound is very useful to understand its behavior and to predict the
efficacy of a treatment under controlled conditions. To assess the validity of the model
applied, the model must have a good fit to experimental data in terms of R2, which must
range between 0 and 1; the adjustment is better if this parameter is nearer to 1 [22].
The application of the Gompertz model to data obtained from the time‐kill assay al‐
lows us to know parameters like the growth rate (μ), lag period duration (LPD), and the
maximum population density (MPD). We used this model for the bacterial growth being
applied for the control conditions and 0.5 MIC at pH 7.4 (Table 4 and Table 5). With these

Antibiotics 2021, 10, 222 9 of 14
results, we could observe that the presence of EO diminished the μ, extended the LPD,
and reduced the MPD. Something similar occurred in another study using M. armillaris
EO against lactic acid bacteria [6]. These parameters also changed in a same way because
of the pH decrease, highlighting the lower growth capacity of S. aureus under acidic con‐
ditions. Weinrick et al. (2004) found that S. aureus in acidic conditions modifies its gene
expression to promote defense mechanisms against acidity, which can lead to a slower
growth rate [35].
At pH 6.5 and 5.0, only the control increased the bacterial count, so the Gompertz
model was not applied for 0.5 MIC. In this case, and for curves obtained using one MIC,
two MIC, four MIC, and eight MIC (where bacterial death was observed), we applied the
sigmoid minus the base model (Table 6 and Table 7). With this model, we obtained the
TI50 (time to reach 50% of the maximum drop in the bacterial count, Nmax). This parameter
is lower while the EO concentration increases, and the reduction is independent of the
pH. On the other hand, Nmax is much closer to N0 with a higher concentration of EO, indi‐
cating that there is a much greater bacterial effect, since it is possible to eliminate all the
initial inoculum. Navarro‐Cruz et al. (2018) found that, when modeling the antibacterial
effect of the essential oil of Lippia berlandieri against S. aureus, the time needed to decrease
the initial inoculum by 50% was shorter when modifying the pH from 7 to 5 [36], coincid‐
ing with our findings for M. armillaris.
The antibacterial effect (Index E) of EO is shown in Figure 3. The EO improves its
antimicrobial activity at a lower pH, since lower concentrations are required to achieve
the same effect. This behavior was similar for both the reference and wild‐type strains.
Modeling this data by applying a sigmoid model let us obtain different valuable parame‐
ters (Table 8), such as the concentration necessary to reach 50% of the maximum effect
(C50). This parameter was smaller at lower pH for all the strains evaluated. Another im‐
portant parameter is the Emax; this decreases at acidic pH, but we must consider that the
E0 is also smaller; this is because S. aureus is slightly susceptible at acidic pH. The lower
maximum antibacterial effect at a lower pH may be influenced by a lower bacterial growth
capacity, coinciding with that demonstrated by Weinrick et al. (2004) [35]. At high con‐
centrations, the antibacterial effect was similar (and close to virtual eradication) for the
three pH, while at acidic pH, the E0 was lower, which affected the value of the Emax.
4. Materials and Methods
4.1. M. armillaris Essential Oil Extraction
The collection of leaves and herbaceous branches was carried out in Coronel Brand‐
sen, Buenos Aires, Argentina (latitude 35°06’18.9” S and longitude 58°10´57.0” W). A sam‐
ple portion was reserved for identification and further storage at the LPAG herbarium at
the Faculty of Agrarian and Forestry Sciences, UNLP [37]. EO was obtained by steam dis‐
tillation of the whole collected fresh biomass (44.85 kg). Subsequently, the EO was dried
with sodium sulfate anhydrous at room temperature, filtered with a cotton funnel, and
stored at 4 °C in an amber glass bottle.
4.2. Essential Oil Characterization
The EO composition was analyzed by GC–MS‐FID, as we previously described [4].
We performed assays on the established parameters of quality control commonly used for
essential oils [38] to characterize the EO of M. armillaris, since it is not described in the
literature. In this way, the physicochemical characteristics such as appearance at 20 °C,
odor, flavor, color, refractive index, density (using a pycnometer), and pH were analyzed.
Additionally, we checked the solubility in different solvents: mineral oil (1:1); water (1:10),
and ethanol 70% (1:1). On the other hand, the acid value and esterification index were
determined following the recommendations of Argentinian Pharmacopeia VII Ed (2013)
[39]:

Antibiotics 2021, 10, 222 10 of 14
Acid value (amount of free fatty acids, defined as the number of mg of potassium
hydroxide necessary to neutralize the free acids present in 1.0 g of sample): 10.0 g of sam‐
ple, exactly weighed and previously neutralized against phenolphthalein with 0.1‐N so‐
dium hydroxide, were dissolved in 50 mL of alcohol contained in an Erlenmeyer flask
(Becton Dickinson®). One milliliter of phenolphthalein (prepared at 1% in alcohol) was
added, and it was titrated with 0.1‐N potassium hydroxide until a persistent pink colora‐
tion for 30 s. The acid number was calculated as the mg of KOH necessary to neutralize
the free fatty acids in one gram of sample. All reagents were purchased from Sigma Al‐
drich, St. Louis, MO, USA.
Esterification index (defined as the number of mg of potassium hydroxide necessary
to saponify the esters present in 1.0 g of sample): 2 g of sample, exactly weighed, was
transferred to a 250‐mL Erlenmeyer, previously weighed, and 25 mL of neutralized alco‐
hol were added while stirring, and 1 mL of phenolphthalein (prepared in a 1% ethanol
solution) was added. It was titrated with 0.5‐N alcoholic potassium hydroxide until com‐
pletely neutralizing the free fatty acids. Then, 25.0 mL of 0.5‐N alcoholic potassium hy‐
droxide was added. It was heated in a water bath, with an appropriate coolant to maintain
reflux for 30 min, stirring frequently, and excess potassium was titrated with 0.5‐N hydro‐
chloric acid. A determination was made with a blank. The difference between the vol‐
umes, in mL, of 0.5‐N hydrochloric acid consumed by the sample and the blank, multi‐
plied by 28.05, and divided by the weight, in g, of the sample taken, is the esterification
index.
4.3. Inhibitory and Bactericidal Activity of M. armillaris Essential Oil Against S. aureus
Six wild‐type (n = 6) S. aureus isolated, according to National Mastitis Council proce‐
dure [40], from subclinical mastitis Holstein cows were used. The protocol followed the
Guide for the Care and Use of Agricultural Animals in Agricultural Research and Teach‐
ing (Federation of Animal Science Societies—FASS) and was approved by the Institutional
Committee (CICUAL) of the Faculty of Veterinary Sciences, National University of La
Plata, Buenos Aires, Argentina (47.3.15J). The strains were identified phenotypically as a
Gram‐positive, catalase‐positive, β‐hemolytic, Voges Proskauer‐positive fermentation of
trehalose, mannitol, and maltose. The isolates are part of the strains collection of our La‐
boratory (Laboratorio de Estudios Farmacológicos y Toxicológicos -LEFyT- Faculty of Veteri-nary Sciences, UNLP). Minimum inhibitory concentration (MIC) and minimum bactericidal
concentration (MBC) of EO were established by broth microdilution method in 96‐well
polystyrene microplates (Becton Dickinson®). Mueller Hinton Broth (MHB) culture me‐
dium was used with the addition of 0.5% of Tween 80. This surfactant enhanced the dis‐
solution of the EO in the aqueous culture medium. MICs and MBCs were evaluated at 3
different pH to emulate extracellular and intracellular (inside cytosol or phagolysosome)
conditions where S. aureus was internalized (7.4, 6.5, and 5.0, respectively). This pH ad‐
justment of the medium was carried out by addition of HCl to the broth. The range of
essential oil concentrations evaluated was 50 to 0.09 μL/mL, and each plate was inoculated
with a final bacterial concentration of 5 × 10⁵ CFU/mL and incubated at 35 °C for 18–24 h.
MIC was established as the lowest concentration inhibiting bacterial growth. Positive
(without antimicrobials) and negative controls (without antimicrobials and inoculums)
with MHB containing 0.5% Tween 80 were performed. Every determination for each
strain was evaluated at the different 3 pH conditions by triplicate. For quality control, S.
aureus ATCC 29213® was used, and the susceptibility to erythromycin was checked for this
strain by the control procedure [26].
Once the MIC was established, 25 μL were taken from each well, showing no evident
bacterial growth, then inoculated individually in nutritive agar plates for colony counting
after incubation at 35 °C for 18–24 h. MBC was the lowest antimicrobial concentration in
which the initial inoculum fell (99.9%).

Antibiotics 2021, 10, 222 11 of 14
4.4. Time‐kill Assay and Antibacterial Activity Index of the EO
Once the MICs of the EO and its combinations were identified, data were used to
perform time‐kill assays to evaluate the antibacterial activity index (E). Each S. aureus
strains were faced with different concentrations (0.5 MIC, 1 MIC, 2 MIC, 4 MIC, and 8
MIC) of EO, including the quality control strain S. aureus ATCC 29213®.
We prepared 7 tubes, one for each concentration, and a positive (without antimicro‐
bials) and a negative (without antimicrobials and inoculums) control. Each one contained
a final volume of 1 mL including MHB with 0.5% Tween 80 (pH 7.4, 6.5, and 5.0), antimi‐
crobials, and a final inoculum of 5 × 10⁵ CFU/mL. Incubations were carried out at 35 °C.
Bacterial plate count was carried out at the initial time, 2, 4, 8, 12, and 24 h after incubating
at 35 °C by 24 h. The assay was performed in triplicate for each strain.
Data obtained in the time‐kill assay was used to create CFU/mL vs. time graphs and
to evaluate the antibacterial activity index (E). Once E indexes were obtained, we graphed
the E index vs. EO concentration (Log10) to compare what happens at the 3 pH evaluated.
The wild strains were grouped according to the MIC, obtaining two groups of three strains
for each one (using the mean of triplicates for each strain). Graphics were plotted using
the GraphPad Prism 6 program (GraphPad Software, Inc).
E index was defined as the difference in Log10 between the bacterial count (CFU/mL)
at the initial time (nt‐0) and at the end of the test (nt‐24): E = (nt‐24)‐(nt‐0). We considered
3 theoretical breakpoints to establish the bacteriostatic effect (E = 0), bactericidal effect (E
= −3), and effect of virtual eradication of bacteria (E = −4) [41].
4.5. Modeling Bacterial Growth and Death for S. aureus in Presence of EO
With data obtained in the time‐kill assay, we carried out the mathematical modeling
to describe the growth and death of S. aureus in presence of EO. For growth, we applied
the Gompertz model obtaining the specific growth rate (μ), the lag phase duration (LPD),
and the maximum population density (MPD) [23]. The mathematical expression of this
model is:
Log N = a + c. exp (−exp (−b (t−m))) (1)
where Log N is the decimal logarithm of the microbial counts (Log10 CFU/mL) at time t
(hours), a is the Log10 of the asymptotic bacterial counts when the time decreases indefi‐
nitely (Log10 CFU/mL), c is the Log10 of the asymptotic counts when the time increases
indefinitely (Log10 CFU/mL), m is the time required to reach the maximum growth rate
(hours), and b is the growth rate relative to time m (hours−1). Therefore, we can obtain: μ
= b. c/e (Log10 CFU/mL. hours), where e = 2.7182, LPD = m ‐1/b (hours), and MPD = a + c
(Log10 CFU/mL). The equation was fitted to the microbial development data using a non‐
linear regression with the Sigma Plot program (Sigma Plot 12.0, 2011), since the parame‐
ters of the Gompertz model are nonlinear.
In the case of the curves where bacterial death was observed, the experimental data
of CFU/mL vs. time were fitted with a sigmoid model minus the base:
N = N0 − (Nmax. Tγ)/(TI50γ + Tγ) (2)
where N is the bacterial count (CFU/mL) at time T (hours), N0 is the initial inoculum con‐
centration (CFU/mL), Nmax is the maximum drop in the bacterial count (CFU/mL), TI50 is
the time necessary to reach 50% of the maximum bacterial inhibition (hours), and ϒ is the sigmoidicity coefficient. Experimental data were fitted with the nonlinear least squares
regression model using the software Sigma Plot 12.0, as mentioned before.
Finally, we applied the sigmoid model, which is analogous to the maximum re‐
sponse, or Hill [25,42] to the values of index E vs. EO concentration to understand the
mechanics of the relationship between the concentration of these and their bactericidal
effects and, thus, be able to obtain more information about the behavior of S. aureus under
the different conditions evaluated. Redefining the previous equation:

Antibiotics 2021, 10, 222 12 of 14
E = E0 − (Emax. Cγ)/(C50γ + Cγ) (3)
where E is the index E (Log10 CFU/mL) for a concentration C (μL/mL), E0 is the index E in
the absence of the antimicrobial (Log10 CFU/mL), Emax is the maximum reduction in Log10
of E0, C50 (μL/mL) is the concentration that causes 50% of the reduction of the Emax, and ϒ is the coefficient of sigmoidicity. The experimental data were fitted with the nonlinear
least squares regression model using Sigma Plot software (Sigma Plot 12.0, 2011).
5. Conclusions
The essential oil of M. armillaris has good antimicrobial activity against S. aureus. This
improves slightly with the acidification of the culture medium and presents a bactericidal
activity where the MBC is close to the MIC. The analysis of biological systems using math‐
ematical models allows to obtain more information that simplifies collecting data from the
observation of the results of an in vitro test. We highlighted the antimicrobial potential of
M. armillaris EO against S. aureus under acidic conditions, resulting in an interesting factor
for the control of S. aureus infections and food contamination.
Author Contributions: Conceptualization, N.M. and D.B.; methodology, D.B. and N.M.; software,
D.B.; validation, D.B and M.L.M.; formal analysis, D.B.; GC analysis, A.B.; investigation, D.B.,
L.G.C., and K.J.L.; material preparation, L.G.C. and K.J.L.; resources, N.M.; writing—original draft
preparation, D.B., L.G.C., and K.J.L.; writing—review and editing, D.B., M.L.M., and N.M.; super‐
vision, N.M.; project administration, N.M.; and funding acquisition, N.M. All authors have read
and agreed to the published version of the manuscript.
Funding: This work was partially financed by the Laboratory of Pharmacological and Toxicologi‐
cal Studies (LEFyT) and the National Agency for Scientific and Technical Promotion (ANPCyT)
(PICT 15‐831).
Data Availability Statement: The data presented in this study are available on request from the
corresponding author.
Acknowledgments: The authors thank the National Scientific and Technical Research Council
(CONICET) for their collaboration in granting Ph.D. scholarships, and the National Agency for
Scientific and Technical Promotion (ANPCyT) (PICT 15‐831).
Conflicts of Interest: The authors declare no conflicts of interest.
References
1. Collignon, P.J.; McEwen, S.A. One Health‐Its Importance in Helping to Better Control Antimicrobial Resistance. Trop. Med.
Infect. Dis. 2019, 4, 22, doi:10.3390/tropicalmed4010022.
2. Shaaban, H.A. Essential Oil as Antimicrobial Agents: Efficacy, Stability, and Safety Issues for Food Application. In Essential
Oils—Bioactive Compounds, New Perspectives and Applications; Santana de Oliveira, M., Almeida da Costa, W., Gomes Silva, S.,
Eds.; IntechOpen Limited: London, UK, 2020; pp. 1–33, doi:10.5772/intechopen.92305.
3. Nazzaro, F.; Fratianni, F.; De Martino, L.; Coppola, R.; De Feo, V. Effect of essential oils on pathogenic bacteria. Pharmaceuticals
2013, 6, 1451–1474, doi:10.3390/ph6121451.
4. Buldain, D.; Buchamer, A.V.; Marchetti, M.L.; Aliverti, F.; Bandoni, A.; Mestorino, N. Combination of Cloxacillin and Essential
Oil of Melaleuca armillaris as an Alternative Against Staphylococcus aureus. Front. Vet. Sci. 2018, 5, 177,
doi:10.3389/fvets.2018.00177.
5. Chabir, N.; Romdhane, M.; Valentin, A.; Moukarzel, B.; Marzoug, H.N.; Brahim, N.B.; Mars, M.; Bouajila, J. Chemical study and
antimalarial, antioxidant, and anticancer activities of Melaleuca armillaris (Sol Ex Gateau) Sm essential oil. J. Med. Food 2011, 14,
1383–1388, doi:10.1089/jmf.2010.0168.
6. Hayouni, E.A.; Bouix, M.; Abedrabba, M.; Leveau, J.Y.; Hamdi, M. Mechanism of action of Melaleuca armillaris (Sol. Ex Gaertu)
Sm. essential oil on six LAB strains as assessed by multiparametric flow cytometry and automated microtiter‐based assay. Food
Chem. 2008, 111, 707–718.
7. Silva, C.J.; Barbosa, L.C.; Maltha, C.R.; Pinheiro, A.L.; Ismail, F.M. Comparative study of the essential oils of seven Melaleuca
(Myrtaceae) species grown in Brazil. Flavour Fragr. J. 2007, 22, 474–478, doi:10.1002/ffj.1823.
8. Rizk, M.; Ibrahim, N.; El‐Rigal, N. Comparative In vivo Antioxidant Levels in Schistosoma mansoni Infected mice Treated with
Praziquantel or Essential Oil of Melaleuca armillaris Leaves. Pak. J. Biol. Sci. 2012, 15, 971–978, doi:10.3923/pjbs.2012.971.978.

Antibiotics 2021, 10, 222 13 of 14
9. Amri, I.; Mancini, E.; De Martino, L.; Marandino, A.; Hamrouni, L.; Mohsen, H.; Bassem, J.; Scognamiglio, M.; Reverchon, E.;
De Feo, V. Chemical Composition and Biological Activities of the Essential Oils from Three Melaleuca Species Grown in Tunisia.
Int. J. Mol. Sci. 2012, 13, 16580–16591, doi:10.3390/ijms131216580.
10. Mushtaq, S.; Shah, A.M.; Shah, A.; Lone, S.A.; Hussain, A.; Hassan, Q.P.; Ali, M.N. Bovine mastitis: An appraisal of its alternative
herbal cure. Microb. Pathog. 2018, 114, 357–361, doi:10.1016/j.micpath.2017.12.024.
11. Stewart, G.C. Staphylococcus aureus. In Foodborne pathogens: Microbiology and Molecular Biology; Fratamico, P.M., Bhunia, A.K.,
Smith, J.L., Eds.; Caister Academic Press: Norfolk, UK, 2005; pp. 273–284.
12. Pal, M.; Berhanu, G.; Megersa, L.; Ramana, K. Epidemiology, Pathogenicity, Animal Infections, Antibiotic Resistance, Public
Health Significance, and Economic Impact of Staphylococcus Aureus: A Comprehensive Review. Am. J. Public Health Res. 2020, 8,
14–21, doi:10.12691/ajphr‐8‐1‐3.
13. Monistero. V.; Graber, H.U.; Pollera, C.; Cremonesi, P.; Castiglioni, B.; Bottini, E.; Ceballos‐Marquez, A.; Lasso‐Rojas, L.;
Kroemker, V.; Wente, N.; et al. Staphylococcus aureus Isolates from Bovine Mastitis in Eight Countries: Genotypes, Detection of
Genes Encoding Different Toxins and Other Virulence Genes. Toxins 2018, 10, 247, doi:10.3390/toxins10060247.
14. Mestorino, N.; Errecalde, J. Pharmacokinetic‐Pharmacodynamic considerations for bovine mastitis treatment. In A Bird’s‐Eye
View of Veterinary Medicine; Pérez Marín, C.C., Ed.; InTech: Rijeka, Croatia, 2012; pp. 423–472, doi:10.5772/31721.
15. Gruet, P.; Maincent, P.; Berthelot, X.; Kaltsatos, V. Bovine mastitis and intramammary drug delivery: Review and perspectives.
Adv. Drug. Deliv. Rev. 2001, 50, 245–259, doi:10.1016/s0169‐409x(01)00160‐0.
16. Algharib, S.A.; Dawood, A.; Xie, S. Nanoparticles for treatment of bovine Staphylococcus aureus mastitis. Drug deliv. 2020, 27,
292–308, doi:10.1080/10717544.2020.1724209.
17. Llinares, P.; Barberán, J.; Montejo, M.; Salavert, M.; Alvarez‐Rocha, L.; Maseda, E.; Moreno, A.; Pasquau, J.; Gómez, J.; Parra, J.;
et al. Guía de tratamiento antimicrobiano de la infección por Staphylococcus aureus. Rev. Esp. Quimioter. 2013, 26, 1–84.
18. Shryock, T.R.; Mortensen, J.E.; Baumholtz, M. The effects of macrolides on the expression of bacterial virulence mechanisms. J.
Antimicrob. Chemother. 1998, 41, 505–512, doi:10.1093/jac/41.5.505.
19. Lemaire, S.; Van Bambeke, F.; Mingeot‐Leclercq, M.P.; Glupczynski, Y.; Tulkens, P.M. Intraphagocytic Methicillin‐Resistant
Staphylococcus aureus are susceptible to Meropenem and Cloxacillin: Role of acid pH. Antimicrob. Agents Chemother. 2007, 51,
1627–1632, doi:10.1128/AAC.01192‐06.
20. Juven, B.J.; Kanner, J.; Schved, F.; Weisslowicz, H. Factors that interact with the antibacterial action of thyme essential oil and
its active constituents. J. Appl. Bacteriol. 1994, 76, 626–631, doi:10.1111/j.1365‐2672.1994.tb01661.x.
21. Andraud, M.; Chauvin, C.; Sanders, P.; Laurentie, M. Pharmacodynamic modeling of in vitro activity of marbofloxacin against
Escherichia coli strains. Antimicrob. Agents Chemother. 2011, 55, 756–761, doi:10.1128/AAC.00865‐10.
22. Jaiswal, A.K.; Jaiswal, S. Modelling the effects of natural antimicrobials as food preservatives. In Handbook of Natural Antimicro‐
bials for Food Safety and Quality; Taylor, M., Ed.; Woodhead Publishing Limited: Cambridge, UK, 2014; pp. 259–284.
23. Whiting, R.C.; Buchanan, R.L. Microbial modeling. Food Technol. 1994, 48, 113–119.
24. Mocada Cardenas, A. Farmacocinética y Farmacodinamia Intracelular de Antimicrobianos Utilizados en la Terapia de la Mas‐
titis Subclínica Bovina por Staphylococcus aureus. Doctoral Thesis, FCV‐UNLP, La Plata, Argentina, 2017,
doi:10.35537/10915/58588.
25. Yu, Y.; Rüppel, D.; Weber, W.; Derendorf, H. PK/PD Approaches. In Drug Discovery and Evaluation: Methods in Clinical Pharma‐
cology; Hock, F., Gralinski, M., Eds.; Springer International Publishing: Cham, Switzerland, 2018; pp. 1–23, doi:10.1007/978‐3‐
319‐56637‐5_26‐1.
26. CLSI. Performance Standards for Antimicrobial Disk and Dilution Susceptibility Tests for Bacteria Isolated from Animals; Second Infor‐
mational Supplement. CLSI Document VET01‐S2; Clinical and Laboratory Standards Institute: Wayne, PA, USA, 2013.
27. Rodríguez, P.; Sierra, W.; Rodríguez, S.; Menéndez, P. Biotransformation of 1,8‐cineole, the main product of Eucalyptus oils.
Electron. J. Biotechnol. 2006, 9, doi:10.4067/S0717‐34582006000300011.
28. Falci, S.P.P.; Teixeira, M.A.; Chagas, P.F.; Martinez, B.B.; Teixeira Loyola, A.B.A.; Ferreira, L.M.; Veiga, D.F. Antimicrobial ac‐
tivity of Melaleuca sp. oil against clinical isolates of antibiotics resistant Staphylococcus aureus. Acta Cir. Bras. 2015, 30, 491–496,
doi:10.1590/S0102‐865020150070000007.
29. Li, L.; Li, Z.W.; Yin, Z.Q.; Wei, Q.; Jia, R.Y.; Zhou, L.J.; Xu, J.; Song, X.; Zhou, Y.; Du, Y.H.; et al. Antibacterial activity of leaf
essential oil and its constituents from Cinnamomum longepaniculatum. Int. J. Clin. Exp. Med. 2014, 7, 1721–1727.
30. Carson, C.F.; Hammer, K.A.; Riley, T.V. Melaleuca alternifolia (Tea Tree) Oil: A Review of Antimicrobial and Other Medicinal
Properties. Clin. Microbiol. Rev. 2006, 19, 50–62, doi:10.1128/CMR.19.1.50‐62.2006.
31. Oliveira, K.A.R.; Sousa, J.P.; Medeiros, J.A.C.; Figueiredo, R.C.B.Q.; Maganni, M.; de Siqueira, J.P., Jr.; Leite de Souza, E. Syner‐
gistic inhibition of bacteria associated with minimally processed vegetables in mixed culture by carvacrol and 1,8‐cineole. Food
Control 2015, 47, 334–339, doi:10.1016/j.foodcont.2014.07.014.
32. Yáñez Rueda, X.; Cuadro Mogollón, O.F. Composición química y actividad antibacteriana del aceite esencial de las especies
Eucalyptus globulus y E. camaldulensis de tres zonas de Pamplona (Colombia). Bistua: Rev. Fac. Cienc. Básicas 2012, 10, 52–61.
33. Pankey, G.A.; Sabath, L.D. Clinical Relevance of Bacteriostatic versus Bactericidal Mechanisms of Action in the Treatment of
Gram‐Positive Bacterial Infections. Clin. Infect. Dis. 2004, 38, 864–870, doi:10.1086/381972.
34. Craig, W.A. Pharmacokinetic/pharmacodynamic parameters: Rationale for antibacterial dosing of mice and men. Clin. Infect.
Dis. 1998, 26, 1–12, doi:10.1086/516284.

Antibiotics 2021, 10, 222 14 of 14
35. Weinrick, B.; Dunman, P.M.; McAleese, F.; Murphy, E.; Projan, S.J.; Fang, Y.; Novick, R.P. Effect of mild acid on gene expression
in Staphylococcus aureus. J. Bacteriol. 2004, 186, 8407–8423, doi:10.1128/JB.186.24.8407‐8423.2004.
36. Navarro‐Cruz, A.R.; Ochoa‐Velasco, C.E.; Caballero‐Alvarez, F.J.; Lazcano‐Hernández, M.A.; Vera‐López, O.; López‐Malo, A.;
Avila‐Sosa, R. Effect of pH and Mexican Oregano (Lippia berlandieri Schauer) Essential Oil Added to Carboxymethyl Cellulose
and Starch Edible Films on Listeria monocytogenes and Staphylococcus aureus. J. Food Qual. 2018, 2018, 1–6,
doi:10.1155/2018/1659394.
37. Holmgren, P.K.; Holmgren, N.H.; Barnett, L.C. Index Herbariorum, Part I: The Herbaria of the World, 8th ed.; The New York Botanic
Garden Press: New York, NY, USA, 1990.
38. Plaza, M.; Ricalde, M. Establecer parámetros de control de calidad físico‐químicos del aceite esencial del Schinus molle l. obtenido
por arrastre de vapor. Rev. Cienc. Tecnol. Innovación 2015, 11, 693–696.
39. Farmacopea Argentina, 7th ed.; Ministerio de salud de la nación, ANMAT, INAME: Buenos Aires, Argentina, 2003; Volume 1.
40. NMC. Laboratory Handbook on Bovine Mastitis; National Mastitis Council Inc.: Madison, WI, USA, 1999.
41. Sidhu, P.; Landoni, M.; Aliabadi, F.; Lees, P. PK‐PD integration and modeling of marbofloxacin in sheep. Res. Vet. Sci. 2010, 88,
134–141, doi:10.1016/j.rvsc.2009.05.013.
42. Weidmann, C.; Dell’Elce, A. Evaluación de la Actividad Antibacteriana In Vitro de Marbofloxacina Sobre Escherichia coli; Entre
la Biología Descriptiva y el Modelo Matemático. In Proceedings of the XXI Encuentro de Jóvenes Investigadores de la Univer‐
sidad Nacional del Litoral, Santa Fe, Argentina, 3–4 October 2017. Available online: https://bibliotecavir‐
tual.unl.edu.ar:8443/handle/11185/1893 (accessed on 9 September 2020).