Embed Size (px)
Citation preview
MLA annual report 2009-10Partners from paddock to plate
MLA annual report 2009-10Partners from paddock to plate
1 Highlights2 Chairman’s report
4 Managing Director’s report
6 About MLA6 How we work 7 What we do 7 Our partnership with industry
and government8 How we evaluate our work
9 Corporate sustainability9 Our staff 10 Our organisation structure12 Our members 14 The Australian community15 Protecting the environment16 Our financial position 17 Five years at a glance
18 REVIEW OF OPERATIONS
19 Increasing market access20 Highlights 20 Operating environment21 Setting standards 21 Breaking down barriers22 Maintaining and liberalising access to
world meat markets22 Maximising market options for the
livestock export trade
23 Growing demand24 Highlights 24 Operating environment26 Feeling good about buying red meat26 Red meat for mind over matter27 Aggressive promotion in the domestic
market28 Aggresive promotion in export markets29 The proof of the pudding30 Boosting carcase value
31 Enhancing competitiveness and sustainability
32 Highlights 32 Operating environment33 Caring for our animals35 Caring for our land37 Farming for our future38 Improving industry and market
information
39 Increasing industry capability40 Highlights 40 Operating environment41 Information equals profitability42 Building world class skills and
innovation capability
44 CORPORATE GOVERNANCE44 Corporate governance statement 48 Directors’ report52 Auditor independence declaration
53 FINANCIAL STATEMENTS53 Income statement54 Balance sheet55 Statement of recognised income and
expense56 Statement of cash flows57 Notes to the financial statements78 Directors’ declaration79 Independent audit report
80 USEFUL INFORMATION80 Summary of key documents80 Glossary of terms80 Table and chart index
IBC INDEX
Who we areMeat & Livestock Australia (MLA) is a producer-owned company. We provide marketing, innovation and research services and solutions to the Australian red meat industry, including livestock producers and lot feeders, meat processors, wholesalers, food service operators, retailers and exporters of red meat and livestock.
We are funded by:
transaction levies paid on livestock sales•
Australian Government dollar-for-dollar funds for investment in •research and development
voluntary contributions from individual processors, wholesalers, •foodservice operators and retailers
contributions from processor and livestock export industry bodies•
See page 16 for the relative contribution of each to total revenue.
Our vision
A profitable and sustainable meat and livestock industry that meets consumer and community expectations
Our mission
To deliver world-class services and solutions in partnership with industry and government
Our values
Collaborate with stakeholders•
Seek excellence•
Deliver value•
Work as a team and meet deadlines•
Act with integrity•
Never forget where the money comes from •
Published by Meat & Livestock Australia Limited, ABN 39 081 678 364
October 2010
© Meat & Livestock Australia Limited (2010)ISBN:
Meat & Livestock Australia acknowledges the matching funds provided by the Australian Government to support the research and development detailed in this report.
“In 2009-10, MLA continued to partner with all sectors of the red meat supply chain to improve market access, grow demand, increase competitiveness and sustainability and build the industry’s capabilities from paddock to plate. This partnership has seen the Australian industry navigate its way through a challenging economic climate.” David Palmer, MLA Managing Director
Contents
1HIGHLIGHTS 2009-10
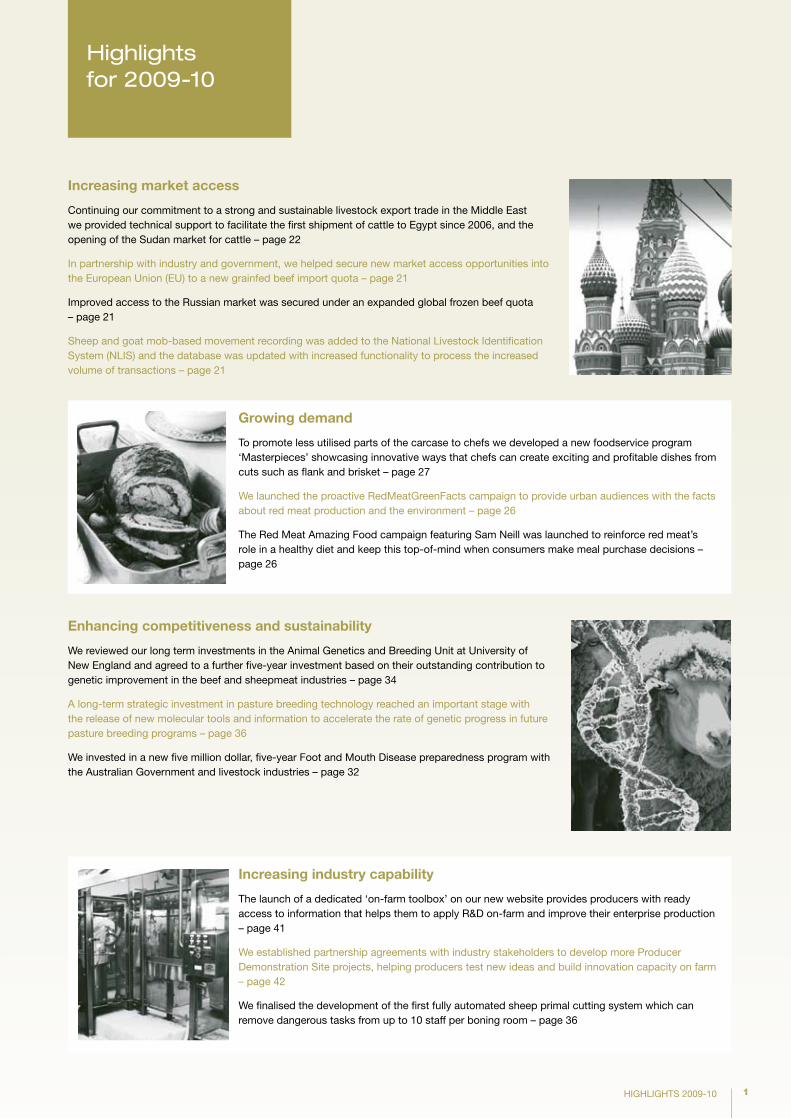
Highlights for 2009-10
Increasing market access
Continuing our commitment to a strong and sustainable livestock export trade in the Middle East we provided technical support to facilitate the first shipment of cattle to Egypt since 2006, and the opening of the Sudan market for cattle – page 22
In partnership with industry and government, we helped secure new market access opportunities into the European Union (EU) to a new grainfed beef import quota – page 21
Improved access to the Russian market was secured under an expanded global frozen beef quota – page 21
Sheep and goat mob-based movement recording was added to the National Livestock Identification System (NLIS) and the database was updated with increased functionality to process the increased volume of transactions – page 21
Enhancing competitiveness and sustainability
We reviewed our long term investments in the Animal Genetics and Breeding Unit at University of New England and agreed to a further five-year investment based on their outstanding contribution to genetic improvement in the beef and sheepmeat industries – page 34
A long-term strategic investment in pasture breeding technology reached an important stage with the release of new molecular tools and information to accelerate the rate of genetic progress in future pasture breeding programs – page 36
We invested in a new five million dollar, five-year Foot and Mouth Disease preparedness program with the Australian Government and livestock industries – page 32
Increasing industry capability
The launch of a dedicated ‘on-farm toolbox’ on our new website provides producers with ready access to information that helps them to apply R&D on-farm and improve their enterprise production – page 41
We established partnership agreements with industry stakeholders to develop more Producer Demonstration Site projects, helping producers test new ideas and build innovation capacity on farm – page 42
We finalised the development of the first fully automated sheep primal cutting system which can remove dangerous tasks from up to 10 staff per boning room – page 36
Growing demand
To promote less utilised parts of the carcase to chefs we developed a new foodservice program ‘Masterpieces’ showcasing innovative ways that chefs can create exciting and profitable dishes from cuts such as flank and brisket – page 27
We launched the proactive RedMeatGreenFacts campaign to provide urban audiences with the facts about red meat production and the environment – page 26
The Red Meat Amazing Food campaign featuring Sam Neill was launched to reinforce red meat’s role in a healthy diet and keep this top-of-mind when consumers make meal purchase decisions – page 26
2 CHAIRMAN’S REPORT
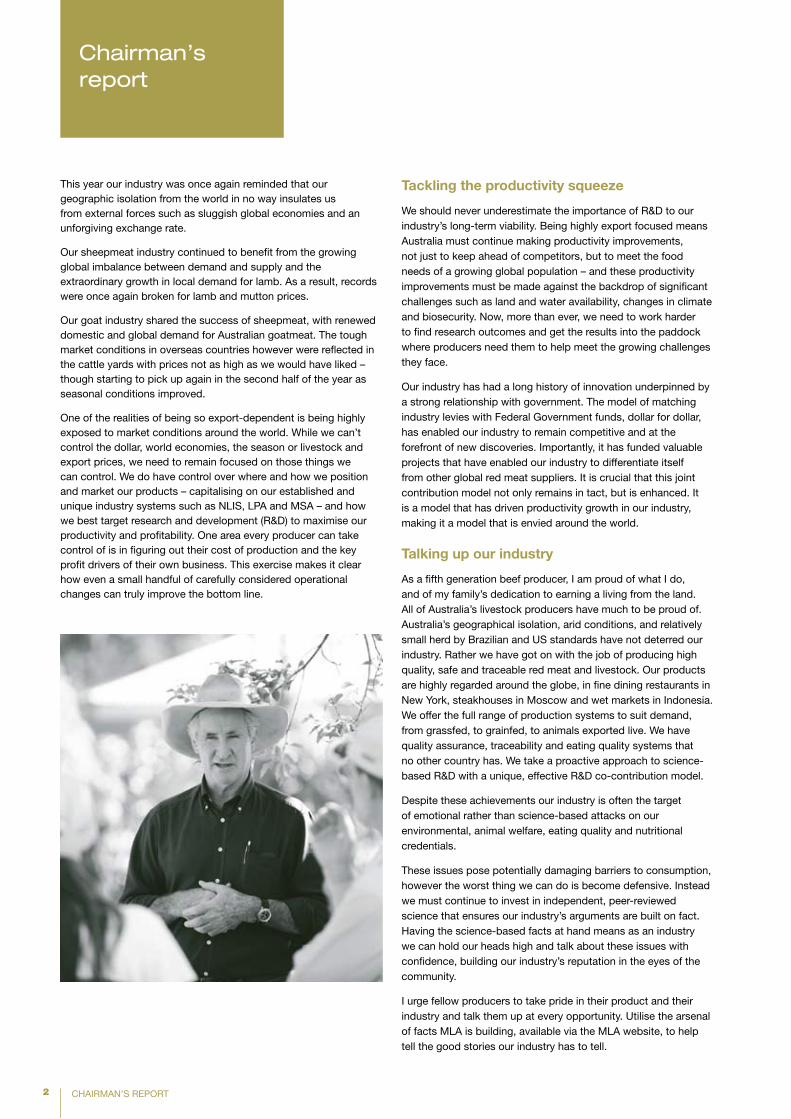
Chairman’s report
This year our industry was once again reminded that our geographic isolation from the world in no way insulates us from external forces such as sluggish global economies and an unforgiving exchange rate.
Our sheepmeat industry continued to benefit from the growing global imbalance between demand and supply and the extraordinary growth in local demand for lamb. As a result, records were once again broken for lamb and mutton prices.
Our goat industry shared the success of sheepmeat, with renewed domestic and global demand for Australian goatmeat. The tough market conditions in overseas countries however were reflected in the cattle yards with prices not as high as we would have liked – though starting to pick up again in the second half of the year as seasonal conditions improved.
One of the realities of being so export-dependent is being highly exposed to market conditions around the world. While we can’t control the dollar, world economies, the season or livestock and export prices, we need to remain focused on those things we can control. We do have control over where and how we position and market our products – capitalising on our established and unique industry systems such as NLIS, LPA and MSA – and how we best target research and development (R&D) to maximise our productivity and profitability. One area every producer can take control of is in figuring out their cost of production and the key profit drivers of their own business. This exercise makes it clear how even a small handful of carefully considered operational changes can truly improve the bottom line.
Tackling the productivity squeeze
We should never underestimate the importance of R&D to our industry’s long-term viability. Being highly export focused means Australia must continue making productivity improvements, not just to keep ahead of competitors, but to meet the food needs of a growing global population – and these productivity improvements must be made against the backdrop of significant challenges such as land and water availability, changes in climate and biosecurity. Now, more than ever, we need to work harder to find research outcomes and get the results into the paddock where producers need them to help meet the growing challenges they face.
Our industry has had a long history of innovation underpinned by a strong relationship with government. The model of matching industry levies with Federal Government funds, dollar for dollar, has enabled our industry to remain competitive and at the forefront of new discoveries. Importantly, it has funded valuable projects that have enabled our industry to differentiate itself from other global red meat suppliers. It is crucial that this joint contribution model not only remains in tact, but is enhanced. It is a model that has driven productivity growth in our industry, making it a model that is envied around the world.
Talking up our industry
As a fifth generation beef producer, I am proud of what I do, and of my family’s dedication to earning a living from the land. All of Australia’s livestock producers have much to be proud of. Australia’s geographical isolation, arid conditions, and relatively small herd by Brazilian and US standards have not deterred our industry. Rather we have got on with the job of producing high quality, safe and traceable red meat and livestock. Our products are highly regarded around the globe, in fine dining restaurants in New York, steakhouses in Moscow and wet markets in Indonesia. We offer the full range of production systems to suit demand, from grassfed, to grainfed, to animals exported live. We have quality assurance, traceability and eating quality systems that no other country has. We take a proactive approach to science-based R&D with a unique, effective R&D co-contribution model.
Despite these achievements our industry is often the target of emotional rather than science-based attacks on our environmental, animal welfare, eating quality and nutritional credentials.
These issues pose potentially damaging barriers to consumption, however the worst thing we can do is become defensive. Instead we must continue to invest in independent, peer-reviewed science that ensures our industry’s arguments are built on fact. Having the science-based facts at hand means as an industry we can hold our heads high and talk about these issues with confidence, building our industry’s reputation in the eyes of the community.
I urge fellow producers to take pride in their product and their industry and talk them up at every opportunity. Utilise the arsenal of facts MLA is building, available via the MLA website, to help tell the good stories our industry has to tell.
3CHAIRMAN’S REPORT
Growing demand for red meat
Foresight and long-term investment in positioning our products in over 100 markets around the globe has allowed us to ride the roller coaster of consumer confidence brought on by economic volatility in recent years.
With 65 per cent of our products consumed outside Australia, market access is the blood in our veins.
After decades of persistence by industry and the Australian government, one reward received this year was securing greater access to the highly-prized European Union market. Australia now has shared access to the 20,000 tonne grainfed beef quota in the EU established with the US. This is a great win for our industry but there is still much more to do in the EU. Our industry will continue to work hard to seek increased access for Australian sheepmeat and beef into this high value market.
Another achievement that has been years in the making has been the transformation of the Australian lamb industry. Once a by-product of the wool industry, our lamb industry is now based extensively on prime lamb production. The transformation, in response to consumer demand for larger, leaner carcases, has resulted in record domestic and export expenditures on lamb. Industry-funded marketing efforts have helped position lamb as Australia’s national dish, and it is also gaining a reputation around the world as an easy-to-prepare, nutritious and delicious product. This year we witnessed record prices for lambs due to strong domestic and export demand, tight global lamb supplies and the commencement of flock rebuilding activities in some regions.
We will all need to draw on our strengths to respond to upcoming challenges at a global, national, regional and farm level. We must continue to employ the work ethic that has led to our past achievements – unfailing persistence, hard work, a solid foundation of research and development and an attitude of continual improvement.
Don HeatleyChairman
4 MANAGING DIRECTORS’ REPORT
Managing Director’s report
This year, the Australian red meat and livestock industry operated against a backdrop of diminishing returns on investment in farm businesses, shaky consumer sentiment in major export markets and intensified competition. Assisted, however, by an excellent season in eastern Australia, a robust domestic market with consumption and expenditure up, and good demand from South East Asia/Chinas, the industry has produced in excess of six billion beef, sheepmeat and goatmeat meals with weekly shipments worth approximately $100 million for beef and $32 million for sheepmeat.
MLA has again been well-funded by industry and government to provide services and solutions all geared towards growing demand for red meat, driving costs out of businesses and improving productivity.
In 2009-10 the company maintained stable financial management recording a surplus of $1.1 million following a large surplus in 2008-09 of $16.5 million.
Revenue increased by $8.4 million to $171.8 million reflecting increased government matching R&D funds (+$6.6 million) and an increase in private contributions through the MLA Donor Company (up $3.8 million). Income from levies was down 1.8 per cent to $96.4 million.
Expenditure increased by $23.9 million to $170.7 million as a result of the additional investment in research and development primarily in the area of improving productivity and enhancing sustainability. Increased private contributions through the MLA donor company along with matching government matching funds were a catalyst for the adoption of new technologies in plant and on-farm. Marketing and communications programs were also boosted such as communicating the environmental and animal welfare credentials of the industry to urban consumers (+$1.2 million). Full details of our programs and outcomes is contained in the review of operations from page 18.
Increasing market access
Our relationships both in-market and with the government have allowed our industry to turn commercial arguments into useful negotiations, which this year elicited some distinct market access breakthroughs.
The door of the elusive European Union market opened a crack this year via the US negotiation for an increase in the High Quality Beef quota. In partnership with the Australian Government, our industry has successfully negotiated to supply as part of this broader arrangement.
In Russia – a market that continues to offer much promise with nearly 70,000 tonnes of beef shipped in 2008-09 – we have worked with government and industry to ensure Australia is positioned equally with other major suppliers, Argentina and Brazil, to supply a joint 450,000 tonne ‘other country’ import quota.
Bi-lateral agreements continue to offer the most constructive mechanism for access improvements, and three major negotiations continued this year with Japan, China and Korea. There are strong signals of a positive conclusion with Korea during the next year, which is vital to ensure the competitiveness of Australian beef is not eroded.
Growing demand
With continued pressure from a high $A and subdued economies in our major export markets, we strenuously held onto Australian beef’s position overseas by asserting its key attributes of trust, health, safety and taste via trade workshops and seminars and the equivalent of 30,000 in-store tasting days in our major markets to entice consumers to the meat cabinet.
At home, beef defied the international trend with sales up by $800 million on 2008-09. Our consistent approach to educating consumers via Entice magazine coordinated with TV advertising and in-store promotions consolidated the place of beef on dinner plates across the country. Aims to further invigorate the domestic beef market kick off in October 2010 with a campaign to ensure beef remains an iconic centre-of-plate product.
Demand for lamb and sheepmeat was spectacular both domestically and overseas. The prime lamb industry, worth more than $3.3 billion this year, continued to tap the rich vein of Sam Kekovich for Australia Day and Mother’s Day to drive sales over the period, despite higher prices.
Goatmeat was a strong performer on the international stage with export values increasing by 45 per cent to $104 million, with apparent further demand in need of supply.
The growing momentum of the Meat Standards Australia (MSA) grading program continued in 2009-10, with beef numbers reaching 1.25 million head – an increase of 27 per cent on last year – and lamb numbers more than doubling in its second full year of processing to 508,000 head.
We bolstered our proactive environmental communication efforts with the launch of RedMeatGreenFacts – a program of activities across the internet, school forums and media to counter unsubstantiated claims about the impact of red meat production on
5MANAGING DIRECTORS’ REPORT
the environment. The program has already started to help deliver more balanced metropolitan media reporting.
Enhancing sustainability and competitiveness
The variability of Australia’s climate and rapidly increasing input costs continue to put pressure on the profitability of both beef and sheepmeat businesses. Backed by a sound R&D investment strategy underpinned by the National RD&E framework, we remained focused on discovering and delivering innovative solutions, tools and information that create greater productivity and defray input costs eating away at the industry’s profitability.
Working from the ground up, our investments in land management have yielded:
an integrated weed management strategy for summer perennial •weeds which is reducing chemical costs by 95 per cent and increasing profit by $30-47/ha
improvements to the leucaena forage plant through •development of varieties that are bug-resistant and more edible for livestock
a phosphorus decision-making tool to guide effective fertiliser •application.
Tailored animal management characterised our sheep and cattle programs with the extension of the Lifetime Ewe Management program illustrating gains of about $50/ha, and a suite of projects on heifer fertility bearing $10.95 million for the northern pastoral industry.
Off-farm sustainability saw our work with the processing industry trial water saving systems and generate renewable energy from effluent ponds which generated savings of $1,200 a week and 35c/head, respectively.
Our collaboration with the commercial sector through the MLA Donor Company leveraged joint Australian Government contributions to the value of $23.2 million this year to accelerate broad scale commercial uptake of R&D technologies and information across industry.
Increasing industry capability
Understanding the opportunities and how to appropriately act upon them is fundamental to the viability of red meat and livestock businesses across the nation.
This year we investigated key profit drivers through a series of three situation analyses for southern beef, northern beef and sheepmeat demonstrating what could be learnt from the top 20 per cent of businesses and how average businesses stacked up.
We engaged more than 10,500 producers through our key suite of programs – More Beef from Pastures, Making More From Sheep and Beef Up forums – which delivered improved management practices and were taken up by 60 per cent of attendees to not only drive profit and productivity but also improve natural resource management.
Measuring performance
Our performance in delivering services to industry came under intensified scrutiny this year with an independent review carried out by Arche Consulting as part of our Deed of Agreement with the Australian Government. The key findings of the review showed that MLA delivered value to stakeholders and maintained high standards of corporate governance, evaluation and planning processes. It also highlighted areas for improvement which will be implemented throughout the next operating year.
Our commitment to deliver value is embedded in the individual performance of staff. I thank and commend them for their hard work throughout 2009-10.
The way forward
MLA’s strategic direction is determined by industry and with the release of the Meat Industry Strategic Plan 2010-2015 we undertook a comprehensive review of our own strategic plan to ensure alignment of purpose in delivering on the needs of industry for the next five years.
In 2010-11 MLA will have particular focus on:
Delivering a powerful new domestic beef campaign that reminds •consumers of the desirability of beef and in turn helps increase demand
Continuing to inform consumer/ community attitudes on •the facts about the environmental contribution of red meat producers
Encouraging producers to take up the outcomes of their levy •investment in R&D and make further productivity gains through our on-farm extension programs for cattle, sheep and goat producers
Driving for better market access outcomes in existing markets •like Korea, and emerging economies such as China and South East Asia; while seeking resolutions in sensitive markets like Indonesia.
David PalmerManaging Director
6 ABOUT MLA
About MLA
How we work The Australian meat and livestock industry operates within a challenging physical, financial and regulatory environment. The industry faces pressure from other protein products, competing red meat supplying countries, the climate and other environmental factors, and increasing community and government scrutiny. The local and global market place is constantly changing and the industry must be positioned to respond appropriately to meet changing needs and preserve market trust.
Producers compete for land from urbanisation, alternative land-use such as cropping, and for natural resources such as water. They are increasingly having to prove their environmental stewardship through the responsible management of land and water.
The processing sector operates on tight margins and improving cost efficiency and productivity is critical for ensuring a profitable platform is maintained and industry growth is supported.
Government priorities, local, regional and global meat industry trends, macro and micro economic drivers, and the outcomes of regular industry consultations are all carefully considered in planning our work.
The focus and direction of our marketing, research and development effort was provided by the industry peak councils’ Meat Industry Strategic Plan 2004–2009 (MISP) and is closely aligned to the Australian Government’s national and rural research priorities.
The imperatives of the MISP address three key industry drivers:
markets and consumers – creating access advantages, •value-added products and marketing programs
product – focusing on food safety and eating quality •
supply chain – addressing community concerns and •whole-of-chain efficiencies
In planning our activities MLA operates with a commitment to transparency and accountability. A triple bottom line approach is taken in our strategic and operational goal setting and evaluation processes.
Our priority alignment
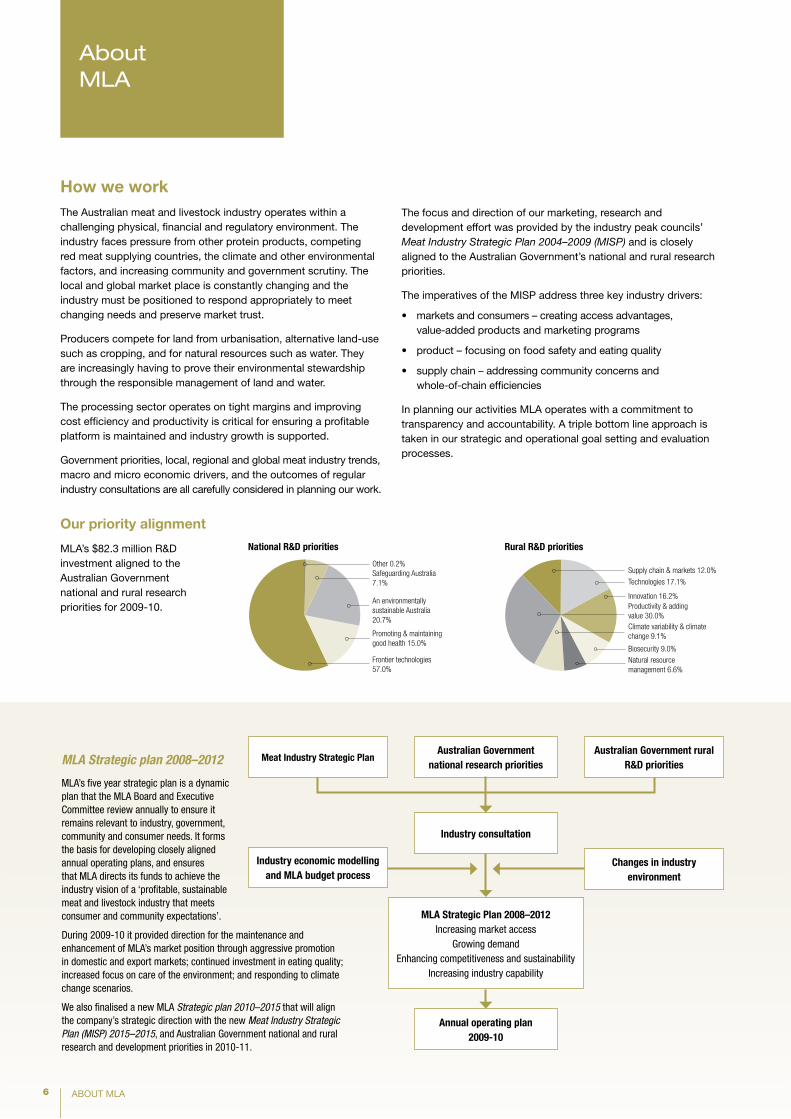
MLA’s $82.3 million R&D investment aligned to the Australian Government national and rural research priorities for 2009-10.
MLA Strategic plan 2008–2012
MLA’s five year strategic plan is a dynamic plan that the MLA Board and Executive Committee review annually to ensure it remains relevant to industry, government, community and consumer needs. It forms the basis for developing closely aligned annual operating plans, and ensures that MLA directs its funds to achieve the industry vision of a ‘profitable, sustainable meat and livestock industry that meets consumer and community expectations’.
During 2009-10 it provided direction for the maintenance and enhancement of MLA’s market position through aggressive promotion in domestic and export markets; continued investment in eating quality; increased focus on care of the environment; and responding to climate change scenarios.
We also finalised a new MLA Strategic plan 2010–2015 that will align the company’s strategic direction with the new Meat Industry Strategic Plan (MISP) 2015–2015, and Australian Government national and rural research and development priorities in 2010-11.
Australian Government rural R&D priorities
Meat Industry Strategic Plan
Industry consultation
MLA Strategic Plan 2008–2012Increasing market access
Growing demandEnhancing competitiveness and sustainability
Increasing industry capability
Annual operating plan 2009-10
Australian Government national research priorities
Changes in industry environment
Industry economic modelling and MLA budget process
Other 0.2%Safeguarding Australia 7.1%
Frontier technologies 57.0%
An environmentally sustainable Australia 20.7%
Promoting & maintaining good health 15.0%
National R&D priorities
Supply chain & markets 12.0%
Biosecurity 9.0%
Productivity & adding value 30.0%
Natural resource management 6.6%
Climate variability & climate change 9.1%
Innovation 16.2%
Technologies 17.1%
Rural R&D priorities
7ABOUT MLA
What we doEvery aspect of our work is geared to delivering world-class services and solutions for a profitable and sustainable red meat and livestock industry. We carry out these services to support the following strategic imperatives:
Increasing market access
Growing demand
Enhancing competitiveness and sustainability
Increasing industry capability
Our 2009-10 Annual operating plan, drawn out of the MLA Strategic plan 2008–2012, is assessed in the ‘Review of operations’ on pages 18–42. It provides a detailed overview of the economic and social environment in which we worked during the year, the outcomes against targeted measures and commentary on our key initiatives.
Collaboration
With the increasing costs of the current economic climate there is fierce competition for funding locally and internationally. Producers in different industries, along with private and government organisations, are facing many of the same challenges, and maximising the return on investment is crucial to sustainable growth.
We continually strive for efficiencies in how we deliver benefits to our members and key stakeholders. Leveraging our investments in partnership with industry and government is a key mechanism by which it is possible to achieve this outcome.
Our R&D investments, matched dollar-for-dollar by the Australian Government, work harder through successful leveraging in state agencies, other research and development corporations, co-operative research centres, the CSIRO and international research agencies.
Collaboration is important to:
maximise the return on MLA investments•
avoid duplication and generate synergies with other research •investors, and
maximise delivery to producers through collaborative efforts•
Some of our successful collaborations during the year included:
Securing new access under a European Union 20,000 tonne •grainfed beef import quota in partnership with industry and government – page 21
Investment in the Sheep CRC Lifetime Ewe Management (LTEM) •program which extended the Victorian-based program to a national initiative providing producers with the tools and skills to confidently manage their breeding flock – page 34
Pastures Australia (a joint venture between MLA and four other •R&D organisations) released a new phosphorus decision tool that gives producers and fertiliser industry advisors a guide to appropriate phosphorous applications – page 35
In partnership with Robotic Technologies Ltd (a joint venture •between Scott Technology and Silver Fern Farms in NZ) we finalised the development of the first fully automated sheep primal cutting system – page 37
Expanding investment opportunities
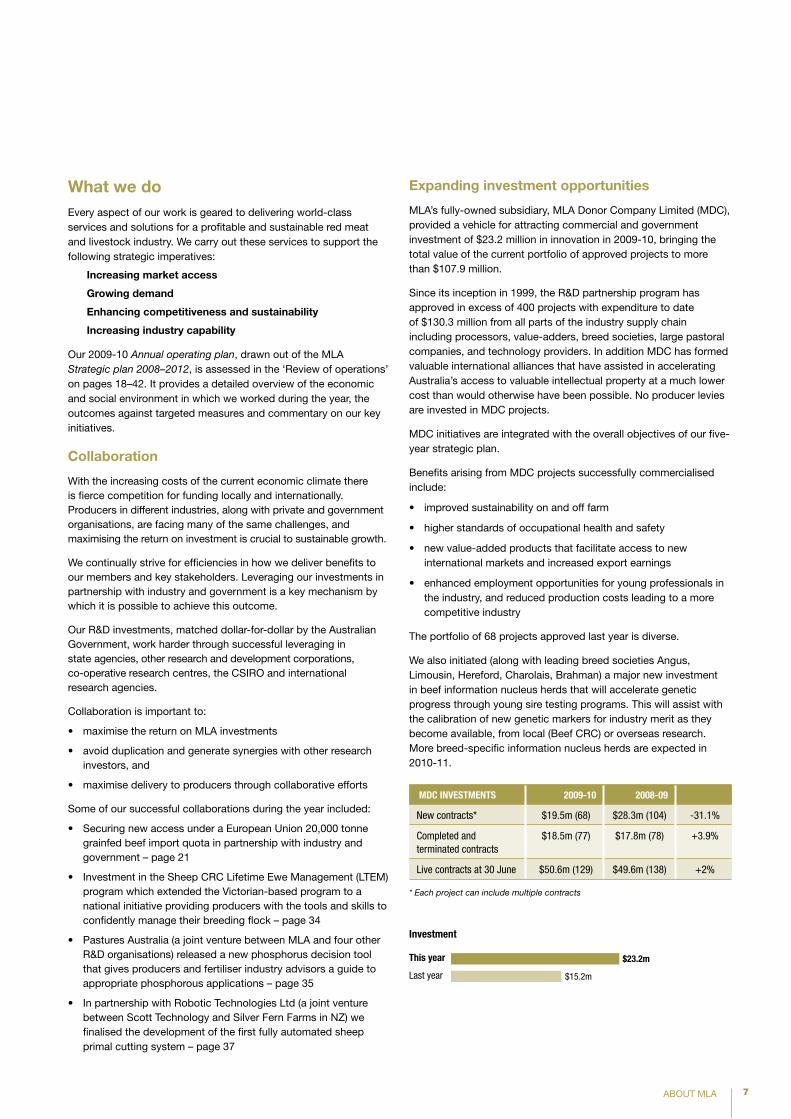
MLA’s fully-owned subsidiary, MLA Donor Company Limited (MDC), provided a vehicle for attracting commercial and government investment of $23.2 million in innovation in 2009-10, bringing the total value of the current portfolio of approved projects to more than $107.9 million.
Since its inception in 1999, the R&D partnership program has approved in excess of 400 projects with expenditure to date of $130.3 million from all parts of the industry supply chain including processors, value-adders, breed societies, large pastoral companies, and technology providers. In addition MDC has formed valuable international alliances that have assisted in accelerating Australia’s access to valuable intellectual property at a much lower cost than would otherwise have been possible. No producer levies are invested in MDC projects.
MDC initiatives are integrated with the overall objectives of our five-year strategic plan.
Benefits arising from MDC projects successfully commercialised include:
improved sustainability on and off farm•
higher standards of occupational health and safety•
new value-added products that facilitate access to new •international markets and increased export earnings
enhanced employment opportunities for young professionals in •the industry, and reduced production costs leading to a more competitive industry
The portfolio of 68 projects approved last year is diverse.
We also initiated (along with leading breed societies Angus, Limousin, Hereford, Charolais, Brahman) a major new investment in beef information nucleus herds that will accelerate genetic progress through young sire testing programs. This will assist with the calibration of new genetic markers for industry merit as they become available, from local (Beef CRC) or overseas research. More breed-specific information nucleus herds are expected in 2010-11.
MDC InveStMentS 2009-10 2008-09
New contracts* $19.5m (68) $28.3m (104) -31.1%
Completed and terminated contracts
$18.5m (77) $17.8m (78) +3.9%
Live contracts at 30 June $50.6m (129) $49.6m (138) +2%
* Each project can include multiple contracts
Investment
this year
Last year
$23.2m
$15.2m
8 ABOUT MLA
Program Promise Progress Performance
Increasing cost efficiency and productivity in lamb production and aggressive promotion in the market place
A domestic and export lamb industry with a combined value of at least $2 billion by 2000 and $2.8 billion by 2005
Changing consumer and industry attitudes and behaviours; increasing demand for lamb products; broad industry participation in extension activities; widespread adoption of information and tools, and on-farm implementation of R&D outcomes
The $639 million# invested by MRC, AMLC and MLA between 1991 and 2007 has had a positive influence on lamb production, industry and consumer attitudes, contributing to increased turn-off of larger, leaner carcases; increased consumer demand; higher returns; and $1.39 to $2.39 billion in industry value added at the farm gate
Improving industry and market information
Provide effective, independent, targeted market information that meets stakeholder needs and assists with planning, decision making and performance management
MLA Market Information has evolved over the past decade from providing a ‘bare bones’ statutory livestock-oriented information service to one with an expanded breadth and depth of coverage and a whole-of-supply-chain perspective
The $45.2 million# invested by the MLA Market Information program has provided the red meat and livestock industry with a comprehensive set of independent sources of market information to help fill gaps and inform decisions, with total benefits conservatively valued at $255 million
# Actual cash flow expenditure over the life of program
Source: CIE/MLA Evaluation Series:Increasing cost efficiency and productivity – on farm, and aggressive promotion in the market place (lamb)Improving industry and market information
MDC HIGHLIGHtS FROM 2009-10
Objective Measure Highlight Benefit
Increase industry’s R&D investment, innovation culture and capability
Implement a balanced portfolio of R&D partnerships
63 projects approved valued at $23.2m across all sectors of industry
Continued research without relying on industry levy funds
Facilitate adoption and uptake of partnership program outcomes
Commercial validation of four robotic processor automation technologies
Enhanced safety for workers in the industry, improved yield and increased $/head
Support an innovation culture and capability
Supported the establishment of an Australian Scott Automation and processor joint-venture and an Australian subsidiary
Potential large scale rollout of automation supported by a robust Australian based technology capability
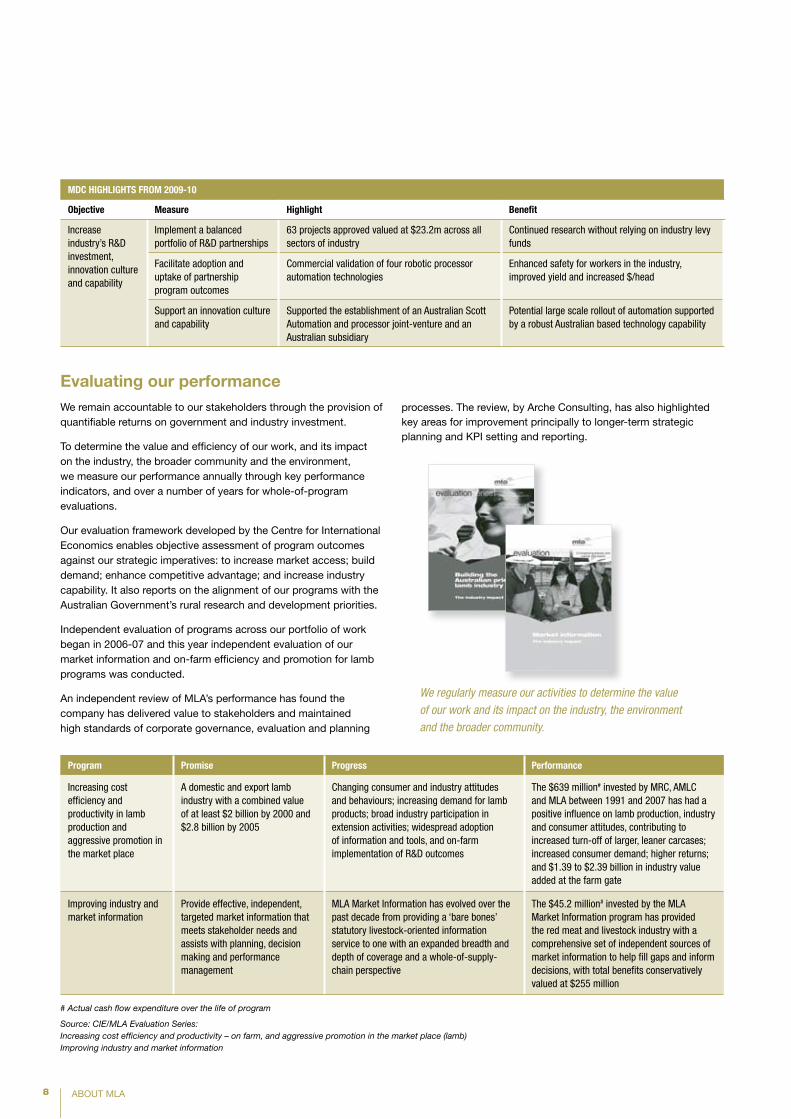
We regularly measure our activities to determine the value
of our work and its impact on the industry, the environment
and the broader community.
Evaluating our performance We remain accountable to our stakeholders through the provision of quantifiable returns on government and industry investment.
To determine the value and efficiency of our work, and its impact on the industry, the broader community and the environment, we measure our performance annually through key performance indicators, and over a number of years for whole-of-program evaluations.
Our evaluation framework developed by the Centre for International Economics enables objective assessment of program outcomes against our strategic imperatives: to increase market access; build demand; enhance competitive advantage; and increase industry capability. It also reports on the alignment of our programs with the Australian Government’s rural research and development priorities.
Independent evaluation of programs across our portfolio of work began in 2006-07 and this year independent evaluation of our market information and on-farm efficiency and promotion for lamb programs was conducted.
An independent review of MLA’s performance has found the company has delivered value to stakeholders and maintained high standards of corporate governance, evaluation and planning
processes. The review, by Arche Consulting, has also highlighted key areas for improvement principally to longer-term strategic planning and KPI setting and reporting.
9CORPORATE SUSTAINABILITY
Corporate sustainability
Careful crafting of our work ensures we help achieve economic and productivity gains for Australia’s red meat and livestock industry, as well as delivering a mix of economic, social and environmental benefits to the Australian community.
Our staff Our mission to provide world-class services and solutions for the Australian red meat industry hinges on attracting and retaining innovative and professional staff. The ability of our people to develop solutions that meet current and future industry challenges is critical to the success of our business within the dynamic red meat and livestock industry.
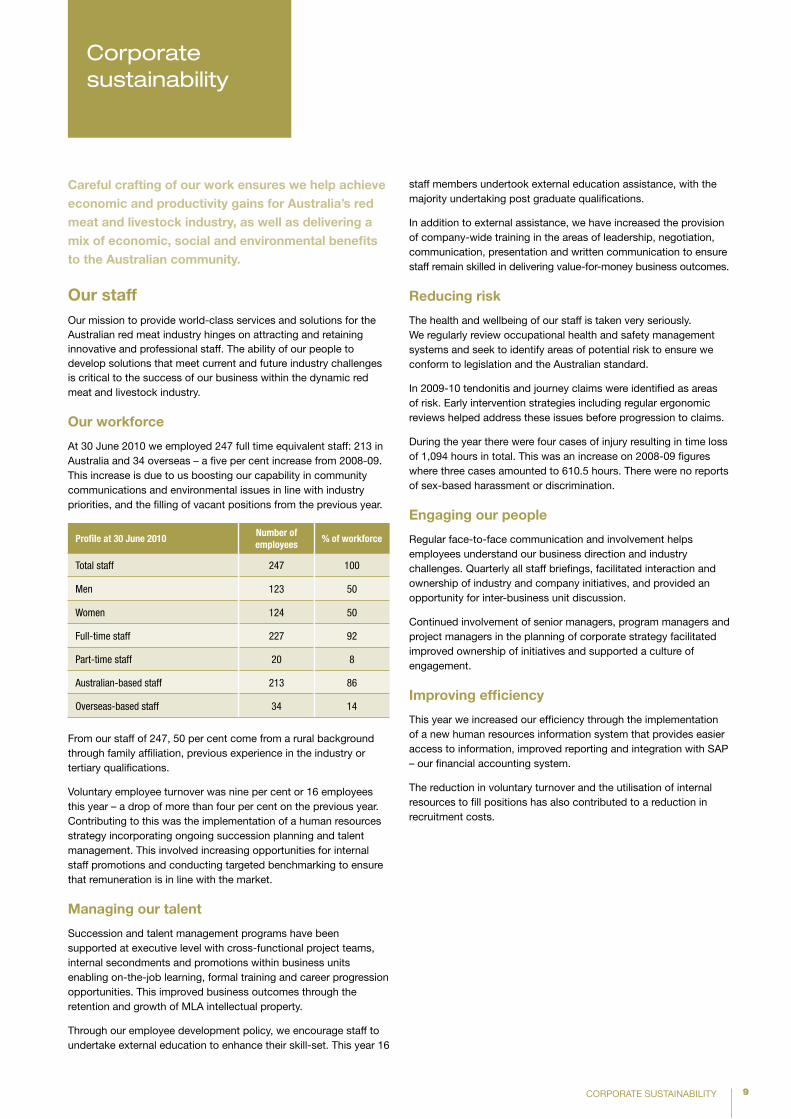
Our workforce
At 30 June 2010 we employed 247 full time equivalent staff: 213 in Australia and 34 overseas – a five per cent increase from 2008-09. This increase is due to us boosting our capability in community communications and environmental issues in line with industry priorities, and the filling of vacant positions from the previous year.
Profile at 30 June 2010number of employees
% of workforce
Total staff 247 100
Men 123 50
Women 124 50
Full-time staff 227 92
Part-time staff 20 8
Australian-based staff 213 86
Overseas-based staff 34 14
From our staff of 247, 50 per cent come from a rural background through family affiliation, previous experience in the industry or tertiary qualifications.
Voluntary employee turnover was nine per cent or 16 employees this year – a drop of more than four per cent on the previous year. Contributing to this was the implementation of a human resources strategy incorporating ongoing succession planning and talent management. This involved increasing opportunities for internal staff promotions and conducting targeted benchmarking to ensure that remuneration is in line with the market.
Managing our talent
Succession and talent management programs have been supported at executive level with cross-functional project teams, internal secondments and promotions within business units enabling on-the-job learning, formal training and career progression opportunities. This improved business outcomes through the retention and growth of MLA intellectual property.
Through our employee development policy, we encourage staff to undertake external education to enhance their skill-set. This year 16
staff members undertook external education assistance, with the majority undertaking post graduate qualifications.
In addition to external assistance, we have increased the provision of company-wide training in the areas of leadership, negotiation, communication, presentation and written communication to ensure staff remain skilled in delivering value-for-money business outcomes.
Reducing risk
The health and wellbeing of our staff is taken very seriously. We regularly review occupational health and safety management systems and seek to identify areas of potential risk to ensure we conform to legislation and the Australian standard.
In 2009-10 tendonitis and journey claims were identified as areas of risk. Early intervention strategies including regular ergonomic reviews helped address these issues before progression to claims.
During the year there were four cases of injury resulting in time loss of 1,094 hours in total. This was an increase on 2008-09 figures where three cases amounted to 610.5 hours. There were no reports of sex-based harassment or discrimination.
Engaging our people
Regular face-to-face communication and involvement helps employees understand our business direction and industry challenges. Quarterly all staff briefings, facilitated interaction and ownership of industry and company initiatives, and provided an opportunity for inter-business unit discussion.
Continued involvement of senior managers, program managers and project managers in the planning of corporate strategy facilitated improved ownership of initiatives and supported a culture of engagement.
Improving efficiency
This year we increased our efficiency through the implementation of a new human resources information system that provides easier access to information, improved reporting and integration with SAP – our financial accounting system.
The reduction in voluntary turnover and the utilisation of internal resources to fill positions has also contributed to a reduction in recruitment costs.
Our organisation structure
MLA operates in partnership with industry and government to deliver world-class products and programs.
BEIjInG:
BAHRAIn
MOSCOW
SEOUL TOKYOTAIWAn:
pHILIppInES:
MALAYSIA:
InDOnESIA
MELBOURnE
: Asian representative office
pERTH
BRUSSELS
WASHInGTOn
ADELAIDESYDnEY
ARMIDALE BRISBAnE
Industry peak councils
The following peak councils provide policy direction, scrutinise budgets and monitor our performance on behalf of the red meat industry:
Australian Lot Feeders’ Association
Australian Livestock Exporters’ Council
Australian Meat Industry Council
Cattle Council of Australia
Goat Industry Council of Australia
Sheepmeat Council of Australia
The Australian Government
The Australian Government sets high priority R&D objectives covering community, industry and environmental concerns. These are addressed via our Memorandum of Understanding and Commonwealth Deed of Agreement.
Our Board of Directors
The Board sets strategic priorities and direction for the company, approves and monitors progress against the Strategic Plan, evaluations performance and budgets, and oversees risk management and compliance. For our current Board members and their profiles see the Directors’ Report on page 48.
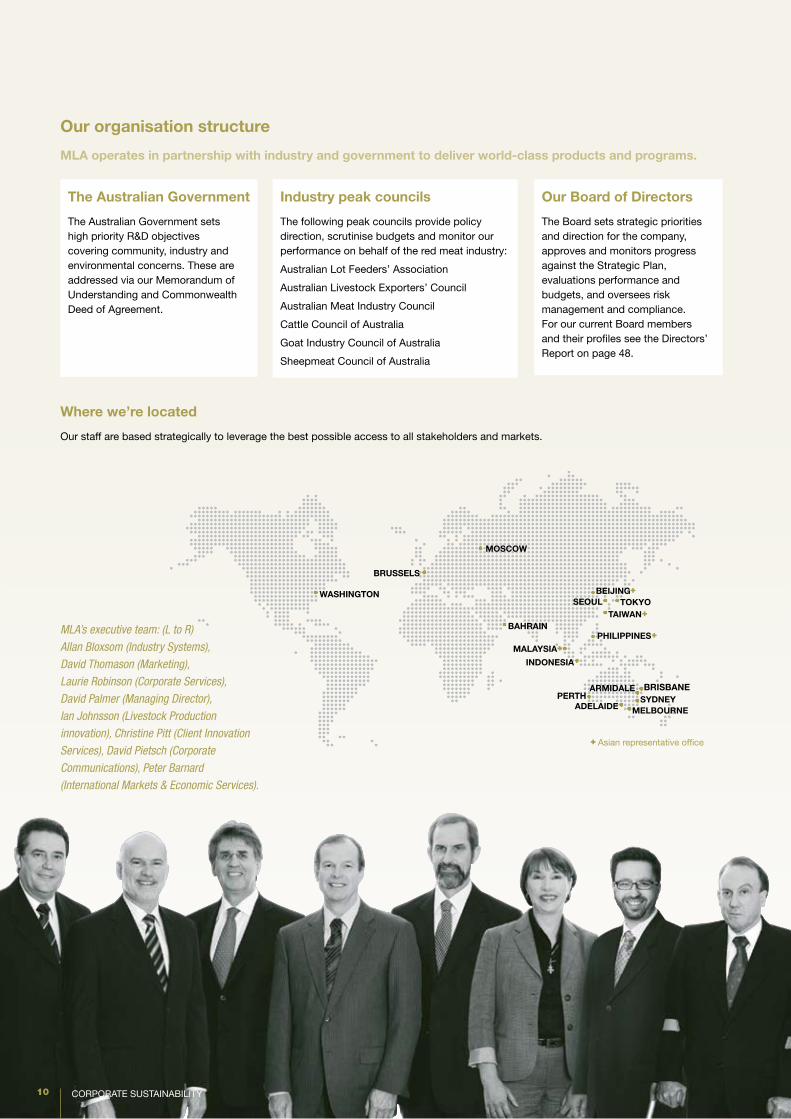
Where we’re located
Our staff are based strategically to leverage the best possible access to all stakeholders and markets.
MLA’s executive team: (L to R)
Allan Bloxsom (Industry Systems),
David Thomason (Marketing),
Laurie Robinson (Corporate Services),
David Palmer (Managing Director),
Ian Johnsson (Livestock Production
innovation), Christine Pitt (Client Innovation
Services), David Pietsch (Corporate
Communications), Peter Barnard
(International Markets & Economic Services).
CORPORATE SUSTAINABILITY10
11CORPORATE SUSTAINABILITY
Client and Innovation Services (CIS)
Fosters an industry-wide culture of •continuous improvement, innovation and increased professionalism by partnering with processors and other value chain participants to develop and implement effective innovation and R&D strategies
General Manager: Christine pittDBA MHA BSc MAICD
Christine held a number of senior positions in retail, manufacturing and financial service companies before joining MLA. She now oversees our extensive off-farm R&D and client innovation programs, and is responsible for the activities of the MLA Donor Company.
Communications (CC)
Aims to ensure industry stakeholders •are aware of MLA’s role in the red meat and livestock industry, the opportunities created by MLA’s programs and their potential benefits to industry; and to communicate the integrity of the industry to the broader community
General Manager: David pietschBA (Comms), GAICD
After growing up on a mixed farming property near Inglewood in southern Queensland, David has undertaken a number of agricultural communications roles. Immediately prior to joining MLA, he spent five years as policy director with AgForce Cattle which gave him a strong perspective on both producer and industry interests. David has been with MLA since 2004 and became General Manager Communications in 2009.
Corporate Services (CS)
Provides support services, risk •management, corporate governance, budget, planning and financial reporting to MLA management and stakeholders
General Manager: Laurie RobinsonCPA
Laurie joined MLA in October 2006. He has extensive experience in all aspects of financial and corporate management and has been employed as a finance director and chief financial officer level across publicly listed and multi-national companies within Australia and overseas. Immediately prior to joining MLA Laurie worked for Dairy Farmers as Chief Financial Officer.
Industry Systems (IS)
Underpins Australia’s reputation as a •supplier of safe, quality red meat with the management, communication and development of industry systems
General Manager: Allan Bloxsom
Allan has 40 years experience in the red meat industry having worked in, or with, various sectors of the supply chain. He is responsible for the industry systems that provide the foundation for differentiating the integrity and eating quality of Australia’s red meat products in domestic and international markets.
Note: This was Allan Bloxsom’s final year in this
role. Michelle Gorman is now in this position.
Marketing (DM)
Grows demand and promotes the •quality, safety and nutritional value of Australian red meat in the domestic market
General Manager: David ThomasonBBus
David’s extensive experience in consumer marketing was gained with iconic food brands such as Cottee’s and Tip Top. He champions consumer-focused marketing with emphasis on quality improvement, nutrition, product development and impactful promotion, all of which support MLA’s reputation for marketing excellence.
Note: This was David Thomason’s final year in this role. Glen Feist is now in this position.
International Markets and Economic Services (IMES)
Works with industry and government •to protect and increase access to international markets; provides market information and analysis that supports the Australian red meat and livestock industry; includes the overseas regional offices whose activities support the development of strong supply chains and customer loyalty to Australian red meat and livestock by promoting its quality, safety and nutritional value in international markets
General Manager: peter BarnardPhD Econ
Peter, through his contribution to market access outcomes and to comprehensive market analysis, is well-respected within the agribusiness sector and government. He has many years’ experience in agricultural policy formulation as well as being a major participant in international forums on the global red meat industry and its opportunities.
Livestock production Innovation (LpI)
Conducts R&D targeted at improving •on-farm practices to develop a competitive advantage for the red meat industry; and delivers programs to extend the results of R&D to industry, creating opportunities for profitable and sustainable red meat production
General Manger: Ian johnsson,B Rur Sc, PhD
Ian joined MLA in January 2007, bringing with him over 30 years of agricultural research experience. His hands-on research in the livestock arena, combined with his senior management with MLA’s predecessor organisations and more recently Australian Pork Limited has put him in a good position to oversee and develop the on-farm research portfolio for the red meat and livestock industry.
Our Executive Committee
The Managing Director and seven General Managers make up MLA’s Executive Committee, which is responsible for guiding the company’s performance through the development of key strategies, business plans and policies, and ensuring we meet our corporate objectives.
Managing Director: David palmer see page 48 in the Directors’ Report for David’s profile.
12 CORPORATE SUSTAINABILITY
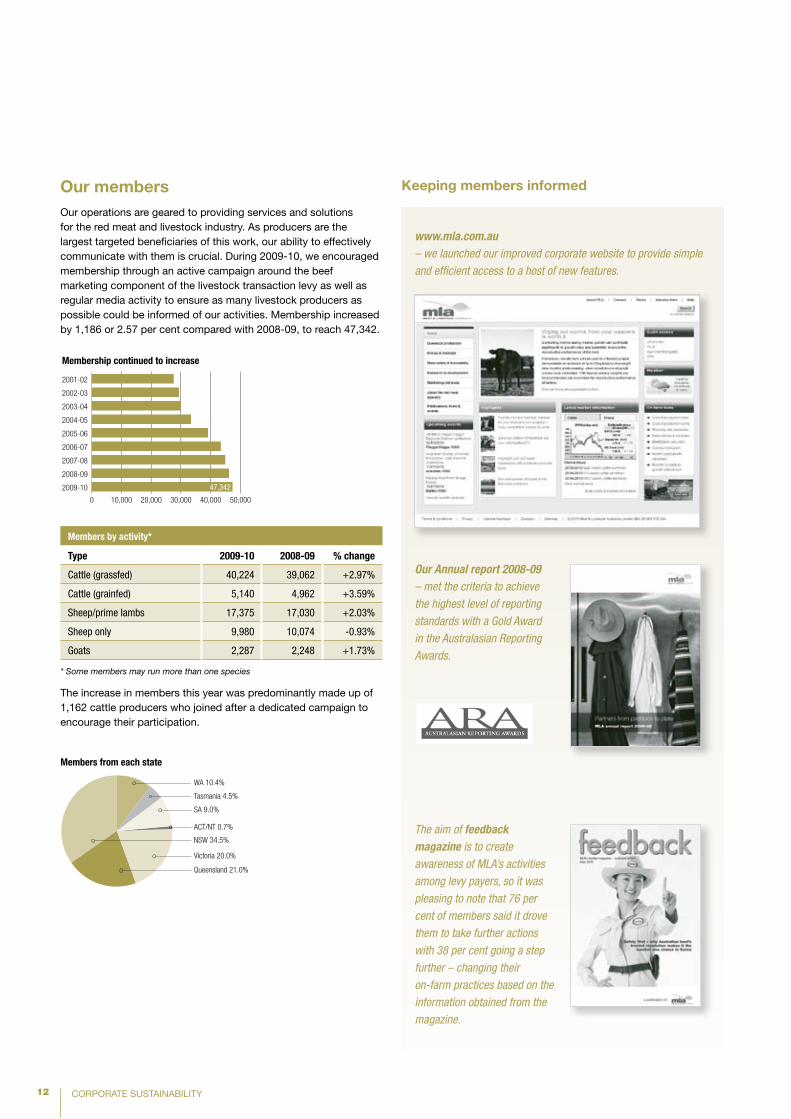
Our members Our operations are geared to providing services and solutions for the red meat and livestock industry. As producers are the largest targeted beneficiaries of this work, our ability to effectively communicate with them is crucial. During 2009-10, we encouraged membership through an active campaign around the beef marketing component of the livestock transaction levy as well as regular media activity to ensure as many livestock producers as possible could be informed of our activities. Membership increased by 1,186 or 2.57 per cent compared with 2008-09, to reach 47,342.
Keeping members informed
www.mla.com.au – we launched our improved corporate website to provide simple
and efficient access to a host of new features.
Members by activity*
type 2009-10 2008-09 % change
Cattle (grassfed) 40,224 39,062 +2.97%
Cattle (grainfed) 5,140 4,962 +3.59%
Sheep/prime lambs 17,375 17,030 +2.03%
Sheep only 9,980 10,074 -0.93%
Goats 2,287 2,248 +1.73%
* Some members may run more than one species
The increase in members this year was predominantly made up of 1,162 cattle producers who joined after a dedicated campaign to encourage their participation.
The aim of feedback magazine is to create
awareness of MLA’s activities
among levy payers, so it was
pleasing to note that 76 per
cent of members said it drove
them to take further actions
with 38 per cent going a step
further – changing their
on-farm practices based on the
information obtained from the
magazine.
Our Annual report 2008-09
– met the criteria to achieve
the highest level of reporting
standards with a Gold Award
in the Australasian Reporting
Awards.
Source: DAFF
ACT/NT XX%
Tasmania XX%
SA XX%
WA XX%
NSW XX%
Victoria XX%
Queensland XX%
0 10,000 20,000 30,000 40,000 50,000
2009-10
2008-09
2007-08
2006-07
2005-06
2004-05
2003-04
2002-03
2001-02
Members from each state
Membership continued to increase
47,342
Source: DAFF
ACT/NT 0.7%
Tasmania 4.5%
SA 9.0%
WA 10.4%
NSW 34.5%
Victoria 20.0%
Queensland 21.0%
0 10,000 20,000 30,000 40,000 50,0002009-10
2008-09
2007-08
2006-07
2005-06
2004-05
2003-04
2002-03
2001-02
Members from each state
13CORPORATE SUSTAINABILITY
An increased effort to integrate face-to-face events, publications, media and online communications continued to ensure our members are aware of MLA’s role in the industry and of the opportunities and potential benefits created by our programs, with 96 per cent valuing our activities*. Members gave us a rating of 3.46 out of 5 for our communication activities (from a favourability mean of 3.55 out of 5 in 2008**).
Our corporate website, launched in June, was redeveloped this year to improve its useabilty and relevance to our members. The new site – built on the back of extensive producer consultation, is now structured to provide easy access to our information, and hosts a range of new features including a ‘prices & markets’ hub, weather centre, and producer tool box containing calculators and guides for a broad range of production issues. The launch was accompanied by an integrated awareness campaign which generated a record 34,500 visitors to the site in June (an increase of approximately 20 per cent on the average monthly traffic for the old site).
feedback magazine is the key information source for MLA activities among members* and is most often seen as useful, up to date and informative about other producers’ experiences. Importantly, it drives members to seek further information by visiting the MLA website or ordering/downloading publications. To maintain interest in the magazine this year, we enhanced the regional splits (three versions of the magazine are produced for the north, south-east and south-west). This provided more tailored, relevant information for our readers through the ‘insights’ series, market information, diary page and advertisement. We also tailored the splits with a catalogue of relevant publications on the reverse of the flysheet to increase uptake of MLA publications and services.
feedbackTV continued to complement the magazine with 64 per cent of members who had watched it rating it as a useful resource*. Supporting the DVD and our efforts to integrate our communications across channels, we:
established a • feedbackTV channel on You Tube – www.youtube.com/mlafeedbacktv attracting nearly 10,000 views
implemented a DVD directory of episodes in • feedback magazine
established links to our YouTube channel throughout •www.mla.com.au
We continued to foster our partnership with rural media to achieve widespread coverage of our activities and ensure industry is fairly represented in the media. We collaborated on four joint press features with the Rural Press Group and The Weekly Times focused on key issues of interest and activities that impact on the industry. We also integrated our traditional annual media briefing on industry projections with related on-farm impacts to communicate clear messages for individual businesses. In addition, media coverage on MLA and its activities increased by 50 per cent on 2008-09 with a considerable proportion of the coverage in 2009-10 comprising our research and development activities.
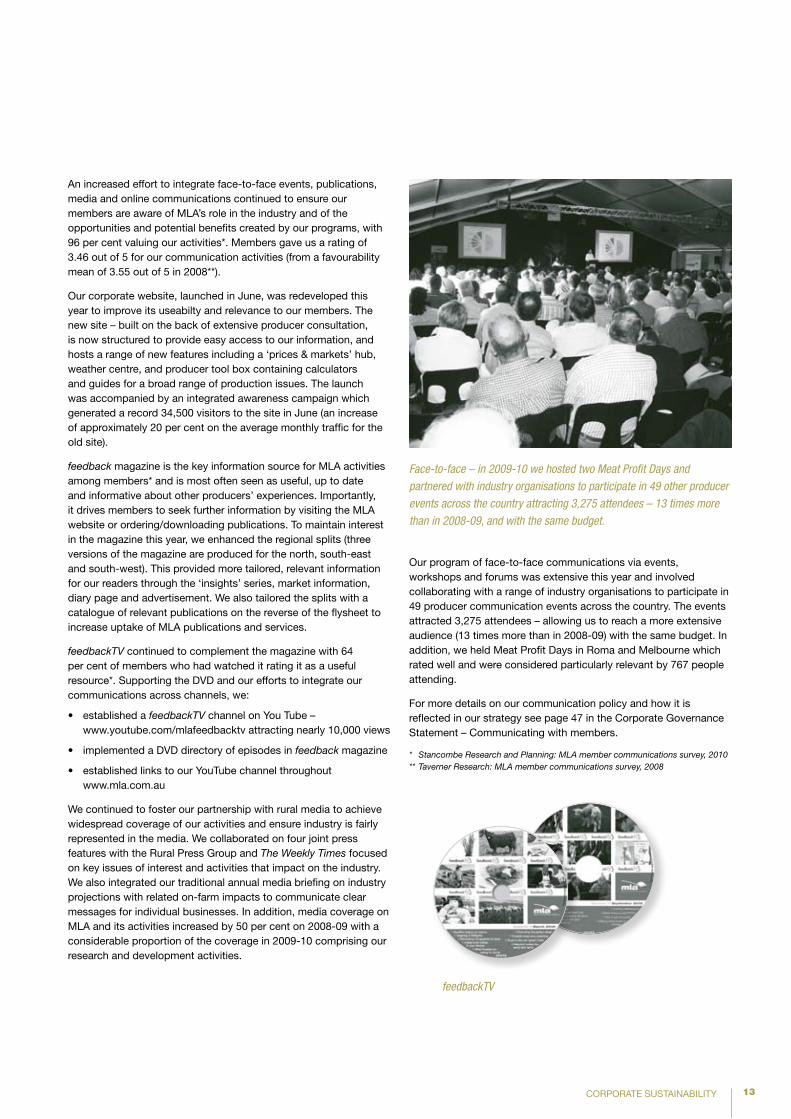
Our program of face-to-face communications via events, workshops and forums was extensive this year and involved collaborating with a range of industry organisations to participate in 49 producer communication events across the country. The events attracted 3,275 attendees – allowing us to reach a more extensive audience (13 times more than in 2008-09) with the same budget. In addition, we held Meat Profit Days in Roma and Melbourne which rated well and were considered particularly relevant by 767 people attending.
For more details on our communication policy and how it is reflected in our strategy see page 47 in the Corporate Governance Statement – Communicating with members.
* Stancombe Research and Planning: MLA member communications survey, 2010** Taverner Research: MLA member communications survey, 2008
Face-to-face – in 2009-10 we hosted two Meat Profit Days and
partnered with industry organisations to participate in 49 other producer
events across the country attracting 3,275 attendees – 13 times more
than in 2008-09, and with the same budget.
feedbackTV
14 CORPORATE SUSTAINABILITY
The Australian community
The long history of innovation, underpinned by pioneering research and development, has laid the foundations for today’s Australian livestock industry. In 2009-10 we invested $82.3 million in a range of programs benefiting not only the red meat industry but also the wider Australian community.
Investing in tomorrow
The red meat industry will play an important role in meeting the future food needs of a growing global population and addressing significant challenges such as land and water availability, changing climate and biosecurity. Our investment in the development of scientists and researchers, through scholarship and training programs, contributes to the maintenance of research capability in Australia shoring up expertise to tackle new and emerging challenges.
Building Australia’s body of research, and the growing community of scientists who supply it, not only directly benefits our industry but also maintains society’s knowledge, skills and ability to adapt to oncoming challenges. Throughout the year we completed 184 research contracts and began another 212. In conjunction we supported 12 researchers and invested $284,816 through our postgraduate and scholarship program, which cover a wide range of on-farm and off-farm innovation activities.
R&D investments
2009-10 2008-09 % change
New contracts*$30.3m
(212)$27.3m
(194)+11.0%
Completed and terminated contracts
$30.3m (184)
$47.4m (382)
-36.1%
Live contracts at 30 June$75.1m
(304)$75.1m
(276)0%
* Each project can include multiple contracts
While we do not directly invest in infrastructure for R&D, our long-term collaboration with other research and development agencies – including CSIRO, universities and state departments of agriculture – has helped maintain a pool of research facilities. This collaboration has also facilitated the development of the national research, development and extension strategy and allowed us to establish an array of national research projects. In 2009-10 the company had 150 collaborative agreements in place with more than $60 million in co-investment designed to deliver great productivity and community benefits.
Healthy eating, healthy living
Productivity gains in the red meat and livestock industry are also delivering significant consumer benefits including the supply of abundant, affordable, sustainable and nutritious food.
In consultation with key representatives in the public health sector this year, we explored the nutrition and sustainability issues affecting public health. We worked with Horticulture Australia Limited, Dairy Australia and the Australian Egg Corporation Limited to raise awareness of issues related to primary food production in Australia at the Public Health Association of Australia (PHAA) and Dieticians Association of Australia (DAA) conferences. This led to discussions on an integrated food policy where all aspects of the food system that impact public health – including health, food security, economic sustainability and social equity – be considered in conjunction with environmental sustainability.
Supporting discussions with the public health sector we invested in 16 nutrition-focussed research projects this year (compared to the 13 in 2008-09). These projects aimed to deliver credible and sound nutrition evidence for better understanding red meat’s role in a healthy diet and its contribution to improving public health in Australia. Our ongoing research into food trends and main meal practices led to a new study on the ‘meal repertoire’ of different groups in Australia. The results of this project will be developed into an in-depth brochure looking at how and why people determine what meals they eat and what influences the meals they choose.
Global food security
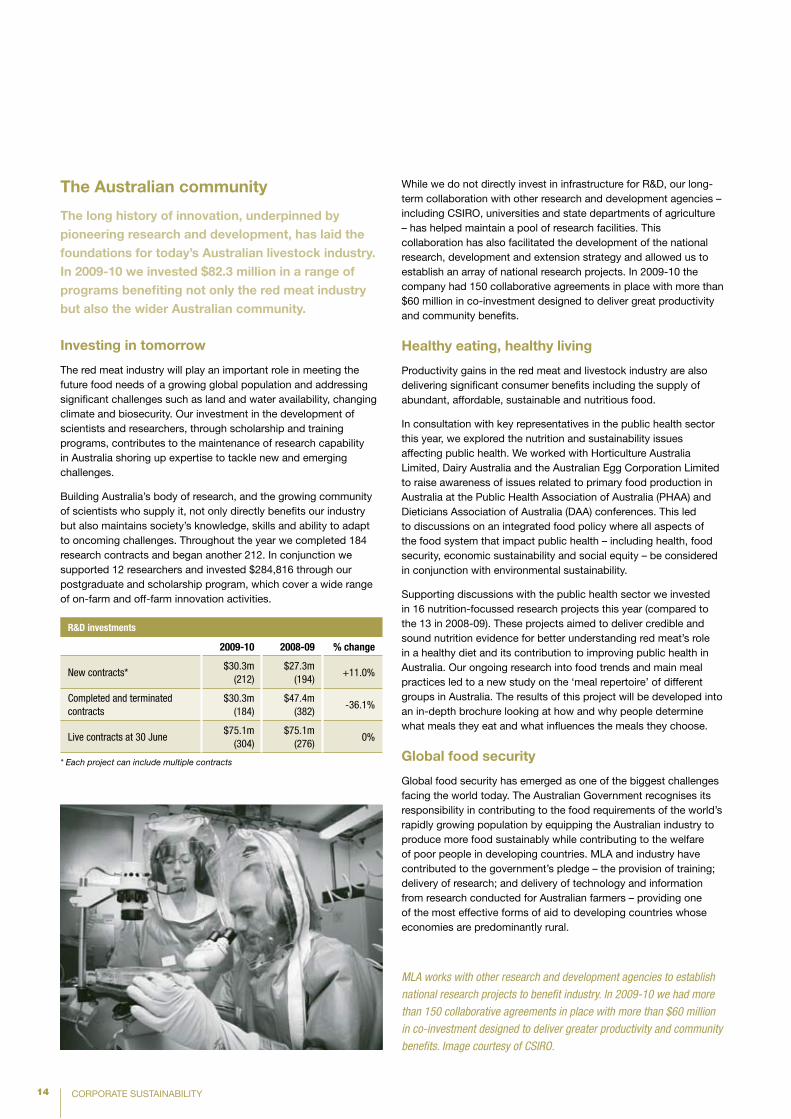
Global food security has emerged as one of the biggest challenges facing the world today. The Australian Government recognises its responsibility in contributing to the food requirements of the world’s rapidly growing population by equipping the Australian industry to produce more food sustainably while contributing to the welfare of poor people in developing countries. MLA and industry have contributed to the government’s pledge – the provision of training; delivery of research; and delivery of technology and information from research conducted for Australian farmers – providing one of the most effective forms of aid to developing countries whose economies are predominantly rural.
MLA works with other research and development agencies to establish
national research projects to benefit industry. In 2009-10 we had more
than 150 collaborative agreements in place with more than $60 million
in co-investment designed to deliver greater productivity and community
benefits. Image courtesy of CSIRO.
15CORPORATE SUSTAINABILITY
protecting the environment
The productive capability of the red meat industry rests on its ability to implement practical measures that both prevent damage to and repair the land. It is a duty of care that not only benefits business, but importantly protects the environment for future generations. Our portfolio of research equips industry with information, tools and innovative technologies to carry out their custodianship.
Duty of care
To develop and promote sustainable production systems, our investments in both basic and applied science are strategically aligned. This ensures industry is well positioned to manage the risks associated with the future sustainability of red meat production and to demonstrate its environmental credentials to an increasingly concerned community and government.
In ensuring our approach will meet future environmental challenges and community expectations, we integrated our program of activity with the Australian Government’s National RD&E priorities, the Climate Change Research Strategies for Primary Industries (CCRSPI) and the national natural resource management strategy.
In 2009-10, 78 of our on-farm projects were deliberately shaped to not only elicit environmental outcomes, but to ensure productivity improvements were built into the foundations of the research which ultimately drive uptake by industry.
This year we:
funded development of sampling methodology for estimating •the impacts of pasture type and management on soil carbon stocks in grazing lands, which will provide robust information for producers and the industry on the potential for soil carbon sequestration in emissions trading
continued to contribute to the development of the Managing •Climate Variability Program which helps producers manage climate risk on-the-ground by improving the accuracy of seasonal weather forecasts to enable better farm business decisions
incorporated new data from the MLA and Australian •Government-supported Reducing Emissions from Livestock Research Program into the FarmGAS Calculator to assist in developing options to reduce methane emissions while increasing productivity
reviewed the water use and GHG emissions from red meat •production to respond in a balanced way to the inaccurate public reports on the ‘environmental footprint’ of red meat production and to provide advice on practices to reduce impacts through practical management options without reducing production
Research defined the unique qualities of Australian red meat and its production systems to ensure consumers can continue to feel confident they have made the right choice when they purchase red meat.
Environmental issues – particularly the role of ruminant livestock in global warming – demand good research and good communication.
Much had been made of ‘more meat means more heat’ research, but over the past year we have reiterated with science that Australia’s production systems cannot be directly compared with the grain-based US beef sector or Brazil’s Amazonian ranches.
Until an international standard allows an accurate ‘life cycle analysis’ (LCA) of the environmental impact of livestock between countries, we are supporting LCAs of Australian production systems to provide domestic benchmarks that can be used as the basis of monitoring future improvements. This year LCAs were completed on three southern red meat supply chains, with two more on northern beef supply chains currently being developed.
We’ve been able to show that, compared to supply chains elsewhere, Australian red meat production systems are relatively efficient, providing industry with a baseline it can use to show improved environmental performance. This formed the backbone of our communications with the community and government and ensured government policies fairly considered Australian red meat production; and reassured consumers that Australian red meat producers are responsible stewards of the land.
For additional details on our program of activities addressing environmental issues see page 37 in the ‘Review of operations’.
Containing the corporate footprint
Our work assists industry to measure and improve the sustainable management of the environment. In developing and delivering information and tools, we are mindful that we also operate in a sustainable way.
This year we continued to monitor and reduce travel, paper use and promote energy efficiency.
Informing industry and our trading partners of new developments, challenges and opportunities requires our people to travel around the country and the globe. We continued to consolidate our travel requirements for both environmental and economic gains, maintaining our 2008-09,10 percent reduction in travel costs.
The dissemination of information is core to our business and to do this sustainably we are continually improving our electronic communications and reducing our reliance on paper-based communications. In 2009-10 we doubled the number of emails to members – encouraging them to move to online sources for their information needs, and increased the number of member email addresses in our database from around 16,000 to over 23,000. Subsequent traffic to the MLA website increased by approximately 50 per cent and we intend to move more of our corporate governance and stakeholder reporting activities online following changes to the MLA constitution at our 2009 annual general meeting.
16
Retained surplus
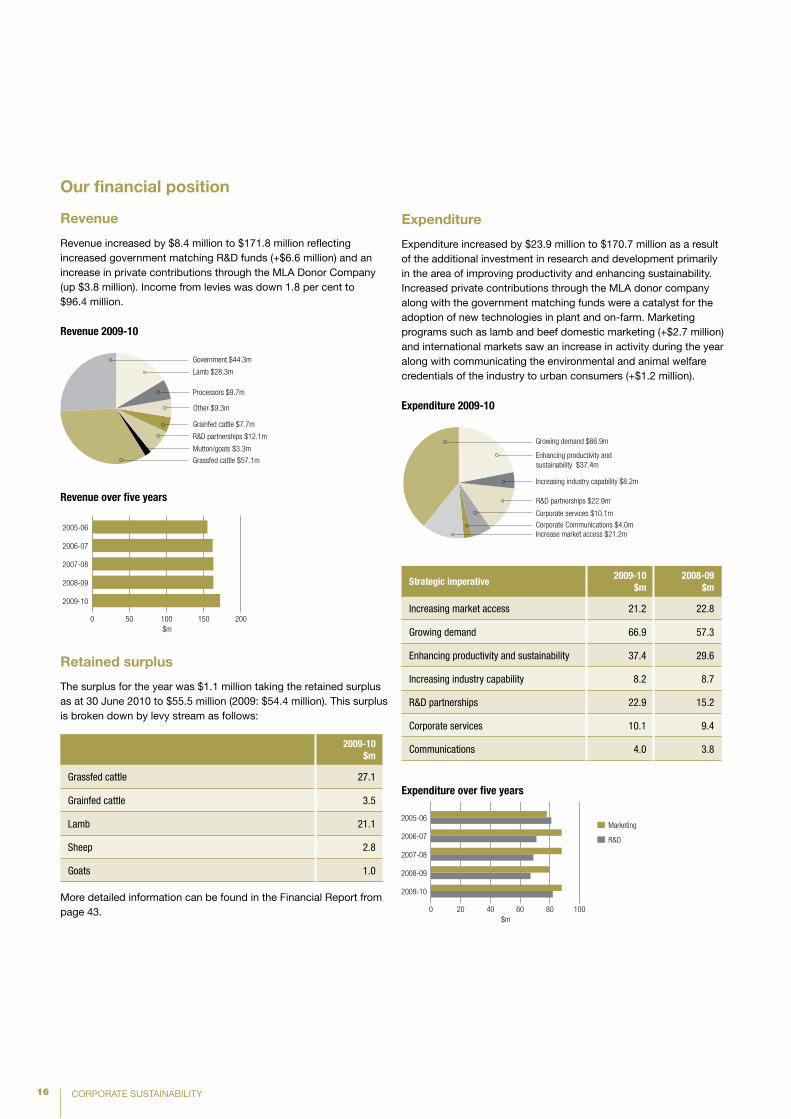
The surplus for the year was $1.1 million taking the retained surplus as at 30 June 2010 to $55.5 million (2009: $54.4 million). This surplus is broken down by levy stream as follows:
2009-10 $m
Grassfed cattle 27.1
Grainfed cattle 3.5
Lamb 21.1
Sheep 2.8
Goats 1.0
More detailed information can be found in the Financial Report from page 43.
CORPORATE SUSTAINABILITY
Our financial position
Revenue
Revenue increased by $8.4 million to $171.8 million reflecting increased government matching R&D funds (+$6.6 million) and an increase in private contributions through the MLA Donor Company (up $3.8 million). Income from levies was down 1.8 per cent to $96.4 million.
Processors $9.7m
Other $9.3m
Government $44.3m
Lamb $28.3m
Grassfed cattle $57.1m
Grainfed cattle $7.7m
R&D partnerships $12.1m
Mutton/goats $3.3m
0 50 100 150 200
2009-10
2008-09
2007-08
2006-07
2005-06
0 20 40 60 80 100
2009-10
2008-09
2007-08
2006-07
2005-06
Revenue 2009-2010
Revenue over five years Expenditure over five years
Enhancing productivity and sustainability $37.4m
R&D partnerships $22.9m
Increase market access $21.2m
Growing demand $66.9m
Corporate services $10.1m
Corporate Communications $4.0m
Increasing industry capability $8.2m
Expenditure 2009-2010
$m $m
Marketing
R&D
Revenue over five years
Processors $9.7m
Other $9.3m
Government $44.3m
Lamb $28.3m
Grassfed cattle $57.1m
Grainfed cattle $7.7m
R&D partnerships $12.1m
Mutton/goats $3.3m
0 50 100 150 200
2009-10
2008-09
2007-08
2006-07
2005-06
0 20 40 60 80 100
2009-10
2008-09
2007-08
2006-07
2005-06
Revenue 2009-2010
Revenue over five years Expenditure over five years
Enhancing productivity and sustainability $37.4m
R&D partnerships $22.9m
Increase market access $21.2m
Growing demand $66.9m
Corporate services $10.1m
Corporate Communications $4.0m
Increasing industry capability $8.2m
Expenditure 2009-2010
$m $m
Marketing
R&D
expenditure 2009-10
Processors $9.7m
Other $9.3m
Government $44.3m
Lamb $28.3m
Grassfed cattle $57.1m
Grainfed cattle $7.7m
R&D partnerships $12.1m
Mutton/goats $3.3m
0 50 100 150 200
2009-10
2008-09
2007-08
2006-07
2005-06
0 20 40 60 80 100
2009-10
2008-09
2007-08
2006-07
2005-06
Revenue 2009-2010
Revenue over five years Expenditure over five years
Enhancing productivity and sustainability $37.4m
R&D partnerships $22.9m
Increase market access $21.2m
Growing demand $66.9m
Corporate services $10.1m
Corporate Communications $4.0m
Increasing industry capability $8.2m
Expenditure 2009-2010
$m $m
Marketing
R&D
Revenue 2009-10
Processors $9.7m
Other $9.3m
Government $44.3m
Lamb $28.3m
Grassfed cattle $57.1m
Grainfed cattle $7.7m
R&D partnerships $12.1m
Mutton/goats $3.3m
0 50 100 150 200
2009-10
2008-09
2007-08
2006-07
2005-06
0 20 40 60 80 100
2009-10
2008-09
2007-08
2006-07
2005-06
Revenue 2009-2010
Revenue over five years Expenditure over five years
Enhancing productivity and sustainability $37.4m
R&D partnerships $22.9m
Increase market access $21.2m
Growing demand $66.9m
Corporate services $10.1m
Corporate Communications $4.0m
Increasing industry capability $8.2m
Expenditure 2009-2010
$m $m
Marketing
R&D
expenditure over five years
Strategic imperative2009-10
$m2008-09
$m
Increasing market access 21.2 22.8
Growing demand 66.9 57.3
Enhancing productivity and sustainability 37.4 29.6
Increasing industry capability 8.2 8.7
R&D partnerships 22.9 15.2
Corporate services 10.1 9.4
Communications 4.0 3.8
Expenditure
Expenditure increased by $23.9 million to $170.7 million as a result of the additional investment in research and development primarily in the area of improving productivity and enhancing sustainability. Increased private contributions through the MLA donor company along with the government matching funds were a catalyst for the adoption of new technologies in plant and on-farm. Marketing programs such as lamb and beef domestic marketing (+$2.7 million) and international markets saw an increase in activity during the year along with communicating the environmental and animal welfare credentials of the industry to urban consumers (+$1.2 million).
17CORPORATE SUSTAINABILITY
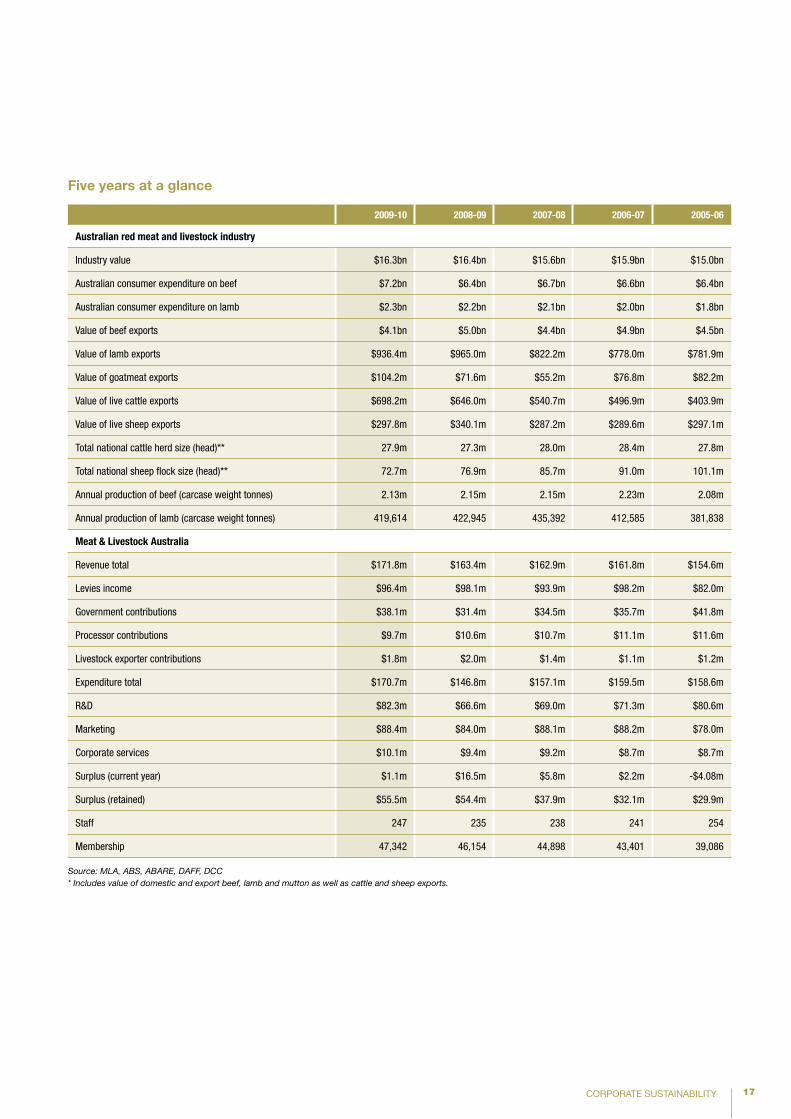
Five years at a glance
2009-10 2008-09 2007-08 2006-07 2005-06
Australian red meat and livestock industry
Industry value $16.3bn $16.4bn $15.6bn $15.9bn $15.0bn
Australian consumer expenditure on beef $7.2bn $6.4bn $6.7bn $6.6bn $6.4bn
Australian consumer expenditure on lamb $2.3bn $2.2bn $2.1bn $2.0bn $1.8bn
Value of beef exports $4.1bn $5.0bn $4.4bn $4.9bn $4.5bn
Value of lamb exports $936.4m $965.0m $822.2m $778.0m $781.9m
Value of goatmeat exports $104.2m $71.6m $55.2m $76.8m $82.2m
Value of live cattle exports $698.2m $646.0m $540.7m $496.9m $403.9m
Value of live sheep exports $297.8m $340.1m $287.2m $289.6m $297.1m
Total national cattle herd size (head)** 27.9m 27.3m 28.0m 28.4m 27.8m
Total national sheep flock size (head)** 72.7m 76.9m 85.7m 91.0m 101.1m
Annual production of beef (carcase weight tonnes) 2.13m 2.15m 2.15m 2.23m 2.08m
Annual production of lamb (carcase weight tonnes) 419,614 422,945 435,392 412,585 381,838
Meat & Livestock Australia
Revenue total $171.8m $163.4m $162.9m $161.8m $154.6m
Levies income $96.4m $98.1m $93.9m $98.2m $82.0m
Government contributions $38.1m $31.4m $34.5m $35.7m $41.8m
Processor contributions $9.7m $10.6m $10.7m $11.1m $11.6m
Livestock exporter contributions $1.8m $2.0m $1.4m $1.1m $1.2m
Expenditure total $170.7m $146.8m $157.1m $159.5m $158.6m
R&D $82.3m $66.6m $69.0m $71.3m $80.6m
Marketing $88.4m $84.0m $88.1m $88.2m $78.0m
Corporate services $10.1m $9.4m $9.2m $8.7m $8.7m
Surplus (current year) $1.1m $16.5m $5.8m $2.2m -$4.08m
Surplus (retained) $55.5m $54.4m $37.9m $32.1m $29.9m
Staff 247 235 238 241 254
Membership 47,342 46,154 44,898 43,401 39,086
Source: MLA, ABS, ABARE, DAFF, DCC* Includes value of domestic and export beef, lamb and mutton as well as cattle and sheep exports.
18 REVIEW OF OPERATIONS
Review of operationsFollowing is a report of our activities and outcomes for the 2009-10 financial year, aligned with our four imperatives and structured according to our five-year strategic plan.
19INCREASING MARKET ACCESS
Increasing market access
20 Highlights
20 Operating environment
21 Setting standards
21 Maintaining and liberalising access to world meat markets
22 Maximising market options for the livestock export trade
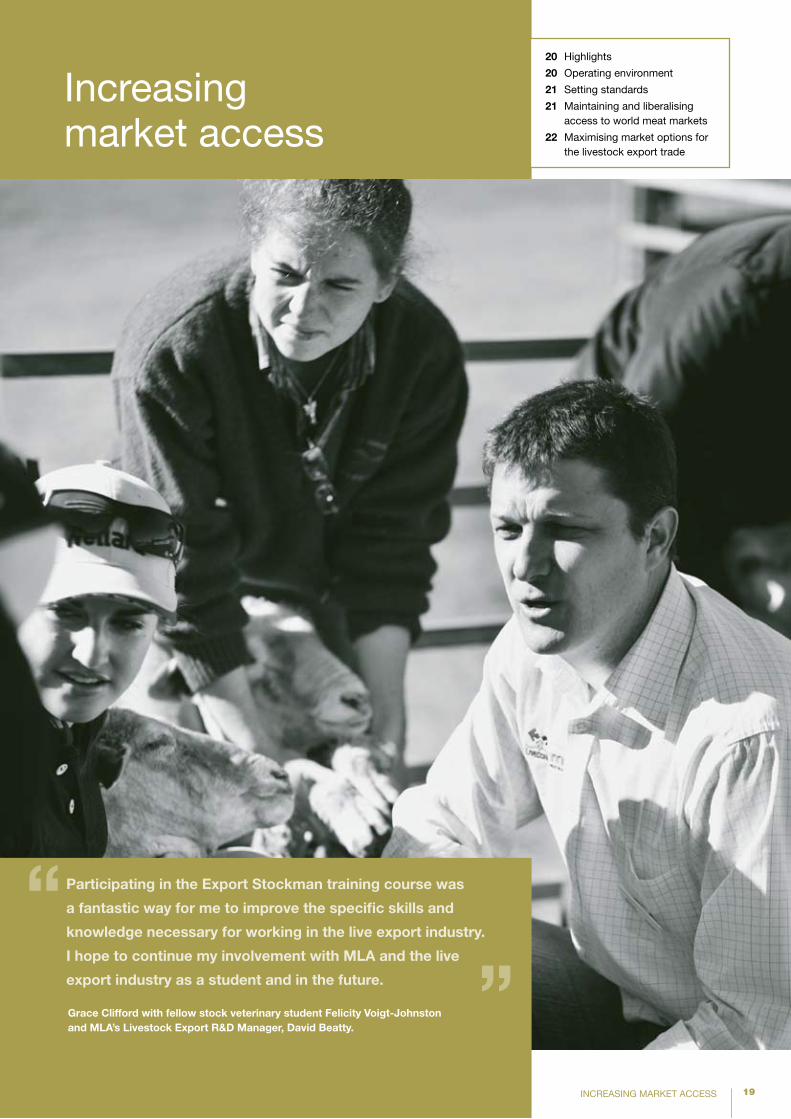
“”Grace Clifford with fellow stock veterinary student Felicity Voigt-johnston
and MLA’s Livestock Export R&D Manager, David Beatty.
participating in the Export Stockman training course was
a fantastic way for me to improve the specific skills and
knowledge necessary for working in the live export industry.
I hope to continue my involvement with MLA and the live
export industry as a student and in the future.
20 INCREASING MARKET ACCESS
Highlights
Guided by the Australian Government research priorities:•Productivityandaddingvalue•Supplychainandmarkets
Increasing market access
Investment
this year
Last year
$21.2m
$22.8m
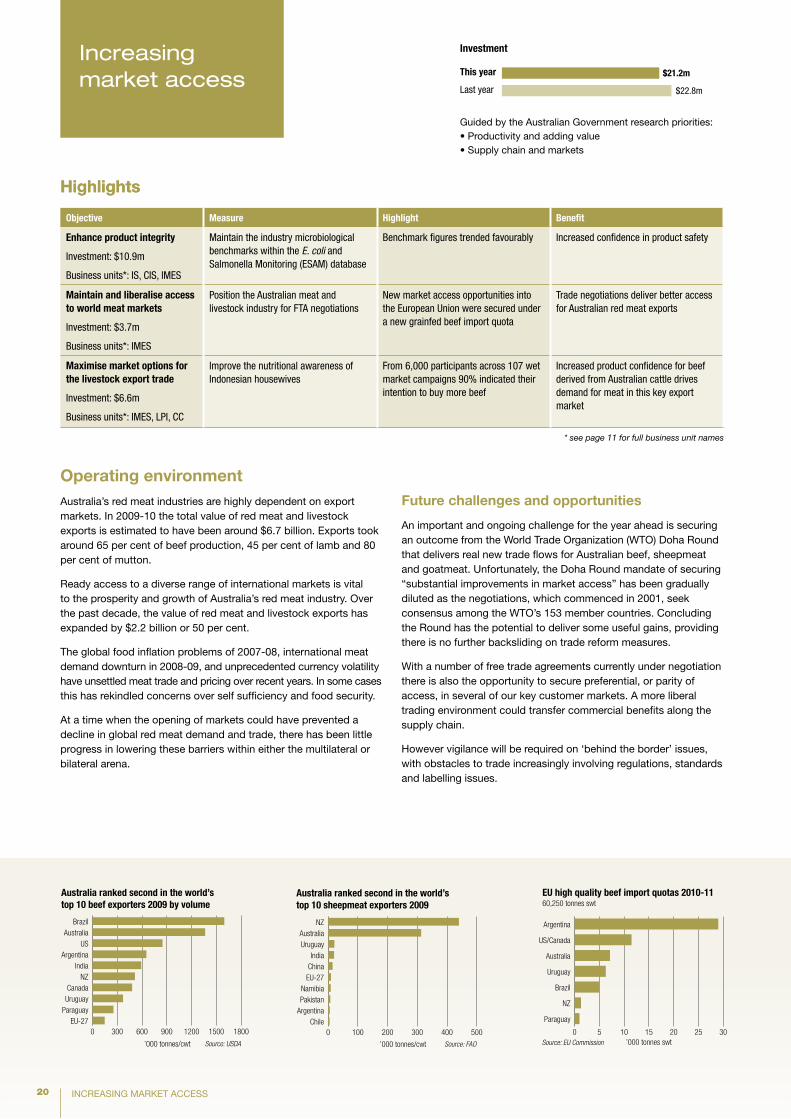
Operating environment Australia’s red meat industries are highly dependent on export markets. In 2009-10 the total value of red meat and livestock exports is estimated to have been around $6.7 billion. Exports took around 65 per cent of beef production, 45 per cent of lamb and 80 per cent of mutton.
Ready access to a diverse range of international markets is vital to the prosperity and growth of Australia’s red meat industry. Over the past decade, the value of red meat and livestock exports has expanded by $2.2 billion or 50 per cent.
The global food inflation problems of 2007-08, international meat demand downturn in 2008-09, and unprecedented currency volatility have unsettled meat trade and pricing over recent years. In some cases this has rekindled concerns over self sufficiency and food security.
At a time when the opening of markets could have prevented a decline in global red meat demand and trade, there has been little progress in lowering these barriers within either the multilateral or bilateral arena.
Objective Measure Highlight Benefit
enhance product integrity
Investment: $10.9m
Business units*: IS, CIS, IMES
Maintain the industry microbiological benchmarks within the E. coli and Salmonella Monitoring (ESAM) database
Benchmark figures trended favourably Increased confidence in product safety
Maintain and liberalise access to world meat markets
Investment: $3.7m
Business units*: IMES
Position the Australian meat and livestock industry for FTA negotiations
New market access opportunities into the European Union were secured under a new grainfed beef import quota
Trade negotiations deliver better access for Australian red meat exports
Maximise market options for the livestock export trade
Investment: $6.6m
Business units*: IMES, LPI, CC
Improve the nutritional awareness of Indonesian housewives
From 6,000 participants across 107 wet market campaigns 90% indicated their intention to buy more beef
Increased product confidence for beef derived from Australian cattle drives demand for meat in this key export market
* see page 11 for full business unit names
Highlights
Future challenges and opportunities
An important and ongoing challenge for the year ahead is securing an outcome from the World Trade Organization (WTO) Doha Round that delivers real new trade flows for Australian beef, sheepmeat and goatmeat. Unfortunately, the Doha Round mandate of securing “substantial improvements in market access” has been gradually diluted as the negotiations, which commenced in 2001, seek consensus among the WTO’s 153 member countries. Concluding the Round has the potential to deliver some useful gains, providing there is no further backsliding on trade reform measures.
With a number of free trade agreements currently under negotiation there is also the opportunity to secure preferential, or parity of access, in several of our key customer markets. A more liberal trading environment could transfer commercial benefits along the supply chain.
However vigilance will be required on ‘behind the border’ issues, with obstacles to trade increasingly involving regulations, standards and labelling issues.
0 300 600 900 1200 1500 1800EU-27
ParaguayUruguayCanada
NZIndia
ArgentinaUS
AustraliaBrazil
’000 tonnes/cwt Source: USDA
Australia ranked second in the world’s top 10 beef exporters 2009 by volume
0 100 200 300 400 500Chile
ArgentinaPakistanNamibia
EU-27ChinaIndia
UruguayAustralia
NZ
’000 tonnes/cwt Source: FAO
Australia ranked second in the world’s top 10 sheepmeat exporters 2009
EU high quality beef import quotas 2010-11
0 5 10 15 20 25 30
Paraguay
NZ
Brazil
Uruguay
Australia
US/Canada
Argentina
’000 tonnes swtSource: EU Commission
EU sheepmeat import quotas 2010
0 50 100 150 200 250
Other*
Uruguay
Chile
Australia
Argentina
NZ
’000 tonnes/cwtSource: EU Commission
60,250 tonnes swt
60,250 tonnes shipped weight/fiscal year
000' tonnes cwt/calendar year
283,837 tonnes cwt
EU high quality beef import quotas remained the same
Uruguay 10.5%
Brazil 15.1%
US/Canada 17.4%New Zealand 2.0%
Australia 10.8%
Paraguay 1.5%
Argentina 43.8%
Source: EU Commission
283,387 tonnes carcase weight/calendar year
EU sheepmeat import quotas remained the same
Uruguay 2.0%Other 1.0%
New Zealand 80.1%Australia 6.6%Chile 2.2%Argentina 8.1%
Source: EU Commission
PMS 5835Tints 70%, 45%, 30%, 15%
BlackTints 60%, 40%, 20%, 10%
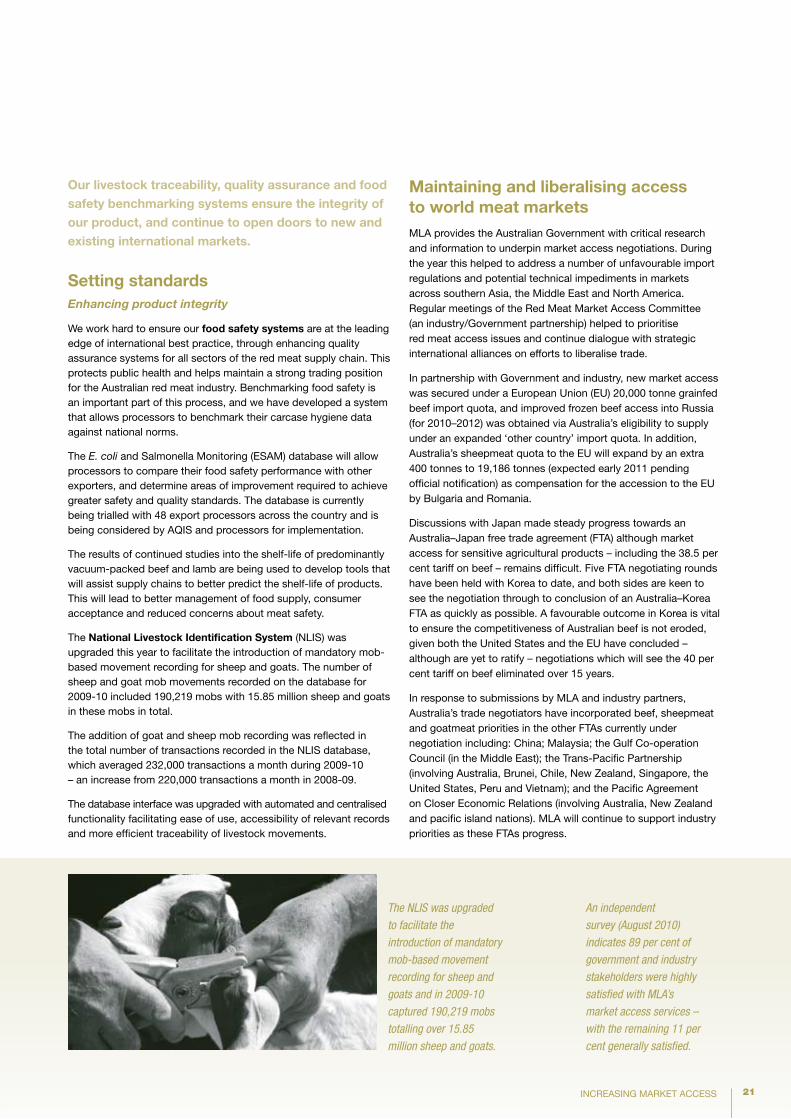
21INCREASING MARKET ACCESS
Our livestock traceability, quality assurance and food safety benchmarking systems ensure the integrity of our product, and continue to open doors to new and existing international markets.
Setting standardsEnhancing product integrity
We work hard to ensure our food safety systems are at the leading edge of international best practice, through enhancing quality assurance systems for all sectors of the red meat supply chain. This protects public health and helps maintain a strong trading position for the Australian red meat industry. Benchmarking food safety is an important part of this process, and we have developed a system that allows processors to benchmark their carcase hygiene data against national norms.
The E. coli and Salmonella Monitoring (ESAM) database will allow processors to compare their food safety performance with other exporters, and determine areas of improvement required to achieve greater safety and quality standards. The database is currently being trialled with 48 export processors across the country and is being considered by AQIS and processors for implementation.
The results of continued studies into the shelf-life of predominantly vacuum-packed beef and lamb are being used to develop tools that will assist supply chains to better predict the shelf-life of products. This will lead to better management of food supply, consumer acceptance and reduced concerns about meat safety.
The national Livestock Identification System (NLIS) was upgraded this year to facilitate the introduction of mandatory mob-based movement recording for sheep and goats. The number of sheep and goat mob movements recorded on the database for 2009-10 included 190,219 mobs with 15.85 million sheep and goats in these mobs in total.
The addition of goat and sheep mob recording was reflected in the total number of transactions recorded in the NLIS database, which averaged 232,000 transactions a month during 2009-10 – an increase from 220,000 transactions a month in 2008-09.
The database interface was upgraded with automated and centralised functionality facilitating ease of use, accessibility of relevant records and more efficient traceability of livestock movements.
Maintaining and liberalising access to world meat markets MLA provides the Australian Government with critical research and information to underpin market access negotiations. During the year this helped to address a number of unfavourable import regulations and potential technical impediments in markets across southern Asia, the Middle East and North America. Regular meetings of the Red Meat Market Access Committee (an industry/Government partnership) helped to prioritise red meat access issues and continue dialogue with strategic international alliances on efforts to liberalise trade.
In partnership with Government and industry, new market access was secured under a European Union (EU) 20,000 tonne grainfed beef import quota, and improved frozen beef access into Russia (for 2010–2012) was obtained via Australia’s eligibility to supply under an expanded ‘other country’ import quota. In addition, Australia’s sheepmeat quota to the EU will expand by an extra 400 tonnes to 19,186 tonnes (expected early 2011 pending official notification) as compensation for the accession to the EU by Bulgaria and Romania.
Discussions with Japan made steady progress towards an Australia–Japan free trade agreement (FTA) although market access for sensitive agricultural products – including the 38.5 per cent tariff on beef – remains difficult. Five FTA negotiating rounds have been held with Korea to date, and both sides are keen to see the negotiation through to conclusion of an Australia–Korea FTA as quickly as possible. A favourable outcome in Korea is vital to ensure the competitiveness of Australian beef is not eroded, given both the United States and the EU have concluded – although are yet to ratify – negotiations which will see the 40 per cent tariff on beef eliminated over 15 years.
In response to submissions by MLA and industry partners, Australia’s trade negotiators have incorporated beef, sheepmeat and goatmeat priorities in the other FTAs currently under negotiation including: China; Malaysia; the Gulf Co-operation Council (in the Middle East); the Trans-Pacific Partnership (involving Australia, Brunei, Chile, New Zealand, Singapore, the United States, Peru and Vietnam); and the Pacific Agreement on Closer Economic Relations (involving Australia, New Zealand and pacific island nations). MLA will continue to support industry priorities as these FTAs progress.
The NLIS was upgraded
to facilitate the
introduction of mandatory
mob-based movement
recording for sheep and
goats and in 2009-10
captured 190,219 mobs
totalling over 15.85
million sheep and goats.
An independent
survey (August 2010)
indicates 89 per cent of
government and industry
stakeholders were highly
satisfied with MLA’s
market access services –
with the remaining 11 per
cent generally satisfied.
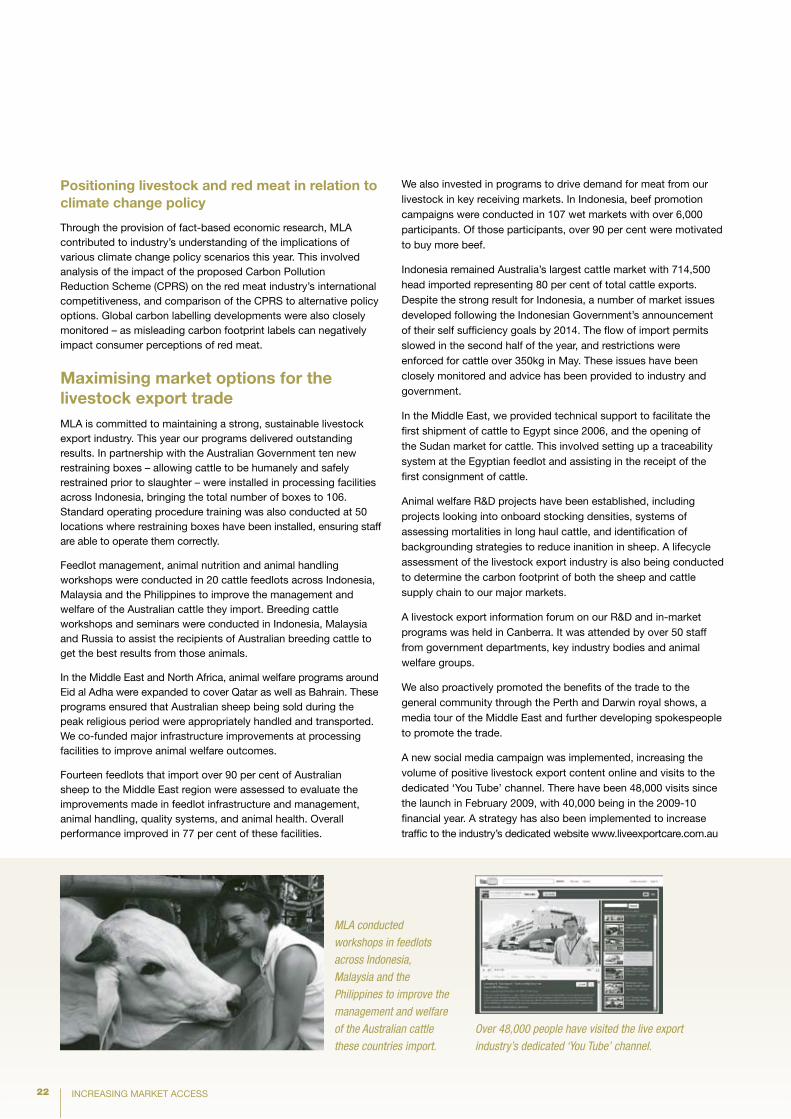
22 INCREASING MARKET ACCESS
positioning livestock and red meat in relation to climate change policy
Through the provision of fact-based economic research, MLA contributed to industry’s understanding of the implications of various climate change policy scenarios this year. This involved analysis of the impact of the proposed Carbon Pollution Reduction Scheme (CPRS) on the red meat industry’s international competitiveness, and comparison of the CPRS to alternative policy options. Global carbon labelling developments were also closely monitored – as misleading carbon footprint labels can negatively impact consumer perceptions of red meat.
Maximising market options for the livestock export trade MLA is committed to maintaining a strong, sustainable livestock export industry. This year our programs delivered outstanding results. In partnership with the Australian Government ten new restraining boxes – allowing cattle to be humanely and safely restrained prior to slaughter – were installed in processing facilities across Indonesia, bringing the total number of boxes to 106. Standard operating procedure training was also conducted at 50 locations where restraining boxes have been installed, ensuring staff are able to operate them correctly.
Feedlot management, animal nutrition and animal handling workshops were conducted in 20 cattle feedlots across Indonesia, Malaysia and the Philippines to improve the management and welfare of the Australian cattle they import. Breeding cattle workshops and seminars were conducted in Indonesia, Malaysia and Russia to assist the recipients of Australian breeding cattle to get the best results from those animals.
In the Middle East and North Africa, animal welfare programs around Eid al Adha were expanded to cover Qatar as well as Bahrain. These programs ensured that Australian sheep being sold during the peak religious period were appropriately handled and transported. We co-funded major infrastructure improvements at processing facilities to improve animal welfare outcomes.
Fourteen feedlots that import over 90 per cent of Australian sheep to the Middle East region were assessed to evaluate the improvements made in feedlot infrastructure and management, animal handling, quality systems, and animal health. Overall performance improved in 77 per cent of these facilities.
We also invested in programs to drive demand for meat from our livestock in key receiving markets. In Indonesia, beef promotion campaigns were conducted in 107 wet markets with over 6,000 participants. Of those participants, over 90 per cent were motivated to buy more beef.
Indonesia remained Australia’s largest cattle market with 714,500 head imported representing 80 per cent of total cattle exports. Despite the strong result for Indonesia, a number of market issues developed following the Indonesian Government’s announcement of their self sufficiency goals by 2014. The flow of import permits slowed in the second half of the year, and restrictions were enforced for cattle over 350kg in May. These issues have been closely monitored and advice has been provided to industry and government.
In the Middle East, we provided technical support to facilitate the first shipment of cattle to Egypt since 2006, and the opening of the Sudan market for cattle. This involved setting up a traceability system at the Egyptian feedlot and assisting in the receipt of the first consignment of cattle.
Animal welfare R&D projects have been established, including projects looking into onboard stocking densities, systems of assessing mortalities in long haul cattle, and identification of backgrounding strategies to reduce inanition in sheep. A lifecycle assessment of the livestock export industry is also being conducted to determine the carbon footprint of both the sheep and cattle supply chain to our major markets.
A livestock export information forum on our R&D and in-market programs was held in Canberra. It was attended by over 50 staff from government departments, key industry bodies and animal welfare groups.
We also proactively promoted the benefits of the trade to the general community through the Perth and Darwin royal shows, a media tour of the Middle East and further developing spokespeople to promote the trade.
A new social media campaign was implemented, increasing the volume of positive livestock export content online and visits to the dedicated ‘You Tube’ channel. There have been 48,000 visits since the launch in February 2009, with 40,000 being in the 2009-10 financial year. A strategy has also been implemented to increase traffic to the industry’s dedicated website www.liveexportcare.com.au
MLA conducted
workshops in feedlots
across Indonesia,
Malaysia and the
Philippines to improve the
management and welfare
of the Australian cattle
these countries import.
Over 48,000 people have visited the live export
industry’s dedicated ‘You Tube’ channel.
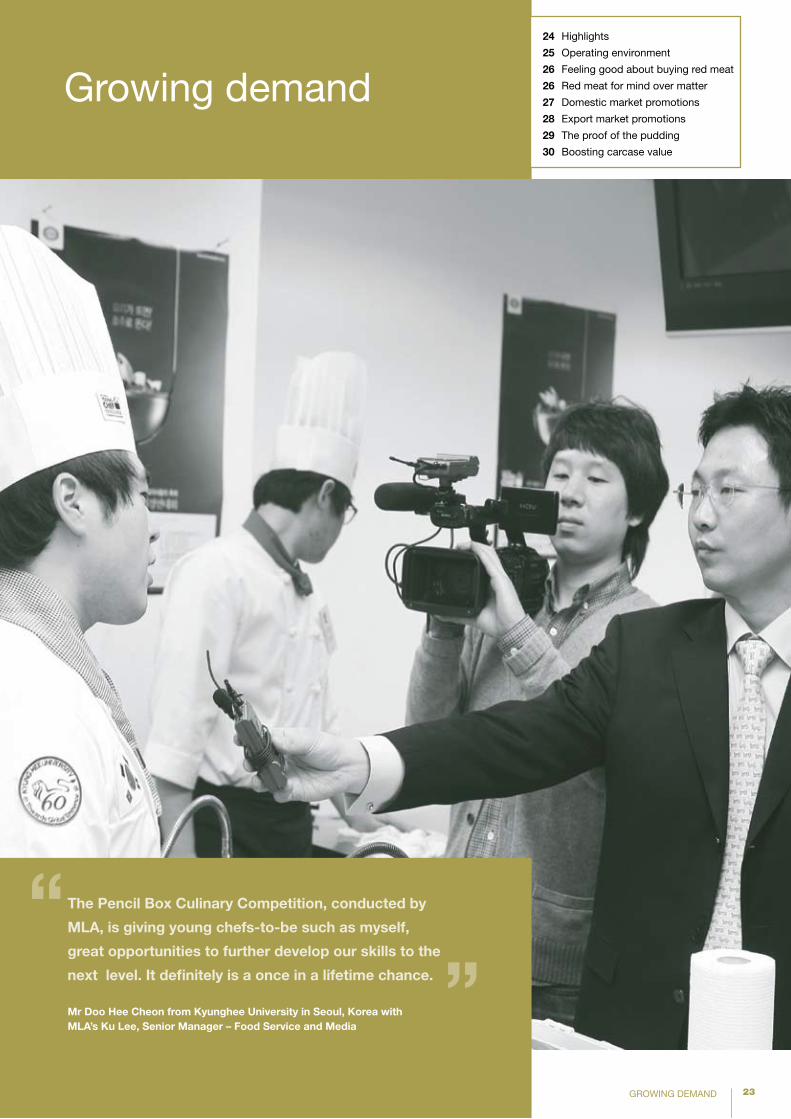
23
24 Highlights
25 Operating environment
26 Feeling good about buying red meat
26 Red meat for mind over matter
27 Domestic market promotions
28 Export market promotions
29 The proof of the pudding
30 Boosting carcase value
GROWING DEMAND
“Mr Doo Hee Cheon from Kyunghee University in Seoul, Korea with MLA’s Ku Lee, Senior Manager – Food Service and Media
”The pencil Box Culinary Competition, conducted by
MLA, is giving young chefs-to-be such as myself,
great opportunities to further develop our skills to the
next level. It definitely is a once in a lifetime chance.
Growing demand
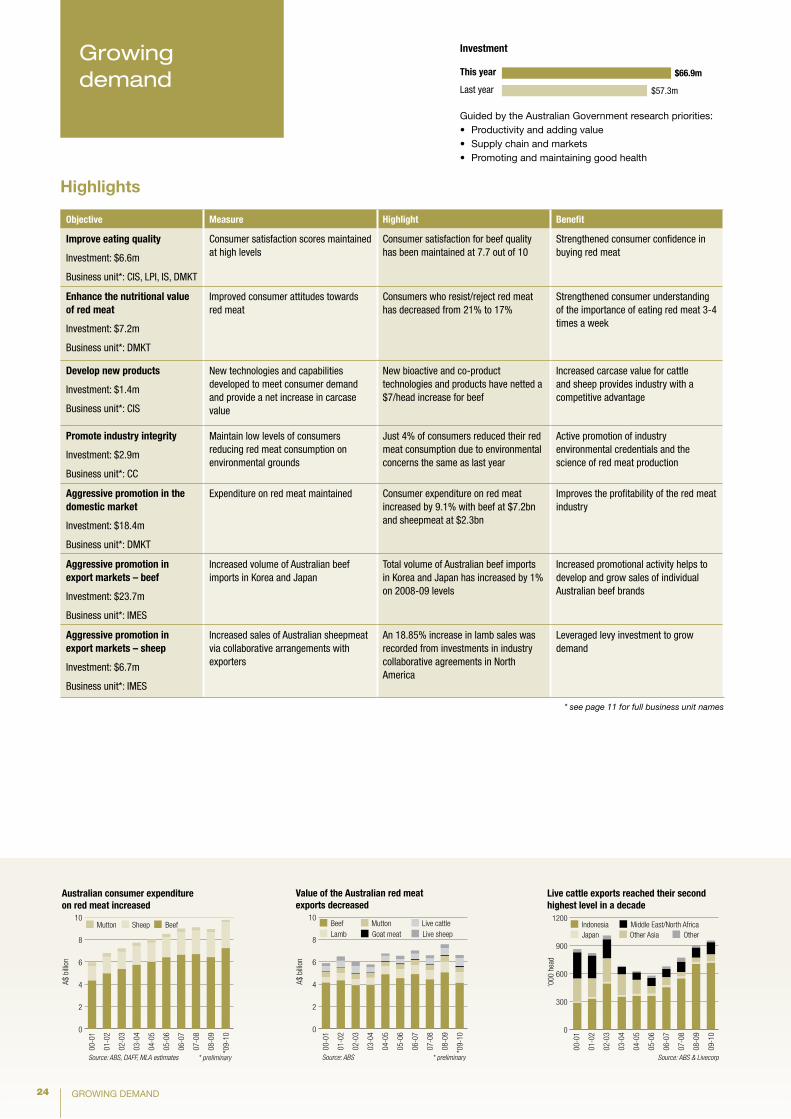
24
Highlights
GROWING DEMAND
Guided by the Australian Government research priorities:• Productivityandaddingvalue• Supplychainandmarkets• Promotingandmaintaininggoodhealth
Investment
this year
Last year
$66.9m
$57.3m
Growing demand
Objective Measure Highlight Benefit
Improve eating quality
Investment: $6.6m
Business unit*: CIS, LPI, IS, DMKT
Consumer satisfaction scores maintained at high levels
Consumer satisfaction for beef quality has been maintained at 7.7 out of 10
Strengthened consumer confidence in buying red meat
enhance the nutritional value of red meat
Investment: $7.2m
Business unit*: DMKT
Improved consumer attitudes towards red meat
Consumers who resist/reject red meat has decreased from 21% to 17%
Strengthened consumer understanding of the importance of eating red meat 3-4 times a week
Develop new products
Investment: $1.4m
Business unit*: CIS
New technologies and capabilities developed to meet consumer demand and provide a net increase in carcase value
New bioactive and co-product technologies and products have netted a $7/head increase for beef
Increased carcase value for cattle and sheep provides industry with a competitive advantage
Promote industry integrity
Investment: $2.9m
Business unit*: CC
Maintain low levels of consumers reducing red meat consumption on environmental grounds
Just 4% of consumers reduced their red meat consumption due to environmental concerns the same as last year
Active promotion of industry environmental credentials and the science of red meat production
Aggressive promotion in the domestic market
Investment: $18.4m
Business unit*: DMKT
Expenditure on red meat maintained Consumer expenditure on red meat increased by 9.1% with beef at $7.2bn and sheepmeat at $2.3bn
Improves the profitability of the red meat industry
Aggressive promotion in export markets – beef
Investment: $23.7m
Business unit*: IMES
Increased volume of Australian beef imports in Korea and Japan
Total volume of Australian beef imports in Korea and Japan has increased by 1% on 2008-09 levels
Increased promotional activity helps to develop and grow sales of individual Australian beef brands
Aggressive promotion in export markets – sheep
Investment: $6.7m
Business unit*: IMES
Increased sales of Australian sheepmeat via collaborative arrangements with exporters
An 18.85% increase in lamb sales was recorded from investments in industry collaborative agreements in North America
Leveraged levy investment to grow demand
* see page 11 for full business unit names
954,661 headAustralian live cattle exports 2009-10
Saudi Arabia 0.9%
Indonesia 79.5%
Japan 1.8%Libya 2.1%Malaysia 0.8%
China 5.9%Jordan 3.1%
Brunei 0.4%
Israel 4.1%Philippines 1.5%
Source: ABS & Livecorp
A$ b
illion
Australian consumer expenditure on red meat increased
Source: ABS, DAFF, MLA estimates
0
2
4
6
8
10BeefMutton Sheep
00-0
1
01-0
2
02-0
3
03-0
4
04-0
5
05-0
6
06-0
7
07-0
8
08-0
9
*09-
10
00-0
1
01-0
2
02-0
3
03-0
4
04-0
5
05-0
6
06-0
7
07-0
8
08-0
9
*09-
10
* preliminary
* preliminary
A$ b
illion
Value of the Australian red meat exports decreased
Source: ABS
0
2
4
6
8
10
LambBeef
Goat meatMutton
Live sheepLive cattle
Source: ABS & Livecorp
00-0
1
01-0
2
02-0
3
03-0
4
04-0
5
05-0
6
06-0
7
07-0
8
08-0
9
09-1
0
Live cattle exports reached their second highest level in a decade
’000
hea
d
0
300
600
900
1200
JapanMiddle East/North AfricaIndonesia
OtherOther Asia
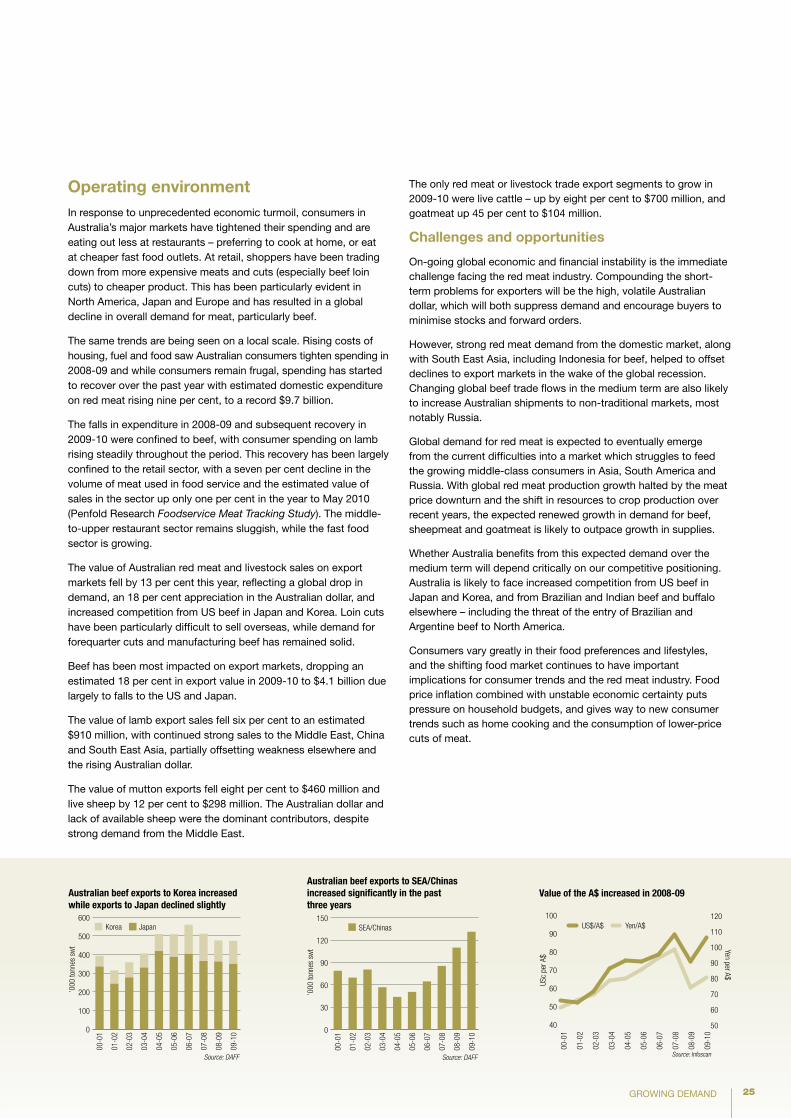
25GROWING DEMAND
Operating environment In response to unprecedented economic turmoil, consumers in Australia’s major markets have tightened their spending and are eating out less at restaurants – preferring to cook at home, or eat at cheaper fast food outlets. At retail, shoppers have been trading down from more expensive meats and cuts (especially beef loin cuts) to cheaper product. This has been particularly evident in North America, Japan and Europe and has resulted in a global decline in overall demand for meat, particularly beef.
The same trends are being seen on a local scale. Rising costs of housing, fuel and food saw Australian consumers tighten spending in 2008-09 and while consumers remain frugal, spending has started to recover over the past year with estimated domestic expenditure on red meat rising nine per cent, to a record $9.7 billion.
The falls in expenditure in 2008-09 and subsequent recovery in 2009-10 were confined to beef, with consumer spending on lamb rising steadily throughout the period. This recovery has been largely confined to the retail sector, with a seven per cent decline in the volume of meat used in food service and the estimated value of sales in the sector up only one per cent in the year to May 2010 (Penfold Research Foodservice Meat Tracking Study). The middle-to-upper restaurant sector remains sluggish, while the fast food sector is growing.
The value of Australian red meat and livestock sales on export markets fell by 13 per cent this year, reflecting a global drop in demand, an 18 per cent appreciation in the Australian dollar, and increased competition from US beef in Japan and Korea. Loin cuts have been particularly difficult to sell overseas, while demand for forequarter cuts and manufacturing beef has remained solid.
Beef has been most impacted on export markets, dropping an estimated 18 per cent in export value in 2009-10 to $4.1 billion due largely to falls to the US and Japan.
The value of lamb export sales fell six per cent to an estimated $910 million, with continued strong sales to the Middle East, China and South East Asia, partially offsetting weakness elsewhere and the rising Australian dollar.
The value of mutton exports fell eight per cent to $460 million and live sheep by 12 per cent to $298 million. The Australian dollar and lack of available sheep were the dominant contributors, despite strong demand from the Middle East.
The only red meat or livestock trade export segments to grow in 2009-10 were live cattle – up by eight per cent to $700 million, and goatmeat up 45 per cent to $104 million.
Challenges and opportunities
On-going global economic and financial instability is the immediate challenge facing the red meat industry. Compounding the short-term problems for exporters will be the high, volatile Australian dollar, which will both suppress demand and encourage buyers to minimise stocks and forward orders.
However, strong red meat demand from the domestic market, along with South East Asia, including Indonesia for beef, helped to offset declines to export markets in the wake of the global recession. Changing global beef trade flows in the medium term are also likely to increase Australian shipments to non-traditional markets, most notably Russia.
Global demand for red meat is expected to eventually emerge from the current difficulties into a market which struggles to feed the growing middle-class consumers in Asia, South America and Russia. With global red meat production growth halted by the meat price downturn and the shift in resources to crop production over recent years, the expected renewed growth in demand for beef, sheepmeat and goatmeat is likely to outpace growth in supplies.
Whether Australia benefits from this expected demand over the medium term will depend critically on our competitive positioning. Australia is likely to face increased competition from US beef in Japan and Korea, and from Brazilian and Indian beef and buffalo elsewhere – including the threat of the entry of Brazilian and Argentine beef to North America.
Consumers vary greatly in their food preferences and lifestyles, and the shifting food market continues to have important implications for consumer trends and the red meat industry. Food price inflation combined with unstable economic certainty puts pressure on household budgets, and gives way to new consumer trends such as home cooking and the consumption of lower-price cuts of meat.
898,962 tonnes swt
index (1998-99 = 100)
Australian beef exports 2009-10: Japan was the top destination with a 40% share
Korea 15%Hong Kong 1%
Indonesia 6%
Philippines 2%
US 25%
Taiwan 4%
Singapore 1%
Malaysia 1%
Russia 3%
Japan 42%
Source: DAFF
156,971 tonnes swt
Australian lamb exports 2009-10: The US was the largest lanb importer taking a third of our exports
Jordan 9%
Japan 6%
Hong Kong 10%
UK 7%
UAE 12%China 10%
South Africa 3%Malaysia 3%
PNG 7%
US 32%
Source: DAFF
’000
tonn
es s
wt
’000
tonn
es s
wt
Source: DAFF
Source: DAFF
0
100
200
300
400
500
600JapanKorea
0
30
60
90
120
150SEA/Chinas
00-0
1
01-0
2
02-0
3
03-0
4
04-0
5
05-0
6
06-0
7
07-0
8
08-0
9
09-1
0
00-0
1
01-0
2
02-0
3
03-0
4
04-0
5
05-0
6
06-0
7
07-0
8
08-0
9
09-1
0
Australian beef exports to SEA/Chinas increased significantly in the past three years
00-0
1
01-0
2
02-0
3
03-0
4
04-0
5
05-0
6
06-0
7
07-0
8
08-0
9
09-1
0
Australian beef exports to Korea increased while exports to Japan declined slightly
50
60
70
80
90
100
110
120
Source: Infoscan
Yen/A$US$/A$
USc
per A
$
Yen per A$
40
50
60
70
80
90
100
US imp. US¢/lbAust. exp. A¢/kg
Value of the A$ increased in 2008-09
99-0
0
00-0
1
01-0
2
02-0
3
03-0
4
04-0
5
05-0
6
06-0
7
07-0
8
08-0
9
09-1
0
50
70
90
110
130
150
pric
e to
Aus
t. ex
porte
rs A
¢/kg
FAS
price to US importers US¢/lb CIF
250
290
330
370
410
450
Price of Australian 90CL cow beef to US 1999-2010
0 500 1,000 1,500 2,000ColombiaParaguayUruguay
ArgentinaCanada
NZIndia
USAustralia
Brazil
’000 tonnes/cwt Source: USDA
Graph heading text top 10
60%, 40%, 20%, 10%
PMS 5835 70%, 45%, 30%, 15%
Source: Steiner Consulting Group, MLA
US grainfed Choice steer
Aust. grassfed trade steer
98-9
9
99-0
0
00-0
1
01-0
2
02-0
3
03-0
4
04-0
5
05-0
6
06-0
7
07-0
8
08-0
9
09-1
0
80
100
120
140
160
180
200
Cattle prices – Australia vs US
Source: Steiner Consulting Group, MLA
widen
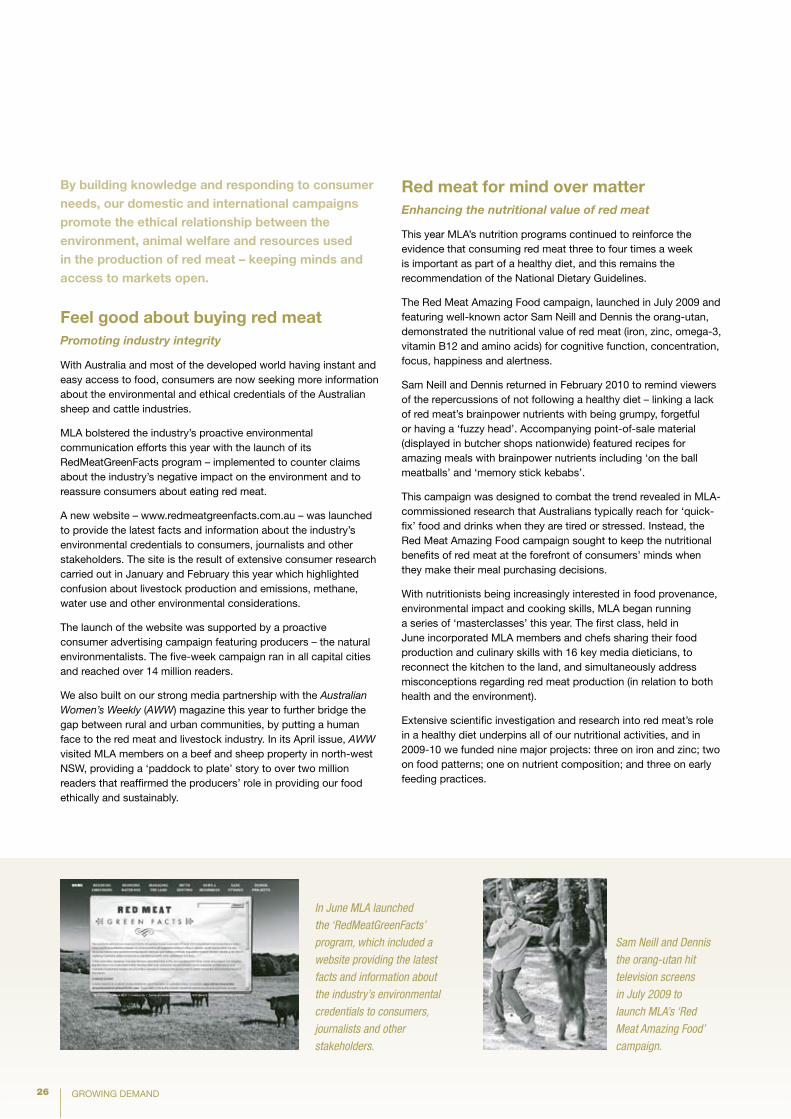
26 GROWING DEMAND
By building knowledge and responding to consumer needs, our domestic and international campaigns promote the ethical relationship between the environment, animal welfare and resources used in the production of red meat – keeping minds and access to markets open.
Feel good about buying red meatPromoting industry integrity
With Australia and most of the developed world having instant and easy access to food, consumers are now seeking more information about the environmental and ethical credentials of the Australian sheep and cattle industries.
MLA bolstered the industry’s proactive environmental communication efforts this year with the launch of its RedMeatGreenFacts program – implemented to counter claims about the industry’s negative impact on the environment and to reassure consumers about eating red meat.
A new website – www.redmeatgreenfacts.com.au – was launched to provide the latest facts and information about the industry’s environmental credentials to consumers, journalists and other stakeholders. The site is the result of extensive consumer research carried out in January and February this year which highlighted confusion about livestock production and emissions, methane, water use and other environmental considerations.
The launch of the website was supported by a proactive consumer advertising campaign featuring producers – the natural environmentalists. The five-week campaign ran in all capital cities and reached over 14 million readers.
We also built on our strong media partnership with the Australian Women’s Weekly (AWW) magazine this year to further bridge the gap between rural and urban communities, by putting a human face to the red meat and livestock industry. In its April issue, AWW visited MLA members on a beef and sheep property in north-west NSW, providing a ‘paddock to plate’ story to over two million readers that reaffirmed the producers’ role in providing our food ethically and sustainably.
Red meat for mind over matterEnhancing the nutritional value of red meat
This year MLA’s nutrition programs continued to reinforce the evidence that consuming red meat three to four times a week is important as part of a healthy diet, and this remains the recommendation of the National Dietary Guidelines.
The Red Meat Amazing Food campaign, launched in July 2009 and featuring well-known actor Sam Neill and Dennis the orang-utan, demonstrated the nutritional value of red meat (iron, zinc, omega-3, vitamin B12 and amino acids) for cognitive function, concentration, focus, happiness and alertness.
Sam Neill and Dennis returned in February 2010 to remind viewers of the repercussions of not following a healthy diet – linking a lack of red meat’s brainpower nutrients with being grumpy, forgetful or having a ‘fuzzy head’. Accompanying point-of-sale material (displayed in butcher shops nationwide) featured recipes for amazing meals with brainpower nutrients including ‘on the ball meatballs’ and ‘memory stick kebabs’.
This campaign was designed to combat the trend revealed in MLA-commissioned research that Australians typically reach for ‘quick-fix’ food and drinks when they are tired or stressed. Instead, the Red Meat Amazing Food campaign sought to keep the nutritional benefits of red meat at the forefront of consumers’ minds when they make their meal purchasing decisions.
With nutritionists being increasingly interested in food provenance, environmental impact and cooking skills, MLA began running a series of ‘masterclasses’ this year. The first class, held in June incorporated MLA members and chefs sharing their food production and culinary skills with 16 key media dieticians, to reconnect the kitchen to the land, and simultaneously address misconceptions regarding red meat production (in relation to both health and the environment).
Extensive scientific investigation and research into red meat’s role in a healthy diet underpins all of our nutritional activities, and in 2009-10 we funded nine major projects: three on iron and zinc; two on food patterns; one on nutrient composition; and three on early feeding practices.
In June MLA launched
the ‘RedMeatGreenFacts’
program, which included a
website providing the latest
facts and information about
the industry’s environmental
credentials to consumers,
journalists and other
stakeholders.
Sam Neill and Dennis
the orang-utan hit
television screens
in July 2009 to
launch MLA’s ‘Red
Meat Amazing Food’
campaign.
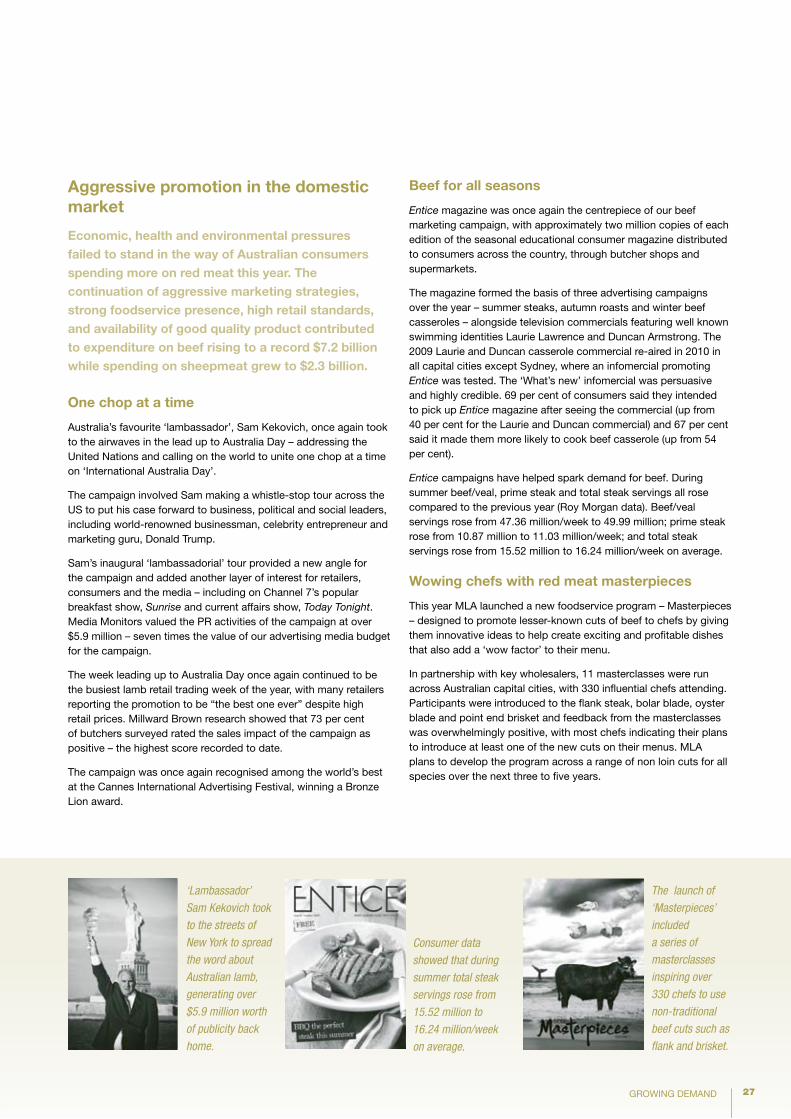
27GROWING DEMAND
Aggressive promotion in the domestic market
Economic, health and environmental pressures failed to stand in the way of Australian consumers spending more on red meat this year. The continuation of aggressive marketing strategies, strong foodservice presence, high retail standards, and availability of good quality product contributed to expenditure on beef rising to a record $7.2 billion while spending on sheepmeat grew to $2.3 billion.
One chop at a time
Australia’s favourite ‘lambassador’, Sam Kekovich, once again took to the airwaves in the lead up to Australia Day – addressing the United Nations and calling on the world to unite one chop at a time on ‘International Australia Day’.
The campaign involved Sam making a whistle-stop tour across the US to put his case forward to business, political and social leaders, including world-renowned businessman, celebrity entrepreneur and marketing guru, Donald Trump.
Sam’s inaugural ‘lambassadorial’ tour provided a new angle for the campaign and added another layer of interest for retailers, consumers and the media – including on Channel 7’s popular breakfast show, Sunrise and current affairs show, Today Tonight. Media Monitors valued the PR activities of the campaign at over $5.9 million – seven times the value of our advertising media budget for the campaign.
The week leading up to Australia Day once again continued to be the busiest lamb retail trading week of the year, with many retailers reporting the promotion to be “the best one ever” despite high retail prices. Millward Brown research showed that 73 per cent of butchers surveyed rated the sales impact of the campaign as positive – the highest score recorded to date.
The campaign was once again recognised among the world’s best at the Cannes International Advertising Festival, winning a Bronze Lion award.
Beef for all seasons
Entice magazine was once again the centrepiece of our beef marketing campaign, with approximately two million copies of each edition of the seasonal educational consumer magazine distributed to consumers across the country, through butcher shops and supermarkets.
The magazine formed the basis of three advertising campaigns over the year – summer steaks, autumn roasts and winter beef casseroles – alongside television commercials featuring well known swimming identities Laurie Lawrence and Duncan Armstrong. The 2009 Laurie and Duncan casserole commercial re-aired in 2010 in all capital cities except Sydney, where an infomercial promoting Entice was tested. The ‘What’s new’ infomercial was persuasive and highly credible. 69 per cent of consumers said they intended to pick up Entice magazine after seeing the commercial (up from 40 per cent for the Laurie and Duncan commercial) and 67 per cent said it made them more likely to cook beef casserole (up from 54 per cent).
Entice campaigns have helped spark demand for beef. During summer beef/veal, prime steak and total steak servings all rose compared to the previous year (Roy Morgan data). Beef/veal servings rose from 47.36 million/week to 49.99 million; prime steak rose from 10.87 million to 11.03 million/week; and total steak servings rose from 15.52 million to 16.24 million/week on average.
Wowing chefs with red meat masterpieces
This year MLA launched a new foodservice program – Masterpieces – designed to promote lesser-known cuts of beef to chefs by giving them innovative ideas to help create exciting and profitable dishes that also add a ‘wow factor’ to their menu.
In partnership with key wholesalers, 11 masterclasses were run across Australian capital cities, with 330 influential chefs attending. Participants were introduced to the flank steak, bolar blade, oyster blade and point end brisket and feedback from the masterclasses was overwhelmingly positive, with most chefs indicating their plans to introduce at least one of the new cuts on their menus. MLA plans to develop the program across a range of non loin cuts for all species over the next three to five years.
‘Lambassador’
Sam Kekovich took
to the streets of
New York to spread
the word about
Australian lamb,
generating over
$5.9 million worth
of publicity back
home.
Consumer data
showed that during
summer total steak
servings rose from
15.52 million to
16.24 million/week
on average.
The launch of
‘Masterpieces’
included
a series of
masterclasses
inspiring over
330 chefs to use
non-traditional
beef cuts such as
flank and brisket.
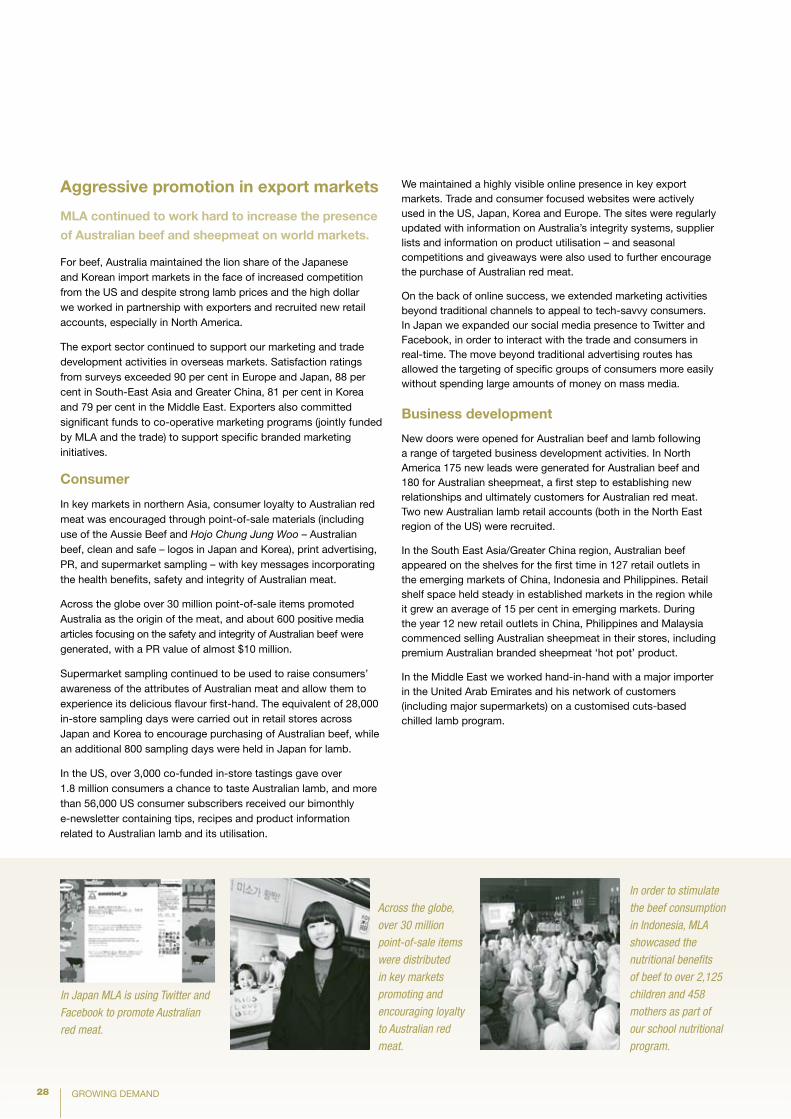
28 GROWING DEMAND
Aggressive promotion in export markets
MLA continued to work hard to increase the presence
of Australian beef and sheepmeat on world markets.
For beef, Australia maintained the lion share of the Japanese and Korean import markets in the face of increased competition from the US and despite strong lamb prices and the high dollar we worked in partnership with exporters and recruited new retail accounts, especially in North America.
The export sector continued to support our marketing and trade development activities in overseas markets. Satisfaction ratings from surveys exceeded 90 per cent in Europe and Japan, 88 per cent in South-East Asia and Greater China, 81 per cent in Korea and 79 per cent in the Middle East. Exporters also committed significant funds to co-operative marketing programs (jointly funded by MLA and the trade) to support specific branded marketing initiatives.
Consumer
In key markets in northern Asia, consumer loyalty to Australian red meat was encouraged through point-of-sale materials (including use of the Aussie Beef and Hojo Chung Jung Woo – Australian beef, clean and safe – logos in Japan and Korea), print advertising, PR, and supermarket sampling – with key messages incorporating the health benefits, safety and integrity of Australian meat.
Across the globe over 30 million point-of-sale items promoted Australia as the origin of the meat, and about 600 positive media articles focusing on the safety and integrity of Australian beef were generated, with a PR value of almost $10 million.
Supermarket sampling continued to be used to raise consumers’ awareness of the attributes of Australian meat and allow them to experience its delicious flavour first-hand. The equivalent of 28,000 in-store sampling days were carried out in retail stores across Japan and Korea to encourage purchasing of Australian beef, while an additional 800 sampling days were held in Japan for lamb.
In the US, over 3,000 co-funded in-store tastings gave over 1.8 million consumers a chance to taste Australian lamb, and more than 56,000 US consumer subscribers received our bimonthly e-newsletter containing tips, recipes and product information related to Australian lamb and its utilisation.
We maintained a highly visible online presence in key export markets. Trade and consumer focused websites were actively used in the US, Japan, Korea and Europe. The sites were regularly updated with information on Australia’s integrity systems, supplier lists and information on product utilisation – and seasonal competitions and giveaways were also used to further encourage the purchase of Australian red meat.
On the back of online success, we extended marketing activities beyond traditional channels to appeal to tech-savvy consumers. In Japan we expanded our social media presence to Twitter and Facebook, in order to interact with the trade and consumers in real-time. The move beyond traditional advertising routes has allowed the targeting of specific groups of consumers more easily without spending large amounts of money on mass media.
Business development
New doors were opened for Australian beef and lamb following a range of targeted business development activities. In North America 175 new leads were generated for Australian beef and 180 for Australian sheepmeat, a first step to establishing new relationships and ultimately customers for Australian red meat. Two new Australian lamb retail accounts (both in the North East region of the US) were recruited.
In the South East Asia/Greater China region, Australian beef appeared on the shelves for the first time in 127 retail outlets in the emerging markets of China, Indonesia and Philippines. Retail shelf space held steady in established markets in the region while it grew an average of 15 per cent in emerging markets. During the year 12 new retail outlets in China, Philippines and Malaysia commenced selling Australian sheepmeat in their stores, including premium Australian branded sheepmeat ‘hot pot’ product.
In the Middle East we worked hand-in-hand with a major importer in the United Arab Emirates and his network of customers (including major supermarkets) on a customised cuts-based chilled lamb program.
Across the globe,
over 30 million
point-of-sale items
were distributed
in key markets
promoting and
encouraging loyalty
to Australian red
meat.
In Japan MLA is using Twitter and
Facebook to promote Australian
red meat.
In order to stimulate
the beef consumption
in Indonesia, MLA
showcased the
nutritional benefits
of beef to over 2,125
children and 458
mothers as part of
our school nutritional
program.
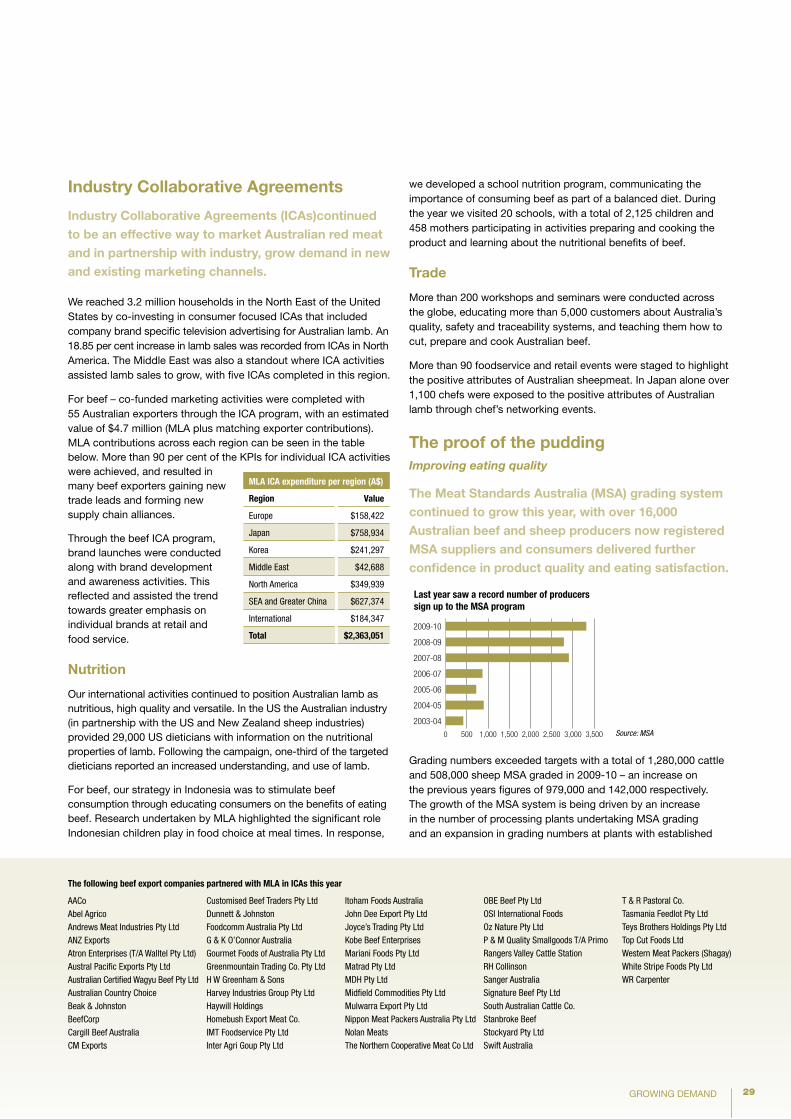
29GROWING DEMAND
Industry Collaborative Agreements
Industry Collaborative Agreements (ICAs)continued to be an effective way to market Australian red meat and in partnership with industry, grow demand in new and existing marketing channels.
We reached 3.2 million households in the North East of the United States by co-investing in consumer focused ICAs that included company brand specific television advertising for Australian lamb. An 18.85 per cent increase in lamb sales was recorded from ICAs in North America. The Middle East was also a standout where ICA activities assisted lamb sales to grow, with five ICAs completed in this region.
For beef – co-funded marketing activities were completed with 55 Australian exporters through the ICA program, with an estimated value of $4.7 million (MLA plus matching exporter contributions). MLA contributions across each region can be seen in the table below. More than 90 per cent of the KPIs for individual ICA activities were achieved, and resulted in many beef exporters gaining new trade leads and forming new supply chain alliances.
Through the beef ICA program, brand launches were conducted along with brand development and awareness activities. This reflected and assisted the trend towards greater emphasis on individual brands at retail and food service.
nutrition
Our international activities continued to position Australian lamb as nutritious, high quality and versatile. In the US the Australian industry (in partnership with the US and New Zealand sheep industries) provided 29,000 US dieticians with information on the nutritional properties of lamb. Following the campaign, one-third of the targeted dieticians reported an increased understanding, and use of lamb.
For beef, our strategy in Indonesia was to stimulate beef consumption through educating consumers on the benefits of eating beef. Research undertaken by MLA highlighted the significant role Indonesian children play in food choice at meal times. In response,
we developed a school nutrition program, communicating the importance of consuming beef as part of a balanced diet. During the year we visited 20 schools, with a total of 2,125 children and 458 mothers participating in activities preparing and cooking the product and learning about the nutritional benefits of beef.
Trade
More than 200 workshops and seminars were conducted across the globe, educating more than 5,000 customers about Australia’s quality, safety and traceability systems, and teaching them how to cut, prepare and cook Australian beef.
More than 90 foodservice and retail events were staged to highlight the positive attributes of Australian sheepmeat. In Japan alone over 1,100 chefs were exposed to the positive attributes of Australian lamb through chef’s networking events.
The proof of the puddingImproving eating quality
The Meat Standards Australia (MSA) grading system continued to grow this year, with over 16,000 Australian beef and sheep producers now registered MSA suppliers and consumers delivered further confidence in product quality and eating satisfaction.
0 500 1,000 1,500 2,000 2,500 3,000 3,500
2003-04
2004-05
2005-06
2006-07
2007-08
2008-09
2009-10
Source: MSA
Last year saw a record number of producers sign up to the MSA program
MLA ICA expenditure per region (A$)
Region value
Europe $158,422
Japan $758,934
Korea $241,297
Middle East $42,688
North America $349,939
SEA and Greater China $627,374
International $184,347
total $2,363,051
AACoAbel AgricoAndrews Meat Industries Pty LtdANZ ExportsAtron Enterprises (T/A Walltel Pty Ltd)Austral Pacific Exports Pty LtdAustralian Certified Wagyu Beef Pty LtdAustralian Country ChoiceBeak & JohnstonBeefCorpCargill Beef AustraliaCM Exports
Customised Beef Traders Pty LtdDunnett & JohnstonFoodcomm Australia Pty LtdG & K O’Connor AustraliaGourmet Foods of Australia Pty LtdGreenmountain Trading Co. Pty LtdH W Greenham & SonsHarvey Industries Group Pty LtdHaywill HoldingsHomebush Export Meat Co.IMT Foodservice Pty LtdInter Agri Goup Pty Ltd
Itoham Foods AustraliaJohn Dee Export Pty LtdJoyce’s Trading Pty LtdKobe Beef EnterprisesMariani Foods Pty LtdMatrad Pty LtdMDH Pty LtdMidfield Commodities Pty LtdMulwarra Export Pty LtdNippon Meat Packers Australia Pty LtdNolan MeatsThe Northern Cooperative Meat Co Ltd
OBE Beef Pty LtdOSI International FoodsOz Nature Pty LtdP & M Quality Smallgoods T/A PrimoRangers Valley Cattle StationRH CollinsonSanger AustraliaSignature Beef Pty LtdSouth Australian Cattle Co.Stanbroke BeefStockyard Pty LtdSwift Australia
T & R Pastoral Co.Tasmania Feedlot Pty LtdTeys Brothers Holdings Pty LtdTop Cut Foods LtdWestern Meat Packers (Shagay)White Stripe Foods Pty LtdWR Carpenter
the following beef export companies partnered with MLA in ICAs this year
Grading numbers exceeded targets with a total of 1,280,000 cattle and 508,000 sheep MSA graded in 2009-10 – an increase on the previous years figures of 979,000 and 142,000 respectively. The growth of the MSA system is being driven by an increase in the number of processing plants undertaking MSA grading and an expansion in grading numbers at plants with established
Source: MSA
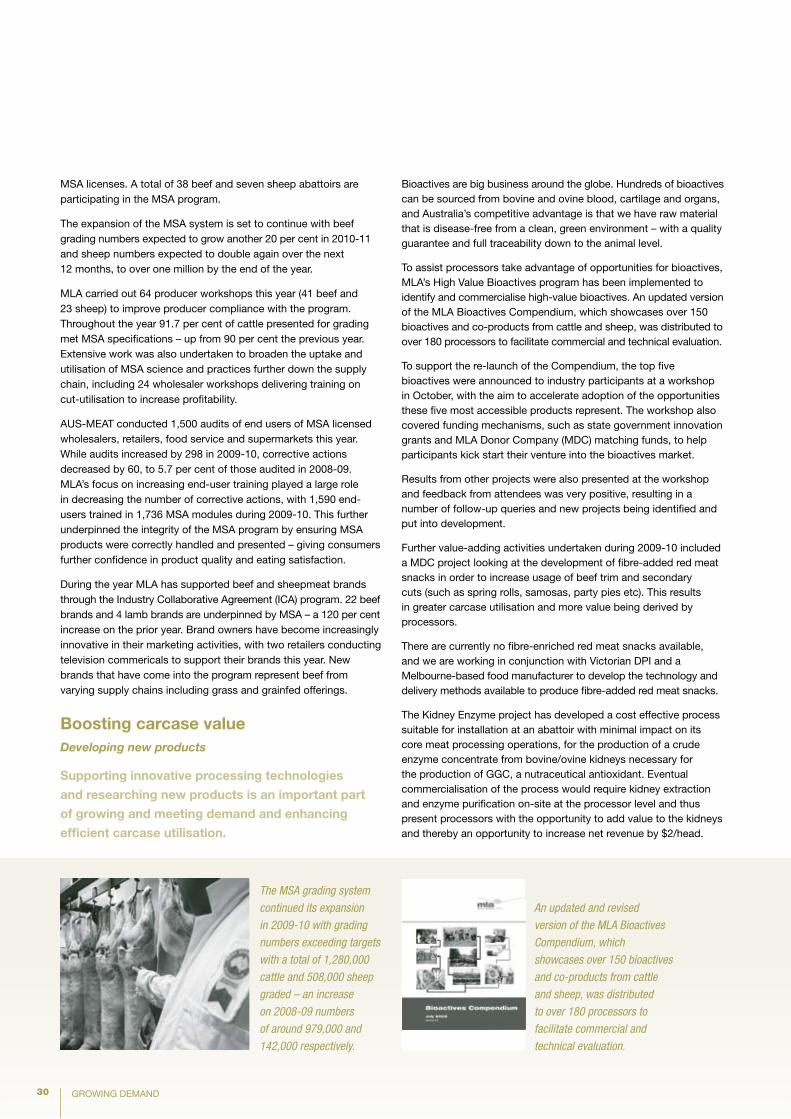
30 GROWING DEMAND
MSA licenses. A total of 38 beef and seven sheep abattoirs are participating in the MSA program.
The expansion of the MSA system is set to continue with beef grading numbers expected to grow another 20 per cent in 2010-11 and sheep numbers expected to double again over the next 12 months, to over one million by the end of the year.
MLA carried out 64 producer workshops this year (41 beef and 23 sheep) to improve producer compliance with the program. Throughout the year 91.7 per cent of cattle presented for grading met MSA specifications – up from 90 per cent the previous year. Extensive work was also undertaken to broaden the uptake and utilisation of MSA science and practices further down the supply chain, including 24 wholesaler workshops delivering training on cut-utilisation to increase profitability.
AUS-MEAT conducted 1,500 audits of end users of MSA licensed wholesalers, retailers, food service and supermarkets this year. While audits increased by 298 in 2009-10, corrective actions decreased by 60, to 5.7 per cent of those audited in 2008-09. MLA’s focus on increasing end-user training played a large role in decreasing the number of corrective actions, with 1,590 end-users trained in 1,736 MSA modules during 2009-10. This further underpinned the integrity of the MSA program by ensuring MSA products were correctly handled and presented – giving consumers further confidence in product quality and eating satisfaction.
During the year MLA has supported beef and sheepmeat brands through the Industry Collaborative Agreement (ICA) program. 22 beef brands and 4 lamb brands are underpinned by MSA – a 120 per cent increase on the prior year. Brand owners have become increasingly innovative in their marketing activities, with two retailers conducting television commericals to support their brands this year. New brands that have come into the program represent beef from varying supply chains including grass and grainfed offerings.
Boosting carcase valueDeveloping new products
Supporting innovative processing technologies
and researching new products is an important part
of growing and meeting demand and enhancing
efficient carcase utilisation.
Bioactives are big business around the globe. Hundreds of bioactives can be sourced from bovine and ovine blood, cartilage and organs, and Australia’s competitive advantage is that we have raw material that is disease-free from a clean, green environment – with a quality guarantee and full traceability down to the animal level.
To assist processors take advantage of opportunities for bioactives, MLA’s High Value Bioactives program has been implemented to identify and commercialise high-value bioactives. An updated version of the MLA Bioactives Compendium, which showcases over 150 bioactives and co-products from cattle and sheep, was distributed to over 180 processors to facilitate commercial and technical evaluation.
To support the re-launch of the Compendium, the top five bioactives were announced to industry participants at a workshop in October, with the aim to accelerate adoption of the opportunities these five most accessible products represent. The workshop also covered funding mechanisms, such as state government innovation grants and MLA Donor Company (MDC) matching funds, to help participants kick start their venture into the bioactives market.
Results from other projects were also presented at the workshop and feedback from attendees was very positive, resulting in a number of follow-up queries and new projects being identified and put into development.
Further value-adding activities undertaken during 2009-10 included a MDC project looking at the development of fibre-added red meat snacks in order to increase usage of beef trim and secondary cuts (such as spring rolls, samosas, party pies etc). This results in greater carcase utilisation and more value being derived by processors.
There are currently no fibre-enriched red meat snacks available, and we are working in conjunction with Victorian DPI and a Melbourne-based food manufacturer to develop the technology and delivery methods available to produce fibre-added red meat snacks.
The Kidney Enzyme project has developed a cost effective process suitable for installation at an abattoir with minimal impact on its core meat processing operations, for the production of a crude enzyme concentrate from bovine/ovine kidneys necessary for the production of GGC, a nutraceutical antioxidant. Eventual commercialisation of the process would require kidney extraction and enzyme purification on-site at the processor level and thus present processors with the opportunity to add value to the kidneys and thereby an opportunity to increase net revenue by $2/head.
An updated and revised
version of the MLA Bioactives
Compendium, which
showcases over 150 bioactives
and co-products from cattle
and sheep, was distributed
to over 180 processors to
facilitate commercial and
technical evaluation.
The MSA grading system
continued its expansion
in 2009-10 with grading
numbers exceeding targets
with a total of 1,280,000
cattle and 508,000 sheep
graded – an increase
on 2008-09 numbers
of around 979,000 and
142,000 respectively.
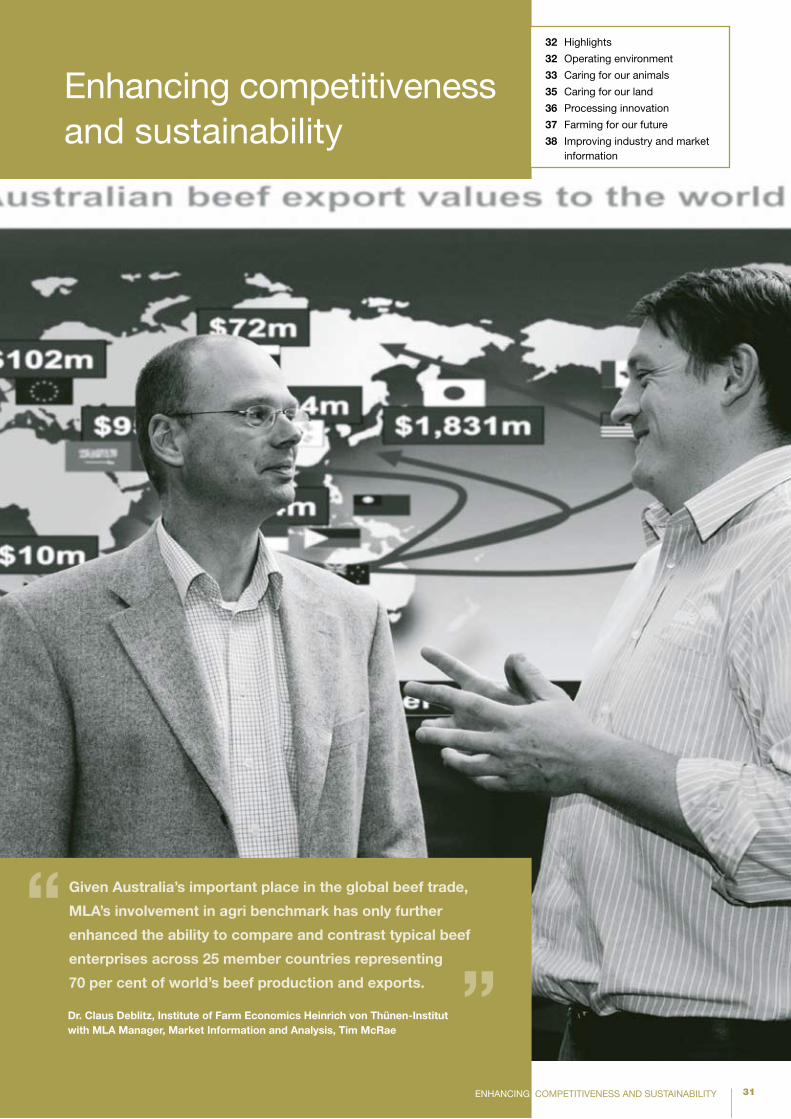
31
32 Highlights
32 Operating environment
33 Caring for our animals
35 Caring for our land
36 Processing innovation
37 Farming for our future
38 Improving industry and market information
Dr. Claus Deblitz, Institute of Farm Economics Heinrich von Thünen-Institut with MLA Manager, Market Information and Analysis, Tim McRae ”
Given Australia’s important place in the global beef trade,
MLA’s involvement in agri benchmark has only further
enhanced the ability to compare and contrast typical beef
enterprises across 25 member countries representing
70 per cent of world’s beef production and exports.
“
Enhancing competitiveness and sustainability
ENHANCING COMPETITIVENESS AND SUSTAINABILITY
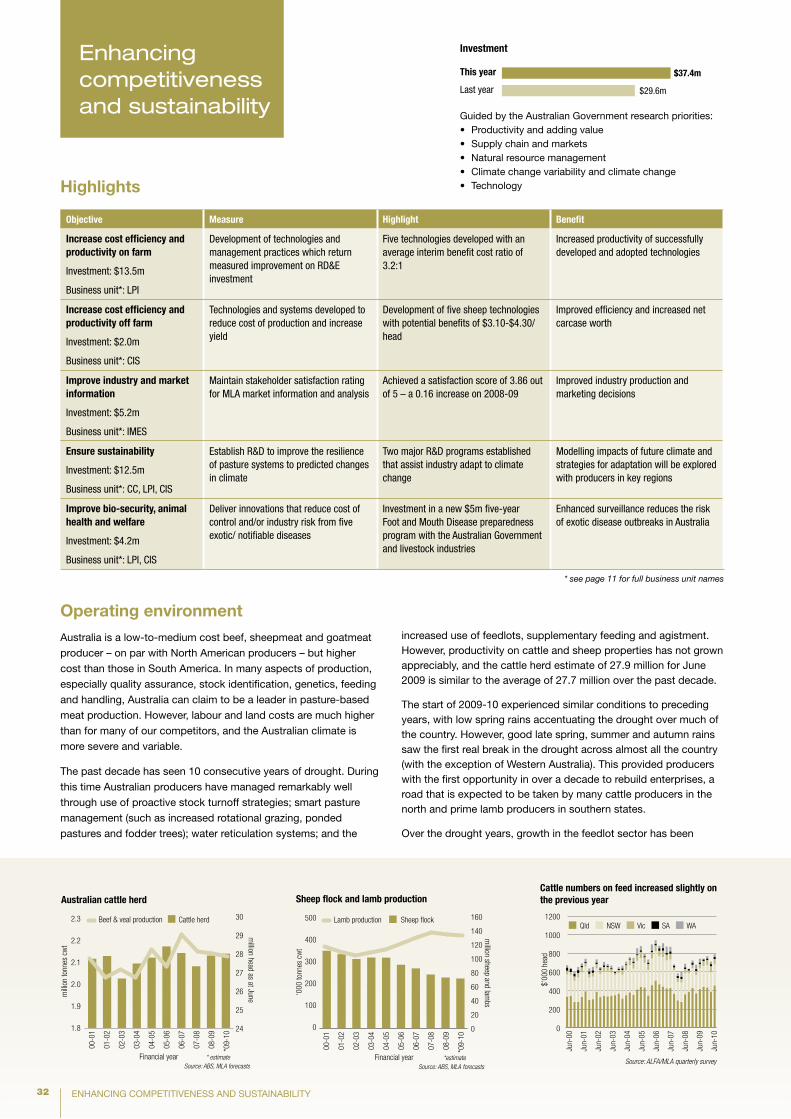
32
Highlights
ENHANCING COMPETITIVENESS AND SUSTAINABILITY
Guided by the Australian Government research priorities:Productivity and adding value•Supply chain and markets•Natural resource management •Climate change variability and climate change• Technology•
Investment
this year
Last year
$37.4m
$29.6m
Enhancing competitiveness and sustainability
Objective Measure Highlight Benefit
Increase cost efficiency and productivity on farm
Investment: $13.5m
Business unit*: LPI
Development of technologies and management practices which return measured improvement on RD&E investment
Five technologies developed with an average interim benefit cost ratio of 3.2:1
Increased productivity of successfully developed and adopted technologies
Increase cost efficiency and productivity off farm
Investment: $2.0m
Business unit*: CIS
Technologies and systems developed to reduce cost of production and increase yield
Development of five sheep technologies with potential benefits of $3.10-$4.30/head
Improved efficiency and increased net carcase worth
Improve industry and market information
Investment: $5.2m
Business unit*: IMES
Maintain stakeholder satisfaction rating for MLA market information and analysis
Achieved a satisfaction score of 3.86 out of 5 – a 0.16 increase on 2008-09
Improved industry production and marketing decisions
ensure sustainability
Investment: $12.5m
Business unit*: CC, LPI, CIS
Establish R&D to improve the resilience of pasture systems to predicted changes in climate
Two major R&D programs established that assist industry adapt to climate change
Modelling impacts of future climate and strategies for adaptation will be explored with producers in key regions
Improve bio-security, animal health and welfare
Investment: $4.2m
Business unit*: LPI, CIS
Deliver innovations that reduce cost of control and/or industry risk from five exotic/ notifiable diseases
Investment in a new $5m five-year Foot and Mouth Disease preparedness program with the Australian Government and livestock industries
Enhanced surveillance reduces the risk of exotic disease outbreaks in Australia
* see page 11 for full business unit names
Operating environment Australia is a low-to-medium cost beef, sheepmeat and goatmeat
producer – on par with North American producers – but higher
cost than those in South America. In many aspects of production,
especially quality assurance, stock identification, genetics, feeding
and handling, Australia can claim to be a leader in pasture-based
meat production. However, labour and land costs are much higher
than for many of our competitors, and the Australian climate is
more severe and variable.
The past decade has seen 10 consecutive years of drought. During
this time Australian producers have managed remarkably well
through use of proactive stock turnoff strategies; smart pasture
management (such as increased rotational grazing, ponded
pastures and fodder trees); water reticulation systems; and the
increased use of feedlots, supplementary feeding and agistment. However, productivity on cattle and sheep properties has not grown appreciably, and the cattle herd estimate of 27.9 million for June 2009 is similar to the average of 27.7 million over the past decade.
The start of 2009-10 experienced similar conditions to preceding years, with low spring rains accentuating the drought over much of the country. However, good late spring, summer and autumn rains saw the first real break in the drought across almost all the country (with the exception of Western Australia). This provided producers with the first opportunity in over a decade to rebuild enterprises, a road that is expected to be taken by many cattle producers in the north and prime lamb producers in southern states.
Over the drought years, growth in the feedlot sector has been
Beef & veal production
00-0
1
01-0
2
02-0
3
03-0
4
04-0
5
05-0
6
06-0
7
07-0
8
08-0
9
*09-
10
0
20
40
60
80
100
120
140
160
million sheep and lam
bs
Sheep flock Lamb production
0
100
200
300
400
500
Sheep flock and lamb production
Financial year Source: ABS, MLA forecasts
*estimate
00-0
1
01-0
2
02-0
3
03-0
4
04-0
5
05-0
6
06-0
7
07-0
8
08-0
9
*09-
10
24
25
26
27
28
29
30
million head as at June
Cattle herd
1.8
1.9
2.0
2.1
2.2
2.3
Australian cattle herd
Financial year Source: ABS, MLA forecasts
* estimate
milli
on to
nnes
cw
t‘0
00 to
nnes
cw
t
Source: ALFA/MLA quarterly survey
Jun-
00
Jun-
01
Jun-
02
Jun-
03
Jun-
04
Jun-
05
Jun-
06
Jun-
07
Jun-
08
Jun-
09
Jun-
10
0
200
400
600
800
1000
1200NSWQld Vic SA WA
Cattle numbers on feed increased slightly on the previous year
$’00
0 he
ad
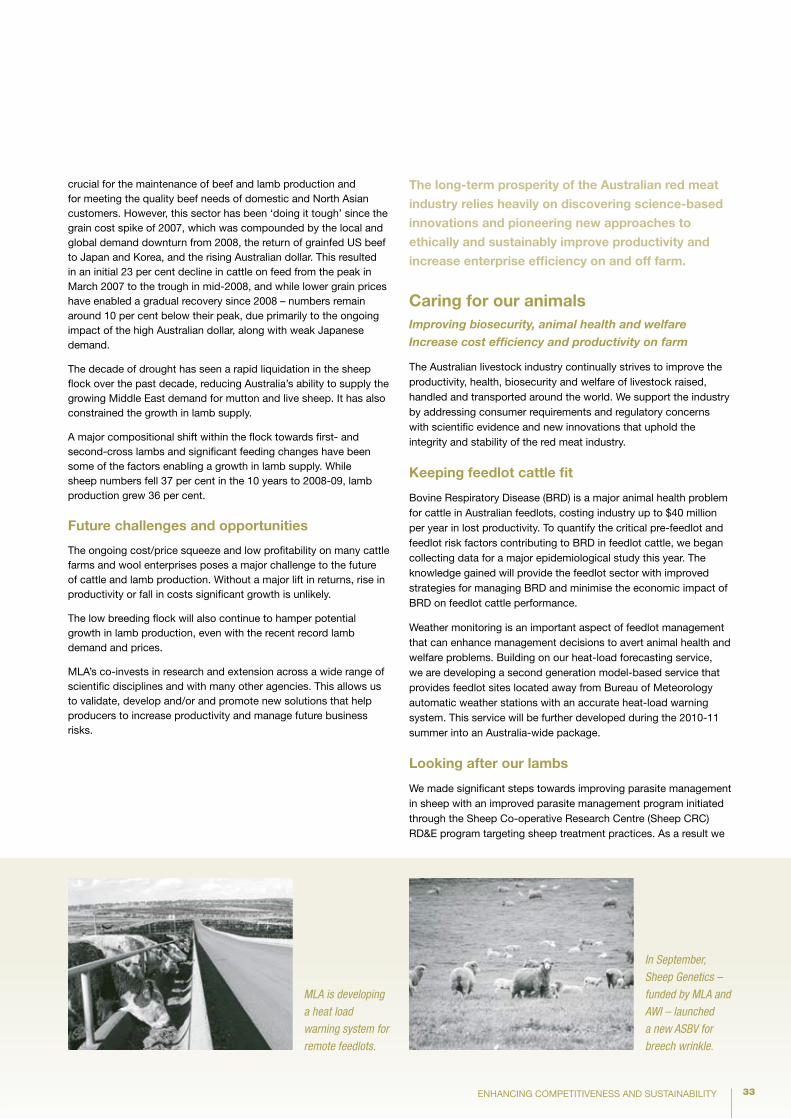
33ENHANCING COMPETITIVENESS AND SUSTAINABILITY
crucial for the maintenance of beef and lamb production and for meeting the quality beef needs of domestic and North Asian customers. However, this sector has been ‘doing it tough’ since the grain cost spike of 2007, which was compounded by the local and global demand downturn from 2008, the return of grainfed US beef to Japan and Korea, and the rising Australian dollar. This resulted in an initial 23 per cent decline in cattle on feed from the peak in March 2007 to the trough in mid-2008, and while lower grain prices have enabled a gradual recovery since 2008 – numbers remain around 10 per cent below their peak, due primarily to the ongoing impact of the high Australian dollar, along with weak Japanese demand.
The decade of drought has seen a rapid liquidation in the sheep flock over the past decade, reducing Australia’s ability to supply the growing Middle East demand for mutton and live sheep. It has also constrained the growth in lamb supply.
A major compositional shift within the flock towards first- and second-cross lambs and significant feeding changes have been some of the factors enabling a growth in lamb supply. While sheep numbers fell 37 per cent in the 10 years to 2008-09, lamb production grew 36 per cent.
Future challenges and opportunities
The ongoing cost/price squeeze and low profitability on many cattle farms and wool enterprises poses a major challenge to the future of cattle and lamb production. Without a major lift in returns, rise in productivity or fall in costs significant growth is unlikely.
The low breeding flock will also continue to hamper potential growth in lamb production, even with the recent record lamb demand and prices.
MLA’s co-invests in research and extension across a wide range of scientific disciplines and with many other agencies. This allows us to validate, develop and/or and promote new solutions that help producers to increase productivity and manage future business risks.
The long-term prosperity of the Australian red meat
industry relies heavily on discovering science-based
innovations and pioneering new approaches to
ethically and sustainably improve productivity and
increase enterprise efficiency on and off farm.
Caring for our animalsImproving biosecurity, animal health and welfareIncrease cost efficiency and productivity on farm
The Australian livestock industry continually strives to improve the productivity, health, biosecurity and welfare of livestock raised, handled and transported around the world. We support the industry by addressing consumer requirements and regulatory concerns with scientific evidence and new innovations that uphold the integrity and stability of the red meat industry.
Keeping feedlot cattle fit
Bovine Respiratory Disease (BRD) is a major animal health problem for cattle in Australian feedlots, costing industry up to $40 million per year in lost productivity. To quantify the critical pre-feedlot and feedlot risk factors contributing to BRD in feedlot cattle, we began collecting data for a major epidemiological study this year. The knowledge gained will provide the feedlot sector with improved strategies for managing BRD and minimise the economic impact of BRD on feedlot cattle performance.
Weather monitoring is an important aspect of feedlot management that can enhance management decisions to avert animal health and welfare problems. Building on our heat-load forecasting service, we are developing a second generation model-based service that provides feedlot sites located away from Bureau of Meteorology automatic weather stations with an accurate heat-load warning system. This service will be further developed during the 2010-11 summer into an Australia-wide package.
Looking after our lambs
We made significant steps towards improving parasite management in sheep with an improved parasite management program initiated through the Sheep Co-operative Research Centre (Sheep CRC) RD&E program targeting sheep treatment practices. As a result we
MLA is developing
a heat load
warning system for
remote feedlots.
In September,
Sheep Genetics –
funded by MLA and
AWI – launched
a new ASBV for
breech wrinkle.
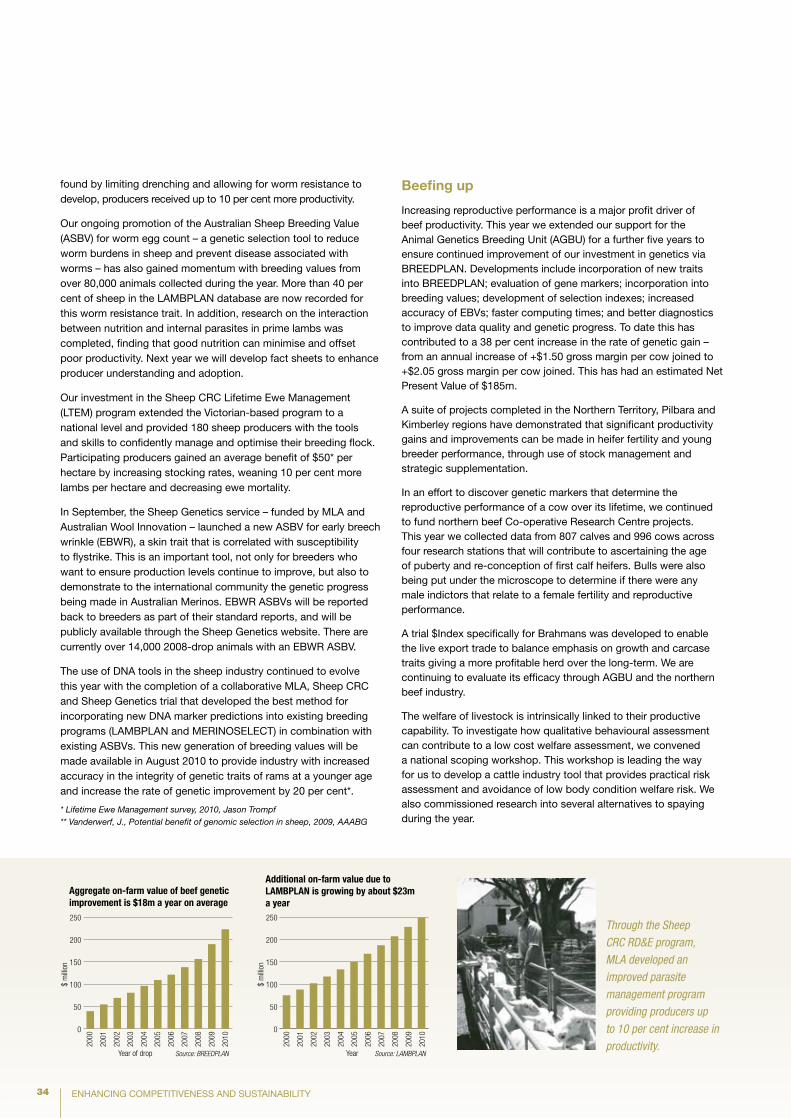
34 ENHANCING COMPETITIVENESS AND SUSTAINABILITY
found by limiting drenching and allowing for worm resistance to develop, producers received up to 10 per cent more productivity.
Our ongoing promotion of the Australian Sheep Breeding Value (ASBV) for worm egg count – a genetic selection tool to reduce worm burdens in sheep and prevent disease associated with worms – has also gained momentum with breeding values from over 80,000 animals collected during the year. More than 40 per cent of sheep in the LAMBPLAN database are now recorded for this worm resistance trait. In addition, research on the interaction between nutrition and internal parasites in prime lambs was completed, finding that good nutrition can minimise and offset poor productivity. Next year we will develop fact sheets to enhance producer understanding and adoption.
Our investment in the Sheep CRC Lifetime Ewe Management (LTEM) program extended the Victorian-based program to a national level and provided 180 sheep producers with the tools and skills to confidently manage and optimise their breeding flock. Participating producers gained an average benefit of $50* per hectare by increasing stocking rates, weaning 10 per cent more lambs per hectare and decreasing ewe mortality.
In September, the Sheep Genetics service – funded by MLA and Australian Wool Innovation – launched a new ASBV for early breech wrinkle (EBWR), a skin trait that is correlated with susceptibility to flystrike. This is an important tool, not only for breeders who want to ensure production levels continue to improve, but also to demonstrate to the international community the genetic progress being made in Australian Merinos. EBWR ASBVs will be reported back to breeders as part of their standard reports, and will be publicly available through the Sheep Genetics website. There are currently over 14,000 2008-drop animals with an EBWR ASBV.
The use of DNA tools in the sheep industry continued to evolve this year with the completion of a collaborative MLA, Sheep CRC and Sheep Genetics trial that developed the best method for incorporating new DNA marker predictions into existing breeding programs (LAMBPLAN and MERINOSELECT) in combination with existing ASBVs. This new generation of breeding values will be made available in August 2010 to provide industry with increased accuracy in the integrity of genetic traits of rams at a younger age and increase the rate of genetic improvement by 20 per cent*.
* Lifetime Ewe Management survey, 2010, Jason Trompf** Vanderwerf, J., Potential benefit of genomic selection in sheep, 2009, AAABG
Beefing up
Increasing reproductive performance is a major profit driver of beef productivity. This year we extended our support for the Animal Genetics Breeding Unit (AGBU) for a further five years to ensure continued improvement of our investment in genetics via BREEDPLAN. Developments include incorporation of new traits into BREEDPLAN; evaluation of gene markers; incorporation into breeding values; development of selection indexes; increased accuracy of EBVs; faster computing times; and better diagnostics to improve data quality and genetic progress. To date this has contributed to a 38 per cent increase in the rate of genetic gain – from an annual increase of +$1.50 gross margin per cow joined to +$2.05 gross margin per cow joined. This has had an estimated Net Present Value of $185m.
A suite of projects completed in the Northern Territory, Pilbara and Kimberley regions have demonstrated that significant productivity gains and improvements can be made in heifer fertility and young breeder performance, through use of stock management and strategic supplementation.
In an effort to discover genetic markers that determine the reproductive performance of a cow over its lifetime, we continued to fund northern beef Co-operative Research Centre projects. This year we collected data from 807 calves and 996 cows across four research stations that will contribute to ascertaining the age of puberty and re-conception of first calf heifers. Bulls were also being put under the microscope to determine if there were any male indictors that relate to a female fertility and reproductive performance.
A trial $Index specifically for Brahmans was developed to enable the live export trade to balance emphasis on growth and carcase traits giving a more profitable herd over the long-term. We are continuing to evaluate its efficacy through AGBU and the northern beef industry.
The welfare of livestock is intrinsically linked to their productive capability. To investigate how qualitative behavioural assessment can contribute to a low cost welfare assessment, we convened a national scoping workshop. This workshop is leading the way for us to develop a cattle industry tool that provides practical risk assessment and avoidance of low body condition welfare risk. We also commissioned research into several alternatives to spaying during the year.
Through the Sheep
CRC RD&E program,
MLA developed an
improved parasite
management program
providing producers up
to 10 per cent increase in
productivity.
$ m
illion
Year of drop
0
50
100
150
200
250
2000
2001
2002
2003
2004
2005
2006
2007
2008
2009
2010
$ m
illion
Year
0
50
100
150
200
250
2000
2001
2002
2003
2004
2005
2006
2007
2008
2009
2010
Source: LAMBPLAN
Source: BREEDPLAN
Additional on-farm value due to LAMBPLAN is growing by about $23m a year
Aggregate on-farm value of beef genetic improvement is $18m a year on average
$ m
illion
Year of drop
0
50
100
150
200
250
2000
2001
2002
2003
2004
2005
2006
2007
2008
2009
2010
$ m
illion
Year
0
50
100
150
200
250
2000
2001
2002
2003
2004
2005
2006
2007
2008
2009
2010
Source: LAMBPLAN
Source: BREEDPLAN
Additional on-farm value due to LAMBPLAN is growing by about $23m a year
Aggregate on-farm value of beef genetic improvement is $18m a year on average
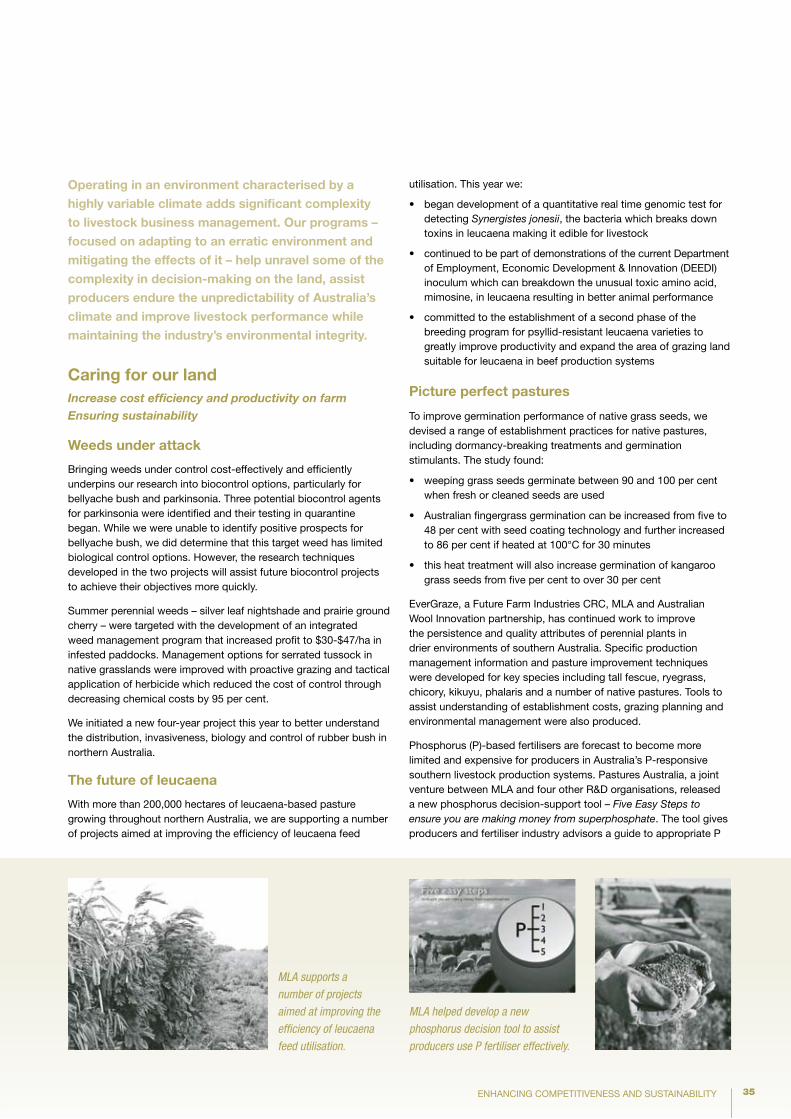
35ENHANCING COMPETITIVENESS AND SUSTAINABILITY
Operating in an environment characterised by a highly variable climate adds significant complexity to livestock business management. Our programs – focused on adapting to an erratic environment and mitigating the effects of it – help unravel some of the complexity in decision-making on the land, assist producers endure the unpredictability of Australia’s climate and improve livestock performance while maintaining the industry’s environmental integrity.
Caring for our landIncrease cost efficiency and productivity on farmEnsuring sustainability
Weeds under attack
Bringing weeds under control cost-effectively and efficiently underpins our research into biocontrol options, particularly for bellyache bush and parkinsonia. Three potential biocontrol agents for parkinsonia were identified and their testing in quarantine began. While we were unable to identify positive prospects for bellyache bush, we did determine that this target weed has limited biological control options. However, the research techniques developed in the two projects will assist future biocontrol projects to achieve their objectives more quickly.
Summer perennial weeds – silver leaf nightshade and prairie ground cherry – were targeted with the development of an integrated weed management program that increased profit to $30-$47/ha in infested paddocks. Management options for serrated tussock in native grasslands were improved with proactive grazing and tactical application of herbicide which reduced the cost of control through decreasing chemical costs by 95 per cent.
We initiated a new four-year project this year to better understand the distribution, invasiveness, biology and control of rubber bush in northern Australia.
The future of leucaena
With more than 200,000 hectares of leucaena-based pasture growing throughout northern Australia, we are supporting a number of projects aimed at improving the efficiency of leucaena feed
utilisation. This year we:
began development of a quantitative real time genomic test for •detecting Synergistes jonesii, the bacteria which breaks down toxins in leucaena making it edible for livestock
continued to be part of demonstrations of the current Department •of Employment, Economic Development & Innovation (DEEDI) inoculum which can breakdown the unusual toxic amino acid, mimosine, in leucaena resulting in better animal performance
committed to the establishment of a second phase of the •breeding program for psyllid-resistant leucaena varieties to greatly improve productivity and expand the area of grazing land suitable for leucaena in beef production systems
picture perfect pastures
To improve germination performance of native grass seeds, we devised a range of establishment practices for native pastures, including dormancy-breaking treatments and germination stimulants. The study found:
weeping grass seeds germinate between 90 and 100 per cent •when fresh or cleaned seeds are used
Australian fingergrass germination can be increased from five to •48 per cent with seed coating technology and further increased to 86 per cent if heated at 100°C for 30 minutes
this heat treatment will also increase germination of kangaroo •grass seeds from five per cent to over 30 per cent
EverGraze, a Future Farm Industries CRC, MLA and Australian Wool Innovation partnership, has continued work to improve the persistence and quality attributes of perennial plants in drier environments of southern Australia. Specific production management information and pasture improvement techniques were developed for key species including tall fescue, ryegrass, chicory, kikuyu, phalaris and a number of native pastures. Tools to assist understanding of establishment costs, grazing planning and environmental management were also produced.
Phosphorus (P)-based fertilisers are forecast to become more limited and expensive for producers in Australia’s P-responsive southern livestock production systems. Pastures Australia, a joint venture between MLA and four other R&D organisations, released a new phosphorus decision-support tool – Five Easy Steps to ensure you are making money from superphosphate. The tool gives producers and fertiliser industry advisors a guide to appropriate P
MLA supports a
number of projects
aimed at improving the
efficiency of leucaena
feed utilisation.
MLA helped develop a new
phosphorus decision tool to assist
producers use P fertiliser effectively.
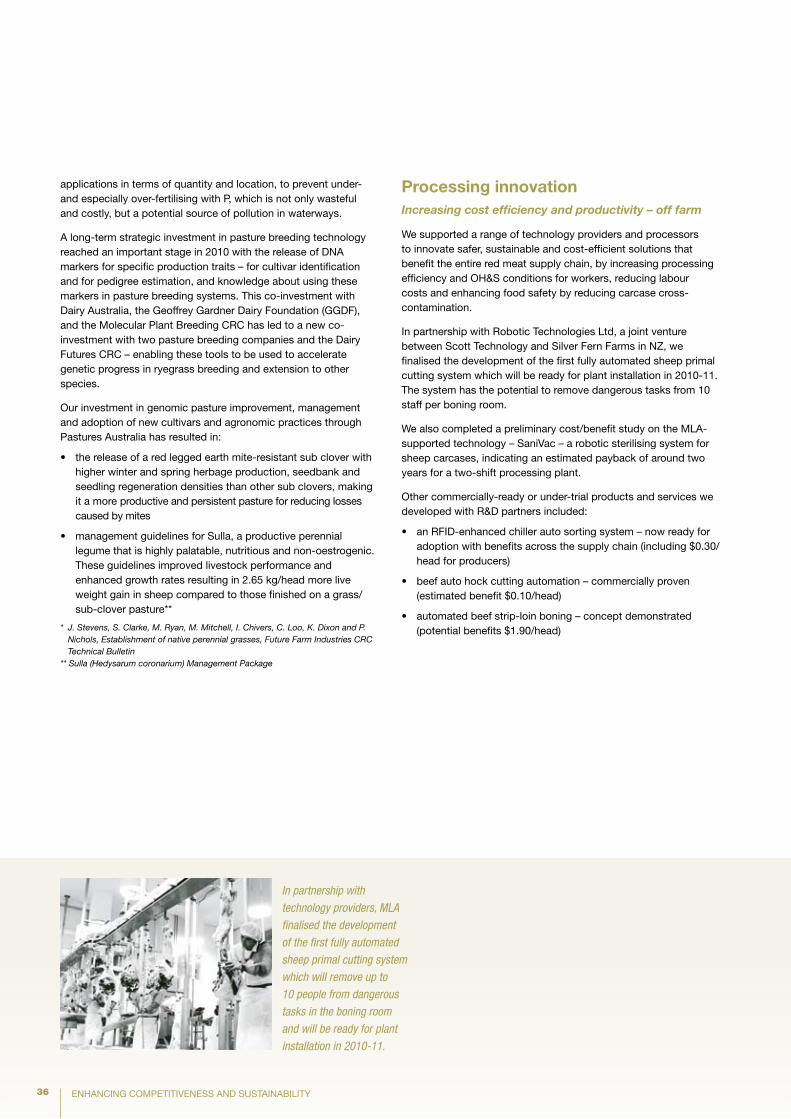
36 ENHANCING COMPETITIVENESS AND SUSTAINABILITY
applications in terms of quantity and location, to prevent under- and especially over-fertilising with P, which is not only wasteful and costly, but a potential source of pollution in waterways.
A long-term strategic investment in pasture breeding technology reached an important stage in 2010 with the release of DNA markers for specific production traits – for cultivar identification and for pedigree estimation, and knowledge about using these markers in pasture breeding systems. This co-investment with Dairy Australia, the Geoffrey Gardner Dairy Foundation (GGDF), and the Molecular Plant Breeding CRC has led to a new co-investment with two pasture breeding companies and the Dairy Futures CRC – enabling these tools to be used to accelerate genetic progress in ryegrass breeding and extension to other species.
Our investment in genomic pasture improvement, management and adoption of new cultivars and agronomic practices through Pastures Australia has resulted in:
the release of a red legged earth mite-resistant sub clover with •higher winter and spring herbage production, seedbank and seedling regeneration densities than other sub clovers, making it a more productive and persistent pasture for reducing losses caused by mites
management guidelines for Sulla, a productive perennial •legume that is highly palatable, nutritious and non-oestrogenic. These guidelines improved livestock performance and enhanced growth rates resulting in 2.65 kg/head more live weight gain in sheep compared to those finished on a grass/sub-clover pasture**
* J. Stevens, S. Clarke, M. Ryan, M. Mitchell, I. Chivers, C. Loo, K. Dixon and P. Nichols, Establishment of native perennial grasses, Future Farm Industries CRC Technical Bulletin
** Sulla (Hedysarum coronarium) Management Package
processing innovation Increasing cost efficiency and productivity – off farm
We supported a range of technology providers and processors to innovate safer, sustainable and cost-efficient solutions that benefit the entire red meat supply chain, by increasing processing efficiency and OH&S conditions for workers, reducing labour costs and enhancing food safety by reducing carcase cross-contamination.
In partnership with Robotic Technologies Ltd, a joint venture between Scott Technology and Silver Fern Farms in NZ, we finalised the development of the first fully automated sheep primal cutting system which will be ready for plant installation in 2010-11. The system has the potential to remove dangerous tasks from 10 staff per boning room.
We also completed a preliminary cost/benefit study on the MLA-supported technology – SaniVac – a robotic sterilising system for sheep carcases, indicating an estimated payback of around two years for a two-shift processing plant.
Other commercially-ready or under-trial products and services we developed with R&D partners included:
an RFID-enhanced chiller auto sorting system – now ready for •adoption with benefits across the supply chain (including $0.30/head for producers)
beef auto hock cutting automation – commercially proven •(estimated benefit $0.10/head)
automated beef strip-loin boning – concept demonstrated •(potential benefits $1.90/head)
In partnership with
technology providers, MLA
finalised the development
of the first fully automated
sheep primal cutting system
which will remove up to
10 people from dangerous
tasks in the boning room
and will be ready for plant
installation in 2010-11.
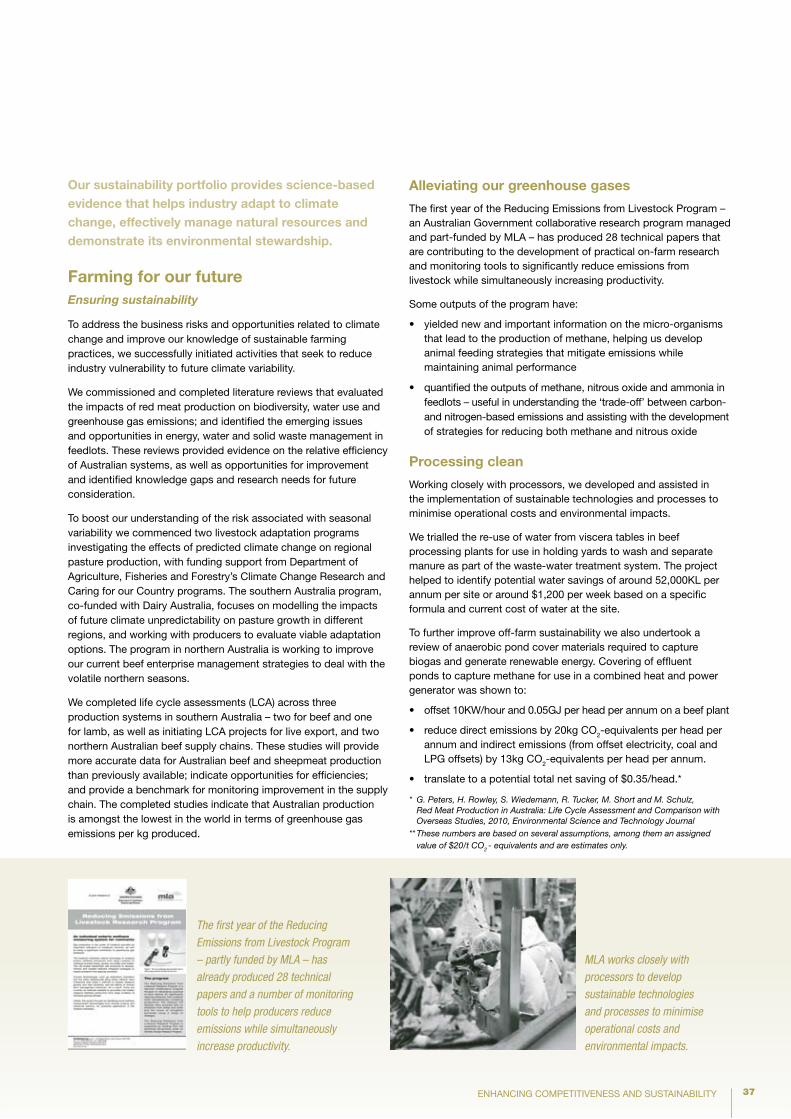
37ENHANCING COMPETITIVENESS AND SUSTAINABILITY
Our sustainability portfolio provides science-based evidence that helps industry adapt to climate change, effectively manage natural resources and demonstrate its environmental stewardship.
Farming for our futureEnsuring sustainability
To address the business risks and opportunities related to climate change and improve our knowledge of sustainable farming practices, we successfully initiated activities that seek to reduce industry vulnerability to future climate variability.
We commissioned and completed literature reviews that evaluated the impacts of red meat production on biodiversity, water use and greenhouse gas emissions; and identified the emerging issues and opportunities in energy, water and solid waste management in feedlots. These reviews provided evidence on the relative efficiency of Australian systems, as well as opportunities for improvement and identified knowledge gaps and research needs for future consideration.
To boost our understanding of the risk associated with seasonal variability we commenced two livestock adaptation programs investigating the effects of predicted climate change on regional pasture production, with funding support from Department of Agriculture, Fisheries and Forestry’s Climate Change Research and Caring for our Country programs. The southern Australia program, co-funded with Dairy Australia, focuses on modelling the impacts of future climate unpredictability on pasture growth in different regions, and working with producers to evaluate viable adaptation options. The program in northern Australia is working to improve our current beef enterprise management strategies to deal with the volatile northern seasons.
We completed life cycle assessments (LCA) across three production systems in southern Australia – two for beef and one for lamb, as well as initiating LCA projects for live export, and two northern Australian beef supply chains. These studies will provide more accurate data for Australian beef and sheepmeat production than previously available; indicate opportunities for efficiencies; and provide a benchmark for monitoring improvement in the supply chain. The completed studies indicate that Australian production is amongst the lowest in the world in terms of greenhouse gas emissions per kg produced.
Alleviating our greenhouse gases
The first year of the Reducing Emissions from Livestock Program – an Australian Government collaborative research program managed and part-funded by MLA – has produced 28 technical papers that are contributing to the development of practical on-farm research and monitoring tools to significantly reduce emissions from livestock while simultaneously increasing productivity.
Some outputs of the program have:
yielded new and important information on the micro-organisms •that lead to the production of methane, helping us develop animal feeding strategies that mitigate emissions while maintaining animal performance
quantified the outputs of methane, nitrous oxide and ammonia in •feedlots – useful in understanding the ‘trade-off’ between carbon- and nitrogen-based emissions and assisting with the development of strategies for reducing both methane and nitrous oxide
processing clean
Working closely with processors, we developed and assisted in the implementation of sustainable technologies and processes to minimise operational costs and environmental impacts.
We trialled the re-use of water from viscera tables in beef processing plants for use in holding yards to wash and separate manure as part of the waste-water treatment system. The project helped to identify potential water savings of around 52,000KL per annum per site or around $1,200 per week based on a specific formula and current cost of water at the site.
To further improve off-farm sustainability we also undertook a review of anaerobic pond cover materials required to capture biogas and generate renewable energy. Covering of effluent ponds to capture methane for use in a combined heat and power generator was shown to:
offset 10KW/hour and 0.05GJ per head per annum on a beef plant•
reduce direct emissions by 20kg CO• 2-equivalents per head per annum and indirect emissions (from offset electricity, coal and LPG offsets) by 13kg CO2-equivalents per head per annum.
translate to a potential total net saving of $0.35/head.*•
* G. Peters, H. Rowley, S. Wiedemann, R. Tucker, M. Short and M. Schulz, Red Meat Production in Australia: Life Cycle Assessment and Comparison with Overseas Studies, 2010, Environmental Science and Technology Journal
** These numbers are based on several assumptions, among them an assigned value of $20/t CO2 - equivalents and are estimates only.
The first year of the Reducing
Emissions from Livestock Program
– partly funded by MLA – has
already produced 28 technical
papers and a number of monitoring
tools to help producers reduce
emissions while simultaneously
increase productivity.
MLA works closely with
processors to develop
sustainable technologies
and processes to minimise
operational costs and
environmental impacts.
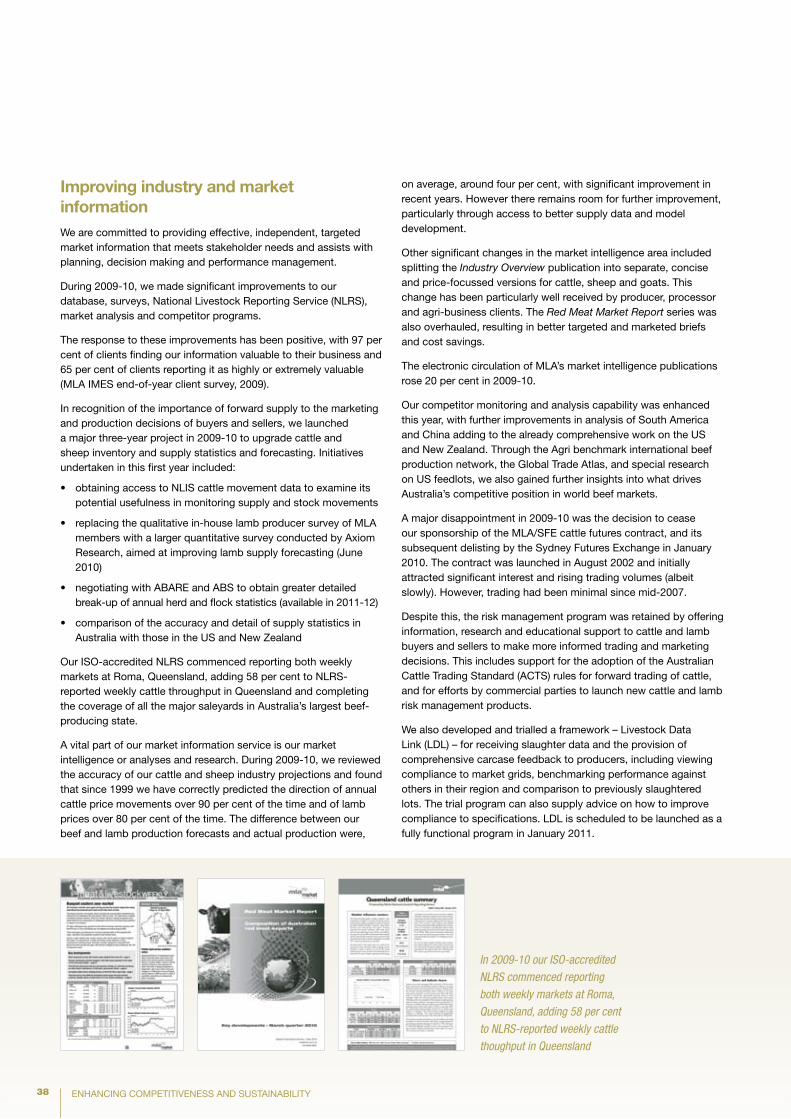
38 ENHANCING COMPETITIVENESS AND SUSTAINABILITY
Improving industry and market information We are committed to providing effective, independent, targeted market information that meets stakeholder needs and assists with planning, decision making and performance management.
During 2009-10, we made significant improvements to our database, surveys, National Livestock Reporting Service (NLRS), market analysis and competitor programs.
The response to these improvements has been positive, with 97 per cent of clients finding our information valuable to their business and 65 per cent of clients reporting it as highly or extremely valuable (MLA IMES end-of-year client survey, 2009).
In recognition of the importance of forward supply to the marketing and production decisions of buyers and sellers, we launched a major three-year project in 2009-10 to upgrade cattle and sheep inventory and supply statistics and forecasting. Initiatives undertaken in this first year included:
obtaining access to NLIS cattle movement data to examine its •potential usefulness in monitoring supply and stock movements
replacing the qualitative in-house lamb producer survey of MLA •members with a larger quantitative survey conducted by Axiom Research, aimed at improving lamb supply forecasting (June 2010)
negotiating with ABARE and ABS to obtain greater detailed •break-up of annual herd and flock statistics (available in 2011-12)
comparison of the accuracy and detail of supply statistics in •Australia with those in the US and New Zealand
Our ISO-accredited NLRS commenced reporting both weekly markets at Roma, Queensland, adding 58 per cent to NLRS-reported weekly cattle throughput in Queensland and completing the coverage of all the major saleyards in Australia’s largest beef-producing state.
A vital part of our market information service is our market intelligence or analyses and research. During 2009-10, we reviewed the accuracy of our cattle and sheep industry projections and found that since 1999 we have correctly predicted the direction of annual cattle price movements over 90 per cent of the time and of lamb prices over 80 per cent of the time. The difference between our beef and lamb production forecasts and actual production were,
on average, around four per cent, with significant improvement in recent years. However there remains room for further improvement, particularly through access to better supply data and model development.
Other significant changes in the market intelligence area included splitting the Industry Overview publication into separate, concise and price-focussed versions for cattle, sheep and goats. This change has been particularly well received by producer, processor and agri-business clients. The Red Meat Market Report series was also overhauled, resulting in better targeted and marketed briefs and cost savings.
The electronic circulation of MLA’s market intelligence publications rose 20 per cent in 2009-10.
Our competitor monitoring and analysis capability was enhanced this year, with further improvements in analysis of South America and China adding to the already comprehensive work on the US and New Zealand. Through the Agri benchmark international beef production network, the Global Trade Atlas, and special research on US feedlots, we also gained further insights into what drives Australia’s competitive position in world beef markets.
A major disappointment in 2009-10 was the decision to cease our sponsorship of the MLA/SFE cattle futures contract, and its subsequent delisting by the Sydney Futures Exchange in January 2010. The contract was launched in August 2002 and initially attracted significant interest and rising trading volumes (albeit slowly). However, trading had been minimal since mid-2007.
Despite this, the risk management program was retained by offering information, research and educational support to cattle and lamb buyers and sellers to make more informed trading and marketing decisions. This includes support for the adoption of the Australian Cattle Trading Standard (ACTS) rules for forward trading of cattle, and for efforts by commercial parties to launch new cattle and lamb risk management products.
We also developed and trialled a framework – Livestock Data Link (LDL) – for receiving slaughter data and the provision of comprehensive carcase feedback to producers, including viewing compliance to market grids, benchmarking performance against others in their region and comparison to previously slaughtered lots. The trial program can also supply advice on how to improve compliance to specifications. LDL is scheduled to be launched as a fully functional program in January 2011.
In 2009-10 our ISO-accredited
NLRS commenced reporting
both weekly markets at Roma,
Queensland, adding 58 per cent
to NLRS-reported weekly cattle
thoughput in Queensland
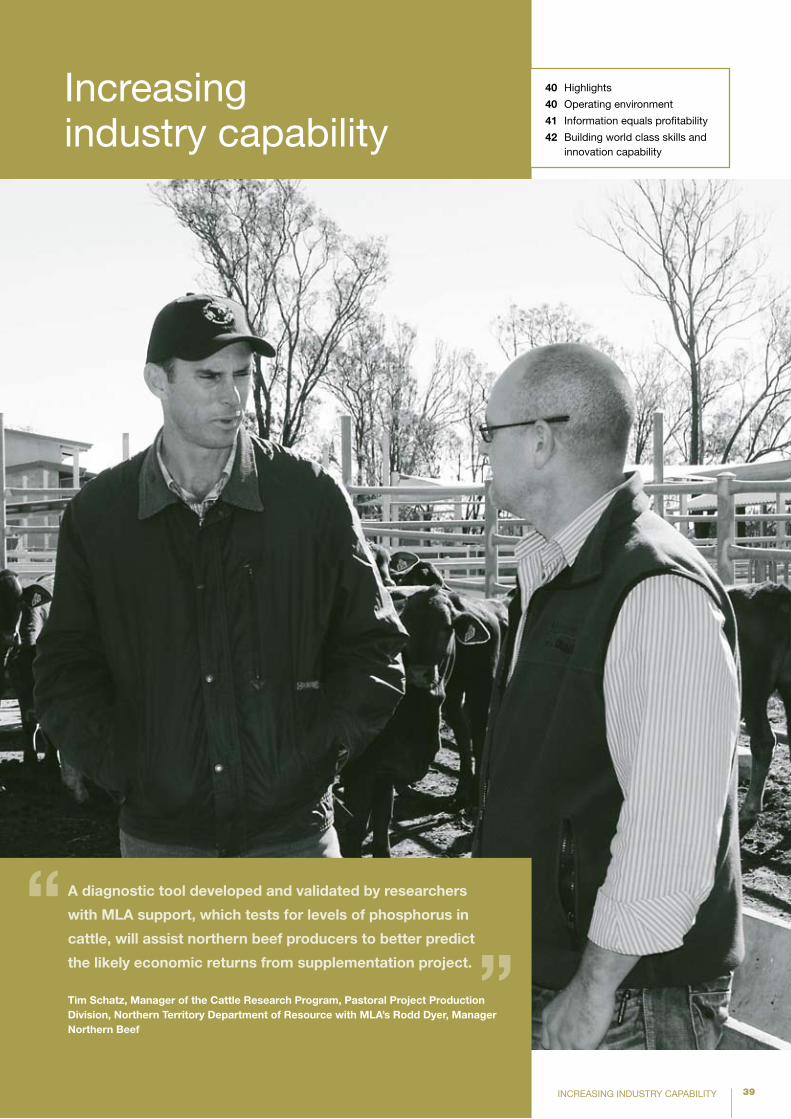
39
40 Highlights
40 Operating environment
41 Information equals profitability
42 Building world class skills and innovation capability
INCREASING INDUSTRY CAPABILITY
”Tim Schatz, Manager of the Cattle Research program, pastoral project production Division, northern Territory Department of Resource with MLA’s Rodd Dyer, Manager northern Beef
A diagnostic tool developed and validated by researchers
with MLA support, which tests for levels of phosphorus in
cattle, will assist northern beef producers to better predict
the likely economic returns from supplementation project.
“
Increasing industry capability
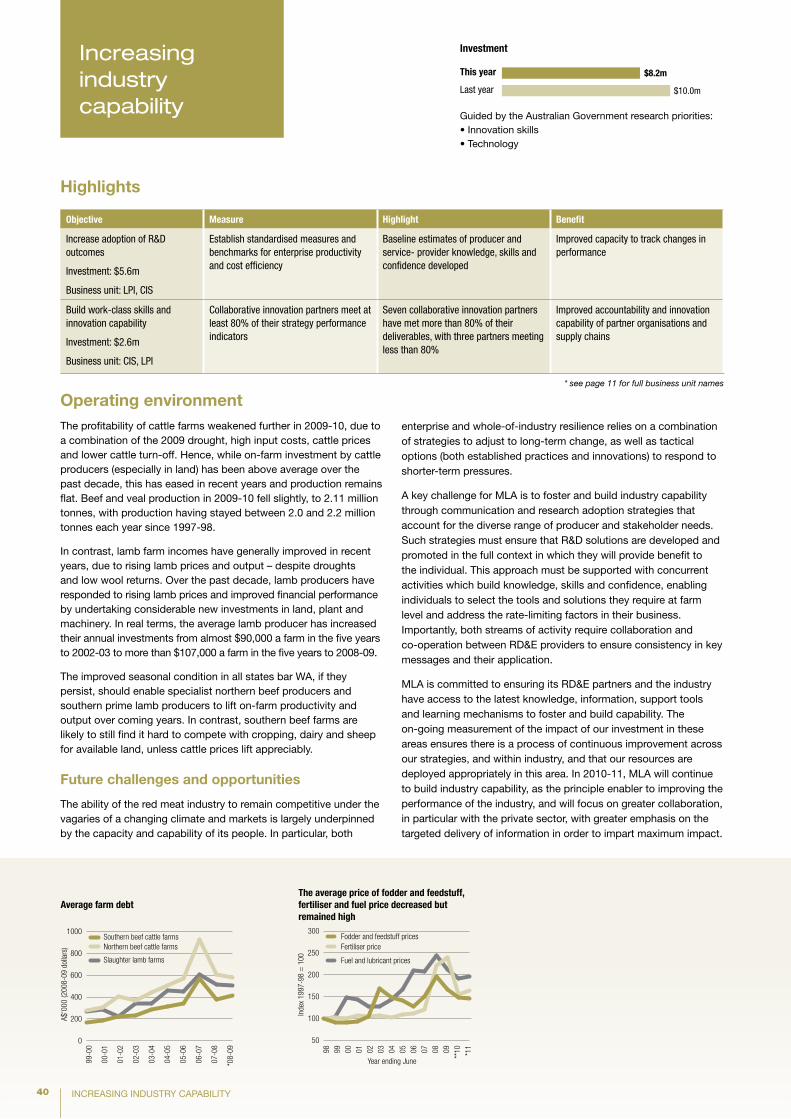
40
Highlights
INCREASING INDUSTRY CAPABILITY
Guided by the Australian Government research priorities:•Innovationskills•Technology
Investment
this year
Last year
$8.2m
$10.0m
Increasing industry capability
Objective Measure Highlight Benefit
Increase adoption of R&D outcomes
Investment: $5.6m
Business unit: LPI, CIS
Establish standardised measures and benchmarks for enterprise productivity and cost efficiency
Baseline estimates of producer and service- provider knowledge, skills and confidence developed
Improved capacity to track changes in performance
Build work-class skills and innovation capability
Investment: $2.6m
Business unit: CIS, LPI
Collaborative innovation partners meet at least 80% of their strategy performance indicators
Seven collaborative innovation partners have met more than 80% of their deliverables, with three partners meeting less than 80%
Improved accountability and innovation capability of partner organisations and supply chains
* see page 11 for full business unit names
Operating environment The profitability of cattle farms weakened further in 2009-10, due to a combination of the 2009 drought, high input costs, cattle prices and lower cattle turn-off. Hence, while on-farm investment by cattle producers (especially in land) has been above average over the past decade, this has eased in recent years and production remains flat. Beef and veal production in 2009-10 fell slightly, to 2.11 million tonnes, with production having stayed between 2.0 and 2.2 million tonnes each year since 1997-98.
In contrast, lamb farm incomes have generally improved in recent years, due to rising lamb prices and output – despite droughts and low wool returns. Over the past decade, lamb producers have responded to rising lamb prices and improved financial performance by undertaking considerable new investments in land, plant and machinery. In real terms, the average lamb producer has increased their annual investments from almost $90,000 a farm in the five years to 2002-03 to more than $107,000 a farm in the five years to 2008-09.
The improved seasonal condition in all states bar WA, if they persist, should enable specialist northern beef producers and southern prime lamb producers to lift on-farm productivity and output over coming years. In contrast, southern beef farms are likely to still find it hard to compete with cropping, dairy and sheep for available land, unless cattle prices lift appreciably.
Future challenges and opportunities
The ability of the red meat industry to remain competitive under the vagaries of a changing climate and markets is largely underpinned by the capacity and capability of its people. In particular, both
enterprise and whole-of-industry resilience relies on a combination of strategies to adjust to long-term change, as well as tactical options (both established practices and innovations) to respond to shorter-term pressures.
A key challenge for MLA is to foster and build industry capability through communication and research adoption strategies that account for the diverse range of producer and stakeholder needs. Such strategies must ensure that R&D solutions are developed and promoted in the full context in which they will provide benefit to the individual. This approach must be supported with concurrent activities which build knowledge, skills and confidence, enabling individuals to select the tools and solutions they require at farm level and address the rate-limiting factors in their business. Importantly, both streams of activity require collaboration and co-operation between RD&E providers to ensure consistency in key messages and their application.
MLA is committed to ensuring its RD&E partners and the industry have access to the latest knowledge, information, support tools and learning mechanisms to foster and build capability. The on-going measurement of the impact of our investment in these areas ensures there is a process of continuous improvement across our strategies, and within industry, and that our resources are deployed appropriately in this area. In 2010-11, MLA will continue to build industry capability, as the principle enabler to improving the performance of the industry, and will focus on greater collaboration, in particular with the private sector, with greater emphasis on the targeted delivery of information in order to impart maximum impact.
Fodder and feedstuff pricesFertiliser price
Fuel and lubricant prices
98 99 00 01 02 03 04 05 06 07 08 09**
10 *11
98 99 00 01 02 03 04 05 06 07 08 09 10
50
100
150
200
250
300
Source: ABARE
The average price of fodder and feedstuff, fertiliser and fuel price decreased but remained high
**subject to revision
*forecast
*forecast
*forecast
Year ending June
Southern beef cattle farmsNorthern beef cattle farms
Slaughter lamb farms
-100
-50
0
50
100
150
200
Farm business profit is declining slightly
Financial year
Year ending June
Sao Paulo heavy steer >450
Australia medium steer 400-500
50
75
100
125
150
175
200
225
Source: MLA's NLRS, AgraFNP
Source: ABARE
Cattle prices - Australia v/s Brazil
00-0
1
01-0
2
02-0
3
03-0
4
04-0
5
05-0
6
06-0
7
07-0
8
08-0
9
*09-
10
Southern beef cattle farmsNorthern beef cattle farms
Slaughter lamb farms
0
200
400
600
800
1000
Average farm debt
Financial year Source: ABARE
99-0
0
00-0
1
01-0
2
02-0
3
03-0
4
04-0
5
05-0
6
06-0
7
07-0
8
*08-
09
Inde
x 19
97-9
8 =
100
A¢/k
g lw
tA$
’000
(200
8-09
dol
lars
)
*forecast
-100
-50
0
50
100
150
200
Average slaughter lamb farm business profit
Financial year Source: ABARE
00-0
1
01-0
2
02-0
3
03-0
4
04-0
5
05-0
6
06-0
7
07-0
8
08-0
9
*09-
10
A$’0
00 (2
008-
09 d
olla
rs)
*forecast
-100
-50
0
50
100
150
200
Average southern beef cattle farm business profit
Financial year Source: ABARE
00-0
1
01-0
2
02-0
3
03-0
4
04-0
5
05-0
6
06-0
7
07-0
8
08-0
9
*09-
10
A$’0
00 (2
008-
09 d
olla
rs)
*forecast
-100
-50
0
50
100
150
200
Average northern beef cattle farm business profit
Financial year Source: ABARE
00-0
1
01-0
2
02-0
3
03-0
4
04-0
5
05-0
6
06-0
7
07-0
8
08-0
9
*09-
10
A$’0
00 (2
008-
09 d
olla
rs)
A$’0
00 (2
008-
09 d
olla
rs)
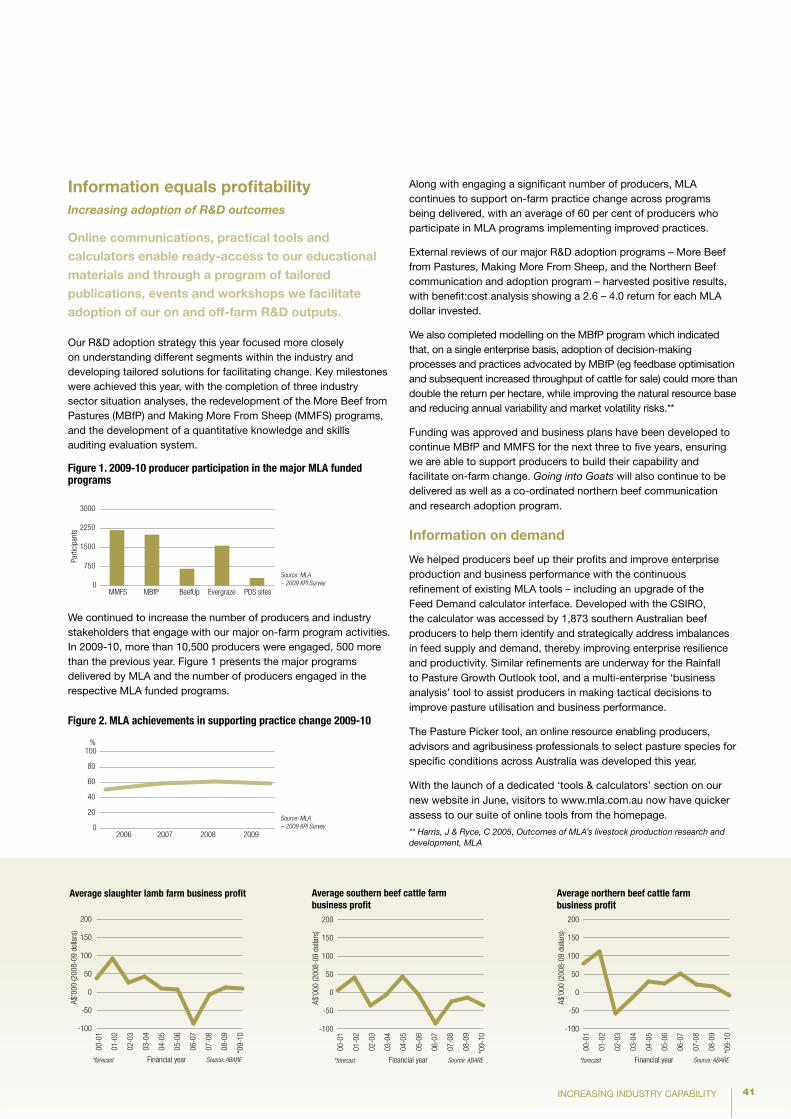
41INCREASING INDUSTRY CAPABILITY
Information equals profitability Increasing adoption of R&D outcomes
Online communications, practical tools and calculators enable ready-access to our educational materials and through a program of tailored publications, events and workshops we facilitate adoption of our on and off-farm R&D outputs.
Our R&D adoption strategy this year focused more closely on understanding different segments within the industry and developing tailored solutions for facilitating change. Key milestones were achieved this year, with the completion of three industry sector situation analyses, the redevelopment of the More Beef from Pastures (MBfP) and Making More From Sheep (MMFS) programs, and the development of a quantitative knowledge and skills auditing evaluation system.
Along with engaging a significant number of producers, MLA continues to support on-farm practice change across programs being delivered, with an average of 60 per cent of producers who participate in MLA programs implementing improved practices.
External reviews of our major R&D adoption programs – More Beef from Pastures, Making More From Sheep, and the Northern Beef communication and adoption program – harvested positive results, with benefit:cost analysis showing a 2.6 – 4.0 return for each MLA dollar invested.
We also completed modelling on the MBfP program which indicated that, on a single enterprise basis, adoption of decision-making processes and practices advocated by MBfP (eg feedbase optimisation and subsequent increased throughput of cattle for sale) could more than double the return per hectare, while improving the natural resource base and reducing annual variability and market volatility risks.**
Funding was approved and business plans have been developed to continue MBfP and MMFS for the next three to five years, ensuring we are able to support producers to build their capability and facilitate on-farm change. Going into Goats will also continue to be delivered as well as a co-ordinated northern beef communication and research adoption program.
Information on demand
We helped producers beef up their profits and improve enterprise production and business performance with the continuous refinement of existing MLA tools – including an upgrade of the Feed Demand calculator interface. Developed with the CSIRO, the calculator was accessed by 1,873 southern Australian beef producers to help them identify and strategically address imbalances in feed supply and demand, thereby improving enterprise resilience and productivity. Similar refinements are underway for the Rainfall to Pasture Growth Outlook tool, and a multi-enterprise ‘business analysis’ tool to assist producers in making tactical decisions to improve pasture utilisation and business performance.
The Pasture Picker tool, an online resource enabling producers, advisors and agribusiness professionals to select pasture species for specific conditions across Australia was developed this year.
With the launch of a dedicated ‘tools & calculators’ section on our new website in June, visitors to www.mla.com.au now have quicker assess to our suite of online tools from the homepage.
** Harris, J & Ryce, C 2005, Outcomes of MLA’s livestock production research and development, MLA
Figure 1. 2009-10 producer participation in the major MLA funded programs
We continued to increase the number of producers and industry stakeholders that engage with our major on-farm program activities. In 2009-10, more than 10,500 producers were engaged, 500 more than the previous year. Figure 1 presents the major programs delivered by MLA and the number of producers engaged in the respective MLA funded programs.
Figure 2. MLA achievements in supporting practice change 2009-10
Fodder and feedstuff pricesFertiliser price
Fuel and lubricant prices
98 99 00 01 02 03 04 05 06 07 08 09**
10 *11
98 99 00 01 02 03 04 05 06 07 08 09 10
50
100
150
200
250
300
Source: ABARE
The average price of fodder and feedstuff, fertiliser and fuel price decreased but remained high
**subject to revision
*forecast
*forecast
*forecast
Year ending June
Southern beef cattle farmsNorthern beef cattle farms
Slaughter lamb farms
-100
-50
0
50
100
150
200
Farm business profit is declining slightly
Financial year
Year ending June
Sao Paulo heavy steer >450
Australia medium steer 400-500
50
75
100
125
150
175
200
225
Source: MLA's NLRS, AgraFNP
Source: ABARE
Cattle prices - Australia v/s Brazil
00-0
1
01-0
2
02-0
3
03-0
4
04-0
5
05-0
6
06-0
7
07-0
8
08-0
9
*09-
10
Southern beef cattle farmsNorthern beef cattle farms
Slaughter lamb farms
0
200
400
600
800
1000
Average farm debt
Financial year Source: ABARE
99-0
0
00-0
1
01-0
2
02-0
3
03-0
4
04-0
5
05-0
6
06-0
7
07-0
8
*08-
09
Inde
x 19
97-9
8 =
100
A¢/k
g lw
tA$
’000
(200
8-09
dol
lars
)
*forecast
-100
-50
0
50
100
150
200
Average slaughter lamb farm business profit
Financial year Source: ABARE
00-0
1
01-0
2
02-0
3
03-0
4
04-0
5
05-0
6
06-0
7
07-0
8
08-0
9
*09-
10
A$’0
00 (2
008-
09 d
olla
rs)
*forecast
-100
-50
0
50
100
150
200
Average southern beef cattle farm business profit
Financial year Source: ABARE
00-0
1
01-0
2
02-0
3
03-0
4
04-0
5
05-0
6
06-0
7
07-0
8
08-0
9
*09-
10
A$’0
00 (2
008-
09 d
olla
rs)
*forecast
-100
-50
0
50
100
150
200
Average northern beef cattle farm business profit
Financial year Source: ABARE
00-0
1
01-0
2
02-0
3
03-0
4
04-0
5
05-0
6
06-0
7
07-0
8
08-0
9
*09-
10
A$’0
00 (2
008-
09 d
olla
rs)
A$’0
00 (2
008-
09 d
olla
rs)
0
20
40
60
80
100
Management Practice Change - Trends
Source: MLA – 2009 KPI Survey
Source: MLA – 2009 KPI Survey
2007 2006 2008 2009
%
0
750
1500
2250
3000
MBfP BeefUp MMFS Evergraze PDS sites
Parti
cipa
nts
0
20
40
60
80
100
Management Practice Change - Trends
Source: MLA – 2009 KPI Survey
Source: MLA – 2009 KPI Survey
2007 2006 2008 2009
%
0
750
1500
2250
3000
MBfP BeefUp MMFS Evergraze PDS sites
Parti
cipa
nts
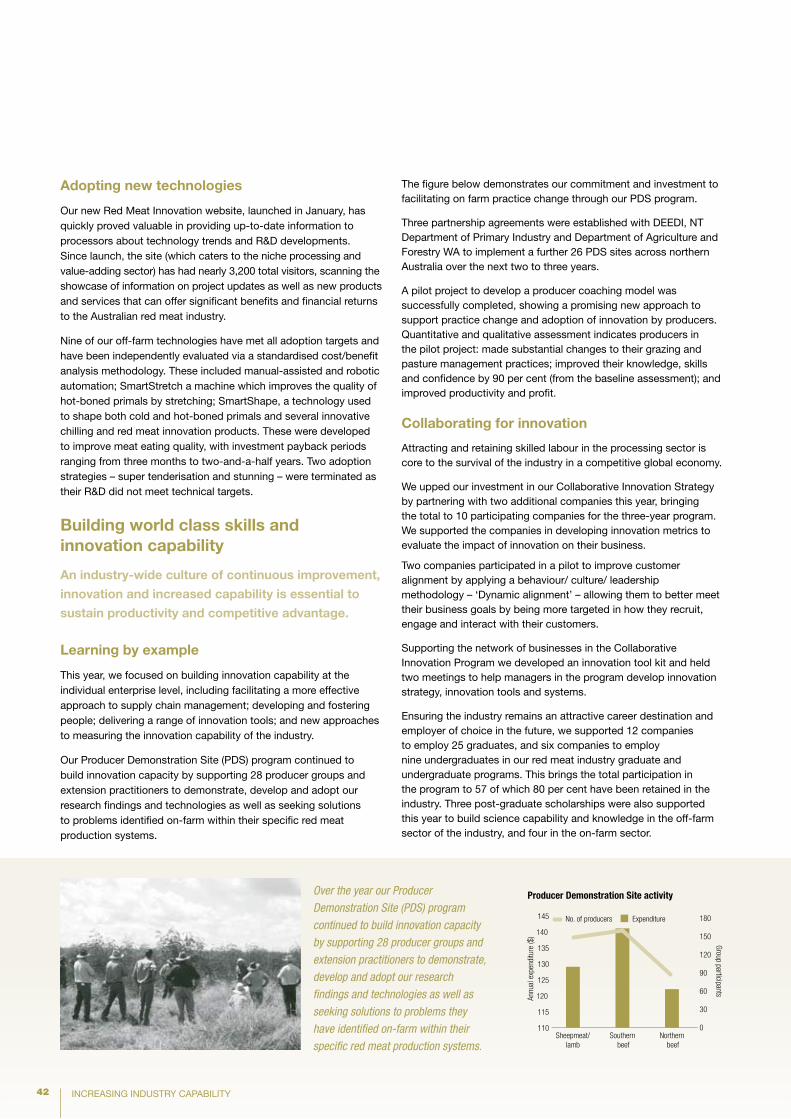
42 INCREASING INDUSTRY CAPABILITY
Adopting new technologies
Our new Red Meat Innovation website, launched in January, has quickly proved valuable in providing up-to-date information to processors about technology trends and R&D developments. Since launch, the site (which caters to the niche processing and value-adding sector) has had nearly 3,200 total visitors, scanning the showcase of information on project updates as well as new products and services that can offer significant benefits and financial returns to the Australian red meat industry.
Nine of our off-farm technologies have met all adoption targets and have been independently evaluated via a standardised cost/benefit analysis methodology. These included manual-assisted and robotic automation; SmartStretch a machine which improves the quality of hot-boned primals by stretching; SmartShape, a technology used to shape both cold and hot-boned primals and several innovative chilling and red meat innovation products. These were developed to improve meat eating quality, with investment payback periods ranging from three months to two-and-a-half years. Two adoption strategies – super tenderisation and stunning – were terminated as their R&D did not meet technical targets.
Building world class skills and innovation capability
An industry-wide culture of continuous improvement,
innovation and increased capability is essential to
sustain productivity and competitive advantage.
Learning by example
This year, we focused on building innovation capability at the individual enterprise level, including facilitating a more effective approach to supply chain management; developing and fostering people; delivering a range of innovation tools; and new approaches to measuring the innovation capability of the industry.
Our Producer Demonstration Site (PDS) program continued to build innovation capacity by supporting 28 producer groups and extension practitioners to demonstrate, develop and adopt our research findings and technologies as well as seeking solutions to problems identified on-farm within their specific red meat production systems.
The figure below demonstrates our commitment and investment to facilitating on farm practice change through our PDS program.
Three partnership agreements were established with DEEDI, NT Department of Primary Industry and Department of Agriculture and Forestry WA to implement a further 26 PDS sites across northern Australia over the next two to three years.
A pilot project to develop a producer coaching model was successfully completed, showing a promising new approach to support practice change and adoption of innovation by producers. Quantitative and qualitative assessment indicates producers in the pilot project: made substantial changes to their grazing and pasture management practices; improved their knowledge, skills and confidence by 90 per cent (from the baseline assessment); and improved productivity and profit.
Collaborating for innovation
Attracting and retaining skilled labour in the processing sector is core to the survival of the industry in a competitive global economy.
We upped our investment in our Collaborative Innovation Strategy by partnering with two additional companies this year, bringing the total to 10 participating companies for the three-year program. We supported the companies in developing innovation metrics to evaluate the impact of innovation on their business.
Two companies participated in a pilot to improve customer alignment by applying a behaviour/ culture/ leadership methodology – ‘Dynamic alignment’ – allowing them to better meet their business goals by being more targeted in how they recruit, engage and interact with their customers.
Supporting the network of businesses in the Collaborative Innovation Program we developed an innovation tool kit and held two meetings to help managers in the program develop innovation strategy, innovation tools and systems.
Ensuring the industry remains an attractive career destination and employer of choice in the future, we supported 12 companies to employ 25 graduates, and six companies to employ nine undergraduates in our red meat industry graduate and undergraduate programs. This brings the total participation in the program to 57 of which 80 per cent have been retained in the industry. Three post-graduate scholarships were also supported this year to build science capability and knowledge in the off-farm sector of the industry, and four in the on-farm sector.
Over the year our Producer
Demonstration Site (PDS) program
continued to build innovation capacity
by supporting 28 producer groups and
extension practitioners to demonstrate,
develop and adopt our research
findings and technologies as well as
seeking solutions to problems they
have identified on-farm within their
specific red meat production systems.
110
115
120
125
130
135
140
145
Group participants
Expenditure No. of producers
0
30
60
90
120
150
180
Producer Demonstration Site activity
Southern beef
Northern beef
Sheepmeat/lamb
Annu
al e
xpen
ditu
re ($
)
FINANCIAL REPORT
Financial reportfor the year ended 30 June 2010
44 Corporate governance statement
48 Directors’ report
52 Auditor’s independence declaration
53 Income statement
54 Statement of comprehensive income
55 Statement of financial position
56 Statement of changes in equity
57 Statement of cash flows
58 Notes to the financial statements
58 1. Corporate information
58 2. Summary of significant accounting policies
61 3. Revenue from continuing operations
61 4. Transaction levies
62 5. Other income
62 6. Expenses and losses
63 7. Trade and other receivables (current)
64 8. Prepayments and deposits
64 9. Investment in associate
65 10. Investments in subsidiaries
65 11. Parent entity information
66 12. Property, plant and equipment
67 13. Intangible assets
67 14. Trade and other payables (current)
68 15. Provisions (current)
68 16. Other liabilities (current)
68 17. Trade and other payables (non-current)
69 18. Provisions (non-current)
69 19. Cash flow hedge reserve
70 20. Foreign currency exposure
70 21. Employee entitlements
70 22. Remuneration of auditors
71 23. Director and executive disclosures
73 24. Notes to the statement of cash flows
73 25. Expenditure commitments
74 26. Members’ funds
74 27. Contributed equity
74 28. Financial risk management objectives and policies
78 Directors’ declaration
79 Independent auditors’ report
43
44 FINANCIAL REPORT
Corporate governance statement
Our corporate governance framework reflects our efforts to ensure that our values underpin the way in which we operate and behave. This framework has been established to ensure that we remain accountable to our stakeholders and that stakeholder interests are protected.
In developing and implementing our corporate governance practices we have taken into account the ASX Corporate Governance Council’s Corporate Governance Principles and Recommendations (2nd edition). Documents and policies relevant to our corporate governance framework are found in the corporate governance section of our website www.mla.com.au.
The Board
Composition
The Board currently comprises 10 directors, with the Managing Director the only executive director. Until November 2009 there were 11 directors; however the Board resolved to reduce the number of directors by one, effective from the 2009 annual general meeting. The Board is a skills-based board with directors appointed for a maximum three-year term, after which time a director may reapply for a position on the Board in the same way as other candidates. The Board has the appropriate range of skills, knowledge and experience necessary to govern the Company, and they provide input into the selection process for directors through the Selection Committee. Further information about the Selection Committee is on page 51.
The Chairman of the Board was appointed in 2005 and is an independent director. The current composition of the Board and details about each director are set out in the Directors’ report on page 48.
Roles and responsibilities
The roles and responsibilities of the Board are formalised in the Board Charter, which is available in the corporate governance section of our website. The Board strives to build sustainable value for MLA’s members and the red meat industry and to achieve the Company’s mission of delivering world class services and solutions in partnership with industry and government. The Board’s responsibilities include:
providing input into and approving management strategies, •budgets, programs and policies
appointing and removing the Managing Director•
assessing performance against strategies to monitor both the •performance of management as well as the continuing suitability of strategies
overseeing the Company and reviewing operating information•
approving and monitoring significant capital expenditure and •significant commitments under agreed programs
ensuring the Company operates with an appropriate corporate •governance structure
ensuring the Company operates in accordance with its objects •and the Industry Memorandum of Understanding
ensuring the Company meets its obligations under the MLA/•Commonwealth Deed of Agreement
Directors may, with the Chairman’s approval, obtain independent professional advice on matters arising in the course of their Board and committee duties. Directors have unlimited access to company records and information.
Board meetings
The Board met 11 times during the year. While meeting agendas are formulated monthly, the Board also has an annual agenda which sets items to be considered and reviewed throughout the year. These items include monthly reviews of the Company’s financial position and management reports, a detailed review of each of the Company’s strategic imperatives and ‘Health Checks’. Health Checks are detailed reviews of allocated topics and include:
State of the industry (industry dynamics and challenges)•
State of the nation (industry outlook and forecasts)•
Consumer trends•
Human resources•
R&D programs•
The annual agenda also sets key review dates for items which must come before the Board under the categories of performance, compliance and governance.
The Board continually strives to ensure its meetings are conducted efficiently to enable sufficient discussion and contribution from all directors. During the year, the Board updated its monthly agenda framework. Each month the Board now undertakes a review of ‘critical issues’. These issues are then categorised into key MLA and Industry Issues. The Board also has a general strategic discussion each month, on a key topic identified by the Board or management. In addition, the Board participated in a strategic planning session with management.
Management attends and provides input into issues arising in Board meetings relevant to their portfolios. Directors regularly meet with management and have regular exposure to other employees through presentations given at Board meetings and attendance by directors at industry meetings, forums and workshops.
During the year, the Board endorsed the MLA Board Operating Principles which set out a series of guidelines for Board behaviour, measurement of Board performance and Board meeting guidelines. A review of the meeting against these principles is provided by a Director at the conclusion of each Board meeting. The Principles are also regularly reviewed by the Board to ensure that it is meeting the guidelines.
Board evaluation
In addition to its own reviews at Board meetings, the Board evaluates its performance on a regular basis with a formal performance review undertaken annually. This year’s performance review was again facilitated by a Board review specialist, with the review focussing on the effectiveness of the Board as a whole and the performance of individual directors. As part of the review, each director completed a survey and was then interviewed. Observations from the review were reported to, and discussed, by the Board.
45FINANCIAL REPORT
Board training
The Board as a whole last undertook formal governance training in April 2009 and plans to participate in further training in the coming year.
A comprehensive induction program was conducted for our new directors at the beginning of 2010. The induction program was also attended by existing directors. As part of the induction program the general managers provided an overview of each business unit as well as the operations of the Company as a whole.
Independence
The Board considers each director’s independence. An independent director is considered to be a non-executive director who is not a member of management and who is free of any business or other relationship that materially interferes with – or could reasonably be perceived to materially interfere with the independent exercise of their judgement.
After considering the relationships between the Company and each of the directors and reviewing financial transactions between the company and the directors, the Board determined that all non-executive directors are independent. The Board will assess independence annually, or more regularly if a director’s circumstances change.
Conflicts of Interest
Each director provides information about their business and other interests to the Board at the time of their appointment. This information is regularly updated and the Company maintains a standing notice of director interests which it distributes with Board papers each month.
In accordance with the Corporations Act, a director with a material personal interest in a matter is prevented from voting on the matter at a Board meeting or being present while the matter is discussed, unless the Board resolves otherwise.
Board committeesThere were three Board committees that met during the year:
Audit Committee•
Membership Committee•
Remuneration Committee•
All Board committees are comprised solely of non-executive directors, with management attending committee meetings by invitation only.
A program of committee meetings is developed at the beginning of each year and committees also meet when required. The Chair of each committee provides a verbal update of each committee meeting to the Board and minutes of all committee meetings are provided in the Board papers.
The role of each committee is set out in the committee charters, which are regularly reviewed. The members of each committee, together with each member’s attendance at meetings are set out in the Director’s report on page 50.
Audit & Risk Committee
During the year, the name of the Audit Committee changed to Audit and Risk Committee to better reflect its responsibilities in the area of risks.
The Audit & Risk Committee oversees the Company’s risk program and has oversight responsibility of the Company’s financial reporting, internal control structure, risk management and the internal and external audit functions. In keeping with community expectations, the chair of the committee is not the Chairman of the Board. The Audit & Risk Committee is required to meet at least three times a year and meets separately with the external auditor at least once each year.
The Audit & Risk Committee is responsible for making recommendations to the Board for the approval of:
the annual audit plan•
annual financial statements•
the external auditor’s report on the annual financial statements•
the external auditor’s report on the Company’s compliance with •the Commonwealth Deed of Agreement
The Audit & Risk Committee is also responsible for making recommendations to the Board about the appointment of the Company’s auditors.
The Audit & Risk Committee reviews the adequacy and effectiveness of internal controls, including the Company’s policies and procedures, to assess, monitor and manage business risk and legal and ethical compliance programs. This review includes monitoring the implementation of the Company’s Risk Management Plan, Fraud Control Plan and Intellectual Property Plan.
It also reviews the Company’s foreign exchange and treasury management and oversees the Company’s risk management program. During the year the Audit & Risk Committee commenced a review of its Charter which will be finalised in the coming year. Further information about the Company’s risk management activities is on page 46.
Remuneration Committee
The Remuneration Committee oversees remuneration practices across the Company. The Committee reviews the policies and systems in place for managing remuneration to ensure they are appropriate and consistent with company objectives. The responsibilities of the Remuneration Committee include the review of:
processes and guidelines for annual staff remuneration reviews •and making recommendations to the Board accordingly
the remuneration package of the Managing Director and making •recommendations to the Board in this regard
remuneration packages for the general managers and other •executives nominated by the Committee, in consultation with the Managing Director
any bonus or special incentive plans and making •recommendations to the Board in this regard
company policies relevant to any human resource issues and •activities that impact on remuneration and compensation.
46 FINANCIAL REPORT
Membership Committee
The Membership Committee was established in August 1998 for the purpose of considering applications for membership of the Company and reviewing processes and systems for the recruitment of members and the management of the members register. Following many years of active membership drives and a membership of more than 47,000, the Board determined in February 2010 to dissolve the Membership Committee, with membership matters to be dealt with by the full Board as required.
Selection CommitteeThe role of the Selection Committee is to report to members of the Company on the suitability of candidates for re-election or election to the office of director at general meetings. The Selection Committee consists of:
three persons elected by members of the Company•
three persons appointed by Peak Councils•
three directors•
The Company’s constitution sets out the requirements for the proceedings of the Selection Committee and the qualifications and skills of candidates in nominated fields which the Selection Committee must consider.
The composition of the Selection Committee, together with each member’s attendance at meetings is set out in the Directors’ report on page 51.
Reporting frameworkThe Company is party to a Deed of Agreement with the Commonwealth of Australia through its Department of Agriculture, Fisheries and Forestry (Deed). The Deed sets out the requirements for the Company’s expenditure of levy funds and matching funds and provides a framework under which the Company must report to the Department. Key reporting obligations include:
Corporate Plan (known as the Strategic Plan): a 3–5 year •strategic plan which sets out the Company’s objectives, performance indicators and resource allocations.
Annual Operating Plan: linked to the Strategic Plan, the Annual •Operating Plan covers intended operations of the Company for the current year and R&D and marketing programs and activities to be undertaken.
Risk Management Plan: specifies measures to manage risk.•
Fraud Control Plan: sets out measures to minimise the risk of •fraud within the Company.
Intellectual Property Plan: specifies procedures for the •management, adoption and commercialisation of intellectual property.
These plans are regularly reviewed and updated.
In accordance with the Deed, the Company engaged Arche Consulting Pty Ltd to conduct a Performance Review (Review), which was completed in June 2010.
The Review took into account, among other things, the performance of MLA in meeting its obligations under the Deed, the implementation of Annual Operating and Corporate Plans and the effectiveness of the Company in meeting the targets and budgets set out in those plans. The Review also considered the delivery to the industry of the benefits foreshadowed in the plans. The Company is currently working through the Review recommendations and is developing an implementation plan.
The Report delivered as part of the Review was provided to the Minister and is available on our website.
Financial and risk managementThe Company’s risk management policies and assessments are documented in the Risk Management Plan (the Plan). The Plan outlines the process followed to identify risks and categorises risks as ‘strategic risks’ or ‘operational risks’. Individual risks have been identified, assessed, categorised and entered into a Business Risk Register, which forms part of the Plan. The Audit Committee receives reports once a year on compliance with the Plan and conducts an annual review of the Plan.
Other key risk management activities undertaken through the year included:
external review of internal fraud controls•
review of year end processes for the Japan Office•
introduction of an R&D Aggregation Policy and Guidelines•
The Audit Committee has received a written declaration from the Managing Director and Chief Financial Officer that the financial reports represent a true and fair view, in all material respects, of the Company’s financial condition and operating results and are in accordance with relevant accounting standards.
Code of business conduct and ethics The Board has implemented a Code of business conduct and ethics (the Code), which embodies the Company’s values and sets out the principles which must be met to ensure that the Company meets its commitments to all stakeholders. Key principles outlined in the Code are:
Acting with openness, integrity and fairness•
Protecting our business and using company resources •appropriately
Protecting confidential information•
Acting responsibly towards individuals•
Acting responsibly in relation to safety, health and the •environment
Avoiding conflicts of interest•
Integrity in financial reporting•
Acting responsibly to members, stakeholders and the •community
Complying with the law•
The Code also establishes a reporting framework to enable employees to report any breach of the Code. All employees are
47FINANCIAL REPORT
required to confirm that they have read and understood the Code each year. A copy of the Code is provided to all new employees on commencement and is a feature of the formal induction training which is provided at least twice a year.
Remuneration and performance arrangements The total limit for directors’ remuneration (excluding the Managing Director) is $750,000. This limit was determined by members at the 2008 annual general meeting. The Remuneration Committee reviews directors’ fees on a regular basis and the Board determined in June 2010 that an increase of 3 per cent will take effect from 1 July 2010, taking the total per annum costs to $458,628. This was the first increase in directors’ fees since July 2004.
The remuneration arrangements for each member of the senior management team, including the Managing Director, comprise both fixed and performance-based remuneration.
The remuneration packages for the senior management team are reviewed each year and include a performance based component to ensure the remuneration structure:
aligns management effort with organisational objectives•
attracts, retains and motivates quality management personnel•
Communicating with members We implement a member communications strategy that seeks to:
create awareness of MLA and its activities amongst MLA members •
demonstrate the relevance and value of the Company and its •programs
proactively engage members to take advantage of the •opportunities created by the Company in partnership with industry and government
In implementing this strategy we employ a variety of communications tactics including radio and print media, magazines and publications, the corporate website, events and our feedbackTV DVDs.
The success of these efforts is measured through member surveys, media and website monitoring, publication orders and increases in membership.
MLA employs a policy of ensuring all members have the opportunity to participate in our annual general meeting (AGM) by rotating its location around the nation. The 2009 AGM was held in Darwin, NT and was preceded by Orange, NSW (2008), Rockhampton, QLD (2007), Adelaide, SA (2006), and Melbourne, VIC (2005).
Events play an important role in giving members information and the direct opportunity to contribute to the direction of the company. In 2009-10 we collaborated with a range of industry organisations to participate in 49 producer events across the company. These events attracted 3,275 attendees (13 times more than in 2008-09) with the same budget.
For the third year, our 2008-09 annual report was made available
through our corporate website as well as in hard copy for members who requested it. Our hard copy Annual report 2008-09 met the criteria to achieve the highest level of reporting standards with a Gold Award in the 2010 Australasian Reporting Awards, while our online Annual report was a finalist for the Electronic (online) Reporting Award. This independent and rigorous assessment of our annual reporting provides valuable feedback that is incorporated into future annual reports.
MLA’s website www.mla.com.au provides information on on-farm tools and resources, post-farm research programs, domestic and international marketing activities, market information and links to websites for key industry systems such as Meat Standards Australia, the National Livestock Identification System and Livestock Production Assurance.
The site is consistently ranked in the Top 10 by website monitoring company Hitwise and maintained 29,500 unique visitors a month during 2009-10.
Our flagship magazine feedback, and DVD program feedbackTV continue to demonstrate the breadth of research and marketing activities that the company undertakes on behalf of industry.
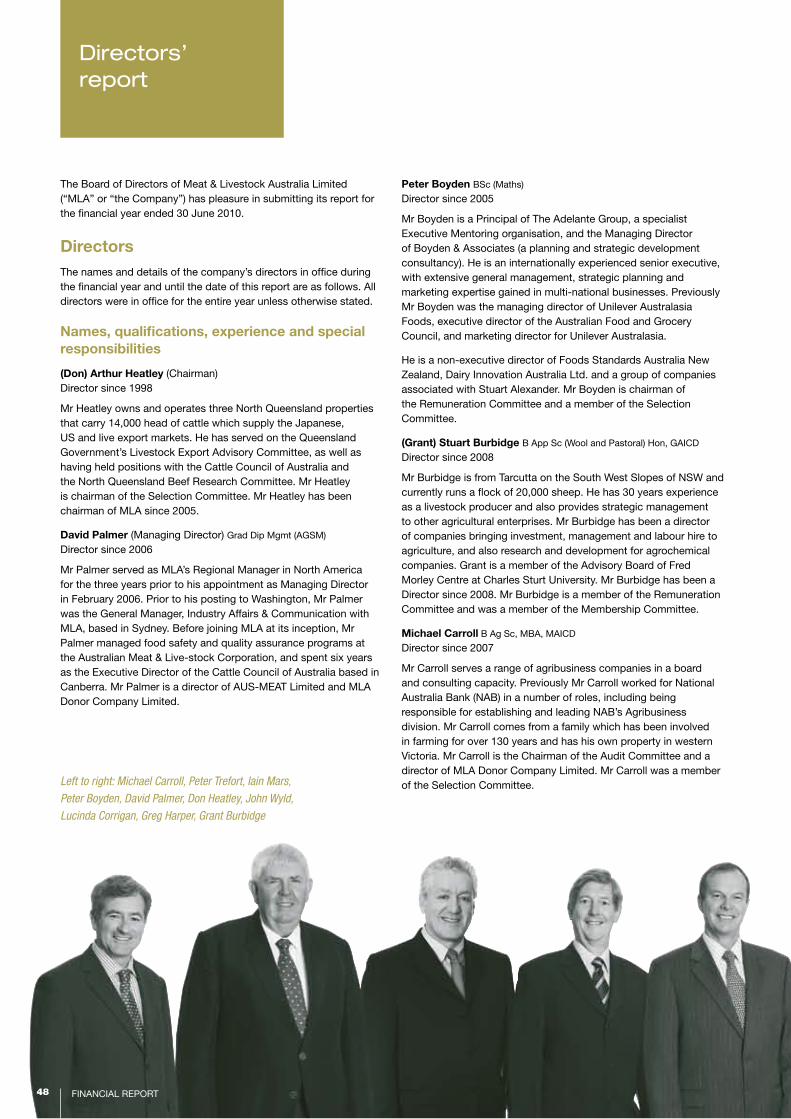
financial RepoRt48
Directors’ report
the Board of Directors of Meat & livestock australia limited (“Mla” or “the company”) has pleasure in submitting its report for the financial year ended 30 June 2010.
Directorsthe names and details of the company’s directors in office during the financial year and until the date of this report are as follows. all directors were in office for the entire year unless otherwise stated.
Names, qualifications, experience and special responsibilities
(Don) Arthur Heatley (chairman)Director since 1998
Mr Heatley owns and operates three north Queensland properties that carry 14,000 head of cattle which supply the Japanese, US and live export markets. He has served on the Queensland Government’s livestock export advisory committee, as well as having held positions with the cattle council of australia and the north Queensland Beef Research committee. Mr Heatley is chairman of the Selection committee. Mr Heatley has been chairman of Mla since 2005.
David Palmer (Managing Director) Grad Dip Mgmt (aGSM)
Director since 2006
Mr palmer served as Mla’s Regional Manager in north america for the three years prior to his appointment as Managing Director in february 2006. prior to his posting to Washington, Mr palmer was the General Manager, industry affairs & communication with Mla, based in Sydney. Before joining Mla at its inception, Mr palmer managed food safety and quality assurance programs at the australian Meat & live-stock corporation, and spent six years as the executive Director of the cattle council of australia based in canberra. Mr palmer is a director of aUS-Meat limited and Mla Donor company limited.
Peter Boyden BSc (Maths)
Director since 2005
Mr Boyden is a principal of the adelante Group, a specialist executive Mentoring organisation, and the Managing Director of Boyden & associates (a planning and strategic development consultancy). He is an internationally experienced senior executive, with extensive general management, strategic planning and marketing expertise gained in multi-national businesses. previously Mr Boyden was the managing director of Unilever australasia foods, executive director of the australian food and Grocery council, and marketing director for Unilever australasia.
He is a non-executive director of foods Standards australia new Zealand, Dairy innovation australia ltd. and a group of companies associated with Stuart alexander. Mr Boyden is chairman of the Remuneration committee and a member of the Selection committee.
(Grant) Stuart Burbidge B app Sc (Wool and pastoral) Hon, GaicD
Director since 2008
Mr Burbidge is from tarcutta on the South West Slopes of nSW and currently runs a flock of 20,000 sheep. He has 30 years experience as a livestock producer and also provides strategic management to other agricultural enterprises. Mr Burbidge has been a director of companies bringing investment, management and labour hire to agriculture, and also research and development for agrochemical companies. Grant is a member of the advisory Board of fred Morley centre at charles Sturt University. Mr Burbidge has been a Director since 2008. Mr Burbidge is a member of the Remuneration committee and was a member of the Membership committee.
Michael Carroll B ag Sc, MBa, MaicD
Director since 2007
Mr carroll serves a range of agribusiness companies in a board and consulting capacity. previously Mr carroll worked for national australia Bank (naB) in a number of roles, including being responsible for establishing and leading naB’s agribusiness division. Mr carroll comes from a family which has been involved in farming for over 130 years and has his own property in western Victoria. Mr carroll is the chairman of the audit committee and a director of Mla Donor company limited. Mr carroll was a member of the Selection committee.Left to right: Michael Carroll, Peter Trefort, Iain Mars,
Peter Boyden, David Palmer, Don Heatley, John Wyld,
Lucinda Corrigan, Greg Harper, Grant Burbidge
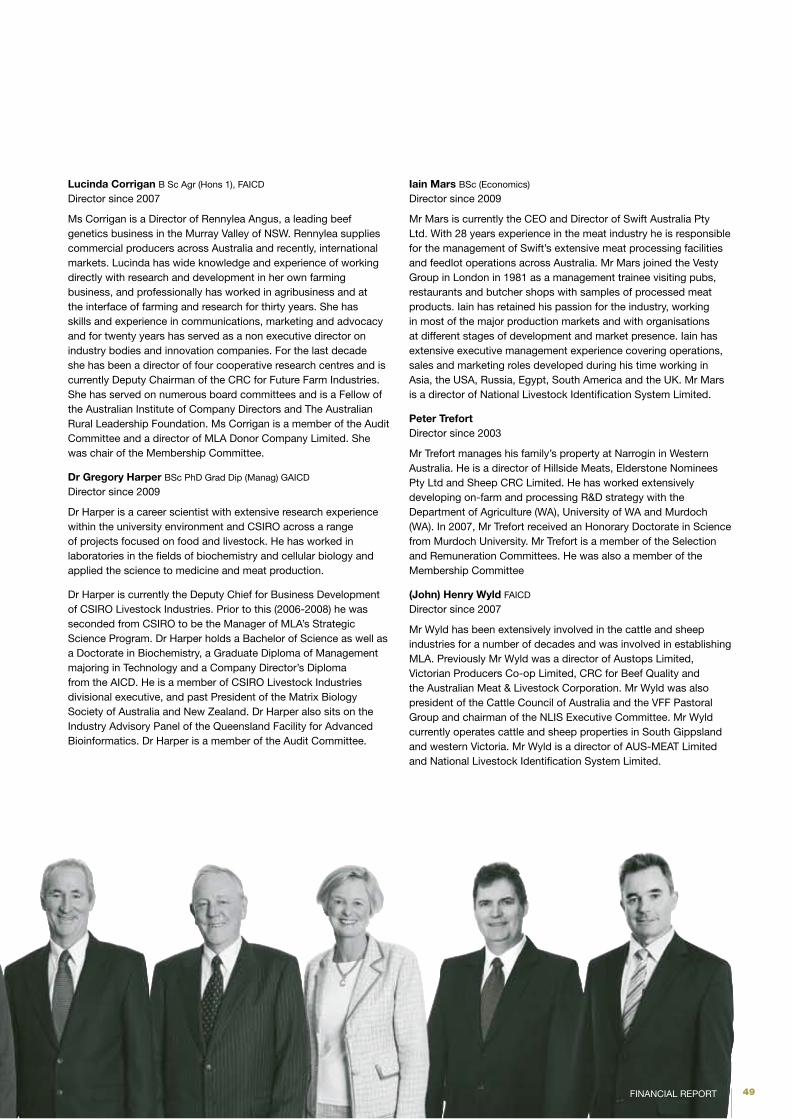
49financial RepoRt
Lucinda Corrigan B Sc agr (Hons 1), faicD
Director since 2007
Ms corrigan is a Director of Rennylea angus, a leading beef genetics business in the Murray Valley of nSW. Rennylea supplies commercial producers across australia and recently, international markets. lucinda has wide knowledge and experience of working directly with research and development in her own farming business, and professionally has worked in agribusiness and at the interface of farming and research for thirty years. She has skills and experience in communications, marketing and advocacy and for twenty years has served as a non executive director on industry bodies and innovation companies. for the last decade she has been a director of four cooperative research centres and is currently Deputy chairman of the cRc for future farm industries. She has served on numerous board committees and is a fellow of the australian institute of company Directors and the australian Rural leadership foundation. Ms corrigan is a member of the audit committee and a director of Mla Donor company limited. She was chair of the Membership committee.
Dr Gregory Harper BSc phD Grad Dip (Manag) GaicD
Director since 2009
Dr Harper is a career scientist with extensive research experience within the university environment and cSiRo across a range of projects focused on food and livestock. He has worked in laboratories in the fields of biochemistry and cellular biology and applied the science to medicine and meat production.
Dr Harper is currently the Deputy chief for Business Development of cSiRo livestock industries. prior to this (2006-2008) he was seconded from cSiRo to be the Manager of Mla’s Strategic Science program. Dr Harper holds a Bachelor of Science as well as a Doctorate in Biochemistry, a Graduate Diploma of Management majoring in technology and a company Director’s Diploma from the aicD. He is a member of cSiRo livestock industries divisional executive, and past president of the Matrix Biology Society of australia and new Zealand. Dr Harper also sits on the industry advisory panel of the Queensland facility for advanced Bioinformatics. Dr Harper is a member of the audit committee.
Iain Mars BSc (economics)
Director since 2009
Mr Mars is currently the ceo and Director of Swift australia pty ltd. With 28 years experience in the meat industry he is responsible for the management of Swift’s extensive meat processing facilities and feedlot operations across australia. Mr Mars joined the Vesty Group in london in 1981 as a management trainee visiting pubs, restaurants and butcher shops with samples of processed meat products. iain has retained his passion for the industry, working in most of the major production markets and with organisations at different stages of development and market presence. iain has extensive executive management experience covering operations, sales and marketing roles developed during his time working in asia, the USa, Russia, egypt, South america and the UK. Mr Mars is a director of national livestock identification System limited.
Peter Trefort Director since 2003
Mr trefort manages his family’s property at narrogin in Western australia. He is a director of Hillside Meats, elderstone nominees pty ltd and Sheep cRc limited. He has worked extensively developing on-farm and processing R&D strategy with the Department of agriculture (Wa), University of Wa and Murdoch (Wa). in 2007, Mr trefort received an Honorary Doctorate in Science from Murdoch University. Mr trefort is a member of the Selection and Remuneration committees. He was also a member of the Membership committee
(John) Henry Wyld faicD
Director since 2007
Mr Wyld has been extensively involved in the cattle and sheep industries for a number of decades and was involved in establishing Mla. previously Mr Wyld was a director of austops limited, Victorian producers co-op limited, cRc for Beef Quality and the australian Meat & livestock corporation. Mr Wyld was also president of the cattle council of australia and the Vff pastoral Group and chairman of the nliS executive committee. Mr Wyld currently operates cattle and sheep properties in South Gippsland and western Victoria. Mr Wyld is a director of aUS-Meat limited and national livestock identification System limited.
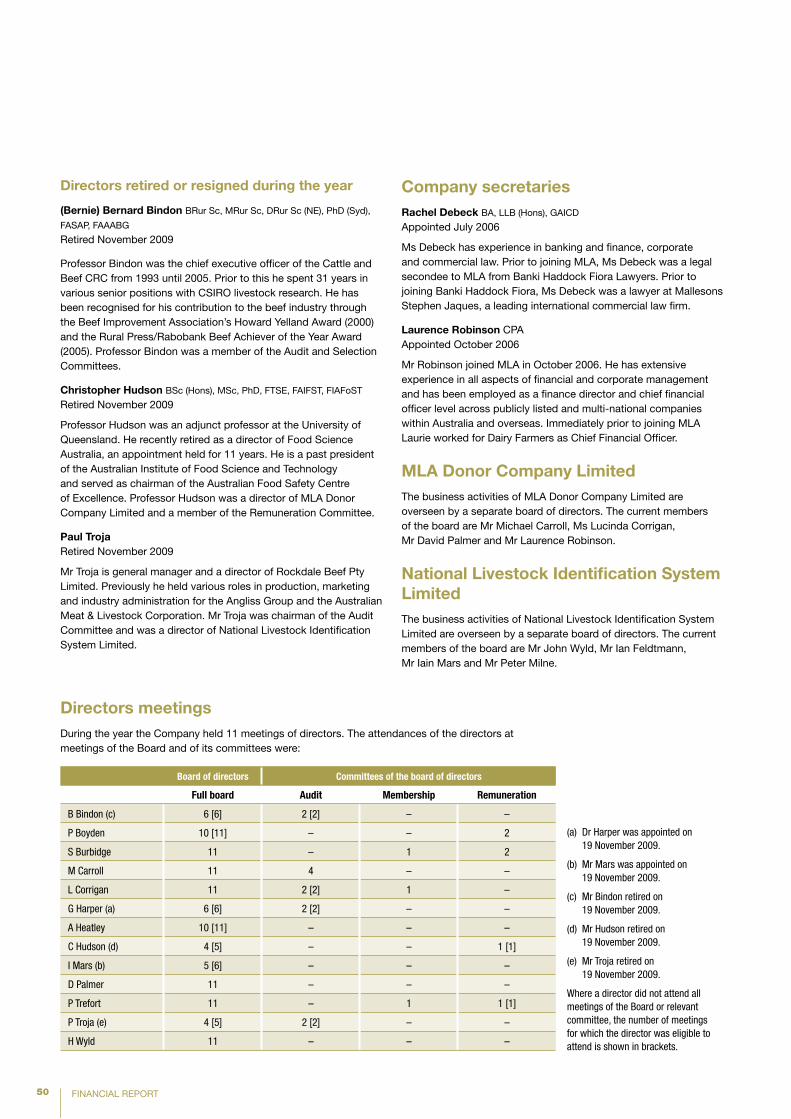
50 financial RepoRt
Directors retired or resigned during the year
(Bernie) Bernard Bindon BRur Sc, MRur Sc, DRur Sc (ne), phD (Syd),
faSap, faaaBG
Retired november 2009
professor Bindon was the chief executive officer of the cattle and Beef cRc from 1993 until 2005. prior to this he spent 31 years in various senior positions with cSiRo livestock research. He has been recognised for his contribution to the beef industry through the Beef improvement association’s Howard Yelland award (2000) and the Rural press/Rabobank Beef achiever of the Year award (2005). professor Bindon was a member of the audit and Selection committees.
Christopher Hudson BSc (Hons), MSc, phD, ftSe, faifSt, fiafoSt
Retired november 2009
professor Hudson was an adjunct professor at the University of Queensland. He recently retired as a director of food Science australia, an appointment held for 11 years. He is a past president of the australian institute of food Science and technology and served as chairman of the australian food Safety centre of excellence. professor Hudson was a director of Mla Donor company limited and a member of the Remuneration committee.
Paul Troja Retired november 2009
Mr troja is general manager and a director of Rockdale Beef pty limited. previously he held various roles in production, marketing and industry administration for the angliss Group and the australian Meat & livestock corporation. Mr troja was chairman of the audit committee and was a director of national livestock identification System limited.
Company secretariesRachel Debeck Ba, llB (Hons), GaicD
appointed July 2006
Ms Debeck has experience in banking and finance, corporate and commercial law. prior to joining Mla, Ms Debeck was a legal secondee to Mla from Banki Haddock fiora lawyers. prior to joining Banki Haddock fiora, Ms Debeck was a lawyer at Mallesons Stephen Jaques, a leading international commercial law firm.
Laurence Robinson cpa appointed october 2006
Mr Robinson joined Mla in october 2006. He has extensive experience in all aspects of financial and corporate management and has been employed as a finance director and chief financial officer level across publicly listed and multi-national companies within australia and overseas. immediately prior to joining Mla laurie worked for Dairy farmers as chief financial officer.
MLA Donor Company Limitedthe business activities of Mla Donor company limited are overseen by a separate board of directors. the current members of the board are Mr Michael carroll, Ms lucinda corrigan, Mr David palmer and Mr laurence Robinson.
National Livestock Identification System Limitedthe business activities of national livestock identification System limited are overseen by a separate board of directors. the current members of the board are Mr John Wyld, Mr ian feldtmann, Mr iain Mars and Mr peter Milne.
Directors meetingsDuring the year the company held 11 meetings of directors. the attendances of the directors at meetings of the Board and of its committees were:
Board of directors Committees of the board of directors
Full board Audit Membership Remuneration
B Bindon (c) 6 [6] 2 [2] – –
P Boyden 10 [11] – – 2
S Burbidge 11 – 1 2
M Carroll 11 4 – –
L Corrigan 11 2 [2] 1 –
G Harper (a) 6 [6] 2 [2] – –
A Heatley 10 [11] – – –
C Hudson (d) 4 [5] – – 1 [1]
I Mars (b) 5 [6] – – –
D Palmer 11 – – –
P Trefort 11 – 1 1 [1]
P Troja (e) 4 [5] 2 [2] – –
H Wyld 11 – – –
(a) Dr Harper was appointed on 19 November 2009.
(b) Mr Mars was appointed on 19 November 2009.
(c) Mr Bindon retired on 19 November 2009.
(d) Mr Hudson retired on 19 November 2009.
(e) Mr Troja retired on 19 November 2009.
Where a director did not attend all meetings of the Board or relevant committee, the number of meetings for which the director was eligible to attend is shown in brackets.
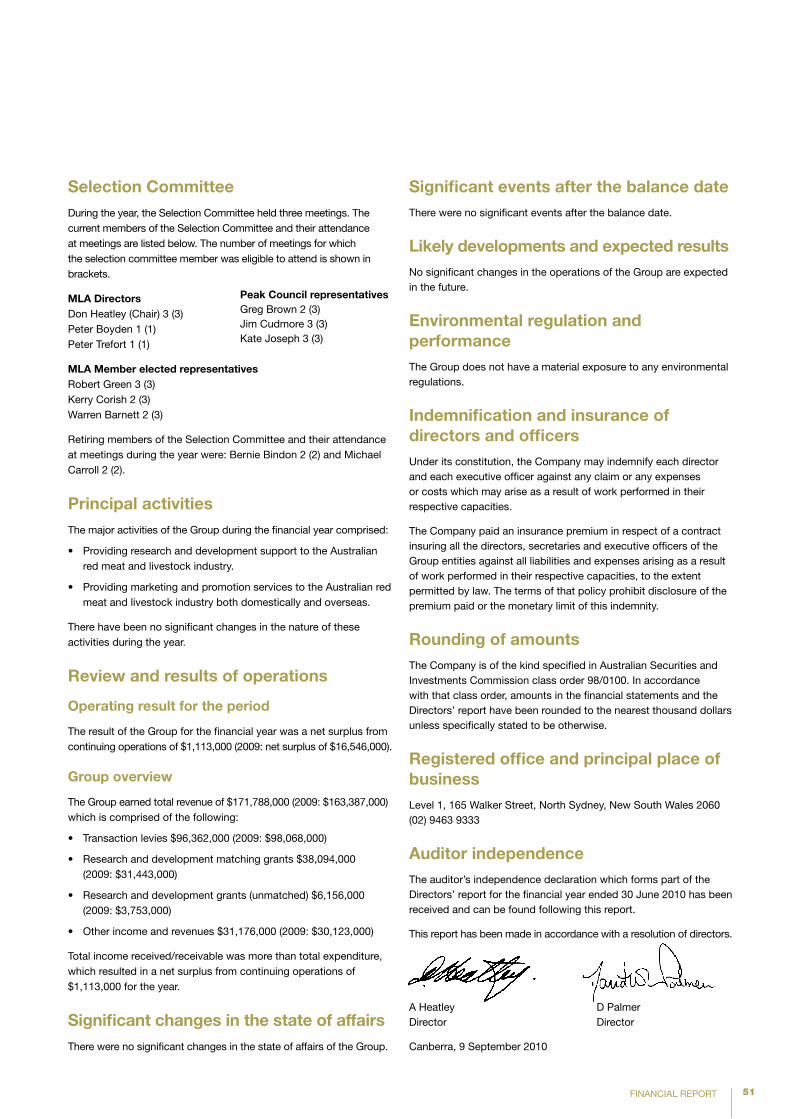
51FINANCIAL REPORT
Selection CommitteeDuring the year, the Selection Committee held three meetings. The current members of the Selection Committee and their attendance at meetings are listed below. The number of meetings for which the selection committee member was eligible to attend is shown in brackets.
MLA DirectorsDon Heatley (Chair) 3 (3)Peter Boyden 1 (1)Peter Trefort 1 (1)
MLA Member elected representativesRobert Green 3 (3)Kerry Corish 2 (3)Warren Barnett 2 (3)
Retiring members of the Selection Committee and their attendance at meetings during the year were: Bernie Bindon 2 (2) and Michael Carroll 2 (2).
principal activitiesThe major activities of the Group during the financial year comprised:
Providing research and development support to the Australian •red meat and livestock industry.
Providing marketing and promotion services to the Australian red •meat and livestock industry both domestically and overseas.
There have been no significant changes in the nature of these activities during the year.
Review and results of operations
Operating result for the period
The result of the Group for the financial year was a net surplus from continuing operations of $1,113,000 (2009: net surplus of $16,546,000).
Group overview
The Group earned total revenue of $171,788,000 (2009: $163,387,000) which is comprised of the following:
Transaction levies $96,362,000 (2009: $98,068,000)•
Research and development matching grants $38,094,000 •(2009: $31,443,000)
Research and development grants (unmatched) $6,156,000 •(2009: $3,753,000)
Other income and revenues $31,176,000 (2009: $30,123,000)•
Total income received/receivable was more than total expenditure, which resulted in a net surplus from continuing operations of $1,113,000 for the year.
Significant changes in the state of affairsThere were no significant changes in the state of affairs of the Group.
Significant events after the balance dateThere were no significant events after the balance date.
Likely developments and expected resultsNo significant changes in the operations of the Group are expected in the future.
Environmental regulation and performanceThe Group does not have a material exposure to any environmental regulations.
Indemnification and insurance of directors and officersUnder its constitution, the Company may indemnify each director and each executive officer against any claim or any expenses or costs which may arise as a result of work performed in their respective capacities.
The Company paid an insurance premium in respect of a contract insuring all the directors, secretaries and executive officers of the Group entities against all liabilities and expenses arising as a result of work performed in their respective capacities, to the extent permitted by law. The terms of that policy prohibit disclosure of the premium paid or the monetary limit of this indemnity.
Rounding of amountsThe Company is of the kind specified in Australian Securities and Investments Commission class order 98/0100. In accordance with that class order, amounts in the financial statements and the Directors’ report have been rounded to the nearest thousand dollars unless specifically stated to be otherwise.
Registered office and principal place of businessLevel 1, 165 Walker Street, North Sydney, New South Wales 2060(02) 9463 9333
Auditor independenceThe auditor’s independence declaration which forms part of the Directors’ report for the financial year ended 30 June 2010 has been received and can be found following this report.
This report has been made in accordance with a resolution of directors.
A Heatley D Palmer Director Director
Canberra, 9 September 2010
peak Council representativesGreg Brown 2 (3)Jim Cudmore 3 (3)Kate Joseph 3 (3)
52 financial RepoRt
Auditor’s independence declaration
Auditor’s independence declaration to the Directors of Meat & Livestock Australia Limited
in relation to our audit of the financial report of Meat & livestock australia limited for the financial year ended 30 June 2010, to the best of my knowledge and belief, there have been no contraventions of the auditor independence requirements of the corporations act 2001 or any applicable code of professional conduct.
ernst & Young
Rob lewispartnerSydney9 September 2010
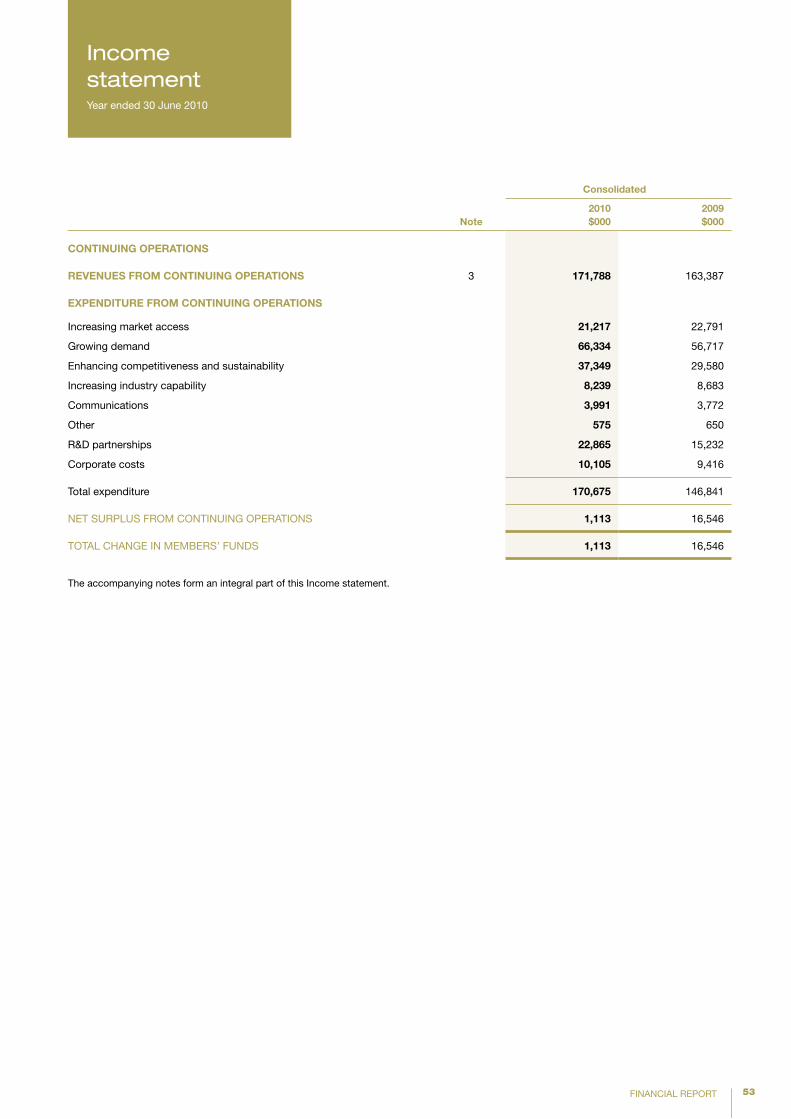
53FINANCIAL REPORT
Income statement Year ended 30 June 2010
note
Consolidated
2010$000
2009$000
COnTInUInG OpERATIOnS
REVEnUES FROM COnTInUInG OpERATIOnS 3 171,788 163,387
EXpEnDITURE FROM COnTInUInG OpERATIOnS
Increasing market access 21,217 22,791
Growing demand 66,334 56,717
Enhancing competitiveness and sustainability 37,349 29,580
Increasing industry capability 8,239 8,683
Communications 3,991 3,772
Other 575 650
R&D partnerships 22,865 15,232
Corporate costs 10,105 9,416
Total expenditure 170,675 146,841
NET SURPLUS FROM CONTINUING OPERATIONS 1,113 16,546
TOTAL CHANGE IN MEMBERS’ FUNDS 1,113 16,546
The accompanying notes form an integral part of this Income statement.
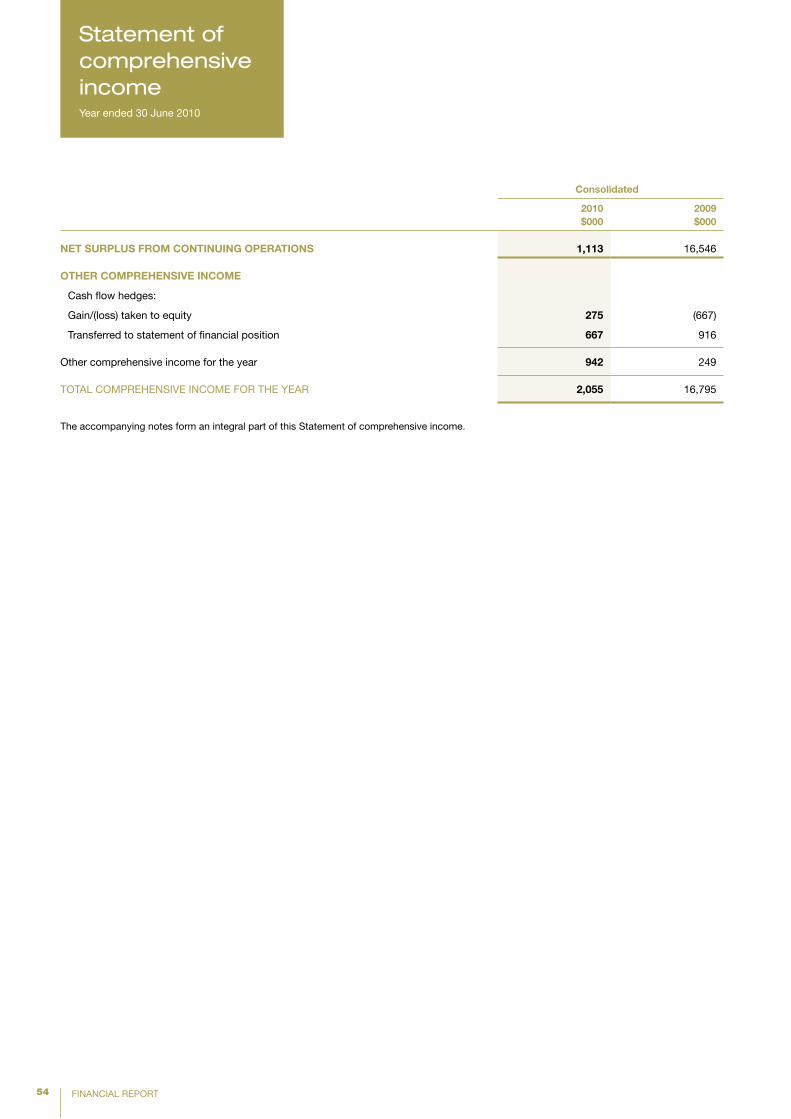
54 FINANCIAL REPORT
Statement of comprehensive incomeYear ended 30 June 2010
Consolidated
2010$000
2009$000
nET SURpLUS FROM COnTInUInG OpERATIOnS 1,113 16,546
OTHER COMpREHEnSIVE InCOME
Cash flow hedges:
Gain/(loss) taken to equity 275 (667)
Transferred to statement of financial position 667 916
Other comprehensive income for the year 942 249
TOTAL COMPREHENSIVE INCOME FOR THE YEAR 2,055 16,795
The accompanying notes form an integral part of this Statement of comprehensive income.
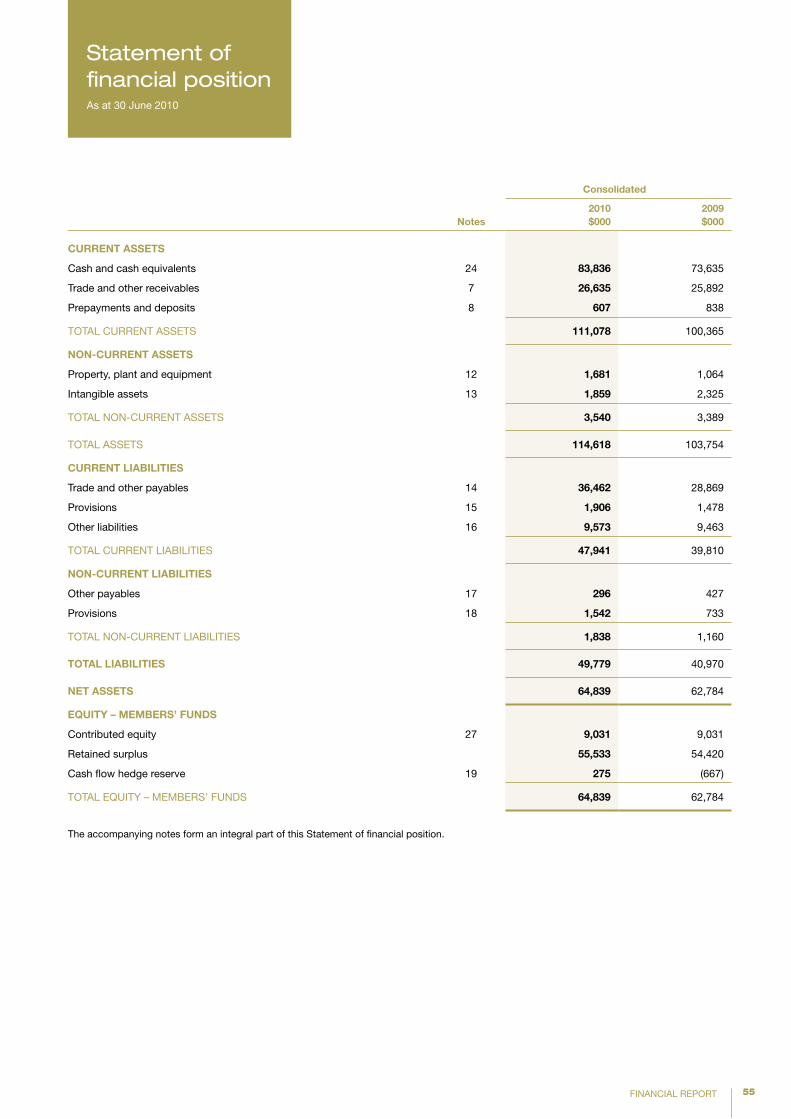
55FINANCIAL REPORT
notes
Consolidated
2010$000
2009$000
CURREnT ASSETS
Cash and cash equivalents 24 83,836 73,635
Trade and other receivables 7 26,635 25,892
Prepayments and deposits 8 607 838
TOTAL CURRENT ASSETS 111,078 100,365
nOn-CURREnT ASSETS
Property, plant and equipment 12 1,681 1,064
Intangible assets 13 1,859 2,325
TOTAL NON-CURRENT ASSETS 3,540 3,389
TOTAL ASSETS 114,618 103,754
CURREnT LIABILITIES
Trade and other payables 14 36,462 28,869
Provisions 15 1,906 1,478
Other liabilities 16 9,573 9,463
TOTAL CURRENT LIABILITIES 47,941 39,810
nOn-CURREnT LIABILITIES
Other payables 17 296 427
Provisions 18 1,542 733
TOTAL NON-CURRENT LIABILITIES 1,838 1,160
TOTAL LIABILITIES 49,779 40,970
nET ASSETS 64,839 62,784
EQUITY – MEMBERS’ FUnDS
Contributed equity 27 9,031 9,031
Retained surplus 55,533 54,420
Cash flow hedge reserve 19 275 (667)
TOTAL EQUITY – MEMBERS’ FUNDS 64,839 62,784
The accompanying notes form an integral part of this Statement of financial position.
Statement of financial positionAs at 30 June 2010
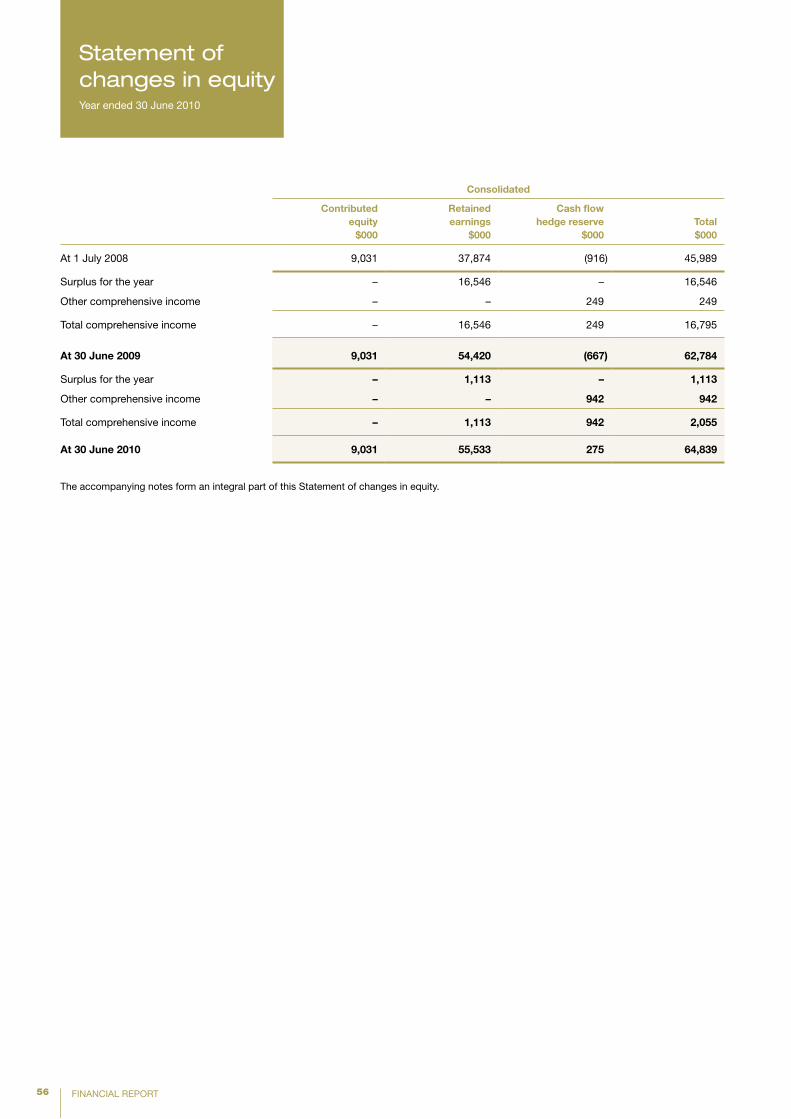
56 FINANCIAL REPORT
Statement of changes in equityYear ended 30 June 2010
Consolidated
Contributed equity
$000
Retained earnings
$000
Cash flow hedge reserve
$000Total $000
At 1 July 2008 9,031 37,874 (916) 45,989
Surplus for the year – 16,546 – 16,546
Other comprehensive income – – 249 249
Total comprehensive income – 16,546 249 16,795
At 30 june 2009 9,031 54,420 (667) 62,784
Surplus for the year – 1,113 – 1,113
Other comprehensive income – – 942 942
Total comprehensive income – 1,113 942 2,055
At 30 june 2010 9,031 55,533 275 64,839
The accompanying notes form an integral part of this Statement of changes in equity.
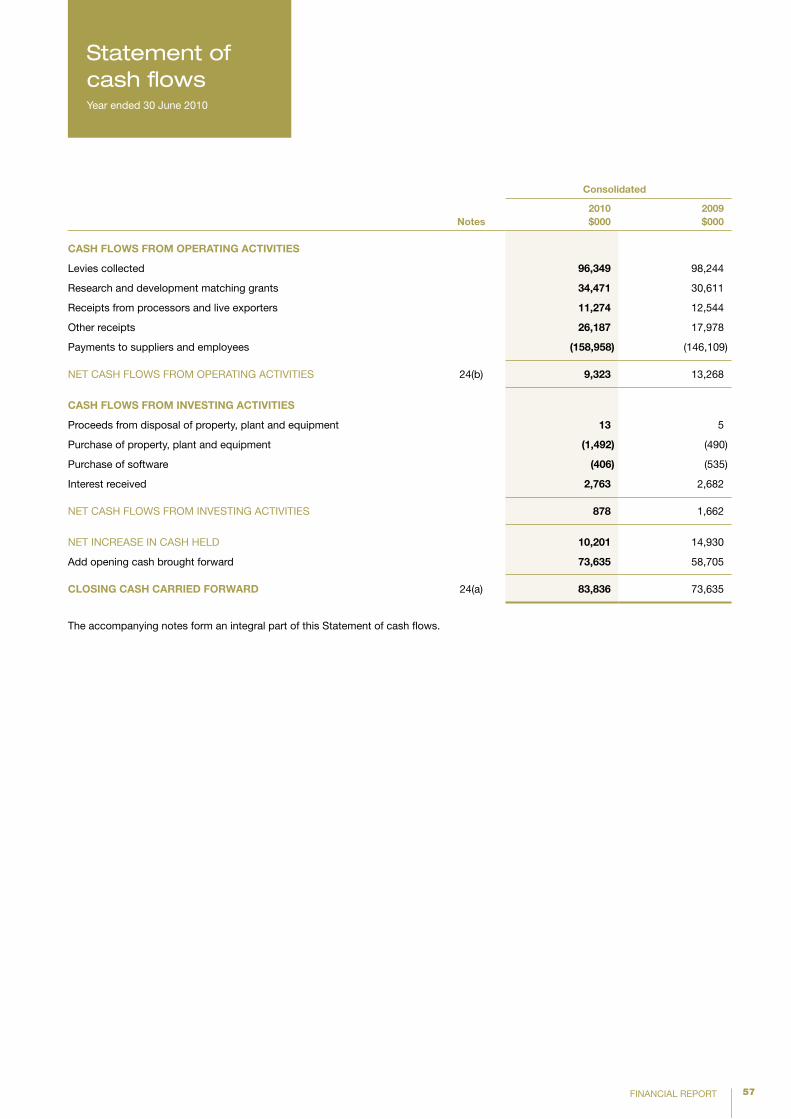
57FINANCIAL REPORT
notes
Consolidated
2010$000
2009$000
CASH FLOWS FROM OpERATInG ACTIVITIES
Levies collected 96,349 98,244
Research and development matching grants 34,471 30,611
Receipts from processors and live exporters 11,274 12,544
Other receipts 26,187 17,978
Payments to suppliers and employees (158,958) (146,109)
NET CASH FLOWS FROM OPERATING ACTIVITIES 24(b) 9,323 13,268
CASH FLOWS FROM InVESTInG ACTIVITIES
Proceeds from disposal of property, plant and equipment 13 5
Purchase of property, plant and equipment (1,492) (490)
Purchase of software (406) (535)
Interest received 2,763 2,682
NET CASH FLOWS FROM INVESTING ACTIVITIES 878 1,662
NET INCREASE IN CASH HELD 10,201 14,930
Add opening cash brought forward 73,635 58,705
CLOSInG CASH CARRIED FORWARD 24(a) 83,836 73,635
The accompanying notes form an integral part of this Statement of cash flows.
Statement of cash flowsYear ended 30 June 2010
58 FINANCIAL REPORT
Notes to the financial statementsYear ended 30 June 2010
1. CORpORATE InFORMATIOn
The financial report of Meat & Livestock Australia Limited (“MLA” or “the Company”) for the year ended 30 June 2010 was authorised for issue in accordance with a resolution of the directors on 09 September 2010.
MLA has prepared a consolidated financial report incorporating the Company and the entities that it controlled during the financial year.
MLA is a company limited by guarantee incorporated in Australia.
The nature of the operations and principal activities of the Group are described in the Directors’ report.
2. SUMMARY OF SIGnIFICAnT ACCOUnTInG pOLICIES
(a) Basis of preparation
The financial report is a general-purpose financial report, which has been prepared in accordance with the requirements of the Corporations Act 2001, Australian Accounting Standards and other authoritative pronouncements of the Australian Accounting Standards Board. The financial report has also been prepared on a historical cost basis except for derivative financial instruments which have been measured at fair value.
The financial report is presented in Australian dollars.
(b) Statement of compliance
The accounting policies adopted are consistent with those of the previous financial year except as follows:
The Group has adopted the following amended Australian Accounting Standards as of 1 July 2009.
AASB 7 • Financial Instruments: Disclosures effective 1 January 2009
AASB 101 • Presentation of Financial Statements (revised 2007) effective 1 January 2009.
AASB 7 Financial Instruments: Disclosures
The amended Standard requires additional disclosures about fair value measurement and liquidity risk. Fair value measurements related to all financial instruments recognised and measured at fair value are to be disclosed by source of inputs using a three level fair value hierarchy, by class. A reconciliation of significant transfers between levels in the fair value hierarchy is provided when required. The amendments also clarify the requirements for liquidity risk disclosures with respect to derivative transactions and assets used for liquidity management. The fair value measurement and liquidity risk disclosures are presented in note 28.
AASB 101 presentation of Financial Statements
The revised Standard separates owner and non-owner changes in equity. The statement of comprehensive income presents all items of recognised income and expense, either in one single statement, or in two linked statements. The Group has elected to present two linked statements.
Australian Accounting Standards and Interpretations that have recently been issued or amended but are not effective have not
been adopted by the Group for the annual reporting period ending 30 June 2010 and the directors having considered the changes to the accounting standards and other than potential disclosure adjustments, do not believe there will be a material impact to the financial statements.
(c) principles of consolidation
The consolidated financial statements comprise the financial statements of Meat & Livestock Australia Limited and its subsidiaries (as outlined in Note 10) as at 30 June each year (the Group).
A subsidiary is an entity over which the Group has the power to govern the financial and operating policies. A subsidiary is fully consolidated from the date on which control is obtained by the Group and cease to be consolidated from the date on which control is transferred out of the Group.
The financial statements of the subsidiaries are prepared for the same reporting period as the group, except NLIS which is for a 15 month period, using consistent accounting policies. All intercompany balances and transactions have been eliminated in full.
(d) Cash and cash equivalents
Cash on hand and in banks and short-term deposits are stated at nominal value.
For the purposes of the Statement of cash flows, cash includes cash on hand and in banks, and money market investments readily convertible to cash within two working days, net of outstanding bank overdrafts.
Included in the balance of cash and cash equivalents are funds received from the Commonwealth Government in relation to the National Livestock Identification System (NLIS). These funds are to be distributed as directed by the NLIS Review Committee and the Minister generally to State Governments based on approved business plans.
(e) Trade and other receivables
Trade receivables are recognised and carried at original invoice amount less a provision for any uncollectible debts. An estimate for doubtful debts is made when there is objective evidence that the Group will not be able to collect the debt. Bad debts are written-off as incurred.
(f) Taxes
Income tax
The Group is exempt from income tax under section 50–40 of the Income Tax Assessment Act 1997.
Goods and Services Tax (GST)
Revenue, expenses and assets are recognised net of the amount of GST except:
Where GST incurred on a purchase of goods and services is not •recoverable from the taxation authority, in which case the GST is recognised as part of the cost of acquisition of the asset or as part of the expense item as applicable.
59FINANCIAL REPORT
Receivables and payables (except accrued income and •expenditure) are stated with the amount of GST included.
The net amount of GST recoverable from, or payable to, the taxation authority is included as part of receivables or payables in the Statement of financial position.
Cash flows are included in the cash flow statement on a gross basis and the GST component of cash flows arising from investing activities, which is recoverable from or payable to the taxation authority are classified as operating cash flows.
Commitments and contingencies are disclosed net of the amount of GST recoverable from, or payable to, the taxation authority.
(g) Revenue recognition
Revenue is recognised to the extent that it is probable that the economic benefits will flow to the Group and the revenue can be reliably measured. Revenue, trade debtors and accrued revenue are recognised for the major business activities as follows:
Transaction levies – revenue is recognised in the period to •which it relates based on confirmations received from the Levies and Revenue Service who collect and distribute levies to the Company.
Research and development matching grants – revenue is •recognised for the matching funding from the Australian government to the extent that the approved eligible research and development expenditure has been incurred. Accrued matching grants represent unclaimed funding for the amount incurred on research and development.
Research and development grants (unmatched) – the Company •receives funding from various external parties to conduct collaborative research and development programs. Revenue is recognised to the extent that the expenditure has been incurred.
R&D partnership income, processor and live exporter •contributions are recognised as revenue to the extent that the expenditure that the revenue relates to has been incurred.
Interest income is taken up as income on an accrual basis.•
(h) Government grants
Government grants are recognised when there is reasonable assurance that the grant will be received and all attaching conditions will be complied with. When the grant relates to an expense item, it is recognised as income over the periods necessary to match the grant on a systematic basis to the costs that it is intended to compensate.
(i) Derivative financial instruments and hedging
The Group uses derivative financial instruments such as forward currency contracts and options contracts to hedge its risks associated with foreign currency fluctuations. Such derivative financial instruments are initially recognised at fair value on the date on which a derivative contract is entered into and are subsequently remeasured to fair value. Derivatives are carried as assets when their fair value is positive and as liabilities when their fair value is negative.
Any gains or losses arising from changes in the fair value of derivatives, except for those that qualify as cash flow hedges, are taken directly to net surplus or deficit for the year.
The fair value of forward currency contracts is calculated by reference to current forward exchange rates for contracts with similar maturity profiles.
For the purposes of hedge accounting, hedges are classified as cash flow hedges when they hedge exposure to variability in cash flows that is attributable either to a particular risk associated with a recognised asset or liability or to a forecast transaction.
A hedge of the foreign currency risk of a firm commitment is accounted for as a cash flow hedge.
At the inception of a hedge relationship, the Group formally designates and documents the hedge relationship to which the Group wishes to apply hedge accounting and the risk management objective and strategy for undertaking the hedge. The documentation includes identification of the hedging instrument, the hedged item or transaction, the nature of the risk being hedged and how the entity will assess the hedging instrument’s effectiveness in offsetting the exposure to changes in the hedged item’s fair value or cash flows attributable to the hedged risk. Such hedges are expected to be highly effective in achieving offsetting changes in fair value or cash flows and are assessed on an ongoing basis to determine that they actually have been highly effective throughout the financial reporting periods for which they were designated.
Hedges that meet the strict criteria for hedge accounting are accounted for as follows:
Cash flow hedges
Cash flow hedges are hedges of the Group’s exposure to variability in cash flows that is attributable to a particular risk associated with a recognised asset or liability or a highly probable forecast transaction and that could affect the surplus or deficit. The effective portion of the gain or loss on the hedging instrument is recognised directly in equity while the ineffective portion is recognised in the Statement of comprehensive income.
Amounts taken to equity are transferred to the Statement of comprehensive income when the hedged transaction affects the surplus or deficit, such as when hedged income or expenses are recognised or when a forecast sale or purchase occurs. When the hedged item is the cost of a non-financial asset or liability, the amounts taken to equity are transferred to the initial carrying amount of the non-financial asset or liability.
If the forecast transaction is no longer expected to occur, amounts previously recognised in equity are transferred to the Statement of comprehensive income. If the hedging instrument expires or is sold, terminated or exercised without replacement or rollover, or if its designation as a hedge is revoked, amounts previously recognised in equity remain in equity until the forecast transaction occurs. If the related transaction is not expected to occur, the amount is taken to the Statement of comprehensive income.
60 FINANCIAL REPORT
2. SUMMARY OF SIGnIFICAnT ACCOUnTInG pOLICIES continued
(j) Foreign currency translation
Both the functional and presentation currency of the Company and its subsidiaries is Australian dollars ($). Each entity in the Company determines its own functional currency and items included in the financial statements of each entity are measured using that functional currency.
Transactions in foreign currencies are initially recorded in the functional currency by applying the budget exchange rate and subsequently revaluing it to the average exchange rate of the month. Monetary assets and liabilities denominated in foreign currencies are retranslated at the rate of exchange ruling at the balance sheet date.
All exchange differences in the consolidated financial report are taken to the Income statement.
Non-monetary items that are measured in terms of historical cost in a foreign currency are translated using the exchange rate as at the date of the initial transaction.
(k) Impairment of assets
The Group assesses at each reporting date whether there is an indication that an asset may be impaired. If any such indication exists, or when annual impairment testing for an asset is required, the Group makes an estimate of the asset’s recoverable amount. When the carrying amount of an asset exceeds its recoverable amount, the asset is considered impaired and is written down to its recoverable amount.
(l) Intangible Assets
Intangible assets acquired are initially measured at cost. Following initial recognition, intangible assets are carried at cost less any accumulated amortisation and any impairment losses.
The useful lives of intangible assets are assessed to be either finite or indefinite. Intangible assets with finite lives are amortised over the useful life and assessed for impairment whenever there is an indication that the intangible asset may be impaired. The amortisation period and the amortisation method for an intangible asset with a finite useful life are reviewed at least at each financial year-end. Changes in the expected useful or the expected pattern of consumption of future economic benefits embodied in the asset are accounted for by changing the amortisation period or method, as appropriate, which is a change in accounting estimate. The amortisation expense on intangible assets with finite lives is recognised in the Income statement in the expense category consistent with the function of the intangible asset.
Intangibles are amortised as follows:Computer software 1–5 years
(m) Leases
Leases are classified at their inception as either operating or finance leases based on the economic substance of the agreement so as to reflect the risks and benefits incidental to ownership. The minimum lease payments of operating leases, where the lessor effectively
retains substantially all of the risks and benefits of ownership of the leased item, are recognised as an expense on a straight-line basis.
The cost of improvements to or on leasehold property is capitalised, disclosed as leasehold improvements, and amortised over the unexpired period of the lease or the estimated useful lives of the improvements, whichever is the shorter, if there is no certainty the Group will obtain ownership by the end of the lease.
(n) property, plant and equipment
CostAll classes of property, plant and equipment are measured at cost.
DepreciationDepreciation is provided on a straight-line basis on all property, plant and equipment.
Life
Leasehold improvementsPlant and equipmentFurniture and fittings
Remaining term of lease 2-5 years3-5 years
The assets’ residual values, useful lives and amortisation methods are reviewed and adjusted, if appropriate at each financial year end.
Derecognition and disposal
An item of property, plant and equipment is derecognised upon disposal or when no further future economic benefits are expected from its use or disposal.
Any gain or loss arising on derecognition of the asset (calculated as the difference between the net disposal proceeds and the carrying amount of the asset) is included in profit or loss in the year the asset is derecognised.
(o) Trade and other payables
Liabilities for trade and other payables are carried at amortised cost, which is the fair value of consideration to be paid in the future for goods and services received prior to the end of the financial year and which are unpaid. These amounts are unsecured and will be paid when due.
(p) Unearned income
Unearned income consists of funds which have been received or invoiced but income recognition has been deferred to future years because the project milestones have not been met or the expenditure to which they relate has not been incurred.
(q) Employee benefits
Provision is made for employee benefits accumulated as a result of employees rendering services up to the reporting date. These benefits include wages and salaries, annual leave, long service leave and other employee benefits.
Liabilities arising in respect of wages and salaries, annual leave, and any other employee benefits expected to be settled within twelve months of the reporting date are measured at their nominal amounts based on remuneration rates which are expected to be paid when the liabilities are settled.
Notes to the financial statementsYear ended 30 June 2010
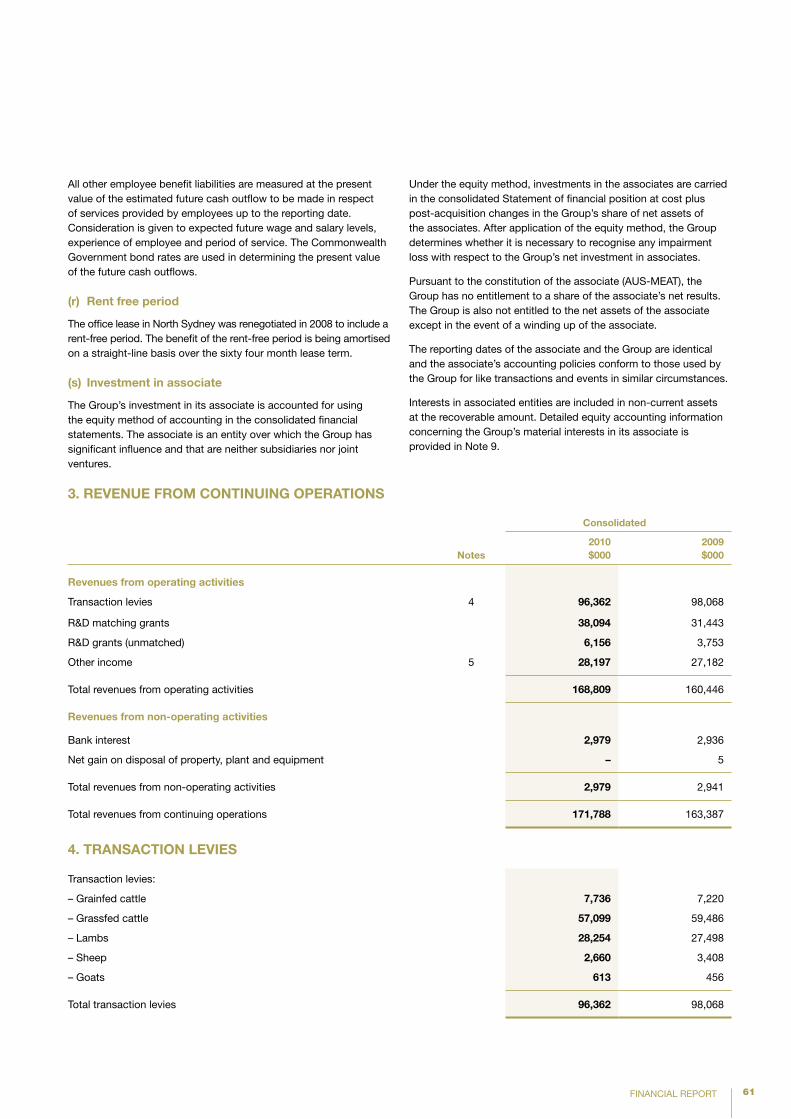
61FINANCIAL REPORT
All other employee benefit liabilities are measured at the present value of the estimated future cash outflow to be made in respect of services provided by employees up to the reporting date. Consideration is given to expected future wage and salary levels, experience of employee and period of service. The Commonwealth Government bond rates are used in determining the present value of the future cash outflows.
(r) Rent free period
The office lease in North Sydney was renegotiated in 2008 to include a rent-free period. The benefit of the rent-free period is being amortised on a straight-line basis over the sixty four month lease term.
(s) Investment in associate
The Group’s investment in its associate is accounted for using the equity method of accounting in the consolidated financial statements. The associate is an entity over which the Group has significant influence and that are neither subsidiaries nor joint ventures.
3. REVEnUE FROM COnTInUInG OpERATIOnS
notes
Consolidated
2010$000
2009$000
Revenues from operating activities
Transaction levies 4 96,362 98,068
R&D matching grants 38,094 31,443
R&D grants (unmatched) 6,156 3,753
Other income 5 28,197 27,182
Total revenues from operating activities 168,809 160,446
Revenues from non-operating activities
Bank interest 2,979 2,936
Net gain on disposal of property, plant and equipment – 5
Total revenues from non-operating activities 2,979 2,941
Total revenues from continuing operations 171,788 163,387
4. TRAnSACTIOn LEVIES
Transaction levies:
– Grainfed cattle 7,736 7,220
– Grassfed cattle 57,099 59,486
– Lambs 28,254 27,498
– Sheep 2,660 3,408
– Goats 613 456
Total transaction levies 96,362 98,068
Under the equity method, investments in the associates are carried in the consolidated Statement of financial position at cost plus post-acquisition changes in the Group’s share of net assets of the associates. After application of the equity method, the Group determines whether it is necessary to recognise any impairment loss with respect to the Group’s net investment in associates.
Pursuant to the constitution of the associate (AUS-MEAT), the Group has no entitlement to a share of the associate’s net results. The Group is also not entitled to the net assets of the associate except in the event of a winding up of the associate.
The reporting dates of the associate and the Group are identical and the associate’s accounting policies conform to those used by the Group for like transactions and events in similar circumstances.
Interests in associated entities are included in non-current assets at the recoverable amount. Detailed equity accounting information concerning the Group’s material interests in its associate is provided in Note 9.
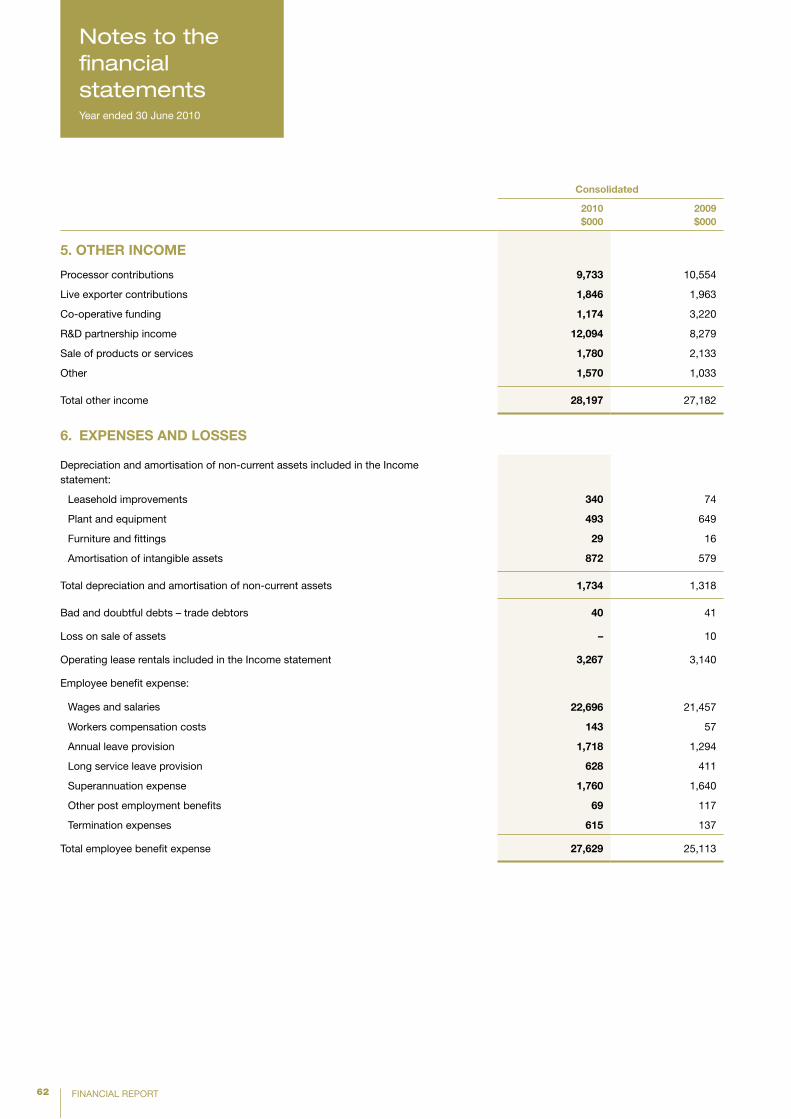
62 FINANCIAL REPORT
Consolidated
2010$000
2009$000
5. OTHER InCOME
Processor contributions 9,733 10,554
Live exporter contributions 1,846 1,963
Co-operative funding 1,174 3,220
R&D partnership income 12,094 8,279
Sale of products or services 1,780 2,133
Other 1,570 1,033
Total other income 28,197 27,182
6. EXpEnSES AnD LOSSES
Depreciation and amortisation of non-current assets included in the Income statement:
Leasehold improvements 340 74
Plant and equipment 493 649
Furniture and fittings 29 16
Amortisation of intangible assets 872 579
Total depreciation and amortisation of non-current assets 1,734 1,318
Bad and doubtful debts – trade debtors 40 41
Loss on sale of assets – 10
Operating lease rentals included in the Income statement 3,267 3,140
Employee benefit expense:
Wages and salaries 22,696 21,457
Workers compensation costs 143 57
Annual leave provision 1,718 1,294
Long service leave provision 628 411
Superannuation expense 1,760 1,640
Other post employment benefits 69 117
Termination expenses 615 137
Total employee benefit expense 27,629 25,113
Notes to the financial statementsYear ended 30 June 2010
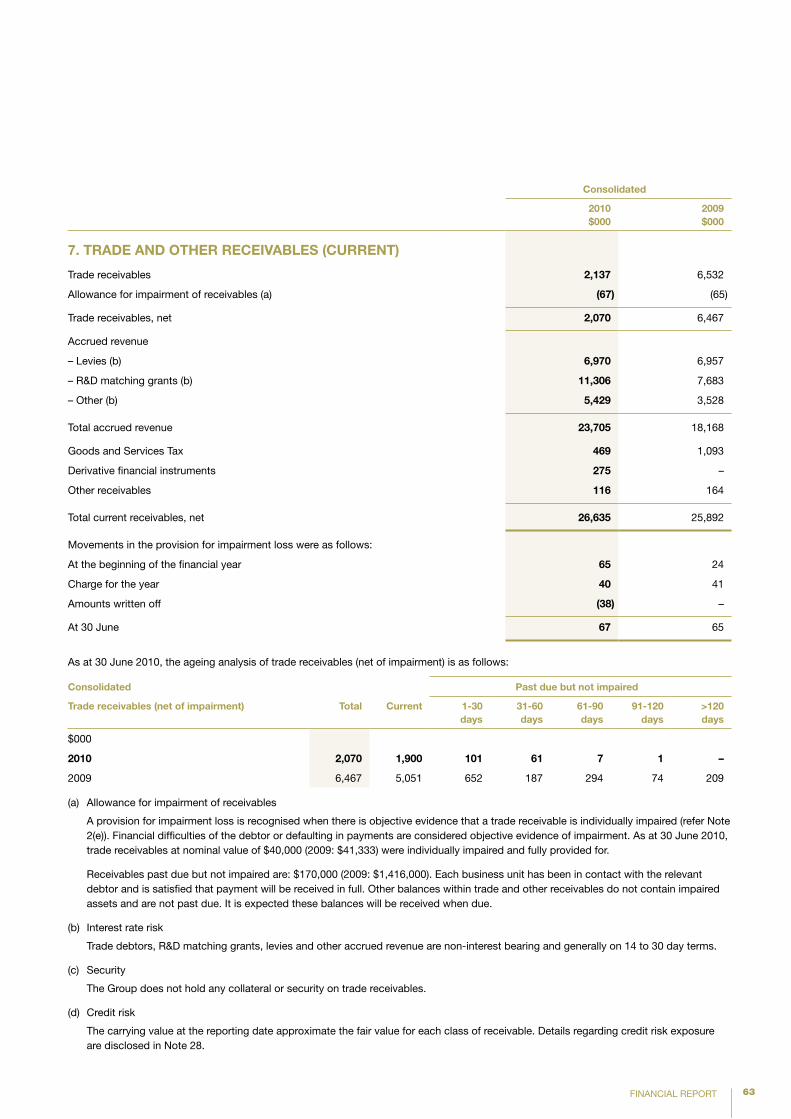
63FINANCIAL REPORT
Consolidated
2010$000
2009$000
7. TRADE AnD OTHER RECEIVABLES (CURREnT)
Trade receivables 2,137 6,532
Allowance for impairment of receivables (a) (67) (65)
Trade receivables, net 2,070 6,467
Accrued revenue
– Levies (b) 6,970 6,957
– R&D matching grants (b) 11,306 7,683
– Other (b) 5,429 3,528
Total accrued revenue 23,705 18,168
Goods and Services Tax 469 1,093
Derivative financial instruments 275 –
Other receivables 116 164
Total current receivables, net 26,635 25,892
Movements in the provision for impairment loss were as follows:
At the beginning of the financial year 65 24
Charge for the year 40 41
Amounts written off (38) –
At 30 June 67 65
As at 30 June 2010, the ageing analysis of trade receivables (net of impairment) is as follows:
Consolidated past due but not impaired
Trade receivables (net of impairment) Total Current 1-30 days
31-60 days
61-90 days
91-120 days
>120 days
$000
2010 2,070 1,900 101 61 7 1 –
2009 6,467 5,051 652 187 294 74 209
(a) Allowance for impairment of receivables
A provision for impairment loss is recognised when there is objective evidence that a trade receivable is individually impaired (refer Note 2(e)). Financial difficulties of the debtor or defaulting in payments are considered objective evidence of impairment. As at 30 June 2010, trade receivables at nominal value of $40,000 (2009: $41,333) were individually impaired and fully provided for.
Receivables past due but not impaired are: $170,000 (2009: $1,416,000). Each business unit has been in contact with the relevant debtor and is satisfied that payment will be received in full. Other balances within trade and other receivables do not contain impaired assets and are not past due. It is expected these balances will be received when due.
(b) Interest rate risk
Trade debtors, R&D matching grants, levies and other accrued revenue are non-interest bearing and generally on 14 to 30 day terms.
(c) Security
The Group does not hold any collateral or security on trade receivables.
(d) Credit risk
The carrying value at the reporting date approximate the fair value for each class of receivable. Details regarding credit risk exposure are disclosed in Note 28.
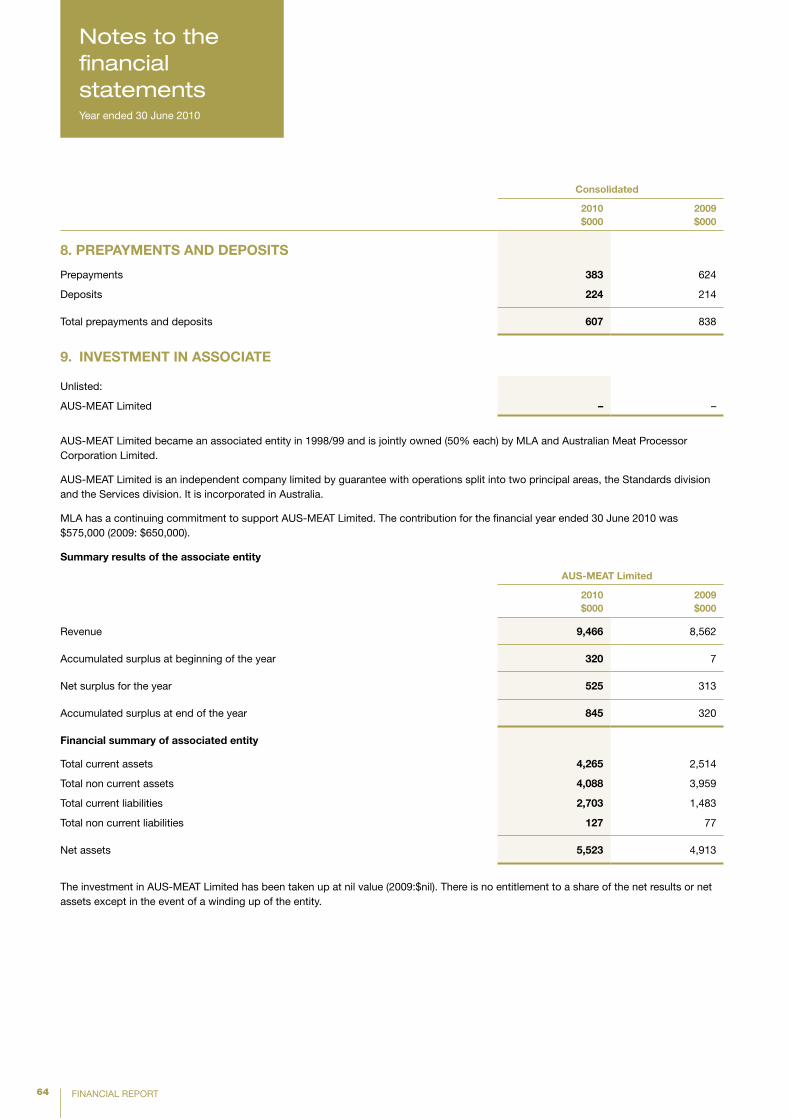
64 FINANCIAL REPORT
Consolidated
2010$000
2009$000
8. pREpAYMEnTS AnD DEpOSITS
Prepayments 383 624
Deposits 224 214
Total prepayments and deposits 607 838
9. InVESTMEnT In ASSOCIATE
Unlisted:
AUS-MEAT Limited – –
AUS-MEAT Limited became an associated entity in 1998/99 and is jointly owned (50% each) by MLA and Australian Meat Processor Corporation Limited.
AUS-MEAT Limited is an independent company limited by guarantee with operations split into two principal areas, the Standards division and the Services division. It is incorporated in Australia.
MLA has a continuing commitment to support AUS-MEAT Limited. The contribution for the financial year ended 30 June 2010 was $575,000 (2009: $650,000).
Summary results of the associate entity
AUS-MEAT Limited
2010 $000
2009 $000
Revenue 9,466 8,562
Accumulated surplus at beginning of the year 320 7
Net surplus for the year 525 313
Accumulated surplus at end of the year 845 320
Financial summary of associated entity
Total current assets 4,265 2,514
Total non current assets 4,088 3,959
Total current liabilities 2,703 1,483
Total non current liabilities 127 77
Net assets 5,523 4,913
The investment in AUS-MEAT Limited has been taken up at nil value (2009:$nil). There is no entitlement to a share of the net results or net assets except in the event of a winding up of the entity.
Notes to the financial statementsYear ended 30 June 2010
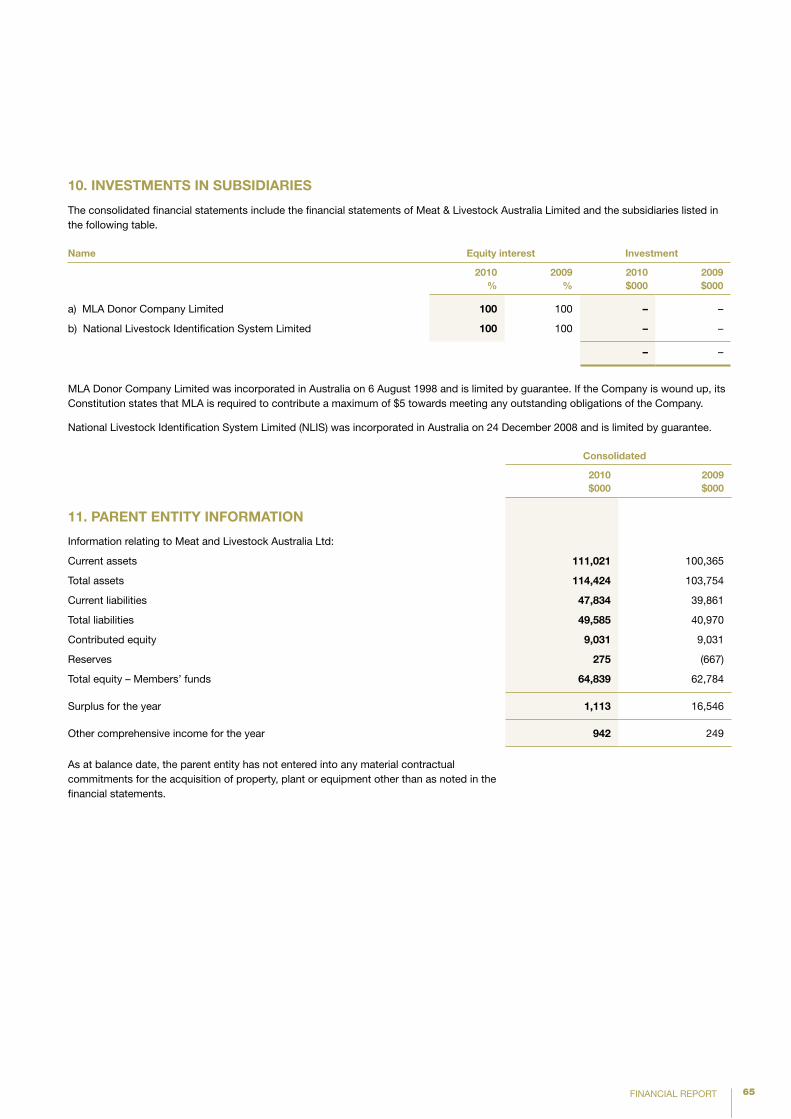
65FINANCIAL REPORT
10. InVESTMEnTS In SUBSIDIARIES
The consolidated financial statements include the financial statements of Meat & Livestock Australia Limited and the subsidiaries listed in the following table.
name Equity interest Investment
2010 %
2009 %
2010 $000
2009 $000
a) MLA Donor Company Limited 100 100 – –
b) National Livestock Identification System Limited 100 100 – –
– –
MLA Donor Company Limited was incorporated in Australia on 6 August 1998 and is limited by guarantee. If the Company is wound up, its Constitution states that MLA is required to contribute a maximum of $5 towards meeting any outstanding obligations of the Company.
National Livestock Identification System Limited (NLIS) was incorporated in Australia on 24 December 2008 and is limited by guarantee.
Consolidated
2010$000
2009$000
11. pAREnT EnTITY InFORMATIOn
Information relating to Meat and Livestock Australia Ltd:
Current assets 111,021 100,365
Total assets 114,424 103,754
Current liabilities 47,834 39,861
Total liabilities 49,585 40,970
Contributed equity 9,031 9,031
Reserves 275 (667)
Total equity – Members’ funds 64,839 62,784
Surplus for the year 1,113 16,546
Other comprehensive income for the year 942 249
As at balance date, the parent entity has not entered into any material contractual commitments for the acquisition of property, plant or equipment other than as noted in the financial statements.
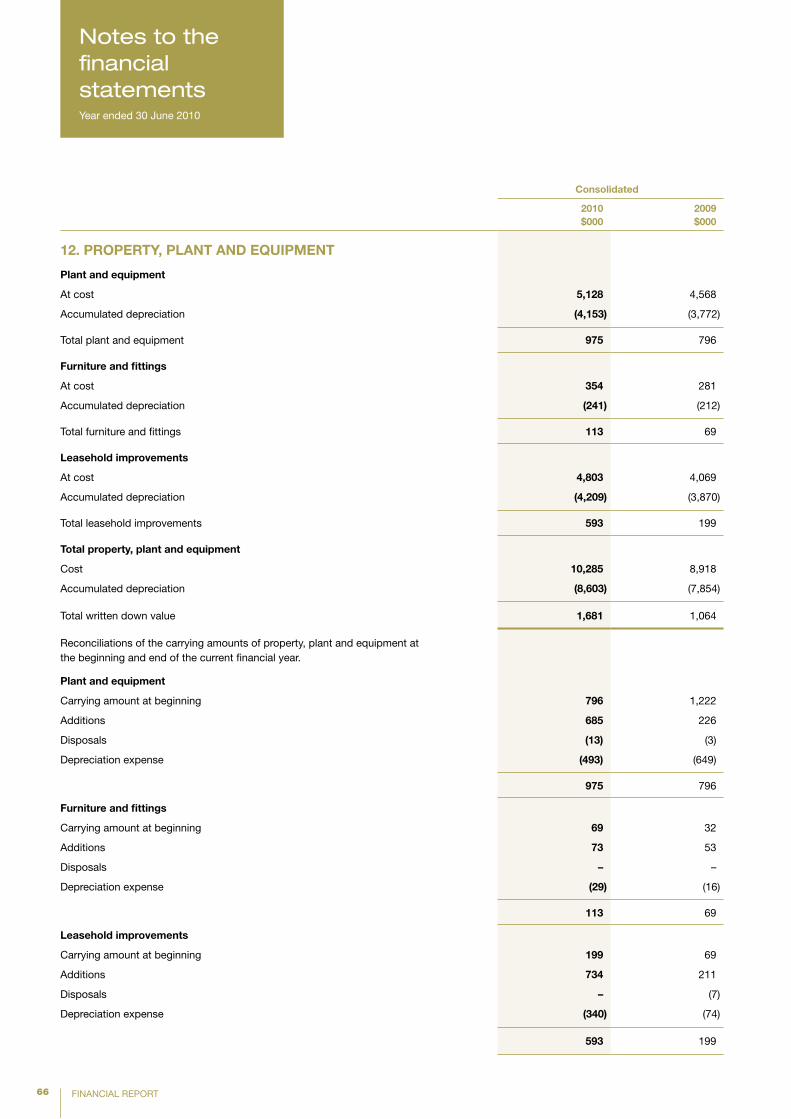
66 FINANCIAL REPORT
Consolidated
2010$000
2009$000
12. pROpERTY, pLAnT AnD EQUIpMEnT
plant and equipment
At cost 5,128 4,568
Accumulated depreciation (4,153) (3,772)
Total plant and equipment 975 796
Furniture and fittings
At cost 354 281
Accumulated depreciation (241) (212)
Total furniture and fittings 113 69
Leasehold improvements
At cost 4,803 4,069
Accumulated depreciation (4,209) (3,870)
Total leasehold improvements 593 199
Total property, plant and equipment
Cost 10,285 8,918
Accumulated depreciation (8,603) (7,854)
Total written down value 1,681 1,064
Reconciliations of the carrying amounts of property, plant and equipment at the beginning and end of the current financial year.
plant and equipment
Carrying amount at beginning 796 1,222
Additions 685 226
Disposals (13) (3)
Depreciation expense (493) (649)
975 796
Furniture and fittings
Carrying amount at beginning 69 32
Additions 73 53
Disposals – –
Depreciation expense (29) (16)
113 69
Leasehold improvements
Carrying amount at beginning 199 69
Additions 734 211
Disposals – (7)
Depreciation expense (340) (74)
593 199
Notes to the financial statementsYear ended 30 June 2010
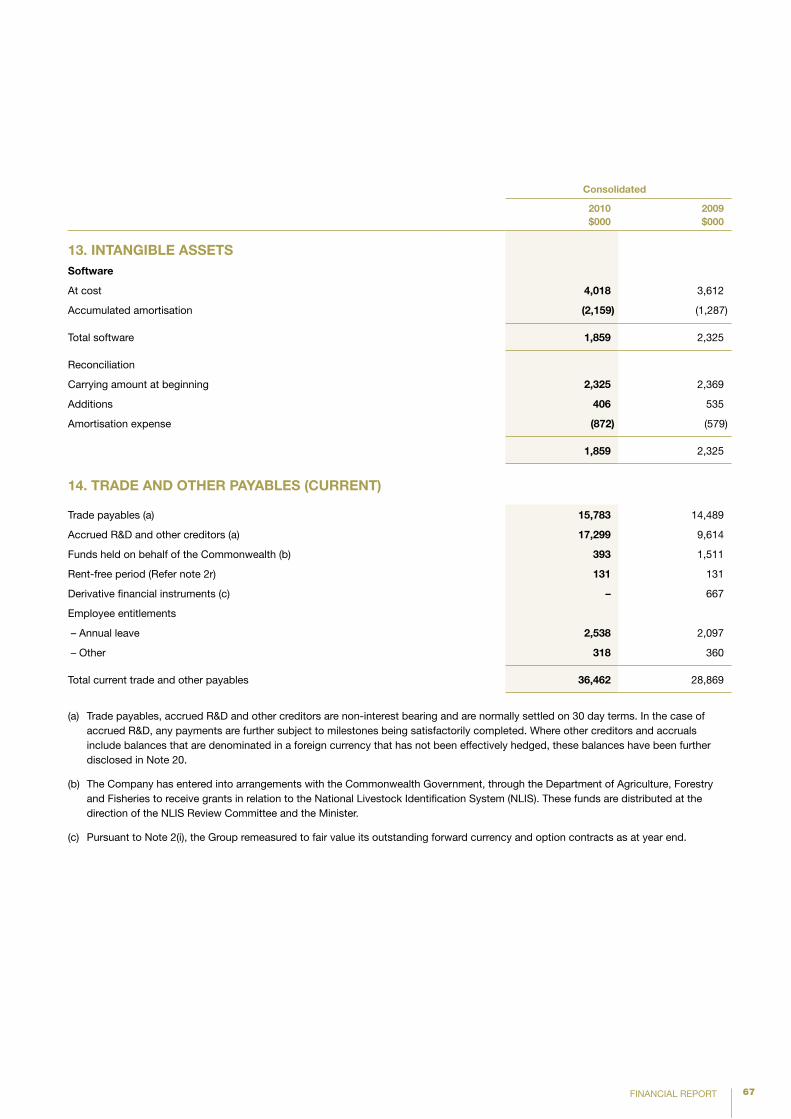
67FINANCIAL REPORT
Consolidated
2010$000
2009$000
13. InTAnGIBLE ASSETSSoftware
At cost 4,018 3,612
Accumulated amortisation (2,159) (1,287)
Total software 1,859 2,325
Reconciliation
Carrying amount at beginning 2,325 2,369
Additions 406 535
Amortisation expense (872) (579)
1,859 2,325
14. TRADE AnD OTHER pAYABLES (CURREnT)
Trade payables (a) 15,783 14,489
Accrued R&D and other creditors (a) 17,299 9,614
Funds held on behalf of the Commonwealth (b) 393 1,511
Rent-free period (Refer note 2r) 131 131
Derivative financial instruments (c) – 667
Employee entitlements
– Annual leave 2,538 2,097
– Other 318 360
Total current trade and other payables 36,462 28,869
(a) Trade payables, accrued R&D and other creditors are non-interest bearing and are normally settled on 30 day terms. In the case of accrued R&D, any payments are further subject to milestones being satisfactorily completed. Where other creditors and accruals include balances that are denominated in a foreign currency that has not been effectively hedged, these balances have been further disclosed in Note 20.
(b) The Company has entered into arrangements with the Commonwealth Government, through the Department of Agriculture, Forestry and Fisheries to receive grants in relation to the National Livestock Identification System (NLIS). These funds are distributed at the direction of the NLIS Review Committee and the Minister.
(c) Pursuant to Note 2(i), the Group remeasured to fair value its outstanding forward currency and option contracts as at year end.
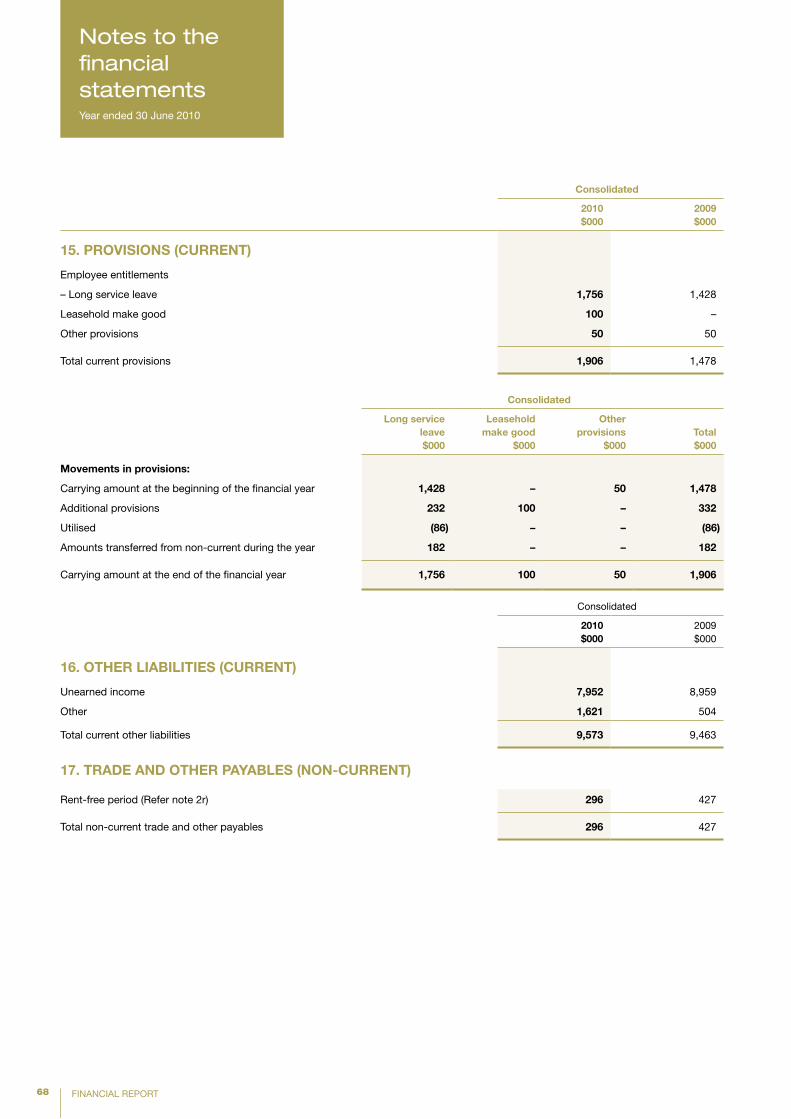
68 FINANCIAL REPORT
Consolidated
2010$000
2009$000
15. pROVISIOnS (CURREnT)
Employee entitlements
– Long service leave 1,756 1,428
Leasehold make good 100 –
Other provisions 50 50
Total current provisions 1,906 1,478
Consolidated
Long service leave$000
Leasehold make good
$000
Other provisions
$000Total$000
Movements in provisions:
Carrying amount at the beginning of the financial year 1,428 – 50 1,478
Additional provisions 232 100 – 332
Utilised (86) – – (86)
Amounts transferred from non-current during the year 182 – – 182
Carrying amount at the end of the financial year 1,756 100 50 1,906
Consolidated
2010$000
2009$000
16. OTHER LIABILITIES (CURREnT)
Unearned income 7,952 8,959
Other 1,621 504
Total current other liabilities 9,573 9,463
17. TRADE AnD OTHER pAYABLES (nOn-CURREnT)
Rent-free period (Refer note 2r) 296 427
Total non-current trade and other payables 296 427
Notes to the financial statementsYear ended 30 June 2010
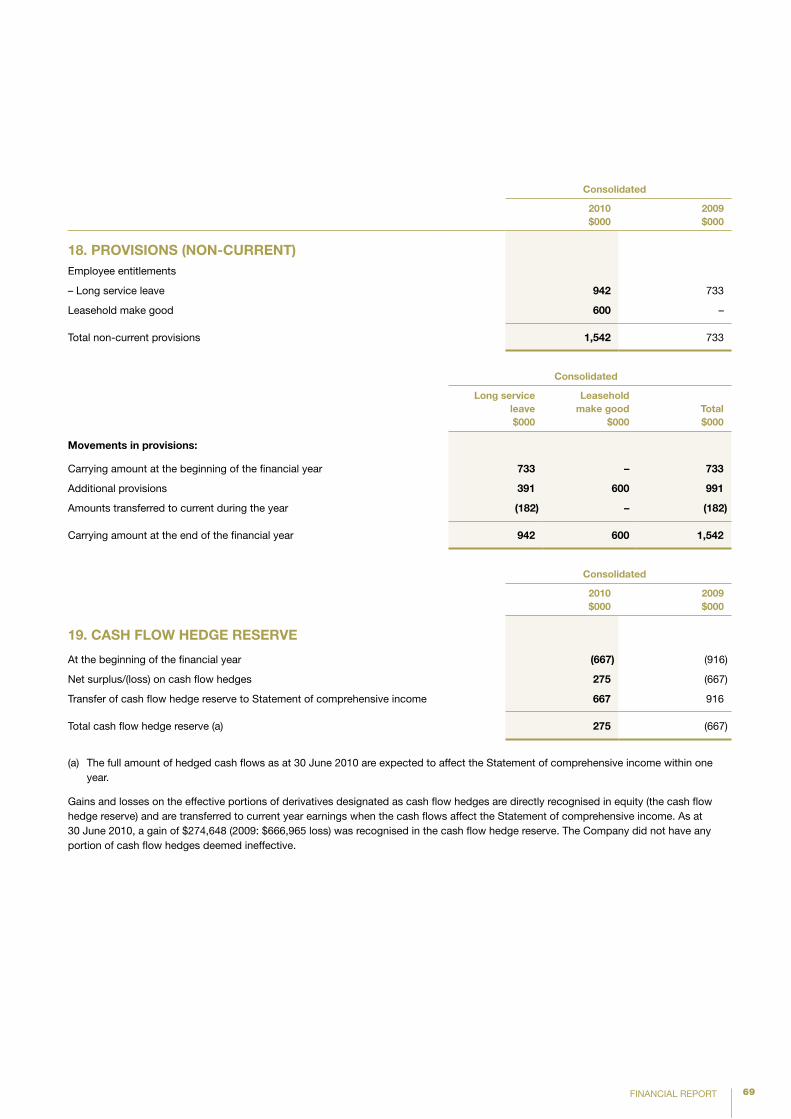
69FINANCIAL REPORT
Consolidated
2010$000
2009$000
18. pROVISIOnS (nOn-CURREnT) Employee entitlements
– Long service leave 942 733
Leasehold make good 600 –
Total non-current provisions 1,542 733
Consolidated
Long service leave$000
Leasehold make good
$000
Total$000
Movements in provisions:
Carrying amount at the beginning of the financial year 733 – 733
Additional provisions 391 600 991
Amounts transferred to current during the year (182) – (182)
Carrying amount at the end of the financial year 942 600 1,542
Consolidated
2010$000
2009$000
19. CASH FLOW HEDGE RESERVE
At the beginning of the financial year (667) (916)
Net surplus/(loss) on cash flow hedges 275 (667)
Transfer of cash flow hedge reserve to Statement of comprehensive income 667 916
Total cash flow hedge reserve (a) 275 (667)
(a) The full amount of hedged cash flows as at 30 June 2010 are expected to affect the Statement of comprehensive income within one year.
Gains and losses on the effective portions of derivatives designated as cash flow hedges are directly recognised in equity (the cash flow hedge reserve) and are transferred to current year earnings when the cash flows affect the Statement of comprehensive income. As at 30 June 2010, a gain of $274,648 (2009: $666,965 loss) was recognised in the cash flow hedge reserve. The Company did not have any portion of cash flow hedges deemed ineffective.
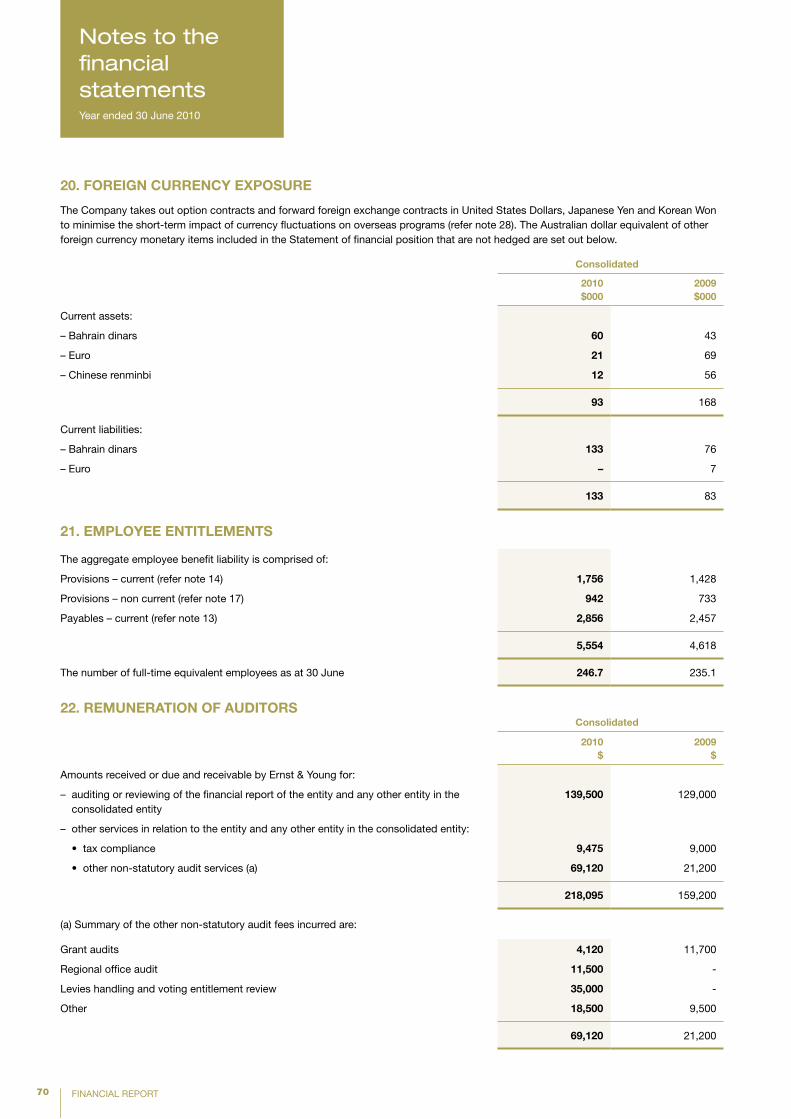
70 FINANCIAL REPORT
20. FOREIGn CURREnCY EXpOSURE
The Company takes out option contracts and forward foreign exchange contracts in United States Dollars, Japanese Yen and Korean Won to minimise the short-term impact of currency fluctuations on overseas programs (refer note 28). The Australian dollar equivalent of other foreign currency monetary items included in the Statement of financial position that are not hedged are set out below.
Consolidated
2010$000
2009$000
Current assets:
– Bahrain dinars 60 43
– Euro 21 69
– Chinese renminbi 12 56
93 168
Current liabilities:
– Bahrain dinars 133 76
– Euro – 7
133 83
21. EMpLOYEE EnTITLEMEnTS
The aggregate employee benefit liability is comprised of:
Provisions – current (refer note 14) 1,756 1,428
Provisions – non current (refer note 17) 942 733
Payables – current (refer note 13) 2,856 2,457
5,554 4,618
The number of full-time equivalent employees as at 30 June 246.7 235.1
22. REMUnERATIOn OF AUDITORSConsolidated
2010$
2009$
Amounts received or due and receivable by Ernst & Young for:
– auditing or reviewing of the financial report of the entity and any other entity in the consolidated entity
139,500 129,000
– other services in relation to the entity and any other entity in the consolidated entity:
• taxcompliance 9,475 9,000
• othernon-statutoryauditservices(a) 69,120 21,200
218,095 159,200
(a) Summary of the other non-statutory audit fees incurred are:
Grant audits 4,120 11,700
Regional office audit 11,500 -
Levies handling and voting entitlement review 35,000 -
Other 18,500 9,500
69,120 21,200
Notes to the financial statementsYear ended 30 June 2010
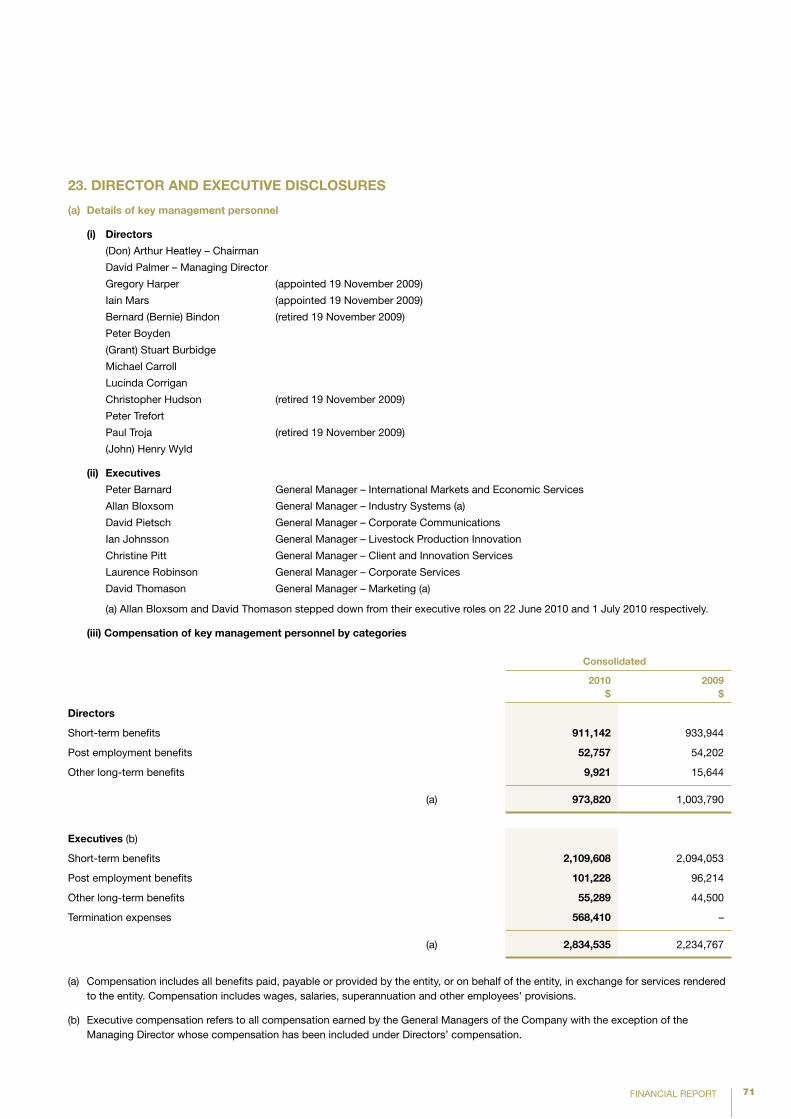
71FINANCIAL REPORT
23. DIRECTOR AnD EXECUTIVE DISCLOSURES
(a) Details of key management personnel
(i) Directors
(Don) Arthur Heatley – Chairman
David Palmer – Managing Director
Gregory Harper (appointed 19 November 2009)
Iain Mars (appointed 19 November 2009)
Bernard (Bernie) Bindon (retired 19 November 2009)
Peter Boyden
(Grant) Stuart Burbidge
Michael Carroll
Lucinda Corrigan
Christopher Hudson (retired 19 November 2009)
Peter Trefort
Paul Troja (retired 19 November 2009)
(John) Henry Wyld
(ii) Executives
Peter Barnard General Manager – International Markets and Economic Services
Allan Bloxsom General Manager – Industry Systems (a)
David Pietsch General Manager – Corporate Communications
Ian Johnsson General Manager – Livestock Production Innovation
Christine Pitt General Manager – Client and Innovation Services
Laurence Robinson General Manager – Corporate Services
David Thomason General Manager – Marketing (a)
(a) Allan Bloxsom and David Thomason stepped down from their executive roles on 22 June 2010 and 1 July 2010 respectively.
(iii) Compensation of key management personnel by categories
Consolidated
2010$
2009$
Directors
Short-term benefits 911,142 933,944
Post employment benefits 52,757 54,202
Other long-term benefits 9,921 15,644
(a) 973,820 1,003,790
Executives (b)
Short-term benefits 2,109,608 2,094,053
Post employment benefits 101,228 96,214
Other long-term benefits 55,289 44,500
Termination expenses 568,410 –
(a) 2,834,535 2,234,767
(a) Compensation includes all benefits paid, payable or provided by the entity, or on behalf of the entity, in exchange for services rendered to the entity. Compensation includes wages, salaries, superannuation and other employees’ provisions.
(b) Executive compensation refers to all compensation earned by the General Managers of the Company with the exception of the Managing Director whose compensation has been included under Directors’ compensation.
72 FINANCIAL REPORT
23. DIRECTOR AnD EXECUTIVE DISCLOSURES continued
(b) Related party transactions
Directors of the Group and directors of its related parties, or their director-related entities, conduct transactions with entities within the Group that occur within a normal employee, customer or supplier relationship on terms and conditions no more favourable than those which it is reasonable to expect the entity would have adopted if dealing with the director or director-related entity at arm’s length in similar circumstances. These transactions include the following and have been quantified below where the transactions are considered likely to be of interest to users of these financial statements:
Professor Bindon was an Adjunct Professor at the University of New England. The Company has paid $2,558,730 (2009:$1,168,817) to •the University of New England for scholarships and to carry out R&D projects.
Mr Burbidge is a member of the Advisory Board at Charles Sturt University: Fred Morley Centre. The Company has paid $154,085 •(2009:$257,180) to Charles Sturt University to carry out R&D projects. Charles Sturt University paid the Company $568 in 2009 for support costs. Mr Burbidge has paid the Company $1,713 (2009:$840) for Merinoselect subscriptions and database charges.
Ms Corrigan is Deputy Chair of Future Farm Industries CRC Limited to which the Company paid $780,000 (2009:$922,992) as •contribution towards R&D projects.
Professor Hudson was an Adjunct Professor at the University of Queensland. The Company has paid $950,072 (2009:$888,254) to the •University of Queensland to carry out R&D projects. University of Queensland has reimbursed the Company $200,557 (2009:$287,417) from the proceeds of the sale of cattle upon completion of a research project.
Mr Troja is a director of Rockdale Beef Pty Ltd and was a director of Itoham Pty Ltd.•
Rockdale Beef has paid the Company $129,724 (2009:$195,760) as contributions towards R&D partnership projects, MSA licence fee, grading services and NLRS subscriptions. The Company also paid Rockdale Beef $145,895 (2009:$116,648) to carry out R&D partnership projects and reimbursement of expenses.
The Company paid Itoham $136,964 (2009:$17,203) for overseas promotions and reimbursement of expenses.
Mr Carroll is a director of Australian Farm Institute Limited. The Company has paid $209,318 (2009:$26,263) Australian Farm Institute for •membership and to carry our R&D projects.
Mr Trefort is a director of Sheep CRC Ltd. The amount payable by the Company to the Sheep CRC is $4,258,650 (2009:$1,900,714) to •carry out R&D projects.
Dr Harper is the Deputy Chief for Business Development of CSIRO Livestock Industries. The Company has paid $4,414,872 •(2009:$1,873,306) to CSIRO primarily to carry out R&D projects, of this $657,589 (2009:$176,796) was paid specifically to the Division of Livestock Industries. CSIRO Division of Livestock Industries has paid the Company $59,635 (2009:$5,042) for royalties.
Mr Mars is the CEO and Director of Swift Australia Pty Ltd. The Company has paid Swift $2,423,719 (2009:$771,884) primarily to carry •out R&D projects. Swift has paid the Company $843,920 (2009:$327,387) for MSA producer training and contributions to projects.
Notes to the financial statementsYear ended 30 June 2010
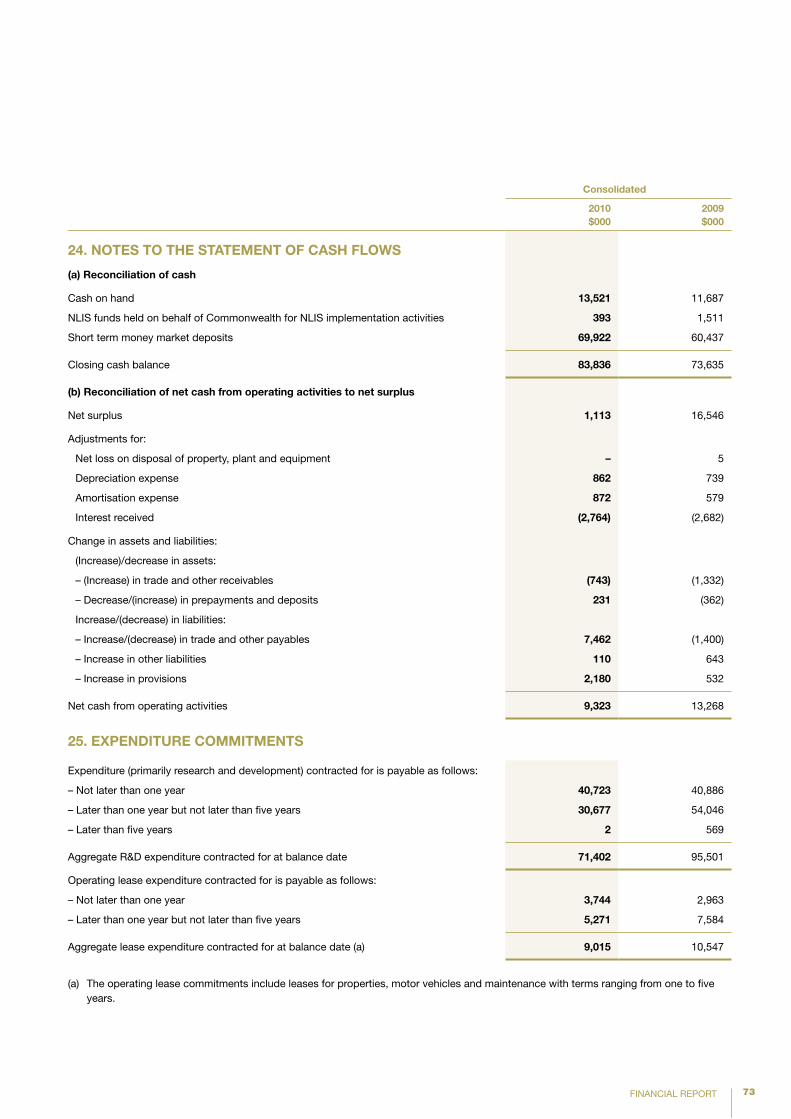
73FINANCIAL REPORT
Consolidated
2010$000
2009$000
24. nOTES TO THE STATEMEnT OF CASH FLOWS
(a) Reconciliation of cash
Cash on hand 13,521 11,687
NLIS funds held on behalf of Commonwealth for NLIS implementation activities 393 1,511
Short term money market deposits 69,922 60,437
Closing cash balance 83,836 73,635
(b) Reconciliation of net cash from operating activities to net surplus
Net surplus 1,113 16,546
Adjustments for:
Net loss on disposal of property, plant and equipment – 5
Depreciation expense 862 739
Amortisation expense 872 579
Interest received (2,764) (2,682)
Change in assets and liabilities:
(Increase)/decrease in assets:
– (Increase) in trade and other receivables (743) (1,332)
– Decrease/(increase) in prepayments and deposits 231 (362)
Increase/(decrease) in liabilities:
– Increase/(decrease) in trade and other payables 7,462 (1,400)
– Increase in other liabilities 110 643
– Increase in provisions 2,180 532
Net cash from operating activities 9,323 13,268
25. EXpEnDITURE COMMITMEnTS
Expenditure (primarily research and development) contracted for is payable as follows:
– Not later than one year 40,723 40,886
– Later than one year but not later than five years 30,677 54,046
– Later than five years 2 569
Aggregate R&D expenditure contracted for at balance date 71,402 95,501
Operating lease expenditure contracted for is payable as follows:
– Not later than one year 3,744 2,963
– Later than one year but not later than five years 5,271 7,584
Aggregate lease expenditure contracted for at balance date (a) 9,015 10,547
(a) The operating lease commitments include leases for properties, motor vehicles and maintenance with terms ranging from one to five years.
74 FINANCIAL REPORT
26. MEMBERS’ FUnDS
The Company is incorporated in Australia and is a company limited by guarantee. If the Company is wound up, its Constitution states that each member is required to contribute a maximum of $5 each towards meeting any outstanding obligations of the Company. At 30 June 2010, the number of members was 47,342 (2009: 46,156).
27. COnTRIBUTED EQUITY
Consolidated
2010$000
2009$000
Capital contribution 9,031 9,031
This amount represents contributions from the Commonwealth Government as initial working capital and property, plant and equipment at written down value transferred from the Australian Meat and Live-stock Corporation and the Meat Research Corporation at nil consideration.
28. FInAnCIAL RISK MAnAGEMEnT OBjECTIVES AnD pOLICIES
MLA’s principal financial instruments include derivatives, cash and cash equivalents. The Group has various other financial assets and liabilities such as trade receivables and trade payables which arise directly from its operations.
MLA enters into derivative transactions, including forward currency contracts and currency option contracts. The purpose is to manage the currency risks arising from the Group’s overseas operations. The main risks arising from the Group’s financial instruments are interest rate risk, foreign currency risk, credit risk and liquidity risk.
The Board reviews and agrees policies for managing each of these risks and they are summarised below.
Oversight responsibility for identification and control of financial risks rests with the Audit Committee under the authority of the Board.
Details of the significant accounting policies and methods adopted, including the criteria for recognition, the basis of measurement and the basis on which income and expenses are recognised, in respect of each class of financial instrument are disclosed in note 2 to the financial statements.
Risk exposures and responses
(i) Interest rate risk
The Group’s exposure to the risk of changes in market interest rates relates primarily to the Group’s cash and short-term deposit holding with a floating interest rate. Cash at bank earns interest at floating rates based on daily bank deposit rates. On call deposits are made for varying periods of between one day and six months, depending on the immediate cash requirements of the Group, and earn interest at the respective short-term deposit rates.
Cash deposits and short term cash assets are held at floating exchange rates of interest that range between 0% and 5.8% at 30 June 2010. Some of these assets are held in foreign currency accounts.
Sensitivity Analysis:
At 30 June 2010, if interest rates moved, as illustrated in the table below, with all other variables held constant, the effect on the Group’s net surplus and equity would have been as follows:
Judgements of reasonable possible movements:
Consolidated
Surplus Equity
2010 $000
2009 $000
2010 $000
2009 $000
+1.00% (2009: +1.00%) 825 688 825 688
-1.00% (2009: -1.00%) (825) (688) (825) (688)
Notes to the financial statementsYear ended 30 June 2010
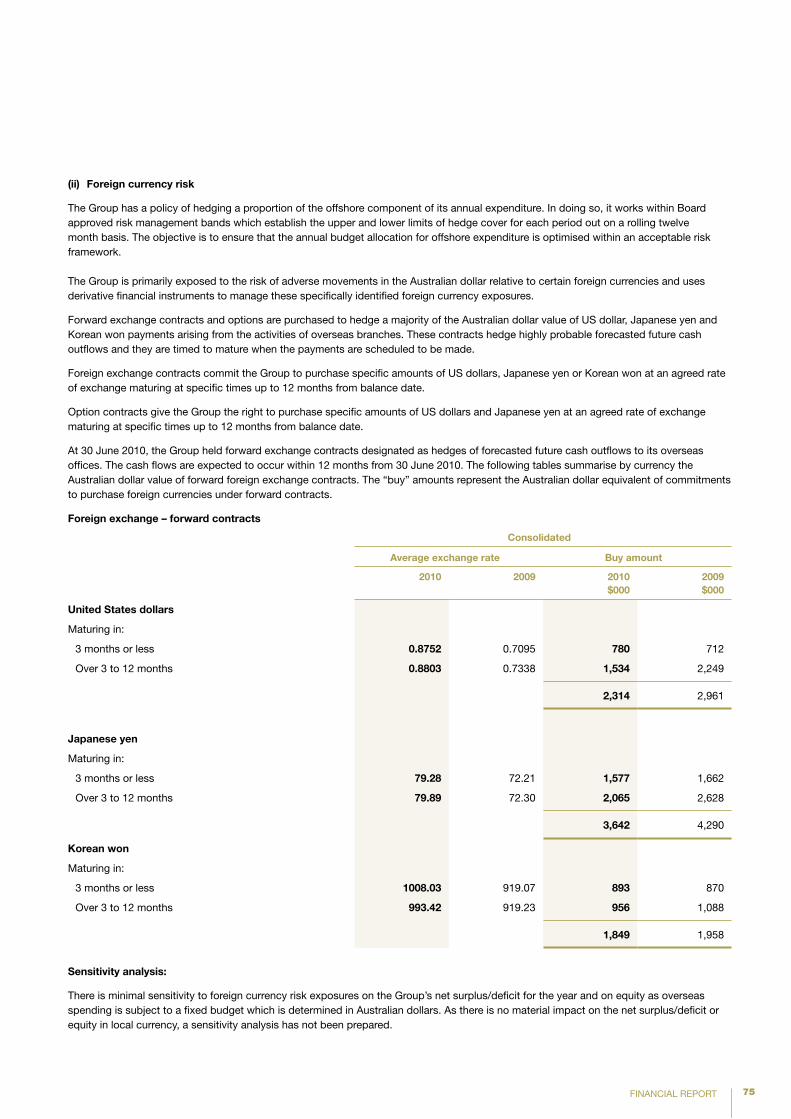
75FINANCIAL REPORT
(ii) Foreign currency risk
The Group has a policy of hedging a proportion of the offshore component of its annual expenditure. In doing so, it works within Board approved risk management bands which establish the upper and lower limits of hedge cover for each period out on a rolling twelve month basis. The objective is to ensure that the annual budget allocation for offshore expenditure is optimised within an acceptable risk framework. The Group is primarily exposed to the risk of adverse movements in the Australian dollar relative to certain foreign currencies and uses derivative financial instruments to manage these specifically identified foreign currency exposures.
Forward exchange contracts and options are purchased to hedge a majority of the Australian dollar value of US dollar, Japanese yen and Korean won payments arising from the activities of overseas branches. These contracts hedge highly probable forecasted future cash outflows and they are timed to mature when the payments are scheduled to be made.
Foreign exchange contracts commit the Group to purchase specific amounts of US dollars, Japanese yen or Korean won at an agreed rate of exchange maturing at specific times up to 12 months from balance date.
Option contracts give the Group the right to purchase specific amounts of US dollars and Japanese yen at an agreed rate of exchange maturing at specific times up to 12 months from balance date.
At 30 June 2010, the Group held forward exchange contracts designated as hedges of forecasted future cash outflows to its overseas offices. The cash flows are expected to occur within 12 months from 30 June 2010. The following tables summarise by currency the Australian dollar value of forward foreign exchange contracts. The “buy” amounts represent the Australian dollar equivalent of commitments to purchase foreign currencies under forward contracts.
Foreign exchange – forward contracts
Consolidated
Average exchange rate Buy amount
2010 2009 2010 $000
2009 $000
United States dollars
Maturing in:
3 months or less 0.8752 0.7095 780 712
Over 3 to 12 months 0.8803 0.7338 1,534 2,249
2,314 2,961
japanese yen
Maturing in:
3 months or less 79.28 72.21 1,577 1,662
Over 3 to 12 months 79.89 72.30 2,065 2,628
3,642 4,290
Korean won
Maturing in:
3 months or less 1008.03 919.07 893 870
Over 3 to 12 months 993.42 919.23 956 1,088
1,849 1,958
Sensitivity analysis:
There is minimal sensitivity to foreign currency risk exposures on the Group’s net surplus/deficit for the year and on equity as overseas spending is subject to a fixed budget which is determined in Australian dollars. As there is no material impact on the net surplus/deficit or equity in local currency, a sensitivity analysis has not been prepared.
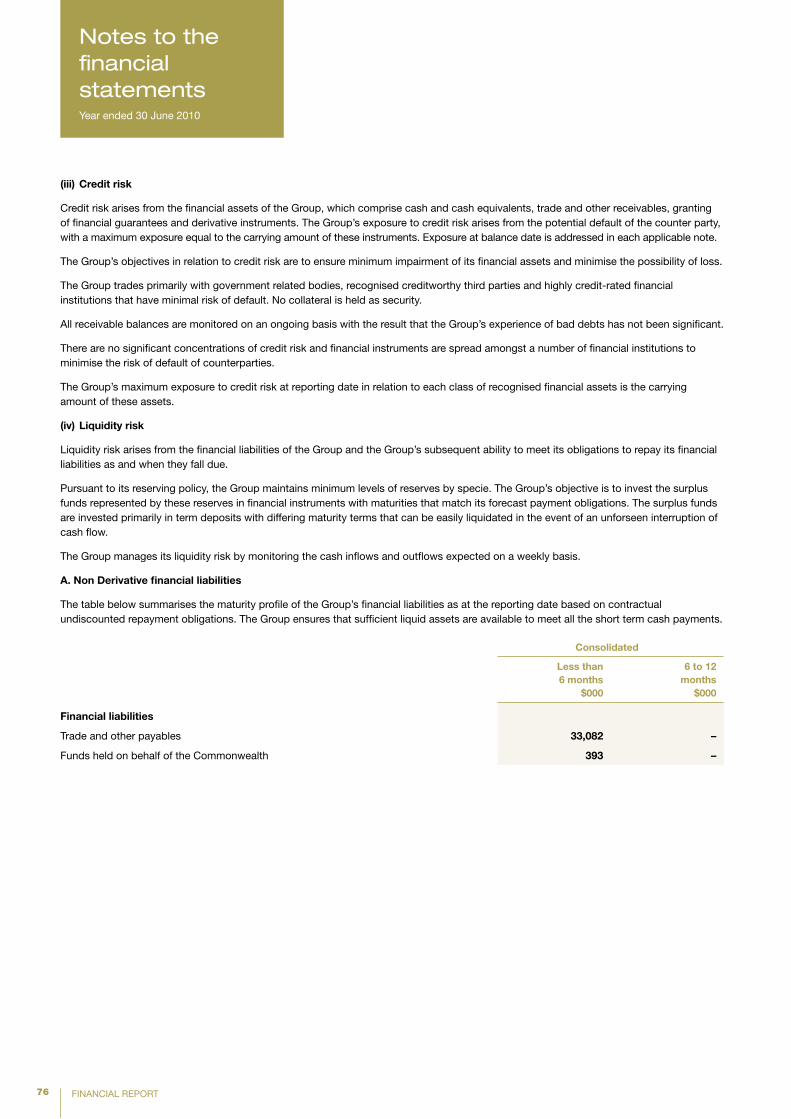
76 FINANCIAL REPORT
(iii) Credit risk
Credit risk arises from the financial assets of the Group, which comprise cash and cash equivalents, trade and other receivables, granting of financial guarantees and derivative instruments. The Group’s exposure to credit risk arises from the potential default of the counter party, with a maximum exposure equal to the carrying amount of these instruments. Exposure at balance date is addressed in each applicable note.
The Group’s objectives in relation to credit risk are to ensure minimum impairment of its financial assets and minimise the possibility of loss.
The Group trades primarily with government related bodies, recognised creditworthy third parties and highly credit-rated financial institutions that have minimal risk of default. No collateral is held as security.
All receivable balances are monitored on an ongoing basis with the result that the Group’s experience of bad debts has not been significant.
There are no significant concentrations of credit risk and financial instruments are spread amongst a number of financial institutions to minimise the risk of default of counterparties.
The Group’s maximum exposure to credit risk at reporting date in relation to each class of recognised financial assets is the carrying amount of these assets.
(iv) Liquidity risk
Liquidity risk arises from the financial liabilities of the Group and the Group’s subsequent ability to meet its obligations to repay its financial liabilities as and when they fall due.
Pursuant to its reserving policy, the Group maintains minimum levels of reserves by specie. The Group’s objective is to invest the surplus funds represented by these reserves in financial instruments with maturities that match its forecast payment obligations. The surplus funds are invested primarily in term deposits with differing maturity terms that can be easily liquidated in the event of an unforseen interruption of cash flow.
The Group manages its liquidity risk by monitoring the cash inflows and outflows expected on a weekly basis.
A. non Derivative financial liabilities
The table below summarises the maturity profile of the Group’s financial liabilities as at the reporting date based on contractual undiscounted repayment obligations. The Group ensures that sufficient liquid assets are available to meet all the short term cash payments.
Consolidated
Less than 6 months
$000
6 to 12 months
$000
Financial liabilities
Trade and other payables 33,082 –
Funds held on behalf of the Commonwealth 393 –
Notes to the financial statementsYear ended 30 June 2010
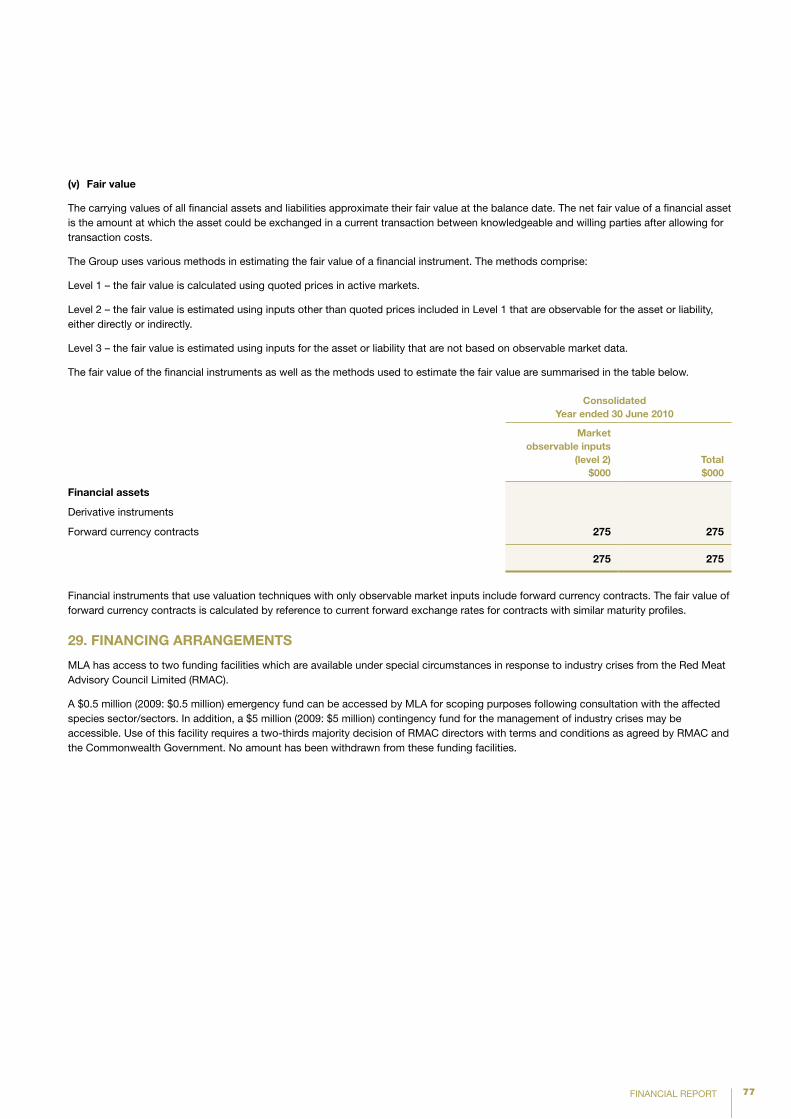
77FINANCIAL REPORT
(v) Fair value
The carrying values of all financial assets and liabilities approximate their fair value at the balance date. The net fair value of a financial asset is the amount at which the asset could be exchanged in a current transaction between knowledgeable and willing parties after allowing for transaction costs.
The Group uses various methods in estimating the fair value of a financial instrument. The methods comprise:
Level 1 – the fair value is calculated using quoted prices in active markets.
Level 2 – the fair value is estimated using inputs other than quoted prices included in Level 1 that are observable for the asset or liability, either directly or indirectly.
Level 3 – the fair value is estimated using inputs for the asset or liability that are not based on observable market data.
The fair value of the financial instruments as well as the methods used to estimate the fair value are summarised in the table below.
Consolidated Year ended 30 june 2010
Market observable inputs
(level 2) $000
Total $000
Financial assets
Derivative instruments
Forward currency contracts 275 275
275 275
Financial instruments that use valuation techniques with only observable market inputs include forward currency contracts. The fair value of forward currency contracts is calculated by reference to current forward exchange rates for contracts with similar maturity profiles.
29. FInAnCInG ARRAnGEMEnTS
MLA has access to two funding facilities which are available under special circumstances in response to industry crises from the Red Meat Advisory Council Limited (RMAC).
A $0.5 million (2009: $0.5 million) emergency fund can be accessed by MLA for scoping purposes following consultation with the affected species sector/sectors. In addition, a $5 million (2009: $5 million) contingency fund for the management of industry crises may be accessible. Use of this facility requires a two-thirds majority decision of RMAC directors with terms and conditions as agreed by RMAC and the Commonwealth Government. No amount has been withdrawn from these funding facilities.
78 FINANCIAL REPORT
Directors’ declaration
In accordance with a resolution of the directors of Meat & Livestock Australia Limited, we state that:
In the opinion of the directors:
(a) the financial statements and notes of the consolidated entity are in accordance with the Corporations Act 2001, including:
(i) giving a true and fair view of the consolidated entity’s financial position as at 30 June 2010 and of their performance for the year ended on that date; and
(ii) complying with Australian Accounting Standards (including Australian Accounting Interpretations) and Corporations Regulations 2001; and
(b) there are reasonable grounds to believe that the Company will be able to pay its debts as and when they become due and payable.
On behalf of the Board
A Heatley Director
D PalmerDirector
Canberra 9 September 2010
79financial RepoRt
Independent auditor’s report
Independent Auditor’s report to the members of Meat & Livestock Australia Limited
Report on the Financial Report
We have audited the accompanying financial report of Meat & livestock australia limited, which comprises the statement of financial position as at 30 June 2010, and the income statement, statement of comprehensive income, statement of changes in equity and statement of cash flows for the year ended on that date, a summary of significant accounting policies, other explanatory notes and the directors’ declaration of the consolidated entity comprising the company and the entities it controlled at the year’s end or from time to time during the financial year.
Directors’ Responsibility for the Financial Report
the directors of the company are responsible for the preparation and fair presentation of the financial report in accordance with the australian accounting Standards (including the australian accounting interpretations) and the corporations act 2001. this responsibility includes establishing and maintaining internal controls relevant to the preparation and fair presentation of the financial report that is free from material misstatement, whether due to fraud or error; selecting and applying appropriate accounting policies; and making accounting estimates that are reasonable in the circumstances.
Auditor’s Responsibility
our responsibility is to express an opinion on the financial report based on our audit. We conducted our audit in accordance with australian auditing Standards. these auditing Standards require that we comply with relevant ethical requirements relating to audit engagements and plan and perform the audit to obtain reasonable assurance whether the financial report is free from material misstatement.
an audit involves performing procedures to obtain audit evidence about the amounts and disclosures in the financial report. the procedures selected depend on our judgment, including the assessment of the risks of material misstatement of the financial report, whether due to fraud or error. in making those risk assessments, we consider internal controls relevant to the entity’s preparation and fair presentation of the financial report in order to design audit procedures that are appropriate in the circumstances, but not for the purpose of expressing an opinion on the effectiveness of the entity’s internal controls. an audit also includes evaluating the appropriateness of accounting policies used and the reasonableness of accounting estimates made by the directors, as well as evaluating the overall presentation of the financial report.
We believe that the audit evidence we have obtained is sufficient and appropriate to provide a basis for our audit opinion.
Independence
in conducting our audit we have met the independence requirements of the corporations act 2001. We have given to the directors of the company a written auditor’s independence Declaration, a copy of which is included in the directors’ report. in addition to our audit of the financial report, we were engaged to undertake the services disclosed in the notes to the financial statements. the provision of these services has not impaired our independence.
Auditor’s Opinion
in our opinion:
1. the financial report of Meat & livestock australia limited is in accordance with the corporations act 2001, including:
(i) giving a true and fair view of the consolidated entity’s financial position at 30 June 2010 and of its performance for the year ended on that date; and
(ii) complying with australian accounting Standards (including the australian accounting interpretations) and the corporations Regulations 2001.
ernst & Young
Rob lewispartnerSydney9 September 2010
80 FINANCIAL REPORT
Useful information
In preparing our Annual Report we reference a number of our planning and evaluation documents.
These are publicly available via our website at www.mla.com.au or by phoning 1800 675 717:
MLA Strategic Plan 2008–2012•
MLA Annual Operating Plan 2009-10•
MLA evaluation series•
Glossary
AFCTS Australian Forward Cattle Trading Standard
AMLC Australian Meat and Live-stock Corporation
ASEAN Association of South-East Asian Nations
AQIS Australian Quarantine and Inspection Service
AWI Australian Wool Innovation
BLC Bahrain Livestock Company
BSE bovine spongiform encephalopathy (mad cow disease)
CPRS Carbon Pollution Reduction Scheme
CRC Cooperative Research Centre
CSIRO Commonwealth Scientific and Industrial Research Organisation
DAFF Department of Agriculture, Forestry and Fisheries
DFAT Department of Foreign Affairs and Trade
DEEDI Department of Employment, Economic Development and Innovation
EBVs Estimated breeding values
EU European Union
eDEC Electronic declaration
EQA eating quality assured
FTA Free trade agreement
HPP high pressure processing
IPM integrated pest management
KPI key performance indicator
MBfP More Beef from Pastures
MDC MLA Donor Company Limited
MLA Meat & Livestock Australia
MMFS Making More From Sheep
MRC Meat Research Corporation
MSA Meat Standards Australia
NCMC Northern Co-operative Meat Company
NLIS National Livestock Identification System
NVD National Vendor Declaration
OH&S Occupational health and safety
PIC Property Identification Code
PIRD Producer Initiated Research and Development
PDS Producer Demonstration Sites
QDPI&F Queensland Department of Primary Industries and Fisheries
R&D research and development
SARDI South Australian Research and Development Institute
SFE Sydney Futures Exchange
US United States
WTO World Trade Organization
Table and chart index
A$ value against US$ and yen (chart) . . . . . . . . . . . . . . . . . . . . . . 25
Australian cattle production and herd (chart) . . . . . . . . . . . . . . . . 32
Australian consumer expenditure on red meat (chart) . . . . . . . . . 24
Australian Government R&D priorities (chart) . . . . . . . . . . . . . . . . . 6
Australian lamb production and sheep flock (chart) . . . . . . . . . . . 32
Australian live cattle exports (chart) . . . . . . . . . . . . . . . . . . . . . . . 24
Australian red meat exports value (chart) . . . . . . . . . . . . . . . . . . . 24
Beef exports to Korea and Japan (chart) . . . . . . . . . . . . . . . . . . . 25
Beef exports to SEA/Chinas (chart) . . . . . . . . . . . . . . . . . . . . . . . . 25
Cattle on feed (chart) . . . . . . . . . . . . . . . . . . . . . . . . . . . . . . . . . . . 32
Enhancing competitiveness and sustainability 2009-10 highlights . . . . . . . . . . . . . . . . . . . . . . . . . . . . . . . . . . . . 32
EU high quality beef import quotas (chart) . . . . . . . . . . . . . . . . . . 20
Expenditure for 2009-10 (chart). . . . . . . . . . . . . . . . . . . . . . . . . . . 16
Farm business profit (chart) . . . . . . . . . . . . . . . . . . . . . . . . . . . . . . 41
Five years at a glance (table) . . . . . . . . . . . . . . . . . . . . . . . . . . . . . 17
Genetic improvement in beef cattle (chart) . . . . . . . . . . . . . . . . . . 34
Genetic improvement in lamb (chart) . . . . . . . . . . . . . . . . . . . . . . 34
Grain, fuel and fertiliser prices (chart) . . . . . . . . . . . . . . . . . . . . . . 40
Increasing industry capability 2009-10 highlights (table) . . . . . . . 40
Increasing market access 2009-10 highlights (table) . . . . . . . . . . 20
Members by activity (table) . . . . . . . . . . . . . . . . . . . . . . . . . . . . . . 12
Membership numbers (chart) . . . . . . . . . . . . . . . . . . . . . . . . . . . . 12
Members by location (chart) . . . . . . . . . . . . . . . . . . . . . . . . . . . . . 12
MDC investment (table) . . . . . . . . . . . . . . . . . . . . . . . . . . . . . . . . . 7
MDC highlights (table) . . . . . . . . . . . . . . . . . . . . . . . . . . . . . . . . . . . 8
MLA ICA expenditure per region (table) . . . . . . . . . . . . . . . . . . . . 29
MSA producer participation (chart) . . . . . . . . . . . . . . . . . . . . . . . . 29
Producer demonstration site activity (chart) . . . . . . . . . . . . . . . . . 42
Revenue for 2009-10 (chart) . . . . . . . . . . . . . . . . . . . . . . . . . . . . . 16
R&D investments (table) . . . . . . . . . . . . . . . . . . . . . . . . . . . . . . . . 14
Staff numbers (table) . . . . . . . . . . . . . . . . . . . . . . . . . . . . . . . . . . . . 9
Strategic imperative investment (table) . . . . . . . . . . . . . . . . . . . . . 16
Top 10 beef exports (chart) . . . . . . . . . . . . . . . . . . . . . . . . . . . . . . 20
Top 10 sheepmeat exports (chart) . . . . . . . . . . . . . . . . . . . . . . . . . 20
FC Front coverIFC Inside front coverIBC Inside back cover
AAbout MLA IFC, 6–8Adoption 40–42Advertising 26Animal health 22, 33 Annual Operating Plan 6-7Assets 54, 65AUS-MEAT 28, 29, 63Australian Government IFC, 6-7, 10, 14, 15, 17, 20-21, 22, 24, 28, 37Australian Wool Innovation (AWI) 34, 35Audit 52, 77Audit committee 45, 50Automation 1, 36Awards 12
BBalance sheet 54Beef Cooperative Research Centre (CRC) 34Beef genetics 34Beef promotion 22, 27, 28-29Bioactives 30Biosecurity 35Board 10, 44, 48-49, 68-69Breeding 33, 34BREEDPLAN 34Butcher training 27, 29
CCarbon Pollution Reduction Scheme 37Cash flow 55-56, 70Cattle Futures 38Chairman 2-3, 48, 51, 76China 21, 28Climate change 15, 33, 22, 37Code of conduct 46Collaboration 7, 21, 28, 29, 34, 35, 40–42Communications 12-13, 22, 26, 38, 41Community 14-15, 22, 26Company secretaries 49Competitiveness 20-21, 31-38Consumers 14Cooperative Research Centre 35, 41Corporate governance 43-44Corporate services 11, 16Corporate sustainability 9–17Cost efficiency 30, 32–34
DDeed of Agreement 10, 46Directors 45, 48-49, 76Drought 32
EEating quality 29Employee engagement 9Employee entitlements 67Enhancing competitiveness and sustainability 31–38Environment 15, 26, 32-33, 35Equity 71Ernst & Young 52, 77Evaluation 8, 44Events 12-14, 22, 26, 27, 29, 30Executive committee 10-11Expenditure 16–17, 25, 41, 53, 55, 61, 71Exports 1, 22, 24-25, 26
FFeedlots 22Financial position 16, 25Financial report 43–77Five years at a glance 17Food safety 21Foodservice 1, 27, 30Forecasts 38–42Free trade agreement 20-21Future Farm Industries CRC 35Future challenges and opportunities 14, 20-21, 25, 33, 40
GGenetics 1, 34, 36Global financial crisis 24-25, 27Glossary 78Goats 21, 25Grazing management 35Greenhouse gas emissions 15, 36Growing demand 23–30
HHeart foundation 26Hedging 58, 67, 73Highlights (2009-10) 1, 20, 24, 32
IImports 7, 20-21Income 16, 53, 55Increasing industry capability 39–42 Increasing market access 19–22Indemnification and insurance 51Indonesia 1, 22Innovation 28, 36Integrity communications 26International 21, 24, 28-29International Collaborative Agreements 29, 30Investment 6, 7, 63
JJapan 21, 28
KKey performance indicators (KPI) 8Korea 23, 28
LLamb promotion 27–29Leases 59Levies 16, 25, 60Liabilities 54, 66Life cycle analysis 32, 37Live Corp 22Livestock export 20, 22
MManaging Director 4-5, 10-11, 48, 51, 76Markets – international 28Markets – domestic 27Market access 19, 22Meat Industry Strategic Plan 6Market information 1, 41, 32, 38Meat Profit Days 13Meat Standards Australia 29Media 13, 27, 28, 34Members 12-13, 47Membership committee 45Methane - see greehouse gas emissionsMLA Donor Company 7, 11, 30Middle East 22, 28, 25, 29Mission IFC
NNational Livestock Identification System (NLIS) 1, 21, 38North America 28-29Nutrition 14, 24, 26, 29
OOrganisation structure 10OH&S 9Operating environment 20, 24, 33, 40, 50-51
PPastures 35Pastures Australia 7, 35Peak Industry Councils 10Performance 8, 16Processors 1, 36, 37Producer demonstration sites 1, 42Producer engagement 13, 35, 41, 42Professional development 9, 14, 42Profit 40, 55Promotion – domestic market 26-27Promotion – international markets 28-29Property, plant and equipment 59, 64Provisions 66Publications 12-13, 38, 41
Q
RRelated party transactions 69Remuneration 68-69Remuneration committee 45Research & development (R&D) 6, 14, 30, 36, 41Retailers 25, 28Revenue 16, 37, 53, 57Risk management 30, 46, 72–75Russia 1, 21
SSelection committee 46, 50Sheep Cooperative Research Centre (CRC) 7, 33, 34 Sheep genetics 34Social media 22, 38South East Asia and China 25Staff 9–11, 41, 48-49Strategic plan 6, 7Surplus – financial 16, 53, 55Sustainability 32
TTaxes 57Training 44Transaction levies 21, 60
UUnited States 24-25, 29
VValues IFCVision IFC
WWater and energy 37Websites 13, 25, 35, 47Welfare 34What we do 7World Trade Organization (WTO) 20-21
XYZ
Index
MLA’s annual report is also available online at www.mla.com.au/annualreport
MLA’s Annual Report 2009-10 is printed on environmentally friendly paper which is 50 per cent recycled, elementally chlorine-free and made of wood fibre from sustainable forests. It meets ISO 14001 environmental management standards.
Meat & Livestock Australia supports the red meat and livestock industry by working
collaboratively to build demand, increase market access and develop a competitive
advantage through research and building capability.
Practical information and tools from our activities are promoted through:
• magazines,factsheetsandotherpublications
• events,workshopsandforums
• printandbroadcastmedia
• websitesandemail
• ourmemberDVD–feedbackTV
We encourage feedback on our annual report and other communications programs
and can be contacted via email at [email protected] or called on 1800 675 717.
For more information on publications, events, media activities and our programs go to
www.mla.com.au.
AuditorsErnst & Young
BankersCommonwealth Bank of Australia
Meat & Livestock Australia LimitedABN 39 081 678 364
Registered address:Level 1, 165 Walker StreetNorth Sydney NSW 2060
Postal address:Locked Bag 991North Sydney NSW 2059
Phone: 02 9463 9333Fax: 02 9463 9393Website: www.mla.com.au


