Embed Size (px)
Citation preview
GST administration end‑year performance report 2009–10
Report presented to the GST Policy and Administration Sub-group (GPAS)
19 November 2010
NAT 72679-11.2010

© CommoNwealth of australia 2010
This work is copyright. Apart from any use as permitted under the Copyright Act 1968, no part may be reproduced by any process without prior written permission from the Commonwealth. Requests and inquiries concerning reproduction and rights should be addressed to the Commonwealth Copyright Administration, Attorney-General’s Department, 3–5 National Circuit, Barton ACT 2600 or posted at http://www.ag.gov.au/cca
Published by
Australian Taxation Office Canberra November 2010 JS 17677
GST ADMINISTRATION END-YEAR PERFORMANCE 2009–10 1
DEPUTY COMMISSIONER’S FOREWORD
I am pleased to present the end-of-year GST administration performance report for the period 1 July 2009 to 30 June 2010. As the Australian economy began to recover from the global economic downturn, higher than originally expected net GST collections occurred. This resulted in two upward revisions of collections at the Mid-Year Economic and Fiscal Outlook (MYEFO) and as part of the May 2010 Budget. Whilst not reaching the levels estimated at the May 2010 Budget, collections did increase by over 6% on the previous year’s collections. We continued to prudently manage our expenditure and it is significant that we achieved outcomes beyond what we had planned. Our active compliance results exceeded planned outcomes by 12% with our audit adjustments raising over $2.2 billion in GST liabilities (excluding penalties and general interest charge [GIC]). Part of the increase in adjustments can be attributed to significant extraordinary and finite risks that have been mitigated by actions during the year, such as refund exploitation (section 13 of the A New Tax System (Goods and Services Tax Transition) Act 1999 (Transition Act) and out of scope supplies) and settlement of a ‘payments to associates’ issue in the securitisation industry. That said, section 13 and out of scope supplies risks remain open as we move into the litigation phase, during which time we will ensure we have robust litigation strategies aimed at bringing these matters to a successful close through the courts.
Litigation through the year has been a mixed picture of favourable (Amex and TT-Line) and unfavourable (Travelex and Gloxinia) decisions. Significant litigation issues remain in train. We continued to support business by helping them understand their rights and responsibilities. We approached those who appeared to be struggling to meet their GST tax obligations, and where appropriate they were provided with more flexible payment arrangements. This has contributed in part to some of the increase in debt holdings; however, our support measures for viable businesses ensured ongoing business participation in the tax system and were cited as best practice during the economic crisis by the Organisation for Economic Co-operation and Development (OECD). We continued to implement innovative approaches to supporting businesses during the year which delivered the following outcomes:
� introduction of a pilot of an improved service model for the provision of interpretative assistance for the top four accounting firms and large law firms. The pilot was successful and has now been extended to all large corporate taxpayers and government entities
� a program of targeted assistance to small business in 16 regional areas across Australia, including the creation of a small business support web page which provides information and support at key stages of the business lifecycle
� extension of our large market relationship management services and products
2 GST ADMINISTRATION END-YEAR PERFORMANCE 2009–10
� launch of the GST food classification decision tool to provide more certainty for users that they are correctly applying the law.
We continued to work with Treasury and other stakeholders to implement recommendations from the Board of Taxation (BoT) review of the legal framework for the administration of the GST. This year saw the Change Program contract come to a close. The change program has brought significant enhancements to our client relationship management system, our case actioning system and our ability to develop and use analytical models to detect instances of non compliance with the GST system. It was pleasing to see that in the May 2010 Budget additional compliance funding was provided to:
� further protect the integrity of the refund system with better detection techniques and additional compliance checks
� respond to serious evasion of GST obligations through more field activity and data matching
� further address activity statement non-lodgment through compliance activity
� address GST debt through collection activities.
This work will add to our already comprehensive compliance program and I look forward to reporting back on our progress through the next year. Our GST administration is well placed to move into the second decade of the GST system and the second century for the Australian Taxation Office (ATO). We will continue to build on our expertise, relationships and commitment, to create the best possible environment for businesses to willingly comply with their GST and other tax obligations. We appreciate the support and interest we receive from our states and territories colleagues, in both our administration and in assisting with compliance initiatives. The relationship is effective because of the willing exchange of views and ideas and will only continue to get stronger.
Shane Reardon Deputy Commissioner

GST ADMINISTRATION END-YEAR PERFORMANCE 2009–10 3
4 GST ADMINISTRATION END-YEAR PERFORMANCE 2009–10
CONTENTS
DEPUTY COMMISSIONER’S FOREWORD 1
01 PERFORMANCE OVERVIEW 5 Key performance results 6 GST revenue 9 GST administration expenditure 10 Our market research 12
02 OUR GST OUTPUTS 15 1.0 Shape, design and build administrative systems 16 1.4 Legal services 17 2.1 Registrations 21 2.2 Processing and accounts 23 2.3 Client contact 26 2.4 Debt collection 28 3.1 Marketing communications 30 3.2 Interpretative assistance and 1.5 Law assurance 32 3.4 Active compliance (ATO) 35 3.4 Active compliance (Australian Customs and Border Protection Service) 40 3.5 Compliance risk identification 42 5.0 Services to governments and agencies 47
03 SCHEDULES 49 Schedule A: Performance outcome measures 50 Schedule B: GST budget and administration activities 53
04 APPENDIX 55 Appendix: Additional funding 56
GST ADMINISTRATION END-YEAR PERFORMANCE 2009–10 5
01 PERFORMANCE OVERVIEW
Our performance highlights including GST revenue outcomes, administration costs and levels of community confidence in our system.
6 GST ADMINISTRATION END-YEAR PERFORMANCE 2009–10
KEY PERFORMANCE RESULTS
Revenue
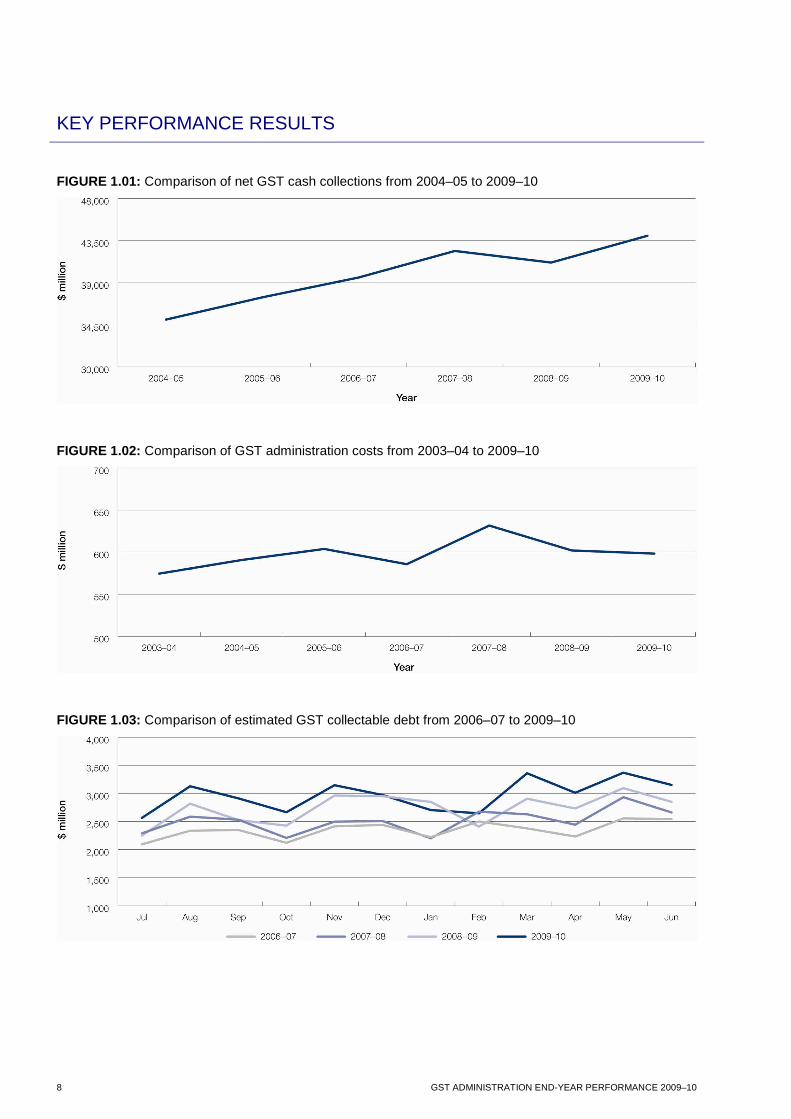
The net GST cash outcome was $44,023 million in the 2009–10 financial year (including net Australian Customs and Border Protection Service collections of $2,764 million). For the historical trend of GST cash collections, refer to figure 1.01 on page 8. This is 6.5% (or $2,693 million) above the 2009–10 Budget estimate of $41,330 million. The net GST cash outcome, including non GIC penalty amounts, was $44,100 million.
Expenditure Preliminary GST administration expenditure was $598.3 million. For the historical trend of actual administration costs, refer to figure 1.02 on page 8. This represents a variation of $26.2 million (4.2%) against the 2009–10 schedule B estimate of $624.4 million.
Debt collection
During the year, GST collectable debt continued to grow. It grew by 10.55% compared to 7.14% in the same period in the previous year. We saw an 8% increase in the value of activity statement payment arrangements entered into. For the historical comparison of collectable debt, refer to figure 1.03 on page 8. Although we are seeing some improvement in the economy following the global economic downturn, there is still a genuine need to support viable businesses experiencing financial difficulty. While our approach has resulted in increased debt holdings, our support measures for viable businesses ensured ongoing business participation in the tax system. The economic environment represents an ongoing challenge for our debt collection activities as businesses continue to struggle to reduce current levels of debt. It is likely that we will experience an increased level of uncollectable debt as some taxpayers decide that they are unable to trade out of their current financial difficulties.
Active compliance
Active compliance results exceeded plan by 12% or $242 million. Our audit adjustments raised over $2.2 billion, excluding penalties and GIC. The strike rate for the year was 60.5%, which was a significant improvement over the 55% rate reported in 2008–09. There were 30 new briefs of evidence referred to the Commonwealth Director of Public Prosecutions (CDPP), 10 more than we expected. They represented approximately $7.7 million in lost GST revenue. These often involved larger amounts of attempted fraud, but we stopped the majority before a refund issued. All 31 matters prosecuted by the CDPP involving GST and/or activity statement fraud resulted in convictions and 28 resulted in custodial sentences. Our lodgment compliance strategy outcomes were:
� on time lodgment performance for activity statements was 73.0% for monthly and 73.3% for quarterly statements
� overall lodgment for activity statements was 83.6% for monthly and 85.2% for quarterly statements
� 750,361 activity statements obtained through our lodgment compliance strategies
� $191,566,777 of GST revenue (excluding penalties and GIC) was raised through our lodgment compliance activities.
Interpretative assistance
In the past year we:
� issued 13 ATO interpretative decisions (ATO IDs) and withdrew seven
� issued two GST draft rulings
� issued one GST draft determination and two final GST determinations
� finalised 4,753 requests for technical advice
� finalised 1,216 objections
� finalised 15 priority technical issues.
We also progressively improved on the achievement of the Taxpayers’ Charter benchmarks. Our response to written technical advice was below those benchmarks or service standards, but we met them for the month of June 2010. We are continuing to meet our service standards in 2010-11.
GST ADMINISTRATION END-YEAR PERFORMANCE 2009–10 7
Compliance risk identification
We have continued to identify and develop strategies to address our risk environment. We have:
� identified 10 new risks
� addressed lower level risks through a range of marketing and education activities
� removed five risks that had been sufficiently mitigated and were no longer required to be listed on the GST Risk Register.
Endemic risks that require ongoing attention include:
� real property
� financial supplies
� serious evasion and fraud
� refund integrity
� integrity of business systems
� small business obligations
� cash economy.
Shape, design and build administrative systems
We worked with Treasury to implement recommendations from the BoT review on the legal framework for the administration of the GST. There have been 11 measures enacted so far, and we are continuing to work closely with Treasury to introduce the remaining measures. The following key GST measures were also implemented during the past year:
� four-year limit on claiming input tax credits
� representatives of incapacitated entities
� cross border transport services
� global roaming services.
Legal services
There were 37 decisions delivered by the courts and the Administrative Appeals Tribunal. Five of these decisions related to procedural matters. In the remaining matters the Commissioner received favourable decisions in 24 cases (75% of cases), unfavourable decisions in five cases (16% of cases) and partly favourable decisions in three cases (9% of cases).
Other key statistics
In 2009–10 we:
� answered 681,898 calls related to GST
� undertook 9,350 business assistance visits
� delivered 1,159 seminars with 31,884 participants
� made 52,755 outbound education calls
� undertook 116 visits to help with record reconstruction
� sent 159,765 printed GST information products to businesses via the publication ordering service
� partnered with 319 external intermediaries (such as banks), reaching an estimated
1.4 million small businesses
� registered 313,208 new GST accounts
� processed 96.9% of GST registration applications within 28 days
� cancelled 240,003 GST registrations
� processed 9,891,610 activity statements
� paid $9.7 million in interest on delayed refunds
� banked 11,571,164 activity statement-related payments with a value of $207.7 billion
� issued 2,071,057 activity statement refunds with a value of $43.9 billion
� processed 97.8% of original activity statement refunds within 14 days.
Legal services – The 2009–10 Commissioner of Taxation Annual Report identifies 38 cases which includes one Luxury Car Tax case. This case is not included in this report.
8 GST ADMINISTRATION END-YEAR PERFORMANCE 2009–10
KEY PERFORMANCE RESULTS
FIGURE 1.01: Comparison of net GST cash collections from 2004–05 to 2009–10
FIGURE 1.02: Comparison of GST administration costs from 2003–04 to 2009–10
FIGURE 1.03: Comparison of estimated GST collectable debt from 2006–07 to 2009–10
GST ADMINISTRATION END-YEAR PERFORMANCE 2009–10 9
GST REVENUE � Net GST revenue (cash basis) was $2,693 million higher than forecast in the May 2010
Budget.
The net GST cash outcome was $44,023 million, which includes net Australian Customs and Border Protection Service collections of $2,7641 million. This is 6.5% or $2,693 million above the 2009–10 Budget estimate of $41,330 million. The net GST cash outcome, including non-GIC penalty amounts, was $44,100 million. The gap between net GST accruals (on a tax liability method [TLM]2 basis) and the cash collection was $1,465 million. The most significant component of this gap relates to gross GST debt. The estimated total statement outcome for the June 2009 to May 2010 activity statements (excluding GST collected by the Australian Customs and Border Protection Service) was $41,965 million. Due to stronger than expected net GST collections and stronger consumption parameters over the first few months of 2009–10, the cash estimate was revised up to $42,300 million at the MYEFO, $970 million higher than the Budget estimate.
In the May 2010 Budget, the cash estimate for the 2009–10 year was once again adjusted upwards by $2,210 million to $44,510 million. The final cash collections outcome for 2009–10 fell short of this estimate by $487 million. TABLE 1.1: GST revenue collected including GST collected by the Australian Customs and Border Protection Service
Net GST cash
collections $m
Net GST accrued (TLM)
$m
2008–09 41,159 42,585
2009–10 44,023 45,488
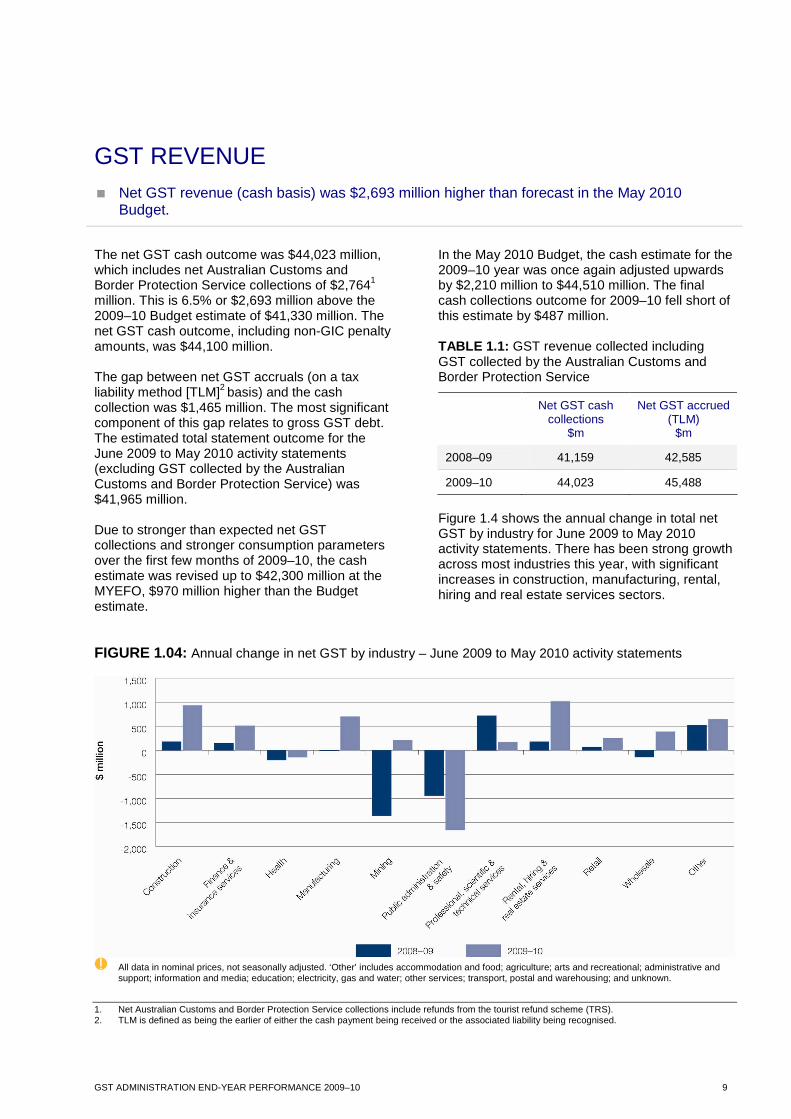
Figure 1.4 shows the annual change in total net GST by industry for June 2009 to May 2010 activity statements. There has been strong growth across most industries this year, with significant increases in construction, manufacturing, rental, hiring and real estate services sectors.
FIGURE 1.04: Annual change in net GST by industry – June 2009 to May 2010 activity statements
All data in nominal prices, not seasonally adjusted. ‘Other’ includes accommodation and food; agriculture; arts and recreational; administrative and
support; information and media; education; electricity, gas and water; other services; transport, postal and warehousing; and unknown.
1. Net Australian Customs and Border Protection Service collections include refunds from the tourist refund scheme (TRS). 2. TLM is defined as being the earlier of either the cash payment being received or the associated liability being recognised.
10 GST ADMINISTRATION END-YEAR PERFORMANCE 2009–10
GST ADMINISTRATION EXPENDITURE � Preliminary GST administration expenditure for 2009–10 was $598.3 million3.
GST administration expenditure for the year was $598.3 million. This represents a variation of $26.2 million (4.2%) against the 2009–10 schedule B estimate of $624.4 million. Refer to table 1.2 on page 11 for details of the breakdown of actual costs and the variance of past year costs to the schedule B plan. As a result of prudent management, improved systems and new approaches we achieved efficiencies in our administration and achieved significant outcomes above the schedule B plan. Our active compliance results were $242 million (12%) above plan and raised $2.2 billion (excluding penalties and GIC). We have delivered improvements in our processes and systems by:
� improving our approach to risk management and case selection, we increased our strike rate by approximately 55% in refund integrity activities
� building relationships with large market businesses and promoting voluntary compliance
� supporting small businesses and engaging emerging generations to gain a better understanding of their needs.
Our active compliance costs were lower by $45.1 million.
In our processing and accounts, costs were lower by $27.6 million. This is as a result of implementing and using the Client Relationship Management system as part of the Change Program. However, some areas cost us more than had been planned. These include:
� design and build administrative systems costs have increased by $13.6 million, this is a result of a change in the way some design activities have been attributed to the GST deliverables. Last year we treated some
design activities as overhead costs and attributed them to all the deliverables whereas this year, we have treated them as direct design and build costs.
Overall, this change had no impact on the total GST expenditure rather a reclassification of costs.
� client contact cost $15.9 million more as a result of some increased call volumes and our systems now allow a more rigorous sampling approach to understanding the nature of calls received by the ATO and the flow on effect to the ATO’s revenue products. The changed sampling methodology has improved the accuracy of the cost attribution process.
� services to governments and agencies have increased by $11.8 million. Costs associated with the Australian Business Register (ABR) work increased in 2009-10 particularly in relation to work associated with AUSkey and the ABR business names project as well as the Standard Business Reporting (SBR) project. The increase was also a result of the reattribution of work associated with the new national Tax Practitioners Board.
Budget arrangements
We are provided with one appropriation from which a number of government outcomes must be managed, including GST expenditure. We allocate resources using a risk management approach. The schedule B plan reports the allocated budget. At the GST administration sub-committee (GSTAS) meeting (24 February 2010), it was agreed to revise the method for calculating the starting base from 2010–11 which will be calculated using the ATO’s planned expenditure.
3. The actual GST administration expenditure for 2009–10 is a preliminary result as it does not yet include any adjustments to our financial statements that may be required from the audit by the Australian National Audit Office (ANAO). GST costs are also subject to the special purpose audit by the ANAO expected in late 2010.
GST ADMINISTRATION END-YEAR PERFORMANCE 2009–10 11
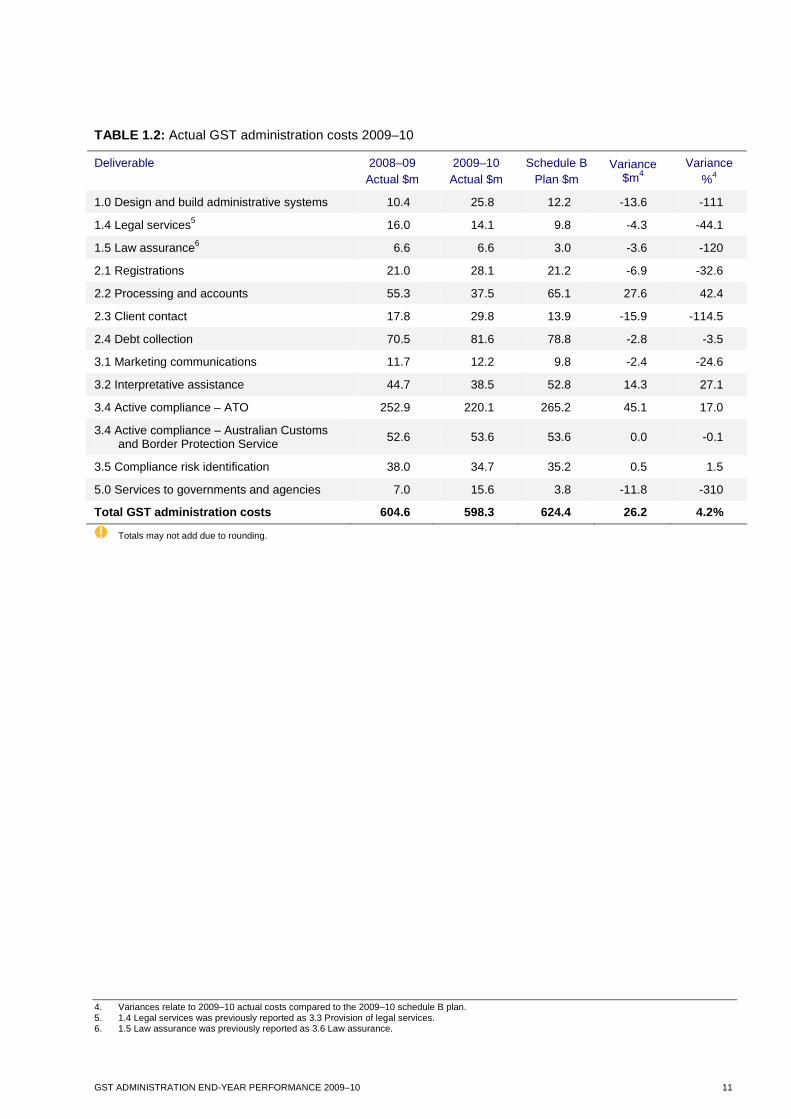
TABLE 1.2: Actual GST administration costs 2009–10
Deliverable 2008–09 Actual $m
2009–10 Actual $m
Schedule B Plan $m
Variance $m4
Variance %4
1.0 Design and build administrative systems 10.4 25.8 12.2 -13.6 -111
1.4 Legal services5 16.0 14.1 9.8 -4.3 -44.1
1.5 Law assurance6 6.6 6.6 3.0 -3.6 -120
2.1 Registrations 21.0 28.1 21.2 -6.9 -32.6
2.2 Processing and accounts 55.3 37.5 65.1 27.6 42.4
2.3 Client contact 17.8 29.8 13.9 -15.9 -114.5
2.4 Debt collection 70.5 81.6 78.8 -2.8 -3.5
3.1 Marketing communications 11.7 12.2 9.8 -2.4 -24.6
3.2 Interpretative assistance 44.7 38.5 52.8 14.3 27.1
3.4 Active compliance – ATO 252.9 220.1 265.2 45.1 17.0
3.4 Active compliance – Australian Customs and Border Protection Service
52.6 53.6 53.6 0.0 -0.1
3.5 Compliance risk identification 38.0 34.7 35.2 0.5 1.5
5.0 Services to governments and agencies 7.0 15.6 3.8 -11.8 -310
Total GST administration costs 604.6 598.3 624.4 26.2 4.2%
Totals may not add due to rounding.
4. Variances relate to 2009–10 actual costs compared to the 2009–10 schedule B plan. 5. 1.4 Legal services was previously reported as 3.3 Provision of legal services. 6. 1.5 Law assurance was previously reported as 3.6 Law assurance.
12 GST ADMINISTRATION END-YEAR PERFORMANCE 2009–10
OUR MARKET RESEARCH � Business Perceptions Survey May 2010
� ATO Professionalism Survey November 2009
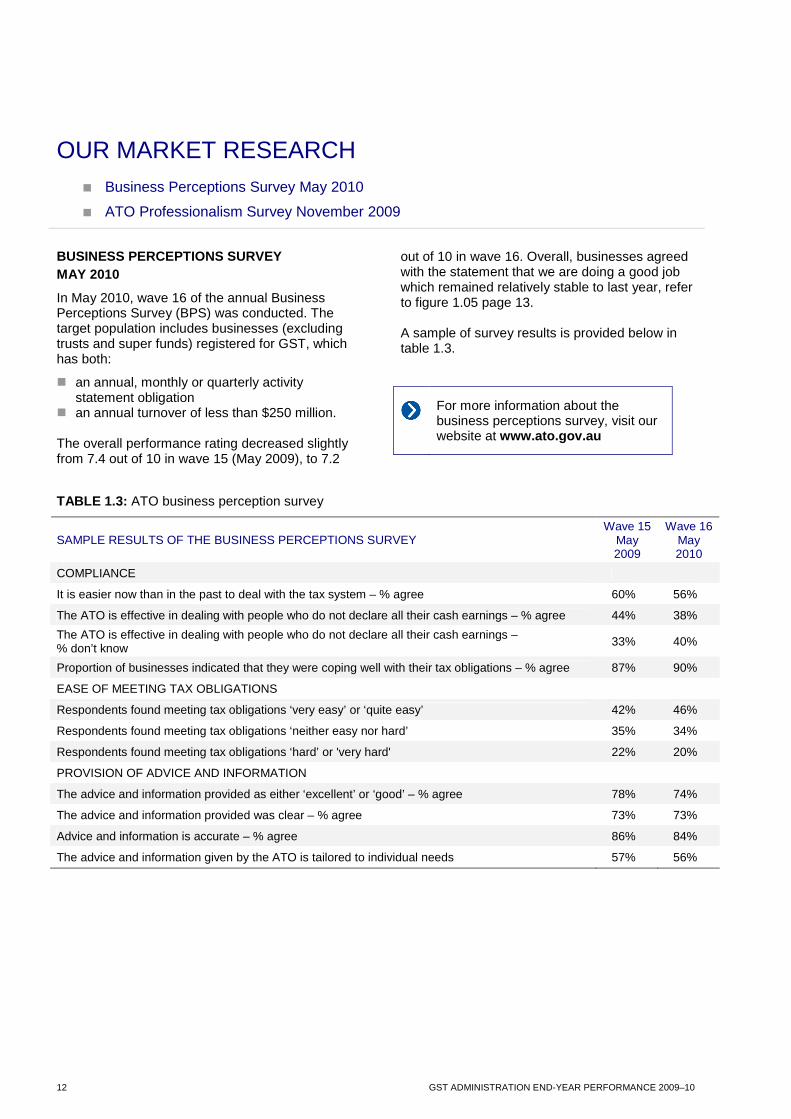
BUSINESS PERCEPTIONS SURVEY MAY 2010
In May 2010, wave 16 of the annual Business Perceptions Survey (BPS) was conducted. The target population includes businesses (excluding trusts and super funds) registered for GST, which has both:
� an annual, monthly or quarterly activity statement obligation
� an annual turnover of less than $250 million. The overall performance rating decreased slightly from 7.4 out of 10 in wave 15 (May 2009), to 7.2
out of 10 in wave 16. Overall, businesses agreed with the statement that we are doing a good job which remained relatively stable to last year, refer to figure 1.05 page 13. A sample of survey results is provided below in table 1.3.
For more information about the business perceptions survey, visit our website at www.ato.gov.au
TABLE 1.3: ATO business perception survey
SAMPLE RESULTS OF THE BUSINESS PERCEPTIONS SURVEY Wave 15
May 2009
Wave 16 May 2010
COMPLIANCE
It is easier now than in the past to deal with the tax system – % agree 60% 56%
The ATO is effective in dealing with people who do not declare all their cash earnings – % agree 44% 38%
The ATO is effective in dealing with people who do not declare all their cash earnings – % don’t know 33% 40%
Proportion of businesses indicated that they were coping well with their tax obligations – % agree 87% 90%
EASE OF MEETING TAX OBLIGATIONS
Respondents found meeting tax obligations ‘very easy’ or ‘quite easy’ 42% 46%
Respondents found meeting tax obligations ‘neither easy nor hard’ 35% 34%
Respondents found meeting tax obligations ‘hard’ or 'very hard' 22% 20%
PROVISION OF ADVICE AND INFORMATION
The advice and information provided as either ‘excellent’ or ‘good’ – % agree 78% 74%
The advice and information provided was clear – % agree 73% 73%
Advice and information is accurate – % agree 86% 84%
The advice and information given by the ATO is tailored to individual needs 57% 56%
GST ADMINISTRATION END-YEAR PERFORMANCE 2009–10 13
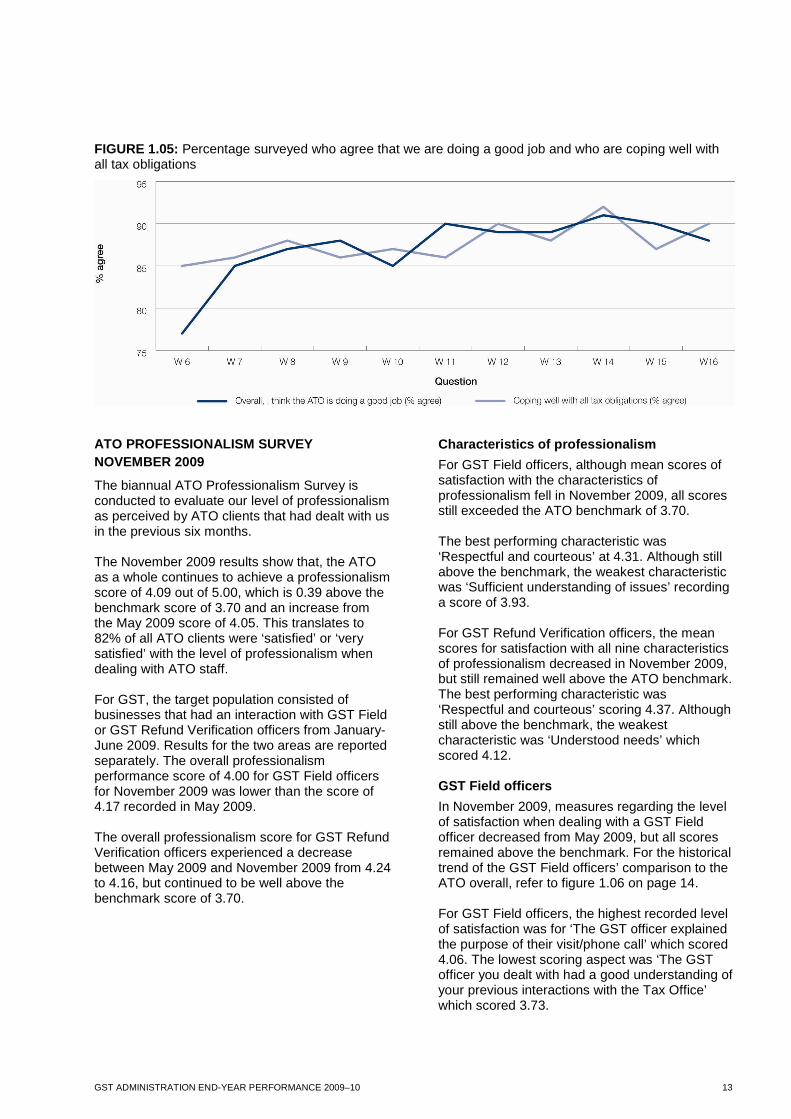
FIGURE 1.05: Percentage surveyed who agree that we are doing a good job and who are coping well with all tax obligations
ATO PROFESSIONALISM SURVEY NOVEMBER 2009 The biannual ATO Professionalism Survey is conducted to evaluate our level of professionalism as perceived by ATO clients that had dealt with us in the previous six months. The November 2009 results show that, the ATO as a whole continues to achieve a professionalism score of 4.09 out of 5.00, which is 0.39 above the benchmark score of 3.70 and an increase from the May 2009 score of 4.05. This translates to 82% of all ATO clients were ‘satisfied’ or ‘very satisfied’ with the level of professionalism when dealing with ATO staff. For GST, the target population consisted of businesses that had an interaction with GST Field or GST Refund Verification officers from January-June 2009. Results for the two areas are reported separately. The overall professionalism performance score of 4.00 for GST Field officers for November 2009 was lower than the score of 4.17 recorded in May 2009. The overall professionalism score for GST Refund Verification officers experienced a decrease between May 2009 and November 2009 from 4.24 to 4.16, but continued to be well above the benchmark score of 3.70.
Characteristics of professionalism
For GST Field officers, although mean scores of satisfaction with the characteristics of professionalism fell in November 2009, all scores still exceeded the ATO benchmark of 3.70. The best performing characteristic was ‘Respectful and courteous’ at 4.31. Although still above the benchmark, the weakest characteristic was ‘Sufficient understanding of issues’ recording a score of 3.93. For GST Refund Verification officers, the mean scores for satisfaction with all nine characteristics of professionalism decreased in November 2009, but still remained well above the ATO benchmark. The best performing characteristic was ‘Respectful and courteous’ scoring 4.37. Although still above the benchmark, the weakest characteristic was ‘Understood needs’ which scored 4.12. GST Field officers
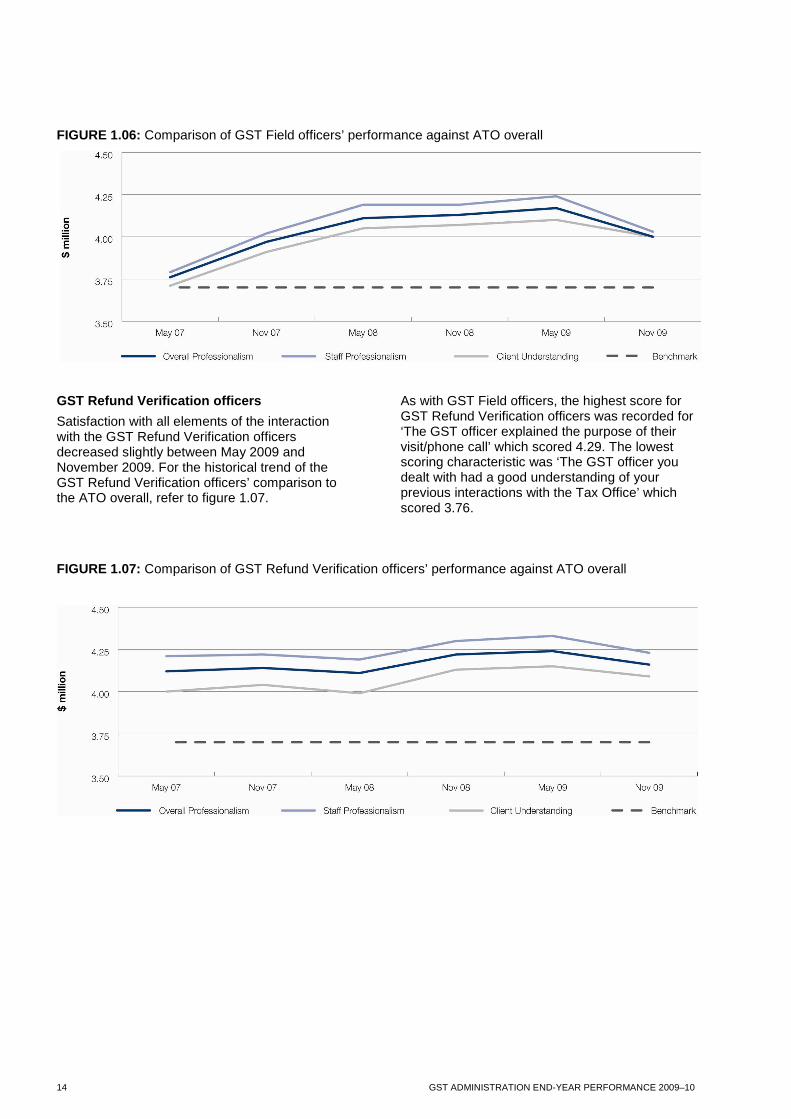
In November 2009, measures regarding the level of satisfaction when dealing with a GST Field officer decreased from May 2009, but all scores remained above the benchmark. For the historical trend of the GST Field officers’ comparison to the ATO overall, refer to figure 1.06 on page 14. For GST Field officers, the highest recorded level of satisfaction was for ‘The GST officer explained the purpose of their visit/phone call’ which scored 4.06. The lowest scoring aspect was ‘The GST officer you dealt with had a good understanding of your previous interactions with the Tax Office’ which scored 3.73.
14 GST ADMINISTRATION END-YEAR PERFORMANCE 2009–10
FIGURE 1.06: Comparison of GST Field officers’ performance against ATO overall
GST Refund Verification officers
Satisfaction with all elements of the interaction with the GST Refund Verification officers decreased slightly between May 2009 and November 2009. For the historical trend of the GST Refund Verification officers’ comparison to the ATO overall, refer to figure 1.07.
As with GST Field officers, the highest score for GST Refund Verification officers was recorded for ‘The GST officer explained the purpose of their visit/phone call’ which scored 4.29. The lowest scoring characteristic was ‘The GST officer you dealt with had a good understanding of your previous interactions with the Tax Office’ which scored 3.76.
FIGURE 1.07: Comparison of GST Refund Verification officers’ performance against ATO overall
GST ADMINISTRATION END-YEAR PERFORMANCE 2009–10 15
02 OUR GST OUTPUTS
The strategic costing framework (SCF) is our primary costing attribution method for GST administration activities. The following selection of SCF outputs is defined in the GST administration performance agreement.
1.0 Shape, design and build administrative systems
1.4 Legal services
2.1 Registrations
2.2 Processing and accounts
2.3 Client contact
2.4 Debt collection
3.1 Marketing communications
3.2 Interpretative assistance and 1.5 Law assurance
3.4 Active compliance (ATO)
3.4 Active compliance (Australian Customs and Border Protection Service)
3.5 Compliance risk identification
5.0 Services to governments and agencies
16 GST ADMINISTRATION END-YEAR PERFORMANCE 2009–10
1.0 SHAPE, DESIGN AND BUILD ADMINISTRATIVE SYSTEMS
KEY STATISTICS
� We provided input into 48 costing proposals for Treasury.
� We provided formal advice in 39 minutes to Treasury.
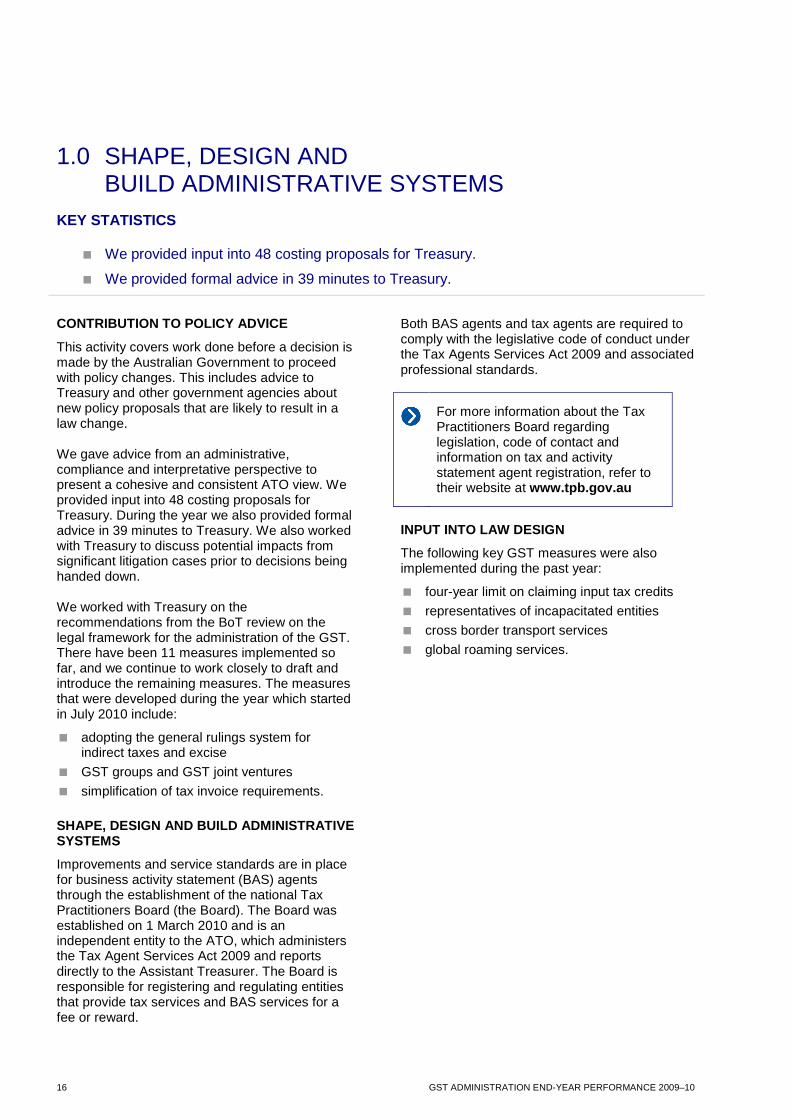
CONTRIBUTION TO POLICY ADVICE
This activity covers work done before a decision is made by the Australian Government to proceed with policy changes. This includes advice to Treasury and other government agencies about new policy proposals that are likely to result in a law change. We gave advice from an administrative, compliance and interpretative perspective to present a cohesive and consistent ATO view. We provided input into 48 costing proposals for Treasury. During the year we also provided formal advice in 39 minutes to Treasury. We also worked with Treasury to discuss potential impacts from significant litigation cases prior to decisions being handed down. We worked with Treasury on the recommendations from the BoT review on the legal framework for the administration of the GST. There have been 11 measures implemented so far, and we continue to work closely to draft and introduce the remaining measures. The measures that were developed during the year which started in July 2010 include:
� adopting the general rulings system for indirect taxes and excise
� GST groups and GST joint ventures
� simplification of tax invoice requirements.
SHAPE, DESIGN AND BUILD ADMINISTRATIVE SYSTEMS
Improvements and service standards are in place for business activity statement (BAS) agents through the establishment of the national Tax Practitioners Board (the Board). The Board was established on 1 March 2010 and is an independent entity to the ATO, which administers the Tax Agent Services Act 2009 and reports directly to the Assistant Treasurer. The Board is responsible for registering and regulating entities that provide tax services and BAS services for a fee or reward.
Both BAS agents and tax agents are required to comply with the legislative code of conduct under the Tax Agents Services Act 2009 and associated professional standards.
For more information about the Tax Practitioners Board regarding legislation, code of contact and information on tax and activity statement agent registration, refer to their website at www.tpb.gov.au
INPUT INTO LAW DESIGN
The following key GST measures were also implemented during the past year:
� four-year limit on claiming input tax credits
� representatives of incapacitated entities
� cross border transport services
� global roaming services.
GST ADMINISTRATION END-YEAR PERFORMANCE 2009–10 17
1.4 LEGAL SERVICES KEY STATISTICS
� There were 37 GST related decisions involving the Commissioner handed down by the courts and the Administrative Appeals Tribunal (AAT).
LITIGATION AND APPLICATIONS FOR REVIEW
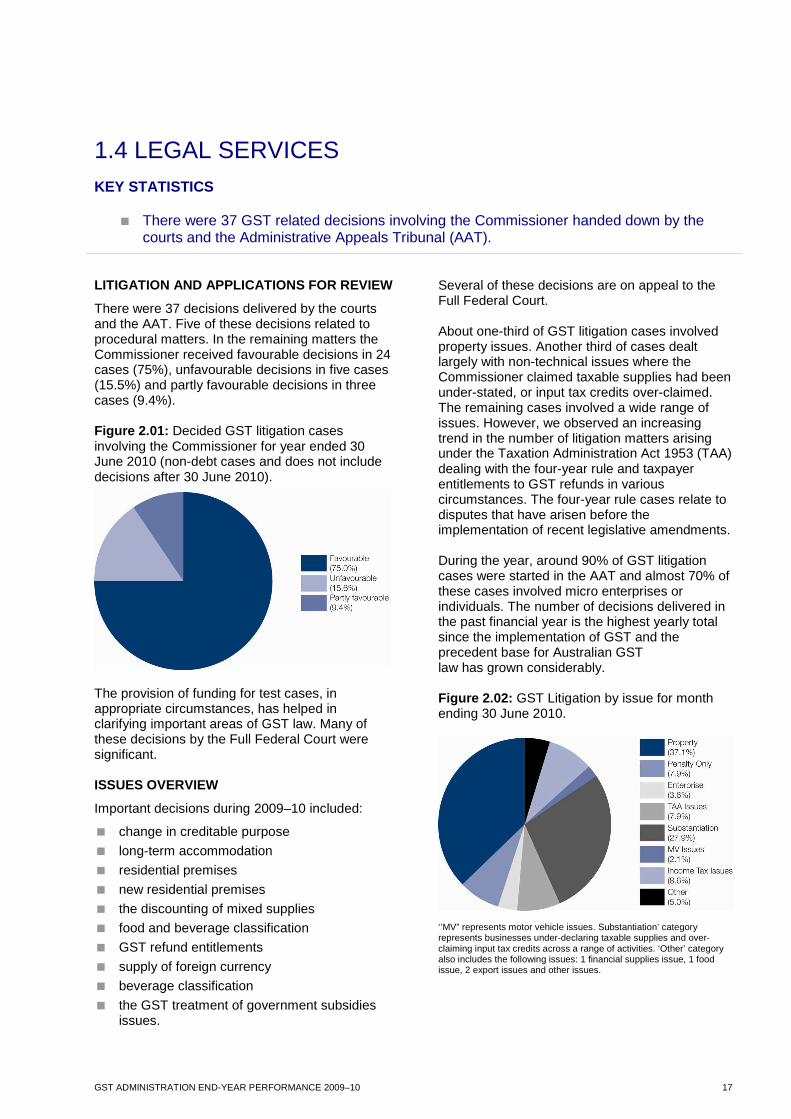
There were 37 decisions delivered by the courts and the AAT. Five of these decisions related to procedural matters. In the remaining matters the Commissioner received favourable decisions in 24 cases (75%), unfavourable decisions in five cases (15.5%) and partly favourable decisions in three cases (9.4%). Figure 2.01: Decided GST litigation cases involving the Commissioner for year ended 30 June 2010 (non-debt cases and does not include decisions after 30 June 2010).
The provision of funding for test cases, in appropriate circumstances, has helped in clarifying important areas of GST law. Many of these decisions by the Full Federal Court were significant. ISSUES OVERVIEW
Important decisions during 2009–10 included:
� change in creditable purpose
� long-term accommodation
� residential premises
� new residential premises
� the discounting of mixed supplies
� food and beverage classification
� GST refund entitlements
� supply of foreign currency
� beverage classification
� the GST treatment of government subsidies issues.
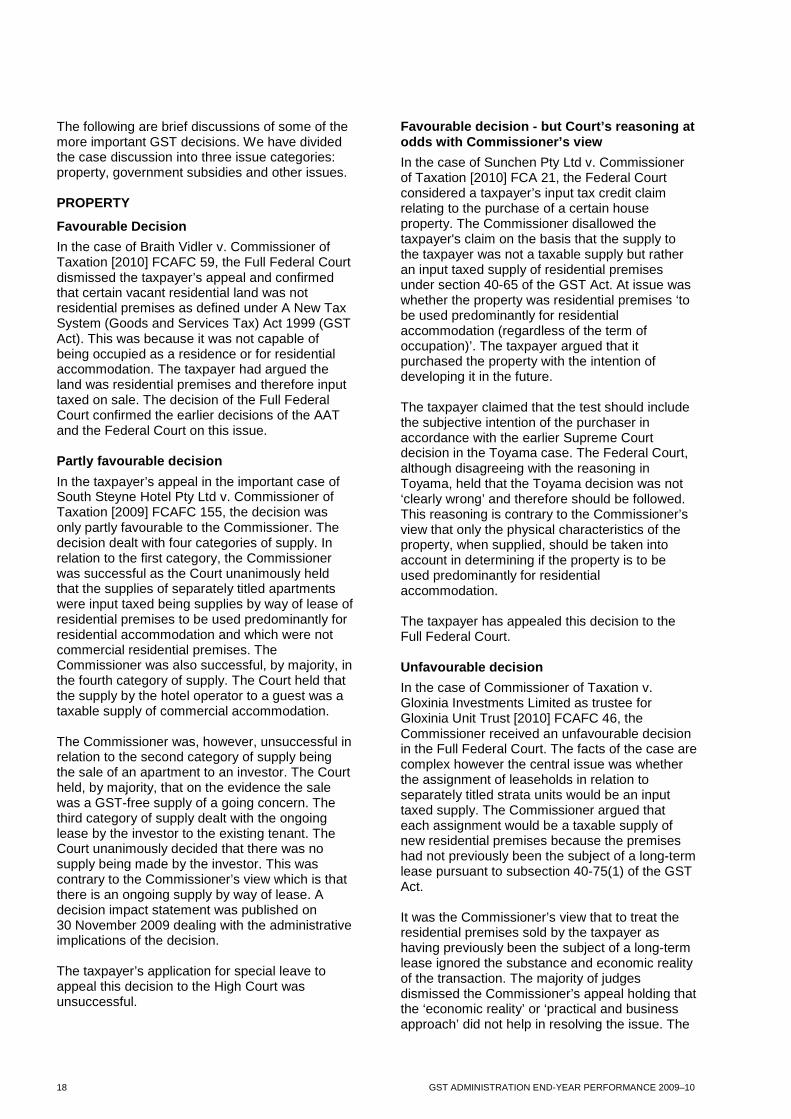
Several of these decisions are on appeal to the Full Federal Court. About one-third of GST litigation cases involved property issues. Another third of cases dealt largely with non-technical issues where the Commissioner claimed taxable supplies had been under-stated, or input tax credits over-claimed. The remaining cases involved a wide range of issues. However, we observed an increasing trend in the number of litigation matters arising under the Taxation Administration Act 1953 (TAA) dealing with the four-year rule and taxpayer entitlements to GST refunds in various circumstances. The four-year rule cases relate to disputes that have arisen before the implementation of recent legislative amendments. During the year, around 90% of GST litigation cases were started in the AAT and almost 70% of these cases involved micro enterprises or individuals. The number of decisions delivered in the past financial year is the highest yearly total since the implementation of GST and the precedent base for Australian GST law has grown considerably. Figure 2.02: GST Litigation by issue for month ending 30 June 2010.
‘’MV” represents motor vehicle issues. Substantiation’ category represents businesses under-declaring taxable supplies and over-claiming input tax credits across a range of activities. ‘Other’ category also includes the following issues: 1 financial supplies issue, 1 food issue, 2 export issues and other issues.
18 GST ADMINISTRATION END-YEAR PERFORMANCE 2009–10
The following are brief discussions of some of the more important GST decisions. We have divided the case discussion into three issue categories: property, government subsidies and other issues. PROPERTY
Favourable Decision
In the case of Braith Vidler v. Commissioner of Taxation [2010] FCAFC 59, the Full Federal Court dismissed the taxpayer’s appeal and confirmed that certain vacant residential land was not residential premises as defined under A New Tax System (Goods and Services Tax) Act 1999 (GST Act). This was because it was not capable of being occupied as a residence or for residential accommodation. The taxpayer had argued the land was residential premises and therefore input taxed on sale. The decision of the Full Federal Court confirmed the earlier decisions of the AAT and the Federal Court on this issue. Partly favourable decision
In the taxpayer’s appeal in the important case of South Steyne Hotel Pty Ltd v. Commissioner of Taxation [2009] FCAFC 155, the decision was only partly favourable to the Commissioner. The decision dealt with four categories of supply. In relation to the first category, the Commissioner was successful as the Court unanimously held that the supplies of separately titled apartments were input taxed being supplies by way of lease of residential premises to be used predominantly for residential accommodation and which were not commercial residential premises. The Commissioner was also successful, by majority, in the fourth category of supply. The Court held that the supply by the hotel operator to a guest was a taxable supply of commercial accommodation. The Commissioner was, however, unsuccessful in relation to the second category of supply being the sale of an apartment to an investor. The Court held, by majority, that on the evidence the sale was a GST-free supply of a going concern. The third category of supply dealt with the ongoing lease by the investor to the existing tenant. The Court unanimously decided that there was no supply being made by the investor. This was contrary to the Commissioner’s view which is that there is an ongoing supply by way of lease. A decision impact statement was published on 30 November 2009 dealing with the administrative implications of the decision. The taxpayer’s application for special leave to appeal this decision to the High Court was unsuccessful.
Favourable decision - but Court’s reasoning at odds with Commissioner’s view
In the case of Sunchen Pty Ltd v. Commissioner of Taxation [2010] FCA 21, the Federal Court considered a taxpayer’s input tax credit claim relating to the purchase of a certain house property. The Commissioner disallowed the taxpayer's claim on the basis that the supply to the taxpayer was not a taxable supply but rather an input taxed supply of residential premises under section 40-65 of the GST Act. At issue was whether the property was residential premises ‘to be used predominantly for residential accommodation (regardless of the term of occupation)’. The taxpayer argued that it purchased the property with the intention of developing it in the future. The taxpayer claimed that the test should include the subjective intention of the purchaser in accordance with the earlier Supreme Court decision in the Toyama case. The Federal Court, although disagreeing with the reasoning in Toyama, held that the Toyama decision was not ‘clearly wrong’ and therefore should be followed. This reasoning is contrary to the Commissioner’s view that only the physical characteristics of the property, when supplied, should be taken into account in determining if the property is to be used predominantly for residential accommodation. The taxpayer has appealed this decision to the Full Federal Court. Unfavourable decision
In the case of Commissioner of Taxation v. Gloxinia Investments Limited as trustee for Gloxinia Unit Trust [2010] FCAFC 46, the Commissioner received an unfavourable decision in the Full Federal Court. The facts of the case are complex however the central issue was whether the assignment of leaseholds in relation to separately titled strata units would be an input taxed supply. The Commissioner argued that each assignment would be a taxable supply of new residential premises because the premises had not previously been the subject of a long-term lease pursuant to subsection 40-75(1) of the GST Act. It was the Commissioner’s view that to treat the residential premises sold by the taxpayer as having previously been the subject of a long-term lease ignored the substance and economic reality of the transaction. The majority of judges dismissed the Commissioner’s appeal holding that the ‘economic reality’ or ‘practical and business approach’ did not help in resolving the issue. The
GST ADMINISTRATION END-YEAR PERFORMANCE 2009–10 19
Commissioner sought special leave to appeal this decision to the High Court. Subsequent to 30 June 2010, special leave to appeal to the High Court was refused. The implications of the decision are currently being considered and a decision impact statement will be issued in due course. GOVERNMENT SUBSIDIES
Favourable decision
The Full Federal Court considered the issue of consideration in the taxpayer appeal case of TT-Line Company Pty Ltd v. Commissioner of Taxation [2009] FCAFC 178. In this matter, the taxpayer was a company wholly-owned by the State of Tasmania which operated a ferry service between Tasmania and the Australian mainland. A government rebate arrangement existed whereby the fare payable by a passenger to the taxpayer allowed for a deduction in respect of the rebate. The Commissioner argued that the taxpayer was required to pay GST in respect of the amount it received from a customer as well as the amount of the government rebate. This was because it was consideration within the meaning of section 9-15 of the GST Act and that the exception in paragraph 9-15(3)(c) was not satisfied as the payment of the rebate was not ‘specifically covered’ by an appropriation under Australian law. The Full Federal Court unanimously dismissed the taxpayer’s appeal, although the judges adopted different approaches in reaching their decisions. Unfavourable decision
In the decision in Secretary to the Department of Transport (Victoria) v. Commissioner of Taxation [2009] FCA 1209, the Federal Court considered the question of supply in the context of government subsidies. The taxpayer administered a program under which it provided a subsidy of the metered taxi-cab fare for taxi-cab travel by Victorian residents who suffered from a disability. At issue was whether the taxpayer was entitled to an input tax credit for the GST component of the payments made by the taxpayer to the taxi-cab operators under the program. The Commissioner argued there was no entitlement because the provisions of section 11-5 of the GST Act were not met. The Court delivered an unfavourable decision in finding that the supply by the taxi-cab operator was not just a supply to the passenger but also a supply to the taxpayer. As a result the taxpayer was entitled to its input tax credit. The Commissioner’s appeal in relation
to this decision was dismissed in a majority decision of the Full Federal Court in July 2010. In addition to its importance in relation to the treatment of government subsidies this decision is also highly relevant to the analysis of multi-party transactions. The Commissioner is seeking special leave to appeal the decision to the High Court. OTHER ISSUES
An important decision in relation to the supply of rights was seen in the Full Federal Court case of Travelex Limited v. Commissioner of Taxation [2009] FCAFC 133. The decision dealt with a taxpayer’s appeal relating to the supply of foreign currency by the taxpayer on the departure side of the Australian Customs and Border Protection Service barrier at Australian international airports. The taxpayer contended that the supply was a supply of or in relation to rights for use outside Australia and therefore a GST-free supply under section 38-190 of the GST Act. The Commissioner argued that the supply was a financial supply of currency and therefore input taxed. The taxpayer’s appeal was dismissed. The majority of judges accepted that a supply made in relation to rights should be construed as meaning ‘a supply of rights’ and refers to the dominant aspect of the supply. The rights in this case were seen as merely incidental to the currency that could not be supplied independently of the currency. Subsequent to 30 June 2010, the taxpayer’s appeal to the High Court against this decision was successful in a 3-2 majority decision. Unfavourable decision
In the decision of Luxottica Retail Australia Pty Ltd v. Commissioner of Taxation [2010] AATA 22, the AAT considered important GST provisions as well as issues relating to GST refunds under the TAA. The taxpayer is a retailer of spectacles. Under various sales promotions, spectacle frames were offered to customers at a discount on condition that the customers also purchased lenses for those frames. There was no discount for the lenses, which were GST-free. The taxpayer claimed that GST should be calculated on the discounted frame price. The Commissioner however argued that the discount should be apportioned between the frame and the lenses. The case also raised the residual discretion in respect of GST refunds. The AAT agreed with the Commissioner that the taxpayer made one supply comprising the two components,

20 GST ADMINISTRATION END-YEAR PERFORMANCE 2009–10
taxable frames and GST-free lenses. However the AAT held that it was appropriate for the taxpayer to apply the discount to the frames only as the arrangement was not ‘contrived or artificial’. On the GST refund issue the AAT decided that the residual discretion should be exercised in favour of the taxpayer even though no reimbursement to the taxpayer’s customers had been made. A decision impact statement was published on 6 August 2010 regarding the case. The Commissioner has appealed the mixed supply issue to the Full Federal Court. The decision will provide greater certainty on the application of section 9-80 of the GST Act in apportioning the consideration for a supply that includes taxable and non-taxable parts.
UPDATE TO EARLIER REPORTED OUTCOME
The Federal Court decision in American Express International Inc and Anor v Commissioner of Taxation [2009] FCA 683, was reported in the 2008-09 GST Administration Performance report. The decision was unfavourable to the Commissioner. Subsequent to 30 June 2010 the Commissioner was successful in his appeal of this decision to the Full Federal Court in a majority decision.
For more information about GST rulings, visit our website at www.ato.gov.au .
OTHER LITIGATION INFORMATION
TABLE 2.1: Table of other GST litigation outcomes in 2009–10
Name of Case Venue Issue Outcome
Meridien Marinas Horizon Shores
Pty Ltd
Federal Court Commercial accommodation – supply of marina berths
Favourable
Lansell House Pty Ltd & Perfek Pty Ltd
Federal Court Food classification case Favourable
(subject to taxpayer’s appeal to Full Federal Court)
JMB Beverages
Pty Ltd
Full Federal Court
Beverage classification case Favourable
Melbourne Car Shop Pty Ltd
Federal Court GST and LCT issues – intention to hold vehicle as trading stock
Favourable
LeasePlan Australia Limited
Federal Court Division 66 of the GST Act – second hand goods. Acquiring vehicles ‘for the purposes of sale’.
Unfavourable
GST ADMINISTRATION END-YEAR PERFORMANCE 2009–10 21
2.1 REGISTRATIONS
KEY STATISTICS
� We registered 313,208 new GST accounts in 2009–10.
� We processed 96.9% of GST registration applications within 28 days.
� There were 2,721,013 active GST accounts as at 30 June 2010.
� We cancelled 240,003 GST registrations in 2009–10.
� There were 9,743 businesses registered to defer GST of which 6,667 deferred at 30 June 2010 with a value of $1.6 billion.
� $19.3 billion in GST was deferred at 30 June 2010 (down 7.3% compared with 2008–09).
GST REGISTRATIONS
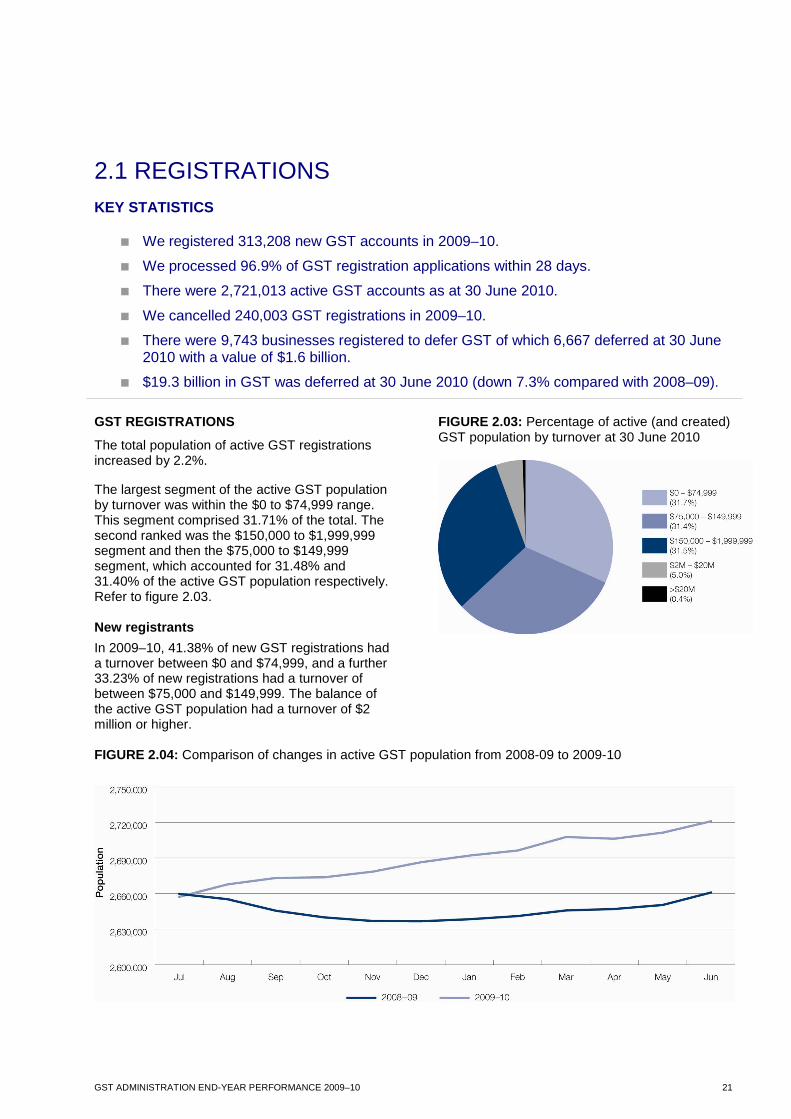
The total population of active GST registrations increased by 2.2%. The largest segment of the active GST population by turnover was within the $0 to $74,999 range. This segment comprised 31.71% of the total. The second ranked was the $150,000 to $1,999,999 segment and then the $75,000 to $149,999 segment, which accounted for 31.48% and 31.40% of the active GST population respectively. Refer to figure 2.03. New registrants
In 2009–10, 41.38% of new GST registrations had a turnover between $0 and $74,999, and a further 33.23% of new registrations had a turnover of between $75,000 and $149,999. The balance of the active GST population had a turnover of $2 million or higher.
FIGURE 2.03: Percentage of active (and created) GST population by turnover at 30 June 2010
FIGURE 2.04: Comparison of changes in active GST population from 2008-09 to 2009-10
22 GST ADMINISTRATION END-YEAR PERFORMANCE 2009–10
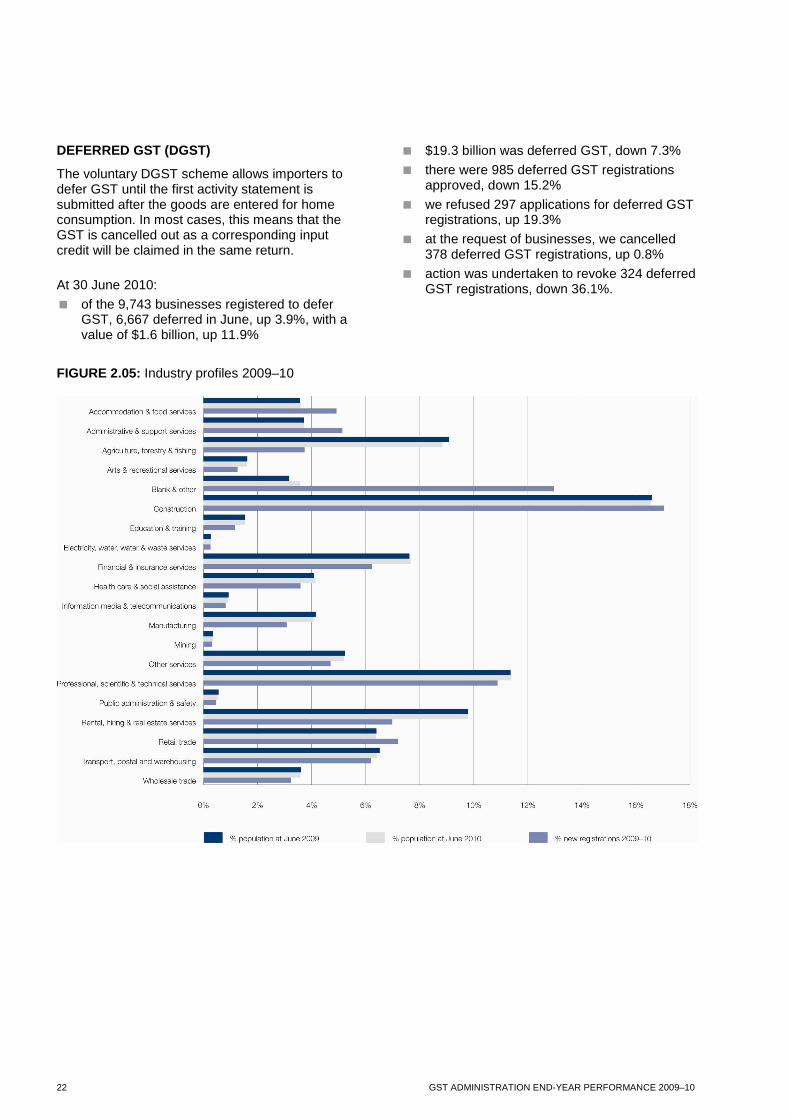
DEFERRED GST (DGST)
The voluntary DGST scheme allows importers to defer GST until the first activity statement is submitted after the goods are entered for home consumption. In most cases, this means that the GST is cancelled out as a corresponding input credit will be claimed in the same return.
At 30 June 2010:
� of the 9,743 businesses registered to defer GST, 6,667 deferred in June, up 3.9%, with a value of $1.6 billion, up 11.9%
� $19.3 billion was deferred GST, down 7.3%
� there were 985 deferred GST registrations approved, down 15.2%
� we refused 297 applications for deferred GST registrations, up 19.3%
� at the request of businesses, we cancelled 378 deferred GST registrations, up 0.8%
� action was undertaken to revoke 324 deferred GST registrations, down 36.1%.
FIGURE 2.05: Industry profiles 2009–10
GST ADMINISTRATION END-YEAR PERFORMANCE 2009–10 23
2.2 PROCESSING AND ACCOUNTS
KEY STATISTICS
� We processed 9,891,610 activity statements (down 1.5%).
� We banked 11,571,164 activity statement-related payments with a value of $207.7 billion (up 0.9% in number and down 2.8% in value).
� We issued 2,071,057 activity statement refunds with a value of $43.9 billion (down 16.2% in number and down 14.4% in value).7
� We processed 97.8% of original activity statement refunds within 14 days (up 3.1%).7
� We paid $9.7 million in interest on delayed refunds (down 27.5%).8
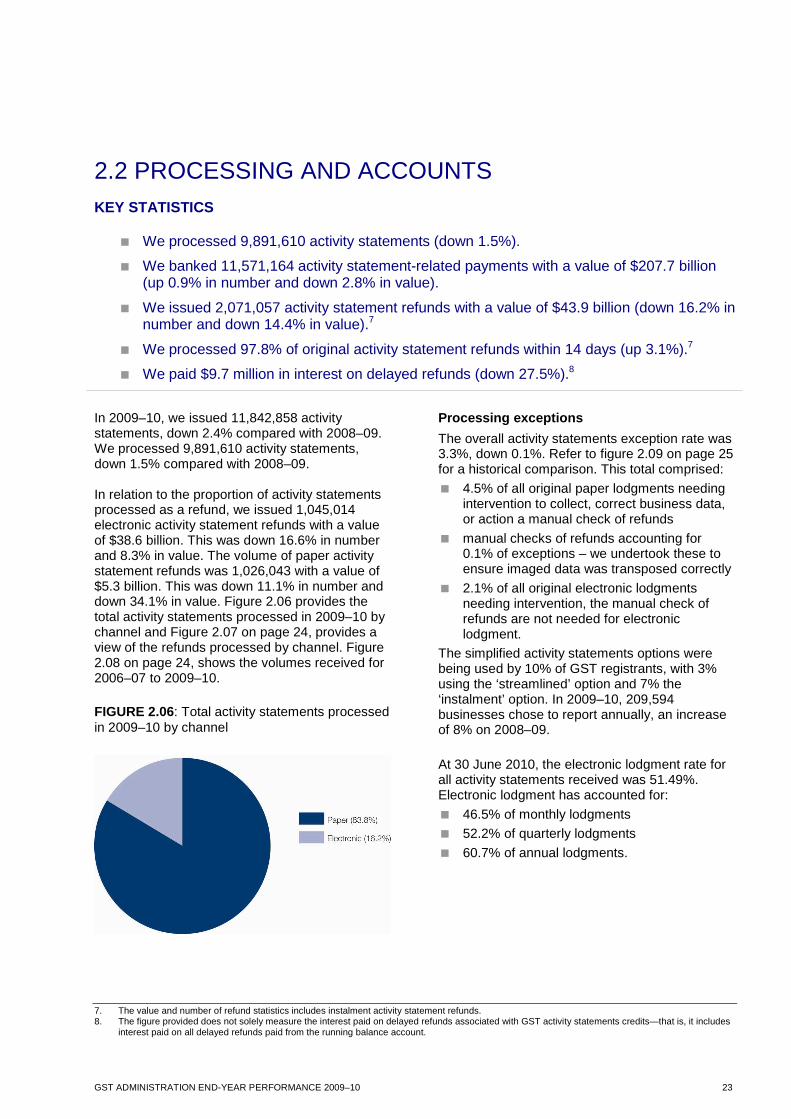
In 2009–10, we issued 11,842,858 activity statements, down 2.4% compared with 2008–09. We processed 9,891,610 activity statements, down 1.5% compared with 2008–09. In relation to the proportion of activity statements processed as a refund, we issued 1,045,014 electronic activity statement refunds with a value of $38.6 billion. This was down 16.6% in number and 8.3% in value. The volume of paper activity statement refunds was 1,026,043 with a value of $5.3 billion. This was down 11.1% in number and down 34.1% in value. Figure 2.06 provides the total activity statements processed in 2009–10 by channel and Figure 2.07 on page 24, provides a view of the refunds processed by channel. Figure 2.08 on page 24, shows the volumes received for 2006–07 to 2009–10.
FIGURE 2.06: Total activity statements processed in 2009–10 by channel
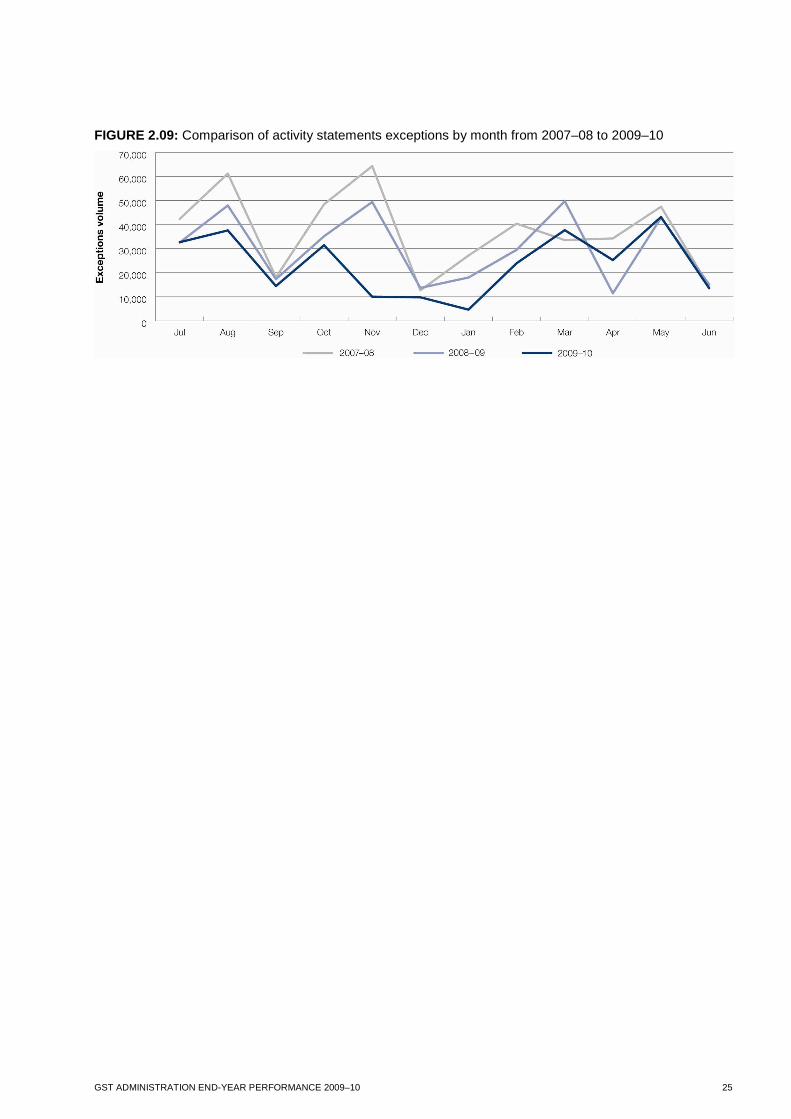
Processing exceptions
The overall activity statements exception rate was 3.3%, down 0.1%. Refer to figure 2.09 on page 25 for a historical comparison. This total comprised:
� 4.5% of all original paper lodgments needing intervention to collect, correct business data, or action a manual check of refunds
� manual checks of refunds accounting for 0.1% of exceptions – we undertook these to ensure imaged data was transposed correctly
� 2.1% of all original electronic lodgments needing intervention, the manual check of refunds are not needed for electronic lodgment.
The simplified activity statements options were being used by 10% of GST registrants, with 3% using the ‘streamlined’ option and 7% the ‘instalment’ option. In 2009–10, 209,594 businesses chose to report annually, an increase of 8% on 2008–09.
At 30 June 2010, the electronic lodgment rate for all activity statements received was 51.49%. Electronic lodgment has accounted for:
� 46.5% of monthly lodgments
� 52.2% of quarterly lodgments
� 60.7% of annual lodgments.
7. The value and number of refund statistics includes instalment activity statement refunds. 8. The figure provided does not solely measure the interest paid on delayed refunds associated with GST activity statements credits—that is, it includes
interest paid on all delayed refunds paid from the running balance account.
24 GST ADMINISTRATION END-YEAR PERFORMANCE 2009–10
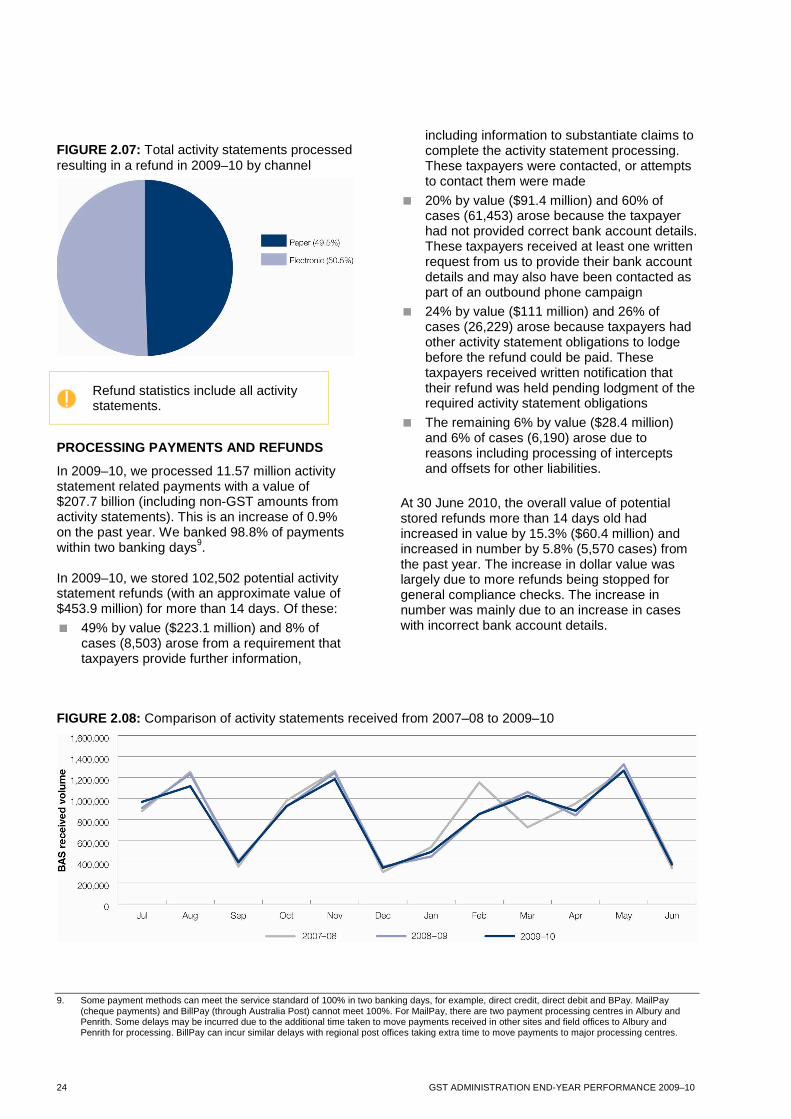
FIGURE 2.07: Total activity statements processed resulting in a refund in 2009–10 by channel
Refund statistics include all activity statements.
PROCESSING PAYMENTS AND REFUNDS
In 2009–10, we processed 11.57 million activity statement related payments with a value of $207.7 billion (including non-GST amounts from activity statements). This is an increase of 0.9% on the past year. We banked 98.8% of payments within two banking days9. In 2009–10, we stored 102,502 potential activity statement refunds (with an approximate value of $453.9 million) for more than 14 days. Of these:
� 49% by value ($223.1 million) and 8% of cases (8,503) arose from a requirement that taxpayers provide further information,
including information to substantiate claims to complete the activity statement processing. These taxpayers were contacted, or attempts to contact them were made
� 20% by value ($91.4 million) and 60% of cases (61,453) arose because the taxpayer had not provided correct bank account details. These taxpayers received at least one written request from us to provide their bank account details and may also have been contacted as part of an outbound phone campaign
� 24% by value ($111 million) and 26% of cases (26,229) arose because taxpayers had other activity statement obligations to lodge before the refund could be paid. These taxpayers received written notification that their refund was held pending lodgment of the required activity statement obligations
� The remaining 6% by value ($28.4 million) and 6% of cases (6,190) arose due to reasons including processing of intercepts and offsets for other liabilities.
At 30 June 2010, the overall value of potential stored refunds more than 14 days old had increased in value by 15.3% ($60.4 million) and increased in number by 5.8% (5,570 cases) from the past year. The increase in dollar value was largely due to more refunds being stopped for general compliance checks. The increase in number was mainly due to an increase in cases with incorrect bank account details.
FIGURE 2.08: Comparison of activity statements received from 2007–08 to 2009–10
9. Some payment methods can meet the service standard of 100% in two banking days, for example, direct credit, direct debit and BPay. MailPay (cheque payments) and BillPay (through Australia Post) cannot meet 100%. For MailPay, there are two payment processing centres in Albury and Penrith. Some delays may be incurred due to the additional time taken to move payments received in other sites and field offices to Albury and Penrith for processing. BillPay can incur similar delays with regional post offices taking extra time to move payments to major processing centres.
GST ADMINISTRATION END-YEAR PERFORMANCE 2009–10 25
FIGURE 2.09: Comparison of activity statements exceptions by month from 2007–08 to 2009–10
26 GST ADMINISTRATION END-YEAR PERFORMANCE 2009–10
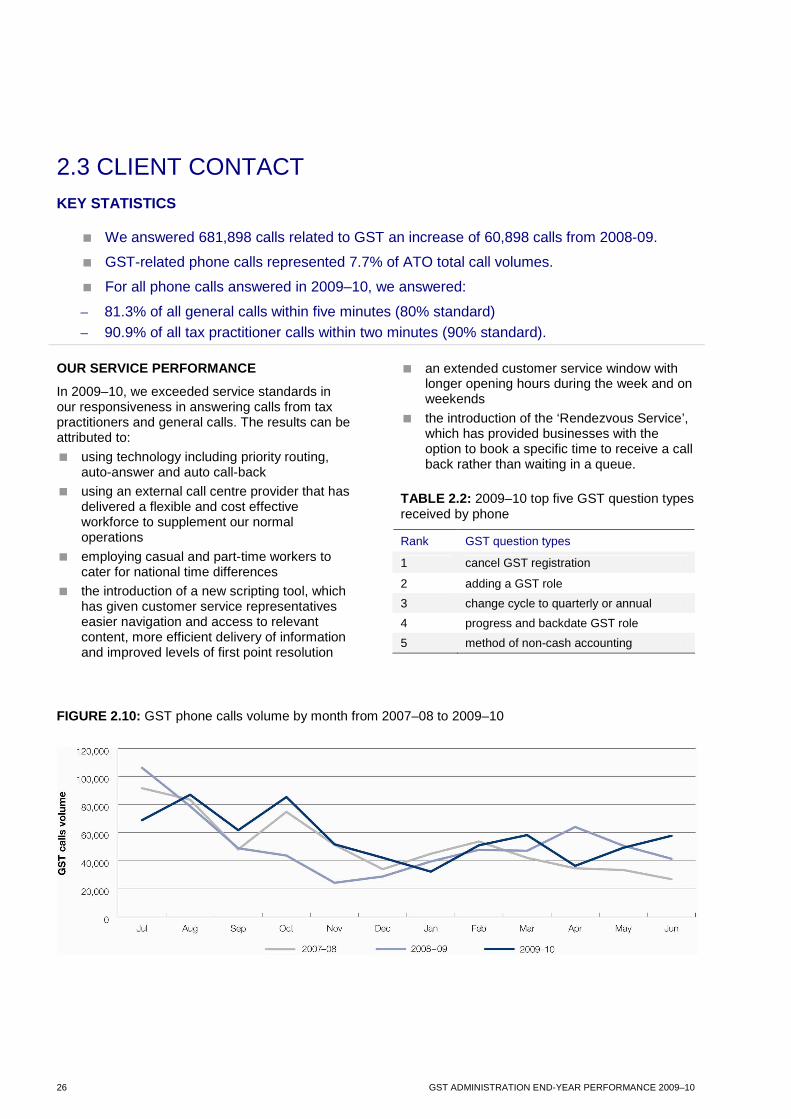
2.3 CLIENT CONTACT KEY STATISTICS
� We answered 681,898 calls related to GST an increase of 60,898 calls from 2008-09.
� GST-related phone calls represented 7.7% of ATO total call volumes.
� For all phone calls answered in 2009–10, we answered:
– 81.3% of all general calls within five minutes (80% standard) – 90.9% of all tax practitioner calls within two minutes (90% standard).
OUR SERVICE PERFORMANCE
In 2009–10, we exceeded service standards in our responsiveness in answering calls from tax practitioners and general calls. The results can be attributed to:
� using technology including priority routing, auto-answer and auto call-back
� using an external call centre provider that has delivered a flexible and cost effective workforce to supplement our normal operations
� employing casual and part-time workers to cater for national time differences
� the introduction of a new scripting tool, which has given customer service representatives easier navigation and access to relevant content, more efficient delivery of information and improved levels of first point resolution
� an extended customer service window with longer opening hours during the week and on weekends
� the introduction of the ‘Rendezvous Service’, which has provided businesses with the option to book a specific time to receive a call back rather than waiting in a queue.
TABLE 2.2: 2009–10 top five GST question types received by phone
Rank GST question types
1 cancel GST registration
2 adding a GST role
3 change cycle to quarterly or annual
4 progress and backdate GST role
5 method of non-cash accounting
FIGURE 2.10: GST phone calls volume by month from 2007–08 to 2009–10
GST ADMINISTRATION END-YEAR PERFORMANCE 2009–10 27
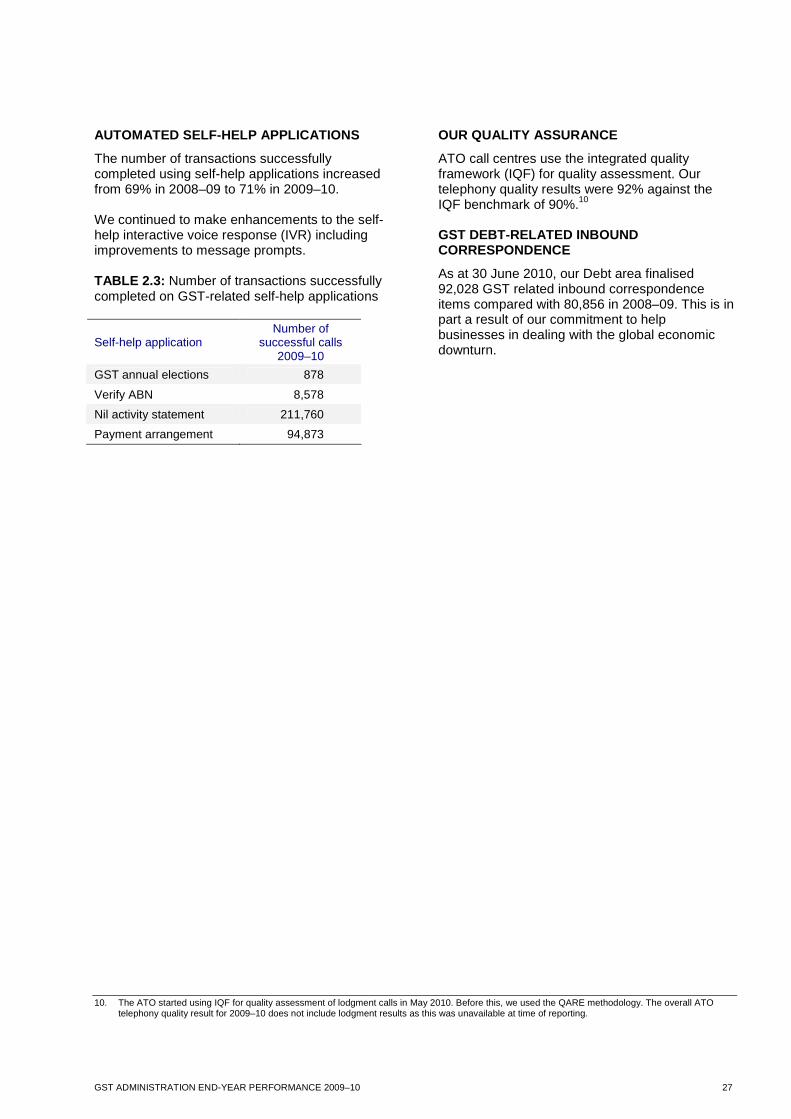
AUTOMATED SELF-HELP APPLICATIONS
The number of transactions successfully completed using self-help applications increased from 69% in 2008–09 to 71% in 2009–10. We continued to make enhancements to the self-help interactive voice response (IVR) including improvements to message prompts. TABLE 2.3: Number of transactions successfully completed on GST-related self-help applications
Self-help application Number of
successful calls 2009–10
GST annual elections 878
Verify ABN 8,578
Nil activity statement 211,760
Payment arrangement 94,873
OUR QUALITY ASSURANCE
ATO call centres use the integrated quality framework (IQF) for quality assessment. Our telephony quality results were 92% against the IQF benchmark of 90%.10 GST DEBT-RELATED INBOUND CORRESPONDENCE
As at 30 June 2010, our Debt area finalised 92,028 GST related inbound correspondence items compared with 80,856 in 2008–09. This is in part a result of our commitment to help businesses in dealing with the global economic downturn.
10. The ATO started using IQF for quality assessment of lodgment calls in May 2010. Before this, we used the QARE methodology. The overall ATO telephony quality result for 2009–10 does not include lodgment results as this was unavailable at time of reporting.
28 GST ADMINISTRATION END-YEAR PERFORMANCE 2009–10
2.4 DEBT COLLECTION KEY STATISTICS
� Estimated total GST debt outstanding at 30 June 2010 was $4.289 billion.11
� Collectable GST debt outstanding at 30 June 2010 was estimated to be $3.152 billion.11
� In 2009–10 the value of collectable GST debt increased by 10.55%12 compared to 7.14% in 2008–09.
� 668,433 activity statement payment reminder letters were issued.
� In 2009–10, $641.3 million of GST was written off compared to $650.2 million for 2008–09 which is substantially up on pre global economic downturn years at $482.7 million in 2007–08 and $451.4 million in 2006–07.
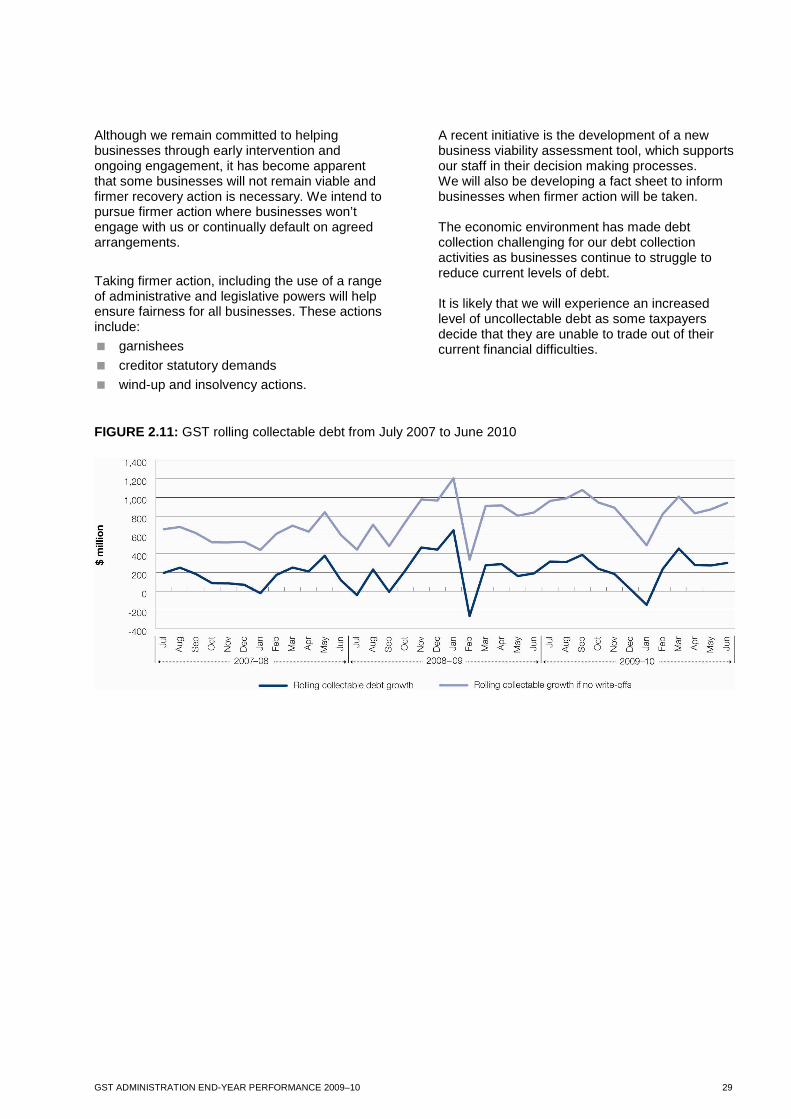
During the year, GST collectable debt grew by 10.55% compared to 7.14% in 2008-09. We saw an 8% increase in the value of activity statement payment arrangements entered into during the year. We focused on supporting viable small business to remain engaged in the tax system. The growth in GST collectable debt and level of GST debt write-off can largely be attributed to ongoing impacts of the global economic downturn. Small businesses in our micro-market segment (with an annual turnover of less than $2 million) continued to account for the majority of activity statement debt, representing 69% of collectable debt holdings and 73% of cases. They remain a key focus area for us. On 1 June 2009, we introduced two key measures to help small businesses facing temporary difficulties. The measures were:
� 12-month GIC free payment arrangements where businesses agree to direct debit or are able to demonstrate on-going viability
� deferred activity statement payment due dates.
We have now extended these measures for a further 12 months, until 30 June 2011. Other assistance to businesses in meeting their payment obligations included:
� the introduction of credit cards as a payment option on a business-as-usual basis and increasing the maximum payment limit of $50,000 (this follows an evaluation of a pilot conducted in 2009). Over the year, businesses made 72,824 payments with a value of $420 million12
� access to a payment arrangement calculator on our website
� making it easier for businesses to find information that will help them deal with a tax debt by creating a dedicated page on our website.
The Debt Collection Enhancement Project, which contributes to our efforts to contain GST debt growth continues to be on track overall. Activities include:
� our use of external collection agencies is an important part of our efforts to collect GST debt. During the year, some 440,000 activity statement cases were referred to external collection agencies. Activity statement referrals accounted for 87% of all cases referred. In 2009–10, the return on investment for the use of the mercantile agencies was around $23 for every $1 expended. This return reflects the high collection nature of the cases referred. The values are based on payments made using the external collection agents payment slip
� more than 670,000 ATO initiated conversations, using dialler technology with clients were made to address their debt.
.
11. GST collectable debt and attribution rate for June 2010 is provisional until RAB receive ANAO sign off. 12. Figures relate to all revenue types.
GST ADMINISTRATION END-YEAR PERFORMANCE 2009–10 29
Although we remain committed to helping businesses through early intervention and ongoing engagement, it has become apparent that some businesses will not remain viable and firmer recovery action is necessary. We intend to pursue firmer action where businesses won’t engage with us or continually default on agreed arrangements.
Taking firmer action, including the use of a range of administrative and legislative powers will help ensure fairness for all businesses. These actions include:
� garnishees
� creditor statutory demands
� wind-up and insolvency actions.
A recent initiative is the development of a new business viability assessment tool, which supports our staff in their decision making processes. We will also be developing a fact sheet to inform businesses when firmer action will be taken. The economic environment has made debt collection challenging for our debt collection activities as businesses continue to struggle to reduce current levels of debt. It is likely that we will experience an increased level of uncollectable debt as some taxpayers decide that they are unable to trade out of their current financial difficulties.
FIGURE 2.11: GST rolling collectable debt from July 2007 to June 2010
30 GST ADMINISTRATION END-YEAR PERFORMANCE 2009–10
3.1 MARKETING COMMUNICATIONS KEY STATISTICS
� We supported the BoT review recommendations and have:
– updated 25 GST related information products – updated 22 industry issue registers to reflect these changes – published seven new products on our website to inform businesses of the
recommendations. � We sent the activity statement service provider newsletter via email to more than 4,900
subscribers.
� We sent 159,765 printed GST information products to taxpayers via the publication ordering service.
� We published 36 new GST information products and over 100 small business benchmarks on our website.
� We updated over 320 GST information products on our website.
GST COMMUNICATION ACTIVITIES AND PRODUCTS
We undertook wide-ranging communications activities to support the implementation of the BoT review recommendations. We provided timely information about relevant changes to GST law and communicated them to businesses, tax agents, bookkeepers and industry associations. To reflect the changes in law we also:
� updated 25 GST related information products
� updated 22 industry issues registers to reflect these changes
� published seven new products on our website to inform businesses of the recommendations.
To address specific risks and community needs, we developed communication products including:
� small business support pages on our website, which lists information and support relevant to small businesses at any stage of the business life cycle
� GST and integrity of business systems fact sheet to alert businesses to the risk of incorrectly reporting GST due to failure in their systems for recording and reporting
� two topic guides on our website, one each for GST and luxury car tax.
SMALL BUSINESS BENCHMARKS
By 30 June 2010, we had published over 100 small business benchmarks to:
� help businesses meet their tax obligations by enabling them to compare their performance against the rest of their industry
� help us to identify businesses that may be avoiding their tax obligations by not reporting some or all of their business income.
We promoted the small business benchmarks extensively through a combination of articles, media releases and paid advertising. As part of our small business assistance program we have published a range of online information and tools. There is also a small business support web page, which had 46,064 views as at 30 June 2010. This also contains self-help calculators and links to frequently requested publications. ONLINE SERVICES
A key focus of our marketing communications activity is to increase the take-up of ATO online services. We have been promoting the government initiative of SBR. This is designed to reduce the reporting burden for businesses in Australia. We are one of 12 participating agencies, which also include state and territory revenue offices.
GST ADMINISTRATION END-YEAR PERFORMANCE 2009–10 31
This will offer Australian businesses, accountants, bookkeepers, registered BAS agents, registered tax agents and payroll professionals a quicker and simpler way to prepare and lodge reports to government. As well as making it possible to complete reports in accounting systems, SBR also provides the connection between the user's accounting system and the participating agencies. As with our online portals, SBR is secured by AUSkey. AUSkey was launched in May 2010 and offers improvements over our existing digital certificate system including:
� a quick and easy registration process
� an online management facility.
For more information, visit our website at www.ato.gov.au/onlineservices
NON-ENGLISH SPEAKING BACKGROUND, INDIGENOUS AND DISABILITY BUSINESS PARTICIPANTS
We have continued to communicate GST information to our diverse business participants. For non-English speaking background business participants, we have:
� produced monthly tax segments in 22 languages broadcast nationally on SBS and 17 community or local radio stations. Segments in Vietnamese, Cantonese and Mandarin provided the opportunity for listeners to phone in with questions in a ‘talk-back’ section
� delivered information at 39 community events and/or tax expositions, 52 community tax advisory service visits and 77 GST-focused seminars
� prepared and issued the following in-language products
– Tax in Australia, ABN entitlement and GST requirements (translated in Chinese) and published in the Australian immigration book (Chinese edition)
– small business benchmarks – flyer and fact sheet translated into eight languages
– small business benchmarks article translated into 11 languages
– GST fraud and cash economy editorials and media releases translated into seven languages, published on our website and sent to 41 ethnic newspapers.
For Indigenous communities, we have presented information and answered queries on tax basics (including GST) for Indigenous businesses in Melbourne and regional Victoria through the Koori Business Network. We have also been working collaboratively with Aboriginal Affairs Victoria, the Registrar of Indigenous Corporations and Swinburne University to administer governance training to Indigenous organisations that includes GST information. The training provides Indigenous organisations with the skills and knowledge to run effective organisations and improve service delivery in their community sector. Additionally, for Indigenous and disability audiences, radio segments on the National Indigenous Radio Service and Radio for the Print Handicapped went to air in October 2009 to coincide with the launch of the small business benchmarks. This work will continue through 2010–11.
32 GST ADMINISTRATION END-YEAR PERFORMANCE 2009–10
3.2 INTERPRETATIVE ASSISTANCE AND 1.5 LAW ASSURANCE KEY STATISTICS
� We issued 13 ATO interpretative decisions (ATO IDs) and withdrew seven.
� We issued two GST draft rulings.
� We issued one GST draft determination and two final GST determinations.
� We finalised 4,753 requests for technical advice.
� We finalised 1,216 objections.
� We finalised 15 priority technical issues.
RESPONSE TO WRITTEN TECHNICAL ADVICE
Our response to written technical advice was below the Taxpayers’ Charter benchmarks or service standards. Our performance was adversely affected by the introduction of our new interpretative assistance system as part of the Change Program, including a lack of familiarity of staff with these new systems. To mitigate this, we implemented a number of strategies during 2009–10, including:
� providing support and training in relation to the Siebel system in Interpretative Assistance
� focusing on revising our work practices and procedures
� introducing a more formal and structured approach to active case management.
Throughout the year we progressively improved on the achievement of the Taxpayers’ Charter benchmarks, and we met the benchmarks for the month of June 2010. We are continuing to meet our service standards in 2010–11.
In addition, we finalised 3% more cases than received, bringing down our overall stock on hand.
INTERPRETATIVE ADVICE AND PRIVATE RULINGS
The following categories of advice were prominent in our work during the year:
� privatisations
� mining, resource and energy sales
� property issues
– sale of property and whether it is the sale of commercial residential property or residential property (fit for human habitation)
– retirement village issues
– sale of property as a going concern
� financial supplies and insolvency
� classification of food items.
OBJECTIONS
We received more objections than anticipated in 2009–10. It was predominantly due to the focus of active compliance on motor vehicle incentives claimed by the motor vehicle industry. It is envisaged that this issue will continue into the 2010–11 year. TABLE 2.4: Number of objections finalised and received from 2006–07 to 2009–10
Objections Finalised Received
2006-07 3,420 2,684
2007-08 1,854 1,226
2008-09 1,295 1,156
2009-10 1,216 1,507
DIFFERENTIATED SERVICE MODEL
In December 2009, we implemented a pilot program to provide a differentiated service. This was in respect of the resolution of private binding ruling requests and objections of clients of the top four accounting firms and large law firms. This was known as the Differentiated Service Model (DSM). The pilot aimed to improve our administration of complex technical issues. We were seeking to balance timeliness and accuracy in our management of complex technical topics with improved certainty for the taxpayer. We planned to achieve these outcomes by having
GST ADMINISTRATION END-YEAR PERFORMANCE 2009–10 33
a shared commitment from both the ATO and the taxpayer or their representative to undertake regular communication, identify issues early, consult and share all relevant information in a timely and structured manner. All parties involved in the pilot were committed to certain service delivery standards and escalation points were established. Feedback from internal and external stakeholders indicated that the pilot was successful and delivered an improved service for the participants. We have since expanded the program to all large taxpayers, including the government and their advisors. It is now known as the Early Engagement approach.
CASE STUDY: interpretative assistance
In December 2009, we received an urgent request for a private binding ruling from a large accounting firm in regards to a client who was about to dispose of a high profile asset. They were seeking confirmation that the supply of the asset would be GST-free. The accounting firm lodged hundreds of pages of documents and asked for urgent consideration given that settlement of the contract was due to occur at the end of January 2010. Through the DSM, senior leadership was involved early in the preparation of the rulings. By working together in a cooperative manner we were able to finalise the private binding ruling and issue it as requested before the asset sale had occurred. The accounting firm subsequently contacted us with the following message: ‘I greatly appreciate the manner in which you carried out this assignment, by working cooperatively with us to issue the ruling within the required timeframe and for keeping us informed as to the progress of the application at all times. I think this is a great example of how we can work together in achieving efficient and effective outcomes for business. Once again, thank-you and your team for all of your help in respect of our ruling applications.’
WRITTEN ADVICE TECHNICAL QUALITY ASSURANCE
We now use the IQF to assure the quality of our written advice. Assessments have been undertaken across nine key quality elements during 2009–10, including:
� administrative soundness
� integrity
� correctness
� appropriateness.
Approximately 90% of cases have met the quality standards. Assessment data will continue to be analysed to identify and alert us to opportunities for improvement. GST RULINGS PROGRAM
The following GST public rulings and determinations were issued in 2009–10:
� GST Ruling 2009/D1 - Goods and services tax: application of subsection 11-15(5) of the A New Tax System (Goods and Services Tax) Act 1999 to acquisitions relating to the provision of accounts by Australian authorised deposit taking institutions
� GST Ruling 2010/D1 - Goods and services tax: interest-free loans received by the developer of a retirement village
� GST Determination 2009/D2 - Goods and services tax: Are there GST consequences where a land owner engages the services of an associate to arrange construction of residential premises for lease under an arrangement described in Taxpayer Alert TA 2009/5?
� GST Determination 2009/2 – Goods and services tax: Are there GST consequences where a partner in a partnership takes goods held as trading stock for private or domestic purposes.
34 GST ADMINISTRATION END-YEAR PERFORMANCE 2009–10
ADOPTING THE GENERAL RULINGS SYSTEM FOR INDIRECT TAXES AND EXCISE
On 28 June 2010, the Tax Laws Amendment (2010 GST Administration Measures No. 2) Act 2010 received royal assent. Schedule 2 to this Act amends the GST Act, the Excise Act 1901, the TAA and the Income Tax Assessment Act 1997 (ITAA 1997) to include indirect tax rulings and excise advice in the general rulings regime that applies to income tax and other taxes. The change will apply to:
� indirect tax and excise rulings made by the Commissioner of Taxation on or after 1 July 2010
� private indirect tax rulings that have been applied for, or that are in operation immediately before 1 July 2010
� public indirect tax rulings that are gazetted or labelled as public rulings on or before 30 June 2010.
We invested in the development of processes to support the introduction of the new rulings system. In preparation for the alignment, all published indirect tax material that had not been labelled or gazetted as a public ruling were reviewed in consultation with the National Tax Liaison Group (NTLG) GST Sub-committee, and relevant ATO industry forums. In total, this constituted approximately 1,800 products and issues listed in issue registers. The results of this product review was that there were 47 issues that identified the ATO view in issue registers or products that were not labelled as public rulings. These items were published on our website. The NTLG GST Sub-committee members and industry were encouraged to provide their views regarding the significance of those issues. The issues were reviewed by a panel of senior ATO officers and external members of the Public Rulings Panel to determine the most significant issues for conversion to a public ruling product. Once the outcome of this review is finalised the program of work will be progressed.
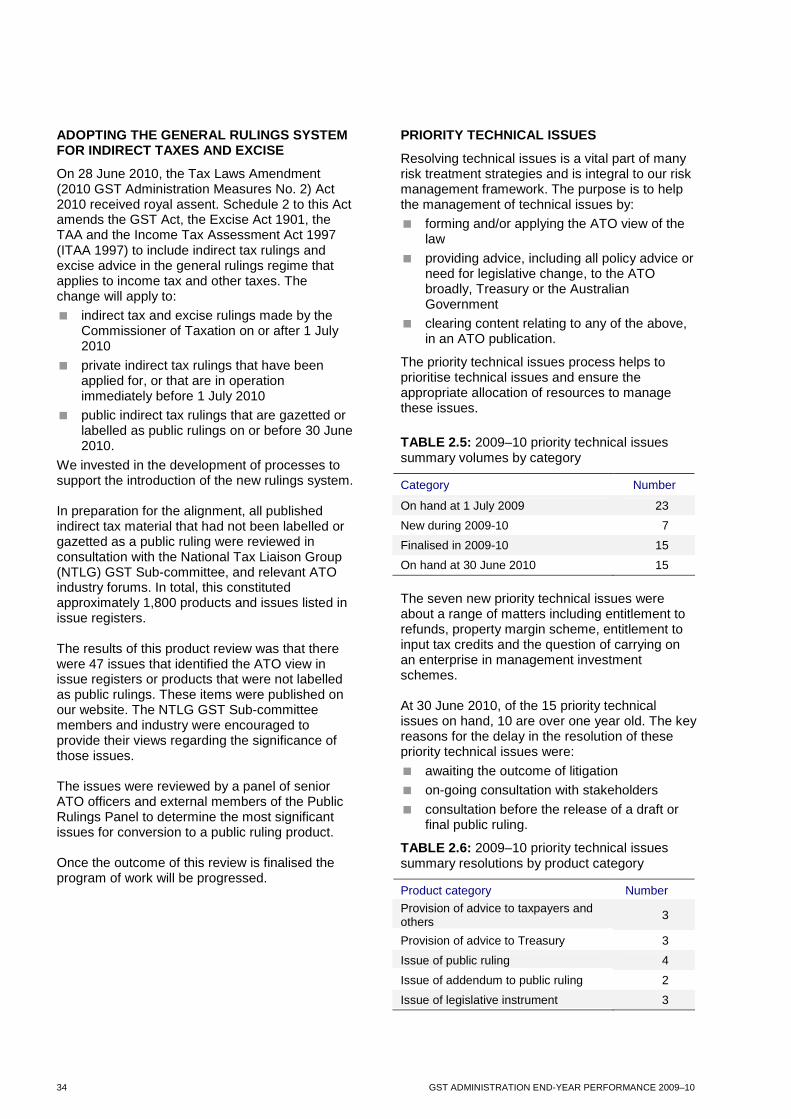
PRIORITY TECHNICAL ISSUES
Resolving technical issues is a vital part of many risk treatment strategies and is integral to our risk management framework. The purpose is to help the management of technical issues by:
� forming and/or applying the ATO view of the law
� providing advice, including all policy advice or need for legislative change, to the ATO broadly, Treasury or the Australian Government
� clearing content relating to any of the above, in an ATO publication.
The priority technical issues process helps to prioritise technical issues and ensure the appropriate allocation of resources to manage these issues.
TABLE 2.5: 2009–10 priority technical issues summary volumes by category
Category Number
On hand at 1 July 2009 23
New during 2009-10 7
Finalised in 2009-10 15
On hand at 30 June 2010 15
The seven new priority technical issues were about a range of matters including entitlement to refunds, property margin scheme, entitlement to input tax credits and the question of carrying on an enterprise in management investment schemes. At 30 June 2010, of the 15 priority technical issues on hand, 10 are over one year old. The key reasons for the delay in the resolution of these priority technical issues were:
� awaiting the outcome of litigation
� on-going consultation with stakeholders
� consultation before the release of a draft or final public ruling.
TABLE 2.6: 2009–10 priority technical issues summary resolutions by product category
Product category Number
Provision of advice to taxpayers and others 3
Provision of advice to Treasury 3
Issue of public ruling 4
Issue of addendum to public ruling 2
Issue of legislative instrument 3
GST ADMINISTRATION END-YEAR PERFORMANCE 2009–10 35
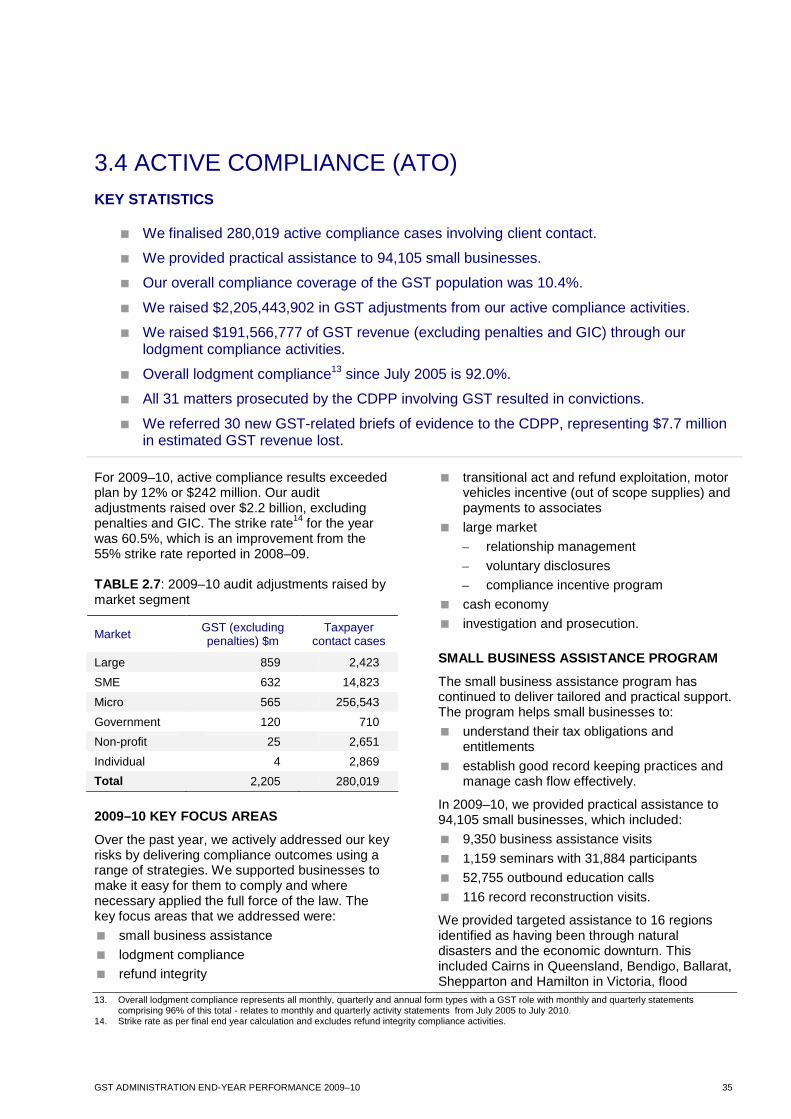
3.4 ACTIVE COMPLIANCE (ATO) KEY STATISTICS
� We finalised 280,019 active compliance cases involving client contact.
� We provided practical assistance to 94,105 small businesses.
� Our overall compliance coverage of the GST population was 10.4%.
� We raised $2,205,443,902 in GST adjustments from our active compliance activities.
� We raised $191,566,777 of GST revenue (excluding penalties and GIC) through our lodgment compliance activities.
� Overall lodgment compliance13 since July 2005 is 92.0%.
� All 31 matters prosecuted by the CDPP involving GST resulted in convictions.
� We referred 30 new GST-related briefs of evidence to the CDPP, representing $7.7 million in estimated GST revenue lost.
For 2009–10, active compliance results exceeded plan by 12% or $242 million. Our audit adjustments raised over $2.2 billion, excluding penalties and GIC. The strike rate14 for the year was 60.5%, which is an improvement from the 55% strike rate reported in 2008–09. TABLE 2.7 : 2009–10 audit adjustments raised by market segment
Market GST (excluding penalties) $m
Taxpayer contact cases
Large 859 2,423
SME 632 14,823
Micro 565 256,543
Government 120 710
Non-profit 25 2,651
Individual 4 2,869
Total 2,205 280,019 ,
2009–10 KEY FOCUS AREAS
Over the past year, we actively addressed our key risks by delivering compliance outcomes using a range of strategies. We supported businesses to make it easy for them to comply and where necessary applied the full force of the law. The key focus areas that we addressed were:
� small business assistance
� lodgment compliance
� refund integrity
� transitional act and refund exploitation, motor vehicles incentive (out of scope supplies) and payments to associates
� large market
– relationship management
– voluntary disclosures
– compliance incentive program
� cash economy
� investigation and prosecution.
SMALL BUSINESS ASSISTANCE PROGRAM
The small business assistance program has continued to deliver tailored and practical support. The program helps small businesses to:
� understand their tax obligations and entitlements
� establish good record keeping practices and manage cash flow effectively.
In 2009–10, we provided practical assistance to 94,105 small businesses, which included:
� 9,350 business assistance visits
� 1,159 seminars with 31,884 participants
� 52,755 outbound education calls
� 116 record reconstruction visits.
We provided targeted assistance to 16 regions identified as having been through natural disasters and the economic downturn. This included Cairns in Queensland, Bendigo, Ballarat, Shepparton and Hamilton in Victoria, flood
13. Overall lodgment compliance represents all monthly, quarterly and annual form types with a GST role with monthly and quarterly statements comprising 96% of this total - relates to monthly and quarterly activity statements from July 2005 to July 2010.
14. Strike rate as per final end year calculation and excludes refund integrity compliance activities.
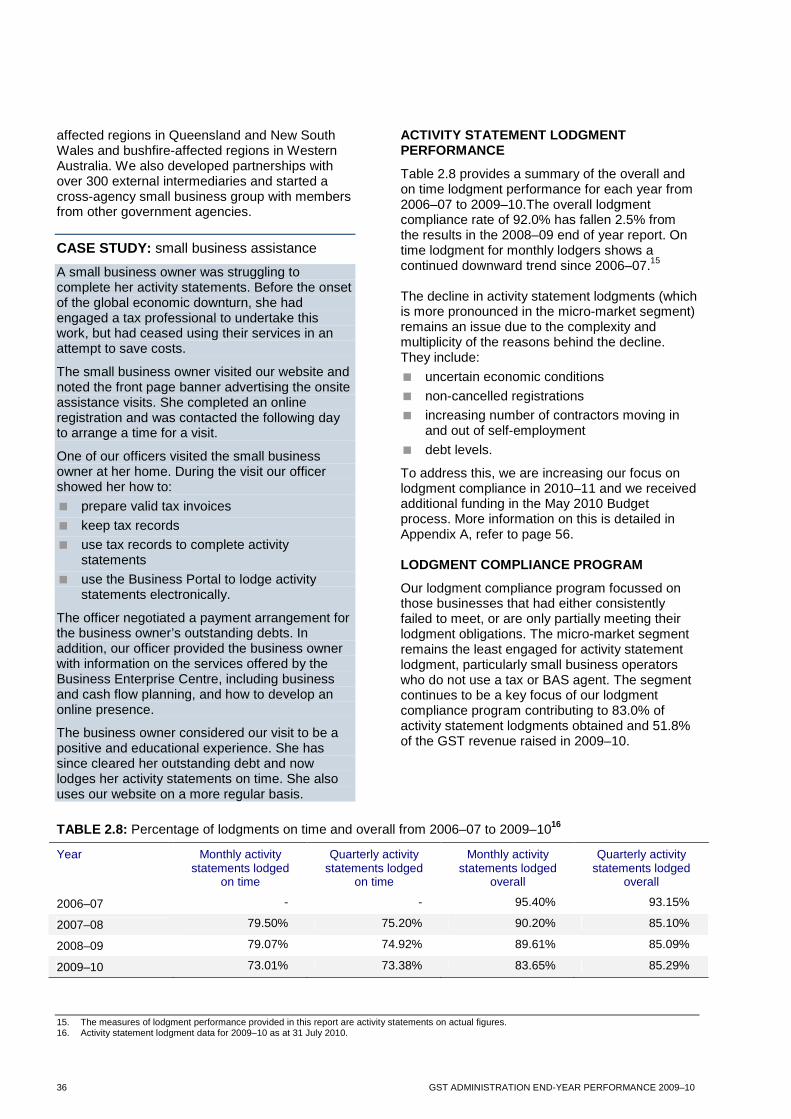
36 GST ADMINISTRATION END-YEAR PERFORMANCE 2009–10
affected regions in Queensland and New South Wales and bushfire-affected regions in Western Australia. We also developed partnerships with over 300 external intermediaries and started a cross-agency small business group with members from other government agencies.
CASE STUDY: small business assistance
A small business owner was struggling to complete her activity statements. Before the onset of the global economic downturn, she had engaged a tax professional to undertake this work, but had ceased using their services in an attempt to save costs.
The small business owner visited our website and noted the front page banner advertising the onsite assistance visits. She completed an online registration and was contacted the following day to arrange a time for a visit.
One of our officers visited the small business owner at her home. During the visit our officer showed her how to:
� prepare valid tax invoices
� keep tax records
� use tax records to complete activity statements
� use the Business Portal to lodge activity statements electronically.
The officer negotiated a payment arrangement for the business owner’s outstanding debts. In addition, our officer provided the business owner with information on the services offered by the Business Enterprise Centre, including business and cash flow planning, and how to develop an online presence.
The business owner considered our visit to be a positive and educational experience. She has since cleared her outstanding debt and now lodges her activity statements on time. She also uses our website on a more regular basis.
ACTIVITY STATEMENT LODGMENT PERFORMANCE
Table 2.8 provides a summary of the overall and on time lodgment performance for each year from 2006–07 to 2009–10.The overall lodgment compliance rate of 92.0% has fallen 2.5% from the results in the 2008–09 end of year report. On time lodgment for monthly lodgers shows a continued downward trend since 2006–07.15 The decline in activity statement lodgments (which is more pronounced in the micro-market segment) remains an issue due to the complexity and multiplicity of the reasons behind the decline. They include:
� uncertain economic conditions
� non-cancelled registrations
� increasing number of contractors moving in and out of self-employment
� debt levels.
To address this, we are increasing our focus on lodgment compliance in 2010–11 and we received additional funding in the May 2010 Budget process. More information on this is detailed in Appendix A, refer to page 56. LODGMENT COMPLIANCE PROGRAM
Our lodgment compliance program focussed on those businesses that had either consistently failed to meet, or are only partially meeting their lodgment obligations. The micro-market segment remains the least engaged for activity statement lodgment, particularly small business operators who do not use a tax or BAS agent. The segment continues to be a key focus of our lodgment compliance program contributing to 83.0% of activity statement lodgments obtained and 51.8% of the GST revenue raised in 2009–10.
TABLE 2.8: Percentage of lodgments on time and overall from 2006–07 to 2009–1016
Year Monthly activity statements lodged
on time
Quarterly activity statements lodged
on time
Monthly activity statements lodged
overall
Quarterly activity statements lodged
overall
2006–07 - - 95.40% 93.15%
2007–08 79.50% 75.20% 90.20% 85.10%
2008–09 79.07% 74.92% 89.61% 85.09%
2009–10 73.01% 73.38% 83.65% 85.29%
15. The measures of lodgment performance provided in this report are activity statements on actual figures. 16. Activity statement lodgment data for 2009–10 as at 31 July 2010.
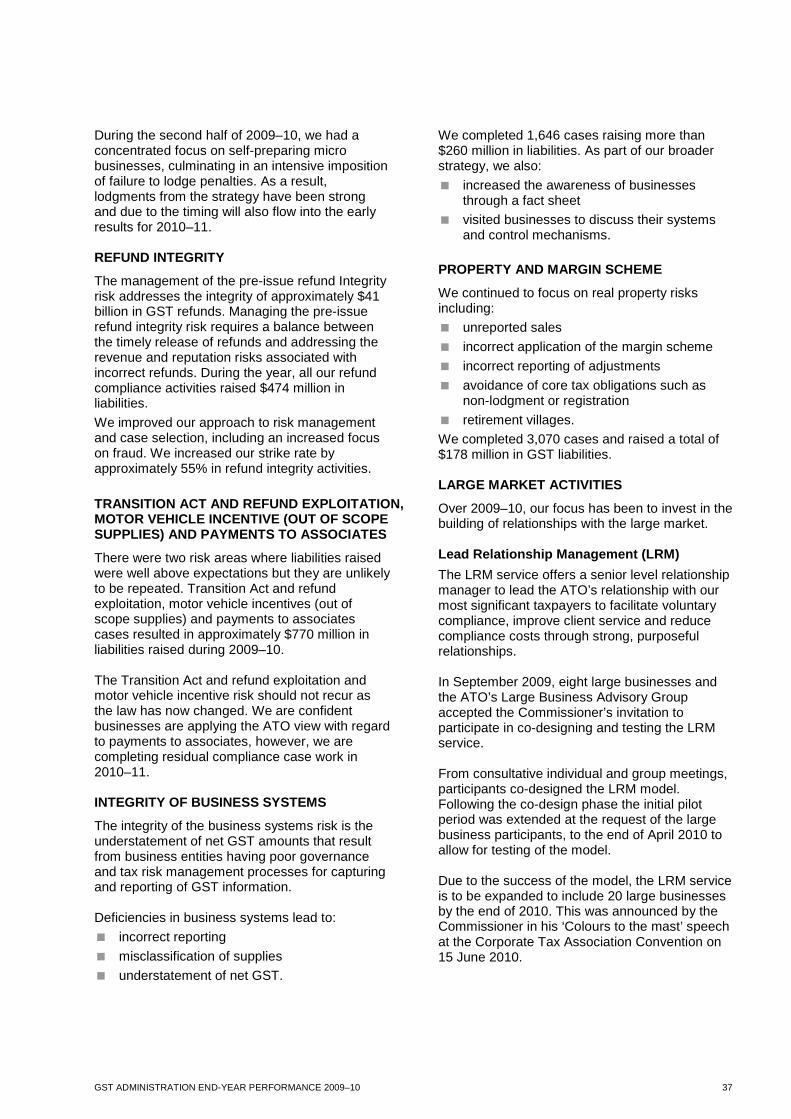
GST ADMINISTRATION END-YEAR PERFORMANCE 2009–10 37
During the second half of 2009–10, we had a concentrated focus on self-preparing micro businesses, culminating in an intensive imposition of failure to lodge penalties. As a result, lodgments from the strategy have been strong and due to the timing will also flow into the early results for 2010–11. REFUND INTEGRITY
The management of the pre-issue refund Integrity risk addresses the integrity of approximately $41 billion in GST refunds. Managing the pre-issue refund integrity risk requires a balance between the timely release of refunds and addressing the revenue and reputation risks associated with incorrect refunds. During the year, all our refund compliance activities raised $474 million in liabilities.
We improved our approach to risk management and case selection, including an increased focus on fraud. We increased our strike rate by approximately 55% in refund integrity activities.
TRANSITION ACT AND REFUND EXPLOITATION, MOTOR VEHICLE INCENTIVE (OUT OF SCOPE SUPPLIES) AND PAYMENTS TO ASSOCIATES
There were two risk areas where liabilities raised were well above expectations but they are unlikely to be repeated. Transition Act and refund exploitation, motor vehicle incentives (out of scope supplies) and payments to associates cases resulted in approximately $770 million in liabilities raised during 2009–10. The Transition Act and refund exploitation and motor vehicle incentive risk should not recur as the law has now changed. We are confident businesses are applying the ATO view with regard to payments to associates, however, we are completing residual compliance case work in 2010–11. INTEGRITY OF BUSINESS SYSTEMS
The integrity of the business systems risk is the understatement of net GST amounts that result from business entities having poor governance and tax risk management processes for capturing and reporting of GST information. Deficiencies in business systems lead to:
� incorrect reporting
� misclassification of supplies
� understatement of net GST.
We completed 1,646 cases raising more than $260 million in liabilities. As part of our broader strategy, we also:
� increased the awareness of businesses through a fact sheet
� visited businesses to discuss their systems and control mechanisms.
PROPERTY AND MARGIN SCHEME
We continued to focus on real property risks including:
� unreported sales
� incorrect application of the margin scheme
� incorrect reporting of adjustments
� avoidance of core tax obligations such as non-lodgment or registration
� retirement villages.
We completed 3,070 cases and raised a total of $178 million in GST liabilities. LARGE MARKET ACTIVITIES
Over 2009–10, our focus has been to invest in the building of relationships with the large market. Lead Relationship Management (LRM)
The LRM service offers a senior level relationship manager to lead the ATO’s relationship with our most significant taxpayers to facilitate voluntary compliance, improve client service and reduce compliance costs through strong, purposeful relationships. In September 2009, eight large businesses and the ATO’s Large Business Advisory Group accepted the Commissioner’s invitation to participate in co-designing and testing the LRM service. From consultative individual and group meetings, participants co-designed the LRM model. Following the co-design phase the initial pilot period was extended at the request of the large business participants, to the end of April 2010 to allow for testing of the model. Due to the success of the model, the LRM service is to be expanded to include 20 large businesses by the end of 2010. This was announced by the Commissioner in his ‘Colours to the mast’ speech at the Corporate Tax Association Convention on 15 June 2010.
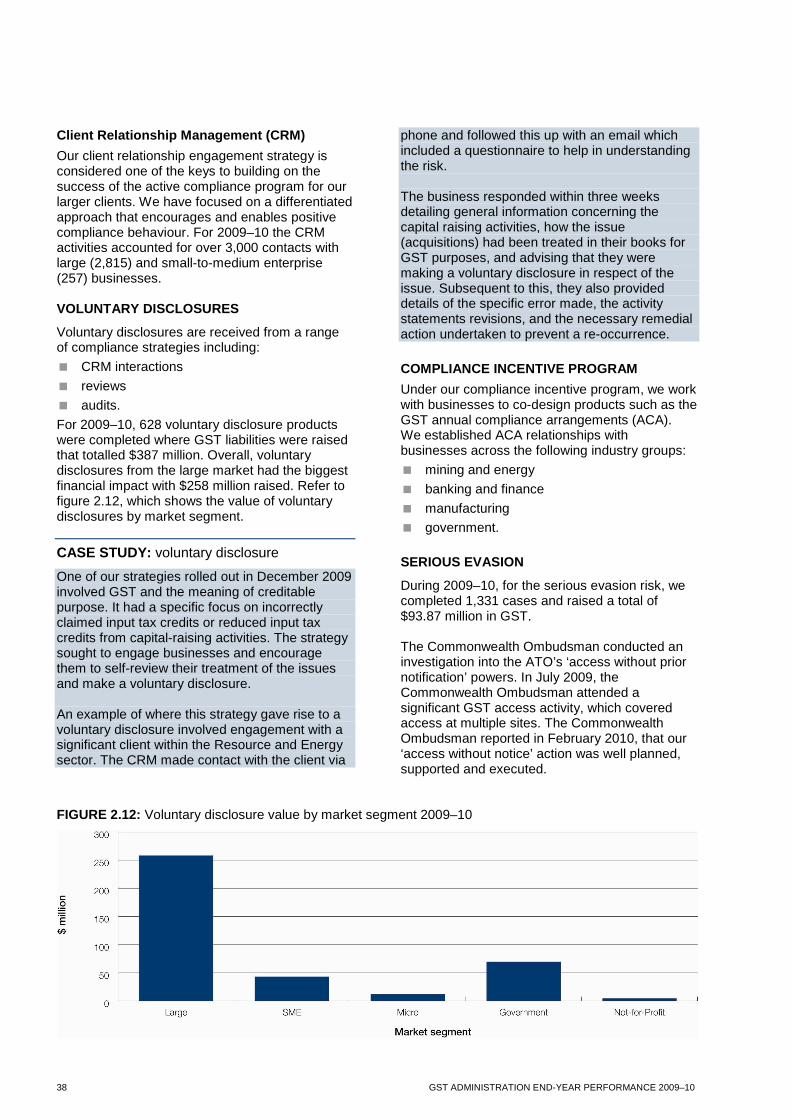
38 GST ADMINISTRATION END-YEAR PERFORMANCE 2009–10
Client Relationship Management (CRM)
Our client relationship engagement strategy is considered one of the keys to building on the success of the active compliance program for our larger clients. We have focused on a differentiated approach that encourages and enables positive compliance behaviour. For 2009–10 the CRM activities accounted for over 3,000 contacts with large (2,815) and small-to-medium enterprise (257) businesses. VOLUNTARY DISCLOSURES
Voluntary disclosures are received from a range of compliance strategies including:
� CRM interactions
� reviews
� audits.
For 2009–10, 628 voluntary disclosure products were completed where GST liabilities were raised that totalled $387 million. Overall, voluntary disclosures from the large market had the biggest financial impact with $258 million raised. Refer to figure 2.12, which shows the value of voluntary disclosures by market segment.
CASE STUDY: voluntary disclosure
One of our strategies rolled out in December 2009 involved GST and the meaning of creditable purpose. It had a specific focus on incorrectly claimed input tax credits or reduced input tax credits from capital-raising activities. The strategy sought to engage businesses and encourage them to self-review their treatment of the issues and make a voluntary disclosure. An example of where this strategy gave rise to a voluntary disclosure involved engagement with a significant client within the Resource and Energy sector. The CRM made contact with the client via
phone and followed this up with an email which included a questionnaire to help in understanding the risk. The business responded within three weeks detailing general information concerning the capital raising activities, how the issue (acquisitions) had been treated in their books for GST purposes, and advising that they were making a voluntary disclosure in respect of the issue. Subsequent to this, they also provided details of the specific error made, the activity statements revisions, and the necessary remedial action undertaken to prevent a re-occurrence.
COMPLIANCE INCENTIVE PROGRAM
Under our compliance incentive program, we work with businesses to co-design products such as the GST annual compliance arrangements (ACA). We established ACA relationships with businesses across the following industry groups:
� mining and energy
� banking and finance
� manufacturing
� government.
SERIOUS EVASION
During 2009–10, for the serious evasion risk, we completed 1,331 cases and raised a total of $93.87 million in GST. The Commonwealth Ombudsman conducted an investigation into the ATO’s ‘access without prior notification’ powers. In July 2009, the Commonwealth Ombudsman attended a significant GST access activity, which covered access at multiple sites. The Commonwealth Ombudsman reported in February 2010, that our ‘access without notice’ action was well planned, supported and executed.
FIGURE 2.12: Voluntary disclosure value by market segment 2009–10
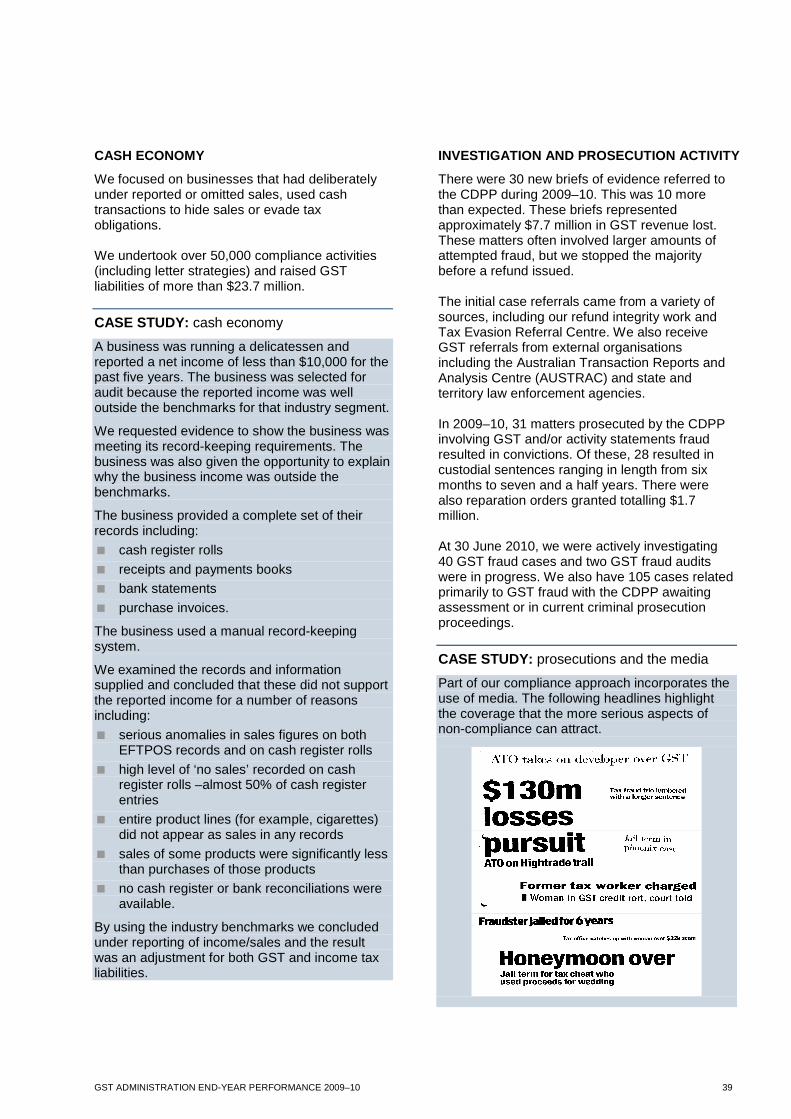
GST ADMINISTRATION END-YEAR PERFORMANCE 2009–10 39
CASH ECONOMY
We focused on businesses that had deliberately under reported or omitted sales, used cash transactions to hide sales or evade tax obligations. We undertook over 50,000 compliance activities (including letter strategies) and raised GST liabilities of more than $23.7 million.
CASE STUDY: cash economy
A business was running a delicatessen and reported a net income of less than $10,000 for the past five years. The business was selected for audit because the reported income was well outside the benchmarks for that industry segment.
We requested evidence to show the business was meeting its record-keeping requirements. The business was also given the opportunity to explain why the business income was outside the benchmarks.
The business provided a complete set of their records including:
� cash register rolls
� receipts and payments books
� bank statements
� purchase invoices.
The business used a manual record-keeping system.
We examined the records and information supplied and concluded that these did not support the reported income for a number of reasons including:
� serious anomalies in sales figures on both EFTPOS records and on cash register rolls
� high level of ‘no sales’ recorded on cash register rolls –almost 50% of cash register entries
� entire product lines (for example, cigarettes) did not appear as sales in any records
� sales of some products were significantly less than purchases of those products
� no cash register or bank reconciliations were available.
By using the industry benchmarks we concluded under reporting of income/sales and the result was an adjustment for both GST and income tax liabilities.
INVESTIGATION AND PROSECUTION ACTIVITY
There were 30 new briefs of evidence referred to the CDPP during 2009–10. This was 10 more than expected. These briefs represented approximately $7.7 million in GST revenue lost. These matters often involved larger amounts of attempted fraud, but we stopped the majority before a refund issued. The initial case referrals came from a variety of sources, including our refund integrity work and Tax Evasion Referral Centre. We also receive GST referrals from external organisations including the Australian Transaction Reports and Analysis Centre (AUSTRAC) and state and territory law enforcement agencies. In 2009–10, 31 matters prosecuted by the CDPP involving GST and/or activity statements fraud resulted in convictions. Of these, 28 resulted in custodial sentences ranging in length from six months to seven and a half years. There were also reparation orders granted totalling $1.7 million. At 30 June 2010, we were actively investigating 40 GST fraud cases and two GST fraud audits were in progress. We also have 105 cases related primarily to GST fraud with the CDPP awaiting assessment or in current criminal prosecution proceedings.
CASE STUDY: prosecutions and the media
Part of our compliance approach incorporates the use of media. The following headlines highlight the coverage that the more serious aspects of non-compliance can attract.
40 GST ADMINISTRATION END-YEAR PERFORMANCE 2009–10
3.4 ACTIVE COMPLIANCE (AUSTRALIAN CUSTOMS AND BORDER PROTECTION SERVICE) KEY STATISTICS
� Australian Customs and Border Protection Service:
– processed 13.59 million import lines with an import value of $205.84 billion – collected $2.832 billion GST from import lines – deferred $19.049 billion GST from import lines – processed 3.3 million export lines with an export value of $200.58 billion – administered 444,441 claims for tourist refund scheme (TRS) made over the 12-month
period – approved 98.00% of all invoices produced for TRS purposes over the 12-month period – processed $69.015 million of GST and wine equalisation tax (WET) claims paid under TRS
over the 12-month period. � Australian Customs and Border Protection Service cleared:
– 3.316 million import declarations including declarations through self-assessed clearances (SAC)
– 1.227 million export declarations. Australian Customs and Border Protection Service plays a vital role in providing effective protection for the Australian community, including the collection of border-related duties and taxes from cargo and passengers. Reports and declarations covering imports and exports are electronically assessed through compliance monitoring, pre-clearance intervention and post transaction verification programs, and are screened against a variety of profiles to identify high-risk goods and possible revenue risks. As part of this integrated approach, the Australian Customs and Border Protection Service verifies that GST is correctly accounted for when goods are imported and exported. The Australian Customs and Border Protection Service also administers and assures compliance of claims under the TRS for GST refunds. COMPLIANCE ASSURANCE
Background
The Australian Customs and Border Protection Service delivered a risk targeted and sustainable program of treatments relevant to its compliance
objectives. These objectives deal with regulatory risk in, and assurance of the integrity of, the end-to-end cargo process. The methods used to achieve this include:
� identifying, assessing and responding to regulatory risks in ways that, as appropriate to risk consequence, disrupts, reduces, contains, and monitors non-compliance
� monitoring key regulatory compliance indicators such as leakage in revenue collections and adherence to border controls
� administering a high quality and robust licensing regime for customs brokers, and depot and warehouse operators
� helping clients to comply with border laws and their obligations in the import and export of goods and encouraging compliance across industry groups.
Compliance assurance activities for the 2009–10 financial year
The Australian Customs and Border Protection Service assessed import transactions with a customs value totalling $42.9 billion and export transactions totalling $46.06 billion in free-on-board (FOB) value. Total GST overstatements
GST ADMINISTRATION END-YEAR PERFORMANCE 2009–10 41
were $87,696,441 and total GST understatements were $116,632,657 with a net revenue effect of $28,936,216. Imports (post transaction)
During 2009–10, the Australian Customs and Border Protection Service conducted post transaction compliance activity (i.e. audits) across a wide range of companies. The customs value of the imported goods covered by these activities was in excess of $4 billion. The total customs value of imports was $205.84 billion in the financial year. Post transaction compliance activities identified GST overstatements of $1,397,775 and GST understatements totalling $4,951,212. Imports (pre-clearance intervention)
Pre-clearance intervention (PCI) activities are activities conducted prior to the release of the goods from the control of the Australian Customs and Border Protection Service. These include leverage exercises and profile matches that may result in the identification of errors in tariff classification, valuation and/or the misuse of GST exemptions. Because of improved targeting, there was a general increase in the use of these compliance products. The customs value of the imported goods covered by these activities was in excess of $38 billion. Compliance Assurance PCI activities identified GST overstatements of $86,298,666 and GST understatements totalling $111,681,445. Some examples of the outcome of these activities include Desktop Verification Exercises, which identified GST understatements of $37 million and activities on import declarations that had not been finalised that identified $15 million in understated GST. Specific follow up liaison, education and regulatory checks with major industry clients have seen levels of voluntary compliance improve. Exports (post transaction)
The FOB value of the exported goods covered by post-transaction activities was $1.6 billion, representing 0.79% of the total FOB value of $200.58 billion in the financial year. Post transaction activities identified the majority of errors were FOB value and Australian Harmonized Export Commodity Classification (AHECC) code errors that affect balance of trade
figures and may also affect the companies activity statements. Post transaction compliance activities identified FOB overstatements of $2,487,945 million and FOB understatements totalling $8,112,450 million. Exports (pre-clearance intervention)
The FOB value of the exported goods covered by these activities was $44.46 billion, representing 22.17% of the total FOB value of exports in the financial year. The real time compliance activities identified FOB overstatements totalling $6,851,916,916 and FOB understatements of $7,756,490,922. The large amount of FOB overstatements identified in real time export activity is mainly due to a number of common errors including the failure to use decimal places and the use of incorrect currencies. The compliance program uses an active export assurance approach, which includes the profiling of large value exports. Compliance real-time intervention results in the correction of these errors, and provides opportunity for our focused education programs, which help in ensuring the ongoing integrity of export data. TOURIST REFUND SCHEME
In 2009–10, the Tourist Refund Office noted a slight decrease in the number of TRS claims, the amount of GST refunded, and the average value of claims paid. The reduction in claims may be attributed to the strengthening of the Australian dollar. Travellers may be electing to spend their money overseas rather than within Australia. It is anticipated that upon implementation of proposed legislative changes, the TRS will experience an increase in the number of claims presented at the border. These proposed changes will enable more travellers to claim back the GST on their purchases by extending the timeframe in which purchases can be made from 30 days to 60 days before the traveller leaves Australia and allowing the consolidation of multiple valid tax invoices from the one Australian business number.
42 GST ADMINISTRATION END-YEAR PERFORMANCE 2009–10
3.5 COMPLIANCE RISK IDENTIFICATION KEY STATISTICS
� 70 intelligence activities were completed in 2009–10.
� 10 new risks were added to our GST risk register. OUR APPROACH
During 2009–10, we built on our understanding of the GST risk landscape and the factors likely to impact the GST revenue activity base. We undertook a variety of intelligence activities, including analysis of the:
� Chinese economy and its impacts on Australia
� size and scale of planned liquefied natural gas projects in Australia
� impacts from the mining and resource industry (with a focus on GST refunds).
We are improving the way we identify and treat risks. Current approaches include:
� the development of a risk differentiation framework for large economic groups, using indicators of consequence and likelihood
� designing end-to-end risk management strategies across the micro, small to medium and large markets, including a whole-of-tax approach to risk identification and sharing
� greater engagement with business associations and tax practitioners by our senior leaders
� increased use of intelligence from the Tax Evasion Referral Centre to identify emerging issues and trends
� intervening early during the property development lifecycle to promote voluntary compliance.
NEW RISKS
During the year, 10 new risks were identified, including:
� the supply of residential accommodation by government departments to other government departments and their employees
� incorrect reporting of the sale or transfer of real property by a mortgagee in possession
� organised missing supplier fraud.
Of the 10 risks:
� one was considered as significant
� one was considered as high
� the remaining risks were rated from medium to low.
Lower level risks were treated through a range of marketing and education activities, including meeting with industry groups. By the end of the year five risks had been sufficiently mitigated. This has enabled us to apply our resources to higher priority risks. EXISTING RISKS
At 30 June 2010, there were 45 risks on the GST Risk Register, with three being rated severe and 19 high. The remaining 23 risks are rated as significant to low, of which eight are at an acceptable level. Due to the design of the GST system and the nature of the certain types of transactions, a number of endemic risks exist. These include:
� real property
� financial supplies
� serious evasion and fraud
� refund integrity
� integrity of business systems
� small business obligations
� cash economy.
HEADLINE RISKS
The following information identifies the key focus areas that we addressed in the 2009–10 year. SERIOUS EVASION AND REFUND FRAUD
Serious evasion and refund fraud are endemic risks in which perpetrators continually adapt their approaches to counter the various controls we put in place. Monitoring refunds is not only a priority for protecting the loss of revenue but also for
GST ADMINISTRATION END-YEAR PERFORMANCE 2009–10 43
identifying more systemic evasive behaviours. We have continued to refine our detection methods through the use of analytical modelling, data matching and information sharing with other agencies. The approach has enabled us to keep abreast of existing and new attacks on the system. During the past year, these changes resulted in:
� a significant increase in strike rate, up from 14.7% in 2008–09 to 22.9% in 2009–10
� a 42% increase in the amount of GST revenue protected before issue
� a reduction in the number of refund interventions, down from 3.6% of total refund lodgments in 2008–09 to 2.9% in 2009–10
� a reduction in value of refund interventions from 26.3% in 2008-09 to 19.6% in 2009–10
� a sustained improvement in voluntary compliance as a result of our refund intervention activities
� over 2,700 potential fraudulent GST refunds that were referred for audit
� 465 complex audits completed with an average strike rate of 68%
� over 130 potential fraud referrals for criminal investigation.
In addition, we significantly expanded our major fraud assessment capabilities and we identified over 100 potential major fraud groups that were escalated for audit and investigation. From a variety of intelligence sources we have identified and investigated suspected serious evasion in the areas of:
� export diversion
� registered training organisations
� deficit trading – enterprises that have shown prolonged periods of unsustainable profit performance
� prestige motor vehicles
� tax agents who display explicit non-compliant behaviour.
While we progress the above matters, we continue to maintain a broader scan of the system to identify emerging risks and develop new treatments and controls to address those risks.
FOCUS ON: serious evasion
Businesses were selected for audit activity based on our assessment of intelligence received from multiple sources, including other government agencies. In addition to potential tax evasion issues, the intelligence also indicated matters of interest to other agencies, such as consumer protection and fraud issues.
Audit activity identified that the taxpayers were operating a sophisticated sports arbitrage betting scheme which presented significant tax evasion issues, including:
� the incorrect reporting of income
� the non-reporting of income
� the non-registration of entities that were required to be registered for GST.
We have participated in a multi-agency operation to address the public interest concerns raised by the activities of those businesses.
To date, we have completed audits on 30 entities involved in the scheme. We have been required to use our formal powers to conduct interviews and obtain information and documents.
Outcomes include:
� raising assessments totalling almost $14 millon
� referring matters for further criminal investigation
� participating in a joint campaign with other government agencies, to raise public awareness of the risks associated with these schemes.
FINANCIAL SUPPLIES
During the year, we have focused on gaining a greater understanding of two key areas of risk:
� apportionment
� mergers and acquisitions.
We have undertaken greater consultation and engagement with industry to identify risks that were caused by a lack of interpretative or administrative clarity. Strategically targeted compliance activities have also enabled us to build increased understanding of the most appropriate methods to treat these risks.
44 GST ADMINISTRATION END-YEAR PERFORMANCE 2009–10
Our collaborative approach has enabled us to obtain agreement from industry as to the highest priority issues and jointly progress their resolution. Significant advances have been made in resolving many of these issues and we are well placed to resolve outstanding issues and deal with emerging risks in the coming year.
We also reviewed arrangements relating to merger and acquisition transactions and identified issues in instances where an associated entity was interposed with the intent of obtaining a GST benefit that would not otherwise be available. As a result, we issued a taxpayer alert outlining our concerns with these arrangements.
REFUND EXPLOITATION
During 2009–10, we continued to challenge claims where taxpayers and their advisors attempted to obtain significant windfall gains by exploiting the GST system.
Most of these claims related to transactions said to have been incorrectly classified as taxable supplies on which GST had been overpaid. This was contrary to published ATO views that the supplies were taxable. Due to operation of the ‘four-year’ provisions, in the event that the refund claims were allowed, we would not be able to recover the corresponding GST that had previously been claimed by the recipients of the supplies.
In the vast majority of the 495 cases we finalised in 2009–10, we determined that taxpayers were not entitled to the refunds claimed. Overall we protected revenue to the value of $696 million.
Given the large number of potential claims involved, we worked with taxpayers and their advisors to establish an orderly process for dealing with their rights of review that minimised the costs to both the taxpayers and to us.
We expect that some taxpayers will pursue their claims further by challenging our decision through litigation.
We have initiated legislative amendments to remove these anomalies and exploitation opportunities, and remain alert for other opportunistic attacks on the system.
PROPERTY
Many risks associated with property are endemic and are driven by a number of factors, including:
� market conditions
� the frequent influx of new entrants into the tax system
� opportunity created by the typically high value of transactions
� law design features, such as the ability to reduce tax obligations provided by concessional taxing regimes and the complexity of the provisions.
While the incorrect treatment of property transactions remains a risk for us, our mitigation strategies have resulted in an improvement to the application of the margin scheme and adjustments relating to a change in creditable purpose. We have provided clarification of the law through the publication of public products, such as rulings and determinations and through guidance provided in case law, resulting in a substantial reduction in our priority technical issues.
Improvements in data matching and our business models have further increased our strike rates on audit cases.
Other manifestations such as retirement villages and disengaged property developers continue to be focus areas for risk mitigation activities. We work closely with external and internal stakeholders to better understand the risks and issues affecting the property development industry.
For example, we are currently working with the retirement village industry and internally with our income tax areas to ensure that all risks and issues associated with the retirement village industry are identified so that relevant treatment strategies can be developed.
We are improving the whole-of-tax and government approaches to the property risk by building stronger relationships with external agencies, such as the various offices of state revenue. Our goal is to promote:
� a shared and common understanding of all property risks
� improved sharing of intelligence, (particularly identified cases of non-compliance)
� improved quality of shared data
� deployment of joint strategies for addressing all tax risks associated with property.
Our treatment strategies continue to be market segment specific and tailored to reflect the level of risk manifested. For taxpayers who choose to disengage from the tax system, we develop integrated treatment strategies to encourage future compliance and to deter egregious behaviour, including using default assessments and prosecutions.
GST ADMINISTRATION END-YEAR PERFORMANCE 2009–10 45
We encourage willing participation in the tax system by:
� leveraging off property developer ’touch points’ and initiating contact with relevant community stakeholders over the life of a property development
� developing an interactive tool that will be available on our website which will provide guidance and support to intermediaries and businesses undertaking GST property transactions
� improve information sources such as our website in the form of an overview page linking to all property related information across all taxes.
We are applying compliance effectiveness measures to our treatment strategies with the success indicators aligned to correct lodgment, reporting, payment and registration.
CASE STUDY: real property
A company developed a 40-unit, strata-titled, apartment block and sold 36 of the units at market value. Sales of those units were reported on the appropriate activity statement. However, the company:
� sold three of the remaining four units to suppliers for well below market value as settlement for outstanding accounts
� transferred ownership of the single remaining unit to the spouse of a director of the company
� failed to report the sales and transfer of ownership on their relevant activity statement.
As a result of our data-matching activities, we identified the company's unreported transactions and raised the appropriate assessments.
We also contacted the relevant office of state revenue. As a result action was taken to recoup the under-paid stamp duty for the units sold for less than the market value.
SMALL BUSINESS OBLIGATIONS
The obligation support visit program alerted small businesses to the assistance available to address challenges faced as a result of the global economic downturn. Our investment in the program was a direct response to support those micro businesses identified as being vulnerable to the economic downturn.
The program visited over 5,500 taxpayers during 2009–10. Post visit outcomes demonstrated
a positive influence on improving the compliance behaviour of those visited, particularly in the facilitation of payment arrangements for outstanding debt. Since the program started around $40 million has been covered by payment arrangements as a result of the visits.
Regular debriefing of staff allowed us to gain a good insight into the challenges facing taxpayers in terms of their business relationships with suppliers, finance providers and the broader community.
The improvement in the economic climate towards the end of the financial year has resulted in this targeted approach being discontinued, however our small business assistance program continues to provide businesses with an awareness of the products and services available to help them to comply with their tax obligations.
CASE STUDY: small business obligations
A taxpayer was operating as a taxi driver in a regional area. He applied for and obtained an ABN and GST registration but did not lodge or report any income or GST on his activity statements.
This client was selected for an obligation support visit. During the visit, our officer identified a number of compliance issues, including:
� non-lodgment and non-reporting
� non-payment of debt
� lack of knowledge of his tax obligations.
Our officer identified there were potential issues across this region within the taxi industry, including:
� lack of adequate record keeping
� non-lodgment of activity statements
� GST was not reported or remitted
� PAYG instalments were not reported or remitted
� a general lack of knowledge of small business taxation obligations as they apply to the taxi industry.
The officer undertaking the visit identified that this taxpayer had obtained their understanding of their taxation obligations from the taxi licence lessor, and this practice was widespread across the region.
In addition to negotiating a payment arrangement with the specific taxpayer, our officer also attended industry seminars in the local region, to engage with the industry and deliver our key messages that will influence compliance into the future.
46 GST ADMINISTRATION END-YEAR PERFORMANCE 2009–10
INTEGRITY OF BUSINESS SYSTEMS
Integrity of business systems (IBS) risks result from deficiencies in business systems, processes and safeguards. Our analysis of recent compliance activity in the large market, indicate that errors are more likely to occur in the financial services and insurance, retail, mining and manufacturing industries. For the small to medium market our analysis indicates errors are more likely to occur in the construction, wholesale, retail trade, transport and postal services industries. Our 2009–10 strategies combined a mix of education, support and enforcement, including:
� publication and distribution of an IBS fact sheet via the ATO website and through our large market client relationship managers
� the provision of a personalised module to support small businesses with their record keeping obligations through the small business assistance program
� refinement of our automated case selection model
� development of compliance products and approaches specifically targeted at the small to medium market (for roll-out in the 2010–11).
During the year, we undertook more than 1,600 compliance interactions and raised assessments for more than $260 million of GST, including $155 million which was voluntarily disclosed. Key strategies for 2010–11 include:
� collaboration with Treasury to develop legislation relating to recommendations from the BoT review
� publishing industry and market specific record keeping booklets
� developing a Governance and Risk Management Guide for the large market
� compliance reviews targeting specific risk manifestations such as joint ventures within the mining sector and merger and acquisition activity
� an increased focus in the small to medium market through a ‘GST 10 year project’. The project will encourage small to medium businesses to examine the integrity of their systems, processes and controls, and also undertake activities to assist them to voluntarily comply with their GST obligations.
CASE STUDY: integrity of business systems
We identified a manufacturing company as being at risk and commenced a review of their business systems. During the course of our review, we identified that the company had a number of systemic issues which contributed to errors on their activity statements, including:
� GST reports not reconciled to the GST general ledger
� a lack of documented procedures for processing accounts payable, accounts receivable and preparing activity statements
� poor procedures for processing sales invoices, resulting in sales being omitted from activity statements
� incorrectly claiming GST credits on purchases paid for on behalf of related entities
� incorrect tax codes used in accounting software.
During the course of our review, the company instigated an internal examination and identified and voluntarily disclosed an error that related to more than $500,000 of unpaid GST. As a result of our review, the company is more aware of the deficiencies in its systems and processes, and has taken steps to address them.
CASH ECONOMY
We increased the visibility of our approach to addressing this risk. We also used small business benchmarks and expanded our program of data matching. We contacted over one million small business operators in 2009–10. The intent was to identify taxpayers:
� that operated outside small business benchmarks
� whose lifestyle could not be supported by their reported income.
From this we identified different strategies which included advisory letters that provided a small business operator the opportunity to review their affairs and make a voluntary disclosure through to full cash economy audits.
GST ADMINISTRATION END-YEAR PERFORMANCE 2009–10 47
5.0 SERVICES TO GOVERNMENTS AND AGENCIES KEY STATISTICS
� 103 GST related ministerials were answered in 2009–10.
� 35 question time briefs and 46 committee briefs were completed.
� 1,608 complaints were received.
In 2009–10, we managed external and internal stakeholder relationships with the following:
� government
� the Treasury
� ministers
� state and territory revenue offices and treasuries
� Australian Customs and Border Protection Service
� Inspector General of Taxation
� the Commonwealth Ombudsman
� Australian National Audit Office (ANAO)
� the BoT.
Services to the Treasurer, Assistant Treasurer, Ministers and the Australian Parliament were managed through timely and credible advice, including ministerial representations, briefings to parliament and government.
We answered 103 GST related ministerials in 2009–10. A large number related to the cash economy including tax evasion referrals. There was only a small increase in ministerial correspondence for GST. There were 31 minutes sent to the Minister, which was a 30% increase on 2008–09. TABLE 2.8: 2009–10 activities for services to government
WORKING WITH THE INSPECTOR GENERAL OF TAXATION (IGOT)
The ATO has worked to implement the outstanding recommendations made by the IGoT in June 2008 about the large market. The IGoT has now finalised their report into the implementation of the agreed recommendations from their review of the large market active compliance and was submitted to the then Assistant Treasurer, The Hon. Nick Sherry. The ATO has responded formally as part of the review process.
In the report there are two recommendations that are considered partially implemented and the ATO agrees with this view. The IGoT considers that there is an additional recommendation in relation to the remission of the GIC that is not implemented. The IGoT believes that the quantum of GIC being remitted should be calculated. The ATO position, in accordance with PS LA 2006/8, is that the amount of GIC is not a factor in making remission decisions.
The ATO adopted all necessary action to satisfy the elements of the original recommendation and that there is no further action necessary.
COMPLAINTS
We had an increase in complaints during the past year, with the majority of complaints received relating to held refunds which were being checked as part of our refund integrity process. The volume of the complaints increased significantly to 1,608 from 580 in the past year.
Of these complaints, 87% related to activity statement refunds that had been stopped due to strategies implemented to address the refund fraud risk. There was an increase in requests for the release of refunds due to claims of hardship. The majority of these complaints were lodged by tax agents rather than businesses. A differentiated strategy for actioning refund fraud cases was implemented in late 2009–10 to reduce case cycle times and delays.
Activity Number Compared to 2009–10
Parliamentary briefings 46 Down 39%
Ministerials 103 Up 7%
MP phone queries 126 Up 20%
Minutes to minister 31 Up 30%
Minutes to Treasury 39 Down 26%
Costings to Treasury 48 Up 23%
Complaints 1608 Up 180%
Ombudsman cases 15 Up 150%
48 GST ADMINISTRATION END-YEAR PERFORMANCE 2009–10
CROSS-AGENCY INITIATIVES
During 2009–10, the ATO Revenue Office Compliance Committee (ATRO CC) has worked to demonstrate the mutual benefits that our agencies gain through regular contact and joint initiatives. Through the Compliance Committee’s working groups there has been a focus in employer obligations and property. Achievements of these working groups have resulted in products such as the life cycle of a property developer and employment user pathways. The ATRO CC and the working groups have also shared information and tools such as the Computer Assisted Verification tool to aid in the administration of our tax systems and helped to leverage opportunities for shared skilling and development.
GST ADMINISTRATION END-YEAR PERFORMANCE 2009–10 49
03
SCHEDULES
� Schedule A Performance outcome measures � Schedule B GST budget and administration activities
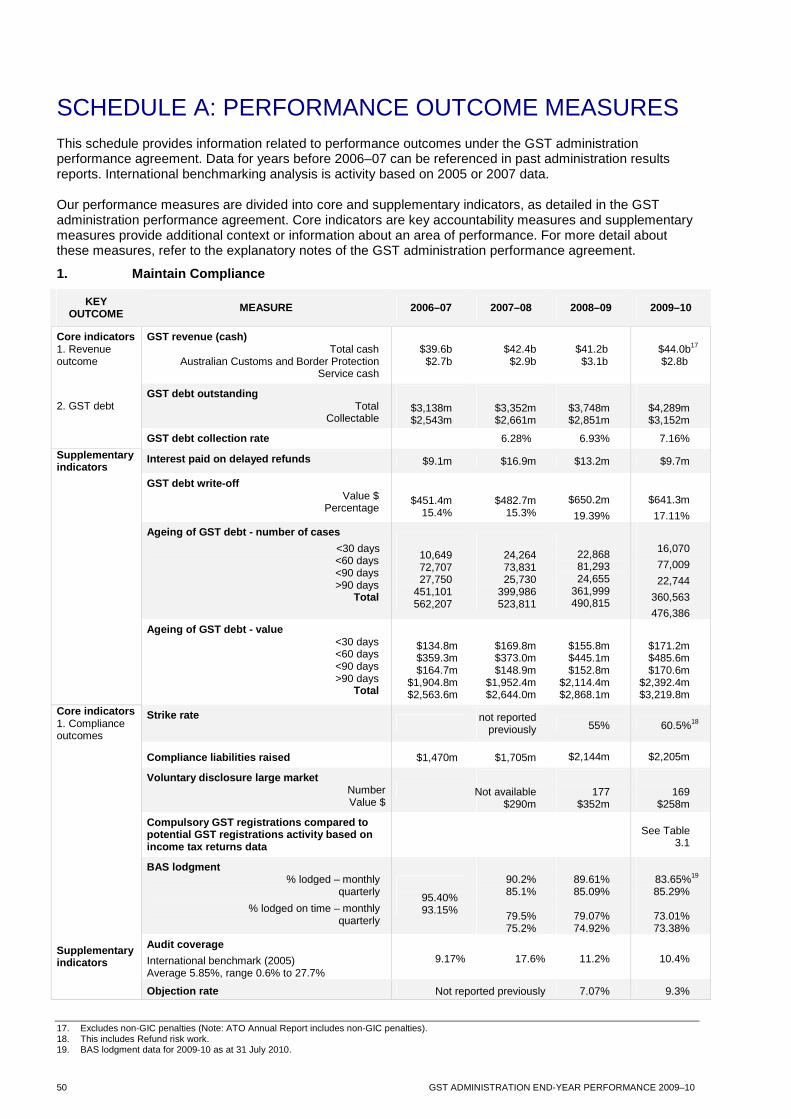
50 GST ADMINISTRATION END-YEAR PERFORMANCE 2009–10
SCHEDULE A: PERFORMANCE OUTCOME MEASURES This schedule provides information related to performance outcomes under the GST administration performance agreement. Data for years before 2006–07 can be referenced in past administration results reports. International benchmarking analysis is activity based on 2005 or 2007 data. Our performance measures are divided into core and supplementary indicators, as detailed in the GST administration performance agreement. Core indicators are key accountability measures and supplementary measures provide additional context or information about an area of performance. For more detail about these measures, refer to the explanatory notes of the GST administration performance agreement.
1. Maintain Compliance
KEY OUTCOME MEASURE 2006–07 2007–08 2008–09 2009–10
Core indicators 1. Revenue outcome
GST revenue (cash) Total cash
Australian Customs and Border Protection Service cash
$39.6b $2.7b
$42.4b $2.9b
$41.2b $3.1b
$44.0b17 $2.8b
2. GST debt GST debt outstanding
Total Collectable
$3,138m $2,543m
$3,352m $2,661m
$3,748m $2,851m
$4,289m $3,152m
GST debt collection rate 6.28% 6.93% 7.16%
Supplementary indicators
Interest paid on delayed refunds $9.1m $16.9m $13.2m $9.7m
GST debt write-off
Value $ Percentage
$451.4m
15.4%
$482.7m
15.3%
$650.2m
19.39%
$641.3m
17.11%
Ageing of GST debt - number of cases
<30 days <60 days <90 days >90 days
Total
10,649 72,707 27,750
451,101 562,207
24,264 73,831 25,730
399,986 523,811
22,868 81,293 24,655
361,999 490,815
16,070
77,009
22,744
360,563
476,386
Ageing of GST debt - value <30 days <60 days <90 days >90 days
Total
$134.8m $359.3m $164.7m
$1,904.8m $2,563.6m
$169.8m $373.0m $148.9m
$1,952.4m $2,644.0m
$155.8m $445.1m $152.8m
$2,114.4m $2,868.1m
$171.2m $485.6m $170.6m
$2,392.4m $3,219.8m
Core indicators 1. Compliance outcomes
Strike rate
not reported previously 55% 60.5%18
Compliance liabilities raised $1,470m $1,705m $2,144m $2,205m
Voluntary disclosure large market
Number Value $
Not available $290m
177
$352m
169
$258m
Compulsory GST registrations compared to potential GST registrations activity based on income tax returns data
See Table 3.1
BAS lodgment % lodged – monthly
quarterly
% lodged on time – monthly quarterly
95.40% 93.15%
90.2% 85.1%
79.5% 75.2%
89.61% 85.09%
79.07% 74.92%
83.65%19 85.29%
73.01% 73.38%
Supplementary indicators
Audit coverage
International benchmark (2005) Average 5.85%, range 0.6% to 27.7%
9.17% 17.6% 11.2% 10.4%
Objection rate Not reported previously 7.07% 9.3% 17. Excludes non-GIC penalties (Note: ATO Annual Report includes non-GIC penalties). 18. This includes Refund risk work. 19. BAS lodgment data for 2009-10 as at 31 July 2010.
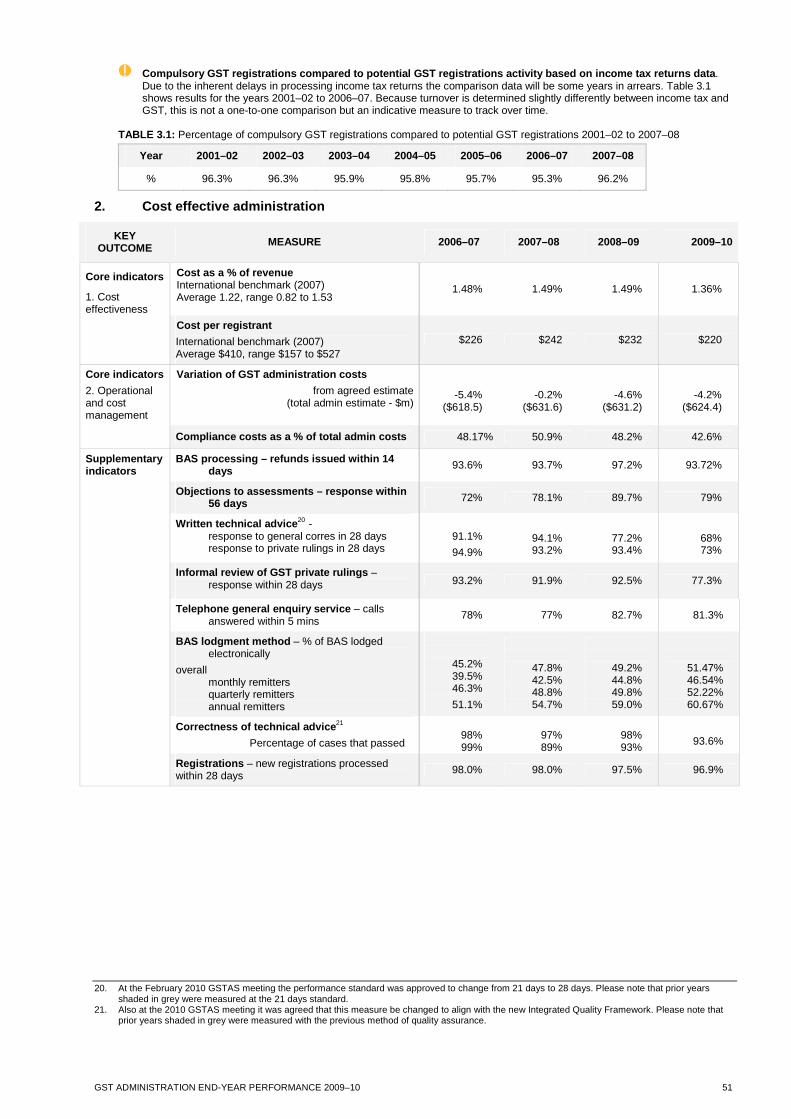
GST ADMINISTRATION END-YEAR PERFORMANCE 2009–10 51
Compulsory GST registrations compared to potential GST registrations activity based on income tax returns data . Due to the inherent delays in processing income tax returns the comparison data will be some years in arrears. Table 3.1 shows results for the years 2001–02 to 2006–07. Because turnover is determined slightly differently between income tax and GST, this is not a one-to-one comparison but an indicative measure to track over time.
TABLE 3.1: Percentage of compulsory GST registrations compared to potential GST registrations 2001–02 to 2007–08
Year 2001–02 2002–03 2003–04 2004–05 2005–06 2006–07 2007–08
% 96.3% 96.3% 95.9% 95.8% 95.7% 95.3% 96.2%
2. Cost effective administration
KEY OUTCOME MEASURE 2006–07 2007–08 2008–09 2009–10
Core indicators
1. Cost effectiveness
Cost as a % of revenue International benchmark (2007) Average 1.22, range 0.82 to 1.53
1.48% 1.49% 1.49% 1.36%
Cost per registrant
International benchmark (2007) Average $410, range $157 to $527
$226 $242 $232 $220
Core indicators
2. Operational and cost management
Variation of GST administration costs
from agreed estimate (total admin estimate - $m)
-5.4%
($618.5)
-0.2%
($631.6)
-4.6%
($631.2)
-4.2%
($624.4)
Compliance costs as a % of total admin costs 48.17% 50.9% 48.2% 42.6%
Supplementary indicators
BAS processing – refunds issued within 14 days 93.6% 93.7% 97.2% 93.72%
Objections to assessments – response within 56 days 72% 78.1% 89.7% 79%
Written technical advice 20 - response to general corres in 28 days response to private rulings in 28 days
91.1%
94.9%
94.1% 93.2%
77.2% 93.4%
68% 73%
Informal review of GST private rulings – response within 28 days 93.2% 91.9% 92.5% 77.3%
Telephone general enquiry service – calls answered within 5 mins
78% 77% 82.7% 81.3%
BAS lodgment method – % of BAS lodged electronically
overall monthly remitters quarterly remitters annual remitters
45.2% 39.5% 46.3%
51.1%
47.8% 42.5% 48.8% 54.7%
49.2% 44.8% 49.8% 59.0%
51.47% 46.54% 52.22% 60.67%
Correctness of technical advice 21
Percentage of cases that passed
98% 99%
97% 89%
98% 93%
93.6%
Registrations – new registrations processed within 28 days 98.0% 98.0% 97.5% 96.9%
20. At the February 2010 GSTAS meeting the performance standard was approved to change from 21 days to 28 days. Please note that prior years
shaded in grey were measured at the 21 days standard. 21. Also at the 2010 GSTAS meeting it was agreed that this measure be changed to align with the new Integrated Quality Framework. Please note that
prior years shaded in grey were measured with the previous method of quality assurance.
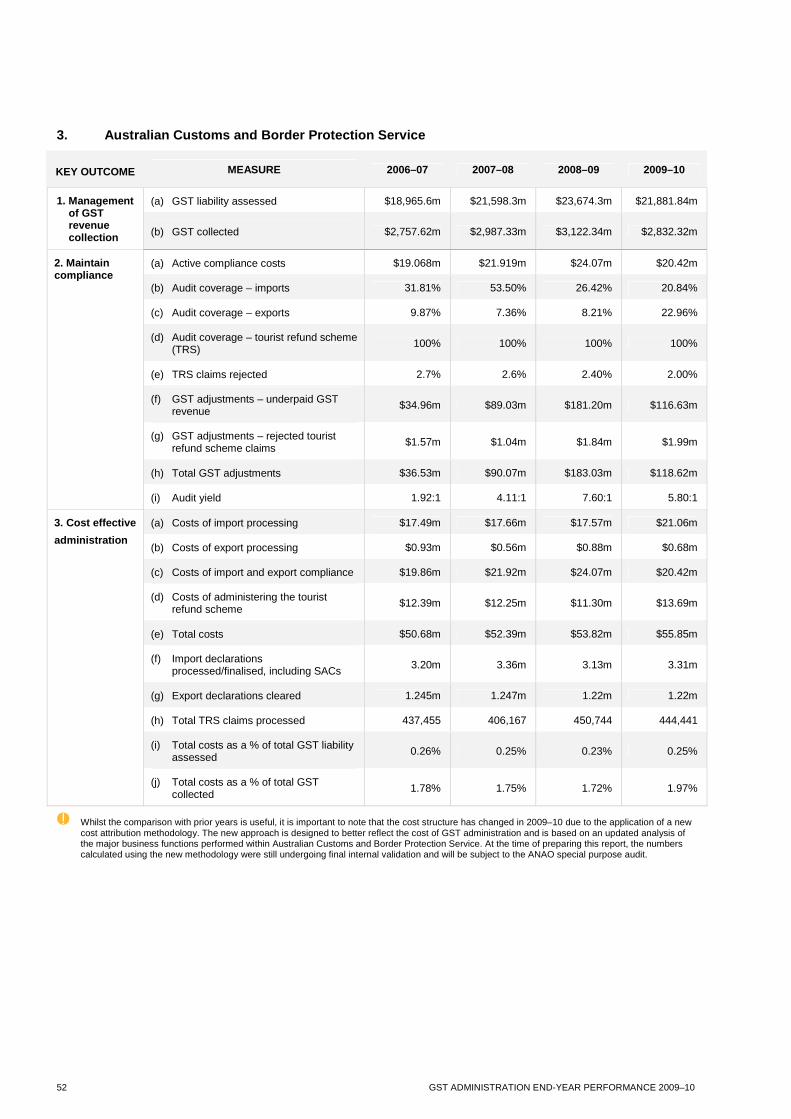
52 GST ADMINISTRATION END-YEAR PERFORMANCE 2009–10
3. Australian Customs and Border Protection Service
KEY OUTCOME MEASURE 2006–07 2007–08 2008–09 2009–10
(a) GST liability assessed $18,965.6m $21,598.3m $23,674.3m $21,881.84m 1. Management of GST revenue collection (b) GST collected $2,757.62m $2,987.33m $3,122.34m $2,832.32m
(a) Active compliance costs $19.068m $21.919m $24.07m $20.42m 2. Maintain compliance
(b) Audit coverage – imports 31.81% 53.50% 26.42% 20.84%
(c) Audit coverage – exports 9.87% 7.36% 8.21% 22.96%
(d) Audit coverage – tourist refund scheme (TRS)
100% 100% 100% 100%
(e) TRS claims rejected 2.7% 2.6% 2.40% 2.00%
(f) GST adjustments – underpaid GST revenue
$34.96m $89.03m $181.20m $116.63m
(g) GST adjustments – rejected tourist refund scheme claims
$1.57m $1.04m $1.84m $1.99m
(h) Total GST adjustments $36.53m $90.07m $183.03m $118.62m
(i) Audit yield 1.92:1 4.11:1 7.60:1 5.80:1
(a) Costs of import processing $17.49m $17.66m $17.57m $21.06m 3. Cost effective
administration (b) Costs of export processing $0.93m $0.56m $0.88m $0.68m
(c) Costs of import and export compliance $19.86m $21.92m $24.07m $20.42m
(d) Costs of administering the tourist refund scheme
$12.39m $12.25m $11.30m $13.69m
(e) Total costs $50.68m $52.39m $53.82m $55.85m
(f) Import declarations processed/finalised, including SACs
3.20m 3.36m 3.13m 3.31m
(g) Export declarations cleared 1.245m 1.247m 1.22m 1.22m
(h) Total TRS claims processed 437,455 406,167 450,744 444,441
(i) Total costs as a % of total GST liability assessed
0.26% 0.25% 0.23% 0.25%
(j) Total costs as a % of total GST collected
1.78% 1.75% 1.72% 1.97%
Whilst the comparison with prior years is useful, it is important to note that the cost structure has changed in 2009–10 due to the application of a new cost attribution methodology. The new approach is designed to better reflect the cost of GST administration and is based on an updated analysis of the major business functions performed within Australian Customs and Border Protection Service. At the time of preparing this report, the numbers calculated using the new methodology were still undergoing final internal validation and will be subject to the ANAO special purpose audit.
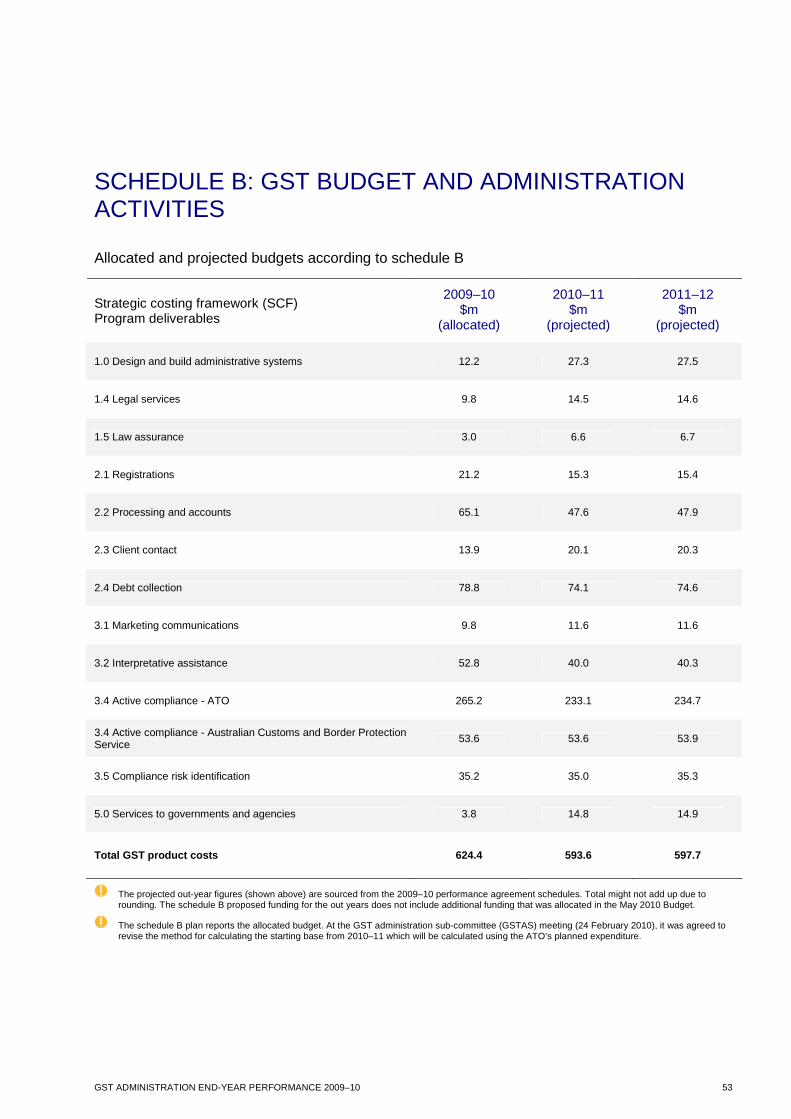
GST ADMINISTRATION END-YEAR PERFORMANCE 2009–10 53
SCHEDULE B: GST BUDGET AND ADMINISTRATION ACTIVITIES
Allocated and projected budgets according to schedule B
Strategic costing framework (SCF) Program deliverables
2009–10 $m
(allocated)
2010–11 $m
(projected)
2011–12 $m
(projected)
1.0 Design and build administrative systems 12.2 27.3 27.5
1.4 Legal services 9.8 14.5 14.6
1.5 Law assurance 3.0 6.6 6.7
2.1 Registrations 21.2 15.3 15.4
2.2 Processing and accounts 65.1 47.6 47.9
2.3 Client contact 13.9 20.1 20.3
2.4 Debt collection 78.8 74.1 74.6
3.1 Marketing communications 9.8 11.6 11.6
3.2 Interpretative assistance 52.8 40.0 40.3
3.4 Active compliance - ATO 265.2 233.1 234.7
3.4 Active compliance - Australian Customs and Border Protection Service 53.6 53.6 53.9
3.5 Compliance risk identification 35.2 35.0 35.3
5.0 Services to governments and agencies 3.8 14.8 14.9
Total GST product costs 624.4 593.6 597.7
The projected out-year figures (shown above) are sourced from the 2009–10 performance agreement schedules. Total might not add up due to rounding. The schedule B proposed funding for the out years does not include additional funding that was allocated in the May 2010 Budget.
The schedule B plan reports the allocated budget. At the GST administration sub-committee (GSTAS) meeting (24 February 2010), it was agreed to revise the method for calculating the starting base from 2010–11 which will be calculated using the ATO’s planned expenditure.

54 GST ADMINISTRATION END-YEAR PERFORMANCE 2009–10
GST ADMINISTRATION END-YEAR PERFORMANCE 2009–10 55
04 APPENDIX
APPENDIX: ADDITIONAL FUNDING
� ATO additional funding for GST compliance activities announced in the May 2010 Budget
56 GST ADMINISTRATION END-YEAR PERFORMANCE 2009–10
APPENDIX: ADDITIONAL FUNDING � ATO additional funding for GST compliance activities announced in the May 2010 Budget.
Additional funding was announced in the May 2010 Budget to support a new program titled ‘Working together to encourage voluntary compliance 2011–14’. This program includes:
� protecting the integrity of the refund system by
– completing 42,000 additional refund verification cases over four years
– referring 1,750 additional refund integrity cases for audit action
– developing new fraud detection models
– enhanced data and intelligence sharing with external agencies
– more criminal investigations and prosecutions of GST refund frauds.
� responding to community concerns about serious evasion of GST obligations. 1,200 additional audits over four years
– 600 of the additional audits to focus on the property industry
– ‘whole-of-government’ approaches to strategic risks and issues.
� addressing rising rates of activity statement non-lodgment through
– one million additional instances of contact with businesses
– additional instances of ‘strong enforcement’ activity
– intensive tracing of 400,000 businesses whose address details are incorrect or out of date
– escalation of extreme cases for prosecution or default assessment.
� the ongoing funding for strategies which have proven effective in dealing with expanding levels of unpaid debt through
– continuing relationships with external debt collection agencies
– maintaining referrals to these agencies at 200,000 per year
– focusing the internal debt collection capability on ‘aged’ debt
– addressing a forecast pool of 91,800 debts which will be aged more than two years.
For more details of the announcement of this additional funding, refer to the 2010–11 Australian Budget Paper no.2, Part 1: revenue measures. A copy can be obtained on the Australian Government website at www.budget.gov.au