Embed Size (px)
Citation preview
finalrepport
This publication is published by Meat & Livestock Australia Limited ABN 39 081 678 364 (MLA). Care is taken to ensure the accuracy of information in the publication. Reproduction in whole or in part of this publication is prohibited without the prior written consent of MLA.
Review of grain-based ethanol production effects on Australian livestock industries
Project code: B.FLT.0139
Prepared by: SG Wiedemann, PJ Watts, M Quinn, H MacIntosh, W Yates, J Doyle, R Lawrence & M Burger
Date published: August 2008
ISBN: 9781741912647
PUBLISHED BY Meat & Livestock Australia Locked Bag 991 NORTH SYDNEY NSW 2059
FEEDLOTS
Meat & Livestock Australia acknowledges the matching funds provided by the Australian Government to support the research and development detailed in this publication.
Review of grain-based ethanol production effects on Australian livestock industries
Page 2 of 148
Abstract Grain based ethanol production in Australia is currently very limited, despite Australian government taxation concessions until 2011, some start up assistance to selected plants, and various state government assistance programs. There are, however, publicly stated intentions by ethanol companies in Australia to substantially increase investment in grain based ethanol manufacture. The implications of this growth in ethanol production for the grain dependent livestock industries in Australia have been the subject of a number of recent government reports and industry funded studies. However, there is a much larger body of documentation globally, which contains much technical information as well as economic assessments of the magnitude and implications of ethanol production based on grain usage. This project reviewed the currently available material of most relevance to the grain based ethanol and grain dependent livestock industry interface in Australia, to provide a succinct baseline summary of the current state of knowledge and identify any information gaps and research requirements. MLA managed the project on behalf of the Feedgrain Partnership, which is a group of R&D funding agencies covering the feedgrain supply chain in Australia.
Review of grain-based ethanol production effects on Australian livestock industries
Page 3 of 148
Executive Summary Energy security and reliance on finite oil resources has led to the establishment of a global biofuel industry based primarily on sugar and grain feedstocks. This move has been led by Brazil (sugar-based ethanol) and the US (corn-based ethanol). Australia is less advanced in its adoption of biofuels, and to date only limited domestic production exists. However, numerous development applications have been lodged for the construction of grain-based ethanol plants in many areas of the eastern grain belt, prompting concern over future grain supplies to other users, notably grain dependent livestock industries. This report provides a summary of the literature available on issues related to grain-based ethanol production together with identification of information gaps and key research requirements. It is noted that this industry is progressing at a rapid rate world-wide, and this report assesses literature released prior to February 2008. While there are many different biofuels, produced by different means, this report is focussed on ethanol produced from grain. Grain-based ethanol can be produced from any grain, and maximum yields are primarily determined by starch content and starch yield. Maximum ethanol yield is in the order of 440 L / tonne of grain; however, yields reported in the literature tend to be 40-60L less than this. In Australia, grain-based ethanol production is primarily carried out via a dry milling process that produces valuable co-products, collectively referred to as distillers grains. The US has an established grain-based ethanol industry and grain dependent livestock industries are providing a means of utilising the co-products. Variation in co-product nutrient quality remains an issue and the practical management issues within grain dependent livestock industries for handling inherent variation remains unknown. The same issues will be faced in Australia if a grain-based ethanol industry is established. These co-products may present an economical and effective way to supplement protein and digestible fibre for dairy cattle, phosphorus and crude protein for pork producers, crude protein for poultry growers, and crude protein and energy for lot fed beef cattle. However, relevant Australian grain dependent industries can only make assumptions on the quality of ethanol co-products and although the US experience provides assistance in these assumptions, the true nature of co-products will remain unknown until they become available. The actual role and value of distillers grain in feedlot production will not be known until co-product is available and efficiency of use will be dependent on the basis of cost and energy. For pork production, the majority of research has concerned the use of corn and sorghum-based DDGS, whereas in Australia, the primary grain source for distillers grain would be wheat, barley, and to a lesser extent sorghum. Hence, performance cited and observed in reviewed literature may provide different production responses. Corn-based WDGS and DDGS appear to provide an alternative to natural protein sources and partial energy sources in lactating dairy cow diets. However, Australian dairies may not be able to utilise DDGS to the same extent due to production management systems, diets capability, and the limited energy content of wheat-based WDGS and DDGS.
Review of grain-based ethanol production effects on Australian livestock industries
Page 4 of 148
Work regarding wheat-based DDGS suggests this can be included in growing poultry diets; however, this will require supplemental lysine and methionine to make up for amino acid unavailability due to heat damage during processing. It is noted that these co-products are variable and must be monitored frequently to ensure consistency within diets. In addition to this, storage and handling of distillers grains is difficult, with the wet product having a storage life of approximately 3 days unless the material is ensiled. It is possible that higher market prices and demand for distillers grains will prompt a move towards quality assurance, leading to improved consistency over time. This has been observed in some parts of the US. The establishment of a quality assurance system may also enhance the ability of users to store and handle distillers grains. The establishment of grain-based ethanol plants in Australia pose some environmental and resource impact concerns, notably the requirement for water (approximately four times the yield of ethanol from the plant). These concerns will need to be addressed on a case-by-case basis. The sustainability of grain-based ethanol production and usage in the broader context has not been adequately assessed in Australia. Whilst grain-based ethanol is promoted as a source of renewable transport fuel with potential to reduce greenhouse gases, the literature has a wide degree of variability on these points. The variability in reported GHG benefits and the key position of this driver in the argument for grain-based ethanol usage highlight the need for further research in this area. The literature reports an average net energy gain for grain-based ethanol of approximately 30%, clearly showing that grain-based ethanol is not a long-term solution to energy requirements in Australia. Furthermore, few studies have assessed net energy value in the Australian context where average crop yields are lower and less consistent than in the US where the majority of research has been conducted. It is highly likely that future energy security and GHG reduction will focus on energy derived from second-generation biofuels or other feedstock. Australia has the opportunity to focus on these energy sources, which offer much larger fuel yields and GHG benefits than grain-based ethanol production. Considering the issue ethically, the impact of diverting grain exports to grain-based ethanol production needs to be considered by the community and agricultural industries. The global grain market has been significantly impacted by the reduction in US corn exports to the world market, contributing to higher grain and food prices in some countries, and further reduction in tradable world grain reserves is likely to exacerbate this problem. A further ethical issue related to global biofuel trade relates to the need for environmental labelling to ensure sustainable production in developing countries. This must be addressed to ensure biofuel trade does not exacerbate GHG production through forest clearing for biofuel production. Global grain-based ethanol production is progressing at a rapid rate, led by the US where the industry is expected to double when plants currently under construction come on line. A range of government incentives is promoting this move, the most significant being the 36 billion gallon biofuel target. In other regions of the world, Europe, Asia and Canada are all expected to become significant producers of biofuels by 2010. Production in other regions of the world is not known. It is noted that grain-based ethanol predictions are frequently over estimated and will be driven by global oil and grain prices. There have already been moves in China and Russia to limit biofuel production from grain in order to curb escalating food grain prices. The status of grain-based ethanol production in Australia is largely driven by the price of oil and input grain. While there has been a considerable amount of interest in developing grain-based
Review of grain-based ethanol production effects on Australian livestock industries
Page 5 of 148
ethanol plants in eastern Australia, only one of these proposed plants (the Dalby Bio-Refinery) is under construction at this stage, while one other (Manildra) has expanded production. Production incentives available for establishing grain-based ethanol plants include several incentive mechanisms, notably the capital grant system and a biofuel producer rebate to subsidise the fuel excise. This rebate reduces the 38.14 cent fuel excise to zero, however this is set to increase to 12.5 cents by 2015. In respect to ethanol demand, state policies are driving demand through a range of mechanisms including advertising and mandates. Mandates are in place for NSW (2% currently, increasing to 10% by 2011), Queensland (5% by 2010) and a biofuel target of 5% in Victoria. Assuming these mandates remain, the likely ethanol requirement in these three states will be approximately 1150 ML by 2010. If this demand is met through local grain-based ethanol production, the grain requirement is roughly 3 million tonnes of grain (assuming the ethanol yield is 390 L / t). In the Australian context, the future price of oil and grain will be the key variable determining the viability of a grain-based ethanol industry. There is considerable uncertainty associated with demand and especially supply factors operating in this market. Recent rises in the price of feed grains is a function of supply constraints, declining stocks and increasing global demand driven by economic growth, increased intensive livestock industry demand and the rise of the biofuel sector. In addition to this, global Government policies on grain imports, ethanol excise and imports and GHG abatement will largely determine the impact of the grain-based ethanol industry on the agricultural sector. The grain dependent livestock industries are likely to incur higher prices of feed grains as both the grain-based ethanol industry and livestock feeders compete for scarce grain supply, especially in below average rainfall years. While increased demand may lead to higher grain production in Australia, the sustainability of this move in a mixed farming context may be questioned. In addition to this, expanding grain production into marginal farming areas to meet demand is not likely to remain sustainable in the long term. Projected increases in demand and price for grain as an ethanol feedstock will be impacted by:
accelerated grain production through yield increases and increased plantings; a slowdown in ethanol expansion – e.g. if the oil price collapses or feedstock prices increase
substantially; breakthroughs in second-generation processing technologies for ethanol production making
other feedstock more economical than grain; the degree to which second-generation ethanol feedstock compete with grain for the factors
of production (land, labour, water, etc); ethanol import policies such that ethanol is sourced from the cheapest global supplier; and any decline in intensive livestock feeding due to a slowdown in demand for intensive animal
products. The biofuel industry creates a demand for feed grain and, while oil prices remain high, is likely to underpin relatively high prices for feed grains in domestic and international markets. Biofuels will be increasingly produced from products other than grain, driven by the need to reduce competition with food supply and produce higher yields of fuel per hectare. Because of the fledgling status of the grain-based ethanol industry, Australia has the opportunity to progress to a second-generation biofuel production system without entering into wide-scale production of grain-based ethanol. Before progressing towards this goal however, there is a need for research to address the sustainability and impact of second-generation biofuel production in the Australian agricultural context. The impact on livestock industries will need to be incorporated into this research, considering competition for land and key inputs such as grass, grain and water.
Review of grain-based ethanol production effects on Australian livestock industries
Page 6 of 148
Contents Page
1 Background......................................................................13
2 B.FLT.0139 Project description ......................................15
2.1 Project objectives............................................................................................15
2.2 Project reporting structure.............................................................................15
3 Biofuels.............................................................................16
3.1 What are biofuels? ..........................................................................................16
3.1.1 First-generation biofuels....................................................................................16
3.1.2 Second-generation biofuels...............................................................................16
3.1.3 Third-generation biofuels...................................................................................18
3.2 Ethanol and ethanol based biofuels ..............................................................18
4 Grain-based ethanol production ....................................20
4.1 Grain-based ethanol production process .....................................................20
4.2 Theoretical ethanol production from grain ...................................................23
4.3 By-products of grain-based ethanol production ..........................................25
4.3.1 Carbon dioxide ..................................................................................................25
4.3.2 Solid co-products...............................................................................................25 4.3.2.1 Whole stillage ..........................................................................................................26 4.3.2.2 Condensed distillers solubles (CDS) .......................................................................26 4.3.2.3 Wet distillers grains (WDG)......................................................................................26 4.3.2.4 Wet distillers grains with solubles (WDGS)..............................................................26 4.3.2.5 Dry distillers grains (DDG) .......................................................................................26 4.3.2.6 Dry distillers grains with solubles (DDGS) ...............................................................26 4.3.2.7 Modified distillers grains with solubles (MDGS).......................................................26
4.3.3 Standardisation of terminology..........................................................................27
4.4 Environmental impact of ethanol plants .......................................................30
4.4.1 Water impacts ...................................................................................................30
4.4.2 Community amenity impacts .............................................................................31
Review of grain-based ethanol production effects on Australian livestock industries
Page 7 of 148
5 Environmental analysis of grain-based ethanol production........................................................................33
5.1 Net energy value..............................................................................................33
5.1.1 Grain production on farm...................................................................................34
5.1.2 Transport...........................................................................................................35
5.1.3 Plant energy usage ...........................................................................................35
5.1.4 Energy credits from co-products .......................................................................35
5.1.5 Net GHG balance..............................................................................................36
5.1.6 Alternative perspectives in NEV estimation.......................................................36
5.2 Life cycle assessment ....................................................................................37
5.3 Environmental sustainability and resource use...........................................40
5.4 The ‘Food vs. Fuel’ debate .............................................................................42
6 Global grain-based ethanol production.........................44
6.1 Grain-based ethanol production (Europe, Asia, Canada)............................44
6.2 Grain-based ethanol production in the US ...................................................46
6.2.1 Location and volume of ethanol production.......................................................46
6.2.2 Ethanol production incentives in the US............................................................48 6.2.2.1 Twenty in Ten ..........................................................................................................48 6.2.2.2 Renewable Fuel Standards (RFS)...........................................................................48 6.2.2.3 Volumetric Ethanol Excise Tax Credit (VEETC) – The “Blenders’ Credit” ...............48 6.2.2.4 Small Ethanol Producer Tax Credit..........................................................................49 6.2.2.5 Tax credit for E85 infrastructure ..............................................................................49 6.2.2.6 Ethanol trade policy .................................................................................................49 6.2.2.7 State Incentives .......................................................................................................50
6.2.3 Costs of production ...........................................................................................52
6.2.4 Availability and pricing of co-products ...............................................................52
7 Grain-based ethanol production in Australia................53
7.1 Location and volume of ethanol production.................................................53
7.1.1 Existing ethanol plants ......................................................................................53
7.1.2 Proposed grain-based ethanol plants................................................................54 7.1.2.1 Marinna Energy .......................................................................................................56 7.1.2.2 Dalby Bio-Refinery...................................................................................................56
Review of grain-based ethanol production effects on Australian livestock industries
Page 8 of 148
7.1.2.3 Lemon Tree Ethanol ................................................................................................57 7.1.2.4 Four Arrows .............................................................................................................57 7.1.2.5 Rockdale..................................................................................................................57 7.1.2.6 Agri Energy proposals .............................................................................................58 7.1.2.7 Primary Energy ........................................................................................................58
7.2 Ethanol production incentives in Australia ..................................................60
7.2.1 Production subsidies .........................................................................................60
7.2.2 Biofuels Capital Grants Program.......................................................................61
7.2.3 Ethanol Distribution Program ............................................................................62
7.2.4 Research grants................................................................................................62
7.3 State government incentives and mandates ................................................62
7.3.1 Queensland.......................................................................................................62
7.3.2 New South Wales..............................................................................................63
7.3.3 Victoria ..............................................................................................................63
7.3.4 Western Australia ..............................................................................................63
7.3.5 Other states.......................................................................................................64
7.4 Demand for ethanol in Australia ....................................................................64
7.5 Availability and pricing of co-products .........................................................65
8 Nutritional value of grain-based ethanol co-products .66
8.1 Introduction .....................................................................................................66
8.2 Differences in milling and resultant co-products .........................................66
8.3 Nutrient composition and variability in grain-based ethanol co-products 67
8.3.1 Crude fat ...........................................................................................................68
8.3.2 Crude protein ....................................................................................................69
8.3.3 Neutral detergent fibre (NDF)............................................................................71
8.3.4 Minerals.............................................................................................................71
8.4 Research regarding distillers grains as feedstuffs ......................................72
8.4.1 Beef cattle .........................................................................................................72
8.4.2 Dairy..................................................................................................................75
8.4.3 Pigs ...................................................................................................................77
8.4.4 Poultry ...............................................................................................................80
8.5 Potential issues with grain-based ethanol co-products ..............................82
Review of grain-based ethanol production effects on Australian livestock industries
Page 9 of 148
8.5.1 Nutrient management........................................................................................82
8.5.2 Storage and handling ........................................................................................83
8.5.3 Economics of feeding grain-based ethanol co-products....................................84
8.5.4 Grain-based ethanol co-products and animal diseases.....................................86
8.6 Conclusion.......................................................................................................88
9 Impact of grain-based ethanol on feedgrain supply & price..................................................................................96
9.1 Background .....................................................................................................96
9.1.1 Feedstock costs ................................................................................................97
9.1.2 Government regulation......................................................................................97
9.1.3 The impact of new conversion technologies......................................................98
9.2 Global feedgrain impacts ...............................................................................99
9.2.1 Supply and demand ..........................................................................................99
9.2.2 Grain price.......................................................................................................100
9.2.3 Grain price volatility .........................................................................................103
9.2.4 Dried distillers grain.........................................................................................104
9.2.5 The Canadian Experience...............................................................................104
9.2.6 What next? ......................................................................................................106
9.3 Australian feed grain impacts ......................................................................108
9.3.1 Supply and demand ........................................................................................108
9.4 Data limitations..............................................................................................112
9.5 Conclusion.....................................................................................................112
10 Information gaps and recommendations ....................116
11 Bibliography...................................................................119
12 Websites .........................................................................147
12.1 Renewable Fuels ...........................................................................................147
12.1.1 ENVIROFUEL – Sustainable transport for Australia........................................147
Review of grain-based ethanol production effects on Australian livestock industries
Page 10 of 148
12.1.2 Bioenergy Australia .........................................................................................147
12.1.3 Evolve Cleaner Fuels ......................................................................................147
12.1.4 Renewable Fuels Association .........................................................................147
12.1.5 American Coalition for Ethanol (ACE) .............................................................147
12.1.6 National Corn-to-Ethanol Research Center (NCERC).....................................147
12.1.7 BBI International..............................................................................................148
12.1.8 Ethanol Producer Magazine ............................................................................148
12.1.9 Distillers Grains ...............................................................................................148
12.1.10 Biofuels Australasia.........................................................................................148
12.2 Ethanol Plants ...............................................................................................148
12.2.1 Dalby Bio-Refinery ..........................................................................................148
12.2.2 E3 BioFuels Genesis.......................................................................................148
12.2.3 Cornhusker Energy .........................................................................................148
12.2.4 Pacific Ethanol, Inc..........................................................................................148
Review of grain-based ethanol production effects on Australian livestock industries
Page 11 of 148
List of Figures Figure 1 - Schematic of grain-based ethanol production (taken from www.dalbybiorefinery.com.au)
...........................................................................................................................................21 Figure 2 - Typical grain-based ethanol plant - Front Range Energy in Windsor, Colorado, 182 ml/yr
(taken from www.pacificethanol.net) .................................................................................21 Figure 3 - Diagram of corn wet milling and dry milling processes from the work of Shurson et al.
(2005) ................................................................................................................................22 Figure 4 - Theoretical efficiency of starch conversion to ethanol (Smith et al. 2006).........................23 Figure 5 - Ethanol yield from 1 tonne of sorghum (12% moisture and 72% starch + sugar) .............24 Figure 6 - Ethanol production process showing various co-products (Lardy 2007) ...........................28 Figure 7 - Variation in net energy value of corn based ethanol reported in the literature (Wang, cited
in APL 2007) ......................................................................................................................34 Figure 8 - Cost of avoiding GHG emissions using different biofuel sources (IES 2008)....................39 Figure 9 - A process tree showing an LCA of ethanol from wheat (O’Connell et al. 2007)................40 Figure 10 - Projected biofuel use and grain demand in the EU to 2016 (OECD-FAO 2007) .............45 Figure 11 - Growth in US ethanol production (1980-2007) (Source: www.ethanol.org).....................46 Figure 12 - Location of ethanol plants in US (April 2007) ..................................................................47 Figure 13 - US states where ethanol production incentives apply .....................................................51 Figure 14 - Location of proposed grain-based ethanol plants and grain production density in
Australia (2008) .................................................................................................................59 Figure 15 - Corn and sorghum wet distillers grains ...........................................................................92 Figure 16 - World ethanol production (Hart 2006) .............................................................................96 Figure 17 - Global commodity prices (FAO 2007) ...........................................................................101 Figure 18 - Implied price volatility (FAO 2007).................................................................................103 Figure 19 - Western Canadian feed wheat prices (Can$/tonne) (Mussell et al. 2007) ....................105 Figure 20 - Australia’s wheat production, 1950-2007 (ABS 2007)...................................................109 Figure 21 - Australia’s coarse grain production, 1971-2006 (ABARE 2007)....................................109 Figure 22 - Australia’s grain prices, 1981-2006 (ABARE 2007).......................................................110 Figure 23 - Australia’s coarse grain use, 2002 – 2008 (ABS 2007).................................................111
Review of grain-based ethanol production effects on Australian livestock industries
Page 12 of 148
List of Tables Table 1 - Theoretical ethanol yield from grains with variable moisture, starch & efficiency ...............24 Table 2 - Ethanol production from different grain sources reported in the literature..........................25 Table 3 - Typical analyses of ethanol co-products.............................................................................27 Table 4 - Summary of LCA studies for grain-based ethanol used in car travel..................................38 Table 5 - Costs of ethanol production in the USA..............................................................................52 Table 6 - Costs of ethanol plant construction and expansion in the USA ..........................................52 Table 7 - Product components of demand for petroleum based transport fuels in Australia .............53 Table 8 - Estimates of current production (2006/07) for ethanol and biodiesel in Australia...............53 Table 9 - Summary of proposed grain-based ethanol plants in Australia ..........................................55 Table 10 - Proposed excise levels on ethanol fuel 2011 - 2015 ........................................................60 Table 11 - Ethanol demand under various mandating scenarios.......................................................64 Table 12 - Nutrient profiles of whole shelled corn, and five reported values of DDGS ......................89 Table 13 - Nutrient profiles of some reported values of DDGS..........................................................90 Table 14 - Recommended and maximum inclusion levels for distillers grains based on existing
research.............................................................................................................................91 Table 15 - World cereal market at a glance (FAO 2007) .................................................................100 Table 16 - Estimated feedstock required for grain-based ethanol ...................................................111
List of Photographs Photograph 1 - Wet distillers grains (WDG).......................................................................................29 Photograph 2 - WDG stored in a silage bag ......................................................................................29 Photograph 3 - Dry distillers grains (DDG) ........................................................................................29 Photograph 4 - Clockwise from the top left, Unloaded sorghum wdgs with high moisture content
requires a large area for storage, due to the inability to stack the product for storage; Sorghum and corn wdgs piles; Corn wdgs being unloaded; Pile of corn ddgs...........93
Photograph 5 - Left: Bagging and storage of corn wdgs. Right: Corn wdgs prior to storage (Courtesy of Iowa State University).............................................................................................94
Photograph 6 - Anticipation of the grain demand for new ethanol plants under construction in the US has increased grain prices for livestock producers.....................................................95
Review of grain-based ethanol production effects on Australian livestock industries
Page 13 of 148
1 Background Concern over energy security and reliance on oil supplies has become a significant global issue (O'Connell et al. 2007; International Energy Agency 2006). This, together with concerns over climate change and greenhouse gas production have lead many governments, including Australia, to seek alternative transport fuels in the form of biofuels (Charles et al. 2007; O'Connell et al. 2007). It is clear that traditional supplies of fossil fuels needed to make liquid fuels will be exhausted in the future. However, the timeframe for this decline in production is uncertain (Charles et al. 2007). Biofuels are promoted as ‘renewable’ and ‘green’ in both the scientific literature and media. Their main negative image comes from the potential conflict between use for food or fuel, and the effect of this on global food prices. This report will investigate the literature presenting a review of the global industry and the main opinions promoting and criticising this industry. While biofuels are produced from a range of sources and processing techniques, this report is focussed on grain-based ethanol production with the main feedstocks used globally including corn (US, Canada, China), wheat (EU, Australia) and sorghum (US, Australia). Taking a broad view, biofuels are likely to become a permanent part of the agricultural production environment. This needs to occur in a way that is truly sustainable at a national and global level. In addition to this, the interaction with other industries must be balanced with the pressure for land use and vital food production. Grain is a domestic and export food source in Australia, and is essential to the production of livestock. Addition of a new demand stream into the domestic and global feed grain market will result in higher grain prices as a result of competition for supply. One partial solution to this is increasing the overall grain supply (potential for this was demonstrated in the US with a record corn crop in 2007, 60 Mt above the previous year). However, increased supply must be considered in a broad context, taking into consideration alternative uses for additional grain and environmental costs of expanded production. It is already recognised that some countries, in their quest to produce biofuels, are clearing forested land and emitting large amounts of CO2 into the atmosphere, in order to reduce GHG emissions through use of biofuels. Such decisions lack a rigorous system approach to assessing impacts and potential benefits from a change in production, potentially exacerbating the problem they seek to solve. Looking forward, biofuel production is moving rapidly towards second-generation biofuels, and this will both clarify and complicate the issue of ‘renewable’ and ‘green’ biofuel production. Clearly, the direct competition for food and fuel is abated. However, competition over land and water use remains significant. Second-generation biofuel production may also compete directly for grazing land, adding a different dimension to the interface between biofuel and food. The intensive livestock industries may, in this case, offer some solutions by decreasing the land required for grazing and making room for expansion of second-generation biofuels. There is a large volume of material that has been produced to support or contest the ‘sustainable’ and ‘green’ image of grain-based biofuels. Reviews of this literature have been compiled by Charles et al. (2007), Henke et al. (2003), Junginger (2007), Patzek (2004), Shapouri et al. (2003), Von Blottnitz & Curran (2007) and others. This report is the result of a literature review and desktop study of current and projected grain-based ethanol production both in Australia and globally. The report explores the impact of proposed expansion of Australian and global grain ethanol industries on animal industries reliant on grain as a primary feedstock. This report is one of several reports released by various organisations in Australia over the past 12 months. The reader is encouraged to review these reports to gain a more complete picture of the industry, including broad implications
Review of grain-based ethanol production effects on Australian livestock industries
Page 14 of 148
of biofuel usage in Australia (O'Connell et al. 2007), economic and policy implications (Batten et al. 2007) and the response from other feedgrain users (APL 2007). The production of ethanol from grain is a relatively new development in the feedgrain market. Large scale and increasing sales of US maize to ethanol plants are already reported to be placing upward pressure on feedgrain prices. US energy policy envisages substantially increased ethanol production in the United States. This increased ethanol production is supported by a range of government subsidies. Grain-based ethanol production in Australia is currently very limited, despite Australian government taxation concessions until 2011, some start up assistance to selected plants, and various state government assistance programs. There are, however, publicly stated intentions by ethanol companies in Australia to substantially increase investment in grain-based ethanol manufacture. The implications of the growth in ethanol production for grain dependent livestock industries in Australia have been the subject of recent government reports and industry funded studies. There is a much larger body of documentation globally. This documentation contains much technical information, as well as economic assessments of the magnitude and implications of ethanol production based on grain usage. The assessment of how grain-based ethanol manufacture in Australia may affect the livestock industries is made more difficult by the limited scope of publicly available government statistical data. This project will bring together currently available material of most relevance to the grain-based ethanol and grain dependent livestock industry interface in Australia to provide a succinct baseline summary of the current state of knowledge and identify any knowledge gaps. MLA managed the project on behalf of the Feedgrain Partnership, which is a group of R&D funding agencies covering the feedgrain supply chain in Australia.
Review of grain-based ethanol production effects on Australian livestock industries
Page 15 of 148
2 B.FLT.0139 Project description The project is an extensive desktop study, which will address the following components:
review the currently available literature on the global grain-based ethanol industry, and its current and potential impacts on the feedgrain market in general, and grain dependent livestock industries in general;
identify the documentation of most relevance to the best available understanding of the current and potential effects on Australian grain dependent livestock industries of global grain-based ethanol manufacture;
document the currently available information, and related information sources, on the size, location and planned development of the Australian ethanol industry;
identify and document any specific information on the following areas: o the availability of the by-product from ethanol production (DDGS), and effects of the
supply/price of global DDGS on the Australian grain dependant livestock industries. o the evaluation of the energetic efficiency of producing ethanol from grains grown
under Australian conditions and environmental impacts. identify any gaps in the available information which, if filled, would significantly enhance the
quality of information available to the Feedgrain Partnership; and recommend any further R&D activities to fill the identified gaps.
2.1 Project objectives
Conduct a desktop literature review that will:
Provide a stocktake of available literature on the global ethanol industry as it affects the feedgrain market in Australia.
Identify the key information from this stocktake to understanding the current and foreseeable impacts of these developments on the interface between the feedgrain market and livestock industries in Australia.
Drawing on the preceding, report on information gaps that significantly hamper our knowledge base, and recommend any further studies, or statistical coverage, that would fill those gaps.
2.2 Project reporting structure
Because of the large amount of reference material available, the project output includes, in addition to this report, an extended bibliography and a large volume of reference material supplied in electronic form. Note:
Chapter 8 was prepared by M Quinn, J Doyle & R Lawrence, Integrated Animal Production Inc. Toowoomba, Qld. Chapter 9 was prepared by H Macintosh & W Yates, Warwick Yates & Associates Pty Ltd, Adelaide Street, Brisbane Qld.
Review of grain-based ethanol production effects on Australian livestock industries
Page 16 of 148
3 Biofuels
3.1 What are biofuels?
Simply stated, biofuels are liquid or gas fuels produced from plant material or biomass. Production is categorised based on the type of feedstock and process used to generate fuel. While there are numerous different biofuels that can be manufactured, the most common of these are ethanol and biodiesel. This report is focussed on grain-based ethanol production from first-generation technologies. However, other means of production have been included in the following sections for reference. 3.1.1 First-generation biofuels
First-generation biofuels are produced from ‘mature’ or well-developed technologies, which, in some cases, have been used for thousands of years. These include the production of ethanol from sugar or from grain starch, and biodiesel production from the transesterfication of oils and fats. The production of ethanol proposed in Australia is currently based on these first-generation technologies. While it is true to identify grain-based ethanol production as a first-generation biofuel, there have been significant gains in the efficiency of production of ethanol from grain in the past 5-10 years as processing technology improves. Ethanol production from grain will be discussed at length in Chapter 4. 3.1.2 Second-generation biofuels
Second-generation biofuel production includes processing technologies that are currently under development for production of biofuel from alternative non-food materials. These methods generally utilise plant biomass (i.e. straw, woodchips) as the primary feedstock for fuel generation (i.e. cellulosic ethanol plants). While these technologies are not new, the wide-scale commercialisation of second-generation biofuel production has not eventuated to date. Second-generation technologies have the advantage of using the majority of biomass produced by the plant rather than only a fraction (i.e. starch in grain). Hence, potential fuel yield per hectare is greater (Charles et al. 2007; Kim & Dale 2004). Many processes can be used in the production of ethanol from biomass, including enzyme hydrolysis, ammonia fibre explosion (AFEX) (Dale 2007) and anhydrous pyrolysis (chemical decomposition of organic material by heating in the absence of oxygen to produce bio-oil or syngas) (Charles et al. 2007). These technologies are rapidly improving the efficiency of production, and several are currently being trialled in pilot scale plants (Dale 2007). Second-generation biofuels are seen as the direction of the future for sustainable fuel production in the US, and the future prospect of this system is primarily based on crop biomass such as corn stover (Perlack et al. 2005; Wu et al. 2006). Most research agrees that second-generation biofuels have a strongly positive energy balance and lower GHG production than grain ethanol (Wu et al. 2006; Farrell et al. 2006; Kim & Dale 2005a; Sheehan et al. 2004; Wang et al. 1999), though these conclusions are contested by some (Pimentel & Patzek 2005). Cellulosic ethanol production has a lower yield per tonne than grain. Wang et al. (1999) propose future yields of 76 Gal / dry ton (261 L / dry tonne) for woody cellulosic biomass and 80 Gal / dry ton (275 L / dry tonne) for herbaceous cellulosic biomass. Yields are typically lower because the feedstock is made up of complex cellulose, hemi-cellulose and lignin components that are difficult to
Review of grain-based ethanol production effects on Australian livestock industries
Page 17 of 148
break down into their constituent sugars. However, technology in this area is improving rapidly and yields are expected to increase to 90 Gal / dry ton (309 L / dry tonne) by 2012 (Wu et al. 2006). It must be noted that predictions from various researchers (including Wang et al. 1999) have presented an optimistic view of technological improvement and yet, despite their predictions, commercial production is not underway. Cellulosic ethanol also produces a significant energy by-product because of the lower conversion rate of plant material to sugars. This leaves amounts of biomass available to generate electricity within the facility. In some cases, additional electricity in excess of the needs of the facility can be sold back to the power grid, accruing further benefits from CO2 offsets against coal fired electricity production. Kim & Dale (2004) estimate that potential global ethanol production using biomass produced from wasted crops and crop residues is 491 GL / yr. This could replace some 353 GL / yr of petroleum, offsetting global fossil fuel reliance for transportation by 32% when this ethanol is used as E85 fuel in a ‘midsize passenger vehicle’. Use of crop residue for ethanol production, as recommended by Kim & Dale (2004) and Perlack et al. (2005), has raised questions over the sustainability of agricultural soils producing these crops because of reduced carbon inputs to the soil (Wilhelm et al. 2007). Research on the use of corn stover in the US has recognised the need for some residue to be left for erosion control. However, the amount recommended by Perlack et al. (2005) is not considered adequate to maintain soil carbon levels (Wilhelm et al. 2006). A significant body of research and extension has highlighted the importance of cereal crop residue retention for maintaining soil organic carbon in Australian cropping soils (Chan et al. 2003; Farquharson et al. 2003). In light of this, second-generation biofuel production from cereal crop residue may only be suitable in limited situations. Other negative environmental affects have also been listed for crop residue ethanol production, including acidification and eutrophication (Kim & Dale 2005a; Pimentel & Patzek 2005) Cellulosic ethanol production in Australia is being advanced by construction of a pilot plant to produce ethanol from sugar cane bagasse and wood waste in Northern NSW. This plant is currently under construction and aims to meet outcomes for demonstrating effective technology in ethanol production by late 2008 - 2009 (Ethtec 2008). Research on the potential of ethanol from wood products in Australia has also been conducted by the RIRDC (Enecon Pty Ltd 2002). While there are no commercial cellulosic ethanol plants in operation worldwide, the research and investment into this process is likely to improve the efficiency significantly during the next 5 – 20 years, as projected by Wu et al. (2006). It is noted that six second-generation biofuel plants, utilising straw and crop biomass, are currently under construction in the US with a view to making cellulosic ethanol production economically viable in the US by 2012 (USDE 2007). Assuming the technological advances required for economic production of second-generation biofuels are achieved, this feedstock could surpass ethanol from grain in the US (Wang et al. 1999). However, considering the investment in grain-based ethanol, it remains a topic of debate as to whether this will influence grain ethanol production in the short to medium term (Baker & Zahnister 2007). In some cases, it may be possible to reconfigure ethanol plants to process biomass, reducing the capital expenditure for transferring to the alternative feedstock. Second-generation biofuels will introduce a range of opportunities and threats for grain and livestock producers, mainly related to competition for land (cropland and pasture), and potential for useful by-product transfer.
Review of grain-based ethanol production effects on Australian livestock industries
Page 18 of 148
The rate of progress towards second-generation biofuels may be one of the most significant future impacts on the ethanol and grains industries, and a more detailed assessment of second-generation biofuel production in relation to the grain and livestock industries may be warranted to determine threats and opportunities. 3.1.3 Third-generation biofuels
Third-generation biofuels refer to the production of fuels from novel technologies and plant breeding programs. Genetic modification of plants may allow direct production of biodiesel from oil producing plants or algae, saving manufacturing costs and reducing land requirements. There is a significant amount of research being directed towards these technologies in the US and other parts of the world. However, currently the cost of production is significantly higher than comparative products. It is difficult to assess the future impact of third-generation biofuel production on the grain ethanol industry. However, research and investments will continue to seek production options that limit the adverse affects of other methods, notably competition for food and land resources. 3.2 Ethanol and ethanol based biofuels
Ethanol is currently the most widely produced biofuel worldwide. Ethanol (ethyl alcohol – chemical formula C2H5OH) is a clear liquid with a faint odour made from the fermentation of sugars. These sugars may be sourced from grain, sugar or biomass, with global production being dominated by corn-based ethanol in the USA and sugar-based production in Brazil. Ethanol is most commonly known for its inclusion in alcoholic drinks, and has many commercial uses in the cleaning, personal hygiene, and renewable fuels industries. Ethanol has a high latent heat of vaporisation and contains oxygen, characteristics that are relevant to its environmental performance in combustion as a motor fuel, and in its storage and distribution. Ethanol is flammable, volatile, moderately toxic and very soluble in water. Ethanol has an energy value of 23.5 MJ/L, compared to 34.4 MJ/L for petrol (Centre for International Economics 2005), giving ethanol approximately 68% of the energy density of petrol. Pure (100%) ethanol is not generally used as a motor fuel. Instead, a percentage of ethanol is combined with unleaded petrol. This is beneficial because the ethanol increases the fuel's octane rating and decreases petrol's harmful emissions. Ethanol is known as both an ‘octane enhancer’ and an ‘oxygenate’. An octane enhancer is a component added to petrol to increase the research octane number and to reduce engine knock. An oxygenate is a fuel octane component containing hydrogen, carbon and oxygen in its molecular structure. Oxygenates are often added to petrol to increase octane, to extend petrol supplies and to induce a lean shift (‘enleanment’) in the engine's operation. Oxygenates chemically ‘enlean’ the fuel by providing it with additional oxygen, altering the air/fuel ratio and thereby improving combustion and reducing tailpipe emission of carbon monoxide (CO) for vehicles where no feed-back control of the air/fuel ratio exists (Orbital Energy Company 2003). Ethanol is typically added to petrol in small amounts. However, it may be substituted at any ratio. It is noted that the lower energy value of ethanol leads to lower overall energy in blended fuel, potentially leading to lower fuel economy for blended fuels. The most common blends used internationally are:
Review of grain-based ethanol production effects on Australian livestock industries
Page 19 of 148
E10 - 10% ethanol and 90% unleaded petrol
E10 is approved for use in any make or model of vehicle sold in the US but not in Australia. Many US car makers recommend its use because of its high performance and clean-burning characteristics. Today about 46% of America's petrol contains some ethanol, most as E10 blend. This is also considered the most appropriate blend for the Australian market (O'Connell et al. 2007). It is important to note that it does not take a special vehicle to run on the E10 ethanol blend. All vehicles can use up to 10% ethanol with no modifications to the engine.
E85 - 85% ethanol and 15% unleaded petrol
E85 is an alternative fuel for use in flexible fuel vehicles (FFVs). This blend is not sold in Australia but there are currently more than 6 million FFVs on America's roads and car makers are rolling out more each year. In conjunction with increased numbers of flexible fuel vehicles, more E85 pumps are being installed across the US. When E85 is not available, these FFVs can operate on straight petrol or any ethanol blend up to 85%.
Review of grain-based ethanol production effects on Australian livestock industries
Page 20 of 148
4 Grain-based ethanol production
4.1 Grain-based ethanol production process
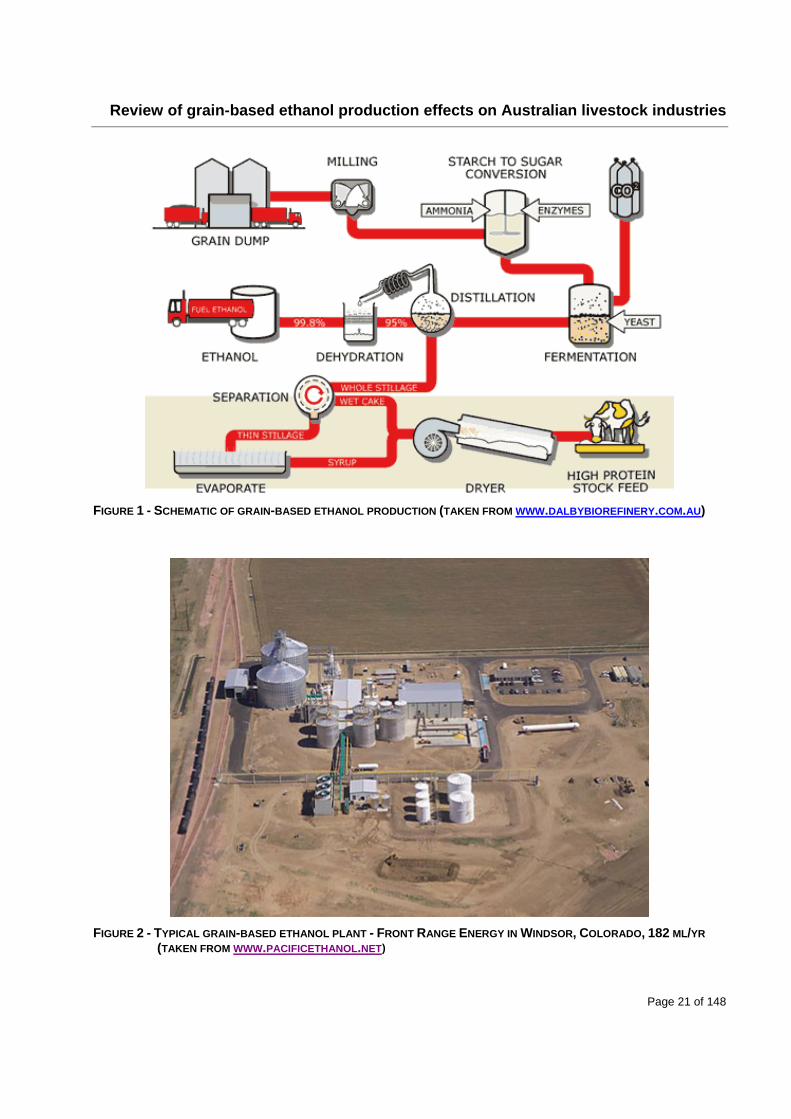
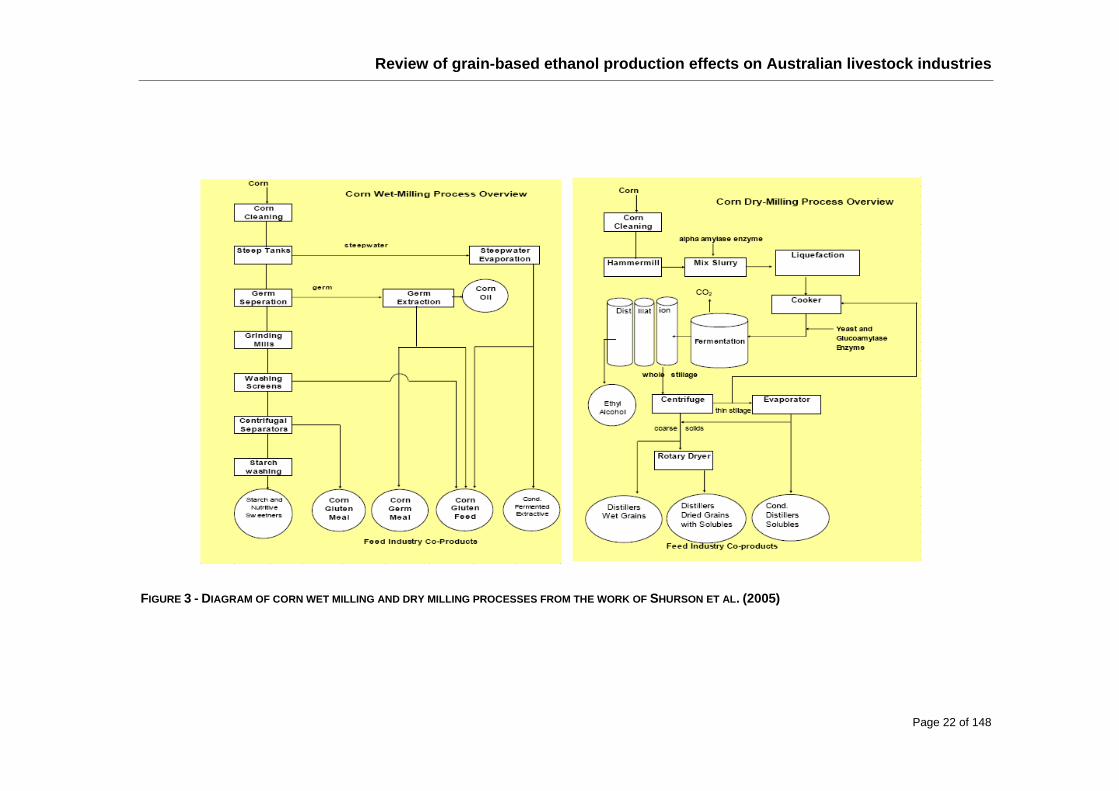
Grain-based ethanol can be produced by a dry or wet milling process. Figure 1 provides a schematic view of the dry milling manufacturing process. A detailed overview of both dry and wet milling processes is provided in Figure 3. Dry milling is the more prevalent processing technique (accounting for the greater majority of ethanol plants in the US). Figure 2 shows an aerial view of a typical US grain-based ethanol plant. All plants proposed for Australia will use the dry milling process. Dry and wet milling differs in both the production process and the number and type of co-products produced. The primary processing difference is in the initial grain treatment phase. Wet milling involves steeping grain in water and dilute acid for 24-48 hours prior to milling and separation into constituent parts. A wet milling plant may be considered more versatile because of the greater number of product options for the grain. However, it is also considerably more expensive to construct and operate (Dale & Tyner 2006). The co-products of wet milling include corn oil, corn germ or corn bran, corn gluten meal, corn steep liquor and corn gluten feed (combination of corn bran and corn steep liquor). Wet milling and these co-products are not relevant to Australia and therefore will not be discussed further. Dry milling of grains is a less complex process compared to wet milling, resulting in fewer co-products but represents the most popular method of grain-based ethanol production. The dry milling process involves three main steps. The first step is to grind the grain into a fine powder (meal), followed by liquefaction and saccharification. Liquefaction and saccharification involve heating and the addition of water together with enzymes (or acid) to liquefy the starch, and then cooling and addition of secondary enzymes together with water. This results in conversion of the liquid starch into fermentable sugars (saccharification). Once this step is complete, yeast is added and the slurry of grain and water is placed into a series of fermenters, which assist the yeast in converting the sugars into ethanol and carbon dioxide. Ammonia solution or sulphuric acid is generally added to adjust pH to maintain optimum conditions for fermentation. This usually takes around 48 hours and produces a mix of liquids and solids with an alcohol content of around 13-16%. This fermented slurry and water (mash) is known as “beer”. This mix is then pumped from the fermentation tanks into a distillation system, which removes the alcohol from the water and the solids. This distillation gives a liquid that is around 96% ethanol (hydrous ethanol – 190 Proof). The remaining liquids and solids are called whole stillage from which the co-products are derived. The 96% ethanol liquid is then dehydrated using a molecular sieve, removing virtually all the water and giving pure ethanol (200 Proof). At this stage, toxic chemicals are added to the ethanol to make it unsuitable for human consumption. This is called denaturing and, for fuel ethanol, involves adding 2-5% petrol. After denaturing, the anhydrous ethanol is ready to be blended as a fuel additive. The production of ethanol results in a number of by-products. These are discussed in Section 4.3 and shown in Figure 6. The chemical process of ethanol production is outlined below, showing the theoretical production rate of ethanol from grain.
Review of grain-based ethanol production effects on Australian livestock industries
Page 21 of 148
FIGURE 1 - SCHEMATIC OF GRAIN-BASED ETHANOL PRODUCTION (TAKEN FROM WWW.DALBYBIOREFINERY.COM.AU)
FIGURE 2 - TYPICAL GRAIN-BASED ETHANOL PLANT - FRONT RANGE ENERGY IN WINDSOR, COLORADO, 182 ML/YR
(TAKEN FROM WWW.PACIFICETHANOL.NET)
Review of grain-based ethanol production effects on Australian livestock industries
Page 22 of 148
FIGURE 3 - DIAGRAM OF CORN WET MILLING AND DRY MILLING PROCESSES FROM THE WORK OF SHURSON ET AL. (2005)
Review of grain-based ethanol production effects on Australian livestock industries
Page 23 of 148
4.2 Theoretical ethanol production from grain
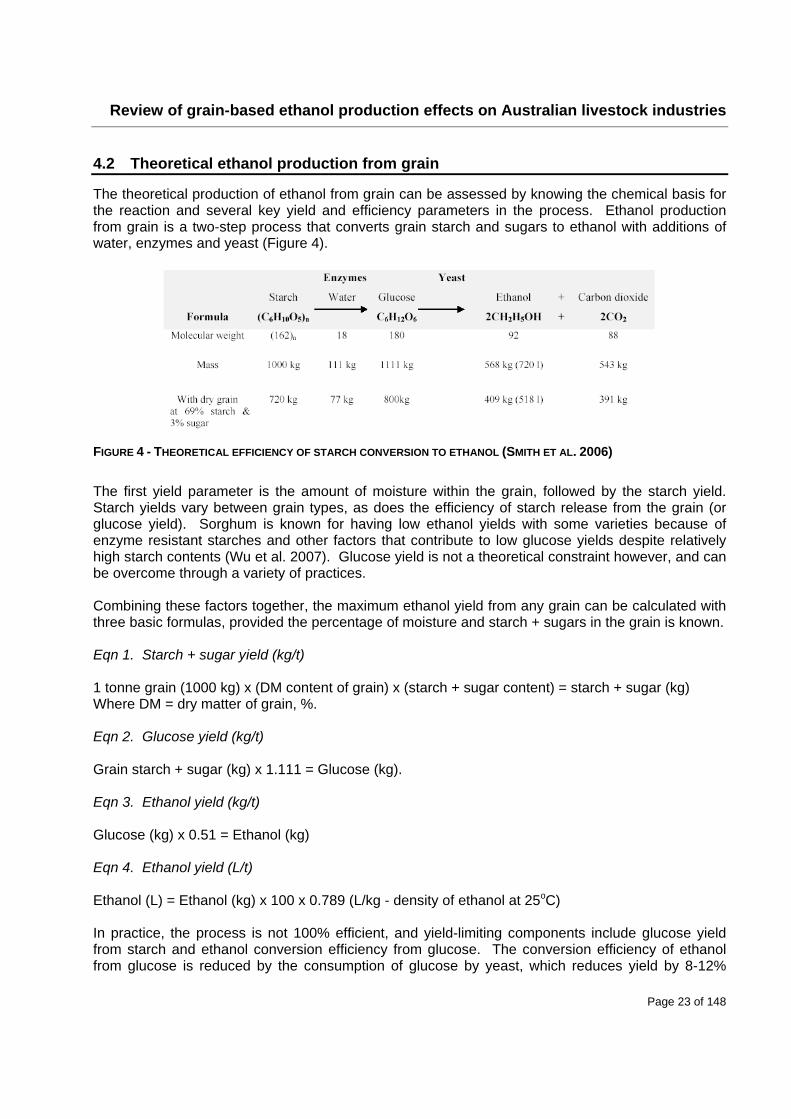
The theoretical production of ethanol from grain can be assessed by knowing the chemical basis for the reaction and several key yield and efficiency parameters in the process. Ethanol production from grain is a two-step process that converts grain starch and sugars to ethanol with additions of water, enzymes and yeast (Figure 4).
FIGURE 4 - THEORETICAL EFFICIENCY OF STARCH CONVERSION TO ETHANOL (SMITH ET AL. 2006)
The first yield parameter is the amount of moisture within the grain, followed by the starch yield. Starch yields vary between grain types, as does the efficiency of starch release from the grain (or glucose yield). Sorghum is known for having low ethanol yields with some varieties because of enzyme resistant starches and other factors that contribute to low glucose yields despite relatively high starch contents (Wu et al. 2007). Glucose yield is not a theoretical constraint however, and can be overcome through a variety of practices. Combining these factors together, the maximum ethanol yield from any grain can be calculated with three basic formulas, provided the percentage of moisture and starch + sugars in the grain is known. Eqn 1. Starch + sugar yield (kg/t) 1 tonne grain (1000 kg) x (DM content of grain) x (starch + sugar content) = starch + sugar (kg) Where DM = dry matter of grain, %. Eqn 2. Glucose yield (kg/t) Grain starch + sugar (kg) x 1.111 = Glucose (kg). Eqn 3. Ethanol yield (kg/t) Glucose (kg) x 0.51 = Ethanol (kg) Eqn 4. Ethanol yield (L/t) Ethanol (L) = Ethanol (kg) x 100 x 0.789 (L/kg - density of ethanol at 25oC) In practice, the process is not 100% efficient, and yield-limiting components include glucose yield from starch and ethanol conversion efficiency from glucose. The conversion efficiency of ethanol from glucose is reduced by the consumption of glucose by yeast, which reduces yield by 8-12%
Review of grain-based ethanol production effects on Australian livestock industries
Page 24 of 148
(Smith et al. 2006; Patzek 2004). In current ethanol production, there is scope for improving efficiency of conversion to minimise these losses. Using the above information, the rate of ethanol production from any grain can be estimated. Using sorghum for example, assuming the grain has 12% moisture and 72% starch + sugar; the ethanol yield is shown in Figure 5. This is a theoretical rate of production and assumes 100% conversion of starch to glucose and 92% conversion of glucose to ethanol.
Eqn 1 1000 (kg) x 0.88 DM x 0.72 starch + sugar = 634 starch + sugar (kg)
Eqn 2
634 starch + sugar (kg) x 1.111 = 704 glucose (kg)
Eqn 3 704 glucose (kg) x 0.51 = 360 ethanol (kg)
Eqn 4 360 ethanol (kg) x 0.92 efficiency of conv x 0.789 L/kg density = 420 L
FIGURE 5 - ETHANOL YIELD FROM 1 TONNE OF SORGHUM (12% MOISTURE AND 72% STARCH + SUGAR)
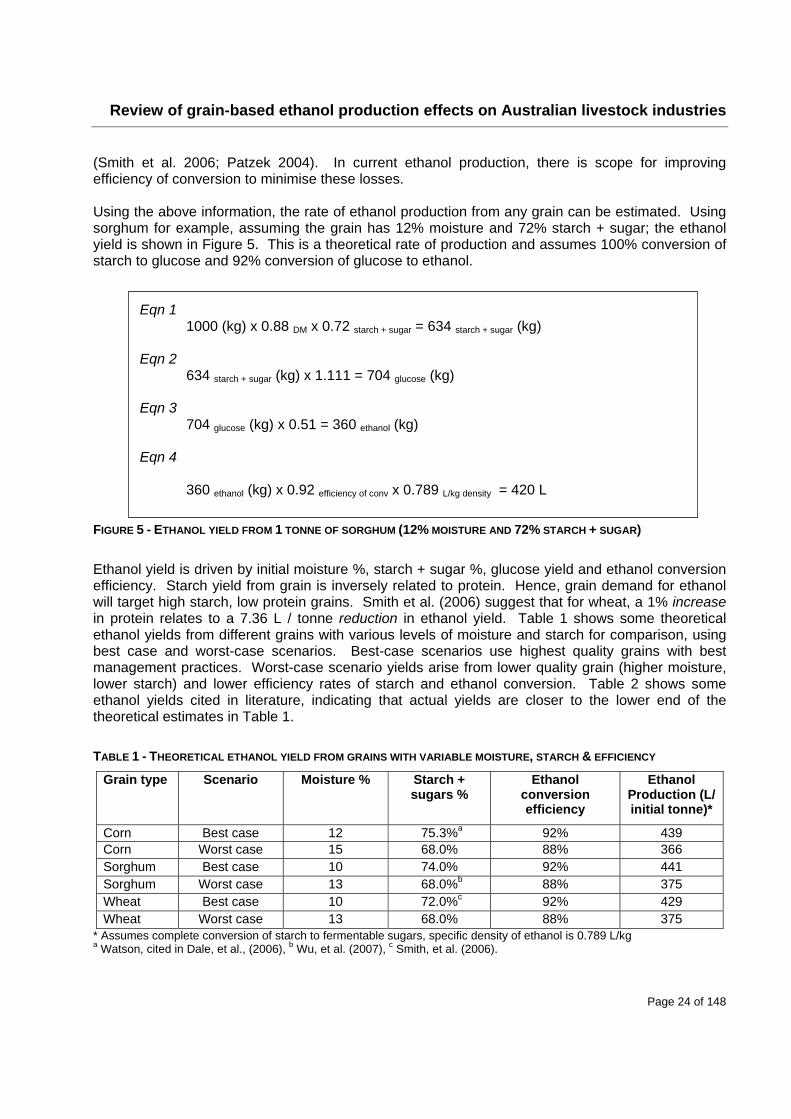
Ethanol yield is driven by initial moisture %, starch + sugar %, glucose yield and ethanol conversion efficiency. Starch yield from grain is inversely related to protein. Hence, grain demand for ethanol will target high starch, low protein grains. Smith et al. (2006) suggest that for wheat, a 1% increase in protein relates to a 7.36 L / tonne reduction in ethanol yield. Table 1 shows some theoretical ethanol yields from different grains with various levels of moisture and starch for comparison, using best case and worst-case scenarios. Best-case scenarios use highest quality grains with best management practices. Worst-case scenario yields arise from lower quality grain (higher moisture, lower starch) and lower efficiency rates of starch and ethanol conversion. Table 2 shows some ethanol yields cited in literature, indicating that actual yields are closer to the lower end of the theoretical estimates in Table 1.
TABLE 1 - THEORETICAL ETHANOL YIELD FROM GRAINS WITH VARIABLE MOISTURE, STARCH & EFFICIENCY
Grain type Scenario Moisture % Starch + sugars %
Ethanol conversion efficiency
Ethanol Production (L/ initial tonne)*
Corn Best case 12 75.3%a 92% 439 Corn Worst case 15 68.0% 88% 366 Sorghum Best case 10 74.0% 92% 441 Sorghum Worst case 13 68.0%b 88% 375 Wheat Best case 10 72.0%c 92% 429 Wheat Worst case 13 68.0% 88% 375
* Assumes complete conversion of starch to fermentable sugars, specific density of ethanol is 0.789 L/kg a Watson, cited in Dale, et al., (2006), b Wu, et al. (2007), c Smith, et al. (2006).
Review of grain-based ethanol production effects on Australian livestock industries
Page 25 of 148
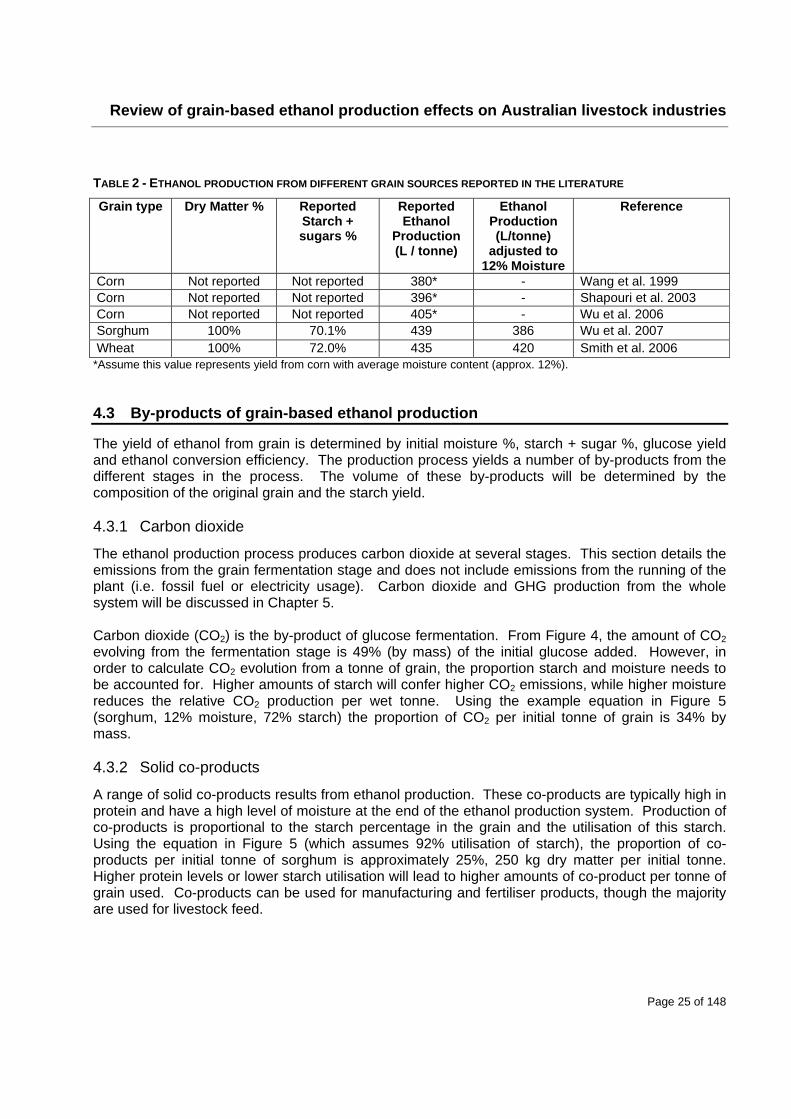
TABLE 2 - ETHANOL PRODUCTION FROM DIFFERENT GRAIN SOURCES REPORTED IN THE LITERATURE
Grain type Dry Matter % Reported Starch + sugars %
Reported Ethanol
Production (L / tonne)
Ethanol Production (L/tonne)
adjusted to 12% Moisture
Reference
Corn Not reported Not reported 380* - Wang et al. 1999 Corn Not reported Not reported 396* - Shapouri et al. 2003 Corn Not reported Not reported 405* - Wu et al. 2006 Sorghum 100% 70.1% 439 386 Wu et al. 2007 Wheat 100% 72.0% 435 420 Smith et al. 2006
*Assume this value represents yield from corn with average moisture content (approx. 12%). 4.3 By-products of grain-based ethanol production
The yield of ethanol from grain is determined by initial moisture %, starch + sugar %, glucose yield and ethanol conversion efficiency. The production process yields a number of by-products from the different stages in the process. The volume of these by-products will be determined by the composition of the original grain and the starch yield. 4.3.1 Carbon dioxide
The ethanol production process produces carbon dioxide at several stages. This section details the emissions from the grain fermentation stage and does not include emissions from the running of the plant (i.e. fossil fuel or electricity usage). Carbon dioxide and GHG production from the whole system will be discussed in Chapter 5. Carbon dioxide (CO2) is the by-product of glucose fermentation. From Figure 4, the amount of CO2 evolving from the fermentation stage is 49% (by mass) of the initial glucose added. However, in order to calculate CO2 evolution from a tonne of grain, the proportion starch and moisture needs to be accounted for. Higher amounts of starch will confer higher CO2 emissions, while higher moisture reduces the relative CO2 production per wet tonne. Using the example equation in Figure 5 (sorghum, 12% moisture, 72% starch) the proportion of CO2 per initial tonne of grain is 34% by mass. 4.3.2 Solid co-products
A range of solid co-products results from ethanol production. These co-products are typically high in protein and have a high level of moisture at the end of the ethanol production system. Production of co-products is proportional to the starch percentage in the grain and the utilisation of this starch. Using the equation in Figure 5 (which assumes 92% utilisation of starch), the proportion of co-products per initial tonne of sorghum is approximately 25%, 250 kg dry matter per initial tonne. Higher protein levels or lower starch utilisation will lead to higher amounts of co-product per tonne of grain used. Co-products can be used for manufacturing and fertiliser products, though the majority are used for livestock feed.
Review of grain-based ethanol production effects on Australian livestock industries
Page 26 of 148
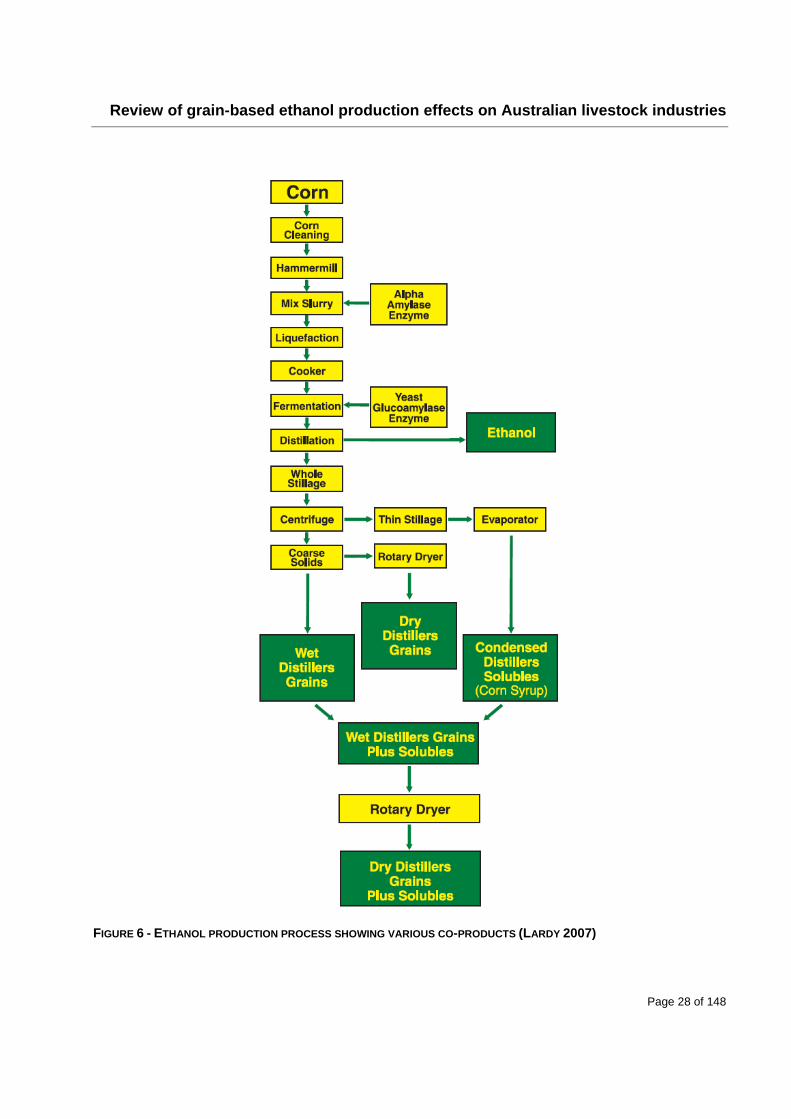
4.3.2.1 Whole stillage Whole stillage is the remnant of the fermentation process after the ethanol has been distilled off. This product is typically centrifuged to produce wet distillers grains (solid component) and thin stillage (sweet water - liquid component). 4.3.2.2 Condensed distillers solubles (CDS) Condensed distillers solubles (corn syrup) is the syrup produced from evaporating down thin stillage (5-7% solids) and contains 25% solids. These solubles can then be added to the wet distillers grains. Table 3 gives typical analyses for condensed distillers soluble. Further nutrient details are given in Chapter 8. 4.3.2.3 Wet distillers grains (WDG) Wet distillers grains (Photograph 1) is the solid component of the centrifuging of the whole stillage (30-35% solids). The shelf life of WDG is typically 4-5 days depending on temperature but it can be ensiled in silage bags (Photograph 2). Table 3 gives typical analyses for WDG. Further nutrient details are given in Chapter 8. 4.3.2.4 Wet distillers grains with solubles (WDGS) Wet distillers grains with solubles is WDG combined with the syrup concentrate (solubles) from thin stillage. Table 3 gives typical analyses for WDGS. Further nutrient details are given in Chapter 8. 4.3.2.5 Dry distillers grains (DDG) Dry distillers grains (Photograph 3) is WDG that has been dried down to 90% solids. Considerable energy is required to dry the WDG but this process increases the storage life of the product and reduces transport costs. Conventional drying of WDG to DDG accounts for 38-40% of a plant’s overall energy consumption (Ethanol Producer Magazine 2007). Table 3 gives typical analyses for DDG. Further nutrient details are given in Chapter 8. 4.3.2.6 Dry distillers grains with solubles (DDGS) Dry distillers grains with solubles is WDGS that has been dried down to 90% solids. Considerable energy is required to dry the WDGS but this process increases the storage life of the product and reduces transport costs. DDGS from a conventional dry-grind corn plant has 26 to 30% protein, 10 to 12% crude fibre and 8 to 10% crude fat. Table 3 gives typical analyses for DDGS. Further nutrient details are given in Chapter 8. 4.3.2.7 Modified distillers grains with solubles (MDGS) Another product that has emerged from dry milling processes is modified distillers grains (MDGS) which removes a portion of the germ and provides a co-product intermediate, with respect to dry matter content, between WDGS and DDGS. Table 3 gives typical analyses for MDGS. Further nutrient details are given in Chapter 8.
Review of grain-based ethanol production effects on Australian livestock industries
Page 27 of 148
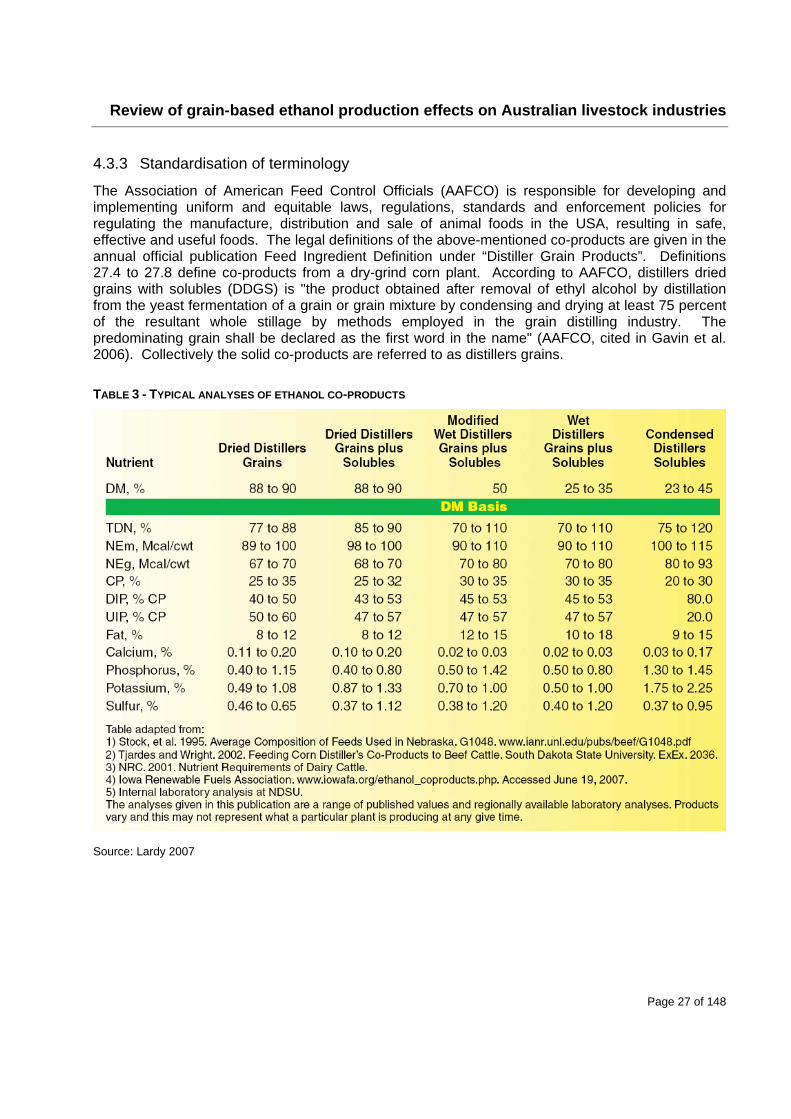
4.3.3 Standardisation of terminology
The Association of American Feed Control Officials (AAFCO) is responsible for developing and implementing uniform and equitable laws, regulations, standards and enforcement policies for regulating the manufacture, distribution and sale of animal foods in the USA, resulting in safe, effective and useful foods. The legal definitions of the above-mentioned co-products are given in the annual official publication Feed Ingredient Definition under “Distiller Grain Products”. Definitions 27.4 to 27.8 define co-products from a dry-grind corn plant. According to AAFCO, distillers dried grains with solubles (DDGS) is "the product obtained after removal of ethyl alcohol by distillation from the yeast fermentation of a grain or grain mixture by condensing and drying at least 75 percent of the resultant whole stillage by methods employed in the grain distilling industry. The predominating grain shall be declared as the first word in the name" (AAFCO, cited in Gavin et al. 2006). Collectively the solid co-products are referred to as distillers grains.
TABLE 3 - TYPICAL ANALYSES OF ETHANOL CO-PRODUCTS
Source: Lardy 2007
Review of grain-based ethanol production effects on Australian livestock industries
Page 28 of 148
FIGURE 6 - ETHANOL PRODUCTION PROCESS SHOWING VARIOUS CO-PRODUCTS (LARDY 2007)
Review of grain-based ethanol production effects on Australian livestock industries
Page 29 of 148
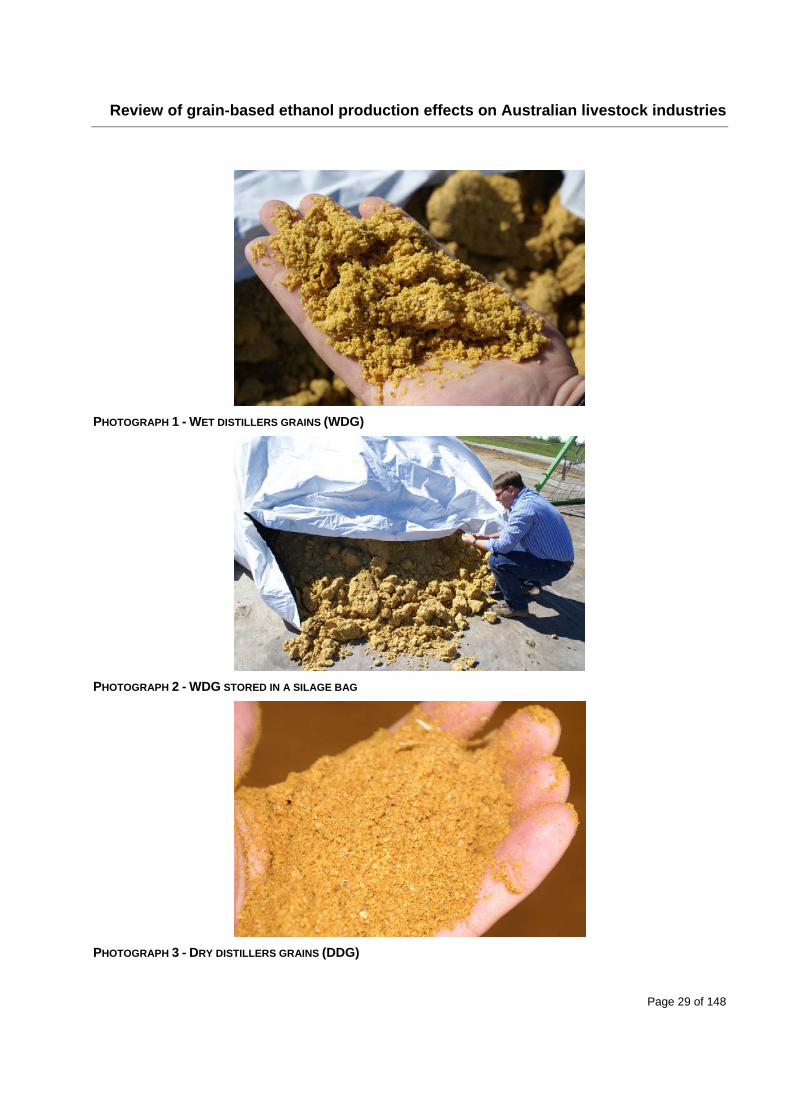
PHOTOGRAPH 1 - WET DISTILLERS GRAINS (WDG)
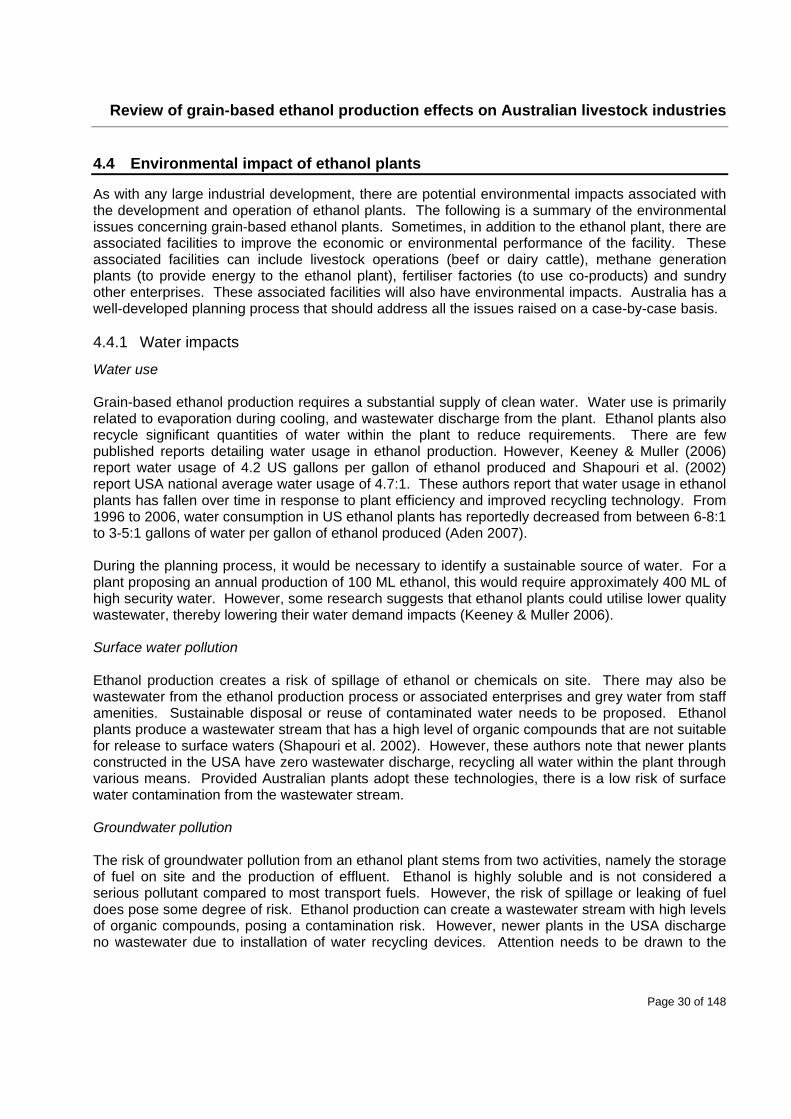
PHOTOGRAPH 2 - WDG STORED IN A SILAGE BAG
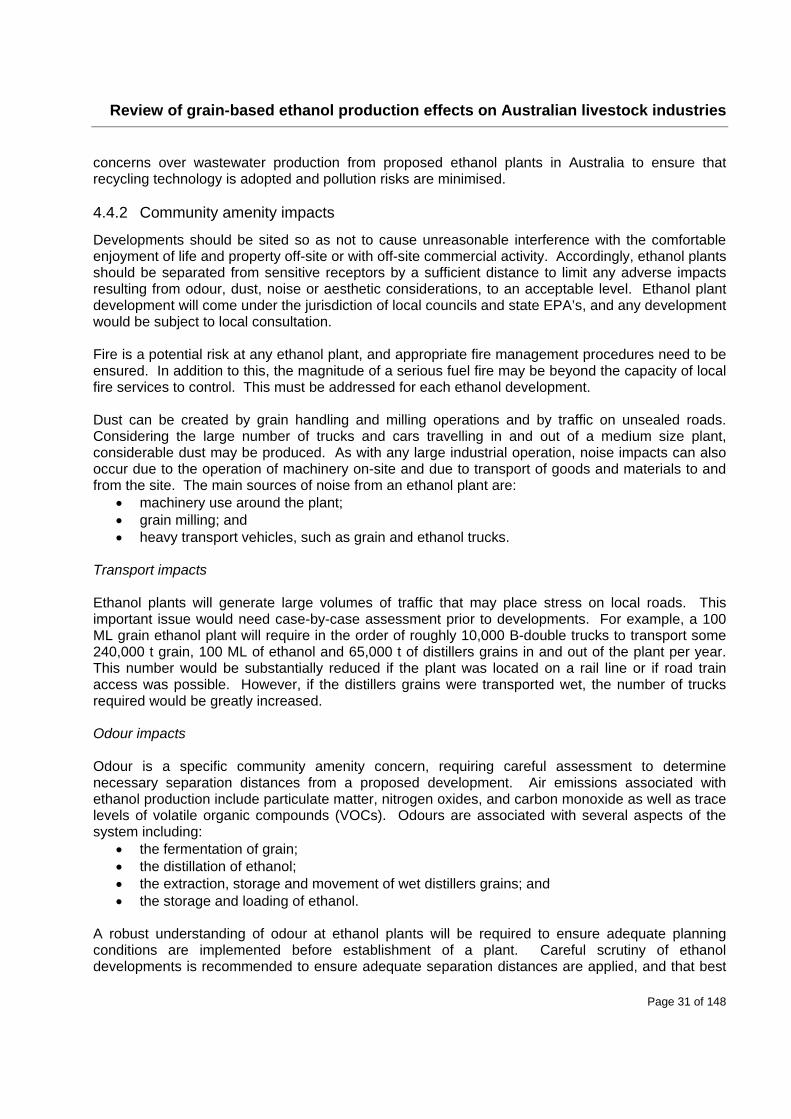
PHOTOGRAPH 3 - DRY DISTILLERS GRAINS (DDG)
Review of grain-based ethanol production effects on Australian livestock industries
Page 30 of 148
4.4 Environmental impact of ethanol plants
As with any large industrial development, there are potential environmental impacts associated with the development and operation of ethanol plants. The following is a summary of the environmental issues concerning grain-based ethanol plants. Sometimes, in addition to the ethanol plant, there are associated facilities to improve the economic or environmental performance of the facility. These associated facilities can include livestock operations (beef or dairy cattle), methane generation plants (to provide energy to the ethanol plant), fertiliser factories (to use co-products) and sundry other enterprises. These associated facilities will also have environmental impacts. Australia has a well-developed planning process that should address all the issues raised on a case-by-case basis. 4.4.1 Water impacts
Water use Grain-based ethanol production requires a substantial supply of clean water. Water use is primarily related to evaporation during cooling, and wastewater discharge from the plant. Ethanol plants also recycle significant quantities of water within the plant to reduce requirements. There are few published reports detailing water usage in ethanol production. However, Keeney & Muller (2006) report water usage of 4.2 US gallons per gallon of ethanol produced and Shapouri et al. (2002) report USA national average water usage of 4.7:1. These authors report that water usage in ethanol plants has fallen over time in response to plant efficiency and improved recycling technology. From 1996 to 2006, water consumption in US ethanol plants has reportedly decreased from between 6-8:1 to 3-5:1 gallons of water per gallon of ethanol produced (Aden 2007). During the planning process, it would be necessary to identify a sustainable source of water. For a plant proposing an annual production of 100 ML ethanol, this would require approximately 400 ML of high security water. However, some research suggests that ethanol plants could utilise lower quality wastewater, thereby lowering their water demand impacts (Keeney & Muller 2006). Surface water pollution Ethanol production creates a risk of spillage of ethanol or chemicals on site. There may also be wastewater from the ethanol production process or associated enterprises and grey water from staff amenities. Sustainable disposal or reuse of contaminated water needs to be proposed. Ethanol plants produce a wastewater stream that has a high level of organic compounds that are not suitable for release to surface waters (Shapouri et al. 2002). However, these authors note that newer plants constructed in the USA have zero wastewater discharge, recycling all water within the plant through various means. Provided Australian plants adopt these technologies, there is a low risk of surface water contamination from the wastewater stream. Groundwater pollution The risk of groundwater pollution from an ethanol plant stems from two activities, namely the storage of fuel on site and the production of effluent. Ethanol is highly soluble and is not considered a serious pollutant compared to most transport fuels. However, the risk of spillage or leaking of fuel does pose some degree of risk. Ethanol production can create a wastewater stream with high levels of organic compounds, posing a contamination risk. However, newer plants in the USA discharge no wastewater due to installation of water recycling devices. Attention needs to be drawn to the
Review of grain-based ethanol production effects on Australian livestock industries
Page 31 of 148
concerns over wastewater production from proposed ethanol plants in Australia to ensure that recycling technology is adopted and pollution risks are minimised. 4.4.2 Community amenity impacts
Developments should be sited so as not to cause unreasonable interference with the comfortable enjoyment of life and property off-site or with off-site commercial activity. Accordingly, ethanol plants should be separated from sensitive receptors by a sufficient distance to limit any adverse impacts resulting from odour, dust, noise or aesthetic considerations, to an acceptable level. Ethanol plant development will come under the jurisdiction of local councils and state EPA’s, and any development would be subject to local consultation. Fire is a potential risk at any ethanol plant, and appropriate fire management procedures need to be ensured. In addition to this, the magnitude of a serious fuel fire may be beyond the capacity of local fire services to control. This must be addressed for each ethanol development. Dust can be created by grain handling and milling operations and by traffic on unsealed roads. Considering the large number of trucks and cars travelling in and out of a medium size plant, considerable dust may be produced. As with any large industrial operation, noise impacts can also occur due to the operation of machinery on-site and due to transport of goods and materials to and from the site. The main sources of noise from an ethanol plant are:
machinery use around the plant; grain milling; and heavy transport vehicles, such as grain and ethanol trucks.
Transport impacts Ethanol plants will generate large volumes of traffic that may place stress on local roads. This important issue would need case-by-case assessment prior to developments. For example, a 100 ML grain ethanol plant will require in the order of roughly 10,000 B-double trucks to transport some 240,000 t grain, 100 ML of ethanol and 65,000 t of distillers grains in and out of the plant per year. This number would be substantially reduced if the plant was located on a rail line or if road train access was possible. However, if the distillers grains were transported wet, the number of trucks required would be greatly increased. Odour impacts Odour is a specific community amenity concern, requiring careful assessment to determine necessary separation distances from a proposed development. Air emissions associated with ethanol production include particulate matter, nitrogen oxides, and carbon monoxide as well as trace levels of volatile organic compounds (VOCs). Odours are associated with several aspects of the system including:
the fermentation of grain; the distillation of ethanol; the extraction, storage and movement of wet distillers grains; and the storage and loading of ethanol.
A robust understanding of odour at ethanol plants will be required to ensure adequate planning conditions are implemented before establishment of a plant. Careful scrutiny of ethanol developments is recommended to ensure adequate separation distances are applied, and that best
Review of grain-based ethanol production effects on Australian livestock industries
Page 32 of 148
practice management is applied to odour and other air emissions. However, plants have been located in residential areas overseas, suggesting that odour problems can be managed.
Review of grain-based ethanol production effects on Australian livestock industries
Page 33 of 148
5 Environmental analysis of grain-based ethanol production Ethanol is promoted as a renewable energy source for use in replacement of fossil fuels. In addition to this, ethanol is reported to provide a net reduction in GHG emissions when compared to existing fossil fuels such as petrol. However, there is considerable debate over the net energy gain and GHG reductions from grain-based ethanol. This debate is informed by two types of system analyses; net energy value (NEV - also known as net energy balance - NEB), and life cycle assessment (LCA). Essentially the NEV approach calculates the net energy gain / loss from producing one unit of ethanol, while LCA may extend the analysis to compare ethanol with conventional fossil fuels in their end use, i.e. driving a car 1 km. These forms of assessment will give different results. However, the LCA approach incorporates the NEV and generally provides a more complete comparison of fuel sources when used for their intended purpose. In addition to providing data on energy balance, an LCA study may report on a range of other potential environmental impacts. Literature presenting results from both assessment methods are provided in Sections 5.1 and 5.2. Section 5.3 discusses resource issues related to use of arable land and water for the production of fuel, while Section 5.4 discusses the ethical debate surrounding the use of a grain resource for fuel compared to human or animal consumption. It must be noted that research in this field is progressing rapidly and this will influence the overall conclusions relating to net energy value. 5.1 Net energy value
Net energy value (NEV) is the assessment of energy required to produce a unit of ethanol compared with the energy value of the resultant ethanol. There is a long-standing debate over the ability for grain-based (corn) ethanol to produce a greater amount of energy than is required to grow the corn, transport and process this into ethanol (see Figure 7). In the more recent literature, this debate is largely between Pimentel and Patzek (Patzek et al. 2005; Pimentel & Patzek 2005; Patzek 2004; Pimentel 2003) and Shapouri, Kim & Dale and others (Hill et al. 2006; Wu et al. 2006; Kim & Dale 2005a; Kim & Dale 2005b; Shapouri et al. 2003; Wang et al. 1999). Calculation of net energy value essentially takes an inventory approach to calculate primary and secondary energy inputs derived from diesel, petroleum, natural gas, coal etc during the three main phases of the ethanol production chain, namely grain production on farm, transport of grain to the ethanol plant and ethanol production within the plant. The NEV of grain-based ethanol within the literature varies significantly. Research by Pimentel (2003) and Pimentel & Patzek (2005) suggest a negative energy balance in the order of -30%. In contrast to these, several other researchers estimate a net energy benefit of 25 – 50% from corn ethanol production (Hill et al. 2006; Shapouri et al. 2003; Shapouri et al. 2002; Wu et al. 2006; Wang et al. 1999). An Australian LCA study commissioned by MLA (Cottrell et al. 2007) concluded that the NEV of sorghum and wheat ethanol in Australia is around neutral when the WDG is dried (NEV of -2% to + 12% for wheat and sorghum respectively), and positive if no drying is applied (+ 39% for wheat and sorghum).
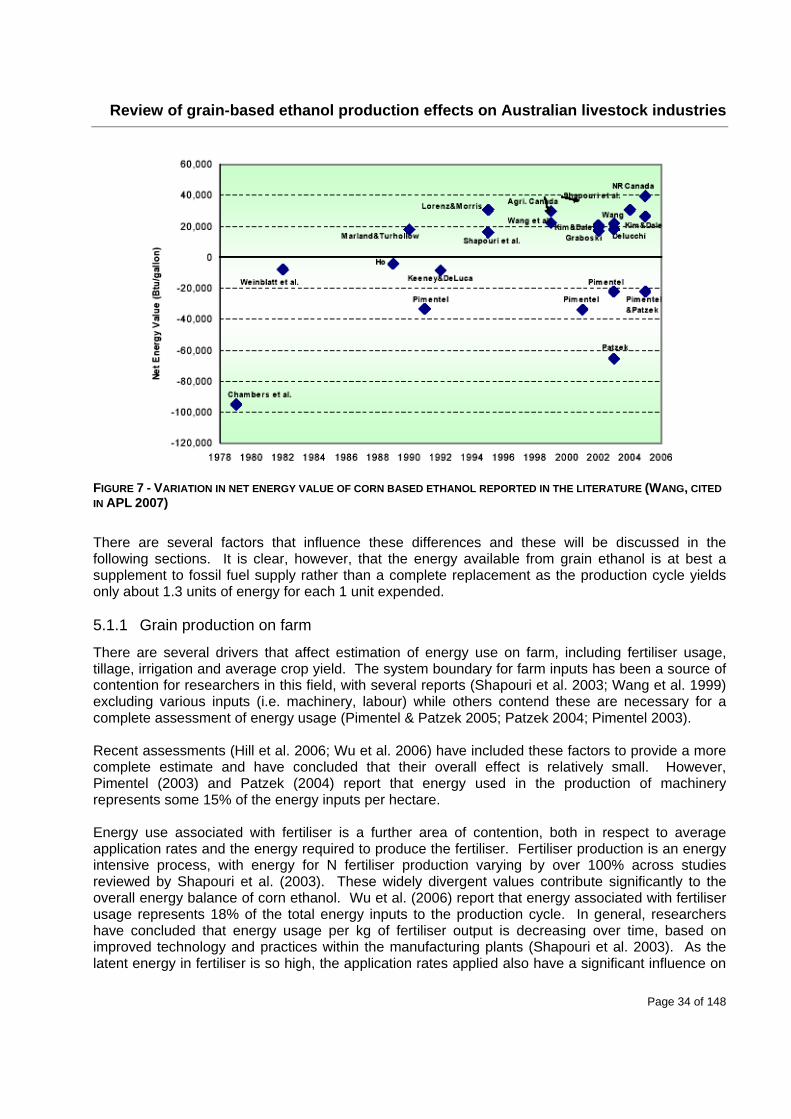
Review of grain-based ethanol production effects on Australian livestock industries
Page 34 of 148
FIGURE 7 - VARIATION IN NET ENERGY VALUE OF CORN BASED ETHANOL REPORTED IN THE LITERATURE (WANG, CITED
IN APL 2007)
There are several factors that influence these differences and these will be discussed in the following sections. It is clear, however, that the energy available from grain ethanol is at best a supplement to fossil fuel supply rather than a complete replacement as the production cycle yields only about 1.3 units of energy for each 1 unit expended. 5.1.1 Grain production on farm
There are several drivers that affect estimation of energy use on farm, including fertiliser usage, tillage, irrigation and average crop yield. The system boundary for farm inputs has been a source of contention for researchers in this field, with several reports (Shapouri et al. 2003; Wang et al. 1999) excluding various inputs (i.e. machinery, labour) while others contend these are necessary for a complete assessment of energy usage (Pimentel & Patzek 2005; Patzek 2004; Pimentel 2003). Recent assessments (Hill et al. 2006; Wu et al. 2006) have included these factors to provide a more complete estimate and have concluded that their overall effect is relatively small. However, Pimentel (2003) and Patzek (2004) report that energy used in the production of machinery represents some 15% of the energy inputs per hectare. Energy use associated with fertiliser is a further area of contention, both in respect to average application rates and the energy required to produce the fertiliser. Fertiliser production is an energy intensive process, with energy for N fertiliser production varying by over 100% across studies reviewed by Shapouri et al. (2003). These widely divergent values contribute significantly to the overall energy balance of corn ethanol. Wu et al. (2006) report that energy associated with fertiliser usage represents 18% of the total energy inputs to the production cycle. In general, researchers have concluded that energy usage per kg of fertiliser output is decreasing over time, based on improved technology and practices within the manufacturing plants (Shapouri et al. 2003). As the latent energy in fertiliser is so high, the application rates applied also have a significant influence on
Review of grain-based ethanol production effects on Australian livestock industries
Page 35 of 148
NEV. Differences in studies based on US corn show application rates from 125 kg N / ha (Shapouri et al. 1995, cited in Shapouri et al. 2003) to 153 kg N / ha (Pimentel & Patzek 2005). These differences are significant, and highlight the necessity for accurate data pertaining to fertiliser manufacturing and use in Australian grain production for accurate analyses to be completed. The use of irrigation for growing grain ethanol crops will also contribute to energy input. Pimentel (2003) and Pimentel & Patzek (2005) suggest that for corn production in the USA, a small but significant irrigation component must be included in the farm input section. This however, does not make a very large contribution to energy balances averaged across the whole US Corn Belt. If ethanol production were initiated in irrigation areas of Australia such as the Murrumbidgee Irrigation Area (MIA), this would need to be considered in any assessment of NEV. 5.1.2 Transport
Transport is also a relatively minor energy usage in most US energy balance studies, as shown by Hill et al. (2006) and the review undertaken by Patzek (2004). Some researchers extend the system boundary to include movement of staff to and from the ethanol plant daily, which will have a small but noticeable effect on the energy balance (Patzek 2004; Pimentel 2003). Most of these studies assume corn is transported a relatively short distance to the ethanol plant (< 50 km) which may not be the case for grain-based ethanol production in Australia because of the lower yields per hectare. This may increase the impact of grain transport on NEV in the Australian context, and this would require further research once clear supply chains for ethanol production have been established. 5.1.3 Plant energy usage
Estimates of energy usage by ethanol plants have been extensively reviewed. Shapouri et al. (2003) summarise the results from reports dating 1990-2002 and show a range in energy inputs from 11.39 – 20.94 MJ/L of ethanol. Kim & Dale (2005b) summarise energy use from a number of reports to give a range of 10.8 – 13.9 MJ/L for dry milling and 9.8-18.5 MJ/L for wet milling (numbers converted from MJ/kg to MJ/L). The energy input is related to milling practices. Dry milling results in lower energy input than wet milling practices. According to Wu et al. (2006), the energy usage in the ethanol plant is 57% of total fossil fuel energy usage. Several researchers contend that the energy requirement of ethanol plants is declining over time as technology and economies of scale improve (Kim & Dale 2005b; Shapouri et al. 2003). Again, the estimates of energy use within ethanol plants tend to be divided, with Pimentel (Pimentel & Patzek 2005; Pimentel 2003; Pimentel 2001; Pimentel & Pimentel 1996) and Patzek (Patzek 2004; Patzek et al. 2005), estimating higher energy consumption within the plant compared to Kim & Dale (Kim & Dale 2005b), Shapouri (Shapouri et al. 2003; Shapouri et al. 2002) and Wu & Wang (Wu et al. 2006; Wang et al. 1999). 5.1.4 Energy credits from co-products
Perhaps the strongest defining factor in the estimation of NEV for grain-based ethanol is the value placed on co-products. As discussed in Section 4.3, there are a number of co-products from ethanol production that can be used as animal feeds or fertilisers (see Chapter 8). These are usually assigned an energy credit when calculating NEV. However, the magnitude of this credit is variable depending on the means of allocation. Ethanol co-products contain high levels of protein and a lower proportion of energy. Hence they are generally compared with protein sources used for livestock feed. However, there is considerable variation in the nutritional value of these co-products (see Chapter 8).
Review of grain-based ethanol production effects on Australian livestock industries
Page 36 of 148
Credits are usually allocated by estimating the amount of energy that would have been consumed in the production of an alternative protein used for animal feed, most commonly soybean meal and oil (Kim & Dale 2005a; Shapouri et al. 2003). When this form of energy credit is given, it generally provides approximately 30% energy credit to the process, often taking a net deficit or neutral energy balance to a positive balance (Hill et al. 2006; Shapouri et al. 2003). This form of energy credit relies on the co-products being a suitable substitute for other protein sources used for livestock feed. If the co-product is not used to its full potential it may be argued that this energy credit system is not valid. An alternative co-product from grain-based ethanol production is fertiliser, which may have a higher net energy credit than animal feed when produced in association with electricity (CSIRO 2007; O’Connell et al. 2007). Pimentel & Patzek (2005) and Patzek (2004) have questioned the process of energy crediting. Patzek (2004) suggests that for a corn system to be sustainable over time, the co-products from the process need to be returned to the soil to maintain organic matter and soil nutrient levels. While this represents a fundamental difference in approach, it does attempt to address questions over the sustainability of continuous cropping for grain ethanol. 5.1.5 Net GHG balance
Reduction in GHG production is considered a benefit of using ethanol based fuels. However, within the scope of a net energy balance study which only compares GHG production for ethanol to the end of the production chain, the benefit is typically low (Kim & Dale 2005a). Reported GHG reductions for corn based ethanol range from 12% (Hill et al. 2006), to a projected improvement in GHG production of 21-24% in 2012 (Wu et al. 2006). Arguably, GHG production is more fairly represented by the total GHG production derived from the use of the fuel for its intended purpose (i.e. driving a car). This form of assessment is reported in the section on LCA. 5.1.6 Alternative perspectives in NEV estimation
The degree of variation in the scope of NEV calculation results in estimates ranging from approximately -30% to +50%. The two researchers who contest the NEV of grain-based ethanol consistently, Patzek and Pimentel, have furthered the debate by suggesting that energy inputs should include not only the farm, transport and ethanol plant requirements, but also the actual energy contained in the harvested grain. Following this approach, the energy lost during the fermentation of the grain (and subsequent CO2 production) is also included in the NEV, resulting in a large deficit. This approach is rejected by the majority of researchers because the energy in the grain is considered the free product of sunlight and is therefore not accountable. However, Pimentel and Patzek contend that water and land resources are the limiting factor in grain energy production, and therefore the energy is not strictly a free resource. Taking this approach, the energy efficiency reported in several published papers is highly negative (- 100%) (Patzek et al. 2005; Patzek 2004). Although these reports are commonly rejected, their central theme is the competition between fuel and food production for limited land and water resources, and this is a relevant topic for debate. These issues will be considered further in Sections 5.3 and 5.4.
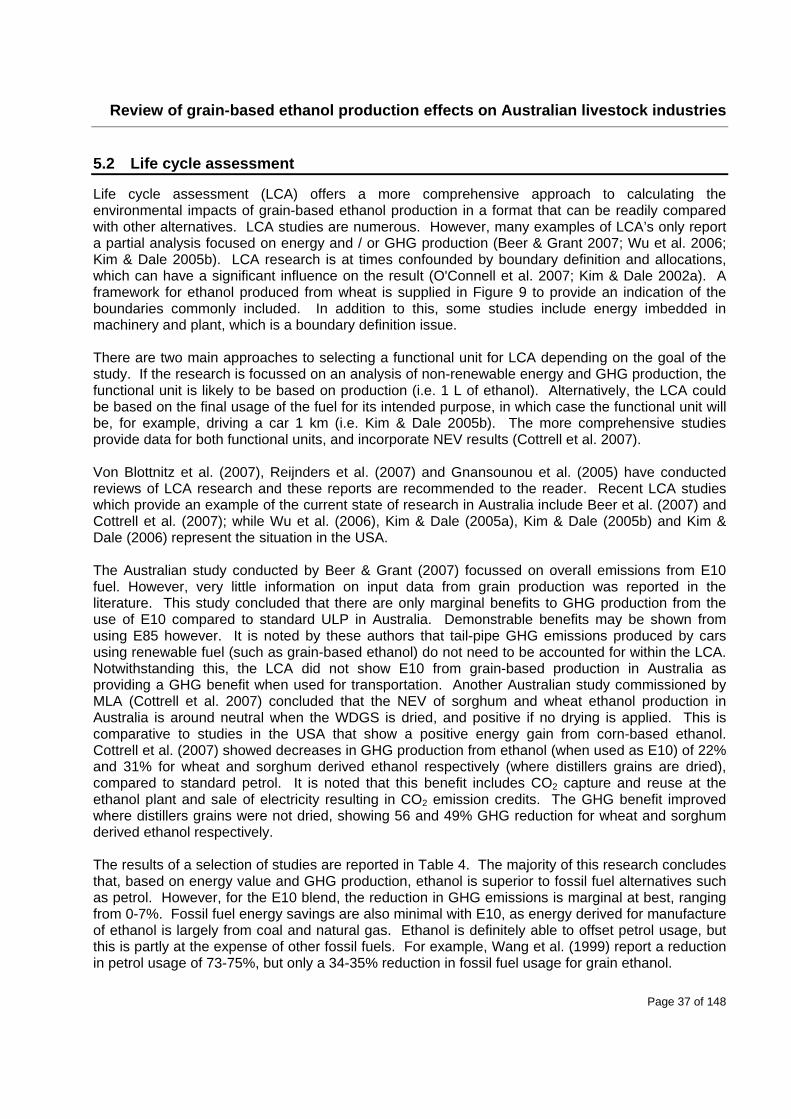
Review of grain-based ethanol production effects on Australian livestock industries
Page 37 of 148
5.2 Life cycle assessment
Life cycle assessment (LCA) offers a more comprehensive approach to calculating the environmental impacts of grain-based ethanol production in a format that can be readily compared with other alternatives. LCA studies are numerous. However, many examples of LCA’s only report a partial analysis focused on energy and / or GHG production (Beer & Grant 2007; Wu et al. 2006; Kim & Dale 2005b). LCA research is at times confounded by boundary definition and allocations, which can have a significant influence on the result (O'Connell et al. 2007; Kim & Dale 2002a). A framework for ethanol produced from wheat is supplied in Figure 9 to provide an indication of the boundaries commonly included. In addition to this, some studies include energy imbedded in machinery and plant, which is a boundary definition issue. There are two main approaches to selecting a functional unit for LCA depending on the goal of the study. If the research is focussed on an analysis of non-renewable energy and GHG production, the functional unit is likely to be based on production (i.e. 1 L of ethanol). Alternatively, the LCA could be based on the final usage of the fuel for its intended purpose, in which case the functional unit will be, for example, driving a car 1 km (i.e. Kim & Dale 2005b). The more comprehensive studies provide data for both functional units, and incorporate NEV results (Cottrell et al. 2007). Von Blottnitz et al. (2007), Reijnders et al. (2007) and Gnansounou et al. (2005) have conducted reviews of LCA research and these reports are recommended to the reader. Recent LCA studies which provide an example of the current state of research in Australia include Beer et al. (2007) and Cottrell et al. (2007); while Wu et al. (2006), Kim & Dale (2005a), Kim & Dale (2005b) and Kim & Dale (2006) represent the situation in the USA. The Australian study conducted by Beer & Grant (2007) focussed on overall emissions from E10 fuel. However, very little information on input data from grain production was reported in the literature. This study concluded that there are only marginal benefits to GHG production from the use of E10 compared to standard ULP in Australia. Demonstrable benefits may be shown from using E85 however. It is noted by these authors that tail-pipe GHG emissions produced by cars using renewable fuel (such as grain-based ethanol) do not need to be accounted for within the LCA. Notwithstanding this, the LCA did not show E10 from grain-based production in Australia as providing a GHG benefit when used for transportation. Another Australian study commissioned by MLA (Cottrell et al. 2007) concluded that the NEV of sorghum and wheat ethanol production in Australia is around neutral when the WDGS is dried, and positive if no drying is applied. This is comparative to studies in the USA that show a positive energy gain from corn-based ethanol. Cottrell et al. (2007) showed decreases in GHG production from ethanol (when used as E10) of 22% and 31% for wheat and sorghum derived ethanol respectively (where distillers grains are dried), compared to standard petrol. It is noted that this benefit includes CO2 capture and reuse at the ethanol plant and sale of electricity resulting in CO2 emission credits. The GHG benefit improved where distillers grains were not dried, showing 56 and 49% GHG reduction for wheat and sorghum derived ethanol respectively. The results of a selection of studies are reported in Table 4. The majority of this research concludes that, based on energy value and GHG production, ethanol is superior to fossil fuel alternatives such as petrol. However, for the E10 blend, the reduction in GHG emissions is marginal at best, ranging from 0-7%. Fossil fuel energy savings are also minimal with E10, as energy derived for manufacture of ethanol is largely from coal and natural gas. Ethanol is definitely able to offset petrol usage, but this is partly at the expense of other fossil fuels. For example, Wang et al. (1999) report a reduction in petrol usage of 73-75%, but only a 34-35% reduction in fossil fuel usage for grain ethanol.
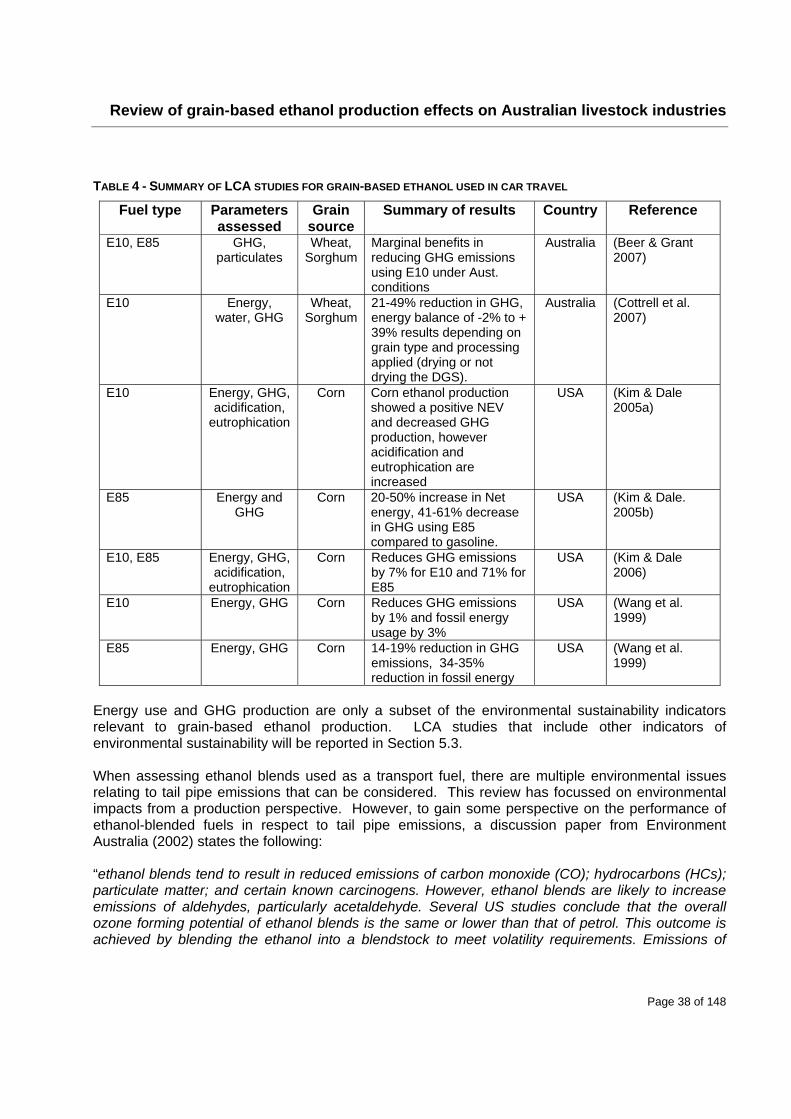
Review of grain-based ethanol production effects on Australian livestock industries
Page 38 of 148
TABLE 4 - SUMMARY OF LCA STUDIES FOR GRAIN-BASED ETHANOL USED IN CAR TRAVEL
Fuel type Parameters assessed
Grain source
Summary of results Country Reference
E10, E85 GHG, particulates
Wheat, Sorghum
Marginal benefits in reducing GHG emissions using E10 under Aust. conditions
Australia (Beer & Grant 2007)
E10 Energy, water, GHG
Wheat, Sorghum
21-49% reduction in GHG, energy balance of -2% to + 39% results depending on grain type and processing applied (drying or not drying the DGS).
Australia (Cottrell et al. 2007)
E10 Energy, GHG, acidification,
eutrophication
Corn Corn ethanol production showed a positive NEV and decreased GHG production, however acidification and eutrophication are increased
USA (Kim & Dale 2005a)
E85 Energy and GHG
Corn 20-50% increase in Net energy, 41-61% decrease in GHG using E85 compared to gasoline.
USA (Kim & Dale. 2005b)
E10, E85 Energy, GHG, acidification,
eutrophication
Corn Reduces GHG emissions by 7% for E10 and 71% for E85
USA (Kim & Dale 2006)
E10 Energy, GHG Corn Reduces GHG emissions by 1% and fossil energy usage by 3%
USA (Wang et al. 1999)
E85 Energy, GHG Corn 14-19% reduction in GHG emissions, 34-35% reduction in fossil energy
USA (Wang et al. 1999)
Energy use and GHG production are only a subset of the environmental sustainability indicators relevant to grain-based ethanol production. LCA studies that include other indicators of environmental sustainability will be reported in Section 5.3. When assessing ethanol blends used as a transport fuel, there are multiple environmental issues relating to tail pipe emissions that can be considered. This review has focussed on environmental impacts from a production perspective. However, to gain some perspective on the performance of ethanol-blended fuels in respect to tail pipe emissions, a discussion paper from Environment Australia (2002) states the following: “ethanol blends tend to result in reduced emissions of carbon monoxide (CO); hydrocarbons (HCs); particulate matter; and certain known carcinogens. However, ethanol blends are likely to increase emissions of aldehydes, particularly acetaldehyde. Several US studies conclude that the overall ozone forming potential of ethanol blends is the same or lower than that of petrol. This outcome is achieved by blending the ethanol into a blendstock to meet volatility requirements. Emissions of
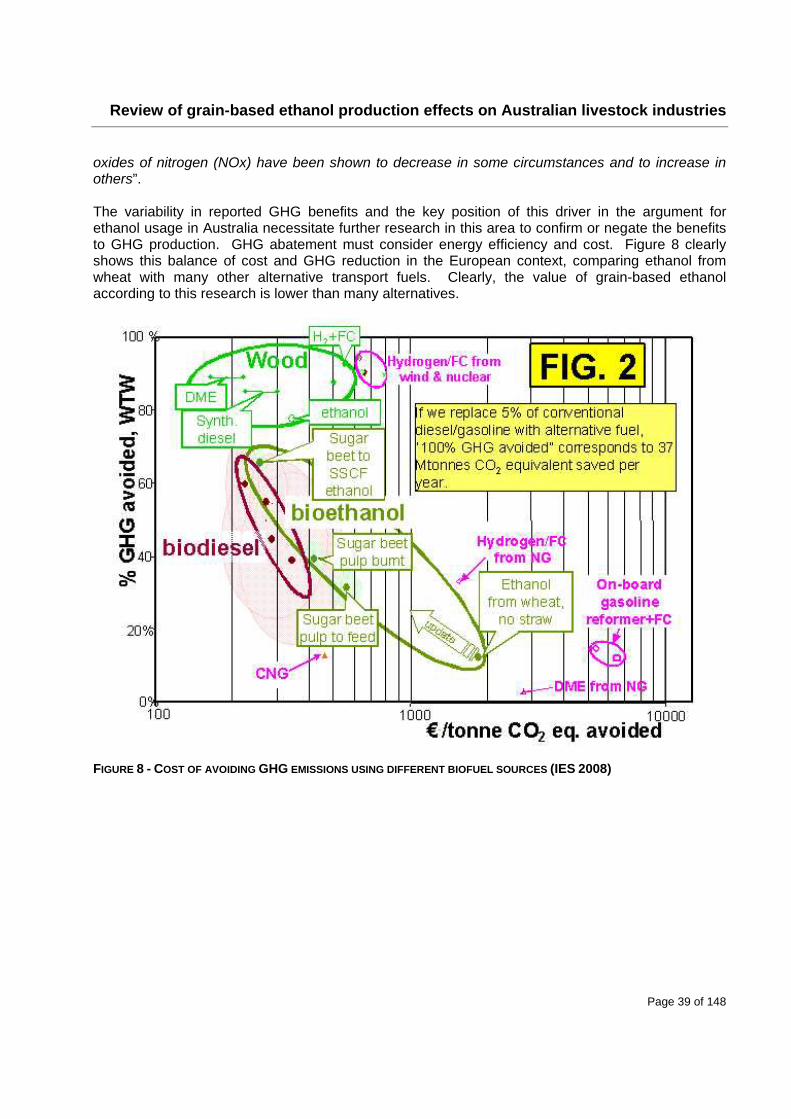
Review of grain-based ethanol production effects on Australian livestock industries
Page 39 of 148
oxides of nitrogen (NOx) have been shown to decrease in some circumstances and to increase in others”. The variability in reported GHG benefits and the key position of this driver in the argument for ethanol usage in Australia necessitate further research in this area to confirm or negate the benefits to GHG production. GHG abatement must consider energy efficiency and cost. Figure 8 clearly shows this balance of cost and GHG reduction in the European context, comparing ethanol from wheat with many other alternative transport fuels. Clearly, the value of grain-based ethanol according to this research is lower than many alternatives.
FIGURE 8 - COST OF AVOIDING GHG EMISSIONS USING DIFFERENT BIOFUEL SOURCES (IES 2008)
Review of grain-based ethanol production effects on Australian livestock industries
Page 40 of 148
FIGURE 9 - A PROCESS TREE SHOWING AN LCA OF ETHANOL FROM WHEAT (O’CONNELL ET AL. 2007)
Note: The thickness of the arrows indicates the proportion of the GHG emissions from each step. 5.3 Environmental sustainability and resource use
In addition to energy use and GHG production, the environmental sustainability of grain-based ethanol will depend on a suite of factors including potential degradation of land and water resources, together with other environmental impacts such as atmospheric acidification. LCA studies offer a comprehensive structure for assessing environmental impacts. However, these studies rarely cover the full range of issues relevant to agriculture. This problem has been identified by Heuvelmans et al. (2005) who note that LCA methodology is still under development in respect to agriculturally specific impacts.
Review of grain-based ethanol production effects on Australian livestock industries
Page 41 of 148
“Renewable” fuel by definition must be derived from a source that can be supplied continuously over time without resource depletion. Grain-based ethanol proponents argue that ethanol is ‘renewable’ because the energy is captured by the sun through photosynthesis. This principle cannot be directly contested. However, some researchers (Patzek et al. 2005; Pimentel et al. 2005; Patzek 2004; Pimentel 2003) suggest that a true definition of “renewable” must take into consideration the other limiting resources used in the process, namely water and good quality agricultural land. By broadening the definition of “renewable”, these researchers call for the inclusion of impacts on soil erosion and water use. In this context, Patzek et al. (2005), Pimentel & Patzek (2005), Patzek (2004) and Pimentel (2003) do not consider corn-based ethanol renewable. While the conclusions drawn by both Patzek and Pimentel have been widely disputed in the literature (e.g. Farrel et al. 2006b; Shapouri et al. 2003), these disputes generally focus on allocation methods for conducting the NEV study of corn ethanol. The broader assessment of ethanol sustainability including land and water usage has not been addressed by many of the prominent researchers of grain-based ethanol systems such as Wu et al. (2006), Shapouri et al. (2003) and Wang et al. (1999). Kim & Dale (2005a) report ethanol production from corn has a significant impact on soil acidification and eutrophication, largely because of fertiliser usage. In their review of some 47 published LCA studies of ethanol production, von Blottnitz & Curran (2007) point out that, only seven of these studies covered a wider range of environmental impacts. It is concerning that ethanol production is being assessed on such a limited number of parameters, leaving room for environmental impacts to shift from one area to another without being assessed. Further research to assess the ‘whole system’ environmental impacts with a broad range of LCA indicators would provide valuable information on the true sustainability of ethanol production. Of particular concern is the situation where increased grain demand is met by expanding cropland into grassland and marginal farming areas (von Blottnitz & Curran 2007). This can lead to much higher GHG production, reduced sequestration of carbon and other adverse environmental impacts. The issue of environmental sustainability is linked to resource availability. There are limited supplies of arable land and water both in Australia and worldwide, and there is potential conflict between how these resources will be used in the future. Until this point, most agricultural land has been used for the production of food and fibre. However, biofuel production from grain, oil or cellulose is increasingly competing for these resources. While global estimates are prone to inaccuracy, it is notable that the world supply of available cropland and irrigation resources are reported to have declined significantly in the past decade (-20% and -12% respectively (Pimentel 2003)). This is likely to be the converging result of increased urban sprawl onto agricultural land and land degradation. Further, Pimentel (2006) suggests that some 10 million ha of agricultural land becomes unproductive per year (worldwide) because of soil erosion. The sustainability of grain-based ethanol is, in the broader context, an argument over the sustainability of modern grain production methods. Pimentel (2003) is clear about this, stating that “corn production [in the US] causes more total soil erosion than any other crop”. Concerns over the sustainability of grain production transfer to all industries relying on grain as a feedstock, including animal feeding. It is noted that there have been significant concerns raised by the Australian Agriculture Assessment regarding soil acidification, annual soil loss and water quality impacts from agriculture in Australia (NLWRA 2001). To determine accurately the sustainability of grain-based ethanol in Australia, these impacts need to be assessed and assigned to ethanol production where applicable. This is an area of expanding research for all agricultural and food production LCA studies, and should be promoted to ensure that Australia develops a healthy balance between agricultural production and sustainable use of the nation’s limited land and water
Review of grain-based ethanol production effects on Australian livestock industries
Page 42 of 148
resources. It has been observed that high demand for corn in the US over the past 2 years has led to expansion of cropping production, sometimes into marginal areas. To balance the discussion, O’Connell et al. (2007) comment that diverting Australian grain from export markets to ethanol production will have no net effect on the environment as production has not changed. If, however, production increased significantly above current levels the sustainability of this shift would need to be reassessed (O'Connell et al. 2007). This is an issue that will require careful observation if demand for grain is sustained and prices remain high. Expansion or increased pressure on Australia’s limited cropping land would result in a reduction in grazing land and could lead to poorer annual yields over time because of increased cropping pressure. Considering the fragility of Australian cropping regions, impacts from such a shift must be accounted for in any state or national move to promote grain-based ethanol production and use. Globally, there are concerns that biofuel production will lead to extensive forest clearing, and this has, to some extent, already taken place in parts of South East Asia. Considering the goal of biofuel usage to provide a green, environmentally sustainable fuel source, these practices must be seen as counterproductive. Particularly with respect to global warming, the practice of deforestation to expand biofuel production must be questioned. Pressure for land and water resources will increase in the future as expanding populations demand greater quantities of food, fibre and fuel from limited land and water resources (O'Connell et al. 2007). In the past, this need has been partly met by expansion of arable land, but land resources for further expansion of cropping are very limited. This places added emphasis on maintaining sustainable use of cropland for future production. In addition to land usage, water use is another issue of global concern that may influence agriculture significantly in the future. To date most LCA studies have not addressed water use from the grain production phase of the system (eg. Cottrell et al. 2007) because this is not seen as water ‘use’. This problem in terminology has been identified by Heuvelmans (2005) and several others. Water use in agriculture is an issue that is being increasingly scrutinised as available water resources are stretched. It is possible that water footprints and ‘virtual water’ usage will become a major factor in commodity trading worldwide as global population expands. Hence, the virtual water usage to produce ethanol will need to be assessed in order to compare with other competing products such as cereal based foods and meat. This competition for land and water use is one of the major factors contributing to the ‘food vs. fuel’ debate discussed in the following section. 5.4 The ‘Food vs. Fuel’ debate
Grain-based ethanol production diverts a supply of grain that can be used for human or animal consumption to the production of fuel. This allocation of grain raises certain ethical concerns when, at a global scale, food grain and agricultural land for food production are both in limited supply (Pimentel 2003). The debate can be split into two issues, viz, the use of a food resource (grain) to produce fuel, and the use of finite land and water resources to grow any form of biomass for fuel production. These issues have been the subject of a considerable amount of media exposure in the US (Carey et al. 2007; Muller et al. 2007; The Economist 2007a & b; Samuelson 2007; NFU 2007; Brown 2006). Using grain for ethanol adds a new and very different demand stream to the world grain market, which is linked to oil prices rather than food. According to The Economist, this is leading to higher
Review of grain-based ethanol production effects on Australian livestock industries
Page 43 of 148
global grain prices and pressure on food markets (The Economist 2007b). While direct competition between grain used for food and fuel is not likely to be of concern in wealthy countries where an excess of grain is produced and food prices constitute a relatively low proportion of expenditure, this is not the case in many less developed countries. Higher food prices in countries where food is a major part of living costs will have a large effect on households and the overall economy of these countries, and this is at least partly attributable to grain-based ethanol production. Concerns have also been raised over ethanol production in regions of the world where food security is scarce, or where remnant vegetation is cleared in order to produce ethanol or other biofuel crops. Production of ethanol in these regions will have a more immediate effect on the local population from the diversion of land resources and available food to production of ethanol feedstock for export. This highlights the need for some form of production protocol and labelling to ensure global ethanol trade does not promote major conflicts in resource usage. While the balance of advantage from higher grain prices is generally against the less developed nations of the world, it should also be noted that some less developed nations who produce export grain may actually benefit through improved terms of trade and stronger rural economies (Muller et al. 2007; The Economist 2007a). Ethanol proponents claim that grain trade on the world market is largely determined by the ability to pay, excluding many countries that are not able to purchase grain irrespective of price. This, together with other factors such as political stability and infrastructure, have all contributed to inequitable food distribution throughout the world well before any conflict between fuel and food grain uses had arisen. While this may be the case, adding a significant demand stream into the global grain market must have a significant impact on grain prices, affecting less developed nations who are net importers of grain. The issues of environmental sustainability, competition for land, food and fibre production from the world’s agricultural land are intertwined and highly relevant to the subject of ethanol production. There is a growing amount of balanced, objective literature addressing the issue, and the reader is encouraged to take note of the influential papers, many of which have been cited in the preceding sections. Progress towards sustainable energy production must not be pursued at the expense of food that would otherwise be used for human consumption. However, it must be noted that global food distribution is a complex global problem that existed well before grain demand for biofuel. It appears, therefore, that sustainable and ethical grain-based ethanol production in Australia should be assessed with respect to the impact of diverting grain supplies on local and global food prices (including flow on effects to animal products reliant on grain) and resource use (including both sustainability and competition for land and water resources). While these issues have been considered in some detail by O’Connell et al. (2007) and others, further assessment of sustainable ethanol production from first and second-generation technologies in Australia will be valuable, provided this assessment considers the complex interactions between the grain and grain dependent livestock industries.
Review of grain-based ethanol production effects on Australian livestock industries
Page 44 of 148
6 Global grain-based ethanol production The global ethanol industry is driven largely by Brazil (sugar cane ethanol production) and the US (corn-based ethanol) which each produce roughly 40% of global supplies of ethanol. Global grain-based ethanol is dominated by corn ethanol production in the US. However, interest is increasing in many regions of the world including Europe (EBIO 2006; Punter et al. 2004; Elsayed et al. 2003) and Asia (Ohga & Koizumi 2007). This chapter reviews production of grain-based ethanol in key regions of the world, with major emphasis being placed on the US, while production in Australia will be addressed in Chapter 7. Production will be discussed in relation to potential impacts on feed grain supplies and additional distillers grains that may become available to the grain dependent livestock industries. It must be realised that this is a rapidly moving industry world-wide and changes are being made on a daily basis in response to political and market pressures. For example, within the time of this report being compiled, rapid expansion in the US is being reported, concurrent with reports of a severe cost-price squeeze within the industry, potentially causing bankruptcy for some smaller companies and halting development (Wall Street Journal 2007). These complexities make establishing the ‘status quo’ of global production and projected production difficult, however it is clear that production is rising rapidly throughout the world, albeit slower than many proponents would suggest. 6.1 Grain-based ethanol production (Europe, Asia, Canada)
Outside the US and Australia, interest in grain-based ethanol production is expanding in several regions of the world including Europe (EBIO 2006; Punter et al. 2004; Elsayed et al. 2003), Asia (Ohga & Koizumi 2007) and Canada (OECD-FAO 2007). In comparison to the US, total production in these regions is relatively insignificant. However, if the US is seen as taking a global lead these high-energy use regions may also become major centres for production. It is assumed that current production is minimal for Africa, South America and Eastern Europe, and projected production for these regions are not known. Further discussion of the effects of expanded grain-based ethanol production on grain prices will be the focus of Chapter 9. Europe Europe is a major producer of biodiesel. However, ethanol production is also increasing rapidly. According to the European Bioethanol Fuel Association (EBIO 2007), current production capacity is 4036 ML, of which approximately 46% is grain-based. A further 3521 ML of capacity is under construction, of which approximately 85% (3000 ML) is grain-based. With the plants currently under construction, this represents approximately 10% of the projected US production capacity to around 2009. The EU has a policy to increase biofuel usage to 10% of all transport fuel by 2020 (BBC News 2007). However, most countries are well behind in achieving this target (de Miguel 2006). Fuel usage in Europe in 2004 was 270 Mt, of which 40% was petrol and 60% diesel. This equals approximately 146,000 ML of petrol. Projected consumption is estimated to rise to 325 Mt by 2020 (Panorama 2005). Assuming the same proportion of petrol to diesel, the total petrol consumption will be approximately 176,000 ML. To give a very rough indication of the potential market for ethanol, 10% by volume of this amount is 17,600ML, giving an approximate target for ethanol if it claimed the whole biofuel market for transport petrol. EU policy incorporates an assumption that a proportion of this will be produced using second-generation technology. However, if grain-based
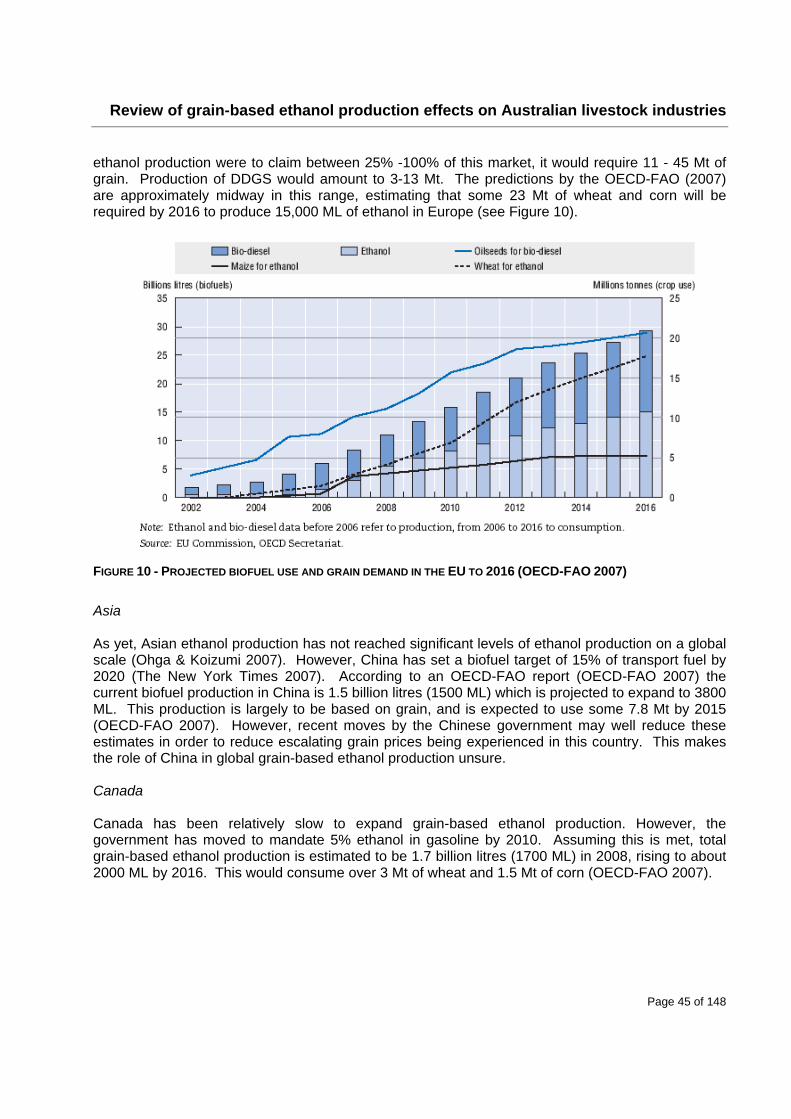
Review of grain-based ethanol production effects on Australian livestock industries
Page 45 of 148
ethanol production were to claim between 25% -100% of this market, it would require 11 - 45 Mt of grain. Production of DDGS would amount to 3-13 Mt. The predictions by the OECD-FAO (2007) are approximately midway in this range, estimating that some 23 Mt of wheat and corn will be required by 2016 to produce 15,000 ML of ethanol in Europe (see Figure 10).
FIGURE 10 - PROJECTED BIOFUEL USE AND GRAIN DEMAND IN THE EU TO 2016 (OECD-FAO 2007)
Asia As yet, Asian ethanol production has not reached significant levels of ethanol production on a global scale (Ohga & Koizumi 2007). However, China has set a biofuel target of 15% of transport fuel by 2020 (The New York Times 2007). According to an OECD-FAO report (OECD-FAO 2007) the current biofuel production in China is 1.5 billion litres (1500 ML) which is projected to expand to 3800 ML. This production is largely to be based on grain, and is expected to use some 7.8 Mt by 2015 (OECD-FAO 2007). However, recent moves by the Chinese government may well reduce these estimates in order to reduce escalating grain prices being experienced in this country. This makes the role of China in global grain-based ethanol production unsure. Canada Canada has been relatively slow to expand grain-based ethanol production. However, the government has moved to mandate 5% ethanol in gasoline by 2010. Assuming this is met, total grain-based ethanol production is estimated to be 1.7 billion litres (1700 ML) in 2008, rising to about 2000 ML by 2016. This would consume over 3 Mt of wheat and 1.5 Mt of corn (OECD-FAO 2007).
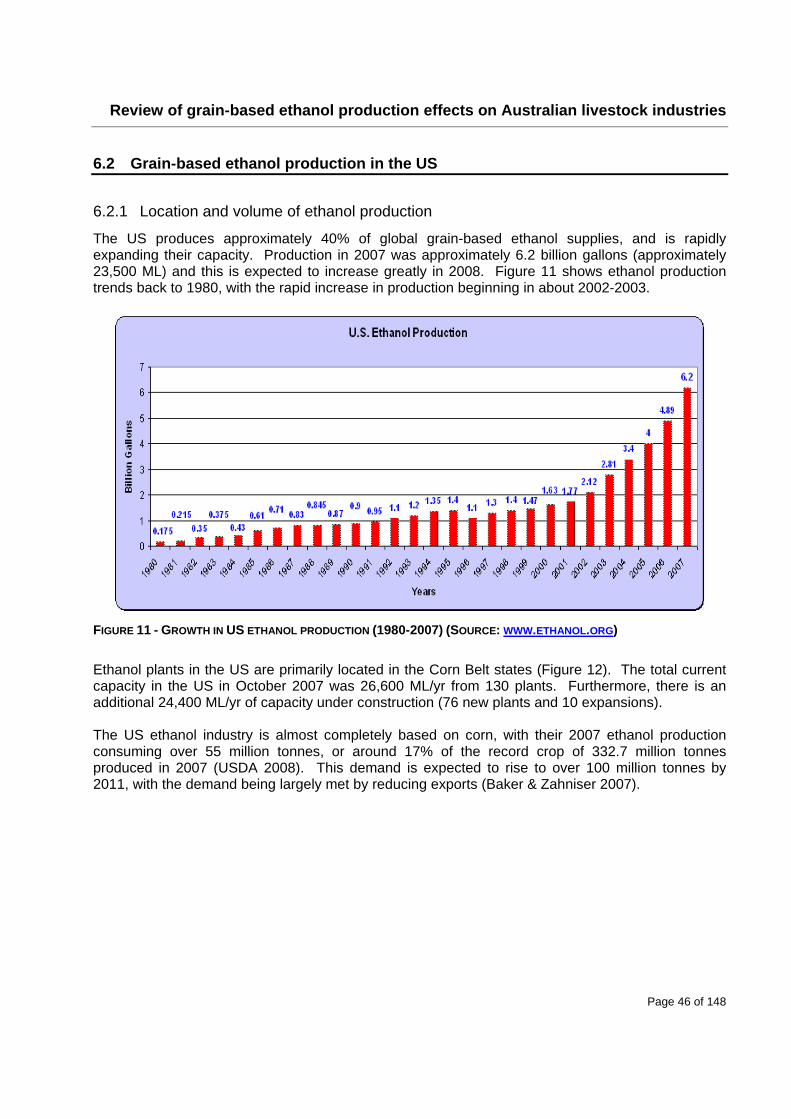
Review of grain-based ethanol production effects on Australian livestock industries
Page 46 of 148
6.2 Grain-based ethanol production in the US
6.2.1 Location and volume of ethanol production
The US produces approximately 40% of global grain-based ethanol supplies, and is rapidly expanding their capacity. Production in 2007 was approximately 6.2 billion gallons (approximately 23,500 ML) and this is expected to increase greatly in 2008. Figure 11 shows ethanol production trends back to 1980, with the rapid increase in production beginning in about 2002-2003.
FIGURE 11 - GROWTH IN US ETHANOL PRODUCTION (1980-2007) (SOURCE: WWW.ETHANOL.ORG)
Ethanol plants in the US are primarily located in the Corn Belt states (Figure 12). The total current capacity in the US in October 2007 was 26,600 ML/yr from 130 plants. Furthermore, there is an additional 24,400 ML/yr of capacity under construction (76 new plants and 10 expansions). The US ethanol industry is almost completely based on corn, with their 2007 ethanol production consuming over 55 million tonnes, or around 17% of the record crop of 332.7 million tonnes produced in 2007 (USDA 2008). This demand is expected to rise to over 100 million tonnes by 2011, with the demand being largely met by reducing exports (Baker & Zahniser 2007).
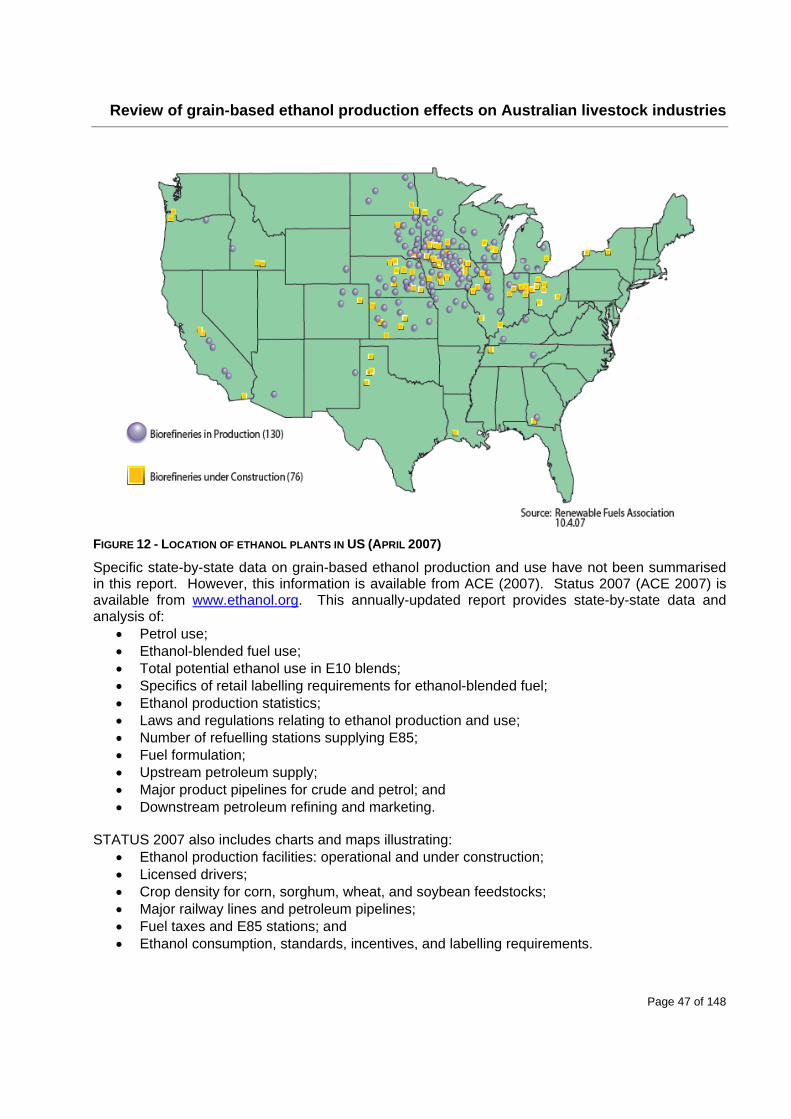
Review of grain-based ethanol production effects on Australian livestock industries
Page 47 of 148
FIGURE 12 - LOCATION OF ETHANOL PLANTS IN US (APRIL 2007)
Specific state-by-state data on grain-based ethanol production and use have not been summarised in this report. However, this information is available from ACE (2007). Status 2007 (ACE 2007) is available from www.ethanol.org. This annually-updated report provides state-by-state data and analysis of:
Petrol use; Ethanol-blended fuel use; Total potential ethanol use in E10 blends; Specifics of retail labelling requirements for ethanol-blended fuel; Ethanol production statistics; Laws and regulations relating to ethanol production and use; Number of refuelling stations supplying E85; Fuel formulation; Upstream petroleum supply; Major product pipelines for crude and petrol; and Downstream petroleum refining and marketing.
STATUS 2007 also includes charts and maps illustrating:
Ethanol production facilities: operational and under construction; Licensed drivers; Crop density for corn, sorghum, wheat, and soybean feedstocks; Major railway lines and petroleum pipelines; Fuel taxes and E85 stations; and Ethanol consumption, standards, incentives, and labelling requirements.
Review of grain-based ethanol production effects on Australian livestock industries
Page 48 of 148
6.2.2 Ethanol production incentives in the US
Incentives are a significant driver behind US ethanol production, and these incentives have covered several levels of the industry from the manufacturers to distributors. Many of these incentives do not specify the source of the ethanol (grain, cellulosic) and hence production will lean towards the most economically viable option (currently grain-based production). It is unlikely that the US industry could sustain high levels of production and growth without these subsidies, as shown by the recent downturn in growth following oversupply (The Wall Street Journal 2007). The main subsidies for the US are presented below, and some states have further incentives in addition to these listed. Further incentives and significant research funding have been aimed at the promotion of cellulosic ethanol production, including grants of $6-7 million for construction of cellulosic ethanol plants. 6.2.2.1 Twenty in Ten The US President’s ‘Twenty in Ten’ goal is to reduce US gasoline consumption by 20% in ten years to 2017. This target has an integrated approach focussing on reducing fuel usage and mandating 35 billion gallons of renewable and alternative fuels (The White House 2007). This was subsequently raised to 39 billion gallons by 2022 in June 2007, with 15 billion gallons of this to be produced from corn (The New York Times 2007). This mandate is not limited to ethanol and biodiesel. However, they will clearly have a significant role to play. This target is almost 5 times the goal set by the Energy Policy Act of 2005 (EP Act 2005), and offers a clear market incentive for expansion in the ethanol industry. If all this fuel were supplied from ethanol, it would require 130,200 ML / yr, well beyond the capacity of the US grain-based ethanol industry to produce. 6.2.2.2 Renewable Fuel Standards (RFS) The EP Act 2005 established the first-ever Renewable Fuels Standard (RFS) in federal law, requiring increasing volumes of ethanol and biodiesel to be blended with the US fuel supply between 2006 and 2012. The Environmental Protection Agency (EPA) is responsible for implementing and enforcing the RFS program. The EP Act required 3.1 billion gallons (11,735 ML) to be blended into transport fuel in 2005, increasing to 5 billion gallons, which was then amended to 8 billion gallons (30,283 ML) by 2012. These quantities are significantly below the targeted production by 2012; however, demand is expected to grow under the influence of a variety of incentives. 6.2.2.3 Volumetric Ethanol Excise Tax Credit (VEETC) – The “Blenders’ Credit” The American Jobs Creation Act of 2004 created the Volumetric Ethanol Excise Tax Credit (VEETC) to replace the partial tax exemption ethanol-blended fuel received from the federal excise tax on petrol. Prior to VEETC, ethanol-enriched fuel (E10) received a 5.2 cent per gallon partial exemption from the 18.4 cents per gallon gas tax, effectively reducing the tax rate on E10 to 13.2 cents per gallon. States that used significant volumes of ethanol-blended fuel argued the imbalance in the taxation of the fuels short-changed what they received for highway improvements under the Highway Trust Fund. Under VEETC, the federal excise tax on petrol and ethanol-blended fuel was made consistent at 18.4 cents per gallon, ensuring ethanol-blended fuel remits the same to the Highway Trust Fund as all petrol. Additionally, the tax incentive was shifted from a partial exemption to a tax credit that oil companies could qualify for based on the volume of ethanol they blend with petrol. Referred to as the “blender’s credit,” VEETC provides oil companies with an economic incentive to blend ethanol with petrol, totalling 51 cents per gallon on pure ethanol, 5.1 cents per gallon for E10, and 42 cents per gallon on E85. VEETC provides the tax incentive until December
Review of grain-based ethanol production effects on Australian livestock industries
Page 49 of 148
31, 2010. The tax credit is passed on to motorists in the form of more cost-effective fuel at the pump. 6.2.2.4 Small Ethanol Producer Tax Credit The American Jobs Creation Act of 2004 included provisions that improved the Small Ethanol Producer Tax Credit by allowing the $1.5 million credit to be passed through to farmer-owners of ethanol cooperatives. Prior to that change, patrons of cooperatives involved with ethanol production could not elect to pass the value of the credit to the cooperative members. The EP Act 2005 made further modifications to the tax credit by amending the definition of a “small ethanol producer” from one that produces 30 million gallons of ethanol to one that produces 60 million gallons of ethanol per year. Under this provision of the tax code (section 40 tax credit), ethanol producers that manufacture 60 million gallons of ethanol or less per year qualify for a tax credit equalling 10 cents per gallon on 15 million gallons of fuel ethanol. The maximum incentive is $1.5 million annually. This tax credit is in effect through to December 31, 2010. 6.2.2.5 Tax credit for E85 infrastructure The EP Act 2005 created a 30% federal income tax credit, up to $30,000 maximum, to establish alternative fuel infrastructure. The provision permits taxpayers to claim a 30% credit for the cost of installing clean-fuel vehicle refuelling property to be used in a trade or business of the taxpayer or installed at the principal residence of the taxpayer. Under the provision, clean fuels are any fuel at least 85% of the volume of which consists of ethanol, natural gas, compressed natural gas, liquefied natural gas, liquefied petroleum gas, and hydrogen and any mixture of diesel fuel and biodiesel containing at least 20% biodiesel. The provision is effective for property placed in service after December 31, 2005 and before January 1, 2010. 6.2.2.6 Ethanol trade policy
Ad Valorem tariff
US ethanol imports are subject to a 2.5% ad valorem tariff, which is quite modest compared to the tariffs that other countries impose. For example, Brazil levies a 20% ad valorem tariff on ethanol imports.
Secondary tariff
All ethanol blended with petrol in the US qualifies for the VEETC or blenders’ credit, no matter the country of origin of the fuel ethanol. To offset this fact and to ensure that taxpayer dollars are not invested to support foreign ethanol production, US ethanol imports from non-Caribbean Basin countries are subject to a 54 cent per gallon secondary tariff. This tariff is in effect through to January 1, 2009.
Review of grain-based ethanol production effects on Australian livestock industries
Page 50 of 148
Duty-free imports from Caribbean Basin nations
Under the Caribbean Basin Initiative (CBI), up to 7% of domestic ethanol production (about 350 million gallons of ethanol based on 2006 production data) may be imported to the US duty-free so long as the fuel ethanol is derived from nations covered by the CBI.
6.2.2.7 State Incentives In addition to federal incentives, numerous US states have their own incentive programs. ACE (2007) provides information on a state-by-state basis. Figure 13 shows the US states where ethanol production incentives apply.
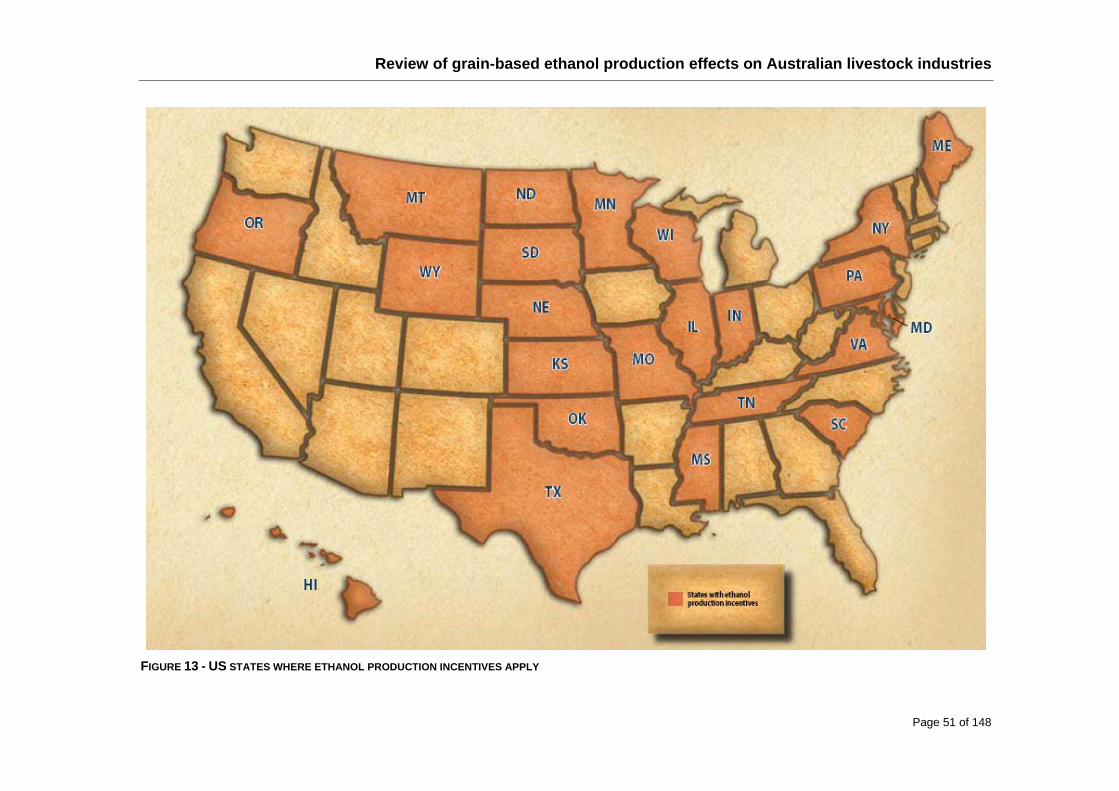
Review of grain-based ethanol production effects on Australian livestock industries
Page 51 of 148
FIGURE 13 - US STATES WHERE ETHANOL PRODUCTION INCENTIVES APPLY
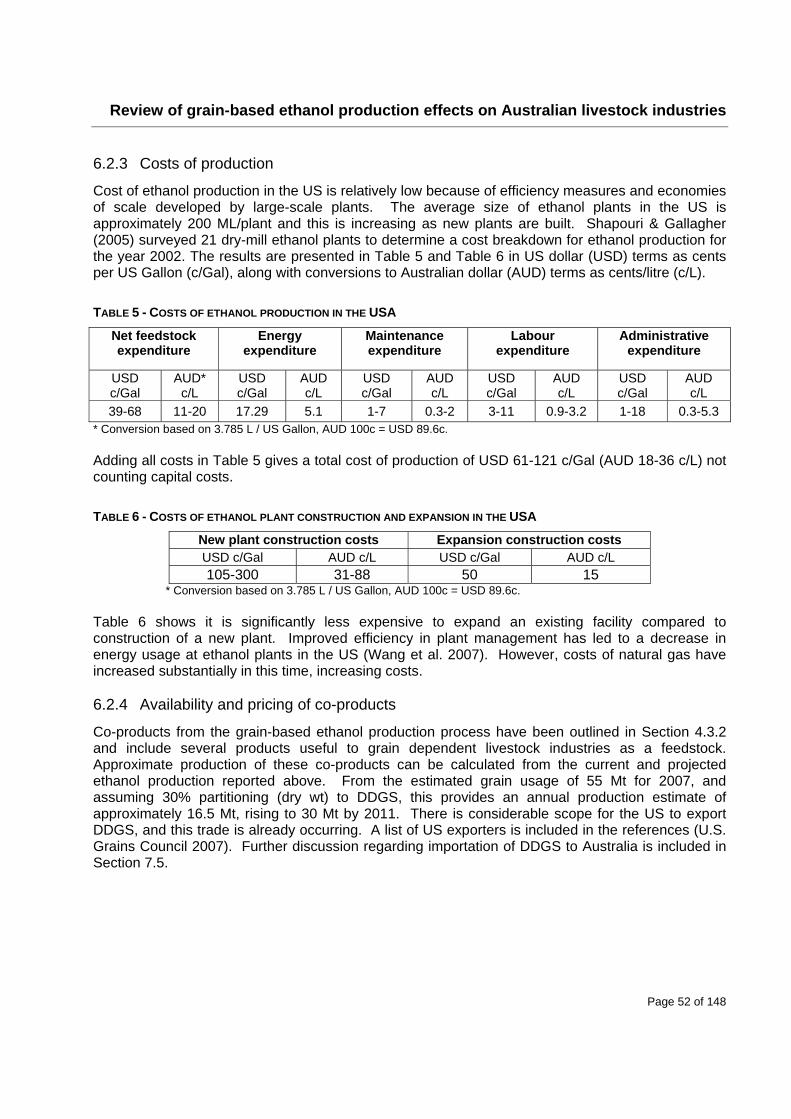
Review of grain-based ethanol production effects on Australian livestock industries
Page 52 of 148
6.2.3 Costs of production
Cost of ethanol production in the US is relatively low because of efficiency measures and economies of scale developed by large-scale plants. The average size of ethanol plants in the US is approximately 200 ML/plant and this is increasing as new plants are built. Shapouri & Gallagher (2005) surveyed 21 dry-mill ethanol plants to determine a cost breakdown for ethanol production for the year 2002. The results are presented in Table 5 and Table 6 in US dollar (USD) terms as cents per US Gallon (c/Gal), along with conversions to Australian dollar (AUD) terms as cents/litre (c/L).
TABLE 5 - COSTS OF ETHANOL PRODUCTION IN THE USA
Net feedstock expenditure
Energy expenditure
Maintenance expenditure
Labour expenditure
Administrative expenditure
USD c/Gal
AUD* c/L
USD c/Gal
AUD c/L
USD c/Gal
AUD c/L
USD c/Gal
AUD c/L
USD c/Gal
AUD c/L
39-68 11-20 17.29 5.1 1-7 0.3-2 3-11 0.9-3.2 1-18 0.3-5.3 * Conversion based on 3.785 L / US Gallon, AUD 100c = USD 89.6c. Adding all costs in Table 5 gives a total cost of production of USD 61-121 c/Gal (AUD 18-36 c/L) not counting capital costs.
TABLE 6 - COSTS OF ETHANOL PLANT CONSTRUCTION AND EXPANSION IN THE USA
New plant construction costs Expansion construction costs USD c/Gal AUD c/L USD c/Gal AUD c/L 105-300 31-88 50 15
* Conversion based on 3.785 L / US Gallon, AUD 100c = USD 89.6c. Table 6 shows it is significantly less expensive to expand an existing facility compared to construction of a new plant. Improved efficiency in plant management has led to a decrease in energy usage at ethanol plants in the US (Wang et al. 2007). However, costs of natural gas have increased substantially in this time, increasing costs. 6.2.4 Availability and pricing of co-products
Co-products from the grain-based ethanol production process have been outlined in Section 4.3.2 and include several products useful to grain dependent livestock industries as a feedstock. Approximate production of these co-products can be calculated from the current and projected ethanol production reported above. From the estimated grain usage of 55 Mt for 2007, and assuming 30% partitioning (dry wt) to DDGS, this provides an annual production estimate of approximately 16.5 Mt, rising to 30 Mt by 2011. There is considerable scope for the US to export DDGS, and this trade is already occurring. A list of US exporters is included in the references (U.S. Grains Council 2007). Further discussion regarding importation of DDGS to Australia is included in Section 7.5.
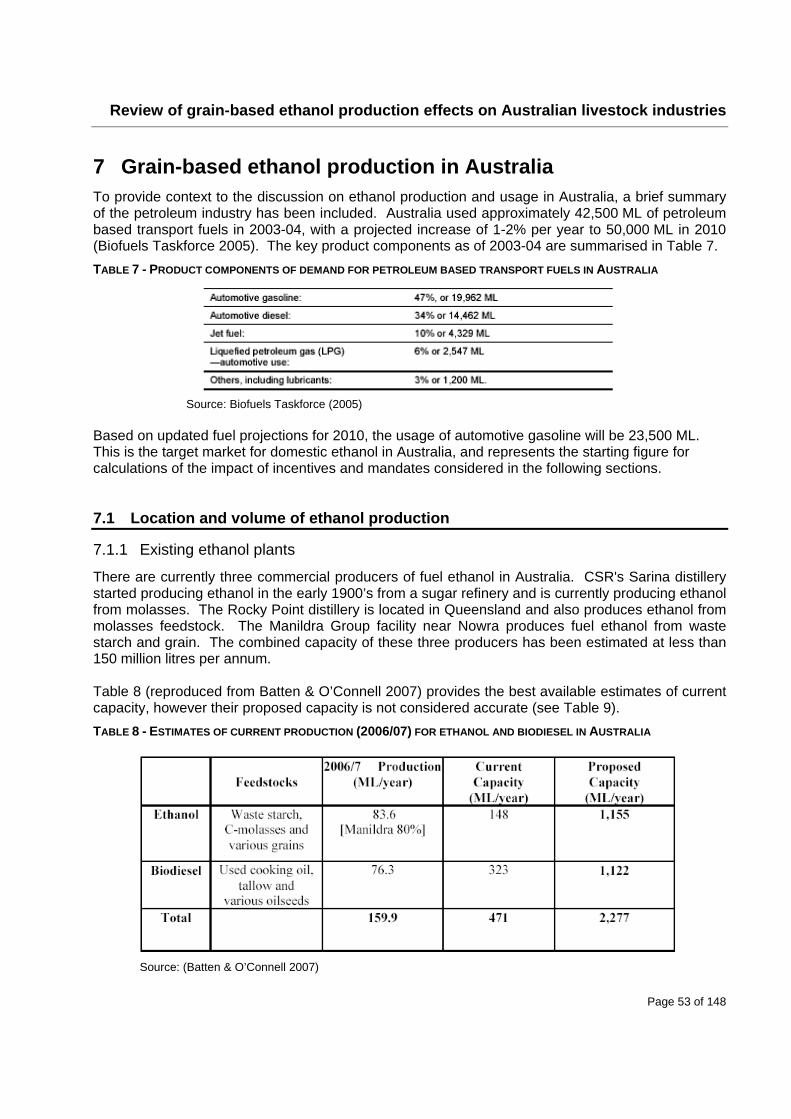
Review of grain-based ethanol production effects on Australian livestock industries
Page 53 of 148
7 Grain-based ethanol production in Australia To provide context to the discussion on ethanol production and usage in Australia, a brief summary of the petroleum industry has been included. Australia used approximately 42,500 ML of petroleum based transport fuels in 2003-04, with a projected increase of 1-2% per year to 50,000 ML in 2010 (Biofuels Taskforce 2005). The key product components as of 2003-04 are summarised in Table 7.
TABLE 7 - PRODUCT COMPONENTS OF DEMAND FOR PETROLEUM BASED TRANSPORT FUELS IN AUSTRALIA
Source: Biofuels Taskforce (2005)
Based on updated fuel projections for 2010, the usage of automotive gasoline will be 23,500 ML. This is the target market for domestic ethanol in Australia, and represents the starting figure for calculations of the impact of incentives and mandates considered in the following sections. 7.1 Location and volume of ethanol production
7.1.1 Existing ethanol plants
There are currently three commercial producers of fuel ethanol in Australia. CSR's Sarina distillery started producing ethanol in the early 1900’s from a sugar refinery and is currently producing ethanol from molasses. The Rocky Point distillery is located in Queensland and also produces ethanol from molasses feedstock. The Manildra Group facility near Nowra produces fuel ethanol from waste starch and grain. The combined capacity of these three producers has been estimated at less than 150 million litres per annum. Table 8 (reproduced from Batten & O’Connell 2007) provides the best available estimates of current capacity, however their proposed capacity is not considered accurate (see Table 9).
TABLE 8 - ESTIMATES OF CURRENT PRODUCTION (2006/07) FOR ETHANOL AND BIODIESEL IN AUSTRALIA
Source: (Batten & O’Connell 2007)
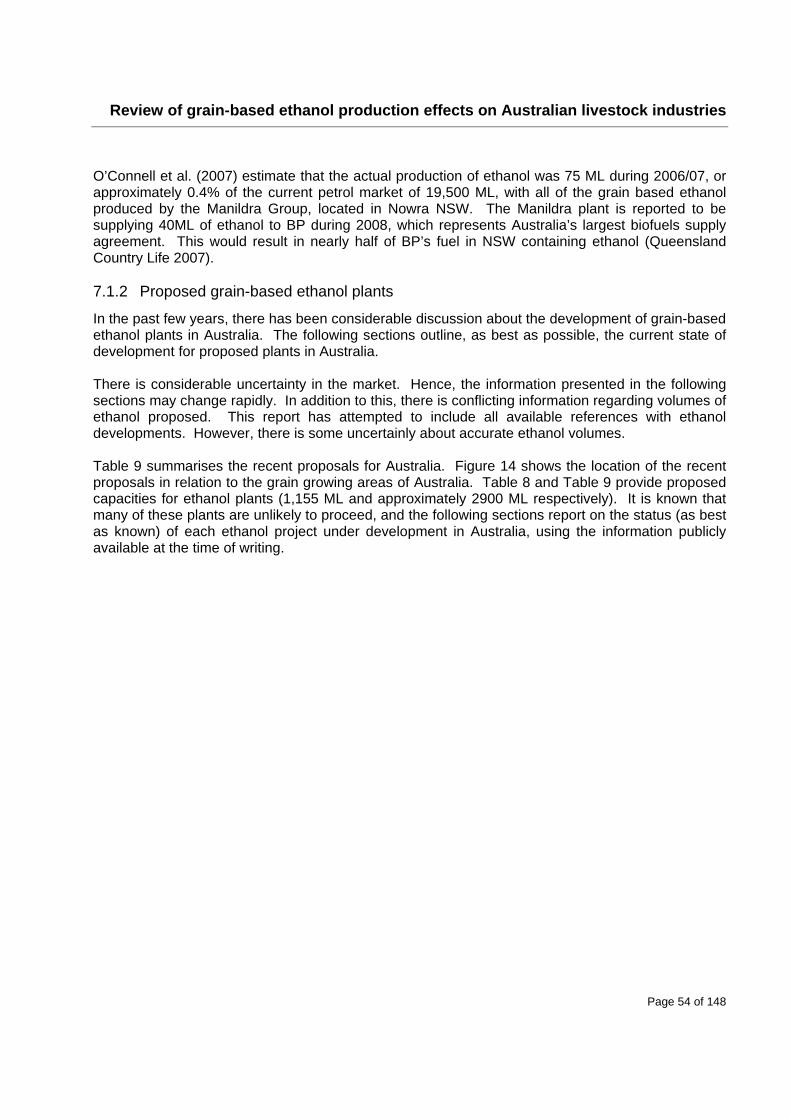
Review of grain-based ethanol production effects on Australian livestock industries
Page 54 of 148
O’Connell et al. (2007) estimate that the actual production of ethanol was 75 ML during 2006/07, or approximately 0.4% of the current petrol market of 19,500 ML, with all of the grain based ethanol produced by the Manildra Group, located in Nowra NSW. The Manildra plant is reported to be supplying 40ML of ethanol to BP during 2008, which represents Australia’s largest biofuels supply agreement. This would result in nearly half of BP’s fuel in NSW containing ethanol (Queensland Country Life 2007). 7.1.2 Proposed grain-based ethanol plants
In the past few years, there has been considerable discussion about the development of grain-based ethanol plants in Australia. The following sections outline, as best as possible, the current state of development for proposed plants in Australia. There is considerable uncertainty in the market. Hence, the information presented in the following sections may change rapidly. In addition to this, there is conflicting information regarding volumes of ethanol proposed. This report has attempted to include all available references with ethanol developments. However, there is some uncertainly about accurate ethanol volumes. Table 9 summarises the recent proposals for Australia. Figure 14 shows the location of the recent proposals in relation to the grain growing areas of Australia. Table 8 and Table 9 provide proposed capacities for ethanol plants (1,155 ML and approximately 2900 ML respectively). It is known that many of these plants are unlikely to proceed, and the following sections report on the status (as best as known) of each ethanol project under development in Australia, using the information publicly available at the time of writing.
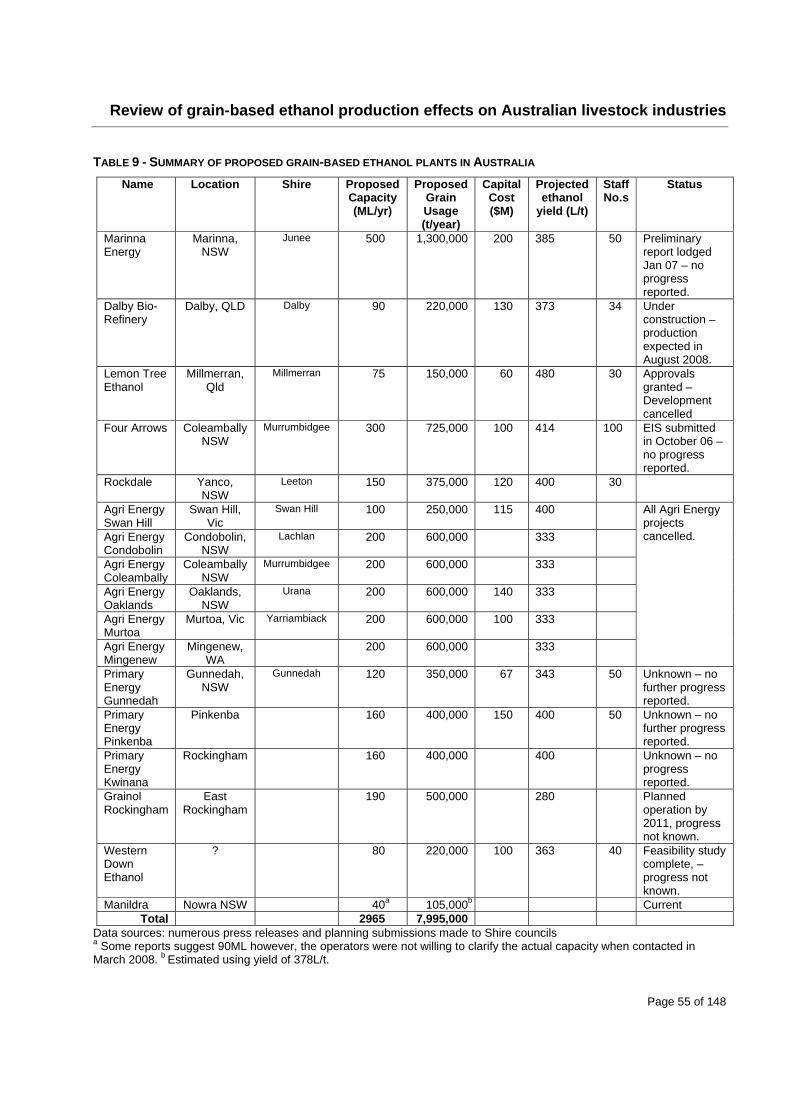
Review of grain-based ethanol production effects on Australian livestock industries
Page 55 of 148
TABLE 9 - SUMMARY OF PROPOSED GRAIN-BASED ETHANOL PLANTS IN AUSTRALIA
Name Location Shire Proposed Capacity (ML/yr)
Proposed Grain Usage (t/year)
Capital Cost ($M)
Projected ethanol
yield (L/t)
Staff No.s
Status
Marinna Energy
Marinna, NSW
Junee 500 1,300,000 200 385 50 Preliminary report lodged Jan 07 – no progress reported.
Dalby Bio-Refinery
Dalby, QLD Dalby 90 220,000 130 373 34 Under construction – production expected in August 2008.
Lemon Tree Ethanol
Millmerran, Qld
Millmerran 75 150,000 60 480 30 Approvals granted – Development cancelled
Four Arrows Coleambally NSW
Murrumbidgee 300 725,000 100 414 100 EIS submitted in October 06 –no progress reported.
Rockdale Yanco, NSW
Leeton 150 375,000 120 400 30
Agri Energy Swan Hill
Swan Hill, Vic
Swan Hill 100 250,000 115 400
Agri Energy Condobolin
Condobolin, NSW
Lachlan 200 600,000 333
Agri Energy Coleambally
Coleambally NSW
Murrumbidgee 200 600,000 333
Agri Energy Oaklands
Oaklands, NSW
Urana 200 600,000 140 333
Agri Energy Murtoa
Murtoa, Vic Yarriambiack 200 600,000 100 333
Agri Energy Mingenew
Mingenew, WA
200 600,000 333
All Agri Energy projects cancelled.
Primary Energy Gunnedah
Gunnedah, NSW
Gunnedah 120 350,000 67 343 50 Unknown – no further progress reported.
Primary Energy Pinkenba
Pinkenba 160 400,000 150 400 50 Unknown – no further progress reported.
Primary Energy Kwinana
Rockingham 160 400,000 400 Unknown – no progress reported.
Grainol Rockingham
East Rockingham
190 500,000 280 Planned operation by 2011, progress not known.
Western Down Ethanol
? 80 220,000 100 363 40 Feasibility study complete, –progress not known.
Manildra Nowra NSW 40a 105,000b Current Total 2965 7,995,000
Data sources: numerous press releases and planning submissions made to Shire councils a Some reports suggest 90ML however, the operators were not willing to clarify the actual capacity when contacted in March 2008. b Estimated using yield of 378L/t.
Review of grain-based ethanol production effects on Australian livestock industries
Page 56 of 148
7.1.2.1 Marinna Energy B.L.J Pty Ltd trading as Marinna Energy has proposed the construction and operation of a 500ML grain-based ethanol refinery producing fuel ethanol to be combined with a co-generation plant and a liquid fertiliser production facility at Marinna, New South Wales (Smith 2007). The facility is proposed to comprise:
Ethanol refinery; Co-generation unit; Animal feed and drying process; and Liquid fertiliser process.
The proposed development is on an 80 ha site located at Marinna NSW, 7 kilometres north east of Junee, producing:
500 ML of fuel grade ethanol; Approximately 100 gWh of green electricity to be added to the state wide grid; Approximately 800,000 tonnes of WDG which depending on management decisions during
the production processes could be dried into 100,000 tonnes of DDG or animal feed and 300,000 tonnes left as WDG;
Approximately 200,000 tonnes of liquid fertiliser; 5,000 tonnes other products including liquid ammonia & CO2
The ethanol plant will require 2.25 ML/day of water (820 ML/yr assuming 365 days per year operation) to produce 500 ML/yr of ethanol. The plant will create 50 direct jobs and cost in the order of $200M to construct. A dried animal feed processing unit and dryer will be established on the site to take 350,000 tonnes of WDG and dry it to 15-20% moisture content for animal feed supply. The energy to dry the WDG will be provided by the on-site co-generation unit and the on-site solar and other energy provision resources. Combined with a centrifuge dryer and high flow air drying, the unit will produce 100,000 tonnes of dried animal feed per year. The processing unit will be negatively ventilated and have air scrubbers attached to ensure that minimum air emissions are released from the site. The drying process will handle approximately 1000 tonnes of WDG per day on average in order to produce the 100,000 tonnes of final dried product. A Preliminary Assessment Report was prepared in January 2007 (Smith 2007) followed by press releases about the project. In that report, it was stated that Marinna Energy plan to complete the Environment Assessment Report by June 2007. However, no progress has been reported. 7.1.2.2 Dalby Bio-Refinery Dalby Bio-Refinery Limited (DBR) is developing a large-scale grain-based ethanol plant at Dalby. The plant will produce 90 ML of ethanol per annum. DBR announced a $130 million financial package that is expected to cover the construction to completion. The plant is expected to be commissioned in August 2008, and construction was well under way in late 2007 (ABC News September 2007). This is the only development of its kind expected to be operational in the near future.
Review of grain-based ethanol production effects on Australian livestock industries
Page 57 of 148
The Dalby Bio-Refinery has reported that several petroleum companies were expected to sign contracts with DBR for the delivery of ethanol, including Caltex. According to an article in ABC Rural in 2005, Caltex signed a deal to take an undisclosed amount of ethanol per year. In order to produce 90ML of ethanol the plant is expected to consume 220,000 tonnes of locally produced sorghum. Dalby Bio-Refinery and Graincorp worked together to create a fixed price contract with growers. The contract is based on fixed hectares and not tonnes and covers crop years 2007/08, 2008/09 and 2009/10. The first delivery is scheduled for mid 2008. Operating at maximum capacity, it is estimated that the Dalby Bio-Refinery will produce approximately 60,000 tonnes of DDGS. 7.1.2.3 Lemon Tree Ethanol Lemon Tree Ethanol Pty Ltd has proposed to build a 75 ML ethanol plant on a cattle feedlot site near Millmerran, producing ethanol from barley, wheat, sorghum and small grains. The by-product from the plant, wet distillers grain, will be used as a feed input for the feedlot. Lemon Tree Ethanol was awarded a $5.85 million grant, through the Federal Government’s Invest Australia program, to assist the establishment of the grain to ethanol plant. However, construction plans fell behind schedule following an appeal against the development application on the basis of health and environmental risks. Because of these delays, the expiry for using the Federal Government grant passed and the grant was returned (Pfeffer 2007). No further development has taken place at this site. 7.1.2.4 Four Arrows Four Arrows Ethanol Pty Ltd is part of the Four Arrows Group (www.4arrows.com.au/4ag.aspx). They have proposed an ethanol plant producing 300 ML/yr to be built just north of Coleambally, NSW. The proposal also includes a free-stall dairy with 6000 milkers and a total herd of 18,000 head. The ethanol plant would use 725,000 tonnes per year of wheat, barley and corn and the wet distillers grain would be fed to the dairy cattle. The CO2 by-product from the ethanol process is to be captured and used in carbonated beverages and for industrial purposes. The dairy will produce 30,000 tonnes of manure per year to be spread on farmland. The EIA (Booth Associates 2006) is available at http://boothassociates.com.au/fourarrows/documents.html In a press release on 19 October 2007, it was noted that, despite the delays in the application process, the company remained committed to getting its plant up and running, though development has not begun. 7.1.2.5 Rockdale Babcock & Brown Australia Pty Ltd is proposing to develop an ethanol production facility at the Rockdale feedlot site near Yanco, NSW (EA Systems 2006). Rockdale Beef is an integrated 53,333 head cattle feedlot and 650 head/day abattoir. The plant will be developed in two stages with an ultimate capacity of 150 ML/yr at a capital cost of $120M. It is proposed that the plant would use 375,000 tonnes of grain per year (mainly wheat) and produce 220,000 t/yr of WDG. Development at this site has not progressed to date.
Review of grain-based ethanol production effects on Australian livestock industries
Page 58 of 148
7.1.2.6 Agri Energy proposals Agri Energy Ltd is a public company listed on the Australian Stock Exchange. Agri Energy wholly owns Australian Biofuels Pty Ltd (www.aael.net) which manages all of the Australian projects. Until recently, Agri Energy was proposing several grain-based ethanol plants across Australia including Swan Hill, Oaklands, Condobolin, Coleambally, Mingenew and Murtoa. The proposals were at different states of progression with the Swan Hill proposal most developed. Environmental permits for the project were issued in September 2004. Turner (2007) stated that construction of the Swan Hill plant had commenced, engineering design was 76% complete and start up was planned for early 2009. However, in October 2007, Agri Energy Limited (AEL) has announced the scrapping of all its Australian biofuels operations. The Melbourne company told the Australian Stock Exchange the decision was "a result of … ongoing high feedstock prices and continued uncertainty from the investment community, government and community support for alternative transport fuels in Australia. Investment in offshore markets, particularly the United States and European biofuels industries, represents a preferred medium-term focus." The Swan Hill ethanol plant was sold to a securities company because of market conditions and lack of government and community support for alternative fuels. Agri Energy does have a 12-month buyback option on the project (ABC News 2007c). 7.1.2.7 Primary Energy Primary Energy Pty Limited is a privately owned Australian company, who proposed the development of ethanol plants in Rockingham/Kwinana and Gunnedah. Primary Energy has signed an agreement with BP, as a co-developer, to establish the ethanol plant in the Kwinana/Rockingham region. The plant is proposed to produce 160 ML of ethanol from 400,000 tonnes of wheat per annum. These developments are not believed to have progressed to date.
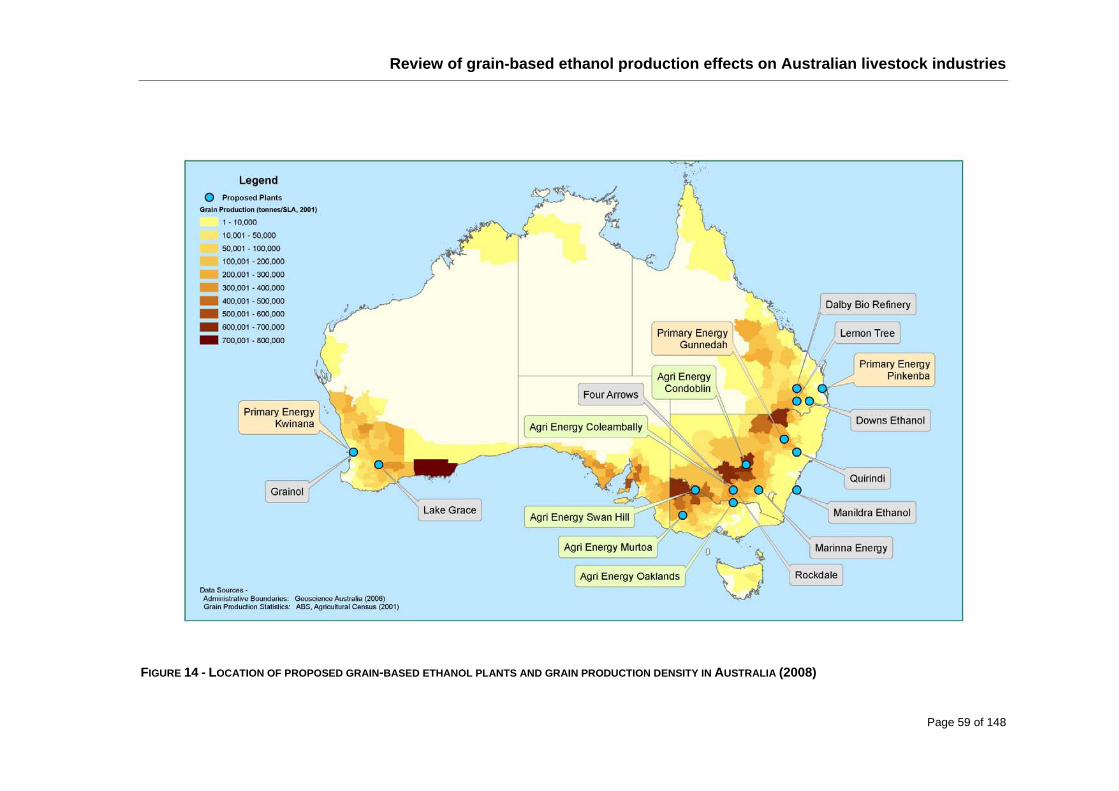
Review of grain-based ethanol production effects on Australian livestock industries
Page 59 of 148
FIGURE 14 - LOCATION OF PROPOSED GRAIN-BASED ETHANOL PLANTS AND GRAIN PRODUCTION DENSITY IN AUSTRALIA (2008)
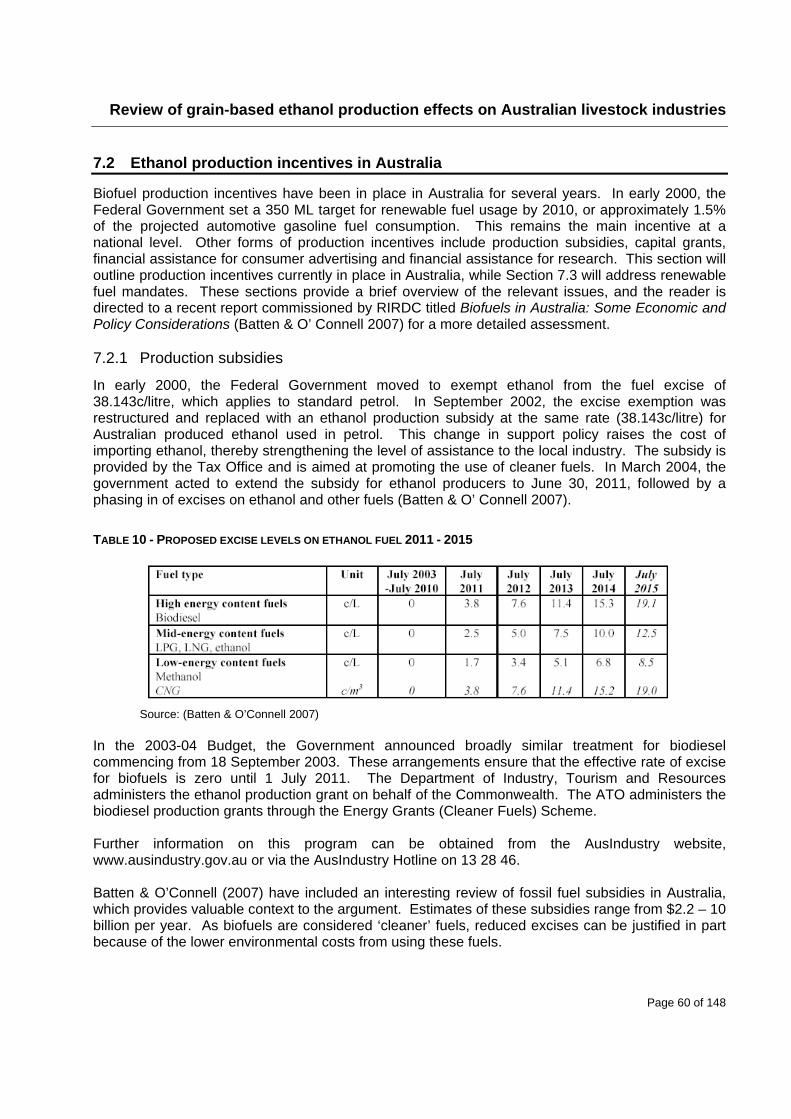
Review of grain-based ethanol production effects on Australian livestock industries
Page 60 of 148
7.2 Ethanol production incentives in Australia
Biofuel production incentives have been in place in Australia for several years. In early 2000, the Federal Government set a 350 ML target for renewable fuel usage by 2010, or approximately 1.5% of the projected automotive gasoline fuel consumption. This remains the main incentive at a national level. Other forms of production incentives include production subsidies, capital grants, financial assistance for consumer advertising and financial assistance for research. This section will outline production incentives currently in place in Australia, while Section 7.3 will address renewable fuel mandates. These sections provide a brief overview of the relevant issues, and the reader is directed to a recent report commissioned by RIRDC titled Biofuels in Australia: Some Economic and Policy Considerations (Batten & O’ Connell 2007) for a more detailed assessment. 7.2.1 Production subsidies
In early 2000, the Federal Government moved to exempt ethanol from the fuel excise of 38.143c/litre, which applies to standard petrol. In September 2002, the excise exemption was restructured and replaced with an ethanol production subsidy at the same rate (38.143c/litre) for Australian produced ethanol used in petrol. This change in support policy raises the cost of importing ethanol, thereby strengthening the level of assistance to the local industry. The subsidy is provided by the Tax Office and is aimed at promoting the use of cleaner fuels. In March 2004, the government acted to extend the subsidy for ethanol producers to June 30, 2011, followed by a phasing in of excises on ethanol and other fuels (Batten & O’ Connell 2007).
TABLE 10 - PROPOSED EXCISE LEVELS ON ETHANOL FUEL 2011 - 2015
Source: (Batten & O’Connell 2007)
In the 2003-04 Budget, the Government announced broadly similar treatment for biodiesel commencing from 18 September 2003. These arrangements ensure that the effective rate of excise for biofuels is zero until 1 July 2011. The Department of Industry, Tourism and Resources administers the ethanol production grant on behalf of the Commonwealth. The ATO administers the biodiesel production grants through the Energy Grants (Cleaner Fuels) Scheme. Further information on this program can be obtained from the AusIndustry website, www.ausindustry.gov.au or via the AusIndustry Hotline on 13 28 46. Batten & O’Connell (2007) have included an interesting review of fossil fuel subsidies in Australia, which provides valuable context to the argument. Estimates of these subsidies range from $2.2 – 10 billion per year. As biofuels are considered ‘cleaner’ fuels, reduced excises can be justified in part because of the lower environmental costs from using these fuels.
Review of grain-based ethanol production effects on Australian livestock industries
Page 61 of 148
Considering the future excise rates, these have been developed based on energy content relative to petrol. Hence, ethanol will have a lower excise than petrol due to its lower energy content (roughly 68% that of petrol). Following this rationale, the excise on ethanol would be 25 c/L. The targeted ethanol excise for 2015 (half the rate determined by energy content, or 12.5 c/L) is a continued incentive towards production and use of ethanol. The current production subsidy has been described by Centre for International Economics (2005) as an unofficial tariff on imported ethanol. Australian Pork Limited have pointed out that, in effect, the production subsidy for Australian produced grain-based ethanol provides a subsidy on grain purchased by the industry. Australian Pork Limited assume a yield of 380 L of ethanol per tonne of grain and presumably a production subsidy of 25c/L, to estimate a grain subsidy of $95/t under the current situation, or $47.50/t under the 2015 production subsidies (APL 2007). This subsidy, provided by taxpayer dollars, is seen to be a challenge to a free market for grain trading and is probably the most important inequality related to the biofuel industry. Batten & O’Connell (2007) note that this subsidy may result in a less efficient domestic ethanol industry, and does not seem to relate to the supposed benefits of biofuel usage, namely reduced GHG emissions and urban air quality. From 2011, the disparity between excises on local produced or imported ethanol will be removed, leaving Australian producers to compete on the global ethanol market. 7.2.2 Biofuels Capital Grants Program
The Government announced on 25 July 2003 its intention to provide a capped amount of $37.6 million to fund one-off capital grants for projects that provide new or expanded biofuels production capacity. The Biofuels Capital Grants Program aimed to increase the availability of biofuels for the domestic transport market. Grants have been provided at a rate of 16 cents per litre for new or expanded projects producing a minimum of 5 million litres of biofuel per annum. Grants were limited to a maximum of $10 million per project, payable in three instalments consisting of:
25 per cent of the grant amount on evidence of final investment decision and the commencement of construction;
25 per cent of the grant amount on commissioning of the plant; and 50 per cent of the grant amount on the first commercial sale into the domestic transport fuels
market. Successful applicants under the two rounds of the Biofuels Capital Grants Program were:
CSR Distilleries, an ethanol plant at Sarina, Qld ($4.16m). Schumer Pty Ltd (Rocky Point Sugar Mill and Distillery), an ethanol plant at Woongoolba, Qld
($2.4m). Biodiesel Industries Australia, a biodiesel plant at Rutherford, NSW ($1.28m). Biodiesel Producers Ltd, a biodiesel plant at Barnawartha, Vic ($9.6m). Australian Renewable Fuels, a biodiesel plant at Port Adelaide, SA ($7.15m). Riverina Biofuels Pty Ltd, a biodiesel plant at Deniliquin, NSW ($7.15m). Lemon Tree Ethanol Pty Ltd, an ethanol plant at Millmerran, QLD ($5.85m).
Note that only one grain-based ethanol plant (Lemon Tree Ethanol Pty Ltd) was successful in obtaining a grant under this scheme. Subsequently this grant was handed back to the government after expiry following delays in spending the grant on construction.
Review of grain-based ethanol production effects on Australian livestock industries
Page 62 of 148
All the funding for this program has been committed and no further rounds are to be held. Further information on the Biofuels Capital Grants Program can be obtained from the AusIndustry website, www.ausindustry.gov.au or via the AusIndustry Hotline on 13 28 46. 7.2.3 Ethanol Distribution Program
On 14 August 2006, the former Prime Minister John Howard announced the establishment of the Ethanol Distribution Program, which commenced on 1 October 2006. This program has funding of $17.2 million, and provides grants to encourage the development of facilities at service stations to sell ethanol blended petrol. The program provides grants of up to $20,000 for retail service stations to reduce the cost of installing or converting infrastructure to supply E10:
an Infrastructure Upgrade Grant of up to $10,000 for service stations that upgrade existing equipment or install new equipment to provide for the sales of E10 (work must be completed between 1 October 2006 and 31 March 2008);
a further Sales Target Grant of up to $10,000 for those retail service stations that have upgraded their site and have reached a specified E10 sales target within 12 months of completing the upgrade.
Further information on the Ethanol Distribution Program can be obtained from the AusIndustry website, www.ausindustry.gov.au or via the AusIndustry Hotline on 13 28 46. 7.2.4 Research grants
The Australian Government has allocated $7.72 million under the National Collaborative Research Infrastructure Strategy to construct two pilot scale facilities for development of novel biofuel production technologies and to enhance related laboratory infrastructure at three universities. In addition to this, funding of approximately $7.5 million has also been allocated for innovative renewable fuel projects under the Renewable Energy Development Initiative. 7.3 State government incentives and mandates
State government incentives have been summarised in the RIRDC commissioned report by Batten & O’Connell (2007), and a brief overview of key incentives is included in this section. As no national mandates have been applied to date, mandates will be covered in this section. 7.3.1 Queensland
Queensland has been the most proactive in promoting the biofuel industry (Batten & O’Connell 2007). Incentives are summarised as follows:
Promoting government fleets to run on E10 where possible. A state Blueprint and Ethanol Industry Action Plan providing $7.3 million to support the
Queensland ethanol industry, including: o lobbying the Commonwealth Government to introduce a national mandate for E10
fuel; o promoting quality standards for ethanol fuels, and encouraging monitoring of
standards under relevant State and Commonwealth Acts; o lobbying the Commonwealth Government to retain domestic ethanol production
grants indefinitely; o assisting the provision of infrastructure for the production, distribution and export of
ethanol through the provision of funds;
Review of grain-based ethanol production effects on Australian livestock industries
Page 63 of 148
o a mandate for a minimum 5% ethanol in regular unleaded petrol produced and wholesaled in Queensland from 31 December 2010.
The relevant policy document is the Queensland Ethanol Industry Action Plan 2005-2007 (Queensland Government 2005-2007) 7.3.2 New South Wales
NSW has announced support for ethanol, with a range of incentives including: in principle support for a 10% ethanol mandate in unleaded petrol produced and wholesale,
on a phase in basis with full implementation by 2011; a 2% mandate on the total volume of petrol sold in NSW from September 2007 as a first step
to the 10% mandate; endorsed usage of E10 fuel in the government car fleet “where practicable, available and
cost effective”. Policy document: Biofuel (Ethanol Content) Bill 2007. 7.3.3 Victoria
Victorian incentives and mandates are as follows: a biofuels target of 5% of the fuel industry (400 ML); all government vehicles to use ethanol blended fuel whenever possible; trials are being conducted on the use of biodiesel in heavy vehicles; a $5 million Biofuels Infrastructure Grant (BIG) program provided to assist infrastructure
development. Policy documents: Driving Growth: A Road Map and Action Plan for the Development of the Victorian Biofuels Industry - Published April 2007. In addition to this, an Inquiry into Mandatory Ethanol and Biofuels Targets in Victoria began in March 2007, and the Economic Development and Infrastructure Committee is to report to the Victorian Government on 31 March 2008. 7.3.4 Western Australia
Incentives from the Western Australian Government include: Establishment of a Biofuels Taskforce to examine the role of biofuels in the state. Report
released May 2007 (Western Australian Biofuels Taskforce 2007). Recommendations include:
o Reviewing and addressing opportunities and impediments to the development of a biofuels industry in Western Australia.
o Increasing consumer acceptance and use of biofuels. o Using biofuels as cost-effective alternatives to petrol/diesel. o Maximising WA’s participation in providing biofuels to meet the national 350 ML fuel
target. o Maximising WA's opportunity to leverage funds from Commonwealth funding
programs related to biofuels. o Provision of a consultation mechanism with industry and the Federal Government. o Promoting a whole of government and industry approach to the use of biofuels.
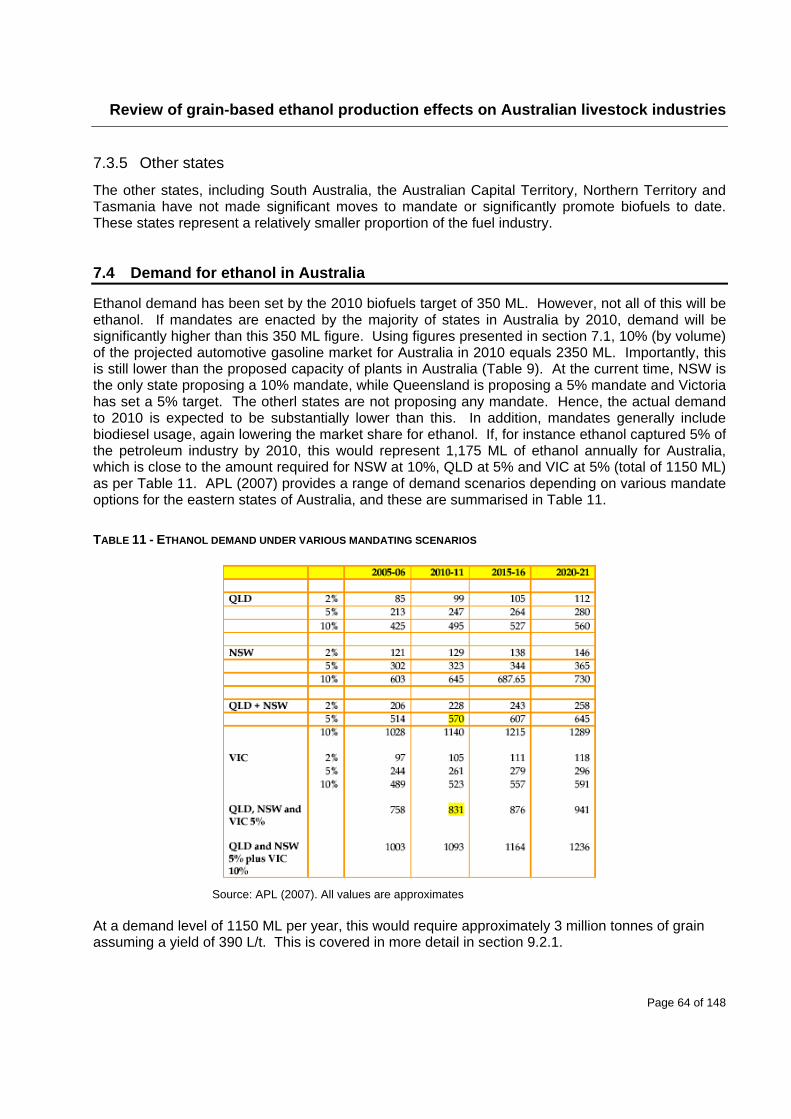
Review of grain-based ethanol production effects on Australian livestock industries
Page 64 of 148
7.3.5 Other states
The other states, including South Australia, the Australian Capital Territory, Northern Territory and Tasmania have not made significant moves to mandate or significantly promote biofuels to date. These states represent a relatively smaller proportion of the fuel industry. 7.4 Demand for ethanol in Australia
Ethanol demand has been set by the 2010 biofuels target of 350 ML. However, not all of this will be ethanol. If mandates are enacted by the majority of states in Australia by 2010, demand will be significantly higher than this 350 ML figure. Using figures presented in section 7.1, 10% (by volume) of the projected automotive gasoline market for Australia in 2010 equals 2350 ML. Importantly, this is still lower than the proposed capacity of plants in Australia (Table 9). At the current time, NSW is the only state proposing a 10% mandate, while Queensland is proposing a 5% mandate and Victoria has set a 5% target. The otherl states are not proposing any mandate. Hence, the actual demand to 2010 is expected to be substantially lower than this. In addition, mandates generally include biodiesel usage, again lowering the market share for ethanol. If, for instance ethanol captured 5% of the petroleum industry by 2010, this would represent 1,175 ML of ethanol annually for Australia, which is close to the amount required for NSW at 10%, QLD at 5% and VIC at 5% (total of 1150 ML) as per Table 11. APL (2007) provides a range of demand scenarios depending on various mandate options for the eastern states of Australia, and these are summarised in Table 11.
TABLE 11 - ETHANOL DEMAND UNDER VARIOUS MANDATING SCENARIOS
Source: APL (2007). All values are approximates
At a demand level of 1150 ML per year, this would require approximately 3 million tonnes of grain assuming a yield of 390 L/t. This is covered in more detail in section 9.2.1.
Review of grain-based ethanol production effects on Australian livestock industries
Page 65 of 148
7.5 Availability and pricing of co-products
Several US exporters were contacted by email to ascertain quality of DDGS for trade and approximate prices. In a response from Vic Heinold of Consolidated Grain and Barge (pers. comm. August 2007), the following points were made:
Quality - highly variable. However, there are some quality checks, such as a minimum ‘ProFat’ = 35% and 12.5 % maximum for moisture on all product shipped.
Price - (best guess) the product would deliver into Australia in the mid to high $200 (US) range.
Capability to export - our company has the capability to market this product to Australia and would be happy to work with you if there is future interest.
Enquiries were also made with AQIS (Australian Quarantine & Inspection Service) to ascertain the import status of DDGS. In a conversation with Joel Freeman (pers. comm. January 2008) it was evident that DDGS are considered a low risk import (because of the ethanol treatment process), and Joel indicated that a couple of permits to import bulk DDGS have been issued by AQIS. Most concerns focus on potential for contamination of the product at the plant or during transportation. Further inquires to AQIS regarding DDGS importations are summarised as following:
AQIS must assess the product and production facility from which the DDGS are produced, particularly noting whether the product meets the required temperatures during production, and that the final product is protected from post-processing contamination.
This can be done by means of a desk audit, and provided sufficient information is made available, a permit may be issued without a facility inspection.
It is noted, however, that for most countries, an AQIS officer must inspect the manufacturing facility. The cost of this inspection is the responsibility of the importer.
The initial permit to import requires collection of a significant amount of information, relying on documented QA procedures at the supply source. The possibility of importing without inspection of the production facilities in the US will reduce costs considerably. In addition, all imports must be inspected on arrival in Australia prior to shipment up-country.
Review of grain-based ethanol production effects on Australian livestock industries
Page 66 of 148
8 Nutritional value of grain-based ethanol co-products (Chapter 8 was prepared by M Quinn, J Doyle & R Lawrence, Integrated Animal Production Inc. Toowoomba, Qld.)
8.1 Introduction
In the US, the recent emergence of grain-based ethanol production for fuel source has created availability of a variety of solid co-products suitable for feed for grain dependent livestock producers. Inclusion of any feed ingredient whether as grain, protein meal, oil or fibre source is dictated by nutrient composition and ultimately production cost into the diet. For grain-based ethanol plants and grain-dependent livestock producers, the conversion of grain to fuel or feed constitutes the largest input cost in most operations. With increased production of grain-based ethanol, competition has arisen between grain-based ethanol manufacturers and grain-dependent livestock for grain as a source of starch for fermentation and finally energy. Livestock digestion and metabolism have an absolute requirement for carbohydrate sources for cellular oxidation or combustion into energy to maintain life and production. Although there seems to be few existing strategies to alleviate competition among producers of grain-based ethanol and meat/milk for grain, there are however, possibilities for the inclusion of co-products derived from grain-based ethanol production that may reduce the dependence on feed grains for livestock producers. The inclusion of these grain-based ethanol co-products into livestock diets is dictated by suitability for livestock species, availability of these products relative to other feed ingredient nutrients, inherent variation within the co-product, and ultimately, dependence on grain cost. 8.2 Differences in milling and resultant co-products
Ethanol from grain is produced generally from two processing methods termed “Wet Milling” and “Dry Milling”. These methods produce a multitude of co-products that can be used either singularly or more often are blended together for inclusion in livestock feeds. The processes of wet milling and dry milling are described in Figure 3 (Shurson et al. 2005). In the US, corn constitutes the largest grain source for grain-based ethanol production, and to lesser extent grain sorghum, barley, and wheat. The majority of research existing has been conducted using corn-based derivatives. Therefore, when addressing feedstuff products, unless otherwise stated, the reader may conclude that ethanol co-products in question are derived from corn grain. Dry milling of grains is a less complex process compared to wet milling, resulting in fewer co-products but represents the most popular method of grain-based ethanol production. The dry milling process involves grinding the grain, wetting, and cooking. Following the cooking step, enzymes and yeast are added to the slurry of grain and water to ferment to ethanol followed by distillation. Once the alcohol is removed, the resulting product is called stillage, from which the co-products are derived. The three primary co-products that result from dry-milling of corn include distillers grains (bran associated with corn following extraction of starch), distillers solubles (wet fraction of stillage), and distillers grains plus solubles. Distillers grain without solubles can be sourced wet (wet distillers grain, WDG) or dry (dry distillers grain, DDG). Wet distillers grains with solubles (WDGS) can then be dried down to create dry distillers grains with solubles (DDGS). For the purpose of this review, differences exist between WDG, WDGS, DDG and DDGS. The combination of distillers grains and solubles (WDGS and DDGS) is common practice in the industry and reflects the majority of research conducted. All distillers grain derived from commercial plants contains some quantity of solubles (Kononoff and Erickson 2006). Another product that has
Review of grain-based ethanol production effects on Australian livestock industries
Page 67 of 148
emerged from dry milling processes is modified distillers grains (MDGS) which removes a portion of the germ, providing a by-product intermediate between WDGS and DDGS, with respect to dry matter. A significant issue for nutritionists and grain-dependent livestock producers regarding the acceptance of grain-based ethanol co-products (distillers grains) is variation in nutrient profile and moisture. This variation is dependent largely upon the quality of the grain source used for fermentation production. Grain variety, kernel size, bulk density of the grain (kg/hL), and percentage of screening influences the final composition and nutrient profile of the distillers grains. 8.3 Nutrient composition and variability in grain-based ethanol co-products
A major focal point within grain-dependent livestock production is consistency, and in particular, consistency of dietary nutrients. A discussion of the nutrient profiles of several co-products from dry milling grain-based ethanol production and variability associated with those products follows. Precision nutrient analyses are performed on a regular basis by livestock nutritionists to evaluate current commodity and feedstuff nutrient values in order to formulate diets to maximise performance and minimise variation within an operation. The greatest concern for livestock nutritionists in assessing the dietary inclusion of DDGS and WDGS is the inherent variation commonly observed within these co-products. As starch is removed for fermentation to ethanol, existing nutrients are concentrated and, in some cases, the availability of these nutrients is altered. The nutrient concentrating effect may appear appealing, as it reduces the need for additional nutrient supplementation, yet this procedure decreases starch content. These co-products may initially appear to provide a cost effective protein or energy source. However, inconsistency in dry matter content and nutrients, as shown in Table 12, make it difficult to rely on these products. On an average dry matter basis, distillers grain with solubles is composed of 35% solubles and 65% distillers grain. All nutrients reported are presented on a 100% dry matter basis. The grain fraction of distillers grain with solubles averages approximately 34% dry matter (DM), 30-34% crude protein (CP), 8% fat, 9.1% crude fibre, and approximately 0.6% phosphorus (P). The solubles fraction or the liquid component of distillers grain with solubles is lower in CP averaging 20%, higher in fat at 17%, lower in fibre at 1.4%, and higher in P at 1.3% than the grain portion of DGS (Knott et al. 2004). Blending in various amounts of the two ingredients results in the products with nutrients profiles as listed in Table 12. As a rule of thumb, the nutrient profile of the original grain multiplied by three provides a rough estimation of the nutrient content of the distillers grain with solubles. However, it should be noted that not all grains contain similar concentrations of starch and therefore differences in nutrient profile are dependent on the amount of starch typical of a particular grain. The components of the grain that are left after starch removal include fibre (expressed as NDF, most of which is readily digestible NDF for ruminants), fat (crude fat or ether extract), crude protein (crude protein = nitrogen x 6.25), and ash (minerals). As previously stated, the nutrient profile of DGS can vary considerably depending on type of grain-base, however, despite these large nutrient differences neither the Nutrient Requirements of Beef Cattle (NRC 2000), nor the Nutrient Requirement of Swine (NRC 1998) distinguish between distillers grain with solubles derived from different grains. Thus, the assumption made by these references is that irrespective of primary grain
Review of grain-based ethanol production effects on Australian livestock industries
Page 68 of 148
(corn, sorghum, wheat), the nutrient content is the same. Research trials observe that the energetic value and nutrient digestibility may in fact differ between these products. An additional discrepancy is the energy value for corn DDGS is different in the Beef NRC compared to the Swine NRC. Thus, conflicting text values increases uncertainty to assign an appropriate value to these co-products. The values listed in both NRC volumes may also reflect the apparent mixture of both corn and sorghum that typically occurs at distillers plants. In some cases, corn and sorghum blends will be processed together resulting in a mixture of DDGS from corn and sorghum. Further variation results from differences between ethanol plants. The NRC values for beef, dairy, and pigs may be somewhat reflective of WDGS and DDGS products derived from older ethanol plants (Birkelo et al. 2004). In newer generation plants, the nutrient profiles may be slightly different to that previously reported (Spiehs et al. 2002). Therefore previous estimates of energy density used to formulate livestock diets from distillers grain with solubles from more advanced new plants may actually under-estimate or over-estimate energy content, thus adding to variation in performance and calculated nutrient density. The majority of variability seen in nutrient profiles of these DDGS is related to the amount of added solubles (Knott et al 2004). Knott et al. (2004) compared random samples of distillers solubles and distillers grains from six grain-based ethanol plants located in Minnesota. The samples in their study were collected before the distillers solubles and distillers grains were added together and dried down to make DDGS. Knott et al. (2004) assumed that the DDGS was composed of 40% distillers solubles and 60% distillers grains. Knott et al. (2004) noted significant differences in coefficients of variation for specific nutrient levels in the DDGS samples. Akayezu et al. (1998) summarised the nutrient values of several types of distillers grains products, both wet and dry. The authors’ assessment reveals a significant range in CP, DM, ether extract, NDF and ash and found in many cases a wide range of nutrient values for distillers products originating from the same grains source. This is an important consideration when trying to assign a single nutrient value such as an average CP for corn DDGS when clearly there is still a significant range among all corn DDGS products for CP. Finally, variability is inevitable because a multitude of grains may be blended together at any time for ethanol production, resulting in a distillers grain product varying in composition. In most cases, when two grains are blended, the majority grain used will be named for the distillers grains. Thus, corn DDGS may be all corn, blended corn and sorghum, or blended wheat and corn. It is difficult to distinguish and impossible to avoid. Nevertheless, this review will attempt to discuss distillers products in relative terms of nutrient composition and variability so that some understanding may be present of the potential for each product to be utilised as a feedstuff. 8.3.1 Crude fat
Crude fat content of corn DDGS according to Beef NRC (NRC 2000) is listed as 10.3% and according to Swine NRC (1998) fat content is 9.0%, with varying values listed based on plant and sampling period. Fat content of corn DDGS ranges from 8-11% and will depend largely on the type of grains used for ethanol production. Preston (2007) lists ether extract (fat) content of corn DDGS at 11.0%, while sorghum DDGS is 10.0%, barley DDGS at 3.7%, and wheat DDGS at 3.4% (Nyachoti et al. 2005), based on average of three values. Winter cereal grains are inherently lower in fat, producing DGS possessing lower fat and/or energy content. Again, age of ethanol plant influences nutrient content of co-products with new plants having greater ability to precisely separate and refine co-products. Spiehs et al. (2002) sampled over a two-year period from distillers plants in Minnesota and South Dakota and recorded crude fat at 10.9% for corn DDGS and 8.2% from plants that were older than 5 years in production. Assessing consistency of nutrient content based on
Review of grain-based ethanol production effects on Australian livestock industries
Page 69 of 148
coefficient of variation (CV) highlighted the difference between plants for crude fat values with “old” plants averaging 12.6% CV while “new” plants had an average of 7.8%. This indicates a reduction in the variability of nutrient profile as newer technology is implemented between these Midwest plants. However, the large CV’s present with regards to samples indicate there is still a relatively large amount of variation among samples. Many nutritionists attribute the fat content of distillers grain with solubles to drive performance greater than that observed with dry rolled corn in beef and dairy cattle studies. Mixed findings from field research and at a university level had led to much speculation as to what the appropriate energy value should be placed on distillers grain with solubles. Much of the difference in performance and research results may also be due in part to variability in distillers grain with solubles themselves. When a greater proportion of the higher fat content solubles is added into a typical type of distillers grain, the resulting distillers grain with solubles will possess greater energy content than other samples. When evaluating tabular values for DDGS such as the Beef NRC (2000), DDGS have an energetic value equal to that of corn grain. Preston (2007) reported DDGS as 5.5% energetically greater than steam-flaked corn. Assessing the energetic values of corn DDGS compared to corn grain in the Swine NRC, DDGS is valued at 85% of the DE of corn grain. The apparently large differences in energetic value between pigs and cattle for DDGS are mostly attributable to the NDF fraction of DDGS, which can be readily digested to a greater extent by ruminants than in monogastrics such as pigs. According to Spiehs et al. (2004), DDGS were less than 1% greater energetically than corn grain. DDGS derived from wheat have an energetic value that is approximately 86% that of soft white wheat (NDSU 1999; NRC 2000). Presumably this reported lower energetic value of wheat distillers grains is relative to low fat content of wheat based DDGS. Interestingly, WDGS is particularly favoured by beef and some dairy cattle nutritionists because of its apparent higher energy content compared to DDGS. In the Beef Cattle NRC, WDGS is given a 3.3% higher energy value compared to DDGS. Many nutritionists suggest that the moisture in the WDGS helps to “tie the ration together,” providing a physical texturing effect, observing a slight increase in feed intake. Why WDGS is perceived to contain greater energy values in beef cattle diets is not readily recognised through the product’s nutrient content. The moisture content of WDGS (approximately 65%) decreases product shelf life dramatically (i.e. free radical rancidity – spoilage), lowering potential storage period and is difficult to handle. 8.3.2 Crude protein
An important aspect of DDGS for livestock diets is for use as a protein source. Corn DDGS typically contain approximately 30% crude protein. Of that crude protein, around 60-70% is undegradable intake protein (UIP). Whereas in WDGS, the UIP value is lower. This particular attribute of containing high UIP makes DDGS useful as a protein source for pigs, poultry and dairy diets. A major influence on the amount of protein in the WDGS or DDGS is directly related to the specific grain used. Research suggests that DDGS protein values are generally lowest for corn and barley at approximately 30%, sorghum 32%, and wheat at 34-36% (NDSU 1999; Nyachoti et al. 2005; Preston 2007). A limitation for the inclusion of DDGS in pig diets is the variability of protein. When crude protein content of DDGS varies as much as 10% in some cases (Knott et al. 2004) a large uncertainty is introduced in formulation of livestock diets to meet specific protein requirements. One recommendation from researchers at the University of Nebraska is that producers must obtain samples of DDGS to build a database of relative protein values over a long period. The producers
Review of grain-based ethanol production effects on Australian livestock industries
Page 70 of 148
may then use historical values to balance for an average or minimum protein value thereby lowering the incidence of under-feeding of protein. For feedlot cattle, WDGS and DDGS have been proposed to alleviate a large proportion of protein supplements in these diets. Corn WDGS and DDGS are used frequently as both an energy and protein source. However, products such as wheat WDGS or DDGS may not serve in the same capacity in beef cattle rations as corn WDGS and DDGS. Firstly, wheat WDGS and DDGS contain significantly less crude fat and therefore possess a lower energy content compared to corn WDGS and DDGS. Secondly, one must recognize not only the amount of protein in the by-product but also protein fraction of degradability for beef and dairy cattle. Beef and dairy cattle require a specific blend of degradable intake protein (DIP) and undegradable intake protein (UIP). Corn WDGS and DDGS are relatively low in DIP, limiting use as a sole protein source in feedlot diets. Many beef nutritionists must still supply urea (DIP source) at a small amount in feedlot diets in order to meet the animal’s DIP requirement. Wheat WDGS and DDGS may possess a significantly greater proportion of DIP because soft white wheat grains contain a large protein fraction as DIP. Reported nutrient values for wheat WDGS and DDGS suggest it to be more valuable as a protein source rather than energy source, lowering dependency of other natural protein sources derived from oilseed meals. However, the specific nutrient attributes of the by-product dictates value to a particular species. Australian producers should not expect the same level of performance in response to wheat WDGS and DDGS, because of inherent lower fat or energy content compared to corn WDGS and DDGS reported in US research. Because the nutrient profile of WDGS and DDGS is largely dependent on the grain used for its production, types of wheat produced in Australia may possess a higher protein content and lower energy content than what has been reported in North American research. Dairy industry nutritionists in the US utilise DDGS because of its relatively high content of rumen undegradable protein (RUP – Beef refer to as UIP) and high levels of NDF (partially digestible fibre fraction of cereal grains). The heat treatment of WDGS or the drying process to DDGS renders a portion of the protein unavailable for rapid ruminal breakdown increasing the RUP fraction for digestion at the small intestine. Feeding optimal levels of RUP source in dairies has been shown to increase milk protein yield and percentage of milk protein. As previously discussed, the fraction of RDP (beef refer to as DIP) and RUP (beef refer to as UIP) are largely dependent on the grain nutrient content used for the distillers product. A problem associated with DDGS is that lysine is particularly susceptible to heat treatment and lysine digestibility may be reduced in DDGS. If not accounted for properly in pig, poultry and dairy diets, reduced lysine availability will suppress production. Inherent differences exist amongst grains and by-product types, WDGS and DDGS produced from wheat may not have a similar value as UIP sources for dairy producers as those produced from other grains. Many proponents of grain-based ethanol production and DDGS suggest that DDGS makes an excellent protein source for pigs and poultry. However, one of the most variable amino acids in corn DDGS is lysine. Thus, nutritionists must still add or provide adequate amounts of lysine and methionine (e.g. essential amino acids) in the diets to meet animal requirements. Another problem that is posed with variability in lysine content is that any additional lysine supplementation may be in excess of requirement and thereby increase production cost. It is important for nutritionists including DDGS in pig and poultry diets, to not only evaluate the lysine and methionine content of the product, but also take into account the availability of these essential amino acids (AA). Heat treatment used
Review of grain-based ethanol production effects on Australian livestock industries
Page 71 of 148
in the drying process may reduce availability or ileal digestibility in monogastrics of certain AA. Spiehs et al. (2002) observed that lysine was the most variable AA with a CV of 17.3% for DDGS sampled from 10 commercial ethanol plants in the US. These authors also listed lysine values from plants sampled to range from 0.72% to 1.02%, reducing accuracy of exact formulation for lysine:calorie ratios. The second most variable AA of plants sampled according to Spiehs et al. (2002) was methionine. Methionine values in this study ranged from 0.49% to 0.69% with an average of 0.55% and a CV of 13.6%. While proponents of grain-based ethanol and DDGS make the claim that these co-products are excellent sources of protein it should be noted that they cannot meet all dietary AA or protein requirements for grain dependent livestock. 8.3.3 Neutral detergent fibre (NDF)
Distillers grains on average have approximately 40 to 48% neutral detergent fibre (NDF) on a dry matter basis. NDF is an important nutrient fraction for dairy cattle because it is largely digested, contributes to acetate production within the rumen and is used in the calculation of dry matter intake. Acetate is important (volatile fatty acid - produced by specific rumen microbes) for dairy producers because it is a precursor for milk fat synthesis. Thus, WDGS or DDGS feeding may be beneficial for increasing acetate production. Wheat DDGS used in the study conducted by Nyachoti et al. (2005) ranged between 33-34% NDF, indicating that wheat based WDGS and DDGS may actually have a lower value for NDF relative to corn and sorghum based WDGS and DDGS. 8.3.4 Minerals
Another component of distillers grains receiving a great deal of attention is the macro-mineral variation. Knott et al. (2004) observed the phosphorus content of WDGS and DDGS was highly dependent on the amount of added solubles. Knott et al. (2004) also noted that distillers grains with solubles have approximately 2.3 times more P on a dry matter basis than the grain portion of DDGS. Similar to the variation in fat content, P is also highly variable in these co-products. Proponents of ethanol argue that the rich P value of the co-products can be utilised by pork producers as a good source of bio-available P. Again, precision formulation of diets to meet specific P requirements of animals will be difficult to establish due to the variation. Knott et al. (2004) report P concentration with a CV of 7.6 and 22.4% in samples of WDGS where 100% of solubles were added. Similarly, Spiehs et al. (2002) listed P values at 0.89% with a coefficient of variation of 11.7%. Other nutrients have proven to be even more variable than P, including calcium (Ca) 0.06% and 57.2%, potassium (K) 0.94% and 14.0%, magnesium (Mg) 0.33% and 12.1%, sulphur (S) 0.47% and 37.1%, sodium (Na) 0.24% and 70.5%, zinc (Zn) 97.5 ppm and 80.4%, manganese (Mn) 15.8 ppm and 32.7%, copper (Cu) 5.9 ppm and 20.4%, and iron (Fe) with 119.8 ppm and 41.1%, for average and CV, respectively. Dietary S content is a concern for beef cattle feeders that tend to incorporate large amounts of distillers grains in the ration. Excessive dietary S levels in rations can potentiate disorders such as polioencephamalacia (PEM). In addition, variability in other nutrients such as Na may affect intake and other normal physiological functions if levels become excessive. It should be noted that the mineral content of WDGS and DDGS listed above is derived from corn-based distillers grain with some sorghum blends. However, the major nutrients of concern in DDGS, P and S, are similar between corn and wheat and may be a reasonable estimation of expected values from wheat based DDGS. For example, wheat based DDGS pig diets in the study conducted by Nyachoti et al. (2005) list P values at 0.85% and Ca at 0.16%, which are comparable to corn DDGS values for mineral composition. Corn based distillers products have also been utilised in part as a B-vitamin source.
Review of grain-based ethanol production effects on Australian livestock industries
Page 72 of 148
Consequently, there is little research focusing on the use of corn or other distillers grains as a source of B-vitamins. Table 13 lists nutrient profiles for DDGS for different grain sources. 8.4 Research regarding distillers grains as feedstuffs
The use of WDGS and DDGS has gained popularity in the US primarily based on availability and pricing. Because of increasing grain-based ethanol production, grain prices have increased substantially for grain-dependent livestock producers allowing for appropriately priced by-product feeds to be considered for inclusion in rations. One large incentive for producers to use distillers grains is proximity to ethanol production facilities. The drying of WDGS to produce DDGS is an expensive process and is reflected in the relatively higher price of DDGS compared to WDGS. Therefore, livestock operations located close to ethanol facilities may be able to secure WDGS at a lower cost reducing operational feed costs through lower freight and feedstuff costs. Cost effectiveness of WDGS and DDGS is considered on a relative energy value. This value determines how these products can be appropriately priced on an energy unit basis and what their respective replacement value of a base grain within the animal ration. Energetic values are generally assigned or calculated based on animal performance through research projects. Ultimately, there is more research regarding distillers grains relative to beef and dairy cattle because those industries are the major users of distillers grains. Beef and dairy cattle may more efficiently utilise WDGS and DDGS because of the physiological advantage of digestion of the fibre fraction through rumen microbes. Monogastrics, including pigs and poultry, are unable to fully digest or utilise a majority of the components of the distillers grains to the extent of cattle. Secondly, feed delivery systems commonly used in pig and poultry operations limit the amount of WDGS that may be used, ultimately requiring DDGS or dehydrated co-products as the only logistical option for these operations. As mentioned previously, the energy content of WDGS and DDGS is based upon calculations obtained from animal performance conducted in research trials and the following section will review current research in beef, dairy, pigs and poultry.
8.4.1 Beef cattle
The greatest proportion of research investigating both WDGS and DDGS relative to animal performance has come from the beef cattle feeding sector. A recent report conducted by the USDA estimated grain-based ethanol co-product usage of any type was approximately 49% (beef cattle supplementation, 13%; cattle on feed, 36%) for all cattle operations in the Midwest United States (NASS 2007). One of the reasons for the large use in this sector is the relatively high fat and/or energy content of corn-derived distillers grains. The Australian ethanol industry would be largely dependent on wheat as the primary grain for ethanol production. As discussed in the previous section, the energy content of wheat-derived distillers may be as much as 13% lower in energy value than corn derived distillers grains, with some estimates as low as 17% (NDSU 1999). As the majority of the existing research was completed with the use of corn-derived distillers grains, it is likely that the performance of cattle will be significantly less with wheat distillers grains than what research suggests with corn distillers grains. Several conflicting reports exist regarding the energy value of corn-derived distillers grains and their interaction with dry-rolled corn (DRC) versus steam-flaked corn (SFC). Research involving DRC based diets suggests that WDGS and DDGS may have a slightly greater grain replacement value than that reflected in the research with SFC based diets. This is an important consideration because grain-processing interactions may influence the relative energy values within certain production
Review of grain-based ethanol production effects on Australian livestock industries
Page 73 of 148
diets. In Australia, the primary basis for most feedlot diets is dry-rolled or tempered wheat. Therefore, the energetic replacement value of wheat WDGS and DDGS may affect its pricing structure relative to that of wheat. Evaluating early beef feedlot industry research suggests that WDG, are suitable for inclusion in finishing feedlot diets. Several early studies completed at the University of Nebraska have reported improved performance in finishing cattle when a proportion of the DRC in the diet was replaced with corn WDGS up to 40% (DM basis). Larson et al. (1993) observed improved average daily gain (ADG), and gain efficiency (dry matter conversion, gain:feed (G:F)) when WDG and WDGS were included in finishing diets for both calves and yearling cattle. It should be noted that the WDG contained an uncharacteristically high fat content at 13.7%, undoubtedly contributing to the enhanced performance. When the solubles (thin stillage, uncondensed) fraction was blended with the WDG the fat content was 11.6%. This value would be similar to what is typically observed in WDGS and DDGS from commercial ethanol plants to date. Because there is a significant proportion of ethanol production in the US that also comes from sorghum, researchers also evaluated the differences between sorghum WDGS and DDGS. Lodge et al. (1997) fed DRC based diets supplemented with 40% (DM basis) of sorghum WDG, WDGS or DDGS. Lodge et al. (1997) noted that performance was similar to the DRC based control with a slight reduction in performance with the sorghum DDGS. The conclusion of the research was that sorghum WDG, WDGS and DDGS possessed energy levels that were equivalent to 96, 102 and 80% respectively of the Net Energy of Gain (NEg) values of DRC. A study evaluating corn WDGS and sorghum WDGS in beef finishing diets reported improved ADG and G:F in cattle fed either corn WDGS or sorghum WDGS in dry rolled corn based diets (Al-Suwaiegh et al. 2002). These results suggest that there is no difference in performance between corn WDGS and sorghum WDGS when fed to finishing cattle. The similarity in results among comparisons of corn and sorghum WDGS and DDGS may be the reason there is no differentiation of corn or sorghum distillers grains in the beef cattle NRC. Although results from several studies imply there is no difference between wet and dry DGS or between corn and sorghum based DGS, WDGS are generally believed to be more digestible and contain more energy than DDGS (fat, WDGS=14.5% and DDGS=14.0%, (Al-Suwaiegh et al. 2002)). Typically corn-based distillers grains are thought to contain more energy than sorghum (NEg of 1.65 vs 1.41 Mcal/kg respectively for WDGS; Preston 2007), which also may be accounted for by fat content in corn versus sorghum DGS. Klopfenstein (1996) recommended the use of distillers grains as an energy source due to the apparent improvement in performance. Work from Vander Pol et al. (2006) evaluated the optimal inclusion of corn WDGS and concluded that inclusion of 30-40% (DM basis) resulted in the most beneficial performance relative to DRC based diets containing no WDGS. Trenkle (2007) also observed that modified corn distillers grains might be included in finishing cattle diets up to 47% (DM basis) without negatively affecting performance. In later research, Vander Pol et al. (2006b) examined the inclusion of 30% corn WDGS in a series of diets differing largely in the method of grain processing (i.e. finely-ground corn, DRC, SFC, and high moisture corn). Vander Pol et al. (2006b) observed that inclusion of WDGS in diets, based on SFC and finely ground corn, reduced performance relative to that of DRC and high moisture corn based finishing diets. These observations indicate that WDGS possesses a different energetic value when included in diets based on differing methods of grain processing. However, not all research has alluded to improvements in performance up to 40% inclusion. Several studies investigating distillers grains with SFC based diets suggest that optimal inclusion levels may be closer to 10 or 15% on a dry matter basis. Gordon et al. (2002) and Daubert et al. (2005) conducted two studies investigating the inclusion of distillers grains with solubles in diets
Review of grain-based ethanol production effects on Australian livestock industries
Page 74 of 148
based on SFC. Gordon et al. (2002) reported optimal performance at approximately 15% DDGS. Similarly, when Daubert et al. (2005) added sorghum WDGS to SFC based diets they noted that performance was increased at 8-16% (DM basis). Depenbusch et al. (2007a) evaluated inclusion of either sorghum WDGS or DDGS with 0 or 6% alfalfa hay in the diet, or corn WDGS or DDGS at 15% of diets (DM) based on SFC and noted no difference in performance in either sorghum or corn WDGS or DDGS or in diets without DDGS. Similar results were noted by May (2007) feeding SFC based diets and corn DDGS. However, Depenbusch et al. (2007b) noted a significant decrease in performance with the addition of 25% (DM basis) corn WDGS to diets based on SFC. These results are also supported by Vasconcelos et al. (2007) where increasing concentrations of sorghum WDGS inclusion in SFC diets resulted in linear reductions in performance of finishing steers. Silva et al. (2007) fed sorghum WDGS at either 0 or 15% of diet DM replacing both soybean meal and SFC in the diet and determined that the NEg value of sorghum WDGS was 91% of DRC. Further supporting the large associative differences in distillers products with diet grain source is the study conducted by May et al. (2007), which found no improvement in performance, and a decrease in feed intake with increasing inclusion of sorghum WDGS in SFC based diets. May et al. (2007) also evaluated WDGS in DRC based diets and reported increased feed efficiency with sorghum WDGS inclusion to 30%. The studies highlight the differences in feeding responses of distillers grains associated with grain processing method and nutrient variation of co-products. Differences in site and extent of digestion or a shift in digestion kinetics may be responsible for the negative associative effect with SFC and distillers products. Metabolism work completed by May (2007) suggests that corn DDGS influence both DRC and SFC based ration digestion and that may attribute to differences seen in response to distillers grains. May (2007) reported, when corn DDGS were fed in SFC based diets with silage as the only forage source, DDGS replacement of SFC resulted in similar performance to those feedlot heifers fed control diets. Ultimately, it appears that distillers products are not equivalent to SFC on an energy basis, and these differences in energy are reflected by reduced performance with inclusion into SFC rations. It appears that distillers grains should be considered to possess higher energy content with DRC diets. Although research suggests this may be the case, ultimately, it does not have the same outcome in every situation, as evidenced by May (2007), and that there may be even more complex interactions involving not only grain processing but roughage sources or roughage inclusion levels.
Little research has been conducted for wheat-based WDGS or DDGS in finishing beef cattle rations. Presumably, with similar technology producing both corn and wheat distillers grains with solubles, similar variability would be associated with these specific grain co-products. Additionally, by-product variability would be responsible for performance variation. McKinnon et al. (2006) investigated the use of wheat distillers grains in finishing feedlot diets based on barley grain. In this study steers were fed diets containing 0, 5, 10, 15, or 20% wheat DDGS (DM basis) for the duration of the finishing period. McKinnon et al. (2006) concluded that performance was similar up to 20% wheat DDGS in the finishing diet compared to finishing diets containing no DDGS. The authors also suggested wheat DDGS has a similar energetic value to dry rolled barley. This estimated energetic content supports the reference values of NDSU (1999) for wheat based DDGS, but would not support the values presented in Table 13, according to Mohawk Canada Ltd ethanol plants.
The use of corn DDGS has been a popular supplement for grazing cows and calves consuming low-quality forage. Characteristics of corn DDGS make it suitable for range or limit-fed supplements because of high concentrations of protein and P. However, DDGS is typically low in DIP. In response to this obvious deficiency, Stalker et al. (2007) reported that cattle supplemented with corn DDGS digested low quality forage to a sufficient degree such that no DIP form was needed in
Review of grain-based ethanol production effects on Australian livestock industries
Page 75 of 148
addition to DDGS to improve digestibility. The authors speculated that sufficient amounts of urea-nitrogen were recycled back into the rumen to meet DIP requirements when cattle were fed DDGS. Lancaster et al. (2004) observed that grazing calves creep-fed with corn DDGS had similar ADG to calves that were creep-fed with soybean meal. In support, Harborth et al. (2006) noted that weight gains of cows grazing native Kansas grass pastures and supplemented with either soybean meal, corn DDGS or sorghum DDGS were not different. These results were supported by the findings of EPP et al. (2007) where steers grazing summer bluestem grasses, and supplemented with increasing levels of sorghum DDGS, had increased ADG compared to those not supplemented. These data suggest that DDGS from either corn or sorghum grains may provide adequate amounts of protein to improve gains of cattle grazing low quality forage. Analyses of wheat based DDGS suggest that it may contain high concentrations of DIP relative to corn and sorghum DDGS and therefore may be particularly useful as a supplemental protein feed. The US has an established grain-based ethanol industry and grain-dependent livestock industries are providing a means of utilising the co-products. Research cited highlights that variation in by-product nutrient quality remains an issue and the practical management issues within feedlots for handling inherent variation remains unknown. The same issues will be faced in Australia if a grain-based ethanol industry is established. Relevant Australian industries can only make assumptions on the quality of ethanol co-products and although the US experience provides assistance in these assumptions, the true nature of co-products will remain unknown until they become available. Kennedy (2007) authored a paper for CSIRO Livestock Industries on nutritive value of distiller grains. The paper relies on many assumptions at many levels including average nutritional values of barley, sorghum, wheat and corn (limited data set and considerable variation within data set), estimated nutrient profile of distillers grains, based on computer model using assumed average grain nutrient values and use of model to estimate beef cattle performance. Conclusions drawn by Kennedy (2007) do not reflect the US experience and highlight inaccuracies associated with initial assumptions. Specifically, that distillers grains from all grain sources possess similar energetic values, replacement of grain with distillers grain consistently improves feed efficiency (research has shown both positive and nil effects, replacement response dependent on grain processing methods) and that distillers grain reduces subclinical acidosis. Kennedy (2007) suggests value in establishing a starting point for assessing the role of distillers grain in feedlot production. However, actual value will not be known until co-product is available and efficiency of use will be dependent on cost and energy basis. 8.4.2 Dairy
A second and large usage of distillers grain in the US is within the dairy industry. According to NASS (2007), approximately 38% of Midwestern dairies are feeding distillers co-products of some kind. Characteristics of DDGS particularly suitable for the dairy industry include rumen undegradable protein (RUP or UIP) for synthesis of milk protein or milk yield, partially inert fat (fat associated with germ portion) and thereby reduce effects on fibre digestion and large quantity of NDF (reduce roughage inclusion). Differences in nutrient values assigned different grain DDGS sources remain high and discretion is best exercised in characterising the effects observed in research conducted using specific grain sources of DDGS. There are several aspects of overall nutrition and management of the US and Australian dairy industries that differ. Primarily, a majority of Australian dairy producers are grazing based, supplemental management systems. Dairies in the US almost entirely use a total mixed ration (TMR) which ensures ease of WDGS and DDGS use.
Review of grain-based ethanol production effects on Australian livestock industries
Page 76 of 148
All research in the US was completed with inclusions of DDGS in TMR. Early research conducted by Nichols et al. (1998) suggests that milk yield is improved with the addition of corn DDG compared with soybean meal (SBM). Nichols et al. (1998) reported increased milk yield, protein yield, and solids non-fat yield. There has been some speculation by Nichols et al. (1998) that due to variable low content of lysine in corn DDG, it may not serve as a substantial source of natural protein compared with SBM. Nichols et al. (1998) also investigated the addition of rumen protected lysine and methionine (RPLM) with the SBM and corn DDG treatments. Little difference existed in milk performance in the cows fed corn DDG versus those fed DDG plus the RPLM, suggesting that lysine or methionine were not limiting. It should be noted that the experimental rations did differ in terms of the Net Energy of Lactation (NEL) prior to the initiation of the study, where the corn DDG diet had a greater NEL content compared with the SBM treatment. Shingoethe et al. (1999) evaluated the response of corn WDG and reported no difference in milk yield, milk fat percentage or yield, lactose, fat corrected milk (FCM), or energy corrected milk (ECM) compared with control. However, results showed a significant fall in milk protein percentage, milk protein yield, and dry matter intake for those cows fed corn WDG. However, these results with reduced feed intake and lower protein yields may be an anomaly, because they are not supported by other research. Another study was conducted to determine the value of corn dried distillers grains as a protein replacement for other traditional sources of true protein such as fishmeal and SBM. Results from Lui et al. (2000) indicated that use of corn DDG maintained milk production but also met the apparent UIP requirements of the cows compared with cows fed diets supplemented with a blend of other protein supplements. Additionally, Birkelo et al. (2004) performed metabolism studies to estimate energy content of corn WDGS for lactating cows. Birkelo et al. (2004) concluded that estimations for DE, ME, and NEL for WDGS were 7, 11, and 15% greater that those reported for corn DDGS in the NRC (2001), respectively. In support, Anderson et al. (2006) compared production from cows fed corn DDGS and WDGS at 10 and 20% of the diet DM. Birkelo et al. (2004) reported greater values for milk yield, fat yield, protein yield, ECM, and feed efficiency in those cows fed distillers grains in any form or level compared to those cows that were not fed distillers co-products. Anderson et al. (2006) examined differences in production between corn DDGS and WDGS finding that milk fat percentage, protein yield and protein percentage of milk was greater for those cows fed WDGS. Research regarding performance with WDGS follows similar observations, as with beef cattle, WDGS appears to enhance performance to a greater degree than DDGS. University research suggests that differences exist between corn DDGS and WDGS with respect to energy content and production response. Al-Suwaiegh et al. (2002) evaluated performance of lactating cows fed either corn or sorghum WDGS and DDGS. They noted that no differences existed between corn WDGS or DDGS or sorghum WDGS and DDGS. Nor were there any differences in response to feeding the different co-products in digestive parameters in lactating cows. These trials contrast with the previous findings, suggesting product variability may play a significant role in differences observed in response to production and performance. Leonardi et al. (2005) evaluated the concentrations of corn DDGS that could be fed relative to increasing the energy content of the diet through adding corn oil. They recorded a linear increase in milk yield, milk fat percentage, and protein yield with increasing levels of corn DDGS up to 15% DM inclusion. The study also noted that 15% corn DDG was equivalent to approximately 2% added corn oil to the diet on a NEL basis. Numerous studies in the US regarding distillers grains derived from corn or sorghum suggest that grain-based ethanol co-products increase diet energy density and can partially meet true protein
Review of grain-based ethanol production effects on Australian livestock industries
Page 77 of 148
requirement in TMR for dairy cows. Studies have investigated replacing up to 30% of the diet DM with grain-based ethanol co-products and observed increased performance. However, researchers do not recommend inclusion over 30% in dairy diets (Kalscheur 2006). This may be in part to negative effects of high inclusion of unsaturated fat found in distillers grains. Corn WDGS and DDGS appear to provide an alternative to natural protein sources and partial energy sources in lactating dairy cow diets. Australian dairies may not be able to utilise DDGS to the same extent due to production management systems, diets capability and the limited energy content of wheat-based WDGS and DDGS. Other researchers have centred on the properties of distillers grains that may make it a valuable replacement for forage inclusion in diets. Distillers grains have a very high content of NDF, but very low lignin content increasing digestibility. In theory, replacing some forage with DDGS may allow for a more energy dense diet, which may increase milk yield while not negatively affecting milk fat content from reduced forage in the diet. Replacement of some dietary NDF with dried distillers grains blended with corn hominy by-product was examined in work conducted by Zhu et al. (1997). Both the control diet (no DDG) and the DDG with corn hominy supplemented diet contained similar NDF concentrations. The inclusion of DDG was 17% on a dry matter basis. The study reported that there was no difference in feed intake, milk yield, 4% FCM milk yield, milk fat percentage or yield, or milk protein percentage or yield. Zhu et al. (1997) suggest that up to 17% of the diet DDG may provide a significant alternative for reducing the inclusion of expensive forages such as lucerne or corn silage in dairy TMR. The results of the previous study should be reviewed thoroughly, while distillers grains can replace some dietary NDF, the particle size of these grains may not provide adequate supply of effective NDF to support milk fat synthesis. At high inclusion, without adequate forage inclusion, milk fat depression and considerably lower milk quality may occur (Cyriac et al. 2005). 8.4.3 Pigs
The pork industry has been utilising corn-based distillers grains and conducting research since the early 1950’s. Relevance of this early research work is limited due to changes in ethanol production practices. However, the same concerns apply to variation in nutrient composition, particularly lysine digestibility, P availability and excretion, and energy content. Some of the aspects of nutrient profiles in DDGS products have been investigated using animal performance models (Cromwell et al. 1993; Fastinger and Mahan 2006; Stein et al. 2006; Pederson et al. 2007). Cromwell et al. (1993) evaluated sources of corn DDGS from nine different plants to determine nutritional properties of the co-products for pigs and chicks. They classified the DDGS samples based on a colour score and formulated diets by combining samples similar in colour score and nutritional analysis and compared those to diets based on corn and soybean meal diets. Of the nine samples used by Cromwell et al. (1993), the range in lysine was 0.43 to 0.89%. Cromwell et al. (1993) concluded that DDGS samples that were darker in colour had lower lysine content. When samples of similar colour were blended together and added to growing pig (initial BW=16 kg) diets at 20% of the diet, the authors observed reduced ADG and feed efficiency (feed:gain) when crude protein content was held constant. Cromwell et al. (1993) concluded from performance results that those DDGS samples that were darker in colour most likely were lower in lysine content and/or lysine availability, which resulted in reduced performance. These data were supported by the findings of Fastinger and Mahan (2006) where DDGS samples that were darker in colour had lower lysine content and lower apparent ileal digestibility of lysine. Stein et al. (2006) evaluated 10 samples of DDGS based on AA and energy digestibility for growing pigs (initial BW=34 kg). The DDGS samples utilised in experimental diets ranged in lysine content from 0.68 to 0.85%. Stein et
Review of grain-based ethanol production effects on Australian livestock industries
Page 78 of 148
al. (2006) suggested that little variation existed among samples and/or batches for ileal digestion of AA other than lysine and methionine. Stein et al. (2006) did note greatest variation in ileal digestibility occurred with lysine followed by methionine. Wahlstrom et al. (1970) conducted three studies evaluating corn DDGS and supplemental L-lysine levels and their effects on growing pig performance. Wahlstrom et al. (1970) reported that average daily feed intake and ADG were not affected by DDGS inclusion up to 20% of the diet. Pigs that were fed 20% DDGS had reduced feed:gain compared to pigs fed 0% DDGS. The authors also assessed the effects of DDGS in growing diets on digestibility of protein, nitrogen-free extract, and dry matter. Wahlstrom et al. (1970) observed that average protein digestibility was reduced with increasing amounts of DDGS in the diets. Additionally, in pigs fed the diets containing 20% DDGS, nitrogen free extract and dry matter digestibility were reduced compared to those pigs fed 0% DDGS. Presumably, these differences in diet digestibility may be related to higher fibre content in the DDGS diets leading to lower digestibility. Wahlstrom et al. (1970) also examined supplementing 0% and 20% corn DDGS with 0.15% and 0.25% L-lysine in growing gilts and barrows. Combined performance of gilts and barrows resulted in decreased ADG and increased feed:gain in the 20% DDGS treatment compared with the 0% DDGS treatment. When an additional 0.15% and 0.25% lysine was combined with the 20% DDGS performance was not suppressed. The primary concern with inclusion of DDGS is lysine availability and/or digestibility and level of supplemental lysine required to meet requirements. It is therefore preferable to formulate based on the total lysine content and thus account for deficiencies in available lysine level caused by heat damage. On an energetic basis, Pederson et al. (2007) concluded that the average DE and ME of 10 distillers samples did not differ from the DE and ME of corn grain. This suggests that partial replacement of corn grain is possible based on performance, and that optimal performance is more dependent on providing appropriate AA profiles rather than additional energy. Stein (2007) proposed that when evaluating the quality of DDGS for pig diets on lysine basis, only use the product if the lysine:crude protein ratio is 2.80%. Other research has focused less on nutrient interactions of DDGS and more on practical inclusion limitations in growing and nursery pig diets. Data from Senne et al. (1995) challenged previous notions about DDGS maxims in nursery and finishing pig diets. Senne et al. (1995) reported that sorghum DDGS could partially replace corn up to 20% in nursery and 30% in finishing pig diets. In following work, Senne et al. (1996) examined even greater inclusion of sorghum based DDGS in corn diets and found comparable performance in nursery pig diets up 45% DDGS and up to 60% DDGS inclusion in finishing pig diets. The results of Senne et al. (1996) were supported at lower levels (up to 15%) of DDGS inclusion in nursery pig diets by Lineen et al. (2006a). Similarly, Whitney and Shurson (2004) examined inclusion of corn based DDGS in nursery pig diets up to 25% in two separate experiments. In experiment 1, Whitney and Shurson (2004) reported no difference in performance during phase 2 (d0-14) or 3 (d14-35) of a 35 day nursery period with up to 25% DDGS. In experiment 2, during phase 2, Whitney and Shurson (2004) did observe a linear reduction in feed intake and a tendency for a linear reduction in ADG with increasing inclusion of DDGS in nursery diets. However, there was no difference in performance over the entire 35-day period in experiment 2. DeDecker et al. (2005) also reported that growing pigs maintained performance similar to that of pigs fed no DDGS, when fed up to 30% DDGS in growing diets. Similar results were observed in Lineen et al. (2006a) with up to 15% of the diet as DDGS. Not all research has demonstrated equivalent performance where DDGS constituted a large proportion of the diet (greater than 15-20%). Whitney et al. (2001) reported reduced ADG when grow-finish pigs were fed
Review of grain-based ethanol production effects on Australian livestock industries
Page 79 of 148
diets supplemented with 20% and 30% DDGS, as did Lineen et al. (2006b) when grow-finish diets exceeded 15% of the diets as DDGS. Benz et al. (2007) confirmed in later research that ADG, ADFI, carcass weight and percent yield all decreased with increasing DDGS inclusion from 0% to 20% of the diet with the biggest differences occurring from 15-20%. Research findings vary, some suggesting that corn DDGS has an ME equivalent to corn or sorghum DDGS is equivalent to that of corn, with other research finding growing pigs will consume less of a diet supplemented with DDGS than one without DDGS. Additionally, performance such as ADG or feed:gain are conflicting. Hastad et al. (2005) addressed this possible energetic or feed preference question by conducting a series of experiments evaluating growing pig preference for non-DDGS diets of DDGS based on corn or sorghum. Hastad et al. (2005) concluded that typically pigs preferred diets based on corn and soybean meal without distillers grains (corn or sorghum). Additionally, pigs chose DDGS over WDGS in diets, with the highest consumption of control or non-DDGS diets. These data supported the earlier work completed by Hastad et al. (2004) where they observed greater intake of diets without DDGS based on corn and soybean compared to those supplemented with 10%, 20%, 30% or 35% DDGS. Recent research indicates DDGS can be added in pig diets up to 60% with mixed results above 20% inclusion. Optimal maximum inclusion rates may actually be closer to 15% for grow-finish diets. Newly weaned pigs or nursery pigs may be less tolerant to DDGS before it affects feed intake or growth. When the AA profile of DDGS is known and introduced to nursery pigs at a young age producers may be able to achieve 20% inclusion without detrimental effects. The majority of research has examined the use of corn and sorghum-based DDGS, whereas in Australia, the primary grain source for distillers grain would be wheat, barley and to a lesser extent sorghum. Performance cited and observed in reviewed literature may provide different production responses. Replacing a cereal grain with distillers grain removes starch from the diet with fibre as its replacement. Monogastrics are less efficient in utilising the fibre component of DDGS compared to ruminants. The benefit of corn and sorghum DDGS in pig diets is the high fat content. Given the inherently low fat content of wheat grain, wheat based DDGS would most likely not be as good an energy source as corn DDGS. Nyachoti et al. (2005) evaluated the use of wheat based DDGS in pig diets and digestion and metabolism of energy and amino acids compared to wheat grain. Nyachoti et al. (2005) noted large differences between three separate batches of wheat DDGS obtained from the same plant. Differences were attributed to wheat cultivars, mixtures of other grains, differences in yields and variation in refinement during production. In the Nyachoti et al. (2005) study, the wheat DDGS was 95.6% dry matter, contained 40.4% crude protein (N x 6.25), a gross energy (GE) of 20.5 MJ/kg, ether extract (fat) of 3.7%, total P 0.85% and lysine 0.67%. Nyachoti et al. (2005) observed that the wheat based distillers diets had significantly lower ileal digestibility of dry matter, nitrogen (CP), energy, but greater phosphorus and calcium digestion compared to that of the wheat based diets. Total tract digestibility followed a similar trend with lower digestion of dry matter and energy, but with a greater digestion of nitrogen, phosphorus, and calcium. Ileal digestion of lysine was not different between wheat DDGS and the wheat based diet. Nyachoti et al. (2005) concluded that wheat DDGS contained approximately 7.5% less DE than wheat grain. This was reported for both winter wheat based DDGS and mixed wheat based DDGS. These results are supported by Widyaratne and Zijlstra (2004) who fed wheat based DDGS at 25%
Review of grain-based ethanol production effects on Australian livestock industries
Page 80 of 148
of the diet to growing pigs and observed lower performance compared to control diets containing no DDGS. Other researchers have examined the apparent availability of P for digestion seen with Nyachoti et al. (2005) in an attempt to alleviate the need to supplement inorganic P in pig diets. Recently Hill et al. (2007) investigated using DDGS in sow lactation diets in order to meet the P requirements and reduce faecal P excretion. Nyachoti et al. (2005) reported that lactating sows could maintain productivity when some of the P was supplied by DDGS and that after 14 days faecal P was reduced in sows fed 15% DDGS diets. Greater P digestibility was also observed in Widmer et al. (2007) and Pederson et al. (2007). Likewise, in 25% wheat DDGS diets fed to growing pigs, apparent total tract digestion of P was approximately 0.55% compared with 0.08% in the control diet. DDGS samples contain more available P compared to that of corn or wheat grain. Carcass fat composition requires consideration with the inclusion of DDGS in the diet, particularly if supplying belly pork into the Asian markets. Corn and sorghum have large concentrations of polyunsaturated fatty acids (PUFA, primarily 18:2n6, linoleic acid). DDGS derived from those grains also have a fat content that is high in PUFA. High levels of PUFA in finishing pig diets are associated with reduced belly firmness in the US. Benz et al. (2007) found back fat, jowl fat and belly fat iodine levels as well as percentage of C18:2 fatty acids increased with increasing DDGS in the diet from 0% to 20% in grower pigs. Wheat based DDGS does not contain the same concentration of fat as found in corn and sorghum DDGS and may not contribute to reduced belly firmness in pork carcasses, but this has not been investigated. 8.4.4 Poultry
Issues concerning the use of DDGS in poultry diets include amino acid profile, consistency of lysine availability, colorimetric analysis and mineral content (phosphorus and sodium). Research by Cromwell et al. (1993) examined aspects of DDGS using performance modelling for day old growing chicks to define nutritional characteristics of nine different DDGS samples differing in colour. Cromwell et al. (1993) observed a relationship between colour of DDGS and growth rates of chicks fed diets with 20% DDGS. These findings emphasise the need to assess amino acid profile of DDGS sources regardless of protein concentration. The results of Cromwell et al. (1993) are supported by those of Ergul et al. (2003) who concluded that colour of DDGS was correlated with digestibility of lysine, cysteine and threonine (r = 0.67, 0.67 and 0.51 respectively). Dried distillers grain with solubles samples that were lighter in colour and/or more yellow were associated with greater lysine digestibility (0.65%), while darker and less yellow DDGS were correlated with lower digestibility (0.38%). Lumpkins and Batal (2005) performed slope-ratio assays to determine availability of lysine and P from DDGS. They concluded that lysine availability was approximately 90% of total lysine and phosphorous availability was 61%. Martinez Amezuca et al. (2004) also evaluated P availability and suggested that heat treatment may reduce lysine digestion while improving P availability for growing chicks. Lumpkins et al. (2004) completed two studies where diets were fed with up to 18% DDGS inclusion to chicks from 0 to 18 days and growing broilers to 42 days of age. Compared to the control diets there was little difference in performance or carcass yield for entire 42 days for lower levels of DDGS. The 18% DDGS diets had reduced growth and decreased feed efficiency over the first 16-day starter period. From this work, DDGS was recommended to be safely used at 6% in starter diets and up to 12-15% in grower/finisher periods. Thacker and Widyaratne (2007) supported these findings and feeding recommendations for broilers in a similar experiment.
Review of grain-based ethanol production effects on Australian livestock industries
Page 81 of 148
Roberson (2003) fed growing-finishing diets to turkey hens and reported that finishing performance was improved as DDGS was increased in the diet from 0 up to 27%. In another study performed by Roberson (2003), DDGS replaced 10% of corn and soybean meal and similar finishing performance was maintained in turkey hens. A study by Abe et al. (2004) involving a diet with 10% high protein DDGS in growing turkey diets reported that feed intake and ADG were reduced for the first 10 days of dietary treatment but were not different from days 11-18 when compared to the control treatment during the experimental period. These results lead the authors to suggest that high protein DDGS may be included in growing turkey diets up to 10% and may be increased without negatively affecting performance after 14 days. Noll and Brannon (2006) suggest that corn DDGS may be supplemented up to 20% in growing turkey diets without differing in performance to the control treatment. Interactions between DDGS addition and egg production, quality, and colour in laying hens have also been investigated. Lumpkins et al. (2005) replaced corn/soybean meal in both a high and low density diet of laying hens (25-43 weeks of age) with 0 or 15% corn DDGS. Lumpkins et al. (2005) reported no differences in egg production between both diets containing 0% or 15% DDGS. There was lower egg production observed in hens fed the low-density diets with 15% DDGS from 25-32 weeks of age. Lumpkins et al. (2005) suggest that DDGS can be incorporated up to 15% in laying hen diets. Roberson et al. (2005) fed corn DDGS at 0%, 5%, 10% or 15% to laying hens using a yellow DDGS for weeks 48 to 56, and then switched to brown DDGS during 58 to 67 weeks. The authors stated that DDGS supplementation had limited effects on egg production overall, but decreased egg production with increasing DDGS content in the diet for weeks 52-53, reduced egg weight during 63 weeks of age, smaller egg mass at 51 and 53 weeks, and lower specific gravity at week 51. The proximity of the reduction in egg quality and characteristics suggest variation in DDGS. Yolk colour increased with increasing concentration of DDGS. The majority of poultry research investigated the use of corn DDGS. Differences in energy between corn and wheat based DDGS make recommendations more uncertain regarding the inclusion of wheat DDGS. Differences in energy, protein, and AA profile exist between the two co-products and careful analysis of amino acid profile and mineral concentrations is recommended prior to inclusion in poultry diets. Thacker and Widyaratne (2007) did complete a titration study investigating the inclusion of graded levels of wheat DDGS (0, 5, 10, 15 or 20% inclusion) in broiler chick diets. They reported that digestibility coefficients of dry matter, energy, and P declined with increasing concentrations of DDGS in the diet. However, balancing diets eliminates performance differences when including DDGS. It appears that much of the research suggests inclusion of corn DDGS in growing turkey and broiler diets up to levels of 15% without detrimentally affecting performance. 10-12% may be more optimal. Levels below 10% are recommended for the starter period. The formulation of poultry diets including DDGS should be based on total AA to satisfy all AA requirements for optimum growth. The energetic density of corn DDGS allows it to replace a proportion of the corn/soybean meal in the diet but may not be equivalent in the instance of wheat based growing diets. Work regarding wheat-based DDGS suggests that similar to corn DDGS, wheat DDGS can be included in growing poultry diets requiring supplemental lysine and methionine to account for AA unavailability because of heat damage during processing.
Review of grain-based ethanol production effects on Australian livestock industries
Page 82 of 148
8.5 Potential issues with grain-based ethanol co-products
8.5.1 Nutrient management
Distillers grain with solubles represents all the nutrients within a particular grain excluding starch. The feeding of distillers grain with solubles must therefore consider costs associated with excessive supply of some nutrients (i.e. minerals and nitrogen). Supplying nutrients above an animal’s requirements results in excretion and nutrient loss, which may have both production and environmental ramifications. For example, the metabolism and excretion of excess protein increases the maintenance energy requirement of the animal and lowers the energy available for growth or production. Modifying ethanol production procedures can reduce P content of distiller grains and thereby P loss in manure. P disposal and ammonia release from manure are two major issues in US livestock industries (Klopfenstein and Erickson 2002). It has been suggested that only modest inclusion of distillers grain with solubles in feedlot cattle diets can significantly increase the amount of P excreted annually (Klopfenstein and Erickson 2002; Depenbusch et al. 2007c). Iowa State University observed that increasing P intake increased faecal P excretion. The US industry average P content of feedlot manure is estimated at 0.35% (Klopfenstein and Erickson 2002). Meyer et al. (2006) fed finishing steers diets with 0%, 10% or 20% corn WDGS and recorded P excretion and retention. They reported that in those steers fed 10% and 20% corn DDGS that P excretion was 24% and 31% greater respectively. Iowa State University (2006) has developed a model to estimate P excretion for corn DDGS inclusion diets. Phosphorus excretion for cattle fed 0, 15, 25 and 40% corn DDGS were 4.5, 5.4, 6.3 and 7.7 kg respectively. Trenkle (2006) suggests that when DDGS are included in finishing diets at 20 and 40% (DM basis) that P excretion in increased by 60 and 120% respectively. Distillers grains in lactating dairy cattle diets do not pose any issues with respect to P excretion due to significant supply of P for milk production. Cromwell (2002) reported that faecal P concentration of dairy cows was approximately 0.79% compared to 1.07% for beef cattle, 2.97% for pigs and 1.62% for poultry. Pigs have the greatest concentration of P in their manure but lower on a mass basis. Confined beef cattle operations are responsible for the largest proportion of manure P of all the livestock industries. In the pork industry, feeding distillers grains has actually been proposed as a means of reducing faecal P concentrations. In the previous section, Hill et al. (2007), Pederson et al. (2007) and Widmer et al. (2007) investigated the availability of P in DDGS co-products. All authors noted in all cases that DDGS inclusion increased P digestibility and reduced P in the manure. Xu et al. (2005) suggested that the inclusion of DDGS in growing pig diets along with phytase enzyme (enzyme that makes P more readily available) might ultimately eliminate the need to provide supplemental inorganic P minerals sources. When Xu et al. (2005) added 10% and 20% DDGS to growing pig diets, faecal P was reduced by 16% and 34% respectively. However, the additional dietary fibre resulted in 15% and 30% more faecal output overall which virtually offset the reduction in P from the addition of DDGS. In a second experiment, these treatments were repeated with the addition of phytase enzyme. The pigs that were fed the 20% DDGS with phytase had faecal P concentrations that were 53% lower than the control diet. The single largest source of ammonia volatilisation is derived from the application of livestock manure, followed by the housing of intensive meat and dairy animal production (Phillips and Pain 1998). Livestock operations of all species face a challenge in regular management of ammonia-N
Review of grain-based ethanol production effects on Australian livestock industries
Page 83 of 148
from manure. Efficient use of N or CP in the diets of livestock or restraint from feeding excessive levels of N may assist in reducing ammonia emissions from the intensive production of livestock. Ammonia-N volatilisation appears to constitute approximately 53 to 55% of the total N fed to cattle (Todd et al. 2007). When distillers grains are utilised as an energy source in corn based feedlot diets, crude protein, or N, is in excess of the animal’s nutritional requirement. Increasing N content of manure and avoiding ammonia volatilisation requires changes to manure management through increasing areas on which manure is spread and selecting suitable high N use crops. However, disposal limitations exist due to P content. Wheat-based distillers grains with solubles would be most commonly used in Australia and typically contains 36-40% CP. The increasing popularity of the use of distillers grains with solubles may result in increased atmospheric acidification through ammonia volatilisation in beef cattle operations. Todd et al. (2006) stated that reducing dietary crude protein content was the most practical way to reduce ammonia emissions in feedlots. The pork and poultry industries have also received much attention regarding the volatilisation of ammonia from effluent. Factors that contribute to ammonia volatilisation from poultry and pig effluent or manure include dry matter of manure or slurry (wet slurries have lower ammonia volatilisation than drier manure samples) and ambient temperature and humidity in manure disposal area. The primary method of reducing ammonia emissions is to avoid excessive feeding of N. 8.5.2 Storage and handling
The low dry matter (30-35%) (high moisture content) of wet distillers grains increases transport costs, spoilage and shrink (i.e. water evaporation, seepage and fat rancidity). Spoilage of WDGS is largely dependent on environmental conditions (ambient temperature, humidity) with spoilage occurring within 3 days of delivery. Mixing WDGS with forages (hay, hulls) and ensiling has been used as a long-term method of preservation. The low pH value of WDGS (3.0-4.0) makes ensiling a viable option (Garcia and Kalscheur 2007). However, ensiled WDGS can still experience losses similar to other forms of silage production. Using bags, an Iowa State University study calculated shrink from the ensiling of WDGS and 20% hay to be approximately 9%, of which 7.2% occurred following the bagging. Iowa State University scientists also evaluated long-term storage of MDGS, (approximately 50% moisture) and found that MDGS could be ensiled without the addition of any other ingredients. They reported an overall shrink of 16.7% with the product, 5% was due to spoilage after bagging, and 8% was attributable to handling and storage. Use of bacterial/enzyme inoculants have been shown to reduce shrink from heating and mould degradation (Spangler et al. 2004). Mixing WDGS with 40% hay enabled ensiling in bunkers. Wheat straw and/or sorghum stubble might be the most logical products to use in Australia. In comparison, DDGS has a dry matter of 88%, which significantly increases storage period and lowers transport costs. DDGS has presented some storage and flowability challenges due to its high fat content, moisture content and small but fibrous particles. Corn based DDGS has a higher fat content than wheat-based DDGS and thus may prove the more difficult of the two to handle. Some settling, compaction and bridging may occur during long transport, and vibration may be required to initiate flow. Studies initiated by Johnston et al. (2007) report the flow rate of DDGS out of a feed truck at 9% moisture is 60% better than DDGS at 12% moisture, and are currently experimenting with additive treatments which may improve flowability such as limestone, zeolite and a grain conditioner. In a feedmill, DDGS must therefore be handled as a protein meal (similar to canola, sunflower or cottonseed meal) and placed in a protein bin rather that being treated as a grain. When incorporating DDGS
Review of grain-based ethanol production effects on Australian livestock industries
Page 84 of 148
into pelleted diets, the high fat content, fibrous nature and lack of starch is a consideration in the total combination of dietary ingredients. Maintaining a minimum starch level from wheat grain or a pellet binder may aid in producing a more resilient pellet. There is some question over the mycotoxin risk of DDGS particularly if stored for lengthy period. To be safe, the addition of a mycotoxin binder to the feed of monogastrics may be desirable when using significant levels of DDGS in the diet. Several options for grain-dependent livestock producers may be considered when evaluating the storage and handling of WDGS, ranging from blending of forages or other co-products, to treating with inoculants, and bagging or bunker ensiling. All of these methods may be applied to improve the handling and storage of WDGS, but the only way that WDGS or DDGS may be utilised by grain-dependent livestock producers is if it is economical and the co-products are competitively priced relative to other grain, protein or energy sources. 8.5.3 Economics of feeding grain-based ethanol co-products
The nutrient profile, availability, acceptability to livestock, and variation associated with feeding distillers co-products are all aspects of the industry that have been the subject of considerable research. None of these aspects is of practical importance if an economic incentive does not exist for distillers grains inclusion by the livestock producer. There are several considerations when evaluating a feedstuff for inclusion in production rations for livestock. Some of these considerations include price of competing ingredients, consistency of supply, consistency of the nutrient profile, energetic density of the feedstuff, handling, storage, shrink associated with handling and storage and transportation costs (Iowa State University 2005). There are two ways that grain-based ethanol co-products are priced. The first of these is on the basis of price per unit of energy. When evaluating a feedstuff in this manner it is most appropriate to compare it to competing energy sources in livestock diets. In most livestock diets in Australia, wheat grain is the base for growing and finishing rations. Therefore, energetically, wheat grain will be the standard to which WDGS and DDGS is compared. Depending on the industry in which the feedstuff is used, it may have a differing value based on species and its value relative to growth and/or acceptability for production. For example, the pork industry utilises ME, which uses units based on MJ/kg. The energetic value of DDGS would be different for pigs compared with dairy cattle, which use the Net Energy System based on Net Energy of Lactation (NEL, Mcal/kg). Grain-based ethanol co-products typically have a greater energy value in ruminant species compared to monogastrics because ruminants possess the capacity for high digestion of the nutrient fractions, particularly the fibre portion, of these co-products. The energetic value of WDGS and DDGS was discussed more thoroughly in section 8.3 and has been the centre of much research in livestock production. However, there is still substantial conflicting opinions concerning the relative energetic values to place on corn and sorghum derived distillers grains with solubles. Currently, there is a relatively large body of research with many different applications. What is common in the beef cattle sector of the industry is to price WDGS or DDGS at approximately 90-95% the value of corn. Although there is much data to substantiate the claim that WDGS and DDGS may have a greater energetic value than corn, this pricing structure is still commonly used. Therefore, distillers co-products track the price of corn grain. Originally, it was thought that because these feedstuffs were co-products they would have a relatively stable pricing structure and would be less related to the price of corn. However, that has not been the situation.
Review of grain-based ethanol production effects on Australian livestock industries
Page 85 of 148
One benefit when pricing corn-based distillers grains with solubles is that research suggests they have an energetic value similar to that of corn. The relative lack of research regarding wheat-based distillers grains puts it at a disadvantage in pricing scenarios. The few data that do exist defining the price of wheat DDGS and WDGS suggest that it has a substantially lower energetic value than that of wheat grain. Beef cattle performance summaries suggest that wheat WDGS has an energetic value equivalent to that of barley grain. Based on that limited data set, producers, from an energy standpoint, could afford to purchase wheat based DDGS and WDGS and include in livestock diets on an energy replacement similar to barley (McKinnon et al. 2006). Similar results have been witnessed in pig and poultry research suggesting energetic values equal to that of barley grain. If distillers grains with solubles produced in Australian ethanol plants are valued energetically based on research performed in the US using corn grain and corn based DDGS and WDGS then wheat-based products will be over-priced relative to other feedstuffs. There may be some associative effect in beef cattle diets between wheat grain and sorghum DDGS or WDGS. However, this is speculation and without supporting research. The second manner in which grain-based ethanol co-products or feedstuffs may be priced is according to price per unit of protein. In this scenario DDGS may be more valuable to swine or poultry producers as a source of protein compared with beef cattle and dairy producers where DDGS may be of less value as a protein source relative to other products that can be utilised by ruminant animals (for example hays, legumes and urea). In the situation where wheat WDGS or DDGS is priced as a source of protein, the feedstuffs that would be comparable are soybean meal, canola meal, or meat and blood meal for pigs. It is more difficult to define DDGS for pig and poultry diets as a protein source relative to other feedstuffs because of the complexity of formulation of diets based on a wide AA profile and availability. Consequently, it would be more accurate for grain dependent livestock producers to price wheat or sorghum based DDGS relative to wheat grain because it will have a similar AA profile to wheat, but at a greater nutrient concentration. In pig diets, DDGS may be utilised for specific required nutrients in diets based on different production stages and growth rates. For example, producers might value DDGS for its protein content when included in nursery and grow/finish diets, but for its available P and fibre content when included in gestating sow diets. Therefore, the pricing of WDGS and DDGS in pig and poultry diets is complex and nutrients from these co-products can be utilised to help meet a number of various requirements by the animals. Pricing WDGS and DDGS in ruminant operations is much simpler than dealing with the complexities of nutrient requirements for monogastrics. In these situations, WDGS and DDGS may be calculated directly on a price per unit of protein replacement of other sources rather than on AA profile as with pig and poultry diets. For example: Canola meal @ 41% CP and 92% DM (NRC 2000), costs $400 per tonne Wheat DDGS @ 35% CP and 88% dry matter
Calculate: ($400 per tonne)/ (0.92 DM percentage) / (0.41 CP percentage) = $1060/Unit CP $1060/ Unit CP x (0.35 CP percentage DDGS) x (0.88 DM DDGS percentage) = $327 per tonne, as a replacement for canola This is a simplistic example and other factors are best considered when selecting protein sources such as DIP content, CP digestibility and consistency of supply.
Review of grain-based ethanol production effects on Australian livestock industries
Page 86 of 148
Proximity to ethanol plants and the costs associated with transportation of distillers grains is a very important aspect of inclusion into production diets. Those operations in close proximity to ethanol plants will have a large advantage in availability of co-products as well as reduced transport costs, which is one of the largest factors contributing to the inclusion of WDGS in rations (NASS 2007). While economics associated with transport costs from the ethanol plant to the livestock producer are important considerations, there are other factors such as increased grain demand in surrounding areas of the plant that may act to inflate grain prices for livestock producers. Factoring transport in to the equation from the previous section:
Producer prices DDGS at $327/ tonne, with transport costs at approximately $2/km. Then a 150km total costs would be: = ($2/km @ 150 km trip = $300/25 tonnes = $12.00/ tonne + $327) = $339/tonne delivered approximately 150 km away from the plant.
It would be inappropriate to suggest pricing ranges for distillers grain with solubles considering the different distances producers will reside from ethanol plants. Obviously, rates for transport and feed costs will vary based on distance and contracting between livestock producers and ethanol plants. Estimations and pricing must occur independently for producers along with nutritionists for optimal economic benefit to the livestock producer. Vander Pol et al. (2005) concluded that as distance from the ethanol plant increased up to 170km (after which distance it is unlikely that incorporation of WDGS would be economically feasible) profit/head return by using WDGS in rations is reduced. Logically, as the expense of feedstuffs increases with increasing transport costs, the return on feed investment will decrease. Again, this research was based on corn WDGS and DDGS, which has a higher energetic value than wheat, or sorghum based distillers grain with solubles. When used as a protein source, there may not be as large of a direct response in performance when including distillers grain with solubles products, but savings may actually appear indirectly based on a reduction of the use of other more expensive protein sources. 8.5.4 Grain-based ethanol co-products and animal diseases
Researchers have suggested implications for the interaction between nutrients and characteristics of distillers grains with solubles and health in livestock animals. The use of feed additive products such as those termed “probiotics” have received attention in recent research due to potential health benefits associated with digestion and gut health. One particular aspect of probiotics for monogastrics is that they commonly contain Lactobacillus species, bacteria that may promote gut health in the intestines of monogastrics. Distillers grains, and specifically wheat WDGS typically possesses populations of Lactobacillus, and sometimes yeast (Pederson et al. 2003). With the hypothesis that WDGS may improve health in pigs through probiotic action, Pederson et al. (2003) investigated wheat WDGS from a microbiological standpoint to determine if the strains of bacteria commonly found in WDGS could aid in health for pigs. Other properties of WDGS such as a low pH (approx. 3.6) and high concentrations of organic acids have also been suggested as characteristics favouring digestive health benefits of livestock. Pederson et al. (2003) point out that in order for a bacterial species to be considered a probiotic it must be able to withstand very low pH (as in stomach acid) as well as capable to colonize mucus membranes or gut epithelial tissues. Pederson et al. (2003) discovered that a few strains of Lactobacillus species found in wheat WDGS were able to grow at high temperatures (up to 54º C), were able to survive in stomach acid, and did bind with mucus in vitro. Pederson et al. (2003) concluded that the properties of bacteria species specifically selected for when WDGS are produced might have some biological
Review of grain-based ethanol production effects on Australian livestock industries
Page 87 of 148
properties that make them suitable candidates for use as probiotics, or may help explain health improvements sometimes observed with WDGS feeding. A common health problem in pigs is the enteric disease commonly termed ‘ileitis’. It is caused by several bacteria species that invade and infect epithelial cells on the small intestinal wall leading to haemorrhaging, ulceration, and necrosis (Whitney et al. 2006). Some researchers have suggested that feeding of higher levels of fibre or insoluble fibre may promote functionality of intestinal epithelial cells and can reduce the complications associated with detrimental bacterial colonisation on the intestinal wall. Distillers dried grains are known to contain large proportions of insoluble fibre for monogastrics and have been suggested as a means to combat ileitis in pigs. Whitney et al. (2003) investigated the use of DDGS in decreasing negative effects observed when nursery pigs were challenged with Lawsonia intracellularis. Seventeen day old pigs (n = 80) were challenged by oral inoculation and fed diets based on corn and soybean meal with 0, 10 or 20% DDGS. Included in the trial was one negative control treatment in which pigs were not challenged nor were they fed DDGS. Twenty-one days following the challenge all pigs were euthanized for evaluation of intestinal mucosa and tissue analysis. As expected, bacterial challenge of the pigs resulted in poorer growth, and reduced health, with Whitney et al. (2003) concluding that feeding DDGS had no impact on lesion size or occurrence. Through this study, it appears that dietary inclusion of fibre from DDGS feeding in pig diets may not help reduce the severity of ileitis. The influence of sulphur (S) content in WDGS and DDGS is a concern for cattle producers who typically feed diets with large amounts of distillers grain with solubles. Endogenous S content of corn averages around 0.12% and the concentrating effect of corn-based distillers grain with soluble for S is approximately 0.36%. Typically, S concentrations of distillers grain with solubles range from 0.40 to 0.50% (DM basis). There are several factors that contribute to elevated S levels in DDGS, including popular use of sulphuric acid to maintain a stable pH for yeast growth, and the inherent S content of yeast cells (3.9 g/kg; White and Johnson 2003). Excessive levels of S in the diets of beef and dairy cattle can result in health problems and suppressed performance. Polioencephalomalacia (PEM) is a disorder that can occur when cattle consume excessive amounts of S through diet and/or water intake. The high S content in cattle results in dysfunction of the central nervous system, leading to conditions observed that are commonly characterized as “brainers”. This neurological condition occurs because certain S compounds in the rumen alter fermentation characteristics that degrade thiamine (B1), resulting in thiamine deficiency influencing normal cellular metabolism (Crawford 2007). Beef cattle may tolerate a maximum S content in the diet up to 0.40% (NRC, 2005). However, dependent on overall mineral balance with diets, reduced performance has been observed with as little as 0.25% total S in the diet of feedlot cattle (Zinn et al. 1997). Wheat and corn contain similar S concentrations (NRC 2000), and as sulphuric acid will most likely remain in high use within the ethanol industry, producers feeding wheat based distillers grain with soluble to cattle must be aware of contributing S content from diet and/or water to maximise performance as well as suppress the incidence of PEM. Another health concern for beef cattle producers feeding WDGS is the proliferation of fungi in WDGS and the production of mycotoxins. One aspect of storage and handling of WDGS previously mentioned was use of WDGS inventory approximately 3 to 4 days following delivery. Aside from shrink and spoilage, one of the main reasons for this recommendation is that in some cases fungi commonly found on farming operations such as Aspergillus flavus and Fusarium spp can contaminate high moisture feed products. These fungi produce mycotoxins that may result in reduced intake and performance in livestock operations. While researchers infer that it’s unknown if
Review of grain-based ethanol production effects on Australian livestock industries
Page 88 of 148
significant mycotoxin production may occur from these fungi during a normal inventory storage period, a risk still exists. 8.6 Conclusion
In summation, there exists a relative wealth of data regarding the inclusion of distillers grains in livestock diets. Much of the research has been conducted using corn and sorghum-based distillers grain with solubles, and may prove of limited practical application when evaluating the use of products that would become available to the Australian grain dependent livestock industries. However, some evidence suggests that wheat-based DDGS and some sorghum-based DDGS may have a replacement value as a feedstuff that is roughly 90% the value of rolled wheat on a net energy of gain basis. Furthermore, the value of wheat-based distillers grain with solubles may be greater if used as a protein source. However, the ethanol industry in Australia will not produce adequate quantities of distillers grains with solubles to provide the grain dependent livestock industry with a consistent supply of the by-product feedstuff. The most important factors that will determine the inclusion of wheat-based distillers grains with solubles in livestock diets will first be location of the livestock relative to the plant, energetic and/or protein value of the co-product relative to other sources, and finally the availability of a consistent supply with a reasonable (minimal) amount of nutrient variation. There is a lack of information characterising performance associated with feeding a wheat-based product in Australian production scenarios, and more information is needed to make appropriate recommendations for the proper inclusion of products resulting from the Australian grain-based ethanol industry.
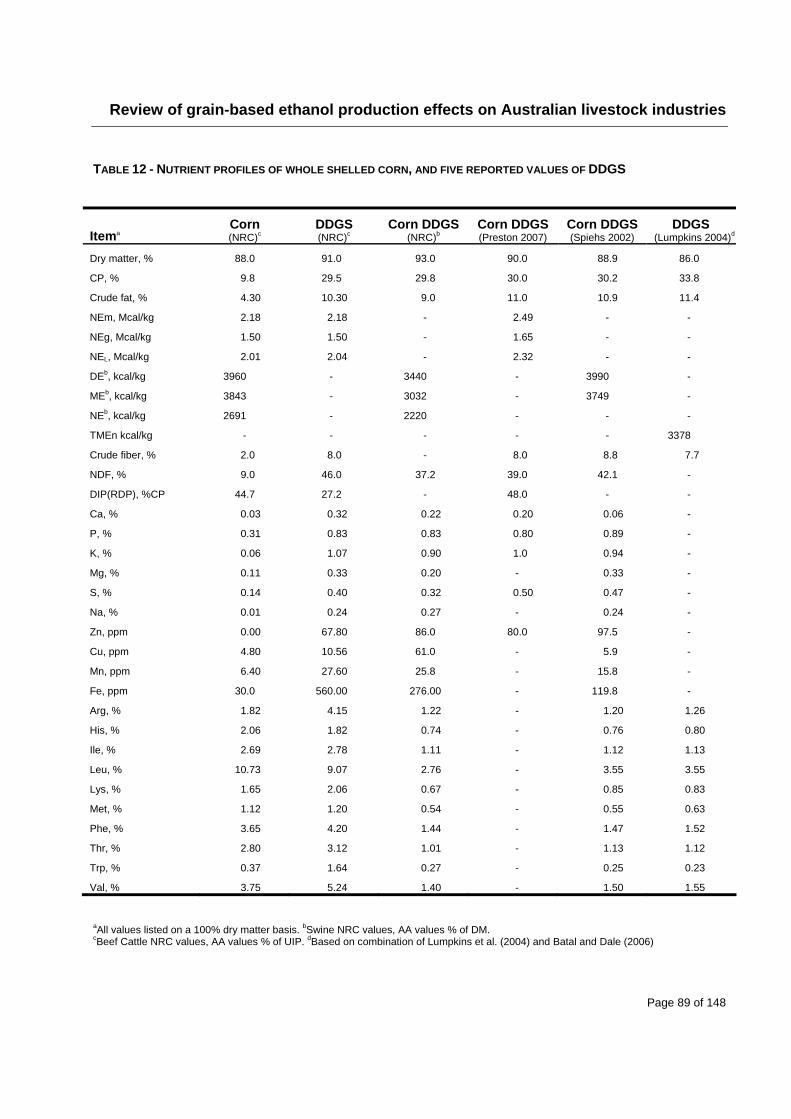
Review of grain-based ethanol production effects on Australian livestock industries
Page 89 of 148
TABLE 12 - NUTRIENT PROFILES OF WHOLE SHELLED CORN, AND FIVE REPORTED VALUES OF DDGS
aAll values listed on a 100% dry matter basis. bSwine NRC values, AA values % of DM. cBeef Cattle NRC values, AA values % of UIP. dBased on combination of Lumpkins et al. (2004) and Batal and Dale (2006)
Itema Corn (NRC)c
DDGS (NRC)c
Corn DDGS (NRC)b
Corn DDGS (Preston 2007)
Corn DDGS (Spiehs 2002)
DDGS (Lumpkins 2004)d
Dry matter, % 88.0 91.0 93.0 90.0 88.9 86.0
CP, % 9.8 29.5 29.8 30.0 30.2 33.8
Crude fat, % 4.30 10.30 9.0 11.0 10.9 11.4
NEm, Mcal/kg 2.18 2.18 - 2.49 - -
NEg, Mcal/kg 1.50 1.50 - 1.65 - -
NEL, Mcal/kg 2.01 2.04 - 2.32 - -
DEb, kcal/kg 3960 - 3440 - 3990 -
MEb, kcal/kg 3843 - 3032 - 3749 -
NEb, kcal/kg 2691 - 2220 - - -
TMEn kcal/kg - - - - - 3378
Crude fiber, % 2.0 8.0 - 8.0 8.8 7.7
NDF, % 9.0 46.0 37.2 39.0 42.1 -
DIP(RDP), %CP 44.7 27.2 - 48.0 - -
Ca, % 0.03 0.32 0.22 0.20 0.06 -
P, % 0.31 0.83 0.83 0.80 0.89 -
K, % 0.06 1.07 0.90 1.0 0.94 -
Mg, % 0.11 0.33 0.20 - 0.33 -
S, % 0.14 0.40 0.32 0.50 0.47 -
Na, % 0.01 0.24 0.27 - 0.24 -
Zn, ppm 0.00 67.80 86.0 80.0 97.5 -
Cu, ppm 4.80 10.56 61.0 - 5.9 -
Mn, ppm 6.40 27.60 25.8 - 15.8 -
Fe, ppm 30.0 560.00 276.00 - 119.8 -
Arg, % 1.82 4.15 1.22 - 1.20 1.26
His, % 2.06 1.82 0.74 - 0.76 0.80
Ile, % 2.69 2.78 1.11 - 1.12 1.13
Leu, % 10.73 9.07 2.76 - 3.55 3.55
Lys, % 1.65 2.06 0.67 - 0.85 0.83
Met, % 1.12 1.20 0.54 - 0.55 0.63
Phe, % 3.65 4.20 1.44 - 1.47 1.52
Thr, % 2.80 3.12 1.01 - 1.13 1.12
Trp, % 0.37 1.64 0.27 - 0.25 0.23
Val, % 3.75 5.24 1.40 - 1.50 1.55
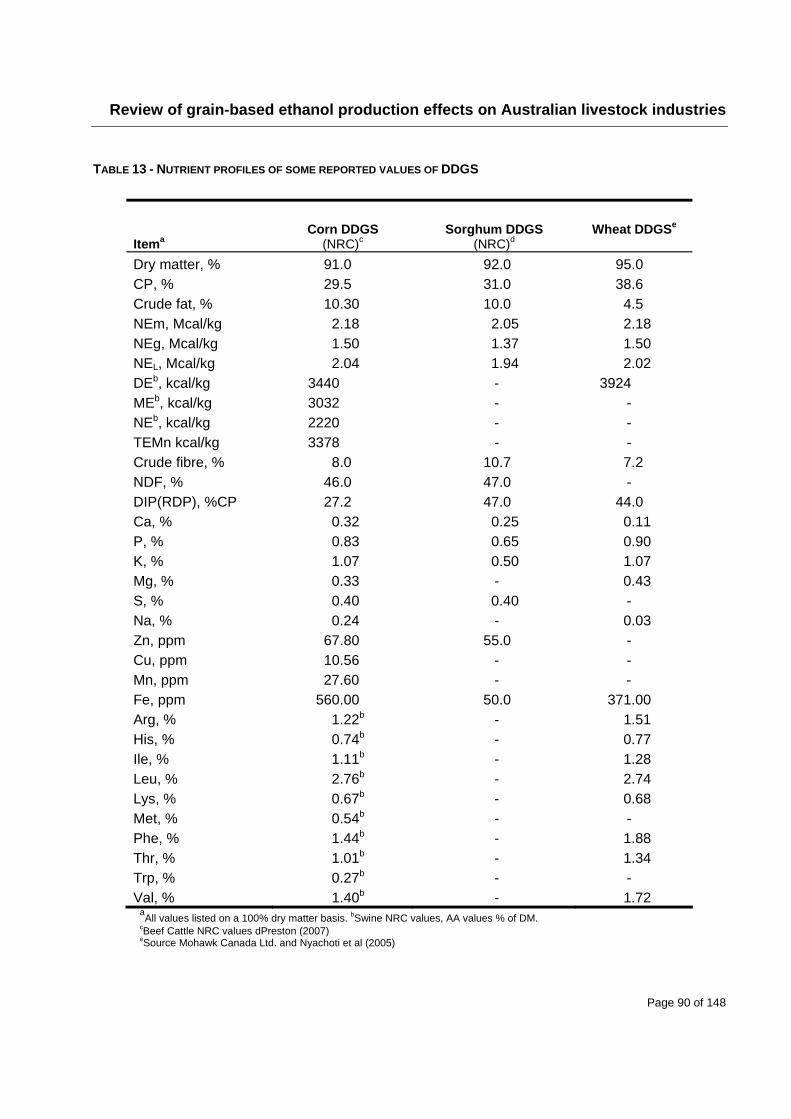
Review of grain-based ethanol production effects on Australian livestock industries
Page 90 of 148
TABLE 13 - NUTRIENT PROFILES OF SOME REPORTED VALUES OF DDGS
Itema Corn DDGS
(NRC)c Sorghum DDGS
(NRC)d Wheat DDGSe
Dry matter, % 91.0 92.0 95.0 CP, % 29.5 31.0 38.6 Crude fat, % 10.30 10.0 4.5 NEm, Mcal/kg 2.18 2.05 2.18 NEg, Mcal/kg 1.50 1.37 1.50 NEL, Mcal/kg 2.04 1.94 2.02 DEb, kcal/kg 3440 - 3924 MEb, kcal/kg 3032 - - NEb, kcal/kg 2220 - - TEMn kcal/kg 3378 - - Crude fibre, % 8.0 10.7 7.2 NDF, % 46.0 47.0 - DIP(RDP), %CP 27.2 47.0 44.0 Ca, % 0.32 0.25 0.11 P, % 0.83 0.65 0.90 K, % 1.07 0.50 1.07 Mg, % 0.33 - 0.43 S, % 0.40 0.40 - Na, % 0.24 - 0.03 Zn, ppm 67.80 55.0 - Cu, ppm 10.56 - - Mn, ppm 27.60 - - Fe, ppm 560.00 50.0 371.00 Arg, % 1.22b - 1.51 His, % 0.74b - 0.77 Ile, % 1.11b - 1.28 Leu, % 2.76b - 2.74 Lys, % 0.67b - 0.68 Met, % 0.54b - - Phe, % 1.44b - 1.88 Thr, % 1.01b - 1.34 Trp, % 0.27b - - Val, % 1.40b - 1.72
aAll values listed on a 100% dry matter basis. bSwine NRC values, AA values % of DM.
cBeef Cattle NRC values dPreston (2007) eSource Mohawk Canada Ltd. and Nyachoti et al (2005)
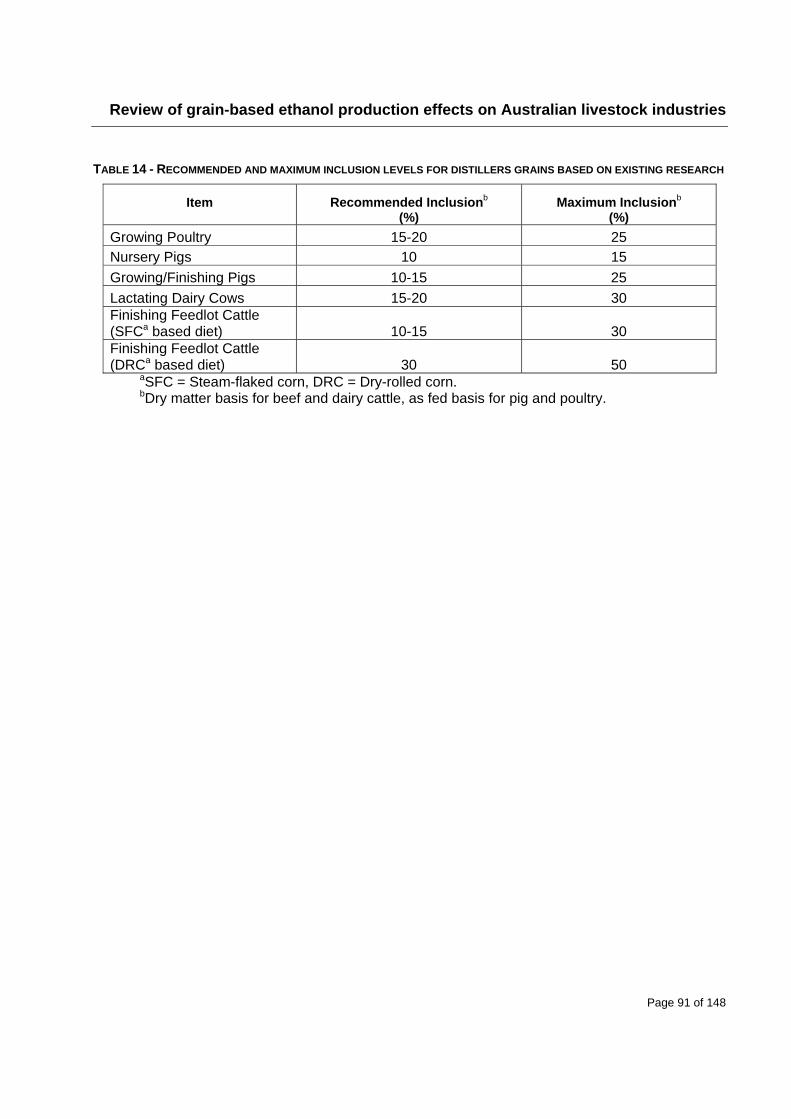
Review of grain-based ethanol production effects on Australian livestock industries
Page 91 of 148
TABLE 14 - RECOMMENDED AND MAXIMUM INCLUSION LEVELS FOR DISTILLERS GRAINS BASED ON EXISTING RESEARCH
Item
Recommended Inclusionb (%)
Maximum Inclusionb (%)
Growing Poultry 15-20 25 Nursery Pigs 10 15
Growing/Finishing Pigs 10-15 25
Lactating Dairy Cows 15-20 30 Finishing Feedlot Cattle (SFCa based diet) 10-15 30 Finishing Feedlot Cattle (DRCa based diet) 30 50
aSFC = Steam-flaked corn, DRC = Dry-rolled corn. bDry matter basis for beef and dairy cattle, as fed basis for pig and poultry.
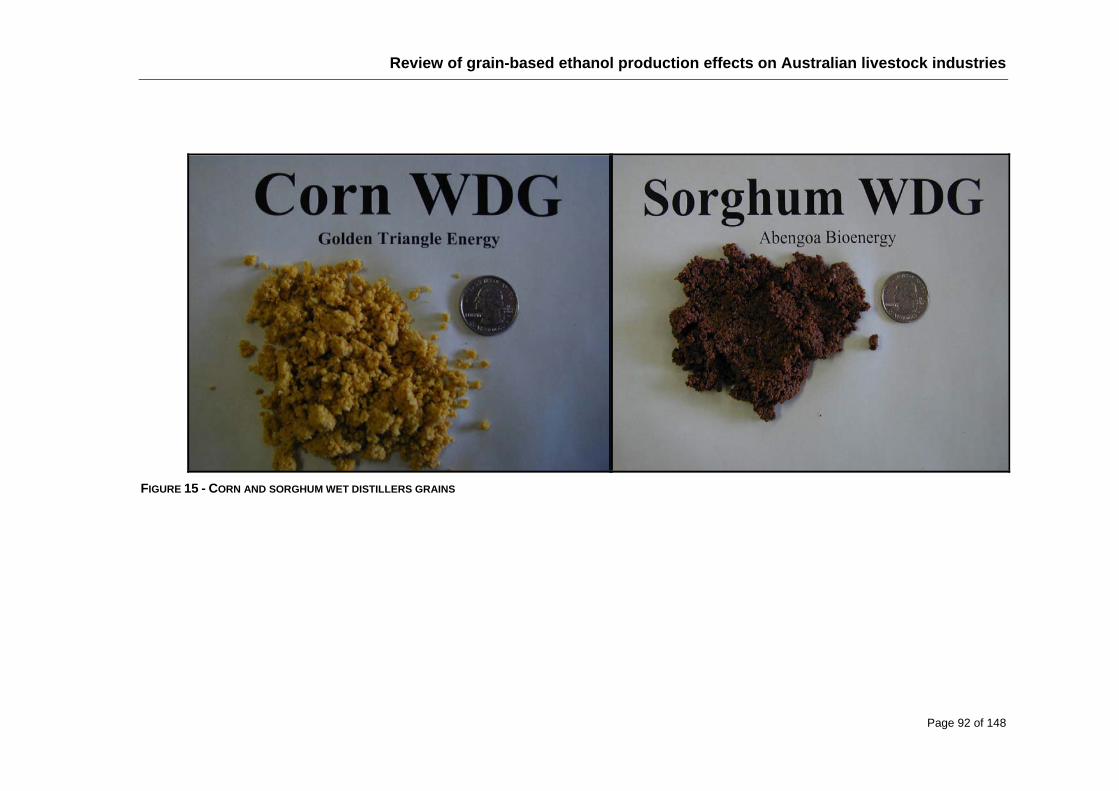
Review of grain-based ethanol production effects on Australian livestock industries
Page 92 of 148
FIGURE 15 - CORN AND SORGHUM WET DISTILLERS GRAINS
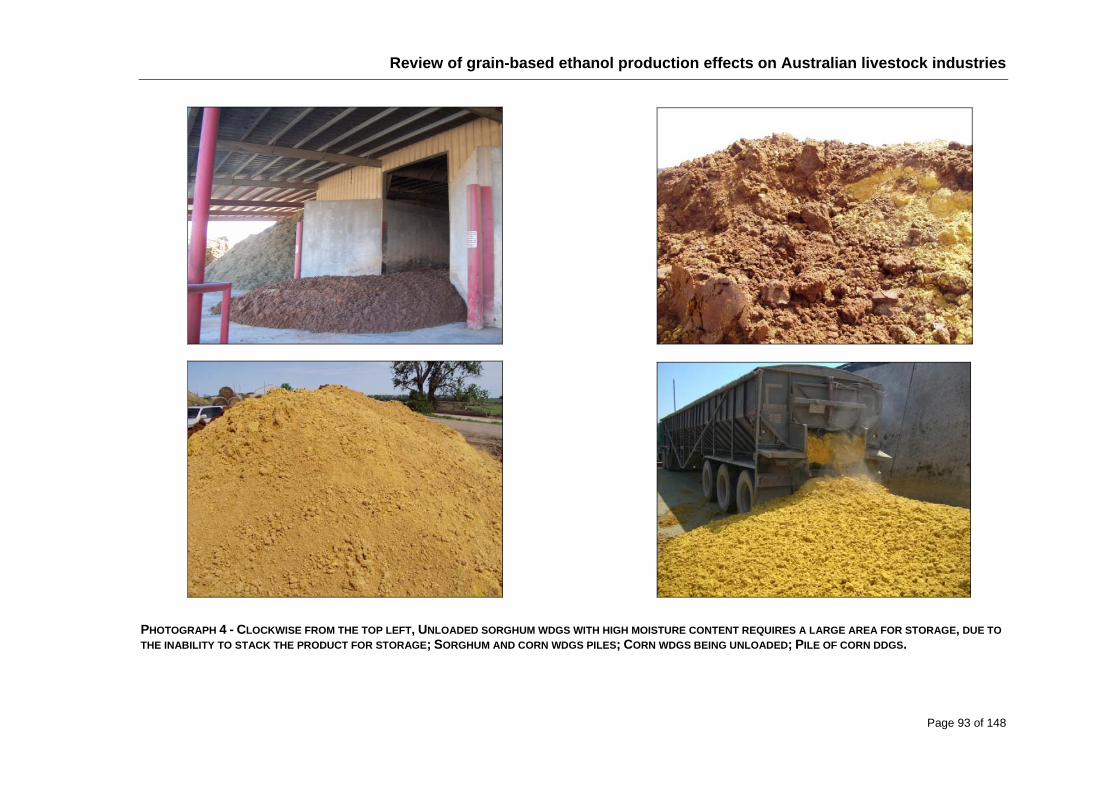
Review of grain-based ethanol production effects on Australian livestock industries
Page 93 of 148
PHOTOGRAPH 4 - CLOCKWISE FROM THE TOP LEFT, UNLOADED SORGHUM WDGS WITH HIGH MOISTURE CONTENT REQUIRES A LARGE AREA FOR STORAGE, DUE TO
THE INABILITY TO STACK THE PRODUCT FOR STORAGE; SORGHUM AND CORN WDGS PILES; CORN WDGS BEING UNLOADED; PILE OF CORN DDGS.
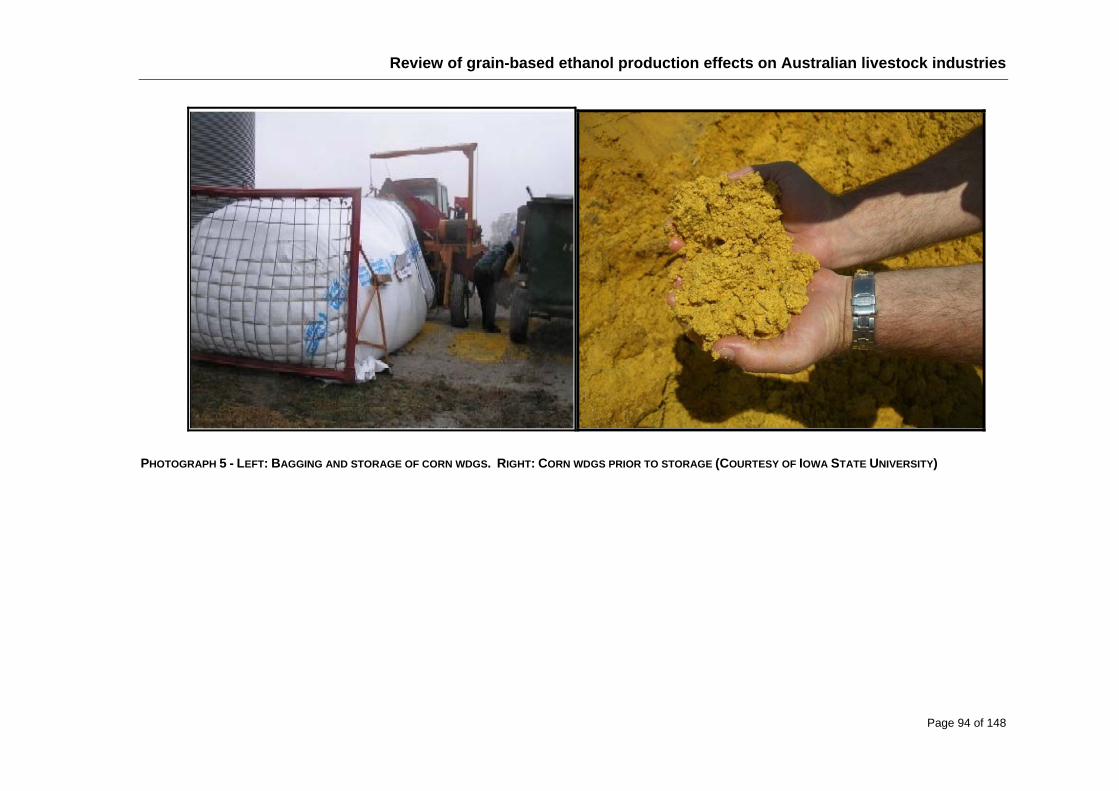
Review of grain-based ethanol production effects on Australian livestock industries
Page 94 of 148
PHOTOGRAPH 5 - LEFT: BAGGING AND STORAGE OF CORN WDGS. RIGHT: CORN WDGS PRIOR TO STORAGE (COURTESY OF IOWA STATE UNIVERSITY)
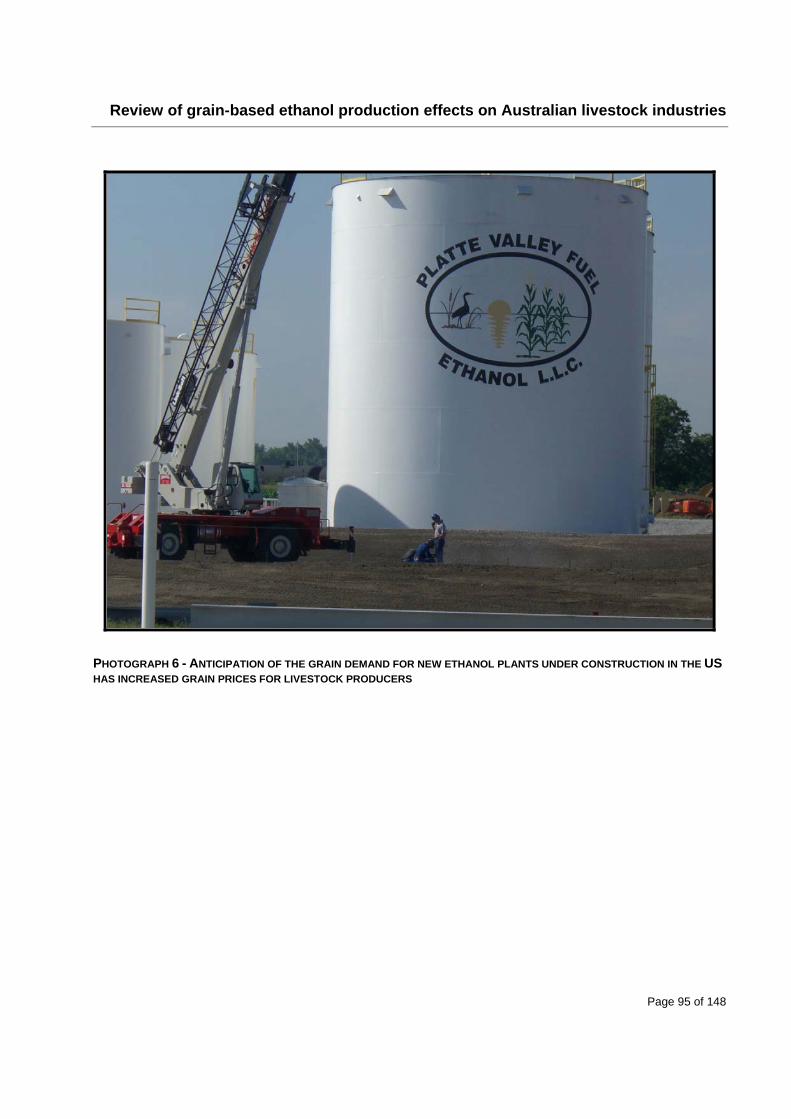
Review of grain-based ethanol production effects on Australian livestock industries
Page 95 of 148
PHOTOGRAPH 6 - ANTICIPATION OF THE GRAIN DEMAND FOR NEW ETHANOL PLANTS UNDER CONSTRUCTION IN THE US
HAS INCREASED GRAIN PRICES FOR LIVESTOCK PRODUCERS
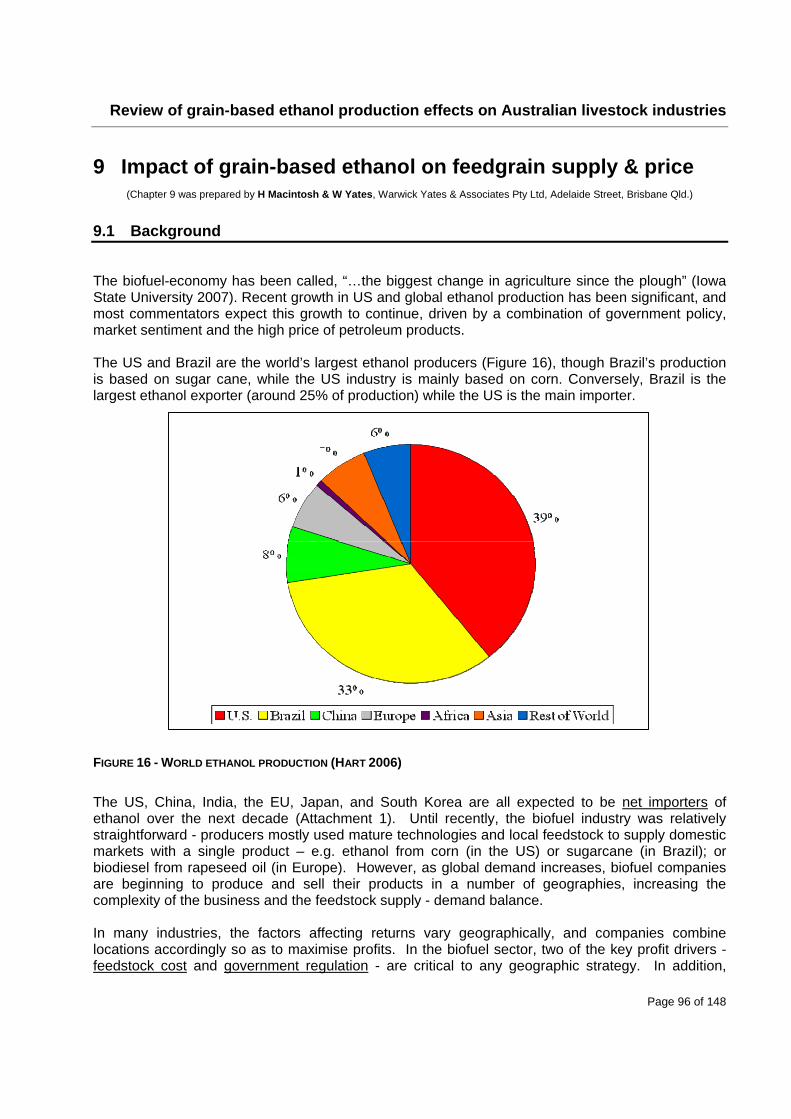
Review of grain-based ethanol production effects on Australian livestock industries
Page 96 of 148
9 Impact of grain-based ethanol on feedgrain supply & price (Chapter 9 was prepared by H Macintosh & W Yates, Warwick Yates & Associates Pty Ltd, Adelaide Street, Brisbane Qld.)
9.1 Background
The biofuel-economy has been called, “…the biggest change in agriculture since the plough” (Iowa State University 2007). Recent growth in US and global ethanol production has been significant, and most commentators expect this growth to continue, driven by a combination of government policy, market sentiment and the high price of petroleum products. The US and Brazil are the world’s largest ethanol producers (Figure 16), though Brazil’s production is based on sugar cane, while the US industry is mainly based on corn. Conversely, Brazil is the largest ethanol exporter (around 25% of production) while the US is the main importer.
FIGURE 16 - WORLD ETHANOL PRODUCTION (HART 2006)
The US, China, India, the EU, Japan, and South Korea are all expected to be net importers of ethanol over the next decade (Attachment 1). Until recently, the biofuel industry was relatively straightforward - producers mostly used mature technologies and local feedstock to supply domestic markets with a single product – e.g. ethanol from corn (in the US) or sugarcane (in Brazil); or biodiesel from rapeseed oil (in Europe). However, as global demand increases, biofuel companies are beginning to produce and sell their products in a number of geographies, increasing the complexity of the business and the feedstock supply - demand balance. In many industries, the factors affecting returns vary geographically, and companies combine locations accordingly so as to maximise profits. In the biofuel sector, two of the key profit drivers - feedstock cost and government regulation - are critical to any geographic strategy. In addition,
Review of grain-based ethanol production effects on Australian livestock industries
Page 97 of 148
conversion technologies will increasingly affect production costs as second generation production processes become viable. 9.1.1 Feedstock costs
Feedstock accounts for 50% to 80% of biofuel production costs, so feedstock price has a significant impact on returns. In the US, for example, every US$1 increase in the price of a bushel of corn raises the production cost of ethanol by US$0.35 per gallon and reduces the producer’s operating margin by 20% (Caesar et al. 2007). Many different types of biomass can be used as feedstock, and costs vary hugely by region. Fermentable sugars from Brazil’s sugarcane, for example, are less than half as expensive as those from European sugar beet. Government subsidies and alternative uses of feedstock also affect input costs. In many regions, rising demand affects both the cost and availability of feedstock. From 2003 to 2006, the percentage of the total US corn harvest used to produce ethanol rose from 12% to 16%. However, the US Government goal of 35 billion gallons of alternative fuels a year by 2017, if based entirely on corn, will require 40% of that year’s expected harvest to meet even half the target. Not surprisingly, the cost of corn has soared: average wholesale prices rose from US$1.90 a bushel in 2005 to US$2.41 in 2006, and corn has regularly surpassed US$4 a bushel on the spot market since late 2006 (Caesar et al. 2007). Because commercially viable ethanol facilities require a large volume of feedstock (e.g. corn or other coarse grains), the rapid growth in the number of these facilities could, given the absence of a viable non-food feedstock, have a significant impact on world agriculture. To date, there have been few attempts to use economic tools and models to examine the likely size of the ethanol industry or the impact of this industry on world agriculture. Over the last twelve to eighteen months, public awareness and debate has intensified over the extent to which the expansion of the ethanol industry has resulted in higher agricultural commodity prices and, more importantly, whether and to what extent there has been an impact on consumer food prices (Elobeid et al. 2007). 9.1.2 Government regulation
Whether through subsidies, import tariffs, or research grants, government regulation has helped drive both demand and profitability in the biofuel industry. Because the energy policies of most nations are still evolving, government regulation is perhaps the greatest source of uncertainty for the sector and will have a significant impact on profitability. Subsidies have played a significant role in establishing the biofuel industry in many countries, and a lowering or removal of these subsidies will have a significant impact on the sector. Recently, some governments have decided to eliminate subsidies, replacing them with a mandated blend rate. Blend rates guarantee producers a certain level of sales, but the elimination of subsidies and the fact that supply is likely to exceed mandated demand in the short term should depress margins (Caesar, et al. 2007). In such a market, companies generate attractive returns only when the cost curve is steep and lower-cost producers operate under the price umbrella established by marginal, high-cost producers. Since feedstock, all of which currently are globally traded commodities, accounts for about 80% of the production cost of biofuel, the cost curve is not steep (i.e. the volume of production has little impact on the unit cost of production), suggesting that the removal of subsidies will cause
Review of grain-based ethanol production effects on Australian livestock industries
Page 98 of 148
profit margins to fall substantially from recent levels. This should, in turn, put downward pressure on feedstock prices. Other policies are also uncertain - with some exceptions, current biofuel regulations in the European Union and the United States protect domestic producers, but these policies - especially import tariffs may change (Caesar et al. 2007). Regulators (particularly in the USA) increasingly recognise that current trade policy, which taxes imports of ethanol but not of petroleum, may not serve the longer term goal of achieving energy security. As evidence amasses confirming sugarcane ethanol’s importance for reducing carbon emissions, US regulators may ease restrictions on its importation (Enkvist et al.), putting downward pressure on the price of ethanol and on alternative domestic feedstock prices. While Brazil is the world’s largest exporter of ethanol and the second largest producer, after the United States, Brazil primarily uses sugar cane for its production. Exports of much cheaper produced Brazilian ethanol to the United States, the largest nearby market, remain limited because of the high US import tariff (US$0.54 per gallon). 9.1.3 The impact of new conversion technologies
The use of “next-generation” cellulosic biomass feedstock has the potential to dramatically expand the resource base for producing biofuel. So far, however, the production costs from cellulosic biomass are not competitive with petroleum-derived fuels, but this is likely to change in the medium term. The economic competitiveness of biofuels and the development of the alternative conversion pathways will depend on the future price of petroleum. Since many of these conversion technologies are close to being viable, their deployment is important so that operators can establish new facilities. Government incentives can also play an important role in the early stages of the second generation of biofuel production. According to Caesar et al. (2007) the emergence of these alternative technologies could radically change the biofuel landscape, including:
Lowering production costs in China to as little as US$0.60 per gallon (from about US$1.80) making Chinese bioethanol one of the world’s cheapest biofuels.
In the United States and Brazil cellulosic ethanol production costs won’t be much lower than today’s corn and sugarcane based ethanol costs. Facilities processing cellulosic material will be likely to supplement rather than replace existing production methods, though cellulosic technology would have a significantly better energy balance than do the current corn ethanol production systems.
In Europe cellulosic technology could lower production costs enough to threaten companies producing beet (or wheat) ethanol using current methods.
Again, Government policy will have a large impact on the direction and development of these new technologies, and it is important that these policies do not unduly favour the existing technologies over new ones.
Review of grain-based ethanol production effects on Australian livestock industries
Page 99 of 148
9.2 Global feedgrain impacts 9.2.1 Supply and demand FAO's latest forecast (February 2008) shows that there are good prospects for world cereal production in 2008. Wheat crops already planted in the northern hemisphere auger well for a significant increase in global output during the year (FAO 2008). FAO’s estimate of global cereal output in 2007 now stands at some 2,102 million tonnes (rice in milled terms), virtually unchanged since the previous report in December, and representing a 4.6% increase from 2006. The bulk of the increase came from a record corn crop in the United States, which helped to raise world coarse grains output by 8.4% to 1,069 million tonnes. Wheat production also increased compared to the previous year but not by as much as had been hoped. World cereal utilisation in 2007/08 is forecast to expand to 2,120 million tonnes, or 2.6% above the previous season (Table 15). This relatively strong growth (about 1.6% above the 10-year average) reflects higher food and feed utilisation as well as a significant increase in industrial use. The industrial usage of cereals is traditionally mostly related to the production of starch and sweeteners and therefore largely stable, however, in recent years the rapidly growing biofuel sector is emerging as a leading source of demand. It is estimated that at least 100 million tonnes of cereals are currently used to produce biofuel, of which corn accounts for at least 95 million tonnes, representing 12% of total world utilisation. In 2007/08, the United States is expected to use at least 81 million tonnes of corn to produce ethanol, up 32 million tonnes (37%) from the previous season (FAO 2008). Global cereal stocks by the close of 2008 are expected to fall to about 405 million tonnes, down 22 million tonnes (5%) from the already low levels at the start of the season. This will be the lowest closing stocks level since 1982. At the current forecast levels, the ratio of world cereal stocks to utilisation is put at about 19% (FAO 2007) (see Table 15). Cereal supplies are low mainly because of dwindling stock levels carried over from the previous season. With world demand showing little sign of abating, international prices for most cereals remain high while world reserves are trending to yet another decline from already low levels. Although a significant expansion in winter wheat plantings in the northern hemisphere is likely to result in much higher wheat production in 2008, assuming normal weather conditions, the current situation is such that it may require significant increases in production of more than one season’s cereal crop for markets to regain their stability and for prices to decline significantly below the recent highs (FAO 2008). Table 15 illustrates that the recent surge in grain prices is a function of supply problems combined with increased demand, of which biofuels make up only a part of the equation. Total feed use of coarse grains is forecast to increase by 1.4% in 2007/08, to 624 million tonnes. However, on an individual grain basis, stronger increases are expected only for maize (1.5%) and sorghum (8%) because of this season’s tighter supplies of other feed grains. Total use of barley for feed is forecast to fall by 3%, to around 97 million tonnes, mainly due to reduced production and high prices. Global food consumption of coarse grains is forecast to reach 182 million tonnes, up 1.4% from the previous season.
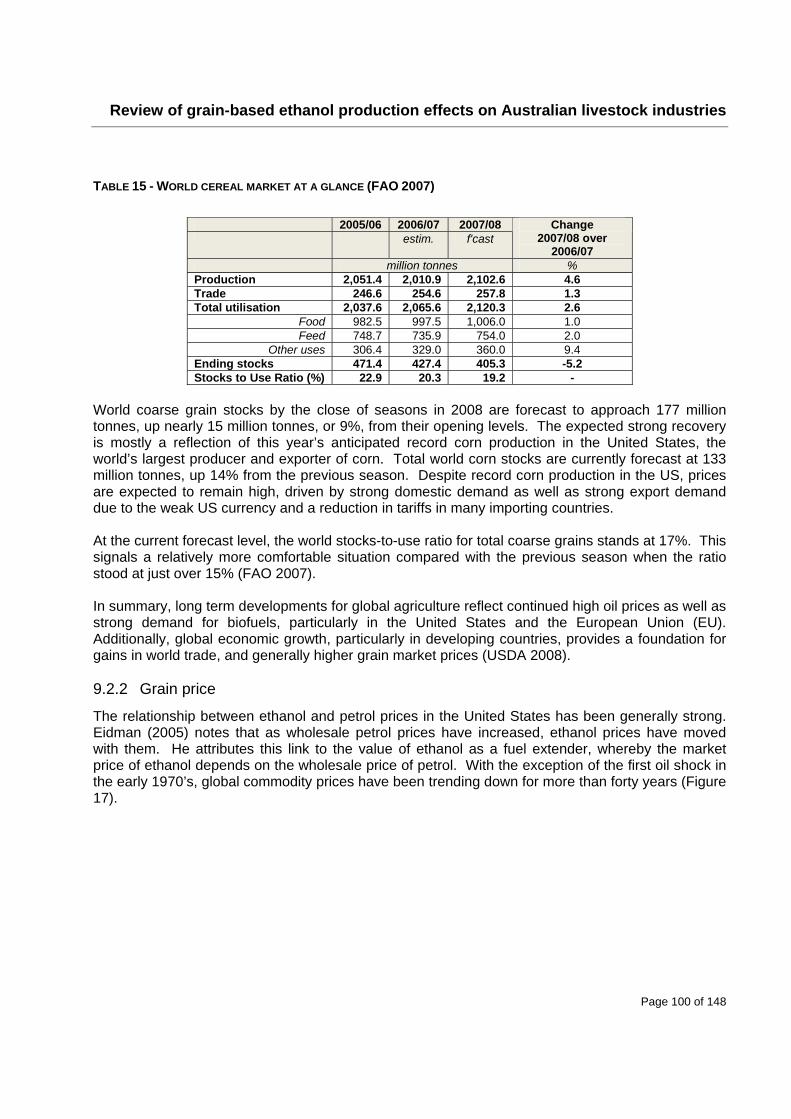
Review of grain-based ethanol production effects on Australian livestock industries
Page 100 of 148
TABLE 15 - WORLD CEREAL MARKET AT A GLANCE (FAO 2007)
2005/06 2006/07 2007/08 estim. f'cast
Change 2007/08 over
2006/07 million tonnes %
Production 2,051.4 2,010.9 2,102.6 4.6 Trade 246.6 254.6 257.8 1.3 Total utilisation 2,037.6 2,065.6 2,120.3 2.6
Food 982.5 997.5 1,006.0 1.0 Feed 748.7 735.9 754.0 2.0
Other uses 306.4 329.0 360.0 9.4 Ending stocks 471.4 427.4 405.3 -5.2 Stocks to Use Ratio (%) 22.9 20.3 19.2 -
World coarse grain stocks by the close of seasons in 2008 are forecast to approach 177 million tonnes, up nearly 15 million tonnes, or 9%, from their opening levels. The expected strong recovery is mostly a reflection of this year’s anticipated record corn production in the United States, the world’s largest producer and exporter of corn. Total world corn stocks are currently forecast at 133 million tonnes, up 14% from the previous season. Despite record corn production in the US, prices are expected to remain high, driven by strong domestic demand as well as strong export demand due to the weak US currency and a reduction in tariffs in many importing countries. At the current forecast level, the world stocks-to-use ratio for total coarse grains stands at 17%. This signals a relatively more comfortable situation compared with the previous season when the ratio stood at just over 15% (FAO 2007). In summary, long term developments for global agriculture reflect continued high oil prices as well as strong demand for biofuels, particularly in the United States and the European Union (EU). Additionally, global economic growth, particularly in developing countries, provides a foundation for gains in world trade, and generally higher grain market prices (USDA 2008). 9.2.2 Grain price
The relationship between ethanol and petrol prices in the United States has been generally strong. Eidman (2005) notes that as wholesale petrol prices have increased, ethanol prices have moved with them. He attributes this link to the value of ethanol as a fuel extender, whereby the market price of ethanol depends on the wholesale price of petrol. With the exception of the first oil shock in the early 1970’s, global commodity prices have been trending down for more than forty years (Figure 17).
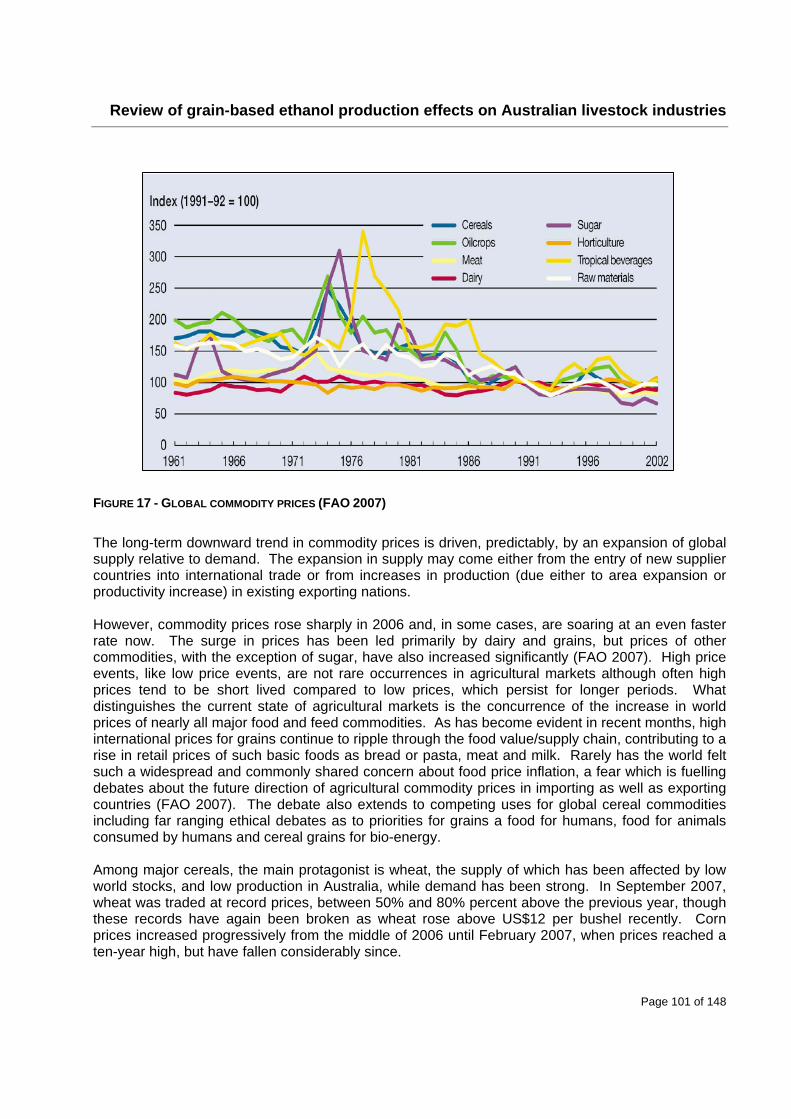
Review of grain-based ethanol production effects on Australian livestock industries
Page 101 of 148
FIGURE 17 - GLOBAL COMMODITY PRICES (FAO 2007)
The long-term downward trend in commodity prices is driven, predictably, by an expansion of global supply relative to demand. The expansion in supply may come either from the entry of new supplier countries into international trade or from increases in production (due either to area expansion or productivity increase) in existing exporting nations. However, commodity prices rose sharply in 2006 and, in some cases, are soaring at an even faster rate now. The surge in prices has been led primarily by dairy and grains, but prices of other commodities, with the exception of sugar, have also increased significantly (FAO 2007). High price events, like low price events, are not rare occurrences in agricultural markets although often high prices tend to be short lived compared to low prices, which persist for longer periods. What distinguishes the current state of agricultural markets is the concurrence of the increase in world prices of nearly all major food and feed commodities. As has become evident in recent months, high international prices for grains continue to ripple through the food value/supply chain, contributing to a rise in retail prices of such basic foods as bread or pasta, meat and milk. Rarely has the world felt such a widespread and commonly shared concern about food price inflation, a fear which is fuelling debates about the future direction of agricultural commodity prices in importing as well as exporting countries (FAO 2007). The debate also extends to competing uses for global cereal commodities including far ranging ethical debates as to priorities for grains a food for humans, food for animals consumed by humans and cereal grains for bio-energy. Among major cereals, the main protagonist is wheat, the supply of which has been affected by low world stocks, and low production in Australia, while demand has been strong. In September 2007, wheat was traded at record prices, between 50% and 80% percent above the previous year, though these records have again been broken as wheat rose above US$12 per bushel recently. Corn prices increased progressively from the middle of 2006 until February 2007, when prices reached a ten-year high, but have fallen considerably since.
Review of grain-based ethanol production effects on Australian livestock industries
Page 102 of 148
Supply constraints in the face of brisk demand for biofuels triggered the initial increase in maize prices. However, reacting to a massive expansion in plantings and expectations of a record crop, prices started to come down, although they remained above 2006 levels. Barley prices also rose due to supply problems in Australia and Ukraine and tighter availability of maize and other feed grains (FAO 2007). The high feedgrain prices have also raised costs for animal production resulting in increased livestock prices; particularly poultry, which rose by at least 10%. In addition, consumption growth and a gradual easing of trade restrictions are contributing to the increased demand for meat and poultry (FAO 2007). However, the persistent upward trend in international prices of most agricultural commodities is only partly a reflection of tightening supply, as global markets have become increasingly inter-related. As a result, linkages and spill-over effects from one market to another have greatly increased in recent years, not only among agricultural commodities, but across all commodities and between commodities and the financial sector (FAO 2007). Similarly, market-oriented policies are gradually making agricultural markets more transparent and, in the process, are elongating the financial opportunities for increased portfolio diversification and reduction in risk exposures. This is a development that is taking place just as financial markets around the world are experiencing the most rapid growth, driven by plentiful international liquidity. This abundance of liquidity reflects favourable economic performances around the world, notably among emerging economies, low interest rates and high petroleum prices. These developments have paved the way for massive amounts of cash becoming available for investment in markets that use financial instruments linked to the functioning of agricultural commodity markets (e.g. futures and options). The buoyant financial markets are boosting asset allocation and drawing the attention of speculators to such markets, as a way of spreading their risk and pursuing of more lucrative returns. Such influx of liquidity is likely to influence the underlying spot markets to the extent that they affect the decisions of farmers, traders and processors of agricultural commodities. It seems most likely that speculators contribute more to raising spot price volatility than to the absolute price level (FAO 2007). Rapidly rising petroleum prices have contributed to the increase in price of most agricultural crops by increasing input costs and by boosting demand for agricultural crops used as feedstock in producing alternative energy sources (biofuels). National policies aimed at reducing greenhouse gas emissions are largely behind the recent growth of the biofuel industry However, rising fossil fuel prices and attempts to reduce US dependence on imported oil have provided the extra incentive for many countries to opt for more challenging crop production targets. This combination of high petroleum prices and the desire to address environmental issues is currently at the forefront of the rapid expansion of the biofuel sector. In the absence of a rapid change in policy direction and/or oil prices, this is likely to boost demand for feedstocks, most notably, sugar, maize, rapeseed, soybean, palm oil and other oil crops as well as wheat for many more years. However, much will also depend on the supply and demand fundamentals of the biofuel sector itself (FAO 2007). On another level, exchange rates play a critical role and, rarely, have they been as important in shaping agricultural prices as in recent months. The decline in the US dollar against most currencies since 2005 has boosted demand for US products. As international prices of most commodities are also primarily expressed in US dollars, this weakening of the dollar has helped
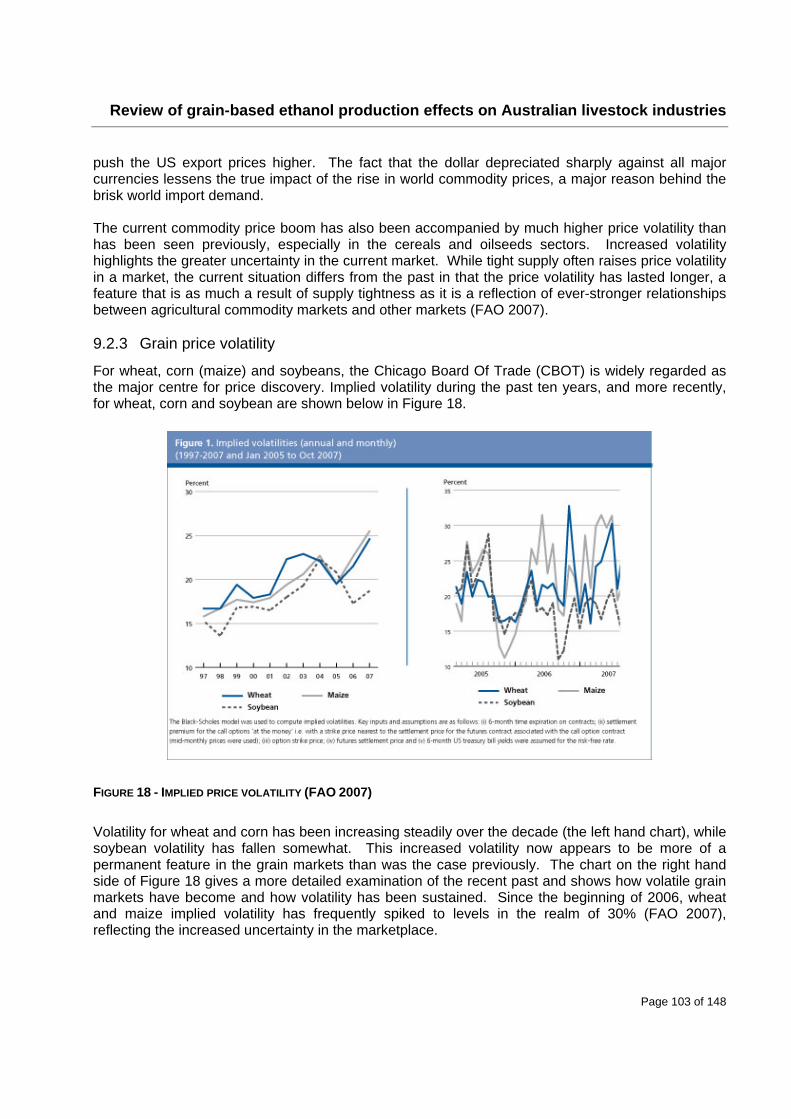
Review of grain-based ethanol production effects on Australian livestock industries
Page 103 of 148
push the US export prices higher. The fact that the dollar depreciated sharply against all major currencies lessens the true impact of the rise in world commodity prices, a major reason behind the brisk world import demand. The current commodity price boom has also been accompanied by much higher price volatility than has been seen previously, especially in the cereals and oilseeds sectors. Increased volatility highlights the greater uncertainty in the current market. While tight supply often raises price volatility in a market, the current situation differs from the past in that the price volatility has lasted longer, a feature that is as much a result of supply tightness as it is a reflection of ever-stronger relationships between agricultural commodity markets and other markets (FAO 2007). 9.2.3 Grain price volatility
For wheat, corn (maize) and soybeans, the Chicago Board Of Trade (CBOT) is widely regarded as the major centre for price discovery. Implied volatility during the past ten years, and more recently, for wheat, corn and soybean are shown below in Figure 18.
FIGURE 18 - IMPLIED PRICE VOLATILITY (FAO 2007)
Volatility for wheat and corn has been increasing steadily over the decade (the left hand chart), while soybean volatility has fallen somewhat. This increased volatility now appears to be more of a permanent feature in the grain markets than was the case previously. The chart on the right hand side of Figure 18 gives a more detailed examination of the recent past and shows how volatile grain markets have become and how volatility has been sustained. Since the beginning of 2006, wheat and maize implied volatility has frequently spiked to levels in the realm of 30% (FAO 2007), reflecting the increased uncertainty in the marketplace.
Review of grain-based ethanol production effects on Australian livestock industries
Page 104 of 148
9.2.4 Dried distillers grain
Biofuel proponents often cite the availability of dried distillers grains (DDG) as a benefit to the intensive animal industries, which will largely offset any increase in the price of traditional feedgrains. Canadian analysis (Mussell et al. 2007) suggests that an expansion of the ethanol sector will lead to an increase in feedgrain prices, and an increase in the supply of DDG as it has in the US. The empirical analysis shows that DDG acts as a substitute for both feedgrains and protein across species with sharply different nutritional requirements and that the price of DDG falls as feedgrain prices rise. 9.2.5 The Canadian Experience
In Canada, as in Australia, fuel is a shared regulatory jurisdiction between the federal and provincial governments. Both levels of government have commitments to renewable fuels and, despite some obvious geographic differences, the impact of ethanol production on the livestock sector in Canada provides a useful indicator of what could occur in Australia. There are nine commercial ethanol plants in Canada with a total production capacity of 735 million litres per year. Plants currently planned and/or under construction are expected to almost double the current capacity. Four of the currently operating plants use corn as a feedstock, while the remaining five plants produce ethanol using wheat. Current provincial mandates for ethanol create a demand for approximately 1 billion litres per annum (Sanford 2006) so there is still expansion required if that demand is going to be met by domestic production. Feed wheat is the primary feedstock for commercial ethanol production in Western Canada. However, the influence of ethanol development is also relevant on barley pricing because of the arbitrage effect between barley and US corn, and because barley is a latent feedstock for ethanol production (Mussell et al. 2007). Figure 19 illustrates weekly selling prices for feed wheat at three Western Canada locations over the period 2000 to the third quarter of 2007. Over the period, feed wheat prices averaged around Can$133/tonne to Can$142/tonne, though there are periods of clear deviation from this average. Severe droughts occurred in Western Canada during the 2001 and 2002 crop year, leading to sharply higher prices. The second significant spike in feed wheat has occurred since mid-2006 when the surge in biofuel production emerged. However, despite the surge in demand, prices were only just approaching the highs of 2001/02 by mid-2007. Feed barley has exhibited similar price trends over the same period.
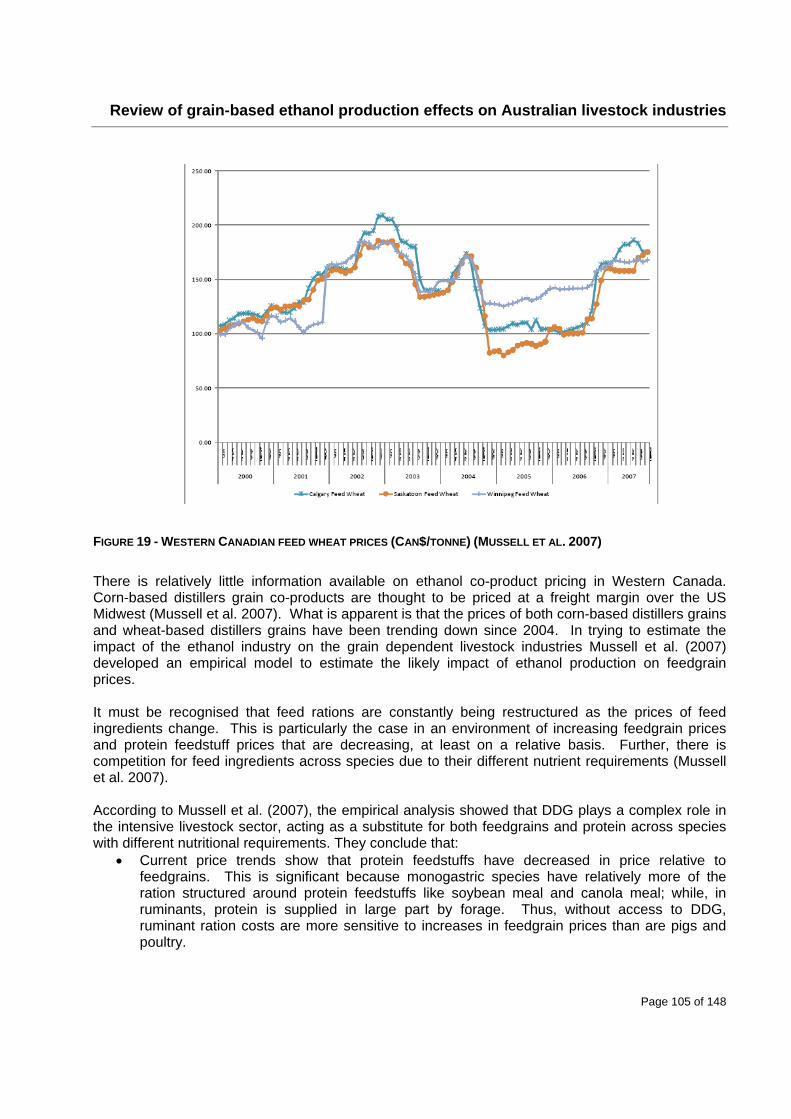
Review of grain-based ethanol production effects on Australian livestock industries
Page 105 of 148
FIGURE 19 - WESTERN CANADIAN FEED WHEAT PRICES (CAN$/TONNE) (MUSSELL ET AL. 2007)
There is relatively little information available on ethanol co-product pricing in Western Canada. Corn-based distillers grain co-products are thought to be priced at a freight margin over the US Midwest (Mussell et al. 2007). What is apparent is that the prices of both corn-based distillers grains and wheat-based distillers grains have been trending down since 2004. In trying to estimate the impact of the ethanol industry on the grain dependent livestock industries Mussell et al. (2007) developed an empirical model to estimate the likely impact of ethanol production on feedgrain prices. It must be recognised that feed rations are constantly being restructured as the prices of feed ingredients change. This is particularly the case in an environment of increasing feedgrain prices and protein feedstuff prices that are decreasing, at least on a relative basis. Further, there is competition for feed ingredients across species due to their different nutrient requirements (Mussell et al. 2007). According to Mussell et al. (2007), the empirical analysis showed that DDG plays a complex role in the intensive livestock sector, acting as a substitute for both feedgrains and protein across species with different nutritional requirements. They conclude that:
Current price trends show that protein feedstuffs have decreased in price relative to feedgrains. This is significant because monogastric species have relatively more of the ration structured around protein feedstuffs like soybean meal and canola meal; while, in ruminants, protein is supplied in large part by forage. Thus, without access to DDG, ruminant ration costs are more sensitive to increases in feedgrain prices than are pigs and poultry.
Review of grain-based ethanol production effects on Australian livestock industries
Page 106 of 148
The nature of substitution in diets is such that distillers grains is used mainly in place of feedgrains in the energy component of ruminant diets, while distillers grains is used mainly in place of protein feedstuffs in monogastric diets.
Overall, the distribution of livestock species in Western Canada is oriented toward cattle that depend on diets structured around feedgrains, and forages that are priced at their opportunity cost as feedgrains. Thus, the availability of distillers grains that has decreased in price relative to feedgrains and can serve as a feedgrain substitute is critical. However, based on current information relative to history, the expansion of the grain-based ethanol industry will be detrimental to the grain dependent livestock sector from a cost perspective.
9.2.6 What next?
During the 1990’s when oil was cheap and biofuels unknown, grain demand was growing by about 1.2% per annum. In recent years, grain demand growth has increased to 1.4% per annum, and is predicted to grow to 1.9% per annum for the next decade (The Economist 2007a). Increased grain-based ethanol capacity in the US and an emerging grain-based ethanol industry in China can be expected to drive up global grain prices. Medium term increases in global grain prices could be in the order of 20 to 30 per cent – a significant turn-around from the experience of previous decades. The main factor affecting the uncertainty in agricultural markets is how linkages with other markets will influence the direction and magnitude of price changes. Nowhere is this more evident than in the current debate about wheat plantings. To most farmers, the current high wheat prices are only one reason to plant more wheat. The other is the general anticipation that even if wheat prices were to decline from their current high values, the decrease is expected to be less than those of other crops. Thus, farmers would be better off planting more land to wheat because of its higher relative profitability compared with other crops. In fact, all indications point to more wheat being planted around the world for harvest next year (FAO 2007). The recent decision by the European Union to release land from its set-aside programmes and the move by other major producing countries such as India to encourage farmers to grow more wheat by raising wheat procurement prices are also likely to pave the way for a much-needed rebound in world production in 2008. This, of course, assumes a ‘normal’ weather situation. Yet a strong expansion in wheat production, assuming normal growth in consumption, is bound to bring down wheat prices. What of other crops? If more wheat gets planted, what will happen to the prices of other crops? Part of the answer can be found in the recent corn experience - once corn prices began to rise, global plantings expanded – increasing by 19% in the US alone. Higher plantings and favourable weather drove production to a record and started to push down prices. Given a limited potential for expanding the agricultural frontier, the increase in corn plantings was at the expense of reductions in areas dedicated to several other crops, the production of which suffered as a result. It is clear that by shifting land out of one crop into another, prices of those crops with reduced planting are likely to increase. Such trends have always existed and switching crops to maximise returns is nothing new. Most countries produce a host of crops and planting periods together with areas can be similar, making substitution easier. However, what makes recent episodes differ from the past is that inventories are at very low levels, which makes prices particularly sensitive to unexpected changes in supply or demand. In other words, agricultural markets, and food crops in particular, may be going through a period whereby stocks, especially those in major exporting countries, no longer play their traditional
Review of grain-based ethanol production effects on Australian livestock industries
Page 107 of 148
role as a buffer against sudden fluctuations in production and demand. This change has come about because of reduced government interventions associated with a general policy shift towards liberalising agricultural commodity markets (FAO 2007). Given the link between the price of petroleum and ethanol, Elobeid et al. (2007) state that estimates of the long-term potential for ethanol production can be made by calculating the corn price at which the incentive to expand ethanol production disappears. They conclude that under current US ethanol tax policy, if the prices of crude oil, natural gas and distillers grain stay at current levels, the break–even corn price is $4.05 per bushel (equivalent to US$162/tonne). They use a multi– commodity, multi–country system of integrated commodity models to estimate that, at this price, corn–based ethanol production in the US would reach 31.5 billion gallons per year. Supporting this level of production would require 95.6 million acres planted to corn (an increase of around 20% over current levels). Total production would be approximately 15.6 billion bushels, compared to 11.0 billion bushels today. Most of the additional corn acres would come from reduced soybean acreage. The demand for biotech corn varieties that allow for continuous corn production would increase dramatically as would the demand for corn, soybean, and wheat varieties that can be grown in marginal areas (Elobeid et al. 2007). A recent OECD/FAO (2007) report concludes that increased demand for bio-fuels is causing fundamental changes to agricultural markets that could drive up world prices for many farm products. The report says that while temporary factors such as droughts in wheat-growing regions and low stocks explain in large measure the recent hikes in farm commodity prices, there are longer term structural changes underway which could maintain relatively high nominal prices for many agricultural commodities over the coming decade. In the US, annual corn-based ethanol output is expected to double between 2006 and 2016. In the European Union the amount of oilseeds (mainly rapeseed) used for biofuels is set to grow from just over 10 million tonnes to 21 million tonnes over the same period. In Brazil, annual ethanol production is projected to reach some 44 billion litres by 2016 from around 21 billion today. Chinese ethanol output is expected to rise to an annual 3.8 billion litres, a 2 billion-litre increase from current levels. The impact of these changes on grain dependent livestock industries will depend on a range of parameters including the ability of species to adapt to ethanol co-products; the viability of non-food feedstocks; the price of petroleum products; the development of new ethanol processing technologies; government policy. While the corn demand of the ethanol industry is linked to energy prices and government policy, livestock corn demand is linked to meat prices – currently corn is worth more as ethanol than it is as feed. In order to limit the impact of rising cereal prices on domestic food consumption, governments from both cereal importing and exporting countries have taken a range of policy measures, including lowering import tariffs, raising food subsidies, and banning or imposing duties on basic food exports. Food security is, once again, becoming a significant issue for governments around the world, and is likely to guide biofuel policy in many countries for the short to medium term. As an example of the shift in thinking, many European governments are planning to ban biofuels made from crops grown on high-value conservation lands. The main problem with Europe’s new law, in fact, may be that it is not stringent enough, though there is a growing realisation that previous
Review of grain-based ethanol production effects on Australian livestock industries
Page 108 of 148
polices to promote biofuels may not even lead to better environmental outcomes and are contributing to food price inflation. 9.3 Australian feed grain impacts 9.3.1 Supply and demand
As is the case elsewhere, the price received by biofuels in Australia is determined by the price of petroleum products and the relative excise treatment of biofuels. Section 7.2 outlines the current ethanol production incentives in Australia. Under the current regime, locally produced biofuels remain excise free so, when sold on the retail market, receive a substantial advantage of 38.143 cents per litre compared with petrol and diesel (For business users, who receive taxation credits for some or all of the excise paid on fuel purchases, the advantage for biofuels can be much less pronounced or absent) (CIE 2007). Despite this, there is some existing and substantial projected demand for grain-based ethanol production in Australia, which when coupled with low supply, and rising global demand could drive up grain prices in Australia. This position is accentuated with Australia’s limited ability to supplement depleted grain supplies in severe drought years by importing grain. To date, competition with food producers for crops has not been an issue for Australia’s few ethanol producers, since those already established use co-products – waste starch from flour milling and C-molasses from sugar refining. However, higher levels of ethanol production from C-molasses could be expected to place upward pressure on the C-molasses price, and eventually have an impact on the price and availability of A, B and C-molasses for other uses – such as in the food additive and stock feed markets (O'Connell et al. 2007). As the grain-based ethanol industry expands, competition for feed grains will become an issue until new generation biofuel plants look to feedstocks other than grain. While it has been stated that the recent increases in commodity prices is due to competing demand between food and ethanol, the extent to which ethanol production is driving price (compared with other factors) is unclear. What is clear is that, regardless of whether there is a significant ethanol industry in Australia, the competing markets for grain will, increasingly, be driven by the global demand for biofuels and increased demand from intensive livestock industries. Increases in the global commodity price will mean that both grain-based ethanol producers and grain dependent livestock producers will have to deal with increased costs. However, increased grain prices in response to a new market may not be a long term phenomenon – if supply expands to meet the new demands, economic theory predicts that the price will stabilise at slightly higher than the cost of grain production (Batten et al. 2007). When or whether this occurs, the volatile nature of Australian grain supply will be a recurring problem for supply competition especially in those years of below average rainfall in the Australian grain belt. Yield variability is a major constraint on farmers’ ability to increase crop productivity, as increased variability poses a significant risk to getting returns on investment in nitrogen fertiliser. A Bureau of Rural Sciences study (Walcott 2001) observed that, those areas with a rainfall reliability of 70 per cent or better have generally low variability in wheat yields. Areas with high yield variability all appear to occur in areas where rainfall reliability is lower than 30 percent during the growing season for wheat. This emphasises the dominant role of rainfall in defining Australian broadacre agriculture.
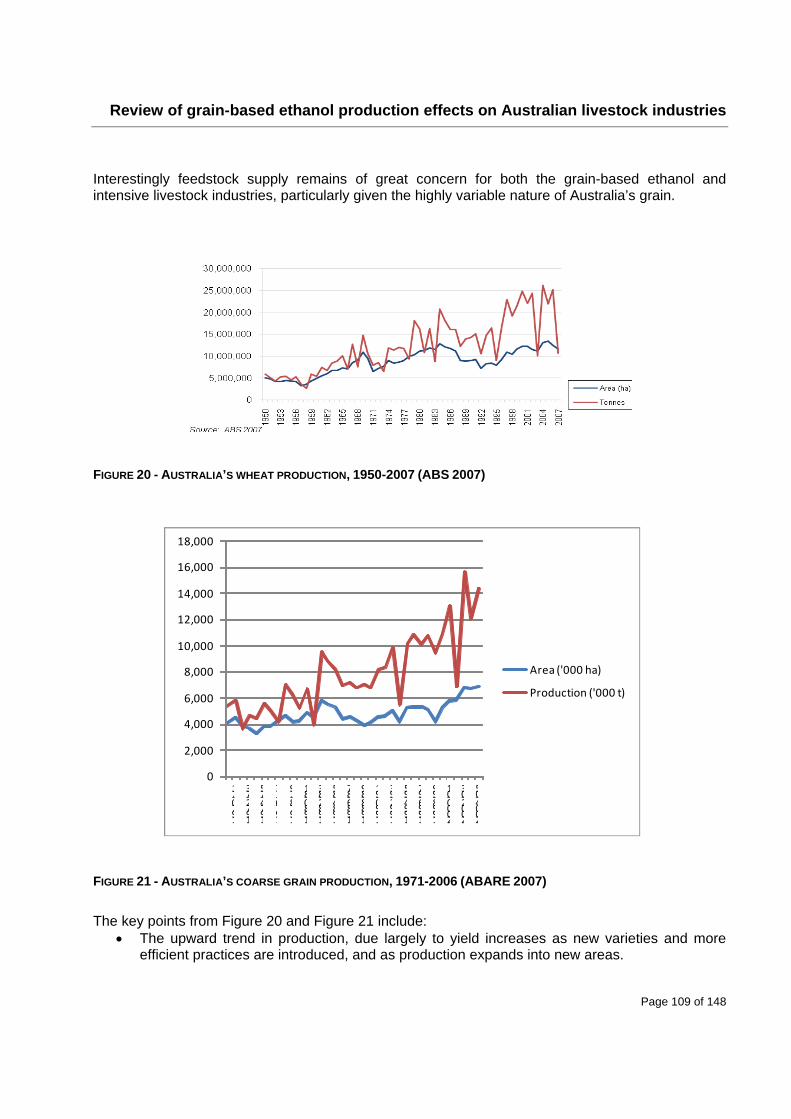
Review of grain-based ethanol production effects on Australian livestock industries
Page 109 of 148
0
2,000
4,000
6,000
8,000
10,000
12,000
14,000
16,000
18,000
1970‐71
1972‐73
1974‐75
1976‐77
1978‐79
1980‐81
1982‐83
1984‐85
1986‐87
1988‐89
1990‐91
1992‐93
1994‐95
1996‐97
1998‐99
2000‐01
2002‐03
2004‐05
Area ('000 ha)
Production ('000 t)
Interestingly feedstock supply remains of great concern for both the grain-based ethanol and intensive livestock industries, particularly given the highly variable nature of Australia’s grain.
FIGURE 20 - AUSTRALIA’S WHEAT PRODUCTION, 1950-2007 (ABS 2007)
FIGURE 21 - AUSTRALIA’S COARSE GRAIN PRODUCTION, 1971-2006 (ABARE 2007)
The key points from Figure 20 and Figure 21 include:
The upward trend in production, due largely to yield increases as new varieties and more efficient practices are introduced, and as production expands into new areas.
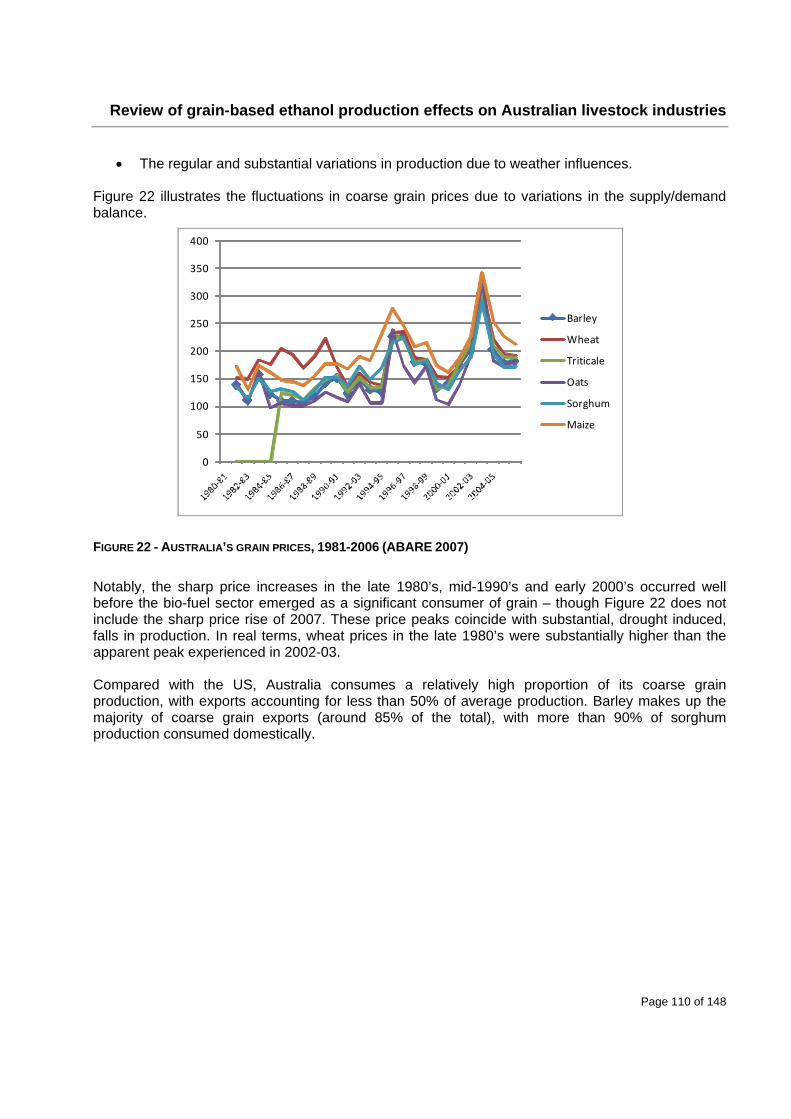
Review of grain-based ethanol production effects on Australian livestock industries
Page 110 of 148
0
50
100
150
200
250
300
350
400
Barley
Wheat
Triticale
Oats
Sorghum
Maize
The regular and substantial variations in production due to weather influences. Figure 22 illustrates the fluctuations in coarse grain prices due to variations in the supply/demand balance.
FIGURE 22 - AUSTRALIA’S GRAIN PRICES, 1981-2006 (ABARE 2007)
Notably, the sharp price increases in the late 1980’s, mid-1990’s and early 2000’s occurred well before the bio-fuel sector emerged as a significant consumer of grain – though Figure 22 does not include the sharp price rise of 2007. These price peaks coincide with substantial, drought induced, falls in production. In real terms, wheat prices in the late 1980’s were substantially higher than the apparent peak experienced in 2002-03. Compared with the US, Australia consumes a relatively high proportion of its coarse grain production, with exports accounting for less than 50% of average production. Barley makes up the majority of coarse grain exports (around 85% of the total), with more than 90% of sorghum production consumed domestically.
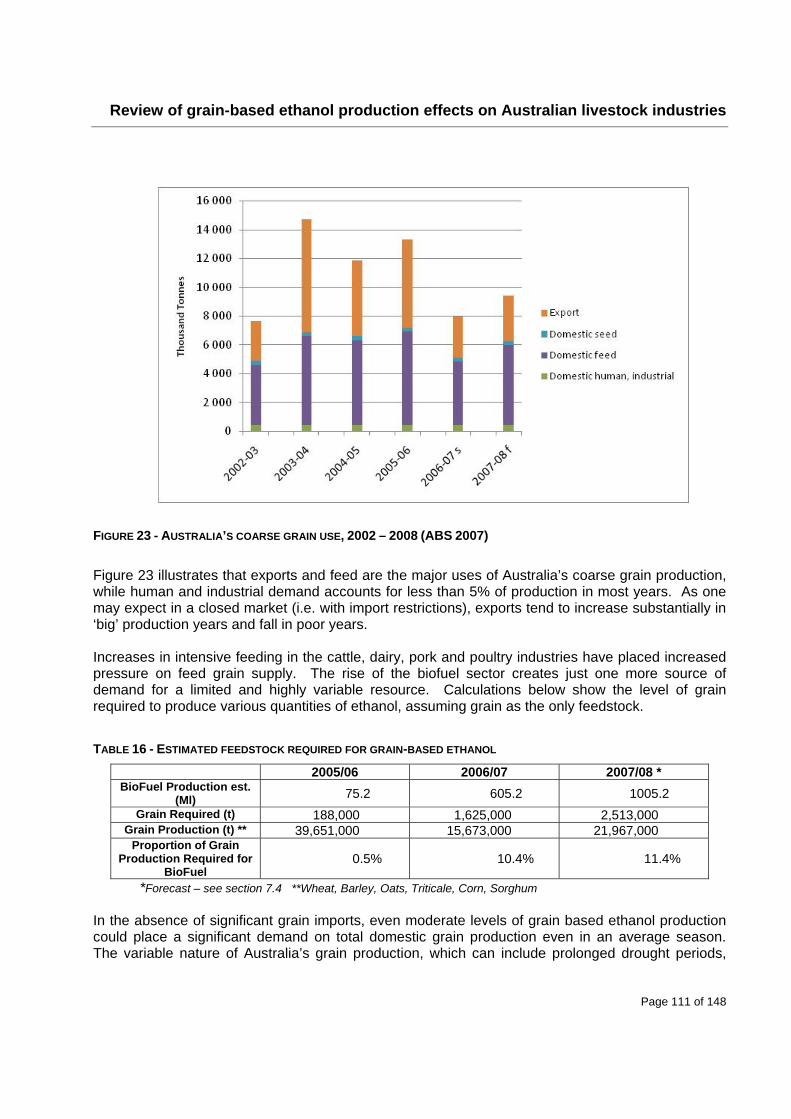
Review of grain-based ethanol production effects on Australian livestock industries
Page 111 of 148
FIGURE 23 - AUSTRALIA’S COARSE GRAIN USE, 2002 – 2008 (ABS 2007)
Figure 23 illustrates that exports and feed are the major uses of Australia’s coarse grain production, while human and industrial demand accounts for less than 5% of production in most years. As one may expect in a closed market (i.e. with import restrictions), exports tend to increase substantially in ‘big’ production years and fall in poor years. Increases in intensive feeding in the cattle, dairy, pork and poultry industries have placed increased pressure on feed grain supply. The rise of the biofuel sector creates just one more source of demand for a limited and highly variable resource. Calculations below show the level of grain required to produce various quantities of ethanol, assuming grain as the only feedstock.
TABLE 16 - ESTIMATED FEEDSTOCK REQUIRED FOR GRAIN-BASED ETHANOL
2005/06 2006/07 2007/08 * BioFuel Production est.
(Ml) 75.2 605.2 1005.2
Grain Required (t) 188,000 1,625,000 2,513,000 Grain Production (t) ** 39,651,000 15,673,000 21,967,000
Proportion of Grain Production Required for
BioFuel 0.5% 10.4% 11.4%
*Forecast – see section 7.4 **Wheat, Barley, Oats, Triticale, Corn, Sorghum
In the absence of significant grain imports, even moderate levels of grain based ethanol production could place a significant demand on total domestic grain production even in an average season. The variable nature of Australia’s grain production, which can include prolonged drought periods,
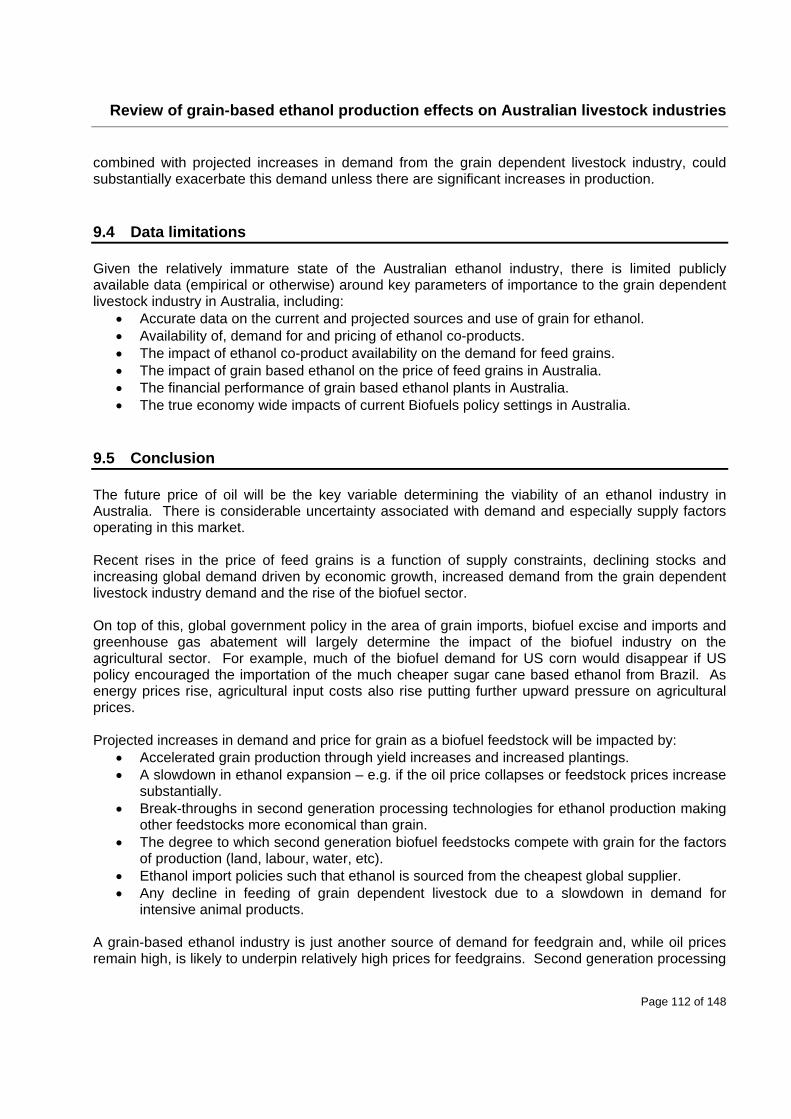
Review of grain-based ethanol production effects on Australian livestock industries
Page 112 of 148
combined with projected increases in demand from the grain dependent livestock industry, could substantially exacerbate this demand unless there are significant increases in production.
9.4 Data limitations Given the relatively immature state of the Australian ethanol industry, there is limited publicly available data (empirical or otherwise) around key parameters of importance to the grain dependent livestock industry in Australia, including:
Accurate data on the current and projected sources and use of grain for ethanol. Availability of, demand for and pricing of ethanol co-products. The impact of ethanol co-product availability on the demand for feed grains. The impact of grain based ethanol on the price of feed grains in Australia. The financial performance of grain based ethanol plants in Australia. The true economy wide impacts of current Biofuels policy settings in Australia.
9.5 Conclusion The future price of oil will be the key variable determining the viability of an ethanol industry in Australia. There is considerable uncertainty associated with demand and especially supply factors operating in this market. Recent rises in the price of feed grains is a function of supply constraints, declining stocks and increasing global demand driven by economic growth, increased demand from the grain dependent livestock industry demand and the rise of the biofuel sector. On top of this, global government policy in the area of grain imports, biofuel excise and imports and greenhouse gas abatement will largely determine the impact of the biofuel industry on the agricultural sector. For example, much of the biofuel demand for US corn would disappear if US policy encouraged the importation of the much cheaper sugar cane based ethanol from Brazil. As energy prices rise, agricultural input costs also rise putting further upward pressure on agricultural prices. Projected increases in demand and price for grain as a biofuel feedstock will be impacted by:
Accelerated grain production through yield increases and increased plantings. A slowdown in ethanol expansion – e.g. if the oil price collapses or feedstock prices increase
substantially. Break-throughs in second generation processing technologies for ethanol production making
other feedstocks more economical than grain. The degree to which second generation biofuel feedstocks compete with grain for the factors
of production (land, labour, water, etc). Ethanol import policies such that ethanol is sourced from the cheapest global supplier. Any decline in feeding of grain dependent livestock due to a slowdown in demand for
intensive animal products. A grain-based ethanol industry is just another source of demand for feedgrain and, while oil prices remain high, is likely to underpin relatively high prices for feedgrains. Second generation processing
Review of grain-based ethanol production effects on Australian livestock industries
Page 113 of 148
technologies will widen the ethanol feedstock options, perhaps reducing the demand for feedgrains. However, feedgrains will remain a feedstock option in these new plants, putting a floor under the global grain price. The intensive livestock industries are likely to incur higher prices of feedgrains as both the biofuels industry and livestock feeders compete for scarce grain supply especially in below average rainfall years. If biofuel plants were located on the Australian seaboard they would have the option to import and utilise grain at world parity price unlike livestock feeders who are constrained to only use domestically produced feed grain because of quarantine considerations. While no one questions the need to develop biofuels and a sustainable future fuel supply there needs to be serious policy debate and decisions made as to how the biofuels industry and intensive livestock industries can continue to add to successful economic growth.
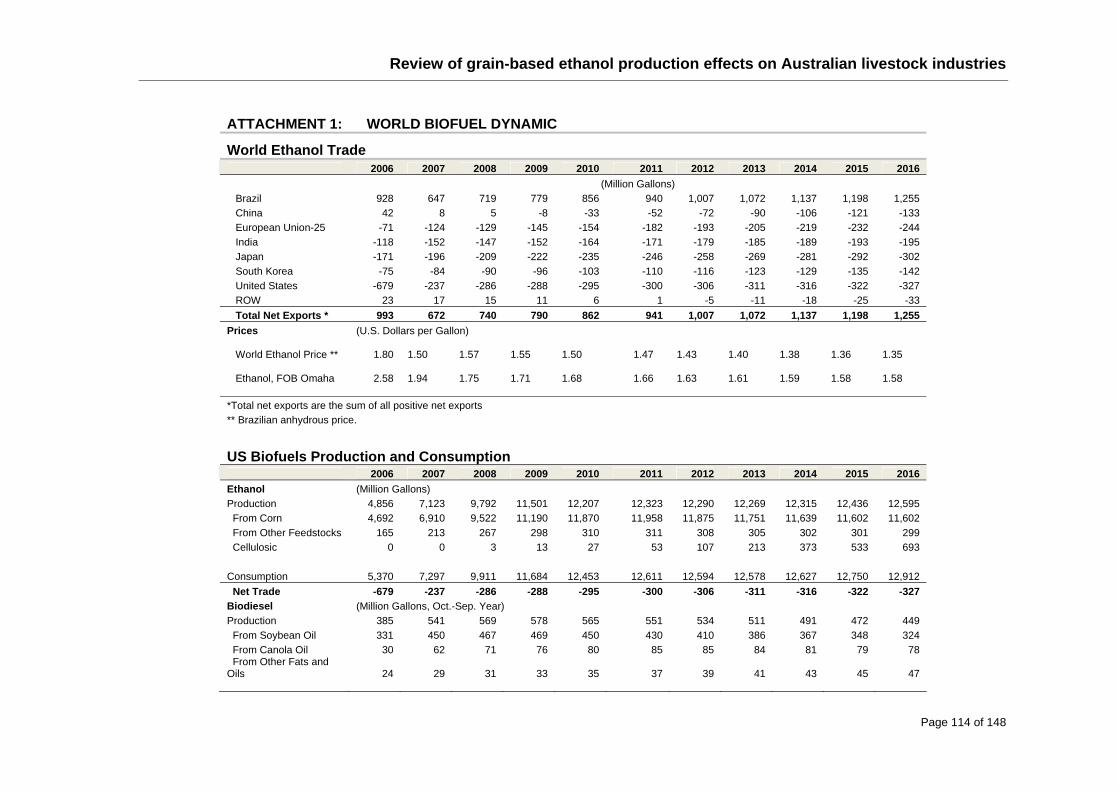
Review of grain-based ethanol production effects on Australian livestock industries
Page 114 of 148
ATTACHMENT 1: WORLD BIOFUEL DYNAMIC
World Ethanol Trade 2006 2007 2008 2009 2010 2011 2012 2013 2014 2015 2016
(Million Gallons)
Brazil 928 647 719 779 856 940 1,007 1,072 1,137 1,198 1,255
China 42 8 5 -8 -33 -52 -72 -90 -106 -121 -133
European Union-25 -71 -124 -129 -145 -154 -182 -193 -205 -219 -232 -244
India -118 -152 -147 -152 -164 -171 -179 -185 -189 -193 -195
Japan -171 -196 -209 -222 -235 -246 -258 -269 -281 -292 -302
South Korea -75 -84 -90 -96 -103 -110 -116 -123 -129 -135 -142
United States -679 -237 -286 -288 -295 -300 -306 -311 -316 -322 -327
ROW 23 17 15 11 6 1 -5 -11 -18 -25 -33
Total Net Exports * 993 672 740 790 862 941 1,007 1,072 1,137 1,198 1,255
Prices (U.S. Dollars per Gallon)
World Ethanol Price ** 1.80 1.50
1.57
1.55
1.50 1.47
1.43
1.40
1.38
1.36
1.35
Ethanol, FOB Omaha 2.58 1.94
1.75
1.71
1.68 1.66
1.63
1.61
1.59
1.58
1.58
*Total net exports are the sum of all positive net exports
** Brazilian anhydrous price.
US Biofuels Production and Consumption 2006 2007 2008 2009 2010 2011 2012 2013 2014 2015 2016
Ethanol (Million Gallons)
Production 4,856 7,123 9,792 11,501 12,207 12,323 12,290 12,269 12,315 12,436 12,595
From Corn 4,692 6,910 9,522 11,190 11,870 11,958 11,875 11,751 11,639 11,602 11,602
From Other Feedstocks 165 213 267 298 310 311 308 305 302 301 299
Cellulosic 0 0 3 13 27 53 107 213 373 533 693
Consumption 5,370 7,297 9,911 11,684 12,453 12,611 12,594 12,578 12,627 12,750 12,912
Net Trade -679 -237 -286 -288 -295 -300 -306 -311 -316 -322 -327
Biodiesel (Million Gallons, Oct.-Sep. Year)
Production 385 541 569 578 565 551 534 511 491 472 449
From Soybean Oil 331 450 467 469 450 430 410 386 367 348 324
From Canola Oil 30 62 71 76 80 85 85 84 81 79 78 From Other Fats and Oils 24 29 31 33 35 37 39 41 43 45 47
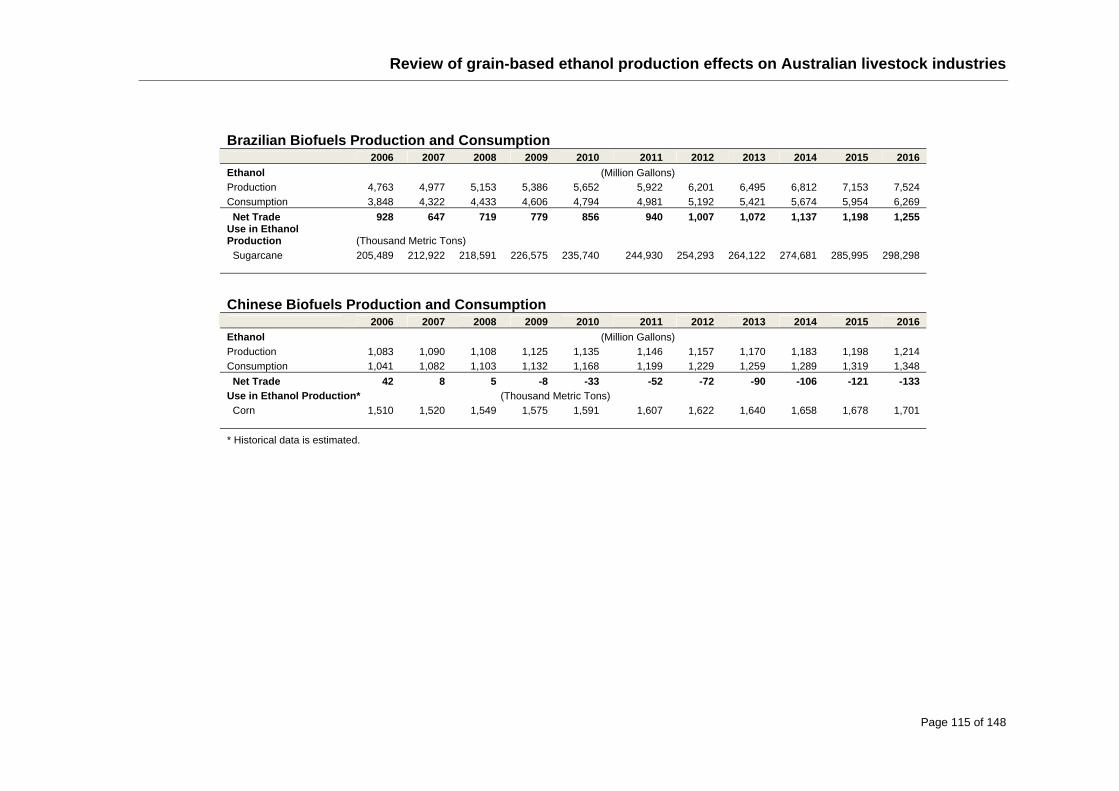
Review of grain-based ethanol production effects on Australian livestock industries
Page 115 of 148
Brazilian Biofuels Production and Consumption 2006 2007 2008 2009 2010 2011 2012 2013 2014 2015 2016
Ethanol (Million Gallons)
Production 4,763 4,977 5,153 5,386 5,652 5,922 6,201 6,495 6,812 7,153 7,524
Consumption 3,848 4,322 4,433 4,606 4,794 4,981 5,192 5,421 5,674 5,954 6,269
Net Trade 928 647 719 779 856 940 1,007 1,072 1,137 1,198 1,255 Use in Ethanol Production (Thousand Metric Tons)
Sugarcane 205,489 212,922 218,591 226,575 235,740 244,930 254,293 264,122 274,681 285,995 298,298
Chinese Biofuels Production and Consumption 2006 2007 2008 2009 2010 2011 2012 2013 2014 2015 2016
Ethanol (Million Gallons)
Production 1,083 1,090 1,108 1,125 1,135 1,146 1,157 1,170 1,183 1,198 1,214
Consumption 1,041 1,082 1,103 1,132 1,168 1,199 1,229 1,259 1,289 1,319 1,348
Net Trade 42 8 5 -8 -33 -52 -72 -90 -106 -121 -133
Use in Ethanol Production* (Thousand Metric Tons)
Corn 1,510 1,520 1,549 1,575 1,591 1,607 1,622 1,640 1,658 1,678 1,701
* Historical data is estimated.
Review of grain-based ethanol production effects on Australian livestock industries
Page 116 of 148
10 Information gaps and recommendations Grain-based ethanol production in Australia is a fledgling industry, and many of the potential impacts of expanding production are not known. Research and opinion from other countries where grain-based ethanol production is established, particularly the US, provide a valuable basis for assessing the prospective research needs in the Australian context. The authors note that research and global development in the field of biofuels is progressing rapidly. This report has reviewed literature through to February 2008, and it is recommended that an annual review is carried out to update the literature and status of the Australian and global biofuels industry with reference to the Australian feed grain market and livestock producers. There is a growing need for research to inform a strategic approach to biofuel production in Australia, aiming to produce multiple benefits to all sectors of the agricultural community while being environmentally sustainable if possible. Factors to be addressed should include the spatial distribution of grain production and grain co-products, annual supply issues influenced by rainfall, and competition between land uses for food (crop and livestock), fibre and biofuels. A review of Australian land assets and potential production of grain, biomass and other important agricultural products may be warranted. The role of climate and variable rainfall in this review is critical, as is the influence of changed land use on a range of sustainability indicators such as groundwater recharge, erosion and soil health. Ethanol is promoted as a source of renewable transport fuel with potential benefits to the environment through reduction of greenhouse gases. However, there is significant variation within the literature over the net energy gain and greenhouse gas benefits from using grain-based ethanol in Australia and around the world. It is recommended that further research is commissioned to assess the sustainability of grain-based ethanol production in Australia, considering the range of environmental impacts experienced in the cropping cycle, viz acidification, eutrophication, salinity, soil erosion and soil health (incorporating the impact of removing carbon in second-generation ethanol processing technologies). Consideration should also be given to the environmental impact of expanding cropping areas or increasing the intensity of crop rotations to increase yield that is a likely outcome from higher prices and demand. Many of these factors could be addressed by use of comprehensive life cycle assessment. The sustainability of resource use (land and water) in the context of Australian grain-based ethanol production needs to be assessed before major changes in production of first or second-generation ethanol feeder crops takes place. Australia has the potential to benefit greatly from the learning experienced in other forerunner countries such as the US, and may be able to effectively jump to second-generation biofuel production without strong reliance on grain-based ethanol if this is promoted, and this should be promoted by the agricultural industries provided it can be proven sustainable. The variability in reported GHG benefits and the key position of this driver in the argument for ethanol usage in Australia necessitate further research in this area to confirm or negate the benefits to GHG emissions and this research should be promoted by the grain dependent intensive livestock industries. This is a key recommendation to allow the agricultural industries and government to have an informed stance on the issue.
Review of grain-based ethanol production effects on Australian livestock industries
Page 117 of 148
It is noted that on average, the net energy gain provided by grain ethanol is 30%, showing clearly that grain-based ethanol is not a solution to long-term energy requirements in Australia. Furthermore, few studies have assessed this in the Australian context where average crop yields are lower and less consistent than in the US. It is recommended that energy balance research or LCA address this information gap when grain-based production plants (i.e. the Dalby Bio-Refinery) have been commissioned in Australia. In assessing energy balance, it is of key importance to access accurate data on the latent energy in Australian fertilisers and sustainable rates of application for grain production in Australia. In addition to this, assessment of grain transportation distances based on average yields and competitive usage under ethanol industry expansion scenarios may be warranted. Australia is a major global exporter of grain, and the impact of diverting grain exports to ethanol production needs to be considered from an ethical viewpoint. The global grain market has been significantly impacted by the reduction in US corn exports to the world market, contributing to higher grain and food prices in some countries. Australia must carefully assess the stance of the community on this issue before proceeding to consume significantly larger quantities of grain for ethanol. A further ethical issue related to global biofuel trade relates to the need for environmental labelling to ensure sustainable production in developing countries. This must be addressed to ensure biofuel trade does not exacerbate GHG production through forest clearing for biofuel production. These protocols must be established prior to future biofuel importation. Apart from the competition for grain use, there are also potential synergies between livestock producers and biofuel producers in relation to reuse of co-products for animal feed, as have been seen by the proposed development of ethanol plants on feedlot and dairy sites in Australia and the apparent shift of feedlot beef production in the US towards ethanol production regions (Sprague 2007). This highlights the need for an integrated approach to agriculture that captures benefits as best as possible while minimising threats. In addressing nutritional value of ethanol co-products, it is clear that distillers grain (wet or dry) may be used effectively in a variety of grain dependent livestock operations to meet metabolic requirements for the efficient production of animals. Wheat-based distillers grain may present an economical, effective way to supplement protein and digestible fibre for dairy cattle, P and CP for pork operators, CP for poultry growers, and CP and energy for beef cattle feedlots. It is noted that ethanol production is the economic driver of the production process and distillers grains is a secondary product that must be removed for production purposes. This scenario presents little incentive for ethanol plants in controlling nutrient variation for distillers grain; hence, variation is likely to be a factor that must be accounted for while using these products. This being stated, higher market prices and demand for distillers grains may prompt a move towards quality assurance, leading to improved consistency over time. This is likely to be a market driven move following the establishment of local markets. The establishment of a quality assurance system may also enhance ability of users to store and handle distillers grain. Despite this, research may be needed to devise strategies for extending shelf life or storage of WDGS if this feedstock becomes widely available. Distillers grains have been the recent subject of considerable research in the US, however the performance using these products in livestock diets has been somewhat variable. In general, most results suggest that distillers grain can be included in diets without deleterious effects. However, there may be a range of environmental consequences resultant from these diets.
Review of grain-based ethanol production effects on Australian livestock industries
Page 118 of 148
In Australia, the development of a significant biofuel industry would prompt the need for research in the areas of nutrient management because of increased levels of nitrogen excretion. This may lead to increased ammonia volatilisation, greenhouse gas production and nitrogen levels in manure, all of which must be assessed if new diets are established for widespread use. Additionally, research examining the impacts of DGS inclusion on a metabolic basis is needed for a number of livestock species. In order to maximise DGS dietary inclusion for livestock production response researchers must first gain a greater comprehension of specific nutrient metabolism, to allow the industry to modify their management and feeding accordingly. Recent rises in the price of feed grains is a function of supply constraints, declining stocks and increasing global demand driven by economic growth, increased intensive livestock industry demand and the rise of the biofuel sector. Further assessment of the impact of grain-based ethanol production on global grain prices and the effect of stocks of distillers grain available for import to Australia may be warranted as the international production system stabilises over time. If grain-based ethanol plants were located on the Australian seaboard they would have the option to import and utilise grain at world parity price unlike livestock feeders who are constrained to only use domestically produced feed grain because of quarantine considerations. This may be a positive outcome for users of grain-based ethanol co-products, as this would provide an added feedstock supply into the country. It is noted that ethanol will be increasingly produced from products other than grain. Because of the fledgling status of the grain-based ethanol industry, Australia has the opportunity to progress to a second-generation biofuel production system without entering into wide-scale production of grain-based ethanol. Hence, research focussed on second-generation ethanol production in Australia is recommended. The associated benefits of second-generation ethanol production technologies include higher energy yield potential per hectare and lower competition for food resources. Research needs to address the impact of second-generation biofuel production on agricultural land and competing industries. This research needs also to address the sustainability of second-generation ethanol production in the Australian agricultural context using a comprehensive framework such as LCA. Because of the rapidly changing nature of global ethanol production, it is also recommended that this report be updated within the next 12-18 months, with the incorporation of the biodiesel industry sector in order to benefit from the constant release of further research.
Review of grain-based ethanol production effects on Australian livestock industries
Page 119 of 148
11 Bibliography ABARE. (2007), Outlook for biofuels in Australia, Australian Commodities, March Quarter, (A.
Wright, Ed.) 14. ABARE. (2007), Australian Crop Report - December 2007. Canberra. ABARE. (2006), Grain Industry Financial Performance of Farms in 2005-2006. Australian Grains
06.1, April 2006, ABC News. (2006), Riverina grain growers wil soon have the chance to capitalise on the growing
ethanol industry with plans for a plant at Coleambally, ABC News, 5 April, Retrieved 23 August, 2007, from http://www.abc.net.au/news/stories/2006/04/05/1608937.htm
ABC News. (2007a), An ethanol plant could be up and running in the Wide Bay, within two years if
trails of the crop sweet sorghum prove successful, ABC News, 26 September, Retrieved 11 August, 2007, from http://www.abc.net.au/news/stories/2007/09/26/2044107.htm
ABC News. (2007b), Plans have been lodged with the New South Wales Government for a $120
million ethanol plant at Oaklands in the southern Riverina, 23 March, Retrieved 1 November, 2007, from http://www.abc.net.au/news/stories/2007/03/23/1879665.htm
ABC News (2007c).,The company hoping to build a $100 million ethanol plant in the Wimmera, in
western Victoria, says the facility could be finished by the end of 2009, Published 20 September, Retrieved 11 October, 2007, from
http://www.abc.net.au/news/stories/2007/09/20/2038632.htm Abe, C., Nagle, N. J., Parsons, C., Brannon, J., & Noll, S. L. (2004), High protein corn distillers dried
grains as a feed ingredient. J. Anim. Sci. , 82 (Suppl. 1):264 (Abstr.). ACE (2007), STATUS 07: A state by state handbook, American Coalition for Ethanol (ACE), Sioux
Falls, South Dakota. ACE (n.d.),Fuel Economy Study, Comparing Performance and Cost of Various Ethanol Blends and
Standard Unleaded Gasoline, American Coalition for Ethanol, Retrieved Novemebr 16, 2007, from http://www.ethanol.org/pdf/contentmgmt/ACEFuelEconomyStudy_001.pdf
Aden, A. (2007), Water Usage for Current and Future Ethanol Production. Southwest Hydrology ,
September/October, pp. 22-23. Akayezu, J.-M., Linn, J. G., Harty, S. R., & Cassady, J. M. (1998), Use of distillers grains & co-
products in Ruminant diets, University of Minnesota, Retrieved November 8, 2007, from http://www.ddgs.umn.edu/articles-dairy/1998-Akayezu-%20MNC.pdf
ALFA (n.d.), Cattle Council Australia. Implications of Subsidised Ethanol Production on CCA and
ALFA Members. ALFA (2007), Ethanol making in the US, ALFA Lotfeeding, March , pp. 15-18.
Review of grain-based ethanol production effects on Australian livestock industries
Page 120 of 148
ALFA (n.d.), The fact about ethanol subsidies, Australian Lot Feeders Association. Retrieved 18 December 2007, from
http://www.feedlots.com.au/members/private/ethanoldocs/lfgugbrochure.pdf Al-Suwaiegh, S., Fanning, K. C., Grant, R. J., Milton, C. T., & Klopfenstein, T. J. (2002), Utilization of
distillers grains from the fermentation of sorghum or corn in diets for finishing beef and lactating dairy cattle. J. Anim. Sci., 80, 1105-1111.
Anderson, J. L., Schingoethe, D. J., Kalschear, K. F., & Hippen, A. R. (2006), Evaluation of dried
and wet distillers grains included at two concentration in the diets of lactating dairy cows. J Dairy Sci. , 89, 3133-3142.
Anderton, N., & Kingwell, R. (2007). Economics of grain accumulation for ethanol production: an
Australian regional case study. 51st Annual Conference, AUstralian Agriculture & Resource Economics Society. Queenstown, New Zealand.
APL (2003), Submission to the Department of Foreign Affairs and Trade Australia-United States
Free Trade Agreement, Australian Pork Limited, 15 January, Retrieved 31 December, 2007, from: http://www.apl.au.com/media/USFTA%20Submission.pdf
APL (2007a), August 2007 Pork Report, Australian Pork Limited, Market Reporting Service, 1
November, Retrieved December 31, 2007, from http://www.apl.au.com/media/ImportsExportsDom%20Prod%20August%20Report%202007.
pdf APL (2007b), Australian Pork Limited Annual Report 2006-07. Canberra, ACT. APL (2007c), Victorian Biofuels Inquiry Submission by Australian Pork Limited, Australia Pork,
August 2007, Canberra, ACT. ATSE. (2007), Biofuels, Energy and Agriculture: Powering Towards or Away From Food Security?
Australian Acedemy of Technological Sciences and Engineering, Drowford Fund Seminar, 15 August, Retrieved 12 November, 2007, from http://www.crawfordfund.org/events/conference07.htm
AusIndustry. (n.d.), Biofuels Capital Grants (BCG) - Fact Sheet, An Australian Government Initiative
AusIndustry. Retrieved 12 12, 2007, from http://www.ausindustry.gov.au/content/content.cfm?ObjectID=8B98D9B4-D244-43EF-A4AA7D42B39DFE1B&L2Parent=aeb901e5-7cb8-4143-a3bf33b2423f9da6&L3Parent=258F42DD-E01B-4BAA-A9643E3BCC9706C5
Australian Biofuels. (2007), Oaklands Ethanol Production Facility, Australia Biofuels, July 14,
Retrieved 26 August 2007, from http://www.indcor.com.au/index.php?p=site&sp=projects&ps=abf&pID=00000026
Australian Biofuels. (2007), Swan Hill Ethanol Pty Ltd, Australian Biofuels.23 August, Retrieved 6
August, 2007, from http://www.aael.net/index.php?p=site&sp=projects&ps=abf&pID=00000004 Australian Grain (2007), Ethanol underpinning grain demand, Australian Grain, July-August, p. 19.
Review of grain-based ethanol production effects on Australian livestock industries
Page 121 of 148
Badger, P. C. (2002), Ethanol from cellulose: A general review, Retrieved November 6, 2007, from
http://www.hort.purdue.edu/newcrop/ncnu02/pdf/badger.pdf Baker, A., & Zahniser, S. (2007), Ethanol Reshapes the Corn Market. Amber Waves , 5, 1-5. Batal, A. B., & Dale, N. M. (2006), True Metabolizable Energy and Amino Acid Disgestibiity of
Distillers Dried Grains with Solubles. Appl. Poult. , 15, 89-93. Batal, A., & Dale, N. (2003), Mineral Composition of Distillers Dried Grains with Solubles. Research
Report, University of Georgia, Poultry Science, Georgia. Batten, D., & O'Connell, D. (2007), Biofuels in Australia Some economic and policy considerations.
Australian Government, Rural Industries Research and Development Corporation. RIRDC Publication No 07/177.
BBC News (2007), EU ministers agree biofuel target, BBC News, 15 February 2007, Retrieved from
http://news.bbc.co.uk/1/hi/world/europe/6365985.stm Beer, T., & Grant, T. (2007), Life-cycle analysis of emissions from fuel ethanol and blends in
Australian heavy and light vehicles. Journal of Cleaner Production , 15, 833-837. Beer, T., Olaru, D., van der Schoot, M., Grant, T., Keating, B., Hatfield Dodds, S., et al. (2003),
Appropriateness of a 350 Million Litre Biofuels Target. Australian Government, Department of Industry Tourism and Resources.
Belyea, R. L., Rausch, K. D., & Tumbleson, M. E. (2004), Composition of corn and distillers dried
grains with solubles from dry grind ethanol processing. Bioresource Technology , 94, 293-298.
Bensaid, B., (2004), Road Transport Fuels in Europe: the Explosion of Demand for Diesel Fuel, IFP,
Rueil-almaison Cedex, France. Benson, C. S., Wright, C. L., Tjardes, K. E., Nicolai, R. E., & Rops, B. D. (2005), Effects of Feeding
Varying Concentrations of Dry Distillers Grains with Solubles to Finishing Steers on Feedlot Performance, Nutrient Management and Odour Emissions. Department of Animal and Sciences & Agricultural and Biosystems Engineering. SDSU.
Benz, J. M., M. D. Tokach, S. S. Dritz, J. L. Nelssen, J. M. DeRouchey, and R. D. Goodband.
(2007), Effects of dried distillers grains with solubles and extruded expelled soybean meal on growth performance and carcass characteristics of grow-finish pigs. Kan. State Ag Exp. St. Rep. of Prog. No. 985. pp. 105-113.
Bernard, D. J. (2007), Controlling Feed Costs Over the Long Haul. The University of Georgia.
Kentucky: Kentucky Dairy Conference. Biofuels Taskforce (2005), Report of the Biofuels Taskforce to the Prime Minister, Industry,
Infrastructure and Environment Division Department of the Prime Minister and Cabinet.
Review of grain-based ethanol production effects on Australian livestock industries
Page 122 of 148
Birkelo, C. P., Brouk, M. L., & Schingoethe, D. J. (2004), The energy content of wet corn distillers grains for lactating dairy cows. J. Dairy Sci. , 87, 1815-1819.
Bishop, C. (2007), Crop of Challenges, (J. Mathers, Ed.), The Roadahead Magazine, Oct/Nov, pp.6-
9. Bonnardeaux, J. (2007), Potential Uses for Distillers Grains. Government of Western Austrlia,
Department of Agriculture and Food, South Perth. Bothast, R. J. (2005), New Technologies in Biofuel Production. Southern Illinois University , National
Corn-To-Ethanol Research Center, Edwardsville. Bourne, J. K. (2007), Growing Fuel The Wrong Way, The Right Way. National Geographic , 2007,
October pp. 41-58. Bozon, I. J., Campbell, W. J., & Lindstrand, M. (2007), Global trends in energy. The McKinsey
Quarterly , 1, pp. 48-55. Brough, D. (2005), French Grain, Beet Areas for Ethanol Seen Surging, Planet ARK, 26 September,
Retrieved 10 22, 2007, from http://www.planetark.com/dailynewsstory.cfm/newsid/32661/story.htm Brown, L. (2006), Starving for Fuel: How Ethanol Production Contributes to Global Hunger, The
Globalist, 2 August, Retrieved January 23, 2008, from http://www.theglobalist.com/StoryId.aspx?StoryId=5518 Caesar, W. K., Riese, J., & Seitz, T. (2007), Betting on biofuels. The McKinsey Quarterly , 2, pp. 54-
63. Campbell, S. J. (2006), Renewable Fuels Discussion points for the Livestock Industry. Carey, J., Carter, A., & Shameen, A. (2007), Food vs Fuel, Business Week Online, 5 February,
Retrieved January 23, 2008, from http://www.businessweek.com/magazine/content/07_06/b4020093.htm Casey, K., Grandin, T., Gardner, T., Holcomb, G., Klett, H., Kenyon, R., et al. (1994), Designing
Better Feedlots. (P. Watts, & R. Tucker, Eds.) State of Queensland Department of Primary Industries.
Cattle Council of Australia, ALFA. Implications of Subsidised Ethanol Production on CCA and ALFA
Members. CARD. (2007), Centre for Agricultural and Rural Development, 5 November, Ethanol Plants,
Retrieved 15th, Nov, 2007, from: http://www.card.iastate.edu/research/bio/tools/ethanol.aspx Chambers, W. (2004), Forecasting Feed Grain Prices in a Changing Environment. FDS-04F-01,
United States Department of Agriculture, Economic Research Service.
Review of grain-based ethanol production effects on Australian livestock industries
Page 123 of 148
Chan, K. Y., Heenan, D. P., & So, H. B. (2003), Sequestration of carbon and changes in soil quality under conservation tillage on light-textured soils in Australia: a review. Australian Jounrnal of Experimental Agriculture , 43, 325-334.
Charles, M. B., Ryan, R., Ryan, N., & Oloruntoba, R. (2007), Public policy and biofuels: The way
forward? Energy Policy , 35, 5737-5746. CIE. (2005), Impact of ethanol policies on feedgrain users in Australia. Centre for International
Economics, Canberra & Sydney. CIE. (2007), The Economics of Biofuels for Western Australia. Centre for International Economics
Canberra. Clark, P. W., & Armentano, L. E. (1993), Effectiveness of Neutral Detergent Fiber inWhole
Cottonseed and Dried Distillers Grains Compared with Alfalfa Haylage. Journal of Dairy Science , 76, 2644-2650.
Cohn, D. R., Bromberg, L., & Heywood, J. B. (2005), Direct Injection Ethanol Boosted Gasoline
Engines: Biofuels Leveraging for Cost Effective Reduction of Oil Dependence and CO2 Emissions. PSFC/JA-06-16, Massachusetts Institute of Technology, Cambridge.
Coltrain, D. (2004), Economic Issues with Ethanol, Revisisted. Kansas State University, Department
of Agricultural Economics. Core, J. (2004), New Milling Methods Improve Corn Ethanol Production, Agricultural Research, July,
Retrieved 11 15, 2007, from http://www.ars.usda.gov: http://www.ars.usda.gov/is/AR/archive/jul04/corn0704.htm?pf=1
Cottrell, A., Rigby, G., Scaife, P., Brown, P., & Wibberley, L. (2007). Ethanol production from grain,
Life cycle and techno-economic assessment. Appendix 3, CSIRO Energy Technology, Energy and Technology Group.
Crawford, G. I. (2007), Managing sulfur concentrations in feed and water. Proc. 68th Minn. Nutr.
Conf. St. Paul, MN. Cromwell, G. L. (2002), Approaches to meeting the animal's phosphorus requirement. Proc.
Minnessota Nut. Conf. Minneapolis-St. Paul, MN. Cromwell, G. L., Herkelman, K. L., & Stahly, T. S. (1993), Physical , chemical and nutritional
characteristics of distillers dried grains with solubles for chicks and pigs. J. Anim. Sci. , 71, 679-686.
CSIRO. (2007), Biofuels in Australia - issues and prospects. Australian Government, Rural
Industries Research and Development Corporation. Currie, J. (2007), Food, Feed and Fuels: An outlook on the agriculture, livestock and biofuel
markets, Goldman Sachs Group, March 2007, Retrieved 11th May, 2007, from http://www.gceholdings.com/pdf/GoldmanReportFoodFeedFuel.pdf
Review of grain-based ethanol production effects on Australian livestock industries
Page 124 of 148
Currie, J., Nathan, A., Gutman, J., & Zhang, R. (2007), Commodities Food, Feed and Fuel An agricultural livestock and biofuel primer. The Global Sacks Group.
Cyriac, J., Abdelqader, M. M., Kalscheur, K. F., Hippen, A. R., & Schingoethe, D. J. (2005), Effect of
replacing forage fiber with non-forage fiber in lactating dairy cow diets. J. Dairy Sci. , 88 (Suppl 1):252 (Abstr.).
Dalby Bio-Refinery Limited. (2007), The Process, Dalby Bio-Refinery Limited, 4 June, Retrieved
August 6, 2007, from http://www.dalbybiorefinery.com.au/html/process.htm Dale, B. E. (2007), Why cellulosic ethanol is nearer than you may think. NACAA Conference. Grand
Rapids, Michigan: Michigan State University. Dale, R. T., & Tyner, W. E. (2006), Economic and Technical Analysis of Ethanol Dry Milling: Model
Description. Staff Paper # 06-04, Purdue University, Department of Agricultural Economics , West Lafayette, IN.
Darby, M. (2006), Australia Biofuels Annual. USDA Foreign Agricultural Services, Canberra. Daubert, R W; Drouillard, J S; Loe, E R; Sindt, J J; Depenbusch, B E; Fox, T J; Greenquist, M A;
Corrigan, M E. (2005), Optimizing use of wet sorghum distillers grain with solubles in flaked-corn finishing diets. Kansas State Univ. Exp. Stat. Rep. of Prog. No943, (pp. 15-18).
Davis, K. (2001), Corn Milling, Processing and Generation of Co-products, Minnesota Nutrition
Conference Minnesota Corn Growers Association Technical Symposium, 11 September, Retrieved 11 07, 2007, from http://www.distillersgrains.org/files/grains/K.Davis--Dry&WetMillProcessing.pdf
DeDecker, J M; Ellis, M; Wolter, B F; Spencer, J; Webel, D M; Bertelsen, C R; Peterson, B A (2005),
Effects of dietary level of distillers dried grains with solubles and fat on the growth performance of growing pigs. J. Animal Sci. , 83 (Suppl.2), 79.
Depenbusch, B. E., Drouillard, J. S., Loe, E. R., Corrigan, M. E., & Quinn, M. J. (2007 a), Optimizing
use of distillers grains with solubles (DGS) in finishing cattle diets. Kansas State Univ. Exp. Stat. Rep of Prog. No. 978, (pp. 63-68).
Depenbusch, B. E., Drouillard, J. S., Loe, E. R., & Quinn, M. J. (2007b), Efficacy of feed grade
antibiotics in finishing diets containing distillers grains with solubles (DGS). Kansas State Univ. Exp. Stat. Rep. of Prog. No. 978, (pp. 73-77).
Depenbusch, B. E., Drouillard, J. S., Loe, E. R., Quinn, M. J., & Corrigan, M. E. (2007c), Degermed
corn distillers grain with solubles (DGS) have feed value similar to traditional distillers grains. Kansas State Univ. Exp. Rep. or Prog. No. 978, (pp. 69-72).
de Miguel (2006), Outlook for Bioethanol in Europe Boosting consumption, European Fuel
Association (eBIO), World Biofuels 2006, 9-11 May, Seville. DEWHA (2002), Setting the Ethanol Limit in Petrol. Australian Government, Department of the
Environment, Water, Heritage and the Arts, Environemnt Australia, Canberra.
Review of grain-based ethanol production effects on Australian livestock industries
Page 125 of 148
DEWHA (2005), Setting National Fuel Quality Standards. Australian Governement, Department of the Environment and Heritage Water, Heritage and the Arts, Canberra.
Dias De Oliveira, M. E., Burton, V. E., & Rykiel JR., E. J. (2005), Ethanol as Fuel: Energy, Carbon
Dioxide Balances, and Ecological Footprint. BioScience , 55 (No. 7), 593-602. DiCostanzo, A. (1995), Supplementing Beef Cow Rations. University of Minnesota, St. Paul,
Department of Animal Science. DiPardo, J. (2000), Outlook for Biomass Ethanol Production and Demand, Energy Information
Administration, 26 April, Retrieved November 5, 2007, from http://tonto.eia.doe.gov/FTPROOT/features/biomass.pdf Distillers Grains Quarterly. (2005), Opportunities & Challenges for Distillers Grains. Distillers Grains
Quarterly , Volume 1 (Issue 1). Distillers Grains Technology Council. (2005), Availability, Distillers Grains Technology Council.
Retrieved 09 25, 2007, from http://www.distillersgrains.org/grains/availability.html Doughtery, E., & Geuder, J. (2008), 2007 Corn Crop a Record Breaker, USDA Reports - Cotton,
Rice Yields Hit All-Time Highs, USDA National Agricultural Statistics Services. Retrieved from http://www.nass.usda.gov/Newsroom/2008/01_11_2008.asp
Drewitt, R. (n.d.), Ethanol Distillers Approved, Grains Council of Australia. Retrieved November 16,
2007, from www.grainscouncil.com: http://www.grainscouncil.com/GW06/Presentations/Drewitt.pdf EA Systems (2006), Background Document, Preliminary Environmental Assessment – Proposed
Ethanol Plant, Report number 21480.13601, Environmental & Agricultural Science & Engineering, Armidale, NSW.
Ebert, J. (2007), New and Improved. Ethanol Producer Magazine, August, Retrieved 11 15, 2007,
from http://ethanolproducer.com: http://ethanolproducer.com/article.jsp?article_id=3166 EBIO. (2006). Outlook for Bioethanol in Europe Boosting Consumption, European Bioethanol Fuel
Association. Retrieved January 23, 2008, from http://www.ebio.org/downloads/publications/060509_eBIO_WBC_Seville_2006_def.pdf EBIO (2007), Production Capacity Installed, European Bioethanol Fuel Association, Retrieved
December 2007 from http://www.ebio.org/production_data_pci.php. Economics Consulting Services. (2007), Sugar and Ethanol Production Potential: Ord River Stage II.
Mt Pleasant, Western Australia. Eden, R. E. (1992), Code of Practice Piggeries. Victoria: Health Commission of Victoria and
Department of Agriculture. EIA (2007), Annual Energy Outlook 2007 with projections to 2030, Energy Information
Administration, February, l. Retrieved December 17, 2007, from http://www.eia.doe.gov/oiaf/analysispaper/biomass.htm
Review of grain-based ethanol production effects on Australian livestock industries
Page 126 of 148
Eidan, V. R. (2005), Agriculture as a Producer of Energy. In Agriculture as a Producer and
Consumer of Energy, (J. Outlaw, K. J. Collins, & J. A. Duffield, Eds.). Eisenthal, J. (2007), Retrieved 11 12, 2007, from www.ethanol.org:
http://www.ethanol.org/pdf/contentmgmt/March_07_ET_cover_story.pdf Elobeid, A., Tokgoz, S., Hayes, D., Babcock, B., & Hart, C. (2007), The Long-Run Impact of Corn-
Based Ethanol on the Grain, Oilseed, and Livestock Sectors: A Preliminary Assessment. AgBioForum , 10 (1), 11-18.
Elsayed, M. A., Matthews, R., & Mortimer, N. D. (2003), Carbon and energy balances for a range of
biofuels options. Sheffield Hallam University, Resources Research Unit. Emergent Futures. (2007)., Victorian Biofuels Inquiry submision by Australian Pork Limited.
Australian Pork, Canberra. Enecon Pty Ltd. (2002), Wood for Alcohol Fuels Status of technology and cost/benefit analysis of
farm for bioenergy. Rural Industries Research and Development Corporation. RIRDC Publication No 02/141.
Enkvist, P., Naucler, T., & Rosander, J. (n.d.), A cost curve for greenhouse gas reduction. The
McKinsey Quarterly . EA Systems Pty Ltd. (2006), Preliminary Environmental Assessment - Proposed Ethanol Plant.
Background Document. Environmental resources Management Australia. (2006), Proposed Ethanol Production Facility at
Oaklands. Preliminary Assessment Report, Australia Ethanol Limited. EP Act (2005), Energy Policy Act of 2005, Public Law, 105-58 August 8, Australia. Epp, M., B. Barnhardt, A. Bryant, and D. Blasi. 2007. Dried distillers grains improve the performance
of beef cattle intensively grazing early summer bluestem pasture. Kan. Ag. Exp. St. Rep. of Prog. No. 978. pp/ 60-61.
Ergul, T., Amezuca, M. C., Parson, C. M., Walters, B., Brannon, J., & Noll, S. L. (2003), Amino acid
digestibility in corn distillers dried grains with solubles. Poult. Sci. , 82 (Suppl.1):70 (Abstr). Erickson, T. J., Klopfenstein, T. J., Adams, D. C., & Rasby, R. J. (2006), Utilization of Corn Co-
Products in the Beef Industry, Distillers Grains Quarterly, First Quarter, Retrieved from www.distillersgrainsquarterly.com: http://www.distillersgrainsquarterly.com/article-print.jsp?article_id=1180
Ethanol Producer Magazine (2007a), New and Improved, August, Retrieved November 2007 from
http://ethanolproducer.com/issue.jsp?issue_id=72 Ethanol Producer Magazine (2007b), From Operating Ease to Operating Costs, September,
Retrieved November 2007 from http://ethanolproducer.com/issue.jsp?issue_id=73
Review of grain-based ethanol production effects on Australian livestock industries
Page 127 of 148
Ethtec. (2008), Ethanol Technologies Limited. Retrieved January 22, 2008, from http://www.ethtec.com.au/default.asp?ID=about_us
Etter, L., & Brat, I. (2007), US ethanol engine is sputtering. The Wall Street Journal, October 2,
2007, p. 5. European Bioethanol Fuel Association. (2006), STRONG GROWTH IN 2006 BIOETHANOL FUEL
PRODUCTION, European Bioethanol Fuel Association, 21 March, Retrieved 12 13, 2007, from http://www.ebio.org/downloads/press/070321_PR_eBIO_on_production_2006.pdf
Ewall, M. (2006), Energy Justice.net. Retrieved 02 20, 2008, from
http://www.energyjustice.net/ethanol/factsheet.html Faaij, A. (2006), The global dimensions of bioenergy markets, trade and sustainable development.
Copernicus Institute, Utrecht University. FAO. (2008), Crop Prospects and Food Situation. (no 1.). FAO. (2007), Food Outlook Global Market Analysis. Retrieved March 2008, 18, from
http://www.fao.org/docrep/010/ah876e/ah876e13.htm Farquharson, R., Schwenke, G., & Mullen, J. (2003), Should we manage soil organic carbon in
Vertosols in the northern grain region Australia? Australain Journal of Experimental Agriculture , 43 (3), 261-270.
Farrel, A. E., Plevin, R. J., Turner, B. T., Jones, A. D., O'Hare, M., & Kammen, D. M. (2006), Ethanol
Can Contribute to Energy and Environmental Goals. Science , 311, 506-508. Fastinger, N. D., and D. C. Mahan. (2006), Determination of the ileal amino acid and energy
digestibilities of corn distillers dried grains with solubles using grower-finisher pigs. J. Anim. Sci. 84, 1722-1728.
Feed Lotting. (n.d.), Energy crises creates new opportunities for Australian farmers. today's FEED
LOTTING . Ferguson, A. R. (2004), Energy Bulletin. Retrieved 09 06, 2007, from www.energybulletin.net:
http://www.energybulletin.net/2456.html Food & Water Watch, Network for New Energy Choices, Institute for Energy and the Environment at
Vermont Law School. (2007), The Rush to Ethanol Not All Biofuels Are Created Equal. Food and Agricultural Policy Research Institute. (2001), Impacts of Increased Ethanol and Biobiesel
Demand. FAPRI-UMC Report#13-01, University of Missouri, Iowa State University. Foote, C. (2004), Human Resource/Staffing Survey of the Australian Pork Industry. Workhorse
Recruitment. Australian Pork. Foran, B. (2001), CSIRO. Retrieved 11 1, 2007, from http://www.cse.csiro.au/publications/2001/biofueleconomy-01-10.pdf
Review of grain-based ethanol production effects on Australian livestock industries
Page 128 of 148
Fritsche, U. R. (2006), Sustainable Biofuels: Environmental Considerations. BELV/gtz/WWI International Conference. Washington, D.C.
Fuller, G. (2007), Ethanol on way at Dalby. The Land, August 2, 2007, p. 3. Garcia, A., & Kalscheur, K. (2007), Storage of wet distillers grians. Proceedings of the Tri-State
Dairy Nutrition Conference. Gillard, M., O'Connell, C., Brockway, D., & Keniry, J. (2005), Report of the Biofuels Taskforce to the
Prime Minister. Australian Government, Biofuels Taskforce. Global Subsidies Initiative. (n.d.), Global Subsidies Initiative. Retrieved 11 2, 2007, from
www.globalsubsidies.org: http://www.globalsubsidies.org/rubrique.php3?id_rubrique=1&lang=en
Gnansounou, E., & Dauriat, A., (n.d.), Energy Balance of Bioethanol: A Synthesis. Swiss Federal
Institute of Technology (EPFL), Laboratory of Energy Systems, Lausanne, Switzerland. Goodwin, S. (2007), Plant waste fuels future, Australia's technology a world first. The Land
November 22, 2007. Gordon, C M; Drouillard, J S; Gosch, J; Sindt, J J; Montgomery, S P; Pike, J N; Kessen, T J;
Sulpizio, M J; Spire, M F; Higgins, J J (2002), Dakota Gold brand distillers grains with solubles: effects on finishing performance and carcass characteristics. Kansas STate Univ. Exp. STat. Rep. of Prog. No.890, (pp. 27-29).
Government of Western Australia, Department of Agriculture and Food. (2006), Ethanol Production
from Grain. Retrieved December 18, 2007, from http://www.agric.wa.gov.au/content/SUST/BIOFUEL/200601_BFGrainEthEcon.pdf
Graf, A., & Koehler, T. (2000), Oregon Cellulose-Ethanol Study An evaluation of the potential for
ethanol production in Oregon using cellulose-based feedstocks. Bryan & Bryan Inc., Celilo Group.
Grainol Ltd. (n.d.), Grainol Ltd. Retrieved October 29, 2007, from www.grainol.com.au:
http://www.grainol.com.au/brochure.pdf Greer, D. (2005), Retrieved 09 06, 2007, from
http://www.harvestcleanenergy.org/enews/enews_0505/enews_0505_Cellulosic_Ethanol.htm Greer, D. (2007), Realities, Opportunities for Cellulosic Ethanol. BioCycle , 48 (1), 46. Hallam, L. (2007), Envirofuel -Sustainable Transport for Australia. Retrieved November 16, 2007,
from www.envirofuel.com.au: http://envirofuel.com.au/2007/10/11/ethanol-plant-planned-for-casino/
Ham, G. A., Stock, R. A., Klopfenstein, T. J., Larson, E. M., Shain, D. H., & Hoffman, R. P. (1994),
Wet corn distillers byproducts compared with dried corn and distillers grains with solubles as a source of protein and energy for ruminants. J. Anim. Sci. , 72, 3246-3257.
Review of grain-based ethanol production effects on Australian livestock industries
Page 129 of 148
Harborth, K. W., Marston, T. T., & Llewellyn, D. A. (2006), Comparison of corn and grain sorghum dried distillers grains as protein supplements for growing beef. Kansas State Univ. Exp. Stat. Rep. of Prog. No. 959, (pp. 3-6).
Hastad, C W; Nelssen, J L; Goodband, R D; Tokach, M D; Dritz, S S; DeRouchey, J M; Frantz, N Z
(2005), Adding dried distillers grains to swine diets affects feed preference. Kansas State Univ. Exp. Stat. Rep. of Prog. No. 964, (pp. 149-159).
Hastad, C W; Nelssen, J L; Goodband, R D; Tokach, M D; Dritz, S S; DeRouchey, J M; Frantz, N Z
(2004), Effects of increasing dried distillers grains on feed intake. Kansas State Univ. Exp. Stat. Rep. of Prog. No. 940, (pp. 132-138).
Hebebrand, C., & Laney, K. (2007), An Examination of U.S. and EU Government Support to
Biofuels: Early Lessons. United Nations Foundation, International Food & Agricultural Trade Policy Council.
Henke, J. M., Klepper, G., & Schmitz, N. (2005), Tax Exemption for Biofuels inGermany: Is Bio-
Ethanol an Option for Climate Policy. Energy , 30 (14), 2617-2635. Heuvelmans, G., Muys, B., & Feyen, J. (2005), Extending the life Cycle Methodolgy to Cover
Impacts of Land Use Systems on the Water Balance. LCA Methodolgy , 10 (2), 113-119. Higgins, P. (2006 a), GRDC Update Paper – Energy in Agriculture – The Effects of Biofuel
Developments on the Grain Industry, Emergent Futures, 12 January, Retrieved December 20, 2007, from http://www.emergentfutures.com.au/wpdl/GRDCFarmUpdates_EffectsBiofuelsonGrainIndustry_paper_Feb2007.pdf?PHPSESSID=9d35c943d86cafcd1a66da206b4d0af3
Higgins, P. (2006 b), Oil price spike to the end, you can bet on it. The Age .High Plains Midwest AG
Journal, 15 August. Hill, G. M., Link, J. E., Rincker, M. J., Kirkpatrick, D. L., Gibson, M. L., & Karges, K. (2007),
Utilisation of distillers dried grains with solubles and phytase in sow lactation diets to meet the sow's P requirement and reduce faecal P concentration. J. Anim. Sci. 10, 2527/jas.2006-381.
Hill, J., Nelson, E., Tilman, D., Polasky, S., & Tiffany, D. (2006), Environment, economic, and
energetic costs and benefits of biodiesel and ethanol biofuels. Proceedings of the National Academy of Science of the United States of America,25 July, 103 (no. 30), pp. 11206-11210.
Holmes Sackett & Associates. (2004), Managing sheep in droughtlots, A best practice guide. Hunt, S. (n.d), Biofuels for Transport: Global Potential and Implications for Sustainable Agriculture
and Energy in the 21st Century, Worldwatch Institute, Washington D.C. IEA (2006), World Energy Outlook, . Summaries and Conclusions, International Energy Agency,
Paris.
Review of grain-based ethanol production effects on Australian livestock industries
Page 130 of 148
International Fuel Quality Center. (2004), Setting a Quality Standard for Fuel Ethanol. DEH Ethanol Standard 18/2004 Report, Australian Government, Department of the Enivornment and Heritage.
IES (2007), Well-to-wheels analysis of alternative fuels & power-trains, Institute for Environment and
Sustainability Retrieved form http://ies.jrc.cec.eu.int/115.html Iowa State University. (2005), Ethanol Co-Products for Cattle, Retrieved November 22, 2007, from
http://www.extension.iastate.edu/Publications/IBC28.pdf Iowa State University. (2006), Use of distillers grains in feedlot diets: Impact on phosphorus
excretion. www.iowabeefcenter.org. July 2006 pub. (IBC 29). Accessed November 23, 2007.
Iowa State University (2007), Iowa Beef Center, Long term storgae of wet distillers grains and CDS,
Retrieved July 2007, from http://www.iowabeefcenter.org/content/News-Publications/2007/distillers%20newsletters/Distillers%20Newsletter%20July%20Final.pdf
Johnston, L., Shurson, J., & Goihl, J. (2007), Additives to Improve Flowability of DDGS Studied.
National Hog Farmer , December 15. Jolly, S., & Wallace, A. (2007), Best practice for production feeding of lambs: A review of the
literature. Meat & Livestock Australia, Sydney, NSW. Junginger, M. 2007, Lessons from (European) Bioenergy Policies – Results of a literature review for
IEA Bioenergy Task 40, Copernicus Institute, Utrecht University. Kaiser, R. M. (2005), Variation in Composition of Distillers Wet Grains with Solubles. University of
Wisconsin-Extension, Department of Animal Science. Midwest: State Dairy Nutrition & Management Conferneces.
Kalscheur, K. F. (2006), Using distillers grains in dairy cattle diets. Pro. from 2006 Penn State Dairy
Nutrition Workshop, (pp. 79-86). Grantville PA. Keeney, D., & Muller, M. (2006), Water Use by Ethanol Plants Potential Challenges. Institute for
Agricultural and Trade Policy, Minneapolis, Minnesota. Keniry, J. (2006), Biofuels the greta debate, Farm Writers' Association of NSW, 30 June, Retrieved
02 20, 2008, from www.nswfarmwriters.org/speakers/Biofuels_300606.ppt Kennedy, P. (2007), Nutritive value of distillers grains. Appendix 2, CSIRO Livestock Industries. Kim, S., & Dale, B. E. (2002a), Allocation Procedure in Ethanol Production System from Corn Grain.
The International Journal of Life Cycle Assessment , 7 (4), 237-243. Kim, S., & Dale, B. E. (2002b), Renewable Fuels Association. Retrieved 11 15, 2007, from
http://www.ethanolrfa.org/objects/documents/82/allocation_procedures.pdf Kim, S., & Dale, B. E. (2004), Global potential bioethanol production from waste crops and crop
residues. Biomass and Bioenergy , 26, 361-375.
Review of grain-based ethanol production effects on Australian livestock industries
Page 131 of 148
Kim, S., & Dale, B. E. (2005a), Life cycle assessment of various cropping systems utilized for
producing biofuels: Bioethanol and biodiesel. Biomass and Bioenergy , 29, 426-439. Kim, S., & Dale, B. E. (2005b), Environmental aspects of ethanol derived from no-tilled corn grain:
nonrenewable energy consumption and greenhouse gas emissions. Biomass and Bioenergy, 28, 475-489.
Kim, S., & Dale, B. (2006), Ethanol Fuels: E10 - E85 - Life Cycle Perspectives. The International
Journal of Life Cycle Assessment , 11 (2), 117-121. Klopfenstein, T. (1996), Distillers grains as an energy source and effect of drying on protein
availability. Anim. Feed Sci. and Tech. 60:201-207 Klopfenstein, T. J., & Erickson, G. E. (2002), Effects of manipulating protein and phosphorus
nutrition of feedlot cattle on nutrient management and the environment. J. Anim. Sci. , 80 (E. Suppl. 2):E106-E114.
Knott, J., Shurson, J., & Goihl, J. (2004), Effects of the nutrient variability of distillers solubles and
grains within ethanol plants and the amount of distillers solubles blended with distillers grains on fat, protein and phosphorus content of DDGS. Retrieved October 30, 2007, from http://www.ddgs.umn.edu/articles-proc-storage-quality/2004-Knott-%20Nutrient%20variability.pdf
Kononoff, P. J., & Erickson, G. E. (2006), Feeding corn milling co-products to dairy and beef cattle.
Proc. from the 21st Annual Southwest Nutrient & Management Conference. Tempe, AZ. Koplow, D. (2006), Biofuels - At What Cost?, Earth Track, October, Cambridge, MA. Koplow, D. (2007), Biofuels - At What Cost? Governemnt support for ethanol and biodiesel in the
United States: 2007 Update. Earth Track, Cambridge, MA. Kryzanowski, T. (2007), Manure Manager Magazine. Retrieved 09 6, 2007, from
www.manuremanager.com: http://www.manuremanager.com/index.php?option=com_content&task=view&id=13&Itemid=9
Lancaster, P., Williams, J., Corners, J., Thompson, L., McNamara, D., & Ellersieck, M. (2004), The
effect of distillers grains with solubles as the protein source in creep feed. J. Animal Sci. , 82:332 (Abstr).
Lardy, G. (2007), Feeding Coproducts of the Ethanol Industry to Beef Cattle. AS-1242, North Dakota
State Univeristy, NDSU Extension Service , North Dacota. Lardy, G., & Anderson, V. (2003), Alternative Feeds for Ruminants, May, NDSU Extension Service,
North Dakota. Larson, E. M., Stock, R. A., Klopfenstein, T. J., Sindt, M. H., & Huffman, R. P. (1993), Feeding value
of wet distillers byproducts for finishing ruminants. J. Animal Sci. , 71, 2228-2236.
Review of grain-based ethanol production effects on Australian livestock industries
Page 132 of 148
Leonardi, C., Bertics, S., & Armentano, L. E. (2005), Effects of increasing oil from distillers grains or corn oil on lactation performance. J. Animal Sci. , 88, 2820-2827.
Lewis, D. (2007), Business Day. Retrieved 10 22, 2007, from
http://www.smh.com.au/news/business/rising-grain-prices-put-a-dent-in-fuel-revolution/2007/10/19/1192301043371.html
Lewis, D. (2007), Fuel for thought. Good Living , September 4, 2007 p. 10. Linneen, S K; Steidinger, M U; Tokach, M D; DeReouchey, J M; Goodban, R D; Dritz, S S; Nelssen,
J L (2006a), Effects of dried distillers grain with solubles on nursery pig performance. Kansas State Univ. Exp. Stat. Rep. of Prog. No. 966, (pp. 100-102).
Linneen, S K; Tokach, M D; DeRouchey, J M; Goodband, R D; Dritz, S S; Nelssen, J L; Gottlob, R
O; Main, R G (2006b), Effects of dried distillers grain with solubles on growing-finishing pig performance. Kansas State Univ. Exp. Stat. Rep. of Prog. No. 966, (pp. 103-110).
Liu, C., Schingoethe, D. J., & Stegeman, G. A. (2000), Corn distillers grains versus a blend of
protein supplements with or without ruminally protected amino acids for lactating cows. J. Animal Sci. , 83, 2075-2084.
Lodge, S. L., Stock, R. A., Klopfestein, T. J., Shain, D. H., & Herold, D. W. (1997), Evaluation of corn
and sorghum distillers byproducts. 75, 37-43. LOTFEEDING (2008), Using wet distillers grains in Texas Panhandle feedlots, January,
LOTFEEDING , pp. 51-54. Lumpkins, B. S., Batal, A. B., & Dale, N. M. (2004), Evaluation of distillers dried grains with solubles
as a feed ingredient for broilers. Poult. Sci. , 83, 1891-1896. Lumpkins, B. S., & Batal, A. B. (2005a), The bioavailbility of lysine and phosphorus indistillers dried
grains with solubles, Poultry Sci, 84, 581-586. Lumpkins, B. S., Batal, A., & Dale, N. (2005b), Use of distillers dried grains plus solubles in laying
hen diets. J. Appl. Poult. Res , 14, 25-31. Lumpkins, B. S., A. B. Batal, and N. M. Dale. (2004), Evaluation of distillers dried grains with
solubles as a feed ingredient for broilers. Poult. Sci. 83:1891-1896. Lynd, L. R., & Lave, L. (2003), Cellulosic Ethanol Fact Sheet, National Commission on Energy
Policy Forum: The Future of Biomass and Transportation Fuels, 13 June, Retrieved 11 6, 2007, from http://www.energycommission.org/files/finalReport/IV.4.c%20-%20Cellulosic%20Ethanol%20Fact%20Sheet.pdf
Macarthur Agribusiness. (2003), ALFA Australian Ethanol Industry Issues Paper "A Potential Serious
Competitor for Feedgrains?". Discussion Draft. Macarthur Agribusiness. (2003). Delvelopment of Regional Fuel Ethanol Industries Based on Grain
Feedstock and Possible Effects on the Lot Feeding and Pork Industries. ALFA.
Review of grain-based ethanol production effects on Australian livestock industries
Page 133 of 148
Mackey, B. R., Cornelius, J. C., Whitley, C., & Nelson, G. A. (1982), Economic and Policy Assessment of the Potential for Ethanol and Distillers' Feeds in Oregon. Oregon, Agricultural Experiment Station.
Malcolm, F. (2007), Where we stand on ethanol. Lotfeeding, May 2007 pp. 4-6. Mannitoba Agriculture (2001), Crop Rotations and Timing of Manure Applications, Mannitoba
Agriculture, Food and Fural Initiatives , June, Retrieved November 11, 2007, from https://www.gov.mb.ca/agriculture/soilwater/manure/fdb01s04.html
Marino, M. (2007), An unassuming starch factory on the banks of the Shoalhaven River in Nowra,
NSW, is playing an important part in the everyday life of many Australians, Grains Research & Development Corporation, 27 September, Retrieved October 23, 2007, from www.grdc.com.au: http://www.grdc.com.au/director/events/groundcover?item_id=A5B55D1DED8B9C20860C0CDE8C6EE077&article_id=A9763EE1A8AEDE76FC6664D30A923319
Martinez Amezcua, C., Parsons, C. M., & Noll, S. L. (2004), Content and relative bioavailbility of
phosphorus in distillers dried grains with solubles in chicks. Poult. Sci. , 83, 971-976. Mateo, K. S., Tjardes, K. E., Wright, C. L., & Bradley, R. D. (n.d.), Evaluation of Feeding Wet
Distillers Grains with Solubles, Dry Distillers Grains with Solubles and Blood Meal to Growing Steers. SDSU, Department of Animal and Range Sciences.
Mathews, J. (2006), A Biofuels Manifesto: Why biofuels industry creation should be ‘Priority Number
One’ for the World Bank and for developing countries, 9 October, Macquuarie University, Sydney.
Mathews, J. A. (2007), Prospects for a Biofuels Industry in Australia. Macquarie Graduate Scholl of
Management, Sydney. May, M. L. (2007), The effects of grain processing method, wet and dry distillers grains with solubles
and roughage level on performance and carcass characteristics of finishing cattle. Master's Thesis, Kansas State University, Manhattan.
May, M. L., Drouillard, J. S., Quinn, M. J., & Walker, C. E. (2007), Wet distillers grains with solubles
in beef finishing diets comprised of steam-flaked or dry-rolled corn. Kansas State Univ. Exp. Stat. Rep. of Prog. No. 978, (pp. 57-59).
McKinnon, J., Beliveau, R., & Raez, V. (2006), Optimum level of wheat-based dried distillers grains
fro feedlot cattle. Interim Report#2, University of Saskatchewan. Meerdink G. L., Belyea, R.L. & Tumbleson, M. E. 2006, Distillers Grains Terminology: Getting
Started with the Basics, Second Quarter 2006 Issue, Distillers Grains Quarterly. Meyer, N., Pingel, D., Dikeman, C., & Trenkle, A. (2006), Phosphorus excretions of feedlot cattle fed
diets containing corn or distillers co products. AS leaflet R2123, Iowa State Univrsity, Animal Ind.Rep.
Review of grain-based ethanol production effects on Australian livestock industries
Page 134 of 148
MDH (2003), Public Health Assessment Gopher State Ethanol, City of St. Paul. The Minnesota Department of Health, Ramsey County, Minnessota.
Miles, R. (2005), Ethanol - a Credible Diversification Opportunity for Regional Australia or Not?
International Ethanol Conference . Milford, B. (2007), Ethanol from Cellulose – Whats happening in the US?, Biofuels Australia.
Retrieved 11 6, 2007, from http://www.biofuelsaustralasia.com.au/article.jsp?article_id=1213&article_title=Ethanol+from+Cellulose+%3F+What%3Fs+Happening+in+the+U.S.%3F
Mintert, J. (2007), Increasing Ethanol Production and Cattle Feeding Geography. FEED LOT , pp.
12-13. MLA. (2007), (Meat & Livestock Australia Limited (MLA)) Retrieved 11 12, 2007, from
www.mla.com.au: http://www.mla.com.au/TopicHierarchy/News/MediaReleases/MLA+lamb+survey+%E2%80%93+lamb+supply+set+to+fall+due+to+the+drought.htm
Moir, D. (2006), Department of Western Australia Farmnote. Retrieved December 31, 2007, from
http://www.agric.wa.gov.au/content/PW/AH/DIS/P/FN046_2003.PDF Muller, M., Yelden, T., & Schoonover, H. (2007), Food versus Fuel in the United States. Institute for
Agriculture and trade Policy, Environment and Agriculture Program, Minnesota. Mussell, A., Oginskyy, A., & Stiefelmeyer, K. (2007), Status and Competitive Impacts of Ethanol
Development on Canadia Livestock Industries. George Morris Centre. NASS (2007), National Agricultural Statistics Service and United States Department of Agriculture.
2007. Ethanol co-products used for livestock feed. http://usda.mannlib.cornell.edu/usda/current/EthFeed/EthFeed-06-29-2007_revision.pdf. Accessed November 6, 2007.
Nastari, P. M. (2005), Ethanol - The Global Overview. International Ethanol Conference. Brisbane:
Queensland Government. National Agricultural Statistics Services and United States Department of Agriculture. (2007).
Ethanol co-products used for livestock feed. Retrieved November 6, 2007, from http://usda.mannlib.cornell.edu/usda/current/EthFeed/EthFeed-06-29-2007_revision.pdf
NFU (2007), Biofuels – Some Myths and Misconceptions, National Farmers Union, June, Retrieved
02 20, 2008, from http://www.nfuonline.com/documents/Bioenergy/Biofuels%20-%20some%20myths%20and%20misconceptions%20final%20draft.pdf
Naughten, B. (2001), Viability of sugar cane based fuel ethanol. ABARE project 2614, Australian
Bureau of Agricultural and Resource Economics, Canberra. NDSU (1999), North Dakota State University. 1999. Nutrient content of alternative feeds for
ruminants. Accessed 14 September, 2007 from http://www.ag.ndsu.edu/pubs/ansci/livestoc/as1182-3.html.
Review of grain-based ethanol production effects on Australian livestock industries
Page 135 of 148
Newlands, N. K., Foyle, J., & Yang, L. L. (2006), Potential Net Reductions In Greenhouse Gas
Emissions From Farm Bioenergy Production In Canada. American Society of Agricultural and Biological Engineers.
Nichols, J. R., Schingoethe, D. J., Maiga, H. A., Brouk, M. J., & Piepenbrink, M. S. (1998),
Evaluation of corn distillers grains and ruminally protected lysine and methionine for lactating dairy cows. J. Dairy Sci. , 81, 482-491.
Nilles, D. (2005), Barley, Distillers grains blend looks promising, Distillers Grains Quarterly, Fourth
Quarter, Retrieved from http://www.distillersgrainsquarterly.com/article-print.jsp?article_id=1182
NLWRA. (2001), Australian Agricultural Assessment 2001 Volume 1. Theme report for the National
Land and Water Resources Audit, Canberra. Noll, S. L., & Brannon, J. (2006), Inclusion levels of corn distillers grains with solubles and poultry
byproduct meal in market turkeys. Proc.2006 Poult. Sci. Assoc. Mtg. NRC. (1998). Nutrient Requirements of Swine. National Academy Press . NRC. (2000). Nutrient Requirements of Beef Cattle. National Academy Press . NRC. (2001). Nutrient Requirements of Dairy Cattle. National Academy Press . NRC. (2005). Mineral Tolerance of Animals. National Academy Press . Nyachoti, C. M., House, J. D., Slominski, B. A., & Seddon, I. R. (2005), Energy and nutrient
disgestibilties in wheat dried distillers grains with solubles fed to growing pigs. J. Sci. Food Agric. , 85, 2581-2586.
O'Connell, D. Batten, D. O'Connor, M, May, B. Raison, J. Keating, B. Beer, T. Braid, A. Haritos, V.
Cameron, B. Poole, M. Poulton, P. Graham, S. Dunlop, M. Grant, T. Campbell, P. Lamb, D. (2007), Biofuels in Australia - issues and prospects. Australian Government, Rural Industries Research and Development Corporation.
OECD-FAO. (2007), OECD-FAO Agricultureal Outlook 2007-2016, Organisation for Economic Co-
operation and Development. Retrieved January 23, 2008, from http://www.oecd.org/dataoecd/6/10/38893266.pdf
Ohga, K., & Koizumi, T. (2007), Biofuels Polices in Asia: Trade effects on World Agriculture and
Biofuels Trade, USDA Agricultural Outlook Forum, 2 March, Retrieved 02 19, 2008, from http://www.usda.gov/oce/forum/2007%20Speeches/PDF%20PPT/K%20Ohga.pdf
Orbital Engine Company. (2003), A testing Based Assessment tp Determine Impacts of a 20%
Ethanol Gasoline Fuel Blend on the Australian Passenger Vehicle Fleet - 2000hrs Material Compatibility Testing. Market Barriers to the Uptake of Biofuels Study.
Otto, D., & Gallagher, P. (2003), Economic Effects of Current Ethanol Industry Expansion in Iowa,
Iowa State Univeristy, June, Retrieved November 6, 2007, from
Review of grain-based ethanol production effects on Australian livestock industries
Page 136 of 148
http://www.agmrc.org/NR/rdonlyres/D949FB63-E1D0-40D6-86CD-5B710B8663DF/0/economiceffectsiaethanol.pdf
Parliment of Australia Finance and Public Administration. (2003), Parliment of Australia Finance and
Public Administration, June 24, 2003. Retrieved 12 11, 2007, from http://www.aph.gov.au/senate/committee/fapa_ctte/reg_partner_prog/hearings/add_info/primary_energy.pdf
Parliment of New South Whales. (2007), Biofuel (Ethanol Content) Bill 2007. Parliment of New South
Whales, Sydney. Patzek, T. W. (2004), Thermodynamics of the Corn-Ethanol Biofuel Cycle. Critical Reviews in Plant
Sciences , 23 (6), 519-567. Patzek, T. W., Anti, S.-M., Campos, R., Ha, K. W., Lee, J., Li, B., et al. (2005), Ethanol from corn:
Clean renewable fuel for the future, or drain on our resources and pockets? Environment, Development and Sustainability , 7, 319-336.
Pederson, C., Boersma, M. G., & Stein, H. H. (2007), Digestibilty of energy and phosphorus in ten
samples of distillers dried grains with solubles fed to growing pigs. J. Anim. Sci. , 85, 1168-1176.
Pederson, C., Jonsson, H., Linderg, J. E., & Roos, S. (2003), Microbiological characteristics of wet
wheat distillers grain, with focus on isolation of lactobacilli with potential as probiotics. J. App. Env.Micro. , 70, 1522-1527.
Perlack, R. D., Wright, L. L., Turhollow, A. F., Graham, R. L., Stokes, B. J., & Erbach, D. C. (2005),
Biomass as feedstock for a bioproducts for a bioenergy and bioproducts industry: the technical feasibility of a billion-ton annual supply. U.S. Department of Energy U.S. Department of Agriculture.
Pffeffer, B (2007), Lemon Tree ethanol delayed, Queensland Country Life, 8 November. Phillips, V. R., & Pain, B. F. (1998), Gaseous emissions from the different stages of European
livestock farming. Environmentally friendly management of farm animal waste. 67-72. Pimentel, D., and Pimentel, M., 1996, Food, Energy and Society: Colorado Univ. Press, Boulder,
CO, 363 p. Pimentel, D., 2001, The limitations of biomass energy, in Encyclopedia on Physical Science and
Technology: Academic Press, San Diego. CA. p. 159–171. Pimentel, D. (2003), Ethanol Fuels: Energy Balance, Economics, and Envronmental Impacts are
Negative. Natural Resources Research , 12 (No. 2), 127-134. Pimentel, D., & Patzek, T. W. (2005), Ethanol Production Using Corn, Switchgrass, and Wood;
Biodiesel Production Using Soybean and Sunflower . Natural Resources Research , 14 (1), 65-76.
Review of grain-based ethanol production effects on Australian livestock industries
Page 137 of 148
Pimentel, D. (2006), Soil Erosion: A food and environemntal threat. Environment, Development and Sustainability , 8, 119-137.
Planning and Environmental Court (2004), Emissions Report, BD831 of 2004. Pollak, M. (2007), Global and local input to biofuels inquiry. The Australian Financial Review , 26
September, p. 11. Punter, G., Richeard, D., Larive, J., Edwards, R,. Mortimer, N., Horne, R., Bauen, A,. Woods, J.,
(2004), Well-to-Wheel Evaluation for Production of Ethanol from Wheat, LowCVP, FWg-P-04-024.
Preston, R. L. (2007), Feed Composition Tables 2007, Accessed September 14, 2007 from
http://beefmagazine.com/nutrition/feed-composition-tables/beef_feed_composition/ QCL (2005), Downs ethanol Christmas present, Queensland Country Life, 1 January, Retrieved from
http://qcl.farmonline.com.au/news.asp?editorial_id=61409&class_id=1 QCL (2007), BP and Manildra announce big ethanol deal, Queensland Country Life. 22 August,
Retrieved October 22, 2007, from www.qcl.farmonline.com.au: http://qcl.farmonline.com.au/news_daily.asp?ag_id=44765
Queensland Government. (2005-2007), Queensland Ethanol Industry Plan 2005-2007, Queensland
Government Tourism, Regional Devlopment and Industry, Retrieved 12 11, 2007, from http://www.dtrdi.qld.gov.au/dsdweb/v3/guis/templates/content/gui_cue_doc.cfm?id=18857
EPA (n.d.), Diesohol for road transport, Queensland Government Environmental Protection Agency,
Retrieved 11 28, 2007, from http://www.epa.qld.gov.au/publications?id=1098 Reijnders, L., & Huijbregts, M. (2007), Life cycle greenhouse gas emissions, fossil fuel demand and
solar energy conversion efficiency in European bioethanol production for automotive purposes. Journal of Cleaner Production , 15, 1806-1812.
RFA (2005), Homegrown for the Homeland, Ethanol Industry Outlook, Renewable Fuels
Association, Retrieved 12 13, 2007, from http://www.ethanolrfa.org/objects/pdf/outlook/outlook_2005.pdf RFA (2006), From Niche to Nation, Ethanol Industry Outlook, Renewable Fuels Association,
Retrieved 12 13, 2007, from http://www.ethanolrfa.org/objects/pdf/outlook/outlook_2006.pdf Rinehart, D., & Roberts, K. (2007), Ethanol byproducts and maize supply chain study tour to USA.
Meat & Livestock Australia, Australian Lot Feeders' Association. Sydney: Meat & Livestock Australia Limited.
Roberson, K. D. (2003), Use of dried distillers grainss with solubles in growing-finishing diets of
turkey hens. Int. J. Poult. Sci. , 2 (6), 389-393. Rosentrater, K. A. (2006), Ethanol Processing Co-Products - Current Constraints and Future
Directions, ECI, March,. Retrieved 11 15, 2007, from http://services.bepress.com/eci/bioenergy_i/7/
Review of grain-based ethanol production effects on Australian livestock industries
Page 138 of 148
Rosentrater, K. A. (2006), Some Physical Properites of Distillers Grains With Solubles (DDGS).
Applied Engineering in Agriculture , 22(4), 589-595. Rubin, J., Shenfeld, A., Tal, B., Buchanan, P., & Lovely, W. (2007), Fueling Inflation, CIBC World
Markets, 22 October, Retrieved November 16, 2007, from www.research.cibcwm.com: http://research.cibcwm.com/economic_public/download/soct07.pdf
Ruddick, G. (2004), Ethanol Holdup, Tamworth News, 23 March, Retrieved November 16, 2007,
from http://www.tamworth.yourguide.com.au/detail.asp?story_id=294656 Samuelson, R. J. (2007),. Fuel vs. Fuel, Washingtonpost.com, 12 December, Retrieved January 23,
2008, from http://www.washingtonpost.com/wp-dyn/content/article/2007/12/11/AR2007121101834.html
Sanford, J. (2006), A Growing Concern - Planning to cash in on the ethanol boom? Bank on
serendipity, Canadian Business Online, 9-22 October, Retrieved 2008, from http://www.canadianbusiness.com/markets/commodities/article.jsp?content=20061009_81190_81190
Schingoethe, D. J., Brouk, M. J., & Birkelo, C. P. (1999), Milk production and composition from cows
fed wet corn distillers grains. J. Dairy Sci. , 82, 574-580. Schnepf, R. (2006), European Union Biofuels Policy and Agriculture: An Overview. CRS Report for
Congress, Congressional Research Service. Senator Feinstein. (2005), Senate Approves 8 Billion Gallon Ethanol Mandate, News from Senator
Feinstein, 15 May, Retrieved 02 20, 2008, from http://feinstein.senate.gov/05releases/r-ethanol-amndt.htm
Senne, B W; Hancock, J D; Mavromichalis, I; Johnson, S L; Sorrell, P S; Kim, I H; Hines, R H
(1996), Use of sorghum-based distillers grains in diets for nursery and and finishing pigs. Kansas State Univ. Exp. Stat. Rep. or Prog No. 772, (pp. 140-145).
Senne, B W; Hancock, J D; Sorrell, P S; Kim, I H; Traylor, S L; Hines, R H; Behnke, K C (1995),
Effects of distillers grains on growth performance in nursery and finishing pigs. Kansas State Univ. Exp. Station Rep. of Prog. No.746, (pp. 68-71).
Seungdo, K., & Dale, B. E. (2004), Global potential bioethanol production from wasted crops and
crop residues. Biomass and Bioenergy , 26, 361-375. Sexten, J. (2006), Feeding Distillers Grains to Beef Cattle. Extension, University of Illinois . SFMCA. (2005), Submission by the stock feed manufacturer's council of Australia to the Biofuels
Task Force. Shannon & Ors v Dalby Town Council & Ors (2004), QPEC 062, BD 831 of 2004, Planning &
Environmental Court of Queensland, Brisbane, July 2004.
Review of grain-based ethanol production effects on Australian livestock industries
Page 139 of 148
Shapouri, H., & Gallagher, P. (2005), USDA's 2002 Ethanol Cost-of-Production Survey. Agricultural Economic Report Number 841, United States Department of Agriculture, Office of Energy Policy and New Uses .
Shapouri, H., Duffield, J. A., & Wang, M. (2003), The Energy Balance of Corn Ethanol Revisited.
American Society of Agricultural Engineers , 46 (4), 959-968. Shapouri, H., Duffield, J. A., & Wang, M. (2002), The Energy Balance of Corn Ethanol: An Update.
Agricultural Economic Report No. 813, U.S. Department of Agriculture, Office of the Chief Economist, Office Policy and New Uses.
Sheehan, J., Camobreco, V., Duffield, J., Gradoski, M., & Shapouri, H. (1998), An Overview of
Biodiesel and Petroleum Diesel Life Cycles. U.S. Department of Agriculture, U.S. Department of Energy. Cole Boulevard, Golden, Colorado: National Technical Information Services, US Department of Commerce,Springfield, VA.
Sheehan, J., Aden, A., Paustian, K., Kendrick Killian, Brenner, J., Walsh, M., & Nelson, R. (2004),
Energy and Environmental Aspects of Using Corn Stover for Fuel Ethanol. Sheorain, V., Banka, R., & Chavan, M. (2000). Ethanol Production from Sorghum. Technical and
institutional options for sorghum grain mold management:proceedings of an international consultation, International Crops Research Institute for the Semi-Arid Tropics, ICRISAT, Patancheru,India.
Shigechi, H., Koh, J., Fujita, Y., Matsumoto, T., Bito, Y., Ueda, M., (2004). Direct Production of
Ethanol from Raw Starch via Fermentation by use of a Novel Surface-Engineered Yeast Strain Codisplaying Glucoamylase and a -Amylase. Applied and Environmental Microbiolgy , 70 (No.8), 5037-5040.
Shingoethe, D.J., Brouk, M.J., Birkelo, C.P. (1999), Milk Production and Composition from Cows
Fed Wet Corn Distillers Grains, J. Dairy Sci., 82, 574-580. Shirek, M. (2007). Ethanol Producer Magazine. August 2007 Retrieved 11 15, 2007, from
www.ethanolproducer.com: http://ethanolproducer.com/article.jsp?article_id=3165 Shurson, J., Noll, S., & Goihl, J. (2005). Corn by-product diveristy and feeding value to non-
ruminants. Proc. from 66th Minnesota Nut. Conf. . St. Paul, MN. Shurson, J. (2006). Shipping It Out DDGS Export Market Update. Distillers Grains Quarterly 2006,
Second Quarter, pp. 16-19. Single Vision Grains Australia. (2007), Prospects for a viable grain based Australian Biofuels
Industry There is no single solution, Green Paper, February, Single Vision Grains Australia. Capalaba, Queensland, Retrieved 12 18, 2007, from http://www.singlevision.com.au/documents/Prospects%20for%20a%20viable%20grain%20based%20Australian%20Biofuels%20Industry.pdf
Smith, S. (2007). Proposed Ethanol Refinery & Associated Facilities at Marinna, NSW. Pacific
Environmental.
Review of grain-based ethanol production effects on Australian livestock industries
Page 140 of 148
Smith, T., Kindred, D., Brosnan, J., Weightman, R., Shepherd, M., & Sylvester-Bradley, R. (2006), Wheat as a feedstock for acohol production, Research Review, December, HGCA.
Spangler, D., Gravert, S., Ayangbile, G., & Casper, D. (2004). Silo-King enhances the storage life
and digestibility of wet distillers grains. J. Anim. Sci. 83 (Suppl.2) , 50 (Abstr.). Spiehs, M. J., Whitney, M. H., & Shurson, G. C. (2002). Nutrient database for distillers dried grains
with solubles produced from new ethanol plants in Minnesota and South Dakota. J. Anim. Sci. , 80, 2639-2645.
Sprague, J. I. (2007). Distillers Grain Kansas Cattleman's Day Report, Feedlot, May/June, Volume
XV, 10, pp. 16-17. Stalker, L. A., Adams, D. C., & Klopfenstein, T. J. (2007). Urea inclusion in distillers dried grains
supplements. Prof. Anim.Sci. , 23, 290-394. Steenblik, R. (2007), Biofuels At What Cost?, Global Subsidies Initiative, September, Retrieved
November 5, 2007, from www.globalsubsidies.org: http://www.globalsubsidies.org/IMG/pdf/biofuel_synthesis_report_26_9_07_master_2_.pdf
Stein, H. H. (2007), Distillers dried grains with solubles (DDGS) in diets fed to swine, Retrieved
November 23, 2007, from http://www.ilpork.com/2007%20info%20for%20web/DDGS%20brochure.pdf Stein, H. H., Gibson, M. L., Pederson, C., & Boersma, M. G. (2006). Amino acid and energy
digestibility in ten samples of distillers dried grain with solubles fed to growing pigs. J. Anim. Sci. , 84, 853-860.
SFMCA (2007), Submission by the Stock Feed Manufacturer's Council of Australia and Stock Feed
Manufacturers' Association of Victoria to the Inquiry into Mandatory Ethanol and Biofuels Targets in Victoria, August, Retrieved 10 31, 2007, from http://www.parliament.vic.gov.au/edic/inquiries/biofuels/submissions/BIO_Sub_23_SFMCA.pdf
Suszkiw, J. (2007), DDGs: Ethanol byproducts to fight weeds and boost crop yields. Australia Grain,
May – June, p. 37. Svonja, G. (2007), From Operating Ease to Operating Costs: Weighing Differences in DDGS Dryers,
Ethanol Producer Magazine, June, Retrieved 11 15, 2007, from http://ethanolproducer.com: http://ethanolproducer.com/article.jsp?article_id=3032
Syvret, P. (2008), Ethanol fuel is not so green. The Courier-Mail , p. 56. Thacker, P. A., & Widyaratne, G. P. (2007), Nutritional value of diets containing graded levels of
wheat distillers grains with solubles fed to broiler chicks. Journal of the Science of Food and Agriculture , 87 (7), 1386-1390.
The Economist. (2007a), Biofuelled - Grain prices go the way of the oil price. The Economist, 21
June, Retrieved 10th Oct, 2007, http://www.economist.com/finance/displaystory.cfm?story_id=9378875
Review of grain-based ethanol production effects on Australian livestock industries
Page 141 of 148
The Economist. (2007b), Castro was right. The Economist, 7 April, 383 (8523), pp. 11-12. The Economist. (2007c), Ethanol Schmethanol, The Economist, 27 September, Retrieved October
10, 2007, from http://www.economist.com/science/displaystory.cfm?story_id=9861379 The International Grains Council. (2007). Industrial use of grains. Australia Grain , November-
December, p. 30. The Land. (2007), Ethanol help urged, The Land Newspaper, 6 September, North Richmond, NSW. The National Corn Growers Association. (n.d.). Producing Food and Fuel, Retrieved November 6,
2007, from http://www.ncga.com/news/OurView/pdf/2006/FoodANDFuel.pdf The Stock Feed Manufacturers' Council of Australia. (2005), Submission by the Stock Feed
Manufacturer’s Council of Australia to the Wheat Export Marketing Consultation Committee, The Stock Feed Manufacturers' Council of Australia, June, . Retrieved December 12, 2007, fromhttp://www.sfmca.com.au/info_centre/documents/233/WheatExp.Mark.ConsComm.Subm..pdf
The Toowoomba Chronicle (2007), $200 million ethanol plan, The Toowoomba Chronicle, 22
October, Retrieved 10 22, 2007, from http://www.thechronicle.com.au/localnews/storydisplay.cfm?storyid=3695767&thesection=localnews&thesubsection=&thesecondsubsection
The Wall Street Journal (2007), U.S. ethanol engine is sputtering, Corporate News, 2 October, The
Wall Street Journal. http://www.wsj.com The White House (2007), Fact Sheet: Harnessing the Power of Technology for a Secure Energy
Future, White House News, Office of the Press Secretary, 22 February. Thomson, I. (2007), The Power of Politics, Biofuels Australasia, July, Retrieved 08 23, 2007, from
http://www.biofuelsaustralasia.com.au/article.jsp?article_id=1221&article_title=The+Power+of+Politics
Thomson, M. (2008), Bush over a barrel on oil. Country Life . Thomson, R. (2004), Ethanol Plant gets $1.1 Million Funding, NENWACC News, 7th Edition,
November, Retrieved 10 23, 2007, from www.nenwacc.com.au: http://www.nenwacc.com.au/Documents/Newsletters/Nov04%20News.pdf
Todd, R. W., Cole, N. A., & Clark, N. R. (2006), Reducing crude protein in beef cattle diets reduces
ammonia emissions from artificial Feedyard surfaces. J. Environ. Qual. , 35, 404-411. Todd, R. W., Cole, N. A., & Clark, R. N. (2007), Ammonia Emissions from Open Lot Beef Cattle
Feedyards on the Southern High Plains, USDA Agricultural Research Service, Retrieved October 23, 2007, from http://www.epa.gov/ttn/chief/conference/ei16/session5/todd.pdf
Trenkle, A. (2006), With increasing availability of distillers grains will phosphorus be a problem for
Iowa Livestock producers? Iowa State Univ. Anim. Ind. Rep. 2006 A. S. Leaflet R2124.
Review of grain-based ethanol production effects on Australian livestock industries
Page 142 of 148
Trenkle, A. (2007), Performance of finishing steers fed modified wet distillers grains. Iowa State
University Anim. Ind. Rep. 2007 A.S. Leaflet wet distillers grains. Trewin, D. (2006), 2006 Year Book Australia. ABS Catalogue No. 1301.0, Australian Bureau of
Statistics, Canberra. Tuttle, C. (2006), U.S. Biofuels Industry Capital Markets Perspective. Jefferies. Turner (n.d.), It’s all about agriculture, Australian Biofuels Pty Ltd. Tzilivakis, J., Warner, D., May, M., Lewis, K., & Jaggard, K. (2005). An assessment of the energy
inputs and greenhouse gas emissions in sugar beet production in the UK. Elsevier Agricultural Systems , 85 (2), 101-119.
U.S. Grains Council. (2007). U.S. Suppliers Of Distillers Dried Grains with Solubles (DDGS),
Retrieved November 15, 2007, from www.grains.org: http://www.grains.org/galleries/DDGS%20User%20Handbook/13%20-%20DDGS%20Suppliers%20List.21%20Sept%2007.pdf
Umwelt (Australia) Pty Ltd. (2007), Kwinana Ethanol Bio-Refinery, Primary Energy, February,
Retrieved 10 22, 2007, from www.umwelt.com.au: http://www.umwelt.com.au/kwinana-ethanol/downloads.asp
Umwelt (Australia) Pty Ltd. (2006), Primary Energy Press Release, 15 September, Retrieved 10 31,
2007, from http://www.umwelt.com.au/kwinana-ethanol/pressrelease.asp Umwelt (Australia) Pty Ltd. (2006), Proposed Pinkenba Ethanol Bio-Refinery. Initial Advice
Statement, Primary Energy. University of Missouri (2006), FAPRI Ethanol Briefing Materials for Congressman Peterson,
University of Missouri, Food and Agricultural Policy Research Institute, Collage of Agriculture, Food and Natural Resources March, Retrieved 11 6, 2007, from http://www.fapri.missouri.edu/outreach/publications/2006/FAPRI_UMC_Report_02_06.pdf
University of Nebraska. (2006), Mixing Dry Materials with Wet Ethanol Byproducts Increases
Storage Life, University of Nebraska, Institute of Agriculture and Natural Resources, 27 June, Retrieved 2007, from http://ianrnews.unl.edu/static/0606270.shtml
Urbanchuk, J. M., Barker, G., & Wells, W. (2005),The Economics of a Queensland Ethanol Industry,
LECG, 8 May, Retrieved December 18, 2007, from http://www.grainscouncil.com/Policy/Biofuels/Qld_Biofuels_study.pdf
USDE (2007), DOE Mission Focus: Ethanol, United States Department of Energy Office of Science,
May, Retrieved from www.genomicsgtl.energy.gov/biofuels USDE (2007), DOE Selects Six Cellulosic Ethanol Plants for Up to $385 Million in Federal Funding,
United States Department of Energy, 28 February, Retrieved January 22, 2008, from http://www.energy.gov/news/4827.htm
Review of grain-based ethanol production effects on Australian livestock industries
Page 143 of 148
USDA. (2008), USDA Agricultural Projections to 2017. Washington. van der Aar, P. J., Junginger, M., Faaij, A., Rosillo-Calle, F., Woods, J., Cooper, G., et al. (2007),
Biofuels: implications for the feed industry. (P. v. Jannes Doppenberg, Ed.) The Netherlands: Wageningen Academic Publishers.
van Soest, P. J., & Mason, V. C. (1991), The influence of the maillard reaction upon the nutriative
value of fibtous feeds. Anim. Feed Sci. Technol. , 32, pp. 45-53. Vander Pol, K., Erickson, G., & Klopfenstein, T. (2005), Economics of wet distillers grains use in
feedlot diets. J. Ani. Sci. , 83 (Suppl.2):95 (Abstr.). Vander Pol, K. J., Erickson, G. E., Klopfenstein, T. J., Greenquist, M. A., & Robb, T. (2006a), Effect
of dietry inclusion of wet distillers grains on feedlot performance of finishing cattle and energy value relative to corn. Nebraska Beef Report 2006.
Vander Pol, K. J., Erickson, G. E., Klopfenstein, T. J., Greenquist, M. A., & Robb, T. (2006b), Effect
of corn processing in finishing diets containng wet distillers grains on feedlot performance and carcass charteristics of finishing steers. 2006 Nebraska Beef Report.
Vasconcelos, J. T., Shaw, L. M., Lemon, K. A., Cole, N. A., & Galyean, M. L. (2007), Effects of
graded levels of sorghum wet distillers grains and degraded intake protein supply on performance and carcass characteristics of feedlot cattle fed steam-flaked corn-based diets. Prof. Anim. Sci. , 23, 267-475.
von Blottnitz, H., & Curran, M. A. (2007), A review of assessments conducted on bio-ethanol as a
transporation fuel from a net energy, greenhouse gas, and environmental life cycle perspective. Journal of Cleaner Production , 15, 607-619.
von Braun, J. (2007), Promises and Challenges When Food Makes Fuel. Crawford Fund
Conference on Biofuels, Energy, and Agriculture - Powering towards world food security. Canberra: IFPRI.
Wahlstrom, R. C., German, C. S., & Libal, G. W. (1970), Corn distillers dried grains with solubles in
growing-finishing swine rations. J. Anim. Sci. , 30 (4), 532-535. Walcott, J. 2001, “Land Use Change, Productivity and Diversification”, Bureau of Rural Sciences,
Canberra. Wang, M. (2002), Energy and Greenhouse Gas Emissions Effects of Fuel Ethanol. Environmental
and Energy Study Institute, Center for Transportation Research Argonne National Laboratory, Washington, D. C.
Wang, M., Duffield, J. A., & Shapouri, H. (2003), The Energy Balance of Corn Ethanol Revisited.
American Society of Agriculture Engineers , 46 (4), 959-968. Wang, M., Saricks, C., & Santini, D. (1999), Effects of Fuel Ethanol Use on Fuel-Cycle Energy and
Greenhouse Gas Emissions. ANL/ESD-38, Argonne National Laboratory, Center for Transportation Research, Energy Systems Division, Argonne, Illinois.
Review of grain-based ethanol production effects on Australian livestock industries
Page 144 of 148
Weaver, L. (2007), Global feed markets: can U.S. ethanol deliver?, FEED International , December, p. 4.
Weaver, L. (2007), Making sense of the new energy crises. FEED International, July, pp. 21-23. Weigel, J. C., Loy, D., & Kilmer, L. (n.d.), Feed Co-Products of the Dry Corn Milling Process,
Distillers Grains, Retrieved 11 15, 2007, from www.distillersgrains.com: http://www.distillersgrains.com/pdf/drymillingbook.pdf
Westcott, P. C. (2007), U.S. Ethanol Expansion Driving Changes Throughout the Agriculture Sector.
Amber Waves ,September, Volume 5 (Issue 4). WA Biofuels Taskforce (2007), Western Australia Biofuels Taskforce Report, Department of
Agriculture and Food, Wester Australia. White, P., & Johnson, L. (2003), Corn:Chemistry and technology. In Association of Cereal Chemists
(2nd ed., p. 706). St. Paul, MN. Whitney, M. H., & Shurson, G. C. (2004), Growth performance of nursery pigs fed diets containing
increasing levels of corn distillers dried grains with solubles originatiog from a modern Midwestern ethanol plant. J. Animal. Sci. , 82, 122-128.
Whitney, M. H., Shurson, G. C., Johnston, L. J., Wulf, D., & Shanks, B. (2001), Growth preformance
and carcass characteristics of grow-finish pigs fed increasing levels of distillers dried grains with solubles. J. Animal Sci. , 79 (Suppl. 1):108 .
Whitney, M. H., Shurson, G. C., & Guedes, R. C. (2007), Effect of dietary inclusion of distillers dried
grains with solubles on the ability of growing pigs to resist a lawsonia intracellularis challenge. J. Anim. Sci. , 84, 1860-1869.
Whittington, T. (2006), Biodiesel Production and Use by Farmers Is It worth Considering?
Government of Western Australia, Department of Agriculture and Food. Widmer, M. R., McGinnis, L. M., & Stein, H. H. (2007), Energy, phosphorus, and amino acid
digestibility of high-protein distillers dried grains and corn germ fed to growing pigs. J. Anim. Sci. , 85, 2994-3003.
Widyaratne, G. P., & Zijlstra, R. T. (2004), Nutritional value of corn and wheat distillers grain and
growth performance. Prairie Swine Center Annual Research Report. Wilcox, L. (2005), Energy Outlook: Impacts on Biofuelsand Implications for the Farm Sector, Crop
Management Conference, Missouri, 14 December, Retrieved 11 06, 2007, from http://www.fapri.missouri.edu/outreach/presentations/2005/cropmang_dec05.pdf
Wilhelm, W. W., Johnson, M. F., Karlen, D. L., & Lightle, D. T. (2007), Corn Stover to Sustain Soil
Organic Carbon Further Constrains Biomass Supply. Agronomy Journal , 99, 1665-1667. Wilkins, A., & Hancock, N. (n.d.), An overview of the potential for a Biofuels Industry in Western
Australia, Department of Agriculture Western Australia, Retrieved from http://www.agric.wa.gov.au/content/SUST/BIOFUEL/OverviewWAbiofuelsIndustry.pdf
Review of grain-based ethanol production effects on Australian livestock industries
Page 145 of 148
Wilson, M. (2007), Welcome to the closed-loop revolution, E3 BioFuels, Retrieved 11 07, 2007, from
www.e3biofuels.com: http://www.e3biofuels.com/PDF/2006NovDec-FarmFutures.pdf Wilson-Field, K. (2008), Driving change with alternative fuels, Sustainability Matters,
February/March, pp. 10-12. Winters, P. (n.d.). Industrial Biotechnology Is Revolutionizing the Production of Ethanol
Transportation Fuel Biotechnology Industry Organization, Washington D.C., Retrieved 2007, from www.bio.org: http://www.bio.org/ind/biofuel/CellulosicEthanolIssueBrief.pdf
Worldwatch Institute (2006), Biofuels for transportation, Worldwatch Institute, 7 June, Retrieved
November 5, 2007, from www.bioenergy-world.com: http://www.bioenergy-world.com/europe/2008/IMG/pdf/Biofuels_for_Transport___Worldwatch_Institute.pdf
Wu, M., Wang, M., & Huo, H. (2006), Fuel-Cycle Assessment of Selected Bioethanol Production
Pathways in the United States. Center for Transportation Research, Energy Systems Division, Argonne National Laboratory.
Wu, X., Sang, Y., Zhao, R., Seib, P. A., Shi, Y., & Wang, D. (2007), Factors Adversely Affecting
Ethanol Production in the Dry Grind Processing of Sorghum. ASABE Annual International Meeting, Paper Number:076230. Minneapolis, Minnesota.
Wylie, P. (n.d.), Manageing sorghum for high yields, Horizon Rural Management, Retrieved 02 20,
2008, from http://www.horizonrural.com.au/Free%20reports/Sorghum%20Review.pdf Wylie, P. (2005), Searching for the facts on Ethanol, Horizon Rural Management, October, Vol 1,
Retrieved 11 16, 2007, from www.horizonrural.com.au: http://horizonrural.com.au/Free%20reports/Ethanol%20report.pdf
Xu, G., Whitney, M., Shurson, J., (2005), The Effects of Adding Distillers Dried Grains with Solubles,
with and without Phytase, to Swine Diets on Phosphorus Balance, and Phosphorus Levels and Chemical Forms of Phosphorus in Swine Manure, Summery Report 3/2/05, Department of Animal Science University of Minnesota.
Yates, W. J., & Coombs, R. (2003), Reveiw Options to Reduce Feedstuff Supply Variability in
Australia. Sydney: Meat and Livestock Australia Ltd. Yee, W., Taylor, F., McAloon, A., Wooley, R., & Ibsen, K. (2000), Determining the Cost of Producing
Ethanol from Corn Starch and lignocellulosic Feedstocks. National Renewable Energy Laboratory, US Department of Agriculture and US Department of Energy.
zFacts. (n.d.), Why we like Cellulosic Ethanol, zFacts.com. Retrieved 09 6, 2007, from
http://zfacts.com/p/85.html Zhan, X., Wang, D., Bean, S. R., Mo, X., Sun, X. S., & Boyler, D. (2006), Ethanol production form
supercritical-fluid-extrusion cooked sorghum. Industrial Crops and Products , 23 (3), 304-310.
Review of grain-based ethanol production effects on Australian livestock industries
Page 146 of 148
Zhang, L. (2006), The U.S. Dry Mill Ethanol Industry, Biomass Research and Development Initiative, 8 April, Retrieved 11 07, 2007, from www.brdisolutions.com: http://www.brdisolutions.com/pdfs/drymill_ethanol_industry.pdf
Zhu, J. S., Stokes, S. R., & Murphy, M. R. (1997), Substitution of neutral detergent fiber from forage
with neutral detergent fiber from by-products in the diets of lactating cows. J. Dairy Sci. , 80. Zinn, R. A., Alvarez, E., Mendez, M., Mantano, M., Ramirez, E., & Shen, Y. (1997), Influence of
dietary sulfure level on growth performance and digestive function in feedlot cattle. J. Anim. Sci., 1723-1728.
Review of grain-based ethanol production effects on Australian livestock industries
Page 147 of 148
12 Websites
12.1 Renewable Fuels
12.1.1 ENVIROFUEL – Sustainable transport for Australia
This site was started to promote the use and knowledge of alternative fuels in Australia. Since its inception Envirofuel has grown to cover the wider scope of sustainable transport, of which alternative fuels are a small part. Envirofuel scans the Australian and global news for information on sustainable transport that is applicable to all forms of transport in Australia.(http://envirofuel.com.au/) 12.1.2 Bioenergy Australia
Bioenergy Australia was established in 1997 as a government-industry forum to foster and facilitate the development of biomass for energy, liquid fuels, and other value added bio-based products. Bioenergy Australia is concerned with all aspects of biomass and bioenergy, from production through to utilisation, and its work embraces technical, commercial, economic, societal, environmental, policy and market issues (www.bioenergyaustralia.org/). 12.1.3 Evolve Cleaner Fuels
This is a site promoting ethanol fuel stations in Australia (www.evolvecleanerfuels.com). 12.1.4 Renewable Fuels Association
As the national trade association for the U.S. ethanol industry, the Renewable Fuels Association (RFA) promotes policies, regulations and research and development initiatives that will lead to the increased production and use of fuel ethanol. RFA membership includes a broad cross-section of businesses, individuals and organizations dedicated to the expansion of the U.S. fuel ethanol industry. (www.ethanolrfa.org). This website has statistics on the size and location of the US grain-based ethanol industry as well as several reports. 12.1.5 American Coalition for Ethanol (ACE)
ACE is the grassroots voice of the U.S. ethanol industry, the nation's largest non-profit association dedicated to the use and production of ethanol. ACE members include ethanol producers, industry suppliers, associations, and individuals who care about renewable fuel (www.ethanol.org/). 12.1.6 National Corn-to-Ethanol Research Center (NCERC)
The NCERC (www.ethanolresearch.com/) is a not-for-profit research centre focused on the validation of near-term technologies for enhancing the economics and sustainability of renewable fuel production. Alternate use of the facility for bio-processing scale up or validation is also possible. The Centre conducts work for industrial or institutional Clients under confidentiality agreements on a fee-for-service basis. The Centre also conducts its own research in areas of unmet need by leading or participating in collaborative grant-funded research. Utilizing the pilot plant as an experiential classroom, the NCERC provides workforce development training on Corn-to-Ethanol production process to those interested in a career in the industry.
The facility has all of the unit operations and laboratory capabilities of a commercial facility albeit on a much smaller scale. These capabilities make the facility ideal for validating commercial concepts
Review of grain-based ethanol production effects on Australian livestock industries
Page 148 of 148
for improving fuel ethanol production, generating co-products for feeding trials or process streams for further development, toll use of individual or collective unit operations for other bioprocessing needs, and laboratory method development or analytical services.
12.1.7 BBI International
www.bbibiofuels.com/ 12.1.8 Ethanol Producer Magazine
This is a monthly magazine covering a wide range of ethanol issues (www.ethanolproducer.com). 12.1.9 Distillers Grains
This is a quarterly magazine about the use of distillers grains (www.distillersgrainsquarterly.com/). 12.1.10 Biofuels Australasia
www.biofuelsaustralasia.com.au/ 12.2 Ethanol Plants
Examples of websites of grain-based ethanol plants in Australia and the USA. 12.2.1 Dalby Bio-Refinery
(www.dalbybiorefinery.com.au/) 12.2.2 E3 BioFuels Genesis
This facility near Mead, Nebraska is a combined ethanol plant (95 ML/yr), cattle feedlot (28,000 head) and anaerobic digester (methane generation plant) (www.e3biofuels.com). The E3 BioFuels Genesis plant at Mead officially began production in the spring of 2007; sufficient biogas to power the ethanol distillery has been produced on-site since December 2006. The complex—a commercial-scale, integrated system that profitably manages the wastes generated by CAFOs and produces ethanol—is the first of its kind. 12.2.3 Cornhusker Energy
Cornhusker Energy is a privately-held company dedicated to adding value to central Nebraska's corn production by turning locally-grown corn into clean-burning ethanol. (www.cornhuskerenergy.com/c3/) 12.2.4 Pacific Ethanol, Inc.
In order to meet the West Coast’s current ethanol needs, Pacific Ethanol plans to construct over 420 million gallons of capacity in the next four years. Today Pacific Ethanol operates the largest ethanol plant on the West Coast and has broken ground on several cutting-edge, strategically located production plants. (www.pacificethanol.net/site/index.php/about/facilities/).


