Embed Size (px)
Citation preview

© The Author 2012. Published by Oxford University Press. All rights reserved. For Permissions, please email: [email protected]
Mitochondrial DNA heteroplasmy in diabetes and normal adults: Role of acquired and inherited mutational patterns in twins
Gal Avital1, Mor Buchshtav1, Ilia Zhikov1,2, Jeanette Tuval (Feder)1, Sarah Dadon1, Eitan Rubin2,3, Dan Glass4, Timothy D Spector4 and Dan Mishmar1* 1. Department of Life Sciences, Ben-GurionUniversity of the Negev, Beer-Sheva, Israel 84105 2. National institute of Biotechnology in the Negev (NIBN) , Ben-Gurion University of the Negev, Beer-Sheva, Israel 84105 3. Department of Microbiology and Immunology Faculty of Health Sciences, Ben-GurionUniversity of the Negev, Beer-Sheva, Israel 84105 4. Department of Twin Research & Genetic Epidemiology, Division of Genetics and Molecular Medicine, KingsCollege, London, UKSE1 7EH *Please correspond with: Dan Mishmar, PhD, Department of Life Sciences, Building 40, Room 005, Ben-GurionUniversity of the Negev, BeerSheva, Israel 84105, Tel: +972-8-6461355, Tel: +972-8-6461356, Email: [email protected]
HMG Advance Access published June 26, 2012 at K
ing's College L
ondon on July 10, 2012http://hm
g.oxfordjournals.org/D
ownloaded from
Abstract
Heteroplasmy, the mixture of mitochondrial genomes (mtDNA), varies among individuals
and cells. Heteroplasmy levels alter the penetrance of pathological mtDNA mutations, and the
susceptibility to age-related diseases such as Parkinson's disease. Although mitochondrial
dysfunction occurs in age-related type 2 diabetes mellitus (T2DM), the involvement of
heteroplasmy in diabetes is unclear. We hypothesized that heteroplasmic mutational pattern
(HM) may change in T2DM. To test this, we used next-generation sequencing, i.e. massive
parallel sequencing (MPS), along with PCR-cloning-Sanger sequencing to analyze HM in
blood and skeletal muscle DNA samples from monozygotic twins either concordant or
discordant for T2DM. Great variability was identified in the repertoires and amounts of HMs
among individuals, with a tendency towards more mutations in skeletal muscle than in blood.
Whereas many HMs were unique, many were either shared among twin pairs or among
tissues of the same individual, regardless of their prevalence. This suggested a heritable
influence on even low abundance HMs. We found no clear differences between T2D and
controls. However, we found ~5-fold increase of HMs in non-coding sequences implying the
influence of negative selection (p<0.001). This negative selection was evident both in
moderate-highly abundant heteroplasmy (>5% of the molecules per sample) and in low
abundance heteroplasmy (<5% of the molecules). Although our study found no evidence
supporting the involvement of HMs in the etiology of T2DM, the twin study found clear
evidence of a heritable influence on accumulation of HMs as well as the signatures of
selection in heteroplasmic mutations.
at King's C
ollege London on July 10, 2012
http://hmg.oxfordjournals.org/
Dow
nloaded from

Introduction
Heteroplasmy, i.e. the mixed population of mitochondrial DNA (mtDNA) sequences
in tissues or cells, is a common feature of mitochondrial genetics (1). In humans, the
percentage of heteroplasmic mutations in a given sample correlates with penetrance of disease
phenotypes (2). Patterns of heteroplasmic mutations are known to vary among different
tissues within each individual, with the highest level recorded in post-mitotic tissues such as
muscle and brain. Additionally, variability in heteroplasmic mutational patterns among tissue
samples has been reported in forensic cases (3). The origin of heteroplasmic mutations can be
either age-related accumulation or heritable variation (4, 5). However, the proportion of
heteroplasmic mtDNA mutations that are heritable rather than accumulate in an organism is
unknown.
Unlike nuclear DNA, the cellular cytoplasm is assumed to divide randomly. Therefore
it has been suggested that heteroplasmic mutational patterns are likely to differ among
daughter cells due to replicative segregation, which is the cellular equivalent of genetic drift
in the population (1). Nevertheless, it has been recently argued that nonrandom forces play a
role in shaping the repertoire of heteroplasmic mutations in human cells(6, 7). Moreover, we
showed that recurrent de novo mutations in cancer which have reached homoplasmy
preferentially recapitulate the ancestral mtDNA state, further supporting the role natural
selection plays in shaping the repertoire of heteroplasmic mutations (8). Therefore, both
random and non-random forces are likely to shape the repertoire of heteroplasmic mutations
in the cell.
The role of heteroplasmic mutations in rare mitochondrial disorders has been
established but their involvement in many common complex disorders has not been
thoroughly assessed. Over representation of heteroplasmic mtDNA mutations was reported in
Parkinson's disease (9). However, despite the major role of mitochondria in metabolism,
patterns of heteroplasmy have not received much attention in metabolic disorders. This is
despite mitochondrial dysfunction being well known to play a central role in metabolic
disorders such as type 2 diabetes mellitus (T2DM) (10). Firstly, expression levels of genes
involved in the energy producing system of the mitochondria, i.e. oxidative phosphorylation
(OXPHOS) were reduced in T2DM as compared to normal controls (11). Secondly, offspring
of T2DM patients that had not developed the disease showed reduced ATP production (12).
Thirdly, certain populations studied demonstrate an association of T2DM with mtDNA
at King's C
ollege London on July 10, 2012
http://hmg.oxfordjournals.org/
Dow
nloaded from

common variants (13-15). Finally, differential levels of heteroplasmy of the A3243G mtDNA
mutation have been shown to cause diabetes (16). These studies drew our attention to the
possibility that patterns of heteroplasmy could be altered in T2DM and may even play a role
in the disease etiology.
Here we investigate several basic features of heteroplasmy in healthy and disease
conditions. These features include the contribution of inherited versus acquired somatic
mutations to heteroplasmic mutational patterns, the effect of natural selection on
heteroplasmic mutations and the contribution of heteroplasmy to T2DM. We use next
generation sequencing supplemented by a cloning-Sanger sequencing approach to investigate
the heteroplasmic mutational pattern utilising a twin design of monozygotic (MZ) twins either
concordant or discordant to T2DM.
Results
Assessing the pattern of heteroplasmic mutations in T2DM twins by cloning and
sequencing: We assessed the heteroplasmic mutational pattern in monozygotic twins, either
concordant or discordant for T2DM. First, we utilized a previously described approach (17)
combining PCR amplification of a D-loop mtDNA fragment, bacterial cloning and Sanger
sequencing of ~20 clones from each of the tested samples. These included blood DNA
samples (representing mitotic cells) of 9 T2DM discordant and 11 T2DM concordant twins,
and available skeletal muscle DNA (representing post-mitotic cells) from 3 concordant and 4
discordant T2DM twins. To assess the error rate of this approach we have PCR amplified the
insert of one of the clones, re-transformed to E-coli and isolated 20 clones. After repeating
this process three independent times, only one mutation – length variation of the cytosine
repeat in position 309 was identified, suggesting a very low polymerase error rate. While
analyzing the clones from our twins' samples, excluding indels from the analysis, higher
proportions and a more diverse landscape of heteroplasmic mutations were observed in
skeletal muscle compared with corresponding blood samples. The repertoire and frequency of
the heteroplasmic mutations were different between twin pairs. Shared heteroplasmic
mutations were found among some of the twin pairs (Table S1). Careful analysis of the
mutational pattern in the T2DM concordant and discordant twins considering quantity of
mutations, mutational distribution in the DNA fragment, and percentage of heteroplasmic
clones in the samples did not reveal notable difference between any of the T2DM discordant
twin members. Thus the mutational landscape and frequency identified using this technique
at King's C
ollege London on July 10, 2012
http://hmg.oxfordjournals.org/
Dow
nloaded from
did not reveal significant correlation between any tested attribute of the heteroplasmic
mutations and the disease phenotype.
Since the PCR-cloning-sequencing approach did not reveal any clear difference
between the T2DM discordant twins several possibilities emerged: (A) Heteroplasmic
mutational pattern is not clearly correlated with T2DM. (B) The resolution of the PCR-
cloning-sequencing is limited to the number of analyzed clones per sample (up to 29 clones in
certain samples of our analysis) and a higher resolution technique should be sought. (C) The
analysis using the PCR-cloning-sequencing approach is limited to a relatively short mtDNA
fragment (in our case, part of the non-coding region), and T2DM associated mutations could
inhabit other parts of the mitochondrial genome. Considering these caveats we sought a
technique that will increase the resolution for the detection of heteroplasmic mutations
throughout the mtDNA. Next generation sequencing or massive parallel sequencing (MPS,
SOLiD ABI) technology enabled the detection of heteroplasmic mutations as low as 1.6% of
the analyzed sample (18, 19) using multiple sequence reads per mtDNA nucleotide position
(20). Thus, MPS was utilized to sequence the PCR amplified whole mtDNA from blood and
skeletal muscle DNA samples available from 4 T2DM discordant and 3 T2DM concordant
twin pairs.
MPS of the whole mtDNA in the tested twins samples: Analysis of the MPS data revealed
full coverage for the whole mitochondrial genome in each of the samples analyzed from blood
and skeletal muscle. Since we aimed at analyzing heteroplasmic mutations as rare as 1.6% we
focused our analysis only on nucleotide positions having more than 1000X read coverage. A
mean of 12625.64 mtDNA positions had such coverage (Table S2, Figure S1A, S1B), i.e.
only a subset of the nucleotide positions were eventually analyzed in each of the samples. In
general, the DNA quality from skeletal muscle biopsies was lower than that obtained from
blood and indeed the sequence coverage in blood samples was higher than that of the skeletal
muscle (Figure S1A, S1B). Despite this, we maintained the minimal coverage threshold in
order to avoid the detection of false heteroplasmic mutations.
After applying our stringent bioinformatic filters (see Materials and Methods), a total
of 64 heteroplasmic mutations were identified, of which 52 mutations where found in skeletal
muscle and 12 in blood samples. Of the 64 heteroplasmic mutations, 55 were previously
described in the public databases (www.mtdb.igp.uu.se, www.mitomap.org), including 2
mutations that were previously shown to define the known mtDNA haplogroups H and UK (at
positions 7028 and 9055, respectively). While comparing the two cell types, the mean number
at King's C
ollege London on July 10, 2012
http://hmg.oxfordjournals.org/
Dow
nloaded from
of heteroplasmic mutations per individual in skeletal muscle was 3.5±1.28 (S.E.) and in blood
it was 1.0±0.23 (S.E.) (Figure 1).
The heteroplasmy levels per individual ranged from 1.67% to 48.71% per mutation
(Table S3). When dividing the overall mutations according to their prevalence in the samples,
24 mutations (37.5%) encompassed each 1.6-5% of the reads, 25 mutations (39.1%)
encompassed each 5-10% of the reads, 7 mutations (10.9%) encompassed each 10-15% of the
reads and 8 mutations (12.5%) encompassed each more than 15% of the reads. While
comparing the D-loop fragment analyzed by PCR-cloning-Sanger sequencing with the MPS
results, we found that the vast majority of the heteroplasmic mutations found in the cloning-
sequencing approach were also present in the MPS raw data. Nevertheless, most of these
mutations were removed by our stringent filters (Tables S1, S3), consistent with similar
analyses of heteroplasmy (6, 18) thus leaving three heteroplasmic mutations confirmed by
both techniques: A73G in the skeletal muscle of samples 12662 and 12661, A385G in the
skeletal muscle of sample 51402 and C64A in the skeletal muscle of samples 68441 and
70251.
Since the D-loop contains multiple low complexity repeat regions that are not easily
sequenced by MPS and hence removed by our analysis filters we sought to validate non D-
loop heteroplasmic mutations identified by the MPS. Two such heteroplasmic mutations (at
positions 9077 and 15132) were present in a relatively high fractions of the MPS sequence
reads (more than 35%) thus facilitating their identification by traditional Sanger sequencing of
PCR products. Direct Sanger sequencing of PCR products encompassing these positions in
samples harboring these mutations as well as in a sample that was negative for these
mutations confirmed the existence of the mutations as reported by the MPS (Fig. S2).
Notably, the mutation at position 15132 was detected by MPS in the blood and skeletal
muscle of sample 68842 as well as in the blood of sample 68841 but not in the skeletal muscle
of the latter individual. While carefully inspecting the MPS raw data, we have identified
heteroplasmy at this position in the skeletal muscle of sample 68841, but filter D (see
Materials and Methods) removed it from the final results.
In order to assess possible association of the heteroplasmic mutational pattern with
T2DM we compared the pattern of heteroplasmy focusing on the discordant twins. Similar to
the cloning-sequencing approach, while considering heteroplasmic mutation levels, repertoire
and distribution throughout the mtDNA, no clear disease-associated pattern emerged. In
summary, we did not find any clear association of any of the tested attributes of heteroplasmy
with T2DM.
at King's C
ollege London on July 10, 2012
http://hmg.oxfordjournals.org/
Dow
nloaded from

Previous studies have reported decreased mtDNA copy number in T2DM samples
(21). We compared the mtDNA copy number between discordant and concordant twins
(Table 1). One twin pair concordant for diabetes (70251-2) had a large difference in mtDNA
copy number, but being T2DM concordant this difference could not be related to disease
state. When comparing all the discordant twins, the ratio of the mtDNA copy number between
the healthy twin and the diabetic twin was close to one i.e. there was no difference in the
mtDNA copy number between healthy and diabetic twins.
Taken together, the cloning sequencing analysis of mtDNA control region, MPS
analysis of whole mtDNA sequences and mtDNA copy number analysis did not reveal any
clear T2DM-associated pattern in our twins.
Assessment of MPS errors of PCR products: To assess the level of MPS errors resulting
from PCR amplification we first cloned one of the amplified mtDNA fragments (Fragment 1,
mtDNA nucleotide positions 16387 to 6001) and used it as a template for PCR amplification
and sequenced the PCR product using SOLiD ABI. Our analysis revealed a single mutation in
a heteroplasmic state (nucleotide position 2924). Since this mutation was identified in a
heteroplasmic state in 8 unrelated samples (from the same sequencing run) we excluded this
mutation from further analysis. As a result our control clone did not harbor any heteroplasmic
mutations above 1.6% of the reads, which is the accepted cut-off (18).
Additionally, the quality of heteroplasmy detection could also be assessed by
analyzing recurrent heteroplasmy in twins. The majority of the heteroplasmic mutations (37
of 64 instances) are observed in paired samples (different tissues from the same individual or
samples of twin pairs). Considering the low rate of heteroplasmy in general (about 0.4
mutations per kbp), the probability of observing 17 or more common mutations shared
between twins is highly unlikely (p<1E-4, based on 10,000 permutations). These results are in
agreement with previous reports (6, 18) that demonstrate accurate and sensitive detection of
heteroplasmy with MPS, provided that careful filtering of erroneous reads and bases is
applied.
Heritable heteroplasmic mutations in monozygotic twins: The analysis of heteroplasmic
mutations in the monozygotic twins (SOLiD ABI data) revealed three types of mutations:
those that were shared among lymphocytes and skeletal muscle of the same individuals
(N=14), those shared among twins (N=23) and the unique mutations (N=27). Although only
using additional DZ twins can fully quantify shared environmental effects- we assumed that
at King's C
ollege London on July 10, 2012
http://hmg.oxfordjournals.org/
Dow
nloaded from
the shared mutations, either among twins or between tissues of the same individual (a total of
15 mutations), were predominantly heritable changes. In contrast the unique mutations
(singletons), i.e. those appearing only once within a certain individual (a total of 27 changes),
are likely to be enriched for changes that have accumulated over the lifetime of the individual.
Inspection of the repertoire and distribution of the heteroplasmic mutations revealed
that it was very diverse among unrelated individuals (especially in skeletal muscle), but
similar within a twin pair (Table S3, Figure 2a). Notably, 8 out of 12 of the heteroplasmic
mutations that were identified in blood were also found in skeletal muscle of the same
individual. Since mutations that are shared between twins pairs, rather than between unrelated
individuals, and mutations shared between tissues of the same individuals are likely to have
arisen once during development we interpret both these mutations as reflecting shared
germline mutations rather than independent somatic mutational events. Accordingly, 57.8%
of the total set of heteroplasmic mutations were shared between twin pairs or tissues of the
same individual (Figure 2b);37.5% of the shared mutations had low heteroplasmic level (1.6-
5.0%) which indicates that inherited heteroplasmic mutations can be found as rare somatic
variants.
We examined unique mutations for recurrence among unrelated individuals and
identified four such mutations (mtDNA positions 64, 73, 750, 7028). As the mtDNA is
regarded as a single locus, only a linked combination of mutations could be regarded as
sample contamination. None of the recurrent mutations were in combination with another
recurrent mutation between two tested unrelated individual. Two of the four recurrent
mutations were non-coding (D-loop), one was at an rRNA coding region, and one was a
synonymous mutation at a coding gene (MT-CO1) region. Three of the four recurrent
mutations were transversions, much more than expected by chance (p=2E-4, binomial
distribution). We cannot exclude mutational hotspots as the reason for recurrence of these
mutations. It is noteworthy that mutations at positions 414 and 408, previously argued to be
over represented in aged individuals, were found to be recurrent in the PCR-cloning but were
removed from the MPS data as they reside within low complexity repeat regions.
Signatures of negative selection in heteroplasmic mutations: While inspecting the
positions of heteroplasmic mutations (Table 2), we found that ~40% of the mutations
occurred within the mtDNA non-coding regions. The rest of the heteroplasmic mutations
(60%) mapped to the mtDNA coding sequences (rRNA, tRNA and protein coding genes).
Similar non-coding/coding mutation ratios was obtained even when the mutations were
at King's C
ollege London on July 10, 2012
http://hmg.oxfordjournals.org/
Dow
nloaded from

divided into unique or shared or whether they occurred in healthy or patient individuals
(Figure 3). Since non-coding sequences encompass only ~7% of the human mtDNA, this
finding indicates clear over-representation of heteroplasmic mutations in non-coding
sequences (p<0.001). Even while dividing the heteroplasmic mutations by their levels (1.6-
5%, and higher than 5%) the over-representation of non-coding sequences was observed
regardless whether the mutations were 'shared' or unique. This ratio implies nonrandom
characteristics in the appearance of both low and high level heteroplasmic mutations. While
considering only mutations occurring in protein-coding genes, we observed under
representation (though not statistically significant) of non-synonymous mutations (40% or
less) as compared to synonymous (60% or more). We also found an over-representation of
transitions versus transversions. Such transition bias was previously observed in population
genetics studies in humans and other species (22-24). This suggests similar selective
constraints acting on the mtDNA both within cells and at the population level.
We noticed that most of the recorded heteroplasmic mutations were identified in a
single twin pair (i.e. 68841,2, Fig.2a). In order to avoid sampling bias we repeated our
analysis excluding these twins and still observed highly significant over representation of non
coding mutations (chi square, p<0.001, Table S4). We thus conclude that negative selection is
likely to act on the accumulation of heteroplasmic mutations in our entire twin sample.
Discussion
Our sequence analysis of mtDNA control region (cloning-sequencing) and whole
mtDNA (MPS) of monozygotic twins revealed several novel insights into one of the most
fundamental characteristics of mitochondrial genetics – heteroplasmy. Firstly, the higher level
of heteroplasmy in skeletal muscle versus blood samples supported previous suggestions that
the level of heteroplasmy is higher in post-mitotic tissues (1). Secondly, the repertoire and
level of heteroplasmy varied widely among different individuals. Thirdly, a large portion of
the heteroplasmic mutational pattern was inherited rather than de-novo among twins. This
was more evident in twins with many heteroplasmic mutations. Finally, a clear pattern of
negative selection was observed both among highly abundant and low prevalence
heteroplasmic mutations. All these observations underline both the usage of MPS and the
choice of identical twins as a successful approach to investigate the nature of heteroplasmic
mutations.
at King's C
ollege London on July 10, 2012
http://hmg.oxfordjournals.org/
Dow
nloaded from

T2DM concordant and discordant twins were utilized to compare the etiological role
of acquired heteroplasmic mutational pattern differences within a constant genetic
background. Although our study enabled high resolution and identification of multiple
heteroplasmic mutations, no clear T2DM-associated pattern was identified. Two obvious
reasons could underlie these findings: (A) T2DM is an extremely complex disorder and is
frequently referred to as a family of disorders. The disease is caused by interplay between
multiple genetic and environmental factors resulting in estimated heritability of ~50% (25).
Thus, although MZ twins notably reduce the genetic variability between the twin members,
the genetic and epigenetic variability across individuals is still likely to be great. (B) Although
multiple sources point to the role that mitochondrial dysfunction plays in the etiology of
T2DM it is possible that any effect is dependent on small effect sizes and the sample size
should be increased to exclude these and possible clinical subgroups (26).
That many heteroplasmic changes were either common in both twins within a pair or
shared across both blood or skeletal muscle samples from the same individual suggest that
many of the heteroplasmic mutations are inherited rather than accumulated over the lifetime
of the individual. Although previous reports suggested the inheritance of certain discovered
heteroplasmic mutations (reviewed in (27, 28)), especially disease-causing mutations, the
extent of this phenomenon was not thoroughly addressed. In mice, apparently neutral
heteroplasmic variants could persist for at least 14 generations (29). Recent MPS analysis
(SOLiD ABI) of whole mtDNA sequences from several generations of mice either carrying a
mutated DNA PolG or wild type revealed among other findings a notable proportion of
heteroplasmic mutations sharing among sibs, suggesting their inheritance from the maternal
egg cytoplasm (20). Similarly, MPS analysis (Illumina) of whole mtDNA sequences from a
single individual revealed mutations shared among different tissues (18). These findings,
along with our observation of notable sharing of heteroplasmic mutational repertoires even
among twin members having multiple heteroplasmic mutations raise the possibility that
transmission of multiple heteroplasmic mutations could constitute a common phenomenon,
despite the possible action of the mitochondrial bottleneck during the development of the
female germline (30, 31).
We noticed that the vast majority of the mutations identified by the PCR-cloning
sequencing technique were present in the MPS data, but were removed from our final analysis
by our stringent filters. Notably, the purpose of our filters was to reduce the effect of false
positive results. Therefore, we decided against retaining these particular mutations and
removing others just because these mutations were also observed in the cloning sequencing
at King's C
ollege London on July 10, 2012
http://hmg.oxfordjournals.org/
Dow
nloaded from

technique. We are aware that by taking this approach, many true heteroplasmic mutations will
be overlooked, thus increasing the rate of false negative results. An excellent example for this
outcome is the mutation at position 15132 which was identified by the MPS and confirmed by
Sanger Sequencing in several samples but was removed from the MPS analysis of the skeletal
muscle of sample 68841 by our filter D. Hence, utilizing our filters could reduce false positive
results but may lead to overlooking true heteroplasmic mutations. This is one of the reasons
why PCR-cloning-Sanger sequencing was used in addition to MPS, as these techniques are
complementary: the drawbacks of one are relieved by the other. As an example, low
complexity repeat regions could be analyzed by the cloning-sequencing approach but
currently cannot be analyzed by MPS, at least not with high certainty. Secondly, the short
reads generated by SOLiD interferes with identifying mutational combinations, which could
be partially identified by the cloning-sequencing approach. Thirdly, mutations in the MPS are
discovered at much higher resolution than by the cloning-sequencing approach and as a result
many mutations are seen in the MPS but not by cloning. Thus until long high quality reads are
generated by any of the MPS platforms there is benefit in using the current MPS platforms in
combination with complementary techniques, such as the cloning sequencing approach.
Inheritance of heteroplasmic mutational patterns may have serious implications on
evolution, since these could set the basis for recombination, thus resulting in new genetic
backgrounds (27). Nevertheless, recombination events among mtDNA molecules which differ
in a single mutation, which constitute most events of heteroplasmy(3), are likely to have
relatively little influence on evolution. Alternatively, recombination among mixed
populations of mtDNA molecules that differ in their type (different haplogroups) would likely
influence population genetic variation. Such a mixture of two different mtDNA types could
occur upon rare paternal leakage of mtDNA(32, 33). Our results, both using the cloning-
sequencing and MPS techniques, did not reveal clear evidence for such a pattern. As SOLiD
analysis produces short reads, combinations of mtDNA mutations within a single molecule
could not be easily detected. This may be overcome by introduction of MPS techniques
generating long reads of single molecules, such as the recently developed technique by Pacific
biosciences (www.pacificbiosciences.com).
While investigating the distribution of heteroplasmic mutations we found significant
over representation of mutations in the control region, suggesting the action of negative
selection on the mtDNA coding region. Recent studies in mice used experimental designs that
could adequately differentiate between drift and selection (20, 34, 35). These studies
generated maternal mice heteroplasmic for pathogenic mutations, and then tracked their
at King's C
ollege London on July 10, 2012
http://hmg.oxfordjournals.org/
Dow
nloaded from

progression into future generations. All three studies presented evidence for purifying
selection during oogenesis within few generations. Two plausible mechanisms of selection,
working at the organelle level, have been put forward by Shoubridge and Wai(36): (A)
pathogenic mtDNA mutations may make the mitochondria prone to autophagy, or (B) non-
silent mutations will simply make these mitochondria less efficient at replication, leading to
them being outnumbered by healthy organelles. A recent study suggested that mitophagy
factors actively select against mutated mtDNA molecule in human cells, thus supporting the
autophagy mechanism (37). Additionally, we found that the effect of negative selection was
evident both when analyzing low abundance (1.6-5%) or high abundance (>5%) mutations,
which argues for the existence of an active selective mechanism that sifts through the
repertoire of heteroplasmic mutations. This is further supported by the fact that 85.9% (55/64)
out of the identified heteroplasmic mutations were already present in the public databases,
thus reflecting selection against rarer variants which are expected to be enriched with
mutations with deleterious potential.
In summary we performed deep sequence analysis of heteroplasmic mutational pattern
throughout the human mtDNA in monozygotic twins either discordant or concordant for the
T2DM phenotype. Although no clear correlation between heteroplasmic mutations and T2DM
could be observed, we identified evidence both for the inheritance of heteroplasmic mutations
and for the action of negative natural selection even over low abundance heteroplasmic
mutations.
Materials and methods:
Data set: Blood samples were collected from 20 Caucasian twin pairs (Table S5) 11
concordant and 9 discordant to T2DM, and skeletal muscle samples from a subgroup of 3
concordant and 4 discordant twins (www.twinsuk.ac.uk) from the TwinsUK registry (38). The
samples were taken from individuals at age 50 or above. DNA from blood was extracted
utilizing Nucleon BACC 3 DNA extraction kit (www.GEN-PROBE.COM). DNA from
skeletal muscle was extracted using QIAGEN DNeasy Blood & Tissue kit.
PCR amplification of an mtDNA D-loop fragment and bacterial cloning to detect
heteroplasmic mutations:PCR amplification of a 600bp fragment from the mtDNA D-loop
(nucleotide positions 1-600 in the revised Cambridge Reference Sequence (rCRS),
at King's C
ollege London on July 10, 2012
http://hmg.oxfordjournals.org/
Dow
nloaded from

GeneBankaccession number NC_012920) was performed using all blood and skeletal muscle
samples. PCR amplification was performed in a 20 μl volume containing 5 × GC buffer
(FINNZYMES), 1 mMdNTPs mix (Bio-Lab Ltd), 2.5 mM MgSO4 (FINNZYMES), 0.5 μM of
each primer (IDT), 1 unit of PhusionTaq polymerase (FINNZYMES) and 50 nanograms of
the DNA samples as templates. Primers pairs used for PCR amplification are either (A) 16526
F: CCTACTTCAGGGTCATAAAG and 626 R: TTTATGGGGTGATGTGAGCC, or (B) 1-
F: CCGGCCGGATCCGATCACAGGTCTATCACCC and 722-R:
GGCCGGAAGCTTTCGTGGTGATTTAGAGGGT. Numbers in the primer names designate
the nucleotide position of their 5' end.
Reaction conditions were as follows: denaturation at 98°C for 30 seconds followed by 35
cycles each including denaturation at 98°C for 10 seconds, annealing at 60°C for 60 seconds
and elongation at 72°C for 30 seconds. The cycles were followed by an extension step at 72°C
for 5 min. The reaction was concluded at 15˚C and stored at -20˚C until usage. PCR products
were visualized on a standard 2% Agarose gel with EtBr to ensure specificity and were then
purified using Wizard SV Gel and PCR Clean-up system (Promega), following manufacture
protocol. The purified PCR products were ligated into pGEMT-Easy vector (Promega). The
ligation reaction was performed using T4 ligase (Promega) with vector/insert ratio 1:3 at 4oC
overnight according to the protocol of DNA Ligation Kit (Promega). Then, 5 μl of the ligation
reaction were mixed with 50 μl of competent E.colicells(DH5 α) and were subjected to
electric shock using GenePulserXcell (BIO-RAD). Following electroporation, 500 μl of LB
were added, and cells were shaken gently at 37°C for 1 hour. The bacteria were plated onto
LB Petri dishes containing 50 μg/ml ampicillin, 40 μg of 0.1 M IPTG and 40 μl of 2%-X-gal,
and grown overnight at 37°C. Following 'blue/white colony selection at least 20 colonies
(white colonies contains the plasmid) from each individual were isolated, and grown in 5 ml
liquid LB with 100 mg/ml ampicillin at 37°C for 12 hours, shaking. The plasmid was purified
using Wizard plus SV minipreps DNA purification system (Promega), according to the
manufacturer protocol. We used restriction enzyme Eco521 (Fermentas) to confirm the
existence of the insert in the plasmids. In order to detect sequence variation within each
sample, 20-24 plasmid clones from each of the tested samples (i.e. blood DNA samples from
22 twin pairs and skeletal muscle DNA from 9 twin pairs, a total of ~1120 plasmid clones)
were sequenced by an ABI 3100 sequencing machine using SP6 and T7 standard primers. The
analysis of samples from two T2DM discordant twin pairs was omitted because of cross
contamination (see below), thus leaving 1080 clones for further analysis. Sequences generated
from clones of each given sample were aligned, consensus sequence was generated and
at King's C
ollege London on July 10, 2012
http://hmg.oxfordjournals.org/
Dow
nloaded from
heteroplasmic mutations were identified by comparing each of the aligned clones' sequences
to the rCRS and to the consensus sequence of the individual using Sequencher 4.10.1. The
heteroplasmic mutations were defined as those differing from the consensus sequence of the
individual and were documented for each sample.
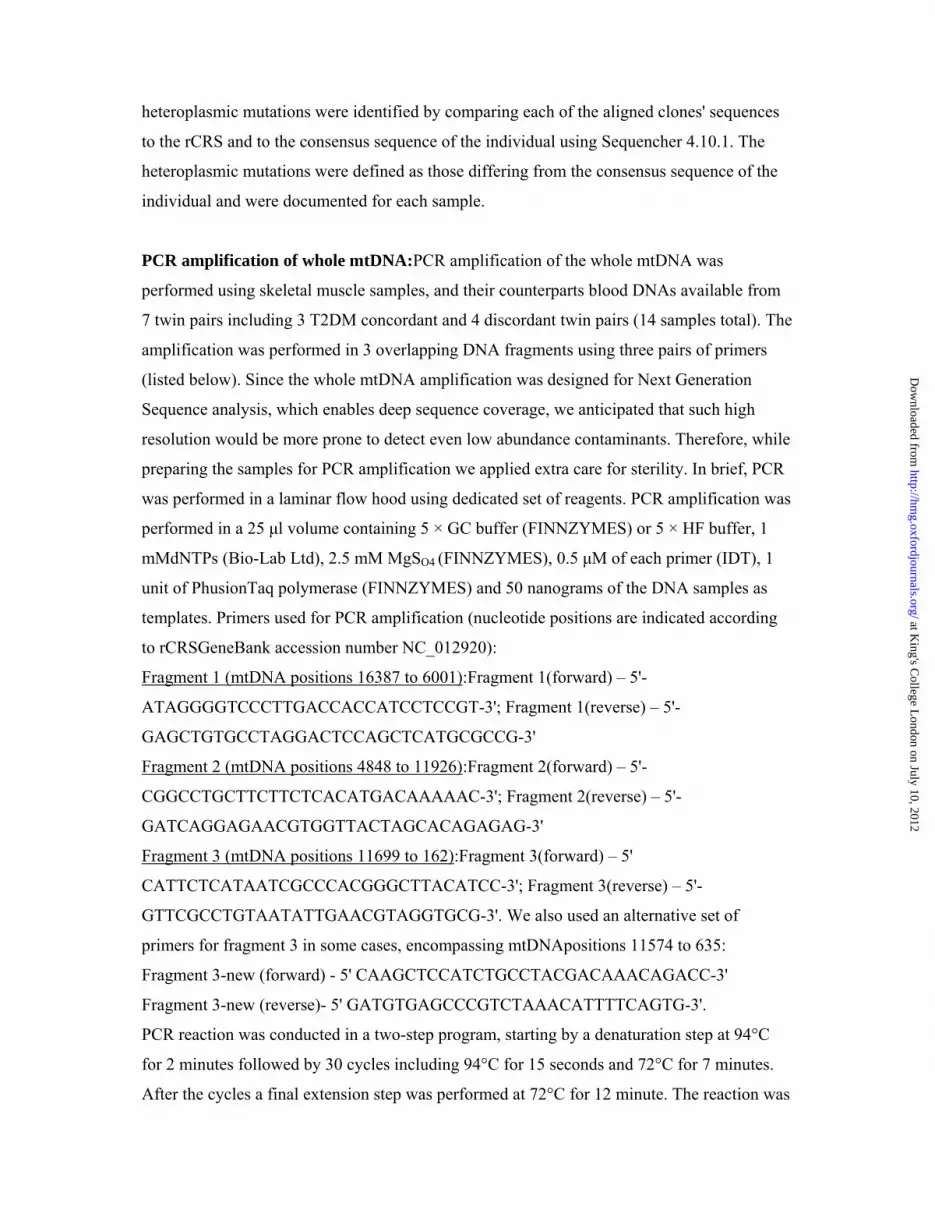
PCR amplification of whole mtDNA:PCR amplification of the whole mtDNA was
performed using skeletal muscle samples, and their counterparts blood DNAs available from
7 twin pairs including 3 T2DM concordant and 4 discordant twin pairs (14 samples total). The
amplification was performed in 3 overlapping DNA fragments using three pairs of primers
(listed below). Since the whole mtDNA amplification was designed for Next Generation
Sequence analysis, which enables deep sequence coverage, we anticipated that such high
resolution would be more prone to detect even low abundance contaminants. Therefore, while
preparing the samples for PCR amplification we applied extra care for sterility. In brief, PCR
was performed in a laminar flow hood using dedicated set of reagents. PCR amplification was
performed in a 25 μl volume containing 5 × GC buffer (FINNZYMES) or 5 × HF buffer, 1
mMdNTPs (Bio-Lab Ltd), 2.5 mM MgSO4 (FINNZYMES), 0.5 μM of each primer (IDT), 1
unit of PhusionTaq polymerase (FINNZYMES) and 50 nanograms of the DNA samples as
templates. Primers used for PCR amplification (nucleotide positions are indicated according
to rCRSGeneBank accession number NC_012920):
Fragment 1 (mtDNA positions 16387 to 6001):Fragment 1(forward) – 5'-
ATAGGGGTCCCTTGACCACCATCCTCCGT-3'; Fragment 1(reverse) – 5'-
GAGCTGTGCCTAGGACTCCAGCTCATGCGCCG-3'
Fragment 2 (mtDNA positions 4848 to 11926):Fragment 2(forward) – 5'-
CGGCCTGCTTCTTCTCACATGACAAAAAC-3'; Fragment 2(reverse) – 5'-
GATCAGGAGAACGTGGTTACTAGCACAGAGAG-3'
Fragment 3 (mtDNA positions 11699 to 162):Fragment 3(forward) – 5'
CATTCTCATAATCGCCCACGGGCTTACATCC-3'; Fragment 3(reverse) – 5'-
GTTCGCCTGTAATATTGAACGTAGGTGCG-3'. We also used an alternative set of
primers for fragment 3 in some cases, encompassing mtDNApositions 11574 to 635:
Fragment 3-new (forward) - 5' CAAGCTCCATCTGCCTACGACAAACAGACC-3'
Fragment 3-new (reverse)- 5' GATGTGAGCCCGTCTAAACATTTTCAGTG-3'.
PCR reaction was conducted in a two-step program, starting by a denaturation step at 94°C
for 2 minutes followed by 30 cycles including 94°C for 15 seconds and 72°C for 7 minutes.
After the cycles a final extension step was performed at 72°C for 12 minute. The reaction was
at King's C
ollege London on July 10, 2012
http://hmg.oxfordjournals.org/
Dow
nloaded from
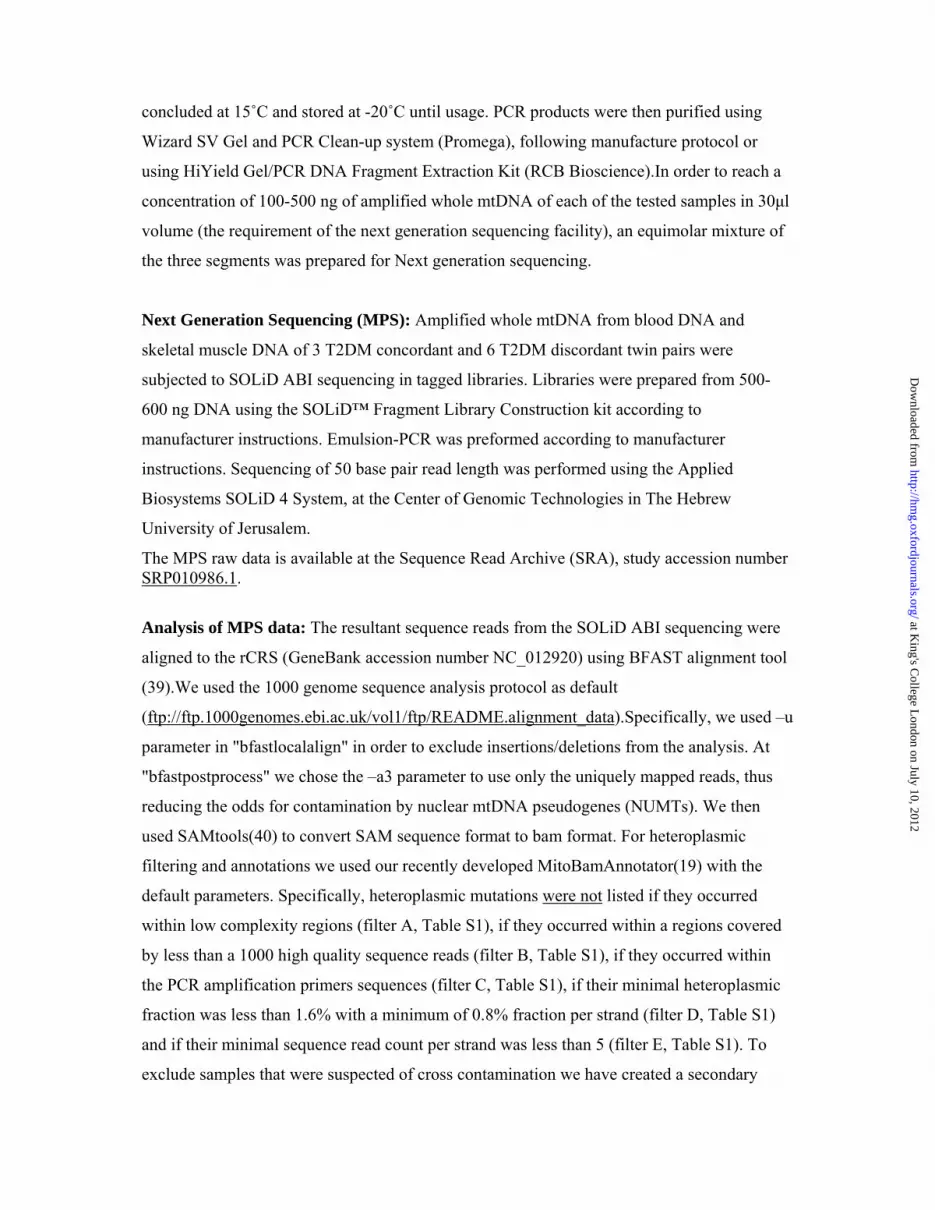
concluded at 15˚C and stored at -20˚C until usage. PCR products were then purified using
Wizard SV Gel and PCR Clean-up system (Promega), following manufacture protocol or
using HiYield Gel/PCR DNA Fragment Extraction Kit (RCB Bioscience).In order to reach a
concentration of 100-500 ng of amplified whole mtDNA of each of the tested samples in 30μl
volume (the requirement of the next generation sequencing facility), an equimolar mixture of
the three segments was prepared for Next generation sequencing.
Next Generation Sequencing (MPS): Amplified whole mtDNA from blood DNA and
skeletal muscle DNA of 3 T2DM concordant and 6 T2DM discordant twin pairs were
subjected to SOLiD ABI sequencing in tagged libraries. Libraries were prepared from 500-
600 ng DNA using the SOLiD™ Fragment Library Construction kit according to
manufacturer instructions. Emulsion-PCR was preformed according to manufacturer
instructions. Sequencing of 50 base pair read length was performed using the Applied
Biosystems SOLiD 4 System, at the Center of Genomic Technologies in The Hebrew
University of Jerusalem.
The MPS raw data is available at the Sequence Read Archive (SRA), study accession number SRP010986.1.
Analysis of MPS data: The resultant sequence reads from the SOLiD ABI sequencing were
aligned to the rCRS (GeneBank accession number NC_012920) using BFAST alignment tool
(39).We used the 1000 genome sequence analysis protocol as default
(ftp://ftp.1000genomes.ebi.ac.uk/vol1/ftp/README.alignment_data).Specifically, we used –u
parameter in "bfastlocalalign" in order to exclude insertions/deletions from the analysis. At
"bfastpostprocess" we chose the –a3 parameter to use only the uniquely mapped reads, thus
reducing the odds for contamination by nuclear mtDNA pseudogenes (NUMTs). We then
used SAMtools(40) to convert SAM sequence format to bam format. For heteroplasmic
filtering and annotations we used our recently developed MitoBamAnnotator(19) with the
default parameters. Specifically, heteroplasmic mutations were not listed if they occurred
within low complexity regions (filter A, Table S1), if they occurred within a regions covered
by less than a 1000 high quality sequence reads (filter B, Table S1), if they occurred within
the PCR amplification primers sequences (filter C, Table S1), if their minimal heteroplasmic
fraction was less than 1.6% with a minimum of 0.8% fraction per strand (filter D, Table S1)
and if their minimal sequence read count per strand was less than 5 (filter E, Table S1). To
exclude samples that were suspected of cross contamination we have created a secondary
at King's C
ollege London on July 10, 2012
http://hmg.oxfordjournals.org/
Dow
nloaded from

sequence based on the rCRS reference sequence with the second best base of the
heteroplasmic mutations of each individual. This 'secondary sequence' generated from each of
the analyzed samples was analyzed by Haplogrep(41) which classifies mitochondrial DNA
into the known population genetic backgrounds in humans (haplogroups). This procedure
enabled us detecting samples from two of the 9 twin pairs the secondary sequence of which
resembled well known human mtDNA haplogroup. Samples from these two twin pairs were
excluded from further analysis thus leaving 20 twin pairs in the bacterial cloning Sanger
sequencing (11 T2DM concordant and 9 discordant) and 7 pairs (3 T2DM concordant and 4
discordant) for further analysis.
PCR amplification and Sanger sequencing of mtDNA fragments encompassing positions
9077 and 15132 to validate non D-loop heteroplasmic mutations observed by MPS: We
PCR amplified mtDNA nucleotide positions 8815-9819 and 14838-15912 (according to the
revised Cambridge Reference Sequence, GenBank accession number NC_012920) to verify
the identified high level MPS heteroplasmic mutations at positions 9077 (within 95451 and
95452 blood and skeletal muscle samples) and 15132 (in 68841, 688412 blood and skeletal
muscle samples) using 51401 blood sample as a negative control for both amplified
fragments. PCR amplification was performed in a 25 μl reaction volume containing 5 × GC
buffer (FINNZYMES) or 5 × HF buffer, 1 mM dNTPs (Bio-Lab Ltd), 2.5 mM MgSO4
(FINNZYMES), 0.5 μM of each primer (IDT), 1 unit of Phusion Taq polymerase
(FINNZYMES) and 50 nanograms of the DNA samples as templates. Primers used for PCR
amplification: Position 8815 to 9819- forward 5’ CTCATTTACACCAACCACCC 3’
reverse GCCAATAATGACGTGAAGTCC. Position 14838 to 15912 – forward 5’
TCCAACATCTCCGCATGATG 3’ reverse 5’ TCTCCGGTTTACAAGACTGG 3’.
Reaction conditions were as follows: denaturation at 94°C for 2 minutes followed by 30
cycles each including denaturation at 94°C for 15 seconds, annealing at 58°C for 30 seconds
and elongation at 72°C for 30 seconds. The cycles were followed by a final extension step at
72°C for 12 minutes. The reaction was concluded at 15˚C and stored at -20˚C until usage.
PCR products were visualized on a standard 1% agarose gel with EtBr to ensure specificity
and were then purified using Wizard SV Gel and PCR Clean-up system (Promega), following
manufacture protocol. Each of the tested samples were sequenced in the ABI 3100 sequencing
machine using the above mentioned amplification primers (BGU sequencing facility).
Sequences generated from each given sample were aligned to the rCRS using Sequencher
4.10.1. (GeneCodes inc.)
at King's C
ollege London on July 10, 2012
http://hmg.oxfordjournals.org/
Dow
nloaded from

Mitochondrial DNA copy number: Previously mtDNA copy number was shown to differ
between type 2 diabetes individuals versus healthy people (21). Therefore we assessed
mtDNA copy number in our tested samples by real time PCR. Specifically, real time PCR
assessment of the mtDNA copy number was assessed by comparing Ct of a nuclear DNA
encoded locus (NDUFC2), an mtDNA encoded marker (the gene ND3) and a standard
plasmid reference amplified using known concentration (see detailed explanation below). To
amplify ND3 (rCRS nucleotide position 10166-10355), an mtDNA encoded gene, we used the
following primers (numbers correspond to the nucleotide position of the 5w end of the
primers in rCRS):
Forward - 10166F: 5'- TTACGAGTGCGGCTTCGACC-3'
Reveres - 10355R: 5'- ACTCATAGGCCAGACTTAGG-3'
The primers for our nuclear DNA locus were designed from exon II of NDUFC2 (GeneBank
accession number CR533448):
Forward 5’-GGTTTGCATCGCCAGCTTC-3’
Reveres 5’- CAGGAAAATCCTCTGGATG-3’
PCR amplification was performed in a 20μl volume, 25 nanograms of the DNA samples as
templates, 1X Absolute Blue SYBR Green ROX Mix (Thermo) and 50 mM of each primer.
Thermal reaction conditions are preheating at 94°C for 15 seconds and 40 cycle including a
denaturation step at 98°C for 10 seconds, annealing step at 60°C for 20 seconds and extension
step at 72°C for 15 seconds. The final extension was at 72°C for 7 minutes. The reaction was
concluded by cooling the samples to 15oC. The amplification was monitored using the
MX3000P Real-time PCR machine (Stratagene). The threshold cycle (Ct) values were related
to standard curve made using cloned PCR products of each of the amplified fragments,
separately. The copy number of this calibrator was determined by dividing the total DNA
concentration by the molecular weight of each plasmidmolecules. The molecular weight of
cloned plasmidmolecules was estimated as follows: (bp x MWt)/A, whereMWt denotes the
molecular weight of double-stranded DNA (660 g/mole), A denotes Avogadro’s number (6.02
x1023 molecules/mole). Calibrators were prepared by serial 10x dilutions of the plasmid DNA
samples which range from106 to 109 plasmid copies. Calibration curve was established using
these calibrator samples.
Simulating concordant heteroplasmic mutations: The number of concordant
heteroplasmies expected by chance was estimated using highly liberal simulations: (1)
kMandkBheteroplasmic mutations were randomly drawn from a genome of length LM and LB
at King's C
ollege London on July 10, 2012
http://hmg.oxfordjournals.org/
Dow
nloaded from

(correspondingly) for every the blood (B) and Muscle (M) sample of every individual, where
kX is the number of heteroplasmic variations observed in tissue X (i.e. B or M) of that
individual and LX is the coverage of tissue X (i.e. B or M) for that individual; (2) the
simulated heteroplasmic mutations of both samples (blood/muscle) of each individual were
combined; and (3) the number of positions found to harbor heteroplasmic mutations in each
pair of twins is counted as the number of positions common to the two lists of mutations
generated in step (2). The probability to observe 17 concordant mutations is taken as the
fraction of simulations in which 17 or more positions were shared between twins.
Control clone for MPS analysis: In order to control for mutations generated by our
experimental procedure we assessed the level of heteroplasmic mutations in one of our
amplified segments of the whole human mtDNA (Fragment 1 – see above). In order to
achieve a template free of intracellular variation the purified PCR product was cloned, i.e.
ligated into pGEMT-Easy vector (Promega). The ligation reaction was performed using T4
ligase (Promega) with vector/insert ratio 1:3 at 4oC overnight according to the protocol of
DNA Ligation Kit (Promega). Then, 5 μl of the ligation reaction were mixed with 50 μl of
competent E.colicells(DH5 α) and were subjected to electric shock using GenePulserXcell
(BIO-RAD). Following electroporation, 500 μl of LB were added, and cells were shaken
gently at 37°C for 1 hour. The bacteria were plated onto LB Petri dishes containing 50 μg/ml
ampicillin, 40 μg of 0.1 M IPTG and 40 μl of 2%-X-gal, and grown overnight at 37°C.
Following 'blue/white' colony selection at least 20 colonies (white colonies contains the
plasmid) were isolated, and grown in 5 ml liquid LB with 100 mg/ml ampicillin at 37°C for
12 hours, shaking. The plasmid was purified using Wizard plus SV miniprep DNA
purification system (Promega), according to the manufacturer protocol. We used restriction
enzymesScaI and HpaI (Fermentas)to confirm the existence of the insert in the plasmids. We
sequenced the insert by an ABI 3100 sequencing machine using SP6 and T7 standard primers.
After verifying the presence of mtDNA fragment 1 in the plasmid, we used the plasmid as a
template for PCR amplification utilizing the original fragment 1 amplification primers (as
mentioned above). The purified PCR product was sequenced using SOLiD and analyzed (as
mentioned above).
Acknowledgements
This work funded by an Israeli Science Foundation grant 387/08 and a grant from the
National Institute of Biotechnology in the Negev (NIBN) (D.M.). TwinsUK is funded by the
at King's C
ollege London on July 10, 2012
http://hmg.oxfordjournals.org/
Dow
nloaded from

Wellcome Trust and the NIHR Biomedical Resource Centre Grant to Guys and St Thomas’
hospitals and KCL. TS is an NIHR Senior Investigator and an ERC Senior Researcher. DG
was supported by the MRC. The authors would like to thank Ms Anya Gorodetzky for her
contribution during the very early stages of the work and to Gabriela Surdulescu and staff at
the DTR.
at King's C
ollege London on July 10, 2012
http://hmg.oxfordjournals.org/
Dow
nloaded from
References
1. Larsson, N.G. (2010) Somatic mitochondrial DNA mutations in mammalian aging. Annu. Rev. Biochem., 79, 683-706. 2. Craven, L., Elson, J.L., Irving, L., Tuppen, H.A., Lister, L.M., Greggains, G.D., Byerley, S., Murdoch, A.P., Herbert, M. and Turnbull, D. (2011) Mitochondrial DNA disease: new options for prevention. Hum. Mol. Genet., 20, R168-174. 3. Budowle, B., Allard, M.W., Wilson, M.R. and Chakraborty, R. (2003) Forensics and mitochondrial DNA: applications, debates, and foundations. Annu. Rev. Genomics Hum. Genet., 4, 119-141. 4. Sondheimer, N., Glatz, C.E., Tirone, J.E., Deardorff, M.A., Krieger, A.M. and Hakonarson, H. (2011) Neutral mitochondrial heteroplasmy and the influence of aging. Hum. Mol. Genet., 20, 1653-1659. 5. Goto, H., Dickins, B., Afgan, E., Paul, I.M., Taylor, J., Makova, K.D. and Nekrutenko, A. (2011) Dynamics of mitochondrial heteroplasmy in three families investigated via a repeatable re-sequencing study. Genome Biol., 12, R59. 6. Li, M., Schonberg, A., Schaefer, M., Schroeder, R., Nasidze, I. and Stoneking, M. (2010) Detecting heteroplasmy from high-throughput sequencing of complete human mitochondrial DNA genomes. Am. J. Hum. Genet., 87, 237-249. 7. Chinnery, P.F., Thorburn, D.R., Samuels, D.C., White, S.L., Dahl, H.H., Turnbull, D.M., Lightowlers, R.N. and Howell, N. (2000) The inheritance of mitochondrial DNA heteroplasmy: random drift, selection or both? Trends Genet., 16, 500-505. 8. Zhidkov, I., Livneh, E.A., Rubin, E. and Mishmar, D. (2009) mtDNA mutation pattern in tumors and human evolution are shaped by similar selective constraints. Genome Res., 19, 576-580. 9. Clark, J., Dai, Y. and Simon, D.K. (2011) Do somatic mitochondrial DNA mutations contribute to Parkinson's disease? Parkinsons Dis, 2011, 659-694. 10. Wang, C.H., Wang, C.C. and Wei, Y.H. (2010) Mitochondrial dysfunction in insulin insensitivity: implication of mitochondrial role in type 2 diabetes. Ann. N Y Acad. Sci., 1201, 157-165. 11. Mootha, V.K., Lindgren, C.M., Eriksson, K.F., Subramanian, A., Sihag, S., Lehar, J., Puigserver, P., Carlsson, E., Ridderstrale, M., Laurila, E. et al. (2003) PGC-1alpha-responsive genes involved in oxidative phosphorylation are coordinately downregulated in human diabetes. Nat. Genet., 34, 267-273. 12. Petersen, K.F., Dufour, S., Befroy, D., Garcia, R. and Shulman, G.I. (2004) Impaired mitochondrial activity in the insulin-resistant offspring of patients with type 2 diabetes. N. Engl. J. Med., 350, 664-671. 13. Feder, J., Ovadia, O., Blech, I., Cohen, J., Wainstein, J., Harman-Boehm, I., Glaser, B. and Mishmar, D. (2009) Parental diabetes status reveals association of mitochondrial DNA haplogroup J1 with type 2 diabetes. BMC Med. Genet., 10, 60. 14. Fuku, N., Park, K.S., Yamada, Y., Cho, Y.M., Matsuo, H., Segawa, T., Watanabe, S., Kato, K., Yokoi, K., Nozawa, Y. et al. (2007) Mitochondrial Haplogroup N9a Confers Resistance against Type 2 Diabetes in Asians. Am. J. Hum. Genet., 80, 407-415. 15. Saxena, R., de Bakker, P.I., Singer, K., Mootha, V., Burtt, N., Hirschhorn, J.N., Gaudet, D., Isomaa, B., Daly, M.J., Groop, L. et al. (2006) Comprehensive association testing of common mitochondrial DNA variation in metabolic disease. Am. J. Hum. Genet., 79, 54-61. 16. Olsson, C., Zethelius, B., Lagerstrom-Fermer, M., Asplund, J., Berne, C. and Landegren, U. (1998) Level of heteroplasmy for the mitochondrial mutation A3243G correlates with age at onset of diabetes and deafness. Human Mutation, 12, 52-58.
at King's C
ollege London on July 10, 2012
http://hmg.oxfordjournals.org/
Dow
nloaded from

17. Coskun, P.E., Beal, M.F. and Wallace, D.C. (2004) Alzheimer's brains harbor somatic mtDNA control-region mutations that suppress mitochondrial transcription and replication. Proc. Natl. Acad. Sci. U S A., 101, 10726-10731. 18. He, Y., Wu, J., Dressman, D.C., Iacobuzio-Donahue, C., Markowitz, S.D., Velculescu, V.E., Diaz, L.A., Jr., Kinzler, K.W., Vogelstein, B. and Papadopoulos, N. (2010) Heteroplasmic mitochondrial DNA mutations in normal and tumour cells. Nature, 464, 610-614. 19. Zhidkov, I., Nagar, T., Mishmar, D. and Rubin, E. (2011) MitoBamAnnotator: A web-based tool for detecting and annotating heteroplasmy in human mitochondrial DNA sequences. Mitochondrion, 11, 924-928. 20. Ameur, A., Stewart, J.B., Freyer, C., Hagstrom, E., Ingman, M., Larsson, N.G. and Gyllensten, U. (2011) Ultra-deep sequencing of mouse mitochondrial DNA: mutational patterns and their origins. PLoS Genet, 7, e1002028. 21. Lim, S., Park, K.S., Kim, M.S., Cho, B.Y. and Lee, H.K. (2001) Relationship between various surrogate indices of insulin resistance and mitochondrial DNA content in the peripheral blood of 18 healthy volunteers. Mitochondrion, 1, 71-77. 22. Graur, D. and Li, W.H. (2000) Fundamentals of molecular evolution. Sinauer Associates, Sunderland, MA. 23. Keller, I., Bensasson, D. and Nichols, R.A. (2007) Transition-transversion bias is not universal: a counter example from grasshopper pseudogenes. PLoS Genet, 3, e22. 24. Belle, E.M., Piganeau, G., Gardner, M. and Eyre-Walker, A. (2005) An investigation of the variation in the transition bias among various animal mitochondrial DNA. Gene, 355, 58-66. 25. Lehtovirta, M., Pietilainen, K.H., Levalahti, E., Heikkila, K., Groop, L., Silventoinen, K., Koskenvuo, M. and Kaprio, J. (2010) Evidence that BMI and type 2 diabetes share only a minor fraction of genetic variance: a follow-up study of 23,585 monozygotic and dizygotic twins from the Finnish Twin Cohort Study. Diabetologia, 53, 1314-1321. 26. Andrew, T., Calloway, C.D., Stuart, S., Lee, S.H., Gill, R., Clement, G., Chowienczyk, P., Spector, T.D. and Valdes, A.M. (2011) A twin study of mitochondrial DNA polymorphisms shows that heteroplasmy at multiple sites is associated with mtDNA variant 16093 but not with zygosity. PLoS One, 6, e22332. 27. White, D.J., Wolff, J.N., Pierson, M. and Gemmell, N.J. (2008) Revealing the hidden complexities of mtDNA inheritance. Mol. Ecol., 17, 4925-4942. 28. Lutz-Bonengel, S., Schmidt, U., Sanger, T., Heinrich, M., Schneider, P.M. and Pollak, S. (2008) Analysis of mitochondrial length heteroplasmy in monozygous and non-monozygous siblings. Int. J. Legal Med., 122, 315-321. 29. Gyllensten, U., Wharton, D., Josefsson, A. and Wilson, A.C. (1991) Paternal inheritance of mitochondrial DNA in mice. Nature, 352, 255-257. 30. Cao, L., Shitara, H., Sugimoto, M., Hayashi, J., Abe, K. and Yonekawa, H. (2009) New evidence confirms that the mitochondrial bottleneck is generated without reduction of mitochondrial DNA content in early primordial germ cells of mice. PLoS Genet, 5, e1000756. 31. Cree, L.M., Samuels, D.C., de Sousa Lopes, S.C., Rajasimha, H.K., Wonnapinij, P., Mann, J.R., Dahl, H.H. and Chinnery, P.F. (2008) A reduction of mitochondrial DNA molecules during embryogenesis explains the rapid segregation of genotypes. Nat. Genet., 40, 249-254. 32. Schwartz, M. and Vissing, J. (2002) Paternal inheritance of mitochondrial DNA. N. Engl. J. Med., 347, 576-580. 33. Schwartz, M. and Vissing, J. (2004) No evidence for paternal inheritance of mtDNA in patients with sporadic mtDNA mutations. J. Neurol. Sci., 218, 99-101.
at King's C
ollege London on July 10, 2012
http://hmg.oxfordjournals.org/
Dow
nloaded from

34. Stewart, J.B., Freyer, C., Elson, J.L., Wredenberg, A., Cansu, Z., Trifunovic, A. and Larsson, N.G. (2008) Strong purifying selection in transmission of mammalian mitochondrial DNA. PLoS Biol, 6, e10. 35. Fan, W., Waymire, K.G., Narula, N., Li, P., Rocher, C., Coskun, P.E., Vannan, M.A., Narula, J., Macgregor, G.R. and Wallace, D.C. (2008) A mouse model of mitochondrial disease reveals germline selection against severe mtDNA mutations. Science, 319, 958-962. 36. Shoubridge, E.A. and Wai, T. (2007) Mitochondrial DNA and the mammalian oocyte. Curr. Top Dev. Biol., 77, 87-111. 37. Suen, D.F., Narendra, D.P., Tanaka, A., Manfredi, G. and Youle, R.J. (2010) Parkin overexpression selects against a deleterious mtDNA mutation in heteroplasmic cybrid cells. Proc. Natl. Acad. Sci. U S A, 107, 11835-11840. 38. Moayyeri, A., Hammond, C.J., Valdes, A.M. and Spector, T.D. (2012) Cohort Profile: TwinsUK and Healthy Ageing Twin Study. Int. J. Epidemiol. 39. Homer, N., Merriman, B. and Nelson, S.F. (2009) BFAST: an alignment tool for large scale genome resequencing. PLoS One, 4, e7767. 40. Li, H., Handsaker, B., Wysoker, A., Fennell, T., Ruan, J., Homer, N., Marth, G., Abecasis, G. and Durbin, R. (2009) The Sequence Alignment/Map format and SAMtools. Bioinformatics, 25, 2078-2079. 41. Kloss-Brandstatter, A., Pacher, D., Schonherr, S., Weissensteiner, H., Binna, R., Specht, G. and Kronenberg, F. (2011) HaploGrep: a fast and reliable algorithm for automatic classification of mitochondrial DNA haplogroups. Hum. Mutat., 32, 25-32.
at King's C
ollege London on July 10, 2012
http://hmg.oxfordjournals.org/
Dow
nloaded from

Figure legends:
Figure 1: Distribution of the number of heteroplasmic mutations per individual in blood and skeletal muscle. The size of each dot is proportional to the number of subjects it refers to. The black line represents the median.
Figure 2a- Distribution of shared versus unique heteroplasmic mutations in skeletal muscle and blood samples. Y axis - the number of heteroplasmic mutations, color divided in each sample into unique and shared. X axis – Sample IDs. P- Patient; M – Skeletal Muscle sample; B- Blood sample. In black - mutations that are shared between twins, in grey - unique mutations.
Figure 2b- Inherited and acquired heteroplasmic mutations. The distribution of the sum of the shared (black area) versus the sum of unique heteroplasmic mutations (grey area). Sum of the shared mutations is 32, sum of the unique mutations is 25. Figure 3: Over representation of heteroplasmic mutations in non-coding regions. In black - coding mtDNA coding sequences (rRNA, tRNA, protein coding genes);In grey - non-coding- all non-coding mtDNA regions, mainly the D-loop.
at King's C
ollege London on July 10, 2012
http://hmg.oxfordjournals.org/
Dow
nloaded from

Tables: Table 1: mtDNA copy number analysis in twin samples subjected to whole mtDNA next generation sequencing. The table shows the copy number of the tested nuclear DNA locus NDUFC2 (NDUFC2.Av), the mitochondrial DNA gene ND3 (ND3.Av) and the ratio between them (ND3fold), reflecting mtDNA copy number. Twins fold ratio –the ratio between the twins. Twins ID
NDUFC2.Av ND3.Av ND3fold Twins fold ratio
12661 6.34E+02 2.49E+05 392.8
12662 2.51E+01 1.22E+04 484.6
1.233
68841 4.76E+02 5.00E+05 1,050.60
68842 1.08E+02 1.34E+05 1,239.90
0.847
95451 3.25E+02 1.48E+05 455
95452 7.44E+02 5.24E+05 703.6
0.647
17201 8.38E+02 6.00E+05 716.3
17202 6.52E+02 5.12E+05 785.1
1.096
51401 7.44E+02 1.78E+05 239.2
51402 5.60E+02 2.28E+05 408.2
0.586
51611 1.62E+02 5.41E+04 333.9
51612 5.50E+02 2.66E+05 483.1
0.691
70251 4.57E+01 1.14E+05 2,486.20
70252 4.61E+02 3.06E+05 662.6
3.752
at King's C
ollege London on July 10, 2012
http://hmg.oxfordjournals.org/
Dow
nloaded from

Table 2: Distribution of the heteroplasmic mutations throughout the mtDNA found in the twins' whole mtDNA MPS. The table shows the sum of heteroplasmic mutation considering the 7 twin pairs subjected to whole mtDNA sequencing (total, shared, unique, patient*, healthy) and their distribution in the mtDNA (protein coding genes, tRNA, rRNA, non-coding region), whether the mutations are synonymous or non-synonymous, and if they are transitions or transversions. Shared – a set of mutations that were found to be shared either among twin pairs or between blood and skeletal muscle of the same individual (also see text). Unique – singleton mutations found in certain individuals. *The patient group includes the discordant patient and the concordant patient.
Total mutations
Protein coding region
tRNA rRNA Non-coding regions
Synonymous Non synonymous
Transition Transversion
Total analyzed samples (N=14)
64 31 0 5 28 20 11 62 2
Shared 37 19 0 2 16 12 7 37 0 Unique 27 12 0 3 12 7 5 25 2 Healthy samples (N=4)
28 15 0 2 11 10 5 27 1
Patient samples (N=10)
36 16 0 3 17 9 7 35 1
at King's C
ollege London on July 10, 2012
http://hmg.oxfordjournals.org/
Dow
nloaded from

at King's C
ollege London on July 10, 2012
http://hmg.oxfordjournals.org/
Dow
nloaded from

at King's C
ollege London on July 10, 2012
http://hmg.oxfordjournals.org/
Dow
nloaded from

at King's C
ollege London on July 10, 2012
http://hmg.oxfordjournals.org/
Dow
nloaded from

at King's C
ollege London on July 10, 2012
http://hmg.oxfordjournals.org/
Dow
nloaded from


