Embed Size (px)
Citation preview

Mirfield Matters Residents Survey 2015 Mirfield Town Council Survey Report December 2015

[Page left intentionally blank]

Contents
1. Introduction 1
2. Methodology 2
2.1 Analysis 3
2.2 Respondent Profile 3
3. Main Findings 6
3.1 Living in Mirfield 6
3.2 Health services in Mirfield 11
3.3 Leisure facilities in Mirfield 14
3.4 Getting around your area 19
3.5 Your local environment 21
3.6 Crime and anti-social behaviour 26
3.7 Information and communication 33

[Page left intentionally blank]

Mirfield Matters Residents Survey 2015 December 2015
1
1. Introduction
The survey was commissioned by Mirfield Town Council. Understanding the views and opinions of the residents of Mirfield is vital to provide a basis for their community action plan and inform potential policy decisions. By carrying out this survey the residents’ views will help shape those areas and ensure that councillors are fully aware of the views of the whole community.
The information that can be delivered from this survey will need to be put into context with the views of other key stakeholders, council strategies and central government policies in order to deliver a community plan that matches the aspirations and needs of Mirfield residents.
By carrying out the survey the town council will ensure that the residents are given a strong voice in the future of their area.
The survey repeats a previous resident’s survey carried out in 2007 and enables Mirfield Town Council to track views, issues and progress over time.
Mirfield Town Council commissioned Spirul to undertake a survey of all households within Mirfield in order to:
Provide councillors with up-to-date information on local residents’ perceptions; and
Ensure that the information collected is Mirfield-focused and reliable at the local level.
The aim of the survey is to give all 8,965 households in Mirfield the opportunity to comment on the issues that affect local residents in their daily lives and that the council has an influence on. More importantly the survey will ensure that residents are able to express their opinions during the development stage and will enable councillors and officers to identify key priorities that residents would like addressed.

Mirfield Matters Residents Survey 2015 December 2015
2
2. Methodology
The twelve page postal self-completion questionnaire used in 2007 was reviewed by Mirfield Town Council and amended slightly to bring it up to date for 2015.
The survey sample was provided by Kirklees Council and consisted of all 8,965 properties within the Mirfield area.
The front page of the questionnaire consisted of a covering letter outlining the purpose of the survey and requesting the participation of residents over the age of 18. The questionnaire was also offered to residents in large print or other formats and a help line number was included for residents to call if they needed any help completing the questionnaire.
The questionnaire and covering letter were distributed by post to all properties within the sample. Residents were given four weeks to return their questionnaires. A postcard was sent out after two weeks to remind residents to return their questionnaires. Completed questionnaires were sent directly to Spirul in pre-paid envelopes, thereby ensuring respondents’ confidentiality.
Questionnaires were mailed out to all 8,965 addresses in the Mirfield area on the 21st October 2015, reminder postcards were sent out on the 4th November and the closing date for responses was 17th November 2015.
In total, 2491 completed questionnaires were received by the closing date, representing a response rate of 28%.
Key question areas covered in the survey include:
Residents’ perceptions of their local area;
Their experiences of accessing health services;
Their use of and satisfaction with leisure facilities, community facilities and leisure activities;
Their experience of public transport and which types of transport they use;
Their experience and perceptions of crime and anti-social behaviour in Mirfield; and
Their main sources of information and awareness and involvement with Mirfield Town Council local councillors, Dewsbury and District Committee and Mirfield Town Council.

Mirfield Matters Residents Survey 2015 December 2015
3
2.1 Analysis
It should be remembered that although all households in Mirfield were given the opportunity to take part in the survey, not all households responded.
The survey data is based on the total number of respondents who answered the question appropriately. For each question there will be people who forget to tick the box or who ticked “not applicable”, these will be treated as ‘missing values’ and will not be used. Therefore, all of these responses are excluded from the calculation of the final rating.
Where percentages do not add up to 100, this may be due to computer rounding, or multiple responses.
A sample size of 2491 is subject to a confidence interval of +/- 1.67% at the 95% confidence level. This means that overall we can be 95% certain that results for the whole population (i.e. all residents within the Mirfield area) lie within 1.67% of the figures reported.
In order to highlight differences in views and perceptions over time, results from the 2007 survey have been included, where directly comparable.
2.2 Respondent Profile
Two thirds of respondents to the survey (65%) have lived in Mirfield for more than 20 years and one third for less than 20 years (35%); 22% have lived in Mirfield for 6 to 20 years and 12% for 5 years or less.
One third of respondents live in the Battyeford area (35%), one third in the Crossley & Northorpe area (35%) and just under one third (28%) in the Eastthorpe & Hopton area.
Two fifths of respondents (40%) live in adult households, 45% live in households over 65 years old and 15% live in households with children.

Mirfield Matters Residents Survey 2015 December 2015
4
The following charts show the profile of respondents to the survey compared to the 2011 census profile of Mirfield.
Figure 1. Gender Comparison (%)
57
43
48
52
0 20 40 60 80 100
Female
Male
Mirfield
Respondents
A higher proportion of female residents responded to the survey (76%), than male (43%). As is normal in postal self-completion surveys, male and younger residents are less likely to respond. The age profile of respondents shows that more residents over 50 years old and fewer residents under 30 years old responded to the survey compared to the overall population of Mirfield. Younger respondents are therefore under represented compared to the area overall. Please note that the figures relate to respondents and residents over the age of 18 only.
Figure 2. Age Comparison (%)
4
31
65
3
25
72
0 20 40 60 80 100
Under 30
30 - 50
Over 50
Mirfield
Respondents

Mirfield Matters Residents Survey 2015 December 2015
5
The respondents are predominantly from a white background (95%), with 5% from a Black or minority ethnic (BME) background. The profile of the sample broadly follows that of the overall population of Mirfield.
Figure 3. Ethnicity Comparison (%)
95
5
94
6
0 20 40 60 80 100
White
BME
Mirfield
Respondents
A higher proportion of respondents have a limiting long-term illness, (26%), than the population overall (19%). Limiting long-term illness covers any long-term illness; health problem or disability which limits daily activities or work.
Figure 4. Long-term Illness Comparison (%)
26
74
19
81
0 20 40 60 80 100
Long-term
illness
No long-
term illness
Mirfield
Respondents

Mirfield Matters Residents Survey 2015 December 2015
6
3. Main Findings
3.1 Living in Mirfield
Key Findings
Overall, the majority of respondents are satisfied with Mirfield as a place to live.
There are high levels of satisfaction amongst respondents with shopping facilities, parks and open spaces and street lighting in the area.
Satisfaction is much lower with traffic flow and road and pavement repairs.
Traffic flow, road and pavement repairs and health services people are most in need of improvement in Mirfield.
Overall the majority of respondents (85%) are satisfied with Mirfield as a place to live. One quarter of respondents (26%) are very satisfied with Mirfield as a place to live. This is an increase from 2007 where only two thirds of residents (68%) were satisfied or very satisfied and only one in ten respondents were very satisfied (10%).
Figure 5. Overall satisfaction with local area
(%)
10
58
19
11
2
26
60
11
4
1
0 20 40 60 80 100
Very satisfied
Satisfied
Neither
satisfied nor
dissatisfied
Dissatisfied
Very
dissatisfied
2015
2007
“We have lived here for over 40 years and have been happy here” “We love Mirfield and living here”

Mirfield Matters Residents Survey 2015 December 2015
7
There are high levels of satisfaction amongst respondents with shopping facilities (71%), parks and open spaces (67%) and street lighting (61%) in the area. Highest levels of dissatisfaction are expressed by respondents for traffic flow (78%) and road and pavement repairs (71%).
Satisfaction with health services with health services (2007=75%, 2015=49%) has fallen significantly since 2007. Satisfaction with shopping facilities (2007=49%, 2015=71%), parks and open spaces (2007=54%, 2015=67%), community activities and facilities (2007+19%, 2015=34%) and activities and facilities for young people (2007=5%, 2012=19%) has risen significantly since 2007.
Figure 6.a Satisfaction/dissatisfaction with the following
in Mirfield %
19
8
27
34
13
38
55
71
67
61
49
48
14
42
48
16
43
32
18
18
27
19
33
78
31
18
71
20
12
10
14
12
32
Activities/facilities for young people
Traffic flow
Sports & leisure facilities
Community activities/facilities
Road & pavement repairs
Affordable decent housing
Air quality
Shopping facilities
Parks and open spaces
Street lighting
Health services
Very satisfied/ Satisfied Neither satisfied nor dissatisfied Dissatisfied/ Very dissatisfied

Mirfield Matters Residents Survey 2015 December 2015
8
Figure 6.b Satisfaction/dissatisfaction with the following
in Mirfield %
5
8
14
19
19
30
49
49
54
62
75
19
8
27
34
13
38
55
71
67
61
49
0 10 20 30 40 50 60 70 80 90 100
Activities/facilities for young people
Traffic flow
Sports & leisure facilities
Community activities/facilities
Road & pavement repairs
Affordable decent housing
Air quality
Shopping facilities
Parks and open spaces
Street lighting
Health services
2007:Very satisfied/Satisfied 2015:Very satisfied/Satisfied
A significant number of respondents are neither satisfied nor dissatisfied with activities and facilities for young people (48%), community activities/facilities (48%), affordable decent housing (43%), sports and leisure facilities (42%) and air quality (32%).
Respondents aged over 50 are less satisfied with air quality (52%) than respondents aged 30 to 50 (63%) and respondents aged under 30 (59%).

Mirfield Matters Residents Survey 2015 December 2015
9
Respondents aged under 30 are far more satisfied with traffic flow (41%) than respondents aged 30 to 50 (10%) and respondents aged over 50 (7%).
Respondents aged over 50 (36%) are less satisfied with affordable, decent housing than respondents aged 30 to 50 (41%) and respondents aged under 30 (51%). Male Respondents (34%) are also less satisfied with affordable, decent housing than female respondents (40%).
Respondents aged under 30 (24%) are more satisfied with road and pavement repairs, than respondents aged 30 to 50 (61%) and respondents aged over 50 (11%).
Female respondents (25%) and respondents aged under 30 (21%) are less satisfied with sports and leisure facilities than male respondents (30%) and respondents aged 30 to 50 (29%) and respondents aged over 50 (27%).
Male respondents are more dissatisfied with community activities/facilities (32%) than female respondents (37%).
Respondents aged over 50 (15%) are less satisfied with activities and facilities for young people than respondents aged 30 to 50 (26%) and respondents aged under 30 (23%).
Frequently suggested improvements for Mirfield include creating a bypass for Mirfield, less traffic in Mirfield, a larger health centre with adequate parking, repairs to roads and pavements and to stop building new houses in the area.
“Bypass so Mirfield is not used as a through way for all traffic”
“Bypass to inject life into town centre”
“Larger health centre with parking spaces and easier to get an appointment”
“Larger health centre with more doctors”
“Many roads and pavements need a total re-haul”
“Many roads are full of potholes and are in urgent need of attention”
“Stop building more houses in Mirfield”
“Stop building more houses when the roads are already very congested”

Mirfield Matters Residents Survey 2015 December 2015
10
Figure 7. Most in need of improvement %
1
2
2
3
3
6
6
18
25
33
1
3
14
2
1
3
3
25
4
42
0 5 10 15 20 25 30 35 40 45
Air quality
Parks and open spaces
Health services
Affordable decent housing
Community activities/facilities
Shopping facilities
Sports & leisure facilities
Road & pavement repairs
Activities/facilities for young people
Traffic flow
2007 2015
Traffic flow was mentioned most frequently by respondents as being most in need of improvement (42%). One quarter of respondents (25%) said that road and pavement repairs are most in need of improvement and 14% said that health services were most in need of improvement.
One quarter of respondents (25%) mentioned activities for young people most frequently in 2007, compared to only 4% in 2015. Health services were only mentioned most frequently by 2% of respondents in 2007, compared to 14% in 2015.

Mirfield Matters Residents Survey 2015 December 2015
11
3.2 Health services in Mirfield
Key Findings
Twice as many respondents find getting an appointment for dental services easier than for GP services.
Respondents said they find it easier to register for GP services than dental services.
Most respondents find travelling to pharmacies, opticians, GP services and dental services easy.
More respondents would prefer one large health centre than a number of smaller centres.
Respondents find it easier to register for GP services (73%), than dental services (53%). One third have found registering for dental services difficult (29%), compared to only 7% who have had difficulty registering for GP services. Over half of respondents (56%) find getting an appointment for GP services difficult or very difficult.
Respondents find it easy to travel to pharmacies (86%), opticians (82%), GP services (79%) and dental services (78%). Respondents also find registering for GP services easy (73%).
A significantly lower proportion of respondents find getting an appointment easy or very easy in 2015, compared to 2007 (2007=67%, 2015=25%). Fewer respondents in 2015 said that
they found registering for GP services easy or very easy than in 2007 (2007=86%, 2015=73%).
A higher proportion of women than men find it easier to register for GP services (male=76%, female=70%) and dental services (male=50%, female=56%).
Respondents aged under 30 (51%) find getting an appointment with a GP easier than respondents aged 30 to 50 (22%) and respondents aged over 50 (25%).
Respondents aged under 30 (46%) and respondents aged over 50 (57%) find it easier to get a dental appointment than respondents aged 30 to 50 (25%).
Two thirds of respondents (67%) would prefer one large health centre in Mirfield, rather than a number of smaller health centres.
Respondents suggested numerous locations for a new health centre in Mirfield; Station Road, Old Bank Road. A central location with plenty of parking was frequently mentioned.
“Somewhere in the centre of Mirfield with parking facilities near a bus route”
“Somewhere people can park their cars without blocking roads”

Mirfield Matters Residents Survey 2015 December 2015
12
Figure 8.a Accessing health services in Mirfield %
25
53
54
73
78
79
82
86
18
18
23
21
16
14
14
11
56
29
23
7
6
8
3
4
Getting an appointment for GP services
Registering for dental services
Getting an appointment for dental services
Registering for GP services
Travelling to dental services
Travelling to GP services
Travelling to opticians
Travelling to pharmacies
Very easy/easy Neither easy nor difficult Difficult/very difficult

Mirfield Matters Residents Survey 2015 December 2015
13
Figure 8.b Accessing health services in Mirfield %
53
54
67
79
80
82
86
87
53
54
25
78
82
79
73
86
0 10 20 30 40 50 60 70 80 90 100
Registering for dental services
Getting an appointment for dental services
Getting an appointment for GP services
Travelling to dental services
Travelling to opticians
Travelling to GP services
Registering for GP services
Travelling to pharmacies
2007:Very easy/Easy 2015: Very easy/easy

Mirfield Matters Residents Survey 2015 December 2015
14
3.3 Leisure facilities in Mirfield
Key Findings
The most popular leisure/sporting activity amongst respondents is walking.
However one third of respondents said that they don’t take part in sports at all.
The most frequently used sports and leisure facilities used by respondents are those not run by Kirklees Active Leisure.
Satisfaction with facilities for children and young people in parks and play areas in Mirfield varied across different age categories. Satisfaction was greatest in respect of facilities for younger children (aged 4 to 11 years).
Satisfaction with facilities for children and young people in parks and play areas in Mirfield, in particular for older children and young people aged 8 to 16 years old has increased.
Regular usage of community facilities is low with three quarters of respondents saying that they do not use a community centre, church hall, scout hut or similar at least once a month.
The majority of respondents feel that there are adequate community facilities in Mirfield for use by local people for social activities.
Public footpaths and the canal are the areas used most by Mirfield residents for leisure activities such as walking, fishing and horse riding.
The areas reported as being most in need of improvement by respondents were public footpaths and parks.
The most popular leisure/sporting activity that respondents take part in regularly (i.e. at least once a month) is walking (45%), whilst over one third of respondents (36%) don’t take part in any sports. Weight training/keeping fit (16%) and swimming (15%) are also popular sporting activities.
Walking is more popular amongst respondents aged 30 to 50 (54%) than respondents aged under 30 (41%) than respondents aged over 50 (42%).
More respondents aged over 50 (41%) don’t take part in any sport than respondents aged under 30 (31%) and respondents aged 30 to 50 (22%).
The sports and leisure facilities most frequently attended by respondents in the last 6 months, are those not run by Kirklees Active Leisure (38%). Dewsbury Sports Centre (31%), Spenborough Swimming Pool and Sports Complex (22%) and Huddersfield Sports Centre (20%) are also frequently used by respondents.
Other sports and leisure facilities used by respondents include; MFG Sports Centre, Total Fitness, Brighouse Leisure Centre and Roy Ellams Gym.

Mirfield Matters Residents Survey 2015 December 2015
15
Figure 9. Regular (i.e. at least once a month) sporting activity %
45
16
15
11
10
7
5
3
2
2
2
1
1
36
Walking
Gym/Weight training/Yoga etc.
Swimming
Running/Jogging
Cycling
Golf
Football
Bowling
Tennis
Cricket
Fishing
Squash
Rugby
I don't take part in sports
N.B: Sporting activity mentioned by 1% or more of respondents only shown.

Mirfield Matters Residents Survey 2015 December 2015
16
Figure 10.a Satisfaction/dissatisfaction with facilities in parks
and play areas for children and young people in Mirfield %
20
35
48
41
43
35
39
23
17
12-16 years old
8-11 years old
4-7 years old
Very satisfied/ Satisfied Neither satisfied nor dissatisfied Dissatisfied/ Very dissatisfied
Figure 10. Satisfaction/dissatisfaction with facilities in parks and
play areas for children and young people in Mirfield %
5
22
43
20
35
48
0 10 20 30 40 50 60 70 80 90 100
12-16 years old
8-11 years old
4-7 years old
2007:Very satisfied/Satisfied 2015:Very satisfied/Satisfied

Mirfield Matters Residents Survey 2015 December 2015
17
Satisfaction with facilities for children and young people in parks and play areas in Mirfield varied across different age categories. Satisfaction was greatest in respect of facilities for younger children aged 4 to 11 years (48%) and lowest in respect of children and young people aged 12 to 16 years old (20%). One third of respondents (39%) are dissatisfied with facilities for children and young people aged 12 to 16 years old.
Satisfaction with facilities for children and young people in parks and play areas has increased in comparison for all age categories, in particular children and young people aged 8 to 11 years old (2007=22%, 2015=35%) and children and young people aged 12 to 16 years old (2007=5%, 2015=20%).
The most frequently given reasons for respondents’ dissatisfaction with facilities in parks and play areas for children aged 4 to 7 years old are that there are not enough facilities near to where they live; existing facilities have a limited amount of equipment; facilities are spoilt by vandalism, graffiti, broken glass, dog mess and long grass; the facilities are used by older children; and they are not safe.
“Basic park equipment, not very imaginative, bins not emptied enough, grass only half cut, dog mess”
“Existing areas are spoilt with litter, broken bottles, cans etc. left by unruly youths and facilities are damaged”
“Not enough in parks for young children, sometimes there is no gate or equipment is broken due to older children…”
Respondents who are dissatisfied with facilities for children and young people aged 8 to 11 years old say this is because there are too few facilities available and the facilities that are available cater to younger children or are unsafe, neglected and dirty.
“Not enough play areas for children at this age”
“Not really anywhere for them to play, park filled with rubbish, grass too long, rides too young for them, skate park is a disgrace”
“Skate park at Knowl often busy with older kids and swings too young, can’t play football in Knowl park when grass isn’t cut”
The most frequently given reasons for respondents’ dissatisfaction with facilities in parks and play areas for children aged 12 to 16 years old are that they don’t cater for this age group, which often results in groups of teenagers hanging around with nothing to do and grass areas are not cut.
“Bring back grass cutting, reducing space to play football, games etc.”
“Need more open areas for recreation, well lit and easy to view”
“Nowhere to go, they feel like adults but are not”
“Need organised clubs and places to 'hang out' with their friends, rather than the parks at night”

Mirfield Matters Residents Survey 2015 December 2015
18
Regular usage of community facilities is low with three quarters (76%) of respondents saying that they do not use a community centre, church hall, scout hut or similar at least once a month.
Respondents aged 30 to 50 (29%) are more likely to use a community facility than respondents aged under 30 (20%) and respondents aged over 50 (23%). Female respondents (29%) are more likely to use a community facility than male respondents (18%).
The majority of respondents (78%) feel that there are adequate community facilities in Mirfield for use by local people for social activities. This is also an increase from 2007 (61%).
Respondents who do not feel that there are adequate community facilities in Mirfield made a number of suggestions for improvements, the most frequent of these was for some sort of community building.
“A better equipped community centre, youth club or sports club“
“Larger community facility hub including improved library space, arts and crafts, cafes”
“Its own modern community centre please”
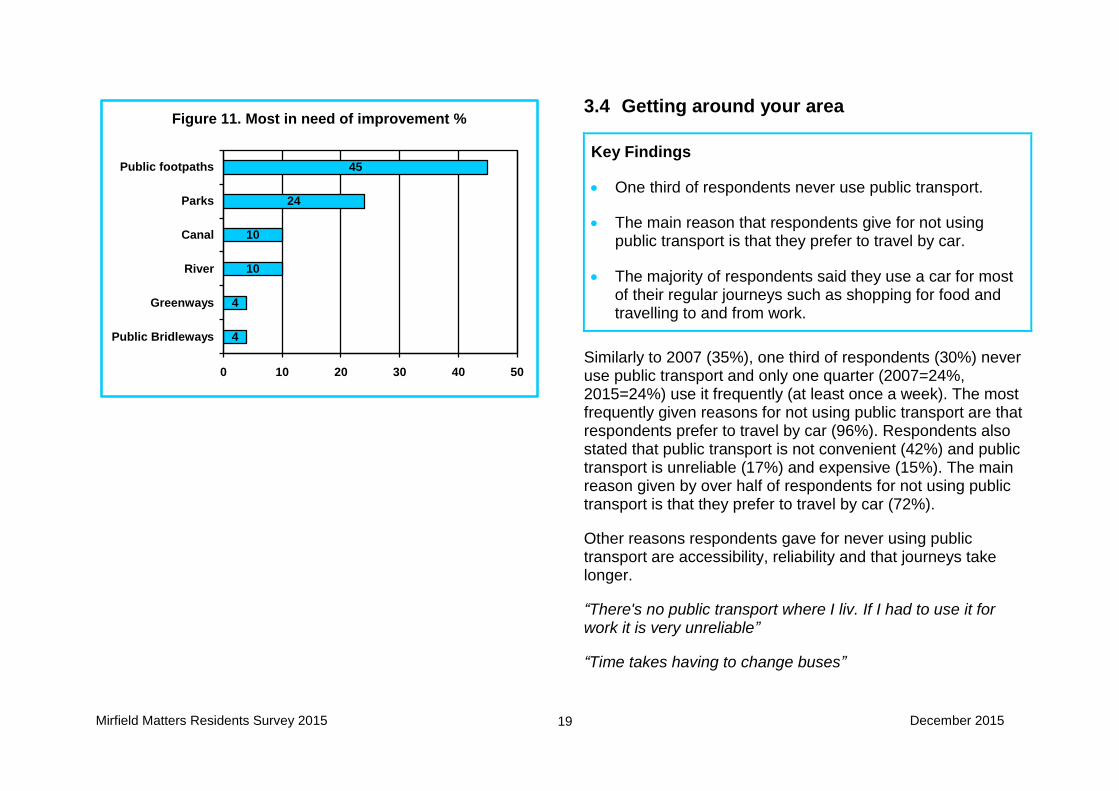
Public footpaths (60%) and the canal (48%) are the areas used most by Mirfield residents for leisure activities such as walking, fishing and horse riding. One quarter of respondents (25%) don’t use any of the facilities regularly.
The area most frequently reported as being in need of improvement by respondents were public footpaths (90%). Public footpaths were also most frequently mentioned as in need of improvement in 2007, but by fewer respondents (58%).
“Access for some footpaths is impossible, too overgrown”
“A lot of footpaths are not in a good state of repair”
“Access, some paths along the canal are overgrown and make walking with small children difficult”
Half of respondents also said that parks were most in need of improvement (50%).
“The park at Bolderstone is very poor, not looked after and overgrown”
“The parks this year in Mirfield have not been kept up to standard…”
“There seems to be less grass cutting, bin emptying, litter picking, leaving an unsightly mess”
One third of respondents (36%) do not think that any of the areas are in need of improvement. This compares to only 15% of respondents who said that they did not think any area was in need of improvement in 2007.
The areas reported as being most in need of improvement by respondents were public footpaths (53%) and parks (21%).
Mirfield Matters Residents Survey 2015 December 2015
19
Figure 11. Most in need of improvement %
4
4
10
10
24
45
0 10 20 30 40 50
Public Bridleways
Greenways
River
Canal
Parks
Public footpaths
3.4 Getting around your area
Key Findings
One third of respondents never use public transport.
The main reason that respondents give for not using public transport is that they prefer to travel by car.
The majority of respondents said they use a car for most of their regular journeys such as shopping for food and travelling to and from work.
Similarly to 2007 (35%), one third of respondents (30%) never use public transport and only one quarter (2007=24%, 2015=24%) use it frequently (at least once a week). The most frequently given reasons for not using public transport are that respondents prefer to travel by car (96%). Respondents also stated that public transport is not convenient (42%) and public transport is unreliable (17%) and expensive (15%). The main reason given by over half of respondents for not using public transport is that they prefer to travel by car (72%).
Other reasons respondents gave for never using public transport are accessibility, reliability and that journeys take longer.
“There's no public transport where I liv. If I had to use it for work it is very unreliable”
“Time takes having to change buses”

Mirfield Matters Residents Survey 2015 December 2015
20
The majority of respondents said they use a car for most of their regular journeys such as shopping for food (82%), travelling to and from work (77%), education and training (75%) and for leisure activities (70%). The exception to this is taking children to and from school, where one in four respondents walk (45%) and only half of respondents travel by car (50%).
Figure 12. Use of public transport %
24
14
27
35
24
18
29
30
0 5 10 15 20 25 30 35 40
Frequently (at least
once a week)
Occasionally (less than
once a week)
Rarely (a few times a
year)
Never
2007 2015

Mirfield Matters Residents Survey 2015 December 2015
21
3.5 Your local environment
Key Findings
Satisfaction with the standard of Mirfield town centre and local shopping areas is fairly high, in contrast dissatisfaction is highest with regards to the cleanliness of public toilets and pavements.
The majority of respondents disagree with the idea that any business should be allowed to build its premises in parks, open green spaces or moorland in Mirfield.
Less than half of respondents think that there are particular “grot spots” in Mirfield that are in need of attention.
People living in Mirfield are concerned about the environment. The vast majority of respondents said they are either very concerned or fairly concerned about the environment.
The most popular actions taken by respondents to protect the environment are: recycling paper, glass etc; reducing the amount of energy used in the home; and reducing the amount of water used in the home.
Satisfaction with the standard of cleanliness of Mirfield town centre (66%) and local shopping areas (64%) is fairly high. Over half of respondents (54%) are also satisfied with the cleanliness of roads across Mirfield.
In contrast dissatisfaction is highest with regards to the cleanliness of public toilets (37%) and pavements (35%). One quarter of respondents are also dissatisfied or very dissatisfied with parks and play areas (23%).
“Footpaths are often litter strewn and dog dirt about”
“There is a problem with litter accumulation”
“Public toilets are disgusting”
“Public toilets are dirty and inadequate”
“Grass needs cutting, dog mess, overflowing bins in the park”
Satisfaction with the cleanliness of Mirfield town centre (2007=43%, 2015=66%) and local shopping areas (2007=41%, 2015=64%) are significantly higher than in 2007.
Respondents aged over 50 are less satisfied with the cleanliness of roads (50%), than respondents aged under 30 (73%) and respondents aged 30 to 50 (66%).
Respondents aged over 50 are less satisfied with the cleanliness of pavements (37%), than respondents aged under 30 (57%) and respondents aged 30 to 50 (53%).

Mirfield Matters Residents Survey 2015 December 2015
22
Respondents aged over 50 are less satisfied with the cleanliness of open green spaces (41%), than respondents aged under 30 (41%) and respondents aged 30 to 50 (47%).
Respondents aged over 50 are also less satisfied with the cleanliness of Mirfield town centre (63%), than respondents aged under 30 (77%) and respondents aged 30 to 50 (73%).
As in 2007, the majority of respondents (91%) disagree with the idea that any business should be allowed to build its premises in parks, open green spaces or moorland in Mirfield, with two thirds of these respondents (68%) strongly disagreeing.
Figure 13.a Satisfaction with standard of cleanliness in Mirfield %
15
39
40
43
44
54
64
66
49
44
37
23
36
27
28
26
37
18
23
35
20
20
8
8
Public toilets
Around schools
Parks and play areas
Pavements
Open green spaces
Roads
Local shopping areas
Mirfield town centre
Very satisfied/ Satisfied Neither satisfied nor dissatisfied Dissatisfied/ Very dissatisfied

Mirfield Matters Residents Survey 2015 December 2015
23
Figure 13.b Satisfaction with standard of cleanliness in Mirfield %
29
30
36
38
41
43
52
40
39
44
43
64
66
54
0 10 20 30 40 50 60 70 80 90 100
Parks and play areas
Around schools
Open green spaces
Pavements
Local shopping areas
Mirfield town centre
Roads
2007:Very satisfied/Satisfied 2015:Very satisfied/Satisfied

Mirfield Matters Residents Survey 2015 December 2015
24
Figure 14. Building businesses in open green
space in Mirfield %
2
2
6
22
68
2
4
8
23
68
0 10 20 30 40 50 60 70 80 90 100
Strongly agree
Agree
Neither
Disagree
Strongly
disagree
2007 2015
Less than half of respondents (41%) think that there are particular “grot spots” in Mirfield that are in need of attention. This compares to more than half of respondents in 2007 (58%). Respondents mentioned a wide variety of “grot spots”.
Respondents mentioned a wide variety of “grot spots”. The following were frequently mentioned:
Crossley Lane;
Knowl Park;
Mirfield Railway Station;
The canal; and
The Greenway.
People living in Mirfield are concerned about the environment. The vast majority of respondents (89%) said they are either very concerned (37%) or fairly concerned (52%) about the environment.
The most popular actions taken by respondents to protect the environment are: recycling paper, glass etc (93%); reducing the amount of energy used in the home (75%); and reducing the amount of water used in the home (59%).

Mirfield Matters Residents Survey 2015 December 2015
25
Figure 15. Actions to protect the environment %
7
15
16
18
31
34
54
59
75
93
Installed renewable energy source
Used public transport for environmental reasons
Bought organic food
Not bought something because of packaging
Took action to protect wildlife
Reduced the use of car
Installed an energy efficient boiler
Reduced amount of water used in home
Reduce amount of energy used in home
Recycled paper, glass etc.

Mirfield Matters Residents Survey 2015 December 2015
26
3.6 Crime and anti-social behaviour
Key Findings
Only a minority of respondents have been a victim of crime in the last 12 months. The most frequently experienced crimes are anti-social behaviour and car crime.
Respondents said that they are most worried that the following crimes might happen to them in the future: assault, house burglary and car crime.
Abandoned and burnt out cars, noisy neighbours or loud parties, people being attacked or harassed because of their skin colour, ethnic origin or religion and people being insulted, pestered or intimidated in the street are not considered to be a big problem in Mirfield. Respondents are more concerned about people using or dealing drugs, rubbish or litter lying around, teenagers hanging around on the street and vandalism, graffiti and other deliberate damage.
Police patrols, parental responsibility, local staffed police station and CCTV are all considered to be important measures in trying to tackle crime and anti-social behaviour throughout Mirfield.
Two thirds of respondents had not contacted the police either by telephone, or in the street, or by calling at a police station in the last 12 months.
Only a minority of respondents (10%) have been a victim of crime in the last 12 months. This is fewer than in 2007 (18%).
A higher proportion of respondents aged 30 to 50 (16%), than respondent aged under 30 (11%) and respondents aged over 50 (8%) reported being the victims of crime in the last 12 month.
The most frequently experienced crimes, by respondents who had been victims of crime in the last 12 months, are anti-social behaviour (37%) and car crime (33%). Only a very small number of respondents, who have been victims of crime in the last 12 months, have experienced racial harassment (5%) and domestic violence (1%).
A higher proportion of respondents aged over 50 (29%) had been the victims of vandalism, than respondents aged 30 to 50 (17%).
A higher proportion of female respondents (40%) had been victims of anti-social behaviour, than male respondents (33%).
The most frequently mentioned “other” crime experienced by respondents in the last 12 months is theft from a garage, shed or garden (12%). Respondents have also identity theft, theft of scooters, mopeds or bikes and dangerous driving.

Mirfield Matters Residents Survey 2015 December 2015
27
Respondents said that they are most worried that the following crimes might happen to them in the future: house burglary (56%), car crime (52%) and vandalism (47%). There is less concern expressed about racial harassment (12%) and domestic violence (6%).
Fear of crime has fallen since 2007, significantly fewer respondents stated that they are worried or very worried about car crime (2007=74%, 2015=52%), vandalism (2007=73%, 2015=47%), house burglary (2007=70%, 2015=56%), robbery (2007=60%, 2015=36%), assault (2007=60%, 2015=32%) or racial harassment (2007=22%, 2015=12%).
Respondents aged under 30 (43%) are less concerned about house burglary than respondents aged 30 to 50 (59%) and respondents aged over 50 (54%).
Respondents aged under 30 (24%) are less worried about assault than respondents over 50 (33%) and respondents aged 30 to 50 (30%).
Respondents aged under 30 (5%) are less worried about racial harassment than respondents over 50 (13%) and respondents aged 30 to 50 (10%).
Female respondents (38%) are more concerned about robbery than male respondents (33%).
Respondents aged over 50 (49%) are more concerned about vandalism than respondents aged under 30 (32%) and respondents aged 30 to 50 (41%).
Figure 16.a Fear of crime %
6
9
12
32
36
47
52
56
94
91
88
68
64
53
49
44
Domestic violence
Other
Racial harassment
Assault
Robbery
Vandalism
Car crime
House burglary
Very worried/worried Not very worried/not at all worried

Mirfield Matters Residents Survey 2015 December 2015
28
Figure 16.b Fear of crime %
5
22
60
60
70
73
74
6
12
62
36
56
47
52
0 10 20 30 40 50 60 70 80 90 100
Domestic violence
Racial harassment
Assault
Robbery
House burglary
Vandalism
Car crime
2007:Very worried/Worried 2015:Very worried/worried
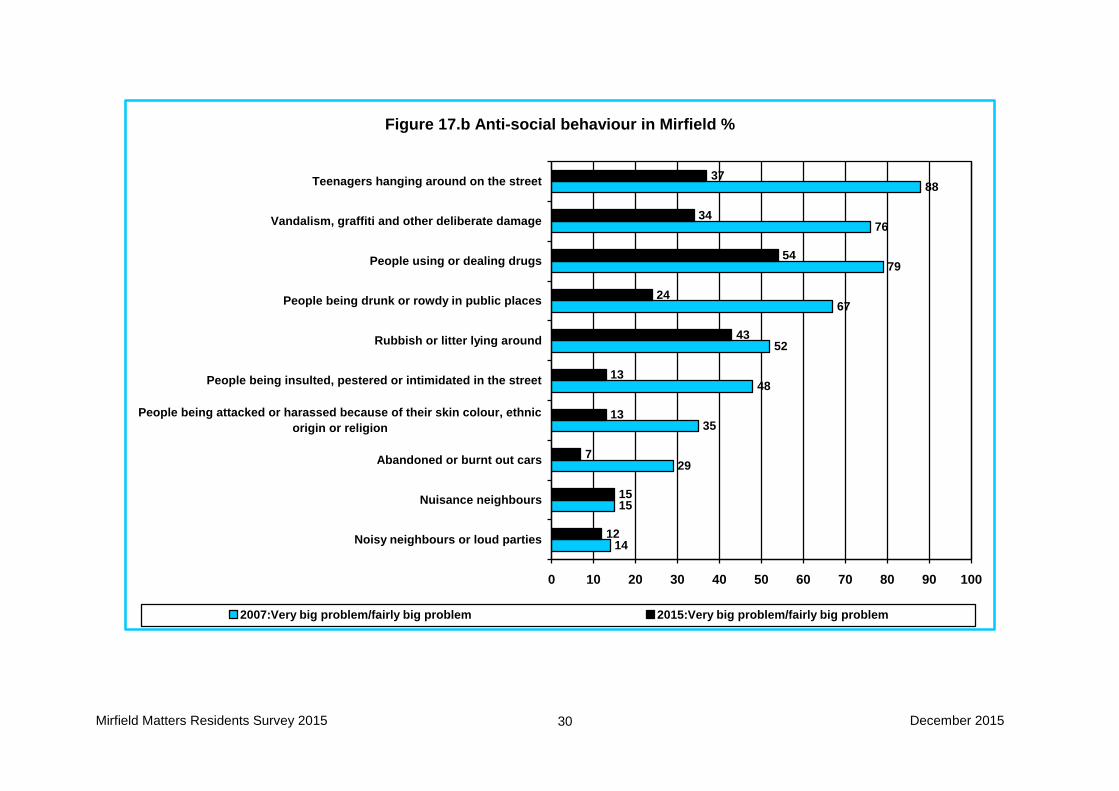
Abandoned and burnt out cars (7%), noisy neighbours or loud parties (12%), people being attacked or harassed because of their skin colour, ethnic origin or religion (13%) and people being insulted, pestered or intimidated in the street (13%) are not considered to be a big problem in Mirfield. Respondents are more concerned about people using or dealing drugs (54%), rubbish or litter lying around (43%), teenagers hanging around on the street (37%) and vandalism, graffiti and other deliberate damage (34%).
Significantly fewer respondents are worried or very worried about anti-social behaviour in 2015 than in 2007.
Respondents aged under 30 (15%) are less worried about noisy neighbours or loud parties than respondents aged 30 to 50 (10%) and respondents aged over 50 (9%).
Respondents aged over 50 (34%) are less worried about teenagers hanging around on streets than respondents aged 30 to 50 (46%) and respondents aged under 30 (51%).

Mirfield Matters Residents Survey 2015 December 2015
29
Female respondents (40%) are more worried about teenagers hanging around on streets than male respondents (33%).
Female respondents (36%) are more worried about vandalism than male respondents (31%).
Respondents aged under 30 (27%) are less worried about vandalism than respondents aged 30 to 50 (35%) and respondents aged over 50 (33%).
Respondents aged over 50 (56%) are more worried about people using or dealing drugs than respondents aged under 30 (50%) and respondents aged 30 to 50 (46%).
Respondents aged 30 to 50 (9%) are less likely to be concerned about people being drunk or rowdy in public places than respondents aged under 30 (29%) or respondents aged over 50 (25%).
Figure 17.a Anti-social behaviour in Mirfield %
7
12
13
13
15
24
34
37
43
54
94
89
91
86
84
77
66
63
57
47
Abandoned or burnt out cars
Noisy neighbours or loud parties
People being attacked or harassed because
of their skin colour, ethnic origin or religion
People being insulted, pestered or
intimidated in the street
Nuisance neighbours
People being drunk or rowdy in public
places
Vandalism, graffiti and other deliberate
damage
Teenagers hanging around on the street
Rubbish or litter lying around
People using or dealing drugs
Very big problem/fairly big problem Not a very big problem/not a problem at all
Mirfield Matters Residents Survey 2015 December 2015
30
Figure 17.b Anti-social behaviour in Mirfield %
14
15
29
35
48
52
67
79
76
88
12
15
7
13
13
43
24
54
34
37
0 10 20 30 40 50 60 70 80 90 100
Noisy neighbours or loud parties
Nuisance neighbours
Abandoned or burnt out cars
People being attacked or harassed because of their skin colour, ethnic
origin or religion
People being insulted, pestered or intimidated in the street
Rubbish or litter lying around
People being drunk or rowdy in public places
People using or dealing drugs
Vandalism, graffiti and other deliberate damage
Teenagers hanging around on the street
2007:Very big problem/fairly big problem 2015:Very big problem/fairly big problem

Mirfield Matters Residents Survey 2015 December 2015
31
As in 2007, police patrols (97%), parental responsibility (98%), CCTV (90%) and local staffed police station (81%) are all considered to be important measures in trying to tackle crime and anti-social behaviour throughout Mirfield.
Female respondents (68%) think that neighbourhood watch is more important than male respondents (62%).
Female respondents (99%) think that parental responsibility is more important than male respondents (93%).
Female respondents (75%) think that police community support officers are more important than male respondents (67%).
Female respondents (35%) also think that police surgeries are more important than male respondents (27%).
Respondents aged under 30 think that all the measures to prevent crime and anti-social behaviour are less important than respondents aged 30 to 50 or respondents aged over 50.
Police patrols are considered to be the most important measure to tackle crime and anti-social behaviour by over one third of respondents (41%). Parental responsibility (17%), local staffed police station (14%) and CCTV (12%) are also seen as the most important measure by significant numbers of respondents.
The majority of respondents (83%) had not contacted the police either by telephone, or in the street, or by calling at a police station in the last 12 months.
A higher proportion of respondents aged 30 to 50 (24%) had contacted the police in the last 12 months than respondents aged under 30 (17%) and respondents aged over 50 (15%).
Two thirds of respondents (65%) who had contacted the police in the last 12 months were satisfied with the way that the police handled the matter.

Mirfield Matters Residents Survey 2015 December 2015
32
Figure 18. Measures to tackle crime and anti-social behaviour in
Mirfield %
30
31
77
81
87
88
32
35
90
83
98
97
0 10 20 30 40 50 60 70 80 90 100
Police surgeries
Council Rangers
CCTV
Local staffed police station
Parental responsibility
Police patrols
2007 2015

Mirfield Matters Residents Survey 2015 December 2015
33
3.7 Information and communication
Key Findings
The Mirfield Reporter and The Press are given by the majority of respondents as their key sources of information about Mirfield Town Council and their local area.
There is a mixed response regarding awareness of how to contact local town councillors. Only one third said they had ever contacted their local town councillors.
Awareness levels of Dewsbury & District Committee (prior to reading the questionnaire) were relatively low. One third of those that are aware of Dewsbury & District Committee have attended a meeting.
Awareness levels of Mirfield Town Council (prior to reading the questionnaire) were higher.
The majority of respondents said it was either very important or important to them to have a town council in Mirfield.
One third of respondents are prepared to pay at least £1 more per year to assist Mirfield Town Council in supporting community projects. However, one third think that £5 per year is about right and one in ten think that the current £5 is too much.
The Mirfield Reporter (47%) and the Press (44%) are given by the majority of respondents as their key sources of information about Mirfield Town Council and their local area. One third of respondents get information about Mirfield Town Council by word of mouth (35%) and Kirklees Together, Kirklees Council’s magazine (30%).
Just under one third of respondents get information about Mirfield Town Council through some form of social media (28%).

Mirfield Matters Residents Survey 2015 December 2015
34
Figure 19. Information sources %
5
6
11
14
15
23
24
30
35
44
47
0 5 10 15 20 25 30 35 40 45 50
Yorkshire Post
Huddersfield Examiner
Dewsbury Reporter
Kirklees Council website
Social Media, i.e facebook, Twitter etc.
Internet
Kirklees Together
Word of Mouth
The Press
Mirfield Reporter
N.B: Information sources mentioned by 5% or more of respondents only shown.

Mirfield Matters Residents Survey 2015 December 2015
35
There is a mixed response regarding awareness of how to contact local town councillors, 43% are aware and 57% are not aware of how to contact their local councillors.
A higher proportion of respondents aged over 50 (48%) know how to contact their local town councillors than respondents aged under 30 (22%) and respondents aged 30 to 50 (33%).
Only one third (36%), said that they had ever contacted their local town councillors.
Awareness levels of Dewsbury & District Committee (prior to reading the questionnaire) were relatively low (35%).
A higher proportion of respondents aged over 50 (68%) were aware of Dewsbury & District Committee than respondents aged under 30 (30%) and respondents aged 30 to 50 (31%).
One third of those that are aware of Dewsbury & District Committee have ever attended a meeting (32%).
The majority of respondents that have attended a Dewsbury & District Committee meeting found the meeting useful and informative (94%) and will attend a meeting again (91%).
Around two thirds of respondents said that they felt comfortable speaking at the meeting (60%), however a similar proportion also felt that the meeting was too formal (69%).
Less than half of respondents felt that their input was taken seriously (45%) and less than one third that action is taken as a result of the meetings (28%).
Awareness levels of Mirfield Town Council (prior to reading the questionnaire) were higher (89%) than awareness of how to contact local councillors or of Dewsbury & District Committee.
The majority of respondents (83%) said it was either very important or important to them to have a town council in Mirfield. Only a very small proportion of respondents feel that Mirfield Town Council is unimportant (6%).
Over a third of respondents are prepared to pay £1 more per year (42%) and one in five respondents are prepared to pay more than £1 per year more (21%) than the current £5 per year to assist Mirfield Town Council in supporting community projects. However, one third think that £5 per year is about right and one in ten think that the current £5 is too much.

Mirfield Matters Residents Survey 2015 December 2015
36
Figure 20. Mirfield area Committee %
28
45
60
69
91
94
37
28
26
17
3
5
35
28
15
12
4
1
Action is taken as a result of the meetings
I felt that my input was taken seriously
I felt comfortable speaking at the meeting
The meeting was too formal
I will attend again
I found the meetings useful and informative
Strongly agree/agree Neither agree nor disagree Disagree/strongly disagree

Mirfield Matters Residents Survey 2015 December 2015
37
Figure 21. Precept to Mirfield Town Council to
assist in supporting community projects %
9
21
28
42
No, £5 per year
is too much
Yes, more than
£1 per year
No, £5 per year
is about right
Yes, £1 per year
more
Mirfield councillors would like to set up some community groups in Mirfield. Initially the groups will look at the outcomes of this survey and take the findings forward to improve life in Mirfield. Local residents were asked if they would be interested in taking part and 178 have said that they would.