Embed Size (px)
Citation preview

MEDIA MATTERS
DIGITAL SOCIETY RESEARCH REPORT VOL. 4

B Media Matters Report 2021
Published by:
Address:
MCMC HQ Tower 1, Jalan Impact Cyber 6, 63000 Cyberjaya,Selangor Darul Ehsan, Malaysia
Website:
https://www.mcmc.gov.my
Tel:
+60 3 8688 8000
Fax:
+60 3 8688 1000
Malaysian Communications and Multimedia Commission
MALAYSIAN COMMUNICATIONS AND MULTIMEDIA COMMISSION, 2021
The information or material in this publication is protected under copyright and, save where otherwise stated, may be reproduced for non-commercial use provided it is reproduced accurately and not used in a misleading context. Where any material is reproduced, the Malaysian Communications and Multimedia Commission (MCMC), as the source of the material, must be identified and the copyright status acknowledged.
The permission to reproduce does not extend to any information or material the copyright of which belongs to any other person, organisation or third party. Authorisation or permission to reproduce such information or material must be obtained from the copyright holders concerned. This work is based on sources believed to be reliable, but the Malaysian Communications and Multimedia Commission does not warrant the accuracy and completeness of any information and cannot accept responsibility for any error or omission.

1Media Matters Report 2021
CONTENTS
Manuscripts4
About1• Digital Society Research
Grant
• Malaysian Communications and Multimedia Commission
02
Message from the Chairman2 03
Executive Summary3 04
Do Mobile Apps Help to Grow Your Business? The Case of Delivery Services in Sabah- Universiti Malaysia Sabah
i 06
Efficient Web Disclosure Practices Among Malaysian Non-Profit Organisations- Universiti Teknologi MARA
iii 34
Contact Us5
Too Young Too Digital: How Malaysian Parents Mediate Their Young Children’s Internet and Digital Device Use- International Islamic University Malaysia
vii 86
Using Survival Data Analysis Perspective to Manage Movement Control Order (MCO) in Selected Countries: Lessons for Malaysia- University Nottingham Malaysia
viii 104
Malaysian Cyberbullying Law: A Work-in-Progress- Universiti Utara Malaysia
ix 118
Factors Affecting Consumers’ Cashless Payment Behaviours Amidst the COVID-19 Pandemic- Universiti Utara Malaysia
ii 18
IT Skills Among Marginalised Communities: The Case of Orphans and Vulnerable Children (OVC) in Malaysia- Universiti Putra Malaysia
iv 46
Homeless People’s Access to Health Information via Digital Communication: A Study in Kuala Lumpur- Universiti Utara Malaysia
v 51
B40 Income Earners’ Digital Literacy: A Focus on Children at Projek Perumahan Rakyat (PPR)- International Islamic University Malaysia
vi 70

2 Media Matters Report 2021
ABOUT
Digital Society Research GrantThe Digital Society Research Grant (DSRG) was conceived to contribute towards the enhancement of information resources that are
necessary and in line with changing community expectations as we navigate the transition towards a sustainable digital civil society. This
grant aims to grow the evidence base necessary for the nation to optimise the advancements made in communications infrastructure
and service deployment. This base will assist the development of policy, programmes, and interventions to promote the inclusion and
participation of all segments of the population as the nation transitions towards being a fully digitally connected and informed society.
Malaysian Communications and Multimedia CommissionThe Malaysian Communications and Multimedia Commission (MCMC) is a statutory body established under the Malaysian
Communications and Multimedia Commission Act 1998 (MCMCA), which implements and promotes the Government’s national policy
objectives for communications and multimedia sector. MCMC regulates and encourages the development of the communications and
multimedia industry, including telecommunications, broadcasting, online activities, postal services, and digital certification.

3Media Matters Report 2021
MESSAGE FROM THE CHAIRMAN
YBhg. Dato’ Dr. Fadhlullah Suhaimi Abdul MalekChairman
‘Digital Adoption, Technologies and Services’
The advent of the COVID-19 pandemic has taught us how
important it is to be digitally connected as it became a necessity
for us to rely on the internet and digital platforms for our daily
interaction and communication. It sparked a widespread and
significant shift from our more traditional lifestyle to a digitally
influenced lifestyle whereby digital communications and
connectivity proved to be a vital key in building a more resilient
society.
The design of the telecommunication infrastructure in Malaysia is
skewed toward enterprise/office buildings rather than residential
based. This design has been put to test during the pandemic
which gave rise to an increase in internet traffic by as much as
70 percent, which led to an inevitable reduction in internet
speed of up to 40 percent and an increase in complaints
from consumers by 70 percent. As such, MCMC has
rigorously endeavoured to balance industry growth to meet
the ever-expanding requirements of digital connectivity
in the country through the Pelan Jalinan Digital Negara
(JENDELA) initiative to provide a better experience for
internet users.
Additionally, in ensuring that we achieve our national
aspiration to be a Digitally Connected and Informed
Society (Digital Society), MCMC provides support to the
Rakyat through Pusat Ekonomi Digital Keluarga Malaysia
(PEDi), where various courses and ICT-based training are
provided to the local community to hone their skills in the
e-commerce business, encourage participation in digital
creation and improve their digital knowledge. This initiative
increases community awareness and involvement towards
improving socio-economic status and empowering human
capital among rural and urban poor communities.
MCMC also facilitates capacity building by encouraging
and promoting collaborative research activities. Under the
Digital Society Research Grant (DSRG), MCMC supports
research projects in the area of digital citizenship, cyber
wellness and digital inclusion. I am pleased to introduce this
fourth edition of Media Matters, a compilation of research
funded under DSRG 2020. The publication showcases
MCMC’s research collaboration with nine local universities,
where the research studies are used to build an evidence
base that can contribute to our understanding and become
a source of information related to the adoption and usage
of digital technologies and services.
In these studies, a wide range of areas, issues and
respondents were researched. One of the research focus
areas was identifying the success or areas of improvement
for digital platforms or devices that are heavily dependent
on technologies that have become a common feature in
our daily lives. Regulation and legislation were also studied
to support the development of policies and practices to
promote improved societal outcomes.
I would like to express my deepest appreciation to all
parties and stakeholders involved in these research projects
and the responsiveness of the research community, without
which this would not have been possible.
Thank you.
YBhg. Dato’ Dr. Fadhlullah Suhaimi Abdul Malek

4 Media Matters Report 2021
EXECUTIVE SUMMARY
As the regulator of Malaysia’s communications and multimedia
(C&M) sector, understanding how the C&M ecosystem evolves
over time remains key to informing regulatory and policy
decisions. In this context, the studies seek to understand
how end-users are being impacted by the evolving internet
landscape, digital applications and devices even as we pursue
an inclusionary agenda to ensure that all segments of society
benefits from ICT.
This is where research plays a crucial role in helping us understand
the issues at hand. In this report, researchers explored areas
such as the communications needs and challenges of vulnerable
groups, how a pervasive usage of digital devices and internet
use impacts children, and to find out in more recent times, how
the pandemic affected digital payments and smartphone use.
The growth was due primarily by the need to stay home for online learning as schools remained closed during the pandemic.
Children, the Future of the Internet
According to the MCMC Internet Users Survey 2020, 88.7 percent of Malaysia’s population were internet users, an increase of 1.3
percent from the previous survey conducted in 2018. More interestingly, there was a 155 percent increase of children between the ages
of 5 and 17 using the internet compared to 2016.
The Impact of the Pandemic
Despite the disruption created by the pandemic, its advent was key to accelerating digital adoption across society as movement
restrictions disrupted daily life. For example, businesses had to go online to ensure business continuity. Society turned to the internet
to conduct all kinds of daily transactions through their smartphones or computers. This new reality produced an increased number of
people using digital mobile applications and cashless payment systems in the new norm.
This posed a challenge for parents who worked from home as
they had to determine the best way to balance the time spent on
devices for learning against the “babysitting effect” of the device.
The increased population of children using the internet has
also increased the prevalence of cyberbullying. This issue
was explored in a study, which revealed gaps in the existing
legislation. To mitigate the identified gaps, the government is
called to address this issue by creating legislation to specifically
address cyberbullying.
A group of researchers explored the digital literacy and IT skills
of the more vulnerable children, such as those from the B40
group and the orphaned. They found that while children from
low-income families could access the internet, digital media and
applications, their skills were lacking in digital content creation
and problem-solving. This limitation has precluded them from the
considerable growth and learning opportunities present on the
internet. The study on vulnerable children found that introducing
IT skills to such a group was essential for improving their
confidence, communication skills and overall IT literacy.

5Media Matters Report 2021
EXECUTIVE SUMMARY
One of the studies conducted looked at the effect of mobile applications such as FoodPanda and Grab on the revenue of businesses
in Sabah.
It also recommended that to expand the take-up and usage of such applications and drive transformative growth of a digital society,
improved internet speeds and infrastructure would be required in Sabah.
The study also found that the growing traction of cashless payments in Malaysia can be encouraged further with improved security and
privacy, increased ease of access to such facilities, and its pervasiveness among merchants.
In addition to the above two studies, researchers have also undertaken a study to asses the accessibility of health related information
by homeless persons. Through the study, it was found that few use mobile phones to seek treatment and to obtain health information.
The outcome of this study is expected to aid authorities to ensure access to treatment is accepted and used by homeless persons in
this manner.
The final study related to the pandemic shared in this report suggested that the media and information technology played a critical role
in helping Malaysia emerge as one of the better-performing nations in preventing the rise of COVID-19 cases during the first wave of
infections.
Another study explored the use of cashless payments, which was found to have increased among Malaysians during the pandemic due to its convenience, flexibility, time savings and contactless features.
The study found that these apps helped improve revenue and provided an important lifeline for business continuity during the movement restrictions imposed during the pandemic.
Conclusion
The events of the past year served to underpin the reality that trends in the communications and multimedia space are fast changing.
Therefore, research will be a vital tool to understand the issues that impact end-users to and to inform the actions or interventions
required to bring about improvements for all stakeholders. The research also will increasingly support the growth and realisation of a
digitally connected and digitally inclusive nation.

6 Media Matters Report 2021
Do Mobile Apps Help to Grow Your Business?
The Case of Delivery Servicesin Sabah
UNIVERSITI MALAYSIA SABAH
RUSLI LATIMAHA, DIANA NABILA CHAU ABDULLAH AND SHAFINAZ NAIM

7Media Matters Report 2021
ABSTRACT
This study was conducted to identify the factors that influenced
consumer choice in using mobile apps and the significant effects
between consumer choice and mobile apps as well as price
increments of goods and services. This research was conducted
in three main cities in Sabah; Kota Kinabalu, Tawau and
Sandakan. A total of 331 respondents representing consumers
and nine respondents representing business owners participated
in the study. Logit regression analysis, analysis of variance,
descriptive and inferential analysis were used in the study. The
study found that promotion, advertising and benchmark of a
modern lifestyle were among the factors that influenced the use
of mobile apps. Based on logit regression results, user’s age,
digital society awareness, signal strength, method of payment,
food and grocery delivery services by private runners, consumer
The revolution of smartphones has created more opportunities
for business owners and consumers. Adequate knowledge
about mobile apps can enhance the potential to conduct more
business and earn more income. Mobile applications or mobile
apps is a new medium of communication for buyers and sellers
to meet virtually to make economic decisions together, which
differs from the traditional mode of business which is gradually
becoming outdated.
The Department of Statistics (2018) reported that the number of
households that have access to mobile phones is 98.4 percent
in Sabah, higher than the national level which is 98.1 percent.
This data indicates the huge potential for a new norm of business
cum lifestyle which is booming in Sabah especially in the three
cities of Tawau, Sandakan and Kota Kinabalu
Nevertheless, only 9.9 percent of Sabahans buy or place orders
for goods and/or services via e-commerce and 19.3 percent
conduct internet banking in 2018 (Department of Statistics,
2018). Part of the reason is that Sabahans have yet to familiarise
themselves with a digital lifestyle. The use of smartphones is
generally for communication and/or social media connections.
Delivery Services in Sabah
Delivery services are not new in Sabah but limited to certain
goods and services such as freight transportation, taxis, and
boats that are closely related to business purposes.
preferences, location, latency and upload speeds influenced the
use of mobile apps. Besides, the mode of payment, grocery
delivery services and preferences significantly affected the use
of mobile apps. Thus, the use of mobile apps has helped to
boost overall business growth. Subsequently, we recommend
that the e-wallet concept that has homogenous functions with
debit cards or internet banking be developed and adopted
across all income groups. The importance of private runners and
developing private runner apps are encouraged. Furthermore,
the state of Sabah is ready for 5G network deployment. Lastly,
the internet speed for households and general use should be
increased and that the price of internet speed packages be
monitored and controlled by the government.
The natural physical setting of Sabah which is hilly and the long
distance between one city centre to another requires efficient
delivery services. Subsequently, smooth delivery services require
an equally if not more efficient mobile apps system in order to
easily access the services.
The existence of various popular delivery services in Sabah such
as UBER, Grab and MyTeksi for transportation purposes, and
Foodpanda, GrabFood and MoreFun have provided a huge
potential for the development of a digital society. The digital
society network is able to contribute to the provision of job
opportunities, and business development by way of broader and
simpler marketing strategy(s).
In 2018, the digital economy contributed 18.5 percent or
RM267.7 billion to the national economy (Department of
Statistics, 2019) It has become a new driver of development in
the 21st century. What is really happening in Malaysia is that
small and medium enterprises (SMEs) businesses are less ready
to adopt digital technologies as compared to the government,
the general population and large export-oriented firms which
dominate the digital economy as their e-commerce adoption is
relatively higher. One way to realize a digital society is through
mobile apps that can be expanded into various services.
INTRODUCTION
Keywords: mobile apps, consumer choice, business owners, Sabah

8 Media Matters Report 2021
INTRODUCTION
Generally, the main demographic using mobile apps consists of middle-income groups residing in urban areas. For conservative
groups, the use of mobile apps has led to price hikes in goods and services compared to conventional methods. It is a well-known fact
that the goal of business entities is to maximize profits and minimise costs, and if the use of mobile apps can meet their goals, then it
is considered effective. However, if the use of mobile apps is not sufficiently comprehensive and does not reach a desired level, it may
hinder the goal of creating a digital society. The higher cost of broadband due to absence of market competition, slow internet speed,
lack of affordability and coverage of fixed broadband may be the reasons that lead to the failure of enacting a digital society.
Therefore, this study identified the factors that influenced consumer choice in using mobile apps for delivery services in Sabah. Besides,
this study attempted to answer the research question, whether there is a significant effect between consumer choice in using mobile
apps and its effect on price increments of goods and services for delivery services in Sabah.
9.9%Sabahans order goods & services via e-commerce
19.3%Sabahans conduct
internet banking
RM267.7billion
Contribution of Sabah’s e-commerce to the national economy
The Department of Statistics (2018) reported
LITERATURE REVIEW
Delivery services are more convenient for online buyers through
mobile apps which forms an essential part of urban logistics
services (Visser et al., 2014). The existence of mobile apps
has made delivery services more important. According to the
research by Mehmood and Najmi (2017), buyers preferred to
enjoy goods and services at the right time, place, quantity and in
a comfortable situation. Thus, mobile apps not only help to grow
business opportunities but also create platforms to enhance the
digital society concept.
There are several delivery services offered by especially well-
known food and beverage (F&B) sectors such as McDonald’s,
KFC and Pizza delivery. As technology advances, high-speed
internet access and interactive apps have created a digital
environment for the adoption of mobile apps in daily life.
Technology has played a major role in the introduction and
advancement of mobile apps. Currently, mobile apps serve
as substitute and as complementary services to complete
transactions and thus have grown to become an essential
part of everyday life (Balapour et al., 2020). From previous
studies, food delivery can significantly predict consumers’
behavioural intention to use mobile apps (Belanche et al., 2020)
and is expected to grow and evolve during the coming years
(Drahokoupil & Piasna, 2019).
Moreover, on average, 89 percent was spent on mobile apps by
consumers due to interactivity, convenience and comfortability
(Kim & Baek, 2018). The interactivity of smartphones led to
increased downloads of mobile apps by consumers. According
to Gill et al. (2017), most buyers searched for online information
through their mobile phones. On average, 60 percent of buyers
agreed that decision-making on purchases was driven by their
own devices or in other words, the device played a significant
role in influencing the buyers (Archacki et al., 2017). In contrast,
except for gamification of mobile apps, it was found that
the convenience factor was not significantly associated with
consumer engagement (Kamboj et al., 2020).
A study by Swani (2020) indicated that perceived usefulness,
top management support and competitive pressures were
the determinants of decision-making to adopt business-to-
business mobile apps in business. These results were supported
by Kamboj et al., 2020) that the perceived ease of use and
usefulness had a significant influence on consumer

9Media Matters Report 2021
LITERATURE REVIEW
89% 60%
Consumers spent on mobile apps due to interactivity,
convenience & comfortability.
Consumers agreed that their devices are their main driver in influencing their
purchases.
MOBILE APPS AS PLATFORMS TO ENHANCE DIGITAL SOCIETY & BUSINESS
OPPORTUNITIES
engagement which focused on gamification of mobile apps.
In contrast, perceived privacy risk negatively influenced the
perceived security of mobile apps (Balapour et al., 2020) and
this could be the reason why some individuals or business
owners were not interested in using mobile apps. At this stage,
to create awareness, particularly privacy awareness, it would be
necessary to alleviate the concerns of people in pursuing the
digital society agenda.
Meanwhile, young women business owners were found to make
more use of mobile apps in African contexts (Owoseni et al.,
2020). In contrast findings by Syukur et al. (2020) revealed that
added value was the strongest factor that affected customers’
choice of mobile apps, followed by functionality, firms’
characteristics, and payment method.
Furthermore, according to Palau-Saumell et al. (2019) habit,
facilitating conditions and intentions were among the significant
factors in using mobile apps for restaurants. The stronger the
habit, the higher the probability of using mobile apps (Limayem et
al., 2007; Venkatesh et al., 2012; Escobar- Rodríguez & Carvajal-
Trujillo, 2014). This proved that there was a direct effect of habit
on technology use.
Seneviratne et al. (2014) found that male users tended to have more paid apps than female users. Categories such as libraries and
demos, transport, video and sports games categories were reported to be more popular with male users, while the casual category was
more popular among female users. According to the researchers, smartphone users could be predicted by gender with an accuracy
of around 70 percent. This statement was supported by Malmi and Weber (2016) who found gender as being the most predictable
indicator. However, a recent study by Palau-Saumell et al. (2019) in a different context found that gender had a modest effect on the use
of mobile apps (Venkatesh et al., 2012). Similarly, a study by Malmi and Weber (2016) indicated that gender was statistically insignificant
to influence the future use of mobile apps.
Furthermore, according to Hwang et al. (2016) and supported by Venkatesh et al. (2012) and Palau-Saumell et al. (2019) age played
a moderate effect in the use of mobile apps. According to the United States Government Accountability Office (GAO) (2014), young
people aged between 18 and 29 years old represent the dominant group using cellular phone internet more than others. However,
Reddick and Zheng (2017) found that there was no evidence of age influencing mobile apps future use on a large-scale. Aside from
that, awareness of digital society might also contribute to the increase in the use of mobile apps or vice versa. Individuals with high
awareness but low needs were less likely to use mobile apps. Surprisingly, individuals with low awareness but high needs also gave
the same response that they were less likely to use mobile apps even after taking into account their high or low socio-economic status
(Malmi & Weber, 2016).
Yu’s (2012) study found a negative relationship between intention to use mobile apps and economic cost. The research focused
more on price-saving orientation and the result was significant (Escobar-Rodríguez & Carvajal-Trujillo, 2014). Examples of price-saving
orientation include discounts during promotion, cheaper price than usual and offer packages. Lastly, according to Palau-Saumell et
al. (2019) there were a number of reasons why people used mobile apps particularly for restaurant purposes such as perceived value,
performance, social influence and others. Therefore, this research was conducted to better understand the effect of mobile apps on
business and society in general.

10 Media Matters Report 2021
METHODOLOGY
Logit Regression
Since the dependent variable was in the binary choice form, we used the logit model to perform the analysis. Logistic regression
analysis is widely used to investigate the relationship between binary choice variables such as what is the factor(s) behind the decision-
making. This model assumes that there is a choice between two alternatives and it depends on identifiable characteristics. Thus, the
purpose of this model is to determine the probability that an individual makes a choice rather than the alternative. This method also fits
in with linear logistic regression models for binary data by using the maximum likelihood method (Hosmer et.al, 1989).
Let yi denote the response of the respondent, i, with respect to the outcome of the independent variables, x1i, x2i, ..., xni.
In this study, let:
Y = 1 denote the use of mobile apps for delivery services
Y = 0 denote not using mobile apps for delivery services
We used odds ratio to measure the probability of an event occurring in the Logit model. If Yi = 1, the probability of event occurring is:
This research used mixed methods comprising quantitative and qualitative methods. There were two separate instruments designed
for the purpose, which consisted of a survey by way of a questionnaire for consumers and a set of structured interview questions
for business owners. The survey was carried out using a structured questionnaire, designed to obtain data. The questionnaire
was divided into three parts with: an introduction that explained the purpose of the survey and assurance of confidentiality to the
respondent; section A gathered demographic data such as location, district, gender, age, education level, marital status, etc.;
section B referred to the respondent’s internet access such as operator, coverage, internet speed, etc.; section C concerned the
use of mobile apps. Due to the movement restriction order, this study was conducted through an online survey. The survey was
conducted via random sampling among respondents over a period between December 2020 and February 2021. The interview
method was conducted to get feedback from business owners. The questions asked were structured and conducted through phone
calls or via online methods.
1 Pi =1 + e−Zi
1
2
Where: Zi = ß0 + ß1Xi
Next, if Yi = 0, the probability of event occurring is: 1 - Pi =1 + e−Zi
1
3 Thus, the odds ratio is as follows:Odds ratio =
1 + eZi
11 + e−Zi
= eZi

11Media Matters Report 2021
METHODOLOGY
To test the goodness of fit of the logit model, we used maximum likelihood methods. Therefore, the model for the mobile apps delivery
services in Sabah is formulated as follows:
Age = age of the respondent (in years)Edu = education level (1 if degree; 0 if otherwise)DSA = digital society awareness (1 if yes; 0 if otherwise) TSUB = type of internet subscription (1 if monthly; 0 if otherwise) Bar = bar signal (bar)Cov = network coverage (generation of broadband cellular network technology)IUse = daily internet usage (1 if more than 13 hours per day; 0 if otherwise)MSI = monthly spending on internet (RM)MOP = mode of payment (1 if COD; 0 if otherwise)
FDS = food delivery services (1 if private runner; 0 if otherwise) GDS = grocery delivery services (1 if private runner; 0 if otherwise) TDS = transport delivery services (1 if private runner; 0 if otherwise) Pref = preferences (1 if mobile apps; 0 if otherwise)DWL = download (megabits per second or Mbps) UPL = upload (megabits per second or Mbps) PNG = ping (milliseconds or ms)Loc = location (1 if living in well-organized house; 0 if otherwise)
Where:MAP = the use of mobile apps (1 if yes; 0 if otherwise) Gen = gender (1 if male; 0 if otherwise)
4 MAPi = α0 + α1Geni + α2Agei + α3Edui + α4DSAi + α5TSUBi + α6Bari + α7Covi + α8IUsei + α9MSli + α10MOPi +
α11FDSi + α12GDSi + α13TDSi + α14Prefi + α15DWLi + α16UPLi + α17PNGi + α18Loci + u1
Analysis of Variance (ANOVA)
ANOVA was used to identify any difference between consumer choice in using mobile apps for delivery services and business growth
in Sabah. Three assumptions in one-way ANOVA, which is the independence of observations, normally distributed in each group for
dependent variables and they have homogeneity of variances.
The one way ANOVA compares two or more means between the groups and determines whether any of those means are statistically
and significantly different from each other. Thus, we ran the test to test the null hypothesis as follows:
To know whether these means were statistically different, we examined the t-test statistics or p-values. We also used F-test to test
the overall significance of the models. The F-statistic evaluates whether the group means is significantly different for an independent
variable with k groups.
H0: µ1 = µ2 = ... = µk
H1: At least one µkis different
where:
µ = group mean k = number of groups

12 Media Matters Report 2021
FINDINGS & ANALYSIS
Consumer Descriptive Analysis Results
This study examined the role of mobile apps in helping
businesses grow by investigating further into the case of delivery
services in Sabah. A total of 331 samples were collected for this
purpose. Based on the results of internet access and coverage
from different network access providers, it can be concluded that
Digi provided excellent service to their customers with strong
connection and 4G coverage on average followed by Maxis and
Celcom, respectively.
The purpose of internet access was mainly spent on learning
purposes, followed closely by usage of social media,
entertainment, online games, online shopping, food delivery and
transport services. The respondents spent 7 to 12 hours per day
on internet usage (38.97%), followed by 13 to 18 hours per day
(32.03%). The reasons the respondents chose to use mobile
apps to purchase their products and services were attributed
to its user-friendly traits (38%) followed by time-saving (24%)
and cost saving (17%). In addition, from time to time, there were
incentives or rewards given through mobile apps purchases such
as discounts, coupons, free delivery, and others.
Food delivery was the most chosen service (53.18%), followed
by transportation (45.32%) and grocery purchasing (17.52%).
Thus, the most critical lesson from these food delivery service
patterns is that customers preferred food delivery because it
was more convenient. Other than that, most of the mobile apps
usage in the three cities were for food delivery services with
6.65 percent from Kota Kinabalu, 6.04 percent from Sandakan
and 13.9 percent from Tawau. There were five main factors that
influenced the respondent’s purchasing decisions via mobile
apps such as promotions and reward points (53%), advertising
(20%), positive customer reviews (10%) and renowned brands
of products (10%).
The results of the study regarding payment method preferences
indicated that 46 percent preferred cash on delivery (COD),
followed by internet banking (28%) and debit card or credit card
(10%). Only 17 percent preferred e-wallet as the payment method
for their purchases via mobile apps. The Foodpanda delivery
service provider was the most preferred (35.05%) followed by
private runners (21.75%), KFC/McD/Pizza (10.88 per cent) and
GrabFood (9%). Apart from that, 45 per cent of the total number
of respondents used private runners for grocery delivery followed
by GrabMart (6.95%), MoreFun (6.04%) and Pandamart (5.44%).
Meanwhile, the choice for transport servicesusing mobile apps
showed that respondents chose GrabCar (37.76%), followed by
MyTeksi (26.28%) and Maxim.
Another important criterion of mobile apps selection was the time
taken to complete delivery services. For example, food delivery
services took 30 minutes to an hour (40.48%), less than 30
minutes (28.7%) and more than an hour (5.74%). For grocery
delivery services, 27.79 percent said that their groceries took 30
minutes to an hour to arrive. On the other hand, transportation
service experienced differences in the time taken to arrive at
respondents’ selected destinations. From the results, 43.81
percent of the respondents said that their transport service
arrived in less than 15 minutes while 19.94 percent said that it
took between 16 to 30 minutes.
Logit Regression Results
All models were considered as good-fitting models with the
McFadden R2 values of between 0.2 and 0.4 (McFadden, 1974;
Louviere et al., 2000). Model 3 had the lowest Akaike Information
Criterion (AIC) and Schwarz Information Criterion (SIC) after
we removed three variables: education (EDU), type of internet
subscription (TSUB) and coverage signal (CVG).

13Media Matters Report 2021
FINDINGS & ANALYSIS
VariableCoefficient Odds Ratio
Model 3
Marginal Effects
Model 3Model 1 Model 2 Model 3
MAP -5.7282 -5.2807 -6.2024 - -
Gen -0.2343 -0.2203 -0.2273 0.7967 -0.0423
Age 0.2822** 0.2807** 0.3354** 1.3985 0.0625
Edu 0.3173 0.3214 - - -
DSA -0.8961** -0.8990** -0.8937** 0.4092 -0.1665
TSUB 0.0731 0.0688 - - -
Bar -0.2916* -0.2968* -0.2951* 0.7445 -0.0550
Cov 0.1033 - - - -
IUse -0.1836 -0.1853 -0.1654 0.8475 -0.0308
MSI 0.0041 0.0041 0.0044 1.0044 0.0008
MOP 1.5766*** 1.5769*** 1.5656*** 4.7854 0.2917
FDS -0.6936* -0.7140* -0.7160* 0.4887 -0.1334
GDS 2.1045*** 2.1242*** 2.0935*** 8.1135 0.3900
TDS -0.2322 -0.2269 -0.2218 0.8011 -0.0413
Pref 1.4926*** 1.5035*** 1.4913*** 4.4429 0.2778
DWL -0.0049 -0.0049 -0.0052 1.0052 -0.0010
UPL -0.0129* -0.0134* -0.0136* 0.9865 -0.0025
PNG 0.0036* 0.0035* 0.0033* 1.0033 0.0006
Loc 0.5013* 0.4910* 0.4691* 1.5986 0.0874
McFadden R2 0.2952 0.2946 0.2934 e−Z 3.0389
AIC 0.8586 0.8531 0.8423 f (Z) 0.1863
SIC 1.0766 1.0598 1.0261 pi 0.2476
LR statistic 103.09*** 102.91*** 102.46***
TABLE 1: Logit Analysis Results
Note: ***,** and * to indicate significant at 1,5 or 10 percent, respectively

14 Media Matters Report 2021
Male respondents were 0.78 times more likely to use mobile apps. From an age perspective, the older respondents were 1.4 times more
likely to use the mobile apps. Further, respondents who had digital awareness were 0.41 times more likely to use mobile apps with the
probability of using mobile apps for delivery services reduced by 16.65 percent. The method of payment also strongly and significantly
affected the use of mobile apps where cashless payment was 4.79 times less likely to use mobile apps with 29.17 percent increase in
the probability of using mobile apps for delivery services in Sabah.
Moreover, food and grocery delivery services brands were statistically significant with negative and positive relationships, respectively.
The respondents of these respective services were 0.49 and 8.11 times more likely to use mobile apps for delivery services if the
services were provided by private runners. The preferences of using mobile apps or not was one of the important variables in this study.
From the analysis, the respondents were 4.44 times more likely to use mobile apps rather than resort to walk-in, ordering from the
website, making a call or other methods of ordering.
Furthermore, uploading and latency/ping were statistically significant, where the respondents were 0.99 and 1 time more likely,
respectively, to use mobile apps. Lastly, respondents who lived in well-organized housing in Sabah were 1.6 times more likely to use
mobile apps for delivery or the probability of using mobile apps increased by 8.74 percent.
Analysis of Variance Results
Table 2 shows that we can reject the null hypothesis and conclude that there is a statistically significant difference between mode of
payment (MOP), grocery delivery services (GDS) and preference to use mobile apps for delivery services in Sabah. In contrast, there
is no significant difference between food delivery services (FDS) and transport delivery services (TDS) in using mobile apps for delivery
services in Sabah.
Therefore, we can conclude that consumers’ choice of MOP, GDS and consumers’ preference to use mobile apps have a significant
effect and indirectly helps business growth in Sabah.
TABLE 2: Analysis of Variance Results
Test MOP FDS GDS TDS Pref
F-statistics 22.522*** 1.4303 27.180*** 0.2965 25.029***
t-statistics 4.7458*** 1.1959 5.2135*** -0.5445 5.0029***
FINDINGS & ANALYSIS

15Media Matters Report 2021
FINDINGS & ANALYSIS
Business Owners Descriptive Analysis Results
A total of nine business owners were interviewed; six were
degree holders, with the highest level of education. For the
rest of the respondents: two were diploma holders and one
respondent had a Sijil Tinggi Persekolahan Malaysia (STPM) / Sijil
Pelajaran Malaysia (SPM) certificate. The findings of the study
also concluded that most of the business owners ran businesses
which included food and beverage (restaurants), children’s
clothing, toys, and household appliances.
All the businesses also subscribed to the internet and spent
between RM58 to RM188 monthly on subscription. In general,
89 percent of the business owners did not equip their premises
with fixed line broadband internet facilities. The findings of
the study also concluded that all businesses advertised their
products and/or services through social media platforms such
as Facebook, while five out of nine respondents advertised their
businesses through Instagram.
The participation of the business owners in delivery platforms
and their use of mobile apps to promote and sell their products
was not subjected to any fee. The business owners only
had to pay for charges imposed by private runners or take a
commission from the sale price. The results of the interviews also
concluded that the minimum number of orders received through
mobile apps was between three to more than 20 orders per day.
Interestingly, all the nine respondents also used private runner
services to deliver their orders, while only three business owners
used registered delivery services such as MoreFun, Foodpanda
and GrabFood.
One of the main factors that influenced the choice of a runner,
whether private or registered, was the runner’s character. Other
factors include price and charges imposed, the availability of
the runner, and trends in using registered runner services such
as GrabFood or Foodpanda. Apart from that, the COVID-19
pandemic had undoubtedly impacted the use of mobile apps.
In terms of experience of using mobile apps, as many as 44
percent of the business owners have been using these apps for
more than two years since they started their business. While the
rest of the business owners have been using mobile apps for one
to two years even though their businesses have been operating
longer than others.
In addition, the analysis also concluded that all business owners
in this study preferred payment methods through internet
banking for any transaction that involved the use of mobile apps
because they were easy to monitor. However, they prioritized
their customers’ convenience and as such, 56 percent of the
business owners gave priority to COD method for making
payments. Other than that, 44 percent of the business owners in
Sabah also provided alternative payment methods via e-wallets
such as Boost and GrabPay. The lack of response to the use
e-wallets as a payment method fromthe general population
resulted in cash payments being a priority for business owners.
The business owners chose to use mobile apps in their business
because of fast transactions, convenience for customers facing
time constraints and to simplify the buying and selling process.
Furthermore, mobile apps are easy-to-use and helps to facilitate
market and business expansion where products can be shipped
to more areas using delivery services, and to fulfill current
business needs.
According to the business owners, before the implementation of
the MCO, the use of mobile apps had helped increase business
revenue because it helped to save time and energy; customers
did not need to walk-in; facilitated work and transactions;
promotions could be carried out actively on various platforms via
mobile applications; facilitated fast transactions, and provided
convenience when engaging customers who made reservations.
During the implementation of the MCO, some of the business
owners were affected but the use of mobile apps and delivery
services helped to ensure that their businesses thrived and
the sales process continued. They also expect that the use of
mobile apps and delivery services will continue to help increase
their business sales after the MCO because of the customers’
own experience in placing orders and their knowledge of the
operation of such businesses.

16 Media Matters Report 2021
Here are some suggestions and recommendations that should be given attention and consideration in formulating a policy(s) that relates
to the use of mobile apps and the creation of a digital society in Sabah and Malaysia.
The e-wallet functionality needs to be detailed and developed across all income groups (T20, M40 and B40). The e-wallet concept
should have homogeneous functions with internet banking such as top-up transactions from savings accounts to money withdrawals.
The convenience of consumers and business owners in using mobile apps are also dependent on the efficiency and ease of the delivery
system. Findings of the study showed that private runners are becoming the main choice of consumers and business owners as they
complement the use of mobile apps and online deliveries.
Based on the results of the study, a majority of the area is covered with 4G networks depending on the respective operators or telcos.
Therefore, the deployment of 5G networks to Sabah needs to be accelerated and expanded, initiated by the public sector, especially in
the education services sector and for online businesses.
There is a need to increase internet speed in Sabah due to usage congestion during peak hours, especially in the morning and evening
during weekdays. internet speeds need to be increased by between 100 and 150 Mbps based on every day online activities such as
checking email, surfing the internet, video streaming, downloading and uploading activities.
For household purposes, it is recommended that the internet speed be increased by between 20 and 35 Mbps. Lastly, there is a need
for the government to create a digital free trade zone (DFTZ) that includes all small and medium-sized industries.
RECOMMENDATIONS
CONCLUSION
This study was conducted in three major cities in Sabah, namely Kota Kinabalu, Tawau and Sandakan. This study focused more on
the effectiveness of mobile apps in helping to grow businesses and accelerate the concept of a digital society, especially in Sabah. The
analysis of the study was conducted using descriptive analysis, logit regression and ANOVA.
The findings of the study have revealed that promotion, advertising and achieving a modern lifestyle are among the factors that influence
the use of mobile apps. From an econometric point of view, the age of the user, digital society awareness, signal strength, method of
payment, food and grocery delivery services by private runners, consumer preferences, location and the latency/ping (including upload
speeds) influence the use of mobile apps for delivery services in Sabah. Besides this, the mode of payment, grocery delivery services
and preferences have a statistically significant effect on the use of mobile apps and helps in overall business growth.
REFERENCES
• Archacki, R., Protextor, K., Barrios, G., & de Bellefonds, N. (2017). Mobile marketing and the new B2B buyer. Boston consulting group report. https://www.bcg.com/en-gb/publications/2017/marketing- sales-digital-go-to-market-transformatiotn-mobile-marketing-new-b2b-buyer.aspx.
• Balapour, A., Nikkhah, H.R., & Sabherwal, R (2020). Mobile application security: Role of perceived privacy as the predictor of security perceptions. International Journal of Information Management, volume 52, p. 1 – 13
• Belanche, D., Casaló, L. V., & Flavián, C. (2019). Artificial Intelligence in FinTech: understanding robo- advisors adoption among customers. Industrial Management & Data Systems. https://doi.org/10.1108/IMDS-08-2018-0368
• Department of Statistics Malaysia. (2018). My local stats Sabah 2017. Department of Statistics, Putrajaya.
• Department of Statistics Malaysia. (2019). Malaysia digital economy 2018. Department of Statistics, Putrajaya.

17Media Matters Report 2021
REFERENCES
In memoriam of Dr. Rusli Bin Latimaha, who passed away on 31 July 2021. Dr. Rusli was a Senior Lecturer at University Malaysia Sabah’s Faculty of Business, Economics and Accountancy and was amongst the first cohort of the Digital Society Research Grant (DSRG) fund.
The late Dr. Rusli’s discipline was Economics, and his research work highlighted the impacts of the economy on ordinary Malaysians. His expertise and contribution were reflected in the DSRG research entitled “Do Mobile Apps Help Grow Your Business? The Case of Delivery Services in Sabah”. This research was co-led with his research team members, Puan Diana Nabila Chau Abdullah and Puan Shafinaz Naim of Universiti Malaysia Sabah.
• Drahokoupil, J., & Piasna, A. (2019). Work in the platform economy: Deliveroo riders in Belgium and the SMart arrangement. ETUI Research Paper-Working Paper.
• Escobar-Rodríguez, T., & Carvajal-Trujillo, E. (2014). Online purchasing tickets for low-cost carriers: An application of the unified theory of acceptance and use of technology (UTAUT) model. Tourism Management, 43, 70–88.
• Gill, M., Sridhar, S., & Grewal, R. (2017). Return on engagement initiatives: A study of a business-to- business mobile app. Journal of marketing, 81(4), 45-66.
• Government Accountability Office. (2014). Mobile devices: Federal agencies’ steps to improve mobile access to government information and services
• Hosmer, D. W., Jovanovic, B., & Lemeshow, S. (1989). Best Subsets Logistic Regression. Biometrics, 45(4), 1265–1270. https://doi.org/10.2307/2531779
• Hwang, K. H., Chan-Olmsted, S., Nam, S. H., & Chang, B. H. (2016). Factors affecting mobile application usage: Exploring the roles of gender, age, and application types from behaviour log data. International Journal of Mobile Communications, 14(3), 256.
• Isman, A., & Canan Gungoren, O. (2014). Digital citizenship. Turkish Online Journal of Educational Technology, 13(1), 73–77.
• Kamboj, S., Rana, S., Drave, V.A., (2020), Factors driving consumer engagement and intentions with gamification of mobile apps. Journal of Electronic Commerce in Organizations, 18(2). https://doi.org/10.4018/JECO.2020040102
• Kim, S., Baek, T.H., Examining the Antecedents and Consequences of Mobile App Engagement, Telematics and Informatics (2017), doi: https://doi.org/10.1016/j.tele.2017.10.008
• Latimaha, R., & Bahari, Z. (2016). Elasticity of demand for cellular phone network access in Malaysia: 2003 to 2011. Malaysian Journal of Economy, 50(2), 125–132.
• Limayem, M., Hirt, S.G., & Cheung, C.M.K. (2007). How habit limits the predictive power of intention: The case of information systems continuance. MIS Quarterly, 31(4), 705–737.
• Louviere, J. J., Hensher, A. D., & Swait, D. J. (2000). Stated choice methods. Cambridge University Press.
• Malmi, E., & Weber, I. (2016). You are what apps you use: Demographic prediction based on user’s apps. Proceedings of the Tenth International AAAI Conference on Web and Social Media, (Vol. 10, No.1).
• McFadden, D. (1974). Conditional logit analysis of qualitative choice behavior. In P. Zarembka (ed.). Frontiers in Econometrics. Academic Press.
• Mehmood SM, Najmi A (2017) Understanding the impact of service convenience on customer satisfaction in home delivery: evidence from Pakistan. Inter J Electron Custom Relat Manage 11(1):23-43
• Owoseni, A., & Twinomurinzi, H. (2020) Evaluating mobile app usage by service sector micro and small enterprises in Nigeria: an abductive approach, Information Technology for Development, 26:4, 762- 772, DOI: 10.1080/02681102.2020.1727825
• Palau-Saumell, R., Forgas-Coll, S., Sánchez-García, J., & Robres, E. (2019). User acceptance of mobile apps for restaurants: An expanded and extended UTAUT-2. Sustainability, 11(4),1210.
• Reddick, C. G., & Zheng, Y. (2017). Determinants of citizens’ mobile apps future use in Chinese local governments: An analysis of survey data. Transforming Government: People, Process and Policy, 11(2), 213–235.
• Seneviratne, S., Seneviratne, A., Mohapatra, P., & Mahanti, A. (2015). Your installed apps reveal your gender and more!.ACM SIGMOBILE Mobile Computing and Communications Review, 18(3), 55-61
• Syukur, M., Kosumsuriya, A. & Jongsureyapart, C. (2020). Selecting on-demand delivery apps: A case study from Thailand. International Journal of Procurement Management, 13(3).
• Swani, K. (2021). To app or not to app: A business-to-business seller’s decision. Industrial Marketing Management, 93, 389-400.
• Venkatesh, V., Thong, J. Y., & Xu, X. (2012). Consumer acceptance and use of information technology: extending the unified theory of acceptance and use of technology. MIS quarterly, 157-178.
• Visser, J.; Nemoto, T.; Browne, M. Home delivery and the impacts on urban freight transport: A review. Procedia-Soc. Behav. Sci. 2014, 125, 15–27.
• Yu, C. S. (2012). Factors affecting individuals to adopt mobile banking: Empirical evidence from the UTAUT model. Journal of electronic commerce research, 13(2), 104.

Factors Affecting Consumers’ Cashless Payment Behaviours
Amidst the COVID-19 Pandemic
UNIVERSITI UTARA MALAYSIA
LU MING PEY AND ZUNARNI KOSIM
18 Media Matters Report 2021

19Media Matters Report 2021
ABSTRACT
The COVID-19 lockdown has caused many to shift to online
shopping and increased the use of cashless payments.
However, the statistics from Bank Negara Malaysia show that
both the amounts of cash circulation and cash withdrawals from
automated teller machines (ATMs) in Malaysia still continues to
rise. Hence, this study examines the influence of the COVID-19
pandemic on consumer behavioural intention to use cashless
payments. This study applied the unified theory of acceptance
and use of technology (UTAUT) model to examine the factors
affecting consumers’ behaviour in adopting cashless payment
with the COVID-19 pandemic acting as the moderating
variable. The findings show that performance expectancy, effort
expectancy, and social influence have significantly affected
consumers’ behavioural intention to use cashless payments
except for facilitating conditions. The findings demonstrate that
The COVID-19 pandemic has spread around the world. It has
affected all markets and sectors of the economy, along with
disrupting daily life. To keep safe from the infections, people are
adopting to the “new normal”. Many retailers and consumers
preferred cashless payments during this period as it could
minimise the handling of physical cash and human contact.
This has significantly impacted consumer behaviour and rapidly
accelerated the adoption of cashless payments during the
COVID-19 pandemic.
In Malaysia, the Prime Minister announced the Movement
Control Order (MCO) on 18 March 2020 due to a significant
increase in COVID-19 cases. During the MCO, businesses and
stores considered as non-essential temporarily closed their
operations to limit the places that people could gather. The
lockdown and social distancing norms have started to change
consumer behaviours. Due to stay-at-home and work-from-
home practices, many people shifted towards online shopping,
increasing the use of cashless payment.
However, according to Povera (2020), the Ministry of Finance
reported that only 5 percent of total daily payments are cashless.
Khairun and Yasmin (2010) revealed that the biggest concern
of using cashless payment is inadequate ICT (information and
communication technology) knowledge and security issues. A
study by Soo et al. (2019) stated that consumers in Malaysia
COVID-19 has significantly moderated the relationship between
four variables (performance expectancy, effort expectancy,
social influence, and facilitating conditions) on the behavioural
intention to use cashless payment. This study further shows
that the majority of respondents will have a high propensity
towards the use of cashless payments in the future and always
try to use cashless as their primary payment method. In brief, the
pandemic has switched consumers’ behaviour and accelerated
the adoption of cashless payment in Malaysia. Practitioners and
cashless payment providers can use these findings as a guide
to encourage consumers to integrate cashless as their preferred
means of payment. This change could help Malaysia successfully
transform into a fully cashless society.
have strong concerns of the security risk of mobile payments
as they do not have confidence in the security of the electronic
network and payment applications.
Another important factor is the financial literacy of consumers.
Bank Negara Malaysia (2018) reported that one of every three
Malaysians consider themselves as having basic financial
literacy, especially among low-income households. This statistic
is supported by a report by Tan and Cheong (2018). They found
that Malaysia is still in its infancy in terms of the use of e-wallets
and still lags behind regional players, such as Singapore, India,
and China.
The concept of behaviour here is the act of people accepting
or refusing to use the system. Kumari and Khanna (2017)
described that a cashless payment is a behavioural change in
the people where people use digital money or plastic cards to
make transactions and eliminates the usage of physical cash
as a medium of exchange. According to Tee and Ong (2016),
the adoption of one type of cashless payment will affect another
type of cashless payment in short run. To reduce and to avoid
the spread of COVID-19, many people opted to use cashless
payments. It is believed that this could accelerate the process
of moving towards cashless payments in Malaysia and shift
consumer’s payment behaviour to cashless even after the
pandemic.
INTRODUCTION
Keywords: COVID-19, cashless payment, UTAUT, consumer behaviour, Malaysia

20 Media Matters Report 2021
This study investigates the influence of the COVID-19 pandemic on consumer payment behaviour in Malaysia. The unified theory of
acceptance and use of technology (UTAUT) model is used to examine the factors that affect consumer behaviour when adopting
cashless payment. The COVID-19 pandemic acts as a moderation variable that influences consumer payment behaviour and facilitates
the adoption of cashless payment in Malaysia.
Before presenting the framework, it will be good to provide an account of the state of knowledge of the study. A summary of what others
said in the area should be exhaustive enough to provide a backdrop of the situation in Malaysia.
The framework in Figure 1 explains the UTAUT model to predict factors affecting consumer behaviour in adopting cashless payments
and further extent the model to investigate the influence of the COVID-19. The COVID-19 pandemic act as moderation variable that is
believed to influence consumer behaviour and accelerate the adoption of cashless payments in Malaysia.
Behavioural intention (BI) refers to the motivational factors that influence a given behaviour where the stronger the intention to perform
the behaviour, the more likely the behaviour will be performed. The behavioural intention is examined as a dependent variable in this
study to measure consumer acceptance to using cashless payments.
Performance expectancy (PE) is the degree to which an individual believes that the use of the technology will provide benefits in
performing certain activities according to Venkatesh et al. (2003). He found that performance expectancy is the strongest predictor of
intention where customer’s intention to use the technology depends on how they perceive the usefulness of the technology.
This is supported by studies such as Martins et al. (2014), Bhatiasevi (2016), Sarfaraz (2017), Friadi et al. (2018) and Savic and Vasić (2019). In this study, the PE measures the degree to which an individual believes that using cashless payments will help them to attain
benefits in performing payment transactions. By having the perception that using cashless payment is useful and effective, it will
increase the behavioural intention to use cashless payment.
LITERATURE REVIEW
INTRODUCTION
FIGURE 1: Conceptual Framework of the Study
COVID-19 Pandemic
Performance Expectancy
Effort Expectancy
Social Influence
Facilitating Conditions
Behavioural
Intention to Use
H1
H5a
H5b
H5c
H5d
H2
H3
H4

21Media Matters Report 2021
LITERATURE REVIEW
Facilitating conditions (FC) is the degree to which an individual
believes that sufficient organizational and technical infrastructure
exists to support the use of the system. Friadi et al. (2018) found
that the availability of resources, self-efficacy and expectation of
easy requirements encourage the intention to use smartphone-
based e-money. However, Bhatiasevi (2016) showed that the
adoption of mobile banking in Thailand was not supported by
facilitating conditions.
The study of Martins et al. (2014) also found that the behavioural
usage of internet banking was not influenced by facilitating
conditions. In this study, the FC reflects the conditions that
support the use of cashless payments. By having a condition
that an individual has necessary knowledge and is supported
with the infrastructure for cashless payments, the higher the
behavioural intention to use cashless payments.
Therefore, this study hypothesizes that:
Performance expectancy has a positive effect on
behavioural intention to use cashless payments.H1
Therefore, this study hypothesizes that:
Effort expectancy has a positive effect on
behavioural intention to use cashless payments.H2
Therefore, this study hypothesizes that:
Facilitating conditions has a positive effect on
behavioural intention to use cashless payment.H4
Therefore, this study hypothesizes that:
Social influence has a positive effect on behavioural
intention to use cashless payment.H3
Effort expectancy (EE) is the degree of ease associated with
the use of the technology as defined by Venkatesh et al. (2003).
Martins et al. (2014), Bhatiasevi (2016), Sarfaraz (2017) and
Friadi et al. (2018) found that the ease of use of the technology
significantly affects the behavioural intention to use. However,
Savic and Vasić (2019) showed the effort expectancy has the
weakest impact on the intention to use mobile banking. In this
study, the EE measures the perceived ease of use of cashless
payments. When the consumer feels that the easier the
cashless payment is to use and does not require much effort,
the behavioural intention to use cashless payment will increase.
Social influence (SI) is the degree to which an individual is
influenced by an important person to use a new system according
to Venkatesh et al. (2003). Savic and Vasić (2019) found that
social influence significantly impacts behavioural intention to use
mobile banking. However, Sarfaraz (2017) showed that there is no
relationship between social influence and mobile banking adoption
in the country of Jordan.
In this study, the SI measures the effect of environmental factors
which is the influence of an important person on an individual
that will affect their intention to use the technology. By having a
majority of important people like family members and close friends
who think that using cashless payment is a wise choice, then the
behavioural intention to use cashless payment increases.
The existing literature demonstrates limited evidence to show the
influence of COVID-19 on cashless payments. However, there is
a study that investigated the changes of consumer behaviour
due to the COVID-19 pandemic. The survey (“Consumer
purchase behavioural changes,” 2020) showed that Malaysians
were shopping online more compared to before the pandemic. In
addition, the RM50 ePenjana incentive, where users can redeem
RM50 credit from supported e-wallet providers, encouraged
people to use cashless payment during the COVID-19 pandemic.
Hence, this may imply that the pandemic acted as a catalyst in
accelerating the migration to a cashless society.
Therefore, this study hypothesizes that:
The COVID-19 pandemic has a positively moderate
relationship between performance expectancy and
the behavioural intention to use cashless payment.
The COVID-19 pandemic has a positively moderate
relationship between effort expectancy and the
behavioural intention to use cashless payment.
The COVID-19 pandemic has a positively moderate
relationship between social influence and the
behavioural intention to use cashless payment.
The COVID-19 pandemic has a positively moderate
relationship between facilitating conditions and the
behavioural intention to use cashless payment.
H5a
H5b
H5c
H5d

22 Media Matters Report 2021
METHODOLOGY
Sampling and Data Collection
The primary data is collected through quantitative and qualitative research. The quantitative data was obtained using a questionnaire
survey. The target population of interest were consumers, including both users and non-users of cashless payments in Malaysia
The sample for the quantitative data was selected using convenience sampling based on the consideration of ease to respondents at
any time. The respondents across the states in Malaysia were surveyed through the distribution of online and hard copy self-administered
questionnaires during November and December 2020. The distribution of a hardcopy survey questionnaire also met the needs of
respondents with low financial literacy and English deficiencies, especially the elderly, respondents in rural areas and those with a lower
education level.
The survey statements utilise a five-point Likert scale that invites respondents to indicate their agreement level, with a rating of 1 meaning
that the respondent strongly disagrees with the statement, and a rating of 5 meaning that the respondent strongly agrees with the
statement. The five-point Likert scale was employed due to its common use from previous studies in this area of research.
Meanwhile, the qualitative data was collected through focus group interviews with six interviewees including users and non-users of
cashless payment. The participation to this study was completely voluntary. Participants were informed about the aim of the study before
they completed the questionnaire. A total of 462 questionnaires were collected and 40 questionnaires were excluded due to incomplete
data. This left 422 responses, indicating a 91.34 percent response rate which was used for analysis to address the objectives of this study.
Demographic Profiles
Table 1 shows the demographic profile of the 422 questionnaire respondents and six interviewees in this study. For the questionnaire
respondents, there were 30.33 percent males and 69.67 percent females. The majority of respondents were 18 to 24 (66.67%) in age,
followed by an age range of 25 to 34 (13.74%), an age range of 35 to 44 (8.77%), an age range of 45 to 54 (4.27%), an age range of 55 to
64 (3.32%), and age 65 and above (2.13%). The education level of the majority of the respondents was university/college at 74.17 percent,
while 12.80 percent being graduate school, 6.40 percent being primary school, 5.69 percent being high school, and 0.95 percent at other
education levels.
A total of 62.56 percent were Malay respondents, 23.46 percent were Chinese respondents, 11.37 percent were Indian respondents, and
2.61 percent were other races. For income level, the majority of the respondents were dependent (37.68%), followed by income in the range
of RM1,000 to RM2,999 (26.54%), below RM1,000 (14.69%), RM5,000 and above (10.66%), and RM3,000 to RM4,999 (10.43%). Further,
65.17 percent of the respondents were from urban areas and 34.83 percent of the survey respondents were from rural areas in Malaysia.
FINDINGS
TABLE 1: Demographic Profiles
DemographicQuestionnaire respondents Interviewees
Gender
Male
Female
16.67%(1)
69.67%(294)
30.33%(128)
83.33%(5)

23Media Matters Report 2021
For the focus group study, there were 83.33 percent males and 16.67 percent female interviewees. Two interviewees were in the age range of 25 to 34 years, one interviewee was 50 years old, two interviewees were in the age range of 55 to 64 years old, and one interviewee was 67 years old. All the interviewees’ education levels were below tertiary level while 50 percent of the interviewees were Malay, and 50 percent were Chinese. The income level for the majority of the interviewees fell in the range of RM1,000 to RM2,999. Majority were residents in rural areas.
FINDINGS
DemographicQuestionnaire respondents Interviewees
18-24 years old
35-44 years old
55-64 years old
25-34 years old
45-54 years old
65 years old and above
Age
Primary
College/University
Others
High School
Graduate School
Education Level
RM1,000 and below
RM3,000 – RM4,999
Dependent
RM1,000 – RM2,999
RM5,000 and above
Income Level
Urban
Rural
Residence
Malay
Indian
Chinese
Others
Ethnic
67.77%(286)
13.74%(58)
8.77%(37)
4.27%(18)
3.32%(14)
2.13%(9)
16.67%(1)
33.33%(2)
33.33%(2)
16.67%(1)
6.40%(27)
0.95%(4)
5.69%(24)
74.17%(313)
12.80%(54)
50%(3)
50%(3)
50%(3)
50%(3)62.56%
(264)
11.37%(48)
2.61%(11)
14.69%(62)
10.43%(44)
10.66%(45)
23.46%(99)
37.68%(159) 16.67%
(1)
16.67%(1)
26.54%(112)
66.67%(4)
34.83%(147)
66.67%(4)
65.17%(275)
33.33%(2)

24 Media Matters Report 2021
FINDINGS
Factors Affecting the Behavioural Intention to Use Cashless Payment
The main objective of this study is to investigate the factors that affect the behavioural intention to use cashless payments in Malaysia
using the UTAUT model.
Table 2 shows the responses of the respondents of this study for the variables that affect the behavioural intention to use cashless
payments.
Statements of Variables 1 2 3 4 5
Performance Expectancy (PE)
PE1 5 (1%) 25 (6%) 88 (21%) 175 (41%) 129 (31%)
PE2 6 (1%) 28 (7%) 99 (23%) 188 (45%) 101 (24%)
PE3 7 (2%) 16 (4%) 97 (23%) 167 (40%) 135 (32%)
PE4 6 (1%) 21 (5%) 99 (23%) 177 (42%) 119 (28%)
PE5 7 (2%) 20 (5%) 110 (26%) 167 (40%) 118 (28%)
PE6 7 (2%) 21 (5%) 99 (23%) 169 (40%) 126 (30%)
Effort expectancy (EE)
EE1 8 (2%) 27 (6%) 97 (23%) 183 (43%) 107 (25%)
EE2 11 (3%) 28 (7%) 91 (22%) 192 (45%) 100 (24%)
EE3 11 (3%) 27 (6%) 89 (21%) 201 (48%) 94 (22%)
EE4 7 (2%) 16 (4%) 97 (23%) 195 (46%) 107 (25%)
EE5 6 (1%) 21 (5%) 88 (21%) 194 (46%) 113 (27%)
EE7 7 (2%) 13 (3%) 95 (23%) 176 (42%) 131 (31%)
Social Influence
SI1 7 (2%) 40 (9%) 155 (37%) 154 (36%) 66 (16%)
SI2 15 (4%) 54 (13%) 155 (37%) 146 (35%) 52 (12%)
SI3 5 (1%) 37 (9%) 134 (32%) 178 (42%) 68 (16%)
SI4 16 (4%) 50 (12%) 160 (38%) 141 (33%) 55 (13%)
SI5 9 (2%) 36 (9%) 152 (36%) 159 (38%) 66 (16%)
SI6 14 (3%) 36 (9%) 145 (34%) 164 (39%) 63 (15%)
Facilitating Conditions
FC1 4 (1%) 21 (5%) 124 (29%) 186 (44%) 87 (21%)
FC2 7 (2%) 22 (5%) 107 (25%) 186 (44%) 100 (24%)
FC3 12 (3%) 50 (12%) 127 (30%) 159 (38%) 74 (18%)
FC4 4 (1%) 39 (9%) 136 (32%) 170 (40%) 73 (17%)
FC5 12 (3%) 26 (6%) 104 (25%) 190 (45%) 90 (21%)
TABLE 2: Items of Variables and the Behavioural Intention to Use Cashless Payment
Note: 1 = Strongly Disagree, 2 = Disagree, 3 = Neutral, 4 = Agree, 5 = Strongly Agree

25Media Matters Report 2021
FINDINGS
This study discovered that the performance expectancy was
found to be the most influential factors affecting the behavioural
intention to use cashless payments in Malaysia. This finding is
consistent with the studies of Venkatesh et al. (2003) and Tarhini
et al. (2016) where performance expectancy was the strongest
predictor of the intention to use technology. The majority of
respondents in this study believed that cashless payments help
them gain benefits when performing payment transactions. In
this instance, 41 percent of the respondents agreed that using
cashless payments would allow them to complete their financial
transactions more quickly (PE1).
Cashless payment offers benefits, such as speed and time
savings. It enables consumers to carry out financial transactions
without visiting brick-and-mortar banks and stores. Indeed, 40
percent of the respondents agreed that they spent less time
doing their financial transactions (PE5), and they also could
access these services at any time (PE6). The short transaction
time and 24/7 access increased the satisfaction of consumers.
Further, 40 percent of the respondents agreed that using
cashless payment for a financial transaction was easier (PE3).
This view is reflected by the 45 percent of the respondents
agreeing with the statements that cashless payment enhance
effectiveness (PE2) and 42 percent agreed with the usefulness
(PE4) of cashless payment system when performing financial
transactions. The cashless payment transactions are recorded
by the system, which allows consumers to keep track of their
spending and enables better budgeting. This is supported
by studies, such as Martins et al. (2014), Bhatiasevi (2016),
Sarfaraz (2017), Friadi et al. (2018) and Savic and Vasić (2019).
Suggestion: Infographics)
This view was also highlighted by users in the interviews as
shown in the following statement:
The second significant variable that influences consumers’
behavioural intention to use cashless payments is effort
expectancy. The behavioural intention to use cashless payments
will increase when consumers believe that the cashless payment
system is easy to use. The majority of the respondents agreed
to all the statements of effort expectancy. Indeed, 43 percent
of the respondents agreed with the statement that learning to
operate cashless payment is easy (EE1). Nowadays, with the stiff
competition between banks and fintech companies to offer this
service, cashless payment applications and their systems are
designed with user-friendly interfaces.
In this study, 45 percent of the respondents agreed with the
statement that the interaction with cashless payment systems
is clear and understandable (EE2). Consumers can operate the
system with minimum assistance. 48 percent of the respondents
agreed that cashless payment systems (EE3) were flexible. This
enabled consumer to quickly master the use of the system (EE4)
as agreed by 46 percent of the respondents.
The cashless payment system is flexible, so consumers can easily
conduct financial transactions at anytime and anywhere with
just a few simple steps needed to complete their transactions.
Overall, the majority of the respondents found cashless
payments easy to use (EE5 and EE7). This result is supported
by other studies, such as Venkatesh et al. (2003), Martins et al.
(2014), Bhatiasevi (2016), Sarfaraz (2017) and Friadi et al. (2018).
One user highlighted this effort expectancy in the interview in the
statement below:
The cashless payment is useful as it is
convenient and provides many benefits. I use
the credit card to buy a TV and convert the
purchase into installments.User 2
I use only e-money. It is easy to use and easy
to learn on how to use it compared to other
cashless payment. I can operate it without
assistance. I simply open my QR code to
make paymentUser 1
I like to use cashless payments. I always get
cashback and rewards from using the credit
card and e-money. Besides that, I can track
my spending from the system.User 3
Further still, this study found that social influence significantly
explains consumer behavioural intention to use cashless
payments in Malaysia. There were 37 percent of the respondents
who have a neutral view on the statement on the influence of
people who are important to them using cashless payment
for their transactions (SI1). Of the statements, most of the
respondents expressed a neutral view on the statements
regarding influence by family.

26 Media Matters Report 2021
FINDINGS
There were 37 percent of the respondents who were neutral
about their family likely recommending that they use cashless
payments (SI2), and 38 percent of them also feel neutral about
their family thinking that they should use cashless payments (SI4).
On the other hand, the majority of the respondents indicated
agreement on the statements of the influence of close friends.
42 percent of the respondents agreed that their close friends
were likely to recommend to them to use cashless payments
(SI3) and 38 percent of the respondents agreed that their close
friends think they should use it (SI5). This may suggest that the
influence of close friends has a greater impact on an individual’s
behaviour compared to family. It should also be noted that the
majority of the respondents in this study were 18 to 24 years old.
According to Lu et al. (2003), young people are easily influenced
by their peers.
Overall, the findings showed that 39 percent of the respondents
agreed that important people around them would influence their
behavioural intention to use cashless payments (SI6). This finding
is corroborated with studies, such as Venkatesh et al. (2003),
Bhatiasevi (2016) and Savic and Vasić (2019). The following
statement during the focus group interview highlights the impact
of social influence:
However, as shown in Table 5, the study found that facilitating
conditions do not significantly influence consumers’ behavioural
intention to use cashless payment. This finding suggests that
the surrounding environment, such as facilities, necessary
knowledge, and resources, are not concerns for an individual
when using cashless payments. Boonsiritomachai and
Pitchayadejanant (2017) demonstrated that facilitating conditions
do not exhibit a direct effect on behavioural intention to use. This
finding is consistent with the studies by Oliveira et al. (2014),
Martins et al. (2014) and Bhatiasevi (2016) who found that
facilitating conditions do not significantly affect the behavioural
intention to use a specific technology.
Although facilitating conditions is an insignificant factor in
explaining the behavioural intention to use cashless payment,
however, as observed from Table 7, the majority of respondents
agreed on all the statements of facilitating conditions. There were
44 percent of the respondents who agreed that their immediate
environment supported their use of cashless payment (FC1) and
they had the necessary knowledge for using cashless payment
(FC2). Also, 45 percent of the respondents agreed that they had
the necessary resources, such as an internet connection and the
devices to use to make a cashless payment (FC5).
Here 38 percent of the respondents agreed that they did not
need assistance when using cashless payment (FC3), while
40 percent of the respondents agreed that facilities for making
cashless payments are widely available in their residence
area (FC4). It should be noted as well that the majority of the
respondents resided in urban areas. The conditions for using
cashless payments are better in urban areas than rural areas.
This factor was highlighted by interviewees as quoted in the
following statements:
My friends encouraged me to use. They told
me the usefulness and convenience of using
cashless payment especially for third party
fund transfer.User 3
The cashless payment is supported in my
living area; I use it in kedai runcit and hawker
center. I have internet data and devices to use
cashless paymentsUser 3
I usually buy necessities and groceries from
retail shops nearby my house, the retailer only
accepts cash as payment Non-User1, 2
and 3
It is difficult to use internet banking and mobile
banking because it requires the key-in of the
TAC for fund transfer within the time given.
E-money is easier to use but wet markets
here do not accept itUser 1

27Media Matters Report 2021
FINDINGS
The Influence of COVID-19 Pandemic on Behavioural Intention to Use Cashless Payment
This study extends the UTAUT model by including the COVID-19 pandemic as a moderating variable to investigate the influence of the
COVID-19 on consumers’ behavioural intention to use cashless payments in Malaysia.
The results from the regression analysis of the influence of COVID-19 on Behaviour Intention to use cashless payment demonstrates
that social influence is the most significant factor that affected the consumer’s behavioural intention to use cashless payments during
the COVID-19 pandemic. This finding suggests that the majority of the respondents were influenced by people who are important to
them to use cashless payment during this period to keep safe from COVID-19 infections.
The second most influential factor are facilitating conditions. The possible reasons behind this factor could be due to the MCO that
was implemented in our country and changed people’s lifestyles. Many merchants started to accept cashless payments during the
pandemic. For example, e-money is now available at pasar and kedai runcit which enable consumers to access a QR code for payment.
In addition, some food delivery services provide a platform for traditional food hawkers and market vendors by using cashless payments.
Moreover, the ePenjana initiative of the RM50 e-wallet and the waiving of RM1 charges for all ATMs using Malaysian Electronic Payment
System (MEPS) by the government during the COVID-19 pandemic has encouraged consumers to adopt cashless payments.
Furthermore, the COVID-19 pandemic has significantly moderated the relationship between effort expectancy and the behavioural
intention to use cashless payment. The new stay-at-home living norms have forced people to use cashless payments more frequently
than before and enhanced the skills for undertaking cashless payments. Besides that, there is also widespread dissemination of
materials demonstrating the cashless payment process, especially for e-money. The behavioural intention to use cashless payments
will thus increase when consumers feel it is easy to use.
In addition, it is interesting to note that the performance expectancy that appeared to be the most influential factor for the behavioural
intention to use cashless payments is the least strong factor explaining the behavioural intention to use cashless payments when
moderated by the COVID-19 pandemic. During the COVID-19 pandemic, people had to adjust to using cashless payment for
transactions. This was most likely due to the fact that people believed cashless payment is convenient for ordering food and purchasing
goods online during the lockdown period.
Table 3 shows the responses from the respondents regarding the influence of the COVID-19 pandemic on consumers behavioural
intention to use cashless payment.
Influence of COVID-19 pandemic 1 2 3 4 5
COVID2 28 (7%) 61 (14%) 121 (29%) 141 (33%) 71 (17%)
COVID3 7 (2%) 20 (5%) 95 (23%) 166 (39%) 134 (32%)
COVID4 4 (1%) 13 (3%) 97 (23%) 183 (43%) 125 (30%)
COVID5 8 (2%) 17 (4%) 102 (24%) 170 (40%) 125 (30%)
COVID6 10 (2%) 28 (7%) 129 (31%) 155 (37%) 100 (24%)
COVID7 7 (2%) 16 (4%) 87 (21%) 187 (44%) 125 (30%)
COVID8 16 (4%) 51 (12%) 115 (27%) 168 (40%) 72 (17%)
COVID9 17 (4%) 43 (10%) 126 (30%) 161 (38%) 75 (18%)
COVID10 18 (4%) 62 (15%) 192 (45%) 141 (33%) 6 (1%)
TABLE 3: The influence of COVID-19 Pandemic and the Behavioural Intention to Use Cashless Payment
Note: 1 = Strongly Disagree, 2 = Disagree, 3 = Neutral, 4 = Agree, 5 = Strongly Agree

28 Media Matters Report 2021
FINDINGS
Due to the COVID-19 pandemic, 33 percent of the respondents agreed that they purchased via cashless payment more frequently than
before (C2). Also, 39 percent of the respondents agreed that the stay-at-home lifestyle changed their behaviour towards online purchasing
(C3). 44 percent of the respondents agreed that they were using cashless payment during the COVID-19 pandemic (C7). In addition,
for the health conscious, 43 percent of the respondents agreed that they used cashless payment for transactions during the COVID-19
pandemic (C4). 40 percent of the respondents agreed that this change would protect them from the COVID-19 infection (C5). 38 percent
of the respondents agreed that they did not want to handle cash and opted to use cashless payments instead during the COVID-19
pandemic (C9) to minimise physical human contact and thereby avoid spreading the virus.
Therefore, 37 percent of the respondents agreed that they use cashless payments even when visiting stores to buy goods (C6). In
addition, 40 percent of the respondents agreed that many retail merchants in their areas of residence accepted cashless payments during
COVID-19 pandemic (C8). To stay safe from infection, cashless payment is one of several ways to limit human contact. This has increased
the adoption of cashless payments and fostered the shifting of Malaysia towards a cashless society.
Moreover, it was surprising to note that 45 percent of the respondents expressed a neutral view of the statement that they would continue
using cashless payment in the future (C10). They neither agreed nor disagreed about using cashless payments. Only 1 percent of the
respondents strongly agreed and 33 percent agreed that they will continue to use cashless payments in the future after COVID-19.
In addition, most of the interviewees did highlight the influence of the COVID-19 pandemic in changing their payment behaviour as showed
by the following statements:
Table 4 highlights the reasons that discouraged non-users from adopting cashless payment. It provides further insight to cashless
payment issuers and the related agencies to take actions to improve the cashless payment conditions and thus increase the adoption
for non-users.
Reasons not using cashless payment 1 2 3 4 5
It is hard to use cashless payment due to lack of IT literacy 6 (11%) 8 (15%) 16 (30%) 7 (13%) 17 (31%)
I prefer using traditional method of payment such as cash 0 (0%) 8 (15%) 14 (26%) 14 (26%) 18 (33%)
I worry about safety and security aspects of cashless payment. 0 (0%) 4 (7%) 16 (30%) 10 (19%) 24 (44%)
I have limited resources necessary for the use of cashless payment. 2 (4%) 6 (11%) 20 (37%) 9 (17%) 17 (31%)
There is lack of facilities for using cashless payment. 0 (0%) 5 (9%) 25 (46%) 13 (24%) 11 (20%)
Some merchants are accepting cashless payment but only for transactions above a certain amount. 2 (4%) 4 (7%) 26 (48%) 15 (28%) 7 (13%)
TABLE 4: Reasons for Not Using Cashless Payment among Non-Users
Note: 1 = Strongly Disagree, 2 = Disagree, 3 = Neutral, 4 = Agree, 5 = Strongly Agree
I use cashless payment during the COVID-19 pandemic because I do not want to handle physical cash
User 1
Due to the COVID-19 pandemic, I would consider learning how to use cashless payment, I worry about being infected by COVID-19, so I asked my son(s) or daughter(s) to help me with cashless payment transactions during this period
Non-user 1
Due to the lockdown, I needed to work-from-home. So I always ordered food and shopped online. I use cashless payment more frequently than beforeUser 3
Although I do not know how to use cashless payments, but in this period, I asked my sister(s) to help me to purchase items online during the COVID-19 pandemicNon-
user 3
Reasons for not using cashless payment among non-users (Table 9)

29Media Matters Report 2021
FINDINGS
This finding revealed that non-users felt that the main reason
for not using cashless payment was the safety and security
aspect of cashless payments. As such, 44 percent of the non-
users strongly agreed with this statement because the cashless
payment systems required financial transactions to be completed
through a transfer of digital information, hence, this might expose
them to the risk of data leakage.
The system could also be attacked by hackers. This finding
was supported by the study by Rotchanakitumnuai and Speece
(2003) where non-internet banking users have higher levels
of concern regarding the use of the web for their financial
transactions.
In addition, 33 percent of non-users strongly agreed that they
preferred to use a traditional method of payment, such as cash.
This view is reflected by the statement where 31 percent of non-
users strongly agreed that it is hard to use cashless payment due
to low information technology (IT) literacy. The cashless payment
system requires information technology knowledge and skills.
Oliveira et al. (2014) demonstrated that internet banking requires
users to have related skills, such as operating computers and
connecting to the internet.
A majority of non-users expressed a neutral view on the
statement where they had only limited resources necessary for
the use of cashless payments. However, there were 31 percent
of non-users strongly agreeing and 17 percent agreeing to this
statement. It should be noted as well that most of the non-users
came from rural areas where poor internet accessibility and
connectivity make cashless payments difficult to be carried out.
Besides that, the majority of non-users expressed a neutral
view regarding the statement about a lack of facilities for using
cashless payments. The point-of-sale is widely available in most
residential areas nowadays as the government has facilitated the
wider outreach for e-payments. The majority of the non-users
also responded neutrally to the statement about merchants only
accepting cashless payment for transactions above a certain
amount.
Consumers’ Post-Adoptive Behaviour on Use of Cashless Payments in Malaysia
This study also investigates consumers’ post-adoptive behaviour on the use of cashless payment in Malaysia. Hsieh et al. (2011)
described that following the adoption of that technology, consumers will discover more functional features of the technology that
support their daily life activities. This knowledge increases the continuance intention of using the technology as explained by Li and Liu
(2011). This investigation is important, so that cashless payment issuers can attract more users and survive and succeed in a highly
competitive market.
Table 5 shows the post-adoptive behaviour on use of cashless payment. The finding shows that 81 percent of the respondents always
try to use cashless as a payment method. The advantages of cashless payment have encouraged people to adopt it. However, 19
percent of the respondents indicated that they do not try hard to use cashless payment, and among them, 48 percent were non-users.
This response was probably due to the lack of facilities and infrastructure in their area of residence that do not support the use of
cashless payment.
Total User Non-user
Tendency to use cashless payment
Always try to use 0 (0%) 8 (15%) 14 (26%)
Does not try hard to use 0 (0%) 4 (7%) 16 (30%)
Ability and willingness to use cashless payment in the future
Able and willing 0 (0%) 5 (9%) 25 (46%)
Unable but willing 0 (0%) 5 (9%) 25 (46%)
Unable and Unwilling 2 (4%) 4 (7%) 26 (48%)
TABLE 5: Post-Adoptive Behaviour on Use of Cashless Payment

30 Media Matters Report 2021
FINDINGS
In addition, 90 percent of the respondents expressed that they remain able and willing to use cashless payments in the future, including
54 percent of non-users. This finding suggests that they will continue to use cashless payment. Because of the COVID-19 pandemic,
people have adjusted to these new norms and switched their payment behaviour to use cashless payment. Three users from the
focus group indicated that they are able and willing to use cashless payment in the future. This view was highlighted in the following
statements:
Table 6 shows the majority of the respondents indicated that they agreed with all the statements of behavioural intention to use cashless
payment. There were 39 percent of the respondents agreeing that they intended to use cashless payments in the future (BI1). Also, 42
percent of the respondents agreed that they believed they would use cashless payment for future transactions (BI2). The respondents
also indicated that they planned to use cashless payment for their next transactions (BI3) with 41 percent agreeing. This is because a
majority of them believed that using cashless payment is a wise choice as a medium of payment (BI4), which was agreed with by 40
percent of the respondents. Also, 44 percent of the respondents agreed that they could see themselves using cashless payment for
handling payment transactions (BI5).
This finding suggests that the majority of the respondents were satisfied with cashless payment systems, and this increased their
continuance intention to use cashless payment in the future.
Meanwhile, 7 percent of the respondents indicated that they are unable and unwilling to use cashless payment. This opinion is probably
due to the fact as mentioned above. Additionally, the habits of using cash and the security issues involved with cashless payment might
be the concerns of people who are unwilling to use cashless payment.
On the other hand, only 3 percent of the respondents expressed that they are unable, but willing to use cashless payment. The possible
reason could be that cashless payment is not supported where they reside. This includes poor internet connectivity, lack of facilities,
infrastructure support and necessary resources, such as internet data and devices to complete financial transactions using cashless
payment. The three non-users expressed their views about this issue during the interview as shown in the following statements:
I have only a Tabung Haji account and Amanah Saham Bumiputera (ASB) account, so I not able to use cashless payment. But I am willing to use it, if in future, all the retailers accept only cashless payment.
Non-User 2
Currently the retailers in my living area accept cash only. In the future, if they accept cashless payment, I will use it
Non-User 1
I willing to use cashless payment, but I cannot use it. Where I live has poor internet connectivity and accessibility
Non-User 3
E-money is easy to use. I am able and willing to use it in the future
User 1
I do not face any difficulty in using cashless payment. I would continue to use cashless payment in the future
User 2
I have used credit cards and mobile banking for about 10 years. For mobile banking, it is user-friendly, I can transfer funds to third-party, pay bills and settle credit card balance just with my fingertips. Meanwhile, credit cards provide incentives such as cashback and rewards. So, I am able and willing to continue use it in the futureUser 3
Behavioural Intention to Use (BI) 1 2 3 4 5
BI1 5 (1%) 17 (4%) 116 (27%) 166 (39%) 118 (28%)
BI2 6 (1%) 16 (4%) 98 (23%) 179 (42%) 123 (29%)
BI3 6 (1%) 23 (5%) 119 (28%) 171 (41%) 103 (24%)
BI4 6 (1%) 19 (5%) 116 (27%) 167 (40%) 114 (27%)
BI5 6 (1%) 18 (4%) 102 (24%) 186 (44%) 110 (26%)
TABLE 6: The Behavioural Intention to Use Cashless Payment
Note: 1 = Strongly Disagree, 2 = Disagree, 3 = Neutral, 4 = Agree, 5 = Strongly Agree

31Media Matters Report 2021
IMPLICATIONS OF THE STUDY
To move into a cashless society, it is essential to ensure that
Malaysians are willing and also able to use cashless payments
for their transactions.
In considering the benefits of cashless payments, it must be
noted that cashless payment systems can keep a record of all
financial transactions and therefore consumers can easily track
their finances through the website or applications. This offers
greater effectiveness in managing personal finances. Additionally,
features such as refunds and cashback guarantees should help
increase the adoption of cashless payment throughout Malaysia
in the future.
However, the lack of knowledge about using cashless payments
is one of the barriers to the wider use of cashless payment as
shown in this study. To achieve a cashless society, there is a need
to increase both information technology and financial literacy
among Malaysians. By improving literacy, more Malaysians will
be able to access innovative financial products and cashless
payments.
Besides that, the availability of cashless payment infrastructure
and the required resources to use cashless payments are also
of concern to consumers. Cashless payment requires financial
transactions to be performed online which then requires owning
a smartphone or similar device. This technology might not be
affordable for some people, as the cost of access to internet data
is borne by the consumer. Therefore, to transform the country
into a cashless society and increase financial inclusion, policy
makers should provide free internet access to the cashless
payment system.
Lastly, cash is still widely used in Malaysia, as reported by the
Ministry of Finance Malaysia (2020). People still feel comfortable
making transactions with cash since it is physically visible.
Therefore, to increase the adoption of cashless payment,
cashless payment channels and instruments must be made
widely available, safe to use, and as convenient as cash.
The results of this study showed that the behavioural intention
to use cashless payment is significantly affected by performance
expectancy, effort expectancy, and social influence. However,
the facilitating conditions were found to be insignificant in its
influence of consumer behavioural intention to use cashless
payment.
On the other hand, this study highlights that the COVID-19
pandemic has significantly moderated the relationship between
factors such as performance expectancy, effort expectancy,
social influence, and facilitating conditions with the behavioural
intention to use cashless payment. During this period,
many people are making online purchases. Additionally, the
promotions, rewards, and incentives offered by the government
and cashless payment providers had encouraged more people
to use cashless payment during this period. Indeed, cashless
payment is one of the alternatives that could limit human contact
and keep people safe from COVID.
In addition, the findings of this study show that the majority of the
respondents do have a high tendency to use cashless payment.
This choice may be due to the advantages of cashless payment
that encourage people to use it. Cashless payment is thus
gaining traction in Malaysia, especially with the encouragement
from the government for moving towards a cashless society
CONCLUSION
and the impact of the COVID-19 pandemic that has changed
people’s lifestyles.
Besides that, the results also showed that the main reasons
discouraging non-users from adopting cashless payment is
security and privacy. The cashless payment system requires
financial transactions to be completed through a transfer of digital
information; hence, this exposes consumer to cybersecurity
risks.
Non-users also revealed that it is hard to use cashless payment
due to low levels of information technology and financial literacy.
Limited resources, lack of facilities, and merchant acceptance
are also reasons that have discouraged the use of cashless
payment among non-users.
This study found that nearly all of the respondents indicated that
they are able and willing to use cashless payment in the future.
However, a small number of the respondents expressed that
they are willing to use cashless payment, but the conditions do
not support them to do so. There is also a small number of the
respondents indicating that they are unable and unwilling to use
cashless payment. This view could be attributed to their habit
of using cash.

32 Media Matters Report 2021
CONCLUSION
To move toward a cashless society, it is important to ensure
that people are able to use cashless payment to achieve
financial inclusion. This could facilitate Malaysia’s successful
transformation into a cashless society.
To move into a cashless society, it is essential to ensure that
Malaysians are willing and also able to use cashless payments
for their transactions.
In considering the benefits of cashless payments, it must be
noted that cashless payment systems can keep a record of all
financial transactions and therefore consumers can easily track
their finances through the website or applications. This offers
greater effectiveness in managing personal finances. Additionally,
features such as refunds and cashback guarantees should help
increase the adoption of cashless payment throughout Malaysia
in the future.
However, the lack of knowledge about using cashless payments
is one of the barriers to the wider use of cashless payment as
shown in this study. To achieve a cashless society, there is a need
to increase both information technology and financial literacy
among Malaysians. By improving literacy, more Malaysians will
be able to access innovative financial products and cashless
payments.
Besides that, the availability of cashless payment infrastructure
and the required resources to use cashless payments are also
of concern to consumers. Cashless payment requires financial
transactions to be performed online which then requires owning
a smartphone or similar device. This technology might not be
affordable for some people, as the cost of access to internet data
is borne by the consumer. Therefore, to transform the country
into a cashless society and increase financial inclusion, policy
makers should provide free internet access to the cashless
payment system.
Lastly, cash is still widely used in Malaysia, as reported by the
Ministry of Finance Malaysia (2020). People still feel comfortable
making transactions with cash since it is physically visible.
Therefore, to increase the adoption of cashless payment,
cashless payment channels and instruments must be made
widely available, safe to use, and as convenient as cash.
Limitations of the Study
The majority population that analysed in this study was
represented by respondents in the age range of 18 to 24
years old. Due to time constraint and MCO implemented in
Malaysia, the optimal approach to collect data was through
online questionnaire. Although this millennial generation are
active internet users and potential users for cashless payment,
however, we need to be caution when generalize the findings
and discussions in relation to this group in the study.
Acknowledgement
We would like to extend our appreciation to Malaysian
Communications and Multimedia Commission (MCMC) for
providing financial support for this study through its Digital
Society Research Grant (DSRG) [Grant No. SO14833].
• Ajzen, I. (2006). Constructing a Theory of Planned Behavior Questionnaire: Conceptual and methodological considerations.
• Bank Negara Malaysia (2018). Annual Report 2018. Retrieved from https://www.bnm.gov.my/documents/20124/3026128/ar2020_en_book.pdf
• Bank Negara Malaysia (2019). Annual Report 2019. Retrieved from https://www.bnm.gov.my/o/annual-report/html/index.html
• Bhatiasevi, V. (2016), An extended UTAUT model to explain the adoption of mobile banking. Information Development, 32(4). https://doi.org/10.1177/0266666915570764
• Boonsiritomachai, W. & Pitchayadejanant, K. (2017). Determinants affecting mobile banking adoption by generation Y based on the Unified Theory of Acceptance and Use of Technology Model modified by the Technology Acceptance Model concept. Kasetsart Journal of Social Sciences. http://doi.org/ 10.1016/j.kjss.2017.10.005
• Consumer purchase behaviour changes amidst convid-19. (2020). Retrieved from https://vase.ai/resources/malaysian-consumer-purchase-behaviour-changes-amidst-covid-19/
REFERENCES

33Media Matters Report 2021
REFERENCES
• Friadi, H., Sumarwan, U. & Kirbrandoko. (2018). Integration of Technology Acceptance Model and Theory of Planned Behaviour of intention to use electronic money. International Journal of Science and Research, 7(2), 711-716.
• Hair, J. F., Black, W. C., Babin, B. J., and Anderson, R. E. (2009). Multivariate Data Analysis. Pearson Education.
• Hsieh, J.J. P., Rai, A. & Xu, S. X. (2011). Extracting Business Value from IT: A Sensemaking Perspective of Post-Adoptive Use. Computer Information Systems Faculty Publications. 32.
• Khairun, N. K. & Yasmin, M. H. (2010). E-commerce adoption in Malaysia: Trends, issues and opportunities. ICT Strategic Review (pp. 89-134). Malaysia: PIKOM Publishers.
• Kumari, N. & Khanna, J. (2017). Cashless payment: A behavioural change to economic growth. International Journal of Scientific Research and Education, 5, 6701-6710.
• Li, H. X. & Liu, Y. (2011). Post adoption behaviour of e-service users: An empirical study on Chinese online travel service users. ECIS 2011 Proceedings. Paper 56.
• Lu, J., Yu, C. S., Liu, C. & Yao, J. (2003). Technology acceptance model for wireless internet, Journal of Internet Research, 13(2), 206-222.
• Martins, C., Oliveira, T. & Popovič, A. (2014). Understanding the Internet banking adoption: A unified theory of acceptance and use of technology and perceived risk application. International Journal of Information Management. 34. 1-13. http://doi.org/10.1016/j.ijinfomgt.2013.06.002.
• Oliveira, T., Faria, M., Thomas, M. A. & Popovic, A. (2014). Extending the understanding of mobile banking adoption: When UTAUT meets TTF and ITM. International Journal of Information Management, 34(5), 689-703.
• Pallant, J. (2005). SPSS survival guide. Crow’s Nest, NSW: Allen & Unwin.
• Povera, A. (January 20, 2020). Central payment infrastructure providers needed to make Malaysia cashless. NST news. Retrieved from https://www.nst.com.my/news/nation/2020/01/558250/central-payment-infrastructure-providers-needed-make-msia-cashless
• Rotchanakitumnuai, S. & Speece, M. (2003). Barriers to Internet banking adoption: a qualitative study among corporate customers in Thailand. International Journal of Bank Marketing, 21(6/7), 312-323. https://doi.org/10.1108/02652320310498465
• Savic, J. & Vasič, A. (2019). Antecedents of mobile banking: UTAUT model. The European Journal of Applied Economics. 16. 20-29. http://doi.org/10.5937/EJAE15-19381.
• Sarfaraz, J. (2017). Unified theory of acceptance and use of technology (UTAUT) model – mobile banking. Journal of Internet Banking and Commerce. 22(3).
• Soo, C. C., Cao Stella, S-T., Guo Trey, J-Y., & Lian Ivey, Z-J. (2019). Consumers’ adoption of mobile payment: Comparison between China and Malaysia. Advances in Business Research International Journal, 5(2), 1-8.
• Tan, Y. & Cheong, Y. L. (2018). Banking on e-wallet in Malaysia. PricewaterhouseCooper. Retrieved from https://www.pwc.com/my/en/assets/blog/pwc-my-deals-strategy-banking-on-the-ewallet-in-malaysia.pdf
• Tarhini, A., El-Masri, M., Ali, M. & Serrano, A. (2016). Extending the UTAUT model to understand the customers’ acceptance and use of internet banking in Lebanon: A structural equation modelling approach. Information Technology & People, 29(4), 830-849.
• Tee, H. & Ong, H. (2016). Cashless payment and economic growth. Financial Innovation, 2(1), 4-12.
• Venkatesh, V., Morris, M., Davis, B. & Davis, F. (2003). User acceptance of information technology: Toward a unified view. MIS Quarterly, 27(3), 425-478.

Efficient Web Disclosure Practices Among Malaysian
Non-Profit Organisations
UNIVERSITI TEKNOLOGI MARA
RAMESH NAIR, ROSHAYANI ARSHAD, RUHAINI MUDA AND SITI AEISHA JOHARRY
34 Media Matters Report 2021

35Media Matters Report 2021
ABSTRACT
With strong roots in target communities, Non-Profit
Organisations (NPOs) are dependent on government funds,
and the goodwill of corporate bodies and individual donors to
carry out their activities. In current times of uncertainty, NPOs
are struggling to stay afloat as funds diminish and partners
prioritise their own survival. The present study is anchored to the
premise that the sustainability of NPOs is highly dependent on
their ability to gain the trust of stakeholders. Therefore, strategic
communication by NPOs is central to their sustainability. In this
study, we examined the practices of NPOs in developing and
measuring the impact of their programmes. Through an analysis
of their official websites, we sought evidence of how programme
outcomes are reported by Malaysian NPOs and the extent to
which these NPOs engage in dialogic communication using
readily available multimedia tools. The findings revealed that
NPO websites generally appeared on surface to promote two-
The present study is located at the intersection of two broad
areas of research, namely outcome and impact assessment and
web-disclosure practices for greater transparency. Both research
domains have received a great deal of scholarly interest.
Many studies on the outcome and impact assessment on NPO
have been examined by many scholars especially by Connolly,
Hyndman & McConville, 2013; Hyndman & McConville, 2018;
Polonsky, Grau & McDonald, 2016; and Yang & Northcott, 2018.
The interest in NPOs has been largely motivated by the fact
that their ability to communicate the value of their funded work
determines their capacity to sustain their initiatives (Polonsky,
Grau & McDonald, 2016). However, research findings reveal
that NPOs struggle to provide quality evidence of the outcome
and long-term impact of their activities because of a failure
to determine outcome indicators and develop an evaluation
system, and the absence of motivations to be accountable to
their stakeholders (Bach-Mortensen & Montgomery, 2018).
Clearly, NPOs are in need of guidance in measuring and reporting
outcomes which in turn determines their ability to sustain
operations and impact target communities. The challenges
facing Malaysian NPOs are the same. In a study on corporate
integrity and accountability among NPOs in Malaysia, Atan, Alam
way communication with stakeholders and the wider community.
The NPOs reported that they took dialogic communication
seriously and responded to communication in a timely manner.
However, the NPOs did not appear to adequately leverage on
the opportunities to make use of their websites for reporting their
initiatives and establishing stakeholder trust. The second phase
of the study suggests that NPOs have the capacity to prepare
outcome reports of activities with some guidance. It was found
that the use of an online system developed by the researchers
helped support the preparation of a thorough outcome report.
The NPOs which participated in the study reported a heightened
sense of awareness about the importance of preparing such
reports for their own sustainability.
& Said (2017) stated that there is a need for NPOs to deliver
outcomes which are aligned to the dimensions of corporate
integrity.
In another study on 50 NPOs in Malaysia, Roshayani, Hisham,
Ezan, Ruhaini and Nair (2018) discovered that the competence
of board members expertise determinants the success of NPOs.
However, these stopped short of examining the capacity of
NPOs in measuring and reporting the outcomes of their activities.
The present study attends to this gap by engaging with a
Malaysian NPO in measuring and reporting the outcomes of their
activities. The present study also examined the pattern of the
usage of multimedia communication by NPOs.
Many earlier studies discovered that NPOs depend a great deal
on their websites for communicating with their stakeholders. For
example, a study by Lee and Blouin (2019) assert that the web-
disclosure practices of NPOs serve a variety of goals including
enhancing public confidence and increasing donations.
INTRODUCTION
Keywords: non-profit organisations, trust, sustainability, web-disclosure practices,outcome report

36 Media Matters Report 2021
INTRODUCTION
However, in an earlier study by Blouin, Lee and Erickson (2018), it was concluded that despite a strong correlation between voluntary
web disclosure and donations received, many NPOs have failed to adopt proper disclosure practices. Unfortunately, there has been
relatively less research focus on the web-disclosure practices of Malaysian NPOs.
To date, there is only one study by Shah, Zainon, Othman and Sundram (2016) which focused on web-disclosure practices of Malaysian
NPOs. In this study, the researchers compared the web-disclosure practices of NPOs in Malaysia and Singapore. It was discovered that
there is a correlation between the size and financial performance of NPOs and the amount of web-disclosed information. The present
study addresses the web-disclosure practices by Malaysian NPOs by making NPO websites the site of study.
The overall aim of the proposed study is to develop a framework and a reporting template for adoption of Malaysian NPOs to plan for,
develop, measure and report on impact-focused programmes. The specific objectives are:
NPOs play a significant role in supporting government-led social
impact initiatives. However according to Cook, Wright and
Andersson (2017), under some conditions, NPOs can negatively
affect the responsiveness of government agencies. The success
of any organisation, even NPOs, lies in their ability to practice
good governance. Indeed, good governance practices serve
to assure the sustainability of NPOs (Roshayani, Hisham, Ezan,
Ruhaini & Nair, 2018).
NPOs increasingly see themselves as being part of the community
development process rather than as charity organisations. This
encourages NPOs to subscribe to a participatory community
development model where empowerment of the target
community is to be achieved through a clear understanding
of issues, leadership, and impact assessment (Doan-Bao,
Papoutsaki & Dodson, 2019).
The success of any NPO-driven initiative hinges on access to
finances provided by external entities which include government
agencies and profit-driven private corporations. However,
accessing funds is a complex process which requires both NPOs
and the funding organisations to mull over various factors such
as reputational risk as they join forces as part of social alliances
(Bocquet, Cotterlaz-Rannard, & Ferrary, 2020). Funding partners
rightfully demand that NPOs provide information which can allow
them to assess the effective delivery of the social initiatives they
are supporting.
As part of social alliances, NPOs and funding agencies need
to agree upon the outcomes and projected long-term impact
of planned initiatives. This needs to be followed by action
on the part of NPOs who need to design a focused impact
assessment framework, put into place a plan for action, initiate
the project and then finally report the outcome. However, despite
increasing pressure to measure and report performance, NPOs
are still failing because of lack of capacity and capability (Bach-
Mortensen & Montgomery, 2018).
The present study is also informed by the fact that although
websites provide NPOs with an excellent platform for enhancing
stakeholder confidence and establishing trust among existing
and future collaborators, many NPOs have failed to adopt web-
disclosure practices (Lee & Blouin, 2019).
LITERATURE REVIEW
To investigate the communication
strategies employed by NPOs in reporting
their initiatives to stakeholders.
1
To investigate current practices of NPOs in measuring and
reporting outcomes of programmes.
2
To intervene, test and refine a framework for the measuring of outcomes and
long-term impact of programmes.
3
To assess the effectiveness of a
developed template for reporting
the outcome of programmes through
web-disclosure practices.
4

37Media Matters Report 2021
This six-month study involved several phases. To address objectives 1 and 2, the study had to determine the NPOs corpus for analysis.
A review of previous studies reveals that the corpus of NPOs which were selected to examine web-disclosure practices was based on
ratings by regulatory bodies (Gandia, 2011), listing by independent bodies such as Guidestar, a US-based website which lists American
NPOs (Lee & Joseph, 2013) or listing by an umbrella body such as an association of NPOs (Carvalho, Ferreira & Lima, 2020).
Unfortunately, drawing on a similar database is not possible in the Malaysian context as there has been no initiative to independently
list or rank Malaysian NPOs, nor is there an umbrella body offering membership to all NPOs in Malaysia. The only database would be
the ones made available by the regulatory agencies which register NPOs, namely, the Registrar of Societies (ROS) and the Companies
Commission of Malaysia (CCM).
A visit to the ROS website reveals that a full list of NPOs is not made available. Instead, visitors to its site need to type in the names
of individual NPOs in a search engine to locate them. In contrast, the CCM website lists NPOs which register under two categories,
namely, Companies Limited by Guarantee and labelled as “Berhad” (809 organisations, updated 24 January 2021), and Companies
Limited by Guarantee but not labelled as “Berhad” (1,334 organisations, updated 24 January 2021). Given the limited access and
absence of any independent listing or ranking of Malaysian NPOs, the list of 2,143 NPOs made available in the CCM website served
as the corpus for the present study.
The stages of data collection and analysis were as follows:
METHODOLOGY
An internet search was carried out in December 2020 to determine the number of NPOs which maintained websites for disseminating information.
1
A data collection instrument was designed and refined for capturing evidence of NPO outcome reporting practices as well as evidence of opportunities for dialogic communication. Towards this end, 13 NPO websites were randomly selected for analysis and refinement of the instrument.
2
A content analysis was undertaken on 100 NPO websites. All NPOs with websites were listed in alphabetical order, and every 6th NPO in the list was selected to make up the sample of 100 NPOs for analysis.
3
The Negeri Sembilan Chapter of the Malaysian English Language Teaching Association (MELTA) was invited as the collaborating NPO for testing and refining a framework for measuring and reporting outcomes and the long-term impact of programmes carried out by NPOs.
6
Telephone interviews were conducted with two NPOs to understand the rationale and justifications for their reporting as well as dialogic communication practices.
5
A survey was conducted on 536 NPOs with websites registered with CCM.4

38 Media Matters Report 2021
FINDINGS AND DISCUSSION
Presence of NPOs through Official Websites
A search of NPOs registered with the CCM revealed that a total of 2,143 NPOs were listed as of 24 January 2021. Next, the researchers
undertook a search to locate the websites of all 2,143 NPOs. It was found that only 663 of these NPOs maintained their own website.
Of this number, 197 were NPOs labelled as “Berhad” and 466 were NPOs without this label.
NPOs registered under CCM are not organisations which are financially challenged given the stringent financial requirements set by
CCM for registration. Yet, only 30.9 percent of all NPOs which have provided evidence of funds amounting to RM1 million or more have
set up websites to disclose information and engage with stakeholders. This finding appears to support the observation of Lee and
Blouin (2019) who assert that American NPOs are indeed reluctant to adopt web-disclosure practices and this is related to a variety of
factors including the resistance to move away from existing practices.
Unfortunately, it is evident that many NPOs in Malaysia are operating without adequately tapping into the multimedia resources which
are available to them for open communication, an important prerequisite for establishing trust. This is reiterated by Twis and Hoefer
(2020) who contend that NPOs which own websites have the potential to enhance stakeholder engagement with the right website
designs.
NPO Communication Strategies
In the present study, we narrow our focus to strategic virtual communication practices as presented by Waters, Burnett, Lamm & Lucas
(2009) in discussing the online communication practices of NPOs. They opine that virtual communication strategies must consider three
main elements, namely disclosure, dissemination and involvement (Gálvez-Rodriguez, Caba-Pérez & López-Godoy, 2014).
These strategies draw focus to the importance of moving beyond the one-directional form of communication which involves disclosure
and dissemination to dialogic or two-way communication opportunities which emphasise involvement.
The websites were therefore examined for evidence of dialogic communication based on the contention that establishing trust
necessitates the sharing of information and engaging in communication with stakeholders who visit the organisation’s website and
social media sites (Wirtz & Zimbres, 2018). Drawing on the work of Nair, Arshad and Muda (2020), all 100 NPO websites were analysed
to find evidence of opportunities for dialogic communication.
FIGURE 1: Dialogic Communication Opportunities
96% 4% 6% 94% 84% 16% 56% 44% 96% 4%
Dialogic Communication Opportunities
Yes No
General Contact Number
Direct Contact Number, with Name of
Contact Person
Feedback FormSocial media links (Facebook, Instagram,
Twitter)
Email address for inquiries
100
0
20
40
60
80

39Media Matters Report 2021
FINDINGS AND DISCUSSION
The findings reveal that a significant majority of the NPOs (96%)
provided a general number to receive telephone calls. However,
very few (6%) provided a name of a person to direct calls to.
Surprisingly, not all NPOs provided links to their social media
sites, suggesting that the desire to connect with the public at
large through immediate conversations may not be universal. It
appears that communication through social media sites is not
necessarily the most preferred option despite the opportunities
for more immediate, real-time engagement made possible
through social media sites.
This observation contests the claims of past studies which
suggest a preference for the sharing of experiences via social
media sites (Ramos, Rita & Moro, 2019). A search was also done
for the presence of feedback forms on the NPO websites as they
too reflect a desire to engage with stakeholders (Midin, Joseph
& Mohamed, 2017). However only 56 percent of all the websites
which make up the corpus of the present study offered feedback
forms to its visitors.
Finally, it was found that all but three websites (96%) listed email
addresses for direct communication. On the surface, it does
appear that Malaysian NPOs do indeed provide opportunities
for dialogic communication with stakeholders. The websites
reflect a focus on communication strategies which move beyond
merely informing visitors to also engaging with them in two-way
conversations.
To further understand the communicative practices by NPOs, a
total of 536 NPOs were invited to participate in a survey, with
52 finally accepting our invitation to participate. In addition,
interviews were carried out with two Malaysian NPOs.
Based on the survey it was found that 50 percent of the NPOs
did not follow a schedule for updating information on their
websites. A total of 14.6 percent of NPOs reported updating their
websites weekly while another 16.7 percent reported updating
their sites on a monthly basis.
The survey also revealed that not all NPOs offered the full
range of dialogic communication opportunities to engage
with their stakeholder. The survey revealed that 79.2 percent
of all respondents provided details of a mailing address on
their website, 93.8 percent provided an email address for
communication purposes, 81.3 percent provided a telephone
contact number, 29.2 percent provided feedback forms, and
77.1 percent provided links to their social media sites via their
website.
When asked about the most preferred mode of communication
by stakeholders, 41.7 percent of the respondents identified
e-mail communication as the most preferred mode, and this
was followed by 20.8 percent who identified text-messaging
services such as WhatsApp and 18.8 percent who reported that
stakeholders engaged with them most throught social media
sites. Communication via telephone calls trailed behind at just
10.4 percent.
Telephone interviews were conducted with two NPOs to further
understand their dialogic communication practices. One was
a wildlife conservation NPO committed to the protection of
Malayan sun bears while the other was an NPO supporting
disadvantaged women from the B40 community. Prior to the
interviews, the websites of both NPOs were examined to guide
the conversation. In the interview, both NPOs strongly agreed
that they regarded their websites as vital platforms for engaging
with their stakeholders. The wild life conservation NPO reported
having spent years developing the site into what it is now. They
were guided by the content of websites managed by reputable
NPOs in the area of conservation.
In contrast, the website managed by the other NPO was
launched recently after they migrated from an older site. In terms
of engaging with their stakeholders and the public at large,
both NPOs were very aware about the need to engage via their
websites.
NPO Practices in Measuring and Reporting Outcomes of
Programmes
In order to propose a systematic way of measuring and reporting
the outcome of NPO programmes, there is a need to first
understand existing practices. A content analysis was therefore
carried out for the 100 randomly selected NPOs to ascertain if
they reported their activities via their websites, and the format in
which the reports were presented. Of the 100 NPOs, six did not
report past activities in any format.
The most popular mode used for reporting activities was via
brief postings on their website events or activities link (86% of
all NPOs). This was followed by 18 percent of all NPOs reporting
past activities via published newsletters and 10 percent reporting
their activities via their annual reports. A few NPOs (6%) reported
their past activities via press releases and none showed evidence
of publishing stand-alone outcome reports.

40 Media Matters Report 2021
The fact that none of the NPOs presented stand-alone outcome
or impact reports of their past activities suggests that Malaysian
NPOs do not see the value of such reports although De Villiers,
Unerman & Rinaldi (2014) observe that stand-alone reports
recognise stakeholder demands for more detailed disclosures
which help them make informed decisions.
Instead, the NPOs present their reports of past activities through
their annual reports and/or newsletter publications which are
uploaded on their websites. This is despite the assertion that
when activity reports are embedded within other documents
such as annual reports, they are less likely to meet the information
demands of stakeholders (Bouten, Everaert, Van Liedekerke, De
Moor & Christiaens, 2011).
NPOs are dependent on the support of stakeholders and donors
for ensuring that they are able to continue with the various
initiatives targeting beneficiaries. Continued financial support
is therefore key for the sustainability of NPOs, and this is only
possible if trust is established, and if donors are convinced
that their financial support translates into impact for the target
beneficiaries.
Interviews with two NPOs revealed that there is indeed awareness
about the importance of sharing information of activities through
their web-disclosure practices. The representatives of both
NPOs asserted that they were committed to effective website
reporting practices, with timely updates. However, they also
reported that updating their websites was time consuming, and
they did not have the resources for this.
Beyond determining whether NPOs reported its activities, there
was also a need to determine if the information reported was
comprehensive. This is because the comprehensiveness of
reports contributes to greater transparency and accountability
(Bouten, Everaert, Van Liedekerke, De Moor & Christiaens,
2011). Therefore, to determine comprehensiveness, the
framework for impact assessment and reporting by the CASS
Centre for Charity Effectiveness (2013) was used to determine if
the reports contained the elements of input, the work carried out,
the outputs, outcomes and potential impact.
The most recent report presented on each of the NPO websites
was analysed to determine if they reported input, a description of
the work carried out, output, outcome and impact. The analysis
of the reports revealed that the most recent reports, regardless
of the mode used (annual report, newsletters, description in the
events page, etc.), contained a few elements, but never all five.
FINDINGS AND DISCUSSION
FIGURE 2: Format for Reporting Past Activities
Reports of past activities
Yes No
Upload annual report (Yes/No)
Published in public access newsletters
(Yes/No)
Reported in dedicated events/activities link
(Yes/No)
Reported in press (Yes/No)
Standalone Outcome/Impact
reports
100
0
20
40
60
80
10% 90% 18% 82% 6% 94% 86% 14% 0% 100%

41Media Matters Report 2021
As reflected in Figure 4, most reports (93%) included the
input that went into the organisation of the activities, while 76
percent of reports described the activities which made up the
programmes. However, the majority of reports failed to report
outputs, while a mere 18 percent attempted to report outcomes
and impact (10%). The observations in the present study are
consistent with those by Hyndman and McConville (2018) who
analysed the reporting practices of the top 100 UK charities.
They reported that the format of the reports varied significantly
and few charities offered explanations when presenting outputs
and outcomes, or linked their activities to their organisation’s
mission or goals.
The survey questionnaire which was distributed to NPOs also
attempted to elicit information on the activity reporting practices
of the NPOs. According to the respondents, the most preferred
way of informing their members or the public of upcoming
activities was through their social media sites, and this was
followed by the use of text-messaging services, sending emails
and only then by posting information on their website.
FINDINGS AND DISCUSSION
FIGURE 3: Content of Past Activity Report
FIGURE 4: Reporting Activities to Members and
the Public at Large
Content of past activities report
Yes No NA
Always Most of time Sometimes
Rarely Never
Inputs (resources description
used to carry out the of work carried out) activities - money,
trainers
Activities Outcomes (changes result from what theproject provides, e.g
increased income after implementing
changes, better student performance
after teachers are trained)
Outputs (products, or that result from a
project’s activities,e.g financial training, business proposals,
trained teachers)
Impact (broader a project’s outputs,
outcomes and activities. e.g former participants
report financial independence, students
report confidence in communicating in
English)
100
0
20
40
60
80
93% 1% 6% 10% 84% 6%18% 76% 6%46% 48% 6%76% 18% 6%
20.40%
28.60%
49%
2%
Total NPOs: 100

42 Media Matters Report 2021
FINDINGS AND DISCUSSION
Next, the respondents were asked if they reported the activities
they carried out to their members and/or the public at large. As
shown in Figure 4, almost half the respondents (49%) made it a
point to report every activity. The remaining reported informing
their members and/or the public most of the time (28.6%) or
sometimes (20.4%). Despite this, almost all respondents (98%)
either agreed or strongly agreed that reporting activities is
important for NPOs.
Consistent with observations made in the content analysis of the
NPO websites, the respondents reported that the most common
means used to report past activities was by sharing a brief write-
up via social media sites. This was followed by those who said
they prepared brief independent reports, and those who reported
activities via newsletters. The large majority of the respondents
(71.7%) claimed that they shared their activity reports within a
week after the event ended while another 21.7 percent reported
that this was done between one and four weeks after an event.
Next, the respondents were asked if they collected data through
surveys when they run their activities. To this, only 27.1 percent
reported doing so all the time. Another 39.6 percent reported
doing so most of the time and 22.9 percent reported doing so
sometimes. In instances when surveys are conducted, only 30.6
percent of all respondents reported using the data in their activity
reports while an equal number (28.6%) reported using the data
most of the time and sometimes.
Framework for Measuring and Reporting Programme
Outcomes by NPOs
This section reports findings from the final phase of the study
which involved intervening, testing and refining a framework for
the measuring of outcomes and long-term impact of programmes
carried out by NPOs, and then, assessing the effectiveness of a
developed template for reporting the outcome of programmes
through web-disclosure practices.
The contention which guided the present study was that NPOs
which voluntarily disclose information through their websites are
likely to be in a better position to establish stakeholder trust and
draw public support for their endeavours. The second phase
of the study was therefore geared at understanding how NPOs
could better leverage on the many activities they carry out by
measuring the outcomes of the activities and reporting it to
stakeholders and the public at large through their websites.
Towards this end, the researchers undertook the development of
an online system for use by NPOs. Its development was guided
by existing literature (CASS Centre for Charity Effectiveness,
2013;
Bouten, Everaert, Van Liedekerke, De Moor & Christiaens,
2011) as well as earlier versions of the system developed by the
researchers over the years.
The system takes users through a series of questions and
responses, and is geared at creating a sense of awareness
about the activities NPOs carry out. They are forced to some
extent to ensure that the objectives of the activities line up to the
organisation’s goals. They are also made to think ahead about
the evidence they need to collect in order to provide evidence
that the activity has met its objectives. The system therefore
serves as a foundation for conceiving appropriate data collection
instruments for measuring and reporting outcomes.
Once the system was developed, it was time to test the system
and refine if further for wider use. The Negeri Sembilan Chapter
of MELTA was engaged for this purpose. A briefing session
was held on 22 January 2021 and involved a presentation by
the researchers on outcome reporting. The presentation was
followed by a discussion during which it was learnt that the
chapter had not considered preparing an outcome report of the
last two activities which they carried out.
They agreed that information sharing was important and were
confident that their activities had an impact on their participants.
However, while they had some data from the past two events
(including some evidence captured through feedback from the
participants which was posted in the chat column as they hosted
the webinars), there was no attempt to report the activities to
stakeholders. In the same briefing session, the deliverables from
the Chapter were spelt out and deadlines for the running of
activities were set.
After a week, a second meeting was held for the Chapter to
present their proposed activity. At this meeting, the Chapter was
introduced to a template presented through an online system
and informed that the framework for impact assessment was
proposed by the CASS Centre for Charity Effectiveness (2013).
The Chapter was asked to complete the template before
finalising arrangements for the proposed activities.
The Chapter completed the template which guided them with
their data collection plans and went on to run the event. Upon
completion of the event, the Chapter provided the researchers
with their outcome report, and an interview was held to get
feedback from the Chapter on the refinement of the online
system and their outcome report preparation experience.
Upon accepting the researchers’ invitation to participate in the
study, the Chapter made the decision to carry out a programme
titled Flipgrid & Real Talk, Real Teachers: Our

43Media Matters Report 2021
FINDINGS AND DISCUSSION
Nogori Champions & E- Classroom Teacher Competition. The objective of the programme was to follow up on two earlier webinars which they had carried out and to have English language teachers use the knowledge gained from those webinars to showcase innovative classroom practices.
The specific objectives of the competition were to recognise English language teachers’ efforts in supporting students’ learning during pandemic-induced school closures, and to showcase best practices in remote learning that has impacted students’ engagement in English language learning. These objectives were aligned to MELTA’s objectives of promoting the teaching and learning of English in Malaysia, and contributing towards the advancement of standards in English language education in Malaysia.
The adoption of the framework made them think more about their targeted outcomes and how to find evidence that those outcomes have been achieved.
The publication of the outcome reports was a way of highlighting the challenges faced by their beneficiaries (in this case, English Language teachers) to the public at large and creating greater awareness. The capturing of data for the outcome report also serves as a useful reference for post-event discussions.
The outcome report provided them with a “systematic” way of carrying out their activities and helped them set the direction for future activities. They intended to submit the outcome report to the Negeri Sembilan State Government who provided them with some funding. The outcome report can indeed serve to convince potential donors about the value of their activities.
The following are the comments provided by the Chapter about using the system:
In addition to feedback from the Chapter which tested the online system, two external experts were also invited to assess the online system. Both were academics with PhD qualifications and research experience in working with NPOs and voluntary disclosure practices. The following comments were provided by the external experts for refining the online system:
The above-mentioned feedback needs to be considered in creating an improved version of the online system. However, it should also be noted that completing the various sections of the system should not be overly taxing on the NPOs. It should not be too lengthy as this may deter NPOs from using the system.
Generally, the initial briefing provided by the researchers and the independent use of the online system served the purpose of helping the Chapter produce an outcome report. The report itself was independently produced by the Chapter without any intervention by the researchers.
The analysis of the outcome report revealed that the Chapter was successful in two significant ways:
However, it should be noted that their understanding of what
is meant by output, outcomes and impact may not be entirely
accurate and this suggests that more guidelines are required to
support NPOs during a stand-alone training session.
• The use of the system still requires an understanding of the objectives of outcome reports, and this requires access to information via briefings or printed guidelines.
• The use of the online system was described as straight-forward and easy to follow. The questions asked in the system were clear. (No suggestions were provided for improving the content of the system)
• Navigation of the system needs improvement as it was sometimes difficult to go back to specific information which was keyed in earlier. The Chapter resorted to printing the entire template for easy reference.
• The final visual which presented the input, output, outcome and impact was helpful in discussions about data collection procedures and also post-event discussions.
• The system should ask users to name the key stakeholders. This is “so that if any monitoring/evaluation on the project is required, they can be reached/identified. The stakeholders may involve internal or external parties.”
• The system should identify the Person-in-Charge for more efficient tracking purposes.
• Rename Section 2 as “Project Details”.• Include a section requiring users to carry out a needs
assessment to help NPOs “understand their capacity in performing the activities and this should be initiated at the beginning of the proposed project. This information is also very important in order for them to look for alternatives in carrying out the project.”
• The users of the system should also be directed to identify “crucial failure factors” and “risk factors” so that they begin anticipating challenges.
They were able to link the activity they carried out to past activities, and in that way, report outputs and outcomes of one activity in relation to another.
1
They were able to develop data collection instruments and report evidence outcomes in relation to the experience of their beneficiaries.
2

44 Media Matters Report 2021
RECOMMENDATIONS
The initial search for NPOs which maintained their own websites revealed that Malaysian NPOs are not leveraging on the potential for
effective stakeholder interaction through web-disclosure practices. The fact that only 30 percent of NPOs registered with CCM possessed
their own website is an indication of lost opportunities.
In the case of NPOs which maintain their own websites, dialogic communication practices varied in terms of the opportunities provided and
their willingness or ability to communicate with stakeholders. This was despite assertions that stakeholder communication was important
for their sustainability.
The opportunity to engage with an NPO and take them through the process of publishing a stand-alone outcome report suggests that
NPOs certainly possess the capacity for effective reporting of their activities. The contention in the present study is that such reports
present opportunities for building stakeholder trust. The practice of reporting activities systematically helps establish the NPOs as
responsible and capable entities who can be entrusted with funds to support various segments of society.
CONCLUSION
REFERENCES
• Atan, R., Alam, M. M., & Said, J. (2017). Practices of corporate integrity and accountability of non-profit organizations in Malaysia. International Journal of Social Economics.
• Bach-Mortensen, A. M., & Montgomery, P. (2018). What are the barriers and facilitators for third sector organisations (non-profits) to evaluate their services? A systematic review. Systematic reviews, 7(1), 13.
• Blouin, M. C., Lee, R. L., & Erickson, G. S. (2018). The impact of online financial disclosure and donations in nonprofits. Journal of Nonprofit & Public Sector Marketing, 30(3), 251-266.
• Bocquet, R., Cotterlaz-Rannard, G., & Ferrary, M. (2020). How Do NPOs Get Funding? A Business Model Perspective Based on the Conversion of Symbolic Capital. Nonprofit and Voluntary Sector Quarterly, 0899764020925912.
Moving forward, it is recommended that NPOs are better regulated. The MCMC as an organisation may
want to consider a more active role in driving regulatory practices, especially in terms of NPO web-disclosure
practices. In this way, initiatives can be put in place to support NPOs and ensure that these organisations
practice good governance by communicating information to their stakeholders and the public at large.
Collaboration with other regulatory agencies such as CCM and ROS may be needed to ensure that Malaysian
NPOs operate within an ecosystem which demands transparency and good governance.
Future research in this area is needed to further understand the limitations under which Malaysian NPOs
operate. The training of NPOs is also essential. The ability to think ahead to programme outcomes, devise
data collection instruments, and then publish reports requires some amount of knowledge and appreciation
of the principles of outcome and impact assessment.
Extrinsic motivations in the forms of awards recognising NPOs for their web-disclosure practices may serve
to encourage NPOs to revisit their communication practices. Such awards may also serve to inform potential
donors about the good governance practices of NPOs.

45Media Matters Report 2021
• Bouten, L., Everaert, P., Van Liedekerke, L., De Moor, L., & Christiaens, J. (2011). Corporate social responsibility reporting: A comprehensive picture? In Accounting Forum, 35(3), 187-204.
• Carvalho, A., Ferreira, M. R., & Lima, S. (2020). Web disclosure of institutional information in nonprofit organizations: an approach in Portuguese charities. International Review on Public and Nonprofit Marketing, 17(1), 41-58.
• Connolly, C., Hyndman, N., & McConville, D. (2013). UK charity accounting: An exercise in widening stakeholder engagement. The British Accounting Review, 45(1), 58-69.
• Cook, N. J., Wright, G. D., & Andersson, K. P. (2017). Local politics of forest governance: Why NGO support can reduce local government responsiveness. World Development, 92, 203-214.
• De Villiers, C., Unerman, J., & Rinaldi, L. (2014). Integrated Reporting: Insights, gaps and an agenda for future research. Accounting, Auditing & Accountability Journal.
• Doan-Bao, C., Papoutsaki, E., & Dodson, G. (2019). Catalysing social change in Ho Chi Minh City, Vietnam: evaluating the LIN model of participatory community development. Community Development Journal, 54(3), 519-540.
• Gálvez-Rodriguez, M. D. M., Caba-Pérez, C., & López-Godoy, M. (2014). Facebook: A new communication strategy for non-profit organisations in Colombia. Public relations review, 40(5), 868-870.
• Gandia, J. L. (2011). Internet disclosure by nonprofit organizations: Empirical evidence of nongovernmental organizations for development in Spain. Nonprofit and voluntary sector quarterly, 40(1), 57-78.
• Hyndman, N., & McConville, D. (2018). Making charity effectiveness transparent: Building a stakeholder‐focussed framework of reporting. Financial Accountability & Management, 34(2), 133-147.
• Lee, R. L., & Blouin, M. C. (2019). Factors affecting web disclosure adoption in the nonprofit sector. Journal of Computer Information Systems, 59(4), 363-372.
• Lee, R. L., & Joseph, R. C. (2013). An examination of web disclosure and organizational transparency. Computers in Human Behavior, 29(6), 2218-2224.
• Midin, M., Joseph, C., & Mohamed, N. (2017). Promoting societal governance: Stakeholders’ engagement disclosure on Malaysian local authorities’ websites. Journal of Cleaner Production, 142, 1672-1683.
• Nair, R., Arshad, R., & Muda, R. (2020). Utilising dialogic corporate web communication: the case of reputational risk management at Tabung Haji. Media International Australia, 1329878X20969467.
• Polonsky, M. J., Grau, S. L., & McDonald, S. (2016). Perspectives on social impact measurement and non-profit organisations. Marketing Intelligence & Planning.
• Ramos, R. F., Rita, P., & Moro, S. (2019). From institutional websites to social media and mobile applications: A usability perspective. European Research on Management and Business Economics, 25(3), 138-143.
• Roshayani, A., Hisham, M. M., Ezan, R. N., Ruhaini, M., & Ramesh, N. (2018). Desired board capabilities for good governance in non-profit organizations. Administratie si Management Public, (30), 127-140.
• Shah, S. Z. A., Zainon, S., Othman, A. A., & Sundram, V. P. K. (2016). Web-Based Disclosure: A Comparative Study between Malaysian and Singaporean Non-Profit Organisations. International Information Institute (Tokyo). Information, 19(9B), 4051.
• Twis, M. K., & Hoefer, R. (2020). Teaching Note—Nonprofit Websites and the Engagement Competency of Social Work Education. Journal of Social Work Education, 56(3), 614-621.
• Waters, R. D., Burnett, E., Lamm, A., & Lucas, J. (2009). Engaging stakeholders through social networking: How nonprofit organizations are using Facebook. Public relations review, 35(2), 102- 106.
• Wirtz, J. G., & Zimbres, T. M. (2018). A systematic analysis of research applying ‘principles of dialogic communication’to organizational websites, blogs, and social media: Implications for theory and practice. Journal of public relations research, 30(1-2), 5-34.
• Yang, C., & Northcott, D. (2018). Unveiling the role of identity accountability in shaping charity outcome measurement practices. The British Accounting Review, 50(2), 214-2
REFERENCES

UNIVERSITI PUTRA MALAYSIA
TAYLOR’S UNIVERSITY
HIZMAWATI MADZIN, SITI KHADIJAH AND MAS NIDA MD. KHAMBARI
AQILAH YAACOB
IT Skills Among Marginalised Communities
The Case of Orphans and Vulnerable Children (OVC)
in Malaysia
46 Media Matters Report 2021

47Media Matters Report 2021
ABSTRACT
Orphan and vulnerable children (OVC) children lose interest in
school due to poverty, emotional and parental sickness or death.
These reasons may lead to OVC having low self-esteem and lack
of current skills. In view of this, it is imperative for the community
to provide educational support for OVC and therefore, Universiti
Putra Malaysia (UPM) had taken the initiative to create a series of
IT skills knowledge transfer programmes to help OVC in Malaysia.
This programme was conducted with the OVC at Persatuan
Kebajikan Anak Pesakit HIV/AIDS Nurul Iman (PERNIM). The
IT skills programmes included the teaching of Microsoft Office
(Word, PowerPoint and Excel) to two groups of participants
comprising eleven primary and nine secondary school students.
The findings showed that this programme had positively improved
the participants’ technical skills, perception, and their confidence
Research that study the impact of educational support toward
OVC are numerous. (Ojiambo & Bratton, 2014) focused on
the effectiveness of group activity play therapy (GAPT) among
Ugandan orphans between ten to twelve years. The outcome
shows a statistical reduction in problematic behaviour with
the implementation of the educational support programme.
Furthermore, (Hunte & White, 2017) suggested applying
technology educational support in Malawi Children’s Village
in using computers at both primary and secondary school levels.
The percentage of the participants with good technical skills in IT
increased from 0.00 percent to 72.73 percent and 11.11 percent
to 77.78 percent for primary and secondary school students
respectively. Meanwhile, the percentage of the participants
with good perceptions of IT increased from 63.64 percent
to 100 percent and 22.22 percent to 100 percent for primary
and secondary school students respectively. In addition, the
percentage of participants with higher confidence in IT increased
from 63.64 percent to 100 percent and 55.56 percent to 100
percent for primary and secondary school students respectively.
It is recommended to have more IT skill programmes in the future
for the OVC to increase their IT knowledge and also level of
communication skills.
(MCV) learning curriculum as the first step for MCV to be
exposed to education that involves technology. (Asqarova,
2014) proposed training the younger generation for social life.
(Stein et al., 2014) focused on educating about poor parental
mental health, institutionalization, under nutrition, and exposure
to violence. These various studies showed that it is important to
support OVC in terms of educational support or providing skills
for them to improve their education and status.
INTRODUCTION
LITERATURE REVIEW
Keywords: IT Skills, Knowledge Transfer, Orphan and Vulnerable Children, Computer Literacy
Orphan and vulnerable children (OVC) can be defined as children
who are orphaned and had lost their parents due to HIV/AIDS.
OVC children lose interest in school due to poverty, emotional
and parental sickness or death. These reasons may lead to OVC
having low self-esteem and lacking contemporary skills including
computer or IT skills which are considered as a required skill
in the world today. However, due to their hardships, the OVC
have very limited access to computer and digital technology.
The research team from Universiti Putra Malaysia (UPM) had
created a programme to transfer computer skills to OVC. The
programme had been conducted with the OVC at Persatuan
Kebajikan Anak Pesakit HIV/AIDS Nurul Iman (PERNIM) and
Rumah Perlindungan Kanak-Kanak HIV Positif (PAKATs).
The objectives of this study are to
Provide programmes that teach basic IT skills of Microsoft Office (Word, Excel, and PowerPoint) to OVC.1
Evaluate the impact of technical, perceptions and confidence in IT of OVC in receiving new IT skills knowledge.
2
Evaluate communication skill of OVC when joining a programme that is organised by a tertiary education entity.3

48 Media Matters Report 2021
LITERATURE REVIEW
One of the technological skills that should be taught is the
ability to use Microsoft (MS) Office in carrying out daily tasks.
The examples of daily activities are report writing, schedule
management and creative content creation. All these activities
are believed to be beneficial to the OVC for their future. The
importance of learning MS Office is not limited to only the OVC.
A survey by Aryanti C. et al. (2020) shows that employers expect
accountant graduates in Indonesia to have knowledge of the
MS Office programme. In South Africa, it is compulsory for all
students in most universities to attend introductory courses,
which includes MS Office skills (Venter and Swart, 2018).
In Salehi H. and Amiri B. (2019) work, they used Microsoft Office
Word to observe Iranian EFL lecturers’ grammar knowledge.
Cunningham U. et al. (2019) observed the use of MS Word to
support English writing skills of Asian students. Based on their
observations, it showed that through MS Word, the students are
more confident when writing in English.
The importance of MS Office to nursing students in higher
education also has been observed by Harerimana A. and Mitshali
N. G. (2019) because it is important for them to achieve their
learning goals and it is required for their future career [7]. From
the response it shows that most nursing students are skilled
in MS Word and PowerPoint. Interestingly, Karakara A. A. W.
and Osabuohien E. S. (2019) studied how ICT could enhance
child learning at home, hence, reducing the risk of a child being
disadvantaged. According to these researchers, there is yet to
be a study conducted on the adoption skills of MS Office for
OVC. Therefore, in this study, we will evaluate how OVC children
adapt to MS Word, PowerPoint and Excel.
The methodology used in implementing the IT skills programmes is a combination of the Hayes Group Mentoring methodology
(Mentoring Methodology, 2021) and the conceptual framework shown in Figure 1. The Hayes Group mentoring method accelerates
the transfer of knowledge (technical, leadership) from experienced UPM lecturers and students (mentors) to newer students (mentees)
which also involves knowledge creation, knowledge implementation and knowledge sharing. In this methodology, there are three
stages involved:
METHODOLOGY
First stage
Design phase (Knowledge Creation) involved all three stakeholders with different types of tasks.
Academician (team members) will identify the aims and objectives based on a discussion with the OVC
community and information given from the OVC community.
Second stage
Implementation phase (Knowledge Implementation). At this stage, the knowledge transfer activities will be
executed.
The final stage
Evaluation phase (Knowledge Sharing). There are two phases in the evaluation phase. The first phase is
the quantitative measurement impact using pre- and post- survey questionnaire. The second phase is
qualitative measurement of soft skills via observation and interview.
1
2
3

49Media Matters Report 2021
FINDINGS AND ANALYSIS
This research project can be considered to be successful since the aims and objectives of the research
project were achieved. We have successfully organised a four day programme and delivered the
knowledge of all the modules that we have created and evaluated the impact of technical and soft skills
of OVC in learning IT skills.
However, there are several limitations, and there are several suggestions that can be incorporated to
improve future undertakings. The suggestions are:
• There should be a continuation of similar programmes for the OVC to continue learning and enhance
their skills.
• To organise a train the trainer programme for OVC to teach other OVC or orphaned welfare associations
in order to empower OVC and marginalised communities with IT skills.
• To have more programmes organised by MCMC, universities or any government institutions that invite
the OVC and other marginalised communities, for them to feel welcome and increase their self-esteem
to face the real world.
RECOMMENDATIONS
This section highlights some key findings, including (i) the access
level to IT, and (ii) the level of IT technical skills, perceptions of IT
and confidence in using IT. It is important to note that access to
IT could significantly affect prior knowledge of IT technical skills,
perceptions of IT and confidence in using IT.
Access to IT
The statistical analysis generally reflects that the participants have
low accessibility to IT facilities (mean ± SE = 2.21 ± 0.29). The
level of accessibility among the participants is quite consistent
(standard deviation = 0.95). Table 1 shows some other interesting
descriptive statistics.
Technical skills of IT, perception of IT and confidence in IT
IT technical skills, perceptions and confidence levels among
primary and secondary school participants vary. The percentage
of the participants with good technical skills in IT increased
from 0.00 percent to 72.73 percent and 11.11 percent to 77.78
percent for primary and secondary school students respectively.
Meanwhile, the percentage of the participants with a good
perception of IT increased from 63.64 percent to 100 percent
and 22.22 percent to 100 percent for primary and secondary
school students respectively. In addition, the percentage of the
participants with higher confidence in IT increased from 63.64
percent to 100 percent and 55.56 percent to 100 percent for
primary and secondary school students respectively. To further
validate the descriptive findings, some hypothesis tests were
conducted for statistical inferences. Table 2 shows the findings of
impact analysis of the technical skills of IT, perceptions of IT and
confidence in IT of the programme.
The findings suggest that the programme has positively impacted
the technical skills, the perceptions and the confidence in IT
among the participants at primary and secondary schools (except
for the perception on IT for primary school participants) (p < 0.05).
TABLE 1: Access to IT among the participants
Access to IT score
Median 2.33Mode 2.33Kurtosis - 0.62Skewness 0.13Range 2.67Minimum 1.00Maximum 3.67
TABLE 2: Wilcoxon sign-ranked test for the impacts
of the programme on the technical skills of IT,
perceptions of IT and confidence in IT
Constructs
Technical
skills of IT
Perceptions
of IT
Confidence
in IT
Primary
School
V = 66
p = 3.84e-03
V = 23.5
p = 1.21e-01
V = 14
p = 9.93e-02
Secondary
School
V = 43
p = 1.17e-02
V = 45
p = 8.85e-03
V = 41
p = 3.22e-02

50 Media Matters Report 2021
OVC in Malaysia can be categorised as a marginalised community where they do not have the opportunity to live normal lives like other
children in their schools. This is because they live in groups in a welfare-provided house with limited facilities and lack of family support. The
lack of facilities and knowledge in using computers means they continue to lag far behind in school education. These reasons may lead
OVC to have low self-esteem and lack of contemporary skills. Therefore, it is significant for the university community to provide educational
support for OVC based on their academic expertise. IT skills can be defined as a lifelong learning skill in today’s world. It is especially
relevant in the context of the COVID-19 pandemic, where the entire world switched to online and digital tools to navigate the new normal.
While our study showed that there been positive impacts in the realm of their IT skills, we also assessed the soft skills of the OVC, especially
on their communication skills. From the results it shows that most of the participants have shown an improved proficiency in their basic
communication skills following their attendance of the IT skills programme. However, there must be a continuation of similar programmes
to ensure that OVC are continuously learning and enhancing their IT and soft skills. This long-life learning education is significant for them
to increase their skills and self-esteem.
CONCLUSION
REFERENCES
• Hunte, S., & White, A. (2017). Case Study: Providing Computer Education at Malawi Children’s Village, (February).
• Ojiambo, D., & Bratton, S. C. (2014). International Effects of Group Activity Play Therapy on Problem Behaviors of Preadolescent Ugandan Orphans, 92(July), 355–365
• Stein, A., Desmond, C., Garbarino, J., Ijzendoorn, M. H. Van, Barbarin, O., Black, M. M., Richter, L. M. (2014). Predicting long-term outcomes for children affected by HIV and AIDS: perspectives from the scientific study of children’ s development, (May), 261–268. Mentoring Methodology - The Hayes Group International, http://www.thehayesgroupintl.com/mentor_process.pdf (accessed on 28th March,2021)
• Asqarova, O. (2014). Using Educational And Moral Activities In Preparing Students Of Orphanages To The Social Life, 188–190.
• European Schoolnet (2013) Survey of Schools: ICT in Education Benchmarking Access, Use and Attitudes to Technology in Europe’s Schools. Belgium.
• Ghasemi, A. and Zahediasl, S. (2012) ‘Normality tests for statistical analysis: a guide for non-statisticians’, International journal of endocrinology and metabolism. 2012/04/20. Kowsar, 10(2), pp. 486–489.
• Rey, D. and Neuhäuser, M. (2011) ‘Wilcoxon-Signed-Rank Test BT - International Encyclopedia of Statistical Science’, in Lovric, M. (ed.). Berlin, Heidelberg: Springer Berlin Heidelberg, pp. 1658–1659.
• Aryanti, C., & Adhariani, D. (2020). Students’ Perceptions and Expectation Gap on the Skills and Knowledge of Accounting Graduates. The Journal of Asian Finance, Economics, and Business, 7(9), 649-657.
• Niati, A., Soelistiyono, A., & Ariefiantoro, T. (2019). Pengembangan Kemampuan Sumber Daya Manusia melalui Pelatihan Komputer Microsoft Office Excel untuk Meningkatkan Kinerja Perangkat Desa Mranggen. E-Dimas: Jurnal Pengabdian kepada Masyarakat, 10(1), 105-110.
• Venter, M., & Swart, A. J. (2018, April). An integrated model for the continuous use intention of Microsoft Office simulation software. In 2018 IEEE Global Engineering Education Conference (EDUCON) (pp. 320-329). IEEE.
• Salehi, D., & Amiri, B. (2019). Impacts of Using Microsoft Word (MS) Software on Iranian EFL Lecturers’ Grammar Knowledge. International Journal of Research in English Education, 4(1), 1-10.
• Cunningham, U., Rashid, S., & Le, T. (2019). The effect of learner training on the use of digital tools to support english writing skills. Asian EFL Journal, 21(2.1), 27-49.
• Harerimana, A., & Mtshali, N. G. (2019). Types of ICT applications used and the skills’ level of nursing students in higher education: A cross-sectional survey. International Journal of Africa Nursing Sciences, 11, 100163.
• Hallila, L. E., Al Zubaidi, R., Al Ghamdi, N., & Alexander, G. (2014). Nursing students’ use of Internet and Computer for their Education in the College of Nursing. International Journal of Nursing & Clinical Practices, 2014.
• Karakara, A. A. W., Osabuohien, E. S., & Chen, L. (2019). Households’ ICT access and educational vulnerability of children in Ghana. Cogent Social Sciences, 5(1), 1701877.

UNIVERSITI UTARA MALAYSIA
UNIVERSITI MALAYA
MOHD ALIF JASNI ANDNORRUZEYATI CHE MOHD NASIR
SITI HAJAR ABU BAKAR AH AND NORALINA OMAR
Homeless People’s Access to Health Information via Digital Communication:
A Study in Kuala Lumpur
51Media Matters Report 2021

52 Media Matters Report 2021
ABSTRACT
The COVID-19 pandemic has prompted significant mobile phone
usage amongst all users and has been especially important in
helping homeless persons throughout the COVID-19 pandemic.
Arguably, the diversity of functions available via mobile phones
has provided significant benefits for users among the homeless
community. These benefits include the use of mobile phones to
access information related to their basic needs such as food,
clothing, and shelter. The present study specifically examines the
use of mobile phones among homeless persons to access health
care information. A mixed-method approach was employed in
this study, involving interviews with twelve homeless persons
and a survey with two hundred homeless mobile phone users
located in Kuala Lumpur. Findings demonstrate a low level of
awareness of available health applications and correspondingly
low incidences of download and usage of such applications.
Arguably the promotion of mobile phones as a tool to access
important health information and utilise health applications would
contribute to the improved management of their respective
illnesses.
Keywords: accessibility, homelessness, mobile phone, health care applications, COVID-19
The research complements the work conducted by the Malaysian
Communications and Multimedia Commission (MCMC) in
providing statistics on mobile phone usage and demographics
in Malaysia. The current study focuses on mobile phone users
from the homeless community, arguing that mobile phones
play a critical role as tools to elicit information on food supplies,
shelter, availability of paid work, and those related to their safety
and that of their families. In striving to ensure digital inclusion
for all users, it is important that homeless persons are also
provided with access and the ability to extract the full benefits of
communications technology and connectivity.
The study addresses the following five research objectives
related to mobile phone users from the homeless community.
Firstly, to identify forms of mobile phone ownership and access.
Secondly, to determine types of mobile phone usage and
activities amongst homeless persons. Thirdly, to analyse the
forms of phone use dependence behaviour amongst homeless
persons. Next, to consider and discuss the extent to which
homeless mobile phone users utilise mobile phones for health-
related information and applications. Lastly, to design a model
of phone usage and accessibility patterns amongst homeless
persons in Malaysia.
Demographic Profile and Homeless Scenario In Malaysia
In Malaysia, homeless persons are not categorised or defined
by statute. The Malaysian Government relies on the Destitute
Persons Act 1977 (Act 183) to provide protections for homeless
persons by providing a legal mechanism to provide shelter at a
welfare home. The Act does not provide a definition for homeless
persons but relies on the term “destitute persons: under Section
2 either (a) being a person who is found begging in a public
place or (b) any idle person found in a public place with no visible
means of subsistence or place of residence.
The Department of Social Welfare Malaysia has released statistics
on the number of beggars from 2017 to 2019 showing a gradual
decline in the number of beggars (used interchangeably with
the homeless for this study) numbering 4,240 (2017), 3,472
(2018), and 3,221 (2019) persons respectively. The census
figures for 2020 are still unavailable and it would be interesting
to see whether the trend of decrease in the number of homeless
persons as recorded from 2017 to 2019 has continued in 2020
and eyond. According to Table 1, Kuala Lumpur recorded the
highest number of homeless Malaysians, comprising 490 men
and 179 women respectfully.
INTRODUCTION
LITERATURE REVIEW

53Media Matters Report 2021
LITERATURE REVIEW
2017 2018 2019 Total
States C NC C NC C NC C NC
M F M F M F M F M F M F M F
Johor 127 52 6 10 158 46 9 25 246 83 18 4 711 71
Kedah 15 9 5 3 74 32 36 13 72 42 25 1 244 83
Kelantan 7 6 1 0 41 8 24 15 49 9 7 0 121 47
Melaka 97 29 25 7 67 20 8 2 125 53 9 1 391 52
N. Sembilan 73 35 11 18 63 15 1 7 91 34 7 8 311 52
Pahang 48 31 6 1 78 34 3 1 49 22 28 25 262 64
Perak 109 31 9 7 44 22 2 0 125 33 7 3 364 28
P. Pinang 382 129 51 19 342 125 87 69 312 130 86 59 1420 371`
Sabah 0 0 0 0 0 0 0 0 58 20 36 45 78 81
Sarawak 55 12 3 0 4 0 0 0 52 17 3 0 140 6
Selangor 136 70 59 73 212 85 98 43 204 59 73 76 766 422
Terengganu 90 22 8 12 105 26 14 20 44 21 4 6 308 64
W.P. Kuala
Lumpur 1639 334 264 73 848 284 117 110 490 179 20 8 3776 592
W.P. Labuan 4 0 2 0 1 0 0 3 8 13 3 0 26 8
Total 2801 766 450 223 2068 687 399 308 1935 722 328 236 8989 1944
Total N and NC 4240 3472 3221 10933
TABLE 1: Homelessness Cases Of Citizens And Non-Citizens By State And Gender (2017-2019)
Indicator: M – Male, F – Female, C – Malaysian Citizens, NC – Non-Malaysian Citizens
Source : Department of Social Welfare Malaysia (2020)
In a 2012 study conducted by The Department of Social Welfare
Malaysia on 1,378 homeless persons, the two main factors
contributing to homelessness was the lack of employment
(46.6%) followed by poverty and low income (17.7%) (Drani,
2016). The largest percentage of homeless persons found on the
streets and shelters were those aged between 30-60 years and
mostly of Malay ethnicity (Alhabshi & Manan 2012; Mohamad,
Ismail, Subhi & Omar 2016). However, as the figures are based
on the numbers of those admitted into welfare homes under the
Destitute Persons Act 1977, there is a possibility that the actual
number of homeless persons is underreported if taking into
account those not admitted into welfare homes.
According to Idris and Ramli (2017), key factors contributing
to homelessness include urban poverty, family conflict, social
problems, and mental health. According to the researchers,
this has led to the homeless persons deciding to take the easy
way out of their problems by choosing to live and sleep on the
streets without considering their hygiene (Idris & Ramli 2017).
Presumably, this lack of concern with hygiene is indicative of a
similar attitude related to their individual health and well-being.

54 Media Matters Report 2021
LITERATURE REVIEW
Plight of the Homeless throughout the COVID-19 Pandemic
Since the first case was reported in the country, the Malaysian
government has played its part in dealing with the effects and
impact of COVID-19 in the country. According to Suah (2020),
COVID-19 has become a pandemic of an unprecedented scale,
heretofore, beyond the experience of our current generation,
infecting well over 3.6 million persons as at 7 May 2020. To date,
the country has shown an increase in the number of active cases
and deaths that eventually led to the Malaysian government
implementing lockdowns. Not all virus carriers and infected
persons show symptoms related to the disease. If symptomatic,
a person is likely to show symptoms such as fever, cough,
vomiting, shortness of breath and so on in a period between 5
to 14 days after the infection occurs (Ministry of Health Malaysia,
2020). To date, 114 million persons have been infected with
the disease, claiming 2.5 million lives worldwide (Worldometer,
2021).
According to Ramli and Dawood (2017), the number of homeless
persons is high in Kuala Lumpur, Selangor, and Penang. In Kuala
Lumpur, most homeless persons are located in Jalan Chow Kit,
Jalan Dang Wangi, Dataran Merdeka, Masjid Jamek and Pasar
Seni. Most of these homeless persons are Malaysians, but there
are homeless persons among the immigrants especially from
Indonesia, Thailand, Vietnam, Cambodia and Myanmar (Adib,
Hussin & Ahmad, 2016). As many as 10 percent of homeless
groups on major roads around Kuala Lumpur are non-citizens
(Adib et al., 2016). However, as the statistical data reported only
refers to official data from various sources and past studies, there
is a high chance that the actual number of homeless persons
currently may be more than the official figure.
Among the most pressing problem is the spread of COVID-19
infection among the homeless community. In the chaos of staying
away from being infected with COVID-19, many homeless
persons are exposed to the risk of infection (Pritchard, 2020). At
the height of the crisis, homeless persons failed to follow orders
to stay indoors because they were homeless (The Times, 2020).
They have no temporary shelter other than at the sidewalk or
under a bridge and would usually rely on the assistance from
the government or non-governmental organisations (NGOs). At
night, homeless persons usually sleep on boxes or mattresses
at the end of shops or covered streets (Sham, & Selvaratnam,
2018). During the day, they move to the surrounding area by
doing various jobs such as collecting used waste to support their
daily lives. It is difficult to change the way they live despite the
government implementing movement restrictions. This situation
makes this study important in examining the benefits of mobile
phones for the homeless community during the COVID-19
pandemic.
Access to Digital Communication by Homeless Persons
ex-inmates, drug addicts or homeless persons (Eyrich-Garg 2010;
Guadagno, Muscanell, & Pollio, 2013; McInnes, Li & Hogan, 2013;
Rice, Lee, & Taitt , 2011; Sala & Mignone, 2014). Due to the living
situations and unstable conditions, mobile phones and internet
access can be very important for maintaining social relationships
and services among homeless persons (Eyrich-Garg, 2010; Rice
et al., 2011). However, previous researches have indeed examined
the use of technology among homeless adults. Rice and colleagues
(2011) demonstrated the prevalence of mobile phones among
homeless youth, although research with homeless adults has
found varying rates of findings (Eyrich-Garg 2010; McInnes, Sawh,
Petrakis, Rao, Shimada, Eyrich-Garg , Anaya & Smelson 2014).
A systematic study by McInnes and colleagues (2013) found that
cellular phone access among the homeless population varied from
44 percent to 62 percent and estimates of internet usage ranged
from 19 percent to 84 percent.
Recent studies show that technology is becoming an increasingly
common element in the lives of homeless persons, leading some
researchers to question the existence of a “digital divide” amongst
homeless persons (Eyrich-Garg 2010; Guadagno et al. 2013; Pollio,
Batey, Bender, Ferguson & Thompson 2013; Sala & Mignone
2014). Other studies have outlined the potential of social media,
mobile phones, and the internet in general to improve the health,
addiction issues, and sexual health of homeless persons (Rice,
Kurzban & Ray 2012; Sala & Mignone 2014). In a qualitative study
conducted on 100 homeless persons by Eyrich-Garg (2010),
results have shown that the main reason for respondents owning
and using mobile phones are related to improving their sense of
security, responsibility (in terms of employment, stable housing,
personal business), and social relationships. Furthermore, it seems
to promise new methods for HIV prevention as well as opportunities
for intervention among persons struggling with debilitating mental
health and addiction issues, which often lead to further rejection
and control in street life (Rice 2010; Rice, Milburn, & Monro 2011;
Rice, Munro, Barman-Adhikari & Young 2011; Sala & Mignone
2014). A study by Prison Fellowship (2017) has placed access to
mobile phones as a necessary requirement of ex-inmates. The
researcher recommends to conduct a more detailed local study on
the purpose of the use and importance of these mobile phones
among homeless persons.
Population, Sample and Sampling of Research
The population of this study is homeless persons located around
Kuala Lumpur The sample units were selected because they had
specific features or characteristics that would allow for detailed
exploration and understanding of the key theme and question to be
studied. In order to study mobile phone access among homeless
persons, it is important to include samples who use mobile phones
and do not use mobile phones to

55Media Matters Report 2021
obtain variations of findings. The researcher had selected a small number of samples to participate in this study. The sample consisted of an estimated 5-25 persons based on the opinion of Cresswell (1998) who suggested the ideal sample number for phenomenological study. This study utilised two types of snowball sampling techniques and purposive sampling in identifying the homeless respondents needed for the study.
The study focused on three sample groups; those not owning either smartphones or cellular phones. The purpose of this study was to select these three groups of samples to enable the researcher to make triangulation between the samples. With that, the research would be able to see the importance of a mobile phone to a homeless person and the factors that caused a group of other homeless persons to opt to not possess a mobile phone. Then, the researcher interviewed the identified homeless respondents. To ensure that this principle of inclusivity guarantees the selection of an inclusive sampling, this study has set inclusion criteria for both groups, as shown in Table 2 below:
LITERATURE REVIEW
Sampling Technique
This study used two types of sampling techniques namely:
The First Sample Group: Homeless Respondents Who Have A Smartphone
• Homeless persons 21 years of age and older.• Have a smartphone.• Not having a stable place to live.• Is a Malaysian citizen only.
The Second Sample Group: Homeless Respondents Who Have A Cellular Phone
• Homeless persons 21 years of age and older.• Have a cellular phone.• Not having a stable place to live.• Is a Malaysian citizen only.
Third Sample Group: Homeless Respondents Who Do Not Have A Mobile Phone
• Homeless persons 21 years of age and older.• Have a smartphone.• Does not have a mobile phone.• Is a Malaysian citizen only.
TABLE 2: Inclusive Features of eligibility for
Homeless Respondens
SmartphoneOwners
Celluler PhoneOwners
Those Not Owning Either
Smartphones Or Cellular Phones
1 2 3
Multistage Random Sampling
Homeless communities are heterogeneous and
diverse. Thus, multistage random sampling is suitable
to be used to ensure that each of these social groups
has a fair opportunity to participate in this study.
This sampling technique allows the samples to
be taken in stages using smaller sampling units at
each stage. Multistage random sampling can be a
complex form of cluster sampling because it involves
the process or procedure of dividing a population or
study sample into specific groups. This multistage
random sampling is typically not uniform across the
study population. The purpose is to enable all the
sampling categories that have been defined in this
study to have an equal opportunity to be selected
and to have representation. The four levels that will
be used are the types of ex-inmates (e.g. homeless
family, homeless youth, homeless disabled, homeless
elderly, homeless ex-inmates, homeless drug addict),
gender, ethnicity, and geographical location.
1
Maximum variation sampling
In line with the sampling method of a quantitative
study that attempts to fairly cover all aspects of
homelessness variables, this study will use a sampling
technique aimed at maximum range variation in order
to find qualitative component respondents. This
sampling technique allows the researcher to gather
views and experiences from various perspectives of
the study respondents.
2

56 Media Matters Report 2021
FINDINGS AND ANALYSIS
To answer all of the research objectives, both quantitative and
qualitative studies study were conducted amongst homeless
persons in Kuala Lumpur in December 2020. This study was
conducted using a cross-sectional method involving a total of
two hundred respondents. Respondents were randomly selected
among the homeless who had their own mobile phones. This
study was conducted using a questionnaire with the role of an
enumerator to help respondents answer it completely. Based on
the pilot study that has been conducted, the average respondent
has a satisfactory language proficiency. The appointment of four
enumerators has assisted in making the data collection. The
presence of these four enumerators helped to speed up the
data collection processes. However, the state of Kuala Lumpur,
being under the movement control command phase, posed a
major challenge to the data collection process. Meanwhile, the
qualitative study involved a total of twelve respondents who were
homeless in the same location. The names of each respondent
were kept confidential and were replaced with pseudonyms.
Identify the type of mobile phone ownership.1
Identify the types of activities and functions of mobile phone use.2
Identify forms of mobile phone dependence
behaviour.
Discuss the use of mobile phones to obtain health information.
Design a model of mobile phone usability and
accessibility.
3
4
5
Name AgeEducationLevel Marital Status Occupation
Source of Income
Period of being Homeless
Mobile Phone Type
Mobile Phone Status
Primary Purpose of Usage
Mobile Phone Status
Application Type
Usage Frequency
Syafiq 55 Form 3 Single Unemployed (diagnosed with high blood pressure)
Bailtulmal (RM400 per month)
10 Years Smart Phone (Huawei)
Second hand (RM300)
Communicate Prepaid (UMobile)
None 3-4 times per day
Firdaus 37 Diploma (Giat MARA)
Married (away from partner for a long time)
Unemployed Unknown 10 Years Smart Phone(Samsung)
Second hand (RM80)
Communicate Prepaid Instagram FacebookWhatsAppMySejahtera
4-5 times per day
Nazri 48 Form 2 Divorced (three children)
Selling cup products (unable to work - OKU)
Pension SOCSO
10 Years Smart Phone(Oppo)
New (RM300)
Communicate Prepaid (Maxis)
Instagram FacebookWhatsAppYouTubeMySejahtera
2-3 times per day
Eddy 51 SPM Divorced (one child)
Unemployed None 10 Years Smart Phone
New Communicate Prepaid Facebook WhatsApp
6-7 times per day
Faiz 36 Form 2 Divorced (one child)
Volunteer (still not working formally due to concerns)
Volunteering Allowance
5 Years Smart Phone (Xiaomi Note 5)
New (self-bought)
Communicate Prepaid (Maxis)
YouTube MySejahteraWhatsApp FacebookTelegram
Frequent
Radhi 24 PMR Single Unemployed None 6 Months None Not Applicable
Not Applicable Not Applicable
Not Applicable Not Applicable
Ishak 38 Primary 6 Divorced (two children)
Unemployed None 6 Years Cellular Phone (Nokia)
Second hand
Communicate Prepaid (Digi)
Not Applicable Not frequent
Saiful 62 Primary 3 Divorced Unemployed None 5 Years None Not Applicable
Not Applicable Not Applicable
Not Applicable Not Applicable
Amirul 52 Primary 5 Single Unemployed None 5 Years None Not Applicable
Not Applicable Not Applicable
Not Applicable Not Applicable
Ikram 39 Form 3 Divorced (one child)
Unemployed Bailtulmal (RM400 per month)
3 Years Cellular Phone(Sony Ericson)
First hand (bought 10 years ago)
Communicate Prepaid (Celcom)
Not Applicable Frequent
Afif 61 Form 5 Divorced (two child)
73 Bailtulmal (RM300 per month)
20 Years Smart phone
Second hand (RM100)
Communicate Prepaid FacebookWhatsApp
Frequent
Zainudin 47 Form 5 Single 12 Bailtulmal (RM300 per month)
Renting for almost six years in rented room
Smart phone
Second hand (RM100)
Communicate Prepaid (UMobile)
Instagram WhatsAppFacebookBigo Live TikTokWechat
Frequent
TABLE 3: Respondents’ Demographics And Mobile
Phone Usage
This study was conducted to meet five main objectives, namely
to:
Demographic Profile of Respondents
It was found that the average age of the respondents in this study
was 45.16 years old with the normal data distribution of standard
deviation as low as 13.25. The youngest homeless person with
a mobile phone among the respondents was 10 years old and
the maximum age of the respondents being 76 years old. A total
of 126 respondents graduated from secondary school (63%),

57Media Matters Report 2021
Name AgeEducationLevel Marital Status Occupation
Source of Income
Period of being Homeless
Mobile Phone Type
Mobile Phone Status
Primary Purpose of Usage
Mobile Phone Status
Application Type
Usage Frequency
Syafiq 55 Form 3 Single Unemployed (diagnosed with high blood pressure)
Bailtulmal (RM400 per month)
10 Years Smart Phone (Huawei)
Second hand (RM300)
Communicate Prepaid (UMobile)
None 3-4 times per day
Firdaus 37 Diploma (Giat MARA)
Married (away from partner for a long time)
Unemployed Unknown 10 Years Smart Phone(Samsung)
Second hand (RM80)
Communicate Prepaid Instagram FacebookWhatsAppMySejahtera
4-5 times per day
Nazri 48 Form 2 Divorced (three children)
Selling cup products (unable to work - OKU)
Pension SOCSO
10 Years Smart Phone(Oppo)
New (RM300)
Communicate Prepaid (Maxis)
Instagram FacebookWhatsAppYouTubeMySejahtera
2-3 times per day
Eddy 51 SPM Divorced (one child)
Unemployed None 10 Years Smart Phone
New Communicate Prepaid Facebook WhatsApp
6-7 times per day
Faiz 36 Form 2 Divorced (one child)
Volunteer (still not working formally due to concerns)
Volunteering Allowance
5 Years Smart Phone (Xiaomi Note 5)
New (self-bought)
Communicate Prepaid (Maxis)
YouTube MySejahteraWhatsApp FacebookTelegram
Frequent
Radhi 24 PMR Single Unemployed None 6 Months None Not Applicable
Not Applicable Not Applicable
Not Applicable Not Applicable
Ishak 38 Primary 6 Divorced (two children)
Unemployed None 6 Years Cellular Phone (Nokia)
Second hand
Communicate Prepaid (Digi)
Not Applicable Not frequent
Saiful 62 Primary 3 Divorced Unemployed None 5 Years None Not Applicable
Not Applicable Not Applicable
Not Applicable Not Applicable
Amirul 52 Primary 5 Single Unemployed None 5 Years None Not Applicable
Not Applicable Not Applicable
Not Applicable Not Applicable
Ikram 39 Form 3 Divorced (one child)
Unemployed Bailtulmal (RM400 per month)
3 Years Cellular Phone(Sony Ericson)
First hand (bought 10 years ago)
Communicate Prepaid (Celcom)
Not Applicable Frequent
Afif 61 Form 5 Divorced (two child)
73 Bailtulmal (RM300 per month)
20 Years Smart phone
Second hand (RM100)
Communicate Prepaid FacebookWhatsApp
Frequent
Zainudin 47 Form 5 Single 12 Bailtulmal (RM300 per month)
Renting for almost six years in rented room
Smart phone
Second hand (RM100)
Communicate Prepaid (UMobile)
Instagram WhatsAppFacebookBigo Live TikTokWechat
Frequent
followed by primary school with a total of 52 persons (26%). Only
a few have education at the college and university level, namely
three respondents equivalent to 1.5 percent . Besides that, 19
persons (9.5%) respondents stated that they have education
from other levels. This findings indicated that majority of the
respondents possessed lower levels of education attainment. In
terms of employment, the statistics obtained were quite alarming
when a total of 168 respondents, representing 84 percent, were
unemployed. This indicated the probability of them either failing to
get any job or not being able to stay in a single job. Unemployment
makes homeless persons live without any form of solid income or
finances. It became the biggest factor to the respondent’s life as a
homeless person.
FINDINGS AND ANALYSIS

58 Media Matters Report 2021
FINDINGS AND ANALYSIS
Lifestyles of Kuala Lumpur Homeless Persons
It was found that the average age of the respondents in this study was 45.16 years old with the normal data distribution of standard deviation
as low as 13.25. The youngest homeless person with a mobile phone among the respondents was 10 years old and the maximum age of the
respondents being 76 years old. A total of 126 respondents graduated from secondary school (63%),
Criteria Frequency Percentage (%) Average Cost
Period being Homeless
Less than 1 year 80 40 -
1-3 years 46 23 -
3-5 years 22 11 -
More than 5 years 52 26 -
Factors contributing to being Homeless
Health 1 0.3 -
Converted to Islam 2 0.6 -
No education 5 1.5 -
COVID-19 3 0.9 -
Flee from employer 1 0.3 -
Lost Work 7 2.1 -
Unemployed 76 22.4 -
Ex-inmate 24 7.1 -
Criminal records 39 11.5 -
Family expulsion 27 7.9 -
Poor 81 23.8 -
Possess a place to stay
Yes 102 51 -
No 98 47 -
Residency type
Daily rented room 22 11 -
Monthly rented room 40 20 -
Transit centre 6 3 -
Seeking shelter at a family/friend’s house 35 17.5 -
Renting Cost - - RM514.75
TABLE 4: Information on the Lifestyle of the Homeless in Kuala Lumpur

59Media Matters Report 2021
FINDINGS AND ANALYSIS
Typically, several factors co-exist or sequentially make the tendency for a person to end up being homeless or forced to stay homeless. Of the
various factors stated, the most cited reasons were poverty as stated by 23.8 percent of the respondents, no job or unemployment (22.4%)
followed by criminal record (11.5%), family expulsion (7.9%) and out of prison (7.1%). The other causes on the list with a record of below 5
percent that can be classified as isolated cases. The research team sees poverty and unemployment as two of the biggest factors that cause
respondents to be living on the streets. They did not manage to change and improve due to the vicissitudes of life.
The data showed that only 9.5 percent of respondents are recipients of any form of welfare assistance from the government or NGOs as a
majority of respondents stated that they did not receive any form of welfare assistance (90.5%). Among the recipients of welfare assistance,
it was found that the types of assistance received were from the Social Welfare Department with three persons (15.8%), one (5.3%) from
Bantuan Sara Hidup (BSH), three (15.8%) from Bantuan Prihatin Nasional (BPN), five (26.3%) each from Baitulmal and Zakat and two (10.5%)
from NGOs.
Criteria Frequency Percentage (%) Average Cost
Income source to pay rent
Own money 41 32.3 -
Govenrment aid 27 21.3 -
NGO aid 12 9.4 -
Aid from family members 12 9.4 -
Aid from relatives 10 7.9 -
Aid from friends 23 18.1 -
Aid from employer 2 1.6 -
Place to spend the night
Sidewalk/Pavement 54 33.5 -
Bridge 29 18 -
Market 22 13.7 -
Public park 27 16.8 -
Overhead bridge 12 7.5 -
Mosque 11 6.8 -
Bus station 6 3.7 -
Recipient of welfare aid
Yes 19 9.5 -
No 181 90.5 -
Type of welfare aid
Bailtulmal 5 26.3 -
Social Welfare Department 3 15.8 -
Zakat 5 26.3 -
BSH 1 5.3 -
BPN 3 15.8 -
NGO 2 10.5 -

60 Media Matters Report 2021
FINDINGS AND ANALYSIS
The first objective of the study was to examine the types of mobile phone ownership among homeless persons. Quantitative data indicated
that all respondents have access to a mobile phone and were able to use mobile phone on a normal basis. This study detailed out the type
of mobile phones and the respondents’ purpose of using mobile phone This can help researchers to identify mobile phone ownership access
and provide a reference to the government to identify the best methods to deliver information and health services to this vulnerable group.
The price of mobile phones owned by the respondents was around RM20 to RM700. On average, the mobile phones would cost RM257.45
each.This price difference is quite significant due to the difference in the type of phones and the ownership status of the phone. Table 5 shows
the patterns of mobile phone usage among homeless persons.
Objective 1:Identifying Types of Mobile Phone Ownership
Criteria Frequency Percentage (%) Average Cost
Mobile Phone Source
Self-bought 174 87.0 -
Gift from family/friends 23 11.5 -
Found 3 1.5 -
Mobile Phone Status
New 77 38.5 -
Second hand 123 61.5 -
Mobile Phone Type
Cellular Phone 79 39.5 -
Smart Phone 121 60.5 -
Service Provider
Maxis 71 35.5 -
UMobile 70 35.2 -
Digi 45 22.5 -
Celcom 40 20 -
Redone 3 1.5 -
XOX 4 2.0 -
Mobile Phone Plan
Prepaid 188 94.0 -
Postpaid 12 6.0 -
TABLE 5: Mobile Phones Pattern of Ownership

61Media Matters Report 2021
FINDINGS AND ANALYSIS
A majority of respondents (123 persons, 6.5%) owned a used mobile phones This figure gives the impression that mobile phones are a
necessity owned by the majority of community members even by those who do not have a good and stable income. This study also found
that a total of 121 persons (60.5%) owned a smartphone. This is a interesting observation considering their limited financial respurces. In
addition, the results showed that only 79 persons (39.5%) respondents were still using cellular phones with functions that can be said to be
very limited. The high craving for smart phones is evident from the amount of mobile phone ownership available among homeless persons.
However, it is important to observe that this study was conducted in the capital, hence smartphone access is also at an encouraging level.
The results of the qualitative study found that out of twelve respondents interviewed, seven respondents use smartphones, two use cellular
phones and three do not use mobile phones. This qualitative findings further confirm the quantitative findings on patterns of mobile phone
use and ownership among homeless persons.
The findings of the quantitative study required respondents to give frequency values of 1 = never, 2 = several times a month,
3 = several times a week and 4 = several times a day on the 15 functions listed by the researcher. All these frequency values were analysed
using frequency analysis to obtain a sequence of functions that are frequently used by most homeless persons.
Objective 2:Types of Activities and Functions of Mobile Phone Use
Criteria Frequency Percentage (%) Average Cost
Reason for choosing a Plan
No monthly commitment 30 14.0 -
Cheap 86 40.2 -
Good coverage 50 23.4 -
Fast / Efficient 48 22.4 -
Connectivity Plan
Yes 124 62 -
No 76 38 -
Total hour(s) of usage per day
1-3 hours 78 39.0 -
4-6 hours 70 35.0 -
More than 6 hours 52 26.0 -
Estimated Monthly Fee - - RM53.78
Mobile Phone Cost - - RM257.45

62 Media Matters Report 2021
FINDINGS AND ANALYSIS
TABLE 6: Usage of Mobile Phone by the Homeless
No.Activities and
UsageNever Several times a month Several times a week Several times a day
1. Messagesending &audiorecording
24 (12.0%) 58 (29.0%) 40 (20.0%) 78 (39.0%)
Smartphone17 (8.5%)
Cellular7 (3.5%)
Smartphone20 (10%)
Cellular38 (19%)
Smartphone33 (16.5%)
Cellular7 (3.5%)
Smartphone51 (25.5%)
Cellular27 (13.5%)
2. Conversationthrough phonecall
24 (12.0%) 42 (21.0%) 59 (29.5%) 75 (37.5%)
Smartphone10 (5%)
Cellular14 (7%)
Smartphone24 (12%)
Cellular18 (9%)
Smartphone38 (19%)
Cellular21 (10.5%)
Smartphone49 (24.5%)
Cellular26 (13%)
3. Photo takingand ideorecording
73 (36.5%) 48 (24.0%) 48 (24.0%) 31 (15.5%)
Smartphone33 (16.5%)
Cellular40 (20%)
Pinar33 (16.5%)
Cellular15 (7.5%)
Smartphone34 (17%)
Cellular14 (7%)
Smartphone21 (10.5%)
Cellular10 (5%)
4. Navigation 119 (59.5%) 38 (19.0%) 24 (12.0%) 19 (9.5%)
Smartphone67 (33.5%)
Cellular52 (26%)
Smartphone24 (12%)
Cellular14 (7%)
Smartphone17 (8.5%)
Cellular7 (3.5%)
Smartphone13 (6.5%)
Cellular6 (3%)
5. Informationseeking online
79 Responden (39.5%) 32 Responden (16.0%) 28 Responden (14.0%) 61 Responden (30.5%)
Smartphone43 (21.5%)
Cellular36 (18%)
Smartphone20 (10%)
Cellular12 (6%)
Smartphone16 (8%)
Cellular12 (6%)
Smartphone42 (21%)
Cellular19 (9.5%)
6. Watchingvideos or films
59 (29.0%) 22 (11.0%) 34 (17.0%) 86 (43.0%)
Smartphone24 (12%)
Cellular34 (17%)
Smartphone11 (5.5%)
Cellular11 (5.5%)
Smartphone20 (10%)
Cellular14 (7%)
Smartphone66 (33%)
Cellular20 (10%)
7. Video call 113 (56.5%) 24.0% 8.0% 11.5%
Pinrar65 (32.5%)
Cellular48 (24%)
Smartphone28 (14%)
Cellular20 (10%)
Smartphone12 (6%)
Cellular4 (2%)
Smartphone16 (8%)
Cellular7 (3.5%)
8. Sending orreceivingemails
110 Responden (55.5%) 47 Responden (23.5%) 28 Responden (14.0%) 15 Responden (7.5%)
Smartphone65 (32.5%)
Cellular45 (22.5%)
Smartphone27 (13.5%)
Cellular20 (10%)
Smartphone17 (8.5%)
Cellular11 (5.5%)
Smartphone12 (6%)
Cellular3 (1.5%)
9. Playing games 108 (54.0%) 32 (16.0%) 22 (11.0%) 38 (19.0%)
Smartphone67 (33.5%)
Cellular41 (20.5%)
Smartphone17 (8.5%)
Cellular15 (7.5%)
Smartphone13 (6.5%)
Cellular9 (4.5%)
Smartphone24 (12%)
Cellular14 (7%)
10. Reading latestnews
58 (29.0%) 22 (11.0%) 32 (16.0%) 88 (44.0%)
Smartphone29 (14.5%)
Cellular29 (14.5%)
Smartphone14 (7%)
Cellular8 (4%)
Smartphone18 (9%)
Cellular14 (7%)
Smartphone60 (30%)
Cellular28 (14%)
11. Using social media
84 (42.0%) 22(11.0%) 42 (21.0%) 52 (26.0%)
Smartphone41 (20.5%)
Cellular43 (21.5%)
Smartphone14 (7%)
Cellular8 (4%)
Smartphone27 (13.5%)
Cellular15 (7.5%)
Smartphone39 (19.5%)
Cellular13 (16.5%)
12. Bankingtransactions
151 (75.5%) 36 (18.0%) 6 (3.0%) 7 (3.5%)
Smartphone91 (45.5%)
Cellular60 (30%)
Smartphone20 (10%)
Cellular16 (8%)
Smartphone5 (2.5%)
Cellular1 (0.5%)
Smartphone5 (2.5%)
Cellular2 (1%)
13. Online purchasing
167 (83.5%) 26 (13.0%) 6 (3.0%) 1 (0.5%)
Smartphone97 (48.5%)
Cellular70 (35%)
Smartphone18 (9%)
Cellular8 (4%)
Smartphone5 (2.5%)
Cellular1 (0.5%)
Smartphone1 (0.5%)
Cellular0 (0.5%)
14. Monitoringof personalhealth
149 (74.5%) 34 (17.0%) 8 (4.0%) 9 (4.5%)
Smartphone89 (44.5%)
Cellular60 (30%)
Smartphone21 (10.5%)
Cellular13 (6.5%)
Smartphone 3 (1.5%)
Cellular5 (2.5%)
Smartphone8 (4%)
Cellular1 (0.5%)
15. Listening tomusics
58 (29.0%) 16 (8.0%) 24 (12.0%) 102 (51.0%)
Smartphone28 (14%)
Cellular30 (15%)
Smartphone6 (3%)
Cellular10 (5%)
Smartphone15 (7.5%)
Cellular9 (4.5%)
Smartphone72 (36%)
Cellular30 (15%)

63Media Matters Report 2021
FINDINGS AND ANALYSIS
In terms of frequency sequence, it was found that the most popular function among the respondents was to send messages and
audio recordings. A total of 176 respondents (88%) use this function at least several times a month. 104 of them are smartphone
users while 72 are cellular phone users. The same value is also obtained through the function of mobile phones making phone calls.
This high value is contributed by the call and message system that can be sent by all types of phones, both smartphones and cellular
phones. In addition, the entertainment function was also found to record a high value. A total of 142 respondents (71%) used mobile
phones to listen to music and watch videos. Both of these functions can also be accessed via smarphones and cellular phones.
However, some of the findings indicated that the function of mobile phones to monitor the level of personal health is still foreign to
some homeless persons in Kuala Lumpur as a total of 149 (74.5%) respondents gave a rating of ‘never’ for this function. Overall,
these findings gave the impression that homeless persons mainly use mobile phone as a device to communicate, for entertainment
purpose and obtain current info. Hence, more complex functions such as health-related functions and banking have not found good
response among the respondents.
The following are the findings of the study from qualitative data. Almost all respondents who have mobile phones use prepaid. Six
out of seven smartphone users have Facebook and WhatsApp. The results of the interviews conducted found that respondents use
mobile phones for several functions such as:
Smartphones or Cellular Phones
The majority of respondents who strongly disagree to spend more money on mobile phones than clothes or food is as many as 76
respondents (38%) in which 50 persons (25%) are smartphone users and 26 persons (13%) are cellular phone users. Furthermore,
the majority of respondents who disagree to rely on mobile phones for the purpose of frequent phone calls especially until late
at night is 75 respondents (37.5%) in which 45 persons (22.5%) use smartphones and 30 persons (15%) use cellular phones. In
addition, the majority of respondents who strongly agree to rely on mobile phones for the purpose of charging mobile phone on
a daily basis equals to 82 respondents (41%) in which 52 persons (26%) are smartphone users and 30 persons (15%) are cellular
phone users.
The study also obtained this information through qualitative research. In this study, two respondents were found to use mobile
phones. For those who use cellular phones, the researchers also asked about why they use cellular phones. There are three major
factors that these homeless persons are aware of. Among them are as follows:
Objective 3:Forms of Mobile Phone Dependence Behaviour
Anxiety of device lost or
damaged.1 Cannot afford to buy
smartphones.2 Easier to use and does not
involve a cost.3
To contact family and friends.1
To use as a medium for entertainment.2
To obtain information on the distribution or distribution of
food from NGOs.3
To support medium through online group formation
(for example WhatsApp group).4
To allow the dealing process to be easier.5
To use as a medium to obtain information.6

64 Media Matters Report 2021
FINDINGS AND ANALYSIS
Persons Who Do Not Have a Mobile Phone
The researcher also obtained information from respondents who do not have a mobile phone about their views on the importance of
the device nowadays. Based on their responses, some indicated that mobile phone is:
In terms of forms of dependency behavior, researchers have discovered several phone-related themes:
The findings of the study show that homeless persons also depend on mobile phones in some aspects of life. This further confirmed
that life in this age of technological advancement and communication requires a person to have a mobile phone to facilitate various
daily affairs in addition to the purpose of social communication and entertainment.
Crucial for important
matters.
1Not affordable
if a person does
not have strong
finances.
2
Significant to get
latest information.
3
Still not an
obligation or of
importance to them.
4
Spending time using
the phone.
1
Relying on the
phone in getting
information.
2
Addicted to the
phone usage.
3
Comfortable sending
messages instead of
face-to-face.
4
Prepaid or Postpaid
In this study, researchers have also identified the factors that motivate respondents to choose between prepaid or postpaid plan.
The study found that all mobile phone users among the respondents choose to use prepaid services. There are two biggest factors
for this which are identified through qualitative research namely:
Researchers found that three respondents said they did not want to commit to a monthly postpaid expenses as they could not afford
it. As such, they are more comfortable in using prepaid and only top-ups when they have the finances or needs.
Benefits of Mobile Phones During the COVID-19 Pandemic
The majority of respondents strongly agreed on the benefits of mobile phones during the COVID-19 pandemic such as obtaining
information on financial assistance, food distribution and basic necessities provided by NGOs. 65 respondents (32.5%) agreed
that using mobile phones can generate ancillary income during the period of the COVID-19 pandemic. Respondents also used
mobile phones to obtain information related to COVID-19 preventive measures, apply for welfare assistance and apply for medical
assistance during the MCO period.
In addition, 111 respondents (55.5%) agreed that mobile phones helped them to stay in touch with family and 102 respondents
(51%) agreed that mobile phones helped respondents stay in touch with contacts and friends during the COVID-19 pandemic.
Mobile phones were also used to obtain information on the assistance provided by the government during the COVID-19 pandemic
period, which was indicated by 80 respondents (40%).
Do not want commitment.1 Cannot afford to use postpaid.2

65Media Matters Report 2021
FINDINGS AND ANALYSIS
The findings of the quantitative study show that the frequency of use of applications on mobile phones to seek treatment is low
among homeless persons. This is because the majority of respondents reported never using all of the applications for the purpose
of obtaining health information. Table 7 shows the use of applications on mobile phones for use in obtaining health information.
To achieve Objective 4, the study was also conducted qualitatively. This study found that access to treatment was not a priority
among homeless persons. However, when asked about the use of mobile phones for treatment, there are several themes obtained
such as:
Objective 4:Use of Mobile Phones to Obtain Health Information
To get an appointment.1 Cannot afford to buy
smartphones.2 For recovery sessions through
online support groups.3
TABLE 7: Usage of Mobile Phone in Getting Treatment by Homeless Persons
No.Activities and
UsageNever Several times a month Several times a week Several times a day
1. MySejahtera 94 (47%) 12 (6%) 28 (14%) 66 (33%)
Smartphone39 (19.5%)
Cellular55 (27.5%)
Smartphone10 (5%)
Cellular2 (1%)
Smartphone26 (13%)
Cellular2 (1%)
Smartphone46 (23%)
Cellular20 (10%)
2. MyHealth 176 (88%) 12 (6%) 4 (2.0%) 8 (4.0%)
Smartphone108 (54%)
Cellular68 (34%)
Smartphone5 (2.5%)
Cellular7 (3.5%)
Smartphone3 (1.5%)
Cellular1 (0.5%)
Smartphone5 (2.5%)
Cellular3 (1.5%)
3. MyFoodSafe 185 (92.5%) 8 (4.0%) 2 (1.0%) 5 (2.5%)
Smartphone112 (56%)
Cellular73 (36.5%)
Smartphone5 (2.5%)
Cellular3 (1.5%)
Smartphone1 (0.5%)
Cellular1 (0.5%)
Smartphone3 (1.5%)
Cellular2 (1%)
4. IDengue 187 (93.5%) 4 (2.0%) 4 (2.0%) 5 (2.5%)
Smartphone115 (57.5%)
Cellular72 (36%)
Smartphone2 (1%)
Cellular2 (1%)
Smartphone2 (1%)
Cellular2 (1%)
Smartphone2 (1%)
Cellular3 (1.5%)
5. MyFoodPremis 191 (95.5%) 4 (2.0%) 3 (1.5%) 2 (1.0%)
Smartphone117 (58.5%)
Cellular74 (37%)
Smartphone2 (1%)
Cellular2 (1%)
Smartphone1 (0.5%)
Cellular2 (1%)
Smartphone1 (0.5%)
Cellular1 (0.5%)
6. Instagram 152 (76.0%) 22 (11.0%) 10 (5.0%) 16 (8.0%)
Smartphone86 (43%)
Cellular66 (33%)
Smartphone17 (8.5%)
Cellular5 (2.5%)
Smartphone9 (4.5%)
Cellular1 (0.5%)
Smartphone9 (4.5%)
Cellular7 (3.5%)
7. Twitter 178 (89.0%) 6 (3.0%) 4 (2.0%) 12 (6.0%)
Smartphone107 (53.5%)
Cellular71 (35.5%)
Smartphone4 (2%)
Cellular2 (1%)
Smartphone4 (2%)
Cellular0 (0%)
Smartphone6 (3%)
Cellular6 (3%)
8. Facebook 98 (49%) 14 (7%) 20 (10%) 68 (34%)
Smartphone46 (23%)
Cellular52 (26%)
Smartphone9 (4.5%)
Cellular5 (2.5%)
Smartphone17 (8.5%)
Cellular3 (1.5%)
Smartphone49 (24.5%)
Cellular19 (9.5%)
9. Telegram 172 (86%) 8 (4%) 4 (2%) 16 (8%)
Smartphone104 (52%)
Cellular68 (34%)
Smartphone5 (2.5%)
Cellular3 (1.5%)
Smartphone2 (1%)
Cellular2 (1%)
Smartphone10 (5%)
Cellular6 (3%)
10. YouTube 83 (41.5%) 14 (7.0%) 36 (18.0%) 67 (33.5%)
Smartphone37 (18.5%)
Cellular46 (23%)
Smartphone11 (5.5%)
Cellular3 (1.5%)
Smartphone25 (12.5%)
Cellular11 (5.5%)
Smartphone48 (24%)
Cellular19 (9.5%)

66 Media Matters Report 2021
FINDINGS AND ANALYSIS
The findings of the quantitative study have led to the construction of the Usage Patterns and Mobile Phone Accessibility for
Homeless Persons Model. The recommendation of this model is a response to the findings of this study. The application of this
model is expected to help MCMC to understand the pattern of mobile phone usage among homeless persons. This model aims to
examine how a group of users from the homeless community access and use mobile phones and the internet (including fixed and
wireless internet resources). The aim is to provide evidence to inform service delivery by NGOs and governments about this group
of users and to develop and improve telecommunications initiatives that address the needs and challenges of mobile phone users,
including homeless users.
Objective 5:Model of Mobile Phone Usability and Accessibility
FIGURE 1: Usage Patterns and Mobile Phone Accessibility for Homeless Persons Model
Types of Activities and Functions of Mobile Phone Usage
• Sending Messages and Audio Recordings• Chat by Phone Call• Take Pictures and Record Videos• Get Directions/Navigation Guides• Finding Information on the internet• Watching Videos or Movies• Make a Video Call• Sending or Receiving Emails• Playing games• Read the Latest News• Socialise on Social Media• For Banking Purposes• Make Online Purchases• Monitor Personal Health Levels• Listening Music
Mobile Phone Ownership Access
• Mobile Phone Resources• Mobile Phone Status• Mobile Phone Type• Service Provider Choice• Mobile Phone Plan• Reason for Using Selected Plan• Internet Connection• Frequency of Daily Use• Estimated Monthly Payment• Phone Price
Dependency towards Mobile Phone Behavior
Getting Treatment
Mobile Phone Usability and Accessibility among Homeless People
• Homeless People’s Demographic• Homeless People’s Activities• Homeless People’s Health Profile• Homeless People’s Crime Profile
• Type of Mobile Phone• Type of Application
Type of Mobile Phone
Type of Mobile Phone
Frequency of Application Use to
gain Health Info
Opportunities to Health Access
Mobile Phone Use for Health Access
Benefit of Mobile Phone

67Media Matters Report 2021
FINDINGS AND ANALYSIS
Meanwhile, the findings of the qualitative study have led to the construction of the Ownership Type, Health Access and Usage
Function for Homeless Persons Model. This model aims to gives a true picture of mobile phone usage among homeless persons.
This is because homeless persons still requires access to a mobile phone despite living in poverty and destitution. This model shows
the function of the phone in homeless circles and the type of mobile phone ownership used by homeless persons.
FIGURE 2: Ownership Type, Health Access and Usage Function for Homeless Persons Model
• Contacting Family and Friends• Get Entertainment• Obtain information on Aids by NGOs• Get Online Support• Simplify the Process of a Matter• Get a Hospital Appointment• Get information
Trust
Ownership and Usage of Cellular and Smart Phones among the Homeless People
Do not have strong finance
Affordable
Not considered Compulsory
Easy Usage
Resilience and Lost Risk
No Commitment
Importance for Urgent Matters
Difficulties to obtain latest Information
Specification of Prepaid
Specification of Cellular Phone
Usability Compatibility

68 Media Matters Report 2021
RECOMMENDATIONS
One of the most important thing to provide to homeless persons is a programme that can help them to get internet service. Telco needs to identify homeless persons who are experiencing financial difficulties and be aware of the special needs of homeless persons to maintain continuity of service in accessing the internet and paying bills. Telco could introduce new assistance and subsidy programmes to support access to mobile and data services (e.g. mobile phones, credit recharges, discount options and Wi-Fi access). Telco needs to consider how these programmes can be provided and function effectively across all mobile service providers.
Internet Service Providers / Telco to Initiate Assistance and Subsidy ProgrammeA
Telco can work with housing providers, local councils and users of these services to develop and promote affordable internet access and provide solutions that enable homeless persons to use digital technology. Communication technology companies are recommended to provide more homeless-friendly technology tools and applications. It is to help them meet the challenges of these groups instead of using technology in their daily lives. It needs to be simpler, easier and more compact for the group to use, whether it suits the physical or mental condition of a homeless person.
Telco to Collaborate with Housing Providers, Local Councils and Service UsersB
MOH needs to organise health awareness campaigns and encourage the download of health applications. Through the provision of this support assistance application, MOH will then be able to obtain their full health information. Because the internet offers good looks and accessible information, these homeless persons are able to go online to avoid this problem. The majority of homeless persons have mobile phones and use them to access the internet. At the same time, the application becomes a key tool to help channel health information to these persons.
Ministry of Health (MOH) to Work on Developing User-Friendly ApplicationsC
Both the Social Welfare Department and Kuala Lumpur City Hall can start thinking of methods in enabling the provision of internet hotspots that can help homeless persons to gain access to the internet. In addition, various jointly programmes can also be initiated to increase the productivity of homeless persons.
Social Welfare Department and Kuala Lumpur City Hall to Work on Placing Internet
Hotspot in Several Places Around Kuala LumpurD
The researcher suggested MCMC to start making statistics that can form and collect information on internet users among homeless persons. This would enable MCMC to identify consumerism trends among homeless persons.
Malaysian Communications and Multimedia Commission (MCMC) to Make Statistics
of Internet Users Among the HomelessE
For telco agencies who are starting or in the process of renewing and updating their services, these
findings show the potential to use online and mobile platforms to deliver services to customers from the
homeless community. Many in this group are not lagging behind in technology although it is true that their
circumstances have caused them to not being able to access these technologies. A simple example can be
demonstrated when researchers found that it is common for homeless persons to own a mobile phone but
gaining access to the internet still remains a difficulty. Moreover, in this population, there are a large number
of persons who are most likely to experience serious difficulties with the costs and conditions to subscribe
to a postpaid plan.

69Media Matters Report 2021
In conclusion, the researcher would like to emphasise that this model of mobile phone usage and accessibility patterns is able to provide
an overview of the use of access, type of ownership and mobile phone use activities among homeless persons. The results found that
these homeless persons use fewer mobile phones to seek treatment and to obtain health information. There are other functions and
activities which have been used by these homeless persons when using the phone. This situation requires MCMC to work with the
MOH in ensuring access to treatment is accepted and used by homeless persons over the phone. As a further step, the need to identify
appropriate applications or awareness programs in promoting access to treatment through homeless persons needs to be mobilised.
CONCLUSION
• Alhabshi, S.M. & Manan, A.K.A. (2012_. Homelessness in Kuala Lumpur, Malaysia: A Case of Agenda Denial. International Journal of Social Science Tomorrow 1(2) 1-9.
• Eyrich-Garg, K.M. (2010). Mobile phone technology: A new paradigm for the prevention, treatment, and research of the non-sheltered “Street” Homeless?’ Journal of Urban Health: Bulletin of the New York Academy of Medicine 87(3): 365–380. doi:10.1007/s11524-010-9456-2
• Guadagno, R., Muscanell, N. & Pollio, D. (2013). The homeless use Facebook?! Similarities of social network use between college students and homeless young adults. Computers in Human Behavior 29(1): 86–89. DOI: 10.1016/j.chb.2012.07.019
• Idris, M.A.H. & Ramli, M.A. (2017). Golongan gelandangan di Malaysia: Antara perluasan tafsiran Asnaf Ibnu Al-Sabil dan Al-Riqab. Dlm Najahurin Lateh, Muhamad Rahimi Osman & Ghafarullahhuddin Din. Isu-Isu Kotemperorari dalam Zakat, Wakaf dan Filantropi Islam. Shah Alam: Akademik Pengajian Islam Kotemporari.
• McInnes, D. K., Li, A. E. & Hogan, T.P. (2013). Opportunities for engaging low-income, vulnerable populations in health care: A systematic review of homeless persons’ access to and use of information technologies. American Journal of Public Health 103(S2): e11–e24. doi: 10.2105/AJPH.2013.301623.
• McInnes, D. K., Sawh, L., Petrakis, B. A., Rao, S. R., Shimada, S. L., Eyrich-Garg, K. M., Gifford, A.L., Anaya, H.D. & Smelson, D.A. (2014). The potential for health-related uses of mobile phones and internet with homeless veterans: Results from a multisite survey. Telemedicine and e-Health 20(9): 801–809. doi: 10.1089/tmj.2013.0329.
• Mohamad, M.S., Ismail, K., Subhi, N. & Omar, N.H. (2016). Hubungan di antara kesihatan mental dengan minat kerjaya dalam kalangan gelandangan di Kem Desa Bina Diri, Malaysia. Akademika 86(1): 11-19. http://dx.doi.org/10.17576/akad-2016-8601-02
• Newman, L. A., Biedrzycki, K. & Baum, F. (2012). ‘Digital technology use among disadvantaged Australians: implications for equitable consumer participation in digitally-mediated communication and information exchange with health services’, Australian Health Review, vol. 36, no. 2, pp. 125-129
• Pollio, D., Batey, D., Bender, K., Ferguson, K. & Thompson, S. 2013. Technology use among emerging adult homeless in two U.S. cities. Social Work 58: 173–175. DOI:10.1093/sw/swt006
• Prison Fellowship (2017). Needs of ex prisoner. https://www.prisonfellowship.org/wp-content/uploads/2017/09/Needs-of-Ex-Prisoners-2017.pdf
• Ramli, M.W. & Dawood, S.R.S 2017. Memahami permasalahan golongan terpinggir di bandar: Kajian kes gelandangan di George Town, Pulau Pinang. Geografi 5(2): 78-94.
• Rice, E., Lee, A. & Taitt, S. (2011). Cell phone use among homeless youth: Potential for new health interventions and research. Journal of Urban Health 88(6): 1175– 1182. doi:10.1007/s11524-011-9624-z
• Rice, E., Kurzban, S. & Ray, D. (2012). Homeless but connected: The role of heterogeneous social network ties and social networking technology in the mental health outcomes of street-living adolescents. Community Mental Health Journal 48(6): 692–698. doi:10.1007/s10597-011-9462-1
• Rice, E., Milburn, N. & Monro, W. (2011). Social networking technology, social network composition, and reductions in substance use in homeless adolescents. Preventative Science 12(1): 80–88. doi: 10.1007/s11121-010-0191-4.
• Rice, E., Munro, W., Barman-Adhikari, A., & Young, S. (2010). Internet use, social networking, and HIV/AIDS risk for homeless adolescents. Journal of Adolescent Health 47(6): 610–613. doi: 10.1016/j.jadohealth.2010.04.016.
• Sala, A. & Mignone, J. (2014). The benefits of information communication technology use by the homeless: a narrative synthesis review. Journal of Social Distress and the Homeless, 23(1): 51-67.
• SKMM (2014). Kajian Pengguna Telefon Bimbit 2014 https://www.SKMM.gov.my/ms/media/announcements/hand-phone-users-survey-2014
REFERENCES

INTERNATIONAL ISLAMIC UNIVERSITY MALAYSIA
SHAFIZAN MOHAMED, SAODAH WOK, NUR SHAKIRA MOHD NASIR AND WAN NORSHIRA WAN MOHD GHAZALI
B40 Income Earners’ Digital Literacy:
A Focus on Children at Projek Perumahan Rakyat (PPR)
70 Media Matters Report 2021

71Media Matters Report 2021
ABSTRACT
Children are frequently denied positive and useful digital media
experiences and skills due to poverty. Therefore, these children
are unable to recognise the potential of digital technologies. In
particular, children of B40 income earners who live in Projek
Perumahan Rakyat (PPR) represent a part of Malaysian society
who may be affected by this lack of access. This study first
evaluated the children’s present level of digital media use and
digital literacy abilities in order to recommend methods that can
aid them. The study was conducted through a phone survey
investigation on 308 children residing at PPRs and found that the
children had limited access to digital devices. Although they had
the basic ability to operate and manage digital devices, they were
not technically able to optimise the consumption and creation
of digital media. Thus, the study recommends for policymakers
and stakeholders to capitalise on existing digital programmes
by focusing on child-specific efforts with an emphasis on digital
parenting.
Keywords: B40, children, DigComp, digital literacy, Projek Perumahan Rakyat (PPR)
Poverty often deprives children from having positive and productive digital media experiences and skills. These children usually lack
access to digital media and are unable to grasp the potential that comes with digital technologies. In current times, digital literacy and
skills are prerequisites to successfully participating in education, industry, and the digital economy, especially with the advent of 4IR.
The pandemic highlighted the importance of digital literacy and it is clear that these children cannot afford to be left behind. Therefore,
this study proposes that by investigating how the B40/PPR children currently access and use the media, relevant digital measures, tools
and initiatives can be developed to help these children break away from the vicious poverty cycle that often shackle their potential to
become successful citizens. To do this, the study asks:
INTRODUCTION
What is the level of digital media adoption and its use among children of the PPR?1 What are the areas of digital media literacy and skills most
required by children of the PPR?2
Children who are digitally literate and have better access to
digital media are able to function more productively in society.
For example, the political world is a reality that most children are
detached from, yet are directly influenced by. They are expected
to then become politically involved citizens as they grow. With
the aid of digital media, children learn to identify their own as well
as other countries’ political leaders; listen as these leaders give
political speeches or argue before their governing bodies; follow
demonstrations; and recognize major issues surrounding political
agendas present in their nation.
The media is crucial in the process of children’s emerging
understanding of reality (Babboo, 2013; Lemish, 2015).
LITERATURE REVIEW
Contemporary digital media affords the ability for children to not
only receive news and information but also create and produce
their own content (Wok & Mohamed, 2017)
Therefore, children need access to the digitally mediated public
domain of media news and current events – both as an audience
whose needs, skills, and interests are taken into consideration
and as participants whose opinions and concerns are being
voiced. As such, digital media literacy through which children will
be able to optimize the affordances of the media is an important
skill that needs to be imparted (Livingstone, 2011).
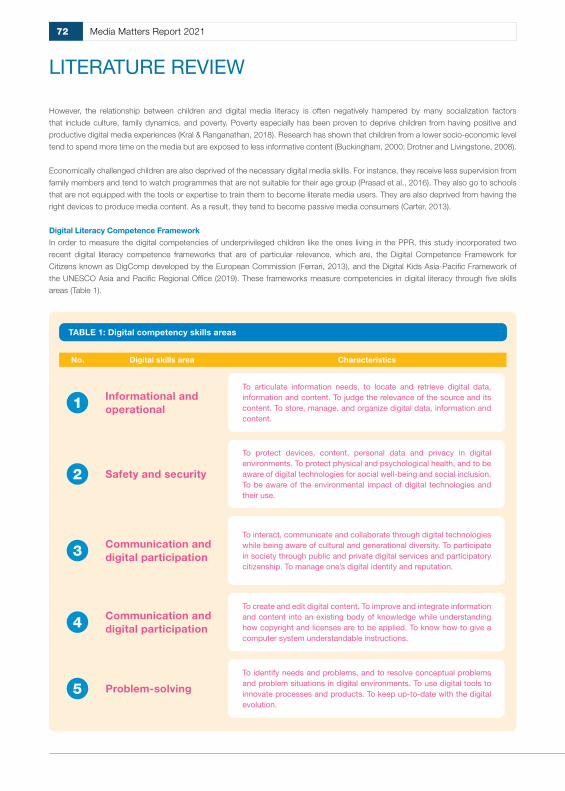
72 Media Matters Report 2021
LITERATURE REVIEW
However, the relationship between children and digital media literacy is often negatively hampered by many socialization factors
that include culture, family dynamics, and poverty. Poverty especially has been proven to deprive children from having positive and
productive digital media experiences (Kral & Ranganathan, 2018). Research has shown that children from a lower socio-economic level
tend to spend more time on the media but are exposed to less informative content (Buckingham, 2000; Drotner and Livingstone, 2008).
Economically challenged children are also deprived of the necessary digital media skills. For instance, they receive less supervision from
family members and tend to watch programmes that are not suitable for their age group (Prasad et al., 2016). They also go to schools
that are not equipped with the tools or expertise to train them to become literate media users. They are also deprived from having the
right devices to produce media content. As a result, they tend to become passive media consumers (Carter, 2013).
Digital Literacy Competence Framework
In order to measure the digital competencies of underprivileged children like the ones living in the PPR, this study incorporated two
recent digital literacy competence frameworks that are of particular relevance, which are, the Digital Competence Framework for
Citizens known as DigComp developed by the European Commission (Ferrari, 2013), and the Digital Kids Asia-Pacific Framework of
the UNESCO Asia and Pacific Regional Office (2019). These frameworks measure competencies in digital literacy through five skills
areas (Table 1).
TABLE 1: Digital competency skills areas
Informational and operational
To articulate information needs, to locate and retrieve digital data, information and content. To judge the relevance of the source and its content. To store, manage, and organize digital data, information and content.
1
Communication and digital participation
To interact, communicate and collaborate through digital technologies while being aware of cultural and generational diversity. To participate in society through public and private digital services and participatory citizenship. To manage one’s digital identity and reputation.
3
Safety and security
To protect devices, content, personal data and privacy in digital environments. To protect physical and psychological health, and to be aware of digital technologies for social well-being and social inclusion. To be aware of the environmental impact of digital technologies and their use.
2
Communication and digital participation
To create and edit digital content. To improve and integrate information and content into an existing body of knowledge while understanding how copyright and licenses are to be applied. To know how to give a computer system understandable instructions.
4
Problem-solving
To identify needs and problems, and to resolve conceptual problems and problem situations in digital environments. To use digital tools to innovate processes and products. To keep up-to-date with the digital evolution.
5
No. Digital skills area Characteristics
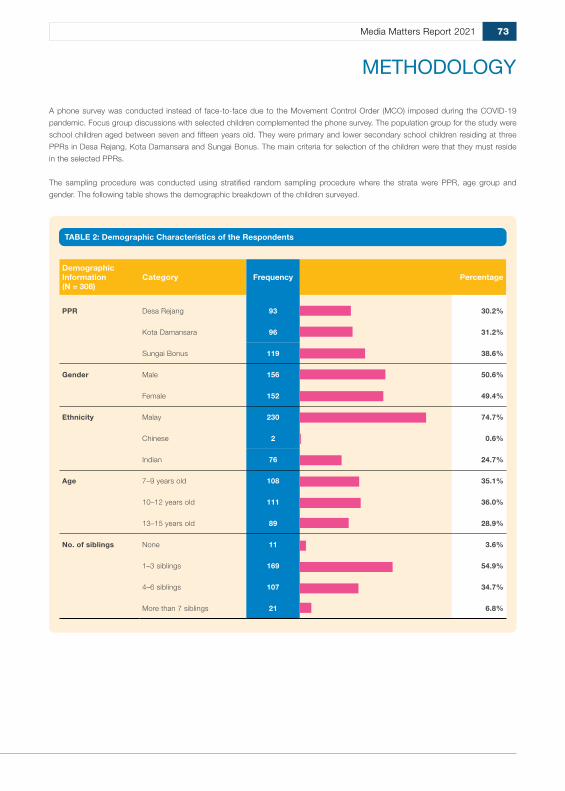
73Media Matters Report 2021
A phone survey was conducted instead of face-to-face due to the Movement Control Order (MCO) imposed during the COVID-19
pandemic. Focus group discussions with selected children complemented the phone survey. The population group for the study were
school children aged between seven and fifteen years old. They were primary and lower secondary school children residing at three
PPRs in Desa Rejang, Kota Damansara and Sungai Bonus. The main criteria for selection of the children were that they must reside
in the selected PPRs.
The sampling procedure was conducted using stratified random sampling procedure where the strata were PPR, age group and
gender. The following table shows the demographic breakdown of the children surveyed.
METHODOLOGY
TABLE 2: Demographic Characteristics of the Respondents
Demographic Information (N = 308)
Category Frequency Percentage
PPR Desa Rejang 93 30.2%
Kota Damansara 96 31.2%
Sungai Bonus 119 38.6%
Gender Male 156 50.6%
Female 152 49.4%
Ethnicity Malay 230 74.7%
Chinese 2 0.6%
Indian 76 24.7%
Age 7–9 years old 108 35.1%
10–12 years old 111 36.0%
13–15 years old 89 28.9%
No. of siblings None 11 3.6%
1–3 siblings 169 54.9%
4–6 siblings 107 34.7%
More than 7 siblings 21 6.8%

74 Media Matters Report 2021
FINDINGS AND ANALYSIS
To answer the first research question that asked about the children’s digital media adoption and use, the study measured the following
components:
The following tables present the results.
Types of Digital Devices and Facilities at Home
Table 3 presents the types of media and digital devices facilities available at the children’s homes. This is to assess the percentage of
media and digital penetration in the children’s everyday lives.
This study discovered that almost all of the children (94.8%) have televisions at home while the majority of them (88.3%) have smartphones. About two-thirds of them (66.2%) do have internet and 68.2 percent of them subscribe to TV ASTRO and Unifi.
Other digital devices and digital facilities are considered under-represented. Almost all of the children (98.4%) do not have console games (PS/Wii) and 94.8 percent of them do not have access to streaming services (Netflix/Viu/AppleTV/Dimsum). The majority of them do not have a computer/laptop (82.8%) and Tablet/iPad (89.6%). In addition, more than three-quarters of them (77.5%) do not have a radio.
TABLE 3: Types of Digital Devices and Digital Facilities at Home
No. Type of Device/Digital Facility (N = 308) Yes (%) No (%)
1. Computer/Laptop 53 (17.2%) 255 (82.8%)
2. Tablet/ iPad 32 (10.4%) 276 (89.6%)
3. Smartphone 272 (88.3%) 36 (11.7%)
4. Internet facilities (wifi/mobile) 204 (66.2%) 104 (33.8%)
5. Radio 69 (22.5%) 239 (77.5%)
6. Television 292 (94.8%) 16 (5.2%)
7. TV subscription (ASTRO, Unifi) 210 (68.2%) 98 (31.8%)
8. Game console (PS/Wii) 5 (1.6%) 303 (98.4%)
9. Streaming services (Netflix/Viu/Apple TV/Dimsum)
16 (5.2%) 292 (94.8%)
Research Question 1:What is the Level of Digital Media Adoption and Its Use among Children of PPR?
1 4
2 3
The types of digital devices and digital facilities
the children had at homeThe social media which they often used
Media platform that the children often usedThe topics which the children usually explored
while surfing when using digital media

75Media Matters Report 2021
Media Usage
Table 4 lists the types of media usage the children often engage in. This is to understand the type of media activities the children often
engage in.
The findings demonstrate that the majority of the children (89.3%) spent their time watching television and also attended online learning/
online classes (88.3%). Many of them spent their time watching YouTube (77.6%), playing games (64.0%), and reading books (61.0%).
On the other hand, the majority of the children did not listen to the radio (85.4%). Almost two-thirds of them (65.9%) did not use social
media. More than half of the children (57.1%) did not text/chat and they also did not surf the internet (55.5%).
Topics Surfed When Using Digital Media
Table 5 as follows describes what the children often search for when using digital media. This is to understand the children’s interest
and the type of information they extract from the internet.
TABLE 4: Media Usage at Home
No. Media Usage Yes (%) No (%)
1. Listen to the radio 45 (14.6%) 263 (85.4%)
2. Watch television 275 (89.3%) 33 (10.7%)
3. Watch YouTube 239 (77.6%) 69 (22.4%)
4. Play games 197 (64.0%) 111 (36.0%)
5. Read books 188 (61.0%) 120 (39.0%)
6. Text/chat 132 (42.9%) 176 (57.1%)
7. Surf the internet 137 (44.5%) 171 (55.5%)
8. Use social media 105 (34.1%) 203 (65.9%)
9. Attend online learning/online classes 272 (88.3%) 36 (11.7%)
TABLE 5: Topics Surfed When Using Digital Media
No. Topics Surfed when Using Digital Media Yes (%) No (%)
1. School subjects 216 (70.1%) 92 (29.9%)
2. Music and songs 137 (44.5%) 171 (55.5%)
3. Drama and film 143 (46.4%) 165 (53.6%)
4. Religion 91 (29.5%) 217 (70.5%)
5. Fashion 29 (9.4%) 279 (90.6%)
6. Food 100 (32.5%) 208 (67.5%)
7. Holiday and vacation 68 (22.1%) 240 (77.9%)
8. Current news 107 (34.7%) 201 (65.3%)
9. Games 144 (48.8%) 164 (53.2%)
FINDINGS AND ANALYSIS

76 Media Matters Report 2021
FINDINGS AND ANALYSIS
It was found that seven in ten of the children used digital media for surfing school subjects (70.1%). The second most surfed topic was
games (48.8%). On the hand, there were many topics that they did not surf when using digital media. Almost all of the children did
not search for sites on fashion (90.6%). More than three-quarters of them did not surf the internet for holiday and vacation information
(77.9%) and seven in ten of them (70.5%) did not even search for information on religion. About two-thirds of them (67.5%) did not
search for information on food and current news (65.3%). More than half of them (55.5%) did not surf the internet for music and songs
while 53.6 percent did not search for sites on dramas and films.
The table shows that the majority of the children did not subscribe to social media. The only two most popular social media platforms
among the children were WhatsApp (47.4%) and YouTube (44.2%). All of them did not subscribe to Tumblr (100.0%). Almost all of
them did not subscribe to WeChat (99.0%) and Twitter (97.4%). A majority of them did not subscribe to Telegram (87.7%) and TikTok
(85.7%). Many did not subscribe to Facebook (79.9%) and Instagram (70.1%). More than half of the children did not subscribe to
YouTube channel (55.8%) and WhatsApp (52.6%).
Social Media Accounts Subscribed
Table 6 below lists the social media accounts subscribed by the children. This is to identify the types of social media accounts most
popular among the children.
TABLE 6: Social Media Accounts Subscribed
No. Social Media Account Yes (%) No (%)
1. Facebook 62 (20.1%) 246 (79.9%)
2. WhatsApp 146 (47.4%) 162 (52.6%)
3. Instagram 92 (29.9%) 216 (70.1%)
4. Twitter 8 (2.6%) 300 (97.4%)
5. TikTok 44 (14.3%) 264 (85.7%)
6. Tumblr 0 (0%) 308 (100.0%)
7. WeChat 3 (1.0%) 305 (99.0%)
8. Telegram 38 (12.3%) 270 (87.7%)
9. YouTube channel 136 (44.2%) 172 (55.8%)

77Media Matters Report 2021
FINDINGS AND ANALYSIS
Informational and Operational Skills
Informational and operational skills revolve around the children’s ability to search, manage and store data and information for effective
use. The following table lists the children’s aptness in certain behaviour that relate to these skills.
To answer this question, the study used a digital literacy framework identified from the literature review. The framework focused on five
domains of literacy skills that include:
TABLE 7: Informational and Operational Skills
No. Informational and Operational Skills Yes (%) No (%)
1. I know how to use digital devices like smartphones, iPad and laptops.
263 (85.4%) 45 (14.6%)
2. I know how to surf the internet using impact changers (browsers) and search engines like Safari, Chrome, Google, Yahoo, etc.
188 (61.0%) 120 (39.0%)
3. I use computer software (e.g., Microsoft Word, Microsoft PowerPoint, Google Docs) to complete my school assignments.
54 (17.5%) 254 (82.5%)
4. I know how to download applications and software through sources such as Google, Playstore and Apple Appstore (e.g., game apps).
249 (80.8%) 59 (19.2%)
5. I know how to upload and share files and images.
129 (41.9%) 179 (58.1%)
6. I know how to keep important information in specific folders.
62 (20.1%) 246 (79.9%)
7. I know how to register my profile to use the internet facilities (e.g. social media platforms, email account).
83 (26.9%) 225 (73.1%)
8. I know which information that I can and cannot share on the internet.
168 (54.5%) 140 (45.5%)
9. I know how to change my password. 122 (39.6%) 186 (60.4%)
Research Question 2:What are the Areas of Digital Media Literacy and Skills Most Required by Children of the PPR?
1 5
4
3
Informational and operational skills Problem-solving skills
Content creation and digital participation
Communication skills and digital involvement
2Safety and security skills

78 Media Matters Report 2021
FINDINGS AND ANALYSIS
Table 7 shows that the majority of the children (85.4%) claimed that they knew how to use digital devices and how to download
applications and software through sources (80.8%). More than half of the children indicated that they knew how to surf the internet
using impact changers (browsers) and search engines (61.0%) and that they knew which information they could and could not share
on the internet (54.5%).
However, there are some informational and operational skills that the children have yet to acquire. The majority of the children (82.5%)
claimed that they did not use computer software to complete learning assignments at school. About three-quarters of them (79.9%)
indicated that they did not know how to keep important information in specific folders and that they did not know how to register
their profiles on the internet facilities (73.1%). More than half of the children (60.4%) said that they did not know how to change their
password and how to upload and share files and images (58.1%).
Safety and Security Skills
Safety and security skills involve the children’s capacity to protect information and personal data. It also involves the children’s ability to
recognise digital identity, measures of safety, responsibility and safe use.
As shown in table 8, the majority of the children (88.0%) claimed that they would report to their parents or the authorities if they were
threatened on the internet. More than three-quarters of the children (77.3%) indicated that they would not cheat or post dangerous
comments on social media as it was against cyber laws. More than half of the children (60.1%) admitted that they would not click on
links that looked strange or suspicious.
TABLE 8: Safety and Security Skills
No. Safety and Security Digital Skills Yes (%) No (%)
1. I will not click or press on links that look strange or suspicious.
185 (60.1%) 123 (39.9%)
2. I know how to download anti-virus tools. 46 (14.9%) 262 (85.1%)
3. I always share my personal information with other people online. (I)
23 (7.5%) 285 (92.5%)
4. I will download anything that I like because everything on the internet is free. (I)
101 (32.8%) 207 (67.2%)
5. I know how to use privacy settings to maintain personal safety / stay away from unwanted acquaintances (e.g., text spam, e-mail).
95 (30.8%) 213 (69.2%)
6. I will answer messages from strangers. (I) 36 (11.7%) 272 (88.3%)
7. I will report to my parents / the authorities if I am threatened on the internet.
271 (88.0%) 37 (12.0%)
8. I know how to protect myself from cyber bullying.
104 (33.8%) 204 (66.2%)
9. I will let my friends be bullied on the internet because there is nothing that can be done. (I)
90 (29.2%) 218 (70.8%)
10. I know what cybercrime is. 134 (43.5%) 174 (56.5%)
11. I will not cheat or post dangerous comments on social media because it is against the rules and regulations (cyber laws).
238 (77.3%) 70 (22.7%)
*(I) Inverse item

79Media Matters Report 2021
FINDINGS AND ANALYSIS
As for the four inverse statements, the results showed the affirmative when the children indicated that they did not agree with the
statements. In sum: (a) they did not always share their information with other people (92.5%); they would not download anything that
they liked just because everything on the internet is free (67.2%); they would not answer messages from strangers (88.3%); and they
would not allow their friends to be bullied on the internet as nothing can be done (70.8%). Even though there was a tendency to agree
with the statements mentioned, the children gave inverse responses. However, two positive statements were answered in the negative:
(a) “I know how to protect myself from cyber bullying” (66.2%) and (b) “I know what cybercrime is” (56.5%). Therefore, some degree of
exposure and learning should be instilled among the children so that they would know how to protect themselves against cyber bullying
and that they know the meaning of cybercrime and how to avoid being its victim.
Communication Skills and Digital Participation
Communication Skills and Digital Participation revolve around the children’s ability to communicate in digital environments, share
resources through network tools, connect with others and collaborate through digital tools and interact and participate in online
communities.
The findings show that the majority of the children (85.7%) claimed that they understood that they had to show respect to other people
on the internet. More than three-quarters of the children (79.2%) indicated that even though they did not agree with someone on the
internet, they would restrain themselves from using a negative tone and 76.9 percent of them indicated that they had no problem
interacting with people of different backgrounds/nationalities/religions/cultures. In addition, 72.1 percent of the children said that they
would not share pictures or information about other people without their permission.
TABLE 9: Communication Skills and Digital Participation
No. Communication Skills and Digital Participation
Yes (%) No (%)
1. I like to share my interests and knowledge with friends on the internet.
97 (31.5%) 211 (68.5%)
2. I make new friends online. 60 (19.5%) 248 (80.5%)
3. Even though I do not agree with someone on the internet, I will restrain myself from using a negative tone.
244 (79.2%) 64 (20.8%)
4. I will not share pictures or information about other people without their permission.
222 (72.1%) 86 (27.9%)
5. I used to quarrel with my friends on the internet. (I)
42 (13.6%) 266 (86.4%)
6. I used to have an argument with an unknown person on the internet. (I)
13 (4.2%) 295 (95.8%)
7. I will definitely be punished or caught if I make a mistake on the internet.
182 (59.1%) 126 (40.9%)
8. I have no problem interacting with people of different backgrounds / nationalities / religions / cultures.
237 (76.9%) 71 (23.1%)
9. I understand that I have to show respect to other people on the internet.
264 (85.7%) 44 (14.3%)
10. I have pretended to be someone else when using the internet /social media. (I)
12 (3.9%) 296 (96.1%)
*(I) Inverse item

80 Media Matters Report 2021
More than half of the children (59.1%) indicated that they would definitely be punished or caught if they made a mistake on the internet.
Out of the ten statements on communication skills and digital participation, three statements were inversely stated. They are statements
5, 6 and 10. For the three inverse statements, it can be implied that they do not quarrel with their friends on the internet (86.4%); they
do not have an argument with an unknown person on the internet (95.8%); and they do not pretend to be someone else when using
the internet/social media (96.1%). However, there are two positive statements that had low results. They are “I like to share my interests
and knowledge with friends on the internet” (31.5%) and “I make new friends online” (19.5%).
Content Creation and Digital Innovation
Content creation and digital innovation covers the children’s capacity to create and edit new digital content, integrate and re-elaborate
previous knowledge and content. It also includes their ability to create artistic productions and multimedia content, utilise computer
programming, and apply intellectual property rights and licenses for use.
FINDINGS AND ANALYSIS
No. Content Creation and Digital Innovation Yes (%) No (%)
1. I can make knowledge representation (e.g., mind mapping, images) using digital media.
75 (24.4%) 233 (75.6%)
2. I can change the wallpaper of a digital device to make it more attractive.
154 (50.0%) 154 (50.0%)
3. I know how to edit audio and sounds. 67 (21.8%) 241 (78.2%)
4. I know how to produce YouTube / TikTok videos.
97 (31.5%) 211 (68.5%)
5. I know how to combine images with text and audio.
94 (30.5%) 214 (69.5%)
6. I can produce graphic art such as posters, cards, banners / memes, etc. using applications on the internet.
62 (20.1%) 246 (79.9%)
7. I know how to programme digital devices (software / application).
16 (5.2%) 292 (94.8%)
8. I know about copyright and licensing rules. 28 (9.1%) 280 (90.9%)
9. I have sold stuff on the internet. 14 (4.5%) 294 (95.5%)
10. I know how to share my work on a suitable virtual platform.
72 (23.4%) 238 (76.6%)
TABLE 10: Content Creation and Digital Innovation
Table 10 lists ten skills that the children may possess. However, the results indicated that they had very poor ability in content creation.
The most they could do was change the wallpaper on the digital screens (50%). Some children had the ability to produce social media
content on sites such as YouTube and TikTok (31.5%).
The children scored low in other content creation and digital innovation skills such as combining images with text and audio (30.5%),
making knowledge representation (24.4%), sharing work on virtual platforms (23.4%), editing audio and sounds (21.8%), and,
producing graphic art (20.1%). The children were rather clueless about copyright and licensing rules (9.1%). They did not know how to
programme digital devices (5.2%) and sell stuff online (4.5%)

81Media Matters Report 2021
Problem-Solving Skills
Problem-solving skills are the high-end skills that measure whether the children can make informed decisions about the most
appropriate digital tool(s) according to purpose or need, solve conceptual problems through digital media, use technologies in a
creative way and solve technical problems.
The finding shows that there were mixed findings with regard to this issue. The problem-solving skills which were acquired by the
children include: information checking (62.3%), using suitable technology and programmes (70.3%), controlling amount of usage
(57.8%), controlling price of usage (63.6%), and identifying age-appropriate information (53.2%). Other problem-solving skills that
the children scored low include optimising online information (29.5%), solving technical problems (29.5%), learning new technology
(41.9%), assisting other people in digital use (40.6%) and performing online commerce (19.2%).
FINDINGS AND ANALYSIS
No. Problem-Solving Skills Yes (%) No (%)
1. If I need information about something I will look for it, straight away on the internet.
91 (29.5%) 217 (70.5%)
2. I will make sure that the information I receive is true and valid before sharing it on the internet.
192 (62.3%) 116 (37.7%)
3. I can solve technical problems or make a decision on the action to be taken to solve a problem.
91 (29.5%) 217 (70.5%)
4. I learned to use new technology by trying it myself.
129 (41.9%) 179 (58.1%)
5. I used to help my family or friends who didn't know how to use digital media.
125 (40.6%) 185 (59.4%)
6. I can use suitable technology and programmes to complete my school assignments.
218 (70.3%) 90 (29.2%)
7. I control the use of digital media and the internet because I know they may affect my mental and physical health.
178 (57.8%) 130 (42.2%)
8. I have bought goods / services on online. 59 (19.2%) 249 (80.8%)
9. I can control the use of the internet because I know it is pricey.
196 (63.6%) 112 (36.4%)
10. I know the appropriate information for my age.
164 (53.2%) 144 (46.8%)
TABLE 11: Problem-Solving Skills

82 Media Matters Report 2021
FINDINGS AND ANALYSIS
Digital Literacy Domains Most Required
The children were categorised into three age groups in order to identify differences in their adoption of digital skills across the different
ages. The study found that in sum, all the children had poor to average digital competencies. However, as expected the younger
children scored lower in all skills when compared to the older children.
TABLE 12: ANOVA Comparisons of Digital Literacy Skills Across Age Groups
Variable Age (years old) N Mean SD F P
Sum b4ca:
Informational and
operational skills
7–9 108 2.824 1.854 59.047 .000
10–12 111 4.414 2.087
13–15 89 5.876 1.953
Total 308 4.279 2.311
Sum b4cb:
Safety and security
digital skills
7–9 108 6.083 1.757 12.918 .000
10–12 111 6.703 1.682
13–15 89 7.3483 1.791
Total 308 6.672 1.807
Sum b4cc:
Communication skills
& digital participation
7–9 108 6.306 1.826 17.556 .000
10–12 111 7.108 1.702
13–15 89 7.787 1.735
Total 308 7.023 1.848
Sum b4d:
Content creation and
digital innovation
7–9 108 .898 1.540 40.251 .000
10–12 111 2.423 2.279
13–15 89 3.517 2.321
Total 308 2.205 2.313
Sum b4e:
Problem-solving skills
7–9 108 3.241 2.135 51.466 .000
10–12 111 4.739 2.319
13–15 89 6.371 1.962
Total 308 4.685 2.485

83Media Matters Report 2021
FINDINGS AND ANALYSIS
FIGURE 1: Mean of Digital Literacy Skills Across Age Groups
10 - 12 years 13 - 15 years7 - 9 years
80
70
30
50
10
60
20
40
0
Information and operational skills
Problem solving skills
Content creation and digital innovation
Communication skills and digital
participation
Safety and security skills
When averaged out from a scale of 1–10, it was found that the children had mostly below to slightly above average adoption of the
skills measured. The two skills domains that scored higher than average were communication skills and digital participation (M=7.023),
followed by informational and operational skills (M=6.672). The three other domains saw below average scores and they included
problem-solving skills (M=4.685), and informational and operational skills (M=4.279). The children scored lowest in content creation
and digital innovation (M=2.205).
This indicated that the children needed significant support in order to become digitally literate and competent. The children scored high
in communication skills because they had translated mostly every day offline, real world ethics and rules such as respect and privacy
in their online interactions. However, whether they can technically translate this to their digital practice is yet to be seen. In addition, the
ANOVA test conducted showed that there was a significant difference in the children’s level of digital literacy skills across different age
groups. The older children aged 13–15 years old scored better in all categories when compared to the younger children.

84 Media Matters Report 2021
FINDINGS AND ANALYSIS
The study found that there is a systematic relationship between age and the adoption of digital skills. The older the children, the more
digitally skilled they become. This finding is supported by the natural tendencies of increased knowledge and skills that come together
with age and experience. Nevertheless, the difference in age did not contribute to an increase in the overall scores. This meant that
ultimately all the children, regardless of age did not perform well on all the skills measured. The low scores especially for content creation
and digital innovation signals a need for more initiatives to be undertaken to ensure that the children can become active digital citizens.
The analysis in the previous section presents us with a picture of the state of digital literacy among the children living at the PPR.
Accordingly, one of the important issues in strengthening digital literacy for these children is to have appropriate measures and policies.
As such, this study recommends that policymakers and other relevant parties:
Leverage on existing community
programmes with basic introduction to
digital literacy
Any existing campaigns or programmes
that focus on digital penetration should
be equipped with simple modules and
guidelines such as simple brochures
and attractive videos to help the children
understand that there is a set of requirements
that come with the devices.
1
Enhance children-focused
programmes
Children-focused programmes must adopt
special methods that can cater to the
children’s ability to conceptualise the notion
of digital literacy. Apart from programmes
that relate digital technologies to Science
Technology, Engineering and Mathematics
(STEM), there could be more creative
partnerships with the arts and gaming
communities to inform the children about
the infinite possibilities of digital media and
opportunities for all kinds of interests.
2
Highlight the importance of digital parenting
More awareness raising and advocacy initiatives must be initiated
to highlight the importance of digital parenting. While parents
have the best opportunity to nurture digitally resilient children, not
all parents have the ability to do so. Unfortunately, parents have
very few places to turn to for advice on digital parenting. Digital
safety campaigns and digital parenting modules are often focused
on reducing exposure to harmful material and restricting children’s
access. This mostly tells parents that the best way to digitally parent
is to restrict and control. The inability to recognise that parents have
unique experiences leads to the failure of providing them with the
right digital parenting skills. Real parents are likely to find it difficult
to locate, evaluate and select resources and guidance appropriate
for their children and their family’s circumstances.
3
Conduct studies to gather more disaggregated data on
children and parents
Disaggregated studies should be able to unravel more in-depth
information about the digital experiences of specific groups of
children based on gender, age, culture, economic background, etc.
In addition, the research would like to recommend that research on
digital parenting focused on parents’ readiness and competencies
are vital to attain a more holistic understanding of how children’s
digital media experience is shaped at home.
4

85Media Matters Report 2021
CONCLUSION
The children at the PPR, like most children today, are gradually going digital by default since they are easily exposed to the digital world
despite scarce resources and devices. However, as this study has discovered, the children have low levels of digital literacy, particularly
in terms of content creation and digital problem-solving. Consequently, they are ill-equipped to participate in a digital world brimming
with opportunities. Hence it is critical that the children be equipped with the necessary skills to navigate the digital world, securely
and successfully. Furthermore, as children’s digital experiences begin at home, parents should monitor their children’s digital usage to
ensure they are capturing the many positive opportunities present in the digital space. Even so, the majority of parents are still struggling
to understand the pervasiveness of the digital revolution and how it is affecting their personal lives. Therefore, digital literacy training for
children should be supplemented with digital parenting programmes.
REFERENCES
• Baboo, S. B. (2013). Media literacy in the lifeworlds of Malaysian children. Global Studies of Childhood, 3(1), 72–85.
• Buckingham, D. (2000). The making of citizens: Young people, news and politics.
• Carter, C. (2013). Children and the news: Rethinking citizenship in the twenty-first century. In D. Lemish (Ed.), The Routledge international handbook of children, adolescents and media (pp. 255–262). Routledge.
• Drotner, K., & Livingstone, S. (Eds.). (2008). The international handbook of children, media and culture. Sage.
• Ferrari, A. (2013). DIGCOMP: A framework for developing and understanding digital competence in Europe. Report EUR 26035 EN. European Commission, Joint Research Centre, Institute for Prospective Technological Studies.
• Kral, I., & Renganathan, S. (2018). Beyond school: Digital cultural practice as a catalyst for language and literacy. In Language Practices of Indigenous Children and Youth (pp. 365-386). Palgrave Macmillan.
• Lemish, D. (2015). Children and media: A global perspective. John Wiley & Sons.
• Livingstone, S. (2010). Digital learning and participation among youth: Critical reflections on future research priorities. International Journal of Learning and Media, 2(2– 3), 1–13
• Prasad, N. V., Balraj, S., Pandian, A., & Nordin, M. Z. (2016). Literacy, Skills and Perception of Young Children on Media Matters. Researchers World, 7(1), 62.
• UNESCO. (2019). Digital Kids Asia-Pacific. https://dkap.org/get-involved/
• Wok, S., & Mohamed, S. (2017). Internet and social media in Malaysia: Development, challenges and potentials. In The evolution of media communication. IntechOpen

Too Young Too Digital:
How Malaysian Parents Mediate Their Young Children’s Internet and
Digital Device Use
INTERNATIONAL ISLAMIC UNIVERSITY
NOR DIANA MOHD MAHUDIN AND NAZARIAH SHARÍE JANON
86 Media Matters Report 2021

87Media Matters Report 2021
ABSTRACT
The way parents mediate their children’s online activities and
use of digital devices can significantly impact the development
of their children. This is especially true for young children under
the age of six years, who are changing physically, cognitively,
socially, and emotionally, more rapidly than at any other phase
in their lives. However, parental mediation practices and views
related to technological devices and digital media use among
young children have not been widely investigated in Malaysia.
Drawing on the ecological techno-subsystem theory that
underpins the study, we collected data from 340 dual-working
parents who have children aged six years old and below. We
assessed parent-child demographic characteristics, children’s
internet usage pattern, parental mediation strategies, and
parental attitude towards the internet and digital media usage.
The results demonstrated that internet and digital device use
was high among young children, with the majority of them using
the media several times a day or at least once a day. The older
the children, the more frequent the usage, with boys exhibiting
more frequent use compared to girls. Although the majority spent
about one hour or less on digital devices, eighty-eight children
exceeded the maximum screen time recommendation. The
results also highlighted that Malaysian parents use mediation
strategies, with active mediation being the highest. Both mothers
and fathers equally used all parental mediation strategies, and
both boys and girls equally received parental mediation. Finally,
our results confirmed that parents’ and children’s demographic
characteristics and parents’ attitude towards the internet and
digital media effectively influenced the strategies that parents
employed to mediate their children’s use of the internet and
digital devices. Building a framework for responsible use and
digital competencies requires considerable effort from parents,
policymakers, the industry, module developers, and the research
community. Results obtained in this study could provide
feedback to these stakeholders to inform the enactment of
relevant policies and to improve current practices.
INTRODUCTION
Keywords: digital devices, internet, parental attitude, parental mediation, young children
Today, not only are children growing up digitally but the age of the general user-base is also getting younger and younger. In fact, most children under the age of two now have an online presence or digital footprint through their parents (Chaudron et al., 2018). While this trend has resulted in a transformation in digital literacy (Neumann, 2018), it has also left darker traces, ranging from psychological to physical problems, such as addiction, problematic use, and lack of sleep (Park & Park, 2021; Sohn et al., 2019).
Under normal circumstances, addressing the challenges arising from the substantial increase in internet usage by young children can be akin to a tightrope walk with no safety net. Under the current COVID-19 pandemic, this issue can be doubly daunting. Families have been experiencing tremendous changes over the past year, with parents attempting to work from home while caring for their children; while children have had to learn remotely using online education arrangements or other available means.
There has been a noticeable increase in internet and digital device use among children worldwide, with very young children showing particularly high usage patterns.
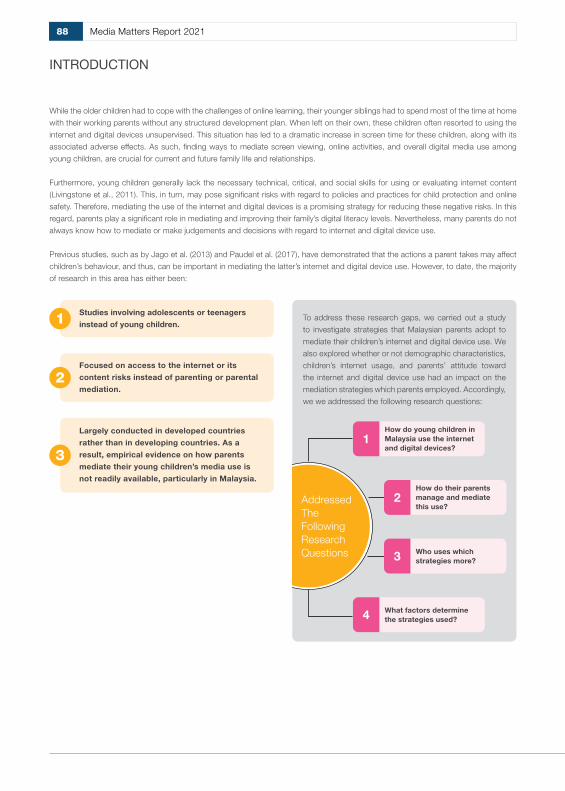
88 Media Matters Report 2021
INTRODUCTION
While the older children had to cope with the challenges of online learning, their younger siblings had to spend most of the time at home
with their working parents without any structured development plan. When left on their own, these children often resorted to using the
internet and digital devices unsupervised. This situation has led to a dramatic increase in screen time for these children, along with its
associated adverse effects. As such, finding ways to mediate screen viewing, online activities, and overall digital media use among
young children, are crucial for current and future family life and relationships.
Furthermore, young children generally lack the necessary technical, critical, and social skills for using or evaluating internet content
(Livingstone et al., 2011). This, in turn, may pose significant risks with regard to policies and practices for child protection and online
safety. Therefore, mediating the use of the internet and digital devices is a promising strategy for reducing these negative risks. In this
regard, parents play a significant role in mediating and improving their family’s digital literacy levels. Nevertheless, many parents do not
always know how to mediate or make judgements and decisions with regard to internet and digital device use.
Previous studies, such as by Jago et al. (2013) and Paudel et al. (2017), have demonstrated that the actions a parent takes may affect
children’s behaviour, and thus, can be important in mediating the latter’s internet and digital device use. However, to date, the majority
of research in this area has either been:
To address these research gaps, we carried out a study
to investigate strategies that Malaysian parents adopt to
mediate their children’s internet and digital device use. We
also explored whether or not demographic characteristics,
children’s internet usage, and parents’ attitude toward
the internet and digital device use had an impact on the
mediation strategies which parents employed. Accordingly,
we we addressed the following research questions:
Addressed The Following Research Questions
How do young children in Malaysia use the internet and digital devices?
1
How do their parents manage and mediate this use?
2
Who uses which strategies more? 3
What factors determine the strategies used?4
Studies involving adolescents or teenagers
instead of young children.1
Focused on access to the internet or its
content risks instead of parenting or parental
mediation.2
Largely conducted in developed countries
rather than in developing countries. As a
result, empirical evidence on how parents
mediate their young children’s media use is
not readily available, particularly in Malaysia.
3

89Media Matters Report 2021
LITERATURE REVIEW
To have an understanding of the broader context in which young children use the internet and digital devices, issues relating to pattern of use, parental mediation strategies, and their attitude towards digital media use must first be understood, and discussed as follows.
Young Children, Internet, and Digital Media
Young children nowadays live in a media-rich environment with
daily exposure to a variety of digital media and technologies,
such as games, smartphones, tablets, computers, and
e-readers. Hutton et al. (2020) and Coyne et al. (2017), among
others, showed that the use of screen-based digital technologies
is prevalent and increasing at home as well as in childcare and
school settings, involving children of very young ages.
In the past year, there have been even more dramatic changes
in online usage patterns due to the coronavirus outbreak
(Statistica, 2020), notably attributed to the growing number of
people working from home, changes in people’s attitude and
behaviour toward online purchases, and most importantly,
increased use of remote learning and home-schooling. As the
demands of working from home, remote learning, and multiple
childcare arrangements are antithetical to one another with their
own responsibilities and expectations, parents are faced with
unprecedented challenges to adapt to (Hitchings & Maclean,
2020).
In Malaysia, too, the role of parents as caretakers, providers,
and educators, has been heavily impacted. With the incessant
lockdowns and restrictions on movement caused by the
pandemic, nurseries, kindergartens, and playschools have been
closed and young children who usually go to these places have
to stay at home. Parents who usually go out to work also have
to be at home.
These sudden changes to lifestyle are mostly felt by dual-working
parents who find it hard to juggle their work and family responsibilities
(Collins et al., 2020). Due to these constraints, parents tend to use
screen devices and digital technologies as ‘babysitters’ when
things get hectic or as a calming tool when their children are upset.
Indeed, research has shown that digital technologies are used in the
parenting of young children, either as a distractor that provides relief
in child-rearing, as a babysitter when the parent is unavailable, or as
a tool to modify children’s behaviour (Elias & Sulkin, 2017).
Parental Mediation Strategy
Parental mediation strategy refers to the interpersonal
communication strategy, style, or practice which parents adopt
to maximise the benefits and mitigate the risks of their children’s
usage of the internet and digital technologies (Kirwil, 2009;
Meeus et al., 2019; Nikken & Jansz, 2013). Six parental mediation
strategies can be found in the literature. First, active mediation
refers to parent-child discussions about internet content, online
activities, and online safety (Nikken & Jansz, 2013; Wu et al.,
2014); while co-use refers to joint device engagement of parent-
child without any necessary discussion about the media.
The effects of screen use on young children’s developmental, physical, and mental health is well established in the literature.
In particular, Hutton et al. (2020) found that
higher screen use is significantly associated
with lower literacy skills, while Dickson et al.’s
(2018) systematic review reported correlational
evidence for the negative relationship between
screen-based activities and the mental health
outcomes of young children. Research has also
linked excessive screen time to physical health
problems, such as obesity, disrupted sleep
schedules, and near-sightedness (Walsh et al.,
2018). Therefore, mediating the use of digital
technologies and the internet may be a promising
strategy for reducing these negative outcomes.
In this regard, parents play a significant role in
mediating and improving their family’s digital
literacy levels.

90 Media Matters Report 2021
LITERATURE REVIEW
Restrictive mediation involves using rules and limitations on young children’s device use and media content (Nikken & Jansz, 2013; Wu
et al., 2014); while technical restrictions refer to parents regulating or restricting their young children from opening certain online media
or mobile apps by installing app locks or relevant software (Kumpulainen et al., 2020). Unlike supervision that involves parents staying
within observable distance from their children while engaging in their digital activities (Shin & Li, 2017), monitoring does not require
parents to be physically present with their children as parents may check their children’s online activity history log through the device.
Past research has pointed out several contexts for the adoption of parental mediation strategies, including: (i) demographic variables
(e.g., parent-child demographic characteristics); (ii) parental variables (e.g., parents’ perception of digital media, parents’ attitude
towards digital media, parents’ skills in digital device use, and parental influence on children’s digital device use); (iii) parent-child
interaction variables (e.g., parenting style and parental involvement); and (iv) child variables (children’s digital device use characteristics
and skills) (Nikken & Jansz, 2013). A recent review by Rodideal (2020) has also emphasised that parental mediation strategies differ with
children’s age. In particular, it suggests that parents utilise multiple mediation strategies, rather than focusing only on one and apply the
strategies in accordance with their children’s age.
Parental Attitude towards the Internet and Digital Media
Parental mediation studies have established that parents vary their mediation strategies according to their attitude to or perception of
the use and effects of digital devices and the internet on their children.
On the other hand, parents who regard digital media as an educational tool or as an entertainment gizmo, are more likely to use digital
devices together with their children (i.e., co-use) or actively discuss the content of the media (Nikken & Schols, 2015; Sonck et al.,
2013).
Additionally, parents who consider media devices as handy to soothe children are more likely to allow their children to watch television
or DVDs for longer periods per day (Vaala, 2014). Nevertheless, past research has also emphasised that parents may change their
mediation strategies retroactively if their children said that they had a negative online experience (Kalmus et al., 2012).
Those who are concerned with or worried about media-related risks and harm are more likely to try to protect their
children by:
Applying restrictions on media use.
1
Monitoring or supervising the
children.
2Critically talking to the children about media
content (Nikken & Schols, 2015; Sonck et
al., 2013).
3

91Media Matters Report 2021
LITERATURE REVIEW
WHAT’S MISSING FROM TODAY’S RESEARCH?
Research Instrument
A cross-sectional survey was conducted using two established scales, i.e., the Parental Mediation Practices Scale (PMPS: Nikken &
Jansz, 2013; Sonck et al., 2013) and the Parental Attitudes about Media for Children Scale (PAMCS: Nikken & Schols, 2015), together
with demographic questions such as on participants’ gender, age, ethnicity, level of education, current state of residence, youngest
child’s age and gender, and digital device use at home.
Parental Mediation Practices Scale (PMPS: Nikken & Jansz, 2013; Sonck et al., 2013)
The PMPS (Nikken & Jansz, 2013; Sonck et al., 2013) measured active mediation (17 items: α = .97); co-use (6 items: α = .88); restrictive mediation (8 items: α = .89); technical mediation (4 items: α = .89); and monitoring (7 items: α = .91). Scores for each sub-scale were obtained, with higher scores indicating higher use of the particular strategy. All these subscales had reliabilities greater than .88, indicating a very high level of inter‐item consistency.
Parental Attitudes about Media for Children Scale (PAMCS: Nikken & Schols, 2015)
The PAMCS (Nikken & Schols, 2015) measured parents’ attitude towards positive media effects (8 items); media functions as a pacifier (4 items); negative media effects (4 items); and media is too complicated for their children (2 items). Similar to the PMPS, the PAMCS scores for each sub-scale were obtained, with higher scores indicating a higher view of the particular domain. These subscales demonstrated adequate reliability, with Cronbach α values ranging from .65 to .89.
As the number of young children who are digital or touch-
screen natives in Malaysia is increasing, parents must learn to
adapt, and their role and involvement must commensurate with
the occurring changes. However, data on parental mediation
practices and strategies in the country are still scarce. To date,
only a few studies have investigated parental mediation in
Malaysia (Kaur & Ahmad, 2019; Othman et al., 2018; however,
these studies involved older children or adolescents from nine
years of age and above.
Furthermore, research has shown that parental mediation may
change over time, with active mediation being more common
among young children; while restrictive mediation with some
co-use increases as children enter middle childhood, and
then, decreases during adolescence (Coyne et al., 2017). In
other words, parental mediation practice may differ at each
developmental stage.
Therefore, we believe that currently, it is vital for researchers in
digital literacy, as a maturing discipline, to begin exploring child
protection and online safety issues related to young children.
This is because a child’s development is influenced by the
reciprocal interactions between a series of nested environments
or ecological systems, such as techno-subsystem, microsystem,
mesosystem, exosystem, macrosystem, and chronosystem
(Johnson & Puplampu, 2008).
The techno-subsystem in particular, focuses on children’s
interaction with their immediate environment via information,
communication, and leisure technologies. The immediate
environment refers to the microsystem, which involves anything
that has direct contact with the children in their immediate
environment, e.g., parents, siblings, teachers, and peers in
school. Internet and digital technologies are considered as
part of the children’s microsystem because it enters their lives
from within their immediate environment, which then influences
parents and parent–child interactions.
METHODOLOGY

92 Media Matters Report 2021
METHODOLOGY
To ascertain the adequacy, suitability,
consistency, and clarity of the items, the
research instrument was pre-tested and
pilot tested first with twenty and sixty
parents, respectively, who did not form
part of the actual study population. These
tests resulted in minor revisions in terms
of wording, layout, and sequencing of
the items and decisions to administer the
instrument through dual languages (i.e.,
Malay and English).
In answering the survey, all participants
were reminded to focus on their youngest
child in the age category of zero to six
years. In the case where parents have
more than one child under the age of six,
they were asked to answer the questions
based on the youngest child in their
household. This instruction was included
to ensure that parents can concentrate
on answering the questionnaire based on
a particular child, hence producing more
exact information, while avoiding possible
contamination from overlapping data
generated by involving many children.
SamplingOur participants were recruited through convenience sampling, but with a concerted effort made to ensure that they fulfilled the inclusion criteria: (i) a parent or caregiver of at least one child aged between zero and six years old; (ii) currently working in Malaysia; (iii) has a spouse/partner who also works full-time; and (iv) able to complete the survey in Malay or English language. In total, 340 parents (male = 165; female = 175) from 14 states responded to the survey. The average age of the parents was 32.73 (SD = 7.04), varying from 18 to 63 years. The majority of them had a bachelor’s degree (48.5%), followed by a diploma (25%), secondary school education (17.9%), master’s or PhD degree (6.5%), primary school education (1.5%), and others (0.6%). The average age of the youngest child in this study was between two to three years.
Data CollectionThe survey period (i.e., pre-test, pilot test, and final study) ran from December 2020 to February 2021 and delivered online. A survey link was generated using Google Forms, which was then shared using social media platforms and WhatsApp to the participants. This approach was used as the current pandemic situation necessitated physical distancing and minimal face-to-face meetings, both of which were required if a paper-based survey was administered. Furthermore, online surveys were cost-efficient, with a lower chance of non-response because of the immediate interactive question-answer procedure (Das et al., 2010). More importantly, given that the pandemic had persisted for more than a year, most households were accustomed to online interactions.
FINDINGS AND DISCUSSION
How Do Young Children in Malaysia Use the Internet and
Digital Devices?
The internet and digital devices have indeed become an integral
part of the lives of young children, as found in this study (Figure
1). In particular, almost 78.2 percent of parents reported that
their youngest child used the internet, digital devices and media
at home. The majority of these children used the media either
several times a day (36.5%) or at least once a day (22.4%).
Consistent with the literature, our study found that the older
the children, the more frequent the usage, with male children
exhibiting more frequent use (41.5%) compared to the girls
(36.8%). The reason for this scenario was not explored in this
study but it may be related to the traditional or cultural practice of
parents treating boys with more tolerance than girls (Goolamally
& Ahmad, 2010), hence further internalising patriarchal norms.
This factor is certainly an area worth pursuing in the future to
better understand the role cultural or societal expectations and
practices play in how young children in Malaysia use the internet
and digital devices.
To examine further the pattern of use, we also analysed the
average time spent on the internet and digital devices by young
children. The results indicated that 122 children spent at least 30
minutes or less on the internet and digital devices (35.9%), with
more boys using them within this time frame (n = 77) compared
to the girls (n = 45). However, more girls were reported to spend
about 30 to 59 minutes using the internet and digital devices (n =
40) than the boys (n = 34). About 88 children (male = 41, female
= 47) exceeded the American Academy of Child and Adolescent.
Psychiatry’s (2020) screen time guidelines of about one hour per
day for children between two to five years of age. Although this is
a statistically small figure, it is rather alarming. The fact that more
girls used the media exceeding the recommended limit for daily
screen time is also unnerving. Studies have shown that young
children use the internet and digital devices to watch video clips,
play games, navigate YouTube, and interact with others via video
calls with family members (Harrison & McTavish, 2018; McClure
et al., 2018). Thus, it is likely that young children in this study also
used these devices for similar reasons.

93Media Matters Report 2021
FINDINGS AND DISCUSSION
SHAPING FAMILY DIGITAL LITERACY
A two-phase study investigating parental mediation practices of young children’s internet and digital technologies use.
Parent’s Gender
Use of Internet and Digital Devices at Home
Frequency of Internet and Digital Device
Use In Children
Feelings about the amount of time Children spent using the Internet and Digital Devices
Children’s Gender
175 (51.5%) 180 (52.9%)165 (48.5%) 160 (47.1%)
252 (74.12%) 88 (25.88%)
Not worryWorry
78.2%21.8%(41.5%)(11.5%) (36.8%)(10.3%)
8.2%22.4% 11.5% 3.2% 1.2% 15.3% 1.8%
Sev
eral
tim
es a
day
Abo
ut o
nce
a da
y
Don
’t kn
ow
Nev
er
Eve
ry fe
w m
onth
s
Eve
ry fe
w w
eeks
1 -
2 da
ys a
wee
k
3 -
5 da
ys a
wee
k
Duration of Internet and Digital
Device Use In Children
15.3%Never
10.3%1 Hr. - 1 Hr. 59 Mins.
0.6%4 Hr. - 4 Hr. 59 Mins.
35.9%< 30 Mins.
7.1%2 Hr. - 2 Hr. 59 Mins.
3.8%5 Hr. - 5 Hr. 59 Mins.
21.8%30 - 59 Mins.
4.1%3 Hr. - 3 Hr. 59 Mins.
1.2%Others
36.5%
FIGURE 1: Demographics and Usage of the Internet and Digital Devices by Young Children
DEMOGRAPHIC

94 Media Matters Report 2021
FINDINGS AND DISCUSSION
How Do Parents Manage and Mediate Their Use?
To understand the prevalence and use of mediation strategies by parents in Malaysia, the study looked into the pattern of mediation
strategies by way of demographic characteristics, parents’ attitude towards digital media, and children’s digital device use. Table 1
and Figure 2 indicate that active mediation is the highest type of parental mediation among the participants, followed by restrictive
mediation, monitoring, co-use, and technical mediation.
Parent’s Gender n
Active Restrictive Monitoring Co-Use Technical
M SD M SD M SD M SD M SD
Male 165 57.60 18.17 27.11 8.29 23.91 7.92 19.45 5.96 13.52 4.99
Female 175 56.94 19.54 28.07 8.04 25.26 7.63 20.52 5.61 13.22 5.28
Total 340 57.26 18.86 27.61 8.17 24.60 7.79 20.00 5.79 13.36 5.13
TABLE 1: Results on Parental Mediation Strategies as Reported by Parents
FIGURE 2: Mean Scores of Parental Mediation Strategies Reported by Parents
Note: ACTIVE = Active mediation; RESTRICTIVE = Restrictive mediation; MONITOR = Monitoring; CO-USE = Co-use; TECHNICAL = Technical mediation
24.6% 13.4%20%27.6%57.3%
Tech
nica
l Med
iatio
n
Co-
use
Mon
itorin
g
Res
tric
tive
Med
iatio
n
Act
ive
Med
iatio
n
60
40
20
0

95Media Matters Report 2021
FINDINGS AND DISCUSSION
These results highlight the diverse, yet contradictory mediation
strategies adopted by parents in Malaysia. On the one hand,
the parents reported active mediation where they discussed
and reflected on the content and use of digital devices and
the internet with their children. On the other hand, the parents
reported a high degree of restrictive mediation where they set
limits on permitted digital and online activities for their children.
The parents also reported high monitoring of their children’s
digital devices and internet use, followed by co-use, where
parents and children use the devices together.
Consistent with previous studies (e.g., Livingstone et al., 2011;
Valcke et al., 2010), technical mediation was the least adopted
mediation strategy. This is ironic because Barbovschi et al. (2014)
argued that technical mediation could be a solution to protect
younger children from unwanted digital and online content.
One possible explanation for the lack of technical mediation is
that it is likely that parents do not have adequate knowledge
on the existence of parental control tools, or they do not know
how to use them, or because of the cost of purchasing such
tools. Consequently, these findings imply that parents need basic
technical digital literacy skills. Inherent in this training must be an
emphasis on tools, applications, or elements that could promote
safer and more responsible use of digital devices and the
internet. Parents should be made aware of how to use parental
control tools to create a safer digital/online environment for their
young children instead of using them to police their activities.
Who Uses Which Strategies More?
This study found that among the participants surveyed, mothers
and fathers were equally likely to use all the five types of parental
mediation strategies (Figure 3). This was reflected in the results
of independent samples t-tests, which indicated that there
were no statistically significant differences in parental mediation
strategies based on parent’s gender, i.e., active mediation: p =
.749, restrictive mediation: p = .277, monitoring: p = .111, co-
use: p = .089, and technical mediation: p = .586.
Mediation strategies also varied almost equally across all levels
of education of the parents, demonstrating that their level of
education did not necessarily determine the strategies which
they employed to mediate their young children’s internet and
digital device use (Figure 4). Nevertheless, results of the analysis
of variance (ANOVA) showed that the use of active mediation
tended to be significantly higher for parents with a diploma (M =
61.48, SD = 19.59) than for parents with a bachelor’s degree (M
= 53.33, SD = 19.25), F(5, 334) = 3.487, p = .004. This may be
due to the different nature of work, roles, and expectations at the
workplace, where those with a bachelor’s degree usually have
a larger scope of job responsibility that may hinder them from
actively mediating their children’s internet and digital device use,
as opposed to those with a diploma.
FIGURE 3: Mothers and fathers make equally
good effort in mediating their young children’s
internet and digital device use
57.60
56.94
23.91
25.26
27.11
26.07
19.45
20.52
13.52
13.22
Act
ive
Med
iatio
n
Res
tric
tive
Med
iatio
n
Mon
itorin
g
Co-
use
Tech
nica
l Med
iatio
n
Parent’s gender (Male)
60
50
40
30
20
10
0
Act
ive
Med
iatio
n
Res
tric
tive
Med
iatio
n
Mon
itorin
g
Co-
use
Tech
nica
l Med
iatio
n
Parent’s gender (Female)
60
50
40
30
20
10
0

96 Media Matters Report 2021
FINDINGS AND DISCUSSION
Both boys and girls received equal parental mediation
(Figure 5). However, the children’s age had a significant impact
on parental mediation strategies. From Figure 6, it can be seen
that active mediation, restrictive mediation, and monitoring,
seemed to increase with children’s age. However, co-use and
technical mediation tended to fluctuate with age. Interestingly,
parents of one-year old children reported the lowest parental
mediation scores across all types of mediation.
Parents are likely to practice higher mediation when the child
is the youngest in response to the need for physical safety and
facilitating sensory stimulation. They may actively use these
strategies with their children as the latter’s gross and fine motor
skills to handle electronic gadgets carefully are rather limited.
Less use of mediation strategies for one-year old children may
be attributed to the parents’ perception that these children have
better physical and motor coordination (e.g., carrying gadgets,
swiping the screen, etc.). This in turn, may give parents the notion
that they can let the children use the devices independently
without mediation. However, parents need to understand that
moral behaviour starts to develop at this stage.
Children who receive parental mediation in terms of duration,
time limit, and the dos and dont’s of using digital devices and the
internet at this stage will be more likely to develop appropriate
skills in using these resources. If the children missed mediation
from parents during this stage, they are likely to face some
adjustment problems in the future (e.g., tantrums, crying,
etc.). Perhaps for this reason, parents return to exercising their
mediation role as the children get older. Consequently, these
findings highlight the need to educate parents to continue
mediating their children’s devices and internet use regardless of
their age.
FIGURE 4: Parental mediation strategies are used by parents regardless of education level
Parent’s Education Level
Active Mediation Restrictive Mediation Monitoring Co-use Technical Mediation
10
40
20
50
70
30
60
0
68.0
0
33.0
0
29.2
0
22.8
0
17.6
0
53.3
3
26.1
0
23.3
3
19.7
6
12.5
0
61.3
0
29.1
8
25.5
4
20.9
2
13.9
3
55.6
8
29.0
0
25.7
7
18.5
5
13.8
6
61.4
8
28.5
9
25.7
3
19.9
3
14.1
6
69.5
0
33.0
0
28.5
0
24.0
0
17.0
0
Primary School Secondary School
Diploma or Eq. Bachelor Degree PhD or Master Degree
Others

97Media Matters Report 2021
FINDINGS AND DISCUSSION
56.57
58.04
27.94
27.23
20.25
19.72
24.90
24.27
13.56
13.14
Act
ive
Med
iatio
n
Res
tric
tive
Med
iatio
n
Mon
itorin
g
Co-
use
Tech
nica
l med
iatio
n
Gender of youngest children (Male)
60
50
40
30
20
10
0
Act
ive
Med
iatio
n
Res
tric
tive
Med
iatio
n
Mon
itorin
g
Co-
use
Tech
nica
l med
iatio
n
Gender of youngest children (Female)
60
50
40
30
20
10
0
FIGURE 5: Boys and girls are equally likely to
receive parental mediation
Age of Youngest Children
FIGURE 6: Active mediation, restrictive mediation,
and monitoring increase with children’s age;
but tend to fluctuate with co-use and technical
mediation
Active Mediation
Restrictive Mediation
Monitoring
Co-use
Technical Mediation
70
60
50
40
30
20
10
0 years old
2 years old
4 years old
1 years old
3 years old
5 years old
6 years old
What Factors Determine the Strategies Used?
To address the question of which factors determine the
strategies applied by parents to mediate their children’s internet
and digital device use, hierarchical multiple regression analyses
were conducted for each of the parental mediation strategies.
As discussed in the introduction and literature review sections,
parents’ and children’s demographic characteristics, duration
and frequency of internet use, as well as parents’ attitude
towards the internet and digital media (ranging from positive
media effects, media functions as a pacifier, negative media
effects, media is too complicated, to parental anxiety), may
influence the strategies that parents employ to mediate their
children’s internet and digital device use. Therefore, we tested
these variables as the predictors for each of the five mediation
strategies.

98 Media Matters Report 2021
FINDINGS AND DISCUSSION
For active mediation, we found that positive media effects (β =
.305, p = .001) was the strongest significant predictor variable,
followed by age of the youngest child (ß = .207, p = .001); parental
worry (ß = .182, p = .001); media functions as a pacifier (ß = -.146,
p = .036); parents’ education level (ß = -.124, p = .019); and total
number of children (ß = .123, p = .022). All of these variables taken
together explained 18.4 percent of the variance, indicating that a
more positive attitude towards media, having older as opposed
to younger children, being more anxious about children’s internet
use, less likely to use the media as a pacifier, having a lower
education level, and having more children are factors associated
with higher active mediation.
As for restrictive mediation, our results showed that it was
significantly predicted by positive media effects (ß = .205, p =
.004) as the strongest predictor. This was followed by age of the
youngest child (ß = .155, p = .013); parental worry (ß = .112, p =
.048); and total number of children (ß = .110, p = .042). Hence,
it can be concluded that having a more positive attitude towards
media, having older as opposed to younger children, being more
worried about children’s internet use, and having more children
are factors associated with higher use of restrictive mediation,
with the regression model effectively explaining 16.8 percent of
the variance.
We also found that four variables significantly predicted monitoring,
i.e., positive media effects (ß = .215, p = .003); parental worry
(ß = .166, p = .004); age of the youngest child (ß = .132, p =
.04); and parent’s gender (ß = .109, p = .04), put in order from
the strongest to the weakest significant predictor. These results
suggest that having a more positive attitude towards media,
being more worried about the children’s internet use, having older
children, and being mothers, are factors associated with higher
use of monitoring, with the regression model accounting for 14.3
percent of the variance.
In contrast to the previous mediation strategies, only two
predictors were significantly correlated with co-use, i.e., positive
media effects (ß = .174, p = .016) and parents’ gender (ß = .113,
p = .033). In particular, fathers tended to have a more positive
attitude towards the internet and digital media use than mothers.
However, mothers scored higher on co-use than fathers, implying
that females are more likely than males to co-use their children’s
internet and digital devices.
Finally, our results demonstrated that technical mediation was
predicted by positive media effects (ß = .275, p = .001) and
parental worry (ß = .160, p = .007). Similarly, these results suggest
that having a more positive attitude towards media use and
being more worried about the children’s internet use are factors
associated with higher use of technical mediation.
Why Do These Results Matter?
Through the findings of this study, we can see that when
parents view the internet and digital device use as a positive
influence on their children’s lives, they are more likely to use
parental mediation strategies, be it active mediation, restrictive
mediation, monitoring, co-use, or technical mediation.
Studies have demonstrated that positive parental perception
of technological devices is associated with effective parental
mediation (Kumpulainen et al., 2020). Moreover, the effect of
this positive perception holds true even among low-income
families (Papadakis et al., 2019). In this regard, parents with a
positive outlook towards media and devices would encourage
their children to explore more with the gadgets to hone their
potential skills.
Our study also points out that active mediation is positively
predicted by parents’ attitude towards using digital devices
and the internet as a pacifier or babysitter for their young
children, as well as by their perceived worry about the amount
of time their young children spend on these devices. Parents’
Predictor
Criterion: Parental Mediation Strategies
Active Restrictive Monitoring Co-Use Technical
B ß p B ß p B ß p B ß p B ß p
Parent's gender .33 .01 .87 1.54 .09 .07 1.70 .11 .04* 1.31 .11 .03* -.21 -.02 .71
Parent's education
level -2.53 -.12 .02* -.87 -.09 .06 -.57 -.07 .21 -.57 -.09 .09 -.46 -.08 .13
Number of children 1.55 .12 .02* .60 .11 .04* .53 .10 .06 .32 .08 .13 .19 .06 .31
Gender of youngest
child .37 .01 .85 -1.07 -.07 .21 -.90 -.06 .27 -.41 -.04 .49 -.50 -.05 .36
Age of youngest child 2.09 .21 .001** .68 .16 .01** .55 .13 .04* .05 .02 .80 .08 .03 .64
Positive media effects 1.02 .31 .001** .29 .21 .004** .29 .22 .003** .18 .17 .02* .25 .28 .001**
Media functions as a
pacifier -.77 -.15 .04* -.09 -.04 .59 -.09 -.04 .55 .13 .08 .25 -.10 -.07 .33
Parental worry 2.88 .18 .001** .77 .11 .048* 1.08 .17 .004** .23 .05 .41 .69 .16 .007**
TABLE 2: Hierarchical Regression Results for Parental Mediation Strategies with Their Associated Significant Predictors

99Media Matters Report 2021
FINDINGS AND DISCUSSION
worry also affects the use of restrictive mediation, monitoring,
and technical mediation. These findings reflect the growing
awareness among parents about their children’s internet and
digital device use and suggest that parents may want to find
ways to mediate the usage differently. Therefore, it is likely that
this perception of worry can be leveraged as a resource that
can nudge or motivate behaviour aimed at mediating the use
of the internet and digital devices among young children. Future
research may want to explore this aspect in the development of
training programmes for parents.
Besides parental attitude to or perception of digital devices/
internet use, prior studies have shown that factors, such as
parents’ level of education (Ochoa & Reich, 2020); age and
gender of parents (Sonck et al., 2013); children’s age (Symons
et al., 2017); and family size (Sonck et al., 2013), can influence
parental mediation, which in turn, may increase or decrease
children’s internet and digital device use. Concurring with the
existing literature, our findings suggest that children’s age,
parent’s level of education, and the number of children, predict
the likelihood of parents engaging in active mediation. Children’s
age and the number of children in the family also predict the
use of restrictive mediation. In contrast, the parent’s gender
is a significant predictor of monitoring and co-use. Based on
these findings, we can conclude that parental mediation is also
associated with demographic variables.
Because parental mediation depends on parents’ and children’s
demographic characteristics, it is crucial for stakeholders to
consider the demographics of both, parents and children in
any intervention to ensure that they provide effective parenting
skills to mitigate associated risks arising from the use of digital
devices. Accordingly, in designing interventions, family-based
intervention programmes that are socio-culturally customised
could be taken into account.
Predictor
Criterion: Parental Mediation Strategies
Active Restrictive Monitoring Co-Use Technical
B ß p B ß p B ß p B ß p B ß p
Parent's gender .33 .01 .87 1.54 .09 .07 1.70 .11 .04* 1.31 .11 .03* -.21 -.02 .71
Parent's education
level -2.53 -.12 .02* -.87 -.09 .06 -.57 -.07 .21 -.57 -.09 .09 -.46 -.08 .13
Number of children 1.55 .12 .02* .60 .11 .04* .53 .10 .06 .32 .08 .13 .19 .06 .31
Gender of youngest
child .37 .01 .85 -1.07 -.07 .21 -.90 -.06 .27 -.41 -.04 .49 -.50 -.05 .36
Age of youngest child 2.09 .21 .001** .68 .16 .01** .55 .13 .04* .05 .02 .80 .08 .03 .64
Positive media effects 1.02 .31 .001** .29 .21 .004** .29 .22 .003** .18 .17 .02* .25 .28 .001**
Media functions as a
pacifier -.77 -.15 .04* -.09 -.04 .59 -.09 -.04 .55 .13 .08 .25 -.10 -.07 .33
Parental worry 2.88 .18 .001** .77 .11 .048* 1.08 .17 .004** .23 .05 .41 .69 .16 .007**
Note: • All values reported here are based on the results in the final model of each hierarchical regression analysis • *p < .05; **p< .01 • R2 Active mediation = .184; R2 Restrictive mediation = .168; R2 Monitoring = .143; R2 Co-use = .155; R2 Technical mediation = .110

100 Media Matters Report 2021
FINDINGS AND DISCUSSION
What We Can Do
Based on the key findings in this study, we recommend that policymakers pay greater attention to the digital literacy skills of young
children and to develop national programmes or policies that educate parents about the various types of mediation strategies. In
particular, these programmes should include more information about co-use and technical mediation, both of which may be unfamiliar
with parents, so that they become more aware of these strategies and know how to practice safer and more responsible use of the
internet and digital devices in their own homes.
To parents and carers, we cannot emphasise enough the importance of communicating with children about their online experiences.
These include being more aware of:
We strongly urge the industry and other stakeholders to help create safer and better internet experiences for young children by ensuring
that support, such as content classification, age-appropriate privacy settings, and robust reporting mechanisms on digital devices and
services, are both available and easily accessible. Likewise, the industry should also make parental controls user-friendly and flexible in
terms of settings and functionalities which are tailored to young children’s needs.
Given that young children lack the necessary skills and level of maturity needed to protect themselves whilst online, the development
of safety mechanisms beyond apps that promote active mediation between parents and children should also be encouraged. Equally
important, the industry, operators, and content providers should promote a ‘user-centric’ approach to digital privacy and ensure
compliance with local and international laws.
In our line of work, we believe that the voice and viewpoints of parents and children are crucial in understanding digital device use, its
risks, and accompanying consequences (be they beneficial or harmful) arising from the use, as well as the strategies to address the
consequences. Therefore, collecting qualitative data in future research would not only complement this quantitative analysis, but would
also strengthen the results, especially on questions such as why parents choose to use a specific strategy(s), the challenges they face in
mediating their young children’s device use, and the kinds of support they need from the government and service providers to mediate
the use, among others. Furthermore, seeking more detailed answers to these questions through a combination of quantitative and
qualitative data could provide a better and more holistic picture of parents’ experiences.
The potential manipulation by deceptive video or photo-sharing platforms.
The potential risks of underage social networking.1
The presence of children’s versions of social media that do not in fact respond to any of their needs. In this regard, we strongly recommend that parents mediate their children’s social media use, taking into account each child’s age and characteristics.
3
2

101Media Matters Report 2021
To the best of our knowledge, this study is the first to examine
strategies for mediating young children’s internet and digital
device use in Malaysia, and the findings offer significant
opportunities to expand the boundaries of existing literature
in this area, which is currently dominated by research on
adolescents or youth in the Western context. More specifically, it
reveals that Malaysian parents do apply mediation practices and
strategies on their children aged six years or below, with active
mediation being the highest.
However, co-use and technical mediation are the two least
adopted strategies, implying that parents require knowledge
and skills to have a better understanding about them. We also
find that Malaysian parents have a high positive attitude towards
the internet and digital media use, and this positive attitude
predicts the use of all mediation strategies. Nevertheless, they
are cautious of the associated adverse effects that come with the
use of these media. In fact, apart from co-use, parents’ anxiety
predicts all mediation strategies. Moreover, the demographics of
both parents and children are essential in the development of any
intervention programme.
The present study was built on prior evidence in the literature
in strengthening the utility of parental mediation research in
the Malaysian context. With over 340 participants from various
states in the country, the data that emerged from this study
could be considered reasonably representative of what people
in different states are currently experiencing.
• American Academy of Child and Adolescent Psychiatry. (2020). Screen time and children. https://www.aacap.org/AACAP/Families_and_Youth/Facts_for_Families/FFF-Guide/Children-And-Watching-TV-054.aspx
• Barbovschi, M., O’Neill, B., Velicu, A., & Mascheroni, G. (2014). Policy Recommendations. Report D5.1. Net Children Go Mobile.
• Chaudron, S., Di Gioia, R., & Gemo, M. (2018). Young Children (0-8) and Digital Technology: A Qualitative Study across Europe, EUR 29070 EN. Publications Office of the European Union. https://doi.org/10.2760/294383
• Collins, C., Landivar, L. C., Ruppanner, L., & Scarborough, W. J. (2020). COVID‐19 and the Gender Gap in Work Hours. Gender, Work & Organization. https://doi.org/10.1111/gwao.12506
• Coyne, S. M., Radesky, J., Collier, K. M., Gentile, D. A., Linder, J. R., Nathanson, A. I., Rasmussen, E. E., Reich, S. M., & Rogers, J. (2017). Parenting and digital media. Pediatrics, 140(Supplement 2), S112–S116. https://doi.org/10.1542/peds.2016-1758N
• Das, M., Ester, P., & Kaczmirek, L. (Eds.). (2010). Social Research and the Internet: Advances in Applied Methods and Research Strategies. Taylor & Francis.
Nevertheless, as with any cross-sectional study using self-
reported data, no causal inferences of the findings were made
to all parents. Furthermore, the survey was administered only to
parents. It would be valuable to also examine children’s accounts
of the effects of parental mediation strategies on their online
experiences.
Parental mediation provides parents with some options for
dealing with the internet and digital device use by their children.
Depending on the type of mediation used and the kind of media
being mediated, parents can influence how their children are
affected by the internet and digital devices. Consequently, they
need to be educated about the strategies available and the relative
effectiveness of these strategies so that the most successful
one(s) can be applied on their children. In short, a better
understanding of all these factors could inform the development
of relevant policies, support digital literacy education, develop
awareness, so as to assist parents in effectively mediating their
young children’s internet and digital device use.
CONCLUSION
REFERENCES

102 Media Matters Report 2021
REFERENCES
• Dickson, K., Richardson, M., Kwan, I., MacDowall, W., Burchett, H., Stansfield, C., Brunton, G., Sutcliffe, K., & Thomas, J. (2018). Screen-based activities and children and young people’s mental health: A Systematic Map of Reviews. EPPI-Centre, Social Science Research Unit, UCL Institute of Education, University College London. https://eppi.ioe.ac.uk/cms/Default.aspx?tabid=3748
• Elias, N., & Sulkin, I. (2017). YouTube viewers in diapers: An exploration of factors associated with amount of toddlers’ online viewing. Cyberpsychology: Journal of Psychosocial Research on Cyberspace, 11(3), Article 2. https://doi.org/10.5817/CP2017-3-2
• Goolamally, N., & Ahmad, J. (2010). Boys do poorly in schools: The Malaysian story. Unpublished Manuscript. https://www.researchgate.net/publication/262689050_BOYS_DO_POORLY_IN_SCHOOLS_THE_MALAYSIAN_STORY
• Harrison, E., & McTavish, M. (2018). ‘i’Babies: Infants’ and toddlers’ emergent language and literacy in a digital culture of iDevices. Journal of Early Childhood Literacy, 18(2), 163–188. https://doi.org/10.1177/1468798416653175
• Hitchings, E., & Maclean, M. (2020). Unprecedented times: Some thoughts on the consequences of the COVID-19 pandemic from a family and social welfare law perspective. Journal of Social Welfare and Family Law, 42(3), 227–280. https://doi.org/10.1080/09649069.2020.1796219
• Hutton, J. S., Dudley, J., Horowitz-Kraus, T., DeWitt, T., & Holland, S. K. (2020). Associations between screen-based media use and brain white matter integrity in preschool-aged children. JAMA Pediatrics, 174(1), e193869. https://doi.org/10.1001/jamapediatrics.2019.3869
• Jago, R., Sebire, S. J., Lucas, P. J., Turner, K. M., Bentley, G. F., Goodred, J. K., Stewart-Brown, S., & Fox, K. R. (2013). Parental modelling, media equipment and screen-viewing among young children: Cross-sectional study. BMJ Open, 3(4). http://dx.doi.org/10.1136/bmjopen-2013-002593
• Johnson, G. M., & Puplampu, K. P. (2008). Internet use during childhood and the ecological techno-subsystem. Canadian Journal of Learning and Technology, 34(1), n1. https://eric.ed.gov/?id=EJ1073829
• Kalmus, V., von Feilitzen, C., & Siibak, A. (2012). Effectiveness of teachers’ and peers’ mediation in supporting opportunities and reducing risks online. In S. Livingstone, L. Haddon, & A. Görzig (Eds.), Children, Risk and Safety on the Internet: Research and Policy Challenges in Comparative Perspective (pp. 245–256). The Policy Press.
• Kaur, N., & Ahmad, Y. (2020, April). Compulsive internet use among students in primary school: The role of parenting monitoring. Journal of Physics: Conference Series, 1529(3), 032074. https://doi.org/10.1088/1742-6596/1529/3/032074
• Kirwil, L. (2009). Parental mediation of children’s internet use in different European countries. Journal of Children and Media, 3(4), 394–409. https://doi.org/10.1080/17482790903233440
• Kumpulainen, K., Sairanen, H., & Nordström, A. (2020). Young children’s digital literacy practices in the sociocultural contexts of their homes. Journal of Early Childhood Literacy, 20(3), 472–499. https://doi.org/10.1177%2F1468798420925116
• Livingstone, S., Haddon, L., Görzig, A., & Ólafsson, K. (2011). Risks and safety on the Internet: The perspective of European children. Full findings and policy implications from the EU Kids Online Survey of 9–16 year olds and their parents in 25 countries. EU Kids Online. http://eprints.lse.ac.uk/id/eprint/33731
• McClure, E. R., Chentsova‐Dutton, Y. E., Holochwost, S. J., Parrott, W. G., & Barr, R. (2018). Look at that! Video chat and joint visual attention development among babies and toddlers. Child Development, 89(1), 27–36. https://doi.org/10.1111/cdev.12833
• Meeus, A., Eggermont, S., & Beullens, K. (2019). Constantly connected: The role of parental mediation styles and self-regulation in pre-and early adolescents’ problematic mobile device use. Human Communication Research, 45(2), 119–147. https://doi.org/10.1093/hcr/hqy015
• Neumann, M. M. (2018). Parent scaffolding of young children’s use of touch screen tablets. Early Child Development and Care, 188(12), 1654-1664. https://doi.org/10.1080/03004430.2016.1278215

103Media Matters Report 2021
REFERENCES
• Nikken, P., & Jansz, J. (2014). Developing scales to measure parental mediation of young children’s internet use. Learning, Media and Technology, 39(2), 250–266. https://doi.org/10.1080/17439884.2013.782038
• Nikken, P., & Schols, M. (2015). How and why parents guide the media use of young children. Journal of Child and Family Studies, 24(11), 3423–3435. https://doi.org/10.1007/s10826-015-0144-4
• Ochoa, W., & Reich, S. M. (2020). Parents’ beliefs about the benefits and detriments of mobile screen technologies for their young children’s learning: A focus on diverse Latine mothers and fathers. Frontiers in Psychology, 11, 2686. https://doi.org/10.3389/fpsyg.2020.570712
• Othman, R., Rahim, K. F., Kamarulzaman, R. A., Amat, D. W., & Sham, R. (2019). Literature review on internet benefits, risks and issues: A case study for cyber parenting in Malaysia. Malaysian E Commerce Journal (MECJ), Zibeline International Publishing, vol.3(2), 12–14. http://doi.org/10.26480/mecj.02.2019.12.14
• Papadakis, S., Zaranis, N., & Kalogiannakis, M. (2019). Parental involvement and attitudes towards young Greek children’s mobile usage. International Journal of Child-Computer Interaction, 22, 100–144. https://doi.org/10.1016/j.ijcci.2019.100144
• Park, J. H., & Park, M. (2021). Smartphone use patterns and problematic smartphone use among preschool children. Plos One, 16(3), 1–12. https://doi.org/10.1371/journal.pone.0244276
• Paudel, S., Jancey, J., Subedi, N., & Leavy, J. (2017). Correlates of mobile screen media use among children aged 0–8: A systematic review. BMJ Open, 7(10). http://dx.doi.org/10.1136/bmjopen-2016-014585
• Rodideal, A. A. (2020). A systematic literature review searching for a comprehensive dynamic model of parental digital mediation strategies. Revista de
• Stiinte Politice, 65, 157–174. https://cis01.ucv.ro/revistadesti intepol it ice/f i les/numarul65_2020/15.pdf
• Shin, W., & Li, B. (2017). Parental mediation of children’s digital technology use in Singapore. Journal of Children and Media, 11(1), 1–19. https://doi.org/10.1080/17482798.2016.1203807
• Sohn, S.Y., Rees, P., Wildridge, B., Kalk, N. J., & Carter, B. (2019). Prevalence of problematic smartphone usage and associated mental health outcomes amongst children and young people: A systematic review, meta-analysis and GRADE of the evidence. BMC Psychiatry, 19(1), 1–10. https://doi.org/10.1186/s12888-019-2350-x
• Sonck, N., Nikken, P., & De Haan, J. (2013). Determinants of internet mediation: A comparison of the reports by parents and children. Journal of Children and Media, 7, 96–113. https://doi.org/10.1080/17482798.2012.739806
• Statistica. (2020). Coronavirus impact on media consumption worldwide - Statistics & Facts. https://www.statista.com/topics/6134/coronavirus-impact-on-media-consumption-us
• Symons, K., Ponnet, K., Emmery, K., Walrave, M., & Heirman, W. (2017). A factorial validation of parental mediation strategies with regard to internet use. Psychologica Belgica, 57(2), 93–111. https://doi.org/10.5334/pb.372
• Vaala, S. E. (2014). The nature and predictive value of mothers’ beliefs regarding infants’ and toddlers’ TV/video viewing: Applying the integrative model of behavioural prediction. Media Psychology, 17(3), 282–310. https://doi.org/10.1080/15213269.2013.872995
• Valcke, M., Bonte, S., Wever, B., & Rots, I. (2010). Internet parenting styles and the impact on Internet use of primary school children. Computers & Education, 55(2), 454–464. https://doi.org/10.1016/j.compedu.2010.02.009
• Walsh, J. J., Barnes, J. D., Cameron, J. D., Goldfield, G. S., Chaput, J. P., Gunnell, K. E., Ledoux, A-A., Zemek, R., & Tremblay, M. S. (2018). Associations between 24-hour movement behaviours and global cognition in US children: A cross-sectional observational study. The Lancet Child & Adolescent Health, 2(11), 783–791. https://doi.org/10.1016/S2352-4642(18)30278-5
• Wu, C. S. T., Fowler, C., Lam, W. Y. Y., Wong, H. T., Wong, C. H. M., & Loke, A. Y. (2014). Parenting approaches and digital technology use of preschool age children in a Chinese community. Italian Journal of Pediatrics, 40(1), 1–8. https://dx.doi.org/10.1186%2F1824-7288-40-44

UNIVERSITY OF NOTTINGHAM MALAYSIA
MANIAM KALIANNAN
Using Survival Data Analysis Perspective toManage Movement Control Order (MCO) in Selected Countries:
Lessons for Malaysia
104 Media Matters Report 2021

105Media Matters Report 2021
ABSTRACT
This research attempts to fit the best survival model for new
COVID-19 case data provided by the World Health Organization
(WHO). The study made comparisons across twelve countries,
selected on the basis of intensity of infection and death,
geographical spread, level of development and political and
cultural affiliations. The number of new COVID-19 infections
were used as a surrogate measure for gauging the efficacy of
Movement Control Order (MCO) or cordon sanitaire. The country
that registered the lowest hazard rate (which is a measure of
the force of infection) was considered the best performing nation
in subduing the on-going infectious and contagious COVID-19
global pandemic. From a statistical perspective, frequency
distribution is known for being able to highlight the maximum or
minimum counts or clusters of cases present in the data but is
statistically inefficient for benchmarking exercise due to presence
of skewness, kurtosis, and great variations in totals. In its place,
the study utilised Survival Data Analysis (SDA) procedures that are
typically applicable to time in an event. Specifically, the lifetable
technique, graphical plotting and regression analysis was used
Positioning the COVID-19 virus as a contagious and highly-
infectious disease and more so, as a life-threatening menace, the
WHO declared the COVID-19 phenomena as a global pandemic
on March 11, 2020 when the number of newly infected reached
118,000 involving 110 countries worldwide (WHO, 12 March
2020). Following the WHO declaration, global nations have
adopted the implementation of different forms of movement
restrictions as a key non-medical measure of cordon sanitaire
in an attempt to subdue the viral spread of the global pandemic,
as per WHO guidelines. In Malaysia, this took the form of the
Movement Control Order (MCO) which was implemented on 18
March 2020.
The WHO has been publishing daily records of new COVID-19
infections and deaths in frequency counts on its website.
Currently, the public policy makers, development practitioners,
media, academia and international organisations are using WHO-
published information for their advocacy activities. Undoubtedly,
data presented in frequency format or single
in identifying the statistical distribution followed by Maximum
Likelihood Estimation (MLE) procedures in determining the final
estimates of scale and shape parameters. From among the well-
known survival models, the SDA procedures concluded that the
Weibull distribution provided the best fit model for COVID-19 data
of new infections for all the nations considered. By examining the
scale and shape parameters, the study revealed that Malaysia
ranked as the best performing nation, while Brazil followed by
United States of America (USA) were the least performing nations
in the implementation of MCO in slowing COVID-19 infections.
The success of the MCO can be attributed to committed political
leadership, resource allocation, application of technology and
medical support and more importantly, the positive attitude and
responsive behaviour of the Malaysian population in adhering to
rules and regulations set out by the authorities.
INTRODUCTION
Keywords: Movement Control Order, Survival Data Analysis
Following the detection of the
COVID-19 virus in Wuhan,
China in late December
2019, the World Health
Organization (WHO) has been
advocating both medical
and non-medical strategies
to mitigate the proliferation
of the disease (WHO, June
2020; WHO, January 2021).

106 Media Matters Report 2021
INTRODUCTION
measures of central tendency or dispersion are easy to compile
and more so, easy to understand and use (Kapur & Saxena,
1999; Owen and Jones, 1985; Manikandan, 2011; Junyong In
and Sangseok Lee, 2017;). Specifically, data in frequency format
provide a quick glance at the entire data conveniently; can spot
maximum and minimum values; and can observe whether they
are concentrated in one area or spread out across the entire
scale; can be converted into single measures of central tendency
and dispersion. (Owen and Jones, 1985; Manikandan, S., 2011;
Junyong In and Sangseok Lee, 2017).
However, for the inter-country comparisons, the frequency-
based data or single measures of central tendency and
dispersion have limitations and lack statistical efficiency for
several reasons (Kapur & Saxena, 1999; Owen and Jones,
1985; Manikandan, 2011; Junyong In and Sangseok Lee,
2017; Charles and Corrinne, 2018). The challenges include
too many observations in the data set and that it is subject to
high fluctuations in revealing patterns and trends. An additional
concern arises in the determination of the number of class
intervals, which are fairly arbitrary and determined depending on
the size of the data. Countries covered in the study also have
great variations in terms of intensity of COVID-19 infections,
geography, demography, socio-economic standing, levels and
quality of health care. Meanwhile, summary measures like mean,
median and mode tend to suffer from distorting effects due to the
presence of extreme high or low scores in the data set.
This paper attempts to benchmark the performance of nations in
relation to the efficacy of their MCO implementation by gauging
the hazard or force of new infections rate using Survival Data
Analysis (SDA) procedures. Pertinently, the SDA methodology
is typically used in clinical environment settings (Kleinbaum
and Klein, 2012; Elisa and John Wenyu, 2013; John et al,
2017) or in reliability life testing experiments in engineering and
manufacturing plants (Sinha, 1986; Laura and Geoffrey, 2010;
Kleinbaum and Klein, 2012). However, in this exercise, an
attempt is being made to measure the force of new COVID-19
infections in the context of public policy.
RESEARCH OBJECTIVES
The research aimed at identifying the best-fit survival model among the four well-known survival models namely Exponential, Weibull,
Gompertz and Linear Exponential distributions entailed the following objectives:
The SDA procedures will be undertaken for each country covered in the study.
To expound the merits and demerits of depicting COVID-19 data using frequency distributions in time-series format and its
inherent statistical limitations for making inter country comparisons on gauging the efficacy of MCOs that were implemented
to mitigate the COVID-19 disease.1
To fit an appropriate statistical distribution for the data on new COVID-19 cases using survival data analysis (SDA)
procedures as the data have “survival time” characteristics. Exponential, linear exponential, Weibull and Gompertz are the
commonly used hazard models, which will be explored in this analysis.2
To describe the characteristic functions of the waiting time phenomena once an appropriate statistical model has been
constructed and its scale and shape parameters are being estimated.3
To interpret the inter country comparisons of results and elucidate the best practices and lessons learnt of countries under
study.4

107Media Matters Report 2021
LITERATURE REVIEW
SDA procedures are typically used in medical and clinical settings
that study the survival time of patients who are subjected to various
forms of medical diagnosis. As such, survival time can relate to time
of death for patients having a certain disease to time to getting cured
from a certain disease (Nasejje, 2015).
In sociology, the survival time is a duration analysis, such as time to find a new job after a period of unemployment or time until re-arrest
after release from prison, etc. (Kishore et al, 2010). In the engineering field, survival time analysis refers to reliability analysis, that is, time
to the failure of a machine equipment in life-testing experiments (Laura & Geoffrey, 2010). Succinctly, survival time is the time elapsed
from an initial event to a well-defined endpoint such as duration involved from birth to death (age duration) or from birth to breast cancer
detection (age duration) or from disease onset to death (disease duration) or marriage to divorce (duration of marriage) etc. (Marie
Raissa NYINAWAJAMBO, 2018; Nasejje, 2015; Kishore et al, 2010).
Daily records of new COVID-19 cases or recovery or deaths have the time elapse characteristics that can be investigated under the survival analysis procedures.
The procedures provide a set of statistical concepts, models and methods for studying the occurrences of
events over time for several subjects and is mostly conducted using survival curves, also referred to as survival
functions (Nasejje, J., 2015; Kishore, J., Khanna, P., Goel, M.K., 2010). In other words, in this exercise, the
SDA procedure is essentially aimed at identifying the appropriate survival distribution for each country. The
well-known survival distributions that are typically considered include Exponential, Compertz, Weibul and
Linear Exponential. Lifetable technique, Cox proportional hazards regression model and MLE procedures that
are considered for obtaining refined scale and shape parameters (Elisa T. Lee and John Wenyuwang, 2013).
The parameters can be used for generating linear hazard plots that are deemed appropriate for making easy
and meaningful inter-country comparisons. However, this study focuses only on the number of new cases of
COVID-19, which can be construed as a surrogate measure for gauging the efficacy of MCO implementation
in a country.

108 Media Matters Report 2021
METHODOLOGY
Study coverage:
The study covered a total of twelve countries across the globe that were selected based on intensity of infection
and death, geographical spread, level of development and political and cultural affiliations. These include
Malaysia, China, Singapore, Japan, South Korea, United Kingdom, Italy, Spain, Nigeria, Iran, Brazil and United
States of America; in total the coverage alone constituted 40.3 percent of total confirmed cases and 45.1 percent
of overall deaths, as of 20 November 2020 when the study commenced.
Study scope:
The study only explored the variable pertaining to the number of new COVID-19 infections which is construed as
a surrogate measure for determining the efficacy of cordon sanitaire measures or MCO.
Reference period Wave I/II:
The study considered the time period of 25 January 2020 to 5 August 2020. Thus, this stipulated duration was
considered as Wave I / II, constituting twenty-eight weeks. Daily records from WHO were converted to weekly
reports to avoid the incidences of intermittent zeros that posed computational problems in SDA statistical
procedures.
Conceptual notion:
The study is premised upon the conceptual notion of survival time S(t) and hazard function as per below:
i. S(t) = Pr (T>t),
where Pr ( ) stands for the probability and T is a random variable denoting the time duration until an event outcome occurs (Elisa, 1980; Regina et al, 1980; Kleinbaum and Klein, 2012; Klein and Moeschberger, 2012; Elisa and John Wenyu, 2013). In the context of the COVID-19 phenomena, the time duration refers to free from infection and survives longer than (t); that is, not occurring by the time (t).
ii. Accordingly, the hazard function h(t) of survival time T gives the conditional failure rate (Elisa, 1980; Regina et al, 1980; Elisa, 1992;
Kleinbaum and Klein, 2012; Klein and Moeschberger, 2012; Elisa and John Wenyu, 2013) as per definition below.
h(t) = limAt 0 At
{Pr{t T t+ tlT t}

109Media Matters Report 2021
SDA Methodological Steps
1 The SDA procedure entails constructing a non-parametric life table for determining the hazard and survival function values.
2 The hazard h(t) and cumulative hazard H(t) graphical procedures to identify the linearity relationship that can be used for estimating scale and shape parameters.
3 The Gehan-Siddiqui semi-parametric regression estimation procedure is deployed to identify the statistical distribution and also to obtain initial estimates of scale and shape parameters.
4 The Maximum Log Likelihood procedures is an integral component of regression procedure to identify the best fitting model among the competing models.
5As a parametric estimation procedure, the MLE procedure is used to obtain the refined measures of scale and shape parameters. The MLE used weighted procedure in which the number of new infections are considered as weights. This is undertaken by using the Newton-Raphson iteration procedure in an Excel Worksheet.
TABLE 1: The non-parametric, graphical and semi-parametric estimation procedure used hazard and survival function values in the life-table columns and theoretical estimation procedure of popular survival models.
Survival Distribution
LinearRelationship
X Y Scaleparameter ( )
Shapeparameter ( )
Exponential distribution
h(t)=constant X=t Y=h(t) is a constant over time.Horizontal line with
slope b=0
Linear Exponential distribution
h(t) = + t X=t Y=h(t) a= increasing trendb= slope of the
linear plot
Weibull distribution h(t) = t ( -1) X=ln (t) Y= ln [h(t)] = [ ](1/Y) =b+1.
Weibull distribution H(t) = ( t) X=ln (t) Y= ln [H(t)] = b=
Gompertz distribution
h(t) = exp ( + t) X=t Y=ln [h(t)] a= b=
METHODOLOGY

110 Media Matters Report 2021
FINDINGS AND ANALYSIS
The profile of summary statistics of newly infected COVID-19 data by country are shown in Table 2, which revealed great inherent
variations in the dataset thus useful for making meaningful comparisons among the nations regarding the efficacy of MCO
implementation.
The graphical investigation revealed that none of the hazard or cumulative hazard plots provided a perfect or almost near perfect linear fit. Nonetheless, effort was made to obtain a linear trend (Y=a+bX) for the best linear fit. Thus, it was obtained and accordingly the scale and shape parametric values were estimated as shown in the Table 3, where it shows only
TABLE 2: Summary Statistics Based on Frequency Distribution
Country Malaysia China South Korea Japan Singapore United Kingdom Spain Italy USA Brazil Nigeria Iran
Maximum Value 1,112 31,822 3,617 3,601 5,873 33,923 59,196 37,812 465,546 320,702 4,464 19,795
Week Maximum Occurred 11th week 6th week 7th week 13th week 13th week 10th week 11th week 9th week 27th week 22nd week 18th week 6th week
Weighted Mean (μ) 12.7 6.0 11.0 18.9 17.6 13.7 14.2 10.9 20.5 20.2 18.3 16.2
Standard Deviation (o) 4.67 3.01 6.99 6.63 4.85 5.08 7.85 4.37 5.70 4.91 4.89 7.22
Coefficient of Variation (%) 36.7 49.9 63.8 35.1 27.6 36.4 55.3 40.3 27.8 24.3 26.8 44.7
Range 1,110 31,818 3,613 3,600 5,864 33,922 59,194 37,809 465,543 320,696 4,463 19,696
Skewness (sk) 1.08 8.83 8.83 0.61 (0.53) (0.68) 3.14 0.59 0.08 (1.72) (1.40) 0.01
Kurtosis (a4) (0.22) 9.27 9.28 1.27 (0.45) (0.56) 2.23 0.77 (0.28) (1.75) (1.36) 0.14
Graphical Model: Malaysia Scale ( ) Shape ( ) Remark
Hazard plot h(t): Linear exponential distribution 0.0024 0.0011 Valid
Hazard plot h(t): Weibull Distribution 0.001292 1.1579 Valid
Cumulative hazard H(t) plot: Weibull Distribution 3.14 E-13 0.2152 Valid
Graphical Model: China Scale ( ) Shape ( ) Remark
Hazard plot h(t): Weibull Distribution 2.33E139 1.0159 Valid
Cumulative hazard H(t) plot: Weibull Distribution 9.27 E-11 0.1952 Valid
Graphical Model: South Korea Scale ( ) Shape ( ) Remark
Hazard plot h(t): Linear exponential distribution 0.0058 0.0005 Valid
Hazard plot h(t): Weibull Distribution 1.29E-31 1.0956 Valid
Cumulative hazard H(t) plot: Weibull Distribution 4.029E-13 0.1876 Valid
Graphical Model: Japan Scale ( ) Shape ( ) Remark
Hazard plot h(t): Weibull Distribution 1.51E-24 1.1639 Valid
Cumulative hazard H(t) plot: Weibull Distribution 1.99E-14 0.2668 Valid
Graphical Model: Singapore Scale ( ) Shape ( ) Remark
Hazard plot h(t): Weibull Distribution 2.13E-19 1.2227 Valid
Cumulative hazard H(t) plot: Weibull Distribution 2.836E-14 0.2642 Valid
Graphical Model: United Kingdom Scale ( ) Shape ( ) Remark
Hazard plot h(t): Weibull Distribution 7.645E18 1.2437 Valid
Cumulative hazard H(t) plot: Weibull Distribution 4.238E-12 0.3468 Valid
TABLE 3: Summary results of Graphical Plots
Graphical Model: Malaysia Scale ( ) Shape ( ) Remark
Hazard plot h(t): Linear exponential distribution 0.0024 0.0011 Valid
Hazard plot h(t): Weibull Distribution 0.001292 1.1579 Valid
Cumulative hazard H(t) plot: Weibull Distribution 3.14 E-13 0.2152 Valid
Graphical Model: China Scale ( ) Shape ( ) Remark
Hazard plot h(t): Weibull Distribution 2.33E139 1.0159 Valid
Cumulative hazard H(t) plot: Weibull Distribution 9.27 E-11 0.1952 Valid
Graphical Model: South Korea Scale ( ) Shape ( ) Remark
Hazard plot h(t): Linear exponential distribution 0.0058 0.0005 Valid
Hazard plot h(t): Weibull Distribution 1.29E-31 1.0956 Valid
Cumulative hazard H(t) plot: Weibull Distribution 4.029E-13 0.1876 Valid
Graphical Model: Japan Scale ( ) Shape ( ) Remark
Hazard plot h(t): Weibull Distribution 1.51E-24 1.1639 Valid
Cumulative hazard H(t) plot: Weibull Distribution 1.99E-14 0.2668 Valid
Graphical Model: Singapore Scale ( ) Shape ( ) Remark
Hazard plot h(t): Weibull Distribution 2.13E-19 1.2227 Valid
Cumulative hazard H(t) plot: Weibull Distribution 2.836E-14 0.2642 Valid
Graphical Model: United Kingdom Scale ( ) Shape ( ) Remark
Hazard plot h(t): Weibull Distribution 7.645E18 1.2437 Valid
Cumulative hazard H(t) plot: Weibull Distribution 4.238E-12 0.3468 Valid

111Media Matters Report 2021
FINDINGS AND ANALYSIS
TABLE 2: Summary Statistics Based on Frequency Distribution
Country Malaysia China South Korea Japan Singapore United Kingdom Spain Italy USA Brazil Nigeria Iran
Maximum Value 1,112 31,822 3,617 3,601 5,873 33,923 59,196 37,812 465,546 320,702 4,464 19,795
Week Maximum Occurred 11th week 6th week 7th week 13th week 13th week 10th week 11th week 9th week 27th week 22nd week 18th week 6th week
Weighted Mean (μ) 12.7 6.0 11.0 18.9 17.6 13.7 14.2 10.9 20.5 20.2 18.3 16.2
Standard Deviation (o) 4.67 3.01 6.99 6.63 4.85 5.08 7.85 4.37 5.70 4.91 4.89 7.22
Coefficient of Variation (%) 36.7 49.9 63.8 35.1 27.6 36.4 55.3 40.3 27.8 24.3 26.8 44.7
Range 1,110 31,818 3,613 3,600 5,864 33,922 59,194 37,809 465,543 320,696 4,463 19,696
Skewness (sk) 1.08 8.83 8.83 0.61 (0.53) (0.68) 3.14 0.59 0.08 (1.72) (1.40) 0.01
Kurtosis (a4) (0.22) 9.27 9.28 1.27 (0.45) (0.56) 2.23 0.77 (0.28) (1.75) (1.36) 0.14
valid models as per and are positive. Interestingly, none of the hazard plot based on Gompertz distribution provided a valid model attributing to <0 for all countries. The countries registered a valid model fit for linear exponential that has characteristics of constant hazard or Weibull distribution that has a “drag effect” phenomena.
TABLE 3: Summary results of Graphical Plots
Graphical Model: Spain Scale ( ) Shape ( ) Remark
Hazard plot h(t): Linear exponential distribution 0.0012 0.0005 Valid
Hazard plot h(t): Weibull Distribution 4.064E-23 1.1762 Valid
Cumulative hazard H(t) plot: Weibull Distribution 1.740E-12 0.3046 Valid
Graphical Model: Italy Scale ( ) Shape ( ) Remark
Hazard plot h(t): Linear exponential distribution 0.0006 0.0049 Valid
Hazard plot h(t): Weibull Distribution 1.805E-20 1.178 Valid
Cumulative hazard H(t) plot: Weibull Distribution 1.389E-11 0.3111 Valid
Graphical Model: USA Scale ( ) Shape ( ) Remark
Hazard plot h(t): Weibull Distribution 2.190E-15 1.4204 Valid
Cumulative hazard H(t) plot: Weibull Distribution 9.602E-17 0.4569 Valid
Graphical Model: Brazil Scale ( ) Shape ( ) Remark
Hazard plot h(t): Weibull Distribution 2.05E-17 1.2871 Valid
Cumulative hazard H(t) plot: Weibull Distribution 1.128E-13 0.3481 Valid
Graphical Model: Nigeria Scale ( ) Shape ( ) Remark
Hazard plot h(t): Weibull Distribution 3.045E-18 1.2412 Valid
Cumulative hazard H(t) plot: Weibull Distribution 5.880E-14 0.2826 Valid
Graphical Model: Iran Scale ( ) Shape ( ) Remark
Hazard plot h(t): Weibull Distribution 8.767E-36 1.0788 Valid
Cumulative hazard H(t) plot: Weibull Distribution 1.654E-16 0.1397 Valid

112 Media Matters Report 2021
FINDINGS AND ANALYSIS
TABLE 4: Summary of Regression Results
Country WeightsWeibull Distribution Linear Exponential Distribution
Scale ( ) Shape ( ) Log L Scale ( ) Shape ( ) Log L
Malaysia
W=1 0.0194 2.3625 -205,586 <0 InvalidW= b*n 0.0171 2.2763 -966,888 0.00056 0.00103 890,001
W= 0.0023 1.8242 -1,068,951 <0 Invalid
China
W=1 0.0194 2.3625 -205,586 <0 InvalidW= b*n 0.0171 2.2763 -966,888 0.00056 0.00103 -890,001
W= 0.0023 1.8242 -1,068,951 <0 Invalid
South Korea
W=1 0.0147 1.9426 -960,440 0.0061 0.0005 -836,894W= b*n 0.0173 2.0761 -947,566 0.01042 0.00011 -750,169
W= 0.00629 2.1559 -1,327,507 <0 Invalid
Japan
W=1 0.0131 2.5399 -3,910,713 <0 InvalidW= b*n 0.0133 2.5450 -3,893,841 <0 Invalid
W= 0.0711 2.5222 -1,552,483 <0 Invalid
Singapore
W=1 0.0164 2.7192 -6,387,305 <0 InvalidW= b*n 0.0123 2.4427 -6,620,173 <0 Invalid
W= 0.00506 2.3078 -8,343,141 <0 Invalid
United Kingdom
W=1 0.0243 3.453 -31,237,066 <0 InvalidW= b*n 0.0292 3.7886 -30,476,212 <0 Invalid
W= 0.00003 1.1484 -51,414,818 <0 Invalid
Spain
W=1 0.0171 2.9696 -37,645,154 0.00145 0.0005 -34,534,303W= b*n 0.0213 3.2809 -21,514,054 0.00410 0.00027 -29,064,327
W= 0.00113 2.1152 -33,190,689 <0 Invalid
Italy
W=1 0.0252 3.0869 -19,041,270 0.00520 0.0006 -14,894,683W= b*n 0.0407 3.9430 -32,710,186 0.00099 0.00133 -19,569,191
W= 0.00005 1.1992 -32,134,445 <0 Invalid
United States of
America
W=1 0.213 4.5993 -779,445,090 0.00701 0.0010 -468,875,735W= b*n 0.0199 4.4764 -791,634,514 <0 Invalid
W= 0.0001 1.7528 1,314,285,972 <0 Invalid
Brazil
W=1 0.0208 3.6416 -368,692 <0 InvalidW= b*n 0.0198 3.5578 -591,656,465 <0 Invalid
W= 0.00874 2.8995 -730,007.314 <0 Invalid
Nigeria
W=1 0.0199 3.0449 -6,810,173 <0 InvalidW= b*n 0.0171 2.8561 -6,970,054 <0 Invalid
W= 0.0175 3.2929 -7,636,386 <0 Invalid
Iran
W=1 0.0133 1.6825 -11,992,623 <0 InvalidW= b*n 0.0111 1.5461 -33,695,046 0.00278 0.00026 -27,753,993
W= 0.0113 1.7491 -35,817,913 0.00126 0.00027 -51,402,674
1vh(i)
1vh(i)
1vh(i)
1vh(i)
1vh(i)
1vh(i)
1vh(i)
1vh(i)
1vh(i)
1vh(i)
1vh(i)
1vh(i)

113Media Matters Report 2021
FINDINGS AND ANALYSIS
TABLE 5: Summary of MLE results
Based on the assumed survival distributions namely Linear Exponential., Weibull and Gompertz and three options of weights
namely W=1 (equal weights), W=bini (interval width * number of cases exposed) and W= 1
vh(i) (reciprocal of variance of hazards in
the ith interval) considerations the results of the regression analysis are shown in Table 3. The columns of the life-table provided the
requisite inputs for X= t or ln (t) and Y= h(t) or ln (t) as per model specification. The Maximum Log Likelihood measures confirmed
that Weibull distribution was deemed the best fit for new COVID-19 case data.
A. Summary of MLE Results
Country MLE: Scale ( ) MLE: Shape ( ) Initial Estimate of Shape ( )
Malaysia 0.05901 2.4895611 2.3625
China 0.05435 3.67566924 3.6235
South Korea 0.05871 2.54883364 2.0761
Japan 0.05836 2.622365 2.5450
Singapore 0.05710 2.903853995 2.7192
United Kingdom 0.05447 3.63660685899 3.7886
Spain 0.05501 3.4654902298 3.2809
Italy 0.05417 3.73379006 3.0869
United States of America 0.05295 4.17889550753 4.5993
Brazil 0.05291 4.19452394721 3.6416
Nigeria 0.05714 2.89420100015 3.0449
Iran 0.05495 3.48554259 1.6825
Using the initial estimates of scale and shape parameters of best fit models that were obtained under the regression procedures,
the MLE procedure was carried out by solving the equation W( ), aimed at determining parametric solutions shape parameter
and scale parameter , for all the countries. The results of and of MLE are shown in Table 4. It can be seen that final estimates
of scale and shape parameters are different from the estimates of under regression procedure. The results showed that Malaysia
recorded the largest scale value of 0.05901 and lowest value of 0.05291 for Brazil. Examining the shape value, the results showed
that Brazil registered the largest value of 4.1945 and Malaysia recorded the smallest value of 2.4896, indicating the force of new
infections of COVID-19 was highest for Brazil and least for Malaysia.
Comparison of Hazard h(t) or Cumulative Hazard Model H(t) Characteristics Functions Between Malaysia and Brazil
The hazard plots in Figure 1 revealed that Brazil had a lower force of infection than that of Malaysia until the 17th week and
thereafter its hazard rate grew exponentially. An examination of the cumulative hazard plots showed that Brazil’s cumulative force
of infection overtook Malaysia at 23rd week; see Figure 2.
10
0.1
0.2
0.3
0.4
0.5
0.6
0.7
0.8
11 216 16 263 13 238 18 282 12 227 17 275 15 2510 204 14 249 19
Hazard Plot h(t)Malaysia
Brazil
Figure 1: Comparison of Hazard h(t) Characteristics Functions Between Malaysia and Brazil

114 Media Matters Report 2021
FINDINGS AND ANALYSIS
10
1.00000
2.00000
3.00000
4.00000
5.00000
6.00000
11 216 16 263 13 238 182 12 227 175 15 2510 204 14 249 19
Cumulative Hazard H(t)Malaysia
Brazil
Figure 2: Comparison of Cumulative Hazard Model H(t) Characteristics Functions Between Malaysia and Brazil
Qualitative Factors
Malaysia’s success story in managing Wave I of the COVID-19 pandemic is attributed to four key factors, summarised as follows:
i) Political leadership: First factor is the committed leadership who provided strategic thinking and a systematic approach
in handling the COVID-19 pandemic through four stages of cordon sanitaire namely the Movement Control Order (MCO),
Conditional Movement Control Order (CMCO), Restricted Movement Control Order (RMCO) and Recovery Movement Control
Order (RMCO), which adhere to the Prevention and Control of Infectious Diseases and Police Act 1987 (Abdullah et al, 2020;
Shah, et al. 2020; Azah Aziz, et al).
ii) Administrative commitments: Second factor is the efficient mobilisation of resources, financial allocation and appropriation
at all levels of Government. During the first MCO cordon sanitaire, the Government ensured the continuity of provision of
essential services like water, electricity, telecommunications and broadcasting, banking, health care systems and pharmacy,
food supply and retail.
To reduce the social mobility and human-to-human touch, the government banned social, religious, sporting and cultural-
related public gatherings, and domestic and international travel. All educational institutions from kindergartens to universities
were also closed (Abdullah et al, 2020; Shah, et al. 2020; Azah Aziz, et al).
When the COVID-19 situation improved, the relaxation of regulations was introduced through the CMCO where key business
and social activities were allowed, involving limited numbers of people while observing standard operating procedures (SOP).
These included social distancing, hand sanitisation, recording of names, telephone numbers and date of visit either in a
notebook or using QR-code scanning applications to enable contact tracing.
With a further decline in new COVID-19 infections, the Government introduced the CMCO, which was subsequently eased
further with the introduction of the RMCO. Under this strategy, all educational institutions, religious and social functions and all
tourism-related economic activities such as meetings, conventions and exhibitions, travel and trade fairs, spa, wellness and
reflexology centres were allowed to resume their operations but subjected to strict adherence to stipulated SOP (Abdullah et
al, 2020; Shah, et al. 2020; Azah Aziz, et al).
As a fourth strategy, the EMCO was introduced to target specific locations or clusters which recorded high incidences of
COVID-19 incidences. With the support of police and soldiers, the EMCO measures were implemented by closing all roads in
infected locations with barbed wired fences. The enforcement order was instituted for fourteen days and health workers were
allowed to conduct a thorough COVID-19 test on all residents. Residents were not allowed to exit and outsiders were not
allowed in, while all businesses activities within the location were shut down. For sustenance, authorities ensured adequate
food and medical supplies (Abdullah et al, 2020; Shah, et al. 2020; Azah Aziz, et al).

115Media Matters Report 2021
FINDINGS AND ANALYSIS
At medical frontlines, the Government dedicated hospitals and makeshift hospitals equipped with modern facilities for handling
COVID-19 cases; installed health screening procedures and thermal scanners at all points of entry; mobilised retired nurses
and health care service providers assisting in the collection of samples and undertaking swab testing procedures; and medical
alliances constituting professional medical societies and corporate organisations were formed complementing the efforts of
the front liner medical staff and re-stocking of medical supplies.
Towards helping patients who faced loss of income and incurred medical expenses, a dedicated COVID-19 fund was also
established. On the socio-economic front, the Government initiated the PRIHATIN financial package aimed not only at
stimulating the ailing economy but also disbursed financial assistance such as one-off payments for low-income families,
unmarried persons, civil servants and pensioners and e-hailing drivers. Electricity bill discounts, moratorium for car and
housing loans, and deferment of education loans were also included in the financial package. The support given was aimed at
safeguarding the lives and livelihood of people across all levels of society.
iii. Deployment of ICT: The mass media assumed the role of informing the public regarding various aspects of cordon sanitaire,
provided daily updates on the COVID-19 situation and delivered public related messages using simplified diagrams or
infographics regarding hand-washing techniques, wearing of face masks and social distancing (Abdullah et al, 2020; Shah, et
al. 2020; Azah Aziz, et al).
iv. Attitude and behavioural aspect of population: Most of the Governments around the globe followed the standard guidelines
provided by the WHO. However, the success of a particular nation could vary greatly as it depends on its people having the
right attitude and disciplined behaviour. In the case of Malaysia, from the onset, its citizens demonstrated the right attitude
and disciplined behaviour in subduing the proliferation of the virus. Moreover, at the grassroots level, people were helping one
another with daily provisions and supplies especially for families and individuals who lost their earning capacity. This is clearly
demonstrated through the fact that Malaysia did not register any street protests regarding human rights, liberty and freedom
that were being witnessed in other countries.
RECOMMENDATION
CONCLUSION
After 25 August 2020 the number of new cases have begun to rise again with the onset of the third wave (Wave III), which is still
on-going and indeed, the total number of cases by end of March 2021 has increased by twenty-five times compared to the total
number of cases recorded during Wave I / II. Despite various movement restrictions that was similar to Wave I/II, the number of
cases proliferated by leaps and bounds in Wave III because of relaxed implementation strategies and lackadaisical attitude and
behaviours of the people. Thus, the study recommends further investigation on the level of virality between Wave I/II and Wave III
and more so, identifying the determinants of virality.
The SDA procedures efficiently reduces the frequency counts to scale and shape parameters. Besides that, the study has outlined
qualitatively the best practices of Malaysia in containing the spread of COVID-19. Such best practices and lessons learnt can be
used for considerations for other countries and also in handling future situations. As a life-threatening menace and being highly
contagious and infectious, the spread of COVID-19 can only be completely contained with global cooperation and collaboration.

116 Media Matters Report 2021
• Abdullah, J. M., Wan Ismail, W. F. N., Mohamad, I., Ab Razak, A., Harun, A., Musa, K. I., & Lee, Y. Y. (2020). A Critical Appraisal of COVID-19 in Malaysia and Beyond. Malaysian Journal of Medical Sciences, 27(2), 1–9. https://doi.org/10.21315/mjms2020.27.2.1
• Anderson, T.W. (1994). The Statistical Analysis of Time Series (1st ed.). Wiley-Interscience.
• Azah Aziz, Jamal Othman, Halyna Lugova and Adlina Suleiman (2020). Malaysia’s approach in handling COVID-19 onslaught: Report on the Movement Control Order (MCO) and targeted screening to reduce community infection rate and impact on public health and economy. Journal of Infection and Public Health. Volume 13, Issue 12, December 2020, Pages 1823-1829. ELSEVIER.
• Brase C. H., & Brase, C. P. (2017). Understandable Statistics: Concepts and Methods (12th ed.). Cengage Learning.
• Brockwell, P.J., & Davis, R. A. (1998). Time Series: Theory and Methods. Springer.
• Cryer, J.D., & Chan, K-S. (2008). Time Series Analysis: With Applications in R. (2nd edition.). Springer.
• Elandt- Johnson, R.C., &. Johnson, N.L. (1980). Survival Models and Data Analysis. John Wiley & Sons. Inc. USA.
• Freeman, L. J., & Vining, G. G. (2010). Reliability Data Analysis for Life Test Experiments with Subsampling. Journal of Quality Technology, 42(3), 233–241. https://doi.org/10.1080/00224065.2010.11917821.
• Freeman, Michael and Zeegers, Maurice (2016). Forensic Epidemiology Principles and Practice. (1st Editioned.). ISBN: 9780124045842. Academic Press.
• Gehan, E. A., & Siddiqui, M. M. (1973). Simple Regression Methods for Survival Time
• In, J., & Lee, S. (2017). Statistical data presentation. Korean Journal of Anaesthesiology, 70(3), 267. https://doi.org/10.4097/kjae.2017.70.3.267
• Kapur, J. N., & Saxena, H.C. (1999). Mathematical Statistics. Fourth Edition. S. Chand and Company Limited.
• Kishore, J., Goel, M. K., & Khanna, P. (2010a). Understanding survival analysis: Kaplan-Meier estimate. International Journal of Ayurveda Research, 1(4), 274. https://doi.org/10.4103/0974-7788.76794
• Klein, J.P., & Moeschberger, M.L. (2012). Survival Analysis Techniques for Censored and Truncated Data. Springer-Verlag.
• Kleinbaum, D.G. & Klein, M. (2012). Survival Analysis: A Self-Learning Text. (3rd ed.). Springer-Verlag.
• Lee, E. T. (1980). Statistical methods for survival data analysis. Lifetime Learning Publications.
• Lee, E. T. (1992). Statistical Methods for Survival Data Analysis (Wiley Series in Probability and Statistics) (2nd ed.). Wiley-Interscience.
REFERENCES

117Media Matters Report 2021
REFERENCES
• Lee, E. T., & Wang, J.W. (2003). Statistical Methods for Survival Data Analysis (Wiley Series in Probability and Statistics) (3rd ed.). Wiley-Blackwell.
• Manikandan, S. (2011). Frequency distribution. Journal of Pharmacology and Pharmacotherapeutics, 2(1), 54. https://doi.org/10.4103/0976-500x.77120
• Owen, F., & Jones, R. (1983). Statistics (2nd ed.). Longman London and New York.
• Ramasamy, R. (1990). Survival Data Analysis of the Flow of Vital Event Forms in Peninsular Malaysia. [Paper presentation]. Seminar paper submitted as a part of requirements for Post Graduate Course in Population Studies, International Institute of Population Sciences, Deonar, Bombay.
• Ramasamy, R. (2008). Measuring Information and Knowledge Development in the New Millennium [Unpublished master’s thesis]. Research thesis submitted for the award of Master of Philosophy by Multimedia University (MMU), Cyberjaya Multimedia University, Malaysia in 2008.
• Rothe, C., Schunk, M., Sothmann, P., Bretzel, G., Froeschl, G., Wallrauch, C., Zimmer, T., Thiel, V., Janke, C., Guggemos, W., Seilmaier, M., Drosten, C., Vollmar, P., Zwirglmaier, K., Zange, S., Wölfel, R., & Hoelscher, M. (2020). Transmission of 2019-nCoV Infection from an Asymptomatic Contact in Germany. New England Journal of Medicine, 382(10), 970–971. https://doi.org/10.1056/nejmc2001468
• Shah, A. U. M., Safri, S. N. A., Thevadas, R., Noordin, N. K., Rahman, A. A., Sekawi, Z., Ideris, A., & Sultan, M. T. H. (2020). COVID-19 outbreak in Malaysia: Actions taken by the Malaysian government. International Journal of Infectious Diseases, 97, 108–116. https://doi.org/10.1016/j.ijid.2020.05.093
• Sinha, S.K. (1986). Reliability and Life Testing. Wiley Eastern Limited. Bombay, India
• WHO (2020). Coronavirus disease (COVID-19) Weekly Epidemiological Update and
• WHO (January 2021). Coronavirus disease (COVID-19) advice for the public. https://www.who.int/emergencies/diseases/novel-coronavirus-2019/advice-for-public. This content is last updated on 6 January 2021.
• Xia, J., Tong, J., Liu, M., Shen, Y., & Guo, D. (2020). Evaluation of coronavirus in tears and conjunctival secretions of patients with SARS‐CoV‐2 infection. Journal of Medical Virology, 92(6), 589–594. https://doi.org/10.1002/jmv.25725

UNIVERSITI UTARA MALAYSIA
ANI MUNIRAH MOHAMAD, AHMAD SHAMSUL ABD AZIZ, NOR AZLINA MOHD NOOR, YUSRAMIZZA MD ISA @ YUSUFF, HUDA HAJI IBRAHIM, OSMAN GHAZALI
Malaysian Cyberbullying Law:
A Work-in-Progress
118 Media Matters Report 2021

119Media Matters Report 2021
ABSTRACT
In Malaysia, cyberbullying cases are on the rise without any
specific legal sanctions to manage them. Cyberbullying should
be addressed so that its most harmful consequences such
as suicide, theft, and rape can be prevented. Despite the
grievous ramifications, existing laws are inadequate to manage
cyberbullying matters. Hence, this research aims to break new
ground in the existing literature by analysing the adequacy of
Malaysian law in addressing cyberbullying as well as considering
other jurisdictions’ experiences through the adoption of
comparative analysis. This research investigated the relevant
crucial aspects of existing and potential modalities to deal with
cyberbullying that are frequently overlooked. By employing
both qualitative and quantitative research methodologies,
data was collected using library-based research, field work
and online survey. Interviews were conducted with nineteen
cyberlaw experts and practitioners while an online survey was
administered in which hundred and twenty respondents from
the general public participated. The research findings have
indicated that there is no specific law to manage cyberbullying
in Malaysia. As it stands, there are laws that potentially cover
cyberbullying, albeit not specifically referring to cyberbullying.
In the international context, it has been evident from findings of
the present study that the international instruments are generally
not binding upon Malaysia. The study therefore proposes the
creation of a stand-alone law to manage traditional bullying
and cyberbullying. Additionally, the study also recommends
alternative governing modalities for dealing with cyberbullying at
different stages.
Cyberbullying has become a concern that has translated
into law to a larger extent and more technologically mature
jurisdictions such as the United States, the United Kingdom,
Canada, Australia, and Japan as well as in smaller countries
like Singapore and the Philippines. Cyberbullying is analogous
to traditional forms of bullying in that it incorporates persistent
behaviours that instil apprehension and fear. However, with
the advent of new technologies, traditional bullying has taken
on entirely new forms through social media mediums such as
Facebook and WhatsApp. Thus, it requires explication of new
forms of cyberbullying. Cyberbullying takes place when people
use, inter-alia, communications technologies, devices, media
and platforms in order to harm others.
Problem Statement
A number of problems confront the cyberbullying phenomenon in
Malaysia. On the basis of the report issued by the United Nations
Children’s Fund (UNICEF) in 2019 on violence against children
in 30 countries, 3 in 10 young people in Malaysia are victims of
cyberbullying (UNICEF, 2019). A total of 28 percent of the 6,953
young people in Malaysia were recently confirmed being the
victims of online abuse, with 43 percent of them experiencing
online private messaging, and gambling through social media
apps, including Whatsapp, Facebook, Instagram, Twitter and
YouTube. The worrying situation of cyberbullying in Malaysia
is further confirmed by empirical data from local research
regarding cyberbullying prevalence and incidents (Sivabalan et.
al, 2020; Ghazali et. al, 2020; Research Institute Malaysian Youth
Development, 2017).
The present laws are inadequate to address cyberbullying
matters. The lack of legal attention to the issue of cyberbullying
is still a problem facing society today. Analysis of existing cyber
laws and traditional criminal laws on cyberbullying has yielded
no definite results, which in essence means that at present,
cyberbullying by itself, despite its grievous ramifications, is not
outlawed in Malaysia. Numerous international and domestic
investigations have indicated the association between
cyberbullying and various adverse consequences to the victims
such as low self-esteem, anxiety, depression and feeling isolation
(Gordon, 2020; Johanis et. al, 2020; Balakrishnan, 2018).
INTRODUCTION
Keywords: Bullying, cyberbullying, cybersecurity, cyberlaws

120 Media Matters Report 2021
RESEARCH OBJECTIVES
Therefore, this study aimed at achieving four main objectives:
any form of internet access can victimise someone irrespective
of the location. Cyberbullying also transcends the limit of time
as it can be done speedily, at any time of the day, week, or year.
Finally, another significant difference is that cyberbullying is not
limited to any specific age group, and the victim might never
grow out of it.
In the context of the present study, cyberbullying can therefore
have the following operational definitions:
Conceptualising Bullying and Cyberbullying
Bullying is the repeated harassment of an individual towards
another person through physical violence, name-calling,
exclusion, creating false accusations, or any other form of
actions that may cause harm (Olweus, 1993). Generally, bullying
can be seen as forceful, targeted, calculated, undesirable,
immoral, unethical, unaccepted, obscene and offensive actions
directed at other people and displaying an imbalance in power
(OnlineSense, 2016), which can be true or imagined. These are
hardly one-off experiences but they are frequent and periodic.
Bullying usually comes in the form of physical attack and verbal
assaults which include rumour-mongering, defaming comments,
and threats.
The advancement of technology and the internet has made
bullying more difficult to combat and victims easier to be
attacked because now, cyberbullies can hide their identity while
causing harm to the victim. This anonymity is the most significant
difference between traditional and cyberbullying, and it is the
internet that gives such an advantage to the bully. People who
suffer from cyberbullying find it almost impossible to track down
their oppressors which makes cyberbullies different from the
traditional bullies known to everyone.
To further aggravate the situation, cyberbullying is not limited
by location, which means that it goes beyond the classroom,
school, campus, or neighbourhood to the extreme reaches of the
world. A cyberbully who is armed with a laptop, smartphone, or
LITERATURE REVIEW
“premeditated, destructive actions, meted out frequently by a person or group of people with the aid of current technologies against an individual less able to fend off such attacks”
(Juvonen & Gross, 2008)
“a hostile, premeditated action, meted out by a person or group, done repeatedly through the internet to someone who cannot protect him/herself against such attacks”
(Smith et al., 2008)
“a person or group of people who intentionally use information and communication technologies to promote planned and continuous harassment targeted at another person or group of people by writing or posting vicious messages or using pictures to harm such person”
(Mason, 2008)
To investigate the adequacy of Malaysian laws in addressing cyberbullying.1
To conduct comparative studies of legislation of other countries and highlight areas that local legislation is complementary
to and in harmony with international laws, treaties and conventions.2
To identify the gap areas in current laws that need to be developed or enhanced. Additionally, if there were to be specific
laws on cyberbullying, to identify which jurisdiction(s) should it fall under.3
To propose other governing modalities to manage cyberbullying in Malaysia.4

121Media Matters Report 2021
LITERATURE REVIEW
Within the international context, UNICEF has defined “bullying”
as “…intentional and aggressive behaviour occurring repeatedly
against a victim where there is a real or perceived power
imbalance, and where the victim feels vulnerable and powerless
to defend himself or herself.” Therefore, when bullying occurs
in the online world–through computers, cell phones or other
electronic devices–it is referred to it as online bullying or
cyberbullying.
Meanwhile, various nations which have their own set of laws
on cyberbullying also provide the definition of bullying and
cyberbullying. For example, the following excerpt is taken from
The Philippines’ Anti-Bullying Act of 2013:
Generally, these definitions suggest that cyberbullying is the act of bullying taking place in the cyber or virtual world. While both cyberbullying and traditional bullying have similarities such as acts of harassment, threatening and aggression, the cyber environment extends the bullying to provide anonymity, larger time and space that bullying can happen anytime and anywhere. In addition, the bullying act will be permanently stored in the cyberspace. These extend the effect of cyberbullying beyond the traditional bullying. Thus, cyberbullying in this study has been defined as any bullying such as intimidating, harassment, frightening and threatening through an electronic medium, particularly in cyberspace. Key elements to describe cyberbullying will be proposed from this study.
Existing Cyberbullying Prevention Strategies in Selected CountriesIn Malaysia, there are no specific laws for cyber harassment and cyberbullying. Nevertheless, there is a general cyberbullying law which is under the Communications and Multimedia Act 1998. Despite that, it currently does not address specific groups such as students and others. However, the Communication and Multimedia Act 1998 can be used for anything related to cyberbullying such as malicious comments, or which annoying, or insulting that is potentially an offence. On the other hand, the Penal Code could potentially be used for any offline and online physical abuse or death threats if they have been reported. Despite the absence of a specific law in Malaysia, the following efforts have been made to combat cyberbullying, such as Klik Dengan Bijak (KDB) - http://www.klikdenganbijak.my,
Section 2. Acts of bullying - For purposes of this Act, “bullying” shall refer to any severe or repeated use by one or more students of a written, verbal or electronic expression, or a physical act or gesture, or any combination thereof, directed at another student that has the effect of actually causing or placing the latter in reasonable fear of physical or emotional harm or damage to his property; creating a hostile environment at school for the other student; infringing on the rights of the other student at school; or materially and substantially disrupting the education process or the orderly operation of a school.
CyberSAFE Malaysia - https://www.cybersafe.my as well as CyberSafe in school - https://cybersafeinschools.my.
Meanwhile, in the international context, such as in the United States, a customised curriculum called I-SAFE curriculum has been developed covering aspects such as internet safety, cyber community citizenship, cybersecurity, personal safety, intellectual property, and law enforcement online (Chibnall, Wallace, & Leicht, 2006). Additionally, the community is encouraged to push for anti-bullying legislation and internet safety policies at the state, local, and district levels (Feinberg & Robey, 2008). Meanwhile, in England, the Department of Education has published a blueprint to deal with cyberbullying at the school level. Comprehensive resources which includes, among others, an interactive anti-bullying information tool for parents and carers and free online training.
In the Philippines, the government has acknowledged cyberbullying as a threat, especially towards children and started to adopt some policies and legal instruments. The Republic Act No. 10627 or the Anti-Bullying Act of 2013 has been enacted to curb cyberbullying among students by making elementary (i.e., primary) and secondary schools prepare and implement guidelines over the matter. On the other hand, in Japan, the Anti-Bullying Act was first initiated by the Japanese government on 28 June 2013, which was then legislated three months later, following the bullying incident of a school student that ended up in suicide. The Act is the first law in Japan that explicitly prevents school bullying. It also includes other related features such as measures for cyberbullying.
The Need for a Specific Legal Framework for Managing CyberbullyingAccording to the findings of a global survey, Malaysia is among the world’s top countries (i.e., ranked sixth among twenty-eight countries in a study on cyberbullying) where parents have reported their children experiencing cyberbullying (The Star, 2019). The survey found that 23 percent of Malaysian parents admitted their children had experienced cyberbullying. Another survey by UNICEF revealed a startling eight out of ten participants surveyed claimed they had fallen victim to bullying in school (The Star, 2019). Even though cyberbullying incidents are on the rise, Malaysia does not have a specific law pertaining to cyberbullying. To date, the Philippines and Singapore are the only two Asian countries which have specific laws for cyberbullying, namely, the Protection from Harassment Act (POHA) in Singapore, and the Anti-Bullying Act of 2013 in the Philippines. Although Malaysia has several written rules which can be used to address cyberbullying, the country should have a specific stand-alone law to address the increasing number of cyberbullying cases.

122 Media Matters Report 2021
METHODOLOGY
The study employed a phenomenological design in which a key phenomenon is investigated (i.e., cyberbullying). The key elements that
were investigated in the study are four-fold in tandem with the objectives of the study:
In the present study, data was collected using two instruments: firstly, qualitative interviews with experts on cyberlaw from government
and non-government organisations, industry practitioners, health practitioners, enforcement officers and higher learning institutions
(sample size: nineteen), and secondly, a quantitative online survey administered to the general public (sample size: hundred and twenty).
The purpose of using two sets of instruments is to enable triangulation to be made between the views of the experts and practitioners
with the understanding and perceptions of the general public. This in turn would increase the validity and reliability of the findings of the
study. The analysis of qualitative data from the interviews and open-ended question of the survey was carried out using computer-aided
qualitative data analysis software ATLAS.ti version nine. The coding process of the data was done using a purely inductive approach,
for which the true meanings of the responses from the interview participants and survey respondents were coded into specific themes
for the purpose of reporting. Meanwhile, the analysis of the quantitative data from the survey was performed using and retrieved directly
from the Microsoft (MS) Office Form, for the purpose of reporting.
The adequacy of the
current Malaysian laws in
addressing cyberbullying.
1The legal position of
cyberbullying in the
international context
(international, regional
and other nations).
2
The gaps that exist in
the Malaysian laws and
the international laws in
addressing cyberbullying.
3
Other governing
modalities in managing
cyberbullying.
4
FINDINGS AND ANALYSIS
Malaysia does not have a specific law on bullying, let alone cyberbullying. However, there are laws in Malaysia that are, even though scattered, could potentially cover cyberbullying. Such laws are categorised into general constitutional provisions on freedom of speech, criminal, cyber and civil laws. For this purpose, the following laws could potentially cover cyberbullying within the ambit of this present study:
Nevertheless, these laws have been found to be inadequate to appropriately address cyberbullying in Malaysia. This is understandable given that such laws would be specific for the purpose in which they have been legislated within the context of their statutes, and no specific reference has been made to bullying or cyberbullying.
Additionally, the data from the interviews indicates that the interview participants observed that cyberbullying should be criminalised, but it might be different for cases involving child perpetrators. In this regard, it was further observed that extended research would need to be carried out to clearly define cyberbullying before it could be treated as a crime. Accordingly, few participants viewed that different forms of punishment should be applied based on the different types or age of perpetrators. In terms of the adequacy of Malaysian laws in addressing cyberbullying, majority of the participants opined that the existing laws had been inadequate and insufficient to properly address cyberbullying.
1 Objective: Malaysian Laws on Cyberbullying
Criminal law• Section 503 and 509 of Penal Code• Section 4 of Sexual Offences against Children Act 2017
2General provision on freedom of speech• Article 10 of Federal Constitution1
Civil Law• Section 81B of Employment Act 1955• Section 20 of Industrial Relation Act 1967• Section 15 of Occupational Safety and Health Act 1994• Section 4 of Defamation Act 1957• Section 130 of Education Act 1996
4
Cyber Law• Section 233 of Communications and Multimedia Act
1998• Section 36 A and 36B of Copyright Act 1987• Section 4 of Computer Crimes Act 1997
3

123Media Matters Report 2021
Within the context of international laws on cyberbullying, there are various laws which rightly cover cyberbullying expressly or within its context.
For this purpose, the following international and regional instruments have been found to be addressing cyberbullying:
What could be gathered from the review of the laws is that international and regional instruments are generally not binding on Malaysia, and
even if they were, these international and regional instruments would not provide adequate recourse for cyberbullying.
2 Objective: International Laws on Cyberbullying
FINDINGS AND ANALYSIS
Legally binding international instruments
• Article 19.1 of United Nations Convention on the Rights of the
Child Article 19.1 of United Nations Convention on the Rights
of the Child (UNCRC)
• Articles 4 and 5 of Budapest Convention on Cybercrime and
Its Additional Protocol
• The Commonwealth of Independent States’ Agreement on
Cooperation in Combating Offences related to Computer
Information of 2001
• Arab League’s (formerly known as the League of Arab States)
Arab Convention on Combating Information Technology
Offences of 2010
• Shanghai Cooperation Organization’s Agreement on
Cooperation in the Field of International Information Security
of 2009
• African Union Convention on Cyber Security and Personal
Data Protection of 2014
• African Union Convention on the Establishment of a Legal
Framework Conducive to Cybersecurity in Africa (2012)
• Council of European Union’s Resolution on a Concerted Work
Strategy and Practical Measures Against Cybercrime
• Directive 2002/58/EC of the European Parliament and of
the Council of 12 July 2002 concerning the processing of
personal data and the protection of privacy in the electronic
communications sector (Directive on privacy and electronic
communications)
• Frame Decision 2005/222/WSiSW [Council Framework
Decision 2005/222/JHA of 24 February 2005 on Attacks
Against Information Systems]
Non-binding international instruments
• United Nations Human Rights Council’s Resolution on the
“Promotion, Protection and Enjoyment of Human Rights on
the Internet” [27 June 2016, U.N. Doc. No. A/HRC/32/L.20]
• United Nations General Assembly’s Resolution on the “Right
to Privacy in the Digital Age” [Third Committee, 1 November
2013, U.N. Doc. A/C.3/68/L.45]
• United Nations General Assembly’s Resolution on the
“Protecting Children from Bullying” [18 December 2014,
U.N. Doc. No.A/69/158]
• United Nations General Assembly’s Resolution on the
“Protecting Children from Bullying” [19 December 2016,
U.N. Doc. No.A/71/176]
• United Nations General Assembly’s Resolution on the
“Protecting Children from Bullying” [17 December 2018,
U.N. Doc. No.A/73/154]
• Economic and Social Council’s Resolution 2011/33 on
Prevention, Protection and International Cooperation
against the Use of New Information Technologies to Abuse
and/or Exploit Children
• International Telecommunication Union (ITU) Guidelines on
Child Online Protection 2020
• League of Arab States Model Law on Combating
Information Technology Offences (2004)
• International Telecommunication Union (ITU)/Caribbean
Community (CARICOM)/Caribbean Telecommunications
Union (CTU) Model Legislative Texts on Cybercrime,
e-Crime and Electronic Evidence (2010)
• Common Market for Eastern and Southern Africa (COMESA)
Cybersecurity Draft Model Bill (2011)
1 2

124 Media Matters Report 2021
Additionally, various countries in Asia particularly and around the world have passed their own national laws to specifically manage cyberbullying and harassment. Examples of other nations’ laws on cyberbullying are presented below:
These selected jurisdictions possess stand-alone legislation to deal with the issue of bullying, cyber bullying and harassment. Generally, these laws provide for legal recognition of bullying, cyberbullying and harassment as a wrong. Not only do these laws provide for the relevant sanctions to the perpetrators of bullying, they also provide for legal remedies and relief to the victims of bullying, as well as prevention strategies to be adopted by the relevant parties such as development of anti-bullying policies in schools and learning institutions (e.g. the Phillippines, Singapore, and United Kingdom). Apart from that, a few states have even passed laws for the promotion of good practices of ICT and the internet as well as prevention of harmful communications (e.g. Australia, Canada, United Kingdom, and New Zealand). Accordingly, other nation’s cyberbullying laws (e.g. the Philippines, Singapore, South Korea, Australia, United Kingdom, and New Zealand) are worthy of investigation for lessons learned, to suit local circumstances.
There is an urgent need to address the gaps in the law by the conceptualisation of the general definition of bullying and cyberbullying, determination of duty of care in cyberbullying cases, specification for punishment for perpetrators of cyberbullying, provision of remedies for perpetrators and victims of cyberbullying, and creation of stand-alone legislation to curb cyberbullying. This was concluded after reviewing Malaysian laws as well as international laws on cyberbullying, and considering various aspects as follows:
FINDINGS AND ANALYSIS
3 Objective: Gaps in Malaysian Laws and International Laws on Cyberbullying
Singapore• Protection from Harassment Act 2014• Computer Misuse and Cybersecurity Act 1993
Japan• Act for the Promotion of Measures to
Prevent Bullying (2013)
Philippines• Anti-Bullying Act of 2013• Revised Penal Code and Cybercrime
Prevention Act of 2012• Civil Code of the Philippines• Labour Code of the Philippines
New Zealand• Harmful Digital Communications Act 2015• Harassment Act 1997
South Africa• Protection from Harassment Act 2010
United Kingdom• Protection from Harassment Act 1997• Computer Misuse Act 1990• Malicious Communications Act 1988• Criminal Justice and Licensing (Scotland) Act 2010
United States (Selected States)• Texas’ Senate Bill 179 David’s Law (2017)• California’s AB1542, “Jordan’s Law” (2017), AB 9 “Seth’s Law” (2011) and California Assembly Bill 2291• Washington’s Rev. Code Wash. (ARCW) § 28A.300.285 (2013)
The non-criminality status of traditional
bullying and cyberbullying in
Malaysia.
1The absence of specific law
to address cyberbullying in
Malaysia.
2The inadequacy of the various laws in
Malaysia to address cyberbullying.
3The non-applicability
of international instruments to the Malaysian context.
4The inadequacy of the applicability of
cases of international instruments to the Malaysian
context to manage cyberbullying in
Malaysia.
5

125Media Matters Report 2021
FINDINGS AND ANALYSIS
The data from interviews and survey indicate that there were various potential governing modalities for cyberbullying that could be adopted, apart from creation of specific laws to govern this act. First and foremost, existing efforts by the government and non-governmental organisations were in abundance. The interviewed experts outlined various programmes and efforts in curbing cyberbullying, as illustrated in the following Figure 1.
In this regard, such governing modalities as proposed by the interview experts could be divided into two parts, namely, (1) preventive measures, and (2) handling of cyberbullying cases, as illustrated in the following Figure 2.
4 Objective: Alternative Governing Modalities for Cyberbullying
Conceptualisation of Legislative Definitions of Bullying and Cyberbullying
There has been no definite conceptualisation of bullying and cyberbullying under Malaysian law to date; hence, there would be a dire need for the proper conceptualisation of legislative definitions of bullying and cyberbullying in Malaysia, to define what elements and actions constitute bullying.
1
Specification for Punishment for Perpetrators of Cyberbullying
There has been a huge gap in the provision of legal sanctions for the punishment for perpetrators of cyberbullying to date; hence, there would need to be a proper specification for such punishment and given the different nature of adults and children, whether there should be a difference in terms of punishment between adult and child perpetrators.
3
Provision of Remedies for Perpetrators and Victims of Cyberbullying
In the absence of legal provisions on the remedies for cyberbullying, no definite relief may be awarded for both perpetrators and victims of cyberbullying. Therefore, there would be an urgent need for specific provisions to be in place to provide for the specific remedies for both perpetrators and victims of cyberbullying.
4
Creation of Stand-Alone Legislation to Curb Cyberbullying
Given the serious ramifications of cyberbullying, it would be pertinent for steps be taken to draft a specific and stand-alone legislation on anti-bullying and anti-cyberbullying.
5
Determination of Duty of Care in Cyberbullying Cases
It would also be pertinent to determine the duty of care in cyberbullying cases, who should be the caretaker of the actions by the perpetrators, and if would make a difference between adult and child perpetrators of cyberbullying. Additionally, it would also be important to determine the duty of care of persons involved in the cyberbullying framework such as the schools, parents, friends and caretakers.
2
15 Efforts by Government/
NGO to address cyberbullying
15
Publication15Counselor’s Roles
15
Cybercrime
Unit
15
#Stand
tog
ether
hastag
15In
stitu
tiona
l P
olic
ies
15
School’s
Policies
15Collaboration
15Channel for
Victims
15
Cam
paign/
Aw
areness
15C
hild
P
rote
ctio
n P
olic
ies
15Res
earc
h
FIGURE 1: Interview Participants’ Views on the Existing Efforts by Organisations in Curbing Cyberbullying

126 Media Matters Report 2021
In terms of governing modalities for cyberbullying, the management and control of cyberbullying could be divided into two main dimensions, namely, the preventive measures (i.e., before cyberbullying happens, so as to prevent the potential occurrence of cyberbullying itself), and the handling of cyberbullying cases (i.e., upon occurrence of cyberbullying incidents).
FINDINGS AND ANALYSIS
Preventive Measures
Preventive actions should include the establishment of internal policies against bullying and cyberbullying in schools,
organisations/ institutions or workplaces. Such policies should be made accessible by the students, parents, workers,
members of staff and persons related to the business affairs of the organisation/institution. Apart from that, efforts should
also be in place to strengthen the family institutions. This follows the idea that family institutions play a vital role in the
shaping and development of an individual’s personality. Among others, families should be mindful of their children, so as
to take part in their children’s lives and engage with their social and daily needs.
1
Handling of Cyberbullying Cases
When a cyberbullying incident takes place, there should be clear, convenient and quick channels for reporting incidents.
Such channels should be made clear to the general public, so as to ensure the proper handling of perpetrators and
victims of cyberbullying. Additionally, protection for perpetrators and victims should also be in place, such as rehabilitation
programmes, counselling sessions, compensation scheme, and other situations for the handling of cyberbullying
perpetrators and victims.
2
16 N
atio
nal P
olic
y
16 School’s
Education/P
olicies
16 Impact Evaluation of
Measures16 suggest Akta
Kepenggunaan
Siber (holistic) 16 More C
ampaign/
Aw
areness
16 C
om
mu
nit
y In
volv
emen
t
16 C
olla
bora
tive
Mon
itorin
g
16 Strengthen
Roles for Child
Protection16 Establish Cyber Ethics
16 Media’s
Education16 Governing
Modalities
for handling
Cyberbullying
16 Handling Cyberbullying
Cases
16 F
inin
g P
aren
ts
16 Adequate
Enforcement 16 Victim
s
Support
16 Channel of Reporting
16 Preventive Measures
FIGURE 2: Interview Participants’ Views on the Governing Modalities for Cyberbullying

127Media Matters Report 2021
RECOMMENDATION
Based on the key findings of the study, this section will present the recommendations of the study. In completing the study entitled,
“The Adequacy of Malaysian Laws in Regulating Cyberbullying”, the researchers hereby offer the following two recommendations to
address this issue. First, the researchers recommend the creation of specific law to address bullying, and second, the researchers
recommend the establishment of a working committee as the focal point for coordination of bullying and cyberbullying cases.
Recommendation 1: Creation of a Specific Law to Address Bullying
It is hereby proposed that a specific law is created to address bullying in general, and cyberbullying in particular. The proposed
name for the law is: “Anti-Bullying Act”. This recommendation comes in light of the passing of similar laws in the Philippines and
various states in the United States of America, as well as the general laws in Singapore, United Kingdom, and New Zealand.
Particularly, the action plan consists of three stages:
It is hereby proposed that the relevant authority to oversee this “Anti-Bullying Act” is the Royal Malaysia Police or Polis Diraja
Malaysia (PDRM) given that the proposed key features of the Act consist of both civil and criminal matters, and PDRM has the
means, capability and expertise to manage the issues related to bullying and cyberbullying. Produced below are the proposed key
features of the “Anti-Bullying Act”.
Stage 1 – Lessons Learned from Other Jurisdictions
Laws on anti-bullying and protection from harassment which had been passed in other nations’ jurisdictions should serve as lessons
to be learned, with intended adoption in Malaysia where applicable to suit to local circumstances. Relevant pieces of legislation
from Asian countries, such as Philippines’ Anti-Bullying Act 2013 and Singapore’s Protection from Harassment Act, as well as
laws from non-Asian countries such as United Kingdom’s Protection for Harassment Act 1997 and New Zealand’s Harmful Digital
Communications Act 2015 are hereby recommended to serve as a guide to be adopted in Malaysia.
Stage 2 - Strengthen the Resilience and the Role of the Local Community
The local community’s resilience and role should be enhanced and strengthened for the proper prevention and handling of
cyberbullying cases. Therefore, it is hereby recommended that input be requested from the public and private offices, including the
non-governmental organisations (NGOs), enforcement officers, family institutions, counsellors, social workers and other relevant
parties.
Stage 3 - Drafting of an Anti-Bullying Bill
With appropriate understanding of other nations’ laws on anti-cyberbullying, the Malaysian government is suggested to proceed
with drafting of the bill by appointment of legal drafters that would focus on the proposed key features of the “Anti-Bullying Act”.
Additionally, it is also proposed that the legal drafters should invite public participation/ consultation with the aim of generating holistic
views by combining the top-down approach by legislatures and the bottom-up approach from citizens for the betterment of the
nation as a whole

128 Media Matters Report 2021
RECOMMENDATION
1. Preamble
2. Definition and Elements
3. Application
4. Remedies
5. Preventive Strategies
6. Mechanism for handling bullying cases
7. Punishment for the perpetrators
8. Remedy/Rights for the victims
ITEM SUGGESTED KEY FEATURE
While outlining the adverse consequences of both traditional and cyberbullying on
people, the preamble conveys explicit prohibitions against bullying in Malaysia. It
further communicates the purpose and importance of the law.
It defines bullying behaviour and what types of actions and conditions related to
traditional and cyberbullying are prohibited. It clearly demarcates the core elements
of prohibited traditional and cyberbullying.
The law directly applies to perpetrators and victims of bullying of all ages. It may
enumerate specific characteristics to convey legal protections for certain classes
of individuals such as children or for any person who is bullied based on individual
characteristics including weight, physical appearance, gender identity, ethnicity and
socio-economic status.
The law determines, creates and adopts criminal or civil actions for prohibited offline
bullying and online bullying according to their established types and elements. The
determination of such actions should also be tailored to suit the adult and child bullies.
The law articulates guidelines and expectations relating to specific preventive
strategies against traditional bullying and cyberbullying, particularly anti-bullying
policies. It sets requirements for workplaces and schools to develop anti-bullying
policies. Additionally, the policies need to provide not only a definition of bullying
behaviour which is compatible with national law but also the scope of traditional and
cyberspace bullying that create a hostile environment at workplaces and schools.
The policies should further outline procedures including written documentation of
reported incidents of bullying at workplaces and schools.
The law creates mechanisms for handling bullying cases, encompassing reporting,
jurisdiction of the court, enforcement of court orders, counselling for victims/
perpetrators, rehabilitation programmes, protection order and community service. It
further delineates prescriptively their specific components and requirements to guide
their development and implementation.
The law includes specific provisions addressing consequences or punishments for
traditional bullying and cyberbullying behaviour. The punishments vary in accordance
with the classifications of perpetrators (i.e., adult perpetrators and child perpetrators
falling under the purview of convictions).
The text of legislation communicates legal assurances to bullying victims of
their rights. The laws explicitly guarantee the avenues of recourse for addressing
concerns regarding prohibited bullying, such as compensation scheme, injunction
order, medical intervention, expedited order and removal of abusive content. The
statements relating to the legal assurances vary with respect to the specificity of
victims’ rights.
TABLE 1: Proposed Key Features of the “Anti-Bullying Act”

129Media Matters Report 2021
RECOMMENDATION
Proposed elements of bullying
Accordingly, by reference to the conceptualisation of bullying in other nations’ laws, the following are the elements of bullying to be
adopted in the proposed “Anti-Bullying Act”:
Based on the aforementioned key elements, the following examples may be useful to clarify the description of traditional bullying
or cyberbullying:
Proposed application of the Act
Meanwhile, the following applications of the Act are proposed, in which the Act would include provisions for addressing:
(To also be introduce in the Literature Review section)
A instructs B to complete A’s homework. If B disagrees, A threatens to do something bad to B. B experiences physical and emotional distress. A commits bullying.1
Adult and child victims of bullying: This follows the fact that both adults and children could fall victims of bullying; hence, legal provisions safeguarding their rights and avenues should be in place.1
Adult of child perpetrators of bullying: This is justified given that both adults and children could become perpetrators of bullying. In essence, different treatments should be in place for adults as against child perpetrators of bullying, due to different physiological and nature of adults and children.
2
Stakeholders for cyberbullying, such as schools, policy makers, solicitors, social workers, etc: Stakeholders are essential parties in the chain of bullying and cyberbullying matters, particularly given that different stakeholders have their respective expertise and way of handling things. Therefore, it is justified to have the proposed new Bullying Act to contain provisions for rights and duties of stakeholders in matters pertaining to bullying.
3
Protected class: Actions, acts, behaviour, statements or caricature that relates to race, colour, religion, sex, disability and national origin. Such actions which relate to certain matters should be clearly set out in the Act.4
A incites hatred towards B, a person of different skin colour. A calls upon other friends to hate B. B experiences damage to his emotional well-being. A commits bullying.2
A, with intention to insult B, transmits insulting private messages to B via social media messaging. As a result, B experiences emotional distress. A commits cyberbullying.3
A, by using a fake social media account, posts humiliating images of B. A has the knowledge that the postings would indeed humiliate B. As a result, B experiences alarming feeling and humiliation. A commits cyberbullying.4
A posts on his social media account a provoking statement relating to a certain religion. A does not have the intention to cause provocation nor the knowledge that such posting is provocative. A does not commit cyberbullying.5
Actus Reus
To harass, threat, abuse/insult,
cause alarm and distress,
provoke, incite hatred,
humiliate.
1
Mens Rea
Intention or knowledge.
2
Impacts on victims
Alarming feelings and causing
distress, damage to a victim’s
psyche.
3Specific subject matters
Actions, acts, statement,
behaviour relating to race,
colour, religion, sex, disability
and national origin (criminal
sanction or civil remedy).
4

130 Media Matters Report 2021
RECOMMENDATION
Recommendation 2: Establishment of Working Committee as Focal Point for Coordination of Bullying and Cyberbullying Cases
Accordingly, by reference to the conceptualisation of bullying in other nations’ laws, the following are the elements of bullying to be
adopted in the proposed “Anti-Bullying Act”:
The second recommendation by the researchers is for the establishment of a working committee to serve as a focal point for
the coordination of bullying and cyberbullying cases. The committee should oversee two important aspects of bullying and
cyberbullying, namely, the prevention strategies, and the handling of bullying and cyberbullying incidents.
Prevention of Bullying and Cyberbullying
The Committee shall oversee the coordination and establishment of anti-bullying policies within organisations, at schools and
learning institutions. Additionally, the committee shall also promote the strengthening of family roles for awareness and handling
of bullying and cyberbullying.
Handling of Bullying and Cyberbullying Incidents
The committee shall establish or cause to be established a quick and easy channel for reporting bullying and cyberbullying
incidents. Apart from that, it is also pertinent to have appropriate implementation of counselling and rehabilitation programmes
for both perpetrators and victims of bullying and cyberbullying cases with the coordination with enforcement officers and relevant
parties. The committee should also evaluate the necessity for the establishment of a victim’s compensation plan in
Cyberbullying Prevention
• Establishment of anti-bullying policies within organisations, at schools and learning institutions
• Strengthening the family roles for awareness and handling of cyberbullying.
Handling of cyberbullying incidents
• Quick and easy channel of reporting, implementation of counselling and rehabilitation programs, coordination with enforcement officers, establishment of victim’s compensation plan, etc.
Kindergartens, schools and
universities (ME and MOHE)
Organisations and workplaces
(MHR)
Family institutions
(department)
Public and private agencies
(including NGO)
Enforcement officers (PDRM,
MOH)
Counsellors, psychiatrists,
social workers
Advocates and solicitors
(Malaysian Bar) & Judicial
officers (Courts)
FIGURE 3: Working Committee as Focal Point for Coordination of Bullying and Cyberbullying Cases

131Media Matters Report 2021
RECOMMENDATION
Among the parties to be involved in this committee, either as a member or contact persons, are:
Kindergartens, schools and universities
(Ministry of Education and Ministry of Higher
Education).
1
Organisations and workplaces (Ministry of
Human Resources).
2
Enforcement officers (including Royal
Malaysia Police and Ministry of Health).
5
Family institutions (government and
private departments involved).
3
Counsellors, psychiatrists and social
workers.
6
Public and private agencies (including
NGOs).
4
Advocates and solicitors (Malaysian
Bar) and judicial officers (the courts).
7
CONCLUSION
The study investigated the adequacy of Malaysian laws in addressing cyberbullying and studied the legal position of cyberbullying
in the international context for comparative analysis. Further, the study identified the gaps in current laws which need improvement
and enhancement, as well as proposed alternative governing modalities for the management of bullying and cyberbullying in
Malaysia.
Essentially, the current landscape of cyberbullying in Malaysia is that Malaysia does not have a specific law to govern cyberbullying.
Although there are some laws that address some aspects of bullying, such laws are inadequate to provide for cyberbullying. For this
purpose, a study was carried out involving nineteen interview participants and hundred and twenty survey respondents. Therefore,
it is suggested that there need to be a holistic approach to address issues encompassing (1) protection of victims of bullying (2)
sanctions to perpetrators (3) compensatory aspects (4) prevention of bullying, and (5) handling mechanism of bullying cases.
Accordingly, the future of the legal framework governing cyberbullying should be in the form of an integrated and holistic approach
with appropriate recognition and highlighting of risk and harms through legislative instruments. Provisions should be made for
duty of care and multiple governing modalities to properly address bullying. Similarly, immediate action is recommended towards
the development of legislative instruments, identification of relevant agencies/stakeholders and setting of governing modalities for
addressing traditional bullying and cyberbullying.

132 Media Matters Report 2021
• Balakrishnan, V. (2018). Actions, emotional reactions and cyberbullying–From the lens of bullies, victims, bully-victims and bystanders among Malaysian young adults. Telematics and Informatics, 35(5), 1190-1200.
• Chibnall, S., Wallace, M., & Leicht, C. (2006). Final Report: I-safe evaluation. Retrieved from http://www.ncjrs.gov/pdffiles1/nij/grants/213715.pdf
• Chin, C. (2017). Govt Out to Put a Stop to Cyberbullying. The Star Online. Retrieved. Retrieved from https://www.thestar.com.my/news/nation/2017/06/18/govt-out-to-put-a-stop-to-cyberbullying-steps-are-being-taken-to-ensure-our-kids-are-safe-online
• Feinberg, T., & Robey, N. (2008). Cyber bullying. Principal Leadership (Middle School Edition), 9(1), 10-14.
• Ghazali, A. H. A., Samah, A. A., Omar, S. Z., Abdullah, H., Ahmad, A., & Shaffril, H. A. M. (2020). Predictors of Cyberbullying among Malaysian Youth. Journal of Cognitive Sciences and Human Development, 6(1), 67-80.
• Gordon, S. (2020). 8 Motives Behind Why Kids Cyberbully. Retrieved from https://www.verywellfamily.com/reasons-why-kids-cyberbully-others-460553
• Johanis, M. A., Bakar, A. R. A., & Ismail, F. (2020, April). Cyber-Bullying Trends Using Social Media Platform: An Analysis through Malaysian Perspectives. In Journal of Physics: Conference Series (Vol. 1529, No. 2, p. 022077). IOP Publishing.
• Juvonen, J., & Gross, E. F. (2008). Extending the school grounds? - Bullying experiences in cyberspace. J. Sch. Health, 78(9), 496-505. doi:10.1111/j.1746-1561.2008.00335.x
• Mason, K. L. (2008). Cyberbullying: A preliminary assessment for school personnel. Psychol. Sch., 45(4), 323-348. doi:10.1002/pits.2030
• Olweus, D. (1993). Bullying at school., MA: Blackwell. Malden, MA: Blackwell Publishing.
• OnlineSense. (2016, Sep 26, 2016). 5 Differences between Cyber Bullying and Traditional Bullying. Retrieved from https://onlinesense.org/5-differences-cyber-bullying-traditional-bullying/
• Research Institute Malaysian Youth Development. (2017). Buli siber dalam Kalangan Remaja Di Malaysia. (Kuala Lumpur, Penerbit Kementerian Belia dan Sukan).
• Sivabalan, T. V., Zaki, R. A., & Yuen, C. W. (2020). The prevalence of cyberbullying and its associated factors among young adolescents in penang, malaysia. Journal of Health and Translational Medicine, 23(Supplement), 202-211.
• Smith, P. K., Mahdavi, J., Carvalho, M., Fisher, S., S. Russell, & Tippett, N. (2008). Cyberbullying: Its nature and impact in secondary school pupils. Journal of Child Psychology and Psychiatry and Allied Disciplines, 49(4), 376-385. doi:10.1111/j.1469-7610.2007.01846.x
• UNICEF (2019) Cyberbullying and online violence in Malaysia,
REFERENCES


www.mcmc.gov.my
MCMC HQ Tower 1, Jalan Impact Cyber 6,63000 Cyberjaya Selangor Darul Ehsan,
Malaysia
T +603 8688 8000 F +603 8688 1006