Embed Size (px)
Citation preview

006) 388–403
www.elsevier.com/locate/geoderma
Geoderma 131 (2
Micromorphological characterization and monitoring of internal
drainage in soils of vineyards and olive groves in central Italy
Edoardo A.C. Costantini*, Sergio Pellegrini, Nadia Vignozzi, Roberto Barbetti
Istituto Sperimentale per lo Studio e la Difesa del Suolo, Firenze, Italy
Available online 13 June 2005
Abstract
Internal drainage class is an interpretative soil quality that derives from the field evaluation of other soil qualities and
characteristics, i.e. soil permeability, texture, structure, redoximorphic features, and may not match the results of measurements
of the actual soil water status.
The aim of this work was to investigate whether a better characterization of standard field assessments of internal drainage
of 12 soils in vineyards and olive groves could be achieved through the qualitative and quantitative micromorphological
analyses.
The results of field and laboratory analyses, as well as of 34 months of monitoring of soil moisture and temperature, and 21
months of water table and redox potential, were related to the micromorphological estimation of the hydromorphy degree,
following the methodology of Aguilar et al. (2003) [Aguilar, J., Fernandez, J., Dorronsoro, C., Stoops, G., Dorronsoro, B.,
2003. Hydromorphy in soils. http://edafologia.ugr.es/hidro/indexw.htm], and to the quantification of porosity using image
analysis.
It was found that soils were only occasionally saturated with water and for short periods, although redox potentials
during autumn and winter indicated probable Mn reduction. Water content monitoring differentiated soils with values far
beyond field capacity throughout the year, and soils with values close to, or higher than, field capacity during rainy
seasons.
Results showed that hydromorphy degree was related to seasonal soil water content and redox potential. An improvement in
this method should consider the presence and the nature of calcite pedofeatures.
The statistical analysis associated the abundance of elongated and irregular macropores, which favor water drainage, to
scarceness of macro- and microhydromorphic features and lower bulk density. The quantity of regular pores, which are less
efficient for downward water transmission, was on the other hand correlated to an average high soil water content and to lower
mean redox potentials. The relevance of elongated and irregular macropores for the internal drainage of this kind of soil
(intensively cultivated, poorly structured, and with low total macroporosity) was also confirmed by the proportion of elongated
and irregular macropores to total macroporosity (PR index). In soils of vineyards and olive groves, optimal drainage conditions
in Mediterranean climate seem to be ensured by PR higher than 0.80.
0016-7061/$ - s
doi:10.1016/j.ge
* Correspondi
E-mail addre
ee front matter D 2005 Elsevier B.V. All rights reserved.
oderma.2005.03.029
ng author. Tel.: +39 55 2491222; fax: +39 55 241485.
ss: [email protected] (E.A.C. Costantini).
E.A.C. Costantini et al. / Geoderma 131 (2006) 388–403 389
The study demonstrated, by means of a field experiment, the unfavorable effect of the common practice of deep plowing
before tree planting in increasing the formation of redoximorphic features, micritic calcite nodules and infillings, within the
deeper horizons of calcareous soils.
D 2005 Elsevier B.V. All rights reserved.
Keywords: Soil; Micromorphology; Drainage; Vineyard; Olive Grove; Italy
1. Introduction
In prime viticultural and olive tree growing areas,
soil hydrological characteristics and water regime
contribute to the quality of wine and olive oil, because
they affect nutrient and oxygen supplies. The rationale
is based upon the observation that environmental
factors influence the hormonal equilibrium of each
variety, which in turn regulates the expression of the
genotype (Van Leeuwen and Seguin, 1997). The fre-
quency and duration of periods of soil wetting are
typically estimated in routine soil survey by the bclassof internal drainageQ. This indicator provides a first
rough approximation. Several strategies can be ap-
plied and combined to improve the routine estimation.
If technical reasons exclude the possibility of a con-
tinuous monitoring, as is generally the case in unre-
stricted and periodically cultivated fields, it is possible
to relate field evaluations to measurements of mois-
ture coming from benchmark soils (Costantini et al.,
1996), use simulation models calibrated on specific
environments (Costantini et al., 2002a), perform a
number of laboratory tests, e.g. measurements of
soil water content at different matric tensions, hydrau-
lic conductivity, etc. The use of the Epic model, in
particular, has produced rather good results in terms of
the water content simulation in some experimental
vineyards and olive tree plantations in central Italy
(Costantini et al., 2002b). Epic estimated a saturated
condition within the soil similarly to monitoring, but it
gave different results in terms of times of the satura-
tion period.
Quantitative analysis of the pore system through
image analysis appears to be another promising tech-
nique enabling a better understanding of soil hydro-
logical properties (e.g. Schaap and Lebron, 2001;
Vervoort and Cattle, 2003). In addition, the thin sec-
tion description for the assessment of hydromorphic
degree (Aguilar et al., 2003) has been proposed as a
method to validate the classification of internal drain-
age and to relate micromorphological redoximorphic
features to soil hydrological regime.
The present work assesses whether the routine
appraisal of soil internal drainage can be refined by
soil thin section analysis, using 12 soils representative
of different wine and olive oil bterroirsQ in the prov-
ince of Siena (central Italy).
2. Area description, methods and materials
2.1. Study area and soils
The trial was conducted in the Province of Siena
(central Italy), in the ambit of a vine and olive tree
zoning. On the basis of a reconnaissance soil survey of
the entire province, 12 representative fields, situated
on 8 farms, were chosen as benchmark soils. Five out
of eight farms are situated in the sub-humid climatic
region, two in the bordering humid region and one in
the dry sub-humid (Fig. 1). Long-term mean annual air
temperature ranges between 13.5 and 14.8 8C, withmaximum in July and minimum in January, and little
yearly and monthly standard variation of the long-term
means. The long-term mean annual rainfall is between
730 and 850 mm, with high yearly and monthly stan-
dard variations. Moister months are usually October,
November and December. Climatic adversities, such
as sudden downpours and hail-storms, can combine
with severe summer drought.
The hilly territory, where vineyards and olive
groves are most widespread, was formed in different
geological eras, and presents extremely variable char-
acteristics. For this reason, it is difficult to make gen-
eralizations that can be widely applied. The low-lying
areas consist of soils with a deep rooting layer, formed
by the deposit of alluvial material dating from the
Quaternary Period. Further uphill, on the Pliocene

PISA
LUCCA
MASSA
SIENA
AREZZO
PISTOIA
LIVORNO
FIRENZE
VITERBO
GROSSETO
LA SPEZIA
40 0 4020 KilometersClimate
Perudic: mm > 1400
Udic: mm > 1200
Sub-humid: mm > 800
Dry sub-humid: mm > 600
Semi-arid: mm < 600
Experimental farm
Fig. 1. Climatic regions and experimental farms in Tuscany (central Italy). Some experimental farms host more experimental plots (see Table 1).
E.A.C. Costantini et al. / Geoderma 131 (2006) 388–403390
and Miocene marine sediments, soils are mainly clay-
ey and enriched by calcareous fossil material, often
rather thin, due to the severe erosion. In the upper part
of the territory, soils are formed in older geological
formations, they are usually moderately stony and
sandy, rich in lime, mingled with wide areas with
clayey and rocky soils. Residual portions of paleosols
are rather widespread, although scattered in the terri-
tory. Long-time agricultural activities make soil distri-
bution and properties even more complex.
The experimental plots lay on slopes and did not
have any permanent groundwater table (Table 1). In
line with typical agricultural practice, on these special-
ized farms all the studied vineyards and olive groves
Table 1
Experimental settings, soil classification, macromorphological redox features, and class of internal drainage
Farm and crop Soil profile
number
Geomorphology and parent material Soil classification
(Soil Taxonomy, 1998)
Depth (cm) and
quantity (%) of
redoximorphic
featuresa
Class of
internal
drainageb
Le Fonti vine 1 Medium part of a slope, 20%; elevation
260 m; aspect 2808; clay schist
Typic Ustorthent,
loamy-skeletal
Absent 2
Le Fonti olive tree 2 Anthropically terraced slope, 30%;
elevation 260 m; aspect 2938; clay schist
Typic Ustorthent,
clayey-skeletal
Absent 2
Le Fonti vine 3 Medium part of a slope, 20%; elevation
260 m; aspect 2808; clay schist
Typic Haplustept,
fine-loamy
Absent 3
Barbi vine 4 Tread, 3%; elevation 480 m; calcareous
sandstone
Typic Calcixerept,
fine-silty
Absent 3
S. Angelo vine 5 Alluvial terrace, 4% slope; elevation
255 m; aspect 1808; alluvial depositswith clayey marl
Typic Calcixerept,
fine
30–60; 1% 3
Le Fonti olive tree 6 Upper part of a slope, 18%; elevation
280 m; aspect 1138; calcareous medium
and fine sands
Udic Calciustept,
coarse-loamy
35–80; 2% 3
80–140; 35%
Trecciano vine 7 Terraced bottom part of a doline, 2%
slope; elevation 400 m; colluviated
residual clay
Typic Haploxerept,
fine
100–150+; 8% 4
Modanella vine 8 Alluvial terrace, 2% slope; elevation
330 m; aspect 1808; alluvial depositswith sandstone
Aquic Haplustept,
loamy-skeletal
10–50; 25% 4
50–90; 20%
90–150+; 7%
Campriano vine 9 Convex slope, 2%; elevation 280 m;
aspect 1588; clayey marl
Aquic Haplustept,
fine
0–30; 5% 5
30–55; 2%
55–100+; 10%
Campriano vine 10 Medium part of a slope, 25%; elevation
275 m; aspect 1358; silty marl
Haplic Ustarent,
fine-loamy
0–30; 15% 5
30–60; 23%
Cetona vine 11 Convex slope, 2%; elevation 328 m;
aspect 458(NE); silty marl
Aquic Haplustept,
fine silty
0–20; 5% 5
20–75; 8%
75–120+; 18%
Strove olive tree 12 Alluvial terrace, 15% slope; elevation
240 m; aspect 3398; alluvial depositswith clay and quartzite
Aquic Paleustalf,
fine
40–90; 25% 5
90–145; 23%
a Redox features are mainly iron depletion on faces of aggregates and pores, and masses of iron and manganese concentrations inside
aggregates. Modal Munsell colors are respectively 10YR 6/1 or 7/2, and 10YR or 7.5 YR 5/8.b 2: Somewhat excessively drained, 3: well drained, 4: moderately well drained, 5: somewhat poorly drained.
E.A.C. Costantini et al. / Geoderma 131 (2006) 388–403 391
were deeply ploughed or backhoed before plantation,
up to a depth of about 0.8 m, resulting in a certain
homogenization of the profile and a fixed rooting
depth. Agricultural husbandry of the crops includes
surface cultivation (harrowing at about 0.1 m depth),
aimed at weed control, several times during the year.
2.2. Field routine description
The soils of the experimental vineyards and olive
tree plantations were routinely described, sampled,
analyzed and classified according to Soil Taxonomy
(Soil Survey Staff, 1999). Main physical, hydrological
and chemical soil characteristics are reported in Table
2. A field assessment of soil internal drainage for the
whole profile was obtained modifying the attributes
suggested by the Soil Survey Division Staff (1993).
The definition of the classes of internal drainage used
was the following: class 2, somewhat excessively
drained: water moves through the soil rapidly. The
soils are commonly coarse-textured and lack redox-
imorphic features. Class 3, well drained: water is
removed from the soil readily but not rapidly. Wet
periods are not so long during the growing season that

Table 2
Main physical, hydrological and chemical soil characteristics
Profile
number
Layer Sand
(dg kg�1)
Clay
(dg kg�1)
Field
capacity
(g g�1)
Wilting
point
(g g�1)
Permeability
classaCOLE
(m m�1)
MWD
(mm)
BD
(g cm�3)
CaCO3 (%) pH O.M.
(dg kg�1)
C/N
Total Active
1 1 18.3 23.3 0.222 0.091 3 0.031 0.48 1.49 10.4 1.1 8.2 0.63 7.2
2 1 21.3 40.3 0.263 0.157 3 0.033 0.93 1.44 10.2 2.3 8.1 1.23 7.1
3 1 27.1 23.6 0.208 0.090 3 0.033 1.20 1.46 14.7 2.2 8.1 1.05 10.2
2 20.8 36.6 0.216 0.116 3 n.d. n.d. n.d. 9.1 1.9 8.2 0.86 n.d.
4 1 17.7 35.3 0.237 0.098 3 0.028 0.27 1.33 28.6 6.1 8.0 0.45 7.3
2 18.2 35.4 0.250 0.108 3 0.022 n.d. 1.51 27.0 4.5 8.1 0.40 n.d.
5 1 24.2 43.7 0.272 0.137 3 0.025 0.55 1.26 7.7 3.6 7.8 1.64 9.4
2 27.8 45.3 0.264 0.132 3 0.025 n.d. 1.47 11.7 4.2 7.9 1.02 n.d.
6 1 46.9 18.2 0.172 0.066 2 0.010 1.57 1.33 25.0 4.2 8.1 1.29 8.2
2 51.0 12.3 0.176 0.083 3 n.d. 1.55 1.45 27.7 6.2 8.3 0.23 n.d.
7 1 15.7 38.9 0.226 0.146 3 0.026 1.86 1.56 0 0 6.0 2.12 108.8
2 11.6 46.0 0.231 0.103 4 0.027 1.15 1.42 0 0 6.2 0.86 n.d.
8 1 39.2 28.2 0.189 0.100 4 0.037 0.38 1.63 traces 0 7.9 0.21 55.4
2 52.4 19.6 0.157 0.083 4 n.d. 0.22 n.d. traces 0 8.0 0.21 n.d.
9 1 15.4 42.3 0.263 0.155 5 0.031 1.77 1.65 13.1 3.9 8.1 1.47 98.0
2 7.2 47.6 0.276 0.162 5 n.d. 0.39 1.78 1.40 0.1 8.6 0.27 n.d.
10 1 24.3 22.6 0.192 0.071 4 0.010 0.51 1.59 34.6 6.0 8.3 0.50 78.4
2 24.5 18.7 0.193 0.068 4 0.012 0.30 1.52 34.6 5.9 8.2 0.66 n.d.
11 1 8.8 28.6 0.254 0.124 4 0.022 0.35 1.45 17.3 4.1 8.2 1.13 90.5
2 5.3 25.7 0.263 0.102 4 0.024 0.21 1.56 17.9 8.1 8.4 0.64 n.d.
12 1 23.2 51.2 0.282 0.160 5 0.030 0.39 1.58 0 0 5.8 0.40 5.3
2 15.5 62.1 0.279 0.156 5 n.d. n.d. 1.50 0 0 6.4 0.20 n.d.
a 2: high (10–100 Am s�1). When moderately moist or wetter, structure that is moderate or strong granular, strong blocky or prismatic smaller
that is very coarse and no stress surfaces or slickensides. Common medium or coarser vertical pores that extend through the layer; 3: moderately
high (10–1 Am s�1). Strong very coarse blocky or prismatic and no stress surfaces or slickensides. z35 percent clay, soft, slightly hard, very
friable or friable. 4: moderately low (1–0.1 Am s�1 ). Few stress surfaces and/or slickensides. 5: low (0.01–0.1 Am s�1). Common or many
stress surfaces and/or slickensides (Soil Survey Staff, 2001).
E.A.C. Costantini et al. / Geoderma 131 (2006) 388–403392
they significantly affect crop behavior or choice of the
crop. These soils are mainly free of redoximorphic
features within the rooting depth. Class 4, moderately
well drained: water is removed from the soil some-
what slowly during some periods of the year. The soils
are wet for only short times during the growing
season, but long enough for crops and agricultural
husbandry to be affected. They commonly have a
moderately low or lower saturated hydraulic conduc-
tivity in a layer within the upper 1 m and show
common redoximorphic features (more than 4–5%),
at least in the lower part of the rooting depth. Class 5,
somewhat poorly drained: water is removed slowly so
that the soil is wet at a shallow depth for significant
periods during the growing season. Crops and agri-
cultural husbandry are deeply affected. The soils com-
monly have a low saturated hydraulic conductivity or
additional water from seepage. They show common
redoximorphic features within the rooting depth.
A field estimation of saturated hydraulic conduc-
tivity class of each horizon was obtained following the
USDA methodology, based upon specific soil proper-
ties, i.e. particle size, structure, consistence, macro-
porosity, presence of pressure faces and slickensides
(Soil Survey Staff, 2001).
2.3. Laboratory analysis
Besides routine physical and chemical analyses,
soils were characterized by bulk density (core meth-
od, replicated samples), moisture content at field
capacity (�33 kPa) and wilting point (�1500 kPa)
by Richards pressure plate extractor (Kassel and
Nielsen, 1986), and coefficient of linear extensibility
(COLE) (Grossman et al., 1968). Active CaCO3 was
analyzed with a solution of ammonium acetate. This
is the more active fraction of CaCO3, which easily
dissolves and precipitates. To evaluate soil aggregate

E.A.C. Costantini et al. / Geoderma 131 (2006) 388–403 393
stability, the mean weight diameter (MWD) of water
stable aggregates was determined by the procedure
described by Kemper and Rosenau (1986). Air-dried
aggregates in the range of 4–2 mm were put directly
on the top of a column of sieves of 2, 1, 0.5, 0.25
mm immersed in water. The column of sieves was
then vertically oscillated in water per 10 min, at a rate
of 30 complete oscillations per minute, by machine
with a stroke of 40 mm. The mass of oven-dried
particles (105 8C for 24 h) in each sieve resisting
breakdown was determined. The respective dry
masses were used to compute the MWD according
to Van Bavel (1949).
2.4. Soil thin section analysis
Three thin sections (55�85 mm) of undisturbed
samples for soil horizon were analyzed to quantify
macroporosity using image analysis. Two images
were captured with a video camera from each section.
These images covered 45�55 mm of the thin section,
avoiding the edges where disruption could have oc-
curred. The images were analyzed by means of the
image analysis techniques using the Image-Pro Plus
software produced by Media Cybernetics (Silver
Spring, MD, USA). Pores larger than 50 Am were
measured. Pore shape was expressed as perimeter2/
(4k area), and pores were divided into regular (shape
factors 1–2), irregular (2–5) and elongated pores (N5).
These classes correspond approximately to those used
by Bouma et al. (1977). Pores of each shape group
were further subdivided into seven size classes (class
1: 50–100 Am, class 2: 100–200 Am, class 3: 200–300
Am, class 4: 300–400 Am, class 5: 400–500 Am, class
6: 500–1000 Am, class 7: N1000 Am) according to
either the equivalent pore diameter for regular and
irregular pores, or to the width for elongated pores
(Pagliai, 1988). According to their sample position,
thin section analysis results were elaborated consider-
ing two functional layers: 0.1–0.3 m (layer 1) and
0.4–0.7 m (layer 2). Stony soils, namely profiles 1, 2,
3, and 4, were only sampled in layer 1.
The same thin sections were used to classify hydro-
morphism degree (Aguilar et al., 2003). This index
ranges from stages 0 to 4 according to groundmass
color, accumulation and depletion features, and some
macromorphological attributes such as color of soil
horizon, mottle presence and their color. The thin
section description followed the codes of Bullock et
al. (1985).
2.5. Moisture and temperature monitoring
Soil water content was measured by the gravimet-
ric method (three samplings with a hand auger) at 0.1–
0.3 m and 0.4–0.7 m depth, as experimental plots
were unrestricted and the use of permanent equip-
ment, like neutron probes or transducer tensiometers,
was not possible, soil temperature at 0.5 m depth
(portable pt100), and redox potential at 0.15 m
(hand-held Barnant pH/mV/ORP meter, two measure-
ments). Measurements were replicated every 2–4
weeks from February 1999 until February 2000 and
from April 2002 until December 2003. Layers 2 of
profiles 1 and 2 were not monitored because of the
excessive stoniness. Results of the trial years were
averaged on a seasonal basis. Electrode calibration
followed the instruction of Barnant Company (Bar-
rington, IL, USA) using solutions buffered to pH 7
and 4 with Quinhydrone. Redox potentials, measured
only during rainy seasons, were normalized at pH 7
according to Patrick et al. (1996).
Water table occurrence was monitored from April
2002 with piezometers in four experimental fields
(profiles 7, 9, 10, and 11), and inside auger holes in
the other soils, with the same observation periodicity.
Tube wells were made of plastic and had the follow-
ing characteristics: 0.04 m diameter, 1.25 m length,
perforated for 10% of the area in the lower 0.4 m,
sealed at the bottom and lined externally with metal
net. They were installed at a depth of 1 m in a 0.07-m-
diameter borehole filled by gravel from the bottom to
a depth of 0.5 m and surrounded by a collar of plastic
film covered by tamped clay.
2.6. Field simulation of deep plowing
In Italy, deep plowing and leveling of slopes al-
most always precedes new plantations of vineyards,
olive groves and orchards in hilly environments. This
operation, aimed to obtain a better macroporosity is
justified by the prevalent microporosity of clayey
soils, which are dominant. Deep plowing is usually
carried out with a mould board plough at 0.8–1.0 m,
but it can also be made by a backhoe. Moreover, land
leveling, aimed at obtaining wide and regularly slop-

E.A.C. Costantini et al. / Geoderma 131 (2006) 388–403394
ing fields, provokes the movement and redistribution
of high quantities of soil, and the burial of surface
horizon in correspondence of concavities along the
slope.
We then simulated the practice of deep plowing
before tree planting, which turns soil horizons upside
down, to check the occurrence of redoximorphic fea-
tures as a consequence of this agrotechnique. Layer 1
of profile 6 was buried at layer 2 depth at the end of
autumn 2002 (30th of November). A 2�2�2 m pit
was dug with a backhoe; layers were separately accu-
Profile 1
Gra
vim
etr
ic w
ate
r c
on
ten
t
0.00
0.05
0.10
0.15
0.20
0.25
0.30
04_02
05_02
06_02
07_02
08_02
09_02
10_02
11_02
12_02
01_03
02_03
03_03
04_03
05_03
06_03
07_03
08_03
09_03
10_03
11_03
12_03 100
200
300
400
500
600
700
0
0
0
0
0
0
0
Gra
vim
etr
ic w
ate
r c
on
ten
t
Profile 3
0.00
0.05
0.10
0.15
0.20
0.25
0.30
04_02
05_02
06_02
07_02
08_02
09_02
10_02
11_02
12_02
01_03
02_03
03_03
04_03
05_03
06_03
07_03
08_03
09_03
10_03
11_03
12_03
100
200
300
400
500
600
700
0
0
0
0
0
0
0
Profile 5
Gra
vim
etr
ic w
ate
r c
on
ten
t
0.00
0.05
0.10
0.15
0.20
0.25
0.30
04_02
05_02
06_02
07_02
08_02
09_02
10_02
11_02
12_02
01_03
02_03
03_03
04_03
05_03
06_03
07_03
08_03
09_03
10_03
11_03
12_03 100
200
300
400
500
600
700 0
0
0
0
0
0
0
10-30 cm 40-70 cm red
Profile 1
Gra
vim
etr
ic w
ate
r c
on
ten
t
0.00
0.05
0.10
0.15
0.20
0.25
0.30
04_02
05_02
06_02
07_02
08_02
09_02
10_02
11_02
12_02
01_03
02_03
03_03
04_03
05_03
06_03
07_03
08_03
09_03
10_03
11_03
12_03 100
200
300
400
500
600
700
0
0
0
0
0
0
0
Profile 1
Gra
vim
etr
ic w
ate
r c
on
ten
t
0.00
0.05
0.10
0.15
0.20
0.25
0.30
04_02
05_02
06_02
07_02
08_02
09_02
10_02
11_02
12_02
01_03
02_03
03_03
04_03
05_03
06_03
07_03
08_03
09_03
10_03
11_03
12_03 100
200
300
400
500
600
700
Profile 1
Gra
vim
etr
ic w
ate
r c
on
ten
t
0.00
0.05
0.10
0.15
0.20
0.25
0.30
04_02
05_02
06_02
07_02
08_02
09_02
10_02
11_02
12_02
01_03
02_03
03_03
04_03
05_03
06_03
07_03
08_03
09_03
10_03
11_03
12_03 100
200
300
400
500
600
700
0.00
0.05
0.10
0.15
0.20
0.25
0.30
04_02
05_02
06_02
07_02
08_02
09_02
10_02
11_02
12_02
01_03
02_03
03_03
04_03
05_03
06_03
07_03
08_03
09_03
10_03
11_03
12_03 100
200
300
400
500
600
700
0
0
0
0
0
0
0
0
0
0
0
0
0
0
0
0
0
0
0
0
0
Gra
vim
etr
ic w
ate
r c
on
ten
t
Profile 3
0.00
0.05
0.10
0.15
0.20
0.25
0.30
04_02
05_02
06_02
07_02
08_02
09_02
10_02
11_02
12_02
01_03
02_03
03_03
04_03
05_03
06_03
07_03
08_03
09_03
10_03
11_03
12_03
100
200
300
400
500
600
700
0
0
0
0
0
0
0
Gra
vim
etr
ic w
ate
r c
on
ten
t
Profile 3
0.00
0.05
0.10
0.15
0.20
0.25
0.30
04_02
05_02
06_02
07_02
08_02
09_02
10_02
11_02
12_02
01_03
02_03
03_03
04_03
05_03
06_03
07_03
08_03
09_03
10_03
11_03
12_03
100
200
300
400
500
600
700
Gra
vim
etr
ic w
ate
r c
on
ten
t
Profile 3
0.00
0.05
0.10
0.15
0.20
0.25
0.30
04_02
05_02
06_02
07_02
08_02
09_02
10_02
11_02
12_02
01_03
02_03
03_03
04_03
05_03
06_03
07_03
08_03
09_03
10_03
11_03
12_03
100
200
300
400
500
600
700
0.00
0.05
0.10
0.15
0.20
0.25
0.30
04_02
05_02
06_02
07_02
08_02
09_02
10_02
11_02
12_02
01_03
02_03
03_03
04_03
05_03
06_03
07_03
08_03
09_03
10_03
11_03
12_03
100
200
300
400
500
600
700
0
0
0
0
0
0
0
0
0
0
0
0
0
0
Profile 5
Gra
vim
etr
ic w
ate
r c
on
ten
t
0.00
0.05
0.10
0.15
0.20
0.25
0.30
04_02
05_02
06_02
07_02
08_02
09_02
10_02
11_02
12_02
01_03
02_03
03_03
04_03
05_03
06_03
07_03
08_03
09_03
10_03
11_03
12_03 100
200
300
400
500
600
700 0
0
0
0
0
0
0
Profile 5
Gra
vim
etr
ic w
ate
r c
on
ten
t
0.00
0.05
0.10
0.15
0.20
0.25
0.30
04_02
05_02
06_02
07_02
08_02
09_02
10_02
11_02
12_02
01_03
02_03
03_03
04_03
05_03
06_03
07_03
08_03
09_03
10_03
11_03
12_03 100
200
300
400
500
600
700Profile 5
Gra
vim
etr
ic w
ate
r c
on
ten
t
0.00
0.05
0.10
0.15
0.20
0.25
0.30
04_02
05_02
06_02
07_02
08_02
09_02
10_02
11_02
12_02
01_03
02_03
03_03
04_03
05_03
06_03
07_03
08_03
09_03
10_03
11_03
12_03 100
200
300
400
500
600
700 0
0
0
0
0
0
0
0
0
0
0
0
0
0
0
0
0
0
0
0
0
10-30 cm 40-70 cm red10-30 cm 40-70 cm redred
Fig. 2. Gravimetric soil water content and normalized redox potential. Prof
years 1999–2000 and 2002–2003.
mulated and then immediately resettled, layer 1 at
layer 2 depth, and vice versa. In late spring 2003
(6th of June), a new pit was dug and layer 1 exhumed
and described macro- and micromorphologically.
2.7. Statistical analysis
The bulk of data was submitted to Principal Com-
ponent Analysis (PCA) test by means of the software
Statistica (StatSoft Inc., Tulsa, OK, USA). The same
software was used to perform analysis of variance and
Profile 2
Re
do
xp
ote
nti
al
(mV
)
.00
.05
.10
.15
.20
.25
.30
04_02
05_02
06_02
07_02
08_02
09_02
10_02
11_02
12_02
01_03
02_03
03_03
04_03
05_03
06_03
07_03
08_03
09_03
10_03
11_03
12_03 100
200
300
400
500
600
700
Profile 4
Re
do
xp
ote
nti
al
(mV
)
.00
.05
.10
.15
.20
.25
.30
05_02
06_02
07_02
08_02
09_02
10_02
11_02
12_02
01_03
02_03
03_03
04_03
05_03
06_03
07_03
08_03
09_03
10_03
11_03
12_03 100
200
300
400
500
600
700
Profile 6
Re
do
xp
ote
nti
al
(mV
)
.30
.00
.05
.10
.15
.20
.25
04_02
05_02
06_02
07_02
08_02
09_02
10_02
11_02
12_02
01_03
02_03
03_03
04_03
05_03
06_03
07_03
08_03
09_03
10_03
11_03
12_03 100
200
300
400
500
600
700
FC 10-30 FC 40-70ox
Profile 2
Re
do
xp
ote
nti
al
(mV
)
.00
.05
.10
.15
.20
.25
.30
04_02
05_02
06_02
07_02
08_02
09_02
10_02
11_02
12_02
01_03
02_03
03_03
04_03
05_03
06_03
07_03
08_03
09_03
10_03
11_03
12_03 100
200
300
400
500
600
700
Profile 2
Re
do
xp
ote
nti
al
(mV
)
.00
.05
.10
.15
.20
.25
.30
04_02
05_02
06_02
07_02
08_02
09_02
10_02
11_02
12_02
01_03
02_03
03_03
04_03
05_03
06_03
07_03
08_03
09_03
10_03
11_03
12_03 100
200
300
400
500
600
700
Profile 2
Re
do
xp
ote
nti
al
(mV
)
.00
.05
.10
.15
.20
.25
.30
04_02
05_02
06_02
07_02
08_02
09_02
10_02
11_02
12_02
01_03
02_03
03_03
04_03
05_03
06_03
07_03
08_03
09_03
10_03
11_03
12_03 100
200
300
400
500
600
700
.00
.05
.10
.15
.20
.25
.30
04_02
05_02
06_02
07_02
08_02
09_02
10_02
11_02
12_02
01_03
02_03
03_03
04_03
05_03
06_03
07_03
08_03
09_03
10_03
11_03
12_03 100
200
300
400
500
600
700
Profile 4
Re
do
xp
ote
nti
al
(mV
)
.00
.05
.10
.15
.20
.25
.30
05_02
06_02
07_02
08_02
09_02
10_02
11_02
12_02
01_03
02_03
03_03
04_03
05_03
06_03
07_03
08_03
09_03
10_03
11_03
12_03 100
200
300
400
500
600
700
Profile 4
Re
do
xp
ote
nti
al
(mV
)
.00
.05
.10
.15
.20
.25
.30
05_02
06_02
07_02
08_02
09_02
10_02
11_02
12_02
01_03
02_03
03_03
04_03
05_03
06_03
07_03
08_03
09_03
10_03
11_03
12_03 100
200
300
400
500
600
700
Profile 4
Re
do
xp
ote
nti
al
(mV
)
.00
.05
.10
.15
.20
.25
.30
05_02
06_02
07_02
08_02
09_02
10_02
11_02
12_02
01_03
02_03
03_03
04_03
05_03
06_03
07_03
08_03
09_03
10_03
11_03
12_03 100
200
300
400
500
600
700
Profile 6
Re
do
xp
ote
nti
al
(mV
)
.30
.00
.05
.10
.15
.20
.25
04_02
05_02
06_02
07_02
08_02
09_02
10_02
11_02
12_02
01_03
02_03
03_03
04_03
05_03
06_03
07_03
08_03
09_03
10_03
11_03
12_03 100
200
300
400
500
600
700Profile 6
Re
do
xp
ote
nti
al
(mV
)
.30
.00
.05
.10
.15
.20
.25
04_02
05_02
06_02
07_02
08_02
09_02
10_02
11_02
12_02
01_03
02_03
03_03
04_03
05_03
06_03
07_03
08_03
09_03
10_03
11_03
12_03 100
200
300
400
500
600
700Profile 6
Re
do
xp
ote
nti
al
(mV
)
.30
.00
.05
.10
.15
.20
.25
04_02
05_02
06_02
07_02
08_02
09_02
10_02
11_02
12_02
01_03
02_03
03_03
04_03
05_03
06_03
07_03
08_03
09_03
10_03
11_03
12_03 100
200
300
400
500
600
700.30
.00
.05
.10
.15
.20
.25
04_02
05_02
06_02
07_02
08_02
09_02
10_02
11_02
12_02
01_03
02_03
03_03
04_03
05_03
06_03
07_03
08_03
09_03
10_03
11_03
12_03 100
200
300
400
500
600
700
FC 10-30 FC 40-70ox FC 10-30 FC 40-70oxox
iles 1 to 6: monitoring years 2002–2003; profiles 7 to 12: monitoring
Profile 11
Gra
vim
etr
ic w
ate
r c
on
ten
t
0.00
0.05
0.10
0.15
0.20
0.25
0.30
02_99
04_99
06_99
08_99
10_99
01_00
04_02
06_02
08_02
10_02
12_02
02_03
04_03
06_03
08_03
10_03
12_03 100
200
300
400
500
600
700
Y
Profile 12
Re
do
xp
ote
nti
al
(mV
)
0.00
0.05
0.10
0.15
0.20
0.25
0.30
02_99
04_99
06_99
08_99
10_99
01_00
04_02
06_02
08_02
10_02
12_02
02_03
04_03
06_03
08_03
10_03
12_03
100
200
300
400
500
600
700
Profile 10
Re
do
xp
ote
nti
al
(mV
)
0.00
0.05
0.10
0.15
0.20
0.25
0.30
02_
99
04_
99
06_
99
08_
99
10_
99
01_
00
04_02
06_
02
08_02
10_
02
12_
02
02_
03
04_
03
06_
03
08_
03
10_
03
12_
03 100
200
300
400
500
600
700
Gra
vim
etr
ic w
ate
r c
on
ten
t
Profile 9
0.00
0.05
0.10
0.15
0.20
0.25
0.30
02_
99
04_
99
06_
99
08_
99
10_
99
01_
00
04_
02
06_
02
08_
02
10_
02
12_
02
02_
03
04_
03
06_
03
08_
03
10_
03
12_
03 100
200
300
400
500
600
700
Profile 7
Gra
vim
etr
ic w
ate
r c
on
ten
t
0.00
0.05
0.10
0.15
0.20
0.25
0.30
02_99
04_99
06_99
08_99
10_99
01_00
04_02
06_02
08_02
10_02
12_02
02_03
04_03
06_03
08_03
10_03
12_03
100
200
300
400
500
600
700
Profile 8
Re
do
xp
ote
nti
al
(mV
)0.30
0.00
0.05
0.10
0.15
0.20
0.25
02_99
04_99
06_99
08_99
10_99
01_00
04_02
06_02
08_02
10_02
12_02
02_03
04_03
06_03
08_03
10_03
12_03
100
200
300
400
500
600
700
10-30 cm 40-70 cm FC 10-30 FC 40-70redox
Profile 11
Gra
vim
etr
ic w
ate
r c
on
ten
t
0.00
0.05
0.10
0.15
0.20
0.25
0.30
02_99
04_99
06_99
08_99
10_99
01_00
04_02
06_02
08_02
10_02
12_02
02_03
04_03
06_03
08_03
10_03
12_03 100
200
300
400
500
600
700
Y
Profile 12
Re
do
xp
ote
nti
al
(mV
)
0.00
0.05
0.10
0.15
0.20
0.25
0.30
02_99
04_99
06_99
08_99
10_99
01_00
04_02
06_02
08_02
10_02
12_02
02_03
04_03
06_03
08_03
10_03
12_03
100
200
300
400
500
600
700
Profile 11
Gra
vim
etr
ic w
ate
r c
on
ten
t
0.00
0.05
0.10
0.15
0.20
0.25
0.30
02_99
04_99
06_99
08_99
10_99
01_00
04_02
06_02
08_02
10_02
12_02
02_03
04_03
06_03
08_03
10_03
12_03 100
200
300
400
500
600
700
Y
Profile 11
Gra
vim
etr
ic w
ate
r c
on
ten
t
0.00
0.05
0.10
0.15
0.20
0.25
0.30
02_99
04_99
06_99
08_99
10_99
01_00
04_02
06_02
08_02
10_02
12_02
02_03
04_03
06_03
08_03
10_03
12_03 100
200
300
400
500
600
700
Y
0.00
0.05
0.10
0.15
0.20
0.25
0.30
02_99
04_99
06_99
08_99
10_99
01_00
04_02
06_02
08_02
10_02
12_02
02_03
04_03
06_03
08_03
10_03
12_03 100
200
300
400
500
600
700
Y
Profile 12
Re
do
xp
ote
nti
al
(mV
)
0.00
0.05
0.10
0.15
0.20
0.25
0.30
02_99
04_99
06_99
08_99
10_99
01_00
04_02
06_02
08_02
10_02
12_02
02_03
04_03
06_03
08_03
10_03
12_03
100
200
300
400
500
600
700
Profile 12
Re
do
xp
ote
nti
al
(mV
)
0.00
0.05
0.10
0.15
0.20
0.25
0.30
02_99
04_99
06_99
08_99
10_99
01_00
04_02
06_02
08_02
10_02
12_02
02_03
04_03
06_03
08_03
10_03
12_03
100
200
300
400
500
600
700
0.00
0.05
0.10
0.15
0.20
0.25
0.30
02_99
04_99
06_99
08_99
10_99
01_00
04_02
06_02
08_02
10_02
12_02
02_03
04_03
06_03
08_03
10_03
12_03
100
200
300
400
500
600
700
Profile 10
Re
do
xp
ote
nti
al
(mV
)
0.00
0.05
0.10
0.15
0.20
0.25
0.30
02_
99
04_
99
06_
99
08_
99
10_
99
01_
00
04_02
06_
02
08_02
10_
02
12_
02
02_
03
04_
03
06_
03
08_
03
10_
03
12_
03 100
200
300
400
500
600
700
Gra
vim
etr
ic w
ate
r c
on
ten
t
Profile 9
0.00
0.05
0.10
0.15
0.20
0.25
0.30
02_
99
04_
99
06_
99
08_
99
10_
99
01_
00
04_
02
06_
02
08_
02
10_
02
12_
02
02_
03
04_
03
06_
03
08_
03
10_
03
12_
03 100
200
300
400
500
600
700
Profile 10
Re
do
xp
ote
nti
al
(mV
)
0.00
0.05
0.10
0.15
0.20
0.25
0.30
02_
99
04_
99
06_
99
08_
99
10_
99
01_
00
04_02
06_
02
08_02
10_
02
12_
02
02_
03
04_
03
06_
03
08_
03
10_
03
12_
03 100
200
300
400
500
600
700
Profile 10
Re
do
xp
ote
nti
al
(mV
)
0.00
0.05
0.10
0.15
0.20
0.25
0.30
02_
99
04_
99
06_
99
08_
99
10_
99
01_
00
04_02
06_
02
08_02
10_
02
12_
02
02_
03
04_
03
06_
03
08_
03
10_
03
12_
03 100
200
300
400
500
600
700
0.00
0.05
0.10
0.15
0.20
0.25
0.30
02_
99
04_
99
06_
99
08_
99
10_
99
01_
00
04_02
06_
02
08_02
10_
02
12_
02
02_
03
04_
03
06_
03
08_
03
10_
03
12_
03 100
200
300
400
500
600
700
Gra
vim
etr
ic w
ate
r c
on
ten
t
Profile 9
0.00
0.05
0.10
0.15
0.20
0.25
0.30
02_
99
04_
99
06_
99
08_
99
10_
99
01_
00
04_
02
06_
02
08_
02
10_
02
12_
02
02_
03
04_
03
06_
03
08_
03
10_
03
12_
03 100
200
300
400
500
600
700
Gra
vim
etr
ic w
ate
r c
on
ten
t
Profile 9
0.00
0.05
0.10
0.15
0.20
0.25
0.30
02_
99
04_
99
06_
99
08_
99
10_
99
01_
00
04_
02
06_
02
08_
02
10_
02
12_
02
02_
03
04_
03
06_
03
08_
03
10_
03
12_
03 100
200
300
400
500
600
700
0.00
0.05
0.10
0.15
0.20
0.25
0.30
02_
99
04_
99
06_
99
08_
99
10_
99
01_
00
04_
02
06_
02
08_
02
10_
02
12_
02
02_
03
04_
03
06_
03
08_
03
10_
03
12_
03 100
200
300
400
500
600
700
Profile 7
Gra
vim
etr
ic w
ate
r c
on
ten
t
0.00
0.05
0.10
0.15
0.20
0.25
0.30
02_99
04_99
06_99
08_99
10_99
01_00
04_02
06_02
08_02
10_02
12_02
02_03
04_03
06_03
08_03
10_03
12_03
100
200
300
400
500
600
700
Profile 8
Re
do
xp
ote
nti
al
(mV
)0.30
0.00
0.05
0.10
0.15
0.20
0.25
02_99
04_99
06_99
08_99
10_99
01_00
04_02
06_02
08_02
10_02
12_02
02_03
04_03
06_03
08_03
10_03
12_03
100
200
300
400
500
600
700Profile 7
Gra
vim
etr
ic w
ate
r c
on
ten
t
0.00
0.05
0.10
0.15
0.20
0.25
0.30
02_99
04_99
06_99
08_99
10_99
01_00
04_02
06_02
08_02
10_02
12_02
02_03
04_03
06_03
08_03
10_03
12_03
100
200
300
400
500
600
700Profile 7
Gra
vim
etr
ic w
ate
r c
on
ten
t
0.00
0.05
0.10
0.15
0.20
0.25
0.30
02_99
04_99
06_99
08_99
10_99
01_00
04_02
06_02
08_02
10_02
12_02
02_03
04_03
06_03
08_03
10_03
12_03
100
200
300
400
500
600
700
0.00
0.05
0.10
0.15
0.20
0.25
0.30
02_99
04_99
06_99
08_99
10_99
01_00
04_02
06_02
08_02
10_02
12_02
02_03
04_03
06_03
08_03
10_03
12_03
100
200
300
400
500
600
700
Profile 8
Re
do
xp
ote
nti
al
(mV
)0.30
0.00
0.05
0.10
0.15
0.20
0.25
02_99
04_99
06_99
08_99
10_99
01_00
04_02
06_02
08_02
10_02
12_02
02_03
04_03
06_03
08_03
10_03
12_03
100
200
300
400
500
600
700
Profile 8
Re
do
xp
ote
nti
al
(mV
)0.30
0.00
0.05
0.10
0.15
0.20
0.25
02_99
04_99
06_99
08_99
10_99
01_00
04_02
06_02
08_02
10_02
12_02
02_03
04_03
06_03
08_03
10_03
12_03
100
200
300
400
500
600
7000.30
0.00
0.05
0.10
0.15
0.20
0.25
02_99
04_99
06_99
08_99
10_99
01_00
04_02
06_02
08_02
10_02
12_02
02_03
04_03
06_03
08_03
10_03
12_03
100
200
300
400
500
600
700
10-30 cm 40-70 cm FC 10-30 FC 40-70redox10-30 cm 40-70 cm FC 10-30 FC 40-70redoxredox
Fig. 2 (continued).
E.A.C. Costantini et al. / Geoderma 131 (2006) 388–403 395
compare macroporosity of layer 1 of profile 6 before
and after burying.
3. Results and analyses
3.1. Main chemical and physical soil characteristics
affecting saturation conditions and redox potential
The majority of the soils were alkaline or moder-
ately alkaline (Table 2), only profiles 12 and 7 had acid
or moderately acid reaction. The normalization at pH 7
of measured redox potentials resulted in a narrowing of
the values between acid and alkaline soils. Of the three
soils without carbonates, profile 7 and 12 were two
very old and leached paleosols, while profile 8 was
formed on pre-weathered alluvial materials.
All soils showed low or very low organic matter
content, with the exception of layer 1 of profile 7
which, according to Italian and international standards
(EUROCONSULT, 1989; SILPA, 1994), had a mod-
erately high value. C/N ratio of the upper layer was
low in profiles 1, 2, 4, 5, 6, and 12, normal in profile 3
and elevated in profiles 7, 8, 9, 10 and 11. The very

E.A.C. Costantini et al. / Geoderma 131 (2006) 388–403396
high C/N values indicate a slow decaying of the or-
ganic matter. High C/N ratio often corresponded to a
very low nitrogen content. The reduced microbiolog-
ical activity could, however, also be due to temporary
periods of water excess. Actually, soils with a high C/
N ratio almost always belonged to class 4 or 5 of
internal drainage and horizon permeability, and
showed mottles in the upper part of the profile.
The COLE values were always slight or moderate
(Shafer and Singer, 1976), thus excluding a high
shrink–swell activity and strongly expressed vertic
properties; nevertheless, the fine-textured soils
showed pressures faces and slickensides.
The aggregate stability index MWD indicated a
moderately good structure only in profiles 2, 6 and
7, and in layer 1 of profile 9. All the other horizons
presented low or very low aggregate stability (Cost-
antini et al., 2002b). This result is rather characteristic
of soils in the Mediterranean region, when poor in
organic matter and intensively cultivated; however, as
MWD did not result being significantly correlated to
the other variables, it was omitted from further ela-
borations. Bulk density values were, on average, rath-
er high, confirming the poor quality of the structure of
these soils.
3.2. Monitoring of water table, moisture, temperature
and redox potential
The regional climate during the trial showed years
1999 and 2000 with normal rainfall, whereas 2002
had a moister summer and 2003 was much drier than
the normal year. A bnormalQ year has rainfall total
amount in the range of Fstandard deviation of the
long-time mean, but a normal year in the Mediterra-
nean climate is most of the time bnot normalQ as
regards monthly precipitation (Costantini et al.,
2002a).
From April 2002, free water occurrence was only
observed in the experimental fields of Trecciano
(profile 7), during December 2002 and January
2003, at 0.45 m and 0.4 m depth, respectively; and
at Cetona (profile 11) in January 2003 at 0.55 m. It
was never observed in the other plots. However, due
to the fact that sampling was carried out on a fort-
nightly schedule we cannot exclude that some short
period of saturation could have occurred between two
measurements.
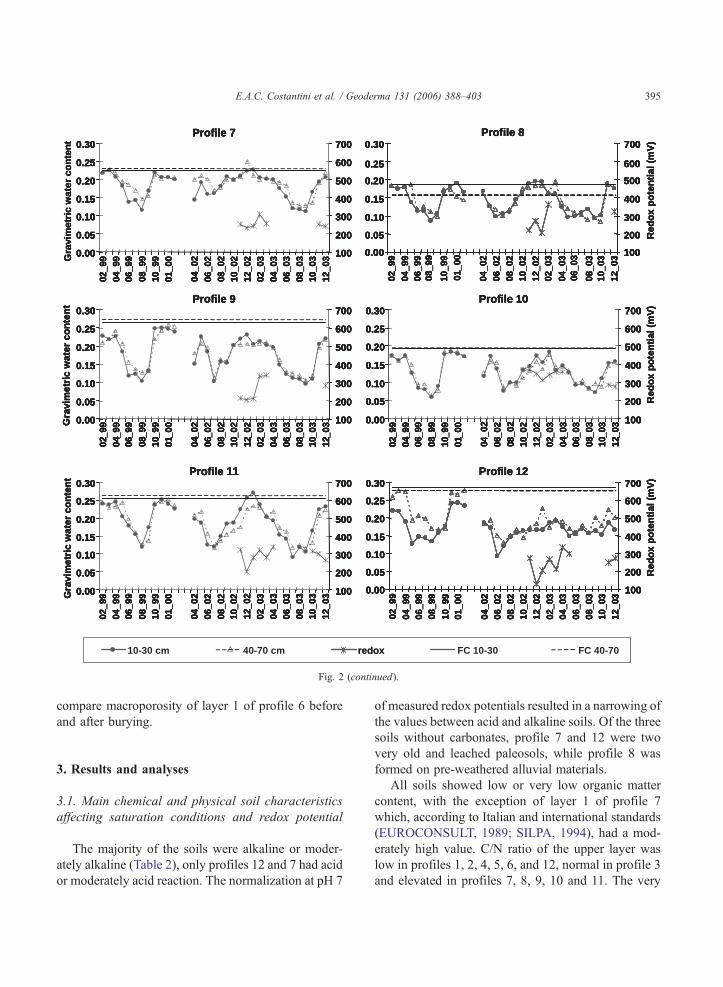
The main results of the monitoring activity are
reported in Fig. 2 and Table 3. Two groups of soils
can be clearly distinguished. The first group, formed
by profiles 1, 2, 3, 4, and 5, always showed water
contents well below their field capacity. All the other
soils showed moisture conditions during the rainy
seasons that in one or both layers, at the time of
sampling, were near to, or exceeded, field capacity.
The first group corresponds to soils with classes of
internal drainages 2 and 3, the second group to 4 and
5. The only exception is constituted by profile 6,
which belongs to the second group, although it was
estimated class 3.
Redox potential values, normalized at pH 7,
showed slight diversity in the studied soils, and the
observed differences were not always correlated with
the moisture content. Profile 6, for instance, which had
a relatively high water content, also showed a rather
high redox potential. Redox values pointed out that all
soils experienced weak reducing conditions during
autumn and winter times. If we consider Mn and Fe
oxides becoming reduced at 395 mV and 180 mV,
respectively (Sequi, 1989), figures indicated that
redox potentials at 0.15 m depth were low enough to
cause the vanishing of oxygen and nitrate, as well as
Mn2+ formation, but only in few cases induced Fe3+
reduction.
3.3. Thin sections macroporosity analysis
Total macroporosity and the sum of the seven size
classes of regular, irregular and elongated macro-
pores, are reported in Table 4. According to the
micromorphometric method (Pagliai, 1988), the
only soil having a moderate macroporosity (10–
25%) below the tilled horizon was profile 3, while
all the other were dense (5–10%) or very dense
(b5%). This result is not surprising for these kinds
of soils, which are poor in organic matter and fre-
quently passed over by farm machinery. The mor-
phological shape of macropores indicated that
regular pores were on average less abundant and
variable than the others (mean 1.15%, standard de-
viation 0.41). Irregular pores had an intermediate
position (mean 2.28%, standard deviation 1.31),
while the elongated were the most represented
(mean 2.30%, standard deviation 2.40). These last
two kinds of pore are the most important for vertical

Table 3
Main results of the hydrological monitoring
Profile
number
Layer Month of the year
when soil
Seasonal mean gravimetric water content (g g�1) and soil temperature at 0.5 m (8C), andmean redox potential at 0.15 m during Autumn and Winter (mV)
temperature at
0.5 m was lower
than 8 8C
Spring Summer Autumn Winter
1 1 Feb_03 0.11 16.5 0.08 27.6 0.14 11.9 278 0.15 6.4 341
2 1 Feb_03 0.15 14.9 0.12 25.1 0.17 14.3 327 0.18 7.3 329
3 1 Feb_03 0.13 15.7 0.10 26.3 0.16 13.6 304 0.17 6.8 338
2 and Dec_03 0.14 0.10 0.14 0.16
4 1 Jan and 0.14 14.7 0.13 25.3 0.18 12.9 279 0.20 5.9 285
2 Feb_03 0.14 0.13 0.17 0.20
5 1 Feb_03 0.15 17.2 0.14 26.9 0.19 15.4 269 0.20 7.8 349
2 0.18 0.15 0.20 0.20
6 1 Feb_03 0.16 15.7 0.10 25.5 0.17 14.7 318 0.20 8.2 324
2 0.16 0.08 0.15 0.20
7 1 Jan and 0.17 15.7 0.15 25.0 0.20 13.2 245 0.21 5.6 269
2 Feb_03 0.20 0.16 0.20 0.21
8 1 Feb_03 0.13 14.3 0.11 25.0 0.17 13.5 273 0.18 6.5 285
2 0.14 0.11 0.17 0.17
9 1 Feb_03 0.17 15.5 0.12 26.6 0.22 14.1 235 0.22 6.5 295
2 0.19 0.13 0.20 0.23
10 1 Feb_03 0.13 16.4 0.08 25.8 0.16 14.1 313 0.17 7.2 304
2 0.14 0.09 0.15 0.17
11 1 Feb_03 0.18 14.5 0.14 24.3 0.22 13.5 281 0.24 6.7 294
2 0.20 0.13 0.21 0.23
12 1 Jan, Feb 0.16 13.5 0.15 24.0 0.18 12.6 232 0.21 4.8 229
2 and Mar_03 0.19 0.17 0.20 0.25
E.A.C. Costantini et al. / Geoderma 131 (2006) 388–403 397
water movement, and could explain the different
hydrology of the studied soils.
The proportion of elongated and irregular macro-
pores on total macroporosity (PR index) ranged from
approximately 0.49 to 0.95. When PR was 0.80 or
more, the elongated pores generally predominated
over the other two kinds of macropores, and the
water content of the layer, apart from layer 1 of profile
8, was never found close to field capacity.
3.4. Micromorphological evidences of hydromorphy
The stage of hydromorphism of the studied soils
ranged between 0 and 3, that is from nil to high
hydromorphism (Aguilar et al., 2003); stage 4, mean-
ing extreme hydromorphism, was never found. Stage
1, indicating an incipient hydromorphy, corresponded
to layers with red or brown color, scarce presence of
Mn mottles and accumulation features, both in macro-
and micromorphology. Stage 2 corresponded to layers
which were yellow in color and had few bleached
mottles and depleted areas, and common Fe–Mn ac-
cumulation features, such as masses with diffuse
boundaries. Stage 3 was characterized by dominant
grayish, reddish and yellowish mottles, abundant
bleached and Fe–Mn depleted zones, and many Fe–
Mn accumulations. The combination of particular
micro- and macromorphological features suggested
by Aguilar et al. (2003) to typify hydromorphism
stage was sometimes difficult to find, thus intermedi-
ate degrees were envisaged.
In general, micromorphological evidence of hydro-
morphy was consistent with soil field description,
although quantitative and qualitative estimation of
redoximorphic features differed.
Besides groundmass color and Fe–Mn accumula-
tion–depletion features, micromorphological analysis
pointed out the presence of crystalline pedofeatures,
namely micritic calcite nodules, infillings and coatings,
in profiles 4, 5, 6, 9, 10 and 11, often associated to
depletion pedofeatures. The abundance of calcite crys-
talline pedofeatures was occasional (layers 1 and 2 of
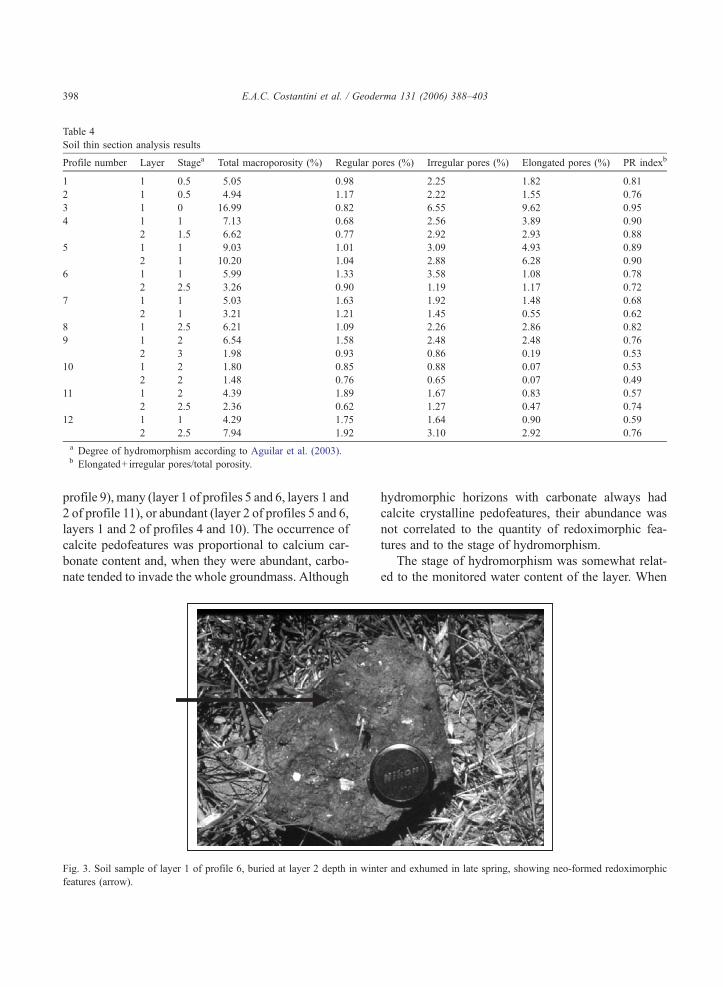
Table 4
Soil thin section analysis results
Profile number Layer Stagea Total macroporosity (%) Regular pores (%) Irregular pores (%) Elongated pores (%) PR indexb
1 1 0.5 5.05 0.98 2.25 1.82 0.81
2 1 0.5 4.94 1.17 2.22 1.55 0.76
3 1 0 16.99 0.82 6.55 9.62 0.95
4 1 1 7.13 0.68 2.56 3.89 0.90
2 1.5 6.62 0.77 2.92 2.93 0.88
5 1 1 9.03 1.01 3.09 4.93 0.89
2 1 10.20 1.04 2.88 6.28 0.90
6 1 1 5.99 1.33 3.58 1.08 0.78
2 2.5 3.26 0.90 1.19 1.17 0.72
7 1 1 5.03 1.63 1.92 1.48 0.68
2 1 3.21 1.21 1.45 0.55 0.62
8 1 2.5 6.21 1.09 2.26 2.86 0.82
9 1 2 6.54 1.58 2.48 2.48 0.76
2 3 1.98 0.93 0.86 0.19 0.53
10 1 2 1.80 0.85 0.88 0.07 0.53
2 2 1.48 0.76 0.65 0.07 0.49
11 1 2 4.39 1.89 1.67 0.83 0.57
2 2.5 2.36 0.62 1.27 0.47 0.74
12 1 1 4.29 1.75 1.64 0.90 0.59
2 2.5 7.94 1.92 3.10 2.92 0.76
a Degree of hydromorphism according to Aguilar et al. (2003).b Elongated+ irregular pores/total porosity.
E.A.C. Costantini et al. / Geoderma 131 (2006) 388–403398
profile 9), many (layer 1 of profiles 5 and 6, layers 1 and
2 of profile 11), or abundant (layer 2 of profiles 5 and 6,
layers 1 and 2 of profiles 4 and 10). The occurrence of
calcite pedofeatures was proportional to calcium car-
bonate content and, when they were abundant, carbo-
nate tended to invade the whole groundmass. Although
Fig. 3. Soil sample of layer 1 of profile 6, buried at layer 2 depth in wint
features (arrow).
hydromorphic horizons with carbonate always had
calcite crystalline pedofeatures, their abundance was
not correlated to the quantity of redoximorphic fea-
tures and to the stage of hydromorphism.
The stage of hydromorphism was somewhat relat-
ed to the monitored water content of the layer. When
er and exhumed in late spring, showing neo-formed redoximorphic

E.A.C. Costantini et al. / Geoderma 131 (2006) 388–403 399
hydromorphy degree was 2 or more, in particular, the
water content during the moister seasons was found to
be higher, or very close, to field capacity.
3.5. Checking the occurrence of redoximorphic
features as a consequence of deep plowing
Layer 1 of profile 6 was found lacking in redox-
imorphic features during the field survey. The horizon
was brown (Munsell 10YR4/3), coarse-loamy, and its
estimated permeability was high (Table 2). Chemical
and physical analyses indicated that the structure was
rather good, bulk density not very high and C/N ratio
equilibrated. Thin section analysis had only evidenced
an incipient stage of hydromorphy, but many micritic
calcite nodules, infillings and coatings. Macroporosity
b
a
Fig. 4. Microphotographs of soil thin sections of exhumed layer 1 of profil
occupy the whole groundmass (25�, frame size 4.5�3 mm); (b) micritic
calcite (100�).
analysis, however, had pointed out a rather low total
quantity of pores, as well as a low incidence of
elongated pores, and elongated plus irregular, on the
total (Table 4). Mean redox potential during the rainy
seasons was quite high, in spite of the number of wet
periods.
When exhumed after having been buried for 6
months, the layer showed an outstanding change in
its macromorphology (Fig. 3). Many dark grayish
brown mottles (Munsell 10YR4/1), and pale brown
(Munsell 10YR6/3), 20 to 60 mm in size, had oc-
curred around main roots. Their examination in thin
section revealed that grayish mottles were constituted
by micritic calcite nodules and infillings, which
tended to occupy the whole groundmass, whereas
pale brown mottles corresponded to somewhat iron
c
e 6 (plain light). (a) Micritic calcite nodules and infillings tending to
calcite stuffing the groundmass (100�); (c) infilling of soft micritic
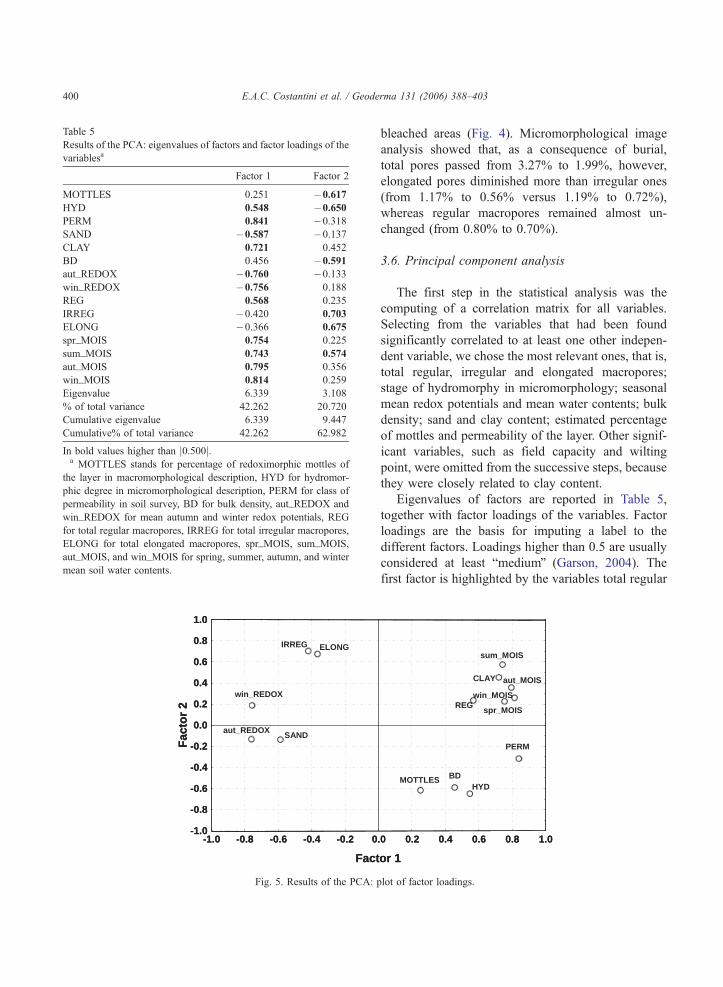
Table 5
Results of the PCA: eigenvalues of factors and factor loadings of the
variablesa
Factor 1 Factor 2
MOTTLES 0.251 �0.617HYD 0.548 �0.650PERM 0.841 �0.318SAND �0.587 �0.137CLAY 0.721 0.452
BD 0.456 �0.591aut_REDOX �0.760 �0.133win_REDOX �0.756 0.188
REG 0.568 0.235
IRREG �0.420 0.703
ELONG �0.366 0.675
spr_MOIS 0.754 0.225
sum_MOIS 0.743 0.574
aut_MOIS 0.795 0.356
win_MOIS 0.814 0.259
Eigenvalue 6.339 3.108
% of total variance 42.262 20.720
Cumulative eigenvalue 6.339 9.447
Cumulative% of total variance 42.262 62.982
In bold values higher than j0.500j.a MOTTLES stands for percentage of redoximorphic mottles of
the layer in macromorphological description, HYD for hydromor-
phic degree in micromorphological description, PERM for class of
permeability in soil survey, BD for bulk density, aut_REDOX and
win_REDOX for mean autumn and winter redox potentials, REG
for total regular macropores, IRREG for total irregular macropores,
ELONG for total elongated macropores, spr_MOIS, sum_MOIS,
aut_MOIS, and win_MOIS for spring, summer, autumn, and winter
mean soil water contents.
Fact
Facto
r 2
SANDaut_REDOX
win_REDOX
IRREG ELONG
-1.0
-0.8
-0.6
-0.4
-0.2
0.0
0.2
0.4
0.6
0.8
1.0
-1.0 -0.8 -0.6 -0.4 -0.2 0
Fact
Facto
r 2
SANDaut_REDOX
win_REDOX
IRREG ELONG
-1.0
-0.8
-0.6
-0.4
-0.2
0.0
0.2
0.4
0.6
0.8
1.0
-1.0 -0.8 -0.6 -0.4 -0.2 0
Fig. 5. Results of the PCA:
E.A.C. Costantini et al. / Geoderma 131 (2006) 388–403400
bleached areas (Fig. 4). Micromorphological image
analysis showed that, as a consequence of burial,
total pores passed from 3.27% to 1.99%, however,
elongated pores diminished more than irregular ones
(from 1.17% to 0.56% versus 1.19% to 0.72%),
whereas regular macropores remained almost un-
changed (from 0.80% to 0.70%).
3.6. Principal component analysis
The first step in the statistical analysis was the
computing of a correlation matrix for all variables.
Selecting from the variables that had been found
significantly correlated to at least one other indepen-
dent variable, we chose the most relevant ones, that is,
total regular, irregular and elongated macropores;
stage of hydromorphy in micromorphology; seasonal
mean redox potentials and mean water contents; bulk
density; sand and clay content; estimated percentage
of mottles and permeability of the layer. Other signif-
icant variables, such as field capacity and wilting
point, were omitted from the successive steps, because
they were closely related to clay content.
Eigenvalues of factors are reported in Table 5,
together with factor loadings of the variables. Factor
loadings are the basis for imputing a label to the
different factors. Loadings higher than 0.5 are usually
considered at least bmediumQ (Garson, 2004). The
first factor is highlighted by the variables total regular
or 1
MOTTLESHYD
PERM
CLAY
BD
REGspr_MOIS
sum_MOIS
aut_MOIS
win_MOIS
.0 0.2 0.4 0.6 0.8 1.0
or 1
MOTTLESHYD
PERM
CLAY
BD
REGspr_MOIS
sum_MOIS
aut_MOIS
win_MOIS
.0 0.2 0.4 0.6 0.8 1.0
plot of factor loadings.

E.A.C. Costantini et al. / Geoderma 131 (2006) 388–403 401
macropores, clay, permeability class, spring, summer,
autumn, and winter soil water contents, which contrast
against sand, autumn and winter mean redox poten-
tials. The second factor indicates that variables esti-
mating percentage of mottles, bulk density and stage
of hydromorphy oppose irregular and elongated
macropores.
It must be noted that the two factors explain most
part of the total variance (about 63%), and they are
both related to soil properties affecting soil water
holding capacity and to morphological consequences
of waterlogging, which contrast with variables asso-
ciated to aeration. This is better shown in the plot of
factor loadings (Fig. 5), which indicates two main
contrasting clusters of variables. The first cluster
groups the variables with a direct relationship with a
high water status, i.e. macro- and microhydromorphy,
soil water content and permeability class, with regular
macropores. The second cluster relates variables
pointing to a good aeration, i.e. sand content, autumn
and winter redox potentials, to irregular and elongated
macropores.
4. Discussion and conclusions
All the experimental vineyard and olive groves are
located on slopes and have rather high external drain-
age (runoff), increased by the up and down slope
tillage, which impedes the permanence of a water
table for long periods. We must moreover consider
that farmers usually avoid unfavorable morphological
positions for these crops (e.g. foot slopes, concavities,
flat plains). Short and occasional water saturation nev-
ertheless occurred when the permeability of a soil
layer, or of the underlying layer, was moderately low
or low. The short period of saturation, however, seems
to have been long enough to cause reductive processes
in some soils. This was probably due to the rather
elevated soil temperature during rainy seasons, foster-
ing anaerobic microbial degradation of organic matter.
Redoximorphic features, however, could have been
formed also as a consequence of plantation. In fact,
the common practice of deep plowing before planta-
tion caused a sudden enhancement of organic matter
in depth, which may have boosted iron and manga-
nese reduction and the formation of a redoximorphic
pattern. The burial of the upper layer, moreover,
seems to lead to a reduction of elongated and irregular
macropores, thus affecting the internal drainage of the
horizon.
Besides iron and manganese oxides, the reducing
conditions could have also affected calcium carbonate
dissolution and precipitation in calcareous soils like
profile 6. When the upper layer of this profile, rich in
total and active carbonates, and medium in organic
matter, was buried at a depth with less macroporosity,
the release of CO2 probably led to over-saturation of
the soil solution with respect to calcite, favoring the
formation of crystallized micrites. A similar process is
reported by Bouzigues et al. (1997) for calcareous
soils on a plateau in the south of France, occurring
in relation to the rising and lowering of groundwater.
Also Tassinari et al. (2002) found calcareous soft
masses correlated to duration of water saturation,
but only in soils of a specific environment, a Pliocene
plateau in the south of France, and not in the other
examined soils.
Our results indicate that micromorphological anal-
ysis could refine the characterization of the internal
drainage through both the qualitative and quantitative
approaches. The first one is relatively cheap and easy,
therefore it is recommended for all horizons which
have a problematic assessment of internal drainage.
The micromorphometric characterization of macro-
porosity instead, being more time consuming and
costly, could be limited to selected benchmark soils.
The estimation of the hydromorphy degree follow-
ing Aguilar et al. (2003) resulted correlated to all the
other variables of interest: directly with bulk density,
regular macropores and the variables indicating a high
water status, inversely with mean seasonal redox
potentials and total irregular and elongated pores.
Our experience, however, suggests that improvement
to this method should consider the presence and the
nature of neoformed calcite, in particular when asso-
ciated with depletion pedofeatures.
The PCA associated the abundance of elongated
and irregular macropores, which favor the water
drainage (Pagliai and Vignozzi, 2002; Pellegrini et
al., 2000), to the other variables pointing to a good
aeration, that is sand content, autumn and winter high
redox potentials. The quantity of regular pores, which
are less efficient for downward water transmission,
was on the other hand grouped together with an
average high seasonal soil water content, a low per-
E.A.C. Costantini et al. / Geoderma 131 (2006) 388–403402
meability class, and macro- and microevidences of
hydromorphy.
The relevance of elongated and irregular macro-
pores for the internal drainage of this kind of soil,
intensively cultivated, poorly structured, and with low
porosity, has been also confirmed by the PR index. In
soils of vineyards and olive groves optimal drainage
conditions seem to be ensured by a PR value higher
than 0.80.
Special care should be given to soils apparently
well drained, but showing many micritic calcite
nodules, infillings and coatings, as well as a PR
value lower than 0.80 and a strongly contrasting
O.M. content between the topsoil and the lower hor-
izons. If deep plowed before the new plantation of a
tree crop, they may experience a severe impairment of
the internal drainage and the occurrence of reductive
conditions.
Acknowledgments
This research was supported by a financial contri-
bution from the Agriculture Department of the Prov-
ince of Siena and by the Special Project bSUOLOQ ofthe Italian Ministry of Agricultural and Forestry Pol-
icies. Thanks are extended to the farms which hosted
the experimental plots.
References
Aguilar, J., Fernandez, J., Dorronsoro, C., Stoops, G., Dorronsoro,
B., 2003. Hydromorphy in soils. http://edafologia.ugr.es/hidro/
indexw.
Bouma, J., Jongerius, A., Boersma, O.H., Jager, A., Schoonderbeek,
D., 1977. The function of different types of macropores during
saturated flow through four swelling soil horizons. Soil Sci. Soc.
Am. J. 41, 945–950.
Bouzigues, R., Ribolzi, O., Favrot, J.C., Valles, V., 1997. Carbonate
redistrbution and hydrogeochemical processes in two calcareous
soils with groundwater in a Mediterranean environment. Eur. J.
Soil Sci. 48, 201–211.
Bullock, P., Fedoroff, N., Jongerius, A., Stoops, G., Tursina, T.,
1985. Handbook for Soil Thin Section Description. Waine
Research Publications, Wolverhampton, England. 150 pp.
Costantini, E.A.C., Campostrini, F., Arcara, P.G., Cherubini, P.,
Storchi, P., Pierucci, M., 1996. Soil and climate functional
characters for grape ripening and wine quality of bVino Nobile
di MontepulcianoQ. Acta Hort. 427 ISHS, 45–55.
Costantini, E.A.C., Castelli, F., Lorenzoni, P., Raimondi, S., 2002a.
Assessing soil moisture regimes with traditional and new meth-
ods. Soil Sci. Soc. Am. J. 66, 1889–1896.
Costantini, E.A.C., Pellegrini, S., Vignozzi, N., Ciampalini, R.,
Magini, S., Barbetti, R., 2002b. Using different methods for
calibrating field characterization of soil hydrological quali-
ties for the vine and olive tree zoning. In: Pagliai, M., Jones,
R. (Eds.), Sustainable Land Management—Environmental Pro-
tection: A Soil Physical Approach. Advances in GeoEcology,
vol. 35, pp. 101–114.
EUROCONSULT, 1989. Agricultural Compendium. Elsevier,
Amsterdam, The Netherlands. 740 pp.
Garson, G.D., 2004. Factor Analysis: SPSS Output (Online) http://
www2.chass.ncsu.edu/garson/pa765/factspss.htm (verified Au-
gust 2004).
Grossman, R.B., Brasher, B.R., Franzmeier, D.P., Walker, J.L.,
1968. Linear extensibility as calculated from natural-clod
bulk density measurements. Proc. Soil Sci. Soc. Am. 32,
570–573.
Kassel, D.K., Nielsen, D.R., 1986. Field capacity and available
water capacity. In: Klute, A. (Ed.), Methods of Soil Analysis,
Part 1, 2nd ed. Am. Soc. Agr, Madison WI, pp. 901–926.
Kemper, W.D., Rosenau, R.C., 1986. Aggregate stability and
size distribution. In: Klute, A. (Ed.), Methods of Soil Analysis,
Part 1, 2nd edn. American Society of Agronomy, Madison, WI,
pp. 425–442.
Pagliai, M., 1988. Soil porosity aspects. Int. Agrophys. 4, 215–232.
Pagliai, M., Vignozzi, N., 2002. Image analysis and microscopic
techniques to characterize soil pore system. In: Blahovec, J.,
Kutilek, M. (Eds.), Physical Methods in Agriculture—Approach
to Precision and Quality. Kluwer Academic/Plenum Publishers,
New York, pp. 13–38.
Patrick, W.H., Gambrell, R.P., Faulkner, S.P., 1996. Redox mea-
surement of soils. Methods of Soil Analysis: Part 3. Chemical
Methods. SSSA Book Series, vol. 5, pp. 1255–1273. Madison,
WI, USA.
Pellegrini, S., Vignozzi, N., Pagliai, M., 2000. Effects of different
management systems on soil structure and compaction of two
soils under viticulture. Agric. Mediterr. 130, 216–222.
Schaap, M.G., Lebron, I., 2001. Using microscope observations of
thin sections to estimate soil permeability with the Kozeny–
Carman equation. J. Hydrol. 251 (3–4), 186–201.
Sequi, P., 1989. I suoli sommersi e il potenziale redox. In:
Sequi, P. (Ed.), Chimica del Suolo. Patron ed. Bologna, Italy,
pp. 419–434.
Shafer, W.M., Singer, M.J., 1976. A new method of measuring
shrink–swell potential using soil pastes. Soil Sci. Soc. Am. J.
40, 805–806.
SILPA, 1994. Metodo unico per interpretare l’analisi del terreno.
Terra e Vita 26, 54–56.
Soil Survey Division Staff, 1993. Soil Survey Manual.
USDA-NRCS Agric. Handbook, vol. 18. Washington D.C.,
USA, 437 pp.
Soil Survey Staff, 1999. Soil taxonomy: a basic system of soil
classification for making and interpreting soil surveys, 2nd ed.
USDA-NRCS Agric. Handbook, vol. 436. U.S. Gov. Print.
Office, Washington, DC, USA. 869 pp.
Soil Survey Staff, 2001. Soil Properties and Qualities. NSSH Part

E.A.C. Costantini et al. / Geoderma 131 (2006) 388–403 403
618 (Exhibits 1–10) (Online) http://soils.usda.gov/technical/
handbook/contents/part618p5.html#ex9 (verified July 2004).
Tassinari, C., Lagacherie, P., Bouzigues, R., Legros, J.P., 2002.
Estimating soil water saturation from morphological soil indi-
cators in a pedologically contrasted Mediterranean region. Geo-
derma 108 (3–4), 225–235.
Van Bavel, C.H.M., 1949. Mean weight diameter of soil aggregates
as a statistical index of aggregation. Proc.-Soil Sci. Soc. Am. 14,
20–23.
Van Leeuwen, C., Seguin, G., 1997. Incidence de la nature du sol et
du cepage sur la maturation du raisin, a Saint emilion, en 1995.
1er Colloque international bLes terroirs viticolesQ Angers,
France. INRA, 154–157.
Vervoort, R.W., Cattle, S.R., 2003. Linking hydraulic conductivity
and tortuosity parameters to pore space geometry and pore-size
distribution. J. Hydrol. 272 (1–4), 36–49.


