Embed Size (px)
Citation preview
Mezgebo, G. B., Monahan, F. J., McGee, M., O'Riordan, E. G.,Marren, D., Listrat, A., Picard, B., Richardson, R. I., & Moloney, A. P.(2019). Extending the grazing period for bulls, prior to finishing on aconcentrate ration: Composition, collagen structure and organolepticcharacteristics of beef. Foods, 8(7), 278.https://doi.org/10.3390/foods8070278
Publisher's PDF, also known as Version of recordLicense (if available):CC BYLink to published version (if available):10.3390/foods8070278
Link to publication record in Explore Bristol ResearchPDF-document
This is the final published version of the article (version of record). It first appeared online via MDPI athttps://doi.org/10.3390/foods8070278 . Please refer to any applicable terms of use of the publisher.
University of Bristol - Explore Bristol ResearchGeneral rights
This document is made available in accordance with publisher policies. Please cite only thepublished version using the reference above. Full terms of use are available:http://www.bristol.ac.uk/red/research-policy/pure/user-guides/ebr-terms/
foods
Article
Extending the Grazing Period for Bulls, Prior toFinishing on a Concentrate Ration: Composition,Collagen Structure and Organoleptic Characteristicsof Beef
Gebrehawerya B. Mezgebo 1,2, Frank J. Monahan 1, Mark McGee 2, Edward G. O’Riordan 2,Declan Marren 2, Anne Listrat 3, Brigitte Picard 3, R. Ian Richardson 4 and Aidan P. Moloney 2,*
1 School of Agriculture and Food Science, University College Dublin, D04V1W8 Dublin, Ireland2 Teagasc, Animal & Grassland Research and Innovation Centre, Grange, Dunsany, Co.,
C15PW93 Meath, Ireland3 UMR1213 Herbivores, INRA, VetAgro Sup, Clermont Université, Université de Lyon,
F-63122 Saint-Genès-Champanelle, France4 Division of Farm Animal Science, Department of Clinical Veterinary Medicine, University of Bristol,
Langford, Bristol BS40 5DU, UK* Correspondence: [email protected]; Tel.: +353-6-906-1100
Received: 25 June 2019; Accepted: 22 July 2019; Published: 23 July 2019�����������������
Abstract: The biochemical and organoleptic characteristics of the longissimus thoracis muscle fromsuckler bulls (n = 56) finished on a concentrate-based system (C) or raised in a pasture-based system(P) incorporating 99 (P99), 162 (P162) or 231 days (P231) of grazing prior to indoor finishing onthe concentrate-based diet were investigated. Age at slaughter increased with increasing period atpasture. Intramuscular fat concentration was lower (p < 0.001) for P99 than for C, P162 and P231bulls, which did not differ. Soluble collagen proportion was lower (p < 0.01) for P162 and P231 thanfor P99 and C bulls. Collagen cross-link content was higher (p < 0.05) for P231 than for P99 and Cbulls and for P162 than for C bulls. The proportion of type I muscle fibres was higher (p < 0.01) forP231 and P162 than for P99 and C bulls. Sensory tenderness was higher (p < 0.001) for C and P162than for P99 and P231 bulls and overall liking was higher (p < 0.01) for C than for P99 and P231 bullsbut similar to P162 bulls. Extending the grazing period to 162 days did not negatively influence thesensory qualities of beef compared to the intensive concentrate-based system.
Keywords: beef; fat score; intramuscular fat; fibre type; sensory quality
1. Introduction
Traditionally, suckler bull beef production was based on the provision of concentrate-based dietsuntil slaughter (i.e., intensive indoor systems) [1,2]. The profitability of such systems in temperateregions, can be enhanced by the use of cheaper feedstuffs such as conserved or grazed pasture [3].Thus, O’Riordan et al. [2] showed that introducing a pasture grazing period of 100 days for sucklerbulls prior to finishing on concentrates decreased the cost of production. It was also reported thatin such suckler beef systems, slaughtering bulls at under 20 months of age was desirable, as somemarkets have an age restriction [1]. However, suckler bulls from such systems, which usually involvelate maturing breed types, risked not achieving the desired carcass fat classification [2,4]. Similarly,such modifications (i.e., incorporating a grazing period) can affect the compositional and eating qualityof beef [4].
The longer bulls are at pasture, the cheaper the cost of production. However, the trade-off betweenthe duration of grazing, carcass fat classification and the extent of the concentrate feeding during
Foods 2019, 8, 278; doi:10.3390/foods8070278 www.mdpi.com/journal/foods
Foods 2019, 8, 278 2 of 17
finishing is important economically. There is a need therefore to investigate the effect of extending thegrazing period combined with finishing suckler bulls on a cereal concentrate on carcass fat classification,as well as other important carcass and meat quality traits. In addition to maximising economic returns,beef from grass fed animals is favoured by some consumers, as it is considered more ‘natural’ [5] andreported to enhance the proportion of nutritionally important fatty acids [6–8]. However, the provisionof grass for a prolonged period in bull beef production systems would likely increase the age atslaughter, which may influence consumer preferences and the sensory qualities of beef [9,10].
Therefore, the objective of the study was to examine the effect of varying the grazing period from0 to approximately 8 months prior to finishing on a cereal-based concentrate (to achieve a carcass fatclassification similar to that achieved by the intensively concentrate fed bulls) on fat and muscle colour,biochemical and sensory characteristics of beef. It was hypothesized that extending the grazing periodup to a full season and its associated increase in slaughter age would negatively influence the qualityof beef, particularly sensory tenderness.
2. Materials and Methods
2.1. Animals and Management
Fifty-six spring born (mean birth date 8 March) Charolais and Limousin sired weaned suckler bullswere purchased at livestock marts in Ireland at approximately 8 months of age and an average initialweight of 372 kg. They were acclimatised to slatted floor accommodation and offered a predominantlyperennial grass silage ad libitum plus 2 kg/head/day of a barley-based concentrate before randomassignment (1 December) to four treatments (14 animals per treatment) balanced for sire breed, birthdate and initial weight. The four treatments were: (1) ad libitum concentrates (870 g/kg rolled barley,60 g/kg soya bean meal, 50 g/kg molasses and 20 g/kg minerals/vitamins) plus grass silage (drymatter (DM) digestibility 700 g/kg) ad libitum until slaughter (C), (2) grass silage ad libitum plus2 kg concentrate daily during the winter (123 days duration) (GS) followed by 99 days at pasture(predominantly perennial ryegrass) and then an indoor finishing period on C until slaughter (P99),(3) GS followed by 162 days at pasture and then an indoor finishing period on C until slaughter(P162) and (4) GS followed by 231 days at pasture and then an indoor finishing period on C untilslaughter (P231). The mean age and live weight were 267 days (sd = 29.0) and 377 kg (sd = 33.1),respectively. A rotational grazing management strategy was used when animals were at pasture.The duration of the concentrate finishing periods were 201, 71, 120 and 121 days for C, P99, P162 andP231 bulls, respectively. The strategy was for C and P99 to have similar carcass weight and for C, P162and P231 to have a similar carcass fat score. The study was carried out under license from the IrishGovernment Department of Health and Children and with the approval of Teagasc, the Agriculturaland Food Development Authority. All procedures used complied with national regulations concerningexperimentation on farm animals.
2.2. Carcass Grading and Muscle Tissue Collection
On the day of slaughter, bulls were transported approximately 30 km to a commercial slaughterplant (Kepak Group, Clonee, Co., Meath, Ireland) and slaughtered immediately after arrival by boltstunning followed by exsanguination from the jugular vein. Electrical stimulation was not appliedand carcasses were hanged by the Achilles tendon. The slaughter and dressing procedures were inaccordance with the Regulations (EC) No. 1099/2009 and No. 853/2004. Post slaughter, carcasseswere weighed and graded for conformation (15 point scale, classes E+ (highest) to P− (lowest), E+ is15) and fatness (15 point scale, scores 5+ (highest) to 1− (lowest), 5+ is 15) according to the EU BeefCarcass Classification Scheme [11]. Approximately 45 min after slaughter, carcasses were placed in achill set at 9 ◦C and ambient temperature was monitored (2 h = 6.6 ◦C, 3.5 h = 7.6 ◦C, 5 h = 8.1 ◦C).After approximately 10 h the chill temperature was reduced to 0 ◦C. At 1 h post-slaughter, a sample
Foods 2019, 8, 278 3 of 17
(ca. 20 g) of longissimus thoracis (LT) muscle tissue (from the 9th rib position) was taken, snap frozenin liquid nitrogen and maintained at −80 ◦C for metabolic enzyme activity and fibre typing analyses.
2.3. Muscle pH and Temperature Measurement
Muscle pH was measured at 2, 3.5, 5 and 48 h post-mortem by making a scalpel incision in themuscle at the 10th rib and inserting a glass electrode (Model EC-2010-06, Reflex Sensors Ltd., Westport,Co., Mayo, Ireland) attached to a portable pH meter (Model no. 250A, Orion Research Inc., Boston,MA, USA) approximately 4.0 cm into the muscle. The temperature was recorded simultaneously andused to make a temperature compensated pH measurement.
2.4. Fat and Muscle Colour Measurements
A detailed procedure is given in [4]. Briefly, at 48 h post-mortem, carcasses were cut at the 5/6rib interface prior to subcutaneous fat and muscle colour measurements. Subcutaneous fat colourwas measured using a Miniscan XE Plus (Hunter Associates Laboratory Inc., Reston, VA, USA) attwo positions: (1) the surface of the lower round/rump region and (2) the surface of the 13th ribregion. For muscle colour measurement, the cut surface of the muscle was first allowed to bloomfor 1 h and the colour (L, a, b) was then measured using the Miniscan XE Plus. The L, a, b colourcoordinates represent lightness (scale 0 (black) to 100 (white)), redness (scale +a (red) to –a (green)) andyellowness (scale +b (yellow) to −b (blue)) of the muscle respectively. A chroma (saturation) colourintensity, C (computed as
√(a2 + b2), where a higher ‘C’ value indicates higher colour saturation) and
hue angle, H (computed as [tan−1(b/a)][180/π], where 0/360◦ is red, 90◦ is yellow, 180◦ is green and270◦ is blue colour) were also determined. Muscle pH and temperature were measured as describedabove. The cube roll (commercial cut that begins between the 5th and 6th rib and ends between the10th and 11th rib) was then removed, The LT perimeter was drawn on translucent paper and the areawas subsequently measured using a digital planimeter (Koizumi Placom, KP-90N, Niigata, Japan).The ribs joint was weighed, dissected into the LT, other lean muscle, fat and bone and the componentsweighed. The LT from the cube roll was vacuum packed, transported to Teagasc, Food Research Centre,Ashtown, Dublin, aged for 14 days at 2 ◦C and then stored at −18 ◦C prior to composition, collagensolubility and cross-link, proteoglycan and sensory analyses.
2.5. Proximate Composition, Collagen Content and Sensory Analyses
Moisture, intramuscular fat (IMF) and protein concentration of the LT muscle were determinedusing the SMART System 5 microwave moisture drying oven, NMR SMART Trac rapid fat analyser(CEM Corporation, Matthews, NC, USA) and LECO FP328 (LECO Corporation, Joseph, MI, USA)protein analyser, respectively [12]. Ash was determined by incinerating samples in a furnace (540 ◦Covernight). Collagen content was determined by quantitative determination of hydroxyproline by acolorimetric reaction [13]. Sensory analysis was conducted at the University of Bristol using a 10-persontrained taste panel who had been selected for their sensory acuity using the methods outlined inBSI [14]. Panellists tasted the samples from every animal in an order based on the designs outlinedin [15] for balancing carryover effects between samples. The panellists assessed each steak using0–100 mm unstructured intensity line scales for a consensually agreed texture profile, where 0 = niland 100 = extreme, and 8 point category scales for tenderness (1 = extremely tough to 8 = extremelytender), juiciness (1 = extremely dry to 8 = extremely juicy), beefy flavour and abnormal beef flavourintensities (1 = extremely weak to 8 = extremely strong). A detailed description of the compositional,collagen and sensory analyses methods is given in [4].
2.6. Collagen Cross-Link Analysis
Collagen cross-links were determined as previously described [16]. Briefly, frozen muscle sampleswere cut into 1 cm3 cubes and powdered in liquid nitrogen prior to analysis. For collagen cross-linkdetermination, about 250 mg of muscle powder were weighed and hydrolysed with 10 mL of 6 N HCl
Foods 2019, 8, 278 4 of 17
overnight at 110 ◦C in a screw-capped glass tube. After hydrolysis, 1 mL of the acid hydrolysate wascentrifuged at 16,000× g for 5 min at 4 ◦C. Then 600 µL of 6 N NaOH and 600 µL of 1 M Tris-HCl wereadded to 600 µL of acid supernatant. Final pH was checked using pH test strip and adjusted to between7 and 7.5 using 6 N HCl or NaOH. Pyridinoline cross-links (pyridinoline + deoxypyridinoline) weredetermined by the enzyme-linked immunoassay Metra Pyd EIA kit (Quidel Corporation, San Diego,CA, USA). Results are expressed in nM of pyridinoline per g DM.
A detailed description of the proteoglycan determination method is given in [16]. Briefly, 100 mgmuscle powder were incubated for 24 h at 4 ◦C with 1 mL extraction buffer (6 M Urea, 1 M NaCl,2% CHAPS (3-((3-Cholamidopropyl) dimethylammonio)-1-propanesulfonate hydrate) and proteaseinhibitor cocktail (1 tablet per 50 mL) (Roche Diagnostics GmbH, Mannheim, Germany). Followingcentrifugation (40 min at 4 ◦C, 15,000× g) the supernatant was recovered and used to determineproteoglycan content [17,18]. This assay is based on the ability of sulphated glycosaminoglycans(GAGs) to bind the cationic dye 1, 9-dimethylmethylene blue (DMMB). Briefly, 1 mL of DMMB solutionwas added to 100 µL of muscle extract and shaken for 30 min at room temperature. After centrifugationfor 15 min at 12,000× g, the supernatant (containing DMMB excess) was removed. One ml of 50 mMsodium acetate buffer solution was added to the residue and shaken for 30 min. Absorbance wasmeasured at 656 nm, with a micro-plate reader (TECAN Infinite, M200, Lyon, France). Concentrationswere determined by comparison with a standard curve of chondroitin-4-sulfate (C4S) in the range 0 to2.5 µg/mL. The data are expressed in µg of C4S-GAGs equivalents per g of DM.
2.7. Muscle Metabolic Enzyme Activity and Fibre Typing
Glycolytic enzyme activities (lactate dehydrogenase (LDH) and phosphofructokinase (PFK)) andoxidative enzyme activities (isocitrate dehydrogenase (ICDH), citrate synthase (CS) and cytochrome coxidase (COX)) were quantified spectrophotometrically [19]. Muscle fibre types were analysed usinghigh-resolution mini-gel electrophoresis [20].
2.8. Statistical Analysis
Data were subjected to analysis of variance using the General Linear Model procedure of SPSS (IBMSPSS Statistics Version 20) where the production system was regarded as a fixed factor. Assessor andsession were also regarded as fixed factors when analysing the sensory data. Means were consideredsignificant at p < 0.05. Muscle pH and temperature data were analysed using the GLM repeatedmeasures (GLM REP) procedure of SPSS. Data were also subjected to multiple analysis of variance tocalculate partial correlation coefficients (p), from the error sum of squares and cross products (SSCP)matrix, between selected production and carcass traits, muscle biochemical composition and sensoryqualities of beef.
3. Results
3.1. Production and Carcass Traits
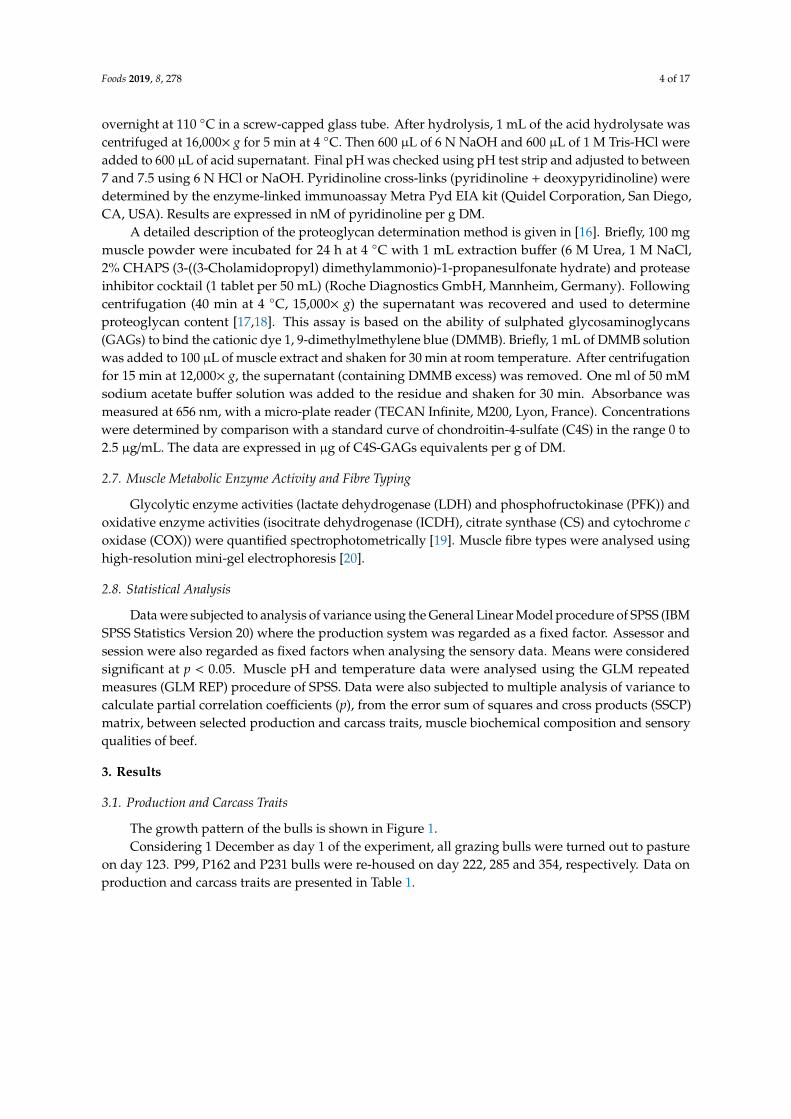
The growth pattern of the bulls is shown in Figure 1.Considering 1 December as day 1 of the experiment, all grazing bulls were turned out to pasture
on day 123. P99, P162 and P231 bulls were re-housed on day 222, 285 and 354, respectively. Data onproduction and carcass traits are presented in Table 1.
Foods 2019, 8, 278 5 of 17
Figure 1. Growth pattern of bulls raised on either a concentrate-based system (C) or pasture-basedsystems (P) incorporating 99 days (P1), 162 days (P2) or 231 days (P3) of grazing period prior to indoorfinishing on a concentrate-based diet (n = 14/treatment).
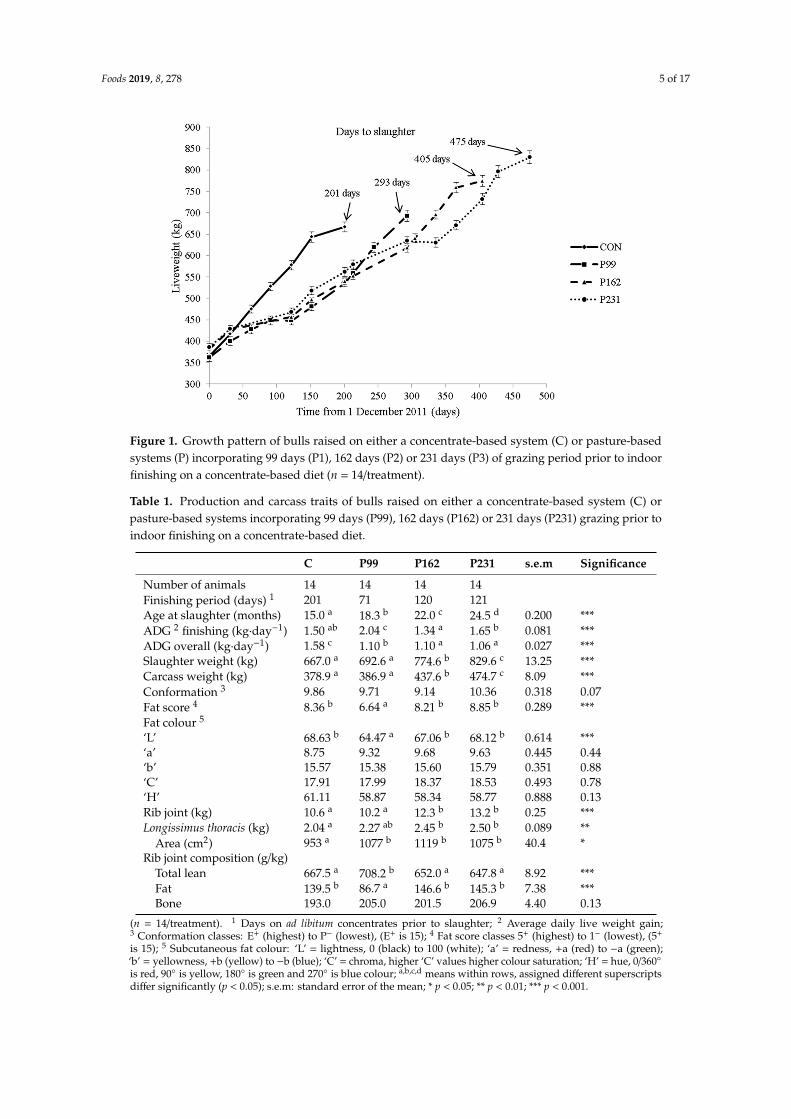
Table 1. Production and carcass traits of bulls raised on either a concentrate-based system (C) orpasture-based systems incorporating 99 days (P99), 162 days (P162) or 231 days (P231) grazing prior toindoor finishing on a concentrate-based diet.
C P99 P162 P231 s.e.m Significance
Number of animals 14 14 14 14Finishing period (days) 1 201 71 120 121Age at slaughter (months) 15.0 a 18.3 b 22.0 c 24.5 d 0.200 ***ADG 2 finishing (kg·day−1) 1.50 ab 2.04 c 1.34 a 1.65 b 0.081 ***ADG overall (kg·day−1) 1.58 c 1.10 b 1.10 a 1.06 a 0.027 ***Slaughter weight (kg) 667.0 a 692.6 a 774.6 b 829.6 c 13.25 ***Carcass weight (kg) 378.9 a 386.9 a 437.6 b 474.7 c 8.09 ***Conformation 3 9.86 9.71 9.14 10.36 0.318 0.07Fat score 4 8.36 b 6.64 a 8.21 b 8.85 b 0.289 ***Fat colour 5
‘L’ 68.63 b 64.47 a 67.06 b 68.12 b 0.614 ***‘a’ 8.75 9.32 9.68 9.63 0.445 0.44‘b’ 15.57 15.38 15.60 15.79 0.351 0.88‘C’ 17.91 17.99 18.37 18.53 0.493 0.78‘H’ 61.11 58.87 58.34 58.77 0.888 0.13Rib joint (kg) 10.6 a 10.2 a 12.3 b 13.2 b 0.25 ***Longissimus thoracis (kg) 2.04 a 2.27 ab 2.45 b 2.50 b 0.089 **
Area (cm2) 953 a 1077 b 1119 b 1075 b 40.4 *Rib joint composition (g/kg)
Total lean 667.5 a 708.2 b 652.0 a 647.8 a 8.92 ***Fat 139.5 b 86.7 a 146.6 b 145.3 b 7.38 ***Bone 193.0 205.0 201.5 206.9 4.40 0.13
(n = 14/treatment). 1 Days on ad libitum concentrates prior to slaughter; 2 Average daily live weight gain;3 Conformation classes: E+ (highest) to P− (lowest), (E+ is 15); 4 Fat score classes 5+ (highest) to 1− (lowest), (5+
is 15); 5 Subcutaneous fat colour: ‘L’ = lightness, 0 (black) to 100 (white); ‘a’ = redness, +a (red) to −a (green);‘b’ = yellowness, +b (yellow) to −b (blue); ‘C’ = chroma, higher ‘C’ values higher colour saturation; ‘H’ = hue, 0/360◦
is red, 90◦ is yellow, 180◦ is green and 270◦ is blue colour; a,b,c,d means within rows, assigned different superscriptsdiffer significantly (p < 0.05); s.e.m: standard error of the mean; * p < 0.05; ** p < 0.01; *** p < 0.001.
Foods 2019, 8, 278 6 of 17
Age at slaughter was lower (p < 0.001) for C than for P99, for P99 than for P162 and for P162 thanfor P231 bulls. The average daily liveweight gain (ADG) during finishing was higher (p < 0.001) forP99 than for P162, P231 and C bulls; for P231 than for P162 bulls, but similar for C and for P162, andfor C and for P231 bulls. The ADG overall was higher (p < 0.001) for C than for P99 bulls, which inturn was higher than for P162 and P231 bulls, which did not differ. Slaughter and carcass weights werelower (p < 0.001) for C and P99 (which did not differ) than for P162 bulls, which in turn was lower(p < 0.001) than for P231 bulls. Fat score was lower (p < 0.001) for P99 than for P162, P231 and C bulls,which did not differ. Of the subcutaneous fat colour coordinates, ‘L’ value was lower (p < 0.001) forP99 than for P162, P231 and C bulls, which did not differ. The weight of the cube roll was similarfor C and P99 and lower (p < 0.001) for P162 and P231 which did not differ. The weight of the LTwithin the cube roll was lower (p < 0.05) for C than for P162, but P99, P162 and P231 did not differ.The cross-sectional area of the LT at the 10th rib was lower for C than for P99, P162 and P231, whichdid not differ. The proportion of fat was lower and the proportion of lean was higher (p < 0.05) for Ccompared to P99, P162 and P231, which did not differ.
3.2. Muscle pH and Temperature Profile
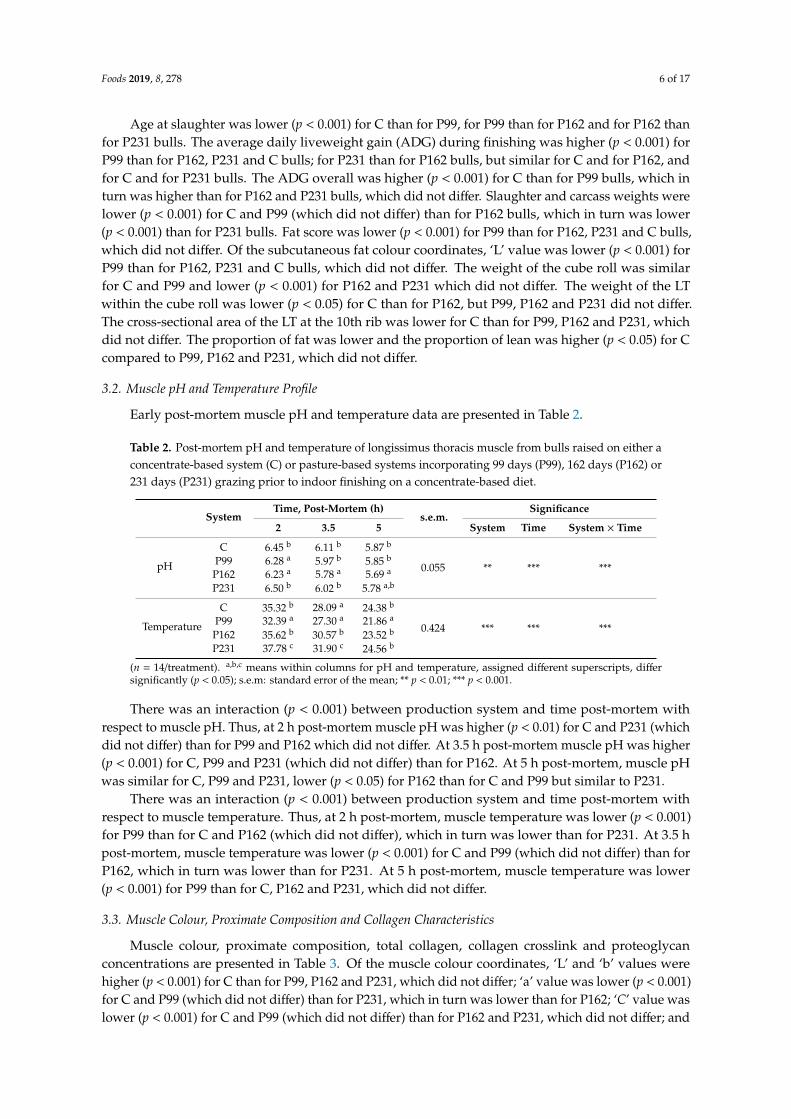
Early post-mortem muscle pH and temperature data are presented in Table 2.
Table 2. Post-mortem pH and temperature of longissimus thoracis muscle from bulls raised on either aconcentrate-based system (C) or pasture-based systems incorporating 99 days (P99), 162 days (P162) or231 days (P231) grazing prior to indoor finishing on a concentrate-based diet.
SystemTime, Post-Mortem (h)
s.e.m.Significance
2 3.5 5 System Time System × Time
pH
C 6.45 b 6.11 b 5.87 b
0.055 ** *** ***P99 6.28 a 5.97 b 5.85 b
P162 6.23 a 5.78 a 5.69 a
P231 6.50 b 6.02 b 5.78 a,b
Temperature
C 35.32 b 28.09 a 24.38 b
0.424 *** *** ***P99 32.39 a 27.30 a 21.86 a
P162 35.62 b 30.57 b 23.52 b
P231 37.78 c 31.90 c 24.56 b
(n = 14/treatment). a,b,c means within columns for pH and temperature, assigned different superscripts, differsignificantly (p < 0.05); s.e.m: standard error of the mean; ** p < 0.01; *** p < 0.001.
There was an interaction (p < 0.001) between production system and time post-mortem withrespect to muscle pH. Thus, at 2 h post-mortem muscle pH was higher (p < 0.01) for C and P231 (whichdid not differ) than for P99 and P162 which did not differ. At 3.5 h post-mortem muscle pH was higher(p < 0.001) for C, P99 and P231 (which did not differ) than for P162. At 5 h post-mortem, muscle pHwas similar for C, P99 and P231, lower (p < 0.05) for P162 than for C and P99 but similar to P231.
There was an interaction (p < 0.001) between production system and time post-mortem withrespect to muscle temperature. Thus, at 2 h post-mortem, muscle temperature was lower (p < 0.001)for P99 than for C and P162 (which did not differ), which in turn was lower than for P231. At 3.5 hpost-mortem, muscle temperature was lower (p < 0.001) for C and P99 (which did not differ) than forP162, which in turn was lower than for P231. At 5 h post-mortem, muscle temperature was lower(p < 0.001) for P99 than for C, P162 and P231, which did not differ.
3.3. Muscle Colour, Proximate Composition and Collagen Characteristics
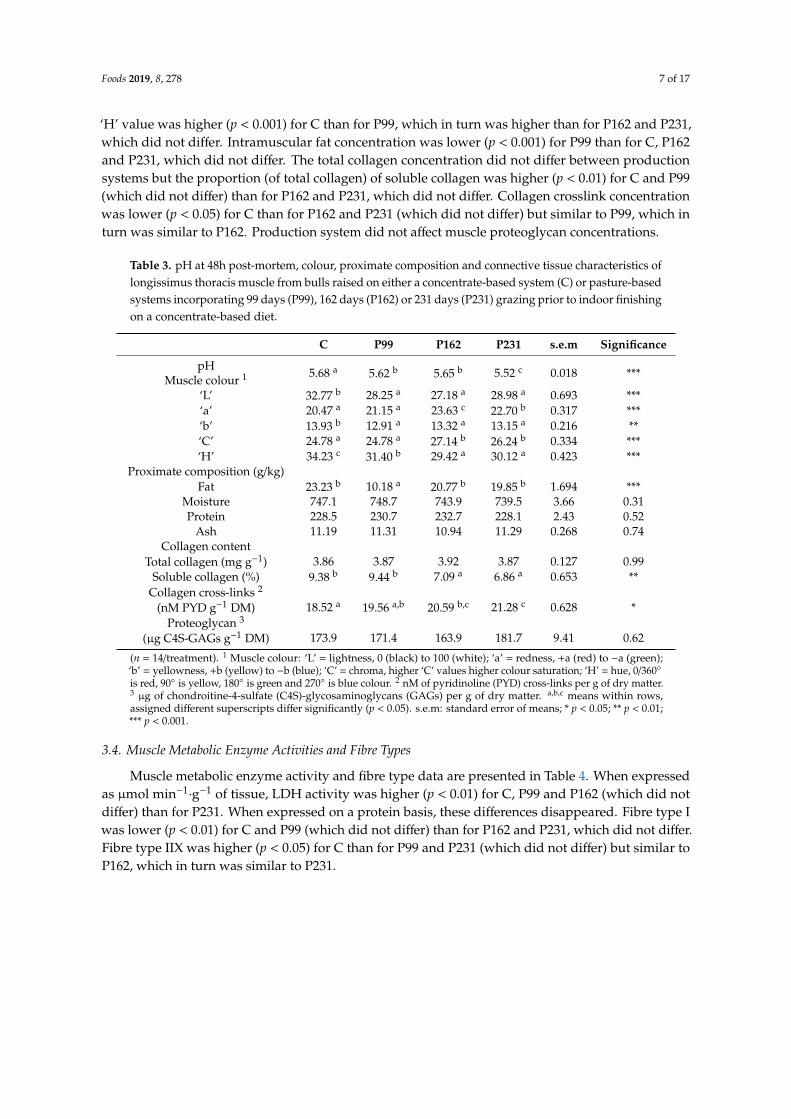
Muscle colour, proximate composition, total collagen, collagen crosslink and proteoglycanconcentrations are presented in Table 3. Of the muscle colour coordinates, ‘L’ and ‘b’ values werehigher (p < 0.001) for C than for P99, P162 and P231, which did not differ; ‘a’ value was lower (p < 0.001)for C and P99 (which did not differ) than for P231, which in turn was lower than for P162; ‘C’ value waslower (p < 0.001) for C and P99 (which did not differ) than for P162 and P231, which did not differ; and
Foods 2019, 8, 278 7 of 17
‘H’ value was higher (p < 0.001) for C than for P99, which in turn was higher than for P162 and P231,which did not differ. Intramuscular fat concentration was lower (p < 0.001) for P99 than for C, P162and P231, which did not differ. The total collagen concentration did not differ between productionsystems but the proportion (of total collagen) of soluble collagen was higher (p < 0.01) for C and P99(which did not differ) than for P162 and P231, which did not differ. Collagen crosslink concentrationwas lower (p < 0.05) for C than for P162 and P231 (which did not differ) but similar to P99, which inturn was similar to P162. Production system did not affect muscle proteoglycan concentrations.
Table 3. pH at 48h post-mortem, colour, proximate composition and connective tissue characteristics oflongissimus thoracis muscle from bulls raised on either a concentrate-based system (C) or pasture-basedsystems incorporating 99 days (P99), 162 days (P162) or 231 days (P231) grazing prior to indoor finishingon a concentrate-based diet.
C P99 P162 P231 s.e.m Significance
pHMuscle colour 1 5.68 a 5.62 b 5.65 b 5.52 c 0.018 ***
‘L’ 32.77 b 28.25 a 27.18 a 28.98 a 0.693 ***‘a’ 20.47 a 21.15 a 23.63 c 22.70 b 0.317 ***‘b’ 13.93 b 12.91 a 13.32 a 13.15 a 0.216 **‘C’ 24.78 a 24.78 a 27.14 b 26.24 b 0.334 ***‘H’ 34.23 c 31.40 b 29.42 a 30.12 a 0.423 ***
Proximate composition (g/kg)Fat 23.23 b 10.18 a 20.77 b 19.85 b 1.694 ***
Moisture 747.1 748.7 743.9 739.5 3.66 0.31Protein 228.5 230.7 232.7 228.1 2.43 0.52
Ash 11.19 11.31 10.94 11.29 0.268 0.74Collagen content
Total collagen (mg g−1) 3.86 3.87 3.92 3.87 0.127 0.99Soluble collagen (%) 9.38 b 9.44 b 7.09 a 6.86 a 0.653 **
Collagen cross-links 2
(nM PYD g−1 DM) 18.52 a 19.56 a,b 20.59 b,c 21.28 c 0.628 *Proteoglycan 3
(µg C4S-GAGs g−1 DM) 173.9 171.4 163.9 181.7 9.41 0.62
(n = 14/treatment). 1 Muscle colour: ‘L’ = lightness, 0 (black) to 100 (white); ‘a’ = redness, +a (red) to −a (green);‘b’ = yellowness, +b (yellow) to −b (blue); ‘C’ = chroma, higher ‘C’ values higher colour saturation; ‘H’ = hue, 0/360◦
is red, 90◦ is yellow, 180◦ is green and 270◦ is blue colour. 2 nM of pyridinoline (PYD) cross-links per g of dry matter.3 µg of chondroitine-4-sulfate (C4S)-glycosaminoglycans (GAGs) per g of dry matter. a,b,c means within rows,assigned different superscripts differ significantly (p < 0.05). s.e.m: standard error of means; * p < 0.05; ** p < 0.01;*** p < 0.001.
3.4. Muscle Metabolic Enzyme Activities and Fibre Types
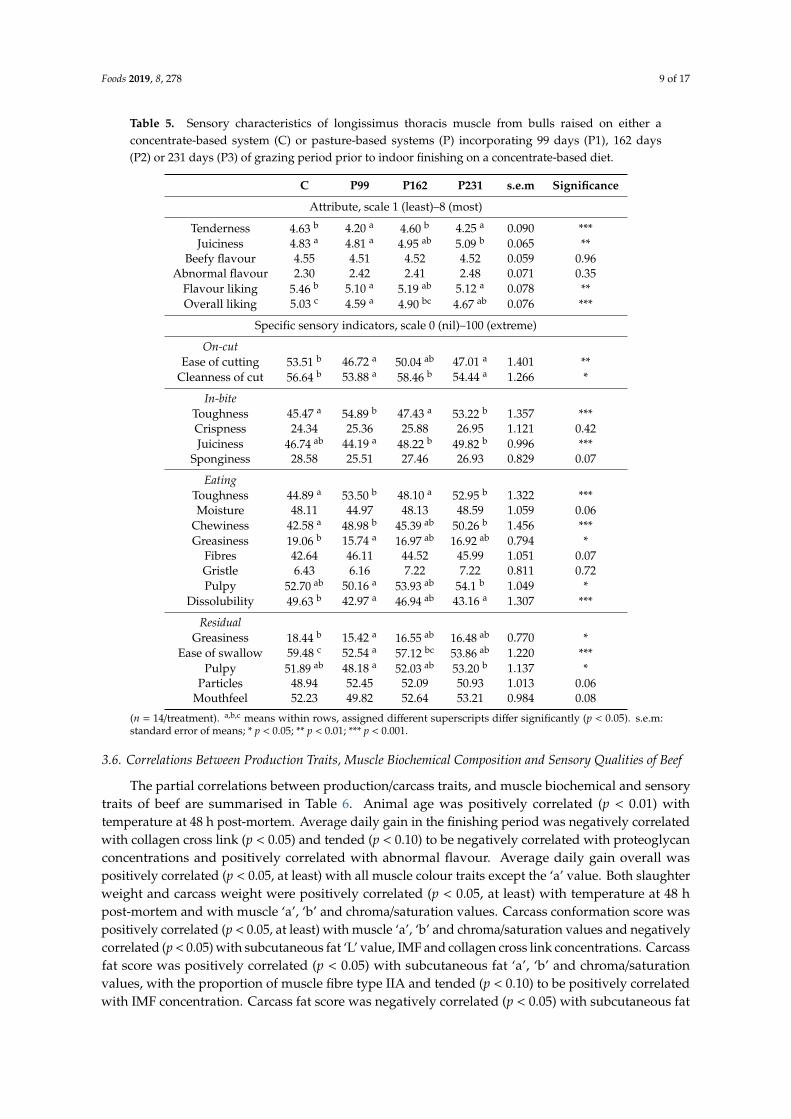
Muscle metabolic enzyme activity and fibre type data are presented in Table 4. When expressedas µmol min−1
·g−1 of tissue, LDH activity was higher (p < 0.01) for C, P99 and P162 (which did notdiffer) than for P231. When expressed on a protein basis, these differences disappeared. Fibre type Iwas lower (p < 0.01) for C and P99 (which did not differ) than for P162 and P231, which did not differ.Fibre type IIX was higher (p < 0.05) for C than for P99 and P231 (which did not differ) but similar toP162, which in turn was similar to P231.
Foods 2019, 8, 278 8 of 17
Table 4. Metabolic enzyme activity and fibre type characteristics of longissimus thoracis muscle frombulls raised on either a concentrate-based system (C) or pasture-based systems incorporating 99 days(P99), 162 days (P162) or 231 days (P231) grazing prior to indoor finishing on a concentrate-based diet.
C P99 P162 P231 s.e.m Significance
Metabolic enzyme activity 1
µmol min−1 g−1 of tissueLDH 998.6 b 968.7 b 992.2 b 885.1 a 24.17 **PFK 111.7 112.4 102.0 93.7 5.89 0.09
ICDH 1.01 1.02 1.11 1.20 0.068 0.17COX 15.11 15.21 14.23 15.95 1.315 0.83CS 5.34 4.58 3.87 4.92 0.463 0.16
µmol min−1·g−1 of protein
LDH 5007.3 5477.8 5122.6 4597.7 275.92 0.17PFK 559.3 636.2 526.7 486.2 41.59 0.08
ICDH 5.12 5.68 5.74 6.23 0.409 0.31COX 75.70 87.06 73.17 81.84 7.985 0.61CS 27.09 26.23 19.79 25.53 2.823 0.26
Protein (mg/g of tissue) 199.6 185.7 194.4 193.3 5.04 0.28Muscle fibre types (%) 2
I 18.48 a 17.08 a 22.46 b 23.14 b 1.45 **IIA 38.62 46.77 37.71 43.04 3.05 0.14IIX 44.14 c 29.83 a 39.83 b,c 33.33 a,b 3.53 *
(n = 14/treatment). 1 LDH: lactate dehydrogenase; PFK: phosphofructokinase; ICDH: isocitrate dehydrogenase;COX: cytochrome c oxidase; CS: citrate synthase. 2 I: oxidative, IIA: oxido-glycolytic, IIX: glycolytic. a,b,c meanswithin rows, assigned different superscripts differ significantly (p < 0.05). s.e.m: standard error of means; * p < 0.05;** p < 0.01.
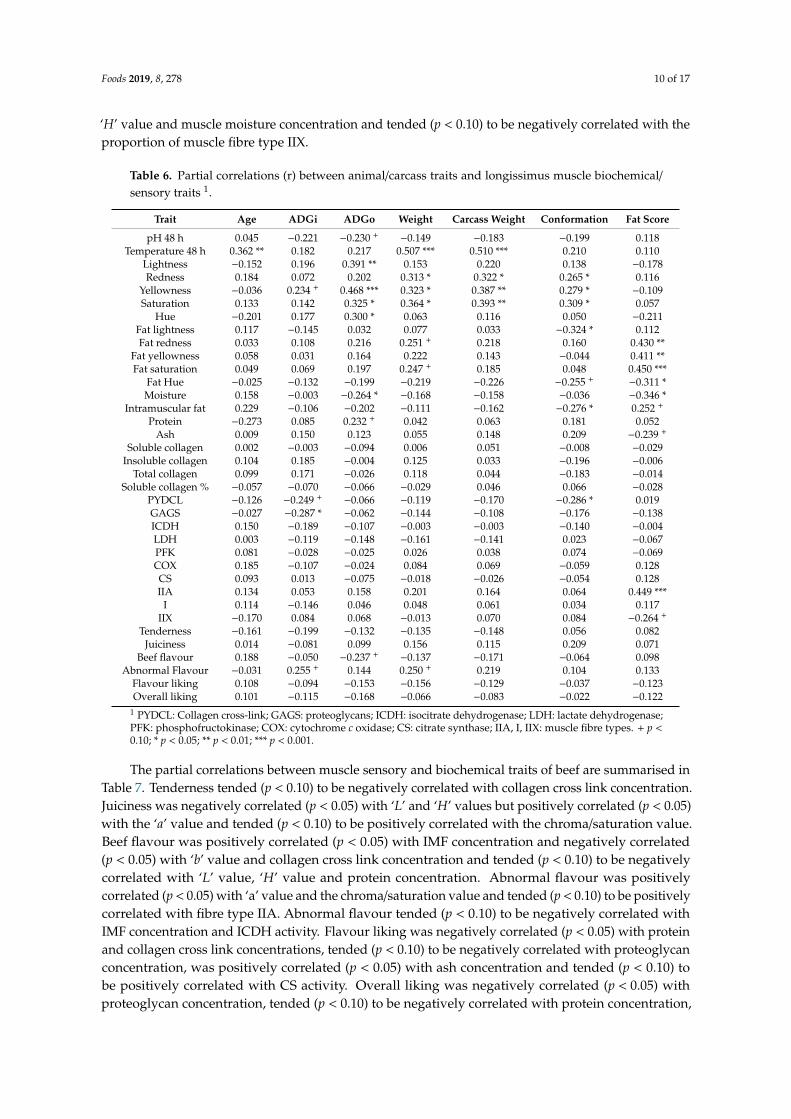
3.5. Sensory Characteristics
Muscle sensory characteristics data are presented in Table 5. Tenderness was higher (p < 0.001) forC and P162 (which did not differ) than for P99 and P231, which did not differ. Juiciness was higher(p < 0.01) for P231 than for C and P99 (which did not differ) but similar to P162, which in turn wassimilar to C and P99. Flavour liking was higher (p < 0.01) for C than for P99 and P231 (which did notdiffer) but similar to P162, which in turn was similar to C and P99. Overall liking was higher (p < 0.001)for C than for P99 and P231 (which did not differ) but similar to P162, which in turn was similar toP231. Ease of cutting was higher (p < 0.01) for C than for P99 and P231 (which did not differ) butsimilar to P162, which in turn was similar to C and P99. Cleanness of cut was higher (p < 0.01) for Cand P162 (which did not differ) than for P99 and P231, which did not differ. Toughness (both duringin-bite and eating) was lower (p < 0.001) for C and P162 (which did not differ) than for P99 and P231,which did not differ. Juiciness (during in-bite) was higher (p < 0.001) for P162 and P231 (which did notdiffer) than for P99, but similar to C, which in turn was similar to P99. Chewiness was lower (p < 0.001)for C than for P99 and P231 (which did not differ) but similar to P162, which in turn was similar to C.Greasiness (both during eating and residual) was higher (p < 0.001) for C than for P99, but similar toP162 and P231, which in turn was similar to P99. Pulpiness (both during eating and residual) washigher (p < 0.001) for P231 than for P99, but similar to C and P23, which in turn was similar to P99.Dissolubility was higher (p < 0.001) for C than for P99 and P231 (which did not differ) but similar toP162, which in turn was similar to P99 and P231. Ease of swallow was higher (p < 0.001) for C than forP99 and P231 (which did not differ) but similar to P162, which in turn was similar to P231.
Foods 2019, 8, 278 9 of 17
Table 5. Sensory characteristics of longissimus thoracis muscle from bulls raised on either aconcentrate-based system (C) or pasture-based systems (P) incorporating 99 days (P1), 162 days(P2) or 231 days (P3) of grazing period prior to indoor finishing on a concentrate-based diet.
C P99 P162 P231 s.e.m Significance
Attribute, scale 1 (least)–8 (most)
Tenderness 4.63 b 4.20 a 4.60 b 4.25 a 0.090 ***Juiciness 4.83 a 4.81 a 4.95 ab 5.09 b 0.065 **
Beefy flavour 4.55 4.51 4.52 4.52 0.059 0.96Abnormal flavour 2.30 2.42 2.41 2.48 0.071 0.35
Flavour liking 5.46 b 5.10 a 5.19 ab 5.12 a 0.078 **Overall liking 5.03 c 4.59 a 4.90 bc 4.67 ab 0.076 ***
Specific sensory indicators, scale 0 (nil)–100 (extreme)
On-cutEase of cutting 53.51 b 46.72 a 50.04 ab 47.01 a 1.401 **
Cleanness of cut 56.64 b 53.88 a 58.46 b 54.44 a 1.266 *
In-biteToughness 45.47 a 54.89 b 47.43 a 53.22 b 1.357 ***Crispness 24.34 25.36 25.88 26.95 1.121 0.42Juiciness 46.74 ab 44.19 a 48.22 b 49.82 b 0.996 ***
Sponginess 28.58 25.51 27.46 26.93 0.829 0.07
EatingToughness 44.89 a 53.50 b 48.10 a 52.95 b 1.322 ***Moisture 48.11 44.97 48.13 48.59 1.059 0.06
Chewiness 42.58 a 48.98 b 45.39 ab 50.26 b 1.456 ***Greasiness 19.06 b 15.74 a 16.97 ab 16.92 ab 0.794 *
Fibres 42.64 46.11 44.52 45.99 1.051 0.07Gristle 6.43 6.16 7.22 7.22 0.811 0.72Pulpy 52.70 ab 50.16 a 53.93 ab 54.1 b 1.049 *
Dissolubility 49.63 b 42.97 a 46.94 ab 43.16 a 1.307 ***
ResidualGreasiness 18.44 b 15.42 a 16.55 ab 16.48 ab 0.770 *
Ease of swallow 59.48 c 52.54 a 57.12 bc 53.86 ab 1.220 ***Pulpy 51.89 ab 48.18 a 52.03 ab 53.20 b 1.137 *
Particles 48.94 52.45 52.09 50.93 1.013 0.06Mouthfeel 52.23 49.82 52.64 53.21 0.984 0.08
(n = 14/treatment). a,b,c means within rows, assigned different superscripts differ significantly (p < 0.05). s.e.m:standard error of means; * p < 0.05; ** p < 0.01; *** p < 0.001.
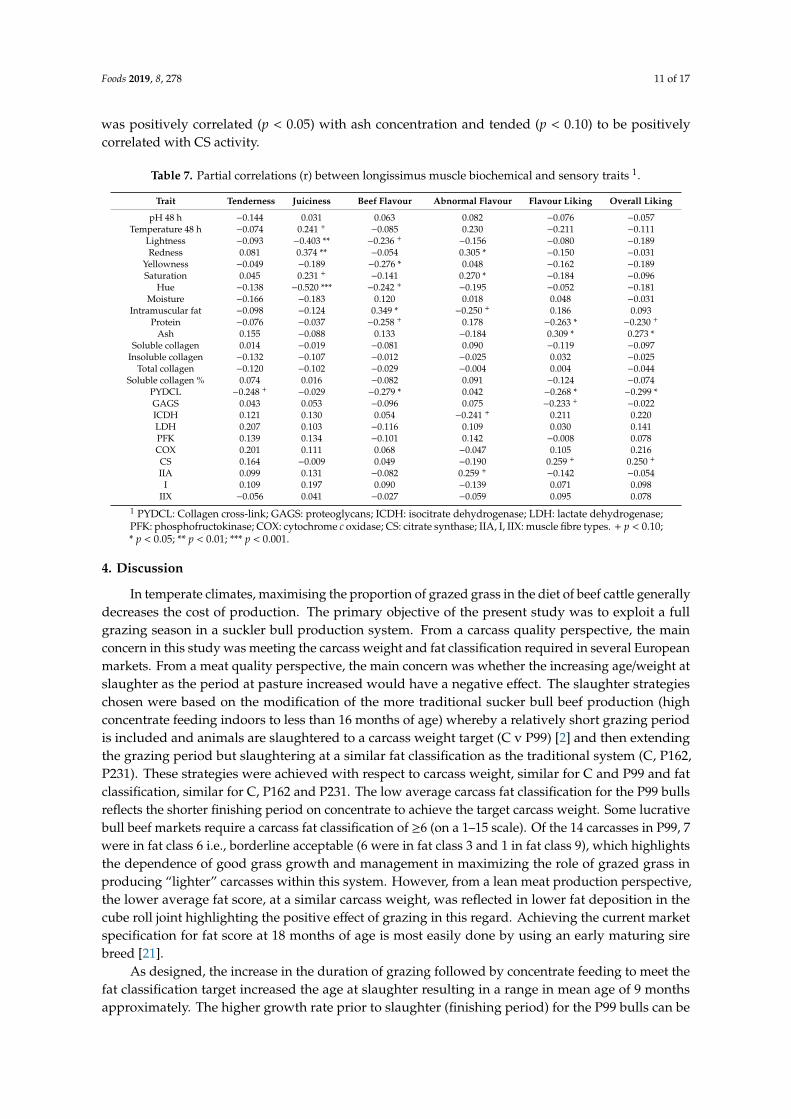
3.6. Correlations Between Production Traits, Muscle Biochemical Composition and Sensory Qualities of Beef
The partial correlations between production/carcass traits, and muscle biochemical and sensorytraits of beef are summarised in Table 6. Animal age was positively correlated (p < 0.01) withtemperature at 48 h post-mortem. Average daily gain in the finishing period was negatively correlatedwith collagen cross link (p < 0.05) and tended (p < 0.10) to be negatively correlated with proteoglycanconcentrations and positively correlated with abnormal flavour. Average daily gain overall waspositively correlated (p < 0.05, at least) with all muscle colour traits except the ‘a’ value. Both slaughterweight and carcass weight were positively correlated (p < 0.05, at least) with temperature at 48 hpost-mortem and with muscle ‘a’, ‘b’ and chroma/saturation values. Carcass conformation score waspositively correlated (p < 0.05, at least) with muscle ‘a’, ‘b’ and chroma/saturation values and negativelycorrelated (p < 0.05) with subcutaneous fat ‘L’ value, IMF and collagen cross link concentrations. Carcassfat score was positively correlated (p < 0.05) with subcutaneous fat ‘a’, ‘b’ and chroma/saturationvalues, with the proportion of muscle fibre type IIA and tended (p < 0.10) to be positively correlatedwith IMF concentration. Carcass fat score was negatively correlated (p < 0.05) with subcutaneous fat
Foods 2019, 8, 278 10 of 17
‘H’ value and muscle moisture concentration and tended (p < 0.10) to be negatively correlated with theproportion of muscle fibre type IIX.
Table 6. Partial correlations (r) between animal/carcass traits and longissimus muscle biochemical/sensory traits 1.
Trait Age ADGi ADGo Weight Carcass Weight Conformation Fat Score
pH 48 h 0.045 −0.221 −0.230 +−0.149 −0.183 −0.199 0.118
Temperature 48 h 0.362 ** 0.182 0.217 0.507 *** 0.510 *** 0.210 0.110Lightness −0.152 0.196 0.391 ** 0.153 0.220 0.138 −0.178Redness 0.184 0.072 0.202 0.313 * 0.322 * 0.265 * 0.116
Yellowness −0.036 0.234 + 0.468 *** 0.323 * 0.387 ** 0.279 * −0.109Saturation 0.133 0.142 0.325 * 0.364 * 0.393 ** 0.309 * 0.057
Hue −0.201 0.177 0.300 * 0.063 0.116 0.050 −0.211Fat lightness 0.117 −0.145 0.032 0.077 0.033 −0.324 * 0.112Fat redness 0.033 0.108 0.216 0.251 + 0.218 0.160 0.430 **
Fat yellowness 0.058 0.031 0.164 0.222 0.143 −0.044 0.411 **Fat saturation 0.049 0.069 0.197 0.247 + 0.185 0.048 0.450 ***
Fat Hue −0.025 −0.132 −0.199 −0.219 −0.226 −0.255 +−0.311 *
Moisture 0.158 −0.003 −0.264 * −0.168 −0.158 −0.036 −0.346 *Intramuscular fat 0.229 −0.106 −0.202 −0.111 −0.162 −0.276 * 0.252 +
Protein −0.273 0.085 0.232 + 0.042 0.063 0.181 0.052Ash 0.009 0.150 0.123 0.055 0.148 0.209 −0.239 +
Soluble collagen 0.002 −0.003 −0.094 0.006 0.051 −0.008 −0.029Insoluble collagen 0.104 0.185 −0.004 0.125 0.033 −0.196 −0.006
Total collagen 0.099 0.171 −0.026 0.118 0.044 −0.183 −0.014Soluble collagen % −0.057 −0.070 −0.066 −0.029 0.046 0.066 −0.028
PYDCL −0.126 −0.249 +−0.066 −0.119 −0.170 −0.286 * 0.019
GAGS −0.027 −0.287 * −0.062 −0.144 −0.108 −0.176 −0.138ICDH 0.150 −0.189 −0.107 −0.003 −0.003 −0.140 −0.004LDH 0.003 −0.119 −0.148 −0.161 −0.141 0.023 −0.067PFK 0.081 −0.028 −0.025 0.026 0.038 0.074 −0.069COX 0.185 −0.107 −0.024 0.084 0.069 −0.059 0.128CS 0.093 0.013 −0.075 −0.018 −0.026 −0.054 0.128IIA 0.134 0.053 0.158 0.201 0.164 0.064 0.449 ***
I 0.114 −0.146 0.046 0.048 0.061 0.034 0.117IIX −0.170 0.084 0.068 −0.013 0.070 0.084 −0.264 +
Tenderness −0.161 −0.199 −0.132 −0.135 −0.148 0.056 0.082Juiciness 0.014 −0.081 0.099 0.156 0.115 0.209 0.071
Beef flavour 0.188 −0.050 −0.237 +−0.137 −0.171 −0.064 0.098
Abnormal Flavour −0.031 0.255 + 0.144 0.250 + 0.219 0.104 0.133Flavour liking 0.108 −0.094 −0.153 −0.156 −0.129 −0.037 −0.123Overall liking 0.101 −0.115 −0.168 −0.066 −0.083 −0.022 −0.122
1 PYDCL: Collagen cross-link; GAGS: proteoglycans; ICDH: isocitrate dehydrogenase; LDH: lactate dehydrogenase;PFK: phosphofructokinase; COX: cytochrome c oxidase; CS: citrate synthase; IIA, I, IIX: muscle fibre types. + p <0.10; * p < 0.05; ** p < 0.01; *** p < 0.001.
The partial correlations between muscle sensory and biochemical traits of beef are summarised inTable 7. Tenderness tended (p < 0.10) to be negatively correlated with collagen cross link concentration.Juiciness was negatively correlated (p < 0.05) with ‘L’ and ‘H’ values but positively correlated (p < 0.05)with the ‘a’ value and tended (p < 0.10) to be positively correlated with the chroma/saturation value.Beef flavour was positively correlated (p < 0.05) with IMF concentration and negatively correlated(p < 0.05) with ‘b’ value and collagen cross link concentration and tended (p < 0.10) to be negativelycorrelated with ‘L’ value, ‘H’ value and protein concentration. Abnormal flavour was positivelycorrelated (p < 0.05) with ‘a’ value and the chroma/saturation value and tended (p < 0.10) to be positivelycorrelated with fibre type IIA. Abnormal flavour tended (p < 0.10) to be negatively correlated withIMF concentration and ICDH activity. Flavour liking was negatively correlated (p < 0.05) with proteinand collagen cross link concentrations, tended (p < 0.10) to be negatively correlated with proteoglycanconcentration, was positively correlated (p < 0.05) with ash concentration and tended (p < 0.10) tobe positively correlated with CS activity. Overall liking was negatively correlated (p < 0.05) withproteoglycan concentration, tended (p < 0.10) to be negatively correlated with protein concentration,
Foods 2019, 8, 278 11 of 17
was positively correlated (p < 0.05) with ash concentration and tended (p < 0.10) to be positivelycorrelated with CS activity.
Table 7. Partial correlations (r) between longissimus muscle biochemical and sensory traits 1.
Trait Tenderness Juiciness Beef Flavour Abnormal Flavour Flavour Liking Overall Liking
pH 48 h −0.144 0.031 0.063 0.082 −0.076 −0.057Temperature 48 h −0.074 0.241 +
−0.085 0.230 −0.211 −0.111Lightness −0.093 −0.403 ** −0.236 +
−0.156 −0.080 −0.189Redness 0.081 0.374 ** −0.054 0.305 * −0.150 −0.031
Yellowness −0.049 −0.189 −0.276 * 0.048 −0.162 −0.189Saturation 0.045 0.231 +
−0.141 0.270 * −0.184 −0.096Hue −0.138 −0.520 *** −0.242 +
−0.195 −0.052 −0.181Moisture −0.166 −0.183 0.120 0.018 0.048 −0.031
Intramuscular fat −0.098 −0.124 0.349 * −0.250 + 0.186 0.093Protein −0.076 −0.037 −0.258 + 0.178 −0.263 * −0.230 +
Ash 0.155 −0.088 0.133 −0.184 0.309 * 0.273 *Soluble collagen 0.014 −0.019 −0.081 0.090 −0.119 −0.097
Insoluble collagen −0.132 −0.107 −0.012 −0.025 0.032 −0.025Total collagen −0.120 −0.102 −0.029 −0.004 0.004 −0.044
Soluble collagen % 0.074 0.016 −0.082 0.091 −0.124 −0.074PYDCL −0.248 +
−0.029 −0.279 * 0.042 −0.268 * −0.299 *GAGS 0.043 0.053 −0.096 0.075 −0.233 +
−0.022ICDH 0.121 0.130 0.054 −0.241 + 0.211 0.220LDH 0.207 0.103 −0.116 0.109 0.030 0.141PFK 0.139 0.134 −0.101 0.142 −0.008 0.078COX 0.201 0.111 0.068 −0.047 0.105 0.216CS 0.164 −0.009 0.049 −0.190 0.259 + 0.250 +
IIA 0.099 0.131 −0.082 0.259 +−0.142 −0.054
I 0.109 0.197 0.090 −0.139 0.071 0.098IIX −0.056 0.041 −0.027 −0.059 0.095 0.078
1 PYDCL: Collagen cross-link; GAGS: proteoglycans; ICDH: isocitrate dehydrogenase; LDH: lactate dehydrogenase;PFK: phosphofructokinase; COX: cytochrome c oxidase; CS: citrate synthase; IIA, I, IIX: muscle fibre types. + p < 0.10;* p < 0.05; ** p < 0.01; *** p < 0.001.
4. Discussion
In temperate climates, maximising the proportion of grazed grass in the diet of beef cattle generallydecreases the cost of production. The primary objective of the present study was to exploit a fullgrazing season in a suckler bull production system. From a carcass quality perspective, the mainconcern in this study was meeting the carcass weight and fat classification required in several Europeanmarkets. From a meat quality perspective, the main concern was whether the increasing age/weight atslaughter as the period at pasture increased would have a negative effect. The slaughter strategieschosen were based on the modification of the more traditional sucker bull beef production (highconcentrate feeding indoors to less than 16 months of age) whereby a relatively short grazing periodis included and animals are slaughtered to a carcass weight target (C v P99) [2] and then extendingthe grazing period but slaughtering at a similar fat classification as the traditional system (C, P162,P231). These strategies were achieved with respect to carcass weight, similar for C and P99 and fatclassification, similar for C, P162 and P231. The low average carcass fat classification for the P99 bullsreflects the shorter finishing period on concentrate to achieve the target carcass weight. Some lucrativebull beef markets require a carcass fat classification of ≥6 (on a 1–15 scale). Of the 14 carcasses in P99, 7were in fat class 6 i.e., borderline acceptable (6 were in fat class 3 and 1 in fat class 9), which highlightsthe dependence of good grass growth and management in maximizing the role of grazed grass inproducing “lighter” carcasses within this system. However, from a lean meat production perspective,the lower average fat score, at a similar carcass weight, was reflected in lower fat deposition in thecube roll joint highlighting the positive effect of grazing in this regard. Achieving the current marketspecification for fat score at 18 months of age is most easily done by using an early maturing sirebreed [21].
As designed, the increase in the duration of grazing followed by concentrate feeding to meet thefat classification target increased the age at slaughter resulting in a range in mean age of 9 monthsapproximately. The higher growth rate prior to slaughter (finishing period) for the P99 bulls can be
Foods 2019, 8, 278 12 of 17
explained by the shorter indoor finishing period as an increase in the length of the finishing periodresults in a progressive decrease in live weight gain [22]. With regard to subcutaneous fat colour,the higher lightness for C, P162 and P231 bulls may be attributed to the higher fat scores of theircarcasses compared to the P99 bulls. A similar observation on the relationship between fat classificationand fat lightness was made by Mezgebo et al. [4] Based on the review of factors influencing fatcolour [23] we hypothesised that fat yellowness would increase as the duration of the grazing periodincreased. The data do not support this hypothesis. If the fat had become more yellow due to grazingand deposition of carotenoids from the grass [23], it seems the length of the finishing period onconcentrates was sufficient to remove this effect.
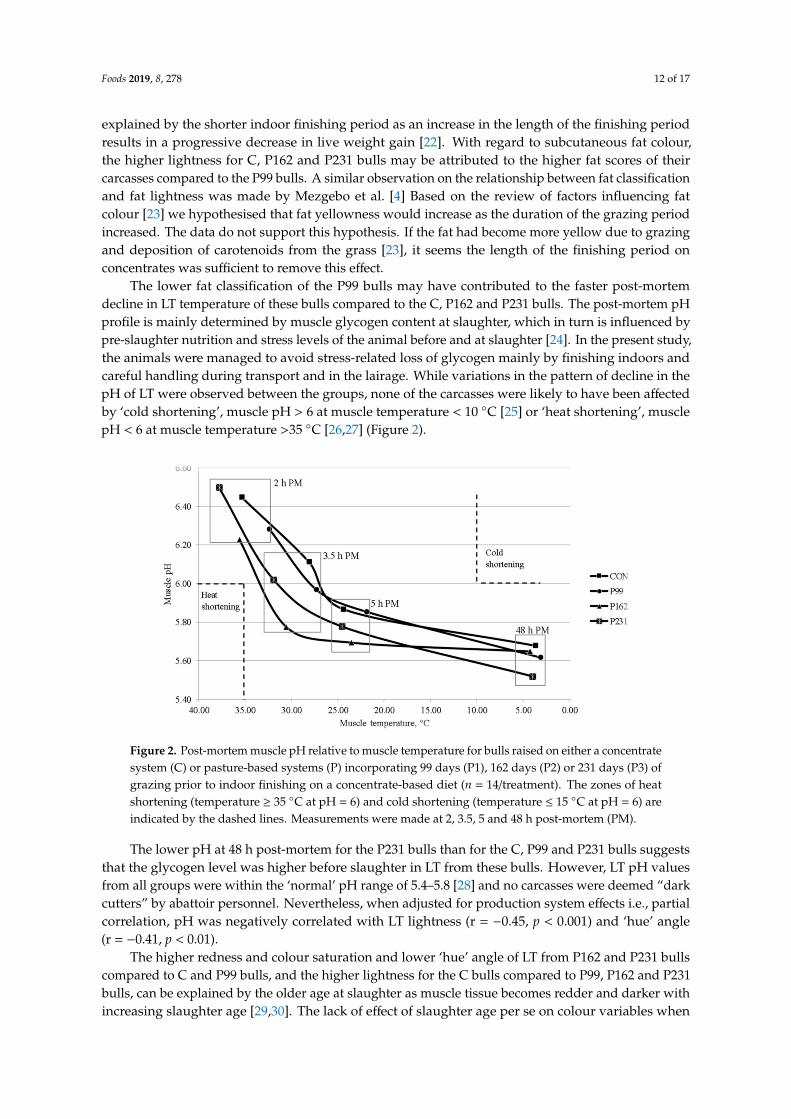
The lower fat classification of the P99 bulls may have contributed to the faster post-mortemdecline in LT temperature of these bulls compared to the C, P162 and P231 bulls. The post-mortem pHprofile is mainly determined by muscle glycogen content at slaughter, which in turn is influenced bypre-slaughter nutrition and stress levels of the animal before and at slaughter [24]. In the present study,the animals were managed to avoid stress-related loss of glycogen mainly by finishing indoors andcareful handling during transport and in the lairage. While variations in the pattern of decline in thepH of LT were observed between the groups, none of the carcasses were likely to have been affectedby ‘cold shortening’, muscle pH > 6 at muscle temperature < 10 ◦C [25] or ‘heat shortening’, musclepH < 6 at muscle temperature >35 ◦C [26,27] (Figure 2).
Figure 2. Post-mortem muscle pH relative to muscle temperature for bulls raised on either a concentratesystem (C) or pasture-based systems (P) incorporating 99 days (P1), 162 days (P2) or 231 days (P3) ofgrazing prior to indoor finishing on a concentrate-based diet (n = 14/treatment). The zones of heatshortening (temperature ≥ 35 ◦C at pH = 6) and cold shortening (temperature ≤ 15 ◦C at pH = 6) areindicated by the dashed lines. Measurements were made at 2, 3.5, 5 and 48 h post-mortem (PM).
The lower pH at 48 h post-mortem for the P231 bulls than for the C, P99 and P231 bulls suggeststhat the glycogen level was higher before slaughter in LT from these bulls. However, LT pH valuesfrom all groups were within the ‘normal’ pH range of 5.4–5.8 [28] and no carcasses were deemed “darkcutters” by abattoir personnel. Nevertheless, when adjusted for production system effects i.e., partialcorrelation, pH was negatively correlated with LT lightness (r = −0.45, p < 0.001) and ‘hue’ angle(r = −0.41, p < 0.01).
The higher redness and colour saturation and lower ‘hue’ angle of LT from P162 and P231 bullscompared to C and P99 bulls, and the higher lightness for the C bulls compared to P99, P162 and P231bulls, can be explained by the older age at slaughter as muscle tissue becomes redder and darker withincreasing slaughter age [29,30]. The lack of effect of slaughter age per se on colour variables when
Foods 2019, 8, 278 13 of 17
adjusted for production system effects in the present study, however, highlights the confounding effectof other production variations on LT colour. It is likely that increasing the grazing period increasedthe total amount of exercise engaged in by the animals when at pasture. However, data with respectto exercise and muscle colour in cattle are equivocal [31]. The higher proportion of LT type I fibres(characteristic of red muscle) for the P162 and P231 bulls compared to C and P99 bulls could alsocontribute to the higher redness.
Deposition of fat generally increases with increasing age and carcass weight of beef cattle [32,33].However, in the present study, the higher IMF concentration (and the proportion of fat in the cuberoll joint) for C compared to P99 bulls despite being younger at slaughter reflects their higher energyconsumption and higher growth rate over the full experimental period as high nutrient/energy intakeresults in higher fat deposition [32–34]. Tat the IMF concentration (and the proportion of fat in the cuberoll joint) was similar for P162 and P231, despite the latter being older and having a heavier carcass atslaughter might reflect a residual effect of the longer grazing period since grazing generally results inlower fat deposition [4,35]. According to [33], animal age is one of the main factors that determinethe physical and chemical properties of muscle connective tissue as the animal ages, the proportionof heat stable (chemically non-reducible) crosslinks, such as pyridinoline and Ehlichs chromagen,increases [36,37], which in turn leads to a decrease in the proportion of heat soluble collagen [37,38].On a production system basis, the data from the present study support these reports with regard tocollagen solubility. However, the lack of a relationship between slaughter age, slaughter weight orcarcass weight and collagen solubility, when adjusted for production system effects, indicates thatthe maturation of collagen is not due to one dominant influence. Moreover, while the lower collagensolubility in LT from P162 and P231 bulls compared to C and P99 bulls could be hypothesised to bedue to the higher pyridinoline cross link concentration (P162 numerically but not significantly, higherthan P99), when adjusted for production system effects this relationship was not significant.
As a general trend, as an animal becomes older (especially beyond sexual maturity) its muscleundergoes less glycolytic and more oxidative metabolism [39,40]. The lower activities of the glycolyticenzymes, LDH and PFK (tendency), in LT from the P231 bulls in the present study could therefore beattributed to their older age at slaughter compared to the C, P99 and P162 bulls. However, these threegroups had similar LDH and PFK activities in LT despite their differences in age indicating that age isnot the only factor influencing the activity of these enzymes. The higher proportion of slow twitch typeI oxidative fibres in LT from the P162 and P231 bulls indicates that an increase in age at slaughter canlead to an increase in oxidative fibres as reported by Jurie et al. [39] which in turn can lead to an increasein oxidative metabolism of the muscle. However, there was no statistically significant difference inthe activity of the oxidative enzymes ICDH, COX and CS. In addition, the higher proportion of type Ioxidative fibres in LT from P162 and P231 bulls compared to P99 bulls could also reflect more physicalactivity due to the extended grazing period [41,42]. The higher proportion of type IIX (fast twitchglycolytic) fibres in LT from C bulls compared to P99 bulls and generally higher for P162 and P231bulls than for the P99 bulls can be explained mainly by the longer duration of concentrate finishingas high energy intake favours glycolytic muscle metabolism [41,43]. In the present study, the typeIIB (fast twitch glycolytic, data not shown) muscle fibre was identified in only 7 animals (1 in C, 4 inP99, none in P162, 2 in P231 bulls; 1 Charolais and 6 Limousin sired bulls)). This might indicate thatexpression of Type IIB fibre is breed specific as it was reported to be identified commonly in Blonded’Aquitaine, a French beef breed [44].
The perception that beef, and bull beef in particular, becomes less tender and less acceptable tothe consumer as an animal becomes older is an important contributor to the inclusion of age limitsin market specifications for bull beef. For steers and heifers, there appears to be little effect of ageon tenderness, at least up to 24 months [45]. The lack of a significant relationship between age andtenderness, when adjusted for production system effects, in the present study indicates that a similarconclusion can be made for bulls. In support of this, Dikeman et al. [46] observed no difference inshear force or sensory tenderness in LT from early maturing bulls as age at slaughter increased from 12
Foods 2019, 8, 278 14 of 17
to 24 months. Similarly, a literature review of mainly French production systems indicated that asage at slaughter increased from 12 to 24 months there was little evidence of an increase in shear forceor decrease in sensory tenderness in meat from bulls [47]. In Irish studies with bulls of dairy origin,there was no difference in shear force or sensory tenderness of LT from production systems similar toC, P99 and P162 where the dairy bulls were 15, 19 and 22 months of age at slaughter, respectively [48].It is difficult, however, in many studies to separate the effects of age per se from other productionfactors, which might contribute to differences in beef tenderness. In a study with similar bulls as thoseused in this study, when averaged across three different production systems, an increase in age from14.5 to 21.2 months did not affect LT tenderness, however, there was an effect of production systemper se [4]. With regard to the eating quality of beef, the differences in sensory characteristics betweenthe treatments in the present study likely reflect the combined and possibly interactive effect of thevariations in pre-slaughter growth rate, IMF concentration, muscle fibre distribution and collagencrosslinks. The lower tenderness, flavour liking and overall liking scores for the P231 bulls comparedto the C bulls could mainly be attributed to their higher collagen cross-link content and altered fibredistribution since the IMF concentration was similar. Similarly, the lower tenderness and flavour scoresfor the P99 bulls compared to the C bulls could be related to the lower IMF concentration since musclestructure was not different. The favourable juiciness scores for both P162 and P231 bulls and the higherjuiciness scores for the P231 bulls compared to the P99 bulls can possibly be related to their older ageat slaughter as beef from older and fatter animals is perceived to be juicier than beef from younger andleaner animals [7,8].
5. Conclusions
This study showed that extending the grazing period of pasture-based systems to 162 and 231days prior to finishing indoors on a high energy concentrate diet, and the associated increase in age atslaughter, produced bulls with a similar carcass fat cover and IMF concentration to the intensivelyconcentrate fed bulls. With regard to eating quality, extending the grazing period to 162 days resultedin beef with a sensory quality (tenderness, flavour liking and overall liking) similar to beef from theintensively concentrate fed bulls. However, a further increase in the grazing period (i.e., to 231 days)led to the production of beef with a lower tenderness, flavour liking and overall liking scores andhigher juiciness values compared to the intensively concentrate fed bulls. These sensory attributeswere also adversely affected by a shorter finishing period on concentrates (71 v. 120 days) after grazing.The impact of post slaughter management of the latter carcasses, such as electrical stimulation or aitchbone hanging, merit investigation. The data also indicate that age per se without reference to theproduction system is not an appropriate market specification from a meat quality perspective.
Author Contributions: Conceptualization, F.J.M., M.M., E.G.O., B.P. and A.P.M.; Formal analysis, G.B.M. andA.P.M.; Funding acquisition, E.G.O.; Investigation, G.B.M., M.M., E.G.O., D.M., A.L., B.P., R.I.R. and A.P.M.;Methodology, G.B.M., D.M., A.L., B.P. and R.I.R.; Resources, B.P., R.I.R. and A.P.M.; Supervision, F.J.M., A.L. andA.P.M.; Writing—original draft, G.B.M.; Writing—review & editing, F.J.M., M.M., E.G.O., B.P., R.I.R. and A.P.M.
Funding: This research and article publishing charge were funded by Teagasc.
Acknowledgments: The senior author acknowledges receipt of a Teagasc Walsh Fellowship and a Teagascinternational award to visit INRA. The assistance of Karen Hussey and other staff at Teagasc Ashtown FoodResearch Centre, and staff at Teagasc Animal and Grassland Research and Innovation Centre, Grange, is alsoacknowledged. The assistance of staff and management at Kepak Group, Clonee, Co. Meath who facilitatedsample collection and carcass measurement is greatly appreciated. The authors thank the staff at INRA, particularlyDavid Chadeyron, for analysis of enzymatic activities and MyHC determination.
Conflicts of Interest: The authors declare no conflict of interest.
References
1. Teagasc. Beef Production System Guidelines; Teagasc: Carlow, Ireland, 2015.2. O’Riordan, E.G.; Crosson, P.; McGee, M. Finishing male cattle from the beef suckler herd. Ir. Grassl. Anim.
Prod. Assoc. J. 2011, 45, 131–146.
Foods 2019, 8, 278 15 of 17
3. Finneran, E.; Crosson, P.; O’Kiely, P.; Shalloo, L.; Forristal, D.; Wallace, M. Stochastic simulation of the cost ofhome-produced feeds for ruminant livestock systems. J. Agric. Sci. 2011, 150, 123–139. [CrossRef]
4. Mezgebo, G.B.; Moloney, A.P.; O’Riordan, E.G.; McGee, M.; Richardson, I.R.; Monahan, F.J. Comparison oforganoleptic quality and composition of beef from suckler bulls from different production systems. Animal2017, 11, 538–546. [CrossRef] [PubMed]
5. Grunert, K.G.; Bredahl, L.; Brunsø, K. Consumer perception of meat quality and implications for productdevelopment in the meat sector—A review. Meat Sci. 2004, 66, 259–272. [CrossRef]
6. French, P.; Stanton, C.; Lawless, F.; O’Riordan, E.G.; Monahan, F.J.; Caffrey, P.J.; Moloney, A.P. Fatty acidcomposition, including conjugated linoleic acid, of intramuscular fat from steers offered grazed grass, grasssilage, or concentrate-based diets. J. Anim. Sci. 2000, 78, 2849. [CrossRef] [PubMed]
7. Baublits, R.T.; Pohlman, F.W.; Brown, A.H.; Johnson, Z.B.; Rule, D.C.; Onks, D.O.; Murrieta, C.M.;Richards, C.J.; Sandelin, B.A.; Loveday, H.D.; et al. Comparison of fatty acid and sensory profiles ofbeef from forage-fed cattle with retail USDA choice and select beef. J. Mus. Foods 2006, 7, 311–329. [CrossRef]
8. Baublits, R.T.; Pohlman, F.W.; Brown, A.H.; Johnson, Z.B.; Rule, D.C.; Onks, D.O.; Murrieta, C.M.;Richards, C.J.; Sandelin, B.A.; Loveday, H.D.; et al. Correlations and prediction equations for fattyacids and sensory characteristics of beef Longissmus rib steaks from forage-fed cattle and retail USDA choiceand select rib steaks. J. Mus. Foods 2009, 20, 1–17. [CrossRef]
9. Dransfield, E.; Martin, J.-F.; Bauchart, D.; Abouelkaram, S.; Lepetit, J.; Culioli, J.; Jurie, C.; Picard, B. Meatquality and composition of three muscles from French cull cows and young bulls. Anim. Sci. 2003, 76,387–399. [CrossRef]
10. Bureš, D.; Barton, L. Growth performance, carcass traits and meat quality of bulls and heifers slaughtered atdifferent ages. Czech J. Anim. Sci. 2012, 57, 34–43. [CrossRef]
11. Anonymous. Community Scale for the Classification of Carcasses of Adult Bovine Animals; EC No. 1208/81 and2930/81; Office for Official Publications of the European Communities: Luxembourg, 2004.
12. AOAC 985.14 and 985.26. Moisture and fat in meat and poultry products. In Official Methods of Analysis ofAOAC International; AOAC: Arlington, VA, USA, 1990.
13. Kolar, K. Colorimetric determination of hydroxyproline as measure of collagen content in meat and meatproducts: NMKL collaborative study. J. AOAC 1990, 73, 54–57.
14. BSI Assessors for Sensory Analysis. BS7667, Part 1. Guide to the Selection, Training and Monitoring of SelectedAssessors; 1993/ISO 8586-1:1993; BSI: London, UK, 1993.
15. MacFie, H.J.; Bratchell, N.; Greenhoff, K.; Vallis, L.V. Designs to balance the effect of order of presentationand first-order carry-over effects in hall tests. J. Sens. Stud. 1989, 4, 129–148. [CrossRef]
16. Dubost, A.; Micol, D.; Meunier, B.; Lethias, C.; Listrat, A. Relationships between structural characteristics ofbovine intramuscular connective tissue assessed by image analysis and collagen and proteoglycan content.Meat Sci. 2013, 93, 378–386. [CrossRef] [PubMed]
17. Farndale, R.W.; Sayers, C.A.; Barrett, A.J. A Direct Spectrophotometric Microassay for SulfatedGlycosaminoglycans in Cartilage Cultures. Connect. Tissue Res. 1982, 9, 247–248. [CrossRef] [PubMed]
18. Barbosa, I.; Garcia, S.; Barbier-Chassefière, V.; Caruelle, J.-P.; Martelly, I.; Papy-García, D. Improved andsimple micro assay for sulfated glycosaminoglycans quantification in biological extracts and its use in skinand muscle tissue studies. Glycobiology 2003, 13, 647–653. [CrossRef] [PubMed]
19. Jurie, C.; Ortigues-Marty, I.; Picard, B.; Micol, D.; Hocquette, J.-F. The separate effects of the nature of dietand grazing mobility on metabolic potential of muscles from Charolais steers. Livest. Sci. 2006, 104, 182–192.[CrossRef]
20. Picard, B.; Barboiron, C.; Chadeyron, D.; Jurie, C. Protocol for high-resolution electrophoresis separation ofmyosin heavy chain isoforms in bovine skeletal muscle. Electrophoresis 2011, 32, 1804–1806. [CrossRef]
21. Mezgebo, G.B.; Monahan, F.J.; McGee, M.; O’Riordan, E.G.; Picard, B.; Richardson, R.R.; Moloney, A.P.Biochemical and organoleptic characteristics of muscle from early and late maturing bulls in differentproduction systems. Animal 2017, 11, 1636–1644. [CrossRef]
22. Caplis, J.; Keane, M.G.; Moloney, A.P.; O’Mara, F.P. Effects of supplementary concentrate level with grasssilage, and separate or total mixed ration feeding, on performance and carcass traits of finishing steers. Ir. J.Agric. Food Res. 2005, 44, 27–43.
Foods 2019, 8, 278 16 of 17
23. Dunne, P.; O’Mara, F.; Monahan, F.; Moloney, A. Changes in colour characteristics and pigmentation ofsubcutaneous adipose tissue and M. longissimus dorsi of heifers fed grass, grass silage or concentrate-baseddiets. Meat Sci. 2006, 74, 231–241. [CrossRef]
24. Ashmore, C.R.; Carroll, F.; Doerr, L.; Tompkins, G.; Stokes, H.; Parker, W. Experimental Prevention ofDark-Cutting Meat. J. Anim. Sci. 1973, 36, 33–36. [CrossRef]
25. Pearson, A. Muscle and Meat Biochemistry. In Food Science and Technology: A Series of Monographs; AcademicPress: London, UK, 1989.
26. Dransfield, E. Modelling post-mortem tenderisation—IV: Role of calpains and calpastatin in conditioning.Meat Sci. 1993, 34, 217–234. [CrossRef]
27. Simmons, N.; Singh, K.; Dobbie, P.; Devine, C. The effect of pre-rigor holding temperature on calpain andcalpastatin activity and meat tenderness. In Proceedings of the 42nd International Congress of Meat Scienceand Technology, Lillehammer, Norway, 1–6 September 1996; pp. 414–415.
28. Viljoen, H.; De Kock, H.; Webb, E.; De Kock, R. Consumer acceptability of dark, firm and dry (DFD) andnormal pH beef steaks. Meat Sci. 2002, 61, 181–185. [CrossRef]
29. Boccard, R.; Naude, R.; Cronje, D.; Smit, M.C.; Venter, H.; Rossouw, E.J. The influence of age, sex and breedof cattle on their muscle characteristics. Meat Sci. 1979, 3, 261–280. [CrossRef]
30. Warriss, P.D. Meat Science: An Introductory Text, 2nd ed.; CABI Publishing: London, UK, 2010.31. Dunne, P.; Monahan, F.J.; Moloney, A.P. Current perspectives on the darker beef often reported from
extensively-managed cattle: Does physical activity play a significant role? Livest. Sci. 2011, 142, 1–22.[CrossRef]
32. Zembayashi, M. Effects of nutritional planes and breeds on intramuscular-lipid deposition in M. longissimusdorsi of steers. Meat Sci. 1994, 38, 367–374. [CrossRef]
33. Oddy, V.H.; Harper, G.S.; Greenwood, P.L.; McDonagh, M.B. Nutritional and developmental effects on theintrinsic properties of muscles as they relate to the eating quality of beef. Aust. J. Exp. Agric. 2001, 41, 921.[CrossRef]
34. Owens, F.N.; Gill, D.R.; Secrist, D.S.; Coleman, S.W. Review of some aspects of growth and development offeedlot cattle. J. Anim. Sci. 1995, 73, 3152. [CrossRef]
35. Vestergaard, M.; Therkildsen, M.; Henckel, P.; Jensen, L.; Andersen, H.; Sejrsen, K. Influence of feedingintensity, grazing and finishing feeding on meat and eating quality of young bulls and the relationshipbetween muscle fibre characteristics, fibre fragmentation and meat tenderness. Meat Sci. 2000, 54, 187–195.[CrossRef]
36. Shorthose, W.; Harris, P. Effects of growth and composition on meat quality. Adv. Meat Sci. 1991, 7, 515–549.37. McCormick, R.J. The flexibility of the collagen compartment of muscle. Meat Sci. 1994, 36, 79–91. [CrossRef]38. Blanco, M.; Jurie, C.; Micol, D.; Agabriel, J.; Picard, B.; Garcia-Launay, F. Impact of animal and management
factors on collagen characteristics in beef: A meta-analysis approach. Animal 2013, 7, 1208–1218. [CrossRef][PubMed]
39. Jurie, C.; Robelin, J.; Picard, B.; Geay, Y. Post-natal changes in the biological characteristics of Semitendinosusmuscle in male Limousin cattle. Meat Sci. 1995, 41, 125–135. [CrossRef]
40. Hocquette, J.; Ortigues-Marty, I.; Pethick, D.; Herpin, P.; Fernandez, X. Nutritional and hormonal regulationof energy metabolism in skeletal muscles of meat-producing animals. Livest. Prod. Sci. 1998, 56, 115–143.[CrossRef]
41. Brandstetter, A.M.; Picard, B.; Geay, Y. Muscle fibre characteristics in four muscles of growing male cattle:Effect of castration and feeding level. Livest. Prod. Sci. 1998, 53, 25–36. [CrossRef]
42. Therkildsen, M.; Vestergaard, M.; Jensen, L.R.; Andersen, H.R.; Sejrsen, K. Effect of feeding level, grazingand fnishing on growth and carcass quality of young Friesian bulls. Acta Agric. Scand. Sect. A Anim. Sci.1998, 48, 193–201.
43. Cassar-Malek, I.; Hocquette, J.F.; Jurie, C.; Listrat, A.; Jailler, R.; Bauchart, D.; Briand, Y.; Picard, B.Muscle-specific metabolic, histochemical and biochemical responses to a nutritionally induced discontinuousgrowth path. Anim. Sci. 2004, 79, 49–59. [CrossRef]
44. Picard, B.; Cassar-Malek, I. Evidence for expression of IIb myosin heavy chain isoform in some skeletalmuscles of Blonde d’Aquitaine bulls. Meat Sci. 2009, 82, 30–36. [CrossRef]
45. Tatum, J.D. Animal Age, Physiological Maturity, and Associated Effects on Beef Tenderness; White Paper, ProductEnhancement Research; National Cattlemen’s Beef Association: Sentenel, CO, USA, 2011.

Foods 2019, 8, 278 17 of 17
46. Dikeman, M.E.; Reddy, G.B.; Arthaud, V.H.; Tuma, H.J.; Koch, R.M.; Mandigo, R.W.; Axe, J.B. LongissimusMuscle Quality, Palatability and Connective Tissue Histological Characteristics of Bulls and Steers FedDifferent Energy Levels and Slaughtered at Four Ages. J. Anim. Sci. 1986, 63, 92–101. [CrossRef] [PubMed]
47. Oury, M.P.; Picard, B.; Istasse, L.; Micol, D.; Dumont, R. Mode de conduite en elevage et tendrete de la viandebovine. INRA Prod. Anim. 2007, 20, 309–326.
48. Nian, Y.; Kerry, J.; Prendiville, R.; Allen, P. The eating quality of beef from young dairy bulls derived fromtwo breed types at three ages from two different production systems. Ir. J. Agric. Food Res. 2017, 56, 31–44.[CrossRef]
© 2019 by the authors. Licensee MDPI, Basel, Switzerland. This article is an open accessarticle distributed under the terms and conditions of the Creative Commons Attribution(CC BY) license (http://creativecommons.org/licenses/by/4.0/).


![[G. F. d'Acquapendente and Don Carlo Medici's gibbosity]](https://img.dokumen.tips/doc/110x75/635458e49ef77da53804a8b4/g-f-dacquapendente-and-don-carlo-medicis-gibbosity.jpg)


