Embed Size (px)
Citation preview
1
Coca-Cola FEMSA
March 2007 – Mexico City
2
Cautionary Statement
•FORWARD-LOOKING STATEMENTS•This presentation contains “forward-looking statements” within the meaning of Section 21E of the Securities Exchange Act of 1934 as amended. These forward-looking statements relate to Coca-Cola FEMSA, S.A. de C.V. and subsidiaries (“KOF”) and their businesses, and are based on KOF management’s current expectations regarding KOF and its businesses. Recipients are cautioned not to put undue reliance on such forward-looking statements, which are not a guarantee of performance and are subject to a number of uncertainties and other factors, many of which are outside KOF’s control, that could cause actual results of KOF and its businesses to differ materially from such statements. KOF is under no obligation, and expressly disclaims any intention or obligation, to update or alter any forward-looking statements, whether as a result of new information, future events or otherwise. The proposed transaction, the financial condition and results of the combined company will be subject to numerous risks and contingencies, including the receipt of financing and regulatory approvals, the ability to realize synergies and successfully integrate operations.
•This document does not represent an offer of any securities for sale. This presentation also includes, and representatives of Coca-Cola FEMSA from time to time may refer to, unaudited pro forma financial information giving effect to the proposed business combination. However, this information is preliminary, not in accordance with generally accepted accounting principles, and notnecessarily indicative of historical financial position or results if the proposed business combination had occurred or of any future financial data.
•ADDITIONAL INFORMATION AND WHERE TO FIND IT•Documents filed by KOF are available at the Securities and Exchange Commission’s public reference room located at 450 Fifth Street, N.W., Washington, D.C. 20594. Investors and security holders may call the Commission at 1-800-SEC-0330 for further information on the public reference room. Free copies of all of KOF’s filings with the Commission may also be obtained by directing a request to:
•COCA-COLA FEMSA•Guillermo González Camarena No. 600, Col. Centro de Ciudad Santa Fé 01210, México D.F., México
•Investor Relations Alfredo Fernandez / (52) 55 5081 51 20 / [email protected] Naranjo / (52) 55 5081 51 48 / [email protected]
3
KOF OVERVIEW
KOF – MEXICO
4
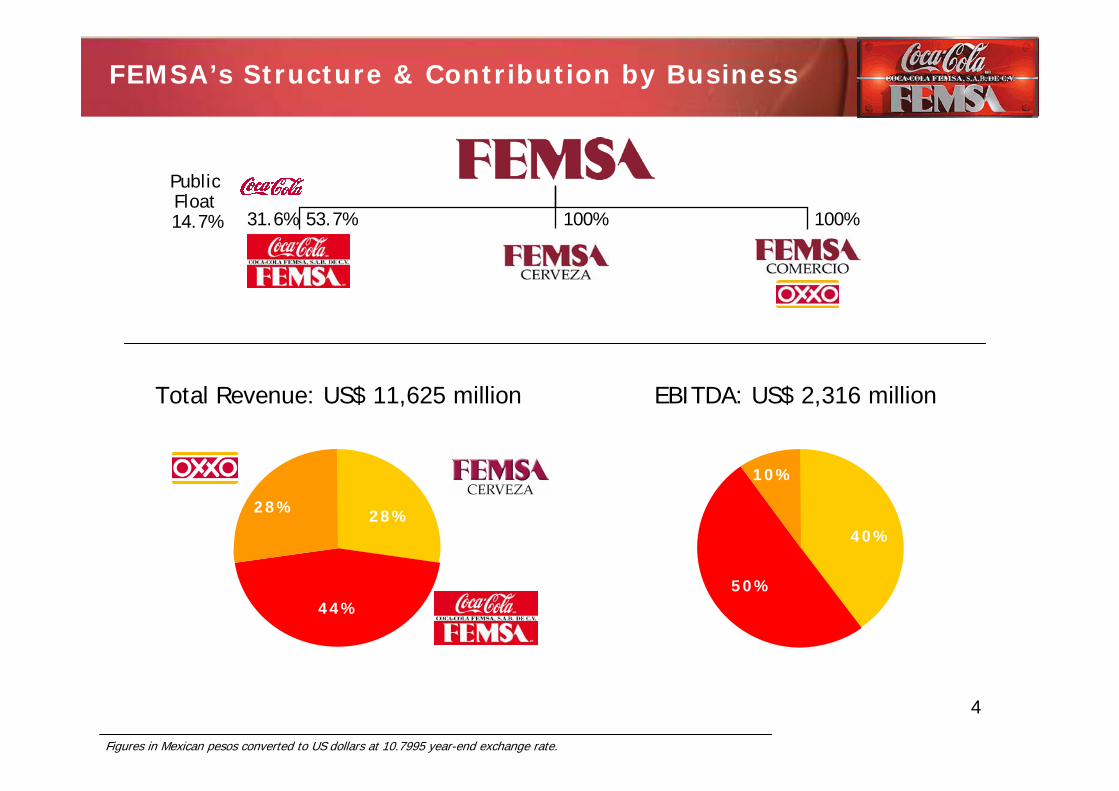
FEMSA’s Structure & Contribution by Business
53.7% 100% 100%31.6%
PublicFloat14.7%
EBITDA: US$ 2,316 millionTotal Revenue: US$ 11,625 million
10%
40%
50%
28% 28%
44%
Figures in Mexican pesos converted to US dollars at 10.7995 year-end exchange rate.
5
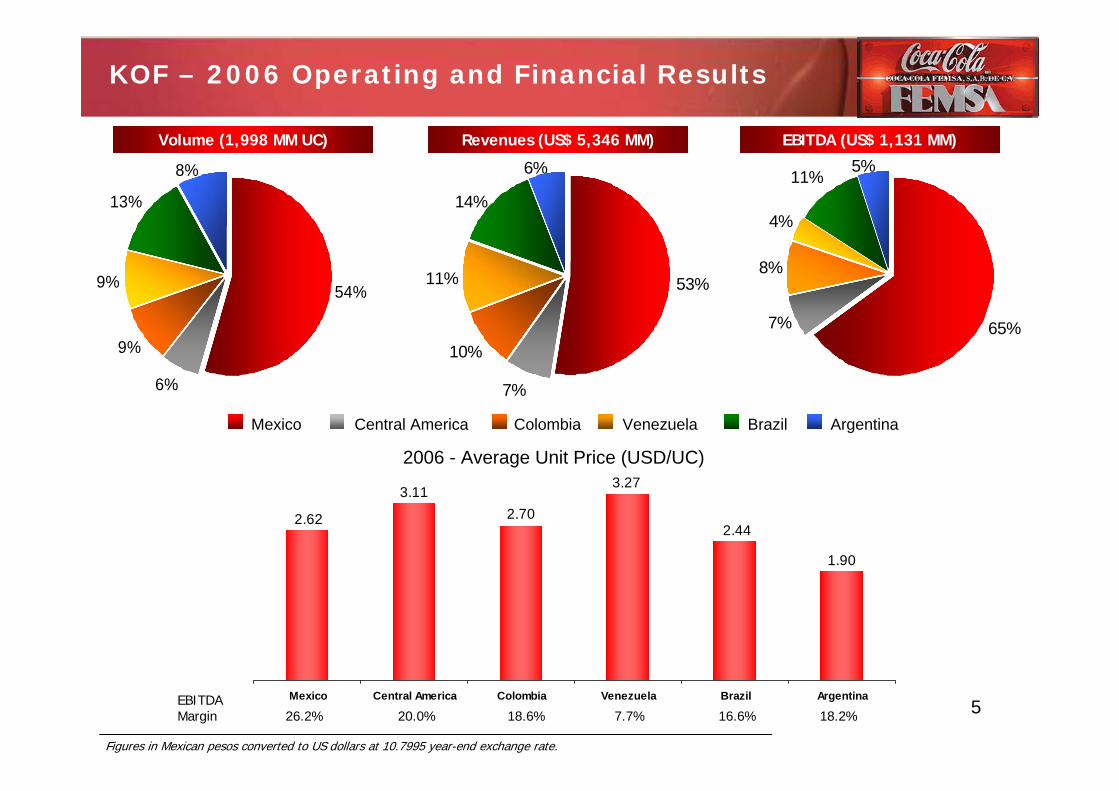
KOF – 2006 Operating and Financial Results
3.11
2.62 2.70
3.27
2.44
1.90
Mexico Central America Colombia Venezuela Brazil Argentina
2006 - Average Unit Price (USD/UC)
53%
7%
10%
11%
14%
6%
Mexico Central America VenezuelaColombia Brazil Argentina
Revenues (US$ 5,346 MM)Volume (1,998 MM UC) EBITDA (US$ 1,131 MM)
Figures in Mexican pesos converted to US dollars at 10.7995 year-end exchange rate.
EBITDAMargin 26.2% 20.0% 18.6% 7.7% 16.6% 18.2%
6%
9%
9%
13%
54%
8%
7%
8%
4%
11%
65%
5%
6
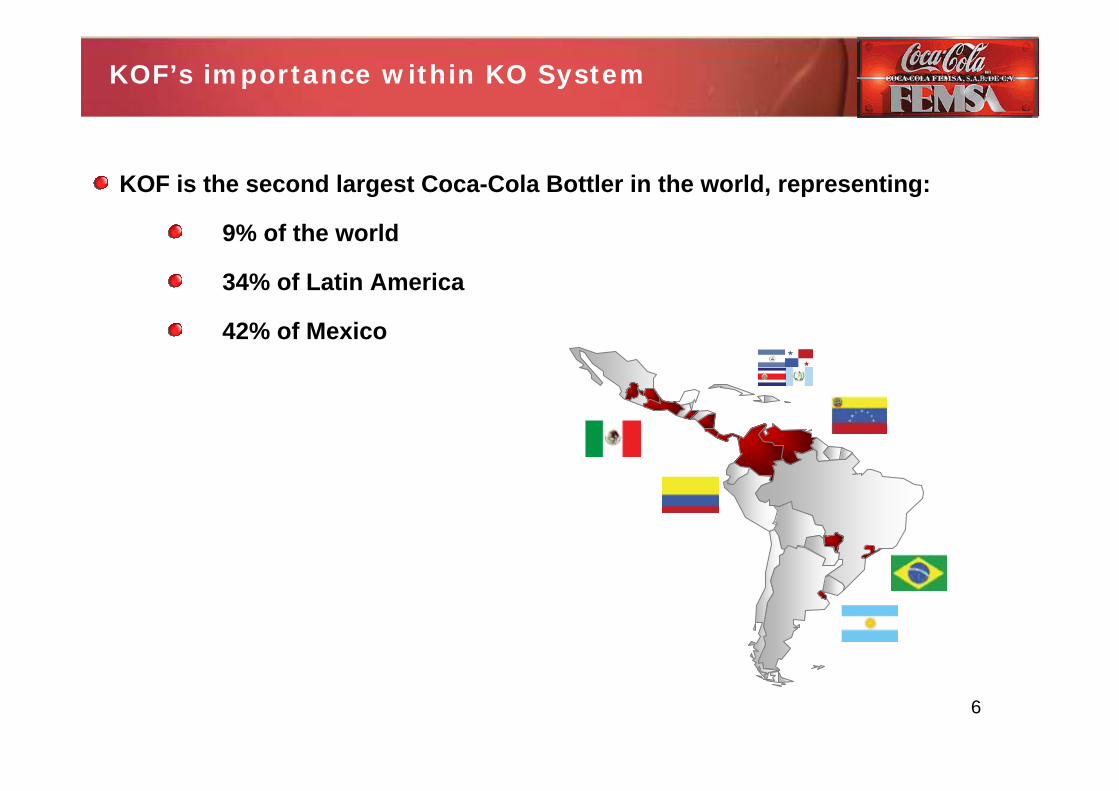
KOF’s importance within KO System
KOF is the second largest Coca-Cola Bottler in the world, representing:
9% of the world
34% of Latin America
42% of Mexico
7
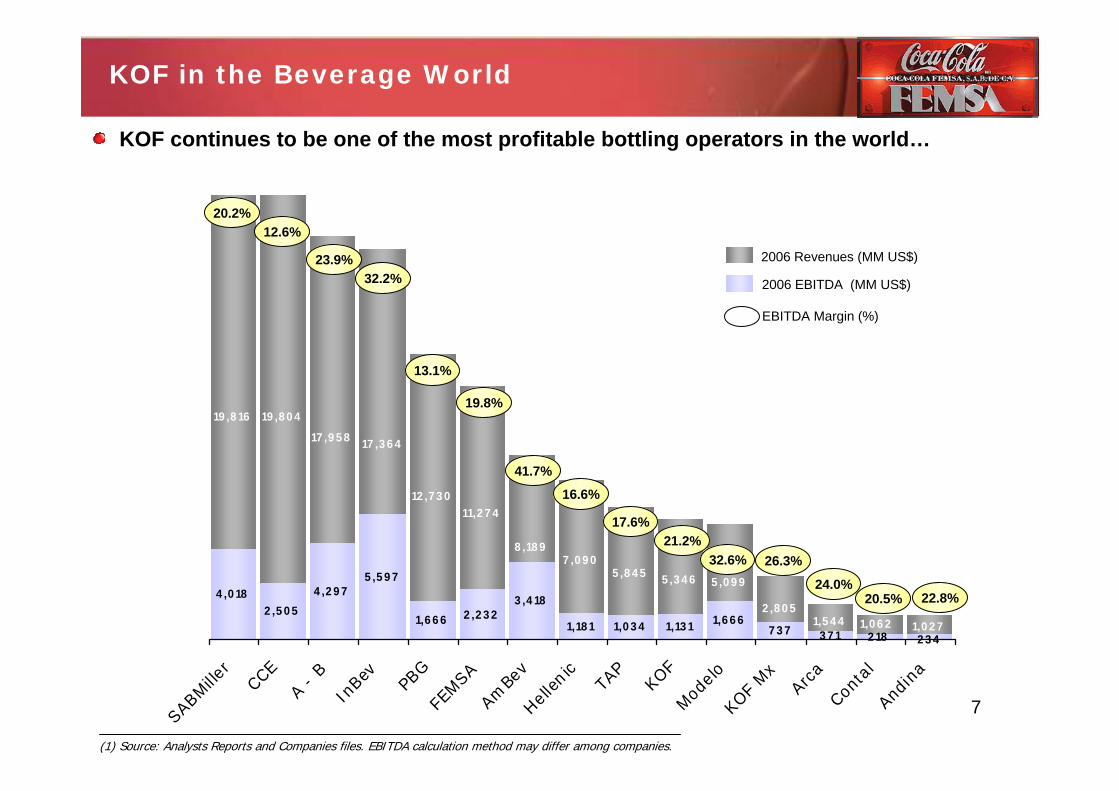
KOF in the Beverage World
KOF continues to be one of the most profitable bottling operators in the world…
(1) Source: Analysts Reports and Companies files. EBITDA calculation method may differ among companies.
19 ,8 16 19 ,8 0 4
17 ,9 5 8 17 ,3 6 4
12 ,7 3 011,2 7 4
8 ,18 97 ,0 9 0
5 ,8 4 5 5 ,3 4 6 5 ,0 9 9
2 ,8 0 51,5 4 4 1,0 2 7
4 ,0 182 ,5 0 5
4 ,2 9 75 ,5 9 7
1,0 3 4 1,13 1 1,6 6 6 1,0 6 22 3 4
1,6 6 6 2 ,2 3 23 ,4 18
1,18 1 7 3 7 3 7 1 2 18
SABM
iller
CCE
A - B
InBe
v
PBG
FEMSA
AmBe
vHell
enic
TAP
KOF
Modelo
KOF
Mx
Arca
Cont
alAn
dina
2006 Revenues (MM US$)
2006 EBITDA (MM US$)
20.2%12.6%
23.9%32.2%
13.1%
19.8%
41.7%
16.6%
17.6%21.2%
32.6%
24.0%20.5% 22.8%
EBITDA Margin (%)
26.3%
8
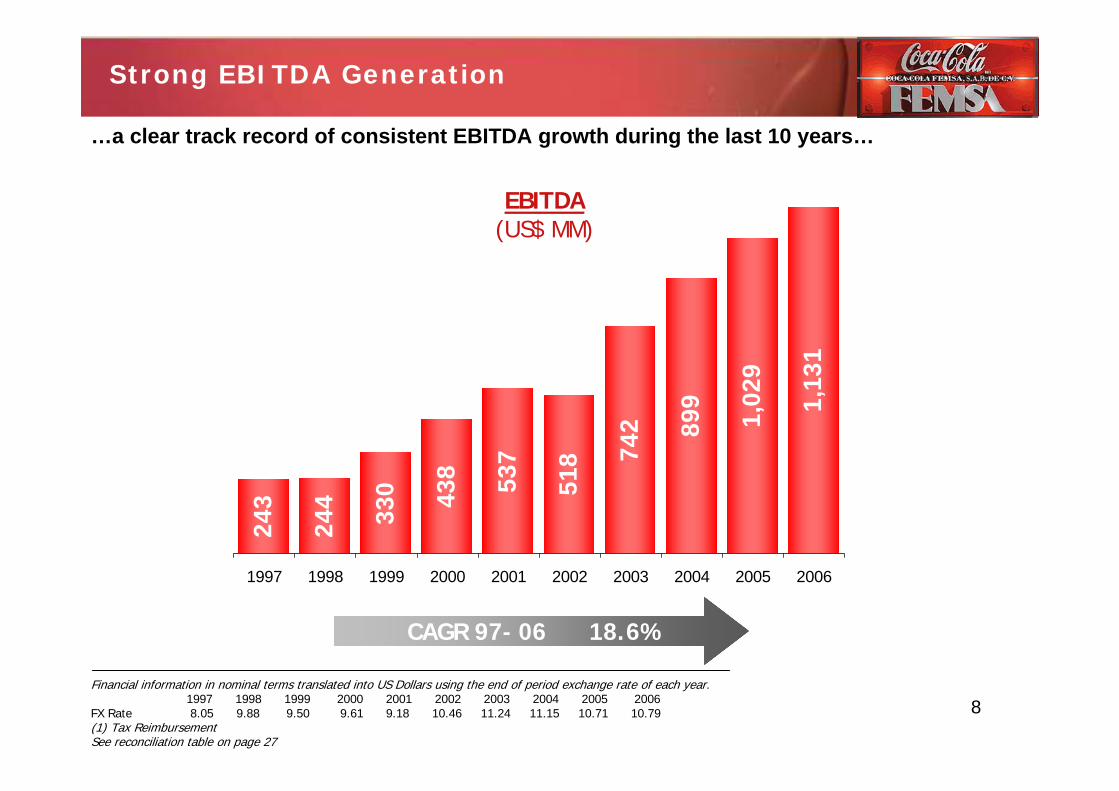
Strong EBITDA Generation
Financial information in nominal terms translated into US Dollars using the end of period exchange rate of each year. 1997 1998 1999 2000 2001 2002 2003 2004 2005 2006
FX Rate 8.05 9.88 9.50 9.61 9.18 10.46 11.24 11.15 10.71 10.79(1) Tax ReimbursementSee reconciliation table on page 27
243
244 330 43
8 537
518 74
2 899
1,02
9
1,13
1
1997 1998 1999 2000 2001 2002 2003 2004 2005 2006
CAGR 97- 06 18.6%
EBITDA(US$ MM)
…a clear track record of consistent EBITDA growth during the last 10 years…
9
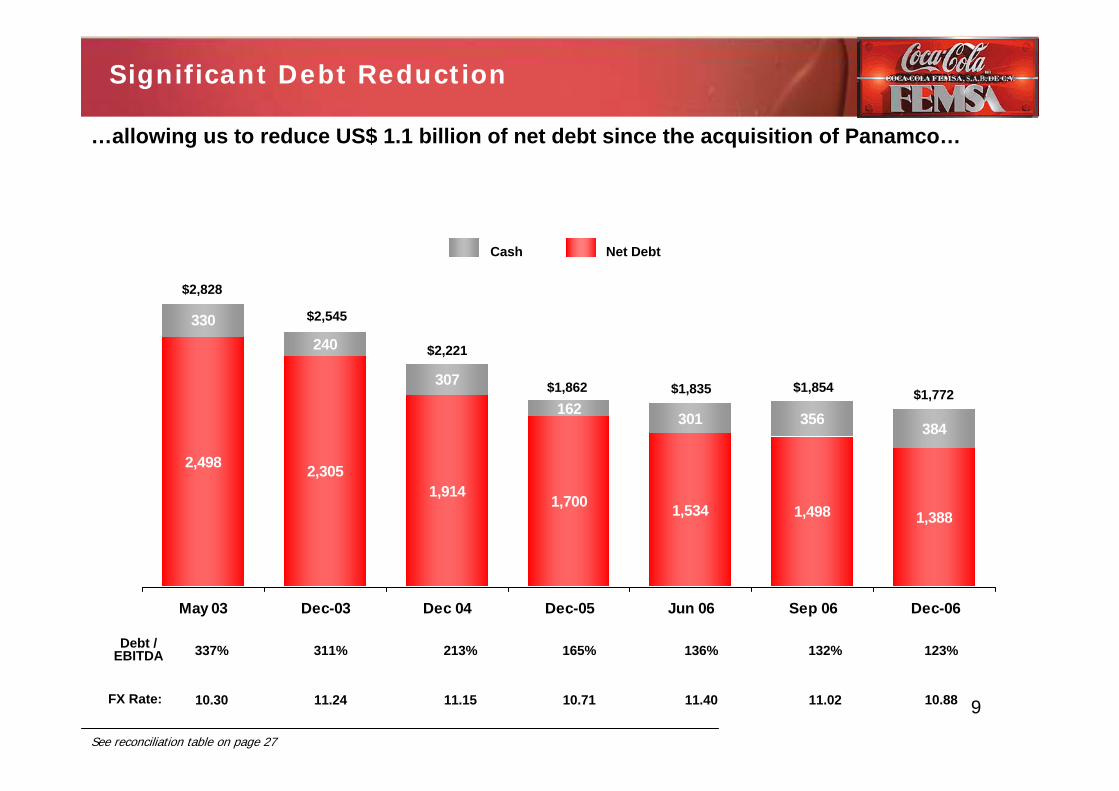
Significant Debt Reduction
2,498 2,3051,914 1,700 1,534 1,498 1,388
162 301
307
240330
356 384
May 03 Dec-03 Dec 04 Dec-05 Jun 06 Sep 06 Dec-06
$2,828
$2,545
FX Rate: 10.30 11.24
$2,221
11.15
Net DebtCash
$1,862
10.71
$1,835
…allowing us to reduce US$ 1.1 billion of net debt since the acquisition of Panamco…
$1,854
11.40 11.02 10.88
$1,772
Debt / EBITDA 311% 213% 165% 123%132%136%337%
See reconciliation table on page 27
10
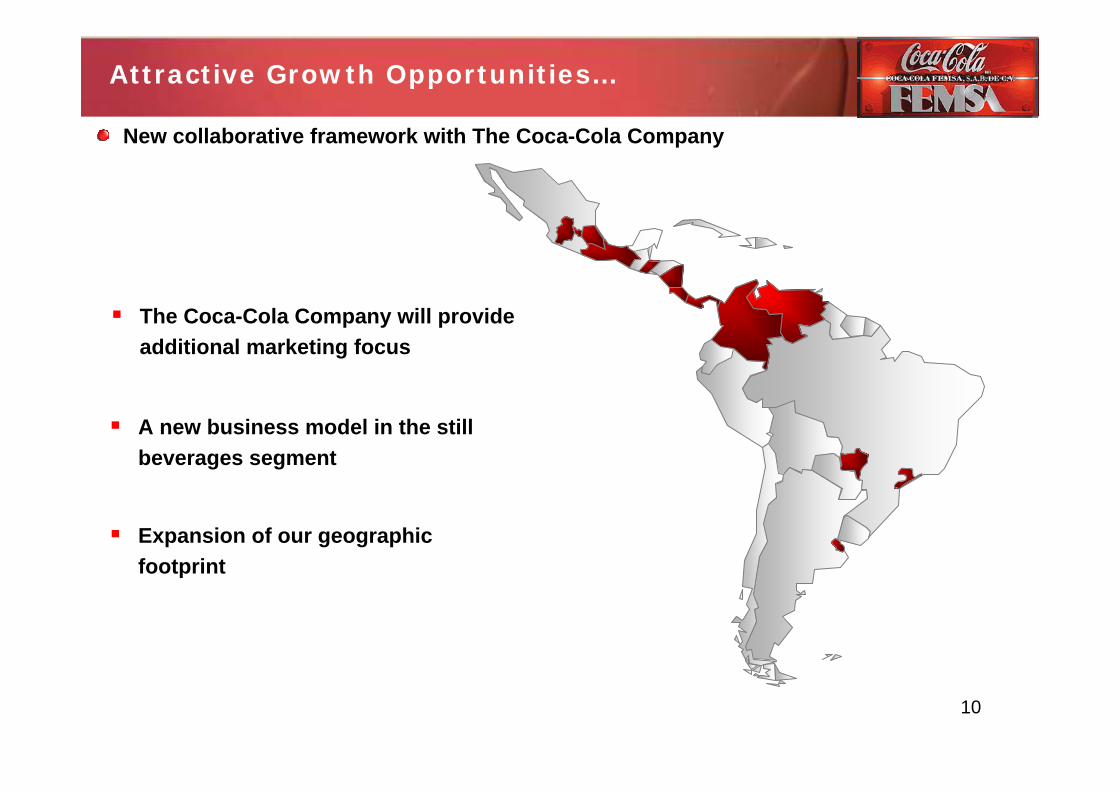
Attractive Growth Opportunities…
Expansion of our geographic footprint
The Coca-Cola Company will provide additional marketing focus
New collaborative framework with The Coca-Cola Company
A new business model in the still beverages segment
11
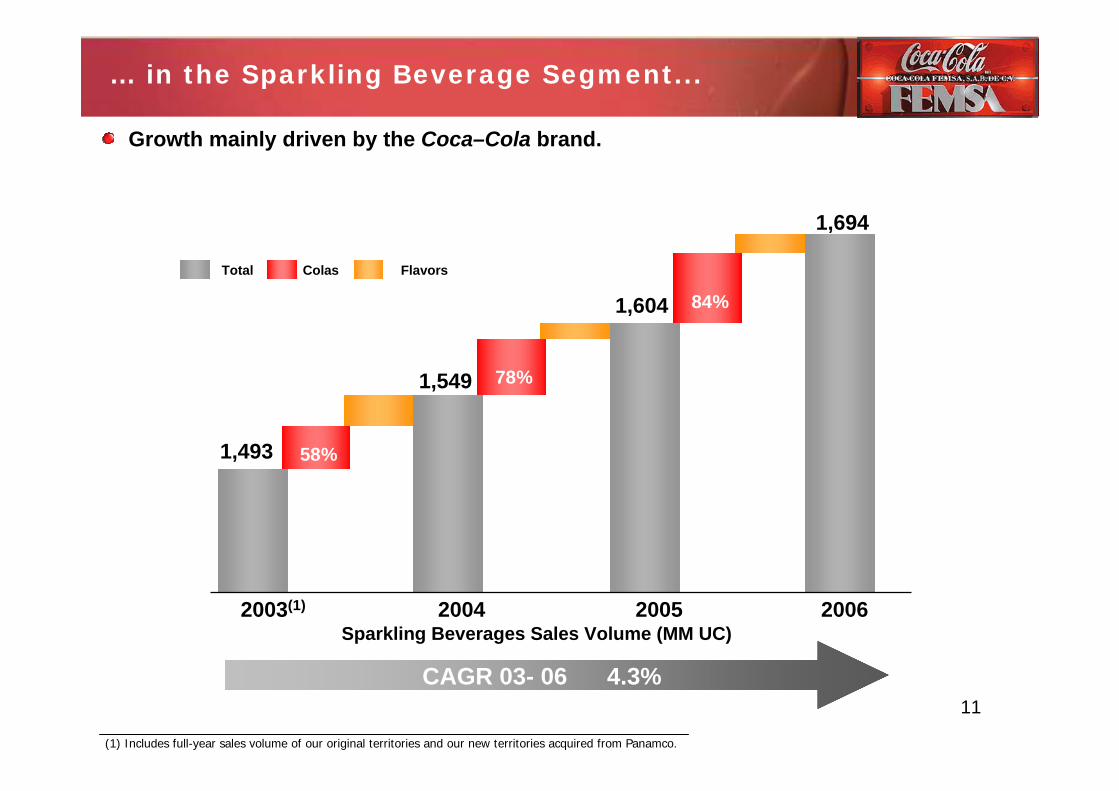
… in the Sparkling Beverage Segment...
CAGR 03- 06 4.3%
2003(1) 2004 2005 2006
ColasTotal Flavors
1,493
Sparkling Beverages Sales Volume (MM UC)
1,549
1,604
1,694
Growth mainly driven by the Coca–Cola brand.
58%
84%
78%
(1) Includes full-year sales volume of our original territories and our new territories acquired from Panamco.
12
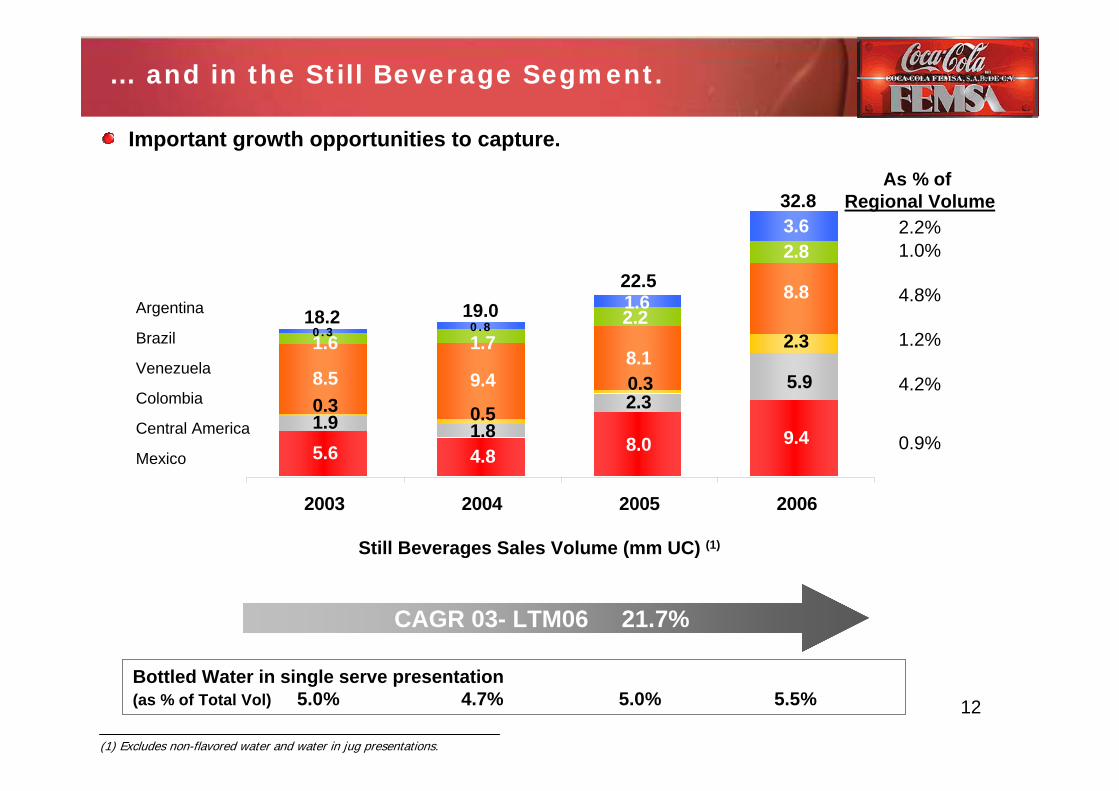
… and in the Still Beverage Segment.
5.6 4.8 8.0 9.41.9 1.8
2.38.5 9.4
8.1
2.8
5.9
2.3
0.3 0.50.3
8.82.2
1.71.6
1.60 . 3 0 . 8
3.6
2003 2004 2005 2006
Mexico
Central America
Venezuela
Colombia
Brazil
Argentina
As % of Regional Volume
2.2%1.0%
4.8%
1.2%
4.2%
0.9%
CAGR 03- LTM06 21.7%
Still Beverages Sales Volume (mm UC) (1)
18.2 19.022.5
32.8
Bottled Water in single serve presentation(as % of Total Vol) 5.0% 4.7% 5.0% 5.5%
(1) Excludes non-flavored water and water in jug presentations.
Important growth opportunities to capture.
13
KOF OVERVIEW
KOF – MEXICO
14
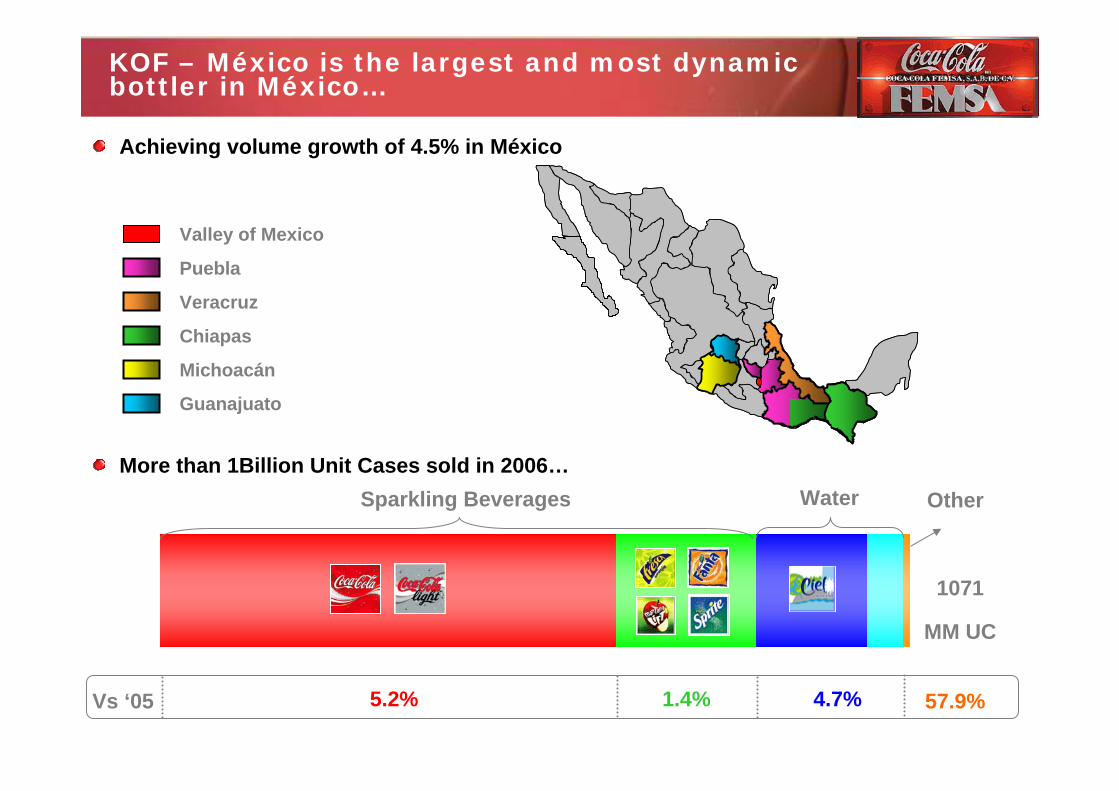
KOF – México is the largest and most dynamic bottler in México…
Achieving volume growth of 4.5% in México
Valley of Mexico
Puebla
Chiapas
Michoacán
Veracruz
Guanajuato
More than 1Billion Unit Cases sold in 2006…
1071
MM UC
Sparkling Beverages Water Other
Vs ‘05 5.2% 1.4% 4.7% 57.9%
15
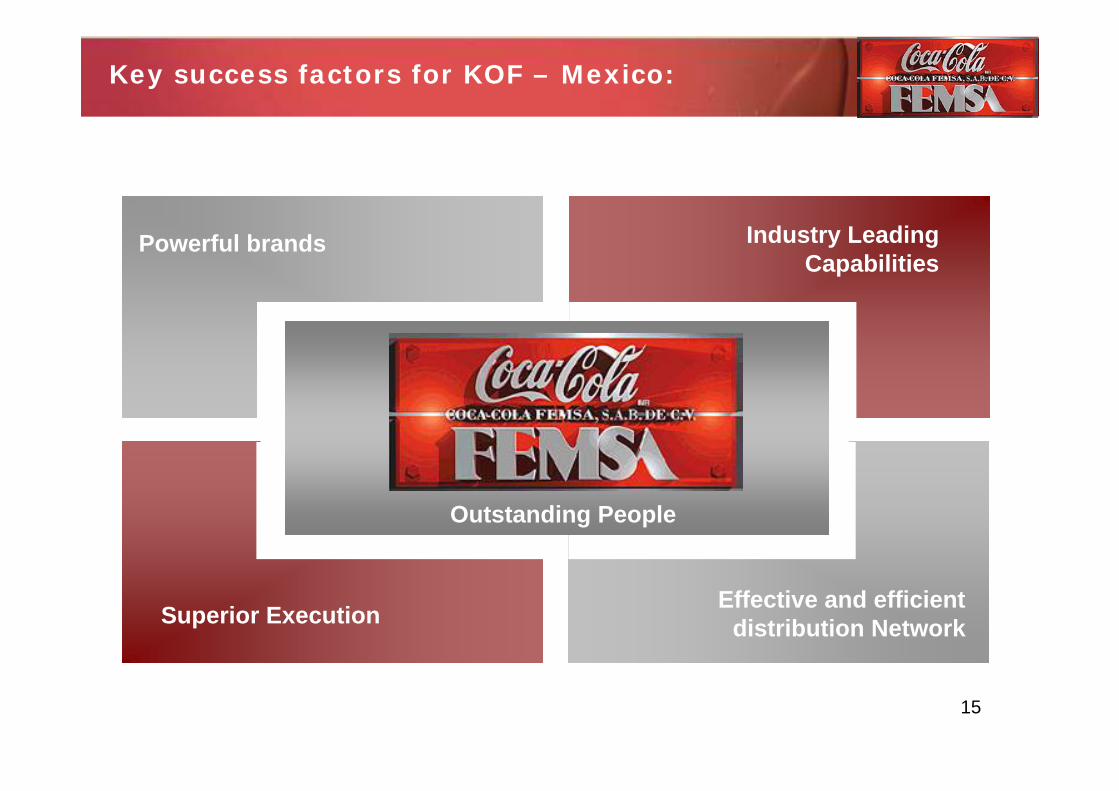
Powerful brands
Effective and efficientdistribution NetworkSuperior Execution
Industry Leading Capabilities
Key success factors for KOF – Mexico:
Outstanding People
16
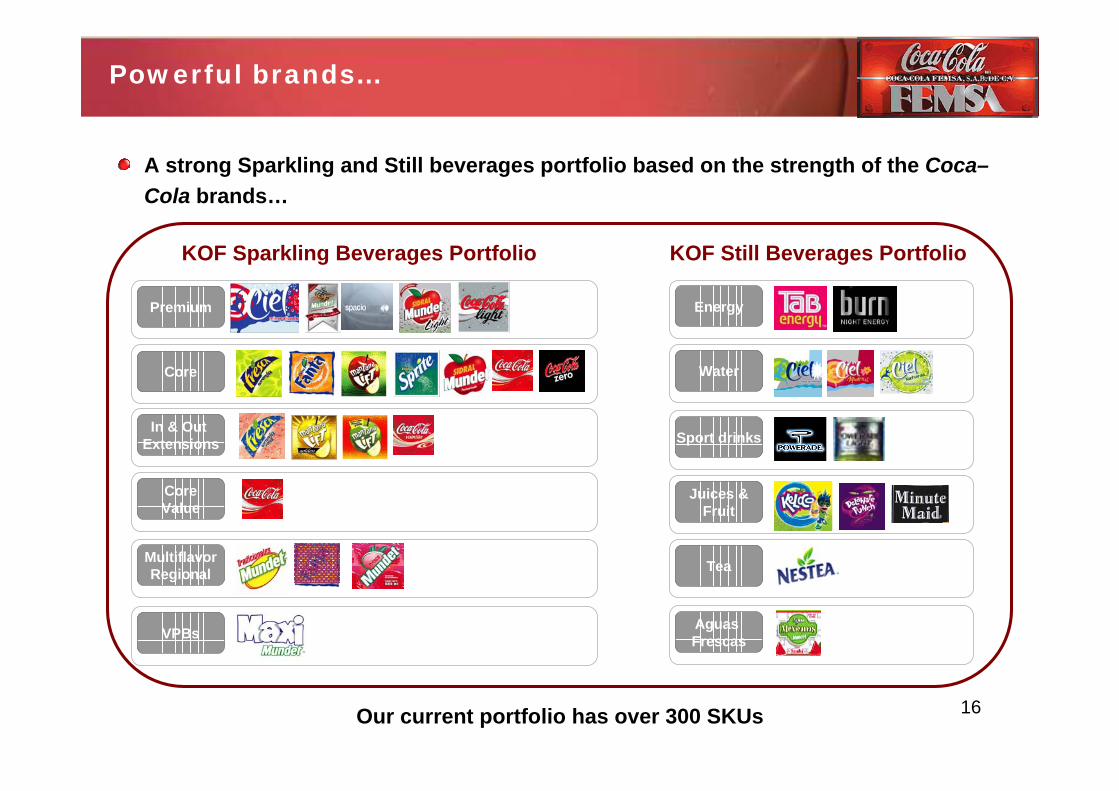
Powerful brands…
Premium
Core
In & OutExtensions
CoreValue
MultiflavorRegional
VPBs
Water
Juices & Fruit
Sport drinks
Tea
Aguas Frescas
Energy
A strong Sparkling and Still beverages portfolio based on the strength of the Coca–Cola brands…
KOF Sparkling Beverages Portfolio KOF Still Beverages Portfolio
Our current portfolio has over 300 SKUs
17
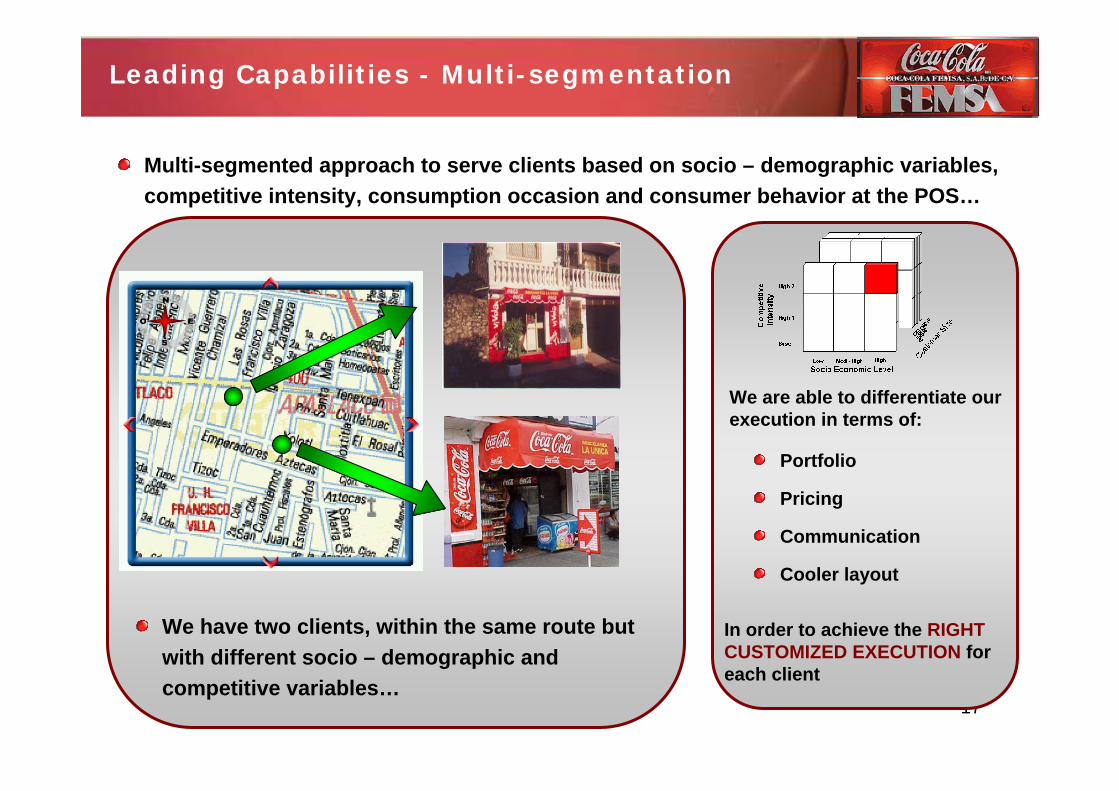
Leading Capabilities - Multi-segmentation
Multi-segmented approach to serve clients based on socio – demographic variables, competitive intensity, consumption occasion and consumer behavior at the POS…
We have two clients, within the same route but with different socio – demographic and competitive variables…
We are able to differentiate our execution in terms of:
Portfolio
Pricing
Communication
Cooler layout
In order to achieve the RIGHT CUSTOMIZED EXECUTION for each client
18
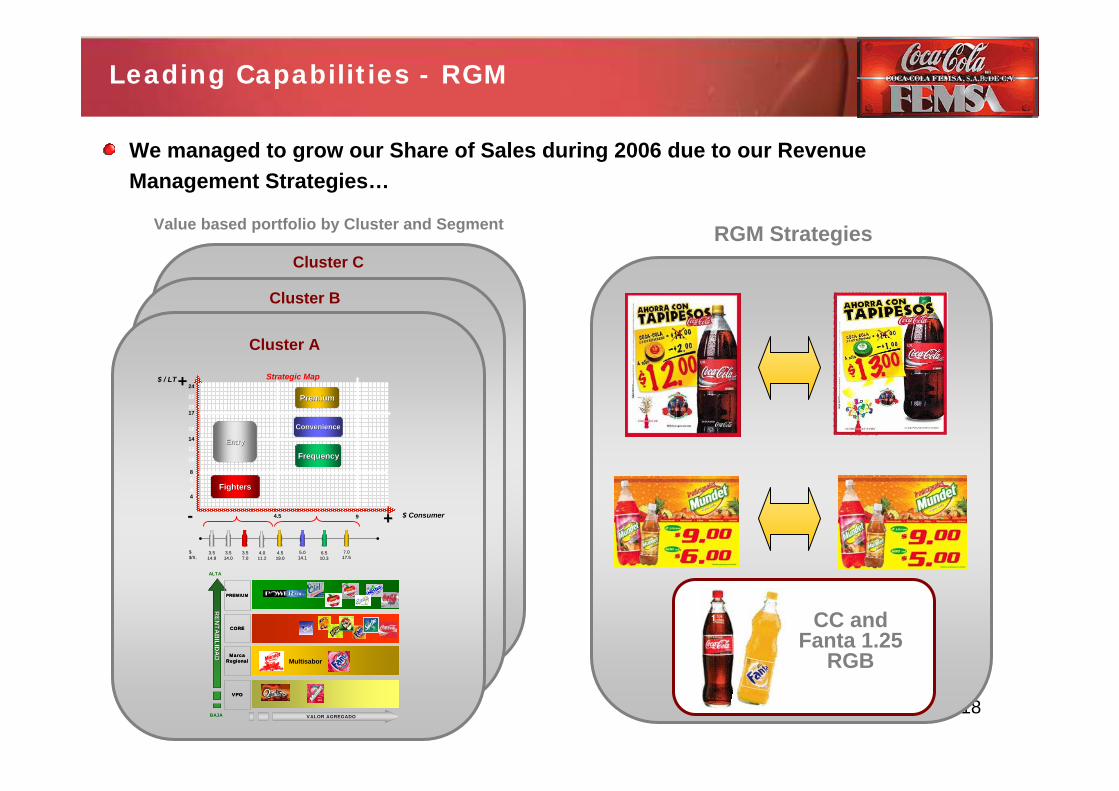
Leading Capabilities - RGM
We managed to grow our Share of Sales during 2006 due to our Revenue Management Strategies…
RGM StrategiesValue based portfolio by Cluster and Segment
FightersFighters
$ / LT
-- ++
++
4.5
8
PremiumPremium
6
44
16
14
12
10
24
22
2017
9
FrequencyFrequency
ConvenienceConvenience
3.53.514.814.8
$$$/$/ltlt..
3.53.514.014.0
4.54.519.019.0
3.53.57.07.0
4.04.011.211.2
6.56.510.310.3
7.07.017.517.5
5.05.014.114.1
Strategic MapStrategic Map
EntryEntry
$ Consumer
MarcaRegional
MarcaRegional
CORECORE
REN
TAB
ILIDA
DR
ENTA
BILID
AD
PREMIUMPREMIUM
VALOR AGREGADOVALOR AGREGADO
ALTA
BAJA
VPOVPO
Multisabor
Cluster A
Cluster B
Cluster C
CC and Fanta 1.25
RGB
19
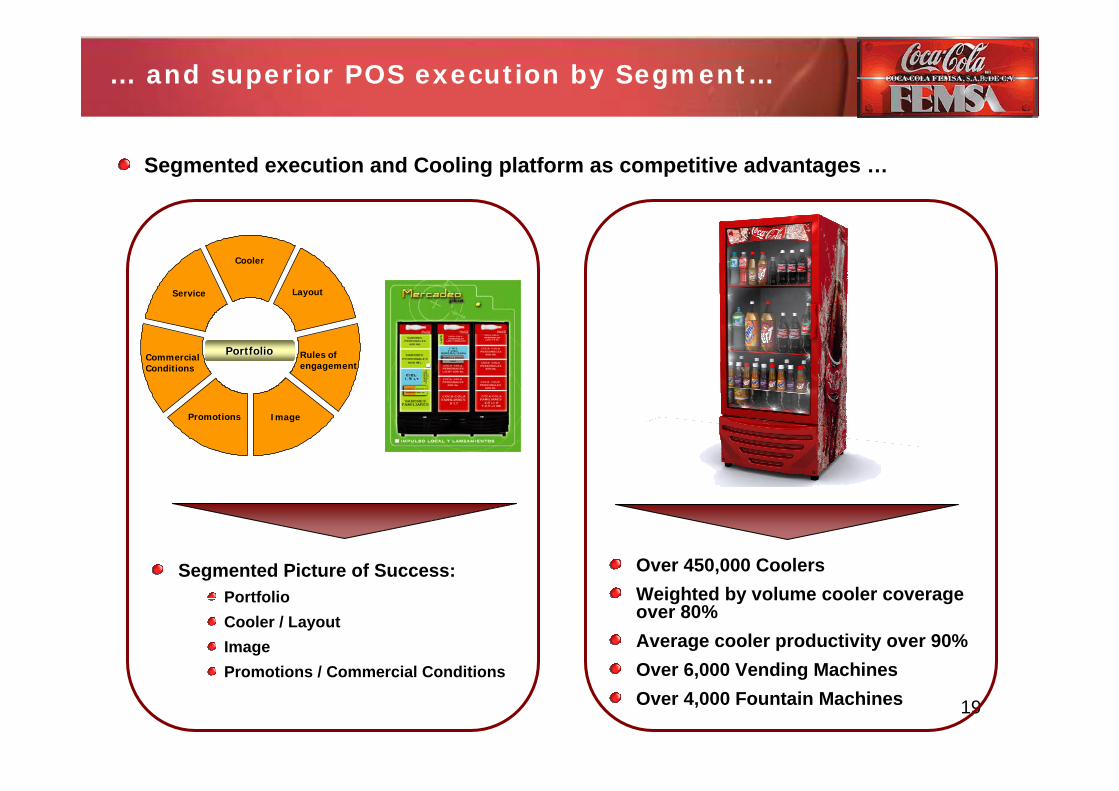
… and superior POS execution by Segment…
Segmented execution and Cooling platform as competitive advantages …
Over 450,000 CoolersWeighted by volume cooler coverage over 80%Average cooler productivity over 90%Over 6,000 Vending MachinesOver 4,000 Fountain Machines
Service
Promotions
CommercialConditions
Rules of engagement
Layout
Image
Cooler
PortfolioPortfolio
Segmented Picture of Success: PortfolioCooler / LayoutImagePromotions / Commercial Conditions
20
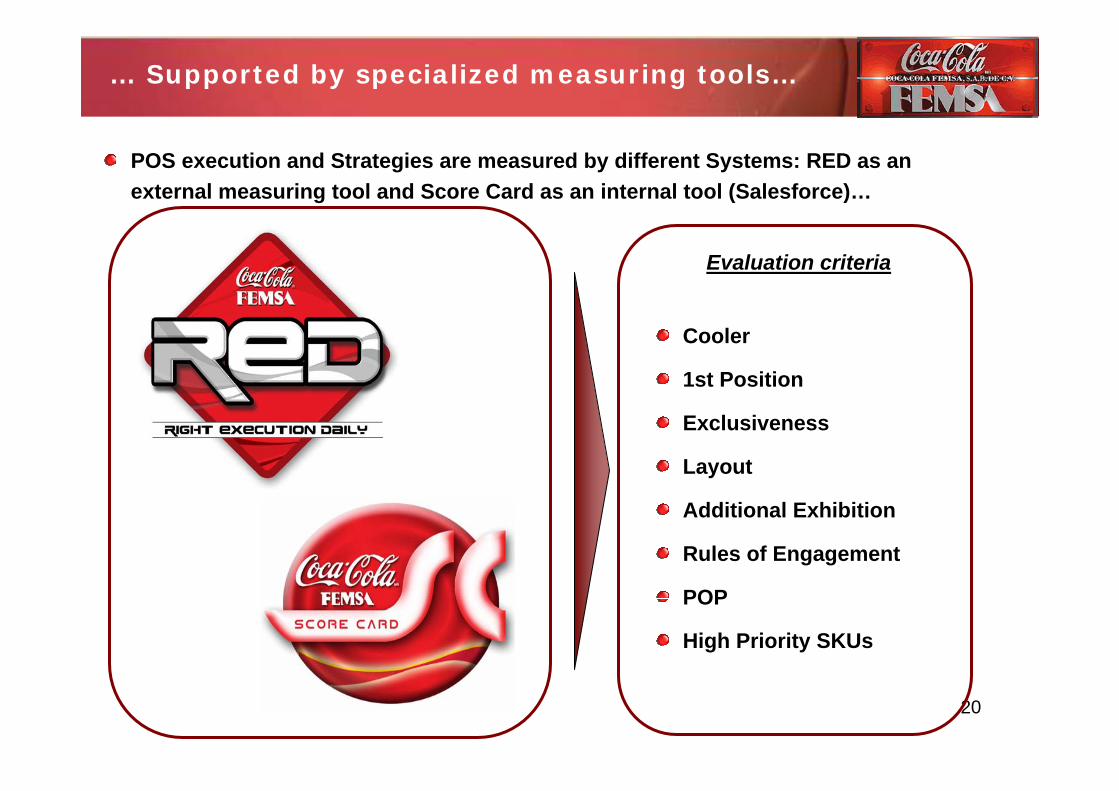
… Supported by specialized measuring tools…
POS execution and Strategies are measured by different Systems: RED as an external measuring tool and Score Card as an internal tool (Salesforce)…
Evaluation criteria
Cooler
1st Position
Exclusiveness
Layout
Additional Exhibition
Rules of Engagement
POP
High Priority SKUs
21
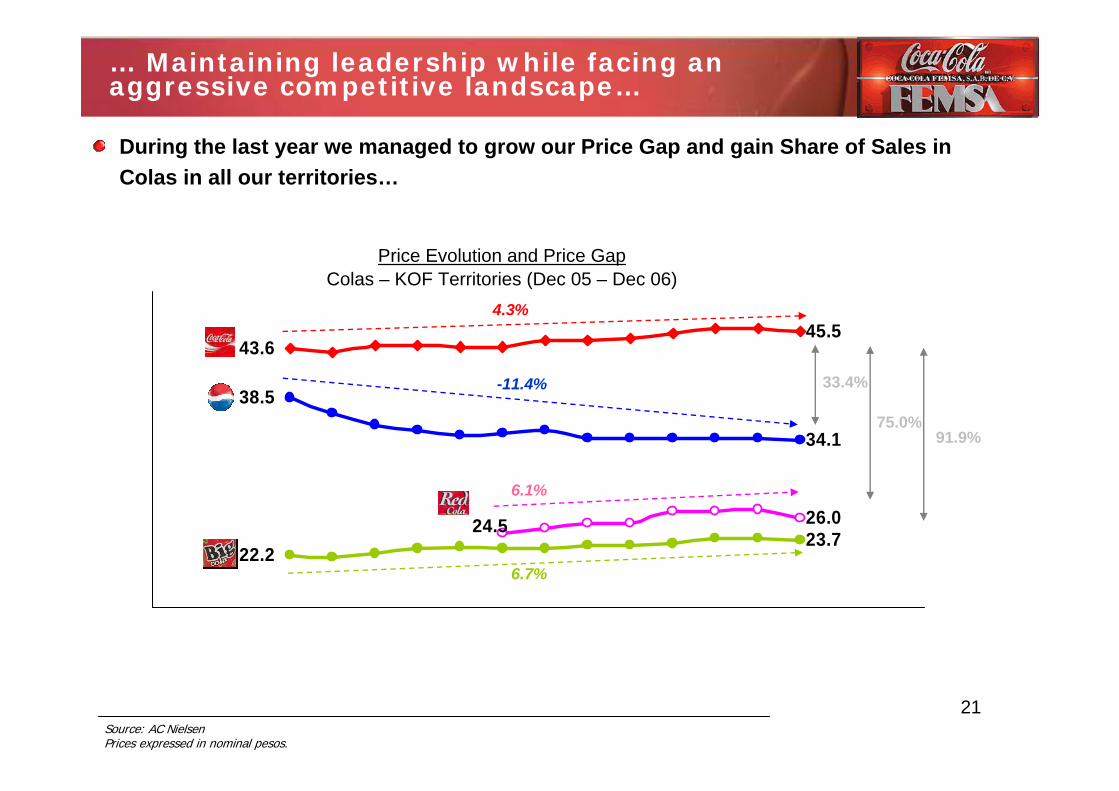
… Maintaining leadership while facing an aggressive competitive landscape…
During the last year we managed to grow our Price Gap and gain Share of Sales in Colas in all our territories…
45.543.6
38.5
34.1
22.223.7
24.5 26.0
33.4%
75.0%91.9%
4.3%
-11.4%
6.1%
6.7%
Price Evolution and Price GapColas – KOF Territories (Dec 05 – Dec 06)
Source: AC NielsenPrices expressed in nominal pesos.
22
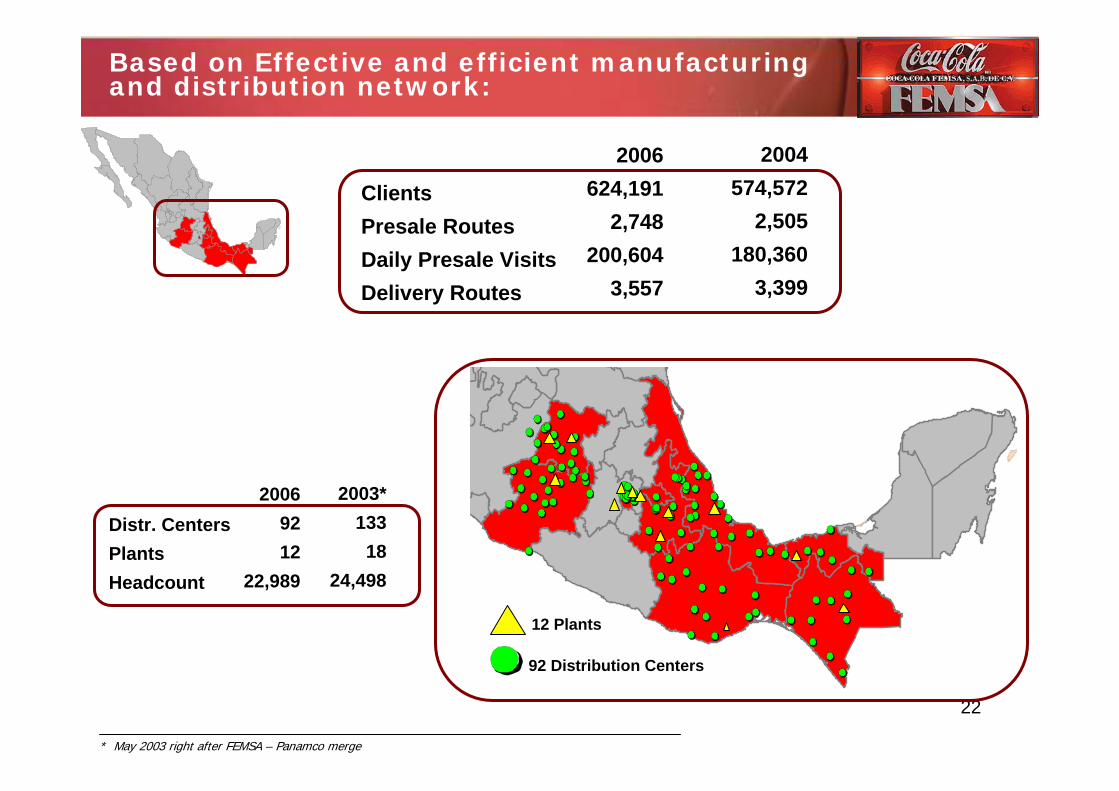
Based on Effective and efficient manufacturing and distribution network:
92 Distribution Centers
12 Plants
ClientsPresale RoutesDaily Presale VisitsDelivery Routes
2006624,191
2,748200,604
3,557
2004574,572
2,505180,360
3,399
* May 2003 right after FEMSA – Panamco merge
Distr. CentersPlantsHeadcount
20069212
22,989
2003*133
1824,498
23
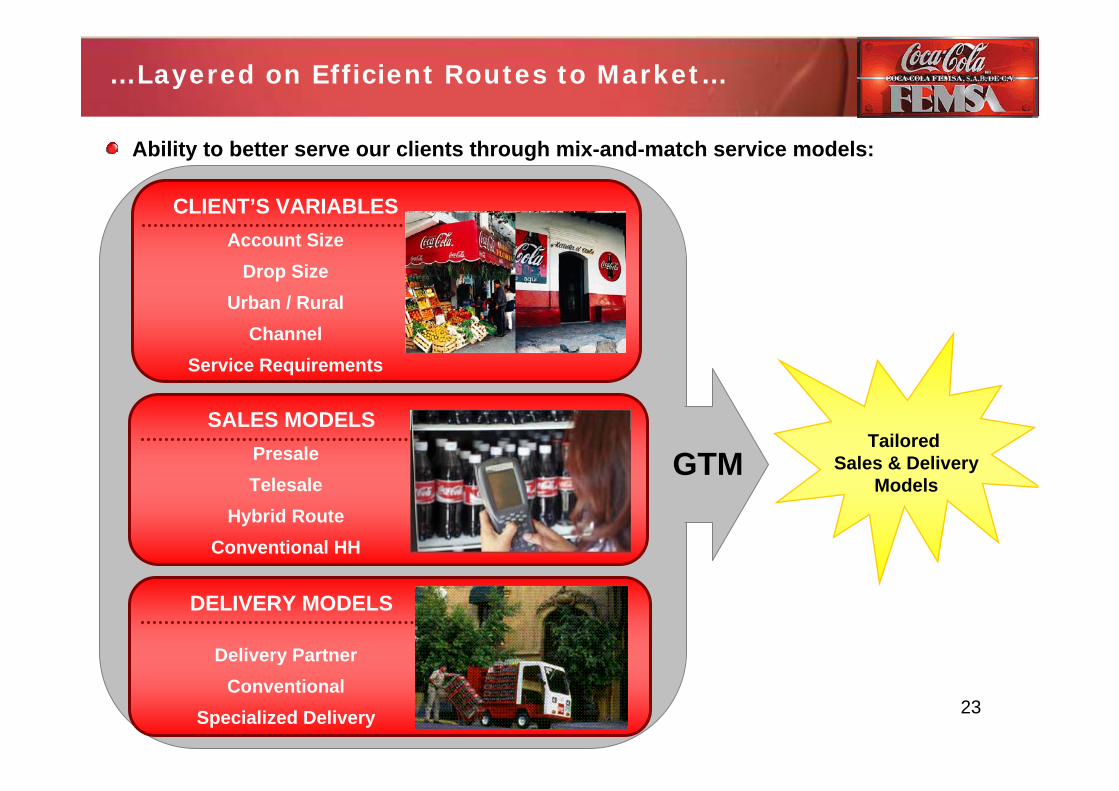
GTM
…Layered on Efficient Routes to Market…
Ability to better serve our clients through mix-and-match service models:
Delivery PartnerConventional
Specialized Delivery
DELIVERY MODELS
PresaleTelesale
Hybrid RouteConventional HH
SALES MODELS
Account SizeDrop Size
Urban / RuralChannel
Service Requirements
CLIENT’S VARIABLES
Tailored Sales & Delivery
Models
24
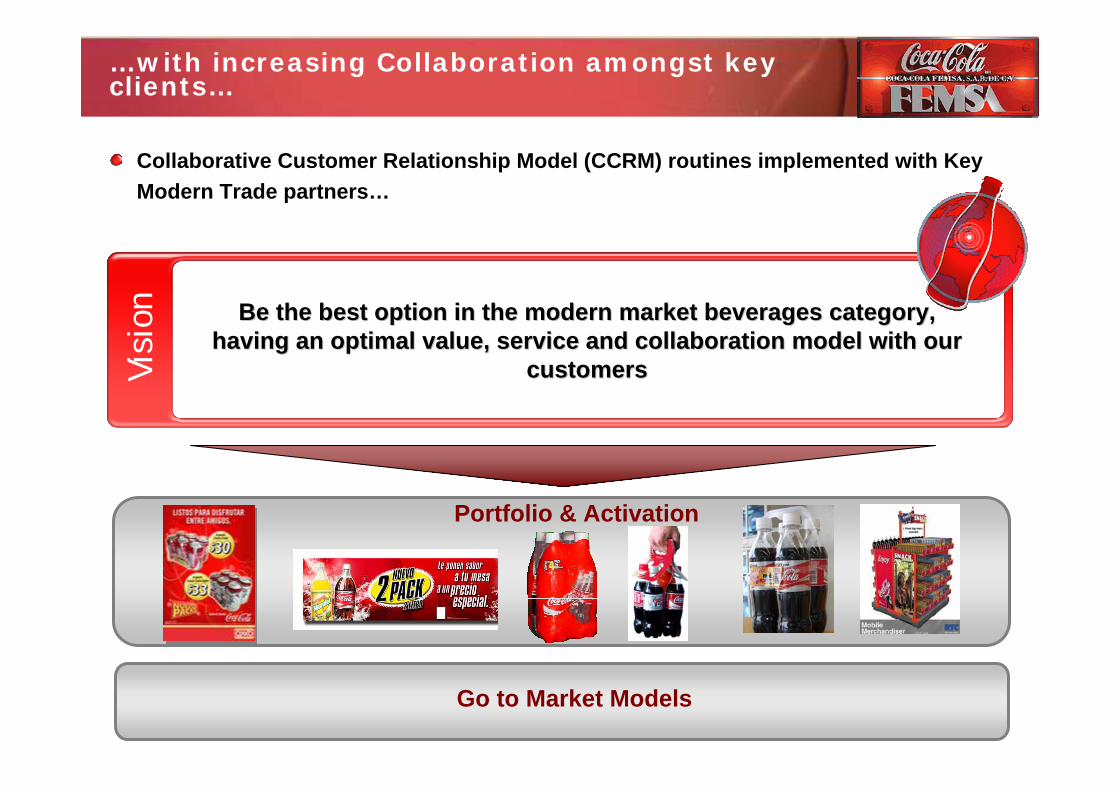
…with increasing Collaboration amongst key clients…
Collaborative Customer Relationship Model (CCRM) routines implemented with Key Modern Trade partners…
Visi
on Be the best option in the modern market beverages category, Be the best option in the modern market beverages category, having an optimal value, service and collaboration model with ouhaving an optimal value, service and collaboration model with our r
customerscustomersVisi
on
Portfolio & Activation
Go to Market Models
25
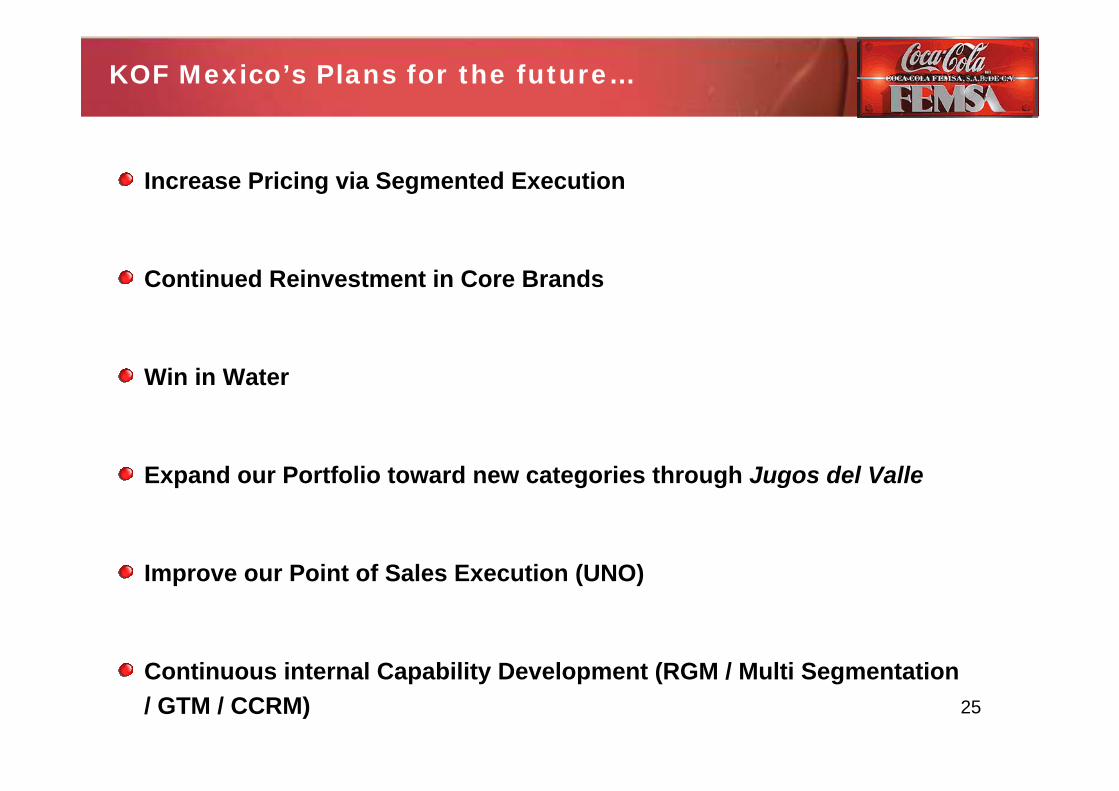
KOF Mexico’s Plans for the future…
Increase Pricing via Segmented Execution
Continued Reinvestment in Core Brands
Win in Water
Expand our Portfolio toward new categories through Jugos del Valle
Improve our Point of Sales Execution (UNO)
Continuous internal Capability Development (RGM / Multi Segmentation / GTM / CCRM)
26
KOF OVERVIEW AND MEXICO FOCUS
March 2007
27
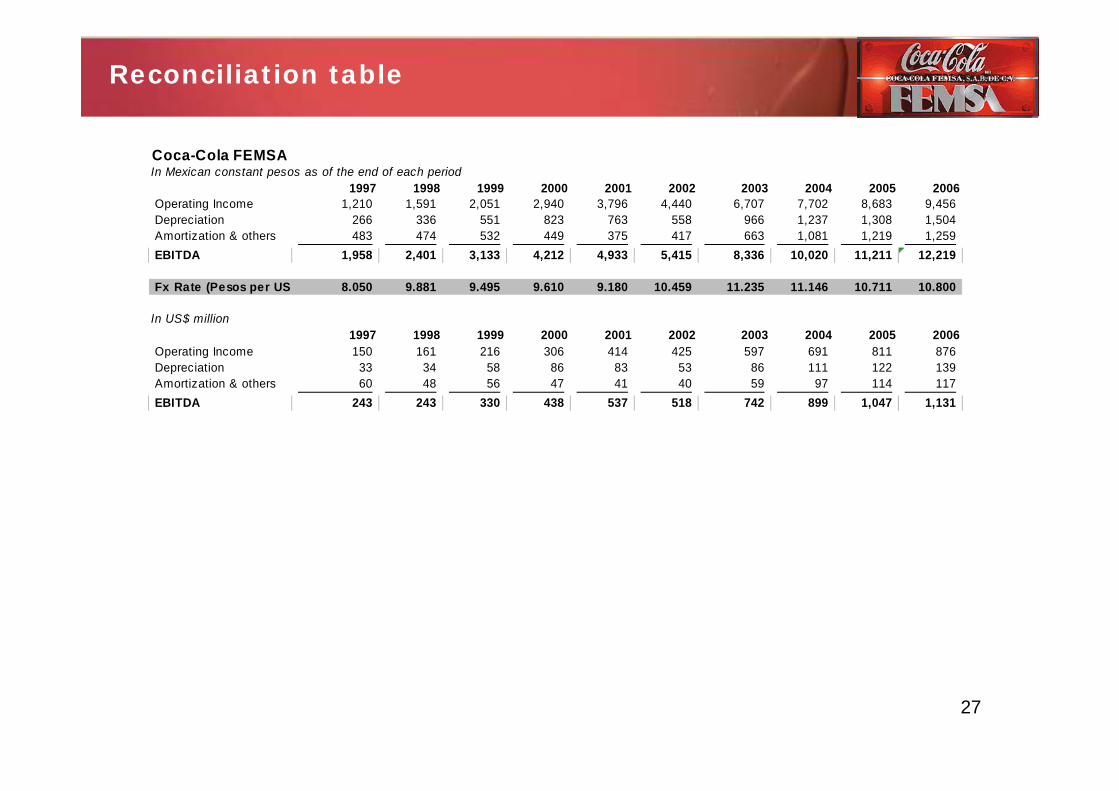
Reconciliation table
Coca-Cola FEMSAIn Mexican constant pesos as of the end of each period
1997 1998 1999 2000 2001 2002 2003 2004 2005 2006Operating Income 1,210 1,591 2,051 2,940 3,796 4,440 6,707 7,702 8,683 9,456 Depreciation 266 336 551 823 763 558 966 1,237 1,308 1,504 Amortization & others 483 474 532 449 375 417 663 1,081 1,219 1,259 EBITDA 1,958 2,401 3,133 4,212 4,933 5,415 8,336 10,020 11,211 12,219
Fx Rate (Pesos per US 8.050 9.881 9.495 9.610 9.180 10.459 11.235 11.146 10.711 10.800
In US$ million1997 1998 1999 2000 2001 2002 2003 2004 2005 2006
Operating Income 150 161 216 306 414 425 597 691 811 876 Depreciation 33 34 58 86 83 53 86 111 122 139 Amortization & others 60 48 56 47 41 40 59 97 114 117 EBITDA 243 243 330 438 537 518 742 899 1,047 1,131


