Embed Size (px)
Citation preview
FORWARD LOOKING STATEMENTS
This document may contain statements, estimates or projections that constitute “forward-looking statements” concerning the financial condition, performance, results, strategy and
objectives of Coca-Cola European Partners plc and its subsidiaries (together “CCEP” or the “Group”). Generally, the words “believe,” “expect,” “intend,” “estimate,” “anticipate,” “project,”
“plan,” “seek,” “may,” “could,” “would,” “should,” “might,” “will,” “forecast,” “outlook,” “guidance,” “possible,” “potential,” “predict” and similar expressions identify forward-looking statements,
which generally are not historical in nature.
Forward-looking statements are subject to certain risks that could cause actual results to differ materially from CCEP’s historical experience and present expectations or projections. As a
result, undue reliance should not be placed on forward-looking statements, which speak only as of the date on which they are made. These risks and uncertainties include but are not
limited to those set forth in the “Risk Factors” section of the 2017 Annual Report on Form 20-F, including the statements under the following headings: Risks Relating to Consumer
Preferences and the Health Impact of Soft Drinks; Risks Relating to Legal and Regulatory Intervention (such as the impact of sugar taxes being implemented in a number of countries in
2018 and the development of regulations regarding packaging); Risks Relating to Business Integration and Synergy Savings; Risks Relating to Cyber and Social Engineering Attacks;
Risks Relating to the Market (such as customer consolidation); Risks Relating to Economic and Political Conditions (such as continuing developments in relation to the UK’s exit from the
EU); Risks Relating to the Relationship with TCCC and Other Franchisors; Risks Relating to Product Quality (such as shortages of raw materials); and Other Risks.
Due to these risks and uncertainties, CCEP’s actual future results, dividend payments, and capital and leverage ratios may differ materially from the plans, goals, expectations and
guidance set out in CCEP’s forward-looking statements. Additional risks and uncertainties that may impact CCEP’s future financial condition and performance are identified in filings with
the SEC which are available on the SEC’s website at www.sec.gov. CCEP does not undertake any obligation to publicly update or revise any forward-looking statements, whether as a
result of new information, future events, or otherwise, except as required under applicable rules, laws and regulations. CCEP assumes no responsibility for the accuracy and completeness
of any forward-looking statements. Any or all of the forward-looking statements contained in this filing and in any other of CCEP’s respective public statements may prove to be incorrect.
RECONCILIATION TO GAAP FINANCIAL INFORMATION
The following presentation includes certain alternative performance measures, or non-GAAP performance measures. Refer to pages 14 – 21 of our 2017 Annual Report issued on 15
March 2018, and pages 14-18 of our 2016 Annual Report issued on 11 April 2017, which detail our non-GAAP performance measures and reconciles, where applicable, our 2017, 2016
and 2015 results as reported under IFRS to the non-GAAP performance measures included in this presentation. For 2015 and 2016, as included within our 2016 Annual Report, we have
given effect to the merger as if it had occurred at the beginning of the periods presented. This presentation also includes certain forward looking non-GAAP financial information. We are
not able to reconcile forward looking non-GAAP information to reported measures without unreasonable efforts because it is not possible to predict with a reasonable degree of certainty
the actual items that may impact comparability throughout 2018.
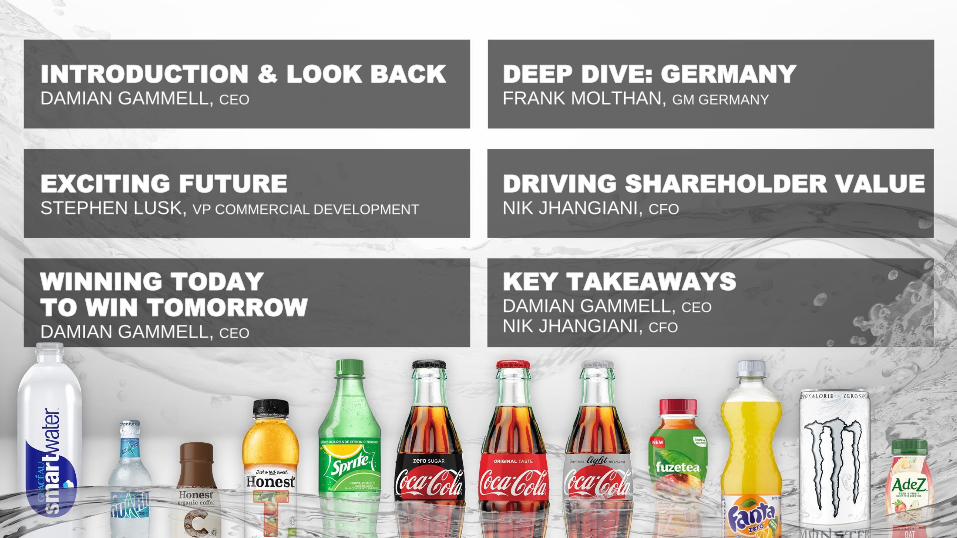
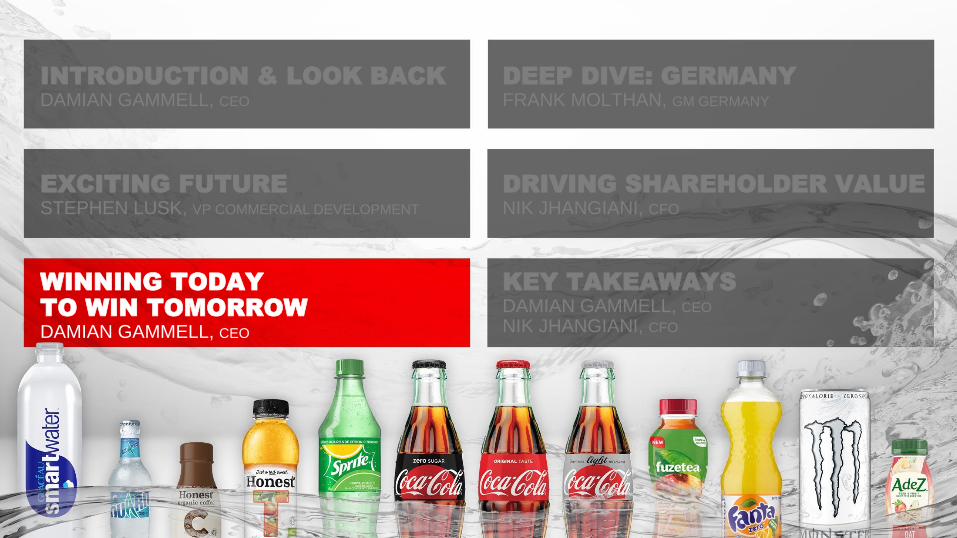
INTRODUCTION & LOOK BACK
DAMIAN GAMMELL, CEO
EXCITING FUTURE
STEPHEN LUSK, VP COMMERCIAL DEVELOPMENT
WINNING TODAY
TO WIN TOMORROW
DAMIAN GAMMELL, CEO
KEY TAKEAWAYS
DAMIAN GAMMELL, CEO
NIK JHANGIANI, CFO
DEEP DIVE: GERMANY
FRANK MOLTHAN, GM GERMANY
DRIVING SHAREHOLDER VALUE
NIK JHANGIANI, CFO
INTRODUCTION & LOOK BACK
DAMIAN GAMMELL, CEO
EXCITING FUTURE
STEPHEN LUSK, VP COMMERCIAL DEVELOPMENT
WINNING TODAY
TO WIN TOMORROW
DAMIAN GAMMELL, CEO
KEY TAKEAWAYS
DAMIAN GAMMELL, CEO
NIK JHANGIANI, CFO
DEEP DIVE: GERMANY
FRANK MOLTHAN, GM GERMANY
DRIVING SHAREHOLDER VALUE
NIK JHANGIANI, CFO
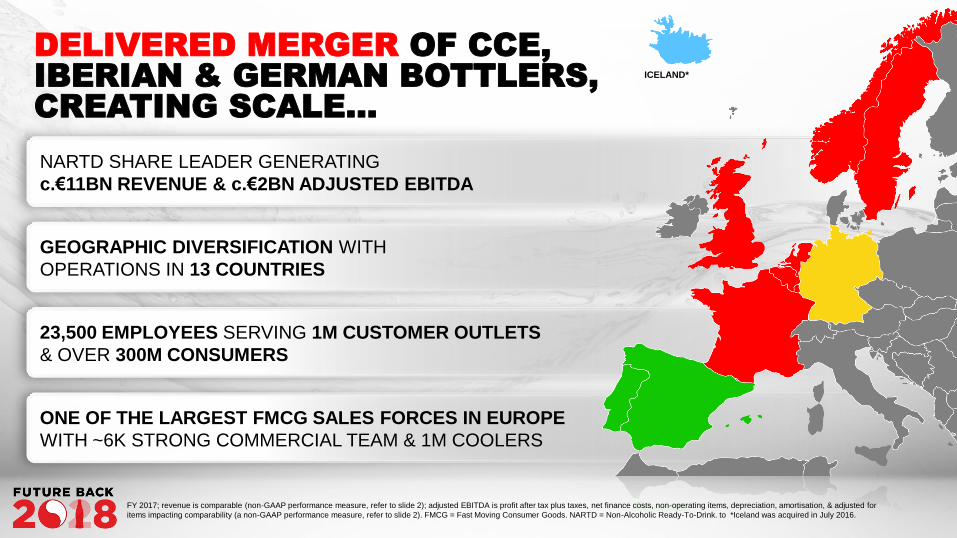
DELIVERED MERGER OF CCE,
IBERIAN & GERMAN BOTTLERS,
CREATING SCALE…
FY 2017; revenue is comparable (non-GAAP performance measure, refer to slide 2); adjusted EBITDA is profit after tax plus taxes, net finance costs, non-operating items, depreciation, amortisation, & adjusted for
items impacting comparability (a non-GAAP performance measure, refer to slide 2). FMCG = Fast Moving Consumer Goods. NARTD = Non-Alcoholic Ready-To-Drink. to *Iceland was acquired in July 2016.
ICELAND*
NARTD SHARE LEADER GENERATING
c.€11BN REVENUE & c.€2BN ADJUSTED EBITDA
GEOGRAPHIC DIVERSIFICATION WITH
OPERATIONS IN 13 COUNTRIES
23,500 EMPLOYEES SERVING 1M CUSTOMER OUTLETS
& OVER 300M CONSUMERS
ONE OF THE LARGEST FMCG SALES FORCES IN EUROPE
WITH ~6K STRONG COMMERCIAL TEAM & 1M COOLERS
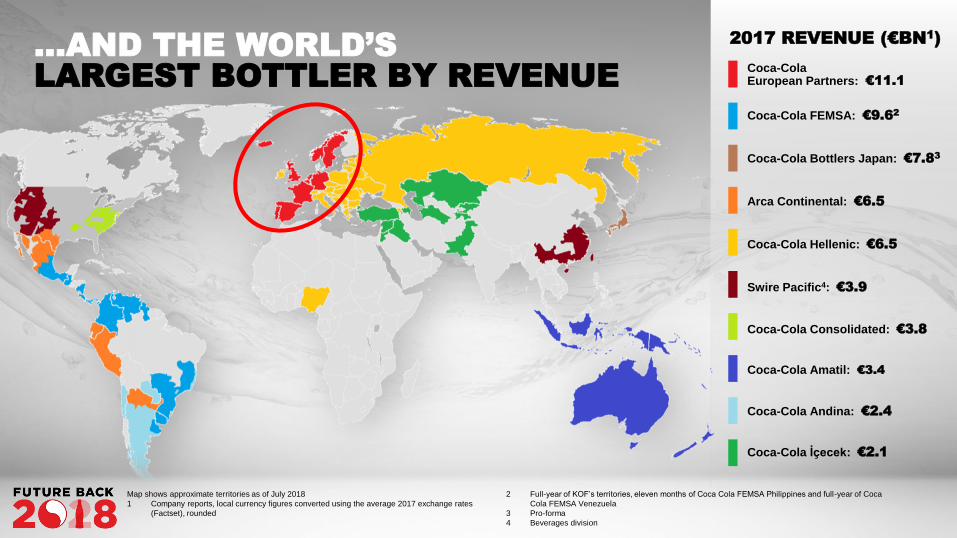
Coca-Cola FEMSA: €9.62
Coca-Cola European Partners: €11.1
Arca Continental: €6.5
Coca-Cola Hellenic: €6.5
Swire Pacific4: €3.9
Coca-Cola İçecek: €2.1
Coca-Cola Consolidated: €3.8
Coca-Cola Bottlers Japan: €7.83
Coca-Cola Andina: €2.4
Coca-Cola Amatil: €3.4
…AND THE WORLD’S
LARGEST BOTTLER BY REVENUE
2017 REVENUE (€BN1)
Map shows approximate territories as of July 2018
1 Company reports, local currency figures converted using the average 2017 exchange rates
(Factset), rounded
2 Full-year of KOF’s territories, eleven months of Coca Cola FEMSA Philippines and full-year of Coca
Cola FEMSA Venezuela
3 Pro-forma
4 Beverages division
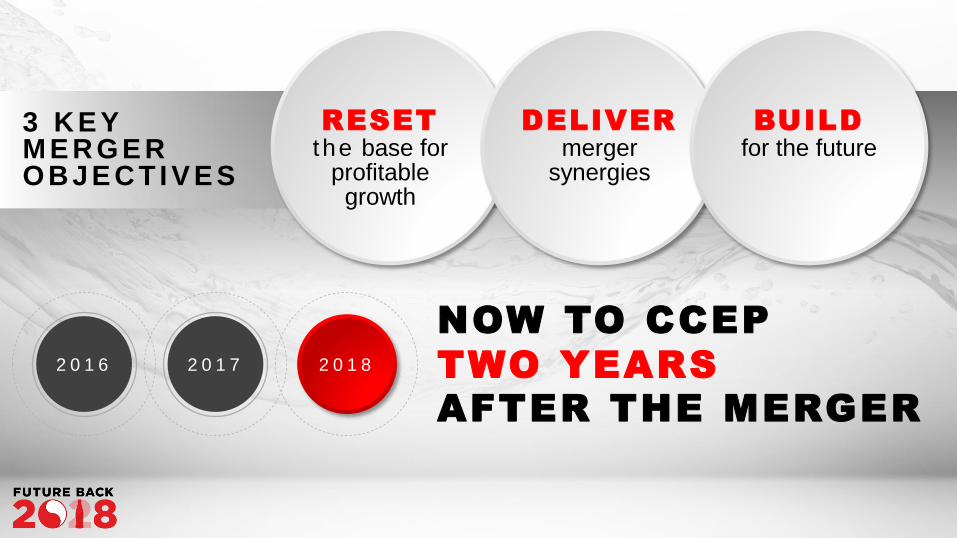
NOW TO CCEP
TWO YEARS2 0 1 6 2 0 1 7
3 K E Y M E R G E RO BJE CT I V E S
RESET
t he base for profitable
growth
AFTER THE MERGER
2 0 1 8
DELIVER
merger synergies
BUILD
for the future
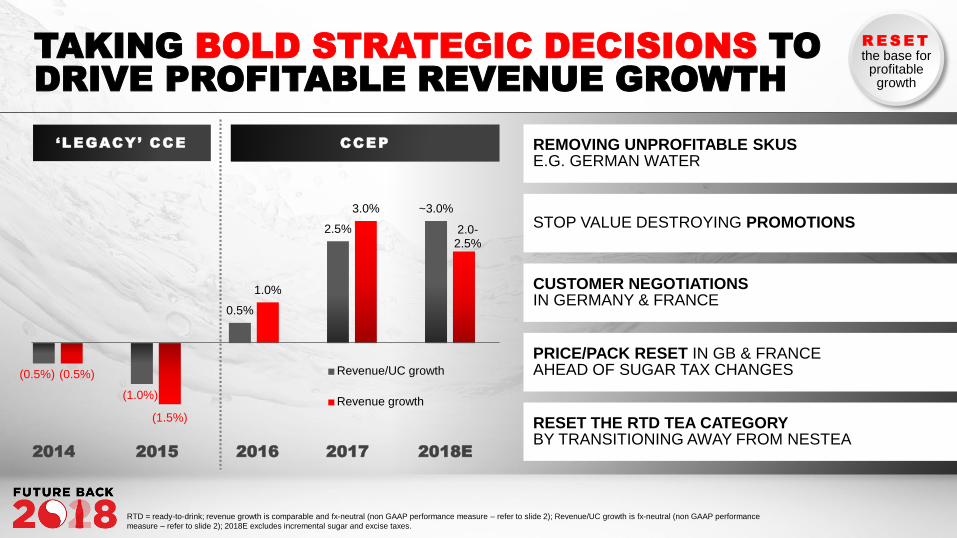
REMOVING UNPROFITABLE SKUS E.G. GERMAN WATER
STOP VALUE DESTROYING PROMOTIONS
CUSTOMER NEGOTIATIONS IN GERMANY & FRANCE
PRICE/PACK RESET IN GB & FRANCE AHEAD OF SUGAR TAX CHANGES
RESET THE RTD TEA CATEGORY BY TRANSITIONING AWAY FROM NESTEA
TAKING BOLD STRATEGIC DECISIONS TO
DRIVE PROFITABLE REVENUE GROWTH
R E S E T
the base for profitable
growth
(0.5%)
(1.0%)
0.5%
2.5%
~3.0%
(0.5%)
(1.5%)
1.0%
3.0%
2.0-2.5%
Revenue/UC growth
Revenue growth
CCEP‘LEGACY’ CCE
2014 2015 2017 2018E2016
RTD = ready-to-drink; revenue growth is comparable and fx-neutral (non GAAP performance measure – refer to slide 2); Revenue/UC growth is fx-neutral (non GAAP performance
measure – refer to slide 2); 2018E excludes incremental sugar and excise taxes.
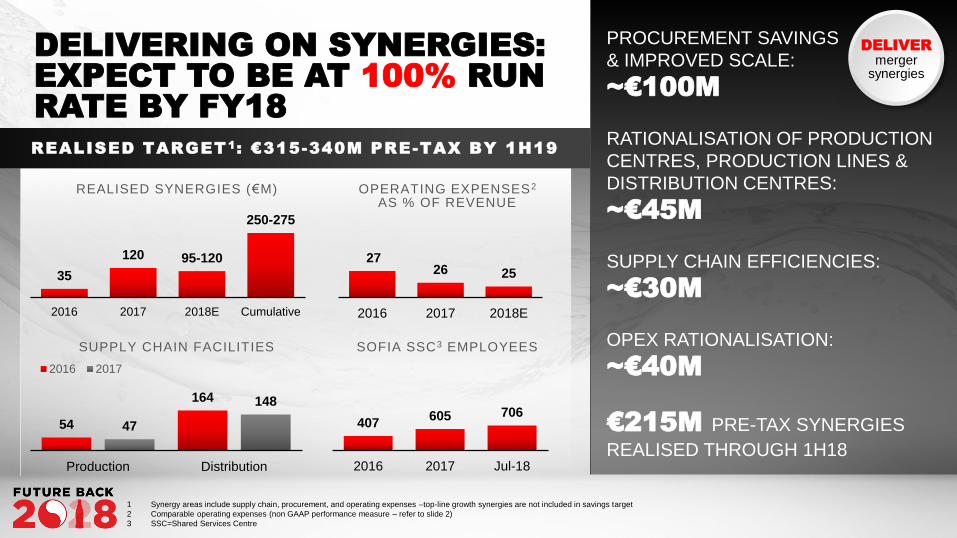
DELIVERING ON SYNERGIES:
EXPECT TO BE AT 100% RUN
RATE BY FY18
35
120 95-120
250-275
2016 2017 2018E Cumulative
PROCUREMENT SAVINGS
& IMPROVED SCALE:
~€100M
RATIONALISATION OF PRODUCTION
CENTRES, PRODUCTION LINES &
DISTRIBUTION CENTRES:
~€45M
SUPPLY CHAIN EFFICIENCIES:
~€30M
OPEX RATIONALISATION:
~€40M
€215M PRE-TAX SYNERGIES
REALISED THROUGH 1H18
REALISED TARGET1: €315-340M PRE-TAX BY 1H19
2726 25
2016 2017 2018E
54
164
47
148
Production Distribution
2016 2017
407605 706
2016 2017 Jul-18
REALISED SYNERGIES (€M) OPERATING EXPENSES2
AS % OF REVENUE
SUPPLY CHAIN FACILITIES SOFIA SSC3 EMPLOYEES
DELIVER
merger synergies
1 Synergy areas include supply chain, procurement, and operating expenses –top-line growth synergies are not included in savings target
2 Comparable operating expenses (non GAAP performance measure – refer to slide 2)
3 SSC=Shared Services Centre
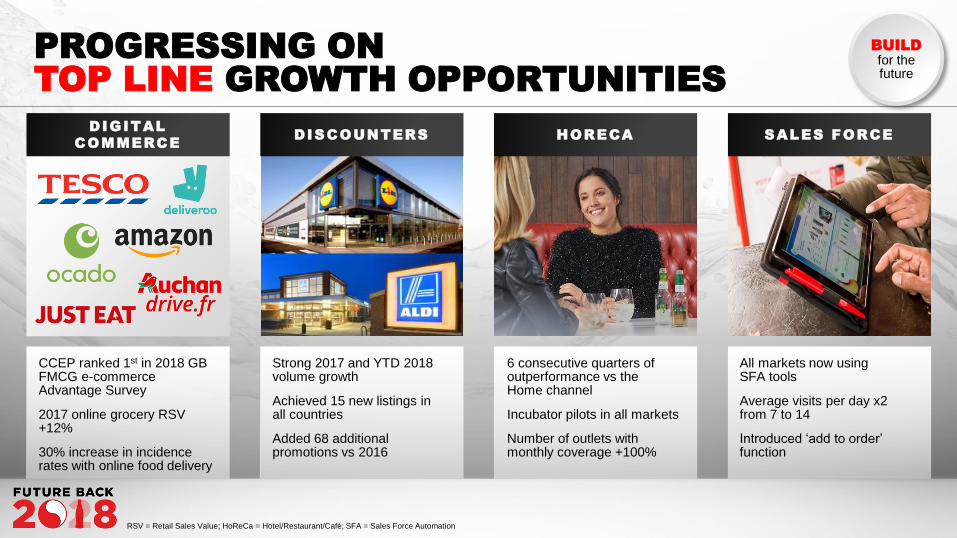
DIGITAL
COMMERCE
PROGRESSING ON
TOP LINE GROWTH OPPORTUNITIES
SALES FORCEDISCOUNTERS HORECA
CCEP ranked 1st in 2018 GB FMCG e-commerce Advantage Survey
2017 online grocery RSV +12%
30% increase in incidence rates with online food delivery
All markets now usingSFA tools
Average visits per day x2 from 7 to 14
Introduced ‘add to order’ function
6 consecutive quarters of outperformance vs theHome channel
Incubator pilots in all markets
Number of outlets with monthly coverage +100%
Strong 2017 and YTD 2018volume growth
Achieved 15 new listings inall countries
Added 68 additional promotions vs 2016
BUILD
for the future
RSV = Retail Sales Value; HoReCa = Hotel/Restaurant/Café; SFA = Sales Force Automation

WE ARE GUIDED BY
FIVE STRATEGIC
IMPERATIVES
SUSTAINABLE
SHAREHOLDER
RETURNS
Customer &
Execution
Centric
Competitiveness
Top Line
Revenue
Growth
Culture &
Capability
Sustainability
& Stakeholder
Equity

VISIONBIGGER
BOLDER
B U T C C E P WA S A LWAY S A B O U T A
BEYOND THE MERGER
A N D

FUTURE
BACK
GROWTH
LEVERS
ENABLED BY
INVESTING IN
CAPABILITIES
WINNING
TODAY
TO WIN
TOMORROW
VOLUME PRICE/MIX
MARKET
EXECUTION
PORTFOLIO
DIVERSIFICATION
COMMITMENT
TO ‘THIS
IS FORWARD’
& OUR
CUSTOMERS
INTRODUCTION & LOOK BACK
DAMIAN GAMMELL, CEO
EXCITING FUTURE
STEPHEN LUSK, VP COMMERCIAL DEVELOPMENT
WINNING TODAY
TO WIN TOMORROW
DAMIAN GAMMELL, CEO
KEY TAKEAWAYS
DAMIAN GAMMELL, CEO
NIK JHANGIANI, CFO
DEEP DIVE: GERMANY
FRANK MOLTHAN, GM GERMANY
DRIVING SHAREHOLDER VALUE
NIK JHANGIANI, CFO
THE FUTURE IS EXCITING!
WORKED BACK TO 2018
LOOKED OUT TO 2028
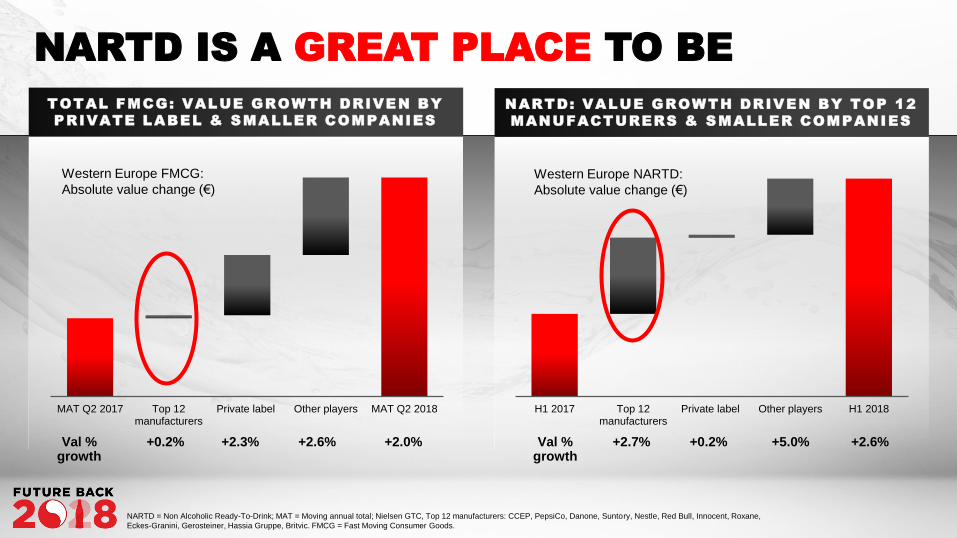
NARTD IS A GREAT PLACE TO BE
TOTAL FMCG: VALUE GROWTH DRIVEN BY
PRIVATE LABEL & SMALLER COMPANIES
MAT Q2 2017 Top 12manufacturers
Private label Other players MAT Q2 2018
Western Europe FMCG:
Absolute value change (€)
H1 2017 Top 12manufacturers
Private label Other players H1 2018
Western Europe NARTD:
Absolute value change (€)
NARTD: VALUE GROWTH DRIVEN BY TOP 12
MANUFACTURERS & SMALLER COMPANIES
+2.7% +0.2% +5.0% +2.6%Val % growth
Val % growth
+0.2% +2.3% +2.6% +2.0%
NARTD = Non Alcoholic Ready-To-Drink; MAT = Moving annual total; Nielsen GTC, Top 12 manufacturers: CCEP, PepsiCo, Danone, Suntory, Nestle, Red Bull, Innocent, Roxane,
Eckes-Granini, Gerosteiner, Hassia Gruppe, Britvic. FMCG = Fast Moving Consumer Goods.
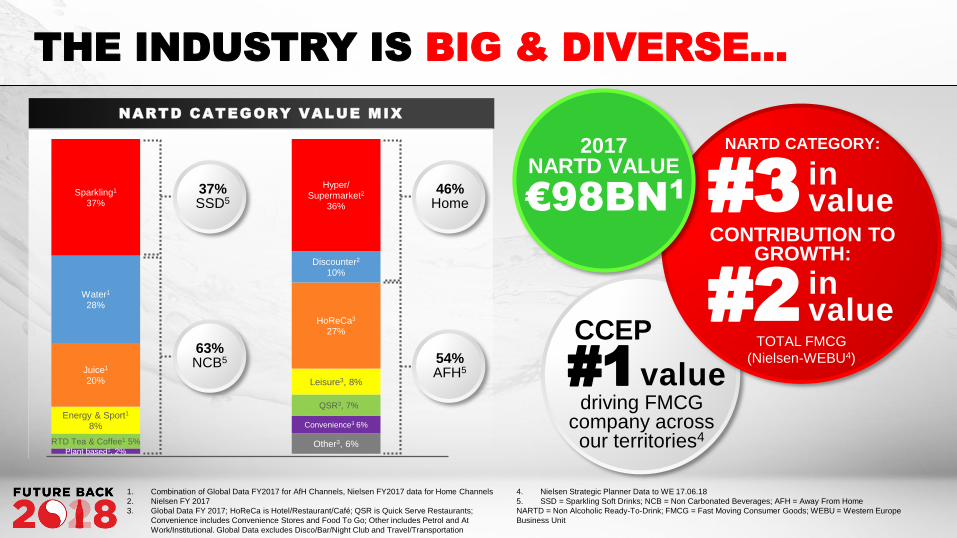
NARTD CATEGORY VALUE MIX
Other3, 6%Plant based1, 2%
Convenience3 6%
RTD Tea & Coffee1 5%
QSR3, 7%Energy & Sport1
8%
Leisure3, 8%
Juice1
20%
HoReCa3
27%
Water1
28%
Discounter2
10%
Sparkling1
37%
Hyper/Supermarket2
36%
CCEP
THE INDUSTRY IS BIG & DIVERSE…
NARTD CATEGORY:
TOTAL FMCG
(Nielsen-WEBU4)
#3invalue
CONTRIBUTION TO GROWTH:
#2invalue
driving FMCG company across our territories4
#1value
37% SSD5
63%NCB5
46%Home
54%AFH5
2017NARTD VALUE
€98BN1
1. Combination of Global Data FY2017 for AfH Channels, Nielsen FY2017 data for Home Channels
2. Nielsen FY 2017
3. Global Data FY 2017; HoReCa is Hotel/Restaurant/Café; QSR is Quick Serve Restaurants;
Convenience includes Convenience Stores and Food To Go; Other includes Petrol and At
Work/Institutional. Global Data excludes Disco/Bar/Night Club and Travel/Transportation
4. Nielsen Strategic Planner Data to WE 17.06.18
5. SSD = Sparkling Soft Drinks; NCB = Non Carbonated Beverages; AFH = Away From Home
NARTD = Non Alcoholic Ready-To-Drink; FMCG = Fast Moving Consumer Goods; WEBU = Western Europe
Business Unit
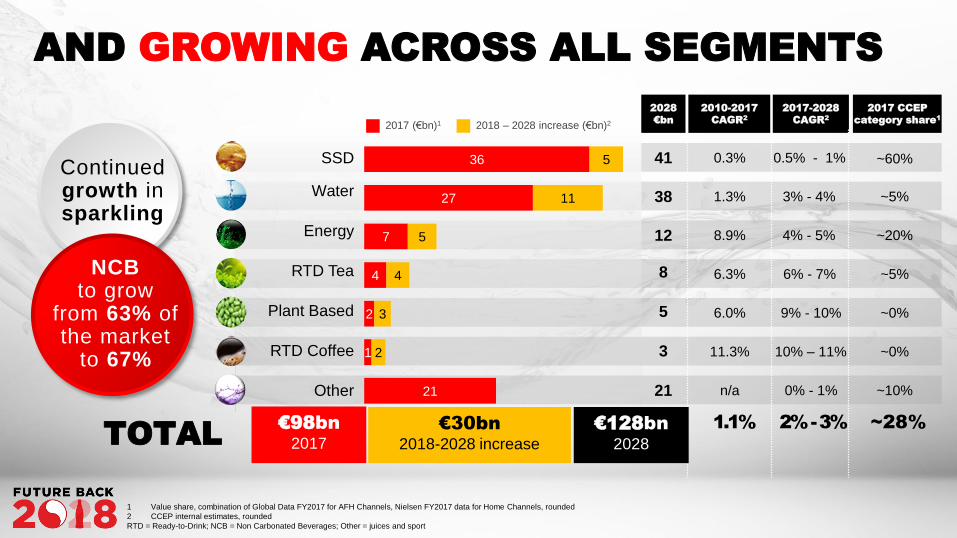
Continued growth insparkling
0.5% - 1%
3% - 4%
4% - 5%
6% - 7%
9% - 10%
10% – 11%
2017-2028
CAGR2
2017 CCEP
category share1
~60%
~5%
~20%
~5%
~0%
~0%
0.3%
1.3%
8.9%
6.3%
6.0%
11.3%
2010-2017
CAGR2
41
38
12
8
5
3
2028
€bn
AND GROWING ACROSS ALL SEGMENTS
NCBto grow
from 63% ofthe market
to 67%
Water
Energy
RTD Tea
Plant Based
RTD Coffee
SSD
Other 21 0% - 1% ~10%n/a
1.1% 2% -3% ~28%
1 Value share, combination of Global Data FY2017 for AFH Channels, Nielsen FY2017 data for Home Channels, rounded
2 CCEP internal estimates, rounded
RTD = Ready-to-Drink; NCB = Non Carbonated Beverages; Other = juices and sport
€98bn
2017
€30bn
2018-2028 increase
€128bn
2028
21
1
2
4
7
27
36
2
3
4
5
11
5
TOTAL
2017 (€bn)1 2018 – 2028 increase (€bn)2
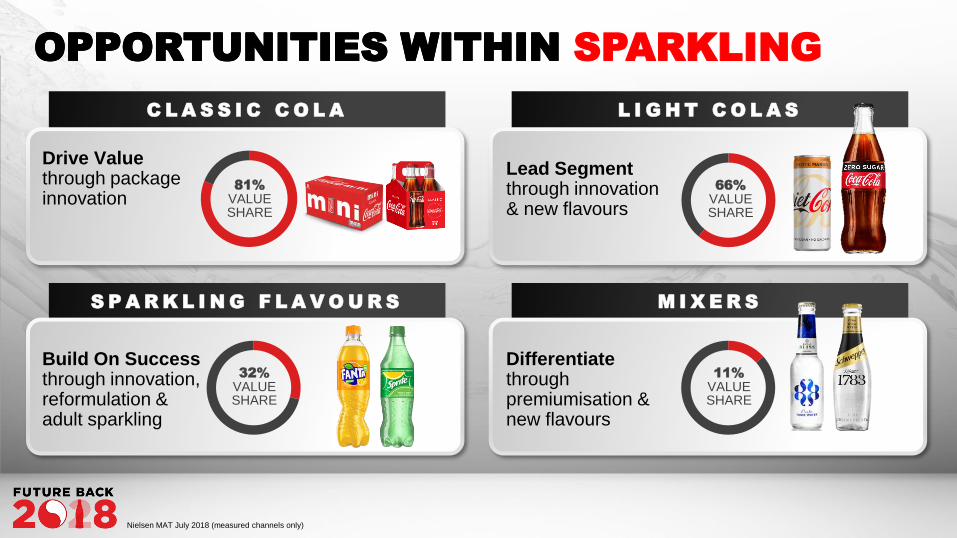
OPPORTUNITIES WITHIN SPARKLING
C L A S S I C C O L A
S P A R K L I N G F L A V O U R S
L I G H T C O L A S
M I X E R S
OPPORTUNITIES WITHIN
32%
VALUE SHARE
Drive Value through package innovation
81%
VALUE SHARE
Build On Successthrough innovation, reformulation & adult sparkling
Lead Segment through innovation & new flavours
Differentiate through premiumisation & new flavours
66%
VALUE SHARE
11%
VALUE SHARE
Nielsen MAT July 2018 (measured channels only)
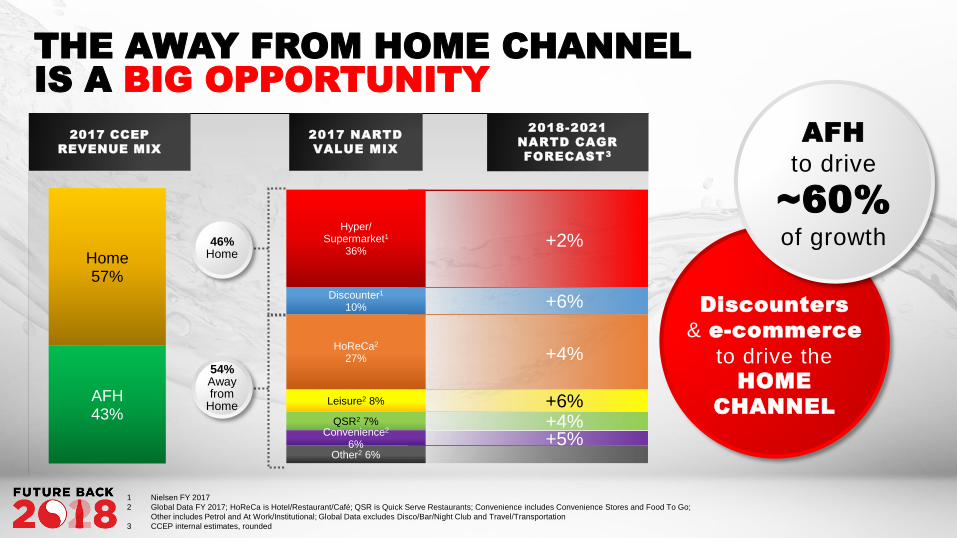
THE AWAY FROM HOME CHANNEL
IS A BIG OPPORTUNITY
2018-2021
NARTD CAGR
FORECAST3
2017 CCEP
REVENUE MIX
46%Home
54%Awayfrom
Home
AFH
to drive
~60%
of growth
Discounters
& e-commerce
to drive theHOME
CHANNEL
Other2 6%
Convenience2
6%
QSR2 7%
Leisure2 8%
HoReCa2
27%
Discounter1
10%
Hyper/Supermarket1
36%
2017 NARTD
VALUE MIX
AFH43%
Home57%
1 Nielsen FY 2017
2 Global Data FY 2017; HoReCa is Hotel/Restaurant/Café; QSR is Quick Serve Restaurants; Convenience includes Convenience Stores and Food To Go;
Other includes Petrol and At Work/Institutional; Global Data excludes Disco/Bar/Night Club and Travel/Transportation
3 CCEP internal estimates, rounded
+2%
+6%
+4%
+6%
+5%+4%
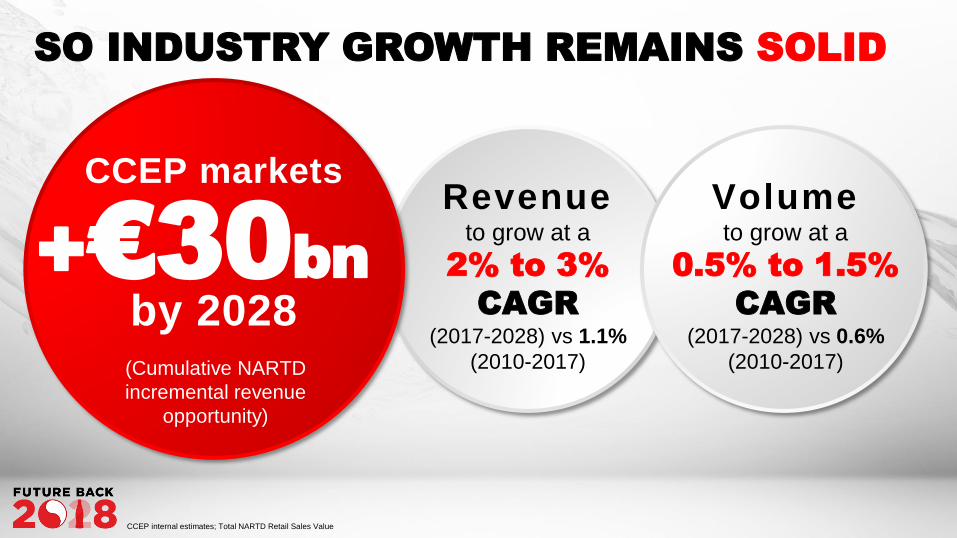
SO INDUSTRY GROWTH REMAINS SOLID
CCEP marketsRevenue
to grow at a
2% to 3%
CAGR
(2017-2028) vs 1.1%
(2010-2017)
by 2028(Cumulative NARTD
incremental revenue
opportunity)
+€30bn
Volumeto grow at a
0.5% to 1.5%
CAGR
(2017-2028) vs 0.6%
(2010-2017)
CCEP internal estimates; Total NARTD Retail Sales Value
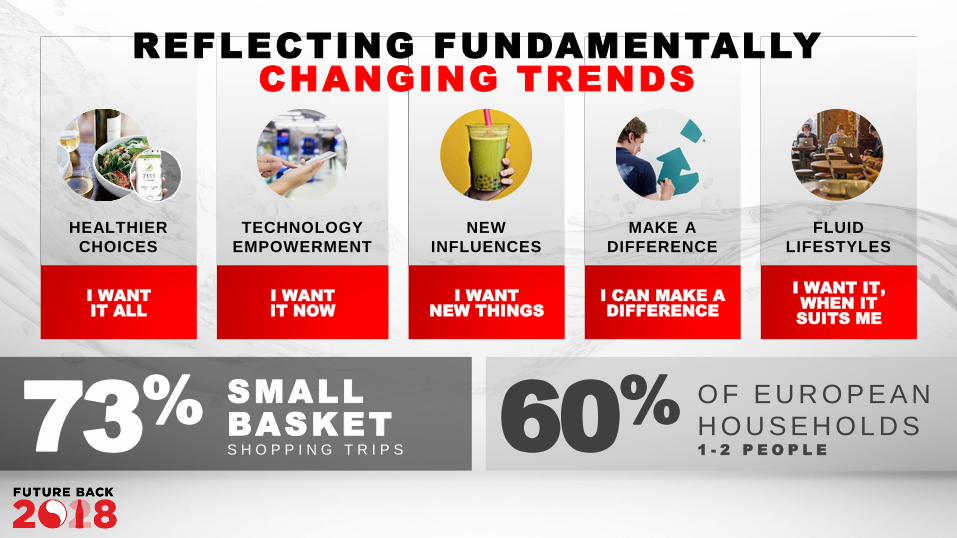
MAKE A
DIFFERENCE
TECHNOLOGY
EMPOWERMENT
HEALTHIER
CHOICES
NEW
INFLUENCES
FLUID
LIFESTYLES
REFLECTING FUNDAMENTALLY
CHANGING TRENDS
73%
SMALL
BASKETS H O P P I N G T R I P S 60
%O F E U R O P E A N
H O U S E H O L D S 1 - 2 P E O P L E
I WANT
IT ALL
I WANT
IT NOW
I WANT
NEW THINGS
I CAN MAKE A
DIFFERENCE
I WANT IT,
WHEN IT
SUITS ME
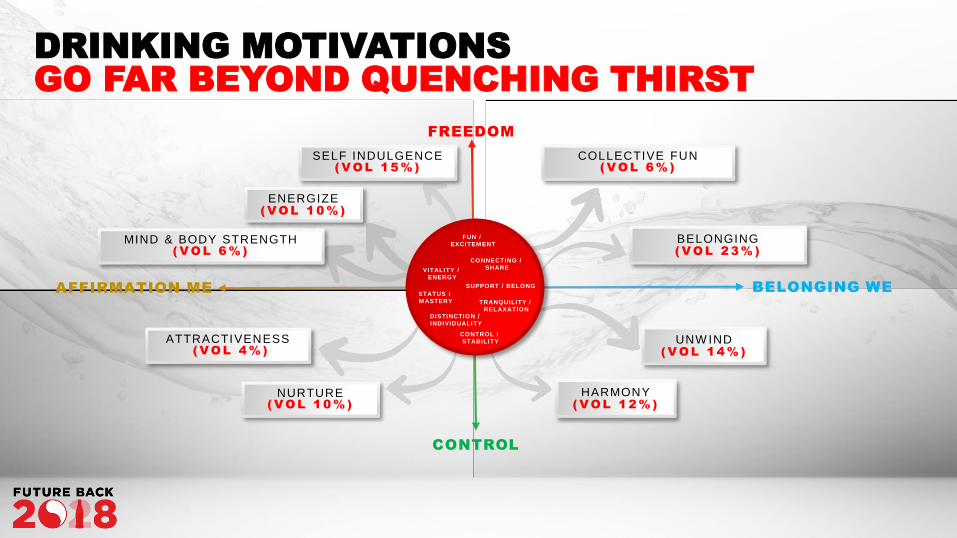
DRINKING MOTIVATIONS
GO FAR BEYOND QUENCHING THIRST
BELONGING( V O L 2 3 % )
SELF INDULGENCE ( V OL 1 5 % )
COLLECTIVE FUN ( V OL 6 % )
UNW IND( V OL 1 4 % )
HARMONY( V OL 1 2 % )
NURTURE ( V OL 1 0 % )
ATTRACTIVENESS( V OL 4 % )
ENERGIZE( V OL 1 0 % )
MIND & BODY STRENGTH ( V O L 6 % )
FUN /
EXCITEM ENT
CONNECTING /
SHARE
SUPPORT / BELONG
TRANQUILITY /
RELAXATION
CONTROL /
STABILITY
DISTINCTION /
INDIVIDUALITY
STATUS /
M ASTERY
VITALITY /
ENERGY
AFFIRMATION ME BELONGING WE
FREEDOM
CONTROL
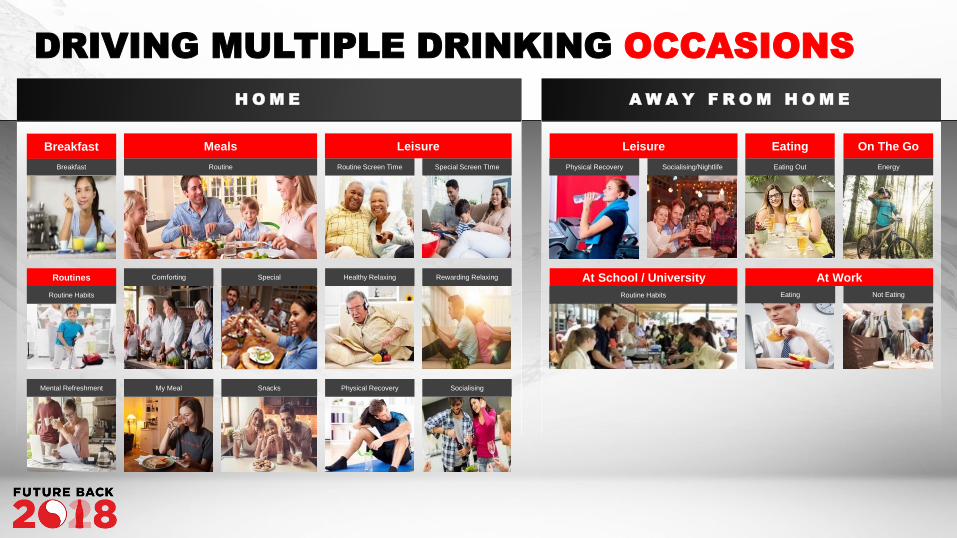
DRIVING MULTIPLE DRINKING OCCASIONS
Breakfast Routine
Comforting Special
My Meal Snacks
Routines
Routine Habits
Mental Refreshment
Breakfast Meals
Routine Screen Time Special Screen TIme
Physical Recovery Socialising
Healthy Relaxing Rewarding Relaxing
Leisure
H O M E A W A Y F R O M H O M E
=
Physical Recovery Socialising/Nightlife
Leisure
Eating Out Energy
Eating On The Go
At School / University At Work
Routine Habits Eating Not Eating
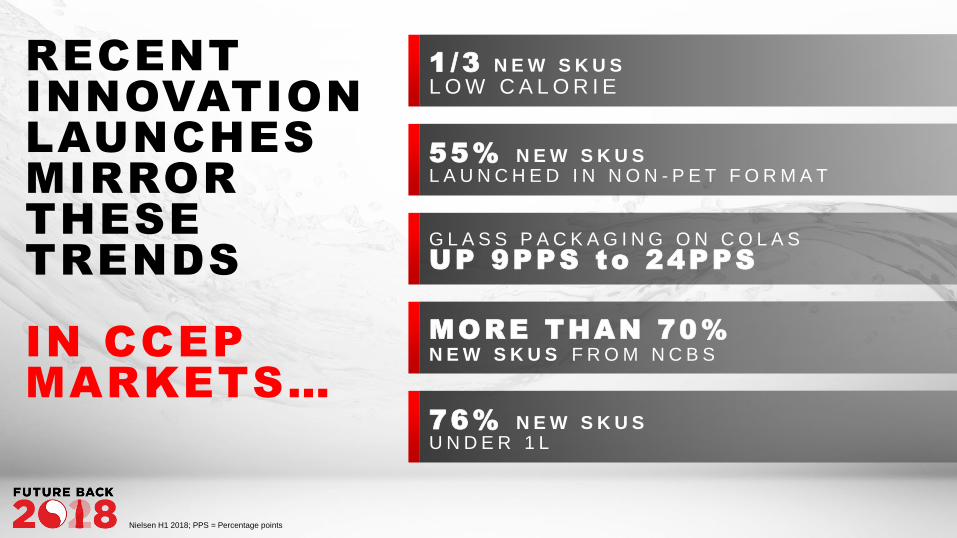
RECENT
INNOVATION
LAUNCHES
MIRROR
THESE
TRENDS
IN CCEP
MARKETS…
1 /3 N E W S K U S
L O W C A L O R I E
55% N E W S K U SL A U N C H E D I N N O N - P E T F O R M A T
G L A S S P A C K A G I N G O N C O L A S
UP 9PPS to 24PPS
MORE THAN 70%
N E W S K U S F R O M N C B S
76% N E W S K U S U N D E R 1 L
Nielsen H1 2018; PPS = Percentage points
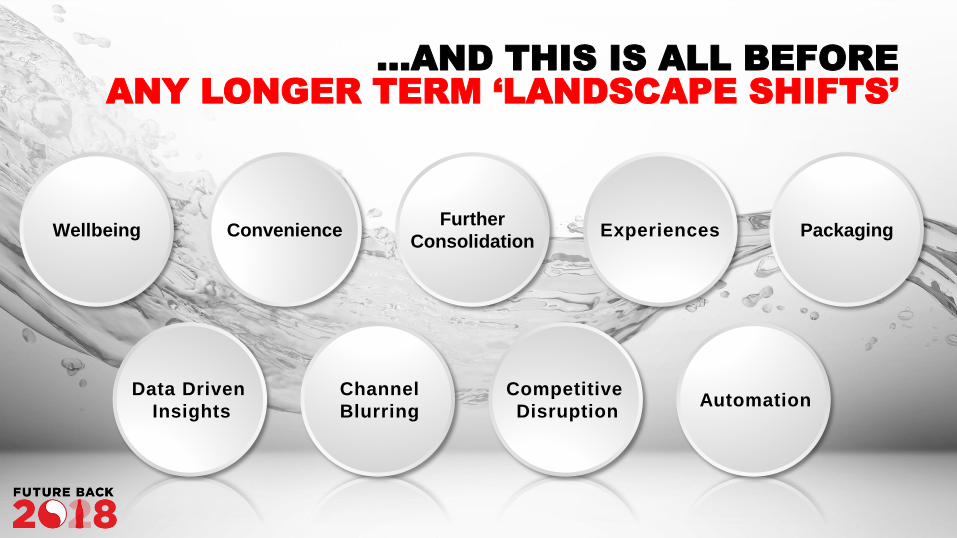
…AND THIS IS ALL BEFORE
ANY LONGER TERM ‘LANDSCAPE SHIFTS’
Wellbeing ConvenienceFurther
ConsolidationExperiences
Data Driven
Insights
Channel
Blurring
Competitive
DisruptionAutomation
Packaging
INTRODUCTION & LOOK BACK
DAMIAN GAMMELL, CEO
EXCITING FUTURE
STEPHEN LUSK, VP COMMERCIAL DEVELOPMENT
WINNING TODAY
TO WIN TOMORROW
DAMIAN GAMMELL, CEO
KEY TAKEAWAYS
DAMIAN GAMMELL, CEO
NIK JHANGIANI, CFO
DEEP DIVE: GERMANY
FRANK MOLTHAN, GM GERMANY
DRIVING SHAREHOLDER VALUE
NIK JHANGIANI, CFO
W E H A V E A S T R A T E G Y T H A T A L L O W S U S T O
GROW FROM OUR CORE
TODAY ALONGSIDE
CHANGE FOR TOMORROW
WINNING TODAY A L L O W S U S T O WIN TOM OR ROW
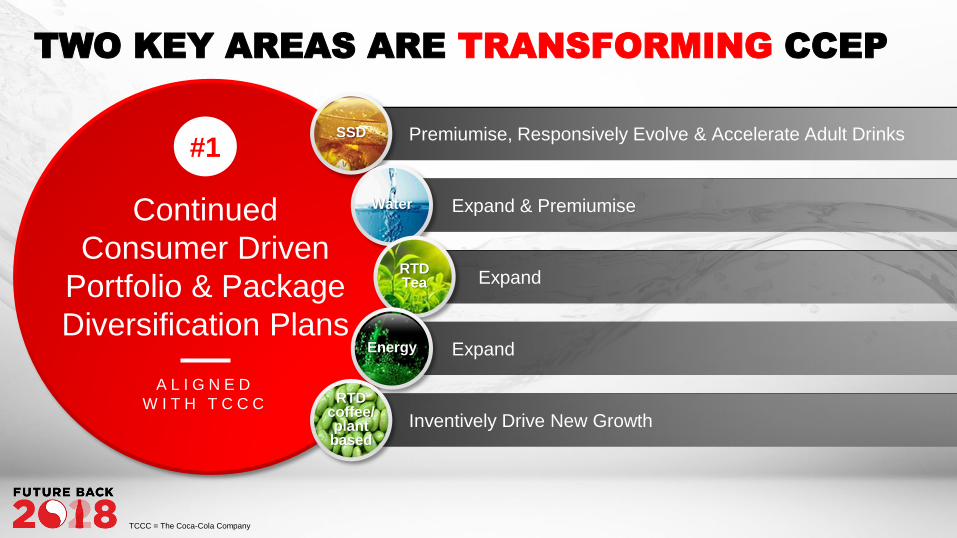
TWO KEY AREAS ARE TRANSFORMING CCEP
Continued
Consumer Driven
Portfolio & Package
Diversification Plans
#1
A L I G N E D
W I T H T C C C
SSD
Water
RTD Tea
Energy
RTD coffee/ plant based
Premiumise, Responsively Evolve & Accelerate Adult Drinks
Expand & Premiumise
Expand
Expand
Inventively Drive New Growth
TCCC = The Coca-Cola Company
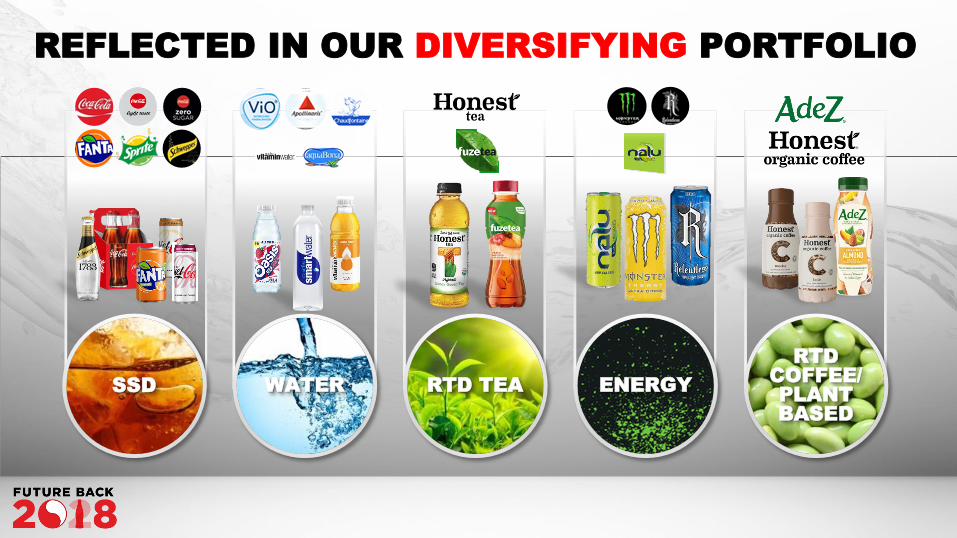
REFLECTED IN OUR DIVERSIFYING PORTFOLIO
SSD WATER RTD TEA ENERGY
RTD
COFFEE/
PLANT
BASED
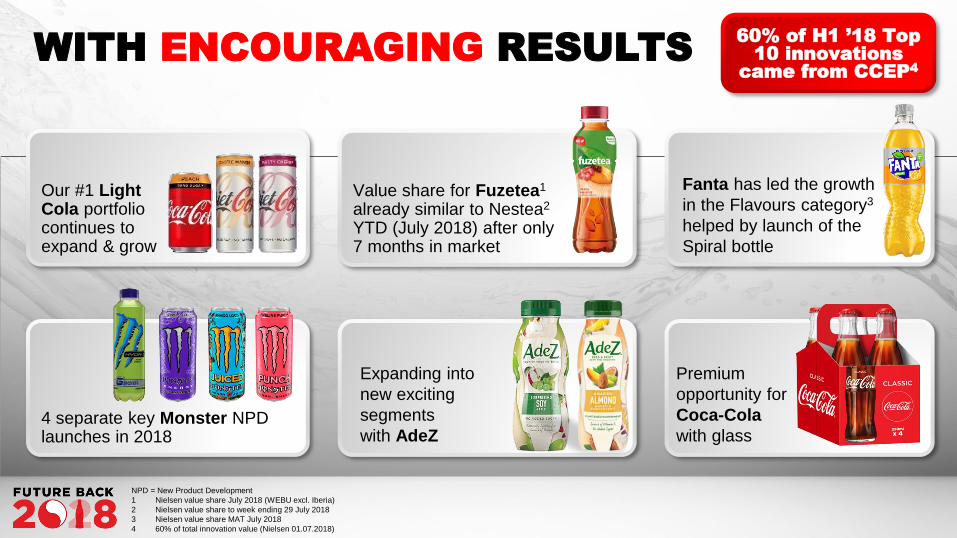
4 separate key Monster NPD launches in 2018
WITH ENCOURAGING RESULTS
Our #1 LightCola portfoliocontinues toexpand & grow
Value share for Fuzetea1
already similar to Nestea2
YTD (July 2018) after only 7 months in market
60% of H1 ’18 Top
10 innovations
came from CCEP4
NPD = New Product Development
1 Nielsen value share July 2018 (WEBU excl. Iberia)
2 Nielsen value share to week ending 29 July 2018
3 Nielsen value share MAT July 2018
4 60% of total innovation value (Nielsen 01.07.2018)
Fanta has led the growth
in the Flavours category3
helped by launch of the
Spiral bottle
Premium
opportunity for
Coca-Cola
with glass
Expanding into
new exciting
segments
with AdeZ
+
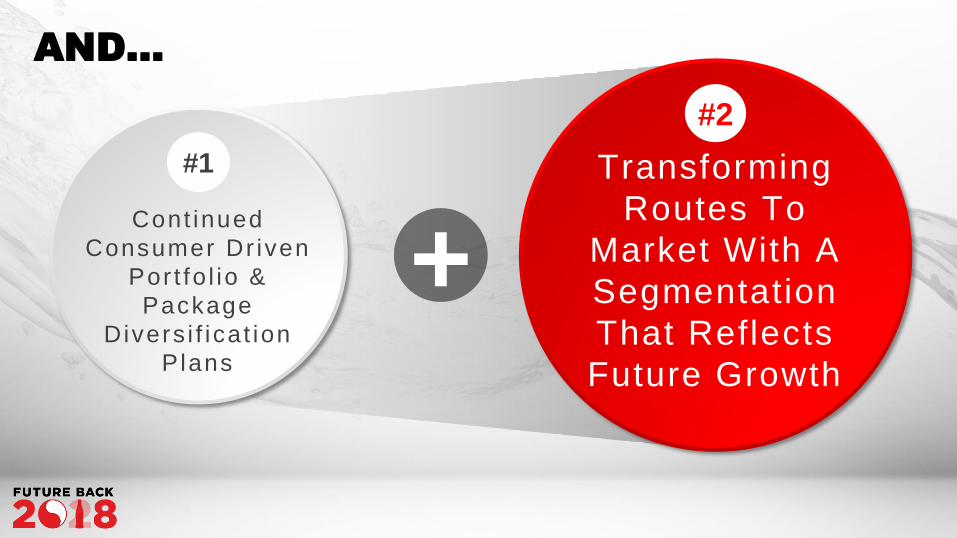
AND…
#1
Cont inued
Consumer Dr iven
Por t fo l io &
Package
Divers i f icat ion
Plans
#2
Transforming
Routes To
Market With A
Segmentation
That Reflects
Future Growth
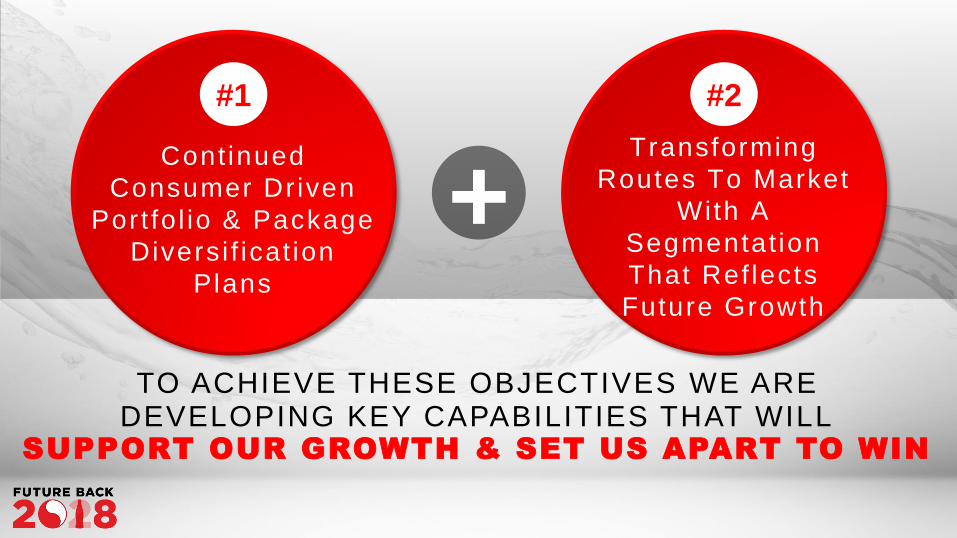
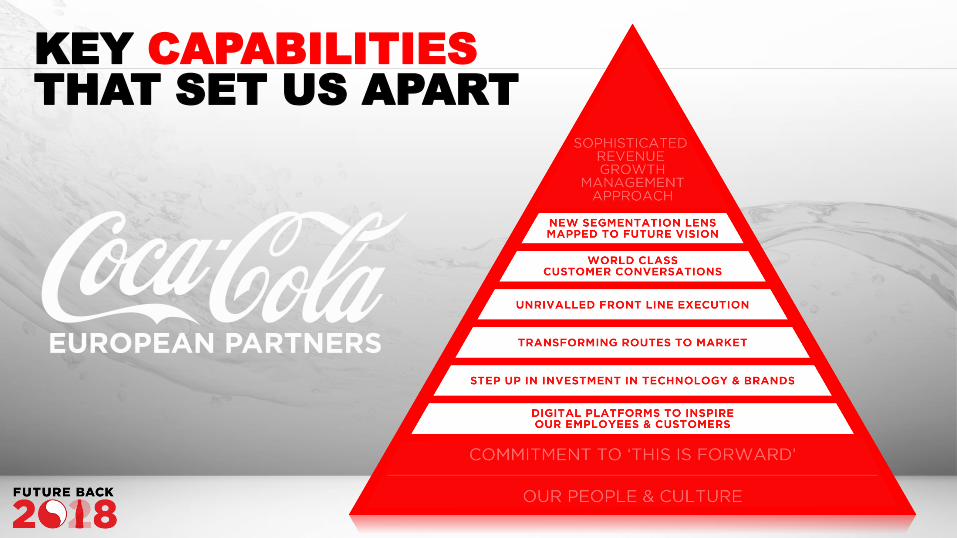
TO ACHIEVE THESE OBJECTIVES WE ARE DEVELOPING KEY CAPABILITIES THAT WILL
SUPPORT OUR GROWTH & SET US APART TO WIN
+
#1
Continued
Consumer Dr iven
Port fo l io & Package
Divers i f icat ion
Plans
#2
Transforming
Routes To Market
With A
Segmentat ion
That Ref lects
Future Growth

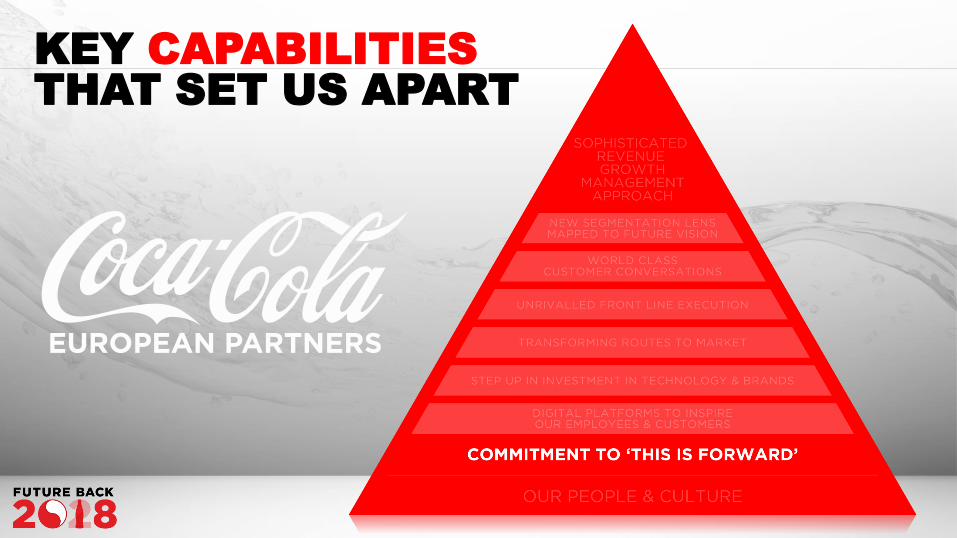
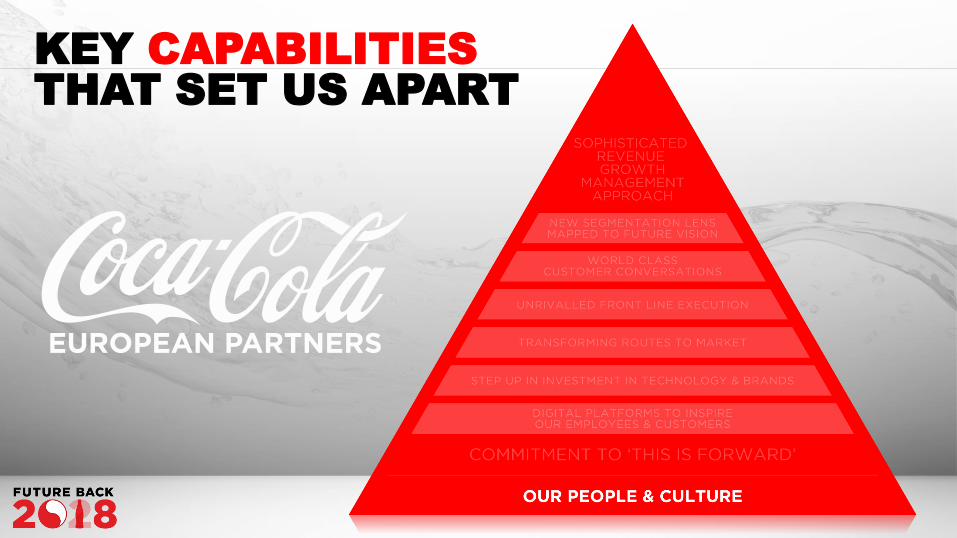
KEY CAPABILITIES
THAT SET US APART
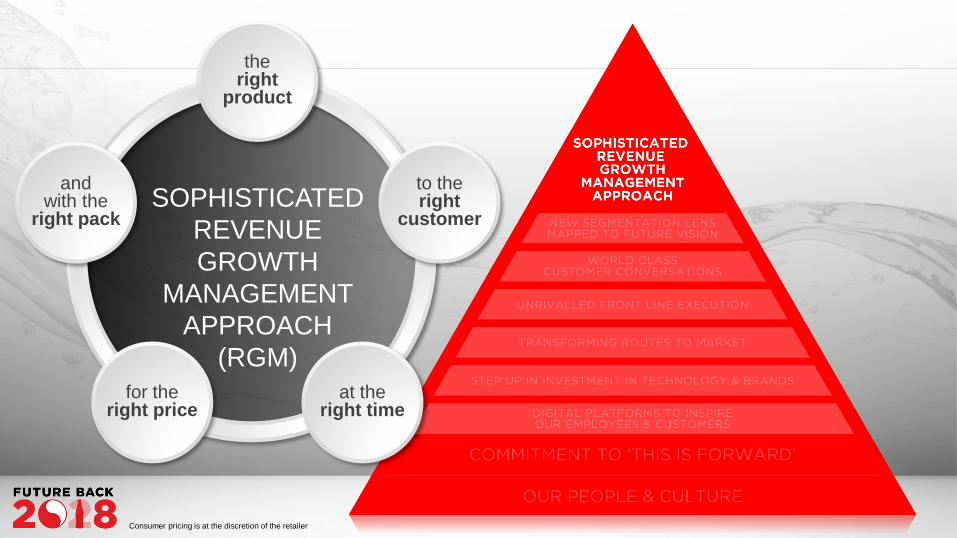
to the right
customer
at the right time
for the right price
andwith the
right pack
the right
product
SOPHISTICATED
REVENUE
GROWTH
MANAGEMENT
APPROACH
(RGM)
Consumer pricing is at the discretion of the retailer
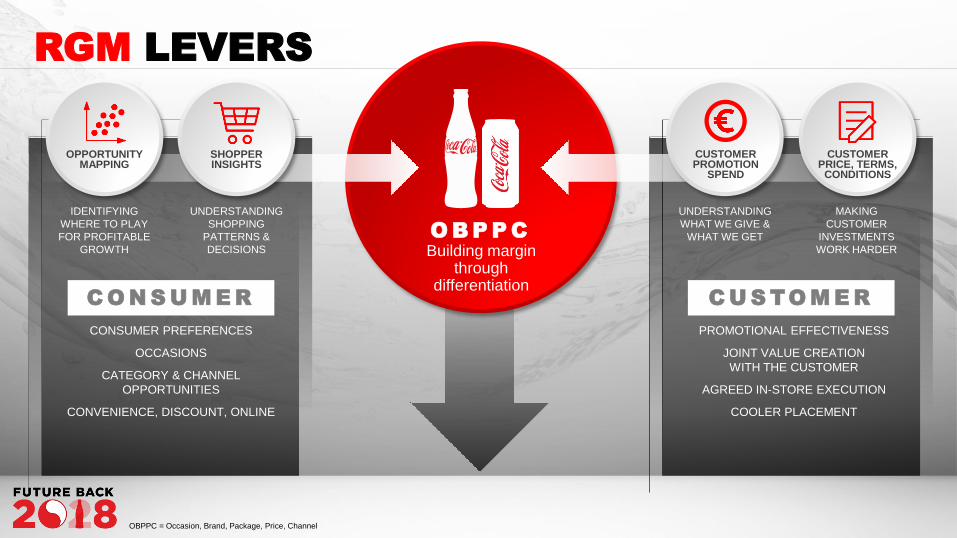
RGM LEVERS
CONSUMER PREFERENCES
OCCASIONS
CATEGORY & CHANNEL
OPPORTUNITIES
CONVENIENCE, DISCOUNT, ONLINE
Building margin through
differentiation
PROMOTIONAL EFFECTIVENESS
JOINT VALUE CREATION
WITH THE CUSTOMER
AGREED IN-STORE EXECUTION
COOLER PLACEMENT
C O N S U M E R C U S TO M E R
O B P P C
OPPORTUNITYMAPPING
SHOPPERINSIGHTS
CUSTOMERPROMOTION
SPEND
CUSTOMER PRICE, TERMS,
CONDITIONS
IDENTIFYING
WHERE TO PLAY
FOR PROFITABLE
GROWTH
UNDERSTANDING
SHOPPING
PATTERNS &
DECISIONS
UNDERSTANDING
WHAT WE GIVE &
WHAT WE GET
MAKING
CUSTOMER
INVESTMENTS
WORK HARDER
OBPPC = Occasion, Brand, Package, Price, Channel
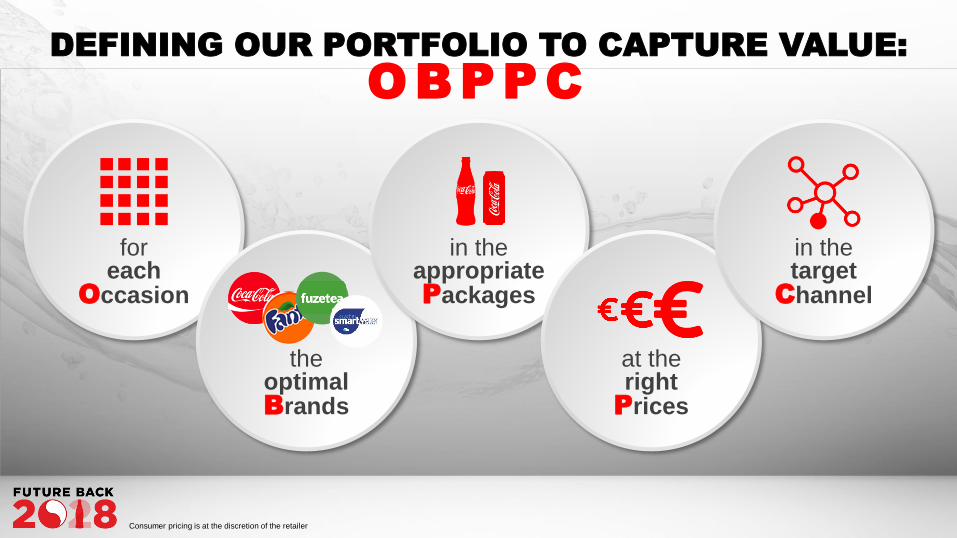
DEFINING OUR PORTFOLIO TO CAPTURE VALUE:
OBPPC
for each
Occasion
the optimalBrands
in the appropriate Packages
at the right
Prices
in the target
Channel
Consumer pricing is at the discretion of the retailer
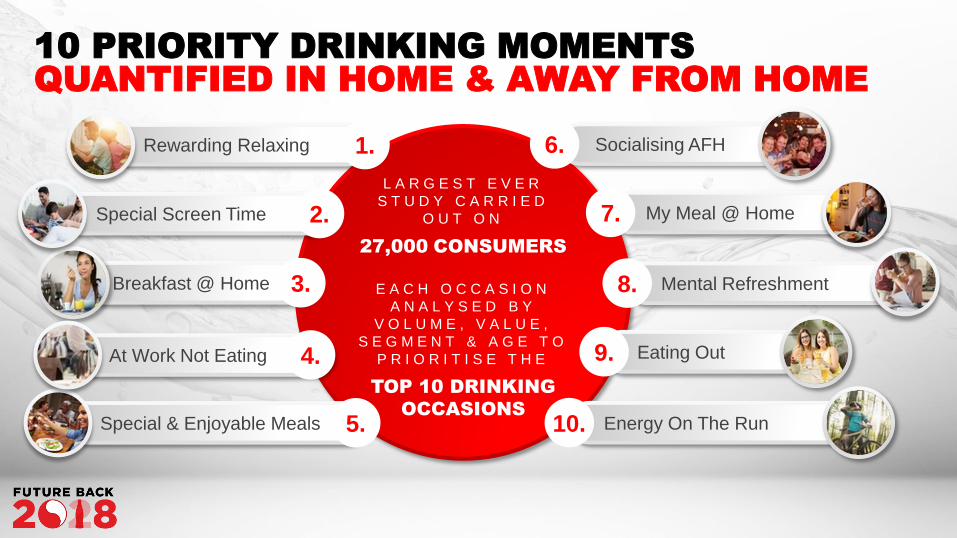
10 PRIORITY DRINKING MOMENTS
QUANTIFIED IN HOME & AWAY FROM HOME
L A R G E S T E V E R
S T U D Y C A R R I E D
O U T O N
27,000 CONSUMERS
E A C H O C C A S I O N
A N A L Y S E D B Y
V O L U M E , V A L U E ,
S E G M E N T & A G E T O
P R I O R I T I S E T H E
TOP 10 DRINKING
OCCASIONS
Rewarding Relaxing
Breakfast @ Home
At Work Not Eating
Special & Enjoyable Meals
My Meal @ Home
Socialising AFH
Mental Refreshment
Eating Out
Special Screen Time
Energy On The Run
3.
4.
5.
1.
7.
8.
9.
10.
6.
2.
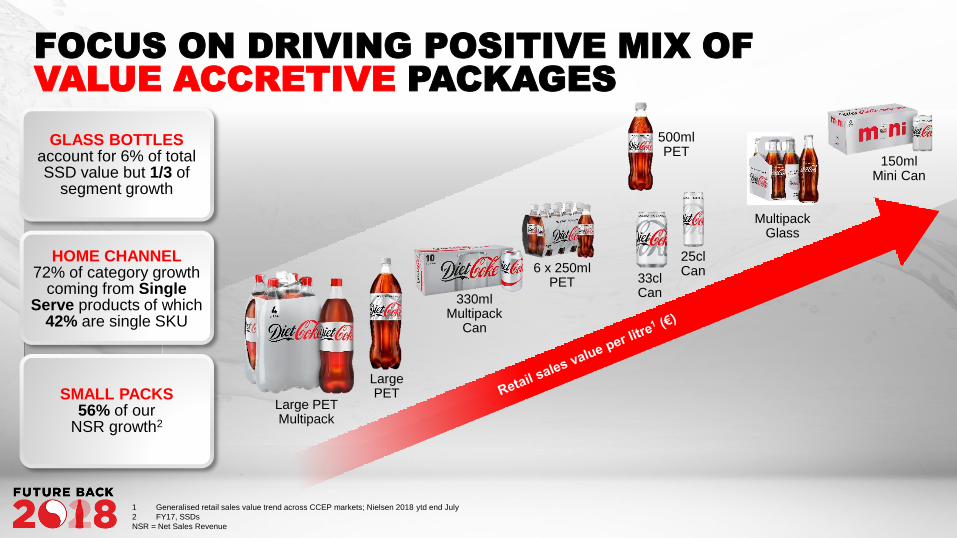
FOCUS ON DRIVING POSITIVE MIX OF
VALUE ACCRETIVE PACKAGES
150ml Mini Can
25cl Can
500ml PET
33cl Can
Large PET
6 x 250ml PET
Large PET Multipack
Multipack Glass
330ml Multipack
Can
GLASS BOTTLESaccount for 6% of total SSD value but 1/3 of
segment growth
HOME CHANNEL72% of category growth
coming from Single Serve products of which
42% are single SKU
SMALL PACKS56% of our
NSR growth2
1 Generalised retail sales value trend across CCEP markets; Nielsen 2018 ytd end July
2 FY17, SSDs
NSR = Net Sales Revenue
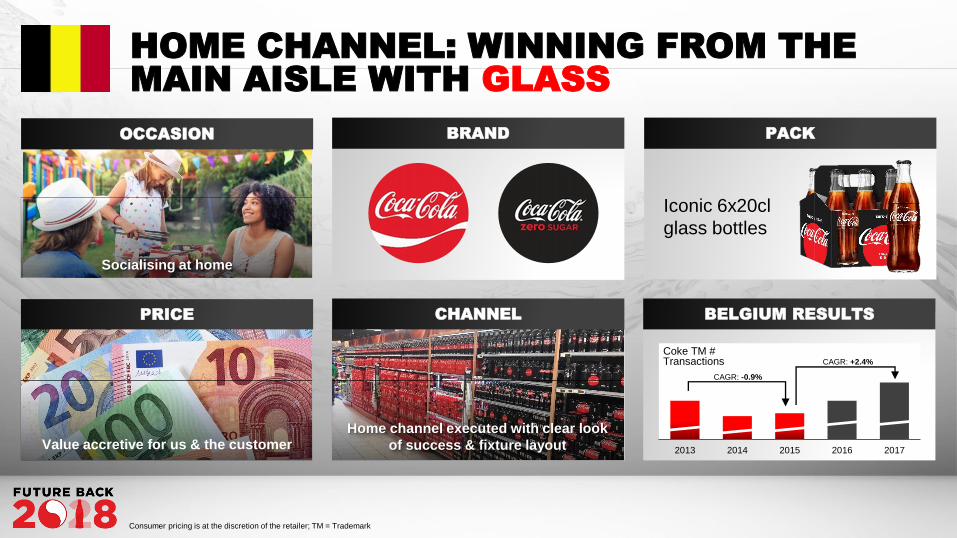
HOME CHANNEL: WINNING FROM THE
MAIN AISLE WITH GLASS
PRICE
Value accretive for us & the customer
OCCASION PACK
BELGIUM RESULTS
Iconic 6x20cl
glass bottles
2013 2014 2015 2016 2017
CHANNEL
BRAND
Consumer pricing is at the discretion of the retailer; TM = Trademark
Coke TM #Transactions
CAGR: -0.9%
CAGR: +2.4%
Home channel executed with clear look
of success & fixture layout
Socialising at home
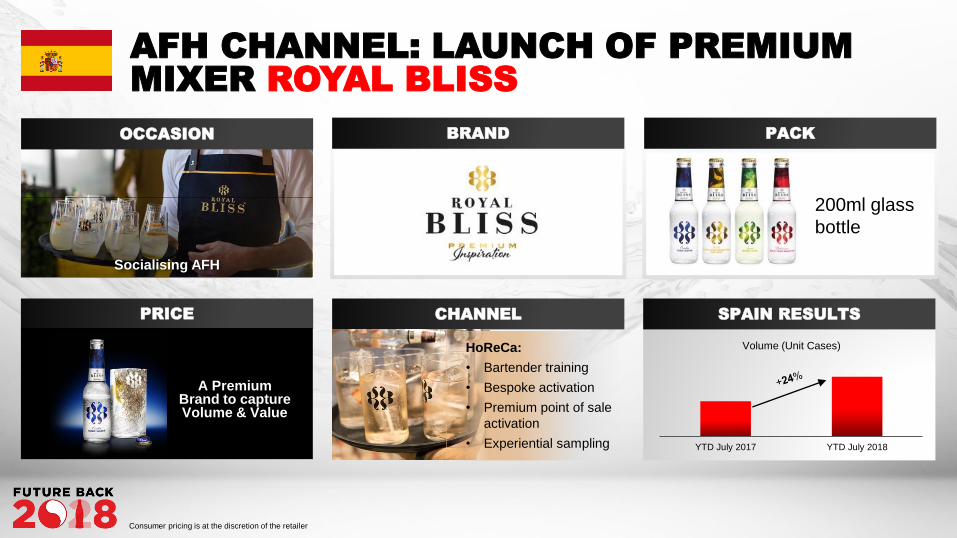
AFH CHANNEL: LAUNCH OF PREMIUM
MIXER ROYAL BLISS
YTD July 2017 YTD July 2018
Volume (Unit Cases)
PRICE
OCCASION PACK
SPAIN RESULTS
200ml glass
bottle
CHANNEL
BRAND
HoReCa:
• Bartender training
• Bespoke activation
• Premium point of sale
activation
• Experiential sampling
A Premium Brand to capture Volume & Value
Consumer pricing is at the discretion of the retailer
Socialising AFH
KEY CAPABILITIES
THAT SET US APART
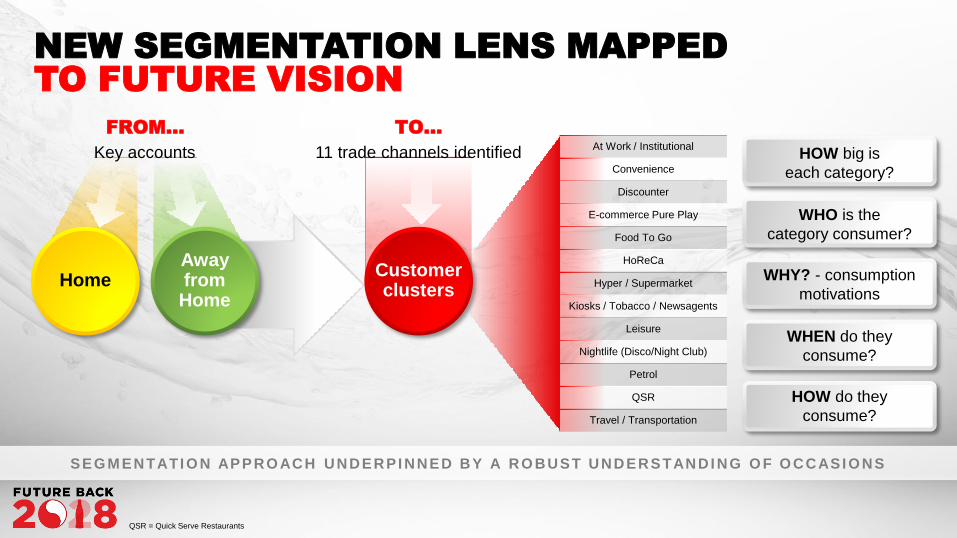
NEW SEGMENTATION LENS MAPPED
TO FUTURE VISION
Home
FROM… TO…
11 trade channels identified Key accounts
AwayfromHome
Customer clusters
HOW big is
each category?
WHO is the
category consumer?
WHY? - consumption
motivations
WHEN do they
consume?
HOW do they
consume?
SEG M ENTATI O N APPRO ACH UNDERPI NNED BY A RO BUST UNDERSTANDI NG O F O CCASI O NS
At Work / Institutional
Convenience
Discounter
E-commerce Pure Play
Food To Go
HoReCa
Hyper / Supermarket
Kiosks / Tobacco / Newsagents
Leisure
Nightlife (Disco/Night Club)
Petrol
QSR
Travel / Transportation
QSR = Quick Serve Restaurants
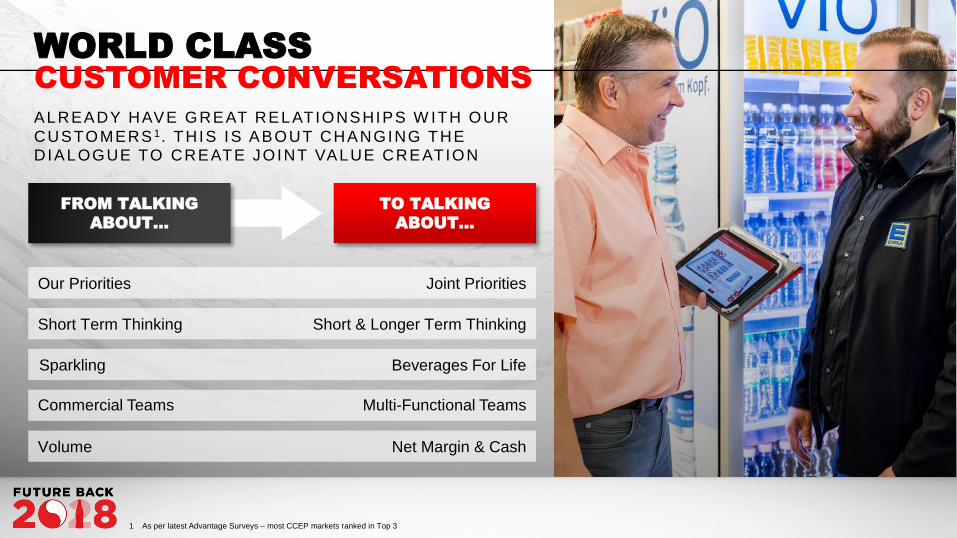
WORLD CLASS
CUSTOMER CONVERSATIONS
ALREADY HAVE GREAT RELATIONSHIPS W ITH OUR
CUSTOMERS 1. THIS IS ABOUT CHANGING THE DIALOGUE TO CREATE JOINT VALUE CREATION
FROM TALKING
ABOUT…
TO TALKING
ABOUT…
Our Priorities
Short Term Thinking
Sparkling
Commercial Teams
Volume
Joint Priorities
Short & Longer Term Thinking
Beverages For Life
Multi-Functional Teams
Net Margin & Cash
1 As per latest Advantage Surveys – most CCEP markets ranked in Top 3
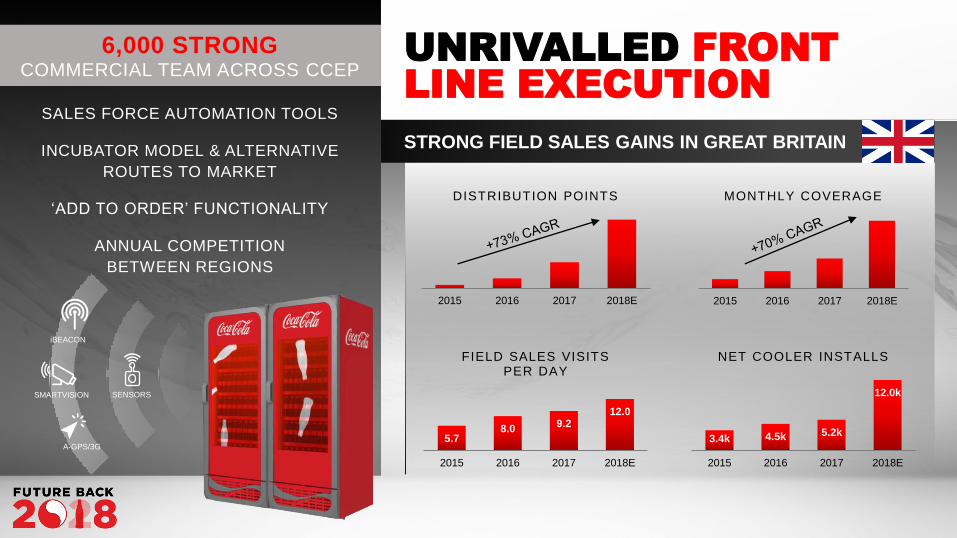
UNRIVALLED FRONT
LINE EXECUTIONSALES FORCE AUTOMATION TOOLS
INCUBATOR MODEL & ALTERNATIVE
ROUTES TO MARKET
‘ADD TO ORDER’ FUNCTIONALITY
ANNUAL COMPETITION
BETWEEN REGIONS
STRONG FIELD SALES GAINS IN GREAT BRITAIN
2015 2016 2017 2018E
MONTHLY COVERAGE
5.78.0
9.212.0
2015 2016 2017 2018E
FIELD SALES VISITS PER DAY
2015 2016 2017 2018E
DISTRIBUTION POINTS
3.4k 4.5k 5.2k
12.0k
2015 2016 2017 2018E
NET COOLER INSTALLS
SENSORS
iBEACON
SMARTVISION
A-GPS/3G
6,000 STRONG COMMERCIAL TEAM ACROSS CCEP
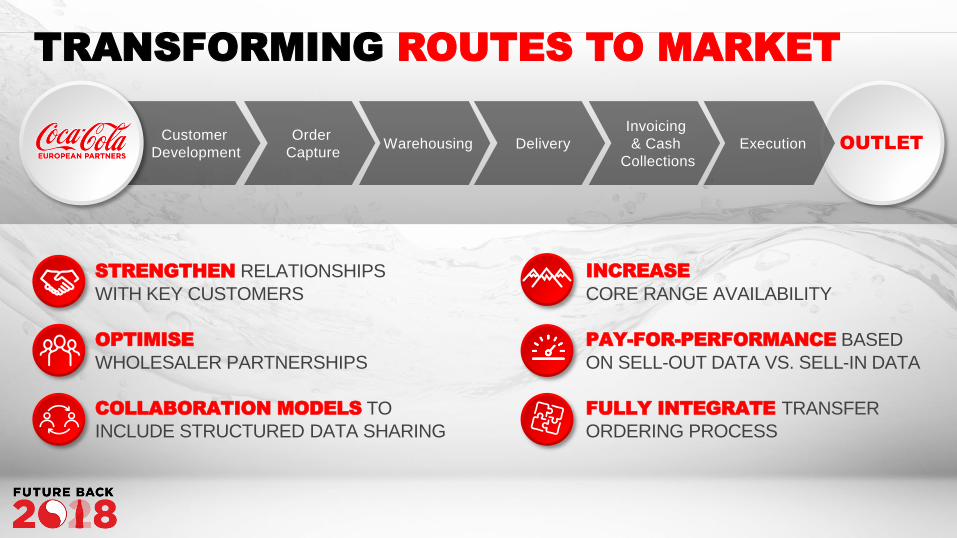
TRANSFORMING ROUTES TO MARKET
STRENGTHEN RELATIONSHIPS
WITH KEY CUSTOMERS
OPTIMISE
WHOLESALER PARTNERSHIPS
COLLABORATION MODELS TO
INCLUDE STRUCTURED DATA SHARING
INCREASE
CORE RANGE AVAILABILITY
PAY-FOR-PERFORMANCE BASED
ON SELL-OUT DATA VS. SELL-IN DATA
FULLY INTEGRATE TRANSFER
ORDERING PROCESS
Customer
Development
Order
CaptureWarehousing Delivery
Invoicing
& Cash
CollectionsOUTLETExecution
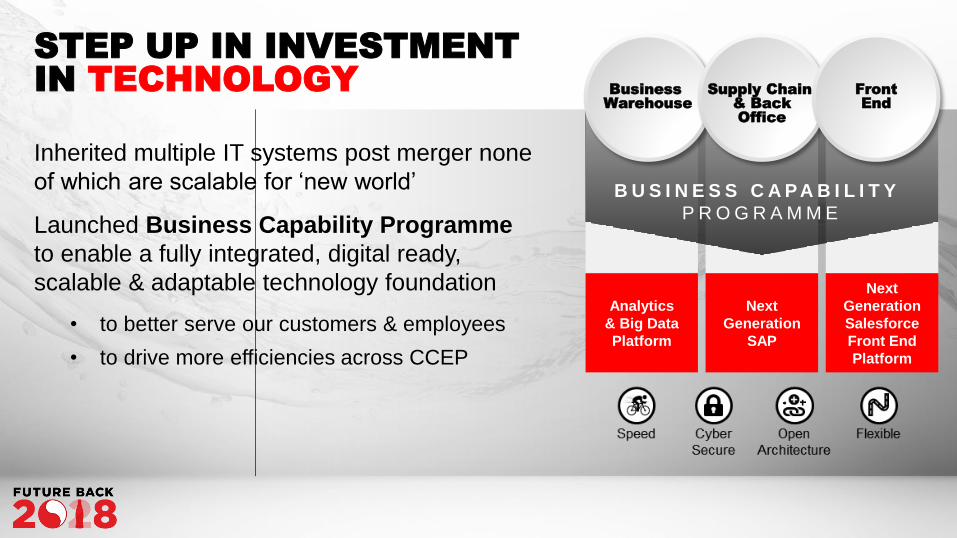
STEP UP IN INVESTMENT
IN TECHNOLOGY
Inherited multiple IT systems post merger none
of which are scalable for ‘new world’
Launched Business Capability Programme
to enable a fully integrated, digital ready,
scalable & adaptable technology foundation
• to better serve our customers & employees
• to drive more efficiencies across CCEP
Analytics
& Big Data
Platform
Next
Generation
SAP
Next
Generation
Salesforce
Front End
Platform
Business
Warehouse
Supply Chain
& Back
Office
Front
End
B U S I N E S S C A P A B I L I T Y
P R O G R A M M E
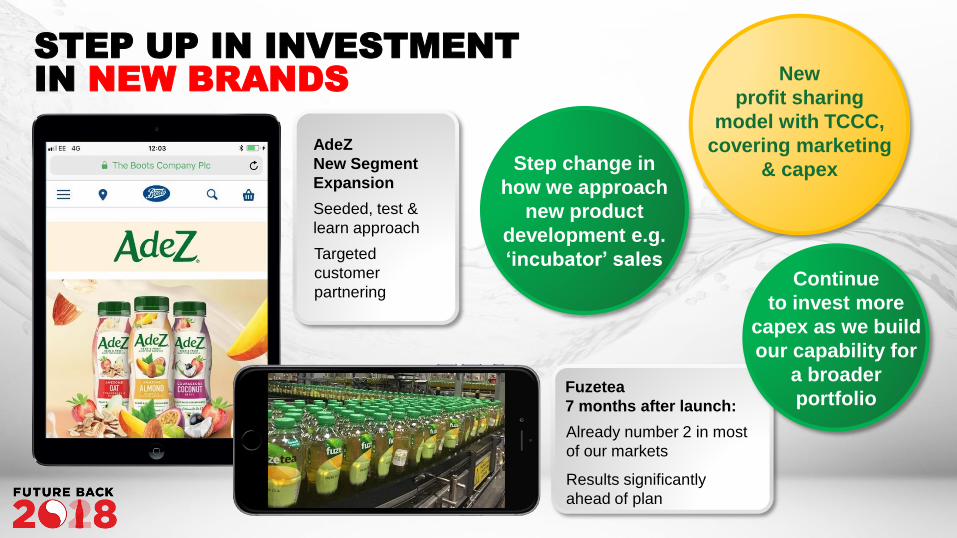
STEP UP IN INVESTMENT
IN NEW BRANDS
Fuzetea
7 months after launch:
Already number 2 in most
of our markets
Results significantly
ahead of plan
AdeZ
New Segment
Expansion
Seeded, test &
learn approach
Targeted
customer
partnering
Step change in
how we approach
new product
development e.g.
‘incubator’ sales
New
profit sharing
model with TCCC,
covering marketing
& capex
Continue
to invest more
capex as we build
our capability for
a broader
portfolio
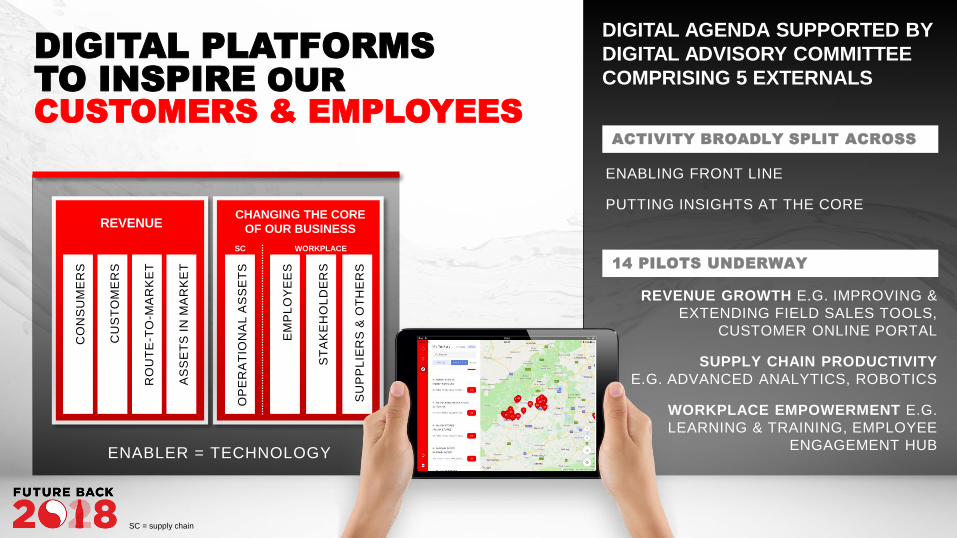
DIGITAL PLATFORMS
TO INSPIRE OUR
CUSTOMERS & EMPLOYEES
CO
NS
UM
ER
S
CU
ST
OM
ER
S
RO
UT
E-T
O-M
AR
KE
T
AS
SE
TS
IN
MA
RK
ET
REVENUE
EM
PL
OY
EE
S
ST
AK
EH
OL
DE
RS
SU
PP
LIE
RS
& O
TH
ER
S
OP
ER
AT
ION
AL
AS
SE
TS
WORKPLACE
CHANGING THE CORE
OF OUR BUSINESS
SC
ENABLER = TECHNOLOGY
ACTIVITY BROADLY SPLIT ACROSS
ENABLING FRONT LINE
PUTTING INSIGHTS AT THE CORE
DIGITAL AGENDA SUPPORTED BY
DIGITAL ADVISORY COMMITTEE
COMPRISING 5 EXTERNALS
REVENUE GROWTH E.G. IMPROVING &
EXTENDING FIELD SALES TOOLS,
CUSTOMER ONLINE PORTAL
SUPPLY CHAIN PRODUCTIVITY
E.G. ADVANCED ANALYTICS, ROBOTICS
WORKPLACE EMPOWERMENT E.G.
LEARNING & TRAINING, EMPLOYEE
ENGAGEMENT HUB
14 PILOTS UNDERWAY
SC = supply chain
KEY CAPABILITIES
THAT SET US APART
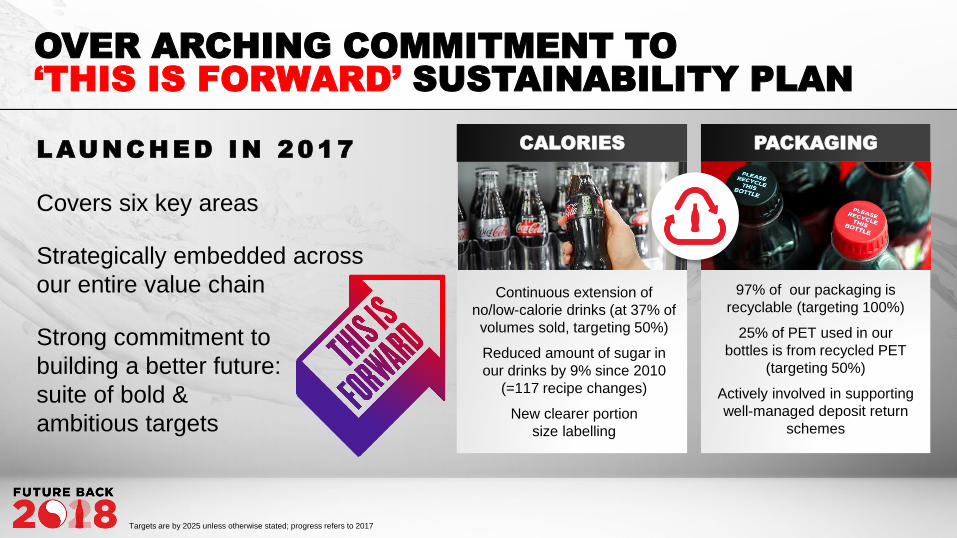
LAUNC HED IN 2017
Covers six key areas
Strategically embedded across
our entire value chain
Strong commitment to
building a better future:
suite of bold &
ambitious targets
OVER ARCHING COMMITMENT TO
‘THIS IS FORWARD’ SUSTAINABILITY PLAN
97% of our packaging is
recyclable (targeting 100%)
25% of PET used in our
bottles is from recycled PET
(targeting 50%)
Actively involved in supporting
well-managed deposit return
schemes
Continuous extension of
no/low-calorie drinks (at 37% of
volumes sold, targeting 50%)
Reduced amount of sugar in
our drinks by 9% since 2010
(=117 recipe changes)
New clearer portion
size labelling
CALORIES PACKAGING
Targets are by 2025 unless otherwise stated; progress refers to 2017
KEY CAPABILITIES
THAT SET US APART
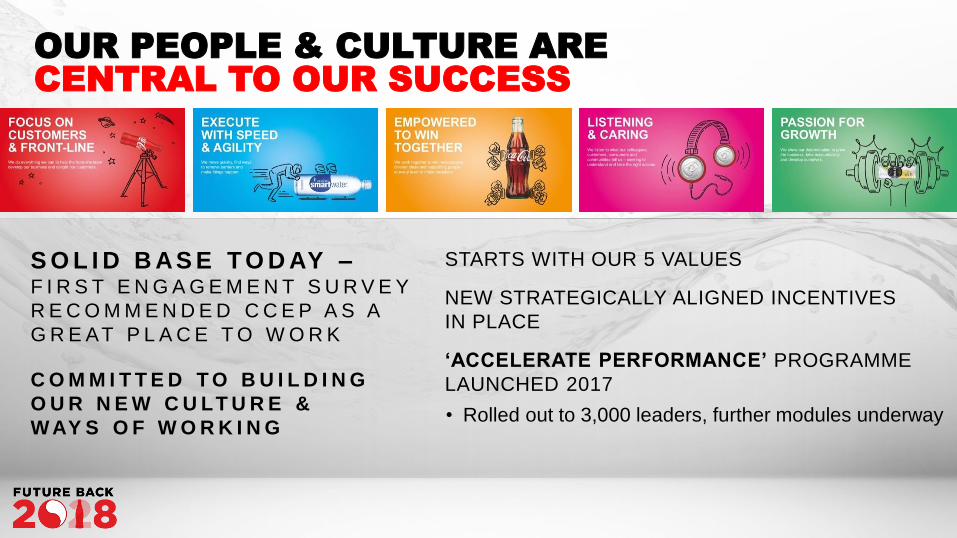
OUR PEOPLE & CULTURE ARE
CENTRAL TO OUR SUCCESS
STARTS WITH OUR 5 VALUES
NEW STRATEGICALLY ALIGNED INCENTIVES
IN PLACE
‘ACCELERATE PERFORMANCE’ PROGRAMME
LAUNCHED 2017
• Rolled out to 3,000 leaders, further modules underway
S O L I D B AS E T O D AY –F I R S T E N G A G E M E N T S U R V E Y
R E C O M M E N D E D C C E P A S A
G R E AT P L A C E T O W O R K
C O M M I T T E D T O B U I L D I N G
O U R N E W C U LT U R E &
W AY S O F W O R K I N G
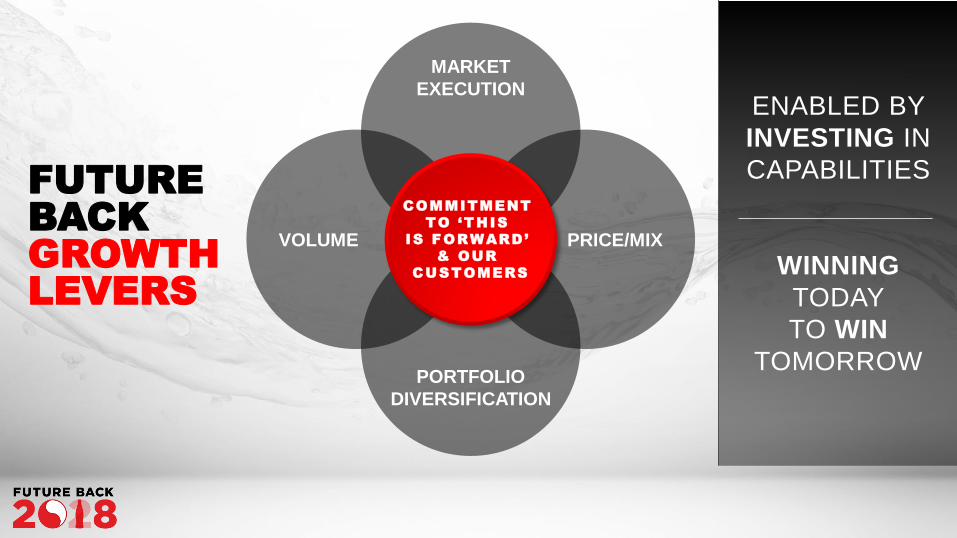
FUTURE
BACK
GROWTH
LEVERS
ENABLED BY
INVESTING IN
CAPABILITIES
WINNING
TODAY
TO WIN
TOMORROW
VOLUME PRICE/MIX
MARKET
EXECUTION
PORTFOLIO
DIVERSIFICATION
COMMITMENT
TO ‘THIS
IS FORWARD’
& OUR
CUSTOMERS
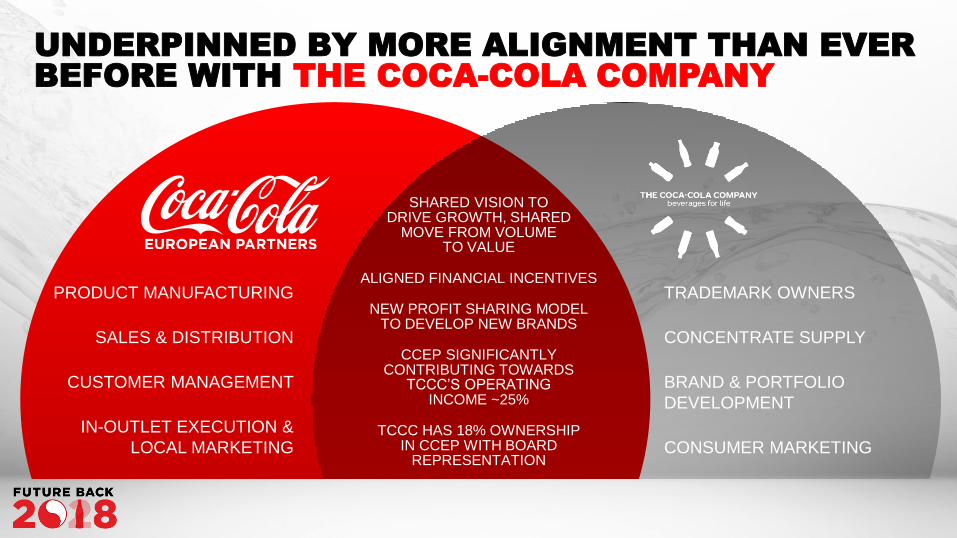
TRADEMARK OWNERS
CONCENTRATE SUPPLY
BRAND & PORTFOLIO
DEVELOPMENT
CONSUMER MARKETING
PRODUCT MANUFACTURING
SALES & DISTRIBUTION
CUSTOMER MANAGEMENT
IN-OUTLET EXECUTION &
LOCAL MARKETING
SHARED VISION TO DRIVE GROWTH, SHARED
MOVE FROM VOLUME TO VALUE
ALIGNED FINANCIAL INCENTIVES
NEW PROFIT SHARING MODEL TO DEVELOP NEW BRANDS
CCEP SIGNIFICANTLY CONTRIBUTING TOWARDS
TCCC’S OPERATING INCOME ~25%
TCCC HAS 18% OWNERSHIP IN CCEP WITH BOARD
REPRESENTATION
UNDERPINNED BY MORE ALIGNMENT THAN EVER
BEFORE WITH THE COCA-COLA COMPANY
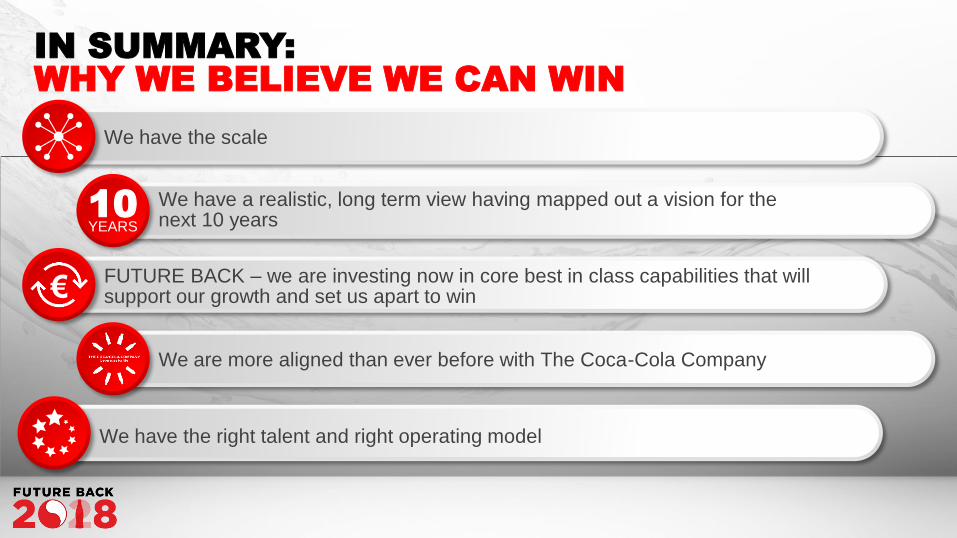
IN SUMMARY:
WHY WE BELIEVE WE CAN WIN
We have the scale
FUTURE BACK – we are investing now in core best in class capabilities that will support our growth and set us apart to win€
We have a realistic, long term view having mapped out a vision for the next 10 years
10YEARS
We have the right talent and right operating model
We are more aligned than ever before with The Coca-Cola Company
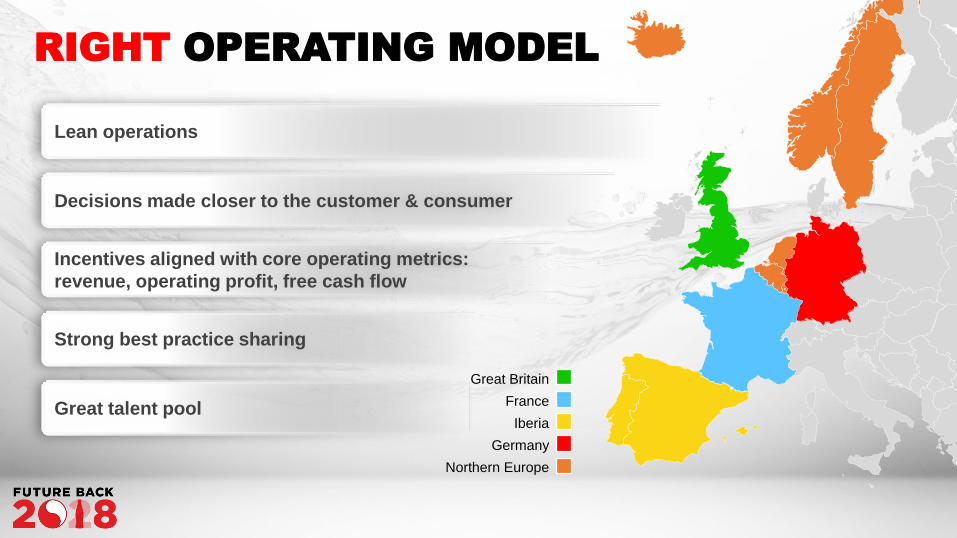
RIGHT OPERATING MODEL
Lean operations
Decisions made closer to the customer & consumer
Incentives aligned with core operating metrics:
revenue, operating profit, free cash flow
Strong best practice sharing
Great talent pool
Great Britain
France
Iberia
Germany
Northern Europe
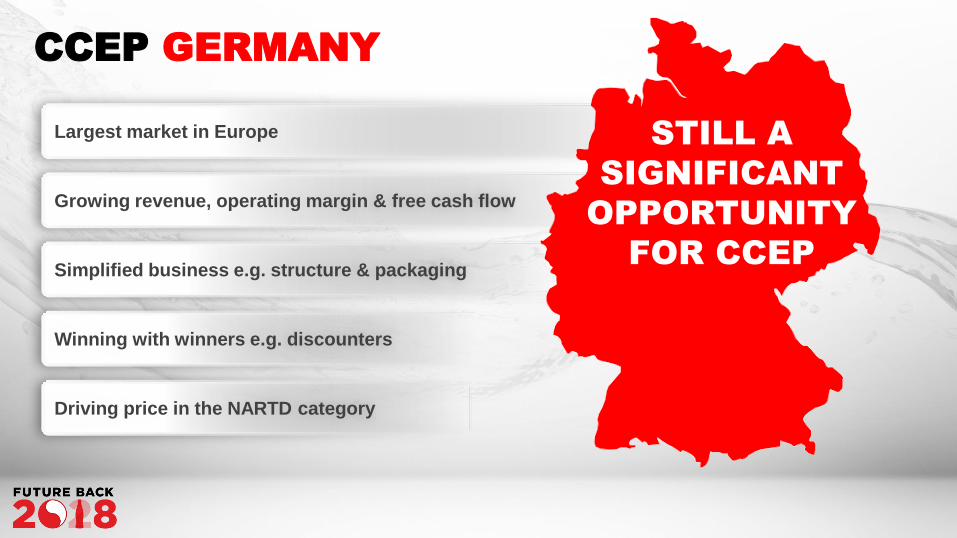
CCEP GERMANY
Largest market in Europe
Growing revenue, operating margin & free cash flow
Simplified business e.g. structure & packaging
Winning with winners e.g. discounters
Driving price in the NARTD category
STILL A
SIGNIFICANT
OPPORTUNITY
FOR CCEP
INTRODUCTION & LOOK BACK
DAMIAN GAMMELL, CEO
EXCITING FUTURE
STEPHEN LUSK, VP COMMERCIAL DEVELOPMENT
WINNING TODAY
TO WIN TOMORROW
DAMIAN GAMMELL, CEO
KEY TAKEAWAYS
DAMIAN GAMMELL CEO
NIK JHANGIANI, CFO
DEEP DIVE: GERMANY
FRANK MOLTHAN, GM GERMANY
DRIVING SHAREHOLDER VALUE
NIK JHANGIANI, CFO
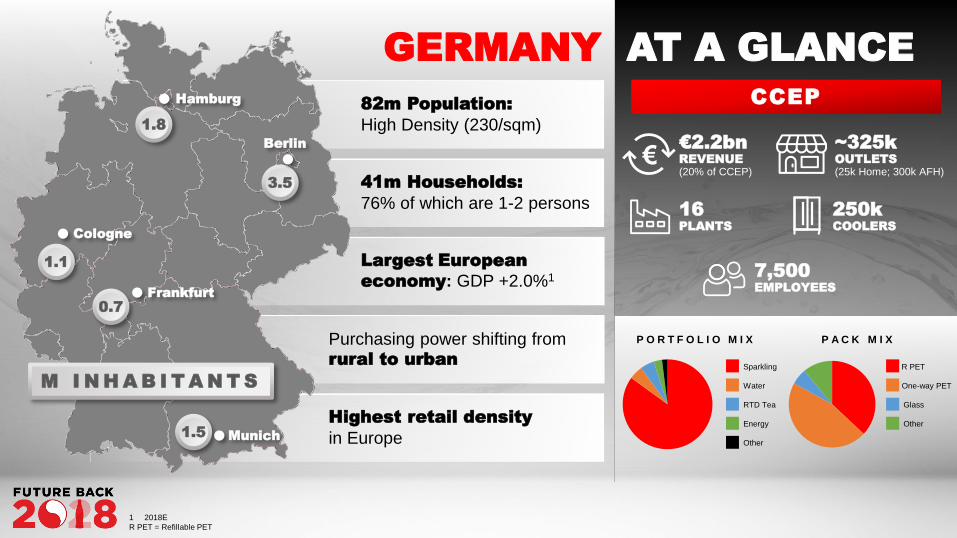
82m Population:
High Density (230/sqm)
41m Households:
76% of which are 1-2 persons
Largest European
economy: GDP +2.0%1
Purchasing power shifting from rural to urban
Highest retail density
in Europe
GERMANY AT A GLANCE
P O R T F O L I O M I X P A C K M I X
CCEP
Water
Sparkling
RTD Tea
Energy
Other
One-way PET
R PET
Glass
Other
16
PLANTS
7,500
EMPLOYEES
~325k
OUTLETS
(25k Home; 300k AFH)
250k
COOLERS
€2.2bn
REVENUE
(20% of CCEP)
1.8
3.5
1.1
0.7
1.5
Cologne
Frankfurt
Berlin
Munich
Hamburg
M I N H A B I T A N T S
€
1 2018E
R PET = Refillable PET
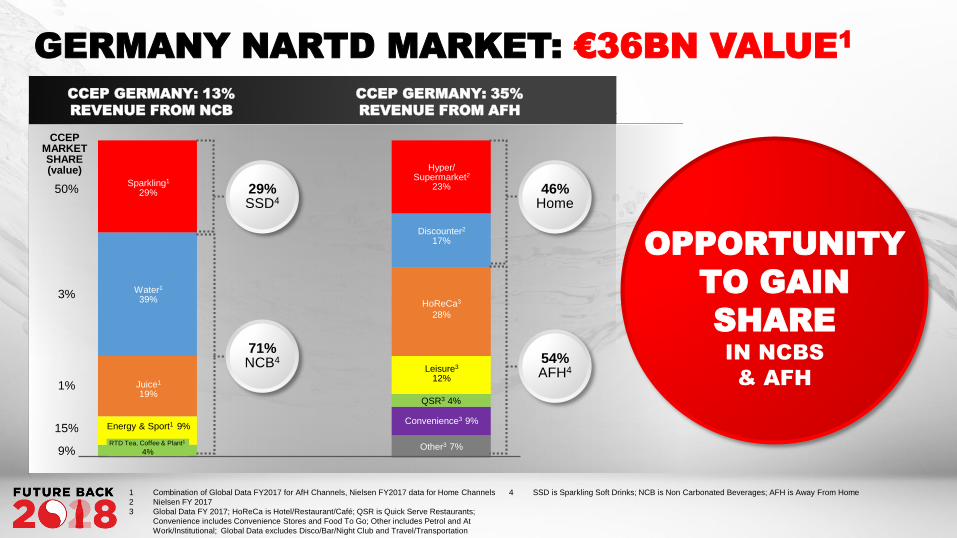
GERMANY NARTD MARKET: €36BN VALUE1
OPPORTUNITY
TO GAIN
SHARE
IN NCBS
& AFH
29% SSD4
71%NCB4
46%Home
54%AFH4
CCEP GERMANY: 13%
REVENUE FROM NCB
CCEP GERMANY: 35%
REVENUE FROM AFH
Sparkling1
29%
Water1
39%
Juice1
19%
Energy & Sport1 9%
RTD Tea, Coffee & Plant1
4%
Hyper/Supermarket2
23%
HoReCa3
28%
Leisure3
12%
Convenience3 9%
Other3 7%
QSR3 4%
Discounter2
17%
1 Combination of Global Data FY2017 for AfH Channels, Nielsen FY2017 data for Home Channels
2 Nielsen FY 2017
3 Global Data FY 2017; HoReCa is Hotel/Restaurant/Café; QSR is Quick Serve Restaurants;
Convenience includes Convenience Stores and Food To Go; Other includes Petrol and At
Work/Institutional; Global Data excludes Disco/Bar/Night Club and Travel/Transportation
4 SSD is Sparkling Soft Drinks; NCB is Non Carbonated Beverages; AFH is Away From Home
CCEPMARKET SHARE (value)
50%
3%
1%
15%
9%
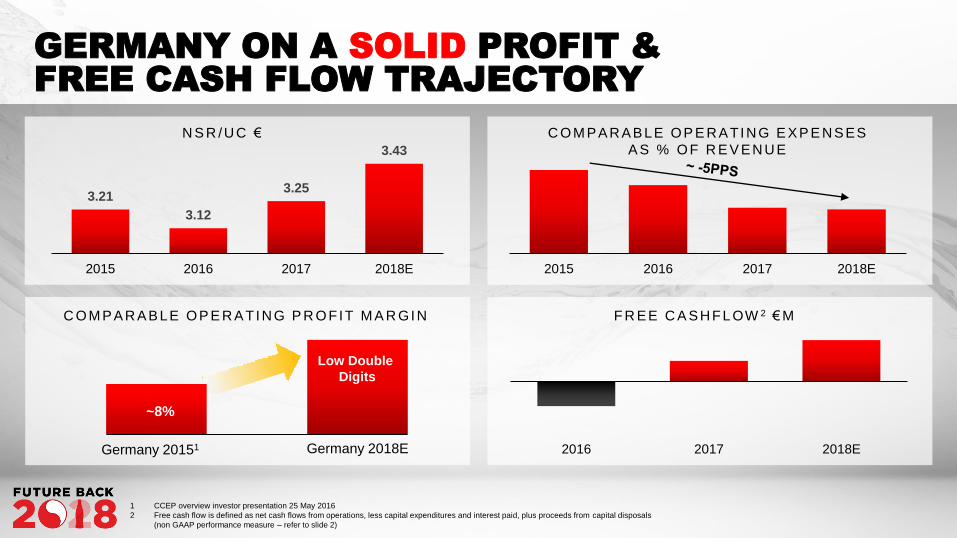
GERMANY ON A SOLID PROFIT &
FREE CASH FLOW TRAJECTORY
3.21
3.12
3.25
3.43
2015 2016 2017 2018E 2015 2016 2017 2018E
N S R /U C € C O M PAR ABLE O P E R ATI N G E XP E N SES
A S % O F R E V EN U E
F R EE C A SH FL OW 2 € M
2016 2017 2018EGermany 20151 Germany 2018E
C O M PAR ABLE O P E R ATI N G P R O FIT M A R GI N
Low Double
Digits
~8%
1 CCEP overview investor presentation 25 May 2016
2 Free cash flow is defined as net cash flows from operations, less capital expenditures and interest paid, plus proceeds from capital disposals
(non GAAP performance measure – refer to slide 2)
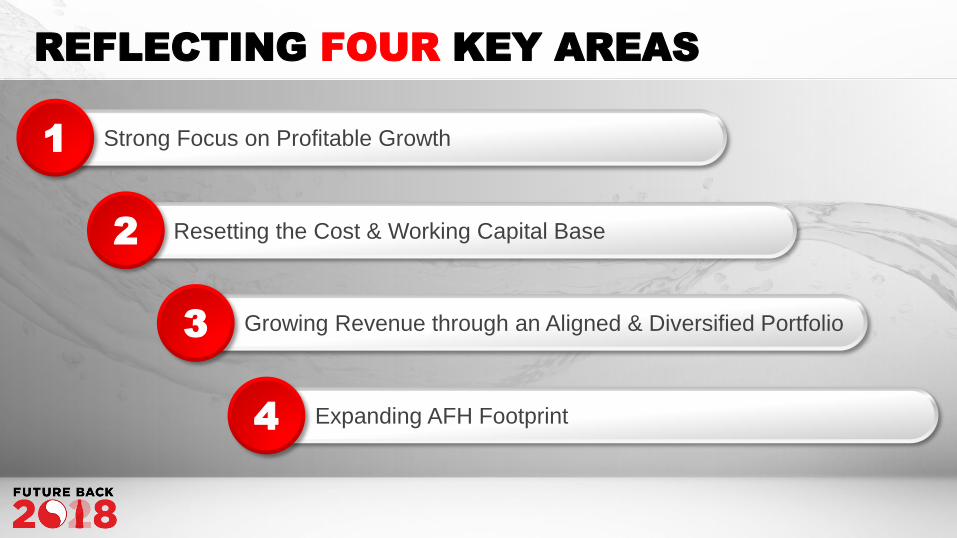
REFLECTING FOUR KEY AREAS
Strong Focus on Profitable Growth1
Resetting the Cost & Working Capital Base2
Growing Revenue through an Aligned & Diversified Portfolio3
Expanding AFH Footprint4
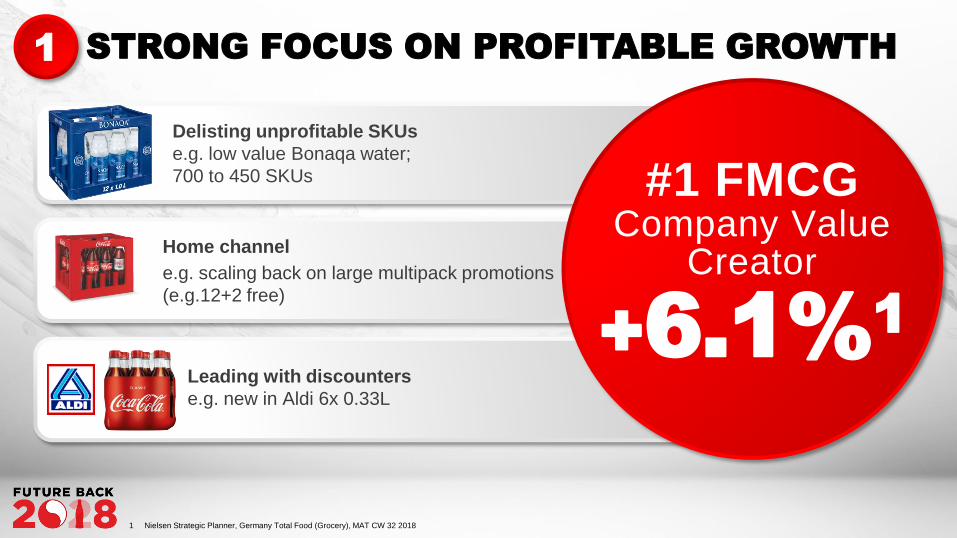
Delisting unprofitable SKUs
e.g. low value Bonaqa water;
700 to 450 SKUs
Home channel
e.g. scaling back on large multipack promotions
(e.g.12+2 free)
Leading with discounters
e.g. new in Aldi 6x 0.33L
STRONG FOCUS ON PROFITABLE GROWTH1
#1 FMCGCompany Value
Creator
+6.1%1
1 Nielsen Strategic Planner, Germany Total Food (Grocery), MAT CW 32 2018
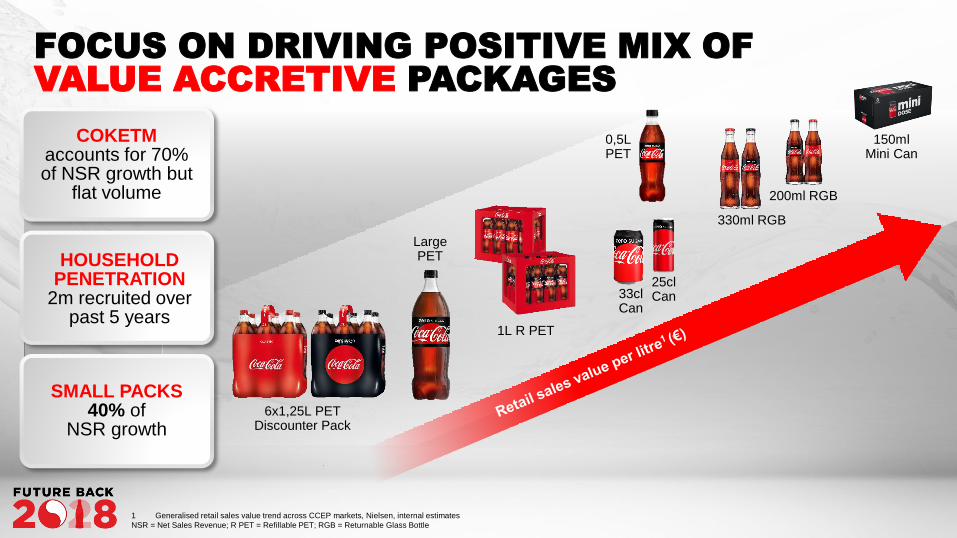
FOCUS ON DRIVING POSITIVE MIX OF
VALUE ACCRETIVE PACKAGES
150ml Mini Can
33cl Can
Large PET
0,5L PET
6x1,25L PET Discounter Pack
330ml RGB
1L R PET
COKETMaccounts for 70% of NSR growth but
flat volume
HOUSEHOLD PENETRATION
2m recruited over past 5 years
SMALL PACKS40% of
NSR growth
1 Generalised retail sales value trend across CCEP markets, Nielsen, internal estimates
NSR = Net Sales Revenue; R PET = Refillable PET; RGB = Returnable Glass Bottle
25cl Can
200ml RGB
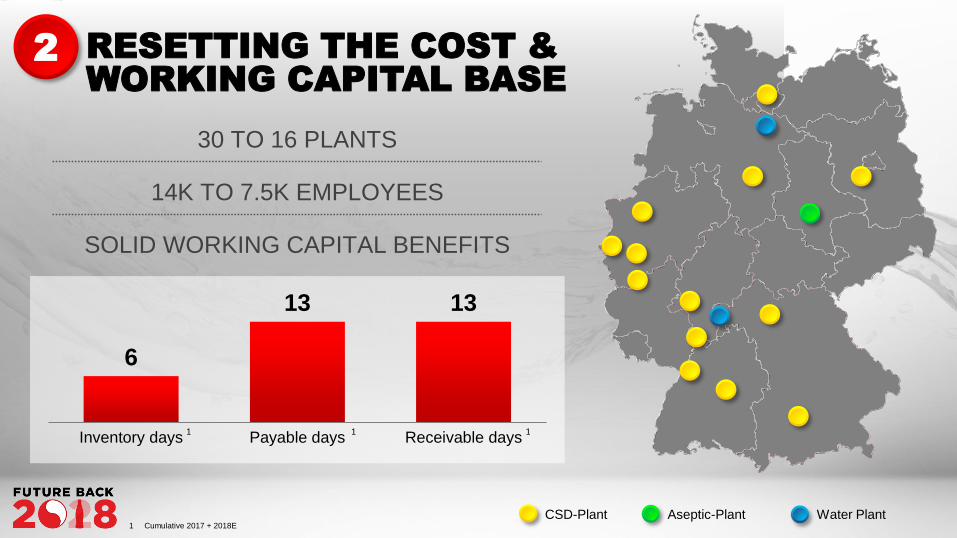
30 TO 16 PLANTS
14K TO 7.5K EMPLOYEES
SOLID WORKING CAPITAL BENEFITS
6
13 13
Inventory days Payable days Receivable days1 1 1
CSD-Plant Aseptic-Plant Water Plant
RESETTING THE COST &
WORKING CAPITAL BASE
2
1 Cumulative 2017 + 2018E
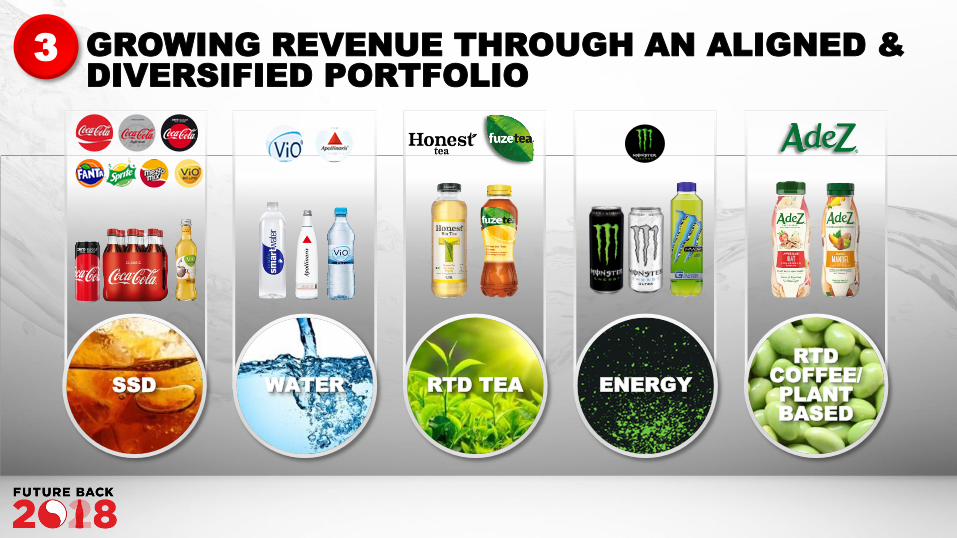
SSD WATER RTD TEA ENERGY
RTD
COFFEE/
PLANT
BASED
3 GROWING REVENUE THROUGH AN ALIGNED &
DIVERSIFIED PORTFOLIO
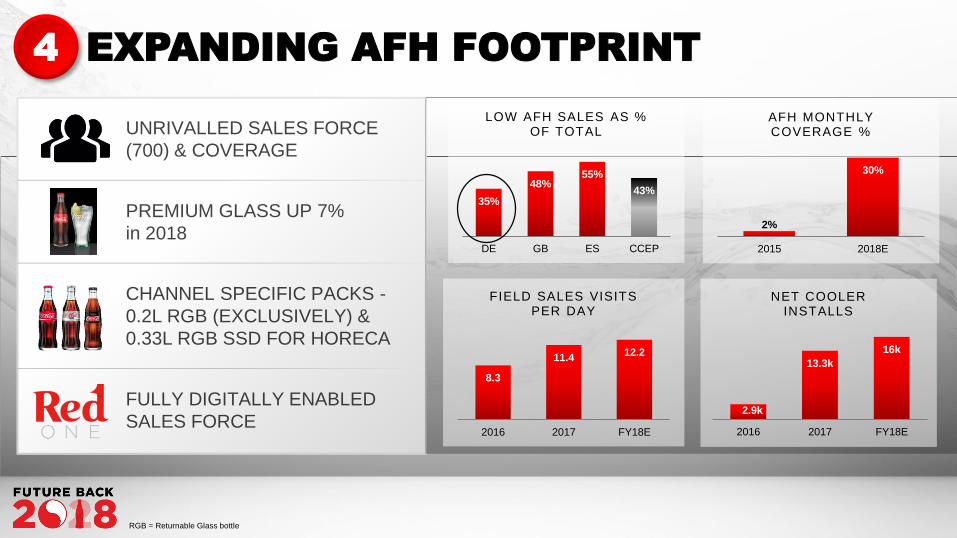
EXPANDING AFH FOOTPRINT
8.3
11.412.2
2016 2017 FY18E
FIELD SALES VISITS PER DAY
35%
48%55%
43%
DE GB ES CCEP
LOW AFH SALES AS % OF TOTAL
2.9k
13.3k
16k
2016 2017 FY18E
NET COOLER INSTALLS
UNRIVALLED SALES FORCE
(700) & COVERAGE
PREMIUM GLASS UP 7%
in 2018
CHANNEL SPECIFIC PACKS -
0.2L RGB (EXCLUSIVELY) &
0.33L RGB SSD FOR HORECA
FULLY DIGITALLY ENABLED
SALES FORCE
2%
30%
2015 2018E
AFH MONTHLY COVERAGE %
RGB = Returnable Glass bottle
4
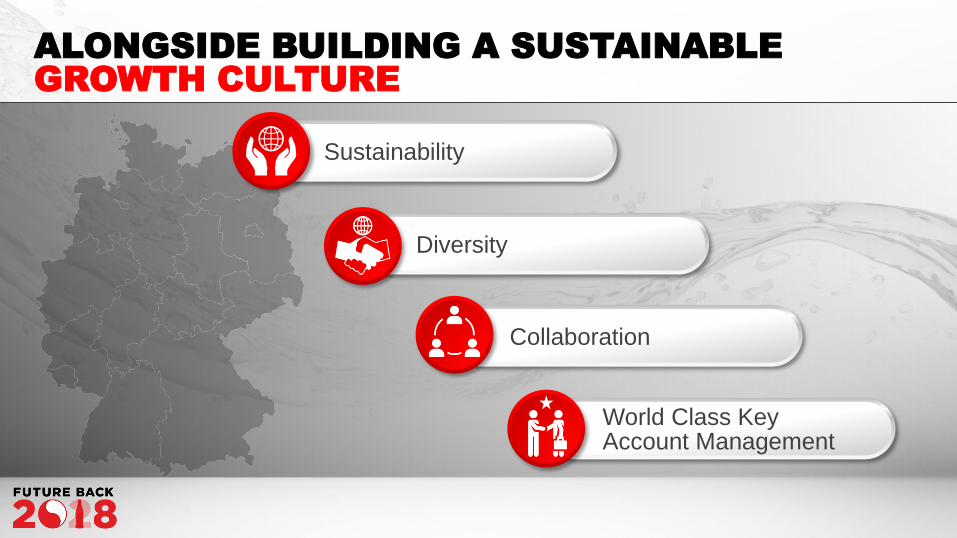
ALONGSIDE BUILDING A SUSTAINABLE
GROWTH CULTURE
World Class Key Account Management
Collaboration
Sustainability
Diversity
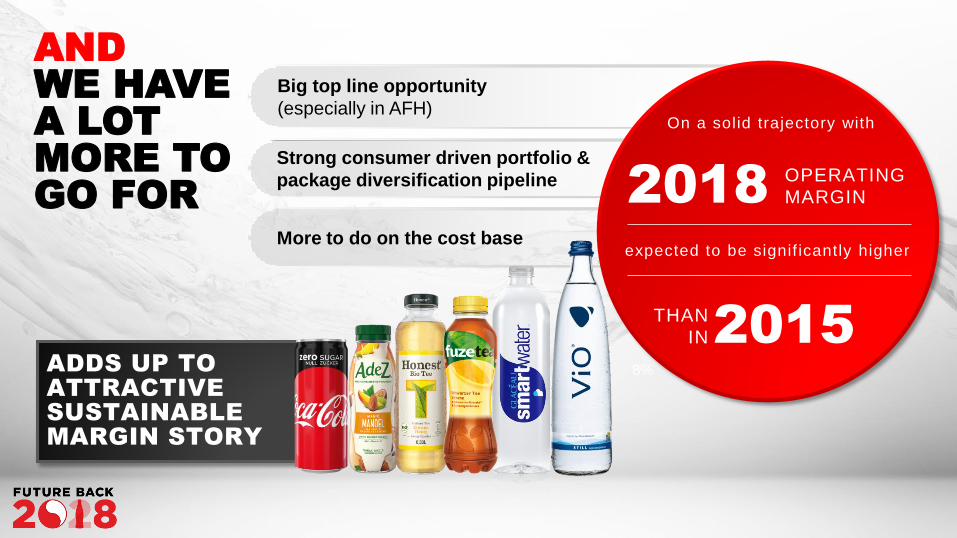
ADDS UP TO
ATTRACTIVE
SUSTAINABLE
MARGIN STORY
AND
WE HAVE
A LOT
MORE TO
GO FOR
8%
Big top line opportunity
(especially in AFH)
Strong consumer driven portfolio &
package diversification pipeline
More to do on the cost base
On a solid trajectory with
expected to be signif icantly higher
2018OPERATING MARGIN
2015THAN
IN
INTRODUCTION & LOOK BACK
DAMIAN GAMMELL, CEO
EXCITING FUTURE
STEPHEN LUSK, VP COMMERCIAL DEVELOPMENT
WINNING TODAY
TO WIN TOMORROW
DAMIAN GAMMELL, CEO
KEY TAKEAWAYS
DAMIAN GAMMELL, CEO
NIK JHANGIANI, CFO
DEEP DIVE: GERMANY
FRANK MOLTHAN, GM GERMANY
DRIVING SHAREHOLDER VALUE
NIK JHANGIANI, CFO
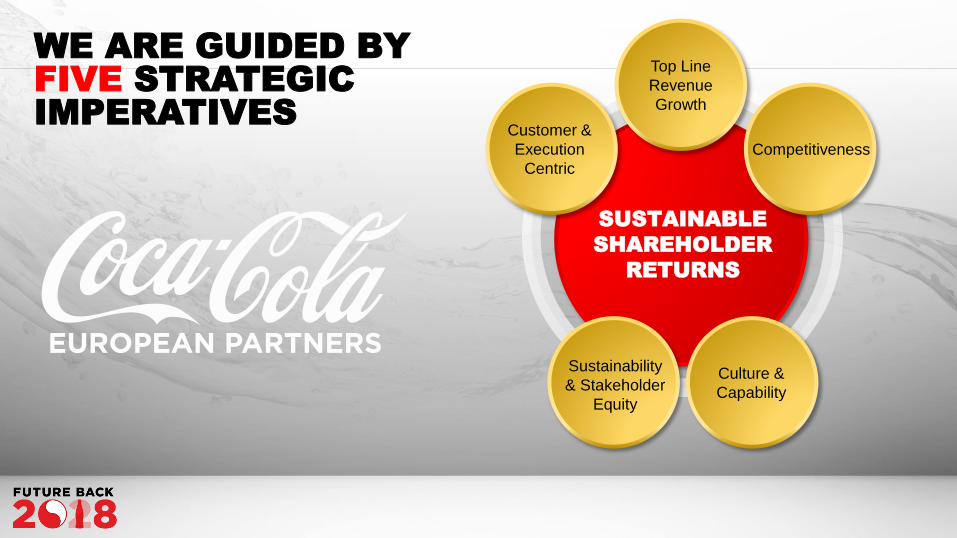
WE ARE GUIDED BY
FIVE STRATEGIC
IMPERATIVES
SUSTAINABLE
SHAREHOLDER
RETURNS
Customer &
Execution
Centric
Competitiveness
Top Line
Revenue
Growth
Culture &
Capability
Sustainability
& Stakeholder
Equity
SUSTAINABLE
SHAREHOLDER
RETURNS
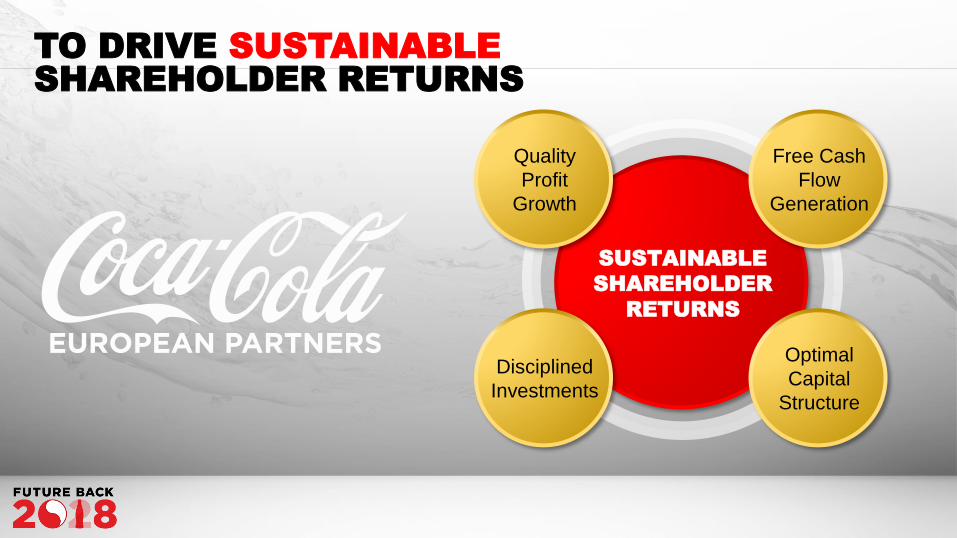
TO DRIVE SUSTAINABLE
SHAREHOLDER RETURNS
Free Cash
Flow
Generation
Optimal
Capital
Structure
Quality
Profit
Growth
Disciplined
Investments
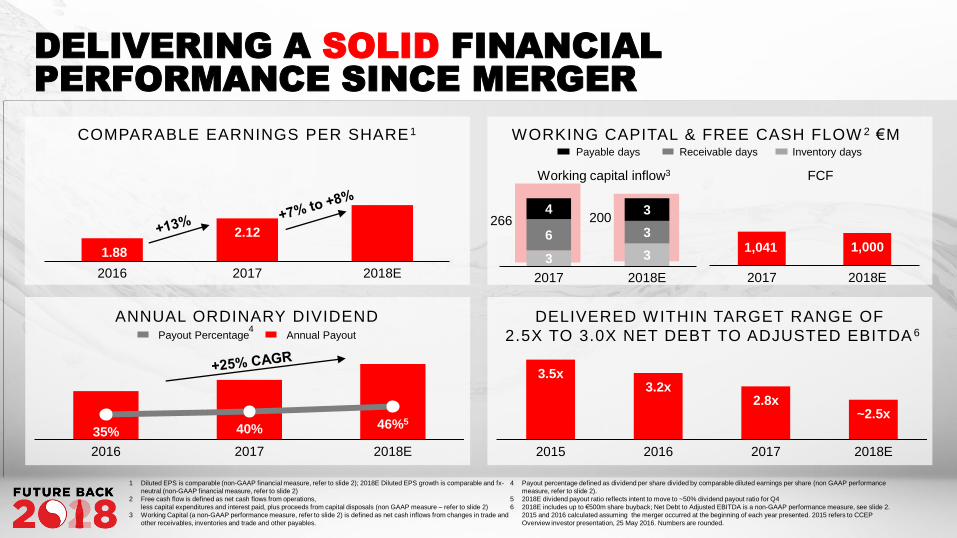
DELIVERING A SOLID FINANCIAL
PERFORMANCE SINCE MERGER
1.88
2.12
2016 2017 2018E
Annual PayoutPayout Percentage
COMPARABLE EARNINGS PER SHARE 1 WORKING CAPITAL & FREE CASH FLOW 2 €M
35% 40% 46%5
2016 2017 2018E
3.5x3.2x
2.8x~2.5x
2015 2016 2017 2018E
ANNUAL ORDINARY DIVIDEND DELIVERED WITHIN TARGET RANGE OF
2.5X TO 3.0X NET DEBT TO ADJUSTED EBITDA 6
1,041 1,000
2017 2018E
Working capital inflow3 FCF
Receivable daysPayable days
3 3
6 3
4 3
2017 2018E
Inventory days
266 200
1 Diluted EPS is comparable (non-GAAP financial measure, refer to slide 2); 2018E Diluted EPS growth is comparable and fx-
neutral (non-GAAP financial measure, refer to slide 2)
2 Free cash flow is defined as net cash flows from operations,
less capital expenditures and interest paid, plus proceeds from capital disposals (non GAAP measure – refer to slide 2)
3 Working Capital (a non-GAAP performance measure, refer to slide 2) is defined as net cash inflows from changes in trade and
other receivables, inventories and trade and other payables.
4 Payout percentage defined as dividend per share divided by comparable diluted earnings per share (non GAAP performance
measure, refer to slide 2).
5 2018E dividend payout ratio reflects intent to move to ~50% dividend payout ratio for Q4
6 2018E includes up to €500m share buyback; Net Debt to Adjusted EBITDA is a non-GAAP performance measure, see slide 2.
2015 and 2016 calculated assuming the merger occurred at the beginning of each year presented. 2015 refers to CCEP
Overview investor presentation, 25 May 2016. Numbers are rounded.
4
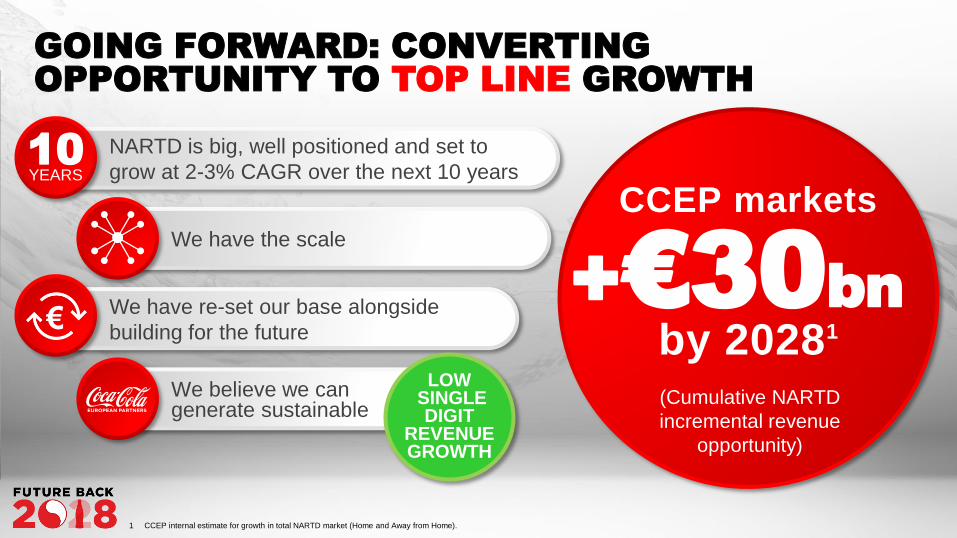
CCEP markets
by 20281
(Cumulative NARTD
incremental revenue
opportunity)
+€30bn
NARTD is big, well positioned and set to
grow at 2-3% CAGR over the next 10 years 10YEARS
GOING FORWARD: CONVERTING
OPPORTUNITY TO TOP LINE GROWTH
We have the scale
We have re-set our base alongside
building for the future
We believe we can generate sustainable
LOWSINGLE DIGIT
REVENUE GROWTH
€
1 CCEP internal estimate for growth in total NARTD market (Home and Away from Home).
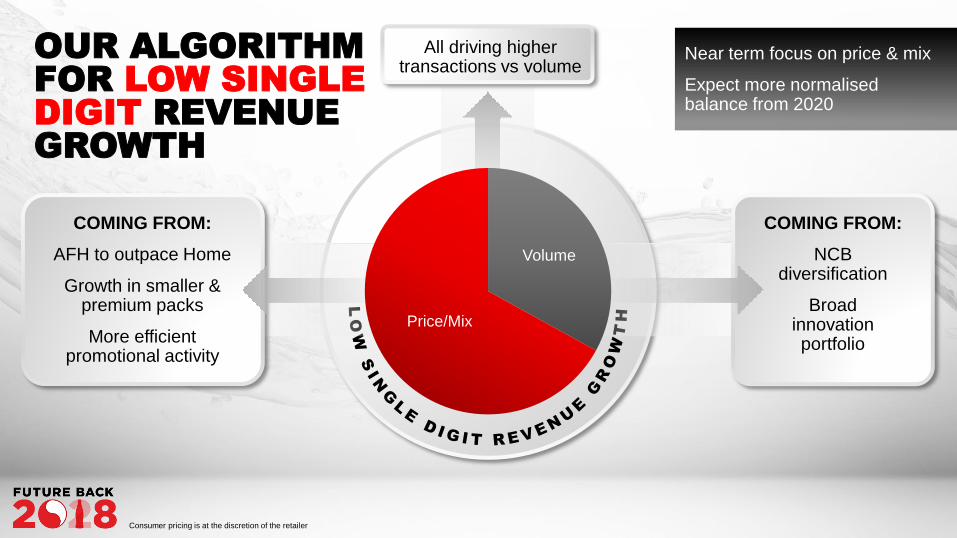
Near term focus on price & mix
Expect more normalisedbalance from 2020
OUR ALGORITHM
FOR LOW SINGLE
DIGIT REVENUE
GROWTH
COMING FROM:
AFH to outpace Home
Growth in smaller & premium packs
More efficient promotional activity
COMING FROM:
NCB diversification
Broad innovation portfolio
All driving higher transactions vs volume
Consumer pricing is at the discretion of the retailer
Volume
Price/Mix
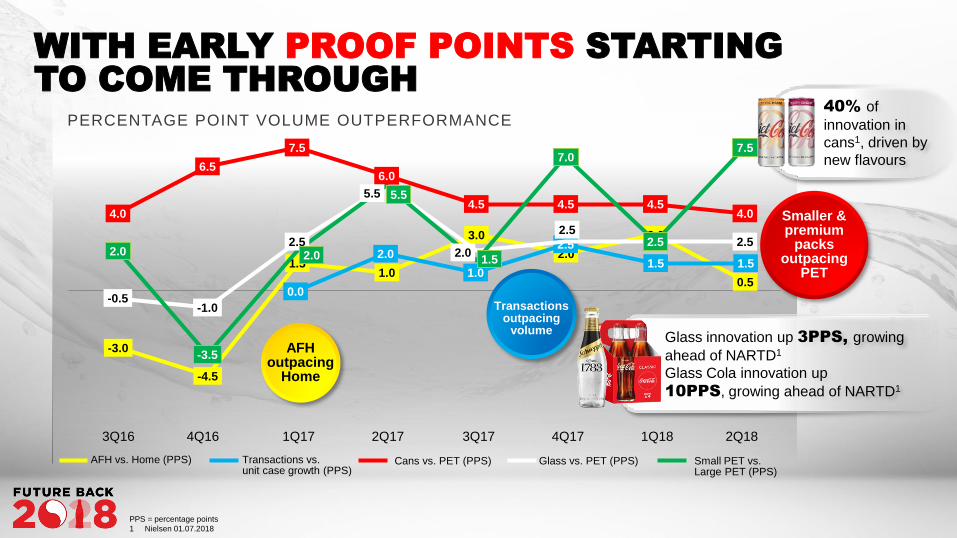
WITH EARLY PROOF POINTS STARTING
TO COME THROUGH
AFHoutpacing
Home
PPS = percentage points
1 Nielsen 01.07.2018
PERCENTAGE POINT VOLUME OUTPERFORMANCE
-3.0
-4.5
1.51.0
3.0
2.0
3.0
0.5
3Q16 4Q16 1Q17 2Q17 3Q17 4Q17 1Q18 2Q18
AFH vs. Home (PPS) Transactions vs. unit case growth (PPS)
Cans vs. PET (PPS) Glass vs. PET (PPS) Small PET vs. Large PET (PPS)
0.0
2.0
1.0
2.5
1.5 1.5
Transactions outpacing
volume
4.0
6.5
7.5
6.0
4.5 4.5 4.54.0
-0.5-1.0
2.5
5.5
2.0
2.52.5 2.5
2.0
-3.5
2.0
5.5
1.5
7.0
2.5
7.5
Glass innovation up 3PPS, growing
ahead of NARTD1
Glass Cola innovation up
10PPS, growing ahead of NARTD1
40% of
innovation in
cans1, driven by
new flavours
Smaller & premium
packs outpacing
PET
0%
50%
100%
150%
200%
SSD LPET SSD Glass SSD MiniCan
SSD Can Energy Water RTDCoffee/Plant
Based
RTD Tea
CCEP
Average
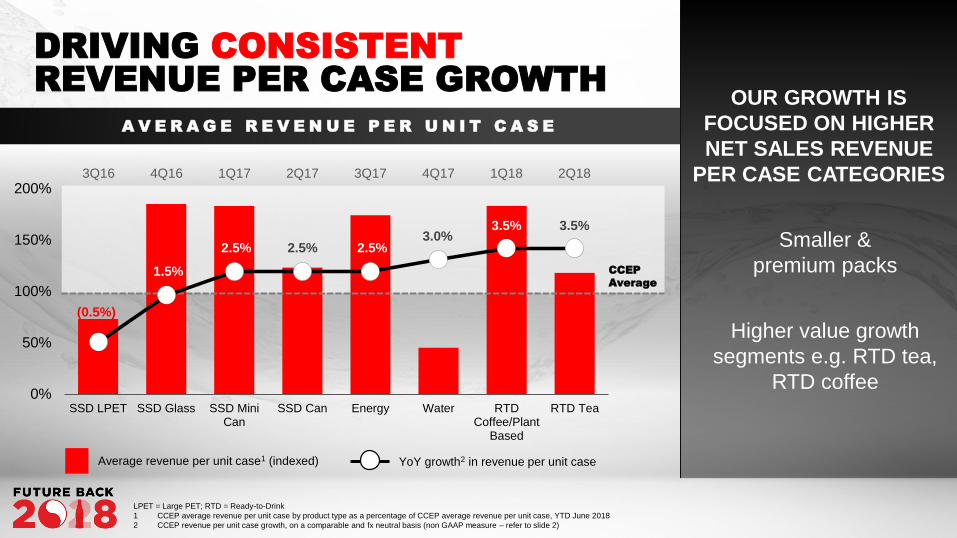
OUR GROWTH IS
FOCUSED ON HIGHER
NET SALES REVENUE
PER CASE CATEGORIES
Smaller &
premium packs
Higher value growth
segments e.g. RTD tea,
RTD coffee
DRIVING CONSISTENT
REVENUE PER CASE GROWTH
A V E R A G E R E V E N U E P E R U N I T C A S E
LPET = Large PET; RTD = Ready-to-Drink
1 CCEP average revenue per unit case by product type as a percentage of CCEP average revenue per unit case, YTD June 2018
2 CCEP revenue per unit case growth, on a comparable and fx neutral basis (non GAAP measure – refer to slide 2)
Average revenue per unit case1 (indexed) YoY growth2 in revenue per unit case
(0.5%)
1.5%
2.5% 2.5% 2.5%3.0%
3.5% 3.5%
3Q16 4Q16 1Q17 2Q17 3Q17 4Q17 1Q18 2Q18
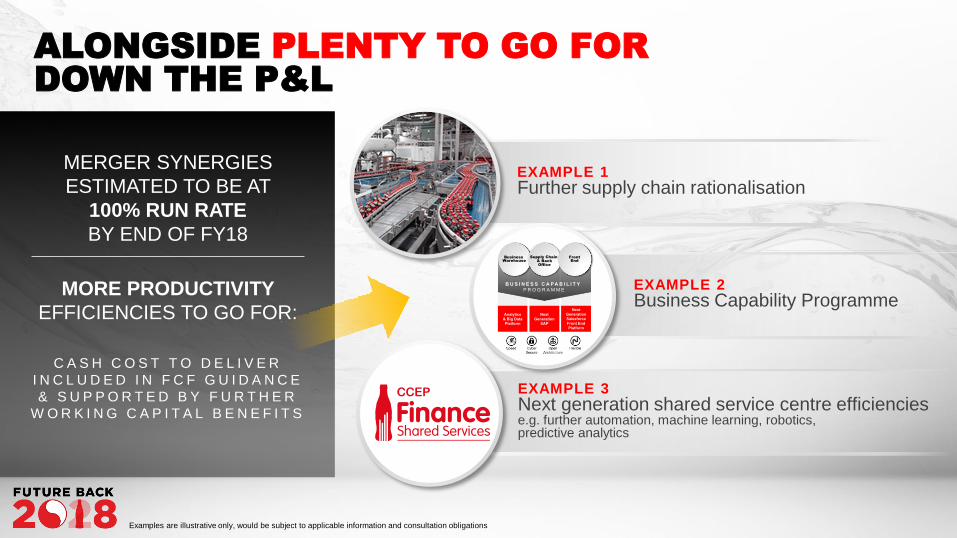
EXAMPLE 1Further supply chain rationalisation
EXAMPLE 2Business Capability Programme
EXAMPLE 3Next generation shared service centre efficienciese.g. further automation, machine learning, robotics, predictive analytics
ALONGSIDE PLENTY TO GO FOR
DOWN THE P&L
MERGER SYNERGIES
ESTIMATED TO BE AT
100% RUN RATE
BY END OF FY18
MORE PRODUCTIVITY
EFFICIENCIES TO GO FOR:
C A S H C O S T T O D E L I V E R
I N C L U D E D I N F C F G U I D A N C E
& S U P P O R T E D B Y F U R T H E R
W O R K I N G C A P I T A L B E N E F I T S
Analytics
& Big Data
Platform
Next
Generation
SAP
Next
Generation
Salesforce
Front End
Platform
Business
Warehouse
Supply Chain
& Back
Office
Front
End
B U S I N E S S C A P A B I L I T Y P R O G R A M M E
Examples are illustrative only, would be subject to applicable information and consultation obligations
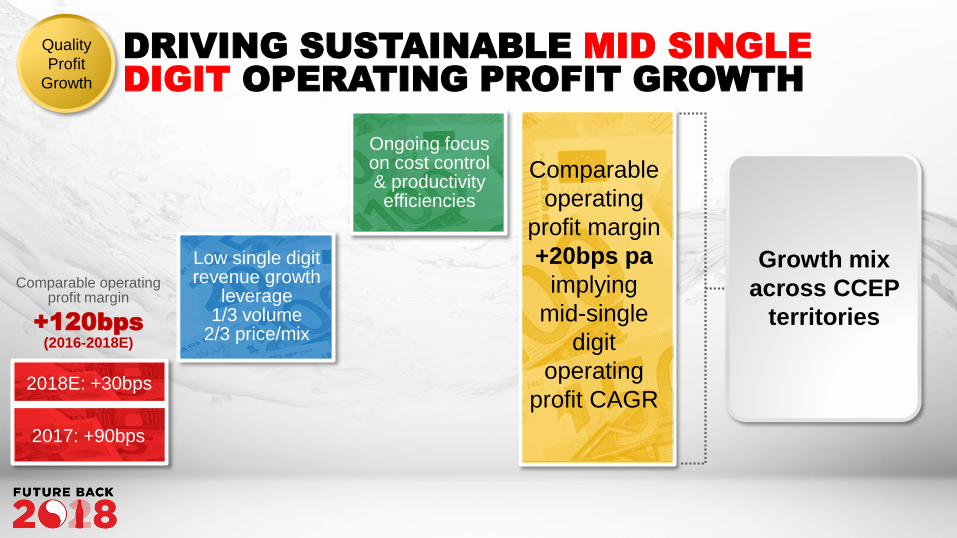
Ongoing focus on cost control & productivity efficiencies
DRIVING SUSTAINABLE MID SINGLE
DIGIT OPERATING PROFIT GROWTH
Growth mix
across CCEP
territories
Comparable
operating
profit margin
+20bps pa
implying
mid-single
digit
operating
profit CAGR
Low single digit revenue growth
leverage1/3 volume
2/3 price/mix
Quality
Profit
Growth
2018E: +30bps
Comparable operating profit margin
2017: +90bps
+120bps
(2016-2018E)
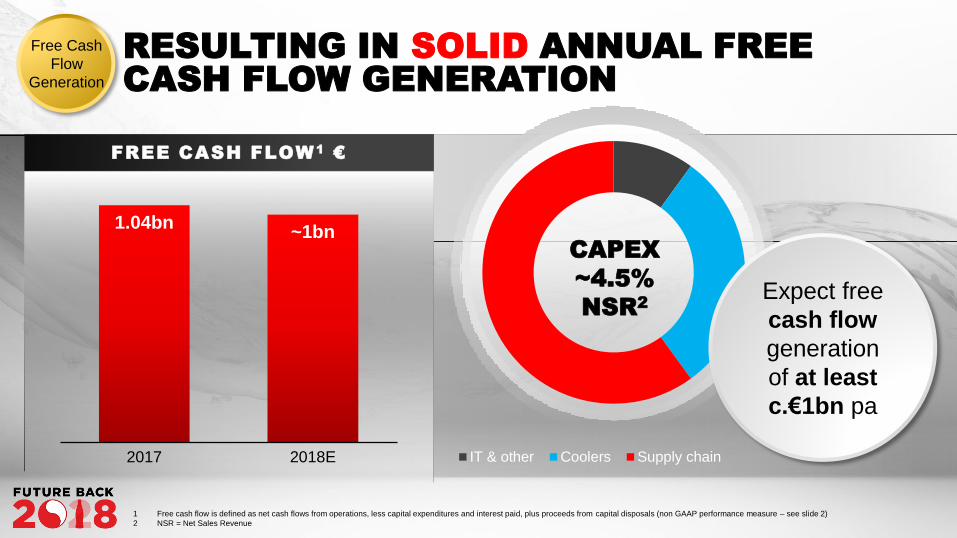
RESULTING IN SOLID ANNUAL FREE
CASH FLOW GENERATION
FREE CASH FLOW1
€
1.04bn~1bn
2017 2018E IT & other Coolers Supply chain
Expect free
cash flow
generation
of at least
c.€1bn pa
CAPEX
~4.5%
NSR2
Free Cash
Flow
Generation
1 Free cash flow is defined as net cash flows from operations, less capital expenditures and interest paid, plus proceeds from capital disposals (non GAAP performance measure – see slide 2)
2 NSR = Net Sales Revenue
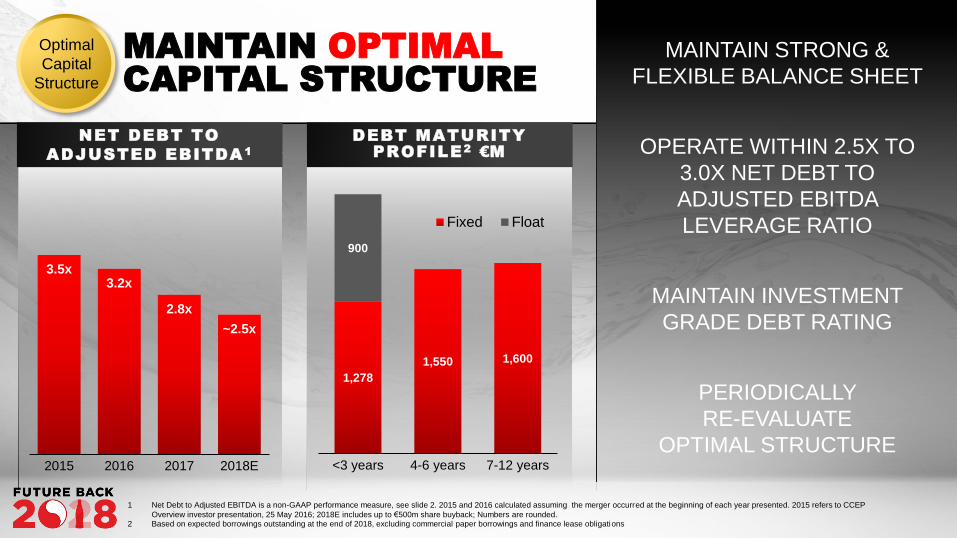
NET DEBT TO
ADJUSTED EBITDA1
MAINTAIN OPTIMAL
CAPITAL STRUCTURE
MAINTAIN STRONG &
FLEXIBLE BALANCE SHEET
OPERATE WITHIN 2.5X TO
3.0X NET DEBT TO
ADJUSTED EBITDA
LEVERAGE RATIO
MAINTAIN INVESTMENT
GRADE DEBT RATING
PERIODICALLY
RE-EVALUATE
OPTIMAL STRUCTURE
Optimal
Capital
Structure
3.5x3.2x
2.8x
~2.5x
2015 2016 2017 2018E
DEBT MATURITY
PROFILE2
€M
1,278
1,550 1,600
900
<3 years 4-6 years 7-12 years
Fixed Float
1 Net Debt to Adjusted EBITDA is a non-GAAP performance measure, see slide 2. 2015 and 2016 calculated assuming the merger occurred at the beginning of each year presented. 2015 refers to CCEP
Overview investor presentation, 25 May 2016; 2018E includes up to €500m share buyback; Numbers are rounded. 2 Based on expected borrowings outstanding at the end of 2018, excluding commercial paper borrowings and finance lease obligations
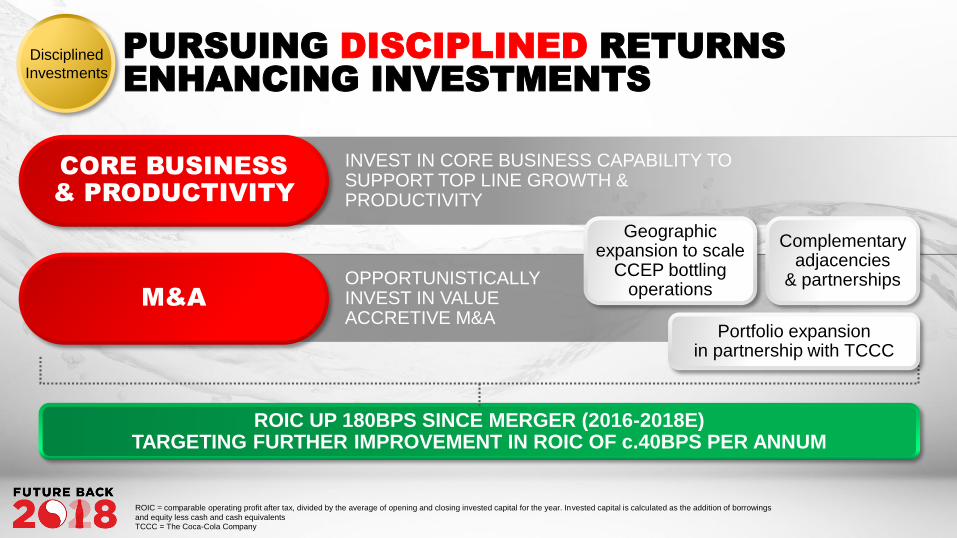
M&A
PURSUING DISCIPLINED RETURNS
ENHANCING INVESTMENTS
INVEST IN CORE BUSINESS CAPABILITY TO SUPPORT TOP LINE GROWTH & PRODUCTIVITY
OPPORTUNISTICALLY INVEST IN VALUE ACCRETIVE M&A
Geographic expansion to scale
CCEP bottling operations
Complementary adjacencies
& partnerships
ROIC UP 180BPS SINCE MERGER (2016-2018E)TARGETING FURTHER IMPROVEMENT IN ROIC OF c.40BPS PER ANNUM
CORE BUSINESS
& PRODUCTIVITY
Disciplined
Investments
ROIC = comparable operating profit after tax, divided by the average of opening and closing invested capital for the year. Invested capital is calculated as the addition of borrowings
and equity less cash and cash equivalentsTCCC = The Coca-Cola Company
Portfolio expansionin partnership with TCCC
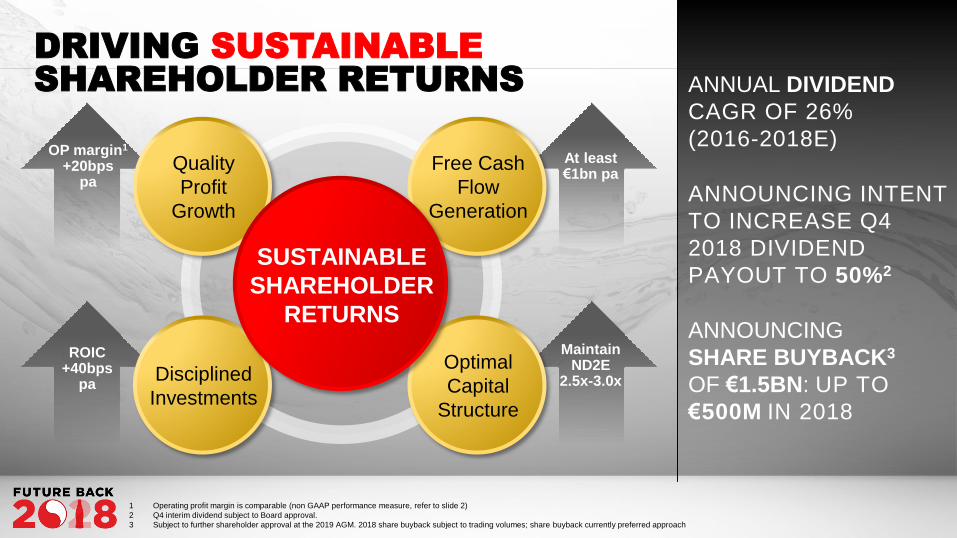
Free Cash
Flow
Generation
Optimal
Capital
Structure
Quality
Profit
Growth
Disciplined
Investments
SUSTAINABLE
SHAREHOLDER
RETURNS
DRIVING SUSTAINABLE
SHAREHOLDER RETURNS ANNUAL DIVIDEND
CAGR OF 26%
(2016-2018E)
ANNOUNCING INTENT
TO INCREASE Q4
2018 DIVIDEND
PAYOUT TO 50%2
ANNOUNCING
SHARE BUYBACK3
OF €1.5BN: UP TO
€500M IN 2018
OP margin1
+20bps pa
At least €1bn pa
ROIC+40bps
pa
Maintain ND2E
2.5x-3.0x
1 Operating profit margin is comparable (non GAAP performance measure, refer to slide 2)
2 Q4 interim dividend subject to Board approval.
3 Subject to further shareholder approval at the 2019 AGM. 2018 share buyback subject to trading volumes; share buyback currently preferred approach
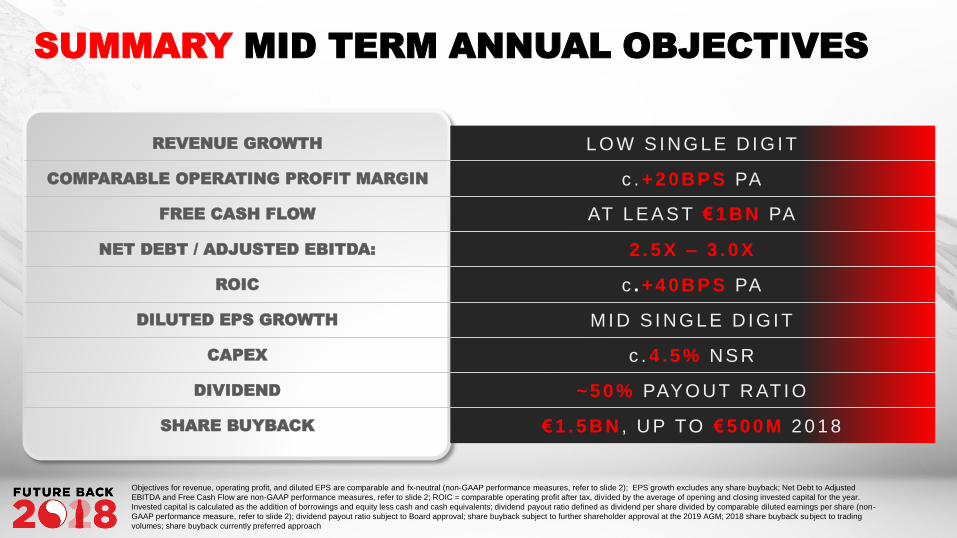
SUMMARY MID TERM ANNUAL OBJECTIVES
REVENUE GROWTH L O W S I N G L E D I G I T
COMPARABLE OPERATING PROFIT MARGIN c . + 2 0B P S PA
FREE CASH FLOW AT L E A S T € 1 BN PA
NET DEBT / ADJUSTED EBITDA: 2 . 5 X – 3 . 0 X
ROIC c . + 4 0B P S PA
DILUTED EPS GROWTH M I D S I N G L E D I G I T
CAPEX c . 4 . 5% N S R
DIVIDEND ~ 5 0 % PAYO U T R AT I O
SHARE BUYBACK € 1 . 5 B N , U P TO € 5 0 0M 2 0 1 8
Objectives for revenue, operating profit, and diluted EPS are comparable and fx-neutral (non-GAAP performance measures, refer to slide 2); EPS growth excludes any share buyback; Net Debt to Adjusted
EBITDA and Free Cash Flow are non-GAAP performance measures, refer to slide 2; ROIC = comparable operating profit after tax, divided by the average of opening and closing invested capital for the year.
Invested capital is calculated as the addition of borrowings and equity less cash and cash equivalents; dividend payout ratio defined as dividend per share divided by comparable diluted earnings per share (non-
GAAP performance measure, refer to slide 2); dividend payout ratio subject to Board approval; share buyback subject to further shareholder approval at the 2019 AGM; 2018 share buyback subject to trading
volumes; share buyback currently preferred approach
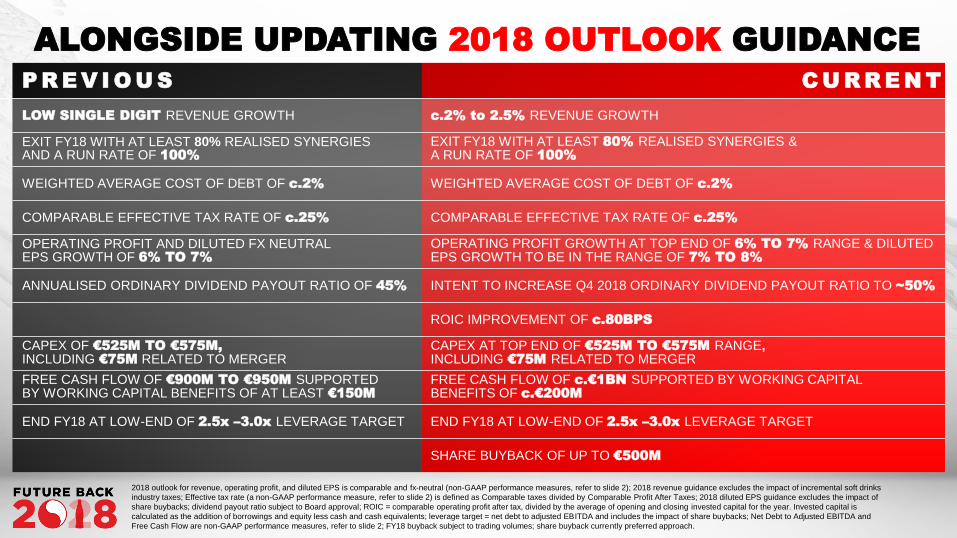
P R E V I O U S C U R R E N T
ALONGSIDE UPDATING 2018 OUTLOOK GUIDANCE
LOW SINGLE DIGIT REVENUE GROWTH c.2% to 2.5% REVENUE GROWTH
EXIT FY18 WITH AT LEAST 80% REALISED SYNERGIES AND A RUN RATE OF 100%
EXIT FY18 WITH AT LEAST 80% REALISED SYNERGIES &A RUN RATE OF 100%
WEIGHTED AVERAGE COST OF DEBT OF c.2% WEIGHTED AVERAGE COST OF DEBT OF c.2%
COMPARABLE EFFECTIVE TAX RATE OF c.25% COMPARABLE EFFECTIVE TAX RATE OF c.25%
OPERATING PROFIT AND DILUTED FX NEUTRAL EPS GROWTH OF 6% TO 7%
OPERATING PROFIT GROWTH AT TOP END OF 6% TO 7% RANGE & DILUTED EPS GROWTH TO BE IN THE RANGE OF 7% TO 8%
ANNUALISED ORDINARY DIVIDEND PAYOUT RATIO OF 45% INTENT TO INCREASE Q4 2018 ORDINARY DIVIDEND PAYOUT RATIO TO ~50%
ROIC IMPROVEMENT OF c.80BPS
CAPEX OF €525M TO €575M,
INCLUDING €75M RELATED TO MERGERCAPEX AT TOP END OF €525M TO €575M RANGE, INCLUDING €75M RELATED TO MERGER
FREE CASH FLOW OF €900M TO €950M SUPPORTED BY WORKING CAPITAL BENEFITS OF AT LEAST €150M
FREE CASH FLOW OF c.€1BN SUPPORTED BY WORKING CAPITAL BENEFITS OF c.€200M
END FY18 AT LOW-END OF 2.5x –3.0x LEVERAGE TARGET END FY18 AT LOW-END OF 2.5x –3.0x LEVERAGE TARGET
SHARE BUYBACK OF UP TO €500M
2018 outlook for revenue, operating profit, and diluted EPS is comparable and fx-neutral (non-GAAP performance measures, refer to slide 2); 2018 revenue guidance excludes the impact of incremental soft drinks
industry taxes; Effective tax rate (a non-GAAP performance measure, refer to slide 2) is defined as Comparable taxes divided by Comparable Profit After Taxes; 2018 diluted EPS guidance excludes the impact of
share buybacks; dividend payout ratio subject to Board approval; ROIC = comparable operating profit after tax, divided by the average of opening and closing invested capital for the year. Invested capital is
calculated as the addition of borrowings and equity less cash and cash equivalents; leverage target = net debt to adjusted EBITDA and includes the impact of share buybacks; Net Debt to Adjusted EBITDA and
Free Cash Flow are non-GAAP performance measures, refer to slide 2; FY18 buyback subject to trading volumes; share buyback currently preferred approach.
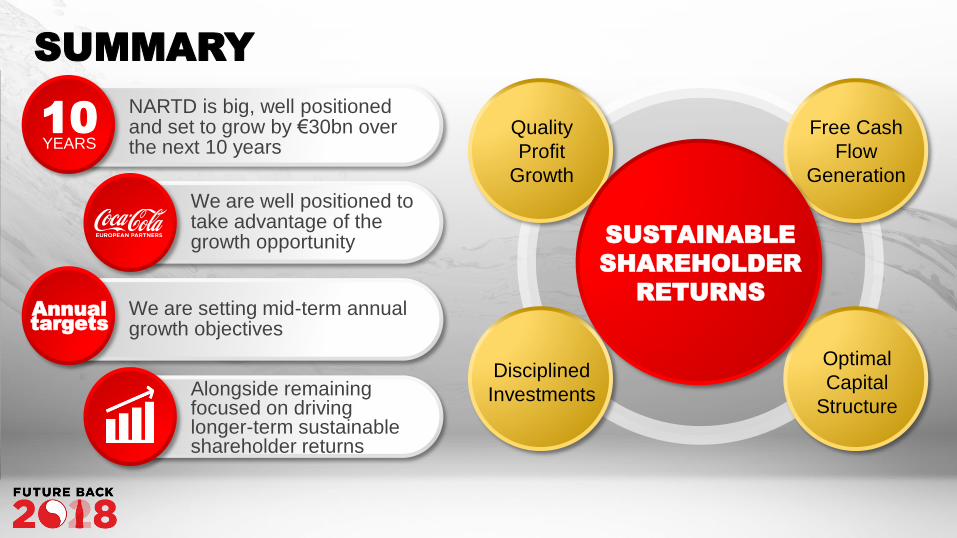
SUMMARY
Free Cash
Flow
Generation
Optimal
Capital
Structure
Quality
Profit
Growth
Disciplined
Investments
SUSTAINABLE
SHAREHOLDER
RETURNS
NARTD is big, well positioned and set to grow by €30bn over the next 10 years
We are well positioned to take advantage of the growth opportunity
We are setting mid-term annual growth objectives
Alongside remaining focused on driving longer-term sustainable shareholder returns
10YEARS
Annual
targets
INTRODUCTION & LOOK BACK
DAMIAN GAMMELL, CEO
EXCITING FUTURE
STEPHEN LUSK, VP COMMERCIAL DEVELOPMENT
WINNING TODAY
TO WIN TOMORROW
DAMIAN GAMMELL, CEO
KEY TAKEAWAYS
DAMIAN GAMMELL, CEO
NIK JHANGIANI, CFO
DEEP DIVE: GERMANY
FRANK MOLTHAN, GM GERMANY
DRIVING SHAREHOLDER VALUE
NIK JHANGIANI, CFO
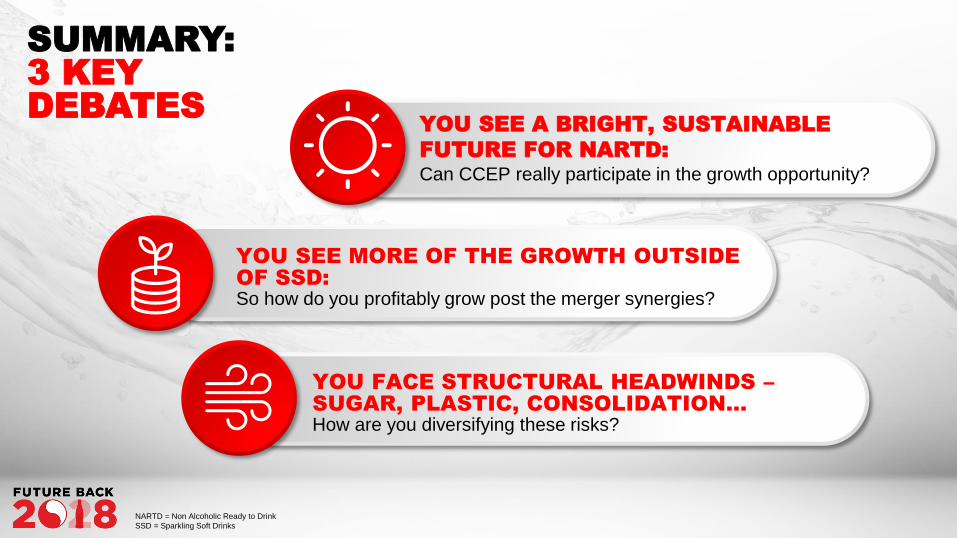
YOU SEE MORE OF THE GROWTH OUTSIDE
OF SSD:
So how do you profitably grow post the merger synergies?
YOU SEE A BRIGHT, SUSTAINABLE
FUTURE FOR NARTD:
Can CCEP really participate in the growth opportunity?
SUMMARY:
3 KEY
DEBATES
YOU FACE STRUCTURAL HEADWINDS –
SUGAR, PLASTIC, CONSOLIDATION…
How are you diversifying these risks?
NARTD = Non Alcoholic Ready to Drink
SSD = Sparkling Soft Drinks
REMARKS
SOL DAURELLA, CHAIRMAN
Q&A
CLOSING REMARKS
DAMIAN GAMMELL, CEO
1
2
3
REMARKS
SOL DAURELLA, CHAIRMAN
Q&A
CLOSING REMARKS
DAMIAN GAMMELL, CEO
1
2
3
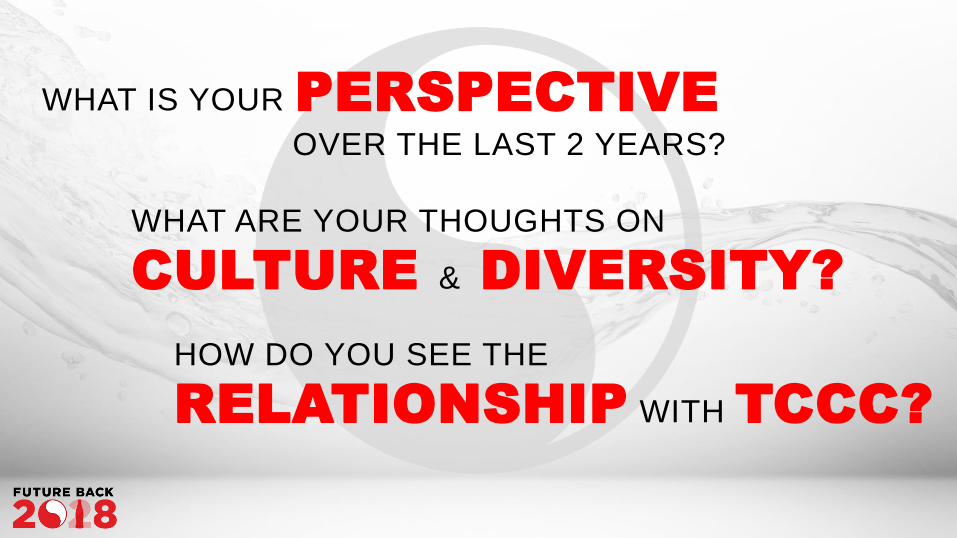
WHAT IS YOUR PERSPECTIVE
OVER THE LAST 2 YEARS?
WHAT ARE YOUR THOUGHTS ON
CULTURE & DIVERSITY?
HOW DO YOU SEE THE
RELATIONSHIP WITH TCCC?
REMARKS
SOL DAURELLA, CHAIRMAN
Q&A
CLOSING REMARKS
DAMIAN GAMMELL, CEO
1
2
3
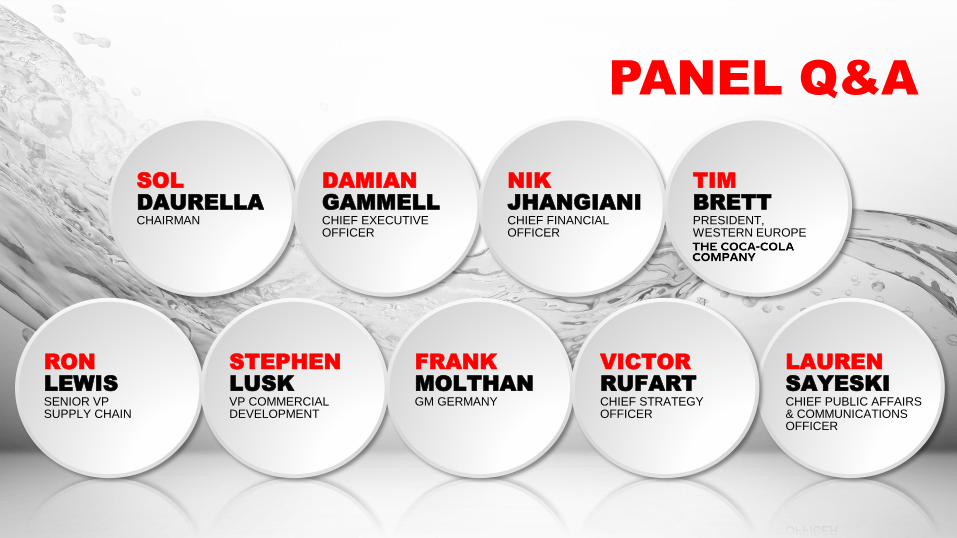
PANEL Q&A
SOL
DAURELLA
CHAIRMAN
DAMIAN
GAMMELL
CHIEF EXECUTIVE OFFICER
NIK
JHANGIANI
CHIEF FINANCIAL OFFICER
LAUREN
SAYESKI
CHIEF PUBLIC AFFAIRS & COMMUNICATIONS OFFICER
RON
LEWIS
SENIOR VP SUPPLY CHAIN
STEPHEN
LUSK
VP COMMERCIAL DEVELOPMENT
FRANK
MOLTHAN
GM GERMANY
VICTOR
RUFART
CHIEF STRATEGY OFFICER
TIM
BRETT
PRESIDENT, WESTERN EUROPE
REMARKS
SOL DAURELLA, CHAIRMAN
Q&A
CLOSING REMARKS
DAMIAN GAMMELL, CEO
1
2
3

FUTURE
BACK
GROWTH
LEVERS
ENABLED BY
INVESTING IN
CAPABILITIES
WINNING
TODAY
TO WIN
TOMORROW
VOLUME PRICE/MIX
MARKET
EXECUTION
PORTFOLIO
DIVERSIFICATION
COMMITMENT
TO ‘THIS
IS FORWARD’
& OUR
CUSTOMERS
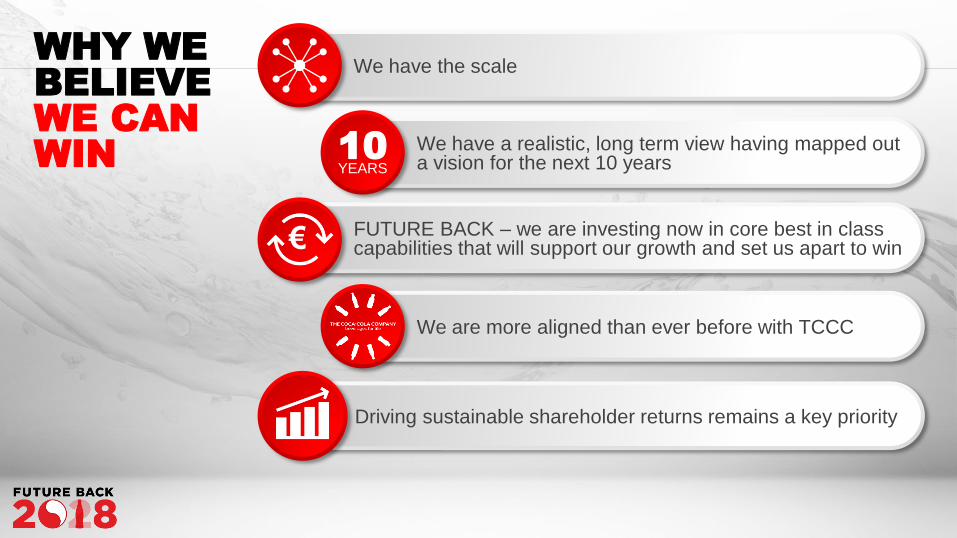
WHY WE
BELIEVE
WE CAN
WIN
We have the scale
We have a realistic, long term view having mapped out a vision for the next 10 years
FUTURE BACK – we are investing now in core best in class capabilities that will support our growth and set us apart to win
We are more aligned than ever before with TCCC
€
10YEARS
Driving sustainable shareholder returns remains a key priority

BUSINESS ANALYTICS
A c t i o n a b l e f o r e s i g h t t o w i n i n t h e m a r k e t p l a c e
L a i a C o l l a z o s , G B C h i e f I n f o r m a t i o n O f f i c e r
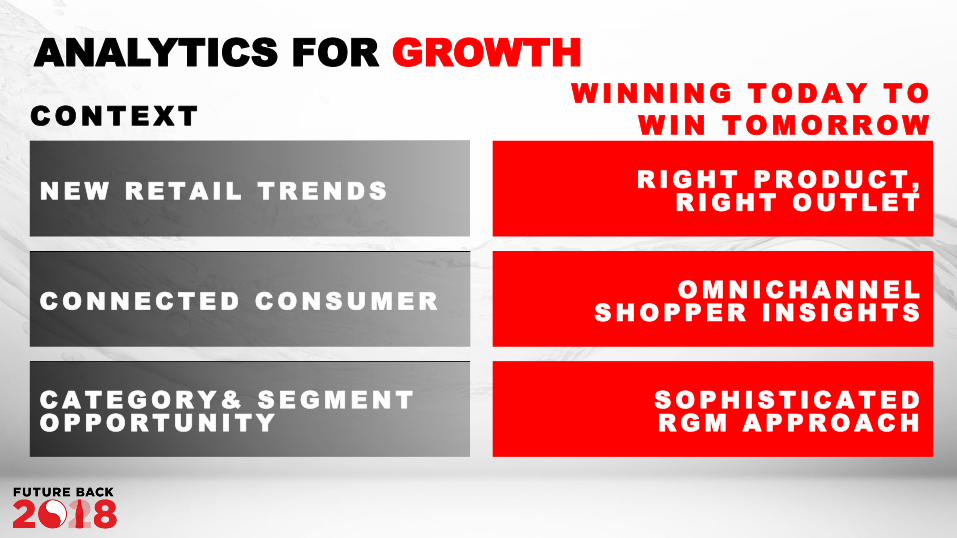
ANALYTICS FOR GROWTH
NEW R ETA IL TR END S
C ONNEC TED C ONSUM ER
C A TEGOR Y & SEGM ENT
OPPOR TUNITY
R IGHT PR OD UC T ,
RIGHT OUTLET
SOPHIST IC A TED
R GM A PPR OA C H
O M N IC H A N N EL
SHOPPER INS IGHTS
CONTEXT
WINNING TODAY TO
WIN TOMORROW
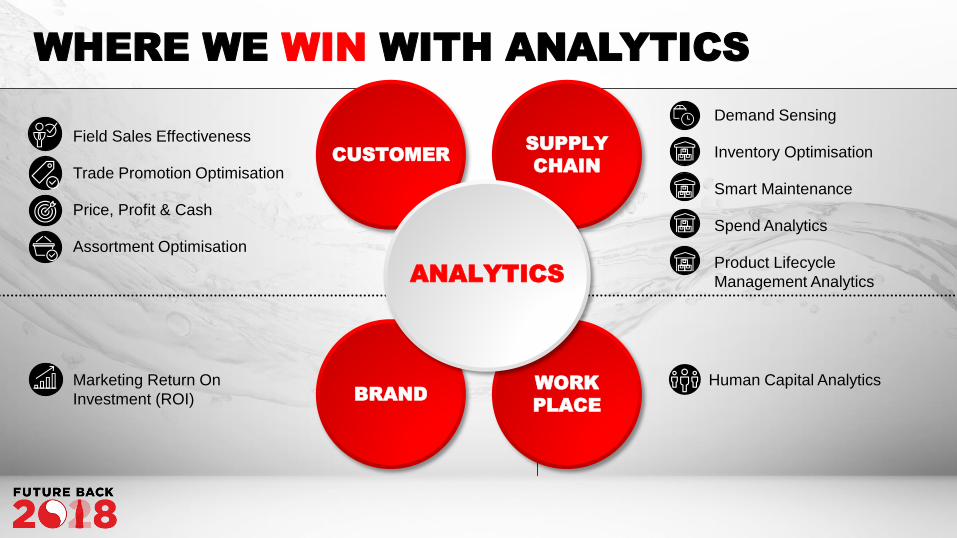
WHERE WE WIN WITH ANALYTICS
Marketing Return On
Investment (ROI)
Field Sales Effectiveness
Trade Promotion Optimisation
Price, Profit & Cash
Assortment Optimisation
Demand Sensing
Inventory Optimisation
Smart Maintenance
Spend Analytics
Product Lifecycle
Management Analytics
Human Capital Analytics
CUSTOMERSUPPLY
CHAIN
BRANDWORK
PLACE
ANALYTICS
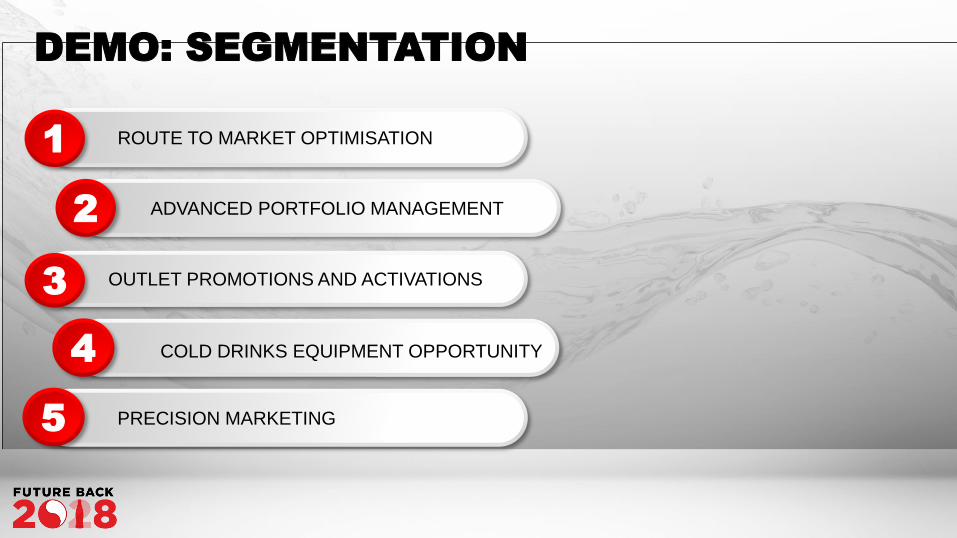
DEMO: SEGMENTATION
ROUTE TO MARKET OPTIMISATION1
ADVANCED PORTFOLIO MANAGEMENT2
3
PRECISION MARKETING
4
5
COLD DRINKS EQUIPMENT OPPORTUNITY
OUTLET PROMOTIONS AND ACTIVATIONS
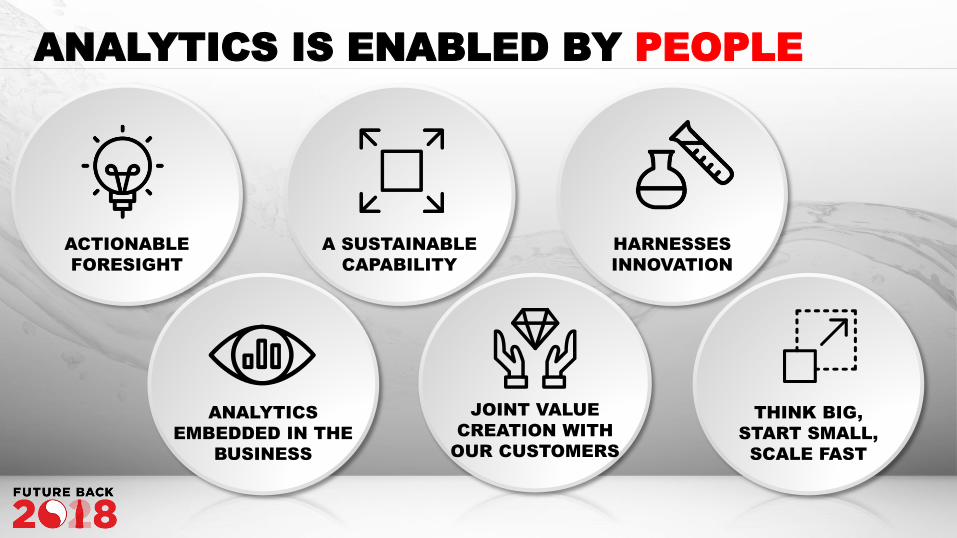
THINK BIG,
START SMALL,
SCALE FAST
ANALYTICS
EMBEDDED IN THE
BUSINESS
JOINT VALUE
CREATION WITH
OUR CUSTOMERS
ANALYTICS IS ENABLED BY PEOPLE
ACTIONABLE
FORESIGHT
A SUSTAINABLE
CAPABILITY
HARNESSES
INNOVATION
DIGITAL PLATFОRMS TO INSPIRE OUR
CUSTOMERS & EMPLOYEES
S t e p h e n M o o r h o u s e , G M N E B U
D a v i d M a r t i n , D i g i t a l S a l e s & M a r k e t i n g D i r e c t o r
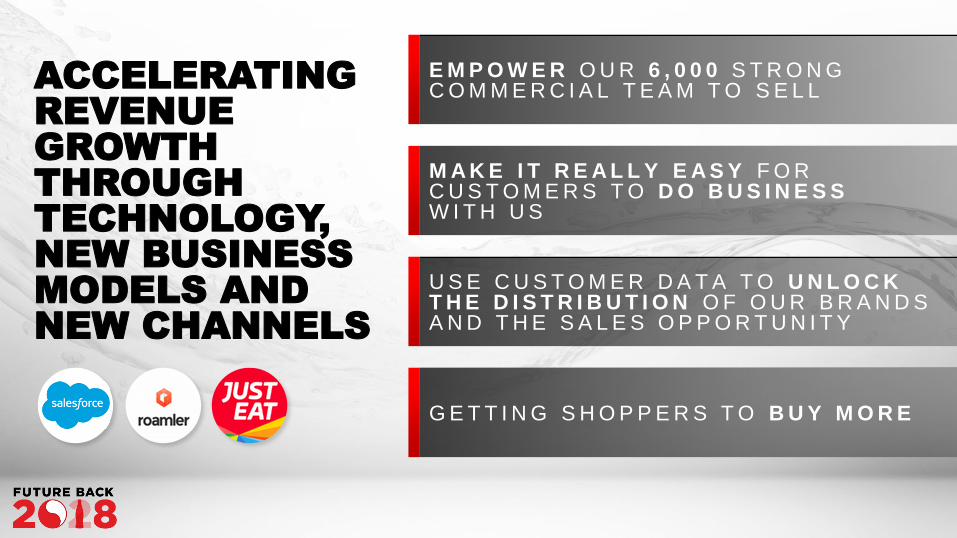
ACCELERATING
REVENUE
GROWTH
THROUGH
TECHNOLOGY,
NEW BUSINESS
MODELS AND
NEW CHANNELS
E M P O W E R O U R 6 , 0 0 0 S T R O N G C O M M E R C I A L T E A M T O S E L L
M A K E I T R E A L L Y E A S Y F O R C U S T O M E R S T O D O B U S I N E S S W I T H U S
U S E C U S T O M E R D A T A T O U N L O C K T H E D I S T R I B U T I O N O F O U R B R A N D S A N D T H E S A L E S O P P O R T U N I T Y
G E T T I N G S H O P P E R S T O B U Y M O R E
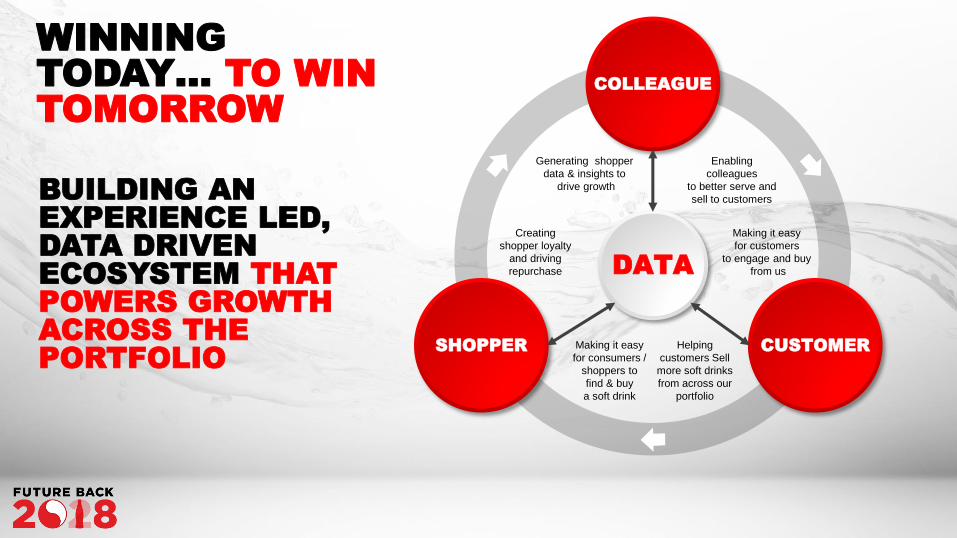
BUILDING AN
EXPERIENCE LED,
DATA DRIVEN
ECOSYSTEM THAT
POWERS GROWTH
ACROSS THE
PORTFOLIO
Making it easy
for customers
to engage and buy
from us
Enabling
colleagues
to better serve and
sell to customers
Helping
customers Sell
more soft drinks
from across our
portfolio
Making it easy
for consumers /
shoppers to
find & buy
a soft drink
Generating shopper
data & insights to
drive growth
Creating
shopper loyalty
and driving
repurchase
SHOPPER
COLLEAGUE
CUSTOMER
DATA
WINNING
TODAY… TO WIN
TOMORROW
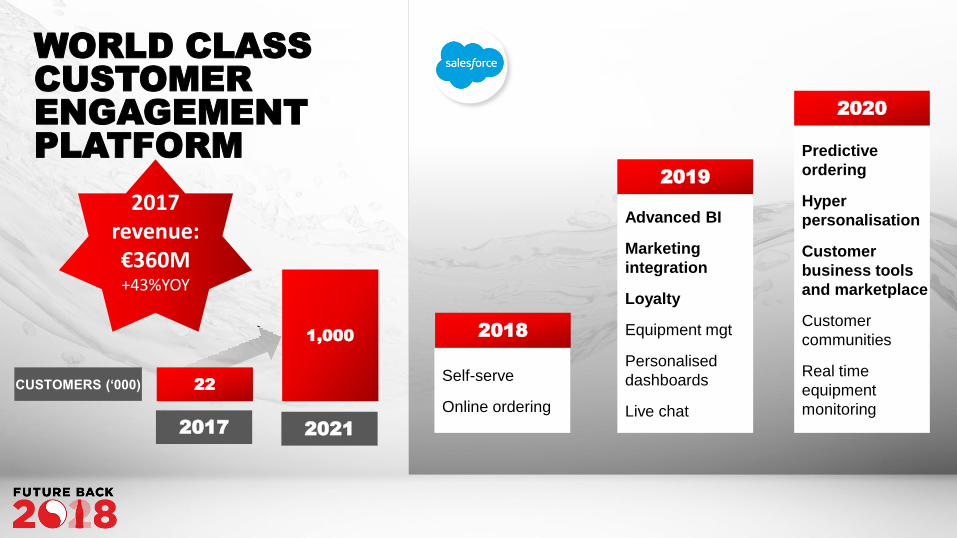
WORLD CLASS
CUSTOMER
ENGAGEMENT
PLATFORM
2017 2021
CUSTOMERS (‘000) 22
1,0002018
2019
2020
Self-serve
Online ordering
Advanced BI
Marketing
integration
Loyalty
Equipment mgt
Personalised
dashboards
Live chat
Predictive
ordering
Hyper
personalisation
Customer
business tools
and marketplace
Customer
communities
Real time
equipment
monitoring
2017 revenue: €360M+43%YOY
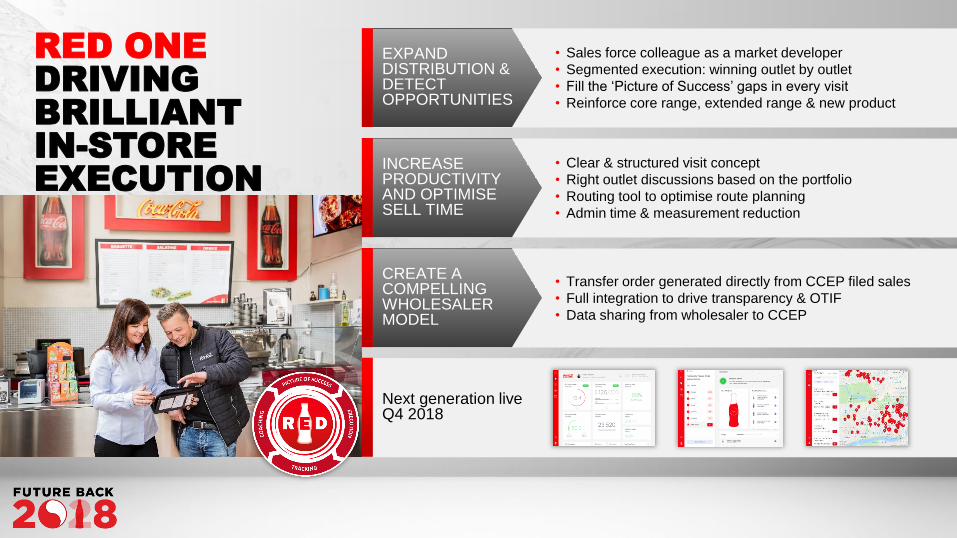
RED ONE
DRIVING
BRILLIANT
IN-STORE
EXECUTION
EXPAND DISTRIBUTION & DETECT OPPORTUNITIES
• Sales force colleague as a market developer
• Segmented execution: winning outlet by outlet
• Fill the ‘Picture of Success’ gaps in every visit
• Reinforce core range, extended range & new product
INCREASE PRODUCTIVITY AND OPTIMISE SELL TIME
• Clear & structured visit concept
• Right outlet discussions based on the portfolio
• Routing tool to optimise route planning
• Admin time & measurement reduction
CREATE A COMPELLING WHOLESALER MODEL
• Transfer order generated directly from CCEP filed sales
• Full integration to drive transparency & OTIF
• Data sharing from wholesaler to CCEP
Next generation live Q4 2018
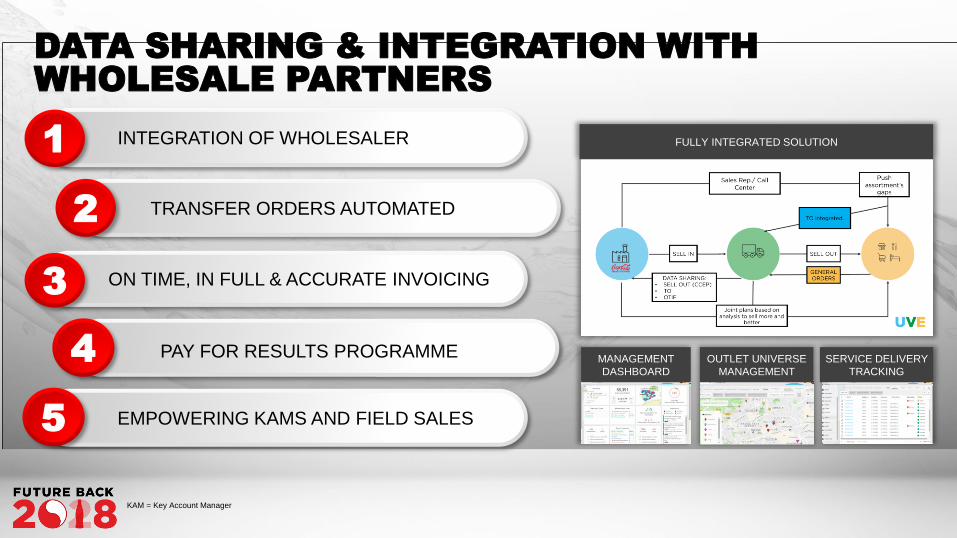
DATA SHARING & INTEGRATION WITH
WHOLESALE PARTNERS
MANAGEMENT
DASHBOARD
OUTLET UNIVERSE
MANAGEMENT
SERVICE DELIVERY
TRACKING
FULLY INTEGRATED SOLUTIONINTEGRATION OF WHOLESALER1
TRANSFER ORDERS AUTOMATED2
3
EMPOWERING KAMS AND FIELD SALES
4
5
PAY FOR RESULTS PROGRAMME
ON TIME, IN FULL & ACCURATE INVOICING
KAM = Key Account Manager
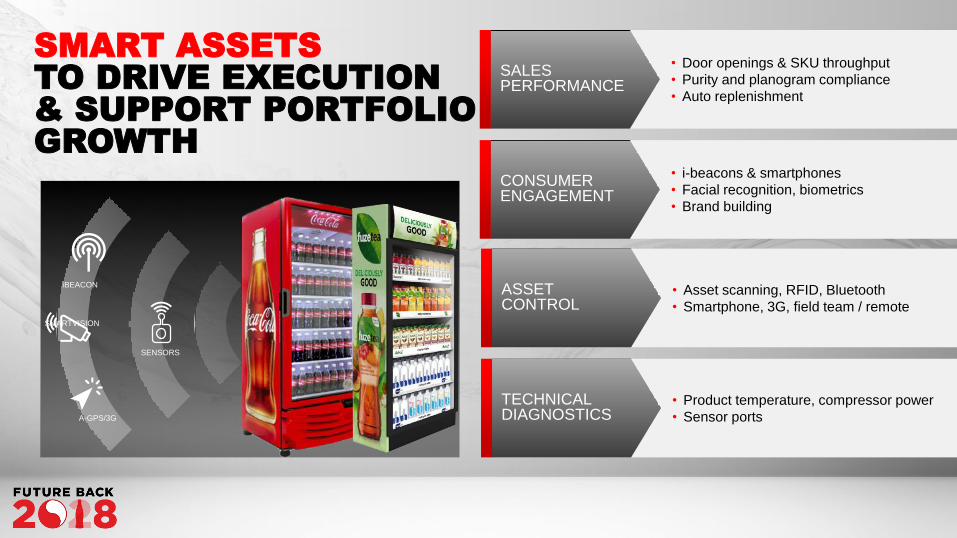
SMART ASSETS
TO DRIVE EXECUTION
& SUPPORT PORTFOLIO
GROWTH
ASSETCONTROL
• Asset scanning, RFID, Bluetooth
• Smartphone, 3G, field team / remote
TECHNICAL DIAGNOSTICS
• Product temperature, compressor power
• Sensor ports
SALES PERFORMANCE
• Door openings & SKU throughput
• Purity and planogram compliance
• Auto replenishment
CONSUMER ENGAGEMENT
• i-beacons & smartphones
• Facial recognition, biometrics
• Brand building
SENSORS
iBEACON
SMARTVISION
A-GPS/3G
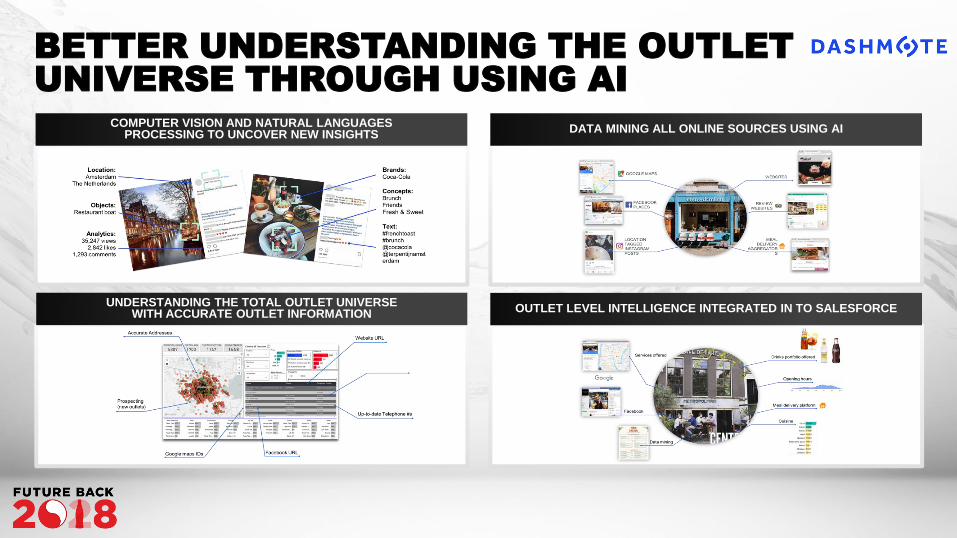
BETTER UNDERSTANDING THE OUTLET
UNIVERSE THROUGH USING AI
COMPUTER VISION AND NATURAL LANGUAGESPROCESSING TO UNCOVER NEW INSIGHTS
DATA MINING ALL ONLINE SOURCES USING AI
UNDERSTANDING THE TOTAL OUTLET UNIVERSEWITH ACCURATE OUTLET INFORMATION OUTLET LEVEL INTELLIGENCE INTEGRATED IN TO SALESFORCE
CCEP AND WORLD CLASS
KEY ACCOUNT MANAGEMENT
S t e p h e n L u s k , V P C o m m e r c i a l D e v e l o p m e n t
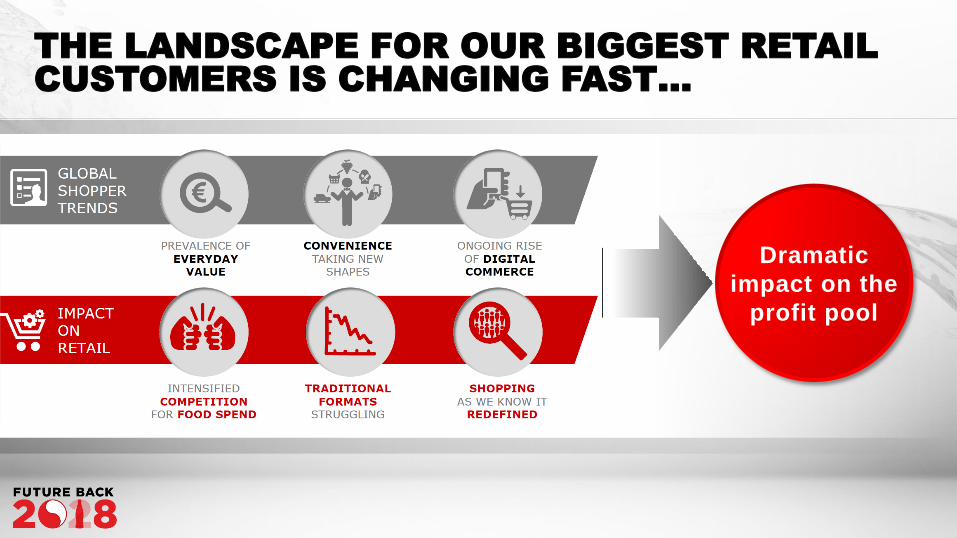
Dramatic
impact on the
profit pool
THE LANDSCAPE FOR OUR BIGGEST RETAIL
CUSTOMERS IS CHANGING FAST…
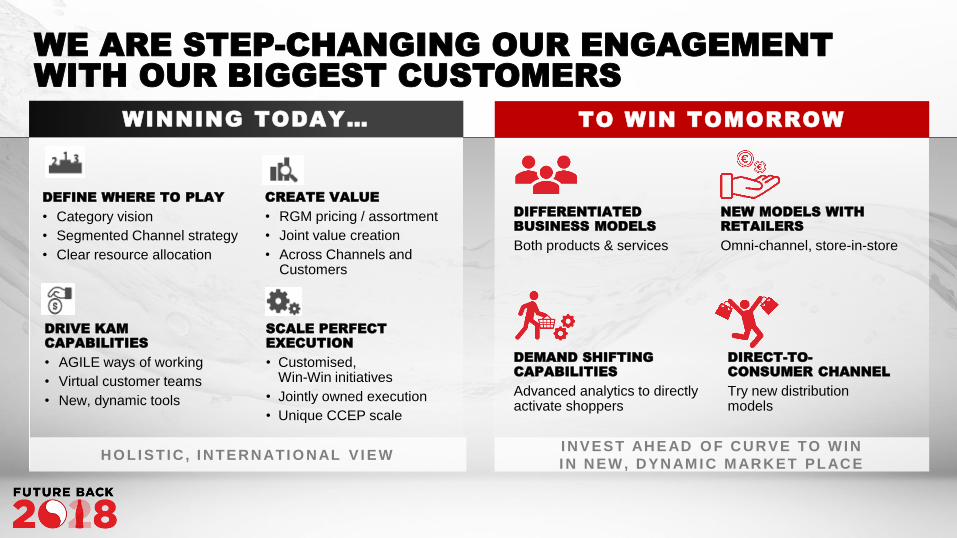
TO WIN TOMORROWWINNING TODAY…
WE ARE STEP-CHANGING OUR ENGAGEMENT
WITH OUR BIGGEST CUSTOMERS
DIFFERENTIATED
BUSINESS MODELS
Both products & services
NEW MODELS WITH
RETAILERS
Omni-channel, store-in-store
DEMAND SHIFTING
CAPABILITIES
Advanced analytics to directly activate shoppers
DIRECT-TO-
CONSUMER CHANNEL
Try new distribution models
DEFINE WHERE TO PLAY
• Category vision
• Segmented Channel strategy
• Clear resource allocation
CREATE VALUE
• RGM pricing / assortment
• Joint value creation
• Across Channels and Customers
DRIVE KAM
CAPABILITIES
• AGILE ways of working
• Virtual customer teams
• New, dynamic tools
SCALE PERFECT
EXECUTION
• Customised, Win-Win initiatives
• Jointly owned execution
• Unique CCEP scale
HO LI STIC , I NTERNATI O NAL V I EWI NVEST AHE AD O F CURVE TO W I N
I N NEW , DYNAM I C M ARKET PLACE
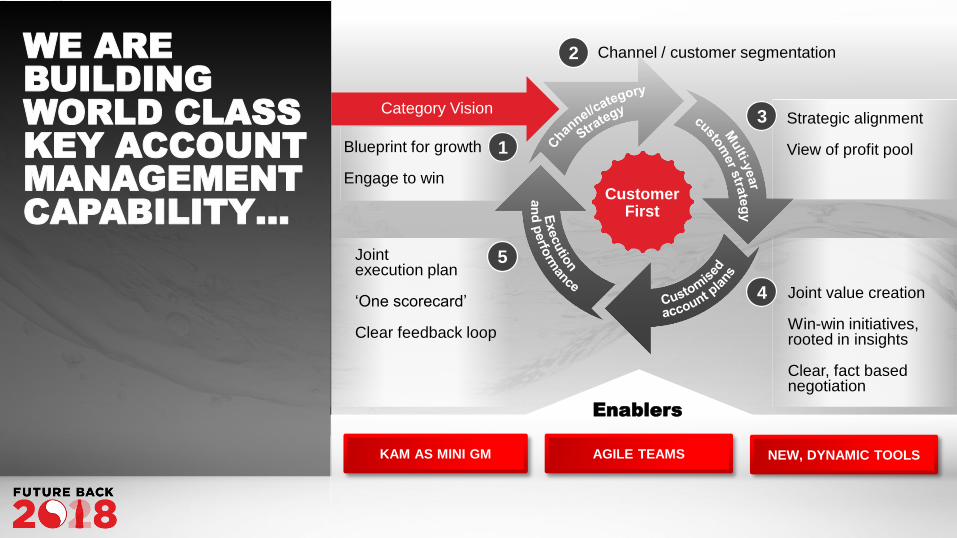
WE ARE
BUILDING
WORLD CLASS
KEY ACCOUNT
MANAGEMENT
CAPABILITY…
AGILE TEAMS NEW, DYNAMIC TOOLSKAM AS MINI GM
Blueprint for growth
Engage to win
Channel / customer segmentation
Strategic alignment
View of profit pool
Joint value creation
Win-win initiatives, rooted in insights
Clear, fact based negotiation
Joint execution plan
‘One scorecard’
Clear feedback loop
Enablers
Category Vision
1
2
3
4
5
CustomerFirst
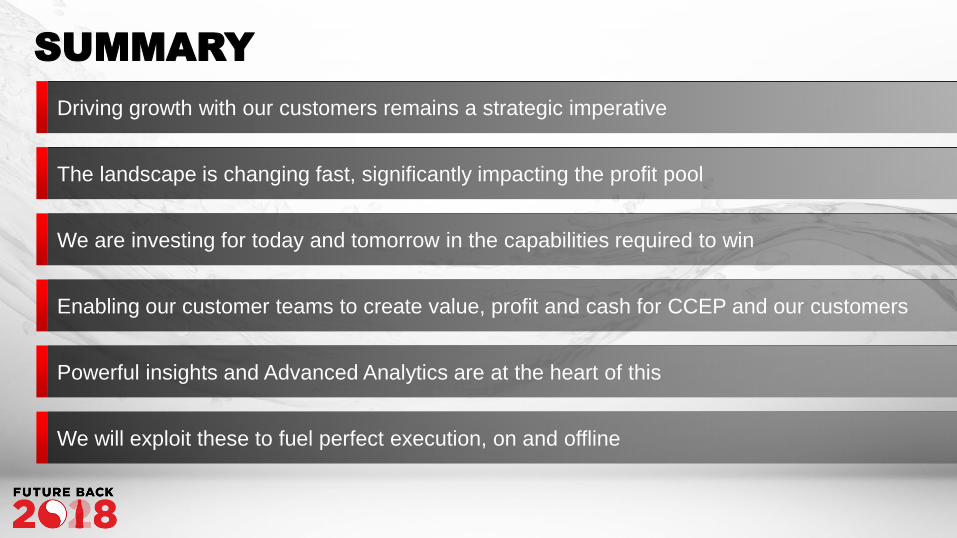
Driving growth with our customers remains a strategic imperative
The landscape is changing fast, significantly impacting the profit pool
We are investing for today and tomorrow in the capabilities required to win
Enabling our customer teams to create value, profit and cash for CCEP and our customers
Powerful insights and Advanced Analytics are at the heart of this
We will exploit these to fuel perfect execution, on and offline
SUMMARY


