Embed Size (px)
Citation preview
METHODS FOR POPULATION-BASED ASSESSMENTS IN POST-
CONFLICT SETTINGS: HEALTH SERVICE PERFORMANCE,
ECONOMIC STATUS AND EQUITY OF UTILIZATION IN
AFGHANISTAN
By
Shivam Gupta
A dissertation submitted to the Johns Hopkins University in conformity with the requirements for the degree of Doctor of Philosophy
Baltimore, Maryland
October 2008
© 2008 Shivam Gupta
All Rights Reserved
UMI Number: 3357166
Copyright 2008 by
Gupta, Shivam
All rights reserved.
INFORMATION TO USERS
The quality of this reproduction is dependent upon the quality of the copy
submitted. Broken or indistinct print, colored or poor quality illustrations and
photographs, print bleed-through, substandard margins, and improper
alignment can adversely affect reproduction.
In the unlikely event that the author did not send a complete manuscript
and there are missing pages, these will be noted. Also, if unauthorized
copyright material had to be removed, a note will indicate the deletion.
®
UMI UMI Microform 3357166
Copyright 2009 by ProQuest LLC.
All rights reserved. This microform edition is protected against
unauthorized copying under Title 17, United States Code.
ProQuest LLC 789 E. Eisenhower Parkway
PO Box 1346 Ann Arbor, Ml 48106-1346
Abstract
There is an urgent need for innovative methods to generate information to
evaluate post-conflict reconstruction, especially in the health sector. In order to translate
the immediate response into a systematic medium and long term health strategy, baseline
estimates of health service performance are required. In war torn Afghanistan, faced with
a monumental task of laying the foundations for an equitable and quality oriented health
system, the Ministry of Public Health used the outdated information from the 1979
census to conduct the first population based health assessment in 2003. Results from a
comparison of these estimates with those generated using the pre-census conducted in
2004 indicate that the originally reported estimates provided information that was
adequate for cross-sectional assessment but of limited use for assessing trends over time.
Logistical concerns of restricted access in post-conflict countries like Afghanistan
require a measure of living standards to be based on information that is easy to collect,
observe and verify. Comparison of principal components analysis based asset index with
expenditure estimates based on out of sample prediction indicated that predicted
expenditure was a more reliable measure to track poverty over time. Regular collection of
data on asset variables to predict expenditure can improve the accessibility of this
information to policy makers. In addition, the predicted expenditure can form the basis
for poverty mapping and targeting through the social protection programs.
Equitable health systems require a sustained increase in utilization of health
services by groups that suffer from the greatest burden of disease - females and the poor.
In Afghanistan, a trend towards equitable utilization in the last four years has occurred
along with simultaneous improvement in quality of health services. The association
u
between different characteristics of health care delivery system and utilization rate
differed across the three outcome groups in the facility catchment area - total population,
the poor and females. Improvement in staffing and service capacity was associated with a
significantly greater increase in utilization in a later year as compared to a similar
improvement in an earlier year. User fee collection was associated with a decrease in
utilization rate, especially by the poor.
Thesis readers:
Dr. David H. Peters (Advisor), Department of International Health
Dr. Laura Morlock (Chair), Department of Health Policy and Management
Dr. Gilbert M. Burnham, Department of International Health
Dr. Stan Becker, Department of Population, Family and Reproductive Health
111

Acknowledgements
I am grateful to the people of Afghanistan, whose generosity enabled the fruition
of this thesis. More than 500 people have worked on the Afghanistan Monitoring and
Technical Support Project since 2004.1 owe a debt of gratitude to all the people who
collected the information; sometimes under difficult circumstances and at great personal
risk to themselves. The team members from JHU and IHMR have facilitated and
supported my thesis research at every stage. I have great appreciation for their efforts and
encouragement.
I feel very lucky and honored to have had teachers who were not only
intellectually stimulating but also very kind and considerate. My advisor Dr. David
Peters, with his cheerful humor and engaging nature, made the whole journey very
enjoyable and interesting. Dr. Peters gave me the freedom to explore different ideas and
ensured that when the need arose, he had the time to help and guide me. I am thankful to
Dr. Gilbert Burnham, Dr. Stan Becker and Dr. Laura Morlock. Their comments and
suggestions during proposal and thesis writing helped me tremendously in improving the
quality of my research. I am also thankful to Dr. Marie-Diener West, Dr. David Bishai,
Dr. Hugh Waters, Dr. Larry Moulton and Dr. Abdullah Baqui. Their help has been
instrumental in clearing the conceptual and methodological roadblocks that I faced during
different phases of my thesis research.
Dr. Mathuram Santosham and his caring wife Dr. Patricia Santosham have always
welcomed me in their home with open arms and have been a wonderful source of moral
support and encouragement for the past five years. Dr. Leon Gordis and his clear and
timely advice about my research and life in general are a treasure that I will cherish for a
iv

long time. I am also thankful to Dr. Robert Black for kindling my interest in International
Public Health and enabling me to pursue the doctoral program at Hopkins.
My life at the school has been truly enriched due to the interactions that I have
had with a wonderful group of friends and colleagues. During the past five years, I have
derived immense pleasure and comfort in the company of Konstantinos Tsilidis, William
Farris, Sandhya Sundaram, Laura Steinhardt, Peter Hansen, Kavitha Viswanathan,
Aneesa Arur, Nagesh Borse, Rebekah Heinzen, Zohra Patel, Nirali Shah, Manjunath
Shankar, Adrijana Corluka, Junko Onishi, Lindsay Grant, Jennifer Moisi, Ehtisham
Akhter, Vikas Dwivedi, Melissa Opryszko, and Krishna Rao. A special thanks to Ms.
Carol Buckley, who has always been available for rescue with her comforting smile and
answers to all administrative questions.
This thesis would not have been possible without the love and support of my
caring family. My parents, Shiv Dutt and Rajeshwari, provided me with a strong
foundation by teaching me the values of compassion, hard work and to provide care to
people who are least capable of doing it on their own. With their lives, they have set an
inspiring example for me to follow. I have been truly blessed to have Andrea as my wife.
Andrea has stood by me through every step of the process and bolstered my confidence
during times of uncertainty. In addition to being a loving wife, Andrea has been a great
friend and I truly respect her advice and enjoy her company. I am very thankful to
Andrea's parents, John and Debbie. Their encouraging words were especially helpful
during times when Andrea was not around due to her work related travel commitments.
Last but certainly not the least, a big thanks to my sister Preeti for being a patient listener
of my endless advice and stories.
v
Table of Contents
Chapter 1 Introduction 1
1.1 Conceptual framework 3
1.2 Study Context: Afghanistan 6
1.3 Problem description 8
1.5 Organization of thesis document 16
Chapter 2 Is an outdated sampling frame adequate for Maternal and Child health care delivery estimates in post-conflict Afghanistan? 18
2.1 Introduction 19
2.2 Methods 22
2.3 Results 31
2.4 Discussion 33
2.5 Conclusion 40
Chapter 3 Use of household asset data to measure living standards and track poverty in post-conflict Afghanistan 47
3.1 Introduction 48
3.2 Methods 54
3.3 Results 60
3.4 Discussion 63
3.5 Conclusion 70
Chapter 4 Equity effects of quality improvements on health service utilization in post-conflict Afghanistan 78
4.1 Introduction 80
4.2 Rationale 82
4.3 Conceptual Framework 85
4.4 Methods 90
vi
4.5 Results I l l
4.6 Discussion 116
4.7 Conclusion 126
Chapter 5 Summary: Findings and implications 137
Appendices 144
Additional tables for Chapter 2 (Study 1) 144
Additional tables for Chapter 4 (Study 3) 150
References 154
Curriculum Vita 168
vii
List of Tables
Table 2.1: Seven priority health indicators for MICS 2003 41
Table 2.2: MICS 2003: Revised (Re-weighted) health service delivery estimates for women 42
Table 2.3: MICS 2003: Revised (Re-weighted) health service delivery estimates for children 43
Table 2.4: MICS 2003: Revised (Re-weighted) confidence intervals for service delivery estimates for women 44
Table 2.5: MICS 2003: Revised (Re-weighted) confidence intervals for service delivery estimates for children 45
Table 3.1: Description of asset variables 72
Table 3.2: Difference in mean of asset variables 72
Table 3.3: Estimated log linear regression coefficients for the 2005 sample 73
Table 3.4: Difference in predicted expenditure between 2004 and 2005 samples 74
Table 3.5: Estimated principal component wealth index coefficients for pooled 2004 and 2005 samples 75
Table 3.6: Difference in wealth index between 2004 and 2005 samples 76
Table 3.7: Estimated probit regression coefficients for the 2005 sample 77
Table 3.8: Difference in predicted probability of a household being poor between 2004 and 2005 samples 77
Table 4.1: Outpatient visit study sample by year of survey 130
Table 4.2: Outpatient visit study sample by number of repeated surveys 130
Table 4.3: Utilization rates by outcome group and year of survey: Mean (standard deviation) 130
Table 4.4: Predictor variables by year of survey: Mean (standard deviation/ percent)... 131
vm
Table 4.5: Estimated rate ratios for Outcome 1: Overall utilization 132
Table 4.6: Estimated rate ratios for Outcome 2: Utilization by females 133
Table 4.7: Estimated rate ratios for Outcome 3: Utilization by poor 134
Table 4.8: Estimated (interaction) rate ratios for Outcome 3: Utilization by poor 135
Table 4.9: Estimated rate ratios for the three outcome groups excluding data from year 2004 136
List of Figures
Figure 1.1: A framework for post-conflict health systems rehabilitation 17
Figure 2.1: Boxplot of difference in point estimates 46
Figure 2.2: Boxplot of difference in confidence interval width 46
Figure 3.1: Kernel density plots for predicted total expenditure - 2004 & 2005 samples 74
Figure 3.2: Kernel density plots for wealth index: 2004 & 2005
samples 76
Figure 4.1: A framework to study the access and utilization of health services 128
Figure 4.2: Mean utilization by outcome group 129
ix
Chapter 1 Introduction
Armed conflicts are an unfortunate reality of this world. In the past thirty years,
more than fifty countries have experienced violent conflicts. These conflicts are most
common in the poorest and least developed countries. In 2000, among the twenty five
countries experiencing conflict, fifteen were from the low-income group (Gleditsch et al.,
2002). Conflicts are a wasteful use of precious national resources and the adverse effects
last longer than the actual conflict itself. In these poor countries, the diversion of social
and health expenditure to fund military spending makes the precarious health situation
worse (Waters et al, 2007).
The direct effects on public health are manifested in terms of a disproportionate
increase in morbidity and mortality, increased susceptibility to communicable diseases,
and long term disability in the population. The indirect effects are more widespread as
they affect every sphere of national well being. The destruction of infrastructure,
equipment and supplies leads to interruption in availability of essential goods like water,
food, and energy. The provision and quality of health care available to the general
population is reduced significantly (Toole et al, 2001). In addition, the foreign
investment decreases and the economic growth stagnates, and in some cases even
reverses. Increase in poverty and worse health situation are common short-term
consequences of armed conflicts (Bantvala & Zwi, 2000; Pedersen, 2002; World Bank,
1998).
Post-conflict reconstruction is a very time and resource intensive activity that
requires active involvement of the population in affected countries and the international
community (Waters et al, 2007). An initial response to the immediate needs of the
1
affected population is important, but economic and social development along with
rehabilitation of health systems is considered essential for long term peace and prosperity
(World Bank, 1998).
A good evidence base on the public health effects of conflict is increasingly
becoming available but studies to monitor and evaluate post-conflict reconstruction are
limited (Bantvala & Zwi, 2000; Waters et al, 2007). A number of problems make the
task of measuring the effects of conflict and the reconstruction efforts difficult. These
include methodological and theoretical shortcomings, inconsistencies in definitions and
terms, restricted access to certain areas and sources of information, lack of current data,
political manipulation of data, and resource constraints (Toole et al., 2001). The scarcity
of reliable, comprehensive data is considered one of the greatest challenges in evaluating
post-conflict reconstruction (Waters et al, 2007). There is an enormous need for
information on health and economic status in post-conflict countries. In the period after
cessation of fighting, this information provides guidance towards prioritization among
reconstruction efforts, donor coordination and policy formulation; while in the long run it
enables sustainability of programs and establishes legitimacy of the national governments
in these countries (Buse & Walt, 1997; Pedersen, 2002; Waters et al, 2007).
Using the example of post-conflict Afghanistan, in this thesis we identify three
specific problems related to lack of data, and provide potential solutions. The three
problems are:
1. Lack of a current sampling frame to enable probability based sampling of
population for baseline evaluation of health service delivery in a post-
conflict population.
2
2. Lack of easy to collect, reliable measures to track economic status and
poverty in a post-conflict population.
3. Lack of information on health service quality and utilization by the
disadvantaged - female and the poor population.
1.1 Conceptual framework
One framework for understanding the information needs for post-conflict
reconstruction, and therefore the linkages between the three studies included in this
document, is the framework proposed by Waters and colleagues for post-conflict health
system rehabilitation (Waters et al, 2007). The relevant parts of this framework have
been discussed in detail in the remaining part of this section, while the other parts are
explained in brief.
The main purpose of the framework proposed by Waters and colleagues is to
enable identification of commonalities across countries - in terms of the inputs and
policies necessary to make crippled health systems function effectively, equitably and in
a sustained manner (Figure 1.1).
The immediate context in terms of pre-conflict health system, the conflict itself
and the post-conflict rehabilitation is provided by national political and economic
framework. The wider international context beyond the national environment is
represented by the donors, as in modern conflicts the ensuing relief and rehabilitation are
strongly influenced by this group of actors.
The key inputs needed for post-conflict rehabilitation include financing, human
resources, physical infrastructure, information systems and essential drugs.
3
The principal policy issues include coordination among donors; political commitment by
host governments; partnership with NGO's; planning, prioritization, and integration of
health services; and the sustainability of the rehabilitation effort.
According to the framework, post-conflict rehabilitation of the health sector can
be viewed as three components: (1) an initial response to immediate health needs; (2) the
restoration or establishment of a package of essential health services; and (3)
rehabilitation of the health system itself. The three components are viewed as parts of a
continuum and where possible, should operate synergistically. There is an enormous need
for information on health and other aspects of the population to enable this synergism
among the three components.
The first step in rehabilitation is to address the immediate health needs of the
displaced and distressed population groups by providing services like: basic and
emergency curative health care, obstetric services, communicable disease control,
immunizations, and supplementary feeding programmes. The incorporation of this fast-
track response into a systematic medium and long term response is considered essential
for the successful reconstruction of the national health system and the first study in this
thesis caters to the information needs of policy makers at this crucial juncture by
evaluating the use of an outdated sampling frame for generation of baseline estimates.
The first study contributes to the pool of information required to anticipate future policies
and programmes and enables the movement towards the principle objectives of all health
systems - efficiency, equity, and positive population health outcomes.
In the second step, based on the information gathered in the relief phase, most
health sector rehabilitation efforts move to restore systematic delivery of essential health
4
services. These efforts focus on a package of cost-effective interventions that address the
greatest health needs of the population.
According to the framework, the implementation of a basic package of health
services should be accompanied by additional components of a comprehensive approach
to health system rehabilitation. In this third step, along with the restoration of essential
health services, additional resources should be directed towards the medium and long-
term needs in the areas of management, financing and health policy. The second and the
third studies in this thesis help in generating some of the required information to enable
this transition.
The second study provides a method to track poverty and economic status in the
post-conflict population. Multiple studies from developing countries have reported that
wealth is intricately linked to health in a population, with poor suffering from a greater
burden of disease (Gwatkin et al., 2005; Peters et ai, 2008; Wagstaff, 2002). A change in
the proportion of poor should prompt an appropriate change in the health policy so that
health services can be offered in an equitable and efficient manner.
Health challenges in post-conflict countries often exist in a broader context of
constitutional weakness with concentration of wealth and power in the hands of a military
and political elite being an important problem that the new national governments face
(Cox, 2001). In the fragile post-conflict environment, ensuring that opportunities for
growth are accessible to the poor is crucial for welfare of ordinary people as well as long
term peace and prosperity. At the national level, the method proposed in the second study
can help in restoring the economic balance by identifying the economically
5
disadvantaged groups, and thereby preferentially directing development programs
towards them.
The third study also provides information towards rehabilitation of health systems
by identifying characteristics of the delivery system that promote greater utilization by
population groups that tend to suffer the greatest burden of disease during and after the
conflict. With the overall long term objective of efficiency, equity and improvement in
population health outcomes in sight, the second study provides information on potential
users of the health system, while the third study provides equity oriented information on
the health system itself.
Using the example of post-conflict Afghanistan, all the three studies provide
guidance towards some of the methods that can be used for gathering important
information about the population and its health status. These studies can help the policy
makers and researchers in operationalizing an information system that can aid in
sustainability of programs and improve the legitimacy of the national government.
1.2 Study Context: Afghanistan
Afghanistan is a land locked country situated at the junction of the middle-eastern
crescent and South-east Asia. The country has suffered almost continuous conflict for the
past century. In recent times, Afghanistan's troubles started in 1979 with Soviet invasion,
followed by a long civil war that ended with Taliban gaining control over majority of the
country. The rule of Taliban led to complete international isolation of Afghanistan,
turning the situation for Afghans from bad to worse. The US intervention in 2001 led to
the removal of Taliban government, though certain parts of Afghanistan still remain
6
volatile and insecure due to a strong presence of Taliban in these areas. The provinces in
the south - Kandahar, Zabul, Uruzgan and Helmand have seen a resurgence of Taliban in
recent times, which is a major cause of concern for Afghan government and its
international partners.
At the fall of Taliban in 2001, the impoverished people of Afghanistan were left
with dysfunctional health system and widespread destruction and dilapidation of the
infrastructure in every sector. Afghanistan ranked among the bottom five countries on the
human development index, which incorporates information on life expectancy, GDP per
capita, literacy and school enrollment (UNDP, 2004). The new democratically elected
government of Afghanistan was charged with recreating a country-wide infrastructure,
including a health system to cope with some of the world's worst health indicators. The
maternal mortality ratio for the country was estimated to be higher than 1,600 per
100,000 live births, with the highest ever recorded ratio of 6,507, being reported from the
province of Badakshan (Bartlett et al, 2005). The infant mortality rate was estimated at
165 per 1000 live births and nearly one in four children died before their fifth birthday
(UNICEF, 2004b).
More than two decades of civil war, and the absence of a central government to
control or deliver services to the entire country, led to a situation where the information
available about health resources in Afghanistan was out of date and scattered. In
anticipation of a large-scale reconstruction in Afghanistan, the Ministry of Public Health1
(MOPH) and its partners decided to conduct a comprehensive inventory of all known
health facilities and related health resources. A comprehensive list of health facilities
1 Before 2004-05, the official name for the Ministry of Public Health was the Ministry of Health.
7
from various sources was created in April 2002 and surveyed by a team of surveyors
using a set of questionnaires specifically created for this purpose.
This assessment revealed a grossly inadequate system with unqualified, under
paid health professionals, unreliable health care facilities lacking in hygiene and proper
equipment, and unlicensed pharmacies selling adulterated drugs. In the immediate post-
conflict period, the ratio of health workers per 1000 population was very low. However,
within the available health workforce there was a relative excess of physicians with a dire
lack of workers among other categories. A majority of the facilities offered some type of
curative care services but severely lacked in provision of maternal and child health
services. In addition, among the available workforce the male to female ratio was
reported to be highly skewed in favor of males with large variations by type of facility.
The availability of health facilities for the general population was very inequitable with
large variations between and within provinces (Management Sciences for Health, 2002).
1.3 Problem description
Problem #1: Lack of a current sampling frame to enable probability based sampling of
population for baseline evaluation of health service delivery in a post-conflict population.
While the absence of a sampling frame of health facilities was circumvented by
surveying all the facilities in Afghanistan, the generation of population level estimates of
health service delivery and utilization presented the first problem that was included as
part of this thesis: the lack of a sampling frame that represented the population living in
Afghanistan in 2003.
8
The use of a sampling frame enables the selection of a random sample of people
that is representative of the population for which the estimates are being generated. In the
post-Taliban period, the first population based health survey of national scope was
conducted in 2003 by UNICEF to generate estimates of delivery practices, immunization
rates, and prevalence of diarrhea and acute respiratory infections (ARI) among children
(UNICEF, 2004a). This Multiple Indicator Clusters Survey (MICS) was required to
provide baseline data for planning a national health strategy to lay the foundations for
equitable, quality health care for the people of Afghanistan. The outdated population
census from the year 1979 was used as the sampling frame for MICS because it was the
only data source available at that time that provided information at a national level. The
survey implementers were well aware of the potential for biased results due to the
inability of 1979 census to account for changes in the population distribution over time.
This pragmatic decision was taken because no national census had been conducted since
1979 and there was an urgent need to collect data on population health, including seven
priority health service delivery indicators. A pre-census enumeration was conducted in
2004 providing an up-to-date source of population distribution and the opportunity to
revise the earlier estimates. A new set of sample weights was generated and used to
calculate provincial and national estimates. By enabling comparison of re-weighted
estimates with those originally reported in the MICS report, the new set of weights
provided an answer to the policy question on adequacy of baseline estimates generated
using an outdated sampling frame.
9
Problem #2: Lack of easy to collect, reliable measures to track economic status and
poverty in a post-conflict population.
In a fragile post-conflict environment, Afghanistan has been undergoing profound
economic, political and social change. Ensuring that the opportunities of developement
are accessible to the poor is crucial for welfare of ordinary people as well as long term
peace and prosperity. The second problem identified and studied as part of this thesis was
the lack of easy to collect, reliable measures to track economic status and poverty in a
post-conflict population.
Improvement in the living standards of the Afghan population has been an explicit
aim of the Government of Islamic Republic of Afghanistan and the donor community. A
pertinent example of this emphasis is the Afghanistan National Development Strategy
(ANDS), which is the centerpiece of Government of Afghanistan's National
Development Framework. ANDS has been produced as a major collaboration between
Afghan and international community to promote growth, generate wealth and reduce
poverty and vulnerability in Afghanistan (T.I.S.A., 2004).
There have been reports that while most of the rural Afghan economy has been
benefiting from economic growth and increase in agricultural harvest, the poorest
sections of the society are still lagging behind (World Bank, 2005). The assessment of
living standards of the population and reduction in poverty is a growing priority for
public policy in Afghanistan. Regular information on economic status over short periods
of time is needed to assess the effects of development efforts on the populations as well
as to identify population groups that might need targeted interventions to improve their
health and develop economically.
10
In Afghanistan, logistical concerns of restricted access to unstable areas and
ongoing security problems favor a more expeditious approach to measuring living
standards. In order to assess the change in economic status over short periods of time,
there is a need for clear indicators that are reliable, easy to collect and easy to verify.
Household income and consumption are the most widely used measures of
economic status in developing countries and have strong theoretical foundations in utility
theory. These measures are absolute in nature. They are considered to be important in
understanding the economic aspect of poverty as consumption is widely used to generate
poverty thresholds (lines) in many countries (Hentschel & Lanjouw, 1996). Consumption
and income surveys require extensive resources of time, money, and personnel, making
them unwieldy for purposes of tracking economic inequality in a population. On the other
hand, regular data collection on asset variables is easier and less resource intensive than
regular income or consumption surveys. Survey modules for asset variables require fewer
questions, which can be collected from a single respondent in a household. The use of
asset variables to rank households and assess the effect of economic status on health
outcomes is fairly common; however, limited research has been conducted on the use of
asset variables to generate an absolute measure of economic status like consumption
expenditure. An urgent need for practical measures for steadily tracking poverty emerged
from international endorsement of Millennium Development Goals and led to recent
studies that have used advanced prediction techniques to link the asset variables directly
to household consumption (Mathiassen, 2007; Stifel & Christiansen, 2007). These studies
provide an inexpensive and efficient technique to utilize information on asset variables
and estimate a measure of economic status that is absolute in nature. The authors
11
employed out of sample prediction techniques to estimate household consumption over
time and generated robust measures to track poverty and inequality in a population.
In this study, we have used the asset variables to assess difference in economic
status and poverty levels between two population samples collected at an interval of one
year. This was done by comparing the results of principal components analysis (PCA)
and out of sample prediction by estimating analogous measures using each of the two
techniques. The two outcomes estimated using out of sample prediction were total
household expenditure and the probability of a household to spend less than $2 US
dollars per day.
Problem #3: Lack of information on effect of health service quality on utilization by the
disadvantaged - the female and the poor population.
Based on the information collected from national surveys like ANHRA and
MICS, the Ministry of Public Health (MOPH) worked closely with development partners
to define a strategy for rapidly expanding the geographic scope and quality of health
services. In 2003, the MOPH and its partners identified a core set of basic health services
and included them in a Basic Package of Health Services (BPHS). The BPHS was an
important policy milestone with streamlining of a fragmented health sector as its primary
goal. The BPHS consisted of cost-effective primary care services designed to meet the
priority needs of rural population, particular women, children and other vulnerable
groups. The MOPH used the BPHS as a central element of its National Health Policy to
"strengthen the delivery of sustainable, quality, accessible health services, especially
12
targeted at women, through planning for, and effective and efficient implementation of
the basic package of health services"(MOPH, 2003a, 2003b).
By 2004, BPHS was being implemented by more than 1,000 health facilities in
the 33 provinces of Afghanistan. There have been encouraging reports of increase in
utilization of health services in the past few years, especially by the female and the poorer
sections of Afghan society. The quality of services provided at health facilities has also
shown improvement (JHU and IHMR, 2008a). However, the association between quality
improvements and service utilization had not been studied in Afghanistan. Increase in
utilization of health services by the poor and females and improvement in quality of
health services are both important policy concerns in Afghanistan. In a majority of
developing countries, the poor and females not only suffer from a greater burden of
disease, but also utilize health services of lower quality. This study was conducted to
assess whether the quality improvements were associated with increase in use of services
by the disadvantaged groups - the poor and females. Of particular interest was to assess if
certain characteristics of health care delivery promoted greater utilization by these
disadvantaged groups. This study investigates the impact of health system development
in Afghanistan on utilization of health services by females and the poor over a period of
four years.
1.4 Relationship between thesis papers and the project from which the data
derive
All three studies in this thesis are based on data from the Afghanistan Monitoring and
Technical Support Project. Since early 2004, The Johns Hopkins University and Institute
13
of Health Management Research have been contracted by the Ministry of Public Health
of the Islamic Republic of Afghanistan to provide technical assistance in a broad range of
areas, including:
1. Developing a framework for monitoring performance in delivery of a Basic
Package of Health Services
2. Conducting primary care facility performance assessments throughout the country
on an annual basis
3. Conducting analysis of surveys implemented by other agencies, including the
2003 Multiple Indicator Cluster Survey and the 2005 National Risk and
Vulnerability Assessments
4. Developing a framework for monitoring performance in delivery of hospital
services
5. Conducting hospital performance assessments throughout the country on an
annual basis
6. Conducting household surveys to assess care seeking behaviors and health
expenditures
7. Conducting a community randomized trial of health financing pilots
8. Conducting a community randomized trial of safe water systems
9. Conducting an assessment of capacity building and learning needs at the Ministry
of Public Health and Provincial Public Health Offices
10. Conducting an assessment of the quality of drugs at primary care facilities
throughout the country and private pharmacies in five major cities
14

11. Conducting an assessment of the performance of community health workers and
their potential to contribute to health improvements in Afghanistan
12. Designing the health module for the 2007 National Risk and Vulnerability
Assessment
13. Advising on the development of monitoring and evaluation plans in other
departments within the Ministry of Public Health, and providing assistance to
Ministry of Public Health leadership and technical staff in the interpretation of
data and its applications for policy development and decision-making
14. Building the capacity of Ministry of Public Health staff in collecting, analyzing
and interpreting data
A large number of staff in Baltimore and Kabul has worked on the Afghanistan
Monitoring and Technical Support Project. I had been employed by the Johns Hopkins
University from June 2004 till June 2007 to work on this project. My role, as it pertains
to the content of this thesis, included the following:
• Participate in survey design, instrument development, training and field
implementation of the National Health Services Performance Assessment
• Participate in the development of the Afghanistan Health Sector Balanced
Scorecard and selection of domains and indicators
• Participate in finalizing the operational definitions and protocols for analyzing
the indicators on the Balanced Scorecard
• Participate in conducting analysis for the indicators on the Scorecard in 2004,
2005, 2006 and 2007
15
• Participate in finalizing the toolkit to provide detailed information on how the
Balanced Scorecard was developed and implemented in Afghanistan.
• Participate in analysis of surveys implemented by other agencies, including the
2003 Multiple Indicator Cluster Survey and the 2005 National Risk and
Vulnerability Assessments.
1.5 Organization of thesis document
This document is organized as follows:
• Chapter two looks at the effect of an outdated sampling frame on adequacy of
health care delivery estimates in post-conflict Afghanistan.
• Chapter three looks at the use of household asset data to measure living standards
and tracking poverty in post-conflict Afghanistan
• Chapter four looks at the equity effects of quality improvements on health service
utilization in post-conflict Afghanistan
• Chapter five provides a summary of the findings and recommendations for policy
makers
The figures and main tables for each study are placed at the end of the specific study.
Additional tables for chapters 2 and 4 are presented in appendix 1 and 2 respectively.
16
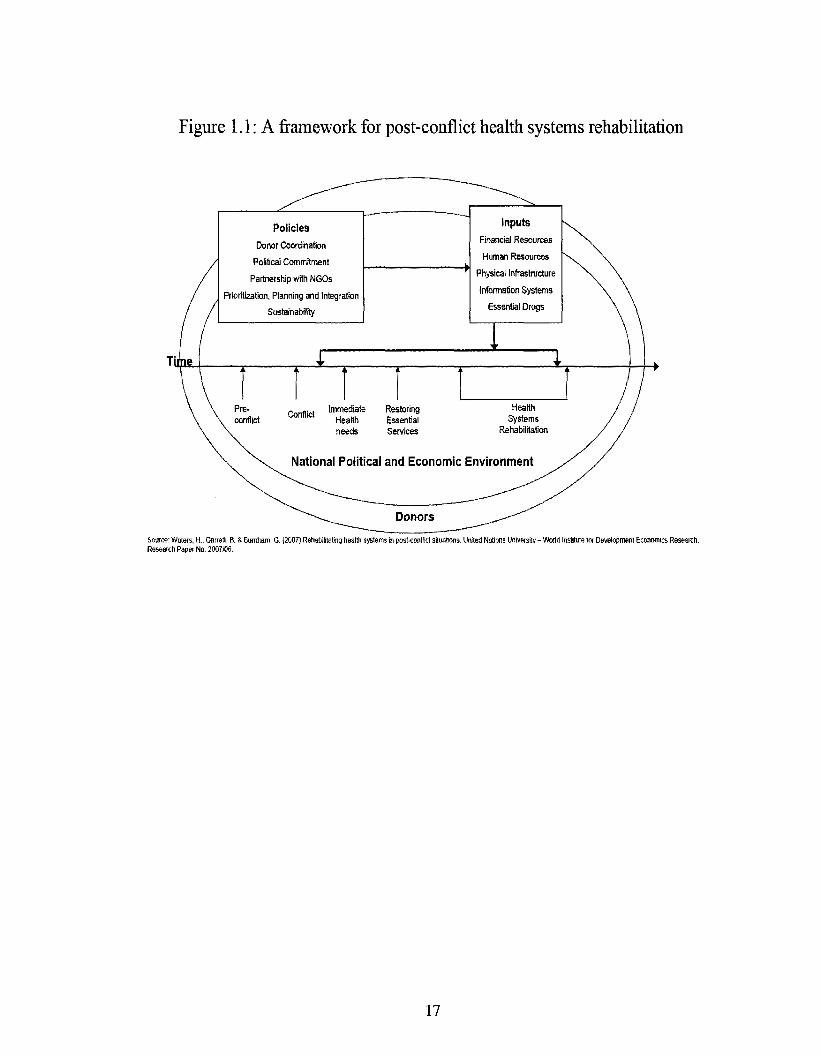
Figure 1.1: A framework for post-conflict health systems rehabilitation
Soiree: Waters, H„, Garrett, B. & Bumtiam, G. {200?) Rehabilitating health system in post-conflict situations. Unfed Nations University - Weald ii Research Paper No. 2007106.
for Development Economics Research.
17
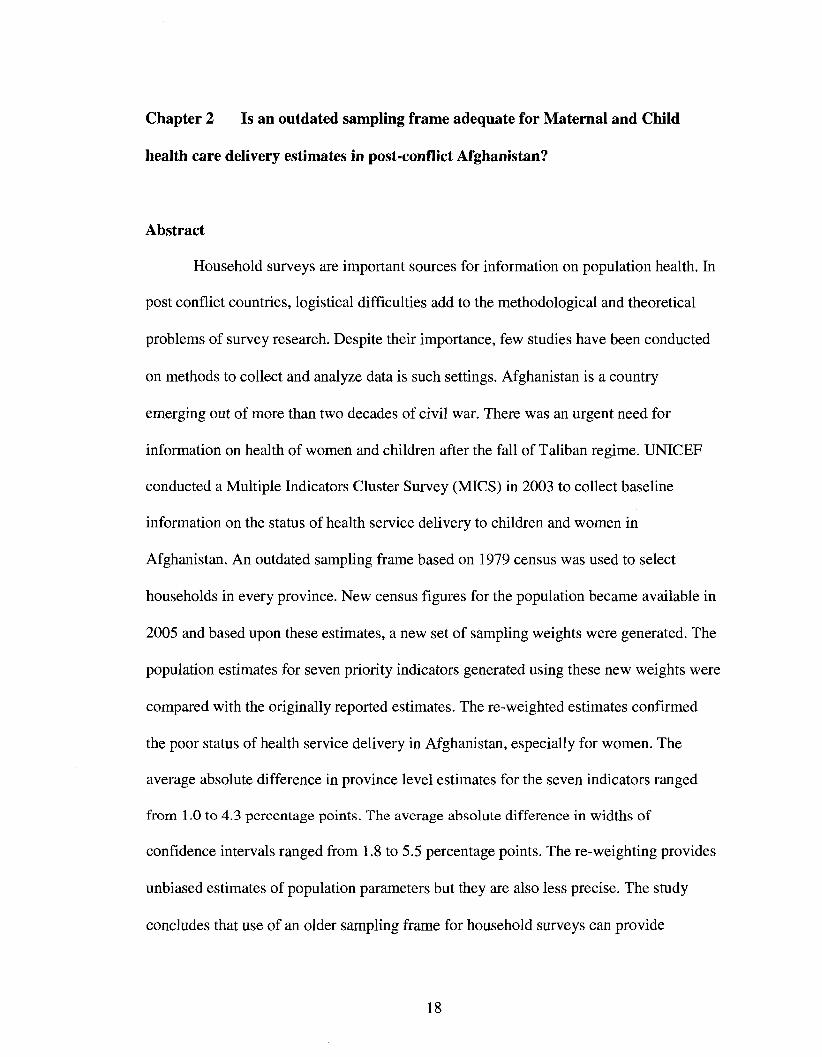
Chapter 2 Is an outdated sampling frame adequate for Maternal and Child
health care delivery estimates in post-conflict Afghanistan?
Abstract
Household surveys are important sources for information on population health. In
post conflict countries, logistical difficulties add to the methodological and theoretical
problems of survey research. Despite their importance, few studies have been conducted
on methods to collect and analyze data is such settings. Afghanistan is a country
emerging out of more than two decades of civil war. There was an urgent need for
information on health of women and children after the fall of Taliban regime. UNICEF
conducted a Multiple Indicators Cluster Survey (MICS) in 2003 to collect baseline
information on the status of health service delivery to children and women in
Afghanistan. An outdated sampling frame based on 1979 census was used to select
households in every province. New census figures for the population became available in
2005 and based upon these estimates, a new set of sampling weights were generated. The
population estimates for seven priority indicators generated using these new weights were
compared with the originally reported estimates. The re-weighted estimates confirmed
the poor status of health service delivery in Afghanistan, especially for women. The
average absolute difference in province level estimates for the seven indicators ranged
from 1.0 to 4.3 percentage points. The average absolute difference in widths of
confidence intervals ranged from 1.8 to 5.5 percentage points. The re-weighting provides
unbiased estimates of population parameters but they are also less precise. The study
concludes that use of an older sampling frame for household surveys can provide
18
adequate baseline estimates for planning and policy implementation in post-conflict
countries. However, the policy makers and researchers should be very aware that this
inexpensive correction in bias is not a substitute for more complex evaluation designs,
which are needed to assess trends and rule out the effect of external factors on health
system performance.
2.1 Introduction
Population surveys are important tools for planning and monitoring health
programs in developing countries. These surveys are also used for performance and
impact evaluation of public health programs. These summative evaluations influence
significant policy decisions on program continuation, allocation of resources and
restructuring (Rossi et al, 1999). In recent times, as a greater proportion of decisions on
program oversight are directly based on these results, such use of evaluation results is
also referred to as 'instrumental' use of evaluation results (Habicht et al, 1999). This
'instrumental' use enables the decision makers to ascertain what information is necessary
for the decision-making, unlike earlier situations when evaluations affected programs and
policies less directly, through changing perceptions.
The basic approach in population based surveys is to collect information from a
random sample of people which is representative of the population (Levy & Lemeshow,
1999). The sampling and data collection is usually conducted in multiple stages to
overcome constraints of time, money and other logistical concerns. Demographic and
Health surveys (DHS) and Living Standards Measurement surveys (LSMS) are examples
of such surveys that provide valuable information on health and economic status in
19
various developing countries. In order for the results to reflect the situation in the
population from which the data are collected, the sampling scheme must be incorporated
in the analysis. This usually requires the use of sampling weights and statistical
techniques to accommodate the multi-stage sampling design. The purpose of weighting
sample data is to assure the representativeness of the sample vis a vis the study
population. The inverse of the selection probability of a sampled unit is used as the
sample weight for that unit. The population estimates generated without sampling
weights and adjustments for multi-stage cluster design could be biased (Korn &
Graubard, 1999; Levy & Lemeshow, 1999). Despite the importance of surveys, research
into this aspect of survey methods is limited. This is especially true in post-conflict
settings where logistical concerns such as restricted access to unstable areas and ongoing
security problems add to the methodological and theoretical shortcomings. The lack of
good routine health information systems, vital registration systems and census data, make
household surveys indispensable in such countries (Bostoen et al, 2007).
The country of Afghanistan is emerging out of more than two decades of civil war
and unrest. The long civil war, the reign of the Taliban, and invasion by the United States
led to massive destruction of infrastructure in the country. At the time of fall of the
Taliban regime, information on health and economic status of the population was very
limited and if available, outdated. Since 2002, the Afghanistan Ministry of Public Health
(MOPH) has pursued a health strategy to "lay the foundations for equitable, quality
health care for the people of Afghanistan" (MOPH, 2003a). The MOPH and other
stakeholders required baseline data for planning, implementation and monitoring of this
health strategy. In the post-Taliban period, the first population based health survey of
20
national scope was conducted by UNICEF and the Central Statistics Office (CSO)
Afghanistan for the MOPH in 2003. This Multiple Indicator Cluster Survey (MICS) used
the outdated population census from the year 1979 for sampling. The survey
implementers were well aware of the potential for biased results due to the non-
representative sampling frame. This pragmatic decision was taken because no national
census had been conducted since 1979 and there was an urgent need to collect
information on population and health estimates (UNICEF, 2004a). A pre-census
enumeration was conducted in 2004-05 providing an opportunity to revise the earlier
estimates. In the present study, a new set of sample weights was generated and used to
calculate provincial and national estimates for seven health service delivery indicators.
These seven indicators (Table 2.1) were considered a top priority by the MOPH and had
definitions that were similar to those of the earlier/original MICS report. The new set of
weights provided a unique opportunity for research into survey methods. This study
compared the re-weighted estimates with those originally reported in the MICS report.
This enabled the measurement of the effect of sampling weights and adjustments for
multi-stage clustered data collection on estimates.
This study had two objectives:
1. Calculate re-weighted estimates for the seven indicators by generating new
weights and using appropriate analytic procedures to account for the multi-stage
clustered sampling design.
2. Compare originally reported estimates with estimates generated using the new
weights to assess the effect of weighting.
21
The MICS survey was the first quantitative evaluation of health programs
implemented in post-Taliban period and provided baseline estimates for future
evaluations of health system performance in Afghanistan. The estimates from MICS have
been put to 'instrumental' use as official health indicators for Afghanistan and have
directly affected health policies and programs in Afghanistan (MOPH, 2004). These
country-wide data for Afghanistan have become more important recently as the MICS
survey from 2003 is one of the few household surveys to date with a national scope and
the health of the population as the specific focus.
2.2 Methods
Original MICS Methodology
Sampling frame
The target population for the MICS survey was the sedentary population of
Afghanistan living in 32 provinces2. The survey planners understood the potential effects
of population displacement due to civil war and change in mortality over time but the
need to generate population estimates was considered urgent. It was decided to use two
sources of data for the sampling frame; the 1979 census data and the National
Immunization Day (NID) coverage data. Both sources had strengths and limitations. The
census data were collected for every province in 1979 using a standardized format, but
these data were 25 years old. The NID data were produced based on the NID coverage in
every (at least yearly) round after 2002. These data were current but some areas of the
country had incomplete coverage and the format of the data in NID was not standardized
for all the provinces. The survey planners carried out a comparative analysis to determine
2 Provinces of Panjsher and Daykundi were created after MICS 2003 survey.
22
the better sampling frame and it was apparent that census data were better to use for rural
areas and the NID for the six largest cities (UNICEF, 2004a). The sampling frame
excluded a number of villages due to loss of 1979 census documents over so many years.
The loss was estimated as 10% of all villages spread over the country. In light of this loss
of data over time, the information from the census that was available at the time of
sampling is provided in table A2.1 of the appendix. Table A2.2 in the appendix is the
updated version released later by the CSO Afghanistan after the completion of actual data
collection for MICS 2003.
Sample size and sample design
The indicators which required the largest sample size were those dealing with
vaccinations. The target group for these indicators was children 12-23 months of age.
An earlier MICS survey estimated that there were 0.26 children aged 12-23 months per
household (UNICEF, 2000). It was desired to estimate immunization coverage at the
province level with a precision of 10%. With this specified and assuming a design effect
of 1.5, the needed sample size was 138-144 children aged 12-23 months in every
province. This figure would be met by surveying 550 households in every province
assuming an immunization prevalence of 50%. The sampling error would be lower for
indicators for which target age groups were broader e.g. Vitamin A supplementation.
A multi-stage cluster sampling was used for the 32 provinces. Information on the
number of households in each village and town of every province was collected from the
1979 census database. A total of twenty clusters was systematically selected without
replacement in each province with probability of selection being proportional to size
23
(PPS), where size was the number of households in a cluster. These clusters were
specified as the primary sampling units (PSU). No attempt was made to exclude villages
and towns that were part of the provincial center district except for provinces where the
six largest cities were located. In order to collect information on 550 households per
province, the total number of households surveyed in every cluster ranged from 27 to 28.
For the six largest cities, the 1979 census had data on the total number of households and
persons only, with no breakdown of the reported figure by clusters. This made these data
unusable for sample site selection by systematic PPS methods. Information on children
under-five years of age and number of households collected as part of yearly national
immunization day (NTD) was used for sampling the clusters in each of the cities. For each
of the six largest cities except Kabul, 20 clusters were selected. Twenty-five clusters were
selected for Kabul city, owing to its larger size. The MICS sample had information on a
total of 20,804 households available for analysis after collection and data cleaning
(UNICEF, 2004a).
Stratification
Data were collected to represent 38 strata (domains); the 32 provinces and the six
largest cities constituted these 38 strata. The number of households sampled and surveyed
in each strata is reported in table A2.3 of the appendix.
Selection of households in a cluster
In each of the 32 provinces, a cluster was a village or a town, with the exception
of six cities where a segment (described in detail later) was considered as a cluster. A
24
household was defined as the people (men and women) usually taking their meals from
the same cooking pot, and those who share household assets and accumulate their
earnings to procure food and other household materials. The possibility of a
dwelling/structure being inhabited by more than one household was considered and
surveyors were instructed to count each household separately in such cases. In each
sampled cluster the number and location of households was verified with the elderly local
residents and a sketch map indicating well known landmarks like mosques, schools, and
health centers was prepared. Every sampled cluster was partitioned into segments of
approximately 55 households each and one segment was selected randomly (Tables A2.4
and A2.5). All households in the selected segment were listed separately even if they
lived in the same structure, such as an apartment house or multi-family compound, and
every alternate household was interviewed with a random start (1st or 2nd). Data were
collected on the number of households in a sampled dwelling, numbers of males and
females in the house, languages spoken in the household, and a limited number of other
variables pertaining to the availability of public infrastructure in the cluster (e.g. road
conditions, schools, clinics). The selection of households in sampled clusters that were
part of the provincial center district/town according to 1979 census was conducted
similarly. The primary purpose of the MICS survey was to generate provincial estimates,
and the villages as well as the towns were selected as part of the 20 sampled clusters in
every province using the PPS technique.
A slightly different sampling methodology was used in the six cities where
information on geographically identifiable segments was available either from the
National Immunization Day (NID) or UN Habitat records. These segments with distinct
25

boundaries and information on number of households and number of under-five children
were created to plan and implement the vaccination drives as part of NID. These
segments were analogous to the clusters in the 32 provinces. A segment in each of the
cities was sampled randomly as all segments were of roughly equal size and PPS
technique would have had no additional benefit. The sampled segment in four of the six
cities was divided into a number of sub-segments of approximately 55 households each
after consulting the elderly local residents. These four cities were Kunduz, Jalalabad,
Kandhar and Mazar-e-sharief. The sub-segments were numbered sequentially and one
sub-segment was selected at random. The sub-segment, thus selected, was listed and
every alternative household was interviewed. In the remaining two cities of Kabul and
Herat, information on household listing was available in each segment; therefore
households were selected randomly within each segment without creating any sub-
segments.
Though a formal ethics committee was not constituted to review the MICS survey
questionnaire, representatives from the MOPH, Ministry of Rural Rehabilitation and
Development (MRRD), Kabul University, international agencies and non-governmental
organizations were involved in the technical review of the survey. The committee
reviewed the entire questionnaire and the methodology. Consent was taken at the
beginning of the questionnaire and the interviewer read out the statement before
administering the questionnaire.
26
2004 Pre-census Data Collection
During 2004, the Central Statistics Office (CSO) Afghanistan sent teams to
conduct door-to-door counts in 29 of 32 provinces, missing only three provinces where
the conditions were deemed too dangerous to send field workers. This pre-census laid the
ground work for future censuses by providing codes for each province, district, village,
sub-village (in large villages), urban sector (nahia), and block. Households were also
numbered. Standardized quality assurance procedures were followed, including several
layers of supervisory teams and systematic re-collection of data from selected sites to
ensure consistency. Based on this work, the CSO published the official population figures
for all provinces (CSO, 2005-06). While the figures for 29 provinces were based on
complete enumeration, the figures for three unsecure provinces were based on
enumeration as well as projections based on demographic models. This study used this
information (refer to table A2.6 in appendix) to generate a new set of sampling weights.
Sampling weight generation based on 2004 pre-census
The original MICS sample was designed to be self-weighting within a province.
Sampling weights were utilized to get estimates representative at the national level. The
original reported estimates did account for the multi-stage clustered design during the
analysis.
To generate weights for the analysis, we could not consider the sample as self-
weighting because the population distribution of Afghanistan changed significantly
between 1979 and 2004. There were massive internal and external population
displacements, causing significant changes in number and distribution of people in the
27
country. The list of villages and towns based on the 1979 census was outdated and
incomplete as new villages had come into existence while some villages had disappeared
due to migration, war, and natural disasters like floods and draughts. In addition, in
Afghanistan there is widely prevalent tradition of naming a village after the name of its
village head. The 1979 census was outdated as the replacement of village heads during
the long gap of 25 years and consequent renaming was not accounted for in the 1979 data
(JHU and IHMR, 2005a). Another argument against self-weighting was the selection of a
segment in majority of the sampled clusters as the households were selected randomly
only in the sampled segment, not in the whole cluster. In this re-analysis, the sampling
design was used to generate new sampling weights as the sample was no longer
considered self-weighting. The sampling weight for every sampled household in a
province was the inverse of the selection probability of that household. In order to
aggregate the sample results at the national level, an additional factor was introduced in
the sampling weight calculation for national estimates only.
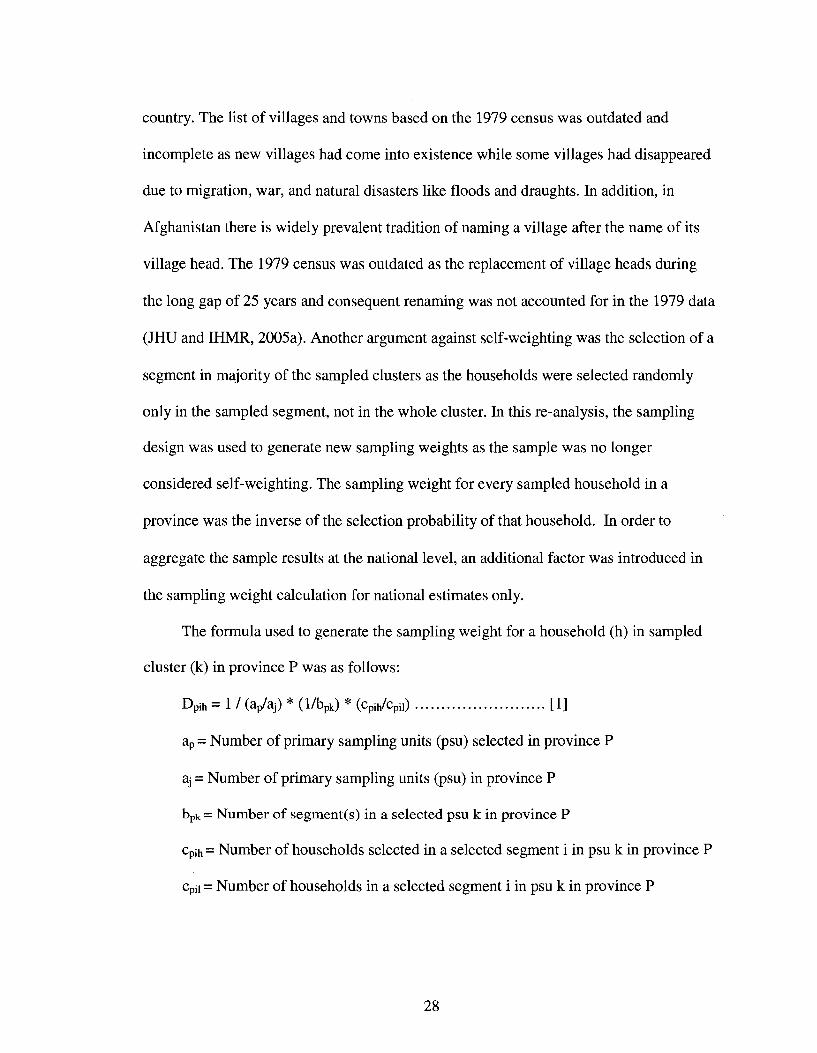
The formula used to generate the sampling weight for a household (h) in sampled
cluster (k) in province P was as follows:
Dpih = 1 /(ap/aj) * (1/bpO * (cpih/cpn) [1]
ap = Number of primary sampling units (psu) selected in province P
aj = Number of primary sampling units (psu) in province P
bPk = Number of segment(s) in a selected psu k in province P
Cpih = Number of households selected in a selected segment i in psu k in province P
cPii = Number of households in a selected segment i in psu k in province P
28
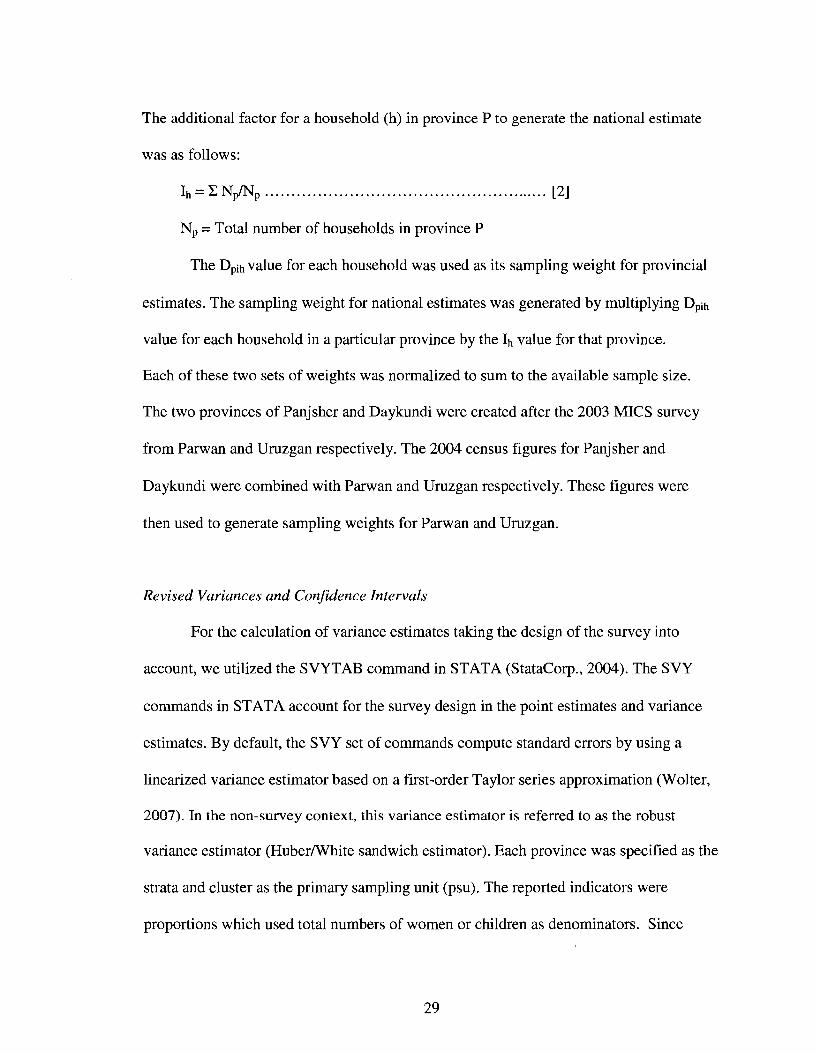
The additional factor for a household (h) in province P to generate the national estimate
was as follows:
Ih = £Np/Np [2]
Np = Total number of households in province P
The Dpih value for each household was used as its sampling weight for provincial
estimates. The sampling weight for national estimates was generated by multiplying Dpih
value for each household in a particular province by the Ih value for that province.
Each of these two sets of weights was normalized to sum to the available sample size.
The two provinces of Panjsher and Daykundi were created after the 2003 MICS survey
from Parwan and Uruzgan respectively. The 2004 census figures for Panjsher and
Daykundi were combined with Parwan and Uruzgan respectively. These figures were
then used to generate sampling weights for Parwan and Uruzgan.
Revised Variances and Confidence Intervals
For the calculation of variance estimates taking the design of the survey into
account, we utilized the SVYTAB command in STATA (StataCorp., 2004). The SVY
commands in STATA account for the survey design in the point estimates and variance
estimates. By default, the SVY set of commands compute standard errors by using a
linearized variance estimator based on a first-order Taylor series approximation (Wolter,
2007). In the non-survey context, this variance estimator is referred to as the robust
variance estimator (Huber/White sandwich estimator). Each province was specified as the
strata and cluster as the primary sampling unit (psu). The reported indicators were
proportions which used total numbers of women or children as denominators. Since
29
these were not fixed for a given province, but are random variables, we estimated the
variance of a ratio. This estimation is done automatically when this type of analysis is
specified in the ST ATA program. For proportions, the confidence interval is derived
using a logit transformation so that the interval lies between 0 and 1 (StataCorp, 2004a).
Results for 32 provinces were presented in tabular form and box plots were used
to summarize the findings. The three out of the total of seven indicators on health service
used to describe delivery to women were: 1) mother's last delivery assisted by unskilled
birth attendant; 2) married women currently not using a method to delay pregnancy, and;
3) antenatal consultation not taken from a doctor or trained birth attendant during the last
pregnancy. The four out of the total of seven indicators that provide information on
health service delivery to children were: 1) Children aged 6-59 months who have not
received vitamin-A supplementation; 2) Children aged 9-59 months who have not
received measles immunization; 3) Children aged 12-23 months who have not received
three doses of DPT immunization, and; 4) Children under five years of age who have not
received BCG immunization.
Estimates for the seven indicators from the original MICS report were compared
with values calculated after re-weighting. The definitions of the seven indicators that
were included in this study were the same as in the original MICS report. This was
confirmed by a separate analysis conducted with the weights used in the original report.
In addition, rural and urban estimates have not been compared as the sampling for the
original MICS survey was intended to provide provincial and national estimates only.
Generating weights to derive separate rural and urban estimates would have deviated
from the sampling scheme followed in most of the provinces; therefore it was not done.
30
2.3 Results
Revised point estimates and confidence intervals
We calculated the revised estimates for the seven indicators for each of the 32
provinces and the nation (Tables 2.2 and 2.3), as well as the revised estimates of
confidence intervals for each of the 32 provinces and the nation (Tables 2.4 and 2.5). A
higher point estimate for any reported indicator represented a worse situation. The results
were reported in this format to make comparisons with the original MICS report more
intuitive and clear.
Three out of the seven indicators were related with health service delivery to
women (Table 2.2). The provincial and national estimates had high values representing
the poor status of health service delivery to women. The provinces of Samangan and
Takhar had the lowest (57.7) and the highest (99.5) percentage of deliveries conducted by
unskilled birth attendants respectively, with a national estimate of 87.4 %. The lowest
estimated percentage of married women under 50 years not using a family planning
method was in Herat (59.1) and the highest was in Paktika (99.8), with a nationwide
figure of 91.2%. The percentage of pregnant women who did not receive any antenatal
care from a skilled professional ranged from 54% (Kabul) to 99.8% (Badghis) with a
national estimate of 86.1 %.
Four out of the seven indicators were related with health service delivery to
children (Table 2.3). The results for these indicators reflected a better situation for
children as compared to women in Afghanistan. Among the four indicators, incomplete
DPT immunization in 12-23 month old children had the highest national estimate (71%)
31
with provincial estimates ranging from 29.6% (Nangarhar) to 98 % (Helmand). Absence
of vitamin A supplementation in 6-59 month old children had the lowest nationwide
estimate (12.6%) among the four child health service delivery indicators. The province of
Badakshan had the lowest estimate (2.8%) for absent vitamin A supplementation to
children while the province of Ghazni had the highest (46.2%). The lowest estimated
percentage of children 9-59 months of age who had not received measles immunization is
in Logar (6.6%) and the highest was in Ghor (47.6%), with a nationwide figure of 23.7%.
The percentage of children under five years of age who did not receive BCG
immunization ranged from 14.1% (Logar) to 79.2% (Baghlan) with a national estimate of
41%.
Comparison of point estimates
The re-weighted MICS estimates for all seven indicators were compared with the
original estimates (Figure 2.1). Almost all of the original estimates were within ten
percentage points of the re-weighted estimates and the median difference across
provinces was close to zero for every indicator. The average absolute difference (re-
weighted - original) for the province level estimates ranged from 1.0 to 4.3 percentage
points across the seven indicators. The difference in national estimates ranged from -1.7
to 2.2 percentage points. In addition, the provinces were ranked for each indicator based
on the point estimate. The provinces with the five highest and the five lowest values were
compared. The provinces included among the five highest and lowest were similar
though the relative ranking within the groups of five was not identical. Four out of five
32
provinces were same for all indicators except the indicator on DPT immunization where
only three highest ranked provinces were same.
Comparison of confidence intervals
The widths of 95% confidence intervals for the re-weighted estimates were
compared with original estimates (Figure 2.2). The median difference in width between
re-weighted and original 95% confidence intervals (CI) was very close to zero for every
indicator. The average absolute difference in confidence interval widths ranged from 1.8
to 5.5 percentage points across the seven indicators. The difference in CI width for
national values ranged from 0.2 to 2.5 percentage points.
2.4 Discussion
Re-weighted point estimates
The re-weighted estimates presented a poor picture of health service delivery in
Afghanistan. On a relative scale, the situation for women was worse than that of children.
Afghanistan is among the three countries with highest maternal mortality ratios in the
world with an estimate that ranges between 1600-1900 deaths/ 100,000 live births
(MOPH, 2004). The three indicators for health delivery for women are important direct
determinants of maternal mortality. The extremely high levels of deliveries being
conducted by unskilled attendants, poor status of antenatal care utilization and low levels
of family planning are important factors contributing to the high number of maternal
deaths in Afghanistan.
33
The child mortality estimates for Afghanistan have always been among the
highest among the world (UNICEF, 2006). According to the child survival series
published in The Lancet, Afghanistan belongs to the group (profile) where 48 percent of
deaths are attributed to pneumonia and diarrhea and 34 percent to causes in the neo-natal
period (Black et ah, 2003). According to UNICEF, measles has been one of the major
killers in Afghanistan, contributing to about 35,000 under five deaths per year. In 2001,
Afghanistan still had the second highest number of under five deaths due to measles in
the world. Immunization campaigns in the form of National Immunization Day were the
first health initiative taken up by the government of Afghanistan after the fall of the
Taliban. Successive NID campaigns enabled immunization of millions of children,
especially against measles, polio, and tuberculosis. In addition, supplementation with
Vitamin A was also an integral part of these NID campaigns (UNICEF, 2006). The child
health service delivery estimates presented in this study probably reflected the situation
that had resulted due to these efforts. The maternal and child health estimates reported in
this study were in conformity with the best estimates report published by UNICEF in
2006 (UNICEF, 2006). This report by UNICEF conducted a thorough search of all
available information on Afghanistan related to women and children and generated
estimates that could be agreed upon by various stakeholders. The indicators were
calculated from both adjusted survey results and using models and indirect deductive
estimates.
Comparison of point estimates and confidence intervals
34
There are only a few reliable sources of information on population in most post-
conflict situations and countries under conflict. Afghanistan is an extreme case of
uncertainty due to long duration of the conflict, deprivation and migration. In such a
country with restricted geographic access and limited availability of female surveyors3,
the MICS study team relied on the outdated 1979 census for a sampling frame in order to
gather important health information in a short period of time.
This analysis, with adjusted sampling weights and clustered sampling design
based on 2004 census data, provided unbiased provincial and national estimates. Use of
sampling weights for weighted estimation is a widely agreed method for descriptive
analysis of population (Korn & Graubard, 1999; Levy & Lemeshow, 1999). While
sample weights and adjustment for multi-stage clustered design provide unbiased
estimates, these adjustments increase the variance of the estimates (Korn & Graubard,
1999; Rust, 1985). This study provided a unique opportunity to measure the bias that can
arise from using incorrect sampling weights in the analytic process. The estimates from
original report have incorrect sampling weights but they do account for the clustered
sampling design. The study found that the average difference in the value of point
estimate was not high though the difference in precision varies greatly. The re-weighted
estimates were less biased estimators of population parameters than the originally
reported estimates. The re-weighted estimates had wider confidence intervals and greater
uncertainty around them. By using available current information about the population,
this study utilizes an inexpensive and relatively quick technique of re-weighting to
measure health service performance in Afghanistan. Re-weighting reduces the need for a
new survey, which usually requires significant commitment of time and money.
3 Teams of female interviewers were used in all the provinces except three remote insecure provinces.
35
One of the most important limitations of this study that might have affected the
findings reported is that the villages and settlements that were created after 1979 had a
zero probability of selection. We were aware of the potential bias that might have been
created, but this analysis could not adjust for these missing sampling units. However, in
order to estimate the bias due to these missing sampling units (villages), a useful
technique could have been employed right after the 2004 pre-census. A representative
sample of households from only those villages that were created after 1979 could have
been selected using a sampling technique similar to original MICS survey and the
calculated estimates could have been compared to the re-weighted estimates. The
comparison of these estimates with re-weighted estimates would have allowed a precise
measurement of the bias due to missing villages in 1979 census.
Another issue was that of using number of households as the denominator for
generating sampling weights instead of the number of women and children. The original
report published by UNICEF had used the number of households for sampling as well as
generating sampling weights. All the comparisons in this study were based on sampling
weights generated from number of households in every province. In developing countries
like Afghanistan where the criterion for eligibility for an individual interview is "ever
married women under 50 years of age", there are generally about 1.0 such women per
household (Verma et al., 1980). The number of households is used as the denominator in
calculating sampling weights for household surveys in developing countries as the
probability of a different result using number of women is very low.
Despite these limitations, the findings in this study have important implications
for policy makers, donors and health researchers in post-conflict settings. In the
36
immediate post-Taliban period a number of baseline assessments were conducted by the
Ministry of Health in Afghanistan to create a framework for national health policy and its
implementation. Afghanistan National Health Resource Assessment (ANHRA) and
MICS were two such examples aimed at baseline evaluation of health infrastructure and
health performance respectively. The MICS 2003 was a cross-sectional survey targeted
primarily towards the needs of policy makers and donors. It had the specific aim of
providing baseline data for planning and evaluation of interventions that improve the life
of women and children in Afghanistan. The MICS data were collected in a scientifically
rigorous manner in a very difficult setting using a probability based sampling technique.
The originally reported estimates were generated taking into account the stratification and
clustering of households even though the sampling weights were incorrect. In light of the
evaluation framework proposed by Habicht and colleagues, we believe that the policy
makers in post-conflict settings can be reassured that expected goals of a baseline
evaluation are being met as long as the information is collected and analyzed in a
scientifically rigorous manner, even though it is based on an older sampling frame
(Habicht et al, 1999). However, it is important to emphasize that the generalizability of
our findings should be tested in other post-conflict settings before being widely accepted.
During the data collection for MICS 2003, the clusters (villages) were sampled based on
the information provided in the 1979 sampling frame, but the selection of a segment
within the clusters and subsequent stages of sampling were based on information that was
collected directly from the community members living there on the day of survey. The
use of current information probably led to a reduction in the bias that might have
otherwise occurred due to an older sampling frame. In the case of sampling within the six
37
largest cities, even the clusters were sampled based on current information, thereby
strengthening the explanation towards reduction in bias in calculated estimates.
The results for the delivery indicators analyzed in this study indicate that the use
of information from 1979 census for MICS 2003 is sufficient for baseline evaluation of
health system performance in Afghanistan. The estimates generated using information
from 1979 census are adequate for cross-sectional assessment in the immediate post-
Taliban period because the two sets of point estimates yield similar inferences. However,
use of these estimates for assessing trends is not without caution. The original MICS
survey was conducted to generate estimates for the 12-23 month age group with a
precision level of +/-10% at the provincial level (UNICEF, 2004a). Among the seven
indicators analyzed in this study, the indicator on DPT immunization was the only
indicator related to this age group. Our results indicate that a large proportion of unbiased
re-weighted estimates have a precision level that is lower than the intended level of +/-
10%. The re-weighted estimates are adequate to assess trends in health system
performance in terms of the magnitude of point estimates at two (or more) points in time
but the use of these imprecise estimates for statistical testing of change in performance is
associated with greater variability in statistical power as compared to (original) estimates.
In other words, for a given level of statistical power the original MICS estimates will be
able detect smaller changes in performance as compared to the unbiased re-weighted
estimates.
While the estimates can be corrected for precision by using new sampling weights
based on current sampling frame, we suggest that researchers and policy makers should
be careful in using these estimates to rule out the effect of external factors on health
38
system performance in Afghanistan. We believe that the method of re-weighting used in
this study is an inexpensive and important tool that can enable the post-hoc use of this
data for analyses of trends, but it cannot substitute the need for a more complex
evaluation design and extensive data collection.
The maternal and child health interventions included in the MICS survey have a
proven record of being efficacious and effective in improving their health status but
researchers should be aware that the post-conflict situation limits the scope of plausible
explanations that can be derived from such a population survey. This aspect should be
kept in mind while measuring the effect of health programs on population health in such
settings. The large scale movement of population due to war renders the unstable
population unsuitable for use as a historical control that is needed to rule out other
explanations of changes in health system performance. In addition, in post-conflict
Afghanistan, it is difficult to rule out other competing explanations like the effect of
programs for poverty alleviation and economic development that could potentially
improve health outcomes.
The design and conduct of population based surveys like MICS present problems
for probability based assessment of changes in health system performance as well. The
efficacious and effective interventions under study cannot be randomized to population
groups as randomization will not only be politically unfeasible but also ethically
incorrect. In addition, the probability based assessment of change is based on the
questionable practice of choosing arbitrary values for Type One (I) and Type Two (II)
errors in such a way as to be willing to not identify a beneficial result four times more
often than to be mistaken in declaring such a result when it is absent. The interventions
39
included in this study have repeatedly been reported to be associated with significant
reduction in morbidity and mortality in developing countries; therefore, evaluation should
not be based only on arbitrary values of type I and type II errors. A higher value of error/s
should be used to evaluate programs and interventions that have proven efficacy,
especially in cases where scientific inferences are not being made (Habicht et al, 1999).
2.5 Conclusion
This study provides the best possible estimates for health services delivery at provincial
and national levels in Afghanistan in 2003. In post-conflict settings, when urgent
information must be gathered on the health status of the population, older sampling
frames can be used for household surveys to derive population estimates that are
adequate to guide policy decisions. The re-weighting method proposed in this study
corrects the problems of precision and bias in population based estimates and enables the
use of these data for analysis of trends, but with greater variability in statistical power.
The users of these surveys to rule out other explanations for changes in health system
performance should be careful while conducting these plausibility and probability
assessments. While a more complex survey design is needed for plausibility and
probability based assessment of changes due to health programs, data collection remains
a real challenge in Afghanistan. Population based health surveys like MICS 2003 can
provide valuable information to policy makers in monitoring and evaluating the health
situation in a rapidly changing post-conflict setting.
40
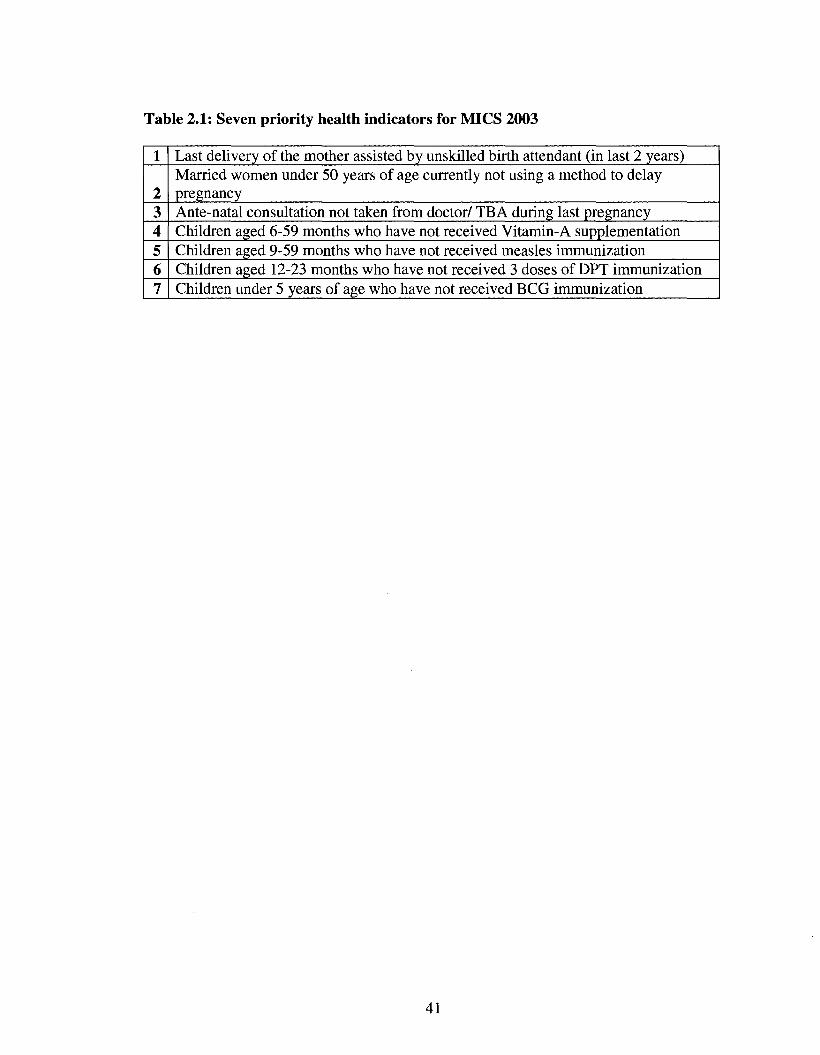
Table 2.1: Seven priority health indicators for MICS 2003
Last delivery of the mother assisted by unskilled birth attendant (in last 2 years)
2 Married women under 50 years of age currently not using a method to delay pregnancy
3 Ante-natal consultation not taken from doctor/ TB A during last pregnancy 4 Children aged 6-59 months who have not received Vitamin-A supplementation 5 Children aged 9-59 months who have not received measles immunization 6 Children aged 12-23 months who have not received 3 doses of DPT immunization 7 Children under 5 years of age who have not received BCG immunization
41
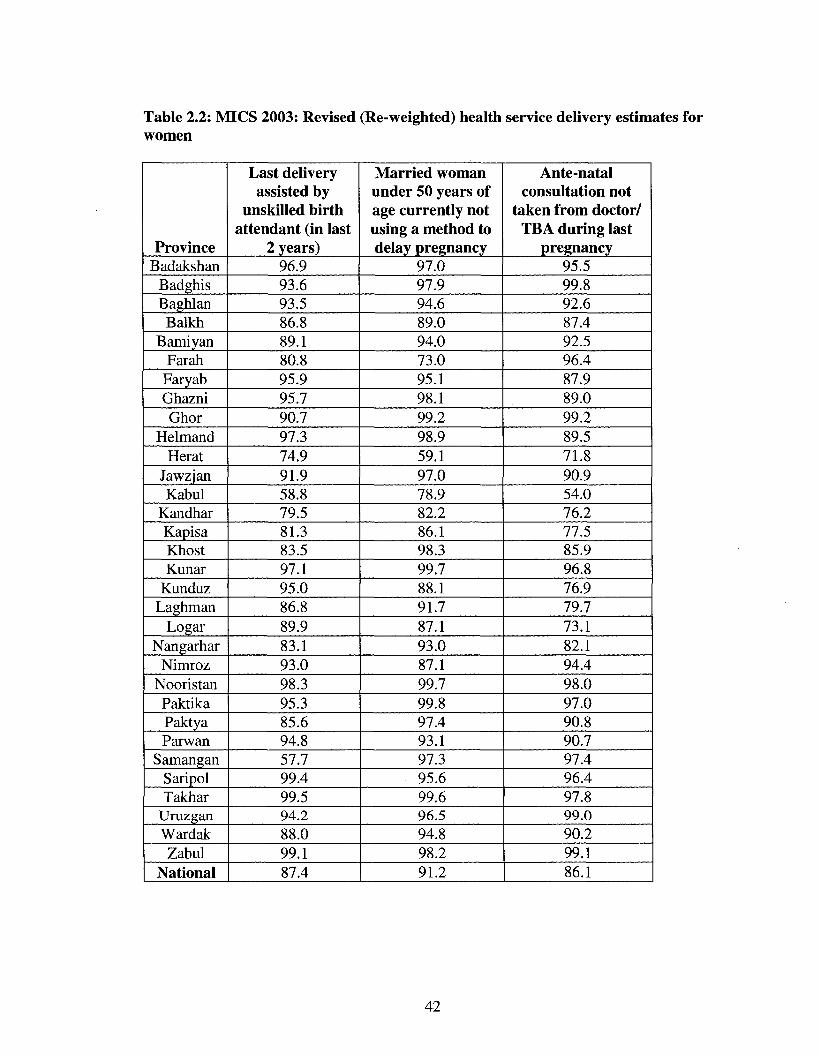
Table 2.2: MICS 2003: Revised (Re-weighted) health service delivery estimates for women
Province Badakshan
Badghis Baghlan Balkh
Bamiyan Far ah
Faryab Ghazni Ghor
Helmand Herat
Jawzjan Kabul
Kandhar Kapisa Khost Kunar
Kunduz Laghman
Logar Nangarhar
Nimroz Nooristan Paktika Paktya Parwan
Samangan Saripol Takhar
Uruzgan Wardak Zabul
National
Last delivery assisted by
unskilled birth attendant (in last
2 years) 96.9 93.6 93.5 86.8 89.1 80.8 95.9 95.7 90.7 97.3 74.9 91.9 58.8 79.5 81.3 83.5 97.1 95.0 86.8 89.9 83.1 93.0 98.3 95.3 85.6 94.8 57.7 99.4 99.5 94.2 88.0 99.1 87.4
Married woman under 50 years of age currently not using a method to delay pregnancy
97.0 97.9 94.6 89.0 94.0 73.0 95.1 98.1 99.2 98.9 59.1 97.0 78.9 82.2 86.1 98.3 99.7 88.1 91.7 87.1 93.0 87.1 99.7 99.8 97.4 93.1 97.3 95.6 99.6 96.5 94.8 98.2 91.2
Ante-natal consultation not
taken from doctor/ TBA during last
pregnancy 95.5 99.8 92.6 87.4 92.5 96.4 87.9 89.0 99.2 89.5 71.8 90.9 54.0 76.2 77.5 85.9 96.8 76.9 79.7 73.1 82.1 94.4 98.0 97.0 90.8 90.7 97.4 96.4 97.8 99.0 90.2 99.1 86.1
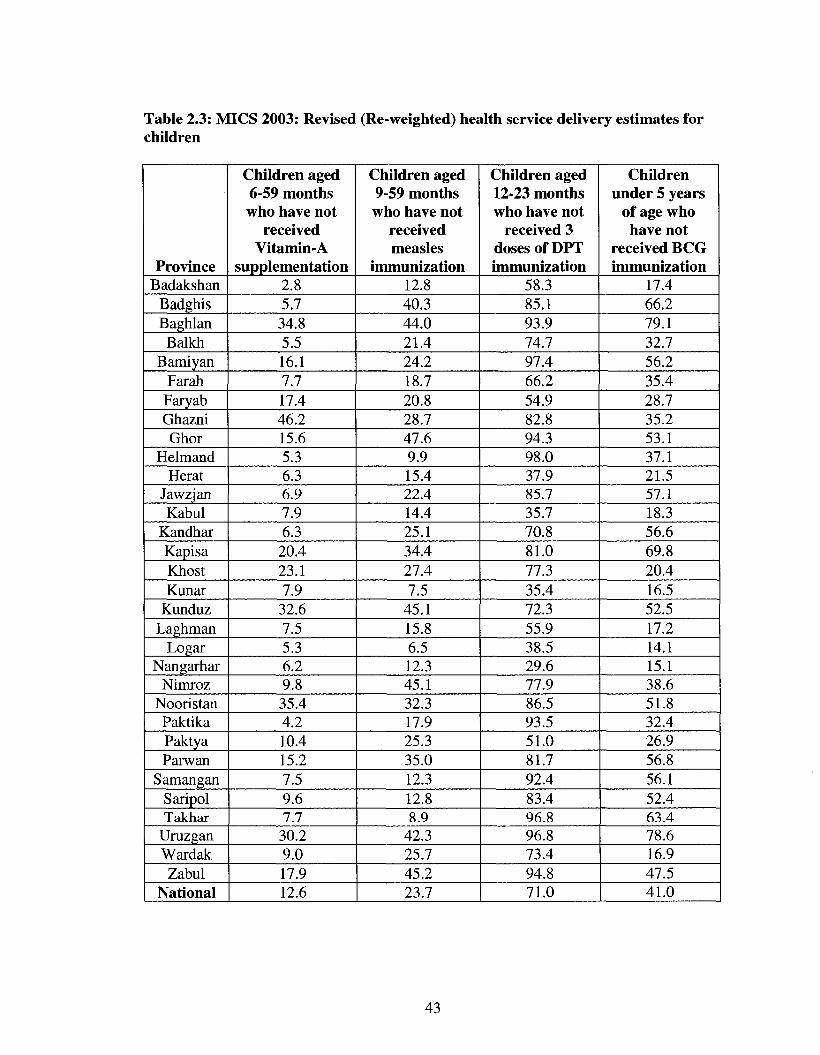
Table 2.3: MICS 2003: Revised (Re-weighted) health service delivery estimates for children
Province Badakshan
Badghis Baghlan Balkh
Bamiyan Far ah Faryab Ghazni Ghor
Helmand Herat
Jawzjan Kabul
Kandhar Kapisa Khost Kunar
Kunduz Laghman
Logar Nangarhar
Nimroz Nooristan Paktika Paktya Parwan
Samangan Saripol Takhar
Uruzgan Wardak Zabul
National
Children aged 6-59 months who have not
received Vitamin-A
supplementation 2.8 5.7 34.8 5.5 16.1 7.7 17.4 46.2 15.6 5.3 6.3 6.9 7.9 6.3
20.4 23.1 7.9 32.6 7.5 5.3 6.2 9.8 35.4 4.2 10.4 15.2 7.5 9.6 7.7 30.2 9.0 17.9 12.6
Children aged 9-59 months who have not
received measles
immunization 12.8 40.3 44.0 21.4 24.2 18.7 20.8 28.7 47.6 9.9 15.4 22.4 14.4 25.1 34.4 27.4 7.5
45.1 15.8 6.5 12.3 45.1 32.3 17.9 25.3 35.0 12.3 12.8 8.9
42.3 25.7 45.2 23.7
Children aged 12-23 months who have not
received 3 doses of DPT immunization
58.3 85.1 93.9 74.7 97.4 66.2 54.9 82.8 94.3 98.0 37.9 85.7 35.7 70.8 81.0 77.3 35.4 72.3 55.9 38.5 29.6 77.9 86.5 93.5 51.0 81.7 92.4 83.4 96.8 96.8 73.4 94.8 71.0
Children under 5 years
of age who have not
received BCG immunization
17.4 66.2 79.1 32.7 56.2 35.4 28.7 35.2 53.1 37.1 21.5 57.1 18.3 56.6 69.8 20.4 16.5 52.5 17.2 14.1 15.1 38.6 51.8 32.4 26.9 56.8 56.1 52.4 63.4 78.6 16.9 47.5 41.0
43
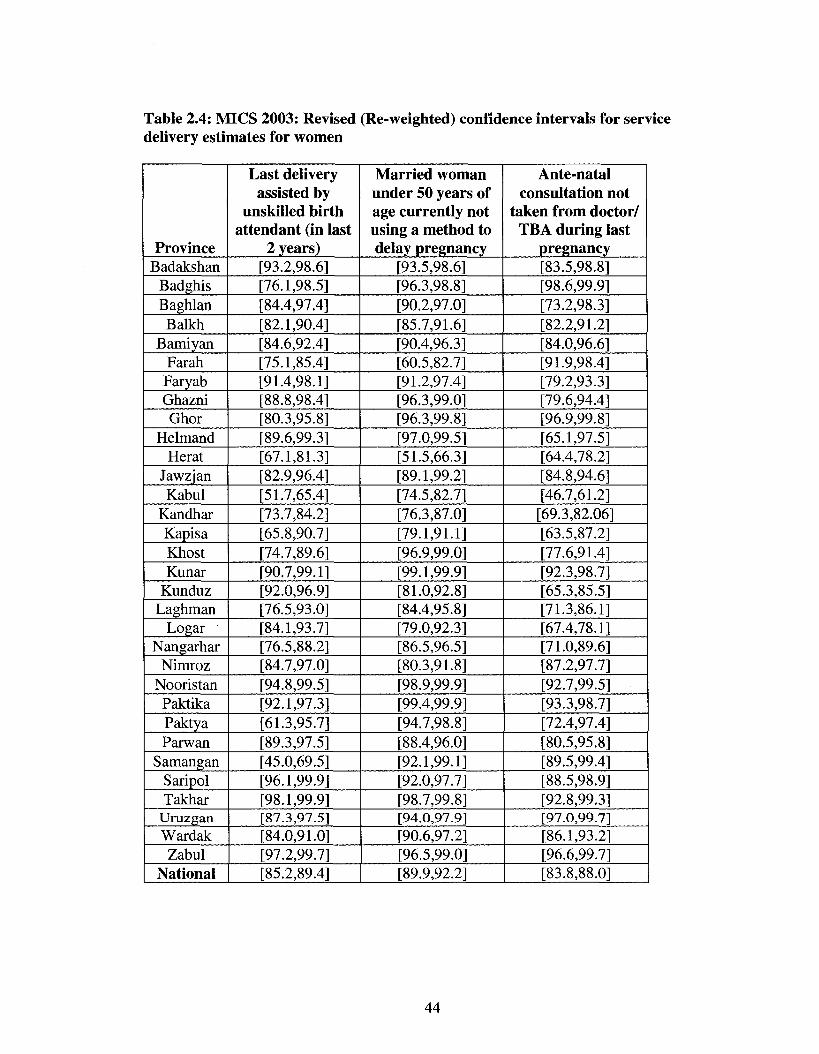
Table 2.4: MICS 2003: Revised (Re-weighted) confidence intervals for service delivery estimates for women
Province Badakshan
Badghis Baghlan Balkh
Bamiyan Far ah Faryab Ghazni Ghor
Helmand Herat
Jawzjan Kabul
Kandhar Kapisa Khost Kunar
Kunduz Laghman
Logar Nangarhar
Nimroz Nooristan Paktika Paktya Parwan
Samangan Saripol Takhar
Uruzgan Wardak Zabul
National
Last delivery assisted by
unskilled birth attendant (in last
2 years) [93.2,98.6] [76.1,98.5] [84.4,97.4] [82.1,90.4] [84.6,92.4] [75.1,85.4] [91.4,98.1] [88.8,98.4] [80.3,95.8] [89.6,99.3] [67.1,81.3] [82.9,96.4] [51.7,65.4] [73.7,84.2] [65.8,90.7] [74.7,89.6] [90.7,99.1] [92.0,96.9] [76.5,93.0] [84.1,93.7] [76.5,88.2] [84.7,97.0] [94.8,99.5] [92.1,97.3] [61.3,95.7] [89.3,97.5] [45.0,69.5] [96.1,99.9] [98.1,99.9] [87.3,97.5] [84.0,91.0] [97.2,99.7] [85.2,89.4]
Married woman under 50 years of age currently not using a method to delay pregnancy
[93.5,98.6] [96.3,98.8] [90.2,97.0] [85.7,91.6] [90.4,96.3] [60.5,82.7] [91.2,97.4] [96.3,99.0] [96.3,99.8] [97.0,99.5] [51.5,66.3] [89.1,99.2] [74.5,82.7] [76.3,87.0] [79.1,91.1] [96.9,99.0] [99.1,99.9] [81.0,92.8] [84.4,95.8] [79.0,92.3] [86.5,96.5] [80.3,91.8] [98.9,99.9] [99.4,99.9] [94.7,98.8] [88.4,96.0] [92.1,99.1] [92.0,97.7] [98.7,99.8] [94.0,97.9] [90.6,97.2] [96.5,99.0] [89.9,92.2]
Ante-natal consultation not
taken from doctor/ TBA during last
pregnancy [83.5,98.8] [98.6,99.9] [73.2,98.3] [82.2,91.2] [84.0,96.6] [91.9,98.4] [79.2,93.3] [79.6,94.4] [96.9,99.8] [65.1,97.5] [64.4,78.2] [84.8,94.6] [46.7,61.2] [69.3,82.06] [63.5,87.2] [77.6,91.4] [92.3,98.7] [65.3,85.5] [71.3,86.1] [67.4,78.1] [71.0,89.6] [87.2,97.7] [92.7,99.5] [93.3,98.7] [72.4,97.4] [80.5,95.8] [89.5,99.4] [88.5,98.9] [92.8,99.3] [97.0,99.7] [86.1,93.2] [96.6,99.7] [83.8,88.0]
44
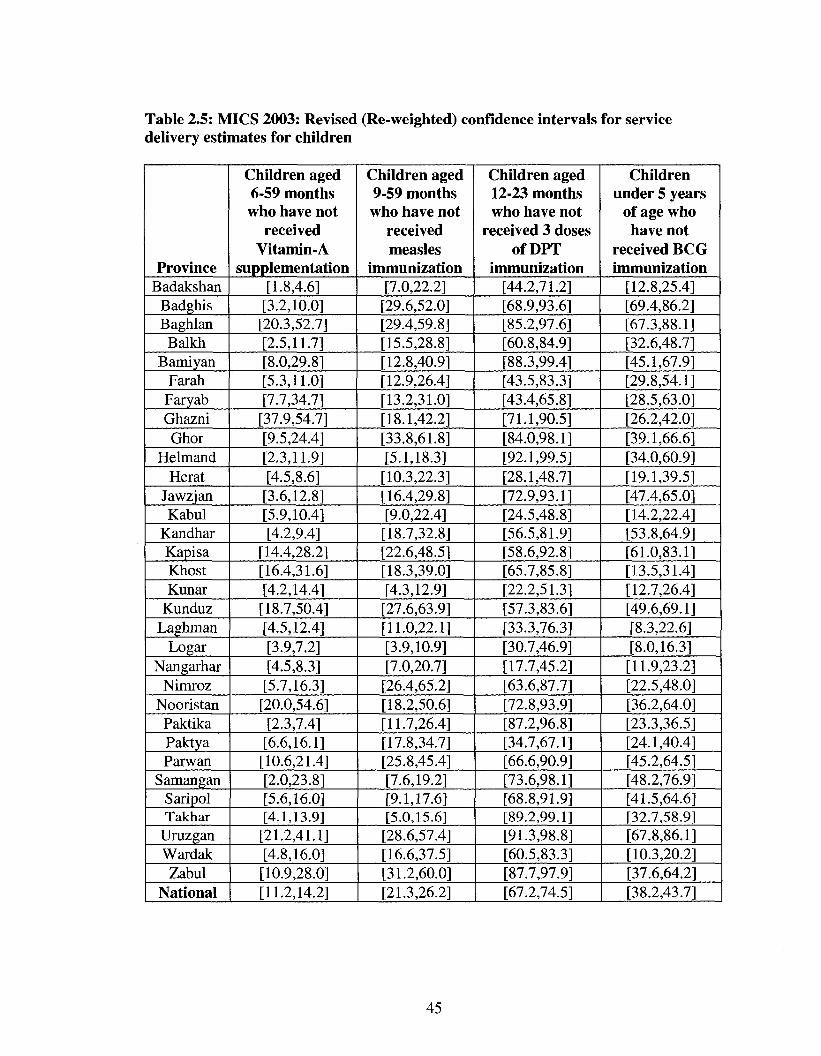
Table 2.5: MICS 2003: Revised (Re-weighted) confidence intervals for service delivery estimates for children
Province Badakshan
Badghis Baghlan
Balkh Bamiyan
Far ah Faryab Ghazni Ghor
Helmand Herat
Jawzjan Kabul
Kandhar Kapisa Khost Kunar
Kunduz Laghman
Logar Nangarhar
Nimroz Nooristan
Paktika Paktya Parwan
Samangan Saripol Takhar
Uruzgan Wardak
Zabul National
Children aged 6-59 months
who have not received
Vitamin-A supplementation
[1.8,4.6] [3.2,10.0]
[20.3,52.7] [2.5,11.7] [8.0,29.8] [5.3,11.0] [7.7,34.7]
[37.9,54.7] [9.5,24.4] [2.3,11.9] [4.5,8.6]
[3.6,12.8] [5.9,10.4] [4.2,9.4]
[14.4,28.2] [16.4,31.6] [4.2,14.4]
[18.7,50.4] [4.5,12.4] [3.9,7.2] [4.5,8.3]
[5.7,16.3] [20.0,54.6]
[2.3,7.4] [6.6,16.1]
[10.6,21.4] [2.0,23.8] [5.6,16.0] [4.1,13.9]
[21.2,41.1] [4.8,16.0]
[10.9,28.0] [11.2,14.2]
Children aged 9-59 months who have not
received measles
immunization [7.0,22.2]
[29.6,52.0] [29.4,59.8] [15.5,28.8] [12.8,40.9] [12.9,26.4] [13.2,31.0] [18.1,42.2] [33.8,61.8] [5.1,18.3]
[10.3,22.3] [16.4,29.8] [9.0,22.4]
[18.7,32.8] [22.6,48.5] [18.3,39.0] [4.3,12.9]
[27.6,63.9] [11.0,22.1] [3.9,10.9] [7.0,20.7]
[26.4,65.2] [18.2,50.6] [11.7,26.4] [17.8,34.7] [25.8,45.4] [7.6,19.2] [9.1,17.6] [5.0,15.6]
[28.6,57.4] [16.6,37.5] [31.2,60.0] [21.3,26.2]
Children aged 12-23 months who have not
received 3 doses of DPT
immunization [44.2,71.2] [68.9,93.6] [85.2,97.6] [60.8,84.9] [88.3,99.4] [43.5,83.3] [43.4,65.8] [71.1,90.5] [84.0,98.1] [92.1,99.5] [28.1,48.7] [72.9,93.1] [24.5,48.8] [56.5,81.9] [58.6,92.8] [65.7,85.8] [22.2,51.3] [57.3,83.6] [33.3,76.3] [30.7,46.9] [17.7,45.2] [63.6,87.7] [72.8,93.9] [87.2,96.8] [34.7,67.1] [66.6,90.9] [73.6,98.1] [68.8,91.9] [89.2,99.1] [91.3,98.8] [60.5,83.3] [87.7,97.9] [67.2,74.5]
Children under 5 years
of age who have not
received BCG immunization
[12.8,25.4] [69.4,86.2] [67.3,88.1] [32.6,48.7] [45.1,67.9] [29.8,54.1] [28.5,63.0] [26.2,42.0] [39.1,66.6] [34.0,60.9] [19.1,39.5] [47.4,65.0] [14.2,22.4] [53.8,64.9] [61.0,83.1] [13.5,31.4] [12.7,26.4] [49.6,69.1] [8.3,22.6] [8.0,16.3]
[11.9,23.2] [22.5,48.0] [36.2,64.0] [23.3,36.5] [24.1,40.4] [45.2,64.5] [48.2,76.9] [41.5,64.6] [32.7,58.9] [67.8,86.1] [10.3,20.2] [37.6,64.2] [38.2,43.7]
45
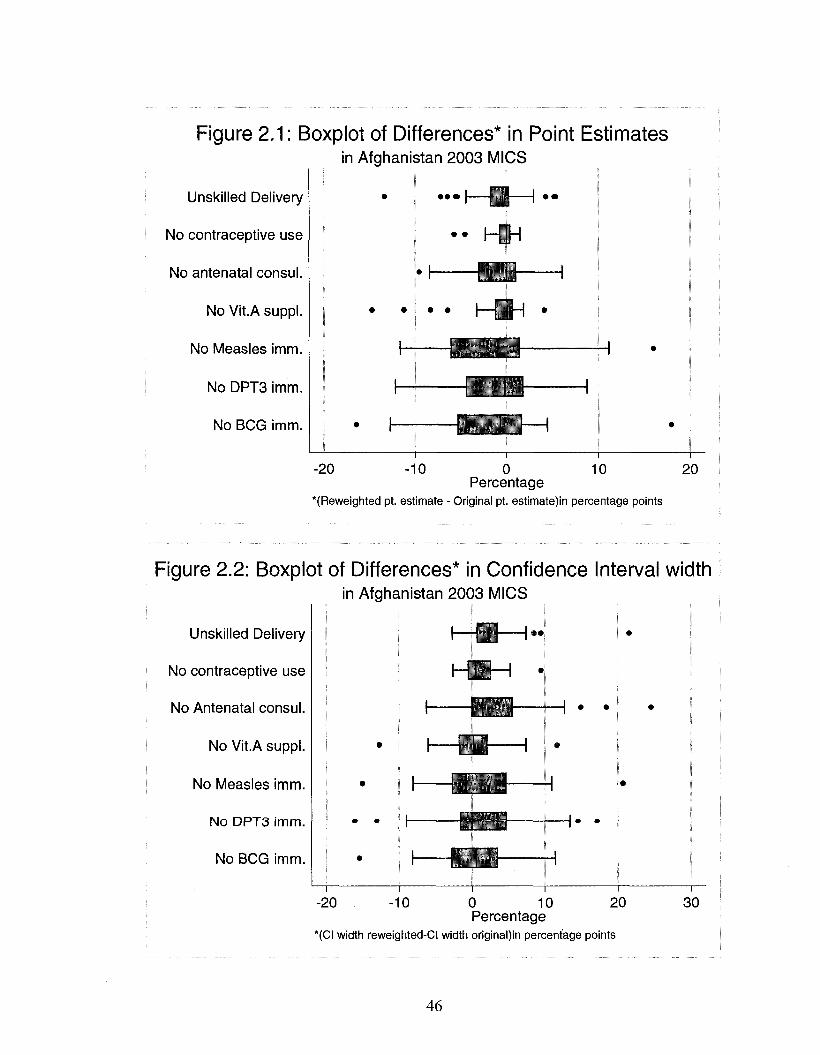
Figure 2.1: Boxplot of Differences* in Point Estimates in Afghanistan 2003 MICS
Unskilled Delivery
No contraceptive use
No antenatal consul.
No Vit.A suppl.
No Measles imm.
No DPT3 imm.
No BCG imm.
" L
• • • I H H
CEQ
— i
10 -20 -10 0 10 20 Percentage
"(Reweighted pt. estimate - Original pt. estimate)in percentage points
Figure 2.2: Boxplot of Differences* in Confidence Interval width in Afghanistan 2003 MICS
Unskilled Delivery
No contraceptive use
No Antenatal consul.
No Vit.A suppl.
No Measles imm.
No DPT3 imm.
No BCG imm.
•OZJ-
• L D — i •
-fr-̂ 4-
i i i
T I I I I
-20 -10 0 10 20 Percentage
*(CI width reweighted-CI width original)in percentage points
30
46
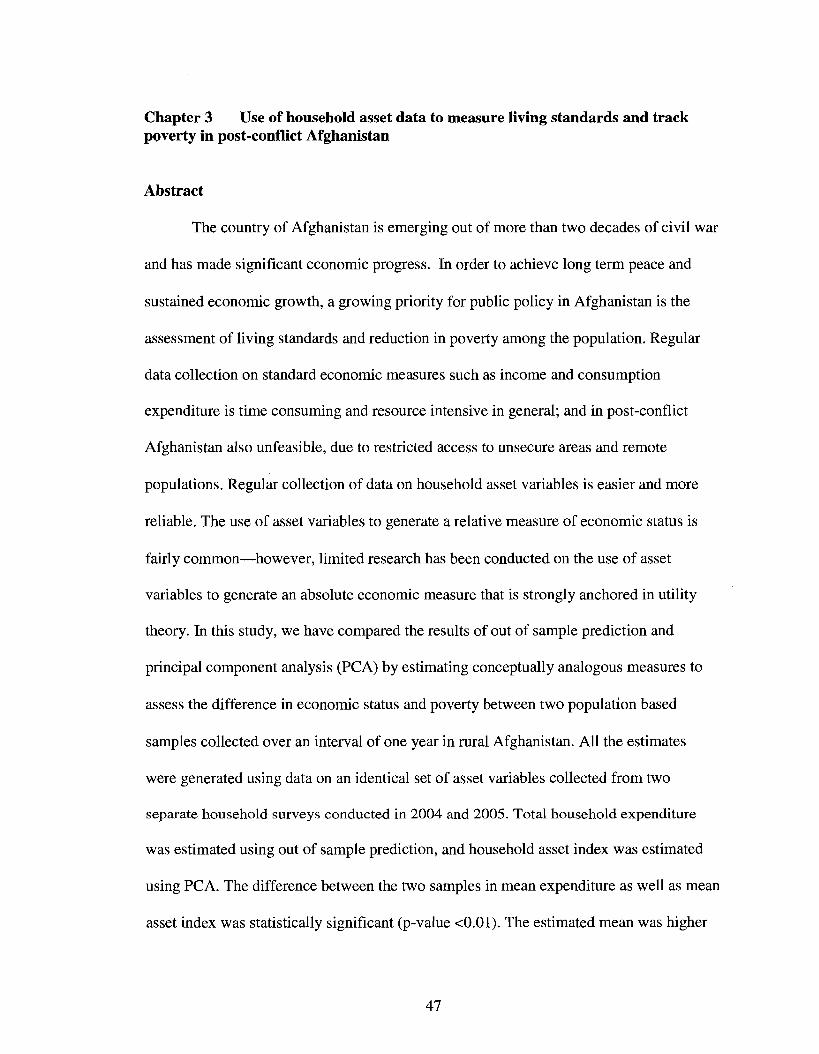
Chapter 3 Use of household asset data to measure living standards and track poverty in post-conflict Afghanistan
Abstract
The country of Afghanistan is emerging out of more than two decades of civil war
and has made significant economic progress. In order to achieve long term peace and
sustained economic growth, a growing priority for public policy in Afghanistan is the
assessment of living standards and reduction in poverty among the population. Regular
data collection on standard economic measures such as income and consumption
expenditure is time consuming and resource intensive in general; and in post-conflict
Afghanistan also unfeasible, due to restricted access to unsecure areas and remote
populations. Regular collection of data on household asset variables is easier and more
reliable. The use of asset variables to generate a relative measure of economic status is
fairly common—however, limited research has been conducted on the use of asset
variables to generate an absolute economic measure that is strongly anchored in utility
theory. In this study, we have compared the results of out of sample prediction and
principal component analysis (PCA) by estimating conceptually analogous measures to
assess the difference in economic status and poverty between two population based
samples collected over an interval of one year in rural Afghanistan. All the estimates
were generated using data on an identical set of asset variables collected from two
separate household surveys conducted in 2004 and 2005. Total household expenditure
was estimated using out of sample prediction, and household asset index was estimated
using PCA. The difference between the two samples in mean expenditure as well as mean
asset index was statistically significant (p-value <0.01). The estimated mean was higher
47
for the 2005 sample for each of the two measures. We also calculated the probability of a
household being poor. A household was defined as poor if the total household
expenditure per day was less than two US dollars. The estimated mean probability of
being poor calculated using out of sample prediction was lower for the 2005 sample by
2.8% and the difference was statistically significant (p-value <0.01). A comparable
analysis based on household asset index resulted in statistically inefficient estimates. In
conclusion, predicted expenditure and asset index are both sensitive to changes in the
estimated mean of asset variables but unlike asset index, predicted expenditure provides
an absolute measure of household economic status. In addition, unlike PCA based asset
index, out of sample prediction provides a simple and statistically efficient tool to track
the economic aspect of poverty. Although our findings lack generalizability to the
Afghan population, they do provide evidence towards improvement in economic status
and reduction in poverty in rural Afghanistan.
3.1 Introduction
Household income and consumption expenditure are the standard economic
measures of material living standards (O'Donnell et al, 2008). Measurement of income
and consumption expenditure is supported by a strong theoretical basis in utility theory
and these two metrics of economic status are absolute in nature. These measures are also
important in understanding the economic aspect of poverty as consumption is a widely
used measure of economic status to generate poverty thresholds (lines) in many countries
(Hentschel & Lanjouw, 1996). Collection of accurate household data on income and
consumption poses various problems for researchers and policy makers in developing
48
countries (Rutstein & Kiersten, 2004). Accurate data collection on household
consumption and income is a very time and resource consuming task (Montgomery et al,
2000). A household can have many earning members with several sources of income.
The respondents might try to hide information from interviewers due to privacy concerns.
In rural households, income and expenditure might not be completely based on market
based transactions due to home production of some goods, which are then consumed
internally and/or traded (Cortinovis et al, 1993). In developing countries, the respondents
might not know their income due to self-employment and other non-cash sources of
income. In addition, a large proportion of households receive income intermittently due
to employment in a large informal sector of the economy. In developing countries,
consumption expenditure is considered a more reliable measure of household living
standard than income (Deaton & Grosh, 2000).
Brief household survey modules on durable consumer goods, housing quality,
water and sanitation facilities and other household characteristics have been used to
expedite the assessment of economic aspect of living standards in developing countries.
These variables on household characteristics are either used individually or in a
combination based on maximizing some statistical property of the resulting measure of
economic status. These household variables are variously referred to as asset variables or
asset indicators. Asset variables have been extensively used to generate a relative
measure of household economic status. The asset index, based on the technique of
principal components, is an example of such a measure where a linear index created from
asset variables captures the largest amount of information that is common to all the
analyzed variables (Filmer & Pritchett, 2001).
49
The use of asset variables to rank households and assess the effect of economic
status on health outcomes is fairly common; however, limited research has been
conducted on the use of asset variables to generate an absolute measure of economic
status grounded in utility theory. An urgent need for practical measures for steadily
tracking poverty emerged from international endorsement of the Millennium
Development Goals and led to recent studies that have used advanced prediction
techniques to link the asset variables directly to household consumption (Mathiassen,
2007; Stifel & Christiansen, 2007). These studies provide an inexpensive and efficient
technique to utilize information on asset variables and estimate a measure of economic
status that is absolute in nature. These authors employed out of sample prediction
techniques to estimate household consumption over time and generated robust measures
to track poverty and inequality in a population.
Afghanistan Context
Afghanistan is a land locked country situated at the junction of the Middle-
Eastern crescent and South-east Asia. A prolonged civil war that lasted more than two
decades, along with foreign occupation and tribal warfare, have severely damaged the
political, social and economic infrastructure of the country. Afghanistan has some of the
worst health indicators in the world and is ranked among the lowest in human
development with one in every two people living in poverty (UNDP, 2004) . Since its
2001 invasion, the USA and other countries, including Japan, the UK and Germany, have
invested billions of dollars in Afghanistan's reconstruction (Bristol, 2005). The economy
has improved significantly since the fall of the Taliban with an infusion of international
50
assistance, recovery of the agricultural sector and growth in the service sector. A recent
report by the World Bank found that the GDP (excluding narcotics) grew by more than
fifty percent in 2003, albeit starting from very low level in 2001. A number of new
employment opportunities were created due to growth in the agricultural sector together
with post war expansion in construction and commercial services (World Bank, 2005).
Available estimates suggest that by March 2006, starting from very low levels in 2001,
the Afghan economy had grown by more than eighty percent (Mali, 2006). .
In this fragile post-conflict environment, Afghanistan is undergoing profound
economic, political and social change and ensuring that the opportunities of growth are
accessible to the poor is crucial for welfare of ordinary people as well as long term peace
and prosperity. Improvement in the living standards of the Afghan population has been an
explicit aim of the Government of Islamic Republic of Afghanistan and the donor
community. A pertinent example of this emphasis is the Afghanistan National
Development Strategy (ANDS), which is the centerpiece of the Government of
Afghanistan's National Development Framework. ANDS has been created as a major
collaboration between Afghanistan and the international community to promote growth,
generate wealth and reduce poverty and vulnerability in Afghanistan (T.I.S.A., 2004).
There have been reports that while most of the rural Afghan economy has been
benefiting from economic growth and increase in agricultural harvest, the poorest
sections of the society are still lagging behind (World Bank, 2005). The assessment of
living standards of the population and reduction in poverty is a growing priority for the
public policy in Afghanistan.
51
In light of these efforts and reports, two important questions that have arisen for
policy makers are:
1. Has the standard of living of the Afghan people improved in the post-Taliban
period?
2. Has the overall rate of poverty changed in light of the overall economic growth in
Afghanistan?
In this study, we have attempted to provide answers to these complex questions
by comparing the results of principal components analysis (PCA) and out of sample
prediction to assess difference in economic status and poverty between two population
based samples collected over an interval of one year. We estimated and compared two
analogous measures of economic status generated using each of the two techniques. The
two outcomes estimated using out of sample prediction are total household expenditure
and the probability of a household spending less than $2 US dollars per day. The two
analogous outcomes estimated using PCA are household asset index and probability of a
household being in the poorest 30% of the index measure. In order to ensure
comparability with the asset index, both the measures estimated using out of sample
regression were based on total household expenditure instead of per capita or other
equivalent measure of expenditure. Asset index based on PCA was calculated at the
household level only, as most of the asset variables included in an asset index are shared
between household members and most are just indicators of possession of at least one or
none, rather than quantities.
The asset variables that were used as predictors in this study can be broadly
classified into three categories: household size, ownership of consumer durables, and
52
dwelling characteristics. The data were collected as part of two separate cross-sectional
household surveys conducted over an interval of one year. The sample for the year 2005
had information on the asset variables and the total household expenditure while the 2004
sample had information on the asset variables only. The use of out of sample prediction
technique allowed the estimation of expenditure for 2004 even though household
expenditure data were not collected from the households surveyed in 2004.
The predicted estimates were then used to test the following hypotheses:
1. The mean total household expenditure differs significantly between the two
samples collected at an interval of one year.
2. The mean probability of a household's total expenditure being less than two
dollars a day differs significantly between the two samples collected at an
interval of one year.
The analogous PCA based measure was mean asset index for the first hypothesis and
mean probability of a household to be in the poorest 30% (by asset index) for the second
hypothesis.
This study is particularly applicable in post-conflict Afghanistan, where logistical
concerns of restricted access to unstable areas and ongoing security problems favor a
more expeditious approach to measuring living standards. There is an urgent need for
measures that are easy to collect, observe and verify. Regular data collection on asset
variables is easier and less resource intensive than regular income or consumption
surveys. Survey modules for asset variables require fewer questions, which can be
collected from a single respondent in a household.
53
Three factors guided our focus on the household level variables that have been
used for estimating outcomes in this study. First, it was our conceptual understanding that
among the various asset indicators of living standards that have been studied in the
literature; in a rapidly developing post-conflict country, ownership of durable goods and
a household's dwelling characteristics are sensitive to a change in economic status of a
population. The second factor was based on studies that had reported that relative
measures of economic status commonly employed in demographic research yield results
that are similar to the absolute measures like consumption (Filmer & Pritchett, 2001;
Filmer & Scott, 2008; Montgomery et al, 2000). We intended to study this issue further
by comparing the predicted absolute measure with the relative measure; both generated
using an identical set of asset variables. The absolute measure in this study is the
predicted total household expenditure and the relative measure is the asset index. The
third was a pragmatic response to a data constraint problem, as only data on household
size, ownership and dwelling characteristics were collected using the same format of
questions in the two surveys, thereby ensuring comparability of results by reducing the
bias that might arise due to difference in survey instruments.
3.2 Methods
Data sources
The two datasets used for the analysis in this study are the National Health
Services Performance Assessment (NHSPA) 2004 and the National Risk and
Vulnerability Assessment (NRVA) 2005. The NHSPA was an annual survey conducted
by the Johns Hopkins University (JHU) and the Institute of Health Management Research
54
(IHMR) for the MOPH in Afghanistan. An important objective of NHSPA was to provide
data on health system performance at provincial and national level and enable the MOPH
to monitor and evaluate the nationwide implementation of the Basic Package of Health
Services (BPHS) (Peters et al., 2007). This study utilizes the household data collected
during the first round of NHSPA conducted in (June-September) 2004. Data were
collected at both household and health facility levels in 2004 but later rounds of NHPS A
have been conducted only at the health facility level. Another household survey was
conducted in (June-August) 2005 as part of the National Risk and Vulnerability
Assessment (NRVA) to collect data at provincial and national levels in Afghanistan. The
NRVA 2005 was undertaken "to collect information to better understand the livelihoods
of both males and females in Afghanistan from rural, urban and migratory
populations"(M.R.R.D., 2005). The NRVA was conducted by the Central Statistical
Office (CSO) for the Ministry of Rural Rehabilitation and Development (MRRD)
Afghanistan.
The data were collected in each the two surveys using probability based multi
stage sampling designs in every province of Afghanistan. However, the actual survey
implementation was not exactly the same between the two assessments. The NHSPA
2004 collected information only from households living within one and a half hour (1.5)
walking distance from a health facility, whereas the sampling of households as part of
NRVA 2005 was not based on any such criteria. Three types of BPHS facilities that were
used to select villages for NHSPA 2004 were, Basic Health Center (BHC),
Comprehensive Health Center (CHC) and District Hospital (DH).
55
In order to circumvent this problem of difference in sampling coverage and to
increase comparability of findings, this analysis used data only from households in
villages within one (1) hour walking distance from a BPHS health facility in either of the
two surveys. The walking time of one hour to the health facility is based on summer
months and only households in rural areas have been included in the study for each of the
two datasets. Urban and rural households in developing countries are considered to differ
significantly in household size, ownership of items and dwelling characteristics (Filmer
& Pritchett, 2001; Vyas & Kumaranayake, 2006). Information on urban households
collected in NRVA 2005 was excluded from this analysis to ensure comparability, as no
information was collected from urban areas as part of NHSPA 2004.
Variable description
Total expenditure was used as the measure of living standard due to conceptual
and pragmatic reasons. Conceptually, asset ownership and dwelling characteristics are
expected to be strongly associated with a household's total expenditure, as both are based
on market transactions. In light of this strong association, and because assets and
dwelling characteristics are the main predictors in this study, the total expenditure was
used as the outcome variable. NRVA 2005 was the most comprehensive assessment of
living standards conducted in Afghanistan since the fall of the Taliban, but it lacked the
information needed to calculate household consumption, thereby guiding the pragmatic
decision to use expenditure as the measure of choice. Consumption is a more
comprehensive measure of living standard as it incorporates monetary value for market
based transactions and the calculation of consumption includes monetary values for home
56
produced food items and the benefit derived from assets like housing. The data on price,
stock and characteristics of consumer durables were not collected from the households
surveyed as part of the NRVA 2005. This prevented the calculation of cost of funds tied
up in these goods as well as the depreciation of these goods. The data on prices of food
items was missing for at least half of the districts that the surveyed households
represented. This prevented the calculation of the value of home produced items for
household consumption.
The expenditure data were collected for a recall period of one month on recurring
items of daily use like food, transport, fuel, soap, detergent, as well as for other items like
taxes. The expenditure data on non-recurrent items like payment for medical services,
education, house repair, special events, debt servicing, house repair, and clothing were
collected for the months that these expenditures existed. The yearly total household
expenditure values were calculated by combining the above two categories to generate
expenditures for a uniform reference period of twelve months.
Fourteen asset variables and their average for each household were calculated
(Table 3.1). The variable on household size represents the number of people (male and
female) in a given household that usually take their meals from the same cooking pot,
share household assets and accumulate earnings to procure food and other household
materials. Nine indicator (dummy) variables were generated, including household
ownership of clock, bicycle, radio, television, sewing machine, refrigerator, car, tractor,
and generator. The four asset variables on characteristics of household's dwelling were:
main source of drinking water, main source of lighting, main source of cooking fuel and
availability of private toilet facilities. The data on these four assets were collected as
57
categorical variables, with limited number of households belonging to some categories.
In order to circumvent this problem, for each of the four variables, categories
representing higher and lower living standards were grouped together to generate binary
variables. In order to maintain comparability, this grouping was based on the technique
used for other reports and studies published using the NHSPA data, especially the
Balanced Scorecard Report (BSC) prepared by the Johns Hopkins University every year
for the MOPH Afghanistan (Hansen et al, 2008c; JHU and IHMR, 2008a).
Statistical Analyses
The analyses for this study were conducted using statistical package by Stata
Corporation (StataCorp., 2004). The sub-sample available for this analysis had data on
8822 households for 2004 and 3844 households for 2005. The estimated mean for each
of the asset variable was calculated for the two samples and the difference was analyzed
for statistical significance using t-test.
The basic approach in out of sample prediction involves two steps. In the first
step, the dataset containing information on the expenditure and assets is used. The
expenditure is treated as the outcome variable in a log linear regression with the
household assets as the explanatory (predictor) variables. In the second step, the
estimated regression coefficients for each explanatory variable and the constant term are
used as weights in a linear equation to predict expenditure for every household in each of
the two yearly samples.
In order to test the first hypothesis we used the generalized linear modeling
approach to fit a log linear model for the 2005 sample.
58
A general equation for log linear regression model is:
Log Yi = po + pXi + £i
i = Household identifier (Unique code for each household)
Yi = Total household expenditure for i* household
xi = Vector of asset variables for ith household
The regression coefficients (P) along with the constant term (Po) were then used to
predict total household expenditure for every household in the 2005 and the 2004
samples. The distribution of predicted total household expenditure for 2004 and 2005
estimates was visually compared by graphing the kernel density plots. The difference in
estimated mean of the predicted total household expenditure between 2004 and 2005
samples was tested for statistical significance by implementing the t-test for two
independent samples.
The asset variables were used to generate an asset index for each of the two years
using principal components analysis. The data for the two years were pooled together to
generate a common set of scoring coefficients for the asset indices. We plotted the kernel
density (probability density) estimates of our index to visually compare the distributions
for 2004 and 2005 samples. The difference in average asset index score was compared
between 2004 and 2005 samples by implementing t-test for two independent samples.
In order to the test the second hypothesis, as a first step, the sampled households
that reported their actual total expenditure to be less than two US dollars per day were
identified for the 2005 sample using the exchange rate of 44.78 Afghanis to 1 US dollar.
This exchange rate is based on the official publication by Afghanistan CSO for 2003
(CSO, 2003). A binary variable was generated where the households spending less than
59
two US dollars per day were coded as being 'poor'. This binary variable was used as the
outcome variable and a probit regression model was fitted for the 2005 sample using the
generalized linear modeling approach.
A general equation for the probit regression model is:
P(yi=l|xi) = 0(p'o + P'xD
i = Household identifier (Unique code for each household)
O = Cumulative normal distribution function
P (yi =1| xi) = Probability for the ith household being poor given the set of asset
variables
X, = Vector of asset variables for i household
The probability of a household being 'poor' was predicted for every household in
the 2005 and the 2004 samples at the estimated mean (of asset variables) for the 2005
sample. The difference in average predicted probability of households between 2004 and
2005 samples was tested for statistical significance by implementing the t-test for two
independent samples.
3.3 Results
As compared to 2004 estimates, the estimated mean was higher for nine and lower
for five asset variables in the 2005 sample (Table 3.2). A total of eleven out of the
fourteen differences were statistically significant (p-value <0.05). The estimated average
household size for the 2005 sample was greater than the estimated average for the 2004
sample by 0.5 (p<0.01). Among the remaining eight out of nine mean estimates that were
higher for 2005 sample, the magnitude of difference was greater than five percent for five
60
variables. Among the five variables that had a lower estimated mean in 2005, the
magnitude of difference was not greater than five percent for any of the variables.
Table 3.3 provides the coefficients estimated from the log linear regression model
that was fitted to test the first hypothesis. Household size4, dwelling characteristics and
ownership of consumer durables were important in explaining the variability in
household expenditure for the 2005 sample. The shape of the probability density plot of
the deviance residuals generated from this model had heavier tails indicating a higher
kurtosis than a density plot of normally distributed residuals. The R squared estimate for
a similar model fitted using ordinary least square (OLS) regression technique was 0.22
and it explained twenty two percent (22%) of the variation in total household
expenditure. The fifteen coefficients along with the constant term were then used to
predict total household expenditure for the 2005 and 2004 samples. The kernel-density
estimates of the distribution of predicted expenditures for each of the two years were
plotted in a graph and visually compared (Figure 3.1). The density functions were similar
in shape with the 2005 distribution slightly shifted to the right, indicating a higher value
for mean expenditure. Both the distributions were skewed to the right, which is a
characteristic of expenditure data in general. In addition, both of the expenditures had a
heavy tailed distribution indicating kurtosis higher than a normal distribution.
The mean estimate of the total household expenditure for the 2005 sample was
greater than mean for 2004 sample by 1466.4 Afghanis (US $32.7) per household (Table
3.4). In addition to using the constant term, these estimates were generated using
coefficients of all the asset variables included in table 3.3 to account for the differences
in household size, ownership of consumer durables and housing characteristics between
4 Square value of household size was included in the model to allow for non linear pattern in the data.
61
the two samples. The t-test implemented towards testing the first hypothesis found the
difference to be statistically significant (p-value <0.01).
The first component explained nearly 20% of the total variability in the asset
variables generated through PCA on the pooled data for 2004 and 2005 (Table 3.5).
Every asset variable was associated with a positive coefficient indicating that ownership
of assets is associated with a higher estimate on the household asset index. The kernel
density plots for the asset indices for 2004 and 2005 samples indicated that the mean
value for the 2005 sample was higher as compared to the 2004 sample. In addition, the
two distributions differed in shape. The 2004 index had lighter tails with a higher degree
of skewness to the right as compared to the 2005 index. The estimated mean of the asset
index for the 2005 sample was greater than mean for 2004 sample and this difference was
statistically significant (p-value <0.01) (Table 3.6).
Household size, dwelling characteristics and ownership of consumer durables
were significant predictors of a household's probability of being poor (Table 3.7). The
fifteen coefficients along with the constant term were then used to predict a household's
probability of being poor for the 2005 and 2004 samples. The average probability of
sampled households to being poor was 31.9% for 2004 and 29.1% for 2005 (Table 3.8).
The t-test implemented towards testing the second hypothesis found the difference of
2.8% to be statistically significant (p-value <0.01). This indicates that as compared to the
2004 sample the proportion of poor households is lower in the 2005 sample by 2.8%.
The households in the poorest 30% had the lowest scores on the asset index and
hence were the poorest on a relative scale. Along the lines of testing the second
hypothesis, we attempted to predict the probability of a household to be in the poorest
62
30% of the 2005 sample. The binary nature of majority of predictors led to some of the
predictors being dropped from the regression model as they predicted the probability of a
household to be in the bottom 30% perfectly. The predictors dropped from the analysis
on pooled dataset were generator, car and tractor. Moreover, the number of predictors
that were dropped from the analysis differed if only the 2005 data were used instead of
pooled dataset. The results of this model were found to be highly inefficient and therefore
not reported here. We were unable to calculate the difference in average probability of
being in the poorest 30% for the 2004 and 2005 samples.
3.4 Discussion
A surge of reconstruction efforts in Afghanistan has created the potential for rapid
improvement in economic status of the population. The findings of our study indicate a
small but statistically significant difference in average expenditure as well as the
proportion of poor households between the two samples.
Other studies have employed a similar technique to track poverty through use of
asset variables to predict consumption. The results of our study compare favorably with
these studies by Mathiassen (2007), Stifel and Christiansen (2007) and Filmer and Scott
(2008). The fifteen predictors included in the log linear model to predict total household
expenditure help in explaining 22% of the variability in expenditure. The study by Stifel
and Christiansen included thirteen predictors to explain 2 1 % of the variability in
consumption per adult equivalent in rural Kenya (Stifel & Christiansen, 2007). The
model implemented by Mathiassen included a higher number of predictors that are able
to explain 39% of the variability in per capita consumption in rural Mozambique
63
(Mathiassen, 2007). Both the studies employed out of sample prediction technique to
generate robust estimate of the poverty measure of headcount ratio and used it to track
poverty over time. The poverty headcount ratio is the proportion of the national
population whose consumption is below the official threshold (or thresholds) set by the
national government. In Afghanistan, currently no such national threshold/s exists due to
lack of nationally representative consumption data. The study by Filmer and Scott was
conducted to compare the effect of different approaches used to aggregate asset variables
in literature with per capita expenditure in terms of the association between economic
status and population level outcomes on health and development. This study used
datasets from eleven countries, each containing an average of thirty asset variables, to
predict per capita expenditure. The R squared for this study ranged from 19% - 72%, with
higher estimates for countries that had data available on greater number of asset variables
(Filmer & Scott, 2008).
The finding of a statistically significant difference in economic status persists
even if the metric is asset index instead of predicted expenditure. This indicates that the
predicted expenditure and the asset index are sensitive to differences in independent
variables between the two samples. We suggest that despite qualitatively similar results,
expenditure is a better measure of economic status as it has strong foundations in utility
theory. Expenditure is an absolute measure of economic status unlike asset index, which
is a relative measure. The coefficients for predicted expenditure are based on maximizing
their capacity to explain the variability in actual expenditure whereas the coefficients in a
PCA based asset index maximize their capacity to explain the variability in the asset
variables that are used to generate the index. The coefficients used to generate an asset
64
index are solely dependent on the asset variables and lack an underlying theoretical basis
making it possible for assets of low monetary value to get a higher coefficient than an
item of high monetary value.
Our findings suggest that out of sample prediction provides a practical method to
measure and steadily track poverty over time. As compared to asset index, this technique
has two distinct advantages. First, unlike asset index it provides a theoretical basis for
identification of poor households by enabling the use of a specified cutoff value that is
based on an absolute measure like expenditure. Second, the probability of a household
being poor based on an absolute cutoff is statistically more efficient than computation
based on a relative cutoff. The ranking of households by asset index is completely based
on the asset variables used to generate the index, therefore the variables that exhibit no
variability in predicting the probability of being poor are dropped from the regression
model.
In addition to above advantages over PCA based asset index, out of sample
prediction has certain useful characteristics of its own. In the absence of regular,
comparable data on actual expenditure, out of sample prediction is an economically
intuitive and inexpensive method for measuring economic status and steadily tracking
poverty in a population over time. Two recent studies have pointed out that predicted
expenditure mimics the 'best possible' linear prediction in situations where asset
indicators are available in more than one datasets, but they can only be related to
expenditures in one (Filmer & Scott, 2008; Stifel & Christiansen, 2007). The ranking of
households based on economic status enables researchers and policy makers to study the
association between economic status and important outcomes on population health and
65
development. Expenditure is one of the most widely prevalent measures of economic
status used to rank households for this purpose. Among all the possible linear
aggregations of asset indicators to rank households based on economic status, predicted
expenditure matches the ranking based on actual expenditure most closely (Filmer &
Scott, 2008).
A majority of variables used in this study were binary in nature, thereby
restricting the combinations of predictors available to predict household expenditure.
This provides a plausible explanation for the heavy tailed distribution of predicted
expenditures for the NHSPA 2004 and NRVA 2005 samples. In the 2005 sample, the
estimated proportion of poor households calculated via predicted expenditure and the
mean probability of households being poor should be equal to the proportion of poor
households estimated using actual expenditure. The heavy tailed distribution of predicted
expenditure limited its ability to correctly identify the poor households. Predicting the
probability of being poor and calculation of the mean did result in an estimate of 0.29,
which is the same as the proportion of poor households estimated using actual
expenditure.
In addition to the above problem, another issue that might have affected the
results is the low number of asset variables available for this study. This is a data
limitation that arose because the 2004 and 2005 datasets were not collected with the
original intent of tracking poverty over time. This low number of variables might have
adversely affected the ability of assets to explain the total variability in expenditure for
prediction as well as the total variability of indicators for asset index.
The findings in this paper are internally valid but have limited external validity.
66
The two datasets used in this study are from households living within one hour walking
distance of a BPHS health facility. The applicability of these findings at a national level
is limited as this study excludes villages that are further away. Earlier studies have
reported that in developing countries, distance from a health facility is related to
economic status and health services utilization by the people, especially in rural areas
(Tlebere et al, 2007). This suggests that the household samples analyzed in this study
might be economically very different than the households living further away. In
addition, the two sample were collected using probability based multi-stage designs but
with different sampling schemes. The standard errors of the estimates in this study have
not been adjusted to account for the difference in sampling schemes, making the
estimates imprecise, even if they are considered to be valid. As a result, the findings in
this study have limited capability to reflect a population level increase in ownership of
durables goods or improvement in a household's dwelling characteristics. In addition,
NRVA 2005 was collected to be representative at national and provincial levels. Unlike
NHSPA 2004 the sample of households from NRVA included in this study might not be
representative of all the households in Afghanistan that are located within one hour of a
BPHS health facility.
Despite these limitations, this study does provide some indication of improvement
in economic status and reduction of poverty in Afghanistan. These findings are limited to
households living within one hour of a BPHS facility but they do provide evidence
towards initial success of national policies implemented as part of ANDS. This is the first
study in a post-conflict setting to use asset variables to track poverty by generating an
absolute measure of economic status. The findings of this study have important
67
implications for poverty reduction in Afghanistan. Unlike the PCA coefficients, the
regression coefficients can be used as weights to create an economic measure of living
standards in a population. The Core Welfare Indicator Questionnaire (CWIQ) technique,
developed by the World Bank, uses a method similar to the one implemented in this study
for identifying poverty predictors and estimation of predicted welfare function for
ranking households for poverty mapping (Fofack, 1999). The CWIQ technique uses a
combination of two different sources - a qualitative survey and a comprehensive
integrated household survey, to identify a set of explanatory variables that explain over
40% of the total variance observed in household aggregate total expenditure. The
predicted welfare function is expressed as the weighted sum of these poverty predictors.
The results of this technique have been successful in accurately identifying different
welfare groups in population in countries like Ghana and Uganda. The out of sample
prediction technique can form the basis for identification of poor households in
Afghanistan. The recent completion of the national pre-census enumeration in
Afghanistan has provided an opportunity to conduct poverty mapping of the Afghan
population to identify the poorest and the most vulnerable groups.
Out of sample prediction technique has important implications for the targeting
approach employed for the much needed social protection programs for the poor in
Afghanistan. A recent assessment by The World Bank has highlighted the lack of
information on extreme poverty and vulnerability in Afghanistan (World Bank, 2005).
The report emphasizes the urgent need for data collection and analysis on this aspect
before launching any new social protection programs. In countries like Chile and Egypt, a
proxy means test approach to predict consumption has been successfully used to target
68
subsidies to the poor households. The term "proxy means test" is used to describe a
situation where information on household or individual characteristics correlated with
welfare levels is used in a formal algorithm to proxy household income, welfare or need
(Grosh & Baker, 1995; Grosh & Glinskaya, 1997). This approach was developed to
improve the targeting accuracy of social protection programs in developing countries
where reliable income and expenditure records are seldom available. A comparative
study of 30 targeted social programs in Latin America reveals that, among all targeting
methods, the proxy means tests used in Chile resulted in the highest targeting rate to the
poor, both in terms of sensitivity (coverage) and specificity (leakage) of the methods
(Grosh, 1994). The Ficha CAS program in Chile used a proxy means test to achieve its
goal of ensuring that the poorest 30 percent of the population receive 72 and 62 percent
of the benefits of the family subsidy and the old age assistance pension programs
respectively (Grosh & Baker, 1995). In Egypt, the technique has been used to achieve the
dual purpose of increasing the equity of food subsidy program and lowering of the
program's budgetary cost to the government (Ahmed & Bouis, 2002). In light of the
evidence from programs in Egypt and Chile, the technique implemented in this study can
be used to gain insight into the economic dimension of poverty in Afghanistan and
identify the potential beneficiaries of social protection programs.
Since 1984, Demographic and Health surveys (DHS) have been conducted in
more than 75 developing countries and have provided valuable nationally representative
data on fertility, family planning, maternal and child health, as well as child survival,
HIV/AIDS, malaria, TB, and nutrition. A PCA based asset index, similar to this study,
generated from the DHS data has been used by the World Bank to report on economic
69
inequalities in health outcomes for many developing countries (Gwatkin et ah, 2000;
McKenzie, 2003). The technique proposed in this study can be used to generate a
measure of economic status for the countries where DHS has been conducted. Unlike
asset index, this will provide an economic measure of living standard that is absolute in
nature as the weights to be used for combining assets will be derived from a regression on
an absolute measure. Like the CWIQ method described above, this would need additional
information from a comprehensive survey that has detailed information on an absolute
measure of economic status like income or consumption. A good example of these types
of surveys is Living Standards Measurement Study (LSMS) that have been conducted by
the World Bank in more than 40 countries since 1980. A set of regression coefficients can
be generated for the list of assets that have the maximum R squared value in predicting
this absolute measure. The predicted measure of economic status will be the weighted
sum of these predictors, with the weights being the regression coefficients.
3.5 Conclusion
Afghanistan provides a unique opportunity to study the relation between a
household's dwelling characteristics and ownership of assets with expenditure in a
rapidly changing economic environment. The use of asset variables to predict total
household expenditure is a simple and effective way to meet the urgent need for practical
methods for steadily tracking poverty over time in Afghanistan. Our findings indicate that
there is some evidence of an improvement in economic status and reduction of poverty in
Afghanistan, though our findings only reflect the situation of households living within
one hour of a BPHS facility. With the availability of nationally representative
70

consumption data in future, this technique can be used to improve the efficiency of
targeting public health interventions and services towards the poorer sections of society
as part of the much needed social protection programs in the country. The proposed
technique can also form the basis for poverty mapping in Afghanistan.
71
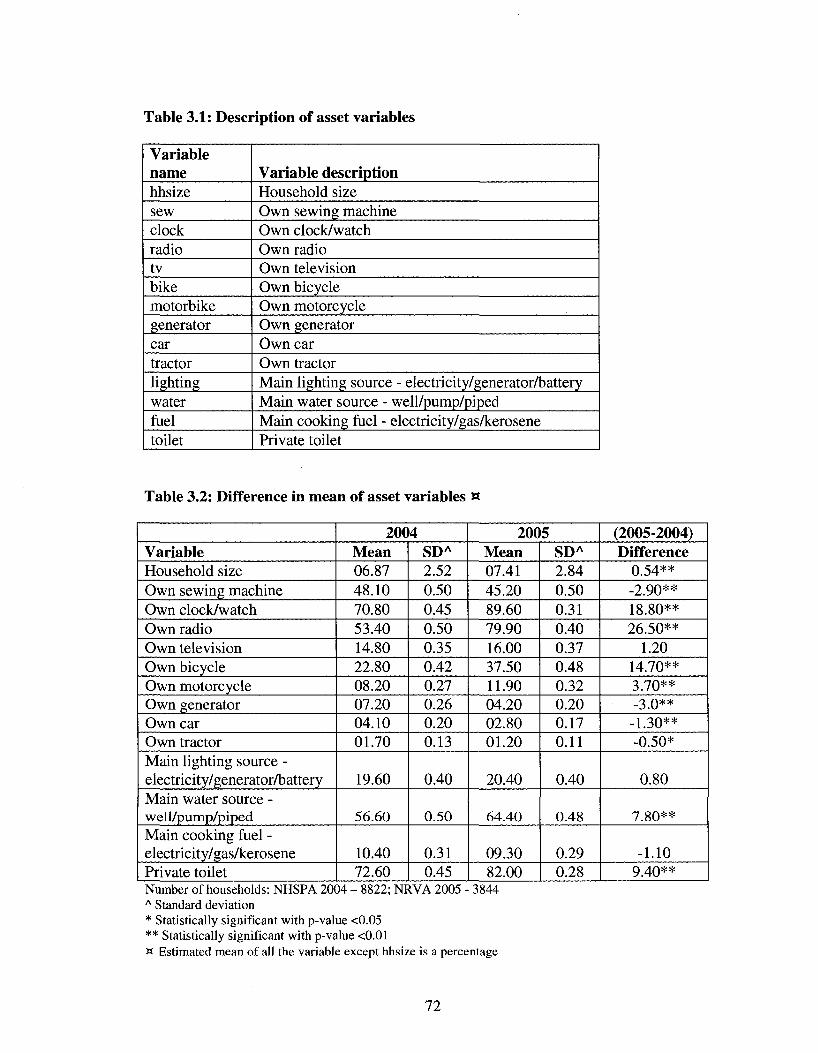
Table 3.1: Description of asset variables
Variable name hhsize sew clock radio tv bike motorbike generator car tractor lighting water fuel toilet
Variable description Household size Own sewing machine Own clock/watch Own radio Own television Own bicycle Own motorcycle Own generator Own car Own tractor Main lighting source - electricity/generator/battery Main water source - well/pump/piped Main cooking fuel - electricity/gas/kerosene Private toilet
Table 3.2: Difference in mean of asset variables «
Variable Household size Own sewing machine Own clock/watch Own radio Own television Own bicycle Own motorcycle Own generator Own car Own tractor Main lighting source -electricity/generator/battery Main water source -well/pump/piped Main cooking fuel -electricity/gas/kerosene Private toilet
20<) Mean 06.87 48.10 70.80 53.40 14.80 22.80 08.20 07.20 04.10 01.70
19.60
56.60
10.40 72.60
4 SDA
2.52 0.50 0.45 0.50 0.35 0.42 0.27 0.26 0.20 0.13
0.40
0.50
0.31 0.45
200 Mean 07.41 45.20 89.60 79.90 16.00 37.50 11.90 04.20 02.80 01.20
20.40
64.40
09.30 82.00
5 SDA
2.84 0.50 0.31 0.40 0.37 0.48 0.32 0.20 0.17 0.11
0.40
0.48
0.29 0.28
(2005-2004) Difference
0.54** -2.90** 18.80** 26.50**
1.20 14.70** 3.70** -3.0**
-1.30** -0.50*
0.80
7.80**
-1.10 9.40**
Number of households: NHSPA 2004 - 8822; NRVA 2005 - 3844 A Standard deviation * Statistically significant with p-value <0.05 ** Statistically significant with p-value <0.01 w Estimated mean of all the variable except hhsize is a percentage
72
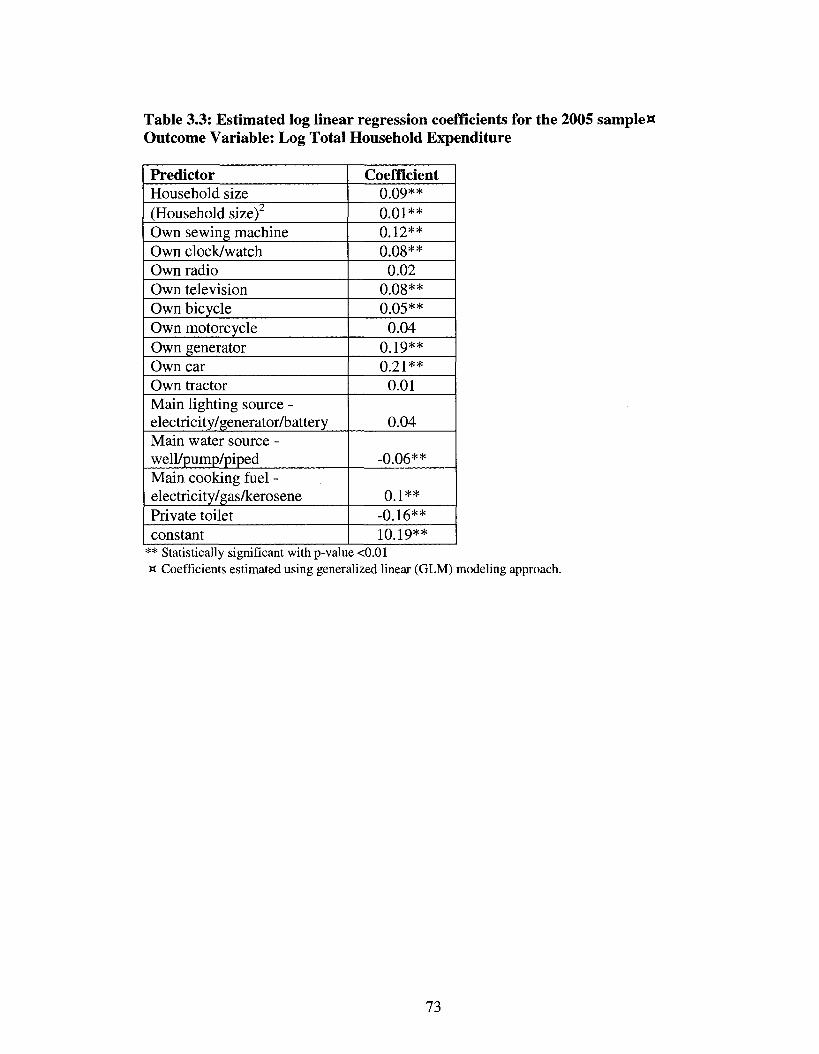
Table 3.3: Estimated log linear regression coefficients for the 2005 sampleW Outcome Variable: Log Total Household Expenditure
Predictor Household size (Household size) Own sewing machine Own clock/watch Own radio Own television Own bicycle Own motorcycle Own generator Own car Own tractor Main lighting source -electricity/generator/battery Main water source -well/pump/piped Main cooking fuel -electricity/gas/kerosene Private toilet constant
Coefficient 0.09** 0.01** 0.12** 0.08**
0.02 0.08** 0.05**
0.04 0.19** 0.21**
0.01
0.04
-0.06**
0.1** -0.16** 10.19**
** Statistically significant with p-value <0.01 H Coefficients estimated using generalized linear (GLM) modeling approach.
73
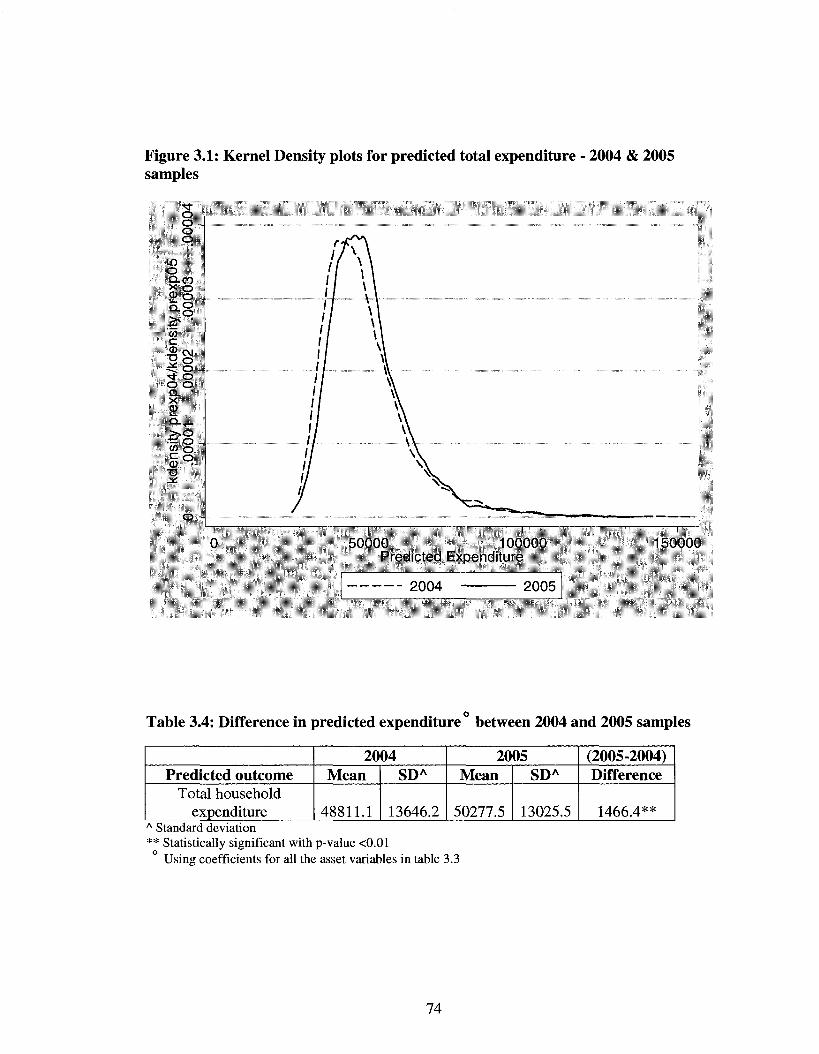
Figure 3.1: Kernel Density plots for predicted total expenditure - 2004 & 2005 samples
'tf o O -o Q
m o Q-CO ><o 2 o ... * 8 > s •
to c .gCM
s ° ^t o o o Q . • X CD 1 _ Q - T -
> . o •t: o .. to o f o <D •
• a J ^
0 - +
50000 100000 Predicted Expenditure
150000
2004 2005
Table 3.4: Difference in predicted expenditure between 2004 and 2005 samples
Predicted outcome Total household
expenditure
2004 Mean
48811.1
SDA
13646.2
2005 Mean
50277.5
SDA
13025.5
(2005-2004) Difference
1466.4** A Standard deviation ** Statistically significant with p-value <0.01
Using coefficients for all the asset variables in table 3.3
74
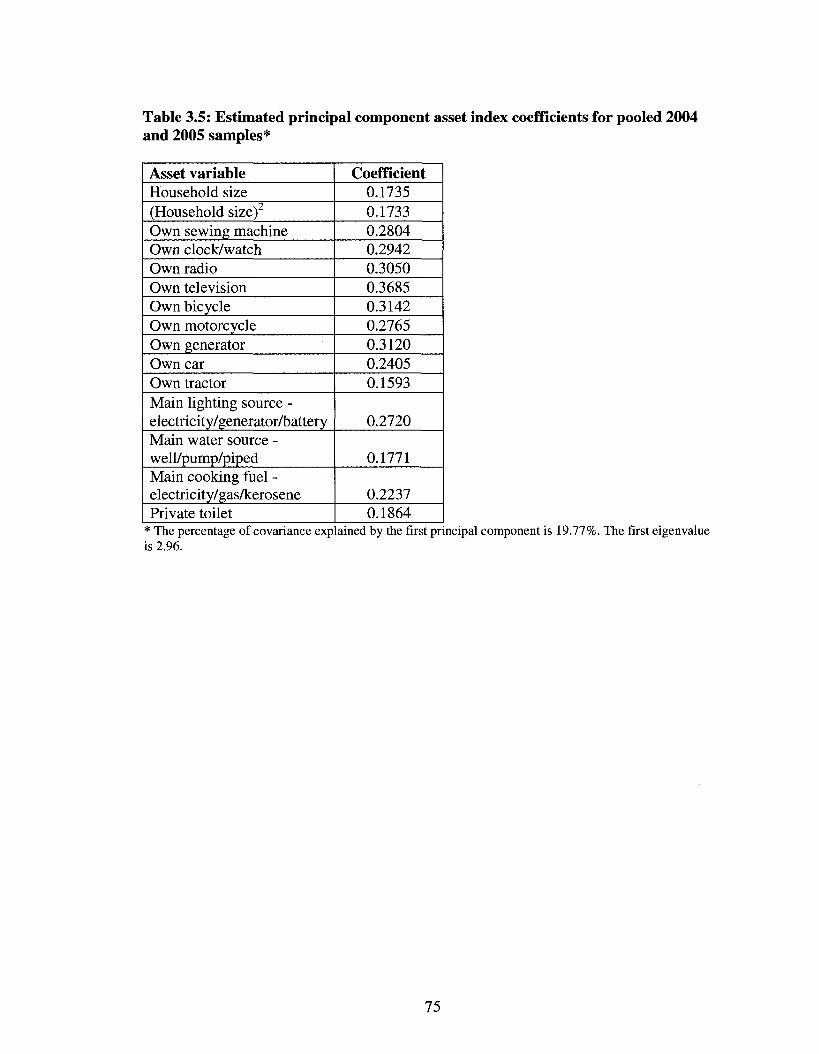
Table 3.5: Estimated principal component asset index coefficients for pooled 2004 and 2005 samples*
Asset variable Household size (Household size) Own sewing machine Own clock/watch Own radio Own television Own bicycle Own motorcycle Own generator Own car Own tractor Main lighting source -electricity/generator/battery Main water source -well/pump/piped Main cooking fuel -electricity/gas/kerosene Private toilet
Coefficient 0.1735 0.1733 0.2804 0.2942 0.3050 0.3685 0.3142 0.2765 0.3120 0.2405 0.1593
0.2720
0.1771
0.2237 0.1864
* The percentage of covariance explained by the first principal component is 19.77%. The first eigenvalue is 2.96.
75
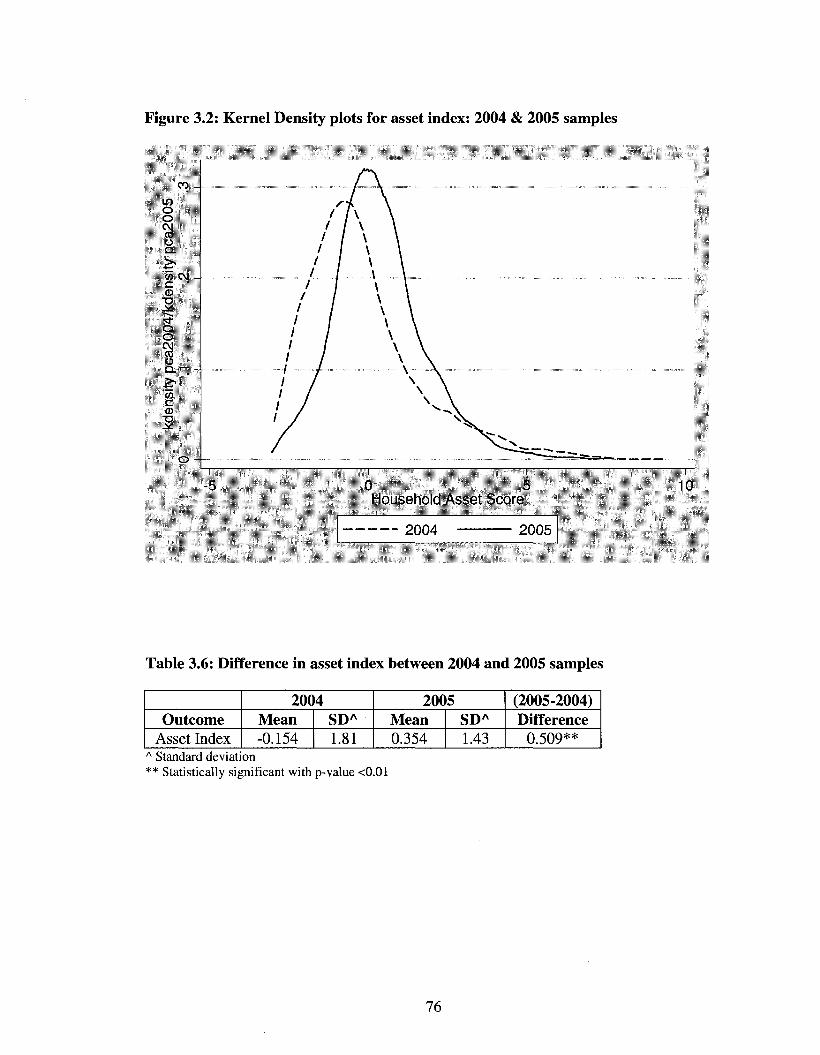
Figure 3.2: Kernel Density plots for asset index: 2004 & 2005 samples
co -in o o CM CO
o Q.
'55 c\i -c CO
T3
o o CM CO
o Q . 1 - ..
"55 c CO
O -•
-5
I \ 1 \ 1 \ 1 \ 1 \ 1 I
1 \ 1 \ 1 I 1 1 1 1 1 / / / / / / /
I i
\ \ \ \ \ \ \ \ \ \ \ \ \ \ \ \ \ \ \ \ \ \
\ \ \ \ \ \
0 5 Household Asset Score
_ ^( j ( j4 *lUUO
Table 3.6: Difference in asset index between 2004 and 2005 samples
Outcome Asset Index
20C Mean -0.154
4 SDA
1.81
20(1 Mean 0.354
15 SDA
1.43
(2005-2004) Difference
0.509** A Standard deviation ** Statistically significant with p-value <0.01
76
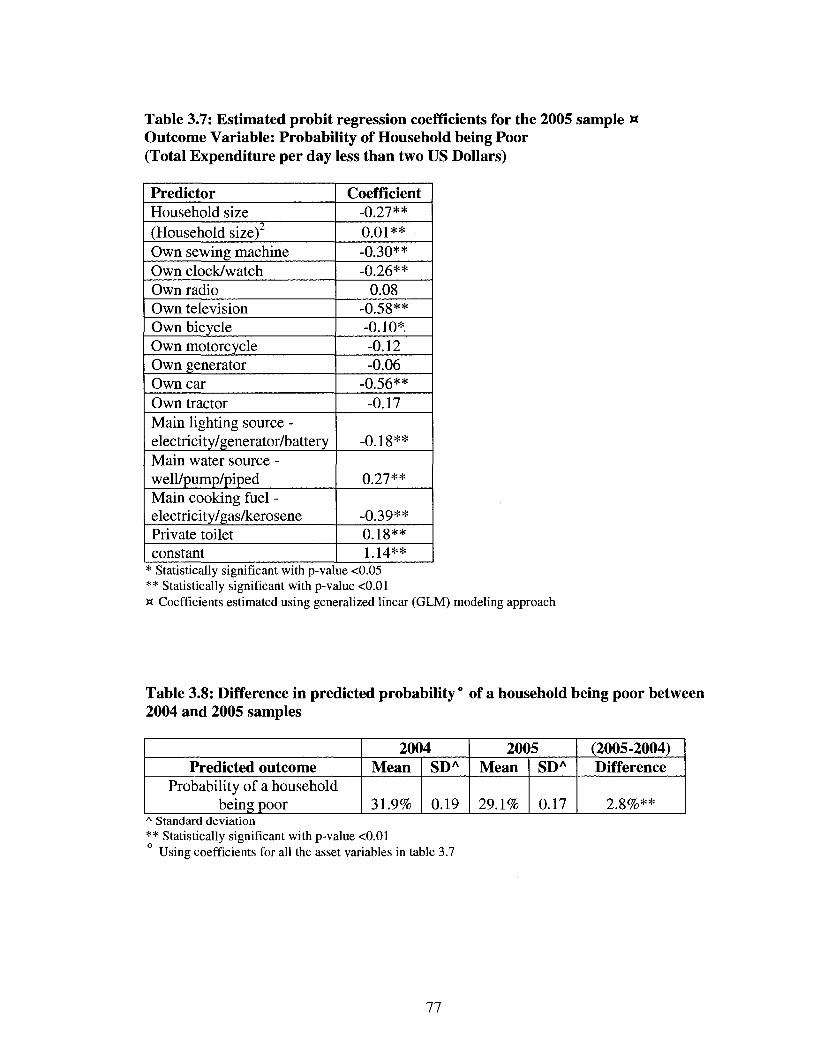
Table 3.7: Estimated probit regression coefficients for the 2005 sample w Outcome Variable: Probability of Household being Poor (Total Expenditure per day less than two US Dollars)
Predictor Household size (Household size) Own sewing machine Own clock/watch Own radio Own television Own bicycle Own motorcycle Own generator Own car Own tractor Main lighting source -electricity/generator/battery Main water source -well/pump/piped Main cooking fuel -electricity/gas/kerosene Private toilet constant
Coefficient -0.27** 0.01** -0.30** -0.26**
0.08 -0.58** -0.10*. -0.12 -0.06
-0.56** -0.17
-0.18**
0.27**
-0.39** 0.18** 1.14**
* Statistically significant with p-value <0.05 ** Statistically significant with p-value <0.01 w Coefficients estimated using generalized linear (GLM) modeling approach
Table 3.8: Difference in predicted probability ° of a household being poor between 2004 and 2005 samples
Predicted outcome Probability of a household
being poor
20(1 Mean
31.9%
14 SDA
0.19
20C Mean
29.1%
15 SDA
0.17
(2005-2004) Difference
2.8%** A Standard deviation ** Statistically significant with p-value <0.01
Using coefficients for all the asset variables in table 3.7
77
Chapter 4 Equity effects of quality improvements on health service utilization in post-conflict Afghanistan
Abstract
In 2003, the Ministry of Public Health (MOPH) started the nationwide
implementation of a Basic Package of Health Services (BPHS) across public health
facilities in Afghanistan to lay the foundations of an equitable health system. Using data
from first four years of BPHS implementation, we set out to assess whether the
association between characteristics of health care delivery system and utilization of
services differed across three outcome groups living in catchment area of health facilities
- total population, the poor and female population. Specifically, this paper focuses on the
relationship between objective measures of technical quality and utilization of health
services by the poor and female population.
The three analyzed outcomes were overall utilization rate, female utilization rate
and utilization rate for the poor. The year of survey and other quantitative measures of
health service delivery characteristics like quality, user fees, facility type and managing
agency were included as the predictors. In addition to a summary index, structural
domain of quality was measured using four indices related to staffing & service capacity;
infrastructure; equipment; and drug supplies. The process domain was measured using
one summary index and two indices related to patient assessment and counseling. Health
facilities were sampled using stratified sampling technique. After excluding facilities
with missing data, the final sample for 2004, 2005, 2006 and 2007 consisted of 350, 593,
562 and 615 facilities respectively. A longitudinal data analysis was conducted using the
78
generalized estimating equations (GEE) technique with bootstrapped standard errors to
account for clustering of observations over time.
The mean monthly utilization rate increased over time for each of the three
outcome groups, with a statistically significant trend over the four years. As compared to
the overall utilization rate, the mean utilization rate was higher for females and the poor
in 2005, 2006 and 2007. In the multivariate analysis including all the predictor variables
in the model, the index on structural quality was significantly associated with higher
utilization rate in each of the three outcome groups (p-value <0.01), whereas process
index was significant only for the utilization by the poor. Staffing and service capacity
was the only quality index significant among each of the three outcome groups. While
infrastructure was found to be significant only for overall and female utilization, drug
availability and patient counseling were significant for utilization by the poor. In the
facility sample from four years, the adjusted rate ratio for user fees was significant for
overall utilization and utilization by poor but not for utilization by females. The highest
decline in utilization associated with collection of user fees was found among the poor.
An explicit focus towards the health needs of women and the poor in provision
and delivery of services has been an important goal of the Ministry of Health and its
partners in Afghanistan. The study findings provide evidence towards the initial success
of this policy objective of the Basic Package of Health Services. Our findings suggest
that higher quality is associated with greater utilization though the association between
different indices of quality and utilization differed by outcome group. Higher quality in
one year leads to an increase in utilization over subsequent years.
79
4.1 Introduction
Afghan context
The country of Afghanistan has suffered from more than two decades of civil war,
and since emerging from conflict has some of the worst human development statistics in
the world. Afghanistan is also one of the poorest countries in the world. The national
health resource assessment conducted after the fall of the Taliban in 2002, found a health
system in utter ruin with thousands of unqualified, under-paid health professionals,
unreliable health care facilities lacking hygiene and proper equipment, and unlicensed
pharmacies selling adulterated drugs (Management Sciences for Health, 2002). The
number of physicians per 1000 population was 0.1, which is very low as compared to 1.1
on average for other developing countries. The survey reported a total of 12,107 health
providers working in active facilities, 28% of which were physicians and specialist
physicians. This indicated a relative excess of physicians in the health workforce, even
though the ratio per 1000 population was very low and the quality of care very variable.
In addition, the male to female ratio was reported to be 3 to 1 with wide fluctuations by
province and facility type.
A majority of the population lived in rural areas with limited availability of health
services and low utilization rates. This scenario was widely prevalent for curative care
and child health services, and the situation was even worse for antenatal and delivery care
services (JHU and IHMR, 2005a; Waldman & Hanif, 2002). To illustrate this point, only
about 52% of facilities surveyed as part on ANHRA in 2002 reported providing a basic
package of Antenatal Care (ANC) services while just 29% of facilities had the necessary
80
equipment and a female health worker to provide the ANC. At the same time, the ANC
utilization rate in 2003 was 14% and the skilled delivery rate was 13%.
In this context, faced with a dysfunctional health system, the Ministry of Public
Health (MOPH) worked closely with development partners to define a strategy for
rapidly expanding the geographic scope and quality of health services. The MOPH and its
partners identified a core set of basic health services to be included in the Basic Package
of Health Services (BPHS) in mid-2002 and finalized the package in March 2003. The
BPHS consists of cost-effective primary care services designed to meet the priority needs
of rural populations, particularly women, children and other vulnerable groups. The
MOPH has used the BPHS as a central element of its National Health Policy to
"strengthen the delivery of sustainable, quality, accessible health services, especially
targeted at women, through planning for, and effective and efficient implementation of
the basic package of health services" (MOPH, 2003a, 2003b).
There have been encouraging reports of increase in utilization of health services
in the past few years, especially by women and poorer sections of Afghan society (Peters
et al., 2007). The quality of services provided at health facilities has also shown
improvement (JHU and IHMR, 2008a). However, the association between quality
improvements and service utilization has not been studied in Afghanistan.
Increase in utilization of health services by the poor and females, and
improvement in quality of health services are both important policy concerns in
Afghanistan. An important objective of this study is to assess whether the quality
improvements are associated with increase in use of services by the disadvantaged
groups; Poor and females. Of particular interest is to assess if certain aspects of quality
81
promote greater utilization by these disadvantaged groups. This study investigates the
impact of health system development in Afghanistan on utilization of health services by
the females and the poor over a period of four years.
This study seeks answer the following questions:
1. Is utilization of health services by the poor and females changing over time in rural
areas?
2. Are changes in quality of health services at BPHS facilities associated with changes in
utilization of health services by the poor and females in Afghanistan?
3. Do the associations between different aspects of quality and utilization differ by the
group of users?
4.2 Rationale
Equity in general terms means that individuals should have equal opportunities to
pursue a life of their choosing and be spared from extreme deprivations in outcomes.
Equity is instrumentally related with development (World Bank, 2006). For societies to
have sustainable growth and development, all members should have similar chances to be
socially active, politically involved and economically productive. Inequalities in wealth
and power with imperfect markets in many countries translate into unequal opportunities.
This leads to wastage of productive potential and to an inefficient allocation of resources.
Economic and political inequalities are associated with impaired institutional
development. These institutions perpetuate inequalities in power, status and health and
negatively affect innovation, investment and risk taking associated with long-term
growth. Equity is helpful in poverty reduction in two ways. It beneficially affects long-
82
term development of the society and directly provides greater opportunities for weaker
sections of the society.
Health is a crucial part of well-being, and of economic and social development.
Improved health contributes to economic growth by reducing production losses caused by
illness; permitting the use of natural resources that would be inaccessible due to illness;
reducing the cost of illness and allowing resources for alternative uses; and enhancing
school enrolment along with the ability to learn (World Bank, 1993). According to
Macinko and Starfield, equity in health may be defined as "the absence of potentially
remediable, systematic differences in one or more aspects of health across socially,
economically, demographically or geographically defined populations or
subgroups"(Macinko, 2002).
Health outcomes are intricately linked to socioeconomic status and gender. A
lower socioeconomic status is an important indicator of poverty. Poverty and ill health
are part of a vicious circle, where poverty leads to ill health and ill health maintains
poverty (Wagstaff, 2002). Recent studies conducted in Afghanistan have reported that the
illness rates among women and the poor are higher than the rates among men and the
economically well off respectively (JHU and IHMR, 2008b; Steinhardt et al, 2007).
These findings are in agreement with the literature from other developing countries where
the poor and women suffer from a greater burden of disease and in some settings have
shorter life expectancy (Gwatkin et al., 2000; Pande & Yazbeck, 2003; Peters et al,
2002). Most experts as well as the general population feel that this type of inequality
violates a sense of fairness, particularly when the people affected can do very little about
it (Alleyne et al, 2000; Le Grand, 1987). Experimental evidence suggests that most of
83
the people behave in ways consistent with fairness, subsequent to caring how they fare
individually (Andersson & Lyttkens, 1999).
Health services utilization directly affects health outcomes and is one of the
important proximate determinants of health (Mosley & Chen, 2003; Wagstaff, 2002). The
relationship between poverty and utilization is thought to be similar to the association
between poverty and health, where worsening poverty leads to a reduction in utilization
and lower utilization helps in maintaining poverty among the poor (Peters et al, 2008).
As compared to males, females have been reported to have higher infant and child
mortality rates, lower immunization rates and lower rates of utilization of primary health
services in general (Ganatra & Hirve, 1994; Shaikh & Hatcher, 2004). This should lead to
a higher utilization of services by these groups but available studies report that this is
seldom the case (Makinen et ai, 2000; Shaikh & Hatcher, 2004). These disadvantaged
groups of poor and females not only utilize health services less often but also utilize
services that are of lower quality (Barber et al, 2007; Buor, 2004). Improvement in
quality of health services has been shown to increase the overall utilization of health
services in developing countries (Chawla & Ellis, 2000; Haddad & Fournier, 1995). Yet
little is known whether improvement in service quality actually benefits these
disadvantaged groups.
Despite the importance attributed to gender specific and pro-poor approaches in
health sector, in practice, many national governments have not been able to prioritize
policies accordingly. A number of successful small scale programs and interventions
have been reported in various settings but there is lack of systematic evidence specific to
these groups at the national level (Peters et al, 2008; Standing, 1997). Keeping this in
84
mind, the main purpose of this study is to provide actionable evidence to policy makers
and program planners to improve equity in developing countries through greater
utilization by these disadvantaged groups. This will be done using data from a nationally
representative sample of health facilities to generate quantitative measures of health
service characteristics, and assesses how each of these aspects is related to utilization by
these groups.
4.3 Conceptual Framework
The framework for this study (Figure 4.1) has been adapted from the access to
medical care framework proposed by Aday and Andersen (Aday & Andersen, 1974).
Access was used in the framework to not only mean the availability of health resources
and services, but whether they are actually utilized by those who need them. To explain
the actual use, this framework used health policy as the starting point and proceeds using
factors like characteristics of health delivery system; characteristics of the population at
risk; utilization of health services; and consumer satisfaction with the services received in
the system. The relevant sections of the framework are discussed below.
A. Characteristics of the health care delivery system
The Aday and Andersen framework describes two main elements in a health care
delivery system - resources and organization. In this study, the access framework by
Aday and Andersen has been modified using Donabedian's quality of care framework.
Donabedian proposed three domains for analyzing the quality of care in a health system:
structure, process and outcome (Donabedian, 1980, 1988). Structure relates to the
characteristics of the system in which care is delivered: it includes attributes of material
85
resources (building, equipment, availability of services, examinations and drugs), human
resources (number and qualification of personnel) and organizational structure (medical
staff organization). Structural features of health care provide the opportunity for
individuals to receive care but do not guarantee it, although they can have direct impact
on processes and outcomes. Process is the actual delivery or receipt of health care.
Process of care in a health system has been described under two categories: clinical care
and interpersonal care. Clinical care refers to the application of clinical medicine to a
particular health problem that a particular individual is suffering from, whereas
interpersonal care describes the interaction of health service provider and the treated
individual. Outcome measures the impact of care on the health status of the users. This is
measured in terms of the change in health status (functional status, clinical outcome) and
the user satisfaction.
Aspects of quality associated with structure and process are under direct control
of policy makers and health professionals and precede the actual utilization of services.
Aspects of quality associated with outcome are not under direct control of policy makers
and health professionals and arise as a result of utilization. The other characteristics of
health care delivery system relevant to this study are type of implementing agency and
user fees. In Afghanistan, public health facilities are managed by either MOPH or an
NGO. These two approaches differ in several respects, including source and level of
funds, management structure and incentives. User fees is a component of organizational
structure that has emerged as an important factor in health systems research and practice
in developing countries, due to an increased emphasis on decentralized decision making
and cost recovery.
86
B. Characteristics of the population at risk
Similar to the Aday and Andersen framework, the framework for this study
describes three components of the population at risk - predisposing, enabling and need.
These are the factors that predispose people to seek care, enable them to seek care and
define their need for services. Predisposing characteristics are those variables that
describe a person's predisposition to use services, such as demographic and social
characteristics and beliefs and perceptions about health services. These characteristics
exist prior to the onset of illness. Enabling characteristics are the means that are available
to the people for the use of services, and include resources specific to the individual and
family (e.g. income, ability to afford costs etc.) and community (rural-urban, travel time).
Need refers to illness levels; the most immediate cause of health services use.
C. Utilization of Health services
The framework describes the utilization as a result of interaction between
characteristics of the health system and the population at risk. In the original Aday and
Andersen framework, utilization was described in terms of its type, site, purpose and the
time interval involved. This study exclusively deals with provision of curative care
through three types of public health facilities in rural Afghanistan over a period of four
years.
D. Relationship among the variables in the framework
Health policy is seen as directly affecting characteristics of the delivery system
and the population at risk. Some of the effects of health policy on the population at risk
are mediated directly (insurance, education) and some indirectly through the delivery
system (relocation of facilities). Various population groups are regarded as having
87
different levels of access to care. When differences are based on need, the access is
considered equitable; when differences are based on factors like age, race, income,
education or geographic location, the access is termed as inequitable (Aday & Andersen,
1981). The delivery system affects the utilization of health services and customer
satisfaction with the services delivered. These effects are determined by the structure
itself and not necessarily mediated by the properties of the potential users. The direct
effects of system properties are important for system-level analyses, where the system
itself, rather than the population at risk, is the unit of concern. The system may also
impact on the characteristics of the population and thereby indirectly affect its utilization
of services and the consumer's satisfaction with services. On the other hand, the
characteristics of the population (attitude towards medical care, income etc) may directly
affect use and satisfaction independent of system properties.
Quality and its effects on health service utilization
There is considerable evidence from various settings that under-utilization of
public health facilities is directly attributable to poor quality of services (Lule et ah,
2000; Mwabu et al, 1993; Rao & Peters, 2007; Wong et al., 1987). The two most
common measures of structural quality that have been extensively documented in the
literature are presence of qualified personnel and availability of drugs (Mariko, 2003;
Mwabu et al., 1993). It has been suggested that patients are attracted by the presence of
qualified personnel and that they are prepared to make substantial efforts to use services
that are technically competent (Haddad & Founder, 1995). Also, availability of drugs has
88
a strong positive effect on utilization of primary health care facilities. Evidence
concerning the effects of other structural attributes like quality of infrastructure is limited.
Structural attributes of quality are considered necessary but not sufficient
conditions for the utilization of health services (Mariko, 2003). Information on process of
care, albeit limited, is also considered important to understand the utilization pattern of
health services. This applies to both clinical and inter-personal aspects of the process of
health service delivery. Mariko highlighted the importance of studying the processes
followed by health care practitioners in estimating the effect of quality on health service
utilization after the introduction of cost recovery program in Bamako, Mali (Mariko,
2003). This study reported that the availability of drugs and good process of care
constitute the two main factors, which have a positive and significant impact on the
choice of health service utilized.
Quality of services is considered a more important predictor of utilization as
compared to the distance that the users have to travel to access the health services
(Acharya & Cleland, 2000; Glei et al, 2003). A logical corollary to this is that users
bypass the facilities with poor quality of services in favor of facilities with higher quality
of services (Akin & Hutchinson, 1999). However, distance from a health facility has
consistently been reported to be an important factor affecting utilization with a large
number of studies reporting an inverse relation between utilization and distance (King,
1966; Moisi, 2008).
89
User Fees and its effects on health service utilization
The collection of a user fee from users of health services is widely prevalent in
developing countries. The proponents of user fees promoted it as an important
mechanism to finance the public system of health care delivery and generate resources
for quality improvements in these countries. However, it remains a contentious policy
issue as available evidence of its effect on utilization is mixed (Peters et al, 2008). A
number of studies have shown that collection of user fees leads to a decrease in
utilization of health services (Collins et al., 1996; Jacobs & Price, 2004). Another set of
studies have reported that this decrease in utilization is highest among the poor (Gilson et
al, 2001; Nyonator & Kutzin, 1999). On the other hand, in selected cases user fee
collection has been associated with improvements in quality as well as increase in
utilization (Litvack & Bodart, 1993; Rao & Peters, 2007). The positive influence of
improvement in quality of health services has been shown to outweigh the negative
influences of user fees on health services utilization (Audibert & Mathonnat, 2000;
Chawla & Ellis, 2000).
4.4 Methods
Data sources
The two sources of data used for this study were the National Risk and
Vulnerability Assessment (NRVA) for the year 2005 and the National Health Services
Performance Assessment (NHSPA) that has been conducted annually from June to
September since 2004.
90
The NRVA was conducted by the Central Statistics Office (CSO) Afghanistan
from June to September of 2005 to collect information to better understand the
livelihoods of rural, urban and migratory (kuchi) households in Afghanistan (M.R.R.D.,
2005). The households were selected using a probability based multi-stage sampling
technique and the collected data were statistically representative of the rural households
at the provincial and national levels. The data on 23,220 rural households (out of a
national sample of 30,822 households) collected from 30 provinces were used in this
study. The household questionnaire that formed the core of NRVA 2005 had a total of 18
sections, with separate sections on household expenditure, ownership of assets, dwelling
characteristics and land ownership.
The NHSPA is an annual facility survey that has been conducted by the MOPH to
collect information on service provision and perspectives of the patient and staff at health
facilities all over Afghanistan. It is a yearly cross sectional survey where a total of twenty
five health facilities providing health services according to the basic package are
surveyed in every province. For this study, the three types of BPHS facilities surveyed
were: Basic Health Center (BHC), Comprehensive Health Center (CHC) and the
outpatient clinics of District Hospitals (DH). Each of these facility types differed in
provided services, staffing levels and the size of the population that they serve; therefore
the twenty five facilities were selected using stratified random sampling in every
province. If fewer than the maximum number of each type of health facility to be
surveyed was present in a province, another type of health facility is randomly sampled
so that up to 25 facilities are surveyed in the province. In provinces where the total
number of facilities is less than 25, all facilities are sampled and surveyed. In 2004, the
91
sampling frame for each province was compiled using the list of all facilities from the
MOPH in Kabul and updated with information from the Provincial Health Directorate
and NGO key informants. This list was updated for 2005, 2006 and 2007 and the updated
list for each year was used to sample facilities for that particular year.
Facilities in provinces that were reported to be too unsafe to survey were removed
from the sampling frame. Any province where more than a third of the facilities were
deemed unsafe was not surveyed. This meant that Helmand, Kandahar, Zabul and
Uruzgan provinces were not surveyed in 2005, 2006, and 2007. The household data
collected from these four provinces as part of NRVA 2005 was also excluded to maintain
representativeness of the analyzed sample.
In each health facility, ten 'new' outpatients were systematically sampled. Out of
these ten new outpatients, a maximum of five were under five years of age and a
maximum of five were over five years of age. A systematic random sampling scheme
with a random start and sampling interval based on the expected number of new
outpatients in each age category in a given year was used to sample these ten patients.
Inpatients admitted for medical treatment in a facility were not included as part of this
study. In this study, a 'new' outpatient was defined as a first time visitor to the health
facility for a specific condition or a repeat visitor because of a worsening of symptoms of
a previous condition. New outpatient visits relate to curative care only, as routine follow-
up and preventive care visits were not included in the category.
The data were collected in every facility via separate modules on: a) health
worker observation b) patient exit interview c) facility assessment. The consultation of
each of the ten patients by the health worker was observed by a trained independent
92
observer. Observers filled out a checklist concerned with technical aspects of care,
including courtesy, patient assessment, physical examination and patient/caretaker
counseling. Before departing from the facility, each of these ten patients was interviewed
in a separate room or a location away from the facility staff and the information was
collected via the exit interview module. The interviewer completing this module collected
information on indicators of patient's household economic status as well as his/her
perspective on the health care and advice that he/she received that day. The facility
assessment module was completed in every facility to collect information on equipment,
supplies, drug stocks, staffing, supervision and management. In addition, facility
surveyors recorded information on the volume of new outpatient visits at the facility from
the sampled facility's administrative records meant for the national Health Management
Information System (HMIS). This module was completed using techniques of direct
observation, review of administrative records and interview of the facility administrator.
Only provinces covered in each of the four yearly NHSPA surveys were retained
in this analysis. Facilities from Helmand, Kandahar, Zabul, Uruzgan and Daykundi
provinces were therefore excluded. Furthermore, surveyed facilities that did not have
outpatient visit records for at least one month preceding the survey were also excluded
from the final sample for analysis. The final samples for 2004, 2005, 2006 and 2007
included 350, 593, 562 and 615 facilities respectively. Tables 4.1 and 4.2 provide details
on the study samples.
For data quality assurance purposes three surveyed facilities per province were
randomly selected for re-survey by an individual who had not been a part of the team of
enumerators. If data discrepancies were deemed to be beyond reasonable bounds,
93
facilities enumerated by that team were re-surveyed. However, the occurrence of a high
percentage of data discrepancies between original and independent repeat survey was
very rare. All survey data were double entered and checked for consistency.
Operationalization of variables
The three outcome variables that were used for this analysis are:
1. New outpatient visits per one thousand (catchment area) population per month:
The data on volume of new outpatient visits in previous months and the catchment area
population were available from the administrative records at every health facility. The
volume of new patients was collected as part of the reporting procedure for the national
health management information system (HMIS). The catchment area population was
calculated by the facility staff based on the geographical area under coverage of the
services provided by the health facility. The data for calculation of catchment area
population was gathered through population surveys conducted by the staff or by using
data from the 2004 pre-census. In the absence of these two sources, the catchment area
population was estimated by facility staff based on their knowledge of the local area and
its population. This variable was calculated as the number of new outpatient visits per
one thousand catchment area population per month and referred to as overall utilization
rate in subsequent section of this study.
2. New female outpatient visits per one thousand (catchment area female) population per
month: The data on volume of new outpatient visits by females in previous months were
available from the administrative records at every health facility. The proportion of
females in every province based on the 2004 pre-census figures was multiplied with the
94
catchment area population to estimate the number of females. This variable was
calculated as the number of new outpatient visits by females per one thousand females in
the catchment area for a period of one month and referred to as female utilization rate in
subsequent section of this study. The calculation of this indicator included data on all
females - under-five as well as adults. Females in the reproductive age group of 15 to 45
years are referred to as 'women' in subsequent sections of this study.
3. New outpatient visits by poor patients per one thousand (catchment area poor)
population per month: A poor patient was defined as a patient belonging to the bottom
40% of the national population when ranked by per capita household expenditure. For
every yearly NHSPA sample, the poor population in the catchment area as well as the
volume of visits by poor patients was calculated using the information on rural
households from NRVA 2005.
Poor population in the catchment area
Information on total expenditure in Afghanis (official Afghan currency) was
collected from every household surveyed for NRVA 2005. The total expenditure for
every sampled household was divided by the number of members in the household to
derive per capita expenditure for that household. The proportion of population in every
province constituting the bottom 40% of national per capita expenditure was estimated by
cross tabulating the bottom 40% of the national population by province using sampling
weights. These sampling weights were provided by CSO and have been used in the past
to generate national and provincial estimates for the NRVA report. The NHSPA
catchment area population of poor was calculated by multiplying the total NHSPA
95
catchment area population for every facility with the proportion of sampled NRVA
population belonging to the poor category in that province.
Volume of visits by poor patients
As part of the data collection for NRVA 2005, information was collected on
ownership of assets, dwelling characteristics and total household expenditure for a
representative sample of rural households in every province. In the exit interview module
of NHSPA, the same questions were asked from every patient except the questions on
total household expenditure. The per capita household expenditure of every surveyed
patient in NHSPA was predicted using the generalized linear modeling technique5.
Using the NRVA data, the per capita household expenditure was treated as the
outcome variable in a log linear regression with asset ownership and dwelling
characteristics as the explanatory variables. The estimated regression coefficients were
then used to predict per capita household expenditure for patients surveyed in every
round of the NHSPA. The predicted per capita expenditure was used to calculate the
proportion of surveyed patients belonging to bottom 40% when ranked by per capita
expenditure. The volume of visits by the poor was calculated by multiplying the total
volume of patients recorded at every facility with the proportion of surveyed patients
belonging to bottom 40% in that province. The variable was calculated as the number of
new outpatient visits by poor per one thousand catchment area population (of poor) for a
period of one month and referred to as utilization rate for the poor in subsequent section
of this study.
The predictor variables used in this study were:
5 This technique has been described in detail in the chapter 3 (second study).
96
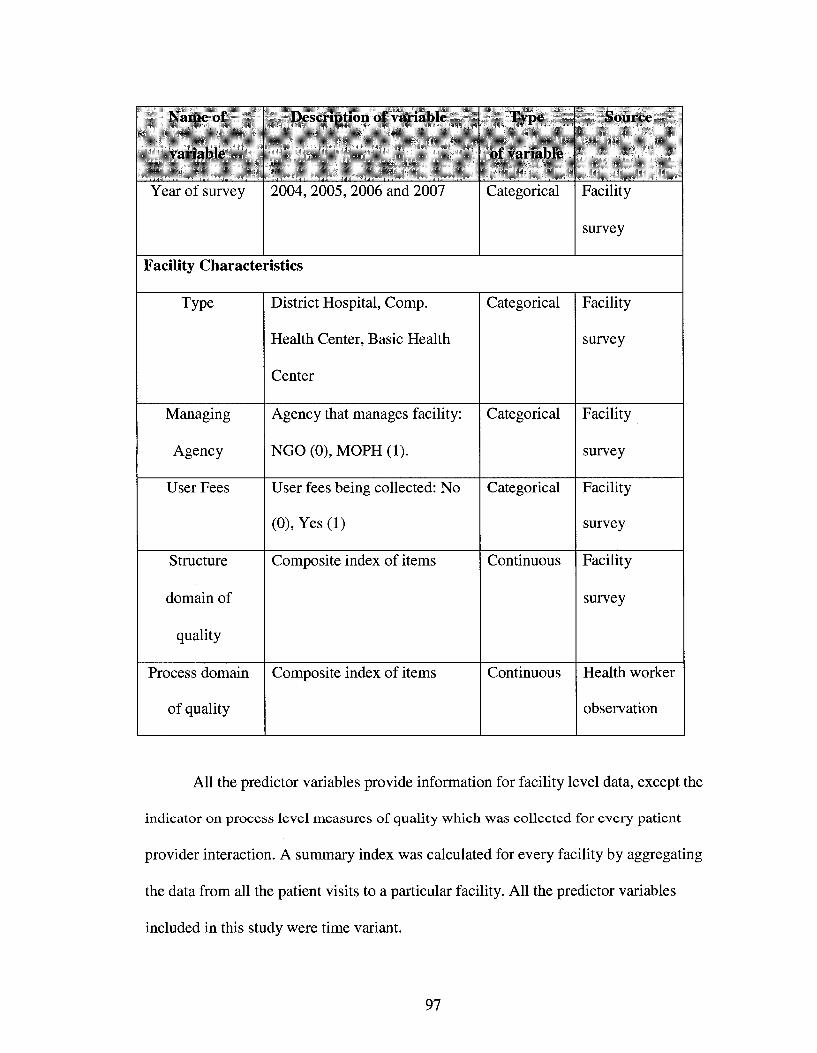
Name of
variable
Year of survey
Description of variable
2004, 2005, 2006 and 2007
Type
of variable
Categorical
Source
Facility
survey
Facility Characteristics
Type
Managing
Agency
User Fees
Structure
domain of
quality
Process domain
of quality
District Hospital, Comp.
Health Center, Basic Health
Center
Agency that manages facility:
NGO (0), MOPH (1).
User fees being collected: No
(0), Yes (1)
Composite index of items
Composite index of items
Categorical
Categorical
Categorical
Continuous
Continuous
Facility
survey
Facility
survey
Facility
survey
Facility
survey
Health worker
observation
All the predictor variables provide information for facility level data, except the
indicator on process level measures of quality which was collected for every patient
provider interaction. A summary index was calculated for every facility by aggregating
the data from all the patient visits to a particular facility. All the predictor variables
included in this study were time variant.
97
Type of facility: In this analysis facilities were classified as Basic Health Centers
(BHC - reference category), Comprehensive Health Centers (CHC), or District Hospitals
(DH) using the standard MOPH classification. Facility type is a potentially important
determinant of health service utilization as different types of health facilities have
different sizes of catchment area population of users. Inclusion of facility type also
controls for the structural variation in quality of care. According to the BPHS, facilities
are classified as BHC, CHC and DH based on differences in staffing levels and provision
of different sets of services. A BHC is supposed to be staffed by vaccinators and a nurse,
midwife or auxiliary midwife, and cover a population of 15,000 to 30,000. The staffing
level of a CHC should include both male and female doctors and nurses, in addition to
midwives and laboratory and pharmacy technicians. CHCs should cover a population of
30,000 to 60,000 and offer a more extensive range of services than BHCs. District
hospitals are supposed to serve up to four districts containing a population of 100,000 to
300,000 people, perform major surgeries and provide comprehensive emergency obstetric
care, including caesarian sections.
Type of implementing agency was a dichotomous variable that measured whether
the MOPH or a non governmental organization (NGO) (reference category) was the
direct provider of services. MOPH-managed facilities and NGO-managed facilities differ
in several respects, including source and level of funds, management structure and
incentives. There has been a heavy emphasis on use of NGOs to deliver services in
Afghanistan and the services have been rapidly expanded through contracting service
delivery to NGOs. It is important to assess utilization rates at MOPH-managed facilities,
relative to those at NGO-managed facilities, to adjust for potential differences in quality
98
of care due to difference in inputs and supervision at facilities managed by these two
managing agencies.
Collection of user fees at a facility was a dichotomous variable that measured if
financial charges are being collected from patients as a payment for services being
delivered to them. These charges could be a flat fee that patients must pay for receiving
services and drugs, a fee for drugs only, or a separate fee for both service and for drugs.
This paper focused on the relationship between objective measures of technical
quality and utilization of health services by different outcome groups. The measures of
technical quality included in this study were based on the quality of care framework
proposed by Avedis Donabedian (Donabedian, 1980, 1986,1988). In addition, these
measures were under direct control of the MOPH, rendering them amenable to change
faster than other measures of quality.
In this paper, structural and process domains of quality were included as
individual predictor variables. In order to study the relationship between specific aspects
of structural and process quality and utilization, these two domains were further
subdivided into six indices and each of these indices was included as a predictor variable.
All items included in quality indices for this study were binary (Yes '17 No '0').
Structural items included variables for facility staffing, equipment, drugs and supplies
and infrastructure. Process items relate to technical quality of care for children under five
years of age and were based largely on assessment, counseling and care seeking priority
indicators for Integrated Management of Childhood Illness (W.H.O., 1999). These items
are based on the indicators included in the Ministry of Public Health's routine monitoring
system, the Afghanistan Balanced Scorecard (BSC). They were developed through
99
formative research and consultative process involving service providers, officials from
the MOPH and content experts from the government and donor agencies. The MOPH
uses these and other indicators on the BSC to clarify strategy, facilitate decision making
and monitoring progress in implementation of services and achievement of desired
outcomes (Hansen et ai, 2008a; JHU and IHMR, 2008a). As the list of items included
under structure and process domains is based on the BSC, it might not have been the
most comprehensive in the general sense of health service quality. This was especially
true for structural measures related to drugs and supplies and for process measures, which
were related to care delivered to under-fives.
In order to ensure comparability across studies, the indices of quality used in this
study were similar to those generated by Arur. Factor analysis (principal component
factor) methods were used as an exploratory data reduction tool to identify the items to be
retained in each index of technical quality (Arur, 2008).
Factor analysis describes the covariance between multiple variables in terms of a
few underlying (or common) factors (Johnson & Wichern, 2002). The number of
components to be retained was decided by examining a scree plot and the face validity of
each component retained. A scree plot graphs eigenvalues. Eigenvalues are a measure of
the proportion of variance explained by each underlying factor. The norm is to retain all
the factors above the 'elbow' of the scree plot. This implies that factors that do not add
substantially to the proportion of variance explained were dropped. After the selection of
items for each index, two sets of facility scores were generated.
The first set of scores was used for exploratory analysis for each year of survey.
In this set, facility score on each index consisted of the 'yes' responses to each item
100
(scored as '1') expressed as a percentage of the total number of items in the index. The
maximum score on each index is 100 and the minimum is 0.
The second set of scores was for the bivariate and multivariate analysis with
pooled data from the four survey years. In this set, the number of 'yes' responses to items
on a particular index was transformed to a standard normal distribution and a
standardized score for each facility was generated.
Indices for structure domain of quality
Based on the exploratory factor analysis, items were assigned to the following four
indices:
Index 1 - Staffing and service capacity: This index assessed the availability of
doctors, nurses and midwives, and the capacity of the facility to provide health
services in terms of equipment, general protocols, laboratory tests and delivery
services. This index included 43 items. Index 1 had an alpha coefficient of 0.94
which indicated relatively high reliability.
Index 2 - Child health services: This index measured facility capacity to provide
child health services, like immunization and growth monitoring, and the presence
of protocols, supplies and equipment. Index 2 included 18 items. Index 2 had an
alpha coefficient of 0.87, suggesting that reliability was relatively high.
Index 3 - Infrastructure: This index was concerned with the presence, physical
condition and cleanliness of infrastructure and the presence and functioning of
basic equipment for clinical services. Index 3 included 19 items. Index 3 had an
alpha coefficient of 0.78.
101
Index 4 - Drags and contraceptive supplies: This index was concerned with the
continuous availability over the previous month of drugs and contraceptives and
their quality in terms of non-expired stocks at the facility. Index 4 included 9 items.
Index 4 had an alpha of 0.86. Tables A4.1 to A4.4 list the items in each individual
index.
Correlations between the four indices ranged from 0.24 (index 3 and index 4) to 0.49
(index 1 and index 3). In general index 4 (Drugs and contraceptives supplies) had the
lowest correlation with the other indices (0.24 to 0.38). Index 1 (Staffing and service
capacity) tended to have higher correlations with the remaining three indices. This was
not surprising since facilities with the highest capacity to provide health services were
likely to have better infrastructure, and have better equipment and supplies. The four
indices captured aspects of structural quality that were intuitively distinct. The child
health services index was dominated by immunization-related variables. Emphasis on
immunization through vertical programmatic efforts may mean that the determinants of
capacity to provide immunization services were different from those of other services.
Index 1, on the other hand, was concerned with an assessment of capacity to provide
health services in terms of clinical staff, equipment and services that are not specific to
children. Index 3 was concerned with the basic pre-requisites for health service delivery
like infrastructure and amenities.
Improving health outcomes is a primary goal of health service provision. An
improvement in technical quality should, ideally, increase the likelihood of better health
outcomes. From this it follows that constructs that measure quality should have a direct
relationship and therefore a strong correlation with improved health outcomes.
102
However, the relationship between quality of care and health outcomes is complex in
general— and especially complex in the case for structural measures of quality.
Evidence suggests that structural measures of quality are relatively weakly linked with
health outcomes as compared to more proximate process measures of quality
(Donabedian, 1988; Mariko, 2003; Peabody et al, 2006).
Nevertheless there is a strong case in favor of measuring and monitoring
structural measures of quality in Afghanistan. Although structure in itself does not tell the
whole story it tells an important part of it. A multi-dimensional assessment of quality that
also includes structural measures is likely to be more valid than one that focuses on either
structural or process aspects in isolation (Donabedian, 1988). Inputs like equipment, staff
and supplies do not guarantee an improvement in the process of care or in health
outcomes. However, in some developing countries where there is a severe shortage of
these inputs, improving structural aspects of quality may be an important pre-requisite to
improving the process of care and therefore health outcomes. The ANHRA's assessment
of health resources clearly suggests that this is the case in Afghanistan (Management
Sciences for Health, 2002).
Indices for process domain of quality
The individual items included in the final indices were concerned with process
aspects of technical quality for patients under-five years of age. Each index included the
binary items assessed from direct observation of the interaction between providers and
patients and their caregivers. These items relate to patient assessment activities and
caretaker counseling (Tables A4.5 & A4.6).
103
Items were assigned to the following two indices based on their factor loadings:
Under 5 index 1- Patient assessment and physical exam index: This index described
the quality of the assessment that the patient receives. The index consisted of 12
items and the cronbach's alpha value for this index was 0.73, which indicated that
reliability was modest but acceptable.
Under 5 index 2- Counseling index: This index was concerned with the quality of
the counseling that the patient receives, including an explanation of the diagnosis,
care to be given at home and danger signs and when to return for a return visit. This
nine item index had a cronbach's alpha value of 0.71 which indicated modest but
acceptable levels of reliability.
The correlation between the two indices was 0.66. Both indices measured the
technical competence of health providers based on Integrated Management of Childhood
Illness (IMCI) protocols. Assessment and caretaker counseling are distinct but integral
aspects of the IMCI strategy (W.H.O., 1999).
Process measures of technical quality are considered to be proximal determinants
of health outcomes (Donabedian, 1988; Peabody et al, 2006) although they tend to be
studied less frequently because of logistical difficulties and problems with measurement
criteria and tools to study the interaction between doctors and patients (Nicholas et al,
1991; Peabody et al, 2006). Recent evidence underscores the importance of directly
examining what providers do rather than what they know or say they do. A study from
India finds that urban doctors operate 'within their knowledge frontier' and do less than
they know they should (Das & Hammer, 2005). The indices in this study measure what
health providers actually do with reference to IMCI protocols. The IMCI approach has
104
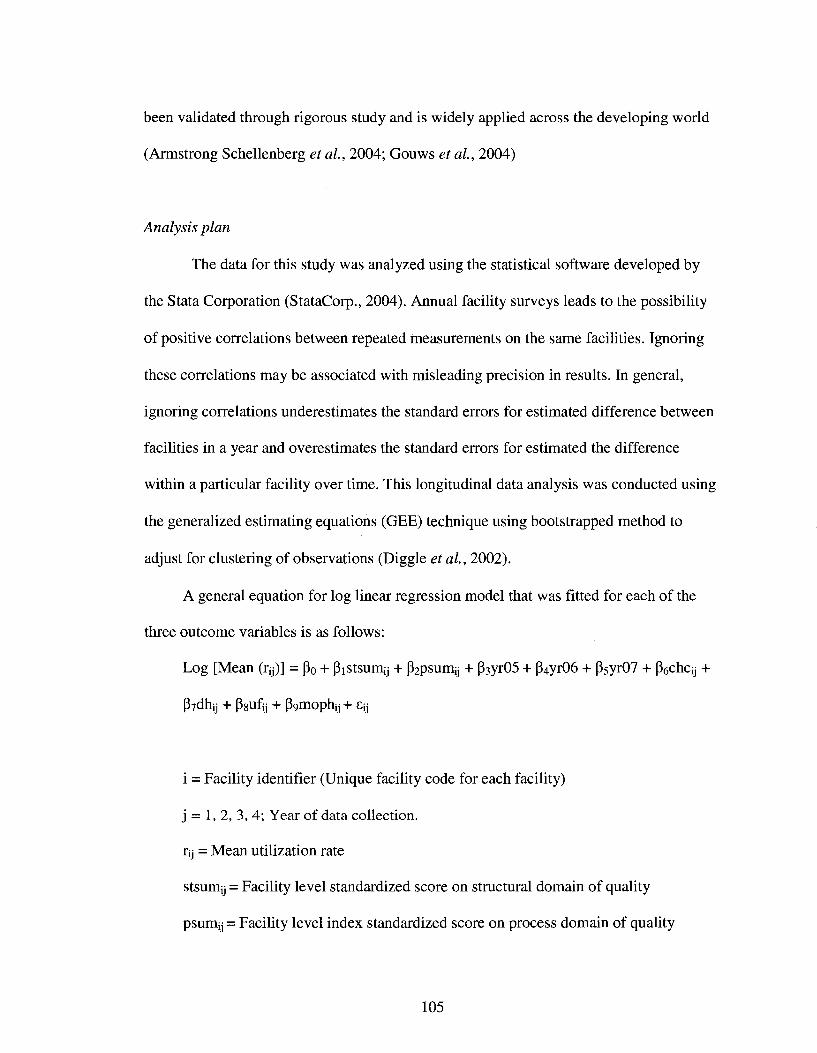
been validated through rigorous study and is widely applied across the developing world
(Armstrong Schellenberg et ah, 2004; Gouws et ah, 2004)
Analysis plan
The data for this study was analyzed using the statistical software developed by
the Stata Corporation (StataCorp., 2004). Annual facility surveys leads to the possibility
of positive correlations between repeated measurements on the same facilities. Ignoring
these correlations may be associated with misleading precision in results. In general,
ignoring correlations underestimates the standard errors for estimated difference between
facilities in a year and overestimates the standard errors for estimated the difference
within a particular facility over time. This longitudinal data analysis was conducted using
the generalized estimating equations (GEE) technique using bootstrapped method to
adjust for clustering of observations (Diggle etah, 2002).
A general equation for log linear regression model that was fitted for each of the
three outcome variables is as follows:
Log [Mean (ry)] = po + Pistsumy + p2psumij + P3yr05 + p4yr06 + P5yr07 + Pechcy +
p7dhij + pgufy + p9mophij + sy
i = Facility identifier (Unique facility code for each facility)
j = 1, 2, 3, 4; Year of data collection.
rij = Mean utilization rate
stsumjj = Facility level standardized score on structural domain of quality
psumy = Facility level index standardized score on process domain of quality
105

yr05: Dummy variable coded as 1 if the observation was from year 2005, coded 0 if
2004
yr06: Dummy variable coded as 1 if the observation was from year 2006, coded 0 if
2004
yr07: Dummy variable coded as 1 if the observation was from year 2007, coded 0 if
2004
chcij = Dummy variable coded as 1 if the facility was a CHC, coded 0 if BHC
dhjj = Dummy variable coded as 1 if the facility was a DH, coded 0 if BHC
ufy: Dummy variable if user fees was being collected, 0 otherwise
mophjj: Dummy variable if the facility was managed by MOPH, 0 if NGO
The interpretation for the p coefficients is as follows:
• (3stsuiriij = Difference in log rate for a 1 unit increase in standardized quality score
(structure level), i.e., log rate for stsuniij + 1 - log rate for stsumjj, other predictors
held constant
Or equivalently
• e Pstsumjj - exponential form of the p coefficient = Rate ratio for a 1 unit increase
in stsumy, i.e., rate ratio for stsuniij + 1 -vs- stsumy, other predictors held constant
Association between individual indices of quality and utilization was analyzed by
replacing the structure level index by four indices of structural quality and process level
index with the two indices of process level quality.
The analysis accounted for the within facility correlation structure by generating
and comparing standard errors using three different assumptions for the working
correlation model within facilities over time. While misspecification of the working
106
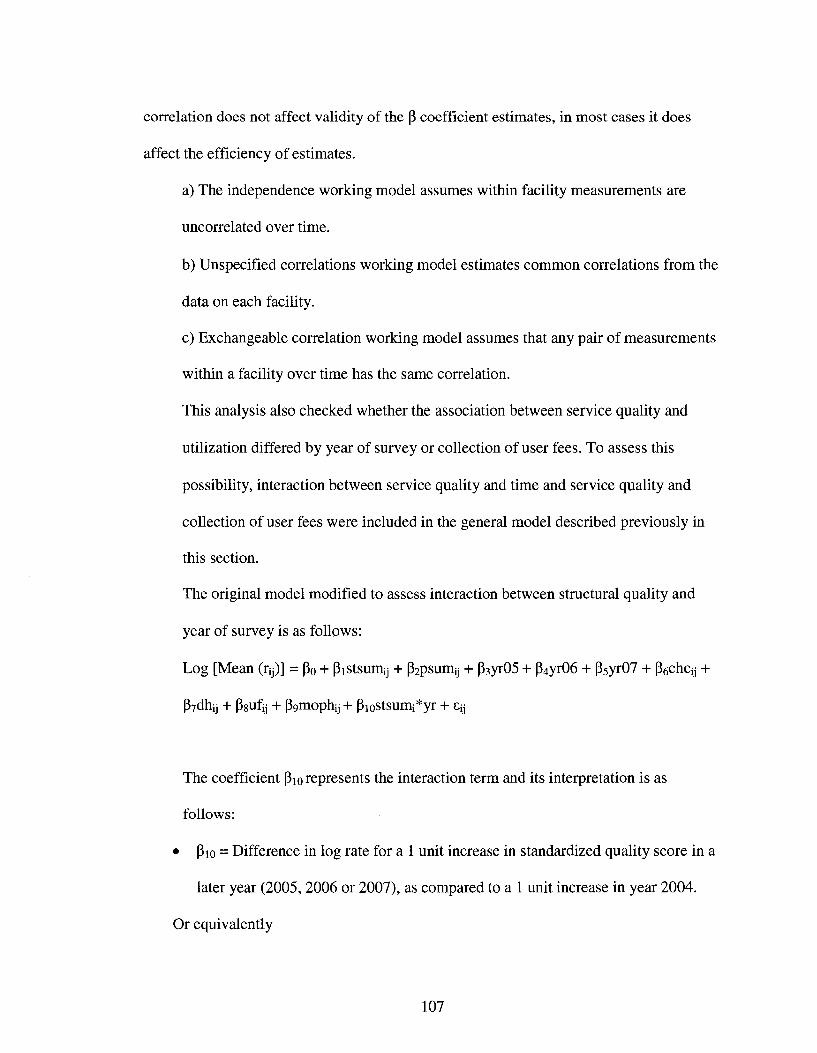
correlation does not affect validity of the P coefficient estimates, in most cases it does
affect the efficiency of estimates.
a) The independence working model assumes within facility measurements are
uncorrelated over time.
b) Unspecified correlations working model estimates common correlations from the
data on each facility.
c) Exchangeable correlation working model assumes that any pair of measurements
within a facility over time has the same correlation.
This analysis also checked whether the association between service quality and
utilization differed by year of survey or collection of user fees. To assess this
possibility, interaction between service quality and time and service quality and
collection of user fees were included in the general model described previously in
this section.
The original model modified to assess interaction between structural quality and
year of survey is as follows:
Log [Mean (rij)] = Po + Pistsuniij + P2psum;j + p3yr05 + P4yr06 + p5yr07 + p6chcjj +
P7dhjj + pgufy + P9inophij + PioStsunii*yr + sy
The coefficient Pio represents the interaction term and its interpretation is as
follows:
• pio = Difference in log rate for a 1 unit increase in standardized quality score in a
later year (2005, 2006 or 2007), as compared to a 1 unit increase in year 2004.
Or equivalently
107
• e pio - exponential form of the P coefficient = Rate ratio for a 1 unit increase in
quality in a later year, as compared to a 1 unit increase in year 2004; i.e., rate
ratio for stsum, + 1 in 2005 -vs- stsum; + 1 in 2004.
Unless otherwise indicated, bootstrapped standard errors and 95% confidence
intervals (CI) are presented here. Bootstrapped confidence intervals and standard errors
are empirical and based on repeated sampling of the available data (Mooney & Duval,
1993). Bootstrapping does not require any assumptions about variable distributions, and
the approaches are based on an analogy between the sample and the population (Mooney
& Duval, 1993) since they sample repeatedly to create a distribution of the test statistic.
The sample of facilities included more than 50% of all eligible public sector facilities
(including NGO-managed) in each of the four years for the provinces included in this
analysis. The high proportion of surveyed facilities suggests that the sample may mirror
the population of public sector facilities well. This also indicates the relevance of
bootstrapping methods to calculate standard errors and confidence intervals.
Although a sample of health facilities was drawn independently in each year, the
high proportion of total facilities sampled indicates that about 18% of facilities with
outpatient visits data were surveyed in each of the four years. The non-parametric
bootstrapping method employed takes the complex survey design and other issues
generated by the design into account. The bootstrapped standard errors were calculated
by re-sampling (with replacement) from the sample of health facilities.
Two additional analyses were conducted for each outcome to check whether
facilities with missing outpatient visit records were systematically different than facilities
that did not have missing outpatient visit records. In the first analysis, a linear regression
108
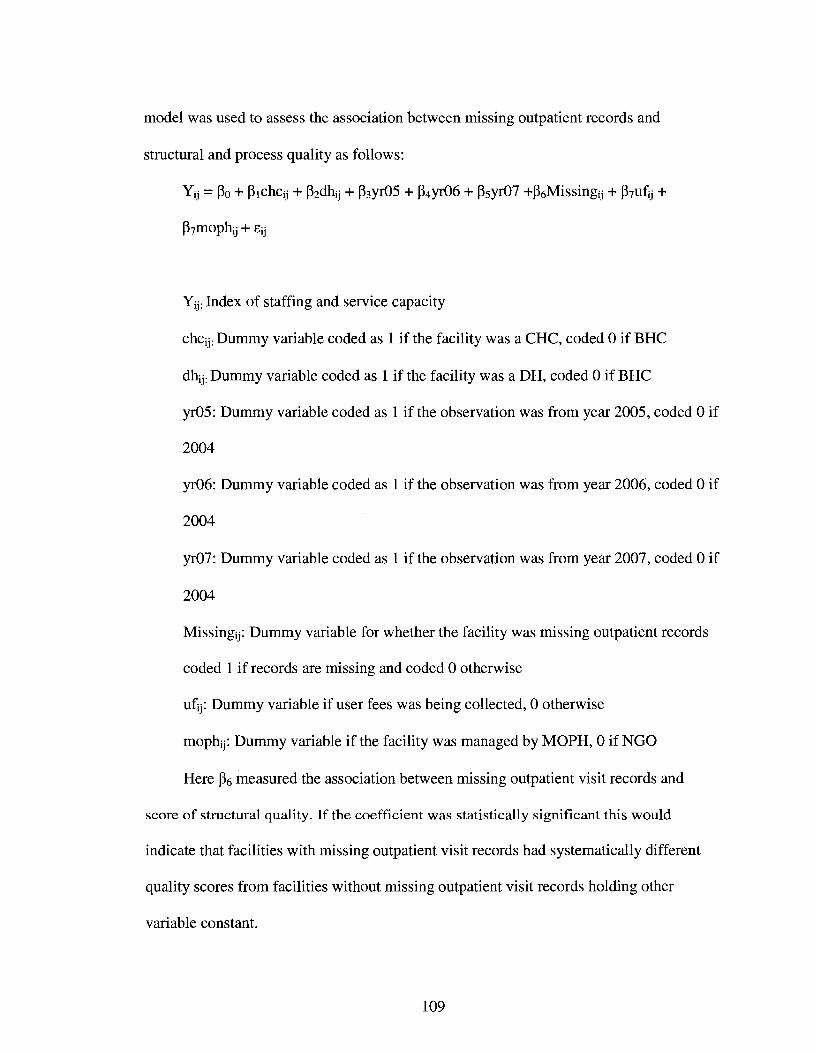
model was used to assess the association between missing outpatient records and
structural and process quality as follows:
Yij = p0 + Pichcy + p2dhij + p3yr05 + p4yr06 + p5yr07 +p6Missingij + p7ufij +
p7mophij + £„
Yij; Index of staffing and service capacity
chcij: Dummy variable coded as 1 if the facility was a CHC, coded 0 if BHC
dhij: Dummy variable coded as 1 if the facility was a DH, coded 0 if BHC
yr05: Dummy variable coded as 1 if the observation was from year 2005, coded 0 if
2004
yr06: Dummy variable coded as 1 if the observation was from year 2006, coded 0 if
2004
yr07: Dummy variable coded as 1 if the observation was from year 2007, coded 0 if
2004
Missingij: Dummy variable for whether the facility was missing outpatient records
coded 1 if records are missing and coded 0 otherwise
ufjj: Dummy variable if user fees was being collected, 0 otherwise
mophij: Dummy variable if the facility was managed by MOPH, 0 if NGO
Here fie measured the association between missing outpatient visit records and
score of structural quality. If the coefficient was statistically significant this would
indicate that facilities with missing outpatient visit records had systematically different
quality scores from facilities without missing outpatient visit records holding other
variable constant.
109
In the second additional analysis, all the data from the year 2004 was excluded and the
original model was refitted. The data from 2004 had outpatient records missing for 38%
of the surveyed facilities, whereas rates of missing data were 4.5%, 9% and 1.5% for
2005, 2006, and 2007 respectively (Table 4.1). The purpose of this was to ascertain
whether the high percentage of missing facilities from 2004 threatens the validity of
findings by fundamentally altering the association between utilization and other
predictors, especially quality of care.
Multicollinearity between independent variables was tested by calculating the
variance inflation factors for the set of explanatory variables for each outcome
individually. The data on utilization rate for each of three outcome groups were over
dispersed as the variance in utilization rate for was higher than the mean of each group.
The log linear models with poisson distribution did not result in a good fit according to
pearson's goodness of fit test (p-value <0.05). The goodness of fit statistic did not
improve with inclusion of interaction terms or multiplying the standard error by a scale
factor. The log linear model fitted with different working correlation models yielded
inconsistent findings for the coefficients and the associated standard errors.
Refitting the subsequent log linear models with a negative binomial distribution
provided a good fit for the over dispersed utilization rate data resulting in lower log
likelihood values and dispersion parameters of around 1.00 for each outcome group.
Multiple iterations of this model with different working correlation structures yielded
consistent results for the coefficients and the associated standard errors. The final model
was fitted assuming an independent working correlation structure and bootstrapped
standard errors. The coefficients for bivariate and multivariate analyses reported in
110
subsequent sections were generated using generalized estimation equation with negative
binomial family of distribution and logarithmic link and bootstrapped standard errors.
4.5 Results
Time trends for outcome groups and predictor variables
Outcome groups
The three outcomes groups analyzed in this study were overall utilization rate,
female utilization rate and utilization rate for the poor.
The mean monthly utilization rate increased over time for each of the three outcome
groups (Figure 4.2). The trend was statistically significant (p-value <0.01) for all three
outcome groups (Table 4.3). As compared to the overall utilization rate, the mean
utilization rate was higher for females and the poor for 2005, 2006 and 2007. Among the
three outcome groups, the highest proportional increase over time was among females
where the utilization rate in 2007 was 2.9 times higher than the rate in 2004.
Predictor variables
Quality of health services
The mean facility score for each index of health service quality improved over
time (Table 4.4). The mean facility score on the summary index for the structure domain
of service quality increased from 39.1 in 2004 to 61.2 in 2007. The mean facility score on
the summary index for the process domain of service quality increased from 37.4 in 2004
to 52.6 in 2007. The trend was statistically significant (p-value <0.01) for the two
summary indices and each of the six indices. Among the six indices of quality, the
111
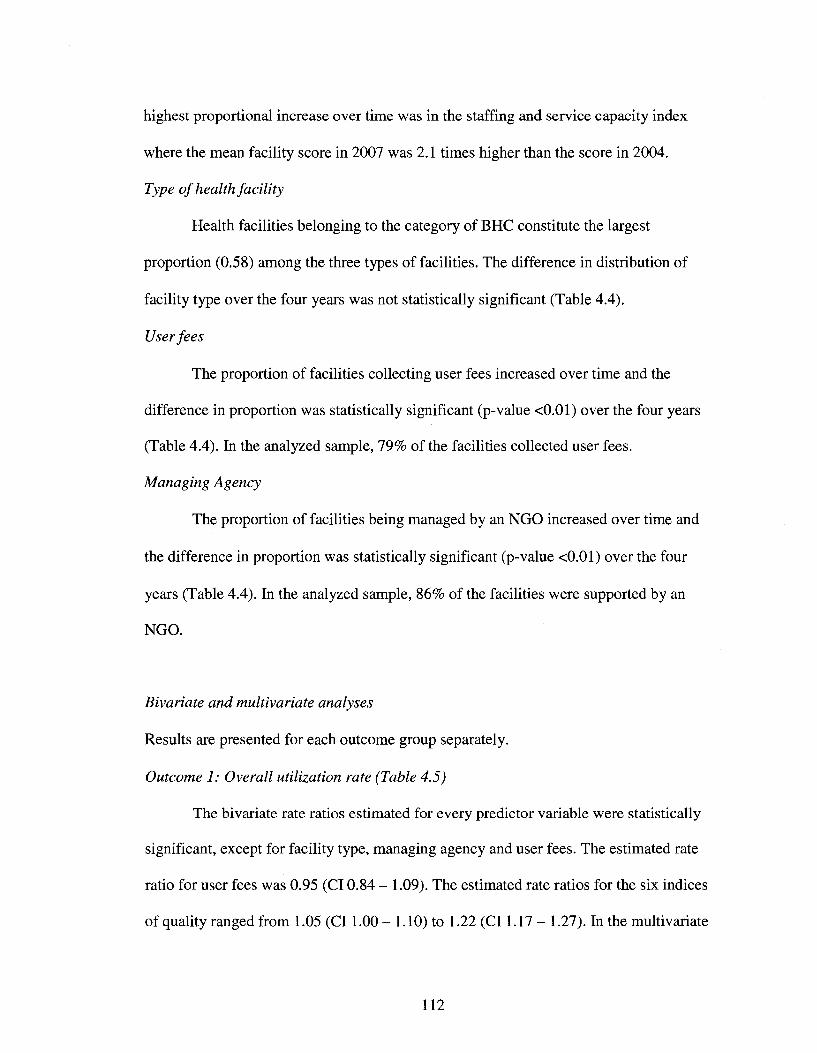
highest proportional increase over time was in the staffing and service capacity index
where the mean facility score in 2007 was 2.1 times higher than the score in 2004.
Type of health facility
Health facilities belonging to the category of BHC constitute the largest
proportion (0.58) among the three types of facilities. The difference in distribution of
facility type over the four years was not statistically significant (Table 4.4).
User fees
The proportion of facilities collecting user fees increased over time and the
difference in proportion was statistically significant (p-value <0.01) over the four years
(Table 4.4). In the analyzed sample, 79% of the facilities collected user fees.
Managing Agency
The proportion of facilities being managed by an NGO increased over time and
the difference in proportion was statistically significant (p-value <0.01) over the four
years (Table 4.4). In the analyzed sample, 86% of the facilities were supported by an
NGO.
Bivariate and multivariate analyses
Results are presented for each outcome group separately.
Outcome 1: Overall utilization rate (Table 4.5)
The bivariate rate ratios estimated for every predictor variable were statistically
significant, except for facility type, managing agency and user fees. The estimated rate
ratio for user fees was 0.95 (CI 0.84 - 1.09). The estimated rate ratios for the six indices
of quality ranged from 1.05 (CI 1.00 - 1.10) to 1.22 (CI 1.17 - 1.27). In the multivariate
112
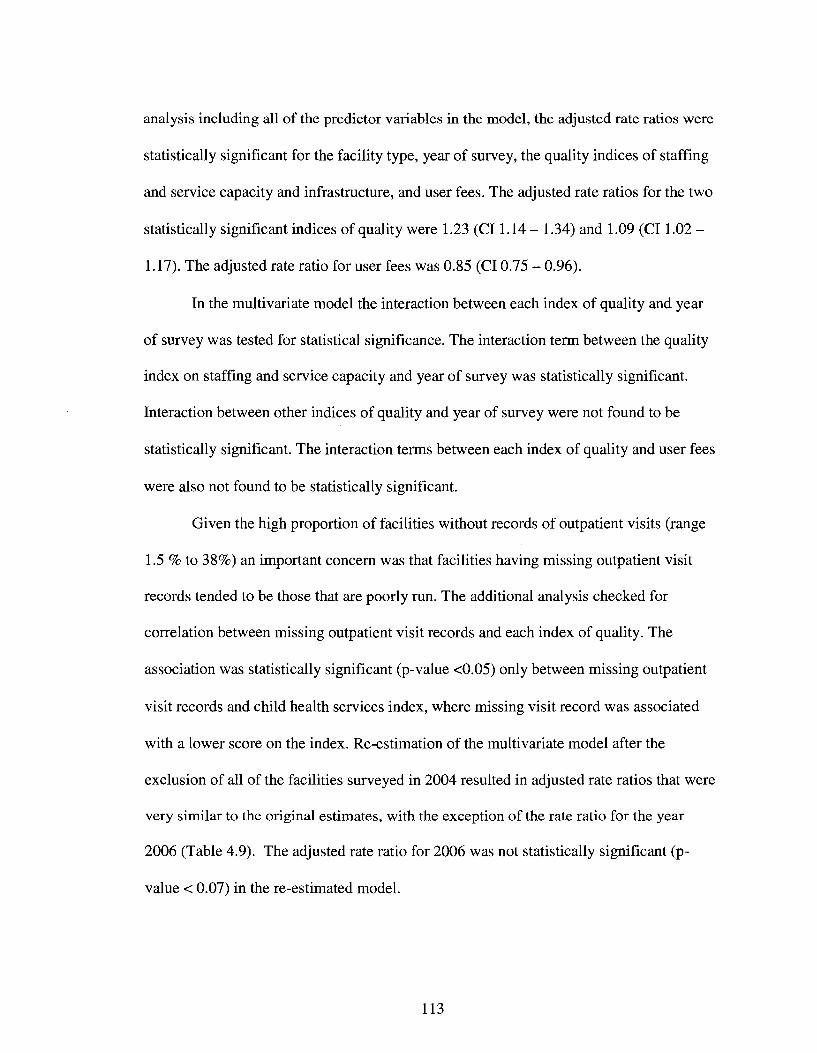
analysis including all of the predictor variables in the model, the adjusted rate ratios were
statistically significant for the facility type, year of survey, the quality indices of staffing
and service capacity and infrastructure, and user fees. The adjusted rate ratios for the two
statistically significant indices of quality were 1.23 (CI 1.14 - 1.34) and 1.09 (CI 1.02 -
1.17). The adjusted rate ratio for user fees was 0.85 (CI 0.75 - 0.96).
In the multivariate model the interaction between each index of quality and year
of survey was tested for statistical significance. The interaction term between the quality
index on staffing and service capacity and year of survey was statistically significant.
Interaction between other indices of quality and year of survey were not found to be
statistically significant. The interaction terms between each index of quality and user fees
were also not found to be statistically significant.
Given the high proportion of facilities without records of outpatient visits (range
1.5 % to 38%) an important concern was that facilities having missing outpatient visit
records tended to be those that are poorly run. The additional analysis checked for
correlation between missing outpatient visit records and each index of quality. The
association was statistically significant (p-value <0.05) only between missing outpatient
visit records and child health services index, where missing visit record was associated
with a lower score on the index. Re-estimation of the multivariate model after the
exclusion of all of the facilities surveyed in 2004 resulted in adjusted rate ratios that were
very similar to the original estimates, with the exception of the rate ratio for the year
2006 (Table 4.9). The adjusted rate ratio for 2006 was not statistically significant (p-
value < 0.07) in the re-estimated model.
113
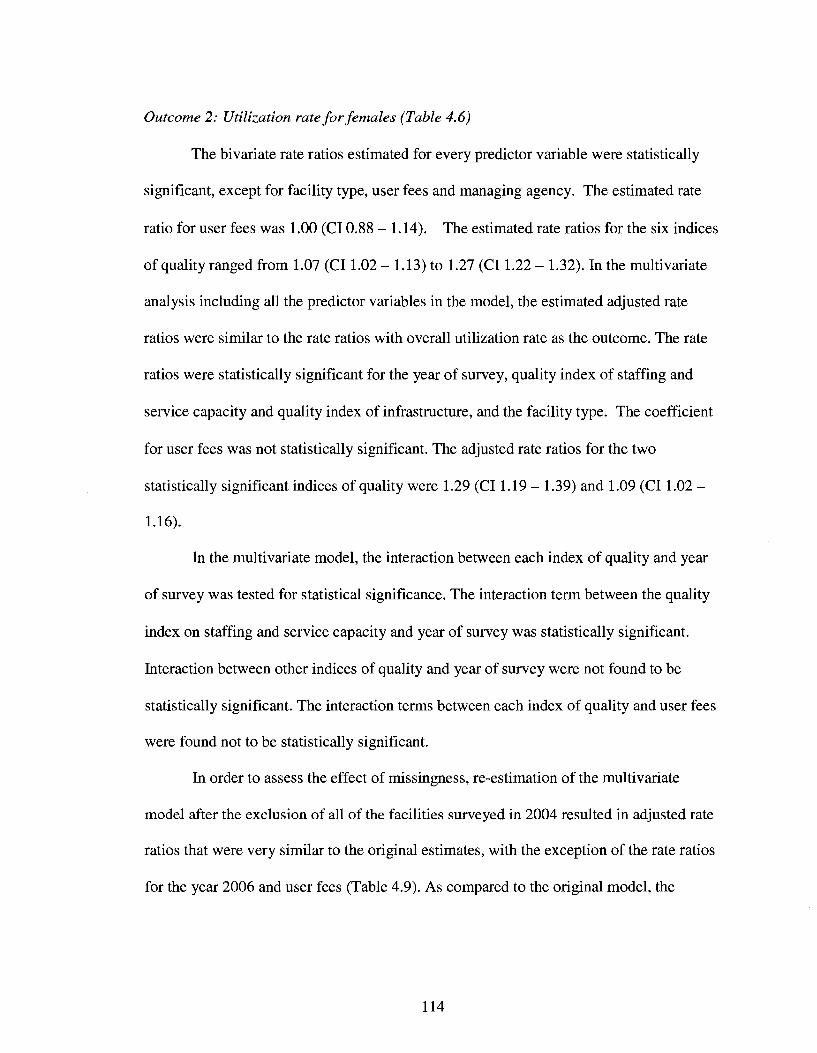
Outcome 2: Utilization rate for females (Table 4.6)
The bivariate rate ratios estimated for every predictor variable were statistically
significant, except for facility type, user fees and managing agency. The estimated rate
ratio for user fees was 1.00 (CI 0.88 - 1.14). The estimated rate ratios for the six indices
of quality ranged from 1.07 (CI 1.02 - 1.13) to 1.27 (CI 1.22 - 1.32). In the multivariate
analysis including all the predictor variables in the model, the estimated adjusted rate
ratios were similar to the rate ratios with overall utilization rate as the outcome. The rate
ratios were statistically significant for the year of survey, quality index of staffing and
service capacity and quality index of infrastructure, and the facility type. The coefficient
for user fees was not statistically significant. The adjusted rate ratios for the two
statistically significant indices of quality were 1.29 (CI 1.19 - 1.39) and 1.09 (CI 1.02 -
1.16).
In the multivariate model, the interaction between each index of quality and year
of survey was tested for statistical significance. The interaction term between the quality
index on staffing and service capacity and year of survey was statistically significant.
Interaction between other indices of quality and year of survey were not found to be
statistically significant. The interaction terms between each index of quality and user fees
were found not to be statistically significant.
In order to assess the effect of missingness, re-estimation of the multivariate
model after the exclusion of all of the facilities surveyed in 2004 resulted in adjusted rate
ratios that were very similar to the original estimates, with the exception of the rate ratios
for the year 2006 and user fees (Table 4.9). As compared to the original model, the
114
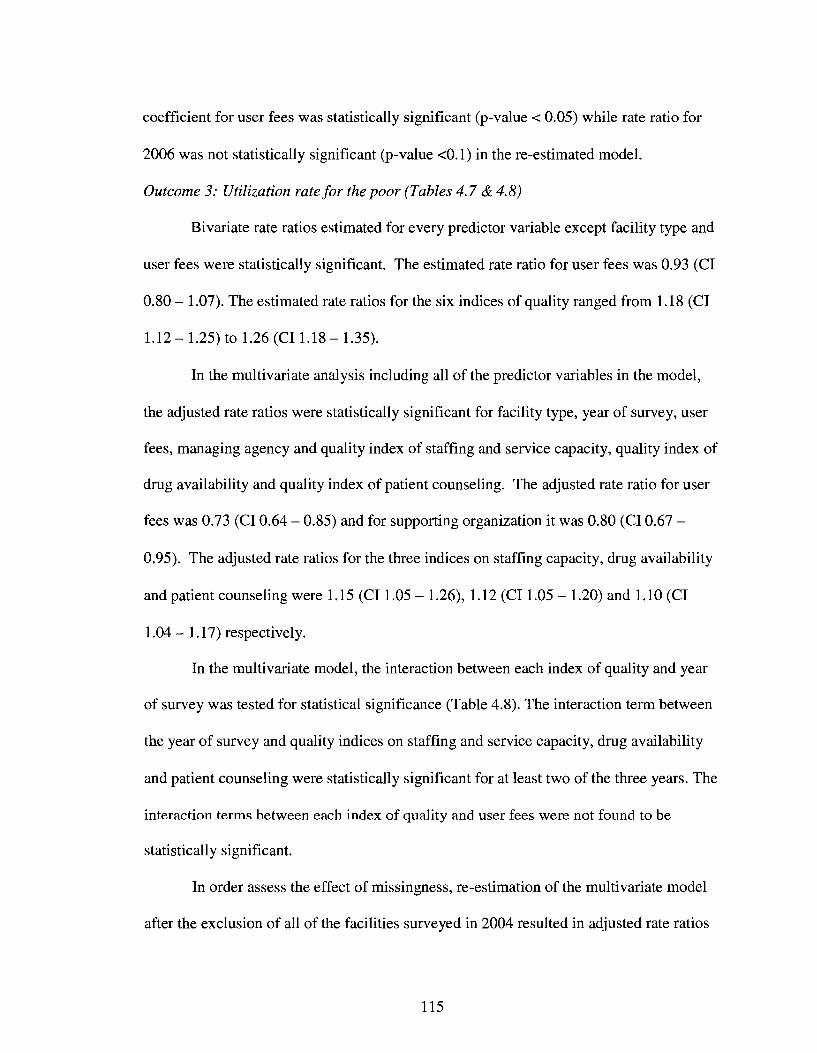
coefficient for user fees was statistically significant (p-value < 0.05) while rate ratio for
2006 was not statistically significant (p-value <0.1) in the re-estimated model.
Outcome 3: Utilization rate for the poor (Tables 4.7 & 4.8)
Bivariate rate ratios estimated for every predictor variable except facility type and
user fees were statistically significant. The estimated rate ratio for user fees was 0.93 (CI
0.80 - 1.07). The estimated rate ratios for the six indices of quality ranged from 1.18 (CI
1.12 - 1.25) to 1.26 (CI 1.18 - 1.35).
In the multivariate analysis including all of the predictor variables in the model,
the adjusted rate ratios were statistically significant for facility type, year of survey, user
fees, managing agency and quality index of staffing and service capacity, quality index of
drug availability and quality index of patient counseling. The adjusted rate ratio for user
fees was 0.73 (CI 0.64 - 0.85) and for supporting organization it was 0.80 (CI 0.67 -
0.95). The adjusted rate ratios for the three indices on staffing capacity, drug availability
and patient counseling were 1.15 (CI 1.05 - 1.26), 1.12 (CI 1.05 - 1.20) and 1.10 (CI
1.04 - 1.17) respectively.
In the multivariate model, the interaction between each index of quality and year
of survey was tested for statistical significance (Table 4.8). The interaction term between
the year of survey and quality indices on staffing and service capacity, drug availability
and patient counseling were statistically significant for at least two of the three years. The
interaction terms between each index of quality and user fees were not found to be
statistically significant.
In order assess the effect of missingness, re-estimation of the multivariate model
after the exclusion of all of the facilities surveyed in 2004 resulted in adjusted rate ratios
115
that were very similar to the original estimates, with the exception of the rate ratio for the
year of survey and drug availability (Table 4.9). The adjusted rate ratios for the year of
survey and drug availability were not statistically significant in the re-estimated model.
4.6 Discussion
The utilization of health services has increased significantly over time in post
conflict Afghanistan. As compared to 2004, the overall utilization rate for the year 2005
increased by 50%. By 2007 the rate increased by 86% from the 2004 level. A number of
studies published recently report an increase in health services utilization at public sector
health facilities in Afghanistan in the initial years after implementation of Basic Package
of Health Services (Hansen et al, 2008b; JHU and fflMR, 2008a). The findings of this
study indicate that the initial increase in utilization of services has continued over time in
Afghanistan.
The findings in this study indicate that this increase in utilization rate by new
outpatients is evident for total catchment area population as well as the two priority
groups; females and the poor. The mean monthly utilization rate for females and the poor
is higher than the overall rate in 2005, 2006, and 2007. The poor have the highest
utilization rate among the three outcome groups in each of the four years. The higher
facility level utilization rates in this study are corroborated by the findings of two recent
household level studies from rural Afghanistan on care seeking practices that reported
that females and the poor households utilize public health facilities more often than males
and richer households, respectively (JHU and fflMR, 2008b; Steinhardt et al., 2007). An
explicit focus towards the health needs of females and the poor in provision and delivery
116
of services has been an important goal of the Ministry of Public Health and its partners in
Afghanistan. The study findings provide evidence towards the initial success of this
policy objective of the Basic Package of Health Services.
The quality of health services delivered at public health facilities has also
improved significantly over time. Health facilities providing higher quality of services
also have a higher rate of utilization in each of the three outcome groups. A large number
of studies have reported this association in various settings; the study of association
between quality and three distinct outcome groups over time is a first. The use of a
comprehensive yet distinct list of facility level characteristics provides actionable
evidence towards promoting equity in health service use by studying the trend in
utilization by individual priority groups. All six indices of quality reflect aspects that are
amenable to change. Each of these indices has high validity and reliability and is
associated with a different aspect of health system management. These indices provide
operational guidance towards monitoring and evaluating the equity promoting policies of
the health system. Based on the differences in association between individual aspect of
quality and utilization by the three outcome groups, policy makers and program planners
can identify aspects that not only promote utilization but also promote equity.
Among the two domains of quality explored in this study, both structure and
process are strongly associated with utilization in each of the three outcome groups,
though in multivariate analysis process level quality is significant only for utilization by
the poor. Among the individual indices of quality, the index measuring the staffing and
service capacity in a facility was the only index significantly associated with each of
three outcomes. In multivariate analysis, one standard unit increase in the measured value
117
of facility score on this index lead to a 23%, 29% and 15% increase in utilization rate
among all new outpatients, new female outpatients and new outpatient visits by the
poorest 40%, respectively. The items included in this index relate to availability of
adequate staff for provision of basic medical services at a health facility and its ability to
perform basic laboratory tests and examinations. HI health is an uncomfortable situation
for the suffering patient and the family. Once the decision to use health services is made,
the patient prefers to use a facility that provides the basic services, has adequate staff and
can perform the necessary laboratory tests and exams, thereby highlighting the all around
association for this index. Each year as part of NHSPA, formative research was
conducted in the community living in catchment areas of surveyed health facilities to
assess their perceptions about quality and barriers to utilization. The two factors that were
included in the description of good quality by a majority of community members were
presence of qualified staff, especially doctors, and the facility's capability to conduct
laboratory tests and examination (JHU and IHMR, 2005b). These qualitative findings
further strengthen the overall importance of our quantitative analyses.
The three outcome groups differ in terms of importance of the second index.
Infrastructure index of structural domain is significantly associated with higher overall
and female utilization rates, while drug availability is the other index important for
greater utilization by poor outpatient. A one standard unit increase in quality on the
infrastructure index was associated with a 9% increase in the rate of utilization for the
females as well as the total catchment area population. Good infrastructure requires a
building that appears to be structurally sound on visible inspection with adequate number
of clean rooms. A facility with good infrastructure is one that provides the patient with a
118
greater sense of comfort before and during the consultation process with a health worker.
In a highly traditional society like Afghanistan, a facility with good infrastructure
provides a greater opportunity for privacy during the consultative process, especially for
reproductive age women. The poor patients, due to lower socio-economic status, might
have a lower sensitivity to issues of privacy and comfort, thereby leading to a non-
differential pattern of utilization in this group based on this factor.
A large number of studies exploring the effect of health service quality on
utilization have reported the importance of regular availability of drugs at a facility in
affecting the utilization of services, though none of them studied the role of drug
availability in utilization by different outcome groups (Lule et al., 2000; Mariko, 2003;
Mwabu et al, 1993). In our study, drug availability is an important predictor of
utilization rate in each of the three outcome groups in bivariate analysis, but after
adjusting for other aspects of quality it is statistically significant only for outpatient visits
by the poor. One standard unit increase in facility score on the drug availability index is
associated with a 12% increase in rate of utilization by the poor, after adjusting for other
predictors. The poor are the most economically vulnerable part of the population and
suffer from a greater burden of disease as compared to those economically well off.
Unlike the general population they are the least capable of consulting private providers or
buying drugs in the open market. While the finding that drug availability is not a
statistically significant factor in overall utilization is a bit surprising, its importance in
affecting the utilization by the poor is a logical expectation.
The process domain of quality was a significant predictor of increase in utilization
rate for each of three outcome groups in bivariate analysis. After adjusting for structure
119
and other predictors, it was a significant predictor only for the outpatient visits by the
poor. Among the two indices representing the process domain, the index on counseling of
patients was significant only for the utilization by the poor group. One standard unit
increase on the counseling index was associated with a 10% increase in utilization by the
poor.
The poor patients represent the lowest 40% of the population in terms of
household expenditure and they have the lowest level of education and exposure to mass
media like radio and television (JHU and IHMR, 2008b). The availability of good
counseling as a source of information and awareness about disease and illness might be
relatively more important for the poor as compared to the general population, thereby
leading to this important association. Another possible explanation for this association
might be that a larger proportion of poor patients are less than five years of age. The poor
tend to have larger families on average as compared to the non poor (Filmer & Scott,
2008; Rutstein & Kiersten, 2004). The poor not only have larger families, they might also
have a greater proportion of members belonging to younger age groups. The process
indices used in our study mostly deal with observation of delivery of services to the
children below five years of age. If the counseling is as important in the total population
of the catchment area as it is for the poor in the same area, a greater number of children
per family among the poor and the measurement of process aspect of quality while
delivering services to children might lead to a significant association when the outcome
of interest is the utilization by the poor.
The lack of strong association between process measures of quality and utilization
of services by females might also be explained by the lack of indices measuring delivery
120
of services specific to females, especially reproductive age women. As compared to the
structure domain of quality, the process domain is more difficult to measure as the
process of health services delivery is specific to patient factors like age, gender and
disease symptoms (Nicholas et ah, 1991; Peabody et ah, 2006). This study was
performed only in general outpatient clinics of health facilities in order to perform facility
assessment with the total catchment area population in perspective. The data collection of
health worker observation was stratified by patient age and the instruments were based on
BVICI instruments in order to ensure comparability with other studies. No data was
collected on process measures of quality in antenatal or postnatal clinics within facilities,
where services specific to women are delivered.
The collection of user fees at health facilities is a variable that has been
extensively studied in the literature. It is a contentious policy issue as available evidence
of its effect on utilization is mixed (Peters et ah, 2008). A pilot study was conducted in
Afghanistan to assess the effect of user fees on various aspects health service delivery,
including its effect on utilization. In the final report published recently, it was found that
the utilization of services increased over time across all the facilities under study, but the
increase in utilization of health services at facilities providing services free of charge was
significantly greater than among facilities charging some form of user fees (JHU and
IHMR, 2008c). In our study, user fee collection at primary health care facilities was
associated with a statistically significant reduction in utilization rates for the total
catchment area population and the poor. The magnitude of reduction in utilization rate for
facilities collecting user fees was 15% for overall utilization and 26% for utilization by
the poor. The findings of our study are in agreement with other studies that report a
121
similar decline in utilization at facilities where user fees are collected (Burnham et al,
2004;Gilson<??a/.,2001).
Our findings suggest that the effect of user fees is not uniform across different
outcome groups. The population group that is most strongly affected by user fees is the
poor and our findings reflect this association by the additional 11% decline in adjusted
rate ratio for the poor as compared to the total catchment area population. The user fee
collection had no significant association with utilization rate by females. Using data from
the four years of survey, the adjusted rate ratio for utilization by females was 0.89 in
magnitude and was not statistically significant, whereas using data from the last three
years, the adjusted rate ratio was 0.85 and statistically significant. According to Hansen et
al, among the BPHS facilities surveyed as part of NHSPA, the provision of antenatal
services for women increased from 58.5% in 2004 to 79.3% in 2005, and this change was
statistically significant. During the same interval, the proportion of women among the
new outpatients also increased significantly from 55.2% to 57.4% (Hansen et al, 2008b).
In 2004, while the general population had a greater choice of facilities to access health
services, the women not only visited the BPHS facilities less often but also had much
lower number of facilities to choose from in order to receive antenatal services. The
situation for women trying to access antenatal care might have changed from 2004 to
2005, leading to user fees becoming a significant factor in choice of health facility.
Our findings indicate that the type of health facility associated with highest
utilization rate is BHC, followed by CHC and then by DH. This finding is evident in each
of the three outcome groups. The most probable explanation for this difference might be
due to the fact that this study was conducted only in the general outpatient clinics of
122
health facilities. BHC's have the smallest catchment area population, and if equal number
of patients visit outpatient clinics across each of the three types of health facilities,
BHC's will have the highest utilization rate. Alternatively, BHC's are the nearest health
facility available to a patient among the three types of public health facilities surveyed in
this study,. Under the assumption of a functioning referral system, an outpatient's first
contact with the health system will be at the level closest to his/her residence, which
among the three types in this study is the BHC.
The management of health facility solely by the MOPH is associated with a 20%
decrease in utilization rate by the poor. The association for other two outcome groups is
not statistically significant. In an earlier study by Hansen et al on significant determinants
of quality of health services in Afghanistan, lower socioeconomic status was found to be
associated with receipt of lower quality services at MOPH facilities only, not at facilities
supported by NGO's (Hansen et al, 2008a). This difference provides a plausible
explanation for the poor utilizing the MOPH facilities less often than the non-poor.
In each of the outcome groups, the statistical significance of an interaction
between staffing and structural capacity and the year of survey suggest that an increase of
one standard unit in quality score on this index leads to a significantly greater increase in
utilization at a facility in a later year as compared to a similar increase in quality an
earlier year. One probable explanation for this interaction is the change in perception of
quality in catchment area population. A good perception of quality among the new users
in one year might have led to an increase in utilization rate over and above what was
expected due to the provision of better quality services at a particular health facility.
123
Study findings for outpatient visits by the poor from the interaction between drug
availability and year of survey yielded statistically significant rate ratios. The overall
coefficient for drug availability was positively associated with utilization though the
coefficients for this interaction were negative, suggesting the possibility of a threshold
value on the index after which there is a reversal of trend. Refitting the model after
excluding data from 2004 resulted in a non-significant coefficient for drug availability,
thereby lending support to hypothesis that increased drug availability was linked with
increase in utilization by the poor but its effect waned after reaching a threshold value at
the end of first year of BPHS implementation. The interaction between counseling with
year of survey also yielded statistically significant results for utilization rate by the poor.
Though the interaction terms for counseling were not found to be significant for each of
the three years of survey, the findings are highly suggestive.
The findings in this study are subject to some limitations. The lack of community
based data precludes us from studying other factors that might affect the choice of health
facility by different outcome groups. Two potentially important variables (enabling
factors) affecting the choice of health facility were cost and travel time. The total cost of
utilizing a particular health facility, besides the actual expenditure on consultation and
drugs, consists of the loss in income of the patient and the accompanying caretaker and
the expenditure incurred on traveling to and from the health facility. A number of studies
have reported that a higher cost or a longer traveling time to a particular health facility
reduces the probability of a patient to use that facility (Akin et ah, 1995; Haddad &
Fournier, 1995; King, 1966; Moisi, 2008; Shaikh & Hatcher, 2004). In order to have
124
adequate information on these important variables, yearly household surveys in the
catchment area would have been needed.
Another potential limitation of this study is the lack of data on private providers
of health services competing with the public health facilities. In addition to medical
providers, this group includes pharmacies and other traditional healers. Though the
longitudinal nature of data enables the association of the increasing trend in utilization to
public health facilities, it cannot measure the proportion of users that have switched over
from private providers (or vice versa) versus the users that are actually 'new'.
The change in security situation in Afghanistan is a potentially important variable
that was not included in this analysis. We tried to control for this variable by excluding
the most insecure provinces from this analysis, though the effect of security on utilization
could not be explored.
The outcomes analyzed in this study rely heavily on the routine reporting system
at health facilities. Exploratory analyses revealed that 38% of the facilities from the year
2004 were missing information on the outcome variable. An important concern was that
these facilities with missing information were providing services of lower quality or were
markedly different from the facilities with information on the outcome variable. The
potential effect of these facilities was studied by performing two additional analyses. The
first analysis was based on the fact that these facilities with missing information had data
available on the quality variables. In the first analysis, the association between missing
value on utilization rate and quality was tested for statistical significance. Each index of
structure domain of quality was included as the outcome variable in a regression model
with a binary explanatory variable that was coded as ' 1' if the facility had missing
125
information on number of visits or catchment area population, and '0' otherwise. The
association was statistically significant (p-value <0.05) only between missing outpatient
visit records and child health services index, where missing visit record was associated
with a lower score on the index. In order to assess the effect of this finding, the
multivariate models for each of the three outcomes were refitted after excluding all the
facilities from the year 2004. The refitted models without data from 2004 yielded results
that were qualitatively similar to the original models fitted with data from 2004. This
implied that the findings of this study are robust to the missing data from the year 2004.
The high proportion of missing outpatient visit rate (12.6% when all years are considered
together) is not entirely unexpected given that both facilities and the reporting system
were being set up during the 2004-2005 period. Based on the two analyses, it is fairly
likely that the missing values reflect the incremental health sector reconstruction
process— rather than poor performance by facilities with missing data.
4.7 Conclusion
The utilization of public health facilities in Afghanistan increased significantly
over the four years. Females and the poor had utilization rates that were higher than the
overall population. The quality of services at health facilities had also improved
significantly over time. Facilities providing services of better quality had higher
utilization rates than facilities providing lower quality services. While higher quality in
one year was associated with greater utilization, higher quality also lead to an increase in
utilization over subsequent years.
126
Both structure and process aspects of quality were significantly associated with
increase in overall utilization as well as utilization by females and the poor, though
among the facilities having similar levels of structural quality, process aspect of quality
was significant only for utilization by the poor.
In each of the three outcome groups, a higher availability of qualified staff and
ability to perform clinical tests and examinations in one year was associated with an
increase in utilization in the next year, which was significantly higher than what was
expected with greater availability of staff or passage of time alone. Increased availability
of drugs and good patient counseling were associated with increase in utilization among
the poor, though the association with drug availability was subject to threshold effects.
Collection of user fees was associated with decline in utilization, with the poor
experiencing the highest decline in rates.
127
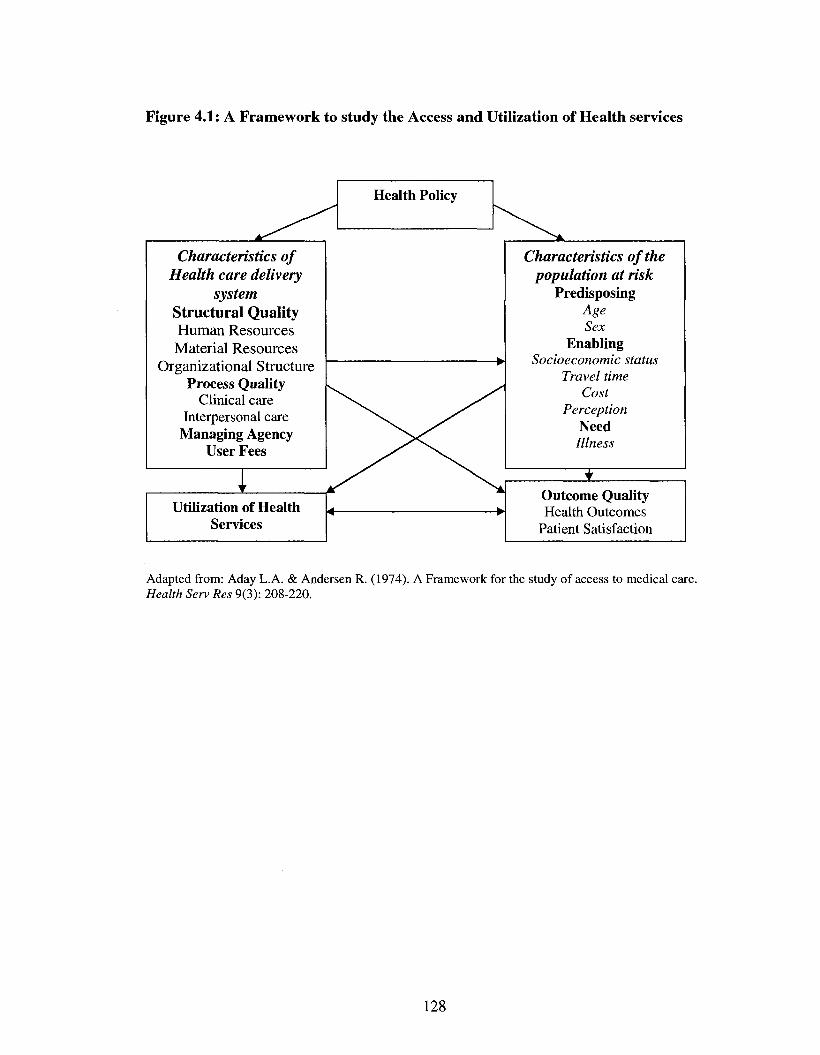
Figure 4.1: A Framework to study the Access and Utilization of Health services
Health Policy
Characteristics of Health care delivery
system Structural Quality Human Resources Material Resources
Organizational Structure Process Quality
Clinical care Interpersonal care
Managing Agency User Fees
i '
Utilization of Health Servi ces
Characteristics of the population at risk
Predisposing Age Sex
Enabling Socioeconomic status
Travel time Cost
Perception Need Illness
t Outcome Quality Health Outcomes
Patient Satisfaction
Adapted from: Aday L.A. & Andersen R. (1974). A Framework for the study of access to medical care. Health Serv Res 9(3): 208-220.
128
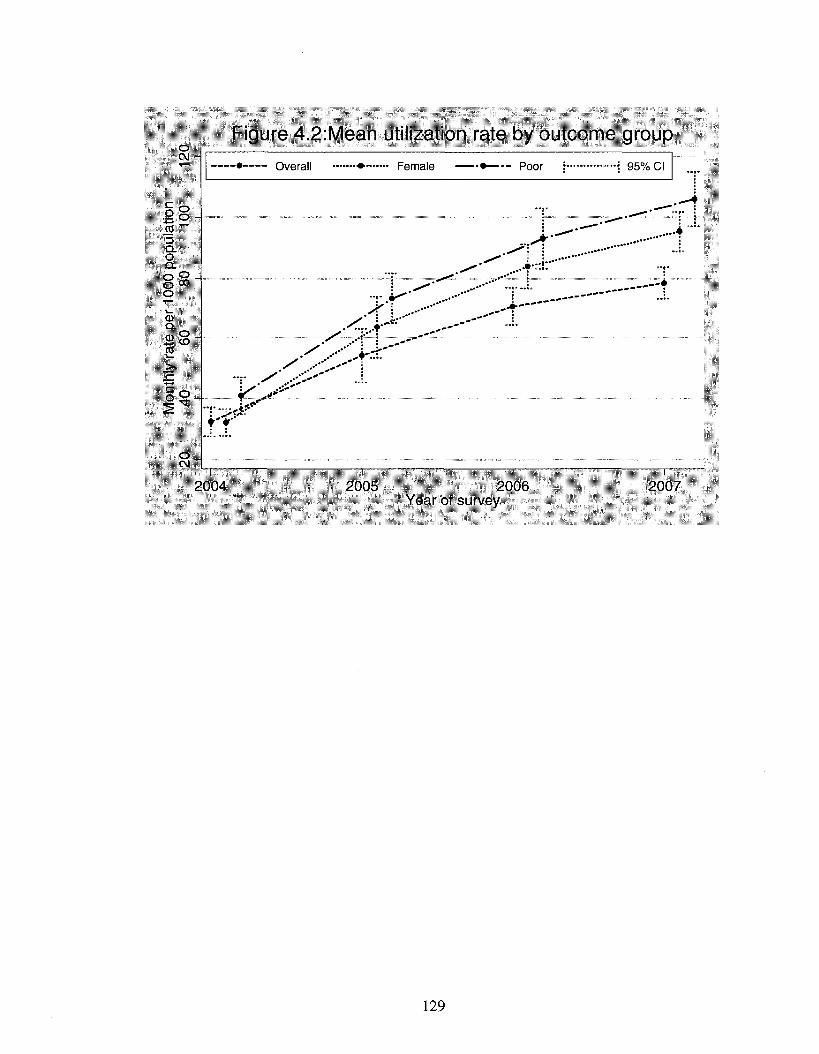
o CM
Figure 4.2:Mean utilization rate by outcome group •-• Overall • Female • Poor i ••—! 95% CI
o ~ o
1" I >-^" * £_ I 3r.»"T a. \ ^ ^ ..••r.r:
CD Q.
o . ^
22 co - . ' .•••!' •
T^T
o CM _ _. . .
2004 2005 2006 2007 Year of survey
129
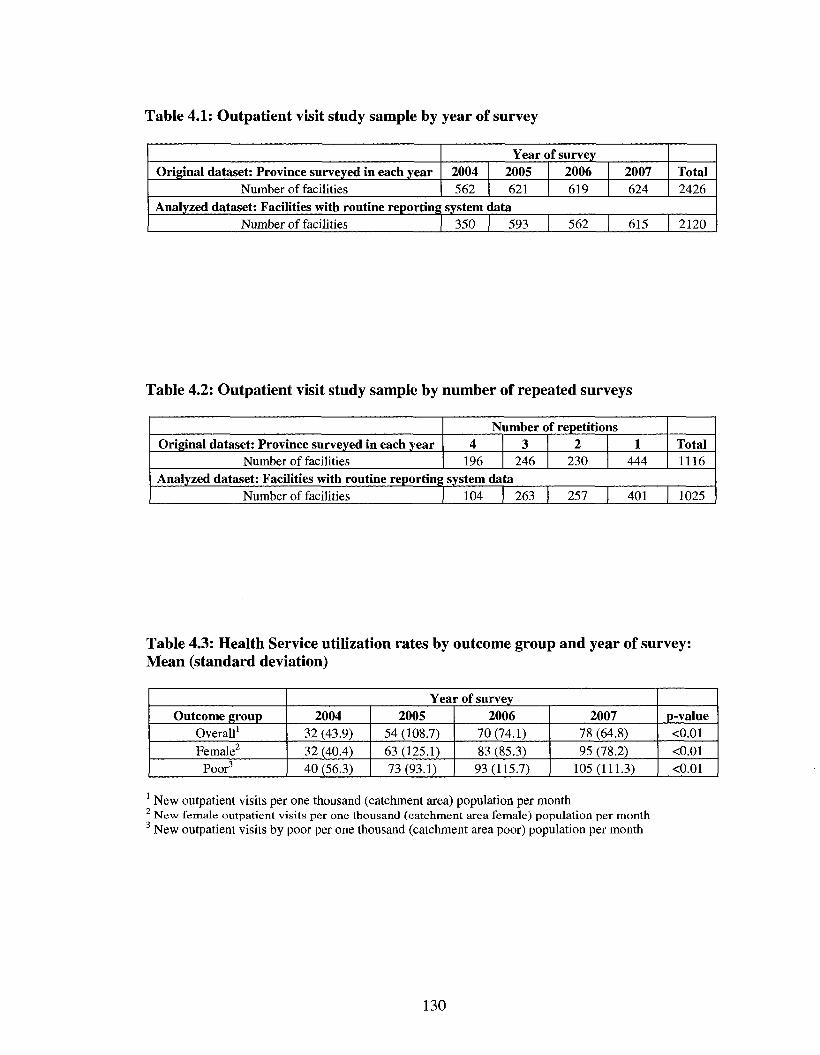
Table 4.1: Outpatient visit study sample by year of survey
Original dataset: Province surveyed in each year Number of facilities
Year of survey 2004 562
2005 621
2006 619
2007 624
Total 2426
Analyzed dataset: Facilities with routine reporting system data Number of facilities 350 593 562 615 2120
Table 4.2: Outpatient visit study sample by number of repeated surveys
Original dataset: Province surveyed in each year Number of facilities
Number of repetitions 4
196 3
246 2
230 1
444 Total 1116
Analyzed dataset: Facilities with routine reporting system data Number of facilities 104 263 257 401 1025
Table 4.3: Health Service utilization rates by outcome group and year of survey: Mean (standard deviation)
Outcome group Overall1
Female2
Poor3
Year of survey 2004
32 (43.9) 32 (40.4) 40 (56.3)
2005 54 (108.7) 63 (125.1) 73(93.1)
2006 70(74.1) 83 (85.3) 93(115.7)
2007 78 (64.8) 95 (78.2)
105(111.3)
p-value <0.01 <0.01 <0.01
1 New outpatient visits per one thousand (catchment area) population per month New female outpatient visits per one thousand (catchment area female) population per month
3 New outpatient visits by poor per one thousand (catchment area poor) population per month
130
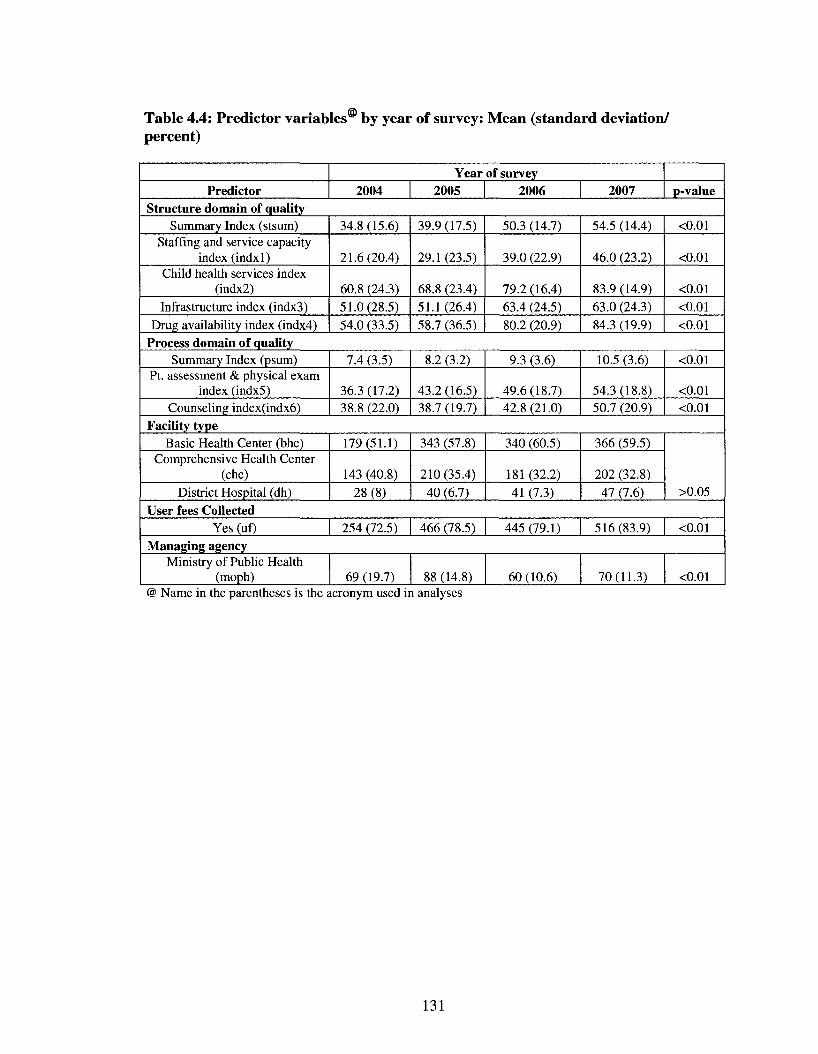
Table 4.4: Predictor variables by year of survey: Mean (standard deviation/ percent)
Predictor Year of survey
2004 2005 2006 2007 p-value Structure domain of quality
Summary Index (stsum) Staffing and service capacity
index (indxl) Child health services index
(indx2) Infrastructure index (indx3)
Drug availability index (indx4)
34.8 (15.6)
21.6(20.4)
60.8 (24.3) 51.0(28.5) 54.0 (33.5)
39.9(17.5)
29.1(23.5)
68.8 (23.4) 51.1 (26.4) 58.7 (36.5)
50.3 (14.7)
39.0 (22.9)
79.2 (16.4) 63.4 (24.5) 80.2 (20.9)
54.5 (14.4)
46.0 (23.2)
83.9 (14.9) 63.0 (24.3) 84.3 (19.9)
<0.01
<0.01
<0.01
<0.01 <0.01
Process domain of quality Summary Index (psum)
Pt. assessment & physical exam index (indx5)
Counseling index(indx6)
7.4 (3.5)
36.3 (17.2) 38.8 (22.0)
8.2 (3.2)
43.2 (16.5) 38.7 (19.7)
9.3 (3.6)
49.6(18.7) 42.8(21.0)
10.5 (3.6)
54.3 (18.8) 50.7 (20.9)
<0.01
<0.01 <0.01
Facility type Basic Health Center (bhc)
Comprehensive Health Center (chc)
District Hospital (dh)
179(51.1)
143 (40.8) 28(8)
343 (57.8)
210 (35.4) 40 (6.7)
340 (60.5)
181 (32.2) 41 (7.3)
366 (59.5)
202 (32.8) 47 (7.6) >0.05
User fees Collected Yes (uf) 254 (72.5) 466 (78.5) 445 (79.1) 516(83.9) <0.01
Managing agency Ministry of Public Health
(moph) 69 (19.7) 88 (14.8) 60 (10.6) 70(11.3) <0.01 @ Name in the parentheses is the acronym used in analyses
131
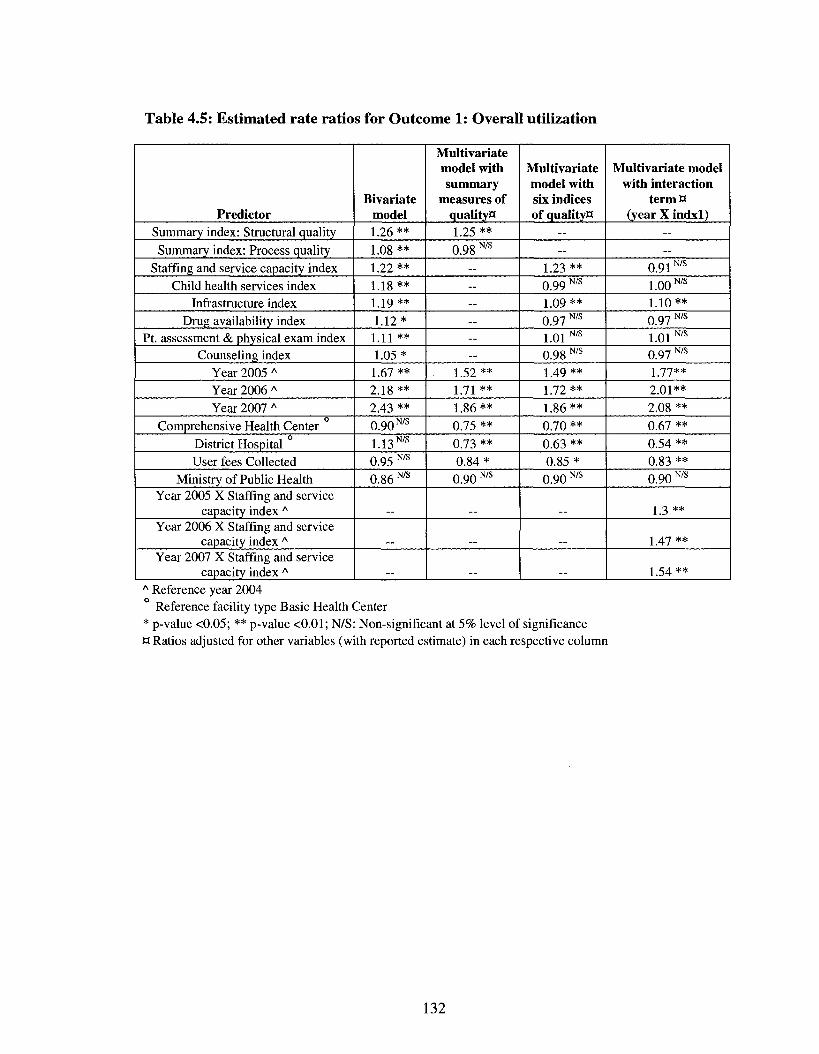
Table 4.5: Estimated rate ratios for Outcome 1: Overall utilization
Predictor Summary index: Structural quality Summary index: Process quality
Staffing and service capacity index Child health services index
Infrastructure index Drug availability index
Pt. assessment & physical exam index Counseling index
Year 2005 A
Year 2006 A
Year 2007 A
Comprehensive Health Center District Hospital User fees Collected
Ministry of Public Health Year 2005 X Staffing and service
capacity index A
Year 2006 X Staffing and service capacity index A
Year 2007 X Staffing and service capacity index A
Bivariate model 1.26 ** 1.08 ** 1.22** 1.18** 1.19 ** 1.12* 1.11 ** 1.05*
1.67 ** 2.18** 2.43 ** 0.90 N/s
1.13 N/s
0.95 N/s
0.86 N/s
Multivariate model with summary
measures of quality** 1.25 ** 0.98 N/s
— — --— — —
1.52** I 7i **
1.86** 0.75 ** 0.73 ** 0.84* 0.90 N/s
Multivariate model with six indices of qualityH
— —
1.23 ** 0.99 N/s
1.09** 0.97 N/s
1.01 N/s
0.98 N/s
1.49 ** 1.72 ** 1.86** 0.70 ** 0.63 ** 0.85*
0.90 N/s
Multivariate model with interaction
termn (year X indxl)
— —
0.91N/s
1.00 N/s
1.10** 0.97 N/s
1.01 N/s
0.97 N/s
1 -7-7**
2.01** 2.08 ** 0.67 ** 0.54 ** 0.83 ** 0.90 N/s
1.3**
I.47 **
1.54 ** A Reference year 2004
Reference facility type Basic Health Center * p-value <0.05; ** p-value <0.01; N/S: Non-significant at 5% level of significance a Ratios adjusted for other variables (with reported estimate) in each respective column
132
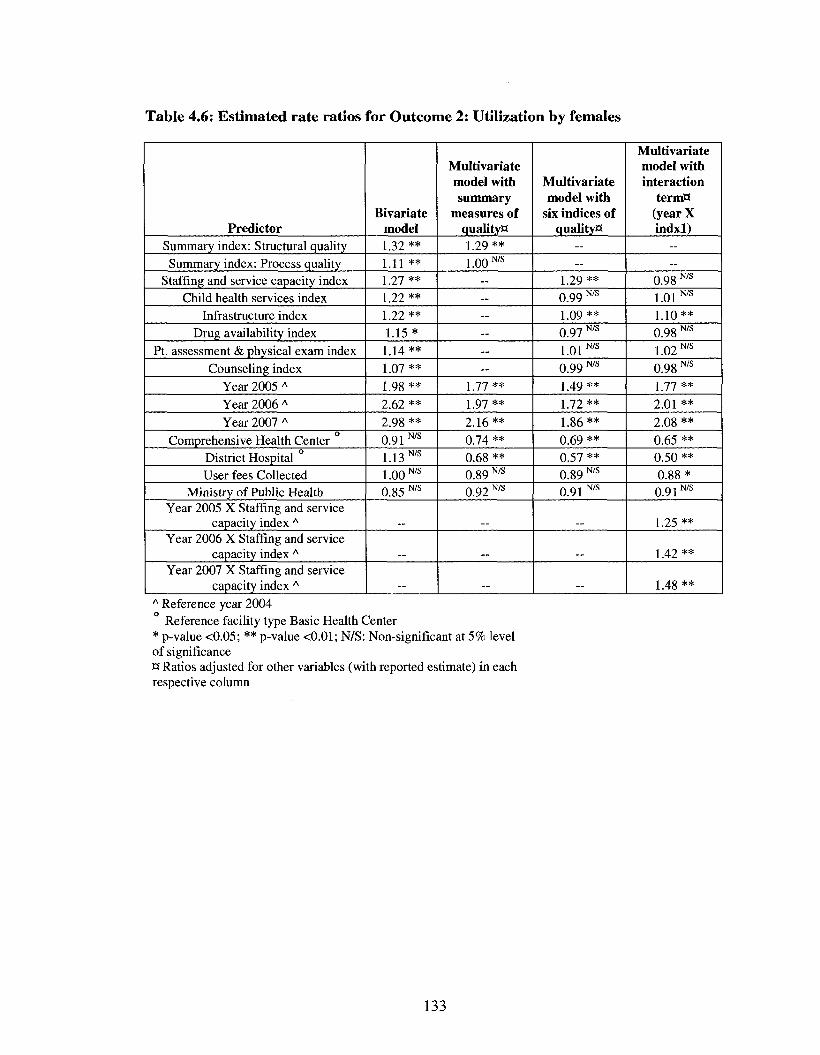
Table 4.6: Estimated rate ratios for Outcome 2: Utilization by females
Predictor Summary index: Structural quality Summary index: Process quality
Staffing and service capacity index Child health services index
Infrastructure index Drug availability index
Pt. assessment & physical exam index Counseling index
Year 2005 A
Year 2006 A
Year 2007 A
Comprehensive Health Center District Hospital User fees Collected
Ministry of Public Health Year 2005 X Staffing and service
capacity index A
Year 2006 X Staffing and service capacity index A
Year 2007 X Staffing and service capacity index A
Bivariate model 1.32 ** 1.11 ** 1.27 ** 1.22 ** 1.22** 1.15*
1.14 ** 1.07 ** 1.98 ** 2.62 ** 2.98 ** 0.91 N/s
1.13 N/s
1.00 N/s
0.85 N/s
_
Multivariate model with summary
measures of quality** 1.29 ** 1.00 N/s
— — — — — —
1.77 ** 1.97 ** 2.16** 0.74 ** 0.68 ** 0.89 N/s
0.92 N/s
..
Multivariate model with
six indices of quality**
— —
1.29 ** 0.99 N/s
1.09 ** 0.97 N/s
1.01 N/s
0.99 N/s
1.49 ** 1.72** 1.86** 0.69 ** 0.57 ** 0.89 N/s
0.91 N/s
Multivariate model with interaction
term** (year X indxl)
— —
0.98 N/s
1.01 N/s
1.10** 0.98 N/s
1 0 2 N/S
0.98 N/s
1 77 **
2.01 ** 2.08 ** 0.65 ** 0.50 ** 0.88*
0.91N/s
1.25 **
1.42**
1.48 ** A Reference year 2004
Reference facility type Basic Health Center * p-value <0.05; ** p-value <0.01; N/S: Non-significant at 5% level of significance H Ratios adjusted for other variables (with reported estimate) in each respective column
133
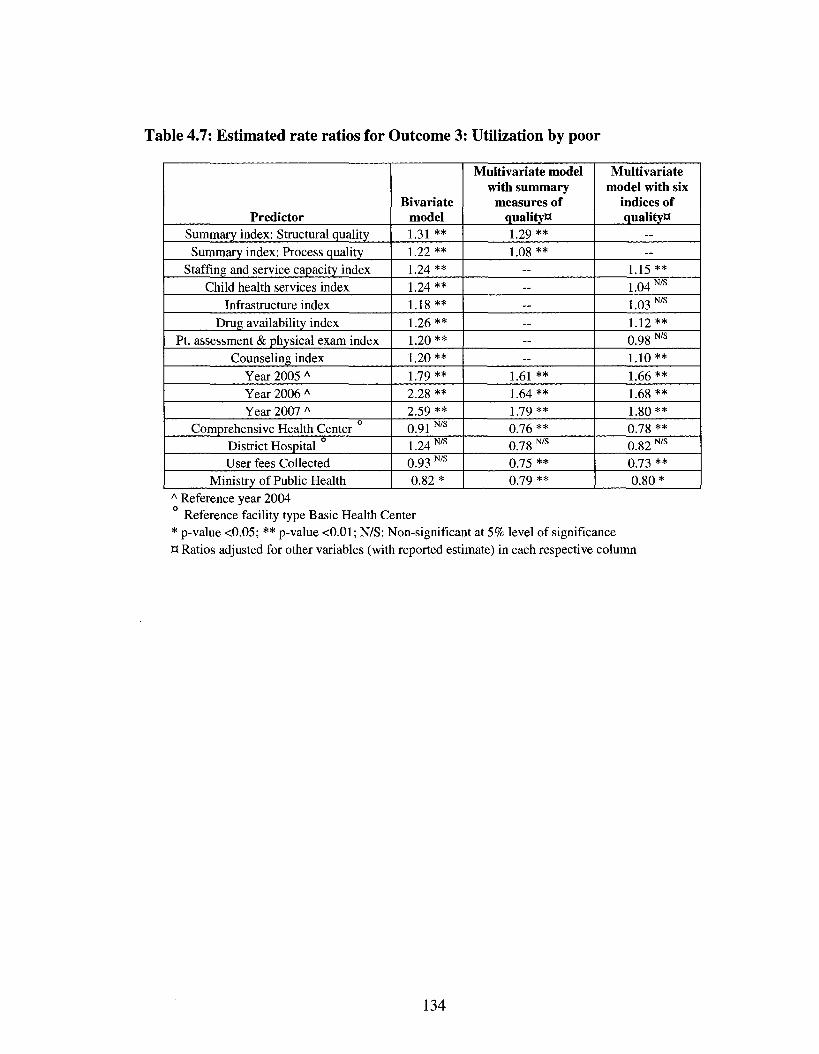
Table 4.7: Estimated rate ratios for Outcome 3: Utilization by poor
Predictor Summary index: Structural quality Summary index: Process quality
Staffing and service capacity index Child health services index
Infrastructure index Drug availability index
Pt. assessment & physical exam index Counseling index
Year 2005 A
Year 2006 A
Year 2007 A
Comprehensive Health Center District Hospital User fees Collected
Ministry of Public Health
Bivariate model 1.31 ** 1.22 ** 1.24 ** 1.24** 1.18** 1.26** 1.20 ** 1.20** 1.79 ** 2.28 ** 2.59 ** 0.91 N/s
1.24 N/s
0.93 N/s
0.82*
Multivariate model with summary
measures of quality** 1.29** 1.08 **
— — — — — —
1.61 ** 1.64 ** 1.79 ** 0.76 ** 0.78 N/s
0.75 ** 0.79 **
Multivariate model with six
indices of quality**
— —
1.15** 1.04 N/s
1.03 N/s
1.12** 0.98 N/s
1.10** 1.66 ** 1.68 ** 1.80** 0.78 ** 0.82 N/s
0.73 ** 0.80*
A Reference year 2004 Reference facility type Basic Health Center
* p-value <0.05; ** p-value <0.01; N/S: Non-significant at 5% level of significance H Ratios adjusted for other variables (with reported estimate) in each respective column
134
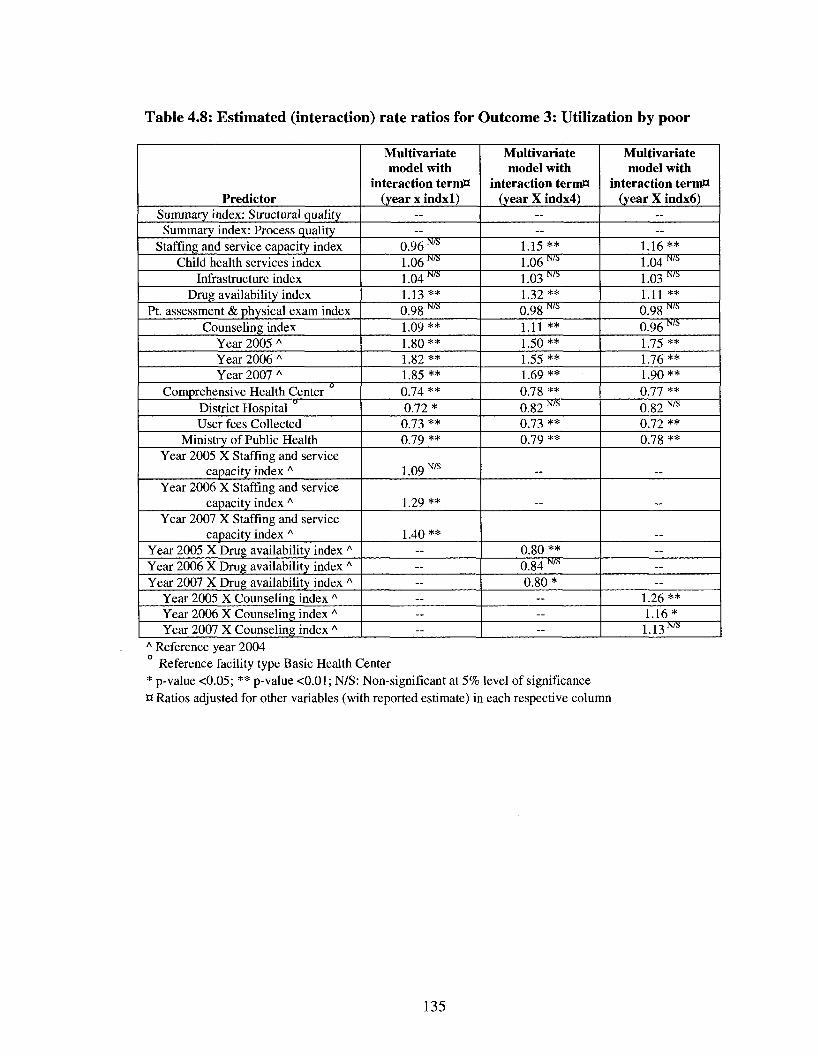
Table 4.8: Estimated (interaction) rate ratios for Outcome 3: Utilization by poor
Predictor Summary index: Structural quality Summary index: Process quality
Staffing and service capacity index Child health services index
Infrastructure index Drug availability index
Pt. assessment & physical exam index Counseling index
Year 2005 A
Year 2006 A
Year 2007 A
Comprehensive Health Center District Hospital User fees Collected
Ministry of Public Health Year 2005 X Staffing and service
capacity index A
Year 2006 X Staffing and service capacity index A
Year 2007 X Staffing and service capacity index A
Year 2005 X Drug availability index A
Year 2006 X Drug availability index A
Year 2007 X Drug availability index A
Year 2005 X Counseling index A
Year 2006 X Counseling index A
Year 2007 X Counseling index A
Multivariate model with
interaction term** (year x indxl)
— —
0.96 m
1.06 m
1.04 m
1.13** 0.98 N/s
1.09 ** 1.80** 1.82** 1.85 ** 0.74 ** 0.72* 0.73 ** 0.79 **
1.09 N/s
1.29 **
1.40 ** — — — — — --
Multivariate model with
interaction termH (year X indx4)
— —
1.15** 1.06™ 1.03 m
1.32** 0.98 *"5
1.11 ** 1.50 ** 1.55 ** 1.69** 0.78 ** 0.82 N/s
0.73 ** 0.79 **
0.80 ** 0.84 NK
0.80* — — --
Multivariate model with
interaction term** (year X indx6)
— —
1.16** 1.04 m
1.03 NIS
1.11 ** 0.98 w s
0.96™ 1.75 ** 1.76** 1.90** 0.77 ** 0.82 N/s
0.72 ** 0.78 **
— — —
1.26** 1.16*
U3m A Reference year 2004
Reference facility type Basic Health Center * p-value <0.05; ** p-value <0.01; N/S: Non-significant at 5% level of significance Q Ratios adjusted for other variables (with reported estimate) in each respective column
135
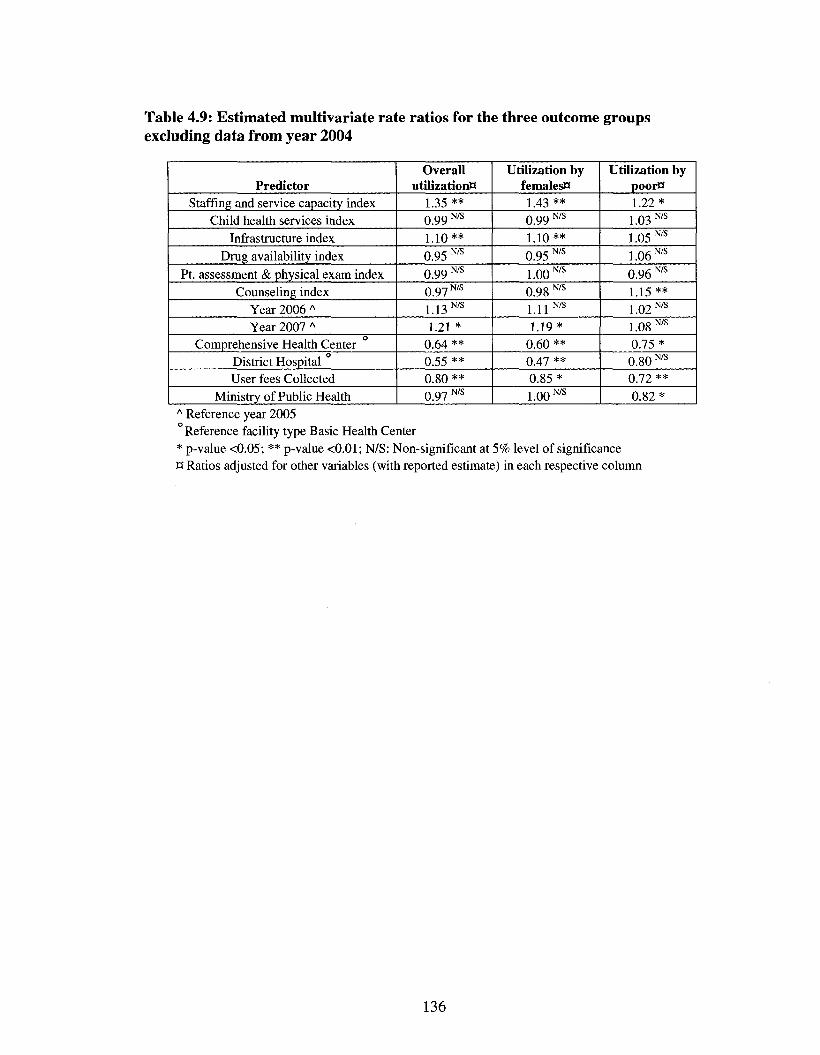
Table 4.9: Estimated multivariate rate ratios for the three outcome groups excluding data from year 2004
Predictor Staffing and service capacity index
Child health services index Infrastructure index
Drug availability index Pt. assessment & physical exam index
Counseling index Year 2006 A
Year 2007 A
Comprehensive Health Center District Hospital User fees Collected
Ministry of Public Health
Overall utilization**
1.35 ** 0.99 N/S
1.10** 0.95 N/s
0 9 9 N/S
0 9 7 N/S
1.13 N/s
1.21 * 0.64 ** 0.55 ** 0.80 ** 0.97 N/s
Utilization by females** 1.43 ** 0.99 N/s
1.10** 0.95 N/s
1.00 N/s
0.98 N/s
1.11™ 1.19*
0.60 ** 0.47 ** 0.85* 1.00 N/s
Utilization by poorB 1.22* 1.03 N/s
1.05 N/s
1.06 N/s
0.96 N/s
1.15** 1 Q 2 N/S
1.08 N/s
0.75* 0.80 N's
0.72 ** 0.82*
A Reference year 2005 Reference facility type Basic Health Center
* p-value <0.05; ** p-value <0.01; N/S: Non-significant at 5% level of significance ct Ratios adjusted for other variables (with reported estimate) in each respective column
136
Chapter 5 Summary: Findings and implications
Good policies require good information, and the health sector is no exception to
this rule. Adequate resources and infrastructure are available in developed countries to
gather, analyze and synthesize this information, and yet developing countries have
chronically suffered from lack of such necessities. Nowhere is this problem more evident
than in countries recovering from decades of conflict, where not only are the resources
constrained but the need for population level information is more urgent.
In post-conflict countries, collection of baseline information on health status of
the population at the cessation of fighting enables the policy makers to formulate future
policies for the successful reconstruction of the national health system. In war torn
Afghanistan, faced with an enormous task of laying the foundations for an equitable and
quality oriented health system, the Ministry of Public Health needed data on health
service delivery in the country. The survey planners used an outdated sampling frame to
gather baseline data through Multiple Indicators Cluster Survey (MICS) in 2003. The
estimates reported in the original MICS report were generated using the information from
the 1979 population census; and were considered to be biased. In the first study, we
generated a new set of reanalyzed estimates using the data from the pre-census conducted
in 2004 and compared them with the originally reported estimates. From a policy
perspective the two sets of estimates provided similar cross-sectional information about
the status of health care delivery in the immediate post-Taliban period. However, the two
sets of estimated differed in statistical precision, thereby affecting the potential use for
assessing trends.
137
In post-conflict settings, when urgent information must be gathered on the health
status of the population, older sampling frames can be used for household surveys to
derive population estimates. The policy makers in post-conflict settings can be reassured
that expected goals of a baseline evaluation are being met as long as the information is
collected and analyzed in a scientifically rigorous manner, even if it is based on an older
sampling frame. However, the generalizability of the reported findings should be tested in
other post-conflict settings before being widely accepted. During the data collection for
MICS 2003, the clusters (villages) were sampled based on the information provided in
the 1979 sampling frame, but the selection of a segment within the clusters and
subsequent stages of sampling were based on information that was collected directly from
the community members living there on the day of survey. The use of current information
probably led to a reduction in the bias that might have otherwise occurred due to an older
sampling frame. In the case of sampling within the six largest cities, even the clusters
were sampled based on current information, thereby strengthening the explanation
towards reduction in bias in calculated estimates.
The estimates generated using older sampling frames are biased and have false
precision, but availability of new data in future can correct for some of these errors. The
method of re-weighting used in this study can enable the post-hoc use of this data for
statistical analyses of trends, but the users should be cautious of the greater variability in
statistical power of these new estimates. In addition, the policy makers and researchers
should be aware that re-weighting has a limited capability to enable study of the effect
due to health programs on population health, because a more complex evaluation design
and extensive data collection are usually needed to rule out the effect of external factors.
138
The findings in the first study indicate that the precision and complexity of an
evaluation must relate to the needs of the user of the particular evaluation and to the type
of inference that will be made based on the particular evaluation. The indicators on
maternal and child health delivery relate to interventions that have proven effectiveness
and efficacy in improving health outcomes in various developing country settings. An
improvement in health service delivery should lead to a reduction in morbidity and
mortality in the population. The evaluation of such interventions should not be evaluated
only on the basis of arbitrary values of precision. The selection of arbitrary values for
Type I and Type II errors is questionable. The commonly used values for probability of
Type I and Type II errors are 0.05 and 0.20, respectively. These values indicate that the
evaluator is willing to not identify a beneficial result four times more often than to be
mistaken in declaring such a result when it is absent. It has been suggested that a higher
value of error should be used to evaluate programs with proven efficacy, especially in
situations where scientific inferences are not being made. We believe that evaluation of
health care delivery in post-conflict settings represents such a situation. There is also a
limited need for complex evaluation designs that include a control group to enable ruling
out the effect of other factors on population health outcomes, especially in the immediate
post-conflict period.
Policy makers in post-conflict countries need to ensure that the opportunities of
growth are accessible to the poor. This requires a measure of living standards that is easy
to collect, observe and verify, so that data can be gathered at regular intervals to monitor
economic status and track poverty. In the third chapter we found that an out of sample
prediction of expenditure using asset variables enables measurement and tracking of
139
poverty in a population over time, thereby making this information more accessible for
policy makers and researchers alike. The study uses data collected from two separate
household surveys over an interval of one year; therefore the results might not be
generalizable to the population of Afghanistan. However, our results do indicate an
improvement in economic status and reduction in poverty over the interval of one year.
The potential implications of our findings are wide ranging. Regular collection of
information on asset variables to predict an absolute measure of economic status like
consumption or expenditure can enable tracking of poverty over time. In addition, the
predicted expenditure can form the basis for poverty mapping and targeting through the
social protection programs. This information on economic status and poverty can also be
linked to reallocation of resources in the health sector, thereby improving the efficiency
and equity of programs to improve health outcomes in the population.
Future research on the use of asset variable to predict consumption should focus
on a more comprehensive set of indicators that can help in explaining a greater proportion
of the variability in consumption. This will help by improving the predictive ability of the
asset variables. This list can include variables that vary by time, like rainfall; or vary by
location, like average number of households with good housing characteristics in a
cluster/district. An important limitation of this technique in general is that the coefficients
used to predict economic status and poverty are stable for only short periods of time.
Repeated household surveys at short intervals to collect information on asset variables
can serve as a complement to consumption surveys conducted at longer intervals. Both
these source of data on economic status can together provide a comprehensive set of
140
information to formulate and implement policy decisions to reduce poverty in post-
conflict settings.
In Afghanistan, the implementation of a Basic Package of Health Services
(BPHS) to address the biggest health needs of the conflict affected population was an
important step towards establishment of an equitable health system. The analysis of
utilization rates over four years showed increasing levels of utilization among the two
priority groups - the poor and females. Barring the first year of implementation of BPHS,
the utilization rates for these two groups has been higher than the overall population
living in facility catchment area. This trend towards equitable utilization has occurred
along with a simultaneous improvement in quality of health services.
We found that improvement in facility staffing and services capacity was the
strongest factor associated with increase in utilization among the overall population as
well as the poor and the females. Improvement in infrastructure was strongly associated
with increase in utilization by females and overall population but not with utilization by
poor. Increased drug availability was linked with increase in utilization by the poor but its
effect waned after reaching a threshold value at the end of first year of BPHS
implementation. The counseling of patients and caretakers about the illness and treatment
lead to an increase in utilization by the poor only. Across all the three, an improvement in
staffing and service capacity appears to increase utilization at a greater rate in later years.
The collection of user fees at health facilities was associated with decrease in
utilization across each of the three outcome groups but the strongest decline was seen in
the rate among the poor. Management of health facilities by a non governmental
141
organization appears to benefit the poor most, though utilization among females and by
the total population also showed an increase.
While the improvement in staffing and service capacity appears to be reinforcing
overall increase in utilization, identification of specific characteristics in the health care
delivery system associated with increased utilization by females and the poor can help the
MOPH in making equity a more sustainable and long lasting feature of public health
system in Afghanistan. An important step can be the improvement in infrastructure of
health facilities with a specific focus on needs of female clients; such as separate waiting
and consultation rooms for women. These improvements along with greater availability
of female oriented services provided by female staff can synergize together and lead to
greater female utilization and quality improvement.
Increased availability of drugs and better counseling of patients and their
caretakers appears to increase the utilization by the poor, though collection of user fee is
associated with a decrease in use by the poor. Among the various interventions available
to reduce the financial burden on the poor, user fee exemptions are being practiced at a
number of public health facilities in Afghanistan. It appears that these exemptions have
not been effective in countering the negative effects of user fees on the poor (JHU and
IHMR, 2008c). An improvement in the targeting of user fee exemptions to the poor might
be a prudent way to achieve a dual objective - to reduce the negative effect of user fees
on utilization by the poor and still generate resource to enhance financial sustainability of
the health system.
The data collection for the national round of National Risk and Vulnerability
Assessment (NRVA 2008) is currently being conducted all over Afghanistan. This
142
assessment will provide nationally representative estimates of household consumption.
The out of sample prediction method used in the third chapter can be used to identify and
target the poor with exemptions for user fees. The information on consumption
expenditure collected from every household can be regressed over a set of asset variables.
The estimated regression coefficients for the assets variable can be used to predict
expenditure and identify the economically weaker households in a community. These
economically disadvantaged households can be provided with user fee exemption cards
and thereby reduce some of the financial constraints faced by them in utilizing health
services.
The sustained increase in utilization by females and the poor is in line with the
MOPH's overall vision of equitable growth in the health sector. Improvement in quality
across all facility types and a higher rate of utilization at the lowest level are also
significant achievements of the primary health care approach pursued by the fledgling
MOPH in Afghanistan. Further investigations are required, however, to determine
whether the increased levels of utilization by the poor and females is also associated with
improvement in health outcomes for these disadvantaged groups.
Reduction in poverty and improvement in quality and utilization might be directly
linked to the long term peace and prosperity in a volatile country like Afghanistan. The
evidence provided in this study can provide useful information to other post-conflict
countries striving to rehabilitate their health systems.
143
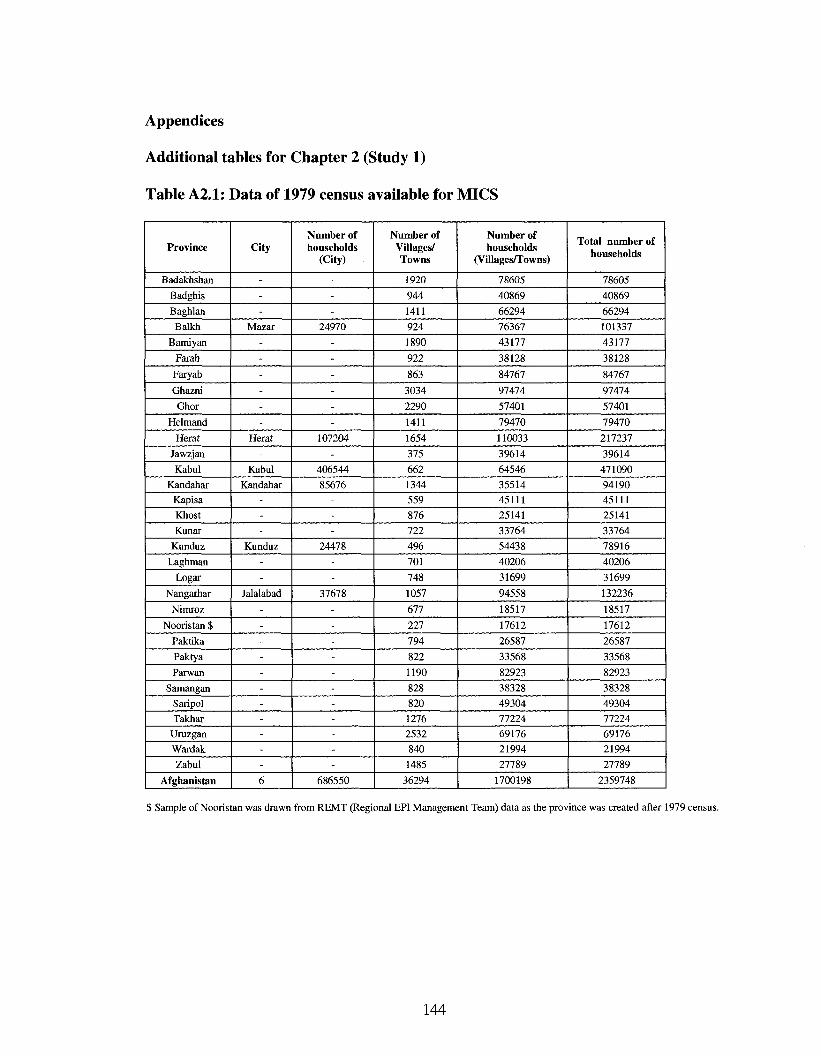
Appendices
Additional tables for Chapter 2 (Study 1)
Table A2.1: Data of 1979 census available for MICS
Province
Badakhshan
Badghis
Baghlan Balkh
Bamiyan
Farah
Faryab
Ghazni
Ghor
Helmand
Herat
Jawzjan
Kabul
Kandahar
Kapisa
Khost
Kunar
Kunduz
Laghman
Logar
Nangarhar
Nimroz
Nooristan $
Paktika
Paktya
Parwan
Samangan
Saripol
Takhar
Uruzgan
Wardak
Zabul
Afghanistan
City
---
Mazar
------
Herat
-Kabul
Kandahar
---
Kunduz
--
Jalalabad
-----------6
Number of households
(City)
---
24970
------
107204
-406544
85676
---
24478
--
37678
-----------
686550
Number of Villages/ Towns
1920
944
1411
924
1890
922
863
3034
2290
1411
1654
375
662
1344
559
876
722
496
701
748
1057
677
227
794
822
1190
828
820
1276
2532
840
1485
36294
Number of households
(Villages/Towns)
78605
40869
66294
76367
43177
38128
84767
97474
57401
79470
110033
39614
64546
35514
45111
25141
33764
54438
40206
31699
94558
18517
17612
26587
33568
82923
38328
49304
77224
69176
21994
27789
1700198
Total number of households
78605
40869
66294
101337
43177
38128
84767
97474
57401
79470
217237
39614
471090
94190
45111
25141
33764
78916
40206
31699
132236
18517
17612
26587
33568
82923
38328
49304
77224
69176
21994
27789
2359748
$ Sample of Nooristan was drawn from REMT (Regional EPI Management Team) data as the province was created after 1979 census.
144
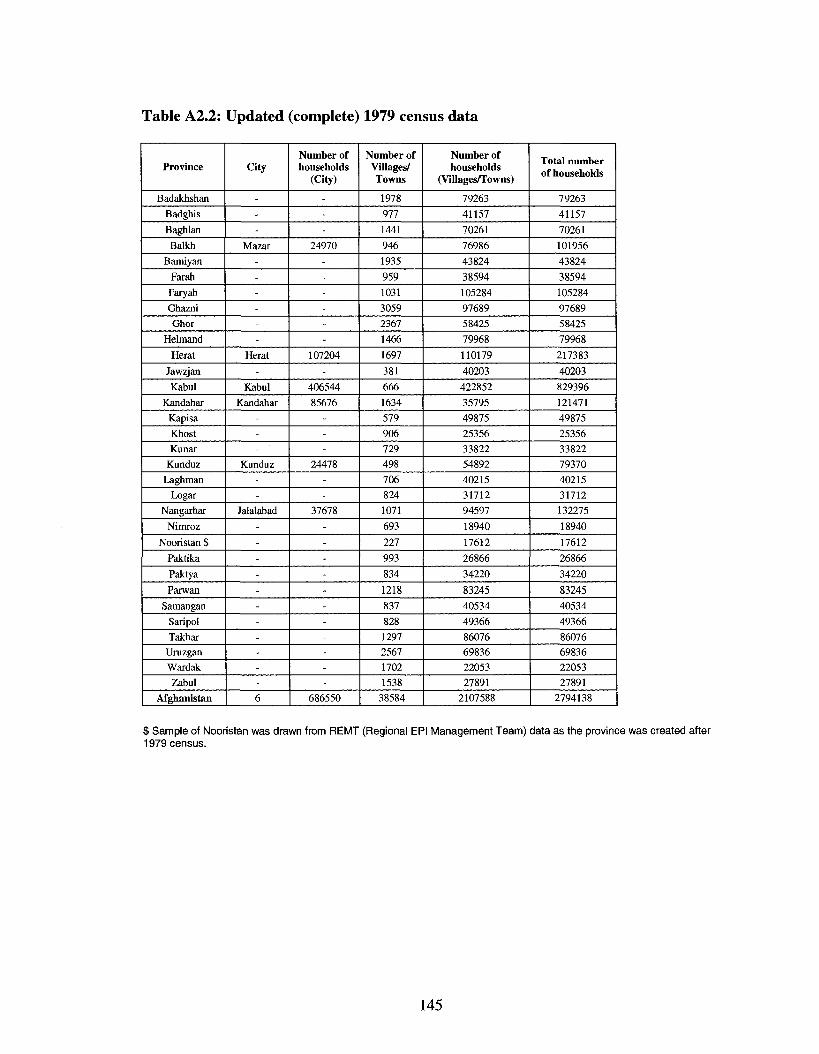
Table A2.2: Updated (complete) 1979 census data
Province
Badakhshan
Badghis
Baghlan
Balkh
Bamiyan
Farah Faryab
Ghazni
Ghor
Helmand
Herat
Jawzjan
Kabul
Kandahar
Kapisa
Khost
Kunar
Kunduz
Laghman
Logar
Nangarhar
Nimroz
Nooristan $
Paktika
Paktya
Parwan
Samangan
Saripol
Takhar
Uruzgan
Wardak
Zabul
Afghanistan
City
---
Mazar
------
Herat
-Kabul
Kandahar
---
Kunduz
--
Jalalabad
-----------6
Number of households
(City)
---
24970
------
107204
-406544
85676
---
24478
--
37678
-----------
686550
Number of Villages/ Towns
1978
977 1441
946 1935
959 1031
3059
2367
1466
1697
381
666 1634
579 906 729 498 706 824 1071
693
227 993 834
1218
837 828 1297
2567
1702
1538
38584
Number of households
(Villages/Towns)
79263
41157
70261
76986
43824
38594
105284
97689
58425
79968
110179
40203
422852
35795
49875
25356
33822
54892
40215
31712
94597
18940
17612
26866
34220
83245
40534
49366
86076
69836
22053
27891
2107588
Total number of households
79263
41157
70261
101956
43824
38594
105284
97689
58425
79968
217383
40203
829396
121471
49875
25356
33822
79370
40215
31712
132275
18940
17612
26866
34220
83245
40534
49366
86076
69836
22053
27891
2794138
$ Sample of Nooristan was drawn from REMT (Regional EPI Management Team) data as the province was created after 1979 census.
145
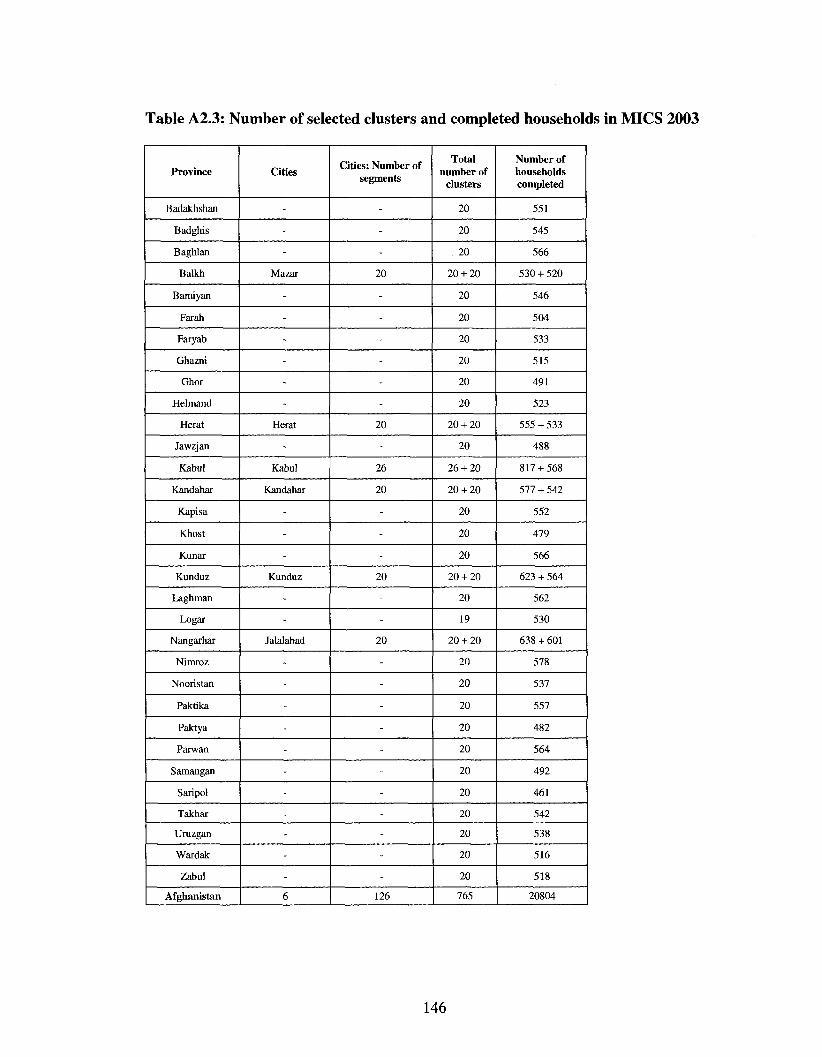
Table A2.3: Number of selected clusters and completed households in MICS 2003
Province
Badakhshan
Badghis
Baghlan
Balkh
Bamiyan
Farah
Faryab
Ghazni
Ghor
Helmand
Herat
Jawzjan
Kabul
Kandahar
Kapisa
Khost
Kunar
Kunduz
Laghman
Logar
Nangarhar
Nimroz
Nooristan
Paktika
Paktya
Parwan
Samangan
Saripol
Takhar
Uruzgan
Wardak
Zabul
Afghanistan
Cities
-
-
-
Mazar
-
-
-
-
-
-
Herat
-
Kabul
Kandahar
-
-
-
Kunduz
-
-
Jalalabad
-
-
-
-
-
-
-
-
-
-
-6
Cities: Number of segments
-
-
-
20
-
-
-
-
-
-
20
-
26
20
-
-
-
20
-
-
20
-
-
-
-
-
-
-
-
-
-
-126
Total number of
clusters
20
20
20
20 + 20
20
20
20
20
20
20
20 + 20
20
26 + 20
20 + 20
20
20
20
20 + 20
20
19
20 + 20
20
20
20
20
20
20
20
20
20
20
20
765
Number of households completed
551
545
566
530 + 520
546
504
533
515
491
523
555 + 533
488
817 + 568
577 + 542
552
479
566
623 + 564
562
530
638 + 601
578
537
557
482
564
492
461
542
538
516
518
20804
146
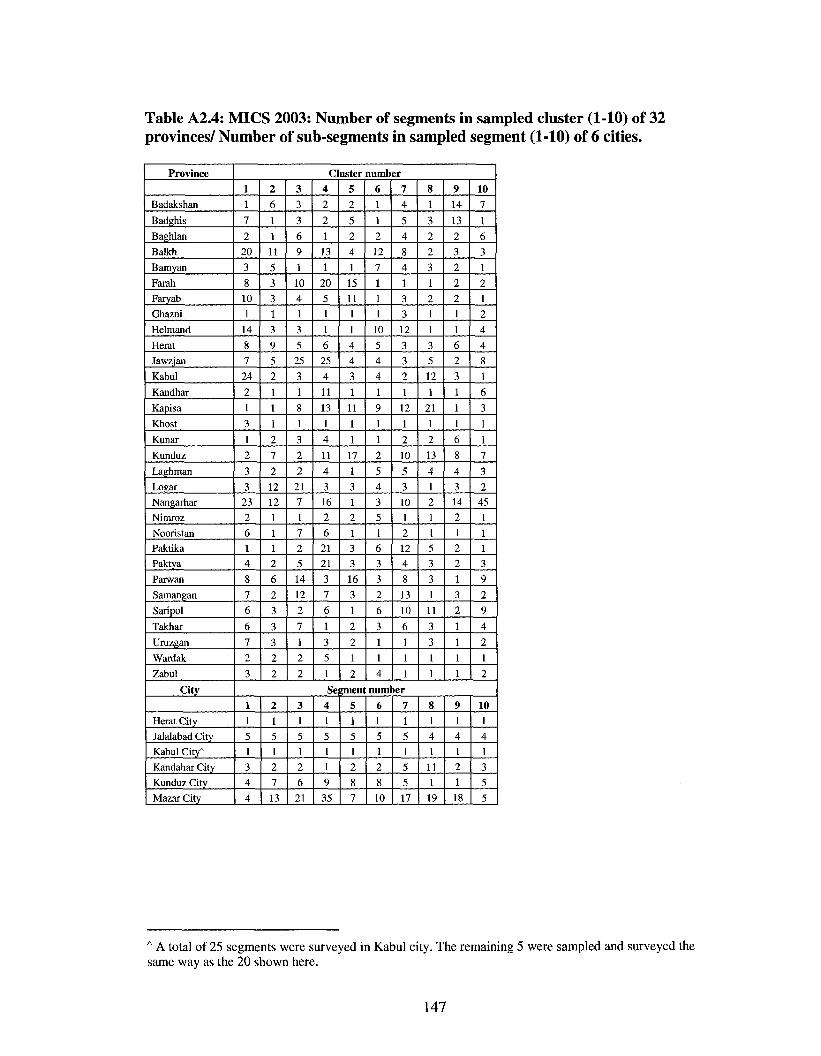
Table A2.4: MICS 2003: Number of segments in sampled cluster (1-10) of 32 provinces/ Number of sub-segments in sampled segment (1-10) of 6 cities.
Province
Badakshan
Badghis
Baghlan
Balkh
Bamyan
Farah
Faryab
Ghazni
Helmand
Herat
Jawzjan
Kabul
Kandhar
Kapisa
Khost
Kunar
Kunduz
Laghman
Logar
Nangarhar
Nimroz
Nooristan
Paktika
Paktya
Parwan
Samangan
Saripol
Takhar
Uruzgan
Wardak
Zabul
City
Herat City
Jalalabad City
Kabul City*
Kandahar City
Kunduz City
Mazar City
Cluster number 1 1
7
2
20
3
8 10 1
14
8 7
24
2
1
3
1
2
3 3
23 2
6 1 4
8
7
6
6
7 2
3
2
6
1
1 11
5
3 3 1
3
9 5
2
1
1
1
2
7
2
12 12
1 1 1 2
6
2
3
3
3 2
2
3
3
3
6 9
1
10 4
1
3
5 25
3
1
8
1
3
2
2
21 7 1
7 2
5 14
12
2
7
1 2
2
4
2
2
1
13
1
20 5 1
1
6 25
4
11
13
1
4
11
4
3
16 2
6 21 21
3
7
6
1
3
5 1
Se 1 1
5 1
3 4
4
2 1
5 1 2
7
13
3 1
5 1 2
6 21
4 1
5 1
1
9
35
5 2
5
2 4
1
15 11
1
1
4 4
3
1
11
1
1
17
1
3 1
2 1 3 3
16
3
1
2
2
1
2
6 1
1
2
12
7 1 1
1
10
5 4
4
1
9 1
1 2
5 4 3
5 1 6 3
3 2
6
3
1
1
4
7
4
5
4
8 4
1 3
3 12
3 3
2
1
12
1
2
10
5
3 10 1 2 12 4
8
13
10
6
1
1
1
8
1
3 2
2
3
1 2
1
1
3 5
12
1
21
1
2
13
4
1 2 1
1 5 3
3 1
11
3
3 1
1
9 14
13 2
3
2
2 2 1
1
6 2
3
1
1
1
6 8
4
3 14
2 1 2 2
1
3
2
1
1
1
1
10 7
1
6
3 1
2 1
2
4
4
8
1
6
3
1
1
7
3
2 45 1
1 1 3
9
2
9
4
2 1
2
anient number
5 1
5 1 2
8
7
6 1
5 1
2
8 10
7
1
5 1
5 5
17
8 1
4 1
11 1
19
9 1 4 1 2
1
18
10
1 4 1
3
5 5
A A total of 25 segments were surveyed in Kabul city. The remaining 5 were sampled and surveyed the same way as the 20 shown here.
147
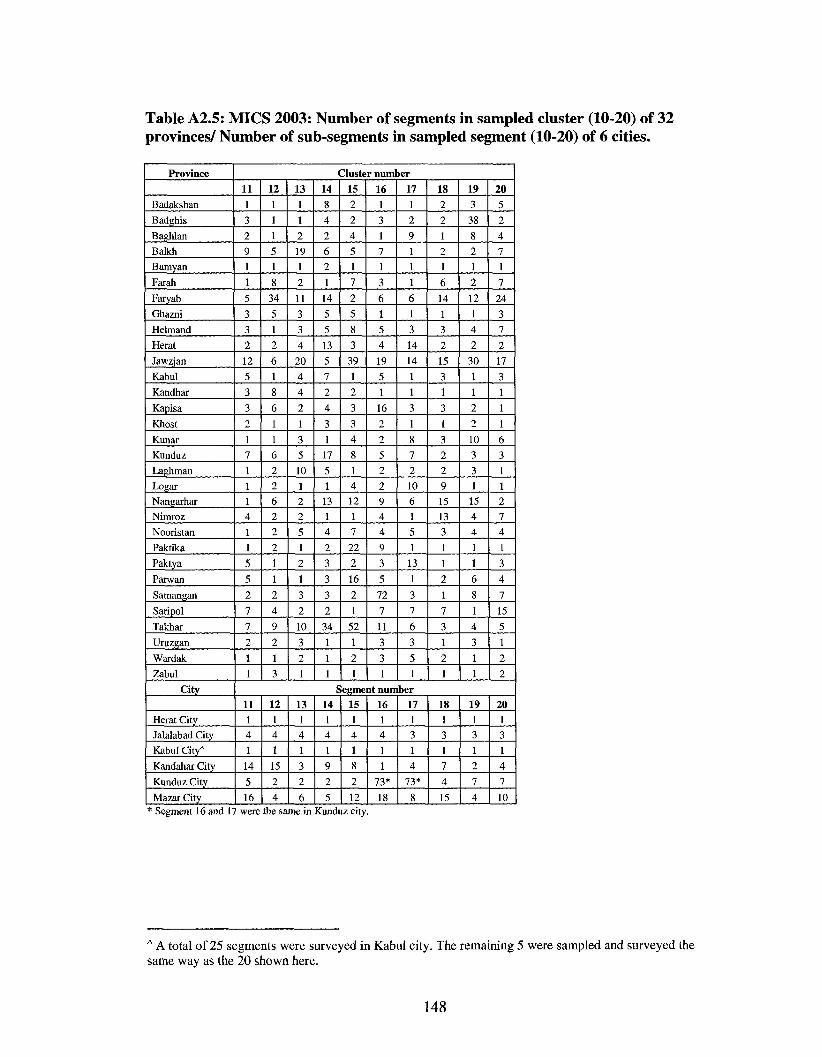
Table A2.5: MICS 2003: Number of segments in sampled cluster (10-20) of 32 provinces/ Number of sub-segments in sampled segment (10-20) of 6 cities.
Province
Badakshan
Badghis
Baghlan
Balkh
Bamyan
Farah
Faryab
Ghazni
Helmand
Herat
Jawzjan
Kabul
Kandhar
Kapisa
Khost
Kunar
Kunduz
Laghman
Logar
Nangarhar
Nimroz
Nooristan
Paktika
Paktya
Parwan
Samangan
Saripol
Takhar
Uruzgan
Wardak
Zabul
City
Herat City
Jalalabad City
Kabul City*
Kandahar City
Kunduz City
Mazar City
Cluster number
11 1
3 2
9 1
1
5
3
3
2
12
5
3
3
2
1
7
1 1 1 4
1
1
5
5
2
7
7
2
1 1
12
1
1
1
5
1
8
34
5
1
2
6
1
8
6
1
1
6
2 2
6
2
2
2
1
1
2
4
9
2
1
3
13 1
1
2
19
1
2
11
3
3
4
20
4
4
2
1
3
5
10
1 2
2
5
1
2
1
3
2
10
3
2
1
14
8
4
2
6
2
1
14
5
5
13
5
7
2
4
3
1
17
5
1
13
1
4
2
3
3
3
2
34
1
1
1
15 2
2
4
5
1
7
2
5
8
3
39
1
2
3
3
4
8
1 4
12
1
7
22
2
16
2
1
52
1
2
1
16 1
3
1
7
1
3
6
1
5
4
19
5
1
16
2
2
5
2
2
9
4
4
9
3
5
72
7
11
3
3
1
17 1
2
9
1 1
1
6
1
3
14
14
1
1
3
1
8
7
2
10
6
1
5
1
13
1
3
7
6
3
5
1
18 2
2
1
2
1
6
14
1
3
2
15
3
1
3
1
3
2
2
9
15
13
3
1
1
2
1
7
3
1
2
1
19 3
38
8
2
1
2
12
1
4
2
30
1
1
2
2
10
3
3
1 15
4
4
1
1
6
8
1
4
3
1 1
20
5
2
4
7
1
7
24
3
7
2
17
3
1
1
1
6
3
1
1 2
7
4
1
3
4
7
15
5
1
2
2
Segment number 11 1 4
1
14
5
16
12 1 4
1
15
2
4
13 1 4
1
3
2
6
14 1
4
1
9
2
5
15 1 4
1
8
2
12
16 1 4
1
1
73*
18
17 1
3
1
4
73*
8
18 1 3
1
7
4
15
19 1
3
1
2
7
4
20 1
3
1
4
7
10 * Segment 16 and 17 were the same in Kunduz city.
A A total of 25 segments were surveyed in Kabul city. The remaining 5 were sampled and surveyed the same way as the 20 shown here.
148
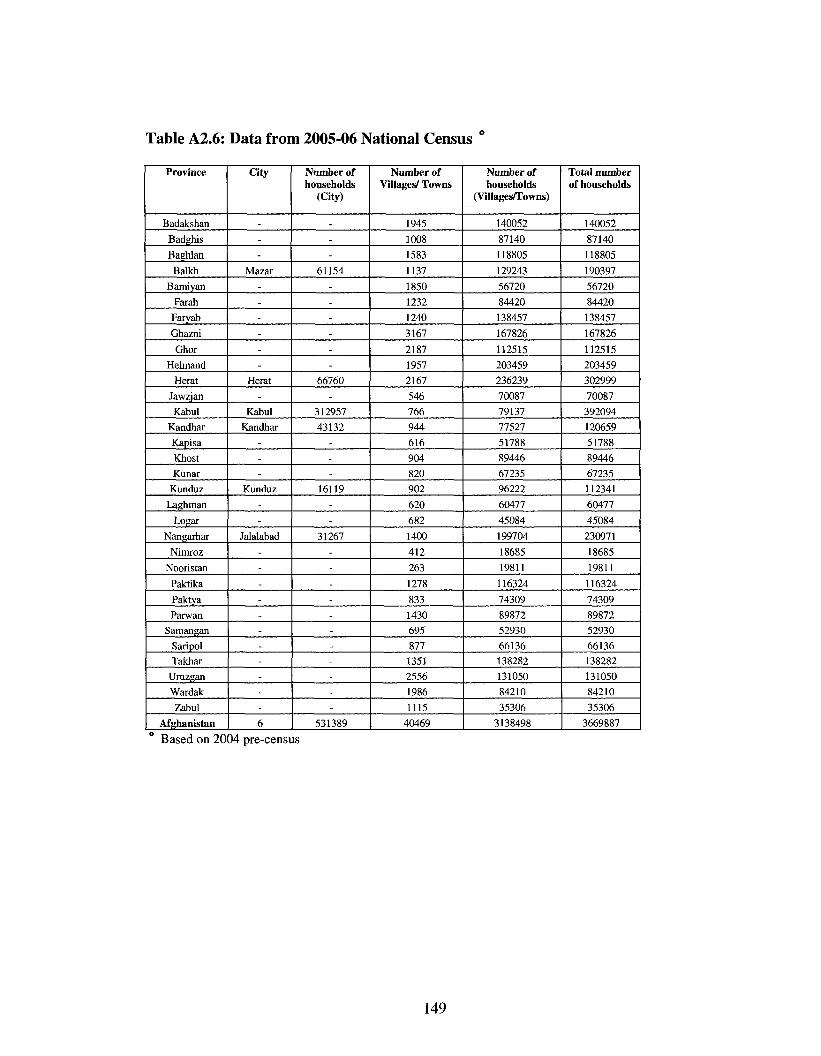
Table A2.6: Data from 2005-06 National Census °
Province
Badakshan
Badghis
Baghlan
Balkh
Bamiyan
Farah
Faryab
Ghazni
Ghor
Helmand
Herat
Jawzjan
Kabul
Kandhar
Kapisa
Khost
Kunar
Kunduz
Laghman
Logar
Nangarhar
Nimroz
Nooristan
Paktika
Paktya
Parwan
Samangan
Saripol
Takhar
Uruzgan
Wardak
Zabul
Afghanistan
City
---
Mazar ------
Herat -
Kabul
Kandhar ---
Kunduz --
Jalalabad ---------. -6
Number of households
(City)
---
61154 -. ----
66760 -
312957
43132 ---
16119 --
31267 --. --------
531389
Number of Villages/ Towns
1945
1008
1583
1137
1850
1232
1240
3167
2187
1957
2167
546
766
944
616
904
820
902
620
682
1400
412
263
1278
833
1430
695
877
1351
2556
1986
1115
40469
Number of households
(Villages/Towns)
140052
87140
118805
129243
56720
84420
138457
167826
112515
203459
236239
70087
79137
77527
51788
89446
67235
96222
60477
45084
199704
18685
19811
116324
74309
89872
52930
66136
138282
131050
84210
35306
3138498
Total number of households
140052
87140
118805
190397
56720
84420
138457
167826
112515
203459
302999
70087
392094
120659
51788
89446
67235
112341
60477
45084
230971
18685
19811
116324
74309
89872
52930
66136 138282
131050
84210
35306
3669887
Based on 2004 pre-census
149
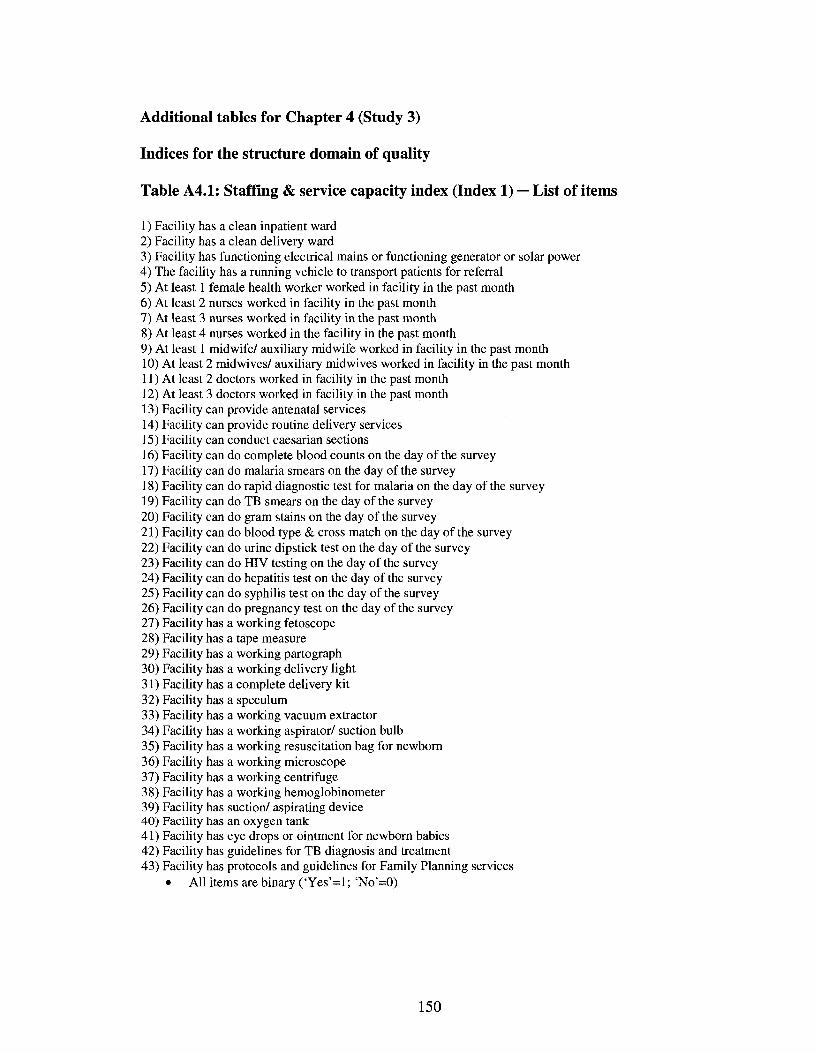
Additional tables for Chapter 4 (Study 3)
Indices for the structure domain of quality
Table A4.1: Staffing & service capacity index (Index 1) — List of items
1) Facility has a clean inpatient ward 2) Facility has a clean delivery ward 3) Facility has functioning electrical mains or functioning generator or solar power 4) The facility has a running vehicle to transport patients for referral 5) At least 1 female health worker worked in facility in the past month 6) At least 2 nurses worked in facility in the past month 7) At least 3 nurses worked in facility in the past month 8) At least 4 nurses worked in the facility in the past month 9) At least 1 midwife/ auxiliary midwife worked in facility in the past month 10) At least 2 mid wives/ auxiliary mid wives worked in facility in the past month 11) At least 2 doctors worked in facility in the past month 12) At least 3 doctors worked in facility in the past month 13) Facility can provide antenatal services 14) Facility can provide routine delivery services 15) Facility can conduct caesarian sections 16) Facility can do complete blood counts on the day of the survey 17) Facility can do malaria smears on the day of the survey 18) Facility can do rapid diagnostic test for malaria on the day of the survey 19) Facility can do TB smears on the day of the survey 20) Facility can do gram stains on the day of the survey 21) Facility can do blood type & cross match on the day of the survey 22) Facility can do urine dipstick test on the day of the survey 23) Facility can do HIV testing on the day of the survey 24) Facility can do hepatitis test on the day of the survey 25) Facility can do syphilis test on the day of the survey 26) Facility can do pregnancy test on the day of the survey 27) Facility has a working fetoscope 28) Facility has a tape measure 29) Facility has a working partograph 30) Facility has a working delivery light 31) Facility has a complete delivery kit 32) Facility has a speculum 33) Facility has a working vacuum extractor 34) Facility has a working aspirator/ suction bulb 35) Facility has a working resuscitation bag for newborn 36) Facility has a working microscope 37) Facility has a working centrifuge 38) Facility has a working hemoglobinometer 39) Facility has suction/ aspirating device 40) Facility has an oxygen tank 41) Facility has eye drops or ointment for newborn babies 42) Facility has guidelines for TB diagnosis and treatment 43) Facility has protocols and guidelines for Family Planning services
• All items are binary ('Yes'=l; 'No'=0)
150
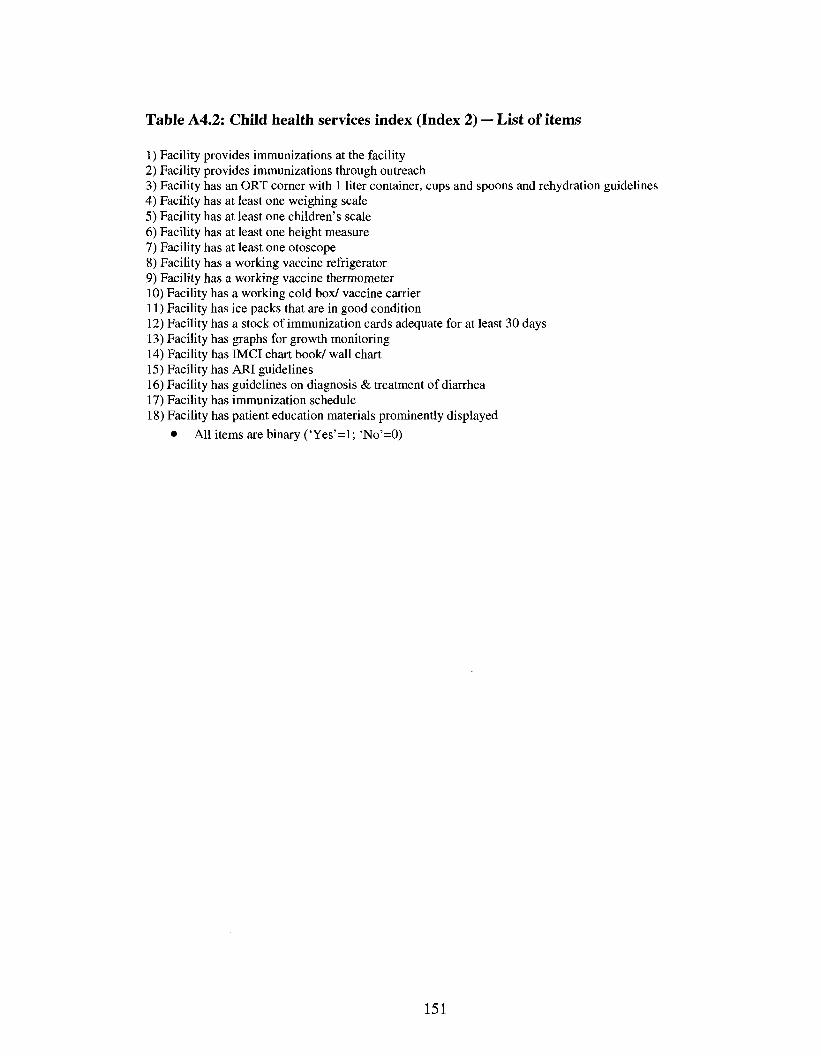
Table A4.2: Child health services index (Index 2) — List of items
1) Facility provides immunizations at the facility 2) Facility provides immunizations through outreach 3) Facility has an ORT corner with 1 liter container, cups and spoons and rehydration guidelines 4) Facility has at least one weighing scale 5) Facility has at least one children's scale 6) Facility has at least one height measure 7) Facility has at least one otoscope 8) Facility has a working vaccine refrigerator 9) Facility has a working vaccine thermometer 10) Facility has a working cold box/ vaccine carrier 11) Facility has ice packs that are in good condition 12) Facility has a stock of immunization cards adequate for at least 30 days 13) Facility has graphs for growth monitoring 14) Facility has IMCI chart book/ wall chart 15) Facility has ARI guidelines 16) Facility has guidelines on diagnosis & treatment of diarrhea 17) Facility has immunization schedule 18) Facility has patient education materials prominently displayed
• All items are binary ('Yes'=l; 'No'=0)
151
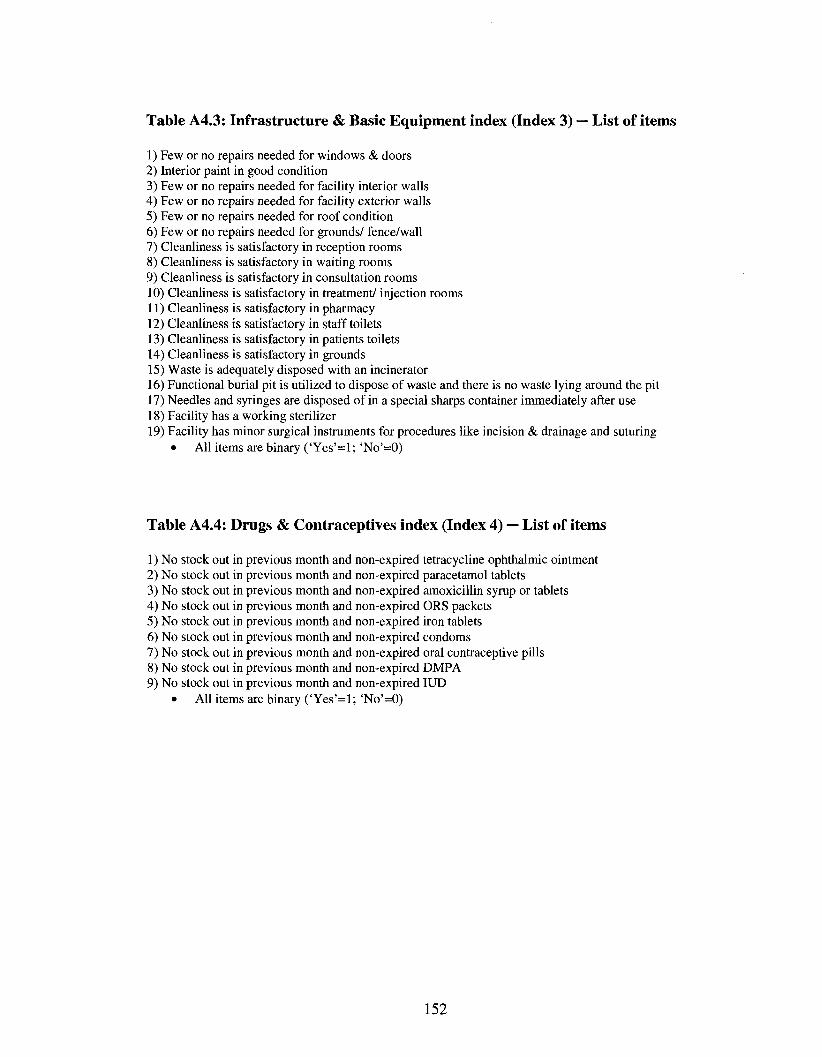
Table A4.3: Infrastructure & Basic Equipment index (Index 3) — List of items
1) Few or no repairs needed for windows & doors 2) Interior paint in good condition 3) Few or no repairs needed for facility interior walls 4) Few or no repairs needed for facility exterior walls 5) Few or no repairs needed for roof condition 6) Few or no repairs needed for grounds/ fence/wall 7) Cleanliness is satisfactory in reception rooms 8) Cleanliness is satisfactory in waiting rooms 9) Cleanliness is satisfactory in consultation rooms 10) Cleanliness is satisfactory in treatment/ injection rooms 11) Cleanliness is satisfactory in pharmacy 12) Cleanliness is satisfactory in staff toilets 13) Cleanliness is satisfactory in patients toilets 14) Cleanliness is satisfactory in grounds 15) Waste is adequately disposed with an incinerator 16) Functional burial pit is utilized to dispose of waste and there is no waste lying around the pit 17) Needles and syringes are disposed of in a special sharps container immediately after use 18) Facility has a working sterilizer 19) Facility has minor surgical instruments for procedures like incision & drainage and suturing
• All items are binary ('Yes'=l; 'No'=0)
Table A4.4: Drugs & Contraceptives index (Index 4) — List of items
1) No stock out in previous month and non-expired tetracycline ophthalmic ointment 2) No stock out in previous month and non-expired paracetamol tablets 3) No stock out in previous month and non-expired amoxicillin syrup or tablets 4) No stock out in previous month and non-expired ORS packets 5) No stock out in previous month and non-expired iron tablets 6) No stock out in previous month and non-expired condoms 7) No stock out in previous month and non-expired oral contraceptive pills 8) No stock out in previous month and non-expired DMPA 9) No stock out in previous month and non-expired IUD
• All items are binary ('Yes'=l; 'No'=0)
152
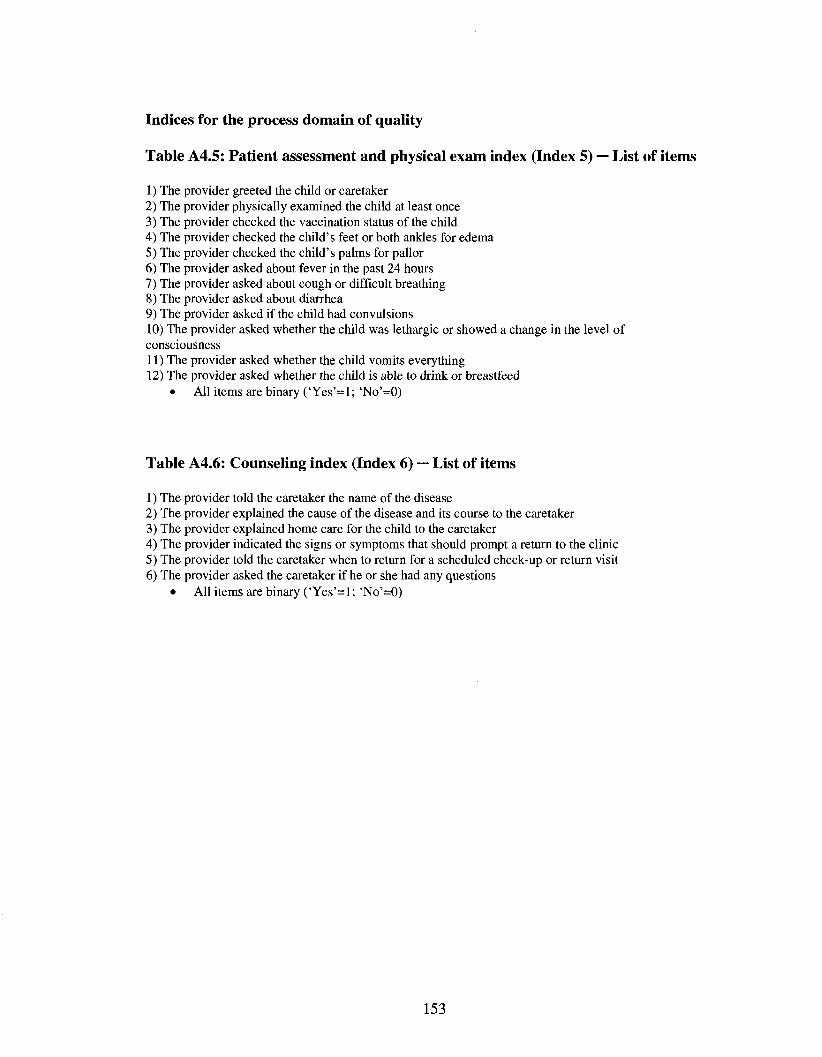
Indices for the process domain of quality
Table A4.5: Patient assessment and physical exam index (Index 5) — List of items
1) The provider greeted the child or caretaker 2) The provider physically examined the child at least once 3) The provider checked the vaccination status of the child 4) The provider checked the child's feet or both ankles for edema 5) The provider checked the child's palms for pallor 6) The provider asked about fever in the past 24 hours 7) The provider asked about cough or difficult breathing 8) The provider asked about diarrhea 9) The provider asked if the child had convulsions 10) The provider asked whether the child was lethargic or showed a change in the level of consciousness 11) The provider asked whether the child vomits everything 12) The provider asked whether the child is able to drink or breastfeed
• All items are binary ('Yes'=l; 'No'=0)
Table A4.6: Counseling index (Index 6) — List of items
1) The provider told the caretaker the name of the disease 2) The provider explained the cause of the disease and its course to the caretaker 3) The provider explained home care for the child to the caretaker 4) The provider indicated the signs or symptoms that should prompt a return to the clinic 5) The provider told the caretaker when to return for a scheduled check-up or return visit 6) The provider asked the caretaker if he or she had any questions
• All items are binary ('Yes'=1; 'No'=0)
153
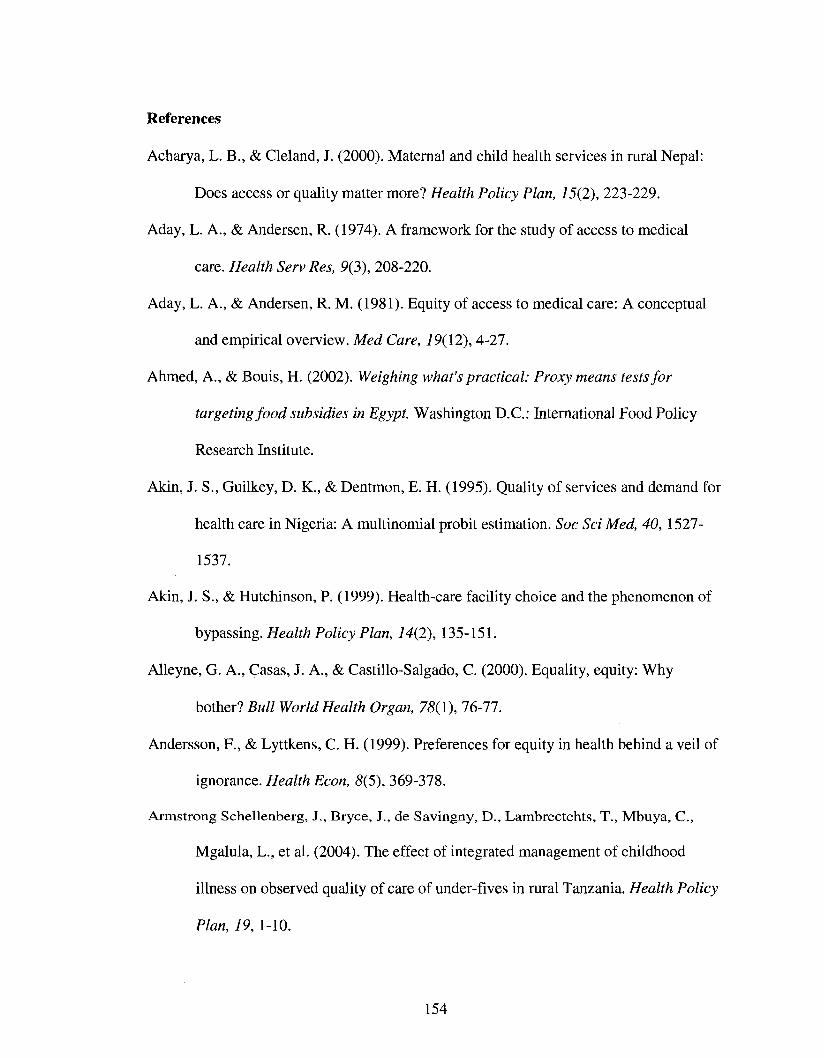
References
Acharya, L. B., & Cleland, J. (2000). Maternal and child health services in rural Nepal:
Does access or quality matter more? Health Policy Plan, 15(2), 223-229.
Aday, L. A., & Andersen, R. (1974). A framework for the study of access to medical
care. Health Serv Res, 9(3), 208-220.
Aday, L. A., & Andersen, R. M. (1981). Equity of access to medical care: A conceptual
and empirical overview. Med Care, 29(12), 4-27.
Ahmed, A., & Bouis, H. (2002). Weighing what's practical: Proxy means tests for
targeting food subsidies in Egypt. Washington D.C.: International Food Policy
Research Institute.
Akin, J. S., Guilkey, D. K., & Dentmon, E. H. (1995). Quality of services and demand for
health care in Nigeria: A multinomial probit estimation. Soc Sci Med, 40, 1527-
1537.
Akin, J. S., & Hutchinson, P. (1999). Health-care facility choice and the phenomenon of
bypassing. Health Policy Plan, 14(2), 135-151.
Alleyne, G. A., Casas, J. A., & Castillo-Salgado, C. (2000). Equality, equity: Why
bother? Bull World Health Organ, 78(1), 76-77.
Andersson, F., & Lyttkens, C. H. (1999). Preferences for equity in health behind a veil of
ignorance. Health Econ, 8(5), 369-378.
Armstrong Schellenberg, J., Bryce, J., de Savingny, D., Lambrectchts, T., Mbuya, C ,
Mgalula, L., et al. (2004). The effect of integrated management of childhood
illness on observed quality of care of under-fives in rural Tanzania. Health Policy
Plan, 19,1-10.
154
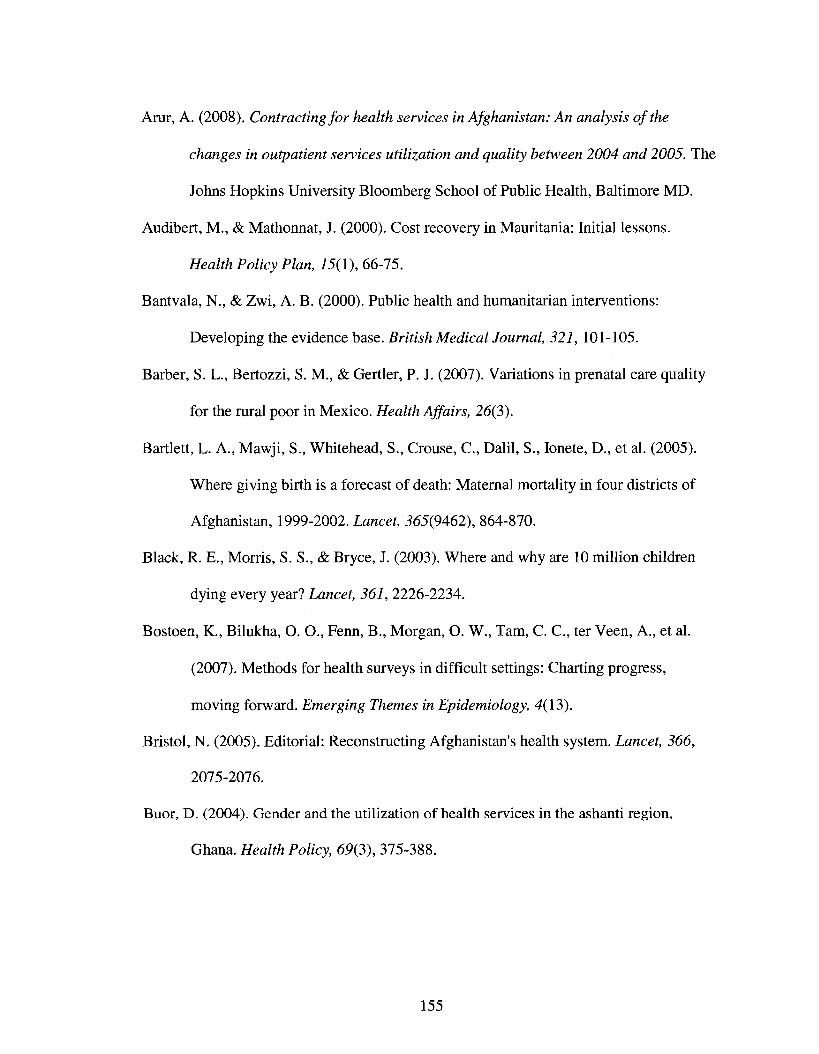
Arur, A. (2008). Contracting for health services in Afghanistan: An analysis of the
changes in outpatient services utilization and quality between 2004 and 2005. The
Johns Hopkins University Bloomberg School of Public Health, Baltimore MD.
Audibert, M., & Mathonnat, J. (2000). Cost recovery in Mauritania: Initial lessons.
Health Policy Plan, 15(1), 66-75.
Bantvala, N., & Zwi, A. B. (2000). Public health and humanitarian interventions:
Developing the evidence base. British Medical Journal, 321, 101-105.
Barber, S. L., Bertozzi, S. M., & Gertler, P. J. (2007). Variations in prenatal care quality
for the rural poor in Mexico. Health Affairs, 26(3).
Bartlett, L. A., Mawji, S., Whitehead, S., Crouse, C , Dalil, S., Ionete, D., et al. (2005).
Where giving birth is a forecast of death: Maternal mortality in four districts of
Afghanistan, 1999-2002. Lancet, 365(9462), 864-870.
Black, R. E., Morris, S. S., & Bryce, J. (2003). Where and why are 10 million children
dying every year? Lancet, 361, 2226-2234.
Bostoen, K., Bilukha, O. O., Fenn, B., Morgan, O. W., Tam, C. C , ter Veen, A., et al.
(2007). Methods for health surveys in difficult settings: Charting progress,
moving forward. Emerging Themes in Epidemiology, 4(13).
Bristol, N. (2005). Editorial: Reconstructing Afghanistan's health system. Lancet, 366,
2075-2076.
Buor, D. (2004). Gender and the utilization of health services in the ashanti region,
Ghana. Health Policy, 69(3), 375-388.
155
Burnham, G. M., Pariyo, G., Galiwango, E., & Wabwire-Mengen, F. (2004).
Discontinuation of cost sharing in Uganda. Bull World Health Organ, 82(3), 187-
195.
Buse, K., & Walt, G. (1997). An unruly melange? Coordinating external resources to the
health sector: A review. Soc Sci Med, 45(3), 449-463.
Chawla, M., & Ellis, R. P. (2000). The impact of financing and quality changes on health
care demand in Niger. Health Policy Plan, 15(1), 76-84.
Collins, D., Quick, J. D., Musau, S. N., Kraushaar, D., & Hussein, I. M. (1996). The fall
and rise of cost sharing in Kenya: The impact of phased implementation. Health
Policy Plan, 11(1), 52-63.
Cortinovis, I., Vela, V., & Ndiku, J. (1993). Construction of a socio-economic index to
facilitate analysis of health in data in developing countries. Soc Sci Med, 36,
1087-1097.
Cox, M. (2001). State building and post-conflict reconstruction: Lessons from Bosnia.
Geneva: Center for applied studies in International negotiations.
CSO. (2003). Afghanistan statistical yearbook. Central statistics office. Afghanistan.
Retrieved 02/28, 2008, from http://www.cso-
af.net/cso/index.php?page=5&language=en&menutitle=Statistical%20Indicators
CSO. (2005-06). Census results. Central statistics office. Afghanistan. Retrieved 12/12,
2007, from http://www.cso-
af.net/cso/documents/estimated%20population%201384.xls
Das, J., & Hammer, J. (2005). Money for nothing: The dire straits of medical practice in
Delhi, India. Journal of Development Economics, 83(1), 1-36.
156
Deaton, A., & Grosh, M. (2000). Consumption. In Designing household survey
questionnaires for developing countries: Lessons from 15 years of the living
standards measurement study. Washington D.C.: The World Bank.
Diggle, P. J., Heagerty, P., Liang, K. Y., & Zeger, S. L. (2002). Analysis of longitudinal
data (Second ed.): Oxford University Press.
Donabedian, A. (1980). The definitions of quality and approaches to its assessment. Ann
Arbor: Health Administration Press, School of Public Health, The University of
Michigan.
Donabedian, A. (1986). Criteria and standards for quality assessment and monitoring.
QRB Qual Rev Bull, 12, 99-108.
Donabedian, A. (1988). The quality of care. How can it be assessed? JAMA, 260, 1743-
1748.
Filmer, D., & Pritchett, L. H. (2001). Estimating wealth effects without expenditure data -
or tears: An application to educational enrollments in states in India.
Demography, 38, 115-132.
Filmer, D., & Scott, K. (2008). Assessing asset indices. (Policy Research Working Paper
No. 4605). Washington D.C.: The World Bank.
Fofack, H. (1999). Annex 4 - poverty predictors: Estimation and algorithm for computing
predicted welfare function. In T. Marchant (Ed.), Core welfare indicator survey
(CWIQ) handbook. Washington D.C.: The World Bank.
Ganatra, B., & Hirve, S. (1994). Male bias in health care utilization for under-fives in a
rural community in western India. Bull World Health Organ, 72(1), 101-104.
157
Gilson, L., Kalyalya, D., Kuchlerc, F., Lakea, S., Orangad, H., & Ouendo, M. (2001).
Strategies for promoting equity: Experience with community financing in three
African countries. Health Policy, 58(1), 37-67.
Gleditsch, N. P., Wallensteen, P., Eriksson, M., Sollenberg, M., & Strand, H. (2002).
Armed conflict, 1946-2001: A new dataset. Journal of Peace Research, 39(5).
Glei, D. A., Goldman, N., & Rodriguez, G. (2003). Utilization of care during pregnancy
in rural Guatemala: Does obstetrical need matter? Soc Sci Med, 57,2447-2463.
Gouws, E., Bryce, J., Habicht, J. P., Amaral, J., Pariyo, G., Schellenberg, J. A., et al.
(2004). Improving antimicrobial use among health workers in first-level facilities:
Results from the multi-country evaluation of the Integrated management of
childhood illness strategy. Bull World Health Organ, 82(509-15).
Grosh, M., & Baker, J. (1995). Proxy means tests for targeting social programs.
Simulations and speculation. (LSMS Working paper No. 118). Washington D.C.:
The World Bank.
Grosh, M., & Glinskaya, E. (1997). Proxy means testing and social assistance in
Armenia. Washington D.C.: The World Bank.
Grosh, M. E. (1994). Administering targeted social programs in Latin America: From
platitudes to practice. Washington D.C.: The World Bank.
Gwatkin, D. R., Rutstein, S., & Johnson, K. (2000). Socioeconomic differences in health,
nutrition, and population. H.N.PJ poverty thematic group of the World Bank.
Washington, D.C.
158
Gwatkin, D. R., Wagstaff, A., & Yazbeck, A. S. (2005). Reaching the poor with health,
nutrition, and population services. What works, what doesn't, and why?
Washinton D.C.: The World Bank.
Habicht, J. P., Victora, C. G., & Vaughan, J. P. (1999). Evaluation designs for adequacy,
plausibility and probability of public health programme performance and impact.
International Journal of Epidemiology., 28, 10-18.
Haddad, S., & Fournier, P. (1995). Quality, cost and utilization of health services in
developing countries. A longitudinal study in Zaire. Social Science and Medicine,
40(6), 743-753.
Hansen, P. M., Peters, D. H., Niayesh, H., Edwards, A., Gupta, S., Arur, A., et al.
(2008a). Determinants of primary care service quality in Afghanistan. Int J Qual
Health Care, Forthcoming December 2008.
Hansen, P. M., Peters, D. H., Niayesh, H., Singh, L. P., Dwivedi, V., & Burnham, G.
(2008b). Measuring and managing progress in the establishment of basic health
services: The Afghanistan balanced scorecard. Int J Health Plann Manage, 23,
107-117.
Hansen, P. M., Peters, D. H., Viswanathan, K., Rao, K. D., Mashkoor, A., & Burnham,
G. (2008c). Client perceptions of the quality of primary care services in
Afghanistan. International Journal for Quality in Health Care, Forthcoming
December 2008.
Hentschel, J., & Lanjouw, P. (1996). Constructing an indicator of consumption for the
analysis of poverty: Principles and illustrations with reference to Ecuador.
(LSMS Working paper No. 124). Washington D.C.: The World Bank.
159
Jacobs, B., & Price, N. (2004). The impact of the introduction of user fees at a district
hospital in Cambodia. Health Policy Plan, 19(5), 310-321.
Mali, A. A. (2006). The future of Afghanistan. Parameters: The United States Army's
Senior Professional Journal, XXXW(Spring), 4-19.
Johns Hopkins University Bloomberg School of Public Health, and Institute of Health
Management Research (2005a). Afghanistan Multiple Indicator Cluster
Survey(MICS) 2003. A re-analysis of critical health service delivery indicators.
Kabul: Ministry of Public Health. Afghanistan.
Johns Hopkins University Bloomberg School of Public Health, and Institute of Health
Management Research (2005b). Afghanistan National Health Services
Performance Assessment: Results of formative research. Kabul: Policy and
Planning Division. Ministry of Public Health.
Johns Hopkins University Bloomberg School of Public Health, and Institute of Health
Management Research (2008a). Afghanistan health sector balanced scorecard:
National and provincial results. Kabul: Policy and Planning Division. Ministry of
Public Health.
Johns Hopkins University Bloomberg School of Public Health, and Institute of Health
Management Research (2008b). Afghanistan Health Survey 2006: Estimates of
priority health indicators for rural Afghanistan. Kabul: General Directorate of
Policy and Planning. Ministry of Public Health.
Johns Hopkins University Bloomberg School of Public Health, and Institute of Health
Management Research (2008c). Final evaluation report on health financing
160
pilots: The effects of user fees vs. Free services on primary care in Afghanistan.:
General Directorate of Policy and Planning. Ministry of Public Health.
Johnson, R. A., & Wichern, D. W. (2002). Applied multivariate statistical analysis.
Upper Saddle River, NJ 07458: Pearson Education International.
King, M. H. (1966). Medical care in developing countries. Nairobi, Kenya: Oxford
University Press.
Korn, E. L., & Graubard, B. I. (1999). Analysis of health surveys: John Wiley & Sons,
Inc.
Le Grand, J. (1987). Equity, health and health care. Social Justice Research, 1(3), 257-
274.
Levy, P. S., & Lemeshow, S. (1999). Sampling of populations: Methods and
applications.: John Wiley & Sons, Inc.
Litvack, J. I., & Bodart, C. (1993). User fees plus quality equals improved access to
health care: Results of a field experiment in Cameroon. Soc Sci Med, 37(3), 369-
383.
Lule, G. S., Tugumisirize, J., & Ndekha, M. (2000). Quality of care and its effects on
utilization of maternity services at health center level. East African Medical
Journal, 77, 250-255.
M.R.R.D. (2005). National Risk and Vulnerability Assessment (NRVA) 2005 results and
reports. Retrieved 02/28, 2008, from http://www.mrrd.gov.af/nss-
vau/NRV A_2005 .htm
Macinko, J. A., Starfield, B. (2002). Annotated bibliography in equity in health, 1980-
2001. International Journal for Equity in Health., 1(1).
161
Makinen, M., Waters, H., Rauch, M., Almagambetova, N., Bitran, R., Gilson, L., et al.
(2000). Inequalities in health care use and expenditures: Empirical data from eight
developing countries and countries in transition. Bull World Health Organ, 78(1),
55-65.
Management Sciences for Health, Health and Development Services, Management
Sciences for Health/ Europe. (2002). Afghanistan National Health Resource
Assessment. Kabul: Ministry of Health, Transitional Islamic Government of
Afghanistan.
Mariko, M. (2003). Quality of care and the demand for health services in Bamako, Mali:
The specific roles of structural, process, and outcome components. Soc Sci Med,
56(6), 1183-1196.
Mathiassen, A. (2007). A model based approach for predicting annual poverty rates
without expenditure data. Journal of Economic Inequality.
McKenzie, D. J. (2003). Measure inequality with asset indicators. Bureau for Research
and Economic Development. Working Paper No. 042.
Moisi, J. (2008). Mortality, morbidity, immunization coverage and distance to health
facilities in Kilifi district, Kenya., The Johns Hopkins University Bloomberg
School of Public Health, Baltimore MD.
Montgomery, M. R., Gragnolati, K., Burke, A., & Parades, E. (2000). Measuring living
standards with proxy variables. Demography, 37, 155-174.
Mooney, C. Z., & Duval, R. D. (1993). Bootstrapping: A non parametric approach to
statistical inference. Newbury Park, California: Sage Publications.
162
MOPH. (2003a). Interim health strategy 2002-2003. A strategy to lay foundations.
Kabul: Ministry of Health. Transitional Islamic Government of Afghanistan.
MOPH. (2003b). A basic package of health services for Afghanistan. Kabul: Ministry of
Health, Transitional Islamic Government of Afghanistan.
MOPH. (2004). Afghanistan health indicators. Kabul: Ministry of Public Health, Islamic
Republic of Afghanistan.
Mosley, W. H., & Chen, L. C. (2003). An analytical framework for the study of child
survival in developing countries. 1984. Bull World Health Organ, 81(2), 140-145.
Mwabu, G., Ainsworth, M., & Nyamete, A. (1993). Quality of care and choice of medical
treatment. An empirical analysis. Journal of Human Resources, 28(4), 836-862.
Nicholas, D. D., Heiby, J. R., & Hatzell, T. A. (1991). The quality assurance project:
Introducing quality improvement to primary health care in less developed
countries. Quality Assurance in Health Care, 3(3), 147-165.
Nyonator, F., & Kutzin, J. (1999). Health for some? The effects of user fees in the volta
region of Ghana. Health Policy Plan, 14(A), 329-341.
O'Donnell, O., van Doorslayer, E., Wagstaff, A., & Lindelow, M. (2008). Measurement
of living standards. In Analyzing health equity using household survey data. A
guide to techniques and their implementation. Washington D.C.: The World
Bank.
Pande, R. P., & Yazbeck, A. S. (2003). What's in a country average? Wealth, gender, and
regional inequalities in immunization in India. Soc Sci Med, 57(11), 2075-2088.
163
Peabody, J. W., Taguiwalo, M. M., Robalino, D. A., & Frenk, J. (2006). Improving the
quality of care in developing countries: The World Bank & Oxford University
Press.
Pedersen, D. (2002). Political violence, ethnic conflict, and contemporary wars: Broad
implications for health and social well-being. Social Science and Medicine, 55(2),
175-190.
Peters, D. H., Garg, A., Bloom, G., Walker, D. G., Brieger, W. R., & Rahman, M. H.
(2008). Poverty and access to health care in developing countries. Annals of New
York Academy of Sciences., 1136, 161-171.
Peters, D. H., Noor, A. A., Singh, L. P., Kakar, F. K., Hansen, P. M., & Burnham, G.
(2007). A balanced scorecard for health services in Afghanistan. Bulletin of World
Health Organization., 85(2), 145-151.
Peters, D. H., Yazbeck, A. S., Sharma, R. R., Ramana, G. N. V., Pritchett, L. H., &
Wagstaff, A. (2002). Better health systems for India's poor: Findings, analysis
and options. Washington D.C.: IBRD/ World Bank.
Rao, K. D., & Peters, D. H. (2007). Quality improvement and its impact on the use and
equality of outpatient health services in India. Health Econ, 16, 799-813.
Rossi, P. H., Freeman, H. E., & Lipsey, M. W. (1999). Evaluation: A systematic
approach (6th ed.). Thousand Oaks CA: SAGE Publications, Inc.
Rust, K. (1985). Variance estimation for complex estimators in sample surveys. Journal
of Official Statistics, 7(4), 381-397.
Rutstein, S. O., & Kiersten, J. (2004). The DHS wealth index. (No. 6). Calverton, MD:
ORC Macro.
164
Shaikh, B. T., & Hatcher, J. (2004). Health seeking behavior and health service
utilization in Pakistan: Challenging the policy makers. Journal of Public Health,
27(1), 49-54.
Standing, H. (1997). Gender and equity in health sector reform programmes: A review.
Health Policy and Planning, 72(1), 1-18.
StataCorp. (2004a). Survey data and other reference manuals. Stata statistical package.
Release 8. College Station, TX: Stata Corp LP.
StataCorp. (2004). Stata statistical package. Release 8. College station, TX.: Stata Corp
LP.
Steinhardt, L. C , Waters, H., Rao, K. D., Naeem, A. J., Hansen, P. M., & Peters, D. H.
(2007). The effect of wealth status on care seeking and health expenditures in
Afghanistan.Unpublished manuscript.
Stifel, D., & Christiansen, L. (2007). Tracking poverty over time in the absence of
comparable consumption data. The World Bank Economic Review, 27(2), 317-
341.
T.I.S.A. (2004). Securing Afghanistan's future: Accomplishments and the strategic path
forward. (Government/ International agency report). Kabul.
Tlebere, P., Jackson, D., Loveday, M., Matizirofa, L., Mbombo, N., Doherty, T., et al.
(2007). Community-based situation analysis of maternal and neonatal care in
south africa to explore factors that impact utilization of maternal health services.
Journal of Midwifery & Women's Health, 52(4), 342.
165
Toole, M. J., Waldman, R. J., & Zwi, A. B. (2001). Complex humanitarian emergencies.
In M. H. Merson, R. E. Black & A. J. Mills (Eds.), International public health:
Diseases, programs, systems, and policies. Gaithersburg: Aspen.
UNDP. (2004). Afghanistan National Human Development Report. Security with a
human face: Challenges and responsibilities. Kabul.
UNICEF. (2000). Afghanistan multiple indicator cluster survey. Situational analysis of
children and women in east of Afghanistan. Retrieved 12/12, 2007, from
http://www.childinfo.org/MICS2/newreports/afghanistan/Afghanistan2.PDF
UNICEF. (2004a). Afghanistan: Progress of provinces. Multiple indicators clusters
survey 2003. Retrieved September 12, 2008, from
http://www.childinfo.org/MICS2/newreports/afghanistan/AfghanistanMICS2003.
£df
UNICEF. (2004b). The State of Worlds Children 2004. New York.
UNICEF. (2006). Best estimates of social indicators for children in Afghanistan: 1990-
2005. New York: United Nations Children's Fund.
Verma, V., Scott, C , & O'Muircheartaigh, C. (1980). Sample designs and sampling
errors for the world fertility survey. Journal of the Royal Statistical Society. Series
A (General). 143(4), 431-473.
Vyas, S., & Kumaranayake, L. (2006). Constructing socio-economic status indices: How
to use principal components analysis. Health Policy and Planning, 21(6), 459-
468.
W.H.O. (1999). IMCI information package: IMCI indicators, monitoring, and
evaluation. Geneva: WHO.
166
Wagstaff, A. (2002). Poverty and health sector inequalities. Bull World Health Organ,
80(2), 97-105.
Waldman, R., & Hanif, H. (2002). The public health system in Afghanistan: Current
issues. Kabul: Afghanistan Research and Evaluation Unit.
Waters, H., Garrett, B., & Burnham, G. (2007). Rehabilitating health systems in post-
conflict situations. (Research Paper): United Nations University - World Institute
of Developement Economics Research.
Wolter, K. M. (2007). Introduction to variance estimation. (2nd ed.). New York:
Springer.
Wong, E. L., Popkin, B. M., Guilkey, D. K., & Akin, J. S. (1987). Accessibility, quality
of care and prenatal care use in the Philippines. Soc Sci Med, 24(11), 927-944.
World Bank. (1993). World Development Report: Investing in health. Washington D.C.:
The World Bank.
World Bank. (1998). Post conflict reconstruction: The role of the World Bank.
World Bank. (2005). Afghanistan: Poverty, vulnerability and social protection - an initial
assessment. Washington D.C.: The World Bank.
World Bank. (2006). World development report: Equity and development. Washington
D.C.: The World Bank.
167
Curriculum Vita Shivam Gupta
EDUCATION:
9/04 -10/08 The Johns Hopkins Bloomberg School of Public Health. Doctor of Philosophy, International Health, Health Systems Program. Thesis topic: Methods for population-based assessments in post-conflict settings: Health service performance, economic status and equity of utilization in Afghanistan.
7/03 - 5/04 The Johns Hopkins Bloomberg School of Public Health. Master of Public Health. Program concentration: Women's and Reproductive Health.
7/97 - 3/03 Manipal Academy of Higher Education. Bachelor of Medicine and Bachelor of Surgery (equivalent to M.D.), Kasturba Medical College, Karnataka, India.
SELECTED WORK EXPERIENCE:
10/07-3/08 Consultant, World Bank. Analyzed the differences in health outcomes, the main determinants of health outcome variations, and helped in identifying the main policy interventions that have taken place within Afghanistan after the removal of Taliban in 2001.
6/04 - 6/07 Monitoring and Evaluation Specialist, Johns Hopkins University. Assisted with design, development of instruments, writing field manuals, conducting training, supervising data collection and conducting analysis for the Afghanistan National Health Services Performance Assessment.
3/03 - 7/03 Research Officer, Institute of Health Management Research, India. Assisted the faculty with conceptualizing research questions, development of research proposal and study designs, data analysis and writing draft reports.
2/02 - 2/03 Medical Intern, Sawai Man Singh Medical College, Jaipur, India. One year rotating internship. Worked as physician's assistant at the rural health training center for six weeks, urban health training center for two weeks, immunization center, infectious disease hospital, family planning clinic (one week each). Also worked as an assistant to the chief resident in departments of Pediatric Medicine, Internal Medicine, Surgery, Ophthalmology and Otolaryngology.
168

SELECTED TEACHING EXPERIENCE:
6/04 - 12/06 Graduate Teaching Assistant, Johns Hopkins Bloomberg School of Public Health. Assisted the faculty in teaching the following courses: Pregnancy Outcomes in Developing and Developed Countries (summer intersession 2004), Principles of Epidemiology (2004), Managing Health Services Organizations (2004 - 2006).
PUBLICATIONS:
Hansen PM, Peters DP, Niayesh H, Edward A, Gupta S, Arur A, Burnham G. Determinants of primary care service quality in Afghanistan. International Journal for Quality in Health Care. Forthcoming, December 2008.
Pandian V, Vaswani R S, Mirski M A, Haut E, Gupta S, Bhatti N I. Safety of Percutaneous Dilatational Tracheostomy in Coagulopathy Patients. Ear, Nose and Throat Journal, (Accepted for publication September 12, 2008)
LANGUAGES: • English & Hindi: native fluency. • Dari: beginner.
FELLOWSHIPS AND AWARDS:
• 2005 - 2008: Department Fellowship, International Health, Bloomberg School of Public Health, Johns Hopkins University.
• 2002: Fellowship by the International Epidemiological Association (IEA) to present a paper at the XVI World Congress of Epidemiology in Montreal, Canada.
PERSONAL DATA: Born July 16, 1979 in Jaipur, Rajasthan, India.
169