Embed Size (px)
Citation preview

REVIEW ARTICLEpublished: 10 October 2013
doi: 10.3389/fphys.2013.00278
Methods and approaches in the topology-based analysis ofbiological pathwaysCristina Mitrea1†, Zeinab Taghavi1†, Behzad Bokanizad1, Samer Hanoudi1, Rebecca Tagett1,
Michele Donato1, Calin Voichita1 and Sorin Draghici1,2*
1 Department of Computer Science, Wayne State University, Detroit, MI, USA2 Department of Obstetrics and Gynecology, Wayne State University, Detroit, MI, USA
Edited by:
Matthew Oberhardt, Tel AvivUniversity, Israel
Reviewed by:
William Lytton, SUNY Downstate,USAFeilim Mac Gabhann, Johns HopkinsUniversity, USANikolaos Tsoukias, FloridaInternational University, USA
*Correspondence:
Sorin Draghici, Department ofComputer Science, Wayne StateUniversity, 5057 Woodward Ave.Suite 14200.8, Detroit, MI 48202,USAe-mail: [email protected]†These authors have contributedequally to this work.
The goal of pathway analysis is to identify the pathways significantly impacted in a givenphenotype. Many current methods are based on algorithms that consider pathways assimple gene lists, dramatically under-utilizing the knowledge that such pathways are meantto capture. During the past few years, a plethora of methods claiming to incorporatevarious aspects of the pathway topology have been proposed. These topology-basedmethods, sometimes referred to as “third generation,” have the potential to bettermodel the phenomena described by pathways. Although there is now a large varietyof approaches used for this purpose, no review is currently available to offer guidancefor potential users and developers. This review covers 22 such topology-based pathwayanalysis methods published in the last decade. We compare these methods based on:type of pathways analyzed (e.g., signaling or metabolic), input (subset of genes, all genes,fold changes, gene p-values, etc.), mathematical models, pathway scoring approaches,output (one or more pathway scores, p-values, etc.) and implementation (web-based,standalone, etc.). We identify and discuss challenges, arising both in methodology andin pathway representation, including inconsistent terminology, different data formats, lackof meaningful benchmarks, and the lack of tissue and condition specificity.
Keywords: pathway analysis, topology, signaling pathways, metabolic pathways, mathematical model, network
topology, statistical significance
1. INTRODUCTIONIn molecular biology and genetics, there is a large gap betweencurrent data analysis techniques and their ability to derive preciseand accurate functional information from the large and con-stantly growing volume of high throughput molecular data. Thecapability of obtaining a comprehensive lists of genes/proteinsthat are different between two phenotypes is routine1 in researchtoday. And yet, the holy grail of high-throughput has not deliv-ered so far. Even though high-throughput comparisons arerelatively easy to perform, understanding the phenomena thatdetermine the measured changes is as challenging as ever, if notmore so. Therefore, it is crucial to develop effective ways to ana-lyze the vast amount of data that has been and will continue to becollected.
A major contributor to the gap between our ability to collectdata and our ability to interpret it, is the fact that living organismsare complex systems whose emerging phenotypes are the resultsof thousands of complex interactions taking place on variousmetabolic and signaling pathways. The ability to correctly infer
1Such experiments are currently offered by a number of academic coresand private companies for a fixed and reasonable fee. Examples of suchcores include: Duke Proteomics Core Facility, Johns Hopkins MicroarrayCore, CMMB Research Facility (Univ. of South Florida), MD Anderson CoreFacility, UCLA DNA Microarray Core Facility, Stanford Genomic Resources,Dana-Farber Microarray Core, etc.
the perturbed pathways responsible for a phenotype from a listof differentially expressed (DE) genes or proteins may be the keyto transforming the now abundant high-throughput expressiondata into biological knowledge. In turn, this can help understandmechanisms of disease, develop better drugs, personalize drugregimens, etc. For our purposes, pathways are models describ-ing the interactions of genes, proteins, or metabolites within cells,tissues, or organisms, not simple lists of genes. This is why, inthis paper, we focus exclusively on pathway analysis methods thataim to identify the pathways that are significantly impacted ina condition under study, taking pathway topology into account.This process uses two types of data: (i) previously accumulatedknowledge in the form of known pathways, represented as graphsand (ii) experiment data, such as gene expression values or pro-tein or metabolite abundance data obtained when comparing twophenotypes.
In spite of the crucial importance of this problem and of therecent increase in the number of methods and approaches forpathway analysis, to our knowledge there is no current reviewfocused on topology-based methods. A reason for this may berelated to the challenges currently associated with this problem.A first such challenge is the lack of standards for the evaluationof the results of the analyses. This has lead to the proliferation ofmany techniques that have never been compared with each otherin a consistent way. Another set of challenges is related to thepathways themselves. Not only there is no universal agreement for
www.frontiersin.org October 2013 | Volume 4 | Article 278 | 1

Mitrea et al. Topology-based pathway analysis methods
the representation of information content in pathway databases,but the very definition of a pathway is not completely agreedupon Chowbina et al. (2009). Some authors use the term “path-way” to refer to a simple list of genes (such as those associatedwith a given Gene Ontology (GO) term), lacking any structureand any information about the interactions between these genes.Many others use graphs to capture relationships but the mean-ing of edges and nodes varies dramatically from one source toanother. Figure 5 shows not fewer than five different types ofgraphs, all referred to as “pathways.” Even pathways from thesame source, often use different representations. For instance,genes/proteins are associated with nodes in KEGG signaling path-ways while they are associated with edges in KEGG metabolicpathways.
The subset of available techniques that consider the path-ways as simple lists of genes, such as those associated with aGO term (or another arbitrary descriptor) are worth of furtherdiscussion. Here, we will refer to these as gene set analysis meth-ods, rather than pathway analysis methods. A comprehensive listof such techniques, as well as some comparisons between themcan be found in several well-developed surveys (Misman et al.,2009; Chuang et al., 2010; Kelder et al., 2010; Emmert-Streib andGlazko, 2011; Khatri et al., 2012). While useful for the purpose forwhich they have been developed - to analyze sets of genes - thesemethods do not take into consideration the topology of the path-ways, and hence completely ignore the interactions described bythe pathways, the different types of genes, the position of the geneson their respective pathways, etc. This is illustrated in Figure 1. Insome sense, the very reason for the existence of the pathways is todescribe the way various genes interact. Therefore, methods that
perform the analysis only on sets of genes, ignoring the topol-ogy of the pathway, are not included in the scope of the presentreview.
Recent pathway analysis algorithms have become more refinedthan gene set analysis methods by incorporating topology(Figure 2). A first attempt to incorporate topology informa-tion in the analysis of pathways was through the use of graphtheory methods. This approach became popular in the lastdecade (Chuang et al., 2010; Barabási et al., 2011). Aittokallio andothers survey graph-based analysis methods. They identify cate-gories based on global structural properties, local structural con-nectivity, or hierarchical functional organization, and describethe features of gene regulatory networks, metabolic networks,and protein-protein interaction (PPI) networks (Aittokallio andSchwikowski, 2006). Some of these graph theory methods andconcepts are relevant to the pathway analysis methods able tocompare phenotypes, which are the focus of the current review.However, as a broad category, the approaches based on graphtheory methods are not able to identify the pathways that are sig-nificant in a given phenotype comparison and therefore, do notfall within the scope of this review.
Varadan and others (Varadan et al., 2012) review the use ofbiological knowledge bases for cancer diagnosis and prognosis.They attempt to evaluate the performance of three topology-based methods, SPIA, PARADIGM, and PathOlogist, on the sameinput datasets to compare the biological relevance of their out-puts. Unfortunately, since the 3 tools did not use the samepathway database, the authors chose to re-implement SPIA andadapt it to the pathway database used by the other two, so that theresult from all three would be comparable. The authors discuss
FIGURE 1 | Gene sets are not pathways. (A) shows a small part ofthe MAPK signaling pathway from KEGG. This pathway shows thelocation of various genes or gene products (inside the cell, outside ofit, or in the membrane), what gene interacts with what other gene(s),the type of each interaction (activation, repression, phosphorylation,etc.), the direction of the signal propagation, and potentially many other
things (e.g., complex formation, etc.). (B) presents the same part of thesame pathway as a gene set (no interactions). The gene set has lostall the structure and the additional information captured by the originalpathway. This comparison shows how much important knowledgeexistent in pathway database is ignored when pathways are treated assimple gene sets.
Frontiers in Physiology | Computational Physiology and Medicine October 2013 | Volume 4 | Article 278 | 2

Mitrea et al. Topology-based pathway analysis methods
FIGURE 2 | Generalized overview of the data flow in pathway analysis methods. For each module, the various options available for different methodssurveyed, as well as the comparison criteria used in this paper are presented in the white boxes.
relative performance of the three methods, but could not drawdefinitive conclusions regarding the superiority of one tool ver-sus another. We also ran their version of SPIA and the originalSPIA implementation from Bioconductor, using exactly the sameinput, and obtained different results. This indeed demonstratessome of the inherent problems encountered when comparingpathway analysis methods. First of all, it is difficult to success-fully re-implement an algorithm to force it to work on otherdata sources, especially when the re-implementation is done bythird parties. Furthermore, sometimes the mere ability to repro-duce published results - which is at the base of modern scientificresearch - is questionable in this area. For instance, in spite of hav-ing access to the source code and having the full cooperation ofthe authors, we could not even reproduce the results reported inVaske et al. (2010).
Four topology-based tools, along with several gene-basedmethods, were recently reviewed by Khatri and others Khatri et al.
(2012). This recent survey groups functional analysis based onGO together with pathway analysis methods. With this very loosedefinition of a pathway and pathway analysis, the authors presentthe limitations and challenges of various methods in general,and categorize topology-based methods as “third-generation”tools. However, even though it is very recent, this existing surveyonly includes 4 out of the 22 topology-based analysis methodsreviewed here.
In a different direction, researchers tackle the problem ofunderstanding disease by looking at signaling networks from theperspective of fault tolerance. Fault tolerance is a measure of thevulnerability of signaling networks to the abnormal function of itscomponents. Abdi and Emamian survey this direction in a com-prehensive study Abdi and Emamian (2010). Valuable results arepresented highlighting vulnerable molecules in different molec-ular networks for biological phenomena such as mitosis or p53signaling.
www.frontiersin.org October 2013 | Volume 4 | Article 278 | 3

Mitrea et al. Topology-based pathway analysis methods
Kinetic/stoichiometric models based on the molecular mecha-nisms of interaction have been used for over 25 years in order tosimulate biochemical phenomena. Such models are in some sensethe ultimate tools because they can predict exact quantities forany variable in the system. However, their use is limited by theneed to know the precise initial concentration for most reactants,exact reaction constants for all reactions, as well as the appro-priate time scale for the studied phenomenon. Furthermore,the goals of such models are very different from the goals ofpathway analysis methods. The goal of such kinetic models isto fully describe the biochemical phenomena involved and tomake quantitative predictions about some of the reaction prod-ucts involved. In contrast, the goal of pathway analysis methodsis to identify the most significantly impacted pathways from alarge collection of heterogeneous pathways, based on incompleteinformation. Furthermore, kinetic models work for biochemi-cal pathways describing reactions of the same type (biochemical)with known reaction constants (Steuer, 2007). The pathwayswe are considering here include gene signaling pathways con-taining different “signals” (inhibition, activation, phosphoryla-tion, methylation, etc.) happening at many levels (transcription,translation, post-translational, etc.) between heterogeneous com-ponents (mRNA, DNA, protein, metabolites, etc.). Therefore,the entire body of work concerned with modeling biochem-ical pathways using mathematical models (e.g., differential ordifference equations) does not fall within the scope of thisreview.
Finally, it is important to state that we do not intend to assessthe efficacy of each method, since there is not a universally recog-nized correct output of such tools. Designing benchmark datasetswould help to determine the most effective mathematical modelbut this is beyond the intended scope of the current review andhence, it is not attempted here.
In this paper, we describe 22 topology-based pathway analy-sis methods designed to analyze either signaling pathways (seeFigure 3), or metabolic pathways (Figure 4). There are sev-eral commercial tools used for pathway analysis, which do notincorporate the pathway topology when computing pathwayscores including Ingenuity Pathway Analysis (Ingenuity Systems,www.ingenuity.com) and Genomatix (Genomatix Software,www.genomatix.de). Since these tools only perform a gene setanalysis, failing to take advantage of the additional knowledgeincorporated in the pathways, they will not be consideredhere. We found only two commercial tools that do incor-porate topology in the pathway analysis. These are Pathway-Guide (Advaita Corporation, http://www.advaitabio.com) andMetaCore (Thomson Reuters, http://www.thomsonreuters.com).
We categorize and compare all surveyed methods based on dif-ferent criteria including: the type of input required, the type ofoutput provided, the mathematical models used, and the imple-mentation used. In section 2, we discuss the options for inputdata in different tools, in particular, the challenges specific totopology-based methods. Section 3 reviews the underlying math-ematical models and scoring methods currently available to ratepathway deregulation. Section 4 focuses on the types of out-put provided. Finally, section 5 presents issues regarding theimplementation of the methods. To the best of our knowledge,
FIGURE 3 | Timeline showing when the surveyed pathway analysis
tools, working mainly with signaling pathways, became available (this
time may be different from publication time shown in Table 1). Someof the methods use additional interaction information that may be from anin-house or public gene/protein interaction knowledge base.BAPA-IGGFD (Zhao et al., 2012) and TBScore (Ibrahim et al., 2012)acronyms were assigned to the respective methods, in this manuscript, forease of reference. The commercial tools, Pathway-Guide and MetaCore arenot included in this figure.
FIGURE 4 | Timeline showing the availability of pathway analysis tools
that work mainly with metabolic pathways.
our review is the only comprehensive survey of topology-basedpathway analysis methods to date.
2. INPUT DATAThis review focuses on pathway analysis methods that try toexploit some of the information contained in the pathway topol-ogy in order to identify the pathways that are significantlyimpacted in a condition under study. In order to address thisproblem, any pathway analysis method will need: (i) a collec-tion of pathways capturing our current knowledge about theinteractions of genes, proteins, metabolites, or compounds inan organism (usually from a pathway database), and (ii) exper-imental data in the form of measurements of gene expression,protein abundance, metabolite concentration, or copy numbers.The pathway data is accumulated, updated, and refined by amass-ing knowledge from scientific literature describing individualinteractions or high throughput experiment results. The experi-ment data is usually provided by measurements comparing two ormore phenotypes such as treated vs. untreated, disease vs. healthy,or treated with drug A vs. drug B.
Analysis methods take various approaches to accommodatethe different formats commonly used for both types of data. Inthis section, we compare all methods reviewed based on theirinput types and formats, and discuss the particular difficultiesencountered when incorporating the pathway interactions intotopology-based analysis methods.
Frontiers in Physiology | Computational Physiology and Medicine October 2013 | Volume 4 | Article 278 | 4

Mitrea et al. Topology-based pathway analysis methods
2.1. EXPERIMENT DATAMost methods analyze data from high-throughput experiments,such as microarrays, next-generation sequencing, or proteomics.Most analysis methods accept either a list of gene IDs or a list ofsuch gene IDs associated with measured changes. These changescould be measured with different technologies and therefore canserve as proxies for different biochemical entities. For instance,one could use gene expression changes measured with microar-rays, or protein levels measured with a proteomic approach, etc.Transcription data is often used to approximate the proteome,since high-throughput protein abundance data is not readilyavailable. Most methods expect a consistent input i.e., all val-ues are expected to be of the same type. MetPA, which is ametabolic pathway analysis method, is the only method that doesnot accept gene expression. This method uses as input either a listof “important” compounds, or a metabolite concentration table.
Different analysis methods use different input formats. Manymethods accept a list of all genes considered in the experimenttogether with their expression values. Some analysis methodsselect a subset of genes, considered to be differentially expressed(DE), based on a predefined cut-off. The cut-off is typicallyapplied on fold-change, statistical significance, or both. A selec-tion based on both criteria can be performed easily if the data isdisplayed as a volcano plot, i.e., in a coordinate system that hasfold changes on the x axis and the negative log of the p-valueon the y axis. In such a plot, genes that have large absolute foldchanges as well as significant p-values will appear in the top partof the plot, towards the sides. These methods use the list of DEgenes and their corresponding fold-change values as input. Othermethods use only the list of DE genes, without correspondingexpression values, because their scoring methods are based onlyon the relative positions of the genes in the graph. Methods whichuse cut-offs are sensitive to the chosen threshold value, because asmall change in the cut-off may drastically change the numberof selected genes (Nam and Kim, 2008). As a consequence, somegenes with moderate differential expression may be lost, eventhough they might be important players in the impacted path-ways (Ben-Shaul et al., 2005). Furthermore, the genes included inthe set of DE genes can vary dramatically if the selection meth-ods are changed. Hence, the results of pathway analyses based onDE genes may be vastly different depending on both the selectionmethod as well as the threshold value (Pan et al., 2005). On theother hand, methods which do not use a threshold are more sen-sitive to the noise coming from the (very many) genes that do notchange much between the two phenotypes, genes that are nor-mally eliminated by the DE selection process. An approach usedto address this issue while still using all gene measurements usesthe individual p-values of each gene (Voichita et al., 2012).
Among the surveyed methods, ScorePAGE, PathOlogist,NetGSA, TopologyGSA, PWEA, TAPPA, ACST, BPA, BAPA-IGGFD, and DEGraph use all genes together with their expressionvalues as input. However, for BPA and BAPA-IGGFD 2, the foldchanges are only used to label each gene and not considered in
2BAPA-IGGFD (Zhao et al., 2012) and TBScore (Ibrahim et al., 2012)acronyms were assigned to the respective methods, in this manuscript, forease of reference.
the analysis itself. In BPA, this label is whether the gene is DE ornot and in BAPA-IGGFD, the label states whether the gene is up-regulated or down-regulated. Therefore, these two methods canbe categorized as using a cut-off on the input gene list. Methodsthat use the DE gene list and their associated values includePathway-Guide, Pathway-Express, SPIA, and TBScore. However,the impact analysis which is the approach used by Pathway-Guide,Pathway-Express and SPIA has been recently extended to workwith the set of all genes as well (Voichita et al., 2012), so thesecan now be used either with or without DE genes. Moreover, thisfunctionality is now available as part of the Bioconductor pack-age ROntoTools. 3 MetaCore, TopoGSA, and EnrichNet use onlythe DE gene list without associated expression values. CePa is amethod that has two options. It can work with either a list of DEgenes, or the whole list of genes with their expression values andphenotype labels. GANPA and THINK-Back Density Analysis(DS) modify existing gene set analysis methods, such as GSEA, bycalculating topology-based weights for each gene before applyingthe main gene set analysis method. In these methods, the gene setanalysis used in the second stage uses as input the list of all geneswith their expression values. However, the weighting process usedin the first stage requires DE genes with their values, for GANPA,and the list of DE genes, for THINK-Back-DS.
2.2. PATHWAY DATABiological processes can be represented by different types of mod-els. Usually pathways, such as signaling or metabolic pathways, aresets of genes and/or gene products that interact with each otherin a coordinated way to accomplish a given biological functionor process. A typical signaling pathway (in KEGG for instance)uses nodes to represent genes or gene products and edges torepresent signals, such as activation or repression, that go fromone gene to another. A typical metabolic pathway uses nodes torepresent biochemical compounds and edges to represent reac-tions that transform one or more compound(s) into one or moreother compounds. These reactions are usually carried out or con-trolled by enzymes, which are in turn coded by genes. Hence, ina metabolic pathway, genes or gene products are associated withedges rather than nodes, as in a signaling pathway. The immediateconsequence of this difference is that many techniques cannot beapplied directly on all available pathways. There are other typesof biological networks that incorporate genome wide interactionsbetween genes or proteins such as protein-protein interaction(PPI) networks. These networks are not restricted to specific bio-logical functions. The main caveat related to PPI data is that mostsuch data are obtained from a bait-prey laboratory assay, ratherthan from in vivo or in vitro studies. The fact that two proteinsstick to each other in an assay performed in an artificial envi-ronment can be misleading since the two proteins may never bepresent at the same time in the same tissue or the same part of thecell.
The pathway data that is the input of the pathway analysismethods, generally come from a single source such as a singlepathway database. In some analysis methods a second sourceof interaction data is used, such as a gene/protein interaction
3http://bioconductor.org/packages/release/bioc/html/ROntoTools.html
www.frontiersin.org October 2013 | Volume 4 | Article 278 | 5
Mitrea et al. Topology-based pathway analysis methods
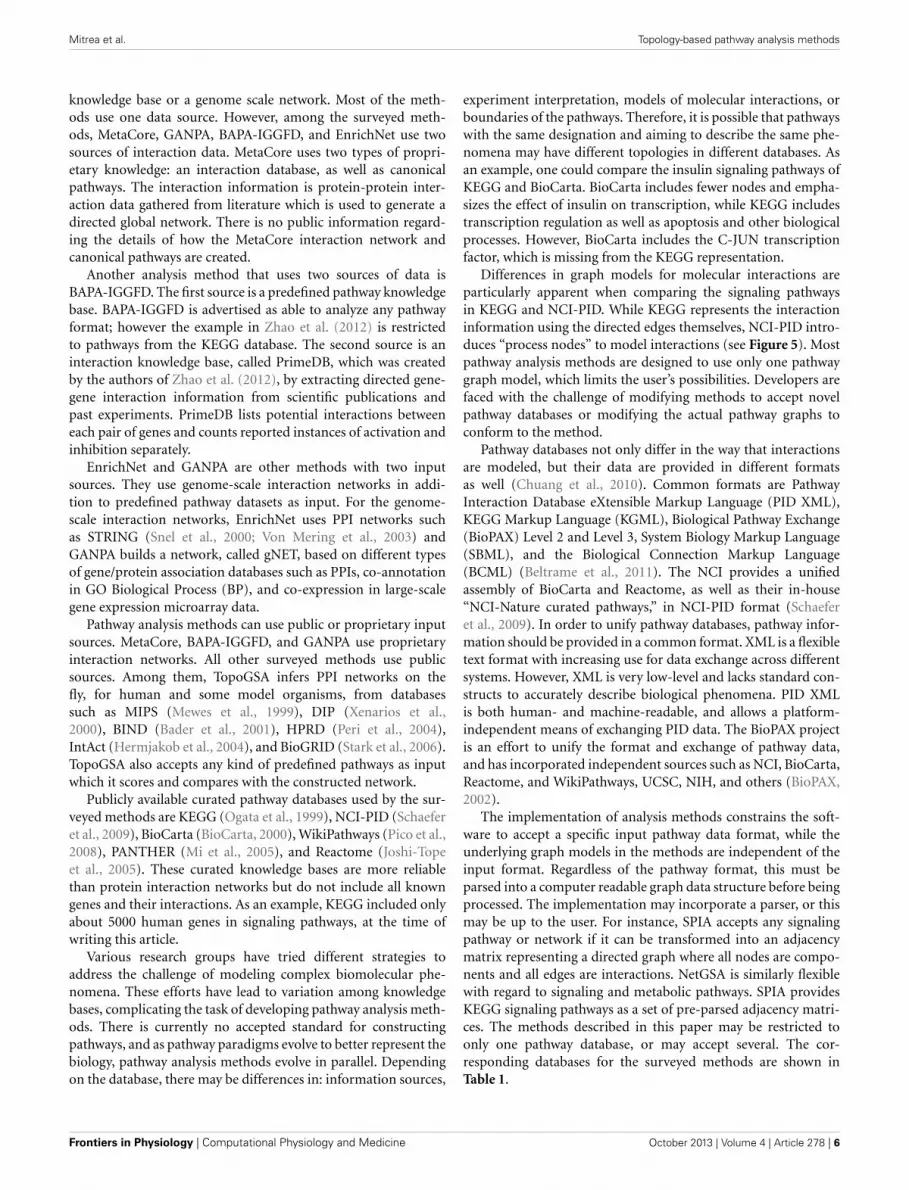
knowledge base or a genome scale network. Most of the meth-ods use one data source. However, among the surveyed meth-ods, MetaCore, GANPA, BAPA-IGGFD, and EnrichNet use twosources of interaction data. MetaCore uses two types of propri-etary knowledge: an interaction database, as well as canonicalpathways. The interaction information is protein-protein inter-action data gathered from literature which is used to generate adirected global network. There is no public information regard-ing the details of how the MetaCore interaction network andcanonical pathways are created.
Another analysis method that uses two sources of data isBAPA-IGGFD. The first source is a predefined pathway knowledgebase. BAPA-IGGFD is advertised as able to analyze any pathwayformat; however the example in Zhao et al. (2012) is restrictedto pathways from the KEGG database. The second source is aninteraction knowledge base, called PrimeDB, which was createdby the authors of Zhao et al. (2012), by extracting directed gene-gene interaction information from scientific publications andpast experiments. PrimeDB lists potential interactions betweeneach pair of genes and counts reported instances of activation andinhibition separately.
EnrichNet and GANPA are other methods with two inputsources. They use genome-scale interaction networks in addi-tion to predefined pathway datasets as input. For the genome-scale interaction networks, EnrichNet uses PPI networks suchas STRING (Snel et al., 2000; Von Mering et al., 2003) andGANPA builds a network, called gNET, based on different typesof gene/protein association databases such as PPIs, co-annotationin GO Biological Process (BP), and co-expression in large-scalegene expression microarray data.
Pathway analysis methods can use public or proprietary inputsources. MetaCore, BAPA-IGGFD, and GANPA use proprietaryinteraction networks. All other surveyed methods use publicsources. Among them, TopoGSA infers PPI networks on thefly, for human and some model organisms, from databasessuch as MIPS (Mewes et al., 1999), DIP (Xenarios et al.,2000), BIND (Bader et al., 2001), HPRD (Peri et al., 2004),IntAct (Hermjakob et al., 2004), and BioGRID (Stark et al., 2006).TopoGSA also accepts any kind of predefined pathways as inputwhich it scores and compares with the constructed network.
Publicly available curated pathway databases used by the sur-veyed methods are KEGG (Ogata et al., 1999), NCI-PID (Schaeferet al., 2009), BioCarta (BioCarta, 2000), WikiPathways (Pico et al.,2008), PANTHER (Mi et al., 2005), and Reactome (Joshi-Topeet al., 2005). These curated knowledge bases are more reliablethan protein interaction networks but do not include all knowngenes and their interactions. As an example, KEGG included onlyabout 5000 human genes in signaling pathways, at the time ofwriting this article.
Various research groups have tried different strategies toaddress the challenge of modeling complex biomolecular phe-nomena. These efforts have lead to variation among knowledgebases, complicating the task of developing pathway analysis meth-ods. There is currently no accepted standard for constructingpathways, and as pathway paradigms evolve to better represent thebiology, pathway analysis methods evolve in parallel. Dependingon the database, there may be differences in: information sources,
experiment interpretation, models of molecular interactions, orboundaries of the pathways. Therefore, it is possible that pathwayswith the same designation and aiming to describe the same phe-nomena may have different topologies in different databases. Asan example, one could compare the insulin signaling pathways ofKEGG and BioCarta. BioCarta includes fewer nodes and empha-sizes the effect of insulin on transcription, while KEGG includestranscription regulation as well as apoptosis and other biologicalprocesses. However, BioCarta includes the C-JUN transcriptionfactor, which is missing from the KEGG representation.
Differences in graph models for molecular interactions areparticularly apparent when comparing the signaling pathwaysin KEGG and NCI-PID. While KEGG represents the interactioninformation using the directed edges themselves, NCI-PID intro-duces “process nodes” to model interactions (see Figure 5). Mostpathway analysis methods are designed to use only one pathwaygraph model, which limits the user’s possibilities. Developers arefaced with the challenge of modifying methods to accept novelpathway databases or modifying the actual pathway graphs toconform to the method.
Pathway databases not only differ in the way that interactionsare modeled, but their data are provided in different formatsas well (Chuang et al., 2010). Common formats are PathwayInteraction Database eXtensible Markup Language (PID XML),KEGG Markup Language (KGML), Biological Pathway Exchange(BioPAX) Level 2 and Level 3, System Biology Markup Language(SBML), and the Biological Connection Markup Language(BCML) (Beltrame et al., 2011). The NCI provides a unifiedassembly of BioCarta and Reactome, as well as their in-house“NCI-Nature curated pathways,” in NCI-PID format (Schaeferet al., 2009). In order to unify pathway databases, pathway infor-mation should be provided in a common format. XML is a flexibletext format with increasing use for data exchange across differentsystems. However, XML is very low-level and lacks standard con-structs to accurately describe biological phenomena. PID XMLis both human- and machine-readable, and allows a platform-independent means of exchanging PID data. The BioPAX projectis an effort to unify the format and exchange of pathway data,and has incorporated independent sources such as NCI, BioCarta,Reactome, and WikiPathways, UCSC, NIH, and others (BioPAX,2002).
The implementation of analysis methods constrains the soft-ware to accept a specific input pathway data format, while theunderlying graph models in the methods are independent of theinput format. Regardless of the pathway format, this must beparsed into a computer readable graph data structure before beingprocessed. The implementation may incorporate a parser, or thismay be up to the user. For instance, SPIA accepts any signalingpathway or network if it can be transformed into an adjacencymatrix representing a directed graph where all nodes are compo-nents and all edges are interactions. NetGSA is similarly flexiblewith regard to signaling and metabolic pathways. SPIA providesKEGG signaling pathways as a set of pre-parsed adjacency matri-ces. The methods described in this paper may be restricted toonly one pathway database, or may accept several. The cor-responding databases for the surveyed methods are shown inTable 1.
Frontiers in Physiology | Computational Physiology and Medicine October 2013 | Volume 4 | Article 278 | 6

Mitrea et al. Topology-based pathway analysis methods
FIGURE 5 | Comparison of representative graph models for molecular
interactions as used by different pathway databases. In a KEGGsignaling pathway (A) nodes represent genes/gene products and edgesrepresent regulatory signals such as activation, inhibition, phosphorylation,etc. (see http://www.genome.jp/kegg/document/help_pathway.html fordetails). In the chemical network representation of a KEGG metabolicpathway (B) the nodes represent biochemical compounds and edgesrepresent chemical reactions. These chemical reactions are performed byenzymes which are proteins encoded by genes. Hence, in contrast withthe signaling pathways in which genes are associated with nodes, in ametabolic pathways genes are associated with edges. This is the mainreason most methods developed for signaling pathways cannot be applieddirectly to metabolic pathways. In an NCI-PID signaling pathway (C) nodesfall in two categories: component nodes representing biomolecularcomponents, or process nodes representing biochemical reactions orbiological processes. Edges connect two biomolecular components
through a biochemical reaction or a biological process. Process nodes canhave 3 states: positive regulation, negative regulation, or “involved in.”(see http://pid.nci.nih.gov/userguide/network_maps.shtml for details). In aprotein-protein interaction network (D) nodes represent proteins and theinteractions among them represent physical binding. These interactionscan be inferred from two-hybrid assays and they may be either undirected(top), or directed from the bait protein to the prey protein (bottom). In theBiological Pathway Exchange (BioPAX) (E) nodes are physical entities andedges are conversions. BioPAX entities can represent complexes, DNA,proteins, RNA, small molecules, DNA regions or RNA regions. Conversionscan represent biochemical reactions complex assembly or degradation,transport or transport with biochemical reaction. This model is very genericand increasingly flexible. It provides a standard for pathway information tobe available in machine readable format, therefore easy to use for pathwayanalysis and to exchange between pathway databases (see http://www.biopax.org/release/biopax-level3-documentation.pdf for details).
3. MATHEMATICAL MODELSFor topology-based pathway analysis methods, the mathematicalmodel describes how the graph and the experiment data are pro-cessed to compute a score for each pathway. The score quantifiesthe significance of changes in a (sub)pathway between the twophenotypes. This score may be a statistical significance or othernon-statistical method-specific metric. The diversity of currenttopological based pathway analysis methods reflects the variety ofmathematical models available for graphs. The output is typicallya list of ranked (sub)pathways.
3.1. GRAPH MODELSTwo major graph models are used to represent biological net-works and pathways. The first model, hereon referred to as“single-type,” allows only one type of node, the biological compo-nent (i.e., a gene or protein), with edges representing molecularinteractions occurring between the nodes (e.g., Figure 5A). Incontrast, the second graph model, hereon referred to as “multi-type,” allows multiple type of nodes, such as components andinteractions (e.g., Figure 5C). Multi-type graph models are morecomplex than single-type, but they capture more pathway char-acteristics. For example, single-type models are limited whentrying to describe “all” and “any” relations between multiplecomponents that are involved in the same interaction. Bipartitegraphs, which contain two types of nodes and allow connectiononly between nodes of different types, are a particular case ofmulti-type graph models.
In most databases, pathways use the single-type graph modeland the signaling and metabolic pathways from databases suchKEGG and BioCarta are good examples. In signaling pathways,
nodes are genes and edges describe various molecular interac-tions, which include activation/transcription/positive regulation,repression/blockage/negative regulation, (de)phosphorylation,binding/association. Metabolic pathways can be represented aseither chemical networks or protein networks. In the chem-ical network representation, nodes are metabolites and edgesare enzymes and/or substrates that catalyze the chemical reac-tions. In the protein network, the representation is reversed;nodes are enzymes and edges are metabolites. Among the sur-veyed methods which work with metabolic pathways only MetPAuses biochemical networks from KEGG. ScorePAGE and TAPPAuse protein networks. Nevertheless, the most popular represen-tation of metabolic pathways in public databases is the chemi-cal network. In KEGG and BioCarta, the majority of edges inboth metabolic and signaling pathways are directed, but bindingbetween compounds is represented by undirected edges.
Protein-protein interaction (PPI) networks, constructed frominteraction databases, use a single-type graph model. The nodesrepresent proteins and the edges depict their association/binding.Sometimes the edges are undirected, while some other times, theedges are directed to describe which protein was used as the baitand which one acted as the prey.
Reactome and NCI-PID are databases that use a bipartitegraph model to represent pathways. Genes, metabolites, or molec-ular complexes are represented as component nodes, while inter-action nodes define the chemical reactions or molecular processesthat occur between the input and output component nodes. Theedges, which connect a component node to an interaction node,specify the component’s type of contribution to the reaction.These can be positive or negative regulation, among others.
www.frontiersin.org October 2013 | Volume 4 | Article 278 | 7

Mitrea et al. Topology-based pathway analysis methods
Table 1 | Comparison of topology-based pathway analysis methods based on different criteria related to the input.
Method name Experiment input Interaction network database name Year References
ScorePAGE All genes expression KEGG metabolic 2004 Rahnenführer et al., 2004
MetaCore* DE genes list Literature-based genome-scale interaction network;proprietary canonical pathway, genome-scalenetwork
2004 N/A
Pathway-Express DE genes with values,All genes expression**
KEGG signaling 2005 Khatri et al., 2005,Draghici et al., 2007,Khatri et al., 2007,Voichita et al., 2012
TAPPA All genes expression KEGG metabolic 2007 Gao and Wang, 2007
PathOlogist All genes expression KEGG 2007 Efroni et al., 2007
Pathway-Guide* DE genes with fold change(FC) values, DE genes list,All genes with values, DEgenes with FCs and p-values
KEGG signaling, REACTOME, NCI, BioCarta 2009 N/A
SPIA DE genes with values KEGG signaling 2009 Tarca et al., 2009
NetGSA All genes expression KEGG signaling 2009 Shojaie and Michailidis, 2009,Shojaie and Michailidis, 2010
PWEA All genes expression YeastNet 2010 Hung et al., 2010
TopoGSA DE genes list Genome-scale PPI network, KEGG 2010 Glaab et al., 2010
PARADIGM All genes expression, copynumber, proteins level
Constructed PPI networks from MIPS, DIP, BIND,HPRD, IntAct, and BioGRID
2010 Vaske et al., 2010
TopologyGSA All genes expression NCI-PID 2010 Massa et al., 2010
DEGraph All genes expression KEGG 2010 Jacob et al., 2010
MetPA DE metabolites with values KEGG metabolic 2010 Xia and Wishart, 2010
BPA All genes expression -with cut-off
NCI-PID 2011 Isci et al., 2011
GANPA DE genes with values,All genes expression
Genome-scale PPI network, KEGG, REACTOME,NCI-PID, HumanCyc
2011 Fang et al., 2011
BAPA-IGGFD All genes expression -with cut-off
Literature-based gene-gene interaction database,KEGG, WikiPathways, REACTOME, MSigDB,GO BP, PANTHER;constructed gene association network from PPIs;co-annotation in GO Biological Process (BP); andco-expression in microarray data
2012 Zhao et al., 2012
CePa DE genes list / All genesexpression
NCI-PID 2012 Gu et al., 2012
THINK-Back-DS DE genes with values,All genes expression
KEGG, PANTHER, BioCarta, REACTOME,GenMAPP
2012 Farfán et al., 2012
TBScore DE genes with values KEGG signaling 2012 Ibrahim et al., 2012
ACST All genes expression KEGG signaling 2012 Mieczkowski et al., 2012
(Continued)
Frontiers in Physiology | Computational Physiology and Medicine October 2013 | Volume 4 | Article 278 | 8

Mitrea et al. Topology-based pathway analysis methods
Table 1 | Continued
Method name Experiment input Interaction network database name Year References
EnrichNet DE genes list Genome-scale PPI network, KEGG, BioCarta,WikiPathways, REACTOME, NCI-PID, InterPro,GO with STRING 9.0
2012 Glaab et al., 2012
*commercial methods; **released in 2013 as part of ROntoTools.
(http://www.bioconductor.org/packages/release/bioc/html/ROntoTools.html)
N/A, No publication available. Experiment input describes the type of experiment data input required by the method. The meaning of each term is as follows: “DE
genes with values/DE metabolites with values” represents the list of differentially expressed (DE) genes or metabolites with their fold-change value or t-statistics.
Sometimes this list is accompanied by the list of total genes monitored in the experiment; “DE genes list” represents a list of selected genes, usually DE genes
(this is just a list of IDs, without associated fold-changes). “All genes expression” represents the list of all genes in all samples together with their expression
values. Some methods require all genes, but then perform the analysis using a flag for the DE genes - these are marked as “with cut-off.” Some methods use
one type of input in a gene weighting stage while using another type of input to assess the pathway significance. Interaction network type and database name
is the input knowledge source for the analysis method and the databases proposed by the software. Some of the methods can use any pathway, but provide
parsed data for the pathway databases listed here. “Pathway” refers to any kind of signaling or metabolic pathway or gene regulatory network. “Genome scale
interaction network” refers to interaction networks constructed from protein interactions or co-annotation from GO databases, literature, or co-expression inferred
from existing microarray experiments. “Constructed network” means that the analysis method uses pathways created by its authors rather than pathways from a
reference database. Year denotes the year of the first published paper describing the method. References denotes the first published paper describing the method.
The majority of analysis methods surveyed here use a single-type graph model. Some apply the analysis on a directed orun-directed single-type network built using the input pathway,while others transform the pathways into graphs with specificcharacteristics. An example of the later is TopologyGSA, whichtransforms the directed input pathway into an undirected decom-posable graph, that has the advantage of being easily broken downinto separate modules (Lauritzen, 1996). In this method, decom-posable graphs are used to find “important” submodules - thosewhich drive the changes across the whole pathway. For each path-way, TopologyGSA creates an undirected moral graph4 from theunderlying directed acyclic graph (DAG) by connecting the par-ents of each child and removing the edge direction. The moralgraph is then used to test the hypothesis that the underlying net-work is changed significantly between the two phenotypes. If thethe research hypothesis is rejected, a decomposable/triangulatedgraph is generated from the moral graph by adding new edges.This graph is broken into the maximal possible submodules andthe hypothesis is re-tested on each of them.
BPA is another method that implements pathway graph pre-processing. This method uses Bayesian networks to representbiological pathways. In Bayesian networks, random variables areassigned to each node of a DAG network and the edges representthe conditional dependencies between nodes. Before assigning therandom variables, the pathway graph is checked for cycles. If thegraph is not a DAG, Spirtes’ method (Spirtes, 1995) is used toremove the cycles while the (in)dependency rules in the initialpathway graph are preserved.
Another example is BAPA-IGGFD, which is a method thatsimplifies pathway graphs by removing any edge representing
4The moral graph of a DAG is the undirected graph created by adding an(undirected) edge between all parents of the same node (sometimes calledmarrying), and then replacing all directed edges by undirected edges. Thename stems from the fact that, in a moral graph, two nodes that have acommon child are required to be married by sharing an edge.
interactions other than activation and inhibition. In addition,the pathways are pruned keeping only elements from three cat-egories: signal receptors (including ligands) are at the beginning,transcription factors are usually at the end, and their direct regu-lators are in the middle. This pre-processing is motivated by noisereduction in the final scoring of genes that have a less importantfunctional role in the pathway or belong to multiple pathwayswhere they play different roles. (Zhao et al., 2012) includes onlyan intuitive high-level description of this process is presented,without a detailed algorithm.
CePa uses a different method to modify the input pathwaysbefore the analysis. The NCI knowledge base is used as a sourceof NCI-Nature, BioCarta, Reactome, and KEGG pathways, whichare provided in PID or short NCI-PID format. The pathway datais organized in the form of multi-type graphs, which are used togenerate directed single-type graphs, where each node can rep-resent one or multiple genes. A node in the generated graphis considered to be DE if any of its gene components is DE.Unfortunately, the details of how the original pathways are parsedto generate the new networks are not provided by the authors ofCePa.
PathOlogist and PARADIGM are the two surveyed meth-ods that use multi-type graph models. PathOlogist uses abipartite graph model with component and interaction nodes.PARADIGM, conceptually motivated by the central dogma ofmolecular biology, takes a pathway graph as input and convertsit into a more detailed graph, where each component node isreplaced by several more specific nodes: biological entity nodes,interaction nodes, and nodes containing observed experimentdata. The observed experiment nodes could in principle containgene expression and copy number information. Biological entitynodes are DNA, mRNA, protein, and active protein. The inter-action nodes are transcription, translation, or protein activation,among others. Biological entity and interaction node values arederived from these data and specify the probability of the nodebeing active. These are the hidden states of the model.
www.frontiersin.org October 2013 | Volume 4 | Article 278 | 9

Mitrea et al. Topology-based pathway analysis methods
3.2. SCORING METHODSThe goal of the scoring method is to compute a score for eachpathway based on the graph model, resulting in a ranked list ofpathways or sub-pathways. There are a variety of approaches toquantify the changes in a pathway. Some of the analysis meth-ods use a hierarchically aggregated scoring algorithm, where onthe first level, a score is calculated and assigned to each nodeor pair of nodes (component and/or interaction). On the sec-ond level, these scores are aggregated to compute the score of thepathway. On the last level, the statistical significance of the path-way score is assessed using univariate hypothesis testing. Anotherapproach, used by BPA, BAPA-IGGFD, NetGSA, TopologyGSA,and DEGraph, assigns a random variable to each node and a mul-tivariate probability distribution is calculated for each pathway.The output score can be calculated in two ways. One way is to usemultivariate hypothesis testing to assess the statistical significanceof changes in the pathway distribution between the two pheno-types. The other way is to estimate the distribution parametersbased on the Bayesian network model and use this distributionto compute a probabilistic score to measure the changes. In thissection, we provide details regarding the scoring algorithms of thesurveyed methods. See Figure 6 for scoring algorithms categories.
3.2.1. Hierarchically Aggregated Scoring AlgorithmsThese analysis approaches are detailed in Figure 7. In this fig-ure, the analysis is divided into three levels: node-level scoring,pathway-level scoring and significance assessment. All methodscompute node level scores. One or both remaining levels may beskipped by certain approaches. PARADIGM is the only one that
provides as direct output the node scores, rather than the path-way scores. These scores can be input into a gene set or pathwayanalysis algorithm, or a simple averaging function can be used toscore the pathways and rank them, as in Vaske et al. (2010). Therest of the methods go on to the second level where the scoresof the pathways are calculated. Some methods stop at the secondlevel, outputting the whole list of ranked pathways without evalu-ating their statistical significance, which is done by the remainingmethods on the next level.
Node Level Scoring. Here we categorize and describe the sur-veyed methods based on their node level scoring model. Mostof the surveyed analysis methods incorporate pathway topol-ogy information in the node scores. There are methods suchas TAPPA and ACST that incorporate this information in thepathway scores. In TAPPA, the score of each node is the squareroot of the normalized log gene expressions (node value). ACSTcalculates the node level score using a sign statistic. The signreflects the direction of the gene expression change betweenthe phenotypes under study. This statistic can be a representedby a t-value or the log fold change of the gene expression.The statistic is standardized using a local mean and standarddeviation.
The rest of the analysis algorithms use a variety of approachesto incorporate topology in the node level scores. We categorizethem into methods that use graph measures (centrality), similar-ity measures, and probabilistic graphical models. TBScore is anexception that can not fall into either of these groups. TBScoreweights the pathway DE genes based on their log fold change and
FIGURE 6 | Comparison of the mathematical models of the surveyed
pathway analysis methods. “Aggregate scoring” and “Weighted gene set”panels show methods that perform node-level scoring followed bypathway-level scoring performed either as an aggregation of the node scoresor as a weighted gene set analysis, using the node scores as weights. Themethods are divided according to their node-level scoring methods: graph
measure techniques, similarity measurement techniques, probabilisticmodels, or using normalized node values based on node value and/orpathway structure. The “Multivariate scoring” methods use multivariatescoring models without node-level scoring. They use node values to directlycompute a pathway score using Bayesian networks or applying multivariatehypothesis tests.
Frontiers in Physiology | Computational Physiology and Medicine October 2013 | Volume 4 | Article 278 | 10

Mitrea et al. Topology-based pathway analysis methods
FIGURE 7 | Diagram of pathway analysis scoring approach for hierarchically aggregated scoring algorithms. The box with the dashed border indicatesthat the user can choose these options, but are not offered by the method implementation.
the number of distinct DE genes directly downstream of them,using a depth-first search algorithm.
MetaCore, Pathway-Guide, Pathway-Express, SPIA, TopoGSA,CePa, EnrichNet, MetPA, THINK-BACK-DS, and GANPA usecentrality measures or a variation of these measures to scorenodes in a given pathway. Centrality measures describe the impor-tance of a node relative to all other nodes in a network. Thereare several centrality measures that can be applied to networksof genes and their interactions and these are degree centrality,closeness, betweenness, and eigenvector centrality. Degree cen-trality accounts for the number of directed edges that enter andleave each node. Closeness sums the shortest distance from eachnode to all other nodes in the network. Node betweenness adds alayer of complexity to closeness; it measures the importance of anode according to the number of shortest paths that pass throughit. Eigenvector centrality uses the network adjacency matrix of agraph to determine a dominant eigenvector; each element of thisvector is a score for the corresponding node. Thus, each scoreis influenced by the scores of neighboring nodes. In the case of
directed graphs, a node that has many downstream genes hasmore influence and receives a higher score.
In MetaCore, a measure similar to node betweenness is usedto score genes. There is no peer-reviewed paper publicly availabledescribing the details of the MetaCore pathway analysis method.We used the study by Dezso et al. (2009) to uncover some ofthese details. In the method by Dezso et al., the DE gene list isoverlapped with a global genome scale network containing all theinteractions in the MetaCore knowledge base. A network, which iscalled condition specific shortest-path network (CSSPN), is builtbased on this overlap. In addition to DE genes, all genes whichare on shortest paths that connect them in the global network areincluded in the CSSPN. For each pair of genes (gi, gj), where gi isin the CSSPN and gj is in the set of DE genes, two parameters Nij
and Kij are computed. Nij is the number of times gi is part of theshortest-paths in the global network between gj and every othergene in the CSSPN. Kij is the number of times gi is part of theshortest-paths in the global network between gj and every othergene in the set of DE genes. It is assumed that the probability to
www.frontiersin.org October 2013 | Volume 4 | Article 278 | 11

Mitrea et al. Topology-based pathway analysis methods
observe these numbers just by chance, given the two sets of genes,the global network which is of size N and the DE genes which is ofsize K, follows a hypergeometric distribution. Based on this distri-bution, K p-values are computed for each gene in the CSSPN andthe minimum of these p-values is selected as the gene score. Usinga predefined threshold on the false discovery rate (FDR) correc-tion of the node scores, a subset of the CSSPN genes is selected.Further processing, in the pathway level scoring, is applied to thislist of selected genes.
Pathway-Guide, Pathway-Express, and SPIA use a perturba-tion factor, which takes into consideration the magnitude of allgene expression changes, the type of each gene, the directionand type of all gene interactions, as well as the efficiency withwhich the perturbation of each gene propagates to the down-stream genes. The impact analysis models the flow of the signalsin the pathways. In essence, the impact factor falls into the eigen-vector centrality category of node scoring approaches. Althoughall three methods use the same impact analysis approach, thereare slight differences between them. Pathway-Guide scores thepathways based on the impact factor as briefly described aboveIn SPIA, the amount of differential expression is subtracted fromthe perturbation score of each node to focus on the amount ofperturbation accumulated at any given node in order to separatethe influence of experiment data and topology. Pathway-Guideis also able to exploit the p-values associated with each gene,as well as identify coherent perturbation cascades that repre-sent putative mechanisms that explain all measured changes. Allthree methods combine the perturbation evidence with a classi-cal enrichment (e.g., hypergeometric), or functional class scoring(e.g., GSEA) to calculate a global p-value. This corresponds to thejoint probability of a pathway having the measured amount ofperturbation, as well as the observed number of DE genes just bychance. TBscore has an interestingly similar approach in captur-ing the pathway perturbation, with the difference that DE geneswith more connected downstream DE genes are considered moresignificant.
TopoGSA extracts a network from databases of protein inter-actions given a list of genes/proteins of interest. All four typesof centrality measures and a fifth measure, called a “clusteringcoefficient” (Watts and Strogatz, 1998) are used to score thenodes in this network. Then, each predefined pathway from aselected dataset is also scored using the same five measures, inde-pendently of the extracted network. Comparing the summarizednode scores for each pathway with node scores from the extractednetwork allows the pathways to be ranked.
In CePa, node weights are computed using five centrality-based measures, and there is an extra case where all the nodeweights are assumed to be equal. The five measures are: in-degree,out-degree, betweenness, in-reach (length of longest shortest paththat starts from the node), and out-reach (length of longest short-est path that ends at the node). CePa offers two options to assessthe significance of pathways. One is based on the hypergeometricanalysis using only node weights. The second is based on enrich-ment analysis and in addition to node weights, node scores areneeded. Node scores are computed using a t-statistic. Pathwaygraphs in CePa can contain nodes representing one or multiplegenes. In the case of single-gene nodes, the score is calculated
based on the expression value of the corresponding gene. In thecase of multi-gene nodes, the node score is the largest principalcomponent of the expression values of the genes in the node.
EnrichNet uses a score similar to centrality closeness measures.This method calculates two distance vectors. The first vectorcontains distances between a list of input genes and a prede-fined pathway/gene set. The second vector contains the distancebetween the same input gene list and a background global set con-taining all pathways. A node score is computed as the distancebetween the node and all DE genes using a random walk withrestart algorithm (Yin et al., 2010) through a genome scale molec-ular interaction network. The interaction network is representedby its weighted adjacency matrix, where weights are interactionstrengths provided by the input knowledge base.
MetPA allows the user to select either the node betweennessor the out-node degree centrality measure for the node score.GANPA (Fang et al., 2011) uses the node degree measure as aweight or score for the gene. THINK-Back-DS uses a measuresimilar to closeness called density score to emphasize the DE geneswhich are in tight clusters.
ScorePAGE and PWEA use similarity measures in their nodelevel scoring. Similarity measures estimate the coexpression,behavioral similarity, or co-regulation of pairs of components.Their values can be correlation coefficients, covariances, or dotproducts of the gene expression profile across time or sample.In these methods, the pathways with clusters of highly correlatedgenes are considered more significant. At the node level, a scoreis assigned to each pair of nodes in the network which is theratio of one similarity measure over the shortest path distancebetween these nodes. Thus, the topology information is capturedin the node score by incorporating the shortest path distance ofthe pair. In ScorePAGE, the correlation coefficient, covariance, ordot product is calculated for all gene pairs across their samples.PWEA uses the correlation coefficient to score node pairs. In thismethod, a score, called “Topological Influence Factor,” or TIF, isassigned to each gene by exponentially averaging the score of allpairs that include the gene. As a consequence, a node involved intight clusters of highly correlated genes has a higher score.
PARADIGM and PathOlogist incorporate the topology in thenode level scoring using a probabilistic graphical model. In thismodel, nodes are random variables, and edges define the con-ditional dependency of the nodes they link. PARADIGM takesobserved experiment data and calculates scores for all componentnodes, in both observed and hidden states, from the detailed net-work created by the method based on the input pathway. For eachnode score, a positive or negative value denotes how likely it isfor the node to be active or inactive, respectively. The scores arecalculated to maximize the occurrence probability of the observedvalues. A p-value is associated with each score of each sample suchthat each node can be tagged as significantly active, significantlyinactive, or not-significant. For each network, a matrix of p-valuesis output, in which columns are samples, and rows are componentnodes.
PathOlogist is also based on a probabilistic graphical model.This method estimates the parameters of one or two distributionsrelated to the up and/or down regulation of each gene using itsexpression values across all samples. These distributions are used
Frontiers in Physiology | Computational Physiology and Medicine October 2013 | Volume 4 | Article 278 | 12
Mitrea et al. Topology-based pathway analysis methods
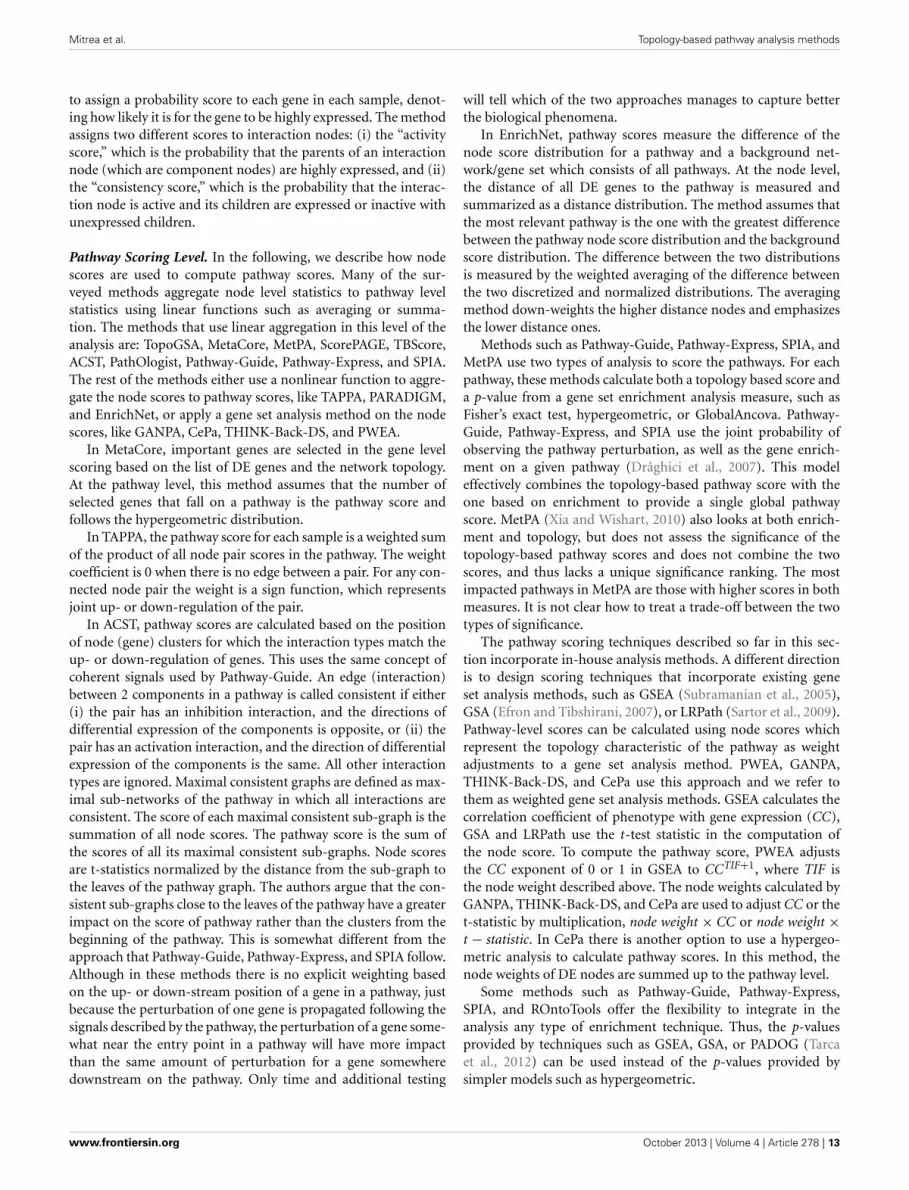
to assign a probability score to each gene in each sample, denot-ing how likely it is for the gene to be highly expressed. The methodassigns two different scores to interaction nodes: (i) the “activityscore,” which is the probability that the parents of an interactionnode (which are component nodes) are highly expressed, and (ii)the “consistency score,” which is the probability that the interac-tion node is active and its children are expressed or inactive withunexpressed children.
Pathway Scoring Level. In the following, we describe how nodescores are used to compute pathway scores. Many of the sur-veyed methods aggregate node level statistics to pathway levelstatistics using linear functions such as averaging or summa-tion. The methods that use linear aggregation in this level of theanalysis are: TopoGSA, MetaCore, MetPA, ScorePAGE, TBScore,ACST, PathOlogist, Pathway-Guide, Pathway-Express, and SPIA.The rest of the methods either use a nonlinear function to aggre-gate the node scores to pathway scores, like TAPPA, PARADIGM,and EnrichNet, or apply a gene set analysis method on the nodescores, like GANPA, CePa, THINK-Back-DS, and PWEA.
In MetaCore, important genes are selected in the gene levelscoring based on the list of DE genes and the network topology.At the pathway level, this method assumes that the number ofselected genes that fall on a pathway is the pathway score andfollows the hypergeometric distribution.
In TAPPA, the pathway score for each sample is a weighted sumof the product of all node pair scores in the pathway. The weightcoefficient is 0 when there is no edge between a pair. For any con-nected node pair the weight is a sign function, which representsjoint up- or down-regulation of the pair.
In ACST, pathway scores are calculated based on the positionof node (gene) clusters for which the interaction types match theup- or down-regulation of genes. This uses the same concept ofcoherent signals used by Pathway-Guide. An edge (interaction)between 2 components in a pathway is called consistent if either(i) the pair has an inhibition interaction, and the directions ofdifferential expression of the components is opposite, or (ii) thepair has an activation interaction, and the direction of differentialexpression of the components is the same. All other interactiontypes are ignored. Maximal consistent graphs are defined as max-imal sub-networks of the pathway in which all interactions areconsistent. The score of each maximal consistent sub-graph is thesummation of all node scores. The pathway score is the sum ofthe scores of all its maximal consistent sub-graphs. Node scoresare t-statistics normalized by the distance from the sub-graph tothe leaves of the pathway graph. The authors argue that the con-sistent sub-graphs close to the leaves of the pathway have a greaterimpact on the score of pathway rather than the clusters from thebeginning of the pathway. This is somewhat different from theapproach that Pathway-Guide, Pathway-Express, and SPIA follow.Although in these methods there is no explicit weighting basedon the up- or down-stream position of a gene in a pathway, justbecause the perturbation of one gene is propagated following thesignals described by the pathway, the perturbation of a gene some-what near the entry point in a pathway will have more impactthan the same amount of perturbation for a gene somewheredownstream on the pathway. Only time and additional testing
will tell which of the two approaches manages to capture betterthe biological phenomena.
In EnrichNet, pathway scores measure the difference of thenode score distribution for a pathway and a background net-work/gene set which consists of all pathways. At the node level,the distance of all DE genes to the pathway is measured andsummarized as a distance distribution. The method assumes thatthe most relevant pathway is the one with the greatest differencebetween the pathway node score distribution and the backgroundscore distribution. The difference between the two distributionsis measured by the weighted averaging of the difference betweenthe two discretized and normalized distributions. The averagingmethod down-weights the higher distance nodes and emphasizesthe lower distance ones.
Methods such as Pathway-Guide, Pathway-Express, SPIA, andMetPA use two types of analysis to score the pathways. For eachpathway, these methods calculate both a topology based score anda p-value from a gene set enrichment analysis measure, such asFisher’s exact test, hypergeometric, or GlobalAncova. Pathway-Guide, Pathway-Express, and SPIA use the joint probability ofobserving the pathway perturbation, as well as the gene enrich-ment on a given pathway (Draghici et al., 2007). This modeleffectively combines the topology-based pathway score with theone based on enrichment to provide a single global pathwayscore. MetPA (Xia and Wishart, 2010) also looks at both enrich-ment and topology, but does not assess the significance of thetopology-based pathway scores and does not combine the twoscores, and thus lacks a unique significance ranking. The mostimpacted pathways in MetPA are those with higher scores in bothmeasures. It is not clear how to treat a trade-off between the twotypes of significance.
The pathway scoring techniques described so far in this sec-tion incorporate in-house analysis methods. A different directionis to design scoring techniques that incorporate existing geneset analysis methods, such as GSEA (Subramanian et al., 2005),GSA (Efron and Tibshirani, 2007), or LRPath (Sartor et al., 2009).Pathway-level scores can be calculated using node scores whichrepresent the topology characteristic of the pathway as weightadjustments to a gene set analysis method. PWEA, GANPA,THINK-Back-DS, and CePa use this approach and we refer tothem as weighted gene set analysis methods. GSEA calculates thecorrelation coefficient of phenotype with gene expression (CC),GSA and LRPath use the t-test statistic in the computation ofthe node score. To compute the pathway score, PWEA adjuststhe CC exponent of 0 or 1 in GSEA to CCTIF+1, where TIF isthe node weight described above. The node weights calculated byGANPA, THINK-Back-DS, and CePa are used to adjust CC or thet-statistic by multiplication, node weight × CC or node weight ×t − statistic. In CePa there is another option to use a hypergeo-metric analysis to calculate pathway scores. In this method, thenode weights of DE nodes are summed up to the pathway level.
Some methods such as Pathway-Guide, Pathway-Express,SPIA, and ROntoTools offer the flexibility to integrate in theanalysis any type of enrichment technique. Thus, the p-valuesprovided by techniques such as GSEA, GSA, or PADOG (Tarcaet al., 2012) can be used instead of the p-values provided bysimpler models such as hypergeometric.
www.frontiersin.org October 2013 | Volume 4 | Article 278 | 13

Mitrea et al. Topology-based pathway analysis methods
Pathway Significance Assessment. Pathway scores are intended toprovide information regarding the amount of change incurred bythe pathway between two phenotypes. However, the amount ofchange is not meaningful by itself since any amount of changecan take place just by chance (i.e., the amount of change is onlythe effect size). An assessment of the significance of the measuredchanges is thus required, and should be done by analysis methodsin the pathway significance assessment level.
Methods such as TopoGSA, MetPA, and EnrichNet, will out-put scores without any significance assessment, leaving it up to theuser to interpret the results. This is problematic because the userdoes not have any instrument to help distinguish between changesdue to noise or random causes, and meaningful changes, unlikelyto occur just by chance and therefore, possibly related to the phe-notype. The rest of the analysis methods perform a hypothesistesting for each pathway. The null hypothesis is that the value ofthe observed statistic is due to random noise or chance alone.The research hypothesis is that the observed values are substan-tial enough that they are potentially related to the phenotype. Ap-value for calculated score is then computed and a user-definedthreshold on the p-value is used to decide whether the the nullhypothesis can be rejected or not for each pathway. Finally, acorrection for multiple comparisons should be performed.
Typically, pathway analysis methods compute one score perpathway. However, methods such as PathOlogist and TAPPAcompute the pathway score considering each sample separately.Therefore, for each pathway there is a population of scores thatcan be analyzed. This population combined with different sam-ple features can provide various feature-specific analyses. Thereare two cases to be considered based on the qualitative or quan-titative nature of the sample feature values. In the first case thesample feature is qualitative with binary values. For example,when samples are tagged corresponding to the two phenotypes,the significance assessment is done by testing whether the scoredistributions are the same in the two groups using two-samplerank-sum tests, such as the Mann–Whitney U-test. If the numberof samples is high enough, the score distributions can be assumedto be normal. The null hypothesis here is that the two nor-mal distributions have equal means and variances, the researchhypothesis is that they are different. In the second case the samplefeature is quantitative with continuous values. Two ways to iden-tify significant pathways are implemented in this case. One way isto partition pathway scores into a known number of clusters, forexample two, using k-means clustering. Cumulative distributionsare calculated for each of the two classes. A logrank test (Mantel,1966), which is a non-parametric statistical test, can be performedto evaluate whether the behavior of the variable is same in the twogroups. Significant pathways are those that can be used to dividesamples into groups with different characteristics. Another way toidentify significant pathways in the case of continuous sample fea-ture values is to find pathways whose scores are linearly correlatedwith the values of the feature. The null hypothesis in this case isthat the correlation is zero, and a t-test is used.
For methods that calculate one score per pathway, the distri-bution of this score under the null hypothesis can be constructedand compared to the observed. However, there are often too fewsamples to calculate this distribution, so it is assumed that the
distribution is known. For example, in MetaCore and many othertechniques, when the pathway score is the number of DE nodesthat fall on the pathway, the distribution is assumed to be hyper-geometric. However, the hypergeometric distribution assumesthat the variables (genes in this case) are independent, which isincorrect, as witnessed by the fact that the pathway graph struc-ture itself is designed to reflect the specific ways in which the genesinfluence each other. Another approach to identify the distribu-tion is to use statistical techniques such as the bootstrap method(Efron, 1979). Bootstrapping can be done either at the samplelevel, by permuting the sample labels, or at gene set level, bypermuting the the values assigned to the genes in the set.
To create the score distribution under the null hypothesis,Pathway-Guide, Pathway-Express, and SPIA methods use boot-strapping at the gene set level. For these methods, samples aredrawn from the distribution of all DE genes and assigned to a geneset which is different from the DE gene set but with equal num-ber. The pathway score is computed assuming the new gene setas a decoy DE gene set. This procedure is repeated for a numberof iterations. The scores resulting from these iterations estimatethe distribution, which is then used to compute a p-value, and apathway score is obtained by combining the gene set enrichmentevidence with the topology-based p-value and applying Fisher’sexact test. The final score is the FDR-adjusted p-value.
TBScore, the hypergeometric extension of CePa, and ACSTcalculate p-values using bootstrapping at the sample level bypermuting the labels of the samples of the two phenotypes.In TBScore and CePa, an iterative procedure is then used toestimate the pathway score distribution under the null hypoth-esis. Correction for multiple comparison, again FDR, is usedto compute the final pathway p-values. In ACST, after p-valuesare computed, a statistical technique called “resampling-basedpoint estimator” is used to estimate the FDRs associated with thepredefined threshold.
Weighted gene set methods surveyed here, PWEA, GANPA,the enrichment analysis extension implemented by CePa, andTHINK-Back-DS, focus on providing a biologically meaningfultopology-based adjustment to existing gene set analysis methods.Therefore the statistical assessment of pathway significance is pro-vided by the already developed methods among which the mostpopular is GSEA (see Figure 7).
3.2.2. Multivariate scoring algorithmsMultivariate scoring analysis methods mostly use multivariateprobability distributions to score pathways and can be groupedin two categories. Methods in the first category use multivari-ate hypothesis testing, while methods in the second category arebased on Bayesian network (see Figure 8).
NetGSA, TopologyGSA, and DEGraph are methods based onmultivariate hypothesis testing. These analysis methods assumethe vectors of gene expression values in each (sub)pathway arerandom vectors with multivariate normal distributions. The net-work topology information is stored in the covariance matrix ofthe corresponding distribution. For a network, if the two distri-butions of the gene expression vectors corresponding to the twophenotypes are significantly different, the network is assumed tobe significantly impacted when comparing the two phenotypes.
Frontiers in Physiology | Computational Physiology and Medicine October 2013 | Volume 4 | Article 278 | 14

Mitrea et al. Topology-based pathway analysis methods
FIGURE 8 | Diagram of pathway analysis scoring approaches for multivariate scoring algorithms.
The significance assessment is done by a multivariate hypothesistest. The definition of the null hypothesis for the statistical testsand the techniques to calculate the parameters of the distributionsare the main differences between these three analysis methods.
In NetGSA, it is assumed that the expression level of the genes(nodes in the network) obtained from experiments are correlatedbecause of the interactions between them. In other words, theedges (interactions) of a graph (pathway) imply correlations. Inorder to compute the distribution parameters, the method definesa set of latent variables, which are the uncorrelated gene expres-sions. The input correlated gene expression vector can be writtenin the form of the product of the vector of latent variables andthe influence matrix. This matrix consists of the weights assignedto each edge measuring the strength of the interaction betweentwo genes. The influence matrix and other parameters for thetwo phenotypes are computed based on linear mixed model the-ory (McLean et al., 1991). The proposed hypothesis test, in thismethod, is to check whether a linear combination of the mean ofthe latent variables, called contrast vector, for the two cases areequal. The proposed contrast vector is computed based on theinfluence matrix and it is proved that the result includes the effectsof all nodes inside a chosen network and excludes any outsideeffects, such as the correlation.
In TopologyGSA, the directed graph is converted into a moralundirected graph, detailed in Section 3.1. The covariance matrices
for each of the two phenotypes are estimated using the IterativeProportional Scaling (IPS) algorithm (Lauritzen, 1996) on thesample covariance for all pairs of genes. The two matrices aredefined such that their inverses have zero elements correspond-ing to the missing edges. A set of two hypothesis tests are appliedto compute the statistical significance of the impact on a givengraph. The first test checks whether the concentration matrices,i.e., the inverses of the covariance matrices, in the two cases areequal. If this hypothesis is rejected, the graph is broken into themaximal possible submodules, and the hypothesis is retested oneach. Based on the equality of concentration matrices, differentstatistical techniques are used in the second hypothesis test. Thesecond test checks the significance of the influence of the graphsbased on the equality of the means of the distributions.
DEGraph finds significant (sub)pathways by using a modi-fied multivariate Hotelling T2-test hypothesis. The modificationincorporates the topology of the network. The difference, referredto as shift, between the mean vectors of gene expression distri-butions corresponding to the two phenotypes is smoothed. Ashift vector is defined to be smooth if the shift values of everytwo connected nodes are similar. The process of smoothing isdone by removing the high frequency shift values according tothe topology of the network. This is achieved by filtering theshift by preserving only the first few components of the graph-Fourier basis of the shift vector. The graph-Fourier in DEGraph
www.frontiersin.org October 2013 | Volume 4 | Article 278 | 15

Mitrea et al. Topology-based pathway analysis methods
is applied by spectral analysis of the graph Laplacian (Chung,1997), which resembles the Fourier decomposition of a func-tion. The smoothed shift vector is used in the Hotelling T2-testto assess the statistical significance of a network. DEGraph alsoprovides an algorithm that allows the exhaustive testing of all thesub-networks of the original network using a branch and boundalgorithm.
BPA and BAPA-IGGFD are two methods based on Bayesiannetworks. In a Bayesian network, which is a special case of prob-abilistic graphical models, a random variable is assigned to eachnode of a directed acyclic (DAG) graph. The edges in the graphrepresent the conditional probabilities between nodes, so that thechildren are independent from each other and the rest of thegraph when conditioned on the parents. In BPA, the value of theBayesian random variable assigned to each node captures the stateof a gene (DE or not). In contrast, in BAPA-IGGFD each randomvariable assigned to an edge is the probability that up or downregulation of the genes at both ends of an interaction are con-cordant with the type of interaction which can be activation orinhibition. In both BPA and BAPA-IGGFD, each random variableis assumed to follow a binomial distribution whose probability ofsuccess follows a beta distribution. However, these two methodsuse different approaches in representing the multivariate distri-bution of the corresponding random vector. BPA assumes that therandom vector has a multinomial distribution, which is the gen-eralization of the binomial distribution. In this case, the vector ofthe success probability follows the Dirichlet distribution, whichis the multivariate extension of the beta distribution. Conversely,BAPA-IGGFD assumes the random variables are independent,therefore the multivariate distributions are calculated by multi-plying the distributions of the random variables in the vector.It is worth mentioning that the assumption of independence inBAPA-IGGFD is contradicted by evidence, specifically in the caseof edges that share nodes.
In BPA a discretized fold change profile is calculated for eachgene. This represents the list of fold changes between everyordered pair of gene expression samples. The pair elementscome from each of the groups corresponding to the two phe-notypes. These fold changes are discretized such that genes withvalues higher than 2 or lower than 0.5 are considered differen-tially expressed and the others are considered to have negligiblechanges. This profile is used as the observed data for the Bayesiannetwork model. In BPA, given a set of parameters (success prob-abilities), the likelihood of observing a specific profile on theBayesian network is assumed to have a multinomial distribu-tion. Using the Bayes rule, the probability of observing the givenprofile without any assumption on the parameters is calculated.The parameters of the distributions are learned from the inputdata (Neapolitan, 2004). The network topology is incorporated inthe distribution parameters and computation method by assum-ing that knowing the values of the parents’ random variables,the children random variables are independent of the rest of thegraph. A hypothesis testing is performed using the null hypoth-esis that the probability of seeing the observed data is the resultof chance. Specifically, a set of observed data is generated in thebootstrapping analysis and its probability is compared with thethe original observed data. The null distribution is approximated
through randomization via bootstrapping. This randomizationtargets the structure of the Baeysian network (i.e., the relationbetween its nodes), which is more relevant than a simple boot-strapping in this case. Sampling with replacement is used whengenerating random data. An upper-tailed test is performed, withthe p-value estimated by the percentage of random scores higherthan the observed one. The process of generating the randomizedsamples is done by bootstrapping. A new fold change profile isgenerated by sampling with replacement from the original foldchange profile.
In BAPA-IGGFD, based on the value of the fold change,discretized values of 0 or 1, corresponding to up- or down-regulation, are assigned to each node of the Bayesian network.For each predefined pathway, a vector of probabilities is com-puted as follows: (1) θi for any parent-less gene gi is theprobability of gi being up-regulated, (2) θi|j for any gene gi
which has an activator parent gj is the probability that bothgenes are coherent in being up-regulated or down-regulated,and (3) φi|j for any gene gi which has an inhibitor parentgj is the probability that the state of up or down regula-tion of the genes are opposite. The vector can be summarizedas θ = ({θi|∀gi is parent-less}, {θi|j|∀gi has an activator parent},{φi|j|∀gj has an inhibitor parent}) which is called the parametervector of the pathway. Each of these parameters are assumedto be independent from each other and follow the beta distri-bution both prior observing the microarray data and after itsobservation. The multivariate joint distributions of the parametervector prior and posterior of the data observation are comparedusing symmetric Kullback-Leibler (SKL) divergence (Kullbackand Leibler, 1951). The pathways for which the prior and pos-terior distributions are dis-similar are assumed to be impactedmore significantly between the two phenotypes. Because of theindependence assumption, the distribution of the parameter vec-tor is calculated by multiplying the beta distribution of each ofthe parameters. The variables of the distributions are calculatedusing PrimeDB database, or in other words, using the numberof journal citations for an interaction type. More details regard-ing PrimeDB are available in section 2.2. We refer to beta(α, β) asthe beta distribution with parameters α and β. For the prior dis-tribution, it is assumed that θi ∼ beta(1, 1), θi|j ∼ beta(ai|j, bi|j),and φi|j ∼ beta(bi|j, ai|j), where ai|j and bi|j are the number ofjournals citing the activation or inhibition between gi and gj,
respectively. For the posterior distribution, it is assumed that θi ∼beta(ni, n − ni), θi|j ∼ beta(ai|j + ni|j, bi|j + n − ni|j), and φi|j ∼beta(bi|j + ni|j, ai|j + n − ni|j), where n is the total number ofmicroarray experiments, ni is the number of experiments inwhich gi is up-regulated, and ni|j is the number of experimentsin which the pairs gi and gj are concordant in up or down reg-ulation. An extension to this method is proposed in which thevariables of beta distributions are not calculated by the input asfixed numbers but are assumed to follow exponential distribu-tions. In this case, the parameters of the exponential distributionsare estimated from PrimeDB and the input data. It is claimedthat this additional probability layer will lead to more robustresults. For genes that have more than one parent the major-ity rule is used to calculate the distribution. The output of thismethod is the list of pathways scored by the SKL divergence.
Frontiers in Physiology | Computational Physiology and Medicine October 2013 | Volume 4 | Article 278 | 16

Mitrea et al. Topology-based pathway analysis methods
The lower the score is the more impacted the pathway isassumed to be.
4. OUTPUTAlthough the goal of the pathway analysis should be a rankedlist of pathways as a unified output, not all tools reviewed hereprovide this. Some methods, such as MetPA provide a list of path-ways with 2 p-values for each pathway, leaving the user to facethe task of deciding which p-value to trust or how to deal withtrade-offs between the two values. Among the methods that rankpredefined pathways from public knowledge bases, some meth-ods, such as TopologyGSA, DEgraph, NetGSA, and ACST, find“important” sub-pathways and rank the mixed list of pathwaysand sub-pathways. In PARADIGM, for each detailed networkcreated by the method based on the input pathway, a matrixof p-values is provided as the output. In this matrix, columnsare samples and rows are component nodes of the network.Each element of this matrix indicates how likely it is for thenode to be in any of the three states comparing the two phe-notypes: (1) significantly active, (2) significantly inactive, or (3)have an insignificant change. These scores can be used as sub-stitutes for log fold changes and, as proposed in Vaske et al.(2010), can be input into a non-topology-based gene set analy-sis algorithm to rank the pathways. Other options to use thesescores are either to apply a simple averaging or counting func-tion on the scores of the significant genes to score the pathway,or they can be used to cluster the genes into groups with similarbehavior. These clusters of genes can be used to further ana-lyze different features assigned to samples to find group-specificfeatures.
Pathway-Guide offers capability to identify so called “coher-ent chains of perturbation propagation,” which are to beinterpreted as putative mechanisms that are compatible with(and therefore could explain) all measured changes throughoutthe entire biological system investigated. Even though uniqueamong all other tools and potentially very useful, this capa-bility is completely independent from the pathway rankingprovided based on the perturbation and enrichment types ofevidence. Therefore, it is possible for pathways that are sig-nificant not to contain such coherent signaling cascades, andconversely, pathways that may contain such cascades may not besignificant.
In many input data sets, the samples are labeled based on dif-ferent parameters. The parameters can have qualitative discretevalues such as, tumor and normal tissue, or quantitative continu-ous values such as, survival time of the cell or drug concentrationused to treat the tissue. For analysis methods that provide apathway score for each sample, such as TAPPA and PathOlogist,the pathway activities can be interpreted based on the samplelabels. NetGSA (Shojaie and Michailidis, 2010) offers more label-ing options in addition to phenotype-based binary labels. Themethod provides simultaneous tests of multiple hypotheses basedon these labels or temporal pathway score correlation to assessthe significance of pathways. The rest of the pathway analysismethods compare the pathways using a single qualitative binarylabel corresponding to the two phenotypes. Methods such asTopoGSA, MetPA, and the hypergeometric extension of CePa
calculate one score for each pair of input samples comparing thetwo phenotypes, while others provide one score for the wholeinput data set.
Some of the methods provide a graphical display of theirresults. This is primarily done for the analysis methods whichhave the ability to provide more than one score for each pathway.For example, analysis methods like TopoGSA have an additionaloption to compare the properties of the input dataset to pre-defined datasets corresponding to known functional processesfrom public databases in a comparative plot. As a result, asummary of network topological properties is displayed for allgene/protein sets in 2D and 3D plots. This functionality allowsthe user to visually identify an input similar to the originalone, based on the plots or based on a tabular ranking using anumerical score to quantify the similarity across all topologicalproperties. Similarly, analysis methods such as Pathway-Guide,Pathway-Express, SPIA, and MetPA which provide two scores(topology based and gene set enrichment) can use a 2D plotto illustrate the distribution of both scores for the analyzedpathways.
From the perspective of the output, the result pathway analysismethods is typically a ranked list of pathways. However, there aretools that only provide nodes scores and further use this scores asinput for an existing gene set analysis method. Visual display ofthe results is a welcomed addition provided by Pathway-Express,Pathway-Guide, SPIA, TopoGSA and MetPA.
5. IMPLEMENTATIONThe mathematical model presented in Section 3 for each analy-sis approach is independent of its implementation as a softwarepackage. Although the main strength of an approach lies in itsalgorithm, its implementation can have an important role inreaching the full potential of that approach, as well as in gain-ing acceptance among the users. Practicality, user-friendliness,output format, and type of interface are all to be considered.Depending on the desired availability and intended audience, asoftware package may be implemented as standalone or web-based.
Web-based tools run the analyses on a remote server providingcomputational power and a graphical interface. On the user side,experiment datasets are uploaded, and on the server side, the toolperforms the analysis. The results are displayed by the browserin the format provided by the tool. The output of most pathwayanalysis methods is a ranked list of pathways or sub-pathways.MetPA, THINK-Back-DS and, EnrichNet are among the methodsthat have web-based implementations. The major advantage ofweb-based tools is that they are user-friendly and do not requirea separate local installation procedure.
Standalone tools need to be installed on local machines whichoften requires administrative skills. Advantages include instantavailability that does not require internet access. Most standalonetools depend on full or partial copies of public pathway databases,stored locally, and need to be updated periodically. Methods likePathway-Guide, ScorePAGE, SPIA, TAPPA, PathOlogist, NetGSA,TopologyGSA, PWEA, ACST, BPA, and GANPA are in this cate-gory. Moreover, there are some methods available both as web-based and standalone, including Pathway-Express, MetaCore,
www.frontiersin.org October 2013 | Volume 4 | Article 278 | 17

Mitrea et al. Topology-based pathway analysis methods
TopoGSA, CePa, and PARADIGM.5 Another major advantage ofstandalone tools are the security and privacy of the experimentdata.
The programming language and style used for implementationplays an important role in the acceptance of a method. Softwaretools that are neatly implemented, packaged, and available onlineare more appealing compared to those that do not have ready-to-use implementations. Many of the methods surveyed hereare implemented in the R programming language and are avail-able as software packages either from bioconductor.org, cran.r-project.org, or the author’s website. Their popularity amongbiologists and bioinformaticians is due to the fact that manybioinformatics dedicated packages are available in R. Pathway-Express (as part of ROntoTools), SPIA, TopoGSA, TopologyGSA,GANPA, DEGraph, NetGSA, ACST, CePa, and ScorePAGE areamong those methods. Pathway-Guide, Pathway-Express, TAPPA,and THINK-Back-DS have an implementation in Java, whichprovides a GUI with self explanatory functionality for users withless software development experience. This allows users to cus-tomize the graphical display of the results, using functionalitiessuch as zoom or rotation. CePa has a web-based implementationin Perl in addition to its R standalone package. The MATLAB pro-gramming language is used for implementation of methods likePathOlogist, BPA, and NetGSA in order to calculate more com-plex equations. Other programming languages like C and C++are also used to implement pathway analysis methods such asPARADIGM and PWEA, which theoretically provide better speedand allow for efficient coding. A summary of the mathematicalmodels and implementation details for the surveyed methods ispresented in Table 2.
From the accessibility perspective, web-based tools have theadvantage of being available from any location as long as thereis an internet connection and a browser available. Also, theupdate is almost seamless to the client. This makes the user’s taskeasy and enables collaboration. Users all over the world can usethe same method without the burden of installing it or keep-ing it up-to-date. The downside, once the internet connectionfails, the tool is unavailable. However, there are methods thatprovide both web-based and standalone implementations andthese are: MetaCore, Pathway-Express, PARADIGM, CePa andTHINK-Back-DS.
6. CONCLUSIONSPathway analysis is a core strategy of many basic research, clinicalresearch, and translational medicine programs. Emerging appli-cations range from targeting and modeling disease networks toscreening chemical or ligand libraries, to identification/validationof drug target interactions for improved efficacy and safety (Arrelland Terzic, 2010). The integration of molecular interaction infor-mation into pathway analysis represents a major advance in thedevelopment of mathematical techniques aimed at the evalua-tion of systems perturbations in biological entities. Out of the22 topological pathway analysis methods presented here, 15 were
5The web-based implementation is only available as part of TCGA while thestandalone is available only as C++ source code that needs to be compiled anddeployed locally.
published in the last 3 years, evidence that there is great interestand desire for progress in this area.
The important milestones in pathway analysis reflected by thissurvey are: the first pathway analysis method for metabolic net-works (Rahnenführer et al., 2004), the first method for signalingpathway and the first method able to take into considerationthe pathway topology (Khatri et al., 2005; Draghici et al., 2007),the first application of topology-based multivariate hypothesistests (Shojaie and Michailidis, 2009), and the first analysis ableusing multi-type graphs from heterogeneous sources (Vaske et al.,2010). In this paper, analysis methods were compared accordingto types of input, scoring algorithms, results, and user accessibil-ity. Each of these aspects presents its own particular challenges.
The validation of pathway analysis results is an importantchallenge researchers face when trying to develop such meth-ods. While biologists are needed to verify the pathway analysisresults, they depend on pathway analysis methods to supporttheir hypotheses. Most efficient progress will occur with a highlevel of communication and collaboration between experimentbiologists, annotators, pathway designers, bioinformaticians, andcomputer scientists. As pathway knowledge becomes more com-plete, the challenge of leveraging this information to extractbiological insight from high throughput data will be redefined.Until then, advances will be incremental. Gold standard experi-ment data sets, designed to affect specific pathways in predefinedways, will be necessary to be able to assess the efficiency of newmethods.
Another challenge we mentioned in this survey is that thesame biological pathways are represented differently from onepathway database to another. In particular, we pointed out thecomplications arising from inconsistent conversions for repre-senting interactions among the different pathway databases, andthe current efforts to address the problem through the creation ofunified formats. However, none of the tools is compatible withall database formats, requiring either modification of pathwayinput or alteration of the underlying algorithm in order to accom-modate the differences. As an example, a study by Vaske andothers (Vaske et al., 2010) attempts to compare SPIA (Tarca et al.,2013) with their tool PARADIGM, by re-implementing SPIA inC, and forcing its compatibility with NCI-PID pathways. Graveimplementation errors are present in the C version of SPIA, inval-idating the comparison. A solution to overcome this challengecould be the development of a unified globally accepted pathwayformat. Another possible solution is to build conversion softwaretools that can translate between pathway formats. Some attemptsexist to use BIO-PAX as the lingua franca for this domain.
Biological networks are divided in various categories con-taining complementary information. Signaling and signal trans-duction are captured by signaling pathways, while biochemicalinteractions are presented in metabolic pathways. In addition,the protein interaction knowledge bases contain different typesof interaction information, complementary to the others. Themajority of pathway databases are manually curated and changeslowly, but they are evolving toward greater content and accu-racy, with new prototype formats being proposed. There is noanalysis method that takes advantage of the information storedin all of these different sources. Few of the methods surveyed
Frontiers in Physiology | Computational Physiology and Medicine October 2013 | Volume 4 | Article 278 | 18

Mitrea et al. Topology-based pathway analysis methods
Table 2 | Comparison of topology-based pathway analysis methods using criteria related to the mathematical model and implementation.
Method name Graph model Scoring method Availability License Language Available from
ScorePAGE Single-type, undirected Hierarchical, similarity Standalone N/A R on demand
MetaCore* Single-type, directed Hierarchical, graph measures Web-based,Standalone
ThomsonReuters
Java Reuters, 2013
Pathway-Express Single-type, directed Hierarchical, graph measures Web-based,Standalone
free** Java,R Draghici et al., 2013
TAPPA Single-type, undirected Hierarchical, NNV Standalone N/A Java N/A
PathOlogist Multi-type, directed Hierarchical, probability Standalone CC-BY MATLAB Greenblum et al., 2013
Pathway-Guide* Single-type, directed Hierarchical, graph measures Standalone AdvaitaCorporation,2013
Java Advaita Corporation,2013
SPIA Single-type, directed Hierarchical, graph measures Standalone GPL (>=2) R Tarca et al., 2013
NetGSA Single-type, directed Mutivariate, hypothesis test Standalone GPL-2 R Shojaie, 2013
PWEA Single-type, undirected Hierarchical, similarity Standalone free** C++ Hung, 2013
TopoGSA Single-type, undirected Hierarchical, graph measures Web-based free** PHP, R Glaab et al., 2013
PARADIGM Multi-type, directed Hierarchical, probability Web-based,Standalone
free**(standalone)UCSC-CGB(web-based)
C Vaske and Benz, 2013b,Vaske and Benz, 2013a
TopologyGSA Single-type, moralundirected
Mutivariate, hypothesis test Standalone AGPL-3 R Massa and Sales, 2013
DEGraph Single-type, undirected Mutivariate, hypothesis test Standalone GPL-3 R Jacob et al., 2013
MetPA Single-type, directed Hierarchical, graph measures Web-based free** PHP, R Xia, 2013
BPA Single-type, DAG Mutivariate, Bayesiannetwork
Standalone free** MATLAB Isci, 2013
GANPA Single-type, undirected Hierarchical, graph measures Standalone GPL-2 R Fang et al., 2013
BAPA-IGGFD Single-type, DAG Mutivariate, Bayesiannetwork
Standalone N/A R N/A
CePa Single-type, directed Hierarchical, graph measures Web-based,Standalone
GPL (>= 2) R Gu, 2013b,Gu, 2013a
THINK-Back-DS Single-type, directed Hierarchical, graph measures Web-based,Standalone
free** Java Farfán et al., 2013b,Farfán et al., 2013a
TBScore Single-type, directed Hierarchical, normalizednode value (NNV)
N/A N/A N/A N/A
ACST Single-type, directed Hierarchical, NNV Standalone CC-BY R Mieczkowski et al., 2013
EnrichNet Single-type, undirected Hierarchical, graph measures Web-based free** PHP Glaab, 2013
*commercial methods; **free for academic and non-commercial use; UCSC-CGB – the University of California Santa Cruz Cancer Genome Browser;
N/A No publicly available implementation, Graph model indicates whether the graph which is remodeled to be suitable for the scoring method is single-type or
multi-type and whether it is directed or undirected. DAG stands for directed acyclic graph. The moral graph is described in Section 3.1. Scoring method encloses the
mathematical model used in the analysis to score nodes and graphs. A detailed description is presented in Section 3.2. Implementation indicates the existence of a
standalone or web-based implementation of the method. License represents the license under which the software is available. GPL - GNU General Public License,
AGPL - GNU Affero General Public License, CC-BY - Creative Commons license. Language represents the programming language used for the implementation.
Available from points to the paper or url associated with the given tool.
www.frontiersin.org October 2013 | Volume 4 | Article 278 | 19
Mitrea et al. Topology-based pathway analysis methods
here use either signaling or metabolic pathways in addition toPPI networks. Promising developments include the integrationof multiple component types and interaction types, each withspecific properties. Although the information is less reliable, non-curated high-throughput protein interaction data is also provinguseful, as protein interaction data can be used to support or filterresults.
High-throughput technologies, developed for biologicalexperiments, are improving in accuracy. However, they are stillprone to error and the resulting data includes a significantamount of noise. In addition, these technologies produce vari-ous types of data among which are genome variations, mRNAlevel, metabolite concentration, or protein abundance. Each ofthese data types provides meaningful yet incomplete informationregarding specific biological phenomena. The next challenge is tobe able to integrate such diverse types of data.
Another challenge is the oversimplification that characterizesmany of the models provided by pathway databases. In principle,each type of tissue might have different mechanisms so generic,organism-level pathways present a somewhat simplistic descrip-tion of the phenomena. Furthermore, signaling and metabolicprocesses can also be different from one condition to another,or even from one patient to another. Understanding the specificpathways that are impacted in a given phenotype or sub-group ofpatients should be another goal for the next generation of pathwayanalysis tools.
Interpreting biological experimental data is also challengingdue to inaccurate assumptions. For instance, most current path-way models show cascades of signals or biochemical processesnext to one another, in time-agnostic diagrams. In reality, thesephenomena happen over time, and often at different time scales.Furthermore, many data sets offer only a snapshot in time, at aparticular moment. Almost by definition, such a frozen snapshotcannot properly capture and show the effect of successive eventsthat take place over time.
The graphical scoring methods presented in this paper arerepresentative of the techniques available for future methods.
We expect to see greater use of different types of data, in addi-tion to greater use of data mining and machine learning whichwill lead to more sophisticated topology-based pathway analysismethods.
It is important to (re-)state that the goal of this paper was tosurvey the main topology-based techniques and methods avail-able to identify the most significant pathways in a comparisonbetween phenotypes. In other words, the goal was to identify,categorize and review these methods without attempting to assesstheir performance. A critical assessment and ranking will be thesubject of a later publication. A natural tendency would be totry to use the various criteria used here to compare variousmethods and thus establish even a partial ordering. For instance,if method X uses only one type of input (e.g., pathways fromKEGG) while method Y uses two types of input (e.g., pathwaysfrom KEGG as well as PPI data), one might be tempted to con-clude that method Y is somewhat more powerful than method X.Similarly, some methods use a subset of DE genes while othersuse the entire set of measured values. Again, it may be temptingto informally conclude that the later methods are more pow-erful since, they take more data into consideration or becausethey eliminate the need for a selection of DE genes. It is ouropinion that such inferences and partial orderings are not advis-able and should not be attempted based on the informationpresented in this paper. A proper assessment of these methodsshould be focused on their ability to identify the pathways thatare truly impacted in the given phenotypes, and not based onsuperficial characteristics or number of features of one type oranother.
ACKNOWLEDGMENTSThis work has been partially supported by the following grants:NIH RO1 DK089167, NIH STTR R42GM087013, and NSF DBI-0965741 (to Sorin Draghici). Any opinions, findings, and conclu-sions or recommendations expressed in this material are those ofthe authors and do not necessarily reflect the views of any of thefunding agencies.
REFERENCESAbdi, A., and Emamian, E. S. (2010).
Fault diagnosis engineering inmolecular signaling networks:an overview and applicationsin target discovery. Chem.Biodivers. 7, 1111–1123. doi:10.1002/cbdv.200900315
Advaita Corporation. (2013) Pathway-Guide Software. Available onlineat: http://www.advaitabio.com/products.html (Accessed on May15, 2013)
Aittokallio, T., and Schwikowski, B.(2006). Graph–based methodsfor analysing networks in cell biol-ogy. Brief. Bioinf. 7, 243–255. doi:10.1093/bib/bbl022
Arrell, D. K., and Terzic, A. (2010).Network systems biology for drugdiscovery. Clin. Pharmacol. Ther. 88,120–125. doi: 10.1038/clpt.2010.91
Bader, G. D., Donaldson, I., Wolting, C,Ouellette, F. B. F., Pawson, T., andHogue, C. W. V. (2001). BIND–the biomolecular interaction net-work database. Nucleic AcidsRes. 29, 242–245. doi: 10.1093/nar/29.1.242
Barabási, A. L., Gulbahce, N., andLoscalzo, J. (2011). Networkmedicine: a network–basedapproach to human disease.Nat. Rev. Genet. 12, 56–68. doi:10.1038/nrg2918
Beltrame, L., Calura, E., Popovici, R. R.,Rizzetto, L., Guedez, D. R., Donato,M., et al. (2011). The biologi-cal connection markup language: aSBGN-compliant format for visu-alization, filtering and analysis ofbiological pathways. Bioinformatics27, 2127–2133. doi: 10.1093/bioin-formatics/btr339
Ben-Shaul, Y., Bergman, H., and Soreq,H. (2005). Identifying subtleinterrelated changes in functionalgene categories using continu-ous measures of gene expression.Bioinformatics 21, 1129–1137. doi:10.1093/bioinformatics/bti149
BioCarta. (2000). BioCarta - ChartingPathways of Life. Technical report,BioCarta. Available online at: http://www.biocarta.com
BioPAX. (2002). The Biological PathwayExchange (BioPAX). Availableonline at: http://www.biopax.org
Chowbina, S. R., Wu, X., Zhang, F.,Li, P. M., Pandey, R., Kasamsetty,H. N., et al. (2009). HPD:an online integrated humanpathway database enabling sys-tems biology studies. BMCBioinformatics 10(Suppl. 11):S5.doi: 10.1186/1471-2105-10-S11-S5
Chuang, H. Y., Hofree, M., and Ideker,T. (2010). A decade of systemsbiology. Ann. Rev. Cell Dev. Biol.26, 721–744. doi: 10.1146/annurev-cellbio-100109-104122
Chung, F. R. K. (1997). Spectral GraphTheory. Providence, RI: AmericanMathematical Society.
Dezso, Z., Nikolsky, Y., Nikolskaya, Y,Miller, J., Cherba, D., Webb, C., et al.(2009). Identifying disease-specificgenes based on their topological sig-nificance in protein networks. BMCSyst. Biol. 3:36. doi: 10.1186/1752-0509-3-36
Draghici, S., Khatri, P., and Voichita,C. (2013) Pathway-Express Software.Available online at: http://vortex.cs.wayne.edu/projects.htm.
Draghici, S., Khatri, P., Tarca, A. L.,Amin, K., Done, A., Voichita, C.,et al. (2007). A systems biology
Frontiers in Physiology | Computational Physiology and Medicine October 2013 | Volume 4 | Article 278 | 20

Mitrea et al. Topology-based pathway analysis methods
approach for pathway level analy-sis. Genome Res. 17, 1537–1545. doi:10.1101/gr.6202607
Efron, B. (1979). Bootstrap meth-ods: another look at the jack-knife. Ann. Stat. 7, 1–26. doi:10.1214/aos/1176344552
Efron, B., and Tibshirani, R. (2007).On testing the significance of sets ofgenes. Ann. Appl. Stat. 1, 107–129.doi: 10.1214/07-AOAS101
Efroni, S., Schaefer, C. F., and Buetow,K. H. (2007). Identification ofkey processes underlying can-cer phenotypes using biologicpathway analysis. PLoS ONE2:e425. doi: 10.1371/journal.pone.0000425
Emmert-Streib, F., and Glazko, G. V.(2011). Pathway analysis of expres-sion data: deciphering functionalbuilding blocks of complex diseases.PLoS Comput. Biol. 7:e1002053. doi:10.1371/journal.pcbi.1002053
Fang, Z., Tian, W., and Ji, H. (2011).A network-based gene-weightingapproach for pathway analy-sis. Cell Res. 22, 565–580. doi:10.1038/cr.2011.149
Fang, Z., Tian, W., and Ji, H. (2013).GANPA Software . Available onlineat: http://cran.r-project.org/web/packages/GANPA/index.html (Accessed on May, 2013)
Farfán, F., Ma, J, Sartor, M. A.,Michailidis, G., and Jagadish,H. V. (2012). THINK Back:knowledge-based interpretationof high throughput data. BMCBioinformatics 13(Suppl 2):S4. doi:10.1186/1471-2105-13-S2-S4
Farfán, F., Ma, J., Sartor, M. A.,Michailidis, G., and Jagadish, H. V.(2013a). THINK-Back-DS SoftwareStandalone. Available onlineat: http://eecs.umich.edu/db/think/files/densityanalysis1.0.zip, a(Accessed on May, 2013)
Farfán, F., Ma, J., Sartor, M. A.,Michailidis, G., and Jagadish, H. V.(2013b). THINK-Back-DS SoftwareWeb-Based. Avaialble onlneat: http://eecs.umich.edu/db/think/software.html, (Accessed on May,2013)
Gao, S., and Wang, X. (2007). TAPPA:topological analysis of pathway phe-notype association. Bioinformatics23, 3100–3102. doi: 10.1093/bioin-formatics/btm460
Glaab, E. (2013). EnrichNet Software.Available online at: http://www.
enrichnet.org, (Accessed on May 15,2013).
Glaab, E., Baudot, A., Krasnogor, N.,Schneider, R., and Valencia, A.(2012). EnrichNet: network-basedgene set enrichment analysis.
Bioinformatics 28, i451–i457. doi:10.1093/bioinformatics/bts389
Glaab, E., Baudot, A., Krasnogor, N.,Schneider, R., and Valencia, A.(2010). TopoGSA: network topolog-ical gene set analysis. Bioinformatics26, 1271–1272. doi: 10.1093/bioin-formatics/btq131
Glaab, E., Baudot, A., Krasnogor,N., Schneider, R., and Valencia,A. (2013). TopoGSA Software.Available online at: http://www.
infobiotics.net/topogsa (Accessedon May 15, 2013).
Greenblum, S. I ., Efroni, S., Schaefer,C. F., and Buetow, K. H. (2013).Pathologist Software. Availableonline at: ftp://ftp1.nci.nih.gov/pub/pathologist/ (Accessed on May15, 2013).
Gu, Z. (2013a). CePa SoftwareStandalone. Available onlineat: http://cran.r-project.org/web/packages/CePa/index.html (Accessed on May 15, 2013).
Gu, Z. (2013b). CePa SoftwareWeb-Based. Available onlineat: http://mcube.nju.edu.cn/cgi-bin/cepa/main.pl (Accessed onMay 15, 2013).
Gu, Z., Liu, J., Cao, K., Zhang, J.,and Wang, J. (2012). Centrality-based pathway enrichment: a sys-tematic approach for finding signif-icant pathways dominated by keygenes. BMC Syst. Biol. 6:56. doi:10.1186/1752-0509-6-56
Hermjakob, H., Montecchi-Palazzi, L.,Lewington, C., Mudali, S., Kerrien,S., Orchard, S., et al. (2004). IntAct:an open source molecular inter-action database. Nucleic AcidsRes. 32(Suppl. 1), D452–D455.doi:10.1093/nar/gkh052
Hung, J.-H. (2013). PWEA SoftwareAvailable Online at: http://zlab.bu.
edu/PWEA/ 2013. (Accessed onMay 15, 2013).
Hung, J.-H., Whitfield, T. W., Yang, T.-H., Hu, Z., Weng, Z., and DeLisi,C. (2010). Identification of func-tional modules that correlate withphenotypic difference: the influenceof network topology. GenomeBiol. 11:R23. doi: 10.1186/gb-2010-11-2-r23
Ibrahim, M. A., Jassim, S., Cawthorne,M. A., and Langlands, K.(2012). A topology-based scorefor pathway enrichment. J.Comput. Biol. 19, 563–573. doi:10.1089/cmb.2011.0182
Isci, S. (2013). BPA Software Availableonline at: http://bumil.boun.edu.tr/bpa (Accessed on May 15, 2013).
Isci, S., Ozturk, C., Jones, J., and Otu,H. H. (2011). Pathway analysisof high-throughput biological data
within a bayesian network frame-work. Bioinformatics 27, 1667–1674.doi: 10.1093/bioinformatics/btr269
Jacob, L., Neuvial, P., and Dudoit,S. (2010). “Gains in powerfrom structured two-sampletests of means on graphs,” inTechnical Report 271, Department ofStatistics, Berkeley, CA: Universityof California. Available online at:http://arxiv.org/abs/1009.5173
Jacob, L., Neuvial, P., andDudoit, S. (2013). DEGraphSoftware. Available onlineat: http://www.bioconductor.org/packages/2.12/bioc/html/DEGraph.html(Accessed on May 15, 2013).
Joshi-Tope, G., Gillespie, M., Vastrik,I., D’Eustachio, P., Schmidt,E., de Bono, B., et al. (2005).REACTOME: a knowledgebaseof biological pathways. NucleicAcids Res. 33, D428–D432. doi:10.1093/nar/gki072
Kelder, T., Conklin, B. R., Evelo, C. T.,and Pico, A. R. (2010). Finding theright questions: exploratory path-way analysis to enhance biologicaldiscovery in large datasets. PLoSBiol. 8:e1000472. doi: 10.1371/jour-nal.pbio.1000472
Khatri, P., Sellamuthu, S., Malhotra,P., Amin, K., Done, A., andDraghici, S. (2005). Recent addi-tions and improvements to theOnto-Tools. Nucleic Acids Res.33(Suppl. 2), W762–W765. doi:10.1093/nar/gki472
Khatri, P., Sirota, M., and Butte, A. J.(2012). Ten years of pathway anal-ysis: current approaches and out-standing challenges. PLoS Comput.Biol. 8:e1002375. doi: 10.1371/jour-nal.pcbi.1002375
Khatri, P., Voichita, C., Kattan, K.,Ansari, N., Khatri, A., Georgescu,C., et al. (2007). Onto-Tools:new additions and improvementsin 2006. Nucleic Acids Res. 37,W206–W211. doi: 10.1093/nar/gkm327
Kullback, S., and Leibler, R. A. (1951).On information and sufficiency.Ann. Math. Stat. 22, 79–86. doi:10.1214/aoms/1177729694
Lauritzen, S. L. (1996). GraphicalModels, Vol. 17. Oxford: OxfordUniversity Press.
Mantel, N. (1966). Evaluation of sur-vival data and two new rank orderstatistics arising in its considera-tion. Cancer Chemother. Rep. 50,163–170.
Massa, M. S., Chiogna, M., andRomualdi, C. (2010). Gene setanalysis exploiting the topology of apathway. BMC Syst. Biol. 4:121. doi:10.1186/1752-0509-4-121
Massa S., and Sales, G. (2013).TopologyGSA Software. Availableonline at: http://cran.r-project.org/web/packages/topologyGSA/index.html (Accessed on May 15, 2013).
McLean, R. A., Sanders, W. L., andStroup, W. W. (1991). A uni-fied approach to mixed linear mod-els. Am. Stat. 45, 54–64. doi:10.1080/00031305.1991.10475767
Mewes, H.-W., Heumann, K., Kaps, A.,Mayer, K., Pfeiffer, F., Stocker, S.,et al. (1999). MIPS: a databasefor genomes and protein sequences.Nucleic Acids Res. 27, 44–48.doi:10.1093/nar/27.1.44
Mi, H., Lazareva-Ulitsky, B., Loo,R., Kejariwal, A., Vandergriff, J.,Rabkin, S., et al. (2005). ThePANTHER database of proteinfamilies, subfamilies, functionsand pathways. Nucleic Acids Res.33(Suppl. 1), D284–D288. doi:10.1093/nar/gki078
Mieczkowski, J., Swiatek-Machado,K., and Kaminska, B. (2012).Identification of pathwayderegulation–gene expressionbased analysis of consistent signaltransduction. PLoS ONE 7:e41541.doi: 10.1371/journal.pone.0041541
Mieczkowski, J., Swiatek-Machado, K.,and Kaminska, B. (2013). ACSTSoftware. Available online at: http://www.plosone.org/article/info:doi/10.1371/journal.pone.0041541#s4(Accessed on May 15, 2013).
Misman, M. F., Deris, S., Hashim, S.Z. M., Jumali, R., and Mohamad,M. S. (2009). “Pathway-basedmicroarray analysis for definingstatistical significant phenotype-related pathways: a review ofcommon approaches,” in ICIME’09.International Conference onInformation Management andEngineering, 2009 (IEEE), (KualaLumpur), 496–500. doi: 10.1109/ICIME.2009.103
Nam, D., and Kim, S.-Y. (2008). Gene-set approach for expression patternanalysis. Brief. Bioinf. 9, 189–197.doi: 10.1093/bib/bbn001
Neapolitan, R. E. (2004). LearningBayesian Networks. Prentice Hall.
Ogata, H., Goto, S., Sato, K., Fujibuchi,W., Bono, H., and Kanehisa, M.(1999). KEGG: kyoto encyclo-pedia of genes and genomes.Nucleic Acids Res. 27, 29–34. doi:10.1093/nar/27.1.29
Pan, K.-H., Lih, C.-J., and Cohen, S. N.(2005). Effects of threshold choiceon biological conclusions reachedduring analysis of gene expressionby dna microarrays. Proc. Natl.Acad. Sci. U.S.A. 102, 8961–8965.doi: 10.1073/pnas.0502674102
www.frontiersin.org October 2013 | Volume 4 | Article 278 | 21

Mitrea et al. Topology-based pathway analysis methods
Peri, S., Navarro, J. D., Kristiansen,T. Z., Amanchy, R., Surendranath,V., Muthusamy, B., et al. (2004).Human protein reference databaseas a discovery resource for pro-teomics. Nucleic Acids Res.32(Suppl. 1), D497–D501. doi:10.1093/nar/gkh070
Pico, A. R., Kelder, T., van Iersel, M.P., Hanspers, K., Conklin, B. R., andEvelo, C. (2008). WikiPathways:pathway editing for the people.PLoS Biol. 6:e184. doi: 10.1371/jour-nal.pbio.0060184
Rahnenführer, J., Domingues, F. S.,Maydt, J., and Lengauer, J. (2004).Calculating the statistical signifi-cance of changes in pathway activ-ity from gene expression data. Stat.Appl. Genet. Mol. Biol. 3. doi:10.2202/1544-6115.1055
Reuters, T. (2013). MetaCoreSoftware. Available online at:http://www.genego.com/metacore.php. (Accessed on May 15 , 2013).
Sartor, M. A., Leikauf, G. D., andMedvedovic, M. (2009). LRpath:a logistic regression approach foridentifying enriched biologicalgroups in gene expression data.Bioinformatics 25, 211–217. doi:10.1093/bioinformatics/btn592
Schaefer, C. F., Anthony, K., Krupa, S.,Buchoff, J., Day, M., Hannay, T.,et al. (2009). PID: the pathwayinteraction database. Nucleic AcidsRes. 37(Suppl. 1), D674–D679. doi:10.1093/nar/gkn653
Shojaie, A. (2013). NetGSASoftware. Available online at:http://www.biostat.washington.edu/∼ashojaie/software/netGSA_1.0.tar.gz. (Accessed on May 15, 2013).
Shojaie, A., and Michailidis, G. (2009).Analysis of gene sets based on theunderlying regulatory network. J.Comput. Biol. 16, 407–426. doi:10.1089/cmb.2008.0081
Shojaie, A., and Michailidis, G. (2010).Network enrichment analysis incomplex experiments. Stat. Appl.Genet. Mol. Biol. 9. doi: 10.2202/1544-6115.1483
Snel, R., Lehmann, G., Bork, P., andHuynen, M. A. (2000). STRING:a web-server to retrieve and dis-play the repeatedly occurring
neighbourhood of a gene. NucleicAcids Res. 28, 3442–3444. doi:10.1093/nar/28.18.3442
Spirtes, P. (1995). “Directed cyclicgraphical representations of feed-back models,” in Proceedingsof the Eleventh Conference onUncertainty in Artificial Intelligence(Morgan Kaufmann PublishersInc.), (Montreal, QC), 491–498.
Stark, C., Breitkreutz, B. J., Reguly,T., Boucher, L., Breitkreutz, A.,and Tyers, M. (2006). BioGRID:a general repository for interac-tion datasets. Nucleic Acids Res.34(Suppl. 1), D535–D539. doi:10.1093/nar/gkj109
Steuer, R. (2007). Computationalapproaches to the topol-ogy, stability and dynamicsof metabolic networks.Phytochemistry 68, 2139–2151. doi:10.1016/j.phytochem.2007.04.041
Subramanian, A., Tamayo, B., Mootha,V. K., Mukherjee, S., Ebert, B.L., Gillette, M. A., et al. (2005).Gene set enrichment analysis: aknowledge-based approach forinterpreting genome-wide expres-sion profiles. Proc. Natl. Acad.Sci. U.S.A. 102, 15545–15550. doi:10.1073/pnas.0506580102
Tarca, A. L., Draghici, S., Bhatti,G., and Romero, R. (2012).Down-weighting overlappinggenes improves gene set analysis.BMC Bioinformatics 13:136. doi:10.1186/1471-2105-13-136
Tarca, A. L., Draghici, S., Khatri,P., Hassan. S. S., Mittal, P., sunKim, J., et al. (2009). A novelsignaling pathway impact analysis(SPIA). Bioinformatics 25, 75–82.doi: 10.1093/bioinformatics/btn577
Tarca, A. L., Khatri, P., andDraghici, S. (2013). SPIASoftware. Available online at:http://bioconductor.org/packages/release/bioc/html/SPIA.html, (Accessedon May 15, 2013).
Varadan, V., Mittal, P., Vaske, C. J., andBenz, S. C. (2012). The integra-tion of biological pathway knowl-edge in cancer genomics: a review ofexisting computational approaches.Signal Process. Mag. IEEE 29, 35–50.doi: 10.1109/MSP.2011.943037
Vaske, C. J., and Benz, S. C. (2013a).PARADIGM Software Standalone.Available online at: http://sbenz.github.com/Paradigm, (Accessedon May 15, 2013).
Vaske, C. J., and Benz, S. C. (2013b).PARADIGM Software Web-Based. Available online at: https://genome-cancer.ucsc.edu/proj/site/hgHeatmap/, (Accessed on May 15,2013).
Vaske, C. J., Benz, S. C., Sanborn,J. Z., Earl, D., Szeto, C., Zhu,J., et al. (2010). Inference ofpatient-specific pathway activitiesfrom multi-dimensional cancergenomics data using PARADIGM.Bioinformatics 26, i237–i245.doi: 10.1093/bioinformatics/btq182
Voichita, C, Donato, M., and Draghici,S. (2012). “Incorporating genesignificance in the impact analysisof signaling pathways,” in MachineLearning and Applications (ICMLA),2012 11th International Conferenceon, IEEE. Vol. 1, (Boca Raton, FL),126–131.
Von Mering, C, Huynen, M., Jaeggi,D., Schmidt, S, Bork, P., and Snel,S. (2003). STRING: a databaseof predicted functional associa-tions between proteins. NucleicAcids Res. 31, 258–261. doi:10.1093/nar/gkg034
Watts, D. J., and Strogatz, S. H.(1998). Collective dynamics of‘small-world’ networks. Nature 393,440–442. doi: 10.1038/30918
Xenarios, I., Rice, D. W., Salwinski,L., Baron, M. K., Marcotte, E. M.,and Eisenberg, D. (2000). DIP:the database of interacting proteins.Nucleic Acids Res. 28, 289–291. doi:10.1093/nar/28.1.289
Xia, J. (2013). MetPA Software .Available online at: http://metpa.metabolomics.ca. (Accessed on May15, 2013).
Xia, J., and Wishart, D. S.(2010). MetPA: a web-basedmetabolomics tool for path-way analysis and visualization.Bioinformatics 26, 2342–2344. doi:10.1093/bioinformatics/btq418
Yin, E., Gupta, M., Weninger, T.,and Han, J. (2010). “A unified
framework for link recommen-dation using random walks,” inAdvances in Social Networks Analysisand Mining (ASONAM), 2010International Conference on, IEEE,(Odense), 152–159.
Zhao, Y., Chen, M. H., Pei, H., Rowe,D., Shin, D. G., Xie, G., et al.(2012). A Bayesian approach topathway analysis by integratinggene–gene functional directionsand microarray data. Stat. Biosci. 4,105–131. doi: 10.1007/s12561-011-9046-1
Conflict of Interest Statement: SorinDraghici is the founder and CEO ofAdvaita Corporation, a Wayne StateUniversity spin-off that commercializesPathway-Guide, one of the pathwayanalysis tools mentioned in this arti-cle. The other authors declare thatthe research was conducted in theabsence of any commercial financialrelationships that could construed as apotential conflict interest.
Received: 31 May 2013; accepted: 15September 2013; published online: 10October 2013.Citation: Mitrea C, Taghavi Z,Bokanizad B, Hanoudi S, Tagett R,Donato M, Voichita C and Draghici S(2013) Methods and approaches in thetopology-based analysis of biologicalpathways. Front. Physiol. 4:278. doi:10.3389/fphys.2013.00278This article was submitted toComputational Physiology andMedicine, a section of the journalFrontiers in Physiology.Copyright © 2013 Mitrea, Taghavi,Bokanizad, Hanoudi, Tagett, Donato,Voichita and Draghici. This is an open-access article distributed under the termsof the Creative Commons AttributionLicense (CC BY). The use, distribution orreproduction in other forums is permit-ted, provided the original author(s) orlicensor are credited and that the origi-nal publication in this journal is cited, inaccordance with accepted academic prac-tice. No use, distribution or reproductionis permitted which does not comply withthese terms.
Frontiers in Physiology | Computational Physiology and Medicine October 2013 | Volume 4 | Article 278 | 22