Embed Size (px)
Citation preview

LATEST RESEARCH:MEASURING THE IMPACT OF CUSTOMER SATISFACTION ON OPERATIONAL PERFORMANCEDecember 2020

RESEARCH: IMPACT OF CSAT ON OPERATIONS
Table of ContentsExecutive Summary & Key Recommendations 2
ABOUT THE RESEARCH PROJECT 3
Operational Environment 4
CSAT Measurements 5KEY TAKEAWAYS 5
KEY TAKEAWAYS 6
KEY TAKEAWAYS 7
KEY TAKEAWAYS 8
CSAT Results 9KEY TAKEAWAYS 10
KEY TAKEAWAYS 12
Technology: The Great Differentiator 13
http://www.servicecouncil.com/@tservicecouncil 2
Measuring the Impact of Customer Satisfaction on Operational Performance | December 2020
EXECUTIVE SUMMARY & KEY RECOMMENDATIONS
Overall, the findings indicate that an increase in CSAT, and companies with high CSAT scores, see over-arching gains in profitability. Higher CSAT scores translate into increases in customer spending, retention, loyalty and higher service revenue.
The below represents a summary of key observations and recommendations:
• The presence of executive management & service executive oversight yields the greatest performance in key operating and customer metrics.
• Consider technology investments which aim towards the creation of a “technician agnostic” infrastructure enabled by information access and empowerment tools.
• The presence of technologies such as Knowledge Management, Service Parts Management, Internet of Things, Artificial Intelligence, and Augmented Reality provide an increase in operational gains, as well as an increase in customer satisfaction.
Those that are implementing new technologies are seeing a rise in CSAT, which is also steering operational gains. In addition, a dedicated executive management team with goals and incentives dedicated to CSAT are paramount to these efforts as well.
Digital transformations should be prioritized and accelerated. From all indications, the concept of thinking big and starting small still applies. Looking backwards, technology adoption and investment has always been viewed in the following 3 phases: Crazy > Dangerous > Obvious.Will you be ahead of the curve and do the obvious before it becomes obvious? Your customers are waiting.
http://www.servicecouncil.com/@tservicecouncil 3
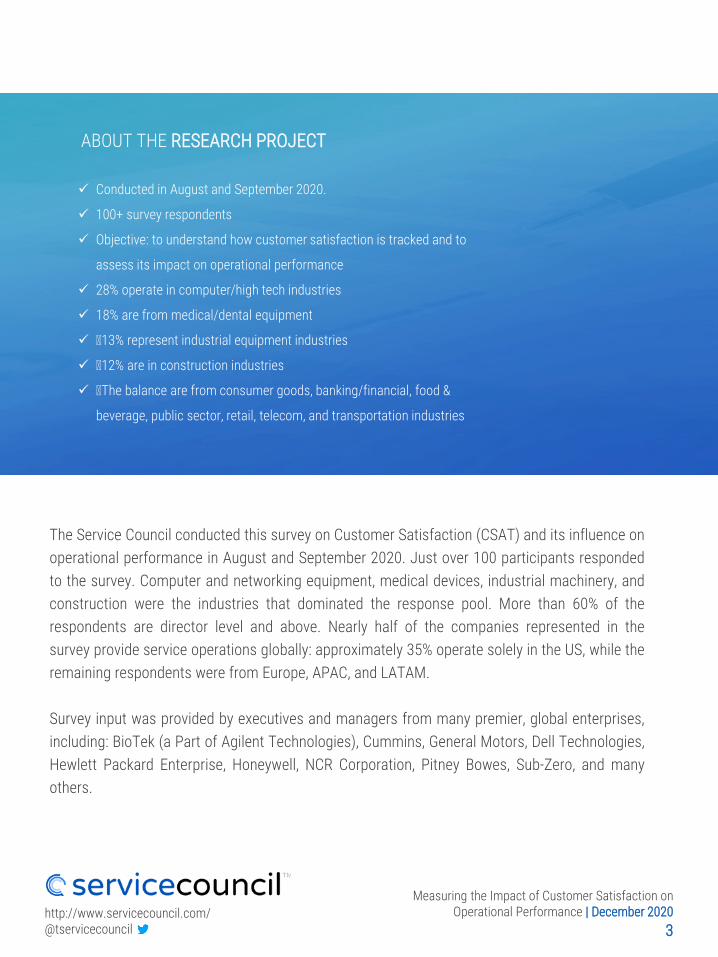
The Service Council conducted this survey on Customer Satisfaction (CSAT) and its influence onoperational performance in August and September 2020. Just over 100 participants respondedto the survey. Computer and networking equipment, medical devices, industrial machinery, andconstruction were the industries that dominated the response pool. More than 60% of therespondents are director level and above. Nearly half of the companies represented in thesurvey provide service operations globally: approximately 35% operate solely in the US, while theremaining respondents were from Europe, APAC, and LATAM.
Survey input was provided by executives and managers from many premier, global enterprises,including: BioTek (a Part of Agilent Technologies), Cummins, General Motors, Dell Technologies,Hewlett Packard Enterprise, Honeywell, NCR Corporation, Pitney Bowes, Sub-Zero, and manyothers.
Conducted in August and September 2020.
100+ survey respondents
Objective: to understand how customer satisfaction is tracked and to
assess its impact on operational performance
28% operate in computer/high tech industries
18% are from medical/dental equipment
13% represent industrial equipment industries
12% are in construction industries
The balance are from consumer goods, banking/financial, food &
beverage, public sector, retail, telecom, and transportation industries
ABOUT THE RESEARCH PROJECT
Measuring the Impact of Customer Satisfaction on Operational Performance | December 2020

http://www.servicecouncil.com/@tservicecouncil 4
More than half of the companies responding to the survey report that they deliver service using theirdirect employees exclusively. Approximately 45% say they use a blended workforce of their ownemployees and sub- contractors. In our discussions with service providers, they indicate that theCOVID-19 pandemic is impacting their direct staffing and is driving more of them to consider the useof sub-contractors to augment their direct service staff. This is consistent with the Service Council’srecommendations that service delivery should be “technician agnostic.” In other words, it’s not theperson delivering the service, or that person’s affiliation with the service company that’s important;it’s the quality of service delivered that’s most critical.
More than 70% of respondents report that service operates as a profit center with its own P&Ltargets; the remaining nearly 30% operate as a cost center. Of those operating as a cost center,approximately 10% are government organizations, whose service operations typically operate as acost center.
Measuring the Impact of Customer Satisfaction on Operational Performance | December 2020
OPERATIONAL ENVIRONMENT
Figure 1 – Direct or Blended Workforce

http://www.servicecouncil.com/@tservicecouncil 5
Measuring the Impact of Customer Satisfaction on Operational Performance | December 2020
CSAT MEASUREMENTS
85% of responding organizations report that they measure customer satisfaction. Virtually all of thecompanies in the top reporting industries measure CSAT. And almost 60% of companies who measure CSAThave been doing so for over five years, and that pays off – see KEY TAKEAWAYS.Respondents use a wide variety of CSAT survey methods and tools to measure and track customersatisfaction, from ad hoc transactional surveys to Customer Effort Score (CES) tracking. CES may be thesurvey tool with which people are least familiar. Briefly, the underlying premise for CES is that serviceorganizations create customer loyalty by reducing customer effort in answering questions and/or resolvingproblems.
Figure 2 – Survey Method/Tools Used
Which of the following are utilized to measure your CSAT? (Please select all that apply)
Figure 3 – Factors Driving CSAT Measurement
What strategic factors drive you to measure CSAT? Please select all that apply)
More than 8 in 10 participants cite “Higher Customer Expectations” as a key factor in wanting to monitor andimprove CSAT. That’s followed closely by worries about both customer satisfaction and competitive inroads.
KEY TAKEAWAYS• Organizations measuring CSAT for more than 5 years earn a 16.5% higher Net Promoter Score (NPS).• This strongly suggests that long-term CSAT monitoring detects customer satisfaction issues, which lead to corrective actions to
bolster customer satisfaction, loyalty, and CSAT scores as a consequence.• More than half of respondents use a combination of NPS, scheduled, and transactional surveys to measure CSAT.• “Consumerization of Service” has taken hold. Business customers have come to expect the same ease and speed of service they
get in their personal lives from organizations like Amazon, Uber, and others. They now expect the same service experience in their business lives as well.
• Service Executives with whom the Service Council has spoken agree that COVID-19 has further heightened customer expectations.• The combined effect is driving greater concern for and focus on customer satisfaction levels, along with more attention to
competitive differentiation in order to avoid customer churn.

http://www.servicecouncil.com/@tservicecouncil 6
Measuring the Impact of Customer Satisfaction on Operational Performance | December 2020
Improving customer satisfaction doesn’t happen magically, it requires a strategy and an investment in effort,time, and almost certainly, some money.
Figure 4 – Balancing CSAT Cost
With regards to balancing improving CSAT with cost, which statement would you say is true (for the next 12 months?)
Figure 5 – CSAT Ownership
Who has primary ownership of your CSAT efforts?
Efforts to improve customer satisfaction and loyalty need guidance. A specific group should have oversightand responsibility. Executive and management leadership, or lack thereof, will influence the success of suchefforts.
KEY TAKEAWAYS• Surprisingly, in spite of the focus on improving customer satisfaction, there is relatively little appetite to invest in customer
satisfaction improvement efforts.• CSAT efforts driven by the service organization with executive leadership support are more than three times as likely to show an
increase in profits than other groups.• Companies with both executive support and a dedicated CSAT team are 2.3 times more likely to see an increase in customer
satisfaction vs. no change.

http://www.servicecouncil.com/@tservicecouncil
Figure 6 – CSAT Goals and Incentives
Do members in your organization have CSAT-related goals or incentives?
Figure 7 – CSAT Resources
Does your CSAT effort have the following?
7
Measuring the Impact of Customer Satisfaction on Operational Performance | December 2020
Nearly three-quarters of service manager, director,and VP-level staff have goals and/or incentives formeeting or exceeding CSAT goals. Most havespecific, targeted goals. A somewhat smallerpercentage have both target goals and incentives forreaching those goals. Goals are slightly moreprominent for service technicians themselves, but40% of technicians have both goals and incentives forreaching those goals.
Efforts to improve customer satisfaction and loyaltyneed guidance. A specific group should haveoversight and responsibility. Executive andmanagement leadership, or lack thereof, willinfluence the success of such efforts.
KEY TAKEAWAYS• Executive leadership in CSAT initiatives pays off. When
CXO’s and VP/SVP’s have CSAT related goals or incentives, their companies are more than twice as likely to show gains in customer satisfaction than not.
• Similarly, service organizations with a dedicated CSAT strategy are nearly twice as likely to see gains in customer satisfaction versus the status quo.
Almost 100% of respondents rate these three factors as the most important in positively impacting customersatisfaction: “speed of service,” “relationship with the service team,” and “asset uptime.” It’s worth noting that“relationship with the service team,” ranks higher than “working with the same service team.” Maintaining asolid relationship with the members of the team responsible for providing service, rather than a specific teammember is helping drive customer satisfaction. This supports the Service Council’s earlier position thatmaintaining solid customer relationships is most influenced by the quality of the service delivered, not thespecific person or team delivering the service.

http://www.servicecouncil.com/@tservicecouncil 8
Measuring the Impact of Customer Satisfaction on Operational Performance | December 2020
Figure 8 – Top Factors Impacting CSAT
In your opinion, which factors impact customer satisfaction the most? (Please select top FOUR answers)
Figure 9 – Initiatives to Improve CSAT
What initiatives do you think need to be prioritized internally to improve your organization’s CSAT scores? (Please select top FOUR answers)
Communication and management focus areidentified as the leading factors that can helpimprove CSAT scores. Investments in newtechnologies and better technician training followclosely, with approximately 65% of participantsidentifying those as key factors as well.
KEY TAKEAWAYS
• Speedy, consistent service and asset reliability are of paramount importance; the specific person delivering the service not so much. This sentiment supports the argument for moving to, or growing an already existing, blended workforce, with both direct employees and sub-contractors.
• Timely, accurate communications to the customer are essential in preserving and improving customer satisfaction.
• Executive management focus on customer satisfaction yields strongly positive results.
• Deployment of state-of-the-art technologies can significantly boost customer satisfaction improvements.

http://www.servicecouncil.com/@tservicecouncil 9
Measuring the Impact of Customer Satisfaction on Operational Performance | December 2020
CSAT RESULTS
Customer spend and brand loyalty are the principal drivers behind efforts at improving CSAT levels.
However, while sustained and improved customer spend seem to be key drivers for CSAT improvement,survey participants decisively indicated that customer spend is not a top measure of actual success. Amajority measure success based on improvements in customer satisfaction, customer loyalty, customerretention, and customer sentiment. Customer spend, revenue, and profitability are significantly lower on thelist of success measurements.
Figure 10 – Top Benefits Expected
What are the main benefits your organization gains by having satisfied customers? (Please select top FOUR answers)
Figure 11 – Success Measurements
How do you measure/evaluate the performance of your CSAT efforts? (Please select top FOUR answers)
http://www.servicecouncil.com/@tservicecouncil 10
Measuring the Impact of Customer Satisfaction on Operational Performance | December 2020
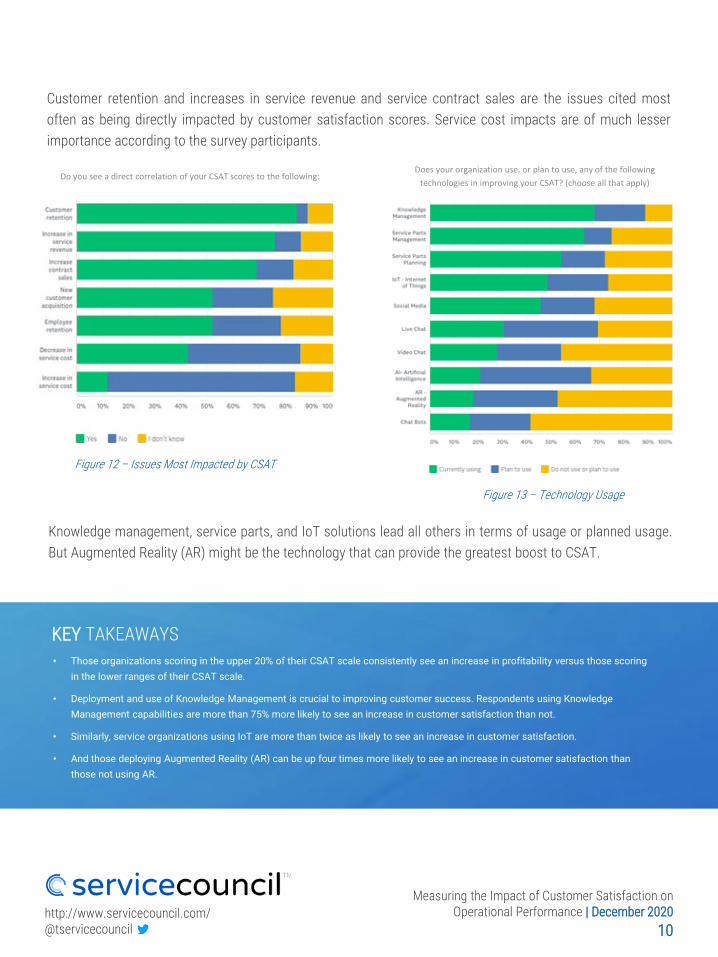
Customer retention and increases in service revenue and service contract sales are the issues cited mostoften as being directly impacted by customer satisfaction scores. Service cost impacts are of much lesserimportance according to the survey participants.
Figure 12 – Issues Most Impacted by CSAT
Do you see a direct correlation of your CSAT scores to the following:
Figure 13 – Technology Usage
Does your organization use, or plan to use, any of the following technologies in improving your CSAT? (choose all that apply)
Knowledge management, service parts, and IoT solutions lead all others in terms of usage or planned usage.But Augmented Reality (AR) might be the technology that can provide the greatest boost to CSAT.
KEY TAKEAWAYS• Those organizations scoring in the upper 20% of their CSAT scale consistently see an increase in profitability versus those scoring
in the lower ranges of their CSAT scale.
• Deployment and use of Knowledge Management is crucial to improving customer success. Respondents using Knowledge Management capabilities are more than 75% more likely to see an increase in customer satisfaction than not.
• Similarly, service organizations using IoT are more than twice as likely to see an increase in customer satisfaction.
• And those deploying Augmented Reality (AR) can be up four times more likely to see an increase in customer satisfaction than those not using AR.
http://www.servicecouncil.com/@tservicecouncil 11
Measuring the Impact of Customer Satisfaction on Operational Performance | December 2020
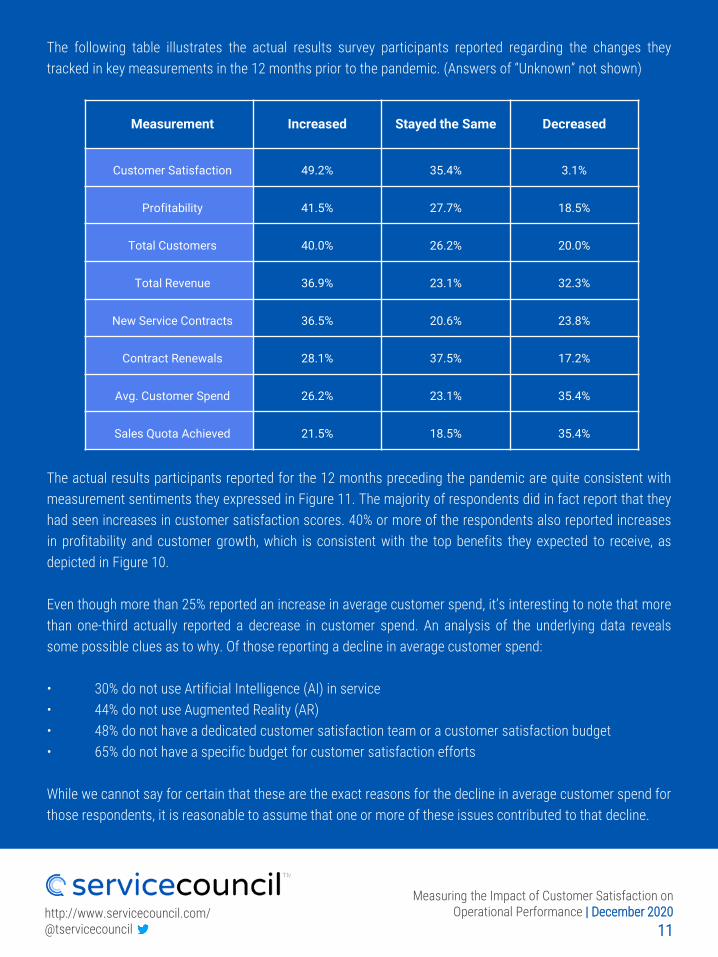
The following table illustrates the actual results survey participants reported regarding the changes theytracked in key measurements in the 12 months prior to the pandemic. (Answers of “Unknown” not shown)
The actual results participants reported for the 12 months preceding the pandemic are quite consistent withmeasurement sentiments they expressed in Figure 11. The majority of respondents did in fact report that theyhad seen increases in customer satisfaction scores. 40% or more of the respondents also reported increasesin profitability and customer growth, which is consistent with the top benefits they expected to receive, asdepicted in Figure 10.
Even though more than 25% reported an increase in average customer spend, it’s interesting to note that morethan one-third actually reported a decrease in customer spend. An analysis of the underlying data revealssome possible clues as to why. Of those reporting a decline in average customer spend:
• 30% do not use Artificial Intelligence (AI) in service• 44% do not use Augmented Reality (AR)• 48% do not have a dedicated customer satisfaction team or a customer satisfaction budget• 65% do not have a specific budget for customer satisfaction efforts
While we cannot say for certain that these are the exact reasons for the decline in average customer spend forthose respondents, it is reasonable to assume that one or more of these issues contributed to that decline.
Measurement Increased Stayed the Same Decreased
Customer Satisfaction 49.2% 35.4% 3.1%
Profitability 41.5% 27.7% 18.5%
Total Customers 40.0% 26.2% 20.0%
Total Revenue 36.9% 23.1% 32.3%
New Service Contracts 36.5% 20.6% 23.8%
Contract Renewals 28.1% 37.5% 17.2%
Avg. Customer Spend 26.2% 23.1% 35.4%
Sales Quota Achieved 21.5% 18.5% 35.4%

http://www.servicecouncil.com/@tservicecouncil 12
Measuring the Impact of Customer Satisfaction on Operational Performance | December 2020
Survey participants use a variety of tools to measure and track CSAT levels. NPS is used by most participants,and a 1 to 5 scale, where 5 is best, is also the predominant source of measure.
Figure 14 – CSAT Measurement Tools Used
What scale do you use to measure CSAT?
KEY TAKEAWAYS
• While NPS is the dominant tool used to measure CSAT, it is by no means the only tool used for that purpose.
• Nearly all NPS users conduct both scheduled and transactional surveys.
• Nearly 60% of NPS users also use the 1 – 5 or the 1 – 10 scales (where the high number is best), apparently for some of the scheduled and/or transactional surveys.
• More than 40% of NPS users also conduct some type customer focus group and/or user group sessions.
• Nearly 20% also make use of the Customer Effort Score (CES).

http://www.servicecouncil.com/@tservicecouncil 13
Measuring the Impact of Customer Satisfaction on Operational Performance | December 2020
TECHNOLOGY: THE GREAT DIFFERENTIATOR
As previously reviewed, the presence of executive management and services leadership (Director Level+), aswell as, the presence of incentives drives greater performance on key operating and customer metrics. Inaddition, the usage of key technologies (Figure 13 – Technology Usage) such as Knowledge Management(KM), Service Parts Management (SPM), and Internet of Things (IoT) solutions lead all others in terms ofcurrently implemented technologies aimed at improving CSAT. With digital transformations being acceleratedto support new service delivery channels driven by customer preferences and expectations, emerging classesof tools and technologies such as Artificial Intelligence (AI), Live/Video Chat, Augmented Reality (AR) andInternet of Things (IoT) are currently being prioritized for investment in the next 12 months.
Let’s look at the impact the presence of these technologies has had, or will have, on operating (profit, cost,etc.) and customer metrics (CSAT, NPS, etc.).
TechnologyIncrease in Total Revenue
Increase in Average
Customer Spend
Increase in Total # of
Customers
Increase in Sales Quota Attainment
Increase in New Contract
Sales
Increase in
CSAT
Increase in Profitability
Artificial Intelligence (AI) 30% 20% 59% 20% 20% 50% 30%
Augmented Reality (AR) 50% 38% 50% 38% 25% 63% 38%
Chat Bots 42% 25% 56% 8% 17% 58% 50%
Internet of Things (IoT) 37% 27% 59% 16% 37% 68% 53%
Knowledge Management (KM) 33% 21% 42% 16% 33% 68% 54%
Live/Video Chat 30% 20% 50% 20% 15% 68% 40%
Service Parts Management
(SPM) 35% 20% 45% 15% 35% 65% 60%
(Data represented is the percentage of respondents who witnessed an increase in operating and customer metrics. Green shaded areas represent the leading technology class witnessing an increase).

LATEST RESEARCH:
MEASURING THE IMPACT OF CUSTOMER SATISFACTION ON OPERATIONAL PERFORMANCEDecember 2020
Are these technologies creating predictable return on investment? It certainly appearsso. Cost reduction and profit are highly measurable and self-explanatory in terms ofreturn on investment and total cost of ownership analyses. The impact of CSATimprovement often leads to an impact in the top CSAT measurements we discussedpreviously (Figure 11: Success Measurements) including CSAT, loyalty, retention,sentiment and spend. Highlighted (green shaded) are the leading technologies drivingan increase on each operating and customer metric. Driving the greatest impact on amultitude of metrics (leading 3 metrics each respectively) are Augmented Reality (AR)and Internet of Things (IoT). Also noteworthy is Service Parts Management (SPM)which is most commonly driving an increase in Profitability.
http://www.servicecouncil.com/@tservicecouncil
Michael Israel | COO
About the author
Michael Israel is Service Council’s COO. Michael has worked in customer and field service for more than 40years. He spent 17 years in his early career managing both domestic and international field service operations,including 12 years with IBM’s Field Engineering organization. Over the past three decades he has heldmanagement and executive roles with major providers of CRM and Field Service software applications,including tenures with IFS, Oracle, and SAP.
His broad experience includes marketing, selling, supporting, and implementing CRM and Field Service softwareapplications. Michael also served as a Field Service analyst for both Aberdeen Group and Technology ServicesIndustry Association (TSIA).


