Embed Size (px)
Citation preview
1
INDUSTRY PROFILE
1.1ABOUT THE INDUSTRY
AUTOMOBILE INDUSTRY IN INDIA – A background of the four wheeler segment
Indian roads saw very less of the four wheelers until 1980s. They were seen as the symbol of those which had arrived. Premier Padminis and the AmbassadorWere favorites on Indian roads.
With liberalization, Government abolished licensing and removed restrictive trade policies. Automobile industries benefited greatly from these measures. Indianmanufacturers started to collaborate with International companies, invested in research and development and introduced fuel efficient and cost efficient products.
Mahindra & Mahindra’s Automotive Chief, Pawan Goenka, who is also President of industry body, Society of Indian Automobile Manufacturers (SIAM) says that “The Indian auto industry and the Indian auto market have become internationally very important and therefore, no one can ignore this market,”
A closer look at the four-wheeler segment in India
The four wheeler segment comprises of the passenger vehicles, utility vehicles and multi-purpose vehicles. India is the 11th largest passenger car market in the world and prominently features on the major automobile players’ road map. The passenger cars segment is has thelargest share in the domestic passenger vehicles industry. It contributes to a total volume of 78% and
2
the rest of the share isenjoyed by utility and sportsvehicles. Some of the keyplayers in the market are Maruti Udyog Ltd. Tata Motors Ltd., Hyundai, Toyota, Honda, Ford and GM. The newer entrants are the marquee brands like Mercedes-Benz, BMW and Volkswagen.
The automotive industry in India is one of the larger markets in the world and had previously been one of the fastest growing globally, but is now seeing flat or negative growth rates. India's passenger car and commercial vehicle manufacturing industry is the sixth largest in the world, with an annual production of more than 3.9 million units in 2011. According to recent reports, India overtook Brazil and became the sixth largest passenger vehicle produced in the world and grew 16 to 18 per cent to sell around three million units in the course of 2011-12. In 2009, India emerged as Asia's fourth largest exporter of passenger cars, behind Japan, South Korea, and Thailand. In 2010, India beat Thailand to become Asia's third largest exporter of passenger cars.As of 2010, India is home to 40 million passenger vehicles. More than 3.7 million automotive vehicles wereproduced in India in 2010 (an increase of 33.9%), makingthe country the second (after China) fastest growing automobile market in the world in that year. According to the Society of Indian Automobile Manufacturers, annual vehicle sales are projected to increase to 4 million by 2015, no longer 5 million as previously projected.
3
“The production of passengervehicles in India wasrecorded at 3.23 million in2012-13 and is expected to grow at a compound annual growth rate (CAGR) of 13 per cent during 2012-2021, as per data published by Automotive Component ManufacturersAssociation of India (ACMA)”The majority of India's car manufacturing industry is based around three clusters in the south, west and north. The southern cluster consisting of Chennai is thebiggest with 35% of the revenue share. The western hub near Mumbai and Pune contributes to 33% of the market and the northern cluster around the National Capital Region contributes 32%.Chennai, with the India operations of Ford, Hyundai, Renault, Mitsubishi, Nissan, BMW, Hindustan Motors, Daimler, Caparo, and PSA Peugeot Citroën is about to begin their operations by 2014. Chennai accounts for 60% of the country's automotive exports. Gurgaon and Manesar in Haryana form the northern cluster where the country's largest car manufacturer, Maruti Suzuki, is based.The Chakan corridor near Pune, Maharashtra is the western cluster with companies like General Motors, Volkswagen, Skoda, Mahindra and Mahindra, Tata Motors, Mercedes Benz, Land Rover, Jaguar Cars, Fiat and Force Motors having assembly plants in the area. Nashik has a major base of Mahindra & Mahindrawith a UV assembly unit and an Engine assembly unit. Aurangabad with Audi, Skoda and Volkswagen also forms part of the western cluster. Another emerging cluster is in the state of Gujarat with manufacturing facility of General Motors in Halol and further planned for Tata Nano at their plant in Sanand. Ford, Maruti Suzuki and Peugeot-Citroen plants are also set to come
4
up in Gujarat.Kolkata with HindustanMotors,Noida with Honda and Bangalore with Toyota are some of the other automotive manufacturing regions around the country
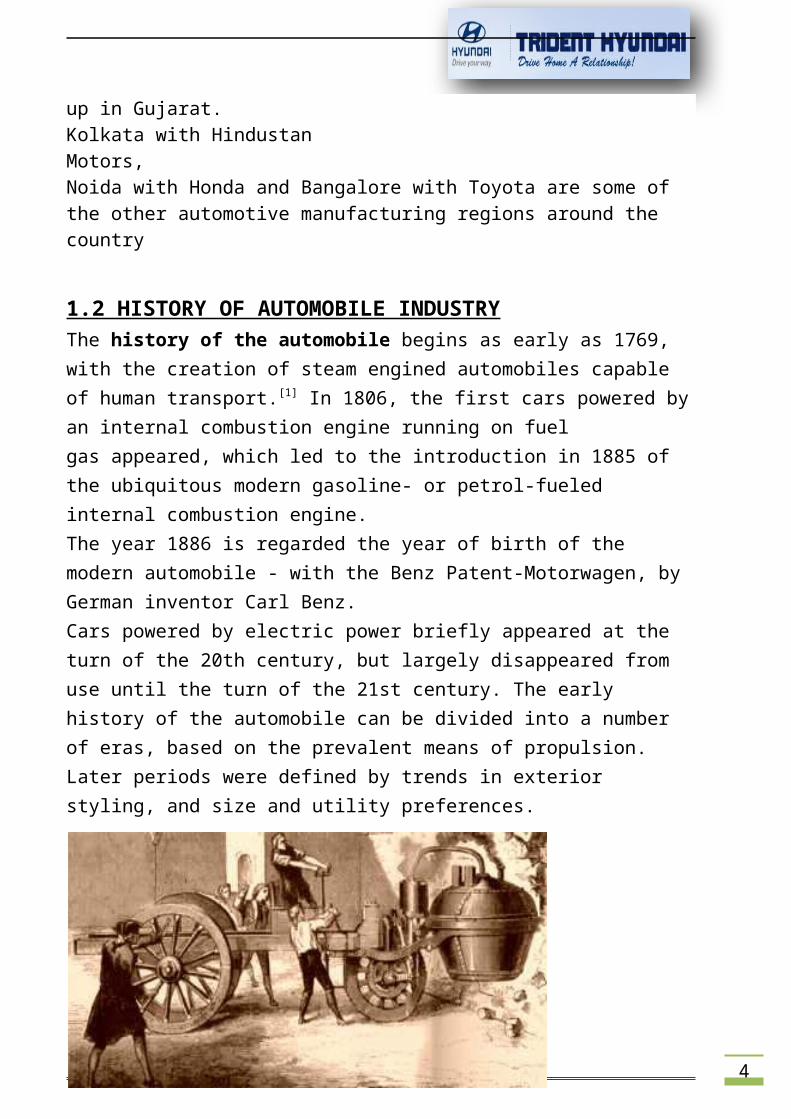
1.2 HISTORY OF AUTOMOBILE INDUSTRYThe history of the automobile begins as early as 1769, with the creation of steam engined automobiles capable of human transport.[1] In 1806, the first cars powered byan internal combustion engine running on fuel gas appeared, which led to the introduction in 1885 of the ubiquitous modern gasoline- or petrol-fueled internal combustion engine.The year 1886 is regarded the year of birth of the modern automobile - with the Benz Patent-Motorwagen, by German inventor Carl Benz.Cars powered by electric power briefly appeared at the turn of the 20th century, but largely disappeared from use until the turn of the 21st century. The early history of the automobile can be divided into a number of eras, based on the prevalent means of propulsion. Later periods were defined by trends in exterior styling, and size and utility preferences.
5
Old Engraving depicting the 1771 crash of Nicolas Joseph Cugnot's steam-powered car into a stone wall.
The automobile as we know it was not invented in a single day by a single inventor. The history of the automobile reflects an evolution that took place worldwide. Starting with the first theoretical plans fora motor vehicle that had been drawn up by both Leonardo da Vinci and Isaac Newton. In 1769, the very first self-propelled road vehicle was a military tractor invented by French engineer and mechanic, Nicolas Joseph Cugnot (1725 - 1804). Cugnot used a steam engine to power his vehicle, built under his instructions at the Paris Arsenal by mechanic Brezin. It was used by the French Army to haul artilleryat a whopping speed of 2 1/2 mph on only three wheels. The vehicle had to stop every ten to fifteen minutes to build up steam power. The steam engine and boiler were separate from the rest of the vehicle and placed in the front (see engraving above). The following year (1770), Cugnot built a steam-powered tricycle that carried four passengers.
Early Electric Cars
6
Steam engines were not theonly engines used in earlyautomobiles. Vehicles withelectrical engines were also invented. Between 1832 and 1839 (the exact year is uncertain), Robert Anderson of Scotland invented the first electric carriage. Electric cars used rechargeable batteries that powered a small electric motor. The vehicles were heavy, slow, expensive, and needed to stop for recharging frequently. 1.3INTRODUCTION TO INDIAN MARKETThe present Indian economy is characterized by increasing in the consumption rate. Today Indian market is exposed to a lot of competitions not only from the domestic players but also global players. The competition in the market is driving every manufacturer to cut costs and focus on satisfying the customer which will surely help him retain his market share and also toenhance it. The customers delight in the business world of marketing today. All the marketers are oriented themselves towards it.
1.4 MARKET SHARE
When Hyundai Motor India Ltd (HMI) started producingcars at a place called Irrungattukottai near the South
7
Indian city of Chennai inSeptember 1998 Cut to 2004.The integrated manufacturingplant set up at an initial investment of US$ 614 millionis now the largest manufacturing facility of Hyundai outside Korea. Hyundai India has a market share of about20 per cent, and its plant rolls out about 600 - 700 cars per day in two shifts.Hyundai India today sells not two but eight brands - Santro, EON, i10, i20, Verna, Elantra, Sonata and Santa Fe. These cars are soldand serviced by a national network of 300 sales and service outlets. HMI’s Santro and Accent are India’s largest selling brands in the B and C segments. The Santro was rated the "Best Small Car" in the JD Power Asia Pacific Initial Quality and APEAL studies for threeyears in a row, and continues to be one of India’s threemost preferred compact cars. The same car is now making important inroads in Europe.
Hyundai India sold 42,113 cars in 2012-13, and this year, they are planning to target the largest and most competitive market of them all now, with localization levels of over 90 percent and the capability to produce world-class automobiles, Hyundai has made India its small car hub. Business world magazine reported in January this year that Hyundai is upping its annual export capacity so that by 2013 it can export 500,000 small cars from its production base in Chennai.
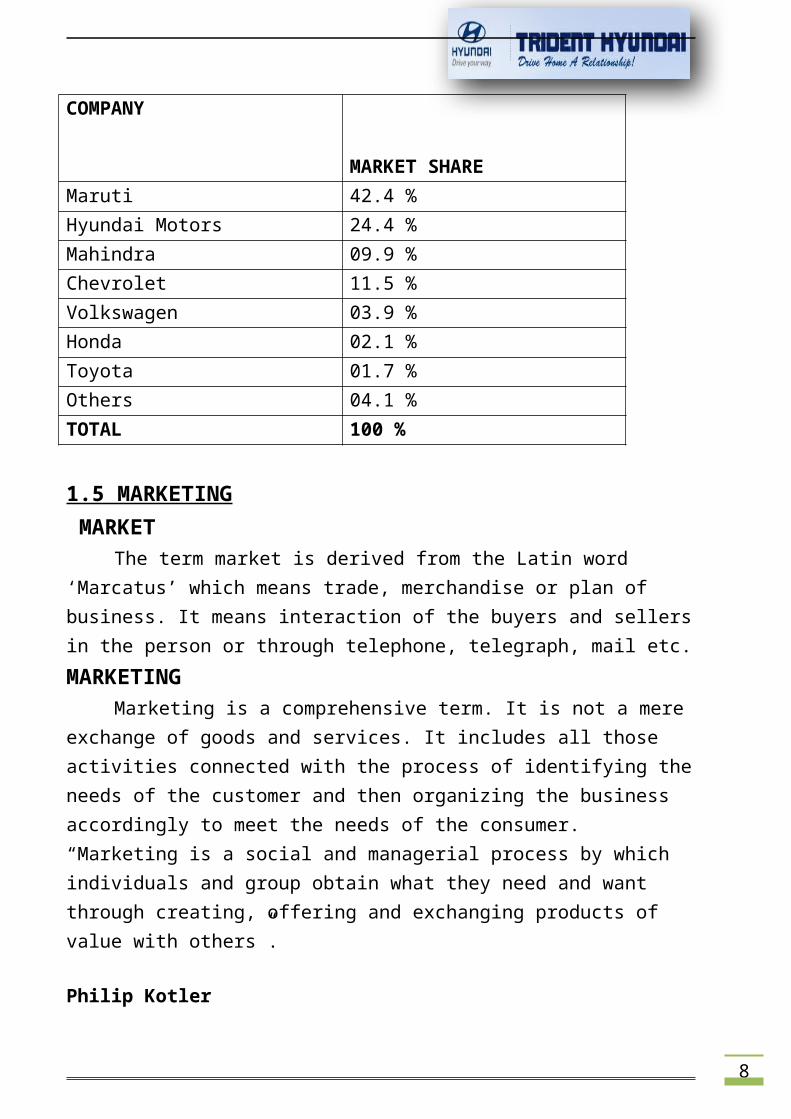
The market shares of leading players for the month of Mar, 2013 is as given below.
8
COMPANY
MARKET SHAREMaruti 42.4 %Hyundai Motors 24.4 %Mahindra 09.9 %Chevrolet 11.5 %Volkswagen 03.9 %Honda 02.1 %Toyota 01.7 %Others 04.1 %TOTAL 100 %
1.5 MARKETING MARKET
The term market is derived from the Latin word ‘Marcatus’ which means trade, merchandise or plan of business. It means interaction of the buyers and sellersin the person or through telephone, telegraph, mail etc.MARKETING
Marketing is a comprehensive term. It is not a mere exchange of goods and services. It includes all those activities connected with the process of identifying theneeds of the customer and then organizing the business accordingly to meet the needs of the consumer.“Marketing is a social and managerial process by which individuals and group obtain what they need and want through creating, offering and exchanging products of value with others”. Philip Kotler
9
“Marketing is the totalsystem of interactingbusiness activities designed to plan, price, promote, and distribute wants satisfying products and service, topresent and potential customers”. Professor William Stanton.
CONSUMER PERCEPTIONThe term perception refers to the complete act of
‘perceiving’ and involving of the psychological factors.Perception is the process by which the mind receives organizes and interprets a particular thing. It is estimated that 90 percent of the stimuli that the individual perceives come through sight and the rest from learning. Price is another element of marketing mixwhere perception has its implication.The basis of perception
We know that sight perception depends on the flow ofphotons in through the pupils and absorbed in the retina. Therefore with the operation of our senses we doknow there is something there can and is influencing thesensory mechanisms within ourselves but we do not necessarily know what it is that is causing the sense ofexperience. This gives rise to two levels of perception.The first is called immediate perception and is totally physical the operation of the physical universe following its mechanistic path ways, some of which happen to occur as neural events in our brain. The second level of perception is the interpretative
10
perception where ourpsychology and attention isimplicated in the perceptualact.
Immediate perception is direct mediated only by physiology of perceiving species. Moving beyond immediate perception such as when a person attends to what they are perceiving, then all the well known aspects come to the fore. The obvious consequence is that we do not necessarily perceive that which we immediately perceive.
The mechanism of immediate perception area set of physical events in the physical universe. The external reality is generating a perpetual field that is influencing the eye, which in turn is influencing the neurons of the visual cortex.
The visual cortex is the reacting part. The interaction of the visual cortex with other parts of thebrain and central nervous systems represented by the arrows to thought and emotion is the beginning of the analysis of the complete act of perception involving theemotive and interpretative elements.
This model of immediate perception says that we immediately perceive reality via the effect a perceptualfield has no sensory apparatus of our physiology.
The study of consumers helps firm and organizations improve their marketing strategies by understanding issues such as:
The psychology of how consumers think, feel, reason, and select between different
11
alternatives (e.g.brands, products).The psychology of howthe consumer is influenced by his or her environment (e.g., culture, family, signs, media).The behavior of consumers while shopping or making other marketing decisions.Limitations in consumer knowledge or information processing abilities influence decisions and marketing outcome.How consumer motivation and decision strategiesdiffer between products that differ in their level of importance or interest that they entail for the consumer.How marketers can adopt and improve their marketing campaigns and marketing strategies tomore effectively reach the consumer.
Understanding these issues help us adopt our strategies by taking the consumer into consideration. Wealso learn that consumer’s will sometimes be persuaded more by logical arguments, but at other times will be persuaded more by emotional or symbolic appeals. By understanding the consumer, we will be able to make a more informed decision as to which strategy to employ.
CONSUMER BEHAVIOUROne official definition of consumer behavior is “The
study of individuals groups, or organizations and the processes they use to select, secure, use, dispose of products, services experiences or idea to satisfy needs
12
and the impacts that theseprocesses have on theconsumer and society.” Thisdefinition brings up some useful points. Behavior occurs either for the individual, or in the
context of a group (e.g., friend’s influence what kinds of clothes person wears) or an organization (people on the job make decisions as to which productsthe firm should use).
Consumer behavior involves the use and disposal of products as well as the study of how they are purchased. Product use is often of great interest to the marketer, because this may influence how a productis best positioned or how we can encourage increased consumption. Since many environmental problems result from product disposal (e.g., motor oil being sent to sewage systems to save the recycling fee, or garbage piling up at landfill) this is also an area of interest.
Customer behavior involves services and ideas as well as tangible products.
The impact of consumer behavior on society is also of relevance. For example, aggressive marketing of high fat foods or aggressive marketing of easy credit may be serious repercussions for the national health and economy.
There are several units in the market that can be analyzed. The main trust in this course is the consumer.However we will also need to analyze our own firm’s strengths and weaknesses and those of competing firms. Finally, we need to assess the marketing environment
13
although we may havedeveloped a product thatoffers great appeal forconsumers a recession may cut demand dramatically.
WHO IS THE CUSTOMER?We all think of customers as the people who sit at
our tables and pay for the goods and services purchased.But they are individuals in their own right. They may bebusiness people, tourists, youngsters, retired couples or celebrities. They cannot be looked upon as an amorphous group - their needs are different and your service should reflect that.
A customer is the most important person in our business.
A customer is a person who comes to us with needs and wants and itis our job to handle them in a manner that is profitable to him/her and ourselves.
A customer is not a cold statistic; he/she is a human being with feelings and deserves to be treated with respect.
A customer is not an interruptionto our work - he is the purpose of it. We are not doing him a favor by serving him, he is doingus a favor by giving us the opportunity to do so.
A customer deserves the most
14
courteousattention we cangive.
Customers are not dependent on us, we are dependent on them!
A Customer is anyone who receives the work youdo!
CUSTOMER SATISFACTION
Winning customers' hearts and minds is increasingly important to customer acquisition and customer retention. It is no coincidence that customer satisfaction research accounts for much of market research activities.
As competitive advantage and differentiation is achieved through product innovation and service performance (rather than competing on cost), it is vitalto monitor and manage customer satisfaction levels.
Customer satisfaction is not just about service levels or product attributes. It can be seen as a function of two main components:
perceptions of product and service levels received
expectation of product and service levels
Customer satisfaction is therefore concerned with service delivery/product performance and expectation management.
15
Customer satisfactionresearch delivers keybenefits:
understanding the underlying drivers of satisfaction
identification of trigger points where satisfaction management is most needed
prioritization of action areas (minimum input for maximum return)
Identification of customer-supplier interactions, internal processes and departments most likely to cause satisfaction/dissatisfaction.
Impact on loyalty and propensity to recommend; a vital bottom line measurement
CUSTOMER SATISFACTION ALSO HELPS YOU TO GET TO GRIPS WITH
Customer Expectations
Attitude and Behavior
Personal Appearance
Maintaining Standards
16
Handling Complaints
Getting it Right First Time
LOYALTY
Loyalty is faithfulness or a devotion to a person, country, group, or cause. (Philosophers disagree as to what things one can be loyal to. Some, argue that one can be loyal to a broad range of things, while others argue that it is only possible for loyalty to be to another person and that it is strictly interpersonal.)
17
2.COMPANY PROFILE
2.1 ORIGIN OF THE COMPANY
HYUNDAI MOTOR COMPANY
The Hyundai Motor Company (HMC) was founded in 1947 as Hyundai Engineering and Construction Co. by the late Ju-Yung Chung. Hyundai Motor Company, established in 1967, is the auto sales leader in the Korean domestic market and exports vehicles to 190 countries worldwide.
Hyundai Motor Company operates the world's largest integrated automobile manufacturing facility in Ulsan, on Korea's southeast coast. In 1996, Hyundai opened the Namyang Technology Research Center, which includes a complete testing facility with a 2.8-mile oval test track and a new $40 million aero acoustic wind tunnel.
18
That same year, 1996, HMCbegan production at itsstate-of-the-art Asan Plant,located southeast of Seoul.
Hyundai now operates eight research centers in Koreaalong with four international centers, including HyundaiAmerica Technical Center, Inc. in Ann Arbor, Michigan, and the Hyundai California Design Center in Irvine, California. Hyundai's automotive technology centers employ approximately 4,100 researchers with an annual budget of five percent of current revenues. Current research projects include: electric-powered vehicles, low-emission gasoline engines, solar-powered vehicles, hydrogen-powered fuel cell vehicles and other alternative fuel vehicles.
Hyundai Motor India Limited (HMIL)Hyundai Motor India Limited (HMIL) is a wholly owned subsidiary of Hyundai Motor Company (HMC). HMIL is the largest passenger car exporter and the second largest car manufacturer in India. It currently markets nine carmodels across segments - in the A2 segment it has the Eon, Santro, i10 and the i20, in the A3 segment the Accent and the Verna, in the A4 segment the Elantra, in the A5 segment Sonata and in the SUV segment the Santa Fe.HMIL's fully integrated state-of-the-art manufacturing plant near Chennai boasts of advanced production, quality and testing capabilities. HMIL forms a critical part of HMC's global export hub, it touched 1.5 million in exports in March 2012. It currently exports to more than 120 countries across EU, Africa, Middle East, LatinAmerica and the Asia Pacific. HMIL has been India's
19
number one exporter for sevenyears in a row. To cater torising demand the companycommissioned its second plant in February 2008 having aninstalled capacity of 330,000 units per annum. To support its growth and expansion plans HMIL currently has 346 dealers and around 800 service points across India. In its commitment to provide customers with cutting-edge global technology, HMIL set up a modern multi-million dollar R&D facility in Hyderabad. The R&D centre endeavors to be a center of excellence in automobile engineering.
MISSIONTo create an exceptional automotive value for our customers by harmoniously blending safety, quality and efficiency. With our diverse team, we will provide responsible stewardship to our community and environmentwhile achieving stability and security now and for future generations.
VISIONThe vision of Hyundai-Kia Motors is to secure world bestinnovations and raise our profile as a premium automaker. Our quest also includes making this world a better place for all by popularizing next-generation eco-friendly technologies and creating a new auto-culture people centered technologies that move customer’s heart.
20
2.2 ORGANISATION STRUCTURE
21
A BRIEF OVERVIEW OFTRIDENT HYUNDAI
IntroductionTrident Hyundai started in 1998 at Bangalore with 30 employees and just one Customer Care Centre. Today, Trident Hyundai has over 600 employees spread over Bangalore, Shimoga and Davengere.The philosophy "Drive Home a Relationship" is a way of work life and is reflected in our deep rooted commitment almost bordering on obsession towards customer satisfaction.This has helped us in setting up new benchmarks in dealership operation and procedures that has been replicated by other automobile dealers in India. We are recipients of many accolades for excellence in the areas of sales, services and finance.We are also an ISO 9001:2000 Company accredited by TUV andhave joined the elite group.
Trident Hyundai offers a perfect career for those who have the flair to excel at work. Freedom of expression and a conducive work environs foster the employees to exploit their talents to the fullest abilities.
22
Palace Orchard at Bangalorehas virtually become alandmark of Country's few multilevel automobile dealerships. Our Customer Care Centres are conveniently spread at Yeshwanthpur, Indira Nagar, JP Nagar, Sheshadripuram and Kalyan Nagar with state-of-the-art equipments and qualified technicians to cater customer needs.
Our goal extends beyond customer satisfaction and we arecommitted in achieving total "Customer Delight".
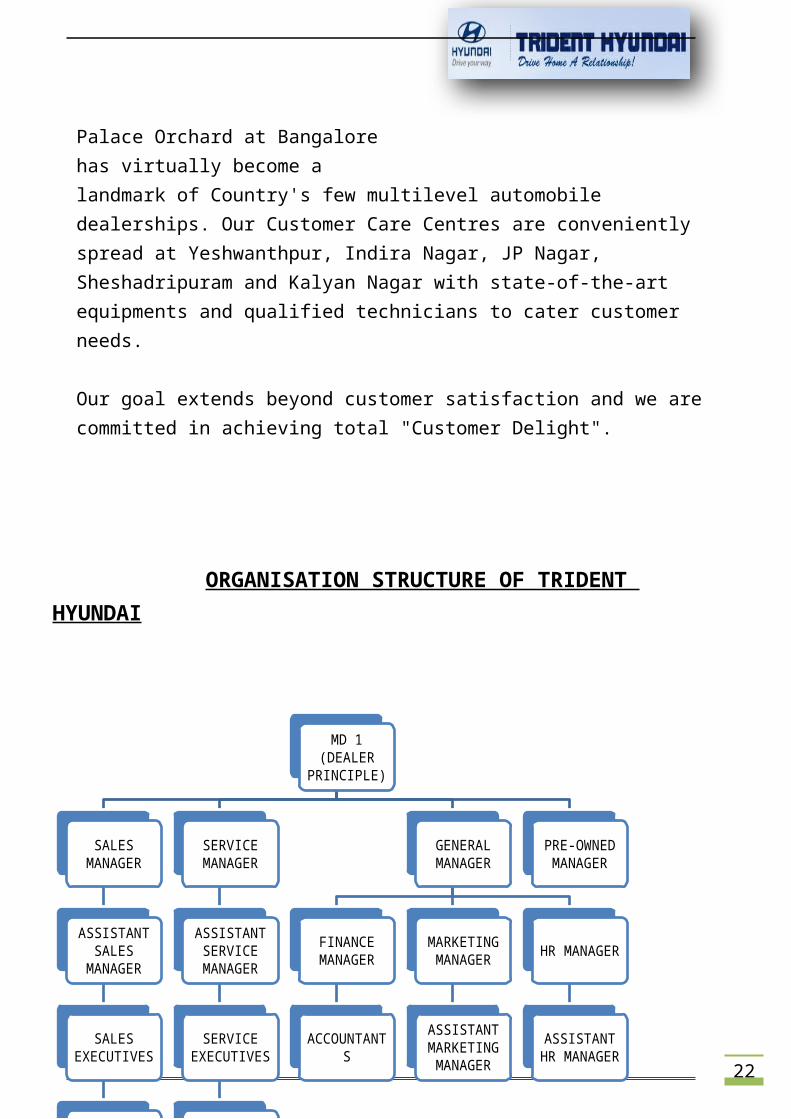
ORGANISATION STRUCTURE OF TRIDENT HYUNDAI
MD 1 (DEALER
PRINCIPLE)
SALES MANAGER
ASSISTANT SALES
MANAGER
SALES EXECUTIVES
CLERKS
SERVICE MANAGER
ASSISTANT SERVICE MANAGER
SERVICE EXECUTIVES
CLERKS
GENERAL MANAGER
FINANCE MANAGER
ACCOUNTANTS
MARKETING MANAGER
ASSISTANT MARKETING MANAGER
HR MANAGER
ASSISTANT HR MANAGER
PRE-OWNED MANAGER
23
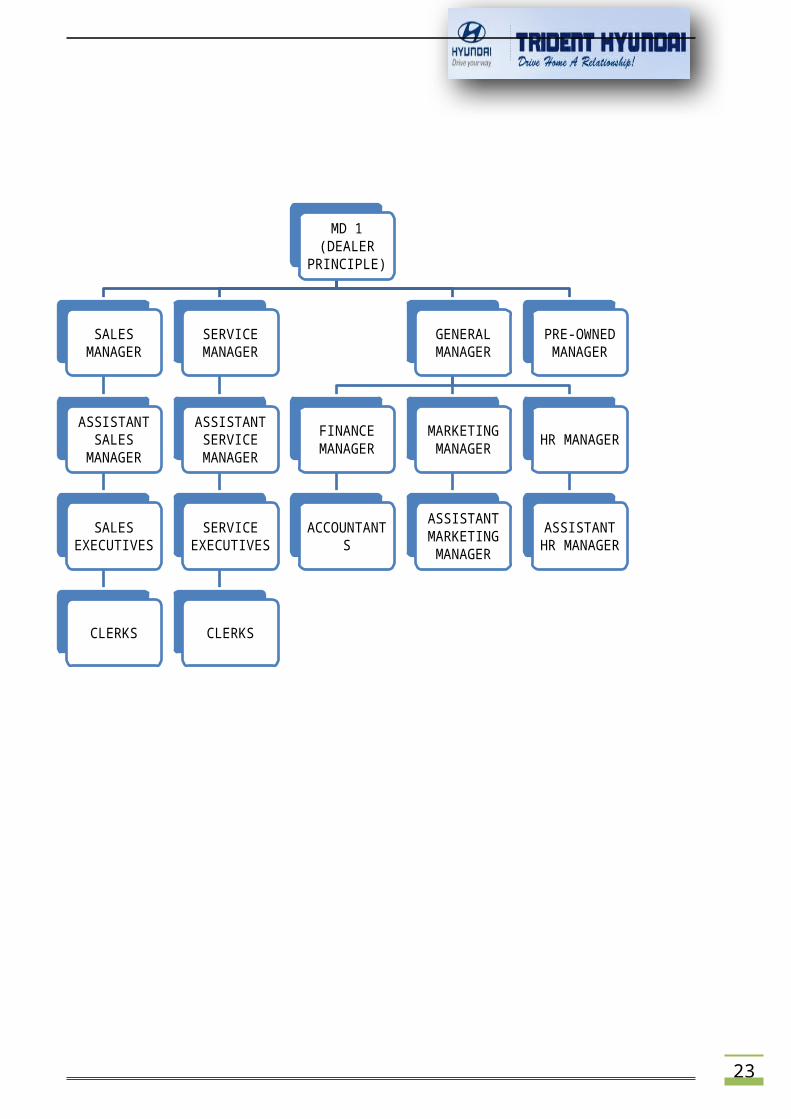
MD 1 (DEALER
PRINCIPLE)
SALES MANAGER
ASSISTANT SALES
MANAGER
SALES EXECUTIVES
CLERKS
SERVICE MANAGER
ASSISTANT SERVICE MANAGER
SERVICE EXECUTIVES
CLERKS
GENERAL MANAGER
FINANCE MANAGER
ACCOUNTANTS
MARKETING MANAGER
ASSISTANT MARKETING MANAGER
HR MANAGER
ASSISTANT HR MANAGER
PRE-OWNED MANAGER
24
BRANCHESTrident Hyundai46/4, Garvebhavi Palya, Begur Hobli Hosur RoadBangalore - 560068 Tel: 080-43433222
Trident HyundaiNo. 9, HAL Airport Road,Kodihalli, Next to Carlton TowersBangalore-560014Tel: 080-43431111
Trident HyundaiNo. 1, Lower Palace OrchardsSankey Road, Next to Cauvery Theater Bangalore - 560003 Tel: 080-43433333
Trident Hyundai No. 111,122 & 125, B Narayanpura, K.R Puram, Bangalore-560016 Tel: 080-67879191 SERVICE STATIONS
1. #99/A, Industrial Suburb, Tumkur Road,
25
Yeshwanthpur, Bangalore - 560022 Ph: 080-4343 3999
2. # 540, Amarjyoti Layout, Koramangala - Indiranagar Ring Road, Domlur, Bangalore - 560071 Ph: 080-4343 3888
3. J P NAGAR # 10th KM, (Anthony's Industrial Area), Kanakpura Main Road, Bangalore - 560078 Ph: 080-4343 3777
4. # 122/1, C Shankar Reddy Layout, Kalyan Nagar, Outer Ring Road, Bangalore - 560043 Ph: 080-4343 3666
5. # 38/4, Sarjapur Road, Jakkasandra, Koramangala, Bangalore - 560038 Ph: 080-4343 3444
6. # 130, 1st Main Road, Sheshadripuram Bangalore - 560020 Ph: 080-4343 3555
7. No.111, 124&125, B Narayanapura Village, Whitefield, Bangalore East Taluk.
26
2.3 PRODUCT PROFILE
A. Hatchbacks
SANTRO Xing
Santro Xing with it’s new aerodynamic styling, power-assisted brakes, the advanced suspensions, the uniquely responsive technology is as much a magnificent creation ofour drive to delight you as much as a benchmark in engineering excellence. Santro is being produced exclusively in India and the Indian Xing will now drive the World.
I101.The BSIV compliant 1.2 Kappa2 engine with VTVT
27
achieved a spectacularfuel mileage of 20.36km/litre
2.Best in class ARAI-Certified fuel efficiency among petrol cars in India
I20 The Winner of the Prestigious ‘Viewer’s Choice of the Year’ and ‘Design of the Year’ Awards, the i20 is all set to sweep you of your feet once again.Reflecting Hyundai's design identity, fluidic sculpture, the new i20 boasts more aggressive and stylish design, giving you extra confidence on the road. The New Hyundai i20 is full of clever technology and smart features. Automatic headlamps, Rain Sensing wipers, Clutch lock function, a rear view parking camera and rear parking sensors are standard on Style models
EON
B. Sedans
Verna Fluidic
The 1.6 L VTVT engine is a powerhouse which is refined to
28
deliver best-in-segment 123ps@6300 rpm leaving thecompetition way behind. Theengine is tuned to generate optimum efficiency without compromising on power. The new Verna also offers a 1.4 L VTVT which boasts of similarly unbeatable performance and best-in-segment mileage of 17.43 Km/L. The Verna features an ABS system and six airbags, including dual front airbags, curtain airbags and side airbags, for better safety
ELANTRA
The New Elantra comes perfectly handy for all occasions. Speed, agility and power come as standard equipment in Elantra. The design is a culmination of European styling and delightful functionality
SONATA
Sonata’s sophistication really shines from all angles together with its impressive rear view with its subtle curvature, fine details and unique rear combination lamps.The Sonata is built like a fortress. The car body incorporates numerous structural protection elements like,dual side impact beams, the energy absorbing collapsible steering column, front and rear crumple zones, cross-bar under the dashboard, engine sub-frame and reinforced bumpers together with the ABS (Anti-locking Braking System), TCS (Traction Control System) and the optional SRS airbag which provides maximum
29
C. SUVSanta Fe
The Santa Fe's craftsmanship is inspired by the heart and completed with technology. You will continue to be pleasantly surprised by the features you discover throughout the vehicle when driving or parked.
SOCIAL RESPONSIBILITY
Hyundai, as a responsible corporate citizen is committed to sustainable social development and the preservation of the environment. All the company's key manufacturing units, including the Indian plant have the ISO 14001 certification for its Environment management practices. Asa part of its social responsibility programs, the company conducts various campaigns to spread awareness of in-car safety and safe driving practices, particularly targeted against drunken driving, speeding.
As a part of its community development projects, the company has adopted a few villages around its factory in Tamil Nadu and has been working towards the social and economic development of these villages, assisting them in the areas of primary health care, education, basic
30
amenities and employmentopportunities.AWARDS AND ACHIEVEMENTS
As one of the fastest growing automobile companies in India, Hyundai has many accomplishments to its credit.
SONATA RANKED"MOST DEPENDABLE MIDSIZE CAR" J.D. POWER AND ASSOCIATES 2013 VEHICLE DEPENDABILITY STUDY
ELANTRA SEDAN AND SANTA FE EARNS A2013 ALG’S HIGHEST RESIDUAL VALUE AWARD
31
ELANTRA NAMED ONE OF THE 10 BEST GREEN CARS OF 2012BY KELLEY BLUE BOOK’S KBB.COM. ELANTRA HAS EARNED THIS AWARD FOR THE SECOND STRAIGHT YEAR
CHAPTER – 3 RESEARCH METHODOLOGY
3.1 INTRODUCTIONThe present Indian economy is characterized by increasing in the consumption rate. Today Indian market is exposed to a lot of competitions not only from the domestic players but also global players. Thecompetition in the market is driving every manufacturer to cut costs and focus on satisfying the customer which will surely help him retain his market share and also to enhance it. The customers delight inthe business world of marketing today. All the marketers are oriented themselves towards it.
3.2 STATEMENT OF PROBLEM
32
Today the company and itsproducts can survive only ifthey can effectively satisfythe consumer expectations, as the consumer is the boss &the king. Trident Hyundai is a very important player in the automobile industry. It has very wide reaching market for its products. In fact it is the market leaderfor most of the four wheeler. So understanding customersatisfaction with respect to Trident Hyundai is very essential. The research is titled as “An Organizational study on customer satisfaction and loyalty towards Hyundai cars with special reference to Trident Motors Pvt. Ltd”
33
3.3 OBJECTIVE OF THESTUDYThe following are the objectives of the study.
To understand the level of customer satisfaction about the Hyundai cars with special reference to trident Hyundai
3.4 SCOPE OF THE STUDY The present study intends to provide an integrated
picture of the level of customer satisfaction towards Hyundai, in the Indian market.
The study was conducted in the city of Bangalore. Customers of Hyundai have been chosen for the study.Availability and accessibility are twin factors for the study held in Bangalore city.
The study is also intended to know the level of customer satisfaction towards Hyundai cars when compared to other brands, as the automobile industryis facing a stiff competition due to globalization.
The study applies to Businessmen, Employed, Engineer, Doctors, Housewife’s, students and people belonging to other profession.
3.5 SOURCES OF DATA
1.PRIMARY DATA 2.SECONDARY DATA
PRIMARY DATA Primary data was collected through a questionnaireand administered to the consumers. SECONDARY DATA
34
It includes both externaland internal data. Internaldata were company
manuals, annual reports, brochures etc. Externaldata are current information
regarding the company subject is obtained fromonline sources, magazines etc.
3.6 SAMPLING DESIGNSampling MethodsConvenient sampling was adopted to select the samples.Sample sizeThe sample size for the project is 50 respondents
Field WorkFor the collection of the data a structured questionnaire has been used. The questionnaire was prepared in such a way so as to gain insights from the respondents.
Plan of Analysis The data collected from questionnaires were processed tabulated and analyzed. To avoid wrong inference certain factors like incomplete and dishonest answers were eliminated.
Tools for Analysis For the purpose of knowing the level of customer satisfaction
35
the data collected isanalyzed using variousstatistical tools like: Thesurvey is classified application which is a device summarizing data and presenting them in tables. This is used for showing relevant sectoral at classification.
3.7 LIMITATION OF STUDYAll the studies to be made have their own parameters andit is difficult to make a study on assumption despite all possible efforts to make this analysis comprehensive, scientific and accurate. Thus there is bound to be some limitations.
Some of the limitations of the study are: Due to time constraints and shortage of other
resources such as money, only hundred respondentswere selected
The sample size was chosen keeping in view the type of product.
As the scope of the study was limited to Bangalore city limits the area factor also emerges as one of the limitation.
The accuracy of the report depends upon how honestly or sincerely the respondents have answered.
36
CHAPTER – DATA ANALYSIS AND INTERPRETATION
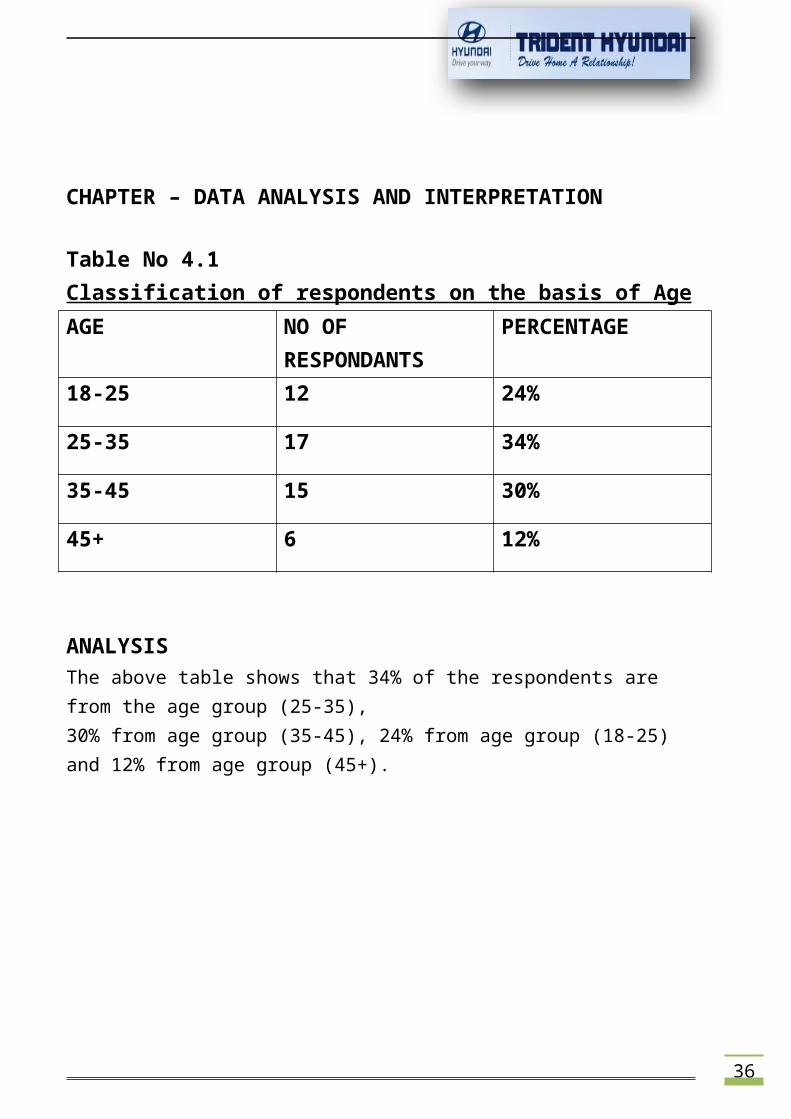
Table No 4.1 Classification of respondents on the basis of AgeAGE NO OF
RESPONDANTSPERCENTAGE
18-25 12 24%
25-35 17 34%
35-45 15 30%
45+ 6 12%
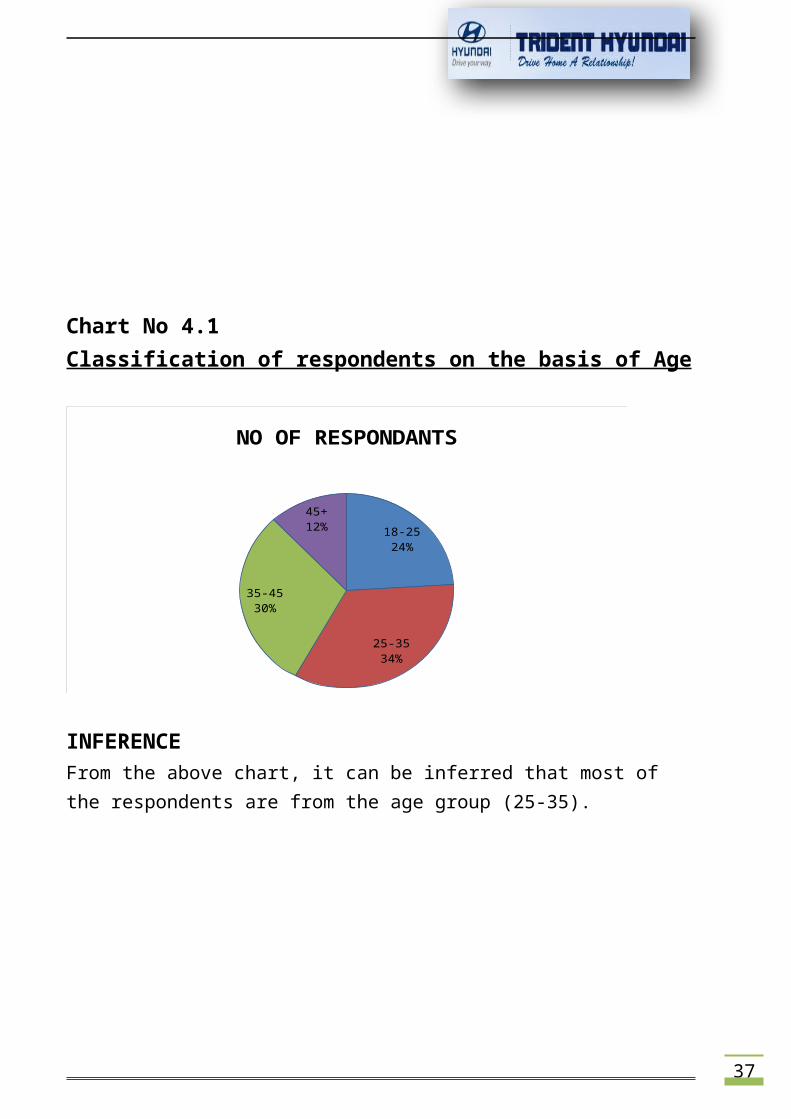
ANALYSISThe above table shows that 34% of the respondents are from the age group (25-35),30% from age group (35-45), 24% from age group (18-25) and 12% from age group (45+).
37
Chart No 4.1 Classification of respondents on the basis of Age
18-2524%
25-3534%
35-4530%
45+12%
NO OF RESPONDANTS
INFERENCEFrom the above chart, it can be inferred that most of the respondents are from the age group (25-35).
38
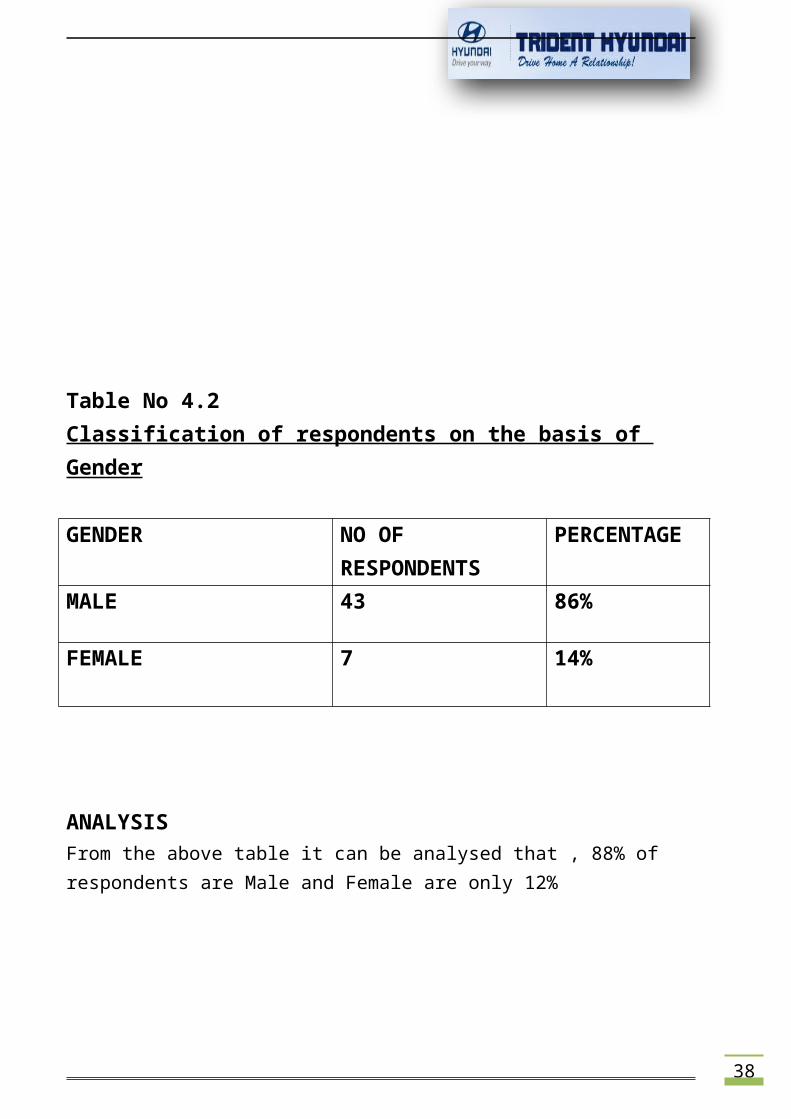
Table No 4.2 Classification of respondents on the basis of Gender
GENDER NO OF RESPONDENTS
PERCENTAGE
MALE 43 86%
FEMALE 7 14%
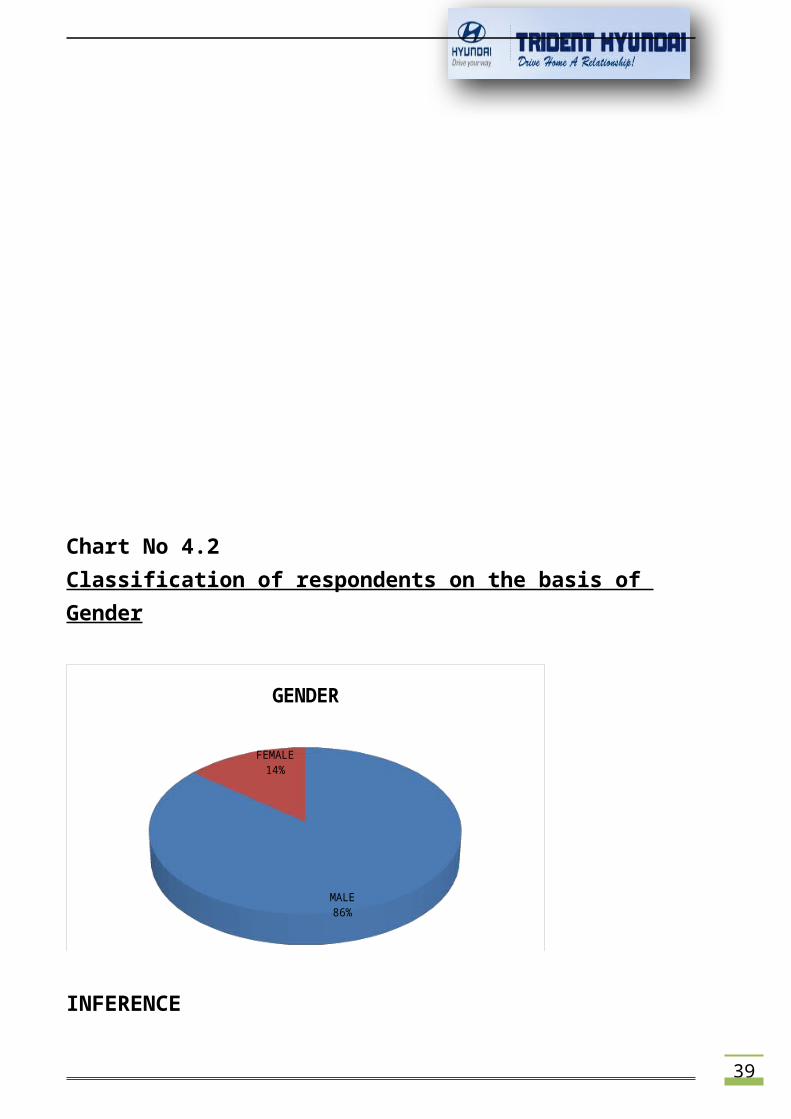
ANALYSISFrom the above table it can be analysed that , 88% of respondents are Male and Female are only 12%
39
Chart No 4.2 Classification of respondents on the basis of Gender
MALE86%
FEMALE14%
GENDER
INFERENCE
40
From the above chart, it canbe inferred that maximum ofthe respondents are MALE.
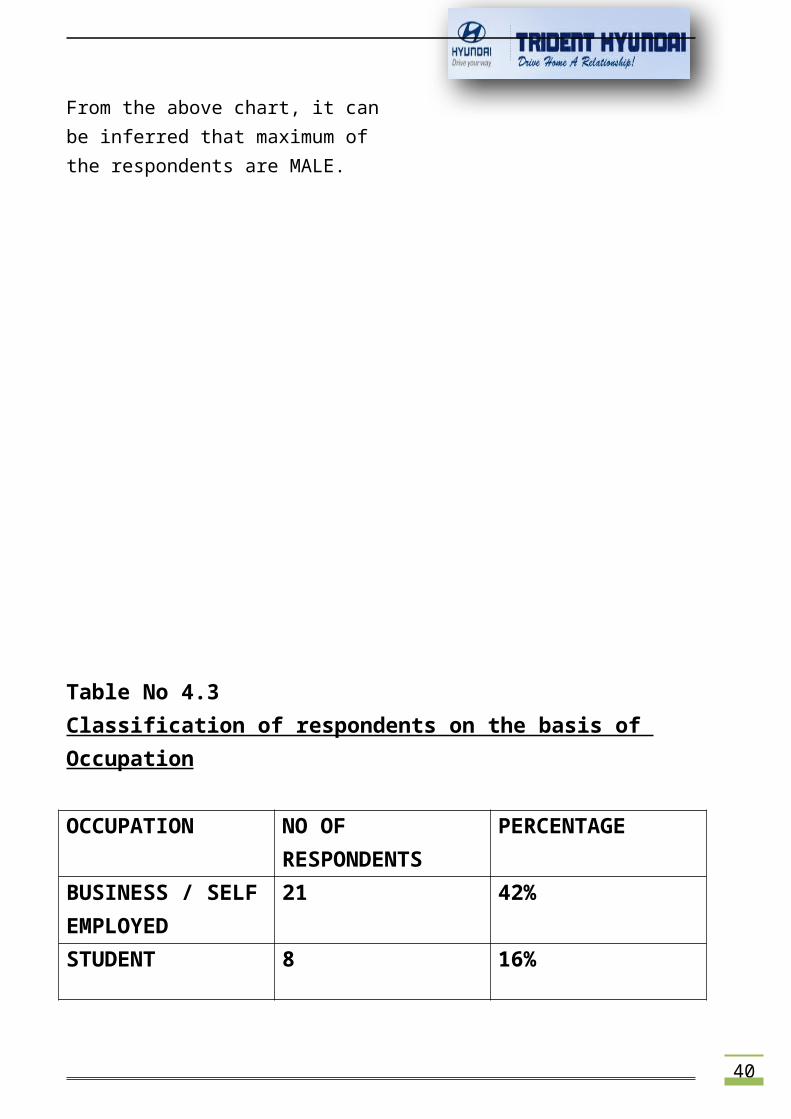
Table No 4.3 Classification of respondents on the basis of Occupation
OCCUPATION NO OF RESPONDENTS
PERCENTAGE
BUSINESS / SELFEMPLOYED
21 42%
STUDENT 8 16%
41
HOUSEWIFE 3
6%SALARIED 18 36%
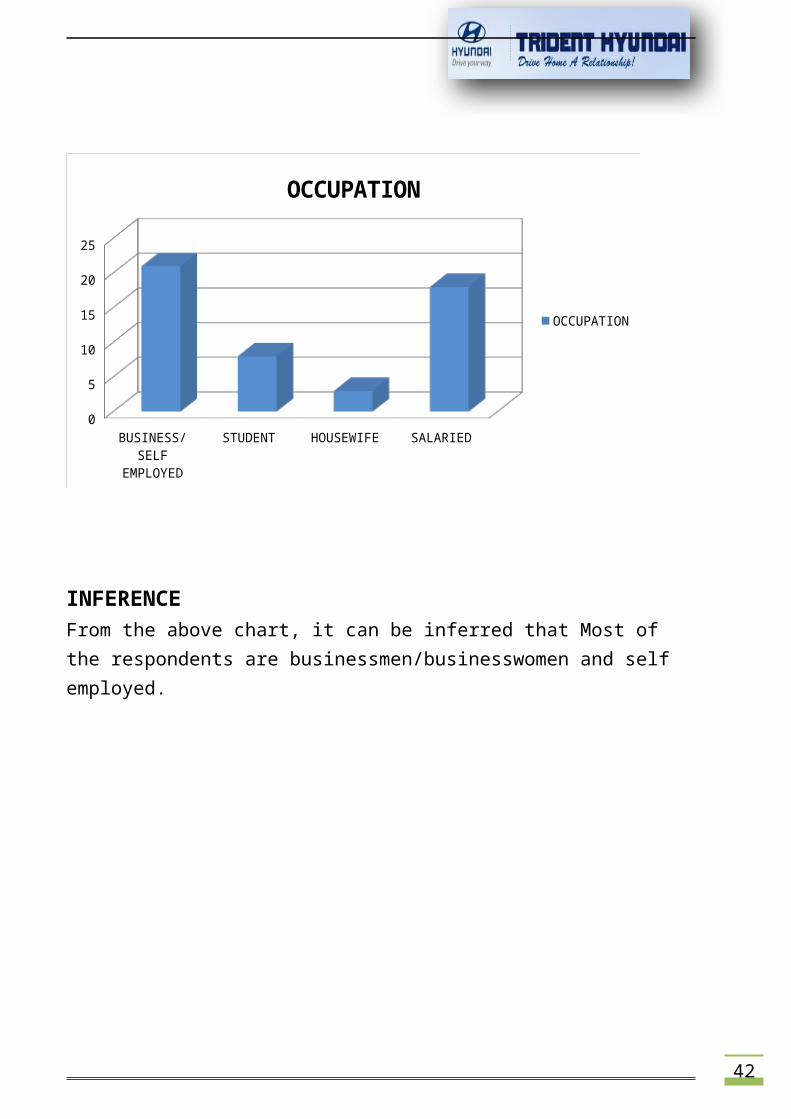
ANALYSISThe above table shows that, 42% of the respondents are self employed and business owners, 36% of them are salaried (engineers, doctors and others), students are 16% and rest 6% are housewives.
Chart No 4.3Classification of respondents on the basis of Occupation
42
BUSINESS/SELF
EMPLOYED
STUDENT HOUSEWIFE SALARIED0
5
10
15
20
25
OCCUPATION
OCCUPATION
INFERENCEFrom the above chart, it can be inferred that Most of the respondents are businessmen/businesswomen and self employed.
43
Table No 4.4 Classification of respondents on the basis of IncomeINCOME NO OF
RESPONDENTSPERCENTAGE
0 – 10 18 36%
10 -20 17 34%
20 – 30 9 18%
30+ 6 12%
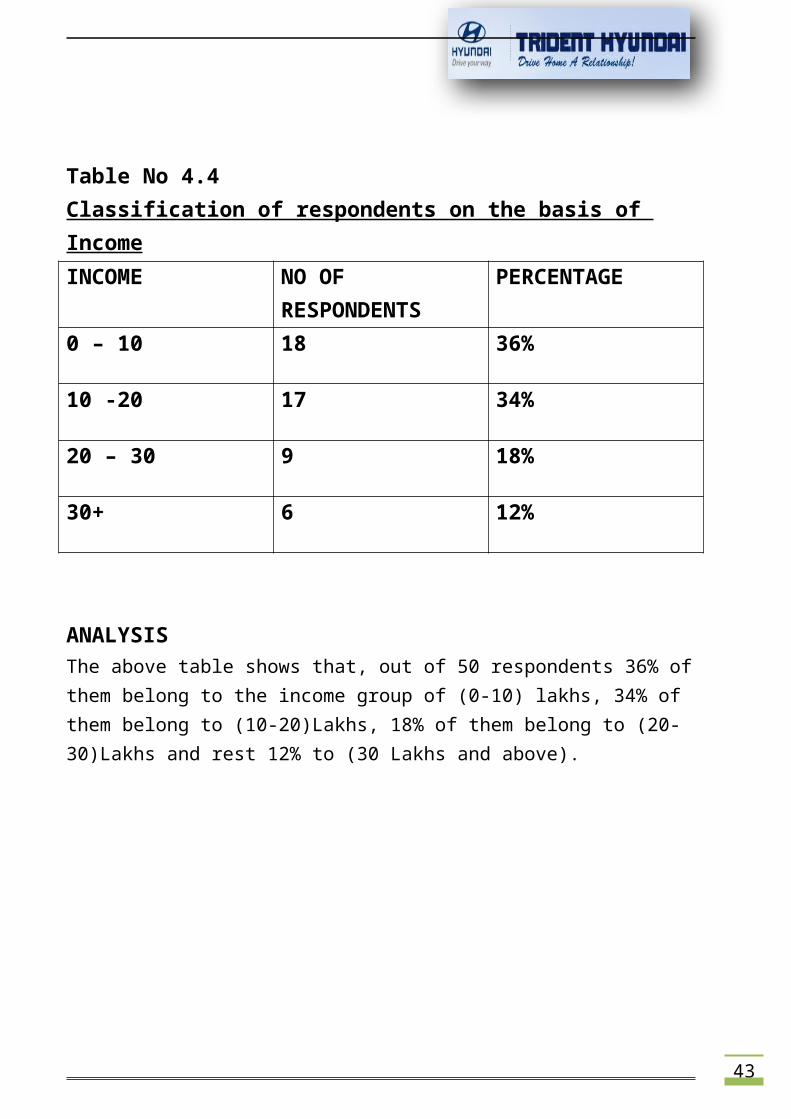
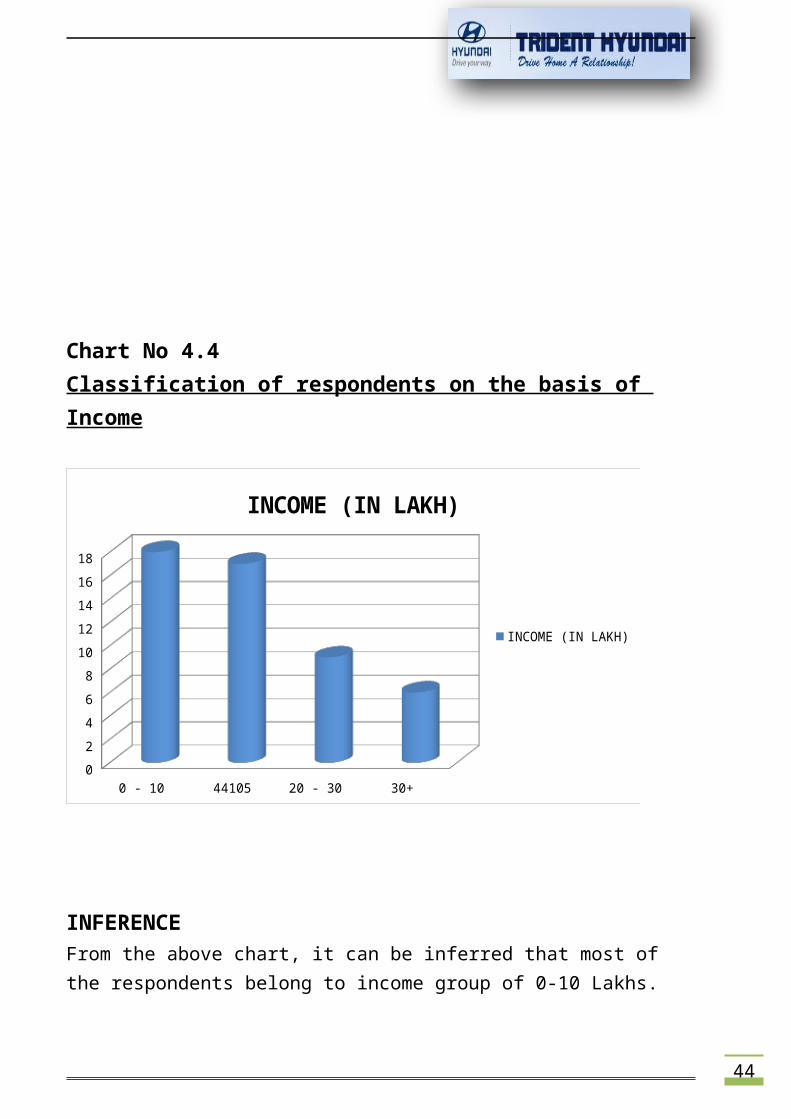
ANALYSISThe above table shows that, out of 50 respondents 36% ofthem belong to the income group of (0-10) lakhs, 34% of them belong to (10-20)Lakhs, 18% of them belong to (20-30)Lakhs and rest 12% to (30 Lakhs and above).
44
Chart No 4.4Classification of respondents on the basis of Income
0 - 10 44105 20 - 30 30+ 024681012141618
INCOME (IN LAKH)
INCOME (IN LAKH)
INFERENCEFrom the above chart, it can be inferred that most of the respondents belong to income group of 0-10 Lakhs.
45
Table No. 4.5Classification of respondents on the basis of Hyundai Car OwnedCAR NO OF
RESPONDENTS
PERCENTAGE
SANTRO 8 16%
EON 3 6%
I10 13 26%
I20 10 20%
GETZ 2 4%
46
ACCENT 1 2%
VERNA 6 12%
ELANTRA
3 6%
SONATA 3 6%
SANTA FE
1 2%
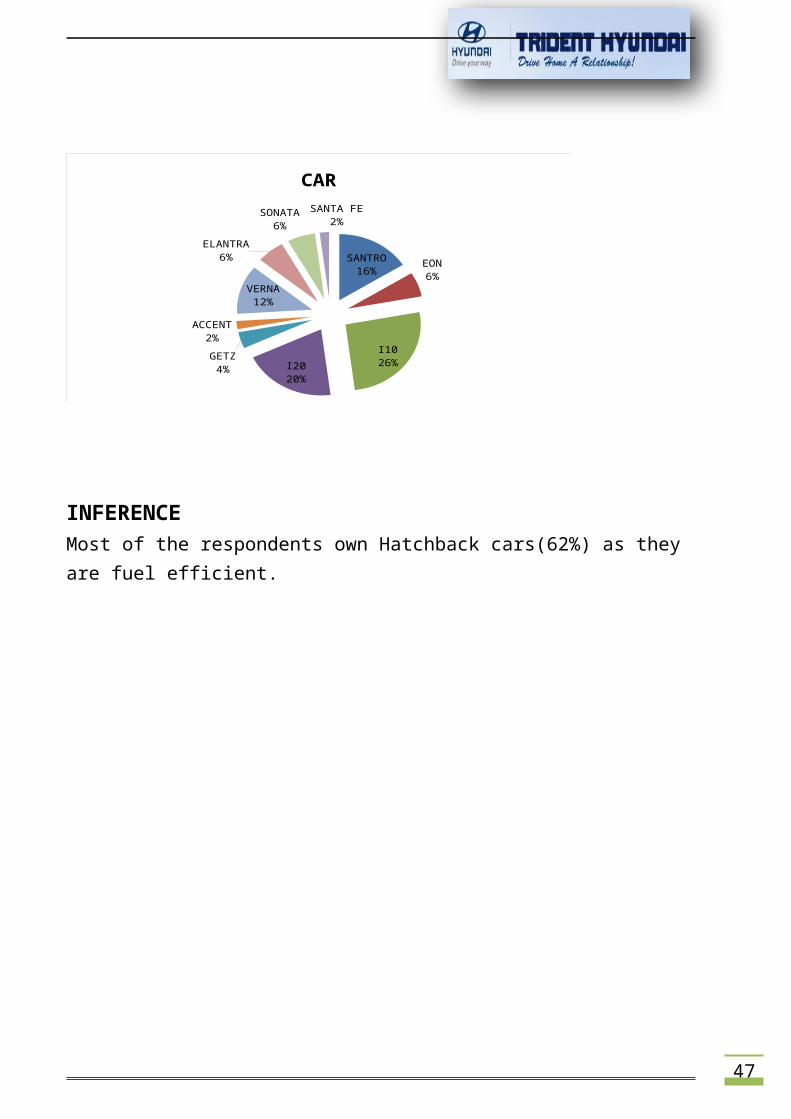
ANALYSISThe above table shows that, 26% of the respondents own an I10, 20% of them own an I20 and 16% of them own Santro. The reason being these three hatchback cars are fuel efficient. Verna is owned by 12% which is the maximum in Sedans. Santa Fe is owned by only 2% of the respondents.
Chart No 4.5Classification of respondents on the basis of Hyundai Car Owned
47
SANTRO16% EON
6%
I1026%I20
20%
GETZ4%
ACCENT2%
VERNA12%
ELANTRA6%
SONATA6%
SANTA FE2%
CAR
INFERENCEMost of the respondents own Hatchback cars(62%) as they are fuel efficient.
48
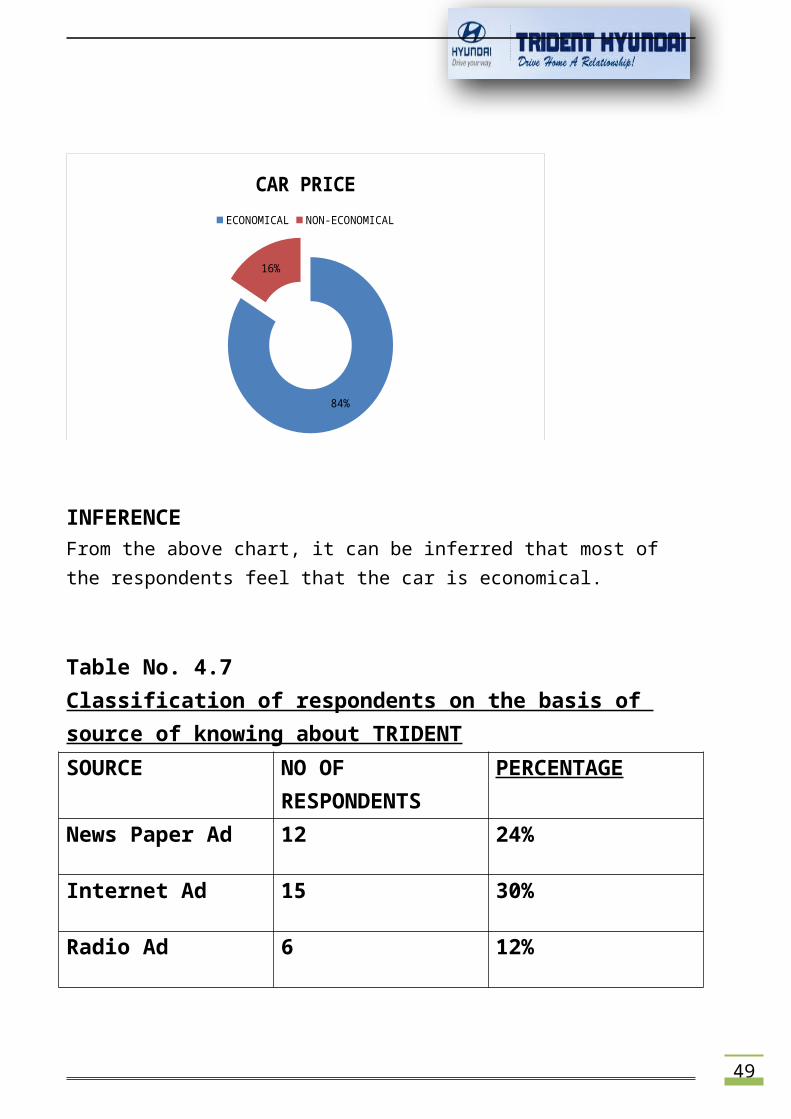
Table No 4.6Classification of respondents on the basis of CarPriceCAR PRICE
NO OF RESPONDENTS
PERCENTAGE
ECONOMICAL
42 84%
NON-ECONOMICAL
8 16%
ANALYSISFrom the above table, it can be analyzed that 84% of therespondents feel the car is economical and the rest 16% feel it is non-economical.
Chart No 4.6Classification of respondents on the basis of CarPrice
49
84%
16%
CAR PRICEECONOMICAL NON-ECONOMICAL
INFERENCEFrom the above chart, it can be inferred that most of the respondents feel that the car is economical.
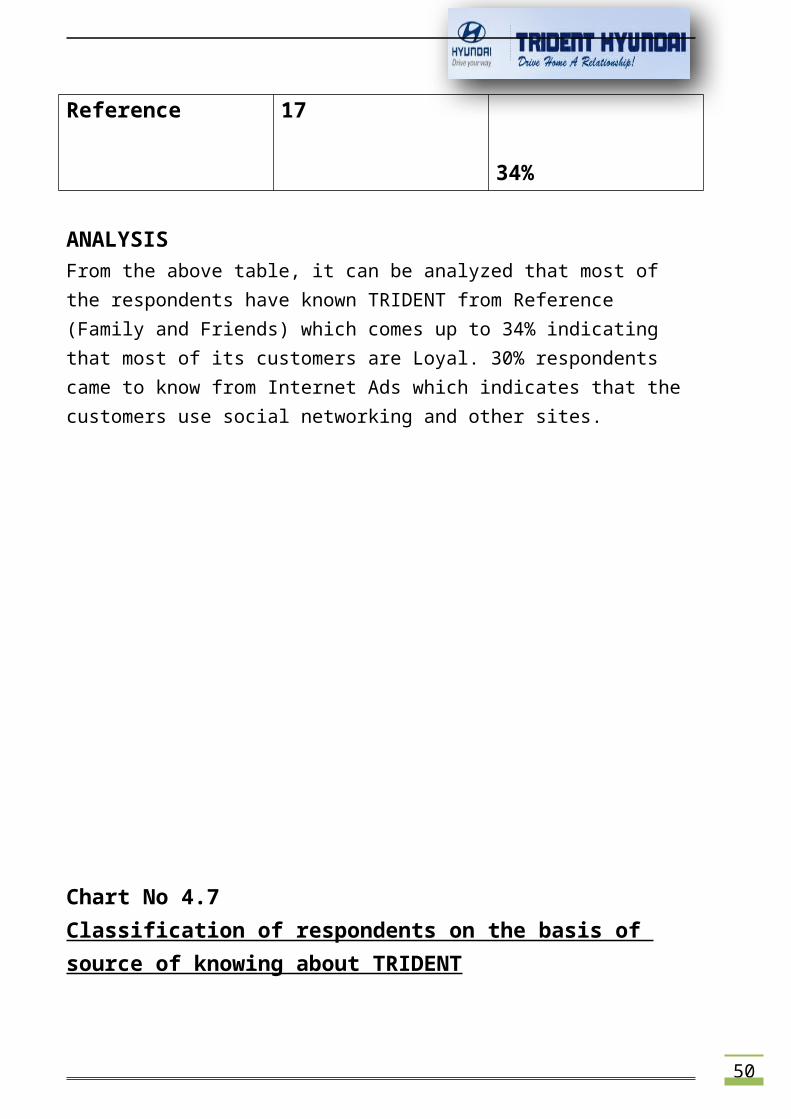
Table No. 4.7Classification of respondents on the basis of source of knowing about TRIDENTSOURCE NO OF
RESPONDENTSPERCENTAGE
News Paper Ad 12 24%
Internet Ad 15 30%
Radio Ad 6 12%
50
Reference 17
34%
ANALYSISFrom the above table, it can be analyzed that most of the respondents have known TRIDENT from Reference (Family and Friends) which comes up to 34% indicating that most of its customers are Loyal. 30% respondents came to know from Internet Ads which indicates that the customers use social networking and other sites.
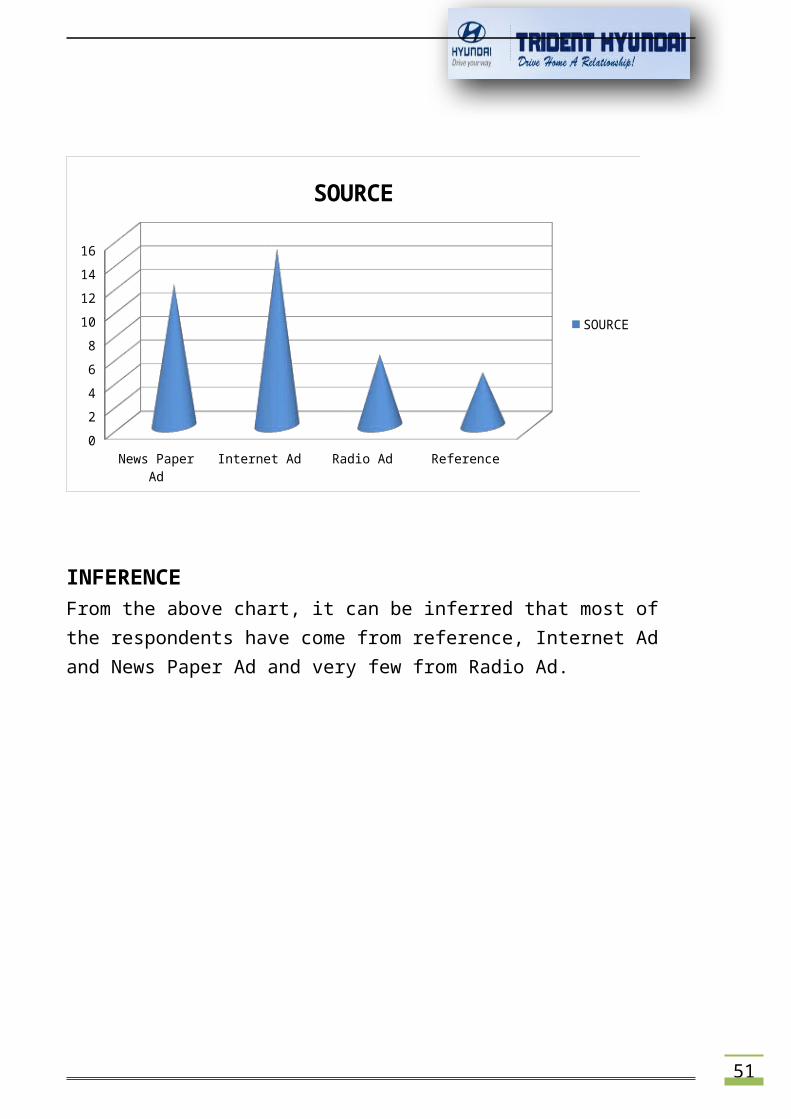
Chart No 4.7Classification of respondents on the basis of source of knowing about TRIDENT
51
News Paper Ad
Internet Ad Radio Ad Reference0246810121416
SOURCE
SOURCE
INFERENCEFrom the above chart, it can be inferred that most of the respondents have come from reference, Internet Ad and News Paper Ad and very few from Radio Ad.
52
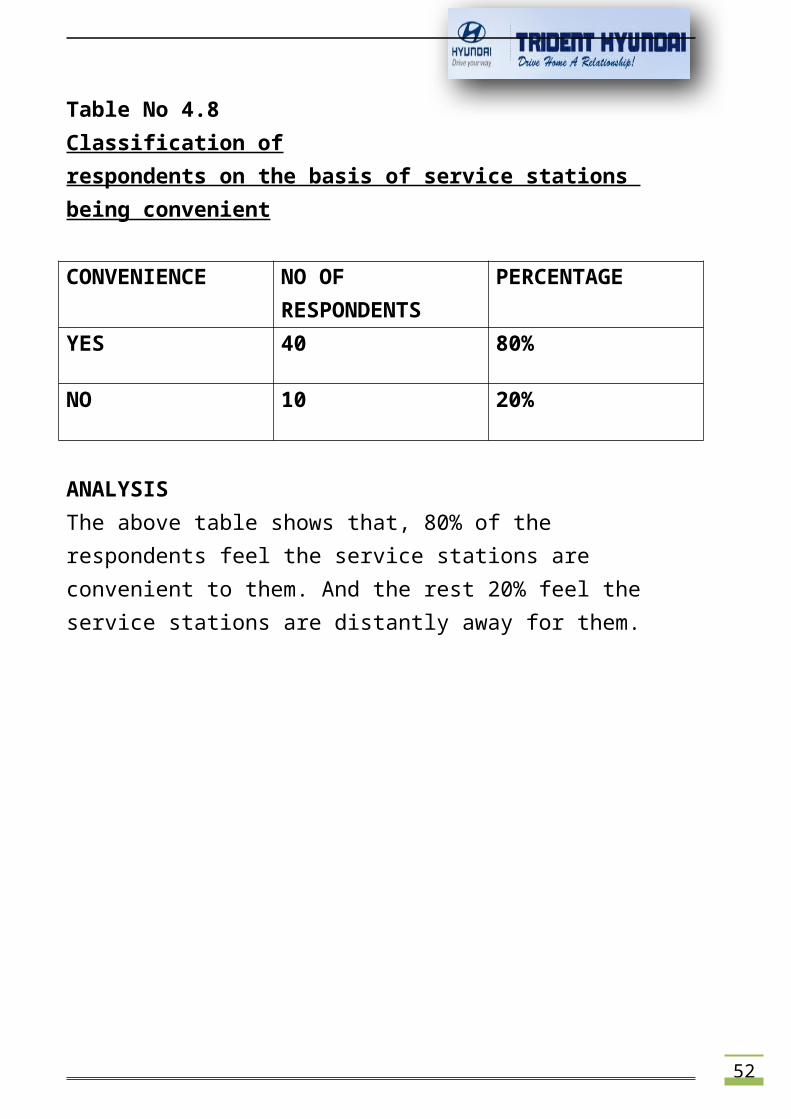
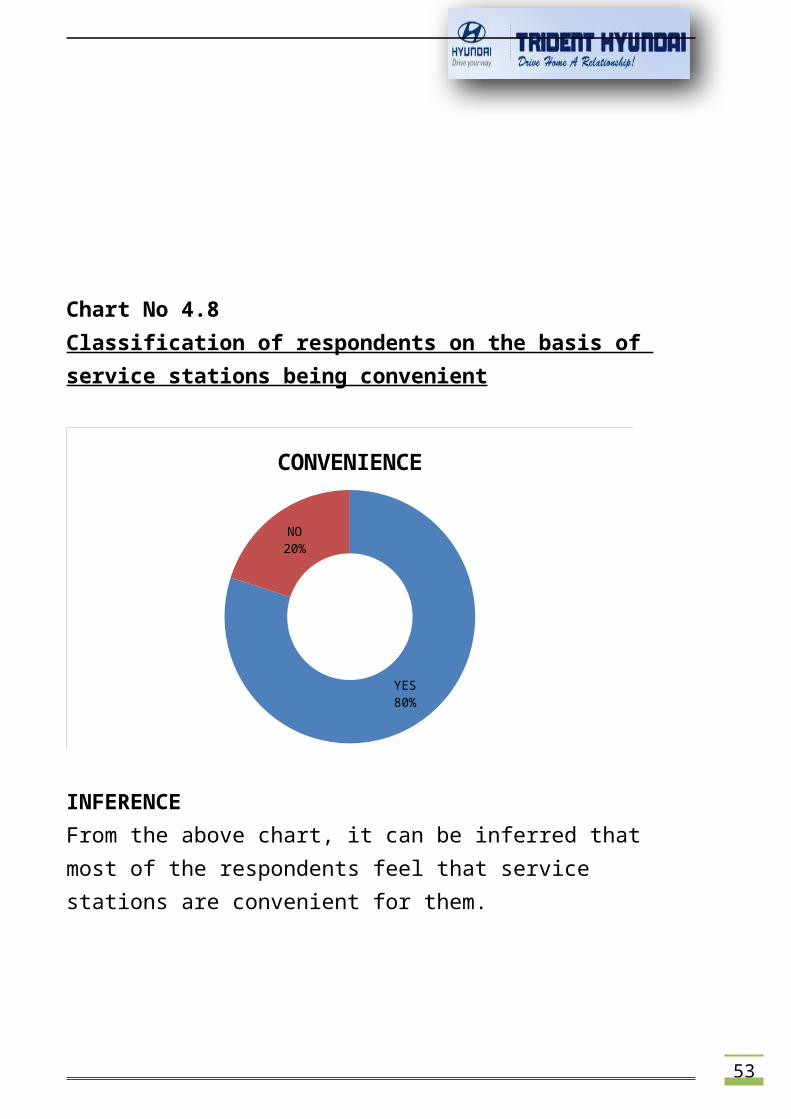
Table No 4.8Classification ofrespondents on the basis of service stations being convenient
CONVENIENCE NO OF RESPONDENTS
PERCENTAGE
YES 40 80%
NO 10 20%
ANALYSISThe above table shows that, 80% of the respondents feel the service stations are convenient to them. And the rest 20% feel the service stations are distantly away for them.
53
Chart No 4.8Classification of respondents on the basis of service stations being convenient
YES80%
NO20%
CONVENIENCE
INFERENCEFrom the above chart, it can be inferred that most of the respondents feel that service stations are convenient for them.
54
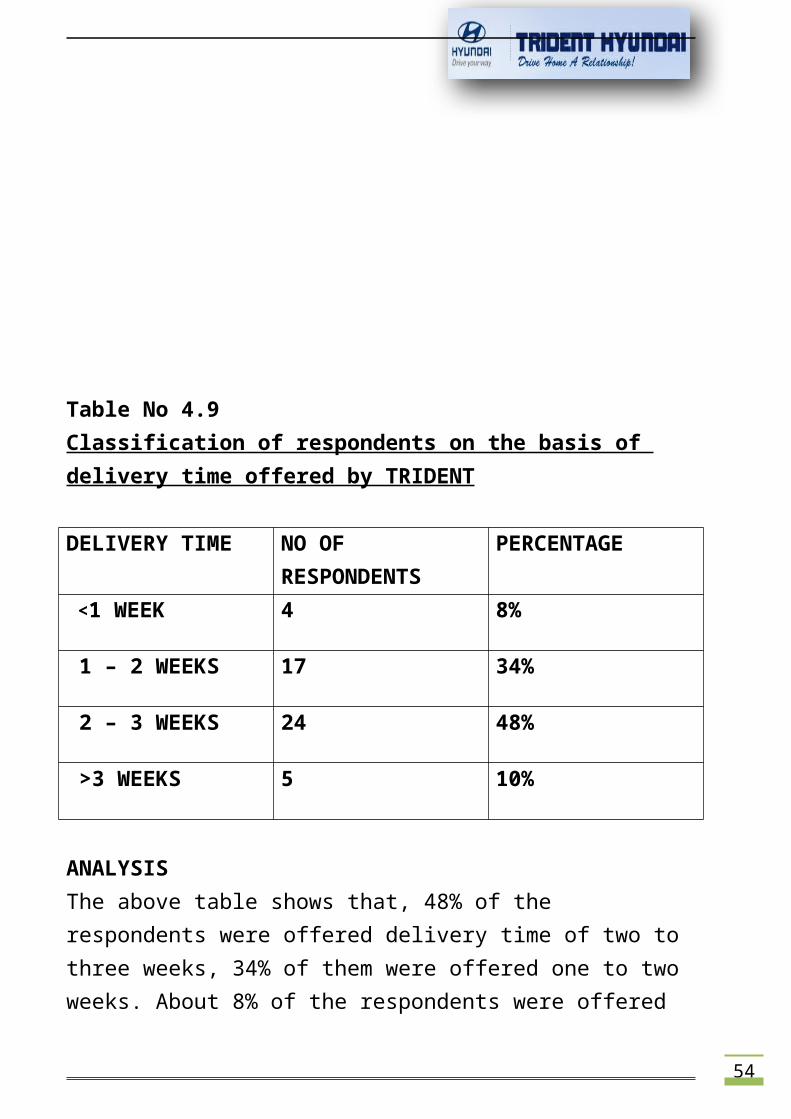
Table No 4.9Classification of respondents on the basis of delivery time offered by TRIDENT
DELIVERY TIME NO OF RESPONDENTS
PERCENTAGE
<1 WEEK 4 8%
1 – 2 WEEKS 17 34%
2 – 3 WEEKS 24 48%
>3 WEEKS 5 10%
ANALYSISThe above table shows that, 48% of the respondents were offered delivery time of two to three weeks, 34% of them were offered one to two weeks. About 8% of the respondents were offered
55
delivery time of less thana week as customerrequired it early or might be due to availabilityof the car. 10% of the respondents were offered delivery time of more than three weeks.
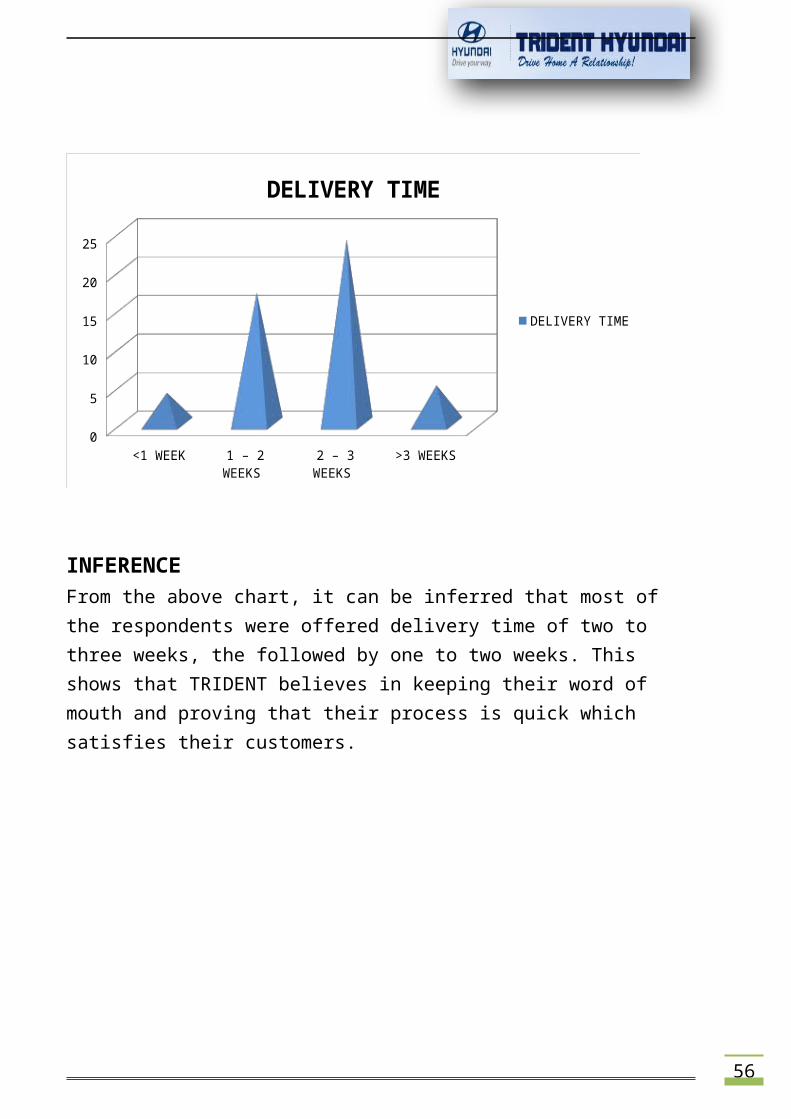
Chart No 4.9Classification of respondents on the basis of delivery time offered by TRIDENT
56
<1 WEEK 1 – 2 WEEKS
2 – 3 WEEKS
>3 WEEKS0
5
10
15
20
25
DELIVERY TIME
DELIVERY TIME
INFERENCEFrom the above chart, it can be inferred that most of the respondents were offered delivery time of two to three weeks, the followed by one to two weeks. This shows that TRIDENT believes in keeping their word of mouth and proving that their process is quick which satisfies their customers.
57
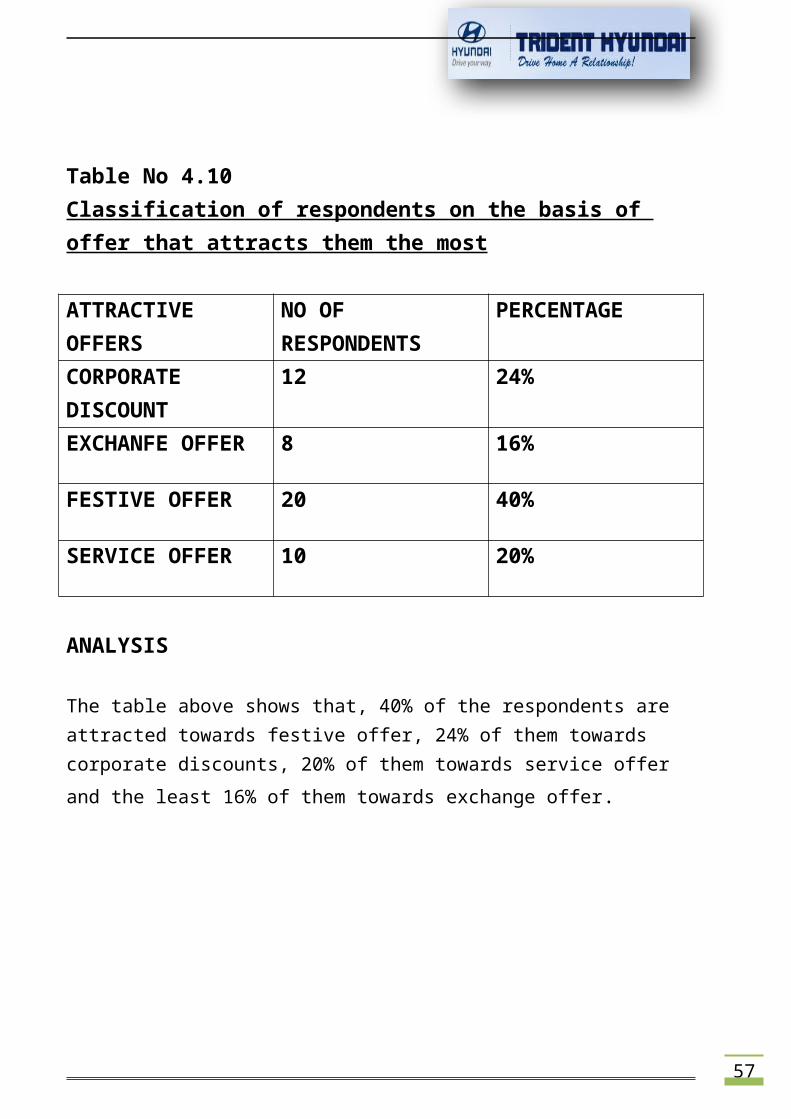
Table No 4.10Classification of respondents on the basis of offer that attracts them the most
ATTRACTIVE OFFERS
NO OF RESPONDENTS
PERCENTAGE
CORPORATE DISCOUNT
12 24%
EXCHANFE OFFER 8 16%
FESTIVE OFFER 20 40%
SERVICE OFFER 10 20%
ANALYSIS
The table above shows that, 40% of the respondents are attracted towards festive offer, 24% of them towards corporate discounts, 20% of them towards service offer and the least 16% of them towards exchange offer.
58
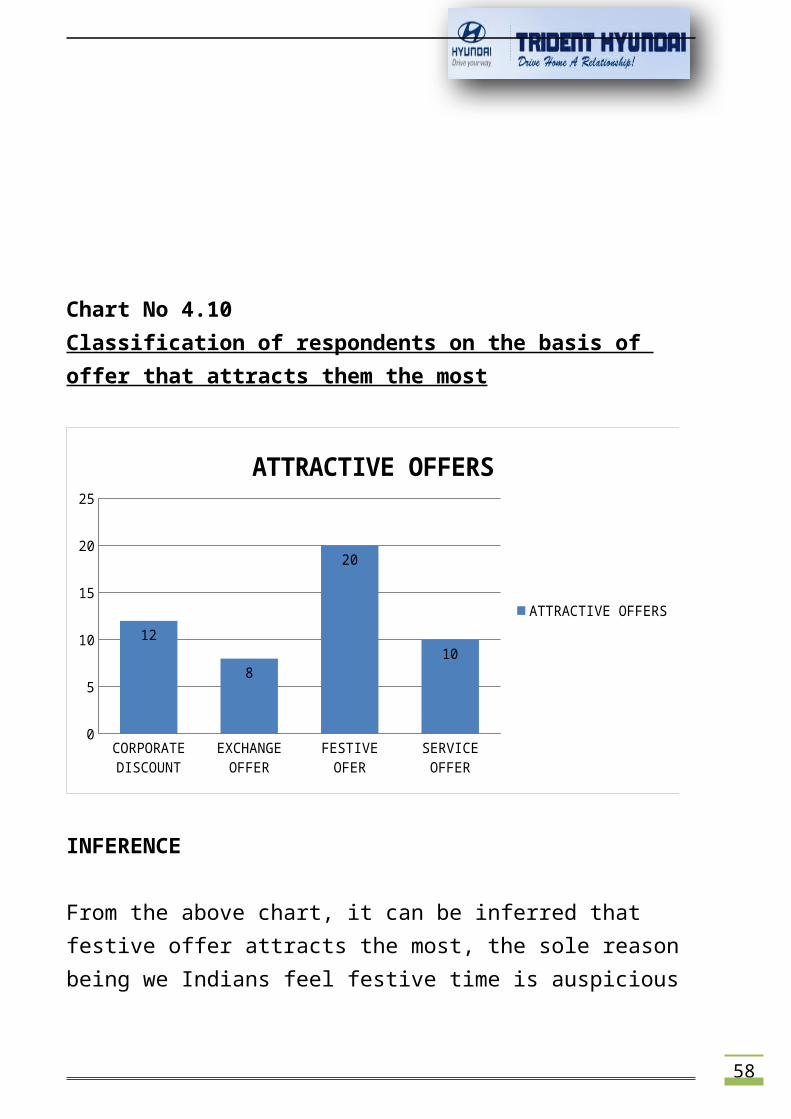
Chart No 4.10Classification of respondents on the basis of offer that attracts them the most
CORPORATE DISCOUNT
EXCHANGE OFFER
FESTIVE OFER
SERVICE OFFER
0
5
10
15
20
25
12
8
20
10
ATTRACTIVE OFFERS
ATTRACTIVE OFFERS
INFERENCE
From the above chart, it can be inferred that festive offer attracts the most, the sole reason being we Indians feel festive time is auspicious
59
to buy anything and peoplealways wish to havediscounts. Corporate discount is taken by customer who work with private and public sector,Then service offer which is a minimal discount onafter sales service. Exchange offer is a give andtake process with discounted value of your old car.
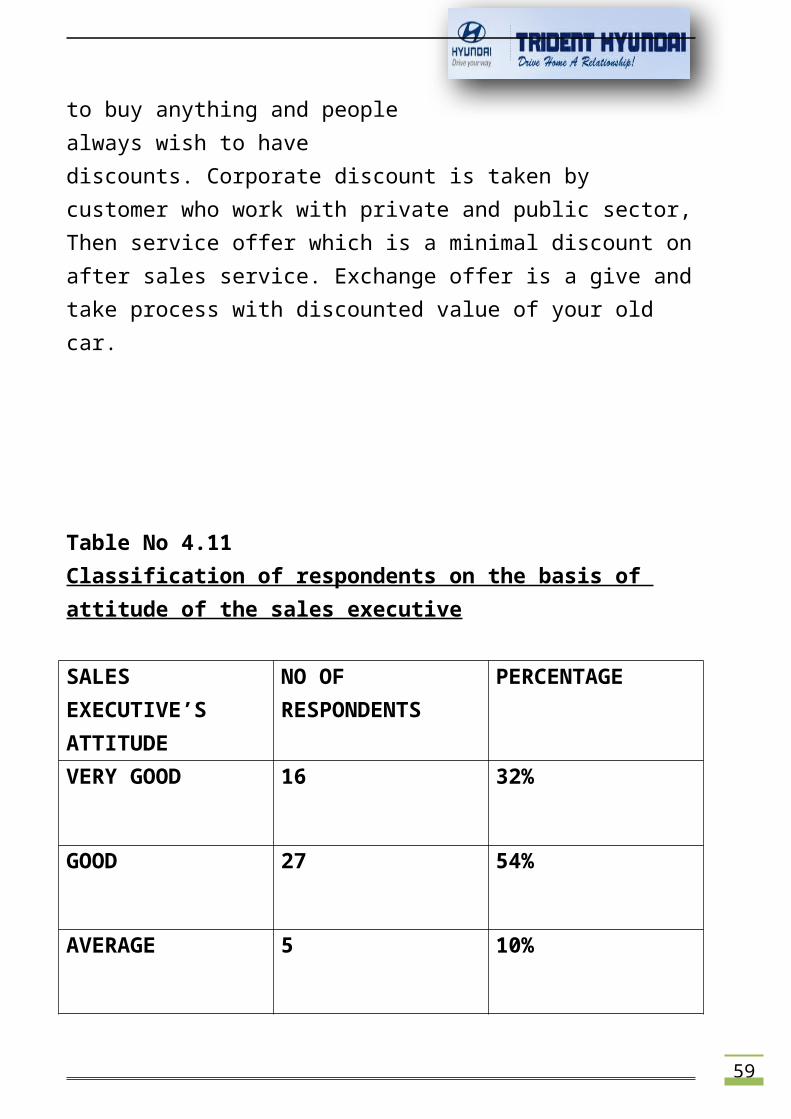
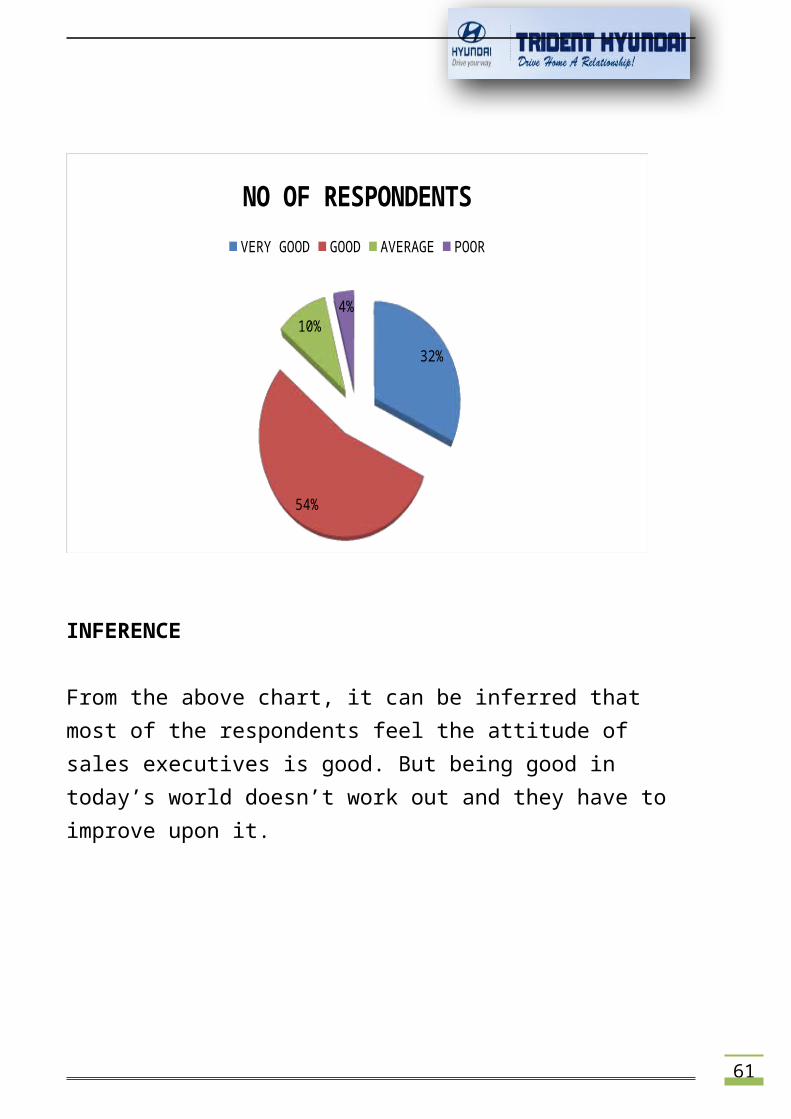
Table No 4.11Classification of respondents on the basis of attitude of the sales executive
SALES EXECUTIVE’S ATTITUDE
NO OF RESPONDENTS
PERCENTAGE
VERY GOOD 16 32%
GOOD 27 54%
AVERAGE 5 10%
60
POOR 2
4%
ANALYSIS
The table above shows that, 54% of the respondents feel the sales executive’s attitude is good, 32% feel its very good, 10% feel its average and 4% feel its poor.
Chart No 4.11Classification of respondents on the basis of attitude of the sales executive
61
32%
54%
10%4%
NO OF RESPONDENTSVERY GOOD GOOD AVERAGE POOR
INFERENCE
From the above chart, it can be inferred that most of the respondents feel the attitude of sales executives is good. But being good in today’s world doesn’t work out and they have to improve upon it.
62
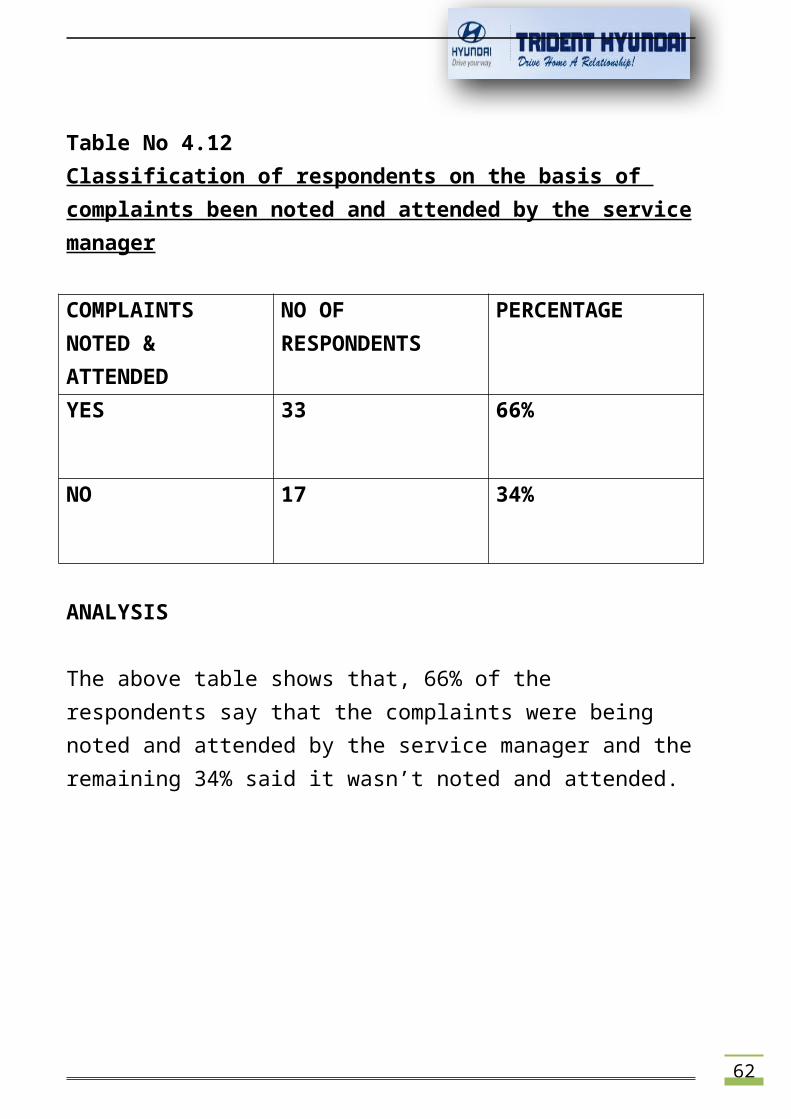
Table No 4.12Classification of respondents on the basis of complaints been noted and attended by the servicemanager
COMPLAINTS NOTED & ATTENDED
NO OF RESPONDENTS
PERCENTAGE
YES 33 66%
NO 17 34%
ANALYSIS
The above table shows that, 66% of the respondents say that the complaints were being noted and attended by the service manager and theremaining 34% said it wasn’t noted and attended.
63
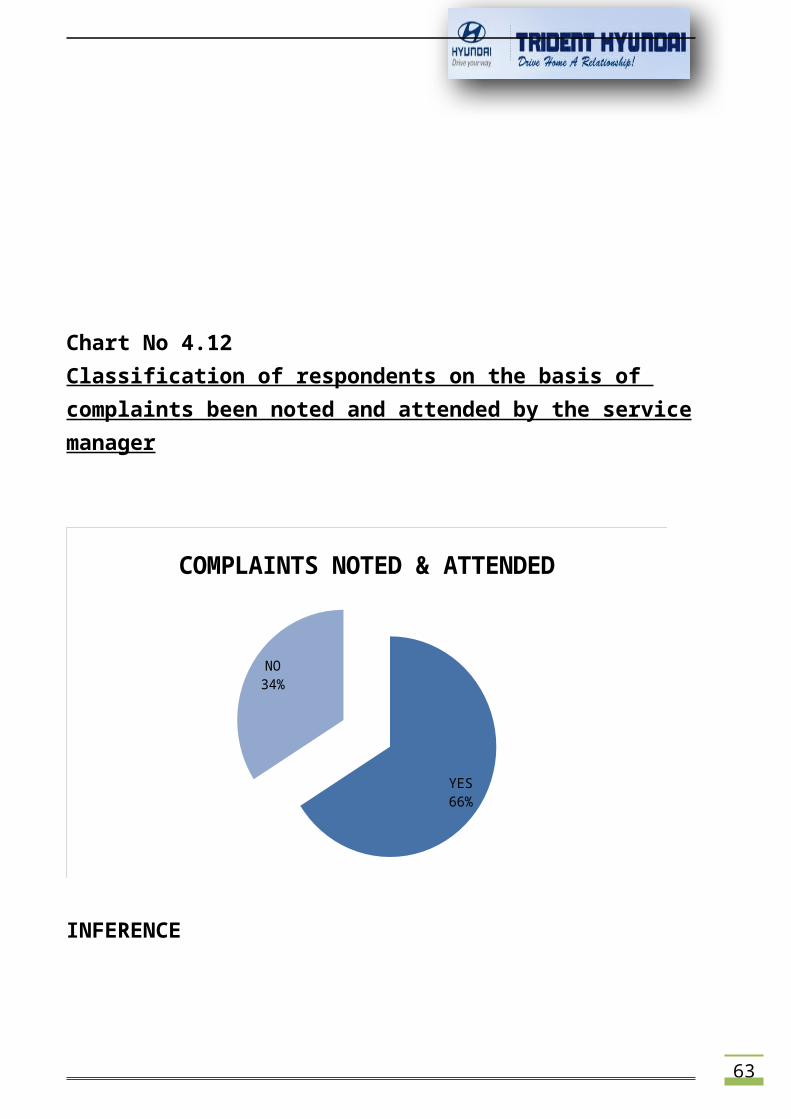
Chart No 4.12Classification of respondents on the basis of complaints been noted and attended by the servicemanager
YES66%
NO34%
COMPLAINTS NOTED & ATTENDED
INFERENCE
64
From the above chart, itcan be inferred that mostof the people are happy with after sales service but not all. Thus TRIDENT has to improve their after sale service to keep their customers intactand to give them a chance to be loyal.
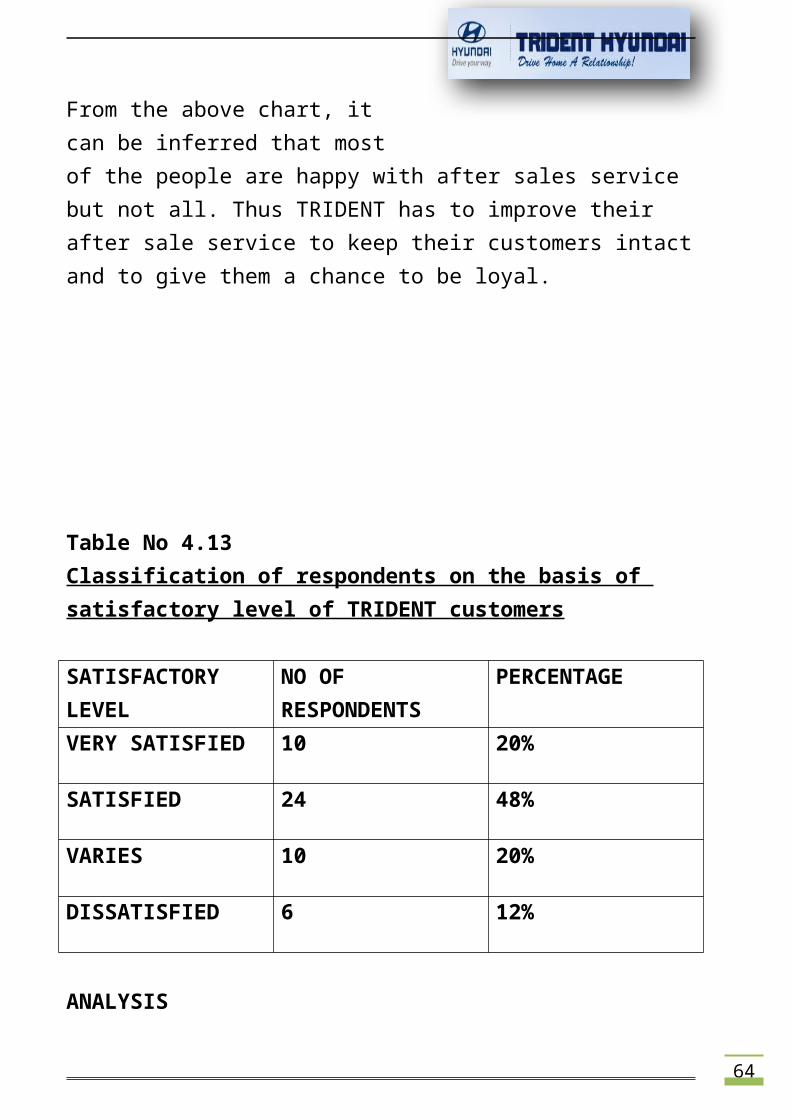
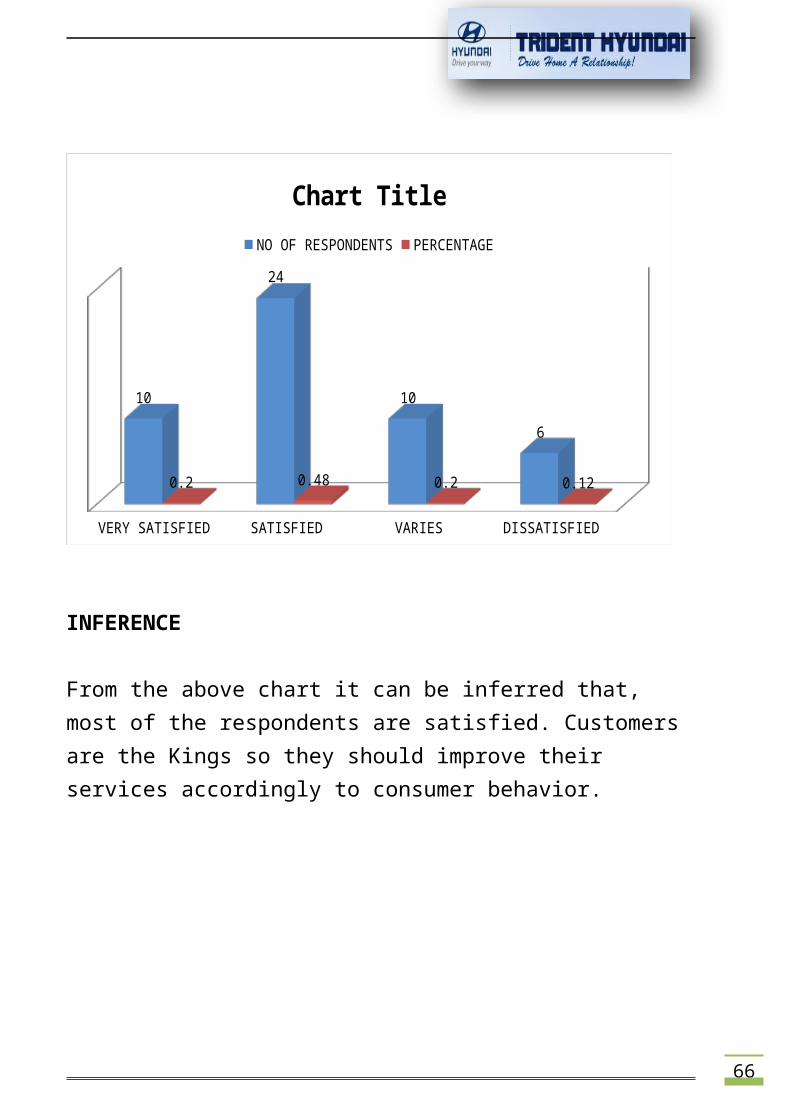
Table No 4.13Classification of respondents on the basis of satisfactory level of TRIDENT customers
SATISFACTORY LEVEL
NO OF RESPONDENTS
PERCENTAGE
VERY SATISFIED 10 20%
SATISFIED 24 48%
VARIES 10 20%
DISSATISFIED 6 12%
ANALYSIS
65
The above table showsthat, 48% of the respondents are satisfied with the service provided, 20% are very satisfied, 20%vary in nature and 12% are dissatisfied.
Chart No 4.13Classification of respondents on the basis of satisfactory level of TRIDENT customers
66
VERY SATISFIED SATISFIED VARIES DISSATISFIED
10
24
10
6
0.2 0.48 0.2 0.12
Chart TitleNO OF RESPONDENTS PERCENTAGE
INFERENCE
From the above chart it can be inferred that, most of the respondents are satisfied. Customers are the Kings so they should improve their services accordingly to consumer behavior.
67
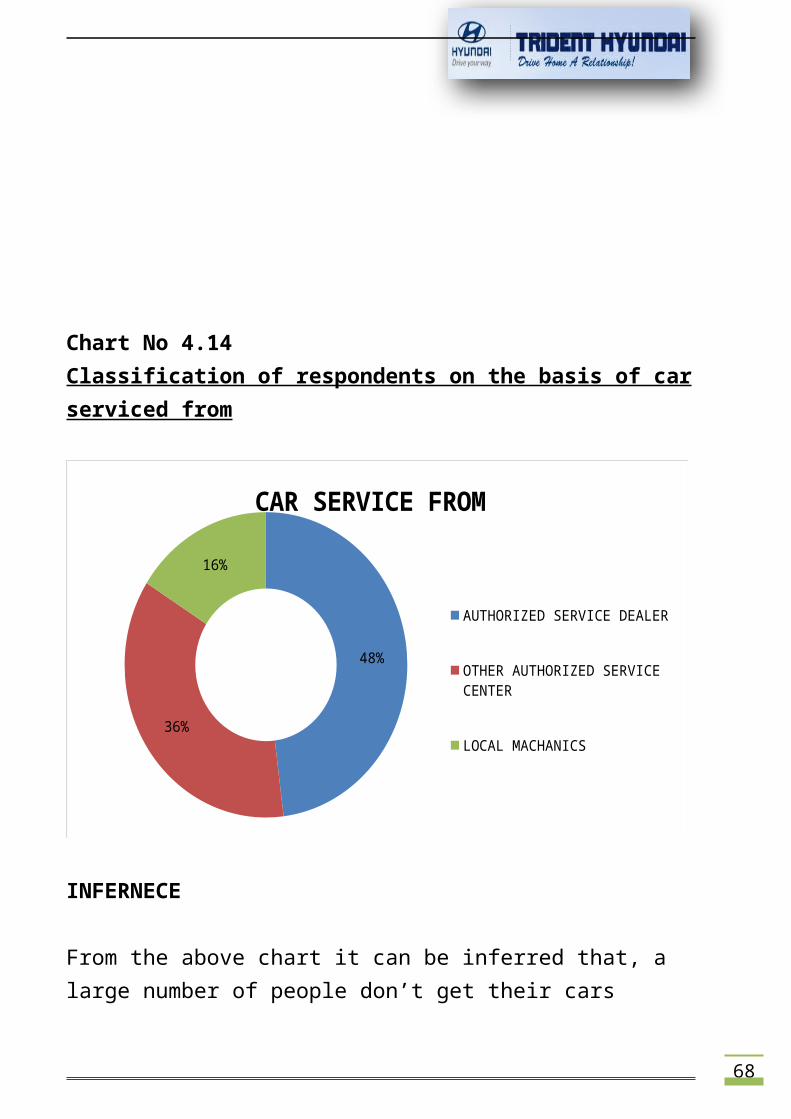
Table No 4.14Classification of respondents on the basis of place car serviced
SERVICE NO OF RESPONDENTS
PERCENTAGE
AUTHORIZED SERVICE DEALER
24 48%
OTHER AUTHORIZED SERVICE CENTER
18 36%
LOCAL MACHANICS 8 16%
ANALYSIS
The above table shows that, 48% of the respondents get their cars serviced from authorized service dealers, 36% of them get it serviced from other authorized service centers, and 16% of them get it from local mechanics
68
Chart No 4.14Classification of respondents on the basis of carserviced from
48%
36%
16%
CAR SERVICE FROM
AUTHORIZED SERVICE DEALER
OTHER AUTHORIZED SERVICE CENTER
LOCAL MACHANICS
INFERNECE
From the above chart it can be inferred that, a large number of people don’t get their cars
69
serviced from TRIDENT.Hence TRIDENT shouldimprove their after sales services.
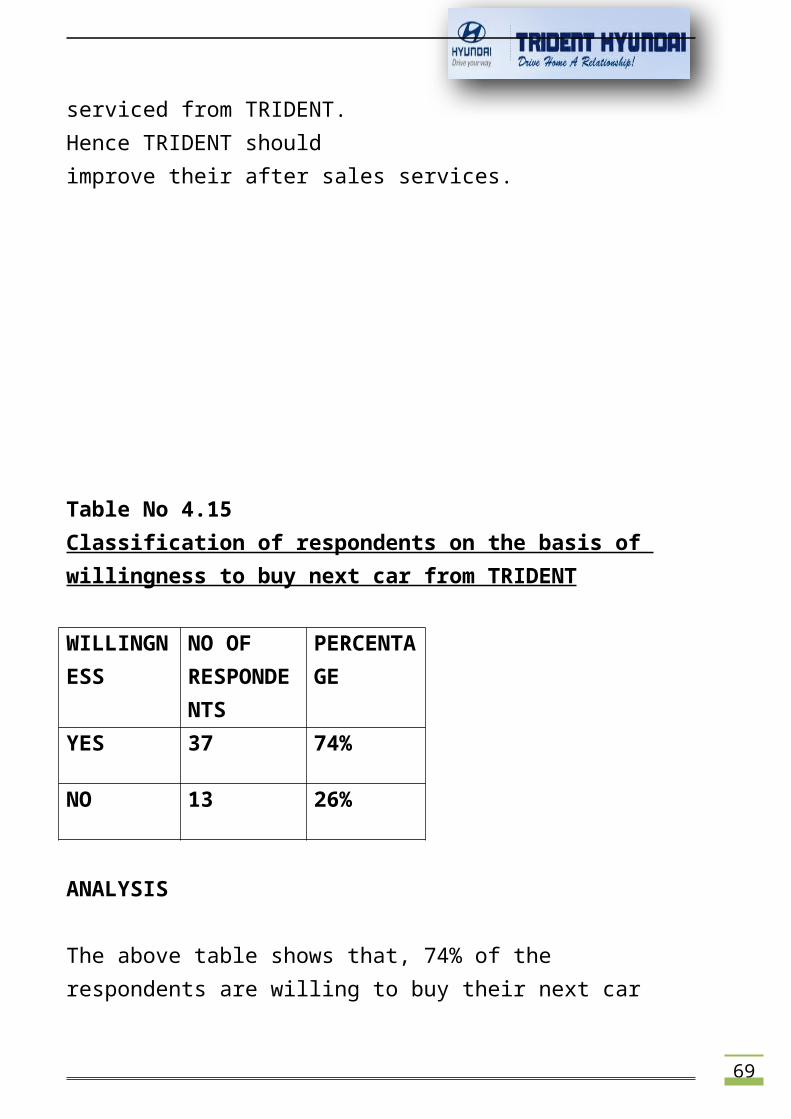
Table No 4.15Classification of respondents on the basis of willingness to buy next car from TRIDENT
WILLINGNESS
NO OF RESPONDENTS
PERCENTAGE
YES 37 74%
NO 13 26%
ANALYSIS
The above table shows that, 74% of the respondents are willing to buy their next car
70
from TRIDENT and the rest26% are unwilling to buyfrom TRIDENT.
Chart No 4.15Classification of respondents on the basis of willingness to buy next car from TRIDENT
71
76%
24%
RECOMMENDATION TO OTHERS
YESNO
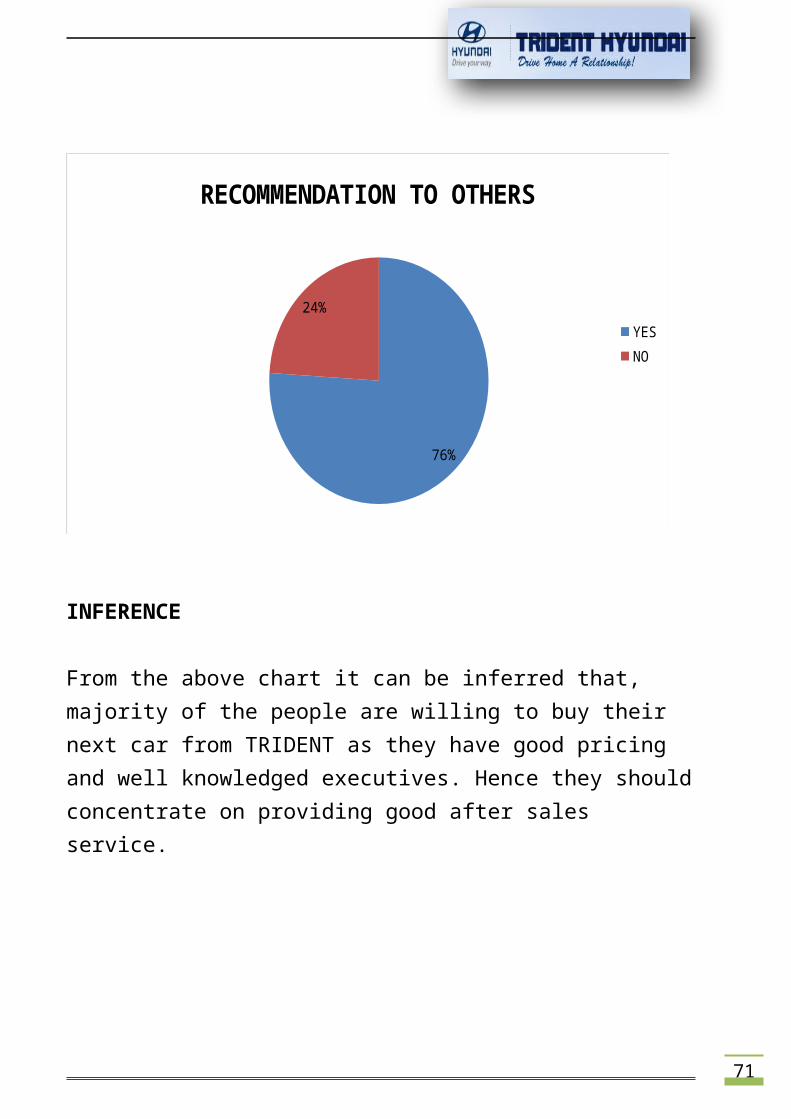
INFERENCE
From the above chart it can be inferred that, majority of the people are willing to buy their next car from TRIDENT as they have good pricing and well knowledged executives. Hence they shouldconcentrate on providing good after sales service.
72
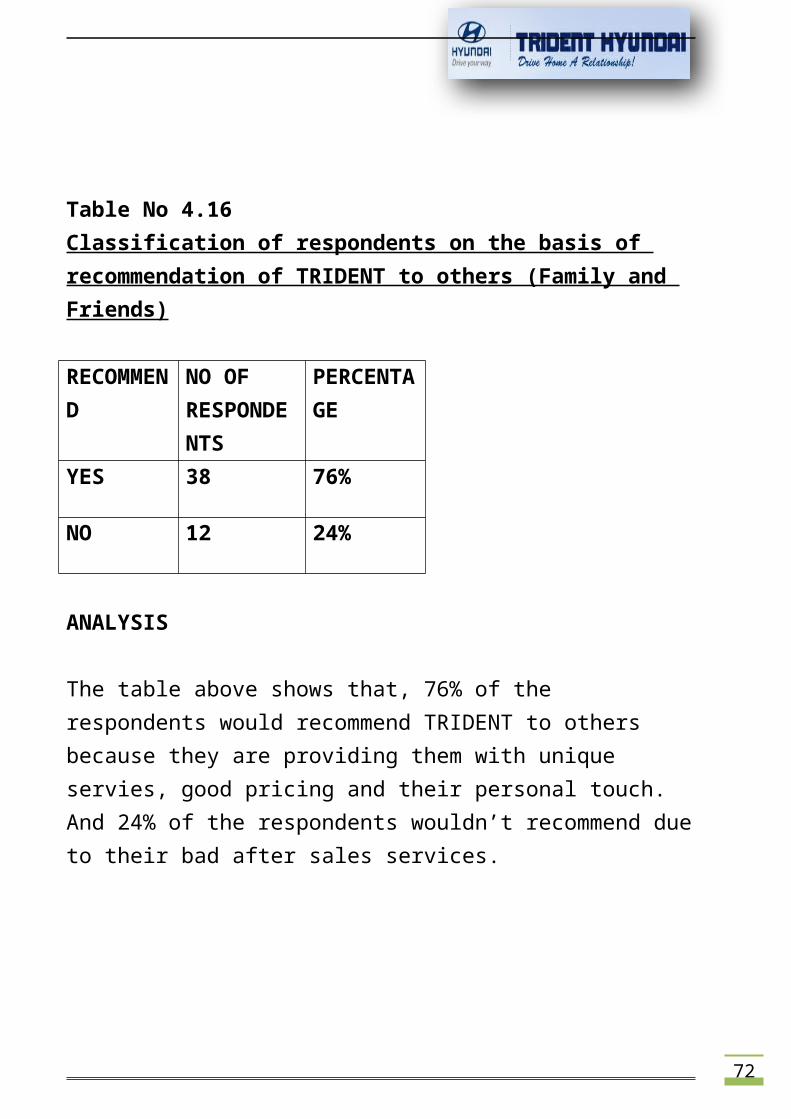
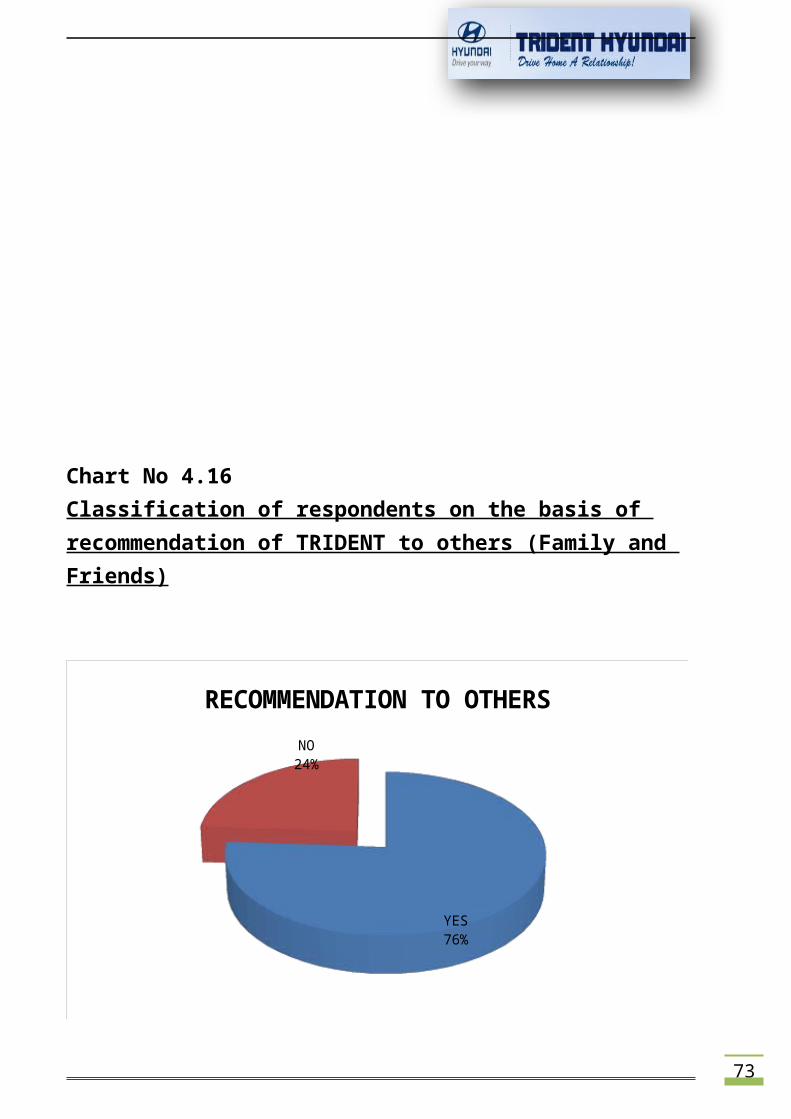
Table No 4.16Classification of respondents on the basis of recommendation of TRIDENT to others (Family and Friends)
RECOMMEND
NO OF RESPONDENTS
PERCENTAGE
YES 38 76%
NO 12 24%
ANALYSIS
The table above shows that, 76% of the respondents would recommend TRIDENT to others because they are providing them with unique servies, good pricing and their personal touch. And 24% of the respondents wouldn’t recommend dueto their bad after sales services.
73
Chart No 4.16Classification of respondents on the basis of recommendation of TRIDENT to others (Family and Friends)
YES76%
NO24%
RECOMMENDATION TO OTHERS
74
INFERENCE
From the above chart it can be inferred that, majority of people would recommend it to other people because the behavior and attitude of salesexecutive is excellent. Hence they should concentrate on providing proper after sale services to their customers so that customers feel satisfied
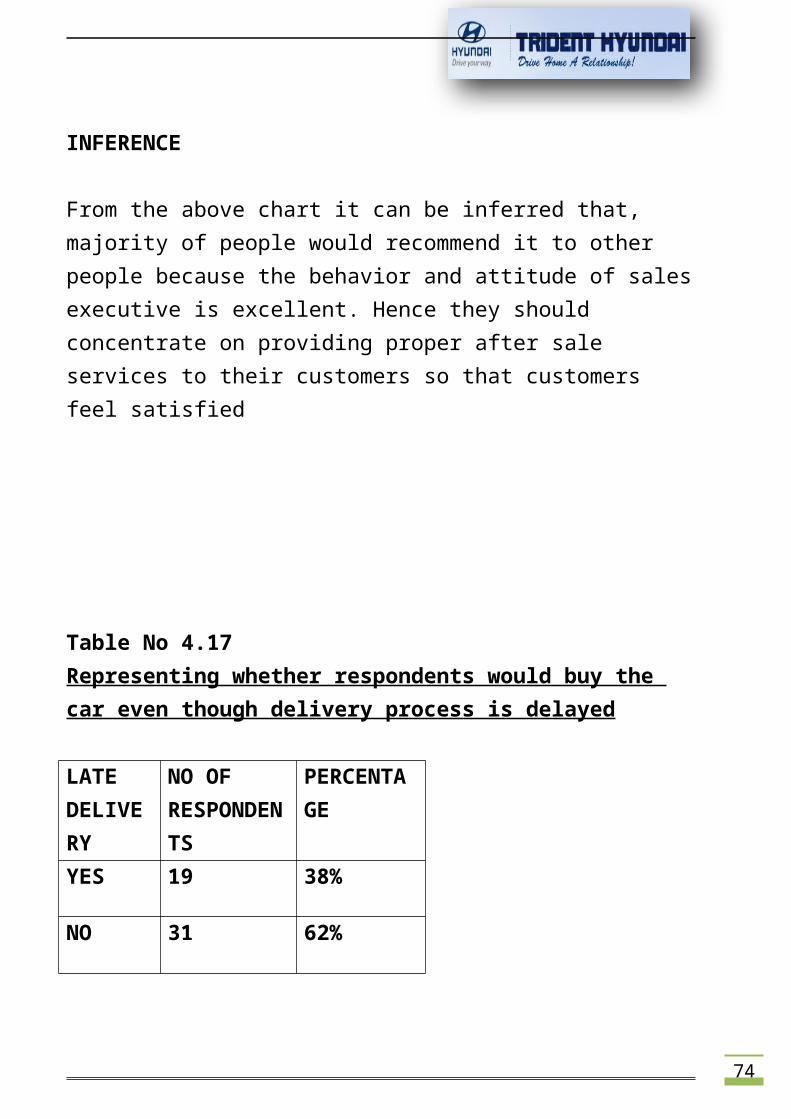
Table No 4.17Representing whether respondents would buy the car even though delivery process is delayed
LATE DELIVERY
NO OF RESPONDENTS
PERCENTAGE
YES 19 38%
NO 31 62%
75
ANALYSIS
The table above shows that, 62% of the respondents won’t buy the car if there would a delay in delivery process. 38% of them would still buy the car even though it is delayed.
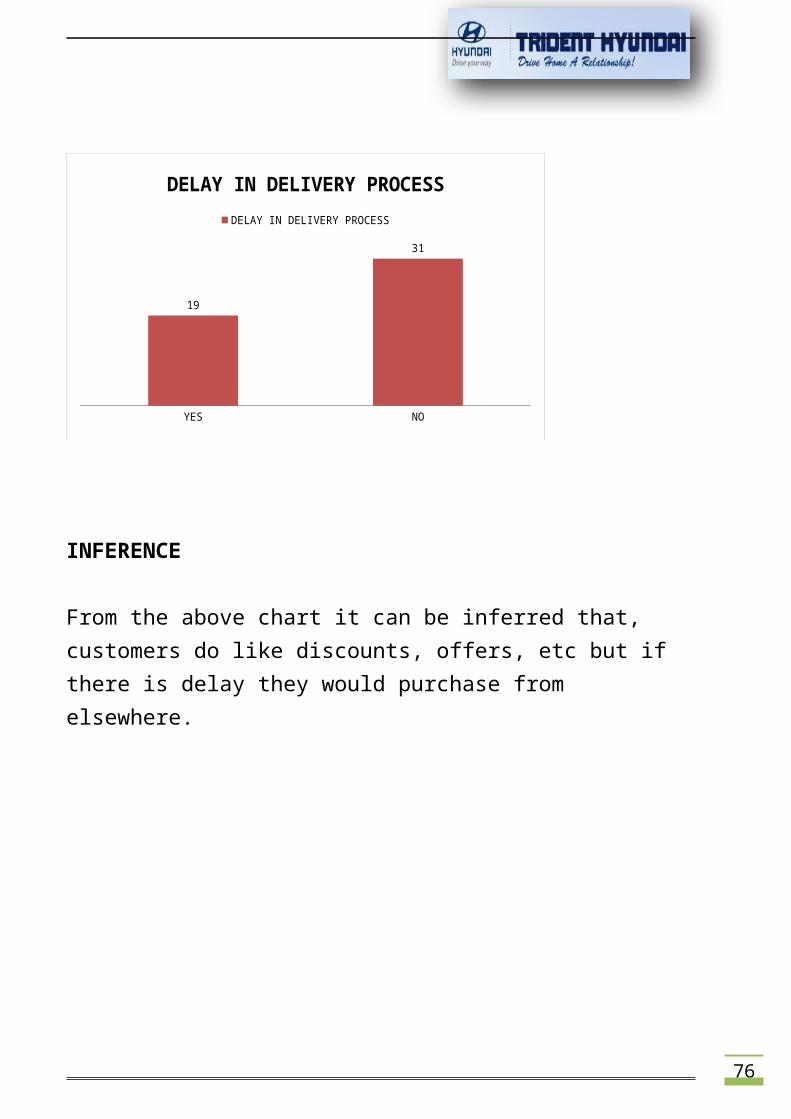
Chart No 4.17Representing whether respondents would buy the car even though delivery process is delayed
76
YES NO
19
31
DELAY IN DELIVERY PROCESSDELAY IN DELIVERY PROCESS
INFERENCE
From the above chart it can be inferred that, customers do like discounts, offers, etc but if there is delay they would purchase from elsewhere.
77
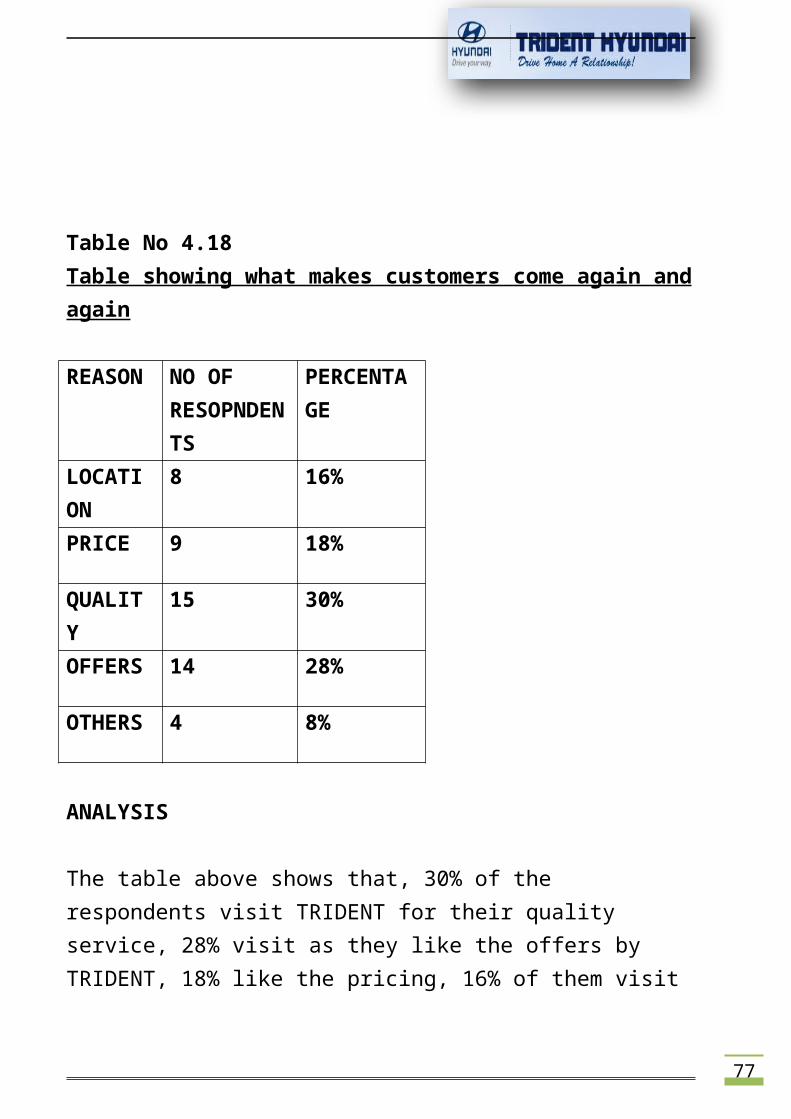
Table No 4.18Table showing what makes customers come again andagain
REASON NO OF RESOPNDENTS
PERCENTAGE
LOCATION
8 16%
PRICE 9 18%
QUALITY
15 30%
OFFERS 14 28%
OTHERS 4 8%
ANALYSIS
The table above shows that, 30% of the respondents visit TRIDENT for their quality service, 28% visit as they like the offers by TRIDENT, 18% like the pricing, 16% of them visit
78
as its convenient and 8%of them have otherreasons.
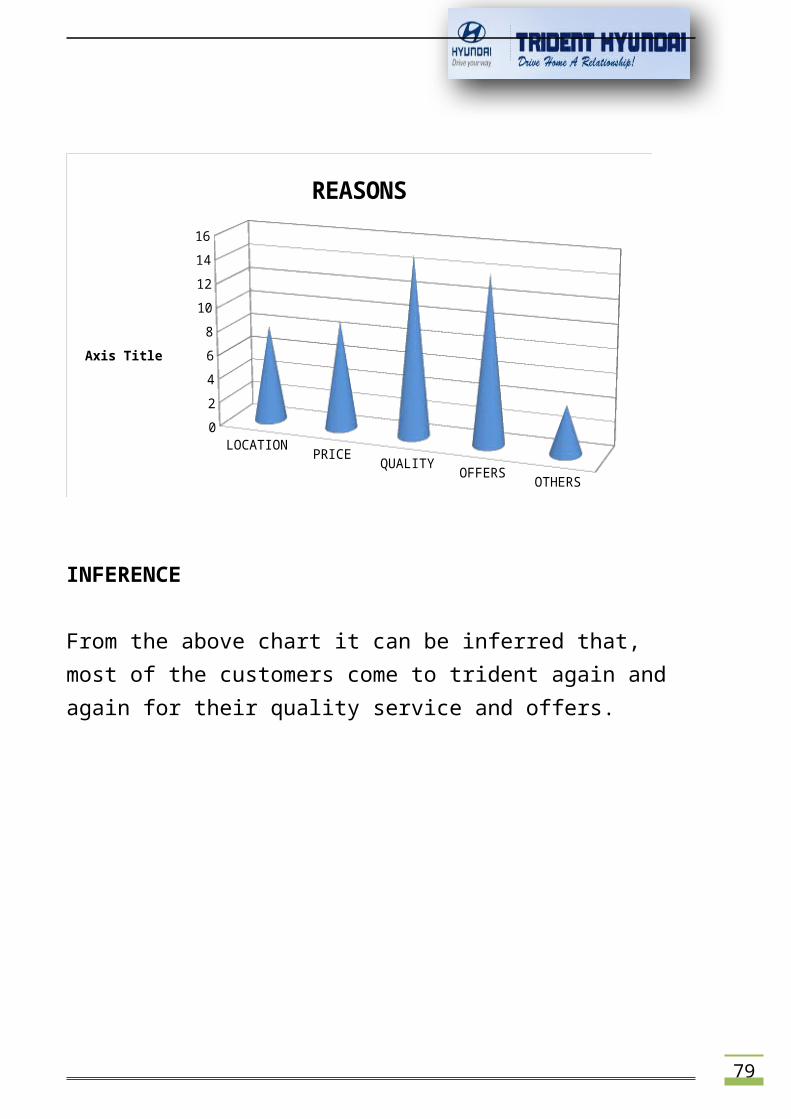
Chart No 4.18Chart showing what makes customers come again andagain
79
LOCATION PRICE QUALITY OFFERS OTHERS
02468
10121416
REASONS
Axis Title
INFERENCE
From the above chart it can be inferred that, most of the customers come to trident again and again for their quality service and offers.
80
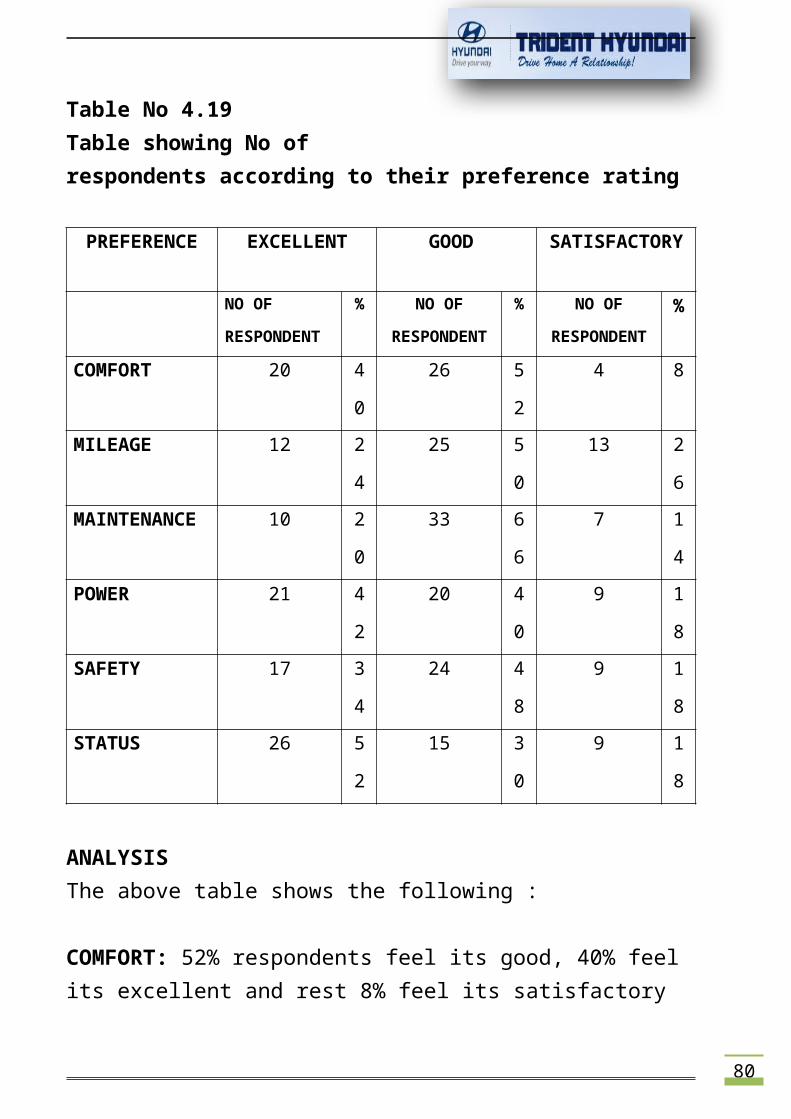
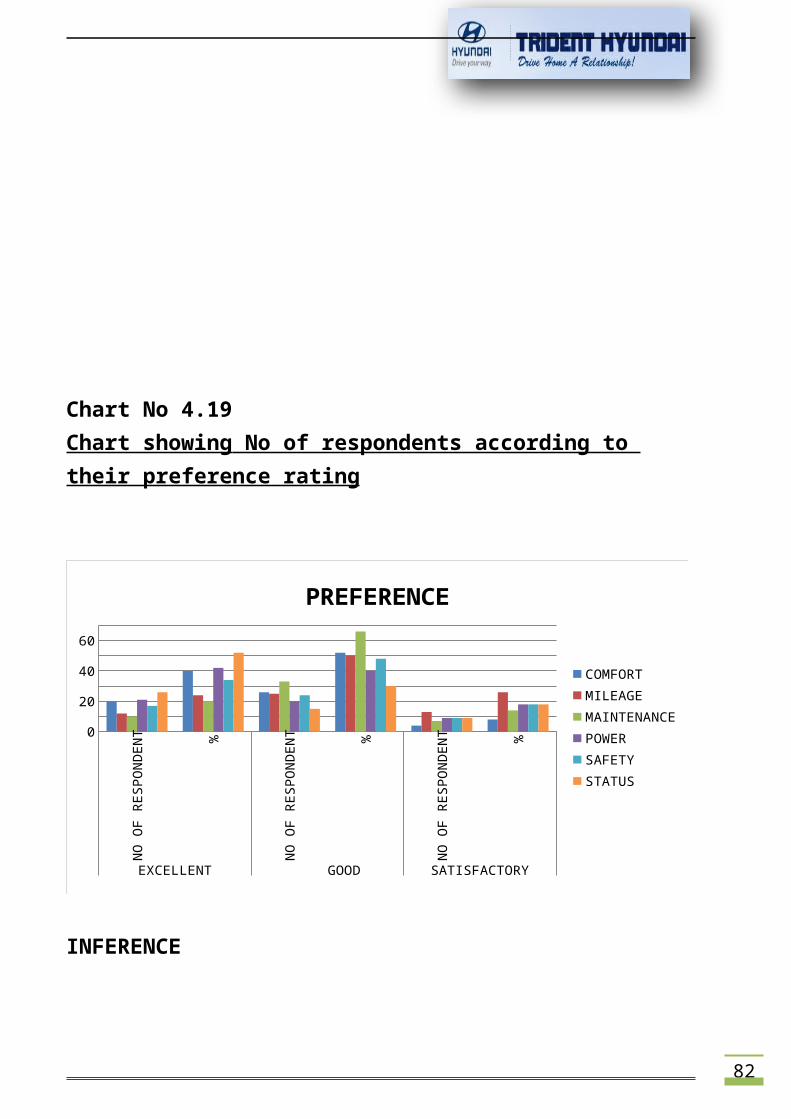
Table No 4.19Table showing No ofrespondents according to their preference rating
PREFERENCE EXCELLENT GOOD SATISFACTORY
NO OF
RESPONDENT
% NO OF
RESPONDENT
% NO OF
RESPONDENT%
COMFORT 20 4
0
26 5
2
4 8
MILEAGE 12 2
4
25 5
0
13 2
6MAINTENANCE 10 2
0
33 6
6
7 1
4POWER 21 4
2
20 4
0
9 1
8SAFETY 17 3
4
24 4
8
9 1
8STATUS 26 5
2
15 3
0
9 1
8
ANALYSISThe above table shows the following :
COMFORT: 52% respondents feel its good, 40% feel its excellent and rest 8% feel its satisfactory
81
MILEAGE: 50% of them sayits good, 24% of them say its excellent and rest say its satisfactory
MAINTENANCE: 66% of respondents say that its good, 20% say that its excellent and 14% say its satisfactory. POWER: 42% of the respondents find the power to be excellent, 40% find it to be good, and 18% find it to be satisfactory.
SAFETY:48% of the respondents find the safety to be good, 34% say that its excellent and 18% find it to be satisfactory
STATUS:52% of the respondents say its excellent, 30% sayits good and 18% say its satisfactory
82
Chart No 4.19Chart showing No of respondents according to their preference rating
NO O
F RE
SPON
DENT %
NO O
F RE
SPON
DENT %
NO O
F RE
SPON
DENT %
EXCELLENT GOOD SATISFACTORY
0
20
40
60
PREFERENCE
COMFORTMILEAGEMAINTENANCEPOWERSAFETYSTATUS
INFERENCE
83
From the above chart itcan be inferred that, mostof the respondents feel that Comfort, Mileage, Maintenance, Power, Safety and Status are good.
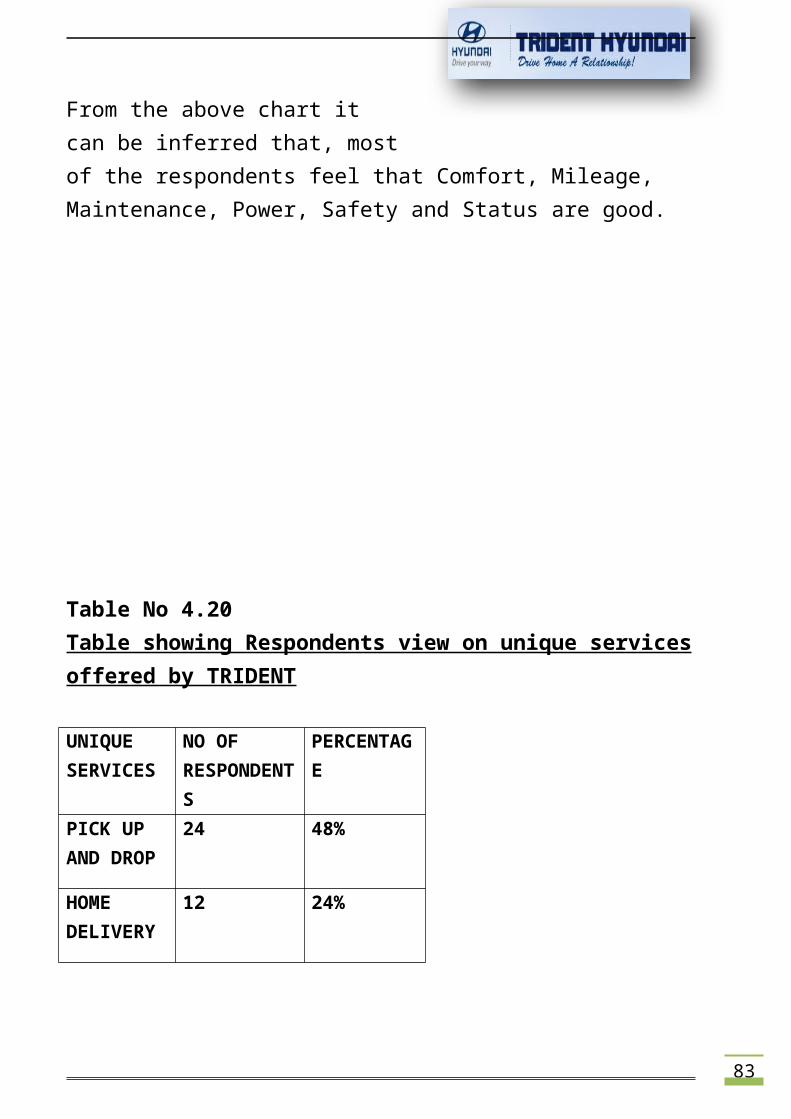
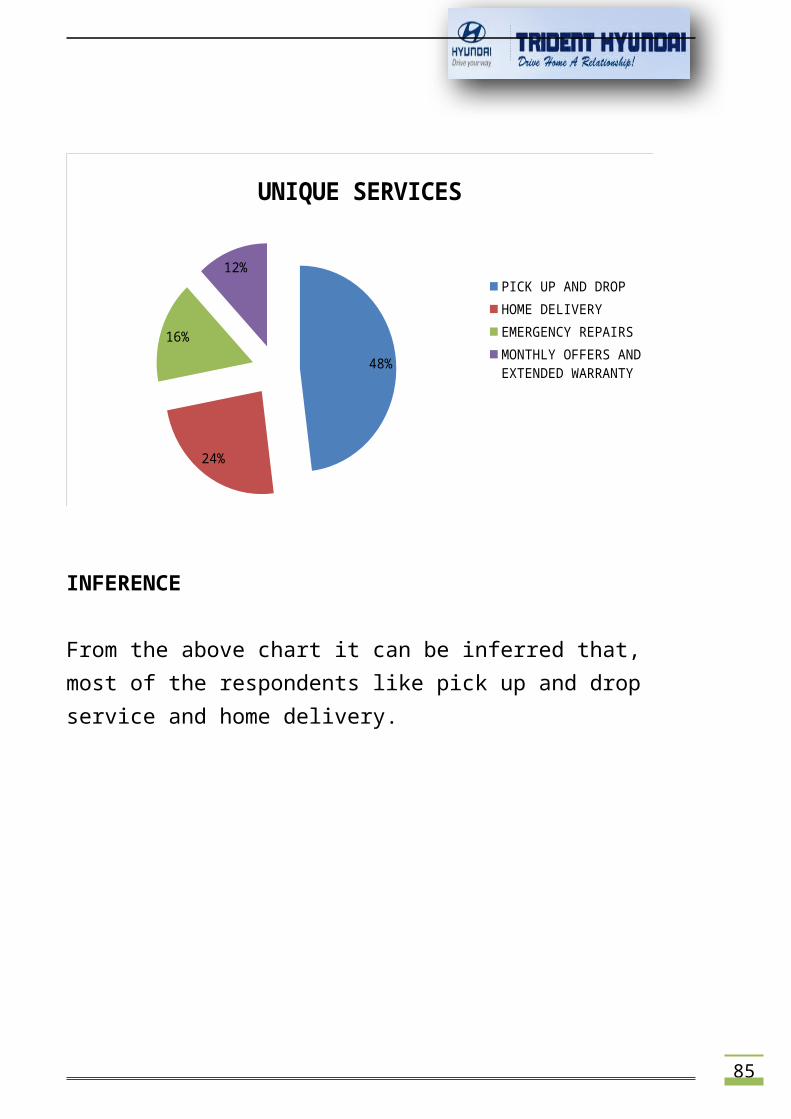
Table No 4.20Table showing Respondents view on unique servicesoffered by TRIDENT
UNIQUE SERVICES
NO OF RESPONDENTS
PERCENTAGE
PICK UP AND DROP
24 48%
HOME DELIVERY
12 24%
84
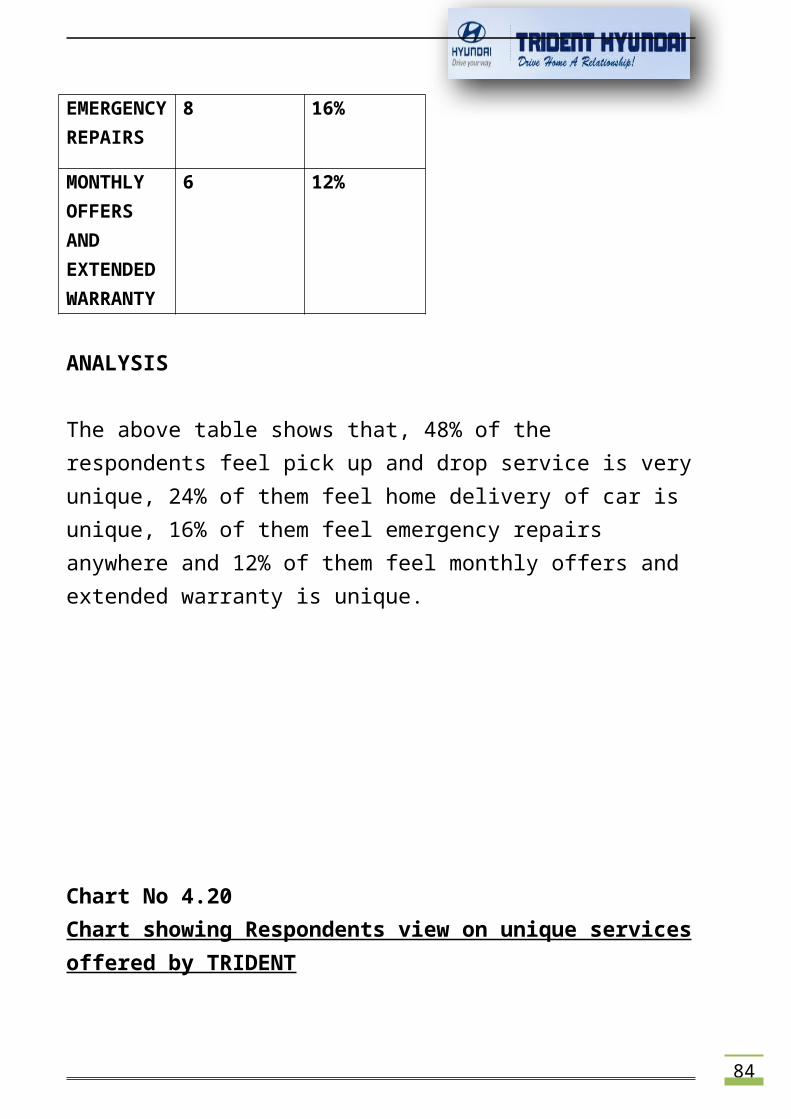
EMERGENCYREPAIRS
8 16%
MONTHLY OFFERS AND EXTENDED WARRANTY
6 12%
ANALYSIS
The above table shows that, 48% of the respondents feel pick up and drop service is veryunique, 24% of them feel home delivery of car is unique, 16% of them feel emergency repairs anywhere and 12% of them feel monthly offers and extended warranty is unique.
Chart No 4.20Chart showing Respondents view on unique servicesoffered by TRIDENT
85
48%
24%
16%
12%
UNIQUE SERVICES
PICK UP AND DROPHOME DELIVERYEMERGENCY REPAIRSMONTHLY OFFERS AND EXTENDED WARRANTY
INFERENCE
From the above chart it can be inferred that, most of the respondents like pick up and drop service and home delivery.
86
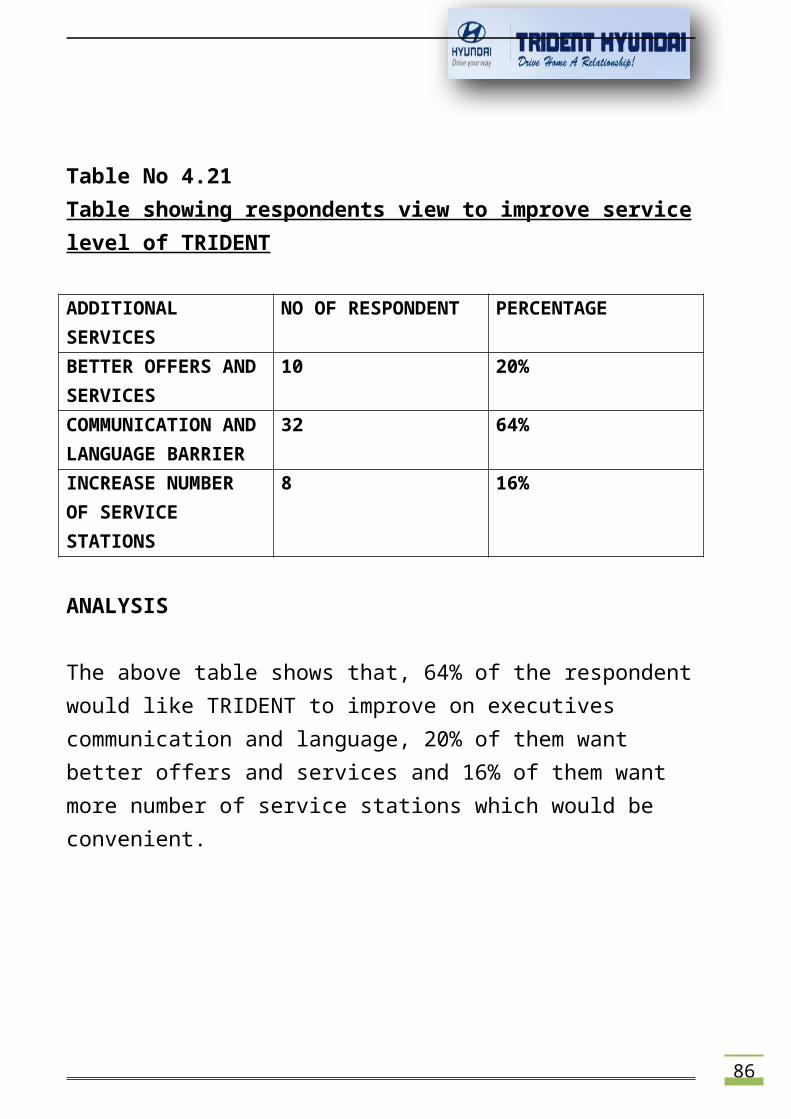
Table No 4.21Table showing respondents view to improve servicelevel of TRIDENT
ADDITIONAL SERVICES
NO OF RESPONDENT PERCENTAGE
BETTER OFFERS ANDSERVICES
10 20%
COMMUNICATION ANDLANGUAGE BARRIER
32 64%
INCREASE NUMBER OF SERVICE STATIONS
8 16%
ANALYSIS
The above table shows that, 64% of the respondentwould like TRIDENT to improve on executives communication and language, 20% of them want better offers and services and 16% of them want more number of service stations which would be convenient.
87
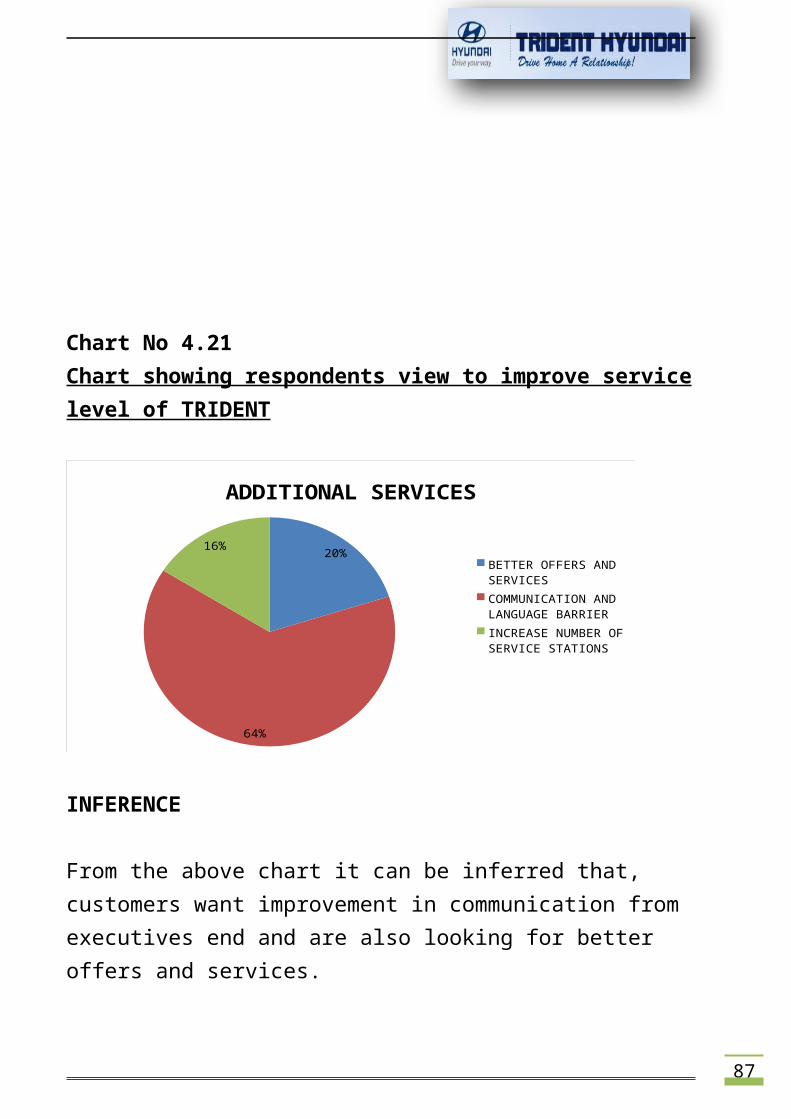
Chart No 4.21 Chart showing respondents view to improve servicelevel of TRIDENT
20%
64%
16%
ADDITIONAL SERVICES
BETTER OFFERS AND SERVICESCOMMUNICATION AND LANGUAGE BARRIERINCREASE NUMBER OF SERVICE STATIONS
INFERENCE
From the above chart it can be inferred that, customers want improvement in communication from executives end and are also looking for better offers and services.
88
FINDING
1. Most of the respondents are in the age group (25-35).2. Maximum number of the respondents are Male3. Most of the respondents are Businessmen, Selfemployed and Salaried.4. Most of the respondents belong to the income group of(0-10) Lakhs.5. More than 60% of the respondents on the whole ownI10, I20 and Santro.6. About 84% of the respondents feel that the car iseconomical.7. Most number of respondents know about TRIDENT eitherthrough Reference or from Internet Ads.8. Nearly 80% of the respondents feel that the servicestations are convenient.9. Most of the respondents were offered two to threeweeks of delivery.10. Offer that attracts customers the most is festiveoffer(40%).
89
11. The sales executive’sattitude towards respondentswas said to be Good by 54% ofthem.12. Most of the customers are happy with service. Butimprovement id required on after-sales service.13. Both Pre-sales and After-sales service issatisfactory according to the respondents.14. Majority of the customers get their cars servicedeither at Authorized dealer service stations or at otherAuthorized service centers.15. 74% of the respondents are willing to buy their nextcar from TRIDENT as they feel that TRIDENT is providingthem better services and a good price.16. The respondents are willing to recommend TRIDENT toothers (Family and Friends).17. Most of the respondents wouldn’t purchase the car ifthere is a delay in the process even though would havebeen offered discounts.18.


