Embed Size (px)
Citation preview

Nat. Hazards Earth Syst. Sci., 13, 1–13, 2013www.nat-hazards-earth-syst-sci.net/13/1/2013/doi:10.5194/nhess-13-1-2013© Author(s) 2013. CC Attribution 3.0 License.
Natural Hazardsand Earth
System Sciences
Liquefaction phenomena associated with the Emilia earthquakesequence of May–June 2012 (Northern Italy)
Emergeo Working Group: G. Alessio, L. Alfonsi, C. A. Brunori, P. Burrato, G. Casula, F. R. Cinti, R. Civico, L. Colini,L. Cucci, P. M. De Martini, E. Falcucci, F. Galadini, G. Gaudiosi, S. Gori, M. T. Mariucci, P. Montone, M. Moro,R. Nappi, A. Nardi, R. Nave, D. Pantosti, A. Patera, A. Pesci, G. Pezzo, M. Pignone, S. Pinzi, S. Pucci, S. Salvi,C. Tolomei, P. Vannoli, A. Venuti, and F. Villani
Istituto Nazionale di Geofisica e Vulcanologia, Via di Vigna Murata, 605, 00143 Rome, Italy
Correspondence to:S. Pucci ([email protected])
Received: 25 July 2012 – Revised: 9 November 2012 – Accepted: 11 December 2012 – Published:
Abstract. In this paper we present the geological effectsinduced by the 2012 Emilia seismic sequence in the PoPlain. Extensive liquefaction phenomena were observed overan area of∼ 1200 km2 following the 20 May,ML 5.9 and29 May, ML 5.8 mainshocks; both occurred on about E–W trending, S dipping blind thrust faults. We collected thecoseismic geological evidence through field and aerial sur-veys, reports from local people and Web-based survey. Onthe basis of their morphologic and structural characteristics,we grouped the 1362 effects surveyed into three main cate-gories: liquefaction (485), fractures with liquefaction (768),and fractures (109). We show that the quite uneven dis-tribution of liquefaction effects, which appear concentratedand aligned, is mostly controlled by the presence of paleo-riverbeds, out-flow channels and fans of the main riverscrossing the area; these terrains are characterised by the per-vasive presence of sandy layers in the uppermost 5 m, a localfeature that, along with the presence of a high water table,greatly favours liquefaction. We also find that the maximumdistance of observed liquefaction from the earthquake epi-centre is∼ 30 km, in agreement with the regional empiricalrelations available for the Italian Peninsula. Finally, we ob-serve that the contour of the liquefaction observations has anelongated shape almost coinciding with the aftershock area,the InSAR deformation area, and the I≥ 6 EMS area. Thisobservation confirms the control of the earthquake source onthe liquefaction distribution, and provides useful hints in thecharacterisation of the seismogenic source responsible forhistorical and pre-historical liquefactions.
1 Introduction
In May–June 2012, a seismic sequence struck a broad area ofthe Emilia-Romagna region in Northern Italy (Fig. 1), result-ing in 26 fatalities and hundreds of injured, 15 000 home-less, severe damage of historical centres and industrialareas, and an estimated economic toll of∼ 2 billion eu-ros. The sequence included two mainshocks. The firstone occurred on 20 May at 02:03 UTC with aML 5.9(44◦53′23′′, 11◦13′47′′, h = 6.3 km; ISIDe Database, 2012),hit in an area between Finale Emilia and San Felice sulPanaro; the second occurred on 29 May at 07:00 UTCwith a ML 5.8 (44◦ 51′03′′, 11◦05′09′′, h = 10.2 km; ISIDeDatabase, 2012), 12 km southwest of the previous mainshock(Fig. 2). Notably, the second shock determined the definitivecollapse of many buildings already weakened. The whole af-tershocks area extended in an E–W direction for more than50 km, and included fiveML ≥ 5.0 events and more than1800 ML > 1.5 events (Fig. 2). The focal mechanisms ofthe main events (Fig. 2) consistently show a compressionalkinematics with E–W oriented nodal planes (dip 50◦–60◦ Nand 30◦–40◦ S; Pondrelli et al., 2012; Scognamiglio et al.,2012; TDMT Database, 2012). These mechanisms are con-sistent with a horizontal, N–S oriented compression (P-axes)defined also by present-day stress indicators in the region(Montone et al., 2012 and references therein; Fig. 1) and bythe GPS-derived velocity field (Devoti et al., 2011).
The epicentral area of the 2012 Emilia sequence fallsin the southern part of the Po Plain,∼ 40 km north of thefoothills of the northern Apennines thrust and fold mountainbelt (Figs. 1 and 2). This portion of the Apennines is char-
Published by Copernicus Publications on behalf of the European Geosciences Union.

2 G. Alessio et al.: Liquefaction phenomena associated with the 2012 Emilia earthquake sequence
#
#
#
#
##
########
#
####
#
##
#
###
#
#
###
#####
##
##
#
#######
##
##
##
# #
#
##
###
##
#
#
#
##
#
#
#
#
#
#
#
#
#
#
#
#
##
#
##
#
##
#####
#
###
#
#
#
##
##
##
#
# ##
#
#
######
#
#
##
##
##
#
##
## #
#
###
##
#
#
###
####
#
###
## #
#
## ##
#
#
##
#
#
##
## #
#
#
##
#
#
##
##
Massa
Pistoia
Rimini
Cesena
Forlì
Ravenna
Bologna
ModenaReggio Emilia
Parma
Piacenza Cremona MantovaRovigo
Ferrara
La Spezia
(
(
(
(
( (
(
(
(
(
(
(
(
(
(
(
!
!
!
!
! !
!
!
!
!
!
!
!
!
!
!Po River
Alps
Apennines
Po Plain
Tyrrhenian Sea
Adriatic Sea
®
12°0'0"E11°0'0"E
45°0'0"N
44°0'0"N
12°0'0"E11°0'0"E
45°0'0"N
44°0'0"N
0 20 40 km
c d e fa b h i lg# # # ## # # #
Fig. 1. Schematic structural setting of the southern Po Plain (main buried structures after Boccaletti and Martelli, 2004) with orientation ofmaximum horizontal stress from focal mechanisms of the Emilia 2012 earthquake sequence (Scognamiglio et al., 2012) and from the Italianpresent-day stress map (Montone et al., 2012). (a) Po Plain units (Plio–Quaternary); (b) Apenninic Units (Meso–Cenozoic); (c) active andrecent (< 1 My) shallow thrusts; (d) active and recent thrust fronts in the Meso–Cenozoic carbonatic sequence; (e) active and recent thrustfronts in the basement; (f) reactivated thrust fronts of the Pliocene–Early Pleistocene (4.5–1 My); (g) maximum horizontal stress orientationfrom earthquake focal mechanisms ofM ≥ 5.0 events of the Emilia 2012 sequence; (h) maximum horizontal stress orientation from pastearthquakes (Mw 5.0 Parma 1983 andMw 5.4 Reggio Emilia 1996); (i) maximum horizontal stress orientation from borehole breakouts(scaled by quality); (l) area of Fig. 2.
acterised by N- and NE-verging thrusts and folds, involv-ing both the terrigeneous sedimentary cover and the carbon-ate Mesozoic sequences resulting from the late Oligocene-Quaternary compressional tectonic phases (i.e. Ghelardoni,1965; Pieri and Groppi, 1981). The external fronts of thenorthern Apennines accretionary prism, namely from W toE, the Monferrato, Emilia, and Ferrara-Romagna arcs, areburied beneath a cover of Pliocene hemipelagites and tur-bidites, up to 2 km thick, and Pleistocene basin and alluvialsediments (Fig. 1; Fantoni and Franciosi, 2010 and refer-ences therein). This earthquake sequence has added stronghints to the definition of the active structures of this portionof the Northern Apennines external fronts. In fact, althoughwith some differences, seismic, InSAR, GPS, and macroseis-mic data from the May–June 2012 sequence consistently sug-gest that two blind thrusts of the Ferrara arc activated duringthe 2012 mainshocks (Figs. 1 and 2), confirming the activityof the external buried fronts (e.g. Burrato et al., 2003; Boc-caletti and Martelli, 2004).
The seismic history of the past 30 yr (ISIDe Database,2012; CSI1.1, 2006) shows low seismicity in coincidenceof the area hit by the 2012 sequence and the same appearstrue for the location of the main historical events (Rovida etal., 2011). In fact, apart from the VII–VIII MCS 1639 earth-quake, based only on one data point in Finale Emilia, onlyearthquakes of moderate magnitude occurred in the area sur-rounding the 2012 seismic sequence (Fig. 2; Camassi et al.,2011; Castelli et al., 2012). The closest and more relevant iscertainly the I= VIII MCS (Mw 5.5) 1570 earthquake thathit the area of Ferrara (Fig. 2), about 30 km east of the 2012sequence. Historical accounts of the 1570 earthquake reportoccurrences of liquefaction phenomena in the area of Ferraraand surroundings as well as of open fractures and changes ofthe water flows in channels (Guidoboni et al., 2007). More re-cently, in 2011 aML 4.8 event hit the area about 20 km NE ofthe 2012 sequence (Fig. 2). Widespread secondary geologicaleffects were produced by the 2012 Emilia sequence and aremainly related to liquefaction phenomena. INGV-Emergeo
Nat. Hazards Earth Syst. Sci., 13, 1–13, 2013 www.nat-hazards-earth-syst-sci.net/13/1/2013/

G. Alessio et al.: Liquefaction phenomena associated with the 2012 Emilia earthquake sequence 3
#
## ##
#
##
##
##
####
###### ####
##
#
#
####
#
#
#
##
###
##
##
####
#
###
##
## #
!
!
!
!
!
!!
!
!
!!
!!
!
!
!
!
!
!
!
!
!
!
!
!
!
!
!
!
!
!
!
!
!
!
!!
!
!
!
!
!
!
!!
!
!
!
!
!!
!!
!
!
!
!
!
!
!
!!!
!!
!
!!
!
!!
!
!
!!
!!
!
!
!
!
!!
!
!
!
!
!
!
!
!
!!
!
!
!
!
!
!
!
!
!
!
!
!
!
!
!!
!
!
!
!
!
!
!
!
!
!!
!
!
!
!
!
!
!
!
!!
!
!
! !
!
!
!!
!
!
!!
!
!
!
!
!
!
!
!
!
!
!
!
!
!!
!
!
!
!!
!
!
!
!
!
!
!
!
!
!
!
!
!
!
!!
!
!
!
!
!
!
!
!
!
!
!
!
!
!
!
!
!
!
!
!
!
!
!
!
!!
!
!
!
!
!
! !
!!
!
!
!
!
!
!
!
!
!!
!
!
!
!
!
!
!
!
!
!
!
!
!
!
!
!
!
!
!!
!
!
!
!
!
!
!
!
!
!
!
!
!
!
!
!
!
!
!
!
!!
!
!
!!
!
!
!
!
!
!
!
!
!
!
!
!
!
!
!
!
!!
!
!
!
!
!
!
!
!
!
!
!!
!
!
!
!
!
!
!
!
!
!
!
!!
!
!
!
!
!
!
!
!
!
!
!
!!!
!
!
!
!
!
!
!!
!
!
!
!
!
!
!
!
!
!
!
!
!
!
!
!
!
!
!
!!
!
!
!
!
!!
!
!
!
!
!
!
!
!
!
!
!
!
!
!!
!
!!
!
!
!
!
!
!
!
!
!!
!
!
!
!
!
!
!
!
!
!
!
!
!
!
!
!
!
!
!
!
!
!
!
!
!
!
!
!
!
!
!
!
!!
!
!
!!
!
!
!!
!
!
!
!!
!
!
!
!
!
!
!
!
!
!
!
!
!
!
!
!
!
!
!
!
!
!
!
!
!
!
!!!
!
!
!
!
!
!
! !
!
!
!
!
!
!
!!
!
!
!
!!
!
!
!
!
!
!
!
!
!
!
!!
!! !
!!
!
!
!
!
!
!
!
!
!
!
!
!
!
!
!
!
!
!
!
!
!
!
!
!
!
!
!
!
!
!
!
!
!!
!
!
!
!
!
!
!
!
!
!
!
!
!
!
!
!
!
!
!
!
!
!
!
!
!
!
!
!
!
!
!
!
!
!
!
!
!
!
!
!
!
!
!
!
!
!
!
!!
!
!
!
!
!
!
!
!!
!
!
!
!
!
!
!
!
!
!
!
!!
!
!
!
!
!
!
!
!
!
!
!
!
!
!
!
!
!
!
!
!
!
!
!
!
!
!
!
!
!
!
!
!
!
!
!
!
!
!
!
!
!
!
!
!
!
!
!
!
!
!
!
!
!
!!
!
!
!
!
!
!
!
!
!
!
! !
!
!
!
!
!
!
!
!
!
!
!
!
!
!!
!!
!
!
!
!
!
!
!
!
!
!
!
!
!
!!
!
!
!
!
!
!
!
!
!
!
!!!
!
!
!
!
!
!
!
!
!
! !
!
!
!
!
!
!
!
!
!
!
!
!
!
!
!
!
!
!
!
!
!
!!
!!
!
!
!
!
!
!
!
!
!
!
!
!
!
!
!
!
!
!
!
!
!
!
!
!
!
!
!
!
!
!
!
!
!
!
!
!
!
!
!
!
!
!
!!
!
!
!
!
!
!
!
!
!
!
!!
!
!
!
!
!
!
!
!
!
!
!
!
!
!
!
!
!
!
!
!
!
!
!
!
!
!
!
!!
!
!
!
!
!
!!
!
!
!
!
!
!!
!
!
! !!
!
!
!
!
!!
!
!
!
!!
!
!!
!
!
!
!
!
!
!
!
!
!
!
!
!
!
!
!
!!
!
!
!
!
!
!
!
!
!
!
!
!
!!
!
!
!!
!
!
!
!
!
!
!!
!
!!!
!
!
!
!
!
!
!
!
!
!
!!
!
!
!
!
!!
!
!
!
!
!
!!
!
! !
!
!
!
!
!
!
!
!
!
!
!
!
!
!
!
!
!
!!
!
!
!
!
!
!
!
!
!!
!
!
! !
!
!
!
!
!
!
!
!
!
!
!
!
!!
!!
!
!
!
!
!
!
!
!
!
!
!
!
!
!
!
!
!
!
!
!
!
!
!
!
!
!
!
!
!
!
!
!
!
!
!
!
!
!
!
!
!
!
!
!
!
!
!
!
!
!
!
!
!
!
!
!!!
!
!
!
!
!
!
!
!
!
!
!
!
!
!
!
!
!
!
!
!
!
!
!
!
!
!
!
!!
!
!
!
!
!
!
!
!
!
!!
!
!
!
!
!
!
!
!
!
!
!
!
!
!
!
!
!
!
!!
!
!
!
!
!
!
!
!
!
!
!
!
!
!
!
!
!
!
!
!
!
!
!
!
!
!
!
!
!
!
!
!
!!
!
!
!
!
!
!
!
!
!
!!
!
!
!
!
!
!!
!
!
!
!
!
!
!
!
!!
!
!
!
!
!
!
!
!
!
!
!
!
!
!
!
!
!
!
!
!
!
!
!
! !
!
!
!
!
!
!
!
!
!
!
!
!
!
!
!
!
!
!
!
!
!
!
!
!
!
!
!!
!
!
!
!
!
!
!
!
!
!
!
!!
!!
!
!
!
!!
!
!
!
!
!
!
!
!
!
!
!
!
!!
!
!
!
!
!
!
!!
!
!!
!!
!
!!
!
!
!
!!
!
!!
!
!
!
!
!!
!
!
!
!
! !
!
!
!
!
!
!
!
!
! !
!
!
!
!
!
!
!
!
!
!!
!
!
!
!
!
!
!!
!
!
!
!
!
!
!
!!
!!
!
!
!
!
!
!
!
!
!
!
!
!
!
!
!
!
!
!
!
!!
!
!
!
!
!
!
!
!
!
!! !
!
!
!
!
!
!
!
!
!
!
!
!
!
!
!
!
!
!
!
!
!
!!
!
!
!!
!
!
!
!
!!
!
!
!
!
!
!
! !!
!
!
!
!
!
!
!!
!
!
!
!
!
!
!
!
!
!
!
!
!!
!
!
!
!
!
!
!
!
!
!
!
!
!
!
!
!
!
!
!
!
!
!
!
!
!!
!
!
!
!
! !
!
!
!
!
!
!
!!!
!
!!
!
!
!!
!
!
!
!
!
!
!
!
!
!
!
!
!
!
!
!
!
!
!
!
!!
!
!
!
!
! !
!
!
!
!
!
!
!
!
!
!
!
!
!!
!
!
!!
!
!
!
!!!
!
!
!
!
!
!
!
!
!
!
!
!
!
!
!
!
!
!
!
!
!
!
!
!
!
!
!
!
!
!
!
!
!
!
!
!
!
!
!
!!
!
!
!
!
!
!
!
!
!
!
!
!
!
!
!
!
!
!
!
!
!
!
!
!
!
!
!!
!
!
!!
!
!
!
!
!
!
!
!
!
!
!
!
!
!
!
!
!
!
!
!
!
!
!
!
!
!!
!
!!
!
!
!
!
!
!
!
!
!
!
!!
!
!
!
!
!
!
!!!
!
!
!
!
!
!
!
!
!
!
!
!
!
!!
!
! !
!
!
!
!
!
!
!
!
!
! !
!
!
!
!
!
!
!
!
!
!
!
!
!
!
!
!
!
!
!
!
!
!
!
!
!
!
!
!
!
!
!
!
!
!
!
!
!
!
!
!
!
!
!!
!
!
!
!
!
!
!
!
!
!
!
!
!
!
!
!
!
!
!
!
!
!
!
!
!
!
!
!
!
!
!
!
!
!
!
!
!
!
!
!
!
!
!
!
!
!
!
!
!
!
!
! !
!
!!!
!
!
! !
! !
!
!
!
!
!
!
!
!
!
!
!
!
!!
!
!
!
!
!!
!
!
!
!
!
!
!
!!
!!
!
!
!
!!
!
!
!
!
!
!
!
!
!
!
!
!
!
!
!
!
!
!
!
!
!
!
!
!
!
!
!
!!!
!
!
!
!
!
!
!
!
!
!!
!
!
!!!
!
!
!
!!
!
! !
!
!!
!
!
!
!
!
!
!
!
!
!
!
!
!
!
!
!
!
!!
!
!
!
!
!
!
!
!!
!
!
!
!
!
!
!!
!
!!
!
!
!
!
!!
!!
!
!
!
!!!
!!
! !!!
!
!
!! !^
^^^̂
^^
2012-05-29 11:00
2012-05-20 02:07
2012-05-20 02:03
2012-05-20 13:18
2012-05-29 07:00
2012-05-29 10:55
2012-06-03 19:20
M 5.9 M 5.1
M 5.1
M 5.8M 5.3M 5.2
M 5.1
1
1
2
2
3
3
4
4
5
5
6
6
7
7
15701639
!2011
!(Ferrara
!
!(Modena
!( ((( (((
(( ((
((Finale Emilia
ai dNov i Moden !!
!
!Mantova
Mirandola
Sant'Agostino
San Felice San Felice sul Panarosul PanaroSan Felice sul Panaro
®
45°0'0"N
#
#
#
45°0'0"N
11°0'0"E 11°30'0"E
11°0'0"E 11°30'0"E
0 5 10km
Po River
^! ! !
Legend
abc
d
f
! e
Fig. 2. Area of the Emilia 2012 earthquake sequence. (a), (b), (c) main active structures from Boccaletti and Martelli (2004), see captionof Fig. 1; (d) historical earthquakes withMe≥ 5 (CPTI11 Catalogue, Rovida et al., 2011); (e)ML 4.8, 2011 event and (f) Emilia 2012sequence (ISIDe Database, 2012): stars stand forML ≥ 5.0 earthquakes (in red the two mainshocks) and numbers refer to focal mechanisms(Scognamiglio et al., 2012); circles of variable size are for earthquakes ofML = 4.1÷ 4.9,ML = 3.1÷ 4.0 andML ≤ 3.0.
Working Group, as well as teams from other institutions (e.g.ISPRA, University of Insubria, Emilia Romagna GeologicalSurvey, etc.), promptly surveyed the area to collect coseismicgeological evidence (for a complete photographic coveragesee Emergeo Working Group, 2012b), coordinating and inte-grating information to assure the maximum coverage of theaffected area. All the survey teams verified that no primarysurface rupture occurred. In this paper we present the datacollected by the Emergeo Working Group through the fol-lowing approaches: (i) field survey; (ii) helicopter and pow-ered hang-glider trike survey; (iii) reports from local peoplecollected in the field or through a Web-based survey acti-vated at the INGV portalhttp://www.haisentitoilterremoto.it/emergeo.html(did you see earthquake geological effects?).For an extended description of the methodologies and tech-nologies used for the survey of the geological effects, seeEmergeo Working Group (2012a).
The significance of the collected data as a key to a bet-ter understanding and evaluation of the liquefaction hazardis then discussed in light of the local geological and geomor-phic setting, the coseismic displacement defined by InSARinterferograms, the seismic sequence and the damage distri-bution.
2 The observed liquefaction phenomena
The most common geological features observed during thepost-earthquake survey were related to liquefaction process.Thanks to the information provided by several local eye-witnesses and also based on the magnitude and timing of themain events, we conclude that the liquefaction process wasinduced by the 20 and 29 May mainshocks. In fact, the onlylarge aftershock that could have produced liquefaction thatwould have been indistinguishable to eye-witnesses is the20 May 2012,ML 5.1, event that occurred only 4 min afterthe first mainshock (Fig. 2). However, this possibility is ruledout because looking at the national and international em-pirical relationships (magnitude vs. liquefaction; e.g. Galli,2000; Obermeier, 1996), there are very few cases of lique-faction induced by earthquakes with a magnitude below 5.5.
Liquefaction is a hydrological phenomenon that originatesby significant shaking during earthquakes, mainly on allu-vial and coastal plains. The strength and stiffness of sat-urated and unconsolidated fine sediment at shallow depth(max. 30 m b.g.s.) are reduced by being shaken to a criticallevel where the effective stress tapers to zero and the sedi-ments become fluid-like, i.e. liquefy. In this process, the over-pressured interstitial water tends to escape upward throughnewly formed, pre-existing fractures and/or anthropic struc-tures (e.g. water wells, foundations, etc.), conduits and vents
www.nat-hazards-earth-syst-sci.net/13/1/2013/ Nat. Hazards Earth Syst. Sci., 13, 1–13, 2013

4 G. Alessio et al.: Liquefaction phenomena associated with the 2012 Emilia earthquake sequence
bringing along the liquefied sediment to the surface andforming sand volcanoes and sand sheets. Based on the abovedescription, it is clear that the Po Plain, filled by alluvial sed-iments hosting multilayered confined aquifers and phreaticaquifers in the first 10 to 30 m (Regione Emilia Romagna,ENI-Agip, 1998; Marcaccio and Martinelli, 2012), has a highpotential for liquefaction; this earthquake sequence has cer-tainly confirmed it.
On the basis of their morphologic and structural charac-teristics, the observed coseismic effects at the surface weregrouped into three main categories (Fig. 3); (i) liquefac-tion: (ii) fracture/liquefaction; and (iii) fracture. Categories(i) and (ii) may be associated to relevant but localised sub-sidence or bulging related to sediments extrusion. Underthe liquefaction category we classified single spots such assand volcanoes, scattered vents and coalescent flat cones,sand infilled water wells, fountains and manholes. The frac-ture/liquefaction category comprises mainly elongated andaligned multiple sand volcanoes, and sand flows from co-seismic open fractures occurring both on natural and pavedground surface. Finally, the fracture category includes newlyformed open fractures and cracks without evident sand ex-trusion at the surface. The surveyed features appear inde-pendent from the type of environment, in fact they occuron roads, buildings, backyards, parks, agricultural fields, etc.Some manmade underground structures such as wells, foun-dations, sewers, etc. forming artificial boundaries represent asimpler escape for the overpressured water.
Besides categorising attributions to specific typologies,we collected structural and morphological data of the ob-served geological surface effects. In particular we measured(1) thickness of the sand volcanoes and area of sand drap-ing; (2) morphology and diameter of the sand outlets; (3)spacing of the sand outlets, length and strike of their align-ments; (4) spacing, length and strike of the fractures and ofthe sand outlet alignments; (5) style of the fractures pattern;and (6) opening and offset of the fractures. Samples of theliquefied extruded sand were collected for sedimentologicalanalysis. The aerial survey integrated the dataset collected inthe field by the analysis of more than 1500 georeferencedphotographs and of more than 3 h of video. The low-altitudeflight plan (∼ 200–300 m) contributed to cover the mesoseis-mal area, having the resolution necessary to detect the pres-ence or the absence of surface coseismic geological effects.Most of the aerial observations were validated by field sur-vey, or, when this was not possible, the careful analysis of theimages allowed attribution of each feature to one categoryand measurement of at least length, strike, and areal extent.Considering the land use, typology and status of the culti-vations covering the flat land, it is possible that some minorevidence was missed but only in coincidence of wheat fields.The georeferenced photographs were analysed and, jointlywith the field data, the observations were stored, analysedand managed in a geographical information system.
22
635
Figure 3: Examples of liquefaction produced by the 2012 Emilia sequence on the ground 636
and on manmade structures: a) detail of aligned multiple sand blows nearby 637 Fig. 3. Examples of surface phenomena produced by the 2012Emilia sequence on the ground and on manmade structures:(a)detail of aligned multiple sand blows nearby Sant’Agostino;(b)∼ 20 cm-wide open fracture with liquefaction near San Carlo. It ispossible to observe several cm-wide, grey sand-filled cracks thatrepresent the path to the surface of the liquefied material;(c) 30 m-long open fracture with massive ejection of dark grey sand in SanCarlo (photo by L. Ghidoni);(d) fracture affecting the bridge overa channel filled with liquefied sand near Burana;(e) the warehouseof this pottery shop in San Carlo was covered by a∼ 15 cm-thicklayer of liquefied sands and silts;(f) liquefied sand filled this waterwell and poured out to cover a∼ 500 m2 circular area;(g) fractureaffecting a paved road in San Carlo;(h) the ground/building limitoften represented a preferential way of outflow for liquefaction, likein this case at San Felice sul Panaro.
As a whole, a total of 1362 sites with geologic co-seismic effects were identified and surveyed over morethan 1200 km2; 768 findings were classified as frac-ture/liquefaction, 485 as liquefaction, and 109 as fracture.
As it appears clearly from Fig. 4, the coseismic effects arenot evenly distributed over the area but mostly appear con-centrated and aligned. For the whole mesoseismal area, thepreferential trend of the linear features (fractures and frac-
Nat. Hazards Earth Syst. Sci., 13, 1–13, 2013 www.nat-hazards-earth-syst-sci.net/13/1/2013/

G. Alessio et al.: Liquefaction phenomena associated with the 2012 Emilia earthquake sequence 5
Bondeno
MirabelloS. Felice sul Panaro
Finale Emilia
Cento
Mirandola
Medolla
Cavezzo
Poggio Rusco
Quistello
Moglia
Scortichino
S. Agostino
S. Prospero
Reggiolo
Carpi
Po River
11°
11°
Gavello
Casumaro
S. Martino Spino
BuranaLiquefaction
Fracture/Liquefaction
Fracture
20th May
20th May
20th May
29th May
29th May
29th May
20th&29th May
Cultivated landWoodland
NW area
SW area
SE area
NE area
Fig.5a
Fig.5c
Fig.5b
Fig.5d
0
4 5
9 0
1 3 5
1 8 0
2 2 5
2 7 0
3 1 5
4 0 5 00 1 0 2 0 3 0
Mesoseismal arean: 877
45° 45°
May 20thMl 5.9May 29th
Ml 5.8
Fig. 4. Location of observed geological effects (1362 data points) distinguished according to the three main categories and the triggeringseismic event. The two mainshocks and the four study areas are presented. The inset shows the rose diagram evidencing the trend distributionof the linear coseismic geological effects (877 fractures and fracture/liquefactions).
ture/liquefactions) ranges between N060–N120. In the fol-lowing, the collected data are presented by subdividing thesurveyed region in four areas: SE, SW, NE, NW (Figs. 4 and5). This is not only a geographic division but reflects also fea-ture characteristics, such as (1) space distribution, (2) timeof occurrence, (3) prevalent typology, and (4) distinctive ar-rangement patterns.
2.1 The SE area
Within the area comprising the villages of Mirabello,Sant’Agostino, San Prospero, Cento, and Finale Emilia,the observed coseismic features belong to all three cate-gories: liquefaction, fracture/liquefaction, fracture. Over a to-tal of 478 observations, 45 % were liquefactions, 40 % frac-ture/liquefactions, and 15 % fractures (Fig. 4). Most of theseeffects occurred during the 20 May shock. A peculiar highdensity of observations is located between Mirabello andSant’Agostino villages. About 1/3 of the total number of ob-servations in the whole area were collected here, in a NE–SWstriking zone about 7 km-long and 0.2 to 0.6 km-wide. Theinteraction of liquefaction effects with man-made structureswas particularly strong, especially in the village of San Carlowhere many buildings, roads, fenced walls, and lifelines wereseverely affected and damaged by fracturing and liquefactionphenomena. Notably, a high percentage of the water wells inthe area were filled by the liquefied sand, often up to the top.
The extruded sands (liquefaction and fracture/liquefactioncategory) were mainly grey medium-to-fine sand and in mi-nor amount hazel sand, suggesting the liquefaction of at leasttwo distinct sandy layers. In a few cases, the two sands wereextruded at the same place, one following the other. Thethickness of the extruded sand in open fields reached about
40 cm, whereas at sites in the San Carlo village garages orground-floor apartments were filled with 1 m-thick sand bod-ies. Maximum observed diameter of sand volcanoes is 10 mthat, when coalescing, extend to a maximum length of 50 m.Many fractures, mostly NE–SW striking, were associatedwith the extrusion of liquefied sand (fracture/liquefactioncategory), and many of them extended to a maximum lengthof 50 m, often showing up to 20 cm opening and more rarely20 cm of vertical separation. The fractures with no sand ex-trusion had a similar strike, were up to a few hundred-m long,displayed usually a clear opening up to 30 cm, and locallyshowed a vertical separation up to 20 cm with both SE andNW downthrown (Fig. 5a). In some artificial cuts open to re-pair coseismically broken pipes, we observed open fracturesinfilled by grey sand that did not reach the surface. This isa further indication that the driving phenomenon here is re-lated to liquefaction even if sand at some locations was notextruded and only fractures or soil bulges were observed. Thelarge amount of extruded sand in the San Carlo area producedimportant emptying and compaction in the liquefied bedsthat produced at the surface a localised subsidence, some-times accompanied by ponding. Subsidence started with theoccurrence of liquefactions but, because settling and re-compaction of sediments is a slow process, it kept increas-ing day by day, representing a further hazard for the involvedman-made structures. To understand this process, we starteda terrestrial LiDAR (TLS) monitoring of the fractures andfracture/liquefactions crossing the Sant’Agostino-San Carlocemetery. On 23 May , the amount of opening and verticalseparation across the most prominent fracture visible in thenorthern wall of the cemetery was 10 cm and 3 cm down toSE, respectively.
www.nat-hazards-earth-syst-sci.net/13/1/2013/ Nat. Hazards Earth Syst. Sci., 13, 1–13, 2013

6 G. Alessio et al.: Liquefaction phenomena associated with the 2012 Emilia earthquake sequence
Fig. 5. Examples of coseismic geological effects of the four study areas at different scales of observation (satellite view from Bing Maps;aerial and field view from Emergeo survey). Red dots indicate the coseismic feature locations. The inset shows the rose diagram displayingthe trend distribution of the linear coseismic geological effects.(a) SE area. Fractures and fractures/liquefactions following the paleochannelmorphologies close to San Carlo village. The aerial view shows a large volume of sand outflow. The detail shows the fracture/liquefactionaffecting the top of the paleobank;(b) SW area. Distribution of liquefactions and fractures/liquefactions at San Felice sul Panaro village.The aerial view shows the trends of the fractures/liquefactions affecting the soccer field. The detail shows the reactivation of the liquefactionoccurred on 29 May through a water well;(c) NE area. Fractures/liquefactions showing a meander-like, complex alignment west of Bondenovillage. The aerial view displays the variability of the fractures/liquefactions trends evidenced by the ploughed field. A detail of the frac-ture/liquefaction is shown;(d) NW area. Distribution of liquefactions and fractures/liquefactions at Quistello village aligned along a buriedchannel. The aerial view shows a ten-of-metres long fractures/liquefactions. A detail of the fracture/liquefaction presents a sink-hole withsoil chips ejected over the sand volcano body.
On 31 May, the analysis of TLS data acquired on the southcemetery boundary wall allowed the estimation of a relativedisplacement along the direction normal to the wall of about5 cm down to SE (total amount). It is noteworthy that the TLSdata precision (for ranging scanner) is about 5–6 mm and theavailability of high density coordinate point cloud achievedbetter values.
The method used to obtain morphological informationfrom TLS analysis is based on the definition of referenceplanes (or other primitives) and on the computation of point-to-plane differences, allowing the creation of detailed maps(Fig. 6a; Pesci et al., 2011). The cemetery’s surrounding
street was monitored, showing interesting features by meansof TLS and GPS integration. In particular, three rapid staticsurveys (Pesci et al., 2012) were performed from 31 May to12 June 2012. The results describe the terrain lowering withvalues ranging from 0.5 cm to about 2.0 cm along the street,showing differential movements (Fig. 6b) with a mean errorof about 6–8 mm (2σ ).
Other liquefaction related features were observed in thisregion but disconnected from the main Sant’Agostino-Mirabello zone. These were concentrated in two spots lo-cated at about 7 km westward and about 2 km southward ofSant’Agostino village. It is noteworthy that at Finale Emilia
Nat. Hazards Earth Syst. Sci., 13, 1–13, 2013 www.nat-hazards-earth-syst-sci.net/13/1/2013/

G. Alessio et al.: Liquefaction phenomena associated with the 2012 Emilia earthquake sequence 7
Fig. 6. (a) San Carlo cemetery wall deformation map across the fracture obtained through terrestrial laser scanning (TLS);(b) San Carlocemetery surrounding street monitored by means of TLS and GPS integration, surveyed from 31 May to 12 June 2012 (terrain lowering:GPS measurements).
village and its surroundings, only minor fracturing occurredon a few paved roads and with no evidence of sand extru-sions.
The preferential trend of the main subset of geologicalobservations from Sant’Agostino and Mirabello ranges be-tween 50◦–90◦ N (Fig. 5a).
2.2 The SW area
Within the area comprising the villages of San Felice sulPanaro, Cavezzo, Medolla, with over a total of 132 obser-vations, 38 % were assigned to liquefaction, 53 % to frac-ture/liquefaction, and 9 % to fracture (Fig. 4). In some sitesof this area the coseismic effects occurred following both the20 and 29 May mainshocks. As in the SE area, here the ex-truded sands were mainly grey medium-to-fine sand and inminor amount hazel sand. The density of effects in this areawere quite low; however, there were a peculiar high density
of observations collected at San Felice sul Panaro (producedby both 20 and 29 May shocks, Fig. 5b), where more than100 liquefactions and fracture/liquefactions were mapped ina 0.2 km2 area between the stadium and the railway station.Here, several water wells and manholes as well as ground–foundation boundaries served as artificial vents and are nowcompletely filled by liquefied sand.
Another area with a relative concentration of effects (pro-duced by the 29 May shock) is in the Cavezzo village, whereliquefactions occurred prevalently within and near the maincanal, and a few fracture/liquefactions were organised in aNE–SW striking zone about 3 km long and up to 0.7 kmwide. Very few additional isolated coseismic features of liq-uefactions and fractures were mapped around the Medollavillage.
In the SW area, linear features indicate two preferentialtrends: N–S and N100–N125 (Fig. 5b).
www.nat-hazards-earth-syst-sci.net/13/1/2013/ Nat. Hazards Earth Syst. Sci., 13, 1–13, 2013

8 G. Alessio et al.: Liquefaction phenomena associated with the 2012 Emilia earthquake sequence
2.3 The NE area
This is another area with important concentration of geo-logical coseismic effects produced by the 20 May main-shock (Fig. 4). In particular, in over a total of 636 observa-tions, 27 % were liquefactions, 70 % fracture/liquefactions,and 3 % fractures. All the identified liquefactions and frac-tures/liquefactions involved grey coarse-to-fine sands, notshowing any significant difference as for their lithologicalcharacteristics and content at a glance. The geological fea-tures in the area appeared organised into two main WNW–ESE trending sets: a northern set comprised between the vil-lages of Bondeno and San Martino Spino, and a southern setbetween Mirabello and Gavello (Figs. 4 and 5c).
The northern set comprised a high concentration of obser-vations, west of the Bondeno and south of the Burana vil-lages, mainly consisting in fractures/liquefactions and rareliquefactions. Fractures with sand extrusion were up to 20 mlong, up to 10 cm wide, and thickness of the sand was upto 30 cm. Although they were sub-clustered in few tens-of-metres wide and some hundred-of-metres long strands, thesefeatures form a zone up to 1.5 km wide and about 4 km long.The zone mainly crosses agricultural fields and only onebuilding was deeply affected by open cracks just south ofBurana.
The southern set of effects comprises all the definedtypologies although fracture/liquefaction features prevailedwith lengths up to 50 m. Fractures/liquefactions and fractureswere seen in a narrow (about 500 m wide) zone, just west ofMirabello, for a length of about 2 km. They were generallyN110 to N140 trending, and about 100 m long (the longest inthe area) (Fig. 5c). Fractures/liquefaction occurred also a fewkm north of Casumaro. Here, these were up to 100 m long,with a prevailing N130–N150 trend, and were comprised ina 500 m wide zone. Fracture/liquefactions were particularlyconcentrated in the area of Scortichino where they formedan up to 1 km wide zone, but comprising two clusters: onejust E–SE of Scortichino, and another located few kilome-tres to the NW. The first cluster was characterised by N050and N090 trends and rare N140–N160 oriented features; thesecond cluster had rather sparse directions and a maximumlength of about 30 m. The presence of liquefaction-relatedfeatures decreased rapidly to the W and NW of the area,where a few liquefactions and fractures/liquefactions wereobserved just E and SE of Gavello and S of San MartinoSpino.
The main trend of the features in the NE area ranged be-tween N060 and N140, with a maximum concentration in theE–W direction (Fig. 5c).
2.4 The NW area
The survey of this area started in detail following the 29 Maymainshock (Fig. 4) because only limited effects were re-ported after the 20 May seismic event. Field and aerial sur-
veys revealed a low density of coseismic effects with mainlysparse and scattered evidences. In over a total of 116 mappedeffects, 38 % were liquefactions, 59 % fracture/liquefactions,and only 3 % fractures (Fig. 4). The extruded sediment, bothby vents or fractures, was consistently made by grey fine sandall over the area. The amount of out-flown sand in individualsand blows rarely draped a ground floor exceeding 10 m2 andthe vents did not build sand volcano bodies taller than 30–35 cm. Concerning the coseismic fractures, the ground fail-ure consisted in open cracks with lateral separation of maxi-mum 30 cm, with no vertical sizable offset. In only one case asink-hole, 50 cm wide and 50 cm deep, in coincidence of liq-uefaction outlet, was observed, presenting evidence of soilchips ejected over the sand volcano body up to a distance of1.5 m (Fig. 5d).
Most of the surface effects were localised close to theMoglia and Quistello villages. The latter presented thelargest amount of fractures accompanied by liquefactions,which appeared to be organised in a system of metres-longsegments striking from N060 to N120 that describe a WSW–ENE oriented,∼ 400 m long alignment. By tracking singleliquefaction outflows and subordinate fractures with lique-factions apparently controlled by anthropic structures (i.e.water wells, building foundations, sewage systems, etc.), thisalignment appeared to extend 600 m further west into the ur-ban area. Inside the Moglia village,∼ 20 sand blows of greyfine sand, whose outlets appeared facilitated by the presenceof buried anthropic structures, described an E–W strip of∼ 300 m. Another relevant coseismic effect occurred 2.0 kmwest of the Moglia village, where an E–W striking, 50 mlong, 30 cm open fracture was accompanied by alignment ofliquefaction outlets and sand draping of∼ 500 m2.
In the remaining area, single fracture/liquefaction and liq-uefaction features were detected at places with the standardexpression observed elsewhere, with small size and no clearindication of structural arrangement.
The main trend of the features in this area was about N070(Fig. 5d).
3 Discussion
Extensive liquefaction was observed following the two main-shocks of the 2012 Emilia seismic sequence in an area ofmore than 1200 km2 within the alluvial Po Plain. Liquefac-tion is a typical secondary coseismic effect that often affectsalluvial and coastal plains, as recently occurred in both the2010 and 2011 Darfield/Christchurch earthquakes in NewZealand, and the 2011 Tohoku earthquake in Japan.
Figure 4 clearly shows that the sites of liquefaction pro-duced by the 2012 Emilia earthquakes are localised inboth clusters and alignments. This is an indication that, al-though the morphology of the activated area appears ho-mogenously flat with very small differences in elevation andquite monotonous from a geologic point of view, there should
Nat. Hazards Earth Syst. Sci., 13, 1–13, 2013 www.nat-hazards-earth-syst-sci.net/13/1/2013/
G. Alessio et al.: Liquefaction phenomena associated with the 2012 Emilia earthquake sequence 9
a b
bc
d
Crevasse channelWell-defined levee ridge
Other fluvial ridges
Well-preserved trace of abandoned river
Poorly-preserved trace of abandoned river Crevasse splayObservations with strike
Observations without strike
c d
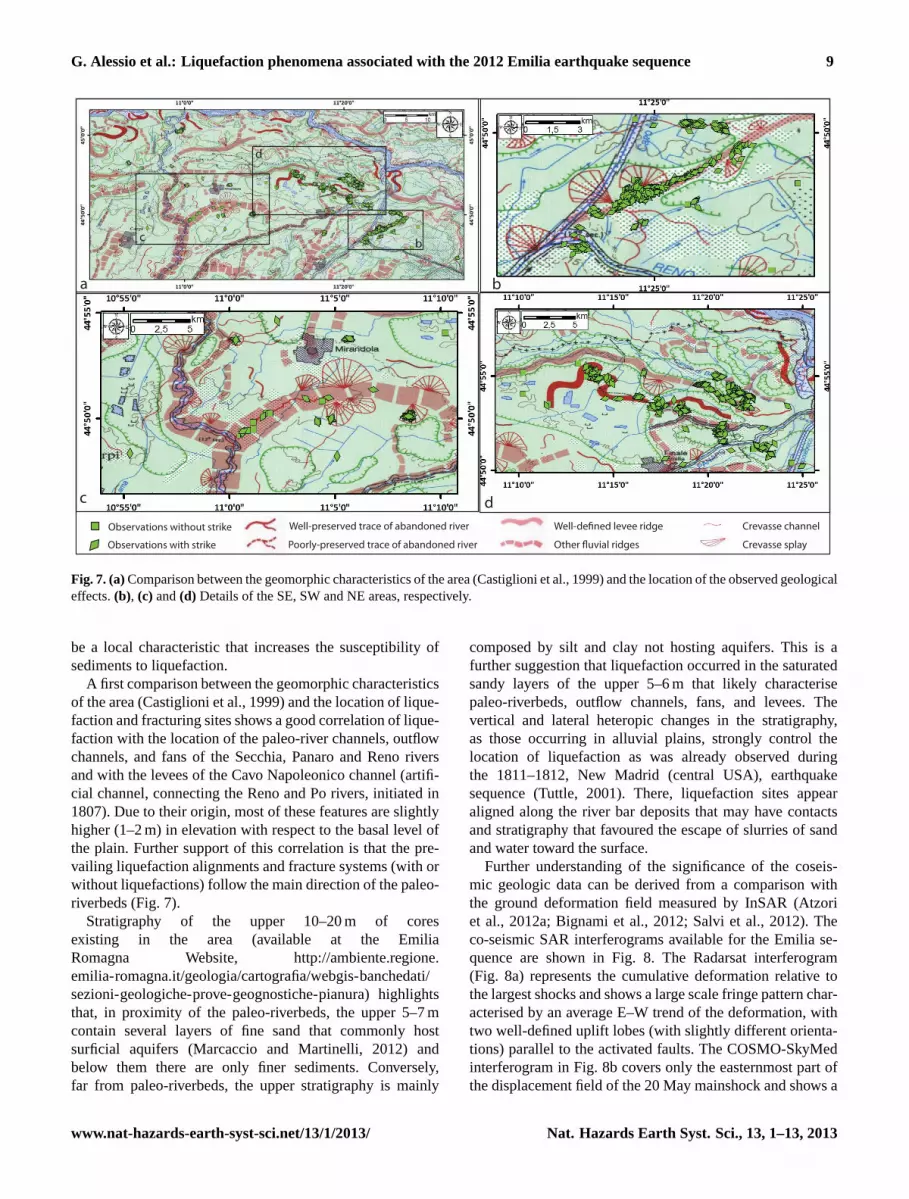
Fig. 7. (a)Comparison between the geomorphic characteristics of the area (Castiglioni et al., 1999) and the location of the observed geologicaleffects.(b), (c) and(d) Details of the SE, SW and NE areas, respectively.
be a local characteristic that increases the susceptibility ofsediments to liquefaction.
A first comparison between the geomorphic characteristicsof the area (Castiglioni et al., 1999) and the location of lique-faction and fracturing sites shows a good correlation of lique-faction with the location of the paleo-river channels, outflowchannels, and fans of the Secchia, Panaro and Reno riversand with the levees of the Cavo Napoleonico channel (artifi-cial channel, connecting the Reno and Po rivers, initiated in1807). Due to their origin, most of these features are slightlyhigher (1–2 m) in elevation with respect to the basal level ofthe plain. Further support of this correlation is that the pre-vailing liquefaction alignments and fracture systems (with orwithout liquefactions) follow the main direction of the paleo-riverbeds (Fig. 7).
Stratigraphy of the upper 10–20 m of coresexisting in the area (available at the EmiliaRomagna Website, http://ambiente.regione.emilia-romagna.it/geologia/cartografia/webgis-banchedati/sezioni-geologiche-prove-geognostiche-pianura) highlightsthat, in proximity of the paleo-riverbeds, the upper 5–7 mcontain several layers of fine sand that commonly hostsurficial aquifers (Marcaccio and Martinelli, 2012) andbelow them there are only finer sediments. Conversely,far from paleo-riverbeds, the upper stratigraphy is mainly
composed by silt and clay not hosting aquifers. This is afurther suggestion that liquefaction occurred in the saturatedsandy layers of the upper 5–6 m that likely characterisepaleo-riverbeds, outflow channels, fans, and levees. Thevertical and lateral heteropic changes in the stratigraphy,as those occurring in alluvial plains, strongly control thelocation of liquefaction as was already observed duringthe 1811–1812, New Madrid (central USA), earthquakesequence (Tuttle, 2001). There, liquefaction sites appearaligned along the river bar deposits that may have contactsand stratigraphy that favoured the escape of slurries of sandand water toward the surface.
Further understanding of the significance of the coseis-mic geologic data can be derived from a comparison withthe ground deformation field measured by InSAR (Atzoriet al., 2012a; Bignami et al., 2012; Salvi et al., 2012). Theco-seismic SAR interferograms available for the Emilia se-quence are shown in Fig. 8. The Radarsat interferogram(Fig. 8a) represents the cumulative deformation relative tothe largest shocks and shows a large scale fringe pattern char-acterised by an average E–W trend of the deformation, withtwo well-defined uplift lobes (with slightly different orienta-tions) parallel to the activated faults. The COSMO-SkyMedinterferogram in Fig. 8b covers only the easternmost part ofthe displacement field of the 20 May mainshock and shows a
www.nat-hazards-earth-syst-sci.net/13/1/2013/ Nat. Hazards Earth Syst. Sci., 13, 1–13, 2013

10 G. Alessio et al.: Liquefaction phenomena associated with the 2012 Emilia earthquake sequence
Fig. 8. Inteferograms showing the coseismic deformation field and the local coseismic effects observed at surface. The site effects aremarked with diamonds whose major axis parallels the feature strike, and with squares if no strike data are available.(a) Radarsat interfero-gram processed by the T.R.E. company (modified fromwww.treuropa.com). It represents the cumulative deformation relative to the largestmainshocks (time window: 12 May–5 June). The inset shows the data from continuous GPS station located at Finale Emilia indicating a clearcoseismic height variation of about 6.5 cm on 20 May (Baldi et al., 2009);(b) COSMO SkyMed image showing the easternmost deformationfield of the 20 May mainshock (red star). White arrow points to the abrupt deviations of the fringes strike;(c) COSMO SkyMed image of thefull deformation field of the 29 May mainshock (red star). Diamonds and squares symbols locate the effects observed following the 29 Mayevent (newly formed and/or reactivation of 20 May features);(d) enlargement of the southwest portion of interferogram in(c). All COSMOinterferograms were processed by the Sigris Project (Atzori et al., 2012a).
concentric fringe pattern with a maximum uplift of∼ 15 cm,occurring about 7 km east of Finale Emilia (upper left side ofthe image). Another COSMO interferogram (Fig. 8c) showsthe whole deformation field relative to the 29 May event. Forthis event, the maximum ground uplift was 12 cm, locatedclose to the Mirandola village.
An initial interesting observation is that most of the datacollected at the surface (white diamonds and squares inFig. 8a) are enclosed within the area of significant defor-mation measured by InSAR and coincide also to the area ofaftershocks concentration (Fig. 9). The observed ground fea-tures were mainly clustered at the borders of the deformedarea, while a very few number of effects occurred in thearea of maximum uplift (Fig. 8a) because, there, no paleo-riverbeds exist (Fig. 7). This lack of stream beds is the resultof the long-term growth of the local buried geological struc-
tures (e.g., Burrato et al., 2012) through repeated earthquakessimilar to the 2012 one. The accumulation of repeated de-formation tends to produce the diversion of the stream bedsfrom the elevated areas (where repeated maximum coseis-mic uplift occurred) toward the lowlands. The high resolu-tion of the COSMO SkyMed images allows drawing addi-tional inferences on the spatial distribution of the local ge-ological effects at surface. In particular, the alignments ofsevere liquefactions and fractures coincide with small scaleand well-defined areas of SAR signal decorrelation. Nearthe decorrelated areas, sharp deviations of the fringe strikefrom the large scale trend occur, with amplitudes varyingfrom hundreds up to thousands of metres (Fig. 8b). The loca-tions of such peculiar fringe patterns often coincide with themapped paleo-riverbeds (Fig. 7) as between the villages ofMirabello and Sant’Agostino, where there is also a promi-
Nat. Hazards Earth Syst. Sci., 13, 1–13, 2013 www.nat-hazards-earth-syst-sci.net/13/1/2013/

G. Alessio et al.: Liquefaction phenomena associated with the 2012 Emilia earthquake sequence 11
Fig. 9.Map of intensity≥ 6 EMS of the 2012 Emilia sequence (bluecircles, modified from Tertulliani et al., 2012), compared with theepicentres (yellow circles) and with the liquefaction pattern (greendiamonds and squares).
nent NE–SW alignment of surface coseismic features (SEarea, see Sect. 2.1; Fig. 8b). This alignment compares verywell to an area of SAR signal decorrelation, whose originis likely due to co-seismic modifications of the surface scat-tering properties caused by the expulsion of ground watersas already observed by Atzori et al. (2012b) for the 2011Christchurch earthquake in New Zealand. Along and close tothe eastern section of this alignment, complex ground defor-mations occur, indicated by sharp bending (up to 90◦) of thelocal fringe trends (white arrow in Fig. 8b). These latter fea-tures indicate areas of differential subsidence characterisedby cross dimensions (up to 3 km) significantly larger than thealignment of the liquefaction effects. Such phenomena arepossibly related to differential compaction or fluid migrationdue to the presence of significant lateral heterogeneities inthe sedimentary bodies forming the ancient riverbeds. Theclose-up in Fig. 8c shows the area of the Cavezzo village(SW area, see Sect. 2.2), another site where the coincidencebetween liquefaction features, decorrelation in the SAR sig-nal and fringe pattern “disturbances” were identified.
Another aspect to be discussed on the basis of the col-lected liquefaction data is about their distribution with re-spect to the location of the causative earthquake, which isrelevant for the definition of the liquefaction hazard. TheEmilia earthquake sequence affected an open and wide al-luvial valley with a quite homogeneous geomorphic setting.The survey of the liquefaction sites can be considered com-plete as it was systematically performed with different ap-proaches and was verified with the findings of other groupsof surveyors (among them, ISPRA, 2012; Uni Insubria, 2012;Regione Emilia-Romagna, 2012); also, the location, size andsource characteristics of the causative earthquakes are known(e.g. Bignami et al., 2012). The Emilia 2012 liquefactiondataset is thus an exceptional case study, especially if com-pared to the handful of related observations from contem-porary reports on the past∼ 1000 yr, of earthquakes whose
location and size contain relevant uncertainties, and mainlyfrom areas with complex geomorphology (e.g. narrow andsmall intramountain valleys in the Apennines). Empirical re-lations, both global (Obermeier, 1996) and regional (Galli,2000), show that the occurrence of liquefaction depends onthe earthquake magnitude and on the distance from the epi-centre, suggesting a maximum distance of 30–40 km for theoccurrence of liquefaction in cases of aM ∼ 6 earthquake.The furthest observed liquefaction from the 2012 epicentresis located at about 30 km (only one site at 40 km), for the 20and 29 May earthquakes. However, it is interesting to notethat the distribution area of liquefaction mimics the E–Welongated area of the aftershocks and that of surface defor-mation depicted by the InSAR. This supports the observa-tion that the spatial distribution of liquefactions is within theexpected distances with respect to the mainshocks but dis-plays a pattern related to the earthquake source geometry(e.g. Tuttle, 2001). In this case, the E–W liquefaction dis-tribution elongated pattern is probably more prominent be-cause of the combined occurrence of the two events alignedin an E–W direction. However, considering that the manifes-tation of liquefaction is related to the largest ground acceler-ations that, at their turn, depend on the source geometry andon rupture kinematics, the elongated distribution of geologi-cal effects may provide insights into the understanding of thesource geometry and of the damage area. It is interesting tonote that, by plotting the damage distribution from Tertullianiet al. (2012), the highest intensities distribution (I≥ 6 EMS)coincides with the liquefaction area (Fig. 9), confirming that,similarly to damage, the liquefaction distribution (although isa secondary geological coseismic effect) has a direct relationto the earthquake source characteristics, at least for similar-sized earthquakes.
All this highlights the potential for the use of paleo-liquefactions observations to investigate the related earth-quake source and the possibility of a reconsideration of his-torical and paleo-liquefaction distributions to better under-stand the characteristics of the earthquake source (e.g., DeMartini et al., 2012; Tuttle, 2001; Tuttle et al., 2002).
4 Conclusions
The 2012 Emilia seismic sequence hit a wide area of thesouthern Po Plain. Because of its high susceptibility to lique-faction of the alluvial plain, this seismic sequence producedthe most prominent extensive liquefaction phenomena of thelast century in Italy (Figs. 3, 4 and 5). The Emergeo Work-ing Group performed a systematic survey of the earthquakesequence area through field, aerial and interview approaches.A total of 1362 observation points were collected, stored ina geographical information system, and made partially avail-able at the addresshttp://www.esriitalia.it/emergeo/. The ob-servations were grouped into three categories: (i) liquefac-tion; (ii) fracture/liquefaction; and (iii) fracture. The distri-
www.nat-hazards-earth-syst-sci.net/13/1/2013/ Nat. Hazards Earth Syst. Sci., 13, 1–13, 2013

12 G. Alessio et al.: Liquefaction phenomena associated with the 2012 Emilia earthquake sequence
bution of liquefaction effects over the territory is uneven andappears mostly controlled by the presence of paleo-riverbeds,levees, out-flow channels and fans (Fig. 7) that are charac-terised by the presence of sandy layers in the upper 5 m. Themaximum distance of observed liquefaction from the relatedearthquake epicentre is 30 km, in agreement with the regionalempirical relations proposed by Galli (2000). Noteworthy,the envelope of all the liquefaction observations is not a circlearound the causative earthquake epicentre but has an elon-gated shape mimicking the aftershock area, the InSAR defor-mation area and the I≥ 6 (EMS) area. In terms of liquefac-tion hazard evaluation, the liquefaction distribution reflectsthe combined effects of the low resistance of the soil to liq-uefaction (loose cohesionless soil with high water table) andthe intensity of the ground motions that can be related in firstapproximation to the earthquake source characteristics (e.g.Tuttle, 2001). The broad area of occurrence of liquefactioncan be roughly represented as the projection to the surfaceof the seismogenic source (or as the area of surface defor-mation); within this area, the stratigraphy and hydrologicalconditions of the upper 5–10 m are a further discriminatorand better defines the areas prone to liquefaction. Future sys-tematic coring and correlation with the extruded sands willallow the definition and characterisation of the sandy layersthat liquefied (at least two different layers according to thecollected observations). This information can be very usefulto trace, also outside the current earthquake area, the zoneswith high potential for liquefaction. To conclude, it is worthremarking that careful geological and geomorphic investiga-tions, integrated to the knowledge of the active faults withseismic potential, can provide the basis for a realistic evalu-ation of the potential for liquefaction in alluvial and coastalplains. Considering that plains are the most common areasfor human developments and infrastructures, this is a topicof high societal impact.
Acknowledgements.We are indebted to the Corpo Forestale delloStato for allowing us two helicopter surveys, the Municipalities,Carabinieri and Fire brigades for their technical support andespecially all the people who contributed directly to the surveyin the field or through the Web. A special thanks to L. Ghidoni,G. Bocchi, L. Larsen, O. Gallerani, L. Mazza, M. Bertazzoniand M. Borgonuovo for sharing with us their photographs. ASIand DPC provided the COSMO-SkyMed images. We thankR. Giuliani, L. Candela, S. Zoffoli and A. Coletta for their supportand M. Lanzarini for the powered hang-glider trike survey. Weare grateful also to P. Guarnieri and to an anonymous reviewerwho, with their comments and suggestions, helped improve thepaper. The Radarsat interferogram is copyright of TeleRilevamentoEuropa srl, Milan.
Edited by: O. KatzReviewed by: P. Guarnieri and one anonymous referee
References
Atzori, S., Merryman Boncori, J. P., Pezzo, G., Tolomei, C.,and Salvi, S.: Secondo report analisi dati SAR e model-lazione della sorgente del terremoto dell’Emilia, SIGRISProject, http://terremoti.ingv.it/images/ultimi-eventi/2012/report sar ingv emilia 2.pdf, 2012a (in Italian).
Atzori, S., Tolomei, C., Antonioli, A., Merryman Boncori, J.P., Bannister, S., Trasatti, E., Pasquali, P., and Salvi, S.: The2010–2011 Canterbury, New Zealand, seismic sequence: multi-ple source analysis from InSAR data, and modeling, J. Geophys.Res., 117, B08305,doi:10.1029/2012JB009178, 2012b.
Baldi, P., Casula, B., Cenni, N., Loddo, F., and Pesci, A.: GPS-basedmonitoring of land subsidence in the Po Plain (Northern Italy),Earth Planet. Sc. Lett., 288, 204–212, 2009.
Bignami, C., Burrato, P., Cannelli, V., Chini, M., Falcucci, E., Fer-retti, A., Gori, S., Kyriakopoulos, C., Melini, D., Moro, M., No-vali, F., Saroli, M., Stramondo, S., Valensise, G., and Vannoli,P.: Coseismic deformation pattern of the Emilia 2012 seismic se-quence imaged by Radarsat-1 interferometry, Ann. Geophys., 55,789–795,doi:10.4401/ag-6157, 2012.
Boccaletti, M. and Martelli, L. (Coords): Carta sismo-tettonica dellaRegione Emilia-Romagna scala 1: 250.000 e note illustrative,Selca, Firenze, 2004.
Burrato, P., Ciucci, F., and Valensise, G.: An inventory ofriver anomalies in the Po Plain, Northern Italy: evidencefor active blind thrust faulting, Ann. Geophys., 46, 865–882,doi:10.4401/ag-3459, 2003.
Burrato, P., Vannoli, P., Fracassi, U., Basili, R., and Valensise, G.: Isblind faulting truly invisible? Tectonic-controlled drainage evo-lution in the epicentral area of the May 2012, Emilia-Romagnaearthquake sequence (northern Italy), Ann. Geophys, 55, 525–531,doi:10.4401/ag-6182, 2012.
Camassi, R., Castelli, V., Molin, D., Bernardini, F., Caracciolo, C.H., Ercolani, E., and Postpischl, L.: Materiali per un catalogodei terremoti italiani: eventi sconosciuti, rivalutati o riscoperti,Quaderni di Geofisica, 96, 51 pp., available at:http://istituto.ingv.it/l-ingv/produzione-scientifica/quaderni-di-geofisica, 2011.
Castelli, V., Bernardini, F., Camassi, R., Caracciolo, C. H., Ercolani,E., and Postpischl, L.: Looking for missing earthquake tracesin the Ferrara-Modena plain: an update on historical seismicity,Ann. Geophys., 55, 519–524,doi:10.4401/ag-6110, 2012.
Castiglioni, G. B., Biancotti, A., Bondesan, M., Cortemiglia,G. C., Elmi, C., Favero, V., Gasperi, G., Marchetti, G.,Orombelli, G., Pellegrini, G. B., and Tellini, C.: Geomorpho-logic map of the Po Plain, Italy, at a scale of 1:250000, EarthSurf. Proc. Land., 24, 1115–1120,doi:10.1002/(SICI)1096-9837(199911)24:12¡1115::AID-ESP38¿3.0.CO;2-Z, 1999.
CSI1.1: Italian Seismicity Catalogue 1981–2002, version 1.1.,INGV-CNT, http://csi.rm.ingv.it/, 2006.
De Martini, P. M., Cinti, F. R., Cucci, L., Smedile, A., Pinzi, S.,Brunori, C. A., and Molisso, F.: Sand volcanoes induced by theApril 6th 2009 Mw 6.3 L’Aquila earthquake: a case study fromthe Fossa area, Italian Journal of Geosciences, 131, 410–422,doi:10.3301/IJG.2012.14, 2012.
Devoti, R., Esposito, A., Pietrantonio, G., Pisani, A. R., andRiguzzi, F.: Evidence of large scale deformation patterns fromGPS data in the Italian subduction boundary, Earth Planet. Sc.Lett., 311, 230–241,doi:10.1016/j.epsl.2011.09.034, 2011.
Nat. Hazards Earth Syst. Sci., 13, 1–13, 2013 www.nat-hazards-earth-syst-sci.net/13/1/2013/

G. Alessio et al.: Liquefaction phenomena associated with the 2012 Emilia earthquake sequence 13
Emergeo Working Group: Alessio, G., Alfonsi, L., Brunori, C. A.,Burrato, P., Casula, G., Cinti, F. R., Civico, R., Colini, L., Cucci,L., De Martini, P. M., Falcucci, E., Galadini, F., Gaudiosi, G.,Gori, S., Mariucci, M. T., Montone, P., Moro, M., Nappi, R.,Nardi, A., Nave, R., Pantosti, D., Patera, A., Pesci, A., Pignone,M., Pinzi, S., Pucci, S., Vannoli, P., Venuti, A., and Villani, F.:Technologies and new approaches used by the INGV EMER-GEO Working Group for real time data sourcing and processingduring the Emilia Romagna (Northern Italy) 2012 earthquakesequence, Ann. Geophys., 55, 689–695, 2012;doi:10.4401/ag-6117, 2012a.
Emergeo Working Group: Alessio, G., Alfonsi, L., Brunori, C. A.,Burrato, P., Casula, G., Cinti, F. R., Civico, R., Colini, L., Cucci,L., De Martini, P. M., Falcucci, E., Galadini, F., Gaudiosi, G.,Gori, S., Mariucci, M.T., Montone, P., Moro, M., Nappi, R.,Nardi, A., Nave, R., Pantosti, D., Patera, A., Pesci, A., Pignone,M., Pinzi, S., Pucci, S., Vannoli, P., Venuti, A., and Villani, F.: Aphotographic dataset of the coseismic geological effects inducedon the environment by the 2012 Emilia (northern Italy) earth-quake sequence, on Miscellanea INGV, 16, ISSN 2039-6651,2012b.
Fantoni, R. and Franciosi, R.: Tectono-sedimentary setting of the PoPlain and Adriatic foreland, Rend. Fis. Acc. Lincei, 21, Supple-ment 1, S197–S209,doi:10.1007/s12210-010-0102-4, 2010.
Galli, P.: New empirical relationships between magnitude and dis-tance for liquefaction, Tectonophysics, 324, 169–187, 2000.
Ghelardoni, R.: Osservazioni sulla tettonica trasversalenell’Appennino Settentrionale, Boll. Soc. Geol. Ital., 84,277–290, 1965.
Guidoboni, E., Ferrari, G., Mariotti, D., Comastri, A., Tarabusi, G.,and Valensise, G.: CFTI4Med, Catalogue of Strong Earthquakesin Italy (461 B.C.–1997) and the Mediterranean Area (760 B.C.–1500), INGV-SGA; available at:http://storing.ingv.it/cfti4med/,2007.
ISIDe Database: Italian Seismological Instrumental and parametricdatabase, INGV,http://iside.rm.ingv.it, 2012.
ISPRA: Geological effects induced by the seismic sequencestarted on May 20, 2012, in Emilia (Mw = 5.9), Prelim-inary Report, Dipartimento Difesa del Suolo, SGI, Roma,31 May 2012, http://www.isprambiente.gov.it/files/progetti/inqua/inqua-primo-rapporto-emilia-2012.pdf/view, 2012.
Marcaccio, M. and Martinelli, G.: Effects on the groundwater levelsof the May–June 2012 Emilia seismic sequence, Ann. Geophys.,55, 811–814,doi:10.4401/ag-6139, 2012.
Montone, P., Mariucci, M. T., and Pierdominici, S.: The Ital-ian present-day stress map, Geophys. J. Int., 189, 705–716,doi:10.1111/j.1365-246X.2012.05391.x, 2012.
Obermeier, S. F.: Use of liquefaction-induced features for paleo-seismic analysis – An overview of how seismic liquefaction fea-tures can be distinguished from other features and how their re-gional distribution and properties of source sediment can be usedto infer the location and strength of Holocene paleo-earthquakes,Eng. Geol., 44, 1–76, 1996.
Pesci, A., Casula, G., and Boschi, E.: Laser scanning the Garisendaand Asinelli towers in Bologna (Italy): detailed deformation pat-terns of two ancient leaning buildings, J. Cult. Herit., 12, 117–127, 2011.
Pesci, A., Casula, G., Teza, G., Bonali, E.. and Boschi, E.: Strat-egy for the detection of vertical movements in historical environ-
ments from fast high-precision GPS measurements, J. Geophys.Eng., 9, 230,doi:10.1088/1742-2132/9/2/230, 2012.
Pieri, M. and Groppi, G.: Subsurface geological structure of the Poplain, Italy, Pubbl. 414, Cons. Naz. Delle Ric., Agip, Rome, Pro-getto Finalizzato Geodinamica, 414, 1981.
Pondrelli, S., Salimbeni, S., Perfetti, P., and Danecek P.: Quickregional centroid moment tensor solutions for the Emilia 2012(northern Italy) seismic sequence, Ann. Geophys., 55, 615–621,doi:10.4401/ag-6146, 2012.
Regione Emilia-Romagna: Primo rapporto sugli effetti dellaliquefazione osservati a S. Carlo, frazione di S. Agostino(Provincia di Ferrara), A cura del gruppo di lavoro per lavalutazione degli effetti di liquefazione a seguito dei terre-moti del 20 e 29 maggio 2012 (Regione Emilia-Romagna,PG. 2012.0134978 del 31/5/2012), Bologna, 25 June 2012,http://ambiente.regione.emilia-romagna.it/geologia/temi/sismica/liquefazione-gruppo-dilavoro/rapportosancarlo.pdf,2012.
Regione Emilia-Romagna and ENI-AGIP: Riserve idriche sotter-ranee della Regione Emilia-Romagna, edited by: Di Dio, G.,S.EL.CA., Firenze, 120 pp., 1998.
Rovida, A., Camassi, R., Gasperini, P., and Stucchi, M. (Eds.):CPTI11, the 2011 version of the Parametric Catalogue of ItalianEarthquakes, Milano, Bologna,http://emidius.mi.ingv.it/CPTI,2011.
Salvi, S., Tolomei, C., Merryman Boncori, J. P., Pezzo, G., Atzori,S., Antonioli, A., Trasatti, E., Giuliani, R., Zoffoli, S., and Co-letta, A.: Activation of the SIGRIS monitoring system for grounddeformation mapping during the Emilia 2012 seismic sequence,using COSMO-SkyMed InSAR data, Ann. Geophys., 55, 797–802,doi:10.4401/ag-6181, 2012.
Scognamiglio, L., Margheriti, L., Mele, F. M., Tinti, E., Bono,A., De Gori, P., Lauciani, V., Lucente, F. P., Mandiello, A.G., Marcocci, C., Mazza, S., Pintore, S., and Quintiliani, M.:The 2012 Pianura Padana Emiliana seimic sequence: locations,moment tensors and magnitudes, Ann. Geophys., 55, 549–559,doi:10.4401/ag-6159, 2012.
TDMT Database: Real-time determination of seismic moment ten-sor for the Italian region, INGV,http://cnt.rm.ingv.it/tdmt.html,2012.
Tertulliani, A., Arcoraci, L., Berardi, M., Bernardini, F., Brizuela,B., Castellano, C., Del Mese, S., Ercolani, E., Graziani, L., Mara-mai, A., Rossi, A., Sbarra, M., and Vecchi, M.: The Emilia 2012sequence: a macroseismic survey, Ann. Geophys., 55, 679–687,doi:10.4401/ag-6140, 2012.
Tuttle, M. P.: The use of liquefaction features in paleoseismology:Lessons learned in the New Madrid seismic zone, central UnitedStates, J. Seismol., 5, 361–380, 2001.
Tuttle, M. P., Schweig, E. S., Sims, J. D., Lafferty, R. H., Wolf,L. W., and Haynes, M. L.: The earthquake potential of the NewMadrid seismic zone, Bull. Seism. Soc. Am., 92, 2080–2089,2002.
Uni Insubria: Earthquake environmental effects accompanying theMay 20, 2012, Finale Emilia earthquake; preliminary report,First report, 29 May 2012, DipSAT Uni Insubria Como, editedby: Berlusconi, A., Livio, F., Ferrario, F., Gambillara, R. andMichetti, A. M., 2012.
www.nat-hazards-earth-syst-sci.net/13/1/2013/ Nat. Hazards Earth Syst. Sci., 13, 1–13, 2013


