Embed Size (px)
Citation preview
Linkages among runoff, dissolved organic carbon, and the stable
oxygen isotope composition of seawater and other water mass
indicators in the Arctic Ocean
Lee W. Cooper,1 Ronald Benner,2 James W. McClelland,3 Bruce J. Peterson,3
Robert M. Holmes,4 Peter A. Raymond,5 Dennis A. Hansell,6
Jacqueline M. Grebmeier,1 and Louis A. Codispoti7
Received 3 March 2005; revised 1 September 2005; accepted 15 September 2005; published 7 December 2005.
[1] Flow-weighted dissolved organic carbon (DOC) concentrations and d18O values weredetermined from major arctic rivers, specifically the Ob, Yenisey, Lena, Kolyma,Mackenzie, and Yukon during 2003–2004. These data were considered in conjunctionwith marine data for DOC, d18O values, nutrients, salinity, and fluorometric indicatorsof DOC obtained during sampling at the shelf-basin boundary of the Chukchi andBeaufort seas. On the basis of these data, freshwater in the sampled marine waters is likelyderived from regional sources, such as the Mackenzie, the Bering Strait inflow, andpossibly eastern Siberian rivers, including the Kolyma, or the Lena, but not rivers fartherwest in the Eurasian arctic. Freshwater from melted sea ice is insignificant over annualcycles, although melted sea ice was a locally dominant freshwater component followingsummer sea-ice retreat in 2002. DOC concentrations were correlated with the runofffraction, with an apparent meteoric water DOC concentration of 174 ± 1 mM. This is lowerthan the flow-weighted concentrations measured at river mouths of the five largest Arcticrivers (358 to 917 mM), indicating removal of DOC during transport through estuaries,shelves and in the deep basin. Flow-weighted DOC concentrations in the two largest NorthAmerican arctic rivers, the Yukon (625 mM) and the Mackenzie (358 mM), are lowerthan in the three largest Eurasian arctic rivers, the Ob (825 mM), the Yenesey (858 mM),and the Lena (917 mM). A fluorometer responding to chromophoric dissolved organicmatter (CDOM) was not correlated with DOC concentrations in Pacific-influenced surfacewaters unlike previous observations in the Atlantic layer. Nutrient distributions,concentrations, and derived ratios suggest the CDOM fluorometer may be responding tothe release of chromophoric materials from shelf sediments. Shipboard incubations ofundisturbed sediment cores indicate that sediments on the Bering and Chukchi Sea shelvesare a net source of DOC to the Arctic Ocean.
Citation: Cooper, L. W., R. Benner, J. W. McClelland, B. J. Peterson, R. M. Holmes, P. A. Raymond, D. A. Hansell,
J. M. Grebmeier, and L. A. Codispoti (2005), Linkages among runoff, dissolved organic carbon, and the stable oxygen
isotope composition of seawater and other water mass indicators in the Arctic Ocean, J. Geophys. Res., 110, G02013,
doi:10.1029/2005JG000031.
1. Introduction
[2] A number of previous studies in the Arctic Oceanhave documented strong linear correlations between salinityand marine dissolved organic carbon (DOC) concentrations[Dittmar and Kattner, 2003, and references therein]. Theseapparently conservative relationships suggest that terrestrialallochthonous DOC entering the Arctic marine environmentis resistant to degradation. Labile, autochthonous DOC bycontrast is rapidly recycled in the upper water column [e.g.,Wheeler et al., 1996]. Much of the work leading to theconclusion that allochthonous DOC is conserved duringtransport through the Arctic Ocean, however, has focusedon the Eurasian side of the basin. In this study we examinednew North American marine data from the Shelf-BasinInteractions (SBI) program and pan-Arctic river data from
JOURNAL OF GEOPHYSICAL RESEARCH, VOL. 110, G02013, doi:10.1029/2005JG000031, 2005
1Department of Ecology and Evolutionary Biology, University ofTennessee, Knoxville, Tennessee, USA.
2Department of Biological Sciences and Marine Science Program,University of South Carolina, Columbia, South Carolina, USA.
3Marine Biological Laboratory, Woods Hole, Massachusetts, USA.4Woods Hole Research Center, Woods Hole, Massachusetts, USA.5School of Forestry and Environmental Science, Yale University, New
Haven, Connecticut, USA.6Division of Marine and Atmospheric Chemistry, Rosenstiel School of
Marine and Atmospheric Science, University of Miami, Miami, Florida,USA.
7University of Maryland Center for Environmental Science, Cambridge,Maryland, USA.
Copyright 2005 by the American Geophysical Union.0148-0227/05/2005JG000031$09.00
G02013 1 of 14
the Pan-Arctic River Transport of Nutrients, Organic Matterand Suspended Sediments (PARTNERS) efforts. Our studyincluded fluorometric indicators of DOC, DOC directlydetermined from bottle samples, and indicators of runoffand water masses such as oxygen isotope ratios, salinity,and inorganic nutrient ratios, to gain an enhanced under-standing of the transport and fate of DOC introduced intothe Arctic marine environment. For the purposes of thisstudy, we define runoff broadly as all freshwater of meteoricorigin including direct precipitation to the sea surface andthe freshwater component of marine waters transportednorth from lower latitudes. The SBI program that providedmarine water samples is a ship-based effort focused on theshelf-basin boundary of the Chukchi and Beaufort seas, andhas sampled seasonally as shelf waters are advected into theCanada basin. Likewise, a large volume of seasonallydistributed runoff chemistry data are being generated byregular sampling of major arctic rivers by the PARTNERSproject.[3] The transport and fate of dissolved organic carbon
delivered into the Arctic Ocean is a potentially importantcarbon system component that could have a significantimpact on global carbon cycling in the context of environ-mental change [Shaver et al., 1992; Neff and Hooper, 2002].The rivers draining into the Arctic Ocean encompass catch-ments that contain about half of the organic carbon storedglobally [Opsahl et al., 1999; Dittmar and Kattner, 2003;Smith et al., 2004]. Ten percent of global runoff flows intothe Arctic Ocean, and many Arctic rivers carry high con-centrations of DOC (up to 1000 mM). Concentrations ofDOC are on average 8 times higher than particulate organiccarbon (POC) in 12 Russian rivers draining into the Arctic[Lobbes et al., 2000], which is consistent with worldwidepatterns of higher DOC relative to POC in lowland riverdischarge [Meybeck, 1982] and the high lateral exportof DOC from wetland and peat-dominated watersheds[Mulholland and Watts, 1982; Raymond and Hopkinson,2003]. In addition to runoff, much of the Arctic coastlineconsists of unconsolidated sediments and peat that isdynamically contributing organic materials to the coastalzone as a result of shoreline erosion [Are, 1999]. The POCload contributed to marine systems in some Arctic conti-nental shelf seas approaches or exceeds that contributedthrough runoff [Rachold et al., 2000], and DOC contribu-tions from peat directly eroded into coastal zones must alsobe significant. Although initial studies have not beenentirely in agreement [e.g., Pastor et al., 2003; Neff andHooper, 2002; Hobbie et al., 2002], climate warming islikely to have a significant impact on organic carbondecomposition on land and ultimately transport of DOCinto the ocean [Freeman et al., 2004; Frey and Smith,2005]. The retreat of seasonal sea ice coverage is also likelyto increase wave-based shoreline erosion [Serreze et al.,2000; Proshutinsky et al., 1999] thereby increasing organiccontributions to coastal areas of the Arctic.[4] Ultimately, the linkages among DOC processes are
central to northern carbon cycling studies, particularly aspermafrost thaws, vegetation changes occur on land, andcoastal erosion accelerates [Benner et al., 2004]. For in-stance, the sources of DOC from terrestrial and aquaticecosystems can vary temporally and spatially due to thenature of arctic and boreal vegetation and soil attributes in
specific watersheds [Waddington and Roulet, 1997; Neffand Hooper, 2002]. Thus a complete understanding of DOCin the coastal zone not only requires marine studies but alsolinked process studies of terrestrial DOC dynamics as wellas the mechanisms controlling DOC production and con-sumption, inputs and coastal zone erosion processes.[5] Among the recent technological introductions to in-
crease information on DOC distributions in arctic marinewaters have been the development of high-resolution fluo-rescence measurement devices that respond to humic sub-stances and other components of terrigenous DOC [e.g.,Guay et al., 1999; Amon et al., 2003]. Although calibrationsof these devices with bottle DOC measurements have beeninitially successful in the Eurasian Arctic [Amon et al.,2003], high-resolution measurements of DOC fluorescencemade during the submarine based SCICEX program [Guayet al., 1999] indicated that the apparent relationship betweenfluorometrically measured DOC and salinity observed offRussian rivers might not be as applicable in the NorthAmerican basin. A distinctly different freshwater DOCconcentration (extrapolating to zero salinity from 30 psu,the least saline water accessible from the submarine that wasused as a sampling platform) was observed in the portionsof the submarine track most influenced by North Americanriver discharge. Hansell et al. [2004] have further expandedunderstanding of this difference by using samples collectedas part of the ship-based SBI program in the Chukchi andBeaufort seas. They interpreted the apparent DOC end-member in runoff in the North American Arctic to be aresult of a longer residence time for DOC in the Beaufortgyre, using radium isotopes as an indicator of time sincecontact with the continental shelf. Their findings indicatethat a substantial proportion of terrigenous DOC can beoxidized in the gyre, which may not be the case for DOCthat is more quickly exported within the Transpolar Driftfrom the Russian shelves.[6] Oxygen isotope ratios of runoff and marine water
masses may be of particular value in tracing DOC as itmoves from estuaries into Arctic marine waters. The d18Ovalues have been successfully used as large-scale tracers ofrunoff and sea ice melt in the Arctic [e.g., Macdonald et al.,1989, 1995; Cooper et al., 1997, 1999a; Ekwurzel et al.,2001]. The oxygen isotope composition of the ocean is littlechanged by sea ice formation and melt, but sea ice forma-tion and dissolution are processes that alter salinities sig-nificantly and complicate the use of salinity as a water masstracer in ice-covered seas. Seawater becomes enriched in18O as it freezes, but the isotopic fractionation observed insea ice is typically small, ranging from 1.6% to 2.5% formultiyear floes with a 2 m thickness [Eicken, 1998]. Arcticfield observations also suggest that an isotopic fractionationof �2% is reasonable as a bulk estimate of the averageenrichment of sea ice in 18O relative to surface seawater[Melling and Moore, 1995; Macdonald et al., 2002; Eickenet al., 2002; Pfirman et al., 2004]. Thus the volume of waterconverted into ice during the formation of a 2-m-thick icefloe in a well-mixed 100-m surface layer undergoing brinerejection would decrease d18O values by �2 percent of theapparent 2% ice-liquid isotopic fractionation (2 m of 100 mconverted to ice), or less than the analytical error of themass spectrometric measurement (0.05 to 0.10%). Duringsea ice melt, under stratified conditions, it is possible that
G02013 COOPER ET AL.: ARCTIC RUNOFF, DOC, AND OXYGEN ISOTOPES
2 of 14
G02013
the slightly elevated 18O content of melted sea ice could bemeasured relative to surface waters that had never beenfrozen, but the large difference from the oxygen isotopecomposition of meteoric runoff allows separation of thisfreshwater derived from melted sea ice.[7] In addition to broadly distinguishing between fresh-
water from continental runoff and sea-ice melt, oxygenisotopes may help us to identify freshwater from individualrivers well into offshore regions. Growing data on majorarctic rivers indicate that they differ substantially in oxygenisotopic composition. In coastal ecosystems, variation ind18O values for freshwater will be larger than the relativelyfixed end-member that is assumed for offshore studies. Thescale of variation will depend upon the rivers contributing tothe localized coastal zone. For example, rivers draininghigher altitude portions of the Brooks Range in Alaska withcontinental climate (e.g., Kuparuk, Sagavanirktok, and Col-ville) are likely to be more depleted in 18O than riversdraining lowland tundra on the North Slope (e.g., MeadeRiver). The geographical variation can be significant, evenduring snowmelt runoff in a single river watershed, such asthe Kuparuk [Cooper, 1998]. These complexities in thestable isotope composition of runoff hold great promise forimproving understanding of coastal physical oceanographicprocesses in the Arctic, but also emphasize the need foradequate temporal and spatial coverage that is difficult toachieve.[8] Over the past several years, new data sources con-
tributed through both marine and river sampling have begunto enhance our understanding of the transport and fateof DOC introduced into the Arctic marine environment[Dittmar and Kattner, 2003; Amon and Meon, 2004; Benneret al., 2004; Hansell et al., 2004; Shin and Tanaka, 2004;Benner et al., 2005; Mathis et al., 2005]. Our goal in thisstudy is to examine new data from SBI in combination withdata from PARTNERS, including fluorometric indicators ofDOC, DOC directly determined from bottle samples, andindicators of runoff and water masses such as oxygenisotope ratios, salinity, and inorganic nutrient ratios in orderto advance the larger objective of understanding DOCtransport and fate.
2. Methods
[9] River data presented here were collected as partof the PARTNERS program (http://ecosystems.mbl.edu/partners/) in 2003–2004 from sampling points near themouths of the Mackenzie, Yukon, Kolyma, Lena, Yenisey,and Ob rivers. The sampling protocol includes use of aUnited States Geological Survey D-96 sampler to acquireflow-weighted, depth-integrated samples across the riverchannel, a Teflon churn to homogenize the samples, andclean sampling techniques to assure high-quality data.Following collection, samples for DOC were filtered withQMA quartz filters, immediately frozen in 125-mL poly-carbonate bottles and kept frozen until analysis. Thepolycarbonate bottles used had been soaked in 1%sulfuric acid overnight and then rinsed with milli-Qwater; each bottle was stored and shipped inside individ-ual plastic bags. Blank tests with these bottles indicatethat there is no measurable leaching associated with thisprotocol. DOC analysis used standard high temperature
oxidation protocols following acidification to releaseinorganic carbon at the Yale School of Forestry andEnvironmental Studies, Yale University. River samplesfor stable oxygen isotope analyses were collected in30-mL high-density polyethylene bottles and stored sealedunder refrigerated conditions. Mass spectrometric analyseswere accomplished at the University of Waterloo with aprecision of <±0.1%.[10] Marine data presented here were generated during
two SBI (http://sbi.utk.edu) cruises of the USCGC Healy inMay–June and July–August 2002. A conductivity-temper-ature-depth profiling system was used to determine temper-ature and salinity and two of the other units on theinstrument package also measured fluorescence associatedwith terrestrial humics and fluorescence associated withchlorophyll. The electronic fluorescence associated withterrestrial humics was measured using a chromophoricdissolved organic matter (CDOM) fluorometer (HaardtOptic and Mikroelektonic, Hamburg) and the instrumentalresponse was compared with several other parameters. Thisdevice incorporates fixed excitation at 350 to 460 nm withmeasurement of emissions at 550 nm. These wavelengthswere chosen based upon on an empirical response toconcentrations of humic substances with terrestrial origins[Amon et al., 2003].[11] Seawater samples were collected from a rosette of
30-L bottles. Inorganic nutrients were determined ship-board using an autoanalyzer; sampling and analyses usedJGOFS and WOCE protocols to assure high-quality data.Other water samples from the rosette of bottles werereturned to the laboratory for determinations of stableoxygen isotopes and DOC. The oxygen isotope compo-sition of the seawater samples was measured using anautomated equilibration unit linked to a Finnigan DeltaPlus dual inlet mass spectrometer at the University ofTennessee. Precision, based upon repeated measurementsof an internal standard, was <0.05%. DOC data usedhere have been presented elsewhere [Hansell et al., 2004;Mathis et al., 2005]. These analyses were accomplishedfollowing filtration with 42-mm GF/F filters mountedwithin polycarbonate filter holders. Samples were storedfrozen in high-density polyethylene bottles and wereanalyzed using standard high temperature oxidation pro-tocols following acidification to release inorganic carbonat the Rosenstiel School of Marine and AtmosphericScience, University of Miami. The detection limit forDOC was approximately 2 mM.[12] Replicate sediment cores were collected using a
133 cm2 HAPS sediment corer for shipboard incubations,which were maintained in the dark at in situ bottomtemperatures in a low temperature incubator for 12–24 hours. Motorized paddles were used to prevent watergradient formation [Grebmeier and McRoy, 1989; Cooperet al., 2002]. Under optimal conditions, the cores recov-ered with our HAPS corer system have very low degreesof disturbance; we have also established criteria to identifydisturbed cores [Cooper et al., 2002]. Subsamples from theoverlying water in these cores were filtered, acidified,frozen and returned to the University of South Carolinafor analysis of DOC concentrations. Other data from thesesediment incubations, including fluxes of dissolved oxy-gen, nutrients, alkalinity, pH, total CO2, and taxonomic
G02013 COOPER ET AL.: ARCTIC RUNOFF, DOC, AND OXYGEN ISOTOPES
3 of 14
G02013

identifications of macrofaunal organisms in the cores willbe reported elsewhere.
3. Results
[13] The oxygen isotope composition and DOC concen-trations of the river waters sampled are shown in Table 1.Values are expressed as both simple averages from seasonalsampling at points of confluence near the mouths of eachriver during 2003 and 2004, as well as flow-weightedaverages based upon historical monthly flow records. Inaddition to core PARTNERS sampling, higher resolutiontemporal and spatial sampling was accomplished at theLena and Yukon rivers for d18O analysis.[14] The d18O values of Arctic Ocean seawater are
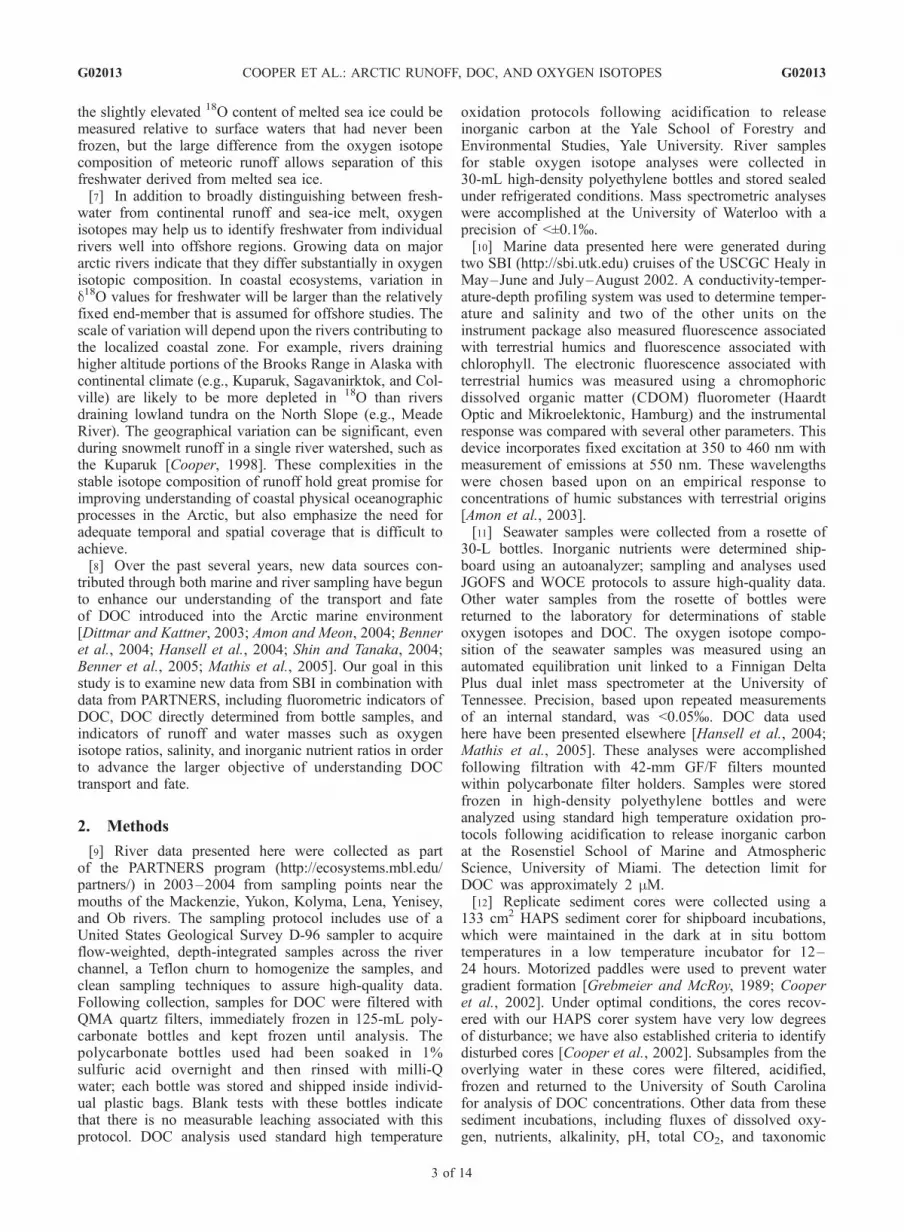
normally well correlated with salinity particularly in areaswith significant runoff. In our SBI sampling, we foundbetter correlations between salinity and d18O values duringthe May–June 2002 cruise (Figure 1) than during thefollow-on cruise in July–August 2002 that occupied thesame general station grid. An analysis of the estimatedcontributions of freshwater derived from melted sea ice andfrom direct runoff is also shown (Figure 1). It was preparedby assuming that these two freshwater sources mixedconservatively with Atlantic water and the mixing couldbe described as part of two three-component mixing equa-tions. An analysis of the estimated runoff component foreach water sample was made by solving three simultaneousequations for a simplified Arctic surface water mixingsystem with components including Atlantic water, runoffand melted sea ice.[15] The core oxygen isotope composition of each of
these three components was designated as follows: sea iced18O value = �1.9% (based upon sea ice sampling [Eickenet al., 2002; H. Eicken, unpublished data, 2004]; Atlanticwater: d18O = +0.3% [Bauch et al., 1995] and Arctic basinrunoff: d18O = �21.0% [Ostlund and Hut, 1984]):
d18O ¼ �1:90=00 � SIMð Þ þ þ0:30=00 � AWð Þ þ �210=00 �MWð Þ;
where SIM is fraction sea ice, AW is fraction Atlanticseawater, and MW is fraction runoff. The core salinity ofeach component was assumed to be as follows: sea ice = �4[Ostlund and Hut, 1984; Bauch et al., 1995; Ekwurzel et al.,2001]; Atlantic water = 34.8; runoff = 0:
S ¼ SIM� 4ð Þ þ AW� 34:8ð Þ þ MW� 0ð Þ;
where S is salinity of sample. The third equation was
SIMþ AWþMW ¼ 1:
[16] These simultaneous equations were solved to providean estimate of the runoff fraction present relative to DOCconcentrations (Figure 2) during the May–June 2002 SBIcruise that was prior to sea ice retreat when runoff was thedominant freshwater source. As expected, DOC concentra-tions were significantly correlated with the estimated runofffraction, although there were indications that DOC concen-trations in many of the Atlantic layer (salinity >33.5)samples were influenced by factors other than runofffraction. For example, many of the Atlantic layer samplepoints fall below the apparent mixing line and may reflectlong-term degradation of DOC (Figure 2). However, small,but unrealistic negative runoff fractions were also observed(Figure 2) and probably reflect uncertainties in the end-member d18O values. These uncertainties limit our capabil-ity to evaluate long-term degradation of DOC in the Atlanticlayer. Therefore, excluding Atlantic layer samples, theregression equation relating the estimated runoff fractionto DOC concentration (DOC= 115� runoff fraction + 58.96)indicates that the estimated DOC concentration in meteoricwater (the apparent DOC concentration in all freshwater ofmeteoric origin) should be approximately 174 mM (Figure 2).Using this method, any deviations of this value from theactual river end-member sampling (Table 1) are presumedto be due to within-system processing.[17] Another means to estimate the apparent meteoric
DOC concentration is to simply regress DOC concentra-tions against salinity [Hansell et al., 2004] or to use stable
Table 1. DOC, Stable Oxygen Isotope Composition, and Runoff Estimates for Six Rivers and the Runoff Incorporated Into the Bering
Strait Inflow to the Arctic Oceana
River
MeanDOC,mM
StandardDeviation
Flow-WeightedDOC, mM N
d18OV-SMOW
MeanStandardDeviation N
d18OV-SMOW
Flow Weighted Runoff, km3 yr�1
Lena 724 283 917 8 �20.8 1.8 26 �20.6 524–533Mackenzie 375 100 358 6 �19.4 0.6 6 �19.0 249–333Ob 733 167 825 7 �15.7 0.9 4 �15.3 404–419Yenisey 733 316 858 8 �19.2 2.1 4 �18.8 562–577Yukon 533 242 625 14 �20.4 0.4 9 �20.2 195Kolyma 500 167 - 7 - - 34 �22.2 71–98Bering Strait runoff
end-member(includes Yukon)
�21.1 1670
aDischarge data are from Dittmar and Kattner [2003], except for the Yukon, which is fromMeybeck [1982]. The Bering Sea runoff end-member estimateis based upon regression of 102 oxygen isotope and salinity measurements made of bottom seawater from the Bering continental shelf (<150 m [Cooper etal., 1997]). DOC data for the Yukon River are from USGS, 2002–2004, and d18O data for the Kolyma River are from Welp et al. [2004], 2003–2004. Allothers are PARTNERS data from 2003–2004. Mean values of d18O and DOC for the rivers are simple averages from separate temporal samplings. Flowweighted data are based upon averaging samples from a given month, and flow weighting these monthly averages using long-term average monthlydischarge data. Missing months have been interpolated for the flow-weighted d18O estimates. Monthly flow rates were obtained from the R-ArcticNet dataarchive at the University of New Hampshire (http://www.r-arcticnet.sr.unh.edu/v3.0/). Flow-weighted DOC values are generally higher than straightaverages because of higher DOC concentrations during high flow.
G02013 COOPER ET AL.: ARCTIC RUNOFF, DOC, AND OXYGEN ISOTOPES
4 of 14
G02013
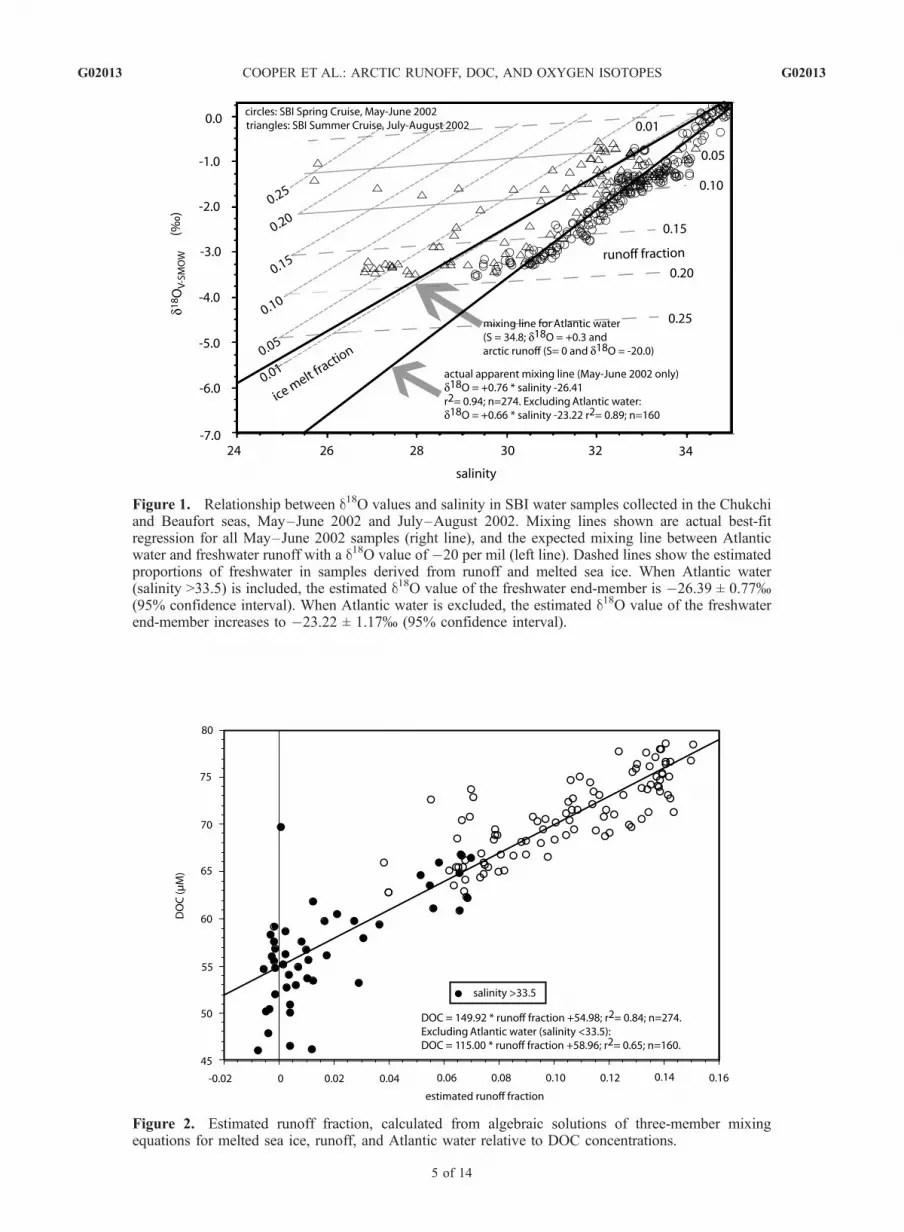
Figure 2. Estimated runoff fraction, calculated from algebraic solutions of three-member mixingequations for melted sea ice, runoff, and Atlantic water relative to DOC concentrations.
Figure 1. Relationship between d18O values and salinity in SBI water samples collected in the Chukchiand Beaufort seas, May–June 2002 and July–August 2002. Mixing lines shown are actual best-fitregression for all May–June 2002 samples (right line), and the expected mixing line between Atlanticwater and freshwater runoff with a d18O value of �20 per mil (left line). Dashed lines show the estimatedproportions of freshwater in samples derived from runoff and melted sea ice. When Atlantic water(salinity >33.5) is included, the estimated d18O value of the freshwater end-member is �26.39 ± 0.77%(95% confidence interval). When Atlantic water is excluded, the estimated d18O value of the freshwaterend-member increases to �23.22 ± 1.17% (95% confidence interval).
G02013 COOPER ET AL.: ARCTIC RUNOFF, DOC, AND OXYGEN ISOTOPES
5 of 14
G02013
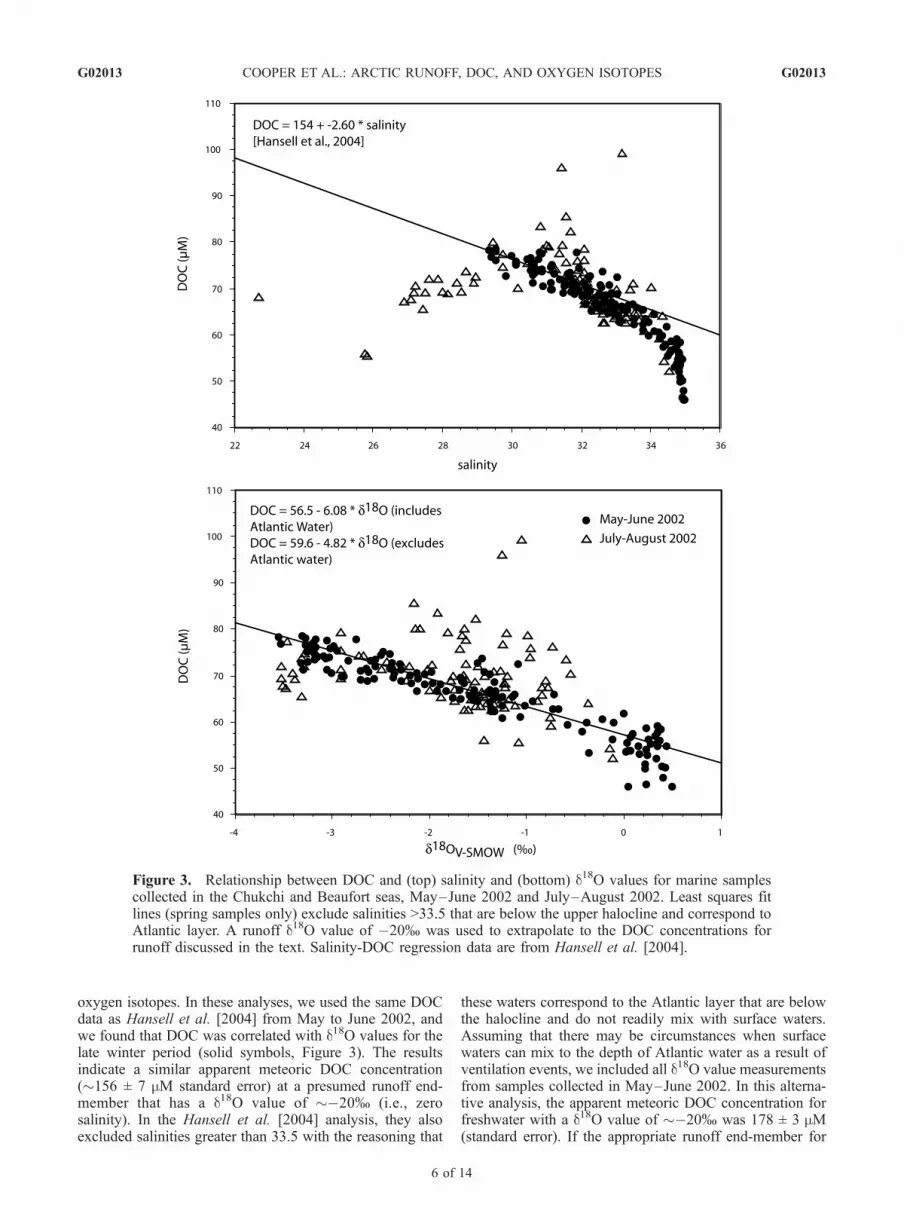
oxygen isotopes. In these analyses, we used the same DOCdata as Hansell et al. [2004] from May to June 2002, andwe found that DOC was correlated with d18O values for thelate winter period (solid symbols, Figure 3). The resultsindicate a similar apparent meteoric DOC concentration(�156 ± 7 mM standard error) at a presumed runoff end-member that has a d18O value of ��20% (i.e., zerosalinity). In the Hansell et al. [2004] analysis, they alsoexcluded salinities greater than 33.5 with the reasoning that
these waters correspond to the Atlantic layer that are belowthe halocline and do not readily mix with surface waters.Assuming that there may be circumstances when surfacewaters can mix to the depth of Atlantic water as a result ofventilation events, we included all d18O value measurementsfrom samples collected in May–June 2002. In this alterna-tive analysis, the apparent meteoric DOC concentration forfreshwater with a d18O value of ��20% was 178 ± 3 mM(standard error). If the appropriate runoff end-member for
Figure 3. Relationship between DOC and (top) salinity and (bottom) d18O values for marine samplescollected in the Chukchi and Beaufort seas, May–June 2002 and July–August 2002. Least squares fitlines (spring samples only) exclude salinities >33.5 that are below the upper halocline and correspond toAtlantic layer. A runoff d18O value of �20% was used to extrapolate to the DOC concentrations forrunoff discussed in the text. Salinity-DOC regression data are from Hansell et al. [2004].
G02013 COOPER ET AL.: ARCTIC RUNOFF, DOC, AND OXYGEN ISOTOPES
6 of 14
G02013

d18O is ��21%, which is within the range observed insome of the flow-weighted river sampling (Table 1), thenthe apparent meteoric DOC concentration increases furtherto 184 ± 3 mM (standard error). Our analysis also showsseasonal differences in apparent meteoric DOC concentra-tions; during the summer sampling (open symbols, Figure 3)the two highest concentrations of DOC were observed inBering Strait, indicating DOC associated with ‘‘fresh’’runoff. In other cases (other open symbols, Figure 3),dilution by melted sea ice reduced DOC concentrations[Shin and Tanaka, 2004; Mathis et al., 2005].[18] The CDOM fluorescence was only strongly corre-
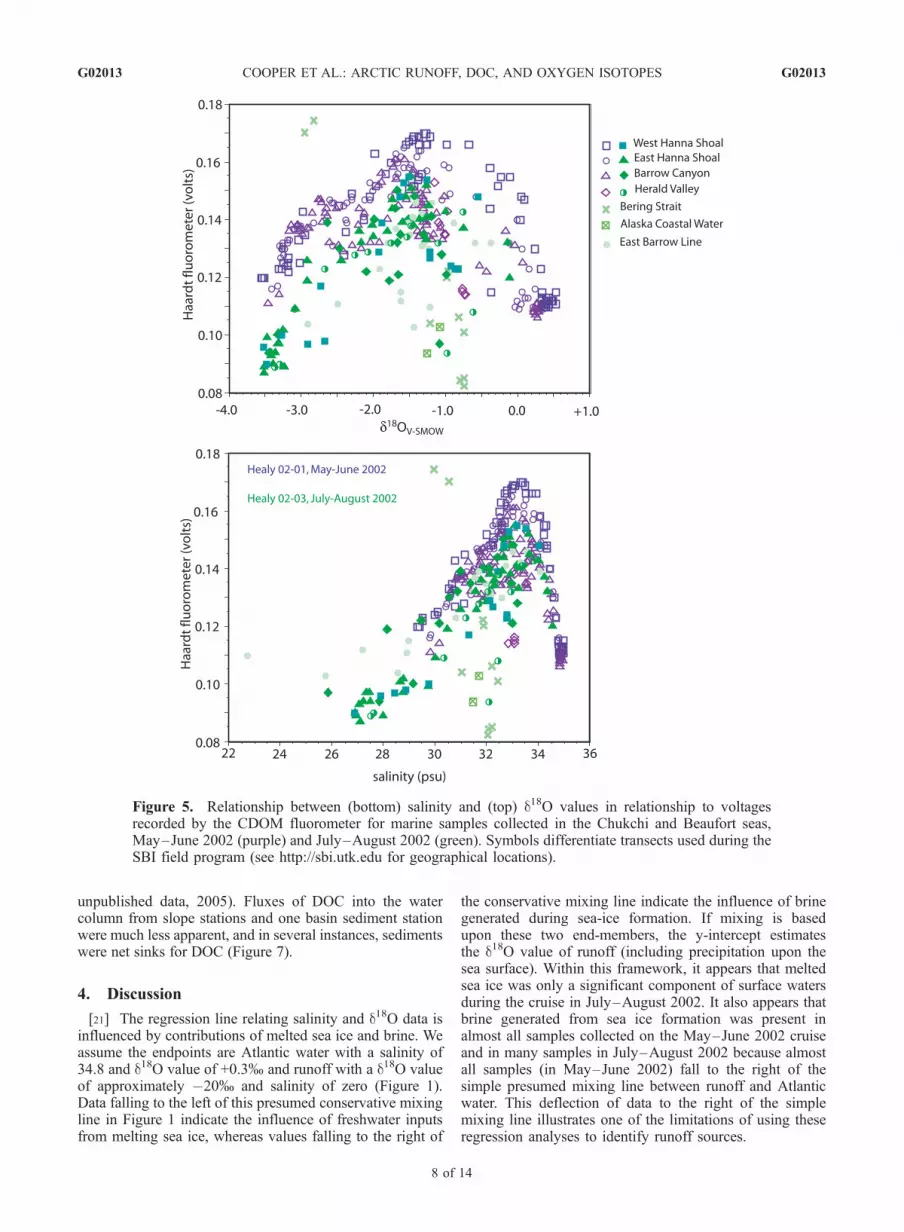
lated with DOC in Atlantic water with salinity greater than33.5 (Figure 4). In waters we sampled that were above theupper halocline (lower salinities), CDOM fluorescence wasnot correlated to DOC concentrations as measured in bottlesamples (Figure 4). With the exception of two Bering Straitsamples collected in July 2002, maximum voltages on bothcruises were observed at waters close to the salinity (33.1)and d18O value (�1.1%) associated with the upper halo-cline that is derived from high-nutrient Bering Sea waterthat has had brine added to it over the winter (Figure 5).Because waters in the upper halocline in the AmerasianArctic are associated with nutrient maxima, we chose tofurther evaluate the CDOM fluorometer voltage data withseveral nutrient parameters to see if some additional infor-mation could be elucidated. By and large, for waters abovethe halocline (salinity <33.5) on the May–June 2002 cruisewhen diluting sea ice melt was negligible, CDOM fluorom-eter voltages were positively correlated with nutrients suchas nitrate (data not shown), phosphate (data not shown), andsilicate (Figure 6). However, despite the generally positive
correlation with silicate, which is probably the best nutrientindicator of the Bering Strait inflow, the highest silicateconcentrations (�45 mM) were not associated with thehighest CDOM fluorometer voltages (Figure 6). We eval-uated another derived nutrient tracer, N* [Gruber andSarmiento, 1997], which has been primarily used as anindicator of denitrification or of nitrogen fixation dependingupon the system, and is based upon observed variances fromRedfield nitrate/phosphate ratios in seawater. In the Gruberand Sarmiento [1997] formulation, N* = (N � 16P +2.90 mmol kg�1) � 0.87, with N and P representingthe inorganic nitrate and nitrite (N) and phosphate pools (P).[19] Ammonium was not explicitly included in the orig-
inal N term defined by Gruber and Sarmiento [1997], butthis ion can be a significant component of inorganicnitrogen available on shelves in the region sampled duringSBI [Codispoti et al., 2005]. Consequently for the SBIsamples, to avoid confusion, we use a modified N* variable,N**, that explicitly also includes concentrations of ammo-nium in addition to nitrate and nitrite. We found a pattern ofincreasing impacts of denitrification (more negative N**values) in water samples that had higher CDOM fluores-cence, although again, the water samples that had beensubject to the highest degree of denitrification impacts onnitrate/phosphate ratios did not exhibit the highest CDOMfluorescence (Figure 5).[20] Results from the shipboard incubation experiments
indicate that some Chukchi shelf (<200 m) sediments are anet source of DOC to overlying waters with mean DOCrelease rates of up to 0.3 mmol m�2 d�1 (Figure 7), whichcoincides with higher sediment oxygen uptake and nutrienteffluxes that were observed in shelf sediments (J. Grebmeier,
Figure 4. Relationship between DOC measured from bottle samples and fluorescence measured by theCDOM fluorometer for marine samples collected in the Chukchi and Beaufort seas, May–June 2002 andJuly–August 2002. Regression line shown is the least squares fit for all data with salinities >33.5(Atlantic layer).
G02013 COOPER ET AL.: ARCTIC RUNOFF, DOC, AND OXYGEN ISOTOPES
7 of 14
G02013
unpublished data, 2005). Fluxes of DOC into the watercolumn from slope stations and one basin sediment stationwere much less apparent, and in several instances, sedimentswere net sinks for DOC (Figure 7).
4. Discussion
[21] The regression line relating salinity and d18O data isinfluenced by contributions of melted sea ice and brine. Weassume the endpoints are Atlantic water with a salinity of34.8 and d18O value of +0.3% and runoff with a d18O valueof approximately �20% and salinity of zero (Figure 1).Data falling to the left of this presumed conservative mixingline in Figure 1 indicate the influence of freshwater inputsfrom melting sea ice, whereas values falling to the right of
the conservative mixing line indicate the influence of brinegenerated during sea-ice formation. If mixing is basedupon these two end-members, the y-intercept estimatesthe d18O value of runoff (including precipitation upon thesea surface). Within this framework, it appears that meltedsea ice was only a significant component of surface watersduring the cruise in July–August 2002. It also appears thatbrine generated from sea ice formation was present inalmost all samples collected on the May–June 2002 cruiseand in many samples in July–August 2002 because almostall samples (in May–June 2002) fall to the right of thesimple presumed mixing line between runoff and Atlanticwater. This deflection of data to the right of the simplemixing line illustrates one of the limitations of using theseregression analyses to identify runoff sources.
Figure 5. Relationship between (bottom) salinity and (top) d18O values in relationship to voltagesrecorded by the CDOM fluorometer for marine samples collected in the Chukchi and Beaufort seas,May–June 2002 (purple) and July–August 2002 (green). Symbols differentiate transects used during theSBI field program (see http://sbi.utk.edu for geographical locations).
G02013 COOPER ET AL.: ARCTIC RUNOFF, DOC, AND OXYGEN ISOTOPES
8 of 14
G02013

[22] Another approach we used was to solve simulta-neous equations for a simple three mixing model system(runoff, melted sea ice, and Atlantic water) in order toestimate runoff fractions in samples on the May–June 2002cruise during which sources of melted ice were negligible(Figure 3). Many of the Atlantic layer samples (salinity>33.5) appeared to naturally separate from water samplesabove the halocline on the basis of DOC concentrations;many Atlantic layer DOC concentrations fell below theregression line relating DOC concentrations and estimated
runoff fraction (Figure 2). These data below the mixing lineprobably reflect long-term degradation of DOC in theAtlantic layer, which has a much longer residence time thansurface layers of the Arctic Ocean. The small, but unrealisticnegative runoff fractions observed in some Atlantic layersamples (Figure 2) also suggest that it is prudent to considerAtlantic layer DOC concentrations separately from surfacewaters. The regression equation used to estimate the appar-ent meteoric DOC concentration (DOC = 115 � MW +58.96) indicates that the DOC concentration in arctic river
Figure 6. (top left and bottom) Relationship between the denitrification indicator N** [Gruber andSarmiento, 1997] and CDOM fluorescence for marine samples collected in the Chukchi and Beaufortseas, May–June 2002 and July–August 2002. (top right) Relationship between silicate concentration andCDOM fluorescence. Regression lines shown are all least squares best fit with associated equations.
G02013 COOPER ET AL.: ARCTIC RUNOFF, DOC, AND OXYGEN ISOTOPES
9 of 14
G02013

water is somewhat higher (174 mM) than estimated fromy-intercepts in simple regression analyses of salinity andd18O versus DOC concentration (�156 mM ± 7 standarderror). Regardless, all estimates are much lower than actualmeasured values in rivers (Table 1).[23] It is possible that the arctic-wide estimate of river
water d18O, �20% [Ostlund and Hut, 1984] used in ourcalculations of conservative mixing is not representative ofthe river waters contributing to the study area. Dominantinputs from the Lena River, Kolyma River, and BeringStrait inflow (includes Yukon) would result in a regionalrunoff end-member closer to �21% (Table 1). Contribu-tions from rivers draining the North Slope of Alaska such asthe Meade, Colville, Kuparuk, and Sagavanirktok are alsolikely to contribute a more depleted d18O end-membervalue, although the Mackenzie is somewhat less depleteddue to its lower latitude origin. Even considering thesesources of variation, the best-fit regression line for theMay–June data suggests a d18O value for freshwater of��26.39 ± 0.77% (95% confidence interval). Althoughrunoff could have this isotopic composition, it is alsopossible that consistent brine injection in almost all watersamples shifted the apparent mixing line to the right anddownward, resulting in a more negative y-intercept that isessentially an artifact (Figure 1). In particular, if we excludeall samples below the upper halocline (salinity >33.5) toremove the Atlantic waters that may not effectively mixwith surface waters, the apparent runoff intercept for d18Oincreases to �23.22 ± 1.17% (95% confidence interval,Figure 1) which is probably more reasonable as a regionalrunoff end-member. Nevertheless, the presence of brine inalmost all samples collected on the May–June 2002 cruiseindicates that the runoff end-member d18O value should becautiously interpreted, and may be too negative. If this is thecase, runoff in the SBI sampling region would likely reflecta slightly less negative runoff intercept, ��20 to �21%,for contributions to surface ocean waters.
[24] Regardless of the uncertainty associated with choos-ing an appropriate regional d18O value for runoff in ourconservative mixing calculations, it is clear that melted seaice was only a significant component of surface watersduring the July–August 2002 cruise. Because sea icecoverage was continuous and nearly 100% in May–June,and largely absent by the time of the July–August cruise inthe same region, we assume that much of the ice covermelted and dissipated in place to generate a freshwater lens.Surface water had a freshwater component from melted seaice that was as high as one-quarter of surface waters duringJuly–August (Figure 1), and in some cases exceeded thefraction of freshwater derived from runoff. However, theabsence of freshwater contributions from sea-ice melt inMay–June along with radium isotope dating of thesesurface waters in the spring by Hansell et al. [2004] indicatethat the freshwater contributed by melted sea ice is almostcompletely overwhelmed by runoff contributions on anannual basis. This is a significant observation because thevolume of freshwater exported in the form of sea ice thatultimately melts in the North Atlantic after it transits FramStrait (2790 km3 yr�1) is on the same scale as Arctic Oceanrunoff (3300 km3 yr�1 [Aagaard and Carmack, 1989]).However, at least in this portion of the Arctic, it does notappear that the large retreat of sea ice that seasonally occursin the Chukchi Sea has more than short-term seasonalimpacts on regional surface salinities.[25] Using the mean discharge data from the rivers shown
in Table 1 that directly discharge into the Arctic Ocean (i.e.,excluding the Yukon), total discharge is approximately1884 km3 yr�1. This discharge accounts for a significantfraction of the �3300 km3 yr�1 of direct runoff into theArctic basin (i.e., excluding freshwater entrained in theBering Strait; [Aagaard and Carmack, 1989]). After incor-porating the proportional contribution of each river’s flow-weighted d18O value (Table 1), an Arctic Ocean d18O valuefor runoff is calculated to be �18.7%. A similar calculationusing Aagaard and Carmack’s [1989] generally higherdischarge volumes for these same rivers was little different,�18.5%. These values are significantly more positive thanthe value commonly ascribed to Arctic Ocean runoff, �20to �21 [Ostlund and Hut, 1984]. One major reason for thesignificant difference is that sampling only the largestrivers (Table 1) biases the precipitation sources to includecomparatively low latitudes that have less heavy isotope-depleted precipitation. The watersheds of several of thelarge rivers draining into the Arctic Ocean includingthe Ob, Yenisey and Mackenzie extend well south into themiddle latitudes of the Northern Hemisphere. In addition,freshwater entrained in Bering Strait, (�1670 km3 yr�1
[Aagaard and Carmack, 1989] and now thought to beprobably higher [Woodgate and Aagaard, 2005]), has ad18O freshwater end-member value during peak summerflow of �21.1% [Cooper et al., 1997; Clement et al.,2004]. When this stable oxygen isotope composition forrunoff in the Bering Strait inflow (�1670 km3 yr�1 ormore) is added to the total discharge of the five rivers(excluding the Yukon) monitored for d18O values (Table 1,1884 km3 yr�1), total runoff for the Bering Strait (assumedto include the Yukon) and the five other rivers in Table 1 isat least 3554 km3 yr�1. The proportional contribution ofeach of these freshwater sources to an integrated d18O value
Figure 7. DOC exchange rates for sediment incubationexperiments undertaken on shipboard at in situ temperaturesin July–August 2002 using undisturbed HAPS cores fromshelf, slope, and basin sediments. Negative uptake ratesreflect release of DOC into the overlying water column.
G02013 COOPER ET AL.: ARCTIC RUNOFF, DOC, AND OXYGEN ISOTOPES
10 of 14
G02013
for runoff is �19.8%, and would be even more negativeif we take into account the higher proportion of fresh-water projected to be present in the Bering Strait inflow[Woodgate and Aagaard, 2005]. Total freshwater input tothe Arctic marine system, including runoff from rivers andthrough Bering Strait and the excess of local precipitationover evaporation is therefore at least �5870 km3 yr�1.Consequently, �60% of that freshwater is supplied by thefive largest rivers that discharge directly into the ArcticOcean (Table 1) plus the freshwater entrained in theBering Strait inflow. The remaining 40% of Arctic runoff,which includes smaller rivers that do not drain subpolar ortemperate latitudes as well as local precipitation on sea ice,would have an integrated d18O value of �21.5% if theoverall end-member for the d18O value of runoff in theArctic Ocean is �20.5%.[26] The end-member d18O values (i.e., y-intercepts for
salinity (x) and d18O (y) regressions) around �23%, such aswe observe in the SBI sampling, can be explained by inputsfrom rivers of eastern Siberia and the North Slope ofAlaska, and freshwater delivered through the Bering Strait.Nonetheless, the runoff end-member for the marine data setcollected on the Chukchi and Beaufort margins is alsoreasonably consistent with a Bering Strait origin withcontributions from the Mackenzie River (somewhat lessdepleted in 18O), from the eastern Siberian rivers such as theKolyma and Lena (somewhat more depleted in 18O), andfrom rivers draining the North Slope of Alaska (even moredepleted in 18O). Contributions of freshwater from the largeEurasian rivers farther to the west do not seem as likely,either on the basis of the d18O values of those rivers orprevailing surface water currents that tend to route surfacewaters out of the Eurasian Arctic via the Transpolar Drift.[27] One other means to address the North American
versus Eurasian origins of runoff on the Chukchi andBeaufort shelf and slope region is to examine distributionsfor tracers that are specific to the North American Arctic orEurasian Arctic. For example, barium concentrations inmajor North American rivers such as the Mackenzie havebeen observed to be higher (138–574 nmol L�1) than in anumber of Eurasian rivers (12–175 nmol L�1 [Guay andFalkner, 1997, 1998]). Although there are complexities withthe use of barium as a runoff tracer because it is biologicallyscavenged, in sampling accomplished in 1993 in the sameshelf-basin boundary region as the 2002 SBI sampling,Guay and Falkner [1997] observed high concentrations ofbarium that they identified as having Mackenzie Riverorigins. In contemporaneous sampling also conducted in1993–1994, Beasley et al. [1998] and Cooper et al. [1999a]found that 237Np/129I ratios were significantly different inthe Canada basin and shelf from that observed on theAmundsen basin and shelf that are highly influenced bythe Ob and Yenesey River outflow. Specifically, in watersinfluenced by Ob and Yenesey runoff in the Amundsenshelf and basin, 237Np/129I ratios are significantly lower(�0.1 to 0.2 atom/atom) than in the Beaufort Sea (>0.3 to0.5 atom/atom) [Cooper et al., 1999a]. In summary, in the1993 sampling on the Beaufort and Chukchi shelf andCanada Basin, not only was a North American river tracer(barium) present, no evidence was found for a significantpresence of an Ob and Yenesey river tracer (low 237Np/129Iratios). The salinity and stable oxygen data from the August
1993 sampling on the Beaufort and Chukchi Sea shelf andbasin [Cooper et al., 1999b] (and unpublished data citedtherein) are similarly distributed in sea ice melt and runofffields to that observed in July–August 2002 (Figure 1). As aresult it seems reasonable to conclude that the DOC andwater carrying it that was sampled in 2002 is likely to be ofprimarily North American (via direct inputs and transportthrough Bering Strait), rather than Eurasian origin regard-less of the evidence for a lengthy transit in the BeaufortGyre [Hansell et al., 2004].[28] The spring sampling in May–June 2002 shows that
water column DOC concentrations are correlated with bothsalinity and d18O values (Figure 3). Although brine injectionin these samples could have some impact on the apparentDOC concentration in the runoff (meteoric water) end-member estimated from DOC versus salinity (Figure 3,zero salinity), the relationship between DOC concentrationsand d18O values provides a runoff end-member estimate thatis much less responsive to brine injection. In addition tolonger residence times of terrigenous DOC in the BeaufortGyre relative to the Transpolar Drift [Hansell et al., 2004],the lower DOC concentrations we report here for NorthAmerican rivers such as the Yukon and Mackenzie (Table 1)may play a role in the difference in the relationship betweensalinity and DOC between the North American and Eur-asian Arctic basins. For the three largest Eurasian rivers, theOb, Yenisey and Lena, the flow-weighted DOC concen-trations in freshwater near river mouths during PARTNERSsampling in 2003–2004 were �800 to 1000 mM, relative tothe apparent meteoric water DOC concentration of �500 to700 mM observed in the Eurasian Arctic basin [Dittmar andKattner, 2003]. This implies that �30% of runoff DOC isinitially reactive and is lost during transport to the ArcticOcean. If the flow-weighted DOC concentrations reportedhere for the Mackenzie (358 mM) and Yukon (625 mM) arerepresentative of the North American Arctic, and if a similar�30% of DOC is reactive over shelves, then the apparentDOC concentration for meteoric waters influenced pre-dominantly by North American rivers would be approxi-mately 250–450 mM. Significantly relatively high DOCwas observed in July 2002 sampling in Bering Strait(Figure 4), which suggests that even if some of theshelf-basin boundary waters sampled were ultimately fromBering Strait sources, significant loss of DOC had occurredby the time we sampled those offshore waters.[29] There is a significant difference between the
expected apparent intercept that is arrived at by subtracting�30% from measured river concentrations (250–450 mM)and the intercept (154 mM) reported by Hansell et al.[2004], which we also corroborated here independentlyusing oxygen isotope measurements and solution of threeend-member mixing equations. This presumably reflects aloss of DOC while surface waters circulate in the BeaufortGyre over a time period estimated from radium isotopemeasurements to be 12 ± 1 years [Hansell et al., 2004].Much of this loss would be due to bacterial decay andphoto-oxidation in the upper water column; small fractionsof terrigenous dissolved organic materials can also betransported into the deep Arctic from shelf waters as aresult of brine injection [Dittmar, 2004]. However ourPARTNERS data and the associated rapid decay projectionssuggest a lower rate of DOC decay than Hansell et al.
G02013 COOPER ET AL.: ARCTIC RUNOFF, DOC, AND OXYGEN ISOTOPES
11 of 14
G02013
[2004] estimated. They projected a loss of 396 ± 50 mM ofDOC over a �12-year period in the Beaufort Gyre, whilethese calculations project a loss of as little as �100 mM overthe same 12-year period, using the Mackenzie River flow-weighted DOC concentrations. The major uncertainties thatare the basis for this difference are the degree of accuracyfor estimates of the concentrations of DOC in major riverssuch as the Mackenzie and Yukon. Hansell et al. [2004] use
higher concentration estimates from other data sources. It isnot clear to what extent DOC is rapidly mineralized, photo-oxidized, or flocculated at river mouths and therefore notmeasured in the offshore Arctic Ocean such as our SBIsampling. Another complication is that DOC concentrationsin Arctic rivers are highly variable, with extreme maximaover a few days at peak runoff [Rember and Trefry, 2004].The only way to adequately address these uncertainties, as
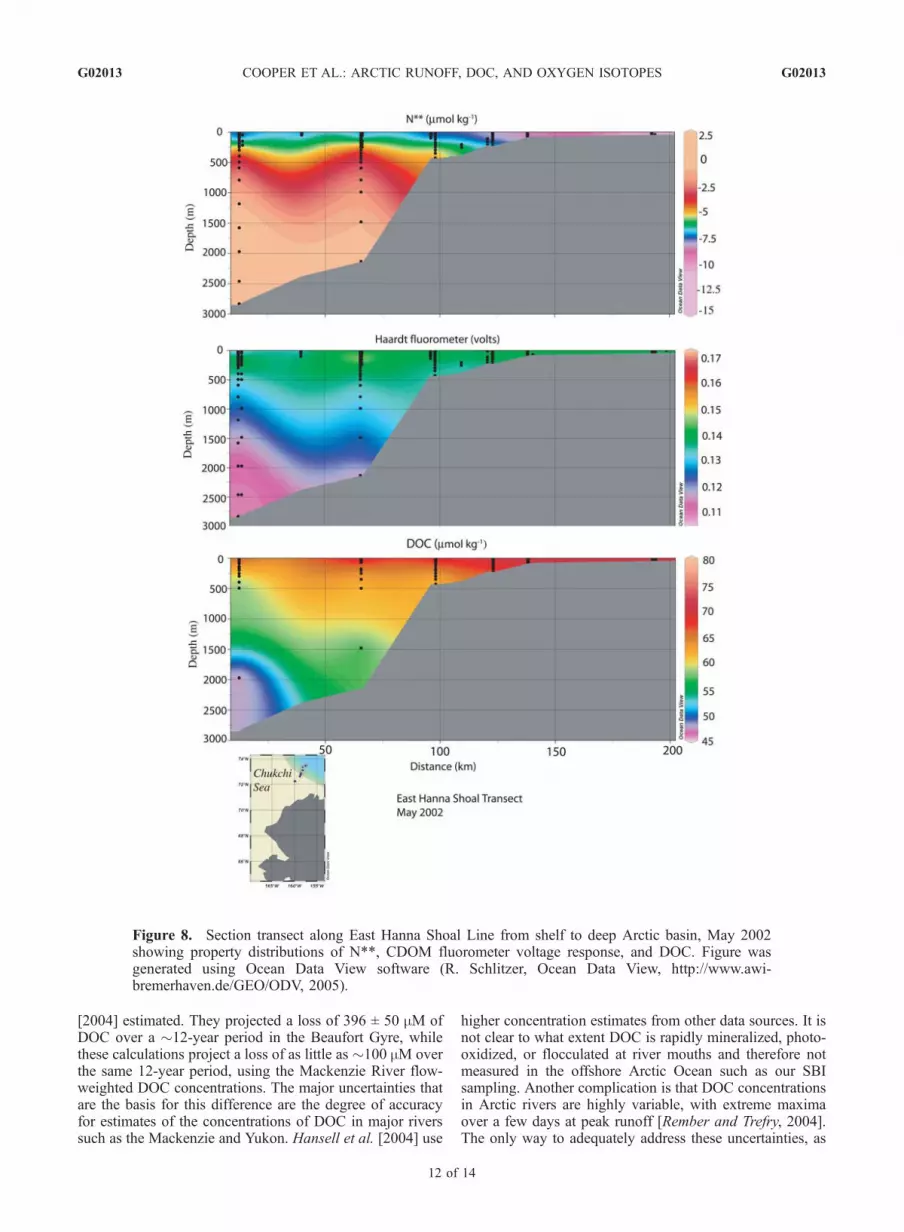
Figure 8. Section transect along East Hanna Shoal Line from shelf to deep Arctic basin, May 2002showing property distributions of N**, CDOM fluorometer voltage response, and DOC. Figure wasgenerated using Ocean Data View software (R. Schlitzer, Ocean Data View, http://www.awi-bremerhaven.de/GEO/ODV, 2005).
G02013 COOPER ET AL.: ARCTIC RUNOFF, DOC, AND OXYGEN ISOTOPES
12 of 14
G02013

well as to understand initial processing of DOC in coastalwaters will be through more detailed sampling of seasonalvariation in runoff, along with measurements of concen-trations of DOC and appropriate tracers in coastal waters.Presumably regular well-coordinated river sampling pro-grams such as PARTNERS will help continue to reconcilethese apparent differences for the largest Arctic rivers.[30] DOC measurements show that the instrumental
(CDOM) fluorometer response is correlated with DOC inthe Atlantic layer (salinity >33.5) as might be expectedsince this fluorometer has been used to produce empiricalestimates of DOC in the Eurasian Arctic [Amon et al., 2003]where Atlantic waters dominate. However, we did notobserve such correlations in the waters above the Atlanticlayer. Higher voltages were observed in the upper halocline(salinity = 33.1; d18O = �1.1; Figure 5), which is character-ized by nutrient maxima and N** minima. Therefore it is notsurprising that nutrients in waters above the halocline weregenerally correlated with instrumental fluorescence duringtheMay–June 2002 cruise when melted sea ice contributionswere negligible (Figure 5). However within the upper halo-cline, nutrient maxima were strongest near the shelf/slopeand the CDOM fluorometer voltages were higher offshore(Figure 8). It is outside of the scope of this study to determinethe actual materials that are contributing to the fluorometervoltage response while not appearing to significantly influ-ence DOC concentrations measured in bottle samples, but wespeculate that materials released from the sediments areinvolved. Our sediment incubation experiments (Figure 7)indicate that DOC can be actively released from continentalshelf sediments, and perhaps this DOC fraction gives arelatively high instrumental fluorometer signal. But why isthe CDOM fluorometer response in the upper haloclinelarger offshore than near the slope? We do know thatturbidity within the halocline increases toward the shore[Codispoti et al., 2005] and perhaps this turbidity depressesthe CDOM signal giving an apparent decrease in ‘‘CDOMDOC’’ toward the shelf/slope (Figure 8). We speculate,therefore, that as the signals generated over the shelf/slopeproceed toward the interior of the Arctic Ocean, turbidity willdecrease the fastest producing an increase in the CDOMfluorometer voltage response while the strength of theobserved nutrient signals decrease more or less as expected.While we cannot specify the particulate or dissolved mate-rials that the CDOM fluorometer is responding to, it is clearthat further investigation is required before the CDOMfluorometer can be routinely used to estimate DOC concen-trations in Arctic waters, despite its apparently consistentperformance in the Eurasian Arctic [Amon et al., 2003].[31] In sediment incubation experiments conducted dur-
ing SBI field studies, DOC effluxes from incubated sedi-ment cores were largest from shelf sediments (Figure 7).Relative to the full water column, these fluxes do not appearlarge, up to 0.3 mmol m�2 d�1, but nevertheless additionalwork is probably necessary to evaluate the importance ofthis flux, which could possibly be detectable on the scale ofindividual ship transects (Figure 8). Concentrations of watercolumn DOC at the depth (�120 m) of the halocline(salinity = 33.1) are approximately 70 mM (Figure 3), so acubic meter of bottom water in contact with the sediments atthis stratified depth would already contain �70 mmol ofDOC. Observations from the SBI field program indicate that
ubiquitous plumes of brine injected shelf waters with highconcentrations of silicate, ammonium and other nutrientsflow into the deeper Arctic basin after coming into contactwith shelf sediments [Codispoti et al., 2005]. The DOCconcentrations from sediments probably are also entrainedin these plumes, including DOC from sediment pore watersthat originate from the breakdown of organic matter, bothmarine and terrestrial, as well as the excretion products frombenthic animals [Hulth et al., 1996]. This suggests that theDOC flux from the sediments would likely be more labilethan that already in the water column. The fact that theseshelves are influenced by extremely high marine primaryproduction and terrestrial input from coastal rivers anderosion, suggests that understanding of DOC transport inthe Arctic needs to consider runoff, erosion and relatedDOC interactions with marine sediments, particularly overthe extensive continental shelves where carbon is processed[Olsson and Anderson, 1997; Fransson et al., 2001].
[32] Acknowledgments. The PARTNERS and SBI projects have beensupported by the Office of Polar Programs of the U.S. National ScienceFoundation. We thank members of the two project teams for the field effortsthat made these data sets possible, particularly the SBI Hydrographic Team,and we acknowledge the excellent support received from the crew andofficers of the USCGC Healy. Zheng-hua Li (University of Tennessee)contributed his expertise to the stable oxygen isotope measurements. Wethank two anonymous reviewers and the Associate Editor for constructivecomments that improved previous versions of the manuscript.
ReferencesAagaard, K., and E. C. Carmack (1989), The role of sea ice and other freshwater in the Arctic circulation, J. Geophys. Res., 94(C10), 14,485–14,498.
Amon, R. M. W., and B. Meon (2004), The biogeochemistry of dissolvedorganic matter and nutrients in two large Arctic estuaries and potentialimplications for our understanding of the Arctic Ocean system, Mar.Chem., 92, 311–330.
Amon, R. M. W., G. Budeus, and B. Meon (2003), Dissolved organiccarbon distribution and origin in the Nordic Seas: Exchanges with theArctic Ocean and the North Atlantic, J. Geophys. Res., 108(C7), 3221,doi:10.1029/2002JC001594.
Are, F. E. (1999), The role of coastal retreat for sedimentation in the LaptevSea, in Land-Ocean Systems in the Siberian Arctic: Dynamics and His-tory, edited by H. Kassens et al., pp. 287–295, Springer, New York.
Bauch, D., P. Schlosser, and R. G. Fairbanks (1995), Freshwater balanceand the sources of deep and bottom waters in the Arctic Ocean inferredfrom the distribution of H2
18O, Prog. Oceanogr., 35, 53–80.Beasley, T., L. W. Cooper, J. Grebmeier, K. Aagaard, J. M. Kelley, andL. R. Kilius (1998), 237Np/129I atom ratios in the Arctic Ocean: Has237Np from western European and Russian fuel re-processing facilitiesentered the Arctic Ocean?, J. Environ. Radioact., 39, 255–277.
Benner, R., B. Benitez-Nelson, K. Kaiser, andR.M.W.Amon (2004), Exportof young terrigenous dissolved organic carbon from rivers to the ArcticOcean, Geophys. Res. Lett., 31, L05305, doi:10.1029/2003GL019251.
Benner, R., P. Louchouarn, and R. M. W. Amon (2005), Terrigenous dis-solved organic matter in the Arctic Ocean and its transport to surface anddeep waters of the North Atlantic, Global Biogeochem. Cycles, 19,GB2025, doi:10.1029/2004GB002398.
Clement, J. L., L. W. Cooper, and J. M. Grebmeier (2004), Late-winterwater column and sea ice conditions in the northern Bering Sea, J. Geo-phys. Res., 109, C03022, doi:10.1029/2003JC002047.
Codispoti, L. A., C. Flagg, and V. Kelly (2005), Hydrographic conditionsduring the 2002 SBI Process Experiments,Deep Sea Res., Part II, in press.
Cooper, L. W. (1998), Isotopic fractionation in snow cover, in IsotopicTracers in Catchment Hydrology, edited by J. J. McDonnell andC. Kendall, pp. 119–136, Elsevier, New York.
Cooper, L. W., T. E. Whitledge, J. M. Grebmeier, and T. Weingartner(1997), The nutrient, salinity, and stable oxygen isotope composition ofBering and Chukchi Seas waters in and near the Bering Strait, J. Geo-phys. Res., 102(C6), 12,563–12,573.
Cooper, L. W., T. Beasley, K. Aagaard, J. M. Kelley, I. L. Larsen, and J. M.Grebmeier (1999a), Distributions of nuclear fuel-reprocessing tracers inthe Arctic Ocean: Indications of Russian river influence, J. Mar. Res.,57(5), 715–738.
G02013 COOPER ET AL.: ARCTIC RUNOFF, DOC, AND OXYGEN ISOTOPES
13 of 14
G02013
Cooper, L. W., G. F. Cota, L. R. Pomeroy, J. M. Grebmeier, and T. E.Whitledge (1999b), Modification of NO, PO, and NO/PO during flowacross the Bering and Chukchi shelves: Implications for use as Arcticwater mass tracers, J. Geophys. Res., 104(C4), 7827–7836.
Cooper, L. W., J. M. Grebmeier, I. L. Larsen, V. G. Egorov, C. Theodorakis,H. P. Kelly, and J. R. Lovvorn (2002), Seasonal variation in sedimenta-tion of organic materials in the St. Lawrence Island polynya region,Bering Sea, Mar. Ecol. Prog. Ser., 226, 13–26.
Dittmar, T. (2004), Evidence for terrigenous dissolved organic nitrogen inthe Arctic deep sea, Limnol. Oceanogr., 49(1), 148–156.
Dittmar, T., andG.Kattner (2003), The biogeochemistry of the river and shelfecosystem of the Arctic Ocean: A review, Mar. Chem., 83, 103–120.
Eicken, H. (1998), Factors determining microstructure, salinity and stable-isotope composition of Antarctic sea ice: Deriving modes and rates ofice growth in the Weddell Sea, in Antarctic Sea Ice: Physical Process,Interactions and Variability, Antarct. Res. Ser., vol. 74, edited by M. O.Jeffries, pp. 89–122, AGU, Washington, D. C.
Eicken, H., H. R. Krouse, D. Kadko, and D. K. Perovich (2002), Tracerstudies of pathways and rates of meltwater transport through Arctic sum-mer sea ice, J. Geophys. Res., 107(10), 8046, doi:10.1029/2000JC000583.
Ekwurzel, B., P. Schlosser, R. A. Mortlock, R. G. Fairbanks, and J. H. Swift(2001), River runoff, sea ice meltwater, and Pacific water distribution andmean residence times in the Arctic Ocean, J. Geophys. Res., 106(C5),9075–9092.
Fransson, A., M. Chierici, L. C. Anderson, I. Bussmann, G. Kattner, E. P.Jones, and J. H. Swift (2001), The importance of shelf processes for themodification of chemical constituents in the waters of the Eurasian ArcticOcean: Implication for carbon fluxes, Cont. Shelf Res., 21, 225–242.
Freeman, C., N. Fenner, N. J. Ostle, H. Kang, D. J. Dowrick, B. Reynolds,M. A. Lock, D. Sleep, S. Hughes, and J. Hudson (2004), Export ofdissolved organic carbon from peatlands under elevated carbon dioxidelevels, Nature, 430, 195–198.
Frey, K. E., and L. C. Smith (2005), Amplified carbon release from vastWest Siberian peatlands by 2100, Geophys. Res. Lett., 32, L09401,doi:10.1029/2004GL022025.
Grebmeier, J. M., and C. P. McRoy (1989), Pelagic-benthic coupling on theshelf of the northern Bering and Chukchi Seas: III. Benthic food supplyand carbon cycling, Mar. Ecol. Prog. Ser., 53, 79–91.
Gruber, N., and J. L. Sarmiento (1997), Global patterns of marine nitrogenfixation and denitrification, Global Biogeochem. Cycles, 11, 235–266.
Guay, C. K., and K. Falkner (1997), Barium as a tracer of Arctic haloclineand river waters, Deep Sea Res., Part II, 44(8), 1543–1569.
Guay, C. K., and K. K. Falkner (1998), A survey of dissolved barium in theestuaries of major Arctic rivers and adjacent seas, Cont. Shelf Res., 18,859–882.
Guay, C. K., G. P. Klinkhammer, K. K. Falkner, R. Benner, P. G. Coble,T. E. Whitledge, B. Black, F. J. Bussell, and T. A. Wagner (1999),High-resolution measurements of dissolved organic carbon in the ArcticOcean by in situ fiber-optic spectrometry, Geophys. Res. Lett., 26,1007–1010.
Hansell, D. A., D. Kadko, and N. R. Bates (2004), Degradation of terrige-nous dissolved organic carbon in the western Arctic Ocean, Science, 204,858–861.
Hobbie, S. E., T. A. Miley, and M. S. Weiss (2002), Carbon and nitrogencycling in soils from acidic and nonacidic tundra with different glacialhistories in Northern Alaska, Ecosystems, 5(8), 761–774.
Hulth, S., P. O. J. Hall, T. H. Blackburn, and A. Landen (1996), Arcticsediments (Svalbard): Pore water and solid phase distributions of C, N, Pand Si, Polar Biol., 16(6), 447–462.
Lobbes, J. M., H. P. Fitznar, and G. Kattner (2000), Biogeochemical char-acteristics of dissolved and particulate organic matter in Russian riversentering the Arctic Ocean, Geochim. Cosmochim. Acta, 64(17), 2973–2983.
Macdonald, R. W., E. C. Carmack, F. A. McLaughlin, K. Iseki, D. M.Macdonald, and M. C. O0Brien (1989), Composition and modificationof water masses in the Mackenzie Shelf Estuary, J. Geophys. Res.,94(C12), 18,057–18,070.
Macdonald, R. W., D. W. Paton, E. C. Carmack, and A. Omstedt (1995),The freshwater budget and under-ice spreading of Mackenzie River waterin the Canadian Beaufort Sea based on salinity and 18O/16O measure-ments in water and ice, J. Geophys. Res., 100(C1), 895–919.
Macdonald, R. W., F. A. McLaughlin, and E. C. Carmack (2002), Freshwater and its sources during the SHEBA drift in the Canada Basin of theArctic Ocean, Deep Sea Res., Part I, 49(10), 1769–1785.
Mathis, J. T., D. A. Hansell, and N. R. Bates (2005), Strong hydrographiccontrols on spatial and seasonal variability of dissolved organic carbon inthe Chukchi Sea, Deep Sea Res., Part II, in press.
Melling, H., and R. M. Moore (1995), Modification of halocline sourcewaters during freezing on the Beaufort Sea Shelf—Evidence fromoxygen isotopes and dissolved nutrients, Cont. Shelf Res., 15, 89–113.
Meybeck, M. (1982), Carbon, nitrogen, and phosphorus transport by worldrivers, Am. J. Sci., 282, 401–450.
Mulholland, P. J., and J. A. Watts (1982), Transport of organic-carbon to theoceans by rivers of North America—A synthesis of existing data, Tellus,34(2), 176–186.
Neff, J. C., and D. U. Hooper (2002), Vegetation and climate controls onpotential CO2, DOC and DON production in northern latitude soils,Global Change Biol., 8(9), 872–884.
Olsson, K., and L. G. Anderson (1997), Input and biogeochemical trans-formation of dissolved carbon in the Siberian shelf seas, Cont. Shelf Res.,17, 819–833.
Opsahl, S., R. Benner, and R. M. W. Amon (1999), Major flux of terri-genous dissolved organic matter through the Arctic Ocean, Limnol.Oceanogr., 44(8), 2017–2023.
Ostlund, H. G., and G. Hut (1984), Arctic Ocean water mass balance fromisotope data, J. Geophys. Res., 89(C4), 6373–6381.
Pastor, J., J. Solin, S. D. Bridgham, K. Updegraff, C. Harth, P. Weishampel,and B. Dewey (2003), Global warming and the export of dissolvedorganic carbon from boreal peatlands, Oikos, 100(2), 380–386.
Pfirman, S. L., W. Haxby, H. Eicken, M. Jeffries, and D. Bauch (2004),Drifting Arctic sea ice archives changes in ocean surface conditions,Geophys. Res. Lett., 31, L19401, do:10.1029/2004GL020666.
Proshutinsky, A., I. V. Polyakov, and M. A. Johnson (1999), Climate statesand variability of Arctic ice and water dynamics during 1946–1997,Polar Res., 18(2), 1–8.
Rachold, V., M. N. Grigoriev, F. E. Are, S. Solomon, E. Reimnitz,H. Kassens, and M. Antonow (2000), Coastal erosion vs. riverine sedi-ment discharge in the Arctic Shelf seas, Int. J. Earth Sci., 89(3), 450–460.
Raymond, P. A., and C. S. Hopkinson (2003), Ecosystem modulation ofdissolved carbon age in a temperate marsh-dominated estuary, Ecosys-tems, 6(7), 694–705.
Rember, R. D., and J. H. Trefry (2004), Increased concentrations ofdissolved trace metals and organic carbon during snowmelt in riversof the Alaskan Arctic, Geochim. Cosmochim. Acta, 68(3), 477–489.
Serreze, M. C., J. E. Walsh, F. S. Chapin, T. Osterkamp, M. Dyurgerov,V. Romanovsky, W. C. Oechel, J. Morison, T. Zhang, and R. G. Barry(2000), Observational evidence of recent change in the northern high-latitude environment, Clim. Change, 46, 159–209.
Shaver, G. R., W. D. Billings, F. S. Chapin III, A. E. Giblin, K. J.Nadelhoffer, W. C. Oechel, and E. B. Rastetter (1992), Global changeand the carbon balance of arctic ecosystems, Bioscience, 42(6), 433–441.
Shin, K.-H., and N. Tanaka (2004), Distribution of dissolved organic matterin the eastern Bering Sea, Chukchi Sea (Barrow Canyon) and BeaufortSea, Geophys. Res. Lett., 31, L24304, doi:10.1029/2004GL021039.
Smith, L. C., G. M. MacDonald, A. A. Velichko, D. W. Beilman, O. K.Borisova, K. E. Frey, K. V. Kremenetski, and Y. Sheng (2004), Siberianpeatlands: A net carbon sink and global methane source since the earlyHolocene, Science, 303, 353–356.
Waddington, J. M., and N. T. Roulet (1997), Groundwater flow and dis-solved carbon movement in a boreal peatland, J. Hydrol., 191, 121–138.
Welp, L. R., J. T. Randerson, J. C. Finlay, S. P. Davydov, G. M. Zimova,A. I. Davydova, and S. A. Zimov (2004), Using stable oxygen isotopesto partition seasonal precipitation inputs in the Kolyma River, EosTrans. AGU, 85(47), Fall Meet. Suppl., Abstract C51B-1045.
Wheeler, P. A., M. Gosselin, E. Sherr, D. Thibault, D. L. Kirchman,R. Benner, and T. E. Whitledge (1996), Active cycling of organiccarbon in the central Arctic Ocean, Nature, 380, 697–699.
Woodgate, R. A., and K. Aagaard (2005), Revising the Bering Strait fresh-water flux into the Arctic Ocean, Geophys. Res. Lett., 32(2), L02602,doi:10.1029/2004GL021747.
�����������������������R. Benner, Department of Biological Sciences and Marine Science
Program, University of South Carolina, Columbia, SC 29208, USA.L. A. Codispoti, University of Maryland Center for Environmental
Science, P.O. Box 775, 2020 Horns Point Road, Cambridge, MD 21613-0775, USA.L. W. Cooper and J. M. Grebmeier, Department of Ecology and
Evolutionary Biology, University of Tennessee, 10515 Research Drive,Suite 100, Knoxville, TN 37932, USA. ([email protected])D. A. Hansell, Division of Marine and Atmospheric Chemistry,
Rosenstiel School of Marine and Atmospheric Science, University ofMiami, 4600 Rickenbacker Causeway, Miami, FL 33149, USA.R. M. Holmes, Woods Hole Research Center, P.O. Box 296, Woods Hole,
MA 02543-0296, USA.J. W. McClelland and B. J. Peterson, Marine Biological Laboratory, 7
MBL Street, Woods Hole, MA 02453, USA.P. A. Raymond, School of Forestry and Environmental Science, Yale
University, 205 Prospect Street, New Haven, CT 06511, USA.
G02013 COOPER ET AL.: ARCTIC RUNOFF, DOC, AND OXYGEN ISOTOPES
14 of 14
G02013


