Embed Size (px)
Citation preview
EUROPEAN ORGANIZATION FOR NUCLEAR RESEARCH
CERN{PPE/95{59
28 April 1995
Lifetimes of Charged and Neutral B
Hadrons Using Event Topology
DELPHI Collaboration
Abstract
The lifetimes of charged and neutral B hadrons have been measured us-ing data collected by the DELPHI experiment at LEP between 1991 and1993. B hadrons are tagged as jets with a secondary vertex and the chargeof the B candidate is taken to be the sum of the charges of the particles
in the secondary vertex. Approximately 1,434,000 multihadronic Z0 decaysyielded 1817 B hadron candidates. The B purity was estimated to be around99.1�0.3%, and 83% (70%) of the events measured as neutral (charged)came from neutral (charged) B's. The mean lifetimes of charged and neu-tral B hadrons were found to be 1.72�0:08 (stat.)�0:06 (syst.) ps and1.58�0:11 (stat.)�0:09 (syst.) ps respectively. The ratio of their lifetimes,�charged=�neutral, was 1:09+0:11�0:10 (stat.)�0:08 (syst.). By making assumptionsabout the B0
s and �0b states, the B+ and B0 meson lifetimes were deter-
mined to be �B+ = 1:72 � 0:08 (stat.)�0:06 (syst.) ps and �B0 = 1:63 �0:14 (stat.)�0:13 (syst.) ps and the ratio of their lifetimes was:�B+=�B0 = 1:06+0:13�0:11 � 0:10. The mean B lifetime was also deduced to be< �B >= 1:64� 0:06 ( stat.)� 0:04 ( syst.) ps.
(To be submitted to Zeit. f. Physik C)
ii
W.Adam50, T.Adye37, E.Agasi31, I.Ajinenko42, R.Aleksan39 , G.D.Alekseev16 , P.P.Allport22, S.Almehed24 ,
S.J.Alvsvaag4, U.Amaldi9, S.Amato47, A.Andreazza28, M.L.Andrieux14 , P.Antilogus25 , V.Anykeyev42,
W-D.Apel17 , Y.Arnoud39, B.�Asman44, J-E.Augustin19 , A.Augustinus31 , P.Baillon9 , P.Bambade19, F.Barao21,
R.Barate14, D.Y.Bardin16, G.J.Barker35, A.Baroncelli40 , O.Barring24, J.A.Barrio26, W.Bartl50 , M.J.Bates37,
M.Battaglia15 , M.Baubillier23 , J.Baudot39, K-H.Becks52, M.Begalli6 , P.Beilliere8 , Yu.Belokopytov9 ,
A.C.Benvenuti5, M.Berggren41 , D.Bertrand2, F.Bianchi45 , M.Bigi45 , M.S.Bilenky16 , P.Billoir23 , D.Bloch10 ,
M.Blume52 , S.Blyth35 , V.Bocci38, T.Bolognese39 , M.Bonesini28 , W.Bonivento28 , P.S.L.Booth22, G.Borisov42 ,
C.Bosio40, S.Bosworth35, O.Botner48, B.Bouquet19 , C.Bourdarios9 , T.J.V.Bowcock22, M.Bozzo13,
P.Branchini40 , K.D.Brand36, R.A.Brenner15, C.Bricman2 , L.Brillault23 , R.C.A.Brown9, P.Bruckman18 ,
J-M.Brunet8, L.Bugge33, T.Buran33, A.Buys9, M.Caccia28, M.Calvi28, A.J.Camacho Rozas41, T.Camporesi9,
V.Canale38, M.Canepa13 , K.Cankocak44, F.Cao2, F.Carena9, P.Carrilho47 , L.Carroll22, C.Caso13,
M.V.Castillo Gimenez49 , A.Cattai9, F.R.Cavallo5 , L.Cerrito38, V.Chabaud9, Ph.Charpentier9 , L.Chaussard25 ,
J.Chauveau23, P.Checchia36 , G.A.Chelkov16, R.Chierici45 , P.Chliapnikov42 , P.Chochula7 , V.Chorowicz9,
V.Cindro43, P.Collins9 , J.L.Contreras19, R.Contri13, E.Cortina49, G.Cosme19, F.Cossutti46, H.B.Crawley1,
D.Crennell37 , G.Crosetti13, J.Cuevas Maestro34 , S.Czellar15 , E.Dahl-Jensen29 , J.Dahm52, B.Dalmagne19 ,
M.Dam33, G.Damgaard29 , A.Daum17, P.D.Dauncey37 , M.Davenport9 , W.Da Silva23 , C.Defoix8,
G.Della Ricca46, P.Delpierre27 , N.Demaria35 , A.De Angelis9 , H.De Boeck2, W.De Boer17, S.De Brabandere2 ,
C.De Clercq2, C.De La Vaissiere23 , B.De Lotto46, A.De Min28, L.De Paula47 , C.De Saint-Jean39 , H.Dijkstra9,
L.Di Ciaccio38 , F.Djama10, J.Dolbeau8 , M.Donszelmann9 , K.Doroba51, M.Dracos10, J.Drees52, K.-A.Drees52,
M.Dris32 , Y.Dufour8, F.Dupont14 , D.Edsall1 , R.Ehret17, G.Eigen4, T.Ekelof48, G.Ekspong44 , M.Elsing52 ,
J-P.Engel10, N.Ershaidat23 , B.Erzen43, M.Espirito Santo21, E.Falk24 , D.Fassouliotis32 , M.Feindt9, A.Ferrer49,
T.A.Filippas32 , A.Firestone1 , P.-A.Fischer10, H.Foeth9, E.Fokitis32 , F.Fontanelli13 , F.Formenti9, B.Franek37,
P.Frenkiel8 , D.C.Fries17, A.G.Frodesen4, R.Fruhwirth50, F.Fulda-Quenzer19 , H.Furstenau9, J.Fuster49,
A.Galloni22 , D.Gamba45, M.Gandelman6 , C.Garcia49, J.Garcia41, C.Gaspar9, U.Gasparini36 , Ph.Gavillet9 ,
E.N.Gazis32, D.Gele10, J-P.Gerber10, M.Gibbs22 , D.Gillespie9 , R.Gokieli51 , B.Golob43 , G.Gopal37 , L.Gorn1,
M.Gorski51 , Yu.Gouz42, V.Gracco13, E.Graziani40 , G.Grosdidier19 , P.Gunnarsson44 , M.Gunther48 , J.Guy37,
U.Haedinger17 , F.Hahn52, M.Hahn17, S.Hahn52, Z.Hajduk18, A.Hallgren48 , K.Hamacher52, W.Hao31,
F.J.Harris35, V.Hedberg24, R.Henriques21 , J.J.Hernandez49, P.Herquet2, H.Herr9, T.L.Hessing9, E.Higon49 ,
H.J.Hilke9, T.S.Hill1, S-O.Holmgren44, P.J.Holt35, D.Holthuizen31 , M.Houlden22 , J.Hrubec50, K.Huet2,
K.Hultqvist44 , P.Ioannou3 , J.N.Jackson22, R.Jacobsson44, P.Jalocha18, R.Janik7, G.Jarlskog24 , P.Jarry39,
B.Jean-Marie19 , E.K.Johansson44 , L.Jonsson24, P.Jonsson24, C.Joram9, P.Juillot10 , M.Kaiser17, G.Kalmus37 ,
F.Kapusta23, M.Karlsson44 , E.Karvelas11 , S.Katsanevas3, E.C.Katsou�s32, R.Keranen15, B.A.Khomenko16,
N.N.Khovanski16, B.King22, N.J.Kjaer29, H.Klein9, A.Klovning4 , P.Kluit31 , J.H.Koehne17, B.Koene31,
P.Kokkinias11 , M.Koratzinos9 , K.Korcyl18, V.Kostioukhine42 , C.Kourkoumelis3 , O.Kouznetsov13 ,
P.-H.Kramer52, M.Krammer50, C.Kreuter17, J.Krolikowski51 , I.Kronkvist24 , Z.Krumstein16 , W.Krupinski18 ,
P.Kubinec7 , W.Kucewicz18 , K.Kurvinen15 , C.Lacasta49, I.Laktineh25 , S.Lamblot23, J.W.Lamsa1, L.Lanceri46 ,
D.W.Lane1, P.Langefeld52 , V.Lapin42 , I.Last22, J-P.Laugier39, R.Lauhakangas15 , G.Leder50, F.Ledroit14 ,
V.Lefebure2, C.K.Legan1, R.Leitner30 , Y.Lemoigne39, J.Lemonne2, G.Lenzen52, V.Lepeltier19 , T.Lesiak36 ,
D.Liko50 , R.Lindner52 , A.Lipniacka19 , I.Lippi36 , B.Loerstad24, M.Lokajicek12 , J.G.Loken35, J.M.Lopez41,
A.Lopez-Fernandez9 , M.A.Lopez Aguera41, D.Loukas11, P.Lutz39, L.Lyons35, J.MacNaughton50, G.Maehlum17 ,
A.Maio21, V.Malychev16 , F.Mandl50 , J.Marco41, B.Marechal47 , M.Margoni36 , J-C.Marin9, C.Mariotti40 ,
A.Markou11, T.Maron52, C.Martinez-Rivero41 , F.Martinez-Vidal49 , S.Marti i Garcia49 , F.Matorras41,
C.Matteuzzi28, G.Matthiae38 , M.Mazzucato36, M.Mc Cubbin9 , R.Mc Kay1, R.Mc Nulty22, J.Medbo48,
C.Meroni28, W.T.Meyer1, M.Michelotto36 , E.Migliore45 , L.Mirabito25 , W.A.Mitaro�50 , U.Mjoernmark24,
T.Moa44, R.Moeller29 , K.Moenig9 , M.R.Monge13, P.Morettini13 , H.Mueller17 , L.M.Mundim6 , W.J.Murray37,
B.Muryn18 , G.Myatt35, F.Naraghi14 , F.L.Navarria5, S.Navas49, P.Negri28, S.Nemecek12, W.Neumann52 ,
N.Neumeister50, R.Nicolaidou3 , B.S.Nielsen29 , M.Nieuwenhuizen31 , V.Nikolaenko10 , P.Niss44, A.Nomerotski36 ,
A.Normand35, W.Oberschulte-Beckmann17 , V.Obraztsov42, A.G.Olshevski16 , A.Onofre21, R.Orava15,
K.Osterberg15, A.Ouraou39, P.Paganini19 , M.Paganoni28 , P.Pages10, H.Palka18, Th.D.Papadopoulou32 ,
L.Pape9, C.Parkes35, F.Parodi13, A.Passeri40 , M.Pegoraro36, L.Peralta21 , H.Pernegger50, M.Pernicka50 ,
A.Perrotta5, C.Petridou46, A.Petrolini13 , H.T.Phillips37 , G.Piana13 , F.Pierre39 , M.Pimenta21 , S.Plaszczynski19 ,
O.Podobrin17 , M.E.Pol6, G.Polok18, P.Poropat46, V.Pozdniakov16 , M.Prest46, P.Privitera38 , N.Pukhaeva16 ,
A.Pullia28 , D.Radojicic35 , S.Ragazzi28 , H.Rahmani32 , J.Rames12, P.N.Rato�20, A.L.Read33, M.Reale52 ,
P.Rebecchi19 , N.G.Redaelli28 , M.Regler50 , D.Reid9 , P.B.Renton35, L.K.Resvanis3 , F.Richard19 , J.Richardson22 ,
J.Ridky12 , G.Rinaudo45 , I.Ripp39, A.Romero45, I.Roncagliolo13 , P.Ronchese36 , L.Roos14, E.I.Rosenberg1 ,
E.Rosso9, P.Roudeau19 , T.Rovelli5 , W.Ruckstuhl31 , V.Ruhlmann-Kleider39 , A.Ruiz41 , H.Saarikko15 ,
Y.Sacquin39 , A.Sadovsky16 , G.Sajot14, J.Salt49, J.Sanchez26, M.Sannino13 , H.Schneider17 , M.A.E.Schyns52,
G.Sciolla45 , F.Scuri46 , Y.Sedykh16 , A.M.Segar35, A.Seitz17, R.Sekulin37 , R.C.Shellard6 , I.Siccama31 ,
P.Siegrist39 , S.Simonetti39 , F.Simonetto36 , A.N.Sisakian16 , B.Sitar7, T.B.Skaali33 , G.Smadja25, N.Smirnov42 ,
O.Smirnova16 , G.R.Smith37 , R.Sosnowski51 , D.Souza-Santos6 , T.Spassov21 , E.Spiriti40 , S.Squarcia13 ,
H.Staeck52, C.Stanescu40, S.Stapnes33 , I.Stavitski36 , K.Stepaniak51 , F.Stichelbaut9 , A.Stocchi19 , R.Strub10 ,
B.Stugu4, M.Szczekowski51 , M.Szeptycka51 , T.Tabarelli28 , J.P.Tavernet23, O.Tchikilev42 , A.Tilquin27 ,
J.Timmermans31, L.G.Tkatchev16, T.Todorov10, D.Z.Toet31, A.Tomaradze2, B.Tome21, L.Tortora40,
iii
G.Transtromer24, D.Treille9 , W.Trischuk9 , G.Tristram8, A.Trombini19, C.Troncon28, A.Tsirou9, M-L.Turluer39,
I.A.Tyapkin16, M.Tyndel37 , S.Tzamarias22 , B.Ueberschaer52, S.Ueberschaer52, O.Ullaland9 , V.Uvarov42,
G.Valenti5, E.Vallazza9, G.W.Van Apeldoorn31 , P.Van Dam31, W.K.Van Doninck2 , J.Van Eldik31 ,
N.Vassilopoulos35 , G.Vegni28, L.Ventura36, W.Venus37, F.Verbeure2, M.Verlato36, L.S.Vertogradov16,
D.Vilanova39 , P.Vincent25 , L.Vitale46, E.Vlasov42, A.S.Vodopyanov16 , V.Vrba12, H.Wahlen52 , C.Walck44 ,
F.Waldner46 , A.Wehr52, M.Weierstall52 , P.Weilhammer9 , A.M.Wetherell9, D.Wicke52 , J.H.Wickens2,
M.Wielers17 , G.R.Wilkinson35 , W.S.C.Williams35 , M.Winter10 , M.Witek9, K.Woschnagg48 , K.Yip35,
O.Yushchenko42 , F.Zach25, C.Zacharatou24, A.Zaitsev42 , A.Zalewska18 , P.Zalewski51 , D.Zavrtanik43 ,
E.Zevgolatakos11 , V.Zhigunov42 , N.I.Zimin16, M.Zito39, D.Zontar43 , R.Zuberi35 , G.C.Zucchelli44 , G.Zumerle36
1Ames Laboratory and Department of Physics, Iowa State University, Ames IA 50011, USA2Physics Department, Univ. Instelling Antwerpen, Universiteitsplein 1, B-2610 Wilrijk, Belgiumand IIHE, ULB-VUB, Pleinlaan 2, B-1050 Brussels, Belgiumand Facult�e des Sciences, Univ. de l'Etat Mons, Av. Maistriau 19, B-7000 Mons, Belgium3Physics Laboratory, University of Athens, Solonos Str. 104, GR-10680 Athens, Greece4Department of Physics, University of Bergen, All�egaten 55, N-5007 Bergen, Norway5Dipartimento di Fisica, Universit�a di Bologna and INFN, Via Irnerio 46, I-40126 Bologna, Italy6Centro Brasileiro de Pesquisas F�isicas, rua Xavier Sigaud 150, RJ-22290 Rio de Janeiro, Braziland Depto. de F�isica, Pont. Univ. Cat�olica, C.P. 38071 RJ-22453 Rio de Janeiro, Braziland Inst. de F�isica, Univ. Estadual do Rio de Janeiro, rua S~ao Francisco Xavier 524, Rio de Janeiro, Brazil7Comenius University, Faculty of Mathematics and Physics, Mlynska Dolina, SK-84215 Bratislava, Slovakia8Coll�ege de France, Lab. de Physique Corpusculaire, IN2P3-CNRS, F-75231 Paris Cedex 05, France9CERN, CH-1211 Geneva 23, Switzerland10Centre de Recherche Nucl�eaire, IN2P3 - CNRS/ULP - BP20, F-67037 Strasbourg Cedex, France11Institute of Nuclear Physics, N.C.S.R. Demokritos, P.O. Box 60228, GR-15310 Athens, Greece12FZU, Inst. of Physics of the C.A.S. High Energy Physics Division, Na Slovance 2, 180 40, Praha 8, Czech Republic13Dipartimento di Fisica, Universit�a di Genova and INFN, Via Dodecaneso 33, I-16146 Genova, Italy14Institut des Sciences Nucl�eaires, IN2P3-CNRS, Universit�e de Grenoble 1, F-38026 Grenoble Cedex, France15Research Institute for High Energy Physics, SEFT, P.O. Box 9, FIN-00014 Helsinki, Finland16Joint Institute for Nuclear Research, Dubna, Head Post O�ce, P.O. Box 79, 101 000 Moscow, Russian Federation17Institut f�ur Experimentelle Kernphysik, Universit�at Karlsruhe, Postfach 6980, D-76128 Karlsruhe, Germany18High Energy Physics Laboratory, Institute of Nuclear Physics, Ul. Kawiory 26a, PL-30055 Krakow 30, Poland19Universit�e de Paris-Sud, Lab. de l'Acc�el�erateur Lin�eaire, IN2P3-CNRS, Bat 200, F-91405 Orsay Cedex, France20School of Physics and Materials, University of Lancaster, Lancaster LA1 4YB, UK21LIP, IST, FCUL - Av. Elias Garcia, 14-1o, P-1000 Lisboa Codex, Portugal22Department of Physics, University of Liverpool, P.O. Box 147, Liverpool L69 3BX, UK23LPNHE, IN2P3-CNRS, Universit�es Paris VI et VII, Tour 33 (RdC), 4 place Jussieu, F-75252 Paris Cedex 05, France24Department of Physics, University of Lund, S�olvegatan 14, S-22363 Lund, Sweden25Universit�e Claude Bernard de Lyon, IPNL, IN2P3-CNRS, F-69622 Villeurbanne Cedex, France26Universidad Complutense, Avda. Complutense s/n, E-28040 Madrid, Spain27Univ. d'Aix - Marseille II - CPP, IN2P3-CNRS, F-13288 Marseille Cedex 09, France28Dipartimento di Fisica, Universit�a di Milano and INFN, Via Celoria 16, I-20133 Milan, Italy29Niels Bohr Institute, Blegdamsvej 17, DK-2100 Copenhagen 0, Denmark30NC, Nuclear Centre of MFF, Charles University, Areal MFF, V Holesovickach 2, 180 00, Praha 8, Czech Republic31NIKHEF-H, Postbus 41882, NL-1009 DB Amsterdam, The Netherlands32National Technical University, Physics Department, Zografou Campus, GR-15773 Athens, Greece33Physics Department, University of Oslo, Blindern, N-1000 Oslo 3, Norway34Dpto. Fisica, Univ. Oviedo, C/P. P�erez Casas, S/N-33006 Oviedo, Spain35Department of Physics, University of Oxford, Keble Road, Oxford OX1 3RH, UK36Dipartimento di Fisica, Universit�a di Padova and INFN, Via Marzolo 8, I-35131 Padua, Italy37Rutherford Appleton Laboratory, Chilton, Didcot OX11 OQX, UK38Dipartimento di Fisica, Universit�a di Roma II and INFN, Tor Vergata, I-00173 Rome, Italy39Centre d'Etude de Saclay, DSM/DAPNIA, F-91191 Gif-sur-Yvette Cedex, France40Istituto Superiore di Sanit�a, Ist. Naz. di Fisica Nucl. (INFN), Viale Regina Elena 299, I-00161 Rome, Italy41C.E.A.F.M., C.S.I.C. - Univ. Cantabria, Avda. los Castros, S/N-39006 Santander, Spain, (CICYT-AEN93-0832)42Inst. for High Energy Physics, Serpukov P.O. Box 35, Protvino, (Moscow Region), Russian Federation43J. Stefan Institute and Department of Physics, University of Ljubljana, Jamova 39, SI-61000 Ljubljana, Slovenia44Fysikum, Stockholm University, Box 6730, S-113 85 Stockholm, Sweden45Dipartimento di Fisica Sperimentale, Universit�a di Torino and INFN, Via P. Giuria 1, I-10125 Turin, Italy46Dipartimento di Fisica, Universit�a di Trieste and INFN, Via A. Valerio 2, I-34127 Trieste, Italyand Istituto di Fisica, Universit�a di Udine, I-33100 Udine, Italy
47Univ. Federal do Rio de Janeiro, C.P. 68528 Cidade Univ., Ilha do Fund~ao BR-21945-970 Rio de Janeiro, Brazil48Department of Radiation Sciences, University of Uppsala, P.O. Box 535, S-751 21 Uppsala, Sweden49IFIC, Valencia-CSIC, and D.F.A.M.N., U. de Valencia, Avda. Dr. Moliner 50, E-46100 Burjassot (Valencia), Spain50Institut f�ur Hochenergiephysik, �Osterr. Akad. d. Wissensch., Nikolsdorfergasse 18, A-1050 Vienna, Austria51Inst. Nuclear Studies and University of Warsaw, Ul. Hoza 69, PL-00681 Warsaw, Poland52Fachbereich Physik, University of Wuppertal, Postfach 100 127, D-42097 Wuppertal 1, Germany
1
1 Introduction
This analysis is an update to the topological By lifetimes measurement, �rst performedusing the 1991 DELPHI data [1]. B hadron candidates are identi�ed as distinct displacedsecondary vertices of charged particle tracks which were reconstructed with high precisionusing the vertex detector. The charge of each B candidate is the total charge of the tracks
assigned to the secondary vertex. The excess decay length method [2] is used to extractthe lifetime.
The current analysis uses events collected from 1991 to 1993, and it therefore supplantsthe previous analysis. The method is dependent upon measuring the production point ofcharged particle tracks and relies heavily upon the silicon vertex detector.
According to the spectator model [3], the light constituent quarks are expected to playa passive role in weak decays of hadrons composed of a heavy quark and light quarks. Thismodel predicts that the lifetimes of all B hadrons are equal and are determined by thelifetime of the b quark. However, the lifetime di�erences between charmed particles clearly
indicate corrections to the spectator model. These are expected [4] to give �B+=�B0 =
1:0 + 0:05 ��
fB200MeV
�2, where fB is the meson decay constant, the value of which is
uncertain at present.A brief description of the detector can be found in section 2. Section 3 explains how
the beam position was found. Section 4 details the event selection procedure, and thevertex reconstruction and selection is in section 5. The sample obtained is shown insection 6, while section 7 describes the �t technique. The B lifetime results are presentedin section 8.
2 The Apparatus
The DELPHI detector has been described in detail elsewhere [5]. The detector wasidentical to that used in [1], and only a very brief summary is given here.
In the barrel region, charged particles were measured by a set of cylindrical trackingdetectors whose z axes are common with the electron beam and with the axis of thesolenoidal magnet which produced a 1.23 T �eld. The positive z axis was oriented alongthe electron beam direction, the radius R was then de�ned in the plane perpendicular toz, and the origin of � pointed to the centre of LEP. The � origin was also taken as the x
axis, and the y axis completed a right-handed coordinate system.The Time Projection Chamber (TPC) was the main tracking device. Charged particle
tracks were reconstructed in three dimensions for radii between 30 cm and 122 cm with upto 16 space points for polar angles between 39� and 141�. Additional measurements wereprovided by the Inner Detector, (ID), between 12 and 28 cm, and the Outer Detector,(OD), at around 200 cm.
The silicon Vertex Detector (VD) [6] had three concentric layers located at averageradii 6.3 cm, 8.8 cm and 10.9 cm, each of which could provide one or two R� coordinates
for particles with polar angle between 43� and 137�. The point precision in R� was 8 �m.yThe symbol B means charged or neutral B hadron.
2
3 Determination of the Interaction Region
The position in x and y, and the width in x of the beam interaction regionz have beenmeasured as a part of this study. This was done by forming a vertex from each hadronicevent, and then combining the vertices to measure the beam position and size.
For each event a common vertex was formed from all the tracks with hits on at least
two layers of the microvertex detector. The track which contributed the largest �2 wasremoved until no track was contributing more than 10 units. Events with at least 8 tracksremaining are depleted in heavy quark species and only these were used to measure thebeam intersection region. These events were accumulated in samples with a typical sizeof 200 events, corresponding to the cartridges written by the data acquisition system. Ineach sample the beam position and x width were �tted from the event vertices.
The �t was a likelihood �t to the position of the vertices with two terms, one forlight quark events, and the other for events which are distorted by lifetime e�ects. Thelatter component was measured by �tting the events from cartridges with more than
250 events. It was found to be reasonably described by a 16% fraction of events with aGaussian width of 270 �m. (This should be compared with an initial 22% of b quarkswith an approximately exponential decay length distribution of mean 3000 �m, and alsoa c contribution). This fraction and width was then �xed for all cartridges, as was the ysize of 20 �m. Cartridges where less than 20 events were available to �nd the beamspotwere excluded. The typical width in x was 100 { 130 �m.
The analysis was also performed using a beamspot calculated from a single �t to allthe tracks on a cartridge [7], rather than to the vertices as described here, as a crosscheck.
4 Event Reconstruction
4.1 Hadronic Event Selection
Only charged particles with a momentum above 0.1 GeV/c, a measured track lengthover 50 cm and an angle to the beam axis exceeding 25� were used in this analysis.
The sum of the energies of these charged particles in each of the forward and backward
hemispheres was required to exceed 3 GeV, and the total energy had to be more than15 GeV. At least six charged particles were required with momenta above 0.2 GeV/c.These cuts selected approximately 1,434,000 events as hadronic Z0 decays.
The quality of the (ID) data was checked by demanding that for each event at least65% of good barrel tracks with vertex detector hits also had ID hits. This removed 5%of events in the data.
After this hadronic event selection, the JADE jet clustering algorithm [8] was appliedto the charged particles using a scaled invariant mass squared cut of 0.04. This large valuereduces the chance of splitting the B decay products into two jets. For the subsequent
analysis each particle was reassigned to the closest jet in � � � space. In simulation thisdecreased the number of B tracks assigned to the wrong jet from 0.03 to 0.022. TheJADE algorithm is an iterative procedure which combines tracks at each step and cannever re-assign them, and it is therefore not a surprise that it is possible to improve the�nal track selection.
The charged particles from light hadron decays or from photon conversions can confusean attempt to �nd a B vertex. To reduce this problem all pairs of oppositely charged
zThe y width was much smaller, and its uncertainty was not a signi�cant error.
3
particles were combined to see if they were consistent with a K0s or � decay or con-
version. The selection criteria were designed for purity rather than e�ciency, to reduce
misidenti�cation of B direct decay products as coming from one of these sources. About0.17 K0
s , 0.06 � and 0.48 per event were identi�ed and the charged particles tagged ascoming from other sources and not considered further.
After the jet �nding and pair rejection, charged particles with momenta lower than0.5 GeV/c or a closest approach to the beam spot in the R� plane larger than 1 cm wereremoved. Only jets with at least three remaining charged particles were accepted. Allselected particles in the jet were required to have hits on at least two (of the three) layersof the vertex detector in order to be considered as reliably measured. Only one jet in �vemet the latter requirement. Over half the loss of jets was due to purely geometric e�ects
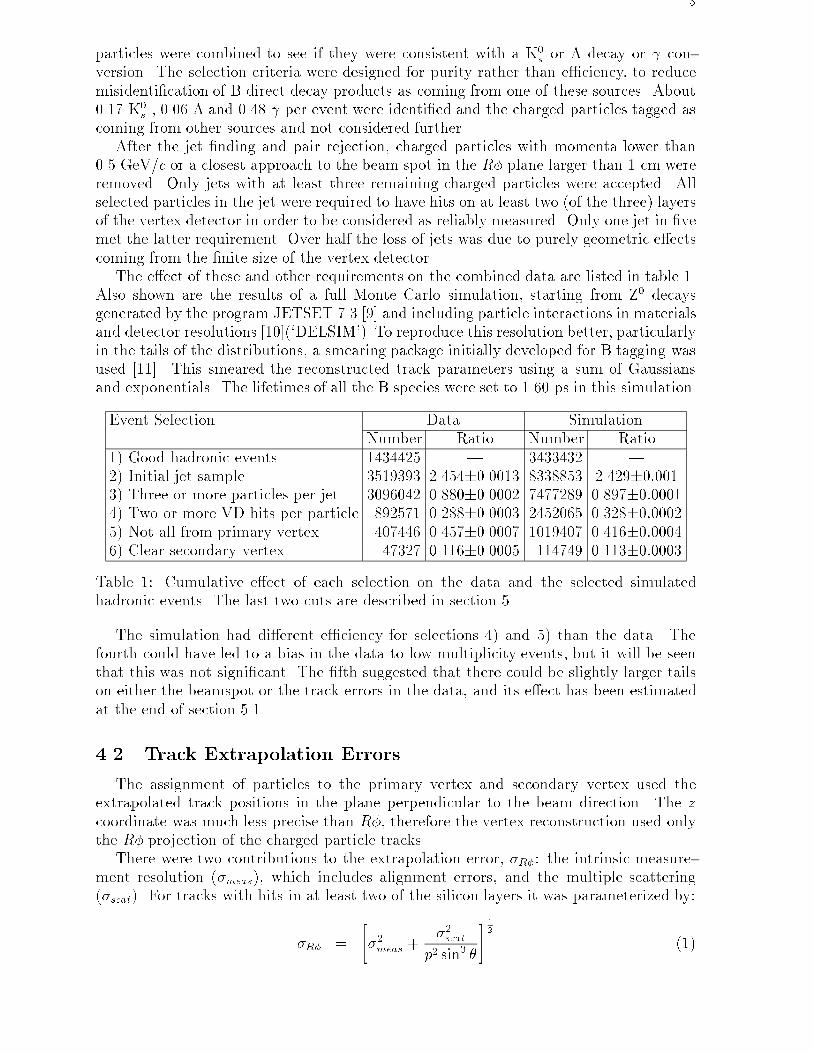
coming from the �nite size of the vertex detector.The e�ect of these and other requirements on the combined data are listed in table 1.
Also shown are the results of a full Monte Carlo simulation, starting from Z0 decaysgenerated by the program JETSET 7.3 [9] and including particle interactions in materialsand detector resolutions [10](`DELSIM'). To reproduce this resolution better, particularlyin the tails of the distributions, a smearing package initially developed for B tagging wasused [11]. This smeared the reconstructed track parameters using a sum of Gaussiansand exponentials. The lifetimes of all the B species were set to 1.60 ps in this simulation.
Event Selection Data SimulationNumber Ratio Number Ratio
1) Good hadronic events 1434425 | 3433432 |2) Initial jet sample 3519393 2.454�0.0013 8338853 2.429�0:0013) Three or more particles per jet 3096042 0.880�0.0002 7477289 0.897�0:00014) Two or more VD hits per particle 892571 0.288�0.0003 2452065 0.328�0:00025) Not all from primary vertex 407446 0.457�0.0007 1019407 0.416�0:00046) Clear secondary vertex 47327 0.116�0.0005 114749 0.113�0:0003
Table 1: Cumulative e�ect of each selection on the data and the selected simulatedhadronic events. The last two cuts are described in section 5
The simulation had di�erent e�ciency for selections 4) and 5) than the data. Thefourth could have led to a bias in the data to low multiplicity events, but it will be seenthat this was not signi�cant. The �fth suggested that there could be slightly larger tailson either the beamspot or the track errors in the data, and its e�ect has been estimated
at the end of section 5.1.
4.2 Track Extrapolation Errors
The assignment of particles to the primary vertex and secondary vertex used theextrapolated track positions in the plane perpendicular to the beam direction. The z
coordinate was much less precise than R�, therefore the vertex reconstruction used onlythe R� projection of the charged particle tracks.
There were two contributions to the extrapolation error, �R�: the intrinsic measure-ment resolution (�meas), which includes alignment errors, and the multiple scattering(�scat). For tracks with hits in at least two of the silicon layers it was parameterized by:
�R� =
"�2meas +
�2scatp2 sin3 �
# 1
2
(1)
4
where p was the particle momentum in GeV/c and � was its polar angle. Values of�meas = 30 � 3 �m and �scat = 70 � 4 �m were used; these represent an average over
di�erent classes of tracks, and are slightly larger than those in reference [6], for whichhits in all three silicon layers were required on each charged particle.
5 Vertex reconstruction
Charged particles had to be assigned to the correct vertex in order to determine thecharge of the B hadron. Each jet was examined independently. If produced by a b quarkit will in general contain several vertices: the primary interaction, b decay, c decay andperhaps s decay. However, in order to simplify the analysis, the jet was assumed tocontain only the primary vertex and a single decay vertex.
A vertex was formed from all selected particles in the jet constrained to pass throughthe measured beam spot, for which the x size was determined as described in section 3,and the y size was assumed to be 10 �m. A larger value of the y size was used in �ndingthe interaction region in order not to reject good vertices. The value used here was more
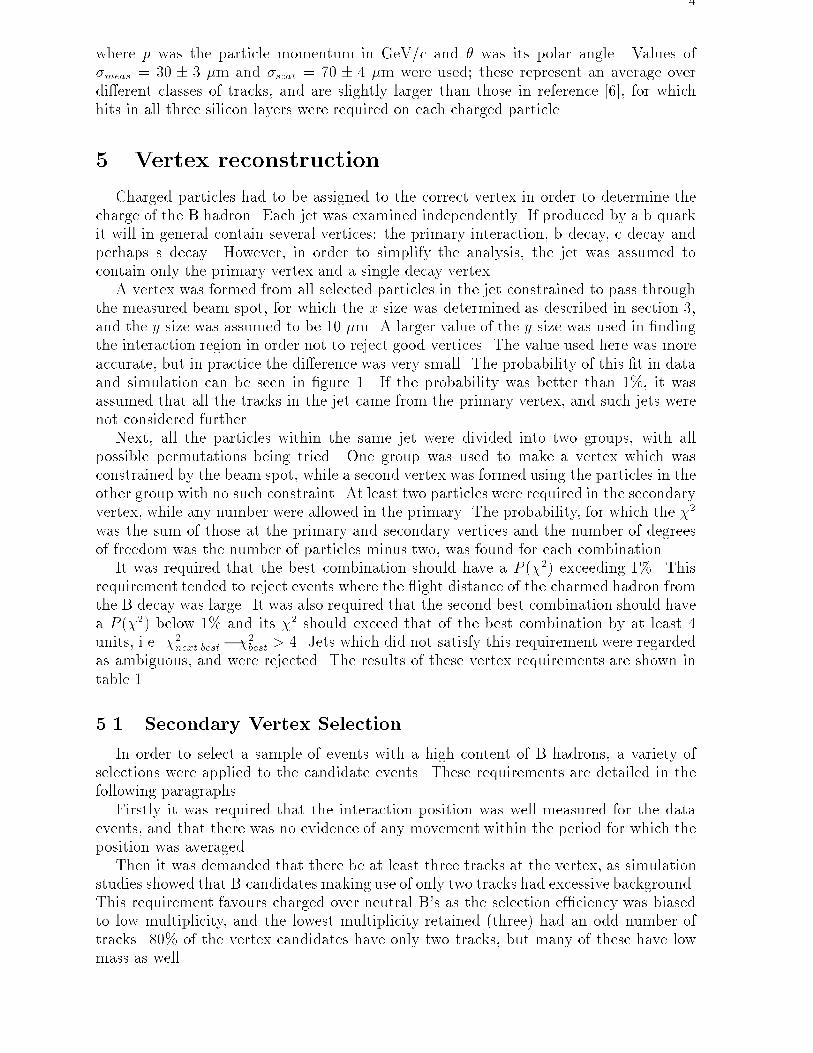
accurate, but in practice the di�erence was very small. The probability of this �t in dataand simulation can be seen in �gure 1. If the probability was better than 1%, it wasassumed that all the tracks in the jet came from the primary vertex, and such jets werenot considered further.
Next, all the particles within the same jet were divided into two groups, with allpossible permutations being tried. One group was used to make a vertex which wasconstrained by the beam spot, while a second vertex was formed using the particles in theother group with no such constraint. At least two particles were required in the secondaryvertex, while any number were allowed in the primary. The probability, for which the �2
was the sum of those at the primary and secondary vertices and the number of degreesof freedom was the number of particles minus two, was found for each combination.
It was required that the best combination should have a P (�2) exceeding 1%. Thisrequirement tended to reject events where the ight distance of the charmed hadron fromthe B decay was large. It was also required that the second best combination should havea P (�2) below 1% and its �2 should exceed that of the best combination by at least 4units, i.e. �2next best��2best > 4. Jets which did not satisfy this requirement were regardedas ambiguous, and were rejected. The results of these vertex requirements are shown in
table 1.
5.1 Secondary Vertex Selection
In order to select a sample of events with a high content of B hadrons, a variety ofselections were applied to the candidate events. These requirements are detailed in thefollowing paragraphs.
Firstly it was required that the interaction position was well measured for the dataevents, and that there was no evidence of any movement within the period for which theposition was averaged.
Then it was demanded that there be at least three tracks at the vertex, as simulationstudies showed that B candidates making use of only two tracks had excessive background.This requirement favours charged over neutral B's as the selection e�ciency was biasedto low multiplicity, and the lowest multiplicity retained (three) had an odd number oftracks. 80% of the vertex candidates have only two tracks, but many of these have lowmass as well.
5
10 4
10 5
10 6
0 0.1 0.2 0.3 0.4 0.5 0.6 0.7 0.8 0.9 1
Num
ber
of je
tsData
Simulation
a)
10 3
10 4
10 5
0 0.1 0.2 0.3 0.4 0.5 0.6 0.7 0.8 0.9 1
DataSimulation
DataSimulation
b)
No cuts P(χ2) > 1%, δ(χ2) > 4
Figure 1: The upper plot shows the P (�2) distributions for one vertex formed from allthe charged particle tracks and the beam spot in data and simulation. The lower plot
shows the P (�2) of the best vertex as described in section 5, both before (�) and after(2) demanding that it be distinct from the next best.
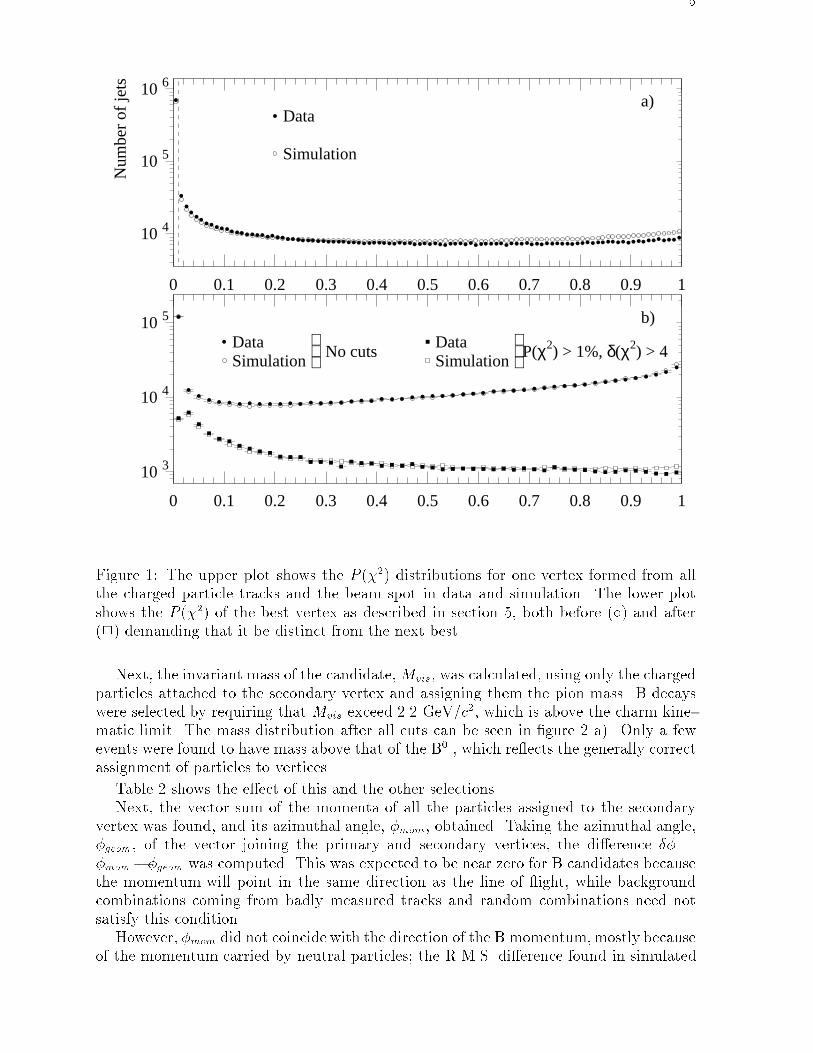
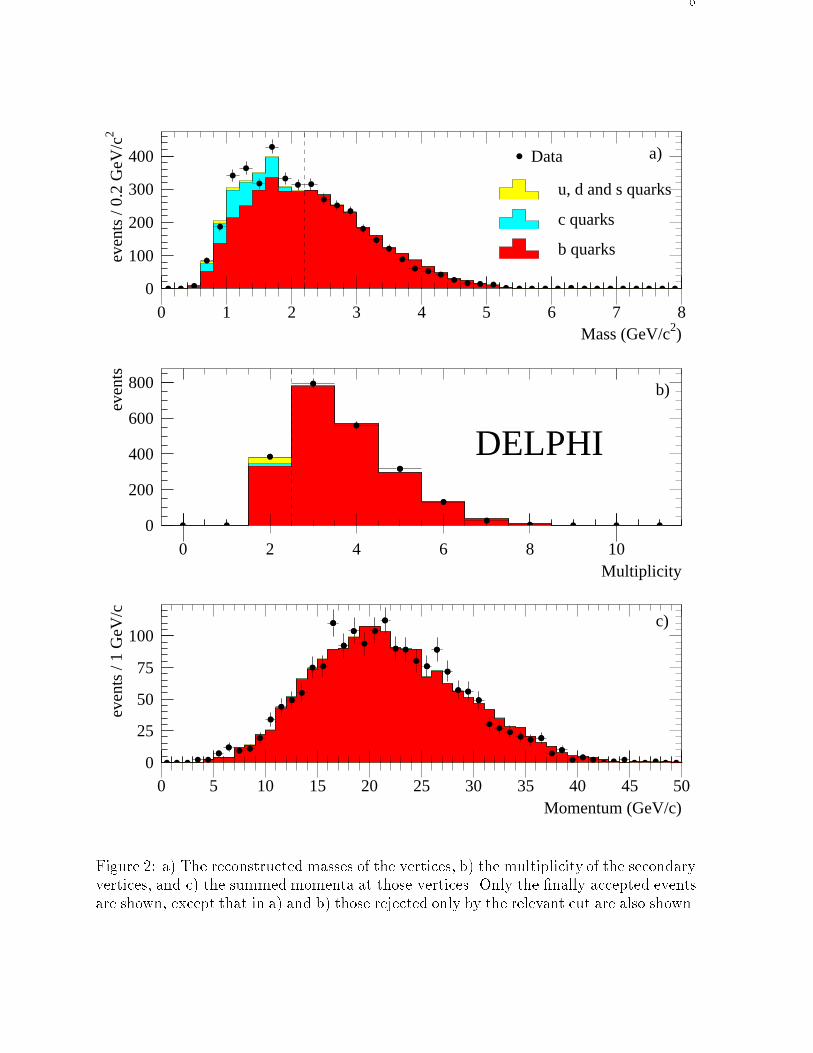
Next, the invariant mass of the candidate,Mvis, was calculated, using only the chargedparticles attached to the secondary vertex and assigning them the pion mass. B decayswere selected by requiring that Mvis exceed 2.2 GeV/c2, which is above the charm kine-matic limit. The mass distribution after all cuts can be seen in �gure 2 a). Only a fewevents were found to have mass above that of the B0 , which re ects the generally correctassignment of particles to vertices.
Table 2 shows the e�ect of this and the other selections.Next, the vector sum of the momenta of all the particles assigned to the secondary
vertex was found, and its azimuthal angle, �mom, obtained. Taking the azimuthal angle,�geom, of the vector joining the primary and secondary vertices, the di�erence �� =
�mom��geom was computed. This was expected to be near zero for B candidates becausethe momentum will point in the same direction as the line of ight, while backgroundcombinations coming from badly measured tracks and random combinations need notsatisfy this condition.
However, �mom did not coincide with the direction of the B momentum,mostly becauseof the momentum carried by neutral particles; the R.M.S. di�erence found in simulated
6
0
100
200
300
400
0 1 2 3 4 5 6 7 8Mass (GeV/c2)
even
ts /
0.2
GeV
/c2
Data
u, d and s quarks
c quarks
b quarks
a)
0
200
400
600
800
0 2 4 6 8 10Multiplicity
even
ts
b)
DELPHI
0
25
50
75
100
0 5 10 15 20 25 30 35 40 45 50Momentum (GeV/c)
even
ts /
1 G
eV/c
c)
Figure 2: a) The reconstructed masses of the vertices, b) the multiplicity of the secondaryvertices, and c) the summed momenta at those vertices. Only the �nally accepted eventsare shown, except that in a) and b) those rejected only by the relevant cut are also shown.
7
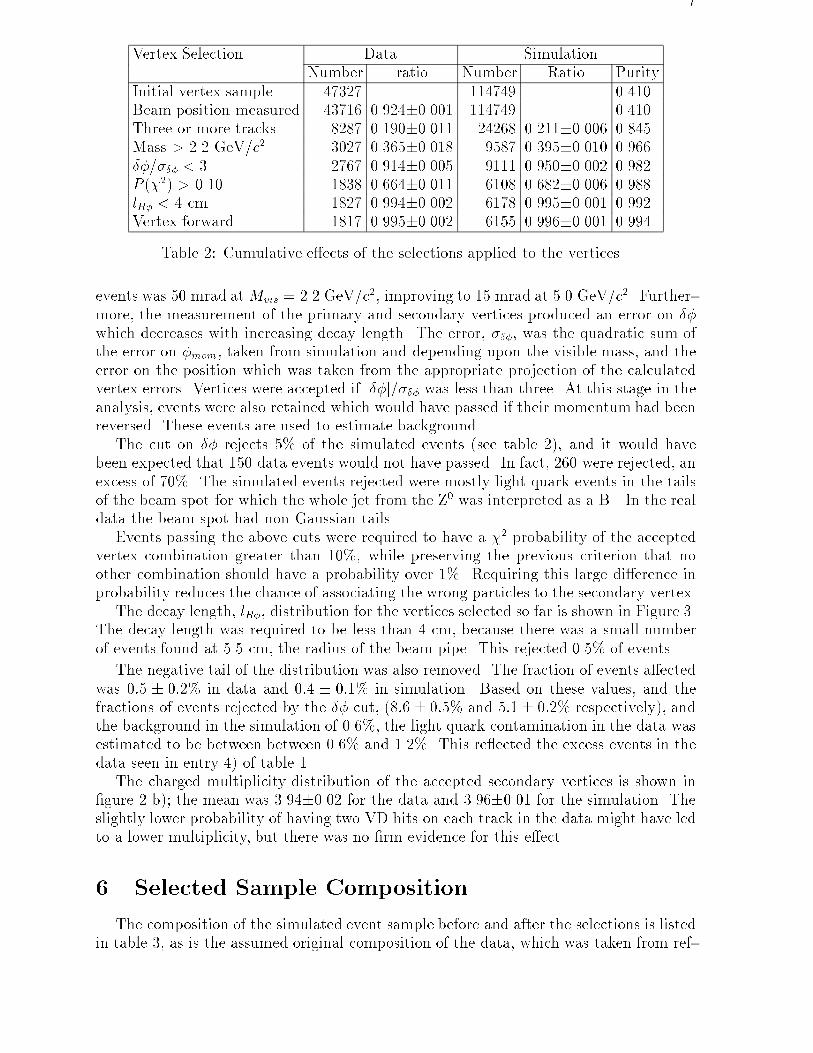
Vertex Selection Data SimulationNumber ratio Number Ratio Purity
Initial vertex sample 47327 | 114749 | 0.410Beam position measured 43716 0.924�0.001 114749 | 0.410Three or more tracks 8287 0.190�0.011 24268 0.211�0.006 0.845Mass > 2.2 GeV/c2 3027 0.365�0.018 9587 0.395�0.010 0.966
��=��� < 3 2767 0.914�0.005 9111 0.950�0.002 0.982P (�2) > 0.10 1838 0.664�0.011 6108 0.682�0.006 0.988lR� < 4 cm 1827 0.994�0.002 6178 0.995�0.001 0.992Vertex forward 1817 0.995�0.002 6155 0.996�0.001 0.994
Table 2: Cumulative e�ects of the selections applied to the vertices.
events was 50 mrad at Mvis = 2.2 GeV/c2, improving to 15 mrad at 5.0 GeV/c2. Further-
more, the measurement of the primary and secondary vertices produced an error on ��
which decreases with increasing decay length. The error, ���, was the quadratic sum ofthe error on �mom, taken from simulation and depending upon the visible mass, and theerror on the position which was taken from the appropriate projection of the calculatedvertex errors. Vertices were accepted if j��j=��� was less than three. At this stage in theanalysis, events were also retained which would have passed if their momentum had beenreversed. These events are used to estimate background.
The cut on �� rejects 5% of the simulated events (see table 2), and it would havebeen expected that 150 data events would not have passed. In fact, 260 were rejected, an
excess of 70%. The simulated events rejected were mostly light quark events in the tailsof the beam spot for which the whole jet from the Z0 was interpreted as a B . In the realdata the beam spot had non Gaussian tails.
Events passing the above cuts were required to have a �2 probability of the acceptedvertex combination greater than 10%, while preserving the previous criterion that noother combination should have a probability over 1%. Requiring this large di�erence inprobability reduces the chance of associating the wrong particles to the secondary vertex.
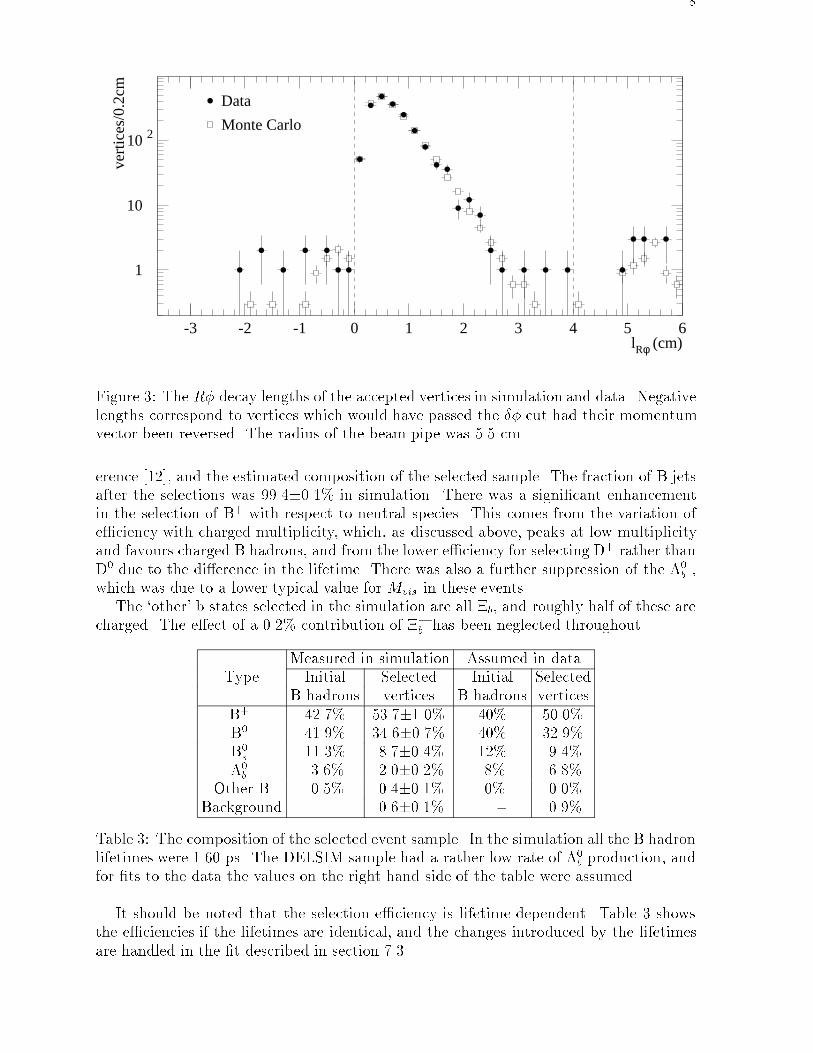
The decay length, lR�, distribution for the vertices selected so far is shown in Figure 3.The decay length was required to be less than 4 cm, because there was a small number
of events found at 5.5 cm, the radius of the beam pipe. This rejected 0.5% of events.
The negative tail of the distribution was also removed. The fraction of events a�ected
was 0:5 � 0:2% in data and 0:4 � 0:1% in simulation. Based on these values, and thefractions of events rejected by the �� cut, (8:6 � 0:5% and 5:1� 0:2% respectively), andthe background in the simulation of 0.6%, the light quark contamination in the data wasestimated to be between between 0.6% and 1.2%. This re ected the excess events in thedata seen in entry 4) of table 1.
The charged multiplicity distribution of the accepted secondary vertices is shown in�gure 2 b); the mean was 3.94�0.02 for the data and 3.96�0.01 for the simulation. Theslightly lower probability of having two VD hits on each track in the data might have ledto a lower multiplicity, but there was no �rm evidence for this e�ect.
6 Selected Sample Composition
The composition of the simulated event sample before and after the selections is listedin table 3, as is the assumed original composition of the data, which was taken from ref-
8
1
10
10 2
-3 -2 -1 0 1 2 3 4 5 6lRφ (cm)
vert
ices
/0.2
cmData
Monte Carlo
Figure 3: The R� decay lengths of the accepted vertices in simulation and data. Negativelengths correspond to vertices which would have passed the �� cut had their momentumvector been reversed. The radius of the beam pipe was 5.5 cm
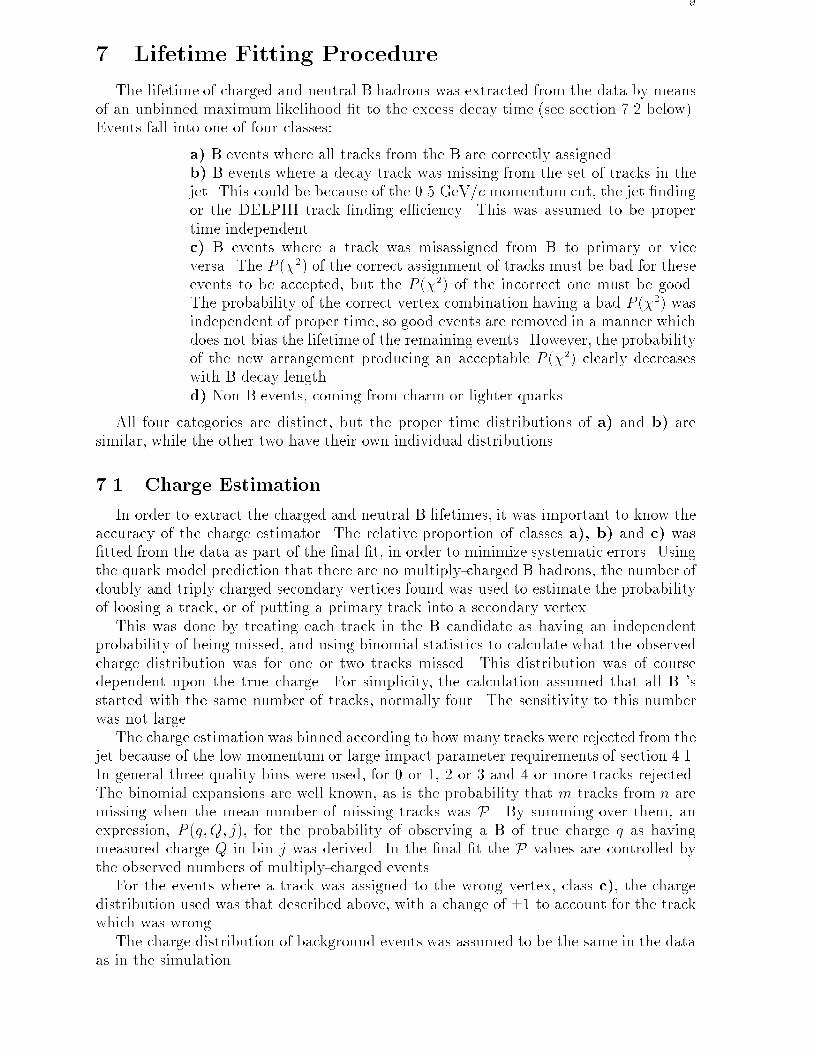
erence [12], and the estimated composition of the selected sample. The fraction of B jetsafter the selections was 99.4�0.1% in simulation. There was a signi�cant enhancementin the selection of B+ with respect to neutral species. This comes from the variation ofe�ciency with charged multiplicity, which, as discussed above, peaks at low multiplicityand favours charged B hadrons, and from the lower e�ciency for selecting D+ rather than
D0 due to the di�erence in the lifetime. There was also a further suppression of the �0b ,
which was due to a lower typical value for Mvis in these events.The `other' b states selected in the simulation are all �b, and roughly half of these are
charged. The e�ect of a 0.2% contribution of ��
b has been neglected throughout.
Measured in simulation Assumed in dataType Initial Selected Initial Selected
B hadrons vertices B hadrons vertices
B+ 42.7% 53.7�1.0% 40% 50.0%B0 41.9% 34.6�0.7% 40% 32.9%B0s 11.3% 8.7�0.4% 12% 9.4%
�0b 3.6% 2.0�0.2% 8% 6.8%
Other B 0.5% 0.4�0.1% 0% 0.0%Background || 0.6�0.1% |- 0.9%
Table 3: The composition of the selected event sample. In the simulation all the B hadronlifetimes were 1.60 ps. The DELSIM sample had a rather low rate of �0
b production, andfor �ts to the data the values on the right hand side of the table were assumed.
It should be noted that the selection e�ciency is lifetime dependent. Table 3 showsthe e�ciencies if the lifetimes are identical, and the changes introduced by the lifetimes
are handled in the �t described in section 7.3.
9
7 Lifetime Fitting Procedure
The lifetime of charged and neutral B hadrons was extracted from the data by meansof an unbinned maximum likelihood �t to the excess decay time (see section 7.2 below).Events fall into one of four classes:
a) B events where all tracks from the B are correctly assigned.b) B events where a decay track was missing from the set of tracks in thejet. This could be because of the 0.5 GeV/c momentum cut, the jet �ndingor the DELPHI track �nding e�ciency. This was assumed to be proper
time independent.c) B events where a track was misassigned from B to primary or viceversa. The P (�2) of the correct assignment of tracks must be bad for theseevents to be accepted, but the P (�2) of the incorrect one must be good.The probability of the correct vertex combination having a bad P (�2) wasindependent of proper time, so good events are removed in a manner whichdoes not bias the lifetime of the remaining events. However, the probabilityof the new arrangement producing an acceptable P (�2) clearly decreaseswith B decay length.
d) Non B events, coming from charm or lighter quarks.
All four categories are distinct, but the proper time distributions of a) and b) aresimilar, while the other two have their own individual distributions.
7.1 Charge Estimation
In order to extract the charged and neutral B lifetimes, it was important to know theaccuracy of the charge estimator. The relative proportion of classes a), b) and c) was�tted from the data as part of the �nal �t, in order to minimize systematic errors. Usingthe quark model prediction that there are no multiply-charged B hadrons, the number ofdoubly and triply charged secondary vertices found was used to estimate the probabilityof loosing a track, or of putting a primary track into a secondary vertex.
This was done by treating each track in the B candidate as having an independentprobability of being missed, and using binomial statistics to calculate what the observedcharge distribution was for one or two tracks missed. This distribution was of coursedependent upon the true charge. For simplicity, the calculation assumed that all B 'sstarted with the same number of tracks, normally four. The sensitivity to this numberwas not large.
The charge estimation was binned according to how many tracks were rejected from thejet because of the low momentum or large impact parameter requirements of section 4.1.
In general three quality bins were used, for 0 or 1, 2 or 3 and 4 or more tracks rejected.The binomial expansions are well known, as is the probability that m tracks from n aremissing when the mean number of missing tracks was P. By summing over them, anexpression, P (q;Q; j), for the probability of observing a B of true charge q as havingmeasured charge Q in bin j was derived. In the �nal �t the P values are controlled bythe observed numbers of multiply-charged events.
For the events where a track was assigned to the wrong vertex, class c), the chargedistribution used was that described above, with a change of �1 to account for the trackwhich was wrong.
The charge distribution of background events was assumed to be the same in the dataas in the simulation.
10
1
10
10 2
10 3
-4 -2 0 2 4
a)
Measured B+ charge
even
ts /
unit
char
ge
1
10
10 2
10 3
-4 -2 0 2 4
b)
Measured B0 charge
1
10
10 2
10 3
-4 -2 0 2 4
c)
DataMonte Carlo
Measured charge
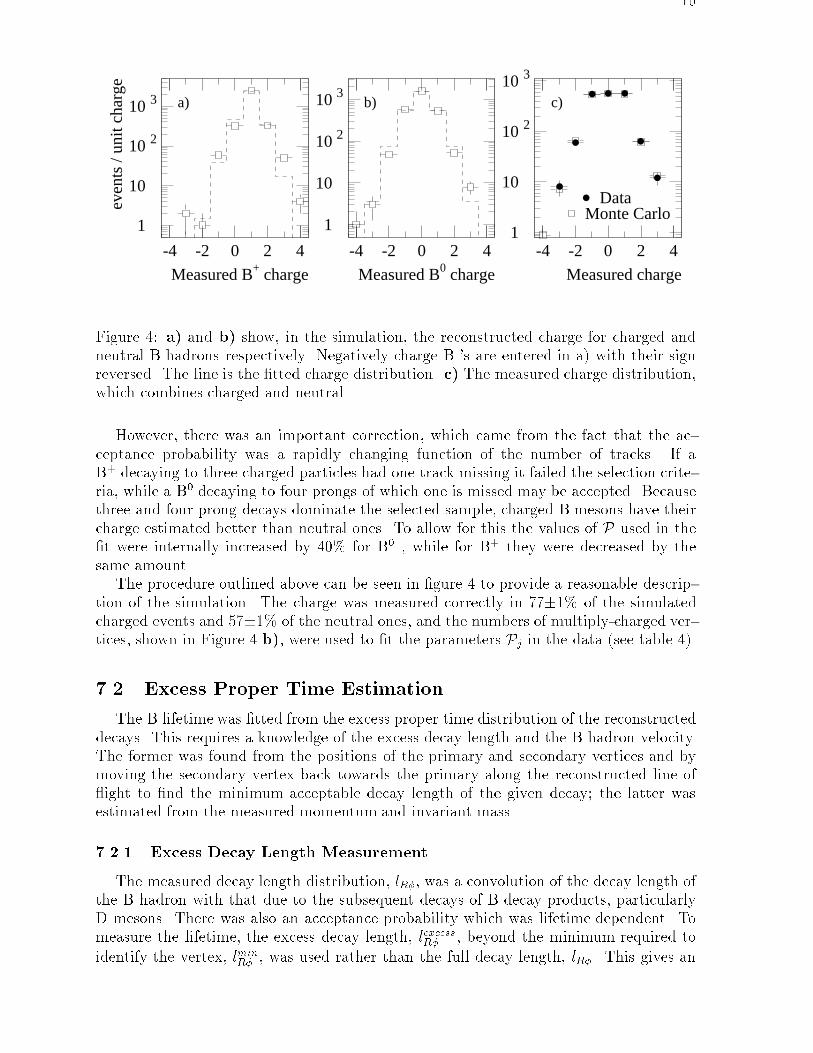
Figure 4: a) and b) show, in the simulation, the reconstructed charge for charged andneutral B hadrons respectively. Negatively charge B 's are entered in a) with their signreversed. The line is the �tted charge distribution. c) The measured charge distribution,which combines charged and neutral.
However, there was an important correction, which came from the fact that the ac-
ceptance probability was a rapidly changing function of the number of tracks. If aB+ decaying to three charged particles had one track missing it failed the selection crite-ria, while a B0 decaying to four prongs of which one is missed may be accepted. Becausethree and four prong decays dominate the selected sample, charged B mesons have theircharge estimated better than neutral ones. To allow for this the values of P used in the�t were internally increased by 40% for B0 , while for B+ they were decreased by thesame amount.
The procedure outlined above can be seen in �gure 4 to provide a reasonable descrip-
tion of the simulation. The charge was measured correctly in 77�1% of the simulatedcharged events and 57�1% of the neutral ones, and the numbers of multiply-charged ver-tices, shown in Figure 4 b), were used to �t the parameters Pj in the data (see table 4).
7.2 Excess Proper Time Estimation
The B lifetime was �tted from the excess proper time distribution of the reconstructed
decays. This requires a knowledge of the excess decay length and the B hadron velocity.The former was found from the positions of the primary and secondary vertices and bymoving the secondary vertex back towards the primary along the reconstructed line of ight to �nd the minimum acceptable decay length of the given decay; the latter wasestimated from the measured momentum and invariant mass.
7.2.1 Excess Decay Length Measurement
The measured decay length distribution, lR�, was a convolution of the decay length ofthe B hadron with that due to the subsequent decays of B decay products, particularlyD mesons. There was also an acceptance probability which was lifetime dependent. Tomeasure the lifetime, the excess decay length, lexcessR� , beyond the minimum required to
identify the vertex, lminR� , was used rather than the full decay length, lR�. This gives an
11
1
10
10 2
0 0.25 0.5 0.75 1 1.25 1.5 1.75 2 2.25 2.5lRφ (cm)
vert
ices
/0.2
cmData
Monte Carlo
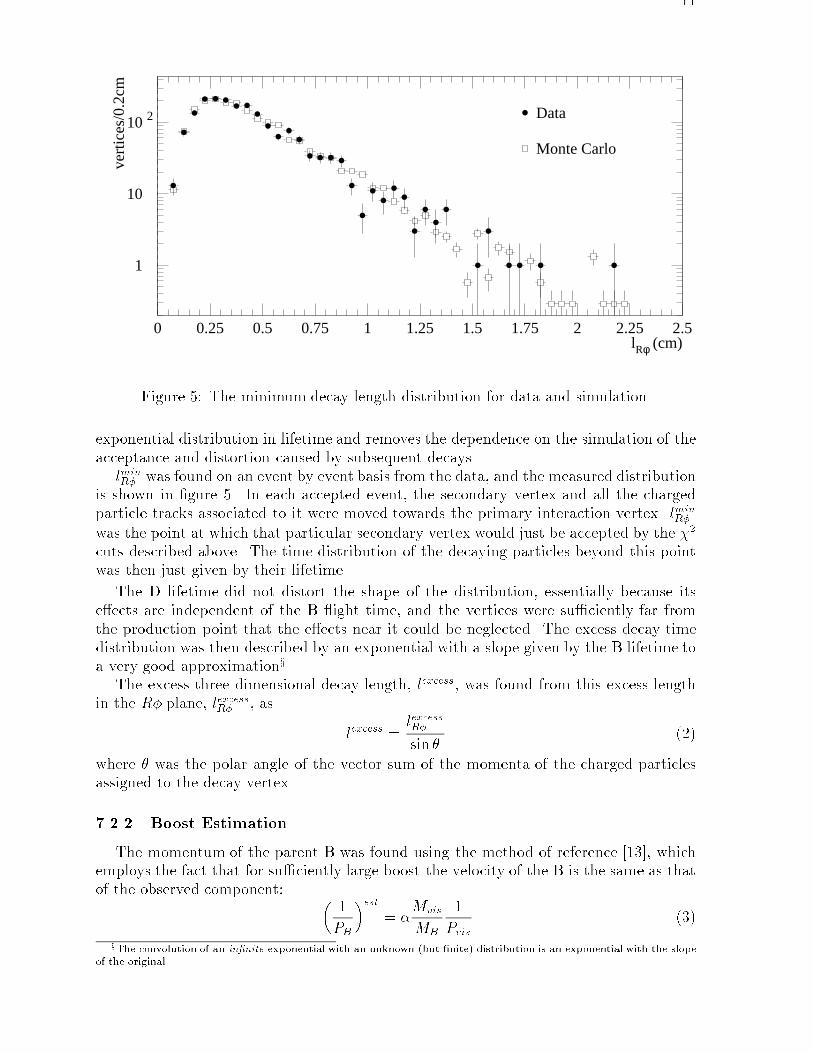
Figure 5: The minimum decay length distribution for data and simulation.
exponential distribution in lifetime and removes the dependence on the simulation of the
acceptance and distortion caused by subsequent decays.lminR� was found on an event by event basis from the data, and the measured distribution
is shown in �gure 5. In each accepted event, the secondary vertex and all the chargedparticle tracks associated to it were moved towards the primary interaction vertex. lmin
R�
was the point at which that particular secondary vertex would just be accepted by the �2
cuts described above. The time distribution of the decaying particles beyond this pointwas then just given by their lifetime.
The D lifetime did not distort the shape of the distribution, essentially because itse�ects are independent of the B ight time, and the vertices were su�ciently far from
the production point that the e�ects near it could be neglected. The excess decay timedistribution was then described by an exponential with a slope given by the B lifetime toa very good approximationx.
The excess three dimensional decay length, lexcess, was found from this excess lengthin the R� plane, lexcessR� , as
lexcess =lexcessR�
sin �(2)
where � was the polar angle of the vector sum of the momenta of the charged particlesassigned to the decay vertex.
7.2.2 Boost Estimation
The momentum of the parent B was found using the method of reference [13], whichemploys the fact that for su�ciently large boost the velocity of the B is the same as thatof the observed component: �
1
PB
�est= �
Mvis
MB
1
Pvis
(3)
xThe convolution of an in�nite exponential with an unknown (but �nite) distribution is an exponential with the slope
of the original.
12
where�
1PB
�estis the estimate of the inverse of the B momentum,MB is the true B hadron
mass, Mvis is the e�ective visible mass, assuming that all the particles are pions, Pvis isthe sum of the momenta of the particles at the secondary vertex and � is a correctionfactor of order one. Substituting this into the equation for the excess proper time gives:
texcess = MB lexcess�1
PB
�est= �
Mvislexcess
Pvis
(4)
The value of � used was (0:871 + 0:0331 �Mvis � 0:00266 �Mvis2)�1, where Mvis is
measured in GeV/c2. This varies from 1.08 to 1.03 in the mass range used. It deviatedfrom one because of the exclusion of charged particles of momentum less than 0.5 GeV/c,the fact that Mvis was calculated assuming that all the particles were pions when it wasvery likely that at least one was a kaon, and because of the missing transverse momentumwhich biased the estimator for low momentum. This parameterization and its coe�cients
were derived from the full simulation, and depended weakly upon the B decay schemeassumed there. The largest error is due to the uncertainty in the B! K+X branchingratio, which contributes approximately 0.004 to the uncertainty in �.
This estimate of the boost of the B had an error of 22% in the simulation, whichincreased the spread of the proper time distribution by a factor of
p1:0 + 0:222 = 1:02.
The value of � was compatible within statistical errors (which were less than 1%) for B0 ,B+ and B0
s , but was 10�2% larger for B baryons in the simulation used. This came fromthe assumption of the pion mass for any protons, which reduced the measured Mvis. No
correction was made for this e�ect; it is in any case comparable with the error on the Bbaryon lifetime.
The `raw' mean momentum of the candidate B's, shown in �gure 2 c), was21.3�0.2 GeV/c in the data and 21.6�0.1 GeV/c in the simulation. The calculatedmean momentum, using equation 3 and assuming that the mass of each B hadron is5.28 GeV/c2, was found to be 35.7�0.2 GeV/c for the data and 35.6�0.1 GeV/c for thesimulation.
7.3 The Fit Method
A maximum likelihood �t was made to the excess proper times of the events. Thisincluded a binned estimation of the probability of reconstructing the charge wrongly,using the number of doubly and triply charged secondary vertices observed in each bin as
described in section 7.1. The likelihood of event i to have observed charge Qi and excessproper time texcessi was taken to be:
Li =X�
P (q�; Qi; ji)C�e�texcessi =�� (5)
where the sum runs over the B hadron species considered in the �t, the background,and the excess events accepted at short decay length (class c) of section 7, denoted`confused'. The two �ts considered later allow the species to be (i) the charged andneutral B hadrons, and (ii) the four most common species (B+, B0, B0
s, �0b) at LEP.
P (q�; Qi; ji) is the probability that a B hadron of charge q� will be reconstructed ashaving charge Qi if the quality bin is ji, C� is the normalization constant for species �,and �� is the mean lifetime typical of species �.
While only the B lifetime distributions are expected to be exponential, the other two
contributions are both small, and an approximate description is adequate. Therefore anexponential distribution is used for each.
13
P (q� ; Qi; i) has been described in section 7.1. It depended on the vector of parametersPi, which were allowed to vary in the �t.
The normalization constants C� are given as:
C� =F�
�� [1 � e�tmax=�� ]
(6)
where the F� are the relative fractions of the various B species and the background in theselected sample, and tmax is the maximum allowed excess proper time of the events used
in the �t and was set to 12 ps to be within the 4 cm decay length cut. The fractions ofthe selected sample, F�, are related to the fractions f� which would have been observedif the lifetimes had been equal:
F� =1
N�Xi
f�e�tmin
i=��P
� f�e�tmin
i=��
(7)
where N is the number of selected events and tmini is the proper time of the minimum
decay distance at which event i would have been observed. The fractions f� are notthe same as the initial fractions of the various B species because of the di�erent selectione�ciencies for the di�erent decay topologies, but are the selected fractions given in table 3.
8 B Lifetime Results
8.1 Fit to B hadron Lifetimes
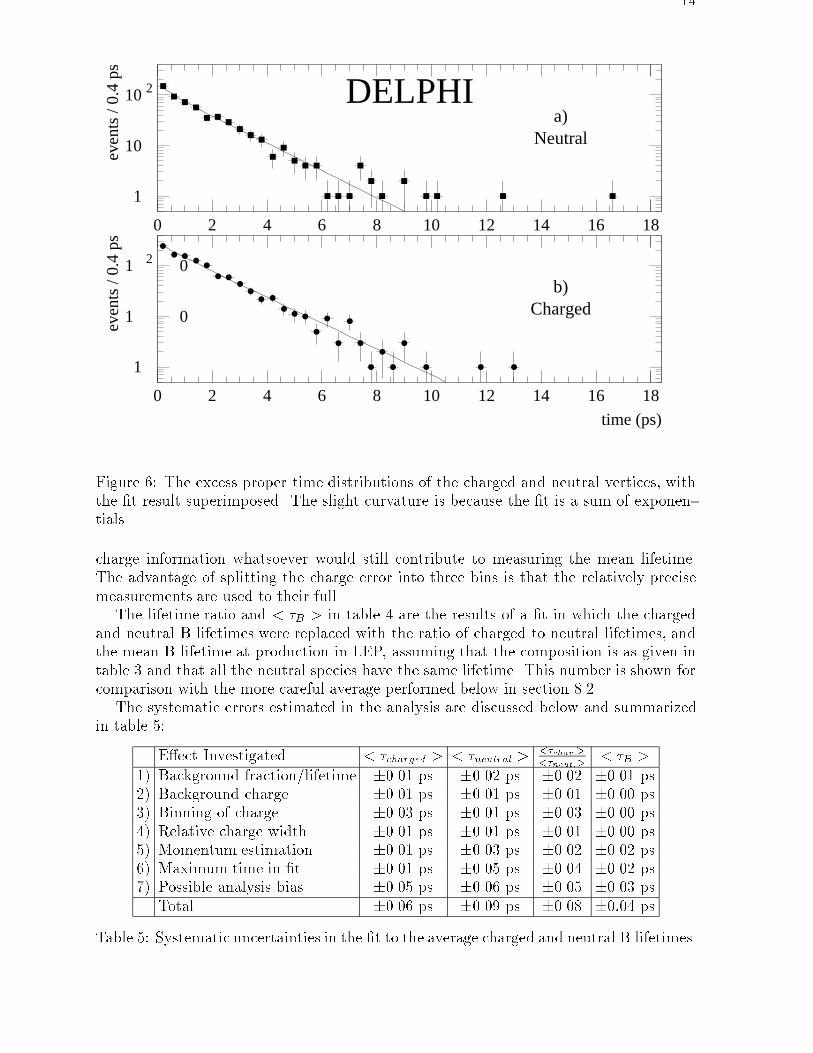
The excess proper time distributions of the charged and neutral vertices are shownin Figure 6. The �t to the average charged and neutral B lifetimes, as described below,is superimposed. In this �t it was assumed that all charged B species have one lifetimeand all neutral ones have another. The relative normalization of the two species was left
free to reduce the dependence upon the simulation. A background fraction of 0.9%, asdescribed in section 5.1 is included. The results of this �t are shown in table 4.
Parameter Data Simulation
Fit result Correct value
< �charged > (ps) 1.72�0.08 1.57�0.05 1.60< �neutral > (ps) 1.58�0.11 1.64�0.06 1.60
�confused(ps) 0.39+0:44�0:20 0.63�0.17f0 0.42�0.05 0.38�0.03
fconfused 0.05�0.04 0.06�0.02P1 0.20�0.12 0.19�0.05P2 0.32�0.10 0.33�0.05P3 0.60�0.10 0.63�0.06
< �charged > = < �neutral > 1.09+0:11�0:10 0.95+0:06�0:06 1.00< �B > 1.64�0.06 1.61�0.03 1.60
Table 4: Fit to average charged and neutral lifetimes, with the statistical errors shown.P is de�ned in section 7.1, and f0 is the fraction of neutral B hadrons which would havebeen selected if the lifetimes had been equal. The last two entries are not independentparameters, but the errors have been calculated separately.
The three classes of P contain 380, 580 and 857 events respectively. The chargemeasurement is poor in P3; but it should be remembered that even events with no
14
1
10
10 2
0 2 4 6 8 10 12 14 16 18
even
ts /
0.4
psDELPHI
a)Neutral
1
1 0
1 02
0 2 4 6 8 10 12 14 16 18
time (ps)
even
ts /
0.4
ps
b)Charged
Figure 6: The excess proper time distributions of the charged and neutral vertices, withthe �t result superimposed. The slight curvature is because the �t is a sum of exponen-tials.
charge information whatsoever would still contribute to measuring the mean lifetime.The advantage of splitting the charge error into three bins is that the relatively precise
measurements are used to their full.The lifetime ratio and < �B > in table 4 are the results of a �t in which the charged
and neutral B lifetimes were replaced with the ratio of charged to neutral lifetimes, andthe mean B lifetime at production in LEP, assuming that the composition is as given intable 3 and that all the neutral species have the same lifetime. This number is shown forcomparison with the more careful average performed below in section 8.2.
The systematic errors estimated in the analysis are discussed below and summarizedin table 5:
E�ect Investigated < �charged > < �neutral ><�char:><�neut:>
< �B >
1) Background fraction/lifetime �0.01 ps �0.02 ps �0.02 �0.01 ps2) Background charge �0.01 ps �0.01 ps �0.01 �0.00 ps3) Binning of charge �0.03 ps �0.01 ps �0.03 �0.00 ps4) Relative charge width �0.01 ps �0.01 ps �0.01 �0.00 ps5) Momentum estimation �0.01 ps �0.03 ps �0.02 �0.02 ps6) Maximum time in �t �0.01 ps �0.05 ps �0.04 �0.02 ps7) Possible analysis bias �0.05 ps �0.06 ps �0.05 �0.03 ps
Total �0.06 ps �0.09 ps �0.08 �0:04 psTable 5: Systematic uncertainties in the �t to the average charged and neutral B lifetimes.
15
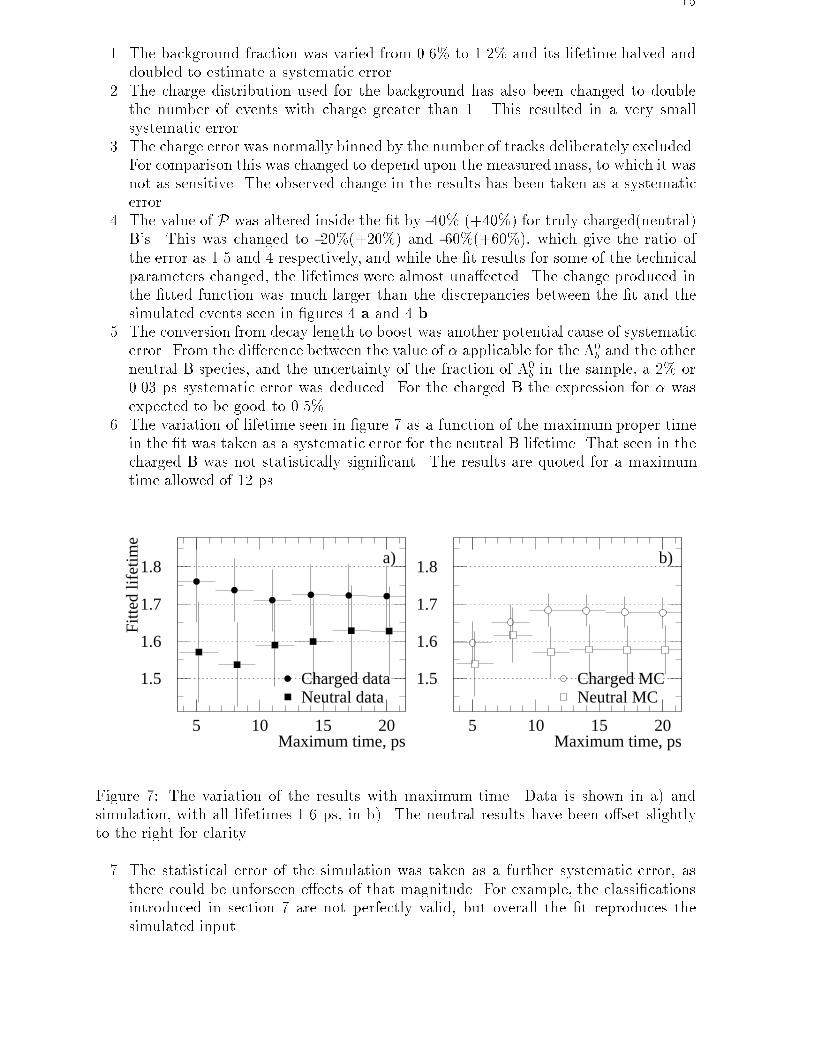
1. The background fraction was varied from 0.6% to 1.2% and its lifetime halved anddoubled to estimate a systematic error.
2. The charge distribution used for the background has also been changed to doublethe number of events with charge greater than 1. This resulted in a very smallsystematic error.
3. The charge error was normally binned by the number of tracks deliberately excluded.For comparison this was changed to depend upon the measured mass, to which it wasnot as sensitive. The observed change in the results has been taken as a systematicerror.
4. The value of P was altered inside the �t by -40% (+40%) for truly charged(neutral)B's. This was changed to -20%(+20%) and -60%(+60%), which give the ratio of
the error as 1.5 and 4 respectively, and while the �t results for some of the technicalparameters changed, the lifetimes were almost una�ected. The change produced inthe �tted function was much larger than the discrepancies between the �t and thesimulated events seen in �gures 4 a and 4 b.
5. The conversion from decay length to boost was another potential cause of systematicerror. From the di�erence between the value of � applicable for the �0
b and the otherneutral B species, and the uncertainty of the fraction of �0
b in the sample, a 2% or0.03 ps systematic error was deduced. For the charged B the expression for � was
expected to be good to 0.5%.6. The variation of lifetime seen in �gure 7 as a function of the maximum proper time
in the �t was taken as a systematic error for the neutral B lifetime. That seen in thecharged B was not statistically signi�cant. The results are quoted for a maximumtime allowed of 12 ps.
1.5
1.6
1.7
1.8
5 10 15 20Maximum time, ps
Fitt
ed li
fetim
e
Charged dataNeutral data
a)
1.5
1.6
1.7
1.8
5 10 15 20Maximum time, ps
Charged MCNeutral MC
b)
Figure 7: The variation of the results with maximum time. Data is shown in a) andsimulation, with all lifetimes 1.6 ps, in b). The neutral results have been o�set slightlyto the right for clarity.
7. The statistical error of the simulation was taken as a further systematic error, as
there could be unforseen e�ects of that magnitude. For example, the classi�cationsintroduced in section 7 are not perfectly valid, but overall the �t reproduces thesimulated input.
16
Variation of the exact values of the cuts used produced changes in the results com-patible with the statistical uctuations expected (e.g. 1.68�0.07 and 1.62�0.10 ps for amass cut at 2.0 GeV/c2 and 1.73�0.07 and 1.54�0.10 ps for a probability cut at 0.03.)These have therefore not been quoted as systematic errors.
There was no evidence for any dependence upon the angles � and � of the B particle.The data have also been divided by the year in which it was recorded, and no year di�ersfrom the mean by more than one standard deviation.
To check the e�ect of the discrepancies seen in table 1, the analysis of the simulation hasbeen performed without the additional smearing of the reconstructed impact parameters.This increases the discrepancies at cuts 4) and 5) by a factor of 2, but hardly changesthe lifetimes reconstructed from the simulation. This is evidence that these discrepancies
are not important.The data have also been �tted excluding those events where more than three tracks
were rejected, 857 events. The results are < �charged >= 1:75�0.09 and < �neutral >=1:59�0.12. These too are consistent.
The results for the mean charged and neutral lifetimes are:
< �charged > = 1:72 � 0:08 ( stat)� 0:06 ( sys) ps
< �neutral > = 1:58 � 0:11 ( stat)� 0:09 ( sys) ps (8)
< �charged > = < �neutral > = 1:09+0:11�0:10 ( stat)� 0:08 ( sys)
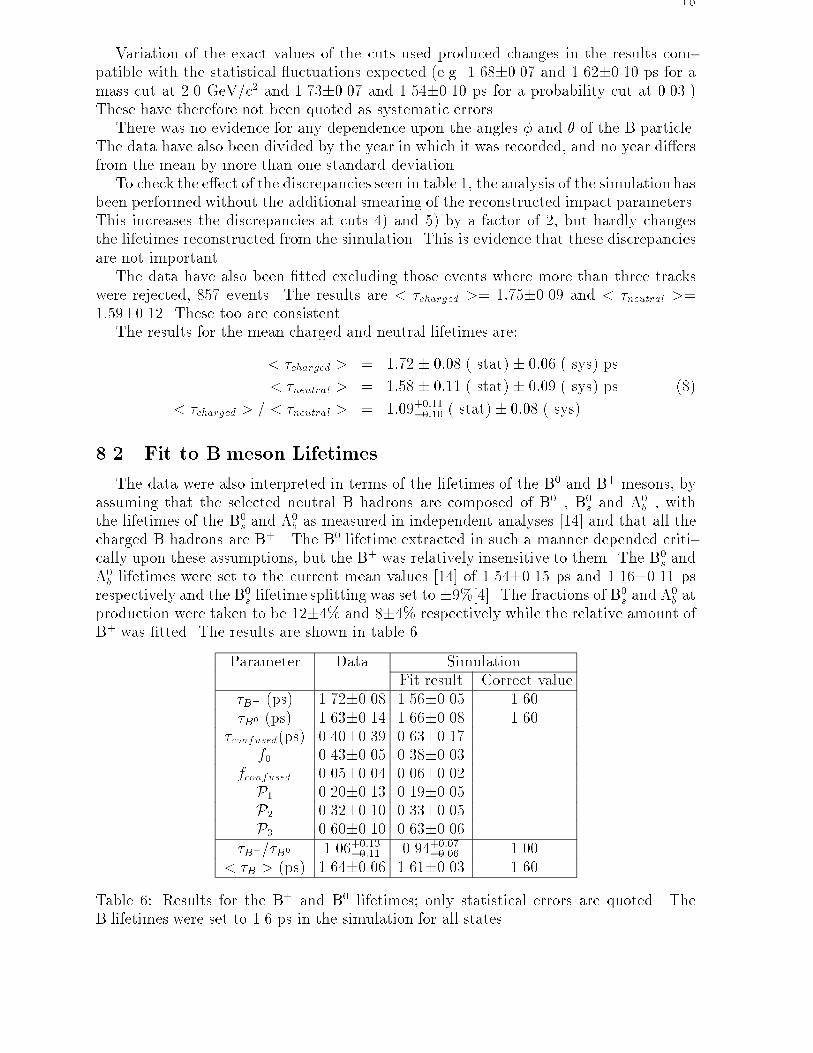
8.2 Fit to B meson Lifetimes
The data were also interpreted in terms of the lifetimes of the B0 and B+ mesons, byassuming that the selected neutral B hadrons are composed of B0 , B0
s and �0b , with
the lifetimes of the B0s and �0
b as measured in independent analyses [14] and that all thecharged B hadrons are B+ . The B0 lifetime extracted in such a manner depended criti-cally upon these assumptions, but the B+ was relatively insensitive to them. The B0
s and�0b lifetimes were set to the current mean values [14] of 1.54�0.15 ps and 1.16�0.11 ps
respectively and the B0s lifetime splitting was set to �9%[4]. The fractions of B0
s and �0b at
production were taken to be 12�4% and 8�4% respectively while the relative amount ofB+ was �tted. The results are shown in table 6.
Parameter Data SimulationFit result Correct value
�B+ (ps) 1.72�0.08 1.56�0.05 1.60
�B0 (ps) 1.63�0.14 1.66�0.08 1.60�confused(ps) 0.40�0.39 0.63�0.17
f0 0.43�0.05 0.38�0.03fconfused 0.05�0.04 0.06�0.02P1 0.20�0.13 0.19�0.05P2 0.32�0.10 0.33�0.05P3 0.60�0.10 0.63�0.06
�B+=�B0 1.06+0:13�0:11 0.94+0:07�0:06 1.00
< �B > (ps) 1.64�0.06 1.61�0.03 1.60
Table 6: Results for the B+ and B0 lifetimes; only statistical errors are quoted. TheB lifetimes were set to 1.6 ps in the simulation for all states.
17
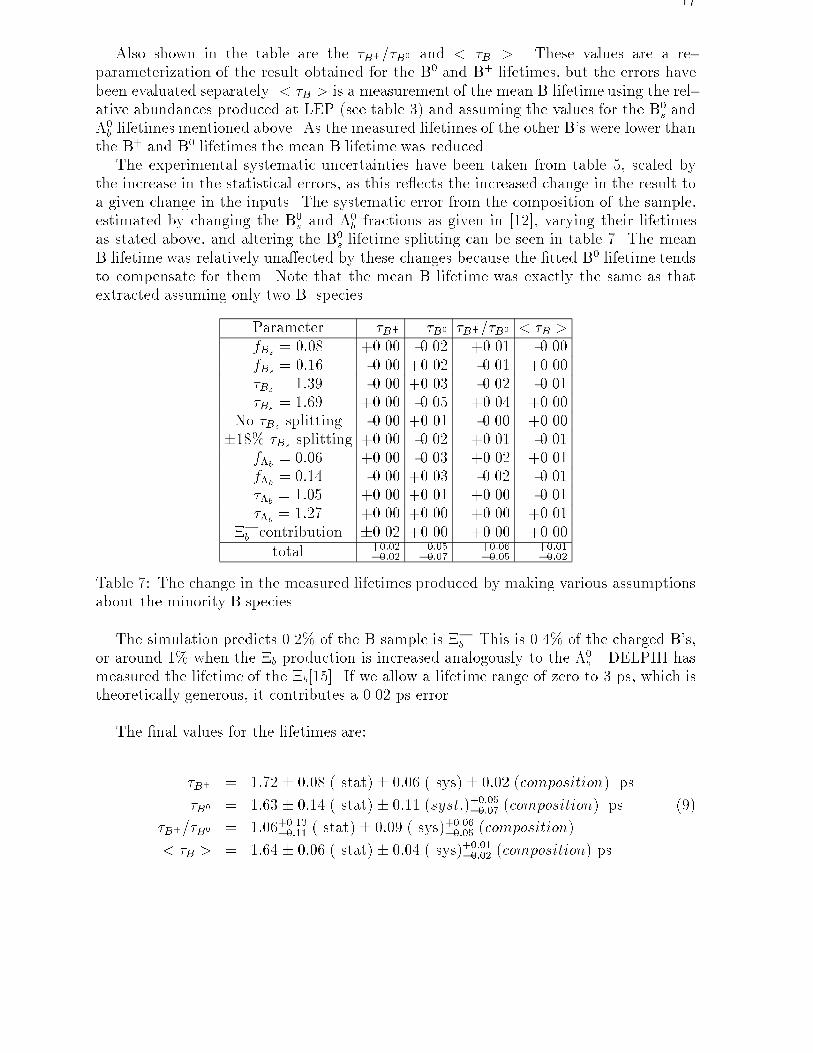
Also shown in the table are the �B+=�B0 and < �B >. These values are a re-parameterization of the result obtained for the B0 and B+ lifetimes, but the errors have
been evaluated separately. < �B > is a measurement of the mean B lifetime using the rel-ative abundances produced at LEP (see table 3) and assuming the values for the B0
s and�0b lifetimes mentioned above. As the measured lifetimes of the other B's were lower than
the B+ and B0 lifetimes the mean B lifetime was reduced.The experimental systematic uncertainties have been taken from table 5, scaled by
the increase in the statistical errors, as this re ects the increased change in the result toa given change in the inputs. The systematic error from the composition of the sample,estimated by changing the B0
s and �0b fractions as given in [12], varying their lifetimes
as stated above, and altering the B0s lifetime splitting can be seen in table 7. The mean
B lifetime was relatively una�ected by these changes because the �tted B0 lifetime tendsto compensate for them. Note that the mean B lifetime was exactly the same as thatextracted assuming only two B species.
Parameter �B+ �B0 �B+=�B0 < �B >
fBs = 0:08 +0.00 -0.02 +0.01 -0.00
fBs = 0:16 -0.00 +0.02 -0.01 +0.00�Bs = 1:39 -0.00 +0.03 -0.02 -0.01�Bs = 1:69 +0.00 -0.05 +0.04 +0.00
No �Bs splitting -0.00 +0.01 -0.00 +0.00�18% �Bs splitting +0.00 -0.02 +0.01 -0.01
f�b = 0:06 +0.00 -0.03 +0.02 +0.01f�b = 0:14 -0.00 +0.03 -0.02 -0.01��b = 1:05 +0.00 +0.01 +0.00 -0.01��b = 1:27 +0.00 +0.00 +0.00 +0.01
��
b contribution �0.02 +0.00 +0.00 +0.00
total +0:02�0:02
+0:05�0:07
+0:06�0:05
+0:01�0:02
Table 7: The change in the measured lifetimes produced by making various assumptionsabout the minority B species.
The simulation predicts 0.2% of the B sample is ��
b . This is 0.4% of the charged B's,or around 1% when the �b production is increased analogously to the �0
b . DELPHI hasmeasured the lifetime of the �b[15]. If we allow a lifetime range of zero to 3 ps, which istheoretically generous, it contributes a 0.02 ps error.
The �nal values for the lifetimes are:
�B+ = 1:72 � 0:08 ( stat)� 0:06 ( sys)� 0:02 (composition) ps
�B0 = 1:63 � 0:14 ( stat)� 0:11 (syst:)+0:05�0:07 (composition) ps (9)
�B+=�B0 = 1:06+0:13�0:11 ( stat)� 0:09 ( sys)+0:06
�0:05 (composition)
< �B > = 1:64 � 0:06 ( stat)� 0:04 ( sys)+0:01�0:02 (composition) ps
18
9 Summary
From 1 434 425 hadronic Z0 decays collected at the LEP collider with the DELPHI
detector between 1991 and 1993, a sample of 1817 B hadron candidates with an estimatedpurity of 99% has been extracted. The results for the mean charged and neutral lifetimesare:
< �charged > = 1:72 � 0:08 ( stat)� 0:06 ( sys) ps
< �neutral > = 1:58 � 0:11 ( stat)� 0:09 ( sys) ps
< �charged > = < �neutral > = 1:09+0:11�0:10 ( stat)� 0:08 ( sys)
The assumptions stated in the previous section allow the B+ and B0 lifetimes to bemeasured. Combining the systematic uncertainties, these are as follows:
�B+ = 1:72 � 0:08 ( stat)� 0:06 ( sys) ps
�B0 = 1:63 � 0:14 ( stat)� 0:13 (syst:) ps
�B+=�B0 = 1:06+0:13�0:11 ( stat)� 0:10 ( sys)
< �B > = 1:64 � 0:06 ( stat)� 0:04 ( sys) ps
A composition systematic uncertainty was taken into account; it is signi�cantly smaller
for the B+ than the B0 because the B+ almost completely dominates the charged state.These results are in agreement with, and supplant, our previous publication [1]. In an
accompanying paper, DELPHI publishes a measurement of these lifetimes based upon D{ lepton correlations [16], �nding �B+ = 1:61+0:16�0:16� 0:12 ps and �B0 = 1:61+0:14�0:13� 0:08 ps.The correlations between this analysis and the one presented here are very small, and theresults have been combined to give:
�B+ = 1:70 � 0:09 ps
and
�B0 = 1:62 � 0:12 ps
The other measurements of these lifetimes presented to the 1994 Rochester Confer-ence [14] by the LEP collaborations have been averaged using the methods of [12] andare: �B+ = 1:57 � 0:11 ps and �B0 = 1:62 � 0:10 ps. These are in agreement with themeasurements presented here.
Acknowledgements
We are greatly indebted to our technical collaborators and to the funding agencies fortheir support in building and operating the DELPHI detector, and to the members ofthe CERN-SL Division for the excellent performance of the LEP collider.
19
References
[1] DELPHI Collaboration, P. Abreu et al., Phys. Lett. B 312 (1993) 253.[2] NA14/2 Collaboration, Alvarez et al., Zeit. Phys. C 47 (1990) 539-546.[3] H. Fritzsch and P. Minkowski, Phys Rep 73 (1981) 67.[4] I. Bigi, B. Blok, M. Shifman, N. Uraltsev, A. Vainshtein in \B decays", 2nd edition,
Ed. S.Stone, World Scienti�c.[5] DELPHI Collaboration, P. Aarnio et al., Nucl. Inst. and Meth. A303 (1991) 233.[6] N. Bingefors et al., Nucl. Inst. and Meth. A328 (1993) 447.[7] D. Johnson, D. Reid and W. Trischuk, \A Beamspot Database for Lifetime Mea-
surements", DELPHI 92-36 PHYS 168, Geneva, 18 March 1992.[8] JADE Collaboration, W. Bartel et al., Zeit. Phys. C 33 (1986) 23.[9] T. Sj�ostrand, Comp. Phys. Comm. 39 (1986) 347;
T. Sj�ostrand and M Bengtsson, Comp. Phys. Comm. 43 (1987) 367.[10] DELSIM Reference Manual, DELPHI 87-98 PROG 100, Geneva, July 1989.
[11] DELPHI Collaboration, P. Abreu at al., Zeit. Phys. C65 (1995) 555.[12] LEP B lifetimes group. D. Bloch et al. \Averaging Lifetimes for B hadron species at
LEP" ALEPH 94-198, DELPHI 94-164 PHYS 467, OPAL TN276.[13] B. Franek, Rutherford Appleton Laboratory, RAL-85-026 (1985).[14] P. Roudeau, proceedings of ICHEP XXVII, Glasgow, IOP, P.J. Bussey and I.G.
Knowles eds, (1995) 325;OPAL Collaboration, R. Akers et al., "Improved measurements of the B0 and B+
meson lifetimes", CERN-PPE/95-19, 1995.[15] DELPHI Collaboration, P. Abreu et al., \Production of strange B-baryons decaying
into �� � `� pairs at LEP", CERN-PPE/95-29, submitted to Zeit. Phys. C.[16] DELPHI Collaboration, P. Abreu et al., \A Measurement of B+ and B0 Lifetimes
using D-lepton events in Z0 Decays", to be submitted to Zeit. Phys. C.


