Embed Size (px)
Citation preview
Prep
rint
- Se
rver
(8
-Jul
y-19
98)
X-L
PNH
E-9
8-04
Laser Wake�eld Acceleration ofElectrons at Ecole Polytechnique
Presented by D. Bernard
F. Amirano�1, S. Baton1, D. Bernard2, B. Cros3, D. Descamps1,
F. Dorchies1, F. Jacquet2, V. Malka1, J. R. Marqu�es1,
G. Matthieussent3, P. Min�e2, A. Modena1, P. Mora4, J. Morillo5,
Z. Najmudin6
1Laboratoire pour l'Utilisation des Lasers Intenses, Ecole Polytechnique, CNRS, 91128
Palaiseau, France
2Laboratoire de Physique Nucl�eaire et des Hautes Energies, Ecole Polytechnique, IN2P3 &
CNRS, 91128 Palaiseau, France
3Laboratoire de Physique des Gaz et des Plasmas, CNRS, Universit�e Paris Sud, 91405 Orsay,
France
4Centre de Physique Th�eorique, Ecole Polytechnique, CNRS, 91128 Palaiseau, France
5Laboratoire des Solides Irradi�es, CEA/DSM/DRECAM,URA-CNRS 1380, Ecole
Polytechnique, 91128 Palaiseau, France
6Imperial College, Blackett Laboratory, SW7 2AZ London, UK
Abstract. The acceleration of electrons injected in a plasma wave generated by the
laser wake�eld mechanism has been observed. A maximum energy gain of 1.6 MeV has
been measured and the maximum longitudinal electric �eld is estimated to 1.5 GV/m.
The experimental data agree with theoretical predictions when 3D e�ects are taken
into account. The duration of the plasma wave inferred from the number of accelerated
electrons is of the order of 1 ps.

I INTRODUCTION
The generation of large amplitude electric �elds in plasmas by high-power lasershas been studied for several years in the context of high-�eld particle acceleration[1]. The ponderomotive force of the laser excites a longitudinal electron plasmawave (EPW) with a phase velocity close to the speed of light [2]. Two mechanismshave been considered to excite the EPW.
In the Laser Beat Wave Acceleration (LBWA) approach, the beating of a twofrequency laser creates a modulation of its intensity. When the frequency di�erenceis equal to the natural oscillation frequency of the plasma electrons !p, an EPW isexcited resonantly. This can lead to large amplitude electric �elds. A precise tuningof the electron density is therefore mandatory in LBWA experiments. LBWA hasbeen extensively studied during the 90's with 1 �m [3] and 10 �m [4{6] lasers.
In the \standard" Laser Wake Field Acceleration (LWFA) approach, a singleshort laser pulse excites the EPW [2,7,8]. As the ponderomotive force associatedwith the longitudinal gradient of the laser intensity exerts two successive pushes inopposite directions on the plasma electrons, the excitation of the EPW is maximumwhen the laser pulse duration is of the order of 1=!p.
At high electron density, and high laser intensity, a long | with respect to 1=!p
| laser pulse breaks into short pulselets at 1=!p through the stimulated Ramanscattering instability [9{11]. In this self-modulated mode (SM LWFA), the veryhigh longitudinal electric �eld of the EPW traps plasma electrons and acceleratesthem to high energies [12{16]. However, SM LWFA may not be the best candidatefor very high energy accelerators, in particular because the EPW grows from aninstability so that its phase is unpredictable, and also because of the low Lorentzfactor p � !=!p of the phase velocity of the EPW at high electron density.
Standard LWFA seems particularly suited for particle acceleration. It is nota�ected by saturation (e.g. relativistic detuning [5] or modulational instability[3]) as is LBWA, and operates at low density, where p can be quite high. Theexcitation of radial EPW by laser wake �eld has already been observed by two-pulse frequency-domain interferometry [17,18].
We present the �rst observation of LWFA of injected electrons. Part of thematerial presented here will be published elsewhere [19]. A particular emphasishas been given to the separation of the signal from the background (BG) noise inthe design of the experimental apparatus [23] and in the analysis of the data. Inthe case of LBWA experiments, Clayton et al. have shown that magnetic and/ortransverse electric �elds, due to a Weibel-like instability [20], still exist in theplasma a long (a few nanoseconds) time after the excitation of the EPW. Electronsde ected by such �elds can scatter on the walls of the vacuum chamber and providespurious signal, as is possibly the case in [21] and in the surprising result of [22].

II LASER WAKEFIELD ACCELERATION
The transverse and longitudinal components of a linear EPW created by laserwake�eld, for a laser beam with a gaussian radial pro�le and a gaussian timedistribution, can be expressed [1,7] as : Er = (4r=w2)A sin (!pt� kpz) and Ez =kpA cos (!pt� kpz), with
A =p�!p�0 exp (�
!2p�2
0
4)
Imaxe
2�0mc!2exp (�2r2
w2); (1)
where the time variation of the laser intensity is described by exp (�(t=�0)2), Imax
is the maximum intensity, w the 1=e2 radius in intensity, and kp = !p=c. At agiven value of �0, Ez varies like (!p�0)
2 exp (�(!p�0)2=4). This gives a broad maxi-
mum close to !p�0 = 2, i.e. !p� = 4pln 2, where � is the pulse duration at FWHM.
With � = 400 fs, this corresponds to an electron density n = 2:2 1016cm�3, an EPWwavelength �p = 226 �m, and an EPW Lorentz factor p = 214. The correspondingHelium pressure is 0.4 mbar for a fully ionized plasma. Finally, the maximum elec-tric �eld at resonance is Ez[GV/m]=1:35 10�18Imax[W/cm2](�[�m])2=� [ps]. Therelative longitudinal perturbation of the electron density is �k = Ez=E0, whereE0 = mc!p=e.
FIGURE 1. Variation of the longitudinal (Ez) and transverse (Er) electric �eld in units of the
cold wave breaking limit E0, as a function of the laser spot size w in units of 2�=�p. The laser
energy is 3 J, duration 350 fs, and !p�0 = 2 (E0=16 GV/m). The limit of the linear region is
obtained for �?� 2, (dashed line), and is approximately independent of laser energy.
The ratio of the transverse to the longitudinal electric �eld, at r � w0=p2 is
Er=Ez =p2�p=�w0, here equal to 4, w0 being the laser beam size w at the waist.
We obtain the value of the relative transverse perturbation of the electron density[17] by �?=�k = (Er=Ez)
2, here equal to 16. This means that, in our conditions,

the EPW is mainly excited in the radial regime : the transverse electric �eld isstronger than the longitudinal electric �eld.
Particle simulations using the model described in Ref. [24] show (Fig. 1) that withour parameters, Ez is actually lower than the linear value given above, when thelaser energy is so high that �? � 2. The cavitation created by the radial oscillationa�ects the development of the longitudinal oscillation. The corresponding limitvalue of �k is here � 10 � 20%.
III EXPERIMENTAL APPARATUS
The experimental apparatus is based on the existing facility already used for thestudy of LBWA [3], and is presented in Ref. [23]. A sketch of the present experimentcan be found in Fig. 2. We use the 400 fs, 1.057 �m chirped pulse ampli�cationlaser at LULI. The 80 mm diameter beam is injected into a pulse compressor, and
FIGURE 2. Layout of the experiment. See text and Ref. [23].
focused in a gas �lled chamber by a 1.4 m focal length 30� o�-axis parabola. Afraction of the compressed beam is collected before focusing and sent to a single-shot second-order autocorrelator for pulse duration measurement. A low intensityfraction of the beam is collected after the plasma and sent to a focal spot monitor.A 300 �A cw electron beam is injected in the plasma at a total energy of 3 MeV

with an RMS spot size of 30�m and an RMS divergence of 10 mrad [23]. Theaccelerated electrons are measured by a magnetic spectrograph and 17 detectors inthe range 3.3 to 5.9 MeV. The linear gates have been withdrawn, and the voltageof the photomultipliers was tuned so that the calibration factor was equal to 2.5ADC (analog to digital converter) count per electron. The duration of the gate wasset to 20 ns.
IV EXPERIMENTAL RESULTS
A series of 250 shots has been performed, most of them with a laser energyin the range 4{9 J. On average, after compression, 20% of this energy is focusedto a spot with typical size w0;H = 30 �m (horizontal waist) and w0;V = 19 �m(vertical waist), with Rayleigh length of z0;H = 2:3 mm and z0;V = 2:0 mm. Witha central spot energy of 1.5 J, the values of the maximum power, intensity, electric�eld, EPW amplitude, and of the expected linear energy gain are Pmax=3.5 TW,Imax = 4 � 1017W=cm2, Ez=1.5 GV/m, �k=10%, �W = �ez0Ez=10 MeV. Themain source of uctuation is due to the laser pulse duration. For shots for whichthe quantities � , E, w0;H;V could be measured, the amplitude varies in the range�k=1{15%. Electron acceleration was observed in all of these shots.
FIGURE 3. Spectrum of a typical shot (dots). The �t is described in the text. The continuous
line shows the sum of the two contributions.
A typical spectrum is presented in Fig. 3 (dots). It shows a peak at low electronenergy, that can be �tted by a decreasing exponential (dotted line) and a high
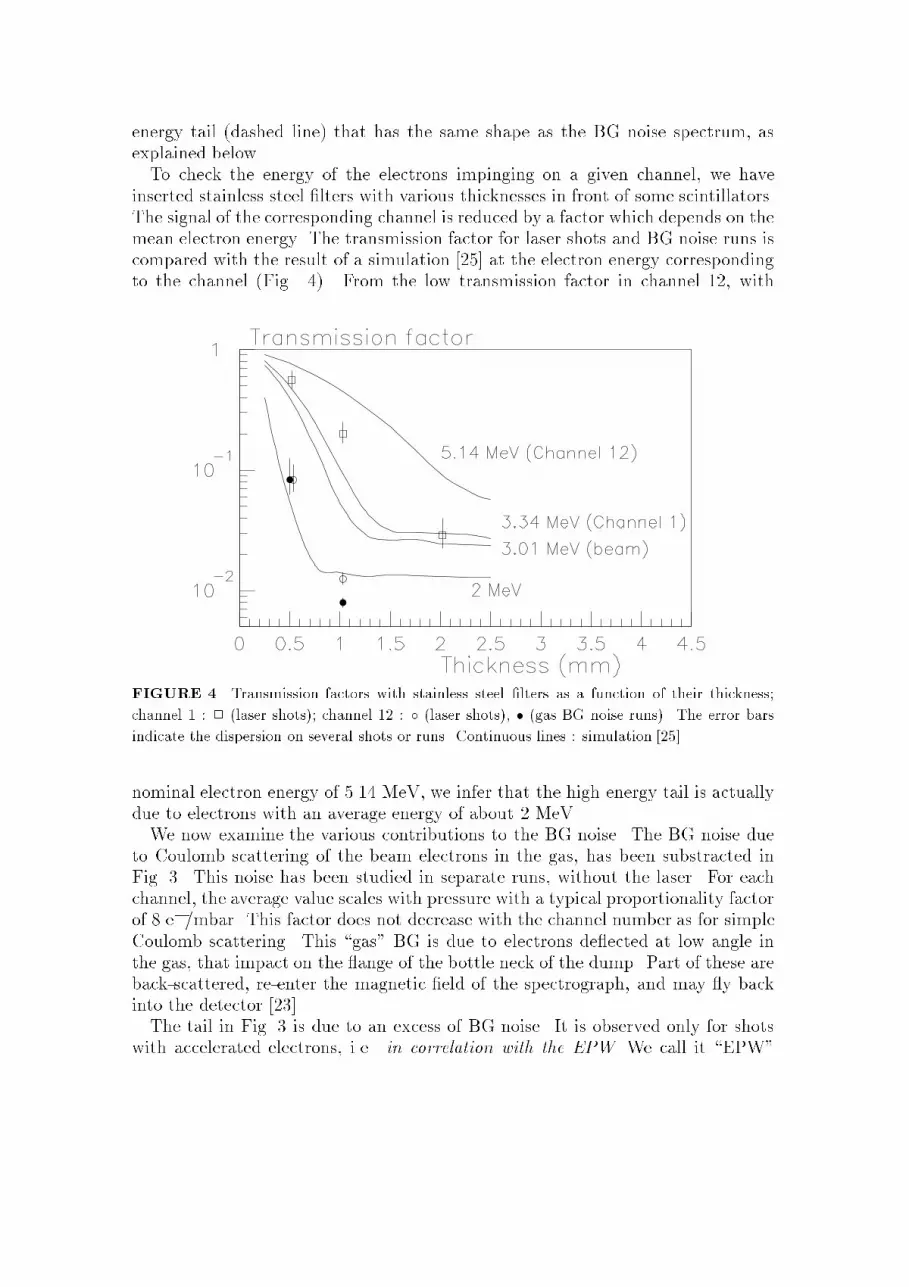
energy tail (dashed line) that has the same shape as the BG noise spectrum, asexplained below.To check the energy of the electrons impinging on a given channel, we have
inserted stainless steel �lters with various thicknesses in front of some scintillators.The signal of the corresponding channel is reduced by a factor which depends on themean electron energy. The transmission factor for laser shots and BG noise runs iscompared with the result of a simulation [25] at the electron energy correspondingto the channel (Fig. 4). From the low transmission factor in channel 12, with
FIGURE 4. Transmission factors with stainless steel �lters as a function of their thickness;
channel 1 : 2 (laser shots); channel 12 : � (laser shots), � (gas BG noise runs). The error bars
indicate the dispersion on several shots or runs. Continuous lines : simulation [25].
nominal electron energy of 5.14 MeV, we infer that the high energy tail is actuallydue to electrons with an average energy of about 2 MeV.We now examine the various contributions to the BG noise. The BG noise due
to Coulomb scattering of the beam electrons in the gas, has been substracted inFig. 3. This noise has been studied in separate runs, without the laser. For eachchannel, the average value scales with pressure with a typical proportionality factorof 8 e�/mbar. This factor does not decrease with the channel number as for simpleCoulomb scattering. This \gas" BG is due to electrons de ected at low angle inthe gas, that impact on the ange of the bottle neck of the dump. Part of these areback-scattered, re-enter the magnetic �eld of the spectrograph, and may y backinto the detector [23].The tail in Fig. 3 is due to an excess of BG noise. It is observed only for shots
with accelerated electrons, i.e. in correlation with the EPW. We call it \EPW"
BG noise. It is due to electrons de ected in the plasma close to the waist, whileCoulomb scattering occurs along the whole path of the electrons, with a di�erentgeometry. To simulate the former, we have introduced a 11 �m Al foil at focus, invacuum. The obtained noise spectrum has a shape similar to the shape of the gasspectrum. The electrons scattered at large angle in the foil are blocked by the d1collimator (See Fig. 12 of Ref. [23]). Few of them are re-scattered at the edge ofthe collimator. As the latter is not at focus, some of them impact on the ange ofthe dump. This is the reason for the similar shape of the two distributions.The signals of three channels have also been recorded on a storage oscilloscope for
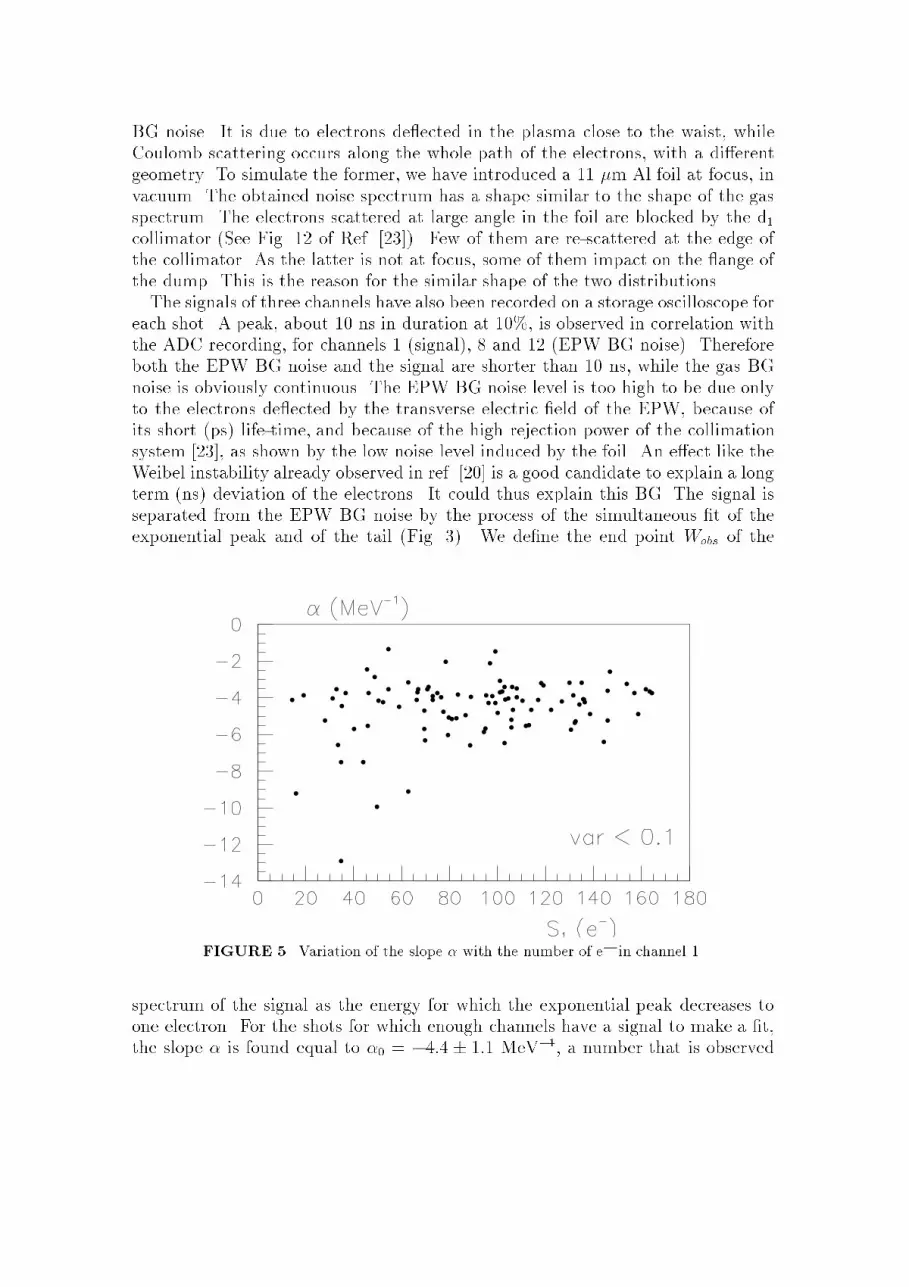
each shot. A peak, about 10 ns in duration at 10%, is observed in correlation withthe ADC recording, for channels 1 (signal), 8 and 12 (EPW BG noise). Thereforeboth the EPW BG noise and the signal are shorter than 10 ns, while the gas BGnoise is obviously continuous. The EPW BG noise level is too high to be due onlyto the electrons de ected by the transverse electric �eld of the EPW, because ofits short (ps) life-time, and because of the high rejection power of the collimationsystem [23], as shown by the low noise level induced by the foil. An e�ect like theWeibel instability already observed in ref. [20] is a good candidate to explain a longterm (ns) deviation of the electrons. It could thus explain this BG. The signal isseparated from the EPW BG noise by the process of the simultaneous �t of theexponential peak and of the tail (Fig. 3). We de�ne the end point Wobs of the
FIGURE 5. Variation of the slope � with the number of e� in channel 1.
spectrum of the signal as the energy for which the exponential peak decreases toone electron. For the shots for which enough channels have a signal to make a �t,the slope � is found equal to �0 = �4:4 � 1:1 MeV�1, a number that is observed

not to depend on the parameters of the laser pulse or of the plasma (as an example,the variation of � with the number of e� in channel 1 is given in Fig. 5). Thereforewe have used the same value � = �0 to compute �Wobs for all the shots.
The variation of the signal S1 in channel 1 with !p�0 is presented in �g. 6(left),where both !p and �0 have been varied. As expected, the data show a maximumclose to !p�0 = 2. The spectrum of �Wobs is much broader (right), as �Wobs varieslike logS1 in the exponential peak. Here, �k is low, and the length of the highgradient region, of the order of 2z0, is smaller than the dephasing length of theelectrons with respect to the EPW, equal to 8 mm. Therefore, �Wobs should havethe same resonant dependance with !p�0 as A (Eq. 1, and curve in Fig. 6 right).Note also that the maximum value of �Wobs, close to 1.6 MeV, is smaller than thevalue obtained from the linear approximation in 1D geometry, close to 10 MeV.
FIGURE 6. Variations of S1(left) and of �Wobs (right) with !p�0. The �tting procedure
(S1 > 10 e�) introduces a cut o� at �Wobs=0.85 MeV. The pressure is varied in the range
0{2 mbar with half of the data taken at \resonance". The main source of variation of !p�0 is the
uctuation of �0. Only data with � < 1 ps are used. The curve describes the !p�0 dependence of
Ez in linear LWFA theory.
The transverse electric �eld of the EPW a�ects the trajectories of the electrons.Depending on their phase, electrons undergo a focusing or defocusing force whenthey enter the EPW. The defocused electrons are expelled radially before they enterthe high accelerating region. On the contrary, the focused electrons are transverselytrapped in the EPW, and should be accelerated in it e�ciently [26].
In fact, a numerical tracking of the trajectories of electrons in the EPW, usingthe code described in [27], shows that most of them miss the waist transversely.
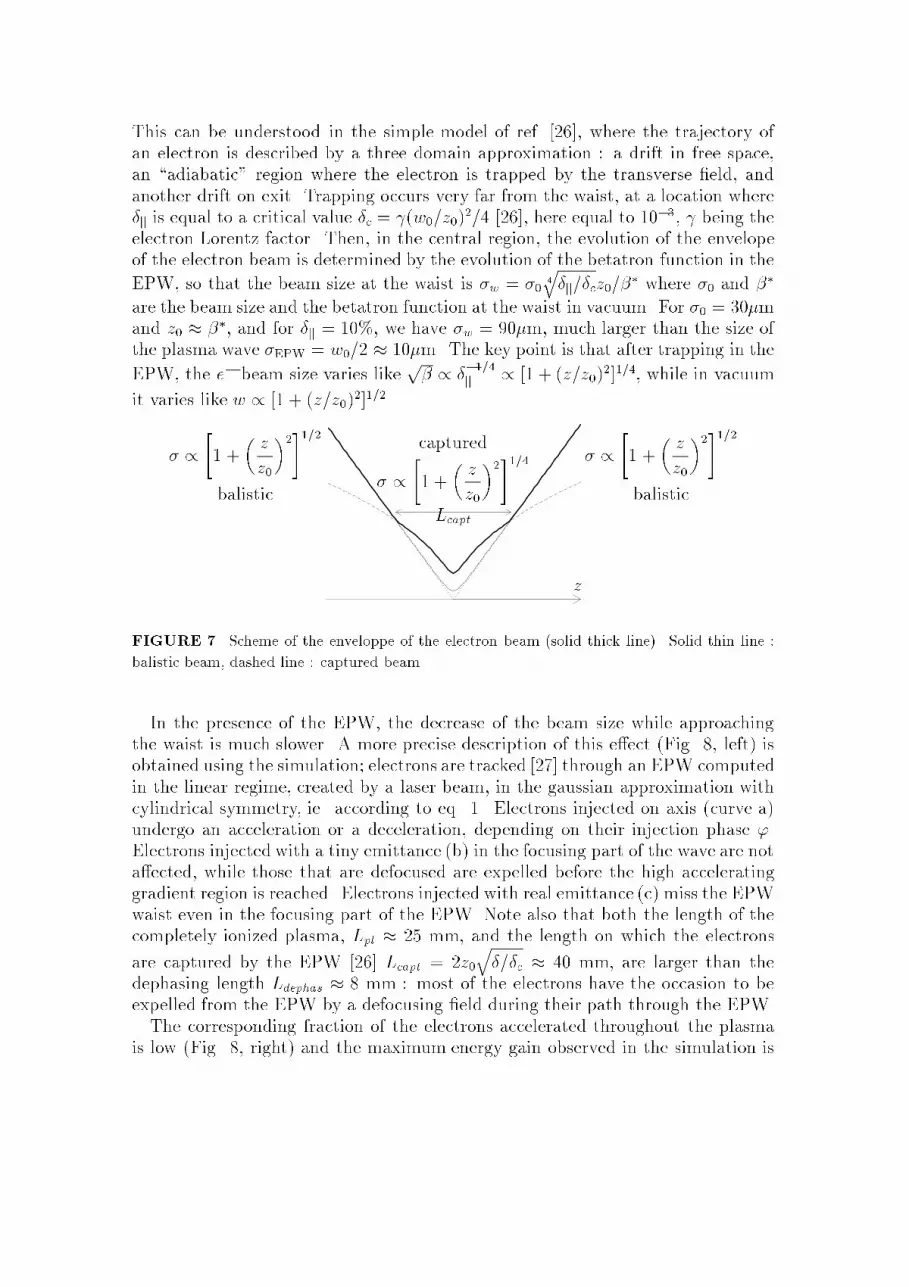
This can be understood in the simple model of ref. [26], where the trajectory ofan electron is described by a three domain approximation : a drift in free space,an \adiabatic" region where the electron is trapped by the transverse �eld, andanother drift on exit. Trapping occurs very far from the waist, at a location where�k is equal to a critical value �c = (w0=z0)
2=4 [26], here equal to 10�3, being theelectron Lorentz factor. Then, in the central region, the evolution of the envelopeof the electron beam is determined by the evolution of the betatron function in the
EPW, so that the beam size at the waist is �w = �04
q�k=�cz0=�
� where �0 and ��
are the beam size and the betatron function at the waist in vacuum. For �0 = 30�mand z0 � ��, and for �k = 10%, we have �w = 90�m, much larger than the size ofthe plasma wave �EPW = w0=2 � 10�m. The key point is that after trapping in the
EPW, the e� beam size varies likep� / �
�1=4k / [1 + (z=z0)
2]1=4, while in vacuum
it varies like w / [1 + (z=z0)2]1=2.
z
balistic
captured
balistic� /
"1 +
�z
z0
�2#1=4� /
"1 +
�z
z0
�2#1=2� /
"1 +
�z
z0
�2#1=2
Lcapt
FIGURE 7. Scheme of the enveloppe of the electron beam (solid thick line). Solid thin line :
balistic beam, dashed line : captured beam.
In the presence of the EPW, the decrease of the beam size while approachingthe waist is much slower. A more precise description of this e�ect (Fig. 8, left) isobtained using the simulation; electrons are tracked [27] through an EPW computedin the linear regime, created by a laser beam, in the gaussian approximation withcylindrical symmetry, ie. according to eq. 1. Electrons injected on axis (curve a)undergo an acceleration or a deceleration, depending on their injection phase '.Electrons injected with a tiny emittance (b) in the focusing part of the wave are nota�ected, while those that are defocused are expelled before the high acceleratinggradient region is reached. Electrons injected with real emittance (c) miss the EPWwaist even in the focusing part of the EPW. Note also that both the length of thecompletely ionized plasma, Lpl � 25 mm, and the length on which the electrons
are captured by the EPW [26] Lcapt = 2z0q�=�c � 40 mm, are larger than the
dephasing length Ldephas � 8 mm : most of the electrons have the occasion to beexpelled from the EPW by a defocusing �eld during their path through the EPW.The corresponding fraction of the electrons accelerated throughout the plasma
is low (Fig. 8, right) and the maximum energy gain observed in the simulation is

much lower than the maximum possible energy gain �W = �ez0Ez. The slope ofthe simulated spectrum is in agreement with the observed value. The acceleratedelectrons are contained in a divergence angle of�70 mrad, well inside the acceptanceof the detector. To reach the maximum possible energy gain, the increase of theradial size of the accelerated electron beam could be overcome either by an injectionat a higher energy, or by a limitation of the EPW length, by using a gas jet.
FIGURE 8. 3D MonteCarlo simulation [27] of the energy gain (left) of 1000 electrons as a
function of their phase with respect to the EPW. a) beam on axis; b) small emittance beam
(30 nm�10 �rad RMS); c) real emittance beam (30 �m�10 mrad RMS). The corresponding
spectrum in the 10 �rst channels (right) shows an exponential peak with a slope of -6.1 MeV�1.
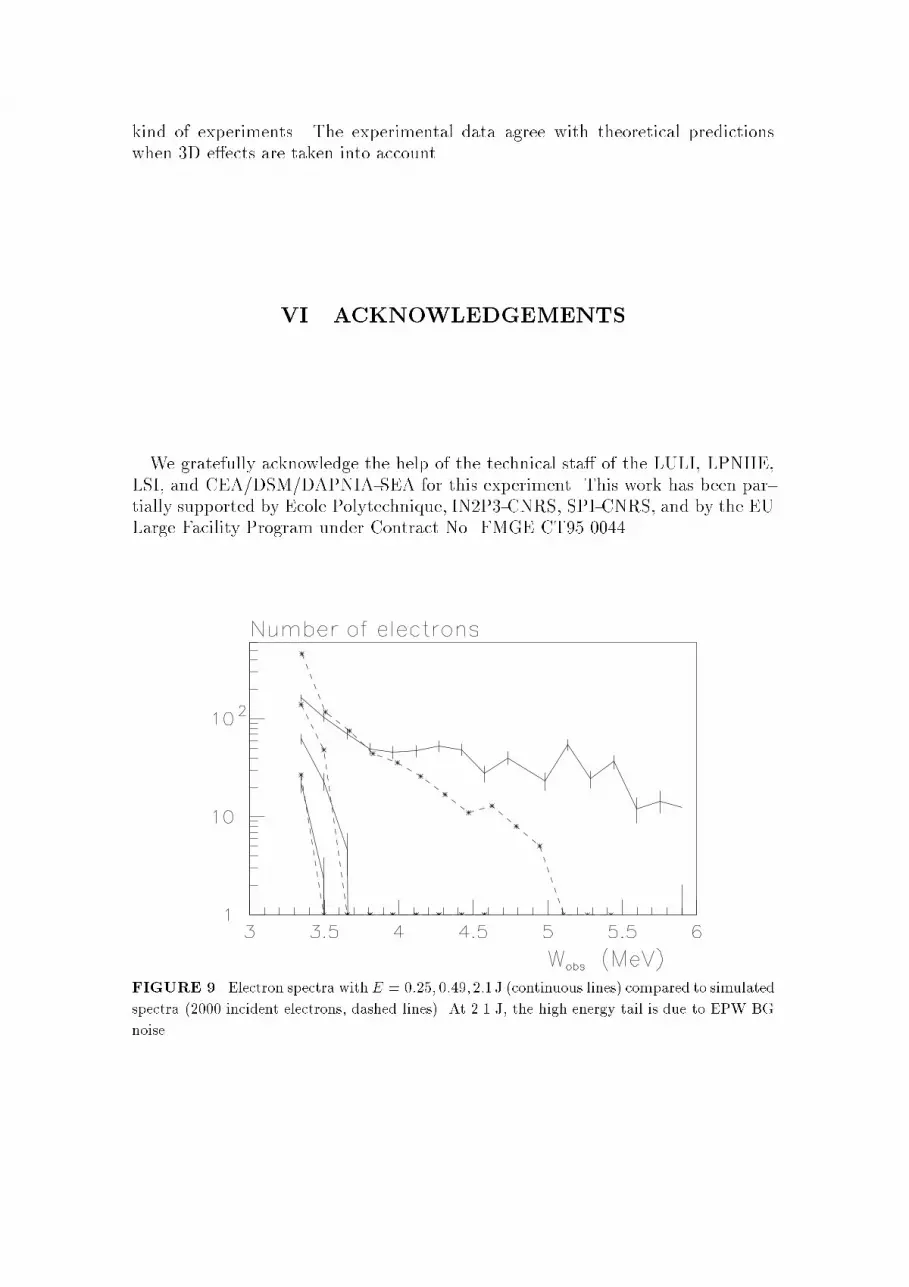
Figure 9 shows electron spectra at three laser central energies. As the electron ow delivered by the Van de Graaf is constant during the life-time T of the EPW,we infer an estimate of T from a comparison of the normalisations of the observedand simulated spectra. The obtained value is of about 1 ps, in agreement withparticle simulations using the model of Ref. [24].
V CONCLUSION
In conclusion, we have observed the acceleration of electrons injected in an EPWgenerated by laser wake�eld, with a maximum energy gain of 1.6 MeV. We alsoobserve a tail in the high energy channels. Our cross-check using stainless steel�lters proves that this tail is actually due to low energy de ected electrons. ThisBG, clearly correlated with the plasma wave, can fake accelerated electrons in this
kind of experiments. The experimental data agree with theoretical predictionswhen 3D e�ects are taken into account.
VI ACKNOWLEDGEMENTS
We gratefully acknowledge the help of the technical sta� of the LULI, LPNHE,LSI, and CEA/DSM/DAPNIA-SEA for this experiment. This work has been par-tially supported by Ecole Polytechnique, IN2P3-CNRS, SPI-CNRS, and by the EULarge Facility Program under Contract No. FMGE CT95 0044.
FIGURE 9. Electron spectra withE = 0:25; 0:49;2:1 J (continuous lines) compared to simulated
spectra (2000 incident electrons, dashed lines). At 2.1 J, the high energy tail is due to EPW BG
noise.

REFERENCES
1. A review can be found in : E. Esarey et al., IEEE Trans. Plasma Science, 24 252
(1996).
2. T. Tajima and J. M. Dawson, Phys. Rev. Lett. 43, 267 (1979).
3. F. Amirano� et al., Phys. Rev. Lett. 74, 5220 (1995);
F. Amirano� et al., IEEE Trans. on Plasma Sci., 24 296 (1996).
4. Y. Kitagawa et al., Phys. Rev. Lett. 68, 48 (1992).
5. C. E. Clayton et al., Phys. Rev. Lett. 70, 37 (1993).
6. N. A. Ebrahim, J. Appl. Phys. 76, 7645 (1994).
7. L. M. Gorbunov and V. I. Kirsanov, Zh. Eksp. Teor. Fiz. 93 509 (1987); Sov. Phys.
JETP 66 290 (1987).
8. P. Sprangle et al., Appl. Phys. Lett. 53 2146 (1988).
9. N. E. Andreev et al., Sov. Phys. JETP 55 571 (1992).
10. T. M. Antonsen Jr. and P. Mora, Phys. Rev. Lett. 69 2204 (1992).
11. P. Sprangle et al., Phys. Rev. Lett. 69 2200 (1992).
12. A. Modena et al., Nature, 377 606 (1995).
13. C. Coverdale et al., Phys. Rev. Lett. 74 4659 (1995).
14. K. Nakajima et al., Phys. Rev. Lett. 74 4428 (1995).
15. A. Ting et al., Phys. Plasmas 5 1889 (1997).
16. R. Wagner et al., Phys. Rev. Lett. 78, 3125 (1997)
17. J. R. Marqu�es et al., Phys. Rev. Lett. 76 3566 (1996);
C. W. Siders et al., Phys. Rev. Lett. 76 3570 (1996).
18. J. R. Marqu�es et al., Phys. Rev. Lett. 78 3463 (1997).
19. Observation of Laser Wake�eld Acceleration of Electrons, F. Amirano� et al.,
preprint X-LPNHE 98/02, April 1998, to appear in Phys. Rev. Lett.
20. C. E. Clayton et al., Phys. Plasma, 1 1753 (1994).
21. K. Nakajima et al., in Proceedings of the International Workshop on Acceleration
and Radiation Generation in Space and Laboratory Plasmas, Kardamily, Greece,
1993, Published in Phys.Scripta T52:61-64,1994.
22. M. Kando et al., KEK Preprint 97-10, April 1997, submitted to Phys. Rev. Lett.
23. F. Amirano� et al., Nucl. Instr. and Meth. A 363 497 (1995).
24. P. Mora, T. M. Antonsen Jr, Phys. Plasma 4 217 (1997).
25. W. R. Nelson et al., The EGS4 code system, SLAC report 265, Dec. 1985.
26. D. Bernard, in Proceedings of the 13th Advanced ICFA Beam Dynamics Workshop
and 1st ICFA Novel and Advanced Accelerator Workshop, Kyoto, Japan, 1997, Nucl.
Instrum. Methods Phys. Res. A 410 (1998) 418.
27. P. Mora, J. Appl. Phys. 71 2087 (1992).


