Embed Size (px)
Citation preview
DISSERTATION
CHALLENGES IN THE SUSTAINABILITY OF LIBYAN AGRICULTURE:
OPPORTUNITIES FOR THE LIBYAN SEED SYSTEM
Submitted by
Neama Lariel
Graduate Degree Program in Ecology
In partial fulfillment of the requirements
For the Degree of Doctor of Philosophy
Colorado State University
Fort Collins, Colorado
Summer 2015
Doctoral Committee: Advisor: Gregory D. Graff
Co-Advisor: Stephen Davies
James Stanelle Dennis Ojima
Copyright by Neama Lariel 2015
All Rights Reserved
ABSTRACT
CHALLENGES IN THE SUSTAINABILITY OF LIBYAN AGRICULTURE:
OPPORTUNITIES FOR THE LIBYAN SEED SYSTEM
Globally, agriculture has met the needs of a growing population remarkably well
(Agriculture and Natural Resources Team of the UK DFID, 2004). However, this success has
been at the expense of our natural resources. A sustainable approach must lead future agricultural
decision-making processes. According to Tilman, Cassman, Matson, and Polasky (2002), the
global population is expected to increase by 50% in 2050; this increase in production will affect
the environment adversely. There are numerous global challenges associated with creating a
sustainable agriculture model.
As one of the most arid countries on Earth and one that is just emerging from decades of
authoritarian rule, Libya faces several big challenges in order for its agriculture to meet demand
in a sustainable manner. Specifically, improvements in Libya’s seed system may be needed to
help close the yield gap, reduce negative externalities associated with agricultural production,
and facilitate the adaptation of Libyan agriculture to climate change.
While there are many factors that contribute to Libya’s apparent current yield gap in
wheat and barley, one of its most important agricultural sectors, the lack of availability of
appropriate genotypes for each environment serves as the primary factor focused on in this study.
The objectives to this research are to understand what varieties farmers currently grow, why they
grow those varieties, and how they access the seed for those varieties as well as understanding
what constrains farmers’ adoption of new varieties in order to recommend mechanisms of
ii
improvement to the seed system in Libya. To achieve sustainability in agriculture, higher yields
must be maintained while minimizing environmental impacts, making it increasingly important
to understand the Libyan seed system and its users and their access.
This research has two primary hypotheses in regards to closing the yield gap: One
focuses on the demand side and why farmers are not adopting improved varieties. The other
concerns the supply side and questions of who provides wheat and barley seed to farmers, under
what arrangements, and where the genetic varieties originate. The preliminary assumption is that
Libyan wheat and barley farmers are more likely to use imported seeds than domestic seeds due
to the lack of availability of improved local varieties due to the lack of breeding programs in
Libya.
iii
ACKNOWLEDGEMENTS
First of all, I would like to gratefully and thankfully acknowledge Allah, that he helped
me to keep doing my dissertation despite all the difficulties. I also have the support from my
family and encouragement from friends. I would like to express my deepest gratitude to my
advisor, Dr. Gregory D. Graff, for his excellent guidance, enthusiasm, patience, and immense
knowledge and providing an excellent atmosphere for doing research. He told me one day that
“people will look to your study and say ‘wow this is the first systematic study’, studies will come
after and they were all inspired by you, Neama!” Also, I would like to thank my committee:
Stephen Davies, Jim Stanelle, and Dennis Ojima.
I would like to thank Dr. Ali Arhama, who helped me to manage and distribute my survey
in Libya. His experience of research in this field, as well financial support for the study were
invaluable, without him, this dissertation could have been completed. Also, thanks go to Dr. Naser
El-Msalati, who helped me distribute surveys in the eastern area and he gave many resources to
support my dissertation.
I would also like to thank my parents, five sisters, and five brothers. They have always
supported me and encouraged me with their best wishes. Also, I dedicate this dissertation to all
my 29 nieces and nephews, with the intent that my work will inspire them in their future work.
Last but not least, I would like to thank all of my friends Tiffany, Patricia, Laura, Jared, Amanda,
Majeda, Wijdan, and Rehab which are great friends and have always been willing to help and
support since my family is far away. They are always cheering me up and have stood by me
through the good times and bad. It would not have been possible to complete my education without
their support.
iv
TABLE OF CONTENTS
ABSTRACT ....................................................................................................................... ii
ACKNOWLEDGEMENTS ...............................................................................................iv
LIST OF TABLES .............................................................................................................ix
LIST OF FIGURES ...........................................................................................................xi
1 Challenges to the Sustainability of Agriculture: Worldwide and in Libya ................. 1
1.1 Sustainability in Agriculture and Economic Development .................................. 1
1.1.1 Closing the Yield Gap ................................................................................... 3
1.1.2 Increasing Production Limits ........................................................................ 4
1.1.3 Reducing Waste ............................................................................................ 5
1.1.4 Changing Diets.............................................................................................. 5
1.1.5 Expanding Aquaculture ................................................................................ 6
1.1.6 Using Water Efficiently ................................................................................ 7
1.1.7 Maintaining Soil Fertility .............................................................................. 8
1.1.8 Controlling Pests ........................................................................................... 9
1.1.9 Producing Livestock Sustainably .................................................................. 9
1.1.10 Stopping Expansion of Agricultural Lands................................................. 10
1.1.11 Adapting to Climate Change ....................................................................... 10
1.2 Overview of Libya’s Economy and Agriculture ................................................ 12
1.2.1 Libya’s Land Resources .............................................................................. 13
1.2.2 The Libyan Economy .................................................................................. 17
1.2.3 Impact of Trade Sanctions .......................................................................... 19
1.2.4 Libyan Agriculture ...................................................................................... 21
1.2.5 The Structure of Libya’s Agriculture Sector .............................................. 22
1.2.6 Government Support of Agriculture in Libya ............................................. 26
1.2.7 Agricultural Marketing in Libya ................................................................. 28
1.2.8 The Current State of Libyan Agriculture and the Continuing Importance of Cereal Grains Production ...................................................................................................... 28
1.3 Sustainability Challenges in Libyan Agriculture ............................................... 30
v
1.3.1 Water Management ..................................................................................... 30
1.3.2 Marginalization of Agriculture Due to Land Use Change .......................... 32
1.3.3 Low Primary Productivity, Due to Low Quality of Farm Inputs, Including Seeds 32
1.3.4 Efficiency and Environmental Safety of Agricultural Chemicals .............. 33
1.3.5 Adaptation to Climate Change .................................................................... 33
1.4 Summary and Conclusions ................................................................................. 34
2 The Yield Gap in Grains Production in Libya ........................................................... 36
2.1 Introduction ........................................................................................................ 36
2.1.1 Why Closing the Yield Gap is Important to Sustainability ........................ 36
2.1.2 Yield as Just One Measure of Sustainability .............................................. 37
2.1.3 Defining the Yield Gap ............................................................................... 38
2.1.4 Actual and Potential Yields ........................................................................ 39
2.1.5 How Yield Gap is Measured ....................................................................... 40
2.2 Current Status of Wheat and Barley in Libya: Is There a Yield Gap? ............... 44
2.3 Measuring the Yield Gap in Libya ..................................................................... 51
2.3.1 Comparison with Yields in Neighboring Countries.................................... 51
2.3.2 Yields on Experimental Fields in Libya ..................................................... 52
2.3.3 Estimated Yields Based on Global Climate Models ................................... 53
2.4 Impacts of Seed Quality on Yields in Libya ...................................................... 53
2.5 Discussion and Conclusions: Farmers’ Choices of Crop Variety in Closing the Yield Gap 54
3 Availability and Adoption of Improved Wheat and Barley Varieties: A Survey of Grain Farmers in Libya ............................................................................................................... 57
3.1 Introduction ........................................................................................................ 57
3.2 Survey Design and Administration .................................................................... 58
3.3 Farmer and Farm Characteristics ....................................................................... 61
3.3.1 Farmers’ Socio-Demographic Characteristics ............................................ 61
3.3.2 Farm Land ................................................................................................... 66
3.3.3 Farm Labor.................................................................................................. 67
vi
3.3.4 Mechanical Technology .............................................................................. 69
3.3.5 Irrigation ..................................................................................................... 70
3.3.6 Fertilizer Use ............................................................................................... 72
3.3.7 Pesticide Use ............................................................................................... 73
3.3.8 Government Support ................................................................................... 75
3.3.9 Marketing .................................................................................................... 76
3.4 Identified Wheat and Barley Varieties Grown in Libya .................................... 80
3.4.1 Varieties of Wheat Grown in Libya ............................................................ 81
3.4.2 Varieties of Barley Grown in Libya............................................................ 84
3.4.3 Definition and description of local or mahale varieties of wheat and barley grown in Libya 86
3.5 Farmer Decisions Regarding Wheat and Barley Varieties ................................. 87
3.5.1 Farmers’ Sources of Wheat and Barley Seeds ............................................ 87
3.5.2 Intentions for Saving Seed and Purchasing Certified Seed ........................ 91
3.5.3 Purchased Versus Saved Seed for Wheat and Barley Varieties ................. 92
3.5.4 Farmers’ Stated Preferences for Growing Wheat and Barley over Other Crops 96
3.5.5 Farmers Stated Preferences for Growing Local (mahale”) Varieties versus Imported Varieties ..................................................................................................... 97
3.5.6 Farmers Stated Preferences for Growing Specific Wheat and Barley Verities 99
3.5.7 Seeding Rates of Wheat and Barley Varieties .......................................... 103
3.6 Logit Analysis of Adoption of Improved Varieties ......................................... 104
3.6.1 Methods and Data for Logit Regression Analysis .................................... 105
3.6.2 Description of Variables Used .................................................................. 105
3.6.3 The First Model: Decision of Farmers to Grow Any Improved Variety .. 110
3.6.4 The Second Model: Decisions of Farmers to Grow Only Improved Varieties 113
3.7 Conclusions ...................................................................................................... 115
4 The Role of an Improved Seed System in Closing the Yield Gap in Libyan Agriculture 117
4.1 Introduction ...................................................................................................... 117
vii
4.1.1 The fundamental importance of a well-functioning seed system ............. 117
4.1.2 National Seed Systems: Formal and Informal Sectors ............................. 119
4.2 The Seed System in Libya ................................................................................ 120
4.2.1 The Public Sector’s Dominant Role in the Seed System in Libya ........... 121
4.2.2 International Organizations Working with the Libyan Seed System ........ 123
4.2.3 The Private Sector’s Uncertain Role in the Libyan Seed System ............. 125
4.3 General Recommendations for Improving Seed Systems in Developing Countries 127
4.3.1 Variety Registration, Testing, Certification, and Labeling ....................... 128
4.3.2 Farmer Engagement and Education .......................................................... 129
4.3.3 Plant Breeders’ Rights (PBRs) as Private Sector Incentives .................... 130
4.3.4 Better Coordination of the Roles of the Public and Private Sectors ......... 130
4.4 A Path Forward for the Libyan Seed System: Conclusions and Recommendations from the Current Study ........................................................................................................ 131
5 Summary and Conclusions ...................................................................................... 135
5.1 Summary of Chapter 1 ..................................................................................... 135
5.2 Summary of Chapter 2 ..................................................................................... 135
5.3 Summary of Chapter 3 ..................................................................................... 136
5.4 Summary of Chapter 4 ..................................................................................... 136
5.5 Limitations of this Study .................................................................................. 136
5.6 Recommendations for Future Studies .............................................................. 137
5.7 Final Conclusions ............................................................................................. 138
References ....................................................................................................................... 140
APPENDIX 1. Survey Cover Letter (English version) .................................................. 150
APPENDIX 2. Survey Cover Letter (Arabic version) .................................................... 152
APPENDIX 3. Survey (English version) ........................................................................ 153
APPENDIX 4. Survey (Arabic version) ......................................................................... 170
APPENDIX 5. Institutional Review Board (IRB) Exemption Letter ............................. 183
viii
LIST OF TABLES
Table 1.1 Land Use in Libya ............................................................................................. 15
Table 1.2 Gross Domestic Product Composition, by Sector ............................................ 19 Table 1.3 Main Crop Production in Libya, Ranked by Production Volume in 2010, in Tonnes........................................................................................................................................... 26 Table 2.2 Barley and Wheat Import Dependency Ratio (IDR), 1990 to 2012 ................. 49 Table 3.1 Numbers of Wheat and Barley Farmers Surveyed, by Region ......................... 60 Table 3.2 Numbers of Wheat and Barley Farmers Responding, by Crop and Region ..... 60 Table 3.3 Income Sources ................................................................................................. 63 Table 3.4 Other Crops Grown on Farm, As Indicator of Degree of Specialization or Diversification................................................................................................................... 64 Table 3.5 Off-Farm Income .............................................................................................. 64 Table 3.6 Sources of Off-Farm Income ............................................................................ 65 Table 3.7 Farm Size .......................................................................................................... 66 Table 3.8 Ownership of Land ........................................................................................... 67 Table 3.9 Area of Land Planted to Wheat or Barley ......................................................... 67 Table 3.10 Additional Workers on Farms......................................................................... 68 Table 3.11 Difficulty in Finding or Hiring Farm Workers ............................................... 68 Table 3.12 Reasons for Difficulty in Finding or Hiring Farm Workers ........................... 69 Table 3.13 Use of Irrigation .............................................................................................. 70 Table 3.14 Cross Relationship between Rainfall and Irrigation ....................................... 71 Table 3.15 Fertilizer Use................................................................................................... 72 Table 3.16 Factors that Influence Fertilizer Use ............................................................... 73 Table 3.17 Experience with Fertilizer Use ....................................................................... 73 Table 3.18 Pesticide Use ................................................................................................... 74 Table 3.19 Factors Influencing Pesticide Use................................................................... 74 Table 3.20 Experience Using Pesticides ........................................................................... 75 Table 3.21 Government Subsidies for Growing Wheat/Barley ........................................ 75 Table 3.22 Type of Subsidies Provided by Government .................................................. 76 Table 3.23 What Farmers Do with Their Grain Harvests ................................................. 77 Table 3.24 Difficulty in Selling Harvest ........................................................................... 77 Table 3.25 Reasons for Difficulty in Selling Harvest ....................................................... 78 Table 3.26 Price Received for Wheat in 2013 .................................................................. 79 Table 3.27 Price Received for Barley in 2013 .................................................................. 79 Table 3.28 Wheat Varieties Identified in the Survey as Being Grown in Libya: Including Number of Farmers and Reported Area .......................................................................................... 80 Table 3.30 Farmers’ Sources of Seeds for Wheat Varieties Grown ................................. 87
ix
Table 3.31 Farmers’ Sources of Seed for Barley Varieties Grown .................................. 89 Table 3.32 Expectation of Saved Seed ............................................................................. 91 Table 3.33 Certified Seed Purchasing ............................................................................... 92 Table 3.34 Share of Wheat Varieties Planted with Newly Purchased or Saved Seed ...... 92 Table 3.35 Share of Barley Varieties Planted with Newly Purchased Seed or Saved Seed94 Table 3.36 Preference for Local (“mahale”) Varieties ..................................................... 98 Table 3.37 Farmers’ Stated Reasons for Choice of Wheat Varieties ............................. 100 Table 3.39 Seeding Rate of wheat Varieties Planted ...................................................... 103 Table 3.40 Seeding Rate of Barley Varieties Planted ..................................................... 104 Table 3.41 Descriptive Statistics of the Primary Explanatory Variables........................ 109 Table 3.42 Correlation Matrix for Primary Explanatory Variables ................................ 109 Table 3.43 “Any Improved” Varieties Model Predication, without Explanatory Factors111 Table 3.44 “Any Improved” Varieties Model Prediction, with Explanatory Factors ..... 111 Table 3.45 Results of Logistic Regression for Any Improved, Using Six Explanatory Variables......................................................................................................................................... 112 Table 3.46 “Only improved” Varieties Model Predication, without Explanatory Factors113 Table 3.47 “Only Improved” Varieties Model Prediction, with Explanatory Factors .... 114 Table 3.48 Results of Logistic Regression for Only Improved, Using Six Explanatory Variables......................................................................................................................................... 115
x
LIST OF FIGURES
Figure 1.1 Timeline of Trade Sanctions in Libya ............................................................. 20 Figure 2.1 Barley and Wheat Area Harvested in Libya, 1990-2013 ................................ 48 Figure 2.2 Barley and Wheat Production in Libya, 1990-2013 ........................................ 48 Figure 2.3 Barley and Wheat Yields in Libya, 1990-2013 ............................................... 48 Figure 2.4 Wheat and Barley Cultivation, by Region of Libya, 2007-2008 ..................... 50 Figure 2.5 Annual Wheat Yields of Northern African Countries and the Region as a Whole, 1961-2011 ......................................................................................................................... 52 Figure 3.1 Wheat and Barley Farms Responding to the Survey (by percentage that grow wheat, barley, and both within each major region) ...................................................................... 61 Figure 3.2 Frequency Distribution of Rainfall on Farms of Survey Respondents............ 71 Figure 3.3 Farmers’ Source of Seeds for Improved Wheat Varieties ............................... 88 Figure 3.4 Farmers’ Source of Seeds for Improved versus Local (“mahale”) Wheat Varieties........................................................................................................................................... 88 Figure 3.5 Farmers’ Sources of Seeds for Improved Barley Varieties ............................. 90 Figure 3.6 Farmers’ Source of Seeds for Improved versus Local (“mahale”) Barley Varieties........................................................................................................................................... 90 Figure 3.7 Areas of Improved Wheat Varieties Planted with Purchased or Saved Seed in 2013........................................................................................................................................... 93 Figure 3.8 Areas of Improved Versus Local (“mahale”) Wheat Varieties Planted with Purchased or Saved Seed in 2013....................................................................................................... 93 Figure 3.9 Areas of Improved Barley Varieties Planted with Purchased or Saved Seed in 2013........................................................................................................................................... 95 Figure 3.10 Hectares of Improved and Local (“mahale”) Barley Varieties Planted in 2013 95 Figure 3.12 Reasons Stated for Growing Improved Barley Varieties, by Variety ......... 102
xi
1 Challenges to the Sustainability of Agriculture: Worldwide and in Libya
1.1 Sustainability in Agriculture and Economic Development
Globally, agriculture has met the needs of a growing population remarkably well
(Agriculture and Natural Resources Team of the UK DFID, 2004). However, this success has
been at the expense of natural resources. Sustainable approaches must lead future agricultural
decision-making processes if agriculture is to continue providing for a growing population. In
1987, the World Commission on Environment and Development (WCED) report provided a
definition of sustainable development: “Humanity has the ability to make development
sustainable to ensure that it meets the needs of the present without compromising the ability of
future generations to meet their needs” (WCED, 1987, p. 16). Many scientists have similar
definitions of sustainability. For example, Dawe and Ryan (2003) define sustainability as
preserving economic prosperity, environmental integrity, and social welfare. The Scottish
Environment Protection Agency (as cited in Dawe and Ryan, 2003) talks about the same three
aspects of sustainability:
“A simple way of picturing sustainable development is to think of it as a stool with three legs, representing the environment, the economy and society, if any leg is more or less important (i.e., shorter or longer) than the others, the stool will be unstable (but perhaps still usable–at least for a while). If any leg is missing, the stool simply will not work. But if all three legs are the same length (i.e., environmental, economic and social considerations have been given equal weight), the result will be a well-balanced stool which will serve its purpose indefinitely–a sustainable stool.” However, these definitions do have differences as well. Tilman et al. (2002) focus on two
of the three aspects when they state that sustainability is the maintenance of high yields in
conjunction with acceptable environmental impact. Krysiak and Krysiak (2006) give a more
1
generalized definition of sustainability when they write that it could be defined as the
requirement to maintain well-being over a long period of time without economic decline.
From these definitions of sustainability, we can understand the essential notion of
agricultural sustainability to mean an increase of production while simultaneously protecting the
environment and social welfare. According to the United Nations Population Division (United
Nations, 2013), the global population is expected to increase by about 50% by 2050. Pardey,
Beddow, Hurley, Beatty, and Eidman (2013) estimates that 70 % more food production will be
needed to meet the demand of this increased population; and by most accounts, this increase in
production will affect the environment adversely. A balance is needed between the two aspects.
Despite rapid technological advances and dramatic yield improvements over the past
half-century (Godfray et al., 2010), today, more than one in seven people still do not have access
to adequate protein and energy from their diet (FAO, 2009). A larger number of people also
suffer from micronutrient deficits and undernourishment (FAO, 2009). Sustainable agriculture
must maintain high yields while minimizing environmental impact. As the global population
continues to climb toward nine billion (Godfray et al., 2010), net benefits that society receives
from agricultural systems and from ecosystem services must be maximized (Tilman et al., 2002).
The challenges that must be addressed globally in order for agriculture to be sustainable
are significant. Several factors directly influence the development of sustainable agriculture. Not
only is population growth a driver of consumption growth, but as a population’s per capita
income increases, their consumption habits change to demand more food diversity and
consumable goods. Recent analyses suggest that the world will need seventy to one hundred
percent more food than agriculture is supplying today (Godfray et al., 2010; Pardey et al., 2013).
2
Some solutions for more sustainable agriculture practices in agricultural and food systems are
already well known.
1.1.1 Closing the Yield Gap
In order to meet the growing demand for food, agricultural systems must close the yield
gap (Foley, Ramankutty & Brauman, 2011; Godfray et al., 2010) while minimizing
environmental impacts. This means production must increase in underperforming lands. Closing
gaps to approximately 95% of their yield potential for sixteen staple food and feed crops could
add 2.3 billion tons of additional production without using more land (Foley et al., 2011). The
kinds of developments that could close yield gaps include the following: improved seed varieties,
water conservation and irrigation, precision agricultural practices, soil nutrients, pest
management, biodiversity conservation, integrating organic agricultural practices, as well as
reforming conventional input rates and timing (Foley et al., 2011; Godfray et al., 2010). In
Africa, the yield gap is greatest. In the mid 1970’s, Africa’s per capita production began to
decrease and recently has reached the equivalent of 1961 per capita production (Godfray et al.,
2010).
Ecological costs from closing the yield gap are inevitable and may not be reflected in
consumer food prices. Specifically, increased agricultural production can be expected to increase
greenhouse emissions and pesticide and nutrient pollution in runoff. Over-extraction of water
may lead to aquifer depletion and water shortages. Soil degradation and biodiversity loss as a
result of land conversion and poor management are likely consequences of increased production
and may also affect capacity for future food production. Overall, ecosystem destruction due to
3
over harvesting of aquatic systems may also be a consequence of production increases (Godfray
et al., 2010).
Another challenge in attempting to close yield gaps is determining where to most
efficiently make scarce financial investments. For example, investment is necessary in regional
and national infrastructure, such as roads and ports, while investing in social and economic
capital is equally necessary (Godfray et al., 2010). High costs of inputs increase farming costs,
while less-developed marketing opportunities often do not provide a fair return on investment.
Maximum production remains unattainable with this barrier in place for farmers (Godfray et al.,
2010). Low yields also occur because of technical insufficiencies that prevent local food
producers from increasing productivity (Godfray et al., 2010). For example, in many countries,
policy is currently ineffective or absent that regulates and educates on the most efficient use of
fertilizers and pesticides (Foley et al., 2011).
1.1.2 Increasing Production Limits
Improving feasible yields on existing farmland in order to minimize further conversion of
natural areas to farmed ground is necessary (Barnett, Payne, & Steiner, 1995; Ruttan, 1999, in
press). Most of the world’s best quality farmable land is already in production, leaving mostly
marginal lands available for further expansion. Thus, expansion may result in low yields and
further land degradation (Cassman, 1999; Young, 1999). Already, limited amounts of water are
available for human consumption and this water is often utilized for non-agricultural purposes,
especially if low yields are the result of the water diversion (Cassman, 1999). Evidence suggests
that genetic improvements in corn and rice have reached their yield ceiling; however, wheat
breeding continues to increase yield potentials via breeding programs (Reynolds, Rajaram, &
Sayre, 1999). Availability of, and knowledge about, biotechnology is limited (Godfray et al.,
4
2010), but this may be an important technology for closing the yield gap. International gene
banks are also valuable, yet it is necessary to ensure that regionally adapted crop and livestock
germplasm is not lost in the process of replacement by modern varieties and breeds (Godfray et
al., 2010). However, there is also an issue with public trust and acceptance of biotechnology
(Godfray et al., 2010). It will be necessary to address these issues in order for this technology to
become part of the sustainable agriculture model. In addition, there is a virtual monopoly on
genetically modified traits, which limits innovation and investment in the technology (Godfray et
al., 2010). Judicious use of existing technologies, both chemicals and biotechnology, could go a
long way in closing the yield gap.
1.1.3 Reducing Waste
Reduction of waste could significantly increase sustainability. Between thirty and forty
percent of all food produced is lost as waste as a result of the lacking food chain infrastructure
for storage, transportation, pest exclusion, or spoilage (Godfray et al., 2010). Also, as the
population increases and consumption increases, directly and indirectly produced volumes of
waste will increase in developing countries and in industrialized countries at the consumer level
(Foley et al., 2011). Since the overall waste challenge is immense Foley et al. (2011) suggest
focusing initially on reducing waste in the most resource intensive foods, such as meat and dairy.
1.1.4 Changing Diets
History has shown that as wealth increases, people shift from a diet primarily of
vegetables to one including larger quantities of meat and protein (Godfray et al., 2010).
Producing meat requires more energy than producing a calorie-equivalent plant-based food
5
(Foley et al., 2011). Decreasing the amount of meat consumed is challenging. Trends in the last
fifty years illustrate an increase in demand for meat and dairy due to increased wealth.
There are pros and cons associated with this worldwide change in eating habits (Godfray
et al., 2010). Negative consequences include substantial variation in production efficiency for
different food sources and a variation in environmental impact of different types of meat eaten
by people, such as the methane gas produced from livestock production. On the other hand, non-
arable land may be used for grazing to provide much needed protein for developing countries.
Livestock is also used as a source of income in poor communities and often plays an important
cultural role. However, there is the possibility that better animal husbandry and genetic
improvement of animal breeds may improve production (Godfray et al., 2010).
Balancing reduction in consumption of meat with increase in consumption of more
efficient types of protein is necessary. The production of one kilogram of meat may necessitate
between three and ten kilograms of grain (Tilman et al., 2002). Shifting diets to include pork,
poultry, or pasture-fed beef and away from grain-fed beef can help increase the energy efficiency
of a protein rich diet (Foley et al., 2011). Well-balanced diets of grain, vegetables and meat must
become a norm for all cultures (Godfray et al., 2010).
1.1.5 Expanding Aquaculture
Aquatic products provide nearly three billion people with at least 15% of their animal-
based protein supply (Godfray et al., 2010). The potential for expansion of aquaculture systems
are greater than the potential for expansion of terrestrial agricultural systems and may be able to
support the sustainable agriculture goal. However, it is important to strategically develop fishery
and coastal zone management in order not to deplete or displace natural fisheries (Whitmarsh &
Palmieri, 2008). Fish growth rates and the length of time required before harvest require a
6
financing arrangement that provides working capital as well as risk management for farmers
(Godfray et al., 2010). Environmental impact from aquaculture inputs, such as disease treatment
chemicals, fish food, fish waste, and genetic contamination of wild species are challenges
associated with expanding aquaculture systems (Godfray et al., 2010).
1.1.6 Using Water Efficiently
As population increases, competition for water and arable land also rises, leading to
increasing food security issues (Godfray et al., 2010). In the past fifty years, world irrigated
cropland has doubled, and now 70% of freshwater withdrawals are used in irrigation (Foley et
al., 2011). According to Gleik (1993) and Postel, Daily, and Ehrlich (1996), it is estimated that
40% of crop yields come from the 16% of arable land that is irrigated.
To meet the growing demand for food while saving water, it is imperative to increase
irrigation efficiency. Since 1978, the global rate of irrigated acres has decreased by five percent
and new dam constructions may only offer a 10% increase in irrigation water supplies over the
next thirty years (Dynesius & Nilsson, 1994; Postel et al., 1996). Many regions, including China,
India, Pakistan, North Africa and the Middle East will soon fall short of an adequate water
supply to sustain per capita food production from irrigated ground (Seckler, Barker, &
Amarasinghe, 1999). Without irrigation, global cereal production would decrease by
approximately 20%, which would require more land to produce equal yields (Foley et al., 2011).
Additionally, agricultural runoff tends to carry more salts, nutrients, minerals and
pesticides into the surface and ground water; this affects downstream agriculture productivity,
natural ecosystems and drinking water (Tilman et al., 2002). Several suggested approaches may
address these challenges, including: utilizing more efficient irrigation technologies, such as drip
7
and pivot irrigation, adding manure to the soil to aid in water retention, reducing tillage, and
breeding more drought resistant crops (Tilman et al., 2002).
1.1.7 Maintaining Soil Fertility
Fertile soil is necessary to support a sustainable agriculture system. However, since 1945,
approximately 17% of arable land has suffered human-induced soil degradation and decreased
productivity, often from poor fertilizer management, soil erosion and shortened fallow periods
(Tilman et al., 2002). Continuous cropping and insufficient nutrient and organic matter
replacement deplete fertility and causes organic soil matter to decline, often to half or less of
original levels (Matson, Naylor, & Ortiz-Monasterio, 1998). Tillage increases the rate of
decomposition of organic matter and the release of mineral nutrients, and erosion may be severe
on slopes that are mismanaged (Tilman et al., 2002). Crop rotation, reduced tillage, cover
cropping, increased fallow periods, manuring, and balanced fertilizer application can all help
maintain and restore soil fertility (Tilman et al., 2002).
Fertilizers are a key component in sustainable agriculture; however, mismanagement of
them has negative impacts. Widespread nutrient pollution and the degradation of surface water
bodies are already prevalent in the world (Godfray et al., 2010). In addition, the release of nitrous
oxide from fertilized fields exasperates climate change. Excess nutrients also have energy costs
associated with the processes that converts atmospheric nitrogen and mined phosphorus into a
plant, an available form of fertilizer.
Although negative environmental consequences occur from over-use of fertilizers, it is
equally a problem that insufficient nutrients are available in worldwide agronomic production.
Many yield gaps are due to incorrect amounts of necessary plant nutrients (Cassman, Doermann,
8
& Walters, 2002). A survey of world agriculture illustrates that there are “hotspots” of both low
nutrient use efficiency and large volumes of excess nutrients. 10% of the world’s croplands
account for 32% of the global nitrogen surplus and 40% of the phosphorus surplus. Policy and
better management strategies could improve the balance between the environment and yields
(Foley et al., 2011)
1.1.8 Controlling Pests
Corn, rice, and wheat are the dominant crop species planted for human consumption.
These three crops make up 60% of human food needs (Tilman et al., 2002). As the acreage for
each of these crops continues to increase, research suggests that the pest pressure will increase
proportionally to the host crop’s abundance (Tilman et al., 2002). Improvement in pest control
can increase yields. Tilman et al. suggested a three-fold approach to addressing pest and
pesticides that includes breeding for new disease resistance, discovering new pesticides and
planting different crops with greater spatial and temporal diversity. Zhu et al. (2000) suggested
that an important and costly rice pathogen was controlled in a large region of China by sowing
two rice varieties in alternating rows. This management strategy increased profitability and
reduced the use of pesticides.
1.1.9 Producing Livestock Sustainably
Since 1970, global per capita meat production has grown more than 60%. This trend is
correlated to global per capita income increases (Tilman et al., 2002). In response to this trend,
livestock production evolved into an industry. In livestock production, large-scale operations are
economically competitive because of economies of scale; however, this scale of production has
health and environmental costs (Martin, 2000). Management practices that may minimize the
health and environmental costs include composting animal wastes to create a crop fertilizer that
9
no longer harbors pathogens (Tilman et al., 2002). Alternatively, pasture-based grazing systems
make widespread use of ecosystem services and minimize negative environmental externalities
associated with protein production (Tilman et al, 2002).
1.1.10 Stopping Expansion of Agricultural Lands
Currently, arable land covers approximately 38% of the earth’s surface (Foley et al.,
2011). The growth in agricultural land development is moving toward tropical ecosystems. In
addition, expanding agriculture into sensitive ecosystems has negative effects on biodiversity,
stored carbon, and important ecosystem services (Foley et al., 2011). Annual estimates show that
five to ten million hectares of forest are still being cleared annually for agricultural expansion
(Foley et al., 2011). Maintaining ecosystem services is imperative for global sustainability. For
example, preserving forests to purify water through soil filtration serves humanity as a whole.
However, it is understood that agricultural practices decrease the ability of an ecosystem to
perform these services (Tilman et al., 2002).
1.1.11 Adapting to Climate Change
Climate change (Godfray et al., 2010) will also affect the global efforts to produce a
sustainable food supply. There are two critical areas of climate change to consider when
discussing sustainable agriculture. They are the impact of agriculture on climate change and the
impact of climate change on agriculture.
Worldwide, agriculture is responsible for thirty to 35% of greenhouse gas emissions,
primarily from tropical deforestation, emissions from livestock, rice cultivation and overly
fertilized soils (Foley et al., 2011). There are many agricultural factors that affect the climate
directly or indirectly, such as: quantity and type of land cover, type of materials used to create a
windbreak, type of irrigation system, and tillage techniques. These factors alter the climate by
10
changing transpiration, adding particles to the air, and modifying both precipitation and wind
(Desjardins, 2009). Approximately 13% of the radiative force from greenhouse gases is produced
by agricultural activity.
In the United States and Canada, carbon dioxide (CO2) produced by agriculture accounts
for six to eight percent. However, greenhouse gases produced from agricultural activities are
mostly in the form of methane (CH4) and nitrous oxide (N2O) (IPCC, 2007). Until the 1970’s,
agricultural activities created more atmospheric CO2 than fossil-fuel burning (Lal, Kimble,
Follett, & Cole, 1998). Agriculture is an important factor in climate change, mostly because
rapid changes in the way land is used causes related environmental changes (Goldewijk, 2004).
From about 1981 to 2001, approximately 75% of the CO2 emissions could be credited to the
burning of fossil-fuel and the remaining 25% could be attributed to land-use changes (IPCC,
2001). Currently, agricultural intensification and development are major contributors to global
climate change (Foley et al., 2011).
Global climate change can affect agriculture in several ways, such as: shifting
temperatures, precipitation, quality of soil, growth patterns for each season, and pest
management. “Resilient agriculture systems” are more likely to maintain economic, ecological
and social benefits when external forces such as climte change and price fluctuations occur. In
order to be sustainble in an unpredictable environment, food production systems should be
developed that are diverse and flexible, with incorporation and management of livestock and
crop production (National Sustainable Agriculture Coalition, 2009).
Global climate change also impacts livestock. For example, the increased temperature
may cause more livestock deaths. Increased temperature may also increase disease, parasites, and
pathogens. Livestock will also need additional water if the temperature increases “Horticultural
11
crops are likely to be more sensitive to climate change than grains and oilseeds” (National
Sustainable Agriculture Coalition, 2009). Increasing temperatures will require a new
management strategy for global agriculture: Crops will require greater water-use efficiency
(Foley et al., 2011), more efficient management of other inputs, and increased use of stress-
tolerant crop varieties.
In conclusion, the global challenges associated with creating a sustainable agriculture
model are numerous. However, by understanding each challenge thoroughly, scientists and
economists can work toward addressing each issue individually and develop solutions with an
interdisciplinary approach. This study focuses on three big challenges in Libya that must be
addressed in order for agriculture to be sustainable: closing the yield gap, negative externalities
associated with closing this yield gap, and agricultural adaptation to climate change by
considering the relationship between sustainability, agriculture, and economic development.
Specifically, the study investigates to what extent an improved seed system and improved
custom management serve to close the yield gap, assist with diminishing negative externalities,
and adapt to climate change.
1.2 Overview of Libya’s Economy and Agriculture
Libya is located in North Africa. It is bordered by Algeria and Tunisia on the west;
Sudan, Chad and Niger on the south; and Egypt and Sudan to the east. Libya’s northern border
has about 2,000 km of Mediterranean coastline. Its total land area is 1.8 million km2, which is
approximately the size of Alaska (Laytimi, 2006).
The population of Libya is increasing 3.1% every year (Government of the Libyan Arab
Jamahiriya, 2006). It was one million in 1955, and is predicted to be more than 12 million by
2025 (Nasid, 2006, as cited in Zidan, 2007). The current population is about six million people.
12
Approximately 85% of the total population lives in or around the capital city of Tripoli or nearby
in Benghazi, both of which are on the Mediterranean Coast. These two urbanizing areas also
account for more than 80% of the country’s agricultural production. In 2001, it was estimated
that one-third of the population in urban areas resided in slums and were below the poverty level
(WFP & FAO, 2011). However, Libya has the highest literacy and education rates in North
Africa. The literacy rate is about 86% for the population over fifteen years old. This includes
91% of the males and 81% of the females (Eastern Mediterranean Regional Health Systems
Observatory, 2007). The average per capita income for the Libyan population is estimated at US
$18,720 per year (Asylum Research Consultancy, 2013).
1.2.1 Libya’s Land Resources
Only two percent of Libya’s total land area is considered suitable for agriculture, all of
which is near the Mediterranean coast. Approximately 95% of Libya’s total land area is desert,
while four percent is grassland, suitable for grazing animals, and one percent is forest (FAO,
2012; Laytimi, 2006). Libya has predominantly dry and semi-dry areas, and the soil is sandy
with low fertility (FAO, 2012). According to Mahdoa (1998), the location of Libya’s semi-desert
areas (characterized by regular drought due to low and intermittent rainfall) are influenced by the
Mediterranean climate in the north. In the desert climate, covering more than 90% of the country,
the temperature varies according to the location and the seasons of the year. There are four main
terrains in Libya: the coastal plains (wet winters and dry summers), the northern mountains,
known as Jabal al-Khaddar and al-Jabal Natusah (which are more humid and have higher
rainfall), the internal depressions (with some oases), and the southern and western mountains
(desert climate, zero rainfall) (FAO, 2005).
13
The usual precipitation in Libya is only 28 mm/year. The annual rainfall amounts are
low; 95% of the total land area receives less than 100 mm/year (FAO, 2005; Goodland, 2013).
The coastal zone, with about 150-400 mm of rain every year, is near the Mediterranean Sea.
According to FAO (2005), this zone has fish resources that are not being utilized to their
potential. The mountain zone, with Jabal al-Khaddar and al-Jabal al-Natusah, receives about
300-450 mm of rain every year, has cold winter temperatures, and shallow soils. The wadis and
oases receive little or no rain, but water is available from the upper aquifers.
However, the most important agricultural zone is the coastal zone and includes about
70% of the agricultural activity in the country. The second most important agricultural area is the
mountain zone and the third area is the oases zone. Approximately 220,000 hectares of
agricultural area gets more than 300 mm of rain every year. Also, approximately 3.2 million
hectares of agricultural area gets 200 mm to 250 mm of rain every year. Irrigated agriculture
was 175,000 hectares in 1970, and increased to 350,000 hectares in 2000 (Government of the
Libyan Arab Jamahiriya, 2006). El-Msalati (2012) estimated that Libya had about 871.3
thousand hectares of arable land in the northwestern regions, 52.34% of that region; and about
416.9 thousand hectares in the northeastern regions, 29.26% of the total area of the region.
However, the total amount of non-arable land in the northwestern areas is about 793.3 thousand
hectares, 47.65%, and total non-viable areas for agriculture in the northeastern regions are nearly
one million hectares, which is 70.73% of that region’s total area. Also, this does not count land
that is under-utilized because of seasonal agriculture. Lower annual growth rates for agricultural
land results from decreasing arable land (about 0.5% per year) because of population
infringement and climate change leading to reduced rainfall. However, the area of agricultural
14
land reserved by the government for sustainable agriculture in Libya during the same period has
increased annually, estimated at 7.2% of total land in the country (El-Msalati, 2012).
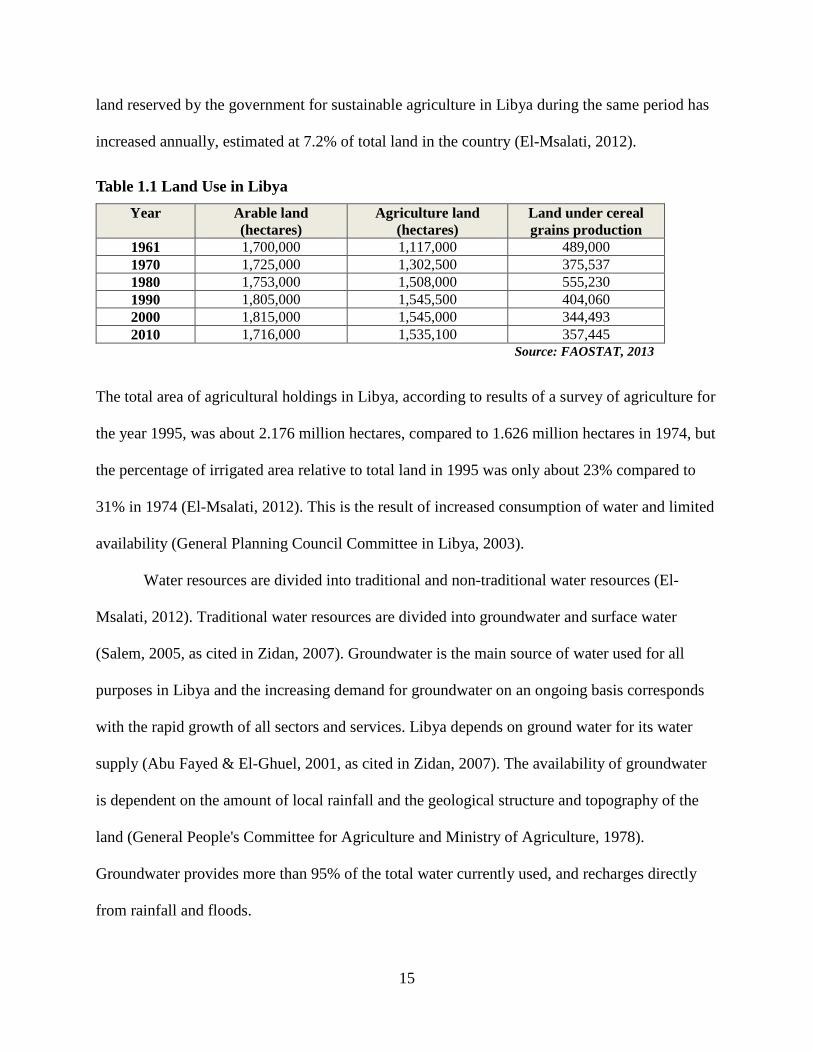
Table 1.1 Land Use in Libya
Source: FAOSTAT, 2013
The total area of agricultural holdings in Libya, according to results of a survey of agriculture for
the year 1995, was about 2.176 million hectares, compared to 1.626 million hectares in 1974, but
the percentage of irrigated area relative to total land in 1995 was only about 23% compared to
31% in 1974 (El-Msalati, 2012). This is the result of increased consumption of water and limited
availability (General Planning Council Committee in Libya, 2003).
Water resources are divided into traditional and non-traditional water resources (El-
Msalati, 2012). Traditional water resources are divided into groundwater and surface water
(Salem, 2005, as cited in Zidan, 2007). Groundwater is the main source of water used for all
purposes in Libya and the increasing demand for groundwater on an ongoing basis corresponds
with the rapid growth of all sectors and services. Libya depends on ground water for its water
supply (Abu Fayed & El-Ghuel, 2001, as cited in Zidan, 2007). The availability of groundwater
is dependent on the amount of local rainfall and the geological structure and topography of the
land (General People's Committee for Agriculture and Ministry of Agriculture, 1978).
Groundwater provides more than 95% of the total water currently used, and recharges directly
from rainfall and floods.
Year Arable land (hectares)
Agriculture land (hectares)
Land under cereal grains production
1961 1,700,000 1,117,000 489,000 1970 1,725,000 1,302,500 375,537 1980 1,753,000 1,508,000 555,230 1990 1,805,000 1,545,500 404,060 2000 1,815,000 1,545,000 344,493 2010 1,716,000 1,535,100 357,445
15
Surface water includes rainwater reserved behind dams and natural springs, and is
considered an important water resource, especially in the northern regions of Libya’s territory.
The total surface water resources are estimated at 170 million cubic meters and contribute about
five percent of the total water resources in Libya (Arab Organization for Agriculture
Development, 1994). Although surface water is less than three percent of the total water in the
country, it is used for residential as well as agricultural activities.
The non-traditional water resources include water reclaimed by desalination, wastewater
treatment, and the Great Manmade River (GMR) project extracting deep aquifer water from
beneath the Sahara desert. Water desalination is important for many countries that have low-
rainfall and coasts as large as Libya. Libyan users represent 69% of those using desalination in
North Africa (Shalluf & Fares, 2003). Goodland (2013) said, “Libya is ranked fifth in the world
in the use of desalination technologies, even though less than two percent of its annual water
demand is satisfied by desalinated water." He further said that the State of the Environment
report in 2002 discussed seventeen desalination plants in Libya, which have reached their design
capacity of approximately 100 million cubic meters/year. Sewage or wastewater treatment is also
an area of interest to be used in agricultural projects. There are about forty treatment plants,
many in major cities, and the total capacity design has about 175 million cubic meters annually
(El-Msalati, 2012; Goodland, 2013).
The third non-traditional water resource is the Great Manmade River (GMR) project. In
1984, Libya started creating the GMR. The water is brought from its source in the desert to the
coast, and it is predicted that the resource will last for 50 years (Loucks, 2004). The
implementation of this project came after many studies of its economic feasibility. It was decided
to exploit the aquifers of fresh water in the southern areas for consumption in the urban and
16
agricultural areas of the coastal North. The goal of this project was stimulating investment in
agriculture and providing drinking water to areas where the population density is concentrated.
The GMR moves over six million cubic meters of water daily. This project is one of the largest
systems for the transfer of water in the world (General People’s Committee for Planning
Economic and Ministry of Economics, 1991). It supplies about 200,000 hectares used for
agriculture. The GMR was expected to provide about 67% of the water needed for agriculture in
1993. However, The GMR now provides more than 70% of the water that is planned for
agricultural use (Goodland, 2013; Government of the Libyan Arab Jamahiriya, 2006). The cost
of his project is estimated at about 25 billion US dollars (Loucks, 2004).
While the GMR has increased irrigated crop production, it is neither sufficient nor
sustainable. Libya grows enough vegetables and fruits to satisfy its food demands within the
country; however, only about 25% of the demand for wheat and barley is supplied from within
the country. These grain crops are grown on different sized farms with greatly varying degrees of
efficiency (Government of the Libyan Arab Jamahiriya, 2006). Only 2.2 million hectares are
arable in Libya. The irrigated arable land is approximately 309,000 hectares and is primarily
from groundwater extraction. Along the coastline, this extraction is depleting the underground
water supply and is causing saline intrusion (Heemskerk & Koopmanschap, 2012).
1.2.2 The Libyan Economy
Agriculture is the second largest sector in the Libyan economy, yet it contributes in most
years an average of less than 10% of the country’s Gross Domestic Product (GDP) (Government
of the Libyan Arab Jamahiriya, 2006). Oil production is the primary sector in the Libyan
economy, to the extent that oil contributes an average of more than 45% of GDP and over 90%
of the country’s export earnings (FAO, 2005; Government of the Libyan Arab Jamahiriya, 2006)
17
and about five percent of the GDP is from the agriculture sector (FAO, 2011). The oil income
and political changes implemented by the longtime Libyan leader, Moammar Gadhafi, were both
factors that have strongly affected the development of Libya (Russo, 2004).
Since the discovery of large amounts of oil, Libya has suffered from what is known as
Dutch Disease. This economic phenomenon occurs as a result of developing one industry or
sector while neglecting others. Two major results most often occur as a result: the appreciation of
its currency, and then a decline in international competitiveness of the other under-developed
sectors. There is a diversion of resources (labor and investment) away from efforts to produce
goods in the other non-export sectors, and into the sector engaged in production of exports. The
major consequences of Dutch Disease are: a decline in exports of traditional goods, an increase
in food commodity prices, and an increase in the number of foreign laborers hired (FAO, 2013).
The source of Libya’s Dutch Disease is its overdependence on the oil sector. Meanwhile,
many other sectors have not been able compete effectively in world trade (Government of the
Libyan Arab Jamahiriya, 2006). The lack of diversification has limited economic growth and
government investment in program development. In 1970, the Libyan government started
exploring alternative sources and ways to increase the country’s income in order to no longer
rely solely on income from oil. Agriculture and manufacturing were the two main alternatives
(Government of the Libyan Arab Jamahiriya, 2006).
To reduce the effect of Dutch Disease, the Libyan government can be proactive and take
some basic steps. First, they must create an oil revenue savings fund to stabilize the economy when
oil prices decrease (Chouikhi, Jbir, & Boujelbene, 2011). Second, they must utilize some of the oil
revenue to fund non-oil products, such as agriculture, by providing money for infrastructure and
technology sectors (Chouikhi et al., 2011).
18
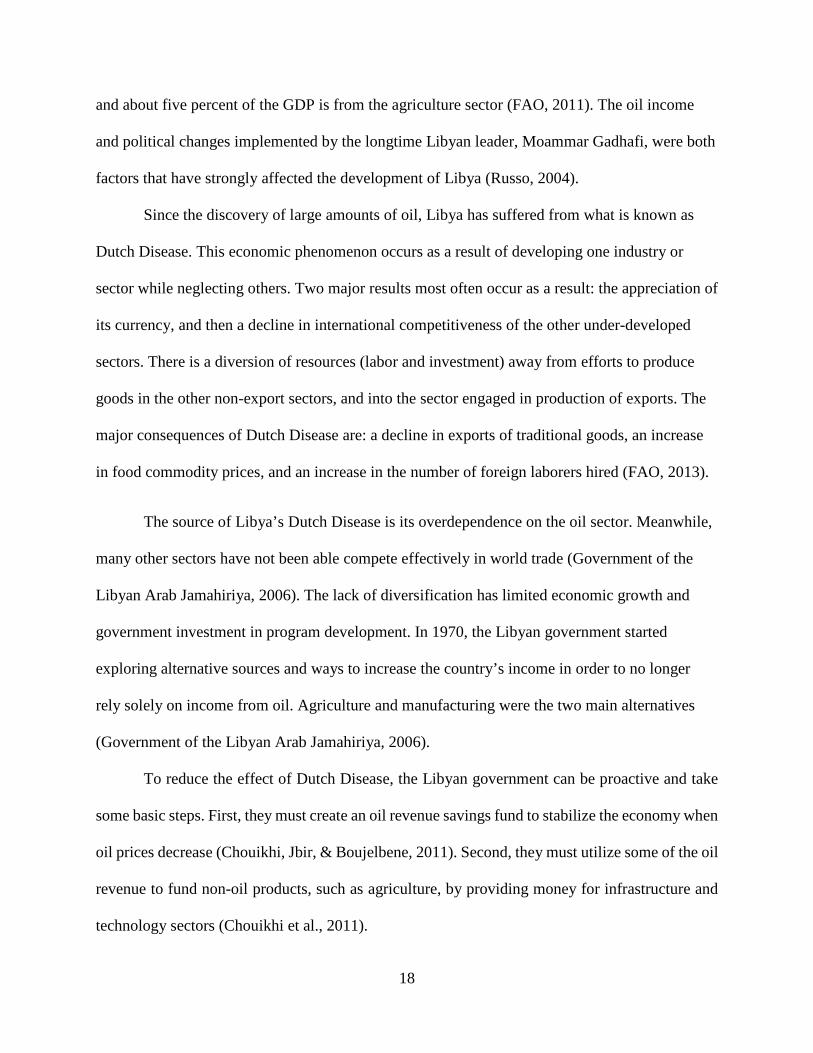
Table 1.2 Gross Domestic Product Composition, by Sector
Sector 2002 2005 2008 Agriculture 5.2% 2.3% 1.9%
Industry (primarily oil) 66.1% 75.5% 78.2% Services 28.7% 22.2% 19.9%
Source: World Bank, 2013
As can be seen from Table 1.2, rather than diversifying and reducing reliance on the oil
industry, Libya’s dependence on oil has gone up in recent years. The oil and gas sector
contributed about 74% of GDP in 2006 (African Economic Outlook, 2008). When the price of
oil in the global market fluctuates, the economy in Libya is affected and also fluctuates
(Government of the Libyan Arab Jamahiriya, 2006). Higher oil prices from 2004-2007 eased the
effects of sanctions and increased foreign trade. Libyan oil production is approximately 1.6
million barrels/day and equals roughly two percent of global trade in oil (WFP & FAO, 2011),
but oil production decreased from the 1980’s until 2003 because of a lack of investment in oil
exploration. Despite this, Libya’s economy grew very well helped by the gas and oil industry and
strong oil prices, but after the 2011 civil war it has been disrupted (African Economic Outlook,
2012). During the 2011 civil war, Libya’s assets were frozen. This impacted the economy by
cutting oil production and exports. The conflict has also caused destruction of infrastructure and
flight of human capital as well as reduced exports and oil production representing about 70% of
Libya’s GDP (African Economic Outlook, 2012).
1.2.3 Impact of Trade Sanctions
In 1986, Gadhafi restructured the government in an attempt to diminish the impact of the United
States’ sanctions on Libya. The sanctions created short-term food and consumer shortages and
negatively affected the growth of the economy when the price of oil declined. Oil was not being
sold to the United States, but exports were still occurring through European companies. The
19
sanctions had little long-term impact, except that the international community saw Gadhafi as a
“red flag,” as a danger to companies considering working with him. After 2004, and the lifting of
sanctions, oil prices and foreign trade increased because Libyan oil could then be sold on the
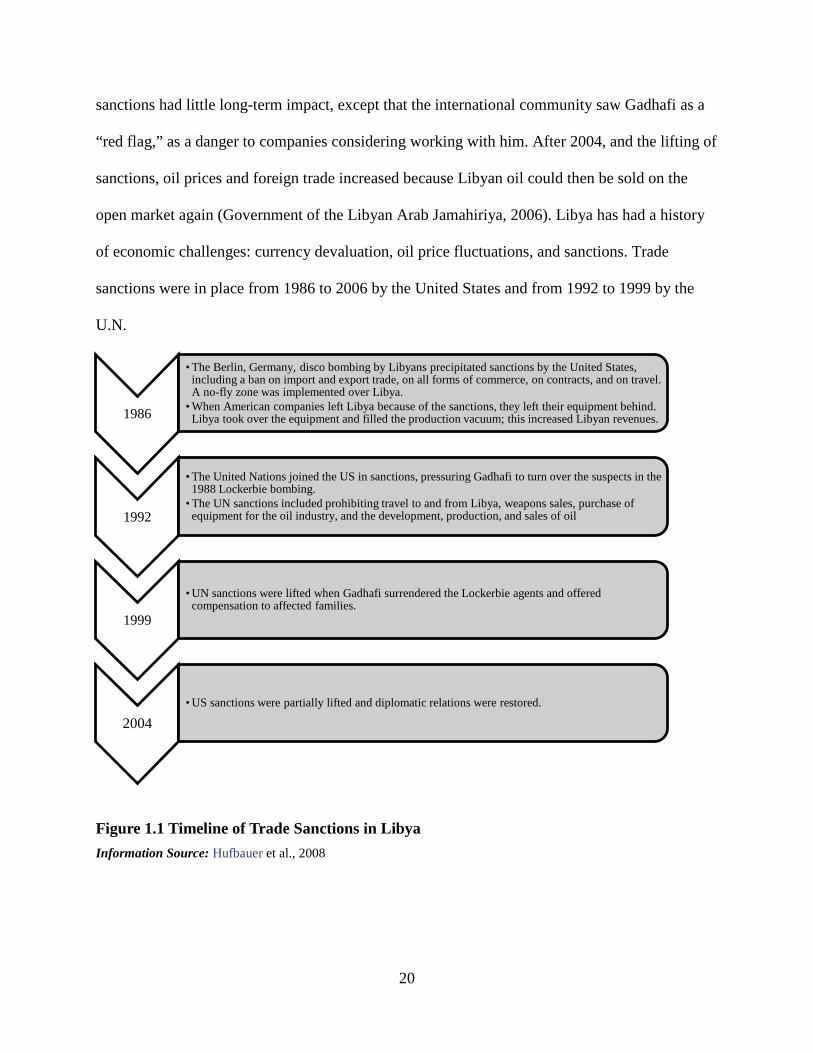
open market again (Government of the Libyan Arab Jamahiriya, 2006). Libya has had a history
of economic challenges: currency devaluation, oil price fluctuations, and sanctions. Trade
sanctions were in place from 1986 to 2006 by the United States and from 1992 to 1999 by the
U.N.
Figure 1.1 Timeline of Trade Sanctions in Libya Information Source: Hufbauer et al., 2008
1986
• The Berlin, Germany, disco bombing by Libyans precipitated sanctions by the United States, including a ban on import and export trade, on all forms of commerce, on contracts, and on travel. A no-fly zone was implemented over Libya.
• When American companies left Libya because of the sanctions, they left their equipment behind. Libya took over the equipment and filled the production vacuum; this increased Libyan revenues.
1992
• The United Nations joined the US in sanctions, pressuring Gadhafi to turn over the suspects in the 1988 Lockerbie bombing.
• The UN sanctions included prohibiting travel to and from Libya, weapons sales, purchase of equipment for the oil industry, and the development, production, and sales of oil
1999
• UN sanctions were lifted when Gadhafi surrendered the Lockerbie agents and offered compensation to affected families.
2004• US sanctions were partially lifted and diplomatic relations were restored.
20
This had an effect of slowing the growth of the economy. Weak institutions and legal systems
further slowed down economic reforms and growth (African Economy Outlook, 2008).
Following the ousting of Gadhafi in 2011, after he had spent over forty years in power,
significant political, economic, and social changes have been underway. Economic production
declined after 2011 due to the civil war, and by 2014 the industry and services sectors had an
almost identical percentage, while the agriculture sector has been fairly stable (Combaz, 2014).
Also, after the end of the Gadhafi regime in 2011, declining oil production has destabilized the
economy. The economy shrank by nearly 42% in 2011 when the country temporarily stopped oil
production and exports. Meanwhile, the international community froze Libya’s assets, essentially
freezing the economy as well (African Economic Outlook, 2012).
1.2.4 Libyan Agriculture
Agriculture is considered the second most important economic sector in Libya after oil.
Important agricultural products include wheat, barley, olives, dates, citrus, vegetables, peanuts,
soybeans, and cattle (Margo, Bonning, & Neighbor, 2012). However, Libya still imports about
75% of its food (Margo et al., 2012). Libya imports corn oil, milk, and wheat flour, with these
three products representing about 40% of all agricultural imports. According to the Agricultural
Research Center (ARC) Libya-ICARDA Collaborative Program (2010b), there has been an
increased quantity of wheat imports, increasing from 380,000 tons in 1990 to 880,000 tons in
2009. Libya does export groundnuts (peanuts) which comprise about 50% of all agriculture
exports (FAO, 2011). Prior to 1958, prior to development of the oil industry, agriculture made up
a significant share of Libya’s GDP, at 30% of the total. However, its contribution has been
decreasing since 1958, when oil was discovered. In 2003, only five percent of GDP was from
Libyan agricultural products (Laytimi, 2006).
21
Libyan farms can be divided into three types: 90% are considered small (less than twenty
hectares), nine percent are medium sized (20-100 hectares), and one percent are large farms
(greater than 100 hectares). In the last 25 years, the number of small farms has grown while the
number of medium and large farms decreased (Government of the Libyan Arab Jamahiriya,
2006). About six percent of the Libyan people make a living from agriculture (Laytimi, 2006).
The largest agricultural areas are in the Gefara Plains near Tripoli and Al-Jabal al Khaddar in the
North East (WFP & FAO, 2011). These two areas account for more than 80% of the country’s
agricultural production. Fruits and vegetables (including potatoes) form the bulk of the output.
Libyan agricultural production only meets 20% of domestic demand for barley and wheat (WFP
& FAO, 2011).
Libya’s ratio of food exports to food imports is low at 11.1%; similar to Tunisia, but
higher than Egypt at 6.9 percent. Meanwhile, export bans and other export restrictions, along
with banking challenges that prevent imports, continue Libya’s food insecurity (WFP & FAO,
2011).
1.2.5 The Structure of Libya’s Agriculture Sector
The agriculture sector in Libya depends heavily on rain-fed cultivation. The land area that
is rain-fed is about 1.5 million hectares or 73% of the total arable land estimated at 2.1 million
hectares. Irrigated agriculture is about 400,000 hectares and constitutes 16% of the total
cultivable land (Lafi, 2004). In 1994, Libya developed plans for the agricultural sector to achieve
food security and the maximum food production. The Libyan government estimated how much
food Libya would need in the future, based on an efficient use of resources, such as proper use of
the most important water sources (Arab Organization for Agriculture Development, 1994).
22
The percentage of wheat varies because it can only be grown during certain seasons and
is dependent on the amount of rainfall. The proportion of wheat has decreased in recent years.
Farmers have begun to increase their plantings of barley—at the expense of wheat—because
barley is easier to dispose of. Also, farmers do not receive subsidies from the government for the
production of wheat. The most important policy of the government’s production plan is the
cultivation of wheat on irrigated land in the desert projects and growing rain-fed wheat on the
areas that have a relatively high rainfall, such as the Green Mountains region of the northeast,
which has more than 250 mm per year. The cultivation of barley in irrigated projects run by the
government and the private cultivation of rain fed barley is done in the areas that have prevailing
rainfall between 150 to 300 mm per year in the northern areas of Libya. The role of the private
sector in increasing the production of wheat and barley is due to a combination of agricultural
policies and price incentives (Arab Organization for Agriculture Development, 1994).
Libya’s statistics on agriculture indicate that the area of planted grain crops during the
period 1990 to 2009 was declining, from 404 thousand hectares to 364 thousand hectares, which
is 9.86 percent of planted area. Also, productivity of grain crops decreased from 0.65 tons/ha to
0.57 tons/ha, a decline of 15%. In 2009, wheat productivity was 0.65 t/ha compared to barley
productivity, which was 0.49 t/ha (FAOSTAT, 2010).
Libya has seen a decline and fluctuation of productivity, higher costs and a change in
planting area due to inefficient use of agricultural resources (El-Msalati, 2012). The consequent
insufficiency in domestic production of grain, while having increasing demand rates, increases
dependence on imports of grain. These consequences negatively affect Libya’s economy.
According to Government of the Libyan Arab Jamahiriya (2006), the productivity and
production of cereal declined in 1996 to 2006 due to mismanagement of irrigated public land, not
23
enough profit for the farmers, little current technology with no improved seeds, fertilizers, and a
lack of agricultural policies that would favor farmers who grow cereal grains.
El-Msalati (2012) reviewed a number of relevant past studies about wheat and barley in
Libya; the following are some examples from El-Msalati. Daba (1991, as cited in El-Msalati,
2012) found that the most important factors affecting the production of rain fed wheat were
rainfall, harvest, and time. The study showed that in each of the harvested areas, the average
productivity per hectare, and total production of rain fed wheat was unstable. The fluctuation can
be traced to weather factors and technical changes in production. Al Sgayna (1993, as cited in El-
Msalati, 2012) found the productivity of wheat and barley crops was lower and varied
significantly from year to year due to climatic, technical and economic factors. Mohammed
(2004, as cited in El-Msalati, 2012) reported that Libya has a greater degree of self-sufficiency in
its production of maize and rapeseed oil than it does with wheat and barley. The average self-
sufficiency for wheat is 35%, while barley’s average self-sufficiency is approximately 21%.
Abdul Hamid (2005, as cited in El-Msalati, 2012) found a general increase in the trend of
consumption in wheat, rice, barley, maize, sugar, potatoes, oils, and fats. The study pointed out
that the average per capita Libyan annual food consumption is greater than what the World
Health Organization recommends. Aldaikh’s (2005, as cited in El-Msalati, 2012) study showed
that the most important determinants for the production of wheat are the amount of wheat that
Libyans consume, the quantity of imported wheat, the quantity of barley that is produced, the
amount of barley that Libyans consume, the acreage of barley, and the quantity of imported
barley. Al Jade (2006, as cited in El-Msalati, 2012) pointed out there was an increase in the area
planted with wheat during the 1980s due to the government encouraging farmers to cultivate
more wheat; however, in the 1990s the amount of area under wheat cultivation began to decline.
24
The study found the most important factors affecting the production of wheat were the size of the
harvested area; for example, increasing the area of cultivation by 10% would increase production
by an estimated 12.7%. Because of the weakness of the price policy for wheat, there is a
weakness in the domestic supply response of wheat to the variables of price.
Azwam (2007, as cited in El-Msalati, 2012) confirmed earlier studies that found the most
important variables specific to wheat production in Libyan agriculture were represented in the
amount of cultivated area, the amounts of rainfall, and the cost per hectare. Osman (2007, as
cited in El-Msalati, 2012) evaluated the main problems faced by the Libyan wheat sector related
to irrigation, fertilization, marketing, and seeds, as well as problems related to harvesting,
machinery, and agricultural labor.
Mohammed (2009, as cited in El-Msalati, 2012) analyzed how the areas of production of
wheat and barley fluctuate year by year in relation to fluctuations in crop prices. The study found
that increasing the price farmers receive for the wheat crop by one dinar leads to an increase in
the area of land planted in wheat crops by 3,300 hectares, and concurrently increasing the price
farmers receive for barley by one dinar leads to a decrease in the area planted in wheat by about
3,300 hectares. While an increase in the price of wheat by one dinar leads to the increased
production of wheat, estimated at 4.84 tonnes, increasing the price of barley by one dinar leads to
a decrease in wheat production by about 2.39 tonnes. Therefore, the barley crop is a competitor
of the wheat crop.
Saad (2009, as cited in El-Msalati, 2012) compared the cultivation of wheat and barley
crops in agricultural projects, both public and private sector, in Shabha. The study found that the
most important economic inputs affecting the production of wheat and barley were: the amount
of phosphate fertilizer, the amount of nitrogen from manure, the amount of compound fertilizer,
25
the amount of seeds, the number of hours of human labor, the number of hours of automated
work, and the amount of water used. The study showed that lacking a proper irrigation system
resulted in about 3.6 percent losses to the wheat crop, and about 2.33 percent to the barley crop.
1.2.6 Government Support of Agriculture in Libya
The Libyan government maintains a number of programs and policies to support
investments in the agricultural sector, largely by giving subsidies for public sector
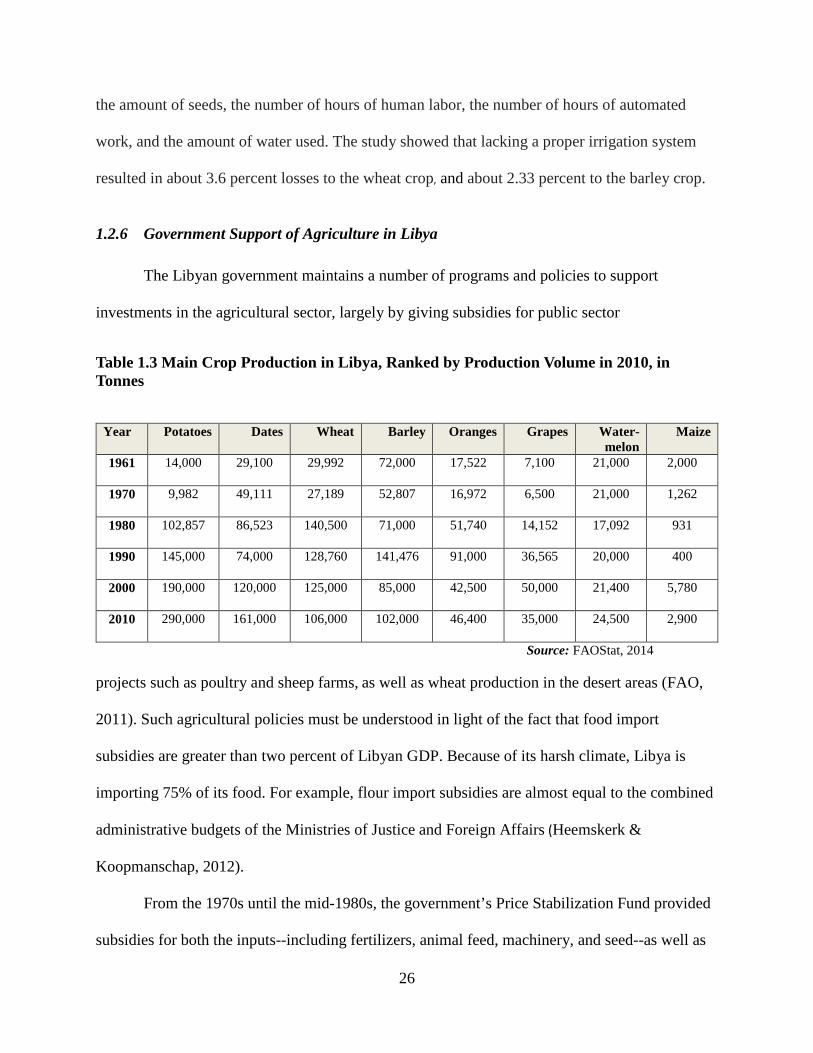
Table 1.3 Main Crop Production in Libya, Ranked by Production Volume in 2010, in Tonnes
Source: FAOStat, 2014
projects such as poultry and sheep farms, as well as wheat production in the desert areas (FAO,
2011). Such agricultural policies must be understood in light of the fact that food import
subsidies are greater than two percent of Libyan GDP. Because of its harsh climate, Libya is
importing 75% of its food. For example, flour import subsidies are almost equal to the combined
administrative budgets of the Ministries of Justice and Foreign Affairs (Heemskerk &
Koopmanschap, 2012).
From the 1970s until the mid-1980s, the government’s Price Stabilization Fund provided
subsidies for both the inputs--including fertilizers, animal feed, machinery, and seed--as well as
Year Potatoes Dates Wheat Barley Oranges Grapes Water-melon
Maize
1961 14,000 29,100 29,992 72,000 17,522 7,100 21,000 2,000
1970 9,982 49,111 27,189 52,807 16,972 6,500 21,000 1,262
1980 102,857 86,523 140,500 71,000 51,740 14,152 17,092 931
1990 145,000 74,000 128,760 141,476 91,000 36,565 20,000 400
2000 190,000 120,000 125,000 85,000 42,500 50,000 21,400 5,780
2010 290,000 161,000 106,000 102,000 46,400 35,000 24,500 2,900
26
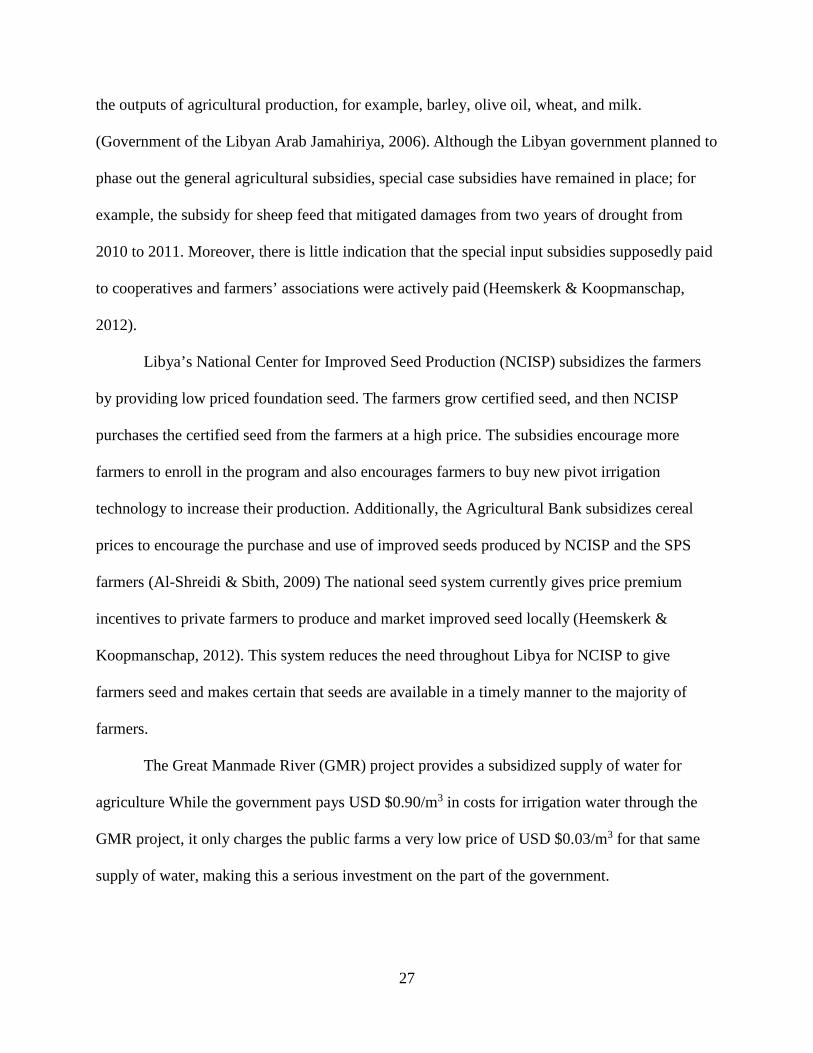
the outputs of agricultural production, for example, barley, olive oil, wheat, and milk.
(Government of the Libyan Arab Jamahiriya, 2006). Although the Libyan government planned to
phase out the general agricultural subsidies, special case subsidies have remained in place; for
example, the subsidy for sheep feed that mitigated damages from two years of drought from
2010 to 2011. Moreover, there is little indication that the special input subsidies supposedly paid
to cooperatives and farmers’ associations were actively paid (Heemskerk & Koopmanschap,
2012).
Libya’s National Center for Improved Seed Production (NCISP) subsidizes the farmers
by providing low priced foundation seed. The farmers grow certified seed, and then NCISP
purchases the certified seed from the farmers at a high price. The subsidies encourage more
farmers to enroll in the program and also encourages farmers to buy new pivot irrigation
technology to increase their production. Additionally, the Agricultural Bank subsidizes cereal
prices to encourage the purchase and use of improved seeds produced by NCISP and the SPS
farmers (Al-Shreidi & Sbith, 2009) The national seed system currently gives price premium
incentives to private farmers to produce and market improved seed locally (Heemskerk &
Koopmanschap, 2012). This system reduces the need throughout Libya for NCISP to give
farmers seed and makes certain that seeds are available in a timely manner to the majority of
farmers.
The Great Manmade River (GMR) project provides a subsidized supply of water for
agriculture While the government pays USD $0.90/m3 in costs for irrigation water through the
GMR project, it only charges the public farms a very low price of USD $0.03/m3 for that same
supply of water, making this a serious investment on the part of the government.
27
1.2.7 Agricultural Marketing in Libya
In the late 1970s, the National Agricultural Marketing Company (NAMC) was created to
manage the export and import of agricultural products. In the late 1980s, when sanctions were
lifted, private distributors and farmers were allowed to sell their produce in private local markets
(Government of the Libyan Arab Jamahiriya, 2006). Two public companies were originally
responsible for marketing inputs. The National Company for Light Supplies (NCLS) marketed
such things as seeds, fertilizers, and pesticides, while the National Company for Heavy
Equipment (NCHE) marketed harvesters, pumps, tractors, ploughs, and irrigation equipment. By
2002, the two companies had been dissolved and the marketing of agricultural inputs was taken
over by the private sector (Government of the Libyan Arab Jamahiriya, 2006).
1.2.8 The Current State of Libyan Agriculture and the Continuing Importance of Cereal
Grains Production
Despite the change in power after the end of the Ghaddafi regime in 2011, the
agricultural sector has not changed significantly and still faces many of the same challenges.
Cereal crops are still of great importance in the food sector of the economy in Libya, and they
occupy the greatest amount of area of all crops grown in Libya.
Cereal crops are associated with the concept of food security, because they supply a high
percentage of calories in the human diet. The cereal crops in Libya include barley, wheat, oats,
millet, and corn. The estimated daily need of an individual human is about 3,611 calories, of
which grain provides about 37%. Grain provides only about 14% of the daily needs for livestock
(Qasem, 1988). One reason why cereal crops are grown in such abundance is because of the
absence of other economic crops competing with them, such as rice, cotton, and sugar cane (El-
Msalati, 2012).
28
Throughout history, wheat and barley grain crops have been the main crops traditionally
associated with the lives of Libyan farm families. To a lesser extent, farm families have raised
corn and millet. Barley is considered one of the most important traditional crops in Libya and has
been ever since ancient times. Originally, it was the only source of grain for bread and meals.
Today in Libya, barley is used in certain popular dishes, but most of the barley crop is used as
feed and fodder for animals—in the forms of the green plant, the grain, or the straw. Wheat is the
second most important field crop after barley, while the oat, millet, and corn crops are planted on
a smaller scale.
The Deputy Minister of Agriculture, Animal and Marine Wealth stated in an interview
that the post-Gaddafi regime in Libya acknowledges and emphasizes the need to recognize and
strengthen the role of the private economic sector and to aid entrepreneurs and the development
of both small and medium enterprises. The Deputy Minister also stated that in order to
accomplish these goals for private sector development, the government will need to bolster the
institutional and regulatory framework. The principles of value chain development will be
incorporated into the agricultural development strategies. For instance, instead of focusing only
on production, there will also be focus on other functions in the chain, such as market orientation
and processing. Also, post-harvest storage losses are currently very high at 25% and need to be
reduced to improve the value of the harvest (Heemskerk & Koopmanschap, 2012).
In conclusion, Libyan agriculture has many reasons to make progress toward
sustainability and has many ways in which to improve. Under the Gadhafi regime, Libya had
many goals for agricultural development. Those goals included:
• increased production with increased efficiency, to ensure food security;
• better management of natural resources, such as water and soil conservation;
29
• increased contribution by agriculture to GDP, for diversification of the economy;
• creation of jobs in the farming sector;
• provision of good infrastructure in the unpopulated areas of the country to encourage
people to live there and create a better rural-urban balance;
• find good sources of industrial materials and inputs, such as seed genetics,
agrochemicals, and other agricultural technologies; and
• Improved management of infrastructure, including the water supply, roads, and
electricity, to minimize agricultural production interruptions (Government of the Libyan
Arab Jamahiriya, 2006).
All of these goals are still necessary to address after Gadhafi in order to serve the population
sustainably.
1.3 Sustainability Challenges in Libyan Agriculture
Despite the change in government regime, Libya still faces the same agricultural
challenges in terms of food security and sustainability. According to a number of researchers (El-
Msalati, 2012), the following six agricultural sustainability challenges are the most important for
Libya: (1) water management; (2) marginalization of agriculture from land use changes,
particularly from urbanization pressures; (3) low primary agricultural productivity, especially
due to poor seed management and lack of improved varieties; (4) efficiency and environmental
safety of agricultural chemical use; (5) adapting to climate change.
1.3.1 Water Management
Because Libya is an arid country receiving limited and erratic rainfall (Wheida &
Verhoeven, 2007), water management is perhaps the most important challenge. Libya's water
30
resources are limited; about 90% come from aquifers, and about 80% of aquifer use is for
agriculture but is limited in infrastructure (Arab Organization for Agriculture Development,
1994; FAO, 2008). Wasteful water practices are common because no costs are associated with
usage (Zidan, 2007). The demand on water continues to increase as the population grows
(Wheida & Verhoeven, 2007). The water exploitation index, which is the total water extracted
per year as a percentage of long-term fresh water resources, is already over 90% (NIC, 2009).
All of these problems are made worse because the country lacks water policy and regulation
(Zidan, 2007).
The water supply and usage are major challenges. In 2013, the total population of Libya
was six million and is expected to rise to twelve million by 2050 (Wheida & Verhoeven, 2007).
Water usage is predicted to also increase in the future with population. Total water withdrawal
for agricultural, domestic and industrial use was estimated at 3,843 million m3 in 1998, with a
water deficit of approximately 1,154 million m3 in 1998. By 2025, the estimated water
requirement for the Libyan population is expected to be between 8,200 and 8,840 million m3,
with a deficit of 4,339 million m3 if water usage patterns continue (Wheida & Verhoeven, 2007).
This is simply unsustainable when rainfall for the country varies between 100-500 mm/yr. in the
north and as little as 10 mm/yr. in the south.
One of the “solutions” the past regime created was the Great Manmade River (GMR).
However, this also created problems. When the river was built, there was a massive loss of
natural habitats. “New” agricultural land requires increased quantities of fertilizers and pesticides
to maximize production in an irrigated system, which means an increased cost to farmers and
increased environmental impacts. The large supply of water without any real regulations has also
resulted in wasteful usage (Zidan, 2007).
31
1.3.2 Marginalization of Agriculture Due to Land Use Change
Urbanization trends have also adversely affected the environment, particularly through
encroachment on agricultural and forest lands, along with pollution of air and water (Goueli,
2004). These factors are increasing desertification in those small areas of Libya that are not
already desert. 25% of prime farmland has been lost to urbanization, while agricultural activities
are pushed on to marginal land. In 1950, 19% of the population lived in urban areas. That
increased, by 2010, to 88%, and by 2030 it is predicted to be 92%. People in the urban areas
have a higher standard of living than in the rural areas and also have a larger energy footprint.
1.3.3 Low Primary Productivity, Due to Low Quality of Farm Inputs, Including Seeds
There is low primary productivity for many crops grown in Libya. One of the main steps
required to raise productivity is to improve the genetic quality of seed, which in turn requires
improvements in the seed production system and in the available propagation material (FAO,
2011). There are specific requirements for the seed genetics needed. Agriculture in Libya is
highly constrained by scarce fresh water resources (Laytimi, 2006; Zidan, 2007) as well as poor
soil fertility, structure, salinity, and drainage (Laytimi, 2006). Climatic conditions also limit yield
due to high temperatures, winds, and temperature fluctuations (Laytimi, 2006). An additional
challenge is the fact that farmers have limited money to invest in farmland and inputs. These
conditions mean that, while farmers need quality seed stock of advanced varieties appropriate for
Libyan conditions, many cannot afford them.
Libya faces seed production quality and supply limitations. Due to limited technical
capacities and quarantine measures, new strains of plant and animal pests and diseases have
entered the country and found their way to the farming sector. Minimal research on genetic
improvement for pest resistance (both public and private) has been conducted, in part, because
32
the country lacks technical expertise in seed genetics. This has led to relative monopoly of
technology in the industry by some public institutions and international companies.
Another major problem is the limitations of seed storage. Minimal infrastructure means
there is little to no temperature or climate control to keep local seeds and tubers viable for the
following season. Also, pest control is limited, and imported seed quality decreases in poor
storage conditions.
1.3.4 Efficiency and Environmental Safety of Agricultural Chemicals
Libya imports nearly all of its agricultural inputs, including seed and animal feed,
fertilizers, pesticides, and agricultural machinery (Government of the Libyan Arab Jamahiriya,
2006; Laytimi, 2006). As a result of limited domestic capacity, there is a lack of understanding
about the dangers associated, in particular, with fertilizer and pesticide use. This has led to too
much chemical being used which has had a negative effects on the soils and waters of Libya
(Laytimi, 2006). Coordinated programs developed to combat agricultural pests are very weak.
Until 2002, two large public companies (NCLS and NCHE) marketed all agricultural inputs
(Government of the Libyan Arab Jamahiriya, 2006). In 2002, the two companies were dissolved
and the private sector began marketing agricultural inputs. No regulations require testing for
input quality at this time (Government of the Libyan Arab Jamahieriya, 2006).
1.3.5 Adaptation to Climate Change
Seasonal precipitation variability in Libya is more evident from 1976-2000, indicating the
growing extent of climate change. The primary anticipated impacts of climate change on Libya
include reduced crop production and food security, reduced available water resources, and
reduced biodiversity (FAO, 2008). Harsh climatic conditions and poor soil already severely limit
33
yield and arable land hectares (WFP & FAO, 2011). Libya is already dry, but has an increasing
drought problem causing decreases in agricultural production (El-Tantawi, 2005). Crop
production is affected by variable temperatures, uneven rainfall, longer periods of drought, and
increases in pests and diseases. Clearly, Libya faces many daunting challenges in the agricultural
sector due to climate change.
1.4 Summary and Conclusions
The regime change in 2011 has brought many changes to Libya, but the agricultural
challenges that have persisted for decades remain. These problems will not wait for the political
situation to resolve itself and yet are interconnected. Strategies must be developed between the
private and public sectors. The driving motives for the Libyan government to invest large
amounts of money and subsidies in agricultural production are social and political, and are not
because of economic principles or for profitability. A new approach is needed that requires
cooperation and supportive institutions. This will require time and the building of trust between
farmers, the private sector, and whatever new government develops. In the future, the objectives
will probably mix social and economic principles, requiring that the economy not be based solely
on the oil industry (Heemskerk & Koopmanschap, 2012).
The challenges facing Libyan agriculture today are evidenced in a large yield gap. While
many parts of the world realize lower yields relative to their potential, the margin is wider in
North Africa and particularly in Libya. The next chapter will define what the yield gap is, how it
is measured, and how Libya compares to other North African countries and the world. The
chapter will also go into more details about the factors contributing to this large yield gap for
Libya. While water resources are likely the most important factor, seed quality and genetics are
also key factors.
34
The overall objectives of this research are to investigate how to achieve greater food
security and sustainability in Libya’s agriculture, which requires higher yields be reached while
minimizing environmental impacts. This makes it increasingly important to understand the
Libyan seed system and its users and their access. What varieties do farmers currently grow?
Why do they grow those particular varieties? How do they access the seed for those varieties?
What constrains farmers’ adoption of new varieties? Investigating these factors will lead to
recommendations for improving the seed system in Libya.
35
2 The Yield Gap in Grains Production in Libya
2.1 Introduction
2.1.1 Why Closing the Yield Gap is Important to Sustainability
Yield is one of the most common measures of crop productivity. It is defined as the
output of a crop per unit of land used to produce metric tons per hectare, according to Beddow,
Hurley, Pardey, and Alston (2013). A yield gap is important because it reveals how efficiently
land and other resources are utilized. In terms of environmental sustainability, according to
Lobell, Cassman, and Field (2009), a yield gap helps bring forth estimates/projections of crop
yields in the future. Closing a yield gap could thus improve agriculture sustainability. Foley et al.
calculate that bringing 16 important feed and food crops to within 95% of their potential yield
worldwide would improve production by about 2.3 billion tones. According to Mueller et al.
(2012), “Yield gaps are caused by deficiencies in the biophysical crop growth environment that
are not addressed by agricultural management practices” (p. 254).
Knowledge of what factors are contributing to a yield gap can help build awareness of
how to develop a sustainable agricultural system. The major factors that could negatively affect
environmental sustainability if not properly managed include genetic varieties, fertilizers,
pesticides, and irrigation. Technology transfer and access issues, such as farmer resistance to
new skills or new technologies, often contribute to yield gap. Additional causes include socio-
economic conditions such as farmers’ income and access to credit, knowledge, and
policy/institutional constraints.
Understanding causes of the yield gap is therefore an important component when trying
to achieve environmental sustainability. Godfray et al. (2010) and Foley et al. both emphasize
36
the importance of closing the yield gap in order to meet the growing global population’s food
demand and to minimize environmental impacts of production. These researchers discussed that
in order to close the yield gap, focus should be put on improved seed varieties, water,
agricultural practices, nutrients, etc.
Crucially, according to Job (2006), closing the yield gap improves more than
productivity, as it can improve the efficiency of production, optimizing the return on inputs of
pesticides, fertilizers, and water. According to Singh et al. (2006), “The yield gap needs to be
bridged by adopting improved soil and water management and fertility management practices
and by alleviation of various production constraints described earlier” (p. 32).
2.1.2 Yield as Just One Measure of Sustainability
Jacobs (1995) and Rigby, Woodhouse, Young, and Burton (2001) claimed there are about
386 definitions of sustainable agriculture, due to the different meanings associated with different
places, time periods, and individuals. Indicators help researchers answer scientific questions and
make scientific measurements in regards to economic and political decision-making, as well as
social and environmental aspects of sustainability. As such, indicators or measures of sustainable
agriculture have value in understanding, developing, and encouraging sustainable practices.
The study by Rigby et al. (2001) framed the dilemma of how to define and measure
sustainable agriculture, taking into account the social, economic, and physical dimensions of
agricultural practices. It used five indicators of sustainable agriculture: seed source, weed
control, crop management, pest control, and soil fertility maintenance. The study’s empirical
analysis focused on physical environmental factors, particularly fertilizers and pesticides, and
analyze agrochemicals in terms of types and magnitudes of effects on the environment.
Fertilizers are a key component in sustainable agriculture; however, mismanagement of them has
37
negative impacts. For example, widespread nutrient pollution and the degradation of surface
water bodies are already prevalent in the world (Godfray et al., 2010). In addition, the release of
nitrous oxide from fertilized fields exacerbates climate change. Although negative environmental
consequences occur from over-use of fertilizers, it is equally a problem that insufficient nutrients
are available in worldwide agronomic production. Many yield gaps are due to incorrect amounts
of necessary plant nutrients (Cassman et al., 2002). Policy and better management strategies
could improve the balance between the environment and yields (Foley et al., 2011).
2.1.3 Defining the Yield Gap
Singh et al. (2006) defined yield gap as “the difference in experimental yield and on-
farm yields” Page #. Hence, yield gap is the difference between the yield potential of perfect
conditions--such as water, temperature, and fertilizer--and actual yield in term of what farmers
really harvest given their resources of limited water, seed, and weather. According to Foley et al.,
yield gap is “the difference between crop yields observed at any given location and the crop’s
potential yields at the same location given current agriculture practices and technologies” (p.
339). Similarly, Nirmala, Deshmanya, Muthuraman, Meera, and Sain (2009) and many other
researchers define yield gap as, “the difference between the maximum attainable yield and the
farm level yield” (238). Pratt-Nin et al. (2010) explained the concept of yield gap as the
“…technical agronomic analysis of production as a measure of performance because it implies a
comparison between yields actually obtained under particular agroecological conditions on
commercial farms and the maximum or potential yield in that region” (p. 66). Licker et al. (2010)
defined yield gap technical as “climatic potential yield – actual yield,” with the yield gap fraction
defined as “1 – (actual yield / climatic potential yield).”
38
Yield gap has, furthermore, been described as being made up of two primary
components: ‘transferable’ and ‘non-transferable’ (Nirmala et al., 2009). Transferable
components are controlled by management practices such as water use, fertilizer use, pesticide
use, etc. to increase efficiency. The non-transferable components are environmental conditions
that cannot be controlled, such as the climate, amount of light, soil quality, water quality, air
quality, and microorganisms. Hence, these definitions bring forth the importance of analyzing
practices and performances of crops to understand the crop’s current level and the attainable
level it could reach.
2.1.4 Actual and Potential Yields
More specifically, actual yield is known as the ‘average farmer yield’ by farmers within a
particular space and time. Van Ittersum et al. (2013) defined actual yield as average yield (Ya)
produced in a farmer’s field. Rabbinge (1993) discussed the fact that farmer yield or actual yield
depends upon control of factors such as pests, weeds, pollutants, and diseases. Potential yield,
however, is defined as the maximum yield achieved by a crop cultivar with adapted nutrients,
complete pest management, and non-limited water use to grow crops efficiently (Evans &
Fischer, 1999). Evans’ (1993, as cited in Lobell et al., 2009) description of potential yield as
determined by factors such as water, temperature, and solar radiation, which are grown under
favorable conditions absent of limitations. According to Pathak et al. (2003), potential yield was
defined “as the maximum yield of a variety restricted only by the season-specific climatic
conditions” (p. 225).
Also, Singh et al. (2006) defined potential yield as “the maximum yield obtained in
research station field experiments conducted under optimal management” (p. 31). According to
Pratt-Nin et al. (2010), “The potential yield is determined by producing the crop without
39
constraints that are normally found at the farmer level” (p. 66). The FAO (2004) in the
International Year of Rice, expanded on this definition by further explaining maximum
attainable yield as “…yield of experimental/on-farm plots with no physical, biological or
economic constraints…” and farm level yield as, “the average farmer’s yield in a given target
area at a given time at a given ecology” (p. 1). Agronomists define theoretical yield or potential
yield as "the maximum yield that can be achieved in a given agroecological zone with a given
cultivar,” additionally, “production is determined solely by CO2, temperature, solar radiation,
and crop characteristics" (Fermont & Bonson, 2011, p. 3). According to Wolf and Vandiepen
(1995), potential yield can be found through determining solar radiation, temperature, and crop
characteristics, which can be recognized in locations where the crop management, plant nutrients
and the water supply are ideal.
2.1.5 How Yield Gap is Measured
Yield gap is measured through examination of location, average yield or actual yield, and
potential or maximum yield. In the study by Nirmala et al. (2009), yield gap is measured in terms
of yield gap 1 and yield gap 2 at three different locations. Yield gap 1 was inferred based on the
difference between the research station’s reported potential yield and the demonstration plot’s
reported yield. Yield gap 2 was measured by the difference between potential yield and farmer’s
yield. The author also took into account the major constraints to rice production in order to infer
yield gap, such as institutional, bio physical, technical, soil problems, machinery, and socio-
economics (Nirmala et al., 2009).
The FAO (2004) in their International Year of Rice publication and later Schneider and
Anderson (2010) break down yield gap analysis into three components. The first yield gap is the
“gap between theoretical potential yield and experimental station yield” (p. 1), which includes
40
breeding new varieties. The second yield gap is measured “between the experiment station yield
and the potential farm yield” (p. 1), which is caused by transferable factors. The third yield gap is
determined “between the potential farm yield and the actual farm yield” (p. 1), which is caused
by the lack of improved seed and low input use, ultimately referring to poor management
practices that are not cost-effective.
According to Lansigan (1998), analysis of yield gap in crop production may be
accomplished by using three sets of elements: growth and yield limiters, including nutrients and
water; growth and yield determinants, including solar radiation and temperature; and finally,
growth and reducing factors including pests, weeds, and diseases. Also, he estimated yield gaps
by using good quality inputs and crop models. Evaluation of such analyses could result in
changes in controllable variable factors such as water and fertilizer.
According to Beddow et al. (2013), yield gap is explained by three concepts. The first is
that yield gap is different between yields accomplished by farmers in countries with high
income, and farmers in countries with low income; thus, by closing the yield gap poverty can be
reduced and solutions found for food security challenges. The second concept of yield gap is the
difference between the experimental yield accomplished by researchers and the commercial yield
accomplished by farmers; therefore, yield gap depends on the location and crop. Finally, the
third concept of yield gap is the difference between some concept of a biological maximum
potential yield and experimental yields.
Licker et al. (2010), estimated yield gap using climatic potential yield, defined as “the
90th percentile yield achieved for a given crop in a given climate zone.…As defined by a
comparative statistical analysis of other regions with similar climatic conditions” (p. 776). They
found in regions with high inputs or in developed countries, the yield gap is low.
41
Actual yield is often measured by a farmer’s crop over a particular time and space. Also,
Beddow et al. discussed actual yield (YA) as “the measured yield at a particular location and
point in time” (p. 11).
Maximum potential yield, in general, is estimated with the results from experimental and
on-station growing areas that use characteristics of the most modern varieties (Fischer, Byerlee,
& Edmeades, 2009). Schneider and Anderson (2010) referred to the three common methods, also
discussed by Lobell et al., to calculate yield potential:
1) To calculate a specific region, controlled field experiments with sanctioned
yield is used.
2) To simulate yield under specified parameters, crop models can be used.
3) Yield potential can be estimated on the basis of the farmer’s maximum yield.
Also, there are several methods to measure potential yields, such as the crop simulation
model. This model estimates potential yields with an understanding of the diversity of weather,
pests, agronomic management, frost, soil and flooding (Aggarwal et al., 2008). Lobell et al.
further discussed how to estimate potential yield by “crop models that assume perfect
management and lack all yield-reducing factors” (5), which could include disease control, pest
management, fertilizer control, and sufficient water use.
Potential yield is also referred to as location specific because it is more dependent on the
climate than on soil properties (van Ittersum et al., 2013). Since it is difficult to understand the
existing management practices in a particular time and space, surveys are often used to measure
yield potential (Lobell et al., 2009). In the study by Aggarwal and Kalra (1994) for example, a
survey was used called the ‘WTGROWS crop model’ of simulated potential yield to develop an
42
understanding of optimal sowing date, in which they found late sowing harvest caused reduced
wheat yields. Potential yield is often gathered from data already collected from institutions that
have determined experimental yields when attempting to improve agronomic practices via
research stations (Pala et al. 2011). According to Martin, Shroyer, Shoup, Olson, and Duncan
(2011), yield potential was defined as “the yield of a crop under ideal conditions. In this context,
yield potential is the yield at the time of the estimation assuming favorable conditions after
evaluation takes place” (p. 1).
As this review shows, actual yield and potential yield are important concepts for
measuring yield gaps. They also have several different definitions and measurements to to find
their results. However, the various definitions are similar, with minor differences based on
academic backgrounds and physical factors. While actual yield can be found as a concrete
number, what the farmer produced, potential yield is an estimate or projection based on
experimentation. Potential yield can be hard to estimate if proper experimentation has not been
conducted. This also complicates measurements of yield gaps. However, finding the yield gap is
an important step in closing this gap.
With limited breeding programs and the increasing concerns of climate change, it is
becoming more important to focus on future yield gaps, to understand how to measure yield gap,
and to practice closing yield gaps to develop food stability. By closing yield gaps, efficiency of
environmental quality and food production will follow. It is important to balance the costs to the
environment when growing wheat and barley in particular, in order to use the land and resources
to its full potential while being mindful of pollutant affects that result.
43
2.2 Current Status of Wheat and Barley in Libya: Is There a Yield Gap?
Wheat and barley grain crops have been the main crops traditionally associated with the
lives of Libyan farm families, with corn and millet being raised to a lesser extent. Barley is
considered one of the most important traditional crops in Libya and has been ever since ancient
times. Originally, it was the only source of grain for bread and meals. Today in Libya, barley is
used in certain popular diets for people, but most barley is used for animal fodder—in the forms
of the green plant, the grain, or the straw. Barley is mostly grown in Libya under rain-fed
environments. Wheat (soft and durum) is the second most important field crop after barley, while
oats and corn crops are planted on a smaller scale. Wheat grows under both rain-fed and irrigated
environments. According to Al-Shreidi and Sbith (2009) wheat supplies 1,311 kilocalories (kcal)
of the needs of an individual in Libya per day. Given that an individual needs 3,330 kcal, this
accounts for nearly 40% of caloric intake for the average Libyan.
Libya is one of the largest wheat importing countries in the world. Quantities imported
ranged from 380,000 tonnes in 1990 to 1,623,390 tonnes in 2012. The total area harvested for
wheat during 1990 was 104,538 hectares and increased to 160,000 hectares in 2013 (FAOSTAT,
2015). See Table 2.1 and Table 2.2 below.
For barley, imported quantities ranged from 832,238 tonnes in 1990 to 179,413 tonnes in
2012. In addition, the total area harvested for barley during 1990 was 296,742 hectares to
200,000 hectares in 2013 (FAOSTAT, 2015). See Table 2.1 and Table 2.2 below.
The Libyan government has established numerous agricultural projects to encourage the
production of wheat and barley in areas where permanent irrigation is used, particularly in the
southwestern and southeastern Sahara desert regions supplied by water from the Great Man-
Made River (GMR) irrigation project. As a result, there has been some gain in production and
44
productivity. Government plans have included increasing the area allocated to growing grain
crops, financial allocations to farmers, securing sources of irrigation to new areas of production,
including diverting water from the Great Man-Made River to the Northern areas. Despite these
efforts, the production of crops still has not reached the goals and productivity was low.
According to Al-Shreidi and Sbith (2009), there has been little success with growing
wheat and barley crops efficiently for the following reasons:
1. Lack of availability of appropriate genotypes for each environment throughout
different areas of agricultural production.
2. Lack of identification of appropriate agricultural operations of the production
process throughout different production conditions.
3. Management service operations are not efficient.
4. There is a low level of fertility in most agricultural soils.
5. There are impacts of weeds, diseases, and pests.
6. Lack of humidity level presents the need for irrigation
7. Spreading the seeds of improved varieties did not reach the required level.
8. Technology for agricultural mechanisms was not available especially for the
private sector.
9. High wastage through harvesting and threshing.
10. Climate change affects the environment for the grain production in different
areas.
More than 90% of the wheat area in Libya is grown with systems of either
permanent or supplementary irrigation. The Morziq (Murzuq) region, in the southwest,
has the most agricultural projects, and produces 49% of total wheat in the country. Marge
45
(Marj), on the northern coast near Benghazi, is the second most productive area, with
16% of wheat and 80% of barley produced in the area, grown under rainfed conditions,
ranging between 50 to 350 mm of rainfall annually (Commission on Public Information
Libya Tripoli, 2007).
46
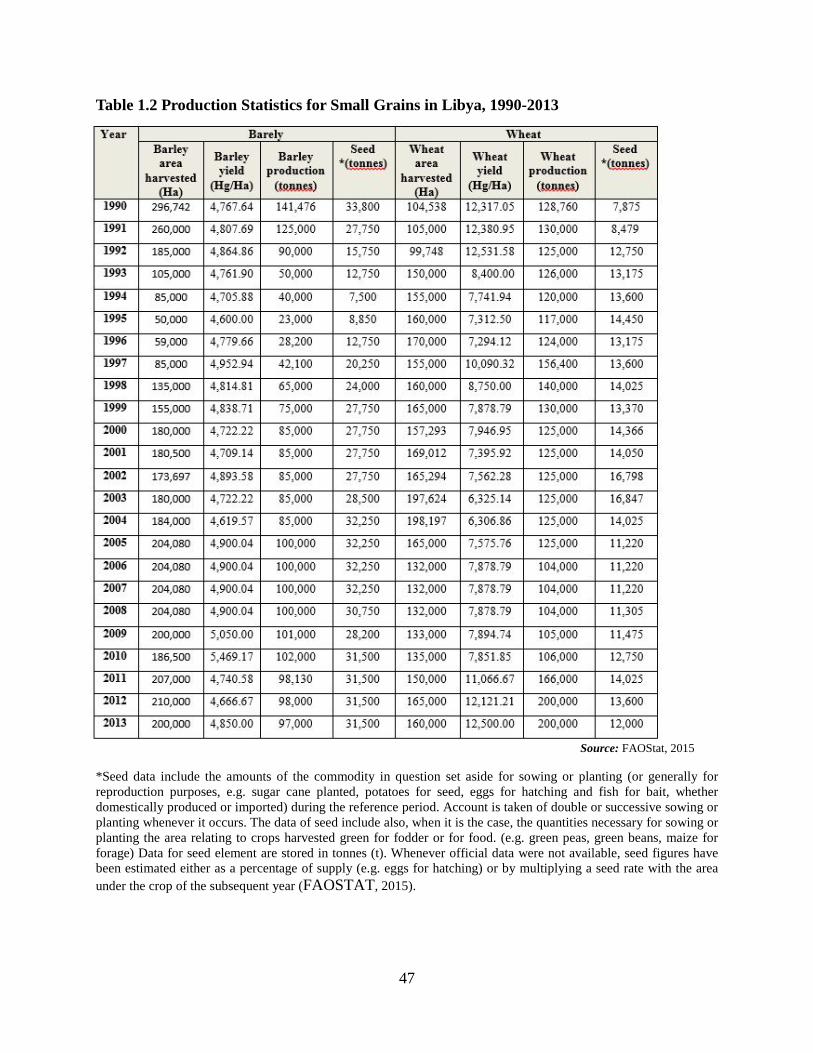
Table 1.2 Production Statistics for Small Grains in Libya, 1990-2013
Source: FAOStat, 2015
*Seed data include the amounts of the commodity in question set aside for sowing or planting (or generally for reproduction purposes, e.g. sugar cane planted, potatoes for seed, eggs for hatching and fish for bait, whether domestically produced or imported) during the reference period. Account is taken of double or successive sowing or planting whenever it occurs. The data of seed include also, when it is the case, the quantities necessary for sowing or planting the area relating to crops harvested green for fodder or for food. (e.g. green peas, green beans, maize for forage) Data for seed element are stored in tonnes (t). Whenever official data were not available, seed figures have been estimated either as a percentage of supply (e.g. eggs for hatching) or by multiplying a seed rate with the area under the crop of the subsequent year (FAOSTAT, 2015).
47
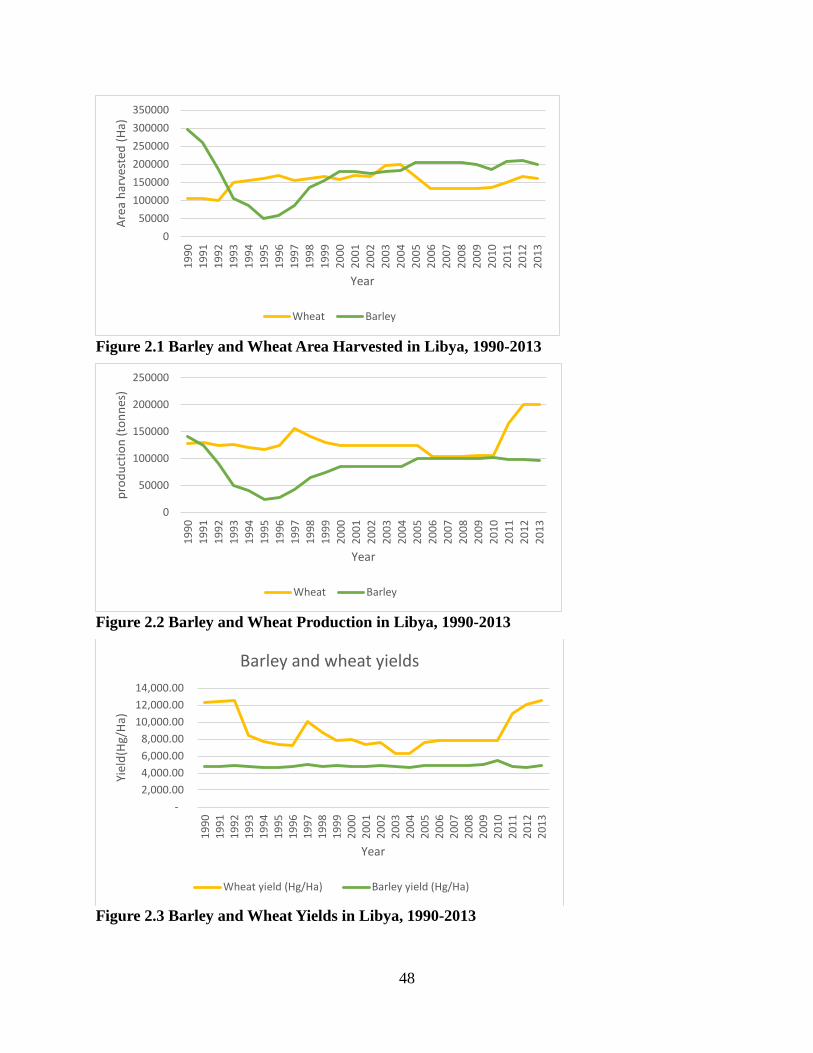
Figure 2.1 Barley and Wheat Area Harvested in Libya, 1990-2013
Figure 2.2 Barley and Wheat Production in Libya, 1990-2013
Figure 2.3 Barley and Wheat Yields in Libya, 1990-2013
050000
100000150000200000250000300000350000
1990
1991
1992
1993
1994
1995
1996
1997
1998
1999
2000
2001
2002
2003
2004
2005
2006
2007
2008
2009
2010
2011
2012
2013
Area
har
vest
ed (H
a)
Year
Wheat Barley
0
50000
100000
150000
200000
250000
1990
1991
1992
1993
1994
1995
1996
1997
1998
1999
2000
2001
2002
2003
2004
2005
2006
2007
2008
2009
2010
2011
2012
2013
prod
uctio
n (t
onne
s)
Year
Wheat Barley
- 2,000.00 4,000.00 6,000.00 8,000.00
10,000.00 12,000.00 14,000.00
1990
1991
1992
1993
1994
1995
1996
1997
1998
1999
2000
2001
2002
2003
2004
2005
2006
2007
2008
2009
2010
2011
2012
2013
Yiel
d(Hg
/Ha)
Year
Barley and wheat yields
Wheat yield (Hg/Ha) Barley yield (Hg/Ha)
48
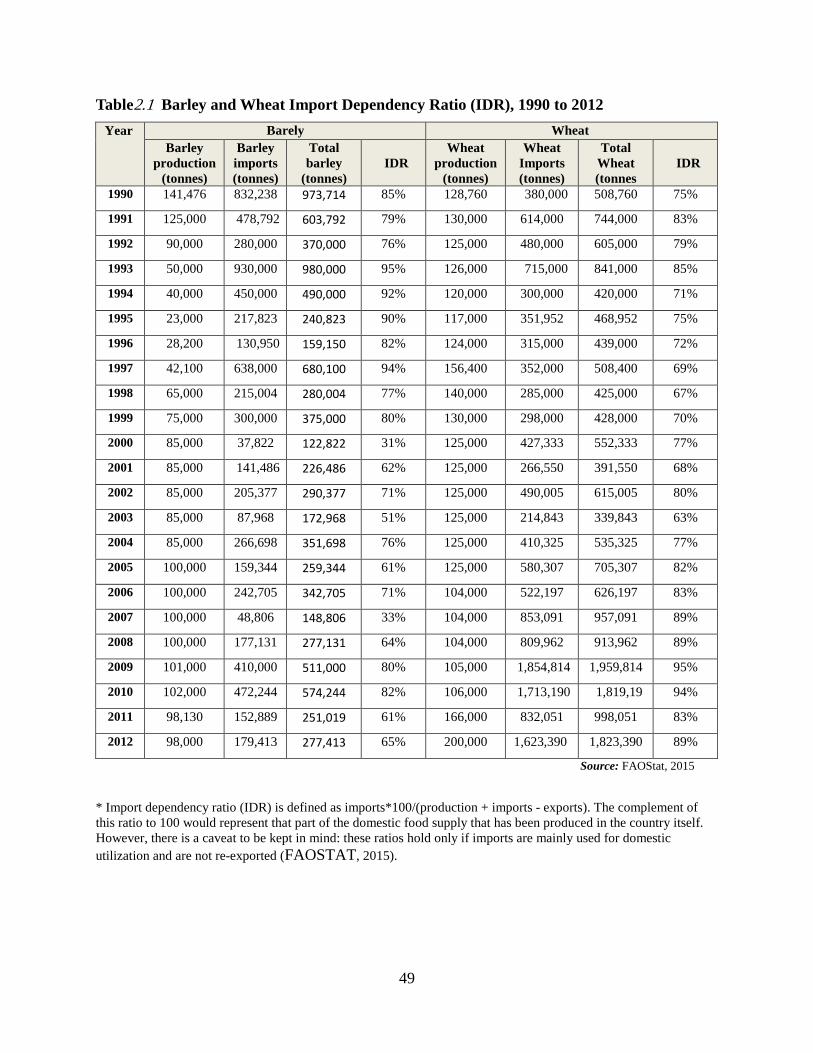
Table 1.2 Barley and Wheat Import Dependency Ratio (IDR), 1990 to 2012 Wheat Barely Year
IDR
Total Wheat (tonnes
Wheat Imports (tonnes)
Wheat production
(tonnes)
IDR
Total barley
(tonnes)
Barley imports (tonnes)
Barley production
(tonnes) 75% 508,760 380,000 128,760 85% 973,714 832,238 141,476 1990
83% 744,000 614,000 130,000 79% 603,792 478,792 125,000 1991
79% 605,000 480,000 125,000 76% 370,000 280,000 90,000 1992
85% 841,000 715,000 126,000 95% 980,000 930,000 50,000 1993
71% 420,000 300,000 120,000 92% 490,000 450,000 40,000 1994
75% 468,952 351,952 117,000 90% 240,823 217,823 23,000 1995
72% 439,000 315,000 124,000 82% 159,150 130,950 28,200 1996
69% 508,400 352,000 156,400 94% 680,100 638,000 42,100 1997
67% 425,000 285,000 140,000 77% 280,004 215,004 65,000 1998
70% 428,000 298,000 130,000 80% 375,000 300,000 75,000 1999
77% 552,333 427,333 125,000 31% 122,822 37,822 85,000 2000
68% 391,550 266,550 125,000 62% 226,486 141,486 85,000 2001
80% 615,005 490,005 125,000 71% 290,377 205,377 85,000 2002
63% 339,843 214,843 125,000 51% 172,968 87,968 85,000 2003
77% 535,325 410,325 125,000 76% 351,698 266,698 85,000 2004
82% 705,307 580,307 125,000 61% 259,344 159,344 100,000 2005
83% 626,197 522,197 104,000 71% 342,705 242,705 100,000 2006
89% 957,091 853,091 104,000 33% 148,806 48,806 100,000 2007
89% 913,962 809,962 104,000 64% 277,131 177,131 100,000 2008
95% 1,959,814 1,854,814 105,000 80% 511,000 410,000 101,000 2009
94% 1,819,19 1,713,190 106,000 82% 574,244 472,244 102,000 2010
83% 998,051 832,051 166,000 61% 251,019 152,889 98,130 2011
89% 1,823,390 1,623,390 200,000 65% 277,413 179,413 98,000 2012
Source: FAOStat, 2015
* Import dependency ratio (IDR) is defined as imports*100/(production + imports - exports). The complement of this ratio to 100 would represent that part of the domestic food supply that has been produced in the country itself. However, there is a caveat to be kept in mind: these ratios hold only if imports are mainly used for domestic utilization and are not re-exported (FAOSTAT, 2015).
49
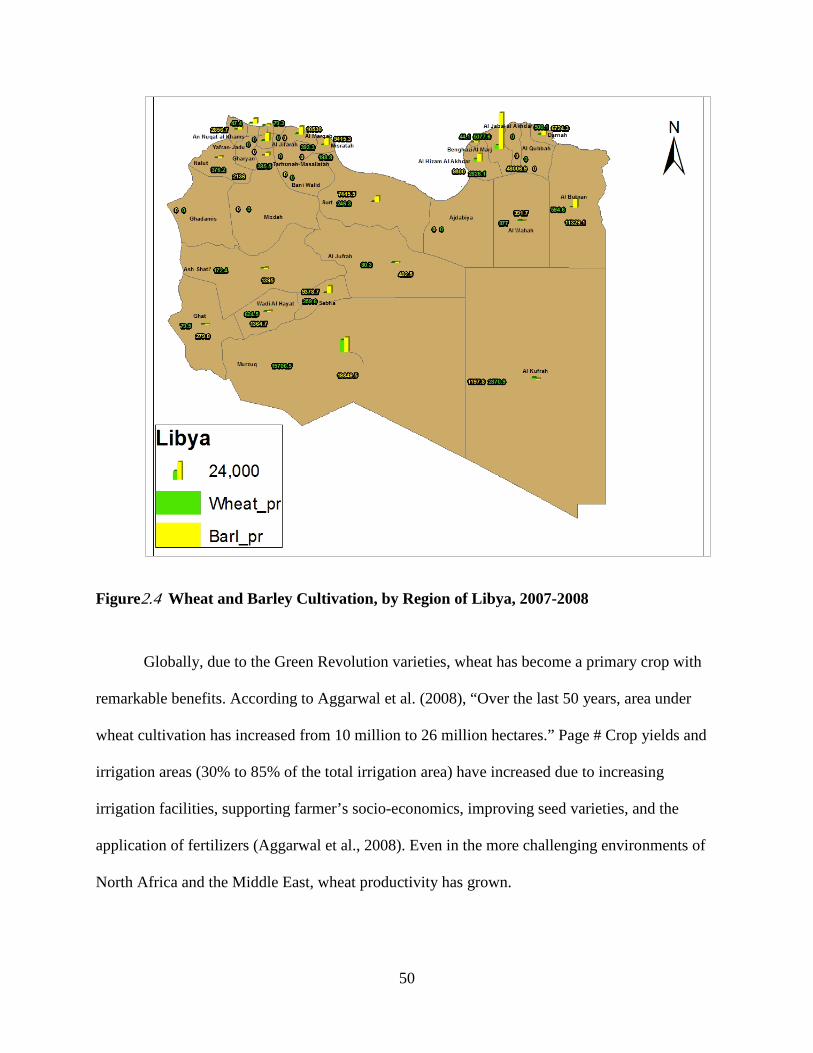
Figure 4.2 Wheat and Barley Cultivation, by Region of Libya, 2007-2008
Globally, due to the Green Revolution varieties, wheat has become a primary crop with
remarkable benefits. According to Aggarwal et al. (2008), “Over the last 50 years, area under
wheat cultivation has increased from 10 million to 26 million hectares.” Page # Crop yields and
irrigation areas (30% to 85% of the total irrigation area) have increased due to increasing
irrigation facilities, supporting farmer’s socio-economics, improving seed varieties, and the
application of fertilizers (Aggarwal et al., 2008). Even in the more challenging environments of
North Africa and the Middle East, wheat productivity has grown.
50
2.3 Measuring the Yield Gap in Libya
Measurement of yield gap in Libya is found by subtracting or taking the fraction of the
actual yield from the potential yield. Actual yield is often measured by a farmer’s crop over a
particular time and space. Actual yield is the economic yield attained at harvest under standard
production conditions. Such data is readily available.
However, potential yield of Libya’s grain crops is more elusive. Such measures can be
found by three possible means. The first is data from neighboring countries such as Morocco,
because of its similar geographic conditions. The second is experimental field data from Libya. .
The third option are estimates or simulated yields from global models associating crop
productivity with climactic data worldwide.
2.3.1 Comparison with Yields in Neighboring Countries
Libyan yields have been among the lowest in the region (Figure 2.5). Moreover, Libya
has apparently not even kept up with the general increase in yields experienced across the region
since the late 1990s. Libyan wheat yields have held constant over the last decade and a gap has
emerged between Libyan wheat yields and wheat yields of even its closest comparison countries.
Today, neighbors such as Tunisia, Algeria, and Morocco have wheat yields that are almost
double those in Libya. Comparing Libya to its neighbors generally, it is clear that the other
countries benefit from a more stable governmental system, they have not had decades of
economic sanctions, they have a more open international trading system, and they also have
more usable water. All of these factors contribute to Libya lagging behind.
51
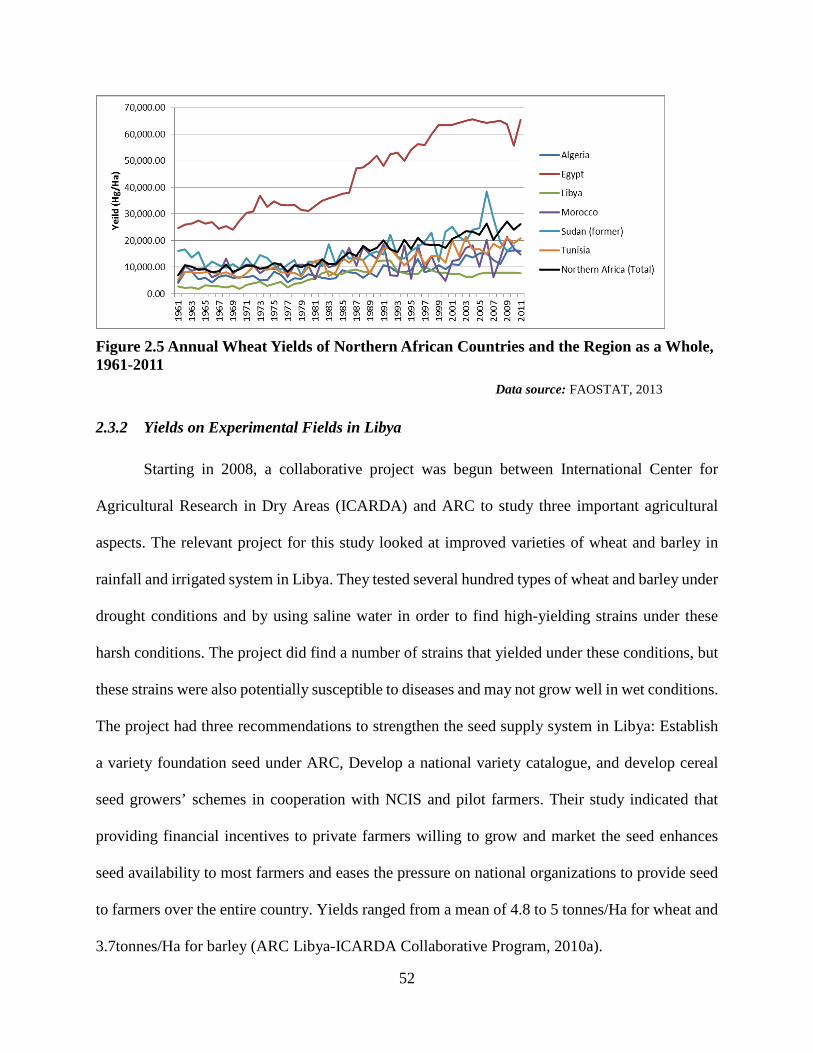
Figure 2.5 Annual Wheat Yields of Northern African Countries and the Region as a Whole, 1961-2011
Data source: FAOSTAT, 2013
2.3.2 Yields on Experimental Fields in Libya
Starting in 2008, a collaborative project was begun between International Center for
Agricultural Research in Dry Areas (ICARDA) and ARC to study three important agricultural
aspects. The relevant project for this study looked at improved varieties of wheat and barley in
rainfall and irrigated system in Libya. They tested several hundred types of wheat and barley under
drought conditions and by using saline water in order to find high-yielding strains under these
harsh conditions. The project did find a number of strains that yielded under these conditions, but
these strains were also potentially susceptible to diseases and may not grow well in wet conditions.
The project had three recommendations to strengthen the seed supply system in Libya: Establish
a variety foundation seed under ARC, Develop a national variety catalogue, and develop cereal
seed growers’ schemes in cooperation with NCIS and pilot farmers. Their study indicated that
providing financial incentives to private farmers willing to grow and market the seed enhances
seed availability to most farmers and eases the pressure on national organizations to provide seed
to farmers over the entire country. Yields ranged from a mean of 4.8 to 5 tonnes/Ha for wheat and
3.7tonnes/Ha for barley (ARC Libya-ICARDA Collaborative Program, 2010a).
52
2.3.3 Estimated Yields Based on Global Climate Models
Traditional methods of estimating potential yield are problematic for Libya based on a
lack of data. One way that potential yields are estimated is by global climate models based on
nonlinear regression analyses within each climate zone in the world (Mueller, Gerber, Johnston,
Ray, Ramankutty, & Johnson, 2012). This seems to be the closest way to find potential yields for
Libya in order find yield gap. An analysis by Licker (2010) using the same methodology as
Mueller et al. shows that if the farmers could reach their climatic potential yield, there would be,
for example, 60% more wheat by managing all of the production factors. However, from this
analysis it is still not clear if all the farmers could achieve the climatic potential yield by
changing their management practices. In some areas, there are massive problems—such social-
economic and political obstacles—to achieve the climatic potential yields. Both studies found
that areas with the lowest yield gaps were in developed countries or areas with high-input
agriculture.
2.4 Impacts of Seed Quality on Yields in Libya
Seed is, in a fundamental sense, the primary agricultural input. Seed provides the
producing organism, which affects all other inputs such as irrigation, fertilizers, insecticides, etc.
With poor seed quality or poor seed genetics, the impact of all other inputs are limited. This
means good quality seed is necessary. Physical purity, germinability, genetic purity and seed
health are the four components of quality seed (Verma, 2011).
From the literature, we know that low quality seed is a major contributing factor to the
low productivity of most agricultural crops in Libya, and a major reason for observed yield gaps.
One of the sector priorities is to use highly productive seeds adapted to the local environment.
Currently, Libya does not have a well-functioning seed system, and therefore, does not have
53
assured access to high quality seed. Additionally, most seeds of improved varieties are imported
and not bred with Libyan conditions in mind, which may also have an impact. All of Libyan
society would directly benefit from a breeding program to select or adapt varieties to Libyan
conditions for increased productivity.
Seed certification is another significant agronomic practice that could improve yields, by
assuring high quality seeds. Seed certification involves processes of seed quality control by
overseeing seed production and multiplication as well as whether the seed reaches certain
standards (Verma, 2011). Lack of quality seed certification is another problem in Libya.
It is expected that better seeds would make a significant contribution to decrease the yield
gap in Libya. However, specific studies about Libyan seed quality and impacts of crop variety
choice on yield are unavailable.
2.5 Discussion and Conclusions: Farmers’ Choices of Crop Variety in Closing the Yield
Gap
Providing a technology with potential to increase yield is one question, but whether or not
the farmer will use that technology is another matter. The farmer’s acceptance of the technology
is vital for its successful implementation.
Griliches (1960) discussed the factors around the rate at which a hybrid corn seed was
accepted and used in U.S agriculture. He observed that adoption timing depends on when the
technology becomes available (date of availability), which is dependent on the activities of seed
producers (market density and cost of entry), which in turn base their activities on the expected
profits and contributions of experimental stations (rates of acceptance). In addition, Griliches
(1960) argued that adoption of a hybrid seed also depends on farmers’ expected profit, in terms
of both the profitability per farm and per acre. Higher yielding hybrid corn was found to be more
54
profitable in good areas than in poor areas, largely because the good areas had better land and
water resources, enabling yield gains and thus returns to be more readily realized. Griliches
(1960) reasoned that the introduction of innovations may lead to an increased gap between the
good regions and poor regions since the good regions have greater incentives to be early adopters
of new technology.
This highlights the importance of the concept of cost of entry and how it differs among
regions. Cost of entry is specifically important to the cost of research, development, marketing,
distribution, and other factors into the cost of introducing a new crop variety. As hybrid corn was
expected to spread more quickly in the good areas with high productivity and growth, breeders
were more likely to focus on developing varieties for these regions. Smale, Hartell, Heisey, and
Senauer (1998) also looked at the genealogical dissimilarity of wheat varieties and highlighted
the pattern that farmers often choose varieties with high economic values, which allows the
researchers to understand the unobservable genetic characteristics.
Heisey, Smale, Byerlee, and Souza (1997) found that when a trade-off is presented
between resistance to disease and yield, some farmers will opt to under-produce in order to
maintain resistance to disease and minimize losses. However, the benefit of higher yield, is leads
most farmers to grow the more susceptible strain. Farmers may continue to grow higher yielding
varieties that are not recommended despite their greater susceptibility to disease due to the
perceived individual cost of switching to a more diverse field of recommended varieties.
Farmers chose to grow only the highest yielding variety over those that would be more resistant
to disease. Farmers also ignored what varieties the farmers around them were using in their
fields. This ignoring of fellow farmer choices as well as recommended strains caused overall
55
lower genetic diversity in the region at the expense of optimizing protection against new strains
of rust.
Smale (2000) discusses collaborative plant breeding (CPB), which uses skills and
experience of both farmers-breeders and professional plant breeders to improve crop varieties for
a given region. How much the farmer and professional breeders engage in the plant breeding
effort depends on many factors, such as the types of characteristics that need improvement,
existing choice of varieties, and ‘intra-population’ selection practices (to pick which types of
seeds to use to improve the crop). The long term goals of CPB depend on who participates. Some
have proposed to support on-farm conservation by linking agricultural subsidies with the
diversity of crop genetic resources.
There are arguments for the approach that participatory breeding can support the
maintenance of more diverse, locally-adapted plant populations. The biological truth of this
proposition still needs to be tested. For economists, a fundamental question surrounding the issue
is whether the efforts will be cost effective for farmers. Examining this question requires the
investigation of issues such as the effectiveness of farmers' methods of seed selection and
management, the nature of the seed supply systems to help the benefits of improved varieties
spread among farmers, and farmer's own perceptions of what goals can be attained through
choice of variety. A better understanding of what farmers know and what they base their
decisions on is critical.
56
3 Availability and Adoption of Improved Wheat and Barley Varieties: A
Survey of Grain Farmers in Libya
3.1 Introduction
Despite regime change in Libya in 2011, continued demand from a growing urban
population is posing greater challenges to agriculture. Small grains farming makes up the largest
share of Libya’s agricultural sector, and yet more than three quarters of grain consumed by the
population must be imported. Improved yield and drought tolerance are essential for Libyan
grain farming to remain viable and sustainable. Central to such improvements are the varieties of
wheat being grown by Libyan farmers. Under the previous government little attention was given
to improvement of the seed system in Libya. Little is known about the crop variety decisions
being made by grain farmers in Libya.
To understand what varieties are being grown in Libya and set a benchmark against
which future analyses can be measured, a survey was conducted of a random sample of Libyan
small grain farmers to determine the following questions: What factors influence and/or are
associated with farmers’ adoption of improved wheat and barley varieties? Why do farmers grow
wheat and barley instead of growing other crops? By description of the wheat and barley
varieties, which wheat and barley varieties? Where do farmers get these varieties? Why do they
grow those varieties? Why do farmers’ prefer those varieties? Do farmers save seed? If so,
which farmers save seed? What are the characteristics of these farmers?
This survey of Libyan grain farmers was conducted to investigate farmers’ decisions
involving seed quality, improved variety adoption, and their relationship to other farming
practices. Collectively, the results help to determine productivity and yield gap, and contribute to
57
the objectives of this study, which are to examine the factors that influence farmers’ adoption of
improved wheat and barley varieties. This chapter includes three main sections: first, a
description of the design and administration of a survey of Libyan small grain farmers; second, a
descriptive summary of the survey results; and third analysis of which factors are associated with
adoption of improved wheat and barley seed varieties by Libyan small grain farmers.
3.2 Survey Design and Administration
The purpose of this survey was to develop a better understanding of the wheat and barley
seed system in Libya, including how farmers choose their wheat and barley seed varieties, and in
turn, how those seed varieties perform in Libyan agriculture. The results of this survey can be
utilized in informing future efforts to improve the seeds system in Libya and to recommend ways
to provide better crop genetics to Libyan farmers.
This survey was prepared by the research team overseen by Dr. Gregory Graff at
Colorado State University. It was reviewed and approved by the Institutional Review Board
(IRB) at Colorado State University before being sent to Dr. Ali Arhama, professor of
Agricultural Economics at the University of Tripoli, Libya. The survey included an informational
cover letter and survey questions in both Arabic and English. The survey questions were
organized into ten sections: socio-demographics, land, farm labor, marketing, seed, mechanical
use, irrigation, fertilizer, pesticide, and government support. The survey was administered in
Libya by Dr. Ali Arhama, of the University of Tripoli, who is also Director of the General
Authority for Cereal Production at the Ministry of Agriculture in Tripoli. The target sample size,
covering both barley and wheat growers, was 181. The sampling distribution was determined
from the 2007 Agricultural Census (Commission on Public Information Libya, 2007) and the
Commission on Public Information regarding where wheat and barley is grown across Libya.
58
Dr. Arhama distributed the survey to the western, southern, and eastern parts of Libya in
May 2014. He also sent the survey to Dr. Naser El-Msalati, professor of Agricultural Economics
at the Omar Al-Mukhtar University, in Bayda, Libya, who helped Dr. Arhama distribute surveys
across the eastern regions of Libya. Dr. El-Msalati asked his students to interview farmers
growing wheat and/or barley. Furthermore, Dr. Arhama sent agronomists to meet famers in the
southern and western regions.
The administration of the survey took longer than expected due to the heightened national
security situation in Libya in 2014. In June, he concluded the survey in the east and the south,
but it was very difficult to collect surveys from the western regions around Tripoli, due to
ongoing civil war violence. Therefore, the total responses collected were from 136 farmers from
eastern and southern Libya. Returning the surveys to the United States was also a significant
challenge due to the siege of the Tripoli international airport in summer of 2014. They were
received in September 2014. Once received, the data was entered into Excel and transferred to
SPSS for analysis.
The surveys were sent to twelve different regions in Libya. Results came from: 46
farmers in Al Marj (33.8%), 45 farmers in Marzuq (33.1%), 12 farmers in Sabha (8.8 percent),
12 farmers in Jabail Akhdar (8.8 percent), 11 farmers in Tubruq (8.1 percent), and 10 farmers in
Derna (7.4 percent). Surveys were also sent to 45 farmers in the western regions of Libya
(including Zawiya, Sirte, Misurata, and Murgub); however, no surveys were collected from the
western regions because it was too dangerous to ask anyone to travel there because of continued
instability and violence following the ousting of Gadhafi (Table 3.1).
59
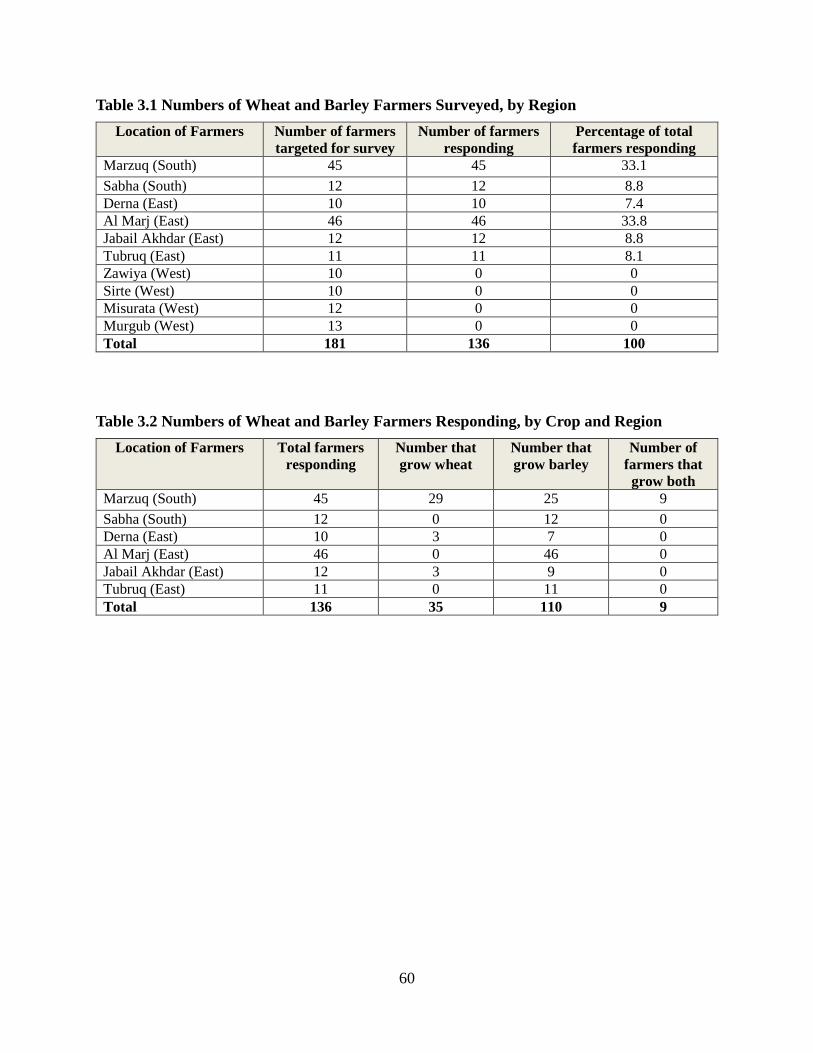
Table 3.1 Numbers of Wheat and Barley Farmers Surveyed, by Region Location of Farmers Number of farmers
targeted for survey Number of farmers
responding Percentage of total farmers responding
Marzuq (South) 45 45 33.1 Sabha (South) 12 12 8.8 Derna (East) 10 10 7.4 Al Marj (East) 46 46 33.8 Jabail Akhdar (East) 12 12 8.8 Tubruq (East) 11 11 8.1 Zawiya (West) 10 0 0 Sirte (West) 10 0 0 Misurata (West) 12 0 0 Murgub (West) 13 0 0 Total 181 136 100
Table 3.2 Numbers of Wheat and Barley Farmers Responding, by Crop and Region
Location of Farmers Total farmers responding
Number that grow wheat
Number that grow barley
Number of farmers that grow both
Marzuq (South) 45 29 25 9 Sabha (South) 12 0 12 0 Derna (East) 10 3 7 0 Al Marj (East) 46 0 46 0 Jabail Akhdar (East) 12 3 9 0 Tubruq (East) 11 0 11 0 Total 136 35 110 9
60
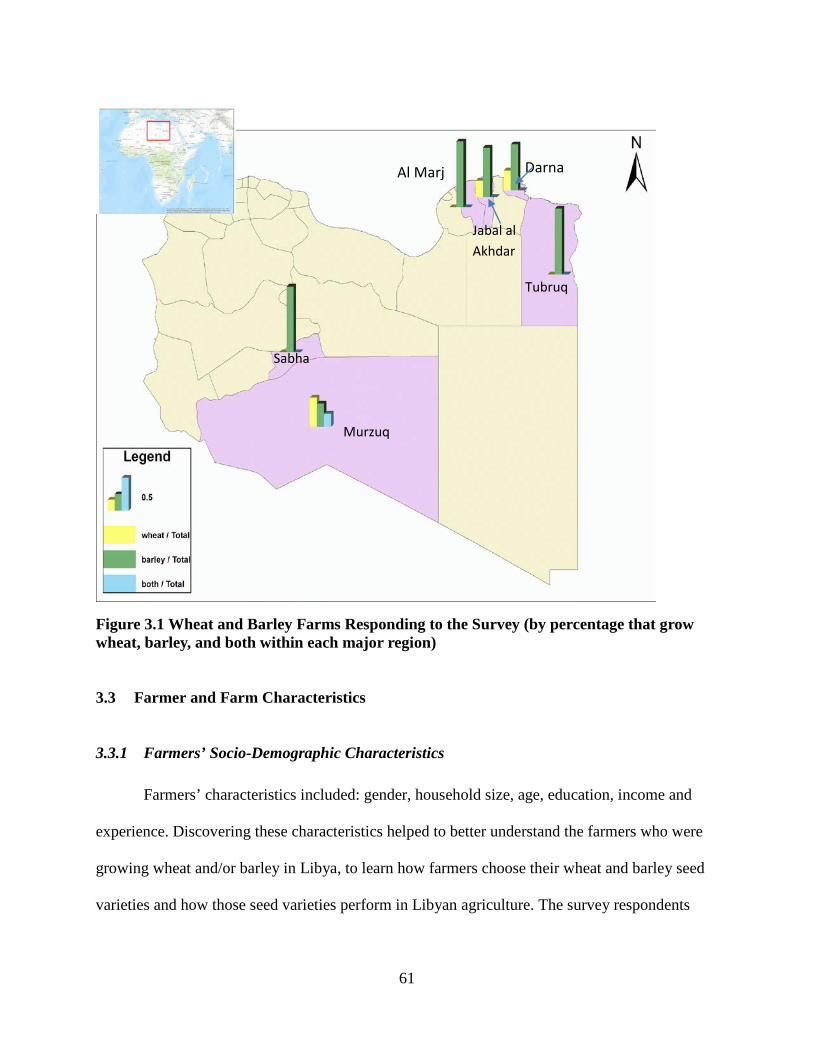
Figure 3.1 Wheat and Barley Farms Responding to the Survey (by percentage that grow wheat, barley, and both within each major region)
3.3 Farmer and Farm Characteristics
3.3.1 Farmers’ Socio-Demographic Characteristics
Farmers’ characteristics included: gender, household size, age, education, income and
experience. Discovering these characteristics helped to better understand the farmers who were
growing wheat and/or barley in Libya, to learn how farmers choose their wheat and barley seed
varieties and how those seed varieties perform in Libyan agriculture. The survey respondents
Murzuq
Sabha
Tubruq
Al Marj Darna
Jabal al Akhdar
61
totaled 136 and all farmers were male. While there is no law that women cannot be farmers in
Libya, traditional cultural and religious gender norms prevent women from farming.
Farmers were asked how many people live in their household. Over half of the
respondents (n = 73; 54%) said that the highest number of people who live together in their
household was six to eight. Thirty-eight farmers (28%) said there were nine or more living in
their household. Seventeen farmers (13%) had four to five people living together. While only
eight farmers (six percent) had from one to three people living in the household. These results
show that typical farming households are large, with 82% of responding households containing
at least six people. A majority of the large households grew barley instead of wheat (65%).
Farmers were asked about the age of the primary farm operator. The highest group
percentage was between 51 and 60 years of age; 55 farmers were in this category (40%). The
next largest group was aged 61 or older (n = 44; 32%). Farmers between 41 and 50 years old had
24 respondents (18%). Eight of the farmers (four percent) were under 30 years old. The smallest
group was between 31 and 40 years old (n = 7; 5 percent). These results show that 72.1% of
farmers were over 50 years old; these demographics are considerably different from the country
as a whole, which is predominantly younger. Older farmers (more than 40 years old)
predominately grew barley rather than wheat (91%).
Farmers were asked about their years of farming experience. As might be expected
based on the previous question of age, 104 (76%) of the respondents reported over ten years of
farming experience. While 25 farmers (18%) said their experience was between five and ten
years. Only seven farmers (five percent) stated their farming experience was less than five years.
These results further show that older and experienced people farm in Libya, while there are few
62
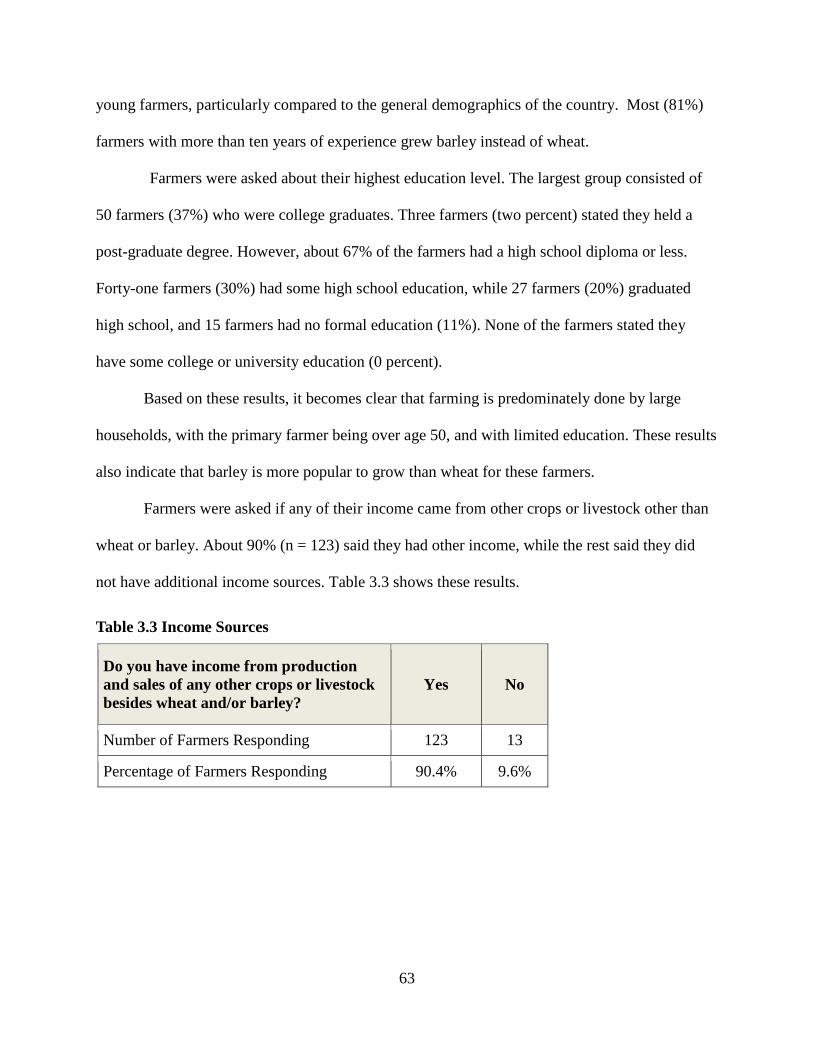
young farmers, particularly compared to the general demographics of the country. Most (81%)
farmers with more than ten years of experience grew barley instead of wheat.
Farmers were asked about their highest education level. The largest group consisted of
50 farmers (37%) who were college graduates. Three farmers (two percent) stated they held a
post-graduate degree. However, about 67% of the farmers had a high school diploma or less.
Forty-one farmers (30%) had some high school education, while 27 farmers (20%) graduated
high school, and 15 farmers had no formal education (11%). None of the farmers stated they
have some college or university education (0 percent).
Based on these results, it becomes clear that farming is predominately done by large
households, with the primary farmer being over age 50, and with limited education. These results
also indicate that barley is more popular to grow than wheat for these farmers.
Farmers were asked if any of their income came from other crops or livestock other than
wheat or barley. About 90% (n = 123) said they had other income, while the rest said they did
not have additional income sources. Table 3.3 shows these results.
Table 3.3 Income Sources
Do you have income from production and sales of any other crops or livestock besides wheat and/or barley?
Yes No
Number of Farmers Responding 123 13
Percentage of Farmers Responding 90.4% 9.6%
63
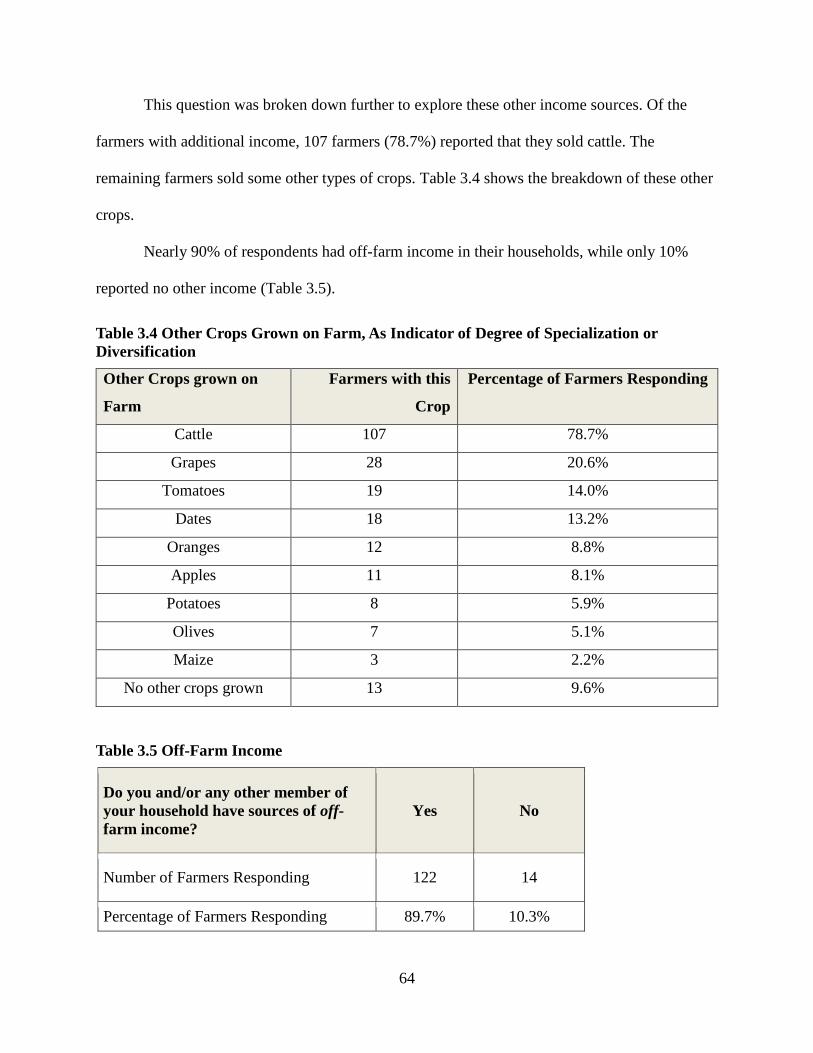
This question was broken down further to explore these other income sources. Of the
farmers with additional income, 107 farmers (78.7%) reported that they sold cattle. The
remaining farmers sold some other types of crops. Table 3.4 shows the breakdown of these other
crops.
Nearly 90% of respondents had off-farm income in their households, while only 10%
reported no other income (Table 3.5).
Table 3.4 Other Crops Grown on Farm, As Indicator of Degree of Specialization or Diversification
Other Crops grown on
Farm
Farmers with this
Crop
Percentage of Farmers Responding
Cattle 107 78.7%
Grapes 28 20.6%
Tomatoes 19 14.0%
Dates 18 13.2%
Oranges 12 8.8%
Apples 11 8.1%
Potatoes 8 5.9%
Olives 7 5.1%
Maize 3 2.2%
No other crops grown 13 9.6%
Table 3.5 Off-Farm Income
Do you and/or any other member of your household have sources of off-farm income?
Yes No
Number of Farmers Responding 122 14
Percentage of Farmers Responding 89.7% 10.3%
64
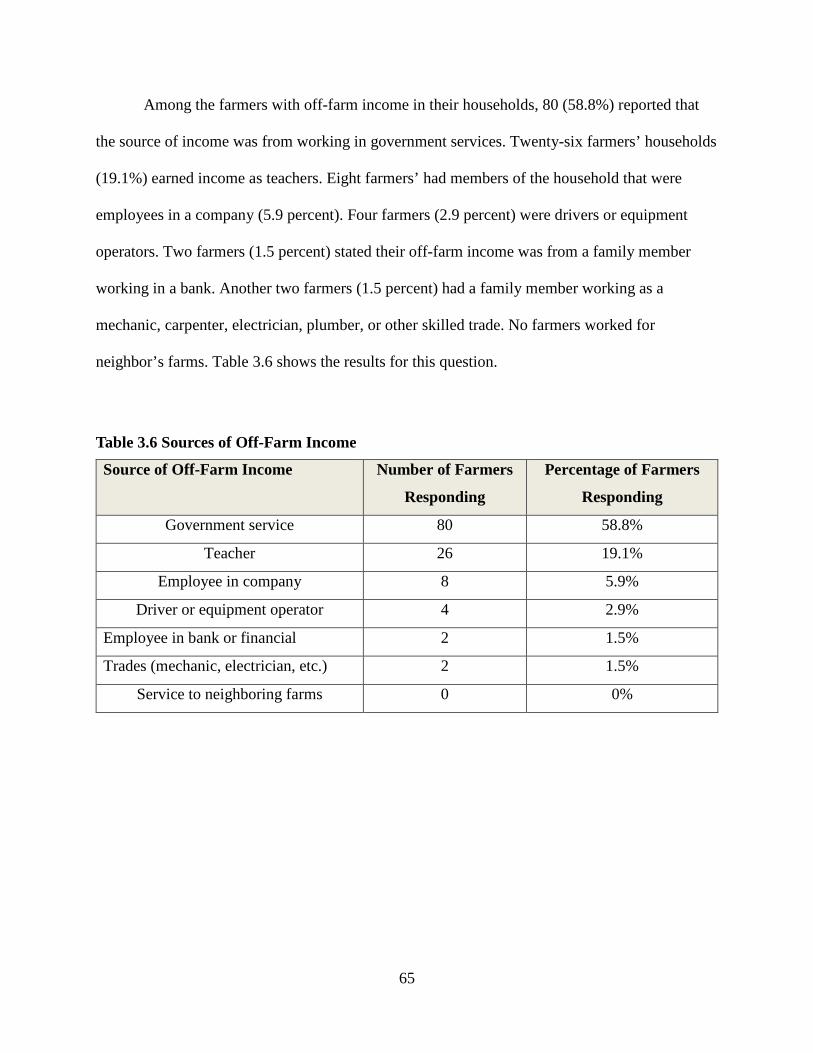
Among the farmers with off-farm income in their households, 80 (58.8%) reported that
the source of income was from working in government services. Twenty-six farmers’ households
(19.1%) earned income as teachers. Eight farmers’ had members of the household that were
employees in a company (5.9 percent). Four farmers (2.9 percent) were drivers or equipment
operators. Two farmers (1.5 percent) stated their off-farm income was from a family member
working in a bank. Another two farmers (1.5 percent) had a family member working as a
mechanic, carpenter, electrician, plumber, or other skilled trade. No farmers worked for
neighbor’s farms. Table 3.6 shows the results for this question.
Table 3.6 Sources of Off-Farm Income
Source of Off-Farm Income Number of Farmers
Responding
Percentage of Farmers
Responding
Government service 80 58.8%
Teacher 26 19.1%
Employee in company 8 5.9%
Driver or equipment operator 4 2.9%
Employee in bank or financial 2 1.5%
Trades (mechanic, electrician, etc.) 2 1.5%
Service to neighboring farms 0 0%
65
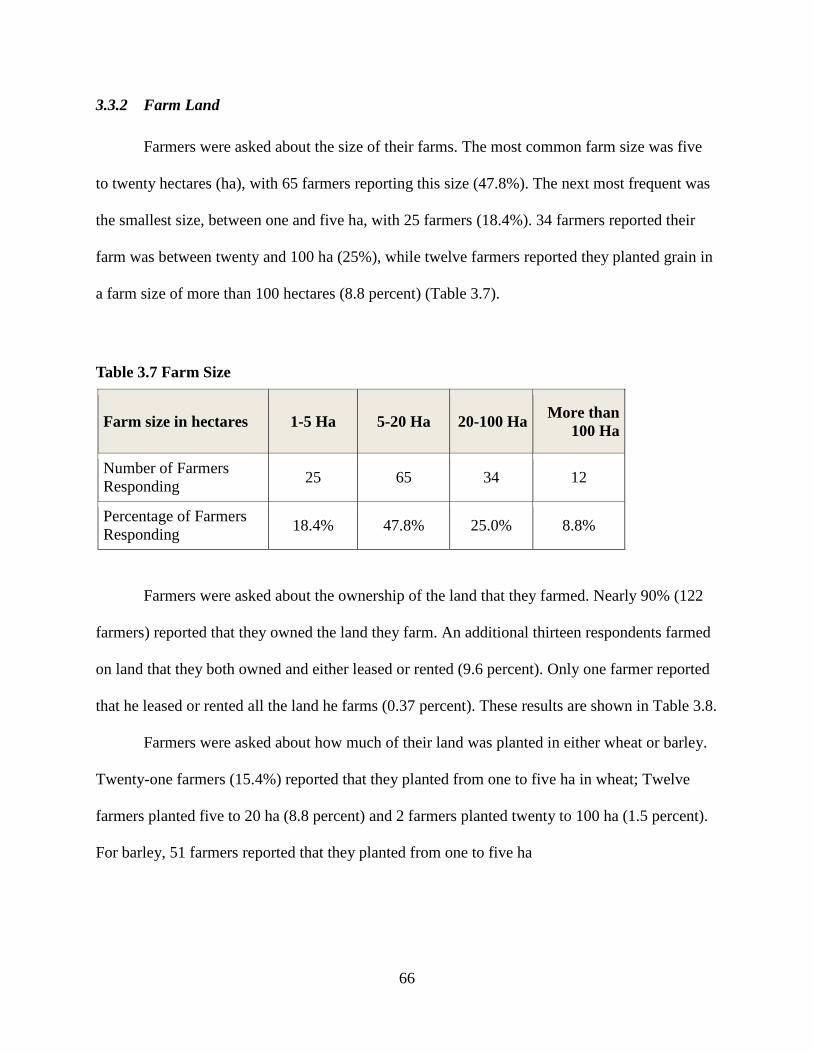
3.3.2 Farm Land
Farmers were asked about the size of their farms. The most common farm size was five
to twenty hectares (ha), with 65 farmers reporting this size (47.8%). The next most frequent was
the smallest size, between one and five ha, with 25 farmers (18.4%). 34 farmers reported their
farm was between twenty and 100 ha (25%), while twelve farmers reported they planted grain in
a farm size of more than 100 hectares (8.8 percent) (Table 3.7).
Table 3.7 Farm Size
Farm size in hectares 1-5 Ha 5-20 Ha 20-100 Ha More than 100 Ha
Number of Farmers Responding 25 65 34 12
Percentage of Farmers Responding 18.4% 47.8% 25.0% 8.8%
Farmers were asked about the ownership of the land that they farmed. Nearly 90% (122
farmers) reported that they owned the land they farm. An additional thirteen respondents farmed
on land that they both owned and either leased or rented (9.6 percent). Only one farmer reported
that he leased or rented all the land he farms (0.37 percent). These results are shown in Table 3.8.
Farmers were asked about how much of their land was planted in either wheat or barley.
Twenty-one farmers (15.4%) reported that they planted from one to five ha in wheat; Twelve
farmers planted five to 20 ha (8.8 percent) and 2 farmers planted twenty to 100 ha (1.5 percent).
For barley, 51 farmers reported that they planted from one to five ha
66
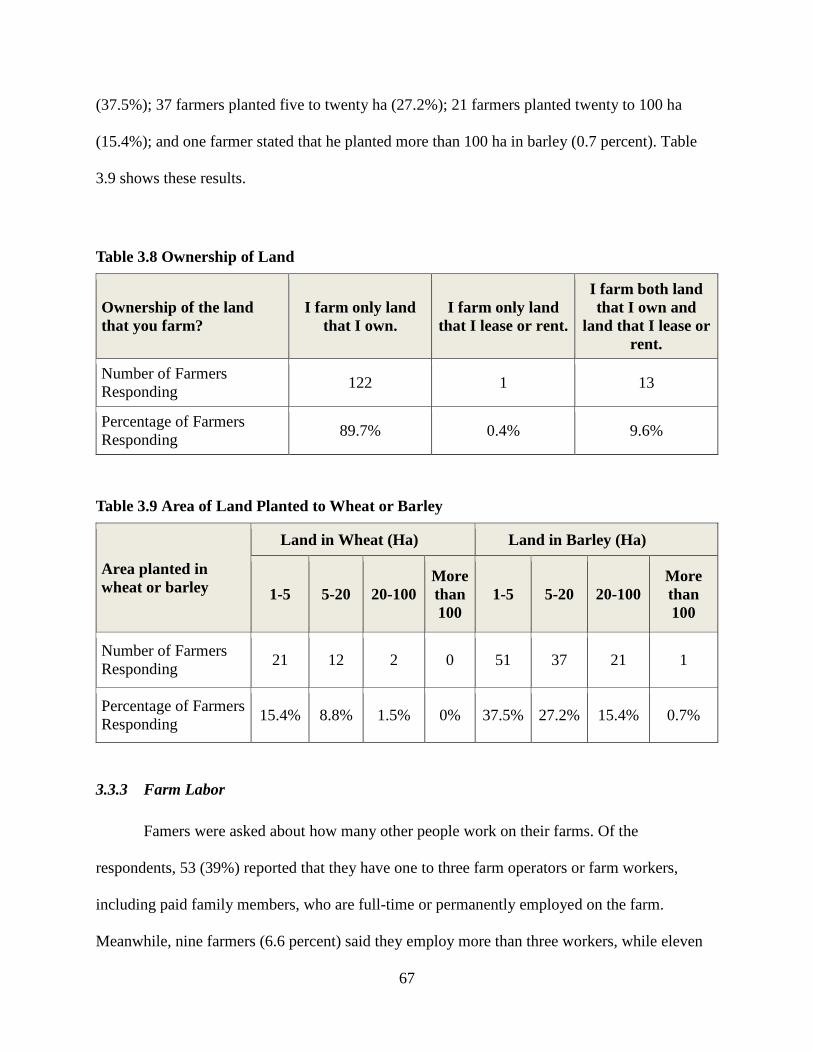
(37.5%); 37 farmers planted five to twenty ha (27.2%); 21 farmers planted twenty to 100 ha
(15.4%); and one farmer stated that he planted more than 100 ha in barley (0.7 percent). Table
3.9 shows these results.
Table 3.8 Ownership of Land
Ownership of the land that you farm?
I farm only land that I own.
I farm only land that I lease or rent.
I farm both land that I own and
land that I lease or rent.
Number of Farmers Responding 122 1 13
Percentage of Farmers Responding 89.7% 0.4% 9.6%
Table 3.9 Area of Land Planted to Wheat or Barley
Area planted in wheat or barley
Land in Wheat (Ha) Land in Barley (Ha)
1-5 5-20 20-100 More than 100
1-5 5-20 20-100 More than 100
Number of Farmers Responding 21 12 2 0 51 37 21 1
Percentage of Farmers Responding 15.4% 8.8% 1.5% 0% 37.5% 27.2% 15.4% 0.7%
3.3.3 Farm Labor
Famers were asked about how many other people work on their farms. Of the
respondents, 53 (39%) reported that they have one to three farm operators or farm workers,
including paid family members, who are full-time or permanently employed on the farm.
Meanwhile, nine farmers (6.6 percent) said they employ more than three workers, while eleven
67
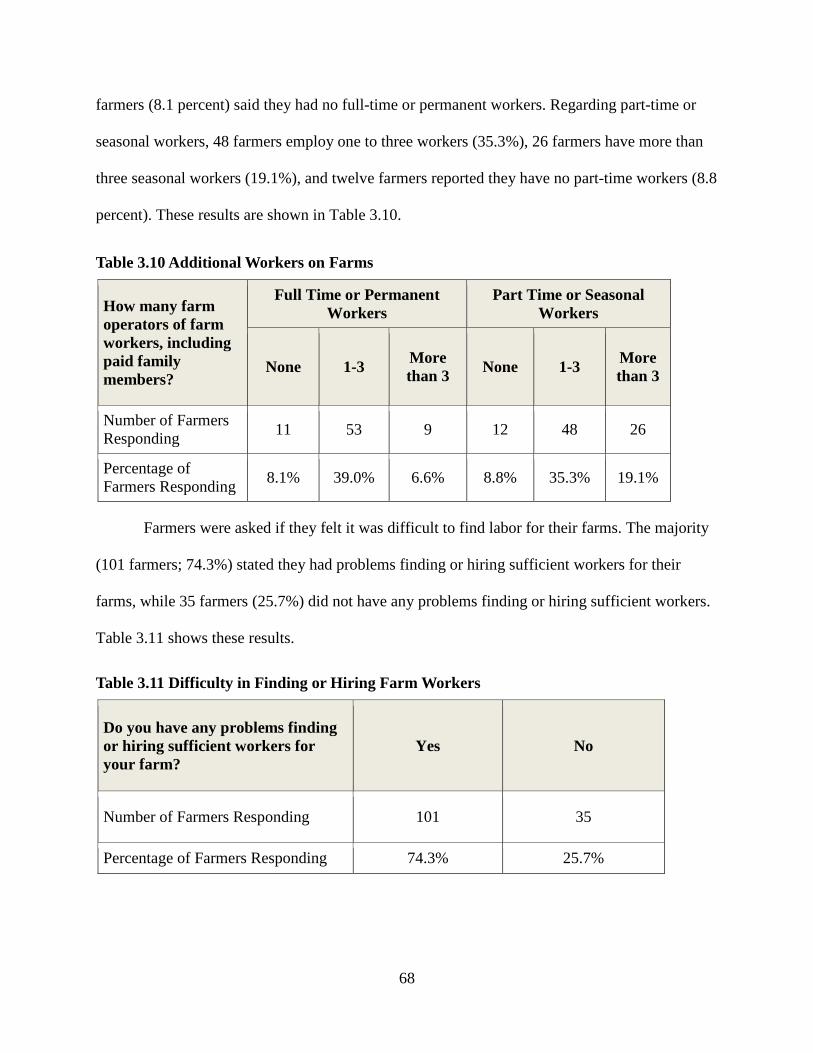
farmers (8.1 percent) said they had no full-time or permanent workers. Regarding part-time or
seasonal workers, 48 farmers employ one to three workers (35.3%), 26 farmers have more than
three seasonal workers (19.1%), and twelve farmers reported they have no part-time workers (8.8
percent). These results are shown in Table 3.10.
Table 3.10 Additional Workers on Farms
How many farm operators of farm workers, including paid family members?
Full Time or Permanent Workers
Part Time or Seasonal Workers
None 1-3 More than 3 None 1-3 More
than 3
Number of Farmers Responding 11 53 9 12 48 26
Percentage of Farmers Responding 8.1% 39.0% 6.6% 8.8% 35.3% 19.1%
Farmers were asked if they felt it was difficult to find labor for their farms. The majority
(101 farmers; 74.3%) stated they had problems finding or hiring sufficient workers for their
farms, while 35 farmers (25.7%) did not have any problems finding or hiring sufficient workers.
Table 3.11 shows these results.
Table 3.11 Difficulty in Finding or Hiring Farm Workers
Do you have any problems finding or hiring sufficient workers for your farm?
Yes No
Number of Farmers Responding 101 35
Percentage of Farmers Responding 74.3% 25.7%
68
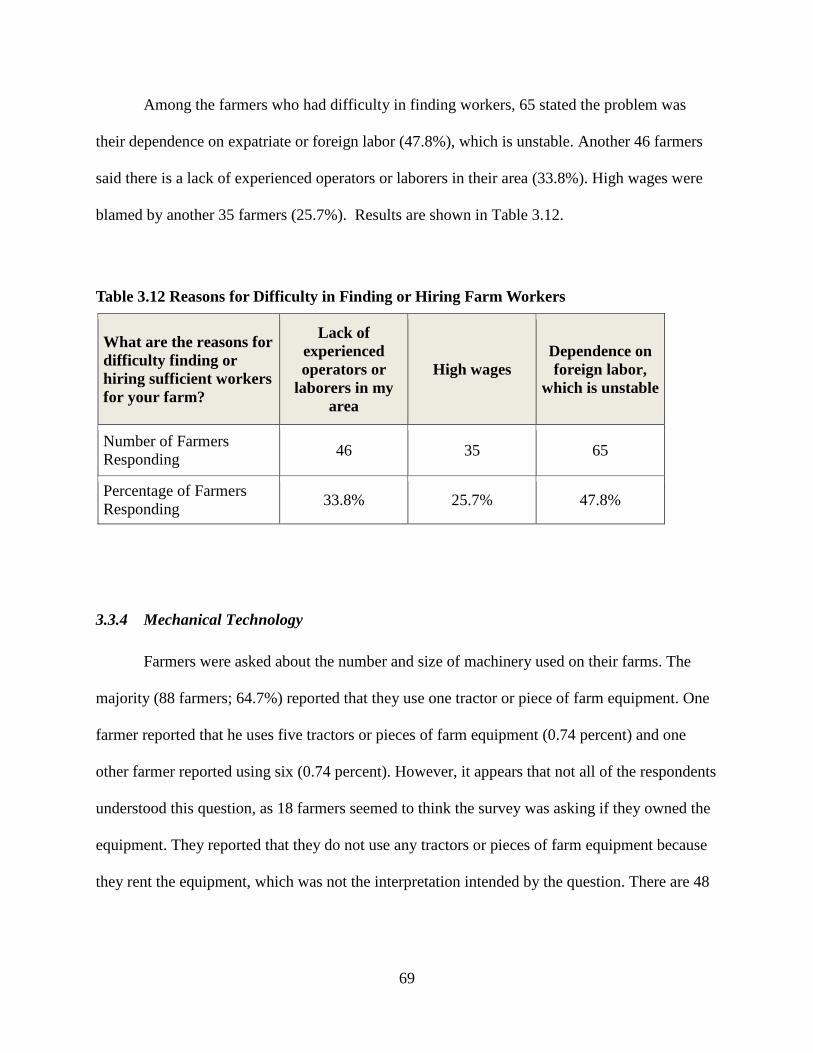
Among the farmers who had difficulty in finding workers, 65 stated the problem was
their dependence on expatriate or foreign labor (47.8%), which is unstable. Another 46 farmers
said there is a lack of experienced operators or laborers in their area (33.8%). High wages were
blamed by another 35 farmers (25.7%). Results are shown in Table 3.12.
Table 3.12 Reasons for Difficulty in Finding or Hiring Farm Workers
What are the reasons for difficulty finding or hiring sufficient workers for your farm?
Lack of experienced operators or
laborers in my area
High wages Dependence on foreign labor,
which is unstable
Number of Farmers Responding 46 35 65
Percentage of Farmers Responding 33.8% 25.7% 47.8%
3.3.4 Mechanical Technology
Farmers were asked about the number and size of machinery used on their farms. The
majority (88 farmers; 64.7%) reported that they use one tractor or piece of farm equipment. One
farmer reported that he uses five tractors or pieces of farm equipment (0.74 percent) and one
other farmer reported using six (0.74 percent). However, it appears that not all of the respondents
understood this question, as 18 farmers seemed to think the survey was asking if they owned the
equipment. They reported that they do not use any tractors or pieces of farm equipment because
they rent the equipment, which was not the interpretation intended by the question. There are 48
69
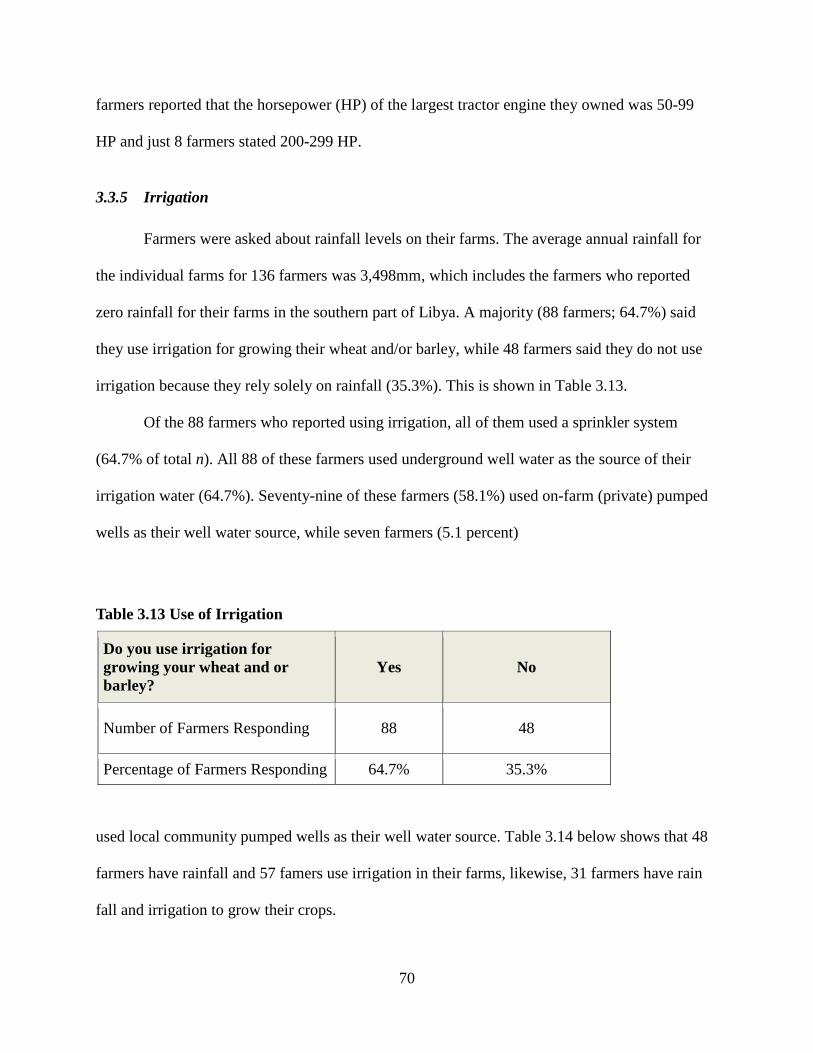
farmers reported that the horsepower (HP) of the largest tractor engine they owned was 50-99
HP and just 8 farmers stated 200-299 HP.
3.3.5 Irrigation
Farmers were asked about rainfall levels on their farms. The average annual rainfall for
the individual farms for 136 farmers was 3,498mm, which includes the farmers who reported
zero rainfall for their farms in the southern part of Libya. A majority (88 farmers; 64.7%) said
they use irrigation for growing their wheat and/or barley, while 48 farmers said they do not use
irrigation because they rely solely on rainfall (35.3%). This is shown in Table 3.13.
Of the 88 farmers who reported using irrigation, all of them used a sprinkler system
(64.7% of total n). All 88 of these farmers used underground well water as the source of their
irrigation water (64.7%). Seventy-nine of these farmers (58.1%) used on-farm (private) pumped
wells as their well water source, while seven farmers (5.1 percent)
Table 3.13 Use of Irrigation
Do you use irrigation for growing your wheat and or barley?
Yes No
Number of Farmers Responding 88 48
Percentage of Farmers Responding 64.7% 35.3%
used local community pumped wells as their well water source. Table 3.14 below shows that 48
farmers have rainfall and 57 famers use irrigation in their farms, likewise, 31 farmers have rain
fall and irrigation to grow their crops.
70
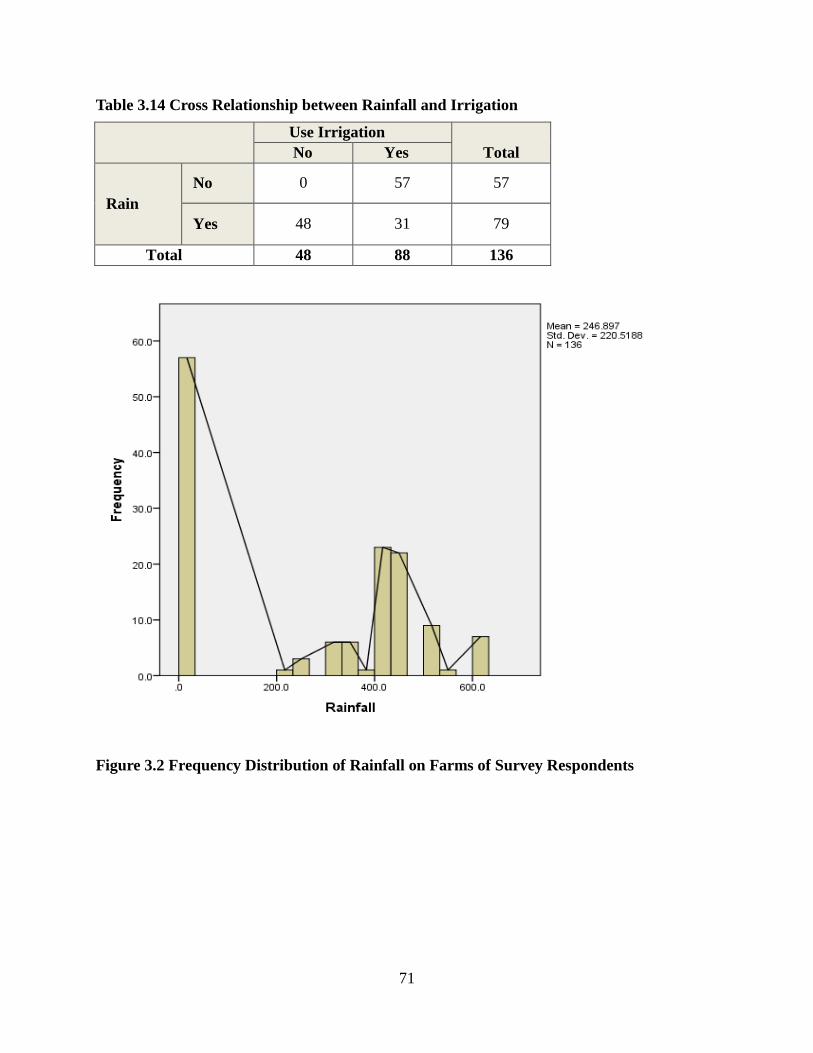
Table 3.14 Cross Relationship between Rainfall and Irrigation Use Irrigation
Total No Yes
Rain No 0 57 57
Yes 48 31 79
Total 48 88 136
Figure 3.2 Frequency Distribution of Rainfall on Farms of Survey Respondents
71
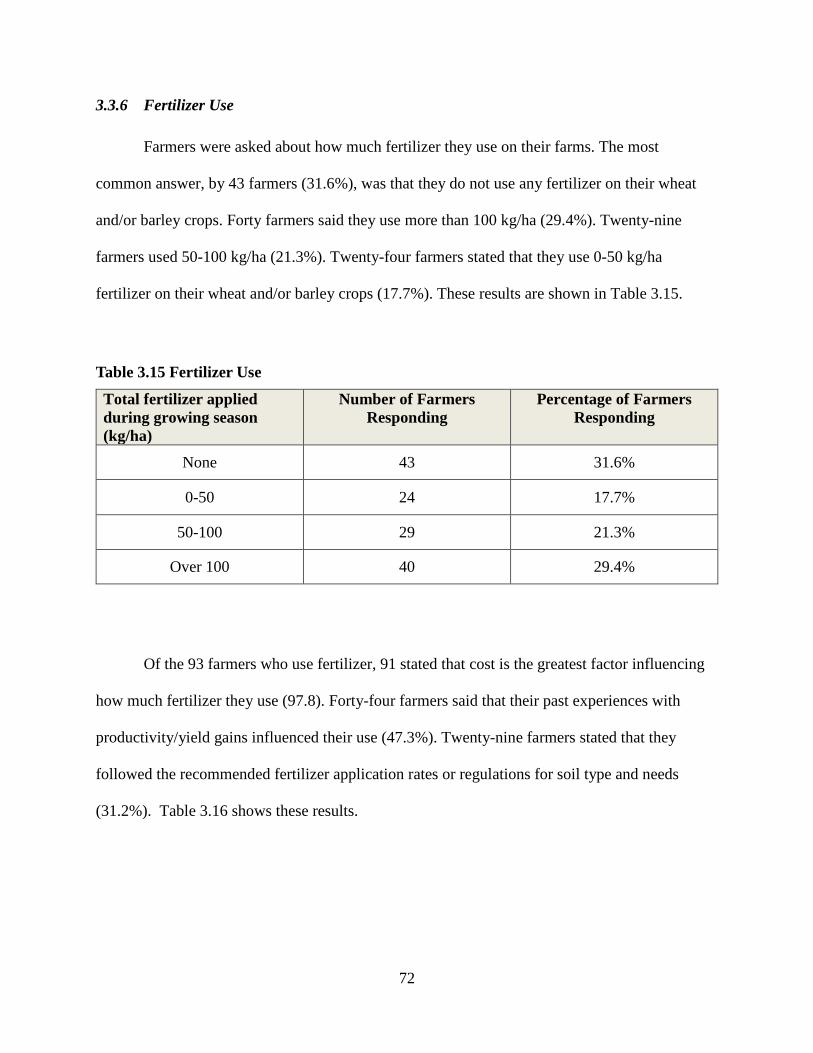
3.3.6 Fertilizer Use
Farmers were asked about how much fertilizer they use on their farms. The most
common answer, by 43 farmers (31.6%), was that they do not use any fertilizer on their wheat
and/or barley crops. Forty farmers said they use more than 100 kg/ha (29.4%). Twenty-nine
farmers used 50-100 kg/ha (21.3%). Twenty-four farmers stated that they use 0-50 kg/ha
fertilizer on their wheat and/or barley crops (17.7%). These results are shown in Table 3.15.
Table 3.15 Fertilizer Use
Total fertilizer applied during growing season (kg/ha)
Number of Farmers Responding
Percentage of Farmers Responding
None 43 31.6%
0-50 24 17.7%
50-100 29 21.3%
Over 100 40 29.4%
Of the 93 farmers who use fertilizer, 91 stated that cost is the greatest factor influencing
how much fertilizer they use (97.8). Forty-four farmers said that their past experiences with
productivity/yield gains influenced their use (47.3%). Twenty-nine farmers stated that they
followed the recommended fertilizer application rates or regulations for soil type and needs
(31.2%). Table 3.16 shows these results.
72
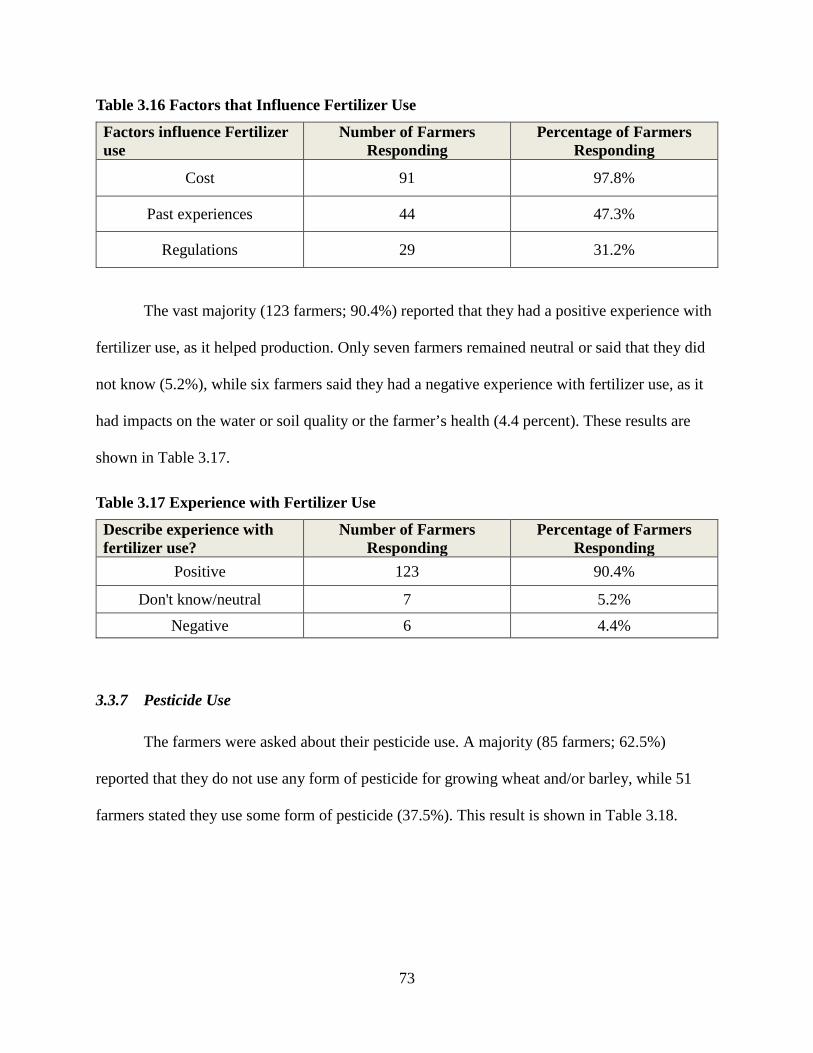
Table 3.16 Factors that Influence Fertilizer Use
Factors influence Fertilizer use
Number of Farmers Responding
Percentage of Farmers Responding
Cost 91 97.8%
Past experiences 44 47.3%
Regulations 29 31.2%
The vast majority (123 farmers; 90.4%) reported that they had a positive experience with
fertilizer use, as it helped production. Only seven farmers remained neutral or said that they did
not know (5.2%), while six farmers said they had a negative experience with fertilizer use, as it
had impacts on the water or soil quality or the farmer’s health (4.4 percent). These results are
shown in Table 3.17.
Table 3.17 Experience with Fertilizer Use
Describe experience with fertilizer use?
Number of Farmers Responding
Percentage of Farmers Responding
Positive 123 90.4%
Don't know/neutral 7 5.2%
Negative 6 4.4%
3.3.7 Pesticide Use
The farmers were asked about their pesticide use. A majority (85 farmers; 62.5%)
reported that they do not use any form of pesticide for growing wheat and/or barley, while 51
farmers stated they use some form of pesticide (37.5%). This result is shown in Table 3.18.
73
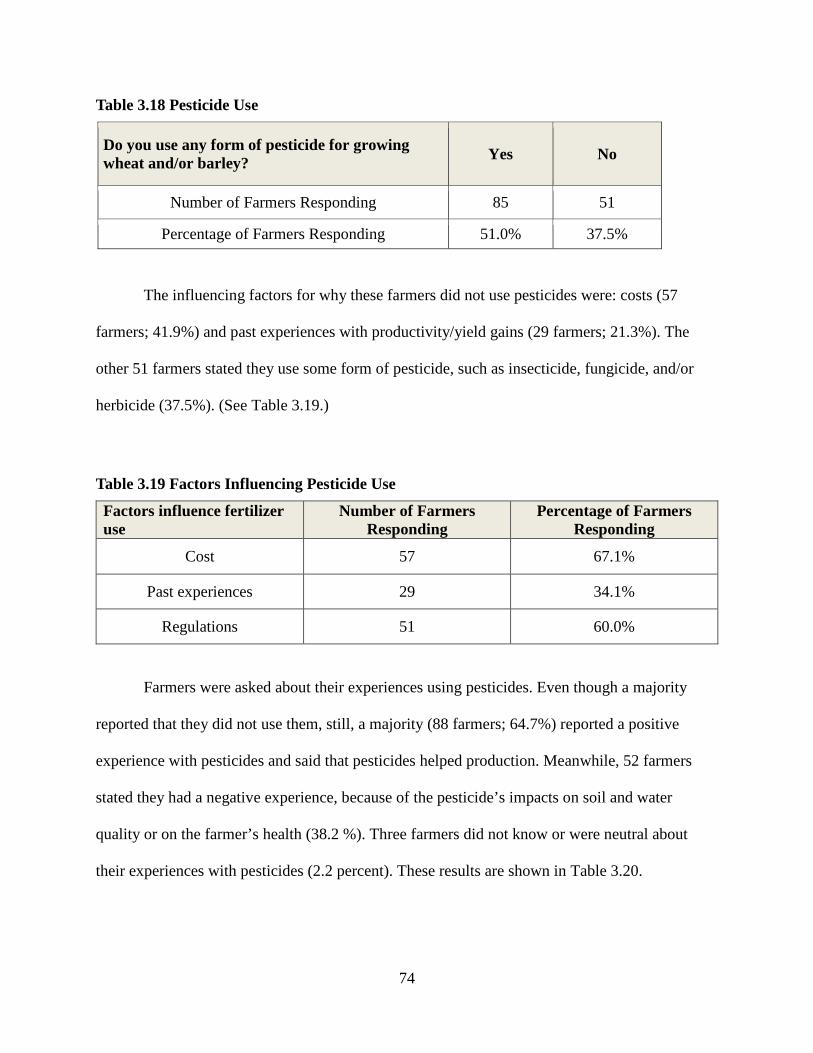
Table 3.18 Pesticide Use
Do you use any form of pesticide for growing wheat and/or barley? Yes No
Number of Farmers Responding 85 51
Percentage of Farmers Responding 51.0% 37.5%
The influencing factors for why these farmers did not use pesticides were: costs (57
farmers; 41.9%) and past experiences with productivity/yield gains (29 farmers; 21.3%). The
other 51 farmers stated they use some form of pesticide, such as insecticide, fungicide, and/or
herbicide (37.5%). (See Table 3.19.)
Table 3.19 Factors Influencing Pesticide Use
Factors influence fertilizer use
Number of Farmers Responding
Percentage of Farmers Responding
Cost 57 67.1%
Past experiences 29 34.1%
Regulations 51 60.0%
Farmers were asked about their experiences using pesticides. Even though a majority
reported that they did not use them, still, a majority (88 farmers; 64.7%) reported a positive
experience with pesticides and said that pesticides helped production. Meanwhile, 52 farmers
stated they had a negative experience, because of the pesticide’s impacts on soil and water
quality or on the farmer’s health (38.2 %). Three farmers did not know or were neutral about
their experiences with pesticides (2.2 percent). These results are shown in Table 3.20.
74
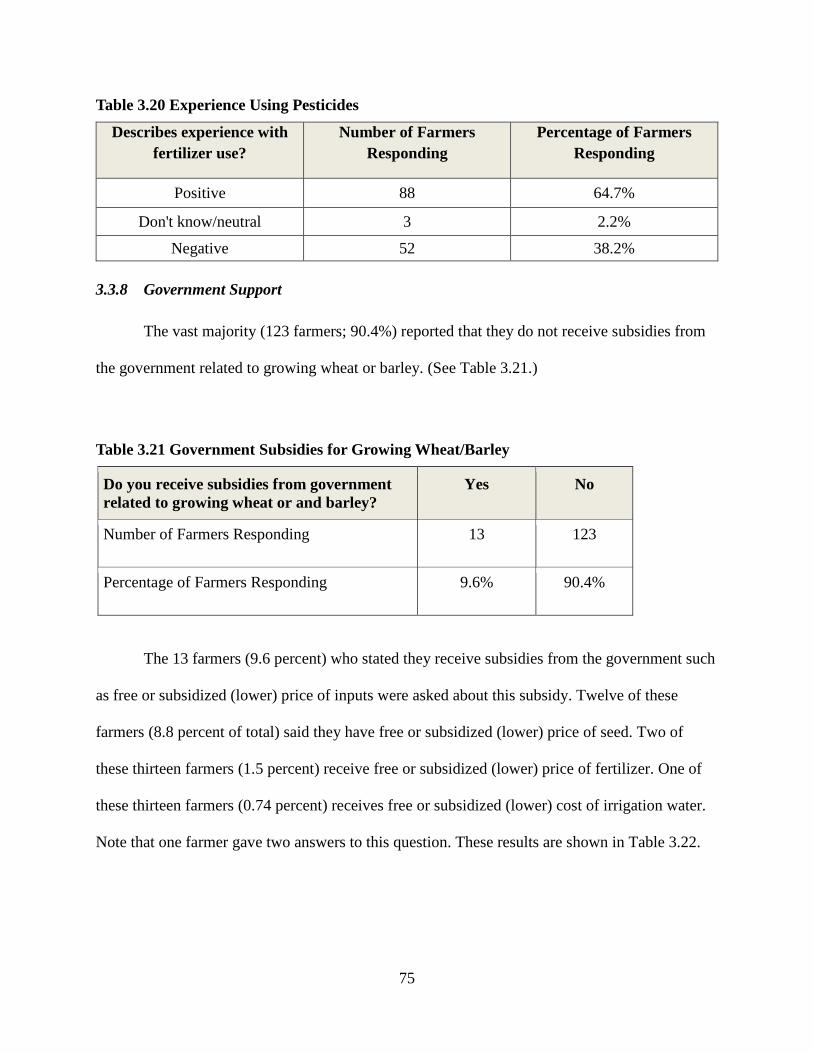
Table 3.20 Experience Using Pesticides
Describes experience with fertilizer use?
Number of Farmers Responding
Percentage of Farmers Responding
Positive 88 64.7%
Don't know/neutral 3 2.2%
Negative 52 38.2%
3.3.8 Government Support
The vast majority (123 farmers; 90.4%) reported that they do not receive subsidies from
the government related to growing wheat or barley. (See Table 3.21.)
Table 3.21 Government Subsidies for Growing Wheat/Barley
Do you receive subsidies from government related to growing wheat or and barley?
Yes No
Number of Farmers Responding 13 123
Percentage of Farmers Responding 9.6% 90.4%
The 13 farmers (9.6 percent) who stated they receive subsidies from the government such
as free or subsidized (lower) price of inputs were asked about this subsidy. Twelve of these
farmers (8.8 percent of total) said they have free or subsidized (lower) price of seed. Two of
these thirteen farmers (1.5 percent) receive free or subsidized (lower) price of fertilizer. One of
these thirteen farmers (0.74 percent) receives free or subsidized (lower) cost of irrigation water.
Note that one farmer gave two answers to this question. These results are shown in Table 3.22.
75
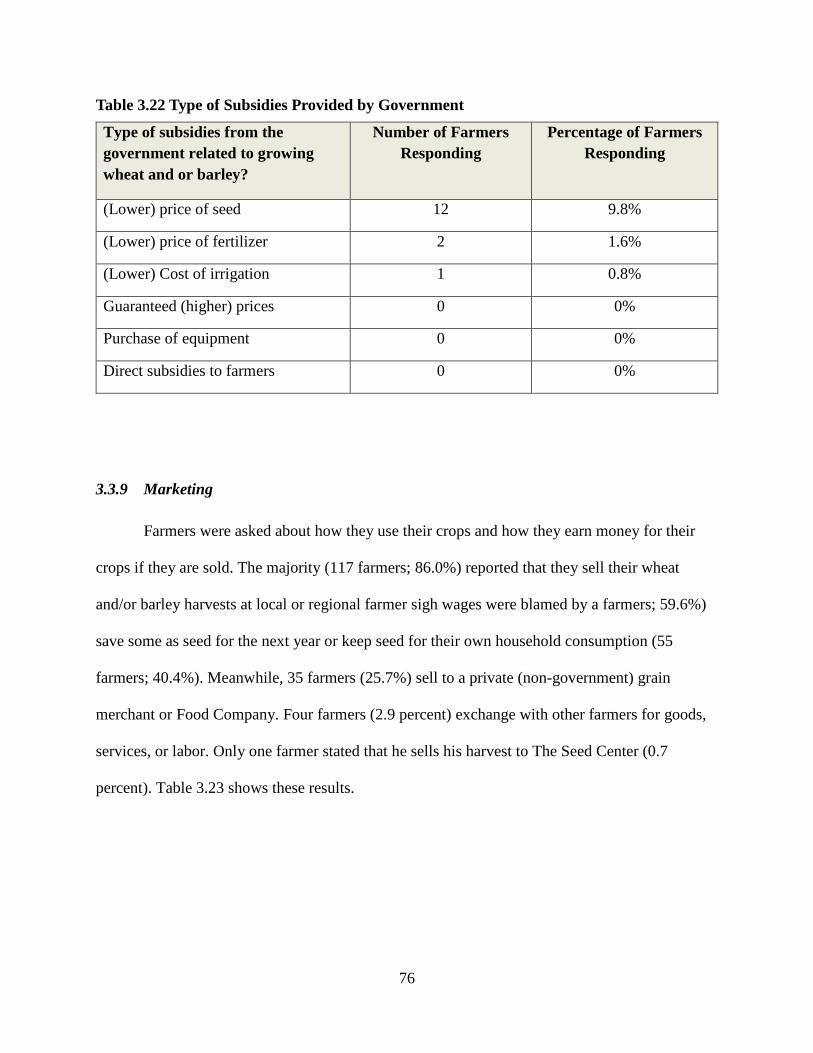
Table 3.22 Type of Subsidies Provided by Government
Type of subsidies from the government related to growing wheat and or barley?
Number of Farmers Responding
Percentage of Farmers Responding
(Lower) price of seed 12 9.8%
(Lower) price of fertilizer 2 1.6%
(Lower) Cost of irrigation 1 0.8%
Guaranteed (higher) prices 0 0%
Purchase of equipment 0 0%
Direct subsidies to farmers 0 0%
3.3.9 Marketing
Farmers were asked about how they use their crops and how they earn money for their
crops if they are sold. The majority (117 farmers; 86.0%) reported that they sell their wheat
and/or barley harvests at local or regional farmer sigh wages were blamed by a farmers; 59.6%)
save some as seed for the next year or keep seed for their own household consumption (55
farmers; 40.4%). Meanwhile, 35 farmers (25.7%) sell to a private (non-government) grain
merchant or Food Company. Four farmers (2.9 percent) exchange with other farmers for goods,
services, or labor. Only one farmer stated that he sells his harvest to The Seed Center (0.7
percent). Table 3.23 shows these results.
76
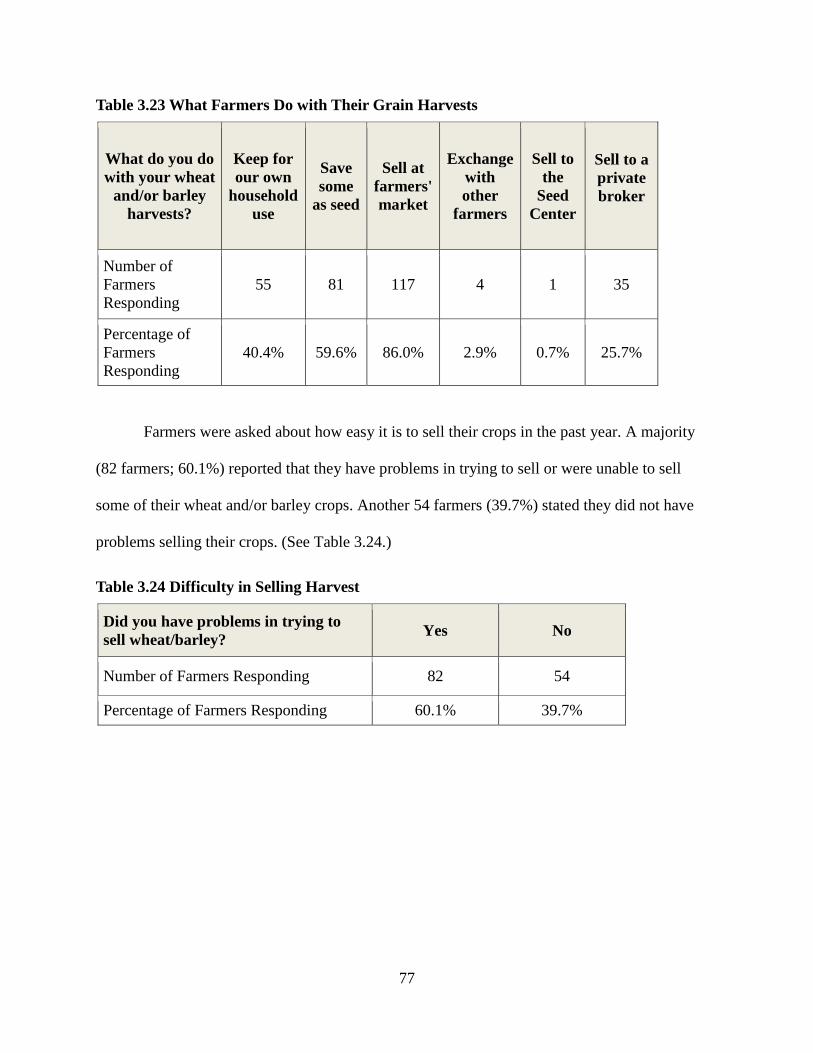
Table 3.23 What Farmers Do with Their Grain Harvests
What do you do with your wheat
and/or barley harvests?
Keep for our own
household use
Save some
as seed
Sell at farmers' market
Exchange with other
farmers
Sell to the
Seed Center
Sell to a private broker
Number of Farmers Responding
55 81 117 4 1 35
Percentage of Farmers Responding
40.4% 59.6% 86.0% 2.9% 0.7% 25.7%
Farmers were asked about how easy it is to sell their crops in the past year. A majority
(82 farmers; 60.1%) reported that they have problems in trying to sell or were unable to sell
some of their wheat and/or barley crops. Another 54 farmers (39.7%) stated they did not have
problems selling their crops. (See Table 3.24.)
Table 3.24 Difficulty in Selling Harvest
Did you have problems in trying to sell wheat/barley? Yes No
Number of Farmers Responding 82 54
Percentage of Farmers Responding 60.1% 39.7%
77
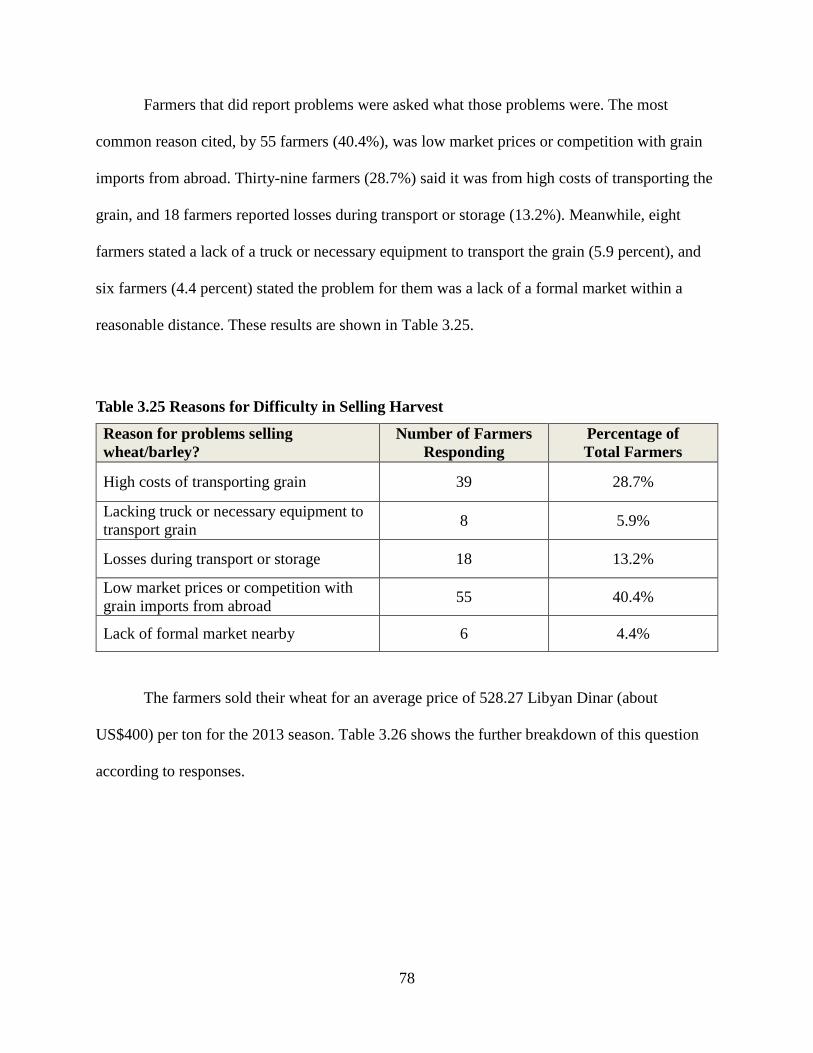
Farmers that did report problems were asked what those problems were. The most
common reason cited, by 55 farmers (40.4%), was low market prices or competition with grain
imports from abroad. Thirty-nine farmers (28.7%) said it was from high costs of transporting the
grain, and 18 farmers reported losses during transport or storage (13.2%). Meanwhile, eight
farmers stated a lack of a truck or necessary equipment to transport the grain (5.9 percent), and
six farmers (4.4 percent) stated the problem for them was a lack of a formal market within a
reasonable distance. These results are shown in Table 3.25.
Table 3.25 Reasons for Difficulty in Selling Harvest
Reason for problems selling wheat/barley?
Number of Farmers Responding
Percentage of Total Farmers
High costs of transporting grain 39 28.7%
Lacking truck or necessary equipment to transport grain 8 5.9%
Losses during transport or storage 18 13.2%
Low market prices or competition with grain imports from abroad 55 40.4%
Lack of formal market nearby 6 4.4%
The farmers sold their wheat for an average price of 528.27 Libyan Dinar (about
US$400) per ton for the 2013 season. Table 3.26 shows the further breakdown of this question
according to responses.
78
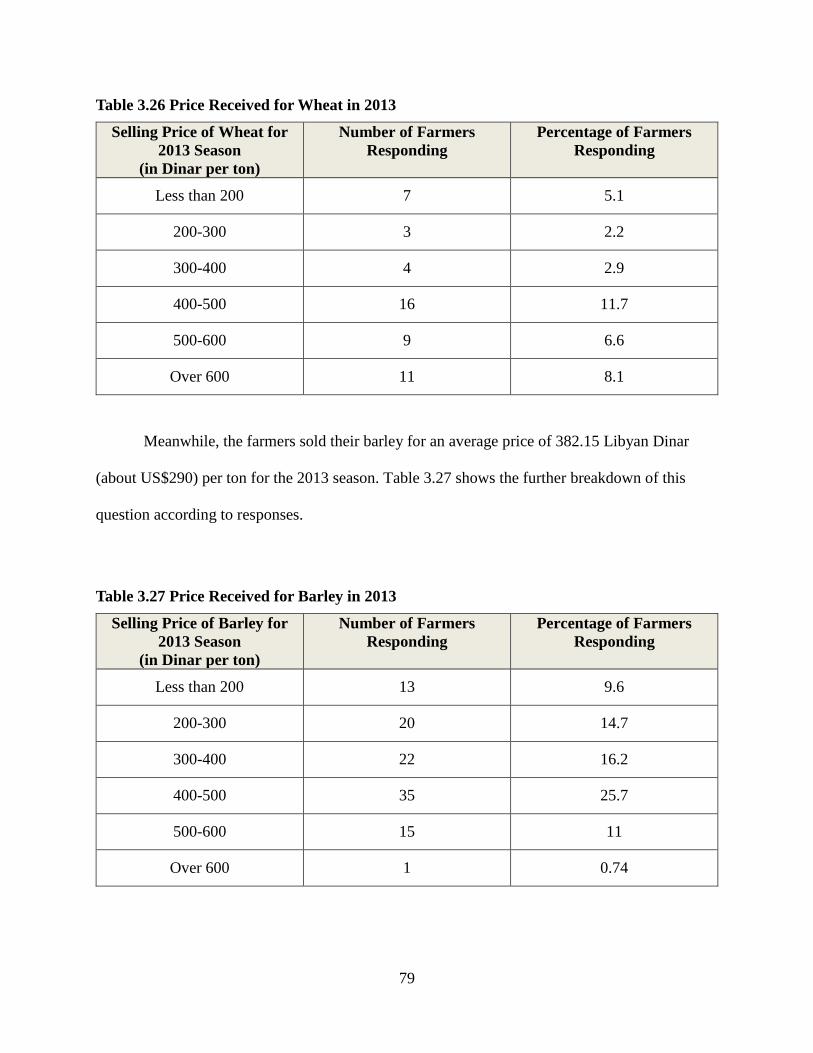
Table 3.26 Price Received for Wheat in 2013
Selling Price of Wheat for 2013 Season
(in Dinar per ton)
Number of Farmers Responding
Percentage of Farmers Responding
Less than 200 7 5.1
200-300 3 2.2
300-400 4 2.9
400-500 16 11.7
500-600 9 6.6
Over 600 11 8.1
Meanwhile, the farmers sold their barley for an average price of 382.15 Libyan Dinar
(about US$290) per ton for the 2013 season. Table 3.27 shows the further breakdown of this
question according to responses.
Table 3.27 Price Received for Barley in 2013
Selling Price of Barley for 2013 Season
(in Dinar per ton)
Number of Farmers Responding
Percentage of Farmers Responding
Less than 200 13 9.6
200-300 20 14.7
300-400 22 16.2
400-500 35 25.7
500-600 15 11
Over 600 1 0.74
79
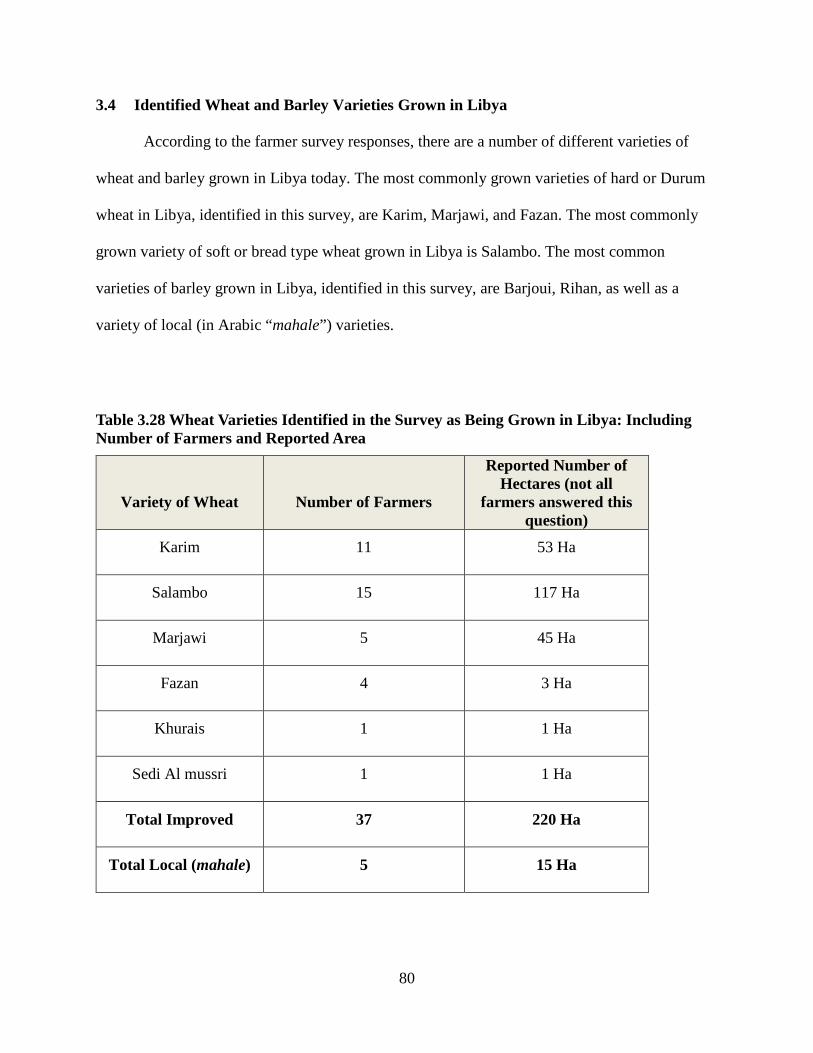
3.4 Identified Wheat and Barley Varieties Grown in Libya
According to the farmer survey responses, there are a number of different varieties of
wheat and barley grown in Libya today. The most commonly grown varieties of hard or Durum
wheat in Libya, identified in this survey, are Karim, Marjawi, and Fazan. The most commonly
grown variety of soft or bread type wheat grown in Libya is Salambo. The most common
varieties of barley grown in Libya, identified in this survey, are Barjoui, Rihan, as well as a
variety of local (in Arabic “mahale”) varieties.
Table 3.28 Wheat Varieties Identified in the Survey as Being Grown in Libya: Including Number of Farmers and Reported Area
Variety of Wheat
Number of Farmers
Reported Number of Hectares (not all
farmers answered this question)
Karim 11 53 Ha
Salambo 15 117 Ha
Marjawi 5 45 Ha
Fazan 4 3 Ha
Khurais 1 1 Ha
Sedi Al mussri 1 1 Ha
Total Improved 37 220 Ha
Total Local (mahale) 5 15 Ha
80
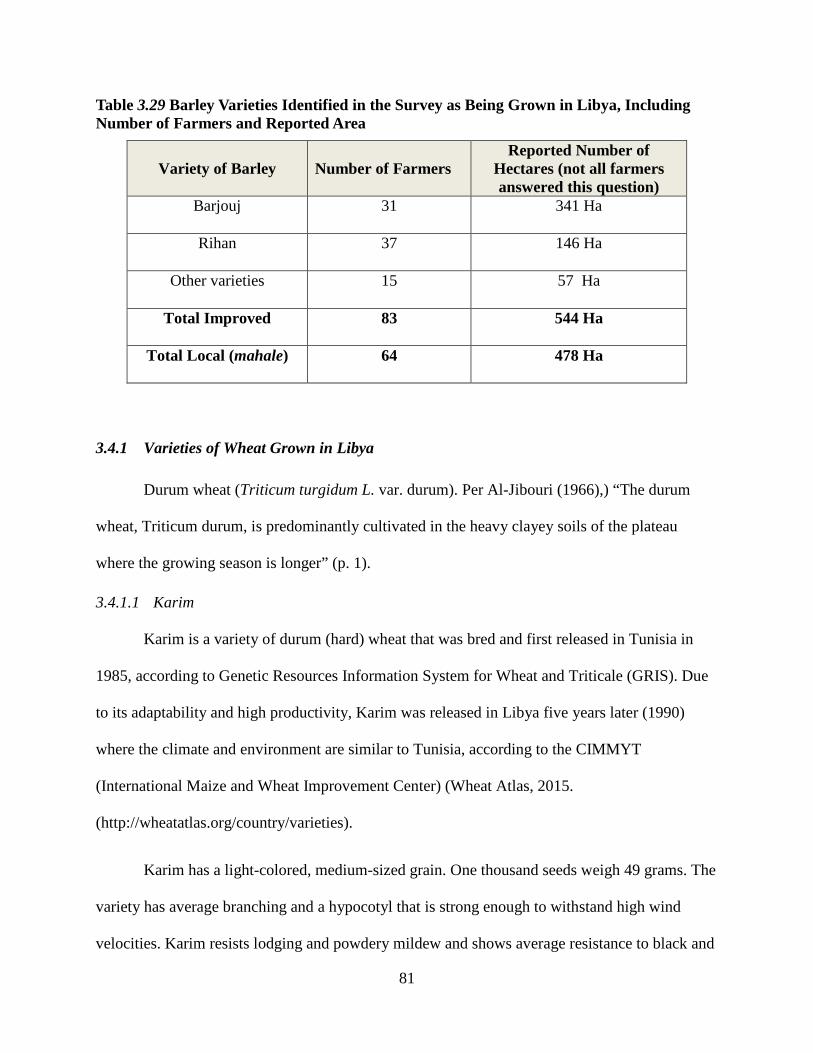
Table 3.29 Barley Varieties Identified in the Survey as Being Grown in Libya, Including Number of Farmers and Reported Area
Variety of Barley Number of Farmers Reported Number of
Hectares (not all farmers answered this question)
Barjouj 31 341 Ha
Rihan 37 146 Ha
Other varieties 15 57 Ha
Total Improved 83 544 Ha
Total Local (mahale) 64 478 Ha
3.4.1 Varieties of Wheat Grown in Libya
Durum wheat (Triticum turgidum L. var. durum). Per Al-Jibouri (1966),) “The durum
wheat, Triticum durum, is predominantly cultivated in the heavy clayey soils of the plateau
where the growing season is longer” (p. 1).
3.4.1.1 Karim
Karim is a variety of durum (hard) wheat that was bred and first released in Tunisia in
1985, according to Genetic Resources Information System for Wheat and Triticale (GRIS). Due
to its adaptability and high productivity, Karim was released in Libya five years later (1990)
where the climate and environment are similar to Tunisia, according to the CIMMYT
(International Maize and Wheat Improvement Center) (Wheat Atlas, 2015.
(http://wheatatlas.org/country/varieties).
Karim has a light-colored, medium-sized grain. One thousand seeds weigh 49 grams. The
variety has average branching and a hypocotyl that is strong enough to withstand high wind
velocities. Karim resists lodging and powdery mildew and shows average resistance to black and
81
yellow leaf rusts in addition to septoria. This seed variety is best used in areas where permanent
irrigation, supplemental irrigation, or rainfall is consistent. In Libya, it is planted in November
during the rainy season and matures in the spring for harvest when soil moisture and the climate
best support it. On average, it takes 135 days to reach maturity. Yield is high, averaging, 5,000
kg/Ha in areas that are irrigated or have consistent rainfall. In areas where irrigation or rainfall is
inconsistent productivity falls dramatically to an average of 600 kg/Ha. (Arhama,
2015a).(General Authority for cereal production, Committee for seed registration, Tripoli Libya,
2015). It is mostly grown in southwest Libya by farms in the major irrigated projects (Arhama,
2013)
3.4.1.2 Marjawi
Marjawi is a variety of durum (hard) wheat developed by CIMMYT. The overall focus of
CIMMYT's durum section is to increase yields in developing countries, ultimately supporting
food security. Their objective is to increase durum wheat productivity by developing germplasm
that is resistant to disease, high quality, and easily adopted by farmers. The Marjawi variety was
released in 1983 in Libya by a breeding program in the Ministry of Agriculture’s Agricultural
Research Center (ARC) at Tripoli (CIMMYT), followed by its release in Syria in 1985 by
(Genetic Resources Information System for Wheat and Triticale (GRIS). Marjawi resists such
diseases as Rust (Arhama, 2015aGeneral Authority for cereal production, Committee for seed
registration, Tripoli Libya, 2015).
3.4.1.3 Fazan:
Fazan is another variety of durum (hard) wheat developed by CIMMYT. It was released
in 1985 in Libya by the breeding program in the Agricultural Research Center (ARC) at Tripoli
82
(CIMMYT). Fazan resists rust (Arhama, 2015aGeneral Authority for Cereal Production,
Committee for Seed Registration, Tripoli, Libya, 2015)
Bread wheat (Triticum aestivum) “Triticum aestivum, is grown mostly in the
coastal plains, semi-desert areas and oases” (Al-Jibouri, 1966, p. 1)
3.4.1.4 Salambo
Salambo is a variety of bread (soft) wheat that was bred and first released in Tunisia in
1980 (CIMMYT). Due to its adaptability and high productivity, later it was released in Libya
where the climate and environment are similar to Tunisia (Wheat Atlas,
2015http://wheatatlas.org/country/varieties).
Salambo is a white-colored, medium-sized grain and spring-based class of wheat. One
thousand seeds weigh 39 grams. It is a variety that has average branching and a hypocotyl that is
strong enough to withstand high wind velocities. Salambo resists lodging and powdery mildew
and shows average resistance to black and yellow leaf rusts, in addition to septoria. This seed
variety is best used in areas where permanent irrigation, supplemental irrigation, or rainfall is
consistent. It is planted in November during the rainy season and matures in the spring for
harvest when soil moisture and the climate best support it. On average, it takes 130 days to reach
maturity. Yield is high, averaging 5,000 kg/ha within the areas that have irrigated systems or
consistent sources of water. In areas where irrigation is inconsistent with a reliance on rain fed
irrigation, productivity falls to an average of 900 to 1,000 kg/ha (Arhama, 2015a). The success of
this variety is best seen in areas that are semi-arid. It is mostly available in the east and south of
Libya (Arhama, 2013).
83
3.4.1.5 Local or mahale varieties of wheat
CIMMYT database reports local (mahale) wheat varieties in Libya, with release dates
prior to 1900.
3.4.2 Varieties of Barley Grown in Libya
3.4.2.1 3.4.2.1 Barjoui
Barjoui is a variety of barley that was developed by the ICARDA. It was registered in
Libya in 1990 by the breeding program of the ARC at Tripoli. The ARC-Libya and ICARDA
have partnered to improve cereal production in Libya. Due to this partnership, beneficial genetic
determinants and variety characteristics were developed, resulting in diversification of barley.
The type of spike in Barjoui has six rows (Hordum vulgare L). Barjoui is resistant to rust
diseases (Arhama, 2015a).
3.4.2.2 Rihan
Rihan is a variety of barley that was bred and first registered in Tunisia in 1987 (Arhama,
2015a). Due to its adaptability and high productivity, it was released in Libya where the climate
and environment are similar to Tunisia. The type of spike in Rihan has six rows (Hordum
vulgare L). Rihan is a yellow-colored, medium-sized grain and spring-based class. One thousand
seeds weigh 42 grams. It is a variety that has average branching and resists grain sprouting and
lodging, which means it is strong enough to withstand high wind velocities. However, it is not
resistant to diseases such as rust. This seed variety is best used in areas where permanent
irrigation, supplemental irrigation, or rainfall is consistent. It is planted from mid-November to
mid-December during the rainy season and matures in the spring for harvest when soil moisture
and the climate best support it. On average, it takes 133 days to reach maturity. Yield is high,
84
averaging, 4,500 kg/ha within areas that have irrigation systems or consistent rainfall. In areas
where irrigation is inconsistent or where there is a reliance on rainfall, productivity falls to an
average of 1,000 to 3,000 kg/ha (Arhama, 2015a).
3.4.2.3 Local or “mahale” 6-row barley
Mahale is a general term for varieties of barley that were present in Libya before 1900.
There are two general types of mahale barley, six-row and two-row.
The mahale six-row barley is a yellow-colored, medium-sized grain and is a spring-based
class. Mahale’s spike has six rows (Hordum vulgare L). One thousand seeds weigh 29 grams. It
is a variety that has average branching and resists grain sprouting and lodging phenomenon that
means it is strong enough to withstand high wind velocities. Mahale is resistant to rust disease. It
is planted from mid-November to mid-December during the rainy season and matures in the
spring for harvest when soil moisture and the climate best support it. On average, it takes 150
days to reach maturity. Yield is high, averaging 5,000 to 6,000 kg/ha within the areas that have
irrigated systems or consistent sources of water (Arhama, 2015a).
3.4.2.4 Local or “mahale” 2-row barley
The mahale 2-row variety is a local variety of barley present in Libya since prior to 1900.
Mahale 2-row is a yellow-colored, medium-sized grain and is a spring-based class. The variety’s
spike has two rows (Hordum distichumi). One thousand seeds weigh 35 to 40 grams. It is a
variety that has average branching and resists grain sprouting and lodging phenomenon that
means it is strong enough to withstand high wind velocities. Mahale 2-row is resistant to rust
disease. This seed variety is supported in the permanent irrigation areas. It is planted from mid-
November to mid-December during the rainy season and matures in the spring for harvest when
soil moisture and the climate best support it. On average, it takes 150 days to reach maturity.
85
Yield is high, averaging 5,000 to 6,000 kg/ha within the areas that have irrigated systems or
consistent sources of water (Arhama, 2015a).
3.4.3 Definition and description of local or mahale varieties of wheat and barley grown in
Libya
A local or mahale variety designation means that it has a local origin within Libya and is
fairly uniform throughout all of Libya (Arhama, 2015b). The mahale varieties of seed have been
used for over one hundred years because of their resistance to conditions such as water stress,
high temperature, or certain insects. The productivity for these varieties is not as high as certain
imported improved varieties from other countries. Unlike some improved varieties of barley and
wheat, the history of the mahale varieties of barley and wheat are difficult to trace through time,
but historians are convinced that the local varieties go back to the Italian farmers’ presence in
Libya prior to 1900. Exactly when these varieties of barley and wheat were first used is difficult
to trace because most of them have no records. They pre-date the adoption of improved varieties.
Usually, farmers will opt for the local or mahale variety when they cannot get improved seeds.
The definition of mahale varieties are landraces that are old traditional seed grown for
many generations and only exist because farmers continue to save the seed and grow them each
year. These Local varieties do not come from a breeding program. “Local varieties of wheat and
barley in Libya are well adapted to the prevailing ecological and environmental conditions”
(Forward by Jose Vallage, as cited in Al-jibouri, 1966, Front matter).
86
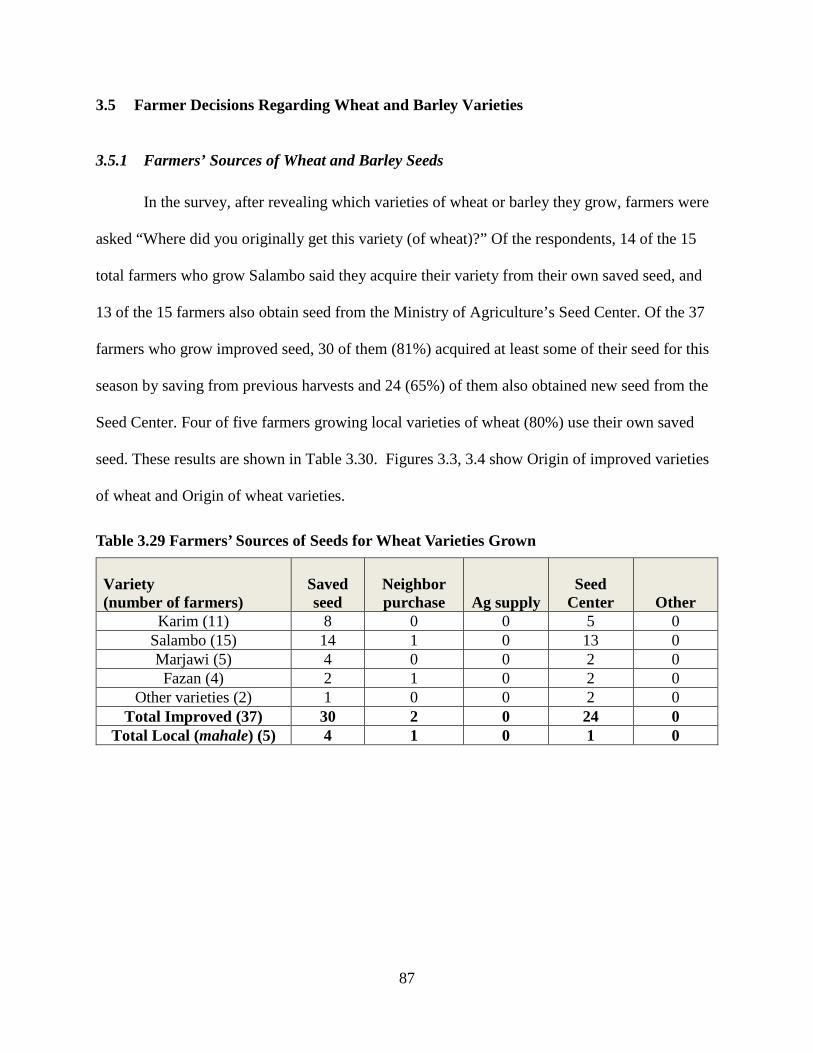
3.5 Farmer Decisions Regarding Wheat and Barley Varieties
3.5.1 Farmers’ Sources of Wheat and Barley Seeds
In the survey, after revealing which varieties of wheat or barley they grow, farmers were
asked “Where did you originally get this variety (of wheat)?” Of the respondents, 14 of the 15
total farmers who grow Salambo said they acquire their variety from their own saved seed, and
13 of the 15 farmers also obtain seed from the Ministry of Agriculture’s Seed Center. Of the 37
farmers who grow improved seed, 30 of them (81%) acquired at least some of their seed for this
season by saving from previous harvests and 24 (65%) of them also obtained new seed from the
Seed Center. Four of five farmers growing local varieties of wheat (80%) use their own saved
seed. These results are shown in Table 3.30. Figures 3.3, 3.4 show Origin of improved varieties
of wheat and Origin of wheat varieties.
Table 3.29 Farmers’ Sources of Seeds for Wheat Varieties Grown
Variety (number of farmers)
Saved seed
Neighbor purchase Ag supply
Seed Center Other
Karim (11) 8 0 0 5 0 Salambo (15) 14 1 0 13 0 Marjawi (5) 4 0 0 2 0 Fazan (4) 2 1 0 2 0
Other varieties (2) 1 0 0 2 0 Total Improved (37) 30 2 0 24 0
Total Local (mahale) (5) 4 1 0 1 0
87
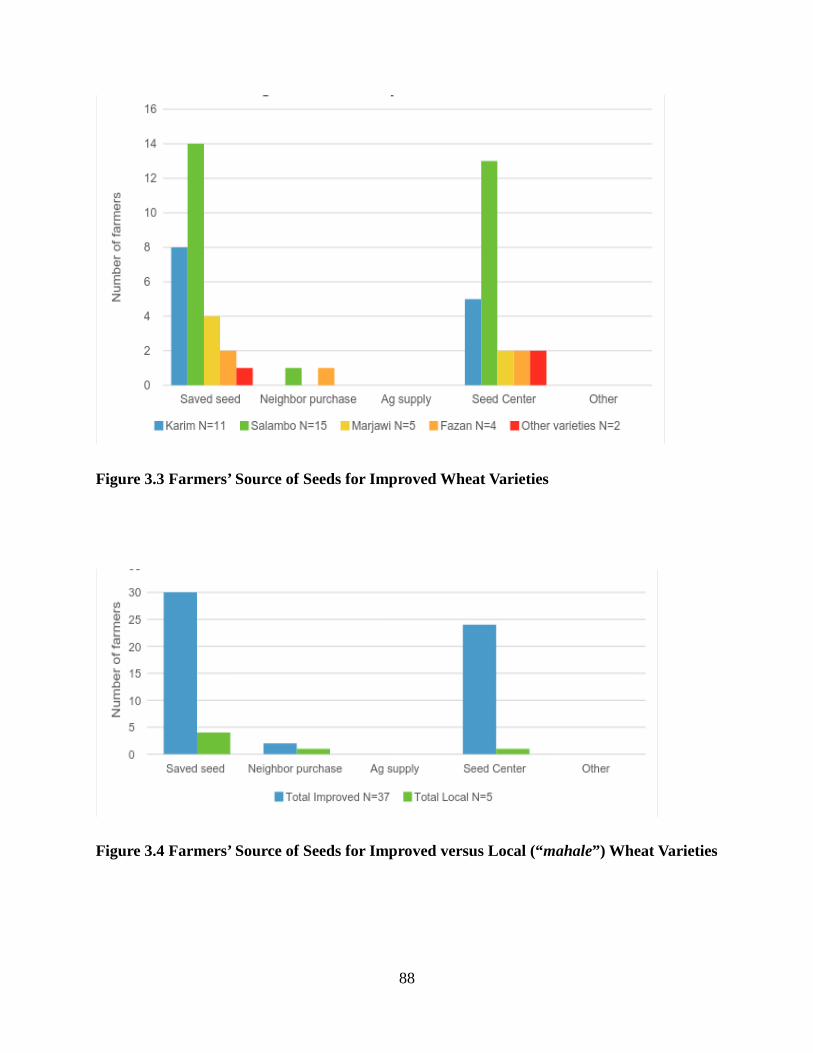
Figure 3.3 Farmers’ Source of Seeds for Improved Wheat Varieties
Figure 3.4 Farmers’ Source of Seeds for Improved versus Local (“mahale”) Wheat Varieties
88
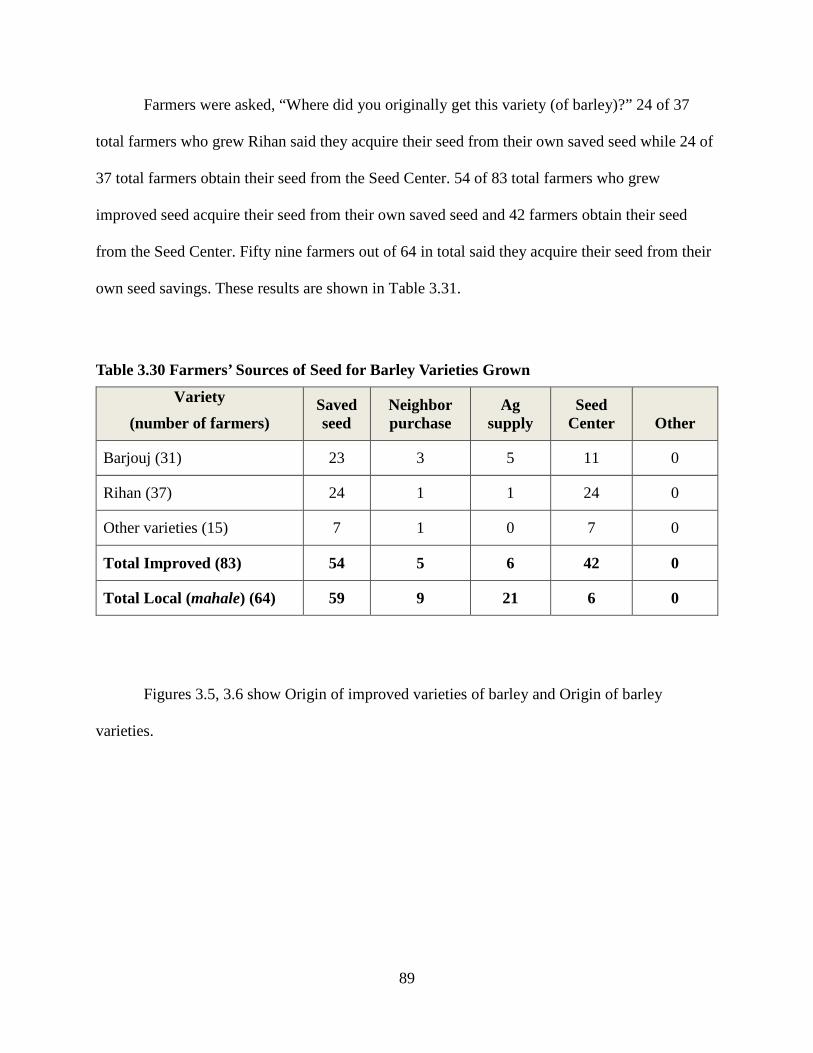
Farmers were asked, “Where did you originally get this variety (of barley)?” 24 of 37
total farmers who grew Rihan said they acquire their seed from their own saved seed while 24 of
37 total farmers obtain their seed from the Seed Center. 54 of 83 total farmers who grew
improved seed acquire their seed from their own saved seed and 42 farmers obtain their seed
from the Seed Center. Fifty nine farmers out of 64 in total said they acquire their seed from their
own seed savings. These results are shown in Table 3.31.
Table 3.30 Farmers’ Sources of Seed for Barley Varieties Grown
Variety (number of farmers)
Saved seed
Neighbor purchase
Ag supply
Seed Center Other
Barjouj (31) 23 3 5 11 0
Rihan (37) 24 1 1 24 0
Other varieties (15) 7 1 0 7 0
Total Improved (83) 54 5 6 42 0
Total Local (mahale) (64) 59 9 21 6 0
Figures 3.5, 3.6 show Origin of improved varieties of barley and Origin of barley
varieties.
89
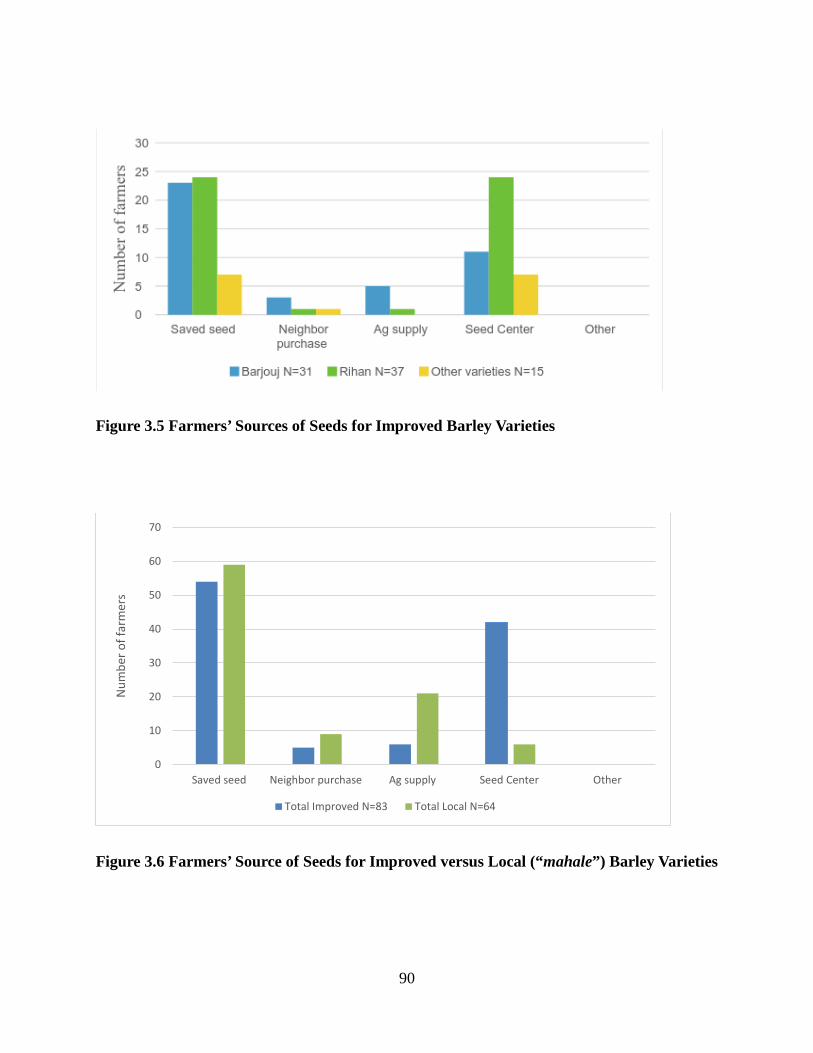
Figure 3.5 Farmers’ Sources of Seeds for Improved Barley Varieties
Figure 3.6 Farmers’ Source of Seeds for Improved versus Local (“mahale”) Barley Varieties
0
10
20
30
40
50
60
70
Saved seed Neighbor purchase Ag supply Seed Center Other
Num
ber o
f far
mer
s
Total Improved N=83 Total Local N=64
90
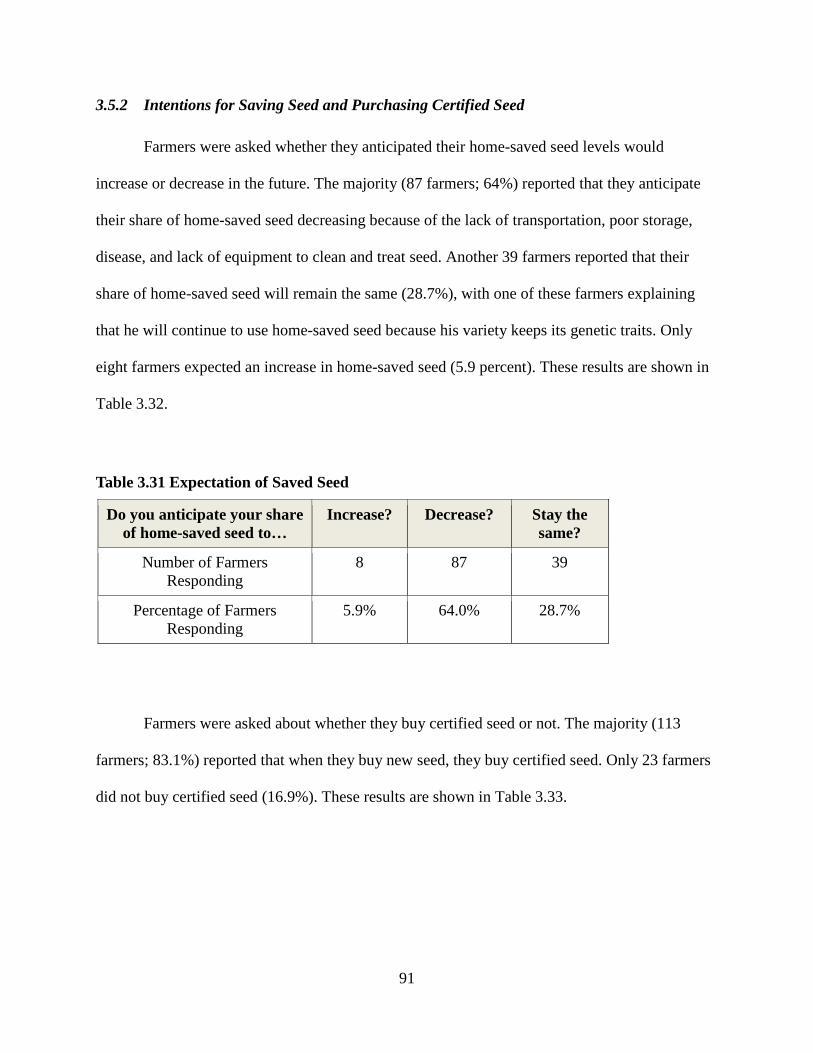
3.5.2 Intentions for Saving Seed and Purchasing Certified Seed
Farmers were asked whether they anticipated their home-saved seed levels would
increase or decrease in the future. The majority (87 farmers; 64%) reported that they anticipate
their share of home-saved seed decreasing because of the lack of transportation, poor storage,
disease, and lack of equipment to clean and treat seed. Another 39 farmers reported that their
share of home-saved seed will remain the same (28.7%), with one of these farmers explaining
that he will continue to use home-saved seed because his variety keeps its genetic traits. Only
eight farmers expected an increase in home-saved seed (5.9 percent). These results are shown in
Table 3.32.
Table 3.31 Expectation of Saved Seed
Do you anticipate your share of home-saved seed to…
Increase? Decrease? Stay the same?
Number of Farmers Responding
8 87 39
Percentage of Farmers Responding
5.9% 64.0% 28.7%
Farmers were asked about whether they buy certified seed or not. The majority (113
farmers; 83.1%) reported that when they buy new seed, they buy certified seed. Only 23 farmers
did not buy certified seed (16.9%). These results are shown in Table 3.33.
91
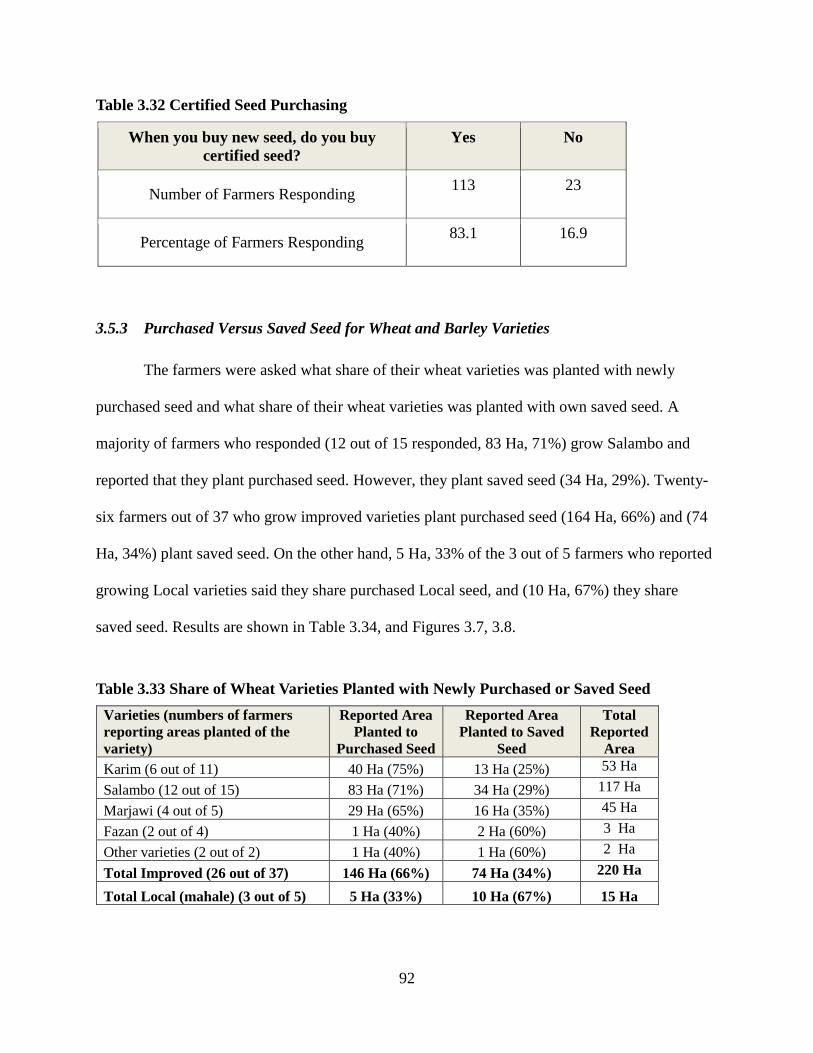
Table 3.32 Certified Seed Purchasing
When you buy new seed, do you buy certified seed?
Yes No
Number of Farmers Responding 113 23
Percentage of Farmers Responding 83.1 16.9
3.5.3 Purchased Versus Saved Seed for Wheat and Barley Varieties
The farmers were asked what share of their wheat varieties was planted with newly
purchased seed and what share of their wheat varieties was planted with own saved seed. A
majority of farmers who responded (12 out of 15 responded, 83 Ha, 71%) grow Salambo and
reported that they plant purchased seed. However, they plant saved seed (34 Ha, 29%). Twenty-
six farmers out of 37 who grow improved varieties plant purchased seed (164 Ha, 66%) and (74
Ha, 34%) plant saved seed. On the other hand, 5 Ha, 33% of the 3 out of 5 farmers who reported
growing Local varieties said they share purchased Local seed, and (10 Ha, 67%) they share
saved seed. Results are shown in Table 3.34, and Figures 3.7, 3.8.
Table 3.33 Share of Wheat Varieties Planted with Newly Purchased or Saved Seed Varieties (numbers of farmers reporting areas planted of the variety)
Reported Area Planted to
Purchased Seed
Reported Area Planted to Saved
Seed
Total Reported
Area Karim (6 out of 11) 40 Ha (75%) 13 Ha (25%) 53 Ha Salambo (12 out of 15) 83 Ha (71%) 34 Ha (29%) 117 Ha Marjawi (4 out of 5) 29 Ha (65%) 16 Ha (35%) 45 Ha Fazan (2 out of 4) 1 Ha (40%) 2 Ha (60%) 3 Ha Other varieties (2 out of 2) 1 Ha (40%) 1 Ha (60%) 2 Ha
Total Improved (26 out of 37) 146 Ha (66%) 74 Ha (34%) 220 Ha
Total Local (mahale) (3 out of 5) 5 Ha (33%) 10 Ha (67%) 15 Ha
92
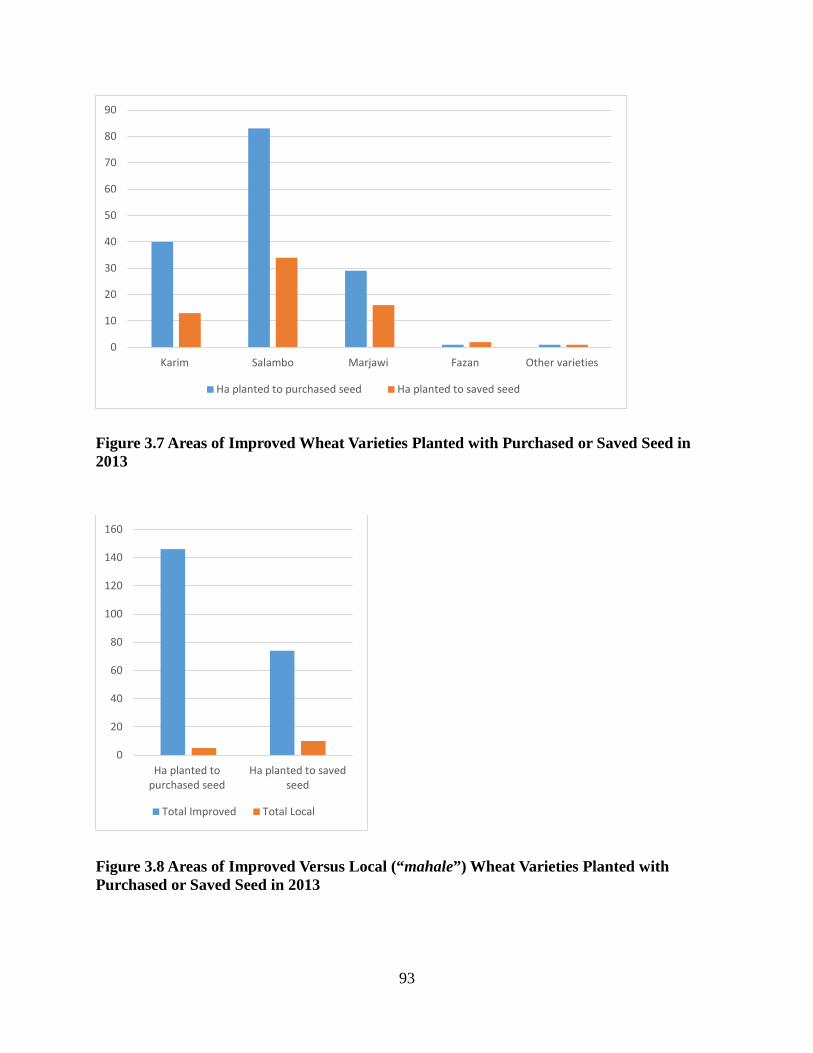
Figure 3.7 Areas of Improved Wheat Varieties Planted with Purchased or Saved Seed in 2013
Figure 3.8 Areas of Improved Versus Local (“mahale”) Wheat Varieties Planted with Purchased or Saved Seed in 2013
0
10
20
30
40
50
60
70
80
90
Karim Salambo Marjawi Fazan Other varieties
Ha planted to purchased seed Ha planted to saved seed
0
20
40
60
80
100
120
140
160
Ha planted topurchased seed
Ha planted to savedseed
Total Improved Total Local
93
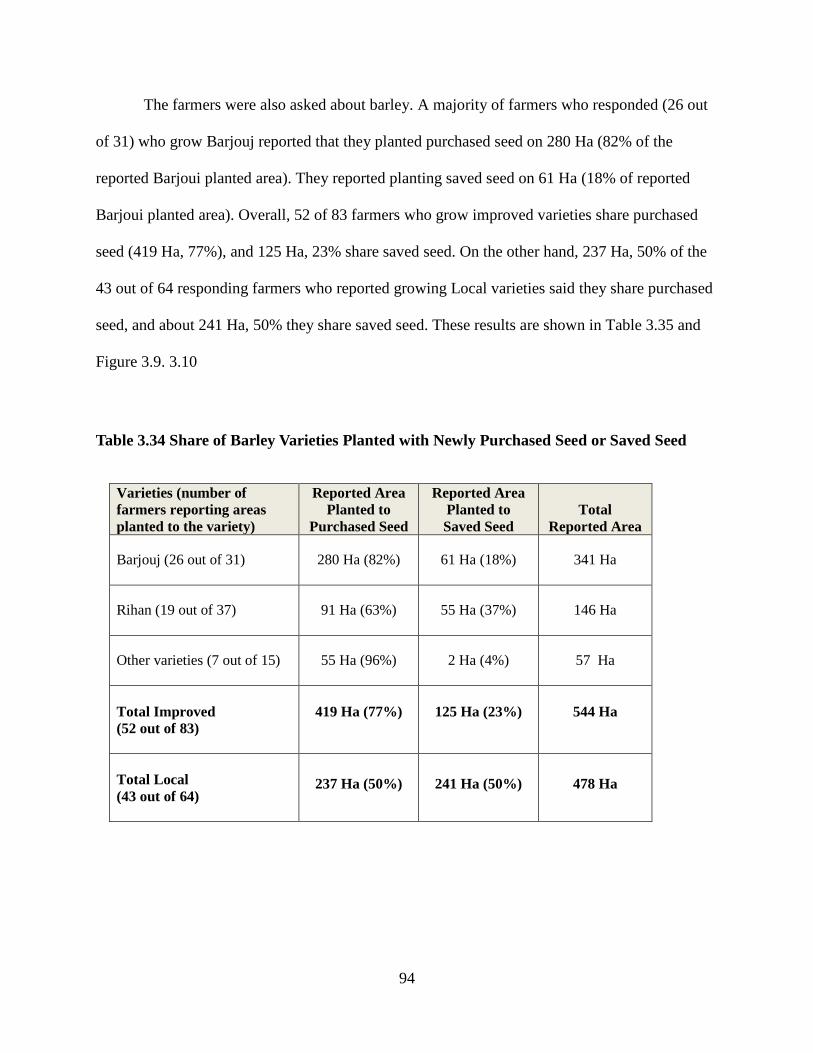
The farmers were also asked about barley. A majority of farmers who responded (26 out
of 31) who grow Barjouj reported that they planted purchased seed on 280 Ha (82% of the
reported Barjoui planted area). They reported planting saved seed on 61 Ha (18% of reported
Barjoui planted area). Overall, 52 of 83 farmers who grow improved varieties share purchased
seed (419 Ha, 77%), and 125 Ha, 23% share saved seed. On the other hand, 237 Ha, 50% of the
43 out of 64 responding farmers who reported growing Local varieties said they share purchased
seed, and about 241 Ha, 50% they share saved seed. These results are shown in Table 3.35 and
Figure 3.9. 3.10
Table 3.34 Share of Barley Varieties Planted with Newly Purchased Seed or Saved Seed
Varieties (number of farmers reporting areas planted to the variety)
Reported Area Planted to
Purchased Seed
Reported Area Planted to Saved Seed
Total Reported Area
Barjouj (26 out of 31) 280 Ha (82%) 61 Ha (18%) 341 Ha
Rihan (19 out of 37) 91 Ha (63%) 55 Ha (37%) 146 Ha
Other varieties (7 out of 15) 55 Ha (96%) 2 Ha (4%) 57 Ha
Total Improved (52 out of 83)
419 Ha (77%) 125 Ha (23%) 544 Ha
Total Local (43 out of 64)
237 Ha (50%) 241 Ha (50%) 478 Ha
94
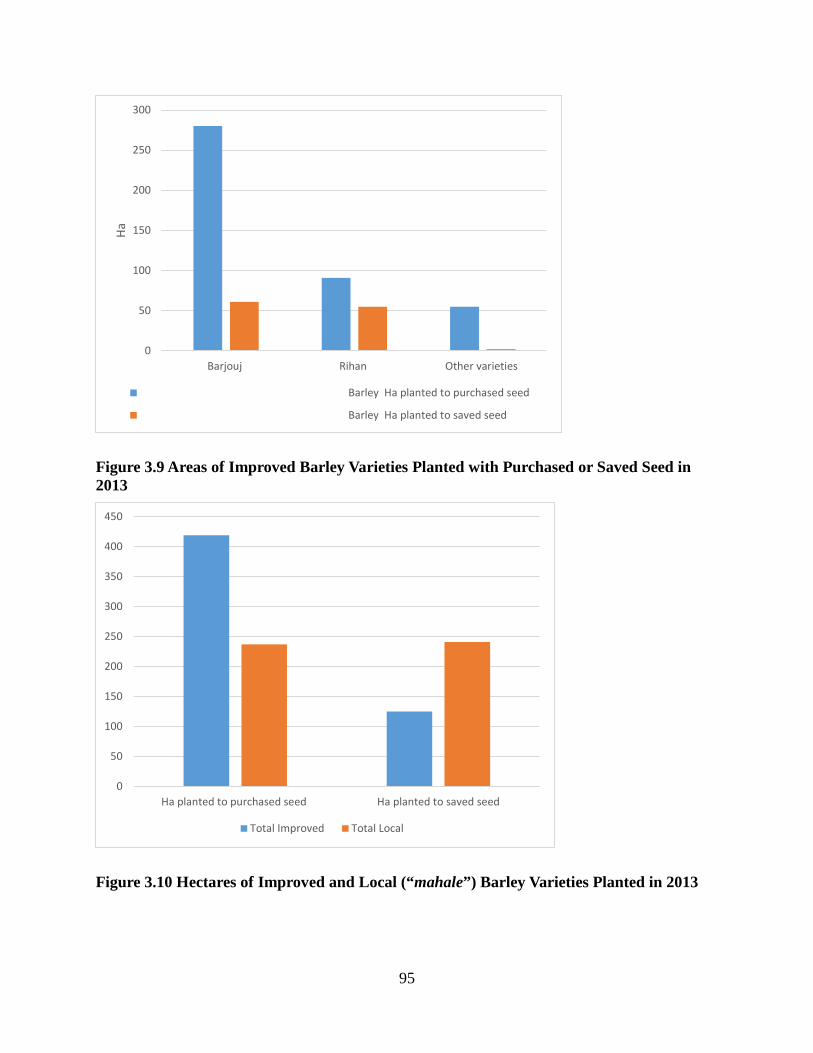
Figure 3.9 Areas of Improved Barley Varieties Planted with Purchased or Saved Seed in 2013
Figure 3.10 Hectares of Improved and Local (“mahale”) Barley Varieties Planted in 2013
0
50
100
150
200
250
300
Barjouj Rihan Other varieties
Ha
Barley Ha planted to purchased seed
Barley Ha planted to saved seed
0
50
100
150
200
250
300
350
400
450
Ha planted to purchased seed Ha planted to saved seed
Total Improved Total Local
95
3.5.4 Farmers’ Stated Preferences for Growing Wheat and Barley over Other Crops
The survey included 136 wheat and/or barley farmers. Farmers were asked, “Why do you
believe growing wheat or barley is better than other crops?” The most frequently reported factor
for growing wheat and/or barley compared to other crops was the lower water requirement; 57
out of 136 (41.9%) farmers reported this. 48 (35.3%) farmers reported that reduced risk of low
yields and reduction of input costs was the second most-reported factor; that is, wheat and barley
are more tolerant to local conditions and less likely to fail than other crops. The third most
frequently reported factor by 37 (27.2%) of the surveyed farmers was their greater familiarity
with wheat and barley than with other crops. Twenty-four (17.6%) farmers reported that family
history was the fourth most frequently reported factor; growing wheat and barley was a tradition
that runs in their family. Finally, 22 (16.2%) farmers believed that wheat and/or barley are less
impacted by diseases than other crops.
Based on the data summarized above, farmers preferred to grow wheat and barley over
other crops that could be grown in the area. Perhaps the fact that barley is grown in the east
where there is plentiful rainfall and wheat is grown in the south where an irrigation project is
already established contributes to why farmers chose water requirements as the number one most
reported factor in planting wheat and barley. The second reason that wheat and barley production
prevails over other crops is that they possess a lower risk than other crops. Lower risk crops tend
to have a higher yield, on average, because switching to other crops can incite many additional
input costs such as fertilizer, pesticides, and irrigation systems. If those crops fail, all of the new
input costs would eat into profits and production. Therefore, wheat and barley have a higher
chance of the farmer making a steady income from production. Another reason that wheat and
barley are grown more is that they are familiar crops. Familiarity means that the farmers know
96
exactly what they need to grow the crops and they also have knowledge of expected production.
Therefore, they don’t have to take the time to learn about other crops.
The fourth most frequently reported reason that wheat and barley are grown from
generation to generation is that it is a family tradition. It is a custom which is well known to
farming families in Libya. The farmers are like a family, many are literally related, and the
farming community remains close to one another. Many farmers have a set exchange of crops
with neighboring farmers. The farmer’s choice to grow wheat and barley is very influenced by
what they saw grown when they were young. By growing the same crops year after year, they
are also able to save their seed to sow next year’s crop. Additionally, in the farmers’ experience,
they have seen less disease in wheat and barley crops; therefore, they see them as disease-
resistant. They are not very willing to plant other crops that may not be as resistant and instead
produce less when affected with unknown diseases. The farmer’s choice to grow wheat and
barley is dependent on many reasons, such as water usage, familiarity, lower risk, family
tradition, and disease resistance.
3.5.5 Farmers Stated Preferences for Growing Local (mahale”) Varieties versus Imported
Varieties
Farmers were asked about their preference for their own landrace or local variety, 125
farmers believed that their own landrace/local/mahale variety was better (more cost effective)
than newly bred improved or imported varieties (91.9%), while eleven farmers disagreed (8.1
percent). These results are shown in Table 3.36.
97
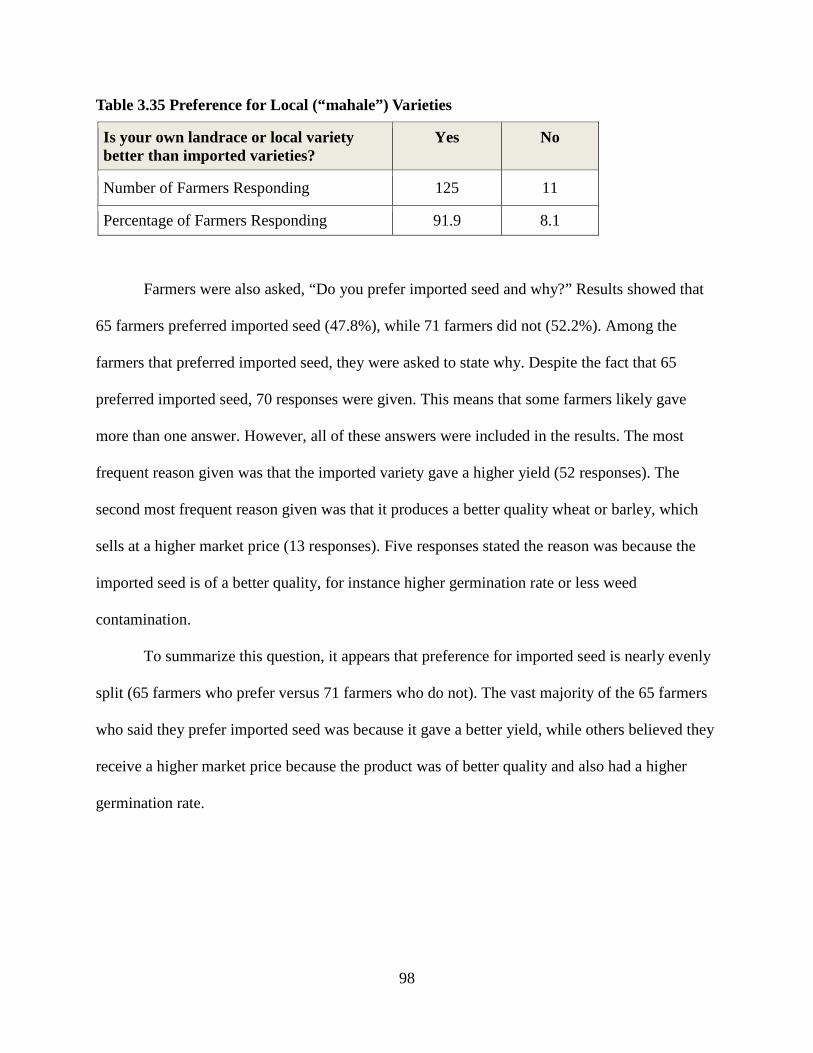
Table 3.35 Preference for Local (“mahale”) Varieties
Is your own landrace or local variety better than imported varieties?
Yes No
Number of Farmers Responding 125 11
Percentage of Farmers Responding 91.9 8.1
Farmers were also asked, “Do you prefer imported seed and why?” Results showed that
65 farmers preferred imported seed (47.8%), while 71 farmers did not (52.2%). Among the
farmers that preferred imported seed, they were asked to state why. Despite the fact that 65
preferred imported seed, 70 responses were given. This means that some farmers likely gave
more than one answer. However, all of these answers were included in the results. The most
frequent reason given was that the imported variety gave a higher yield (52 responses). The
second most frequent reason given was that it produces a better quality wheat or barley, which
sells at a higher market price (13 responses). Five responses stated the reason was because the
imported seed is of a better quality, for instance higher germination rate or less weed
contamination.
To summarize this question, it appears that preference for imported seed is nearly evenly
split (65 farmers who prefer versus 71 farmers who do not). The vast majority of the 65 farmers
who said they prefer imported seed was because it gave a better yield, while others believed they
receive a higher market price because the product was of better quality and also had a higher
germination rate.
98
Farmers were next asked, “Do you prefer seed varieties from Libya?” Nearly all of the
respondents said yes (130 of 136). This means that even the farmers who just said they preferred
imported seeds would rather use Libyan varieties, however they used imported seeds because of
perceived superior quality in imported seeds as shown in the previous question. The most
frequent reason given for preferring Libyan varieties was familiarity (70 responses). Forty-six
responses indicated that they generally prefer seed from Libya, while 41 responses showed the
preference was based on taste and fit for traditional foods.
Based on these two questions, it appears there is support or desire to use local or
domestically developed varieties, however, actual usage is nearly split on using imported seeds.
This indicates that if a Libyan seed program existed that produced high-quality, high-yield
varieties, then many of the farmers currently using imported seeds would likely switch to local
varieties. This bodes well for a potential Libyan seed program and its success if it can produce
high quality varieties and develop a good reputation. This would also lower the risk to farmers
using an imported seed that may not be well acclimated to Libya’s climate and growing
conditions. Additionally, this indicates a likelihood of support from farmers in experimenting
with local varieties to strengthen their quality and insure that stable local varieties will exist for
the future.
3.5.6 Farmers Stated Preferences for Growing Specific Wheat and Barley Verities
Farmers were asked, “Why did you choose to grow this wheat variety?” Results showed
that farmers who prefer to grow Salambo wheat preferred it for its easy access (14 farmers,
93%). The second highest response preferred because of its easy access was Karim wheat variety
(100% or 11 of 11 total farmers). The second reason they chose the Salambo variety was for a
99
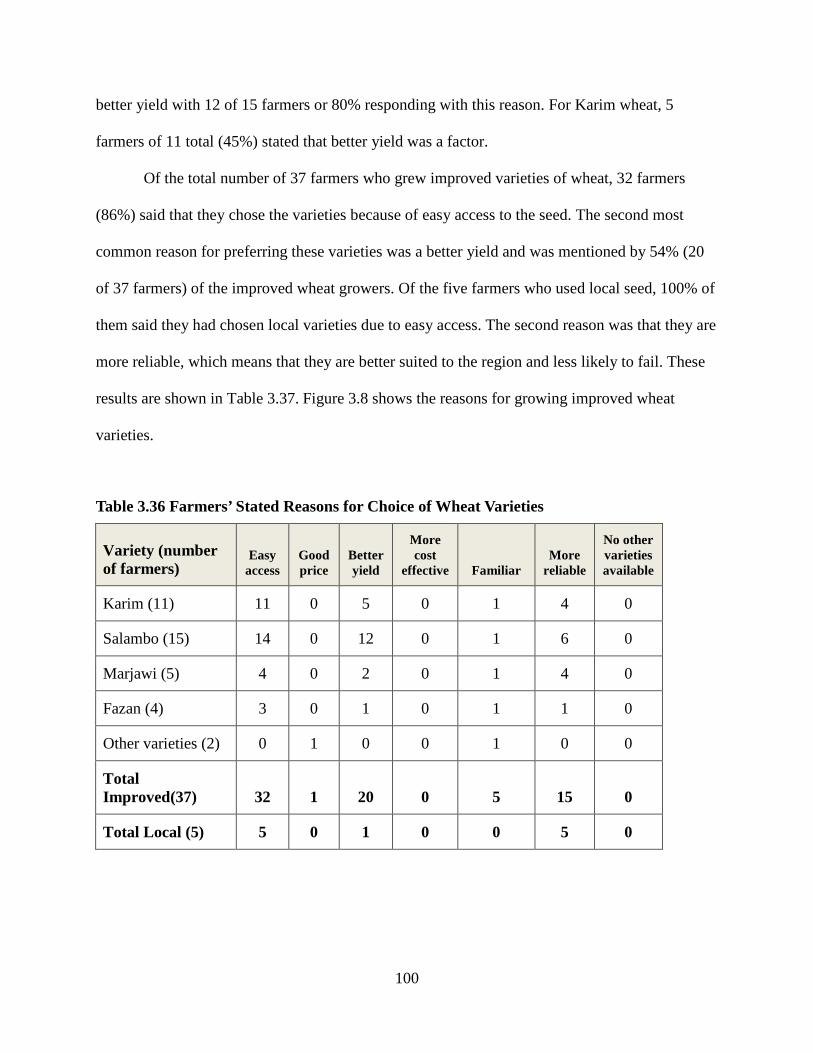
better yield with 12 of 15 farmers or 80% responding with this reason. For Karim wheat, 5
farmers of 11 total (45%) stated that better yield was a factor.
Of the total number of 37 farmers who grew improved varieties of wheat, 32 farmers
(86%) said that they chose the varieties because of easy access to the seed. The second most
common reason for preferring these varieties was a better yield and was mentioned by 54% (20
of 37 farmers) of the improved wheat growers. Of the five farmers who used local seed, 100% of
them said they had chosen local varieties due to easy access. The second reason was that they are
more reliable, which means that they are better suited to the region and less likely to fail. These
results are shown in Table 3.37. Figure 3.8 shows the reasons for growing improved wheat
varieties.
Table 3.36 Farmers’ Stated Reasons for Choice of Wheat Varieties
Variety (number of farmers)
Easy access
Good price
Better yield
More cost
effective Familiar More
reliable
No other varieties available
Karim (11) 11 0 5 0 1 4 0
Salambo (15) 14 0 12 0 1 6 0
Marjawi (5) 4 0 2 0 1 4 0
Fazan (4) 3 0 1 0 1 1 0
Other varieties (2) 0 1 0 0 1 0 0
Total Improved(37) 32 1 20 0 5 15 0
Total Local (5) 5 0 1 0 0 5 0
100
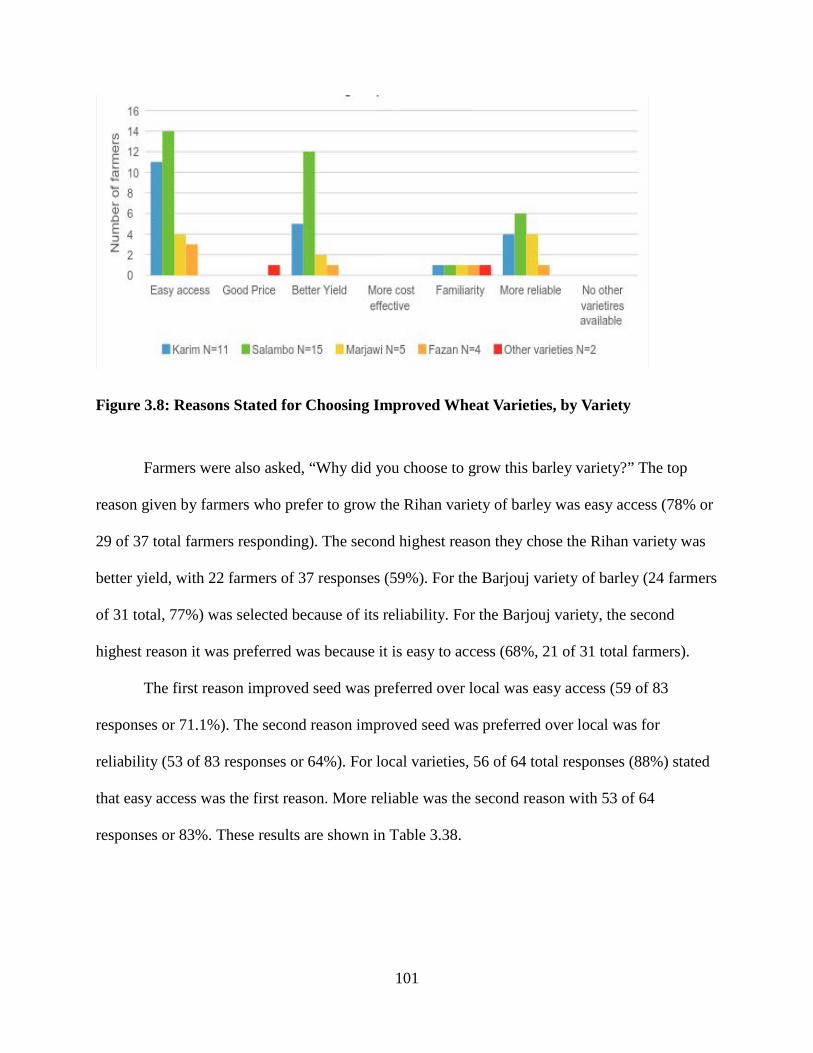
Figure 3.8: Reasons Stated for Choosing Improved Wheat Varieties, by Variety
Farmers were also asked, “Why did you choose to grow this barley variety?” The top
reason given by farmers who prefer to grow the Rihan variety of barley was easy access (78% or
29 of 37 total farmers responding). The second highest reason they chose the Rihan variety was
better yield, with 22 farmers of 37 responses (59%). For the Barjouj variety of barley (24 farmers
of 31 total, 77%) was selected because of its reliability. For the Barjouj variety, the second
highest reason it was preferred was because it is easy to access (68%, 21 of 31 total farmers).
The first reason improved seed was preferred over local was easy access (59 of 83
responses or 71.1%). The second reason improved seed was preferred over local was for
reliability (53 of 83 responses or 64%). For local varieties, 56 of 64 total responses (88%) stated
that easy access was the first reason. More reliable was the second reason with 53 of 64
responses or 83%. These results are shown in Table 3.38.
101
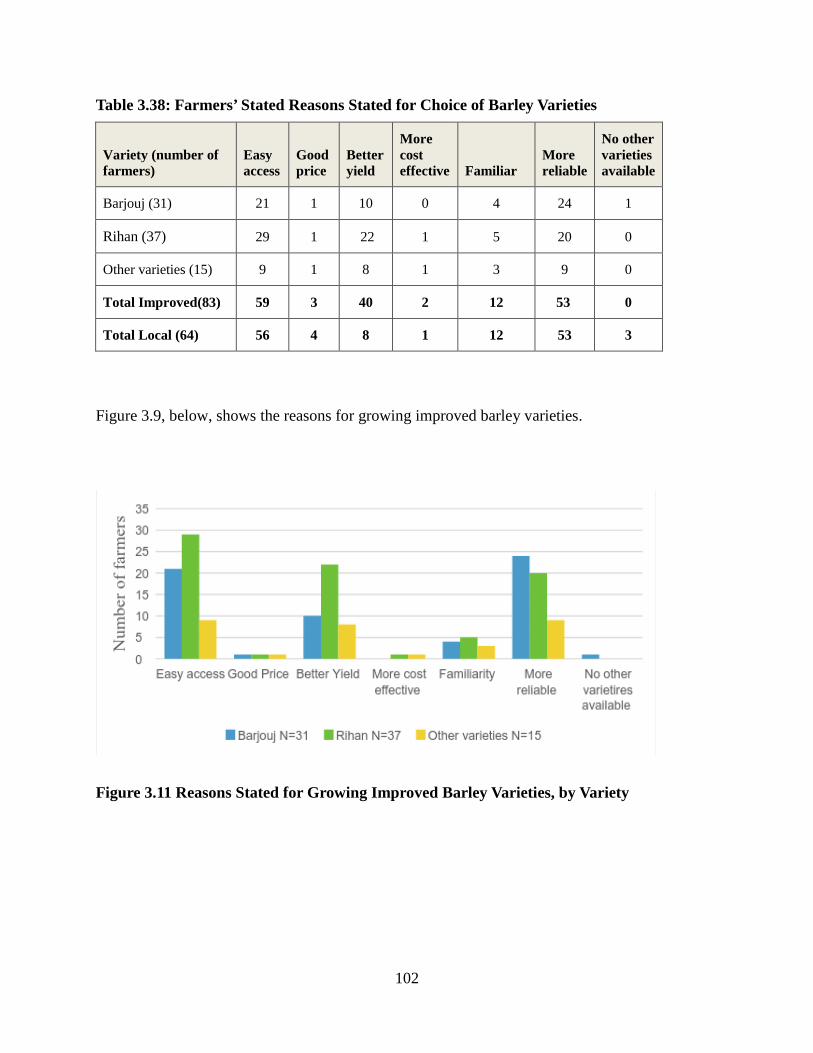
Table 3.38: Farmers’ Stated Reasons Stated for Choice of Barley Varieties
Variety (number of farmers)
Easy access
Good price
Better yield
More cost effective Familiar
More reliable
No other varieties available
Barjouj (31) 21 1 10 0 4 24 1
Rihan (37) 29 1 22 1 5 20 0
Other varieties (15) 9 1 8 1 3 9 0
Total Improved(83) 59 3 40 2 12 53 0
Total Local (64) 56 4 8 1 12 53 3
Figure 3.9, below, shows the reasons for growing improved barley varieties.
Figure 3.11 Reasons Stated for Growing Improved Barley Varieties, by Variety
102
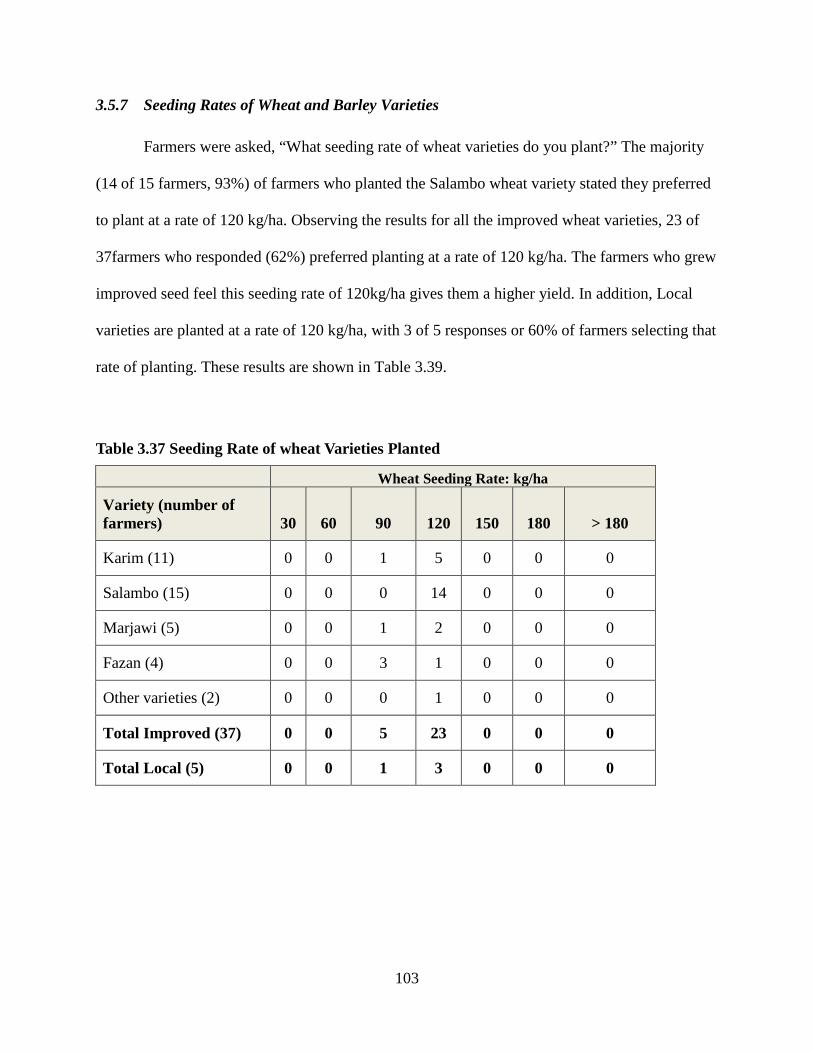
3.5.7 Seeding Rates of Wheat and Barley Varieties
Farmers were asked, “What seeding rate of wheat varieties do you plant?” The majority
(14 of 15 farmers, 93%) of farmers who planted the Salambo wheat variety stated they preferred
to plant at a rate of 120 kg/ha. Observing the results for all the improved wheat varieties, 23 of
37farmers who responded (62%) preferred planting at a rate of 120 kg/ha. The farmers who grew
improved seed feel this seeding rate of 120kg/ha gives them a higher yield. In addition, Local
varieties are planted at a rate of 120 kg/ha, with 3 of 5 responses or 60% of farmers selecting that
rate of planting. These results are shown in Table 3.39.
Table 3.37 Seeding Rate of wheat Varieties Planted
Wheat Seeding Rate: kg/ha
Variety (number of farmers) 30 60 90 120 150 180 > 180
Karim (11) 0 0 1 5 0 0 0
Salambo (15) 0 0 0 14 0 0 0
Marjawi (5) 0 0 1 2 0 0 0
Fazan (4) 0 0 3 1 0 0 0
Other varieties (2) 0 0 0 1 0 0 0
Total Improved (37) 0 0 5 23 0 0 0
Total Local (5) 0 0 1 3 0 0 0
103
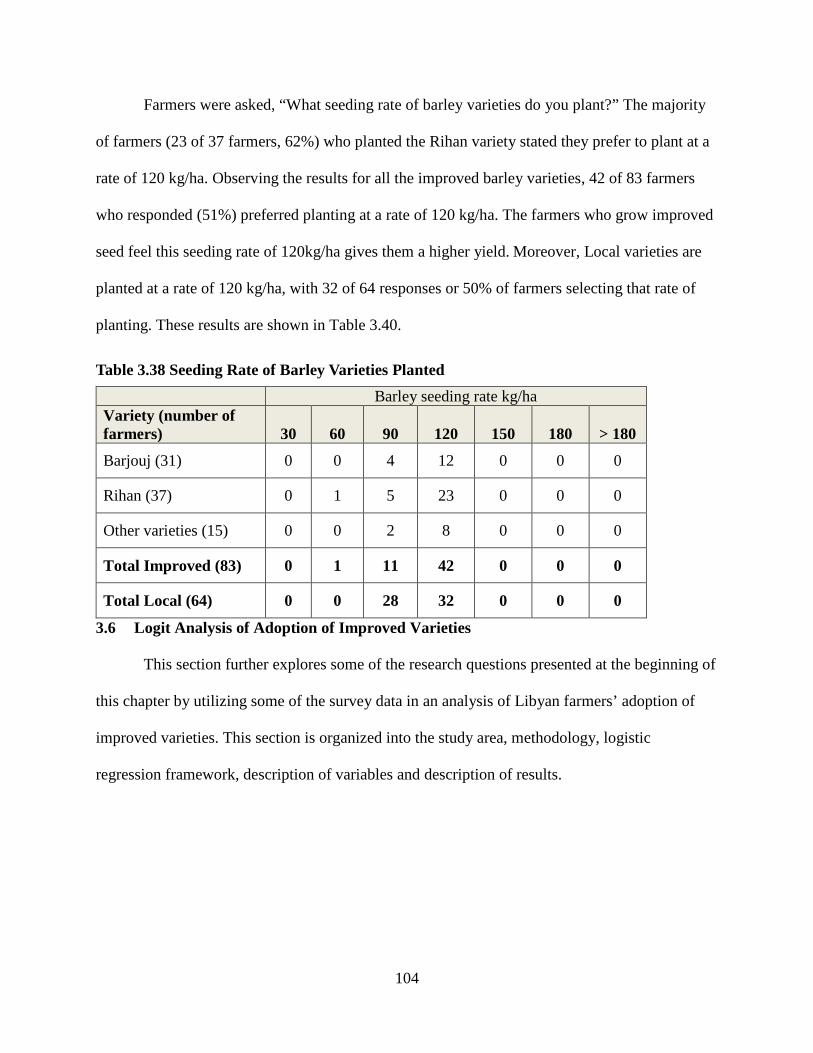
Farmers were asked, “What seeding rate of barley varieties do you plant?” The majority
of farmers (23 of 37 farmers, 62%) who planted the Rihan variety stated they prefer to plant at a
rate of 120 kg/ha. Observing the results for all the improved barley varieties, 42 of 83 farmers
who responded (51%) preferred planting at a rate of 120 kg/ha. The farmers who grow improved
seed feel this seeding rate of 120kg/ha gives them a higher yield. Moreover, Local varieties are
planted at a rate of 120 kg/ha, with 32 of 64 responses or 50% of farmers selecting that rate of
planting. These results are shown in Table 3.40.
Table 3.38 Seeding Rate of Barley Varieties Planted
3.6 Logit Analysis of Adoption of Improved Varieties
This section further explores some of the research questions presented at the beginning of
this chapter by utilizing some of the survey data in an analysis of Libyan farmers’ adoption of
improved varieties. This section is organized into the study area, methodology, logistic
regression framework, description of variables and description of results.
Barley seeding rate kg/ha Variety (number of farmers) 30 60 90 120 150 180 > 180
Barjouj (31) 0 0 4 12 0 0 0
Rihan (37) 0 1 5 23 0 0 0
Other varieties (15) 0 0 2 8 0 0 0
Total Improved (83) 0 1 11 42 0 0 0
Total Local (64) 0 0 28 32 0 0 0
104
3.6.1 Methods and Data for Logit Regression Analysis
As mentioned at the beginning of this chapter, the survey sought to collect detailed
information from 181 wheat and barley farmers in Libya in 2014. Since there was civil war in
Libya at the time of the survey administration, surveys could not be collected from all of the
regions intended, particularly in the west of the country. However, 136 farmers from eastern and
southern Libya responded to the survey, which was the primary data collection method. These
farmers constitute a representative sampling of all small grain farmers in Libya.
Logistic regression was used to predict farmers’ adoption of improved wheat or barley
varieties. Particularly, binary logistic regression was used for this study because the outcome was
dichotomous, (i.e. “yes” or “no”) (Leech, Barrett, & Morgan, et al., 2005). The logistic model for
this study is explained by Davidson and Mackinnon (1995). The model is
pi = 1/1+ exp(βXi)
where pi is the probability of farmer i adopting a new variety and Xi is a vector of farmer i’s
characteristics.
This test was used to examine which factors impact farmers’ adoption of improved wheat
or barley varieties and analyzes by using three groups of explanatory variables--Farmers’ Socio-
Demography Characteristics, Farm Characteristics, and Farmer Preferences–to explain the
decision to adopt.
3.6.2 Description of Variables Used
The dependent variable in the adoption of improved wheat or barley varieties model are
0,1 dummy variables (No,Yes). Two models were used, given the detailed information on
105
farmers planting decisions, reflecting a weaker and stronger interpretation of adoption of
improved varieties:
• “Any improved” is defined to equal 0 for those farmers who did not grow any improved
varieties of either wheat or barley and 1for those farmers who grow any improved variety
of either wheat or barley. In other words, a 0 designates a farmer who grows only local or
mahale varieties on their farm.
• “Only improved” is defined to equal 0 for those farmer who grows some local or
mahale variety of wheat or barley and 1 if for those farmers who grows only improved
varieties on their farm.
These definitions therefore can account for the significant subset of farmers who exhibit
partial adoption. A complete non adopter will be 0 for “any improved” as well as 0 for “only
improved.” A partial adopter will be 1 for “any improved” but 0 for “only improved.” A full
adopter will be 1 for “any improved” as well as 1 for “only improved.”
The independent variables included in the vector Xi: were drawn from 38 possible
variables available from the survey, reduced to three groups with common characteristics:
• Farmers’ Socio -Demographic Characteristics: including age of farm operator,
household size, education, operator experience.
• Farm Characteristics: including farm size, location of farm, irrigation and rainfall, farm
income, crop income, fertilizer, and labor.
• Farmer Preferences: for informal marketing, formal marketing, and seed saving.
Each of the possible explanatory variables was analyzed separately in cross correlation
tests with the adoption variables and those that appeared to be most correlated with the outcome
were further analyzed. From group one (Farmers’ Socio-Demographic Characteristics), the factor
106
identified from cross-correlation tests was education level. From group two (Farm
Characteristics), four factors appear related to the use of improved varieties: irrigation, fertilizer,
farm labor, and farm size. In the third group (Farmer Preferences), the only factor that appeared
to be correlated with improved varieties was seed saving. These six variables were used as
regressors for both models (“any improved” varieties and “only improved” varieties):
● Education: measured by the level of education attainted.
The education variable was defined as “0” value equaling high school or below education
attainment, and “one” value equaling some collage attendance or more. The mean for Education
was 0.39, which means that the education attainment level was closer to a high school average.
Standard deviation for education was 0.489, which means that the data is spread out wider than a
normal distribution.
● Farm size: measured by hectares of planted groups.
Farm Size was defined as “1” value equaling 1-5 ha, “2” value equaling 5-20 ha, “3”
value equaling 20-100 ha, and “4” value equaling more than 100 ha. The mean for Farm size was
2.243, which means that the average farm size was between 5-20 ha and 20-100 ha. Standard
deviation for farm size was 0.8563, which means that the data was very wide.
● Labor: measured by numbers of full and part time workers.
The labor variable was defined as “0” value equaling no employment, “1” value equaling
part-time employment, “2” value equaling both part and full-time employment, and “3” value
equaling full time employment. The mean for labor was 1.74, which means that the average
farmer employs part-time and full-time employees. Standard deviation for labor was 1.054,
which means that the data was widely distributed.
● Irrigation: measured by use of irrigation: yes or no.
107
The irrigation variable was defined as “0” value equaling no irrigation use, and “1” value
equaling some irrigation use. The mean for irrigation was 0.647, which means that the average
farmer uses irrigation. Standard deviation for irrigation was 0.4797, which means that the data is
wider spread than normal.
● Fertilizer: measured by how much fertilizers kg /ha used in their farms.
The fertilizer variable was defined as “0” value equaling no fertilizer use, “1” value
equaling some fertilizer use. The mean for fertilizers was 0.68, which means that the average
farmer uses fertilizer. Standard deviation for fertilizer was 0.467, which means that the data is
closer to a normal distribution.
● Seed Saving Plans: measured by whether they increase, decrease or stay the same
amount of saved seed.
Seed saving variable was defined as “0” value if seed saving is expected to decrease next
year, a “1” value if it is expected to stay the same, and “2” if it is expected to increase. The mean
for seed saving was 0.411, which means that the famers were between stay the same or
decreasing seed saving. The average famer is not planning on increasing his saved seed. Standard
deviation for seed saving was 0.602, which means that the data was wider spread than normal.
Table 3.41 shows the mean and standard deviations for the primary explanatory variables
used in the logit regressions. These descriptive statistics provide a picture of how the data is
distributed. It gives summary of the data and an important way for visualizing patterns that might
emerge from the data. All 136 famers are accounted for with these explanatory variables, and
there are no missing data.
108
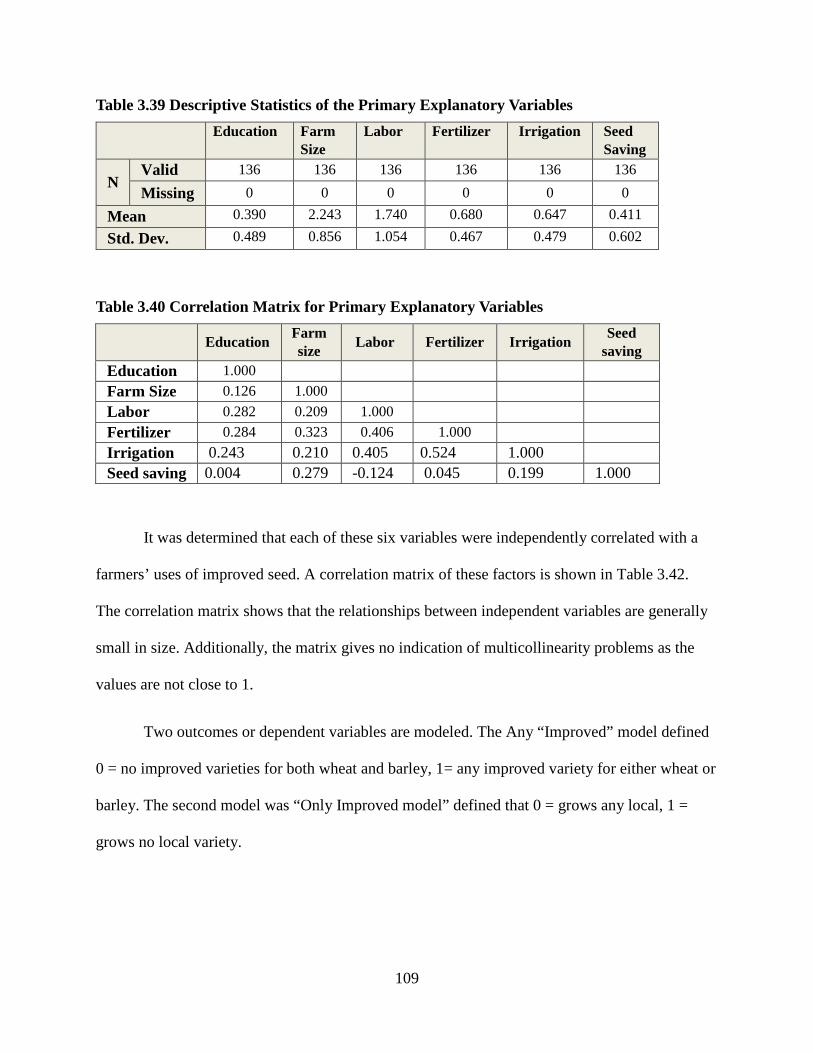
Table 3.39 Descriptive Statistics of the Primary Explanatory Variables Education Farm
Size Labor Fertilizer Irrigation Seed
Saving
N Valid 136 136 136 136 136 136 Missing 0 0 0 0 0 0
Mean 0.390 2.243 1.740 0.680 0.647 0.411
Std. Dev. 0.489 0.856 1.054 0.467 0.479 0.602
Table 3.40 Correlation Matrix for Primary Explanatory Variables
Education Farm
size Labor Fertilizer Irrigation Seed saving
Education 1.000 Farm Size 0.126 1.000 Labor 0.282 0.209 1.000 Fertilizer 0.284 0.323 0.406 1.000 Irrigation 0.243 0.210 0.405 0.524 1.000 Seed saving 0.004 0.279 -0.124 0.045 0.199 1.000
It was determined that each of these six variables were independently correlated with a
farmers’ uses of improved seed. A correlation matrix of these factors is shown in Table 3.42.
The correlation matrix shows that the relationships between independent variables are generally
small in size. Additionally, the matrix gives no indication of multicollinearity problems as the
values are not close to 1.
Two outcomes or dependent variables are modeled. The Any “Improved” model defined
0 = no improved varieties for both wheat and barley, 1= any improved variety for either wheat or
barley. The second model was “Only Improved model” defined that 0 = grows any local, 1 =
grows no local variety.
109
3.6.3 The First Model: Decision of Farmers to Grow Any Improved Variety
This study wanted to identify what factors are associated with farmers who decide not to
grow improved varieties and those who take the step to at least partially adopt improved
varieties. Table 3.43 summarizes the 44 farmers who do not grow any improved varieties (who
grow mahali only) for both wheat and barley and the 92 farmers who grow at least one improved
variety of either wheat or barley. The table shows that without considering the six independent
variables, a random prediction rate of 67.6% was possible simply reflecting their proportions
within the populations of farmers.
66% of those who grow only local varieties were predicted correctly using the six
independent factors and 89% of those who grow any improved varieties were predicted correctly.
Overall, the ability to predict increased from 68% to 82% when considering the six factors
(Table 3.44).
110
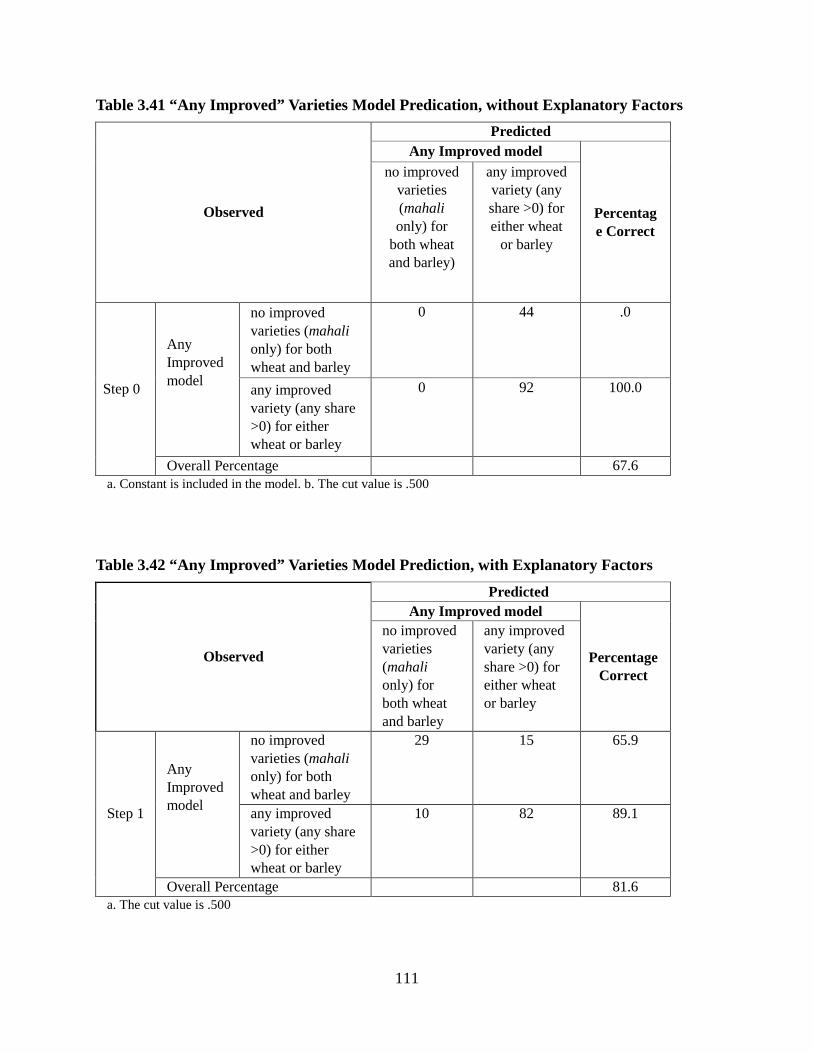
Table 3.41 “Any Improved” Varieties Model Predication, without Explanatory Factors
Observed
Predicted Any Improved model
Percentage Correct
no improved varieties (mahali only) for
both wheat and barley)
any improved variety (any share >0) for either wheat
or barley
Step 0
Any Improved model
no improved varieties (mahali only) for both wheat and barley
0 44 .0
any improved variety (any share >0) for either wheat or barley
0 92 100.0
Overall Percentage 67.6 a. Constant is included in the model. b. The cut value is .500
Table 3.42 “Any Improved” Varieties Model Prediction, with Explanatory Factors
Observed
Predicted Any Improved model
Percentage Correct
no improved varieties (mahali only) for both wheat and barley
any improved variety (any share >0) for either wheat or barley
Step 1
Any Improved model
no improved varieties (mahali only) for both wheat and barley
29 15 65.9
any improved variety (any share >0) for either wheat or barley
10 82 89.1
Overall Percentage 81.6 a. The cut value is .500
111
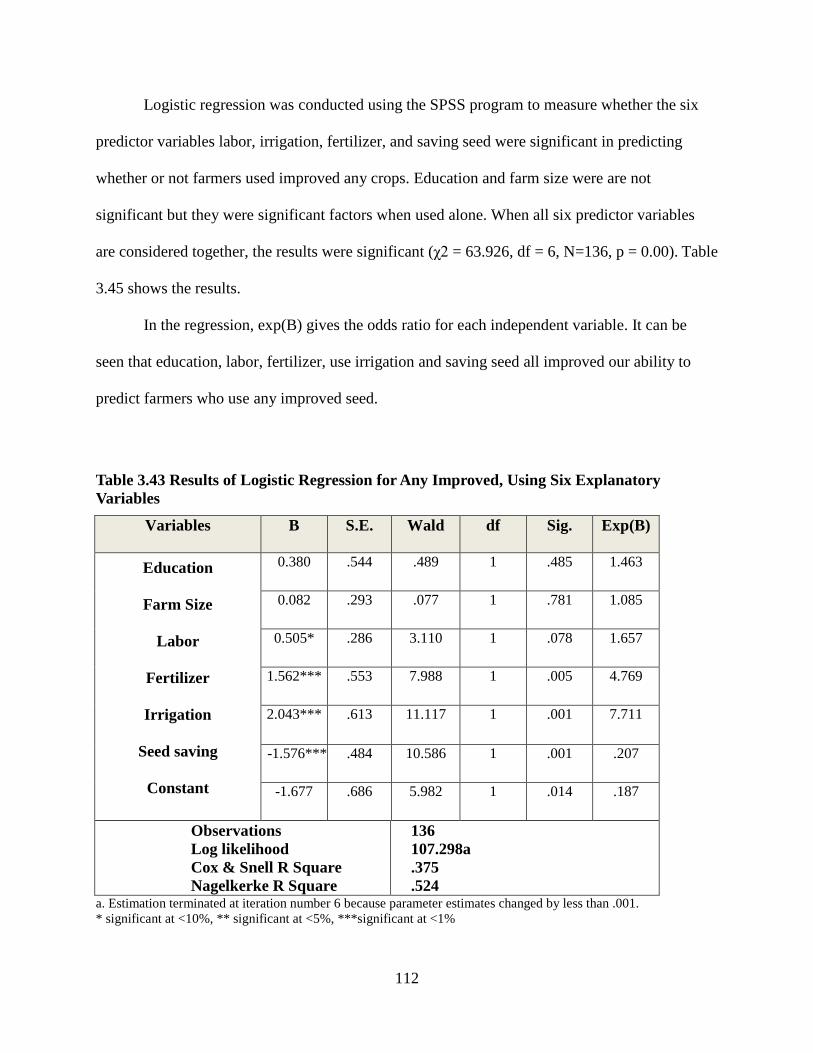
Logistic regression was conducted using the SPSS program to measure whether the six
predictor variables labor, irrigation, fertilizer, and saving seed were significant in predicting
whether or not farmers used improved any crops. Education and farm size were are not
significant but they were significant factors when used alone. When all six predictor variables
are considered together, the results were significant (χ2 = 63.926, df = 6, N=136, p = 0.00). Table
3.45 shows the results.
In the regression, exp(B) gives the odds ratio for each independent variable. It can be
seen that education, labor, fertilizer, use irrigation and saving seed all improved our ability to
predict farmers who use any improved seed.
Table 3.43 Results of Logistic Regression for Any Improved, Using Six Explanatory Variables
Variables B S.E. Wald df Sig. Exp(B)
Education
Farm Size
Labor
Fertilizer
Irrigation
Seed saving
Constant
0.380 .544 .489 1 .485 1.463
0.082 .293 .077 1 .781 1.085
0.505* .286 3.110 1 .078 1.657
1.562*** .553 7.988 1 .005 4.769
2.043*** .613 11.117 1 .001 7.711
-1.576*** .484 10.586 1 .001 .207
-1.677 .686 5.982 1 .014 .187
Observations Log likelihood Cox & Snell R Square Nagelkerke R Square
136 107.298a .375 .524
a. Estimation terminated at iteration number 6 because parameter estimates changed by less than .001. * significant at <10%, ** significant at <5%, ***significant at <1%
112
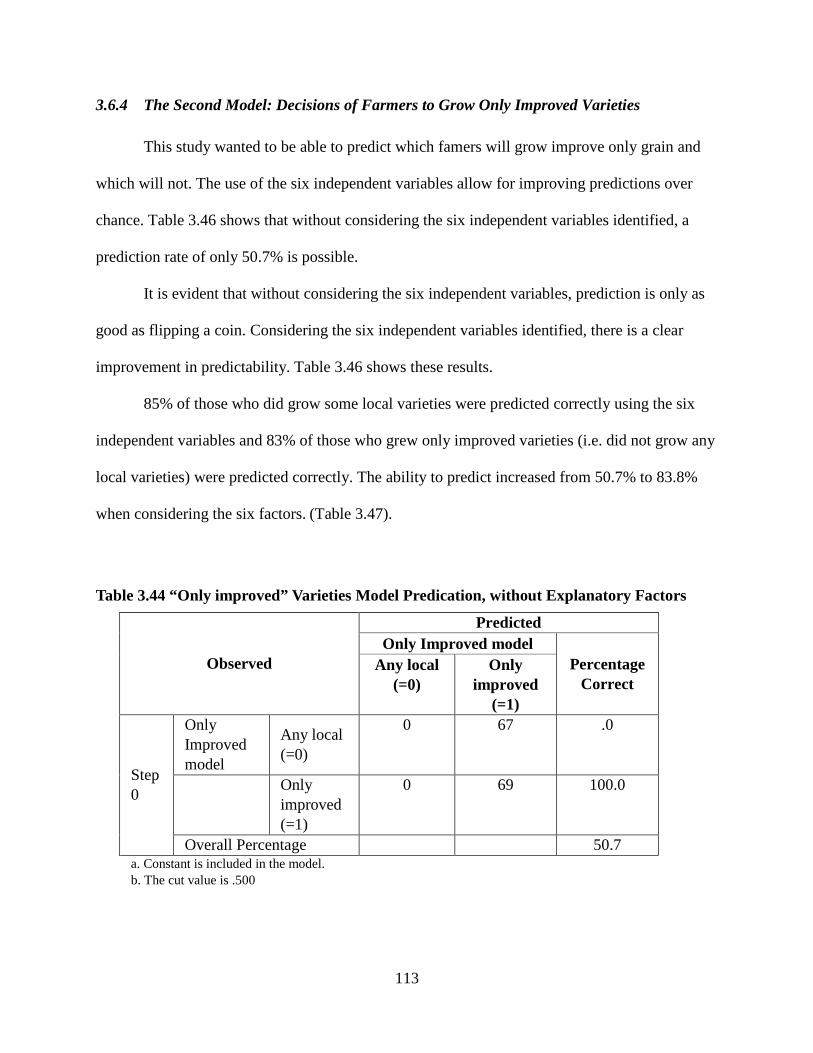
3.6.4 The Second Model: Decisions of Farmers to Grow Only Improved Varieties
This study wanted to be able to predict which famers will grow improve only grain and
which will not. The use of the six independent variables allow for improving predictions over
chance. Table 3.46 shows that without considering the six independent variables identified, a
prediction rate of only 50.7% is possible.
It is evident that without considering the six independent variables, prediction is only as
good as flipping a coin. Considering the six independent variables identified, there is a clear
improvement in predictability. Table 3.46 shows these results.
85% of those who did grow some local varieties were predicted correctly using the six
independent variables and 83% of those who grew only improved varieties (i.e. did not grow any
local varieties) were predicted correctly. The ability to predict increased from 50.7% to 83.8%
when considering the six factors. (Table 3.47).
Table 3.44 “Only improved” Varieties Model Predication, without Explanatory Factors
Observed
Predicted Only Improved model
Percentage Correct
Any local (=0)
Only improved
(=1)
Step 0
Only Improved model
Any local (=0)
0 67 .0
Only improved (=1)
0 69 100.0
Overall Percentage 50.7 a. Constant is included in the model. b. The cut value is .500
113
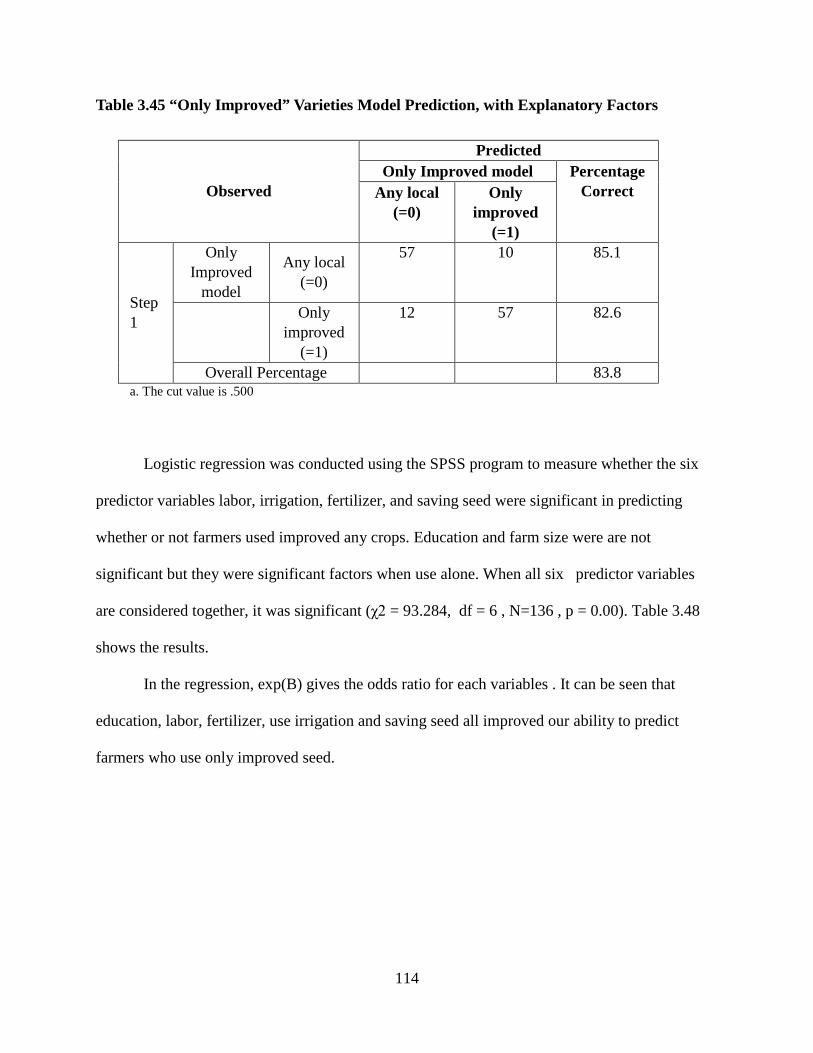
Table 3.45 “Only Improved” Varieties Model Prediction, with Explanatory Factors
Observed
Predicted Only Improved model Percentage
Correct Any local (=0)
Only improved
(=1)
Step 1
Only Improved
model
Any local (=0)
57 10 85.1
Only improved
(=1)
12 57 82.6
Overall Percentage 83.8 a. The cut value is .500
Logistic regression was conducted using the SPSS program to measure whether the six
predictor variables labor, irrigation, fertilizer, and saving seed were significant in predicting
whether or not farmers used improved any crops. Education and farm size were are not
significant but they were significant factors when use alone. When all six predictor variables
are considered together, it was significant (χ2 = 93.284, df = 6 , N=136 , p = 0.00). Table 3.48
shows the results.
In the regression, exp(B) gives the odds ratio for each variables . It can be seen that
education, labor, fertilizer, use irrigation and saving seed all improved our ability to predict
farmers who use only improved seed.
114
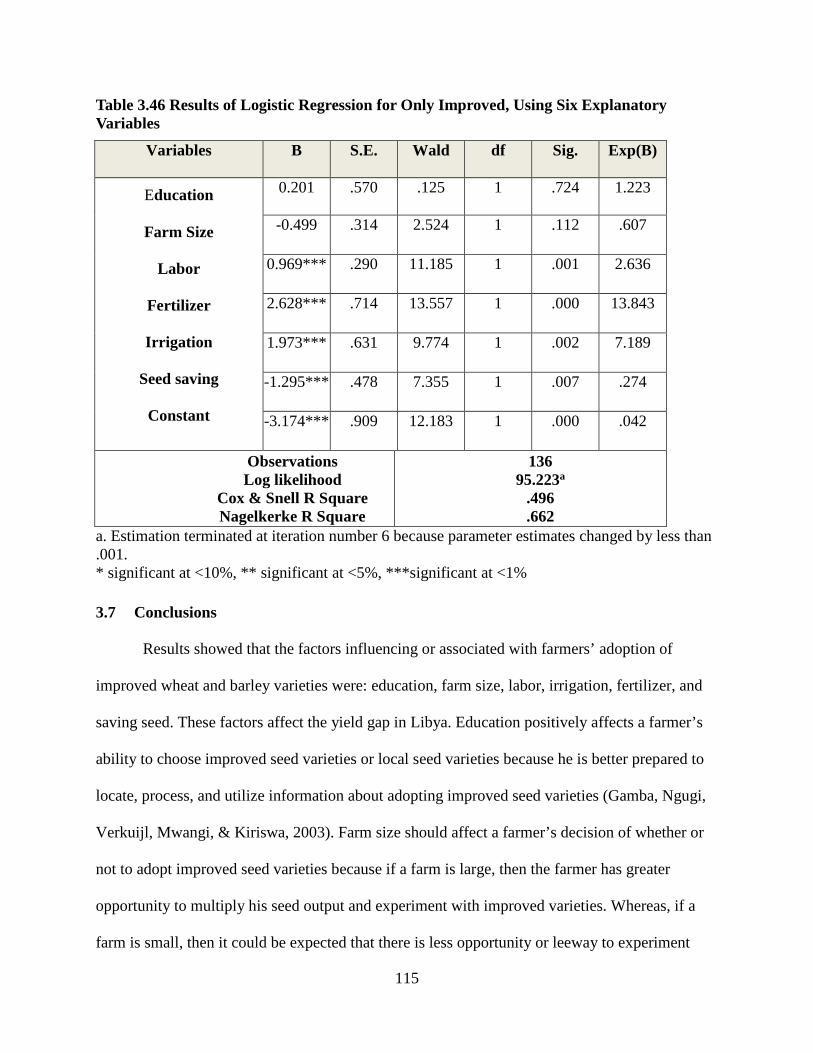
Table 3.46 Results of Logistic Regression for Only Improved, Using Six Explanatory Variables
Variables B S.E. Wald df Sig. Exp(B)
Education
Farm Size
Labor
Fertilizer
Irrigation
Seed saving
Constant
0.201 .570 .125 1 .724 1.223
-0.499 .314 2.524 1 .112 .607
0.969*** .290 11.185 1 .001 2.636
2.628*** .714 13.557 1 .000 13.843
1.973*** .631 9.774 1 .002 7.189
-1.295*** .478 7.355 1 .007 .274
-3.174*** .909 12.183 1 .000 .042
Observations Log likelihood
Cox & Snell R Square Nagelkerke R Square
136 95.223a
.496
.662 a. Estimation terminated at iteration number 6 because parameter estimates changed by less than .001. * significant at <10%, ** significant at <5%, ***significant at <1%
3.7 Conclusions
Results showed that the factors influencing or associated with farmers’ adoption of
improved wheat and barley varieties were: education, farm size, labor, irrigation, fertilizer, and
saving seed. These factors affect the yield gap in Libya. Education positively affects a farmer’s
ability to choose improved seed varieties or local seed varieties because he is better prepared to
locate, process, and utilize information about adopting improved seed varieties (Gamba, Ngugi,
Verkuijl, Mwangi, & Kiriswa, 2003). Farm size should affect a farmer’s decision of whether or
not to adopt improved seed varieties because if a farm is large, then the farmer has greater
opportunity to multiply his seed output and experiment with improved varieties. Whereas, if a
farm is small, then it could be expected that there is less opportunity or leeway to experiment
115
with seed varieties (Gamba et al., 2003). Labor, including both paid household members and
hired laborers, both part-time and full-time, helps farmers solve the problems associated with
labor constraints. Improved seed varieties require timely performance of land preparation, as
well as weeding and harvesting. Labor should have a positive effect on the adoption of improved
seed varieties (Mussei et al, 2001). Irrigation should provide positive effects for the farmers who
adopt improved seed varieties because the improved varieties are developed to make maximum
use of water. Fertilizer can have a positive effect on a crop if it is used. Saving seed, the farmers
who save and use local save will buy less other improved seed. The opposite effect is seen with
farmers who purchase improved seed use less local seed. It is assumed that using improved seed
will increase yield. Finally, farmers in Libya have limited money to invest in farmland and
inputs. These conditions mean that farmers need the highest quality seed stock available from
the most appropriate advanced varieties for Libyan conditions, but many cannot afford them.
116
4 The Role of an Improved Seed System in Closing the Yield Gap in Libyan
Agriculture
4.1 Introduction
This chapter discusses the role of the national seed system in closing the yield gap and
improving the sustainability of Libyan agriculture. The research questions for this chapter
include: What is the current structure and state of the seed system? What is missing in the Libyan
seed system? For wheat and barley seed, where is the genetic material originating that is proving
to be the most effective in Libyan agriculture?
The chapter will start with a review of relevant literature on the Libyan seed system. It
will discuss the background of the current structure and function of the Libyan seed system.
Then it will review past recommendations for improvements in the Libyan seed sector. The
chapter closes with new recommendations based on data and insights from the survey and
analysis in the previous chapter.
4.1.1 The fundamental importance of a well-functioning seed system
Seeds provide humans with our most fundamental capacity for food production.
According to FAO (2009), by 2050, the expected demand for cereals—for both animal feed and
human food—may reach three billion tones. The current demand is about 2.1 billion tones. With
seed being the primary agricultural input, which affects the efficiency of other inputs such as
irrigation, fertilizers, and insecticides, there is a need for good genetic traits and good quality
seed. Seed quality is understood by Verma, (2011) as having four main components: seed health,
physical purity, genetic purity, and germinability, all of which can be improved by a well-
functioning seed system in order to adapt to the environment and enhance production, regardless
117
of the genetic profile contained in the seed. Developing varieties that have superior genetic
characteristics for the farmer’s intended use, as well as making them available at a practical price
at the time and in the location where there is the demand for seed is likewise important (Verma,
2011). Furthermore, since seeds in nature germinate based on time and location, these biological
factors of reproduction and germination are among the most basic seed characteristics essential
to the genetic package. Genetic characteristic are an essential part of seed selection and
production, in order to have a high quality seed available to farmers while minimizing costs,
either environmental or economic.
Improved seeds often benefit from purchased inputs such as fertilizer, herbicide,
pesticide, and irrigation of water in order to maximize seed genetic potential. Fertilizer
application could be used to maximize yield, and even help with enhancing the physical
characters of the harvested product (Verma, 2011). Well managed irrigation and drainage serves
as another important mechanism for improving seed performance because poor seed germination
is often caused by the extremes of dry conditions or excess water. Irrigation management, of
course, depends on soil type, weather conditions, and the timing of crop production. Pest control
combats the effect of insect pests or diseases that may compromise seed quality and crop yields.
Seed treatments can help improve quality and control infestation by providing the right fertilizer
or pest control product directly at the locus of seed germination (Verma, 2011).
Even when a farmer uses a good quality seed with favorable characteristics and/or
improvements, still the seeds might not increase yields or might not adapt to the desired
conditions. Also, a good quality seed cannot overcome inadequate seed storage. It is necessary
for seed to be stored at an ideal temperature range (21o C – 27o C) for instance, to protect seed
from fungi and insect infection (Harrington and Douglas, 1970).
118
Seed certification is another significant agronomic principle that improves yields with
high quality seeds. Seed certification involves various processes of seed quality control by
overseeing seed production and multiplication, as well as determining whether the seed reaches
certain seed standards (Verma, 2011).
4.1.2 National Seed Systems: Formal and Informal Sectors
A national seed system can be thought of as a set of organizations with, “an outline of
measures to be implemented and activities to be carried out to secure timely production and supply
of seeds of prescribed quality in the required quantity” for the nation’s farmers (Feistritzer and
Kelly, 1978). A national seed system provides the interface between domestic and international
seed development and management activities—including the conservation and collection of
germplasm, breeding and improvement of varieties, and distribution of quality seed to farmers—
incorporating international agreements into the practices of local seed industries.
According to van Amstel, Bottema, Sidik, and van Santen (1996), the seed system can be
defined as “the sum of physical, organizational and institutional components, their actions and
interactions that determine seed supply and use, in quantitative and qualitative terms.” Broadly
speaking, there are two primary seed supply sectors, known as the formal and informal seed supply
systems. The difference between formal and informal sectors can be seen in Bishaw’s (2004)
example of a farmer who adopts improved seed varieties from a public sector seed program, while
still saving his own seeds to harvest for next year, which is the informal sector.
The formal seed system encompasses the public seed system, in which there are seed
certification and quality control public services, which are generally provided by the public
sector, as well as the commercial production and sale of seeds, which are generally done by
private enterprises. According to Almekinders and Louette (2000), the formal sector can also
119
include formal ‘farmers’ or ‘local’ seed organizations or associations. One specific service
offered by the formal seed system includes seed processing and multiplication, which is
described by Bishaw (2004) as those processes that provide clean, certified seeds of good quality
to farmers. Almekinders and Louette (2000) discussed the achievements in developing countries
in “high potential yield areas” creating formal sectors to diffuse and develop improved varieties,
while having less success doing so in “low potential yield areas,” with complex soil and climate
conditions.
The informal seed system is mainly comprised of farmers who save their own seeds,
which are often locally adapted landrace varieties, and potentially selling or bartering a portion
of that saved seed locally. According to Pionetti (2006), farmers maintain the actual yield of their
crops by adopting farming practices that coincide with local conditions and their economic
objectives as producers or households. Reasons why farmers save specific varieties of seeds
include ensuring current and future diversity in crops and subsistence foods, gaining seed capital,
and maintaining seed characteristics that meet specific needs (Pionetti, 2006). Human and
environmental forces—specific to the farming system and the location—interact to shape the
local seed supply and its specific characteristics. According to Almekinders and Louette (2000),
the informal sector is based on farmer selection, in which seed is chosen for its full suite of
characteristics and performance in planting, harvest, storage, and re-production of seed.
4.2 The Seed System in Libya
In Libya, the frequent use of low quality seed is a major contributing factor to the low
productivity of some agricultural crops. In regards to trying to improve the productivity for both
formal and informal sectors, one of the sector priorities is to use more productive seeds adapted
to the local environment. All of Libyan society—including the agricultural sector as well as
120
consumers—would directly benefit from better resource management and increased productivity
resulting from improved seeds and seed system. The seed system in Libya involves both the
public and the private sectors, with input from international organizations.
4.2.1 The Public Sector’s Dominant Role in the Seed System in Libya
As early as the 1950s, the Libyan government created plans to improve and increase crop
seeds in the Tripolitania region. In 1958, the government started education for farmers, teaching
them the importance of handling and growing seeds properly (Majbari, 2009). Also in 1958, a
national committee was formed to improve seed production. The intent of the plan was for seeds
to be produced in the Fezzan region of Libya. In the same period, experiments began to produce
seed in the eastern region of Libya (Al-Shreidi and Sbith, 2009).
In 1960, the Ministry of Agriculture purchased high quality wheat and barley grain and
distributed it as improved seed to farmers. Beginning in 1964, farmers were required to label
their seed sacks with information about purity and germination percent (Majbari, 2009). In 1966,
the government began inspecting private farms to verify seed quality (Majbari, 2009). In the
1970s, numerous government agricultural settlement projects were constructed to improve
productivity and to grow seeds and seedlings, such as cereal and fodder crops, in areas of
permanent irrigation in the eastern area and in the south desert area of Fezzan. These two
projects covered an area of approximately 40 hectares. Projects also were started in
supplementary irrigation areas and in the Green Mountain coastal areas that have above average
precipitation rates. Public projects were responsible for seed breeding and seed production to
provide for the needs of the private sector, which included farmers and feed breeders in each
production area of the country (Al-Shreidi and Sbith, 2009).
121
The ARC is a national organization under the Ministry of Agriculture that was created in
the mid-1970s to provide technical assistance for agricultural development and research. At the
time of its creation, the public sector had failed to properly manage the agricultural sector, which
created massive problems and became a source of debt for the government. The center
encouraged the private sector to play a larger role in marketing and processing. The center also
has attempted to open up the agricultural sector to international markets, to strengthen and
establish quality control and health standards, and to enforce their implementation (Arhama,
2013). According to Al-Shreidi and Sbith (2009), ARC has more recently received very little
encouragement from the Libyan government for agricultural research, and there is a lack of
stability in the ARC interactions with international organizations.
By the late 1990s, Libya was importing seed at a cost of about 15 million dinar annually.
In 1998, a law was passed prohibiting the import of seed, which created a shortage of seed as well
as increased illegal purchase of seed. In 1998, the National Center for Improved Seed Production
(NCISP) was established, as part of a government formulated strategy to reduce seed imports and
increase domestic seed production. NCISP began operations in 1999 with three farms for seed
production (WANA Seed Network, 2007).
During the agricultural season of 1999/2000, NCISP started to improve seed production
activity for major winter cereal crops of soft and hard wheat and barley, as well as summer crops,
such as forage crop grasses, oats, and corn (Al-Shreidi and Sbith, 2009). In 2005, a National
Committee for Variety Registration and Seed Certification was established to compile a catalog of
all cereal and vegetable varieties marketed in Libya (Al-Shreidi, 2010). In 2007, the Seed
Producers Society (SPS) was established. Its members are farmers in major seed production areas
of the country who have contractual agreements with the NCISP (Al-Shreidi, 2010). In 2007,
122
NCISP explored alternative seed production arrangements to meet growing demand within Libya
(Al-Shreidi, 2010). In 2009, Libya needed 25,000 tons of seed. NCISP provided more than 80%
of Libya’s need for improved wheat, oat, and barley seed (Al-Shreidi and Sbith, 2009).
The government has imported varieties of seeds for various reasons: the results of
research, the recommendations of expert technical committees, the experiences of countries that
have similar conditions, or the results of experiments carried out by foreign companies
implementing agricultural projects. One result of importing seeds, however, has been
deterioration of the seed varieties within Libya because of the effective absence of a responsible
government agency to monitor the propagation methods and because of the lack of scientific
verification of specific varieties. Given that purity of Libyan seed stock has deteriorated, it
became imperative to continue the import of seed (Al-Shreidi and Sbith, 2009).
4.2.2 International Organizations Working with the Libyan Seed System
In the course of these domestic developments of the public sector, at least two major
international organizations have been working with or within the Libyan national seed system.
The most important organization working in Libya is the FAO, which has proposed plans to
promote the development of a private seed industry. The FAO’s first step in promoting the
industry is to strengthen Libya’s NCISP and the ARC. ICARDA also has a connections with
Libya in their work to build better seed systems, largely with NCISP and ARC.
4.2.2.1 Food and Agricultural Organization (FAO)
As an organization within the United Nations, the FAO focuses on making agriculture
more sustainable, reducing rural poverty, and helping create efficient food systems. In 1952, an
agreement was made between the Libyan government and the FAO of the United Nations that
started introducing seed technical assistance, increasing industry communication, and improving
123
seed production (Majbari, 2009). According to Al-Shreidi and Sbith (2009), the agreement was
targeted especially for seeds for fodder (oats, sorghum, and alfalfa) and cereal (wheat and
barley). In 1955, FAO created a plan to produce seed in different locations in the western region
of Libya at farms belonging to the government.
But it was not until 2002 that an FAO office in Libya was established (FAO, 2011) and
helps Libya with seed management by developing seed and breeding systems. FAO has set up
infrastructure for germplasm information management, has established the foundation for a
massive seed propagation program, has ensured sustainability of seed production activities, and
has created seed quality control procedures.
In May 2005, FAO made excellent progress on their Technical Assistance Project in the
following areas: plant genetic resources; plant breeding and nucleus seed production; variety
release mechanism and seed certification; seed production and processing; and matching experts
with farmers for training. As a result of this program, a system was created to collect and
analyze farm data, develop efficient indicators, bring forth an electronic planning model for
economic analysis, and help design future governmental policies, as well as allow the availability
of electronic data for public use by projects and researchers.
Libya began a contract in 2010 with the FAO to improve wheat and barley grain in
Libya, with the understanding that FAO would begin work in 2011 and complete the work in
2014. However, this work was never even begun because of conflict in Libya. Despite important
plans, FAO has been unable to work in a stable manner with the Libyan Agricultural Ministry
because of the the civil war started in 2011 with the overthrow of Ghaddafi, the NATO-led
bombing with several no-fly zones created over Libya, and the political and civil conflict that
continues to the present.
124
4.2.2.2 International Center for Agricultural Research in Dry Areas (ICARDA)
The International Center for Agricultural Research in Dry Areas (ICARDA) was
established in 1977 becoming one of fifteen research centers around the world supported by the
Consultative Group on International Agricultural Research (CGIAR). ICARDA works on
improving land management, diversifying production systems, and creating better crop and
livestock products.
ICARDA has worked closely with the ARC of the Libyan Ministry of Agriculture, since
the early 1980s. This partnership has resulted in improved germplasm of cereal and legume
crops, training of Libyan researchers, and coordination of donor-supported regional projects.
Currently, three major projects are underway to further their objectives. The projects were started
in 2010 and are intended to last five years. These projects are geared to the three different
agricultural regions in Libya and have a total budget of about nine million U.S. dollars. The four
stated objectives for these projects are: 1) determine the types and extent of different agro-
ecologies of wheat and barley-based systems; 2) determine the productivity constraints for wheat
and barley including physical, biological, managerial and socio-economic factors; 3) use a
participatory approach with farmers and other stakeholders to devise, develop and test potential
options to alleviate those constraints and improve crop productivity and profitability while
conserving natural resources; and 4) build and improve the technical and organizational
capacities of researchers and farmers in the target areas (ARC Libya-ICARDA Collaborative
Program, 2010b ).
4.2.3 The Private Sector’s Uncertain Role in the Libyan Seed System
Today, the Libyan private seed business—as with private businesses in general—are in
their infancy. For much of the Gadhafi regime, private businesses were actively discouraged. The
125
economy was almost entirely dependent on oil revenues and public sector institutions. In 2006
for instance, about 90% of Libyan export income was derived from oil. When seed production
was ramped up in 1999, this was done through government organizations rather than private
industry. Given that the seed system has been dominated by the government and has been the
main point of contact with international organizations as well, the role of the private sector has
been small and unstable, despite a couple of attempts to develop a private seed industry.
In 1975, the Libyan Romanian Company (LRC) was established for the purposes of
starting a seed industry, transferring seed technology, and creating seed breeding farms in the
western area (Al-Shreidi and Sbith, 2009). The LRC was terminated in 1991 when sanctions
were imposed on Libya. At that time, the Libyan authorities contracted with Morocco to produce
seed and to train Libyans in agricultural practices. The Saujet Company of Morocco raised
varieties of barley, as well as hard and soft wheat for evaluation and breeding (Al-Shreidi and
Sbith). The contract lasted only three years. Although farmers used their own seed, especially
wheat and barley, production yields were far too little to meet the country’s demand.
The dominant local seed company in place before the 2011 revolution was Zabtia, which
had been working with Dutch seed companies. When Gadhafi was killed in 2011 during the
NATO-led bombing of the country, the entire national political structure was shaken to its core
and many aspects of society began to change. The process of change is still very active in Libya,
and the end results are unknown. The lack of control and regulation has opened up opportunities
for private businesses to operate freely. However, due to decades of government control, very
few national businesses are capable of taking the lead. Under these conditions, international
businesses have moved in and dominated some sectors. Due to the political upheaval, it is
extremely difficult to get accurate and up-to-date information about Libya. Even though the
126
revolution has ended, it has been impossible to determine Zabtia’s current situation because of
the ongoing civil war.
4.3 General Recommendations for Improving Seed Systems in Developing Countries
There are many common problems in seed systems that need to be addressed throughout
all developing countries, such as: (1) the limited availability for private companies to obtain public
breeding materials and varieties; (2) insufficient legislation to protect the rights of the plant
breeders, which limits local seed company investment and involvement; (3) inefficient seed laws
and regulations; and (4) a lack of complementary inputs, such as fertilizer and pesticides (Stanelle,
2013).
Seed systems in developing countries have both weaknesses and strengths. Weaknesses
include the lack of seed technology, the lack of modern varieties of seeds, inequity of access and
seed diffusion, and lack of knowledge of how to employ modern technology. Despite these
weaknesses, the informal sector shows strengths in local adaptation of local varieties, with
appropriate genetic combinations, as well as crucial knowledge of local conditions. The formal
sector often has weaknesses of inadequate or untimely supplies of improved varieties, limited
selection of locally adapted improved varieties, and a lack of diversity of varieties. However,
under the right conditions the formal seed system can provide good seed technology, with
modern varieties and advanced knowledge of modern technology (Almekinders, 2000).
After decades of strict government control and inconsistent policies, Libya’s seed system
is in need of a major overhaul. The country is not the first to experience decades of strict control
followed rapidly by almost no control at all. Many of the former Soviet republics experienced
something similar after the rapid fall of communism in those countries. For this reason, current
127
literature and recommendations for these countries is helpful for Libya, as well as recent work
done in Pakistan, Cambodia, and Bangladesh, to the extent that these are also developing
countries with comparable political, social, economic, and ecological conditions. What follows
are a number of recommendations from the reviewed literature that directly relate to Libya.
These needs are organized into the following four sections: (1) Varieties Registration,
Certification, and Labeling; (2) Farmer Engagement and Education; (3) Plant Breeders’ Rights
and other Private Sector Incentives; and (4) Better Coordination of the Roles of the Public and
Private Sectors.
4.3.1 Variety Registration, Testing, Certification, and Labeling
First and most fundamentally, it is crucial for developing countries with an immature
seed system to establish a variety registration, with testing and certification, and accurate
labeling of seeds. A seed law and seed regulatory system should ultimately provide “truth in
labeling” so farmers can read the seed bag labels and understand the quality of the genetic inputs
that they are buying for their farming operation. The labels should be an accurate portrayal of the
seed inside the bag. A variety registration list shows what is being used, and ultimately serves to
maintain knowledge of variety characteristics to establish a baseline against which to analyze
future changes. Seed law enforcement designed to protect farmers should require seed sellers to
label appropriately and should randomly test their seeds for accuracy.
Testing is an important capacity for developing countries to establish. Developing
countries should be able to analyze and assess the quality of varieties being imported and sold by
the private sector. Developing countries should improve the inspection of certified seeds in order
to improve the system’s efficiency. Testing facilities should include capacity for conducting field
trials, to see how a variety works in the field, to see how the seed performs under actual farming
128
conditions, to see if it makes positive contributions to production results (including yield levels).
The germination of seed should also be tested, to establish seed quality. Overall, variety testing is
a crucial part of understanding varieties’ susceptibility to diseases, pests, and other problems that
may result when growing those varieties within a country or region.
After testing, the next step in seed certification is to monitor and control seed varieties via
a timely and rigorous certification system. Any certification program should reflect genetic
improvements to enable the partners—such as the government, the seed producers, and in
particular the farmer—to have knowledge or make recommendations of the most appropriate
seeds for a particular farm. This overall program of quality and production monitoring, through
test sampling and field inspections, combined with education, can encourage major
improvements in a seed certification program in a country like Libya, that currently lacks some
of the elements of a basic seed system due to high imports and years of political turmoil.
4.3.2 Farmer Engagement and Education
One of the most important and recurring recommendations in the literature is for better
farmer engagement and education. Seed producers and suppliers should educate farmers on how
to select the best quality seed for their needs and provide a transparent seed production program
that will engage farmers, including advising on production techniques that will produce the
highest yielding results. Past recommendations also include the need for qualification standards
that would assist in maintaining certification experts, which is essential to developing a better
seed system.
According to Stanelle (2013), recommendations for Pakistan included the following:
“Empowering the farmer and seed buyers with better information and enable the market chain to provide the seed products and services they need in order to produce high yields.
129
Use of demonstration plots and famer field days to show the value of the seed, provide for extension training of the famers, establish a communication between the farmers and the other members of the seed supply chain all the way up to the plant breeders so that seed products being developed met the local farmer needs.” (p. 4).
All of these recommendations are certainly relevant to Libya as well.
Stanelle’s (2000) recommendations for the Kosovo are also relevant to Libya. In Kosovo,
work did not get started on time because directors and staff did not have enough knowledge
about the activities they must perform as part of their jobs. Stanelle (2000) foresaw the need to
look at how to train the employees and board members, tailoring the training to what was needed
within that country. Since such associations were new to Kosovo, the people working there knew
little about how such organizations must work to be successful, or how to delegate tasks to
people in a manner that will allow the development of seed production to go smoothly.
4.3.3 Plant Breeders’ Rights (PBRs) as Private Sector Incentives
Plant breeders should also have rights to protect their varieties, as breeders may be
reluctant to enter into business in a country that does not take a stand on this issue. Lack of
breeder rights prevent the best and newest varieties from reaching the country (Stanelle &
Solieng, 2010). Libya currently does not have any plant breeder rights laws. Providing these laws
might encourage private sector investment in the Libyan seed system.
4.3.4 Better Coordination of the Roles of the Public and Private Sectors
Overall, with the right sorts of collaboration, support, and knowledge, both public and
private sector players in the seed system could improve in their respective roles in developing
and maintaining seeds for a more sustainable agriculture.
But this is often difficult to achieve. For example, as private seed companies in Pakistan
were becoming increasingly accepted within the market, the attitudes and policies of the public
130
sector impeded those private companies and prevented them from receiving equal opportunity;
policies and market regulations favored the public sector organizations (Stanelle, 2013).
Furthermore, in many developing countries, there are protective practices, involving political,
social, and economic dimensions that may actively hinder international seed companies from
entering those national markets. In such cases, when an international company attempts to enter a
national seed variety registration program, the company may be met with strong resistance,
sometimes in the name of cultural values, that can strongly influence the development of their
market positions. Without understanding local values, cultures, and economics, outside
companies can face difficulties in the importation and sale of new varieties of seeds (Stanelle,
2013).
Since the current seed system in many developing countries depends more on the public
sector than the private sector, the public and private sectors need to actively work together for a
better system. A better system can be achieved by bringing both public and private together to
make progress with sales and distribution that enhances the farmer’s ability to obtain the desired
seeds, and more international community involvement (Stanelle, 2013). This requires a change in
the attitudes and policies of both public sector and private sector partners.
4.4 A Path Forward for the Libyan Seed System: Conclusions and Recommendations
from the Current Study
From the information compiled about the Libyan agricultural system as well as the
survey conducted in the current study, the following observations can be made:
In Libya, barley is grown on more area but yields are significantly lower than wheat. This
is consistent with the lower income of surveyed farmers growing barley, most commonly with
minimal inputs for their own subsistence use, particularly to feed livestock. In fact, this study
131
finds minimal inputs are used by Libyan farmers on both wheat and barley, but especially in
rainfed barley production systems. Those farmers who are highly dependent on irrigation are at
risk of reductions in available water in coming years, especially those that use water from the
Great Manmade River (GMR) project. Therefore, seed likely to be of interest to Libyan farmers
will be drought tolerant or water-use efficient varieties with low input requirements, to maintain
stable, albeit lower yields than global averages.
According to results of this survey, the Libyan government does not directly support
private farmers through subsidies. Thus, the introduction of well-designed production or input
subsidies might help farmers move away from their current input-cost-minimization strategies
and begin using more improved varieties as well as complementary inputs. It may also help
improve collaboration among farmers.
According to survey results, a substantial number of Libyan farmers with higher
education were among those more likely to use improved seeds. This suggests that increasing
agricultural education or increasing outreach designed to appeal to educated farmers will likely
increase improved seed adoption. It also suggests that educated farmers could be relied upon to
play a role in improving the seed system.
Increased availability of improved varieties may lead to declining farmer interest in
saving local landrace (mahale) seeds, which could lead to the loss of these varieties in the future.
Engaging farmers to save local varieties could be a reason for creating local seed organizations
that can do this in addition to testing, certifying seed, and more.
Finally, since the uprising in 2011 and the NATO-led bombing, the entire national
political and economic structure has been shaken and many aspects of society have changed,
132
with the end results still uncertain. The lack of effective regulation after decades of government
control has created an extremely difficult environment in which to operate.
From these observations, several concluding recommendations and goals can be made for
the Libyan seed system:
• The creation of farmer organizations in Libya can serve as a foundation and framework
for plant breeding and seed dissemination activities, during the current time of political
and social transition. Still, such farmer organizations should work with the Ministry of
Agriculture as well as ARC and the Seed Centers of the Ministry of Agriculture. The
Ministry of Agriculture should continue to serve as the point of contact with ICARDA
and FAO and help support breeding programs for commodities and regions that private
seed companies do not.
• The Libyan farmer organizations can cooperate directly with farmer organizations in
neighboring countries, such as Tunisia, with similar environmental conditions and thus
seed requirements as Libya. This networked structure could make it easier in some ways
to improve and distribute seeds.
• Breeding goals for Libya’s seed system should include: (1) Create an adaptive breeding
program for ultra-hardiness of wheat and barley varieties; (2) Draw upon local landrace
(‘mahale’) varieties for their genetic adaptation to the region, both to preserve crop
biodiversity they embody and to improve them; (3) Not necessarily attain top yield, but
develop varieties that that effectively produce under actual field conditions rather than
idealized lab conditions.
In conclusion, Libya has been under strict control for almost half a century until very
recently. In implementing any future changes in the agricultural sector, it is important to consider
133
the old agricultural system and seed system structure, in order to determine what works and what
does not in the existing system. It is important to understand the positives and negatives within
the Libyan seed system before transitioning into a new system. Change needs to come gradually
and deliberately to establish trust between those who will be implementing the changes and those
who will continue to follow the old ways, (i.e., traditional farmers). Starting with the old
structure as a framework for change is a safe place to begin.
The political structure will be the first step in forming a successful seed system with
support from the international communities. Within the Gadhafi regime, the Libyan government
often created unpredictable policies toward the international companies that were doing business
in Libya. The international sanctions from the United Nations and the United States were a large
part of the reason Libya was not able to participate in more seed system programs. Since the
sanctions have been lifted now, perhaps the new Libyan government will actively participate,
giving the seed system a chance to develop and grow. The only hopeful opportunity for a
productive seed system to overcome the instability that exists today is if the various segments of
politics and society can settle their different ways of thinking.
134
5 Summary and Conclusions
This brief concluding section contains a review of what was learned in each chapter of
this study. The chapter also contains a discussion of the limitations of the study as well as
recommendations for future follow-up studies.
5.1 Summary of Chapter 1
Chapter one presented literature that reviewed challenges to the sustainability of
agriculture in Libya. The chapter included challenges to sustainable agriculture both globally and
in Libya, a literature review on sustainability in agriculture and economic development, and an
overview of Libya and its economy. The last part reviewed Libyan agriculture and sustainability
challenges in Libyan agriculture. It was learned from this chapter that Libya has many
agriculture problems and issues that need to be addressed, such as: poor water management,
negative impacts from the “Great Man–made River”, desertification from urbanization, high
volume imports of food - wheat and barley especially, low agricultural productivity from low
yields and poor seed management, lack of research transfer/education, and weak linkage between
sectors. This lack of education was seen in agricultural inputs, lack of understanding about the
dangers associated with fertilizer and pesticide use, and climate change impacts.
5.2 Summary of Chapter 2
Chapter 2 presented the meaning of yield gap, how it is measured, the fact that Libya has
a larger yield gap than its neighbors, and the importance of closing this gap. Libya is one the
most important wheat importing countries in the world. Additionally, the primary factor
contributing to yield gap that was researched was found to be seed varieties, which is covered in
Chapter 4. Better seed is the primary way to reduce yield gap but very little literature exists for
Libya and farmers closing the yield gap by choices in technology, management, and seeds.
135
5.3 Summary of Chapter 3
Chapter 3 contained a discussion of the research methodology of this study as well as the
results of surveying 136 Libyan farmers. Data provided details on farmer choices by asking them
many questions such as: why farmers grow wheat and barley instead of grow other crops? Which
wheat and barley varieties do farmers grow in Libya? Where did they originate, Do farmers save
seed? If so, which farmers save seed? These results were analyzed to find the economic,
environmental, and cultural /historical factors for these choices and then results were analyzed to
look at farmer adoption of improved wheat and barley varieties in 2013. The farmers chose these
varieties because they believe they make better yield in their famers. The statistically significant
factors found to affect and/or were associated with farmers’ adoption of improved wheat and
barley varieties were: education, farm size, labor, irrigation, fertilizer, and saving seed.
5.4 Summary of Chapter 4
Chapter 4 reviewed the seed system literature, overviewed the current structure and
function of the Libyan seed system, and looked at organizations working with Libyan seed
systems. This chapter also included recommendations were specifically learned from this study,
such as variety Registration, testing, certification, and Labeling, Farmer Engagement and
Education, Plant Breeders’ Rights (PBRs) and other private sector incentives which could
substantially help to close the yield gap in the country.
5.5 Limitations of this Study
As with any study, this study had its limitations. The primary issue while conducting this
study was the state of civil war in Libya at the time of data collection, making collection difficult
and dangerous. This lead to issues of insufficient data. Additionally, government instability
possibly created apprehension for farmer participation. Also, since there was not government at
136
the time, there was no government support forthcoming for this study in any way. Due to the
civil war, data could not be obtained from the western half of the country. It was attempted but
was simply too dangerous to risk. This additional data would have increased the participant
count, which could have helped create more significant correlations and may have changed the
results with western farmers’ opinions. Some farmers did not answer all questions, or understand
all questions, leading to possible unintended responses. Assistants collected data rather than the
author herself; this could potentially have made a difference in farmer’s responses. Lastly, the
potential yield data was not available, therefore the original intent to measure yield gap in Libya
was ultimately not possible.
5.6 Recommendations for Future Studies
Future follow-up studies may want to consider the following recommendations:
1. Reduce the number of questions to save time for farmers, which may lead to more
participants.
2. Make sure units of measurement are clear so that farmers will have no
misunderstandings.
3. Distribute to more farmers, particularly in the west, which may make more results
statistically significant.
4. Some questions could be worded more clearly to avoid any confusion.
5. Future studies would benefit to work with some organization within the country (FAO,
etc.), which may open up more access and data.
137
6. Another interesting area of pursuit would be to look at the laboratories testing seed
quality.
7. If possible, giving farmers some type of compensation for answering surveys would
likely encourage more of them to participate.
8. Lastly, local organizations could work to inform farmer members through channels such
as the internet or phone by using SMS.
5.7 Final Conclusions
In conclusion, Libya has many reasons to make progress toward sustainable agriculture
and many ways to improve. According to Gadhafi’s disposed regime, Libya has many goals for
agricultural development, these goals included: increase production with efficiency to create
food security; better management of natural resources, such as water management and soil
conservation and reclamation; increase agriculture’s contribution to the GDP (diversification of
economy); create jobs in the farming sector; provide a good infrastructure in the unpopulated
areas of the country to encourage people to live there and create a better balance; find good
sources of industrial materials and inputs, such as seeds, genetics, and other agricultural
technologies, that are used by agriculture; and improve management of the water supply, roads,
and electricity to minimize agricultural production interruptions (Government of the Libyan
Arab Jamahiriya, 2006). All of these goals are still necessary to address after Gadhafi. Therefore,
this research focused on developing a strategy for an organized seed breeding, distribution,
storage and education system that functions with available resources such as pesticides,
fertilizers, water, and technology. It focused on what Libya’s seed system must look like in
order to serve the population sustainably.
138
Libya faces seed production, quality and supply limitations. Due to limited technical
capacities and relaxed quarantine measures, new strains of plant and animal pests and diseases
have entered the country and have found their way to the farming sector. Minimal research on
genetic improvement for pest resistance (public and private) has been conducted, in part, because
the country lacks technical expertise in seed genetics. This has led to a monopoly of technology
in the industry by some institutions and international companies.
Another major problem is the limitations of seed storage. Minimal infrastructure means
there is little to no refrigeration or climate control to keep local seeds and tubers viable for the
following season. Also, pest exclusion is limited, and imported seed quality decreases in poor
storage conditions.
In Libya, the frequent use of low quality seed is a major contributing factor to the low
productivity of most agricultural crops. In regards to trying to improve the productivity, one of
the sector priorities is to use highly productive seeds adapted to the local environment. All of
Libyan society would directly benefit from the program through better resource management and
increased productivity. History in Libya has shown a lack of organized seed adoption to
strengthen varieties that are best suited for the country’s environment. As a result, the most
commonly used varieties are not as effective as they could be, which has contributed to lower
production and a significant yield gap relative to neighboring countries.
139
References
African Economic Outlook. (2008). Libya 2008. Retrieved from http://www.oecd.org/dev/emea/40578167.pdf
African Economic Outlook. (2012). Libya 2012. Retrieved from
http://www.africaneconomicoutlook.org/fileadmin/uploads/aeo/PDF/Libya%20Full%20PDF%20Country%20Note.pdf
Aggarwal, P. K., Hebbar, K. B., Venugopalan, M. V., Rani, S., Bala, A., Biswal, A., and Wani,
S.P. (2008). Quantification of yield gaps in rain-fed rice, wheat, cotton and mustard in India. Global Theme on Agroecosystems, Report No. 43.
Aggarwal, P. K., & Kalra, N. (1994). Analyzing the limitations set by climatic factors, genotype, and water and nitrogen availability on productivity of wheat. Climatically potential yields and management strategies. Field Crops Resources, 38, 93-103.
Agriculture and Natural Resources Team of the UK DFID, & Pretty, J. (2004). Agricultural sustainability. Retrieved from http://dfid-agriculture-consultation.nri.org/summaries/wp12.pdf
Al-Jibouri, H. A. (1966). Description and distribution of wheat and barley varieties grown in Libya. Rome, Italy: Food and Agriculture Organization of the United Nations.
Almekinders C., & Louette, D. (2000). Almekinders, C., & de Boef, W. (Eds.). Examples of
innovations in local seed systems in Mesamerica. Encouraging diversity. Plant genetic resource conservation and crop development. (pp. 219-222). London, UK: IT Publications.
Al-Shreidi, A. & Sbith, A. (2009). References study on the development and seed system in Libya. The Research Center of Agriculture and Animals & ICARD. Personal communication.
Al-Shreidi, A. S. (2010). Contributions from seed programs and projects. Seed Info: Official Newsletter of the WANA Seed Network, 38, 9-12. Aleppo, Syria: WANA Seed Network Secretariat.
Arab Organization for Agriculture Development (AOAD). (1994). Agricultural policies in the
eighties held in Libya. Personal communication in Arabic.
ARC Libya-ICARDA Collaborative Program. (2010a). Highlights on major achievements. Personal communication.
ARC Libya-ICARDA Collaborative Program. (2010c). Integrated improvement of wheat and
barley-based cropping systems in rainfed and irrigated areas of Libya. Personal communication.
140
Arhama, A. (2013). National medium-term investment programme. Unpublished presentation. Personal communication.
Arhama, A. (2015a). General authority for cereal production, committee for seed registration,
Tripoli, Libya. Unpublished in Arabic. Personal communication. Arhama, A. (2015b). Personal communication, 2015 April. Asylum Research Consultancy. (2013). Libya Country Report. Commissioned by the Office of
the United Nations High Commissioner for Refugees (UNHCR), Division of International Protection. Retrieved from http://www.refworld.org/pdfid/51de77c24.pdf
Barnett, V., Payne, R., & Steiner, R. (Eds.). (1995). Agricultural sustainability: Economic,
environmental and statistical considerations. Chichester: Wiley.
Beddow, J. M., Hurley, T. M., Pardey, P. G., & Alston, J. M. (2013). Rethinking yield gaps. Unpublished manuscript submitted for publication.
Bishaw, Z. (2004). Wheat and barley seed system in Ethiopia and Syria. (Doctoral dissertation,
Wageningen University, The Netherlands). ISBN: 90-8504-035-3.
Cassman, K. G. (1999). Ecological intensification of cereal production systems: Yield potential, soil quality, and precision agriculture. Proceedings of the National Academy of Sciences of the United States of America, 96, 5952–5959. Retrieved from http://www.pnas.org/content/96/11/5952.full.pdf+html
Cassman, K. G., Doermann, A., & Walters, D. T. (2002). Agroecosystems, nitrogen-use efficiency, and nitrogen management. Ambio, 31,132-140.
Chouikhi, H., Jbir, R., & Boujelbene, Y. (2011). The role of oil price in an exporting country: An empirical study of the Libyan economy. The Journal of Energy and Development, 34, 1-186.
Combaz, E. (2014). Political economy of Libya after the Qadhafi regime. GSDRC: Applied
Knowledge Services. Retrieved from www.gsdrc.org
Commission on Public Information Libya Tripoli. (2007). The final results of the agricultural census 2007. Personal communication in Arabic.
Davidson, R., & MacKinnon, J. G. (1995). Estimation and inference in econometrics.
Econometric Theory, 11, 631- 635. Dawe, N. K., & Ryan, K. L. (2003). The faulty three-legged-stool model of sustainable
development. Conservation Biology, 17(5), 1458-1460. Desjardins, R. L. (2009). The impact of agriculture on climate change. Agriculture and Agri-
Food Canada , Ottawa , Ontario.
141
Dynesius, M,. & Nilsson, C. (1994). Fragmentation and flow regulation of river systems in the northern third of the world. Science, 266, 753-762.
Eastern Mediterranean Regional Health Systems Observatory. (2007). Health Systems Profile - Libya. World Health Organization. Retrieved from http://apps.who.int/medicinedocs/documents/s17302e/s17302e.pdf
El-Msalati, N. (2012). An analytical study for efficiency of cereals crop production in EL-Cabal
EL-Akhdar region, in Libyan Jamahiriya. (Doctoral dissertation, Alexandria University). Personal communication.
El-Tantawi, A. M. M. (2005). Climate change in Libya and desertification of Jifara Plain: Using
geographical information system and remote sensing techniques. (Published Doctoral dissertation, Johannes Gutenberg-Universität, Mainz). Retrieved from http://ubm.opus.hbz-nrw.de/volltexte/2005/794/pdf/diss.pdf
Evans, L. T., & Fischer, R. A. (1999). Yield potential: Its definition, measurement, and significance. Crop Science Society of America, 39(6),1544-1551.
FAO. (2004). Rice and narrowing the yield gap. International Year of Rice 2004. Food and
Agriculture Organization of the United Nations. Retrieved from http://www.fao.org/rice2004/en/f-sheet/factsheet5.pdf
FAO. (2008). Water for agriculture and energy in Africa: The challenges of climate change.
Retrieved from http://www.fao.org/docrep/014/i2345e/i2345e.pdf
FAO. (2009). Global agriculture towards 2050. High level expert forum – How to Feed the World in 2050. Retrieved from http://www.fao.org/fileadmin/templates/wsfs/docs/Issues_papers/HLEF2050_Global_Agriculture.pdf
FAO. (2011). FAO achievements in Libya. Rome, Italy: Publishing Policy and Support Branch,
FAO.
FAO. (2012). Libya production potential. Retrieved from http://www.fao.org/ag/agp/AGPC/doc/field/Wheat/africa/libya/libyaagec.htm
FAO. (2013). Dutch Disease. ftp://ftp.fao.org/docrep/fao/009/ag089e/ag089e02.pdf
FAO, Food and Nutrition Division. (2005). Libyan Arab Jamahiriya nutrition profile. Retrieved from ftp://ftp.fao.org/es/esn/nutrition/ncp/lby.pdf
FAOSTAT. (2010). Statistics from 2010. Retrieved from http://faostat3.fao.org
/home/index.html FAOSTAT. (2013). Statistics from 2013. Retrieved from http://faostat3.fao.org
/home/index.html
142
FAOSTAT. (2014). Statistics from 2014. Retrieved from http://faostat3.fao.org /home/index.html FAOSTAT. (2015). Statistics from 2015. Retrieved from http://faostat3.fao.org /home/index.html Feistritzer, W. P., & Kelly, A. F. (1978). FAO Plant Production Protection Bulletin No.15. Fermont, A., & Bonson, T. (2011). Estimating yield of food crops grown by smallholder farmers:
A review in the Uganda context. Development Strategy and Governance Division. International Food Policy Research Institute.
Fischer, R. A., Byerlee, D., & Edmeades, G. O. (2009). Can technology deliver on the yield
challenge to 2050? Expert Meeting on How to feed the World in 2050 Food and Agriculture Organization of the United Nations Economic and Social Development Department. Retrieved from http://www.fao.org/3/a-ak977e.pdf
Foley, J., Ramankutty, N., & Brauman, K. (2011). Solutions for a cultivated planet. Analysis,
Nature, 478, 337-342.
Gamba, P., Ngugi, C., Verkuijl, H., Mwangi, W., Kiriswa, F. (2003). Wheat farmers’ seed management and varietal adoption in Kenya. Retrieved from http://repository.cimmyt.org:8080/xmlui/bitstream/handle/10883/913/448317.pdf
General People's Committee for Agriculture and Ministry of Agriculture. (1978). Resources of
water in Libya. Geology conference in Tripoli, Libya. Personal communication in Arabic. General People’s Committee for Planning Economic and Ministry of Economics. (1991). Growth
of social and economy in Libya (1970-1990). In Arabic. General Planning Council Committee in Libya. (2003). Agricultural policy in Libya. Libya
Tripoli. In Arabic.
Gleick, P. (1993).Water and conflict: Fresh water resources and international security. International Security, 18, 79-112.
Godfray, H. C. J., Beddington, J. R., Crute, I. R., Haddad, L., Lawrence, D., Muir, J. F., Pretty, J., Robinson, S., Thomas, S. M., & Toulmin, C. (2010). Food security; The challenge of feeding 9 billion people. Science, 327, 812.
Goldewijk, K. K. (2004). Footprint from the past: Blueprint for the future? In R. S. DeFries, G. P. Asner, & R. A. Houghton (Eds.), Ecosytems and land use change, part of the Geophysical Monograph Series, 153, 203-215. Washington, DC: American Geophysical Union.
Goodland, R. (2013). Libya: The urgent transition to environmental sustainability. The Environment General Authority, Tripoli. Retrieved from www.goodlandrobert.com
143
Goueli, A. A. (2004). The agriculture food challenge for North Africa and the Middle East in the new millennium. The Global Forum on Agricultural Research. Retrieved from http://www.egfar.org/egfar/lfm/gphi_documents/02_Region_specific_documents/B_West_Asia_and_North_Africa_(AARINENA)/02_Background_Documents/01_General_issues/B-1-002-B2_agriculture_food_challenge_in_WANA.pdf
Government of the Libyan Arab Jamahiriya. (2006). Food security scheme (wheat, dates &
olives, seed production). Personal communication.
Griliches, Z. (1960). Hybrid corn and the economics of innovation. Science, 275-280.
Harrington, J. F., & Douglas, J. E. (1970). Seed storage and packaging. National Seeds Corporation and Rockefeller Foundation. New Delhi, India
Heemskerk, W., & Koopmanschap, E. (2012). Agribusiness Development in Libya: A fact-finding mission. Project Report. Wageningen, UR: Centre for Development Innovation.
Heisey, P. W., Smale, M., Byerlee, D., & Souza, E. (1997). Wheat rusts and the costs of genetic diversity in the Punjab of Pakistan. American Agriculture Economics Association, 726-737.
Hufbauer, G. C., Schott, J. J., Kimberly, A. E., & Oegg, B. (2008). Economic sanctions and terrorism. Peterson Institute for International Economics. Retrieved from http://www.iie.com/publications/papers/sanctions-iran-84-1_2006-1.pdf
IPCC. (2001). Climate change 2001: The scientific basis. Contribution of Working Group I to the
Third Assessment Report of the Intergovernmental Panel on Climate Change. Cambridge, UK and New York, USA: Cambridge University Press.
IPCC. (2007). Climate change 2007: The physical science basis. Contribution of Working Group I to the Fourth Assessment Report of the Intergovernmental Panel on Climate Change. Cambridge, UK and New York, USA: Cambridge University Press.
Jacobs, M. (1995). Sustainable development—From broad rhetoric to local reality. Conference Proceedings from Agenda 21 in Cheshire, 1 December 1994, Cheshire County Council, Document No. 49.
Job, E. (2006). Yield gap of rice in Alppuzha district of Kerala. Journal of Tropical Agriculture, 44, 88-90.
Krysiak, F., & Krysiak, D. (2006). Sustainability with uncertain future preferences. Environmental and Resource Economics, 33, 511-531.
Lafi, K. A. (2004). Flow of resources between agriculture and industry: Try to apply the product user model in production. (Master’s Thesis in Arabic, Academy of Graduate Studies, Tripoli, Libya.)
144
Lal, R., Kimble, J. M., Follett, R. F., & Cole C. V. (1998). The potential of U.S cropland to sequester carbon and mitigate the greenhouse effect. Boca Raton: CRC Press.
Lansigan, F. P. (1998). Minimum data and information requirements for estimating yield gaps in crop production systems. The Asian Federation for Information Technology in Agriculture. Retrieved from http://www.afita.org/files/web_structure/20110307102312_40199/20110307102312_40199_32.pdf
Laytimi, A. (2006). Market and trade policies for Mediterranean agriculture: The case of fruit/vegetable and olive oil. Agricultural Situation Report-Libya. Retrieved from http://medfrol.maich.gr/documentation/view/reports/wp1-asr/Libya.pdf
Leech, N. L., Barrett, K. C., & Morgan, G. A. (2005). SPSS for intermediate statistics: Use and
interpretation. (2nd ed.). Mahwah, NJ: Lawrence Erlbaum Associates, Publishers.
Licker, R., Johnston, M., Foley, J. A., Barford, C., Kucharik, C. J., Monfreda, C., & Ramankutty, N. (2010). Mind the gap: How do climate and agricultural management explain the ‘yield gap’ of croplands around the world? Global Ecology and Biogeography, 19, 769–782.
Lobell, B. D., Cassman, G. K., & Field, B. C. (2009). Crop yield gaps: Their importance,
magnitudes, and causes. Annual Review of Environment and Resources, 34, 179-204.
Loucks, D. P. (2004). The Great Man Made River in Libya: Does it make sense? Presented at the Third Annual D. R. F. Harleman Honorary Lecture in Environmental Fluid Mechanics. Retrieved from http://www.engr.psu.edu/ce/Divisions/Hydro/seminars/Harleman04.pdf
Mahdoa, M. (1998). Geography of Libyan public. Libya: Garyounis University of Benghazi.
Private communication in Arabic. Majbari, F. A. (2009). Review study on seed production of forage crops and range plants.
Tripoli, Libya: Agriculture Research Center. Margo, G., Bonning, B., & Neighbor, T. W. (2012). Special focus on Libya – Understanding the
Arab spring from inside out. World Affairs Council Resource Packet. Retrieved from https://www.world-affairs.org/wp-content/uploads/2012/04/Libya-cover-and-packet-final-for-web-4.2.12.pdf
Martin, K., Shroyer, J., Shoup, D., Olson, B., & Duncan, S. (2011). Estimating wheat yield.
Kansas State University Agricultural Experiment Station and Cooperative Extension Service. Department of Agronomy. Retrieved from http://www.ellis.k-state.edu/docs/ag-documents/Estimating_Wheat_Yeild.pdf
Martin, L. (2000). Costs of production of market hogs. Western Hog Journal, Banff Pork
Seminar, 2000 Special Edition, 24.
145
Matson, P. A., Naylor, R., & Ortiz-Monasterio, I. (1998). Integration of environmental, agronomic, and economic aspects of fertilizer management. Science, 280, 112–115.
Mueller, N., Gerber, J. S, Johnston, M., Ray, D. K., Ramankutty, N., & Foley, J. A. (2012).
Closing yield gaps through nutrient and water management. Nature, 490, 254 -257.
Mussei, A., Mwanga, J., Mwangi, W., Verkuijl, H., Mongi, R., & Elanga, A. (2001). Adoption of improved wheat technologies by small-scale farmers in Mbeya District, Southern Highlands, Tanzania. International Maize and Wheat Improvement Center (CIMMYT) and the United Republic of Tanzania. Retrieved from http://ageconsearch.umn.edu/bitstream/56190/2/Mbeya_Tanzania.pdf
National Sustainable Agriculture Coalition. (2009). Agriculture and climate change: Impacts and
opportunities at the farm level: A policy position paper. Retrieved from http://sustainableagriculture.net/wpcontent/uploads/2008/08/nsac_climatechangepolicypaper_final_2009_07_161.pdf
NIC. (2009). North Africa: The impact of climate change to 2030 (Selected Countries). Retrieved
from http://livebettermagazine.com/eng/reports_studies/pdf/nic-climate2030_north_africa.pdf
Nirmala, B., Deshmanya, J., Muthuraman, P., Meera, S. N., & Sain, M. (2009). Yield gap
analysis of rice in Raichur district of Karnataka. Karnataka Journal of Agricultural Science, 22(1), 238-239. Retrieved from http://14.139.155.167/test5/index.php/kjas/article/view/1520
Pala, M., Owieis, T., Benli, B., De Pauw, E., El Mouird, M., Karrou, M., Jamal, M., & Zencirci,
N. (2011). Assessment of wheat yield gap in the Mediterranean: Case studies from Morocco, Syria, and Turkey. International Center for Agricultural Research in the Dry Areas (ICARDA), Aleppo, Syria. Retrieved from http://geoagro.icarda.org/downloads/publications/geo/Assessment_of_wheat.pdf
Pardey, P. G., Beddow, J. M., Hurley, T. M., Beatty, T. K. M., & Eidman, V. R. (2013). A
bounds analysis of world food futures: Global agriculture through to 2050. Australian Journal of Agricultural and Resource Economics, 58(4): 571-589.
Pathak, H., Ladha, J. K., Aggarwal, P. K., Peng, S., Das, S., Singh, Y., Singh, B., Kamra, S. K., Mishra, B., Sastri, A. S. R. A. S., Aggarwal, H. P., Das, D. K., & Gupta, R. K. (2003). Trends of climatic potential and on-farm yields of rice and wheat in the Indo-Gangetic Plains. Field Crops Research, 80, 223-234. Retrieved from www.elsevier.com/locate/fcr
Pionetti, C. (2006). Seed diversity in the drylands: Women and farming in south India. Gatekeeper series, 126, 1-26. International Institute for Environment and Development. Retrieved from http://pubs.iied.org/pdfs/14520IIED.pdf
Postel, S. L., Daily, G. C., & Ehrlich, P. R. (1996). Human appropriation of renewable fresh
water. Science, 271,785-788.
146
Pratt-Nin, A., Johson, M., Magalhaes, E., You, L., Dio, X., & Chamberlin, J. (2010). Yield gaps and potential agricultural growth in West and Central Africa. Washington, D.C.: International Food Policy Research Institute.
Qasem, S. (Ed.). (1988). Food security in the Muslim world: Proceedings of the seminar on food
security in the Muslim world. Amman, Jordan: Islamic Academy of Sciences. Retrieved from http://www.philadelphia.edu.jo/newlibrary/pdf/filee7f6f98dfb244c2e93ab5172d45776d0.pdf
Rabbinge, R. (1993). The ecological background in food production. Proceedings of the Ciba
Foundation Symposium 177 on Crop Protection and Sustainable Agriculture. pp. 2–29. Chichester, UK: Wiley.
Reynolds, M. P., Rajaram, S., & Sayre, K. D. (1999). Physiological and genetic changes of irrigated wheat in the post-green revolution period and approaches for meeting projected global demand. Crop Sciences,39, 1611-1621.
Rigby, D., Woodhouse, P., Young, T., & Burton, M. (2001). Constructing a farm level indicator of sustainable agricultural practice. Elsevier Science, Ecological Economics, 463-478.
Russo, P. (2004). Policies for business in the Mediterranean countries: Great Arab popular Socialist Lybian Jamahria. Center for Administrative Innovation in the Euro-Mediterranean Region. http://www.innovations.harvard.edu/sites/default/files/8899.pdf
Ruttan, V. W. (1999). The transition to agriculture sustainability. Proceedings of the National
Academy of Sciences of the United States of America, 96, 5960-5967. Retrieved from www.pnas.org/content/96/11/5960.full
Schneider, K., & Anderson, L. (2010). Yield gap and productivity potential in Ethiopian agriculture: Staple grains & pulses. Evans School Policy Analysis and Research (EPAR) No 98.
Seckler, D., Barker, R., & Amarasinghe, U. (1999). Water scarcity in the twenty-first century.
International Journal of Water Resources Development, 15, 29-42.
Shalluf, F., & Fares, A. (2003). Food security between development of political and investigation of food security in Libya. Garyounis University, Benghazi, Libya. Personal communication in Arabic.
Singh, P., Vijaya, D., Chinh, N. T., Pongkanjana, A., Prasad, K. S., Srinivas, K., & Wani, S. P. (2006). Potential productivity and yield gap of selected crops in the rainfed regions of India, Thailand, and Vietnam. Natural Resource Management Program Report no. 5. International Crops Research Institute for the Semi-Arid Tropics. SAT eJournal, 2(1), 1-32. Retrieved from ejournal.icrisat.org
Smale, M., Bellon, M. R., & Pirigali, P. L. (2000). Farmers, gene banks, and crop breeding: Introduction and overview. In M. Smale (Ed.), Farmers, gene banks and crop breeding:
147
Economic analyses of diversity in wheat, maize, and rice (pp. 3-18). Boston: Kluwer Academic Publishers.
Smale, M., Hartell, J., Heisey, P. W., & Senauer, B. (1998). The contribution of genetic resources and diversity to wheat productivity: A case from the Punjab of Pakistan. In M. Smale (Ed.), Farmers, gene banks and crop breeding: Economic analyses of diversity in wheat, maize, and rice (pp. 145-158). Boston: Kluwer Academic Publishers.
Stanelle, J. (2000). Report of the Consultancy for association training and development of the Kosovo Seed Production System. Prepared for International Fertilizer Development Center (IFDC) and Kosovo Emergency Agri-Inputs Project (KEAP). Personal communication.
Stanelle, J. (2013). Streamlining for a demand driven seed sector in Pakistan. Unpublished manuscript.
Stanelle, J., & Solieng, M. (2010). Cambodia seed sector overview. Prepared for Mr. Pavvo Eliste for the Development of the Community Based Agricultural Productivity Project and The World Bank. Personal communication.
Tilman, D. K. G., Cassman, P. A., Matson, R. N., & Polasky, S. (2002). Agricultural sustainability and intensive production practices. Nature, 418, 671-677.
United Nations, Department of Economic and Social Affairs, Population Division. (2013). World population prospects: The 2012 revision: Volume II: Demographic Profiles. Retrieved from http://esa.un.org/wpp/Documentation/pdf/WPP2012_Volume-II-Demographic-Profiles.pdf
van Amstel, H., Bottema, J.W.T., Sidik, M., & van Santen, C.E. (Eds.). (1996). Integrating seed
systems for annual food crops: Proceedings from a Workshop, 24- 27 Oct 1995, Malang, Indonesia. Bogor, Indonesia: CGPRT Center.
van Ittersum, M. K., Cassman, K. G., Grassini, P., Wolf, J., Tittonell, P., & Hochman, Z. (2013).
Yield gap analysis with local to global relevance – A review. Field Crops Research,143, 4–17.
Verma, O. P. (2011). Seed production techniques of major crops. Delhi: Data Publishing House. WANA Seed Network. (2007). Role of NCISP in seed production in Libya. Seed Info: Official
Newsletter of the WANA Seed Network, 33. Retrieved from http://www.icarda.org/News/Seed
WCED. (1987). Report of the World Commission on Environment and Development: Our
common future. Retrieved from http://www.un-documents.net/our-common-future.pdf WFP, & FAO. (2011). Food Security in Libya - An Overview. Working paper from WFP and
FAO. Retrieved from http://documents.wfp.org/stellent/groups/public/documents/ena/wfp234964.pdf
148
Wheat Atlas. (2015). Released wheat varieties database. Retreived from http://wheatatlas.org/country/varieties
Wheida, E., & Verhoeven, R. (2007). An alternative solution of the water shortage problem in
Libya. Water Resources Management, 21, 961-982. Retrieved from http://link.springer.com/article/10.1007%2Fs11269-006-9067-6
Whitmarsh, D., & Palmieri, M. G. (2008). Aquaculture in the Coastal Zone: Pressures, Interactions and Externalities. In M. Holmer, K. Black, C. M. Duarte, N. Marba, I. Karakassis (Eds.) Aquaculture in the ecosystem (pp. 251-270). Berlin, Germany: Springer Science + Business Media B. V.
Wolf, J., & Vandiepen, C. A. (1995). Effects of climate change on grain maize yield potential in the European Community. Climatic Change, 29, 299-331.
World Bank. (2013). Database. Retrieved from http//www.worldbank.org/ Young, A. (1999). Is there really spare land? A critique of estimates of available cultivable land
in developing countries. Environment, Development and Sustainability, 1(1), 3-18. Zhu,Y., Chen, H., Fan, J., Wang, Y., Li, Y., Chen, J., Fan, J., Yang, S., Hu, L., Leung, H., Mew,
T. W., Teng, P. S., Wang, Z., & Mundt, C. C. (2000). Genetic diversity and disease control in rice. Nature, 406,718-722.
Zidan, A. M. (2007). The impact of the Great Man River Project on Libya’s agricultural activities and the environment. (Master’s Thesis, University Teknologi, Malaysi). Retrieved from http://eprints.utm.my/6377/
149
APPENDIX 1. Survey Cover Letter (English version)
Date: 13 January 2014
Cover Letter
Dear Participant,
My name is Neama Lariel. I am from Libya, but I am currently a Ph.D. student in the Department
of Agricultural & Resource Economics at Colorado State University in the United States. The purpose of
this survey is to develop a better understanding of the wheat and barley seed system in Libya, including
how local farmers choose their wheat and barley seed varieties and how those seed varieties perform in
Libyan agriculture. The information collected in this survey will be analyzed to recommend ways that, in
the future, better crop genetics can be made available to Libyan farmers.
This study is being overseen by Dr. Gregory Graff, professor at Colorado State University. The
administration of the survey within Libya is being managed by Dr. Ali Ahmed Arhama, professor of
Agricultural Economics at the University of Tripoli and Director, General Authority for Cereal Production,
Ministry of Agriculture, Tripoli, Libya.
This survey is intended to be taken by the primary operator of a farm that grows wheat and/ or
barley. It is estimated to take about 15 minutes to complete. Your participation is voluntary and you may
stop answering questions at any time. You may also skip any question that you would rather not answer.
There is no direct benefit for your participation; however, by participating in the survey you will help to
improve our research at Colorado State University and University of Tripoli, which may in turn be useful
in informing future efforts to improve the seeds available to you in Libya. There are NO KNOWN RISKS
in participating and your responses will be treated confidentially: no names will be collected and data will
be reported in aggregate.
If you have any question regarding the specifics of this research project, I can be reached at
[email protected] or by phone at (001) 970-646-2386. You also can connect with Dr. Gregory Graff
at [email protected] or at (001)970-491-4028. . If you have question about human research
participants' rights, please contact Janell Barker, Senior IRB Coordinator for Colorado State University at
[email protected] or (001) 970-491-1655. You can also contact with Dr. Ali Arhama at the
University of Tripoli by phone at (011) 218-21-3891608 or (011) 218-9121`09830.
150
Thank you for your cooperation,
Neama Lariel
151
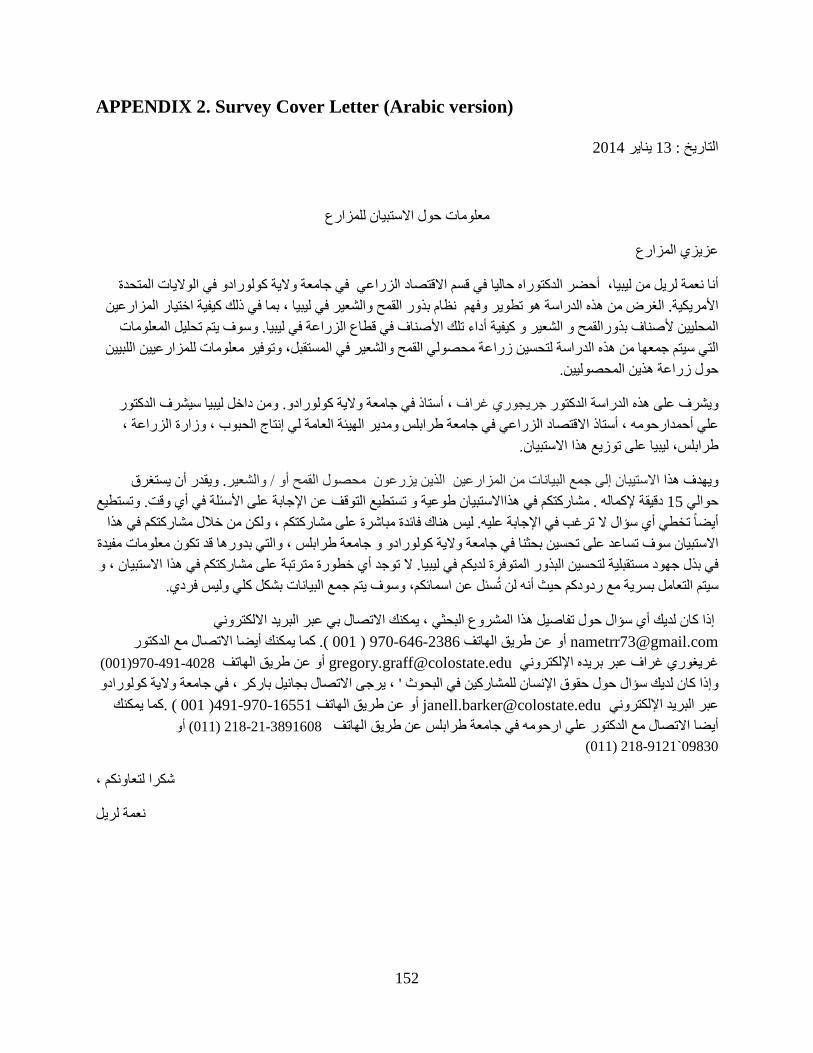
APPENDIX 2. Survey Cover Letter (Arabic version)
2014 ینایر 13: تاریخال
معلومات حول االستبیان للمزارع
المزارع عزیزي
متحدة ال الوالیات في كولورادو والیة جامعة في االقتصاد الزراعي قسم في دكتوراه حالیامن لیبیا، أحضر ال لریل أنا نعمة لمزارعینا اختیار كیفیة ذلك في بما ، لیبیا في والشعیر القمح بذور نظام وفھم تطویر ھو الدراسة ھذه من الغرض. األمریكیة
المعلومات تحلیل یتم وسوف. قطاع الزراعة في لیبیا في األصناف تلك أداء كیفیة و الشعیر و المحلیین ألصناف بذورالقمحیین وتوفیر معلومات للمزارعیین اللب المستقبل، لتحسین زراعة محصولي القمح والشعیر في الدراسة ھذه من جمعھا سیتم التي
حول زراعة ھذین المحصولیین.
الدكتور ومن داخل لیبیا سیشرف. كولورادو والیة جامعة في أستاذ ، غراف جریجوري الدكتور الدراسة ھذه على ویشرف ، الزراعة وزارة ، الحبوب لي إنتاج العامة الھیئة ومدیر طرابلس جامعة في الزراعي االقتصاد أستاذ ، ارحومھأحمد علي
لیبیا على توزیع ھذا االستبیان. طرابلس،
یستغرق أن ویقدر. الشعیر/ واالستیبان إلى جمع البیانات من المزارعین الذین یزرعون محصول القمح أو ھذا ویھدفتستطیع واإلجابة على األسئلة في أي وقت. عن توقفتستطیع ال و ةطوعی ھذااالستبیانمشاركتكم في . إلكمالھ دقیقة 15 حوالي
ھذا يف مشاركتكم خالل من ولكن ، مشاركتكم على مباشرة فائدة ھناك لیس. لیھع خطي أي سؤال ال ترغب في اإلجابةیضاً تأ مفیدةات معلوم تكون قدوالتي بدورھا ، طرابلس جامعة و كولورادو والیة جامعة في بحثنا تحسین على ساعدت سوف االستبیان
و ي ھذا االستبیان ، ف متكمشاركخطورة مترتبة على أي وجدتال . لیبیا في ملدیك المتوفرة البذور لتحسین مستقبلیة جھود بذل في بشكل كلي ولیس فردي.البیانات جمع، وسوف یتم حیث أنھ لن تُسئل عن اسمائكم ردودكمبسریة مع سیتم التعامل
االتصال بي عبر البرید االلكتروني كیمكن ، البحثي المشروع ھذا تفاصیل حول سؤال أي لدیك كان إذا [email protected] الدكتور مع االتصال أیضا یمكنككما ). 001( 970-646-2386 الھاتف طریق عن أو
4028-491-970(001)عن طریق الھاتف أو [email protected] عبر بریده اإللكتروني غراف غریغوري ورادوكول والیة جامعةفي ، باركر بجانیل االتصال یرجى ،' البحوثفي مشاركینلل اإلنسان حقوق حول سؤال لدیك كان إذاو
یمكنك كما) . 001( 491-970-16551 عن طریق الھاتف أو [email protected] عبر البرید اإللكتروني أو 3891608-21-218 (011) الھاتف طریق عن طرابلس جامعة في ارحومھ علي الدكتور مع االتصال أیضا
(011) 218-9121`09830
، لتعاونكم شكرا
نعمة لریل
152
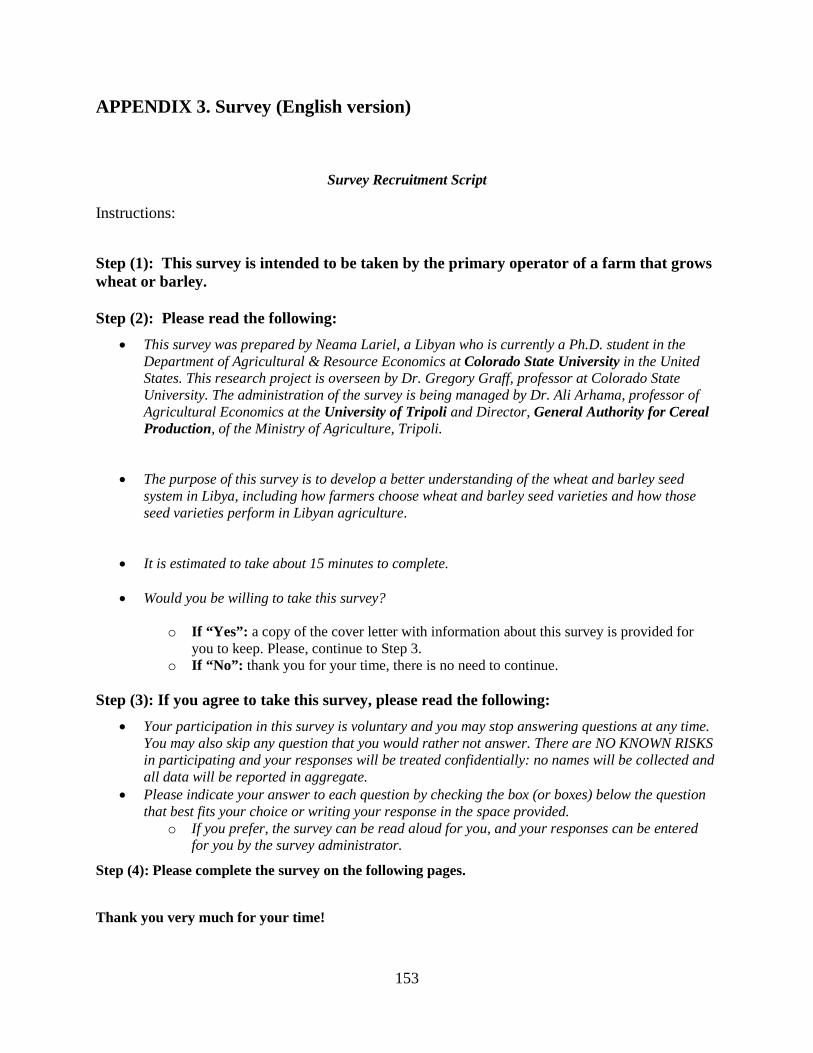
APPENDIX 3. Survey (English version)
Survey Recruitment Script
Instructions:
Step (1): This survey is intended to be taken by the primary operator of a farm that grows wheat or barley. Step (2): Please read the following:
• This survey was prepared by Neama Lariel, a Libyan who is currently a Ph.D. student in the Department of Agricultural & Resource Economics at Colorado State University in the United States. This research project is overseen by Dr. Gregory Graff, professor at Colorado State University. The administration of the survey is being managed by Dr. Ali Arhama, professor of Agricultural Economics at the University of Tripoli and Director, General Authority for Cereal Production, of the Ministry of Agriculture, Tripoli.
• The purpose of this survey is to develop a better understanding of the wheat and barley seed system in Libya, including how farmers choose wheat and barley seed varieties and how those seed varieties perform in Libyan agriculture.
• It is estimated to take about 15 minutes to complete.
• Would you be willing to take this survey?
o If “Yes”: a copy of the cover letter with information about this survey is provided for you to keep. Please, continue to Step 3.
o If “No”: thank you for your time, there is no need to continue.
Step (3): If you agree to take this survey, please read the following: • Your participation in this survey is voluntary and you may stop answering questions at any time.
You may also skip any question that you would rather not answer. There are NO KNOWN RISKS in participating and your responses will be treated confidentially: no names will be collected and all data will be reported in aggregate.
• Please indicate your answer to each question by checking the box (or boxes) below the question that best fits your choice or writing your response in the space provided.
o If you prefer, the survey can be read aloud for you, and your responses can be entered for you by the survey administrator.
Step (4): Please complete the survey on the following pages.
Thank you very much for your time!
153
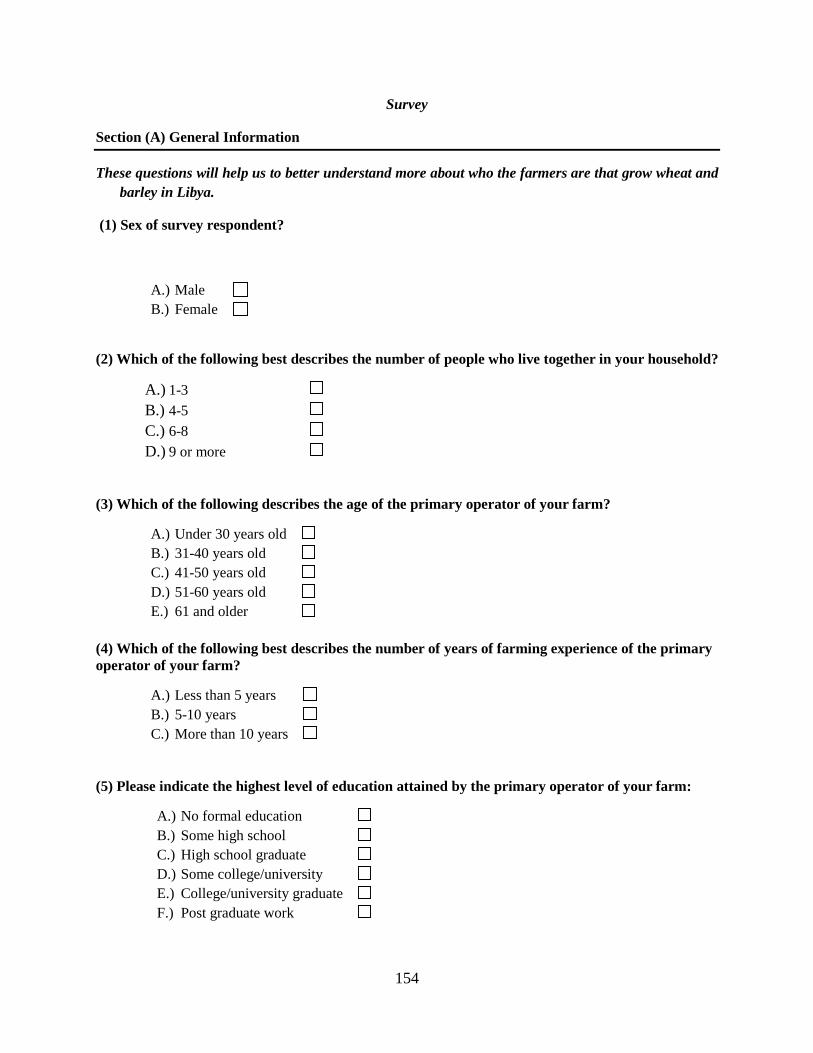
Survey
Section (A) General Information
These questions will help us to better understand more about who the farmers are that grow wheat and barley in Libya.
(1) Sex of survey respondent?
A.) Male B.) Female
(2) Which of the following best describes the number of people who live together in your household?
A.) 1-3
B.) 4-5
C.) 6-8
D.) 9 or more
(3) Which of the following describes the age of the primary operator of your farm?
A.) Under 30 years old B.) 31-40 years old C.) 41-50 years old D.) 51-60 years old E.) 61 and older
(4) Which of the following best describes the number of years of farming experience of the primary operator of your farm?
A.) Less than 5 years B.) 5-10 years C.) More than 10 years
(5) Please indicate the highest level of education attained by the primary operator of your farm:
A.) No formal education B.) Some high school C.) High school graduate D.) Some college/university E.) College/university graduate F.) Post graduate work
154
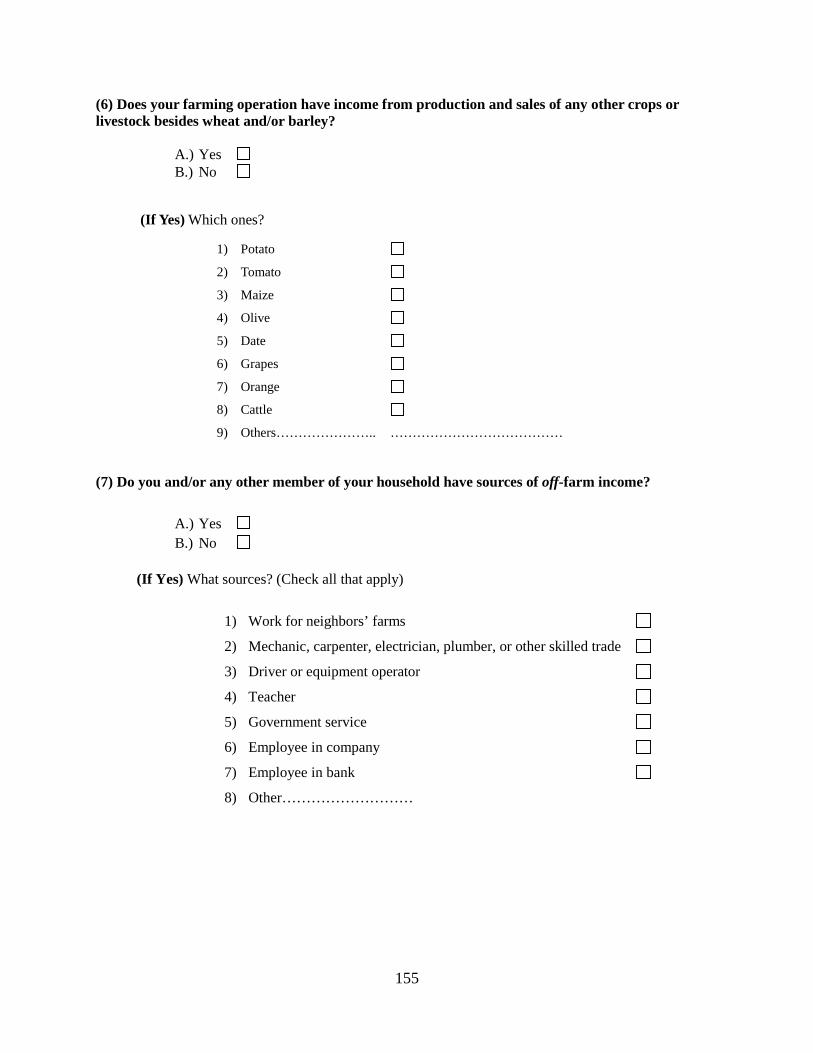
(6) Does your farming operation have income from production and sales of any other crops or livestock besides wheat and/or barley?
A.) Yes B.) No
(If Yes) Which ones?
1) Potato
2) Tomato
3) Maize
4) Olive
5) Date
6) Grapes
7) Orange
8) Cattle
9) Others………………….. …………………………………
(7) Do you and/or any other member of your household have sources of off-farm income?
A.) Yes B.) No
(If Yes) What sources? (Check all that apply)
1) Work for neighbors’ farms
2) Mechanic, carpenter, electrician, plumber, or other skilled trade
3) Driver or equipment operator
4) Teacher
5) Government service
6) Employee in company
7) Employee in bank
8) Other………………………
155
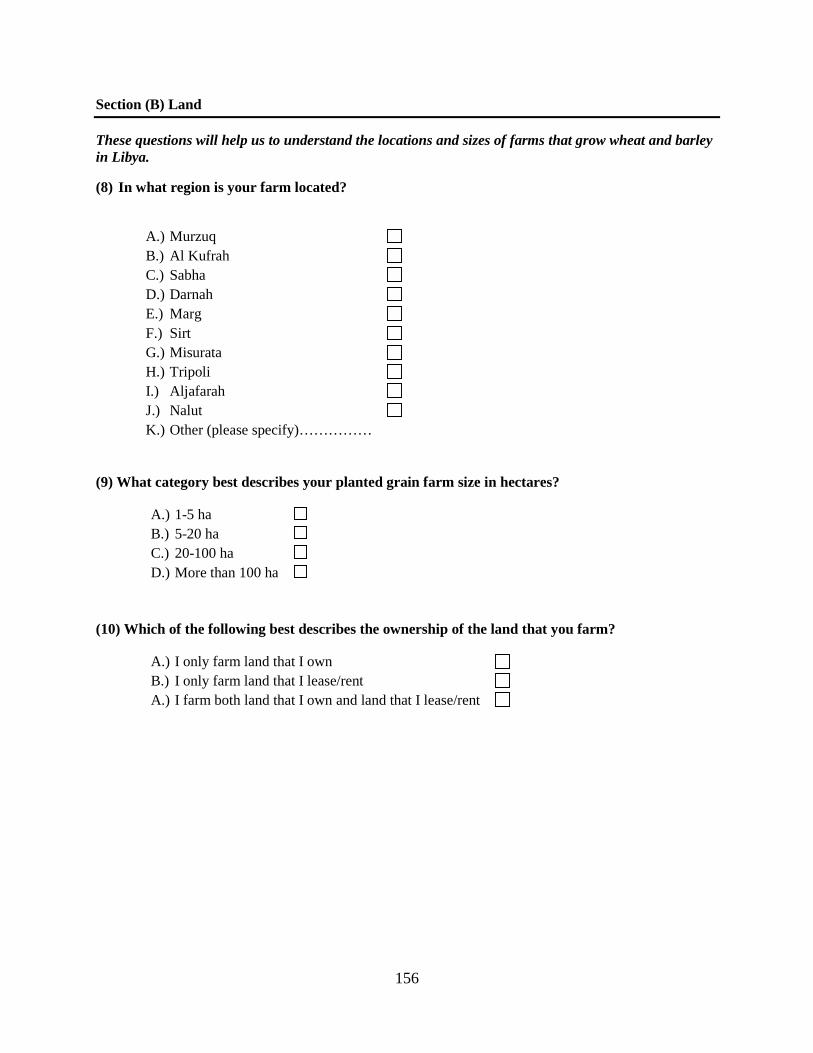
Section (B) Land
These questions will help us to understand the locations and sizes of farms that grow wheat and barley in Libya.
(8) In what region is your farm located?
A.) Murzuq B.) Al Kufrah C.) Sabha D.) Darnah E.) Marg F.) Sirt G.) Misurata H.) Tripoli I.) Aljafarah J.) Nalut K.) Other (please specify)……………
(9) What category best describes your planted grain farm size in hectares?
A.) 1-5 ha B.) 5-20 ha C.) 20-100 ha D.) More than 100 ha
(10) Which of the following best describes the ownership of the land that you farm?
A.) I only farm land that I own B.) I only farm land that I lease/rent A.) I farm both land that I own and land that I lease/rent
156
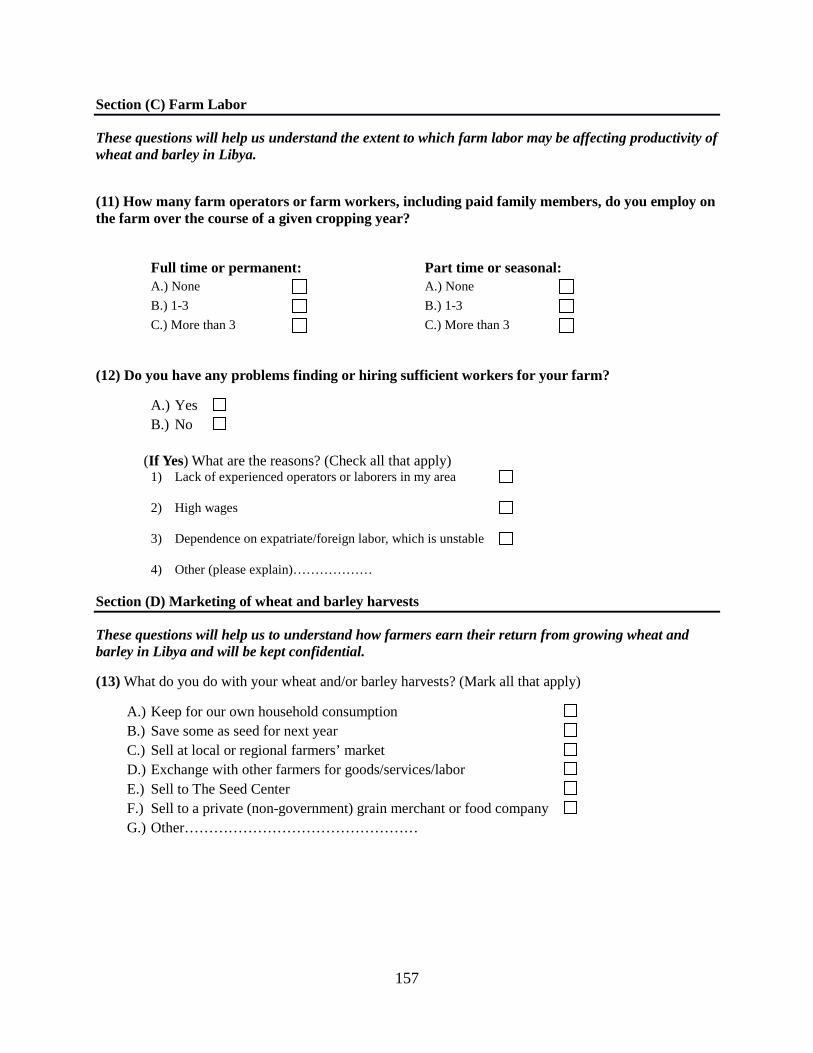
Section (C) Farm Labor
These questions will help us understand the extent to which farm labor may be affecting productivity of wheat and barley in Libya.
(11) How many farm operators or farm workers, including paid family members, do you employ on the farm over the course of a given cropping year?
Full time or permanent: Part time or seasonal: A.) None A.) None B.) 1-3 B.) 1-3 C.) More than 3 C.) More than 3
(12) Do you have any problems finding or hiring sufficient workers for your farm?
A.) Yes B.) No
(If Yes) What are the reasons? (Check all that apply)
1) Lack of experienced operators or laborers in my area
2) High wages
3) Dependence on expatriate/foreign labor, which is unstable
4) Other (please explain)………………
Section (D) Marketing of wheat and barley harvests
These questions will help us to understand how farmers earn their return from growing wheat and barley in Libya and will be kept confidential.
(13) What do you do with your wheat and/or barley harvests? (Mark all that apply)
A.) Keep for our own household consumption B.) Save some as seed for next year C.) Sell at local or regional farmers’ market D.) Exchange with other farmers for goods/services/labor E.) Sell to The Seed Center F.) Sell to a private (non-government) grain merchant or food company G.) Other…………………………………………
157
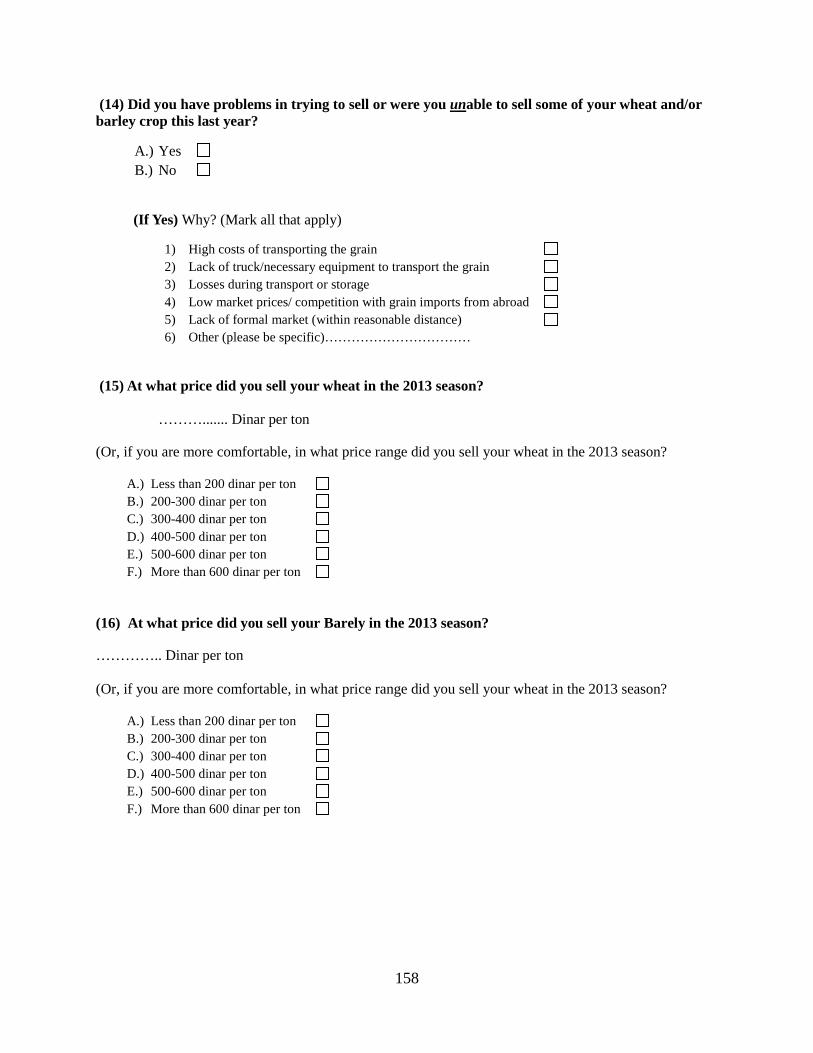
(14) Did you have problems in trying to sell or were you unable to sell some of your wheat and/or barley crop this last year?
A.) Yes B.) No
(If Yes) Why? (Mark all that apply)
1) High costs of transporting the grain 2) Lack of truck/necessary equipment to transport the grain 3) Losses during transport or storage 4) Low market prices/ competition with grain imports from abroad 5) Lack of formal market (within reasonable distance) 6) Other (please be specific)……………………………
(15) At what price did you sell your wheat in the 2013 season?
………....... Dinar per ton
(Or, if you are more comfortable, in what price range did you sell your wheat in the 2013 season?
A.) Less than 200 dinar per ton B.) 200-300 dinar per ton C.) 300-400 dinar per ton D.) 400-500 dinar per ton E.) 500-600 dinar per ton F.) More than 600 dinar per ton
(16) At what price did you sell your Barely in the 2013 season?
………….. Dinar per ton (Or, if you are more comfortable, in what price range did you sell your wheat in the 2013 season?
A.) Less than 200 dinar per ton B.) 200-300 dinar per ton C.) 300-400 dinar per ton D.) 400-500 dinar per ton E.) 500-600 dinar per ton F.) More than 600 dinar per ton
158
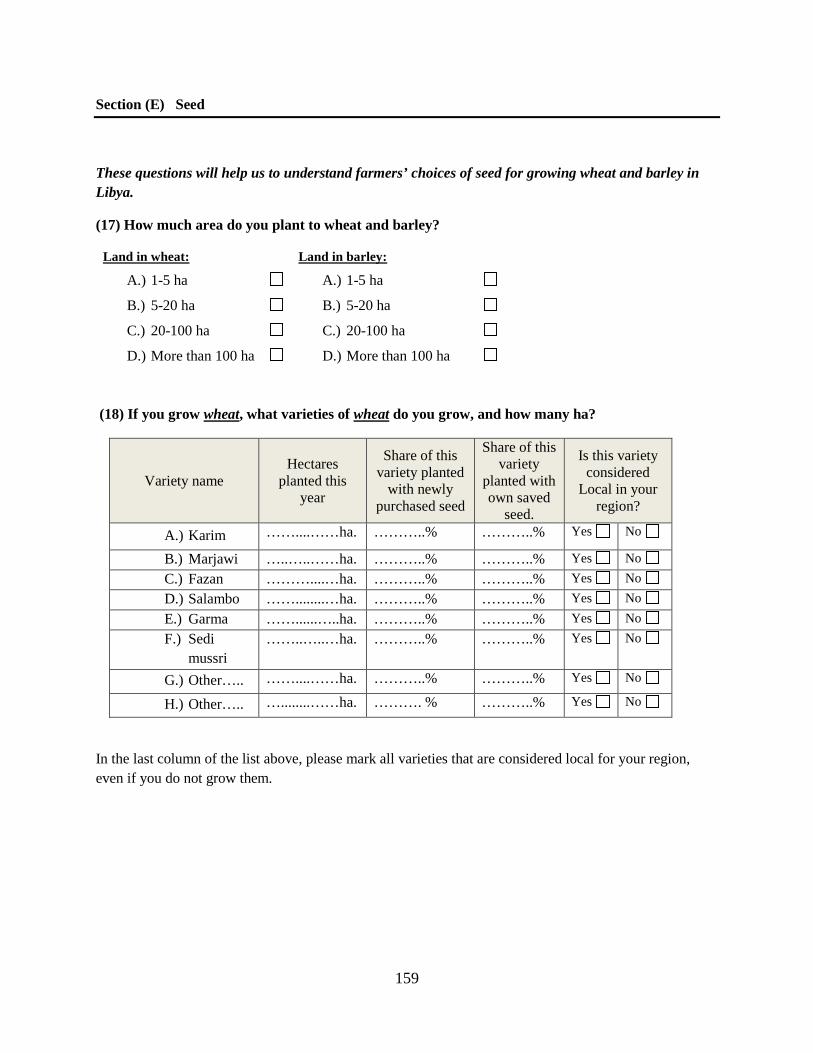
Section (E) Seed
These questions will help us to understand farmers’ choices of seed for growing wheat and barley in Libya.
(17) How much area do you plant to wheat and barley?
Land in wheat: Land in barley:
A.) 1-5 ha A.) 1-5 ha
B.) 5-20 ha B.) 5-20 ha
C.) 20-100 ha C.) 20-100 ha
D.) More than 100 ha D.) More than 100 ha
(18) If you grow wheat, what varieties of wheat do you grow, and how many ha?
Variety name Hectares
planted this year
Share of this variety planted
with newly purchased seed
Share of this variety
planted with own saved
seed.
Is this variety considered
Local in your region?
A.) Karim ……....……ha. ………..% ………..% Yes No
B.) Marjawi …..…..……ha. ………..% ………..% Yes No C.) Fazan ………....…ha. ………..% ………..% Yes No D.) Salambo ……........…ha. ………..% ………..% Yes No E.) Garma ……......…..ha. ………..% ………..% Yes No F.) Sedi
mussri ……..…..…ha. ………..% ………..% Yes No
G.) Other….. ……....……ha. ………..% ………..% Yes No
H.) Other….. …........……ha. ………. % ………..% Yes No
In the last column of the list above, please mark all varieties that are considered local for your region, even if you do not grow them.
159
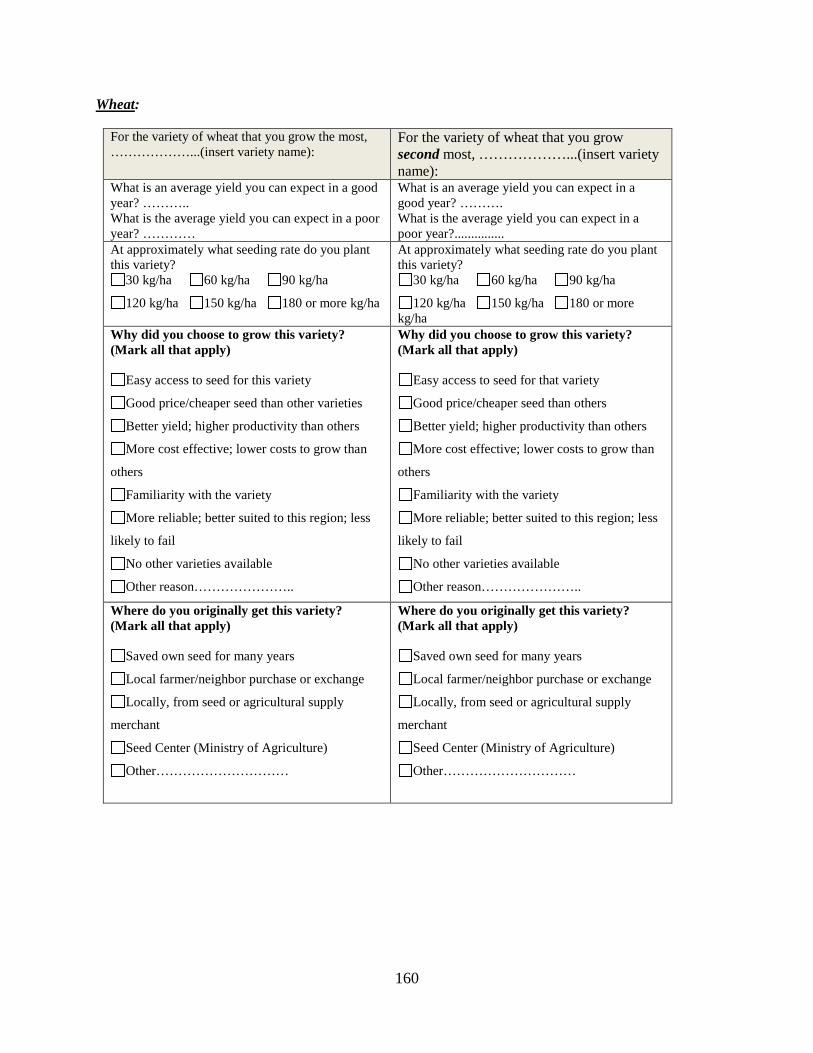
Wheat:
For the variety of wheat that you grow the most, ………………...(insert variety name):
For the variety of wheat that you grow second most, ………………...(insert variety name):
What is an average yield you can expect in a good year? ……….. What is the average yield you can expect in a poor year? …………
What is an average yield you can expect in a good year? ………. What is the average yield you can expect in a poor year?...............
At approximately what seeding rate do you plant this variety?
30 kg/ha 60 kg/ha 90 kg/ha
120 kg/ha 150 kg/ha 180 or more kg/ha
At approximately what seeding rate do you plant this variety?
30 kg/ha 60 kg/ha 90 kg/ha
120 kg/ha 150 kg/ha 180 or more kg/ha
Why did you choose to grow this variety? (Mark all that apply)
Easy access to seed for this variety
Good price/cheaper seed than other varieties
Better yield; higher productivity than others
More cost effective; lower costs to grow than
others
Familiarity with the variety
More reliable; better suited to this region; less
likely to fail
No other varieties available
Other reason…………………..
Why did you choose to grow this variety? (Mark all that apply)
Easy access to seed for that variety
Good price/cheaper seed than others
Better yield; higher productivity than others
More cost effective; lower costs to grow than
others
Familiarity with the variety
More reliable; better suited to this region; less
likely to fail
No other varieties available
Other reason…………………..
Where do you originally get this variety? (Mark all that apply)
Saved own seed for many years
Local farmer/neighbor purchase or exchange
Locally, from seed or agricultural supply
merchant
Seed Center (Ministry of Agriculture)
Other…………………………
Where do you originally get this variety? (Mark all that apply)
Saved own seed for many years
Local farmer/neighbor purchase or exchange
Locally, from seed or agricultural supply
merchant
Seed Center (Ministry of Agriculture)
Other…………………………
160
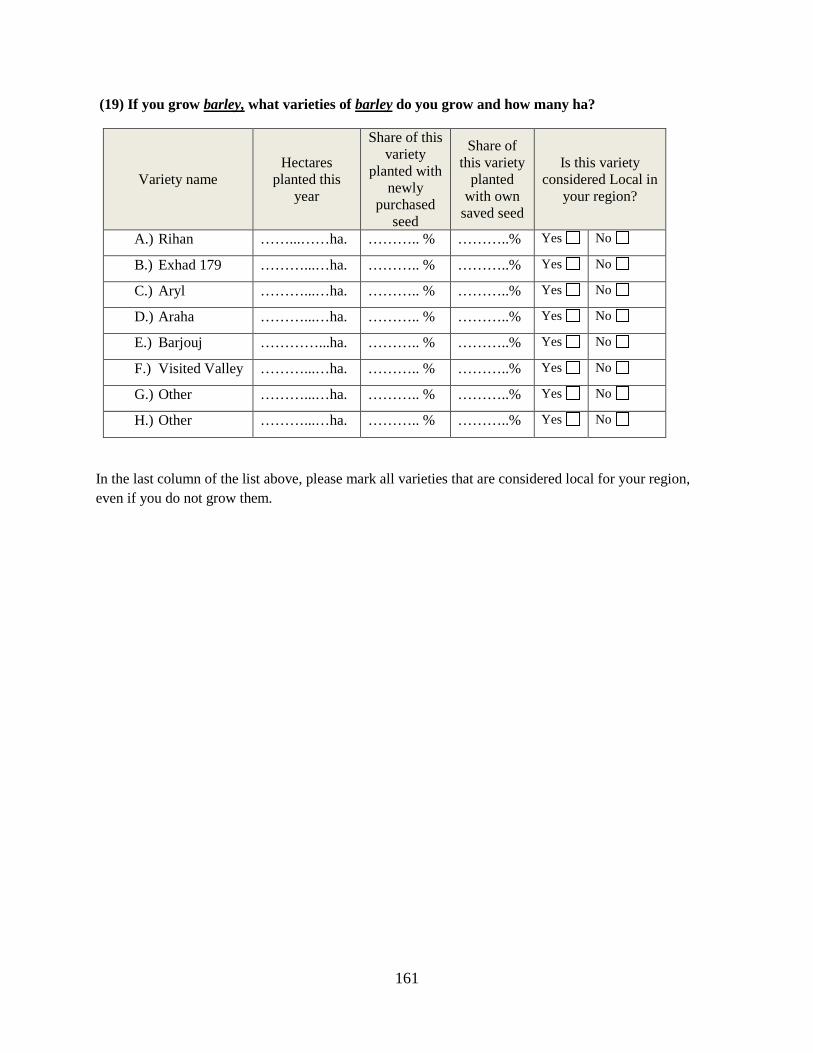
(19) If you grow barley, what varieties of barley do you grow and how many ha?
Variety name Hectares
planted this year
Share of this variety
planted with newly
purchased seed
Share of this variety
planted with own
saved seed
Is this variety considered Local in
your region?
A.) Rihan ……...……ha. ……….. % ………..% Yes No
B.) Exhad 179 ………...…ha. ……….. % ………..% Yes No
C.) Aryl ………...…ha. ……….. % ………..% Yes No
D.) Araha ………...…ha. ……….. % ………..% Yes No
E.) Barjouj …………...ha. ……….. % ………..% Yes No
F.) Visited Valley ………...…ha. ……….. % ………..% Yes No
G.) Other ………...…ha. ……….. % ………..% Yes No
H.) Other ………...…ha. ……….. % ………..% Yes No
In the last column of the list above, please mark all varieties that are considered local for your region, even if you do not grow them.
161
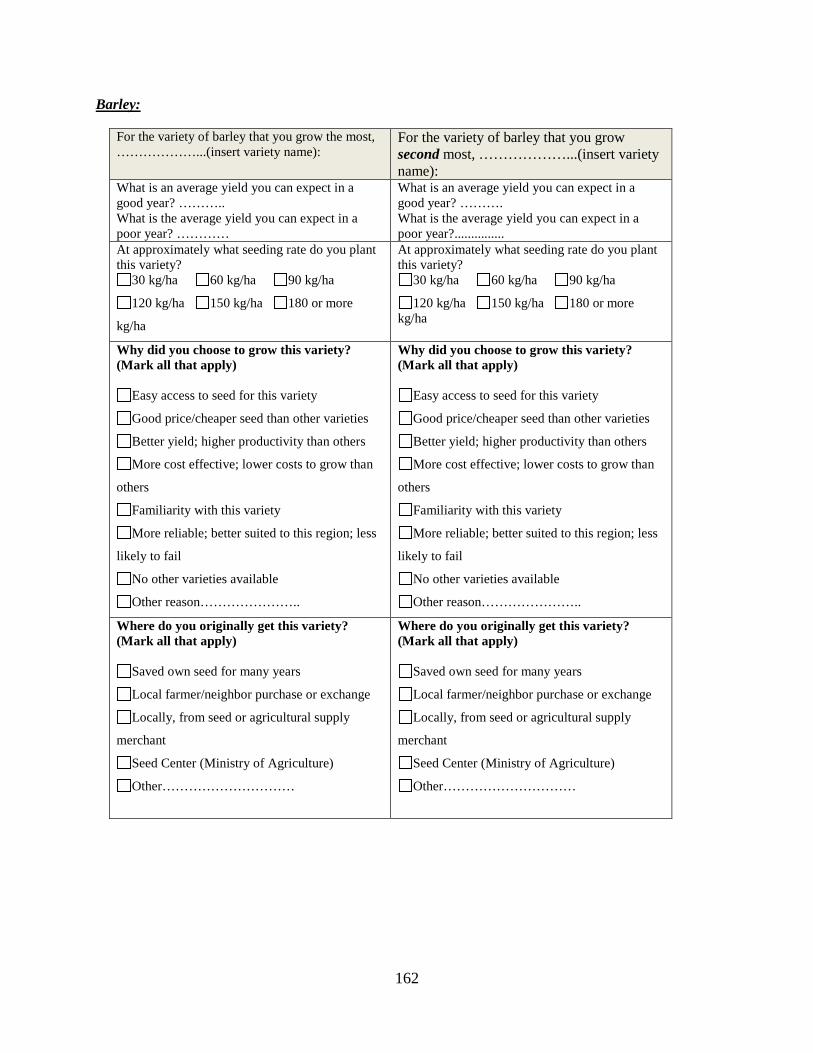
Barley:
For the variety of barley that you grow the most, ………………...(insert variety name):
For the variety of barley that you grow second most, ………………...(insert variety name):
What is an average yield you can expect in a good year? ……….. What is the average yield you can expect in a poor year? …………
What is an average yield you can expect in a good year? ………. What is the average yield you can expect in a poor year?...............
At approximately what seeding rate do you plant this variety?
30 kg/ha 60 kg/ha 90 kg/ha
120 kg/ha 150 kg/ha 180 or more
kg/ha
At approximately what seeding rate do you plant this variety?
30 kg/ha 60 kg/ha 90 kg/ha
120 kg/ha 150 kg/ha 180 or more kg/ha
Why did you choose to grow this variety? (Mark all that apply)
Easy access to seed for this variety
Good price/cheaper seed than other varieties
Better yield; higher productivity than others
More cost effective; lower costs to grow than
others
Familiarity with this variety
More reliable; better suited to this region; less
likely to fail
No other varieties available
Other reason…………………..
Where do you originally get this variety? (Mark all that apply)
Saved own seed for many years
Local farmer/neighbor purchase or exchange
Locally, from seed or agricultural supply
merchant
Seed Center (Ministry of Agriculture)
Other…………………………
Where do you originally get this variety? (Mark all that apply)
Saved own seed for many years
Local farmer/neighbor purchase or exchange
Locally, from seed or agricultural supply
merchant
Seed Center (Ministry of Agriculture)
Other…………………………
162
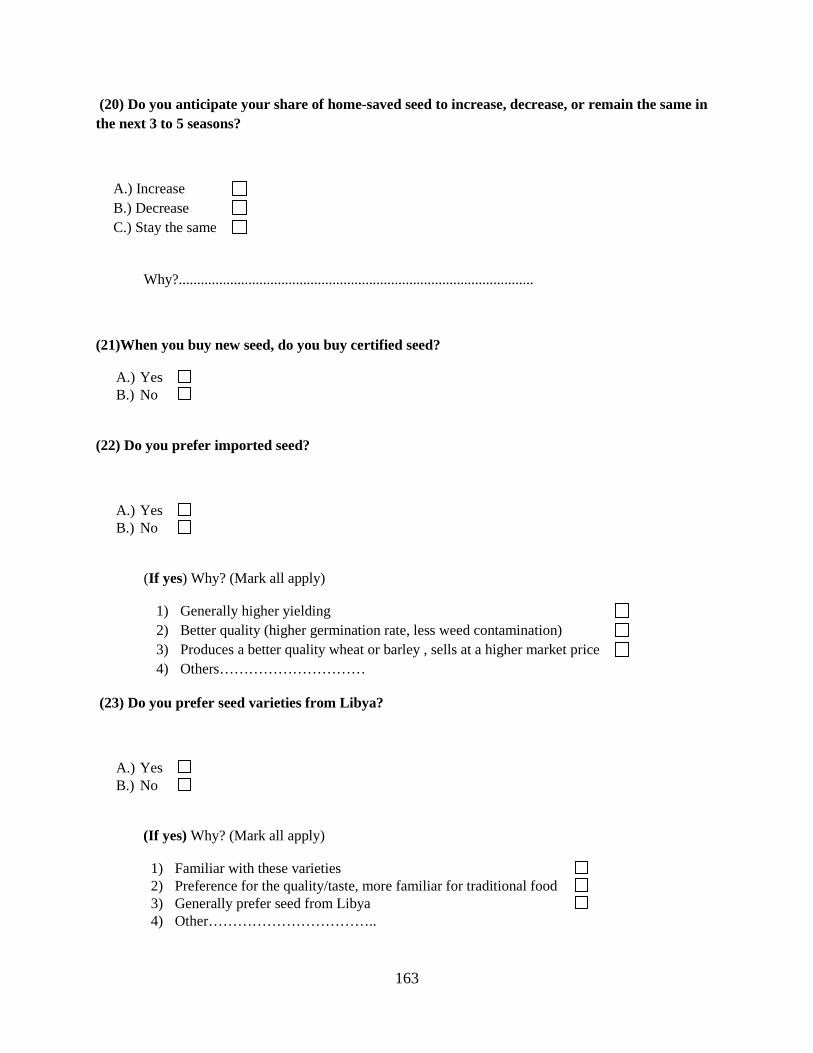
(20) Do you anticipate your share of home-saved seed to increase, decrease, or remain the same in the next 3 to 5 seasons?
A.) Increase B.) Decrease C.) Stay the same
Why?.................................................................................................
(21)When you buy new seed, do you buy certified seed?
A.) Yes B.) No
(22) Do you prefer imported seed?
A.) Yes B.) No
(If yes) Why? (Mark all apply)
1) Generally higher yielding 2) Better quality (higher germination rate, less weed contamination) 3) Produces a better quality wheat or barley , sells at a higher market price 4) Others…………………………
(23) Do you prefer seed varieties from Libya?
A.) Yes B.) No
(If yes) Why? (Mark all apply)
1) Familiar with these varieties 2) Preference for the quality/taste, more familiar for traditional food 3) Generally prefer seed from Libya 4) Other……………………………..
163
(24) In your opinion, is your own landrace/local variety better (more cost effective) than newly bred or imported varieties?
A.) Yes B.) No
(25) Please rank the following choices from most important (=1) to least important (=5) for why you believe growing wheat or barley is better than growing other crops.
1 2 3 4 5 Most important Least important
______ More familiar with wheat and barley than other crops
______ Family history;tradition;runs in the family
______ Lower risk; wheat and barley are more tolerant to local conditions;less likely to fail than other crops
______ Lower water requirement than other crops
______ Less impacted by disease than other crops
______ Cheaper seed costs than other crops
______ Easier to plant, cultivate, harvest (given available labor) than other crops
______ Lower input cost/ requirement (like fertilizer, pesticide) than other crops
______ High demand/ good price for harvest
______ Traditionally consumed in the region / Food more preferred than other crops
______ Government support for growing wheat/barley are better than for growing other crops
Section (F) Mechanical inputs
These questions will help us to understand how machine technology is used to grow wheat and barley in Libya.
(26) How many tractors (pieces of farm equipment) do you use for growing your wheat and barley?...................................
164
What is the horsepower (HP) of the largest tractor engine among those you own?
Section (G) Irrigation
These questions will help us to understand the use of irrigation to grow wheat and barley in Libya. (27) What is the average annual rainfall at your farm? ………………..cm (28) Do you use irrigation for growing your wheat and/or barley?
A.) Yes B.) No
(If Yes) Which kind of irrigation system do you use to grow your wheat and/or barley crops?
1) Flood 2) Sprinkler 3) Other (please specify)………….
(29) What is the irrigation water source you use for growing your wheat and/or barley?
A.) Underground well water B.) Surface water
(If A) What is your well water source?
1) On-farm (private) pumped well 2) On-farm (private) natural source (spring, qanat, oasis, etc) 3) Local community pumped well 4) Local community natural source (spring, qanat, oasis, etc) 5) Manmade River project 6) Other larger regional (government) pumped water project 7) Other (Please specify)…………………………………
A.) Under 20 HP B.) 20-49 HP C.) 50-99 HP D.) 100-199 HP E.) 200-299 HP F.) More than 300 HP
165

(If B) What is your surface water source?
1) On-farm (private) pond or reservoir collecting rain/runoff 2) Local community reservoir or irrigation ditch 3) Larger regional (government) irrigation system 4) Other (Please specify)…………………………………
166
Section (H) Fertilizer
These questions will help us to understand the extent to which fertilizer is utilized in growing wheat and barley in Libya.
(30) How much fertilizer kg/ha on average do you apply total per season in growing your wheat and barley crops?
A.) None B.) 0- 50 kg/ha C.) 50-100 kg/ha D.) More than 100 kg/ha
Please indicate which factors influence how much fertilizer you use (please mark all that apply):
A.) Costs B.) My past experiences with productivity/yield gains C.) Following recommended fertilizer application rates or regulations for soil type
and needs D.) Other ………………………..
(31) What kind of fertilizer do you use, and how much? (provide names and average application rates for all that you apply)
For wheat: For barley:
(N)................... , at ………….. kg/h Such as:
• Anhydrous ammonia—NH3 • Urea—NH2-CO-NH2 • Ammonium nitrate—NH4NO3 • Nitrogen solutions (UAN)— • Ammonium sulfate—(NH4)2SO4
(N)................... , at ………….. kg/ha Such as:
• Anhydrous ammonia—NH3 • Urea—NH2-CO-NH2 • Ammonium nitrate—NH4NO3 • Nitrogen solutions (UAN)— • Ammonium sulfate—(NH4)2SO4
( P).................... , at ………….. kg/ha Such as:
• Diammonium phosphate (DAP)—(NH4)2HPO4
• Monoammonium phosphate (MAP)—NH4H2PO4
• Ammonium polyphosphate • Triple superphosphate—Ca(H2PO4)2
( P).................... , at ………….. kg/ha Such as:
• Diammonium phosphate (DAP)—(NH4)2HPO4
• Monoammonium phosphate (MAP)—NH4H2PO4
• Ammonium polyphosphate • Triple superphosphate—Ca(H2PO4)2
(K)......................., at ………….. kg/ha Such as:
• Potash—KCl or Sul-Po-Mag or K-Mag • Potassium sulfate—K2SO4 • Potassium nitrate—KNO3 • Potassium hydroxide—KOH
(K)......................., at ………….. kg/ha Such as:
• Potash—KCl or Sul-Po-Mag or K-Mag • Potassium sulfate—K2SO4 • Potassium nitrate—KNO3 • Potassium hydroxide—KOH
(lime) …………. , at ………….. kg/ha (lime) …………. , at ………….. kg/ha
(other)………………, at ………….. kg/ha (other)………………, at ………….. kg/ha
167
(32) Which of the following best describes your experience with fertilizer use:
A.) Positive, as it helps production B.) Don’t know/neutral C.) Negative, as it has impacts on the water or soil quality or on farmer’s health D.) Others……………………………………………………
Section (I) Pesticides
These questions will help us to understand the extent to which pesticides are utilized in growing wheat and barley in Libya.
(33) Do you use any form of pesticide?
A.) Yes B.) No
(If Yes) What kind of pesticide do you use? And how often do you apply?
1-2
times
3-5
times
5 or
more
1) Insecticide
2) Fungicide
3) Herbicide
4) Soil sterilizers
5) All of the above
6) Other ………………………………….
(If No) Please indicate which factors influence how the pesticides you use (please mark all that apply):
1) Costs 2) My past experiences with productivity/yield gains 3) Following recommended pesticide application rates or
regulations given my pest problems
4) Other………………………………………….
(34) Which factors best describes your experience with pesticide use:
A.) Positive, as it has helped production B.) Don’t know/neutral C.) Negative, as it impacts on soil and water quality and on farmer health D.) Other……………………………………………………..
168
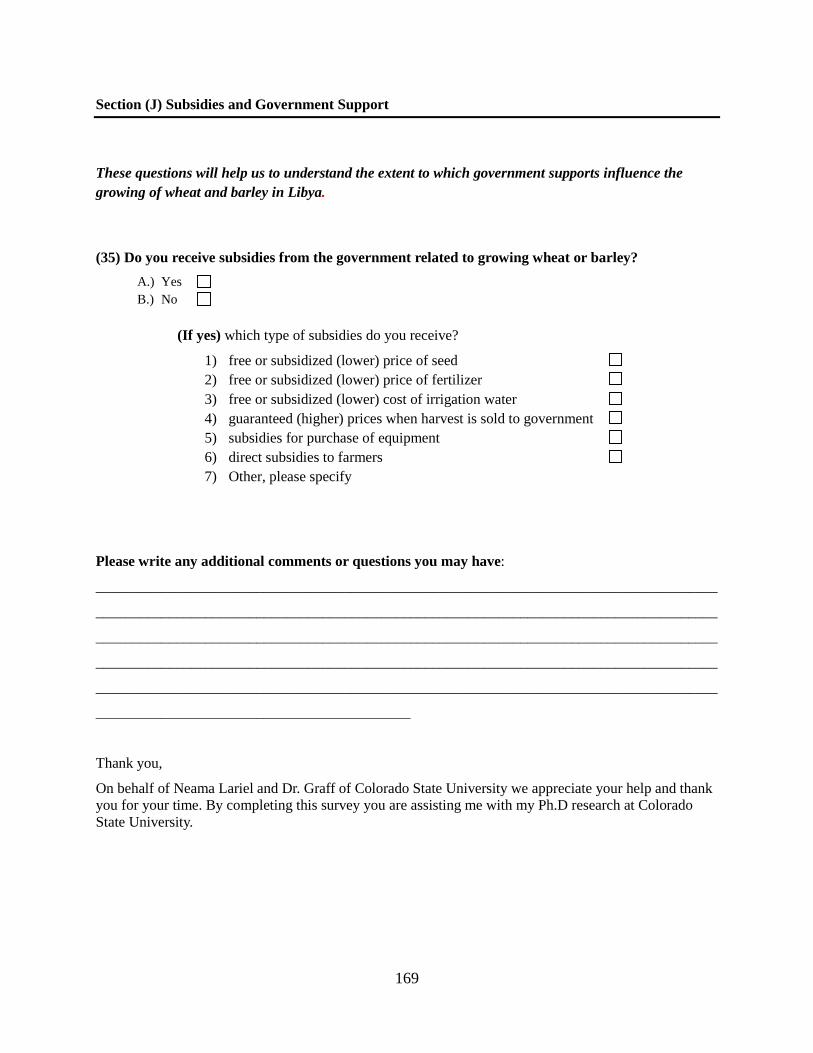
Section (J) Subsidies and Government Support
These questions will help us to understand the extent to which government supports influence the growing of wheat and barley in Libya.
(35) Do you receive subsidies from the government related to growing wheat or barley? A.) Yes B.) No
(If yes) which type of subsidies do you receive?
1) free or subsidized (lower) price of seed 2) free or subsidized (lower) price of fertilizer 3) free or subsidized (lower) cost of irrigation water 4) guaranteed (higher) prices when harvest is sold to government 5) subsidies for purchase of equipment 6) direct subsidies to farmers 7) Other, please specify
Please write any additional comments or questions you may have:
_____________________________________________________________________________________
_____________________________________________________________________________________
_____________________________________________________________________________________
_____________________________________________________________________________________
_____________________________________________________________________________________
___________________________________________
Thank you,
On behalf of Neama Lariel and Dr. Graff of Colorado State University we appreciate your help and thank you for your time. By completing this survey you are assisting me with my Ph.D research at Colorado State University.
169
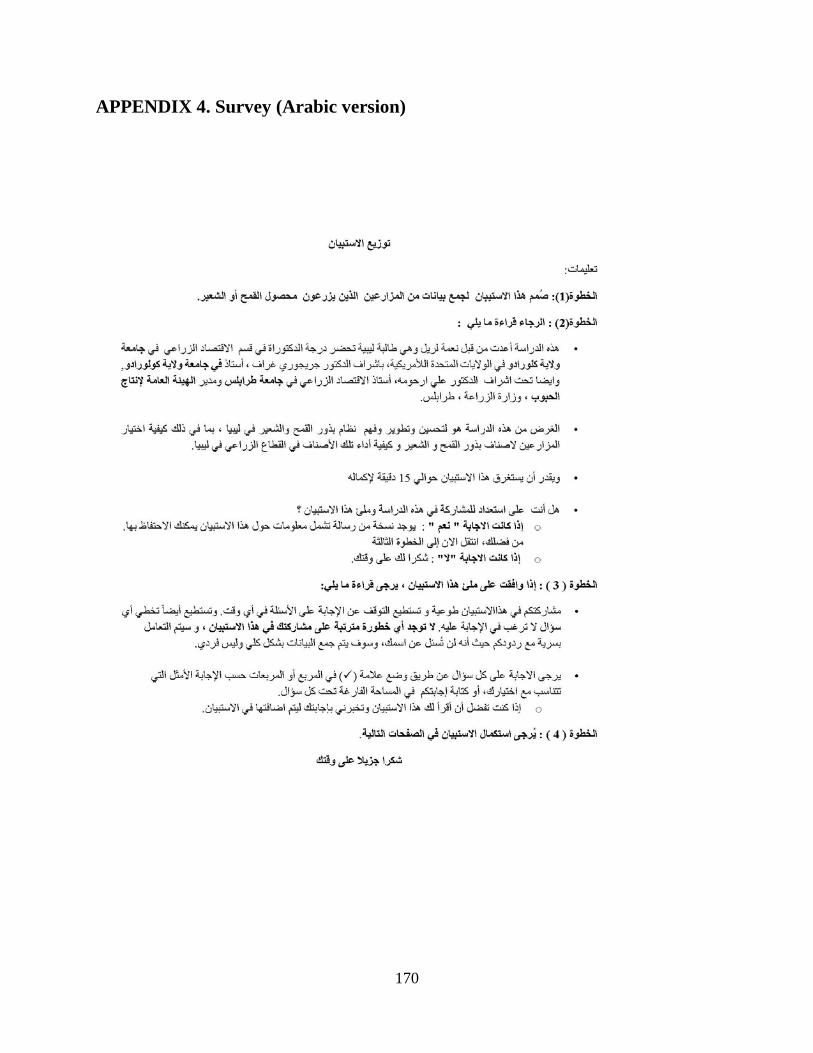
APPENDIX 4. Survey (Arabic version)
170
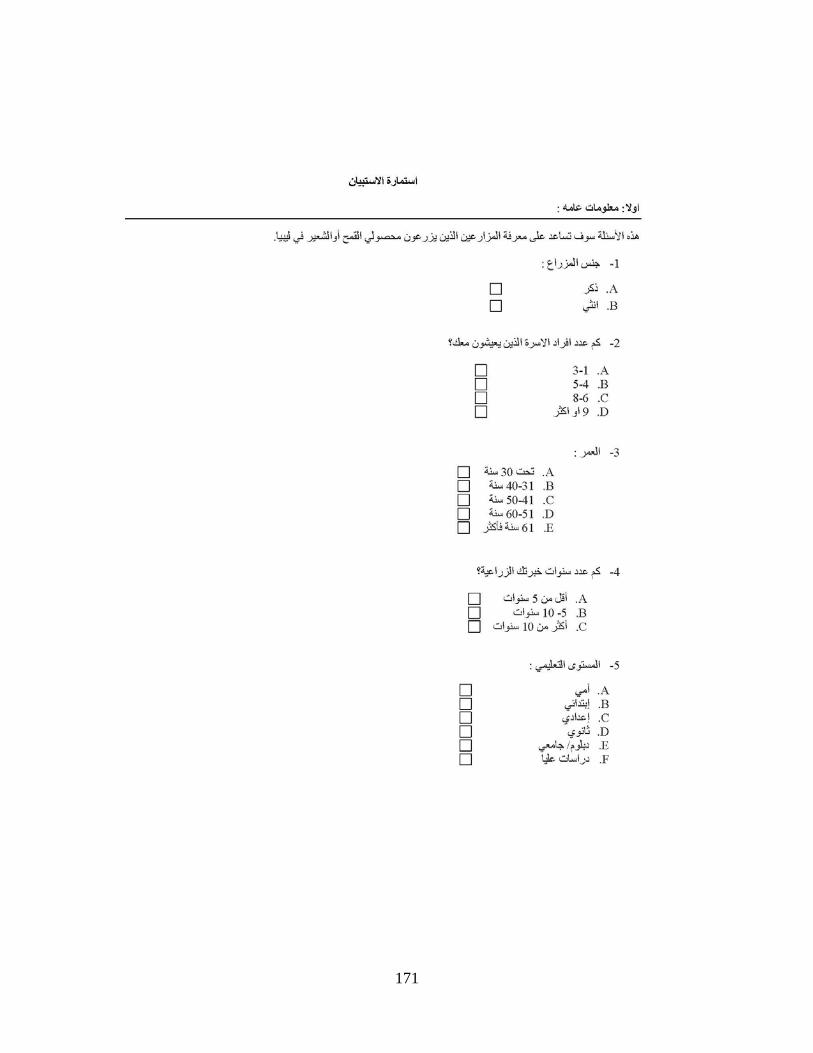
171
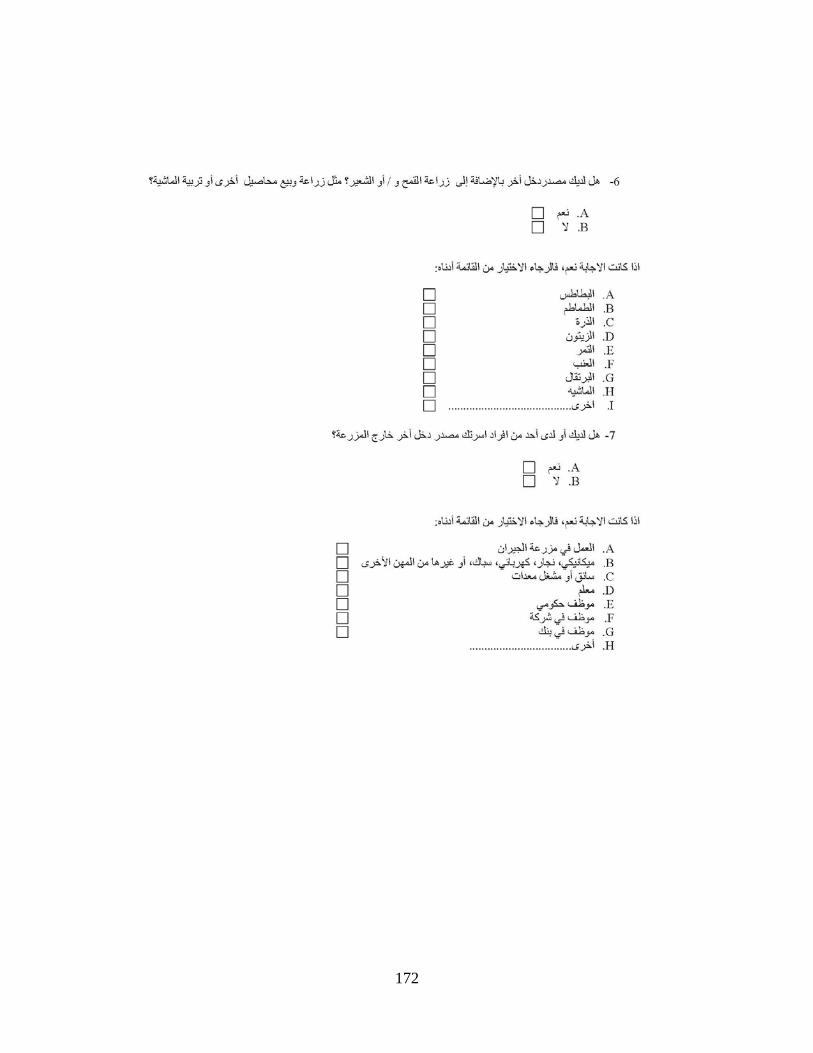
172
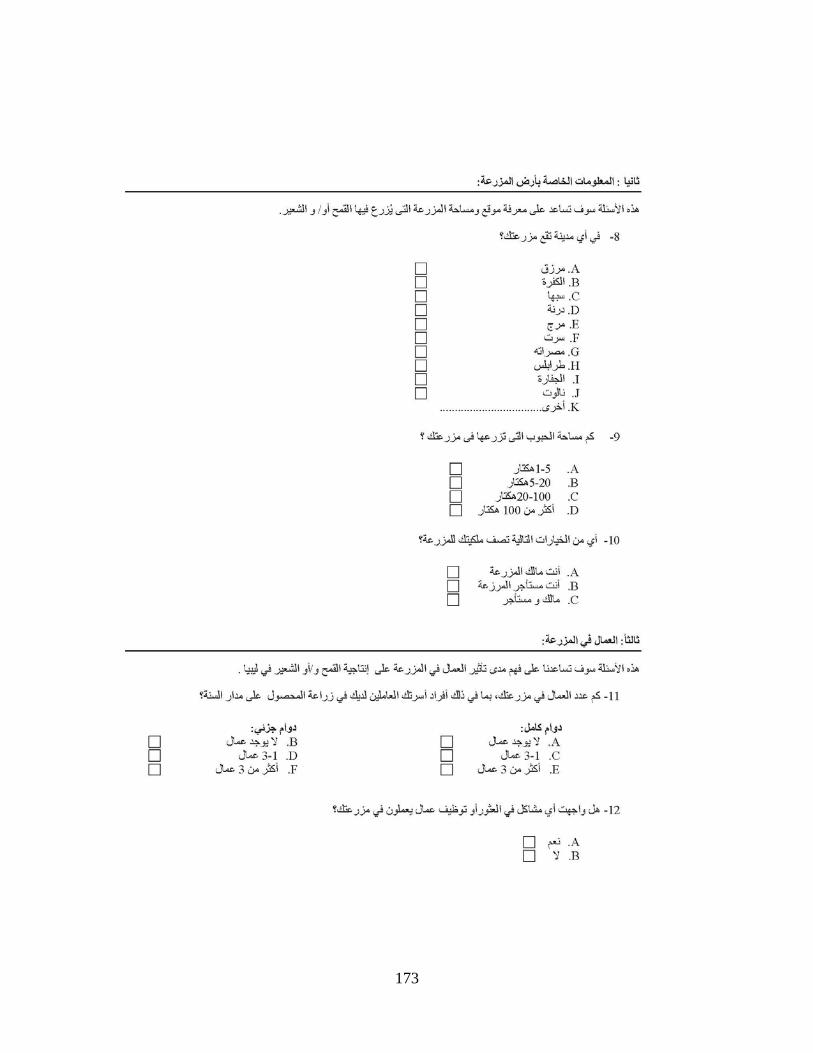
173
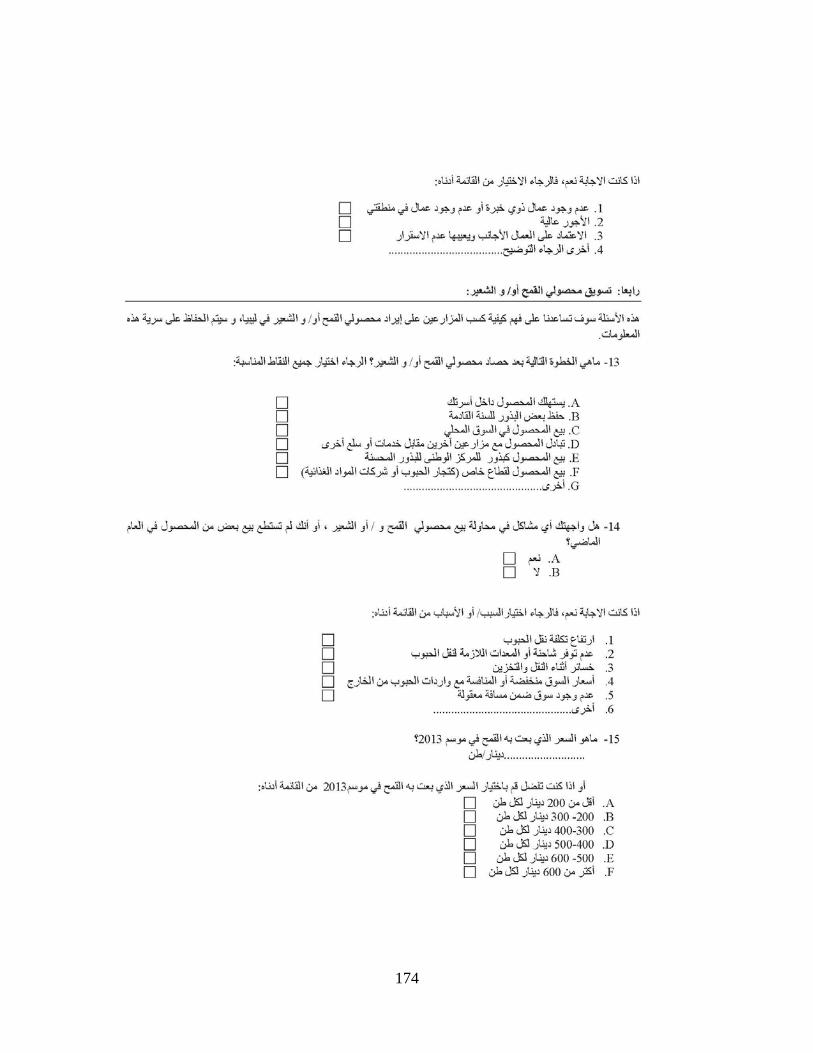
174
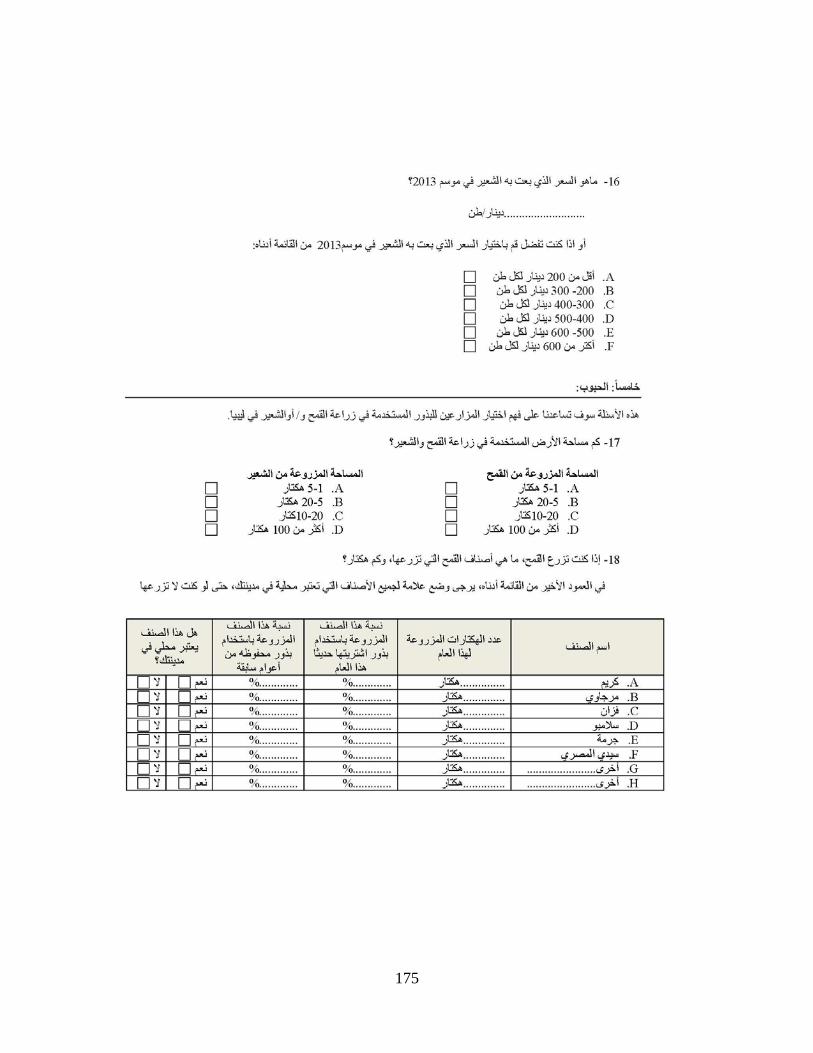
175
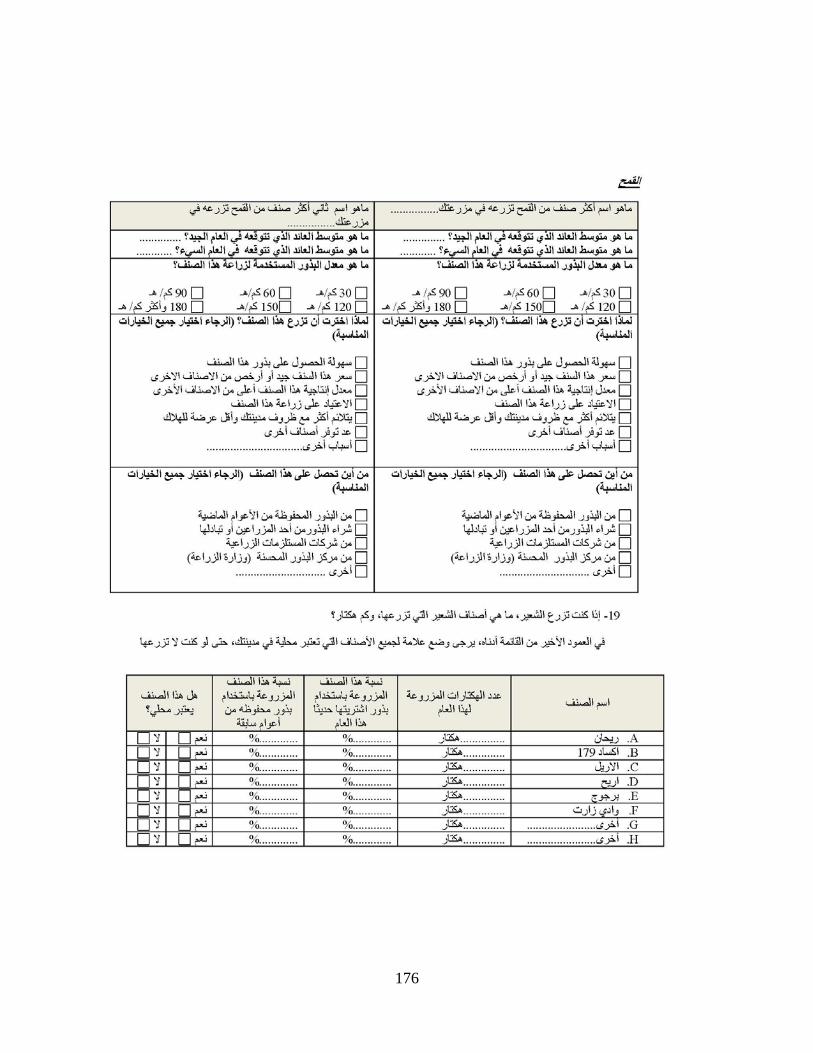
176
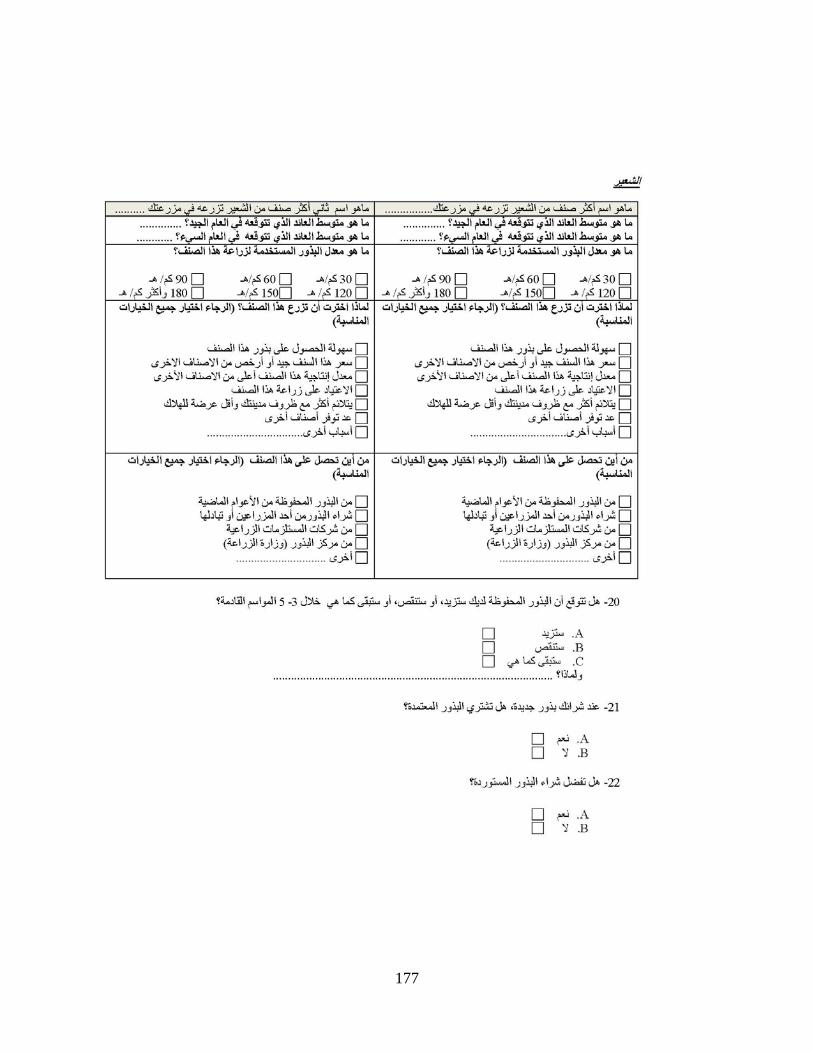
177
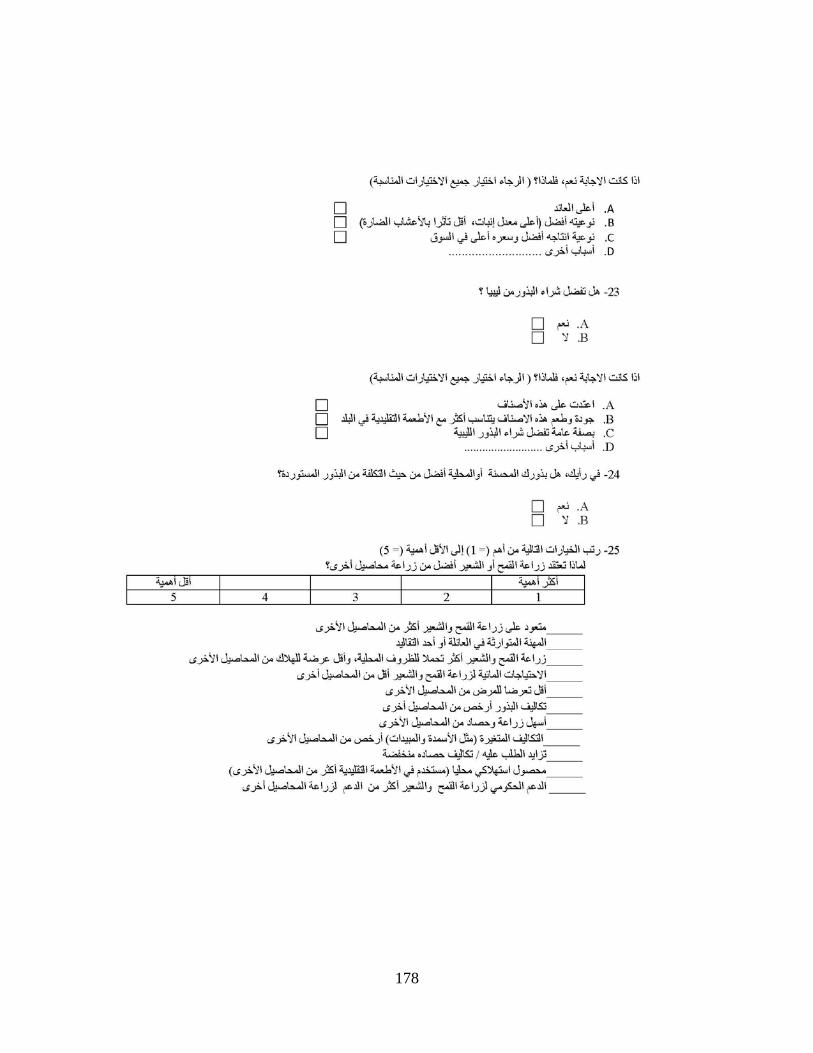
178
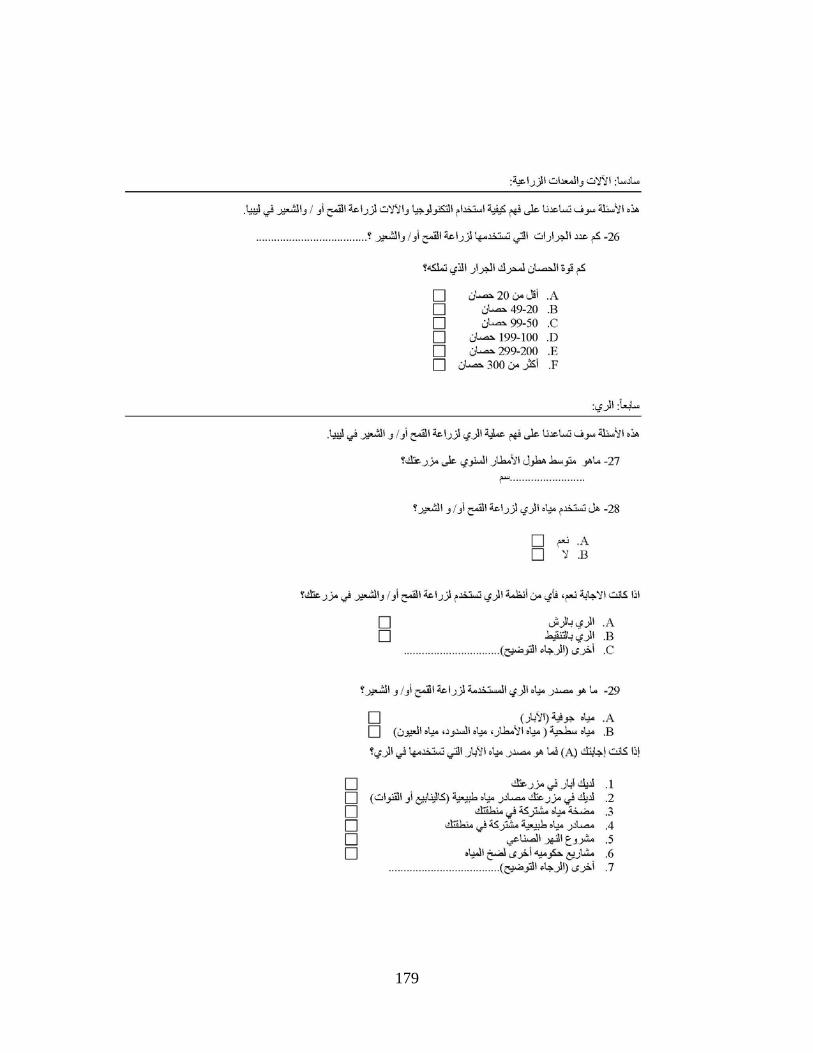
179
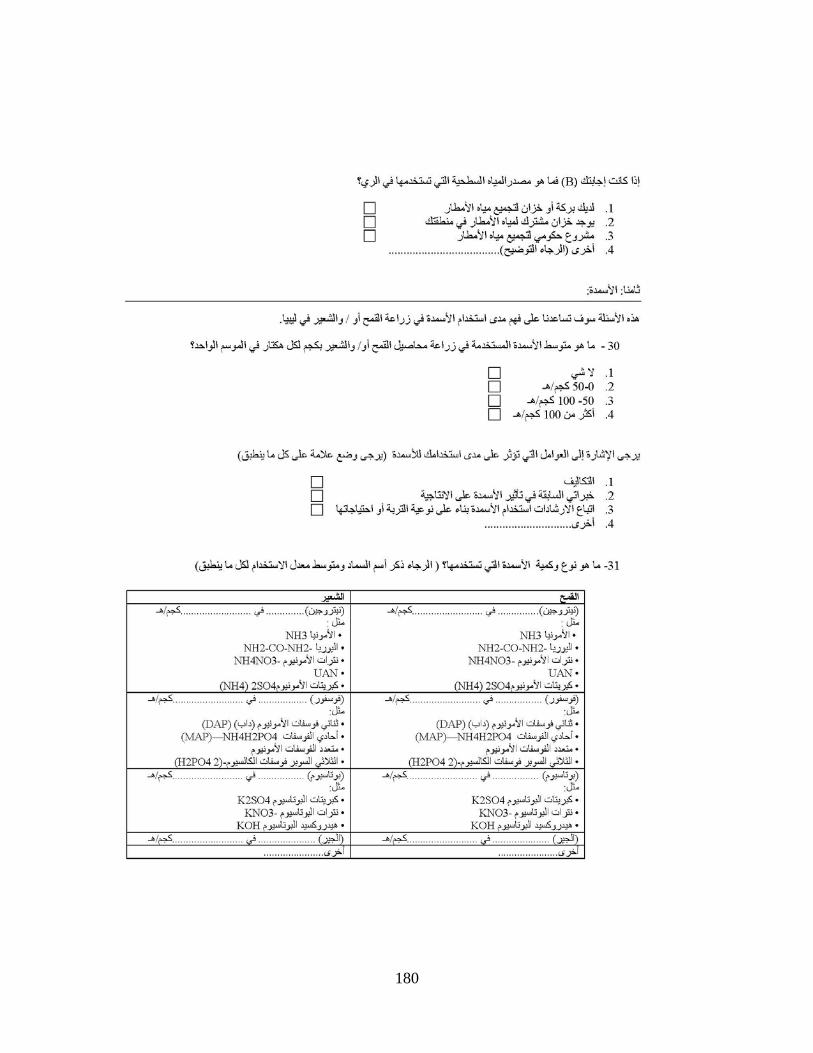
180
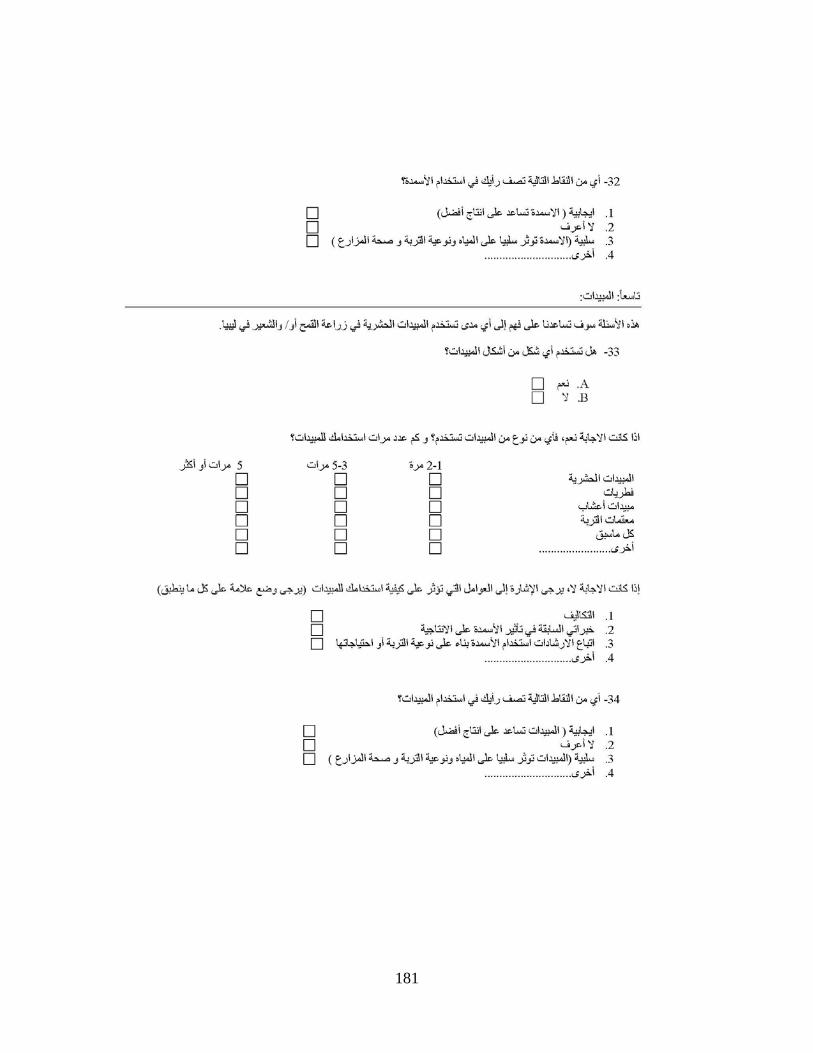
181
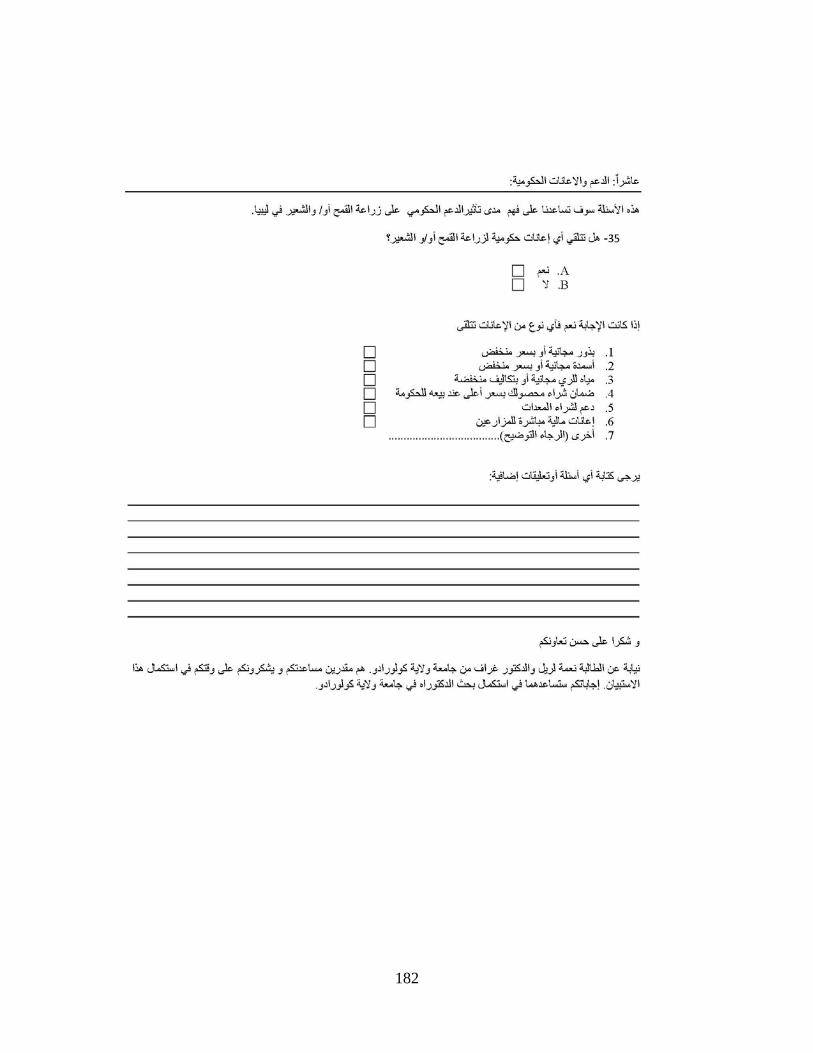
182
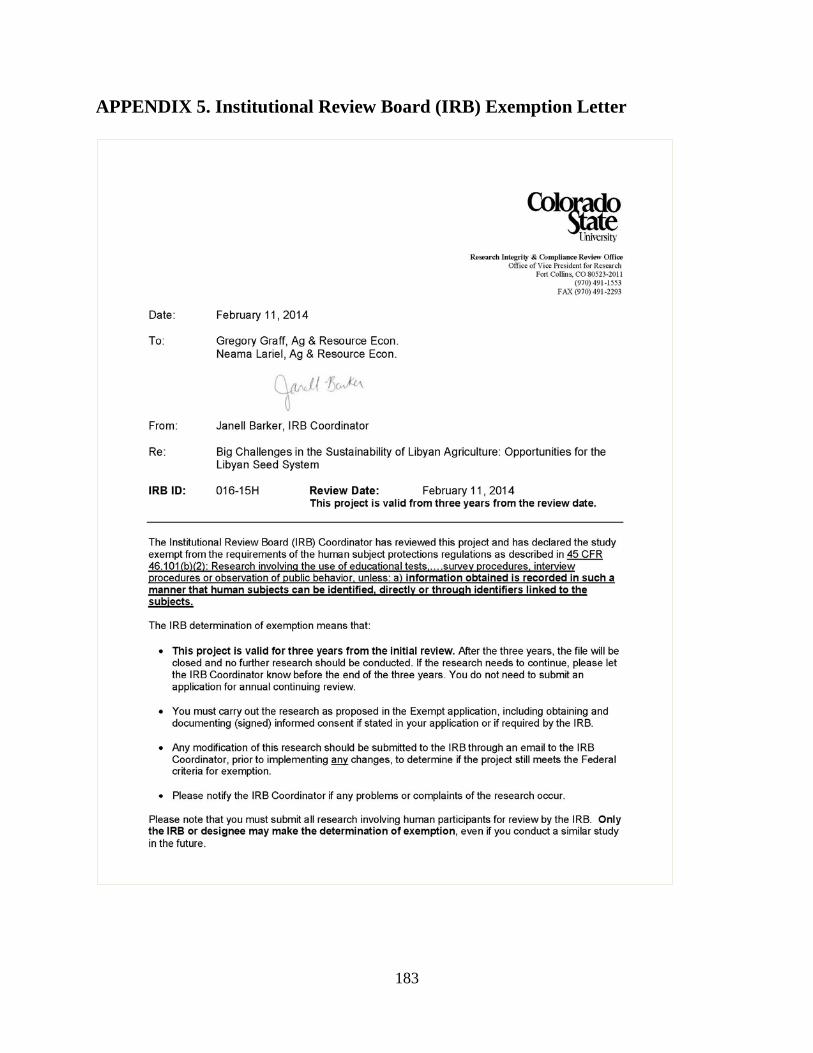
APPENDIX 5. Institutional Review Board (IRB) Exemption Letter
183