Embed Size (px)
Citation preview
This article was published in an Elsevier journal. The attached copyis furnished to the author for non-commercial research and
education use, including for instruction at the author’s institution,sharing with colleagues and providing to institution administration.
Other uses, including reproduction and distribution, or selling orlicensing copies, or posting to personal, institutional or third party
websites are prohibited.
In most cases authors are permitted to post their version of thearticle (e.g. in Word or Tex form) to their personal website orinstitutional repository. Authors requiring further information
regarding Elsevier’s archiving and manuscript policies areencouraged to visit:
http://www.elsevier.com/copyright
Author's personal copy
Available at www.sciencedirect.com
journal homepage: www.elsevier.com/locate/ijhydene
Laminar burning behaviour of biomassgasification-derived producer gas
C. Serranoa,�, J.J. Hernandeza, C. Mandilasb, C.G.W. Sheppardb, R. Woolleyb,1
aE.T.S. Industriales, Universidad de Castilla-La Mancha, Camilo Jose Cela s/n, 13071 Ciudad Real, SpainbSchool of Mechanical Engineering, University of Leeds, Leeds LS2 9JT, UK
a r t i c l e i n f o
Article history:
Received 28 October 2007
Accepted 30 October 2007
Available online 4 December 2007
Keywords:
Producer gas
Burning velocity
Stretch
Cellularity
a b s t r a c t
In the currently reported work, a mixture of H2, CO and N2 (21:24:55 vol%) has been
considered as representative of the producer gas coming from gasification of lignocellulosic
biomass. Laminar burning velocities have been determined, with simultaneous study of
the effects of flame stretch rate and instabilities. Experimentally determined laminar
burning velocities derived from schlieren flame images, over a range of equivalence ratios,
have been compared with those determined using the CHEMKIN code. Good agreement
obtained for 1 bar flames, but significant differences were observed for high pressure
cellular flames. Markstein numbers were also derived from the experimental data and
corresponding Lewis numbers were calculated. Hydrogen thermo-diffusive effects tended
to destabilise lean flames, while the CO content resulted in laminar burning velocity
peaking at very high equivalence ratios. The peak burning rate of producer gas proved
faster than those of conventional fuels, such as isooctane and methane.
& 2007 International Association for Hydrogen Energy. Published by Elsevier Ltd. All rights
reserved.
1. Introduction
Recent European energy policies [1] strongly encourage the
use of biomass in order to address three targets: diversifica-
tion of energy supply, reduction of CO2 emissions and
contribution to rural development. One of the main advan-
tages of gasification is the possibility of installing small, low-
cost and efficient gasifier-engine plants. These enable use of
the biomass close to source and so elimination of most of the
biomass waste storage and transportation costs. In this
manner, biomass gasification constitutes an attractive option
and an alternative to direct combustion. A low-energy-
content gas is generated in the gasification process through
an oxygen deficient reaction; the so-called ‘producer gas’ is an
H2 and CO rich fuel, which also comprises N2, CO2 and small
quantities of CH4 and H2O. Previous studies have shown that
the autoignition delay time of producer gas is longer than that
of isooctane at temperatures below 1100 K [2]; in fact the
knock tendency of a spark ignition engine fuelled with
producer gas is quite low, yielding good engine performance
at very high compression ratios [3,4]. Although the calorific
value of producer gas is ten times lower than that of natural
gas, its stoichiometric fuel/air ratio is ten times higher (it
needs less air to burn). Thus the energy density of the fuel–air
mixture is similar for the two fuels [5] and the loss of power
(cf. natural gas) is low, especially under lean conditions. With
regard to pollutant emissions: the low adiabatic flame
temperature of producer gas helps in limiting NOx produc-
tion, whilst its hydrogen content assists reduction in parti-
culate and unburned hydrocarbon emissions [6,7]. These
properties render this alternative fuel attractive for mechan-
ical or electrical energy production in internal combustion
ARTICLE IN PRESS
0360-3199/$ - see front matter & 2007 International Association for Hydrogen Energy. Published by Elsevier Ltd. All rights reserved.doi:10.1016/j.ijhydene.2007.10.050
�Corresponding author. Tel.: +34 676753120.E-mail address: [email protected] (C. Serrano).1 Current address: Department of Mechanical Engineering, University of Sheffield, UK.
I N T E R N AT I O N A L J O U R N A L O F H Y D R O G E N E N E R G Y 3 3 ( 2 0 0 8 ) 8 5 1 – 8 6 2

Author's personal copy
engines, or in external combustion systems such as Stirling
engines, gas burners and micro-turbines [8]. However, engine/
burner design and the operating parameters must be
optimised to suit the producer gas composition and its
thermo-chemical properties. Laminar burning velocity (ul) is
one of the most important properties governing the combus-
tion behaviour of a fuel. Measurement of laminar burning
velocities is also important to the development and validation
of chemical kinetic mechanisms of unconventional fuels, as
well as for development of predictive models to estimate the
performance and emissions of combustion equipment, and to
prevent and control possible explosion hazards.
Laminar burning velocity is classically defined in relation to
one-dimensional, steady and unstretched flames. These are
also the assumptions typically adopted in most theoretical
combustion models, such as the CHEMKIN code [9] adopted in
the currently reported study, for the calculation of theoretical
laminar burning velocities. However, for experimental spheri-
cally expanding flames similar to those in the combustion
chamber of an SI engine or in the combustion bomb described
below, flame curvature and aerodynamic strain cause the
premixed flame front to become stretched. Differences
between experimentally observed laminar burning velocities
and ideal planar and theoretical unstretched values may be
attributed to the stretch rate experienced by ‘real’ laminar
flames. Additionally, instability resulting from hydrodynamic
disturbances associated with thermal expansion of the burnt
gas may wrinkle and break the flame front into small
combustion cells, causing an increase in effective flame front
area, and associated acceleration of the combustion process
[10]. This phenomenon, very prevalent at high pressures and
particularly for fuels containing significant concentrations of
hydrogen, is usually known as cellularity, which might be
thought of as an intermediate regime between laminar and
turbulent combustion. Much of the variation in values of
laminar burning velocity reported in the literature, generated
using different experimental and theoretical methods, can be
associated with neglect of flame stretch rate and cellularity
effects.
The non-dimensional Markstein number (Ma) is another
important parameter for a burning mixture, characterising its
flame stability and the response of its laminar burning
velocity to stretch rate effects. A fuel’s Markstein number
decreases with pressure and is strongly related to its Lewis
number (Le), Prandtl number and the activation energy of the
combustion process [11]. In non-equidiffusive mixtures,
flame stability is also affected by thermo-diffusive effects,
characterised by Lewis number (defined as the mixture’s
thermal diffusivity divided its mass diffusivity). An effective
Le for a reacting mixture has been defined by Matalon et al.
[12], although for non-stoichiometric mixtures it approaches
the Lewis number based on the deficient species. A flame
having Leo1 may show thermo-diffusive instability, whereas
for Le41 thermo-diffusive effects tend to stabilise the flame
front [13].
Although laminar burning velocities have been experimen-
tally determined for a wide range of pure conventional fuels
(e.g. isooctane [14], propane [15] and methane [16]), there is a
dearth of reliable corresponding data for alternative and
renewable fuel/air mixtures; this is particularly so for H2/CO
rich fuels such as the producer gas coming from biomass
gasification. Huang et al. [17] have determined the burning
velocity of mixtures of primary reference fuels and H2/CO/N2
mixtures for a counterflow burner at room pressure and
temperature (1 bar and 298 K), using digital particle image
velocimetry. They showed that the laminar burning velocity
of isooctane increased with the addition of H2/CO/N2. Han
et al. [18] studied the effect of adding simulated reformer gas
(22.1% H2–7.4% CO, by volume) to a methane/diluent mixture.
They employed a cylindrical combustion vessel and pro-
cessed combustion event pressure records to show an
increase in burning velocity and reduction in equilibrium
NO concentration with increasing reformer gas concentra-
tion. Hassan et al. [19] analysed shadowgraph flame images
for a range of H2/CO/air mixtures, with H2 concentration in
the fuel mixture up to 50 vol%. They suggested that, for low H2
concentration, the effect of stretch rate was insignificant and
that laminar burning velocity peaked at an equivalence ratio
close to two. A number of other workers have provided
theoretically derived values of laminar burning velocity for
such fuels on the basis of chemical kinetic modelling of the
flame front. Sung et al. [20] used the CHEMKIN code in
conjunction with their own reaction mechanism to show an
increase in laminar burning velocity of n-butane and iso-
butane with the addition of reformer gas (30% H2–25% CO–45
%N2, by volume). Calculations were made for combustion
pressures of up to 20 atm. and the separate effects of H2 and
CO were investigated; these showed that H2 led to both an
ARTICLE IN PRESS
Nomenclature
A flame front area
Dij mass diffusivity
Lb Markstein length
Le Lewis non-dimensional number
Ma Markstein number
p pressure
r flame radius
Sn stretched laminar flame speed
Ss unstretched laminar flame speed
t time
T temperature
ul laminar burning velocity
Greek symbols
a stretch rate
at thermal diffusivity
dl laminar flame thickness
f equivalence ratio
rb burned gas density
ru unburned gas density
I N T E R N A T I O N A L J O U R N A L O F H Y D R O G E N E N E R G Y 3 3 ( 2 0 0 8 ) 8 5 1 – 8 6 2852
Author's personal copy
increase in radical concentrations and mixture flame tem-
perature, whilst laminar burning velocity enhancement
associated with CO was mainly due just to the second effect.
Sridhar et al. [21] and Hernandez et al. [22] have provided
theoretically derived laminar burning velocity data for
producer gas, correlated in a relationship of the form
advanced by Metghalchi and Keck [23]. Both studies were
carried out for a wide range of producer gas compositions and
have shown that the CO and H2 contents in producer gas
greatly affect the magnitude of the laminar burning velocity
(ulÞ. In Ref. [22], computed values of ul at 1 bar were compared
to experimental results derived from instantaneous pressure
records generated by deflagrations in a non-optically accessed
200 mm-diameter combustion vessel. Differences between
experimental and theoretical results were possibly associated
with neglect of flame stretch and cellularity. Further insight to
the intrinsic burning properties of producer gas flames is still
needed, as a contribution to the development of more
efficient technologies based on this alternative fuel. The
currently reported work contributes to this. The laminar
combustion behaviour of a mixture comprising 21% H2, 24%
CO, 55% N2 (vol%), representative of the producer gas
generated during the gasification of biomass wastes [24,25],
has been examined with the following objectives:
� To obtain experimental ul values from schlieren images of
the flame over a range of pressures and equivalence ratios,
and to compare those values with those coming from
theoretical modelling.
� To study the effect of stretch rate and cellularity on the
burning rate of producer gas, both at atmospheric and
elevated pressure.
� To compare laminar burning velocities of the producer gas
with those previously found for other fuels (methane,
hydrogen, isooctane) and with those reported for other
H2/CO/N2 mixture compositions.
2. Theoretical and experimental tools
2.1. The CHEMKIN software
The CHEMKIN 4.0 software consists on a set of applications
for solving a range of chemical kinetic problems. The Flame
Speed Calculator application was used to compute laminar
burning velocities for a steady, adiabatic, one-dimensional
and unstretched premixed flame. The code used a hybrid
time-integration and steady-state algorithm to solve compre-
hensive mass species and energy conservation equations. To
enhance the convergence properties, a good starting estimate
of the temperature profile through the flame thickness was
required. Following an earlier study [22], this was accom-
plished by adopting a sigmoid function; with upper limit
above the adiabatic flame temperature, to minimise conver-
gence failures. The problem was solved in an iterative way,
with convenient coarse-to-fine grid refinement and mesh
adaptation parameters at every iterative step, until the
converged solution was found.
The CHEMKIN code has been programmed to evaluate the
thermodynamic and diffusive properties of a multi-compo-
nent mixture and to process chemical reaction mechanisms.
In the currently reported work, the GRI-Mech Version 3 [26]
detailed chemical kinetic mechanism, comprising 325 ele-
mentary reactions and 53 species, has been employed. This
well-known mechanism for methane oxidation has been
verified against more than 60 experimental studies, including
unstretched laminar burning velocity data for CH4/air and
H2/CO/air mixtures.
Covered in the currently reported study are experiments for
a range of lean (f ¼ 0:8) to rich (f ¼ 1:8) equivalence ratios for
three different initial pressure values (1, 2.5 and 5 bar). Since
temperature is unimportant to the hydrodynamics and
morphology of the flame front [14,27], all tests were carried
out for unburned gas at room temperature (295 K). These
same conditions were adopted for the theoretical calculations
in order to assess the effects of flame stretch (well defined at
low pressure) and cellularity (appearing at high pressure) on
the experimentally determined values of laminar burning
velocity.
2.2. Experimental set-up
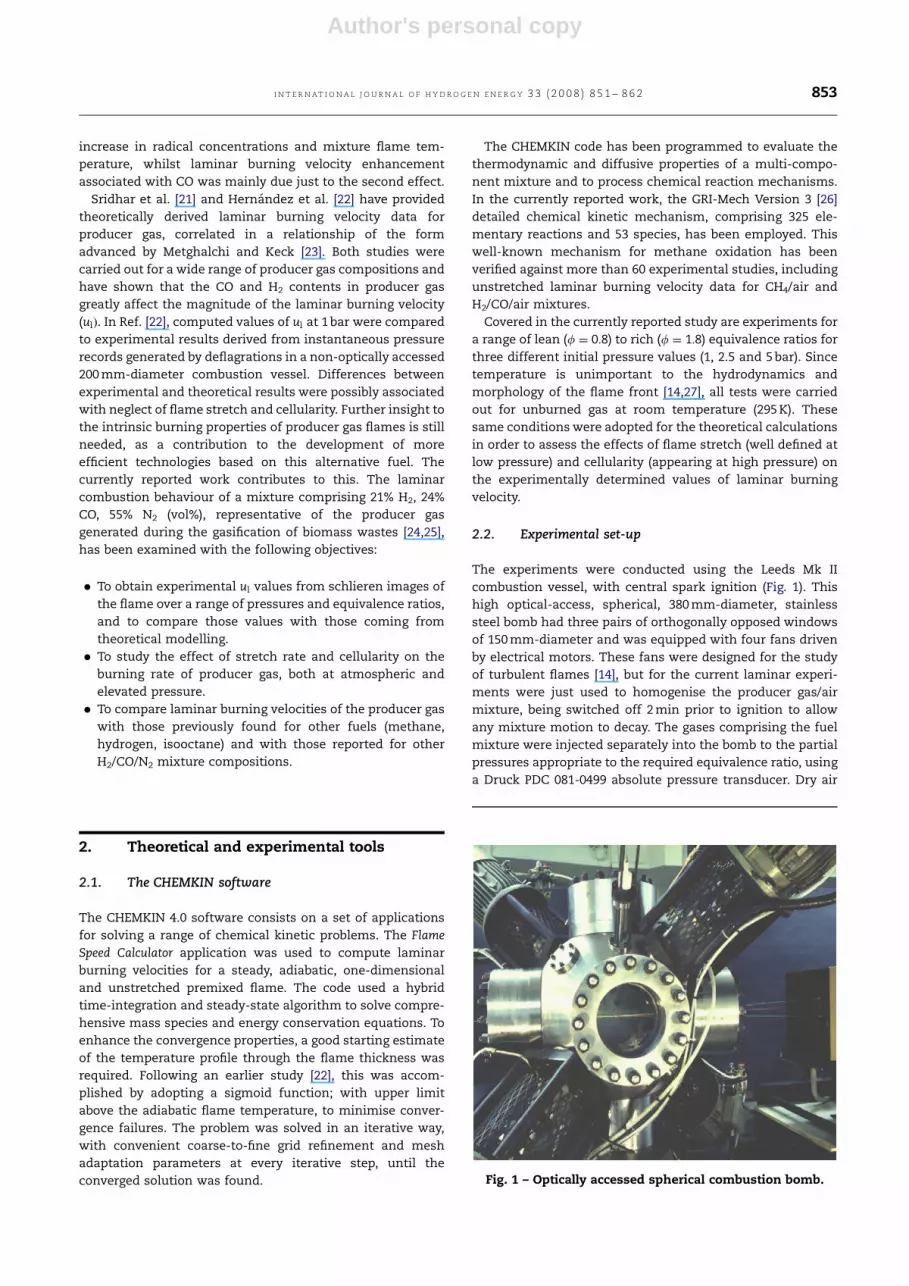
The experiments were conducted using the Leeds Mk II
combustion vessel, with central spark ignition (Fig. 1). This
high optical-access, spherical, 380 mm-diameter, stainless
steel bomb had three pairs of orthogonally opposed windows
of 150 mm-diameter and was equipped with four fans driven
by electrical motors. These fans were designed for the study
of turbulent flames [14], but for the current laminar experi-
ments were just used to homogenise the producer gas/air
mixture, being switched off 2 min prior to ignition to allow
any mixture motion to decay. The gases comprising the fuel
mixture were injected separately into the bomb to the partial
pressures appropriate to the required equivalence ratio, using
a Druck PDC 081-0499 absolute pressure transducer. Dry air
ARTICLE IN PRESS
Fig. 1 – Optically accessed spherical combustion bomb.
I N T E R N AT I O N A L J O U R N A L O F H Y D R O G E N E N E R G Y 3 3 ( 2 0 0 8 ) 8 5 1 – 8 6 2 853
Author's personal copy
from a cylinder was then added until the required total
pressure was reached.
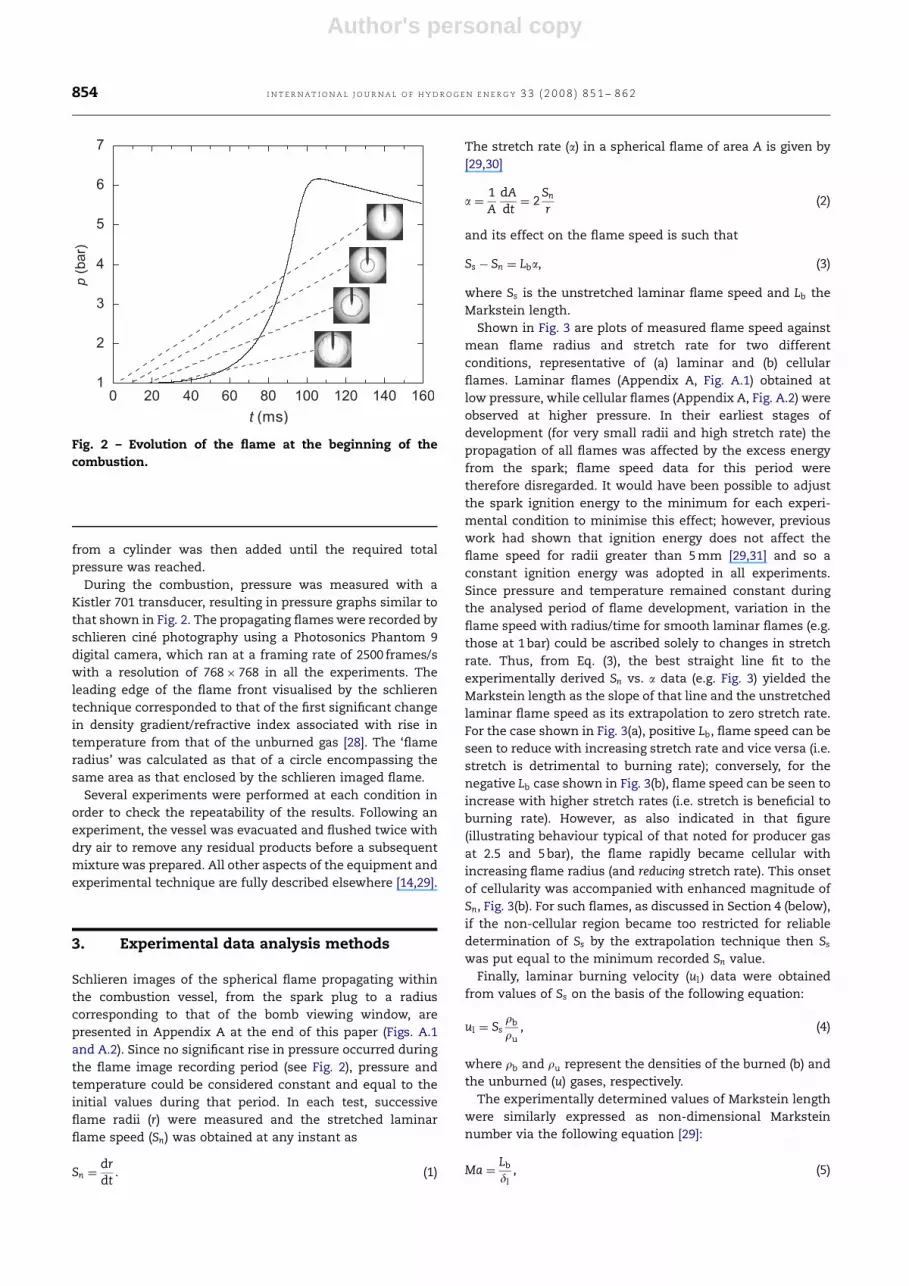
During the combustion, pressure was measured with a
Kistler 701 transducer, resulting in pressure graphs similar to
that shown in Fig. 2. The propagating flames were recorded by
schlieren cine photography using a Photosonics Phantom 9
digital camera, which ran at a framing rate of 2500 frames/s
with a resolution of 768� 768 in all the experiments. The
leading edge of the flame front visualised by the schlieren
technique corresponded to that of the first significant change
in density gradient/refractive index associated with rise in
temperature from that of the unburned gas [28]. The ‘flame
radius’ was calculated as that of a circle encompassing the
same area as that enclosed by the schlieren imaged flame.
Several experiments were performed at each condition in
order to check the repeatability of the results. Following an
experiment, the vessel was evacuated and flushed twice with
dry air to remove any residual products before a subsequent
mixture was prepared. All other aspects of the equipment and
experimental technique are fully described elsewhere [14,29].
3. Experimental data analysis methods
Schlieren images of the spherical flame propagating within
the combustion vessel, from the spark plug to a radius
corresponding to that of the bomb viewing window, are
presented in Appendix A at the end of this paper (Figs. A.1
and A.2). Since no significant rise in pressure occurred during
the flame image recording period (see Fig. 2), pressure and
temperature could be considered constant and equal to the
initial values during that period. In each test, successive
flame radii (r) were measured and the stretched laminar
flame speed (Sn) was obtained at any instant as
Sn ¼drdt
. (1)
The stretch rate (a) in a spherical flame of area A is given by
[29,30]
a ¼1A
dAdt¼ 2
Sn
r(2)
and its effect on the flame speed is such that
Ss � Sn ¼ Lba, (3)
where Ss is the unstretched laminar flame speed and Lb the
Markstein length.
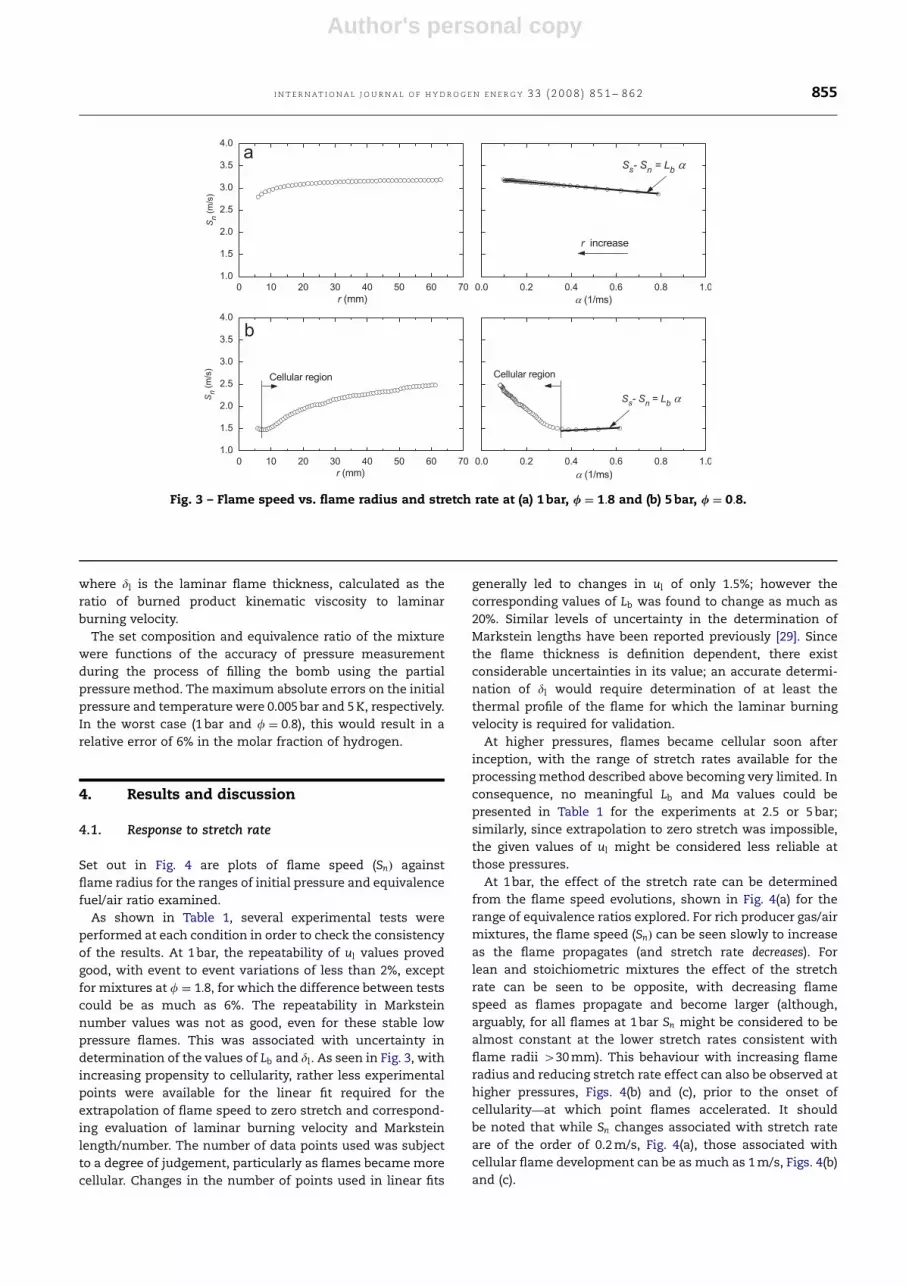
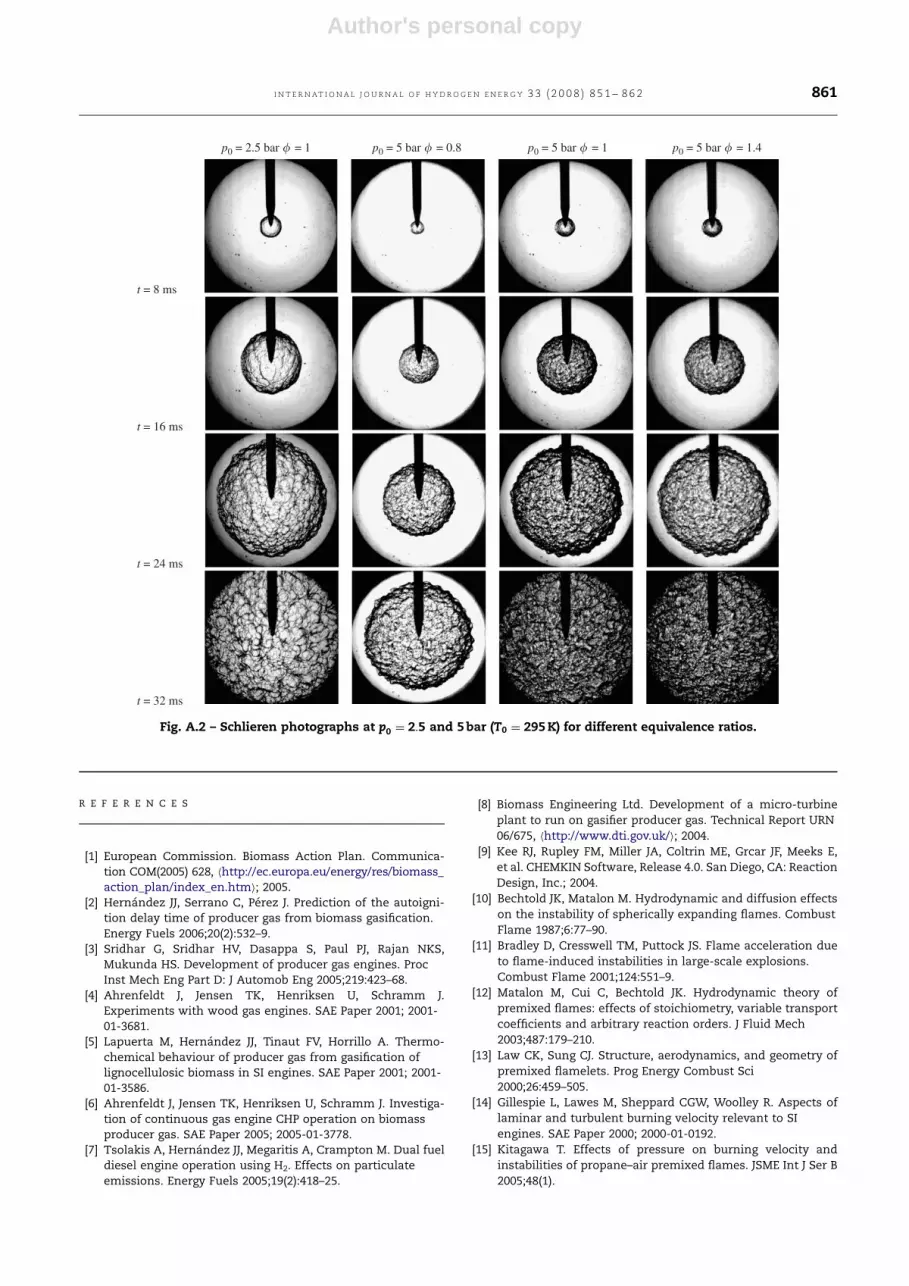
Shown in Fig. 3 are plots of measured flame speed against
mean flame radius and stretch rate for two different
conditions, representative of (a) laminar and (b) cellular
flames. Laminar flames (Appendix A, Fig. A.1) obtained at
low pressure, while cellular flames (Appendix A, Fig. A.2) were
observed at higher pressure. In their earliest stages of
development (for very small radii and high stretch rate) the
propagation of all flames was affected by the excess energy
from the spark; flame speed data for this period were
therefore disregarded. It would have been possible to adjust
the spark ignition energy to the minimum for each experi-
mental condition to minimise this effect; however, previous
work had shown that ignition energy does not affect the
flame speed for radii greater than 5 mm [29,31] and so a
constant ignition energy was adopted in all experiments.
Since pressure and temperature remained constant during
the analysed period of flame development, variation in the
flame speed with radius/time for smooth laminar flames (e.g.
those at 1 bar) could be ascribed solely to changes in stretch
rate. Thus, from Eq. (3), the best straight line fit to the
experimentally derived Sn vs. a data (e.g. Fig. 3) yielded the
Markstein length as the slope of that line and the unstretched
laminar flame speed as its extrapolation to zero stretch rate.
For the case shown in Fig. 3(a), positive Lb, flame speed can be
seen to reduce with increasing stretch rate and vice versa (i.e.
stretch is detrimental to burning rate); conversely, for the
negative Lb case shown in Fig. 3(b), flame speed can be seen to
increase with higher stretch rates (i.e. stretch is beneficial to
burning rate). However, as also indicated in that figure
(illustrating behaviour typical of that noted for producer gas
at 2.5 and 5 bar), the flame rapidly became cellular with
increasing flame radius (and reducing stretch rate). This onset
of cellularity was accompanied with enhanced magnitude of
Sn, Fig. 3(b). For such flames, as discussed in Section 4 (below),
if the non-cellular region became too restricted for reliable
determination of Ss by the extrapolation technique then Ss
was put equal to the minimum recorded Sn value.
Finally, laminar burning velocity (ulÞ data were obtained
from values of Ss on the basis of the following equation:
ul ¼ Ssrb
ru, (4)
where rb and ru represent the densities of the burned (b) and
the unburned (u) gases, respectively.
The experimentally determined values of Markstein length
were similarly expressed as non-dimensional Markstein
number via the following equation [29]:
Ma ¼Lb
dl, (5)
ARTICLE IN PRESS
Fig. 2 – Evolution of the flame at the beginning of the
combustion.
I N T E R N A T I O N A L J O U R N A L O F H Y D R O G E N E N E R G Y 3 3 ( 2 0 0 8 ) 8 5 1 – 8 6 2854
Author's personal copy
where dl is the laminar flame thickness, calculated as the
ratio of burned product kinematic viscosity to laminar
burning velocity.
The set composition and equivalence ratio of the mixture
were functions of the accuracy of pressure measurement
during the process of filling the bomb using the partial
pressure method. The maximum absolute errors on the initial
pressure and temperature were 0.005 bar and 5 K, respectively.
In the worst case (1 bar and f ¼ 0:8), this would result in a
relative error of 6% in the molar fraction of hydrogen.
4. Results and discussion
4.1. Response to stretch rate
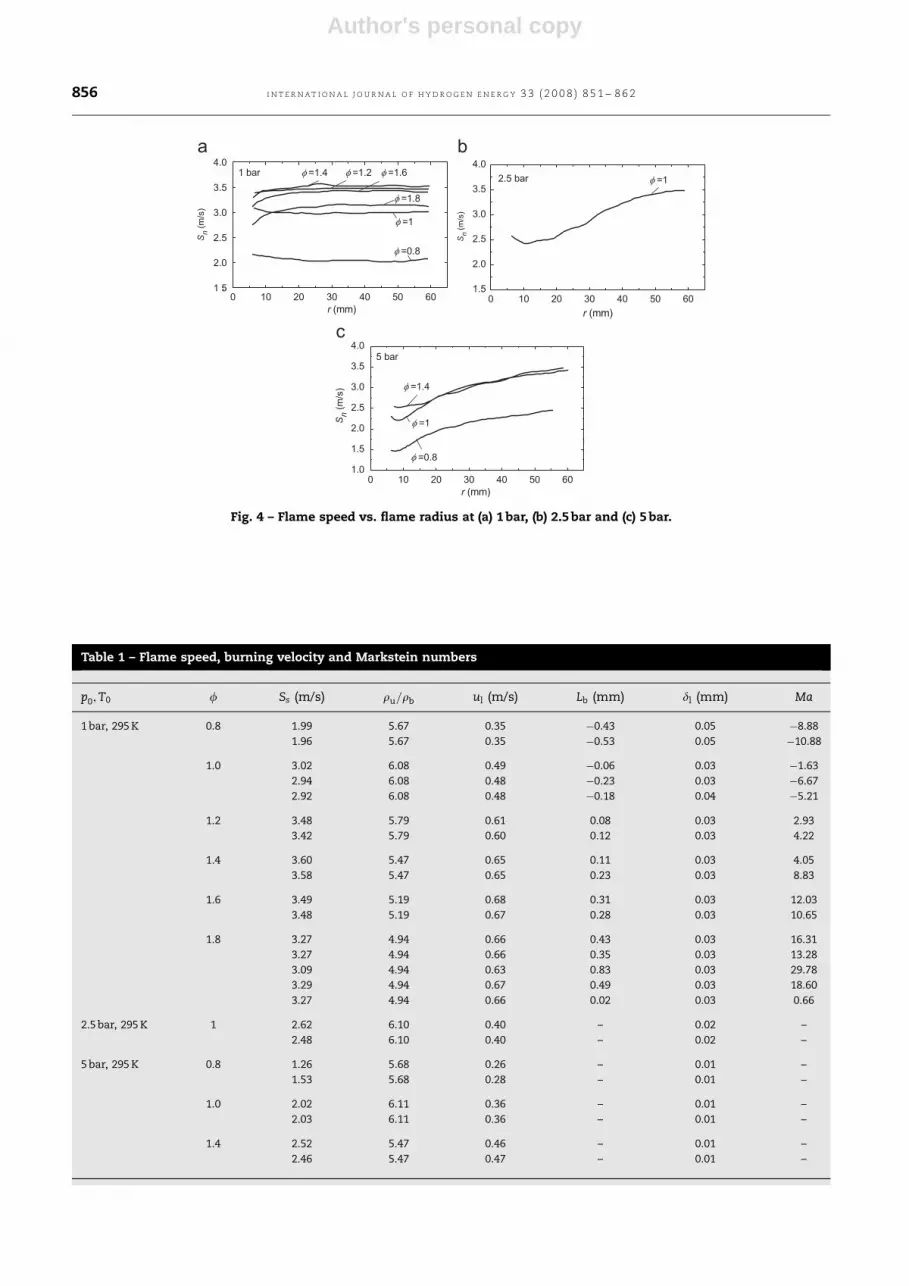
Set out in Fig. 4 are plots of flame speed (SnÞ against
flame radius for the ranges of initial pressure and equivalence
fuel/air ratio examined.
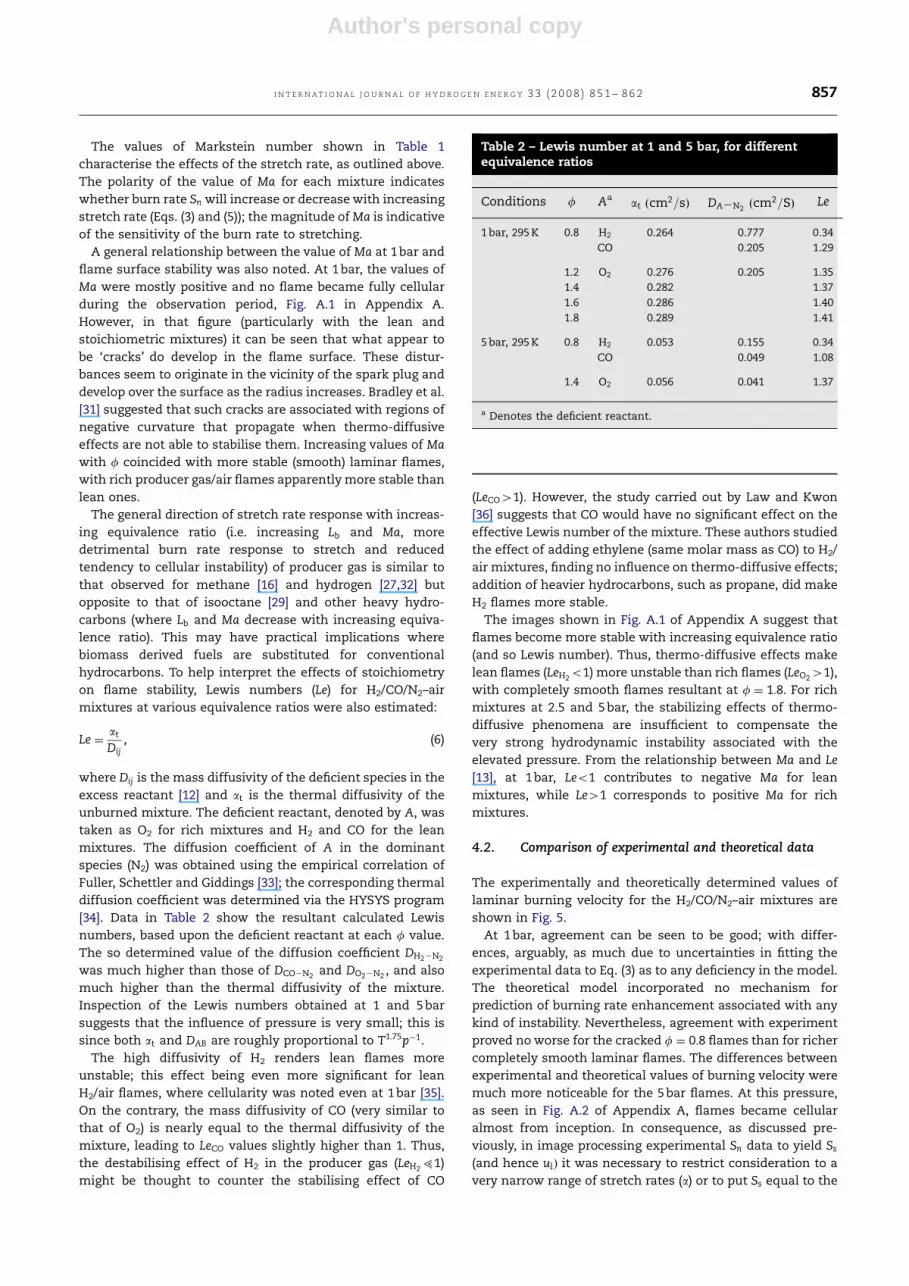
As shown in Table 1, several experimental tests were
performed at each condition in order to check the consistency
of the results. At 1 bar, the repeatability of ul values proved
good, with event to event variations of less than 2%, except
for mixtures at f ¼ 1:8, for which the difference between tests
could be as much as 6%. The repeatability in Markstein
number values was not as good, even for these stable low
pressure flames. This was associated with uncertainty in
determination of the values of Lb and dl. As seen in Fig. 3, with
increasing propensity to cellularity, rather less experimental
points were available for the linear fit required for the
extrapolation of flame speed to zero stretch and correspond-
ing evaluation of laminar burning velocity and Markstein
length/number. The number of data points used was subject
to a degree of judgement, particularly as flames became more
cellular. Changes in the number of points used in linear fits
generally led to changes in ul of only 1.5%; however the
corresponding values of Lb was found to change as much as
20%. Similar levels of uncertainty in the determination of
Markstein lengths have been reported previously [29]. Since
the flame thickness is definition dependent, there exist
considerable uncertainties in its value; an accurate determi-
nation of dl would require determination of at least the
thermal profile of the flame for which the laminar burning
velocity is required for validation.
At higher pressures, flames became cellular soon after
inception, with the range of stretch rates available for the
processing method described above becoming very limited. In
consequence, no meaningful Lb and Ma values could be
presented in Table 1 for the experiments at 2.5 or 5 bar;
similarly, since extrapolation to zero stretch was impossible,
the given values of ul might be considered less reliable at
those pressures.
At 1 bar, the effect of the stretch rate can be determined
from the flame speed evolutions, shown in Fig. 4(a) for the
range of equivalence ratios explored. For rich producer gas/air
mixtures, the flame speed (SnÞ can be seen slowly to increase
as the flame propagates (and stretch rate decreases). For
lean and stoichiometric mixtures the effect of the stretch
rate can be seen to be opposite, with decreasing flame
speed as flames propagate and become larger (although,
arguably, for all flames at 1 bar Sn might be considered to be
almost constant at the lower stretch rates consistent with
flame radii 430 mm). This behaviour with increasing flame
radius and reducing stretch rate effect can also be observed at
higher pressures, Figs. 4(b) and (c), prior to the onset of
cellularity—at which point flames accelerated. It should
be noted that while Sn changes associated with stretch rate
are of the order of 0.2 m/s, Fig. 4(a), those associated with
cellular flame development can be as much as 1 m/s, Figs. 4(b)
and (c).
ARTICLE IN PRESS
Fig. 3 – Flame speed vs. flame radius and stretch rate at (a) 1 bar, / ¼ 1:8 and (b) 5 bar, / ¼ 0:8.
I N T E R N AT I O N A L J O U R N A L O F H Y D R O G E N E N E R G Y 3 3 ( 2 0 0 8 ) 8 5 1 – 8 6 2 855
Author's personal copyARTICLE IN PRESS
Fig. 4 – Flame speed vs. flame radius at (a) 1 bar, (b) 2.5 bar and (c) 5 bar.
Table 1 – Flame speed, burning velocity and Markstein numbers
p0;T0 f Ss (m/s) ru=rb ul (m/s) Lb (mm) dl (mm) Ma
1 bar, 295 K 0.8 1.99 5.67 0.35 �0.43 0.05 �8.88
1.96 5.67 0.35 �0.53 0.05 �10.88
1.0 3.02 6.08 0.49 �0.06 0.03 �1.63
2.94 6.08 0.48 �0.23 0.03 �6.67
2.92 6.08 0.48 �0.18 0.04 �5.21
1.2 3.48 5.79 0.61 0.08 0.03 2.93
3.42 5.79 0.60 0.12 0.03 4.22
1.4 3.60 5.47 0.65 0.11 0.03 4.05
3.58 5.47 0.65 0.23 0.03 8.83
1.6 3.49 5.19 0.68 0.31 0.03 12.03
3.48 5.19 0.67 0.28 0.03 10.65
1.8 3.27 4.94 0.66 0.43 0.03 16.31
3.27 4.94 0.66 0.35 0.03 13.28
3.09 4.94 0.63 0.83 0.03 29.78
3.29 4.94 0.67 0.49 0.03 18.60
3.27 4.94 0.66 0.02 0.03 0.66
2.5 bar, 295 K 1 2.62 6.10 0.40 – 0.02 –
2.48 6.10 0.40 – 0.02 –
5 bar, 295 K 0.8 1.26 5.68 0.26 – 0.01 –
1.53 5.68 0.28 – 0.01 –
1.0 2.02 6.11 0.36 – 0.01 –
2.03 6.11 0.36 – 0.01 –
1.4 2.52 5.47 0.46 – 0.01 –
2.46 5.47 0.47 – 0.01 –
I N T E R N A T I O N A L J O U R N A L O F H Y D R O G E N E N E R G Y 3 3 ( 2 0 0 8 ) 8 5 1 – 8 6 2856
Author's personal copy
The values of Markstein number shown in Table 1
characterise the effects of the stretch rate, as outlined above.
The polarity of the value of Ma for each mixture indicates
whether burn rate Sn will increase or decrease with increasing
stretch rate (Eqs. (3) and (5)); the magnitude of Ma is indicative
of the sensitivity of the burn rate to stretching.
A general relationship between the value of Ma at 1 bar and
flame surface stability was also noted. At 1 bar, the values of
Ma were mostly positive and no flame became fully cellular
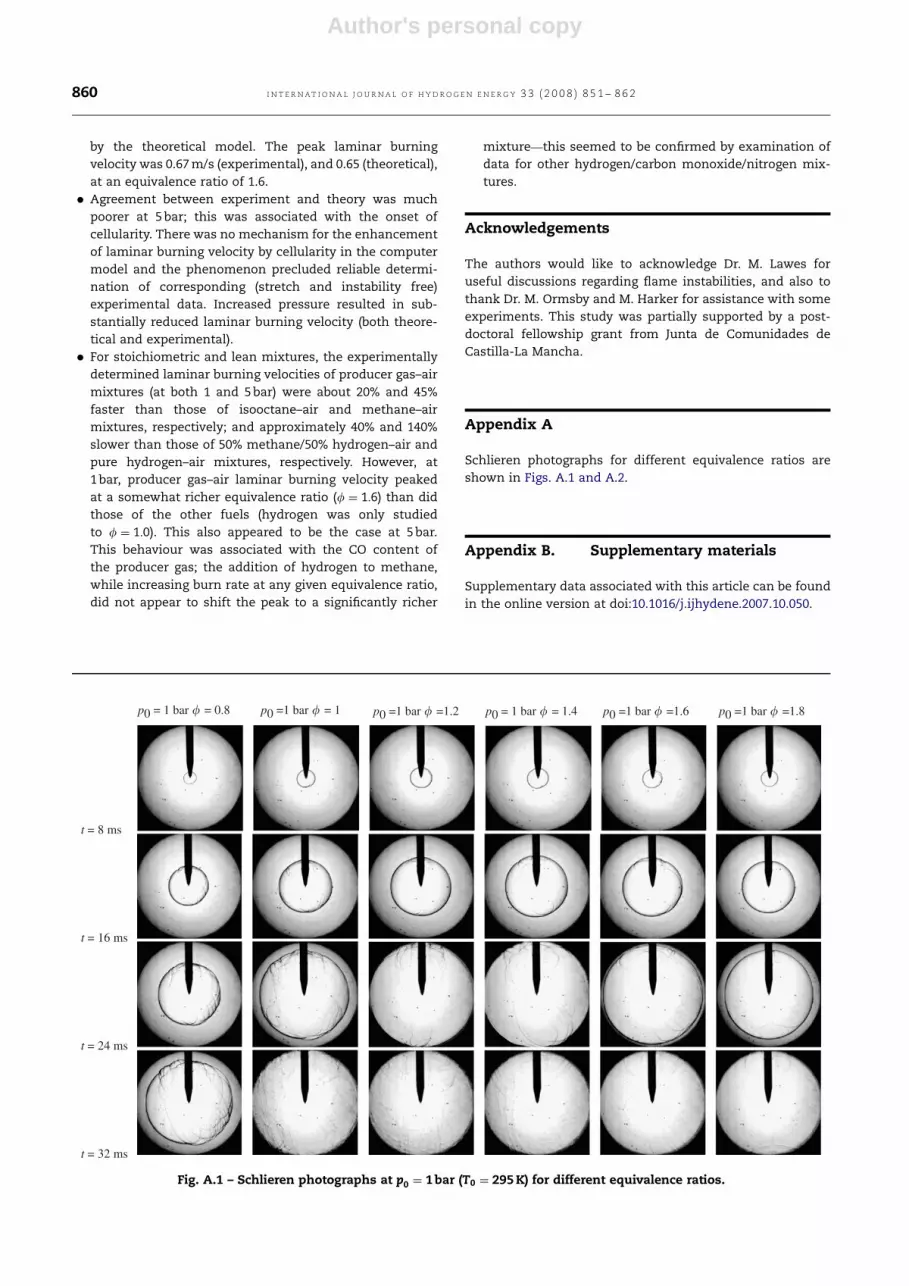
during the observation period, Fig. A.1 in Appendix A.
However, in that figure (particularly with the lean and
stoichiometric mixtures) it can be seen that what appear to
be ‘cracks’ do develop in the flame surface. These distur-
bances seem to originate in the vicinity of the spark plug and
develop over the surface as the radius increases. Bradley et al.
[31] suggested that such cracks are associated with regions of
negative curvature that propagate when thermo-diffusive
effects are not able to stabilise them. Increasing values of Ma
with f coincided with more stable (smooth) laminar flames,
with rich producer gas/air flames apparently more stable than
lean ones.
The general direction of stretch rate response with increas-
ing equivalence ratio (i.e. increasing Lb and Ma, more
detrimental burn rate response to stretch and reduced
tendency to cellular instability) of producer gas is similar to
that observed for methane [16] and hydrogen [27,32] but
opposite to that of isooctane [29] and other heavy hydro-
carbons (where Lb and Ma decrease with increasing equiva-
lence ratio). This may have practical implications where
biomass derived fuels are substituted for conventional
hydrocarbons. To help interpret the effects of stoichiometry
on flame stability, Lewis numbers (Le) for H2/CO/N2–air
mixtures at various equivalence ratios were also estimated:
Le ¼at
Dij, (6)
where Dij is the mass diffusivity of the deficient species in the
excess reactant [12] and at is the thermal diffusivity of the
unburned mixture. The deficient reactant, denoted by A, was
taken as O2 for rich mixtures and H2 and CO for the lean
mixtures. The diffusion coefficient of A in the dominant
species (N2) was obtained using the empirical correlation of
Fuller, Schettler and Giddings [33]; the corresponding thermal
diffusion coefficient was determined via the HYSYS program
[34]. Data in Table 2 show the resultant calculated Lewis
numbers, based upon the deficient reactant at each f value.
The so determined value of the diffusion coefficient DH22N2
was much higher than those of DCO2N2 and DO22N2 , and also
much higher than the thermal diffusivity of the mixture.
Inspection of the Lewis numbers obtained at 1 and 5 bar
suggests that the influence of pressure is very small; this is
since both at and DAB are roughly proportional to T1:75p�1.
The high diffusivity of H2 renders lean flames more
unstable; this effect being even more significant for lean
H2/air flames, where cellularity was noted even at 1 bar [35].
On the contrary, the mass diffusivity of CO (very similar to
that of O2) is nearly equal to the thermal diffusivity of the
mixture, leading to LeCO values slightly higher than 1. Thus,
the destabilising effect of H2 in the producer gas (LeH251)
might be thought to counter the stabilising effect of CO
(LeCO41). However, the study carried out by Law and Kwon
[36] suggests that CO would have no significant effect on the
effective Lewis number of the mixture. These authors studied
the effect of adding ethylene (same molar mass as CO) to H2/
air mixtures, finding no influence on thermo-diffusive effects;
addition of heavier hydrocarbons, such as propane, did make
H2 flames more stable.
The images shown in Fig. A.1 of Appendix A suggest that
flames become more stable with increasing equivalence ratio
(and so Lewis number). Thus, thermo-diffusive effects make
lean flames (LeH2o1) more unstable than rich flames (LeO2
41),
with completely smooth flames resultant at f ¼ 1:8. For rich
mixtures at 2.5 and 5 bar, the stabilizing effects of thermo-
diffusive phenomena are insufficient to compensate the
very strong hydrodynamic instability associated with the
elevated pressure. From the relationship between Ma and Le
[13], at 1 bar, Leo1 contributes to negative Ma for lean
mixtures, while Le41 corresponds to positive Ma for rich
mixtures.
4.2. Comparison of experimental and theoretical data
The experimentally and theoretically determined values of
laminar burning velocity for the H2/CO/N2–air mixtures are
shown in Fig. 5.
At 1 bar, agreement can be seen to be good; with differ-
ences, arguably, as much due to uncertainties in fitting the
experimental data to Eq. (3) as to any deficiency in the model.
The theoretical model incorporated no mechanism for
prediction of burning rate enhancement associated with any
kind of instability. Nevertheless, agreement with experiment
proved no worse for the cracked f ¼ 0:8 flames than for richer
completely smooth laminar flames. The differences between
experimental and theoretical values of burning velocity were
much more noticeable for the 5 bar flames. At this pressure,
as seen in Fig. A.2 of Appendix A, flames became cellular
almost from inception. In consequence, as discussed pre-
viously, in image processing experimental Sn data to yield Ss
(and hence ulÞ it was necessary to restrict consideration to a
very narrow range of stretch rates (a) or to put Ss equal to the
ARTICLE IN PRESS
Table 2 – Lewis number at 1 and 5 bar, for differentequivalence ratios
Conditions f Aa at ðcm2=sÞ DA2N2ðcm2=SÞ Le
1 bar, 295 K 0.8 H2 0.264 0.777 0.34
CO 0.205 1.29
1.2 O2 0.276 0.205 1.35
1.4 0.282 1.37
1.6 0.286 1.40
1.8 0.289 1.41
5 bar, 295 K 0.8 H2 0.053 0.155 0.34
CO 0.049 1.08
1.4 O2 0.056 0.041 1.37
a Denotes the deficient reactant.
I N T E R N AT I O N A L J O U R N A L O F H Y D R O G E N E N E R G Y 3 3 ( 2 0 0 8 ) 8 5 1 – 8 6 2 857
Author's personal copy
minimum observed value of Sn. The difficulty of extrapolating
to zero stretch is likely to have lead to a degree of over-
prediction of ul at the higher pressure, since in Fig. 4(c) the
stretch was seen to increase the burn rate.
Data shown in Fig. 5 suggest that there may be a need to
incorporate some mechanism to account for cellularity in
modelling real flames at high pressure. Nevertheless, there is
agreement between experiment and theory in that laminar
burning velocity decreases with pressure and peaks at very
rich mixtures (f ¼ 1:6). The reason for the latter behaviour is
that, unlike the adiabatic flame temperature of conventional
fuels (which peak at f � 1), the net reaction rate of the
oxidation process for H2/air and CO/air mixtures peaks at
f � 2 [37].
Avoidance of cellularity in high pressure flame experiments
for mixtures containing significant hydrogen content is
problematic. The Princeton group [38] has been able to obtain
laminar flames at high pressure by increasing the Lewis
number of the mixture (e.g. substituting N2 by He). However
this generates a different burning velocity to that obtained
with nitrogen and one-dimension kinetic computations
(tuned using the He data) were required to correct mea-
sured burning velocity; introducing new uncertainties. An
alternative solution might be to quantify the burning
enhancement of cellularity by means of fractal considera-
tions of the flame surface area [39,40]; the ratio of burning
velocities with and without instabilities is taken equal to
that of the surface areas, provided flame stretch effects can
be neglected. To date this technique remains in the develop-
ment stage and requires further validation with well-char-
acterised fuels.
The possible influence of cellular instabilities on premixed
turbulent flames is currently unknown. It is possible that the
high pressure laminar burning velocities presented here (with
some cellularity effects included) might be more appropriate
for use in simplified turbulent burning velocity correlations
than theoretical one-dimensional values. This is the subject
of ongoing research.
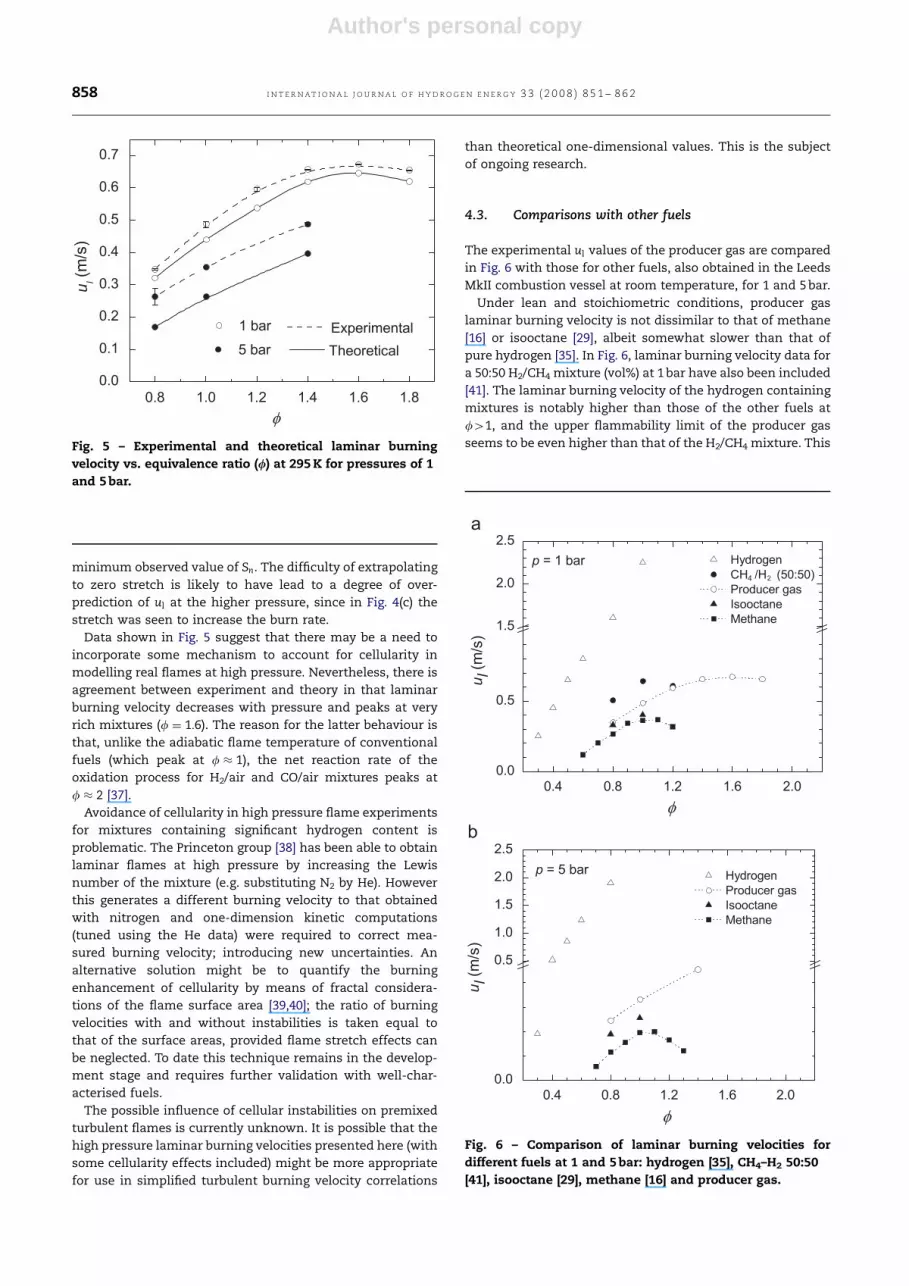
4.3. Comparisons with other fuels
The experimental ul values of the producer gas are compared
in Fig. 6 with those for other fuels, also obtained in the Leeds
MkII combustion vessel at room temperature, for 1 and 5 bar.
Under lean and stoichiometric conditions, producer gas
laminar burning velocity is not dissimilar to that of methane
[16] or isooctane [29], albeit somewhat slower than that of
pure hydrogen [35]. In Fig. 6, laminar burning velocity data for
a 50:50 H2/CH4 mixture (vol%) at 1 bar have also been included
[41]. The laminar burning velocity of the hydrogen containing
mixtures is notably higher than those of the other fuels at
f41, and the upper flammability limit of the producer gas
seems to be even higher than that of the H2/CH4 mixture. This
ARTICLE IN PRESS
Fig. 6 – Comparison of laminar burning velocities for
different fuels at 1 and 5 bar: hydrogen [35], CH4–H2 50:50
[41], isooctane [29], methane [16] and producer gas.
Fig. 5 – Experimental and theoretical laminar burning
velocity vs. equivalence ratio (/) at 295 K for pressures of 1
and 5 bar.
I N T E R N A T I O N A L J O U R N A L O F H Y D R O G E N E N E R G Y 3 3 ( 2 0 0 8 ) 8 5 1 – 8 6 2858
Author's personal copy
is because the value of ul for carbon monoxide/air mixtures
peaks at higher equivalence ratio than that of hydrogen/air
mixtures.
A number of other workers have published laminar burning
velocity data over a range of equivalence ratios at 1 bar and
room temperature for various other H2/CO fuels (with and
without excess nitrogen), Table 3.
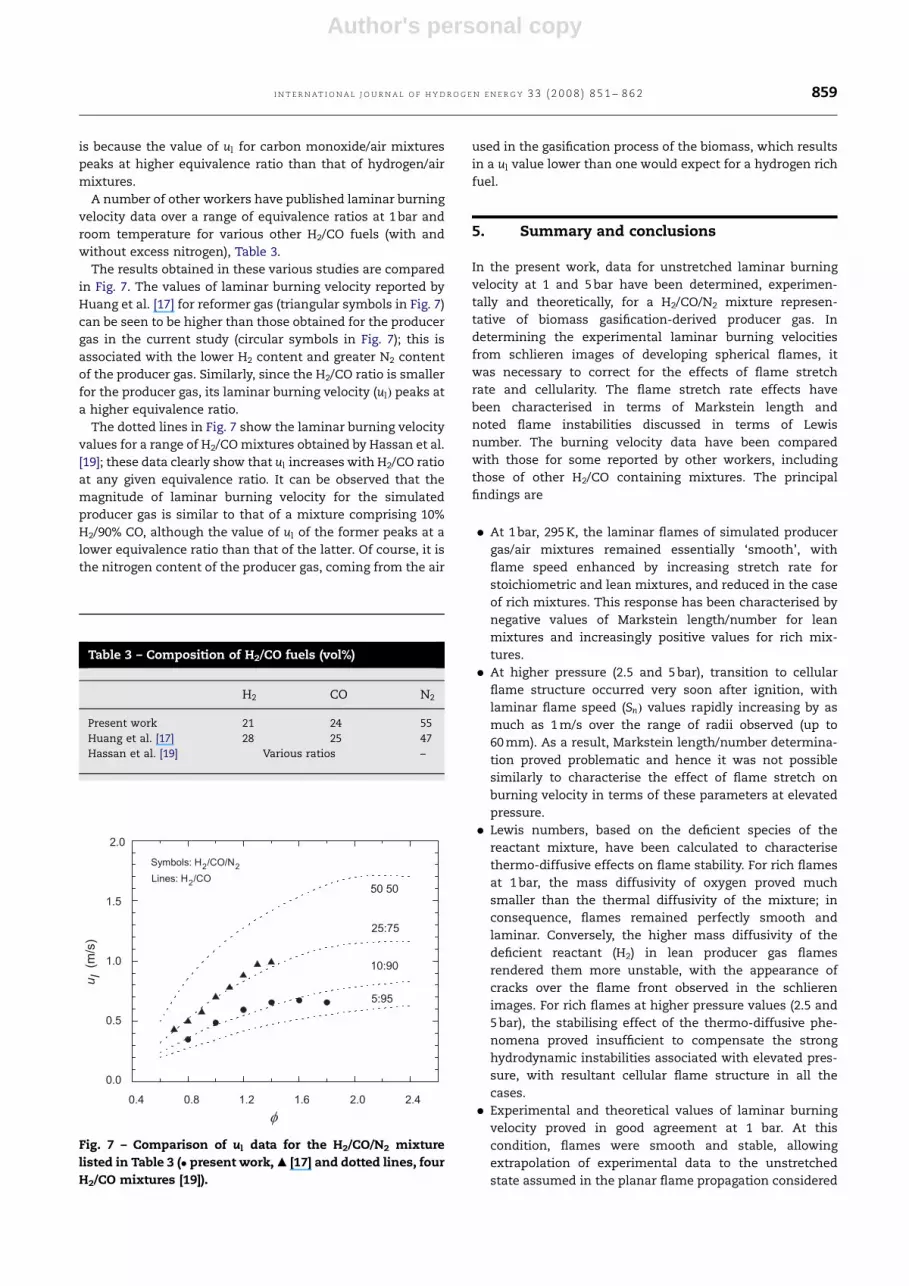
The results obtained in these various studies are compared
in Fig. 7. The values of laminar burning velocity reported by
Huang et al. [17] for reformer gas (triangular symbols in Fig. 7)
can be seen to be higher than those obtained for the producer
gas in the current study (circular symbols in Fig. 7); this is
associated with the lower H2 content and greater N2 content
of the producer gas. Similarly, since the H2/CO ratio is smaller
for the producer gas, its laminar burning velocity (ulÞ peaks at
a higher equivalence ratio.
The dotted lines in Fig. 7 show the laminar burning velocity
values for a range of H2/CO mixtures obtained by Hassan et al.
[19]; these data clearly show that ul increases with H2/CO ratio
at any given equivalence ratio. It can be observed that the
magnitude of laminar burning velocity for the simulated
producer gas is similar to that of a mixture comprising 10%
H2/90% CO, although the value of ul of the former peaks at a
lower equivalence ratio than that of the latter. Of course, it is
the nitrogen content of the producer gas, coming from the air
used in the gasification process of the biomass, which results
in a ul value lower than one would expect for a hydrogen rich
fuel.
5. Summary and conclusions
In the present work, data for unstretched laminar burning
velocity at 1 and 5 bar have been determined, experimen-
tally and theoretically, for a H2/CO/N2 mixture represen-
tative of biomass gasification-derived producer gas. In
determining the experimental laminar burning velocities
from schlieren images of developing spherical flames, it
was necessary to correct for the effects of flame stretch
rate and cellularity. The flame stretch rate effects have
been characterised in terms of Markstein length and
noted flame instabilities discussed in terms of Lewis
number. The burning velocity data have been compared
with those for some reported by other workers, including
those of other H2/CO containing mixtures. The principal
findings are
� At 1 bar, 295 K, the laminar flames of simulated producer
gas/air mixtures remained essentially ‘smooth’, with
flame speed enhanced by increasing stretch rate for
stoichiometric and lean mixtures, and reduced in the case
of rich mixtures. This response has been characterised by
negative values of Markstein length/number for lean
mixtures and increasingly positive values for rich mix-
tures.
� At higher pressure (2.5 and 5 bar), transition to cellular
flame structure occurred very soon after ignition, with
laminar flame speed (SnÞ values rapidly increasing by as
much as 1 m/s over the range of radii observed (up to
60 mm). As a result, Markstein length/number determina-
tion proved problematic and hence it was not possible
similarly to characterise the effect of flame stretch on
burning velocity in terms of these parameters at elevated
pressure.
� Lewis numbers, based on the deficient species of the
reactant mixture, have been calculated to characterise
thermo-diffusive effects on flame stability. For rich flames
at 1 bar, the mass diffusivity of oxygen proved much
smaller than the thermal diffusivity of the mixture; in
consequence, flames remained perfectly smooth and
laminar. Conversely, the higher mass diffusivity of the
deficient reactant (H2) in lean producer gas flames
rendered them more unstable, with the appearance of
cracks over the flame front observed in the schlieren
images. For rich flames at higher pressure values (2.5 and
5 bar), the stabilising effect of the thermo-diffusive phe-
nomena proved insufficient to compensate the strong
hydrodynamic instabilities associated with elevated pres-
sure, with resultant cellular flame structure in all the
cases.
� Experimental and theoretical values of laminar burning
velocity proved in good agreement at 1 bar. At this
condition, flames were smooth and stable, allowing
extrapolation of experimental data to the unstretched
state assumed in the planar flame propagation considered
ARTICLE IN PRESS
Fig. 7 – Comparison of ul data for the H2/CO/N2 mixture
listed in Table 3 (� present work, m [17] and dotted lines, four
H2/CO mixtures [19]).
Table 3 – Composition of H2/CO fuels (vol%)
H2 CO N2
Present work 21 24 55
Huang et al. [17] 28 25 47
Hassan et al. [19] Various ratios –
I N T E R N AT I O N A L J O U R N A L O F H Y D R O G E N E N E R G Y 3 3 ( 2 0 0 8 ) 8 5 1 – 8 6 2 859
Author's personal copy
by the theoretical model. The peak laminar burning
velocity was 0.67 m/s (experimental), and 0.65 (theoretical),
at an equivalence ratio of 1.6.
� Agreement between experiment and theory was much
poorer at 5 bar; this was associated with the onset of
cellularity. There was no mechanism for the enhancement
of laminar burning velocity by cellularity in the computer
model and the phenomenon precluded reliable determi-
nation of corresponding (stretch and instability free)
experimental data. Increased pressure resulted in sub-
stantially reduced laminar burning velocity (both theore-
tical and experimental).
� For stoichiometric and lean mixtures, the experimentally
determined laminar burning velocities of producer gas–air
mixtures (at both 1 and 5 bar) were about 20% and 45%
faster than those of isooctane–air and methane–air
mixtures, respectively; and approximately 40% and 140%
slower than those of 50% methane/50% hydrogen–air and
pure hydrogen–air mixtures, respectively. However, at
1 bar, producer gas–air laminar burning velocity peaked
at a somewhat richer equivalence ratio (f ¼ 1:6) than did
those of the other fuels (hydrogen was only studied
to f ¼ 1:0). This also appeared to be the case at 5 bar.
This behaviour was associated with the CO content of
the producer gas; the addition of hydrogen to methane,
while increasing burn rate at any given equivalence ratio,
did not appear to shift the peak to a significantly richer
mixture—this seemed to be confirmed by examination of
data for other hydrogen/carbon monoxide/nitrogen mix-
tures.
Acknowledgements
The authors would like to acknowledge Dr. M. Lawes for
useful discussions regarding flame instabilities, and also to
thank Dr. M. Ormsby and M. Harker for assistance with some
experiments. This study was partially supported by a post-
doctoral fellowship grant from Junta de Comunidades de
Castilla-La Mancha.
Appendix A
Schlieren photographs for different equivalence ratios are
shown in Figs. A.1 and A.2.
Appendix B. Supplementary materials
Supplementary data associated with this article can be found
in the online version at doi:10.1016/j.ijhydene.2007.10.050.
ARTICLE IN PRESS
p0 = 1 bar � = 0.8 p0 =1 bar � = 1 p0 =1 bar � =1.2 p0 = 1 bar � = 1.4 p0 =1 bar � =1.6 p0 =1 bar � =1.8
t = 8 ms
t = 16 ms
t = 24 ms
t = 32 ms
Fig. A.1 – Schlieren photographs at p0 ¼ 1 bar (T0 ¼ 295 K) for different equivalence ratios.
I N T E R N A T I O N A L J O U R N A L O F H Y D R O G E N E N E R G Y 3 3 ( 2 0 0 8 ) 8 5 1 – 8 6 2860
Author's personal copy
R E F E R E N C E S
[1] European Commission. Biomass Action Plan. Communica-tion COM(2005) 628, hhttp://ec.europa.eu/energy/res/biomass_action_plan/index_en.htmi; 2005.
[2] Hernandez JJ, Serrano C, Perez J. Prediction of the autoigni-tion delay time of producer gas from biomass gasification.Energy Fuels 2006;20(2):532–9.
[3] Sridhar G, Sridhar HV, Dasappa S, Paul PJ, Rajan NKS,Mukunda HS. Development of producer gas engines. ProcInst Mech Eng Part D: J Automob Eng 2005;219:423–68.
[4] Ahrenfeldt J, Jensen TK, Henriksen U, Schramm J.Experiments with wood gas engines. SAE Paper 2001; 2001-01-3681.
[5] Lapuerta M, Hernandez JJ, Tinaut FV, Horrillo A. Thermo-chemical behaviour of producer gas from gasification oflignocellulosic biomass in SI engines. SAE Paper 2001; 2001-01-3586.
[6] Ahrenfeldt J, Jensen TK, Henriksen U, Schramm J. Investiga-tion of continuous gas engine CHP operation on biomassproducer gas. SAE Paper 2005; 2005-01-3778.
[7] Tsolakis A, Hernandez JJ, Megaritis A, Crampton M. Dual fueldiesel engine operation using H2. Effects on particulateemissions. Energy Fuels 2005;19(2):418–25.
[8] Biomass Engineering Ltd. Development of a micro-turbine
plant to run on gasifier producer gas. Technical Report URN
06/675, hhttp://www.dti.gov.uk/i; 2004.
[9] Kee RJ, Rupley FM, Miller JA, Coltrin ME, Grcar JF, Meeks E,et al. CHEMKIN Software, Release 4.0. San Diego, CA: Reaction
Design, Inc.; 2004.
[10] Bechtold JK, Matalon M. Hydrodynamic and diffusion effects
on the instability of spherically expanding flames. Combust
Flame 1987;6:77–90.
[11] Bradley D, Cresswell TM, Puttock JS. Flame acceleration due
to flame-induced instabilities in large-scale explosions.Combust Flame 2001;124:551–9.
[12] Matalon M, Cui C, Bechtold JK. Hydrodynamic theory of
premixed flames: effects of stoichiometry, variable transport
coefficients and arbitrary reaction orders. J Fluid Mech
2003;487:179–210.
[13] Law CK, Sung CJ. Structure, aerodynamics, and geometry of
premixed flamelets. Prog Energy Combust Sci
2000;26:459–505.[14] Gillespie L, Lawes M, Sheppard CGW, Woolley R. Aspects of
laminar and turbulent burning velocity relevant to SI
engines. SAE Paper 2000; 2000-01-0192.
[15] Kitagawa T. Effects of pressure on burning velocity and
instabilities of propane–air premixed flames. JSME Int J Ser B
2005;48(1).
ARTICLE IN PRESS
p0 = 5 bar � = 0.8
t = 8 ms
t = 16 ms
t = 24 ms
t = 32 ms
p0 = 2.5 bar � = 1 p0 = 5 bar � = 1 p0 = 5 bar � = 1.4
Fig. A.2 – Schlieren photographs at p0 ¼ 2:5 and 5 bar (T0 ¼ 295 K) for different equivalence ratios.
I N T E R N AT I O N A L J O U R N A L O F H Y D R O G E N E N E R G Y 3 3 ( 2 0 0 8 ) 8 5 1 – 8 6 2 861
Author's personal copy
[16] Gu XJ, Haq MZ, Lawes M, Woolley R. Laminar burning velocityand Markstein lengths of methane–air mixtures. CombustFlame 2000;121:41–58.
[17] Huang Y, Sung CJ, Eng JA. Laminar flame speeds of primaryreference fuels and reformer gas mixtures. Combust Flame2004;139:239–51.
[18] Han P, Checkel MD, Fleck BA, Nowicki NL. Burning velocity ofmethane/diluent mixture with reformer gas addition. Fuel2007;86:585–96.
[19] Hassan MI, Aung KT, Faeth GM. Properties of laminarpremixed CO/H2/air flames at various pressures. J PropulPower 1997;13(2):239–45.
[20] Sung CJ, Huang Y, Eng JA. Effects of reformer gas addition onthe laminar flame speeds and flammability limits ofn-butane and iso-butane flames. Combust Flame2001;126:1699–713.
[21] Sridhar G, Paul PJ, Mukunda HS. Computational studies of thelaminar burning velocity of a producer gas and air mixtureunder typical engine conditions. Proc Inst Mech Eng Part A JPower Energy 2005;219:195–201.
[22] Hernandez JJ, Lapuerta M, Serrano C, Melgar A. Estimation ofthe laminar flame speed of producer gas from biomassgasification. Energy Fuels 2005;19:2172–8.
[23] Metghalchi M, Keck JC. Laminar burning velocities ofpropane mixtures at high temperature and pressure. Com-bust Flame 1980;38:43–154.
[24] Melgar A, Perez JF, Laget H, Horrillo A. Thermochemicalequilibrium modelling of a gasifying process. Energy ConversManage 2007;48:59–67.
[25] FAO. Wood gas as engine fuel. Food and AgriculturalOrganization of the United Nations (FAO), Rome, 1993.
[26] Smith GP, Golden DM, Frenklach M, Moriarty NW, Eiteneer B,Goldenberg M, et al. GRI-Mech 3.0. Gas Research Institute,hhttp://www.me.berkeley.edu/gri_mech/i; 1995.
[27] Verhelst S, Woolley R, Lawes M, Sierens R. Laminar andunstable burning velocities and Markstein lengths of hydro-gen–air mixtures at engine-like conditions. Proc. Combust.Inst. 2005;30:209–16.
[28] Weinberg FJ. Optics of flames. London: Butterworth; 1963.[29] Bradley D, Hicks RA, Lawes M, Sheppard CGW, Woolley R. The
measurement of laminar burning velocities and Marksteinlengths for iso-octane–air and iso-octane–n–heptane–air
mixtures at elevated temperatures and pressures in anexplosion bomb. Combust Flame 1998;115:126–44.
[30] Bradley D, Gaskell PH, Gu XJ. Burning velocities, Marksteinlengths, and flame quenching for spherical methane–airflames: a computational study. Combust Flame1996;104:176–98.
[31] Bradley D, Sheppard CGW, Woolley R, Greenhalgh DA, LockettRD. The development and structure of flame instabilities andcellularity at low Markstein numbers in explosions. CombustFlame 2000;122:195–209.
[32] Aung KT, Hassan MI, Faeth GM. Flame stretch interactions oflaminar hydrogen/air flames at normal temperature andpressure. Combust Flame 1997;109:1–24.
[33] Poling BE, Prausnitz JM, O’Connell JP. The properties of gasesand liquids. New York: McGraw-Hill; 2001.
[34] Hyprotech. HYSYS 3.01, Documentation. Hyprotech Ltd.Calgary, Alberta, 2002.
[35] Verhelst S. A study of the combustion in hydrogen-fuelledinternal combustion engines. PhD thesis, University ofGhent, Belgium, hhttp://www.floheacom.ugent.be/H2/h2_research_en.htmi; 2005.
[36] Law CK, Kwon OC. Effects of hydrocarbon substitution onatmospheric hydrogen–air flame propagation. Int J HydrogenEnergy 2004;29:867–79.
[37] Griffiths JF, Barnard JA. Flame and combustion. London:Chapman & Hall; 1995.
[38] Burke MP, Qin X, Yu Y, Dryer FL. Measurements ofhydrogen syngas flame speeds at elevated pressures. In:Fifth US combustion meeting. California: San Diego; March2007.
[39] Smallbone A, Kitagawa T, Oonishi T. Unstretched laminarburning velocity estimations from unstable flames at ele-vated pressures. JSME Int J 2006;91-06:15–20.
[40] Al-Shahrany AS, Bradley D, Lawes M, Woolley R. Measure-ment of unstable burning velocities of iso-octane–air mix-tures at high pressure and the derivation of laminar burningvelocities. Proc. Combust. Inst. 2005;30:225–32.
[41] Burluka AA, Fairweather M, Ormsby MP, Sheppard CGW,Woolley R. The laminar burning properties of premixedmethane–hydrogen flames determined using a novel analy-sis method. In: Third European combustion meeting. Crete:Chania; 2007.
ARTICLE IN PRESS
I N T E R N A T I O N A L J O U R N A L O F H Y D R O G E N E N E R G Y 3 3 ( 2 0 0 8 ) 8 5 1 – 8 6 2862


