Embed Size (px)
Citation preview
LUND UNIVERSITY
PO Box 117221 00 Lund+46 46-222 00 00
Extended Producer Responsibility for Closing Material Loops: Lessons from energy-efficient lighting products
Richter, Jessika Luth
2016
Document Version:Publisher's PDF, also known as Version of record
Link to publication
Citation for published version (APA):Richter, J. L. (2016). Extended Producer Responsibility for Closing Material Loops: Lessons from energy-efficient lighting products. Lund University.
Total number of authors:1
General rightsUnless other specific re-use rights are stated the following general rights apply:Copyright and moral rights for the publications made accessible in the public portal are retained by the authorsand/or other copyright owners and it is a condition of accessing publications that users recognise and abide by thelegal requirements associated with these rights. • Users may download and print one copy of any publication from the public portal for the purpose of private studyor research. • You may not further distribute the material or use it for any profit-making activity or commercial gain • You may freely distribute the URL identifying the publication in the public portal
Read more about Creative commons licenses: https://creativecommons.org/licenses/Take down policyIf you believe that this document breaches copyright please contact us providing details, and we will removeaccess to the work immediately and investigate your claim.
Extended Producer Responsibility for Closing Material LoopsLessons from energy-efficient lighting productsJESSIKA LUTH RICHTER
LICENTIATE DISSERTATION |IIIEE | LUND UNIVERSITY

CFL – compact fluorescent lamp
EEE – electrical and electronic equipment
EoL – end-of-life
EPR – extended producer responsibility
EU – European Union
GDL – gas discharge lamp
IPR – individual producer responsibility
LED – light emitting diode
LCA – life cycle assessment
MFA – material flow analysis
MSW – municipal solid waste
PoM – put on market
PRO – producer responsibility organization
PSS – product service system
REE – rare earth element(s)
RoHS – restrictions on the use of hazardous substances
WEEE – waste electrical and electronic equipment
111
2
333
4
555
6
777
8
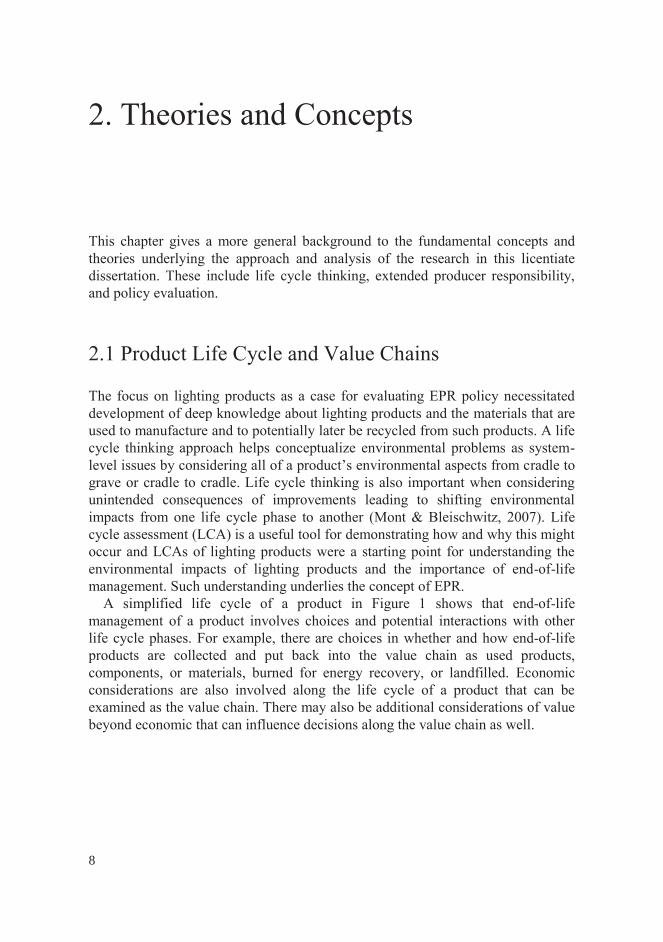
Figure 1. Generic life cycle / value chain of product
999
10
111111
12
3.2.1 EPR evaluation
13
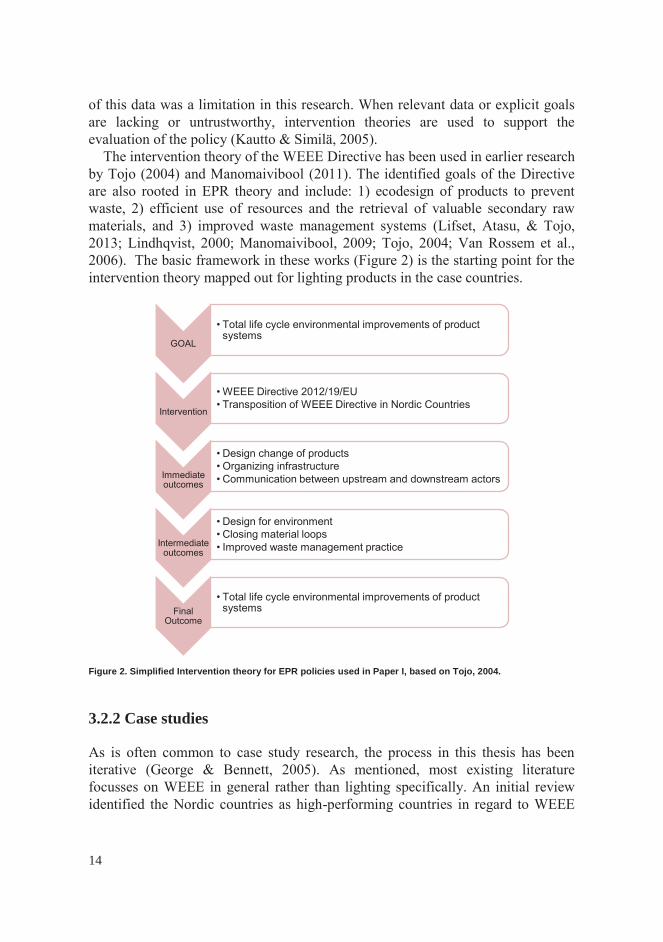
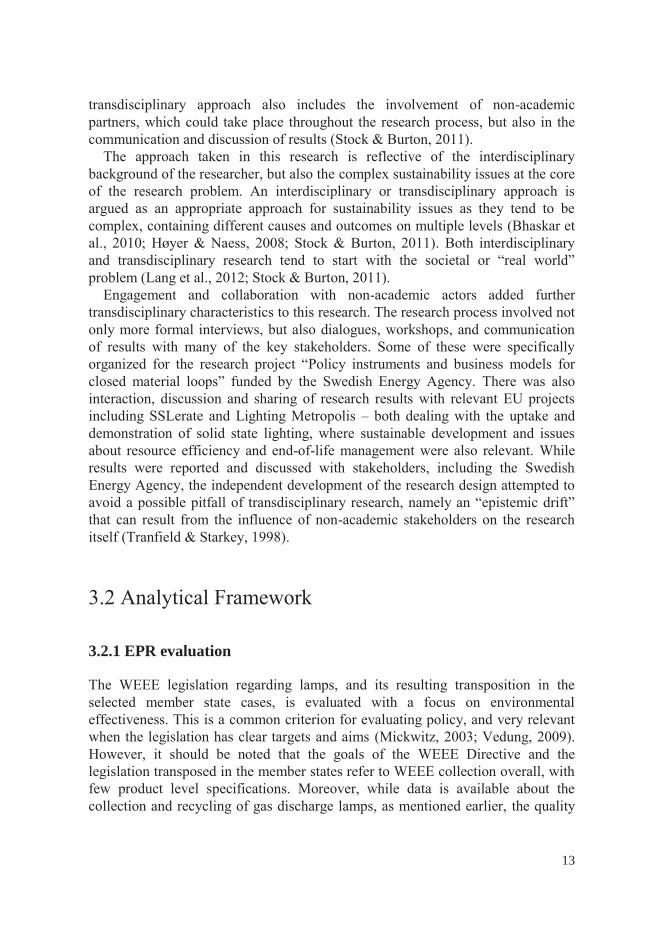
Figure 2. Simplified Intervention theory for EPR policies used in Paper I, based on Tojo, 2004.
3.2.2 Case studies
14
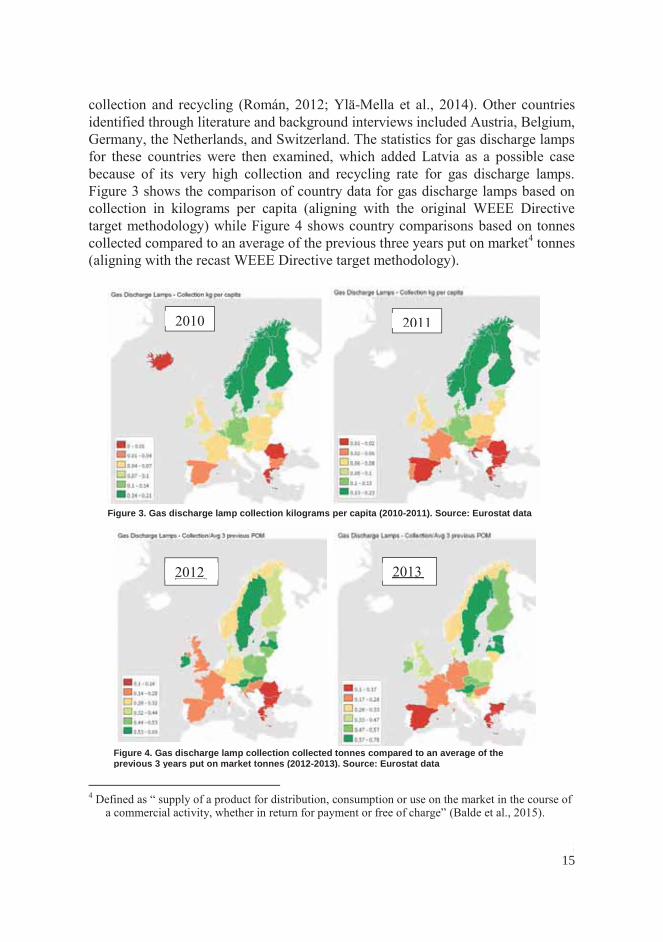
Figure 3. Gas discharge lamp collection kilograms per capita (2010-2011). Source: Eurostat data
Figure 4. Gas discharge lamp collection collected tonnes compared to an average of the previous 3 years put on market tonnes (2012-2013). Source: Eurostat data
1515
3.2.3 Value analysis
16
3.3.1 Literature review
3.3.2 Quantitative data
1717
3.3.3 Interviews
18
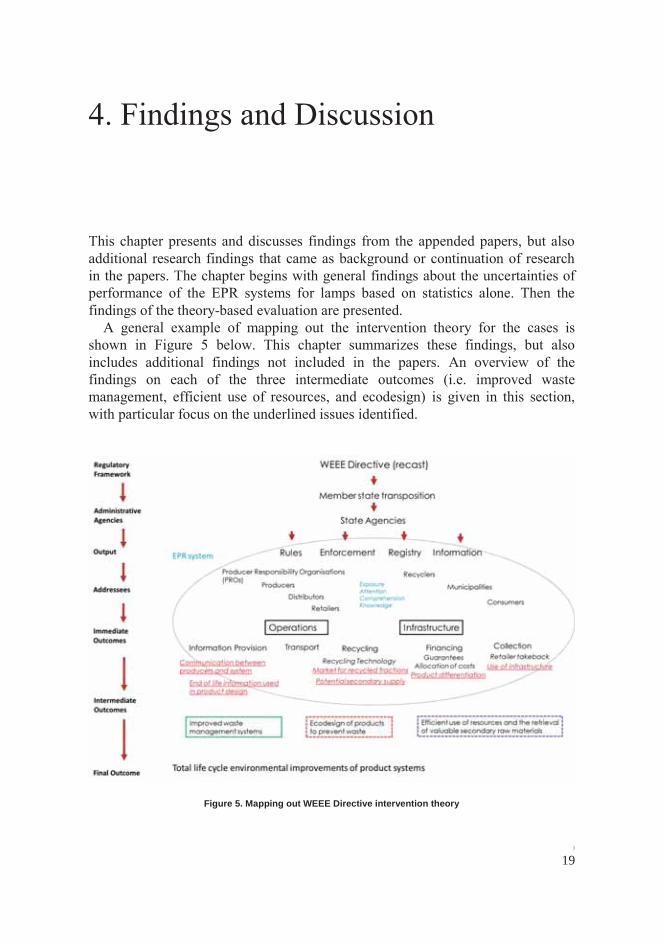
Figure 5. Mapping out WEEE Directive intervention theory
19
20
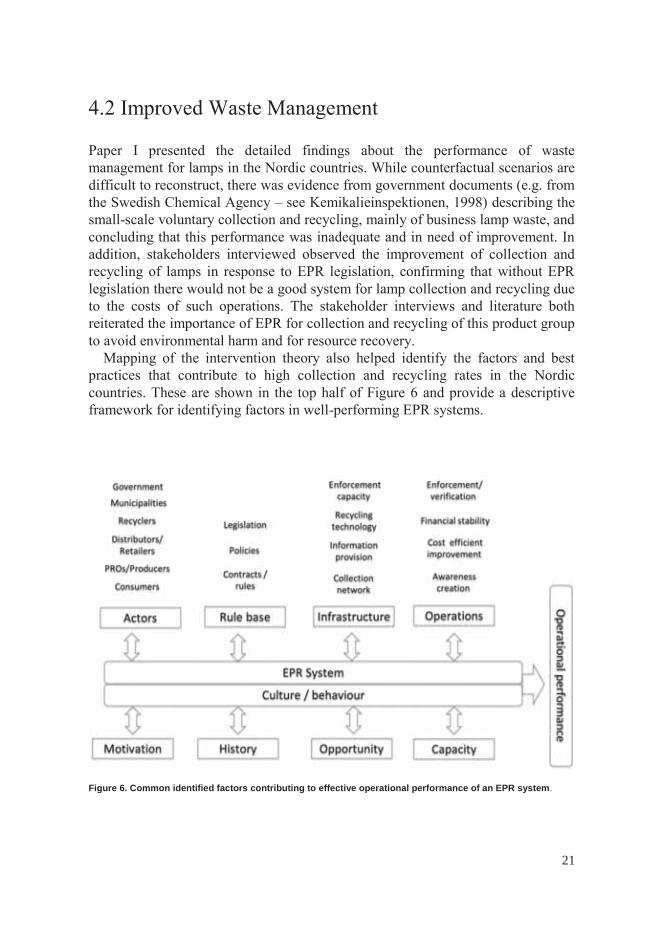
Figure 6. Common identified factors contributing to effective operational performance of an EPR system
21
4.2.1 Culture and behaviour
22
4.2.2 Incentives for further improvement
2323
24
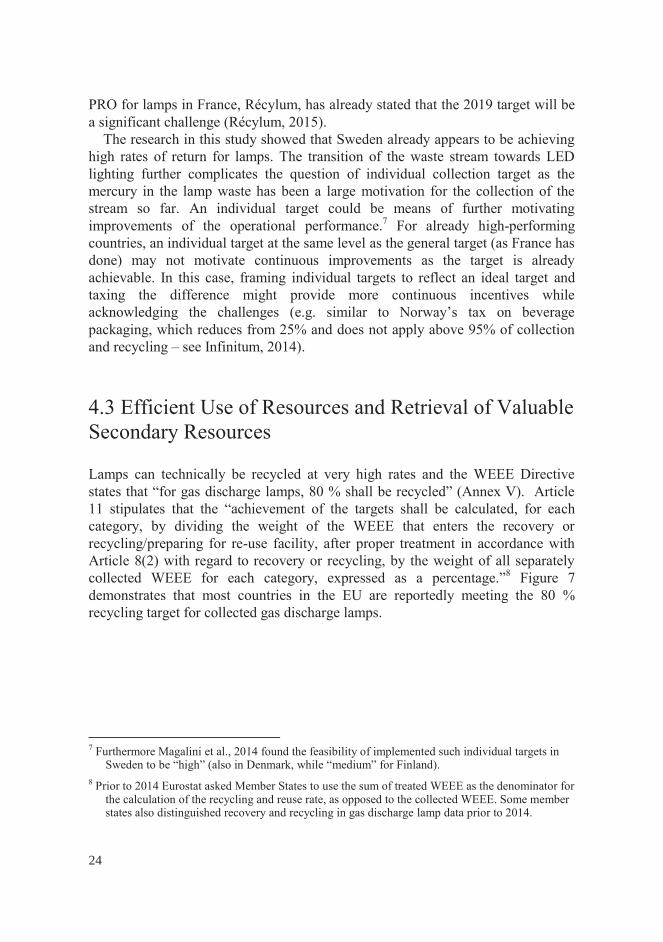
Figure 7. Gas discharge lamp % recycled (of tonnes collected) in 2011. Source: Eurostat statistics
2525
4.3.1 Critical materials
26
27
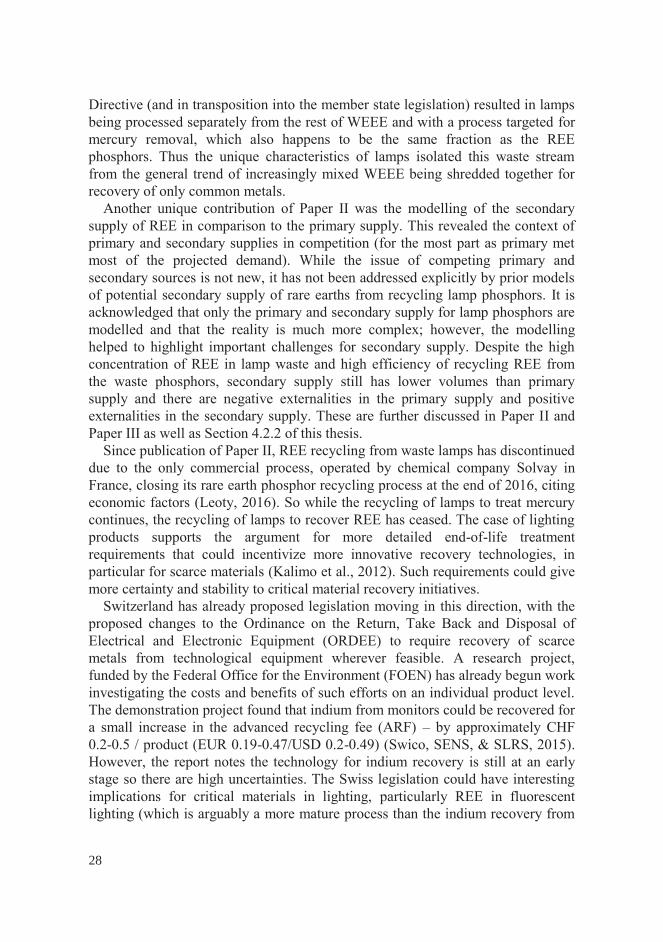
28
4.3.2 Value considerations
2929
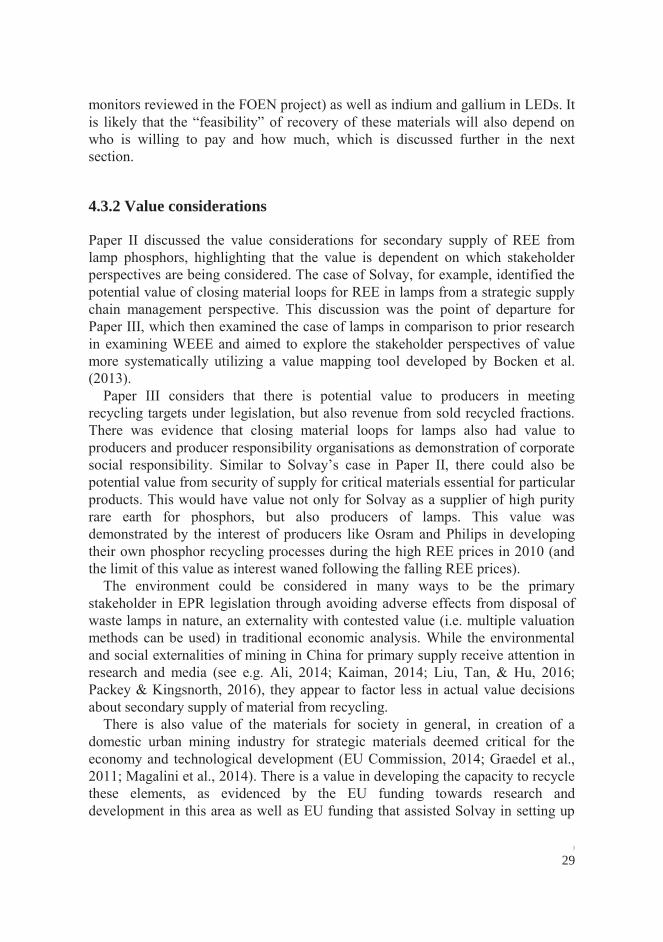
Figure 4. Value mapping for the value of lamps at end-of-useBold text refers to value that is considered currently, regular text to value considered at least partially now, and italicised text refers to value currently not considered generally
30
3131
32
33
34
35
36
3737
38
3939
40
e
41
42
4343
es
44
45
46
4747
Name Organisation, position Stakeholder Group Interview
dateNote
Den
mar
kFi
nlan
dN
orw
aySw
eden
48
Oth
er
4949
50
51
52
53
54
55

56
1/2
Co-authorship statement
All papers/manuscripts with multiple authors which is part of a PhD thesis should contain a co-author statement, stating the PhD student’s contribution to the paper.
1. General information
PhD student
NameJessika Helene Luth RichterCiv.reg.no. (If not applicable, then birth date)19781231-6425E-mailJessika.luth.richter@iiiee.lu.seDepartmentInternational Institute for Industrial Environmental Economics
Principal supervisorNameDr. Thomas [email protected]
2.Title of PhD thesis
TBD
3.This co-authorship declaration applies to the following paper/manuscript:
Title: Extended producer responsibility for lamps in Nordic countries: best practices and challenges in closing material loopsAuthor(s): Jessika Luth Richter, Rob KoppejanJournal: Journal of Cleaner ProductionVol./page: 123 (2016) 167e179DOI: 10.1016/j.jclepro.2015.06.131
4. Contributions to the paper/manuscript made by the PhD student
What was the role of the PhD student in designing the study?
The PhD student took the lead role in developing the research idea and design with the main co-author contribution after this stage of the research (following a request from the special issue editor for an industry co-author if possible).
How did the PhD student participate in data collection and/or development of theory?
The student independently collected all data used in the article/research from interviews, literature, and statistical databases. The student also reviewed prior literature in the field to develop the EPR theory-based evaluation framework used. The collected data and development of theory in the first article draft was then discussed with the co-author.
2/2
4. Contributions to the paper/manuscript made by the PhD student
Which part of the manuscript did the PhD student write or contribute to?
The student initially wrote all parts of the article. A draft of the article was then discussed with the co-author and parts of the discussion rewritten based on feedback and input from the co-author. This feedback and input from the co-author included comments on findings and discussion dealing with uncertainties with product lifetimes, data quality issues, as well as input on Figure 4 (factors in operational performance).
Did the PhD student read and comment on the final manuscript?
The student read, commented and edited the final manuscript. She was solely responsible for preparing the manuscript for submission and for final edits in response to peer review comments.
6161

62

I

Extended producer responsibility for lamps in Nordic countries: bestpractices and challenges in closing material loops
Jessika Luth Richter a, *, Rob Koppejan b
a International Institute for Industrial Environmental Economics, Lund University, Tegn�ersplatsen 4, Lund, Swedenb RKI Sustainable Solutions, Planketent 3, 4471 SC Wolphaartsdijk, Netherlands
a r t i c l e i n f o
Article history:Received 14 February 2015Received in revised form25 June 2015Accepted 26 June 2015Available online 9 July 2015
Keywords:Extended producer responsibilityWEEEGas discharge lampsFluorescent lampsRecyclingCircular economy
a b s t r a c t
Extended Producer Responsibility (EPR) schemes are adopted not only to promote collection and recy-cling of waste products but also to close material loops and incentivise ecodesign. These outcomes arealso part of creating a more circular economy. Evaluations of best practices can inform how to furtheroptimise systems towards more ambitious collection, recycling and recovery of both hazardous andcritical materials. Gas discharge lamps in particular are a key product category in this regard, consideringboth the presence of mercury and of rare earth materials in this waste stream. Nordic countries inparticular are known for advanced collection and recycling systems and this article compares the EPRsystems for gas discharge lamps. The EPR systems for lamps are evaluated using theory-based evaluationapproaches to analyse both the performance of lamp EPR systems and challenges perceived by keystakeholders. The cases were constructed based on primary and secondary literature, statistical data, andinterviews with stakeholders. The findings indicate that the collection and recycling performance isgenerally still high for gas discharge lamps in the Nordic countries, despite some differences in approachand structure of the EPR systems, but there remain opportunities for further improvement. In terms ofEPR goals, there is evidence of improved waste management of these products as a result of the systems;however, there also remain significant challenges, particularly in terms of ecodesign incentives. The keyfactors for best practice are discussed, including aspects of the rule base, infrastructure, and operations.The particular characteristics of this waste category, including the rapidly changing technology, also posechallenges for EPR systems in the future.
© 2015 Elsevier Ltd. All rights reserved.
1. Introduction
Energy efficient lighting is an important part of addressingclimate change and transitioning towards a green economy withelectricity for lighting accounting for approximately 15% of globalpower consumption and 5% of worldwide greenhouse gas (GHG)emissions (UNEP, 2012). Energy efficient gas discharge lamps (alsoknown as fluorescent or mercury lamps), and now increasinglyLEDs, have been gradually replacing traditional incandescent lampsfor the last few decades and this trend has accelerated recently dueto the tightening of energy efficiency regulations in most regions ofthe world (see e.g. UNEP, 2014). In Europe for example, EU Com-mission Regulation EC No 244/, 2009 and EU Commission
Regulation EC No 245/, 2009 introduced stricter energy efficiencyrequirements for lighting products and a similar approach has beenadopted through energy efficiency regulations in the U.S. (UNEP,2014). Lighting represents a key area for achieving the EuropeanUnion (EU) goal to increase energy efficiency by 20% by 2020 andreplacement of inefficient lighting by 2020 is expected to enableenergy savings to power 11 million households a year (EUCommission, 2013). The 2009 regulations initiated a phase-out ofincandescent lamps (EU Commission, 2014a) and resulted in anincrease in gas discharge lamps in the EU general lighting market(accounting for an estimated 43% of units sold in 2011 and 2012(McKinsey and Company, 2012)). A further increase of both gasdischarge lamps and LEDs is expectedwith the phase out of halogenlamps (originally scheduled for 2016, but now delayed to 2018).
However, in transitioning to energy efficient lighting, an inte-grated policy approach must also consider end-of-life managementof energy efficient lamps (UNEP, 2012). The WEEE Directive (EU2002/96/EC and recast 2012/19/EU) has implemented Extended
* Corresponding author. Tel.: þ46 46 222 02 82.E-mail addresses: [email protected] (J.L. Richter), rkoppejan@
outlook.com (R. Koppejan).
Contents lists available at ScienceDirect
Journal of Cleaner Production
journal homepage: www.elsevier .com/locate/ jc lepro
http://dx.doi.org/10.1016/j.jclepro.2015.06.1310959-6526/© 2015 Elsevier Ltd. All rights reserved.
Journal of Cleaner Production 123 (2016) 167e179
Producer Responsibility (EPR) for such waste in EU member statesand banned landfilling of WEEE covered by the legislation. Gasdischarge lamps are covered under category 5 of the WEEE Direc-tive. As a product group, they have special characteristics that makethem particularly challenging for collection and recycling. Theycontain mercury that can be detrimental when released into theenvironment in large enough quantities (Wagner, 2011) or result inhigh mercury emissions when incinerated without adequate filtertechnology (Silveira and Chang, 2011). The fragility of lamps makessafe collection and transportation more complex to ensure thehealth of handlers (Kasser and Savi, 2013; Sander et al., 2013).Avoiding this environmental harm fromwaste gas discharge lampsis a compelling reason for “collecting as much as possible and in asafe way (avoidance of breaking) and to treat them properly”(Huisman et al., 2008, p. 281). However, collection and recycling ofgas discharge lamps represents relatively high cost compared to thevalue of the product (Philips Lighting, 2012) and the lowor negativevalue of the recovered material from lamp waste (G. Lundholm,personal communication, 13 August 2014). While clearly it is ofsocietal value to avoid mercury contamination, this is a positiveexternality and moreover, it is a benefit difficult to quantify ineconomic terms.1 As such, legislation, targets and other drivers areintegral to incentivising end-of-life management (Huisman et al.,2008; G. Lundholm, personal communication, 13 August 2014).The high cost for lamps is tied to necessary recovery of hazardousmaterials increasing recycling costs, but also to challenges in col-lecting lamps. Lamps are lightweight, which means they are a smallpart of total WEEE and that filling trucks for optimal transportationcan be an issue. Lamps are also dispersed in high quantities,geographically and between consumers and businesses. This ne-cessitates the need for an extensive capillary network for collection.
The collection and recycling of gas discharge lamps can alsocreate opportunities to recycle valuable materials. Waste gasdischarge lamps contain rare earth elements (REE) in the phosphorlayer, which is necessary for producing white light. Nearly all globalsupply of europium, 85.2% of terbium and 76.7% of yttrium is usedfor phosphors, and the majority of these are used for lighting ap-plications (Moss et al., 2013; Tan et al., 2014). Despite only using 7%of global REE by volume, due to the high level of purity needed forlighting applications, phosphors represent 32% of the value for rareearth applications (Binnemans et al., 2013; Schüler et al., 2011; U.S.Department of Energy, 2011). The EU Commission's report onCritical Raw Materials for the European Union (EU Commission,2014b), considers the REE group as having the highest supply riskand REE have received increasing attention in the last few yearswith rising prices and concern about supply restrictions fromChina, where over 90% of production takes place (Binnemans et al.,2013; Bloomberg News, 2015). The presence of REE in only smallamounts inwaste products represents a challenge for recycling, butincreased recycling has the potential to address supply risks(Binnemans et al., 2013; Rademaker et al., 2013; Sprecher et al.,2014). However, currently less than 1% of REE is recycled and ex-amples of closing this material loop are rare (Binnemans et al.,2013) but the experience in recycling REE from gas dischargelamps is promising (Dupont and Binnemans, 2015).
EPR systems for lamps have been in place in the EU under theWEEE Directive, but legislation has been present even longer insome countries, like Norway, Sweden, and Austria. Academicliterature has evaluated various aspects of WEEE systems in the EU,
including the challenges for collecting small WEEE (Huisman et al.,2008; Khetriwal et al., 2011; Melissen, 2006) However, there hasbeen not been a comprehensive evaluation of the best practices andchallenges for end-of-life management of gas discharge lampsspecifically, despite this product stream having been acknowledgedto be of particular relevance both for recovery of critical materialsand for avoidance of mercury contamination. The literature that hasaddressed this waste stream has tended to focus on the set up ofEPR systems for lamps in the EU in general (Wagner, 2011, 2013;Wagner et al., 2013) or has emphasised recycling over collectionaspects (Silveira and Chang, 2011). Very little is known about howEPR systems for lamps compare or differ from the structure andperformance of the overall WEEE systems.
The research presented in this paper evaluates EPR systems forlamps in the Nordic countries of Denmark, Finland, Norway andSweden.2 The Nordic countries have been recognised for bestpractices in the area of end-of-life management of WEEE (Rom�an,2012; Yl€a-Mella et al., 2014a,b) and as such also provide goodcases for a deeper analysis of EPR for lamps in particular. Suchanalysis can provide further insight into how to address the uniquechallenges for this waste stream and the factors that potentiallycontribute to better attainment of EPR goals and a more circulareconomy for this key product category. EPR includes goals toconserve source materials by promoting better wastemanagement,ecodesign, and closing material loops and such goals are also anintegral part of a circular economy (EU Commission, 2014c). Thisarticle presents analyses of EPR systems for lamps in Nordiccountries in relation to EPR goals and discusses the factors thatcontribute to well-functioning systems as well as challenges still tobe addressed in further optimising such systems.
Section 2 describes the methodology used in this policy evalu-ation and comparative case study methodology. Section 3 presentsthe findings of the comparative case study and evaluation of theperformance of the Nordic EPR systems in relation to the EPRoutcomes. Section 4 discusses these findings and presents factorsidentified as influential to the success of the systems as well asremaining challenges.
2. Methodology
The research approach used embedded multiple cases in whichmulti-level perspectives were explored simultaneously (e.g. gasdischarge lamps, country perspectives, key stakeholder groups,etc.) (Yin, 2003). Comparative analysis of multiple cases particu-larly suits research evaluating multiple holistic systems and allowscomparison of factors influencing performance (Druckman, 2005).The framework for the initial comparison of the EPR systems forlamps was based on important elements of such systems identifiedby Murphy et al. (2012). Nordic countries are the focus cases inevaluating EPR systems for lamps because they have beendescribed for their best practices in performance for WEEE ingeneral, but they have not been examined in regard to gasdischarge lamps. High performing systems can be studied toidentify the common elements that could be the key to theireffectiveness. It can also reveal context-specific or organisationaldifferences that have or have not influenced effectiveness, as wellas challenges perceived about the different systems from corre-sponding stakeholder groups in each system.
1 Some studies, for example, Hylander and Goodsite (2006) have tried andestimated a cost of USD 2500 to 1.1 million per kg Hg isolated from the biospheredepending on local factors quantity, nature of pollution, media, geography, tech-nology used etc.
2 Iceland has been excluded in this research as its context as well as the imple-mentation and experience thus far with WEEE systems has been quite differentthan other Nordic countries so far. It is expected to further develop and resembleother Nordic country systems in the future (Baxter et al., 2014).
J.L. Richter, R. Koppejan / Journal of Cleaner Production 123 (2016) 167e179168
Policy evaluation, using multiple methods of inquiry to generatepolicy-relevant information that can be utilised to resolve policyproblems (Dunn, 1981), framed this research. In terms of focuscriteria, the WEEE legislation in regard to gas discharge lamps inthe Nordic countries is evaluated primarily for its environmentaleffectiveness, a common criterion evaluating the policy in relationto its goals (Mickwitz, 2003; Vedung, 2008). While there is datarelated to collection and recycling rates, more comprehensive in-formation about EPR systems for energy efficient waste lamps isstill lacking. Moreover, the goals of the WEEE Directive and thelegislation transposed in the member states refer to WEEE collec-tion overall, with few product level specifications. A separate targetfor gas discharge lamps within the Directive is being investigateduntil August 2015 (Article 7.6). In such cases where the data orexplicit goals may be lacking, the use of intervention theories cansupport the evaluation of the policy (Kautto and Simil€a, 2005;Manomaivibool, 2008).
The main policy interventions governing the end-of-life man-agement of gas discharge lamps in the Nordic countries are basedon the principle of EPR, defined as “a policy principle to promotetotal life cycle environmental improvements of product systems byextending the responsibilities of the manufacturer of the product tovarious parts of the entire life cycle of the product, and especially totake-back, recycling and final disposal of the product” (Lindhqvist,2000, p. 154). Moreover, Lindhqvist (2000) argues that EPR entailsdifferent types of responsibilities: liability, physical, financial, andprovision of information (i.e. informative) responsibilities. Policymixes can vary in how these responsibilities are realised anddistributed amongst actors but there are specific goals and out-comes of EPR that should be common to all EPR programmes. Thesehave been outlined by Tojo (2004) and are shown below in relationto the WEEE Directive 2012/19/EU. While the WEEE Directive is themain focus of this article, it is also acknowledged that the Restric-tion on Hazardous Substances in EEE (RoHs) Directive is part of theEU's EPR policy package (van Rossem et al., 2006a). The RoHs Di-rective's influence on design for lamps is also discussed in Section3.2.1. The EU Ecodesign directive also has an indirect effect on EPRpolicies (OECD, 2014).
Theory based (also known as program theory/theory-driven)evaluation includes reconstruction of the intervention (program)theory to model how a policy is supposed to function (Bickman,1987). Using an intervention theory as a basis for environmentalevaluations focusses the evaluation in terms of scale and stake-holders (Mickwitz, 2003). Hansen and Vedung (2010) propose thatan intervention theory consists of three elements: a situation the-ory concerning the context of the intervention; a causal theoryconcerning the implementation and outputs that lead to certainimpacts of the intervention; and a normative theory concerning theenvisioned outcomes of the intervention. This study includes theseelements with the context, implementation and outcomes of theintervention all examined.
In addition, theory based evaluations are grounded in a stake-holder approach (Hansen and Vedung, 2010), but it is a recognisedchallenge that there can exist competing program theories (Dahler-Larsen, 2001). When dealing with more complex program evalua-tions, Hansen and Vedung (2010) suggest a “theory-based stake-holder evaluation” that elaborates upon a “raw” interventiontheory with the perspectives of key stakeholders. Identifying keystakeholders stems from the intervention theory and from this theprimary stakeholders crucial to its implementation and likely tohave in-depth knowledge of the intervention are selected. Theintervention theories from the perspective of these key stake-holders can then be reconstructed to identify similarities, differ-ences, and disagreements (Hansen and Vedung, 2010) or thedistinction between the “espoused theory” and the “theory-in-use”
(Friedman, 2001). The latter distinction is included in this paperwhile stakeholder perspectives of success factors and continuingchallenges for EPR systems are discussed.
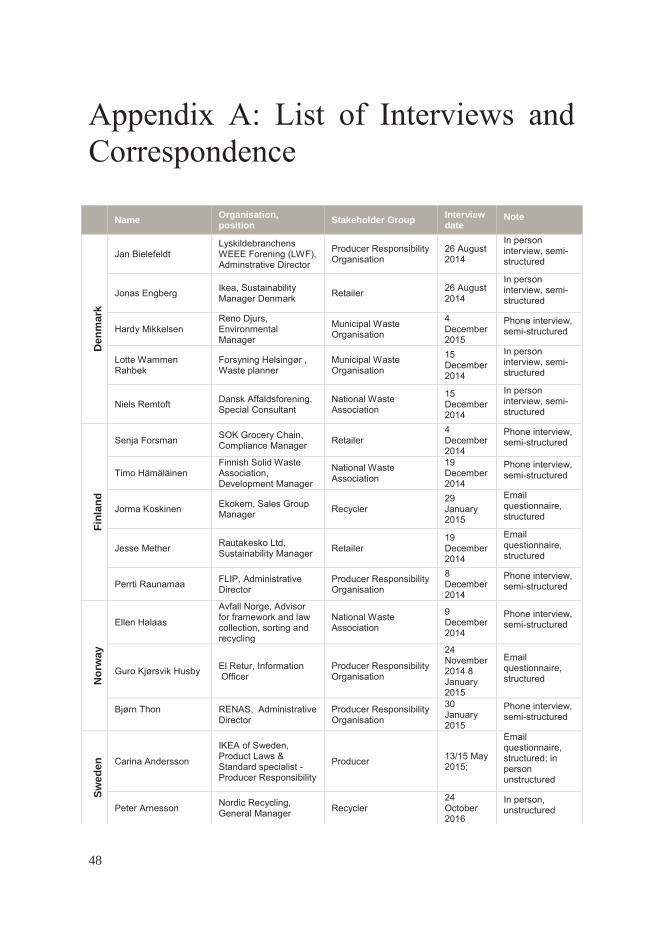
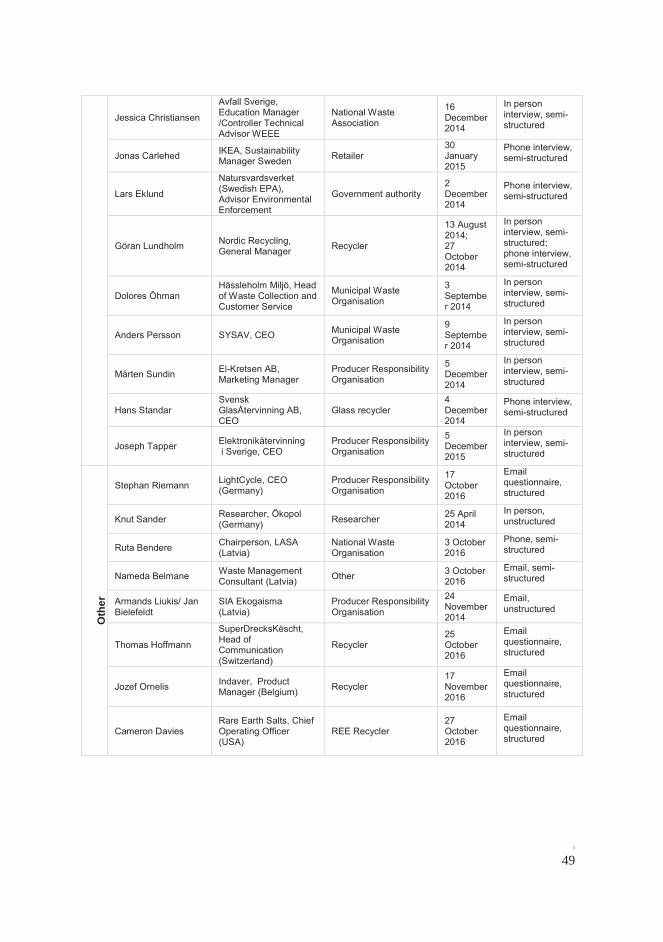
Both the evaluation and cases used data collected from publiclyavailable statistics fromEurostat, national authorities, and producerresponsibility and municipal waste organisation reports. This datawas supplemented and triangulated with peer-reviewed and greyliterature as well as semi-structured interviews with key stake-holders and additional email correspondence (based on interviewprotocols). For each country case, similar stakeholders were inter-viewed with identical protocols. When possible, interviews wererecorded and in person, though they were also conducted by tele-phone. Extensive notes were taken and when necessary, clarifiedagain with the interviewed stakeholder via email correspondence.Lighting producers themselves were not interviewed as earlierresearch has examined EPR from the perspective of lamp andlighting sector producers (see Gottberg et al., 2006). The focus ofthis study is instead on stakeholders downstream from producersinvolved in the practical implementation of the EPR systems forlamps. These stakeholders included managers of producer re-sponsibility organisations (PROs) in each country dealingwith lampcollection, lamp recyclers responsible for recycling lamps in Nordiccountries, and managers of WEEE issues in national waste man-agement associations representing municipalities and municipalwaste management companies in each country. In addition, a fewspecific Nordic retailers and municipal waste management com-panies with initiatives for lamp collection were also interviewed. Alist of organisations and representatives interviewed is included inthe appendix as well as sample interview protocols. Where specificinformation from an interview is presented, the interviewed personis identified, but where there was general consensus amongst agroup of interviewed stakeholders, the group is identified.
3. Findings and analysis
It has been demonstrated and generally accepted that end-of-lifemanagement of WEEE is environmentally beneficial and benefitscan be better realised through increased collection and recyclingrates (Hischier et al., 2005; Khetriwal et al., 2011). In the first versionof the WEEE directive collection rates differed widely betweenmember states, with ten countries failing tomeet the 4 kg per capitatarget in 2010 but most exceeding and the Nordic countries wellexceeding the target (EUCommission, 2013). Yl€a-Mella et al. (2014a)andRom�an (2012) describe the performance ofWEEE systems in theNordic countries as exemplary, citing their high collection rates inNordic countries (ranging from 8 kg/capita/year in Finland to over20 kg/capita/year in Norway) despite low population densities andhigh transport distances, especially in the northern parts of Norway,Sweden, and Finland. Such per capita collection rates rank Nordiccountries all in the top five performing countries in Europe. Asidefrom system architecture, Yl€a-Mella et al. (2014a) attribute thesuccess of the Nordic WEEE systems in part to high awareness ofenvironmental issues among Nordic citizens and further argue thatone of the strengths of the WEEE recovery systems in Nordiccountries is the strong civic support of environmental protectionand willingness to use the WEEE systems in place.
While this measure of performance has been consistent withhistoric WEEE Directive targets measuring performance in terms ofkilograms per capita, the WEEE recast brings new targets whichmeasure collection rates in comparison to product put onmarket inthe previous three years. In the recast the target is 45% of the sales ofproducts in the three preceding years with an increase to 65% by2019 (or 85% of generated WEEE). This has implications for Nordiccountries where there is a high level of EEE products put on themarket, reflecting both the challenging climate conditions and high
J.L. Richter, R. Koppejan / Journal of Cleaner Production 123 (2016) 167e179 169
living standards that make EEE and information technology animportant part of everyday life in Nordic societies (Yl€a-Mella et al.,2014a). Despite this, according to Eurostat statistics, Denmark,Norway and Sweden remain in the top five performing countriesand are already poised to meet the 45% collection target of previousthree years EEE put on market, which is in place from 2016 to 2019.Sweden is already meeting the 65% target that will be in place from2019. However, Finland, having collected only 36% in 2012compared to the previous 3 years EEE put on market, still has im-provements to make to meet this target. However, it has also beensuggested that Finland's lower figures have more to do withcollection reporting rather than actual collection being low (seeBaxter et al., 2014). Another important changewith the recast of theWEEE Directive has been the increased responsibility for retailersand this is examined in further detail in relation to the specific cases.
3.1. Comparing Nordic country cases
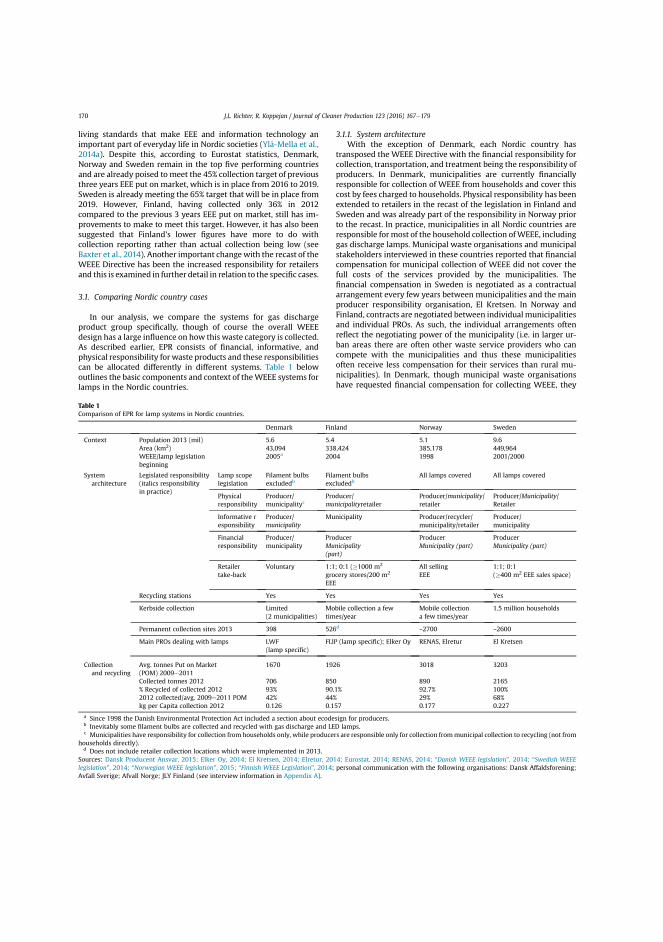
In our analysis, we compare the systems for gas dischargeproduct group specifically, though of course the overall WEEEdesign has a large influence on how this waste category is collected.As described earlier, EPR consists of financial, informative, andphysical responsibility for waste products and these responsibilitiescan be allocated differently in different systems. Table 1 belowoutlines the basic components and context of theWEEE systems forlamps in the Nordic countries.
3.1.1. System architectureWith the exception of Denmark, each Nordic country has
transposed the WEEE Directive with the financial responsibility forcollection, transportation, and treatment being the responsibility ofproducers. In Denmark, municipalities are currently financiallyresponsible for collection of WEEE from households and cover thiscost by fees charged to households. Physical responsibility has beenextended to retailers in the recast of the legislation in Finland andSweden and was already part of the responsibility in Norway priorto the recast. In practice, municipalities in all Nordic countries areresponsible formost of the household collection ofWEEE, includinggas discharge lamps. Municipal waste organisations and municipalstakeholders interviewed in these countries reported that financialcompensation for municipal collection of WEEE did not cover thefull costs of the services provided by the municipalities. Thefinancial compensation in Sweden is negotiated as a contractualarrangement every few years between municipalities and the mainproducer responsibility organisation, El Kretsen. In Norway andFinland, contracts are negotiated between individual municipalitiesand individual PROs. As such, the individual arrangements oftenreflect the negotiating power of the municipality (i.e. in larger ur-ban areas there are often other waste service providers who cancompete with the municipalities and thus these municipalitiesoften receive less compensation for their services than rural mu-nicipalities). In Denmark, though municipal waste organisationshave requested financial compensation for collecting WEEE, they
Table 1Comparison of EPR for lamp systems in Nordic countries.
Denmark Finland Norway Sweden
Context Population 2013 (mil) 5.6 5.4 5.1 9.6Area (km2) 43,094 338,424 385,178 449,964WEEE/lamp legislationbeginning
2005a 2004 1998 2001/2000
Systemarchitecture
Legislated responsibility(italics responsibilityin practice)
Lamp scopelegislation
Filament bulbsexcludedb
Filament bulbsexcludedb
All lamps covered All lamps covered
Physicalresponsibility
Producer/municipalityc
Producer/municipalityretailer
Producer/municipality/retailer
Producer/Municipality/Retailer
Informative responsibility
Producer/municipality
Municipality Producer/recycler/municipality/retailer
Producer/municipality
Financialresponsibility
Producer/municipality
ProducerMunicipality(part)
ProducerMunicipality (part)
ProducerMunicipality (part)
Retailertake-back
Voluntary 1:1; 0:1 (�1000 m2
grocery stores/200 m2
EEE
All sellingEEE
1:1; 0:1(�400 m2 EEE sales space)
Recycling stations Yes Yes Yes Yes
Kerbside collection Limited(2 municipalities)
Mobile collection a fewtimes/year
Mobile collectiona few times/year
1.5 million households
Permanent collection sites 2013 398 526d ~2700 ~2600
Main PROs dealing with lamps LWF(lamp specific)
FLIP (lamp specific); Elker Oy RENAS, Elretur El Kretsen
Collectionand recycling
Avg. tonnes Put on Market(POM) 2009e2011
1670 1926 3018 3203
Collected tonnes 2012 706 850 890 2165% Recycled of collected 2012 93% 90.1% 92.7% 100%2012 collected/avg. 2009e2011 POM 42% 44% 29% 68%kg per Capita collection 2012 0.126 0.157 0.177 0.227
a Since 1998 the Danish Environmental Protection Act included a section about ecodesign for producers.b Inevitably some filament bulbs are collected and recycled with gas discharge and LED lamps.c Municipalities have responsibility for collection from households only, while producers are responsible only for collection frommunicipal collection to recycling (not from
households directly).d Does not include retailer collection locations which were implemented in 2013.
Sources: Dansk Producent Ansvar, 2015; Elker Oy, 2014; El Kretsen, 2014; Elretur, 2014; Eurostat, 2014; RENAS, 2014; “Danish WEEE legislation”, 2014; “Swedish WEEElegislation”, 2014; “Norwegian WEEE legislation”, 2015; “Finnish WEEE Legislation”, 2014; personal communication with the following organisations: Dansk Affaldsforening;Avfall Sverige; Afvall Norge; JLY Finland (see interview information in Appendix A).
J.L. Richter, R. Koppejan / Journal of Cleaner Production 123 (2016) 167e179170
have so far been unsuccessful in this endeavour and do not foreseeany changes in the near future due to a recent agreement betweenthe government and industry regarding ecodesign (N. Remtoft,personal communication, 15 December 2014).
In all Nordic countries, producers are solely responsible fortransport and treatment of the waste lamps collected by munici-palities and retailers, though the exact details of the financial andphysical responsibility for transport of lamps from retailers inSweden remains to be seenwith this aspect remaining vague in therecast legislation. Annex V of the WEEE Directive specifies a targetof 80% of collected gas discharge lamps to be recycled and Annex VIIspecifies that treatment should include removal of mercury.
The duty to provide information to consumers about the WEEEsystem for lamps is distributed differently in the Nordic countries,with different emphasis on the roles of PROs, municipalities, andretailers. PROs interviewed generally felt that adequate informationwas being provided while municipal organisations were morelikely to acknowledge that this was an area that could still beimproved. While consumer knowledge about WEEE in general wasperceived as high, therewere different perceptions about consumerawareness of disposal requirements and environmental impact ofwaste discharge lamps in particular. In Sweden, lamps were spe-cifically targeted in information campaigns by the main PRO (ElKretsen) and the national waste management association (AvfallSverige). In Denmark, the provision of this information was seen tobe more the responsibility of the lamp PRO, and it did run aware-ness campaigns every few years. In Norway, the national wastemanagement association (Avfall Norge) began an awarenesscampaign for smallWEEE, including lamps in 2014. In Finland therehave not been lamp-specific campaigns, and better informationprovision, particularly from retailers with new responsibilitiesunder the recast, was seen as an area for improvement.
The organisation of PROs also differs between the Nordiccountries. Lamp-specific PROs, like those found in Denmark andFinland, were initiated by the lamp producers whowere aware thatthey were putting a product that contained a hazardous substanceon the market and who wanted to ensure the hazards weremanaged properly at the end-of-life phase for these products andthus not jeopardise market acceptance of these products. Largerumbrella PROs run the risk of having decisions dominated by otherwaste streams and not ensuring the interests of lamp producers (J.Bielefeldt, personal communication, 26 August 2014). Examiningthe boards of larger PROs in Norway, it is the case that there is norepresentation by lighting producers or organisations on the boardsof two largest PROs handling lamps and luminaries (see RENAS,2014; Elretur, 2014).
The competing nature of PROs in Norway has resulted in generalissues with collection of WEEE with incidences of PROs refusing tocollect from municipalities once they had reached their targets,requiring intervention from authorities. This situation hasimproved, but the lack of a clearinghouse structure in Norway re-mains a perceived challenge (E. Halaas, personal communication, 9December 2014). Lamp-specific PROs and national waste manage-ment associations reported more cooperation than competitionamongst the several PROs in Finland and Denmark and perceivedthis as strengths of the systems.
In Sweden, a representative of the lighting industry is a presenton the board of the largest PRO, El Kretsen, though the lightingassociation is only one of over twenty owning industry associations(El Kretsen, 2014). Environmental management of waste gasdischarge lamps has also been given priority in Sweden the pastfew years by Swedish Environment Minister Lena Ek, who haspushed for increased collection of this waste stream from 2011whenmeeting with El Kretsen and the national wastemanagementassociation, Avfall Sverige, about improvements to lamp collection
(Pehrson and Balksj€o, 2011, 2012; Von Schultz, 2013). This led to apledge to increase lamp collection by 2 million pieces in 2013 andan information campaign focussed on lamps from households(Avfall Sverige, 2013). In response to this pressure for increasedcollection of lamps as well as other small WEEE, El Kretsen alsoinitiated a project to make collection of lamps even more conve-nient with in-store “Collectors” (“Samlaren” in Swedish). The Col-lectors are closed cabinets positioned most often next to reversevending machines for beverage packaging in grocery stores. Thepilot program with them in Gothenburg, Sweden, was deemed asuccess. At 14e20 SEK/kg (1.5e2.1 Euro/kg) the Collectors werefound to be more expensive than other forms of collection butbecame more cost effective with time as consumers became moreaware of this option and collection increased (El Kretsen and S€orab,2011). Collectors are currently being deployed first in major citiesand increasingly in municipalities throughout southern Swedenwhere over 60 Collectors have been placed in grocery stores in 2014and early 2015. The initiative is being led by municipal wastecompanies and is partially financed by producer compensation tomunicipalities for collection of WEEE (A. Persson, personalcommunication, 9 September 2014).
3.1.2. Collection and recycling performanceThe general WEEE system architectures in the Nordic countries
are described as best examples and perform well in relation to theWEEE Directive goals (Rom�an, 2012; Yl€a-Mella et al., 2014a). Thegeneral architecture also encourages high performance in thecategory of gas discharge lamps with the Nordic countries amongthe top five in Europe in 2012 (Fig. 2) when measuring collection interms of kilograms per capita.
However, when considering the collection rate compared to theamount of gas discharge lamps put on market, a different situationis found. Nordic countries performed better than the overall EUaverage of 37% in 2012 (see Table 1), with the exception of Norway.It should be noted that statistics for this product category are highlyvariable for countries with small amounts of gas discharge lampsrecorded (for example, Eastern European countries). When coun-tries with larger lighting markets are compared (Fig. 3), Sweden,
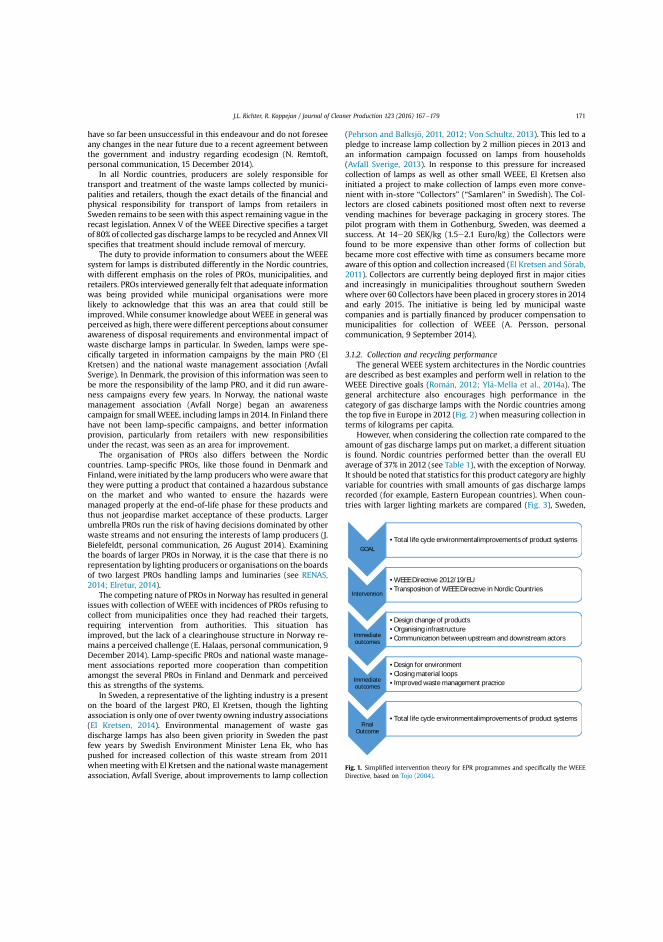
GOAL•Total life cycle environmentalimprovements of product systems
Interven on
•WEEE Direc ve 2012/19/EU •Transposi on of WEEE Direc ve in Nordic Countries
Immediate outcomes
•Design change of products•Organising infrastructure•Communica on between upstream and downstream actors
Immediate outcomes
•Design for environment•Closing material loops•Improved waste management prac ce
Final Outcome
•Total life cycle environmentalimprovements of product systems
Fig. 1. Simplified intervention theory for EPR programmes and specifically the WEEEDirective, based on Tojo (2004).
J.L. Richter, R. Koppejan / Journal of Cleaner Production 123 (2016) 167e179 171
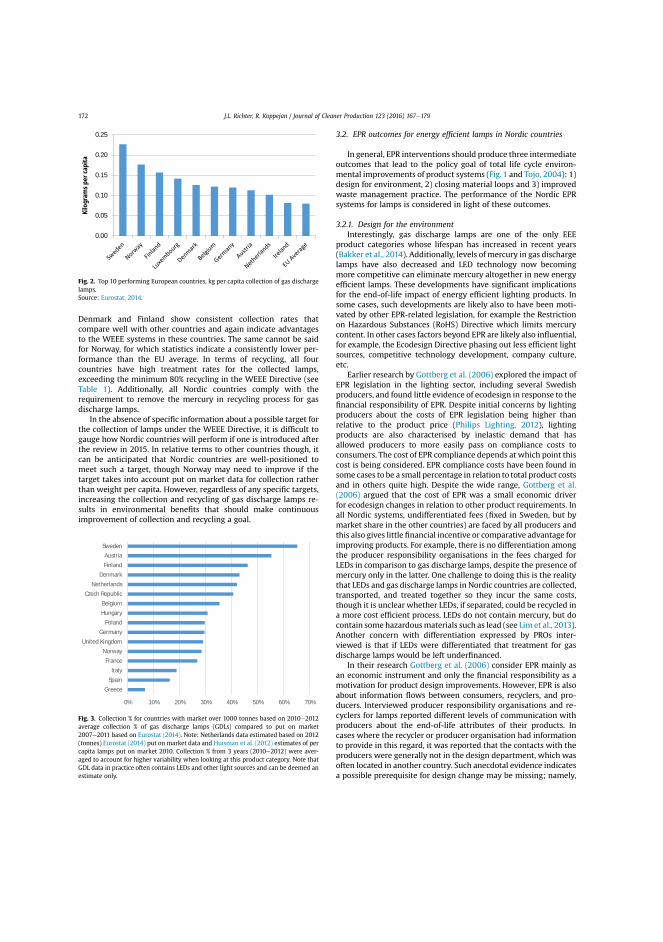
Denmark and Finland show consistent collection rates thatcompare well with other countries and again indicate advantagesto the WEEE systems in these countries. The same cannot be saidfor Norway, for which statistics indicate a consistently lower per-formance than the EU average. In terms of recycling, all fourcountries have high treatment rates for the collected lamps,exceeding the minimum 80% recycling in the WEEE Directive (seeTable 1). Additionally, all Nordic countries comply with therequirement to remove the mercury in recycling process for gasdischarge lamps.
In the absence of specific information about a possible target forthe collection of lamps under the WEEE Directive, it is difficult togauge how Nordic countries will perform if one is introduced afterthe review in 2015. In relative terms to other countries though, itcan be anticipated that Nordic countries are well-positioned tomeet such a target, though Norway may need to improve if thetarget takes into account put on market data for collection ratherthan weight per capita. However, regardless of any specific targets,increasing the collection and recycling of gas discharge lamps re-sults in environmental benefits that should make continuousimprovement of collection and recycling a goal.
3.2. EPR outcomes for energy efficient lamps in Nordic countries
In general, EPR interventions should produce three intermediateoutcomes that lead to the policy goal of total life cycle environ-mental improvements of product systems (Fig. 1 and Tojo, 2004): 1)design for environment, 2) closing material loops and 3) improvedwaste management practice. The performance of the Nordic EPRsystems for lamps is considered in light of these outcomes.
3.2.1. Design for the environmentInterestingly, gas discharge lamps are one of the only EEE
product categories whose lifespan has increased in recent years(Bakker et al., 2014). Additionally, levels of mercury in gas dischargelamps have also decreased and LED technology now becomingmore competitive can eliminate mercury altogether in new energyefficient lamps. These developments have significant implicationsfor the end-of-life impact of energy efficient lighting products. Insome cases, such developments are likely also to have been moti-vated by other EPR-related legislation, for example the Restrictionon Hazardous Substances (RoHS) Directive which limits mercurycontent. In other cases factors beyond EPR are likely also influential,for example, the Ecodesign Directive phasing out less efficient lightsources, competitive technology development, company culture,etc.
Earlier research by Gottberg et al. (2006) explored the impact ofEPR legislation in the lighting sector, including several Swedishproducers, and found little evidence of ecodesign in response to thefinancial responsibility of EPR. Despite initial concerns by lightingproducers about the costs of EPR legislation being higher thanrelative to the product price (Philips Lighting, 2012), lightingproducts are also characterised by inelastic demand that hasallowed producers to more easily pass on compliance costs toconsumers. The cost of EPR compliance depends at which point thiscost is being considered. EPR compliance costs have been found insome cases to be a small percentage in relation to total product costsand in others quite high. Despite the wide range, Gottberg et al.(2006) argued that the cost of EPR was a small economic driverfor ecodesign changes in relation to other product requirements. Inall Nordic systems, undifferentiated fees (fixed in Sweden, but bymarket share in the other countries) are faced by all producers andthis also gives little financial incentive or comparative advantage forimproving products. For example, there is no differentiation amongthe producer responsibility organisations in the fees charged forLEDs in comparison to gas discharge lamps, despite the presence ofmercury only in the latter. One challenge to doing this is the realitythat LEDs and gas discharge lamps in Nordic countries are collected,transported, and treated together so they incur the same costs,though it is unclear whether LEDs, if separated, could be recycled ina more cost efficient process. LEDs do not contain mercury, but docontain some hazardousmaterials such as lead (see Lim et al., 2013).Another concern with differentiation expressed by PROs inter-viewed is that if LEDs were differentiated that treatment for gasdischarge lamps would be left underfinanced.
In their research Gottberg et al. (2006) consider EPR mainly asan economic instrument and only the financial responsibility as amotivation for product design improvements. However, EPR is alsoabout information flows between consumers, recyclers, and pro-ducers. Interviewed producer responsibility organisations and re-cyclers for lamps reported different levels of communication withproducers about the end-of-life attributes of their products. Incases where the recycler or producer organisation had informationto provide in this regard, it was reported that the contacts with theproducers were generally not in the design department, which wasoften located in another country. Such anecdotal evidence indicatesa possible prerequisite for design change may be missing; namely,
0.00
0.05
0.10
0.15
0.20
0.25
Kilo
gram
s pe
r cap
ita
Fig. 2. Top 10 performing European countries, kg per capita collection of gas dischargelamps.Source: Eurostat, 2014.
0% 10% 20% 30% 40% 50% 60% 70%
GreeceSpain
ItalyFrance
NorwayUnited Kingdom
GermanyPoland
HungaryBelgium
Czech RepublicNetherlands
DenmarkFinlandAustria
Sweden
Fig. 3. Collection % for countries with market over 1000 tonnes based on 2010e2012average collection % of gas discharge lamps (GDLs) compared to put on market2007e2011 based on Eurostat (2014). Note: Netherlands data estimated based on 2012(tonnes) Eurostat (2014) put on market data and Huisman et al. (2012) estimates of percapita lamps put on market 2010. Collection % from 3 years (2010e2012) were aver-aged to account for higher variability when looking at this product category. Note thatGDL data in practice often contains LEDs and other light sources and can be deemed anestimate only.
J.L. Richter, R. Koppejan / Journal of Cleaner Production 123 (2016) 167e179172
communication between upstream and downstream participantsmay not be taking place in a way that facilitates relevant infor-mation from downstream reaching those working with producerswho have an influence over design decisions. However, even if thisinformation does reach product designers, its usefulness may belimited due to the (increasingly) long life of lighting products.Indeed, other drivers including market competition and companyculture were found to also be able to explain design improvementsin the lighting sector and causation to EPR legislation alone couldnot be established (Gottberg et al., 2006). This is not surprisinggiven the challenges for design incentives for lamps and these arefurther discussed in Section 4.2.
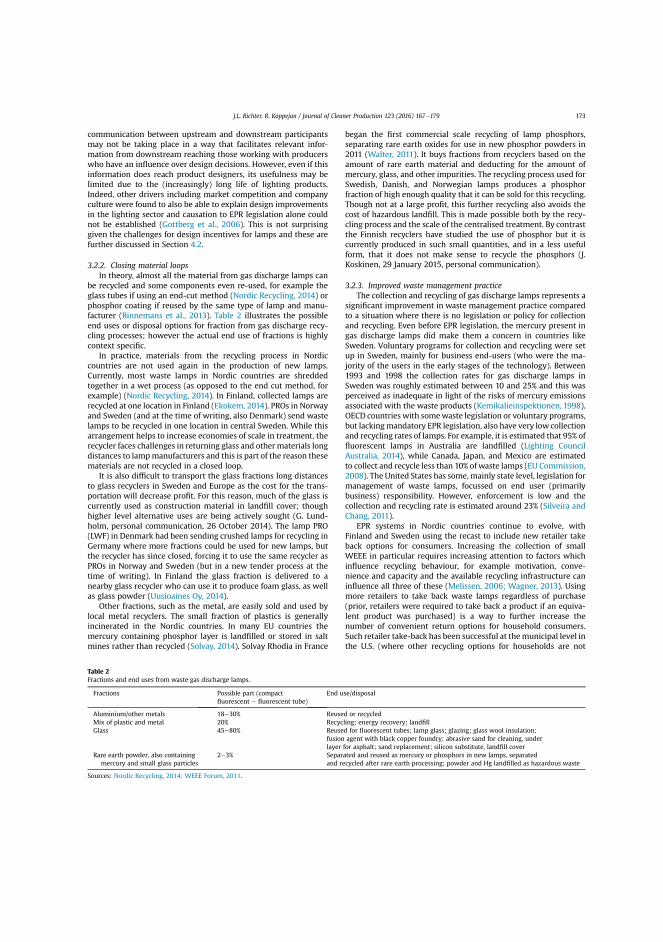
3.2.2. Closing material loopsIn theory, almost all the material from gas discharge lamps can
be recycled and some components even re-used, for example theglass tubes if using an end-cut method (Nordic Recycling, 2014) orphosphor coating if reused by the same type of lamp and manu-facturer (Binnemans et al., 2013). Table 2 illustrates the possibleend uses or disposal options for fraction from gas discharge recy-cling processes; however the actual end use of fractions is highlycontext specific.
In practice, materials from the recycling process in Nordiccountries are not used again in the production of new lamps.Currently, most waste lamps in Nordic countries are shreddedtogether in a wet process (as opposed to the end cut method, forexample) (Nordic Recycling, 2014). In Finland, collected lamps arerecycled at one location in Finland (Ekokem, 2014). PROs in Norwayand Sweden (and at the time of writing, also Denmark) send wastelamps to be recycled in one location in central Sweden. While thisarrangement helps to increase economies of scale in treatment, therecycler faces challenges in returning glass and othermaterials longdistances to lampmanufacturers and this is part of the reason thesematerials are not recycled in a closed loop.
It is also difficult to transport the glass fractions long distancesto glass recyclers in Sweden and Europe as the cost for the trans-portation will decrease profit. For this reason, much of the glass iscurrently used as construction material in landfill cover; thoughhigher level alternative uses are being actively sought (G. Lund-holm, personal communication, 26 October 2014). The lamp PRO(LWF) in Denmark had been sending crushed lamps for recycling inGermany where more fractions could be used for new lamps, butthe recycler has since closed, forcing it to use the same recycler asPROs in Norway and Sweden (but in a new tender process at thetime of writing). In Finland the glass fraction is delivered to anearby glass recycler who can use it to produce foam glass, as wellas glass powder (Uusioaines Oy, 2014).
Other fractions, such as the metal, are easily sold and used bylocal metal recyclers. The small fraction of plastics is generallyincinerated in the Nordic countries. In many EU countries themercury containing phosphor layer is landfilled or stored in saltmines rather than recycled (Solvay, 2014). Solvay Rhodia in France
began the first commercial scale recycling of lamp phosphors,separating rare earth oxides for use in new phosphor powders in2011 (Walter, 2011). It buys fractions from recyclers based on theamount of rare earth material and deducting for the amount ofmercury, glass, and other impurities. The recycling process used forSwedish, Danish, and Norwegian lamps produces a phosphorfraction of high enough quality that it can be sold for this recycling.Though not at a large profit, this further recycling also avoids thecost of hazardous landfill. This is made possible both by the recy-cling process and the scale of the centralised treatment. By contrastthe Finnish recyclers have studied the use of phosphor but it iscurrently produced in such small quantities, and in a less usefulform, that it does not make sense to recycle the phosphors (J.Koskinen, 29 January 2015, personal communication).
3.2.3. Improved waste management practiceThe collection and recycling of gas discharge lamps represents a
significant improvement in waste management practice comparedto a situation where there is no legislation or policy for collectionand recycling. Even before EPR legislation, the mercury present ingas discharge lamps did make them a concern in countries likeSweden. Voluntary programs for collection and recycling were setup in Sweden, mainly for business end-users (who were the ma-jority of the users in the early stages of the technology). Between1993 and 1998 the collection rates for gas discharge lamps inSweden was roughly estimated between 10 and 25% and this wasperceived as inadequate in light of the risks of mercury emissionsassociated with the waste products (Kemikalieinspektionen, 1998).OECD countries with somewaste legislation or voluntary programs,but lackingmandatory EPR legislation, also have very low collectionand recycling rates of lamps. For example, it is estimated that 95% offluorescent lamps in Australia are landfilled (Lighting CouncilAustralia, 2014), while Canada, Japan, and Mexico are estimatedto collect and recycle less than 10% of waste lamps (EU Commission,2008). The United States has some, mainly state level, legislation formanagement of waste lamps, focussed on end user (primarilybusiness) responsibility. However, enforcement is low and thecollection and recycling rate is estimated around 23% (Silveira andChang, 2011).
EPR systems in Nordic countries continue to evolve, withFinland and Sweden using the recast to include new retailer takeback options for consumers. Increasing the collection of smallWEEE in particular requires increasing attention to factors whichinfluence recycling behaviour, for example motivation, conve-nience and capacity and the available recycling infrastructure caninfluence all three of these (Melissen, 2006; Wagner, 2013). Usingmore retailers to take back waste lamps regardless of purchase(prior, retailers were required to take back a product if an equiva-lent product was purchased) is a way to further increase thenumber of convenient return options for household consumers.Such retailer take-back has been successful at themunicipal level inthe U.S. (where other recycling options for households are not
Table 2Fractions and end uses from waste gas discharge lamps.
Fractions Possible part (compactfluorescent e fluorescent tube)
End use/disposal
Aluminium/other metals 18e30% Reused or recycledMix of plastic and metal 20% Recycling; energy recovery; landfillGlass 45e80% Reused for fluorescent tubes; lamp glass; glazing; glass wool insulation;
fusion agent with black copper foundry; abrasive sand for cleaning, underlayer for asphalt; sand replacement; silicon substitute, landfill cover
Rare earth powder, also containingmercury and small glass particles
2e3% Separated and reused as mercury or phosphors in new lamps, separatedand recycled after rare earth processing; powder and Hg landfilled as hazardous waste
Sources: Nordic Recycling, 2014; WEEE Forum, 2011.
J.L. Richter, R. Koppejan / Journal of Cleaner Production 123 (2016) 167e179 173
provided), achieving recycling rates of over 36% from near 0%previously (Wagner et al., 2013). However, because of the existenceof established and better known recycling centres in municipalitiesin Nordic countries, the impact of retailer take back is anticipatedby some stakeholders to have a small, but still positive, impact oncollection of lamps. In Denmark and Sweden there was also evi-dence of municipalities collecting waste lamps through kerbsidecollection for detached households through plastic bags or boxesattached to the top of kerbside recycling bins. While this type ofkerbside collection is relatively new and effectiveness has yet to befully assessed, the initiatives represent attempts to further optimisecollection of this waste stream. Another form of kerbside collection,collection small bins in apartment complexes, has been moreestablished in these countries, as is mobile collection from house-holds a few times year.
Thereweremixed views onwhethermoremarket oversightwasnecessary or whether enforcement was adequate in all countries. Inthe Nordic countries market enforcement is undertaken by typi-cally small authorities (in terms of resources devoted to enforce-ment of WEEE legislation) and takes the form primarily of guidanceabout rules and response in the cases of complaints. Interviewedstakeholders perceived that high levels of cooperation amongstPROs and municipalities were part of why general WEEE systemsperformed well in the Nordic countries. While there were someconcerns about free-riders in the systems, this was not perceived tobe amajor inhibitor of the function of the system, but rather an areawhere the system could still be optimised, but requiring greaterresources than currently available.
4. Best practices and remaining challenges
4.1. Factors in best practice
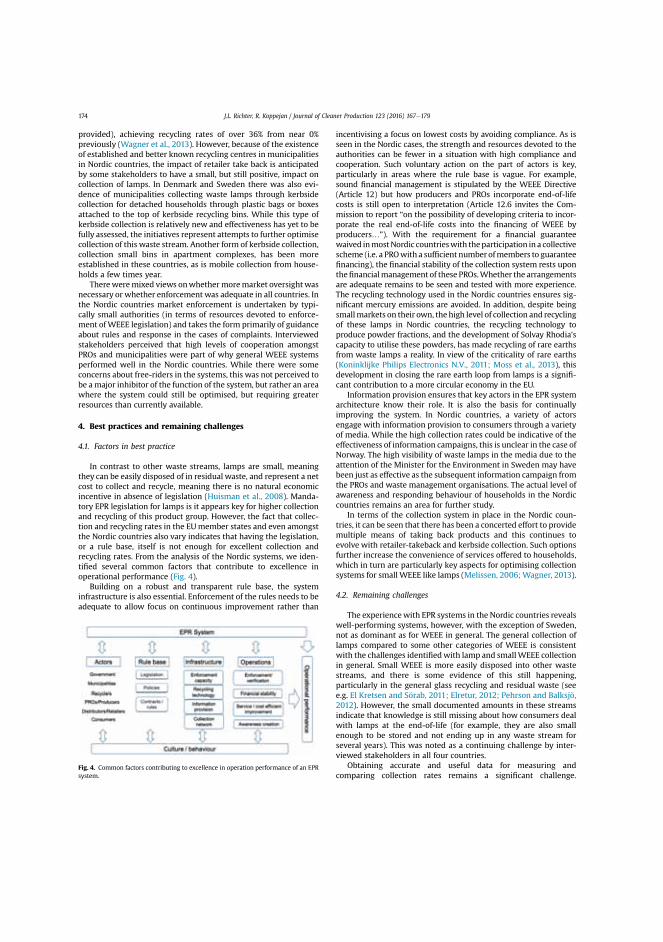
In contrast to other waste streams, lamps are small, meaningthey can be easily disposed of in residual waste, and represent a netcost to collect and recycle, meaning there is no natural economicincentive in absence of legislation (Huisman et al., 2008). Manda-tory EPR legislation for lamps is it appears key for higher collectionand recycling of this product group. However, the fact that collec-tion and recycling rates in the EUmember states and even amongstthe Nordic countries also vary indicates that having the legislation,or a rule base, itself is not enough for excellent collection andrecycling rates. From the analysis of the Nordic systems, we iden-tified several common factors that contribute to excellence inoperational performance (Fig. 4).
Building on a robust and transparent rule base, the systeminfrastructure is also essential. Enforcement of the rules needs to beadequate to allow focus on continuous improvement rather than
incentivising a focus on lowest costs by avoiding compliance. As isseen in the Nordic cases, the strength and resources devoted to theauthorities can be fewer in a situation with high compliance andcooperation. Such voluntary action on the part of actors is key,particularly in areas where the rule base is vague. For example,sound financial management is stipulated by the WEEE Directive(Article 12) but how producers and PROs incorporate end-of-lifecosts is still open to interpretation (Article 12.6 invites the Com-mission to report “on the possibility of developing criteria to incor-porate the real end-of-life costs into the financing of WEEE byproducers…”). With the requirement for a financial guaranteewaived inmostNordic countrieswith theparticipation in a collectivescheme (i.e. a PROwith a sufficient numberofmembers to guaranteefinancing), the financial stability of the collection system rests uponthefinancialmanagement of these PROs.Whether the arrangementsare adequate remains to be seen and tested with more experience.The recycling technology used in the Nordic countries ensures sig-nificant mercury emissions are avoided. In addition, despite beingsmallmarkets on their own, the high level of collection and recyclingof these lamps in Nordic countries, the recycling technology toproduce powder fractions, and the development of Solvay Rhodia'scapacity to utilise these powders, has made recycling of rare earthsfrom waste lamps a reality. In view of the criticality of rare earths(Koninklijke Philips Electronics N.V., 2011; Moss et al., 2013), thisdevelopment in closing the rare earth loop from lamps is a signifi-cant contribution to a more circular economy in the EU.
Information provision ensures that key actors in the EPR systemarchitecture know their role. It is also the basis for continuallyimproving the system. In Nordic countries, a variety of actorsengage with information provision to consumers through a varietyof media. While the high collection rates could be indicative of theeffectiveness of information campaigns, this is unclear in the case ofNorway. The high visibility of waste lamps in the media due to theattention of the Minister for the Environment in Sweden may havebeen just as effective as the subsequent information campaign fromthe PROs and waste management organisations. The actual level ofawareness and responding behaviour of households in the Nordiccountries remains an area for further study.
In terms of the collection system in place in the Nordic coun-tries, it can be seen that there has been a concerted effort to providemultiple means of taking back products and this continues toevolve with retailer-takeback and kerbside collection. Such optionsfurther increase the convenience of services offered to households,which in turn are particularly key aspects for optimising collectionsystems for small WEEE like lamps (Melissen, 2006;Wagner, 2013).
4.2. Remaining challenges
The experiencewith EPR systems in the Nordic countries revealswell-performing systems, however, with the exception of Sweden,not as dominant as for WEEE in general. The general collection oflamps compared to some other categories of WEEE is consistentwith the challenges identifiedwith lamp and smallWEEE collectionin general. Small WEEE is more easily disposed into other wastestreams, and there is some evidence of this still happening,particularly in the general glass recycling and residual waste (seee.g. El Kretsen and S€orab, 2011; Elretur, 2012; Pehrson and Balksj€o,2012). However, the small documented amounts in these streamsindicate that knowledge is still missing about how consumers dealwith lamps at the end-of-life (for example, they are also smallenough to be stored and not ending up in any waste stream forseveral years). This was noted as a continuing challenge by inter-viewed stakeholders in all four countries.
Obtaining accurate and useful data for measuring andcomparing collection rates remains a significant challenge.
Fig. 4. Common factors contributing to excellence in operation performance of an EPRsystem.
J.L. Richter, R. Koppejan / Journal of Cleaner Production 123 (2016) 167e179174
Producers are required in some countries to report based onamounts (C. Andersson, personal communication, 13 May 2015),which are then converted into kilograms for reporting at the EUlevel, which in turn leaves room for error and inconsistency. This isparticularly the case regarding put on market data, which alsoutilise the combined nomenclature (CN) codes used for trading andcustoms. For lighting products these codes are quite general (Wanget al., 2012) and do not align with WEEE product categories. It doesnot help that lighting technology is also changing at a rapid pace,faster than codes which explains why LEDs can be classified underdifferent CN codes and with which the distinction between lampsand luminaires becomes less obvious (LightingEurope, 2014). Withthis complexity comes the risk that put on market data can bemultiplied though double-counting or codes used erroneously.Additionally, lag times resulting from consumers delaying disposalof waste lamp products could affect the collection data. Also, aslifetimes of lamp products have extended, the three year averagefrom put on market may not be the most relevant measure ofcollection effectiveness. It has been proposed that at least 6 years isa more accurate measure of the historic collection rate (EuropeanLighting Companies' Federation, 2003). Even if this change wasmade, it would be a fewmore years before there is adequate data tomeasure this robustly (Sander et al., 2013).
Despite the reasons for making collection and recycling of gaslamps a priority, there is still the risk that this product categoryreceives less emphasis in the overall WEEE systemwith targets stillbased on the overall weight of collected WEEE. There is some evi-dence from Denmark and Finland that the presence of lamp-specific PRO may ensure that lamps are adequately emphasised.However, the case of Sweden demonstrates that the emphasis onthis product category can also be made by other stakeholders (inthat case, the Minister for the Environment) and in fact this may beeven more effective in motivating collection. The effectiveness ofrecent education campaigns in Norway to raise awareness of smallWEEE collection, in which lamps are given special emphasis, stillhas to be gauged, but thus far having neither lamp specific PROs nora particular emphasis on collection of lamps from other influentialstakeholders may help explain the significant difference in per-formance between this category compared to WEEE collectionoverall in that country. Interviewed stakeholders also indicatedthat there was still room for raising the level of consumer aware-ness about gas discharge lamps to include not only disposal op-tions, but the benefits of recycling these products for theenvironment and closing valuable material loops.
Further optimisation of materials in closing the loop andimproving design requires communication between (the right)upstream and downstream actors. The problems with EPR sys-tems incentivising design change are not unique to lamps, but anoverall acknowledged challenge for WEEE systems in general(Huisman, 2013; Kalimo et al., 2012; Lifset et al., 2013; vanRossem et al., 2006b). However, there are challenges alsounique to lamps due to the increasingly prolonged life of lightingproducts. Unlike many other categories of WEEE products inwhich turnover of products becomes shorter and shorter, newenergy saving lamp products have an average lifespan of 8500 hfor a CFL and 25,000 h for LEDs (U.S. Department of Energy, 2012),which can correspond from a few years to several decadesdepending on actual use.3 The lighting industry has used an
average of six years (European Lighting Companies' Federation,2003), but even this means communicating information to up-stream producers as information from actual recycling is often toolate to be relevant for the current design of lighting products.Product designers then must be incentivised to design with end-of-life management in mind without empirical knowledge of thatmanagement. The challenge of providing such incentives iscompounded by the fact that consumers of lighting products donot necessarily respond to environmental design and reward suchefforts. Despite new standards and more efficient lighting optionsavailable, the least expensive and least environmentally beneficiallighting products continue to dominate the market in Europe(Bennich et al., 2014). In light of these challenges, it may well bethat EPR, while part of the means to communicate and incentiviseconsideration of end-of-life management at the design stage, isnot sufficient to overcome the other influences on design. Thesebarriers may need to be addressed through more direct tools toinfluence ecodesign.
The development of new technology such as LEDs and moreintegrated products in lighting is increasing in its pace and marketpenetration (McKinsey and Company, 2012). Such technologiesbring a new set of challenges for WEEE system for lamps. It isunknown whether the smaller amounts of rare earth material (inaddition to other critical materials like Gallium and Indium) willhave the same potential for recycling as the gas discharge lamps.The longer lifetimes of these products may also result in less wastematerial overall to be collected and recovered. The best ways todeal with hazardous materials as LEDs become the dominant lamptype in the waste streams remains a question as to the bestrecycling techniques for integrated LED products. The long life ofthese products and the rapid development of the products maymean that they are disposed before their end-of-life, in which caseopportunities for reuse of some components may becomepossible. Prevention of waste and product design for recycling, oneof the key aims of EPR is still a challenge for lamps, and consid-eration of the new technology will be key to further advancing acircular economy.
5. Conclusion
Collection and recycling of gas discharge lamps should be apriority in a circular economy, in consideration of both theavoided environmental harm of mercury emissions and the po-tential for recycling of valuable materials. Nordic countriesperform well in the collection and recycling of gas dischargelamps compared to other EU countries, and this performance canbe attributed to robust system architectures, as a result of therule base but also other factors. There is evidence that the sys-tems continue to improve in terms of convenience and in closingmaterial loops, with the recycling of rare earths from lampphosphors a notable development. However, challenges remainto further optimise the systems, particularly in terms of meetingEPR goals for better design and in light of rapidly changingtechnology.
Acknowledgements
This research is supported through Swedish Energy Agencygrant number 37655-1. The authors wish to thank Dr. Naoko Tojoand the peer reviewers for helpful comments and insights thatimproved the manuscript. We also wish to thank the interviewedstakeholders who were so generous with their time andexpertise.
3 8.500 is an average but it should be noted that the use varies significantly. In aprofessional situation the product would typically be used more intensely thanhome use, but the users also typically purchase different specifications of lamps (i.e.6000 h CLFs versus a 15,000 h LFLs). So this could result in a majority of fluorescentlamps being disposed around 6000 h, but with a long tail extending decades.
J.L. Richter, R. Koppejan / Journal of Cleaner Production 123 (2016) 167e179 175
Appendix A. List of interviewed stakeholders
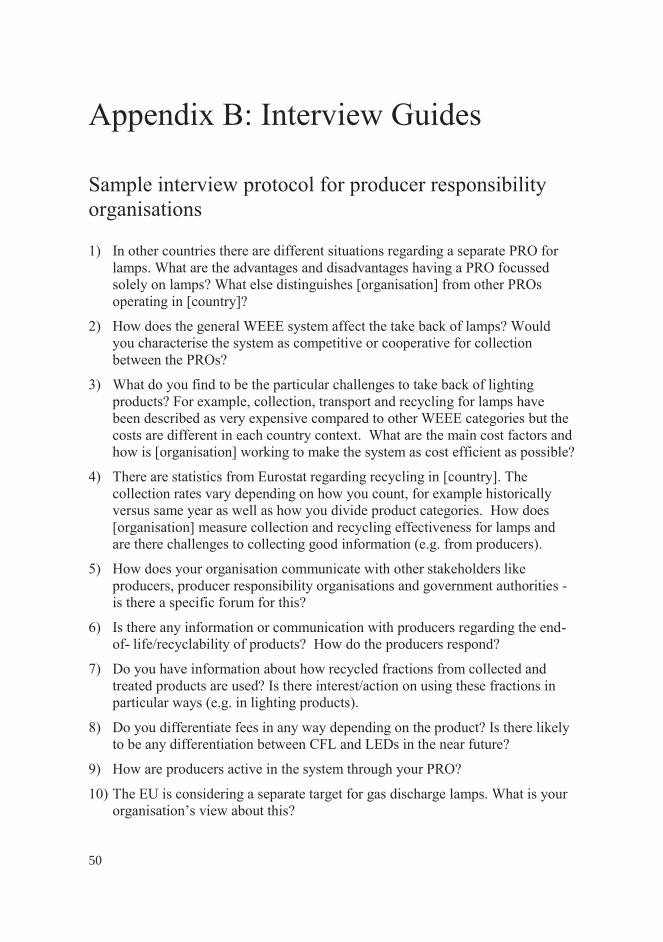
Appendix B. Sample interview protocol for producerresponsibility organisations
1. In other countries there are different situations regarding aseparate PRO for lamps. What are the advantages and dis-advantages having a PRO focussed solely on lamps? Whatelse distinguishes [organisation] from other PROs operatingin [country]?
2. How does the general WEEE system affect the take back oflamps? Would you characterise the system as competitive orcooperative for collection between the PROs?
3. What do you find to be the particular challenges to take backof lighting products? For example, collection, transport andrecycling for lamps have been described as very expensivecompared to other WEEE categories but the costs aredifferent in each country context. What are the main costfactors and how is [organisation] working to make the sys-tem as cost efficient as possible?
4. There are statistics from Eurostat regarding recycling in[country]. The collection rates vary depending on how youcount, for example historically versus same year as well ashow you divide product categories. How does [organisation]measure collection and recycling effectiveness for lamps andare there challenges to collecting good information (e.g. fromproducers).
5. How does your organisation communicate with otherstakeholders like producers, producer responsibility organi-sations and government authorities e is there a specificforum for this?
6. Is there any information or communication with producersregarding the end-of-life/recyclability of products? How dothe producers respond?
7. Do you have information about how recycled fractions fromcollected and treated products are used? Is there interest/action on using these fractions in particular ways (e.g. inlighting products).
8. Do you differentiate fees in any way depending on theproduct? Is there likely to be any differentiation between CFLand LEDs in the near future?
9. How are producers active in the system through your PRO?10. The EU is considering a separate target for gas discharge
lamps. What is your organisation's view about this?11. In the media in some countries, it has been highlighted that
there are still lamps ending up in incineration and glassrecycling. Is it an issue in [country]?
12. Transporting hazardous waste such as lamps could pose risksfrom mercury for waste handlers. Is handling mercury-containing waste products or broken lamps an issue in[country]?
Name Organisation, position Stakeholder group Interview date
Denmark Jan Bielefeldt Lyskildebranchens WEEE Forening (LWF),Administrative Director
Producer ResponsibilityOrganisation (lamps)
In person interview e 26 August 2014
Jonas Engberg Ikea, Sustainability Manager Denmark Retailer In person interview e 26 August 2014Hardy Mikkelsen Reno Djurs, Environmental Manager Municipal Waste Organisation Phone interview e 4 December 2015Lotte WammenRahbek
Forsyning Helsingør, Waste planner Municipal Waste Organisation In person interview e 15 December 2014
Niels Remtoft Dansk Affaldsforening, Special Consultant National Waste ManagementAssociation
In person interview e 15 December 2014
Finland Senja Forsman SOK Grocery Chain Management,Compliance Manager
Retailer Phone interview e 4 December 2014
Timo H€am€al€ainen Finnish Solid Waste Association,Development Manager
National Waste ManagementAssociation
Phone interview e 19 December 2014
Jorma Koskinen Ekokem, Sales Group Manager Recycler Email correspondence e 29 January 2015Jesse Mether Rautakesko Ltd, Sustainability Manager Retailer Email correspondence e 19 December 2014Perrti Raunamaa FLIP, Administrative Director Producer Responsibility Organisation
(lamps)Phone interview e 8 December 2014
Tuomas R€as€anen Elker Oy, Chief Operations Officer Producer Responsibility Organisation Email correspondence e 22 January 2015Norway Ellen Halaas Avfall Norge, Adviser for framework and
law collection, sorting and recyclingNational Waste ManagementAssociation
Phone interview e 9 December 2014
Guro Kjørsvik Husby El Retur, Information Officer Producer Responsibility Organisation Email correspondence e 24 November2014 and 8 January 2015
Bjørn Thon RENAS, Administrative Director Producer Responsibility Organisation Phone interview e 30 January 2015Sweden Carina Andersson IKEA of Sweden, Product Laws & Standard
specialist e Producer ResponsibilityProducer Email correspondence 13 and 15 May 2015
Jessica Christiansen Avfall Sverige, Education Manager/ControllerTechnical Advisor WEEE
National Waste ManagementAssociation
In person interview e 16 December 2014
Jonas Carlehed IKEA, Sustainability Manager Sweden Retailer Phone interview e 30 January 2015Lars Eklund Natursvardsverket (Swedish EPA), Advisor
Environmental EnforcementGovernment authority Phone interview e 2 December 2014
G€oran Lundholm Nordic Recycling, General Manager Recycler In person interview e 13 August 2014;phone interview e 27 October 2014
Dolores €Ohman H€assleholm Milj€o, Head of Waste Collectionand Customer Service
Municipal Waste Organisation In person interview e 3 September 2014
Anders Persson SYSAV, CEO Municipal Waste Organisation In person interview e 9 September 2014Mårten Sundin El-Kretsen AB, Marketing Manager Producer Responsibility Organisation In person interview e 5 December 2014Hans Standar Svensk GlasÅtervinning AB, CEO Glass recycler Phone interview e 4 December 2014Joseph Tapper Elektronikåtervinning i Sverige, CEO Producer Responsibility Organisation In person interview e 5 December 2015
Additional correspondence SERTY (Finland), ERP (Denmark) Producer responsibility organisations Email correspondence
J.L. Richter, R. Koppejan / Journal of Cleaner Production 123 (2016) 167e179176
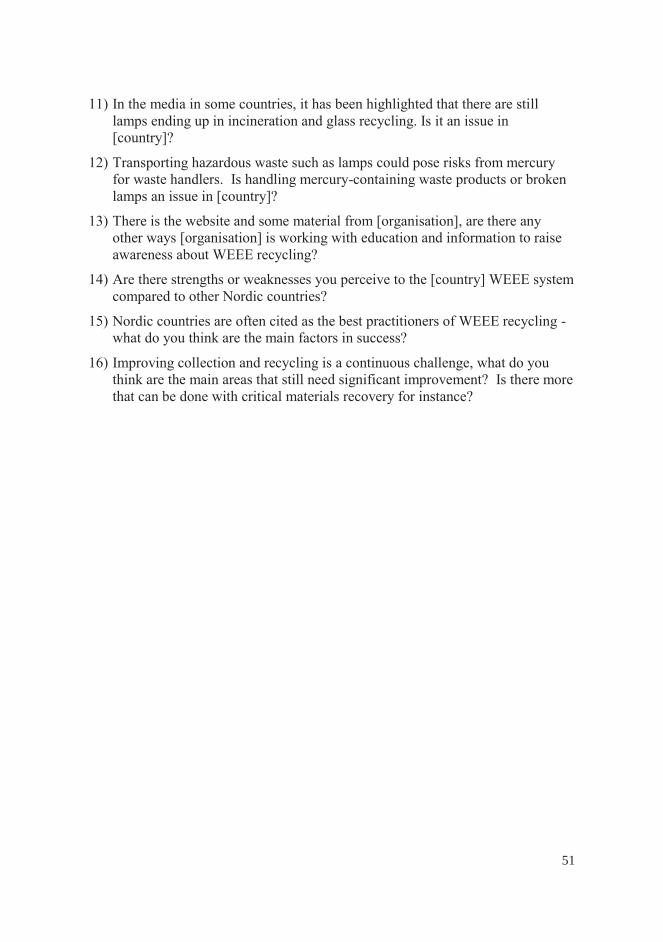
13. There is the website and some material from [organisation],are there any other ways [organisation] is working witheducation and information to raise awareness about WEEErecycling?
14. Are there strengths or weaknesses you perceive to the[country]WEEE system compared to other Nordic countries?
15. Nordic countries are often cited as the best practitioners ofWEEE recycling - what do you think are the main factors insuccess?
16. Improving collection and recycling is a continuous challenge,what do you think are the main areas that still need signif-icant improvement? Is there more that can be done withcritical materials recovery for instance?
Appendix C. Sample interview protocol for national wastemanagement associations
1. What are themain issues in producer responsibility forWEEEwhere your organisation is involved on themember's behalf?
2. How does your organisation communicate with otherstakeholders like producers, producer responsibility organi-sations and government authorities e is there a specificforum for this?
3. Are there any issues with working with the relationshipbetween municipalities and PROs in [country]? Is it a con-tract or other agreement on how the responsibility is allo-cated and managed for collection points and collection?
4. Would you characterise the system as competitive or coop-erative for collection between the PROs?
5. Transporting hazardous waste such as lamps could pose risksfrom mercury for waste handlers. Is handling mercury-containing waste products or broken lamps an issue in[country]?
6. From [organisation] reports there are still some lamps foundin residual waste. Are these and other small electronic wasteperceived as a particular problem?
7. How are municipalities and/or your organisation workingwith increasing collection of lamps and other small WEEE?Are there any pilot projects or innovative examples to furtheroptimise the WEEE system in this respect?
8. There is the website and some material from [organisation],is there more [organisation] is doing to educate about haz-ardous waste like gas discharge lamps?
9. The EU is considering a separate target for gas dischargelamps. What is your organisation's view about this?
10. Are there strengths or weaknesses you perceive to the[country]WEEE system compared to other Nordic countries?
11. Nordic countries are often cited as the best practitioners ofWEEE recycling - what do you think are the main factors insuccess?
12. Improving collection and recycling is a continuous challenge,what do you think are the main areas that still need signif-icant improvement?
References
Avfall Sverige, 2013. Meeting with the Minister of Environment of CFLs. Retrieved21.01.15, from: http://www.avfallsverige.se/nyhetsarkiv/nyhetsvisning/artikel/moete-med-miljoeministern-om-laagenergilampor/.
Bakker, C., Wang, F., Huisman, J., den Hollander, M., 2014. Products that go round:exploring product life extension through design. J. Clean. Prod. 69, 10e16.http://doi.org/10.1016/j.jclepro.2014.01.028.
Baxter, J., Wahlstrom, M., Zu Castell-Rüdenhausen, M., Fråne, A., Stare, M., Løkke, S.,Pizzol, M., 2014. Plastic Value Chains e Case: WEEE (Waste Electric and ElectronicEquipment) in the Nordic Region. Nordic Council of Ministers. Retrieved from:
http://nordic.elibrary.imf.org/doc/IMF931/22027-9789289328029/22027-9789289328029/Other_formats/Source_PDF/22027-9789289328463.pdf.
Bennich, P., Soenen, B., Scholand, M., Borg, N., 2014. Test Report e Clear, Non-Directional LED Lamps. Retrieved from: https://www.energimyndigheten.se/Global/F%C3%B6retag/Ekodesign/Produktgrupper/Belysning/Report%20on%20Testing%20of%20Clear%20LED%20lamps%20v5%205.pdf.
Bickman, L., 1987. The functions of program theory. New Dir. Program Eval. 33,5e18. http://doi.org/10.1002/ev.1443.
Binnemans, K., Jones, P.T., Blanpain, B., Van Gerven, T., Yang, Y., Walton, A.,Buchert, M., 2013. Recycling of rare earths: a critical review. J. Clean. Prod. 51,1e22. http://doi.org/10.1016/j.jclepro.2012.12.037.
Bloomberg News, 2015. China Scraps Rare Earth Export Controls after Losing WTOAppeal. Retrieved from: http://www.bloomberg.com/news/2015-01-06/china-scraps-rare-earth-export-controls-after-losing-wto-appeal.html.
Dahler-Larsen, P., 2001. From programme theory to constructivism on tragic, magicand competing programmes. Evaluation 7 (3), 331e349. http://doi.org/10.1177/13563890122209711.
“Danish WEEE legislation”. Bekendtgørelse om at bringe elektrisk og elektroniskudstyr i omsætning samt håndtering af affald af elektrisk og elektronisk udstyrRessortministerium, Pub. L. No. BEK nr 130 af 06/02/2014 Gældende. (2014).Retrieved from: https://www.retsinformation.dk/Forms/R0710.aspx?id¼161674.
Dansk Producent Ansvar, 2015. WEEE. Retrieved 28.01.15, from: https://www.dpa-system.dk/da/WEEE.
Druckman, D., 2005. Comparative case study approaches. Doing Research. SAGEPublications, Inc, 2455 Teller Road, Thousand Oaks, California 91320, UnitedStates of America, pp. 208e226. Retrieved from: http://srmo.sagepub.com/view/doing-research/SAGE.xml.
Dunn, W.N., 1981. Public Policy Analysis: an Introduction. Prentice-Hall, EnglewoodCliffs, N.J.
Dupont, D., Binnemans, K., 2015. Rare-earth recycling using a functionalized ionicliquid for the selective dissolution and revalorization of Y2O3:Eu3þ from lampphosphor waste. Green Chem. 17 (2), 856e868. http://doi.org/10.1039/C4GC02107J.
Ekokem, 2014. Fluorescent tubes. Retrieved 05.06.15, from: http://www.ekokem.fi/en/waste-services/waste-treatment/other-treatment-methods/fluorescent-tubes.
Elker Oy, 2014. Elker Oy. Retrieved 28.01.15, from: http://www.elker.fi/.El Kretsen, 2014. Om El-Kretsen. Retrieved 21.01.15, from: http://www.elkretsen.se/
om-el-kretsen/.El Kretsen, S€orab, 2011. Framtidens insamlingssystem f€or sm€att el-avfall. Retrieved
from: http://www.elkretsen.se/sitespecific/elkretsen/files/pdfel/rapport_framtidens_insamlingssystem.pdf.
Elretur, 2012. On the Side of the Environment. Elretur's environmental report.Retrieved from: http://www.elretur.no/eng/content/download/4238/27894/file/Milj%C3%B8rapport_2012_English%283%29.pdf.
Elretur, 2014. About Elretur. Retrieved 21.01.15, from: http://www.elretur.no/nor.EU Commission, 2008, November 12. Managing mercury risks from energy-saving
light bulbs. Retrieved 20.10.14, from: http://ec.europa.eu/environment/integration/research/newsalert/pdf/129na1_en.pdf.
EU Commission, 2013, November. Waste statistics e electrical and electronicequipment. Retrieved 27.08.14, from: http://epp.eurostat.ec.europa.eu/statistics_explained/index.php/Waste_statistics_-_electrical_and_electronic_equipment.
EU Commission, 2014a. Eco-design legislation: implementing regulations. Retrievedfrom: http://ec.europa.eu/energy/efficiency/ecodesign/doc/overview_legislation_eco-design.pdf.
EU Commission, 2014b. Report on Critical Raw Materials for the EU. Retrieved from:http://ec.europa.eu/enterprise/policies/raw-materials/files/docs/crm-report-on-critical-raw-materials_en.pdf.
EU Commission, 2014c, July 2. Higher recycling targets to drive transition to a cir-cular economy with new jobs and sustainable growth. Retrieved from: http://europa.eu/rapid/press-release_IP-14-763_en.htm.
European Lighting Companies' Federation, 2003. Let there be light: a blueprint forthe sustainable waste management of lamps in the EU in view of the expectedimplementation of the waste electrical and electronic equipment directive.Retrieved 29.01.15, from: http://www.lightingeurope.org/uploads/files/let_there_be_light_brochure.pdf.
Eurostat, 2014, April. Waste electrical and electronic equipment (WEEE). Retrieved26.08.14, from: http://epp.eurostat.ec.europa.eu/portal/page/portal/waste/key_waste_streams/waste_electrical_electronic_equipment_weee.
“Finnish WEEE legislation”. Valtioneuvoston asetus s€ahk€o- ja elektroniikkalaiter-omusta, Pub. L. No. 07.03.2014/519. (2014). Retrieved from: http://www.finlex.fi/fi/laki/alkup/2014/20140519.
Friedman, V.J., 2001. Designed blindness: an action science perspective on programtheory evaluation. Am. J. Eval. 22 (2), 161e181. http://doi.org/10.1177/109821400102200203.
Gottberg, A., Morris, J., Pollard, S., Mark-Herbert, C., Cook, M., 2006. Producerresponsibility, waste minimisation and the WEEE Directive: case studies ineco-design from the European lighting sector. Sci. Total Environ. 359 (1),38e56.
Hansen, M.B., Vedung, E., 2010. Theory-based stakeholder evaluation. Am. J. Eval. 31(3), 295e313. http://doi.org/10.1177/1098214010366174.
Hischier, R., W€ager, P., Gauglhofer, J., 2005. Does WEEE recycling make sense froman environmental perspective?: the environmental impacts of the Swiss take-back and recycling systems for waste electrical and electronic equipment
J.L. Richter, R. Koppejan / Journal of Cleaner Production 123 (2016) 167e179 177
(WEEE). Environ. Impact Assess. Rev. 25 (5), 525e539. http://doi.org/10.1016/j.eiar.2005.04.003.
Huisman, J., 2013. Too big to fail, too academic to function. J. Ind. Ecol. 17 (2),172e174. http://doi.org/10.1111/jiec.12012.
Huisman, J., Magalini, F., Kuehr, R., Maurer, C., Ogilvie, S., Poll, J., , et al.Stevels, A.,2008. Review of Directive 2002/96 on Waste Electrical and Electronic Equip-ment (WEEE). United Nations University.
Huisman, J., Van der Maesen, M., Eijsbouts, R.J.J., Wang, F., Bald�e, C.P., Wielenga, C.A.,2012. The Dutch WEEE Flows. United Nations University. Retrieved from: http://www.ihdp.unu.edu/file/download/9654.pdf.
Hylander, L.D., Goodsite, M.E., 2006. Environmental costs of mercury pollution. Sci.Total Environ. 368 (1), 352e370. http://doi.org/10.1016/j.scitotenv.2005.11.029.
Kalimo, H., Lifset, R., van Rossem, C., van Wassenhove, L., Atasu, A., Mayers, K., 2012.Greening the economy through design incentives: allocating extended pro-ducer responsibility. Eur. Energy Environ. Law Rev. 21. Retrieved from: http://www.kluwerlawonline.com/document.php?id¼EELR2012023.
Kasser, U., Savi, D., 2013. Risks of Recycling Energy Saving Lamps. Swiss LightingRecycling Foundation, Zurich. Retrieved from: http://www.weee-forum.org/system/files/documents/2013_risks_of_recycling_energy_saving_lamps.pdf.
Kautto, P., Simil€a, J., 2005. Recently introduced policy instruments and interventiontheories. Evaluation 11 (1), 55e68. http://doi.org/10.1177/1356389005053191.
Kemikalieinspektionen, 1998. Kvicksilveravvecklingen i Sverige: redovisning av ettregeringsuppdrag. Kemikalieinspektionen, Solna. Retrieved from: http://libris.kb.se/bib/2795131.
Khetriwal, D.S., Widmer, R., Kuehr, R., Huisman, J., 2011. One WEEE, many spe-cies: lessons from the European experience. Waste Manag. Res. 29 (9),954e962.
Koninklijke Philips Electronics N.V., 2011. Phosphor e a critical component influorescent lamps. Retrieved from: http://www.lighting.philips.com/pwc_li/ph_en/lightcommunity/assets/APR_Phosphor_Brochure_LR.pdf.
Lifset, R., Atasu, A., Tojo, N., 2013. Extended producer responsibility. J. Ind. Ecol. 17(2), 162e166. http://doi.org/10.1111/jiec.12022.
Lighting Council Australia, 2014. FluoroCycle. Retrieved 05.10.14, from: http://www.fluorocycle.org.au/why-recycle.php.
LightingEurope, 2014. LightingEurope Position Paper Customs Codes for LEDLighting Products. Retrieved from: http://www.lightingeurope.org/uploads/files/LightingEurope_Position_Paper_on_LED_Customs_Codes_February2014.pdf.
Lim, S.R., Kang, D., Ogunseitan, O.A., Schoenung, J.M., 2013. Potential environmentalimpacts from the metals in incandescent, compact fluorescent lamp (CFL), andlight-emitting diode (LED) bulbs. Environ. Sci. Technol. 47 (2), 1040e1047.http://doi.org/10.1021/es302886m.
Lindhqvist, T., 2000. Extended Producer Responsibility in Cleaner Production:Policy Principle to Promote Environmental Improvements of Product Sys-tems, vol. 2000. Lund University. Retrieved from: http://lup.lub.lu.se/record/19692.
Manomaivibool, P., 2008. Network management and environmental effective-ness: the management of end-of-life vehicles in the United Kingdom and inSweden. J. Clean. Prod. 16 (18), 2006e2017. http://doi.org/10.1016/j.jclepro.2008.01.013.
McKinsey, Company, 2012. Lighting the Way: Perspectives on the Global LightingMarket, second ed. Retrieved from: http://www.mckinsey.com/~/media/mckinsey/dotcom/client_service/Automotive%20and%20Assembly/Lighting_the_way_Perspectives_on_global_lighting_market_2012.ashx.
Melissen, F.W., 2006. Redesigning a collection system for “small” consumer elec-tronics. Waste Manag. (New York, N.Y.) 26 (11), 1212e1221. http://doi.org/10.1016/j.wasman.2005.08.005.
Mickwitz, P., 2003. A framework for evaluating environmental policy instrumentscontext and key concepts. Evaluation 9 (4), 415e436. http://doi.org/10.1177/1356389003094004.
Moss, R.L., Tzimas, E., Willis, P., Arendorf, J., Espinoza, L.T., et al., 2013. Critical Metalsin the Path towards the Decarbonisation of the EU Energy Sector. Retrievedfrom: http://www.reeminerals.no/images/Marketing/Presseartikler/Critical_Metals_Decarbonisation_small.pdf.
Murphy, S.F., Gregory, J., Kirchain, R., 2012. Evaluating the performance of recyclingsystems. E-Waste Management: from Waste to Resource. Retrieved from:http://www.google.com/books?hl¼en&lr¼&id¼b4VMKs95U5YC&oi¼fnd&pg¼PT242&ots¼MLCo5uhEi1&sig¼4JRQJGsMlSrUKdaWQtgApM7RBxs.
Nordic Recycling, 2014. Use of Fractions. Retrieved 30.08.14, from: http://www.nordicrecycling.se/nr/18-recycling-evy.
“Norwegian WEEE legislation”. Forskrift om endring i forskrift om gjenvinningog behandling av avfall (avfallsforskriften), Pub. L. No. FOR 2015-01-05-4(2015). Retrieved from: https://lovdata.no/dokument/SF/forskrift/2004-06-01-930.
OECD, 2014. The State of Play on Extended Producer Responsibility (EPR): Oppor-tunities and Challenges. Retrieved from: http://www.oecd.org/environment/waste/Global%20Forum%20Tokyo%20Issues%20Paper%2030-5-2014.pdf.
Pehrson, J., Balksj€o, J., 2011, November 21. Milj€oministern oroad: “Situationen €arakut”. SvD.se. Retrieved from: http://www.svd.se/nyheter/inrikes/lena-ek-situationen-ar-akut_6651732.svd.
Pehrson, J., Balksj€o, J., 2012, March 20. Milj€oministern kr€aver system f€or lamp-återvinning. SvD Nyheter. Retrieved from: http://www.svd.se/nyheter/inrikes/miljoministern-kraver-system-for-atervinning_6937369.svd.
Philips Lighting, 2012. Waste Electrical & Electronic Equipment (WEEE).Retrieved 06.10.14, from: http://www.lighting.philips.com/pwc_li/main/light
community/assets/sustainability/Waste-Electorical-Electronic-Equipment-WEEE.pdf.
Rademaker, J.H., Kleijn, R., Yang, Y., 2013. Recycling as a strategy against rare earthelement criticality: a systemic evaluation of the potential yield of NdFeBmagnet recycling. Environ. Sci. Technol. 47 (18), 10129e10136.
RENAS, 2014. Styre og referansegruppe. Retrieved 21.01.15, from: http://www.renas.no/Styre-og-referansegruppe.
Rom�an, E., 2012. 22-WEEE management in Europe: learning from best practice. In:Goodship, V., Stevels, A. (Eds.), Waste Electrical and Electronic Equipment(WEEE) Handbook. Woodhead Publishing, pp. 493e525. Retrieved from: http://www.sciencedirect.com/science/article/pii/B9780857090898500222.
Sander, K., Schilling, S., Wagner, J., Günther, M., 2013. Maßnahmen zur Optimierungder Entsorgung von quecksilberhaltigen Gasentladungslampen und anderenLampen. €OKOPOL GmbH Institut für €Okologie und Politik. Retrieved from:www.intecus.de/link_704.html.
Schüler, D., Buchert, M., Liu, D.-I.R., Dittrich, D.-G.S., Merz, D.-I.C., 2011. Study onRare Earths and Their Recycling. Retrieved from: http://www.wwwoeko.de/oekodoc/1112/2011-003-en.pdf.
Silveira, G.T., Chang, S.-Y., 2011. Fluorescent lamp recycling initiatives in the UnitedStates and a recycling proposal based on extended producer responsibility andproduct stewardship concepts. Waste Manag. Res. 29 (6), 656e668. http://doi.org/10.1177/0734242X10383744.
Solvay, 2014. Loop Life Project. Retrieved from: http://www.solvay.com/en/innovation/european-life-projects/loop-life-project-objectives.html (lastaccessed on 30.09.14.).
Sprecher, B., Kleijn, R., Kramer, G.J., 2014. Recycling potential of neodymium:the case of computer hard disk drives. Environ. Sci. Technol. 48 (16),9506e9513.
“Swedish WEEE legislation”. F€orordning om producentansvar f€or elutrustning, Pub.L. No. 2014:1075. (2014). Retrieved from: http://www.notisum.se/rnp/sls/sfs/20141075.pdf.
Tan, Q., Li, J., Zeng, X., 2014. Rare earth elements recovery from waste fluorescentlamps: a review. Crit. Rev. Environ. Sci. Technol. http://doi.org/10.1080/10643389.2014.900240.
Tojo, N., 2004. Extended Producer Responsibility as a Driver for Design Change-Utopia or Reality? Lund University. Retrieved from: http://lup.lub.lu.se/record/21840.
UNEP, 2012. Achieving the Global Transition to Energy Efficient Lighting Toolkit.United Nations Environment Programme. Retrieved from: http://www.thegef.org/gef/sites/thegef.org/files/publication/Complete%20EnlightenToolkit_1.pdf.
UNEP, 2014. Efficient Lighting Global Policy Map. Retrieved 05.09.14, from: http://learning.enlighten-initiative.org/GlobalPolicyMap.aspx.
U.S. Department of Energy, 2011. Critical Materials Strategy. Retrieved from: http://energy.gov/sites/prod/files/DOE_CMS2011_FINAL_Full.pdf.
U.S. Department of Energy, 2012. Life-Cycle Assessment of Energy and Environ-mental Impacts of LED Lighting Products, Part 1. Retrieved from: http://apps1.eere.energy.gov/buildings/publications/pdfs/ssl/2012_LED_Lifecycle_Report.pdf.
Uusioaines Oy, 2014. Lasinkierr€atyst€a koko Suomen alueella e pullot, purkit jaikkunalasit. Retrieved 25.01.15, from: http://www.uusioaines.com/en/.
van Rossem, C., Lindhqvist, T., Tojo, N., 2006a. Lost in transposition? A study of theimplementation of individual producer responsibility in the WEEE Directive.Retrieved from: http://lup.lub.lu.se/record/955709.
van Rossem, C., Tojo, N., Lindhqvist, T., 2006b. Extended Producer Re-sponsibility: an Examination of Its Impact on Innovation and GreeningProducts (Report). Greenpeace International. Retrieved from: http://lup.lub.lu.se/record/956128.
Vedung, E., 2008. Public Policy and Program Evaluation, fourth ed. TransactionPublishers, New Brunswick, N.J.
Von Schultz, C., 2013, April 18. Nu hamnar fler lampor d€ar de ska. NyTeknik.Retrieved from: http://www.nyteknik.se/nyheter/energi_miljo/miljo/article3678603.ece.
Wagner, T.P., 2011. Compact fluorescent lights and the impact of convenience andknowledge on household recycling rates. Waste Manag. 31 (6), 1300e1306.http://doi.org/10.1016/j.wasman.2011.01.017.
Wagner, T.P., 2013. Examining the concept of convenient collection: an applica-tion to extended producer responsibility and product stewardship frame-works. Waste Manag. 33 (3), 499e507. http://doi.org/10.1016/j.wasman.2012.06.015.
Wagner, T.P., Toews, P., Bouvier, R., 2013. Increasing diversion of household haz-ardous wastes and materials through mandatory retail take-back. J. Environ.Manag. 123, 88e97. http://doi.org/10.1016/j.jenvman.2013.03.020.
Walter, P., 2011, July. Rhodia recovers rare earths. Chem. Ind. Mag. 3. Retrieved from:http://www.soci.org/Chemistry-and-Industry/CnI-Data/2011/3/Rhodia-recovers-rare-earths.
Wang, F., Huisman, J., Bald�e, K., Stevels, A., 2012. A systematic and compatibleclassification of WEEE. Electronics Goes Green 2012þ(EGG), 2012. IEEE, pp. 1e6.Retrieved from: http://ieeexplore.ieee.org/xpls/abs_all.jsp?arnumber¼6360480.
WEEE Forum, 2011. WEEELABEX normative document on treatment v9.0. Retrievedfrom: http://www.weee-forum.org/system/files/weeelabex_v9.0_standard_on_treatment.pdf.
Yin, R., 2003. Case Study Research: Design and Methods, vol. 5. Sage Publications,Inc, p. 11.
J.L. Richter, R. Koppejan / Journal of Cleaner Production 123 (2016) 167e179178

Yl€a-Mella, J., Poikela, K., Lehtinen, U., Tanskanen, P., Rom�an, E., Keiski, R.L.,Pongr�acz, E., 2014a. Overview of the WEEE directive and its implementation inthe nordic countries: national realisations and best practices. J. Waste Manag.2014, e457372. http://doi.org/10.1155/2014/457372.
Yl€a-Mella, J., Poikela, K., Lehtinen, U., Keiski, R.L., Pongr�acz, E., 2014b. Imple-mentation of Waste Electrical and Electronic Equipment Directive in Finland:evaluation of the collection network and challenges of the effective WEEEmanagement. Resour. Conserv. Recycl. 86, 38e46. http://doi.org/10.1016/j.resconrec.2014.02.001.
J.L. Richter, R. Koppejan / Journal of Cleaner Production 123 (2016) 167e179 179


II

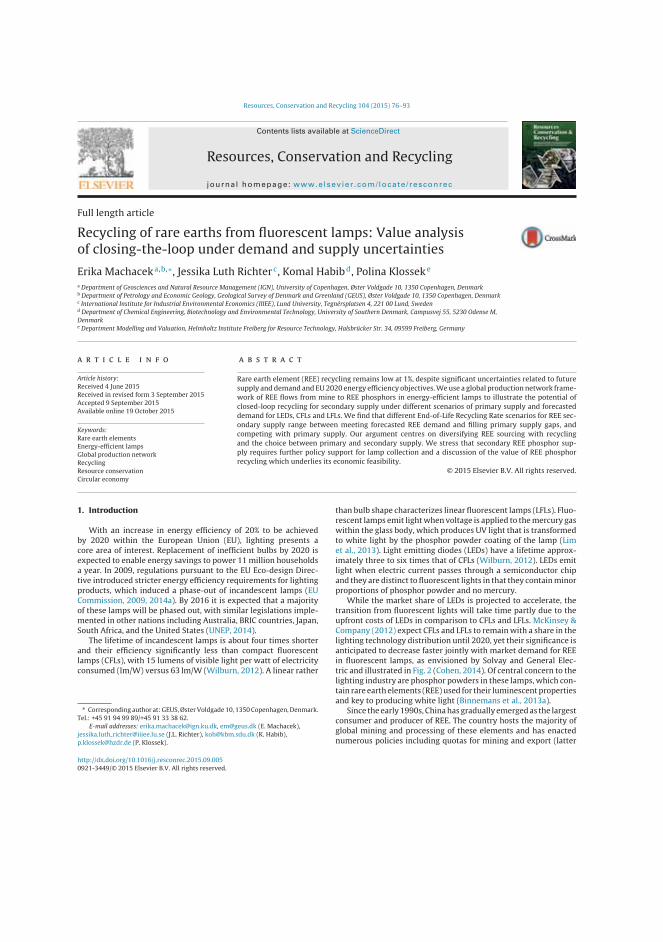
Resources, Conservation and Recycling 104 (2015) 76–93
Contents lists available at ScienceDirect
Resources, Conservation and Recycling
jo u r n al homep age: www.elsev ier .com/ locate / resconrec
Full length article
Recycling of rare earths from fluorescent lamps: Value analysis
of closing-the-loop under demand and supply uncertainties
Erika Machaceka,b,∗, Jessika Luth Richterc, Komal Habibd, Polina Klosseke
a Department of Geosciences and Natural Resource Management (IGN), University of Copenhagen, Øster Voldgade 10, 1350 Copenhagen, Denmarkb Department of Petrology and Economic Geology, Geological Survey of Denmark and Greenland (GEUS), Øster Voldgade 10, 1350 Copenhagen, Denmarkc International Institute for Industrial Environmental Economics (IIIEE), Lund University, Tegnérsplatsen 4, 221 00 Lund, Swedend Department of Chemical Engineering, Biotechnology and Environmental Technology, University of Southern Denmark, Campusvej 55, 5230 Odense M,
Denmarke Department Modelling and Valuation, Helmholtz Institute Freiberg for Resource Technology, Halsbrücker Str. 34, 09599 Freiberg, Germany
a r t i c l e i n f o
Article history:
Received 4 June 2015
Received in revised form 3 September 2015
Accepted 9 September 2015
Available online 19 October 2015
Keywords:
Rare earth elements
Energy-efficient lamps
Global production network
Recycling
Resource conservation
Circular economy
a b s t r a c t
Rare earth element (REE) recycling remains low at 1%, despite significant uncertainties related to future
supply and demand and EU 2020 energy efficiency objectives. We use a global production network frame-
work of REE flows from mine to REE phosphors in energy-efficient lamps to illustrate the potential of
closed-loop recycling for secondary supply under different scenarios of primary supply and forecasted
demand for LEDs, CFLs and LFLs. We find that different End-of-Life Recycling Rate scenarios for REE sec-
ondary supply range between meeting forecasted REE demand and filling primary supply gaps, and
competing with primary supply. Our argument centres on diversifying REE sourcing with recycling
and the choice between primary and secondary supply. We stress that secondary REE phosphor sup-
ply requires further policy support for lamp collection and a discussion of the value of REE phosphor
recycling which underlies its economic feasibility.
© 2015 Elsevier B.V. All rights reserved.
1. Introduction
With an increase in energy efficiency of 20% to be achieved
by 2020 within the European Union (EU), lighting presents a
core area of interest. Replacement of inefficient bulbs by 2020 is
expected to enable energy savings to power 11 million households
a year. In 2009, regulations pursuant to the EU Eco-design Direc-
tive introduced stricter energy efficiency requirements for lighting
products, which induced a phase-out of incandescent lamps (EU
Commission, 2009, 2014a). By 2016 it is expected that a majority
of these lamps will be phased out, with similar legislations imple-
mented in other nations including Australia, BRIC countries, Japan,
South Africa, and the United States (UNEP, 2014).
The lifetime of incandescent lamps is about four times shorter
and their efficiency significantly less than compact fluorescent
lamps (CFLs), with 15 lumens of visible light per watt of electricity
consumed (lm/W) versus 63 lm/W (Wilburn, 2012). A linear rather
∗ Corresponding author at: GEUS, Øster Voldgade 10, 1350 Copenhagen, Denmark.
Tel.: +45 91 94 99 89/+45 91 33 38 62.
E-mail addresses: [email protected], [email protected] (E. Machacek),
jessika.luth [email protected] (J.L. Richter), [email protected] (K. Habib),
[email protected] (P. Klossek).
than bulb shape characterizes linear fluorescent lamps (LFLs). Fluo-
rescent lamps emit light when voltage is applied to the mercury gas
within the glass body, which produces UV light that is transformed
to white light by the phosphor powder coating of the lamp (Lim
et al., 2013). Light emitting diodes (LEDs) have a lifetime approx-
imately three to six times that of CFLs (Wilburn, 2012). LEDs emit
light when electric current passes through a semiconductor chip
and they are distinct to fluorescent lights in that they contain minor
proportions of phosphor powder and no mercury.
While the market share of LEDs is projected to accelerate, the
transition from fluorescent lights will take time partly due to the
upfront costs of LEDs in comparison to CFLs and LFLs. McKinsey &
Company (2012) expect CFLs and LFLs to remain with a share in the
lighting technology distribution until 2020, yet their significance is
anticipated to decrease faster jointly with market demand for REE
in fluorescent lamps, as envisioned by Solvay and General Elec-
tric and illustrated in Fig. 2 (Cohen, 2014). Of central concern to the
lighting industry are phosphor powders in these lamps, which con-
tain rare earth elements (REE) used for their luminescent properties
and key to producing white light (Binnemans et al., 2013a).
Since the early 1990s, China has gradually emerged as the largest
consumer and producer of REE. The country hosts the majority of
global mining and processing of these elements and has enacted
numerous policies including quotas for mining and export (latter
http://dx.doi.org/10.1016/j.resconrec.2015.09.005
0921-3449/© 2015 Elsevier B.V. All rights reserved.
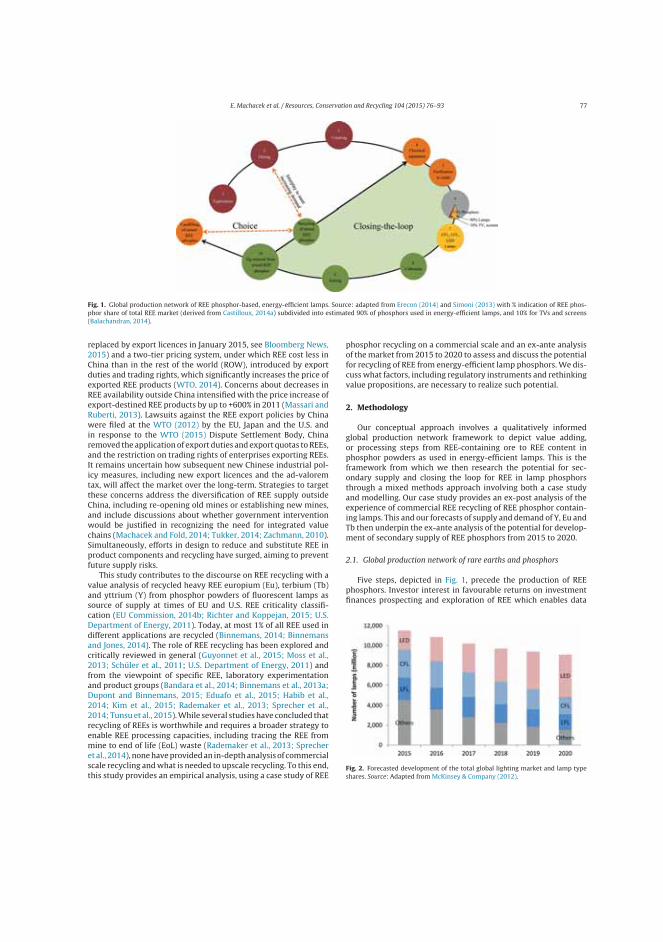
E. Machacek et al. / Resources, Conservation and Recycling 104 (2015) 76–93 77
Fig. 1. Global production network of REE phosphor-based, energy-efficient lamps. Source: adapted from Erecon (2014) and Simoni (2013) with % indication of REE phos-
phor share of total REE market (derived from Castilloux, 2014a) subdivided into estimated 90% of phosphors used in energy-efficient lamps, and 10% for TVs and screens
(Balachandran, 2014).
replaced by export licences in January 2015, see Bloomberg News,
2015) and a two-tier pricing system, under which REE cost less in
China than in the rest of the world (ROW), introduced by export
duties and trading rights, which significantly increases the price of
exported REE products (WTO, 2014). Concerns about decreases in
REE availability outside China intensified with the price increase of
export-destined REE products by up to +600% in 2011 (Massari and
Ruberti, 2013). Lawsuits against the REE export policies by China
were filed at the WTO (2012) by the EU, Japan and the U.S. and
in response to the WTO (2015) Dispute Settlement Body, China
removed the application of export duties and export quotas to REEs,
and the restriction on trading rights of enterprises exporting REEs.
It remains uncertain how subsequent new Chinese industrial pol-
icy measures, including new export licences and the ad-valorem
tax, will affect the market over the long-term. Strategies to target
these concerns address the diversification of REE supply outside
China, including re-opening old mines or establishing new mines,
and include discussions about whether government intervention
would be justified in recognizing the need for integrated value
chains (Machacek and Fold, 2014; Tukker, 2014; Zachmann, 2010).
Simultaneously, efforts in design to reduce and substitute REE in
product components and recycling have surged, aiming to prevent
future supply risks.
This study contributes to the discourse on REE recycling with a
value analysis of recycled heavy REE europium (Eu), terbium (Tb)
and yttrium (Y) from phosphor powders of fluorescent lamps as
source of supply at times of EU and U.S. REE criticality classifi-
cation (EU Commission, 2014b; Richter and Koppejan, 2015; U.S.
Department of Energy, 2011). Today, at most 1% of all REE used in
different applications are recycled (Binnemans, 2014; Binnemans
and Jones, 2014). The role of REE recycling has been explored and
critically reviewed in general (Guyonnet et al., 2015; Moss et al.,
2013; Schüler et al., 2011; U.S. Department of Energy, 2011) and
from the viewpoint of specific REE, laboratory experimentation
and product groups (Bandara et al., 2014; Binnemans et al., 2013a;
Dupont and Binnemans, 2015; Eduafo et al., 2015; Habib et al.,
2014; Kim et al., 2015; Rademaker et al., 2013; Sprecher et al.,
2014; Tunsu et al., 2015). While several studies have concluded that
recycling of REEs is worthwhile and requires a broader strategy to
enable REE processing capacities, including tracing the REE from
mine to end of life (EoL) waste (Rademaker et al., 2013; Sprecher
et al., 2014), none have provided an in-depth analysis of commercial
scale recycling and what is needed to upscale recycling. To this end,
this study provides an empirical analysis, using a case study of REE
phosphor recycling on a commercial scale and an ex-ante analysis
of the market from 2015 to 2020 to assess and discuss the potential
for recycling of REE from energy-efficient lamp phosphors. We dis-
cuss what factors, including regulatory instruments and rethinking
value propositions, are necessary to realize such potential.
2. Methodology
Our conceptual approach involves a qualitatively informed
global production network framework to depict value adding,
or processing steps from REE-containing ore to REE content in
phosphor powders as used in energy-efficient lamps. This is the
framework from which we then research the potential for sec-
ondary supply and closing the loop for REE in lamp phosphors
through a mixed methods approach involving both a case study
and modelling. Our case study provides an ex-post analysis of the
experience of commercial REE recycling of REE phosphor contain-
ing lamps. This and our forecasts of supply and demand of Y, Eu and
Tb then underpin the ex-ante analysis of the potential for develop-
ment of secondary supply of REE phosphors from 2015 to 2020.
2.1. Global production network of rare earths and phosphors
Five steps, depicted in Fig. 1, precede the production of REE
phosphors. Investor interest in favourable returns on investment
finances prospecting and exploration of REE which enables data
Fig. 2. Forecasted development of the total global lighting market and lamp type
shares. Source: Adapted from McKinsey & Company (2012).
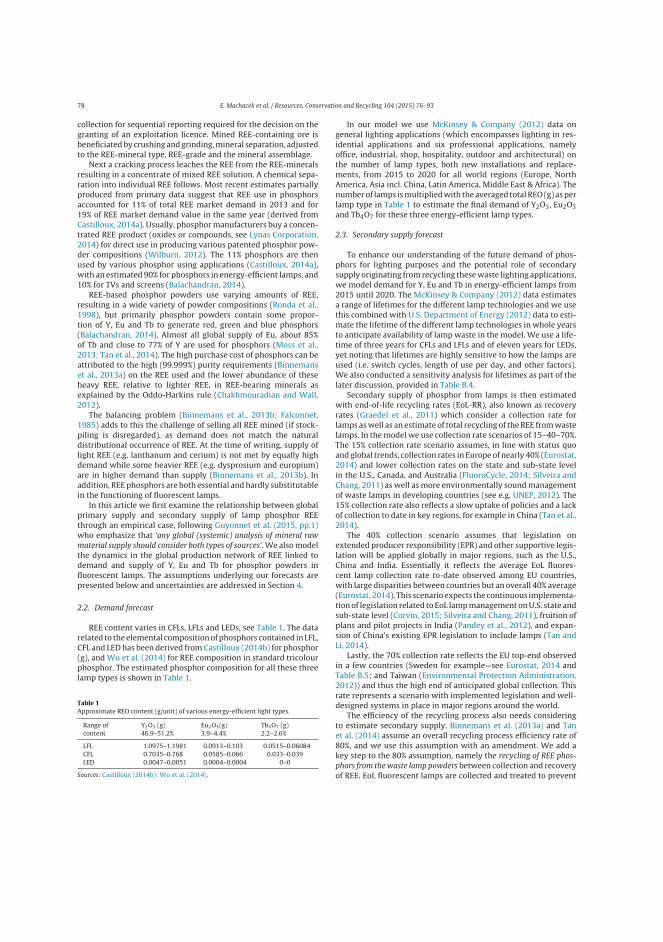
78 E. Machacek et al. / Resources, Conservation and Recycling 104 (2015) 76–93
collection for sequential reporting required for the decision on the
granting of an exploitation licence. Mined REE-containing ore is
beneficiated by crushing and grinding, mineral separation, adjusted
to the REE-mineral type, REE-grade and the mineral assemblage.
Next a cracking process leaches the REE from the REE-minerals
resulting in a concentrate of mixed REE solution. A chemical sepa-
ration into individual REE follows. Most recent estimates partially
produced from primary data suggest that REE use in phosphors
accounted for 11% of total REE market demand in 2013 and for
19% of REE market demand value in the same year (derived from
Castilloux, 2014a). Usually, phosphor manufacturers buy a concen-
trated REE product (oxides or compounds, see Lynas Corporation,
2014) for direct use in producing various patented phosphor pow-
der compositions (Wilburn, 2012). The 11% phosphors are then
used by various phosphor using applications (Castilloux, 2014a),
with an estimated 90% for phosphors in energy-efficient lamps, and
10% for TVs and screens (Balachandran, 2014).
REE-based phosphor powders use varying amounts of REE,
resulting in a wide variety of powder compositions (Ronda et al.,
1998), but primarily phosphor powders contain some propor-
tion of Y, Eu and Tb to generate red, green and blue phosphors
(Balachandran, 2014). Almost all global supply of Eu, about 85%
of Tb and close to 77% of Y are used for phosphors (Moss et al.,
2013; Tan et al., 2014). The high purchase cost of phosphors can be
attributed to the high (99.999%) purity requirements (Binnemans
et al., 2013a) on the REE used and the lower abundance of these
heavy REE, relative to lighter REE, in REE-bearing minerals as
explained by the Oddo-Harkins rule (Chakhmouradian and Wall,
2012).
The balancing problem (Binnemans et al., 2013b; Falconnet,
1985) adds to this the challenge of selling all REE mined (if stock-
piling is disregarded), as demand does not match the natural
distributional occurrence of REE. At the time of writing, supply of
light REE (e.g. lanthanum and cerium) is not met by equally high
demand while some heavier REE (e.g. dysprosium and europium)
are in higher demand than supply (Binnemans et al., 2013b). In
addition, REE phosphors are both essential and hardly substitutable
in the functioning of fluorescent lamps.
In this article we first examine the relationship between global
primary supply and secondary supply of lamp phosphor REE
through an empirical case, following Guyonnet et al. (2015, pp.1)
who emphasize that ‘any global (systemic) analysis of mineral raw
material supply should consider both types of sources’. We also model
the dynamics in the global production network of REE linked to
demand and supply of Y, Eu and Tb for phosphor powders in
fluorescent lamps. The assumptions underlying our forecasts are
presented below and uncertainties are addressed in Section 4.
2.2. Demand forecast
REE content varies in CFLs, LFLs and LEDs, see Table 1. The data
related to the elemental composition of phosphors contained in LFL,
CFL and LED has been derived from Castilloux (2014b) for phosphor
(g), and Wu et al. (2014) for REE composition in standard tricolour
phosphor. The estimated phosphor composition for all these three
lamp types is shown in Table 1.
Table 1Approximate REO content (g/unit) of various energy-efficient light types.
Range of
content
Y2O3 (g)
46.9–51.2%
Eu2O3(g)
3.9–4.4%
Tb4O7 (g)
2.2–2.6%
LFL 1.0975–1.1981 0.0913–0.103 0.0515–0.06084
CFL 0.7035–0.768 0.0585–0.066 0.033–0.039
LED 0.0047–0.0051 0.0004–0.0004 0–0
Sources: Castilloux (2014b); Wu et al. (2014).
In our model we use McKinsey & Company (2012) data on
general lighting applications (which encompasses lighting in res-
idential applications and six professional applications, namely
office, industrial, shop, hospitality, outdoor and architectural) on
the number of lamp types, both new installations and replace-
ments, from 2015 to 2020 for all world regions (Europe, North
America, Asia incl. China, Latin America, Middle East & Africa). The
number of lamps is multiplied with the averaged total REO (g) as per
lamp type in Table 1 to estimate the final demand of Y2O3, Eu2O3
and Tb4O7 for these three energy-efficient lamp types.
2.3. Secondary supply forecast
To enhance our understanding of the future demand of phos-
phors for lighting purposes and the potential role of secondary
supply originating from recycling these waste lighting applications,
we model demand for Y, Eu and Tb in energy-efficient lamps from
2015 until 2020. The McKinsey & Company (2012) data estimates
a range of lifetimes for the different lamp technologies and we use
this combined with U.S. Department of Energy (2012) data to esti-
mate the lifetime of the different lamp technologies in whole years
to anticipate availability of lamp waste in the model. We use a life-
time of three years for CFLs and LFLs and of eleven years for LEDs,
yet noting that lifetimes are highly sensitive to how the lamps are
used (i.e. switch cycles, length of use per day, and other factors).
We also conducted a sensitivity analysis for lifetimes as part of the
later discussion, provided in Table B.4.
Secondary supply of phosphor from lamps is then estimated
with end-of-life recycling rates (EoL-RR), also known as recovery
rates (Graedel et al., 2011) which consider a collection rate for
lamps as well as an estimate of total recycling of the REE from waste
lamps. In the model we use collection rate scenarios of 15–40–70%.
The 15% collection rate scenario assumes, in line with status quo
and global trends, collection rates in Europe of nearly 40% (Eurostat,
2014) and lower collection rates on the state and sub-state level
in the U.S., Canada, and Australia (FluoroCycle, 2014; Silveira and
Chang, 2011) as well as more environmentally sound management
of waste lamps in developing countries (see e.g. UNEP, 2012). The
15% collection rate also reflects a slow uptake of policies and a lack
of collection to date in key regions, for example in China (Tan et al.,
2014).
The 40% collection scenario assumes that legislation on
extended producer responsibility (EPR) and other supportive legis-
lation will be applied globally in major regions, such as the U.S.,
China and India. Essentially it reflects the average EoL fluores-
cent lamp collection rate to-date observed among EU countries,
with large disparities between countries but an overall 40% average
(Eurostat, 2014). This scenario expects the continuous implementa-
tion of legislation related to EoL lamp management on U.S. state and
sub-state level (Corvin, 2015; Silveira and Chang, 2011), fruition of
plans and pilot projects in India (Pandey et al., 2012), and expan-
sion of China’s existing EPR legislation to include lamps (Tan and
Li, 2014).
Lastly, the 70% collection rate reflects the EU top-end observed
in a few countries (Sweden for example—see Eurostat, 2014 and
Table B.5; and Taiwan (Environmental Protection Administration,
2012)) and thus the high end of anticipated global collection. This
rate represents a scenario with implemented legislation and well-
designed systems in place in major regions around the world.
The efficiency of the recycling process also needs considering
to estimate secondary supply. Binnemans et al. (2013a) and Tan
et al. (2014) assume an overall recycling process efficiency rate of
80%, and we use this assumption with an amendment. We add a
key step to the 80% assumption, namely the recycling of REE phos-
phors from the waste lamp powders between collection and recovery
of REE. EoL fluorescent lamps are collected and treated to prevent
E. Machacek et al. / Resources, Conservation and Recycling 104 (2015) 76–93 79
Table 2Components of end-of-life-recycling-rates under three different scenarios.
Scenarios Collection rate of
lamps (%)
REE phosphor
recycling rate (%)
Recycling process
efficiency rate (%)
EoL-RR (%)
Low ambition—top down calculation of EoL-RR of global REE
phosphor capacity eqv. to Solvay’s capacity (450 t) compared
to global total capacity (11,150 t)
15 55 80 7
Medium ambition—top down calculation equivalent to
Solvay’s capacity (450 t) in Europe, North American and
China (1,350 t) compared to global total capacity (11,150 t)
40 59 80 19
High ambition—bottom up calculation from best-case Sweden
scenario (70% collection as per Sweden and Taiwan; 95% REE
phosphor recycling rate in Sweden)
70 95 80 53
Sources: EoL-RR concept as per Graedel et al. (2011) and adapted with REE phosphor recycling rate conceptualized by authors. Overall REE recycling process efficiency rate
are adopted from Binnemans et al. (2013a) and Tan et al. (2014). Note: The REE phosphor recycling rate is calculated on the basis of informed estimates of the ‘collection rate
of lamps’ and the ‘recycling process efficiency rate’.
mercury contamination as there are few other drivers for lamp col-
lection in the first place. For this reason, the EU WEEE Directive
explicitly requires removal of mercury for these types of lamps in
the recycling process and therefore EU recycling rates for collected
lamps are in general over 90% (Eurostat, 2014). While removal of
mercury from lamps involves isolation of the phosphor powder layer
where the majority of mercury is present, it does not always involve
the further recovery of REE from this powder and this fraction is often
landfilled as hazardous waste in the EU (Walter, 2011; Interviewee
C, 2015). Thus, this step leaves a significant gap in the potential for
recycling to achieve higher EoL-RR.
In the low-ambition 15% global lamp collection scenario we
assume that overall, only 7% REE phosphors are recovered of the
lamps collected and recycled. The medium scenario assumes 40%
global lamp collection and a tripling of REE recycling capacity
worldwide with an EoL-RR of 19%. In the most ambitious scenario,
high collection rates like those seen in Sweden are coupled with
the recycling process used in that country in which nearly all waste
phosphor powders are sent for further recovery of REE at Solvay for
a final EoL-RR of 53% (assumptions for each scenario are summa-
rized in Table 2).
2.4. Supply forecast
To calculate the volumes of Eu, Tb and Y available to energy-
efficient lamps in 2015–2020, we estimate total primary supply
volumes. We use current estimates that 100% of Eu, 85% of Tb and
77% of Y are used for phosphors (Moss et al., 2013; Tan et al., 2014)
of which 90% would be available to the production of LEDs, CFLS,
and LFLs and the remaining 10% for TVs and screens (Balachandran,
2014).
We assume that total primary supply volumes consist of Chi-
nese rare earth oxide (REO) production, current rest of world (ROW)
production and forecasted REO production in the ROW. To forecast
future ROW production volumes, we consider a set of ROW devel-
oped REE projects with publicly available data including planned
production volumes, REO distribution, and costs (see Appendix A).
Company-reported dates for starting production provided us with
a sequence for their potential market entry, which we modelled
with three scenarios that considered delays of one, three and five
years in the start of production.
We assume that these projects enter the market when REE prices
make the anticipated production start economically feasible. To
find these prices we used a price model represented by a REE indus-
try cost curve which is based on the indirectly proportional relation
of the supply quantities and prices of individual REO (see Appendix
A, more details available from Klossek et al., n.d.). The price model
is based on REO prices from March 2015 (Metal-Pages) and current
supply volumes of individual REO.
Two approaches guided our calculation of current supply vol-
umes of individual REO for the price model (1) based on the total
mining quota in China, (2) based on the Chinese export quota and
illegal supply. Approach (1) departs from the phase-out of Chi-
nese export quota by May 1st, 2015, and new export licensing. We
assume that the total REO mining quota for 2015 in China could
be a proxy for the potential maximum supply volume which could
come from China. To calculate total REO supply volumes (for each
REO individually) we added the expected REO mining quota in 2015
to current ROW supply volumes.
The second approach uses 2015 REO mining quota in China as a
proxy for maximum REO production volumes in China in 2015. As
the quota for the 1st half of 2015 increased by 11% (Argusmedia,
2015; Shen, 2015) compared to the quota for the 1st half of 2014, we
assume that the total quota in 2015 will be 11% higher than the total
quota in 2014. For 2015 we assume the same distribution of REO
in the mining quota as in 2014 (Chen, 2014). We estimate current
ROW production at 14%, assuming China’s share of global produc-
tion has not changed significantly from the 86% share in 2012 (Tse,
2013 in Wübbeke, 2013). To calculate the volumes of individual
oxides we used the same REO distribution as in the total mining
quota (which in our view represents an average distribution in a
typical hard rock REE deposit).
In the second approach of Chinese export quota and illegal sup-
ply, we acknowledge that Chinese REE export quotas have been
phased out and replaced with an export licensing system. We
expect that in such a situation a part of the illegal export volumes
would be sold via official channels; however the total export vol-
umes (consisting of official and illegal volumes) would not change
significantly. To estimate the export volumes in 2015 (to be a proxy
for the supply volumes coming from China at FOB prices1) we con-
sidered the REE export quota in 2014 as a proxy for the maximum
official export volumes. To find total export volumes we added ille-
gal supply volumes to the export quota (assuming a 40% rate of
illegal supply in total export volumes as estimated by Argusmedia,
2015).
The results of these two different approaches to calculate cur-
rent supply volumes differed slightly. In our view, the Chinese
export quota and illegal supply approach is more realistic as it rep-
resents maximum REO volumes for export to be sold at FOB prices
and considers the domestic REO demand of China, while the first
approach assumes that the total REO production of China could be
exported which is unrealistic. Our results are therefore showing the
1 Free On Board (FOB) implies that the seller fulfils her/his obligation to deliver
when the goods have passed over the ship’s rail at the named port of shipment. This
means that the buyer has to bear all costs and risks of loss of or damage to the goods
from that point. The FOB term requires the seller to clear the goods for export (WCS
International, 2013).
80 E. Machacek et al. / Resources, Conservation and Recycling 104 (2015) 76–93
second approach, while the first approach is illustrated in Fig. A.1.
Results of these calculations (tonnes of REO) were converted to
tonnes of rare earth metals to be compared to the results of the
demand and secondary supply analysis.
2.5. Case study
Known as European key player in REE chemical separation,
Solvay-Rhodia, hereafter ‘Solvay’, operates across a bandwidth of
industrial sectors including energy, automotive and electronics. It
is, jointly with Japanese Shin-Etsu, among the only outside of China
capable of chemically separating REE into both light and heavy
individual REE products to purities of acceptance for customers
on a commercial scale (Interviewee B, 2012; Shin-Etsu Chemical,
2014). Solvay runs REE chemical separation facilities in China and
in La Rochelle, France. It is the first large supplier to the lighting
market with a commercialized recycling process of La, Ce, Eu, Tb,
and Y (Osram and Philips also ran pilot scale recycling projects)
(Binnemans et al., 2013a; Moss et al., 2013; Otto and Wojtalewicz-
Kasprzak, 2012).
Our case study relies on both literature review and semi-
structured interviews with key actors. To enhance reliability of our
empirical data, we interviewed representatives of firms involved
at different stages of the recycling network, specifically collectors,
recyclers and the REE chemical separator and refiner, Solvay, in line
with methods as proposed by Kvale and Brinkmann (2009). Our
data collection followed an iterative process. Phases of empirical
data collection followed desk research for cross-checking avail-
able public data and to triangulate industry data with data from
regulatory institutions, including from the European Commission,
and from scholarly recycling experts. The empirical data served for
identifying factors key to recycling REE, such as related to logistics
and material components which add to the economic feasibility
of REE phosphor recycling. This data also supported our ex-ante
modelling.
3. Results
3.1. Closing-the-loop with REE phosphor recycling: The case of
Solvay
EU funding through LIFE+ of 50% of the project (equivalent
to about EUR 1.1 million for 24 months from June 2012) (EU
Commission, 2011) supported Solvay to commercially recycle
waste lamp phosphors following four years of prior research and
development and industrialization (Solvay, 2014). As Fig. 3 shows,
Solvay receives phosphor powder from recyclers and first removes
the mercury, glass and other components to physically liberate the
rare earth concentrate, which is then sent to the chemical sepa-
ration plant. There, the halophosphates are removed and the REE
phosphors are cracked resulting in a REE concentrate that can
be fed, as in a primary process, into a solvent extraction process
for individual REE chemical separation. High-tech knowledge of
technical staff and internally developed, sophisticated software is
applied to manage this solvent extraction process (Leveque, 2014).
The REEs are then reformulated into new phosphor precursors for
new energy-efficient lamps (Solvay, 2014).
Solvay has developed a flow sheet for the recovery of REEs
from a mixture of halophosphate and REE phosphors. According
to the patent for the process, the final yield of REE is at about 80%
(Braconnier and Rollat, 2010). The objective has been to demon-
strate the industrial processing of 3,000 t of lamp waste/year, which
corresponds to the forecasted European waste production for 2020
(Golev et al., 2014; Solvay, 2014) and results in 90% waste stream
valorisation corresponding to 10–20% of REO (rare earth oxides),
glass (by-product) and phosphate (by-product) at Solvay (2014).
The REEs lanthanum, cerium, europium and gadolinium, terbium,
and yttrium are being recovered (Rollat, 2012). Technical complex-
ities of the recycling process can be better understood in context:
Lamp phosphor powder mixtures are the essence of the light char-
acteristics of a fluorescent lamp and different mixtures are used
in the powder manufacture (Koninklijke Philips Electronics N.V.,
2011) which form the competitive base of lamp manufacturers and
they are protected by patents (Li, 2012). Currently Solvay recycles
several hundred tonnes of rare earth phosphors each year, primarily
from Europe.
While the recycling of phosphor powders is less economical than
other internal projects (Walter, 2011), we conclude that it strength-
ens Solvay’s core competence. Depending on global market pricing
of REOs, the firm’s resources are liberated by sourcing separated
REOs externally rather than conducting the chemical separation
in-house and thus, the firm’s resources are freed-up to pursue high
technical sophistication in REE formulation to customer specifi-
cation. Phosphor recycling reflects an adaptation of Solvay’s REE
subdivision to overall REE industry dynamics and a diversification
strategy in raw material sourcing. Specifically, increasing chal-
lenges encountered by Solvay in accessing REE-bearing ore in China
(Interviewee A, 2012, 2013) and general REE price volatility initi-
ates quarterly decision-making on whether to chemically separate
REEs internally or to purchase them and solely focus on formulation
(Walter, 2011). Golev et al. (2014) stress that the annual objec-
tive of 3,000 t of waste lamp waste recycling would secure ‘Solvay’s
need for critical rare earths to manufacture new lamp phosphors
(. . .).’ In-house solvent extraction is the precursor to formulation
and production of phosphors, constituting a key process to unique
compositions of the phosphor powder. Thus, operating the solvent
extraction processes might provide avenues to run process test
routes and potentially explore new patents.
To understand the drivers for Solvay’s commercialization
project it is important to put it into context of the overall REE mar-
ket. As described in the introduction, particularly between 2009 and
2011 concerns about the supply and price of REE arose as a result of
numerous issues including Chinese restrictions on REE exports. This
was a driver for increased attention in the EU for possible sources of
supplies outside of China, as well as, potential secondary supplies.
Lamps were a viable source of waste phosphor powder in the EU for
a couple of reasons. First, existing legislation (the WEEE Directive)
already mandates the collection of this waste stream. Secondly, the
recycling process of this waste stream typically involved isolating
mercury in the phosphor powder, so this powder was already an
available end fraction of the recycling process (Récylum, 2014).
Moreover, the costs of collection and recycling in EU countries is
borne by the lamp producers and in some cases by municipalities
(such as of collection in Denmark). REE chemical separator/refiner
Solvay only needed to pay for the fractions from recyclers and the
processing from that point onwards. Both researchers and practi-
tioners argue that without legislation, collection and thus recycling
of energy-efficient lamps are unlikely to take place (Huisman et al.,
2008; Interviewee D, 2014; Richter & Koppejan, 2015). The role
of legislation and market drivers for secondary supply are further
discussed later, and we contextualize recycling scenarios within a
future market context in our model.
3.2. Future potential for closing loops: Our model
Our EoL-RR scenarios illustrate how closing-the-loop at dif-
ferent REE phosphor powder recovery ratios can contribute to
secondary supply of Y, Eu and Tb for new phosphor production
to be used in lamps, TVs or screens. We contextualize these EoL-
RR scenarios in a comparison with forecasted demand, as per our
modelled scenario that stipulates the uptake of different lighting
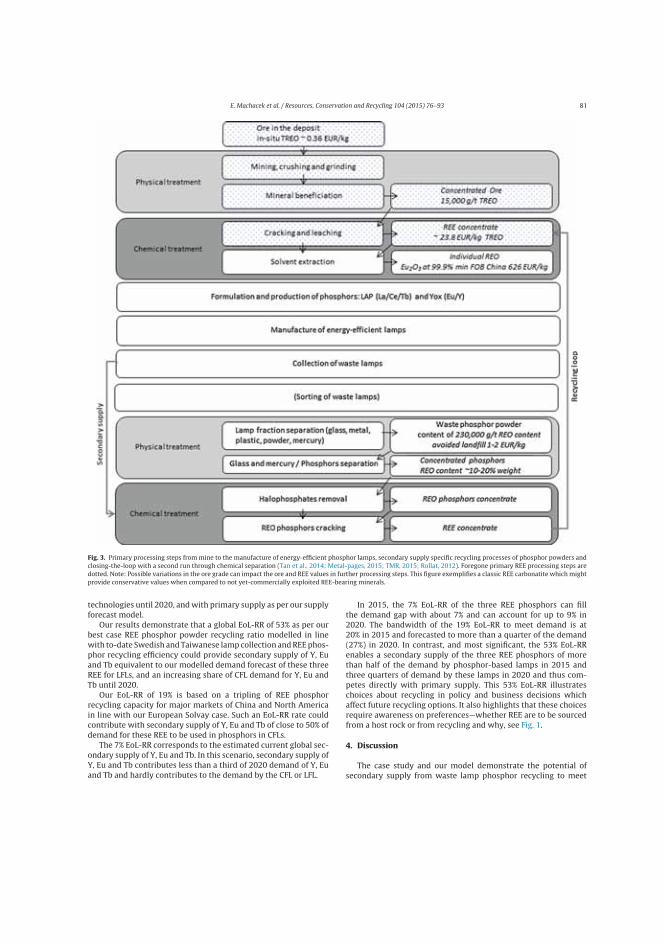
E. Machacek et al. / Resources, Conservation and Recycling 104 (2015) 76–93 81
Fig. 3. Primary processing steps from mine to the manufacture of energy-efficient phosphor lamps, secondary supply specific recycling processes of phosphor powders and
closing-the-loop with a second run through chemical separation (Tan et al., 2014; Metal-pages, 2015; TMR, 2015; Rollat, 2012). Foregone primary REE processing steps are
dotted. Note: Possible variations in the ore grade can impact the ore and REE values in further processing steps. This figure exemplifies a classic REE carbonatite which might
provide conservative values when compared to not yet-commercially exploited REE-bearing minerals.
technologies until 2020, and with primary supply as per our supply
forecast model.
Our results demonstrate that a global EoL-RR of 53% as per our
best case REE phosphor powder recycling ratio modelled in line
with to-date Swedish and Taiwanese lamp collection and REE phos-
phor recycling efficiency could provide secondary supply of Y, Eu
and Tb equivalent to our modelled demand forecast of these three
REE for LFLs, and an increasing share of CFL demand for Y, Eu and
Tb until 2020.
Our EoL-RR of 19% is based on a tripling of REE phosphor
recycling capacity for major markets of China and North America
in line with our European Solvay case. Such an EoL-RR rate could
contribute with secondary supply of Y, Eu and Tb of close to 50% of
demand for these REE to be used in phosphors in CFLs.
The 7% EoL-RR corresponds to the estimated current global sec-
ondary supply of Y, Eu and Tb. In this scenario, secondary supply of
Y, Eu and Tb contributes less than a third of 2020 demand of Y, Eu
and Tb and hardly contributes to the demand by the CFL or LFL.
In 2015, the 7% EoL-RR of the three REE phosphors can fill
the demand gap with about 7% and can account for up to 9% in
2020. The bandwidth of the 19% EoL-RR to meet demand is at
20% in 2015 and forecasted to more than a quarter of the demand
(27%) in 2020. In contrast, and most significant, the 53% EoL-RR
enables a secondary supply of the three REE phosphors of more
than half of the demand by phosphor-based lamps in 2015 and
three quarters of demand by these lamps in 2020 and thus com-
petes directly with primary supply. This 53% EoL-RR illustrates
choices about recycling in policy and business decisions which
affect future recycling options. It also highlights that these choices
require awareness on preferences—whether REE are to be sourced
from a host rock or from recycling and why, see Fig. 1.
4. Discussion
The case study and our model demonstrate the potential of
secondary supply from waste lamp phosphor recycling to meet
82 E. Machacek et al. / Resources, Conservation and Recycling 104 (2015) 76–93
some of the forecasted demand, but the question remains about
what factors impede and promote closed-loop recycling. The Solvay
case demonstrated that market mechanisms as well as legislative
drivers are key to making secondary supply viable. Accessibility of
adequate quantities of REE phosphor waste lamps, marketability of
the recycled REE phosphors, as well as ability to derive adequate
value (the right price at the right time) for these products have been
argued as key bottlenecks to realize closed-loop systems (Guide
and Van Wassenhove, 2009). In this section we first discuss these
bottlenecks in the context of market mechanisms and uncertainties
inherent in forecasting the future of the REE market. We discuss the
factors that enabled REE phosphor recycling so far and what drivers
are necessary for REE phosphor recycling to play a substantial role
in meeting future REE phosphor supply.
4.1. Uncertainties of demand
REE use in phosphors is dependent on technological and socio-
economic developments which impact the market uptake of
lighting technologies. The minor REE content in LEDs is notewor-
thy for demand projections as is the potential redundancy of Tb in
a market dominated by LEDs (U.S. Department of Energy, 2011;
Wilburn, 2012). While the development of LED technology has
progressed faster than anticipated (Danish Energy Agency, Energy
Piano & CLASP European Programme, 2015), there are still concerns
about the technology being ready to replace all lighting applications
(and this was the reason underpinning the recent delay of Stage
6 EcoDesign requirements for lamps in the EU, see Ala-Kurikka,
2015). Also, phosphor powder substitutes might be found which
would strongly influence the price customers are willing to pay for
products and alternative ROW supplies of REE (Zachmann, 2010).
Such a scenario would affect the attractiveness of developing the
secondary supply in absence of other drivers.
Recycling can contribute to remedying the balancing problem,
described earlier, which affects both primary supply and demand,
as argued by other scholars (Binnemans et al., 2013b; Falconnet,
1985). In our supply and demand forecasts we have only considered
the phosphors used for lighting and the technological development
within this field of application. Yet other applications such as TVs
and background lighting screens in tablets, phones and others also
currently demand phosphors based on REE (Balachandran, 2014)
and there may be growth in this demand by these or future applica-
tions (Castilloux, 2014b). Such growth could create new markets for
the secondary supply from recycled lamp phosphors. In addition, it
is uncertain which technologies will dominate the future lighting
market, a factor which will influence the significance of REE lamp
phosphor recycling further: For instance, remote phosphor screw-
based or tube LED lamps (T8) will demand more REE than regular
white LED lamps and LFL tubes (T8) (Castilloux, 2014b).
4.2. Uncertainties for recycled REE phosphor demand
Binnemans and Jones (2014) outlined three possible recycling
routes: (1) direct re-use of the recycled lamp phosphors, (2)
recycling of the various phosphors by physiochemical separation
methods, and (3) chemical attack of the phosphors to recover their
REE content. Options 1 and 2 are linked to a reuse of the powder
by the same manufacturer, while option 3 allows for the use by a
different party (Binnemans and Jones, 2014). The first two options
would likely require a take-back system by the manufacturer, or the
implementation of “closed-loop supply chain management” (Guide
and Van Wassenhove, 2009). To date, closed-loop supply is not
unknown, though more typical for industrial goods like machinery,
tools, and process catalysts (Graedel et al., 2011). With the first two
options, uncertainties as to the quality of the powder would need to
be considered. The powder deteriorates over the lifetime of a lamp
due to exposure to UV radiation and mercury. In addition, recycling
processes will affect the quality of the phosphor powder such as
particle size and thus, the recycled phosphor powder will expec-
tedly be inferior to the original product. Our article addresses the
third recycling route which reflects the Solvay approach in which
the recycled powder is chemically attacked.
Demand for recycled phosphors depends on price, which
involves the cost of recycling lamps (which can be relatively high
compared to the price of the product) (Philips Lighting, 2012). Key
factors include efficient design of the scheme, but also transport
distances and end use for the recycled glass, the main fraction by
weight of the recycling process (Interviewee D, 2014; WEEE Forum,
2010). Notably, depending on the country, costs for recycling and
collection of lamps in Europe can be the responsibility of produc-
ers and are not necessarily borne by lamp phosphor recyclers, e.g.
Solvay, which only pays the recycler for the separated waste phos-
phor powder (Interviewee D, 2014). Currently, several externalities
are not part of the price of both primary and secondary phosphors.
These are discussed later in relation to value.
4.3. Uncertainties of primary supply
The primary supply of REE is uncertain with China possibly fur-
ther consolidating the industry and using integrated production
steps subsidized by the two-tier pricing mechanism for import
substitution, expected to be upheld under the licensing regime.
Further, alternative ROW supply might need to meet growing Chi-
nese REE demand. High-tech skill requirements at each of the
processing steps are obstacles for alternative suppliers and add
to alternative REE supply risk (Hatch, 2011). Project feasibility,
which is evaluated from the reconnaissance exploration to the mine
development stage, is tied to several factors as put forward by
Klossek and van den Boogaart, (2015): land title and location of
the deposit; experience of regulatory authorities with the deposit
type and commodity; REE grade and REE distribution representing
estimated values from geological studies; potential for significant
volume production (t); presence of radioactive elements combined
with environmental legislation; REE mineralogy; opportunities for
project financing; business relationships with separation facili-
ties; availability of expertise, technology, and equipment; strategic
alliances and off-take agreements with end-users; cost competi-
tiveness; obtaining mining permits and social licences to mine; as
well as estimated values of REE and market conditions.
REE deposits are characterized by the different mineralogy of
various REE-containing ores, which may require new, tailor-made
processing routes to be developed (Jordens et al., 2013), as well as
additional financial and human resources, and time in testing their
feasibility which could result in significant project delays, which is
why we model with a one, three and five year delay. Our modelled
three year base scenario is shown in Fig. 4, produced from data
presented in Table A.3. A project start delay by one year modelled
on the export quota and illegal supply approach, affects primary
supply insofar as that primary supply of Eu first meets and exceeds
demand by 20 t in 2019 while in a five year delay Eu demand would
first be met and exceeded by 50 t in 2020. The one year delay resem-
bles the results of a three year delay regarding Eu primary supply. In
none of the delay scenarios, Tb primary supply meets demand and
in all delay scenarios, Y primary supply first meets and exceeds
demand in 2020. Regulations regarding radioactivity applying to
certain deposits, limited access to ROW chemical separation know-
how and the capital and operational cost requirements to establish
a new separation facility, also represent major bottlenecks for alter-
native value chains of junior REE exploration projects in the ROW
(Golev et al., 2014; Machacek and Fold, 2014). As some projects
could become infeasible, future primary REE supply could be lower
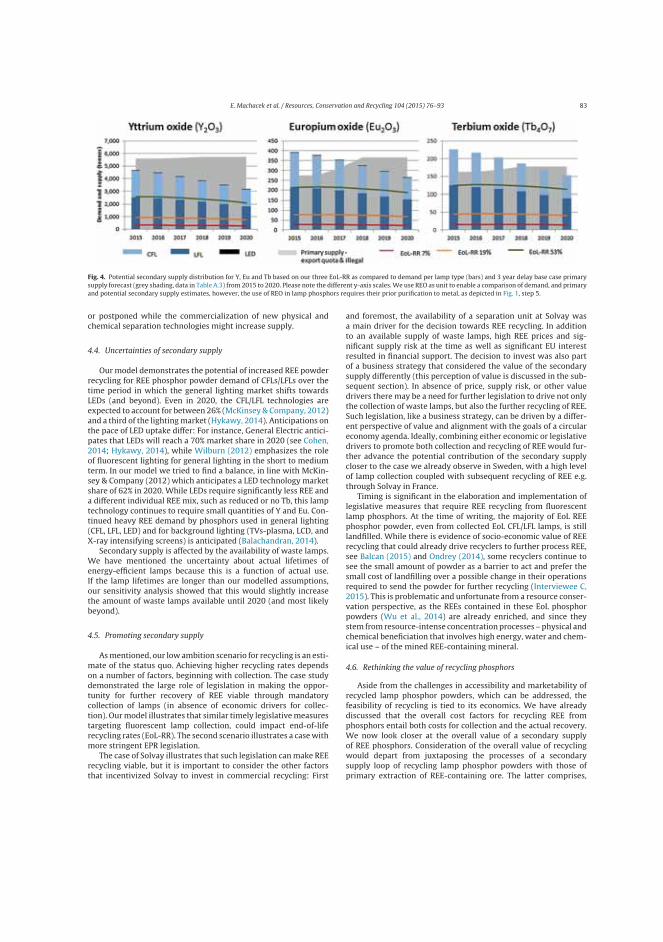
E. Machacek et al. / Resources, Conservation and Recycling 104 (2015) 76–93 83
Fig. 4. Potential secondary supply distribution for Y, Eu and Tb based on our three EoL-RR as compared to demand per lamp type (bars) and 3 year delay base case primary
supply forecast (grey shading, data in Table A.3) from 2015 to 2020. Please note the different y-axis scales. We use REO as unit to enable a comparison of demand, and primary
and potential secondary supply estimates, however, the use of REO in lamp phosphors requires their prior purification to metal, as depicted in Fig. 1, step 5.
or postponed while the commercialization of new physical and
chemical separation technologies might increase supply.
4.4. Uncertainties of secondary supply
Our model demonstrates the potential of increased REE powder
recycling for REE phosphor powder demand of CFLs/LFLs over the
time period in which the general lighting market shifts towards
LEDs (and beyond). Even in 2020, the CFL/LFL technologies are
expected to account for between 26% (McKinsey & Company, 2012)
and a third of the lighting market (Hykawy, 2014). Anticipations on
the pace of LED uptake differ: For instance, General Electric antici-
pates that LEDs will reach a 70% market share in 2020 (see Cohen,
2014; Hykawy, 2014), while Wilburn (2012) emphasizes the role
of fluorescent lighting for general lighting in the short to medium
term. In our model we tried to find a balance, in line with McKin-
sey & Company (2012) which anticipates a LED technology market
share of 62% in 2020. While LEDs require significantly less REE and
a different individual REE mix, such as reduced or no Tb, this lamp
technology continues to require small quantities of Y and Eu. Con-
tinued heavy REE demand by phosphors used in general lighting
(CFL, LFL, LED) and for background lighting (TVs-plasma, LCD, and
X-ray intensifying screens) is anticipated (Balachandran, 2014).
Secondary supply is affected by the availability of waste lamps.
We have mentioned the uncertainty about actual lifetimes of
energy-efficient lamps because this is a function of actual use.
If the lamp lifetimes are longer than our modelled assumptions,
our sensitivity analysis showed that this would slightly increase
the amount of waste lamps available until 2020 (and most likely
beyond).
4.5. Promoting secondary supply
As mentioned, our low ambition scenario for recycling is an esti-
mate of the status quo. Achieving higher recycling rates depends
on a number of factors, beginning with collection. The case study
demonstrated the large role of legislation in making the oppor-
tunity for further recovery of REE viable through mandatory
collection of lamps (in absence of economic drivers for collec-
tion). Our model illustrates that similar timely legislative measures
targeting fluorescent lamp collection, could impact end-of-life
recycling rates (EoL-RR). The second scenario illustrates a case with
more stringent EPR legislation.
The case of Solvay illustrates that such legislation can make REE
recycling viable, but it is important to consider the other factors
that incentivized Solvay to invest in commercial recycling: First
and foremost, the availability of a separation unit at Solvay was
a main driver for the decision towards REE recycling. In addition
to an available supply of waste lamps, high REE prices and sig-
nificant supply risk at the time as well as significant EU interest
resulted in financial support. The decision to invest was also part
of a business strategy that considered the value of the secondary
supply differently (this perception of value is discussed in the sub-
sequent section). In absence of price, supply risk, or other value
drivers there may be a need for further legislation to drive not only
the collection of waste lamps, but also the further recycling of REE.
Such legislation, like a business strategy, can be driven by a differ-
ent perspective of value and alignment with the goals of a circular
economy agenda. Ideally, combining either economic or legislative
drivers to promote both collection and recycling of REE would fur-
ther advance the potential contribution of the secondary supply
closer to the case we already observe in Sweden, with a high level
of lamp collection coupled with subsequent recycling of REE e.g.
through Solvay in France.
Timing is significant in the elaboration and implementation of
legislative measures that require REE recycling from fluorescent
lamp phosphors. At the time of writing, the majority of EoL REE
phosphor powder, even from collected EoL CFL/LFL lamps, is still
landfilled. While there is evidence of socio-economic value of REE
recycling that could already drive recyclers to further process REE,
see Balcan (2015) and Ondrey (2014), some recyclers continue to
see the small amount of powder as a barrier to act and prefer the
small cost of landfilling over a possible change in their operations
required to send the powder for further recycling (Interviewee C,
2015). This is problematic and unfortunate from a resource conser-
vation perspective, as the REEs contained in these EoL phosphor
powders (Wu et al., 2014) are already enriched, and since they
stem from resource-intense concentration processes – physical and
chemical beneficiation that involves high energy, water and chem-
ical use – of the mined REE-containing mineral.
4.6. Rethinking the value of recycling phosphors
Aside from the challenges in accessibility and marketability of
recycled lamp phosphor powders, which can be addressed, the
feasibility of recycling is tied to its economics. We have already
discussed that the overall cost factors for recycling REE from
phosphors entail both costs for collection and the actual recovery.
We now look closer at the overall value of a secondary supply
of REE phosphors. Consideration of the overall value of recycling
would depart from juxtaposing the processes of a secondary
supply loop of recycling lamp phosphor powders with those of
primary extraction of REE-containing ore. The latter comprises,
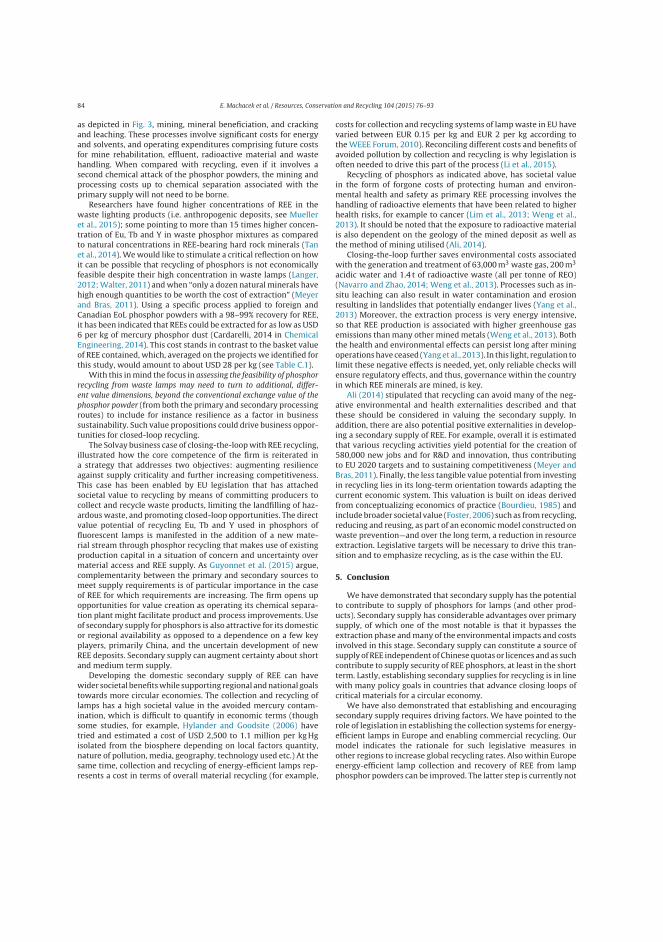
84 E. Machacek et al. / Resources, Conservation and Recycling 104 (2015) 76–93
as depicted in Fig. 3, mining, mineral beneficiation, and cracking
and leaching. These processes involve significant costs for energy
and solvents, and operating expenditures comprising future costs
for mine rehabilitation, effluent, radioactive material and waste
handling. When compared with recycling, even if it involves a
second chemical attack of the phosphor powders, the mining and
processing costs up to chemical separation associated with the
primary supply will not need to be borne.
Researchers have found higher concentrations of REE in the
waste lighting products (i.e. anthropogenic deposits, see Mueller
et al., 2015); some pointing to more than 15 times higher concen-
tration of Eu, Tb and Y in waste phosphor mixtures as compared
to natural concentrations in REE-bearing hard rock minerals (Tan
et al., 2014). We would like to stimulate a critical reflection on how
it can be possible that recycling of phosphors is not economically
feasible despite their high concentration in waste lamps (Langer,
2012; Walter, 2011) and when “only a dozen natural minerals have
high enough quantities to be worth the cost of extraction” (Meyer
and Bras, 2011). Using a specific process applied to foreign and
Canadian EoL phosphor powders with a 98–99% recovery for REE,
it has been indicated that REEs could be extracted for as low as USD
6 per kg of mercury phosphor dust (Cardarelli, 2014 in Chemical
Engineering, 2014). This cost stands in contrast to the basket value
of REE contained, which, averaged on the projects we identified for
this study, would amount to about USD 28 per kg (see Table C.1).
With this in mind the focus in assessing the feasibility of phosphor
recycling from waste lamps may need to turn to additional, differ-
ent value dimensions, beyond the conventional exchange value of the
phosphor powder (from both the primary and secondary processing
routes) to include for instance resilience as a factor in business
sustainability. Such value propositions could drive business oppor-
tunities for closed-loop recycling.
The Solvay business case of closing-the-loop with REE recycling,
illustrated how the core competence of the firm is reiterated in
a strategy that addresses two objectives: augmenting resilience
against supply criticality and further increasing competitiveness.
This case has been enabled by EU legislation that has attached
societal value to recycling by means of committing producers to
collect and recycle waste products, limiting the landfilling of haz-
ardous waste, and promoting closed-loop opportunities. The direct
value potential of recycling Eu, Tb and Y used in phosphors of
fluorescent lamps is manifested in the addition of a new mate-
rial stream through phosphor recycling that makes use of existing
production capital in a situation of concern and uncertainty over
material access and REE supply. As Guyonnet et al. (2015) argue,
complementarity between the primary and secondary sources to
meet supply requirements is of particular importance in the case
of REE for which requirements are increasing. The firm opens up
opportunities for value creation as operating its chemical separa-
tion plant might facilitate product and process improvements. Use
of secondary supply for phosphors is also attractive for its domestic
or regional availability as opposed to a dependence on a few key
players, primarily China, and the uncertain development of new
REE deposits. Secondary supply can augment certainty about short
and medium term supply.
Developing the domestic secondary supply of REE can have
wider societal benefits while supporting regional and national goals
towards more circular economies. The collection and recycling of
lamps has a high societal value in the avoided mercury contam-
ination, which is difficult to quantify in economic terms (though
some studies, for example, Hylander and Goodsite (2006) have
tried and estimated a cost of USD 2,500 to 1.1 million per kg Hg
isolated from the biosphere depending on local factors quantity,
nature of pollution, media, geography, technology used etc.) At the
same time, collection and recycling of energy-efficient lamps rep-
resents a cost in terms of overall material recycling (for example,
costs for collection and recycling systems of lamp waste in EU have
varied between EUR 0.15 per kg and EUR 2 per kg according to
the WEEE Forum, 2010). Reconciling different costs and benefits of
avoided pollution by collection and recycling is why legislation is
often needed to drive this part of the process (Li et al., 2015).
Recycling of phosphors as indicated above, has societal value
in the form of forgone costs of protecting human and environ-
mental health and safety as primary REE processing involves the
handling of radioactive elements that have been related to higher
health risks, for example to cancer (Lim et al., 2013; Weng et al.,
2013). It should be noted that the exposure to radioactive material
is also dependent on the geology of the mined deposit as well as
the method of mining utilised (Ali, 2014).
Closing-the-loop further saves environmental costs associated
with the generation and treatment of 63,000 m3 waste gas, 200 m3
acidic water and 1.4 t of radioactive waste (all per tonne of REO)
(Navarro and Zhao, 2014; Weng et al., 2013). Processes such as in-
situ leaching can also result in water contamination and erosion
resulting in landslides that potentially endanger lives (Yang et al.,
2013) Moreover, the extraction process is very energy intensive,
so that REE production is associated with higher greenhouse gas
emissions than many other mined metals (Weng et al., 2013). Both
the health and environmental effects can persist long after mining
operations have ceased (Yang et al., 2013). In this light, regulation to
limit these negative effects is needed, yet, only reliable checks will
ensure regulatory effects, and thus, governance within the country
in which REE minerals are mined, is key.
Ali (2014) stipulated that recycling can avoid many of the neg-
ative environmental and health externalities described and that
these should be considered in valuing the secondary supply. In
addition, there are also potential positive externalities in develop-
ing a secondary supply of REE. For example, overall it is estimated
that various recycling activities yield potential for the creation of
580,000 new jobs and for R&D and innovation, thus contributing
to EU 2020 targets and to sustaining competitiveness (Meyer and
Bras, 2011). Finally, the less tangible value potential from investing
in recycling lies in its long-term orientation towards adapting the
current economic system. This valuation is built on ideas derived
from conceptualizing economics of practice (Bourdieu, 1985) and
include broader societal value (Foster, 2006) such as from recycling,
reducing and reusing, as part of an economic model constructed on
waste prevention—and over the long term, a reduction in resource
extraction. Legislative targets will be necessary to drive this tran-
sition and to emphasize recycling, as is the case within the EU.
5. Conclusion
We have demonstrated that secondary supply has the potential
to contribute to supply of phosphors for lamps (and other prod-
ucts). Secondary supply has considerable advantages over primary
supply, of which one of the most notable is that it bypasses the
extraction phase and many of the environmental impacts and costs
involved in this stage. Secondary supply can constitute a source of
supply of REE independent of Chinese quotas or licences and as such
contribute to supply security of REE phosphors, at least in the short
term. Lastly, establishing secondary supplies for recycling is in line
with many policy goals in countries that advance closing loops of
critical materials for a circular economy.
We have also demonstrated that establishing and encouraging
secondary supply requires driving factors. We have pointed to the
role of legislation in establishing the collection systems for energy-
efficient lamps in Europe and enabling commercial recycling. Our
model indicates the rationale for such legislative measures in
other regions to increase global recycling rates. Also within Europe
energy-efficient lamp collection and recovery of REE from lamp
phosphor powders can be improved. The latter step is currently not
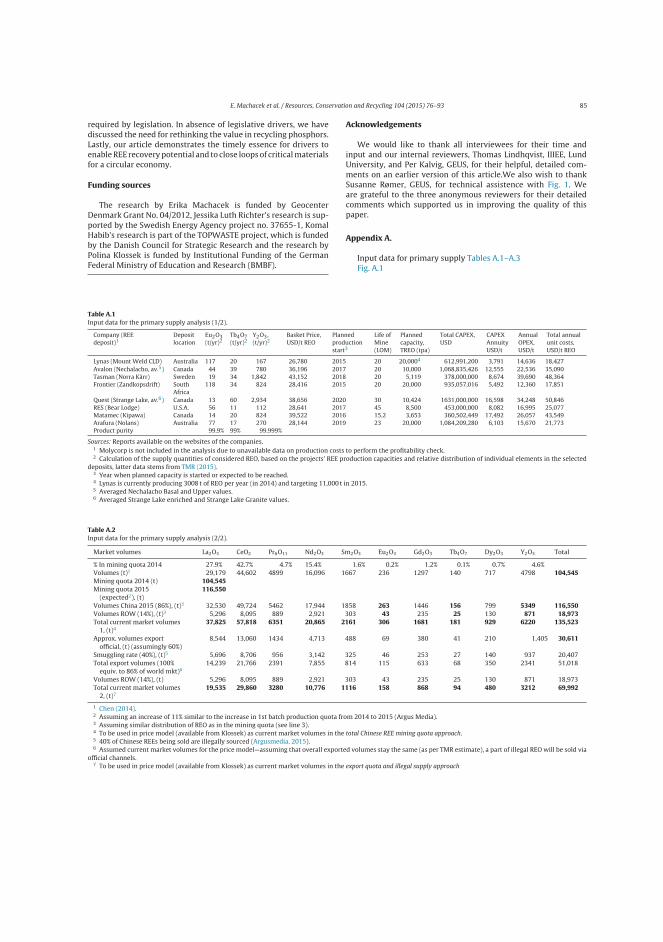
E. Machacek et al. / Resources, Conservation and Recycling 104 (2015) 76–93 85
required by legislation. In absence of legislative drivers, we have
discussed the need for rethinking the value in recycling phosphors.
Lastly, our article demonstrates the timely essence for drivers to
enable REE recovery potential and to close loops of critical materials
for a circular economy.
Funding sources
The research by Erika Machacek is funded by Geocenter
Denmark Grant No. 04/2012, Jessika Luth Richter’s research is sup-
ported by the Swedish Energy Agency project no. 37655-1, Komal
Habib’s research is part of the TOPWASTE project, which is funded
by the Danish Council for Strategic Research and the research by
Polina Klossek is funded by Institutional Funding of the German
Federal Ministry of Education and Research (BMBF).
Acknowledgements
We would like to thank all interviewees for their time and
input and our internal reviewers, Thomas Lindhqvist, IIIEE, Lund
University, and Per Kalvig, GEUS, for their helpful, detailed com-
ments on an earlier version of this article.We also wish to thank
Susanne Rømer, GEUS, for technical assistence with Fig. 1. We
are grateful to the three anonymous reviewers for their detailed
comments which supported us in improving the quality of this
paper.
Appendix A.
Input data for primary supply Tables A.1–A.3
Fig. A.1
Table A.1Input data for the primary supply analysis (1/2).
Company (REE
deposit)1Deposit
location
Eu2O3
(t/yr)2Tb4O7
(t/yr)2Y2O3,
(t/yr)2Basket Price,
USD/t REO
Planned
production
start3
Life of
Mine
(LOM)
Planned
capacity,
TREO (tpa)
Total CAPEX,
USD
CAPEX
Annuity
USD/t
Annual
OPEX,
USD/t
Total annual
unit costs,
USD/t REO
Lynas (Mount Weld CLD) Australia 117 20 167 26,780 2015 20 20,0004 612,991,200 3,791 14,636 18,427
Avalon (Nechalacho, av.5) Canada 44 39 780 36,196 2017 20 10,000 1,068,835,426 12,555 22,536 35,090
Tasman (Norra Kärr) Sweden 19 34 1,842 43,152 2018 20 5,119 378,000,000 8,674 39,690 48,364
Frontier (Zandkopsdrift) South
Africa
118 34 824 28,416 2015 20 20,000 935,057,016 5,492 12,360 17,851
Quest (Strange Lake, av.6) Canada 13 60 2,934 38,656 2020 30 10,424 1631,000,000 16,598 34,248 50,846
RES (Bear Lodge) U.S.A. 56 11 112 28,641 2017 45 8,500 453,000,000 8,082 16,995 25,077
Matamec (Kipawa) Canada 14 20 824 39,522 2016 15.2 3,653 360,502,449 17,492 26,057 43,549
Arafura (Nolans) Australia 77 17 270 28,144 2019 23 20,000 1,084,209,280 6,103 15,670 21,773
Product purity 99.9% 99% 99.999%
Sources: Reports available on the websites of the companies.1 Molycorp is not included in the analysis due to unavailable data on production costs to perform the profitability check.2 Calculation of the supply quantities of considered REO, based on the projects’ REE production capacities and relative distribution of individual elements in the selected
deposits, latter data stems from TMR (2015).3 Year when planned capacity is started or expected to be reached.4 Lynas is currently producing 3008 t of REO per year (in 2014) and targeting 11,000 t in 2015.5 Averaged Nechalacho Basal and Upper values.6 Averaged Strange Lake enriched and Strange Lake Granite values.
Table A.2Input data for the primary supply analysis (2/2).
Market volumes La2O3 CeO2 Pr6O11 Nd2O3 Sm2O3 Eu2O3 Gd2O3 Tb4O7 Dy2O3 Y2O3 Total
% In mining quota 2014 27.9% 42.7% 4.7% 15.4% 1.6% 0.2% 1.2% 0.1% 0.7% 4.6%
Volumes (t)1 29,179 44,602 4899 16,096 1667 236 1297 140 717 4798 104,545Mining quota 2014 (t) 104,545Mining quota 2015
(expected2), (t)
116,550
Volumes China 2015 (86%), (t)3 32,530 49,724 5462 17,944 1858 263 1446 156 799 5349 116,550Volumes ROW (14%), (t)3 5,296 8,095 889 2,921 303 43 235 25 130 871 18,973Total current market volumes
1, (t)4
37,825 57,818 6351 20,865 2161 306 1681 181 929 6220 135,523
Approx. volumes export
official, (t) (assumingly 60%)
8,544 13,060 1434 4,713 488 69 380 41 210 1,405 30,611
Smuggling rate (40%), (t)5 5,696 8,706 956 3,142 325 46 253 27 140 937 20,407
Total export volumes (100%
equiv. to 86% of world mkt)6
14,239 21,766 2391 7,855 814 115 633 68 350 2341 51,018
Volumes ROW (14%), (t) 5,296 8,095 889 2,921 303 43 235 25 130 871 18,973
Total current market volumes
2, (t)7
19,535 29,860 3280 10,776 1116 158 868 94 480 3212 69,992
1 Chen (2014).2 Assuming an increase of 11% similar to the increase in 1st batch production quota from 2014 to 2015 (Argus Media).3 Assuming similar distribution of REO as in the mining quota (see line 3).4 To be used in price model (available from Klossek) as current market volumes in the total Chinese REE mining quota approach.5 40% of Chinese REEs being sold are illegally sourced (Argusmedia, 2015).6 Assumed current market volumes for the price model—assuming that overall exported volumes stay the same (as per TMR estimate), a part of illegal REO will be sold via
official channels.7 To be used in price model (available from Klossek) as current market volumes in the export quota and illegal supply approach
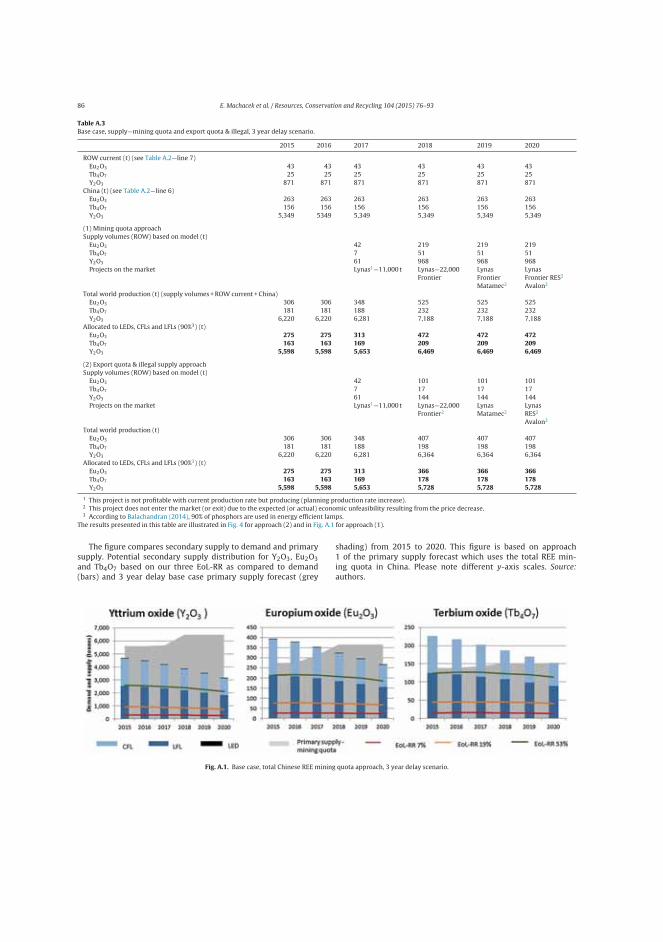
86 E. Machacek et al. / Resources, Conservation and Recycling 104 (2015) 76–93
Table A.3Base case, supply—mining quota and export quota & illegal, 3 year delay scenario.
2015 2016 2017 2018 2019 2020
ROW current (t) (see Table A.2—line 7)
Eu2O3 43 43 43 43 43 43
Tb4O7 25 25 25 25 25 25
Y2O3 871 871 871 871 871 871
China (t) (see Table A.2—line 6)
Eu2O3 263 263 263 263 263 263
Tb4O7 156 156 156 156 156 156
Y2O3 5,349 5349 5,349 5,349 5,349 5,349
(1) Mining quota approach
Supply volumes (ROW) based on model (t)
Eu2O3 42 219 219 219
Tb4O7 7 51 51 51
Y2O3 61 968 968 968
Projects on the market Lynas1—11,000 t Lynas—22,000
Frontier
Lynas
Frontier
Matamec2
Lynas
Frontier RES2
Avalon2
Total world production (t) (supply volumes + ROW current + China)
Eu2O3 306 306 348 525 525 525
Tb4O7 181 181 188 232 232 232
Y2O3 6,220 6,220 6,281 7,188 7,188 7,188
Allocated to LEDs, CFLs and LFLs (90%3) (t)
Eu2O3 275 275 313 472 472 472Tb4O7 163 163 169 209 209 209Y2O3 5,598 5,598 5,653 6,469 6,469 6,469
(2) Export quota & illegal supply approach
Supply volumes (ROW) based on model (t)
Eu2O3 42 101 101 101
Tb4O7 7 17 17 17
Y2O3 61 144 144 144
Projects on the market Lynas1—11,000 t Lynas—22,000
Frontier2
Lynas
Matamec2
Lynas
RES2
Avalon2
Total world production (t)
Eu2O3 306 306 348 407 407 407
Tb4O7 181 181 188 198 198 198
Y2O3 6,220 6,220 6,281 6,364 6,364 6,364
Allocated to LEDs, CFLs and LFLs (90%3) (t)
Eu2O3 275 275 313 366 366 366Tb4O7 163 163 169 178 178 178Y2O3 5,598 5,598 5,653 5,728 5,728 5,728
1 This project is not profitable with current production rate but producing (planning production rate increase).2 This project does not enter the market (or exit) due to the expected (or actual) economic unfeasibility resulting from the price decrease.3 According to Balachandran (2014), 90% of phosphors are used in energy efficient lamps.
The results presented in this table are illustrated in Fig. 4 for approach (2) and in Fig. A.1 for approach (1).
The figure compares secondary supply to demand and primary
supply. Potential secondary supply distribution for Y2O3, Eu2O3
and Tb4O7 based on our three EoL-RR as compared to demand
(bars) and 3 year delay base case primary supply forecast (grey
shading) from 2015 to 2020. This figure is based on approach
1 of the primary supply forecast which uses the total REE min-
ing quota in China. Please note different y-axis scales. Source:
authors.
Fig. A.1. Base case, total Chinese REE mining quota approach, 3 year delay scenario.
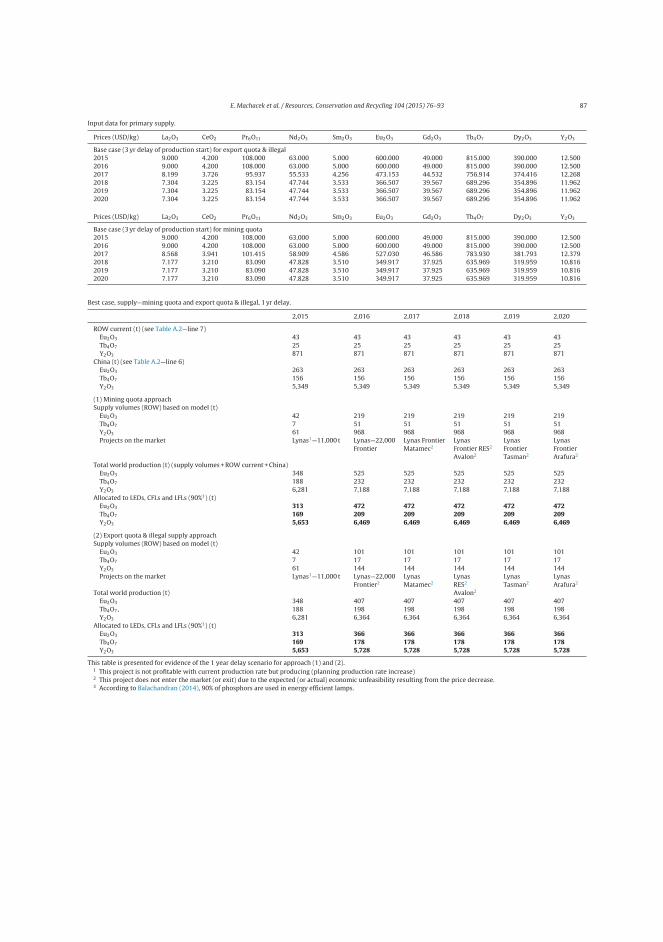
E. Machacek et al. / Resources, Conservation and Recycling 104 (2015) 76–93 87
Input data for primary supply.
Prices (USD/kg) La2O3 CeO2 Pr6O11 Nd2O3 Sm2O3 Eu2O3 Gd2O3 Tb4O7 Dy2O3 Y2O3
Base case (3 yr delay of production start) for export quota & illegal
2015 9.000 4.200 108.000 63.000 5.000 600.000 49.000 815.000 390.000 12.500
2016 9.000 4.200 108.000 63.000 5.000 600.000 49.000 815.000 390.000 12.500
2017 8.199 3.726 95.937 55.533 4.256 473.153 44.532 756.914 374.416 12.268
2018 7.304 3.225 83.154 47.744 3.533 366.507 39.567 689.296 354.896 11.962
2019 7.304 3.225 83.154 47.744 3.533 366.507 39.567 689.296 354.896 11.962
2020 7.304 3.225 83.154 47.744 3.533 366.507 39.567 689.296 354.896 11.962
Prices (USD/kg) La2O3 CeO2 Pr6O11 Nd2O3 Sm2O3 Eu2O3 Gd2O3 Tb4O7 Dy2O3 Y2O3
Base case (3 yr delay of production start) for mining quota
2015 9.000 4.200 108.000 63.000 5.000 600.000 49.000 815.000 390.000 12.500
2016 9.000 4.200 108.000 63.000 5.000 600.000 49.000 815.000 390.000 12.500
2017 8.568 3.941 101.415 58.909 4.586 527.030 46.586 783.930 381.793 12.379
2018 7.177 3.210 83.090 47.828 3.510 349.917 37.925 635.969 319.959 10.816
2019 7.177 3.210 83.090 47.828 3.510 349.917 37.925 635.969 319.959 10.816
2020 7.177 3.210 83.090 47.828 3.510 349.917 37.925 635.969 319.959 10.816
Best case, supply—mining quota and export quota & illegal, 1 yr delay.
2,015 2,016 2,017 2,018 2,019 2,020
ROW current (t) (see Table A.2—line 7)
Eu2O3 43 43 43 43 43 43
Tb4O7 25 25 25 25 25 25
Y2O3 871 871 871 871 871 871
China (t) (see Table A.2—line 6)
Eu2O3 263 263 263 263 263 263
Tb4O7 156 156 156 156 156 156
Y2O3 5,349 5,349 5,349 5,349 5,349 5,349
(1) Mining quota approach
Supply volumes (ROW) based on model (t)
Eu2O3 42 219 219 219 219 219
Tb4O7 7 51 51 51 51 51
Y2O3 61 968 968 968 968 968
Projects on the market Lynas1—11,000 t Lynas—22,000
Frontier
Lynas Frontier
Matamec2
Lynas
Frontier RES2
Avalon2
Lynas
Frontier
Tasman2
Lynas
Frontier
Arafura2
Total world production (t) (supply volumes + ROW current + China)
Eu2O3 348 525 525 525 525 525
Tb4O7 188 232 232 232 232 232
Y2O3 6,281 7,188 7,188 7,188 7,188 7,188
Allocated to LEDs, CFLs and LFLs (90%3) (t)
Eu2O3 313 472 472 472 472 472Tb4O7 169 209 209 209 209 209Y2O3 5,653 6,469 6,469 6,469 6,469 6,469
(2) Export quota & illegal supply approach
Supply volumes (ROW) based on model (t)
Eu2O3 42 101 101 101 101 101
Tb4O7 7 17 17 17 17 17
Y2O3 61 144 144 144 144 144
Projects on the market Lynas1—11,000 t Lynas—22,000
Frontier2
Lynas
Matamec2
Lynas
RES2
Lynas
Tasman2
Lynas
Arafura2
Total world production (t) Avalon2
Eu2O3 348 407 407 407 407 407
Tb4O7, 188 198 198 198 198 198
Y2O3 6,281 6,364 6,364 6,364 6,364 6,364
Allocated to LEDs, CFLs and LFLs (90%3) (t)
Eu2O3 313 366 366 366 366 366Tb4O7 169 178 178 178 178 178Y2O3 5,653 5,728 5,728 5,728 5,728 5,728
This table is presented for evidence of the 1 year delay scenario for approach (1) and (2).1 This project is not profitable with current production rate but producing (planning production rate increase)2 This project does not enter the market (or exit) due to the expected (or actual) economic unfeasibility resulting from the price decrease.3 According to Balachandran (2014), 90% of phosphors are used in energy efficient lamps.
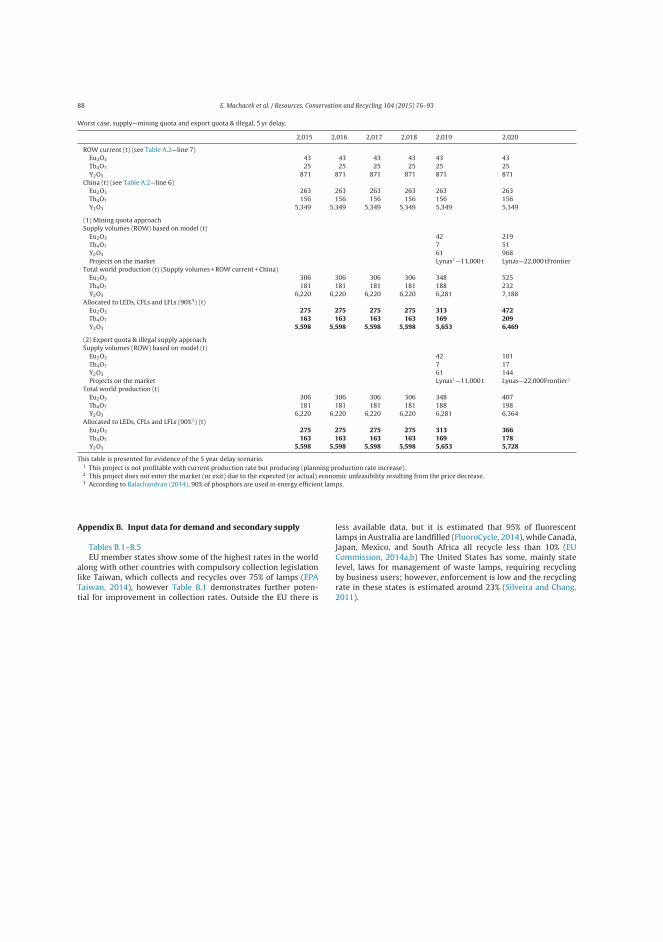
88 E. Machacek et al. / Resources, Conservation and Recycling 104 (2015) 76–93
Worst case, supply—mining quota and export quota & illegal, 5 yr delay.
2,015 2,016 2,017 2,018 2,019 2,020
ROW current (t) (see Table A.2—line 7)
Eu2O3 43 43 43 43 43 43
Tb4O7 25 25 25 25 25 25
Y2O3 871 871 871 871 871 871
China (t) (see Table A.2—line 6)
Eu2O3 263 263 263 263 263 263
Tb4O7 156 156 156 156 156 156
Y2O3 5,349 5,349 5,349 5,349 5,349 5,349
(1) Mining quota approach
Supply volumes (ROW) based on model (t)
Eu2O3 42 219
Tb4O7 7 51
Y2O3 61 968
Projects on the market Lynas1—11,000 t Lynas—22,000 tFrontier
Total world production (t) (Supply volumes + ROW current + China)
Eu2O3 306 306 306 306 348 525
Tb4O7 181 181 181 181 188 232
Y2O3 6,220 6,220 6,220 6,220 6,281 7,188
Allocated to LEDs, CFLs and LFLs (90%3) (t)
Eu2O3 275 275 275 275 313 472Tb4O7 163 163 163 163 169 209Y2O3 5,598 5,598 5,598 5,598 5,653 6,469
(2) Export quota & illegal supply approach
Supply volumes (ROW) based on model (t)
Eu2O3 42 101
Tb4O7 7 17
Y2O3 61 144
Projects on the market Lynas1—11,000 t Lynas—22,000Frontier2
Total world production (t)
Eu2O3 306 306 306 306 348 407
Tb4O7 181 181 181 181 188 198
Y2O3 6,220 6,220 6,220 6,220 6,281 6,364
Allocated to LEDs, CFLs and LFLs (90%3) (t)
Eu2O3 275 275 275 275 313 366Tb4O7 163 163 163 163 169 178Y2O3 5,598 5,598 5,598 5,598 5,653 5,728
This table is presented for evidence of the 5 year delay scenario.1 This project is not profitable with current production rate but producing (planning production rate increase).2 This project does not enter the market (or exit) due to the expected (or actual) economic unfeasibility resulting from the price decrease.3 According to Balachandran (2014), 90% of phosphors are used in energy efficient lamps.
Appendix B. Input data for demand and secondary supply
Tables B.1–B.5
EU member states show some of the highest rates in the world
along with other countries with compulsory collection legislation
like Taiwan, which collects and recycles over 75% of lamps (EPA
Taiwan, 2014), however Table B.1 demonstrates further poten-
tial for improvement in collection rates. Outside the EU there is
less available data, but it is estimated that 95% of fluorescent
lamps in Australia are landfilled (FluoroCycle, 2014), while Canada,
Japan, Mexico, and South Africa all recycle less than 10% (EU
Commission, 2014a,b) The United States has some, mainly state
level, laws for management of waste lamps, requiring recycling
by business users; however, enforcement is low and the recycling
rate in these states is estimated around 23% (Silveira and Chang,
2011).
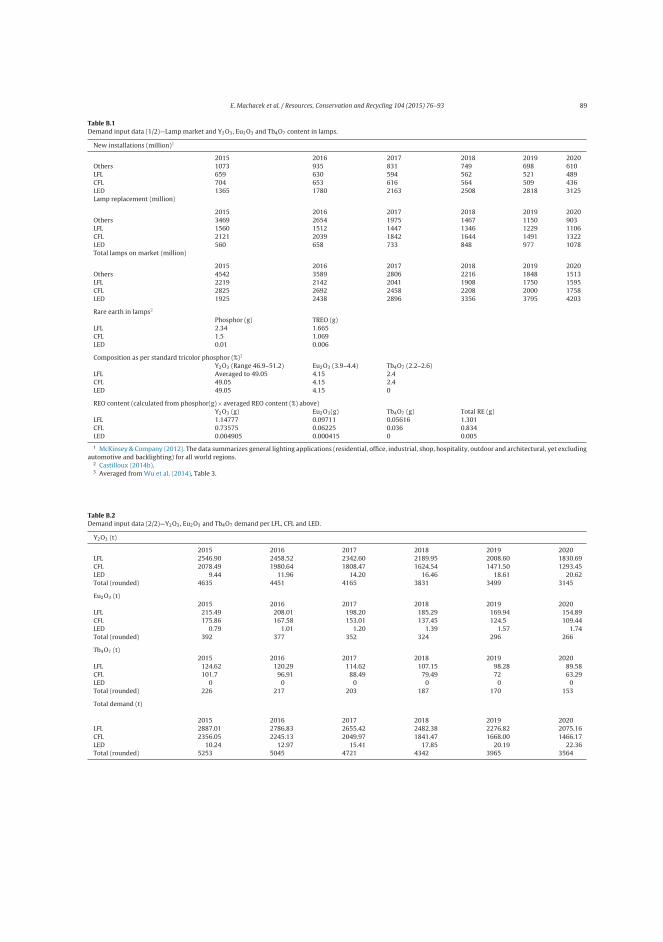
E. Machacek et al. / Resources, Conservation and Recycling 104 (2015) 76–93 89
Table B.1Demand input data (1/2)—Lamp market and Y2O3, Eu2O3 and Tb4O7 content in lamps.
New installations (million)1
2015 2016 2017 2018 2019 2020
Others 1073 935 831 749 698 610
LFL 659 630 594 562 521 489
CFL 704 653 616 564 509 436
LED 1365 1780 2163 2508 2818 3125
Lamp replacement (million)
2015 2016 2017 2018 2019 2020
Others 3469 2654 1975 1467 1150 903
LFL 1560 1512 1447 1346 1229 1106
CFL 2121 2039 1842 1644 1491 1322
LED 560 658 733 848 977 1078
Total lamps on market (million)
2015 2016 2017 2018 2019 2020
Others 4542 3589 2806 2216 1848 1513
LFL 2219 2142 2041 1908 1750 1595
CFL 2825 2692 2458 2208 2000 1758
LED 1925 2438 2896 3356 3795 4203
Rare earth in lamps2
Phosphor (g) TREO (g)
LFL 2.34 1.665
CFL 1.5 1.069
LED 0.01 0.006
Composition as per standard tricolor phosphor (%)3
Y2O3 (Range 46.9–51.2) Eu2O3 (3.9–4.4) Tb4O7 (2.2–2.6)
LFL Averaged to 49.05 4.15 2.4
CFL 49.05 4.15 2.4
LED 49.05 4.15 0
REO content (calculated from phosphor(g) × averaged REO content (%) above)
Y2O3 (g) Eu2O3(g) Tb4O7 (g) Total RE (g)
LFL 1.14777 0.09711 0.05616 1.301
CFL 0.73575 0.06225 0.036 0.834
LED 0.004905 0.000415 0 0.005
1 McKinsey & Company (2012). The data summarizes general lighting applications (residential, office, industrial, shop, hospitality, outdoor and architectural, yet excluding
automotive and backlighting) for all world regions.2 Castilloux (2014b).3 Averaged from Wu et al. (2014), Table 3.
Table B.2Demand input data (2/2)—Y2O3, Eu2O3 and Tb4O7 demand per LFL, CFL and LED.
Y2O3 (t)
2015 2016 2017 2018 2019 2020
LFL 2546.90 2458.52 2342.60 2189.95 2008.60 1830.69
CFL 2078.49 1980.64 1808.47 1624.54 1471.50 1293.45
LED 9.44 11.96 14.20 16.46 18.61 20.62
Total (rounded) 4635 4451 4165 3831 3499 3145
Eu2O3 (t)
2015 2016 2017 2018 2019 2020
LFL 215.49 208.01 198.20 185.29 169.94 154.89
CFL 175.86 167.58 153.01 137.45 124.5 109.44
LED 0.79 1.01 1.20 1.39 1.57 1.74
Total (rounded) 392 377 352 324 296 266
Tb4O7 (t)
2015 2016 2017 2018 2019 2020
LFL 124.62 120.29 114.62 107.15 98.28 89.58
CFL 101.7 96.91 88.49 79.49 72 63.29
LED 0 0 0 0 0 0
Total (rounded) 226 217 203 187 170 153
Total demand (t)
2015 2016 2017 2018 2019 2020
LFL 2887.01 2786.83 2655.42 2482.38 2276.82 2075.16
CFL 2356.05 2245.13 2049.97 1841.47 1668.00 1466.17
LED 10.24 12.97 15.41 17.85 20.19 22.36
Total (rounded) 5253 5045 4721 4342 3965 3564
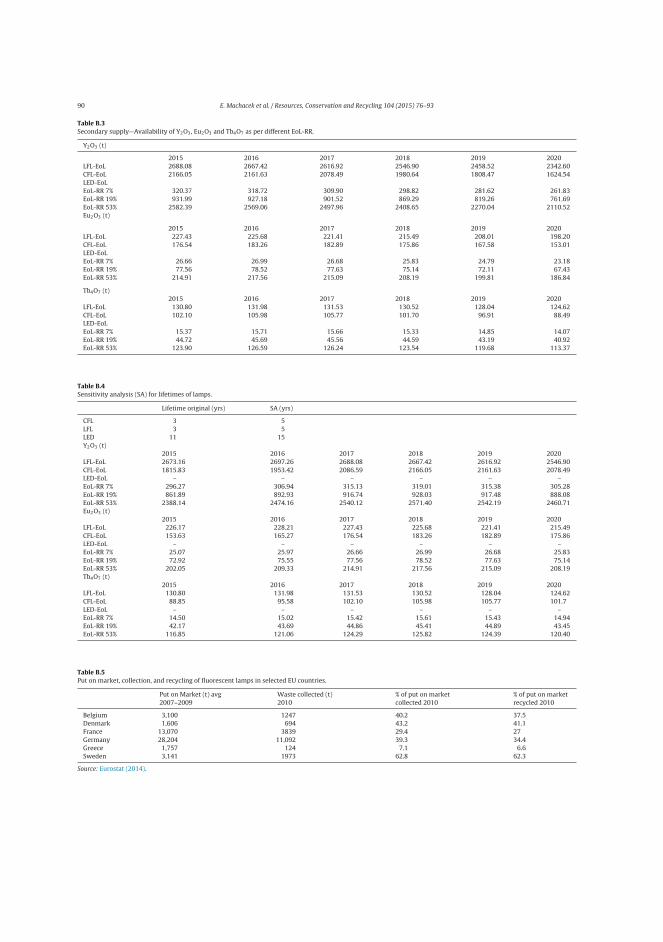
90 E. Machacek et al. / Resources, Conservation and Recycling 104 (2015) 76–93
Table B.3Secondary supply—Availability of Y2O3, Eu2O3 and Tb4O7 as per different EoL-RR.
Y2O3 (t)
2015 2016 2017 2018 2019 2020
LFL-EoL 2688.08 2667.42 2616.92 2546.90 2458.52 2342.60
CFL-EoL 2166.05 2161.63 2078.49 1980.64 1808.47 1624.54
LED-EoL
EoL-RR 7% 320.37 318.72 309.90 298.82 281.62 261.83
EoL-RR 19% 931.99 927.18 901.52 869.29 819.26 761.69
EoL-RR 53% 2582.39 2569.06 2497.96 2408.65 2270.04 2110.52
Eu2O3 (t)
2015 2016 2017 2018 2019 2020
LFL-EoL 227.43 225.68 221.41 215.49 208.01 198.20
CFL-EoL 176.54 183.26 182.89 175.86 167.58 153.01
LED-EoL
EoL-RR 7% 26.66 26.99 26.68 25.83 24.79 23.18
EoL-RR 19% 77.56 78.52 77.63 75.14 72.11 67.43
EoL-RR 53% 214.91 217.56 215.09 208.19 199.81 186.84
Tb4O7 (t)
2015 2016 2017 2018 2019 2020
LFL-EoL 130.80 131.98 131.53 130.52 128.04 124.62
CFL-EoL 102.10 105.98 105.77 101.70 96.91 88.49
LED-EoL
EoL-RR 7% 15.37 15.71 15.66 15.33 14.85 14.07
EoL-RR 19% 44.72 45.69 45.56 44.59 43.19 40.92
EoL-RR 53% 123.90 126.59 126.24 123.54 119.68 113.37
Table B.4Sensitivity analysis (SA) for lifetimes of lamps.
Lifetime original (yrs) SA (yrs)
CFL 3 5
LFL 3 5
LED 11 15
Y2O3 (t)
2015 2016 2017 2018 2019 2020
LFL-EoL 2673.16 2697.26 2688.08 2667.42 2616.92 2546.90
CFL-EoL 1815.83 1953.42 2086.59 2166.05 2161.63 2078.49
LED-EoL – – – – – –
EoL-RR 7% 296.27 306.94 315.13 319.01 315.38 305.28
EoL-RR 19% 861.89 892.93 916.74 928.03 917.48 888.08
EoL-RR 53% 2388.14 2474.16 2540.12 2571.40 2542.19 2460.71
Eu2O3 (t)
2015 2016 2017 2018 2019 2020
LFL-EoL 226.17 228.21 227.43 225.68 221.41 215.49
CFL-EoL 153.63 165.27 176.54 183.26 182.89 175.86
LED-EoL – – – – – –
EoL-RR 7% 25.07 25.97 26.66 26.99 26.68 25.83
EoL-RR 19% 72.92 75.55 77.56 78.52 77.63 75.14
EoL-RR 53% 202.05 209.33 214.91 217.56 215.09 208.19
Tb4O7 (t)
2015 2016 2017 2018 2019 2020
LFL-EoL 130.80 131.98 131.53 130.52 128.04 124.62
CFL-EoL 88.85 95.58 102.10 105.98 105.77 101.7
LED-EoL – – – – – –
EoL-RR 7% 14.50 15.02 15.42 15.61 15.43 14.94
EoL-RR 19% 42.17 43.69 44.86 45.41 44.89 43.45
EoL-RR 53% 116.85 121.06 124.29 125.82 124.39 120.40
Table B.5Put on market, collection, and recycling of fluorescent lamps in selected EU countries.
Put on Market (t) avg
2007–2009
Waste collected (t)
2010
% of put on market
collected 2010
% of put on market
recycled 2010
Belgium 3,100 1247 40.2 37.5
Denmark 1,606 694 43.2 41.1
France 13,070 3839 29.4 27
Germany 28,204 11,092 39.3 34.4
Greece 1,757 124 7.1 6.6
Sweden 3,141 1973 62.8 62.3
Source: Eurostat (2014).
E. Machacek et al. / Resources, Conservation and Recycling 104 (2015) 76–93 91A
pp
end
ix
C.
Tab
le
C.1
Tab
le
C.1
Co
st
est
imate
s
of
dif
fere
nt
RE
E
pro
du
cts
for
com
pari
son
of
RE
E
ph
osp
ho
r
fro
m
pri
mary
an
d
seco
nd
ary
(Eo
L)
sup
ply
.
Inp
ut
Ore
∼0.4
2
USD
/kg
(In
-sit
u
TR
EO
)1
RE
E
con
cen
trate
∼27
.6
USD
/kg
(In
-sit
u
TR
EO
)1
Co
llect
ed
Eo
L
lam
ps
Ph
osp
ho
r
po
wd
ers
Eo
L
RE
E
ph
osp
ho
r
con
cen
trate
Eo
L
RE
E
ph
osp
ho
r
con
cen
trate
Pro
cess
Min
e
&
ben
efi
ciati
on
Cra
ckin
g
&
leach
ing
(im
pu
rity
rem
ov
al)
Ch
em
ical
sep
ara
tio
n
So
rtin
g
Mate
rial
fro
m
Eo
L
lam
ps
Eo
L
lam
p
recy
clin
g
Rem
ain
ing
gla
ss
&
merc
ury
/ph
osp
ho
r
sep
ara
tio
n
Halo
ph
osp
hate
s
rem
ov
al
RE
E
ph
osp
ho
rs
crack
ing
Ou
tpu
t
By
gra
vit
ati
on
al
ben
efi
ciati
on
con
cen
trate
d
ore
(15
,00
0
g/t
RE
O6
or
0.2
–1
5%
gra
de
in
dep
osi
t)
RE
E
con
cen
trate
Ph
osp
ho
r
po
wd
ers
:
Y2O
3
(99
.99
9%
)
14
USD
/kg
2
Eu
2O
3(9
9.9
%)
25
USD
/kg
Tb
2O
3
62
0
USD
/kg
So
rted
Eo
L
lam
ps
So
rted
gla
ss/m
eta
l/p
last
ic
Ph
osp
ho
r
po
wd
er
Co
nce
ntr
ate
d
ph
osp
ho
rs
(23
0,0
00
g/t
RE
O6
or
10
–2
0
wt%
RE
O7)
or
15
%
(CM
I,
20
14
)
or
30
%
tric
olo
ur
ph
osp
ho
r
po
wd
er
con
ten
t
in
recy
cled
ph
osp
ho
r8
RE
E
ph
osp
ho
r
con
cen
trate
RE
E
con
cen
trate
Co
st
of
treatm
en
t
btw
. 0.1
5
an
d
2
EU
R/k
g
for
coll
ect
ion
&
recy
clin
g
(WE
EE
foru
m)
Gla
ss
=
net
cost
*
Meta
ls
=
very
small
po
siti
ve
retu
rn∼
Pla
stic
s
=
small
cost
for
inci
nera
tin
g
Sell
ing
the
po
wd
er
to
So
lvay
is
slig
htl
y
less
the
cost
of
lan
dfi
llin
g
wit
h
So
lvay
pay
ing
tran
spo
rt
cost
s5
Pri
ce
red
uct
ion
s
for
merc
ury
an
d
gla
ss
con
ten
t
in
ph
osp
ho
r
po
wd
er.
Sep
ara
tin
g
Hg
ou
t
is
very
ex
pen
siv
e5
RE
E
ex
tract
ion
fro
m
merc
ury
ph
osp
ho
r
∼6
USD
/kg
3
(Av
oid
ed
)
en
vir
on
-men
tal
cost
63
,00
0
m3
wast
e
gas;
20
0
m3
aci
dic
wate
r;
1.4
t
of
rad
ioact
ive
wast
e
(all
per
t
of
RE
O)4
No
te:
‘Im
pu
rity
rem
ov
al’
refe
rs
to
the
rem
ov
al
of
rad
ioact
ive
ele
men
ts
(if
pre
sen
t
in
the
RE
E-b
eari
ng
min
era
l
ho
st
rock
)
∼1–
2
USD
/kg
(or
SE
K
7–
15
/kg
)
to
lan
dfi
ll
ph
osp
ho
r
po
wd
er5
∼25
00
–1
.1
mil
lio
n
USD
/kg
Hg
iso
late
d
fro
m
bio
sph
ere
9
Note
s:
Cu
rren
t
hy
dro
meta
llu
rgic
al
pro
cess
es
ap
pli
ed
reco
ver
15
wt.
pct
. of
rare
-eart
h
meta
ls
as
ox
ides
con
tain
ed
in
ph
osp
ho
r
du
st
(CM
I
Au
g
20
14
pre
sen
tati
on
).*
Ad
gla
ss:
no
t
clean
en
ou
gh
for
hig
h-e
nd
use
s—g
en
era
lly
NO
T
use
d
in
new
lam
ps.
∼A
d
meta
ls:
mu
st
be
pre
-tre
ate
d
an
d
sep
ara
ted
by
mag
nets
an
d
flo
tati
on
.1
As
of
TM
R
data
base
, av
era
ge
of
data
fro
m
TM
R
for
7
jun
ior
RE
E
pro
ject
s
(as
per
Tab
le
A.1
.,
ex
clu
din
g
Ly
nas
an
d
Ch
ina),
wh
ere
by
the
list
ing
of
two
pro
ject
s
by
on
e
com
pan
y
has
been
sum
med
up
an
d
av
era
ged
.2
Pri
ces
acc
ess
ible
fro
m
pri
ce
chart
s
to
no
n-s
ub
scri
bed
use
rs
of
meta
l-p
ag
es,
Oct
20
14
.3
Card
are
lli
(20
14
)
in
Ch
em
ical
En
gin
eeri
ng
(20
14
)
wh
o
ori
gin
all
y
state
s
in
the
con
tex
t
of
98
–9
9%
reco
very
that
‘RE
Es
can
be
ex
tract
ed
for
as
low
as
USD
7/k
g
of
merc
ury
ph
osp
ho
r
du
st’,
pre
sum
ab
ly
sin
ce
it
is
a
Can
ad
ian
base
d
firm
, th
e
pri
ce
is
ind
icate
d
in
CA
D.
4N
av
arr
o
an
d
Zh
ao
(20
14
),
Wen
g
et
al.
(20
13
).5
Inte
rvie
wee
D
(20
14
)6
MLR
(20
02
);
No
ble
, 20
13
in
Tan
et
al.
(20
14
)7
Ott
o
an
d
Wo
jtale
wic
z-K
asp
rzak
(20
12
).8
Kh
etr
iwal
et
al.
(20
11
).9
Hy
lan
der
an
d
Go
od
site
(20
06
).
Th
e
recy
clin
g
pro
cess
is
cheap
er
the
bett
er
an
d
mo
re
ho
mo
gen
ou
s
the
po
wd
er
qu
ali
ty
is. T
he
sort
ing
an
d
coll
ect
ion
can
infl
uen
ce
the
effi
cien
cy
an
d
cost
so
that
en
ab
lin
g
a
sou
rcin
g
of
the
sam
e
qu
ali
ty
an
d
typ
e
of
lam
p
ph
osp
ho
rs
cou
ld
mak
e
the
RE
E
po
wd
er
recy
clin
g
pro
cess
mo
re
effi
cien
t
an
d
cheap
er,
as
po
inte
d
to
in
Bin
nem
an
s
an
d
Jon
es
(20
14
)
wit
h
the
thre
e
recy
clin
g
rou
tes,
yet
req
uir
es
eit
her
small
er
loo
ps
fro
m
com
pan
ies
tak
ing
back
their
ow
n
pro
du
ct
or
bett
er
sep
ara
tio
n
of
lam
p
typ
es.
92 E. Machacek et al. / Resources, Conservation and Recycling 104 (2015) 76–93
References
Ala-Kurikka, S., April 20, 2015. EU Delays Ban on Inefficient Halogen Bulbs,Retrieved May 10, 2015, from〈http://www.endseurope.com/index.cfm?go=40649〉.
Ali, S.H., 2014. Social and environmental impact of the rare earth industries.Resources 3 (1), 123–134, http://doi.org/10.3390/resources3010123.
Argusmedia, 2015. Production Quotas Drive Chinese REE Consolidation, RetrievedMay 1, 2015, from〈http://www.argusmedia.com/Metals/Metals-Coverage/Rare-Earths〉.
Balachandran, G., 2014. Case study 1—extraction of rare earths for advancedapplications. In: Seetharaman, S. (Ed.), Treatise on Process Metallurgy. Elsevier,Boston, MA, pp. 1291–1340, Retrieved May 20, from〈http://www.sciencedirect.com/science/article/pii/B9780080969886099831〉.
Balcan, 2015. Mercury Recycling, Retrieved May 10, 2015, from〈http://www.cfl-lamprecycling.com/products/mercury-recycling-11.htm〉.
Bandara, H.D., Darcy, J.W., Apelian, D., Emmert, M.H., 2014. Value analysis ofneodymium content in shredder feed: towards enabling the feasibility of rareearth magnet recycling. Environ. Sci. Technol., Retrieved from May 20, 2015,from 〈http://pubs.acs.org/doi/abs/10.1021/es405104k〉.
Binnemans, K., August, 2014. Rare earth recycling and the balance problem. In:Presented at the EREAN Summer School, KU Lueven.
Binnemans, K., Jones, P.T., 2014. Perspectives for the recovery of rare earths fromend-of-life fluorescent lamps. J. Rare Earths 32 (3), 195–200,http://doi.org/10.1016/S1002-0721(14)60051-X.
Binnemans, K., Jones, P.T., Blanpain, B., Van Gerven, T., Yang, Y., Walton, A.,Buchert, M., 2013a. Recycling of rare earths: a critical review. J. Clean. Prod. 51,1–22, http://doi.org/10.1016/j.jclepro.2012.12.037.
Binnemans, K., Jones, P.T., Acker, K., Blanpain, B., Mishra, B., Apelian, D., 2013b.Rare-earth economics: the balance problem. JOM 65 (7), 846–848,http://doi.org/10.1007/s11837-013-0639-7.
Bloomberg News, 2015. China Scraps Rare Earth Export Controls After Losing WTOAppeal, Retrieved from 〈http://www.bloomberg.com/news/2015-01-06/china-scraps-rare-earth-export-controls-after-losing-wto-appeal.html〉.
Bourdieu, P., 1985. The market of symbolic goods. Poetics 14 (1–2), 13–44,http://doi.org/10.1016/0304-422X(85)90003-8.
Braconnier, J.J., Rollat, A., 2010. Process for recovery of rare earths starting from asolid mixture containing a halophosphate and a compound of one or more rareearths. Rhodia Oper.
Castilloux, R., 2014a. Rare Earth Market Outlook: Supply, Demand and Pricing from2014–2020. Adamas Intelligence, pp. 1 (Published on October, 2014).
Castilloux, R., 2014b. Emerging End-Uses of REEs that Could Tranform the MarketPrior to 2020, Retrieved January 10, 2015 from〈http://www.techmetalsresearch.com/emerging-new-end-uses-for-rare-earths/?inf contact key=6e94b9b9423c24cd24af51cbd577019da719e0326996a76b9d8c1fcc2a8980d5〉.
Chakhmouradian, A.R., Wall, F., 2012. Rare earth elements: minerals, mines,magnets (and more). Elements 8 (5), 333–340,http://doi.org/10.2113/gselements.8.5.333.
Chemical Engineering, 2014. A Process that Recovers Rare-Earth Elements from‘urban mining’, Retrieved May 18, 2015 from 〈http://www.electrochem-technologies.com/PDFs/Press Release CHEMENTATOR Chemical EngineeringJune 2014.pdf〉.
Chen, Z., 2014. Integration, competition and application on rare earths. In:Presented at the Rare Earth 2014, Chengdu, China (Retrieved from Availablefrom authors).
Cohen, B., 2014. Release on Metal Events Ltd.’s 10th International Rare EarthsConference, Singapore, November 11-13.
Corvin, A., 2015. Light bulb recycling program aims to protect environment.Columbian, Retrieved, March 1, 2015, from〈http://www.columbian.com/news/2015/mar/01/light-bulb-recycling-lightrecycle-washington/〉.
DEA (Danish Energy Agency, Energy Piano, & CLASP European Programme), 2015.Report on European LED Market, Retrieved April 8, 2015 from〈http://clasponline.org/en/Resources/Resources/PublicationLibrary/2015/New-Data-Show-that-LED-Mass-Market-in-Europe-Will-Occur-Sooner-than-Predicted.aspx〉.
Dupont, D., Binnemans, K., 2015. Rare-earth recycling using a functionalized ionicliquid for the selective dissolution and revalorization of Y2O3:Eu3+ from lampphosphor waste. Green Chem. 17 (2), 856–868,http://doi.org/10.1039/C4GC02107J.
Eduafo, P.M., Strauss, M.L., Mishra, B., 2015. Experimental Investigation ofRecycling Rare Earth Metals from Waste Fluorescent Lamp Phosphors. In:Neelameggham, N.R., Alam, S., Oosterhof, H., Jha, A., Dreisinger, D., Wang, S.(Eds.), Rare Metal Technology. John Wiley & Sons, Inc., Hoboken, NJ, USA, pp.253–259, http://dx.doi.org/10.1002/9781119093244.ch29.
Environmental Protection Administration, 2012. Recycling, Disposal, and RecyclingVolume and Collection Rate of Different Materials. Environmental ProtectionAdministration, Taiwan, Retrieved October 20 2014 from〈http://recycle.epa.gov.tw/Recycle/en/index.html〉.
EPA Taiwan (2014), Presentation on Taiwan by Chen, I-Hsing, Recycling FundManagement Board, Retrieved on September 29, 2015 from http://www2.epa.gov/sites/production/files/2014-08/documents/taiwan presentation 0.pdf.
Erecon, 2014. Strengthening the European rare earths supply-chain. Challengesand policy options. In: A Report by the European Rare Earths CompetencyNetwork., pp. p. 59.
EU Commission, 2009. FAQ: Phasing Out Conventional Incandescent Bulbs,Retrieved May 1, 2015, from 〈http://europa.eu/rapid/press-release MEMO-09-368 en.htm〉.
EU Commission, 2011. Life Projects 2011, Retrieved May 29, 2015, from 〈http://ec.europa.eu/environment/life/publications/lifepublications/compilations/documents/envcompilation11.pdf〉.
EU Commission, 2014a. Eco-design Legislation: Implementing Regulations,Retrieved April 30, 2015 from〈http://ec.europa.eu/energy/efficiency/ecodesign/doc/overview legislation eco-design.pdf〉.
EU Commission, 2014b. Report on Critical Raw Materials for the EU, RetrievedApril 30, 2015, from 〈http://ec.europa.eu/enterprise/policies/raw-materials/files/docs/crm-report-on-critical-raw-materials en.pdf〉.
Eurostat, 2014. Waste Electrical and Electronic Equipment (WEEE), RetrievedAugust 26, 2014, from 〈http://epp.eurostat.ec.europa.eu/portal/page/portal/waste/key waste streams/waste electrical electronic equipment weee〉.
Falconnet, P., 1985. The economics of rare earths. J. Less Common Met. 111 (1),9–15.
FluoroCycle, 2014. Why Should We Recycle Our Waste Lighting?, RetrievedOctober 20, 2014, from 〈http://www.fluorocycle.org.au/why-recycle.php〉.
Foster, R.J., 2006. Tracking globalization. In: Tilley, C., Keane, W., Kuchler, S.,Rowlands, M., Spyer, P. (Eds.), Handbook of Material Culture. Sage, London, pp.285–302.
Golev, A., Scott, M., Erskine, P.D., Ali, S.H., Ballantyne, G.R., 2014. Rare earths supplychains: current status, constraints and opportunities. Resour. Policy, http://dx.doi.org/10.1016/j.resourpol.2014.03.004.
Graedel, T.E., Allwood, J., Birat, J.-P., Buchert, M., Hagelüken, C., Reck, B.K.,Sonnemann, G., 2011. What do we know about metal recycling rates? J. Ind.Ecol. 15 (3), 355–366, http://dx.doi.org/10.1111/j.1530-9290.2011.00342.x.
Guide Jr., V.D.R., Van Wassenhove, L.N., 2009. The evolution of closed-loop supplychain research. Oper. Res. 57 (1), 10–18, http://dx.doi.org/10.1287/opre.1080.0628.
Guyonnet, D., Planchon, M., Rollat, A., Escalon, V., Tuduri, J., Charles, N., Vaxelaire,S., Dubois, D., Fargier, H., 2015. Material flow analysis applied to rare earthelements in Europe. J. Clean Prod., 2015http://dx.doi.org/10.1016/j.jclepro.2015.04.123.
Habib, K., Schibye, P.K., Vestbø, A.P., Dall, O., Wenzel, H., 2014. Material flowanalysis of NdFeB magnets for Denmark: a comprehensive waste flowsampling and analysis approach. Environ. Sci. Technol. 48 (20), 12229–12237,http://doi.org/10.1021/es501975y.
Hatch, G., 2011. Critical Rare Earths Report. Technology Metals Research, Retrievedfrom 〈http://www.techmetalsresearch.com/critical-rare-earths-report/〉.
Huisman, J., Magalini, F., Kuehr, R., Maurer, C., Ogilvie, S., Poll, J., Stevels, A., 2008.Review of Directive 2002/96 on Waste Electrical and Electronic Equipment(WEEE). United Nations University, Bonn.
Hykawy, J., July 9, 2014. Lighting the Way—Rare Earths in Lighting, Retrieved from〈http://investorintel.com/rare-earth-intel/lighting-way-rare-earths-lighting/〉.
Hylander, L.D., Goodsite, M.E., 2006. Environmental costs of mercury pollution. Sci.Total Environ. 368 (1), 352–370,http://doi.org/10.1016/j.scitotenv.2005.11.029.
December 12, 2012. Global Supply Chain & Purchasing Manager. Solvay,Copenhagen (Recorded interview. Transcript available from authors).
Interviewee A, January 17, 2013. Global Supply Chain & Purchasing Manager.Solvay, Copenhagen (Recorded interview. Transcript available from authors).
Interviewee B, December 19, 2012. Industrial director of rare earth activities. In:Solvay Supply Chain. Solvay, Copenhagen (Recorded interview. Transcriptavailable from authors).
Interviewee C, January 29, 2015. Sales group manager for Ekokem Corporation. In:Recycling Process [Personal communication].
Interviewee D, October 27, 2014. General manager nordic recycling. In: RecyclingProcess (Audio-file available from authors).
Jordens, A., Cheng, Y.P., Waters, K.E., 2013. A review of the beneficiation of rareearth element bearing minerals. Miner. Eng. 41, 97–114, http://dx.doi.org/10.1016/j.mineng.2012.10.017.
Khetriwal, D.S., Widmer, R., Kuehr, R., Huisman, J., 2011. One WEEE, many species:lessons from the European experience. Waste Manage. Res. 29, 954–962.
Kim, J., Guillaume, B., Chung, J., Hwang, Y., 2015. Critical and precious materialsconsumption and requirement in wind energy system in the EU 27. Appl.Energy 139 (1), 327–334.
Klossek, P., van den Boogaart, K.G., 2015. Decision-making criteria in the rareearths exploration projects: an interview study. Int. J. Mining and MineralEngineering 6 (3), 199–217, http://dx.doi.org/10.1504/IJMME.2015.071153.
Klossek, P., van den Boogaart, K. G., & Hoeck, M. (n.d.). Assessing the impact of newtechnology on the market case of rare earth elements processing technologies.
Koninklijke Philips Electronics N.V., 2011. Phosphor—A Critical Component inFluorescent Lamps, Retrieved from 〈http://www.lighting.philips.com/pwc li/ph en/lightcommunity/assets/APR Phosphor Brochure LR.pdf〉.
Kvale, S., Brinkmann, S., 2009. Interviews: Learning the Craft of QualitativeResearch Interviewing, second ed. Sage Publications Inc., Thousand Oaks,California, USA.
Langer, T., 2012. Rare earth recovery from Urban mines: recycling of luminescentpoweder from luorescent lamps. In: Presented at the Electronic Recycling,September, 2012, Asia, Retrieved from 〈http://www.globalpsc.net/wp-content/uploads/2012/11/ERA 2012 Osram Langer 1112 EN.pdf〉.
Leveque, A., August, 2014. Extraction and separation of rare earths. In: Presented atthe EREAN Summer School, Leuven, Belgium, (Available from authors).
E. Machacek et al. / Resources, Conservation and Recycling 104 (2015) 76–93 93
Li, J., Zeng, X., Chen, M., Ogunseitan, O.A., Stevels, A., 2015. Control-Alt-Delete:rebooting solutions for the E-waste problem. Environ. Sci. Technol. 49,7095–7108.
Li, L., 2012. Patents compete for priority in the remote-phosphor LED technologyspace. LEDs Magazine, Retrieved May 29, 2015, from〈http://www.ledsmagazine.com/articles/print/volume-9/issue-7/features/patents-compete-for-priority-in-the-remote-phosphor-led-technology-space-magazine.html〉(July/August).
Lim, S.-R., Kang, D., Ogunseitan, O.A., Schoenung, J.M., 2013. Potentialenvironmental impacts from the metals in incandescent, compact fluorescentlamp (CFL), and light-emitting diode (LED) bulbs. Environ. Sci. Technol. 47 (2),1040–1047, http://doi.org/10.1021/es302886m.
Lynas Corporation, May, 2014. Capital Raising and Business Update, Retrieved June12, 2014, from 〈https://www.lynascorp.com/Presentations/2014/Lynas%20Investor%20Presentation%20050514 final%201326317.pdf〉.
Machacek, E., Fold, N., 2014. Alternative value chains for rare earths: theAnglo-deposit developers. Resour. Policy (42), 53–64,http://dx.doi.org/10.1016/j.resourpol.2014.09.003.
Massari, S., Ruberti, M., 2013. Rare earth elements as critical raw materials: focuson international markets and future strategies. Resour. Policy 38 (1), 36–43,http://dx.doi.org/10.1016/j.resourpol.2012.07.001.
McKinsey & Company, 2012. Lighting the Way: Perspectives on the Global LightingMarket, second ed, Retrieved March 7, 2015, from 〈http://www.mckinsey.com/∼/media/mckinsey/dotcom/client service/Automotive%20and%20Assembly/Lighting the way Perspectives on global lighting market 2012.ashx〉.
Metal-pages, 2015. Metal Prices—Rare Earths, Retrieved March, 2015, from〈http://www.metal-pages.com/metalprices/rareearths/〉.
Meyer, L., Bras, B., 2011. Rare earth metal recycling. In: Sustainable Systems andTechnology (ISSST), 2011 IEEE International Symposium, IEEE, pp. 1–6,Retrieved May 29, 2015, from〈http://ieeexplore.ieee.org/xpls/abs all.jsp?arnumber=5936890〉.
Moss, R.L., Tzimas, E., Willis, P., Arendorf, J., Espinoza, L.T., et al., 2013. CriticalMetals in the Path towards the Decarbonisation of the EU Energy Sector,Retrieved April 30 2015 from 〈http://www.reeminerals.no/images/Marketing/Presseartikler/Critical Metals Decarbonisation small.pdf〉.
Mueller, S.R., Wäger, P.A., Widmer, R., Williams, I.D., 2015. A geologicalreconnaissance of electrical and electronic waste as a source for rare earthmetals. Waste Manage., http://doi.org/10.1016/j.wasman.2015.03.038.
Navarro, J., Zhao, F., 2014. Life-cycle assessment of the production of rare-earthelements for energy applications: a review. Energy Syst. Policy 2, 45,http://doi.org/10.3389/fenrg.2014.00045.
Ondrey, G., 2014. A process that recovers rare-earth elements from “urbanmining”. Chem. Eng. 121 (6), 10.
Otto, R., Wojtalewicz-Kasprzak, A., February 2, 2012. Method for Recovery of RareEarths From Fluorescent Lamps, Retrieved from〈http://www.google.com/patents/US20120027651〉.
Pandey, S., Hooda, R., Mishra, A., 2012. Proposed plan for disposal ofmercury-bearing lamps for India. In: Bilitewski, B., Darbra, R.M., Barceló, D.(Eds.), Global Risk-Based Management of Chemical Additives II. Springer,Berlin Heidelberg, pp. 419–439, Retrieved from〈http://link.springer.com/chapter/10.1007/698 2012 172〉.
Philips Lighting, 2012. Waste Electrical & Electronic Equipment (WEEE), RetrievedOctober 6, 2014, from 〈http://www.lighting.philips.com/pwc li/main/lightcommunity/assets/sustainability/Waste-Electorical-Electronic-Equipment-WEEE.pdf〉.
Rademaker, J.H., Kleijn, R., Yang, Y., 2013. Recycling as a strategy against rare earthelement criticality: a systemic evaluation of the potential yield of NdFeBmagnet recycling. Environ. Sci. Technol. 47 (18), 10129–10136,dx.doi.org/10.1021/es305007w.
Récylum, 2014. Les différentes fractions des déchets, Gestion des déchets. CollecteRecyclage, Retrieved October 20, 2014, from〈http://www.recylum.com/collecte-recyclage/traitement/fractions/〉.
Richter, J. L., & Koppejan, R. (2015). Extended producer responsibility for lamps inNordic countries: best practices and challenges in closing material loops.Journal of Cleaner Production. http://doi.org/10.1016/j.jclepro.2015.06.131.
Rollat, A., 2012. How to satisfy the rare earths demand rhodia rare earth systemsinitiatives. In: Presented at the European Society for Engineers andIndustrialists, Retrieved August 31, 2014, from〈http://www.seii.org/seii/documents seii/archives/2012-09-28 A Rollat Terres rares.pdf〉.
Ronda, C.R., Jüstel, T., Nikol, H., 1998. Rare earth phosphors: fundamentals andapplications. J. Alloys Compd. 275–277, 669–676,http://doi.org/10.1016/S0925-8388(98)00416-2.
Schüler, D., Buchert, M., Liu, R., Dittrich, S. and Merz C., 2011, Study on Rare Earthsand Their Recycling. Final Report for the Greens/EFA Group in the EuropeanParliament. Darmstadt, Oeko Institut e.V.
Shen, H., 2015. China Sets First 2015 Rare Earth Production Quota, Retrieved May1, 2015, from 〈http://investorintel.com/technology-metals-intel/china-sets-first-2015-rare-earth-production-quota/〉.
Shin-Etsu Chemical, 2014. Electronics Materials Division, Retrieved October 14,2014, from 〈https://www.shinetsu.co.jp/en/products/electronics.html〉.
Silveira, G.T., Chang, S.-Y., 2011. Fluorescent lamp recycling initiatives in theUnited States and a recycling proposal based on extended producerresponsibility and product stewardship concepts. Waste Manage. Res. 29 (6),656–668, http://doi.org/10.1177/0734242X10383744.
Simoni, M., 2013. When will they start listening to us. In: Presented at the AppliedMinerology, Swiss Federal Institute of Technology and Department ofGeosciences (DERDW) (Available from authors).
Solvay, 2014. Loop Life Project, Retrieved May 29, 2015 from〈http://www.solvay.com/en/innovation/european-life-projects/loop-life-project-objectives.html, last accessed on30.09.2014〉.
Sprecher, B., Kleijn, R., Kramer, G.J., 2014. Recycling potential of neodymium: thecase of computer hard disk drives. Environ. Sci. Technol. 48 (16), 9506–9513,dx.doi.org/10.1021/es501572z.
Tan, Q., Li, J., 2014. A study of waste fluorescent lamp generation in mainlandChina. J. Clean. Prod. 81, 227–233, http://doi.org/10.1016/j.jclepro.2014.06.048.
Tan, Q., Li, J., Zeng, X., 2014. Rare earth elements recovery from waste fluorescentlamps: a review. Crit. Rev. Environ. Sci. Technol.,http://doi.org/10.1080/10643389.2014.900240.
TMR, 2015. Technology Metals Research, Retrieved May 18, 2015 from〈http://www.techmetalsresearch.com/metrics-indices/tmr-advanced-rare-earth-projects-index/〉.
Tukker, A., 2014. Rare earth elements supply restrictions: market failures, notscarcity, hamper their current use in high-tech applications. Environ. Sci.Technol. 48 (17), 9973–9974, http://doi.org/10.1021/es503548f.
Tunsu, C., Ekberg, C., Foreman, M., Retegan, T., 2015. Investigations regarding thewet decontamination of fluorescent lamp waste using iodine in potassiumiodide solutions. Waste Manage. (Oxford) 36, 289–296.
U.S. Department of Energy (DoE), 2011. Critical Materials Strategy, Retrieved from〈http://energy.gov/sites/prod/files/DOE CMS2011 FINAL Full.pdf〉.
U.S. Department of Energy (DoE), 2012. Life-Cycle Assessment of Energy andEnvironmental Impacts of LED Lighting Products, Part 2, Retrieved April 30,2015, from 〈http://apps1.eere.energy.gov/buildings/publications/pdfs/ssl/2012 led lca-pt2.pdf〉.
UNEP, 2012. Achieving the global transition to energy efficient lighting toolkit. In:United Nations Environment Programme, Retrieved May 15, 2015 from〈http://www.thegef.org/gef/sites/thegef.org/files/publication/Complete%20EnlightenToolkit 1.pdf〉.
UNEP (2014). Efficient Lighting Global Policy Map. Retrieved September 5, 2014,from 〈http://learning.enlighten-initiative.org/GlobalPolicyMap.aspx〉.
Walter, P., 2011. SCI—Rhodia recovers rare earths. Chem. Ind. (3), Retrieved April30, 2015 from 〈http://www.soci.org/Chemistry-and-Industry/CnI-Data/2011/3/Rhodia-recovers-rare-earths〉.
WCS International, 2013. World Class Shipping, Retrieved May 29, 2015, from〈http://www.worldclassshipping.com/〉.
WEEE Forum (2010). Key Figure 2009. Retrieved on September 29, 2015 fromhttp://www.weee-forum.org/system/files/kf 2009 final.pdf.
Weng, Z.H., Jowitt, S.M., Mudd, G.M., Haque, N., 2013. Assessing rare earth elementmineral deposit types and links to environmental impacts. Appl. Earth Sci.(Trans. Inst. Min. Metall. B) 122 (2), 83–96, http://dx.doi.org/10.1179/1743275813Y.0000000036.
Wilburn, D.R., 2012. Byproduct Metals and Rare-Earth Elements Used In theProduction of Light-Emitting Diodes—Overview of Principal Sources of Supplyand Material Requirements for Selected Markets (Scientific InvestigationsReport No. 2012-5215). U.S. Geological Survey, Retrieved from〈http://pubs.usgs.gov/sir/2012/5215/〉.
WTO, 2012. Export Restriction—Cases DS431 (Complainant: U.S.), DS432(Complainant: EU), DS433 (Complainant: JP), Retrieved on August 17, 2015from 〈https://www.wto.org〉.
World Trade Organization (WTO), 2014. China—Measures Related to theExportation of Rare Earths, Tungsten, and Molybdenum, Retrieved October 13,2014, from〈http://www.wto.org/english/tratop e/dispu e/cases e/ds431 e.htm〉.
WTO, 2015. Dispute Settlement. Dispute DS431. China—Measures Related to theExportation of Rare Earths, Tungsten and Molybdenum, Retrieved on August17, 2015 from〈https://www.wto.org/english/tratop e/dispu e/cases e/ds431 e.htm〉.
Wu, Y., Yin, X., Zhang, Q., Wang, W., Mu, X., 2014. Review: the recycling of rareearths from waste tricolor phosphors in fluorescent lamps: A review ofprocesses and technologies. Resour. Conserv. Recycl. 88, 21–31,http://doi.org/10.1016/j.resconrec.2014.04.007.
Wübbeke, J., 2013. Rare earth elements in China: policies and narratives ofreinventing an industry. Resour. Policy 38 (3), 384–394,http://doi.org/10.1016/j.resourpol.2013.05.005.
Yang, X.J., Lin, A., Li, X.-L., Wu, Y., Zhou, W., Chen, Z., 2013. China’s ion-adsorptionrare earth resources, mining consequences and preservation. Environ. Dev. 8,131–136, http://doi.org/10.1016/j.envdev.2013.03.006.
Zachmann, G., 2010. Rare Earth—No Case for Government Intervention. Bruegel,Retrieved from 〈http://www.bruegel.org/publications/publication-detail/publication/474-rare-earth-no-case-for-government-intervention/〉.

III

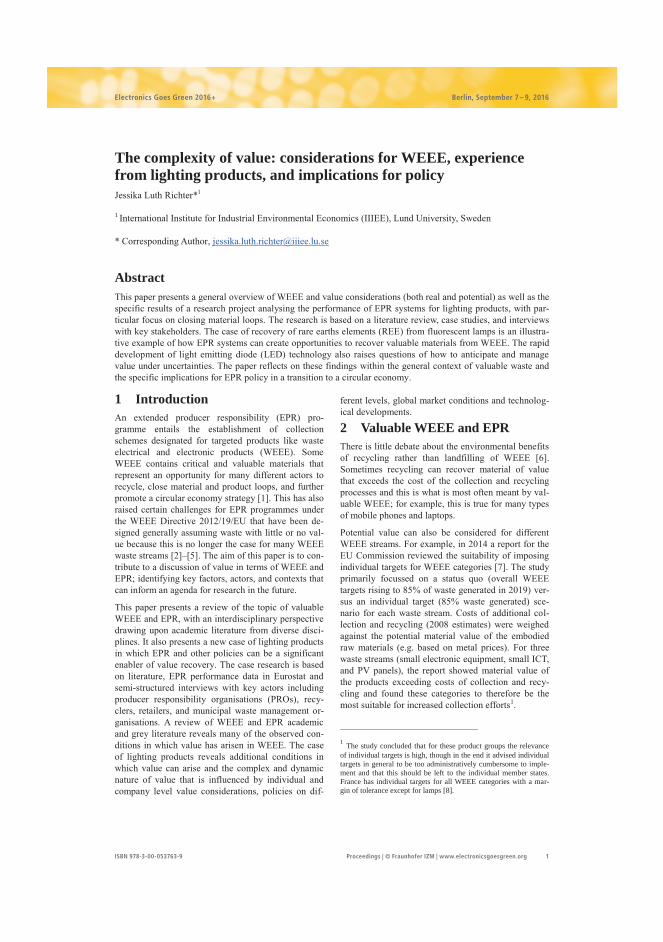
Proceedings | © Fraunhofer IZM | www.electronicsgoesgreen.org 1ISBN 978-3-00-053763-9
Electronics Goes Green 2016+ Berlin, September 7 – 9, 2016
The complexity of value: considerations for WEEE, experience from lighting products, and implications for policy Jessika Luth Richter*1 1 International Institute for Industrial Environmental Economics (IIIEE), Lund University, Sweden * Corresponding Author, [email protected]
Abstract This paper presents a general overview of WEEE and value considerations (both real and potential) as well as the specific results of a research project analysing the performance of EPR systems for lighting products, with par-ticular focus on closing material loops. The research is based on a literature review, case studies, and interviews with key stakeholders. The case of recovery of rare earths elements (REE) from fluorescent lamps is an illustra-tive example of how EPR systems can create opportunities to recover valuable materials from WEEE. The rapid development of light emitting diode (LED) technology also raises questions of how to anticipate and manage value under uncertainties. The paper reflects on these findings within the general context of valuable waste and the specific implications for EPR policy in a transition to a circular economy. 1 Introduction An extended producer responsibility (EPR) pro-gramme entails the establishment of collection schemes designated for targeted products like waste electrical and electronic products (WEEE). Some WEEE contains critical and valuable materials that represent an opportunity for many different actors to recycle, close material and product loops, and further promote a circular economy strategy [1]. This has also raised certain challenges for EPR programmes under the WEEE Directive 2012/19/EU that have been de-signed generally assuming waste with little or no val-ue because this is no longer the case for many WEEE waste streams [2]–[5]. The aim of this paper is to con-tribute to a discussion of value in terms of WEEE and EPR; identifying key factors, actors, and contexts that can inform an agenda for research in the future.
This paper presents a review of the topic of valuable WEEE and EPR, with an interdisciplinary perspective drawing upon academic literature from diverse disci-plines. It also presents a new case of lighting products in which EPR and other policies can be a significant enabler of value recovery. The case research is based on literature, EPR performance data in Eurostat and semi-structured interviews with key actors including producer responsibility organisations (PROs), recy-clers, retailers, and municipal waste management or-ganisations. A review of WEEE and EPR academic and grey literature reveals many of the observed con-ditions in which value has arisen in WEEE. The case of lighting products reveals additional conditions in which value can arise and the complex and dynamic nature of value that is influenced by individual and company level value considerations, policies on dif-
ferent levels, global market conditions and technolog-ical developments.
2 Valuable WEEE and EPR There is little debate about the environmental benefits of recycling rather than landfilling of WEEE [6]. Sometimes recycling can recover material of value that exceeds the cost of the collection and recycling processes and this is what is most often meant by val-uable WEEE; for example, this is true for many types of mobile phones and laptops.
Potential value can also be considered for different WEEE streams. For example, in 2014 a report for the EU Commission reviewed the suitability of imposing individual targets for WEEE categories [7]. The study primarily focussed on a status quo (overall WEEE targets rising to 85% of waste generated in 2019) ver-sus an individual target (85% waste generated) sce-nario for each waste stream. Costs of additional col-lection and recycling (2008 estimates) were weighed against the potential material value of the embodied raw materials (e.g. based on metal prices). For three waste streams (small electronic equipment, small ICT, and PV panels), the report showed material value of the products exceeding costs of collection and recy-cling and found these categories to therefore be the most suitable for increased collection efforts1.
1 The study concluded that for these product groups the relevance of individual targets is high, though in the end it advised individual targets in general to be too administratively cumbersome to imple-ment and that this should be left to the individual member states. France has individual targets for all WEEE categories with a mar-gin of tolerance except for lamps [8].
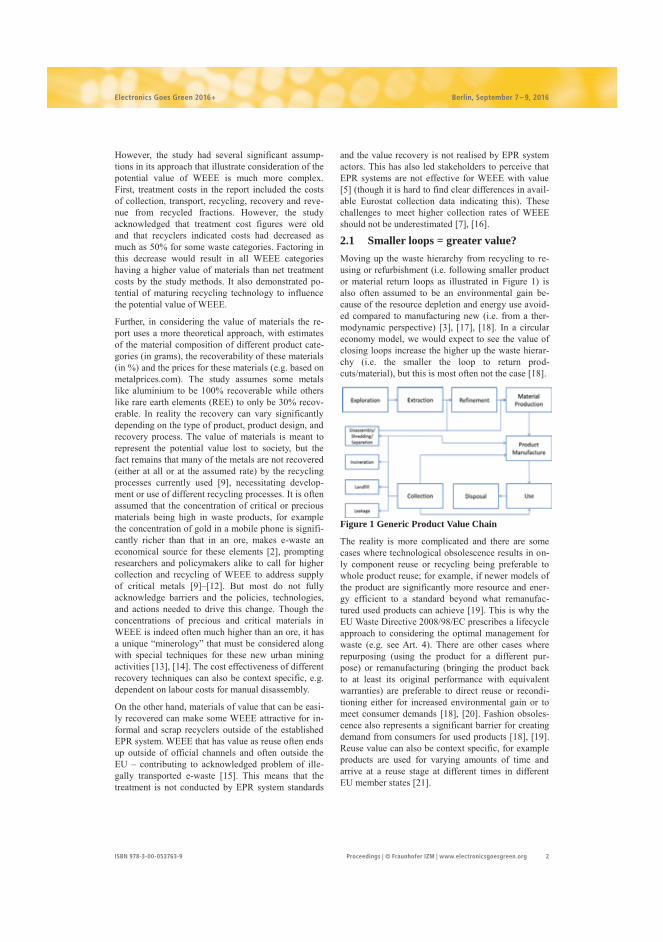
Proceedings | © Fraunhofer IZM | www.electronicsgoesgreen.org 2ISBN 978-3-00-053763-9
Electronics Goes Green 2016+ Berlin, September 7 – 9, 2016
However, the study had several significant assump-tions in its approach that illustrate consideration of the potential value of WEEE is much more complex. First, treatment costs in the report included the costs of collection, transport, recycling, recovery and reve-nue from recycled fractions. However, the study acknowledged that treatment cost figures were old and that recyclers indicated costs had decreased as much as 50% for some waste categories. Factoring in this decrease would result in all WEEE categories having a higher value of materials than net treatment costs by the study methods. It also demonstrated po-tential of maturing recycling technology to influence the potential value of WEEE.
Further, in considering the value of materials the re-port uses a more theoretical approach, with estimates of the material composition of different product cate-gories (in grams), the recoverability of these materials (in %) and the prices for these materials (e.g. based on metalprices.com). The study assumes some metals like aluminium to be 100% recoverable while others like rare earth elements (REE) to only be 30% recov-erable. In reality the recovery can vary significantly depending on the type of product, product design, and recovery process. The value of materials is meant to represent the potential value lost to society, but the fact remains that many of the metals are not recovered (either at all or at the assumed rate) by the recycling processes currently used [9], necessitating develop-ment or use of different recycling processes. It is often assumed that the concentration of critical or precious materials being high in waste products, for example the concentration of gold in a mobile phone is signifi-cantly richer than that in an ore, makes e-waste an economical source for these elements [2], prompting researchers and policymakers alike to call for higher collection and recycling of WEEE to address supply of critical metals [9]–[12]. But most do not fully acknowledge barriers and the policies, technologies, and actions needed to drive this change. Though the concentrations of precious and critical materials in WEEE is indeed often much higher than an ore, it has a unique “minerology” that must be considered along with special techniques for these new urban mining activities [13], [14]. The cost effectiveness of different recovery techniques can also be context specific, e.g. dependent on labour costs for manual disassembly.
On the other hand, materials of value that can be easi-ly recovered can make some WEEE attractive for in-formal and scrap recyclers outside of the established EPR system. WEEE that has value as reuse often ends up outside of official channels and often outside the EU – contributing to acknowledged problem of ille-gally transported e-waste [15]. This means that the treatment is not conducted by EPR system standards
and the value recovery is not realised by EPR system actors. This has also led stakeholders to perceive that EPR systems are not effective for WEEE with value [5] (though it is hard to find clear differences in avail-able Eurostat collection data indicating this). These challenges to meet higher collection rates of WEEE should not be underestimated [7], [16].
2.1 Smaller loops = greater value? Moving up the waste hierarchy from recycling to re-using or refurbishment (i.e. following smaller product or material return loops as illustrated in Figure 1) is also often assumed to be an environmental gain be-cause of the resource depletion and energy use avoid-ed compared to manufacturing new (i.e. from a ther-modynamic perspective) [3], [17], [18]. In a circular economy model, we would expect to see the value of closing loops increase the higher up the waste hierar-chy (i.e. the smaller the loop to return prod-cuts/material), but this is most often not the case [18].
Figure 1 Generic Product Value Chain
The reality is more complicated and there are some cases where technological obsolescence results in on-ly component reuse or recycling being preferable to whole product reuse; for example, if newer models of the product are significantly more resource and ener-gy efficient to a standard beyond what remanufac-tured used products can achieve [19]. This is why the EU Waste Directive 2008/98/EC prescribes a lifecycle approach to considering the optimal management for waste (e.g. see Art. 4). There are other cases where repurposing (using the product for a different pur-pose) or remanufacturing (bringing the product back to at least its original performance with equivalent warranties) are preferable to direct reuse or recondi-tioning either for increased environmental gain or to meet consumer demands [18], [20]. Fashion obsoles-cence also represents a significant barrier for creating demand from consumers for used products [18], [19]. Reuse value can also be context specific, for example products are used for varying amounts of time and arrive at a reuse stage at different times in different EU member states [21].
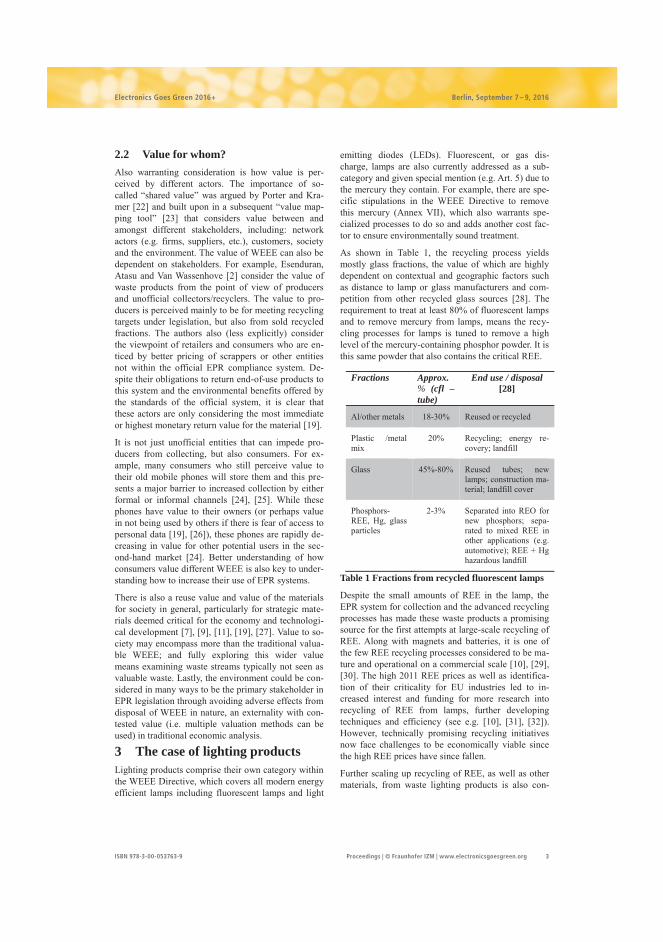
Proceedings | © Fraunhofer IZM | www.electronicsgoesgreen.org 3ISBN 978-3-00-053763-9
Electronics Goes Green 2016+ Berlin, September 7 – 9, 2016
2.2 Value for whom? Also warranting consideration is how value is per-ceived by different actors. The importance of so-called “shared value” was argued by Porter and Kra-mer [22] and built upon in a subsequent “value map-ping tool” [23] that considers value between and amongst different stakeholders, including: network actors (e.g. firms, suppliers, etc.), customers, society and the environment. The value of WEEE can also be dependent on stakeholders. For example, Esenduran, Atasu and Van Wassenhove [2] consider the value of waste products from the point of view of producers and unofficial collectors/recyclers. The value to pro-ducers is perceived mainly to be for meeting recycling targets under legislation, but also from sold recycled fractions. The authors also (less explicitly) consider the viewpoint of retailers and consumers who are en-ticed by better pricing of scrappers or other entities not within the official EPR compliance system. De-spite their obligations to return end-of-use products to this system and the environmental benefits offered by the standards of the official system, it is clear that these actors are only considering the most immediate or highest monetary return value for the material [19].
It is not just unofficial entities that can impede pro-ducers from collecting, but also consumers. For ex-ample, many consumers who still perceive value to their old mobile phones will store them and this pre-sents a major barrier to increased collection by either formal or informal channels [24], [25]. While these phones have value to their owners (or perhaps value in not being used by others if there is fear of access to personal data [19], [26]), these phones are rapidly de-creasing in value for other potential users in the sec-ond-hand market [24]. Better understanding of how consumers value different WEEE is also key to under-standing how to increase their use of EPR systems.
There is also a reuse value and value of the materials for society in general, particularly for strategic mate-rials deemed critical for the economy and technologi-cal development [7], [9], [11], [19], [27]. Value to so-ciety may encompass more than the traditional valua-ble WEEE; and fully exploring this wider value means examining waste streams typically not seen as valuable waste. Lastly, the environment could be con-sidered in many ways to be the primary stakeholder in EPR legislation through avoiding adverse effects from disposal of WEEE in nature, an externality with con-tested value (i.e. multiple valuation methods can be used) in traditional economic analysis.
3 The case of lighting products Lighting products comprise their own category within the WEEE Directive, which covers all modern energy efficient lamps including fluorescent lamps and light
emitting diodes (LEDs). Fluorescent, or gas dis-charge, lamps are also currently addressed as a sub-category and given special mention (e.g. Art. 5) due to the mercury they contain. For example, there are spe-cific stipulations in the WEEE Directive to remove this mercury (Annex VII), which also warrants spe-cialized processes to do so and adds another cost fac-tor to ensure environmentally sound treatment.
As shown in Table 1, the recycling process yields mostly glass fractions, the value of which are highly dependent on contextual and geographic factors such as distance to lamp or glass manufacturers and com-petition from other recycled glass sources [28]. The requirement to treat at least 80% of fluorescent lamps and to remove mercury from lamps, means the recy-cling processes for lamps is tuned to remove a high level of the mercury-containing phosphor powder. It is this same powder that also contains the critical REE.
Table 1 Fractions from recycled fluorescent lamps
Despite the small amounts of REE in the lamp, the EPR system for collection and the advanced recycling processes has made these waste products a promising source for the first attempts at large-scale recycling of REE. Along with magnets and batteries, it is one of the few REE recycling processes considered to be ma-ture and operational on a commercial scale [10], [29], [30]. The high 2011 REE prices as well as identifica-tion of their criticality for EU industries led to in-creased interest and funding for more research into recycling of REE from lamps, further developing techniques and efficiency (see e.g. [10], [31], [32]). However, technically promising recycling initiatives now face challenges to be economically viable since the high REE prices have since fallen.
Further scaling up recycling of REE, as well as other materials, from waste lighting products is also con-
Fractions Approx. % (cfl – tube)
End use / disposal [28]
Al/other metals 18-30% Reused or recycled
Plastic /metal mix
20% Recycling; energy re-covery; landfill
Glass 45%-80% Reused tubes; new lamps; construction ma-terial; landfill cover
Phosphors- REE, Hg, glass particles
2-3% Separated into REO for new phosphors; sepa-rated to mixed REE in other applications (e.g. automotive); REE + Hg hazardous landfill
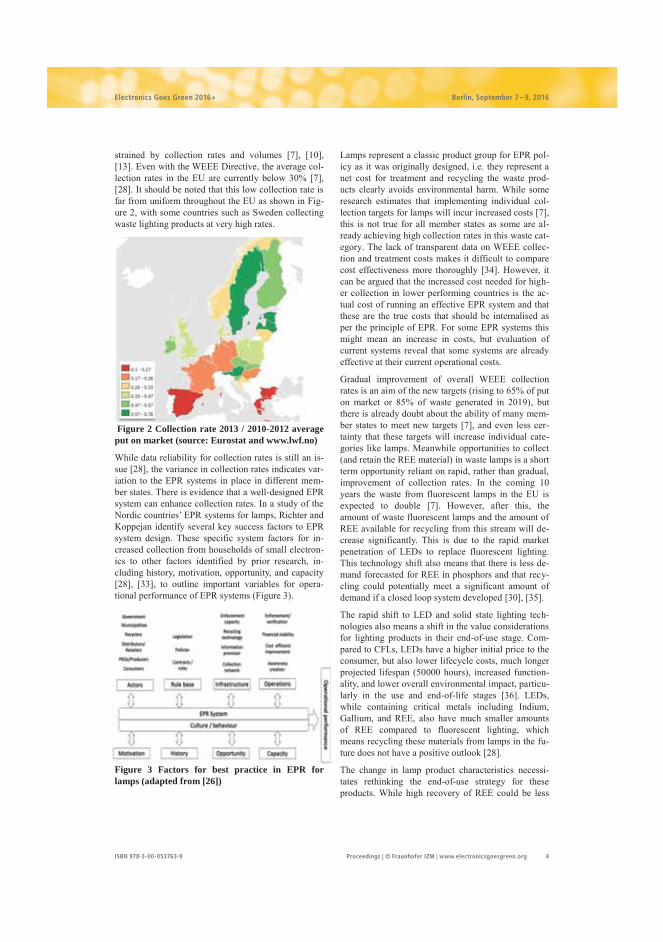
Proceedings | © Fraunhofer IZM | www.electronicsgoesgreen.org 4ISBN 978-3-00-053763-9
Electronics Goes Green 2016+ Berlin, September 7 – 9, 2016
strained by collection rates and volumes [7], [10], [13]. Even with the WEEE Directive, the average col-lection rates in the EU are currently below 30% [7], [28]. It should be noted that this low collection rate is far from uniform throughout the EU as shown in Fig-ure 2, with some countries such as Sweden collecting waste lighting products at very high rates.
Figure 2 Collection rate 2013 / 2010-2012 average put on market (source: Eurostat and www.lwf.no)
While data reliability for collection rates is still an is-sue [28], the variance in collection rates indicates var-iation to the EPR systems in place in different mem-ber states. There is evidence that a well-designed EPR system can enhance collection rates. In a study of the Nordic countries’ EPR systems for lamps, Richter and Koppejan identify several key success factors to EPR system design. These specific system factors for in-creased collection from households of small electron-ics to other factors identified by prior research, in-cluding history, motivation, opportunity, and capacity [28], [33], to outline important variables for opera-tional performance of EPR systems (Figure 3).
Figure 3 Factors for best practice in EPR for lamps (adapted from [26])
Lamps represent a classic product group for EPR pol-icy as it was originally designed, i.e. they represent a net cost for treatment and recycling the waste prod-ucts clearly avoids environmental harm. While some research estimates that implementing individual col-lection targets for lamps will incur increased costs [7], this is not true for all member states as some are al-ready achieving high collection rates in this waste cat-egory. The lack of transparent data on WEEE collec-tion and treatment costs makes it difficult to compare cost effectiveness more thoroughly [34]. However, it can be argued that the increased cost needed for high-er collection in lower performing countries is the ac-tual cost of running an effective EPR system and that these are the true costs that should be internalised as per the principle of EPR. For some EPR systems this might mean an increase in costs, but evaluation of current systems reveal that some systems are already effective at their current operational costs.
Gradual improvement of overall WEEE collection rates is an aim of the new targets (rising to 65% of put on market or 85% of waste generated in 2019), but there is already doubt about the ability of many mem-ber states to meet new targets [7], and even less cer-tainty that these targets will increase individual cate-gories like lamps. Meanwhile opportunities to collect (and retain the REE material) in waste lamps is a short term opportunity reliant on rapid, rather than gradual, improvement of collection rates. In the coming 10 years the waste from fluorescent lamps in the EU is expected to double [7]. However, after this, the amount of waste fluorescent lamps and the amount of REE available for recycling from this stream will de-crease significantly. This is due to the rapid market penetration of LEDs to replace fluorescent lighting. This technology shift also means that there is less de-mand forecasted for REE in phosphors and that recy-cling could potentially meet a significant amount of demand if a closed loop system developed [30], [35].
The rapid shift to LED and solid state lighting tech-nologies also means a shift in the value considerations for lighting products in their end-of-use stage. Com-pared to CFLs, LEDs have a higher initial price to the consumer, but also lower lifecycle costs, much longer projected lifespan (50000 hours), increased function-ality, and lower overall environmental impact, particu-larly in the use and end-of-life stages [36]. LEDs, while containing critical metals including Indium, Gallium, and REE, also have much smaller amounts of REE compared to fluorescent lighting, which means recycling these materials from lamps in the fu-ture does not have a positive outlook [28].
The change in lamp product characteristics necessi-tates rethinking the end-of-use strategy for these products. While high recovery of REE could be less
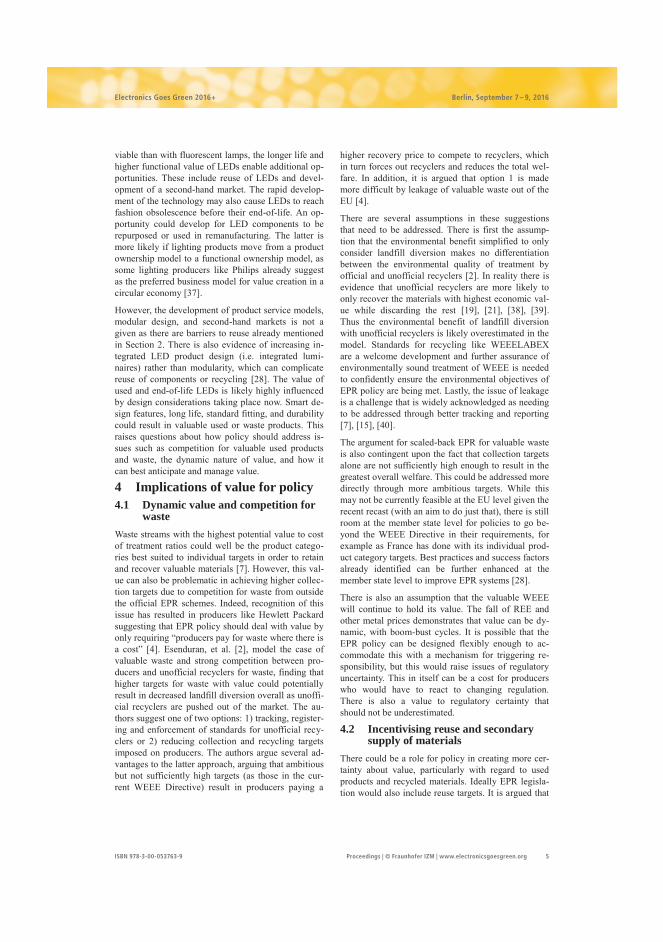
Proceedings | © Fraunhofer IZM | www.electronicsgoesgreen.org 5ISBN 978-3-00-053763-9
Electronics Goes Green 2016+ Berlin, September 7 – 9, 2016
viable than with fluorescent lamps, the longer life and higher functional value of LEDs enable additional op-portunities. These include reuse of LEDs and devel-opment of a second-hand market. The rapid develop-ment of the technology may also cause LEDs to reach fashion obsolescence before their end-of-life. An op-portunity could develop for LED components to be repurposed or used in remanufacturing. The latter is more likely if lighting products move from a product ownership model to a functional ownership model, as some lighting producers like Philips already suggest as the preferred business model for value creation in a circular economy [37].
However, the development of product service models, modular design, and second-hand markets is not a given as there are barriers to reuse already mentioned in Section 2. There is also evidence of increasing in-tegrated LED product design (i.e. integrated lumi-naires) rather than modularity, which can complicate reuse of components or recycling [28]. The value of used and end-of-life LEDs is likely highly influenced by design considerations taking place now. Smart de-sign features, long life, standard fitting, and durability could result in valuable used or waste products. This raises questions about how policy should address is-sues such as competition for valuable used products and waste, the dynamic nature of value, and how it can best anticipate and manage value.
4 Implications of value for policy 4.1 Dynamic value and competition for
waste Waste streams with the highest potential value to cost of treatment ratios could well be the product catego-ries best suited to individual targets in order to retain and recover valuable materials [7]. However, this val-ue can also be problematic in achieving higher collec-tion targets due to competition for waste from outside the official EPR schemes. Indeed, recognition of this issue has resulted in producers like Hewlett Packard suggesting that EPR policy should deal with value by only requiring “producers pay for waste where there is a cost” [4]. Esenduran, et al. [2], model the case of valuable waste and strong competition between pro-ducers and unofficial recyclers for waste, finding that higher targets for waste with value could potentially result in decreased landfill diversion overall as unoffi-cial recyclers are pushed out of the market. The au-thors suggest one of two options: 1) tracking, register-ing and enforcement of standards for unofficial recy-clers or 2) reducing collection and recycling targets imposed on producers. The authors argue several ad-vantages to the latter approach, arguing that ambitious but not sufficiently high targets (as those in the cur-rent WEEE Directive) result in producers paying a
higher recovery price to compete to recyclers, which in turn forces out recyclers and reduces the total wel-fare. In addition, it is argued that option 1 is made more difficult by leakage of valuable waste out of the EU [4].
There are several assumptions in these suggestions that need to be addressed. There is first the assump-tion that the environmental benefit simplified to only consider landfill diversion makes no differentiation between the environmental quality of treatment by official and unofficial recyclers [2]. In reality there is evidence that unofficial recyclers are more likely to only recover the materials with highest economic val-ue while discarding the rest [19], [21], [38], [39]. Thus the environmental benefit of landfill diversion with unofficial recyclers is likely overestimated in the model. Standards for recycling like WEEELABEX are a welcome development and further assurance of environmentally sound treatment of WEEE is needed to confidently ensure the environmental objectives of EPR policy are being met. Lastly, the issue of leakage is a challenge that is widely acknowledged as needing to be addressed through better tracking and reporting [7], [15], [40].
The argument for scaled-back EPR for valuable waste is also contingent upon the fact that collection targets alone are not sufficiently high enough to result in the greatest overall welfare. This could be addressed more directly through more ambitious targets. While this may not be currently feasible at the EU level given the recent recast (with an aim to do just that), there is still room at the member state level for policies to go be-yond the WEEE Directive in their requirements, for example as France has done with its individual prod-uct category targets. Best practices and success factors already identified can be further enhanced at the member state level to improve EPR systems [28].
There is also an assumption that the valuable WEEE will continue to hold its value. The fall of REE and other metal prices demonstrates that value can be dy-namic, with boom-bust cycles. It is possible that the EPR policy can be designed flexibly enough to ac-commodate this with a mechanism for triggering re-sponsibility, but this would raise issues of regulatory uncertainty. This in itself can be a cost for producers who would have to react to changing regulation. There is also a value to regulatory certainty that should not be underestimated.
4.2 Incentivising reuse and secondary supply of materials
There could be a role for policy in creating more cer-tainty about value, particularly with regard to used products and recycled materials. Ideally EPR legisla-tion would also include reuse targets. It is argued that
Proceedings | © Fraunhofer IZM | www.electronicsgoesgreen.org 6ISBN 978-3-00-053763-9
Electronics Goes Green 2016+ Berlin, September 7 – 9, 2016
this currently infeasible, with lack of data being the largest barrier [21]. Arguably this is an extension of existing challenges with information and tracking of WEEE. Better implementation and enforcement of data provision (for example, from reuse centres) and reporting requirements for both recycling and reuse (separately) should be a necessary starting point. Making a requirement that EPR schemes allow reuse organisations access to EEE and WEEE is also a way to increase reuse [19], [21] as well as documenting flows and ensuring quality of reused products [18].
Addressing demand for recycled materials is remains a challenge. As demonstrated by the case of fluores-cent lighting, even with mature recycling technology and increased collection rates, recovery of critical ma-terials is still dependent on market prices for the recy-cled materials. At the peak prices, spurred by Chinese control of the market, it was attractive to find alterna-tives to REE from China either by substitution to de-crease the demand, opening (or reopening) mines like Lynas’ Mount Weld in Australia and Molycorp’s Mountain Pass in California to increase primary sup-ply, or by recycling to provide a secondary supply [35]. The drop in REE prices saw interest in these ini-tiatives wane too, resulting in closing mines like Molycorp’s in California and the announcement by Solvay that it will discontinue its recycling from lamps [41]. While Lynas and Molycorp still struggle with low prices, there were some companies (e.g Sie-mens and companies in Japan) willing to sign longer term contracts with these companies (at presumably higher prices than those from Chinese suppliers) in order to have more certainty and control of their sup-ply chains [30].
Managing supply chains to be more resilient, e.g. though alternative primary supply, has been advocat-ed as a responsible way of addressing material criti-cality [42]. However, this will only be a mainstream practice if it is more widely acknowledged that this certainty of supply is of real value, i.e. an additional cost that companies are willing to pay. By the same argument, secondary supply from recycling can also help with certainty of supply for critical materials. However, there some concerns about volume, timing and quality, mainly because secondary supply chains remain less developed compared to more established primary supply chains [43]. Secondary supply of REE from waste products has another benefit in that it avoids the negative environmental and social impacts of extraction, which can be substantial given the con-siderable amount and nature of illegal mining practic-es in China [44], [45]. Further developing recycling and secondary supply of REE also contributes to-wards waste reduction and resource efficiency goals - all part of the circular economy agenda [35].
While retrieval of valuable secondary materials is part of the stated purpose of the WEEE Directive, this could be strengthened. For example, inclusion of re-cycling of targeted materials and products in the WEEE Directive (i.e. requiring recycling of critical materials where technology is mature, e.g. in fluores-cent lamps) has been suggested [43] and would this would certainly help in incentivising the recycling of critical materials. An added emphasis on this aspect of the rationale for EPR could also be effective in realis-ing higher collection rates (i.e. consumers return products not just to avoid environmental harm of landfilling but to actively conserve material resources [46]). However, this still does not necessarily assure that the recycling efforts match the market demand for the recycled materials. There also needs to be consid-eration in the critical materials strategy of how to best use or store critical materials if supply risks are antic-ipated but not immediate and the value for society of doing so.
To a certain extent, the characteristics of products ini-tiate their value for reuse and/or recycling. As demon-strated by the case of lighting, design decisions made now will influence the feasibility of closing loops decades in the future. It is necessary to look at how policy can then further incentivise design changes that will make reuse, repair and recycling more likely to occur. While this is an aim of the WEEE legislation, this has also been a challenge due to the way EPR schemes are run (collectively) in practice [47]. Better understanding is needed of how to incentive produc-ers to be more involved in the entire lifecycle of their products, e.g. through different business models. There is a role for the Ecodesign Directive and the WEEE Directive to both be enhanced in their design to further incentivise a transition to a circular econo-my, with producers not only thinking about the recy-clability of their products, but also how recycled frac-tions or components of old products could be pre-ferred for use in new products. Fundamental shifts in both producer and consumer perceptions of value are necessary if all waste is to become a resource.
The exploration of waste with value has demonstrated that the value of WEEE is dynamic and complex. Considerations of value depend on actor perspectives and objectives, networks, policies and market dynam-ics. Value also depends on consideration of the exter-nalities, for example the negative environmental and social impacts of primary production and the wider benefits of recycling. It should not be understated that this is, and will continue to be, challenging for policy to address. However, transitioning to a more sustaina-ble and circular economy will require more creative, ambitious and holistic policies encompassing the complexity of value in WEEE.
Proceedings | © Fraunhofer IZM | www.electronicsgoesgreen.org 7ISBN 978-3-00-053763-9
Electronics Goes Green 2016+ Berlin, September 7 – 9, 2016
5 Literature [1] EU Commission, “Higher recycling targets to drive transition to a Circular Economy with new jobs and sustainable growth.” 02-Jul-2014.
[2] G. Esenduran, A. Atasu, V. Wassenhove, and L. N, “Valuable E-Waste: Implications for Extended Producer Responsibility,” Social Science Research Network, Rochester, NY, SSRN Scholarly Paper ID 2694819, Nov. 2015.
[3] G. Esenduran, E. Kemahl o lu-Ziya, and J. M. Swaminathan, “Take-Back Legislation: Conse-quences for Remanufacturing and Environment,” De-cision Sciences, vol. 47, no. 2, pp. 219–256, Apr. 2016.
[4] G. Esenduran and A. Atasu, “The Effect of EPR on the Markets for Waste,” in Environmentally Responsible Supply Chains, A. Atasu, Ed. Springer International Publishing, 2016, pp. 241–257.
[5] N. Kunz, A. Atasu, K. Mayers, and L. van Wassenhove, “Extended Producer Responsibility: Stakeholder Concerns and Future Developments,” INSEAD, White paper, 2014.
[6] R. Hischier, P. Wäger, and J. Gauglhofer, “Does WEEE recycling make sense from an environ-mental perspective?: The environmental impacts of the Swiss take-back and recycling systems for waste electrical and electronic equipment (WEEE),” Envi-ronmental Impact Assessment Review, vol. 25, no. 5, pp. 525–539, Jul. 2005.
[7] F. Magalini, F. Wang, J. Huisman, R. Kuehr, K. Balde, V. van Straalen, M. Hestin, L. Lecerf, U. Sayman, and O. Akpulat, “Study on collection rates of waste electrical and electronic equipment (WEEE),” EU Commission, 2014.
[8] Code de l’environnement, vol. notamment les articles L.120-1, L.541-10, L.541-10-2 et R.543-172 à R.543-20. .
[9] T. E. Graedel, J. Allwood, J.-P. Birat, M. Buchert, C. Hagelüken, B. K. Reck, S. F. Sibley, and G. Sonnemann, “What do we know about metal recy-cling rates?,” Journal of Industrial Ecology, vol. 15, no. 3, pp. 355–366, 2011.
[10] K. Binnemans, P. T. Jones, B. Blanpain, T. Van Gerven, Y. Yang, A. Walton, and M. Buchert, “Recycling of rare earths: a critical review,” Journal of Cleaner Production, vol. 51, pp. 1–22, Jul. 2013.
[11] EU Commission, “Report on Critical Raw materials for the EU,” May 2014.
[12] D. Bauer, D. Diamond, J. Li, D. Sandalow, P. Telleen, and B. Wanner, “US Department of Energy Critical Materials Strategy,” 2010.
[13] S. R. Mueller, P. A. Wäger, R. Widmer, and I. D. Williams, “A geological reconnaissance of electri-cal and electronic waste as a source for rare earth metals,” Waste Management, vol. 45, pp. 226–234, Nov. 2015.
[14] C. Hagelüken and C. W. Corti, “Recycling of gold from electronics: Cost-effective use through ‘De-sign for Recycling,’” Gold Bull, vol. 43, no. 3, pp. 209–220.
[15] B. H. Robinson, “E-waste: An assessment of global production and environmental impacts,” Sci-ence of The Total Environment, vol. 408, no. 2, pp. 183–191, Dec. 2009.
[16] J. Huisman, “Too Big to Fail, Too Academic to Function,” Journal of Industrial Ecology, vol. 17, no. 2, pp. 172–174, Apr. 2013.
[17] T. Boone, V. Jayaraman, and R. Ganeshan, Eds., Sustainable Supply Chains, vol. 174. New York, NY: Springer New York, 2012.
[18] A. M. King, S. C. Burgess, W. Ijomah, and C. A. McMahon, “Reducing waste: repair, recondi-tion, remanufacture or recycle?,” Sust. Dev., vol. 14, no. 4, pp. 257–267, Oct. 2006.
[19] S. Hickey and C. Fitzpatrick, “Reuse Poten-tial: evaluation of reuse opportunities within WEEE compliance schemes,” StEP, Jan. 2016.
[20] T. Zink, F. Maker, R. Geyer, R. Amirtharajah, and V. Akella, “Comparative life cycle assessment of smartphone reuse: repurposing vs. refurbishment,” Int J Life Cycle Assess, vol. 19, no. 5, pp. 1099–1109, Feb. 2014.
[21] N. Seyring, M. Kling, J. Weissenbacher, M. Hestin, L. Lecerf, F. Magalini, D. S. Khetriwal, and R. Kuehr, “Study on WEEE recovery targets, preparation for re-use targets and on the method for calculation of the recovery targets,” EU Commission, 2015.
[22] M. E. Porter and M. R. Kramer, “Creating shared value,” Harvard business review, vol. 89, no. 1/2, pp. 62–77, 2011.
[23] Nancy Bocken, Samuel Short, Padmakshi Rana, and Steve Evans, “A value mapping tool for sustainable business modelling,” Corporate Govern-ance, vol. 13, no. 5, pp. 482–497, Oct. 2013.
[24] R. Geyer and V. D. Blass, “The economics of cell phone reuse and recycling,” Int J Adv Manuf Technol, vol. 47, no. 5–8, pp. 515–525, Sep. 2009.
Proceedings | © Fraunhofer IZM | www.electronicsgoesgreen.org 8ISBN 978-3-00-053763-9
Electronics Goes Green 2016+ Berlin, September 7 – 9, 2016
[25] N. Tojo and P. Manomaivibool, “The Collec-tion and Recycling of Used Mobile Phones: Case studies of selected European Countries,” IIIEE, 2011:06, Jun. 2011.
[26] K. Mishima and H. Nishimura, “Requirement analysis to promote small-sized E-waste collection from consumers,” Waste Manag Res, p. 0734242X15615424, Nov. 2015.
[27] M. Lieder and A. Rashid, “Towards circular economy implementation: a comprehensive review in context of manufacturing industry,” Journal of Clean-er Production, vol. 115, pp. 36–51, Mar. 2016.
[28] J. L. Richter and R. Koppejan, “Extended producer responsibility for lamps in Nordic countries: best practices and challenges in closing material loops,” Journal of Cleaner Production, vol. 123, pp. 167–179, Jun. 2016.
[29] D. Guyonnet, M. Planchon, A. Rollat, V. Es-calon, J. Tuduri, N. Charles, S. Vaxelaire, D. Dubois, and H. Fargier, “Material flow analysis applied to rare earth elements in Europe,” Journal of Cleaner Pro-duction, Apr. 2015.
[30] A. Rollat, D. Guyonnet, M. Planchon, and J. Tuduri, “Prospective analysis of the flows of certain rare earths in Europe at the 2020 horizon,” Waste Management, vol. 49, pp. 427–436, 2016.
[31] C. Tunsu, M. Petranikova, M. Gergori , C. Ekberg, and T. Retegan, “Reclaiming rare earth ele-ments from end-of-life products: A review of the per-spectives for urban mining using hydrometallurgical unit operations,” Hydrometallurgy, vol. 156, pp. 239–258, Jul. 2015.
[32] D. Dupont and K. Binnemans, “Rare-earth recycling using a functionalized ionic liquid for the selective dissolution and revalorization of Y2O3:Eu3+ from lamp phosphor waste,” Green Chem., vol. 17, no. 2, pp. 856–868, Feb. 2015.
[33] F. W. Melissen, “Redesigning a collection system for ‘small’ consumer electronics,” Waste Manag, vol. 26, no. 11, pp. 1212–1221, 2006.
[34] V. Monier, M. Hestin, J. Cave, I. Laureusens, E. Watkins, H. Reisinger, and L. Porsch, “Develop-ment of Guidance on Extended Producer Responsibil-ity,” EU Commission, 2014.
[35] E. Machacek, J. L. Richter, K. Habib, and P. Klossek, “Recycling of rare earths from fluorescent lamps: Value analysis of closing-the-loop under de-mand and supply uncertainties,” Resources, Conser-vation and Recycling, vol. 104, Part A, pp. 76–93, Nov. 2015.
[36] U.S. Department of Energy, “Life-Cycle As-sessment of Energy and Environmental Impacts of LED Lighting Products, Part 3,” Mar. 2013.
[37] Philips Lighting, “Philips’ transition from linear to Circular Economy | Philips Innovation Ser-vices,” 13-Dec-2013. [Online]. Available: http://www.innovationservices.philips.com/news/philips-transition-linear-circular-economy. [Accessed: 09-Jul-2014].
[38] D. S. Khetriwal, R. Widmer, R. Kuehr, and J. Huisman, “One WEEE, many species: lessons from the European experience,” Waste Management & Re-search, vol. 29, no. 9, pp. 954–962, 2011.
[39] D. S. Khetriwal, P. Kraeuchi, and R. Widmer, “Producer responsibility for e-waste management: key issues for consideration–learning from the Swiss ex-perience,” Journal of Environmental Management, vol. 90, no. 1, pp. 153–165, 2009.
[40] S. F. Murphy, J. Gregory, and R. Kirchain, “Evaluating the performance of recycling systems,” in E-waste Management: From Waste to Resource, 2012.
[41] X. Leoty, “La Rochelle : fermeture de l’atelier de recyclage des terres rares de Solvay d’ici fin 2016,” SudOuest.fr. [Online]. Available: http://www.sudouest.fr/2016/01/15/la-rochelle-fermeture-de-l-atelier-de-production-de-solvay-d-ici-fin-2016-2243998-1391.php. [Accessed: 22-Jul-2016].
[42] A. Tukker, “Rare Earth Elements Supply Re-strictions: Market Failures, Not Scarcity, Hamper Their Current Use in High-Tech Applications,” Envi-ron. Sci. Technol., vol. 48, no. 17, pp. 9973–9974, Sep. 2014.
[43] A. Tsamis and M. Coyne, “Rare earth recov-ery offers opportunities for the EU’s high-tech SMEs - Eco-innovation Action Plan -,” European Parliament’s Committee on Industry, Research and Energy, 2014.
[44] D. J. Packey and D. Kingsnorth, “The impact of unregulated ionic clay rare earth mining in China,” Resources Policy, vol. 48, pp. 112–116, Jun. 2016.
[45] S. H. Ali, “Social and Environmental Impact of the Rare Earth Industries,” Resources, vol. 3, no. 1, pp. 123–134, Feb. 2014.
[46] J. Baxter, K.-A. Lyng, C. Askham, and O. J. Hanssen, “High-quality collection and disposal of WEEE: Environmental impacts and resultant issues,” Waste Management.
[47] C. Van Rossem, T. Lindhqvist, and N. Tojo, “Lost in transposition? A study of the implementation of individual producer responsibility in the WEEE Di-rective,” 2006.

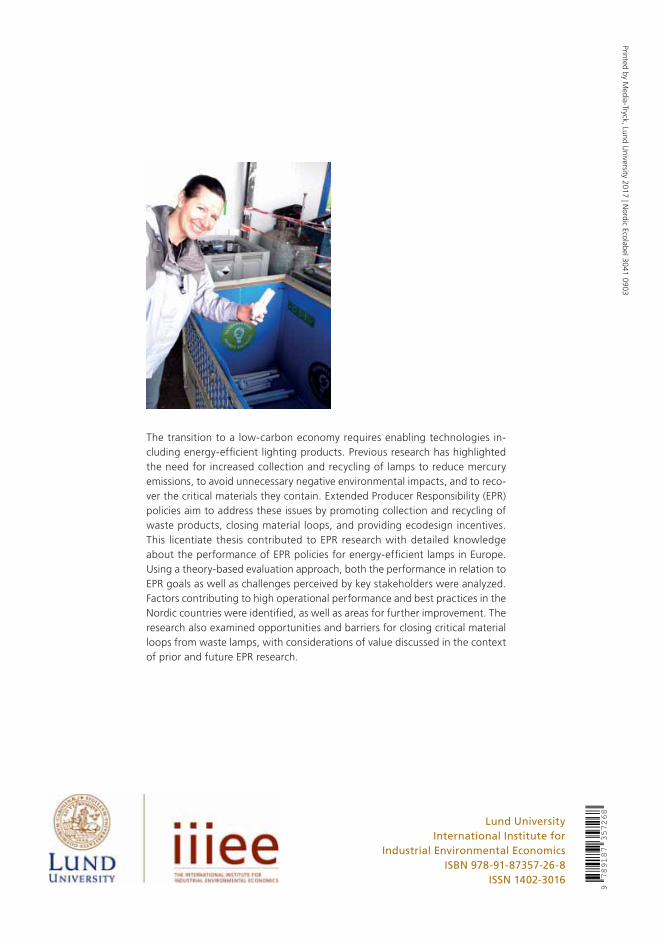
Lund UniversityInternational Institute for
Industrial Environmental EconomicsISBN 978-91-87357-26-8
ISSN 1402-3016
The transition to a low-carbon economy requires enabling technologies in-cluding energy-efficient lighting products. Previous research has highlighted the need for increased collection and recycling of lamps to reduce mercury emissions, to avoid unnecessary negative environmental impacts, and to reco-ver the critical materials they contain. Extended Producer Responsibility (EPR) policies aim to address these issues by promoting collection and recycling of waste products, closing material loops, and providing ecodesign incentives. This licentiate thesis contributed to EPR research with detailed knowledge about the performance of EPR policies for energy-efficient lamps in Europe. Using a theory-based evaluation approach, both the performance in relation to EPR goals as well as challenges perceived by key stakeholders were analyzed. Factors contributing to high operational performance and best practices in the Nordic countries were identified, as well as areas for further improvement. The research also examined opportunities and barriers for closing critical material loops from waste lamps, with considerations of value discussed in the context of prior and future EPR research.
9789187
357268


