Embed Size (px)
Citation preview
Report No. 5906-MA
Malaysia:Industrializing a Primary ProducerOn Two Volumes) Volume I
June, 19%6
East Asia and Pacific Programs Department
FOR OFFICIAL USE ONLY
Docunent-of the World Bank
This report has a restficted distribution and may be used by recipientsonly in th performance of ther official duties. Its contents may not otherwisebe disdosed without World Bank authorization.
Pub
lic D
iscl
osur
e A
utho
rized
Pub
lic D
iscl
osur
e A
utho
rized
Pub
lic D
iscl
osur
e A
utho
rized
Pub
lic D
iscl
osur
e A
utho
rized
Pub
lic D
iscl
osur
e A
utho
rized
Pub
lic D
iscl
osur
e A
utho
rized
Pub
lic D
iscl
osur
e A
utho
rized
Pub
lic D
iscl
osur
e A
utho
rized
CURRENCY EQUIVALENTS
Currency Unit - Ringgit (M$)
1985 March 1986US$1 = M$2.48 M$2.53M$1 = US$0.40 US$0.40
FISCAL YEAR
January 1 - December 31
ABBREVIATIONS
2MP - Second Malaysia Plan (1971-75)3MP - Third Malaysia Plan (1976-80)4MP - Fourth Malaysia Plan (1981-85)5MP - Fifth Malaysia Plan (1986-90)ACI - Action Com,ictee for IncentivesEPF - Employees Provident FundFAMA - Federal Agricultural Marketing AuthorityFAS - United States Dept. of Agriculture Foreign
Agriculture ServiceFELCRA - Federal Land Consolidation and Rehabilitation
AuthorityFELDA - Federal Land Development AuthorityFTZ - Free Trade ZoneICA - Industrial Coordination ActLMW - Licensed Manufacturing WarehouseLPN - National Paddy and Rice AuthorityMADA - Muda Agricultural Development AuthorityMAS - Malaysia Airlines SystemMIDA - Malaysian Industrial Development AuthorityMIPS - Malaysian Industrial Policy StudiesMOA - Ministry of AgricultureMOPGC - Malaysian Oil Palm Growers' CouncilNEP - New Economic PolicyNFPE - Nonfinancial Public EnterprisePERNAS - Perbadanan Nasional BerhadPETRONAS - Petroleum Nasional BerhadPNB - Permodalan Nasional BerhadRISDA - Rubber Industry Smallholder Development AuthorityUSDA - United States Department of Agriculture
FOI eFmCI USE ONLY
This report was prepared by a team that visited Malaysia in July1985. The mission consisted of S. Yusuf (mission chief), D. Bhattasali,W. Cuddihy, S. Faruqi, and R. K. Peters, Jr. The Institute of Strategic andInternational Studies in Kuala Lumpur prepared reviews on four industrialsubsectors. Ms. Helen Callaghan provided assistance in Washington. Thereport was discussed with the authorities in January 1986 and the finalversicn reflects the comments received and is updated on the basis of freshstatistics provided in April 1986. Mr. Vikraz Nehru contributed to therevision.
Ths dowument hu a timed dinrbuio and may be ued by rcipien ondy in te pefonneof their oiidudteL. Its ctent may not odrwe be dicked withut Word hnkauthoriatdon.
ABSTRACT
The report examines Malaysia's prospects for developing export-oriented manufacturing industries on the economic base provided by its primarysectors while persevering with the adjustment program begun in 198S. Malaysiahas an efficient tree crop sector and substantial petroleum resources, but oilproduction is approaching its peak, rubber output is on a declining trend andearnings from palm oil and cocoa, the two most lucrative agricultural exportsof recent years, will take time to recover from the price slump that hasafflicted commodity markets. During the remainder of the eightiea, thecontribution of these subsectors to the growth of the GDP is likely to bemodest. The cut in energy and raw material prices in 1985-86 has also erodedgovernment revenues and the economy's potential for saving. Achievingbalance-of-payments equilibrium and containing the increase in external debtmake a further spell of fiscal austerity unavoidable, and this is underlinedby the restrained investment program outlined in the Fifth Five-Year Plan. Asneither government spending nor the primary sector will contribute signifi-cantly to growth, the report emphasizes the importance of broadening theindustrial base and promoting manufactured exports through major institutionalchanges and a reform of incentives as a way of regaining growth momentum.
MALAYSIA
INDUSTRIALTZING A PRIMARY PRODUCER
Table of ContentsPage No.
SUN ARY AND CONCLUSIONSe.e e...................... e e.............. i
I. TRENDS AND PROSPECTS..RS....C TS..1....e....................
A Changed Environent ........... 1Malaysia's Economy: Recent Developmnts...o............. 2Sources of Growth: Demand Factors....................... 5Sources of Growth: Sectoral Contributiono............... 7Decomposition of Gro w th.... 8Approach to Industrialization......... ............ o...o. 11
II. RESOURCE BALANCES AND THE PUBLIC SECTOR...................... 14
Deficits and Their Fiin .. .. . 15Revenue Generation Through the Tax Systemostem......... 20Spending Cuts...us.................. .... ..... o.......... 23
III. THE ROLE OF LABOR AND EXCHANCE RATES IN EXPORT-ORIENTEDDEVELOPfEfTessoooooeeeooooeeooooo.oo.ooooo.Esoo.o.ooe Tsoooose 28
Labor Markets in East Asia... sia....00............... 28Population and Industrial Progress..........og r e... ... 28Sectoral Labor Suppliesp....0..0... . .. .... 0.. ...... * ..... 29
~~~ 'ages ~~~~~~~~~~~30Wage Competitiveness .... .. 0. 00........0..... 35Exchange Rate Policyo.....y 38
IV. THE FUTURE OF EXPORTS e. ..................................... 43
Export Prospects: Commodity Marketsr.k.e..et.s...... 44Export Prospects: Petroleum............................. 51Export Prospects: Manufactures............00O....... . 53Malaysia's Export Trader.................................. 59International Trading Environment ...... ................. 61
V. EXTERNAL BOnROWING AND CAPITAL FLS......................... 69
International Financial Markets ........... 0 . 71Equity Purchases and Capital Flows 71Regulating Capital Movementsv.... ....... 72
- ii -
Page No.
VI. DIRECT FOREIGN INVESTMENT AND ECONOMIC MODERNIZAIION ......... 74
Direct Foreign Investment in Malaysia.......o.o..oo ..... 74MNC Strategy and the Future of DFI....................... 77
VII. INDUSTRIAL STRATEGY AND DEVELOPMENT ...... .............. ..... o 82
Strategy ........................... ................. 89Market Efficiency ........................................ 90Regulation ................... ............................ 93Industrial Deepening.....4 ......... ... 95Sectoral Constraints and Policies ...........ii..e....s 98Textiles and Clothing........... ........ .98Electrical Machinery and Applianceso.....oo 101Agricultural Machinery ..... ....... o**o . .0.. .. .... * 103Electronics...... 104Wooden Furniture ...... o ............ oG6....o6......... 108Rubber Products .... o... ..... ................... 109
VIII. THE FUTURE OF AGRICULTURE. .... -o ............. .ooee............ 113
Rubber... .... .... o...... -...... 00.........e......00 .... 114Palm Oil ..... o........o............... ..... 122Cocoa ..........o.................................oo ... ....oe.woo.ooe.. 126Tree Crop Sector Summary ........... . .... .. ........-... 129Rice Sectoro............ oo............ ..... 60-000 ........ 130Overview .............. ..............- 13............. . ...... 136
IX. SIMULATINC THE FUT... .......... o.......................... 141
TABLES IN TEXT
l.1 Malaysia: Principal Macro In dicators ... 3 ...... .... 31.2 Malaysia: Demand Decomposition, Sources of Growth ........ oo 61.3 Malaysia: Sectoral Decomposition, Sources of Growth ......... 81.4 Malaysia: Factor Decomposition, Sources of Gro wth 9....- .... g1.5 Malaysia: Allocation of Credit by Sector............... 12
2.1 The Evolution of Resource Balances in the Economy...*......... 152.2 Public Sector Rescurce Balance ............. .................. 162.3 Nonbank Sources of Budget Finance ............... ................... 172.4 Savings Performance of the Federal Government...............O.. 192.5 Public Enterprise Statistics..................... 192.6 Structure of Public Sector Revenues ..... ........................ 202.7 Tax Revenue Buoyancies, 1960-85.................. .............. ... 212.8 Economic Classification of Federal Operating Expenditures ..... 242.9 Federal Subsidy Expenditures ........ ............... ..... *...... 252.10 Federal Government Development Expenditures by Sector..o....... 27
-iii -
Page No.
3.1 Malaysia: Real Average Monthly Earnings in Manufacturing31
3.2 Malaysia: Employment and Productivity by Sector.....ctor..... 323.3 Trend in Employment by Major Occupational Groups, Peninsular
Malaysia, 1962-70 .......- .......................... 343.4 Occupational Structure of Public Sector Employment and All
Urban Employment in Peninsular Malysia yi.a...e9oee*.*9e 343.5 Nominal Average Monthly Earnings in Manufacturing.....o....... 363.6 Value-Added per Worker ...... 373.7 Malaysia: Female Participation in Employment by Sectors,
1 9 5 7 -79oee.*oee**.a..ooooo... es.9 . 383.8 Malaysia: Index of Nominal and Real Effective Exchange
41
4.1 Growth of Exports to the USA.............. ...... ....... 444.2 World Natural Rubber Demand, 1982-2000..........8 494.3 World Production of Major Oils and Fats....................... 504.4 Annual Growth Rates of LDCs' Manufactured Exports............. 544.5 Share of Manufactured Exports in Total Exports................ 544.6 Share of Developed Market Economies in Manufactured Exports
of LDCD.......C.......s. ........... 554.7 Largest Manufactured Exports from Selected Asian Countries
to Major OECD Economies .................. .56
4.8 Fastest-Crowing Manufactured Exports from Selected AsianCountries to Major OECD Economies.... ..... 57
4.9 Malaysia: Merchandise Es p os............................... 594.10 Malaysia: Exports by Destination............................. 604.11 Malaysia: Largest Manufactured Exports to Major OECD
E c o n o m i es-ooo .... o.e.ooee..e ...... ee..000 .... 0-900.04-.. 604.12 Malaysia: Direction of Major Exports.... 624.13 Average Pre- and Post-Tokyo Round Nominal Tariff Protection
in the Developed Markets................ ......... ...... .... 634.14 Pre- and Post-Tokyo Round Sectoral Tariff Averages for the
Developed Countries.....ou.n............... r ............... 644.15 Actual Level of Tariffs Faced by Malaysian Imports .664.16 Malaysia: Nontariff Barriers Affecting Exports............... 67
5.1 Structure and Level of Total Foreign Debt Outstanding andDisbursed ........ ........ ......... * ............ ....... 70
5.2 Ownership or Corporate Assets in Malaysia .725.3 Errors and Omissions in the Balance of Payments 73
6.1 Aggregate Direct Foreign Investment Statistics.............. 766.2 Malaysia: National Distribution of Direct Foreign Investment 78
7.1 Industrial Sector - Basic Data............. t..... ........ .. 847.2 MIDA - Project Approvals, 1981-85 (No. of Projects)........... 857.3 MIDA - Project Approvals, 1981-85 (Amounts). u.n..o............ 867.4 Structure of Protection: MIC Groups (2 Digits) ........ o.... &... 887.5 Structure of Protection: End-Use Groups.......... ...... &... 897.6 Characteristics of the Asian Electronics Industryu............ 1057.7 Composition of Electronic Sector Output....................... 107
-iv-
Page No.
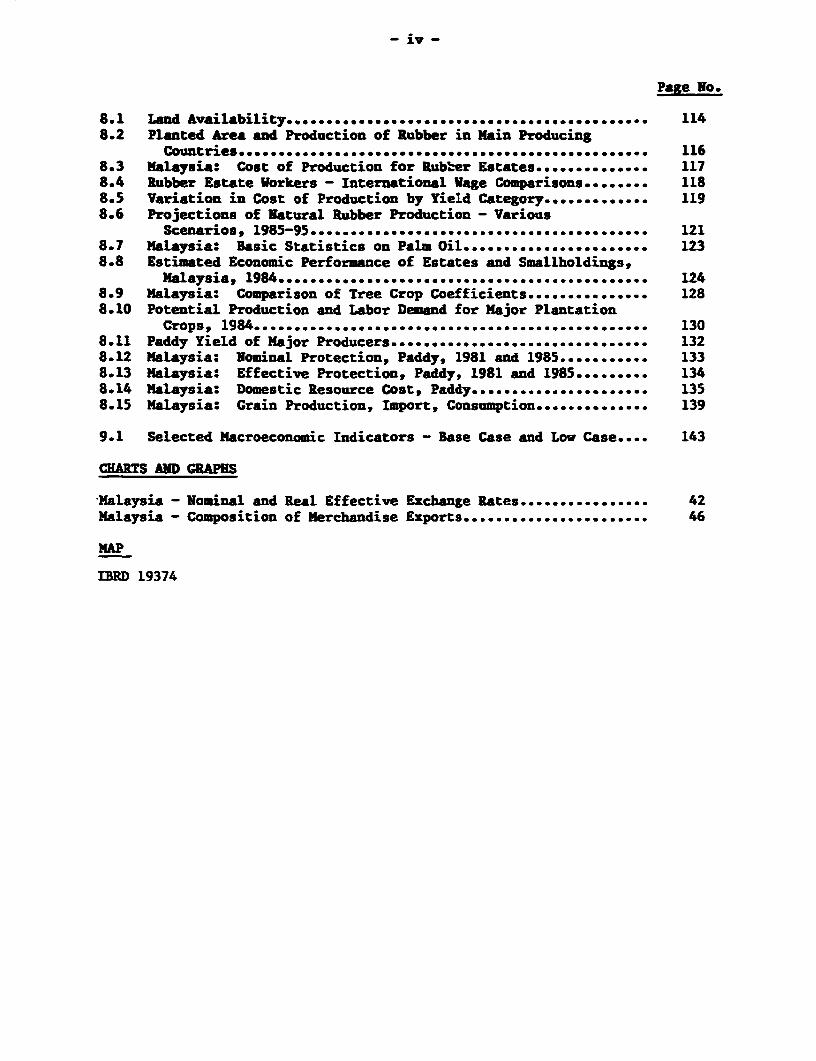
8.1 Land Availabiity ............. ..... ......... ... e** 1148.2 Planted Area and Production of Rubber in Main Producing
8.3 Malaysia: Cost of Production for Rubber Estates.............. 1178.4 Rubber Estate Workers - International Wage Comparisons ........ 1188.5 Variation in Cost of Production by Yield Category.............. 1198.6 Projections of Natural Rubber Production - Various
Scenarios, 1985-95 ... oooeooeoeeeomasoeo..... .............................. 1218.7 Malaysia: Basic Statistics on Palm Oil..o ..... ........... . 1238.8 Estimated Economic Performance of Estates and Smallholdings,
Malaysia, 1984 o e o ms o o oe e o e eo o o..................oo.................... . 1248.9 Malaysia: Comparison of Tree Crop Coefficients ........... o 1288.10 Potential Production and Labor Demand for Major Plantation
Crops, 1984 ooooo.ooo*oeoo.s ... on.o.o ... oo............................ 130
8.11 Paddy Yield of Major Producers.o.o..o......................... 1328.12 Malaysia: Nominal Protection, Paddy, 1981 and 1985............. 1338.13 Malaysia: Effective Protection, Paddy, 1981 and 1985......... 1348.14 Malaysia: Domestic Resource Cost, Paddy...................... 1358.15 Malaysia: Grain Production, Import, Consumption.............. 139
9.1 Selected Macroeconomic Indicators - Base Case and Low Case.... 143
CHARTS AND GRAPHS
Malaysia - Nominal and Real Effective Exchange Rates. ........... o 42Malaysia - Composition of Merchandise Exports...... o.............. 46
MAP
IBRD 19374
Page 1 of 2
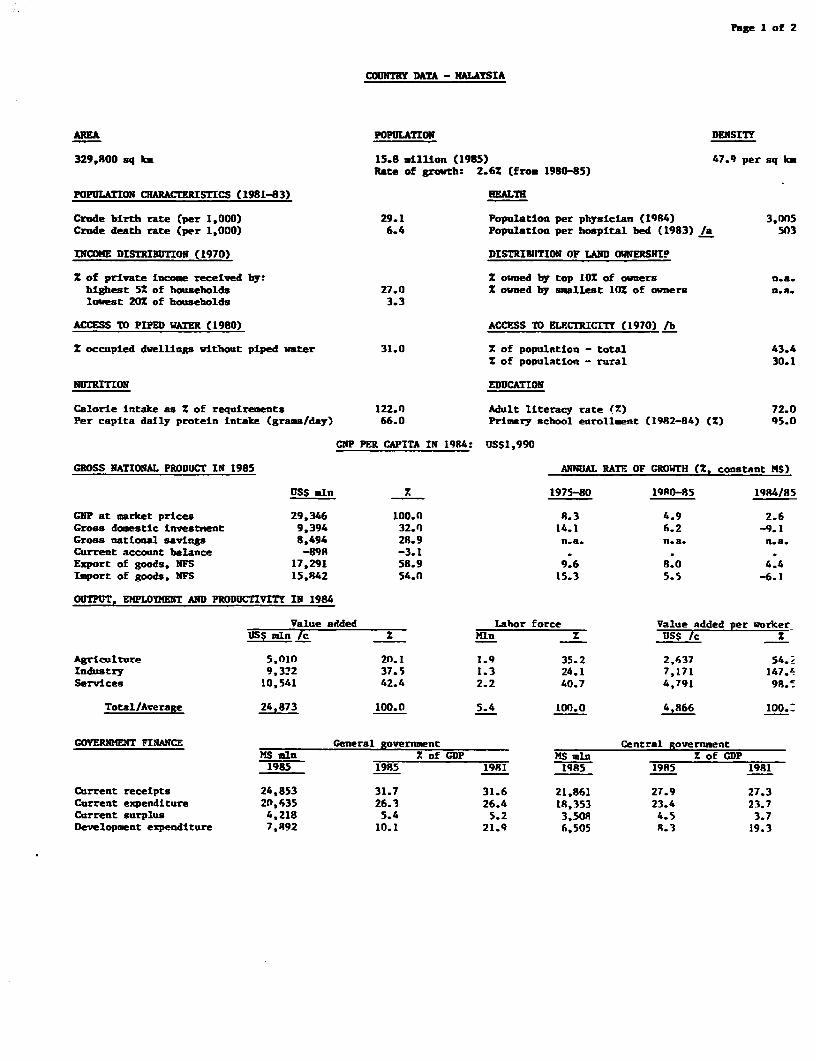
COUNTRY DATA - MALAYSIA
AREA POPULATION DENSITY
329,800 sq km 15.8 million (1985) 47.9 per sq kmRate of growth: 2.62 (from 1980-85)
POPULATION CHARACTERISTICS (1981-83) HEALTH
Crude birth rate (per 1,000) 29.1 Population per physician (1984) 3,005Crude death rate (per 1.000) 6.4 Population per hospital bed (1983) /a 503
INCOME DISTRIRUTION (1970) DISTRIRUTION OF LAND OWNERSHIP
2 of private income received by: Z owned by top 10X of owners n.a.highest 52 of households 27.0 Z owned by smallest 101 of owners n.a.lowest 20X of households 3.3
ACCESS TO PIPED WATER (1980) ACCESS TO ELFCTRICITY (1970) lb
Z occupied dwellings without piped water 31.0 X of population - total 43.42 of population - rural 30.1
NUTRITION EDUCATION
Calorie intake as 2 of requirements 122.0 Adult literacy rate (2) 72.0Per capita daily protein intake (grass/day) 66.0 Primary school enrollment (1982-84) (2) 95.0
GNP PER CAPITA IN 1984: US$1,990
GROSS NATIONAL PRODUCr IN 1985 ANNUAL RATE OF GROWTH (2, constant MS)
USS mln X 1975-80 19R0-85 1984/85
GUP at market prices 29,346 100.0 8.3 4.9 2.6Gross domestic investnent 9,394 32.0 14.1 6.2 -9.1Gross national savings 8,494 28.9 n.a. n.a. n.a.Current account balance -898 -3.1Export of goods. NFS 17,291 58.9 9.6 8.0 4.4Ioport of goods, NFS 15,842 54.n 15.3 5.5 -6.1
OUTPUT, EMPLOYMENT AND PRODUCTIVITY IN 1984
Value added Labor force Value added per workerUs$ min /c Z Mln 2 US5 /c Z
Agriculture 5,01n 20.1 1.9 35.2 2,637 54.;Industry 9.322 37.5 1.3 24.1 7,171 147.4Services 10,541 42.4 2.2 40.7 4,791 9S.'
Total/Average 24,873 100.0 5.4 100.0 4,866 100._
GOVENMMENT FINANCE General government Central governmentMS mln Z of GOP MS =In Z of CDP1985 1985 1981 1985 1985 1981
Current receipts 24,853 31.7 31.6 21,861 27.9 27.3Current expenditure 20,635 26.3 26.4 18,353 23.4 23.7Current surplus 4,218 5.4 5.2 3,50S 4.5 3.7Development expenditure 7,892 10.1 21.9 6,505 8.3 19.3
Page 2 of 2
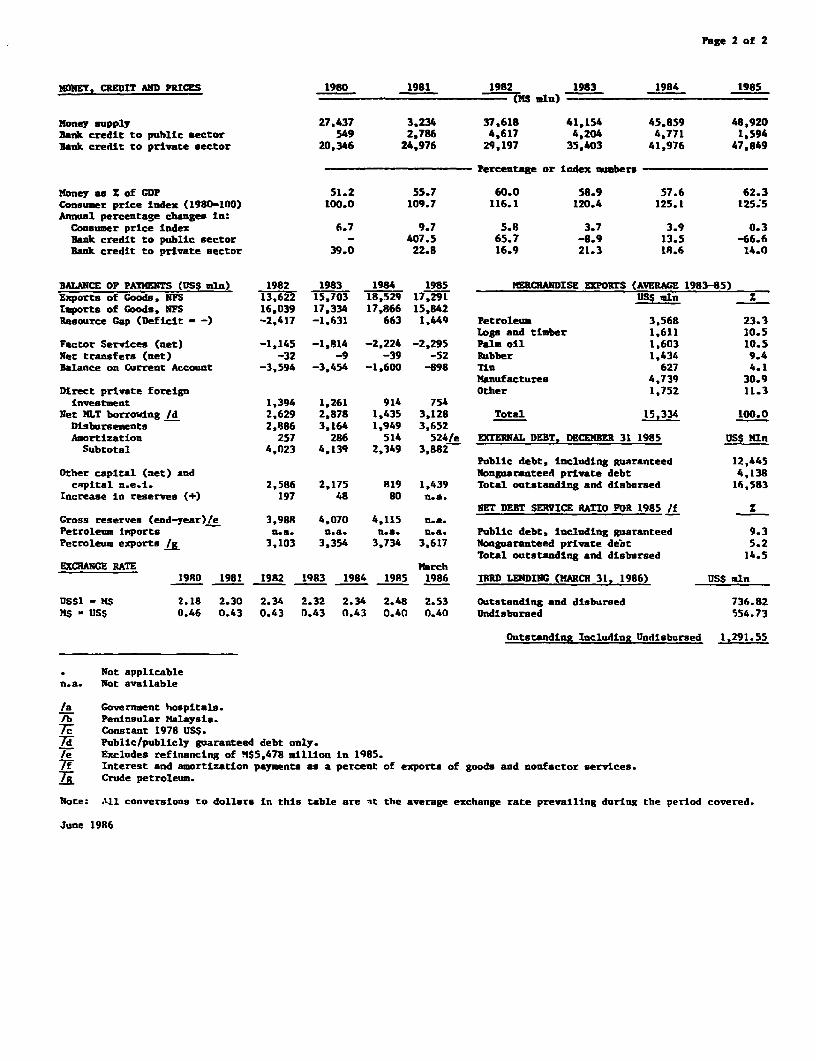
MDNEY, CREDIT AND PRICZS 1980 1981 1982 1983 1984 1985
money supply 27,437 3.234 37,618 41.154 45.859 48,920Bank credit to public sector 549 2,786 4,617 4,204 4,771 1,594Bank credit to private sector 20,346 24,976 29,197 35,403 41,976 47.849
Percentage or Index numbers -
Honey as 2 of GDP 51.2 55.7 60.0 58.9 57.6 62.3Consumer price index (1980-100) 100.0 109.7 116.1 120.4 125.1 125.5Annual percentaSe changes In:
Consumer price lndex 6.7 9.7 5.8 3.7 3.9 0.3Bank credit to public sector - 407.5 65.7 -8.9 13.5 -66.6Bank credit to private sector 39.0 22.8 16.9 21.3 18.6 14.0
BALANCE OP PAYMENTS (US$ aln) 1982 1983 1984 1985 MERCNANDISE EXPORTS (AVERAGE 1983-85)Exports of Goods, NFS 13.622 15.703 18.529 17,291 US$ mln I
Imports of Goods, NFS 16.039 17,334 17.866 15,842Resource Gap (Deficit - -) -2,417 -1.631 663 1.449 Petroleum 3.568 23.3
Logs and timber 1,611 10.5Factor Services (net) -1,145 -1.814 -2.224 -2.295 Palm oil 1,603 10.5Net transfers (net) -32 -9 -39 -52 Ruibber 1,434 9.4Balance on Current Account -3,594 -3,454 -1.600 -898 Tin 627 4.1
Manufactures 4,739 30.9Direct private foreign Other 1,752 11.3
investment 1,394 1,261 914 754Net HLT borrowing /d 2.629 2,878 1,435 3,128 Total 15,334 100.0Disbursements 2,886 3,164 1,949 3,652Amortization 257 286 514 524/e EXTERNAL DEBT, DECEMBER 31 1985 US$ Mln
Subtotal 4,023 4,139 2.349 3,882Public debt, including guaranteed 12,445
Other capital (net) and Nonguaranteed private debt 4,138capital n.e.i. 2,586 2,175 819 1,439 Total outstanding and disbursed 16,583
Increase in reserves (+) 197 48 80 n.a.NET DEBT SERVICE RATIO FOR 1985 /f 1
Gross reserves (end-year)/e 3,98R 4.070 4,115 n.a.Petroleum livports n.a. n.a. n.a. n.a. Public debt, including guaranteed 9.3Petroleun exports /g 3,103 3.354 3,734 3.617 Nonguaranteed private deot 5.2
ETotal outstanding and disbursed 14.5EXCHANGE RATE March
1980 1981 1982 1983 1984 1985 1986 IRRD LENDING (MARCH 31, 1986) USS nln
USSi - MS 2.18 2.30 2.34 2.32 2.34 2.48 2.53 Outstanding and disbursed 736.82MS - USS 0.46 0.43 0.43 0.43 0.43 0.40 0.40 Undisbursed 554.73
Outstanding Including Undisbursed 1,291.55
Not applicablen.a. Not available
/a Government hospitals./b Peninsular Malaysia.7W Constant 1978 US$.T7- Public/publicly guaranteed debt only./e Excludes refinancing of HS5,478 million in 1985.W( Interest and amortization payments as a percent of exports of goods and nonfactor services.2j Crude petroleum.
Note: All conversions to dollars in this table are aet the average exchange rate prevailing during the period covered.
June 1986
- iii -
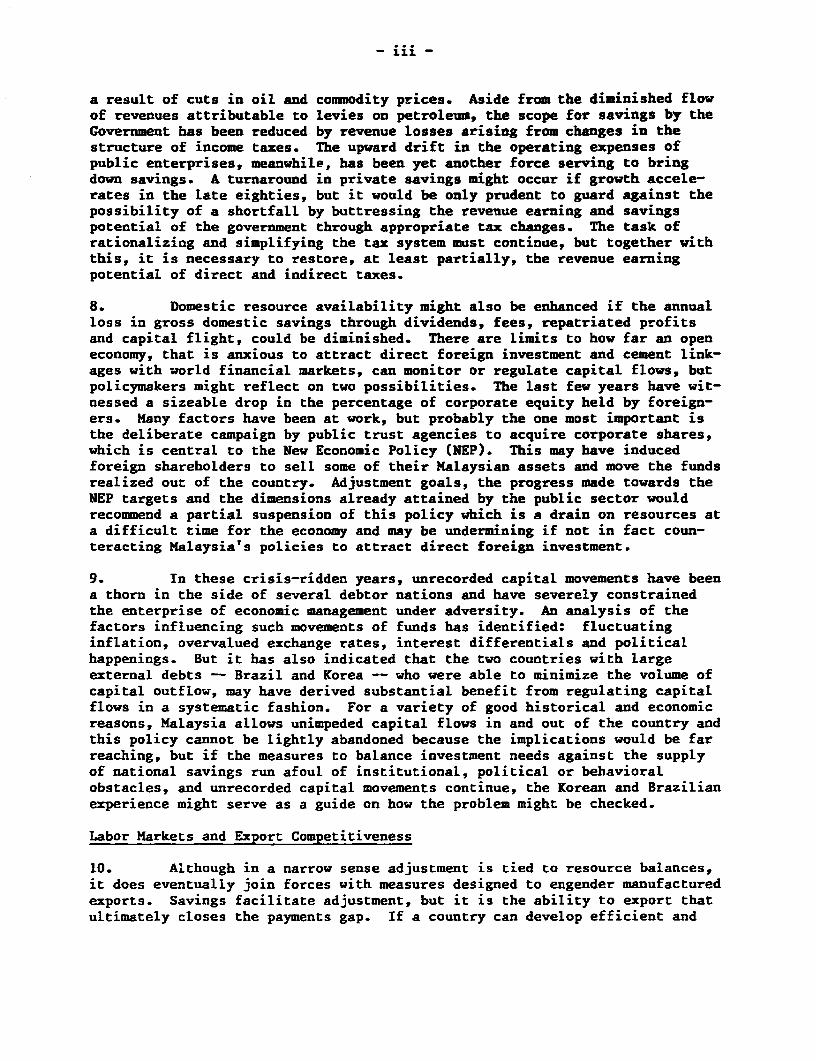
a result of cuts in oil and commodity prices. Aside from the diminished flowof revenues attributable to levies on petroleum, the scope for savings by theGovernment has been reduced by revenue losses arising from changes in thestructure of income taxes. The upward drift in the operating expenses ofpublic enterprises, meanwhile, has been yet another force serving to bringdown savings. A turnaround in private savings might occur if growth accele-rates in the late eighties, but it would be only prudent to guard against thepossibility of a shortfall by buttressing the revenue earning and savingspotential of the government through appropriate tax changes. The task ofrationalizing and simplifying the tax system must continue, but together withthis, it is necessary to restore, at least partially, the revenue earningpotential of direct and indirect taxes.
8. Domestic resource availability might also be enhanced if the annualloss in gross domestic savings through dividends, fees, repatriated profitsand capital flight, could be diminished. There are limits to how far an openeconomy, that is anxious to attract direct foreign investment and cement link-ages with world financial markets, can monitor or regulate capital flows, butpolicymakers might reflect on two possibilities. The last few years have wit-nessed a sizeable drop in the percentage of corporate equity held by foreign-ers. Many factors have been at work, but probably the one most important isthe deliberate campaign by public trust agencies to acquire corporate shares,which is central to the New Economic Policy (NEP). This may have inducedforeign shareholders to sell some of their Malaysian assets and move the fundsrealized out of the country. Adjustment goals, the progress made towards theNEP targets and the dimensions already attained by the public sector wouldrecoamend a partial suspension of this policy which is a drain on resources ata difficult time for the economy and may be undermining if not in fact coun-teracting Malaysia's policies to attract direct foreign investment.
9. In these crisis-ridden years, unrecorded capital movements have beena thorn in the side of several debtor nations and have severely constrainedthe enterprise of economic management under adversity. An analysis of thefactors influencing such movements of funds has identified: fluctuatinginflation, overvalued exchange rates, interest differentials and politicalhappenings. But it has also indicated that the two countries with largeexternal debts - Brazil and Korea -- who were able to minimize the volume ofcapital outflow, may have derived substantial benefit from regulating capitalflows in a systematic fashion. For a variety of good historical and economicreasons, Malaysia allows unimpeded capital flows in and out of the country andthis policy cannot be lightly abandoned because the implications would be farreaching, but if the measures to balance investment needs against the supplyof national savings run afoul of institutional, political or behavioralobstacles, and unrecorded capital movements continue, the Korean and Brazilianexperience might serve as a guide on how the problem might be checked.
Labor Markets and Export Competitiveness
10. A;though in a narrow sense adjustment is tied to resource balances,it does eventually join forces with measures designed to engender manufacturedexports. Savings facilitate adjustment, but it is the ability to export thatultimately closes the payments gap. If a country can develop efficient and
- iv -
competitive exportables., there need not be much tension between the goals ofadjustment and growth. It was stated earlier that the aggregate labor supplysituation in Malaysia is comfortable and wage pressures have been quiterestrained. On closer examination the picture is not without blemishes.
11. The production of tree crops seems headed towards tro-uble. Migra-tion to urban areas is denuding the rural labor force of its younger elements,those who will determine whether the sector thrives in the late nineties andbeyond. Spot labor shortages are being experienced by rubber, oil palm andcocoa estates, and it is evident that once the aging pool of workers retires,rubber production which is difficult to mechanize, may not have a long future.Recruiting young men to harvest oil palm is also becoming harder and longbefore the sector feels the edge of a land constraint, it might have beenbrought to an halt by labor scarcities. A faster increase in wages mightmoderate the exodus. However, the rubber industry is in no position to paymore for its labor, as falling international prices and profitability alreadyputs it at a disadvantage to oil palm cultivation. Wages in the oil palm andcocoa estates have kept pace with productivity and the earnings of harvestershave risen more quickly, but even these industries are hostages of interna-tional price movements and forced to take anxious note of their competitors'cost structures.
12. Agriculture's loss is industry's gain. The labor migration that iscondemning the primary sector to slow growth will ensure that industry bene-fits from elastic supplies. All through the seventies the increase in realwages could, more or less, be paid out of the increments in productivity, butin the early eighties, the impetus provided by public expenditures and highpublic wage scales, resulted in a marked acceleration in the growth of wagesin certain industria' subsectors. Where once Malaysian wages trailed those ofthe East Asian NICs by a wide margin, they have now moved much closer, eventhough, in terms of industrial activity and productivity, Malaysia is not onan equal footing with its industrializing neighbors. The suspicion thatrising costs may be eroding the competitiveness of the manufacturing sectorwas reinforced by the trend in real effective exchange rates. Flexibleexchange rate policies jpted in late 1984 have improved competitiveness andfalling commodity prices in early 1986, combined with the depreciation of theUS dollar, have contributed to this trend.
13. Wage movements have retreated to the trends followed in the seven-ties with the recent interim settlement for public employees allowing only a3.5% p.a. increase. Further, falling raw material prices and expenditures onconstruction and real estate will reduce pressures on relative prices thatbias the scales against tradables. But it may still be necessary to followexchange rate policies that (a) remove any cost disadvantages Malaysian treecrop producers and industrial exporters face vis-a-vis their East Asian compe-titors; and (b) ensure that this equilibrium is sustained by compensating fordifferences in productivity, wage rates and expenditure patterns betweenMalaysia and its neighbors.
Trade Patterns and Comparative Advantage
14. Labor and exchange rate issues bring us to the vezed questionconcerning the size and composition of future trade flows. For a number ofwell-known reasons the OECD countries may grow at a lover average rate in thefuture even after the benefits from lower oil prices are factored in.Combined with protectionism and changing consumer preferences, it suggeststhat export-oriented LDCs such as Malaysia should search for trade and indus-trial policies that might prevail in the face of slowly growing world demandfor traditional items. International trade in the sixties and seventiesappears to have favored the products of chemical, transport and engineeringindustries. The latter two have held their ground in the eighties. A surveyof the most successful exports from the East Asian NICs shows that electro-nics, electrical equipment, office machines, metal products and precisionequipment, have now joined the list. If we extrapolate this pattern into thefuture, it offers some very rough guidelines as to which industries might bestserve export goals in the medium term. Some of these products are tooresearch and capital intensive for a developing economy but certain types ofmachinery, metal products, petrochemicals and the supply of parts for electri-cal, electronic and automotive industries should be within the capabilities ofan industrial newcomer.
Direct Foreign Investment
15. Manufacturing industry in Malaysia has attracted much attention fromforeign investors. Firms producing semiconductors, conrumer electronics,telecommunications equipment, and garments in the Free Trade Zones (FTZs) orthe Licensed Manufacturing Warehouses (LHWs) that account for close to twothirds of manufactured exports, are either foreign-owned or have substantialforeign shareholding. But domestically oriented companies in lines such asfood, beverages, tobacco, automobiles, chemicals and rubber products have alsoserved as conduits for brand names, capital aud technology from abroad.Direct foreign investment (DFI) in all of these subsectors is likely to con-tinue but the available evidence suggests, at least tentatively, that neitherthe skills nor the funds brought in by foreign corporations will do much toadvance Malaysia's industrial ambitions or ease her entry into new exportmarkets.
16. In net terms, that is after subtracting profits and dividends repat-riated from annual DFI, Malaysia has incurred large deficits for well over adecade. Further, foreign companies that have established assembly type opera-tions either to derive cost advantages from using Malaysian labor or to uti-lize the country's textile quotas, have transferred few skills, limited tech-nology and done virtually nothing for industrial deepening. Malaysian firmsare in no better position to establish an independent presence in the inter-national markets for garments and electronic products today than they werefive years ago.
17. If trade barriers continue to hedge the flow of textiles and othercountries seem to offer superior wage bargains, spinning, weaving and garmentmaking operations in Malaysia will not be attracting much new foreign invest-ment. And should the electronics industry find it economically efficient and
- vi -
politically desirable to put up factories in the industrialized countries, thedevelopment of the electronics subsector in Southeast Asian economies mightalso stabilize.
18. A country seeking to deepen its industrial sector, increase manufac-turing value-added and widen its export possibilities cannot rely upon DFI todo the entire job. The objectives of multinational corporations and indus-trializing economies are not always congruent. One is searching for marketsand a means of reducing production costs through efficient sourcing andobtaining the maximum return from its financial options. The other wants todevelop its own independent industrial capacities and appropriate as many ofthe benefits in terms of profits, employment, technology and linkages as ispossible, benefits that the involvement of MNCs often transfers overseas.Malaysia must continue to try and attract DFI because of its effects onemployment generation, the need for foreign borrowing and on technology trans-fer, but increasingly, this will have to be complemented by domestic effortsoriented towards industrial deepening and the assimilation of technology.
Industrial Strategy
19. A declining role for overseas investors means that Malaysi: mustfind an industrial strategy that will harness domestic capital and skills, andgive a direction to the development of the manufacturing sector that is fruit-ful in terms of future exports. From the discussion of international tradingpatterns, the recent history of the manufacturing sector, the state of theincentives system and the projected supply of technical and engineeringskills, the report identifies a three pronged industrial sLrategy comprisedof: privatization that will stabilize, if not reverse, the tendency of thepublic sector to enlarge its industrial role and induce it to concentratecapital and managerial resources in areas where its presence can contributecritically to the development process; a rationalization of incentives andlicensing procedures to minimize distortions introduced by the wide dispersalof tax and tariff rates and regulations governing entry; and support for themanufacture of producer and intermediate goods that will lead to a deepeningof the industrial sector and provide the basis f-- future export growth. Thereport concludes that:
(a) although the average level of effective protection in Malaysia (23Zin 1982) compares favorably with that of other developing economies,the wide dispersion of rates and the frequent recourse to quotasincreases the likelihood of distortions and inefficiencies inresource use. A move towards greater uniformity in rates of effec-tive protection through the adjustment of tariffs at the extremeends, together with the substitution of tariffs for quotas couldadvance the cause of allocative efficiency without compromising thegrowth of current infant industries or the possibility of creatingnew ones.
(b) a diversified industrial system made up of many amaller sized firmswill not be possible without vigorous entrepreneurial activity. Oflate this has been conspicuously absent. It is widely believed inbusiness circles that the strict regulation of business investment
- vii -
by the Government as a part of the Industrial Coordination Act(ICA), might be to blame for the low level of private interest. InDecember 1985, the-Government responded by raising the industriallicensing threshold from N$250,000 to M$l million and therebystrongly reaffirmed its commitment to development led by privateindustry. This is a major step but it may not be enough to crackattitudes towards investment and risk that have hardened after tenyears under the ICA. A move to a M$5 million exemption limit whichwould remove four fifths of industrial projects from the purview ofthe licensing body merits consideration for the medium run. Nowthat a different situation prevails and industrial initiative ratherthan rent-earning primary products must underwrite economic advance,the rules governing the actions of the various players have to bedrafted afresh. Small changes in the architecture of the ICA, whichopen a few windows in the system while retaining much of the struc-ture, may not bring about the decisive shift in business psychologycalled for at this juncture. To the extent allowable by thenation's politics, the Government might wish to divorce the goals ofequity and enlarging the Bumiputra share of the national wealth fromthe pursuit of industrial development and rely upon fiscal and wel-fare policies to achieve the former. Malaysian businessmen arecompeting in an unusually tough envi.1 nment and the greater theburden of licensing, the larger are the social claims on theirearnings, and the smaller their flexibility in allocating resourcesand using available skills, the more likely it is that the race toindustrialize sweeping the eastern margins of the Pacific will bewon by countries where business endeavor is not too rigidly circum-scribed by social obligations.
(c) events in the world market argue against specializing in a narrowrange of products. Amongst the East Asian NICs, those with highlydiversified exports produced by energetic small- and mediumrsizedfirms have taken less of a bruising from protectionism and theswings in trade;
(d) in the early eighties, Malaysian industry has been moving intotransport, machinery, metal and chemical industries. Past trendsindicate that these subsectors, along with electronics, continue tohave high export potential. Excluding some areas in electronics andautomobile production, they also present a new entrant with rela-tively moderate technology, scale and marketing barriers. That isto say, the opportunities for finding and widening export nichesappear to be greater than elsewhere.
Industrial Micro Issues
20. Going beyond broad sectoral strategy, the Report looks at the stateof six manufacturing subsectors and assesses their prospects. They are: tex-tiles, electronics, rubber products, wooden furniture, electrical machineryand equipment, and farm machinery. With the exception of electronics, theproblems of these industries are not dissimilar, although each confronts quitedifferent learning curves and export possibilities. Electronics remain an
- viii -
enclave in the industrial system with a future that is tied to the productionstrategies of foreign firms. If the economics of assembly in offshore plat-forms turns sour, the enclave will shrink; there is only a small chance ofgrowth rivalling the expansion of the seventies and early eighties. Linkagesmay continue to sprout but they will remain sparse, as technology, brand namesand marketing ability are more serious entry barriers than in other subsec-tors.
21. Textiles, and the two resource based industries are likely to behamstrung by slowly growing world demand, and complications introduced bytrade restrictions (textiles) and low profitability (rubber tires). Themachinery subsectors are far better placed as regards both market trends andassimilating technology. But all five subsectors will need much help toloosen a number of constraints.
22. Technical, engineering and design skills are scarce throughout themanufacturing sector and their effects are felt in the mastering of tech-nology, innovation, quality of product, the ability to fully utilize equip-ment, and repair and rebuild machinery. Smaller firms that have limitedcollateral frequently cannot raise sufficient credit and are forced to make dowith old machines, which further detracts from the standards of quality andfinish. Companies that are without foreign partners show scant understandingof marketing techniques that are as important as innovativeness, design,quality and price competitiveness in achieving export success. Finally,Malaysia still has to build the network of channels that will provide manufac-turers the volume of detailed information necessary to detect a market openingand design a product that will fit the market's specifications.
23. Industrial policy must act upon many facets of industrial life. Itmust create the right atmosphere so that entrepreneurs will be stimulated toact; tariff, taxes and subsidies must be fashioned to effectively supportfirms populating the sector; it must ensure that education and training poli-cies generate an adequate supply of skills; R&D activities must be cateredfor. In addition, industrial policy must alleviate some of the micro-problemsthat the average firm encounters on a daily basis, problems associated withcredit sapply, the use of facilities, obtaining raw materials and intermediategoods, and gaining access to market information.
24. The report identifies four areas where active government supportwill be required:
(a) industrial credit, possibly through existing development banks or byway of commercial institutions;
(b) centers for design and research where higher-level skills could beimparted;
(c) vocational training, possibly supplemented by subsidized apprentice-ship programs to meet the needs of modern industry; and
(d) a system for gathering market intelligence from overseas.
- is -
The Agriculture Sector
25. In the simplest terms the future of Malaysian agriculture will bedecided by international market conditions and rural labor supply. Four sub-sectors are covered in the Report: rubber, oil palm, cocoa and rice. Theyall share certain features: in each there is an efficient wing where yieldsare among the highest in the world and the latest technologies are in use, aswell as a backward segment where the smallholders derive low returns from theuse of labor and land. All agricultural activities are threatened to varyingdegrees by the withdrawal of labor, but their fate is likely to be one ofgradual decline rather than a sudden precipitous drop in output.
26. Rubber production is the one area where the large-scale switch tooil palm planned by the estates could have far-reaching effects on productionin the medium run. Rubber has fallen from grace because at prevailing andanticipated prices its profitability does not compare favorably with that ofpalm oil and cocoa. Since the estates cannot readily increase their totalarea, they are cutting rubber trees so as to make room for oil palm. Mean-while, the government is attempting to enlarge the size and productivity ofthe smallholder hectarage by providing replanting subsidies, extension ser-vices and assistance in establishing mini estates. The conclusion of theReport is that with the prices of commodities subject to wide oscillations,and demand being somewhat difficult to predict, it is advisable to maintainefficient and diversified coummodity production. If the estates continuemoving out of rubber, output will diminish and technological change slacken asestates take the lead in planting new clones. Foreign producers will see thisas evidence of a retreat by the world's leading supplier and move to expandtheir own area. Once the rubber industry is left to the smallholders, it willbe of minor significance, and Malaysia's agricultural commodity basket will bereduced to one major export, palm oil and two minor ones, rubber and cocoa.
27. Palm oil's trade prospects are superior to those of rubber, competi-tion from other suppliers is weaker and even at the depressed prices prevail-ing in 1986, it gives higher returns. Malaysia's strategy should encourageestates not to reduce their rubber acreage below 1984 levels and urge small-holders currently growing rubber to plant oil palm instead. Efficient rubberproduction would be retained. Some of the poverty stricken rubber small-holders would be able to raise their earnings by shifting to a new tree crop.Palm oil output would expand and since the differential between smallholdersand estate yields is less for palm oil than that for rubber, the final produc-tion outcome would not depart too far from the scenario where the estatesconvert 70Z of their land to oil palm.
28. The collapse of palm oil prices from about US$730 per ton in 1984 toUS$290 per ton in the first quarter of 1986 should be warning enough as to therisks of increasing supplies at a rate which the market cannot digest and thehazards of specializing in a single comuodity.
The Rice Economy
29. After attempting for several years to meet over 80Z of its needsfrom the domestic production of rice, Malaysia is prepared to settle for amuch lower target. The decision was motivated by low international riceprices that are projected well into the future and the failure of costly pricesupport and subsidy programs to reverse the stagnation in output. Irrigatedareas in four major schemes that are the source of 60Z of the rice producedare productive enough and will flourish so long as no major changes are intro-duced in the incentive system. The problems are in the rainfed areas wheresmallholders achieve low yields and cannot earn enough from rice farming torise above the poverty line. Many farmers in these regions have sought supp-lementary off-farm occupations, and others have given up trying to make endsmeet and migrated to the cities.
30. Policymakers have three options: the high domestic resource costs ofrice production can be used as a justification for scaling down incentives, amove that would swell the numbers seeking urban jobs; over the medium term theGovernment could hold the line on incentives and accept the slow attrition ofthe farm economy; or it could pour funds into developing irrigation facilitiesand infrastructure in the rainfed areas in an attempt to bolster yields, thereturns from rice cultivation and the total production of rice in the country.Concerns arising from food security and uncertainty about the availability ofenough employment in the urban sector limit the palatability of the firstoption. Past experience with small-scale irrigation and the high opportunitycost of capital, suggest that such an approach will not stem migration andcould tie up resources in projects with low returns. On these grounds, thesecond option seems most appropriate for the balance of the eighties. It willprobably result in stagnant or slowly falling levels of production but willminimize dislocation in the rice economy and argue against any costly newexpenditures for developing rice land.
Projecting Growth
31. Malaysia possesses the resources to join the ranks of the NICs, butit will require a steadfast industrial strategy and the benefit of fair inter-national trading weather. The process will take time because new industriesrequire a minimum number of years to mature into seasoned exporters. If theFifth Plan is successful at quickening the tempo of manufacturing activity,the transition from primary producer to an emerging industrial nation would bewell advanced by the beginning of the nineties. The slump in oil and commo-dity prices by depressing public revenues and foreign exchange earnings will,in the short-term, magnify the adjustment problem. To minimize net brorowingsome growth may need to be sacrificed in order that the balance of paymentsdifficulties can be resolved more quickly. Our base scenario assumes there-fore that the economy will gather momentum gradually, with growth remaining inthe 1.52 - 2.5Z range during 1986-87 but picking up in the later years (4.0Z -4.5Z) as the economy moves towards a resource equilibrium by way of fiscalmeasures that restore government savings and the strong check on public expen-ditures proposed in the Fifth Plan. Over this entire period, agriculture andmineral production will contribute very moderately to the expansion of thenational product. The manufacturing sector and the continuing development of

- xi -
social overhead capital will be supplying most of the push, and manufacturedexports will determine whether or not trading goals are met. Should progressin the manufacturing sphere falter, it will be very hard to do justice eitherto the growth objective or that of adjustment.
CHAPTER I: TRENDS AND PROSPECTS
A Changed Environment
1.01 Small open economies lead a vulnerable existence on the interna-tional stage. Where larger countries can find a degree of seclusion from thebustle of the world market to pursue their own domestic designs, an economythe size of Malaysia cannot afford to neglect the activities beyond itsshores. The entire effort of development must be cued to signals arrivingfrom its major trading partners. Ever since the second round of oil priceadjustments in 1979, the tempo of economic activity worldwide has been weaker,in part because of technological, institutional and demand-related develop-ments in the industrial nations; partly also as a result of strains bred bythe rise of many new aspirants to the status of industrial maturity, who haveprofoundly affected the pattern of trade and capital flows.
1.02 The meager productivity gains emanating from the electronics revolu-tion suggest that the time may have passed when the advanced economies couldexpect substantial annual bonuses from the increased efficiency of resourceuse. Aa aging population and institutions canted towards distributive justiceand generous welfare benefits are likely to limit the scale of capital accumu-lation as well as the market directed flexibility in the pricing and the real-locating of resources. Finally, for many basic consumer goods and durables,saturated wants might dislodge the growth in demand from past trends. All ofthese presage a smaller appetite in the markets of the industrial countriesfor the goods produced in the developing world. International trade, theforce behind the widespread surge in postwar living standards, could increasemore fitfully under the weight of restrictions sparked by political concernsand the fears of deindustrialization. With trade and growth slowing, capitalflows that have been so consequential in putting the surplus savings of theadvanced economies behind the industrial ambitions of the LDCs, would alsobegin to falter, especially if debt crises continue to fan the apprehensionsof bankers.
1.03 From the standpoint of the developing market economies, such asMalaysia, the earlier industrial strategy which assumed relatively unimpededaccess to growing markets in the affluent West, might have to be refashionedin important ways. The path revealed by comparative advantage and exportopportunities exploited in the past may have to be reconsidered to allow forthe political limits to the expansion of trade in products favored by newdevelopers, the likely persistence of international capital scarcities, andthe spreading influence of multinational companies (MNCs) in the spheres ofinvestment, trade, technology transfer and product development. Increasingintracompany trade and market sharing by major international industries aresome of the more significant features of the current economic environment. Sofar, at least, policymakers searching for a way around the multiplying com-plexities have leaned upon the themes of trade liberalization, comparativeadvantage and distortion minimizing, policy and price reforms. The challengeis ensuring the fruition of industrial initiatives begun in the recent pastand devising policies that will deliver economic results in the face of muchgreater odds.
- 2-
Malaysia's Economy: Recent Developments
1.04 Five yeers ago it became clear that Malaysia would have to concen-trate on building an industrial system using the resources transferred ou ofthe plantation sector and revenues earned through petroleum imports. With thevitality ebbing from mining and parts of the plantation economy because ofrising costs and weak demand, concentrating investible resources on manufac-turing development using the example of the East Asian NICs, was the mostattractive route. But export led growth must now be managed in a far harsherenvironment and while it might still be the strategy promising the largestrewards, the risks have increased and small countries with limited bargainingpower are very much at the mercy of major trading partners and large multina-tional producers. Over the course of the Fifth Plan period (1986-90) a numberof decisions will have to be taken which will determine the long-run sectoralcomposition and potentialities of the Malaysian economy. It is important thatthese be fully informed not just by the experience of the NICs in the seven-ties and early eighties, but also by the knowledge of how international econo-mic relations are likely to be shaped.
1.05 The speed and direction of Malaysian economic progress in theeighties reflects the interplay of certain policy decisions with internationalmarket developments. Rising commodity prices in 1975-77 and the tripling ofoil prices in 1979-80 provided an infusion of rental earnings which enrichedthe economy and elevated the country's credit standing. Its attractiveness asa base for assembly-type textile and electronics industries, stimulated a sub-stantial volume of foreign investment. MNCs looking for a blend of politicalstability, cheap labor, adequate infrastructure, unfilled export quotas andfiscal incentives, flocked to Malaysia. The factories they helped to estab-lish within and outside Free Trade Zones (FTZs), allowed Malaysia to capital-ize on the enormous growth in the market for semiconductors during 1980-84 aswell as the steady expansion in the demand for cheaper Asian-made garments inthe USA and to a lesser extent the EEC. Intertwined with these was the Gov-ernment's decision to move at all possible speed towards modernizing infra-structure and creating the base for future industrial advance through invest-ments in automobiles, machinery, petrochemicals, ferrous metals and cement. Asecond key decision, motivated by Malaysia's comfortable debt service ratio,the expectation of low or negative real interest rates on foreign loans (aswas the case after the first oil shock) and the desire to cushion the economyagainst externally transmitted recession, was the willingness to borrow heav-ily to finance domestic, primarily public, investment. A third move relatedto the public sector's development push, was the parceling of responsibilitiesto nonfinancial public enterprises (NFPEs) created during 1976-81 without atthe same time erecting a monitoring and control apparatus equal to the task ofsupervising the activities of many agencies and keeping track of the totalfinancial implications of dispersed investment decisions.
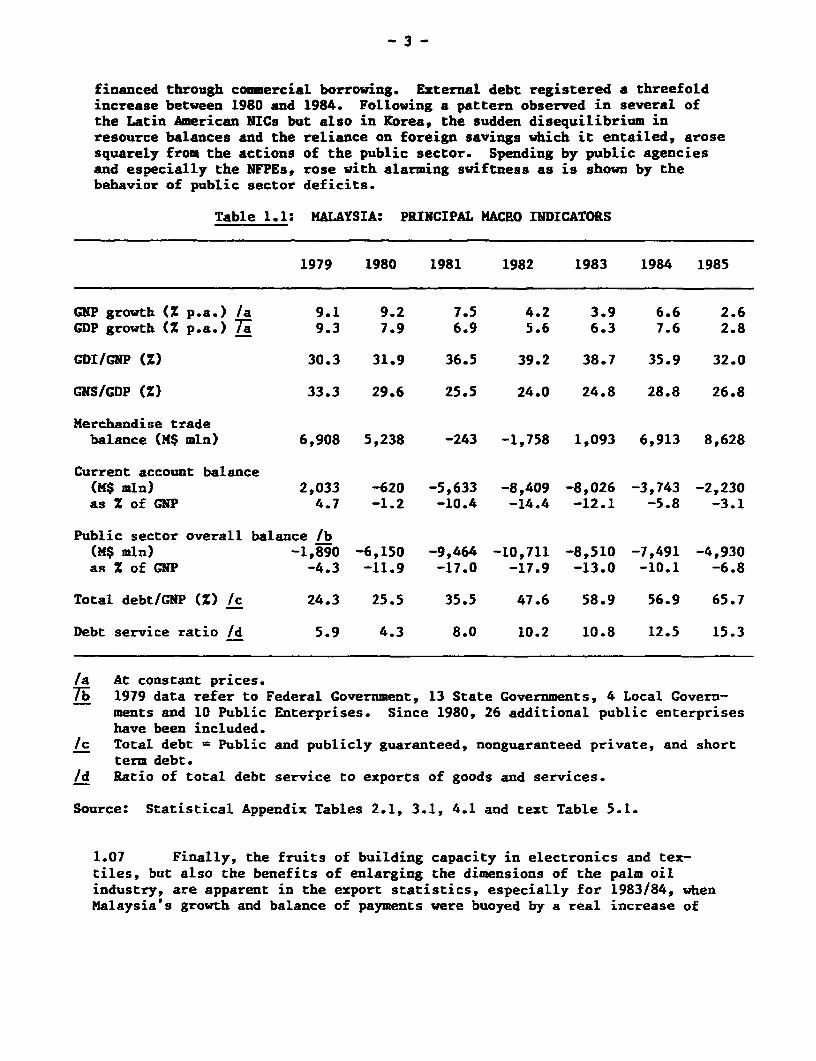
1.06 The effects of these are visible in the macro indicators trackingthe economy's movements in the first half of the eighties (see Table 1.1).First, growth, though lower than the average for the seventies (7.7%) wasfairly stable because of the strong impetus from capital spending. Second,investment outlays rose far above the country's substantial gross nationalsavings, resulting in very large current account deficits that had then to be
- 3 -
financed through commercial borrowing. External debt registered a threefoldincrease between 1980 and 1984. Following a pattern observed in several ofthe Latin American NICs but also in Korea, the sudden disequilibrium inresource balances and the reliance on foreign savings which it entailed, arosesquarely from the actions of the public sector. Spending by public agenciesand especially the NFPEs, rose with alarming swiftness as is shown by thebehavior of public sector deficits.
Table 1.1: MALAYSIA: PRINCIPAL MACRO INDICATORS
1979 1980 1981 1982 1983 1984 1985
GNP growth (Z p.a.) /a 9.1 9.2 7.5 4.2 3.9 6.6 2.6GDP growth (Z p.a.) 7T 9.3 7.9 6.9 5.6 6.3 7.6 2.8
GDI/GNP (Z) 30.3 31.9 36.5 39.2 38.7 35.9 32.0
GNS/GDP (Z) 33.3 29.6 25.5 24.0 24.8 28.8 26.8
Merchandise tradebalance (M$ mln) 6,908 5,238 -243 -1,758 1,093 6,913 8,628
Current account balance(M$ mlin) 2,033 -620 -5,633 -8,409 -8,026 -3,743 -2,230as Z of GNP 4.7 -1.2 -10.4 -14.4 -12.1 -5.8 -3.1
Public sector overall balance /b(M$ mln) -1,890 -6,150 -9,464 -10,711 -8,510 -7,491 -4,930as Z of GNP -4.3 -11.9 -17.0 -17.9 -13.0 -10.1 -6.8
Total debt/GYP (Z) /c 24.3 25.5 35.5 47.6 58.9 56.9 65.7
Debt service ratio /d 5.9 4.3 8.0 10.2 10.8 12.5 15.3
la At constant prices.T7 1979 data refer to Federal Government, 13 State Governments, 4 Local Govern-
ments and 10 Public Enterprises. Since 1980, 26 additional public enterpriseshave been included.
/c Total debt = Public and publicly guaranteed, nonguaranteed private, and shortterm debt.
/d Ratio of total debt service to exports of goods and services.
Source: Statistical Appendix Tables 2.1, 3.1, 4.1 and text Table 5.1.
1.07 Finally, the fruits of building capacity in electronics and tex-tiles, but also the benefits of enlarging the dimensions of the palm oilindustry, are apparent in the export statistics, especially for 1983/84, whenMalaysia's growth and balance of payments were buoyed by a real increase of
- 4 -
14X in exports of goods and nonfactor services. But the economic gains thatso heartened policymakers in 1984 also stemmed from the Government regainingits grip over the spending of independent agencies, which served to narrow thepublic deficit. To ensure that spending by the NFPEs remains harnessed to theobjective of reducing the public sector's deficit, monitoring committees havebeen established in both the Treasury and the Economic Planning Unit (EPU).Backing them up with more detailed surveillance of planned expenditures andaccounts is a newly created monitoring and control unit (CICU).
1.08 The economy entered 1985 in a spirit of considerable optimism butevents during the course of the year belied the earlier expectations. Growthin the US slipped to little over 2% and as this was not counterbalanced bystronger performance in other large industrial nations, world trade quicklyfelt the chill and increased by only 3% as compared to the 9% rate registeredin 1984. This was damaging for Malaysia's manufactured exports and sales ofboth textiles and electronics, the two principal items declined. It may alsohave brought added pressure to bear on the markets for petroleum, palm oil andtin, three of Malaysia's largest commodity exports, that were already feelingthe effects of oversupply. Petroleum prices began to retreat in mid-1985,followed shortly thereafter by palm oil and the market for tin collapsed inlate October. In 1984, Malaysia exported 343,800 bpd of crude at an averageprice per barrel of US$29.87. Sales rose in 1985 to about 354,500 bpd but theweighted price was US$27.50 per barrel. Palm oil did substantially worse.Export earnings from palm oil and products (stearin, olein, kernel oil andcake) dropped by 1lZ from M$5.71 billion in 1984 to M$5.09 billion in 1985.Since tin accounts for less than 3Z of Malaysia's merchandise exports, thesuspension of trading on the London Metal Exchange on October 24 and thecollapse of the price barely dented overall export earnings but the rippleeffects of mine closures and loss of employment were damaging on a regionalscale, the economy of Perak being especially hard hit.
1.09 Overall the deterioration in the terms of trade during 1985 amountedto 5.6%. Combined with the reduction in certain commodity and manufacturedexports as well as the decline in private investment, this resulted in theworst economic performance in a decade. Higher production of petroleum, palmoil and timber helped raise the real GDP by 2.8%, but in nominal terms thedomestic product was 2.1Z less than in 1984. As the economy generated fewerjobs, the unemployment rate climbed to 7.6%. But a slowing economy and fall-ing commodity prices had certain beneficial consequences as well: inflationwas a negligible 0.3% (CPI); and a larger merchandise surplus served to narrowthe current account deficit to 3.3% of GDP. Hence, medium- and long-term(MLT) debt grew 6.9Z to US$16,583 million as against US$15,513 million in 1984.
1.10 Starting in 1986, Malaysia will be charting an economic course thatwill be defined in the Fifth Five Year Plan. For sound political and economicreasons, the Government would like to set its sights as high as possible.During the Second and Third Plan periods, growth rates of GNP averaged 7.1%and 8.6%, respectively. In the first half of the 1980s, growth slowed to 5%p.a. and it appears from the trends projected in the markets for Malaysia'scommodity exports that traditional sectors will need to be strongly abetted byothers sources of growth if the country is to sustain an acceptable pace ofeconomic advance.
-5-
1.11 Lessons learned over the course of the Fourth Plan period have beenchastening. External demand is undependable and traditional exports of commo-dities as well as light manufactures are having to struggle in buyers' marketsor scale ever higher nontariff barriers. At the same time, an aggressiveattempt at generating growth through public investment in both infjastructureand industry may have been a costly way of propelling the economy.- Averageinvestment levels exceeding 36X (1981-83) of CUP added little more than 5%p.a. to the national product but saddled the country with a sizeable debt.
1.12 If growth is to move hand in hand with external adjustment, asmaller quantum of investment must be made to yield larger returns and more ofthe domestic value-added must find its way into exports. What this implies,first of all, is greater factor productivity. Second, Malaysia must enlargethe value-added in important export categories, for example, light manufac-tures, machinery, metal and wood products. Many other changes will also berequired, calling for a very different constellation of policies and a tiltingof initiatives away from the public and towards the private sector. Perhapsthe most effective way of tracing the feasible economic perimeter is to assessthe economy's supply potential from the macro plane and again at the subsec-toral level. Then to juxtapose this with the demand possibilities that we seegerminating internationally in the world of the late eighties.
Sources of Growth: Demand Factors
1.13 An economy's sinews are moved by demand. How rapidly it advancesultimately rests on the strength of demand from expenditures on consumption,investment and exports. Except in certain stages of growth, it is consumptionthat leads the way with capital spending some way behind and trade often adistant third. In Malaysia, the pull of consumption rose significantly fromthe first half of the seventies to the second, because of a major surge inprivate outlays (see Table 1.2). As foreign purchases of import intensiveconsumption and development expenditures outpaced the growth of exports, theexternal account turned from being a small net contributor to growth to asignificant drag on the economy's expansion. In addition, Malaysia's manufac-tured exports that began rising in the late seventies, were based on the pro-cessing of imported intermediate goods. The weight of both private and publicinvestment was greater in the second period when Malaysia, benefiting from theprimary commodity boom and heightened world business activity, was racingahead of the Third Plan's growth targets. A decisive shift in sectoral con-tributions is evident after 1980, with changed external circumstances anddevelopment policies. Most significant was the reduced pull by private con-sumption. Larger public consumption spending, some of it on administration,the rest on welfare and subsidies, compensated only marginally for the halvingof the private sector's contribution to GDP growth. What sustained growth wasthe vast increase in public investment and to a lesser extent private capitaloutlay. As the net demand impetus from trade remained negative and at aboutthe same level as in the late seventies, GDP grew more slowly but it certainly
1/ See Malaysia: Development Strategies and Their Financing, World Bank,Report No. 5560-MA, September 1985.
-6-
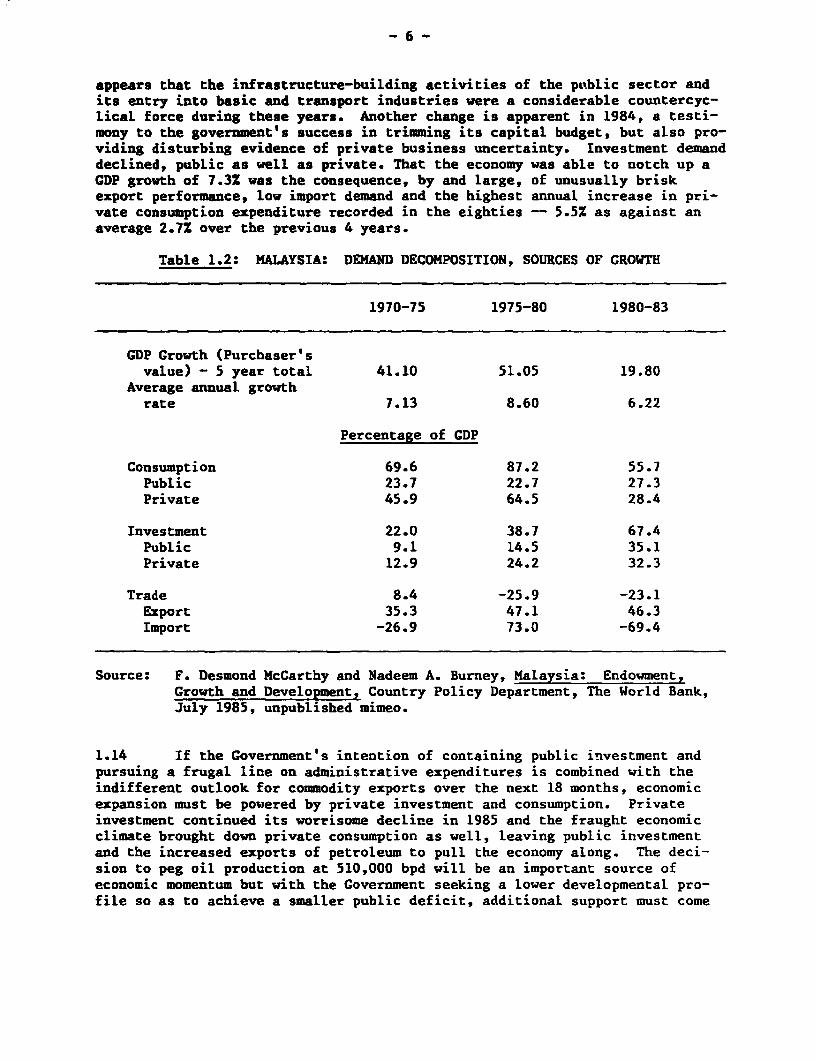
appears that the infrastructure-building activities of the public sector andits entry into basic and transport industries were a considerable countercyc-lical force during these years. Another change is apparent in 1984, a testi-mony to the government's success in trimming its capital budget, but also pro-viding disturbing evidence of private business uncertainty. Investment demanddeclined, public as well as private. That the economy was able to notch up aGDP growth of 7.3% was the consequence, by and large, of unusually briskexport performance, low import demand and the highest annual increase in pri-vate consumption expenditure recorded in the eighties -- 5.5% as against anaverage 2.7% over the previous 4 years.
Table 1.2: MALAYSIA: DEMAND DECOMPOSITION, SOURCES OF GROWTH
1970-75 1975-80 1980-83
GDP Growth (Purchaser'svalue) - 5 year total 41.10 51.05 19.80
Average annual growthrate 7.13 8.60 6.22
Percentage of GDP
Consumption 69.6 87.2 55.7Public 23.7 22.7 27.3Private 45.9 64.5 28.4
Investment 22.0 38.7 67.4Public 9.1 14.5 35.1Private 12.9 24.2 32.3
Trade 8.4 -25.9 -23.1Export 35.3 47.1 46.3Import -26.9 73.0 -69.4
Source: F. Desmond McCarthy and Nadeem A. Burney, Malaysia: Endowment,Growth and Development, Country Policy Department, The World Bank,July 1985, unpublished mimeo.
1.14 If the Government's intention of containing public investment andpursuing a frugal line on administrative expenditures is combined with theindifferent outlook for commodity exports over the next 18 months, economicexpansion must be powered by private investment and consumption. Privateinvestment continued its worrisome decline in 1985 and the fraught economicclimate brought down private consumption as well, leaving public investmentand the increased exports of petroleum to pull the economy along. The deci-sion to peg oil production at 510,000 bpd will be an important source ofeconomic momentum but with the Government seeking a lower developmental pro-file so as to achieve a smaller public deficit, additional support must come
- 7 -
from a revival of private investment. The Government has introduced a numberof measures, which are discussed later in the report, to spur business activ-ity. Entrepreneurial response to these recent moves will determine not justthe scale of economic gains over the short run but also the longer-term pros-pects of the economy that rest very much on the extent and efficiency ofdiversification into tradable manufacturing and tertiary activities. Even ifinternational business activity recovers under the influence of reduced oilprices and inflation rates, the next 12 to 18 months are freighted with muchuncertainty for the Malaysian economy. There has been a significant narrowingof the bases for growth, the reflationary potential of the public sector isseverely constrained, and it is private investment initiatives in what areadmittedly difficult times that will spell the difference between stagnationand a growth rate of 2.5-3.5% which is consonant with continued adjustment.
Sources of Growth: Sectoral Contribution
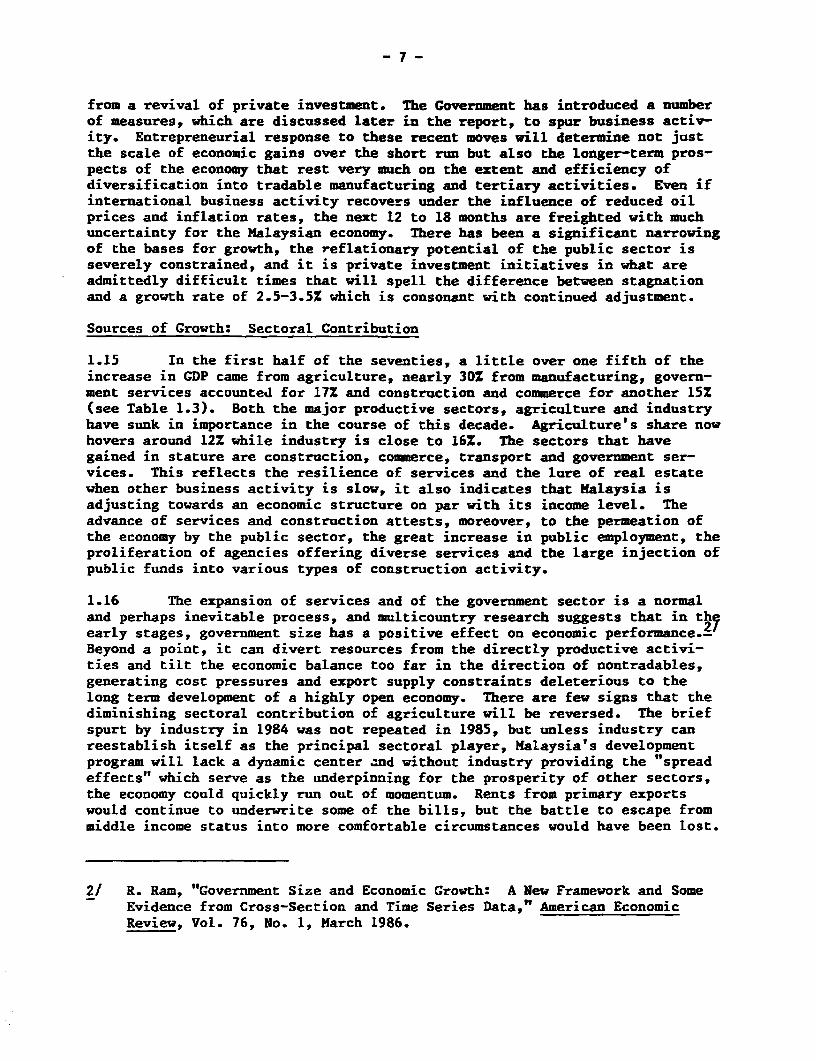
1.15 In the first half of the seventies, a little over one fifth of theincrease in GDP came from agriculture, nearly 30Z from manufacturing, govern-ment services accounted for 17% and construction and commerce for another 15%(see Table 1.3). Both the major productive sectors, agriculture and industryhave sunk in importance in the course of this decade. Agriculture's share nowhovers around 12% while industry is close to 16%. The sectors that havegained in stature are construction, commerce, transport and government ser-vices. This reflects the resilience of services and the lure of real estatewhen other business activity is slow, it also indicates that Malaysia isadjusting towards an economic structure on par with its income level. Theadvance of services and construction attests, moreover, to the permeation ofthe economy by the public sector, the great increase in public employment, theproliferation of agencies offering diverse services and the large injection ofpublic funds into various types of construction activity.
1.16 The expansion of services and of the government sector is a normaland perhaps inevitable process, and multicountry research suggests that in thearly stages, government size has a positive effect on economic performance.2Beyond a point, it can divert resources from the directly productive activi-ties and tilt the economic balance too far in the direction of nontradables,generating cost pressures and export supply constraints deleterious to thelong term development of a highly open economy. There are few signs that thediminishing sectoral contribution of agriculture will be reversed. The briefspurt by industry in 1984 was not repeated in 1985, but unless industry canreestablish itself as the principal sectoral player, Malaysia's developmentprogram will lack a dynamic center and without industry providing the "spreadeffects" which serve as the underpinning for the prosperity of other sectors,the economy could quickly run out of momentum. Rents from primary exportswould continue to underwrite some of the bills, but the battle to escape frommiddle income status into more comfortable circumstances would have been lost.
2/ R. Ram, "'Government Size and Economic Growth: A New Framework and SomeEvidence from Cross-Section and Time Series Data," American EconomicReview, Vol. 76, No. 1, March 1986.
-8-
Table 1.3: MALAYSIA: SECTORAL DECOMPOSITION, SOURCES OF GROWTH(as S of GDP) /a
1970-75 1975-80 1980-83
Agriculture 22.1 16.4 12.8Agriculture & livestock 12.2 10.5 7.2Forestry 9.8 3.4 6.2Fishing 0.1 2.5 -0.6
Mining 2.2 4.3 4.4Manufacturing 29.6 22.8 15.1Electricity, gas & water 2.2 2.7 3.5Construction 3.4 6.3 9.2Commerce 10.9 14.8 14.0Wholesale & retail trade 11.0 13.6 11.8Restaurants & hotels 0.1 1.2 2.2
Transportation & communication 6.3 8.2 12.4Finance & real estate 7.7 6.5 9.0Finance & insurance 5.2 5.0 7.5Real estate 2.4 1.5 1.5
Government service 16.7 11.2 19.8Household, social & community
services 2.3 2.7 1.8
Residual (Import duty, etc.) 3.4 4.1 -2.0
Total 100.0 100.0 100.0
/a Average contribution over the corresponding subperiod.
Source: F. Desmond McCarthy and Nadeem A. Burney, Malaysia: Endowment,Growth and Development, op cit.
Decomposition of Growth
1.17 Another angle from which to view the recent economic performance ofMalaysia is to explain the movements in GDP through the changes in the use ofcapital and labor plus the intangible contributions from education, technol-ogy, scale economies and better resource allocation, what economists amalga-mate into a category labeled as the residual. Studies of the US and the Euro-pean countries covering the period 1950 to 1962 and Japan from 1953 to 1961indicate that factor inputs were responsible for about a third of the expan-sion in Western Europe and Japan and closer to 60Z in the US. The balancecame from the residual, which is to say that improved skills, knowledge andresource utilization provided no less than a third, and in the case of Europealmost two thirds of the growth. One interpretation is that the efficiencyand dynamism of a system are measured by the size of the residual and that the
-9-
maturity of an industrial economy rspresented by its technological orienta-tion, its reserves of human capital and its sophisticated market mechanismshould be captured by increases in the residual.
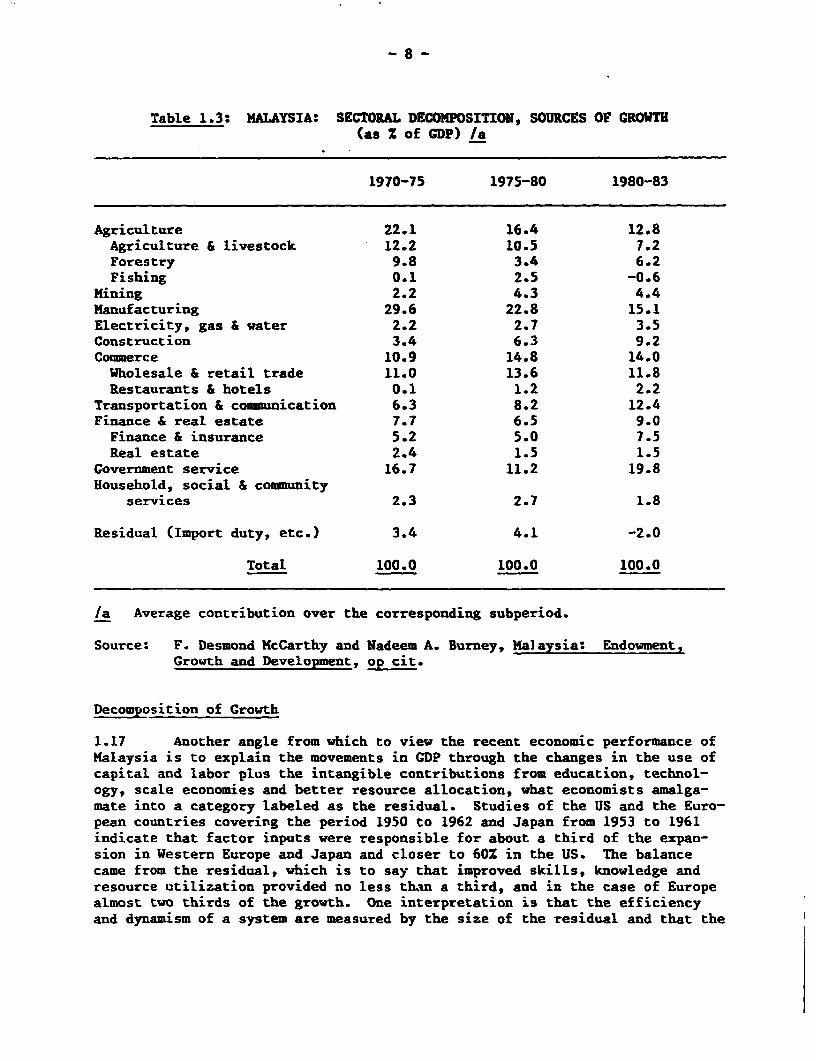
1.18 To apply the procedure devised by Denison 31 in its refined form, isimpossible because detailed statistics on investment, education, plant sizesand a host of other variables, are not routinely gathered in Malaysia. Asimpler procedure which crystallizes usable approximations but does not sepa-rate the residual into its component parts, suggests that factor inputs haveloomed very large in the growth equation (see Table 1.4). For the past oneand half decades, 12-14X of the growth has arisen from the increase in thelabor force. But it is capital that has been the driving force, its shareswelling from 58% to 1081 between 1970-75 and 1980-83. As the influence ofcapital has burgeoned, the residual has fallen away from 28% in the first halfof the seventies to a negative 21Z in the early eighties.
Table 1.4: MALAYSIA: FACTOR DECOMPOSITION, SOURCES OF GROWTH(as X of GDP growth) /a
1970-75 1975-80 1980-83
Factor input 72.0 86.3 121.1Labor 13.6 11.7 13.4Capital 58.4 74.6 107.7Public 24.4 36.6 50.4Private 34.0 38.0 57.3
Residual 28.0 13.7 -21.1
Total 100.0 100.0 100.0
/a Average contributions ove- the corresponding subperiods.
Source: F. Desmond McCarthy and Nadeem A. Burney, Malaysia: Endowment,Growth and Development, op cit.
While these estimates must be treated with all due caution, they are notimplausible and tally very broadly with the story that is told by other eco-nomic indicators. For over eight years, the annual dose of investment hasbeen very large. It was 242 of GNP in 1975 and nearly 37% in 1983. This hasstrained the economy's absorptive capacity and outstripped its ability to findthe supporting technical and managerial skills or for that matter, markets, to
3/ E.F. Denison, Why Growth Rates Differ, Brookings Institution, Washington,D.C., 1967; and E.F. Denison and W.K. Chung, How Japan's Economy Grew,Brookings Institution, 1976.
- 10 -
do justice to the services and goods for which production capacity exists. Sorapidly has the capital base been expanded that new industries have been slowto move up their learning curves and few have made a start at serious appliedresearch or process innovation directly affecting the residual. One implica-tion is that the residual could contribute importantly to future growth, espe-cially since significant additions to the stock of skilled manpower can beexpected in the next few years. A smaller increase in the stock of capitalwould not, therefore, dampen GDP growth, on the contrary it might provide forsorely needed rationalization. A second and less reassuring message can alsobe drawn. If a sizeable proportion of the capital accumulated is in the formof capital intensive projects with very long payback periods or has gone intomanufacturing operations which will have to battle long and hard to find mar-kets for their products, efficiency and learning related gains will accruevery 1,owly. In this connection, the experience of Singapore may be instruc-tive.- Although the growth of manufacturing industries between 1970 and 1979was very rapid, it can be asc:ibed almost entirely to the increase in inputs-- total factor productivity contributed less than than 10Z to the change inproduction. Three reasons have been advanced to explain this phenomenon whichdiffers markedly from total factor productivity trends in Korea and other EastAsian NICs: because Singapore's industry is dominated by foreign firms,little effort has gone into adapting imported technology to the local environ-ment and there has been less room for the learning which is responsible forminor innovations; until recently the emphasis was on labor-intensive assemblyoperations and as Singapore wages were fairly stable in the latter half of theseventies, incentives for raising labor productivity were diluted; andSingapore's financial and commercial expertise does not find an echo in theindustrial sector. As a result, the entrepreneurial efforts at enhancingproductivity have been weak or nonexistent. Each of these causative factorsstraddles the Malaysian experience and should be taken note of in the framingof industrial policies.
1.19 Each of these glances into the past is suggestive i;. its own way.All of them reveal an economy that showed great promise in the seventies,weathered the early eighties with far fewer scars than most others andthroughout this period, has been near the forefront in its propensity toinvest. However, unlike the East Asian NICs who have derived rich export andgrowth dividends from accumulated capital, Malaysia has attained the status ofa middle income country but fallen well short of becoming an industrialnation. It is worth noting why this has transpired, and the reasons for thesurprisingly evanescent nature of the recovery in 1984, as they are the step-ping stones towards an understanding of Malaysia's strategic options.
4/ Y. Tsao, "Growth Without Productivity, Singapore Manufacturing in the1970s," Journal of Development E:onomics, Vol. 18, 1985, pp. 25-38.
- 11 -
Approach to Industrialization
1.20 Lacking natural resources, tbe investment and energies of the EastAsian NICs were directed more forcefully and single-mindedly towards indus-trial advancement. Malaysia put much money into petroleum, palm oil, rubber,tin, timber and cocoa, which has paid handsomely but detracted from the diffi-cult task of laying a secure industrial foundation. Second, from the verystart the public sector has been active in providing infrastructure and ser-vices. As it had access to the earnings from primary production channeledthrough the Government, an increasing amount of investment has found its wayinto office construction, housing, transport facilities and overhead capitalfor agriculture. Because the attention of planners and indigenous businessmenalike was drawn towards the unfolding opportunities in the primary productsector and construction, certain critical aspects of manufacturing develop-ment, relating to technology transfer, securing backward and forward linkages,conscious efforts at grooming import substituting industries for eventualentry into the export market, were given insufficient attention. Exportindustries were left largely in foreign hands instead of becoming a preserveof Malaysian entrepreneurs and the focal center of the economy. In Korea,Hong Kong, and elsewhere in East Asia, the entry of MNCs was followed, after aspell, by competing local investments and the aggressive expansion of inputsuppliers. In Malaysia, the foreign owned assembly operations have long beenseen as providers of employment, some training and a small suite of linkages.
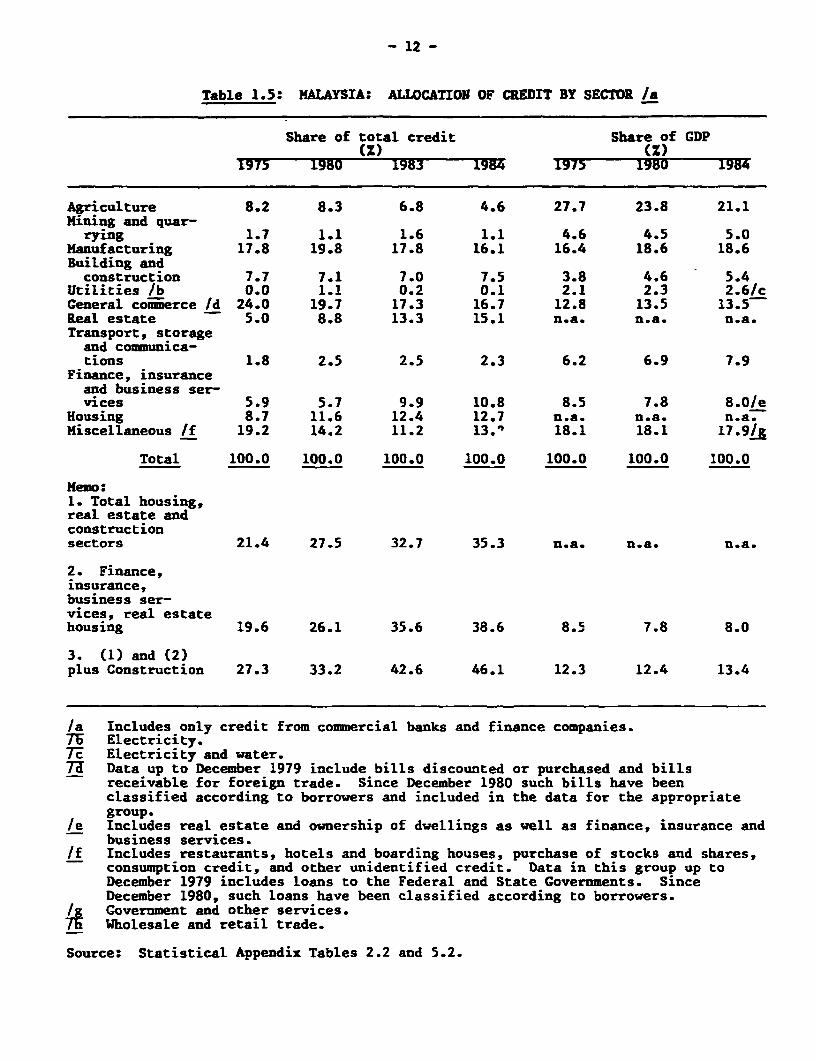
1.21 The narrow dimensions of industrial development were very evident in1984, the best year enjoyed by the economy in the eighties, but one from whichthe economy derived scant long term gains. Manufactured exports, especiallytextiles and electronics which constitute two thirds of the total, rose by 27%pushing the sector's growth to 11%, more than twice the average for thepreceding 3 years. Palm oil production climbed 23X over 1983 and overseassales of crude and processed palm oil were 50Z higher than the year before.But it was housing, real estate and construction that continued to occupy thecenter of the economic stage. Over 35Z of all bank and finance company creditand 44% of total loans were channeled into these subsectors, a continuation ofa trend visible for several years (see Table 1.5). This was significant for anumber of reasons. First, the inclinations of the banking community, lowerconstruction prices, housing programs and the preoccupation of the NFPEs withsuitable office facilities, all continued to draw funds into these activitieseven thoulh signs of an impending glut are widespread. In Kuala Lumpur836,000 m of office space lie unused, rents have dropped precipitously andworse will follow as 65 buildings under construction will add 1.1 million m2
to the rental market by 1987.
- 12 -
Table 1.5: MALAYSIA: ALLOCATION OF CREDIT BY SECTOR /a
Share of total credit Share of GDP(Z) (Z)
1975 1980 1983 1984 1975 1980 1984
Agriculture 8.2 8.3 6.8 4.6 27.7 23.8 21.1Mining and quar-rying 1.7 1.1 1.6 1.1 4.6 4.5 5.0
Manufacturing 17.8 19.8 17.8 16.1 16.4 18.6 18.6Building andconstruction 7.7 7.1 7.0 7.5 3.8 4.6 5.4
Utilities /b 0.0 1.1 0.2 0.1 2.1 2.3 2.6/cGeneral commerce /d 24.0 19.7 17.3 16.7 12.8 13.5 13.5Real estate - 5.0 8.8 13.3 15.1 n.a. n.a. n.a.Transport, storageand commuunica-tions 1.8 2.5 2.5 2.3 6.2 6.9 7.9
Finance, insuranceand business ser-vices 5.9 5.7 9.9 10.8 8.5 7.8 8.0/e
Housing 8.7 11.6 12.4 12.7 n.a. n.a. n.a.Miscellaneous /f 19.2 14.2 11.2 13." 18.1 18.1 17.9/&
Total 100.0 100.0 100.0 100.0 100.0 100.0 100.0
Memo:1. Total housing,real estate andconstructionsectors 21.4 27.5 32.7 35.3 n.a. n.a. n.a.
2. Finance,insurance,business ser-vices, real estatehousing 19.6 26.1 35.6 38.6 8.5 7.8 8.0
3. (1) and (2)plus Construction 27.3 33.2 42.6 46.1 12.3 12.4 13.4
/a Includes only credit from commercial banks and finance companies.71 Electricity.7E Electricity and water.7T Data up to December 1979 include bills discounted or purchased and bills
receivable for foreign trade. Since December 1980 such bills have beenclassified according to borrowers and included in the data for the appropriategroup.
/e Includes real estate and ownership of dwellings as well as finance, insurance andbusiness services.
/f Includes restaurants, hotels and boarding houses, purchase of stocks and shares,consumption credit, and other unidentified credit. Data in this group up toDecember 1979 includes loans to the Federal and State Governments. SinceDecember 1980, such loans have been classified according to borrowers.
/g Government and other services.7h Wholesale and retail trade.
Source: Statistical Appendix Tables 2.2 and 5.2.
- 13 -
1.22 Construction has three negative strikes against it. It has furtherswollen the country's large investment budget at a time when adjustment moti-vated austerities are desirable. It has tightened the financial market forindustrial entrepreneurs, with some deterrent effects on investment in primaryand secondary sectors. But most importantly from the perspective of medium-term investment, the support volunteered by the banks for real estate develop-ment has saddled financial institutions with a large portfolio of doubtfulasbets, some of which are currently nonperforming and many others threatenedby the after-effects of a continuing slump in the market. Such a portfoliowill eat into bank profits, will sharpen their aversion to risks and willweaken their willingness to support an investment drive by the productivesectors.
1.23 Two other developments with a bearing on industrialization must alsobe considered. One is the persistent unresponsiveness of the stock marketboth to the strong economic performance of 1984 and the financial inducementsprovided by the Government in the first half of 1985, which included the open-ing of credit lines for banks lending to investors, lengthening scrip deliverytimes, a halt on new listings and the proposal to establish a M$1 billion fundfor industrial entrepreneurs. The state of the stock market places anotherhurdle in the way of businesses seeking equity financing, but beyond that, italso points towards an undertow of doubt regarding Malaysia's economic futurethat is seemingly impervious to the good economic tidings of 1984 and theGovernment's attempts at sweetening industrial incentives in 1985.
1.24 The foreign share in export industries and equity holdings in theplantation sector offers another clue to the absence of momentum trom thebusiness upswing in 1983/84. The exporting subsectors are among the mostprofitable in the economy but their investment policies are hitched to theglobal concerns of the parent companies and bear little relation to theirannual earnings. Hence, instead of nourishing Malaysian industry and servingas a springboard for an expansion of local manufacturing capacity, these fundsflow out of the country in the form of repatriated dividends and profits.
1.25 These are a few of the recent economic events that will have abearing on development in the coming years but, overlying these, will be theGovernment's fiscal, sectoral, and exchange rate policies together with trendsin domestic labor markets and in export demand. In order to apprehend themacroeconomic constraints and scope for economic maneuver in the spheres ofadjustment and growth, the following chapters will explicate the situation asregards resource balances in public and private sectors; the implications ofrecent trends in the supply and cost of labor for future industrialization andexchange rate policies; growth in the OECD countries and its likely effects oncapital flow as well as the volume and pattern of exports from East Asiancountries. The report will then review industrial and agricultural strategiescalculated to advance Malaysia's development goals. In the closing chapter anumber of scenarios depict the macroeconomic consequences of an interplaybetween policy actions and international economic conditions.
- 14 -
Chapter II: RESOURCE BALANCES AND THE PUBLIC SECTOR
2.01 Malaysia's current account deficit rose from 1.2X of GNP in 1980 toa peak of 14.4% in 1982 before dropping to 3.1X in 1985 (see Table 1.1). Overthese years Malaysia added US$13 billion to the external debt carried overfrom the previous decade, and the debt service ratio (DSR) went from 4.3 in1980 to 15.3 in a matter of 5 years. Although the current account narrowed in1985 because of falling imports, the adjustment problem bedeviling the countryis far from being resolved. Exports earnings are projected to decline in 1986and this will push the DSR higher. The servicing of debt will become easieras the decade progresses, in part because the government took advantage oflower interest rates in 1985 to retire expensive debt acquired in the earlyeighties and replace it with floating rate notes of 20-30 year maturity. Ofequal importance, however, will be measures that serve to restore foreignexchange earnings and minimize the demand for additional borrowing.
2.02 The arithmetic underlying the adjustment difficulties is very plain.Investment climbed very steeply during the Fourth Plan while gross domestic(and national) savings have, on average, been at lower levels than the onesattained over the Third Plan. Domestic savings dropped from about 34% of GNPin 1980 to 30% in 1982, national savings from 31% of GNP to 25.0% (seeTable 2.1). A stronger economic performance, an increase in petroleum produc-tion and favorable terms of trade helped nudge the savings rates upwards in1983 and 1984. But national savings receded once again in 1935 and given thecommodity prices and growth rates being projected for 1986/87, a furtherdecline can be expected, led by public savings. The Government's response tothe balance of payments disequilibrium has been to try and curtail publicinvestment and the completion of several major infrastructure and manufactur-ing projects has abetted adjustment policies but the balancing of domesticresource availability against needs faces three problems. First, discretion-ary private savings have been shrinking and fiscal as well as monetary initia-tives by the authorities to strengthen savings propensities have had limitedeffect: so long as the economy continues to be battered by recessionarypressures, a revival of private savings performance is unlikely. Second,while private investment and consumption remain weak the Go:ernment is almostcompelled to move into the breach partially to salvage its growth objectivesand the size of the public sector sharpens the temptation to act while bol-stering the effectiveness of such actions. In spite of the stringent measuresin effect to check capital spending, public investment increased by 8% in1985. Third, the Federal Government has chipped away at its development andoperating expenditures for the past three years, substantially reducing thepublic sector's resource imbalance, but in the future, public deficits couldbe far more recalcitrant because of emerging trends in revenues and expendi-tures. As this is an issue of major importance, a closer analysis isrequired.
Deficits and Their Financing
2.03 The dimension of the public sector can be readily adduced fromTable 2.2. A picture of resource balances and an idea of the suddenness withwhich the budgetary crisis evolved can also be obtained (Tables 2.1 and 2.2).
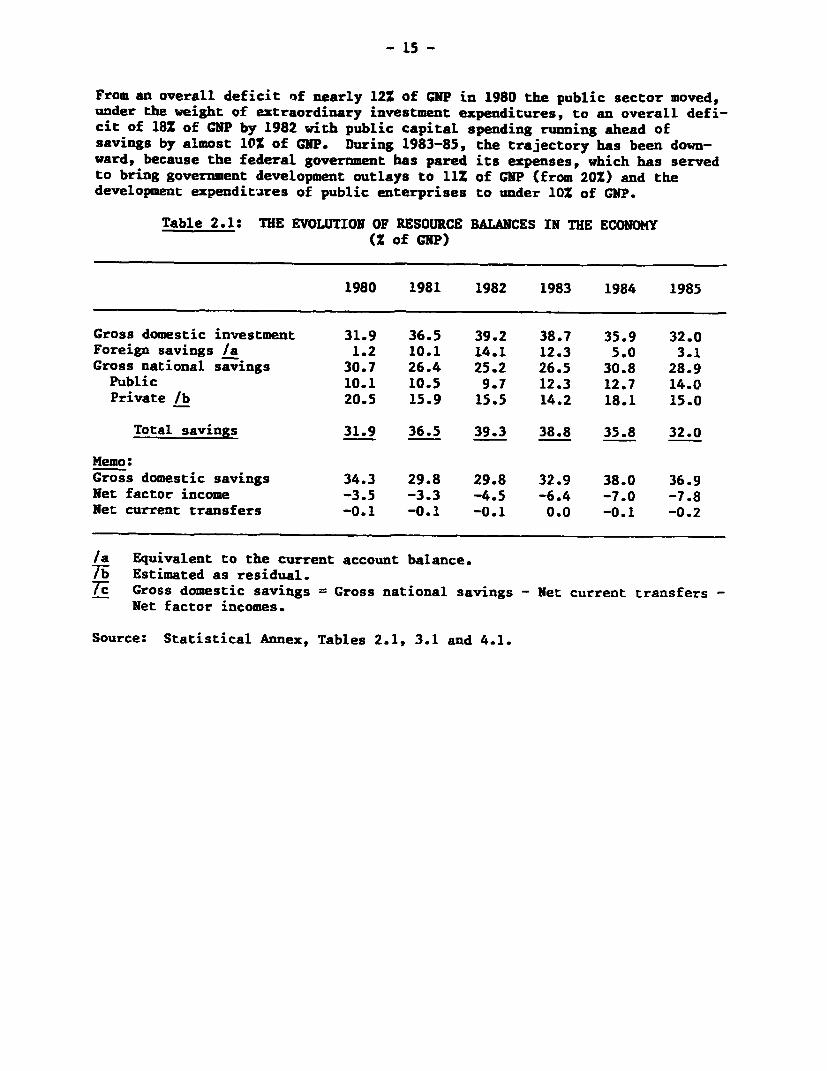
- 15 -
From an overall deficit of nearly 12% of GNP in 1980 the public sector moved,under the weight of extraordinary investment expenditures, to an overall defi-cit of 18Z of GNP by 1982 with public capital spending running ahead ofsavings by almost 10% of GNP. During 1983-85, the trajectory has been down-ward, because the federal government has pared its expenses, which has servedto bring government development outlays to 11% of GNP (from 20%) and thedevelopment expendit-ares of public enterprises to under 10Z of GNP.
Table 2.1: THE EVOLUTION OF RESOURCE BALANCES IN THE ECONOMY(Z of GNP)
1980 1981 1982 1983 1984 1985
Gross domestic investment 31.9 36.5 39.2 38.7 35.9 32.0Foreign savings /a 1.2 10.1 14.1 12.3 5.0 3.1Gross national savings 30.7 26.4 25.2 26.5 30.8 28.9Public 10.1 10.5 9.7 12.3 12.7 14.0Private /b 20.5 15.9 15.5 14.2 18.1 15.0
Total savings 31.9 36.5 39.3 38.8 35.8 32.0
Memo:Gross domestic savings 34.3 29.8 29.8 32.9 38.0 36.9Net factor income -3.5 -3.3 -4.5 -6.4 -7.0 -7.8Net current transfers -0.1 -0.1 -0.1 0.0 -0.1 -0.2
/a Equivalent to the current account balance.Tb Estimated as residual.Tc Gross domestic savings = Gross national savings - Net current transfers -
Net factor incomes.
Source: Statistical Annex, Tables 2.1, 3.1 and 4.1.
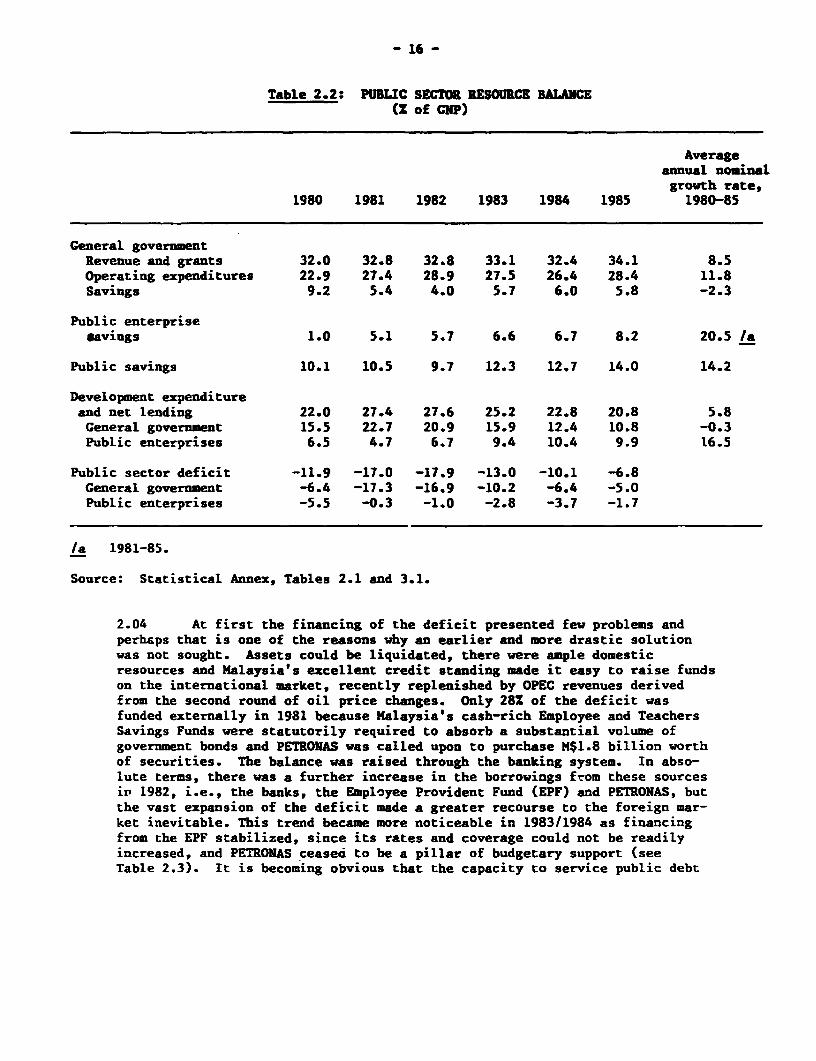
- 16 -
Table 2.2: PUBLIC SECTOR RESOURCE BALANCE(Z of GNP)
Averageannual nominal
growth rate,1980 1981 1982 1983 1984 1985 1980-85
General governmentRevenue and grants 32.0 32.8 32.8 33.1 32.4 34.1 8.5Operating expenditures 22.9 27.4 28.9 27.5 26.4 28.4 11.8Savings 9.2 5.4 4.0 5.7 6.0 5.8 -2.3
Public enterprisesavings 1.0 5.1 5.7 6.6 6.7 8.2 20.5 Ia
Public savings 10.1 10.5 9.7 12.3 12.7 14.0 14.2
Development expenditureand net lending 22.0 27.4 27.6 25.2 22.8 20.8 5.8
General government 15.5 22.7 20.9 15.9 12.4 10.8 -0.3Public enterprises 6.5 4.7 6.7 9.4 10.4 9.9 16.5
Public sector deficit -11.9 -17.0 -17.9 -13.0 -10.1 -6.8General government -6.4 -17.3 -16.9 -10.2 -6.4 -5.0Public enterprises -5.5 -0.3 -1.0 -2.8 -3.7 -1.7
/a 1981-85.
Source: Statistical Annex, Tables 2.1 and 3.1.
2.04 At first the financing of the deficit presented few problems andperhaps that is one of the reasons why an earlier and more drastic solutionwas not sought. Assets could be liquidated, there were ample domesticresources and Malaysia's excellent credit standing made it easy to raise fundson the international market, recently replenished by OPEC revenues derivedfrom the second round of oil price changes. Only 281 of the deficit wasfunded externally in 1981 because Malaysia's cash-rich Employee and TeachersSavings Funds were statutorily required to absorb a substantial volume ofgovernment bonds and PETRONAS was called upon to purchase M$1.8 billion worthof securities. The balance was raised through the banking system. In abso-lute terms, there was a further increase in the borrowings from these sourcesin' 1982, i.e., the banks, the Employee Provident Fund (EPF) and PETRONAS, butthe vast expansion of the deficit made a greater recourse to the foreign mar-ket inevitable. This trend became more noticeable in 1983/1984 as financingfrom the EPF stabilized, since its rates and coverage could not be readilyincreased, and PETRONAS ceased to be a pillar of budgetary support (seeTable 2.3). It is becoming obvious that the capacity to service public debt
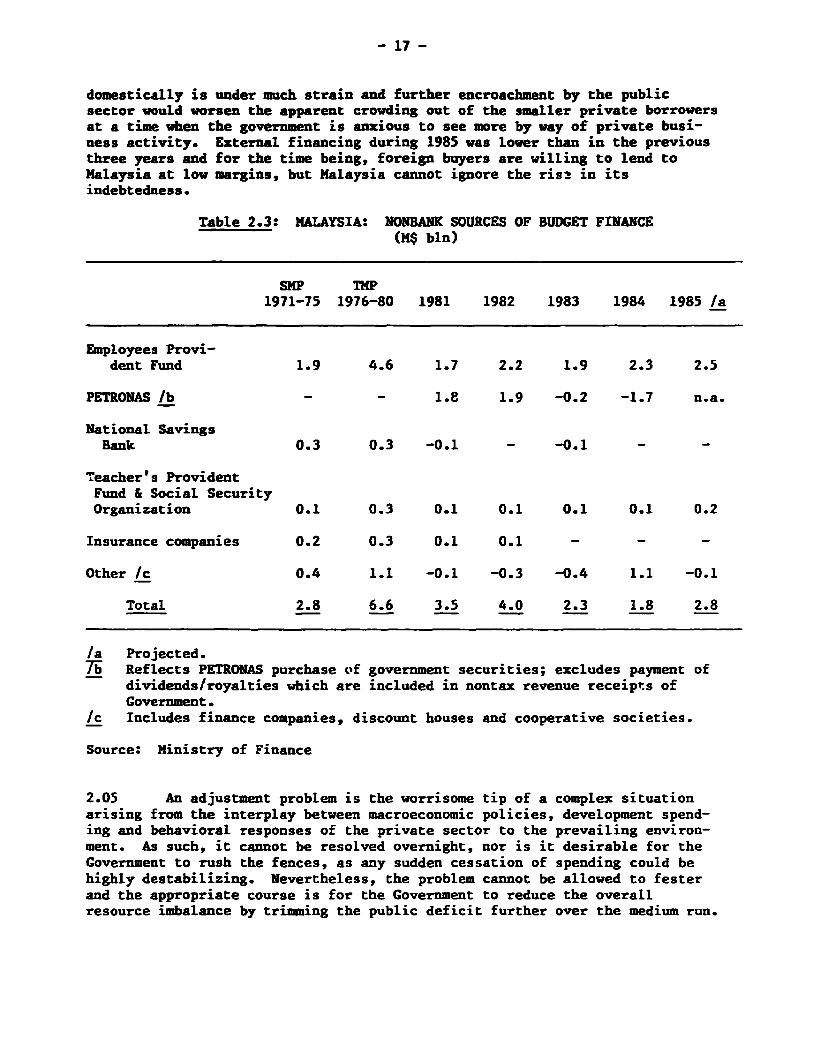
- 17 -
domestically is under much strain and further encroachment by the publicsector would worsen the apparent crowding out of the smaller private borrowersat a time when the government is anxious to see more by way of private busi-ness activity. External financing during 1985 was lower than in the previousthree years and for the time being, foreign buyers are willing to lend toMalaysia at low margins, but Malaysia cannot ignore the ris- in itsindebtedness.
Table 2.3: MALAYSIA: NONBANK SOURCES OF BUDGET FINANCE(M$ bln)
SMP THP1971-75 1976-80 1981 1982 1983 1984 1985 /a
Employees Provi-dent Fund 1.9 4.6 1.7 2.2 1.9 2.3 2.5
PETRONAS /b - - 1.8 1.9 -0.2 -1.7 n.a.
National SavingsBank 0.3 0.3 -0.1 - -0.1 - -
Teacher' s ProvidentFund & Social SecurityOrganization 0.1 0.3 0.1 0.1 0.1 0.1 0.2
Insurance companies 0.2 0.3 0.1 0.1 - - -
Other /c 0.4 1.1 -0.1 -0.3 -0.4 1.1 -0.1
Total 2.8 6.6 3.5 4.0 2.3 1.8 2.8
/a Projected.7i Reflects PETRONAS purchase of government securities; excludes payment of
dividends/royalties which are included in nontax revenue receipts ofGovernment.
/c Includes finance companies, discount houses and cooperative societies.
Source: Ministry of Finance
2.05 An adjustment problem is the worrisome tip of a complex situationarising from the interplay between macroeconomic policies, development spend-ing and behavioral responses of the private sector to the prevailing environ-ment. As such, it cannot be resolved overnight, nor is it desirable for theGovernment to rush the fences, as any sudden cessation of spending could behighly destabilizing. Nevertheless, the problem cannot be allowed to festerand the appropriate course is for the Government to reduce the overallresource imbalance by trimming the public deficit further over the medium run.
- 18 -
Raising tax revenues could help the cause of public saving and augment thevolume of internal financing available to the Government, but the ripplesspreading from tax escalation are deflationary and can blunt business incen-tives. Cuts in operating expenditures, the favorite target of frugal-mindedpolicymakers, also generate reverse multiplier effects and depress the qualityand volume of public services. A reduction in development outlays, aside fromits immediate consequences for aggregate demand, also compromises the aims ofdevelopment. In short, the medicine cannot be made painless, but its palata-bility can be manipulated by suitably mixing the ingredients.
2.06 All the macroeconomic omens (see Chapters 1 and 4) warn of a weaken-ing economy, which argues for a certain judiciousness in pruning public expen-ditures in the short term, although, once the private sector has found itsstride, it would be well to move towards a less extensive public presence inthe economy as is the Government's intention. Over the next five years, theconcerns of adjustment might be more nearly squared with the objectives ofgrowth and modernization if steps are taken to increase revenues and in con-junction, the government controls operating expenses and avoids being drawninto major new capital projects involving large commitments over an extendedtime scale.
2.07 Such a three-pronged approach would compress the public deficit andhave a positive influence on savings. The latter calls for closer governmentattention as the savings performance of the Federal Government and the publicenterprises has deteriorated significantly over the recent past. Governmentsavings as a percentage of CNP slumped from 9.2Z in 1980 to 5.8% in 1985 (seeTable 2.2) and may be headed down, caught between the blades of risingsalaries for public emp'loyees approved in 1985, following a five year intervalin which no structural changes were made, and revenue forecasts clouded by thelower anticipated returns from commodity and income taxes. The resourcebalances of public enterprises add to the gloom. Surpluses on current bal-ances have risen in absolute terms from M$2.2 in 1981 to M$7.2 billion in1984, but almost the entire saving from this source (84%) is attributable toPETRONAS (see Table 2.5). Operating losses are forecast for 15 of 36 enter-prises in 1985 (an increase from 9 in 1981) and with three fourths reportingoverall deficits equal to 11.5% of GNP, funds for capital spending must besupplied by the Federal Government, borrowed overseas or drawn from thecommercial banks. As the outlook for petroleum prices is scarcely encouragingand demand liable to remain soft, PETRONAS may not be able to offset thefinancial erosion so apparent in the accounts of public enterprises.
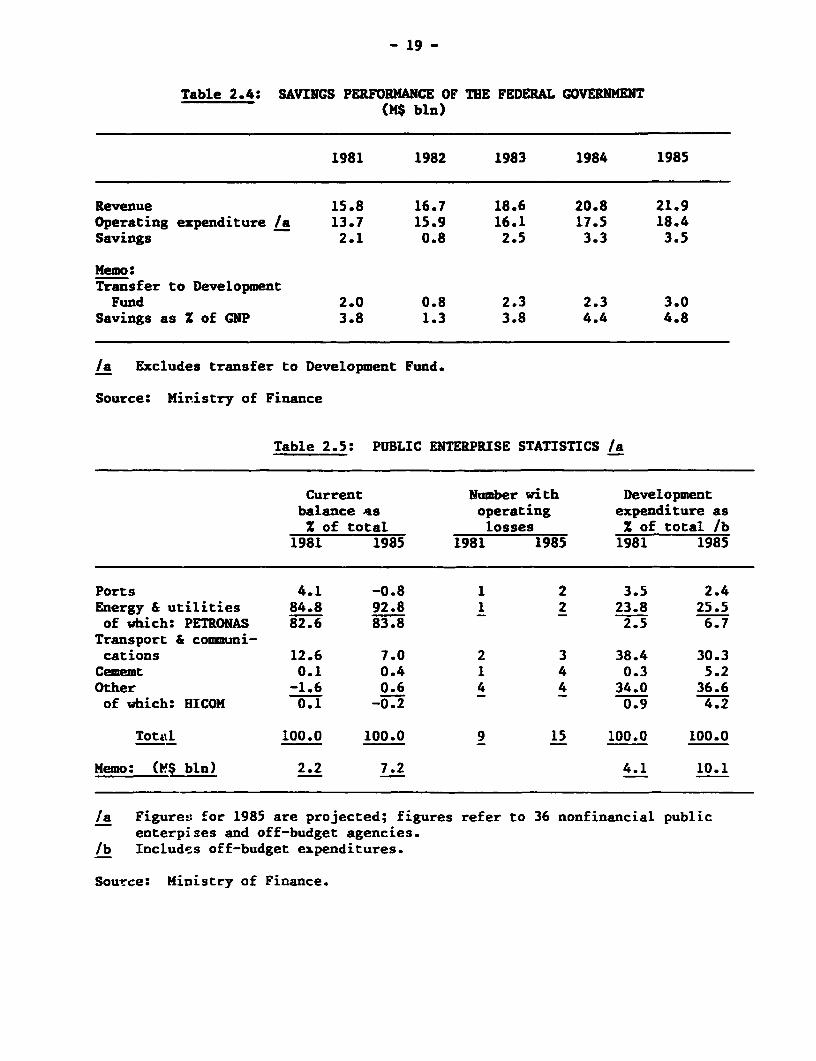
- 19 -
Table 2.4: SAVINCS PERFORMANCE OF THE FEDERAL GOVERNMENT(M$ bln)
1981 1982 1983 1984 1985
Revenue 15.8 16.7 18.6 20.8 21.9Operating expenditure /a 13.7 15.9 16.1 17.5 18.4Savings 2.1 0.8 2.5 3.3 3.5
Memo:Transfer to DevelopmentFund 2.0 0.8 2.3 2.3 3.0
Savings as Z of GNP 3.8 1.3 3.8 4.4 4.8
/a Excludes transfer to Development Fund.
Source: Ministry of Finance
Table 2.5: PUBLIC ENTERPRISE STATISTICS /a
Current Number with Developmentbalance -s operating expenditure asZ of total losses X of total /b
1981 1985 1981 1985 1981 1985
Ports 4.1 -0.8 1 2 3.5 2.4Energy & utilities 84.8 92.8 1 2 23.8 25.5of which: PETRONAS 82.6 83.8 2.5 6.7Transport & communi-cations 12.6 7.0 2 3 38.4 30.3Cememt 0.1 0.4 1 4 0.3 5.2Other -1.6 0.6 4 4 34.0 36.6of which: HICOM 0.1 -0.2 0.9 4.2
Total 100.0 100.0 9 15 100.0 100.0
Memo: (?!$ bln) 2.2 7.2 4.1 10.1
/a Figures for 1985 are projected; figures refer to 36 nonfinancial publicenterpises and off-budget agencies.
/b Includes off-budget expenditures.
Source: Ministry of Finance.
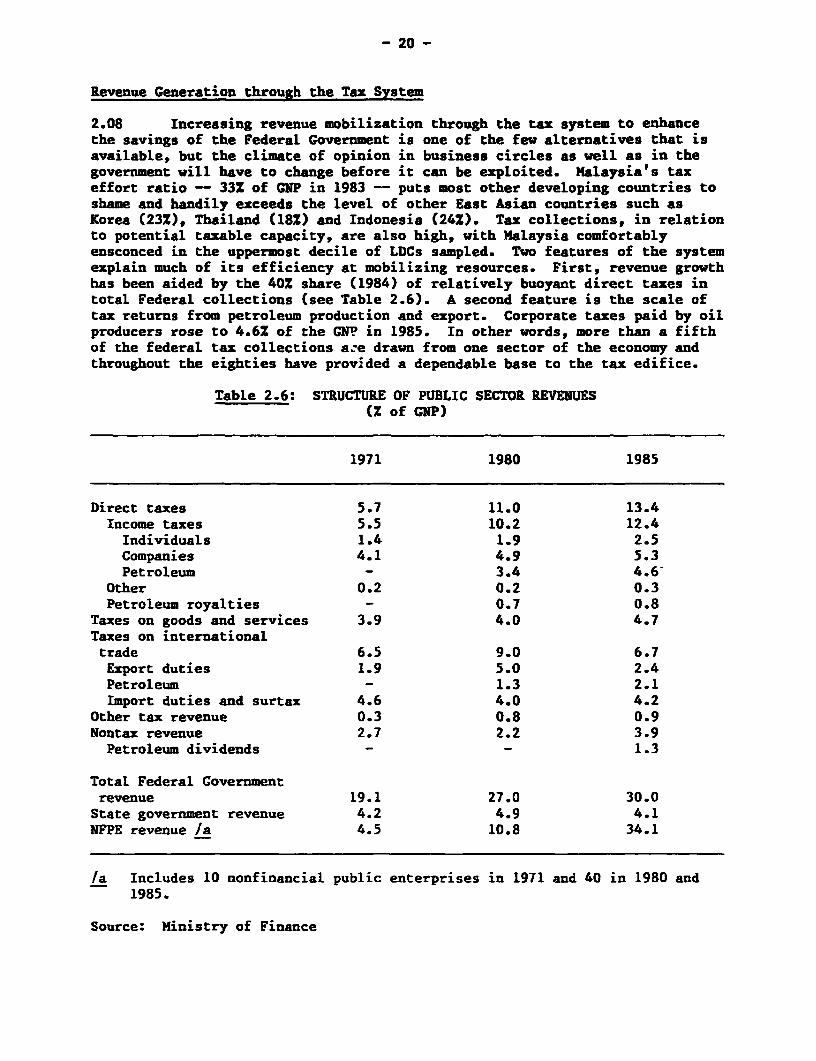
- 20 -
Revenue Generation through the Tax System
2.08 Increasing revenue mobilization through the tax system to enhancethe savings of the Federal Government is one of the few alternatives that isavailable, but the climate of opinion in business circles as well as in thegovernment will have to change before it can be exploited. Kalaysia's taxeffort ratio - 33Z of GNP in 1983 - puts most other developing countries toshame and handily exceeds the level of other East Asian countries such asKorea (23%), Thailand (18Z) and Indonesia (24Z). Tax collections, in relationto potential taxable capacity, are also high, with Malaysia comfortablyensconced in the uppermost decile of LDCs sampled. Two features of the systemexplain much of its efficiency at mobilizing resources. First, revenue growthhas been aided by the 40% share (1984) of relatively buoyant direct taxes intotal Federal collections (see Table 2.6). A second feature is the scale oftax returns from petroleum production and export. Corporate taxes paid by oilproducers rose to 4.6Z of the GN? in 1985. In other words, more than a fifthof the federal tax collections a:e drawn from one sector of the economy andthroughout the eighties have provided a dependable base to the tax edifice.
Table 2.6: STRUCTURE OF PUBLIC SECTOR REVENUES(Z of GNP)
1971 1980 1985
Direct taxes 5.7 11.0 13.4Income taxes 5.5 10.2 12.4Individuals 1.4 1.9 2.5Companies 4.1 4.9 5.3Petroleum - 3.4 4.6
Other 0.2 0.2 0.3Petroleum royalties - 0.7 0.8
Taxes on goods and services 3.9 4.0 4.7Taxes on internationaltrade 6.5 9.0 6.7Export duties 1.9 5.0 2.4Petroleum - 1.3 2.1Import duties and surtax 4.6 4.0 4.2
Other tax revenue 0.3 0.8 0.9Nontax revenue 2.7 2.2 3.9Petroleum dividends - - 1.3
Total Federal Governmentrevenue 19.1 27.0 30.0State government revenue 4.2 4.9 4.1NFPE revenue /a 4.5 10.8 34.1
/a Includes 10 nonfinancial public enterprises in 1971 and 40 in 1980 and1985.
Source: Ministry of Finance
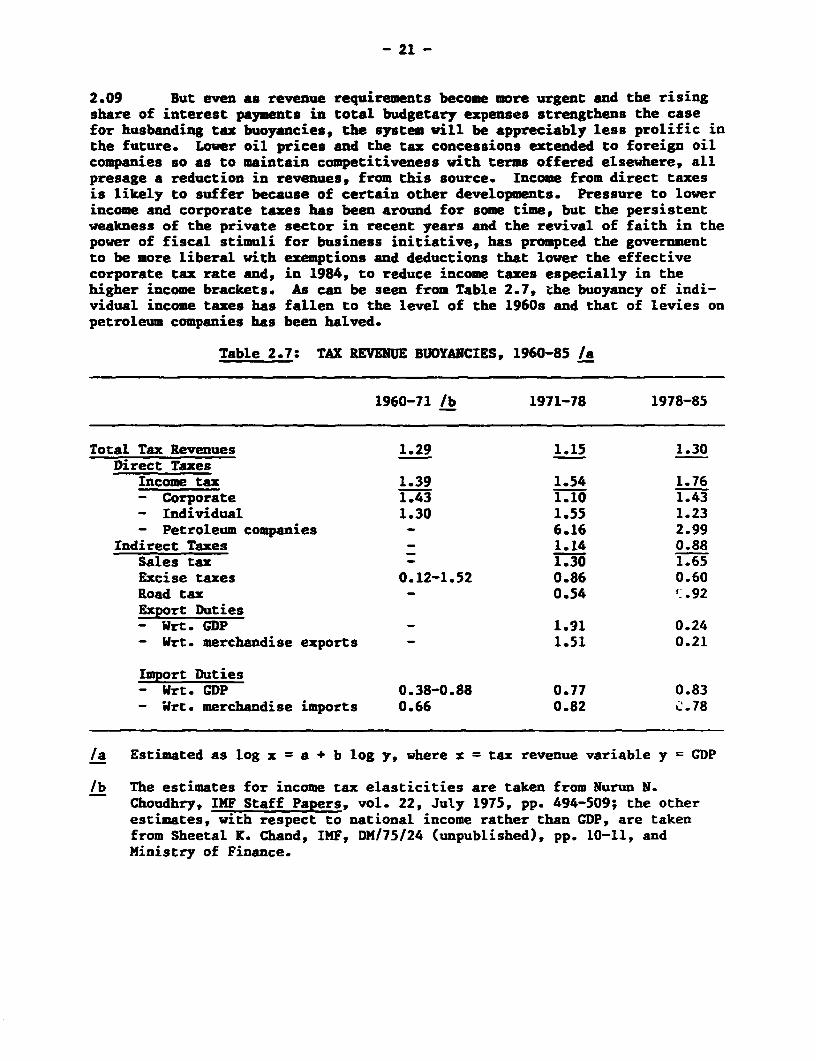
- 21 -
2.09 But even as revenue requirements become more urgent and the risingshare of interest payments in total budgetary expenses strengthens the casefor husbanding tax buoyancies, the system will be appreciably less prolific inthe future. Lower oil prices and the tax concessions extended to foreign oilcompanies so as to maintain competitiveness with terms offered elsewhere, allpresage a reduction in revenues, from this source. Income from direct taxesis likely to suffer because of certain other developments. Pressure to lowerincome and corporate taxes has been around for some time, but the persistentweakness of the private sector in recent years and the revival of faith in thepower of fiscal stimuli for business initiative, has prompted the governmentto be more liberal with exemptions and deductions that lower the effectivecorporate tax rate and, in 1984, to reduce income taxes especially in thehigher income brackets. As can be seen from Table 2.7, the buoyancy of indi-vidual income taxes has fallen to the level of the 1960s and that of levies onpetroleum companies has been halved.
Table 2.7: TAX REVENUE BUOYANCIES, 1960-85 /a
1960-71 /b 1971-78 1978-85
Total Tax Revenues 1.29 1.15 1.30Direct Taxes
Income tax 1.39 1.54 1.76- Corporate 1.43 1.10 1.43- Individual 1.30 1.55 1.23- Petroleum companies - 6.16 2.99
Indirect Taxes 1.14 0.88Sales tax 1.30 1.65Excise taxes 0.12-1.52 0.86 0.60Road tax 0.54 '.92Export Duties- Wrt. CDP 1.91 0.24- Wrt. merchandise exports - 1.51 0.21
Import Duties- Wrt. GDP 0.38-0.88 0.77 0.83- Wrt. merchandise imports 0.66 0.82 c.78
/a Estimated as log x = a + b log y, where x = tax revenue variable y = GDP
/b The estimates for income tax elasticities are taken from Nurun N.Choudhry, IMF Staff Papers, vol. 22, July 1975, pp. 494-509; the otherestimates, with respect to national income rather than GDP, are takenfrom Sheetal K. Chand, IMF, DM/75/24 (unpublished), pp. 10-11, andMinistry of Finance.
- 22 -
2.10 For a period, the state can finance some of its expenditures throughthe issue of debt instruments, but ultimately it is through tax revenues thatthe government must settle its bills and finance the growth in spending.Beyond that, ground will continue to be lost in the area of public savingsunless the tax buoyancy is restored and revenues inciaased. If it is assumedthat the buoyancy of petroleum revenues will be reduced by a third over thenext five years, the buoyancy of the remaining levies must increase very sub-stantially.
2.11 Although the dynamics of growth and industrialization would arguefor direct tax incentives and there is much political demand for this inMalaysia, the case, even at this stage needs a careful review. The evidenceis scarcely unequivocal. Germany and Japan, both of which imposed very higheffective tax rates on capital, have managed high rates of investment andgrowth. The UK, where capital taxes are low by the standards of industrialnations, has done poorly on both counts. Research on the US is equally sug-gestive; investment apparently does respond to tax incentives in the mediumterm, but because savings seem unaffected b reductions in direct taxes, nolonger run gains are likely to be realized.>/ Casual empiricism fails touncover a direct link between private investment behavior and effective ratesof corporate tax action in Malaysia or even in neighboring Indonesia. Taxholidays, which have a tendency to stretch, contain hidden costs, and in fact,ingenious transfer pricing by foreign owned companies can result in negativetax obligations.
2.12 If the decision were taken to restore the buoyancy of the tax systemand compensate for the fall in petroleum revenues, there are two kinds ofoptions. Currently, income taxes are levied on just 10% of wage ea-ners andboth individuals as well as corporations can exploit numerous loopholes toreduce their tax obligations. A wider coverage, fewer exemptions and improvedrecord-keeping through an accelerated expansion of computer facilities wouldbe one way of enlarging revenues from direct taxes without detracting fromprivate capital spending. A second option, frequently discussed but yet to beimplemented, is the broadening of the indirect tax base and steepening ofrates. One round of sales tax changes was introduced in 1982/83 when rateswere increased to an average of 10% from 52 in 1980/81. Selective e.scises onmotor vehicles, alcohol and tobacco were also raised. But to bring about asignificant upward shift of the indirect tax schedule would require displacingthe sales tax currently levied at the manufacturing stage with a broaderexpenditure-type tax which covered all but the essential items of consumptionwith rates on luxury items being substantially higher than those on otherproducts to combat regressivity. As inflationary pressures from other sourcesare likely to be minimal for the coming two to three years, introducing the.tax during this period would defuse one of the criticisms directed at indirecttaxes with an extensive coverage and high rates. Other East Asian countries,e.g., Korea (in 1977) and Indonesia (in April 1985), have moved in this direc-tion, which allows for partially substituting direct with broad-based ilidirect
5/ A. Ando, M. E. Blume and Irwin Friend, The Structure and Reform of the USTax System, MIT Press, 1985, pp. 67-71.
- 23 -
taxes. A tax system restructured along these lines may lend valuable supportto the Government's efforts in two other areas. The redistribution of income,one of the NEP's principal goals, would need to rely less on employment andequity restructuring policies, both of which dilute incentives behindproductive investment. And by enlargini. the fiscal base, the government wouldhave greater flexibility in using EPF funds to encourage private industry.
Spending Cuts
2.13 The tide may have run too far for revenue augmenting measures to beacceptable in the near future. Balancing of resources can then be achievedonly by economizing on operating expenditures, which would enhance publicsavings, and slimming development budgets of government agencies and NFPEs soas to draw investment spending closer to domestic resource supplies. Thisexercise, which can be bureaucratically and politically arduous under the bestof circumstances, is also rendered more treacherous by the possible repercus-sions which cuts in public sector spending may have on private decisions in abecalmed economy. In effect, the policymakers must apply the scalpel withgreat care, trimming the lumpy capital intensive projects whose returns liedistant in time, without detracting from the task of providing suitable lead-ing sectors and sufficient infrastructure to maintain economic dynamism. Thegovernment's intention to concentrate the bulk of its investible funds duringthe latter part of the eighties on projects carried over from the Fourth Planyears that justify completion deserves strong endorsement. It is the mostefficient course to follow from the standpoint of both resource use andadjustment.
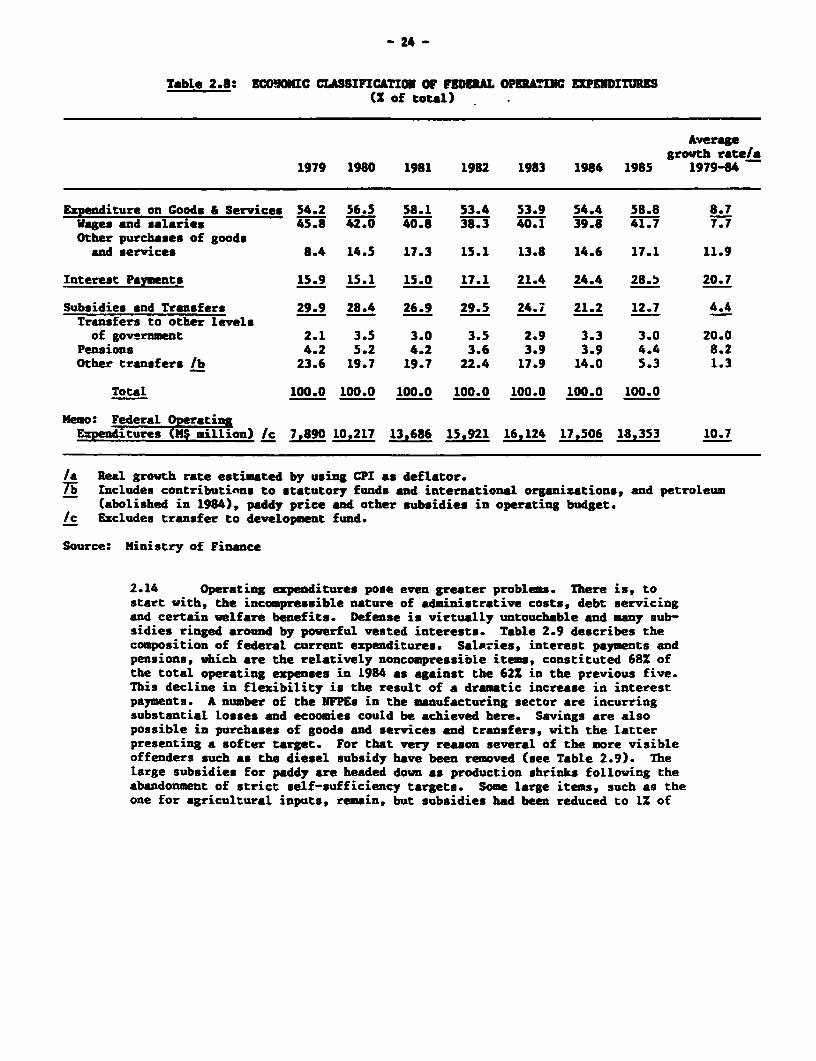
- 24 -
Table 2.8: EC0I0NIC CLASSIFICATION OF FD ERAL OPERATINC EXPEnDITUREStS of total)
Averagegrowth rate/a
1979 1980 1981 1982 1983 1984 1985 1979-84
Expenditure on Goods & Services 54.2 56.5 58.1 53.4 53.9 54.4 58.8 8.7Wages and salaries 45.8 42.0 40.8 38.3 40.1 39.8 41.7 7.7Other purchases of goods
and services 8.4 14.5 17.3 15.1 13.8 14.6 17.1 11.9
Interest Payments 15.9 15.1 15.0 17.1 21.4 24.4 28.5 20.7
Subsidies and Transfers 29.9 28.4 26.9 29.5 24.7 21.2 12.7 4.4Transfers to other levelsof government 2.1 3.5 3.0 3.5 2.9 3.3 3.0 20.0
Pensions 4.2 5.2 4.2 3.6 3.9 3.9 4.4 8.2Other transfers /b 23.6 19.7 19.7 22.4 17.9 14.0 5.3 1.3
Total 100.0 100.0 100.0 100.0 100.0 100.0 100.0
Memo: FederalExpenditures (X*illiLon) /c 7,890 10.217 13.686 15,921 16,124 17,506 18,353 10.7
/a Real growth rate estimated by using CPI as deflator.7i Includes contributions to statutory funds and international organizations, and petroleum
(abolished in 1984), paddy price and other subsidies in operating budget./c Excludes transfer to development fund.
Source: Ministry of Finance
2.14 Operating expenditures pose even greater problems. There is, tostart with, the incompressible nature of administrative costs, debt servicingand certain welfare benefits. Defense is virtually untouchable and many sub-sidies ringed around by powerful vested interests. Table 2.9 describes thecomposition of federal current expenditures. Salaries, interest payments andpensions, which are the relatively noncompressioLe items, constituted 68Z ofthe total operating expenses in 1984 as against the 62Z in the previous five.This decline in flexibility is the result of a dramatic increase in interestpayments. A number of the NFPEs in the manufacturing sector are incurringsubstantial losses and ecoomies could be achieved here. Savings are alsopossible in purchases of goods and services and transfers, with the latterpresenting a softer target. For that very reason several of the more visibleoffenders such as the diesel subsidy have been removed (see Table 2.9). Thelarge subsidies for paddy are headed down as production shrinks following theabandonment of strict self-sufficiency targets. Some large items, such as theone for agricultural inputs, remain, but subsidies had been reduced to 1Z of
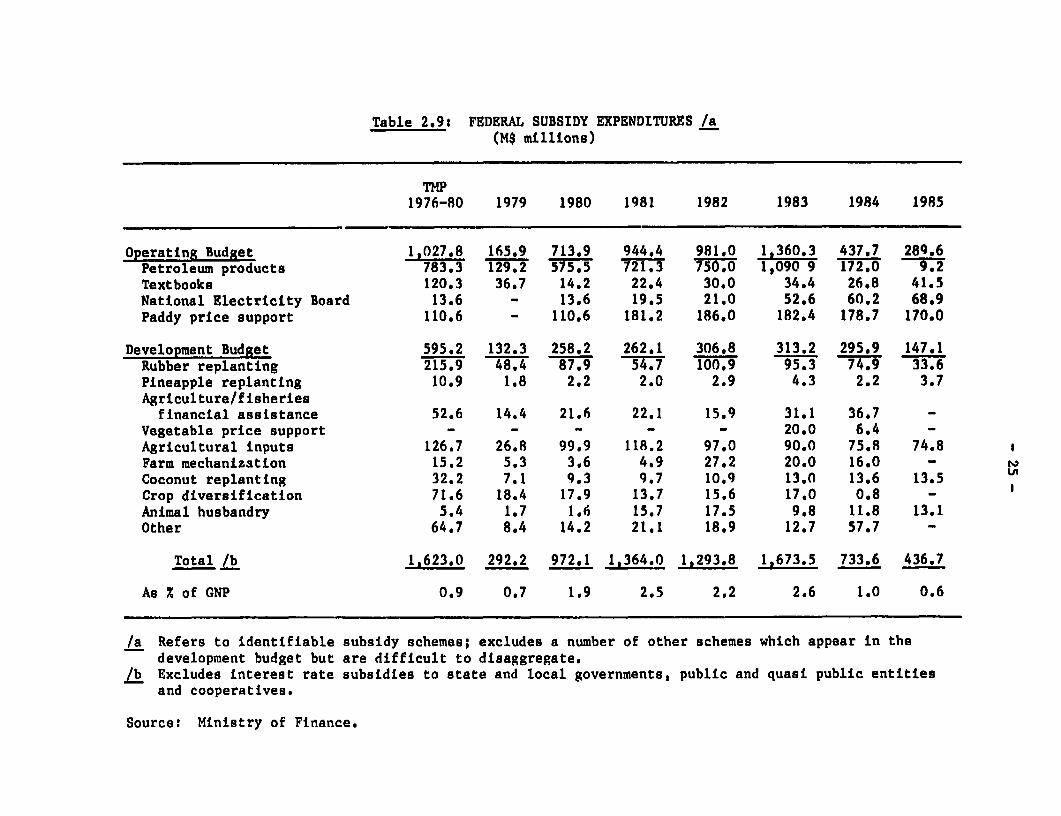
Table 2.9: FEDERAL SUBSIDY EXPENDITURES /a(M$ millions)
TMP1976-80 1979 1980 1981 1982 1983 1984 1985
Operating Budget 1,027.8 165.9 713.9 944.4 981.0 1,360.3 437.7 289.6Petroleum products 783.3 CPU2 575.5 721,3 750.0 1,090 9 172.0 9.Textbooks 120,3 36.7 14.2 22.4 30.0 34.4 26.8 41.5National Electricity Board 13.6 - 13.6 19.5 21.0 52,6 60.2 68.9Paddy price support 110.6 - 110,6 181.2 186.0 182.4 178.7 170.0
Development Budget 595.2 132.3 258.2 262.1 306.8 313.2 295.9 147.1Rubber replanting 215.9 48.4 87.9 54.7 100,.9 95.3 74.9 33.6Pineapple replanting 10.9 1.8 2,2 2.0 2.9 4.3 2.2 3.7Agriculture/fisheriesfinancial assistance 52,6 14.4 21.6 22.1 15.9 31.1 36.7 -
Vegetable price support - - - - - 20,0 6.4 -Agricultural inputs 126.7 26.8 99.9 118.2 97.0 90.0 75.8 74.8 1Farm mechanization 15.2 5.3 3.6 4.9 27.2 20.0 16.0 -Coconut replanting 32.2 7.1 9.3 9.7 10.9 13.0 13.6 13.5Crop diversification 71.6 18.4 17,9 13.7 15.6 17.0 0.8 -Animal husbandry 5.4 1.7 1.6 15.7 17.5 9.8 11.8 13.1Other 64.7 8.4 14.2 21.1 18.9 12.7 57.7 -
Total /b 1,623.0 292.2 972.1 1,364.0 1,293.8 1,673.5 733.6 436.7
As X of GNP 0.9 0.7 1.9 2.5 2.2 2.6 1.0 0.6
/a Refers to identifiable subsidy schemes; excludes a number of other schemes which appear in thedevelopment budget but are difficult to disaggregate.
/b Excludes interest rate subsidies to state and local governments, public and quasi public entitiesand cooperatives.
Source: Ministry of Finance.
- 26 -
GNP by 1984 from 2.6Z a year earlier and the activity of economizing may bemoving very close to the bone though possibilities for additional savings maynot be entirely exhausted. Table 2.10 reveals the distribution of developmentspending but a further careful review of major items of expenditure is neededto advance specific suggestions on how economies might be achieved.
2.15 Three issues emerge from this brief review of resource balances andthe public budget, which bear upon adjustment and growth. First, the downwardslide in the savings of the Federal Government and public enterprises makes itnecessary to sacrifice growth for the sake of BOP equilibrium. Second, asolution to the public deficit and the growing cost of debt servicing must besought through a combination of revenue-raising and expenditure-reducing mea-sures. Unless the tax buoyancy rate is restored, the budgetary situation willcontinue weakening and without tax reforms, government revenues will becomeeven more dependent on a diminished flow of taxes and dividends from t'Le oilsector. Third, given the size of the annual investment budget and operatingexpenses, there is bound to be some further room for economizing should theneed arise, but whether this option is exercised will have to be guided bymacroeconomic exigencies, particularly movements in private consumption andinvestment.
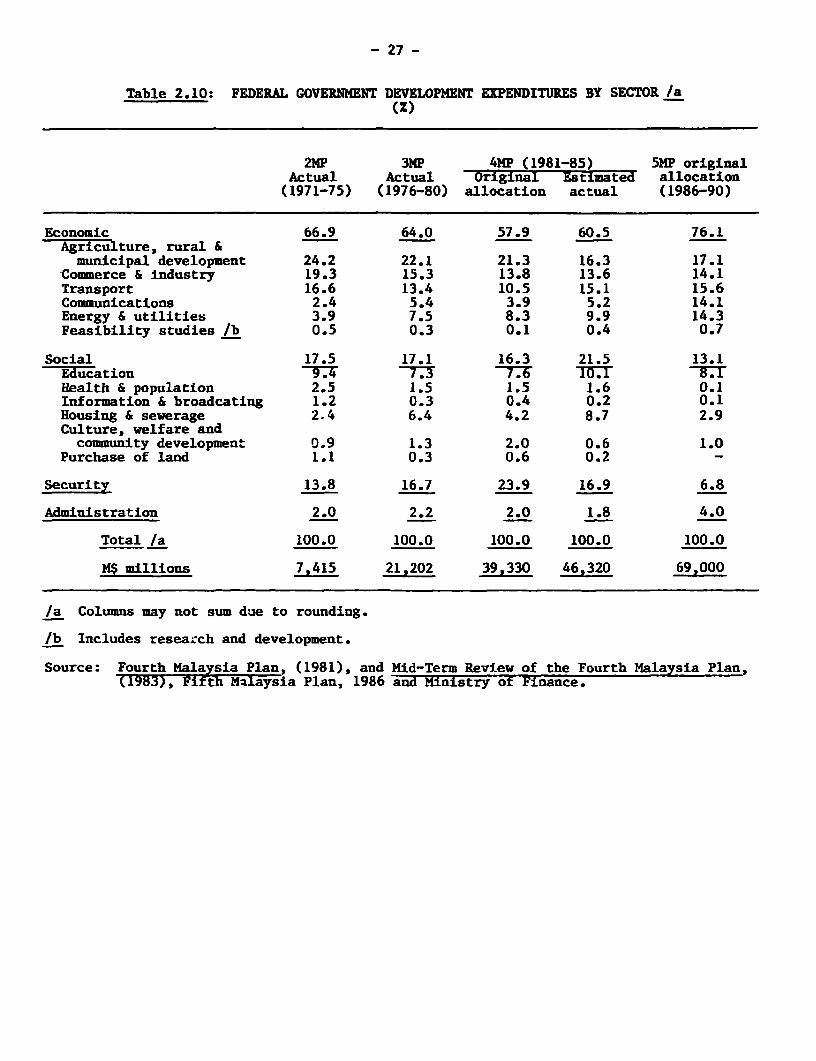
- 27 -
Table 2.10: FEDERAL GOVERNMENT DEVELOPMENT EXPENDITURES BY SECTOR /a(Z)
2MP 3MP 4MP (1981-85) 5MP originalActual Actual Original Estimated allocation(1971-75) (1976-80) allocation actual (1986-90)
Economic 66.9 64.0 57.9 60.5 76.1Agriculture, rural &municipal development 24.2 22.1 21.3 16.3 17.1
.Commerce & industry 19.3 15.3 13.8 13.6 14.1Transport 16.6 13.4 10.5 15.1 15.6Communications 2.4 5.4 3.9 5.2 14.1Energy & utilities 3.9 7.5 8.3 9.9 14.3Feasibility studies /b 0.5 0.3 0.1 0.4 0.7
Social 17.5 17.1 16.3 21.5 13.1Education r; Health & population 2.5 1.5 1.5 1.6 0.1Information & broadcating 1.2 0.3 0.4 0.2 0.1Housing & sewerage 2.4 6.4 4.2 8.7 2.9Culture, welfare andcommunity development 0.9 1.3 2.0 0.6 1.0
Purchase of land 1.1 0.3 0.6 0.2 -
Security 13.8 16.7 23.9 16.9 6.8
Administration 2.0 2.2 2.0 1.8 4.0
Total /a 100.0 100.0 100.0 100.0 100.0
M$ millions 7,415 21,202 39,330 46,320 69,000
/a Columns may not sum due to rounding.
/b Includes resea.ch and development.
Source: Fourth Malaysia Plan, (1981), and Mid-Term Review of the Fourth Malaysia Plan,(1983), Fifth Malaysia Plan, 1986 and Ministry of Finance.
- 28 -
CHAPTER III: THE ROLE OF LABOR AND EXCHANGERATES IN EXPORT-ORIENTED DEVELOPMENT
Labor Markets in East Asia
3.01 East Asian NICs have added new legends to the record of economicdevelopment by following the route of high capital accumulation and managingto avoid the shoals of debt crises through unrelenting pressure on domesticsavings rates. But in examining the experience of Japan, Korea and the rest,economists are having to recognize the pivotal role played by labor marketsand how they have been instrumental in enabling these countries to outdistancetheir competitors. In drawing lessons from the past experience of the NICs inLatin America and East Asia, the course taken by wages and labor supplies, theflexibility with which labor was deployed and trained, require the attentionthat has long been obligatory for capital and technology. Poorly endowed withnatural resources, the East Asian NICs depended on an elastic supply of 'Laborto fuel their drive to modernity and developed institutions which seem marvel-ously attuned to the exacting needs of an export-oriented, manufacturing sys-tem. Having passed one threshold of industrialization and moving to a futurewith high-technology products, they are again looking to the newly acquiredtechnical and scientific skills to complement their -apital resources indevising products that will preserve their trading edge. By the same token,many Latin American countries appear to be losing the race, in spite of ini-tial resource advantages, partly because of rigidities introduced by labormarket institutions that have contributed to inflationary pressures and a slowgrowth in productivity.
3.02 As the dependence on primary products has lessened, Malaysia is alsoconfronted with the necessity of exploiting its labor force more fully, equip-ing workers with the skills that will go towards building industrial strengthand creating market institutions which will guarantee stability, together withallocative flexibility. A number of concerns can be isolated. For the pur-poses of growth, what matters is the supply of labor, the spread of industrialskills, trends in wages and productivity and the size of local markets. Butthe rate of economic expansion will also have a decisive bearing on concernsregarding employment.
Population and Industrial Progress
3.03 Since the problem of market size is linked to labor supply but alsomore generally to macroeconomic issues, it can serve as a point of departure.Malaysia has a population of 15.6 million, growing in recent years at2.4Z p.a. In terms of market size and rate of increase it compares favorablywith the East Asian NICs, except Korea. But just as these economies havefound that domestic sales are inadequate to support rapid growth based onmanufacturing plants of efficient size and have turned overseas in quest ofbuyers, Malaysia is also forced to adopt an export-oriented stance. What thismeans is that Malaysian firms must progress very quickly along their learningcurves and attain a degree of competitiveness that will permit them to drawbenefits from the international economy. The risks are high, for not onlymust companies incur the cost of building facilities of sufficient scale but
- 2!r -
have to take the plunge knowing that a sheltered domestic market can onlyabsorb a part of their output. Other NICs have found an answer to the problemby exploring pathways to greater efficiency in factor markets, production andmarketing, because the alternative of increasing the domestic market throughfaster population growth, poses numerous difficulties.
3.04 Research has shown that gains from scale economies, made pgm sible bya larger population are certainly possible though they may be small.- Whatcannot be sidestepped are the costs associated with a faster growing popula-tion. Costs related to a higher dependency ratio that can reduce householdsavings even as they enlarge the society's carrying costs in the form of edu-cation and health expenditures. Further, if per capita incomes are to be pre-vented from declining, which would defeat the entire purpose of raising thepopulation size, additional saving is necessary on the part of current earnersto provide enough capital to productively employ new workers joining the laborforce. The expense of raising more children and the savings effort would bean immediate drag on the economy. Any conjectural gains from larger marketsize would lie a generation into the future. Domestic markets might besmaller than industrialists would desire but labor supply, which over the nextfive years will be growing at 3.1Z p.a., is unlikely to constrain growth ofindustry.
Sectoral Labor Supplies
3.05 In certain respects, Malaysia's labor market is unique and its spe-cial characteristics, if assiduously managed, could remain an important posi-tive factor in the country's development. Historical, racial and politicalforces have seeded the labor market with "noncompeting groups" occupying dif-ferent sectoral niches. For instance, workers of Tamil extraction, the major-ity over the age of 45, are heavily represented in rubber production and they,together with smaller number of Malay and Chinese laborers in similar agebrackets, comprise a relatively immobile group assuring the continuance andcompetitiveness of the rubber industry over the next decade. But thisreprieve might only take rubber production to the end of this century as fewmembers of the younger generation are disposed to work in rubber plantationsand smallholdings. In fact, a substantial exodus of people from the agricul-tural sector is in progress, the rate of migration having risen from 96 per1,000 in 1970 to 143 per 1,000 ten years later. According to the last census,internal migrants nearly doubled from 1 million to 1.9 million between 1970and 1980. Migrants were preponderantly male though the margin has beenshrinking. Most are drawn from the 15-35 year age bracket and their educa-tional attainments are generally above the average for the rural populace. Ahigh percentage are single. Women also come from younger age groups but areclose to the rural average in terms of schooling. In the early seventies,single female migrants were a small minority and Malay women rarely migratedindependently of their families. With changing mores and the growing accept-ability of dormitory living and urban factory work, single Malay women are nowas predisposed to seek jobs in the cities as females from other racial groups.
6/ C. McNicoll, "Consequences of Rapid Population Growth: Ar Overview,"World Bank Staff Working Paper No. 691, 1984, pp. 36-37.
- 30 -
3.06 For the agricultural sector, the cityward movement of workers spellsthe beginning of a major change. Rubber tapping, a skilled occupation thathas resisted effective mechanization is under the severest longer term threatbecause rubber's lower profitability makes it difficult to offer younger work-ers pecuniary inducements that might persuade them to stay. Yet the peculiarage and skilL composi.ion of the labor force staves off any sudden drop in thesupply of tappers. Other agricultural activities are feeling the pinch aswell. Oil palm harvesters come from the most migracion prone age brackets andtheirs is an unusually demanding occupation. Rising wages can slow but neverarrest a secular decline in labor supply, which has begun to interfere withthe harvesting of the existing palm acreage. Progress has been made at mecha-nizing the cutting of fruit and its transport but the effort of able-bodiedmen cannot yet be substantially reduced. Rice growing, the principal occupa-tion of some 150,000 subsistence farmers is being affected by the pull ofcities as is apparent from land abandonment and declining production. Thefuture of the rice economy is also colored by low absolute returns from smallfarms which the generous subsidies for grain and fertilizers cannot reverse.Hence those who cannot grow enough rice to earn a decent return are turning tooff-farm occupations for supplemental income or emigrating in search of urbanjobs. Rice self-sufficiency had fallen to 70Z in 1984 from 90% in the earlyseventies and the trend foreshadows at best stagnation or, more probably, agradual decline.
Wages
3.07 The agriculture sector's loss is to the advantage of secondary andtertiary activities. For the next five years and perhaps well into the nine-ties the industry and services sectors will benefit from an elastic laborsupply; the combined result of intersectoral migration, rising participationrates of women in the 30-50 year age bracket and the natural increase of theurban population. This will be one factor dampening wage pressures, but forsome time, labor costs will also be influenced by other market characteristicsthat over a ten year period have averted a drift towards a wage-price spiral.Table 3.1 shows the course taken by wages during 1977-83. Growth was moderatein the seventies, accelerated in the early eighties but the tendency for wagesto increase appears to be subsiding in 1983/84. What is striking is the greatvariability in wage movements across subsectors and also the presence of wageasymmetries between different categories of workers. The remuneration ofclerical and lower grade office employees rose much more quickly in 1980-82and unskilled employees in certain branches of industry such as textiles andelectronics gained. When we consider sectoral changes in productivity mea-sured by the increase in value-added per unit of labor (see Table 3.2) growthfor the whole economy averaged 4.2% p.a. between 1975-84 with considerablevariation among sectoral rates; manufacturing grew at 12.5% p.a., while con-struction, government services, and finance and commerce grew only about2% p.a. In some cases, productivity appears to have risen more slowly in theeighties than in the earlier period with agriculture, a few service subsectorsand transport being the activities affected, but manufacturing, constructionand government services did appreciably better. Over the entire stretch, realwages seem to have grown only slightly in excess of productivity, but inrecent years, particularly 1980-83, manufacturing wages were increasing farmore than value-added while agricultural earnings remained more or less in
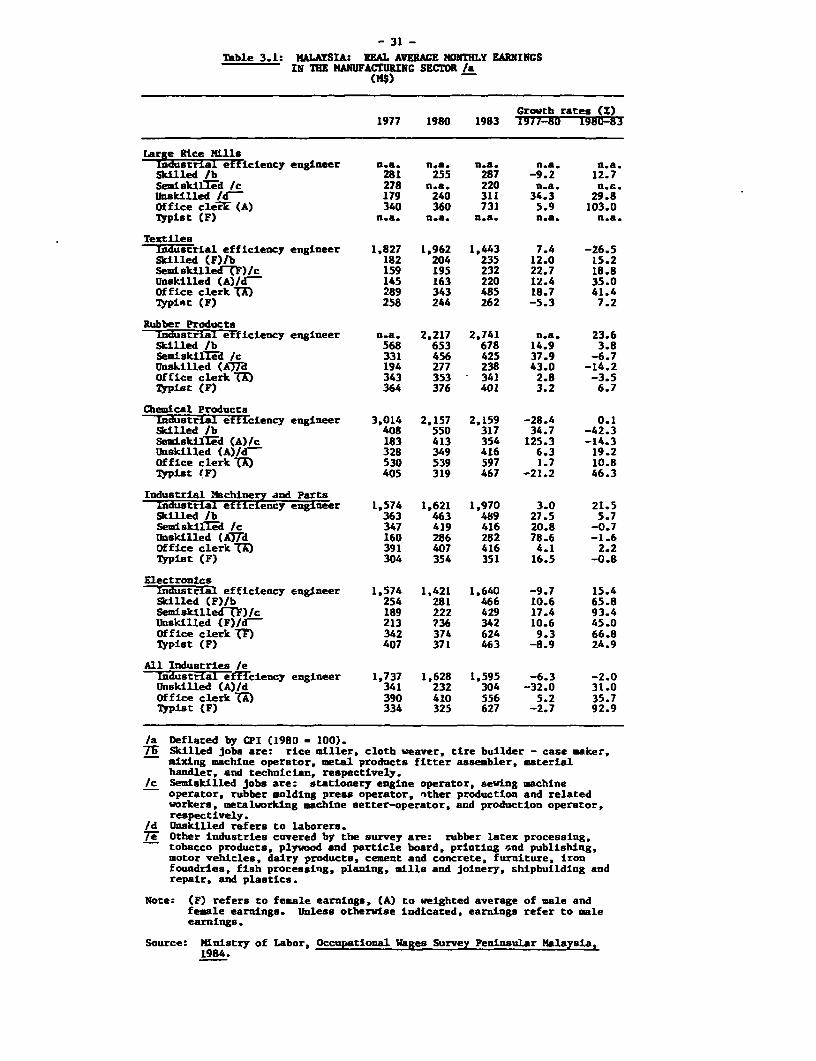
- 31 -Table 3.1: MALAYSIA: REAL AVERAGE MONTHLY EARNINGS
IN THE MANUFACTURING SECTOR /a
Growth rates (x)1977 1980 1983 1977-80 1980-83
Lare Rce MillsIstrial efficiency engineer n.-. n.a. U.S. n.a. n.a.
Skilled /b 281 255 287 -9.2 12.7semiskilrl-d /c 278 n.a. 220 n.a. U.a.Unskilled 1d 179 240 311 34.3 29.8Office cle-W (A) 340 360 731 5.9 103.0Typist (F) n.a. U.S. n.a. n.a. n.s.
TextilesIndustrial efficiency engineer 1.827 1,962 1,443 7.4 -26.5Skilled (F)lb 182 204 235 12.0 15.2SemiskilledCtF/c 159 195 232 22.7 18.8Unskilled (A)/d7 145 163 220 12.4 35.0Office clerk IX) 289 343 485 18.7 41.4Typist (F) 258 244 262 -5.3 7.2
Rubber ProductsIndustrial efficiency engineer n.a. 2,217 2,741 n.a. 23.6Skilled /b 568 653 678 14.9 3.8SemiskillSed /c 331 456 425 37.9 -6.7Unskilled (AMJd 194 277 238 43.0 -14.2Office clerk I) 343 353 341 2.8 -3.5Typist (F) 364 376 401 3.2 6.7
Chemical ProductsIndustrial efficiency engineer 3,014 2,157 2,159 -28.4 0.1Skilled lb 408 550 317 34.7 -42.3semiskilre d (A)/c 183 413 354 125.3 -14.3Unskilled (A)/d 328 349 416 6.3 19.2Office clerk TX) 530 539 597 1.7 10.8Typist (F) 405 319 467 -21.2 46.3
Industrial Machinery and PartsIndustrial efficiency engineer 1,574 1,621 1,970 3.0 21.5Stilled /b 363 463 489 27.5 5.7Semiskilied /c 347 419 416 20.8 -0.7Unskilled (AVid 160 286 282 78.6 -1.6Office clerk -M 391 407 416 4.1 2.2Typist (F) 304 354 351 16.5 -0.8
Electronicsmdustrial efficiency engineer 1,574 1,421 1,640 -9.7 15.4
Stilled (F)/b 254 281 466 10.6 65.8Seniskilled-lF/c 189 222 429 17.4 93.4Unskilled (F)/C 213 736 342 10.6 45.0Office clerk II) 342 374 624 9.3 66.8Typist (F) 407 371 463 -8.9 24.9
All Industries /eIndustrial efficiency engineer 1,737 1,628 1,595 -6.3 -2.0Unskilled (A)/d 341 232 304 -32.0 31.0Office clerk Tn 390 410 556 5.2 35.7Typist (F) 334 325 627 -2.7 92.9
/a Deflated by CPI (1980 - 100).7W Skilled jobs are: rice miller, cloth weaver, tire builder - case maker,
mixing machine operator, metal products fitter assembler, materialhandler, and technician, respectively.
/c Semiskilled jobs are: stationery engine operator, sewing machineoperator, rubber molding press operator, nther production and relatedworkers, metalworking machine setter-operator, and production operator,respectively.
/d Unskilled refers to laborers.7-e Other industries covered by the survey are: rubber latex processing,
tobacco products, plywood and particle board, printing and publishing,motor vehicles, dairy products, cement and concrete, furniture, Ironfoundries, fish processing, planing, mills and joinery, shipbuilding andrepair, and plastics.
Note: (F) refers to female earnings, (A) to weighted average of male andfemale earnings. Unless otherwise indicated, earnings refer to maleearnings.
Source: Ministry of Labor, Occupational Wages Survey Peninsular Malaysia,1984.
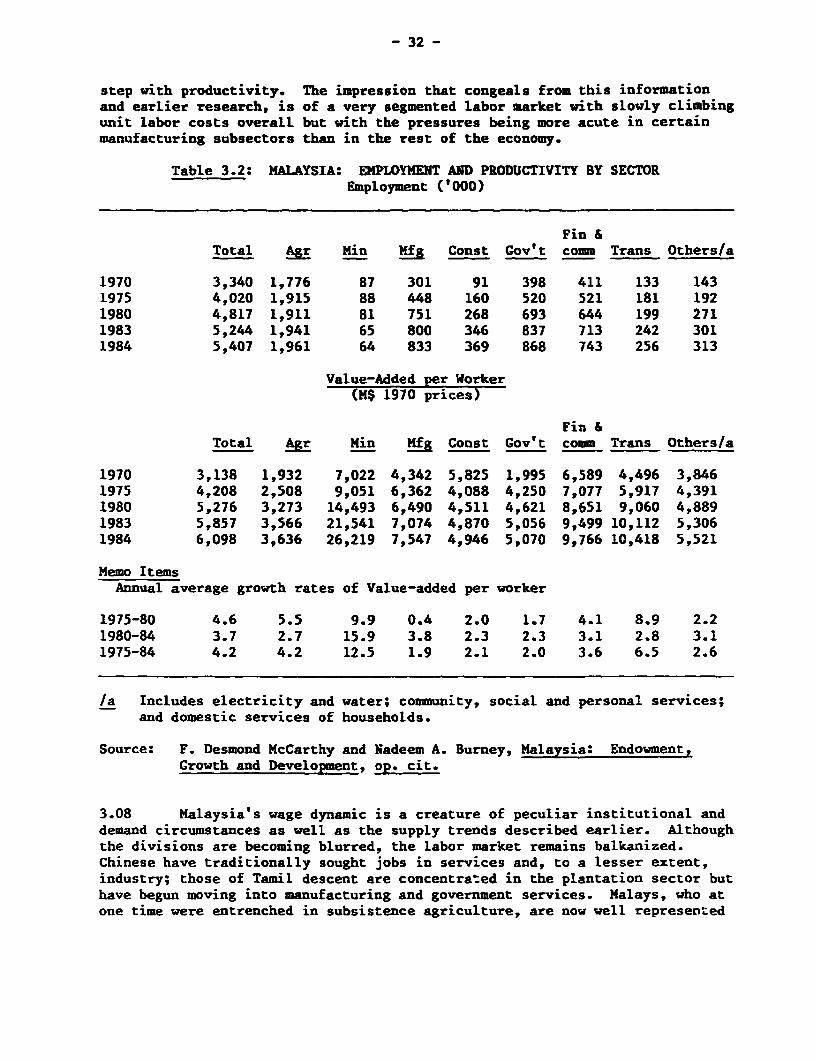
- 32 -
step with productivity. The impression that congeals from this informationand earlier research, is of a very segmented labor market with slowly climbingunit labor costs overall but with the pressures being more acute in certainmanufacturing subsectors than in the rest of the economy.
Table 3.2: MALAYSIA: EMPLOYMENT AND PRODUCTIVITY BY SECTOREmployment ('000)
Fin &Total Agr Kin Mfg Const Gov't comm Trans Others/a
1970 3,340 1,776 87 301 91 398 411 133 1431975 4,020 1,915 88 448 160 520 521 181 1921980 4,817 1,911 81 751 268 693 644 199 2711983 5,244 1,941 65 800 346 837 713 242 3011984 5,407 1,961 64 833 369 868 743 256 313
Value-Added per Worker(M$ 1970 prices)
Fin &Total Agr Min Mfg Const Gov't comm Trans Others/a
1970 3,138 1,932 7,022 4,342 5,825 1,995 6,589 4,496 3,8461975 4,208 2,508 9,051 6,362 4,088 4,250 7,077 5,917 4,3911980 5,276 3,273 14,493 6,490 4,511 4,621 8,651 9,060 4,8891983 5,857 3,566 21,541 7,074 4,870 5,056 9,499 10,112 5,3061984 6,098 3,636 26,219 7,547 4,946 5,070 9,766 10,418 5,521
Memo ItemsAnnual average growth rates of Value-added per worker
1975-80 4.6 5.5 9.9 0.4 2.0 1.7 4.1 8.9 2.21980-84 3.7 2.7 15.9 3.8 2.3 2.3 3.1 2.8 3.11975-84 4.2 4.2 12.5 1.9 2.1 2.0 3.6 6.5 2.6
/a Includes electricity and water; community, social and personal services;and domestic services of households.
Source: F. Desmond McCarthy and Nadeem A. Burney, Malaysia: Endowment,Growth and Development, op. cit.
3.08 Malaysia's wage dynamic is a creature of peculiar institutional anddemand circumstances as well as the supply trends described earlier. Althoughthe divisions are becoming blurred, the labor market remains balkanized.Chinese have traditionally sought jobs in services and, to a lesser extent,industry; those of Tamil descent are concentrated in the plantation sector buthave begun moving into manufacturing and government services. Malays, who atone time were entrenched in subsistence agriculture, are now well represen.ed
- 33 -
in the plantation and the manufacturing labor force but they have, in addi-tion, become the backbone of the work force in the public sector. Only afifth of the working populace is unionized (383 unions in 1982), much of it inthe public and plantation sectors, and fears dating back to the Emergency,have kept alive sentiments preventing the spread of unionization and containedthe political voice as well as bargaining power of organized labor (26 strikeswere reported in 1983). The closing of ranks amongst workers and the narrow-ing of the many fissures in the labor-market is also hindered by the multi-racial mix of the population, and deep-seated conflicts of interest originat-ing from the remaining skewness in the distribution of skills and assets.Thus, Malaysian labor does not possess either the organization or thepolitical voice which have made unions in some of the Latin American economiesso effective in pursuing wage demands.
3.09 The push for higher incomes that might have resulted from competingwage demands by the various labor blocs, especially the efforts by Malay work-ers to draw economically abreast of the others, has been adroitly defused bythe welfare and hiring policies of the Government. Through the farsightedprogram launched by the NEP, the government has been able to elevate theincomes, living standards and access to services enjoyed by the poorer seg-ments of the society. Beyond that, by promoting economic mobility among theMalay population, the Government managed, until recently, to satisfy the aspi-rations of the majority group without affecting too drastically the opportuni-ties available to the others. This balancing out could become difficult underweaker economic conditions, but so far, it has headed off a wage spiral aris-ing from labor market rivalries. Of course, generally conservative fiscal andmonetary policies that have kept the increase in prices to single-digit levelsfor a decade and a half, have given the macroeconomic reinforcement to otherlabor market-related policies and averted the nucleation of inflationaryexpectations that have wreaked such havoc elsewhere.
3.10 This is not to suggest that wage pressures have been absent or thatlabor costs in some sectors of the Malaysian economy have not risen fasterthan is desirable given the competitive international environment. The verylarge expansion of public sector employment in the late seventies and earlyeighties, shifted upwards the demand curve especially for labor with clerical,professional and technical skills. Although the data tend to be scanty,Tables 3.3 and 3.4 give an indication of changing magnitudes, with the jump inclerical workers from 3.5Z of the labor force in 1962 to 8.6% in 1980 beingvery noticeable. During the phase of high growth, the public sector, profitingfrom the surge in revenues associated with higher commodity prices, acted as awage leader, particularly in the low skill categories. Growth in publicemployment led to a tightening of the labor market, while the handsome sala-ries earned by public sector employees probably induced an upward drift inwages paid in parts of the urban, formal sector subject to a demonstrationeffect. Wages and salaries in manufacturing also received a powerful nudgefrom foreign companies producing electronics and textiles, which were expand-ing their operations and bidding aggressively for unskilled workers as well astechnical staff.
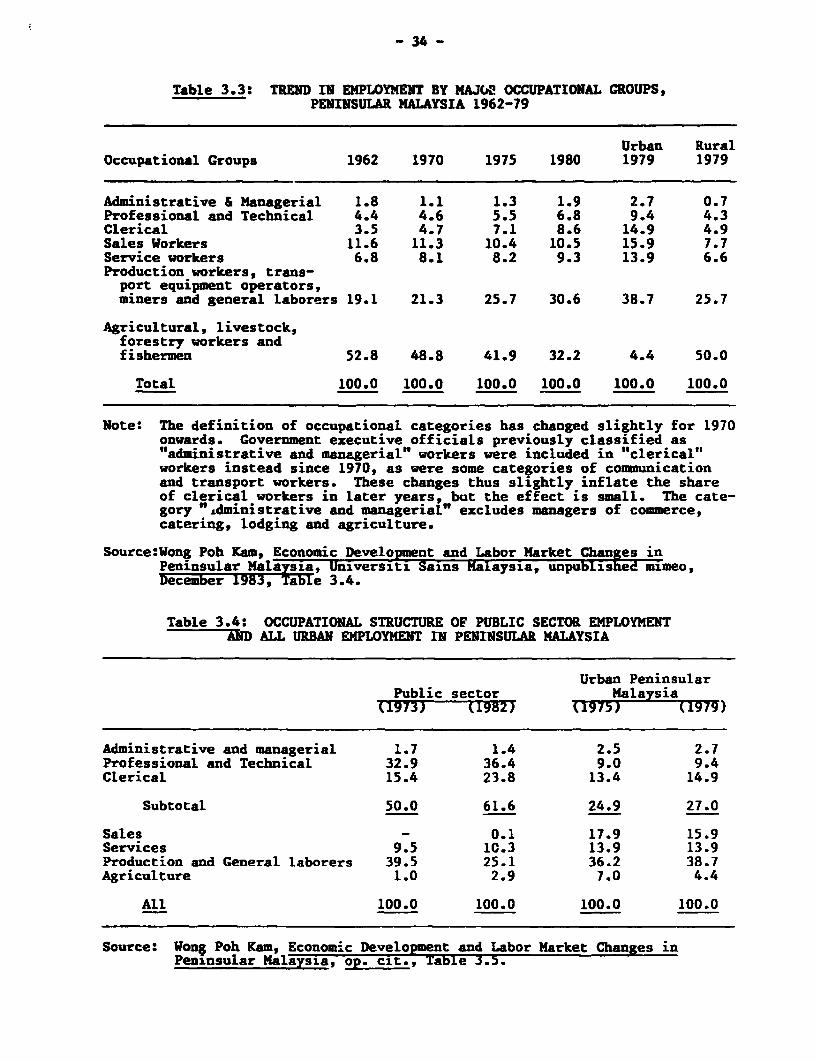
- 34 -
Table 3.3: TREND IN EMPLOYMENT BY MAJC,2 OCCUPATIONAL GROUPS,PENINSULAR MALAYSIA 1962-79
Urban RuralOccupational Groups 1962 1970 1975 1980 1979 1979
Administrative & Managerial 1.8 1.1 1.3 1.9 2.7 0.7Professional and Technical 4.4 4.6 5.5 6.8 9.4 4.3Clerical 3.5 4.7 7.1 8.6 14.9 4.9Sales Workers 11.6 11.3 10.4 10.5 15.9 7.7Service workers 6.8 8.1 8.2 9.3 13.9 6.6Production workers, trans-port equipment operators,miners and general laborers 19.1 21.3 25.7 30.6 38.7 25.7
Agricultural, livestock,forestry workers andfishermen 52.8 48.8 41.9 32.2 4.4 50.0
Total 100.0 100.0 100.0 100.0 100.0 100.0
Note: The definition of occupational categories has changed slightly for 1970onwards. Government executive officials previously classified as"administrative and managerial" workers were included in "clerical"workers instead since 1970, as were some categories of communicationand transport workers. These changes thus slightly inflate the shareof clerical workers in later years, but the effect is small. The cate-gory "aLdministrative and managerial" excludes managers of commerce,catering, lodging and agriculture.
Source:Wong Poh Kam, Economic Development and Labor Market Changes inPeninsular Malaysia, Universiti Sains Malaysia, unpublished mimeo,December 1983, Table 3.4.
Table 3.4: OCCUPATIONAL STRUCTURE OF PUBLIC SECTOR EMPLOYMENTAND ALL URBAN EMPLOYMENT IN PENINSULAR MALAYSIA
Urban PeninsularPublic sector Malaysia
(1973) (1982) k1975) k1919)
Administrative and managerial 1.7 1.4 2.5 2.7Professional and Technical 32.9 36.4 9.0 9.4Clerical 15.4 23.8 13.4 14.9
Subtotal 50.0 61.6 24.9 27.0
Sales - 0.1 17.9 15.9Services 9.5 10.3 13.9 13.9Production and General laborers 39.5 25.1 36.2 38.7Agriculture 1.0 2.9 7.0 4.4
All 100.0 100.0 100.0 100.0
Source: Wong Poh Ram, Economic Development and Labor Market Changes inPeninsular Malaysia, op. Clt., Table .,).
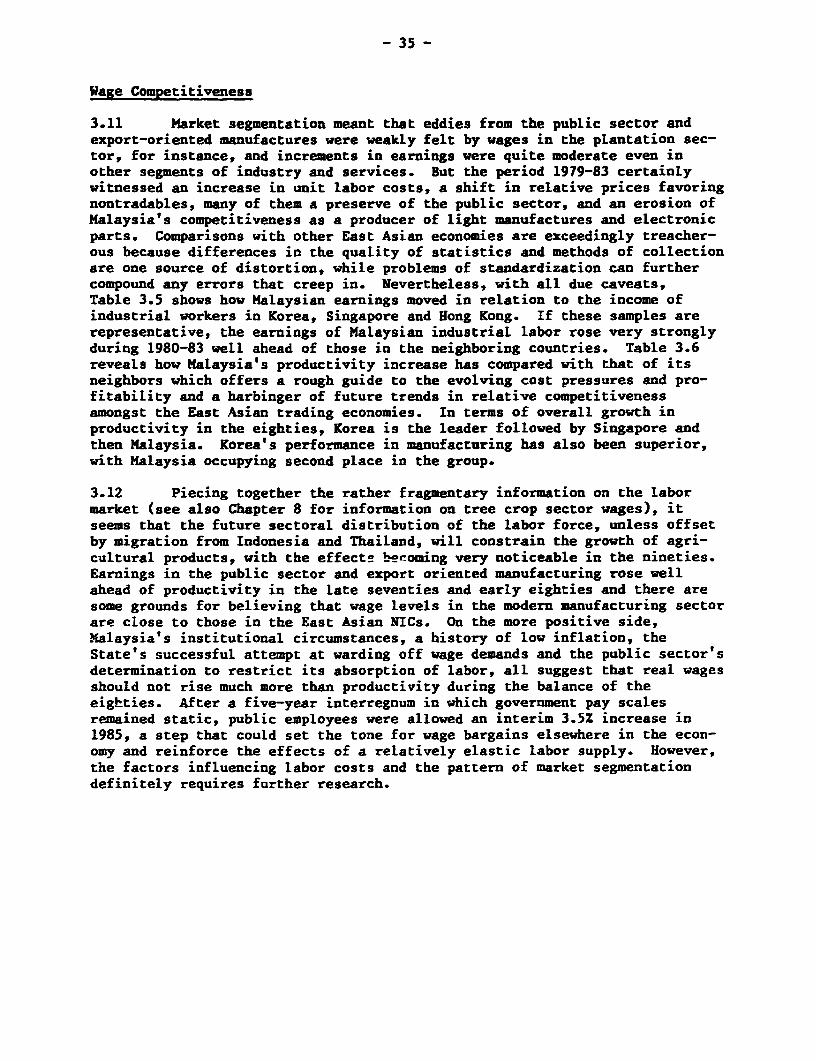
- 35 -
Wage Competitiveness
3.11 Market segmentation meant that eddies from the public sector andexport-oriented manufactures were weakly felt by wages in the plantation sec-tor, for instance, and increments in earnings were quite moderate even inother segments of industry and services. But the period 1979-83 certainlywitnessed an increase in unit labor costs, a shift in relative prices favoringnontradables, many of them a preserve of the public sector, and an erosion ofMalaysia's competitiveness as a producer of light manufactures and electronicparts. Comparisons with other East Asian economies are exceedingly treacher-ous because differences in the quality of statistics and methods of collectionare one source of distortion, while problems of standardization can furthercompound any errors that creep in. Nevertheless, with all due caveats,Table 3.5 shows how Malaysian earnings moved in relation to the income ofindustrial workers in Korea, Singapore and Hong Kong. If these samples arerepresentative, the earnings of Malaysian industrial labor rose very stronglyduring 1980-83 well ahead of those in the neighboring countries. Table 3.6reveals how Malaysia's productivity increase has compared with that of itsneighbors which offers a rough guide to the evolving cost pressures and pro-fitability and a harbinger of future trends in relative competitivenessamongst the East Asian trading economies. In terms of overall growth inproductivity in the eighties, Korea is the leader followed by Singapore andthen Malaysia. Korea's performance in manufacturing has also been superior,with Malaysia occupying second place in the group.
3.12 Piecing together the rather fragmentary information on the labormarket (see also Chapter 8 for information on tree crop sector wages), itseems that the future sectoral distribution of the labor force, unless offsetby migration from Indonesia and Thailand, will constrain the growth of agri-cultural products, with the effects becoming very noticeable in the nineties.Earnings in the public sector and export oriented manufacturing rose wellahead of productivity in the late seventies and early eighties and there aresome grounds for believing that wage levels in the modern manufacturing sectorare close to those in the East Asian NICs. On the more positive side,Malaysia's institutional circumstances, a history of low inflation, theState's successful attempt at warding off wage demands and the public sector'sdetermination to restrict its absorption of labor, all suggest that real wagesshould not rise much more than productivity during the balance of theeighties. After a five-year interregnum in which government pay scalesremained static, public employees were allowed an interim 3.5Z increase in1985, a step that could set the tone for wage bargains elsewhere in the econ-omy and reinforce the effects of a relatively elastic labor supply. However,the factors influencing labor costs and the pattern of market segmentationdefinitely requires further research.
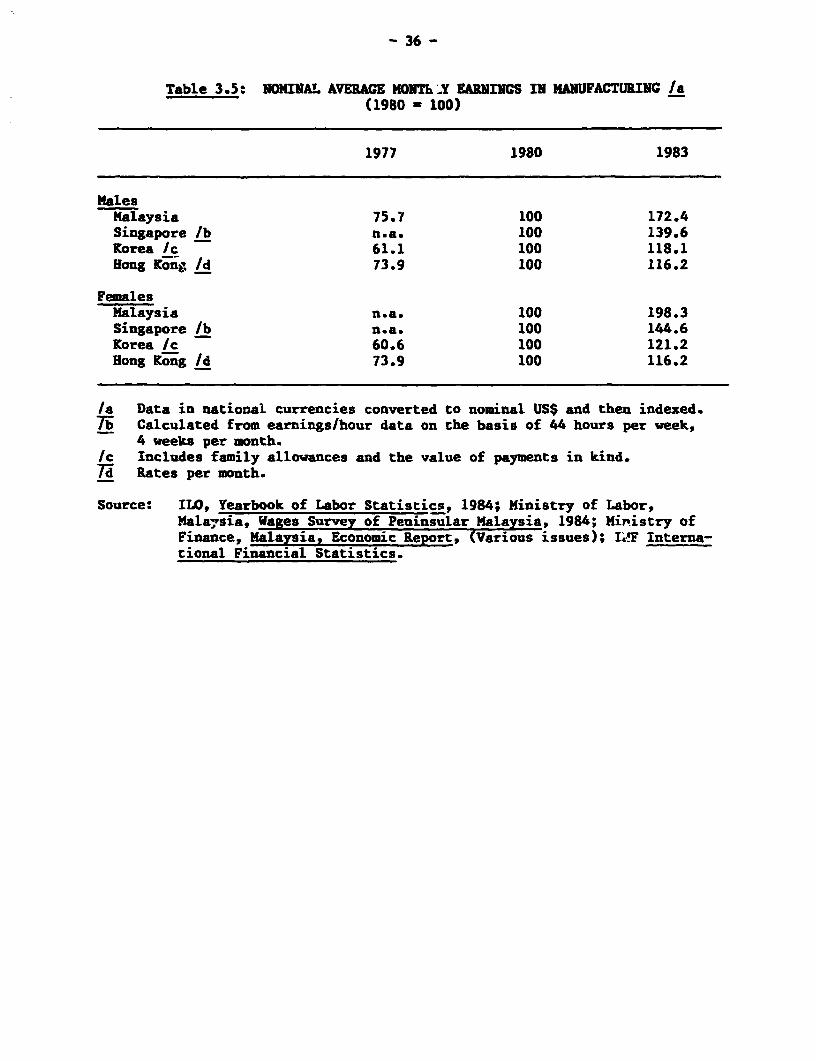
- 36 -
Table 3.5: NOMINAL AVERAGE MONThI.Y EARNINCS IN MANUFACTURING /a(1980 - 100)
1977 1980 1983
MalesMalaysia 75.7 100 172.4Singapore /b n.a. 100 139.6Korea /c 61.1 100 118.1Hong kong /d 73.9 100 116.2
FemalesMalaysia n.a. 100 198.3Singapore /b n.a. 100 144.6Korea /c 60.6 100 121.2Hong Kong /d 73.9 100 116.2
/a Data in national currencies converted to nominal US$ and then indexed.7T Calculated from earnings/hour data on the basis of 44 hours per week,
4 weeks per month./c Includes family allowances and the value of payments in kind.Td Rates per month.
Source: ILO, Yearbook of Labor Statistics, 1984; Ministry of Labor,Mala7sia, Wages Survey of Peninsular Malaysia, 1984; Ministry ofFinance, Malaysia, Economic Report, (Various issues); I5F Interna-tional Financial Statistics.
- 37 -
Table 3.6: VALUE-ADDED PER WORKER(Average annual growth rate, Z p.a.)
Cons- Cov't Fin &Total Agr Min Mfg truction service comm Trans Other
Malaysia1975-80 4.6 5.5 9.9 0.4 2.0 1.7 4.1 8.9 2.21980-83 3.5 2.9 14.1 2.9 2.6 3.0 3.2 3.7 2.81975-83 4.2 4.8 11.4 1.3 2.2 2.2 3.7 6.9 2.4
Korea1975-80 3.9 -0.2 -13.3 7.1 1.2 n.a. n.a. n.a. 1.11980-83 5.3 14.2 11.9 3.9 12.3 n.a. n.a. n.a. -0.21975-83 4.4 5.0 -4.6 5.9 5.2 n.a. n.a. n.a. 0.6
Singapore1975-80 3.3 -0.7 26.3 2.9 -8.5 n.a. 2.8 - 4.41980-83 5.1 11.2 -2.5 2.2 -23.6 n.a. 6.8 -7.1 -3.71975-83 4.0 6.4 14.6 2.6 2.5 n.a. 8.9 -2.7 -2.7
Thailand1975-80 3.0 -0.5 7.8 4.5 -1.7 n.a. 0.8 3.2 4.41980-83 0.2 0.6 -27.4 -0.5 -12.6 n.a. -2.9 2.5 -3.71975-83 2.2 -0.2 3.7 3.1 -4.9 n.a. -0.3 3.0 2.0
Source: Ministry of Finance, Malaysia, Economic Report 1984/85; Department of Sta-tistics, Korea, Korea Statistical Yearbook, 1984; Department of Statis-tics, Singapore. Singapore Yearbook of Statistics, 1982/83 & 1983/84;National Statistical Office, Thailand, Thailand Statistical Yearbook,_976-80 and 1981-84.
3.13 If Malaysian manufacturing wages are approaching those of the EastAsian NICs even though the country lags behind in terms of industrial matur-ity, catching up by way of export led industrialization will be considerablymore difficult. This has implications for industrial and exchange rate policyas well as the urgency of stimulating productivity. Should industrializationflag, unemployment (7.6Z in 1985) affecting primarily school leavers and theunskilled, will emerge as a serious economic and social problem. Many of theinstitutional features and constraints on geographical, sectoral and inter-industry mobility responsible for the large wage differentials and thesluggish adjustment of earnings to changes in market demands will wither overtime, exposing sectors now sheltered from rising costs, but labor supplieswill be a countervailing force. Asido from the natural increase, thereremains a pool of workers in the agriculture sector, and young people fromrural areas will continue to seek urban jobs. Higher rates of participationby married women could also stabilize wages in service and assembly industriesin which women are already welL represented. Just as public sector employment
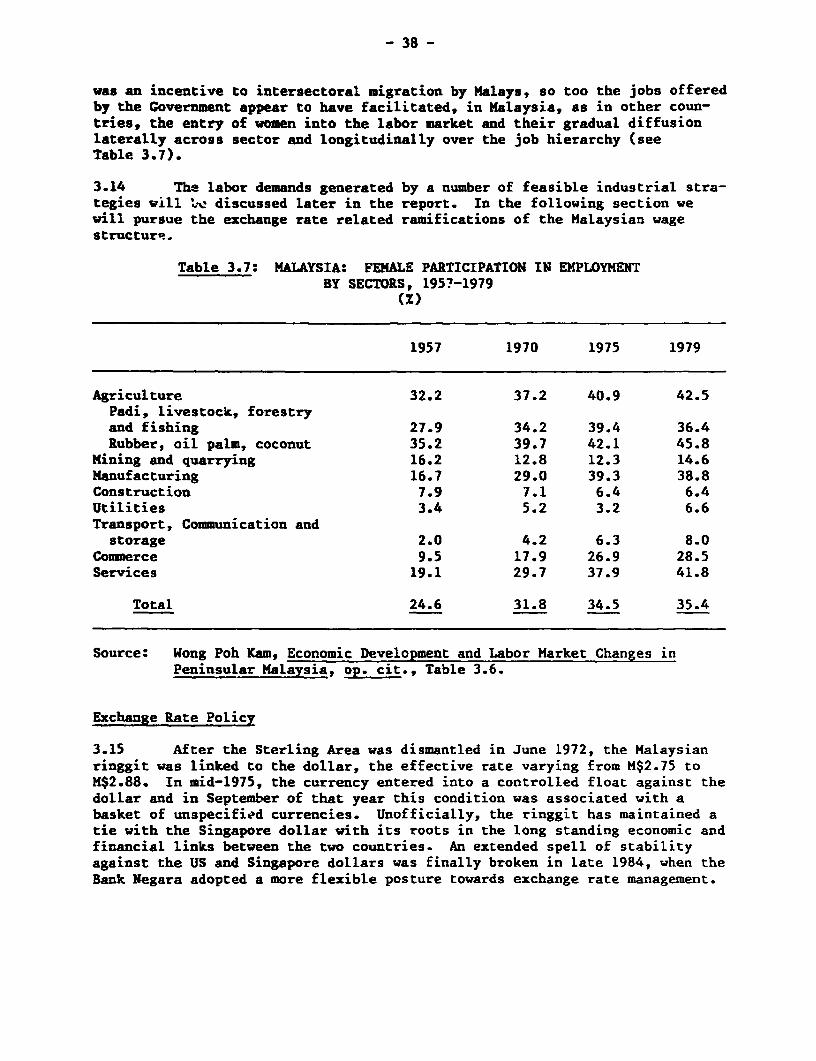
- 38 -
was an incentive to intersectoral migration by Malays, so too the jobs offeredby the Government appear to have facilitated, in Malaysia, as in other coun-tries, the entry of women into the labor market and their gradual diffusionlaterally across sector and longitudinally over the job hierarchy (seeTable 3.7).
3.14 The labor demands generated by a number of feasible industrial stra-tegies will 1.c discussed later in the report. In the following section wewill pursue the exchange rate related ramifications of the Malaysian wagestructure.
Table 3.7: MALAYSIA: FEMALE PARTICIPATION IN EMPLOYMENTBY SECTORS, 1957-1979
(Z)
1957 1970 1975 1979
Agriculture 32.2 37.2 40.9 42.5Padi, livestock, forestryand fishing 27.9 34.2 39.4 36.4Rubber, oil palm, coconut 35.2 39.7 42.1 45.8
Mining and quarrying 16.2 12.8 12.3 14.6Manufacturing 16.7 29.0 39.3 38.8Construction 7.9 7.1 6.4 6.4Utilities 3.4 5.2 3.2 6.6Transport, Communication andstorage 2.0 4.2 6.3 8.0
Commerce 9.5 17.9 26.9 28.5Services 19.1 29.7 37.9 41.8
Total 24.6 31.8 34.5 35.4
Source: Wong Poh Kam, Economic Development and Labor Market Changes inPeninsular Malaysia, op. cit., Table 3.6.
Exchange Rate Policy
3.15 After the Sterling Area was dismantled in June 1972, the Malaysianringgit was linked to the dollar, the effective rate varying from M$2.75 toM$2.88. In mid-1975, the currency entered into a controlled float against thedollar and in September of that year this condition was associated with abasket of unspecifiod currencies. Unofficially, the ringgit has maintained atie with the Singapore dollar with its roots in the long standing economic andfinancial links between the two countries. An extended spell of stabilityagainst the US and Singapore dollars was finally broken in late 1984, when theBank Negara adopted a more flexible posture towards exchange rate management.
- 39 -
3.16 There are two sets of reasons why exchange rate policy might be acritical tool for advancing Malaysia's industrial ambitions. Manipulatingthe exchange rate can serve as an alternative to taz and tariff policiesdesigned to hasten industrialization. Being more neutral, this approach willresult in fewer distortionary side affects and unlike direct controls, it isless susceptible to pressure from interest groups which leaves more discretionin the hands of the central government. By maintaining a suitably competitiveexchange rate, a country can create a system of relative prices that sets inmotion resource transfers favoring ezport and import substituting activities.The transfers are from buyers of imports, or to put it more generally, fromlabor to producers. In effect, a flexible exchange rate policy can reducedomestic labor costs and enhance the returns to tradable goods production, orwhen some of the advantages of lower wages are passed on to final purchasers,increase the competitiveness of exports.
3.17 Maintaining an undervalued rate can be a costly exercise whichmerely transfers resources to foreign buyers, hence the return to an equil-ibrium rate must be the eventual goal. Moreover, the generalized protectionoffered by undervalued exchange rates has a cost and is justified if much ofthe resource reallocation that occurs is efficient, taking into account long-term gains in the form of learning, productivity and managerial improvements.The test of allocative efficiency is the once protected industry's ability tothrive and achieve an above average economic return (to offset the extra costsincurred during the years of protection) after the exchange rate has returnedto equilibrium. If only a fraction of the industries that might emerge arelikely to graduate to efficient and self-sustaining maturity once relativeprice equilibrium is restored, there is the beginning of a case for moreselective intervention. No policymaker can know whether the results a decadeor more later will justify the long-term use of exchange rate policy forindustrial ends. Hence, the risk minimizing strategy has to be properlytimed, that is, exchange rate and other related macroeconomic measures areintroduced when the supply of factors, organizational, information-related andentrepreneurial inputs is assured.
3.18 In this regard, Malaysia has certainly passed the requisite thresh-old. Supplies of semiskilled labor are more than adequate, and in the mediumterm, technical engineering and industrial skills will become more plentiful.The financial and administrative infrastructure is quite well developed andover a twenty year period, the economy has garnered a substantial fund ofindustrial experience. Where uncertainty still lingers is regarding the mana-gerial and marketing capacities of Malaysia's indigenous industrial firms,most of whom are still small by the standards of other East Asian NICs, haveled a sheltered existence and have yet to build the information and sales net-work which is the key to successful exporting.
3.19 The exchange rate can be an important ingredient of long-run indus-trial policy when a certain target real rate is adhered to for a long period.Resource rich primary product-exporting countries, like Malaysia, encounterthe problem of appreciating real effective exchange rates through the follow-ing route: During spells of strong world demand and rising commodity prices,export earnings increase and the nominal exchange rate tends to be fairlyfirm. Because a disproportionate share of development expenditure is absorbed
- 40 -
by construction, services and other domestic nontradables, the relative pricesof these items rise and this propensity is particularly marked when spendingaccelerates in boom years. The twisting of relative prices in favor of non-tradables pulls resources towards nontradables, exerts pressure on wage ratesand results in a real exchange rate appreciation.
3.20 As delineated earlier, Malaysia has pursued a very aggressive devel-opment strategy since the late seventies with high levels of spending oninfrastructure and services. Relative prices followed the classic pattern,with the real estate sector taking the lead in terms of price increases.Wages, because of the factors described above, were slow to respond, but rosequickly in 1981-83. Since the nominal exchange rate was unchanged, the realeffective rate appreciated (see Table 3.8). Public sector investible fundscontinued to flow into the manufacturing sector but private capital increas-ingly sought the high and safe returns from construction, real estate andservices. Since the fourth quarter of 1984, the authorities have allowed theringgit to depreciate against the reference basket of currencies. This, alongwith the check imposed on public spending has served to gradually bring downthe real effective exchange rate. The sharp fall in palm oil prices in thelatter part of 1985 and of petroleum in the first half of 1986 brought renewedpressure on the exchange rate. Estimates of the REER and the NEER using theratio of the domestic CPI to the corresponding trade partner CPI and 1975 asthe base year are shown in Table 3.8. The REER appreciates steadily from thefourth quarter of 1981 to the third quarter of 1984. It then sinks for twoquarters to the level reached in early 1983. The remaining three quarters of1985 witnessed a downward drift until, in line with the sudden fall in oilprices and the depreciation of the dollar, the REER dropped to a point whichin April 1986 approached levels not seen since the early eighties.
3.21 Whether the REER is now close to an "appropriate" level from both ashort- aa well as a longer-term perspective is conjectural. There is littlereason to treat the real effective rate of 1981 as a target for the future ifdomestic and international economic conditions are departing from the situa-tion in the early 1980s. The precipitous decline in Malaysia's terms of tradeand the resulting adjustment problem, as well as the needs of longer-termindustrial and tree-crop development and export growth, would tend to requirea lower real exchange rate for the future. At the sAme time, there isevidence that the growth in wages has been reduced compared to the earlyeighties; real estate investment has been slowing down, industrial produc-tivity wouLd tend to improve as the high investment of recent years bearfruit, and the effects of continued conservative fiscal and monetary policieslead to domestic inflation rates below international rates. These latterfactors would help improve Malaysia's competitiveness.
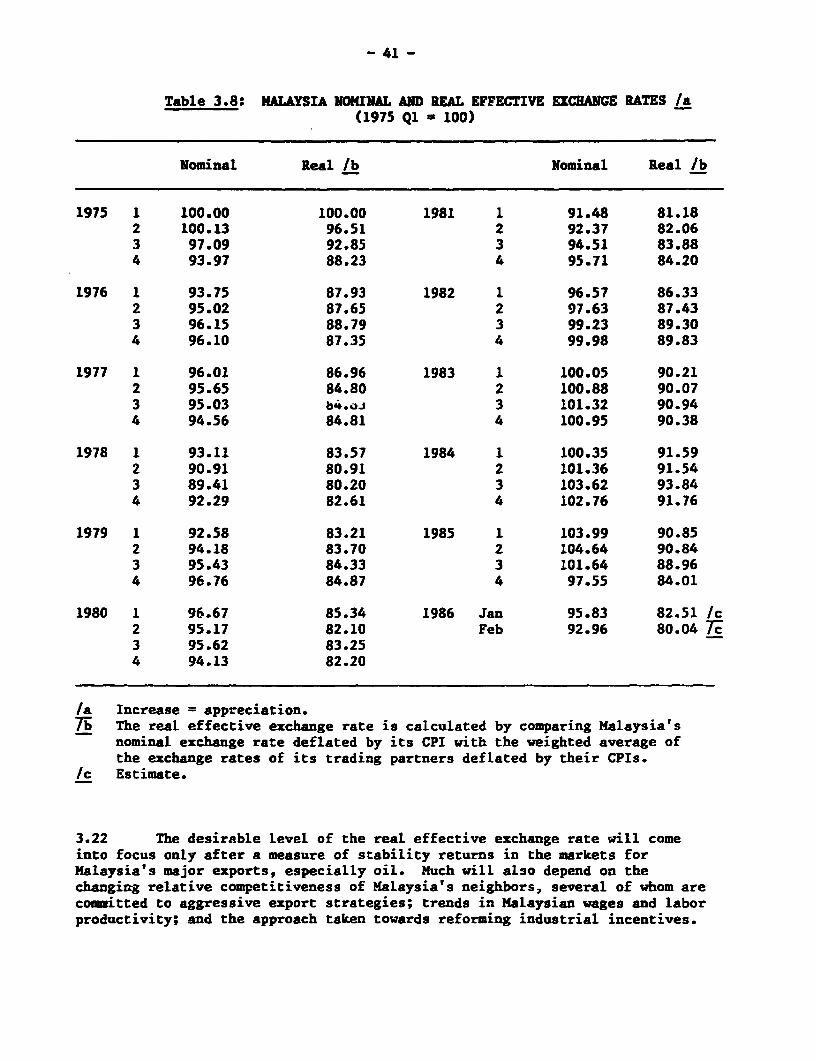
- 41 -
Table 3.8: MALAYSIA NOMINAL AND REAL EFFECTIVE EXCHANGE RATES /a(1975 Ql - 100)
Nominal Real /b Nominal Real /b
1975 1 100.00 100.00 1981 1 91.48 81.182 100.13 96.51 2 92.37 82.063 97.09 92.85 3 94.51 83.884 93.97 88.23 4 95.71 84.20
1976 1 93.75 87.93 1982 1 96.57 86.332 95.02 87.65 2 97.63 87.433 96.15 88.79 3 99.23 89.304 96.10 87.35 4 99.98 89.83
1977 1 96.01 86.96 1983 1 100.05 90.212 95.65 84.80 2 100.88 90.073 95.03 b.4.0. 3 101.32 90.944 94.56 84.81 4 100.95 90.38
1978 1 93.11 83.57 1984 1 100.35 91.592 90.91 80.91 2 101.36 91.543 89.41 80.20 3 103.62 93.844 92.29 82.61 4 102.76 91.76
1979 1 92.58 83.21 1985 1 103.99 90.852 94.18 83.70 2 104.64 90.843 95.43 84.33 3 101.64 88.964 96.76 84.87 4 97.55 84.01
1980 1 96.67 85.34 1986 Jan 95.83 82.51 /c2 95.17 82.10 Feb 92.96 80.04 7T3 95.62 83.254 94.13 82.20
/a Increase = appreciation.7T The real effective exchange rate is calculated by comparing Malaysia's
nominal exchange rate deflated by its CPI with the weighted average ofthe exchange rates of its trading partners deflated by their CPIs.
/c Estimate.
3.22 The desirable level of the real effective exchange rate will comeinto focus only after a measure of stability returns in the markets forMalaysia's major exports, especially oil. Much will also depend on thechanging relative competitiveness of Malaysia's neighbors, several of whom arecommitted to aggressive export strategies; trends in Malaysian wages and laborproductivity; and the approach taken towards reforming industrial incentives.
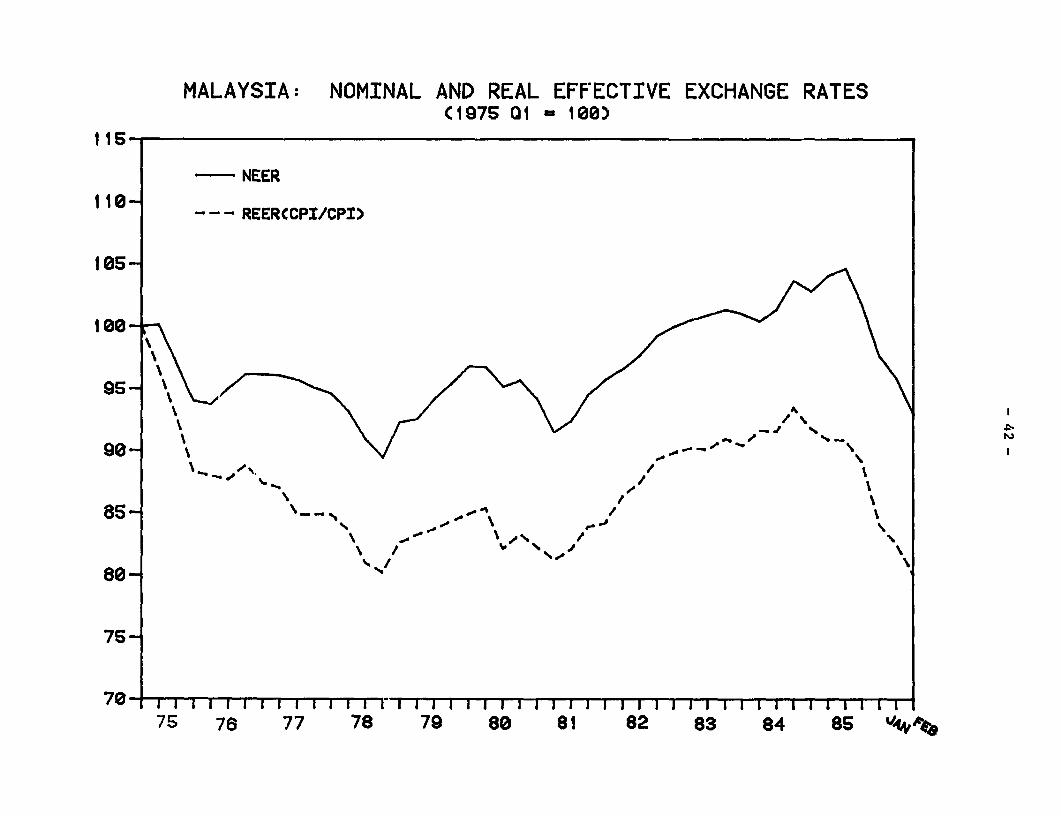
MALAYSIA: NOMINAL AND REAL EFFECTIVE EXCHANGE RATES(197S 01 100)
1s6-
NEER
1 10 - - - REERCCPX/CPX)
185_
906
4% /~~~~~~~~~~~~~~~~~~~~~~~~~~~~~~4
805
75-
70-75 78 77 78 79 80 81 82 83 84 86 V4*'
- 43 -
CHAPTER IV: THE FUTURE OF EXPORTS
4.01 Every economy must first look to its own factor resources whendrawing up a development program. The management of factor supplies and themanner in which they are augmented through improvements in quality and tech-nology is a necessary step towards translating ambition into achievement. Buteconomic links between the national players in the world's market place havebeen multiplying and the percentage of the traded national product hasexpanded remarkably in even the largest economies. For small countries whichhave relied upon external demand to support growth, the dependence is muchmore acute. The ratio of exports to GNP is 53X in Malaysia, 38Z in Korea, and124% in Singapore. Since the import intensity of investment, and lessdirectly consumption, is also quite high, such economies cannot expand withoutadding to their ezternal debt unless exports can be made to grow at a certainrate. The precariousness of the small open economies was clearly revealed inthe early eighties, when the attempt to maintain growth momentum in the faceof slowly increasing world trade combined with higher interest rates to dragmany of the NICs into severe debt crises. If anything the point was drivenhome twice over in 1984 and 1985. First, the strength of business recovery inthe U.S. in conjunction with the overvaluation of the dollar was a bonanza forexporters the world over. Total world trade expanded 9% in 1984, that ofmanufactures by 12Z. A third of the overall increase was traceable to demandin the U.S. and, as can be seen from Table 4.1, sales to the U.S. were respon-sible, in many cases for half or more of the export growth from countries onthe Pacific rim. In the aggregate, the US accounted for close to 96% of thegrowth in manufactured exports of the East Asia region during 1980-84. When,as has been the case over past cycles, the U.S. economy slackened in 1985, theeffects were immediate and by virtue of their suddenness, a source of conster-nation throughout East Asia. The Latin American NICs, who appeared to begaining a grip on their debt problems, once again found themselves on a knifeedge.
- 44 -
Table 4.1: CROWTH OF EXPORTS TO THE US
Growth in goodsexports to US US US
($ value) share of share of 19841983-84 1982-84 1983 exports export growth
___ _. __ ___ _ _(z) - ___ _ _ _ _ _ _
United Kingdom 8.3 5.3 13.8 41.0Japan 38.3 64.0 29.5 79.4Hong Kong 34.3 56.3 32.2 40.2Korea 24.5 63.6 33.8 79.7Singapore 22.2 85.1 18.1 36.4China 60.7 56.0 7.8 41.2Malaysia 22.7 63.4 13.2 25.8Philippines 15.7 30.6 36.3 90.2Thailand 35.9 47.1 15.0 55.3Argentina 20.9 -8.3 9.9 19.4Brazil 46.8 79.8 23.2 54.1Chile -15.9 13.8 28.1 -Mexico 22.9 35.9 58.1 86.9
Source: Data Resources Inc.
4.02 About 26% of Malaysia's export growth in 1984 was the result ofsales to the U.S., but that country accounted for much of the gains in criti-cal items like garments and semiconductors. Demand from other industrial eco-nomies was responsible for perhaps two thirds of the remainder, so that, intotal most of the surge in manufactures and commodities other than palm oilcAme from the advanced countries. Since exports will have to rise faster thanCUP in the coming years, if Malaysia is to stabilize the debt obligations, itseconomic scores will be decisively affected by how successfully the OECD coun-tries can solve the afflictions that have lowered the growth averages from3.4% in the 1970s to 1.5% in the 1980s. Concerning the medium term the OECDcountries look as if they are headed toward a 3% growth rate in 1986. As thefull effects of lower petroleum and commodity prices filter through thesystem, this might rise to 3.5-4% p.a. in 1987-88 helped perhaps by theapproach of elections in the U.S. and the need to find a solution to highrates of unemployment in Western Europe.
Export Prospects: Commodity Markets
4.03 Commodity prices fell by 10% in real terms over the course of thefifties and this rate of decline continued through the sixties. A stronglyexpanding world economy in the early seventies served to reverse the gradualdescent and together with other events made this a turbulent and excitingdncade for producers. Crop failures in 1973-74, fluctuating exchange rates,inflation, and the aggressive behavior of speculators produced cycles of
- 45 -
unusual amplitude. Commodity prices rose to a historical peak in 1971-3 andclimbed again during 1975-77 before commencing a long slow slide whichreturned them by 1985 to real levels seen in the early fifties. Compared tothe price movements that accompanied cycles in the seventies, commodityindicas responded with less alacrity to the 1983-84 business upwelling andalso subsided more quickly in 1985.
4.04 Many parameters appear to be changing and they indicate a return totrends pushed out of mind by the brisk price movements of the seventies.Commodity supplies--agricultural as well as mineral-look healthier than theyhave for a long time, a synergistic outcome of government promotion, technolo-gical advances and the normal response of output to high prices. Further,many countries are being driven by the thirst for foreign exchange intoenlarging their sales at a time when markets are softening. On the side ofdemand, the computerization of stockholding, combined with higher interestrates, has resulted in a lower inventory demand and a reduction of certainstockpiles, most significant being the large metal holdings of the US govern-ment. Relative price stability on a worldwide scale has taken the wind out ofspeculative demand and the shift in consumer preferences towards servicesreferred to above, has pared the coefficients linking commodity consumptionwith GNP growth. Manufacturers have learned to economize cn raw materials andnumerically controlled tools have cut waste. Lastly the hand of substitutionhas been at work, ceaselessly. Natural rubber's share of the total worldmarket for elastomers was 33Z in 1983, compared with 66Z in 1950; while theuse of substitutes such as aluminum and success at lowering metal content andincreasing recovery has nearly halved the co4gumption of tin per unit of GNPin the OECD countries between 1970 and 1983."
4.05 With the share of tin down to 3.2Z of Malaysia's exports in 1984 andthe slowly increasing world demand overshadowed by large stocks and signifi-cant excess capacity not just in Malaysia but also in Thailand, Indonesia andBrazil, the commodity seems destined to continue sinking in the export hori-zon. But over the foreseeable future, rubber, that contributed 9.5X of
7/ See P.F. Drucker, The Changing World Economy, Foreign Affairs, Spring1986, for an interesting discussion of the global implications, and E.D.Larson, M.H. Ross and R.H. Williams, Beyond the Era of Materials,Scientific Americar, June, 1986 for an analysis of the factors behind thefalling demand for certain metals.
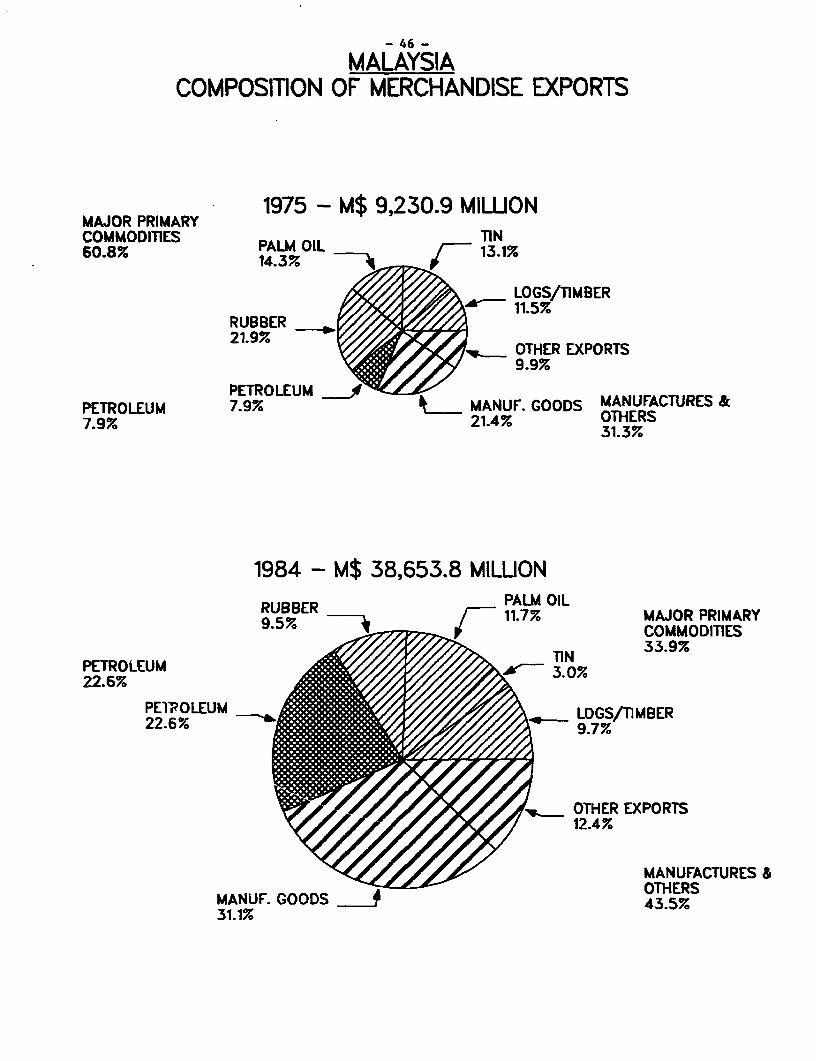
- 46 -
MALAYSIACOMPOSITION OF MERCHANDISE EXPORTS
1975 - M$ 9,230.9 MILUONMAJOR PRIMARYCOMMODITIES TIN60.8% PALM OIL 13.1%
LOGS/TIMBER
RUBBER21.9% , OTHER EXPORTS
9.9%
PETROLEUMMPETROLEUM 7.9% MANUF. GOODS MANUFACTURES &7,9% 21.4% OTHERS
31.3%
1984 - M$ 38,653.8 MILUONRUBBER PALM OIL
B5BR 11.7% MAJOR PRIMARYCOMMODITIES
TIN ~ 33.9%PETROLEUM 3.0%22.6%
PETPOLEUM 3........ ELOGS/TIMBER
9.7%
X r /OTHER EXPORTS12.4%
MANUFACTURES &
MANUF. GOODS + 43O5%31.1%435
- 47 -
exports in t,3S4 and palm oil, the source of another 12%, will remainimportant,8
4.06 Malaysia has been and remains the dominant producer and exporter ofrubber in the world. In spite of gains by new challengers such as Thailandand Indonesia, exports grew 2.7% p.a. between 1965 and 1984 and at the end ofthis period Malaysia held 36% of the market as against 38% two decadesearlier. Although natural rubber, in the company of other commodities,enjoyed more favorable terms during the seventies, the industry has beenbuffetted by falling real prices ever since the close of the Korean war. Inconstant terms, prices declined by two thirds from 1950 to 1984 but even thisdid not stem the march of synthetic rubber whose share of total elastomerconsumption doubled, to 66%, in the mid-eighties. Rubber production flour-ished in the face of falling prices because yields rose 2Z p.a., but as pro-ductivity growth realized from cloning techniques seems to be diminishing, thehigher cost producers among the top five, and especially Malaysia, look to thefuture with some trepidation. After a respite in the seventies, prices beganto slip once again after 1980 and how they behave henceforth will depend verymuch on what happens to the cost of petroleum and to automotive demand. Aprolonged slump in oil prices, by cheapening synthetic rubber, would havegrave consequences for the natural rubber industry, but most analysts areassuming that oil prices should begin recovering in the nineties, with theresult that natural rubber prices, after some further weakening during thesecond half of the eighties, could recover in the next decade.
4.07 Of greater concern perhaps is the slow 1.2% p.a. growth in thedemand for automobiles in advanced countries. As the automotive sector isresponsible for 75% of the natural rubber consumed this will weigh heavily onthe industry. Sellers of natural rubber stand to gain from the progressiveradialization of tires r.ince, although these have twice the life span of thecross-ply variety, they have a higher natural rubber content, and reduced pumpprices of gasoline may encourage motorists to drive more, thereby boostingtire demand. Estimates of gasoline price elasticities in the U.S. for the
81 Tin traded at E 8,145 per ton on the London MetaL Exchange on October24th 1985 when trading was suspended. Resumed trading through informalchannels and through markets in Kuala Lumpur and Thsiland has been atprices ranging from E 3,500-E 4,200. In 1985, Malaysia produced 36,300tons, but as a result of the fall in prices just 199 gravel mines wereoperating in early 1986 as against 360 in 1981. The number of dredgeswas down to 28 from 60 five years ago. Approximately 22,000 people wereemployed by the tin mines, but closures have cut their numbers to lessthan 12,000. Since it costs M$25-26 to produce 1 kg of tin using gravelpumps and M$14-20 per kg by means of dredging, the M$14.20 per kg priceat which tin sold in the Kuala Lumpur market during the second quarter of1986, inflicted considerable hardship. The size of worldwide stocksmakes it unlikely that prices will soon recover and hence Malaysia'sproduction might drop below 20,000 tons in 1986. Since some gravel minesare susceptible to flooding if they are not worked, a portion of thecountry's mining capacity will be irretrievably lost.
- 48 -
1960-80 period suggest that short-term elasticities lie in the -0.2 t -0. 4range while longer-run elasticities range from -0.7 to as much as -1._/ Butcountering these positive shifts will be the downsizing of tires, advances inretreading and technological gains that promote tire lonigevity. Forecasts ofhow much rubber production could be absorbed by 2000 vary widely (see Table4.2). A figure of 6 million tons is not implausible, implying an 2.3% p.a.increase from the 4.2 million ton base in 1984. In this tightening market,Malaysia will have to struggle hard to maintain her market share against otherlower cost producers (especially Indonesia) with more elastic supply poten-tial. Rubber can remain, until at least the end of the century, an importantexport but it is a comodity well past its prime in Malaysia's primary productstable.
9/ C. Kouris, Energy Demand Elasticities in Industrialized Countries: ASurvey, The Energy Journal, Vol. 4, No. 3, 1983.
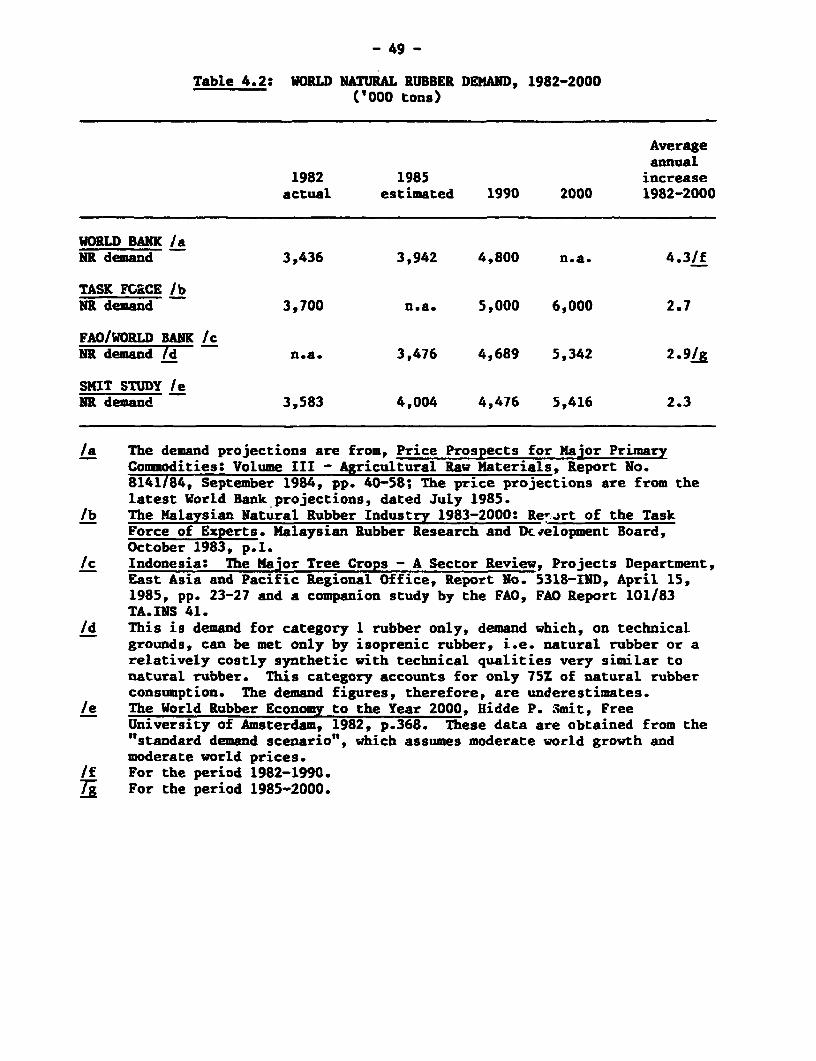
- 49 -
Table 4.2: WORLD NATURAL RUBBER DEMAND, 1982-2000('000 tons)
Averageannual
1982 1985 increaseactual estimated 1990 2000 1982-2000
WORLD BANK /aNR demand 3,436 3,942 4,800 n.a. 4.3/f
TASK FOGCE lbNR demand 3,700 n.a. 5,000 6,000 2.7
FAOIWORLD BANK /cNR demand /d n.a. 3,476 4,689 5,342 2.9/g
SMIT STUDY /eNR demand 3,583 4,004 4,476 5,416 2.3
/a The demand projections are from, Price Prospects for Major PrimaryCommodities: Volume III - Agricultural Raw Materials, Report No.8141/84, September 1984, pp. 40-58; The price projections are from thelatest World Bank projections, dated July 1985.
/b The Kalaysian Natural Rubber Industry 1983-2000: Rev irt of the TaskForce of Experts. Malaysian Rubber Research and Dckelopment Board,October 1983, p.l.
/c Indonesia: The Major Tree Crops - A Sector Review, Projects Department,East Asia and Pacific Regional Office, Report No. 5318-IND, April 15,1985, pp. 23-27 and a companion study by the FAO, FAO Report 101/83TA.INS 41.
/d This is demand for category 1 rubber only, demand which, on technicalgrounds, can be met only by isoprenic rubber, i.e. natural rubber or arelatively costly synthetic with technical qualities very similar tonatural rubber. This category accounts for only 75Z of natural rubberconsumption. The demand figures, therefore, are underestimates.
/e The World Rubber Economy to the Year 2000, Hidde P. ;mit, FreeUniversity of Amsterdam, 1982, p.368. These data are obtained from the'tstandard demand scenario", which assumes moderate world growth andmoderate world prices.
If For the period 1982-1990.7j For the period 1985-2000.
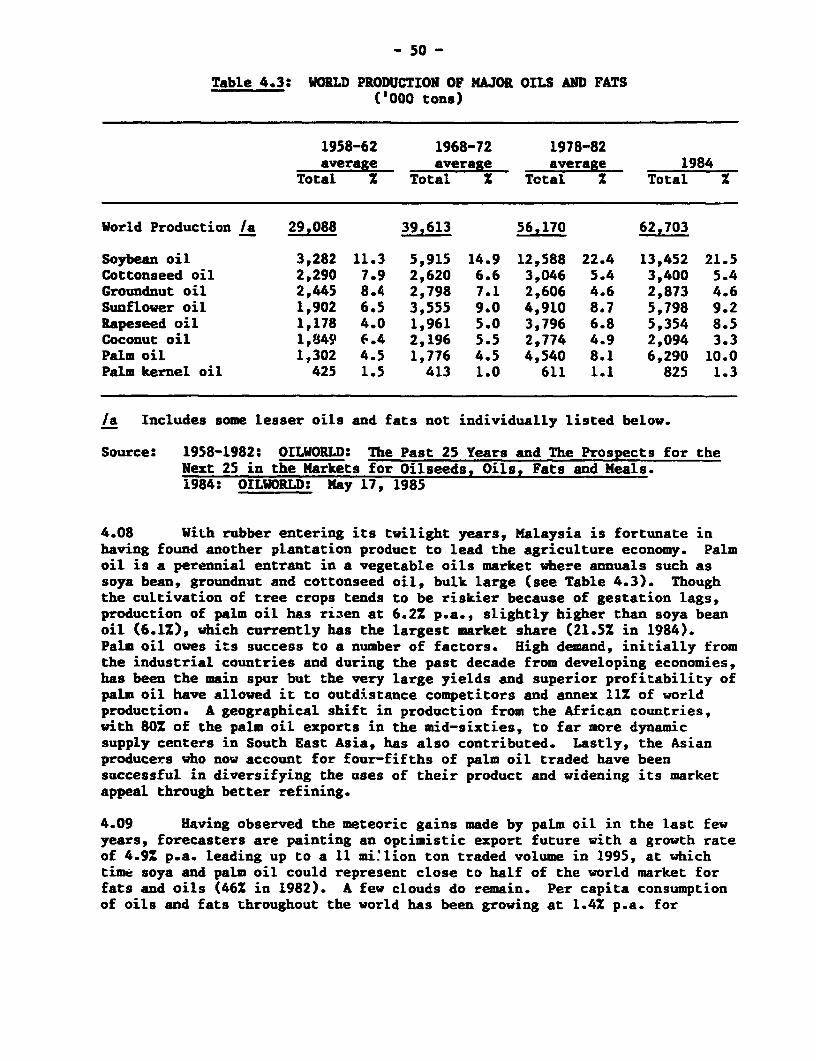
- 50 -
Table 4.3: WORLD PRODUCTION OF MAJOR OILS AND FATS('000 tons)
1958-62 1968-72 1978-82average average average 1984
Total Z Total Z Total X Total Z
World Production /a 29,088 39,613 56,170 62,703
Soybean oil 3,282 11.3 5,915 14.9 12,588 22.4 13,452 21.5Cottonseed oil 2,290 7.9 2,620 6.6 3,046 5.4 3,400 5.4Groundnut oil 2,445 8.4 2,798 7.1 2,606 4.6 2,873 4.6Sunflower oil 1,902 6.5 3,555 9.0 4,910 8.7 5,798 9.2Rapeseed oil 1,178 4.0 1,961 5.0 3,796 6.8 5,354 8.5Coconut oil 1,849 6.4 2,196 5.5 2,774 4.9 2,094 3.3Palm oil 1,302 4.5 1,776 4.5 4,540 8.1 6,290 10.0Palm kernel oil 425 1.5 413 1.0 611 1.1 825 1.3
/a Includes some lesser oils and fats not individually listed below.
Source: 1958-1982: OILWORLD: The Past 25 Years and The Prospects for theNext 25 in the Markets for Oilseeds, Oils, Fats and Meals.1984: OILWORLD: May 17, 1985
4.08 With rubber entering its twilight years, Malaysia is fortunate inhaving found another plantation product to lead the agriculture economy. Palmoil is a perennial entrant in a vegetable oils market where annuals such assoya bean, groundnut and cottonseed oil, bulk large (see Table 4.3). Thoughthe cultivation of tree crops tends to be riskier because of gestation lags,production of palm oil has rizen at 6.2Z p.a., slightly higher than soya beanoil (6.1Z), which currently has the largest market share (21.5Z in 1984).Palm oil owes its success to a number of factors. High demand, initially fromthe industrial countries and during the past decade from developing economies,has been the main spur but the very large yields and superior profitability ofpalm oil have allowed it to outdistance competitors and annex 11 of worldproduction. A geographical shift in production from the African countries,with 80Z of the palm oil exports in the mid-sixties, to far more dynamicsupply centers in South East Asia, has also contributed. Lastly, the Asianproducers who now account for four-fifths of palm oil traded have beensuccessful in diversifying the uses of their product and widening its marketappeal through better refining.
4.09 Having observed the meteoric gains made by palm oil in the last fewyears, forecasters are painting an optimistic export future with a growth rateof 4.92 p.a. leading up to a 11 mi'lion ton traded volume in 1995, at whichtime soya and palm oil could represent close to half of the world market forfats and oils (462 in 1982). A few clouds do remain. Per capita consumptionof oils and fats throughout the world has been growing at 1.42 p.a. for
- 51 -
25 years and was 13 kg in 1982. But in the industrial countries, exceptingJapan, per capita intake was 30 kg which is close to saturation. If anything,for health related reasons, the trend may be downwards and towards soft vege-table oils, which palm oil is not. Hence export hopes rest not on furtherpenetration into protected EEC markets but in finding buyers from among thedeveloping nations, where the per capita consumption is a modest 8.1 kg.
4.10 Because there is such a vast unsatisfied demand particularly in theAsian economies for cooking oil, forecasts call for a 2% p.a. increase in percapita use, a not excessive figure in terms of wants but one that might bedifficult to translate into effective demand. The great surge in Asian andMid-Eastern oil consumption during 1975-82 was assisted by the foreignexchange and income gains arising from changes in petroleum Prices. Arabmarkets are also approaching satiety and the economic difficulties confrontingOPEC are bound to reduce the flow of remittances to countries such asPakistan, India and Sri Lanka. Tne first cwo are among the biggest importersof refined vegetable oils and it is the well-being of their economies thatwill be decisive for the growth of palm oil trade. At this stage it is impos-sible to determine how tightly constrained the Asian nations will be byforeign exchange availability. They might manage to find the resources neededto raise the volume of their consumption by 4.52 annually, though this willdepend on the strength and duration of future business cycles, on the futurecourse of palm oil prices and trends in domestic production. Hard times forthe industry and the accumulation of nearly 900,000 tons in unsold inventoriesby the end of 1985, stemmed from a reduction in demand from India and a shiftby traditional South Asian buyers towards more attractively priced Indonesianpalm oil. Most recent projections assume that Malaysian production will reach6.5 million tons by 1995. Indonesia's output will be 2.3 million tons andWest Africa will continue to stagnate. Based on average OECD growth rates of3.0-3.5% which set the pace for expansion elsewhere, the projected tradedvolume will be absorbed only if prices are significantly lower (in constant1983 dollars) during the 1985-95 period. Lesser growth in the world economy,greater competition from producers of soya oil, a weaker dollar that restoresthe U.S. standing in the vegetable oil market, all of which are on the cards,could limit the increase in palm oil exports, or, alternatively, force priceslower. These factors have already begun to influence prices which had droppedto US$243 per ton by March 1986 from an average of US$729 in 1984.
Export Prospects: Petroleum
4.11 Malaysia produced 446,832 b.p.d. of oil in 1984 and exported343,508 b.p.d. at an average price of $29.87 per barrel, about 30% of itthrough sales on the spot market. The average daily production in 1985 was446,100 b.p.d. with exports running at 354,500 b.p.d. but at a price, th-t forthe year as whole, averaged $27.50 per barrel. About 40% of the oil was soldon the spot market. Petroleum is the country's single largest traded item,encompassing slightly less than a quarter of all the earnings from merchandisesales overseas. How it fares during the second half of the eighties willhave far-reaching consequences for the current balance, the health of thefederal budget and the development program to be launched under the auspicesof the Fifth Plan.
- 52 -
4.12 There is no shortage of speculation concerning the trajectory oilprices and production. Out of all the analysis a number of threads can beglimpsed which make it possible to very roughly chart the terrain ahead. Theoil market has been transformed in a number of ways. OPEC's share of oilproduced during 1984 was just 33% as against 56% in 1973. Oil's share intotal primary energy consumed has tumbled to 432. Higher real interest rates,expectations of further price erosion and a supply situation made easier bythe desperate financial straits of some producers and the large (100 millionbarrels) floating stocks held by Saudi Arabia and Kuwait, have persuaded oilcompanies to reduce inventories. In two of the largest consuming nations, theU.S. and Japan, the coefficients of total energy use in g.d.p. have droppedsubstantially, with oil having taken an especially sharp plunge. There aremany reasons: cars, airplanes and industrial boilers are more fuel efficient,energy intensive basic industries are growing slowly, houses are betterinsulated, coal and nuclear energy are being used more extensively to generateelectricity and after the price of oil rose above $20 per barrel, a host ofindustries, cement, bricks, distillation, metallurgy switched to alternativefuels. A 40% decline in real prices since 1981 may have taken a little of theedge from oil conservation, but the trend is likely to continue, reinforced bychanges in consumption patterns and sustained by the long lives of structuresand capital equipment being put into place.
4.13 So much for longer term demand; the disarray within OPEC, a persist-ing excess supply of nearly 1.5 million b.p.d. and uncertainty about futurereal interest rates have clouded the short-term outlook. The OECD countriesseem headed towards an expansionary phase which should strengthen demandt Butthe sophistication of their buying and refining practices has strengthenedtheir hand vis-a-vis the producers. Japan, for instance, now purchases 50-60%of its oil on the spot market as against 20Z a few years earlier and Japanesetrading houses are aggressive in hunting down bargains. An enlarged catalyticcracking capacity means that a consumer is less tied to a particular oil pro-eucer and can instead refine other types of crude that are more cheaplyavailable.
4.14 Oil producers have placed themselves at a tactical disadvantage bybecoming mired in costly development programs that must be paid for throughsales of oil in a glutted market. As long as Saudi Arabia was able to produceat less than its OPEC allotment (25Z or 4 million b.p.d.) other members couldpump more without depressing prices. But Saudi Arabia needs to pump between2.5-3.0 million b.p.d. to produce the associated gas needed for its petro-chemical, metal and distillation plants (output was in the region of 4.5 mil-lion b.p.d. in mid-1986). Having incurred current account deficits of$20 billion and $25 billion in 1984 and 1985 respectively, the country is alsoapproaching, though more slowly, the budgetary bind many other producers arenow in.
4.15 Beyond 1990 the chances of an upturn in prices are fairly strong forthree supply linked reasons. Lower returns and the increasing disassociationof the major oil companies from production activities, have since about 1981-82 made exploration unappealing. This is beginning to be felt in the reserveproduction ratios (R/P). The average R/P ratio was 35:1 in 1983 but it variedfrom 100:1 in the Gulf areas down to 20:1 elsewhere. New reserves amounting
- 53 -
to five billion barrels per year have been added mostly in remote areas whereproduction is costly. Currently about half of world production is from areaswhere R/P ratios are 20:1. Until producers arrive at an understanding thatwill help to erase the oversupply and real interest rates decrease, petroleumprices will remain weak although the economics of production in the North Seaand the U.S. should prevent a prolonged spell in the $10-$12 range. Even ifthe trend in reserve findings were to continue, while world demand grows 2Zp.a., the R/P ratio will be 15:1 by 1992. Proven worldwide reserves rose from680 billion barrels in 1983 to 707 billion barrels in 1984, but almost theentire increase was in the Gulf region. If exploration continues to wane,non-OPEC reserves and supply conditions would once again permit the cartel topush up prices in the early nineties.
4.16 This is conjecture, but it is informed conjecture being voiced byexperienced market observers, who are taking note of the Soviet Union'sstruggle to maintain its output and sales, now that the large, more easilyaccessible fields are past their prime, the share of U.S. production originat-ing in high cost secondary recovery from depleted fields; and the approachingproduction peaks in Mexico, Algeria and the North Sea.
4.17 Malaysia cannot expect to recoup the revenue lost as a result offalling oil prices by raising production to 510,000 b.p.d., the target for1986, and exports to 395,700 b.p.d. Total earnings from petroleum exportswere US$3.55 billion in 1985. If the price per barrel in 1986 averages US$15per barrel - during April 1986 the various grades of Malaysian crude fetchedbetween US$12.45 (Bintulu) and US$13.50 (Tapis) - export proceeds will beabout US$2.2 billion. In the nineties, however, Malaysia, with current provenreserves of $3.5 billion barrels, enough for 22 years production can lookforward to higher economic returns.
4.18 The above suggests that four commodities-rubber, palm oil, tin andpetroleum-which provided 472 of Malaysia's exports in 1985, may be hemmed inby constraints arising from declining prices and slowly rising demand in thelatter part of the eighties. Resource balancing will be much trickier duringthe Fifth Plan than it was in the Fourth and its search for manufacturedexports will have to be pursued more vigorously than ever.
Export Prospects: Manufactures
4.19 The past behaviour of world trade in manufactured goods is anindifferent guide to market possibilities in the years ahead but it remainsthe only solid empirical bridge that we have to the future. World trade inmanufactures increased by nearly 10% p.a. during 1966-73 and at half that ratefrom 1974 to 1980. However, the manufactured exports of the LDCs performedmuch better in the second half of the seventies growing by 10% p.a. (see Table4.4) although their share of LDCs' total exports (about 20% from 1966 to 1980)changed little (see Table 4.5).
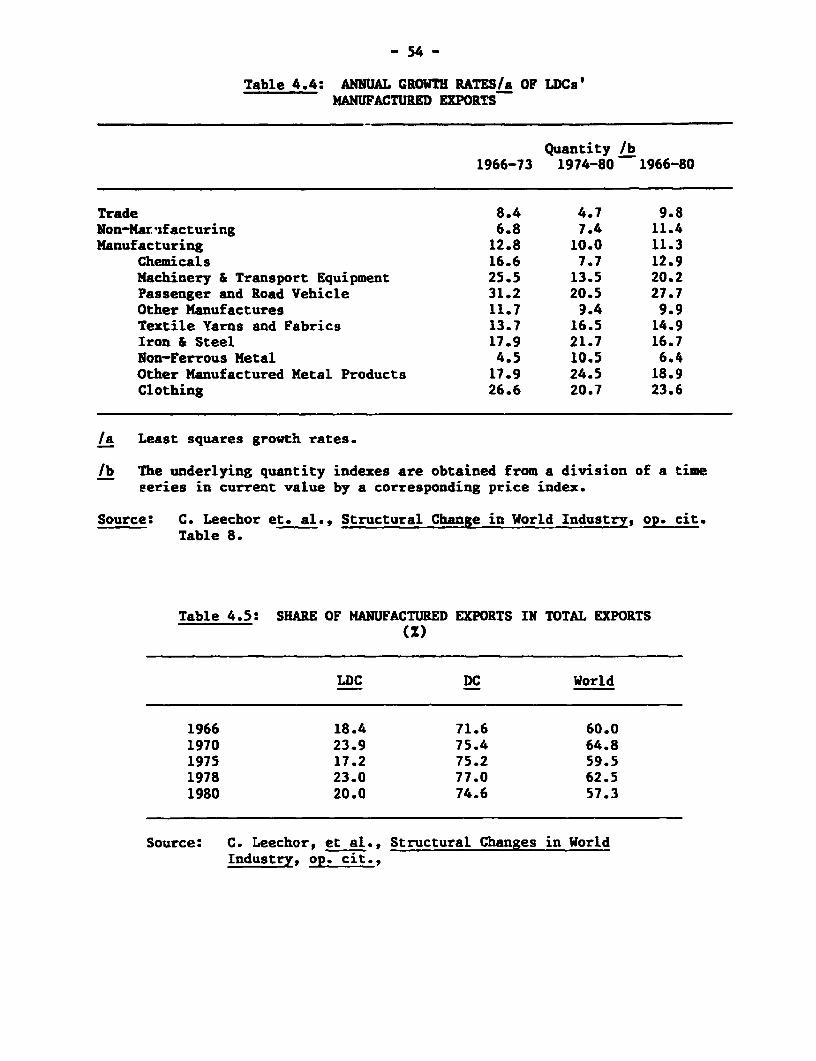
- 54 -
Table 4.4: ANNUAL GROWTH RATES/a OF LDCJ'MANUFACTURED EXPORTS
Quantity /b1966-73 1974-80 1966-80
Trade 8.4 4.7 9.8Non-Mar zfacturing 6.8 7.4 11.4Manufacturing 12.8 10.0 11.3
Chemicals 16.6 7.7 12.9Machinery & Transport Equipment 25.5 13.5 20.2Passenger and Road Vehicle 31.2 20.5 27.7Other Manufactures 11.7 9.4 9.9Textile Yarns and Fabrics 13.7 16.5 14.9Iron & Steel 17.9 21.7 16.7Non-Ferrous Metal 4.5 10.5 6.4Other Manufactured Metal Products 17.9 24.5 18.9Clothing 26.6 20.7 23.6
/a Least squares growth rates.
lb The underlying quantity indexes are obtained from a division of a timeseries in current value by a corresponding price index.
Source: C. Leechor et. al., Structural Change in World Industry, op. cit.Table 8.
Table 4.5: SHARE OF MANUFACTURED EXPORTS IN TOTAL EXPORTS(z)
LDC DC World
1966 18.4 71.6 60.01970 23.9 75.4 64.81975 17.2 75.2 59.51978 23.0 77.0 62.51980 20.0 74.6 57.3
Source: C. Leechor, et al., Structural Changes in WorldIndustry, op. cit.,
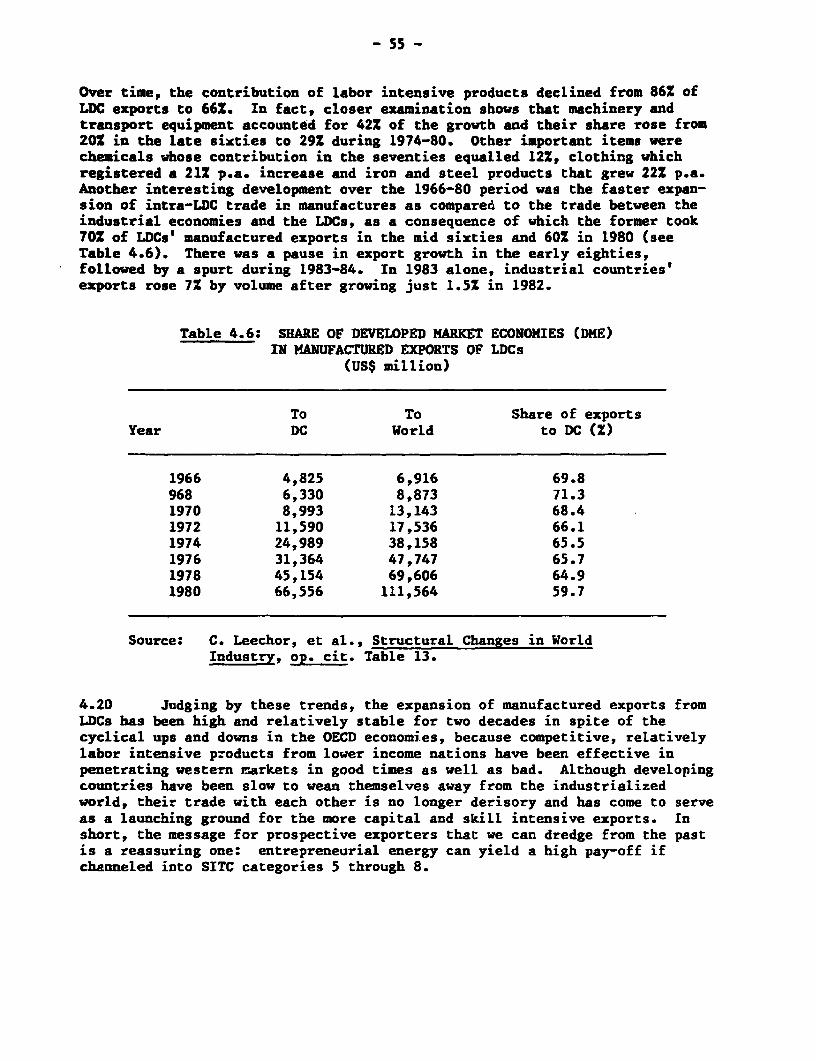
- 55 -
Over time, the contribution of labor intensive products declined from 86X ofLDC exports to 66Z. In fact, closer examination shows that machinery andtransport equipment accounted for 42Z of the growth and their share rose from202 in the late sixties to 29Z during 1974-80. Other important items werechemicals whose contribution in the seventies equalled 121, clothing whichregistered a 212 p.a. increase and iron and steel products that grew 22Z p.a.Another interesting development over the 1966-80 period was the faster expan-sion of intra-LDC trade in manufactures as compared to the trade between theindustrial economies and the LDCs, as a consequence of which the former took70X of LDCs' manufactured exports in the mid sixties and 601 in 1980 (seeTable 4.6). There was a pause in export growth in the early eighties,followed by a spurt during 1983-84. In 1983 alone, industrial countries'exports rose 71 by volume after growing just 1.51 in 1982.
Table 4.6: SHARE OF DEVELOPED MARKET ECONOMIES (DME)IN MANUFACTURED EXPORTS OF LDCs
(US$ million)
To To Share of exportsYear DC World to DC (Z)
1966 4,825 6,916 69.8968 6,330 8,873 71.31970 8,993 13,143 68.41972 11,590 17,536 66.11974 24,989 38,158 65.51976 31,364 47,747 65.71978 45,154 69,606 64.91980 66,556 111,564 59.7
Source: C. Leechor, et al., Structural Changes in WorldIndustry, op. cit. Table 13.
4.20 Judging by these trends, the expansion of manufactured exports fromLDCs has been high and relatively stable for two decades in spite of thecyclical ups and downs in the OECD economies, because competitive, relativelylabor intensive products from lower income nations have been effective inpenetrating western moarkets in good times as well as bad. Although developingcountries have been slow to wean themselves away from the industrializedworld, their trade with each other is no longer derisory and has come to serveas a launching ground for the more capital and skill intensive exports. Inshort, the message for prospective exporters that we can dredge from the pastis a reassuring one: entrepreneurial energy can yield a high pay-off ifchanneled into SITC categories 5 through 8.
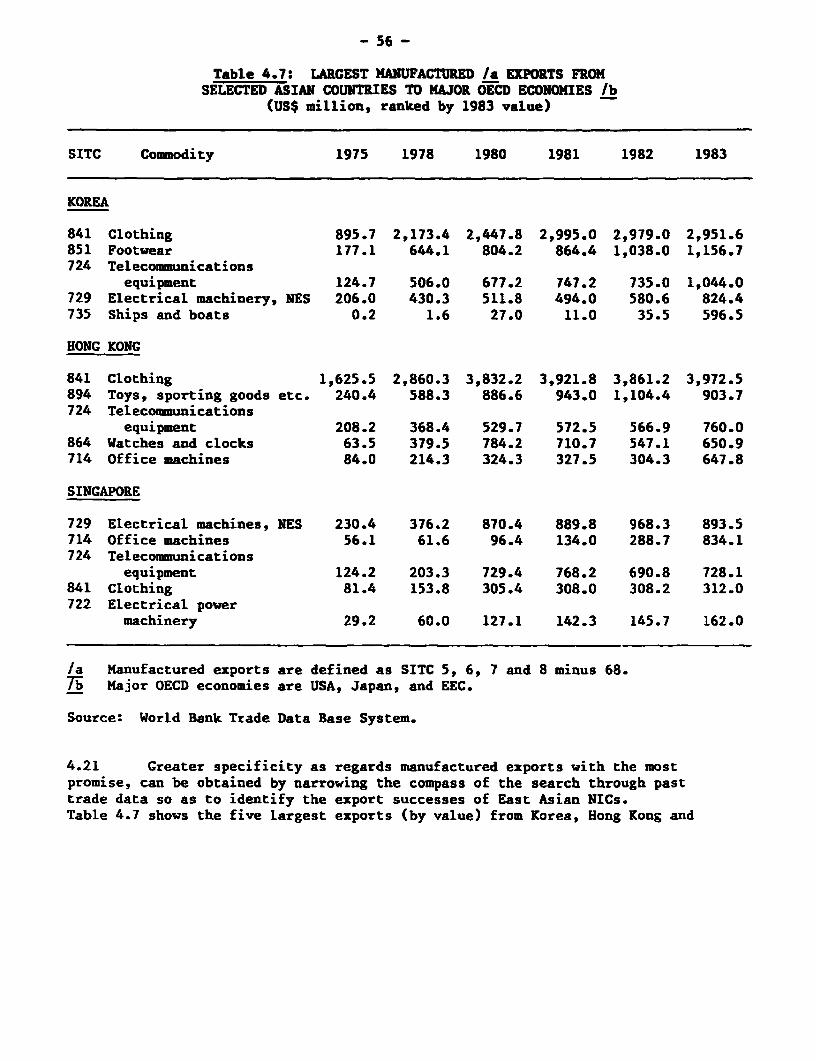
- 56 -
Table 4.7: LARGEST MANUFACTURED /a EXPORTS FROMSELECTED ASIAN COUNTRIES TO MAJOR OECD ECONOMIES /b
(US$ million, ranked by 1983 value)
SITC Commodity 1975 1978 1980 1981 1982 1983
KOREA
841 Clothing 895.7 2,173.4 2,447.8 2,995.0 2,979.0 2,951.6851 Footwear 177.1 644.1 804.2 864.4 1,038.0 1,156.7724 Telecommunications
equipment 124.7 506.0 677.2 747.2 735.0 1,044.0729 Electrical machinery, NES 206.0 430.3 511.8 494.0 580.6 824.4735 Ships and boats 0.2 1.6 27.0 11.0 35.5 596.5
HONG KONG
841 Clothing 1,625.5 2,860.3 3,832.2 3,921.8 3,861.2 3,972.5894 Toys, sporting goods etc. 240.4 588.3 886.6 943.0 1,104.4 903.7724 Telecommunications
equipment 208.2 368.4 529.7 572.5 566.9 760.0864 Watches and clocks 63.5 379.5 784.2 710.7 547.1 650.9714 Office machines 84.0 214.3 324.3 327.5 304.3 647.8
SINGAPORE
729 Electrical machines, NES 230.4 376.2 870.4 889.8 968.3 893.5714 Office machines 56.1 61.6 96.4 134.0 288.7 834.1724 Telecommunications
equipment 124.2 203.3 729.4 768.2 690.8 728.1841 Clothing 81.4 153.8 305.4 308.0 308.2 312.0722 Electrical power
machinery 29.2 60.0 127.1 142.3 145.7 162.0
/a Manufactured exports are defined as SITC 5, 6, 7 and 8 minus 68.7i Major OECD economies are USA, Japan, and EEC.
Source: World Bank Trade Data Base System.
4.21 Greater specificity as regards manufactured exports with the mostpromise, can be obtained by narrowing the compass of the search through pasttrade data so as to identify the export successes of East Asian NICs.Table 4.7 shows the five largest exports (by value) from Korea, Hong Kong and
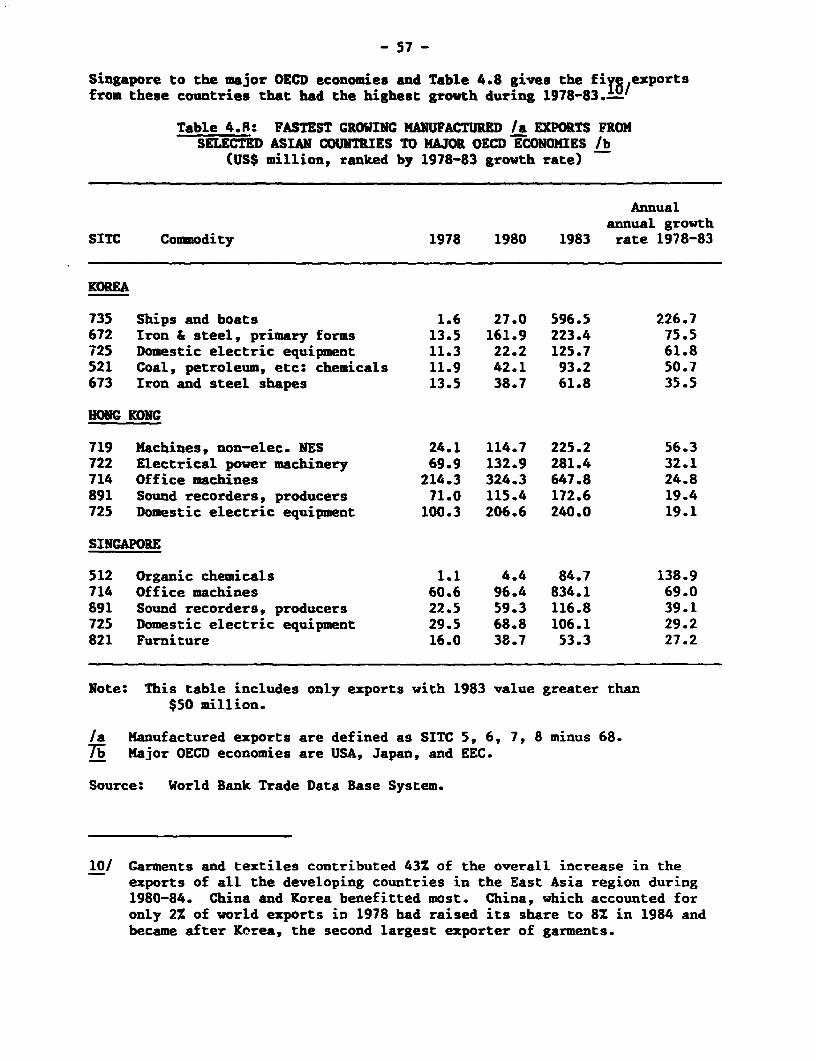
- 57 -
Singapore to the major OECD economies and Table 4.8 gives the fiy81 exportsfrom these countries that had the highest growth during 1978-83.-
Table 4.8: FASTEST GROWING MANUFACTURED /a EXPORTS FROMSELECTED ASIAN COUNTRIES TO MAJOR OECD ECONOMIES /b
(US$ million, ranked by 1978-83 growth rate)
Annualannual growth
SITC Commodity 1978 1980 1983 rate 1978-83
KOREA
735 Ships and boats 1.6 27.0 596.5 226.7672 Iron & steel, primary forms 13.5 161.9 223.4 75.5725 Domestic electric equipment 11.3 22.2 125.7 61.8521 Coal, petroleum, etc: chemicals 11.9 42.1 93.2 50.7673 Iron and steel shapes 13.5 38.7 61.8 35.5
HONG KONG
719 Machines, non-elec. NES 24.1 114.7 225.2 56.3722 Electrical power machinery 69.9 132.9 281.4 32.1714 Office machines 214.3 324.3 647.8 24.8891 Sound recorders, producers 71.0 115.4 172.6 19.4725 Domestic electric equipment 100.3 206.6 240.0 19.1
SINGAPORE
512 Organic chemicals 1.1 4.4 84.7 138.9714 Office machines 60.6 96.4 834.1 69.0891 Sound recorders, producers 22.5 59.3 116.8 39.1725 Domestic electric equipment 29.5 68.8 106.1 29.2821 Furniture 16.0 38.7 53.3 27.2
Note: This table includes only exports with 1983 value greater thar.$50 million.
/a Manufactured exports are defined as SITC 5, 6, 7, 8 minus 68.7i Major OECD economies are USA, Japan, and EEC.
Source: World Bank Trade Data Base System.
10/ Garments and textiles contributed 43% of the overall increase in theexports of all the developing countries in the East Asia region during1980-84. China and Korea benefitted most. China, which accounted foronly 2Z of world exports in 1978 had raised its share to 8% in 1984 andbecame after Korea, the second largest exporter of garments.
- 58 -
Interestingly enough there is considerable overlap among the top exports.Telecommunications equipment and clothing are common to all three countries.Office machines are shared by Hong Kong and Singapore; electrical machinery bySingapore and Korea. Then there are items such as ships, toys, footwear, andelectric power machinery which figure prominently in the exports of a singlecountry. Traditional light manufactures such as textiles, clothing and toysare conspicuously absent from the faster growing commodities. Instead, elec-tronic equipment, electrical and nonelectrical machinery, transport equipmentand metal products are the items that have turned in the best growth perfor-mance. In a few of the East Asian NICs, electrical and electronic goods takentogether, were the largest exports in 1984, finally outdistancing such die-hards as yarn and clothing. None of these economies has been able to upholdthe potential shown by the chemicals industry in earlier years. Both in termsof manufacturing value added and exports, chemicals vied with machinery andmetal products for first place. Although it remains a technologically dynamicindustry the comparative advantage in producing bulk chemicals such as ethy-lene and polypropolene is moving into the hands of the major oil producers,while the large multinational companies seem to have consolidated, even more,their monopoly over technological advances.
4.22 Thus, a second and more particularistic frame of past trade patternsindicates that chemicals, one of the recent industrial stars, has because ofrising stock prices, worldwide overcapacity in bulk chemicals, protectionistmoves by the European countries and the lead taken by U.S. and German firms inthe sphere of new product and process technologies, lost its eminence in thetrading field. It is likely to become a preserve of oil rich nations andadvanced industrial economies. Numerically controlled machine tools, computerdirected machining facilities and manufacturing systems and industrial robots,where the trading possibilities remain very large, seem to be securely in thehands of a small number of Japanese and American companies. Entry barriersrelated to the high research, marketing and capital costs of an efficientsized operation and the necessity of establishing an effective service networkhave prevented the European machinery producers from moving into this market.For the NICs the problems of entry look even more insurmountable. Hence, theymay encounter difficulties in tapping the fastest growing segment of trade inmachinery in the coming years. Korea is now an acknowledged force in theshipbuilding industry and several Korean car manufactures are positioningthemselves for a limited entry into the major western markets either indepen-dently or through the avenues opened by joint production arrangements withAmerican and Japanese manufacturers. But the world shipping glut threatensexisting producers with many years of lean profits and thin order books andwill certainly deter any aspirants from attempting to carve a place forthemselves. The motor car industry has its own eccentric features. Entrybarriers for all the usual reasons having to do with research costs, scale andmarketing are extraordinarily high. But in addition, this industry is ruledby impregnable oligopolies; trade with the industrial countries is subject tocontrols; and, automation may, in time, halve the labor costs of production,currently about 202, which are the source of potential competitiveness for thedeveloping economies.
4.23 Among the rapidly growing manufactured exports of the seventies andearly eighties, those that seem capable of holding their pace are items like
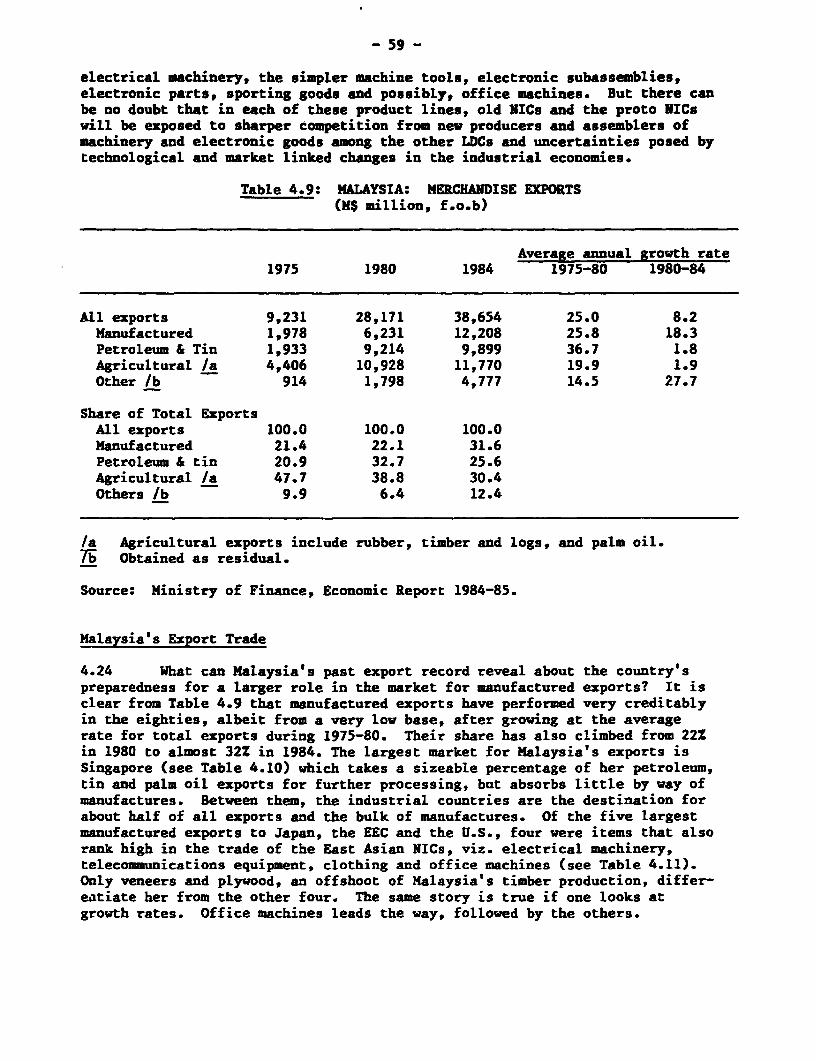
- 59 -
electrical machinery, the simpler machine tools, electronic subassemblies,electronic parts, sporting goods and possibly, office machines. But there canbe no doubt that in each of these product lines, old NICs and the proto NICswill be ezposed to sharper competition from new producers and assemblers ofmachinery and electronic goods among the other LDCs and uncertainties posed bytechnological and market linked changes in the industrial economies.
Table 4.9: MALAYSIA: MERCHANDISE EXPORTS(K$ million, f.o.b)
Average annual growth rate1975 1980 1984 1975-80 1980-84
All exports 9,231 28,171 38,654 25.0 8.2Manufactured 1,978 6,231 12,208 25.8 18.3Petroleum & Tin 1,933 9,214 9,899 36.7 1.8Agricultural /a 4,406 10,928 11,770 19.9 1.9Other /b 914 1,798 4,777 14.5 27.7
Share of Total EzportsAll exports 100.0 100.0 100.0Manufactured 21.4 22.1 31.6Petroleum & tin 20.9 32.7 25.6Agricultural /a 47.7 38.8 30.4Others /b 9.9 6.4 12.4
/a Agricultural exports include rubber, timber and logs, and palm oil.7T Obtained as residual.
Source: Ministry of Finance, Economic Report 1984-85.
Malaysia's Export Trade
4.24 What can Malaysia's past export record reveal about the country'spreparedness for a larger role in the market for manufactured exports? It isclear from Table 4.9 that manufactured exports have performed very creditablyin the eighties, albeit from a very low base, after growing at the averagerate for total exports during 1975-80. Their share has also climbed from 22%in 1980 to almost 32Z in 1984. The largest market for Malaysia's exports isSingapore (see Table 4.10) which takes a sizeable percentage of her petroleum,tin and palm oil exports for further processing, but absorbs little by way ofmanufactures. Between them, the industrial countries are the destination forabout half of all exports and the bulk of manufactures. Of the five largestmanufactured exports to Japan, the EEC and the U.S., four were items that alsorank high in the trade of the East Asian NICs, viz. electrical machinery,telecommunications equipment, clothing and office machines (see Table 4.11).Only veneers and plywood, an offshoot of Malaysia's timber production, differ-enatiate her from the other four. The same story is true if one looks atgrowth rates. Office machines leads the way, followed by the others.
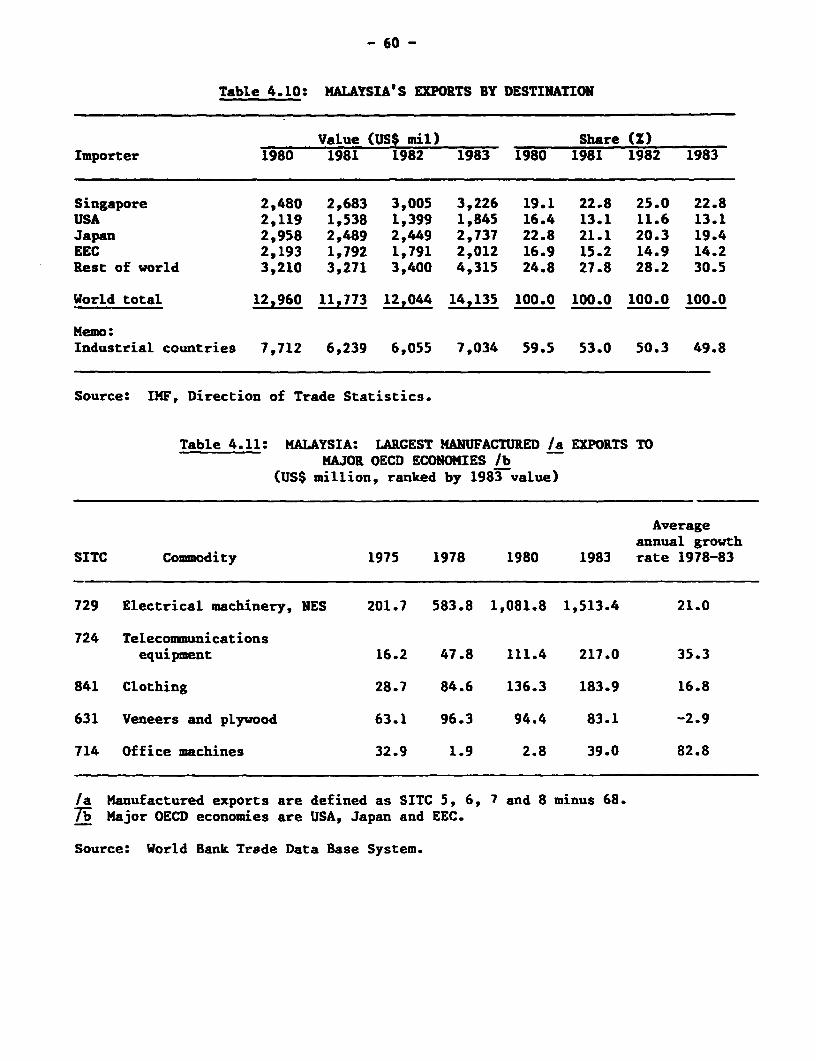
- 60 -
Table 4.10: MALAYSIA'S EXPORTS BY DESTINATION
Value (US$ mil) Share (Z)Importer 1980 1981 1982 1983 1980 1981 1982 1983
Singapore 2,480 2,683 3,005 3,226 19.1 22.8 25.0 22.8USA 2,119 1,538 1,399 1,845 16.4 13.1 11.6 13.1Japan 2,958 2,489 2,449 2,737 22.8 21.1 20.3 19.4EEC 2,193 1,792 1,791 2,012 16.9 15.2 14.9 14.2Rest of world 3,210 3,271 3,400 4,315 24.8 27.8 28.2 30.5
World total 12,960 11,773 12,044 14,135 100.0 100.0 100.0 100.0
Memo:Industrial countries 7,712 6,239 6,055 7,034 59.5 53.0 50.3 49.8
Source: IMF, Direction of Trade Statistics.
Table 4.11: MALAYSIA: LARGEST MANUFACTURED /a EXPORTS TOMAJOR OECD ECONOMIES /b
(USS million, ranked by 1983 value)
Averageannual growth
SITC Commodity 1975 1978 1980 1983 rate 1978-83
729 Electrical machinery, NES 201.7 583.8 1,081.8 1,513.4 21.0
724 Telecommunicationsequipment 16.2 47.8 111.4 217.0 35.3
841 Clothing 28.7 84.6 136.3 183.9 16.8
631 Veneers and plywood 63.1 96.3 94.4 83.1 -2.9
714 Office machines 32.9 1.9 2.8 39.0 82.8
/a Manufactured exports are defined as SITC 5, 6, 7 and 8 minus 68.7i Major OECD economies are USA, Japan and EEC.
Source: World Bank Trade Data Base System.
- 61 -
4.25 The most visible difference between Malaysia and the NICs is in theproportion of manufactured exports in the total. On probing further, certainother points of difference can be detected. First, and most obvious is thatin shared export categories, Malaysia exports smaller volumes of telecommuni-cations equipment, clothing and office machines, than her newly industrializedneighbours. Second, and although this is a difficult distinction to make,more of Malaysia's manufactured exports are produced either by subsidiaries ofMNCs or by firms in which there is foreign involvement. Third, less evidencecan be found that the assembly of clothing, electrical equipment and elec-tronic parts has spilled over into local manufacture of inputs. That is tosay, the deepening of the industrial system has progressed farther and, in twocases, much further in the NICs. Fourth, a related point, indigenous entre-preneurial activity is on a smaller scale and less attracted to manufactur-ing. Finally, while it is apparent that small producers in the NICs, espe-cially in Hong Kong, devote little to R&D, Malaysian companies are conspicuousin their reticence to spend on research.
4.26 Compared to the East Asian DICs, Malaysia's exports of not justmanufactures, but also primary products are less narrowly directed to a fewcountries. This could have affected export growth in the very recent past,but as a longer term strategy it provides the diversification which may becomean important asset in a fractionated world trading environment. The shares ofMalaysia's various trading partners are shown in Table 4.12; it gives a senseof the country's dispersed trading contacts and the low concentration ratiosfor three of the six items.
4.27 Just by looking at the mix of exports, there is little ground forbelieving that Malaysia is specializing in products shunned by the successfulNICs. On the contrary the country seems to be very much in the thick ofthings. But doubts remain as to Malaysia's capacity to fully exploit the deve-lopmental gains from its current industrial fold and therefore, the indigenousindustrial sector's ability to foresee and react autonomously to future exportpossibilities, which has been the basis for self-sustained growth in the NICs(see Chapter 1).
International Trading Environment
4.28 One story is narrated by past statistics, another can be guessedfrom the intense trade negotiations in progress, within and between industrialeconomies. Urless these two can be stitched together the future of manufac-tured exports -&nnot be confidently read out of historical time series andmust remain at the level of vague conjecture. It is a commonplace in theliterature on international trade that the complex web of trade we have todaywas catalysed into existence by a series of trade negotiations - Dillon,Kennedy, Tokyo - that levelled the trade barriers which had risen in earlier,economically troubled decades. After the Tokyo round, as can be seen fromTable 4.13, the average tariff rates in the advanced countries were lowered bybetween 15 and 30Z to an average of about 4.0Z. In terms of import weightedtariff averages on manufactures, the cuts were quite drastic (Table 4.14) andremained significant only on textiles and clothing and finished items in theleather, footwear, rubber and travel goods category.
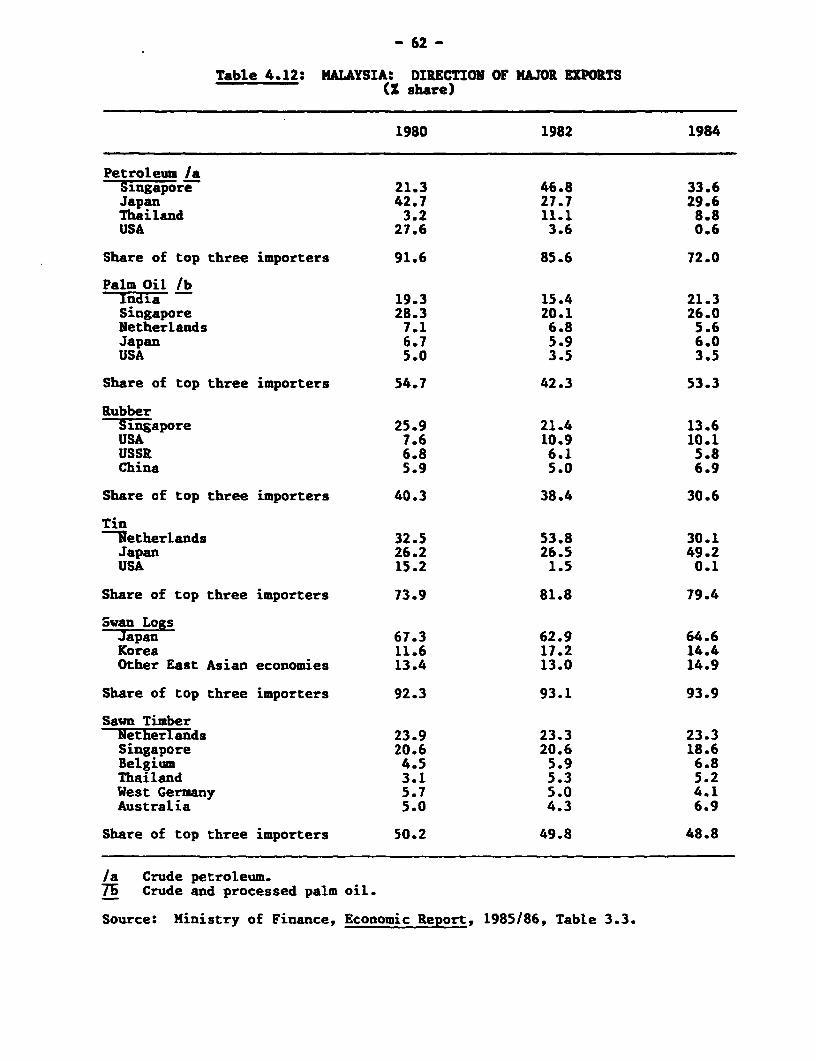
- 62 -
Table 4.12: MALAYSIA: DIRECTION OF MAJOR EXPORTS(X share)
1980 1982 1984
Petroleum /aSingapore 21.3 46.8 33.6Japan 42.7 27.7 29.6Thailand 3.2 11.1 8.8USA 27.6 3.6 0.6
Share of top three importers 91.6 85.6 72.0
Palm Oil /bIndia 19.3 15.4 21.3Singapore 28.3 20.1 26.0Netherlands 7.1 6.8 5.6Japan 6.7 5.9 6.0USA 5.0 3.5 3.5
Share of top three importers 54.7 42.3 53.3
RubberIngapore 25.9 21.4 13.6
USA 7.6 10.9 10.1USSR 6.8 6.1 5.8China 5.9 5.0 6.9
Share of top three importers 40.3 38.4 30.6
TinlNetherlands 32.5 53.8 30.1Japan 26.2 26.5 49.2USA 15.2 1.5 0.1
Share of top three importers 73.9 81.8 79.4
-ssan LogssJapan 67.3 62.9 64.6Korea 11.6 17.2 14.4Other East Asian economies 13.4 13.0 14.9
Share of top three importers 92.3 93.1 93.9
Sawn TimberNetherlands 23.9 23.3 23.3Singapore 20.6 20.6 18.6Belgium 4.5 5.9 6.8Thailand 3.1 5.3 5.2West Germany 5.7 5.0 4.1Australia 5.0 4.3 6.9
Share of top three importers 50.2 49.8 48.8
/a Crude petroleum.75 Crude and processed palm oil.
Source: Ministry of Finance, Economic Report, 1985/86, Table 3.3.
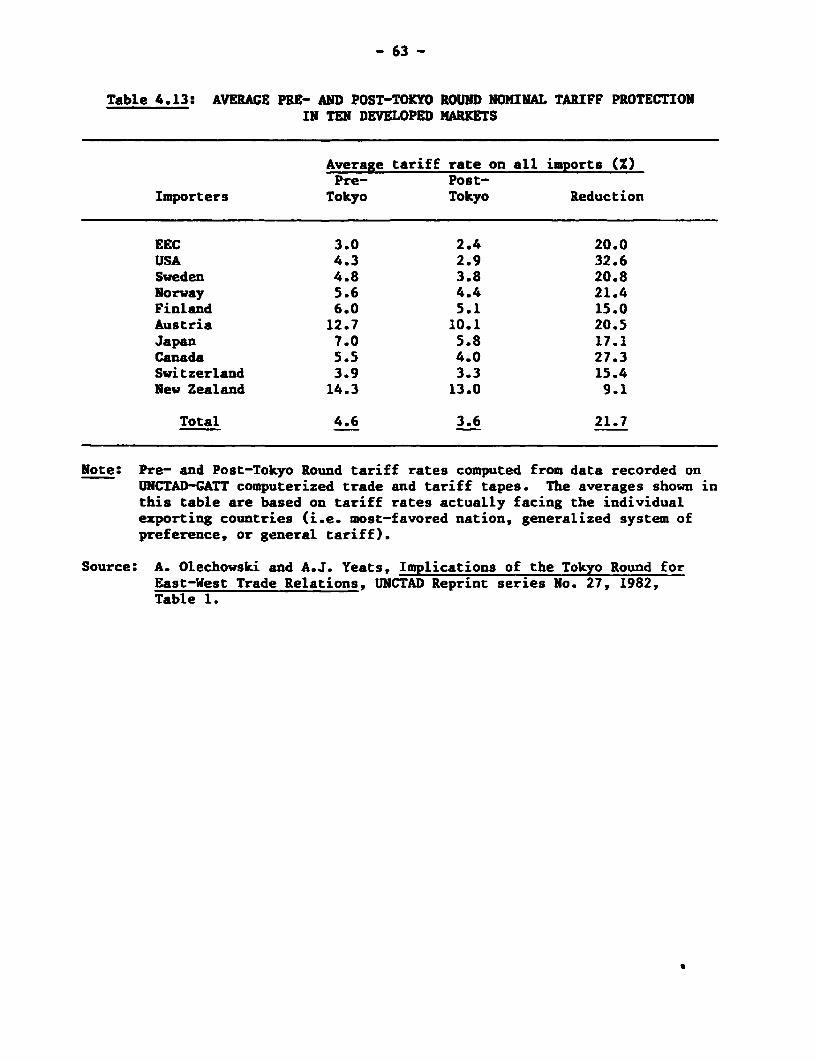
- 63 -
Table 4.13: AVERAGE PRE- AND POST-TOKYO ROUND NOMINAL TARIFF PROTECTIONIN TEN DEVELOPED MARKETS
Average tariff rate on all imports (Z)Pre- Post-
Importers Tokyo Tokyo Reduction
EEC 3.0 2.4 20.0USA 4.3 2.9 32.6Sweden 4.8 3.8 20.8Norway 5.6 4.4 21.4Finland 6.0 5.1 15.0Austria 12.7 10.1 20.5Japan 7.0 5.8 17.1Canada 5.5 4.0 27.3Switzerland 3.9 3.3 15.4New Zealand 14.3 13.0 9.1
Total 4.6 3.6 21.7
Note: Pre- and Post-Tokyo Round tariff rates computed from data recorded onUNCTAD-CATT computerized trade and tariff tapes. The averages shown inthis table are based on tariff rates actually facing the individualexporting countries (i.e. most-favored nation, generalized system ofpreference, or general tariff).
Source: A. Olechowski and A.J. Yeats, Implications of the Tokyo Round forEast-West Trade Relations, UNCTAD Reprint series No. 27, 1982,Table 1.
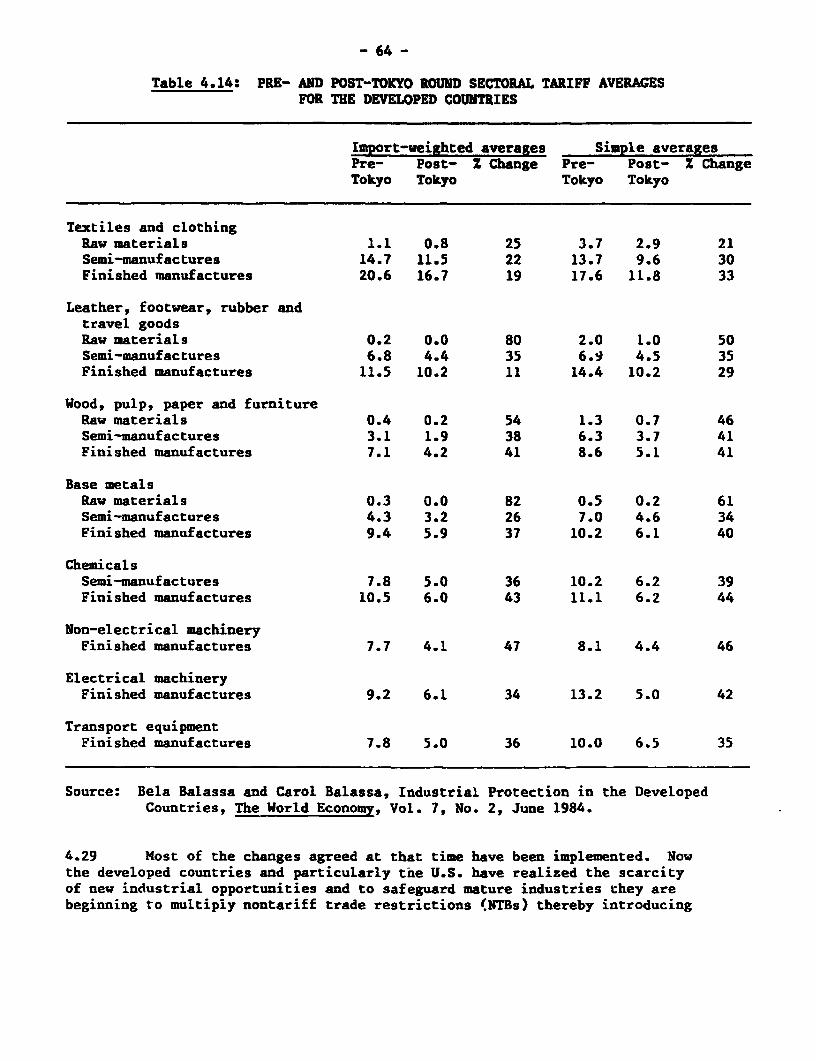
- 64 -
Table 4.14: PRE- AND POST-TOKYO ROUND SECTORAL TARIFF AVERAGESFOR THE DEVELOPED COUNTRIES
Import-veighted averages Simple averagesPre- Post- x Change Pre- Post- Z ChangeTokyo Tokyo Tokyo Tokyo
Textiles and clothingRaw materials 1.1 0.8 25 3.7 2.9 21Semi-manufactures 14.7 11.5 22 13.7 9.6 30Finished manufactures 20.6 16.7 19 17.6 11.8 33
Leather, footwear, rubber andtravel goodsRaw materials 0.2 0.0 80 2.0 1.0 50Semi-manufactures 6.8 4.4 35 6.9 4.5 35Finished manufactures 11.5 10.2 11 14.4 10.2 29
Wood, pulp, paper and furnitureRaw materials 0.4 0.2 54 1.3 0.7 46Semi-manufactures 3.1 1.9 38 6.3 3.7 41Finished manufactures 7.1 4.2 41 8.6 5.1 41
Base metalsRaw materials 0.3 0.0 82 0.5 0.2 61Semi-manufactures 4.3 3.2 26 7.0 4.6 34Finished manufactures 9.4 5.9 37 10.2 6.1 40
ChemicalsSemi-manufactures 7.8 5.0 36 10.2 6.2 39Finished manufactures 10.5 6.0 43 11.1 6.2 44
Non-electrical machineryFinished manufactures 7.7 4.1 47 8.1 4.4 46
Electrical machineryFinished manufactures 9.2 6.1 34 13.2 5.0 42
Transport equipmentFinished manufactures 7.8 5.0 36 10.0 6.5 35
Source: Bela Balassa and Carol Balassa, Industrial Protection in the DevelopedCountries, The World Economy, Vol. 7, No. 2, June 1984.
4.29 Most of the changes agreed at that time have been implemented. Nowthe developed countries and particularly tne U.S. have realized the scarcityof new industrial opportunities and to safeguard mature industries they arebeginning to multiply nontariff trade restrictions (NTBs) thereby introducing
- 65 -
a new note into international trade relations. So far, US sanctions andpenalties have been largely circumvented by foreign suppliers and have ratherperversely, added to the quasi rents ezporters earn in the US market (anexample being cars). This explains how the US was the destination of nearlyhalf the sanufactured goods sold abroad by LDCs in spite of all that has beensaid and done in terms of regulating US imports over the last decade. WhatMalaysia's exporters have to contend with as regards tariff and nontariffbarriers is shown in Tables 4.15 and 4.16. Apart from footwear, textiles andclothing, the levies on other items are light or nonezistent and not signifi-cant impediments. The list of exports that feel the edge of NTBs, is longerand in particular instances these can bite deeper. An example is thelimitation on the export of canned pineapples to Japan.
4.30 The latest moves by the industrial countries, following more thantwo years of at times acrimonious discussion, seem to be of a different orderand in the wingr is legislation that may force a tapering of future exportgrowth from the developing countries. Currently, 27 categories of importsinto Japan are subject to quotas, 23 to the US, and 4 to the UK. About 22Z oftotal imports by the OECD countries are affected by nontariff barriers, but inthe US the level is closer to 45% and it is 36Z for France. Japan, whichtakes just 8Z of LDCs' manufactured exports also has a host of testingrequirements, cultural barriers, inefficiencies in the distribution system andrelationships between producers and sellers, ihst make it difficult for for-eign goods to penetrate the domestic economy. What is so ominous about theprotectionist moves and countermoves is that even the Japanese, with a world-wide trade surplus of $122 billion in 1984 and substantial surpluses withvirtually each v.ie of the East Asian countries, have been sufficientlydisturbed by the growth in imports of yarn, fabrics, and knitwear from China,Pakistan, South Korea and other East Asian economies, to consider applying theMFA for the first time and have exempted synthetic fibers and clothing fromthe Tokyo round related, tariff reductions in July 1985.
4.31 Thirty years of economic diplomacy guided by the dictates of freetrade and comparative advantage has embedded the industrial countries in tradeand monetary regimes that will not dissolve overnight. There are treaties andobligations to be observed and beyond that, a real belief on the part of eco-nomists, statesmen and consumers alike, as to the rightness of the incrementalchanges that have produced the trading environment we now have. But theadvanced countries are finding that the industrial base of their prosperirv isbeing eroded and no other s_.ctor offers the combination of employment, link-ages, productivity growth and value added, to adequately substitute for it.The world, therefore, appears headed towards a long season of managed trade.Treaties entered into by the OECD countries might sustain a liberal core toworld trade; however, the NICs with their limited power to retaliate, will bemore susceptible to such management, both through restrictions on directexports and the large amount of intra-firm trade. Already, close to 25-30% ofOECD trade is "managed". another 10% could be included if intra-firm movementsare accounted for. This proportion could grow, with a situation arising where
11/ See for instance, K. Ohmae, Triad Power, Free Press, 1985, Chapter 8.
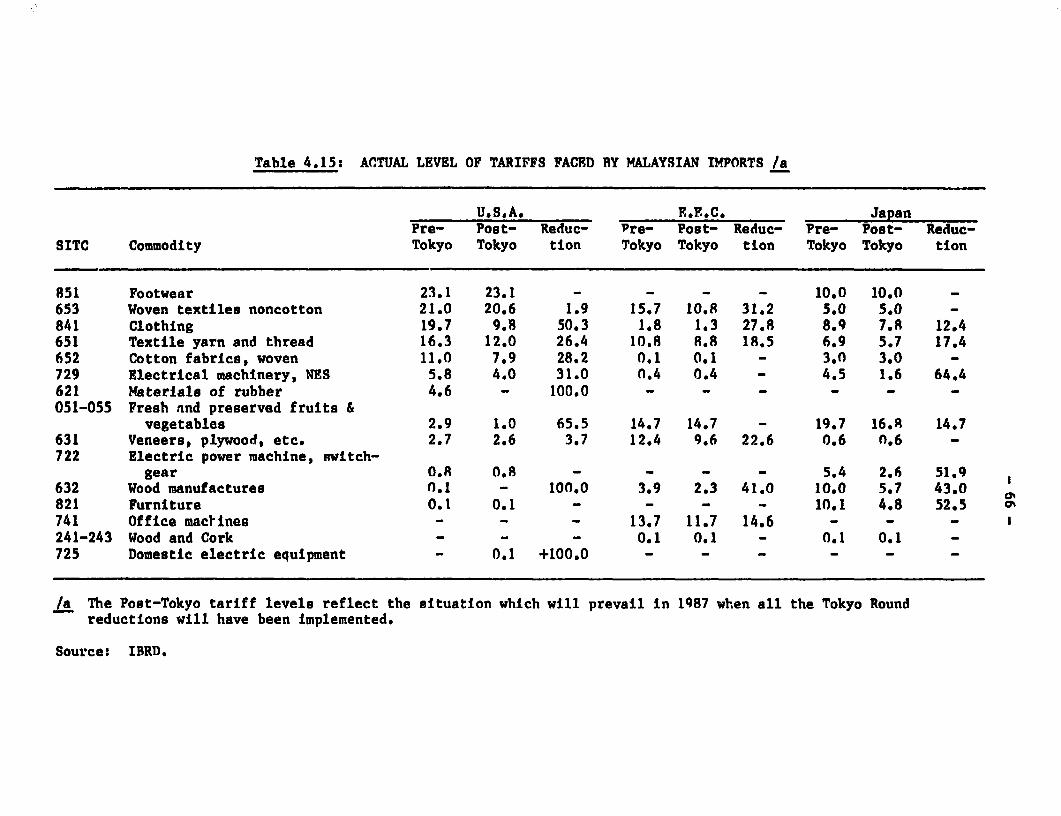
Table 4.15: ACTUAL LEVEL OF TARIFFS FACED BY MALAYSIAN IMPORTS /a
U.S.A. E.E.C. JapanPre- Post- Reduc- Pre- Post- Reduc- Pre- Post- Reduc-
SITC Commodity Tokyo Tokyo tion Tokyo Tokyo tion Tokyo Tokyo tion
851 Footwear 23.1 23.1 - - - - 10.0 10.0 -653 Woven textiles noncotton 21.0 20.6 1.9 15.7 10.8 31.2 5.0 5.0 -841 Clothing 19.7 9.8 50.3 1.8 1.3 27.8 8.9 7.R 12.4651 Textile yarn and thread 16.3 12.0 26.4 10.8 8.8 1.5 6.9 5.7 17.4652 Cotton fabrics, woven 11.0 7.9 28.2 0.1 O.l - 3.0 3.0 -729 Electrical machinery, NES 5.8 4.0 31.0 n.4 0.4 - 4.5 1.6 64.4621 Materials of rubber 4.6 - 100.0 - - - - - -051-055 Fresh nnd preserved fruits &
vegetables 2.9 1.0 65.5 14.7 14.7 - 19.7 16.R 14.7631 Veneers, plywood, etc. 2.7 2.6 3.7 12.4 9.6 22.6 0.6 n.6 -722 Electric power machine, switch-
gear O.R 0.8 - - - - 5.4 2.6 51.9632 Wood manufactures 0.1 - 100.0 3.9 2.3 41.0 10.0 5.7 43.0821 Furniture 0.1 0.1 - - - - 10.1 4.8 52.5741 Office maclines - - - 13.7 11.7 14.6 - - -241-243 Wood and Cork - - - 0.1 0.1 - 0.1 0.1 -
725 Domestic electric equipment - 0.1 +100.0 - - - - - -
/a The Post-Tokyo tariff levels reflect the situation which will prevail in 1987 when all the Tokyo Roundreductions will have been implemented.
Source: IBRD.
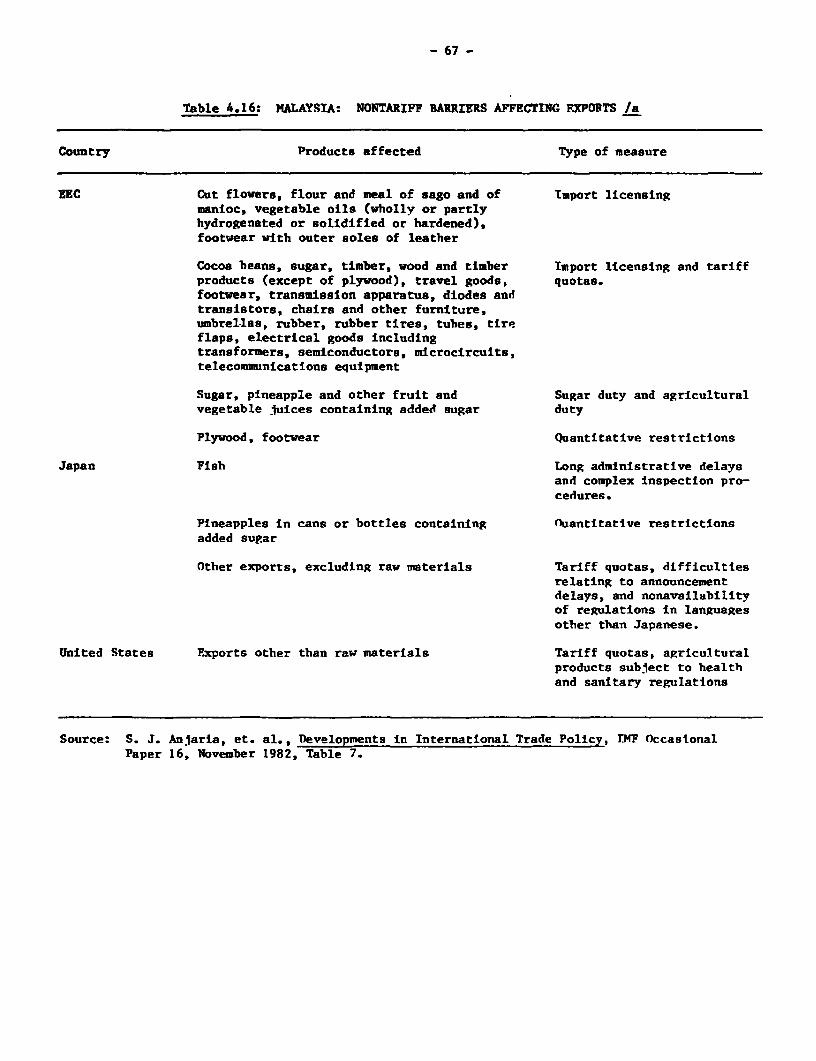
- 67 -
Table 4.16: MALAYSIA: NONTARIFF BARRIERS AFFECTING XPFORTS /a
Country Products affected Type of measure
EEC Cut flowers, flour and meal of sago and of Import licensingmanioc, vegetable oils (wholly or partlyhydrogenated or solidified or hardened),footwear with outer soles of leather
Cocoa beans, sugar, timber, wood and timber Import licensing and tariffproducts (except of plywood), travel goods, quotas.footwear, transmission apparatus, diodes andtransistors, chairs and other furniture,umbrellas, rubber, rubber tires, tubes, tireflaps, electrical goods includingtransformers, semiconductors, microcircuits,telecommunications equipment
Sugar, pineapple and other fruit and Sugar duty and agriculturalvegetable juices containing added sugar duty
Plywood, footwear Quantitative restrictions
Japan Fish Long administrative delaysand complex inspection pro-cedures.
Pineapples in cans or bottles containing nuantitative restrictionsadded sugar
Other exports, excluding raw materials Tariff quotas, difficultiesrelating to announcementdelays, and nonavailabilityof regulations in languagesother than Japanese.
United States Exports other than raw materials Tariff quotas, agriculturalproducts subject to healthand sanitary regulations
Source: S. J. Anjaria, et. al., Developments in International Trade Policy, TMF OccasionalPaper 16, November 1982, Table 7.

- 68 -
the increase in exports from old and new NICs could come to depend on thepolitical and economic tolerability of import penetration on a case by casebasis.
4.32 Should ideas on industrial strategies patterned on the Japdnesemodel prevail in the West, side by side with managed trade, they will negatethe predictive power of past trends in exports. This is not to imply thatexport-led growth will not be possible, but that such growth might have to beachieved by orchestrating small advances by a diffuse conglomeration ofindustries rather than through massive gains achieved by a few "beachhead"sectors.
- 69 -
CHAPTER V: EXTERNAL BORROWING AND CAPITAL FLOWS
5.01 Exports must grow at a rate equal to the interest payable on foreignborrowings for the debt service ratio (DSR) to be held constant, assuming thatthe import elasticity with respect to GNP is unity, which is approximatelywhat it is for Malaysia. Where the objective is to reduce the DSR, exportsmust run ahead of interest rates. Hence any possibility of world trade slow-ing down is a matter of serious concern to countries that have acquired largedebts. Malaysia's debt profile is outlined in Table 5.1. Total MLT debt in1985 stood at US$16.5 billion, a 72 increase over 1984. The share of shortterm borrowings which is an index of vulnerability was 142 in 1985, or belowthe average for developing countries. Attractive rates on 20-30 year floatingrate notes enabled Malaysia to retire a few expensive loans contracted in theearly eighties and to improve the maturity structure of its external debtthereby avoiding a steep increase in amortization payments in themid-eighties. However, the poor performance of merchandise exports pushed theDSR up by 3 points to 15.3. As foreign exchange earnings in 1986 will bereduced still further because of unfavorable commodity prices, the DSR willrise yet more, but it should start to decline in the late eighties. With itsexport and growth prospects rather badly tarnished, the terms on whichMalaysia raises funds on international markets might be steeper than in therecent past, but much will depy2f on the market's ability to defuse theproblems of the major debtors -
12/ For further discussion and comparative information on debt profiles, seeMalaysia: Development Strategies and their Financing, World Bank, ReportNo. 5560-MA, September 1985, Chapter 2.
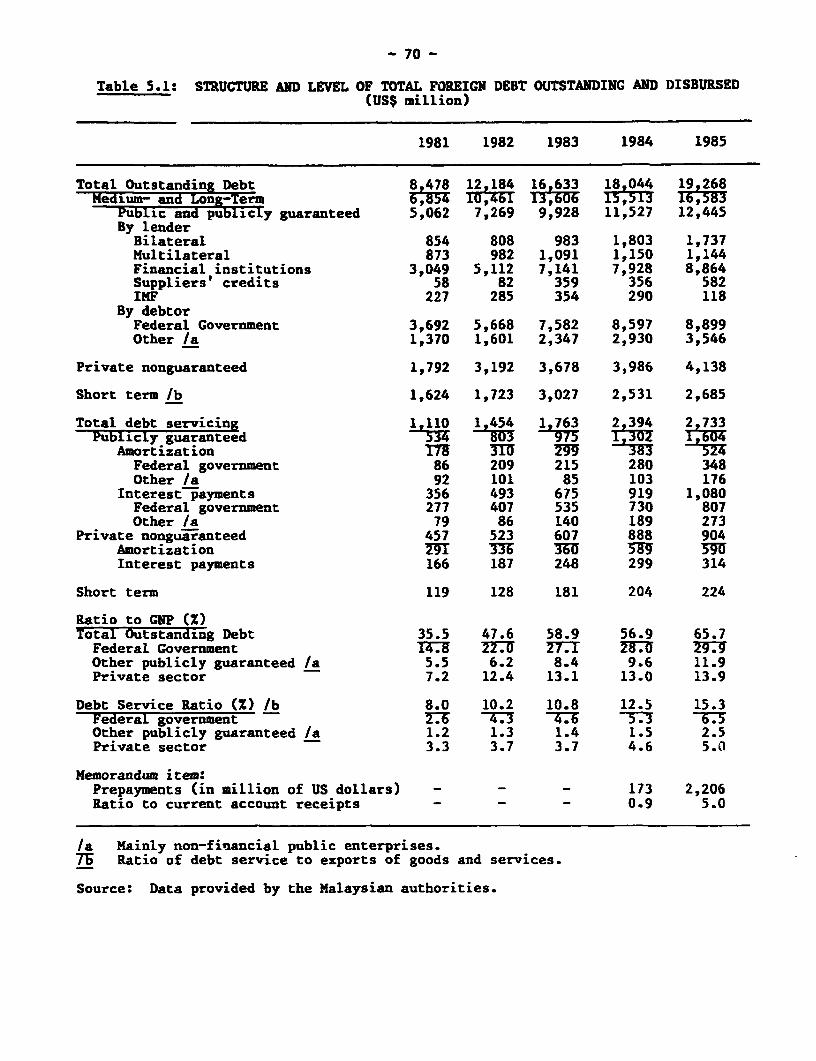
- 70 -
Table 5.1: STRUCTURE AND LEVEL OF TOTAL FOREIGN DEBT OUTSTANDING AND DISBURSED(US$ million)
1981 1982 1983 1984 1985
Total Outstanding Debt 8 478 12 184 16 633 18 044 19 268Medium- and Long-Term 6,854 10 461 13,606 15,513 16,583
Public and publicly guaranteed 5,062 7,269 9,928 11,527 12,445By lenderBilateral 854 808 983 1,803 1,737Multilateral 873 982 1,091 1,150 1,144Financial institutions 3,049 5,112 7,141 7,928 8,864Suppliers' credits 58 82 359 356 582IMF 227 285 354 290 118
By debtorFederal Government 3,692 5,668 7,582 8,597 8,899Other /a 1,370 1,601 2,347 2,930 3,546
Private nonguaranteed 1,792 3,192 3,678 3,986 4,138
Short term /b 1,624 1,723 3,027 2,531 2,685
Total debt servicing 1,110 1,454 1,763 29394 29733Publicly guaranteed ****J*803 975 130Z 1,7604
Amortization 17 1 383 524Federal government 86 209 215 280 348Other /a 92 101 85 103 176
Interest payments 356 493 675 919 1,080Federal government 277 407 535 730 807Other /a 79 86 140 189 273
Private nonguaranteed 457 523 607 888 904Amortization 3YT TM TO 3aY 5Interest payments 166 187 248 299 314
Short term 119 128 181 204 224
Ratio to GNP (Z)Total Outstanding Debt 35.5 47.6 58.9 56.9 65.7Federal Government 147E E77U 2771ET 275 87TOther publicly guaranteed /a 5.5 6.2 8.4 9.6 11.9Private sector 7.2 12.4 13.1 13.0 13.9
Debt Service Ratio (Z) /b 8.0 10.2 10.8 12.5 15.3Federal government 276 -CW3 4.6 -373 -s67Other publicly guaranteed /a 1.2 1.3 1.4 1.5 2.5Private sector 3.3 3.7 3.7 4.6 5.0
Memorandum item:Prepayments (in million of US dollars) - - - 173 2,206Ratio to current account receipts - - - 0.9 5.0
/a Mainly non-financial public enterprises.7b Ratio of debt service to exports of goods and services.
Source: Data provided by the Malaysian authorities.
- 71 -
International Financial Markets
5.02 Between 1983 and 1984 the outstanding debt of the developingcountries rose 6X to $895 billion, but the average interest rate, at 8%, wasbelow that paid in 1982 (9.21), as was the proportion of short-term debt.Conditions for reschedulings were easier in 1984, maturities and grace periodslonger and the mark-up over Libor ranging between 1.5Z and 2% in 1983. In1985, the average spread on syndicated loans fell to 60 basis points from apeak of 115 two years earlier. This easing of terms, aided no doubt, by thesubstantially imprcved trade balances of major debtors occurred in spite ofthe huge demands placed by the U.S. economy on international credit. The1983-84 recove.ry came none too soon. Adjustment measures were seen to yieldimmediate and significant results. Governments could show that the sacrificesimposed were paying off and the banks saw a reassuring drop in repudiationrisks. Were it not for the collapse of oil prices in 1985-86, it would bepossible to claim that the worst stage of the debt problem had been leftbehind. Unfortunately, oil exporters, some of whom also fill the ranks ofmajor debtors, are faced with a squeeze at an awkward moment in theiradjustment schedules. The misfortune of oil producers cheapens the importbill of the non-oil economies, developing or developed, but the developingones stand to lose more from the falling exports to OECD countries than theywill gain from the expected acceleration of business activity. Therefore, ifprudence in debt management was the watchword for 1984-85 it is freighted withmore urgency today. The world lacks the buffer provided by large savingssurpluses and net transfers to the LDCs are becoming negative. It is possiblethat long before insolvency is reached, political events co-uld spark anotherspate of crises. But even if the banks, that are currently flush with cash,supported by western governments can once again paper over the problem, creditcould become tif .-er and dearer, especially for a country whose share oftraded GNP is far above the average and primary commodities comprise the bulkof exports.
Equity Purchases and Capital Flows
5.03 Malaysia's rising debt burden projected over the coming years is acause for worry. Measures that would reduce resource imbalances are discussedin Chapter 2 and the scope for increasing exports is Analyzed in chapters 4and 7. This does not quite exhaust the menu of short-run choices. From thenational accounts it is apparent that between 18 and 20% of gross domesticsavings leaves the country as a result of interest payments, dividends, fees,repatriated profits and unrecorded capital outflows. When interest paymentsare netted out, about 3.4% of GNP is accounted for by the rest. A reductionin these items would narrow the current account deficit and reduce financingrequirements.
5.04 Since the mid-seventies, the government has, through PNB, PERNAS andother agencies purchased equity in foreign firms operating in Malaysia so asto raise the Bumiputra share of corporate wealth. It would appear thatforeigners who are induced to part with their assets do not reinvest the fundsthey receive in the country, and other businesses discouraged by the threat ofequity restructuring prefer to hold foreign assets. As data that would permita direct test of this hypothesis were unavailable, some indirect indicators
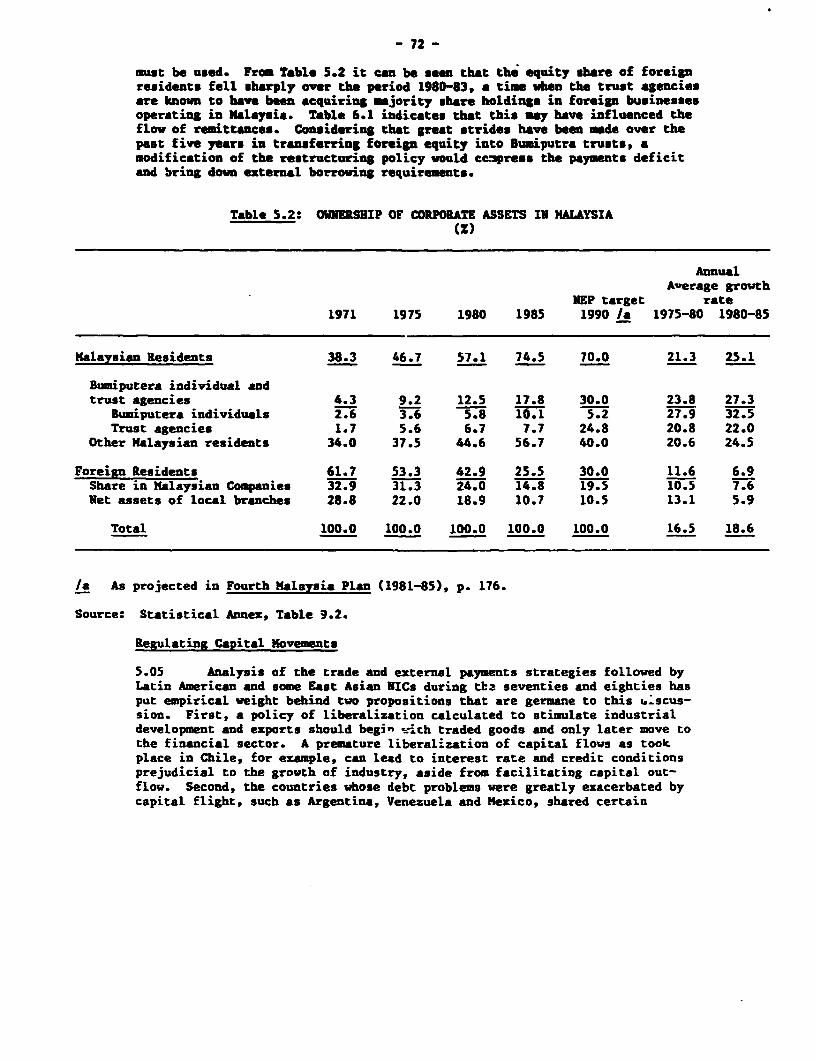
- 72 -
must be used. From Table 5.2 it can be seen that the equity share of foreignresidents fell sharply over the period 1980-83, a time when the trust agenciesare known to have ben acquiring majority share holdings in foreign businessesoperating in Malaysia. Table 6.1 indicates that this may have influenced theflow of remittances. Considering that great strides have been made over thepast five years in transferring foreign equity into Bumiputra trusts, amodification of the restructuring policy would cempreas the payents deficitand bring down external borrowing requirements.
Table 5.2: OUNERSHIP OF CORPORATE ASSETS IN MALAYSIA(Z)
AnnualAverage growth
REP target rate1971 1975 1980 1985 1990 /a 1975-80 1980-85
Malaysian Residents 38.3 46.7 57.1 74.5 70.0 21.3 25.1
Bumiputera individual andtrust agencies 4.3 9.2 12.5 17.8 30.0 23.8 27.3
Bumiputera individuals 2.6 3.6 5.8 10.1 5.2 27.9 32.5Trust agencies 1.7 5.6 6.7 7.7 24.8 20.8 22.0
Other Malaysian residents 34.0 37.5 44.6 56.7 40.0 20.6 24.5
Foreign Residents 61.7 53.3 42.9 25.5 30.0 11.6 6.9Share in Malaysian Companies 32.9 31.3 24.0 14.8 19.5 10.5 7.6Met assets of local branches 28.8 22.0 18.9 10.7 10.5 13.1 5.9
Total 100.0 100.0 100.0 100.0 100.0 16.5 18.6
/a As projected in Fourth Malaysia Plan (1981-85), p. 176.
Source: Statistical Annex, Table 9.2.
Regulating Capital Movements
5.05 Analysis of the trade and external payments strategies followed byLatin American and some East Asian NICs during tba seventies and eighties hasput empirical weight behind two propositions that are germane to this u:scus-sion. First, a policy of liberalization calculated to stimulate industrialdevelopment and exports should begin ,ich traded goods and only later move tothe financial sector. A premature liberalization of capital flows as tookplace in Chile, for example, can lead to interest rate and credit conditionsprejudicial to the growth of industry, aside from facilitating capital out-flow. Second, the countries whose debt problems were greatly exacerbated bycapital flight, such as Argentina, Venezuela and Mexico, shared certain
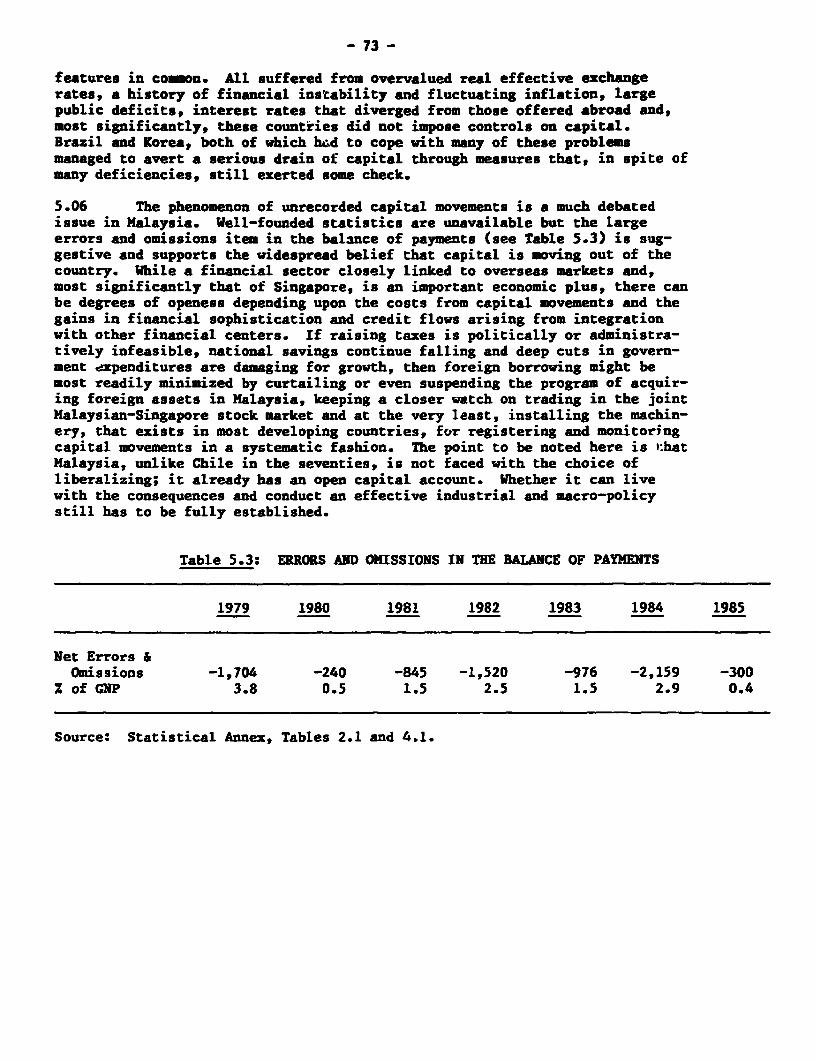
- 73 -
features in coumon. All suffered from overvalued real effective exchangerates, a history of financial instability and fluctuating inflation, largepublic deficits, interest rates that diverged from those offered abroad and,most significantly, these countries did not impose controls on capital.Brazil and Korea, both of which had to cope with many of these problemsmanaged to avert a serious drain of capital through measures that, in spite ofmany deficiencies, still exerted some check.
5.06 The phenomenon of unrecorded capital movements is a much debatedissue in Malaysia. Well-founded statistics are unavailable but the largeerrors and omissions item in the balance of payments (see Table 5.3) is sug-gestive and supports the widespread belief that capital is moving out of thecountry. While a financial sector closely linked to overseas markets and,most significantly that of Singapore, is an important economic plus, there canbe degrees of openess depending upon the costs from capital movements and thegains in financial sophistication and credit flows arising from integrationwith other financial centers. If raising taxes is politically or administra-tively infeasible, national savings continue falling and deep cuts in govern-ment axpenditures are damaging for growth, then foreign borrowing might bemost readily minimized by curtailing or even suspending the program of acquir-ing foreign assets in Malaysia, keeping a closer watch on trading in the jointMalaysian-Singapore stock market and at the very least, installing the machin-ery, that exists in most developing countries, for registering and monitoringcapital movements in a systematic fashion. The point to be noted here is t:hatMalaysia, unlike Chile in the seventies, is not faced with the choice ofliberalizing; it already has an open capital account. Whether it can livewith the consequences and conduct an effective industrial and macro-policystill has to be fully established.
Table 5.3: ERRORS AND OMISSIONS IN THE BALANCE OF PAYMENTS
1979 1980 1981 1982 1983 1984 1985
Net Errors &Omissions -1,704 -240 -845 -1,520 -976 -2,159 -300
Z of GNP 3.8 0.5 1.5 2.5 1.5 2.9 0.4
Source: Statistical Annex, Tables 2.1 and 4.1.
- 74 -
CHAPTER VI: DIRECT FOREIGN INVESTMENT AND ECONOMIC MODERNIZATION
6.01 Accounts of modernization in the East Asian NICs that fasten on howthe governments' support for trade oriented industries served to harness thesocieties' confucian ethics, high savings propensities anti entrepreneurialresourcefulness to this transcendent purpose, often miss the presence of a keyplayer, the MNC. The ascending development curve followed by these economiescannot be understood until the MNC connection has been explicated. BarringKorea, each of the others has depended extensively upon foreign companies toserve as a conduit for capital and technology and as a vehicle for gainingforeign market access for their goods. Both sides have profited from thispact, but by accommodating themselves to MNC needs, these countries haveimparted a certain cast to their development. In a sense, theirs has been acomplementary form of industrialization, heavily concentrated in assemblinggarments, machinery, electronics, footwear, leather goods, consumer durablesand toys. Such industries have permitted the NICs to optimally utilize alarge force of disciplined and educated, but compared to the U.S., relativelylow paid workers. Using machines and in many cases parts and componentsimported from industrial countries, the East Asian economies have made asuccess of producing goods with moderate to low value-added, that by virtue ofa labor content ranging from 20 to 50%, are less profitable to manufacture inthe West. The MNCs are either directly, or as trading middlemen, indirectlyinvolved in a large part of these operations which have materially aided thedevelopment of East Asian industry, enabled Western firms to export machineryand intermediate goods, while consumers in the advanced economies havebenefited from low priced imports. A certain equilibrium in which gains andlosses were balanced is now in danger of being upset by the great success theNICs have had at exploiting backward linkages from export industries intoplant machinery, metal products and many of the intermediate inputs needed byassembly operations. For example, some of the East Asian economies are nowimportant exporters of textile machinery.
6.02 Japan continues to sell a large volume of capital goods in the areaand still enjoys the induced benefits of export growth from East Asia, but theU.S. and the European countries now run adverse trade balances, and thepolitical, if not the economic pressures, these have unleashed cannot beignored by the MNCs, even though their interests are not necessarily congruentwith those of governments and labor in western economies.
Direct Foreign Investment (DFI) in Malaysia
6.03 For over 15 years, between 9% and 15% of gross capital accumulationin Malaysia has come from foreign investors. The share of manufacturinginvestment is much bigger and overseas capital settling largely, but notexclusively, in the Free Trade Zones, has given rise to a major assemblyindustry for electronic products and significantly augmented the capacity ofthe textiles subsector; in 1984, these two industries accounted for over 60%of manufactured exports. Foreign investment has also been attracted intomineral production as well as hotel and banking services, and foreigners stillhold equity in rubber and oil palm plantations. More so than in any of theother South-east Asian economies, Malaysia has relied upon MNCs to supplement
- 75 -
its resources, to assist in the exploitation of natural resources and to leadthe way in manufacturing and certain services. Hence, the evidence ofcomplementary development is more insistent. Unlike the East Asian NICs,Malaysia remains at the final assembly stage, supplying labor to createfinished products using inputs and machinery brought in by the MNCs fromabroad.
6.04 During the Fourth Plan period, some initial moves were made by thepublic sector and private entrepreneurs to deepen the industrial base and meetmore of the demands generated by linkages from the export sector locally.This drive is to continue over the course of the Fifth Plan, mainly throughthe initiative of private businessmen, but the government still looks upon DFIas an essential plank of its development strategy. As in the past, DFI shouldsuprort the growth of manufactured exports and in the process provideemployment that will be sorely needed. It is hoped that MNCs will become moreactive at transferring technology and in satisfying their materialrequirements by using Malaysian subcontractors. Foreign companies are alsoviewed as the answer to the problems of marketing and access to overseasbuyers, faced by developing countries. Finally, injections of equity capitalare thought to be a relatively painless and inexpensive way of accommodatingMalaysia's substantial projected requirements of foreign resources.
6.05 Malaysia's combination of duty free import privileges, tax holidaysand other incentives is no less generous than the package being offeredelsewhere in East Asia, but to counter recent moves by other countries toenhAnce their allure as investment platforms, the government has raised thelimit of 30% equity holding by foreigners, in non-FTZ firms, to 50X and moredepending on the type of investment. This and other measures being planned,to woo MNCs will, it is hoped, allow Malaysia to speed along the path taken bythe NICs.
6.06 An analysis of the nature and importance of DFI in Malaysia has tocontend with a scanty data base, updated with a lag and the quirkiness arisingfrom a sample biased towards smaller firms. Nonetheless enough information isat hand for a start to be made. Perhaps the most important factor is thesteady decline in the growth of DFI between the early 70s and the first halfof this decade (see Table 6.1). Since 1982, in fact, DFI has declined in eachyear. When the inflows are ranged against profit and dividends repatriated,for most years the net flow is significantly negative and the gap is growinglarger as repatriated earnings have remained stable at close to 6.5% of CDPwhile investment has fluctuated and in recent years, followed a descendingspiral. If corporate asset holdings by foreigners (see Table 5.2) is used asa proxy for the stock of foreign capital, then in 1983 the fixed chargerepresented by dividends and profits come to 18.1% (i.e. M$3.0 billion onM$16.7 billion). This is well above the cost of borrowing through otheravenues and puts a very different complexion on the attractiveness of DFT.
6.07 As was alluded to above, foreign investment in the manufacturingsector has caken several forms. The majority of firms in the country's10 Free Trade Zones are wholly owned subsidiaries. The Licensed ManufacturingWarehouses (LMWs)5 that have the privileges accorded to the FTZs but are geo-graphically scattered, also fall into this category. There is, however, a
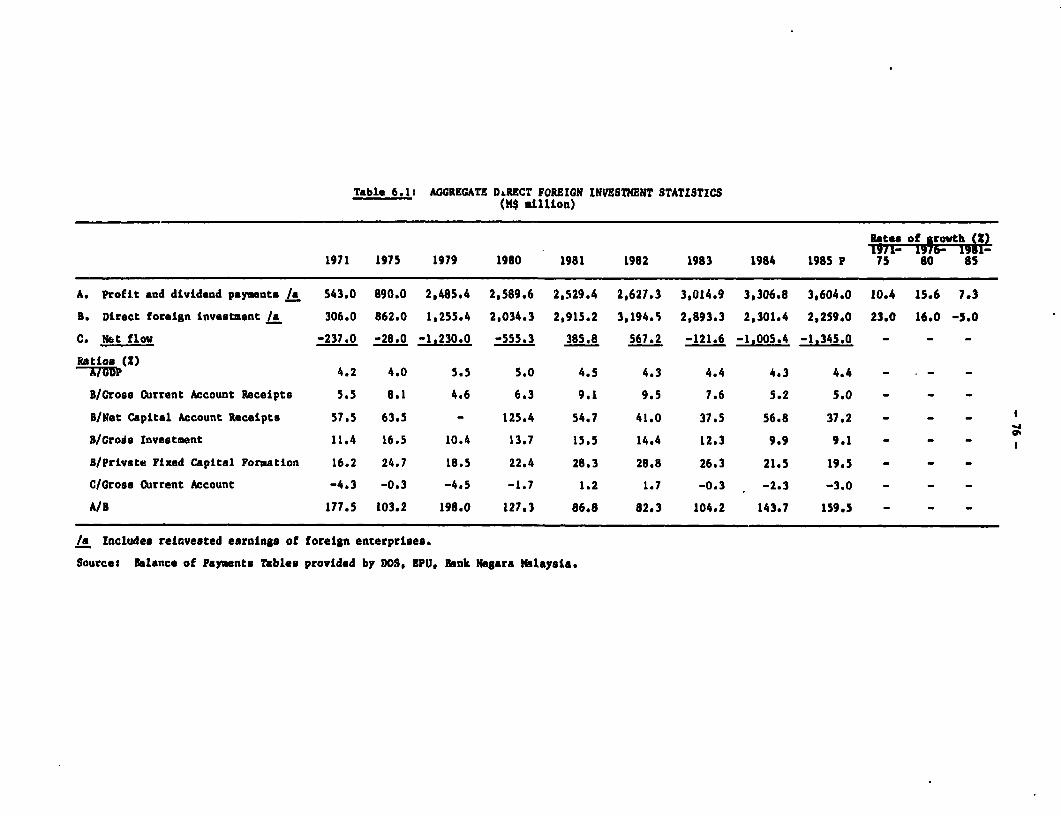
Table 6.1: AGGREGATE D&RECT FOREIGN INVESTMENT STATISTICS(H$ million)
Rates of rovth19 1- 190- I91l-
1971 1975 1979 1980 1981 1982 1983 1984 1985 P 75 80 8S
A. Profit and dividend paymentm /s 543.0 890.0 2,485.4 2,589.6 2,529.4 2,627.3 3,014.9 3,306.8 3,604.0 10.4 15.6 7.3
B. Direct foreign investment /a 306.0 862.0 1,255.4 2,034.3 2,915.2 3,194.5 2,893.3 2,301.4 2,259.0 23.0 16.0 -5.0
C. Net flow -237.0 -28.0 -1,230.0 -555.3 385.8 567.2 -121.6 -1,005.4 -1,345.0 - - -
Ratio. (Z)4.2 4.0 5.5 5.0 4.5 4.3 4.4 4.3 4.4 - - -
B/Gross Current Account Receipts 5.5 8.1 4.6 6.3 9.1 9.5 7.6 5.2 5.0 - - -
B/Net Capital Account Receipts 57.5 63.5 - 125.4 54.7 41.0 37.5 56.8 37.2 - - -
B/Grois Investment 11.4 16.5 10.4 13.7 15.5 14.4 12.3 9.9 9.1 - - -
B/Private Fixed Capital Formation 16.2 24.7 18.5 22.4 28.3 28.8 26.3 21.5 19.5 - - -
C/Gross Current Account -4.3 -0.3 -4.5 -1.7 1.2 1.7 -0.3 -2.3 -3.0 - - -
A/B 177.5 103.2 198.0 127.3 86.8 82.3 104.2 143.7 159.5 - - -
/a Includes reinvested earnings of foreign enterprises.
Sources Blance of Payments Tables provided by DOW, EPU, Bank Ne8ara Nblaysia.
- 77 -
considerable volume of DFI that is outside the enclave sectors and involvesjoint ventures with public and some private sector firms. Although the firmsin the FTZs are wholly trade oriented, other joint ventures have less of anexport bias than the average Malaysian firm. The reason for this can betraced to the objectives of foreign investors. Unlike the situation in theEast Asian NICs, the pattern of foreign participation in Malaysia is veryunusual. Whereas investors from the OECD countries are preponderant else-where, 33Z of DFI in Malaysia has been by the NICs with Singapore in the lead(see Table 6.2). Small and medium sized firms from the NICs have invested inMalaysia to scale tariff barriers and gain a share of the local market; toobtain production cost advantages from Malaysian labor; and to make use ofMalaysia's export quotas to the US and the EEC in items such as textiles,garments and footwear. Because the smaller investors are often short of fundsthey are liable to seek joint ventures with capital-rich public enterprises.
6.08 Capital from the NICs does not bring much technology in its wake orfor that matter an international brand name and access to a worldwide market-ing network. Much of it goes into the traditional, relatively labor intensiveareas like food and beverages, clothing, paper and printing, metal productsand leather goods. Relatively little finds its way into the principal exportsubsectors: electrical and electronic products and scientific and measuringinstruments. In electronics, large MWCs from the US and Japan have 31% and24Z of the fixed assets respectively. The NICs have 16% of the total, much ofit in small scale consumer electronics. Japanese investors dominate thetextile industry with over half of the fixed assets. Investors from the OECDcountries are also prominent in food and beverage industries, tobacco, non-metallic mineral and chemical sectors which sell -nainly to the domesticmarket. Some of the chemicals, nonmetallic and rubber goods investments are acarryover from the pre-independence period when tin, rubber and petroleLwnrefining were a focus of foreign owned manufacturing activities. DFI in foodand tobacco was motivated by the desire to scale tariffs, particularly afte;barriers were raised over the 30Z average in the mid 70s.
6.09 There are two other empirical developments of note: first, thecapital intensity of foreign operations is higher than that of local firms;and second, the capital coefficients are rising with the trend towards automa-tion which has reduced the average level of employment in MIDA approvedforeign ventures.
MNC Strategy and the Future of DFI
6.10 What bearing might DFI have on the industrialization of the economyin the eighties and beyond? The government projects a recovery of the capitalinflow and this receives a measure of support from a study by IMF researcherswhich concludes that a 5Z p.a. real increase in DFI over the next five yearsis a realistic possibility. Whether or not a reversal of the downward trendis likely and the magnitude of the increase if it occurs, no amount of statis-tical legerdemain can wring from past data. What can b- discussed are thechanging strategies of the MWCs, how they affect SE Asian economies, and thenet gains for Malaysia from soliciting the business of foreign companies,small and large.
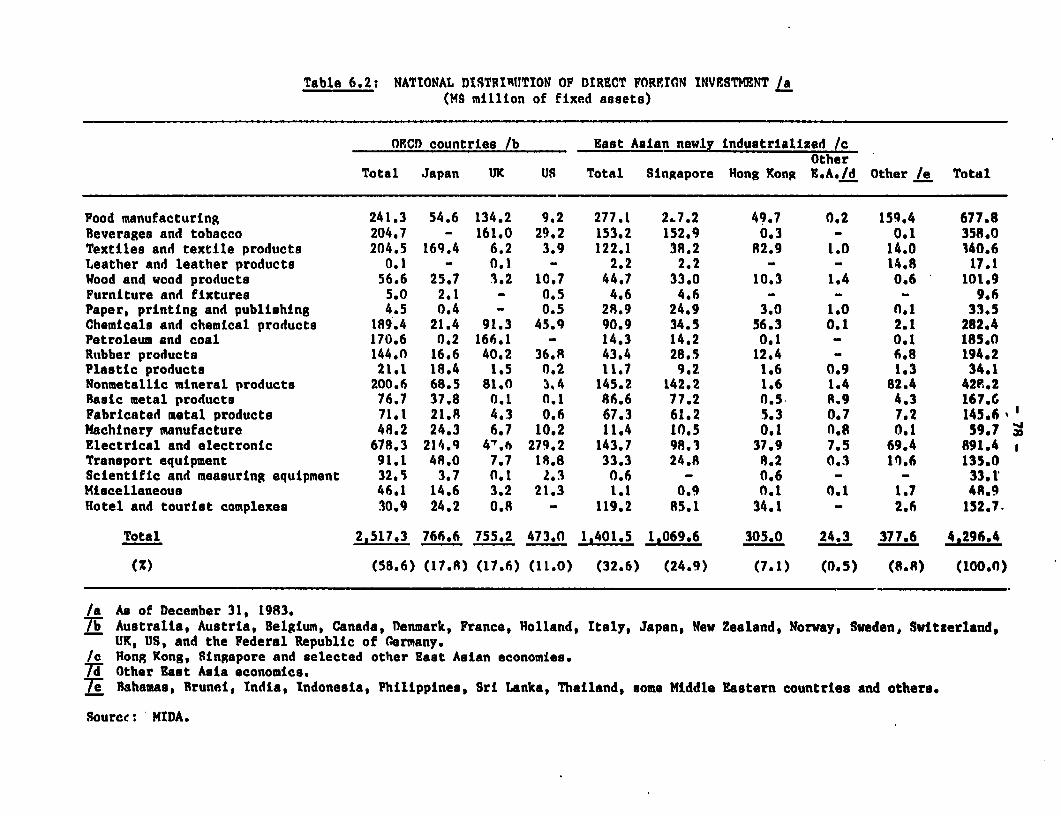
Table 6.2: NATIONAL DISTRIR11TION OF DIRECT FOREIGN INVESTMENT /a(MN million of fixed assets)
OECD countries /b East Asian newly Industrialized /cOther
Total Japan UK US Total Singapore Hong Kong E.*A/d Other /e Total
Food manufacturing 241.3 54.6 134.2 9.2 277.1 2.7.2 49.7 0.2 159.4 677.8Beverages and tobacco 204.7 - 161.0 29.2 153.2 152.9 0.3 - 0.1 358.0Textiles and textile products 204.5 169.4 6.2 3.9 122.1 3R,2 82.9 1.0 14.0 U40.6Leather and leather products 0.1 - 0.1 - 2,2 2,2 - - 14.8 17.1Wood and wood products 56.6 25,7 3,2 10,7 44,7 33,0 10.3 1t4 0.6 101.9Furniture and fixtures 5.0 2,1 - 0.5 4,6 4,6 - - - 9.6Paper, printing and publishing 4.5 o.4 - 0.5 28.9 24,9 3.0 1.0 n.1 33.5Chemicals and chemical products 189.4 21.4 91.3 45.9 90.9 34.5 56.3 0.1 2.1 282.4Petroleum and coal 170.6 O.2 166.1 - 14.3 14.2 0.1 - 0.1 185.0Rubber products 144.0 16.6 40.2 36.8 43.4 28,.5 12.4 - 6.8 194.2Plastic products 21.1 18.4 1.5 0.2 11.7 9.2 1.6 0.9 1.3 34.1Nonmetallic mineral products 200.6 68.5 81.0 1.4 145.2 142.2 1.6 1.4 82.4 42R.2Basic metal products 76.7 37.8 0.1 0.1 86.6 77.2 0.5 8.9 4.3 167.6Fabricated metal products 71.1 21.8 4.3 0.6 67.3 61.2 5.3 0.7 7.2 145.6Machinery manufacture 48.2 24.3 6,7 10,2 11.4 10.5 0.1 n.8 0.1 59.7Electrical and electronic 678.3 214.9 4'.6 279.2 143.7 98.3 37.9 7.5 69.4 891.4Transport equipment 91.1 48.0 7.7 18.8 33.3 24, 8.2 0,3 10.6 135.0Scientific and measuring equipment 32.5 3,7 0.l 2.3 0.6 - 0,6 - - 33.1Miscellaneous 46.1 14,6 3,2 21.3 1.1 0.9 0.l n.1 1.7 48.9Hotel and tourist complexes 30.9 24.2 0.8 - 119.2 85.1 34.1 - 2.6 152.7.
Total 2,517.3 766.6 755.2 473.0 1,401.5 1,069.6 305.0 24.3 377.6 4,296.4
(Z) (58.6) (17.8) (17.6) (11.0) (32.6) (24.9) (7.1) (0.5) (8.R) (100.0)
/a As of December 31, 1983.7TW Australia, Austria, Belgium, Canada, Denmark, France, Holland, Italy, Japan, New Zealand, Norway, Sweden, Switzerland,
UK, US, and the Federal Republic of Oermany./c Hong Kong, Singapore and selected other East Asian economies.7Tr Other East Asia economics.7i Bahamas, Brunei, India, Indonesia, Philippines, Sri Lanka, Thailand, some Middle Eastern countries and others.
Source: MIDA.
- 79 -
6.11 MNCs have thrived because they have certain intangible assets tooffer, be they technology, brand names, managerial skills or marketing capabi-lities, and there is an advantage to selling these through a multi-countryorganizational _y7icle as against making the technology or knowledge availableby other means.- Falling transport costs, the ever closer integration ofnational economies, standardized manufacturing techniques and the perfectionon the one hand of systems for coordinating dispersed production, on the otherof worldwide marketing, has increased the potency of the MNCs. Predictably,they have used these forces to enlarge their worldwide market shares andlessen market uncertainty. But they have also secured their position in otherways as we,i.. Advertising on an international scale has shaped consumertastes, solidified a brand image and created a stable demand where, in thepast there was none. Entry barriers for newcomers have been made stiffer bysystematic product differentiation whose object is to saturate the market. Atechnology policy, partly dictated by the desire to remain -ompetitive againstother multinational firms, partly to push technological change at a pace andin a direction that would be sorely expensive for a new entrant to match, hasconsolidated oligopolistic positions. Size has also meant that the MNCs havethe financial depth to survive swings in the business cycle and to counterprice or product moves by their adversaries.
6.12 Thus the appearance of powerful oligopolies, which betweenthemselves are carving up the world market for a wide range of products, thatare capital, technology and marketing intensive and benefit from high incomeelasticities of demand, is altering the trade environment. Items such asmotorbikes, cameras, VCRs, compact disc players, camcorders, mini and main-frame computers, industrial robots and automobiles, with their short productcycles and close identification to a handful of producers are virtually beyondthe reach of new aspirants. The channels of trade may be wider and deeperthan ever before, which in thecry is a positive development as far as newtrading nations are concerned, but some of the most desirable channels to bein are protectively controlled by MNCs. By one estimate, half of US importsrepresent the internal transactions of large companies.
6.13 The manner in which the MNCs straddle the byways of world trademakes industrialization based on the large-scale exports of manufactures toOECD countries (the biggest, if not the fastest growing markets), an arduoustask without the connivance of MNCs. Whether it is the provision of techno-logy or capital, or market access, or a brand name or even managerial knowhow,MNC participation makes all the other exchange rate, industrial and labormarket policies yield results. The trouble is that many of the developingcountries need the HNCs slightly more than the corporations need their busi-ness or their labor. They are operating in a buyers' market with a string of
13/ Paras 6.11-6.17 are based on research on MNC's discussed in R.E. Caves,Multinational Enterprise and Economic Analysis, Cambridge UniversityPress, 1982; A.M. Rugman, ed. New Theories of the MultinationalEnterprise, St. Martin's Press, 1982; C.P. Kindelberger and D.B.Andretsch, eds. The Multinational Corporation in the 1980s, MIT Press,1983, and C.P. Kindelberger, Multinational Excursions, MIT Press, 1984.
- 80 -
options to choose from and the ability to arbitrage institutional possibi-lities and incentives in different countries.
6.14 For some years, MIC strategies have been in a flux. Protectionismin the advanced countries and the labor saving bias of new technologies havetilted the scales towards investment in the industrial economies. On theother hand, market growth, actual and potential, and financial attractiveness-a combination of fiscal incentives, opportunity for transfer pricing andlower operating costs-have all drawn them towards the NICs. There are manyways of interpreting current events but the widely publicised moves by IBM,Toyota, Fujitsu, Komatsu and others, all suggest that the MNCs see theirfuture lying more towards producing and selling in the industrial countries.DFI may continue to grow, but more of it might be channeled between OECDcountries. The MNCs also recognize that if the exports of the NICs and theproto NICs have to surmount higher trade barriers their market growth, whichwas an important secondary attraction for MNCs, will be lessened.
6.15 There are limited alternatives for a small country to develop exportindustries in subsectors such as consumer durables, electrical and electronicproducts, chemicals, transport equipment and even textiles without linking upwith the MNCs, but Malaysia must also consider strategies that take intoaccount the possibility of diminishing MNC support. There are several reasonsaside from the above-mentioned shift in DFI. Malaysia's smallness makes itintrinsically less attractive as a future market and its wage structure isalmost on par with that of the dynamic NICs. Where Thailand, Indonesia andPhilippines can still lay claim to reserves of cheap labor, Malaysia has lostthe edge. The advantages of political stability are partially vitiated by thepolicies which the government has used to restructure equity. The effect thishas had on foreign investors is amply depicted in the negative capital flowsshown in Table 8.1. Foreigrers' share in corporate equity has fallen from 622in 1971 to 33Z in 1983.
6.16 Many MNCs set up operations in Halaysia when it introduced the FTZin 1972, a novelty in those times. By the eighties most of the tariffscalers, the seekers after textile quotas, producers supplying the largedomestic market for agricultural chemicals, and exporters in the electronicsand garments subsectors, were already in and new capital was being funnelledinto expansion of existing facilities. Jobs had been created - 70,000 in theFTZs alone - but the MNCs had not seen fit to pursue the long-term design,skill and technology transfer programs that gave rise to dense networks ofsubcontractors in some of the NICs and Australia and helped these economiesgain industrial momentum. Domestic value added in Malaysia's FTZs hasstagnated in the 12-15% range. This reflects the MNCs' assessment ofMalaysia's potential as a market and an export platform. In addition it isevidence of their reluctance to part with technology that could impair futuremarket control and the preference for importing parts from their home basesfor reasons of quality and reliability but also because these transactionsserve as a venue for transfer pricing.
6.17 In the mediumrterm, the appropriate policy for Malaysia would be tobid for all the DFI it can attract into assembly type industries by maintain-ing incentives that are competitive. But there would not seem to be much gain

- 81 -
from adding to these incentives as they would be matched by neighbouring econ-omies and in any case the response elasticity of DFI is probably small. Oncethe country has developed its own base of producer goods and parts manufac-turers, more important than DFI will be the skill shown by local businessmenin using NBC contacts to improve their access to western markets and obtain,through licenses or other means, the technologies developed and controlled bythe foreign firus. As regards energy related DFI, the current and projectedoil prices, by squeezing the exploration budgets of the oil majors will reducethe flow of foreign capital into the petroleum sector for some yearsirrespective of how the contract terms are modified.
- 82 -
CHAPTER VII: INDUSTRIAL STRATEGY AND DEVELOPMENT
7.01 Economic tradition calls for developing countries to rigorouslyobserve the dictates of comparative advantage and free trade. Within theinterstices of these rules lies the concept of infant industries, permittingthe use of industrial policies which include not just tariff and taxes butalso attempts to foster research9 labor skills, financial institutions and amentality supporting the goals of modernization. How the rearing of infantmanufacturing firms can be reconciled with the other two has never been satis-factorily explained. Policymakers have been urged to keep incentives asneutral as possible, to allow the market maximum play and to set limits on theperiod of infancy. These rules have been variously translated. In Malaysia'scase, the country remained for long a producer of primary commodities, whilemuch of the output was exported raw or in semi-processed forms, the initialforays into manufacturing were in affiliated fields like rubber goods, vege-table oil refining and tin smelting. Subsequently--during the period datingfrom the late sixties through much of the seventies-the economy moved into amore intensive phase of industrialization. Behind newly raised tariff wallsencouragement was given to firms producing food and beverages as well as lightconsumer goods almost exclusively for the home market; basic materials forexample, agricultural and industrial chemicals, cement, metal products, paperand wood products; and to labor intensive assembly and processing industriesthat were primarily trade oriented.
7.02 Broadly speaking, economic policy did not deviate much from theconventional interpretation of comparative advantage. In fact, through themedium of DFI, Malaysia's export sector evolved on the pattern that would beexpected of a labor rich economy where skill, technology and capital wererelatively scarce. It played host to footloose industries and used MNC andother established chanzels for selling its output overseas. The first phaseof tradable goods development has come to a close. Malaysia has since beendrifting without a coherent strategic direction towards a second phase. Themanufacturing sector expanding around export as well as domestically orientedpoles grew at 13X p.a. between 1973-78, but then slowed to 9.3% p.a. from 1978to 1980'4/ The first half of the eighties has witnessed a furtherdeceleration of the manufacturing sector to about 4.9% p.a. with the impetuscoming mainly from the public sector and to a lesser extent DFI in theelectronics industry, although the data do not permit a partitioning of theinvestment series which would allow the public sector's role to be conclu-sively demonstrated. Textiles attracted the most resources in the seventiesand expanded at 16% p.a., its share of manufactured CDP trebling to 6% by the
14/ The World Bank has reviewed the performance and prospects of Malaysianindustry in two reports issued in the early eighties: Malaysia's Manu-facturing Sector: Development Issues and Policy Options, ReportNo. 3187-MA, April 1981; and Malaysia: Development Issues and Prospectsof Small Enterprises, World Bank Report No. 3851-MA, June 1982. Many oftheir findings in the area of credit availability, technology, skills andmarket access, support the main recommendations of this report.
- 83 -
end of the decade. Growth was slower in the eighties but still a respectable8% p.a. Close behind textiles was electronics and electrical products, but asa result of international demand, the industry showed an improvement inperformance over the seventies; its annual rate of increase over the FourthPlan period was over 132 p.a. Transport equipment, petro-chemicals and metalproducts shared the limelight with textiles and electronics as the majorindustries and all contributed significantly to exports, but the lion's share- almost two thirds - belonged to the two leading subsectors.
7.03 In the earlier stages when capacity expansion was concentrated insectors of low capital intensity, employment in manufacturing increased by 12%p.a. But after 1978, when industries such as petrochemicals and non-ferrousmetals moved to the forefront, jobs became less plentiful, growing by 4Z p.a.between 1978 and 1980 and by around 2Z in the first half of the eighties(1981-85), pointing roughly, towards an elasticity of 0.5 with respect too-itput. As the labor force has been increasing at 3Z during the first half ofthe decade the manufacturing labor force has remained fairly constant at 17.5%of the total.
7.04 Besides the diminished rate of job creation, certain tendencies havebecome more visible. More than a fifth of the manufacturing output was expor-ted in 1984, a 50% increase over 1975. Four sectors, electronics and electri-cal equipment, textiles, petrochemicals and transport equipment dominateexporting activities and close to three fourths of the goods sold overseasoriginate in the FTZs and Licensed Manufacturing Warehouses (LMWs). Althoughvalue-added in petrochemicals is extremely high, the average for the FTZs is232 of sales, less than half of which takes the form oi wages, the balancebeing mostly profits, 90% of them accruing to foreign companies. Imports ofmaterials comprised 75Z of the value of sales from the FTZs, while the ratioof local materials to the total purchased was under 4% as recently as 1982.The situation was only marginally better for the LMWs. Value-added was 38Z,with wage payments and electricity accounting for 40Z and profits, more thantwo thirds claimed by foreign firms, taking up the remainder. LMWs obtained10% of their materials domestically.
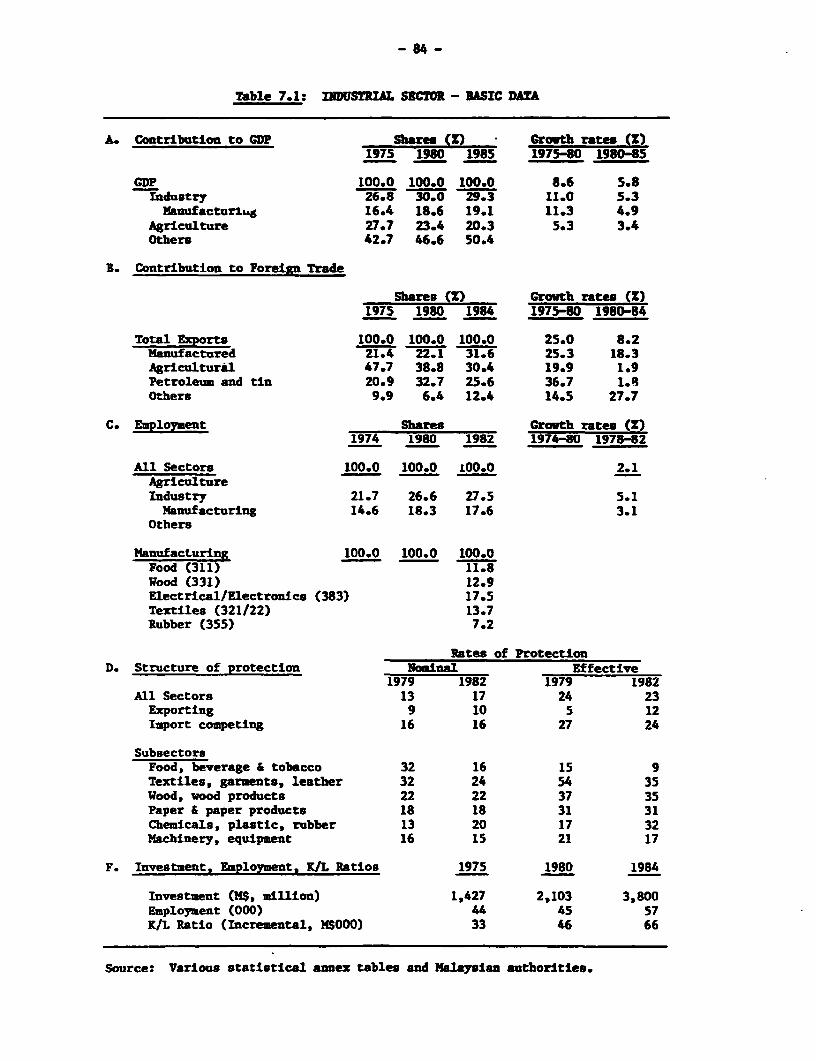
- 84-
Table 7.1: INDUSTRIAL SECTOR - BASIC DATA
A. Contribution to GDP Shares (Z) - Growth rates (Z)1975 1980 1985 1975-80 1980-85
GDP 100.0 100.0 100.0 8.6 5.8Industry 26.8 30.0 29.3 11.0 5.3
Manufacturiag 16.4 18.6 19.1 11.3 4.9Agriculture 27.7 23.4 20.3 5.3 3.4Others 42.7 46.6 50.4
B. Contribution to Foreign Trade
Shares (Z) Growth rates (Z)1975 19 8 1984 1975-80 1980-84
Total Exports 100.0 100.0 100.0 25.0 8.2Manufactured 21.4 22.1 31.6 25.3 18.3Agricultural 47.7 38.8 30.4 19.9 1.9Petroleum and tin 20.9 32.7 25.6 36.7 1.8Others 9.9 6.4 12.4 14.5 27.7
C. Employent Shares Growth rates (Z)1974 1980 1982 1974-80 1978-82
All Sectors 100.0 100.0 100.0 2.1AgricultureIndustry 21.7 26.6 27.5 5.1Nanufacturing 14.6 18.3 17.6 3.1
Others
Manufacturing 100.0 100.0 100.0Food (311) 11.8Wood (331) 12.9Electrical/Electronics (383) 17.5Textiles (321/22) 13.7Rubber (355) 7.2
Rates of ProtectionD. Structure of protection Nominal Effective
1979 1982 1979 1982All Sectors 13 17 24 23Exporting 9 10 5 12Import competing 16 16 27 24
SubsectorsFood, beverage & tobacco 32 16 15 9Textiles, garments, leather 32 24 54 35Wood, wood products 22 22 37 35Paper & paper products 18 18 31 31Chemicals, plastic, rubber 13 20 17 32Machinery, equipment 16 15 21 17
F. Investment, Employment, K/L Ratios 1975 1980 1984
Investment (M$, million) 1,427 2,103 3,800Employment (000) 44 45 57K/L Ratio (Incremental, MSOOO) 33 46 66
Source: Various statistical annex tables and Malaysian authorities.
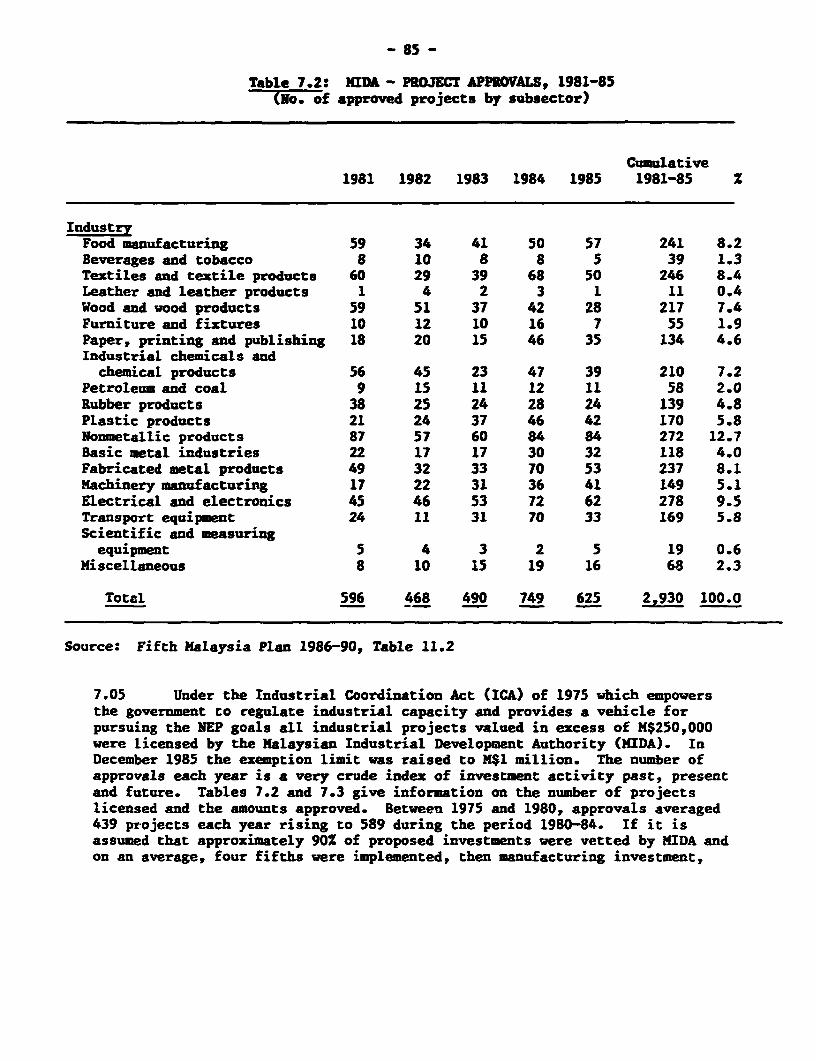
- 85 -
Table 7.2: MIDA - PROJECT APPROVALS, 1981-85(No. of approved projects by subsector)
Cumulative1981 1982 1983 1984 1985 1981-85 z
IndustryFood manufacturing 59 34 41 50 57 241 8.2Beverages and tobacco 8 10 8 8 5 39 1.3Textiles and textile products 60 29 39 68 50 246 8.4Leather and leather products 1 4 2 3 1 11 0.4Wood and wood products 59 51 37 42 28 217 7.4Furniture and fixtures 10 12 10 16 7 55 1.9Paper, printing and publishing 18 20 15 46 35 134 4.6Industrial chemicals andchemical products 56 45 23 47 39 210 7.2
Petroleum and coal 9 15 11 12 11 58 2.0Rubber products 38 25 24 28 24 139 4.8Plastic products 21 24 37 46 42 170 5.8onmoetallic products 87 57 60 84 84 272 12.7Basic metal industries 22 17 17 30 32 118 4.0Fabricated metal products 49 32 33 70 53 237 8.1Machinery manufacturing 17 22 31 36 41 149 5.1Electrical and electronics 45 46 53 72 62 278 9.5Transport equipment 24 11 31 70 33 169 5.8Scientific and measuringequipment 5 4 3 2 5 19 0.6
Miscellaneous 8 10 15 19 16 68 2.3
Total 596 468 490 749 625 2,930 100.0
Source: Fifth Malaysia Plan 1986-90, Table 11.2
7.05 Under the Industrial Coordination Act (ICA) of 1975 which empowersthe government to regulate industrial capacity and provides a vehicle forpursuing the NEP goals all industrial projects valued in excess of M$250,000were licensed by the Malaysian Industrial Development Authority (MIDA). InDecember 1985 the exemption limit was raised to M$l million. The number ofapprovals each year is a very crude index of investment activity past, presentand future. Tables 7.2 and 7.3 give information on the number of projectslicensed and the amounts approved. Between 1975 and 1980, approvals averaged439 projects each year rising to 589 during the period 1980-84. If it isassumed that approximately 90Z of proposed investments were vetted by NIDA andon an average, four fifths were implemented, then manufacturing investment,
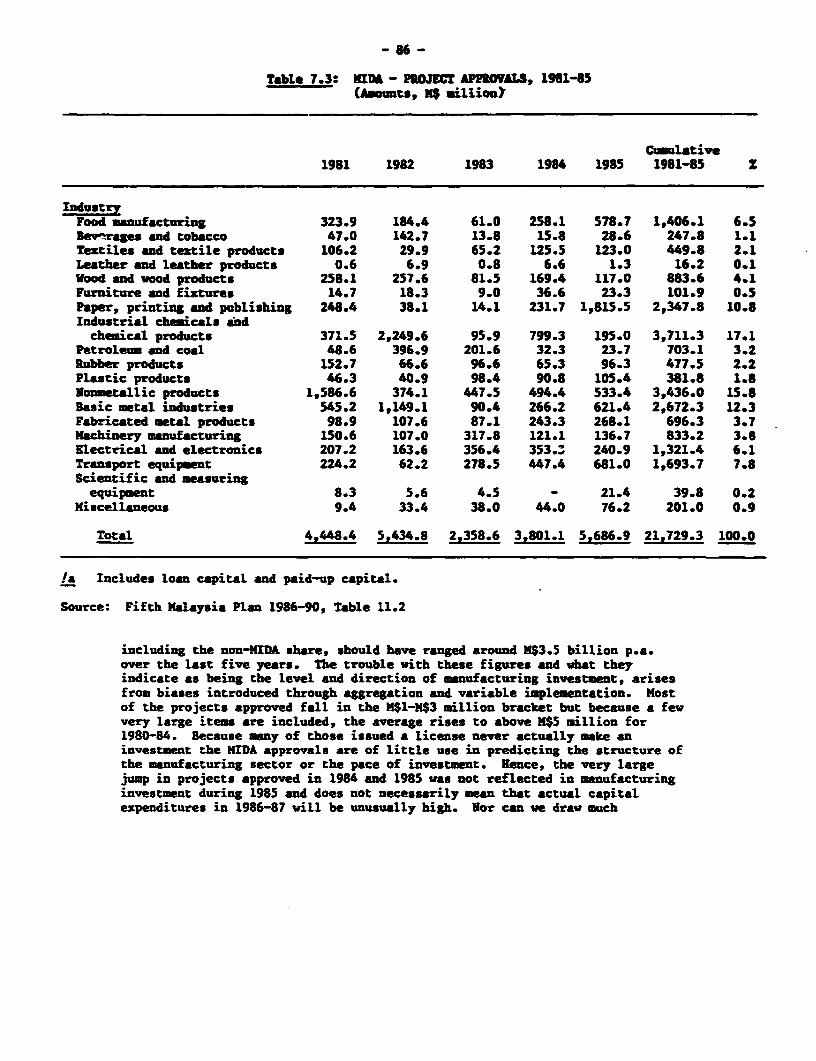
- 86 -
TUble 7.3: MIr - PROJECT APPOVALS, 1981-85(Amounts, M$ millionY
Cumlative1981 1982 1983 1984 1985 1981-85 S
IndustryFood manufacturing 323.9 184.4 61.0 258.1 578.7 1,406.1 6.5Bev-rages and tobacco 47.0 142.7 13.8 15.8 28.6 247.8 1.1Teztiles and textile products 106.2 29.9 65.2 125.5 123.0 449.8 2.1Leather and leather products 0.6 6.9 0.8 6.6 1.3 16.2 0.1Wood and wood products 258.1 257.6 81.5 169.4 117.0 883.6 4.1Furniture and fiztures 14.7 18.3 9.0 36.6 23.3 101.9 0.5Paper, printing and publishing 248.4 38.1 14.1 231.7 1,815.5 2,347.8 10.8Industrial chemicals andchemical products 371.5 2,249.6 95.9 799.3 195.0 3,711.3 17.1
Petroleum and coal 48.6 396.9 201.6 32.3 23.7 703.1 3.2Rubber products 152.7 66.6 96.6 65.3 96.3 477.5 2.2Plastic products 46.3 40.9 98.4 90.8 105.4 381.8 1.8Nonmetallic products 1,586.6 374.1 447.5 494.4 533.4 3,436.0 15.8Basic metal industries 545.2 1,149.1 90.4 266.2 621.4 2,672.3 12.3Fabricated etal products 98.9 107.6 87.1 243.3 268.1 696.3 3.7Machinery manufacturing 150.6 107.0 317.8 121.1 136.7 833.2 3.8Electrical and electronics 207.2 163.6 356.4 353.: 240.9 1,321.4 6.1Transport equipment 224.2 62.2 278.5 447W4 681.0 1,693.7 7.8Scientific and measuringequipment 8.3 5.6 4.5 - 21.4 39.8 0.2
Miscellaneous 9.4 33.4 38.0 44.0 76.2 201.0 0.9
Total 4.448.4 5,434.8 2,358.6 3,801.1 5,686.9 21,729.3 100.0
/a Includes loan capital and paid-up capital.
Source: Fifth Kalaysia Plan 1986-90, Table 11.2
including the non-MIDA share, should have ranged around K$3.5 billion p.a.over the last five years. The trouble with these figures and what theyindicate as being the level and direction of manufacturing investment, arisesfrom biases introduced through aggregation and variable implementation. Mostof the projects approved fall in the M$1-M$3 million bracket but because a fewvery large items are included, the average rises to above M$5 million for1980-84. Because many of those issued a license never actually make aninvestment the MIDA approvals are of little use in predicting the structure ofthe manufacturing sector or the pace of investment. Hence, the very largejump in projects approved in 1984 and 1985 was not reflected in manufacturinginvestment during 1985 and does not necessarily mean that actual capitalexpenditures in 1986-87 will be unusually high. Nor can we draw much
- 87 -
inference about the composition of future output by aggregating the values ofinvestments licensed over a three to four year stretch. Nonetheless, it isuseful to note that if the subsectoral information on amounts and growth ratesduring 1980-84 is pooled, the center of industrial interests, if not actualinvestment outlay appears to be shifting more towards producer goods indus-tries. Food, wood products, textiles and paper still receive substantial,albeit fluctuating amounts of capital, but the emphasis is now on transportequipment, machinery, fabricated metal products and industrial chemicals.
7.06 Though it is a trifle indistinct, this move towards heavy industriesmirrors a change in the structure of protection. A glance at nominal andeffective rates suggests that conditions in the early eighties did not departmuch from those prevailing in the late seventies. Average effective protec-tion (EPR) was 24Z in 1979 and 23Z in 1982. Table 7.4 giving rates for 2-digit groups, shows EPRs rising in just two categories: food and beverages,
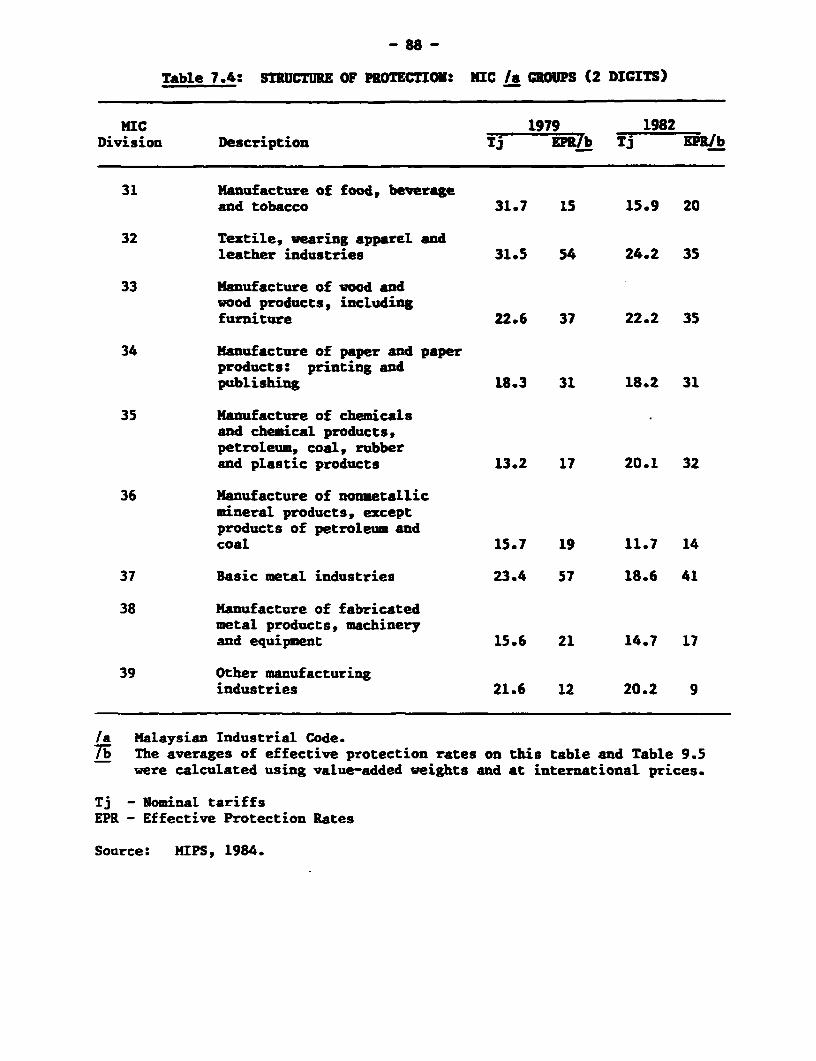
- 88 -
Table 7.4: STRUCTURE OF PROTECTION: DIC /a GROUPS (2 DICITS)
MIC 1979 1982Division Description ij EPRV b Tj EPR/b
31 Manufacture of food, beverageand tobacco 31.7 15 15.9 20
32 Textile, wearing apparel andleather industries 31.5 54 24.2 35
33 Manufacture of wood andwood products, includingfurniture 22.6 37 22.2 35
34 Manufacture of paper and paperproducts: printing andpublishing 18.3 31 18.2 31
35 Manufacture of chemicalsand chemical products,petroleum, coal, rubberand plastic products 13.2 17 20.1 32
36 Manufacture of nonmetallicmineral products, exceptproducts of petroleum andcoal 15.7 19 11.7 14
37 Basic metal industries 23.4 57 18.6 41
38 Manufacture of fabricatedmetal products, machineryand equipment 15.6 21 14.7 17
39 Other manufacturingindustries 21.6 12 20.2 9
/a Malaysian Industrial Code.7i The averages of effective protection rates on this table and Table 9.5
were calculated using value-added weights and at international prices.
Tj - Nominal tariffsEPR - Effective Protection Rates
Source: MIPS, 1984.
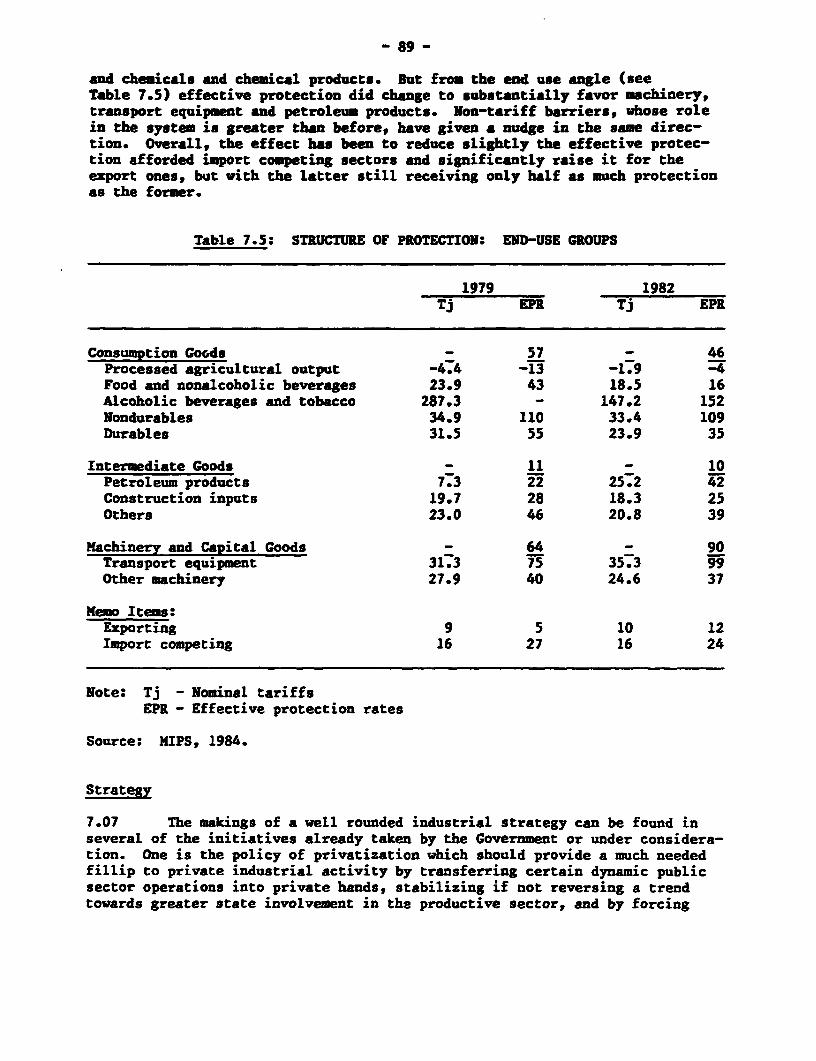
- 89 -
and chemicals and chemical products. But from the end use angle (seeTable 7.5) effective protection did change to substantially favor machinery,transport equipment and petroleum products. Won-tariff barriers, whose rolein the system is greater than before, have given a nudge in the same direc-tion. Overall, the effect has been to reduce slightly the effective protec-tion afforded import competing sectors and significantly raise it for theexport ones, but with the latter still receiving only half as much protectionas the former.
Table 7.5: STRUCTURE OF PROTECTION: END-USE GROUPS
1979 1982Tj EPR Tj EPR
Consumption Goods - 57 - 46Processed agricultural output -4.4 -13 -1.9 -4Food and nonalcoholic beverages 23.9 43 18.5 16Alcoholic beverages and tobacco 287.3 - 147.2 152Nondurables 34.9 110 33.4 109Durables 31.5 55 23.9 35
Intermediate Goods - 11 - 10Petroleum products 7.3 22 25.2 42Construction inputs 19.7 28 18.3 25Others 23.0 46 20.8 39
Machinery and Capital Goods - 64 - 90Transport equipment 31.3 75 35.3 9Other machinery 27.9 40 24.6 37
Memo Items:Exporting 9 5 10 12Import competing 16 27 16 24
Note: Tj - Nominal tariffsEPR - Effective protection rates
Source: HIPS, 1984.
Strategy
7.07 The makings of a well rounded industrial strategy can be found inseveral of the initiatives already taken by the Government or under considera-tion. One is the policy of privatization which should provide a much neededfillip to private industrial activity by transferring certain dynamic publicsector operations into private hands, stabilizing if not reversing a trendtowards greater state involvement in the productive sector, and by forcing
- 90 -
major industrial entities to foresake a sheltered existence and meet the testof the market, helping to increase overall industrial efficiency. Aftertesting the waters through the privatization of an aircraft servicing companyand a toll. road, the Government comienced the process that vill eventuallybring its share in the national airlines (KAS) to 3OZ. Depending on theappetite of the market - and the response to the KAS offering was reassuring -other public enterprises will also be disposed of permitting the state tomarshal its administrative resources on a narrower front.
7.08 Another set of initiatives relate to measures calculated to enhancethe market's allocative efficiency and modify some of the rules governingentrepreneurial access to industrial opportunities. A third involves takingthe high ground of dynamic comparative advantage as described in theIndustrial Master Plan. In other words, promoting the development of indus-trial subsectors that will eventually displace the traditional light manufac-turing industries as the major exporters and industrial employers of the lateeighties and the nineties. The following discussion indicates how theseinitiatives might be integrated and extended so as to comprise an industrialstrategy for the long run.
Market Efficiency
7.09 The Malaysian Industrial Policy Studies (MIPS) completed in early1985 has described the incentives available to industrialists and traced outtheir distortionary effects. The major elements of the current industrialpolicy regime are: tariff structure, tax and tax-related incentives, andfinancial incentives. The analysis of the tariff and tariff related policyinstruments on the manufacturing sector as given in the MIPS shows that;
(a) import tariffs in Malaysia seek to serve simultaneously differentobjectives concerning revenue collection, growth, exports andequity, often with inconsistent and conflicting results. Theadministration of import duties has given rise to biases betweenmanufacturing and other sectors; between different industries withinmanufacturing and firms within industries; between the import-competing and export sector; between FTZ/LMW and non-FTZ/LMW manu-facturing, between first and second phase manufacturing industries;between capital and labor intensive enterprises; and between largeand small firms;
(b) the tax revenue base has been eroded by the use of exemptions fromimport taxes as well as by the large number of zero or low rates;
(c) the use of tariffs and surtaxes, tariff exemptions, specific and advalorem duties is administratively complex, sometimes inefficient,and to a degree obscures their combined effect on effectiveprotection.
The tariff structure in Malaysia has undeniably fostered industrialization inthe import-competing sector but the average level of effective protection andthe wide range of effective tariff rates and domestic resource costs indicatesthat protection of the sector may be in excess of what is required to supportefficient growth.
- 91 -
7.10 The weighted average level of effective protection afforded valueadded in manufacturing industry was an estimated 23Z in 1982. Relative toother developing countries, this is not high, but there is a wide dispersionin effective protection, between as well as within industries, and there aresigns that the dispersion may be growing. For instance, between 1979 and1982, the proportion of free trade value added in manufacturing receivingeffective protection in ezcess of 50X remained constant at around llZ; in thesame period the proportion receiving effective protection less than 5Z,increased from 11 to 24Z.
7.11 A move tovards greater uniformity in rates of effective protectionand a reduction of the 'made-to-measure' character of the present system inMalaysia would seem to be appropriate at this stage. The made-to-measuresystem leaves much to be desired because its administration involves a greatdeal of detailed judgment by tariff authorities about costs, technology andprocesses of productien which may not always be wirhin the technical compe-tence of these authorities. It also introduces an additional uncertainty intobusiness planning. The more complicated the system, the more scope for ad hocdecisions.
7.12 The exceptions to the above are:
(a) infant industry including second-round of import substitutingindustries;
(b) where detailed social cost benefit analysis indicates the presenceof permanent externalities; and
(c) national concerns, such as defense, equity, regional dispersal.
7.13 Some of the existing import competing industries, as the evidenceshows, have remained infant for too long, and there is a need to reduce thelevel of protective assistance available to them, while some new "infants" arebrought on stream. Whether an industry is created as an "infant" should bebased on the introduction of a production technique or technology new toMalaysia. The phasing-out period, say 4 to 7 years, might be fixed from thefirst date of production in Malaysia irrespective of later starts by otherproducers. Most of the second round import substitution industries would fallin this category.
7.14 With these caveats in mind, a phased restructuring of the tariffs isneeded to bring the effective protection rates to a suitable level such as todeliver a subsidy equivalent on the export side that would approximate freetrade conditions for exporters. The analysis in the NIPS offers a detailedrationale for aiming at a uniform EPR of around 13X. While this represents afirst best solution, perhaps a more viable arrangement would be to aim formore modest goals that concern tariff adjustment at the extreme ends in thecase of those industries which have enjoyed protection for a number ofyears. For example, in the initial phase, adjustments in import duties may beundertaken to raise tariffs from zero to 5% where full exemptions are allowed,or a lower rate of protection applies; and at the upper end, tariffs may bephased in a selective fashion on a sector-by-sector basis. These changes, at
- 92 -
the upper end will affect 7X of manufacturing output, and at the lower endabout 10 of output. Thus in terms of output, nearly 17X of manufacturingsector will be affected. Revenue and balance of payments effects of thesechanges, likewise, are estimated to be marginal.
7.15 Tariff and surtax exemptions significantly alter the nominal protec-tion accorded to industries. The value of goods exempted was M$2.6 billion in1982 and the revenue foregone is estimated at M$110 million per year of whichless than half involves exported output. Among export industries, 6 indus-tries accounted for 44% of exemptions granted; among industries producing fordomestic market, 6 industries accounted for 37% of exemptions granted. Thepattern of exemption therefore is concentrated.
7.16 Leaving export industries aside for the time being, a suitableapproach would be to allow the normal exemption period of four years expirefor import competing industries, at least for those industries which haveenjoyed EPRs in excess of 25Z for previous years. This proposal overlaps withthe recommended increase in tariffs from zero to 5% level. Hence, the numberof industries affected is likely to be small; the positive revenue effectwould be significant; no additional study is needed., and, Government couldeasily identify these industries.
7.17 The effects of non-tariff policy instruments on the Halaysianindustrial sector are quite different except for the licensing system whichexerts direct control. A detailed assessment of these instruments is providedin the HIPS. The following is a summary evaluation.
(a) Import quotas: In 1984, nearly 50 items were subject to quotas withvarying degrees of severity. Quotas, however, are prohibitive foronly three industries - iron and steel products (not all items),automotives, and sugar; closely followed by less prohibitive quotasfor timber and cement. The Government might replace some quotaswith tariffs in industries other than those five identified above.
(b) Local Content Plans. This policy is mainly geared to provideprotection to the automotive industry along with a few electricalproducts. Given the sector's importance, the Government may wish toinitiate a subsector policy study if not to liberalize the sector,at least to iron out inconsisteacies inherent in the overlappingpolicy instruments. Some observations may be noted in this regard:
The ban on imports of completely built-up units (CBUs) makes tariffsredundant as a protectionist device - tariffs are then equivalentto a consumption tax on 'luxury' items. The observed price differ-ential between a locally assembled vehicle and equivalent taxachieves the same objective. Given this segmentation, efforts atmarket access by component producers is usually unsuccessful sincethey are saddled with noncompetitive items.
(c) Price Controls. In 1984, 14 manufactured commodities were underprice control. Of these, six commodities could be freely imported,and eight were subject to partial or prohibitive quotas. The
93 -
primary objective of price controls of freely traded items is toeven out price fluctuation, and protection is unintended effect.But for the eight restricted items, price control as well as protec-tion is a combined objective. When tariffs are super-imposed, it istoo complex to determine what is being achieved beside protection tothe industry. The issue needs to be looked at further.
(d) Government Purchasing. The 'buy Malaysia' policy in the publicsector provided the equivalent of an additional tariff of 10Z, priorto 1983. Under the new guidelines initiated in 1984, the protectiveeffect is there but very difficult to measure. Furtherinvestigation of this issue is needed.
(e) Tax and Tax Related Incentives. The major tax instruments arecorporate income tax, tax holidays, capital allowances includingthose for accelerated depreciation and reinvestment, export duties,sales and excise taxes. An important finding of the MIPS is thatwhile tax and financial incentives did augment corporate profits, inabsolute terms their impact has been well below that of thetariff. According to the estimates, in 1980 tax and credit incen-tives together represented nearly 9Z of free-trade value added ascompared to the average trade EPR of 23Z. Further, the pattern ofthese incentives was such as to provide relatively more assistanceto heavily protected subsectors with the exception of electronics -an exporting industry. Tax and credit incentives did increase thecombined rate of protection to all subsectors, favored activitieswith low value-added but did not boost manufacturing as mu-h as wasintended; favored FTZ/LMW exporters over others; as such did notprovide backward linkages in the economy nor did much to helpexporters outside FTZs; did not promote regional dispersal; contri-buted to segmentation of incentives received by firms betweenindustries and within a given industry due to their case-by-caseadministration. Given these conclusions, the basic principles toguide the future reform process are similar to the ones offered intrade policy area. The principles are: economic viability ofprojects; neutrality of investment incentives between various sub-sectors; clearly formulated eligibility criteria; less discretion;preferably automaticity in the award of incentive package; andclearly formulated investment strategy to guide investment deci-sions. Superimposed upon these is the recognition of externali-ties: regional dispersal; ethnic participation and ownership;research, development, and technology transfer; pioneer status andenvironment.
Regulation
7.18 Encouraging entrepreneurial activity in the industrial sector andm-cimising the flexibility of resource use could be the secona strand of thestrategy. Currently most investors are bound by three principal guidelinesthat emerged from the NEP in the mid-seventies. Thirty percent cf a company'sequity must be allocated to Bumiputra investors; a proportion of thoseemployed have to be Bumiputras; and companies whose size places them above an
- 94 -
exemption limit are required to obtain a license from the Secretary General ofthe Ministry of Trade and Industry, advised by the Action Comittee forIncentives (ACI). Of these, it is the licensing process that has attractedthe most attention. The ACI's decision is guided by the goals of the NEP,subsectoral development plans and supply conditions affecting each industry.The actual screening of applications and issuing of permits is done by theMalaysian Industrial Development Authority (MIDA). Licenses place limits onthe production of the items sanctioned, and call for prior approval before anew product can be manufactured or capacity expanded. Further, they maysubject firms to local sourcing requirements and pricing guidelines. Asstated by the MIPS "to the extent that entry to an industry is controlled bythe Secretary General such decisions have clear implications regardingincentives for those firms already in the industry. To the extent that entrymay be denied more efficient enterprises, economic rewards to existing firmsare also affected." Having to go through the process of licensing isdiscouraging in itself, particularly for small investors, when allied with thenecessity of arriving at a certain division of equity and employment, itdissuades all but the most perseverent and well connected. For years, arevision of the licensing limit has been the foremost request voiced bybusinessmen seeking greater freedom in the marketplace. In December 1985, theauthorities responded by introducing significant changes in licensingregulations. Previously, the rule was that all manufacturing enterprises with25 or more employees or with paid-up capital of more than M$250,000 wererequired to apply for a license. This was raised to 50 employees and M$l mil-lion. The Government also permitted export oriented firms to expand capacityand diversify without seeking prior approval. Through its actions thegovernment has decisively signalled its commitment to an industrial strategyin which private initiative is the driving force and this is bound tostrengthen business confidence. However, the road leading to an industrialbase that is on par with East Asian NICs promises to be a long and difficultone requiring a sizeable outlay of capital on risky ventures. The greater isthe maneuvering room and the larger the rewards the more robust will be theentrepreneurial response.
7.19 Policies unveiled in 1985 involve a considerable departure in termsof content as well as tone from the approach taken over the past decade andsuggest a willingness to adapt the NEP guidelines to suit changed circum-stances as well as explore alternative pathways in the hope of finding aneconomic short-cut to the country's social objectives. But the process thatwill eventually lead to the growth of capital and skill intensive industrieswill require reinforcement and the authorities might wish to examine thepolitical viability and economic merit of three further steps:
(a) the price inflation since the ICA was instituted and the anticipatedincrease in average project costs argues for raising the exemptionlimit to M$5 million, not M$l million, which would remove perhaps80X (by number) of all investment decisions from MIDA's purview,clearing the ground of remaining bureaucratic and politicalobstacles to industrial deepening and market effectiveness withoutdiminishing the Government's influence over major investmentdecisions;
- 95 -
(b) the public sector's size plus the progress at putting corporateassets in the hands of trust agencies calls for a reappraisal of theequity restructuring program. Additional gains would certainly riskthe success of the industrial strategy being forged. The entirelylaudable goal of income redistribution might henceforth be pursuedby way of fiscal measures, e.g., the tax changes outlined inChapter 2. It would appear from the relative stability of the Ginicoefficient and the widening intragroup income disparities thatrestructuring corporate wealth may have contributed marginallytowards equity while undermining private investment, growth, and theefficiency with which the stock of industrial assets are utilized;
(c) for the leading manufacturing sectors the availability of skilledworkers and efficient manning practices will be decisive forcompetitiveness. By doing away with some of the embedded rigiditiesthat affect businessmen's flexibility in hiring and deploying laborin these segments of industry, the authorities would move Malaysianfirms to an equal footing with their rivals in East Asia.
Industrial Deepening
7.20 Rapid growth for the purposes of raising incomes and generatingemployment, requires a motor, not just for the next few years but over a timehorizon spanning the nineties and beyond. Since it is becoming increasinglyclear that a crowded international market made more oppressive by protection,will not allow traditional light industries, textiles, footwear, leathergoods, rubber and wood products, etc. to forge ahead, these industries whichundoubtedly have served the developing world well for two decades, cannotpropel the leap to industrial maturity. In reviewing more robust candidates,two kinds of filters might be empLoyed: one being the general guidelineslisted below; the second being cost-benefit analysis:
(i) an industrially ifmature economy should consider technologicallydemanding industries such as electronics, pharmaceuticals andadvanced machine tools, only after the research and technical skillshave been accumulated;
(ii) subsectors where scale economies are not absolutely critical toachieving competitive costs might be favored;
(iii) initially, at least, the push should be into areas where marketingcosts, service requirements and a brand image are only moderatelyimportant and it is possible to either establish links with buyersin developed countries or depend upon MNCs to serve as marketingintermediaries or to sell the product with a minimal marketingoverhead in the less developed countries;
(iv) where possible, the move upscale ought to commence in fields wherethe start-up costs in terms of capital and skill are not overlylarge;
- 96 -
(v) industries where the longer-term value-added is highest should scoreover others;
(vi) indirect as well as direct employment should be used in puttingtogether an investment portfolio; and
(vii) in the interests of speedy export returns, industries where longexperience is a decisive factor, may be given a lesser priority.
7.21 These guidelines can be married to assumptions emerging from theearlier discussion of trade, protectionism and HNC strategy: (i) machinery,transport and metal products having enjoyed the highest export growth ratesduring the sixties and seventies appear to be the strongest contenders forfuture trading success; (ii) although DFI will continue, it will flow into thetraditional assembly industries, foreign investors may not be in the forefrontof an attempt to launch new export oriented, capital goods industries, throughthe infusion of investment and technology. Thus the next stage of Malaysia'sindustrial journey will have to be managed independently and the range ofoptions might be more limited than what emerges from the sectoral reviewscontained in the Industrial Master Plan.
7.22 The medium-term strategy must be to provide support, by way ofinvestment and tax incentives, to the leading export subsectors - textiles,electronics, and leather goods - and to try and raise the multiplier effectsof these industries through employment and product linkages closer to the highlevel of the other East Asian economies. For possibly the next five years themanufacturing export mix will remain weighted with light manufactures andassembled electronic products, produced largely by the subsidiaries of MNCs.Given that the important industrial moves must be made elsewhere and there isa need to manage the flow of profit and dividends from the country, it may notbe fruitful to manipulate the level of effective protection for the exportingsectors or to embellish much further the current suite of incentives forforeign investors, except where it comes to matching the inducements offeredby neighboring economies and affording MICs the opportunity of holdingmajority shares in local, non FTZ subsidiaries. Where these industries areconcerned, it is not at the macro level of tax incentives, tariffs and creditfor facilities that changes are called for, but at the micro and organiza-tional level, to raise export efficiency and to keep demand linkages insidethe country. Some of the measures that might be considered will be outlinedlater, let us turn now to long run strategy.
7.23 The message carried over from the review of international tradingcircumstances underscores the disadvantages of attempting major export gainson narrow sectoral fronts. All the NICs are now in trouble primarily becauseof their very successes at driving deep import wedges into a few vulnerablemarkets. Nibbling at many different export opportunities and occupyinginnocuous market niches is far less likely to invite retaliation and canresult in stable and healthy, although not spectacular, export growth. Thereare five areas in which expanding markets worldwide may permit proto NICs likeMalaysia to satisfy their trade objectives. These are chemical products,electronics, electrical goods, machinery and transport equipment, and metalproducts (see Chapter 4, paras. 4.32-4.36). All of these fields are hotly
- 97 -
contested with advanced as well as industrializing countries jockeying forlarger shares. Since decision-makers everywhere are preparing industrialblueprints out of an identical fund of past experience and very similarprojections, the trajectories being mapped are bound to result in a trouble-some convergence at a future date. Hence it might pay to aim for the greatestdegree of product and market diversity.
7.24 Smallness of size makes it extremely difficult for Malaysia to thinkin terms of exporting final engineered products in all these areas. Theresearch, marketing and engineering costs of independently mounting an opera-tion in an area such as farm machinery, where a few MNCs are entrenched, wouldbe immensely risky and expensive. But selling parts and components to thelarge producers of farm machinery or occupying an untenanted niche with asmall, well-engineered piece of equipment, is certainly possible. The verysame point can be made in each of the other fields.
7.25 If manufacturing investment can be raised, sustained linkages willmultipy and more of the multiplier effects from these expenditures which todayinduce imports of machinery and intermediate goods will remain within thecountry. Research on East Asian economies reveals there is a strongcorrelation between sectoral multipliers and the dimensions of the industrialsystem. But the broadening of the manufacturing sector could also go a longway towards meeting employment goals. Intra and intersectoral dependencegreatly magnifies the employment consequences of investments. On the averagesomewhat over 50X of the employment generated through manufacturing investmentis direct, but the range is all the way from 107 to 85%. Input-output dataindicates that most industries have more backward than forward linkages, withsmaller firms giving rise to greater direct employment. Light manufacturing(food, beverage, tobacco, textiles and leather products) seem to create thelargest output and employment multiplier effects. Those of certain resourcebased industries especially lumber, wood and rubber products are high butpulp, paper and printing along with petroleum give rise to less indirectemployment within manufacturing and across sectors. Multiplier effects in theremaining resource based industries, chemical products, non-metallic mineralproducts and metal products are strong and exceptionally so in the case ufJapan. The "spread effects" from machinery and transport sector developmentare initially quite small since so much equipment is imported, but they becomevery significant as industrialization progresses.
7.26 Capital intensive subsectors that are often criticized for thelimited direct and indirect employment they generate may in fact come outahead over a period of years if they spur higher investment, saving andtechnological change and help to accelerate growth. Electronics, on thecontrary despite its reputation, has limited backward linkages and in the longrun can have negative indirect employment effects, as it threatens through
- 98 -
automation of factories and services to displace numerous blu /57nd whitecollar jobs, changing the very nature of company hierarchies.-
7.27 The strategy being proposed, with its emphasis on industrialdeepening, is better calculated to increase the growth of total employment inthe longer term although the immdiate employment gains might be limitedbecause industrialization in Malaysia is still at an early stage. It is alsooriented towards sustaining current manufactured exports and maximizing futuretrade prospects. Given the wage levels, and the pessimistic demand forecastsfor light manufactures, Malaysia has few alternatives (see Chapters 4). Toindustrialize it must go beyond the light manufacturing perimeter intointermediate and producer goods.
Sectoral Constraints and Policies
7.28 The previous section touched upon policies and issues of a generaland macro nature, but while these may help to provide a suitable environment,a host of micro level problems must be tackled before the strategy will make adent on economic realities. Since a detailed picture of each manufacturingsubsector and the technical difficulties that they face is contained in thegovernment's recently completed Industrial Master Plan, we will concentrate onthe content and scope of mjcyo policies that must continue the work begun byoverall industrial policy. _ From the list of possibilities, six subsectorswere selected to illustrate the nature of micro policies that will have to bedefined to assist infant industries.
Textiles and Clothing
7.29 Although it is relatively small by the standards of the East AsianNICs, Malaysia's textile industry has a significant presence in the domesticmanufacturing sector. Employment in the mid-eighties was close to 75,000 andthe industry contributed a little over 1% to total CDP and about 7Z to manu-facturing output. More than a third of production found its way to theoverseas market but even though it holds second place to electronics on themanufactured exports ladder, textiles still account for less than 3% ofmerchandise exports. In the world textile market, Malaysia remains a minorplayer with 0.39% share of textiles and 0.5Z of the market for apparel.
15/ See "Industrialization and Employment Generation in the Service Sector ofDeveloping Countries: An Appraisal", UNIDP/IS.504, December 1984;P. Meller and M. Marfan, "Small and Large Industry: EmploymentGeneration, Linkages and Key Sectors", Economic Development and CulturalChange, Vol. 29, pp. 263-274, 1980; F. Stewart and P. Streeten,"Conflicts Between Output and Employment Objectives in DevelopingCountries", Oxford Economic Papers, Vol. 23, pp. 145-168, 1971.
16/ The Mission did not have an opportunity to review the Master Plan at thetime the Report was being prepared, but tabular material on the textileand electronic subsector was made available by the authorities.
- 99 -
7.30 Nearly 80% of the production is divided between spinning and weavingimported natural and synthetic yarn, the manufacture of clothing and knittingoperations. The bias imparted by foreign investment - foreign equity holdingsamount to 41% - is towards finishing and assembly operations and in general,import dependence is fairly high, and the value-added under a third of theoutput. As is the case throughout East Asia, the export oriented wing ofMalaysia's textile industry has lived under a suspended sentence and while itsperformance has been quite creditable over the past several years, textilefirms are feeling the strain from the tightening of quotas under a successionof MFAs (Multi-Fibre Agreements); tariffs imposed by the industrial countrieswhich are three to four times higher than the average for manufactures;competition from Thailand, China and Bangladesh; and steadily escalating wagecosts. It is usually very difficult to obtain an accurate readirg of companyprofitability in developing countries because overinvoicing and transferpricing distort capital expenses and the flow of earnings, but Malaysianmanufacturers appear to have been living with narrow if not negative profitmargins for the past three to four years. Most firms gained a breathing spellfrom the strong export and domestic demand in 1984, but the years ahead do notlook especially promising.
7.31 The industry is subject to pressures from several differentdirections. Demand for clothing in western countries which grew 4.5% p.a. inthe sixties, increased by only half as much in the seventies and earlyeighties. Now that women's participation rates in the U.S. and Great Britainhave stabilized, expenditures on clothing, which benefitted from the increasein female job-seekers, is projected to expand by less than 2% p.a. Of course,demand in Malaysia will rise much faster - 6-7% p.a. - and in other LDCs byclose to 4Z, but diminished opportunities in the industrial markets will notbe easily offset, as it is clear that sales to other developing economies willbe constrained by high tariff barriers. A second set of problems stems fromthe burden of labor expenses. In recent years textile wage rates have beenincreasing at a pace not much different from the consumer price index, buttotal payments, including social and incentive outlays, have risen morequickly, swallowing the improvements in productivity. Textile labor costs inKalaysia are now well above those of China, Thailand, Indonesia and Pakistan,some of its principal competitors. Automation, which has transformed thecapital intensity of the textile industry, particularly in the advancedcountries, would help to solve the problem, but the majority of Malaysianfirms are too small - two thir4s have equity of less than M$1 million - andweighed down with cash flow problems, for them to find the necessary capital.
7.32 With the market for lower quality undergarments, hosiery and apparelbesieged by low cost suppliers, the higher wage producers in East Asia arebeing forced to look for markets in quality products. The premium is now ondesign, styling, marketing and delivery which require different skills and achanged approach. Again, few Malaysian firms are in a position to effectivelycompete against the established East Asian NICs. Between them, slowly risingexport demand, quality deficiencies and the costliness of labor reduce thechances of the industry remaining a dynamic force unless some of the domesticconstraints can be eased.
- 100 -
7.33 Textile producers are in difficulty throughout the world, incountries that are the foremost exporters such as W. Germany, Japan, Italy,Korea and Hong Kong as well as in others where the industry is reaching astate of decay. But there are plenty of successful firms sprinkled amongthose that are feeling the strain of the industry's stagnation. The aLilityto thrive against odds seems closely related in the spinning, weaving, dyeingand fabric production segments of the business, to the type of equipment inuse and the efficient management of a highly sophisticated and automatedprocess. Such an operation requires technical and managerial skills oi a highorder, a dependable labor force and a reputation for quality. Garment produc-tion in the middle and upper price brackets, something in which Italy ispreeminent, demands a flair for design, the ability to produce in small lotsand meet exacting deadlines and a well-developed marketing system built aroundrespected brand names and channels for dealing with numerous retailers inimporting countries.
7.34 Malaysian firms are lagging badly on all these counts. Textileoperations are undercapitalized, the equipment is often old, working condi-tions are unsatisfactory and the cadre of textile engineers, foremen, repairtechnicians and professional managers is small. Textile mills can climb outof a deepening rut only by modernizing extensively and strengthening theirworkforce. The latter will have to wait on improvements in the skill composi-tion of the labor force; the former could be helped along by credit policiesthat provided the industry with funds which its low profitability currentlyput out of reach.
7.35 Cutting and sewing activities where labor costs are significant andwhich have yet to feel the breath of automation - although new equipmentcoming off the drawing boards will change this - are still inviting for South-east Asian producers. Scale economies are not important, capital intensity islow and as Italian firms have discovered, family run businesses using acottag- industry approach can be enormously profitable. Unfortunately, Malay-sian firms are stalled by entry barriers related to skills: design, managingand marketing skills. Having been integrated into a trading system where MNCsprovide orders and specifications, they find it hard to muster the talentswhich could serve as the springboard to independence, quality products, aninternational reputation, ties with foreign retailers and a rate of growthabove the modest average.
7.36 Industrial policy cannot afford to remain only at the rarified levelof macro concerns if it is to be of relevance in solving the longer range pro-blems of competitiveness. Since competence in designing is a ubiquitousrequirement across a range of industries and more important than R&D in up-grading consumer goods meant for fashion conscious markets, centers wherethese skills can be taught deserve priority. Advances in marketing can comethrough several avenues, for instance overseas trade centers, governmentsponsored trading companies, and trade fairs used to good effect by theJapanese and Koreans.
- 101 -
Electrical Machinery and Appliances
7.37 Electrical machinery lies within the compass of the industrialcategories identified above as worthwhile prospects for a country movingbeyond industrial adolescence. The nucleus of this subsector already existsbut it is small - less than 3Z of manufacturing value-added - its growth since1979 has been distressingly weak, and progress at enlarging export volume hasbeen poor. Most of the 350 firms operate on a limited scale, employing 25-49workers and are dependent on imported raw materials and components. Largerfirms are either foreign owned or have partnership arrangements with foreigncompanies. They export a somewhat larger percentage of their output and havebeen more effective in creating a network of domestic parts suppliers. Thoughhere again, parts production is at the very early stages. Of the three seg-ments into which the industry is subdivided, the one producing refrigerating,ventilating and air conditioning equipment is the largest, the most exportoriented and has the highest return on assets. The two others, electricalindustrial machinery and electrical appliances cater more for the domesticmarket and have an undistinguished record of profitability although thenumbers of appliance manufacturers has been multiplying quickly.
7.38 The electrical industry in Malaysia dates back to the late fiftieswhen a start was made at producing dry-cell batteries, cables and lamps. Bythe early seventies the subsector claimed 2Z of the manufactured output, butmore than a decade later, Malaysia is still importing a large volume ofappliances and electrical machinery, suggesting that the well-protected localmarket has not been able to excite sufficient entrepreneurial interest inimport-substitution. One explanation offered by industry sources blames theMNCs who have been reluctant to go very far in promoting the manufacture ofdomestic parts since they prefer to import the high value-added items fromtheir overseas factories. They have also discouraged exports where theseconflict with their global sourcing and distribution strategies. Nor haveforeign owned companies attempted to develop a regional center for R&D inMalaysia although this is probably related to the smallness of the market andthe shortage of local researchers and engineers. Finally, the MNCs are blamedfor practicing price discrimination which obviates much of the tariff protec-tion provided and prevents Malaysian businessmen from establishing themselves.
7.39 A second set of reasons points towards deficiencies in skills andtechnology coupled with a reluctance on the part of small businesses andgovernment alike to take up the challenge. For instance, metal working andplastic molding activities, complementary to electrical goods production, isextremely backward. Heat treatment, electro-plating and precision machiningalso have a long way to go before they can match the quality that assemblerstake for granted with imported products. The shortage of engineers is perhapsa more serious hindrance to the deepening of this subsector than it iselsewhere and so long as machinists, fitters and jointers are in short supplythere will remain a ring of truth in the industry's complaint that localsubcontractors can meet neither delivery schedules nor the exacting standardsthat are the basis of quality, finish and durability.
7.40 A third factor behind the industry's immaturity might be thegovernment's penchant for turn-key projects contracted with foreign firms that
- 102 -
deal KaM'vsian producers out of the business they need, to gain experience,expand their facilities and raise earnings. Many opportunities that Mighthave been of advantage to the machinery industry and its affiliates wereignored to save a little time, money and effort at organizing local producers.
7.41 Small and medium scale machinery production and the associated metalworking operations also suffer from numerous, minor, plant level ailments thatcollectively are a serious drag on progress. Plant layout and working condi-tions tend to be substandard. With that goes a lack of adequate technicalmaterial, documentation on how the machine works as well as its full poten-tial, and detailed drawings for the operators. Cleanliness is neglected,machinery is casually maintained and there is a real dearth of in-house repaircapability or skills that would allow for a rebuilding of equipment. Costsbecome inflated because of a relatively high scrap rate and inadequate con-servation of the waste material. Parts producers have to worry about thepurity of the raw material, especially if they are using automated equip-ment. To obtain material that is equal to specifications from foundries andother sources is frequently impossible and this sets off a chain reactionthrough the system leading to wastage in production, substandard quality ofparts, excessive reject rates and extra work by buyers to make the partsusable.
7.42 These problems are not peculiar to Malaysia, they are encountered invarying degrees all over the world and are amenable to solutions. In Germany,where the machinery industry has a high reputation for quality and producti-vity, a widespread and thorough apprenticeship system helps avert skillshortage. Higher level training programs ensure a steady supply of accreditedtechnicians of sufficient calibre. Finally, programs sponsored jointly byindustrial associations and the government make available extension servicesfor improving plant layout, selection of machinery and the setting up ofequipment for most efficient use.
7.43 Reviewing the causes of slow growth in the field of electricalmachinery brings us back to familiar imperatives: the need for skills,technical assistance through industrial extension services, support for localsubcontractors through government projects and development that increasinglyis independent of the MNCs. But fiscal, trade and financial incentives shouldnot be neglected. Currently, a firm with Pioneer status receives tax relieffor 2-8 years. Others can apply for investment tax credit allowing them todeduct 25% of capital expenditures from taxable income. In addition, one-third of any outlay on R&D can be subtracted from gross income. Firms thatexport are permitted (i) an export allowance equal to 5% of sales value;(ii) accelerated depreciation amounting to 40% p.a.; (iii) double deductionfor expenditures on export promotion; (iv) export credit refinancing atpreferential rates; (v) tax allowance for warehouses used to store export-able!; (vi) duty exemption on machinery imports; and (vii) duty drawback onlevies paid on imported intermediate goods.
7.44 Adding to this list or raising tariffs would fatten profit marginsbut have little affect on sectoral vitality. Raising the efficiency of theadministrative apparatus that processes fiscal incentives might be a moreimportant step and the government might also consider double deduction on
- 103 -
capital ezpenditures by component suppliers without whom the industrialfoundations will never be properly laid.
7.45 Financial assistance could make more of a difference becauseproducers that do not have links with a major domestic group or a foreigncompany have a hard time finding credit at acceptable costs. The recentlycreated M$l billion fund will certainly ease the situation once the criteriagoverning eligibility have been clarified. But there is room for involvingthe development banks in the modernization of a few key subsectors, machinerybeing one of them. Special funds managed by public banks have been quiteeffective in Korea and Japan; the possibility of using them in Malaysia isworth studying.
Agricultural Machinery
7.46 The period of most rapid agricultural mechanization was in theseventies and early eighties and this generated demands for equipment thatwere met increasingly from domestic sources. Imports that had supplied 80X ofneeds in 1973 were down to 39Z in 1983, while the number of local firms roseabove 50, and the labor force approached 2,000 workers. Compared with therest of the machinery subsector, agricultural machinery notched up the fastestgrowth rate, the highest return on assets (still a respectable 23Z in 1983)and somewhat less hearteningly, the swiftest increase in nominal wages - 35Zp.a. during 1973-81.
7.47 The government's liberal policies towards the import of farmmachinery, on which no import duties are levied, certainly seem to have servedthe interests of agriculture, but the cost was reduced linkages to themachinery subsector. The local content of simple machines, such as rotovatorsand rotoslashers is now as high as 80X, only the engines being imported fromJapan, but most of the other equipment is assembled from completely knockeddown (CKD) parts. Local content ratios for combines and tractors are as lowas 5-10Z with only items such as the driver hoods and radiator grills beinglocally manufactured.
7.48 The absence of tariff restrictions has not helped the smaller firmsthat have to contend with import duties on parts and materials, rising wagesand scarcity of credit, but the 14 large companies, that account for two-thirds of the assets and half the employment, have also shown no initiative.In spite of the many years they have been in existence their expertise doesnot extend beyond routine assembly. Links with foreign suppliers, several ofwhich maintain small shares in local firms, have not been exploited so as toinduce technology transfer. And the assemblers have not been goaded by apolicy regarding domestic content to encourage the manufacture of parts inMalaysia.
7.49 A priceless opportunity may have been allowed to slip, because theadvanced state of agricultural mechanization and the probability that pro-duction of rice and rubber will stagnate or even decline, all suggest that thedomestic demand for machinery might expand no faster than GNP, i.e. 3.5-4.5Zp.a. Producers, therefore, can expect less of a cushion from rising localsales. Still, the chances of carving an export niche for the simpler kinds of
- 104 -
farm machinery, are much better than for many other manufactured products.Moreover, development of this subsector would dovetail very vell with thedeepening of machinery, metal products and transport industries.
7.50 If the agricultural machinery subsector is to change direction andeventually become an innovative producer of locally designed small machinesand even items such as pedestrian tractors, it will require the effectivejuxtaposition of incentives and constraints. The incentives might have tocome from a degree of protection; the constraints from encouraging firms tosubstitute locally manufactured parts for imported ones. As the design andproduction of parts fashioned to meet ezacting tolerances gathers headway, itwill be easier to think of innovations which might lead the way to exportpossibilities. In its effort to stimulate industrial deepening, Malaysia willsurely be helped by the relative ease of obtaining licenses in a technolog-ically stable industry.
Electronics
7.51 Electronics euphoria is finally beginning to subside as markets forcomputers and peripherals in the U.S. and Japan begin to show signs ofindigestion. But the belief in electronics as the great industrial hope forexport-led developers lives on, especially since demand in the Europeancountries and many of the East Asian economies, because of a late start, isstill racing ahead. Recent experience should, however, be reflected upon byall producers of electronic parts and components as it warns against apronounced commitment to this industry or the advisability of attempting amove ups-ream into electronic equipment and electronic based consumer goods.
7.52 The world market for electronic products has grown from US$50 bil-lion in 1970 to US$380 billion in 1985. The share of semi-conductors was 5.82at the beginning of this period and 9.0X at the end. Some projections envis-age a doubling of the dollar value of electronics production by the earlynineties but only a minor increase in the share of semi-conductors as theprice of logic circuits is expected to remain on a steeply falling trend.Even if this growth materializes, and doubts are now being voiced, the mannerin which worldwide production is organized may look very different, ten yearsfrom now.
7.53 The spread of the electronics industry to East Asia, which commencedin the early seventies, was prompted by the desire of American companies topreserve their profit margins and ward off Japanese competition by transfer-ring some of their labor intensive operations to the opposite shores of thePacific. Where Japanese firms used cheap and elastic capital supplies toautomate, U.S. corporations contained labor costs by moving some factoriesoverseas. The strategy was facilitated by the easy separability of theproduction sequence into segments and the practicability of shipping highvalue items by air. Thus assembly, bonding, testing and 'burn in' of semi-conductors became a thriving labor intensive industry in East Asia. That itwas a low value-added operation based on imported machinery and raw materialdid not trouble the host economies since such investment provided employment,held out the possibility of technology transfer and drew them into the fastestmoving trade stream. Table 7.6 gives a glimpse of the Asian electronics
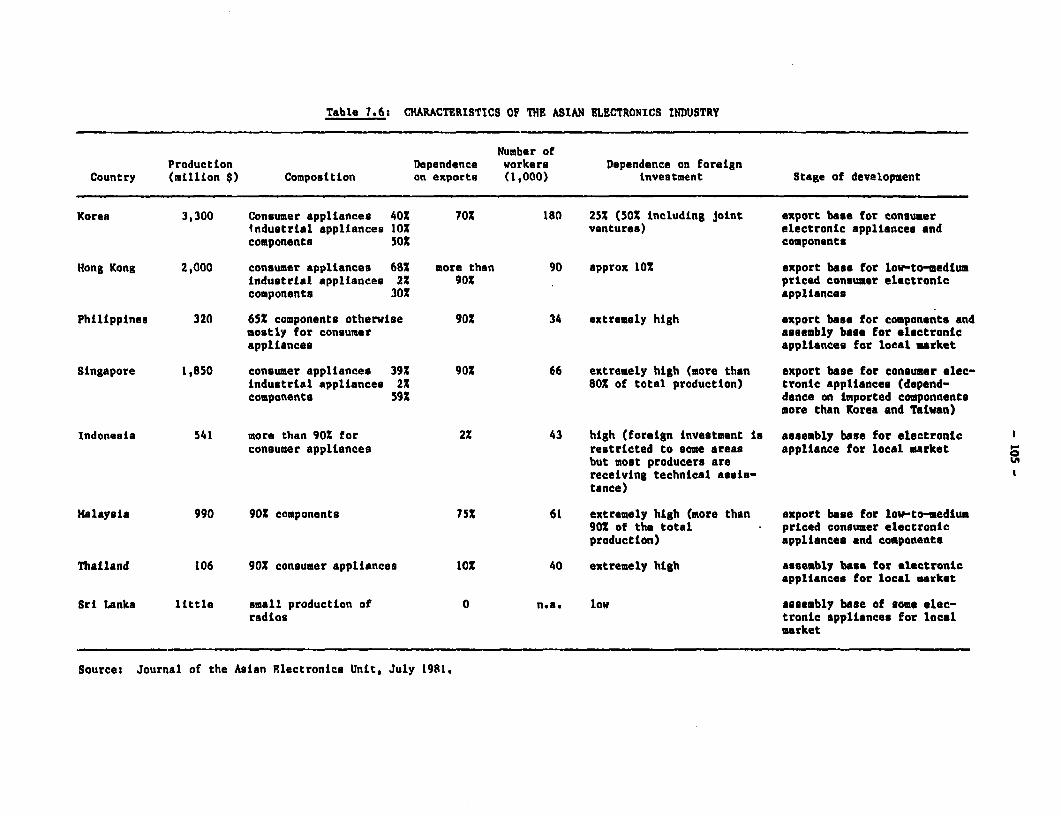
Table 7.6: CHARACTERISTICS OF THE ASIAN ELECTRONICS INDUSTRY
Number ofProduction Dependence workers Dependence on foreign
Country (million $) Composition on exports (1,000) investment Stage of development
Korea 3,300 Consumer appliances 40% 70% lRO 25% (50% including joint export base for consumerindustrial appliances 10% ventures) electronic appliances andcomponents 50% components
Hong Kong 2,000 consumer appliances 68S more than 90 approx 10% export base for low-to-medlumindustrial appliances 2% 90% priced consumer electroniccomponents 30% appliances
Philippines 320 65% components otherwise 90% 34 extremely high export base for components andmostly for consumer assembly base for electronicappliances appliances for local market
Singapore 1,850 consumer appliances 39% 90% 66 extremely high (more than export base for consumer elec-industrial appliances 2% 80% of total production) tronic appliances (depend-components 59% dance on imported componnents
more than Korea and Taiwan)
Indonesia 541 more than 90% for 2% 43 high (foreign investment is assembly base for electronicconsumer appliances restricted to some areas appliance for local market
but most producers are Ireceiving technical asseis-tance)
Halaysia 990 902 components 75% 61 extremely high (more than export base for low-to-medium90% of the total priced consumer electronicproduction) appliances and components
Thailand 106 90% consumer appliances 102 40 extremely high assembly base for electronicappliances for local market
Sri Lanka little small production of 0 n.a. low assembly base of some elec-radios tronic appliances for local
market
Source: Journal of the Asian Electronics Unit, July 1981.
- 106 -
industry in the early eighties. Three features are very apparent. The for-eign presence is high in every country; consumer appliances and componentsdominate production; and much of the output is exported. Where American firmsare involved, it goes mostly to the US; in the case of the Japanese, consumerappliances are sold in East Asia and Europe, while the components might beshipped back to the home base.
7.54 Technology, competition and now protection have wrought greatchanges in the electronics assembly industry and their direction is erodingthe comparative advantage of the East Asian economies. To start with therehas been a tremendous scramble for market share and firms have spared noeffort at advancing technology and paring costs. This has had the effect ofgreatly reducing the profitability of the industry, enhancing the importanceof company sales volume - since profit per item is so depressed - and forcedsellers to shore up the design and reliability of components while stillremaining cost competitive. It has also placed an enormous premium ontechnological change, as an entry barrier, a way of stealing a march oncompetitors, and a device for inflicting losses on other firms with a capitalstake in earlier technologies. Inevitably it has tended to oligopolize theindustry. Large, vertically integrated firms can most effectively reducemarket uncertainty, finance R&D, cross-subsidize chip manufacture, offerstable internal markets for components and absorb the vast capital costsstemming from short product cycles and the rapid obsolescence of capitalequipment.
7.55 The exigencies of cost competitiveness and product reliability havealso brought in their train a form of automation that is suited to small batchproduction. New stand-alone, bonding machines replace 30 operators andadvances in software make possible automatic testing. These technologicalgains reduce defect rates and at the same time diminish labor costs that wereinstrumental in the migration of the electronics industry to low wage develop-ing economies. Protectionism in the western countries is also working tobring the farflung operations of the MNCs back into the industrial world.France and Italy have been sheltering their electronics industries for sometime, but as Europe worries over its shortcomings in the field, others mayfollow. Even the U.S. has become exercised over the consequences of exportingjobs overseas. MNCs, ever alert to shifting sentiments and the configurationof future markets are acting to synchronize their worldwide operations andimpose rationality upon a dispersed system of sourcing, created piecemeal overfifteen years. It is interesting to note that of new semi-conductor invest-ments between 1979-84, all but a handful were in developed countries.Consumer electronics where assembly is labor intensive might continue toflourish in East Asia. However, component manufacture by MNCs may not remaina growth field in an industry headed towards customized chips for special usesthat must be made in small lots and "garden variety" semi-conductors that cancome off automated assembly lines.
7.56 If component manufacture does not expand or grows slowly, what liesahead for the electronics subsector in Malaysia? As indicated in Table 7.7Malaysian production is much more heavily concentrated on components thaneither Korea or Singapore. In 1983, the semi-conductor firms employed 50,000workers, 80Z of them being semi-skilled, female assembly line operators. For
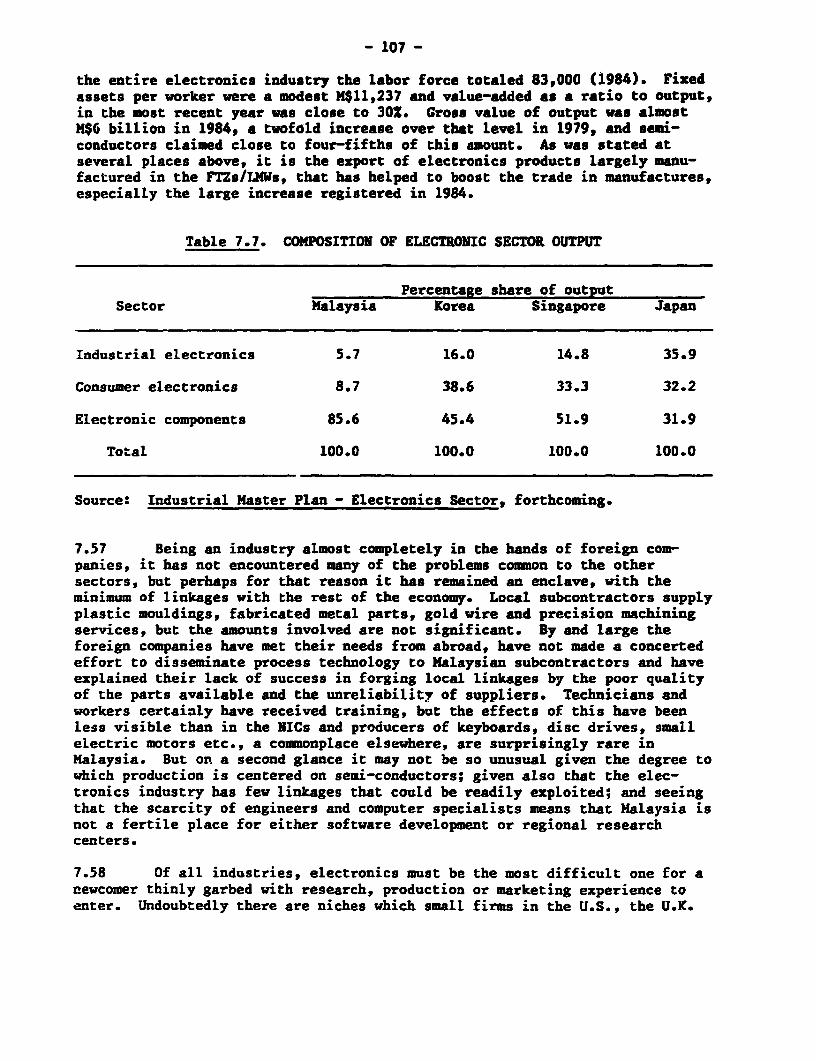
- 107 -
the entire electronics industry the labor force totaled 83,000 (1984). Fizedassets per worker were a modest M$11,237 and value-added as a ratio to output,in the most recent year was close to 302. Gross value of output was almostM$6 billion in 1984, a twofold increase over that level in 1979, and semi-conductors claimed close to four-fifths of this amount. As was stated atseveral places above, it is the export of electronics products largely manu-factured in the FTZs/LMWs, that has helped to boost the trade in manufactures,especially the large increase registered in 1984.
Table 7.7. COMPOSITION OF ELECTRONIC SECTOR OUTPUT
Percentage share of outputSector Malaysia Korea Singapore Japan
Industrial electronics 5.7 16.0 14.8 35.9
Consumer electronics 8.7 38.6 33.3 32.2
Electronic components 85.6 45.4 51.9 31.9
Total 100.0 100.0 100.0 100.0
Source: Industrial Master Plan - Electronics Sector, forthcoming.
7.57 Being an industry almost completely in the hands of foreign com-panies, it has not encountered many of the problems common to the othersectors, but perhaps for that reason it has remained an enclave, with theminimum of linkages with the rest of the economy. Local subcontractors supplyplastic mouldings, fabricated metal parts, gold wire and precision machiningservices, but the amounts involved are not significant. By and large theforeign companies have met their needs from abroad, have not made a concertedeffort to disseminate process technology to Malaysian subcontractors and haveexplained their lack of success in forging local linkages by the poor qualityof the parts available and the unreliabilitv of suppliers. Technicians andworkers certainly have received training, but the effects of this have beenless visible than in the NICs and producers of keyboards, disc drives, smallelectric motors etc., a comonplace elsewhere, are surprisingly rare inMalaysia. But on a second glance it may not be so unusual given the degree towhich production is centered on semi-conductors; given also that the elec-tronics industry has few linkages that could be readily exploited; and seeingthat the scarcity of engineers and computer specialists means that Halaysia isnot a fertile place for either software development or regional researchcenters.
7.58 Of all industries, electronics must be the most difficult one for anewcomer thinly garbed with research, production or marketing experience toenter. Undoubtedly there are niches which small firms in the U.S., the U.K.
- 108 -
and a few Asian economies have been able to capitalize upon. These are insoftware or specialized minicomputers, failsafe computers, and speciallydesigned or customized chips (19Z of the market for semi-conductors in1985). Indian firms drawing upon the country's huge reserves of cheap engin-aering talent have begun collaborating with foreign companies to producespecialized "applications software." Companies in Korea have begun producingcustomised chips along with personal computers, monitors, disc drives andkeyboards. Virtually everything else is managed and orchestrated by a fewlarge Japanese and American firms. Their decisions on sourcing are decisive.
7.59 The gap between Malaysian wages and those paid in the NICs probablynarrowed in the eighties, and the country is less attractive on purely econo-mic grounds, than Thailand or Indonesia. Long association and political sta-bility will help sustain MNC interest, so the medium run prospects of theelectronics industry are good. But as a dynamic core for Malaysia's long-termindustrialization, the industry is probably too technology intensive andoligopolistic to serve as an engine for the development strategy.
Wooden Furniture
7.60 If theory is a guide, Malaysia's comparative advantage would appearto be in resource based industries, among which wooden furniture could be aleading contender. Being a labor intensive subsector that has enjoyed greatsuccess in the East Asian NICs only adds to its appeal. Actual accomplish-ments, however, belie a priori reasoning. Secondary wood processing activi-ties contributed 0.86Z to manufacturing value-added in 1982 (X$154.5 million);exports of furniture were a mere M$19 million in 1984; and Malaysia importedan almost equivalent amount of luxury high fashion pieces from the Europeancountries and mass produced items from its industrializing neighbors.
7.61 That progress has not been faster cannot really be blamed on theincentive system. Nominal tariffs on imported wooden furniture are 55% andeffective protection at 66-73% is among the highest for any industry.Furniture producers are eligible for pioneer status, tax credit and locationalincentives, plus there are special benefits for wood working tools. Thecauses of sluggish development must be sought elsewhere. One view is thatprimary wood production (logs and sawn timber) has long deflected businessmenaway from secondary processing. The ease of producing and trading logs, highprofits, the absence of tariff impediments in developed countries and trouble-free financing have cast furniture production, which tests entrepreneurialmettle, into the shade.
7.62 This is only a part of the explanation and when we look at themicrostructure of the industry certain familiar problems can be espied. Alucrative domestic market has provided fertile soil for new firms but themajority are small operations that produce home furniture of indifferentquality. They labor under five major difficulties: there is a grave shortageof craft skills; design capabilities, even when it comes to copying foreignmodels, are fairly primitive; firms are undercapitalized and few possess therequisite specialized machinery without which decent standards of qualitycannot be attained; many companies that are no more than glorified workshopsare unable to find the collateral needed to obtain a sufficient volume of
- 109 -
credit; because international market prices make it profitable to exportbetter quality wood in the form of logs, domestic producers have to make dowith materials of a lower grade; and the skill shortage extends to repair andtechnical staff so that equipment at the furniture plants is poorly main-tained, aggravating the seriousness of some of the other handicaps.
7.63 The ban on log exports from Peninsular Malaysia since the beginningof 1985, will lessen complaints about the quality of raw materials, but tradeand fiscal policies alone will not loosen the other constraints. Transfer oftechnology may be expedited by a number of recent joint venture agreementsthat have broken the prolonged drought in foreign interest. The companiesinvolved stand to gain both in terms of design and equipment. But unless thescore of enterprises that have joined up with overseas producers can becomenodes for disseminating skills and ideas, furniture manufacturing will beunable to shake free from the inefficiencies that have characterized theindustry. Design, skills, machinery, capital and entrepreneurship are the keywords for a reform program aimed at raising productivity and quality. One canonly repeat the earlier message. Malaysia has attempted to change developmenttracks in a very short span of time and is now finding that the craft,industrial and technical skills which the East Asian NICs had two decades todevelop, are insufficient to fuel the growth of subsectors that are tipped tobecome future export industries. Clearly, furniture production must firstadequately fill its domestic role before any export plans can be considered.If quality and efficiency are to improve, competition from imports ought to bemaintained and over time, increased, but the industry will need assistance atthe very minimum in the areas of design, credit and skills; a discriminatinglocal rzrket aware of fashions overseas and conscious of standards adhered toby foreign producers will do the rest. As the other NICs have shown, smallsize of firms is not a bar to export success as long as domestic producers areprepared to familiarize themselves thoroughly with tastes and demands in theprincipal foreign markets and to then sedulously cultivate the design andcraft skills which will allow them-to fulfil these requirements.
7.64 The availability of domestic raw materials is no guarantee ofsuccess, but furniture manufacturing, at least has the potential foreffectively displacing imports of medium quality home and office furniture.Whether the slow growing and extremely competitive external market will behospitable to Malaysia's exports in the medium run is less certain.
Rubber Products
7.65 Malaysia's preeminence as a rubber producer has raised hopes of thecountry eventually becoming a world class center for the manufacture of rubbergoods. As indicated in Chapter 4, tires and automotive products are the mainusers of rubber, and it is in those areas that Malaysia would have to ventureto acquire a significant share in the world market for rubber products. Forthe domestic economy to benefit from this strategy, acquiring equity in one ofthe multi-national tire manufacturers would have a small pay-off, insteadproduction facilities would have to be developed in Malaysia itself so thatemployment and linkages could be generated. As a core industry, rubber rankslower than some of the others for a variety of reasons. First, the demand fortires and rubber accessories for motor cars is projected to increase slowly in
- 110 -
the industrial countries and this is no longer an industry where large profitscan be made. Imports of rubber goods, excluding footwear, increased innominal terms by just 0.68% p.a. during 1979-83. Second, a dynamic manufac-turer must be at the technological forefront of a highly research intensiveindustry. Third, to join the industry's giants a producer must establishlinks with some of the principal automobile campanies so as to enter themarket for original equipment and, in addition, an intercontinental salesnetwork has to be developed and backed by unflagging advertising campaigns.Fourth, tire production does enjoy scale economies, which is why marketconcentration is so noticeable. This raises the capital costs of entry andlimits the opportunities to large, vertically integrated companies, lesseningspread effects and multi-nucleated development. Fifth, the tire industry inthe West has suffered from the rough economic weather of recent years in thesame way as certain other traditional subsectors, and tire producers aremoving into other product lines. It has, therefore, joined in the call forprotection and a degree of market closure against imports of cheaper tiresfrom NICs such as Korea and Brazil.
7.66 World market circumstances do not look overly propitious and, at themoment, Malaysia's production, research and marketing base is below thestandards of even the East Asian NICs who have entered the tire business. Thelocal industry is almost exclusively (93%) a user of natural rubber which itobtains at a discount over the international price, as compared to theworldwide ratio of natural to synthetic rubber usage (30-70) that is tiltedtowards synthetics. But the industry still consumes only 4.2% of the rubberoutput. There are in the region of 140 companies of a size and capitalintensity that is a little above the manufacturing sector average. Productioncapacity is slanted towards latex products and cires (60% of total), theremainder being in general and industrial rubber goods as well as footwear.Capacity utilization is highest for latex items (70-80%) followed by tires(60-70%) and footwear (50-60%).
7.67 Local consumption of rubber products rose 8.2Z p.a. in the 70s andby 6.2% p.a. during 1980-83 and the industry, especially latex products,expanded strongly with the advantage of high effective protection (rangingfrom 98% to 224%). The effect on Malaysia's world market position wasdisappointing. Although 5% of the latex products demand worldwide has beencaptured by domestic producers, they can lay claim to only 0.1% of the totalrubber goods market and their presence in the critical tire market isnegligible. More surprisingly, the share of rubber goods imports rose from18% in 1970 to 23% in 1983.
7.68 In the medium term, there are reasonable prospects for latexproducts, since the raw material is bulky to transport, and Malaysia canrealistically aim to expand its international share. Domestic tire demandwill receive a boost as the Proton Saga consolidates its position in the newcar market. The profitability of tire manufacture would benefit if the costsof carbon black, produced by a single, heavily protected local firm, could belowered either by allowing in imports or by scaling down the prices of thesingle indigenous supplier.
- ill -
7.69 Longer term plans in the sphere of tire manufactures and export arenot easily reconciled with the projected trends in the manufacturing sector.Electronics poses formidable problems because of research intensity and avertically integrated, oligopolistic industrial structure, so too, does entryinto the world tire market. It will be one thing to meet domestic demand, andanother thing entirely to mobilize the diverse range of skills needed to mounta sustained export drive. Since natural rubber comprises little more than 7%of the cost of a radial tire, the ability to produce rubber is not an espe-cially compelling advantage. Further, Malaysia's best strategy might be toconcentrate its limited supplies of capital, trained manpower and organiza-tional skills into subsectors with the highest linkages and the greatestlikelihood of bringing into existence a flock of smaller producers that can,after they mature, count on firm export demand. Tire manufacturing does nothold out as much hope as some of the other subsectors, and without tires, theremainder of the rubber products industry is sufficiently footloose that asingle country cannot expect to corner more than a fraction of the market.
Summary
7.70 By traversing a few industrial subsectors it is easy to apprec5atehow far Malaysia must go to realize its plan of moving into the industrialcircles peopled by the East Asian NICs. All of the sectors that might con-ceivably serve as building blocks for a modern export-oriented manufacturingsystem are still diminutive in proportions and under-populated by firms with ademonstratcd capacity to provide subsectoral leadership in the export arena.East Asian NICs have been unsparing in their efforts to accumulate humancapital. Together with high rates of saving and investment, this has enabledthem to colonize one manufacturing subsector after another. Malaysia, thanksto its natural resources is not strapped for investible resources, but it isshort of technical and industrial skills and its business talent has beendiverted, in part by government regulation, partly also by the pull of otheropportunities, away from the task of industrializing.
7.71 Malaysia can be justly proud of its many faceted financial system,but when compared to that of Korea or of Japan in the fifties it is apparentthat financial institutions do not see their principal task as that of servingindustry. Financial activity has been influenced by Malaysia's long historyof primary production and its outward looking stance. More recently it hasbeen shaped by the intensive development of housing, infrastructure and realestate. Manufacturing industry is far from being the financial community'slargest customer (see Table 1.5); it is certainly not the one with the mostappealing credentials. Credit does find its way to industry, but it is theresidual left over after other market participants have slaked their require-ments. New credit channels to industry, possibly informed by the experienceof Japanese and Korean development banks, might usefully be dredged. Withoutthem, the medium and smallscale producers of intermediate goods might nevertake root and the entire objective of reaping an export spin-off from thistype of development would be vitiated.
7.72 The message is simple: to the extent that political exigenciespermit, businessmen should be unshackled from the Industrial Coordination Act(ICA) related regulations; engineering, design and vocational skills must be
- 112 -
greatly augmented;A71 and the financial system must be tuned so that themanufacturing secror receives the actention it vill now need. A study ofJapan's industrial strategy since the fifties reveals how MITI nudged majorcompanies towards a new subsector with information, credit, fiscal allowances,and technical support, often through government institutes, and providedprotection until the industry was fit to compete against foreign goods. Atthat stage, tariff barriers were lowered, but by then, the industry was quiteable to stand on its feet.
7.73 Development theory has not yet improved on this recipe except tounderline the importance of following through with a schedule for loweringtariffs. But the contrasting experience of the Latin countries with importsubstituting industrialization suggests that such a strategy must beresolutely export minded and uncompromisingly devoted to eventually achievingcompetitiveness if it is to culminate in a viable industrial system.
17/ A lucid review of the contribution that design has made to the success ofmanufacturing companies is provided by, C. Lorenz, The Design Dimension,Blackwell, 1986.
- 113 -
CHAPTER VIII: THE FUTURE OF AGRICULTURE
8.01 Having scrutinized the most promising segments of the manufacturingsector, it is now the turn of agriculture. The number of questions which canbe profitably pursued is limitless, but from the twin perspectives of growthand trade, the question of greatest importance is the following: given whatis known about factor supplies, technology, institutional processes and pricetrends, how much can rubber, oil palm, cocoa, and rice production contributeto Malaysia's growth and exports and import substitution over the next fiveyears? To limit discussion of the four subsectors to a reasonable length, thematerial presented will stray as little as possible from the above question.
8.02 According to the land use survey of 1980, there are 20 million hec-tares (ha) of agricultural land in Peninsular Malaysia of which 11.2 millionare given over to farming (see Table 8.1). But of the land in use, 634,000 halie idle, 60% of which are suitable for tree crops. A further 2 million haare alienated but not cropped. Of the balance - 6.8 m ha - about 3.8 m hafalls into soil classes I - III and could be drawn into cultivation. However,3 m ha are forestry reserves held by State governments and off-limits toFederal agencies. Ecological concerns increasingly being voiced could alsodetermine how much of the potentially available land is cultivated. From a1975 survey, Sabah is known to have 5.3 million cultivable hectares, less thana fifth of them currently in use. Only half of Sarawak's agricultural land ofover 13.1 million ha has been alienated but is not necessarily cropped. Ofthe remainder, 5-6 million ha is under native rights, leaving about 1-2 m haof forested area accessible for commercial exploirition. When account istaken of the barriers interposed by the claims of individual states and nativerights as well as the difficulties in the way of developing pockets of idle orabandoned acreage, about two million hectares could readily be utilized overthe course of the eighties, a small fraction of the uncultivated agriculturalland. But, as will become clear, land supply is not the binding constrainL onagricultural growth in Malaysia; labor supply, wage costs and the interna-tional market situation, described earlier, are well ahead in the hierarchy ofconstraints.
8.03 Malaysia still has 37% of the labor force employed in agriculture,but the ranks of younger workers are being depleted very rapidly and theeffects are being felt throughout the agriculture sector, even in rice culti-vation where labor saving mechanization has acted as a cushion against theloss of workers to the cities. Large areas of rubber acreage are sporadicallytapped because of low international prices and manpower shortages. Recently,the much less labor intensive oil palm gathering activities have also beenaffected by the scarcity of younger men. And the opportunity costs of labormake upland smallholder rice cultivation an uneconomic proposition at currentand projected world rice prices. Abstracting from demand, it looks as thoughthe growth in production will depend to varying degrees on migration, mechani-zation, wage increases and changes in the productivity of land and labor fromthe application of better technology and management practice.
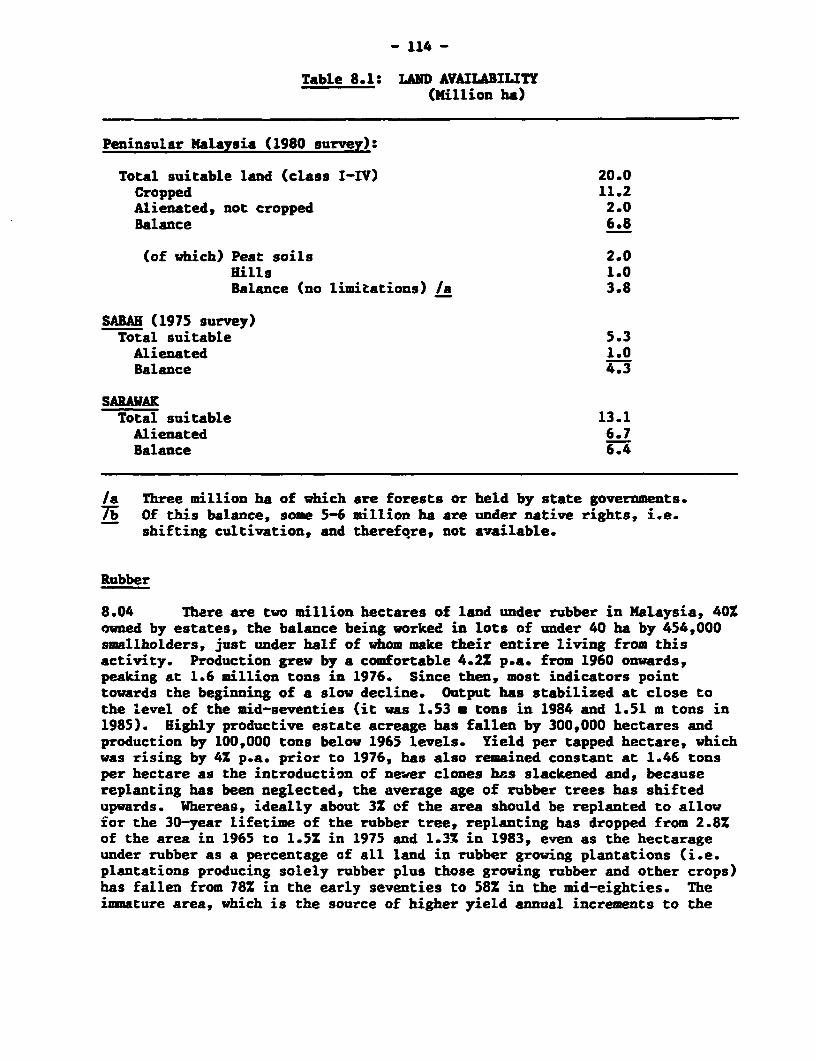
- 114 -
Table 8.1: LAND AVAILABILITY(Million ha)
Peninsular Malaysia (1980 survey):
Total suitable land (class I-IV) 20.0Cropped 11.2Alienated, not cropped 2.0Balance 6.8
(of which) Peat soils 2.0Hills 1.0Balance (no limitations) /a 3.8
SABAH (1975 survey)Total suitable 5.3Alienated 1.0Balance 4.3
SARAWAKTotal suitable 13.1Alienated 6.7Balance 6.4
/a Three million ha of which are forests or held by state governments.7i Of this balance, some 5-6 million ha are under native rights, i.e.
shifting cultivation, and therefore, not available.
Rubber
8.04 There are two million hectares of land under rubber in Malaysia, 401owned by estates, the balance being worked in lots of under 40 ha by 454,000smaliholders, just under half of whom make their entire living from thisactivity. Production grew by a comfortable 4.2Z p.a. from 1960 onwards,peaking at 1.6 million tons in 1976. Since then, most indicators pointtowards the beginning of a slow decline. Output has stabilized at close tothe level of the mid-seventies (it was 1.53 m tons in 1984 and 1.51 m tons in1985). Highly productive estate acreage has fallen by 300,000 hectares andproduction by 100,000 tons below 1965 levels. Yield per tapped hectare, whichwas rising by 41 p.a. prior to 1976, has also remained constant at 1.46 tonsper hectare as the introduction of newer clones has slackened and, becausereplanting has been neglected, the average age of rubber trees has shiftedupwards. Whereas, ideally about 3X of the area should be replanted to allowror the 30-year lifetime of the rubber tree, replanting has dropped from 2.8%of the area in 1965 to 1.5Z in 1975 and 1.3% in 1983, even as the hectarageunder rubber as a percentage of all land in rubber growing plantations (i.e.plantations producing solely rubber plus those growing rubber and other crops)has fallen from 78% in the early seventies to 58% in the mid-eighties. Theimmature area, which is the source of higher yield annual increments to the
- 115 -
stock of trees, was just 14Z of the total in 1983, half of what it had been 20years ago. To compound matters, the quality of the plantation labor force hasdeteriorated and the number of workers has fallen annually by 3.3Z since 1960as a result of area cuts and productivity growth. Where once males outnum-bered women, and young workers made up 5Z of the total, females are a clearmajority (56%) and migration has whittled down the numbers of the young to1%. Thus skilled rubber tappers with productivity differentials of over 20%above the average, are in dwindling supply and the pool of estate manpower isaging, with an increasing number now in the 41-50 year age bracket.
8.05 Much of the decline in estate acreage has been offset by the 260,000hectare expansion of smallholder acreage spearheaded by a number of governmentschemes. The Federal Land Development Authority (FELDA) has planted new areasunder rubber and resettled smallholders on these more fertile and betterdesigned units. By replanting and consolidating existing smallholder plots,another agency - the Federal Land Consolidation and Rehabilitation Authority(FELCRA) - has attempted to improve the smallholder production system.Finally, the Rubber Industry Smallholder Development Authority (RISDA) hastaken the lead in creating mini-estates by agglomerating adjacent units or bystarting ventures for the peasantry in virgin areas. Such efforts, especiallythose of FELCRA, have often been obstructed by the problems associated withtracking absentee owners, obtaining consent and changing titles and RISDA hasyet to achieve the managerial breakthrough required to make mini-estates acommercial success. Moreover, the Mid Term Review of the Fourth Malaysia Planfound that the poverty rate among rubber smallholders had increased from 41.3%in 1980 to 61.1% in 1983. Unfortunately, the yield difference between thehighest-yielding estates and the lowest-yielding smallholdings is as large asever - 1,900 kg/ha as against 700 kg/ha. Further, long experience has shownthat the development and spread of new clones and techniques for maximizingyields depends on the involvement of the estate sector, owing to its size anddynamism. Should the estate sector be eclipsed, smallholder agriculture wouldalso be dragged down.
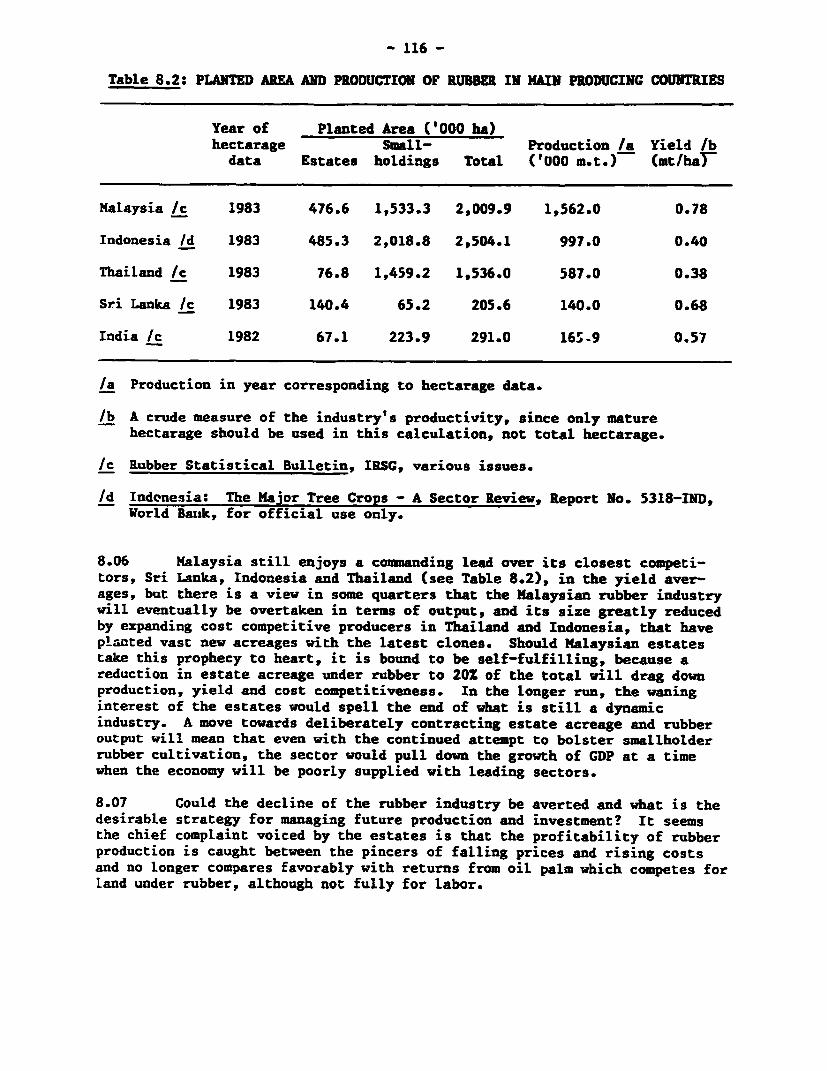
- 116 -
Table 8.2: PLANTED AREA AND PRODUCTION OF RUBBER IN MAIN PRODUCING COUNTRIES
Year of Planted Area ('000 ha)hectarage Small- Production /a Yield /bdata Estates holdings Total ('000 m.t.) (mt/haT_
Malaysia /c 1983 476.6 1,533.3 2,009.9 1,562.0 0.78
Indonesia /d 1983 485.3 2,018.8 2,504.1 997.0 0.40
Thailand /c 1983 76.8 1,459.2 1,536.0 587.0 0.38
Sri Lanka /c 1983 140.4 65.2 205.6 140.0 0.68
India /c 1982 67.1 223.9 291.0 165.9 0.57
/a Production in year corresponding to hectarage data.
lb A crude measure of the industry's productivity, since only maturehectarage should be used in this calculation, not total hectarage.
/c Rubber Statistical Bulletin, IRSC, various issues.
Id Indonesia: The Major Tree Crops - A Sector Review, Report No. 5318-IND,World Bank, for official use only.
8.06 Malaysia still enjoys a commanding lead over its closest competi-tors, Sri Lanka, Indonesia and Thailand (see Table 8.2), in the yield aver-ages, but there is a view in some quarters that the Malaysian rubber industrywill eventually be overtaken in terms of output, and its size greatly reducedby expanding cost competitive producers in Thailand and Indonesia, that haveplanted vast new acreages with the latest clones. Should Malaysian estatestake this prophecy to heart, it is bound to be self-fulfilling, because areduction in estate acreage under rubber to 20Z of the total will drag downproduction, yield and cost competitiveness. In the longer run, the waninginterest of the estates would spell the end of what is still a dynamicindustry. A move towards deliberately contracting estate acreage and rubberoutput will mean that even with the continued attempt to bolster smallholderrubber cultivation, the sector would pull down the growth of GDP at a timewhen the economy will be poorly supplied with leading sectors.
8.07 Could the decline of the rubber industry be averted and what is thedesirable strategy for managing future production and investment? It seemsthe chief complaint voiced by the estates is that the profitability of rubberproduction is caught between the pincers of falling prices and rising costsand no longer compares favorably with returns from oil palm which competes forland under rubber, although not fully for labor.
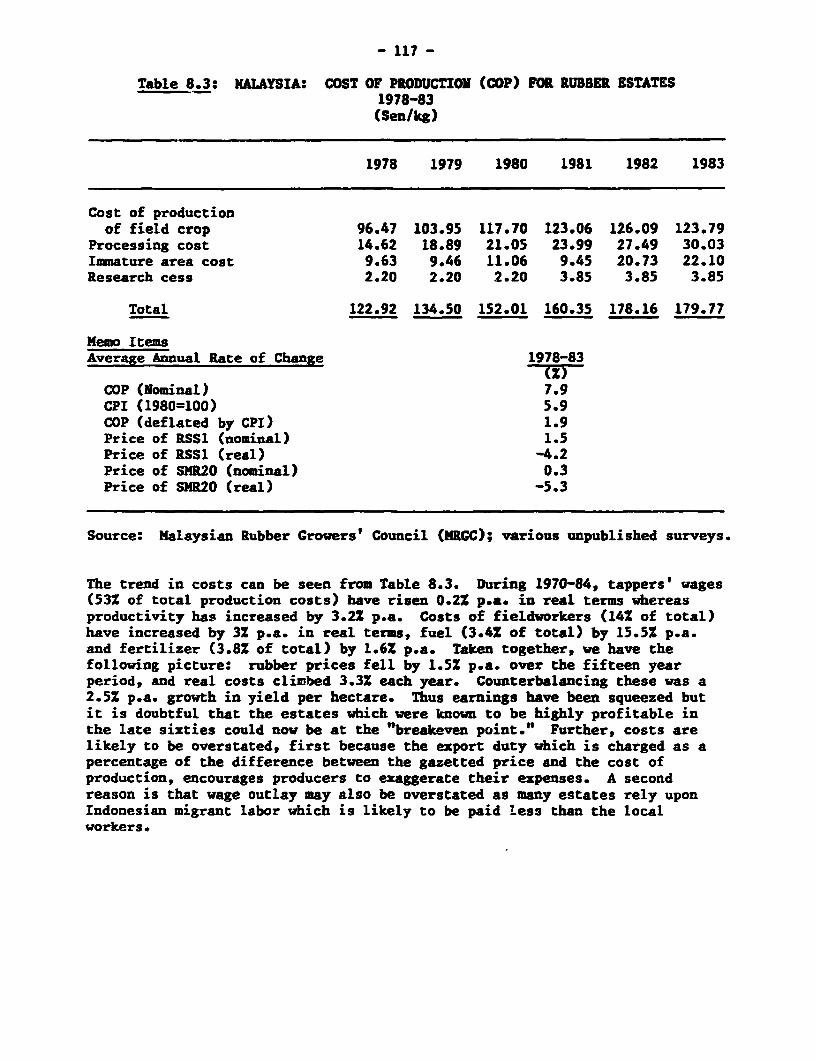
- 117 -
Table 8.3: MALAYSIA: COST OF PRODUCTION (COP) FOR RUBBER ESTATES1978-83
(Sen/kg)
1978 1979 1980 1981 1982 1983
Cost of productionof field crop 96.47 103.95 117.70 123.06 126.09 123.79
Processing cost 14.62 18.89 21.05 23.99 27.49 30.03Immature area cost 9.63 9.46 11.06 9.45 20.73 22.10Research cess 2.20 2.20 2.20 3.85 3.85 3.85
Total 122.92 134.50 152.01 160.35 178.16 179.77
Memo ItemsAverage Annual Rate of Change 1978-83
(Z)COP (Nominal) 7.9CPI (1980=100) 5.9COP (deflated by CPI) 1.9Price of RSS1 (nominal) 1.5Price of RSS1 (real) -4.2Price of SMR20 (nominal) 0.3Price of S1R20 (real) -5.3
Source: Malaysian Rubber Crowers' Council (MRGC); various unpublished surveys.
The trend in costs can be seen from Table 8.3. During 1970-84, tappers' wages(531 of total production costs) have risen 0.2Z p.a. in real terms whereasproductivity has increased by 3.2Z p.a. Costs of fieldworkers (14% of total)have increased by 3Z p.a. in real terms, fuel (3.4Z of total) by 15.51 p.s.and fertilizer (3.8Z of total) by 1.6X p.a. Taken together, we have thefollowing picture: rubber prices fell by 1.5Z p.a. over the fifteen yearperiod, and real costs climbed 3.3Z each year. Counterbalancing these was a2.51 p.a. growth in yield per hectare. Thus earnings have been squeezed butit is doubtful that the estates which were known to be highly profitable inthe late sixties could now be at the "breakeven point." Further, costs arelikely to be overstated, first because the export duty which is charged as apercentage of the difference between the gazetted price and the cost ofproduction, encourages producers to exaggerate their expenses. A secondreason is that wage outlay may also be overstated as many estates rely uponIndonesian migrant labor which is likely to be paid less than the localworkers.
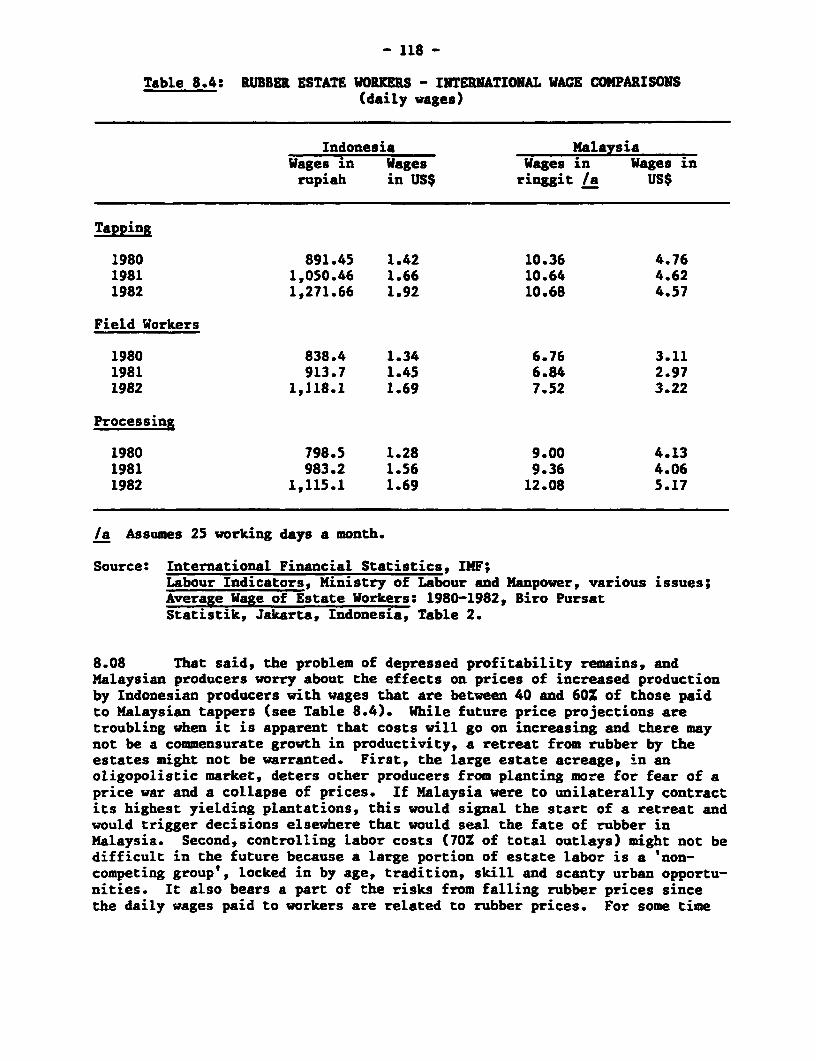
- 118 -
Table 8.4: RUBBER ESTATE WORKERS - INTERNATIONAL WACE COMPARISONS(daily wages)
Indonesia MalaysiaWages in Wages Wages in Wages inrupiah in US$ ringgit /a US$
Tapping
1980 891.45 1.42 10.36 4.761981 1,050.46 1.66 10.64 4.621982 1,271.66 1.92 10.68 4.57
Field Workers
1980 838.4 1.34 6.76 3.111981 913.7 1.45 6.84 2.971982 1,118.1 1.69 7.52 3.22
Processing
1980 798.5 1.28 9.00 4.131981 983.2 1.56 9.36 4.061982 1,115.1 1.69 12.08 5.17
/a Assumes 25 working days a month.
Source: International Financial Statistics, IMF;Labour Indicators, Ministry of Labour and Manpower, various issues;Average Wage of Estate Workers: 1980-1982, Biro PursatStatistik, Jakarta, Indonesia, Table 2.
8.08 That said, the problem of depressed profitability remains, andMalaysian producers worry about the effects on prices of increased productionby Indonesian producers with wages that are between 40 and 60X of those paidto Malaysian tappers (see Table 8.4). While future price projections aretroubling when it is apparent that costs will go on increasing and there maynot be a commensurate growth in productivity, a retreat from rubber by theestates might not be warranted. First, the large estate acreage, in anoligopolistic market, deters other producers from planting more for fear of aprice war and a collapse of prices. If Malaysia were to unilaterally contractits highest yielding plantations, this would signal the start of a retreat andwould trigger decisions elsewhere that would seal the fate of rubber inMalaysia. Second, controlling labor costs (70% of total outlays) might not bedifficult in the future because a large portion of estate labor is a 'non-competing group', locked in by age, tradition, skill and scanty urban opportu-nities. It also bears a part of the risks from falling rubber prices sincethe daily wages paid to workers are related to rubber prices. For some time
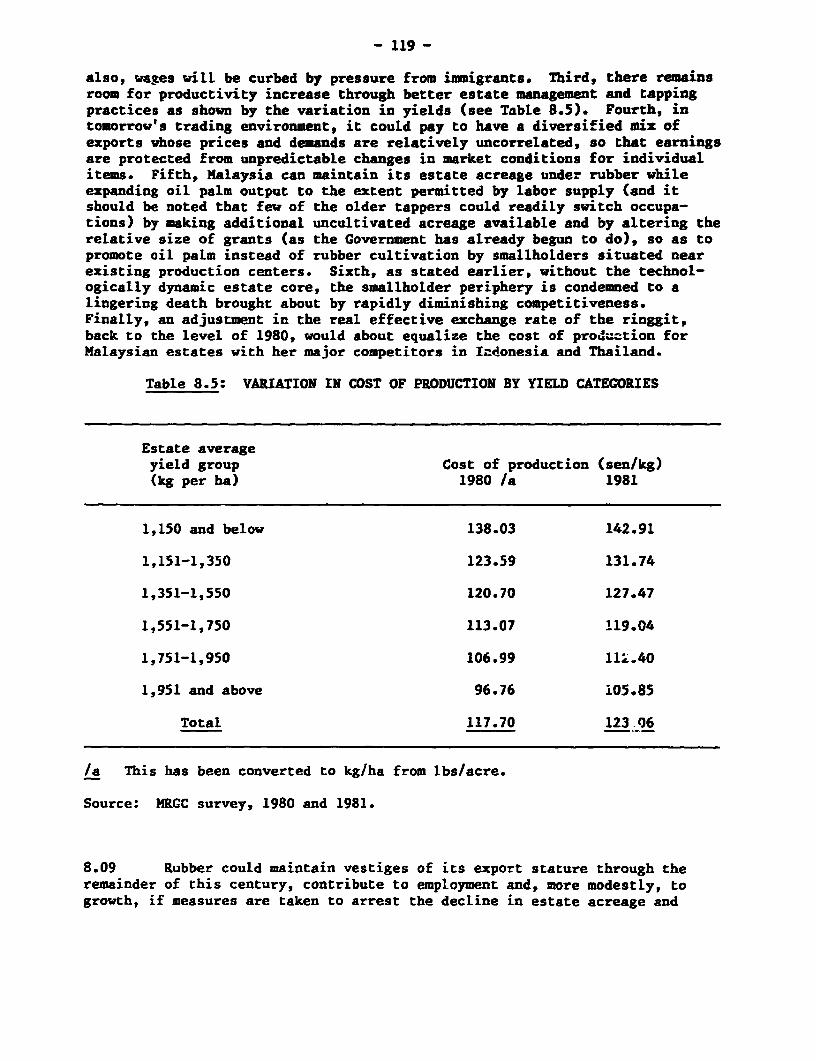
- 119 -
also, wages will be curbed by pressure from imigrants. Third, there remainsroom for productivity increase through better estate management and tappingpractices as shown by the variation in yields (see Table 8.5). Fourth, intomorrow's trading environment, it could pay to have a diversified mix ofexports whose prices and demands are relatively uncorrelated, so that earningsare protected from unpredictable changes in market conditions for individualitems. Fifth, Malaysia can maintain its estate acreage under rubber whileexpanding oil palm output to the extent permitted by labor supply (and itshould be noted that few of the older tappers could readily switch occupa-tions) by making additional uncultivated acreage available and by altering therelative size of grants (as the Government has already begun to do), so as topromote oil palm instead of rubber cultivation by smallholders situated nearexisting production centers. Sixth, as stated earlier, without the technol-ogically dynamic estate core, the smallholder periphery is condemned to alingering death brought about by rapidly diminishing competitiveness.Finally, an adjustment in the real effective exchange rate of the ringgit,back to the level of 1980, would about equalize the cost of prod-.=tion forMalaysian estates with her major competitors in lIdonesia and Thailand.
Table 8.5: VARIATION IN COST OF PRODUCTION BY YIELD CATEGORIES
Estate averageyield group Cost of production (sen/kg)(kg per ha) 1980 /a 1981
1,150 and below 138.03 142.91
1,151-1,350 123.59 131.74
1,351-1,550 120.70 127.47
1,551-1,750 113.07 119.04
1,751-1,950 106.99 111.40
1,951 and above 96.76 i05.85
Total 117.70 123 .06
/a This has been converted to kg/ha from lbs/acre.
Source: MRGC survey, 1980 and 1981.
8.09 Rubber could maintain vestiges of its export stature through theremainder of this century, contribute to employment and, more modestly, togrowth, if measures are taken to arrest the decline in estate acreage and
- 120 -
replanting policies followed, that will safeguard productivity well into thefuture. It would be poor economics and tactically unfortunate, if the gradualwithdrawal from rubber should commence with the dynamic and highly productiveestate sector, rather than stagnant smallholder agriculture. For a smallexpenditure of capital, using land that is in relatively elastic supply andlabor that has few alternative uses, rubber production could continue tosupport the national product and serve as the touchstone for a flourishingrubber products industry.
8.10 Three production scenarios can be visualized. In the first, thegovernment achieves its announced plans of signific.ntly expanding and reha-bilitating smallholder rubber stands. The vacuum created by the withdrawal ofthe estates is filled by aggregating the majority of the smallholders intorelatively efficient estate-like organizations operating under the sharesystem. This is consistent with the government's announced plans. Accordingto these, FELDA will establish 26.4 thousand ha of rubber on PeninsularMalaysia through 1990. After 1990, the planting of rubber will cease, sincethe agency does not intend to develop rubber in Sabah where the majority ofFELDA activities will be concentrated in the nineties. Scenario I alsoassumes that over this period for every two ha of FELDA rubber land needingreplanting only one ha will be planted with rubber. This squares with FELDA'sproposal to add more oil palm and cocoa to its portfolio. FELCUA is currentlyoperating under a government mandate to replant 566.8 thousand ha of 'idle'land during the 1984-1996 period. As 20% is scheduled to be planted underrubber, it is assumed that this will be done in yearly increments of9.4 thousand ha. Meanwhile, BISDA which intends replanting 80 thousand acres(32.4 thousand ha) annually for 1985-1990, with 70Z planted under rubber, isprojected to add 22.7 thousand ha of rubber acreage annually.
8.11 Starting from a total of 65Z of estate cultivated land under rubberin 1983, it is assumed that the area under rubber will decline evenly through-out this period to 33% rubber by 1990. After 1990, the acreage will be heldconstant. The 'other' category of smallholders is assumed to decrease at thesame rate as in the past ten years. The majority of this decline will beabsorbed into either a FELCRA or a RISDA scheme.
8.12 Yields which averaged 1.4 tons per mature ha in 1983 and whichranged between 1.2 and 1.9 tons/ha are projected to increase smoothly to1.7 tons/ha by 1995, a rate of about 2% p.a. The costs of achieving theseplanting programs for the Fifth Development Plan will be about M$1.5 billionin 1984 Malaysian ringgit. This assumes that the 1984 FELDA costs of M$13,270per ha are reasonable estimates for establishing FELCRA schemes ard RISDAmini-estates with the necessary infrasturcture. For FELCRA lands, withoutinfrastructure, the cost is assumed to be M$8,000; for RISDA replantingoutside of the mini-estate schemes, we assume M$5,000 per ha.
8.13 We have also explored two alternative scenarios. Scenario IIassumes that neither FELCRA nor RISDA will be able to completely achieve cheirtargets. This is based upon their historical performance and the sheer magni-tude of the planned planting programs. Therefore, we assume that both agen-cies achieve one half of the officially announced targets. For FELDA and theestate sector, we maintain the assumption of Scenario I. Yield levels also
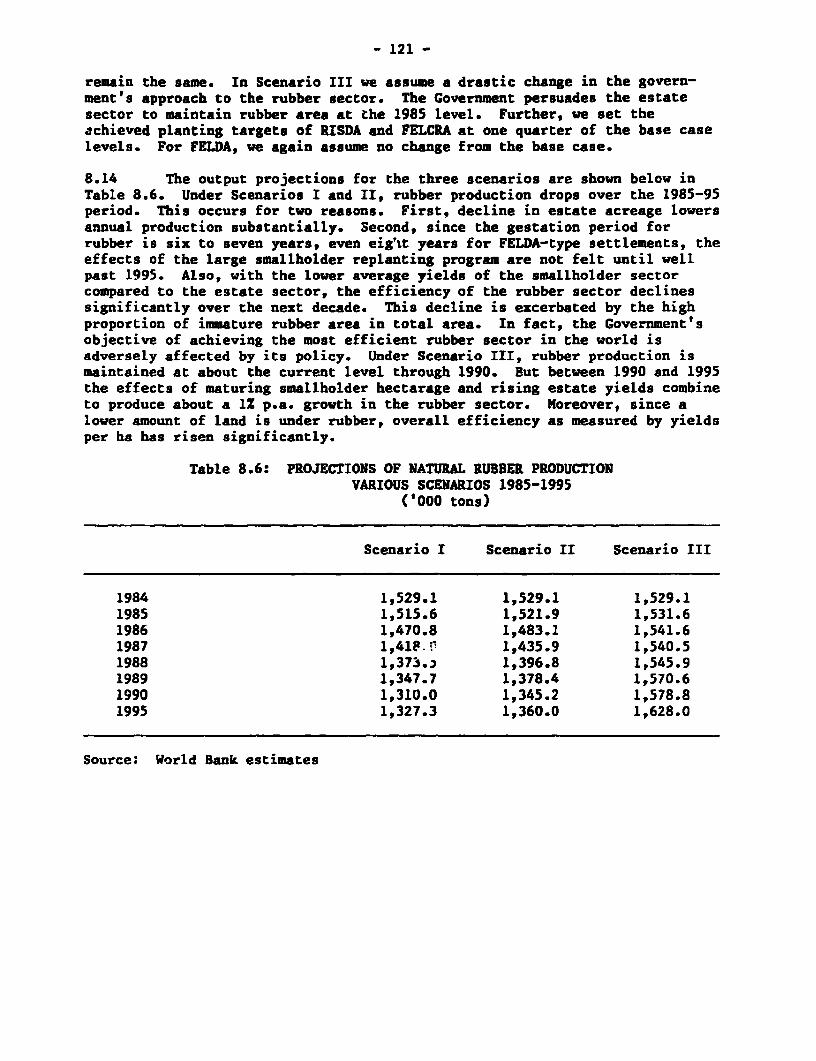
- 121 -
remain the same. In Scenario III we assume a drastic change in the govern-ment's approach to the rubber sector. The Government persuades the estatesector to maintain rubber area at the 1985 level. Further, we set theachieved planting targets of RISDA and FELCRA at one quarter of the base caselevels. For FELDA, we again assume no change from the base case.
8.14 The output projections for the three scenarios are shown below inTable 8.6. Under Scenarios I and II, rubber production drops over the 1985-95period. This occurs for two reasons. First. decline in estate acreage lowersannual production substantially. Second, since the gestation period forrubber is six to seven years, even eig'lt years for FELDA-type settlements, theeffects of the large smallholder replanting program are not felt until wellpast 1995. Also, with the lover average yields of the smallholder sectorcompared to the estate sector, the efficiency of the rubber sector declinessignificantly over the next decade. This decline is excerbated by the highproportion of immature rubber area in total area. In fact, the Government'sobjective of achieving the most efficient rubber sector in the world isadversely affected by its policy. Under Scenario III, rubber production ismaintained at about the current level through 1990. But between 1990 and 1995the effects of maturing smallholder hectarage and rising estate yields combineto produce about a 1Z p.a. growth in the rubber sector. Moreover, since alower amount of land is under rubber, overall efficiency as measured by yieldsper ha has risen significantly.
Table 8.6: PROJECTIONS OF NATURAL RUBBER PRODUCTIONVARIOUS SCENARIOS 1985-1995
('000 tons)
Scenario I Scenario II Scenario III
1984 1,529.1 1,529.1 1,529.11985 1,515.6 1,521.9 1,531.61986 1,470.8 1,483.1 1,541.61987 1,41P. 1,435.9 1,540.51988 1,373.2 1,396.8 1,545.91989 1,347.7 1,378.4 1,570.61990 1,310.0 1,345.2 1,578.81995 1,327.3 1,360.0 1,628.0
Source: World Bank estimates
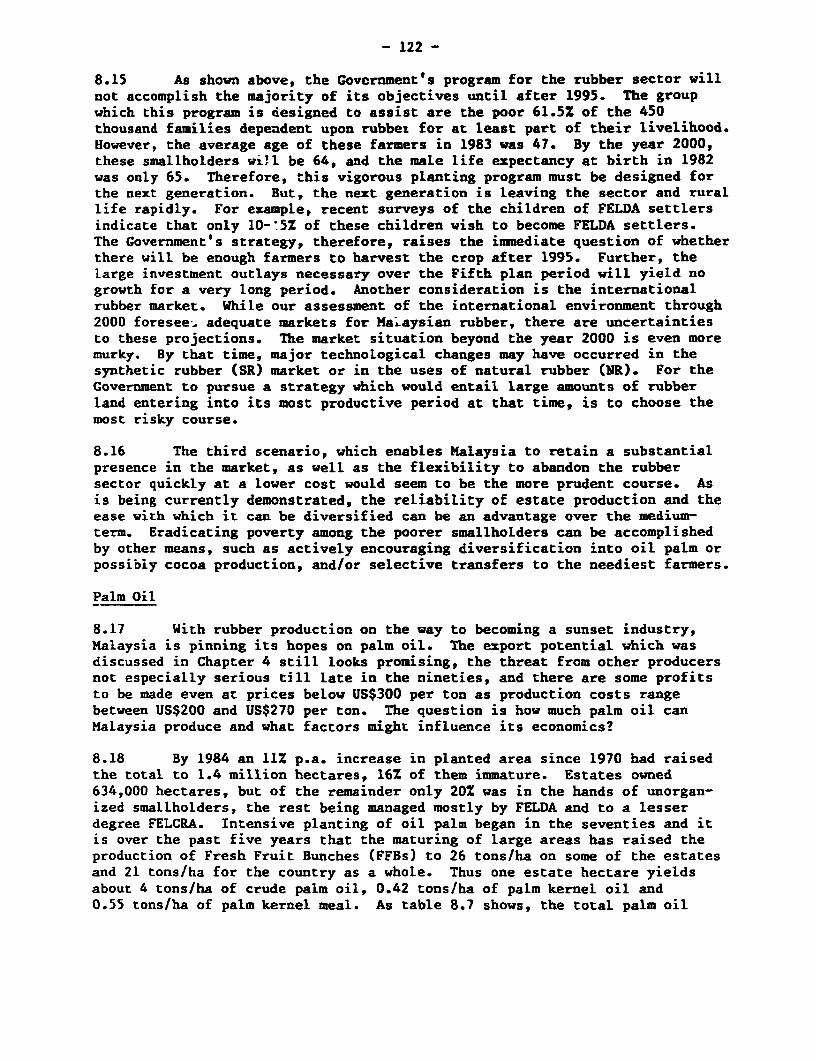
- 122 -
8.15 As shown above, the Government's program for the rubber sector willnot accomplish the majority of its objectives until after 1995. The groupwhich this program is designed to assist are the poor 61.5% of the 450thousand families dependent upon rubbex for at least part of their livelihood.However, the average age of these farmers in 1983 was 47. By the year 2000,these smallholders wi]l be 64, and the male life expectancy at birth in 1982was only 65. Therefore, this vigorous planting program must be designed forthe next generation. But, the next generation is leaving the sector and rurallife rapidly. For example, recent surveys of the children of FELDA settlersindicate that only 10- 5Z of these children wish to become FELDA settlers.The Government's strategy, therefore, raises the immediate question of whetherthere will be enough farmers to harvest the crop after 1995. Further, thelarge investment outlays necessary over the Fifth plan period will yield nogrowth for a very long period. Another consideration is the internationalrubber market. While our assessment of the international environment through2000 foresee-, adequate markets for Ma.Laysian rubber, there are uncertaintiesto these projections. The market situation beyond the year 2000 is even moremurky. By that time, major technological changes may have occurred in thesynthetic rubber (SR) market or in the uses of natural rubber (NR). For theGovernment to pursue a strategy which would entail large amounts of rubberland entering into its most productive period at that time, is to choose themost risky course.
8.16 The third scenario, which enables Malaysia to retain a substantialpresence in the market, as well as the flexibility to abandon the rubbersector quickly at a lower cost would seem to be the more prudent course. Asis being currently demonstrated, the reliability of estate production and theease with which it can be diversified can be an advantage over the medium-term. Eradicating poverty among the poorer smallholders can be accomplishedby other means, such as actively encouraging diversification into oil palm orpossibly cocoa production, and/or selective transfers to the neediest farmers.
Palm Oil
8.17 With rubber production on the way to becoming a sunset industry,Malaysia is pinning its hopes on palm oil. The export potential which wasdiscussed in Chapter 4 still looks promising, the threat from other producersnot especially serious till late in the nineties, and there are some profitsto be made even at prices below US$300 per ton as production costs rangebetween US$200 and US$270 per ton. The question is how much palm oil canMalaysia produce and what factors might influence its economics?
8.18 By 1984 an 11% p.a. increase in planted area since 1970 had raisedthe total to 1.4 million hectares, 16% of them immature. Estates owned634,000 hectares, but of the remainder only 20% was in the hands of unorgan-ized smallholders, the rest being managed mostly by FELDA and to a lesserdegree FELCRA. Intensive planting of oil palm began in the seventies and itis over the past five years that the maturing of large areas has raised theproduction of Fresh Fruit Bunches (FFBs) to 26 tons/ha on some of the estatesand 21 tons/ha for the country as a whole. Thus one estate hectare yieldsabout 4 tons/ha of crude palm oil, 0.42 tons/ha of palm kernel oil and0.55 tons/ha of palm kernel meal. As table 8.7 shows, the total palm oil
- 123 -
production in 1984 was 3.7 million tons. It rose by 9.3n to 4.06 million tonsin 1985.
Table B.7: MALAYSIA: BASIC STATISTICs 0 PALK OIL
1970 1975 1980 1981 1982 1983 1984
Oil palm hectarage ('000 ha) 289.8 641.8 1,023.3 1,121.2 1,182.8 1,253.0 1,361.2
Peninsular MalayliaEstates 193.4 355.2 495.4 551.0 574.6 606.5 634.5Smallholdings 67.5 213.4 411.2 445.5 473.4 493.2 572.9
Sabah 28.9 59.1 94.0 100.6 110.7 128.2 133.7Sarawak - 1.1 14.1 22.7 24.1 25.1 20.2
Crude palm oil production 431.1 1,257.6 2,575.6 2,822.1 3,509.1 3,018.3 3,715.7('000 tons)
Price of locally-deliveredcrude palm oil (M$/ton) 641 1,055.0 919.0 964.0 829.0 991.0 1,407.0
Source: Ministry of Primary Industries.
8.19 Certain features of palm oil agronomics, production and organizationare vital to an understanding of its future prospects. Research on tissueculture cloning is at an early stage so that it is realistic to expect thatthe FFB yield of 30 tons/ha will be achieved and handily surpassed. Theindustry is already benefitting from pollination by African weevil thatdisplaced hand pollination in 1981. Palm oil production is less labor inten-sive than that of rubber, and labor accounts for 381 of costs, but collectingthe FFB. at a time when they have reached optimal ripeness is a physicallydemanding job for younger and stronger workers. Trailers have mechanizedoperations to a degree (and cutting equipment is being experimented with), butlimits to labor augmenting mechanization are apparent from the low 1.1X p.a.increase in harvester productivity since 1975, a period during which theproductivity of other oil palm industry workers was rising 3.6Z p.a. Oil palmcultivation also requires large applications of fertilizer and 25Z of produc-tion costs can be traced to this one item.
8.20 Unlike rubber, the production of palm oil is a more structured pro-cess because of the nature of the fruit. Once the FFBs have been cut, thefruit must be quickly transported in a manner that prevents bruising to apressing mill for extraction of the crude palm oil, failing which the freefatty acid (FFAs) content is elevated. Hence producing areas must be ade-quately supplied with transport infrastructure and eztracting facilities whichexplains the large role of FELDA and FELCRA in the smallholder sector: palm
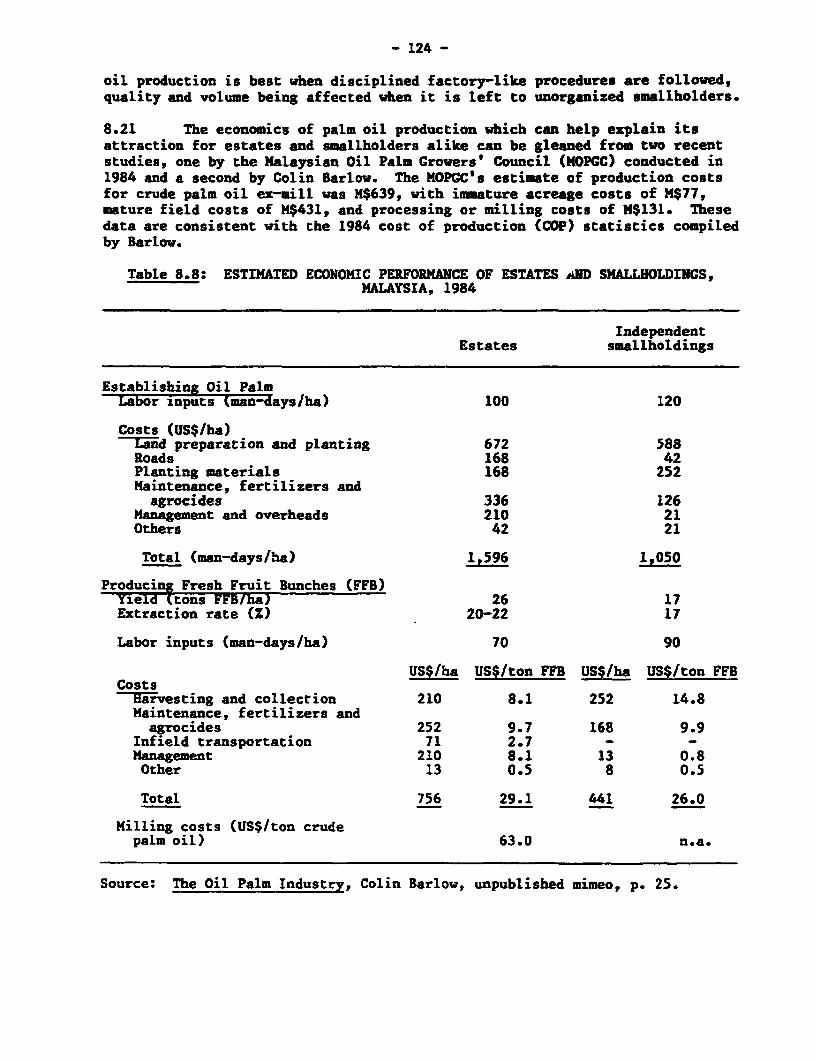
- 124 -
oil production is best when disciplined factory-like procedures are followed,quality and volume being affected when it is left to unorganized smallholders.
8.21 The economics of palm oil production which can help explain itsattraction for estates and smallholders alike can be gleaned from two recentstudies, one by the Malaysian Oil PaLm Growers' Council (MOPGC) conducted in1984 and a second by Colin Barlow. The MOPGC's estimate of production costsfor crude palm oil ex-mill was M$639, with immature acreage costs of M$77,mature field costs of M$431, and processing or milling costs of M$131. Thesedata are consistent with the 1984 cost of production (COP) statistics compiledby Barlow.
Table 8.8: ESTIMATED ECONOMIC PERFORMANCE OF ESTATES AND SMALLHOLDINGS,MALAYSIA, 1984
IndependentEstates smallholdings
Establishing Oil PalmLabor iLnputs (man-days/ha) 100 120
Costs (US$/ha)Land preparation and planting 672 588Roads 168 42Planting materials 168 252Maintenance, fertilizers and
agrocides 336 126Management and overheads 210 21Others 42 21
Total (man-days/ha) 1,596 1,050
Producing Fresh Fruit Bunches (FFB)Yield (tons FFB/ha) 26 17Extraction rate (Z) 20-22 17
Labor inputs (man-days/ha) 70 90
US$/ha US$/ton FFB US$/ha US$/ton FFBCostsHarvesting and collection 210 8.1 252 14.8Maintenance, fertilizers andagrocides 252 9.7 168 9.9
Infield transportation 71 2.7 - -Management 210 8.1 13 0.8Other 13 0.5 8 0.5
Total 756 29.1 441 26.0
Milling costs (US$/ton crudepalm oil) 63.0 n.a.
Source: The Oil Palm Industry, Colin Barlow, unpublished mimeo, p. 25.
- 125 -
8.22 Barlow estimates mature area cost to be US$29.1 per ton FFB. Underhis assumption of 26 tons FFB per ha and assuming a 20S extraction rate, thisproduces a mature hectare cost of US$145.50 per ton of crude palm oil (CPO),or M$349.20 (at an exchange rate of 2.4 ringgit to the US$). His estimate ofmilling costs is US$63 (M$151.20) per ton. This yields a mature hectarageplus milling cost per ton ex-mill of about M$500, about M$60 less than theMOPGC estimate. However, the yield assumption of 26 tons/FFB is too high foran overall estate average, but appropriate for years 8-17. Adding to Barlow'sestimate, the immature field costs from the MOPGC survey of M$77 results inproduction costs of M$577. Since the cost-plus duty formulation may haveintrodtuced an upward bias into the MOPCC's estimate and Barlow's cost ofproduction (COP) could be too low because of his average yield assumption, themost accurate assessment of the average COP for a ton of CPO ex-mill is aroundM$600. By comparing this to the price of locally-delivered CPO shown onTable 8.7, which averaged H$926 for the period 1980-1983, estates were obtain-ing a profit of almost M$326 per ton of CPO. The overall average (includingsmallholders) of CPO yield per ha in Malaysia was 3.5 tons (estate levels areprobably equal or slightly above 4 tons) for the period 1980-1983, producing aprofit per ha of about M$1,100. This average financial pro'Lt ignores theextraordinary profits earned during 1984, when locally deliLvered CPO pricesexceeded M$1,400 per ton.
8.23 Independent smallholders (Barlow's comercial operators) also earnhandsome returns from oil palm cultivation as shown in Column 2 ofTable 8.8. For a typical smallholder, with a yield of 17 tons FFB per ha anda 17Z extraction rate, the COP for mature area is K$367 per ton CPO. Millingcosts are unavailable, but the cost per ton CPO is higher than for estates,since the smallholders have a lower extraction rate, and the crop is of a moreuneven quality than on the estates. With the prevailing price for locally-delivered CPO, the financial return per ha for these smallholders is however,still good. Barlow estimated that for the 90 mandays of work required onthese plots, the daily wage was about M$31 per day for their harvestinglabor. The average return is probably lower since 1984 was a year of veryhigh prices, although even a daily return of one half this level would stillbe higher than alternatives such as rubber and would be enough to pull small-holder families above the M$350 poverty line.
8.24 The most important variables impinging on the growth of the oil palmindustry will be international prices and demand but certain domestic con-straints will also decide how far the industry can move to exploit tradepossibilities. For the estates, labor and land are the two prirary con-cerns. The size of the estate labor force has increased by about 7% p.a.since 1971 and stood at 93,000 in 1983. Of these 46Z were harvesters, theratio being about 0.25-0.33 harvesters per mature hectare. Other plantationworkers can still be recruited without too much difficulty but the supply ofharvesters is relatively inelastic and the situation could grow worse as theagriculture sector is gradually denuded of younger male workers. As it is,some 150.6 thousand tons of FFBs could not be harvested in 1984 because ofmanpower shortages and it is unclear how the projected expansion of estateacreage in the Eastern and Southern parts of Peninsular Malaysia as well as inSabah can be achieved if workers are not to be found or, as in EasternMalaysia, they are disinclined to work on the estates. Supplies might be
- 126 -
enhanced if better wages were paid but the elasticity of response does notappear to be large. For close to a decade, real wages of harvesters have beenrising 5% p.a., far above the growth in productivity, with labor shortagespersisting throughout the period. Nevertheless, given the magnitude ofreturns and the difficulty of mechanizing there may not be many alternativesto an upward shift in the wage schedule.
8.25 Estates complain that they cannot find new land for their schemesand are forced, therefore, to transfer acreage out of rubber production. Thisswitch is undesirable for the reasons listed in the previous section and themost appropriate policy would be for the Government to find a way around thisanomaly: plantations in which the State has a commanding share being unableto expand even though the country has an apparent land surplus. The longerthe delay in finding a solution, the greater the loss of rubber acreage. Butcomplaints from estate managers regarding their land problems do not siteasily with the emerging production constraints arising from having too fewharvesters. If the latter is dominant, a limited supply of land is asecondary matter. There are empirical roads leading to an answer and beforethe estate sector makes some radical decisions concerning its portfolio oftree crops and the rate at which it will enlarge oil palm acreage, a fullerexamination of emerging trends may be warranted.
8.26 Since the estate sector appears to have few degrees of freedom,there is more reason to encourage smallholder development of palm oil ratherthan rubber. This will require a three pronged policy drive. Agencies suchas FELDA which have the land and resources will have to accelerate theirprograms for putting in place the infrastructure and organizational scaffold-ing needed. Second, the Ministry of Agriculture. that now provides extensionto smallholders should improve the quality, comprehensiveness and geographicalcoverage of its services. By the early nineties, the time will be approachingwhen smallholders' oil palm groves will need to be replanted, creating ademand for credit. A suitable program, if introduced in advance, wouldfacilitate the renewal of smallholder stocks.
8.27 Other lesser problems in the areas of duty exemption on refined palmoil exports and refining capacity also beset the industry, but from the angleof growth, labor, smallholder development and land are in the forefront. Theindustry projects a 6.6% p.a. increase in palm oil production during 1984-90with an output of 5.5 million tons in 1990, which would contribute signifi-cantly to the macroeconomic goals of the Fifth Plan. In the absence ofdetailed information regarding rural labor markets or good quantitative pro-jections of intersectoral migration under the weaker economic conditionsforecast for a part of the Fifth Plan period, the influence of labor supplieson palm oil output is difficult to gauge. But if the industry remains on itsproductivity trend, the demand for harvesters will rise roughly by 3% p.a. or8,625 in absolute terms.
Cocoa
8.28 The speed at which cocoa production has risen underlines the second-ary nature of the much touted land constraint on the expansion of peren-nials. From negligible levels in 1970, the acreage under cocoa grew 26% p.a.
- 127 -
to 225,000 ha in 1985, 60% on previously uncultivated land. Out of a totalproduction approaching 90,000 tons of dried beans, more than 75,000 tons wereexported in 1985 (as compared to 66,000 tons in 1984), 15X in semi-processedform, elevating Malaysia into the ranks of the top five producers. Even ifthe rate of new plantings remains at the 10,000 ha/year reached in 1985 forthe rest of the decade (as against 40,000 ha/year in 1981), Malaysia is likelyto become the third biggest exporter, after the Ivory Coast and Brazil.
8.29 Malaysia owes its success to research that allowed vascular streakdisease tolerant, Amazon hybrids to be grown in the country. Further, estateswith 64% of the area are highly productive with yields ranging from 1,000kg/ha to 1,350 kg/ha that rival Brazil's. Because of its stable climate,Malaysia is also a more reliable source of beans in a market subject to largeoscillations induced by the cocoa trees' susceptibility to rainfall varia-bility. It is a very competitive supplier in spite of quite high wagesbecause workers are 50-100% more productive than in Indonesia or the IvoryCoast and transport as well as marketing costs, at US$50 per ton, are aquarter of those charged in Brazil and West Africa.
8.30 Currently about 60Z of the acreage is accounted for by estates inSabah with much of the remainder in Peninsular Malaysia and there is enoughnew land in Pahang and Sabah to more than double the area if demand and laborproblems could be thrust aside. Cocoa is consumed mostly in the industrialcountries, and there the price and income elasticities are low, the latterfalling within the 0.11-0.35 range. Demand that was growing by 3% p.a. in thefifties and sixties more or less ceased expanding in the seventies and it istoo early to say whether the resumed upward trend will persist. Thus the tra-ditional West African suppliers and new entrants such as Malaysia andIndonesia will have to fight over a not especially buoyant market. Weatherrelated price swings such as those which occurred in 1982-83 when crop fail-ures induced a draw down of stocks and resulted in abnormally high prices,stimulate new planting, but do not change underlying demand realities. Whatmakes the market doubly unreliable is that sellers such as the Ivory Coast andMalaysia and a major buyer like the US are not part of the International CocoaAgreement that has tried vainly to bring a semblance of order into cocoa trad-ing. In short, demand projections are distinctly unfavorable and even ifMalaysia elbows its way into third place it will have to be at appreciablylower prices that would vitiate a sizable part of the gains from largerproduction.
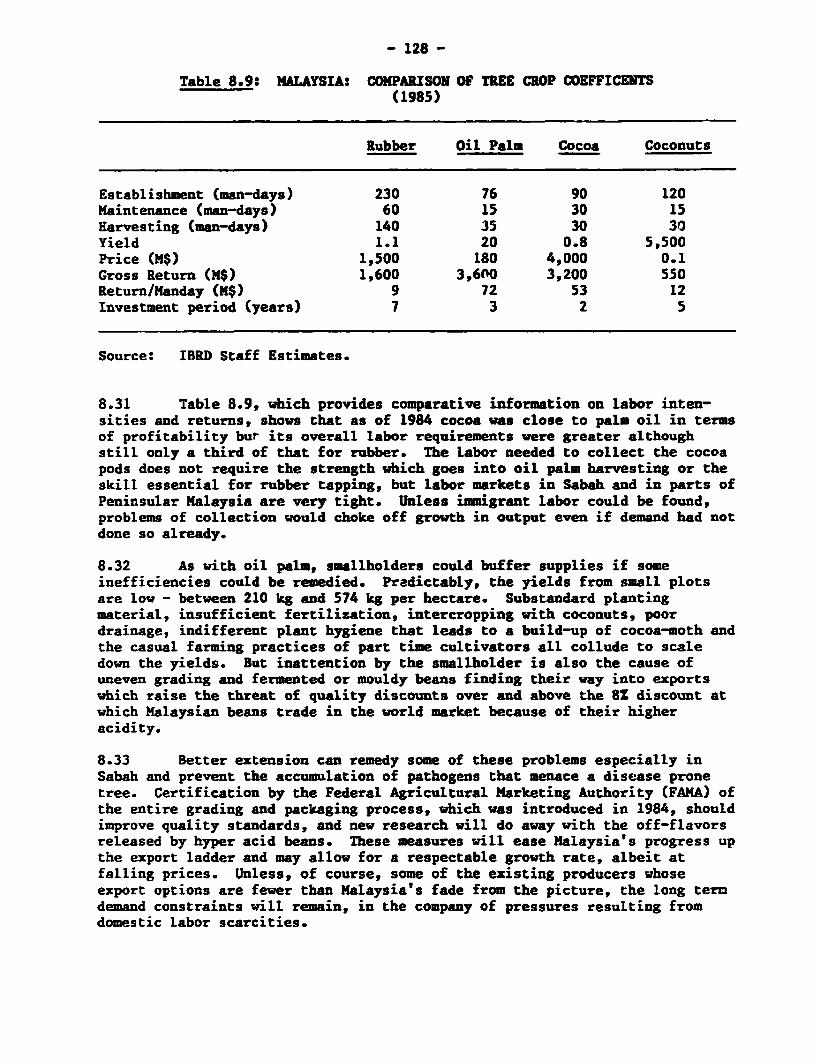
- 128 -
Table 8.9: MALAYSIA: COMPARISON OF TREE CROP COEFFICENTS(1985)
Rubber Oil Palm Cocoa Coconuts
Establishment (man-days) 230 76 90 120Maintenance (man-days) 60 15 30 15Harvesting (man-days) 140 35 30 30Yield 1.1 20 0.8 5,500Price (M$) 1,500 180 4,000 0.1Gross Return (MN) 1,600 3,6n0 3,200 550Return/Manday (M$) 9 72 53 12Investment period (years) 7 3 2 5
Source: IBRD Staff Estimates.
8.31 Table 8.9, which provides comparative information on labor inten-sities and returns, shows that as of 1984 cocoa was close to palm oil in termsof profitability but its overall labor requirements were greater althoughstill only a third of that for rubber. The labor needed to collect the cocoapods does not require the strength which goes into oil palm harvesting or theskill essential for rubber tapping, but labor markets in Sabah and in parts ofPeninsular Malaysia are very tight. Unless immigrant labor could be found,problems of collection would choke off growth in output even if demand had notdone so already.
8.32 As with oil palm, smallholders could buffer supplies if someinefficiencies could be remedied. Pradictably, the yields from small plotsare low - between 210 kg and 574 kg per hectare. Substandard plantingmaterial, insufficient fertilization, intercropping with coconuts, poordrainage, indifferent plant hygiene that leads to a build-up of cocoa-moth andthe casual farming practices of part time cultivators all collude to scaledown the yields. But inattention by the smallholder is also the cause ofuneven grading and fermented or mouldy beans finding their way into exportswhich raise the threat of quality discounts over and above the 8Z discount atwhich Malaysian beans trade in the world market because of their higheracidity.
8.33 Better extension can remedy some of these problems especially inSabah and prevent the accumulation of pathogens that menace a disease pronetree. Certification by the Federal Agricultural Marketing Authority (FAMA) ofthe entire grading and packaging process, which was introduced in 1984, shouldimprove quality standards, and new research will do away with the off-flavorsreleased by hyper acid beans. These measures will ease Malaysia's progress upthe export ladder and may allow for a respectable growth rate, albeit atfalling prices. Unless, of course, some of the existing producers whoseexport options are fewer than Malaysia's fade from the picture, the long termdemand constraints will remain, in the company of pressures resulting fromdomestic labor scarcities.
- 129 -
Tree Crop Sector S.mary
8.34 Malaysia's tree crop sector is arguably the most efficient amongdeveloping countries and so far has enjoyed a successful innings under oftenrather arduous market circumstances. It would be unfortunate if at this junc-ture domestic factor supplies were to interfere with the quest for whateveradditional export possibilities might materialize in the coming years. Fromreviewing the sector's growth prospects, it seems that the problem is not somuch of labor or land scarcity as the chronically inefficient way in whichthese factors are utilized in smallholder production. There would be littlecause to think of expanding estate acreage under oil palm or cocoa or ofreducing that given over to rubber if tne gap between smallholder and estateyields could be narrowed by 10-15Z every year. It is very clear that enlarg-ing the estates by bringing new land into use will have undesirable ecologicalconsequences, would be opposed by the states and will necessitate costlyexpenditure on infrastructure. On top of that, the estates might not find thelabor to work the land or even if they could entice workers away by offeringbetter wages, they may not hold them for long. If ways could be found toelevate the productivity of factors tied up in the smallholder system, thereturns would be immense. As an illustration (see Table 8.10) if all landunder rubber were to obtain the average yield registered by the estates, theoutput for 1984 could be realized from 1.05 million hectares using 306,700workers, as compared to the actual area under rubber of 1.7 million hec-tares. Similarly palm oil production in 1984 could be obtained from 775,000hectares employing 80% of the combined mature estate - smallholder area.Finally, just 105 thousand hectares and 52.5 thousand workers could haveraised the tonnage of cocoa beans produced last year. There is a great dealof slack in the tree crop sector.
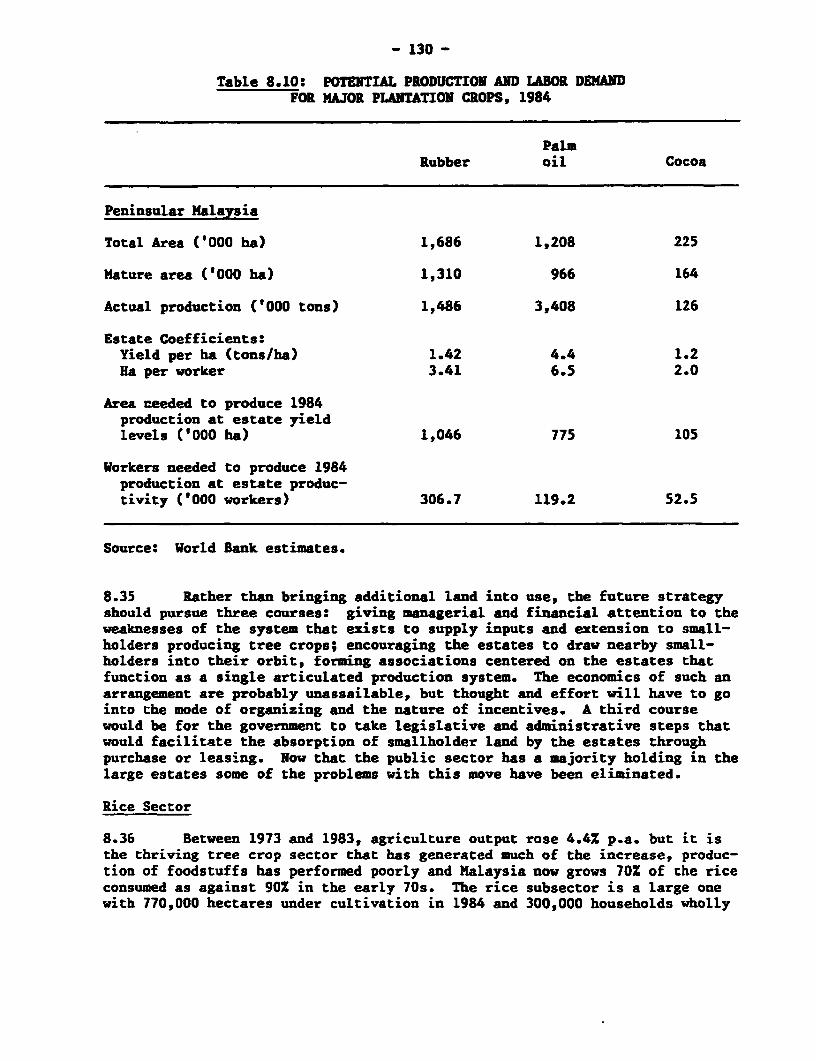
- 130 -
Table 8.10: POTENTfAL PRODUCTION AND LABOR DEMANDFOR MAJOR PLANTATION CROPS, 1984
PalmRubber oil Cocoa
Peninsular Malaysia
Total Area ('000 ha) 1,686 1,208 225
Mature area ('000 ha) 1,310 966 164
Actual production ('000 tons) 1,1486 3,408 126
Estate Coefficients:Yield per ha (tons/ha) 1.42 4.4 1.2Ha per worker 3.41 6.5 2.0
Area needed to produce 1984production at estate yieldlevels ('000 ha) 1,046 775 105
Workers needed to produce 1984production at estate produc-tivity ('000 workers) 306.7 119.2 52.5
Source: World Bank estimates.
8.35 Rather than bringing additional land into use, the future strategyshould pursue three courses: giving managerial and financial attention to theweaknesses of the system that exists to supply inputs and extension to small-holders producing tree crops; encouraging the estates to draw nearby small-holders into their orbit, forming associations centered on the estates thatfunction as a single articulated production system. The economics of such anarrangement are probably unassailable, but thought and effort will have to gointo the mode of organizing and the nature of incentives. A third coursewould be for the government to take legislative and administrative steps thatwould facilitate the absorption of smallholder land by the estates throughpurchase or leasing. Now that the public sector has a majority holding in thelarge estates some of the problems with this move have been eliminated.
Rice Sector
8.36 Between 1973 and 1983, agriculture output rose 4.4% p.a. but it isthe thriving tree crop sector that has generated much of the increase, produc-tion of foodstuffs has performed poorly and Malaysia now grows 70% of the riceconsumed as against 90% in the early 70s. The rice subsector is a large onewith 770,000 hectares under cultivation in 1984 and 300,000 households wholly
- 131 -
or partially engaged in paddy farming. Production peaked at 1.8 million tonsin 1976 and by last year had fallen to 1.6 million valued at about 2% ofGNP. Given the dynamism displayed by some of the other subsectors and thestrides made by Indonesia, Korea and China, the eroding rate of self-sufficiency in rice, is conspicuous. Although the contribution that paddymakes to the national product is a fraction of that of rubber or palm oil, itis by no means negligible and the livelihood of Malaysia's poorer peasants islinked, in part, to rice. Hence the course that rice growing follows isimportant because of the effect it will have on growth directly, as well asindirectly by way of imports. It is also a matter of concern from anotherstandpoint if rice production remains persistently unresponsive to thesubsidies and price supports provided by the government, then the entireeffort at alleviating poverty among rice smallholders might usefully shift toa different tack.
8.37 Compared to other countries in the region, Malaysia's rice sectorstrategy has been no less vigorous in promoting yields. More than a fourth ofthe agriculture development budget has been devoted to irrigation and/ordrainage schemes for paddy and some 300,000 hectares now enjoy controlledwater management permitting double cropping and the timely application ofmoisture recommended by the best scientific practice. In fact, the eightlarge schemes encompassing 55% of the irrigated acreage supply 60% of thetotal rice produced. Since 1979, fertilizer has been provided free to allfarms of under 2.4 hectares and as average farm size is 1.5 - 1.7 hectares andjust 3% are in excess of 10 hectares, most cultivators enjoy fertilizer/paddyprice ratios superior to any in the region. Water is frequently made avail-able without any charge sufficient to recover capital costs while charges todefray operating expenses are quite inadequate. Seeds provided by the MOAseed production center are subsidized and what little credit is required byfarmers is easily obtainad from farmers' associations or the agriculturalbank. Labor shortages are not believed to be a constraint at currentproduction rates in the traditional rice growing areas. In the single crop,rainfed areas, farmers rely on family labor whereas in the Muda AgriculturalDevelopment Authority (MADA) and other schemes mechanization has reduced laborapplication per hectare of rice to as little as 18-20 man-days from 80 in theearly seventies. Farmers in these areas, 30% of whom are nonresident, makeextensive use of contractors who harvest the rice using combines. Directseeding has reduced the labor intensity of planting.
8.38 Although the size of the farm certainly does influence totalincomes, yield seems unrelated to the size of the farm or to tenancy status,so that the structure of the farm system has not been a brake on progress.But in spite of all these benefits and the generous price supports, averageyields (see Table 8.11) in Malaysia are no better than those of its neighborsand well below those of Japan and Korea. Closer examination reveals where theproblem lies.
8.39 Rice agriculture in the major schemes is competitive enough. Wetseason crops yield 3.6-4.5 tons per hectare or up to 9 tons p.a, which is highby any szar.dards. But yields are poor elsewhere, single crop, upland farmsgiving returns of 1.5 tons/ha. Thus productivity in the "rice bowl" areas islargely untouched by the frequently heard problems of small farm size, inter-
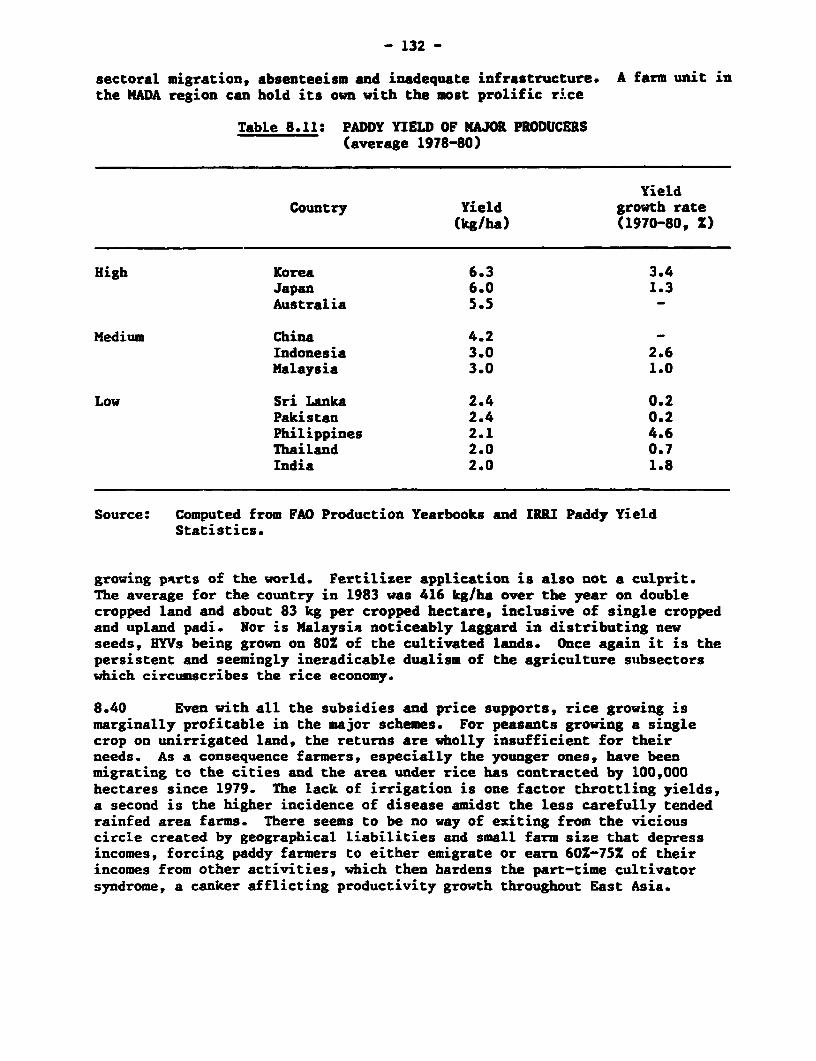
- 132 -
sectoral migration, absenteeism and inadequate infrastructure. A farm unit inthe MADA region can hold its own with the most prolific rice
Table 8.11: PADDY YIELD OF MAJOR PRODUCERS(average 1978-80)
YieldCountry Yield growth rate
(kg/ha) (1970-80, Z)
High Korea 6.3 3.4Japan 6.0 1.3Australia 5.5 -
Medium China 4.2 -Indonesia 3.0 2.6Malaysia 3.0 1.0
Low Sri Lanka 2.4 0.2Pakistan 2.4 0.2Philippines 2.1 4.6Thailand 2.0 0.7India 2.0 1.8
Source: Computed from FAO Production Yearbooks and IRRI Paddy Yieldstatistics.
growing ptrts of the world. Fertilizer application is also not a culprit.The average for the country in 1983 was 416 kg/ha over the year on doublecropped land and about 83 kg per cropped hectare, inclusive of single croppedand upland padi. Nor is Malaysia noticeably laggard in distributing newseeds, HYVs being grown on 80Z of the cultivated lands. Once again it is thepersistent and seemingly ineradicable dualism of the agriculture subsectorswhich circumscribes the rice economy.
8.40 Even with all the subsidies and price supports, rice growing ismarginally profitable in the major schemes. For peasants growing a singlecrop on unirrigated land, the returns are wholly insufficient for theirneeds. As a consequence farmers, especially the younger ones, have beenmigrating to the cities and the area under rice has contracted by 100,000hectares since 1979. The lack of irrigation is one factor throttling yields,a second is the higher incidence of disease amidst the less carefully tendedrainfed area farms. There seems to be no way of exiting from the viciouscircle created by geographical liabilities and small farm size that depressincomes, forcing paddy farmers to either emigrate or earn 60Z-75Z of theirincomes from other activities, which then hardens the part-time cultivatorsyndrome, a canker afflicting productivity growth throughout East Asia.
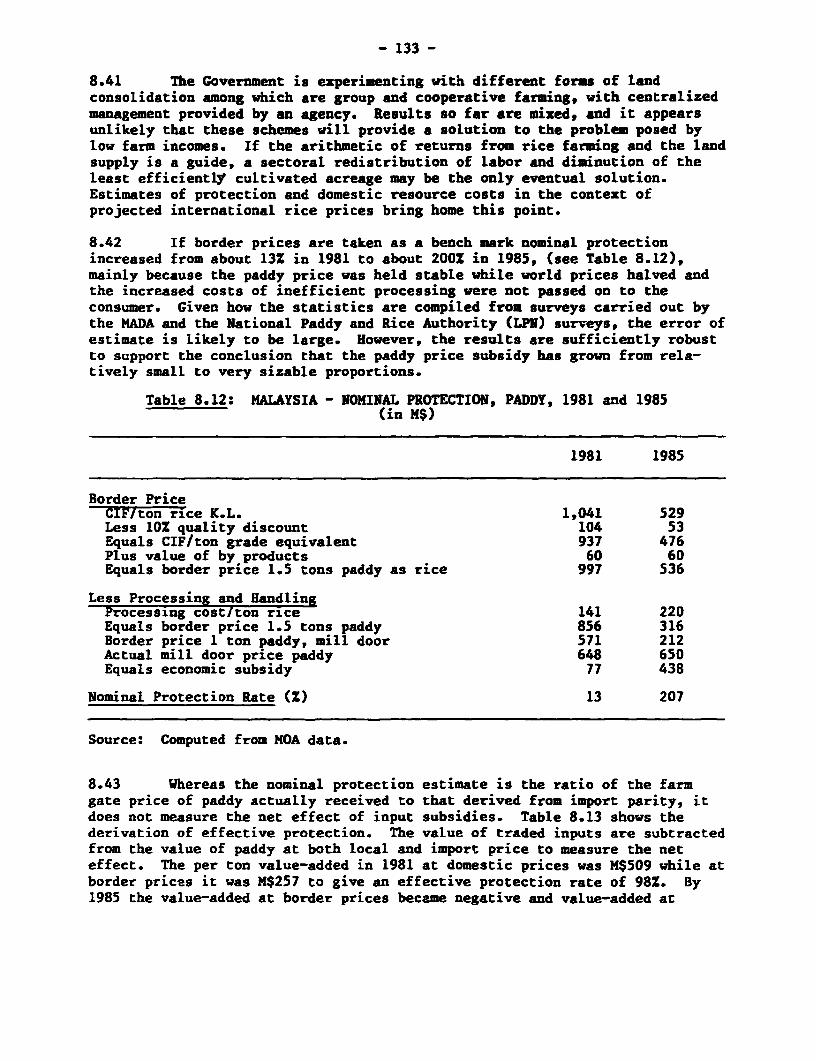
- 133 -
8.41 The Government is experimenting with different forms of landconsolidation among which are group and cooperative farming, with centralizedmanagement provided by an agency. Results so far are mixed, and it appearsunlikely that these schemes will provide a solution to the problem posed bylow farm incomes. If the arithmetic of returns from rice farming and the landsupply is a guide, a sectoral redistribution of labor and diminution of theleast efficiently cultivated acreage may be the only eventual solution.Estimates of protection and domestic resource costs in the context ofprojected international rice prices bring home this point.
8.42 If border prices are taken as a bench mark nominal protectionincreased from about 13Z in 1981 to about 200X in 1985, (see Table 8.12),mainly because the paddy price was held stable while world prices halved andthe increased costs of inefficient processing were not passed on to theconsumer. Given how the statistics are compiled from surveys carried out bythe MADA and the National Paddy and Rice Authority (LPN) surveys, the error ofestimate is likely to be large. However, the results are sufficiently robustto support the conclusion that the paddy price subsidy has grown from rela-tively small to very sizable proportions.
Table 8.12: MALAYSIA - NOMINAL PROTECTION, PADDY, 1981 and 1985(in M$)
1981 1985
Border PriceCIF/ton rice K.L. 1,041 529Less 10% quality discount 104 53Equals CIF/ton grade equivalent 937 476Plus value of by products 60 60Equals border price 1.5 tons paddy as rice 997 536
Less Processing and HandlingProcessing cost/ton rice 141 220Equals border price 1.5 tons paddy 856 316Border price 1 ton paddy, mill door 571 212Actual mill door price paddy 648 650Equals economic subsidy 77 438
Nominal Protection Rate (Z) 13 207
Source: Computed from MOA data.
8.43 Whereas the nominal protection estimate is the ratio of the farmgate price of paddy actually received to that derived from import parity, itdoes not measure the net effect of input subsidies. Table 8.13 shows thederivation of effective protection. The value of traded inputs are subtractedfrom the value of paddy at both local and import price to measure the neteffect. The per ton value-added in 1981 at domestic prices was M$509 while atborder prices it was M$257 to give an effective protection rate of 98%. By1985 the value-added at border prices became negative and value-added at
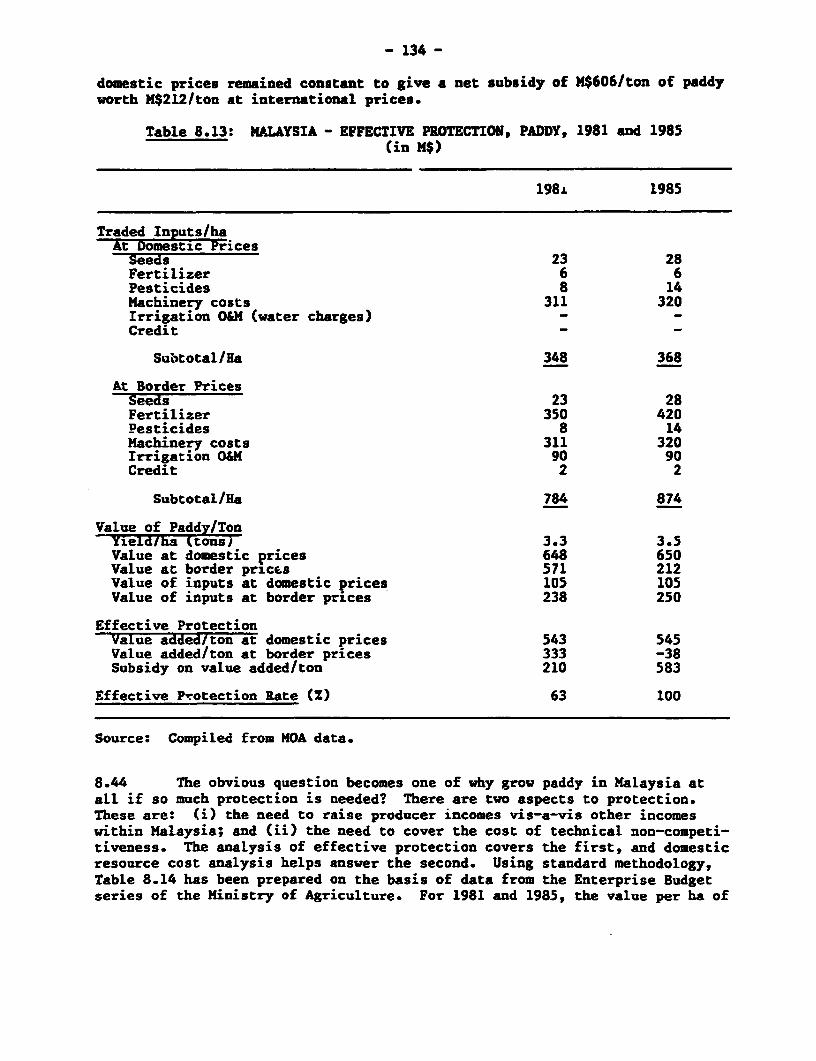
- 134 -
domestic prices remained constant to give a net subsidy of M$606/ton of paddyworth M$212/ton at international prices.
Table 8.13: MALAYSIA - EFFECTIVE PROTECTION, PADDY, 1981 and 1985(in N$)
1981 1985
Traded Inputs/haAt Domestic PricesSeeds 23 28Fertilizer 6 6Pesticides 8 14Machinery costs 311 320Irrigation OM (water charges) - -Credit - -
Subtotal/Ha 348 368
At Border PricesSeeds 23 28Fertilizer 350 420Pesticides 8 14Machinery costs 311 320Irrigation OM 90 90Credit 2 2
Subtotal/Ha 784 874
Value of Paddy/TonYield/ha ktons) 3.3 3.5Value at domestic prices 648 650Value at border prices 571 212Value of inputs at domestic prices 105 105Value of inputs at border prLces 238 250
Effective ProtectionValue addedTton at domestic prices 543 545Value added/ton at border prices 333 -38Subsidy on value added/ton 210 583
Effective Protection Rate (Z) 63 100
Source: Compiled from MOA data.
8.44 The obvious question becomes one of why grow paddy in Malaysia atall if so much protection is needed? There are two aspects to protection.These are: (i) the need to raise producer incomes vis-a-vis other incomeswithin Malaysia; and (ii) the need to cover the cost of technical non-competi-tiveness. The analysis of effective protection covers the first, and domesticresource cost anAlysis helps answer the second. Using standard methodology,Table 8.14 has been prepared on the basis of data from the Enterprise Budgetseries of the Ministry of Agriculture. For 1981 and 1985, the value per ha of
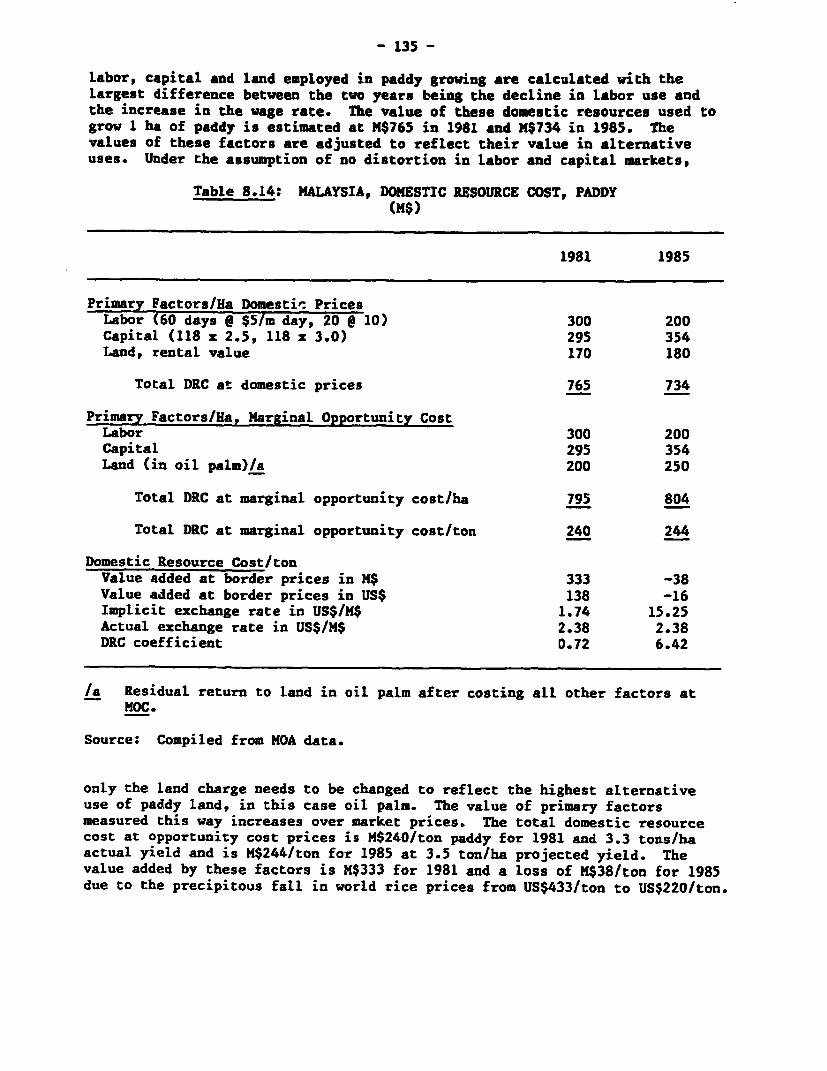
- 135 -
labor, capital and land employed in paddy growing are calculated with thelargest difference between the two years being the decline in labor use andthe increase in the wage rate. The value of these domestic resources used togrow 1 ha of paddy is estimated at M$765 in 1981 and M$734 in 1985. Thevalues of these factors are adjusted to reflect their value in alternativeuses. Under the assumption of no distortion in labor and capital markets,
Table 8.14: MALAYSIA, DOMESTIC RESOURCE COST, PADDY(MN)
1981 1985
Primary Factors/Ha Domesti' PricesLabor (60 days e $5/m day, 20 @ 10) 300 200Capital (118 z 2.5, 118 x 3.0) 295 354Land, rental value 170 180
Total DRC at domestic prices 765 734
Primary Factors/Ha, Marginal Opportunity CostLabor 300 200Capital 295 354Land (in oil palm)/a 200 250
Total DRC at marginal opportunity cost/ha 795 804
Total DRC at marginal opportunity cost/ton 240 244
Domestic Resource Cost/tonValue added at border prices in M$ 333 -38Value added at border prices in US$ 138 -16Implicit exchange rate in US$/M$ 1.74 15.25Actual exchange rate in US$/M$ 2.38 2.38DRC coefficient 0.72 6.42
/a Residual return to land in oil palm after costing all other factors atMOC.
Source: Compiled from MOA data.
only the land charge needs to be changed to reflect the highest alternativeuse of paddy land, in this case oil palm. The value of primary factorsmeasured this way increases over market prices. The total domestic resourcecost at opportunity cost prices is M$240/ton paddy for 1981 and 3.3 tons/haactual yield and is M$244/ton for 1985 at 3.5 ton/ha projected yield. Thevalue added by these factors is M$333 for 1981 and a loss of M$38/ton for 1985due to the precipitous fall in world rice prices from US$433/ton to US$220/ton.
- 136 -
8.45 The domestic resource cost (DRC) coefficient of 0.72 for 1981implies that it cost M$0.72 of domestic resources to earn M$1.00 of value-added and for 1985 it cost K$6.42 to earn K$1.00. An alternative interpreta-tion is that an expenditure of M$240 of domestic resources per ton of paddygrown saved US$138 of foreign exchange to give an implicit partial exchangerate of M$1.74/US$1 for 1981 and M$15.25/US$1 for 1985, compared with anactual exchange rate of 2.38.
8.46 Reworking the DRC analysis with different valuation assumptionsleads to a consistent conclusion that at low yields and world prices, paddyproduction is non-competitive but that at actually achieved global yields and"normal" prices, paddy production makes economic sense. Protection is substi-tuting for fa-m size to increase farm income rather than making an econom-ically l'nsou.me enterprise privately profitable.
Overview
8.47 These estimates and their i'uplications for the lagging segment ofthe rice economy must be leavened with certain other observations beforepolicies can be brought into focus. First there is considerable uncertaintyregarding the opportunity cost of the labor and land used in the single croprice areas. Many of the farmers devote a quarter of their time to paddy. Ifthey were to abandon farming altogether and move to urban areas, it is improb-able, given their age and lack of skills, that they could be readily absorbedeven into informal sector jobs seeing that growth in the mid-80s will below. Hence it might be more accurate to treat the opportunity cost of thetime that they put into rice growing as close to zero in the short run.Second, for these smallholders making the switch to rubber is hardly to berecommended. Lengthy gestation period, low prices and poor yield would dis-qualify this option for the majority. Oil palm, with its shorter gestationrequirements, is marginally more feasible but, except for farms contiguous toareas where palm oil is produced, the changeover could only be managed follow-ing intensive development of infrastructure. Furthermore, the majority offarmers who are in their late forties and fifties might take reluctantly ornot at all to this physically demanding activity with rhythms very differentfrom rice cultivation. From this reasoning and because present land priceshave been elevated through the compounding of rice subsidilp it would followthat on average land also should have a low shadow price._
8.48 The post-harvesting operations of the rice industry is another areaof concern. Despite an installed annual capacity of twice the actual 1.2 mil-lion ton crop, the concentration of deliveries during a shorter time resultingfrom mechanical harvesting is leading to large losses. The mills are notdesigned for bulk deliveries of wet grain and deterioration is increasing withlonger queuing time. Because the coupon subsidy payment is more accessiblefrom direct sales to LPN and because the state miller is not able to ade-quately discount sub-standard grain, the market share going to LPN has doubled
18/ For the purposes of project appraisal, a more careful study of landvalues is desirable.
- 137 -
since 1975 to 40Z even though it has only 16Z of totai milling capacity.Private millers are unwilling to invest in plant expansion, being unable tocompete with LPN's subsidized operation despite milling costs which are 30Zless than those of LPN. Moreover, LPN is not able to develop an adequateinvestment program until the government decides upon the structure of themilling sector. Clearly, there is a case for an urgent policy reconsiderationfollowing a major technical and economic review of the industry, and only thencan a sound investment program be developed.
8.49 A third concern relates to food security: can Malaysia afford todepend on a thin international rice market, whose price volatility has becomemost apparent over the past decade, for a third or more of its needs?Bringing all the elements together: domestic supply, consumption trends andprojections concerning world prices, two recipes emerge. One appears moreappropriate for the medium term, a second might be applicable for the long-run.
8.50 For the next 3-4 years, growth, employment, poverty alleviation andthe current account deficit will be at the center of attention. Seeing thatsectoral sources of growth are few in number, alternative urban job opportuni-ties might be scarce and that there will be continuing pressure to conserveimports, it would be desirable to maintain production to the extent that itcan be managed in all the rice growing areas of the country. This would arguefor retaining what, in the context of prevailing world rice prices, is anexpensive system of subsidies and transfer payments. However, even thoughsome rice acreage and the labor of aging farmers might have low opportunitycosts, capital has a high value and therefore, it would be a misuse of resour-ces to plough large sums into developing the infrastructure of water controls,that would permit double cropping and higher yields in the poorer rice growingareas. The returns simply would not warrant such expenditures. In effect,the recipe calls for at best stability and at the worst a low decline of riceproduction. A 1.6 million ton production rate, very helpful from the stand-point of overall growth, would require a reversal of the trend evident overthe past three years and a return to the historical 1Z p.a. increase in pro-ductivity. Alternatively, rice output could follow the curve down to a lowerbound of 400,000 hectares and a production of 1.3 million tons.
8.51 Over the long haul, altered world rice market conditions, prefer-ences of Malaysian consumers and the economics of rice production argue for achange in the pricing and subsidy system. On balance, the paddy producer hasbeen subsidized substantially over the past ten years with respect to importparity. Similarly the consumer has been taxed and the Government budget haspaid the balance of the producer transfer. In addition substantial inputsubsidies are given. A commensurate supply response has not eventuated, quitethe opposite, and paddy farmers are still poor. In the clasical model, pro-ducer surplus is preferred over consumer surplus with budgetary cost valued atzero. Times have changed and budget resources are seen to have a positivevalue. The price mechanism has not achieved income or output goals and othermeasures seem to be needed to promote the welfare of the rural poor. There isa strong theoretical basis for separating the income and output goals andusing separate instruments for each. An income subsidy tied to output volumeclearly helps least those for whom the policy was designed.
- 138 -
8.52 If one uses purchasing power parity as the reference, then aconstant producer and consumer price since 1974 leads to a 30X decline in realprice for both. During this period the real price (constant dollars) of ricetraded internationally fell 602. *To the extent that rice is a wage good,pricing has kept labor costs higher than in the absence of support. Thepractice is consistent with that of developed countries (US, EEC) in generaland of the more industrialized countries of East Asia (Japan, Korea). Forexample, the Japanese policy has kept producer price of paddy from two to fourtimes higher than international prices since the late 1960s. The differenceshave been that in Japan a supply response was substantial but not in Malaysia,consumers were not able to pass the cost into wage rises in Japan, and budge-tary resources were adequate. Because of these considerations a continuationof pricing practice on the basis of the Japanese experience has hidden costsof a non-trivial nature. While it is not suggested that prices be tied to therise and fall of international paddy prices, it is recommended that some formof moving average relationship between domestic and import prices be adoptedfor allocative pu ses with separate instruments used for welfare andefficiency goals.-
8.53 Self-sufficiency in food supplies has concentrated on riceproduction and consumption because traditionally rice has been the staplefood. However as Malaysia's population and income have risen the consumptionof foods other than rice has risen faster and rice self-sufficiency is nolonger an adquate measure of food security. For example, while self-suffi-ciency in rice fell from 80% to 75% between 1981 and 1983 (see Table 8.15),self-sufficiency in total grains fell from 50% to 39%. Malaysians now eattwice as much maize and 50% more wheat than rice. With almost no domesticfeedgrain production, rising incomes and a high income elasticity of demandfor wheat bread (0.9035), poultry (1.4507) and beef (1.2106), this trend canbe expected to continue. Malaysia is import dependent for the bulk of itsfood supply.
19/ A detailed example of one such scheme is given in "Thailand: Pricing andMarketing Policy for Intensification of Rice Agriculture," World BankCountry Study, 1985, pp. 27-31.
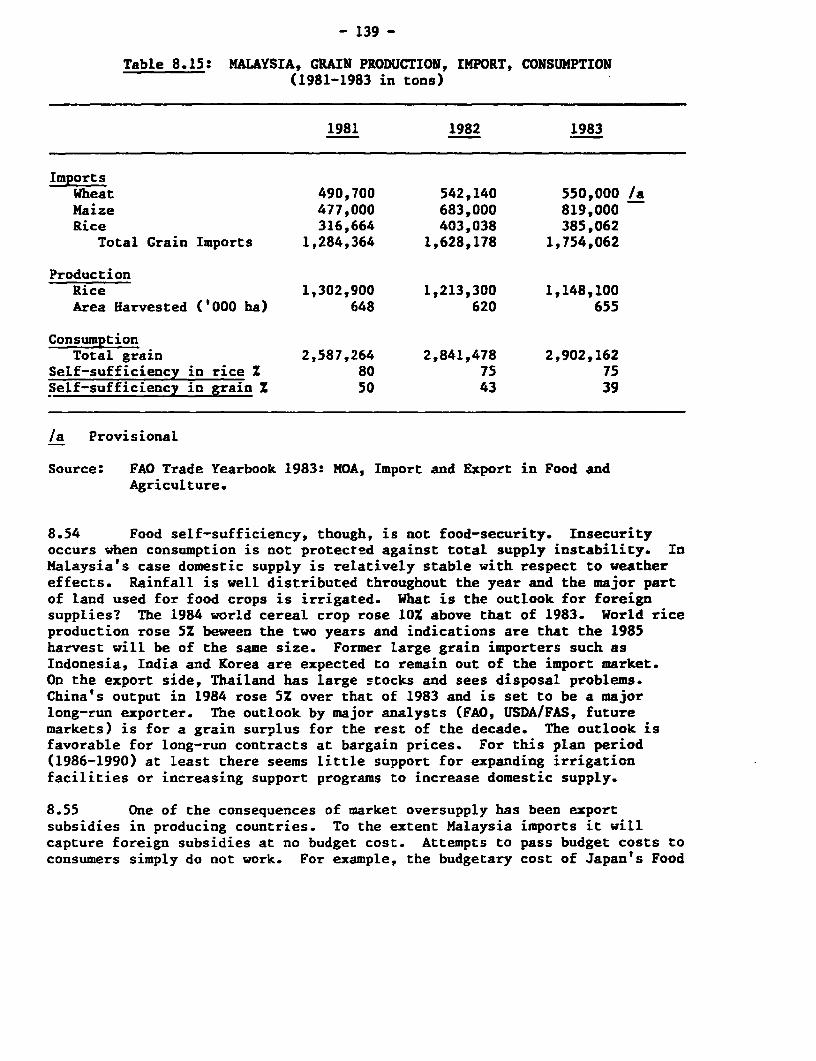
- 139 -
Table 8.15: MALAYSIA, GRAIN PRODUCTION, IMPORT, CONSUMPTION(1981-1983 in tons)
1981 1982 1983
ImportsWheat 490,700 542,140 550,000 /aMaize 477,000 683,000 819,000Rice 316,664 403,038 385,062
Total Grain Imports 1,284,364 1,628,178 1,754,062
ProductionRice 1,302,900 1,213,300 1,148,100Area Harvested ('000 ha) 648 620 655
ConsumptionTotal grain 2,587,264 2,841,478 2,902,162
Self-sufficiency in rice Z 80 75 75Self-sufficiency in grain x 50 43 39
/a Provisional
Source: FAO Trade Yearbook 1983: MOA, Import and Export in Food andAgriculture.
8.54 Food self-sufficiency, though, is not food-security. Insecurityoccurs when consumption is not protected against total supply instability. InMalaysia's case domestic supply is relatively stable with respect to weathereffects. Rainfall is well distributed throughout the year and the major partof land used for food crops is irrigated. What is the outlook for foreignsupplies? The 1984 world cereal crop rose 10Z above that of 1983. World riceproduction rose 52 beween the two years and indications are that the 1985harvest will be of the same size. Former large grain importers such asIndonesia, India and Korea are expected to remain out of the import market.On the export side, Thailand has large stocks and sees disposal problems.China's output in 1984 rose 52 over that of 1983 and is set to be a majorlong-run exporter. The outlook by major analysts (FAO, USDA/FAS, futuremarkets) is for a grain surplus for the rest of the decade. The outlook isfavorable for long-run contracts at bargain prices. For this plan period(1986-1990) at least there seems little support for expanding irrigationfacilities or increasing support programs to increase domestic supply.
8.55 One of the consequences of market oversupply has been exportsubsidies in producing countries. To the extent Malaysia imports it willcapture foreign subsidies at no budget cost. Attempts to pass budget costs toconsumers simply do not work. For example, the budgetary cost of Japan's Food
- 140 -
Agency rice program is US$2.0 billion even though consumers pay two to fourtimes import parity price.
8.56 Malaysia imports about M$4,500 million of agricultural products ofwhich some M$3;500 million is for food. Its agricultural exports amount toM$12,000 million of which M$4,500 million is food. Food imports account for14X of the total value of imports. An absolute shortage of foreign exchangeis not seen as being likely to restrict needed food imports, and movingresources out of the commodity sector where there is a strong comparativeadvantage would reduce export income by more than the value of import savings.In conclusion, substitution of import feedgrains under rainfed conditions andcommercial-sized farms offers more scope for foreign exchange savings thanrice. The import bill for coarse grains (maize, sorghum) is growing fasterand will pass that of rice. Little coarse grain is grown because of lowyields on small farms where returns are less than that for paddy. Thepotential for new development under market determined conditions with statesupport only through an expanded research effort warrants a closer look.
8.57 In closing, it might be useful to look at the rural labor marketpicture in its entirety. If steady efficiency gains can be made in the rubbersector they, along with a specialized labor force, should ensure that untilwell into the 90s rubber production can remain on target with increasing wagesand some use of immigrant labor, the growth of palm oil and cocoa outputshould not be affected until the early 90s. Thereafter, shortages ofharvesters might begin to pinch. There is little doubt that migration of ricecul:ivators will continue, but with further mechanization in the major schemeareas labor shortages could be avoided. By keeping intact the incentivesystem for rice growing and through progress with land consolidation andtechnological improvement the smallholder sector could also prevent muchshrinkage in production, during the balance of the eighties.
- 141 -
CHAPTER IX: SIMULATING THE FUTURE
9.01 A development strategy is perched on many assumptions about worldtrade and capital flows, about government policy and about changes in thestructure of the domestic economy. Until all of these assumptions can bebrought under one roof, it is impossible to divine the total implications forthe future of the system.
9.02 Concerns regarding employment and income growth are a force arguingfor a faster increase in GDP; the need to contain and ultimately reduce thecurrent account deficit supports macroeconomic conservatism. A balancing ofthe two suggests that the appropriate target might be a growth in GDP averag-ing 4% during 1986-90 with the rate in 1986 being below 2Z and rising to 4.5%by 1990. The feasibility of this objective is tightly bound to certainexternal projections, namely:
(a) OECD growth returning to a 3.2-3.5% level in 1986 and subsequentlyremaining in the 3.5-4.0% range through 1990.
(b) International trade increasing by 5-6Z p.a. in the second half ofthe eighties, permitting Malaysia's agricultural exports to rise by4.32 p.a., its sales of forestry products by 2% p.a. andmanufactured exports by 6% p.a.
Cc) minimal improvement in commodity prices. Our projections assumethat the slump in the palm oil market will persist for at leastanother two years; there will be a small recovery in the prices ofrubber, logs and sawn timber by 1987 and petroleum prices per barrelwill climb from a US$15 average in 1986 to US$22 in 1990.
(d) a rebound in the terms of trade index after 1986, but with the levelin 1990 remaining well below that for 1984.
9.03 No less important are certain assumptions relating to investment,savings and the exchange rate:
(a) In line with the Government's stated policy to reduce the publicsector deficit by tightly controlling operating and investmentexpenditures, it is assumed that investment will fall further by 4%in real terms in 1986 before it recovers gradually to a real growthof 4.5% by 1990. Behind this lies a substantial change in thecomposition of capital spending. Because private business activityis expected to be sluggish in 1985-86, public spending on infra-structure and other capital projects where ICORs are high will bethe principal source of investment demand in the economy. There-after, such spending will diminish and private investment in manu-facturing will supply more of the momentum. This change in the mixof investment should have two beneficial effects: the investmentGNP ra-io will be slightly lower but growth will quicken as moreproductive manufacturing projects come on stream. Import elasticitywill be close to unity throughout the remainder of the decade.
- 142 -
(b) Gross national savings which fell to 29% of GNP in 1985 will slipeven lower in 1986-87 to about 27Z of GNP as lower raw materialprices and taxes depress government revenues and diminished incomegrowth moderates private savings propensities. After 1987, arevival in public savings aided by new revenue measures should helprecover lost ground and bring national savings to the level of1985. This is a strong assumption and underlying it is the uncer-tainty regarding the Government's willingness to increase taxrevenues and thereby lift public savings.
(c) The nominal exchange rate will be M$2.65 = US$1 in 1986 and M$2.70 =US$1 for the remainder of the eighties (this assumes some additionaldepreciation of the US$ over the medium term).
9.04 Our base scenario rests on the successful implementation of a con-servative expenditure policy, reforms that will augment federal revenues andan export oriented industrial strategy. A steady contraction of the publicsector deficit to less than 1% of GI7P in 1990 and a rebuilding of Governmentsavings are crucial for the reduction in the current account deficit fromabout 8% of GNP in 1986 to 4.9% by the close of the decade. An expansion ofmanufacturing by 6-7% p.a. during 1987-90 largely on the basis of overseassales will, together with the service sector, generate much of the growth inGDP and employment. According to the Base Scenario, the DSR will reach 19.1Zin 1986 but then begin descending gradually to 17Z in the final year of theFifth Plan. Squeezing the maximum growth from an economy hemmed in by con-straints, some inherited from the past, others arising from the conditionsprevailing in international markets, promises to be no easy task and theadjustment program could be easily derailed by a failure of the industrialdrive. The Low Scenario takes a look into the consequences for the principalmacroeconomic variables of a slower growth in manufacured exports. It assumesthat the authorities are unable to deviate from GDP targets in the face ofrising unemployment and economic expansion is maintained at the rate given inthe Base Scenario by means of public investment and private consumption. Theconsequences are immediate and far-reaching. By the close of the decade thecurrent account deficit is an unsupportable 10% of GNP, while the DSR climbsfrom 19% in 1986 to 22% in 1990, with worse still to come in the earlynineties. A widening external imbalance could be avoided under the LowScenario through greater domestic austerity but then the growth performancewould sink below the modest levels being projected.
9.05 Many other scenarios can be constructed to describe trajectorieswhich follow variations in external circumstances or a different blend offiscal and industrial policies. But the above suffice to convey an idea ofthe system's sensitivity to parameter settings for manufactured exports andpublic finances. Given the proposed uncertainty that shrouds the future ofcommodity markets and fuel prices, building elaborate statistical structuresaround speculation about these would hardly ease the policymakers' task.
9.06 The Malaysian authorities must wrestle with three difficultchallenges: one has to do with managing longer term structural change; thesecond involves squaring the need for a socially acceptable level of economic
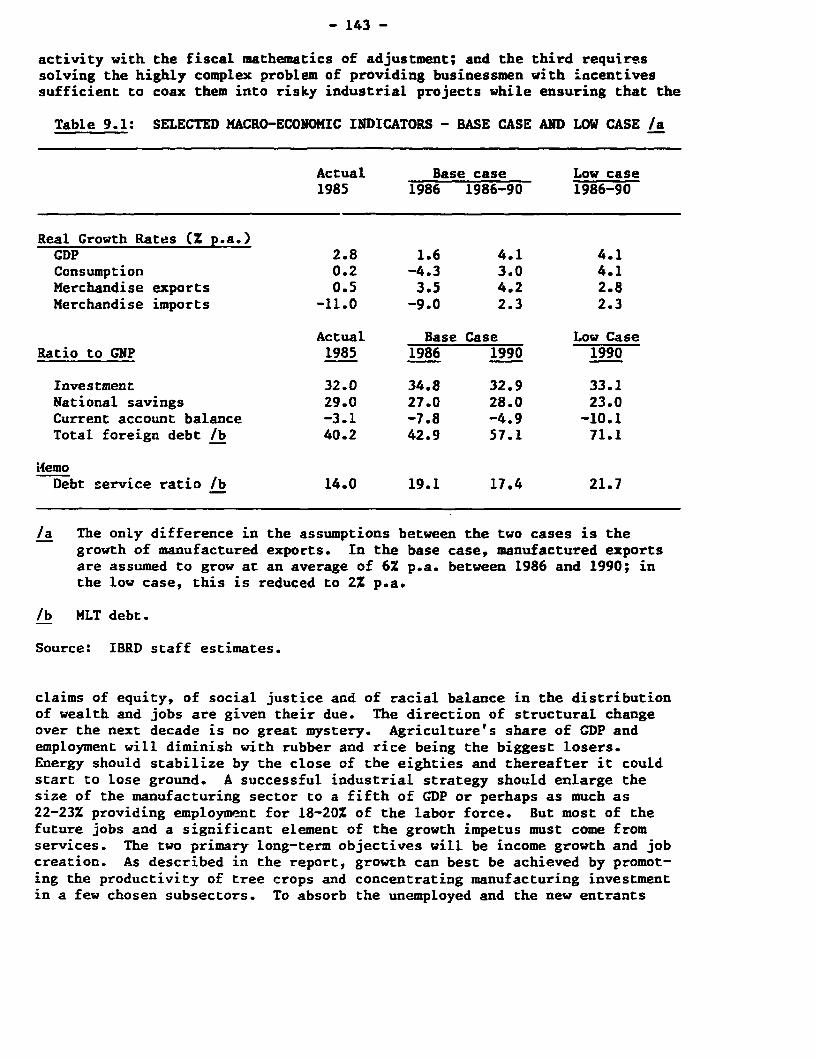
- 143 -
activity with the fiscal mathematics of adjustment; and the third requiressolving the highly complex problem of providing businessmen with incentivessufficient to coax them into risky industrial projects while ensuring that the
Table 9.1: SELECTED MACRO-ECONOMIC INDICATORS - BASE CASE AND LOW CASE /a
Actual Base case Low case1985 1986 1986-90 1986-90
Real Growth Rates (Z p.a.)GDP 2.8 1.6 4.1 4.1Consumption 0.2 -4.3 3.0 4.1Merchandise exports 0.5 3.5 4.2 2.8Merchandise imports -11.0 -9.0 2.3 2.3
Actual Base Case Low CaseRatio to GNP 1985 1986 1990 1990
Investment 32.0 34.8 32.9 33.1National savings 29.0 27.0 28.0 23.0Current account balance -3.1 -7.8 -4.9 -10.1Total foreign debt /b 40.2 42.9 57.1 71.1
iHemoDebt service ratio /b 14.0 19.1 17.4 21.7
/a The only difference in the assumptions between the two cases is thegrowth of manufactured exports. In the base case, manufactured exportsare assumed to grow at an average of 6% p.a. between 1986 and 1990; inthe low case, this is reduced to 2% p.a.
/b MLT debt.
Source: IBRD staff estimates.
claims of equity, of social justice and of racial balance in the distributionof wealth and jobs are given their due. The direction of structural changeover the next decade is no great mystery. Agriculture's share of GDP andemployment will diminish with rubber and rice being the biggest losers.Energy should stabilize by the close of the eighties and thereafter it couldstart to lose ground. A successful industrial strategy should enlarge thesize of the manufacturing sector to a fifth of GDP or perhaps as much as22-23% providing employment for 18-20% of the labor force. But most of thefuture jobs and a significant element of the growth impetus must come fromservices. The two primary long-term objectives will be income growth and jobcreation. As described in the report, growth can best be achieved by promot-ing the productivity of tree crops and concentrating manufacturing investmentin a few chosen subsectors. To absorb the unemployed and the new entrants
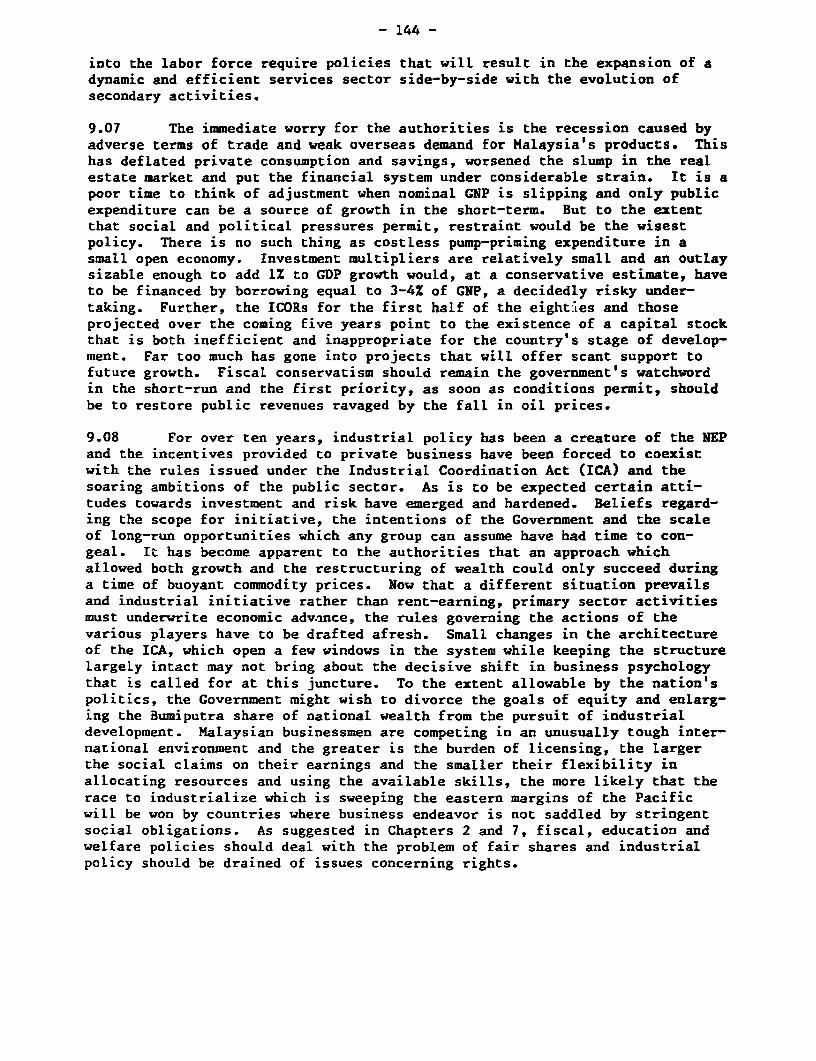
- 144 -
into the labor force require policies that will result in the expansion of adynamic and efficient services sector side-by-side with the evolution ofsecondary activities.
9.07 The immediate worry for the authorities is the recession caused byadverse terms of trade and weak overseas demand for Malaysia's products. Thishas deflated private consumption and savings, worsened the slump in the realestate market and put the financial system under considerable strain. It is apoor time to think of adjustment when nominal GNP is slipping and only publicexpenditure can be a source of growth in the short-term. But to the extentthat social and political pressures permit, restraint would be the wisestpolicy. There is no such thing as costless pump-priming expenditure in asmall open economy. Investment multipliers are relatively small and an outlaysizable enough to add 1Z to GDP growth would, at a conservative estimate, haveto be financed by borrowing equal to 3-4% of GNP, a decidedly risky under-taking. Further, the ICORs for the first half of the eighties and thoseprojected over the coming five years point to the existence of a capital stockthat is both inefficient and inappropriate for the country's stage of develop-ment. Far too much has gone into projects that will offer scant support tofuture growth. Fiscal conservatism should remain the government's watchwordin the short-run and the first priority, as soon as conditions permit, shouldbe to restore public revenues ravaged by the fall in oil prices.
9.08 For over ten years, industrial policy has been a creature of the NEPand the incentives provided to private business have been forced to coexistwith the rules issued under the Industrial Coordination Act (ICA) and thesoaring ambitions of the public sector. As is to be expected certain atti-tudes towards investment and risk have emerged and hardened. Beliefs regard-ing the scope for initiative, the intentions of the Government and the scaleof long-run opportunities which any group can assume have had time to con-geal. It has become apparent to the authorities that an approach whichallowed both growth and the restructuring of wealth could only succeed duringa time of buoyant commodity prices. Now that a different situation prevailsand industrial initiative rather than rent-earning, primary sector activitiesmust underwrite economic advance, the rules governing the actions of thevarious players have to be drafted afresh. Small changes in the architectureof the ICA, which open a few windows in the system while keeping the structurelargely intact may not bring about the decisive shift in business psychologythat is called for at this juncture. To the extent allowable by the nation'spolitics, the Government might wish to divorce the goals of equity and enlarg-ing the Bumiputra share of national wealth from the pursuit of industrialdevelopment. Malaysian businessmen are competing in an unusually tough inter-national environment and the greater is the burden of licensing, the largerthe social claims on their earnings and the smaller their flexibility inallocating resources and using the available skills, the more likely that therace to industrialize which is sweeping the eastern margins of the Pacificwill be won by countries where business endeavor is not saddled by stringentsocial obligations. As suggested in Chapters 2 and 7, fiscal, education andwelfare policies should deal with the problem of fair shares and industrialpolicy should be drained of issues concerning rights.
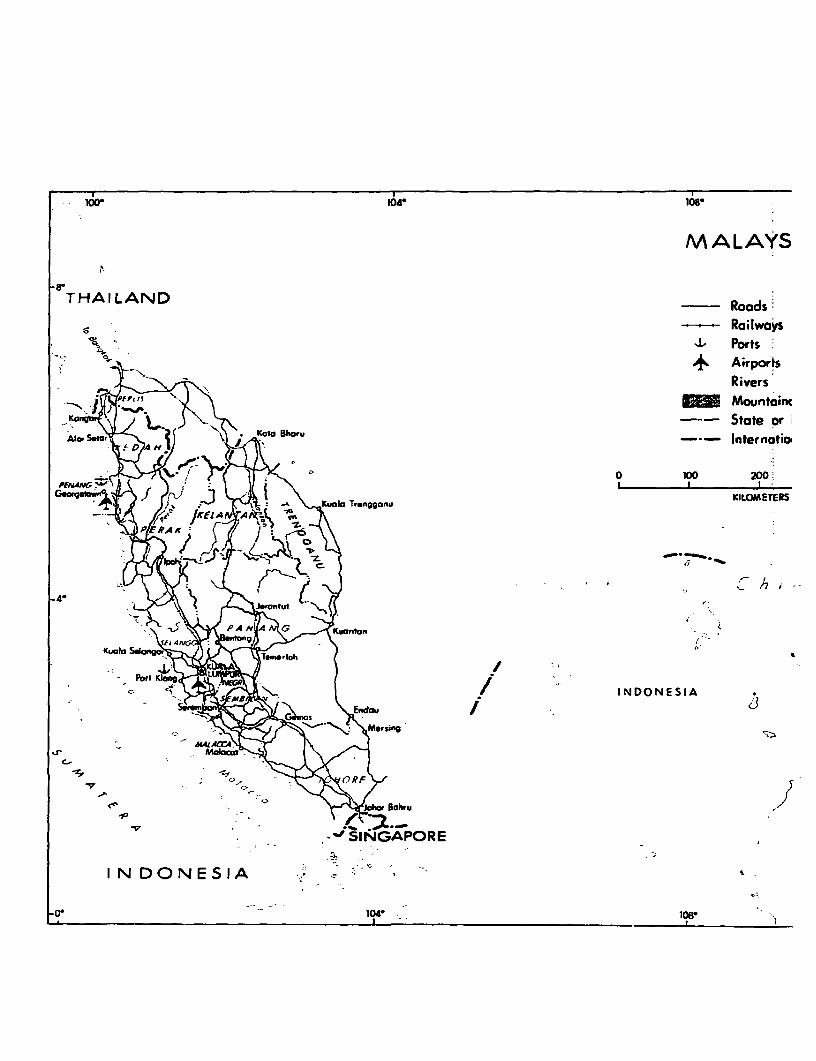
100 104 108
MALAYS
,.
THAI LAND Roads
Railwo's. ' 1' Ports
. 0, -AirportsR iversMountoincStateoICant Xt J \ > Shl~~~~~~~~~~~~~~~~~~~~e or i
Alcw Satc.4x is @3'- 3horu -'- Internatioi
tt^ -7t'0 100 200O
* argutcvimX JJ c 3T- r , gnKILOMETERS
4 t t < i- ~ ~~~~~~~~~~~~~~~. .- ,.
A ~ ~ ~ ~ ~ ~ ~~ G 1
j 4 tB\ KLuolo 5 n ottb
INDONESIA
' iZ mti u x~~~~~ ~ ~ ~~EndouJ :D ~~~~ >~~ o%(Mor~~~sing
- SINGAPORE
I N DONESIA -t
0. - 104 -, 1086
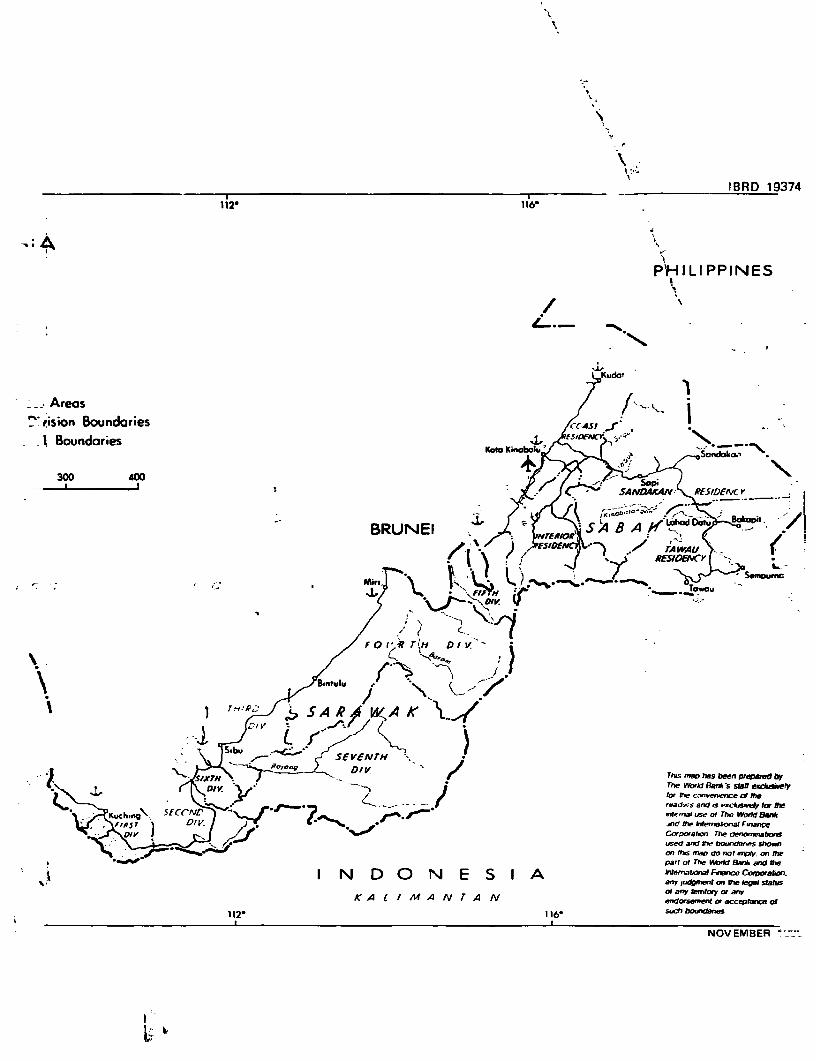
-A
_2 , - -IBRD 19374
PFHILIPPINES
,/
Kudat
Areas K
* -ision Boundaries C*ASI r "
-; Boundaries '1 EFKiV
300 400 ,d_ J SANDAKrAN -,RE5sDiC r ,_ |
BRUNEI S B
/g ) / *t ) **'/ RASA r WA U
- , o ./k rl' D f V.-
\~~~~~~~~~~~~~~ A XJ W,, SA K
5Ev.frwrH , / ~~~~~~~~~~~~~~Thus map has been orpsed byrrle woria flN* s staf excetwf
I N D O N E S I A htmar.nal soF The Wsodd BWm8.~~~~~~~~D nd Vk eon a kl FrwhCs
K A z / M A N Z A N ~~~~~~~~~orp atn Tte eo rwabor
1- 12- 15 16- such bu eo
I XI,I N E S I t uowan
ttN E '
SEVENTH ~ ~ ~ ~ ~ ~ ~ ~ NOEME