Embed Size (px)
Citation preview
Department of Engineering and Design, MSc Petroleum Engineering
LAB.REPORT ON PERMEABILITY AND POROSITYEXPERIMENT
Author: TOLULOPE AFOLABI (3228764) Academic Session: 2014/2015
Lecturer: DR. ELSA ARISTODEMU
Course Moodle: PETROPHYSICS
Mode of Study: FULL TIMEDATE: NOVEMBER 30,2014.
TABLE OF CONTENTCover page------------------------------------ 1Table of context------------------------------------ 2
1.0 Introduction
---------------------------------- 3
1.1 Permeability Measurement -------------------------------- 4
1.2 Aims and objectives------------------------------ 4
1.3 Experimental equipment------------------------------ 5
1.4 Experimental procedure and observations--------------------------- 5i. Experiment one
-------------------------------------------- 5
ii. Experiment two ------------------------------------------------- 6
1.5 Experimental results and calculations--------------------------------- 6
1.6 Presentation and analysis of result --------------------------------- 13
1.7 Error analysis ------------------------------------ 15 1.8 Conclusion ------------------------------------- 15
pg. 2
1.9 References
------------------------------------------- 16
2.0 Porosity measurement ------------------------------------------- 17 2.1 Aim and objectives ------------------------------------------- 17 2.2 Experimental apparatus ------------------------------------------ 17 2.3 Experimental procedures and observation ---------------------------- 17 2.4 Results and calculations ----------------------------------------------- 18 2.5 Discussion-----------------------------------------------19 2.6 Conclusions---------------------------------------------21 2.7 Summary-------------------------------------------- 22 2.8 References----------------------------------------------22 Attach notes-----------------------------------------------23
pg. 3
PERMEABILTY AND POROSITY
1.0 INTRODUCTION :The topic investigated in this experiment were permeabilitydetermination of a porous media and its porosity, permeabilityis a measure of how well a porous media allows the flow offluids through it, Permeability and porosity forms the two majorcharacteristics of reservoir rocks. A reservoir rock must havethe ability to allow petroleum fluids to flow through itsinterconnected pores. Permeability is an indication of theporous medium’s ability to permit fluid flow. Permeability andporosity forms the two major characteristics of reservoir rocks.A reservoir rock must have the ability to allow petroleum fluidsto flow through its interconnected pores. The permeability of aporous medium is a measure of its resistance to the flow of afluid through it. The fluid may be a liquid or a gas. However,the only fluid used in this experiment was water. The majorityof the work was based on using sand as the permeable material.
Basically, permeability could be of three types: absolute
permeability, relative permeability and effective permeability.
The relative permeability of the oil, gas and water would be;
kro = ko/k, krg = kg/k, and krw = kw/k respectively. This
describes the extent to which the fluids hinder one another.
Where:
pg. 4
kro is the relative permeability of the oil
(Dimensionless)
ko is the effective permeability of the oil (Darcy)
k is the absolute permeability of the phase in question
(Darcy)
krg is the relative permeability of the gas
(Dimensionless)
kg is the effective permeability of the gas (Darcy)
krw is the relative permeability of the water
(Dimensionless)
kw is the effective permeability of the water
(Darcy)
The equation that defines permeability in terms of measurable
quantities is Darcy’s law. This equation is given by:
Q=AK∆PμL
(1)
Where:
Q is the flow rate (cm3/s)
K is permeability (Darcy)A is the cross sectional area of bed (cm2)∆P is the pressure drop (atm)μ is the viscosity of the fluid (cP)L is the length of the bed (cm)The above equation can be transposed for the permeability ‘K’as:
pg. 5
K=QμLA∆P (2)
Darcy equation can be written individually for each fluid/phasethat flows in the pore as:
Qi = (Kkriμi ) A∆PiL
(3)Where :
Qi = flow rate of phase i (cm3/s)
K = absolute permeability of medium (mD)Kri = the viscosity of the phase i (cP)∆P = pressure drop (atm)L = length of the medium (cm)A = cross sectional area of medium (cm2)
Porosity of a rock is the fraction of the volume of spacebetween the solid particles of the rock to the total rockvolume. The space includes all pores, cracks, vugs, inter- andintra-crystalline spaces.The porosity is conventionally giventhe symbol Φ, and is expressed either as a fraction varyingbetween 0 and 1, or a percentage varying between 0% and 100%.Sometimes porosity is expressed in porosity units, which are thesame as percent (i.e., 100 porosity units (pu) = 100%).Reservoirs with high porosity indicate abundant fluids in theirpore spaces while those with low porosity indicates low capacityto hold fluids.Knowledge of two basic reservoir properties; porosity and permeability is essential in order to know the types of fluids,amount of fluids, rates of fluid flow and fluid recovery estimates (Tiab and Donaldson, 2012). In addition, porosity can be use quantitatively when it comes to calculating oil reservoircontent volumetrically. Types of porosity are Primary porosity, Secondary, total and effective porosity.Porosity can be calculated as the pore volume of the rockdivided by its bulk volume.
pg. 6
Φ=Porevolume /bulkvolume (Vp/Vb)
Φ=Vb−Vm /Vb=Vp /Vb Porosity can be measured directly or indirectly but thislaboratory measurement of core samples is a direct measurementwhich is generally considered to be reliable and accurate and itrequires measurement of pore volume and bulk volume. The bulk volume is usually estimated by volumetric orgravimetric method, volumetric method measures the volume ofdisplaced liquid by a rock sample when completely immersed inliquid and the gravimetric method is the mass of the sample whenimmersed in a known density liquid. For this experiment, three plugs extracted from sandstone coresample with known permeabilities (50mD, 100mD and 500mD) wereused to carry out a direct measurement of porosity using thegravimetric and volumetric method.The experiment in details
1.1 PERMEABILITY MEASUREMENT1.2 AIMS AND OBJECTIVES:The objectives of the laboratory practical were to determine theabsolute permeability of sand in porous media, and to determinethe relative permeability of multi-phase flow (water and oil)using darcy and corey equations
This experiment was important because knowledge of it would show
how well a porous media allows fluids to flow through it, and as
petroleum engineers, one of the interest in reservoir rocks is
how easily petroleum will flow through them to the wellbore from
where they are transported to the surface.
1.3 EXPERIMENTAL EQUIPMENTIn order to carry out the experiment, apermeability/fluidisation studies apparatus manufactured andsupplied by Armfield (ltd) was used. See figure 1 below.
pg. 7
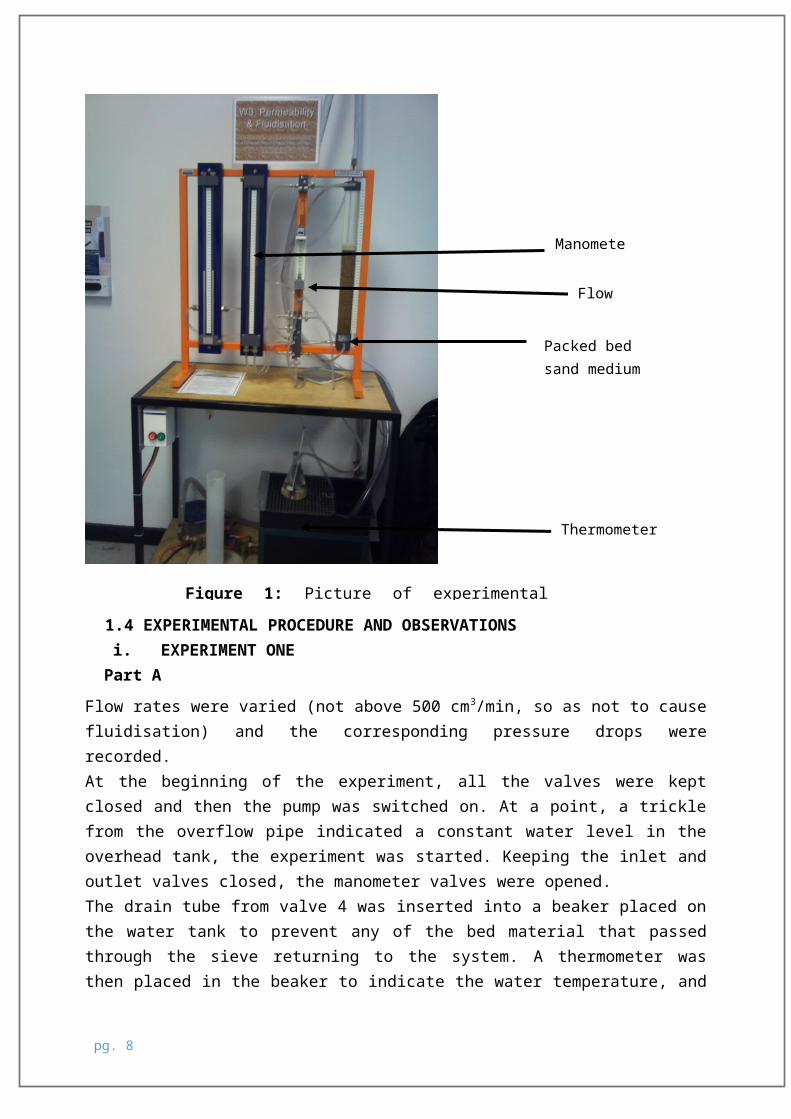
1.4 EXPERIMENTAL PROCEDURE AND OBSERVATIONSi. EXPERIMENT ONEPart A
Flow rates were varied (not above 500 cm3/min, so as not to causefluidisation) and the corresponding pressure drops wererecorded.At the beginning of the experiment, all the valves were keptclosed and then the pump was switched on. At a point, a tricklefrom the overflow pipe indicated a constant water level in theoverhead tank, the experiment was started. Keeping the inlet andoutlet valves closed, the manometer valves were opened. The drain tube from valve 4 was inserted into a beaker placed onthe water tank to prevent any of the bed material that passedthrough the sieve returning to the system. A thermometer wasthen placed in the beaker to indicate the water temperature, and
pg. 8
Manomete
Packed bed sand medium
Flow meter
Thermometer
Figure 1: Picture of experimental
the temperature read after which bed height (L) was recordedalong with the water & mercury manometer zero levels.Valves 1 and 4 were opened to admit water through the column ina down flow direction.Valve 1 was then used to adjust the flow rate (Q) and themanometer levels were both recorded for the various flow rate. The temperature was recorded at the beginning of the experimentand at the end of the experiment to obtain the water averagetemperature.Part B We didn’t carry out this experiment but experimental data weregiven for pressure drop and flow rates for two fluids; oil andwater at different saturations. Here the two fluids wereinjected simultaneously in the cylinder of the sand sample whichwas assumed to be the same sample used in part one.
ii EXPERIMENT TWOThis type of permeability is absolute. For this experiment, thebed heights were varied at different flowrates. In this case,the sand samples were poured into a measuring cylinder tovarious heights (125mm, 215mm and 305m), with known density ofthe fluid (water) the difference in fluid pressures werecalculated from h1 – h2. In both cases, it was observed that the differential pressureincreased with increase in flowrate which is in agreement withDarcy’s law.
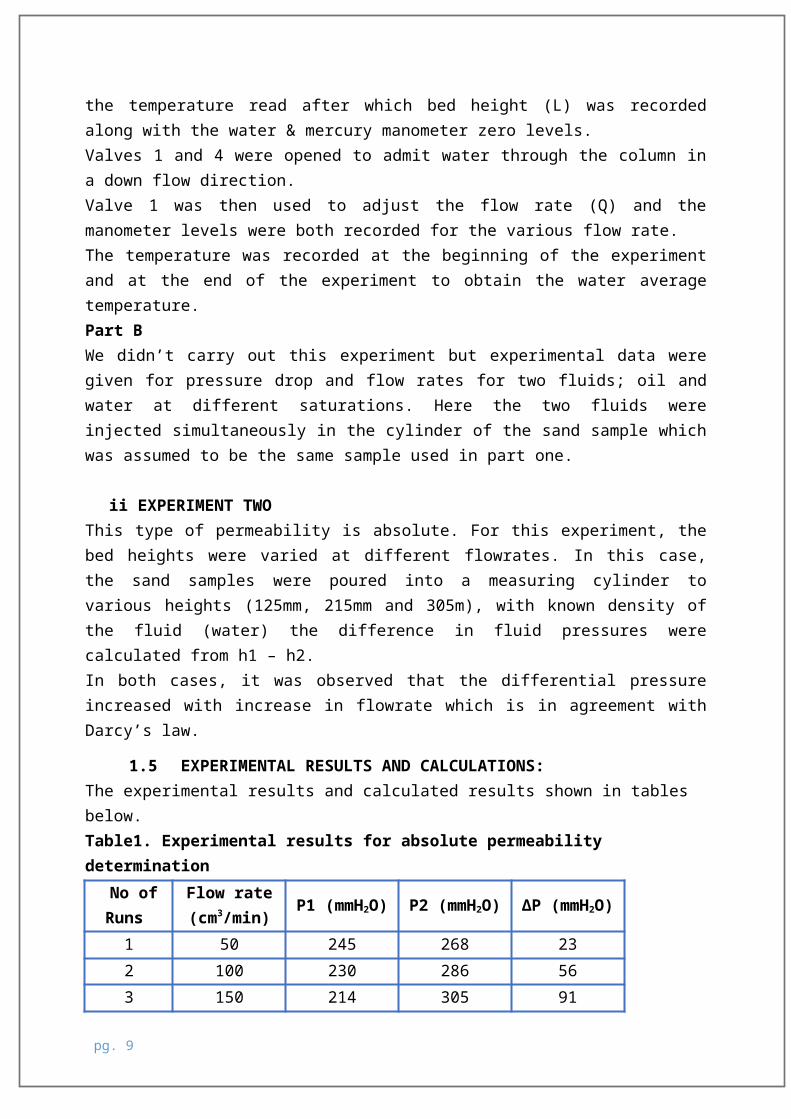
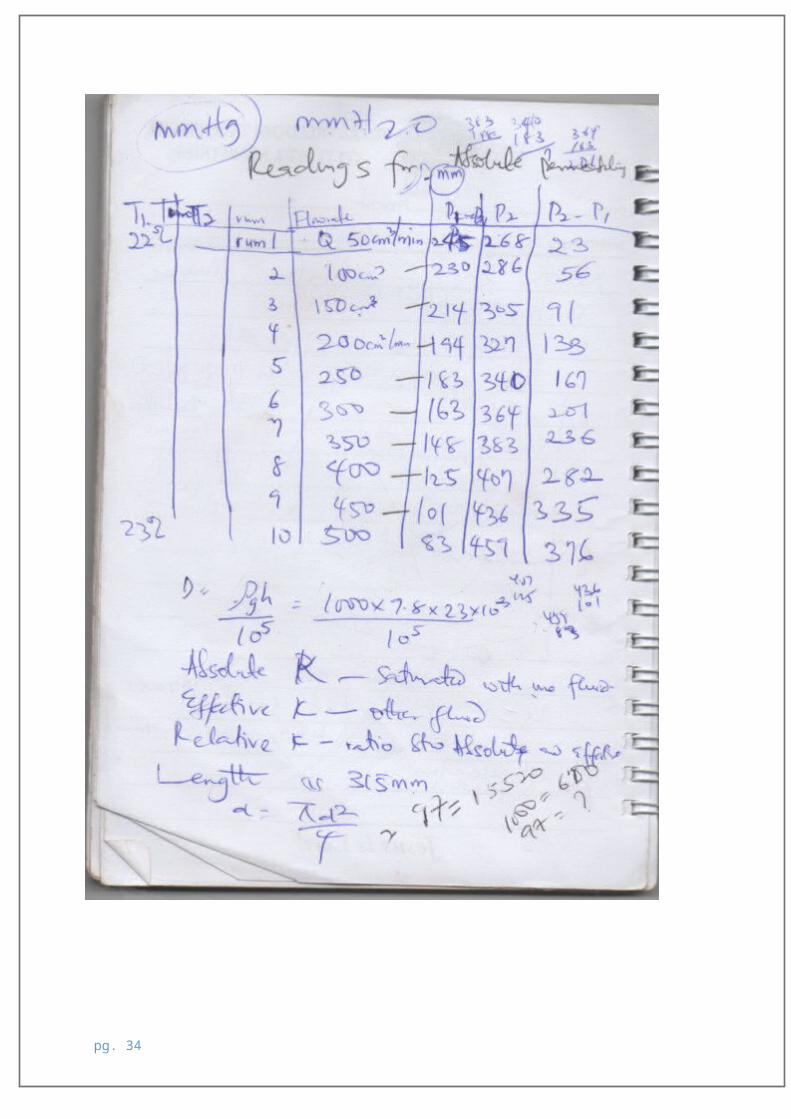
1.5 EXPERIMENTAL RESULTS AND CALCULATIONS:The experimental results and calculated results shown in tables below. Table1. Experimental results for absolute permeability determination No ofRuns
Flow rate(cm3/min) P1 (mmH2O) P2 (mmH2O) ∆P (mmH2O)
1 50 245 268 232 100 230 286 563 150 214 305 91
pg. 9
4 200 194 327 1125 250 183 340 1406 300 163 364 2017 350 148 383 2368 400 125 407 2829 450 101 436 33510 500 83 459 376
Table2. Measured values and calculation of results (Glassbeads)
Length of the bed (cm) 31.5Diameter of the bed (cm) 3.8Area of the bed (cm2) 11.34Average temperature (⁰C) 22.5Pressure at zero flow rate (mmH2O)
P1 = 248P2 = 268
Permeability (Darcy) 0.591DGradient of graph 4.74 *10-3 atm/cm3/s
Table 3. Calculated results for absolute permeability determination.
No of run
Flow rate (cm3/s)
P1 (* 10-3
atm)
P2 (* 10-3
atm)
∆P K (Darcy)(*10-3
atm)
0.83 23.71 25.38 1.67 1.661
1.67 22.26 27.68 5.42 0.512
2.5 20.71 29.51 8.8 0.323
3.33 18.78 31.65 12.87 0.224
4.17 17.71 32.9 15.19 0.185
pg. 10
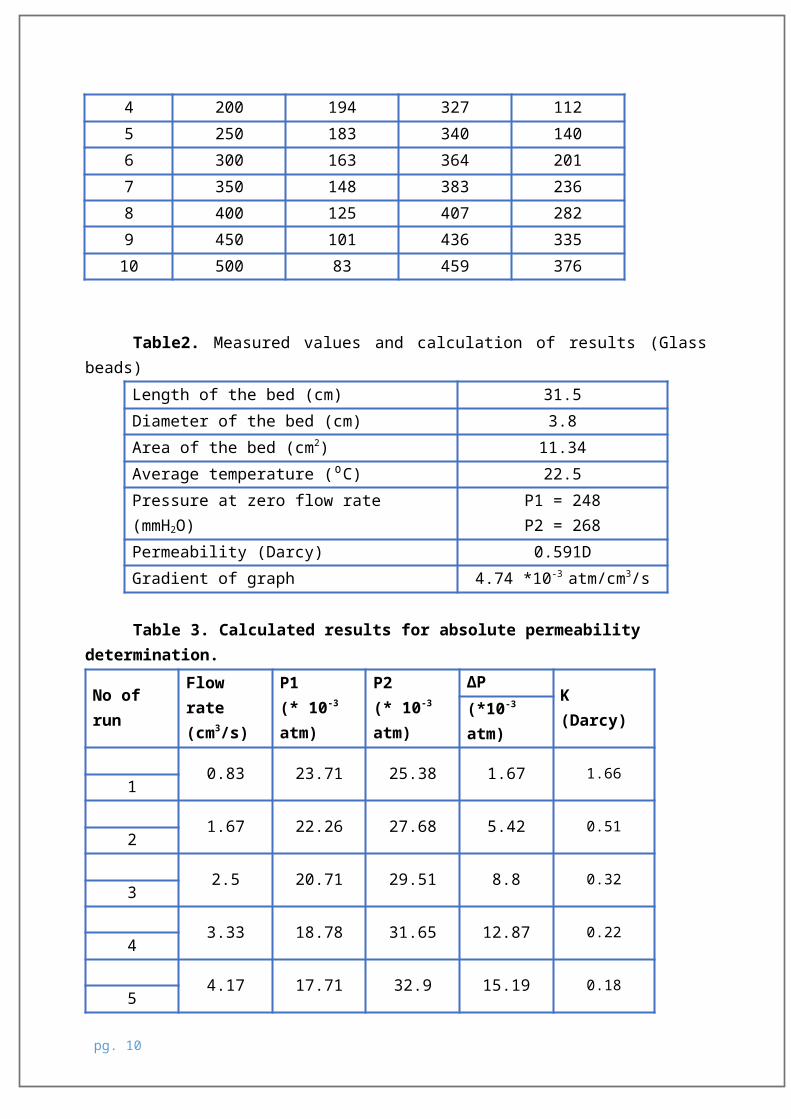
5 15.78 35.22 19.44 0.14
6
5.83 14.32 37.06 22.74 0.127
6.67 12.09 39.39 27.3 0.1028
7.5 9.77 42.19 32.42 0.086910
8.33 8.03 44.42 36.39 0.076
0 1 2 3 4 5 6 7 8 9051015202530354045
Flow rate (cm3/s)
Pres
sure
gra
dien
t (*
10-
3 at
m)
Figure 2: Graph of pressure gradient against flow rate
CALCULATIONS:(a) Experiment 1 (absolute permeability determination) as shown
in the table and graph above(i) Change in pressure ΔP: When P1 = 245 mmH2O and P2 = 268mmH2O
Therefore, ΔP=h2−h1=268−245=23mm (H2O)
To convert change in pressure from mmH2O to atm.
pg. 11
Therefore 23mmH2O can be written as
ΔP=ρ.g.h=1000×9.81×23×10−3
100000 =22.56×10⁻³atm
(ii) Gradient of the graph in figure 1:Change∈pressuredrop(atm)
Change∈flowrate(cm3/seconds)
Converting from cm3/min to cm3/sec : For example when Q = 100cm3/min
Q=100cm3/min60sec/min =1.67cm3/sec
Gradient = ∆(∆P)∆Q = (32.42−8.8 )∗10−3
7.55−2.5 = 4.7 * 10-3 atm/cm3/s
(iii) Absolute permeability: Using equation 2: K=μLA∆P
Where: μ = 1 cP, Length of bed (L) = 315 mm = 31.5cm, Diameter of bed
(d) = 38mm = 3.8cm Area of bed, A=
πd24
=3.14×(3.8)2
4=11.34cm2
K=μA
LΔP
=μA
LGradient
=
111.34
31.54.7×10−3 ¿591millidarcy = 0.59 Darcy
Case Qw(cc/s)
Qo(cc.s)
∆P(atm) kw krw ko kro
80%W, 20% O 5 2 0.03 189.120.316 2.36 0.00
4
60% W, 40% O 4 3 0.05 37.230.063
114.65
0.197
40%W, 60% O 3 4 0.06 2.360.004
301.41 0.51
0
pg. 12
Table 4. Calculated results for relative permeability determination using Corey’s law.
20% W,80% O 2 5 0.08 0 591 1
10 20 30 40 50 60 70 80 900
0.2
0.4
0.6
0.8
1
1.2
krwKro
Water saturation sw (%)
Relative permeability krw, kro
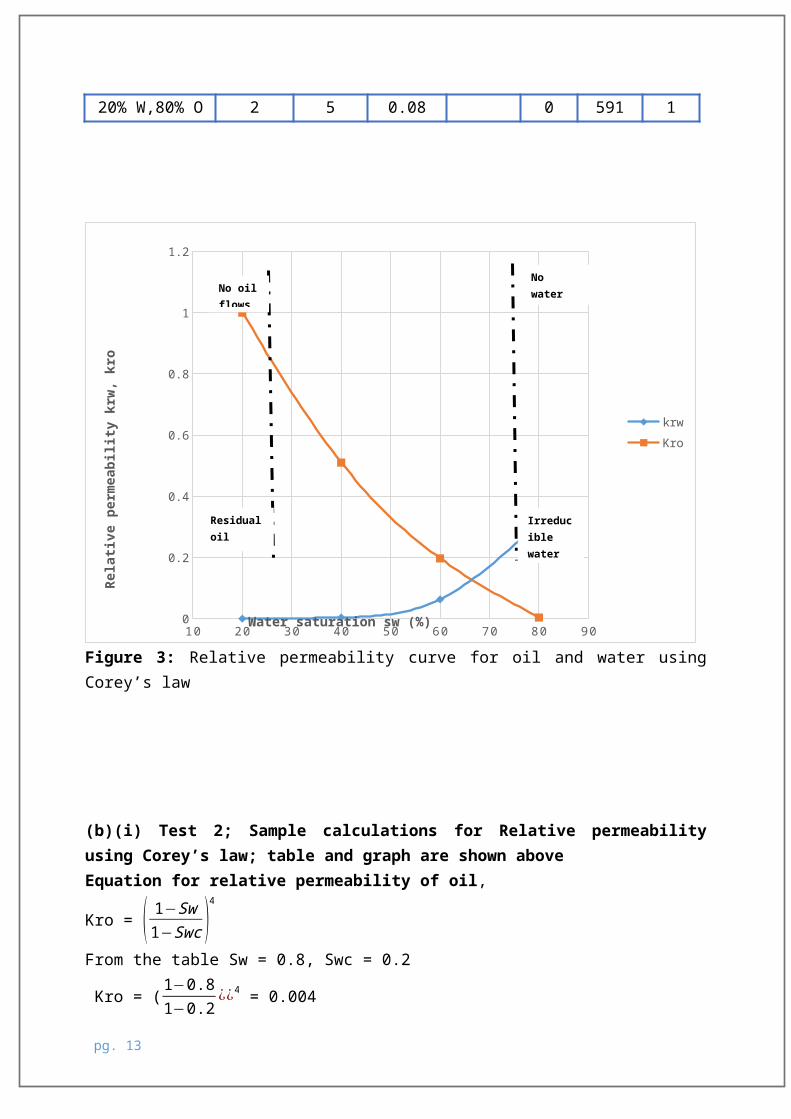
Figure 3: Relative permeability curve for oil and water usingCorey’s law
(b)(i) Test 2; Sample calculations for Relative permeabilityusing Corey’s law; table and graph are shown aboveEquation for relative permeability of oil,
Kro = ( 1−Sw1−Swc )
4
From the table Sw = 0.8, Swc = 0.2
Kro = (1−0.81−0.2
¿¿4 = 0.004
pg. 13
Irreducible water
Residualoil saturati
No water No oil
flows
Effective permeability of oil Ko = Kro *KWhere Kro = 0.004, K= 591mD0.004*591= 2.364
Equationforrelativepermeabilityof water,Krw=(Sw−Swc1−Swc )
4
Krw = (0.8−0.21−0.2 )
4
=0.32
Effective permeability of water Kw = Krw *KWhere Krw = 0.32, K= 591mD0.32*591= 189.12
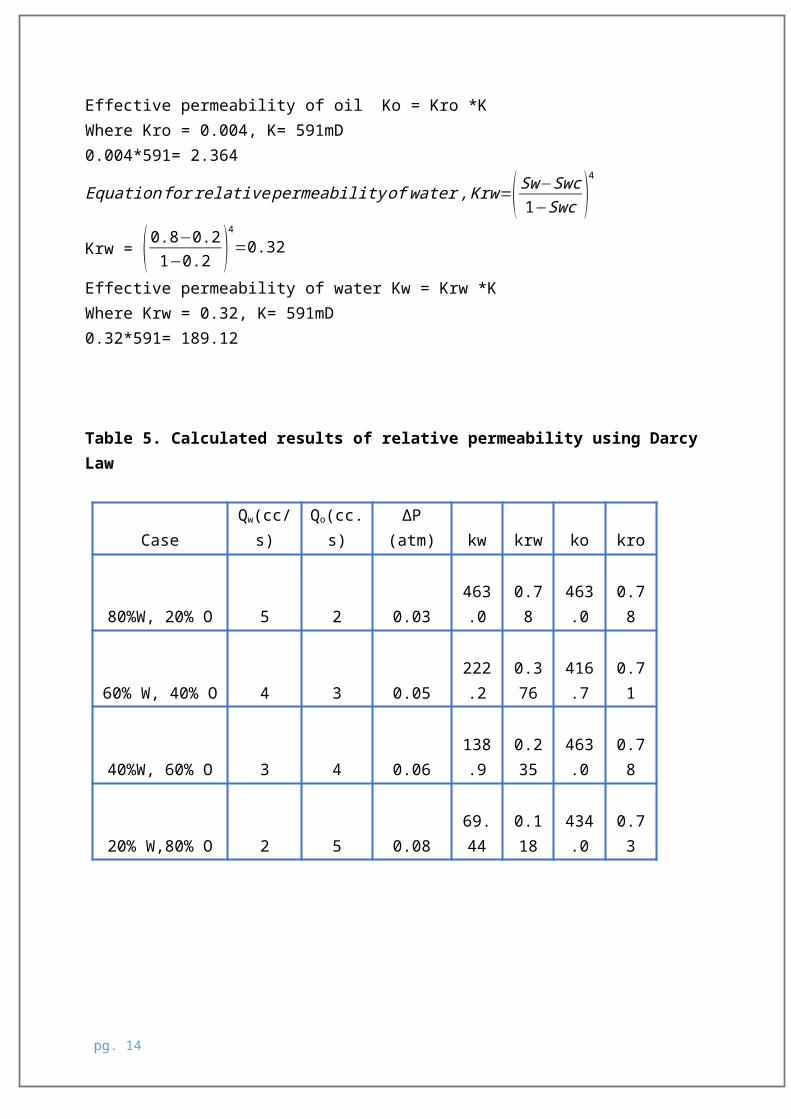
Table 5. Calculated results of relative permeability using DarcyLaw
CaseQw(cc/s)
Qo(cc.s)
∆P(atm) kw krw ko kro
80%W, 20% O 5 2 0.03463.0
0.78
463.0
0.78
60% W, 40% O 4 3 0.05222.2
0.376
416.7
0.71
40%W, 60% O 3 4 0.06138.9
0.235
463.0
0.78
20% W,80% O 2 5 0.0869.44
0.118
434.0
0.73
pg. 14
10 20 30 40 50 60 70 80 900
0.1
0.2
0.3
0.4
0.5
0.6
0.7
0.8
0.9
Krwkro
Water saturation sw (%)
Relative permeability krw, kro
Figure 4: Relative permeability curve for oil and water usingDarcy’s law
(b)(ii) Relative permeability using Darcy’s law as shown in thetable and graph above
Equation for Qi = (Kkriμi ) A∆PiL
Transposing for Kri=Qi×µi×LK×A×∆P
Permeabilityofwaterphaseforrun1,Krw=5×1×31.5
591×11.34×0.03=0.78
Kw = Krw × KKw = 0.78×591 =463mD
Permeabilityof oilphaseforrun1,Kro=2×2.5×31.5
591×11.34×0.03=0.78
Kw = Krw × KKw = 0.78×591 = 463mD
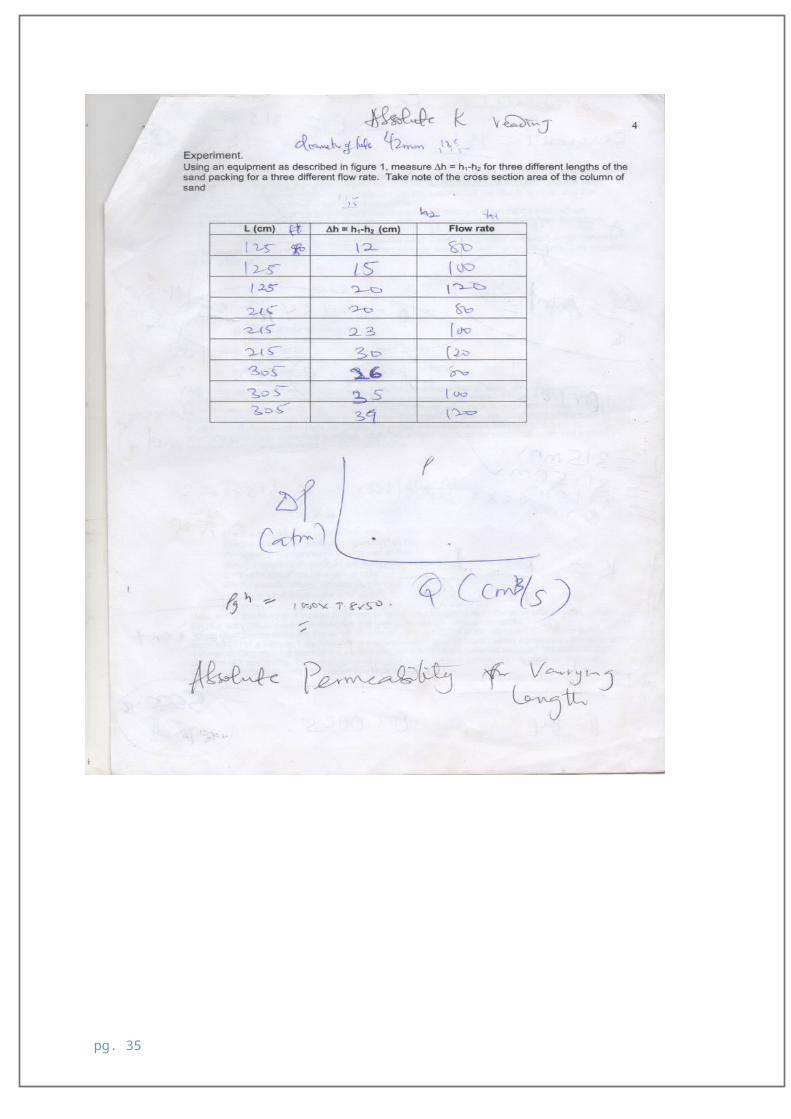
Table 6: Experimental results for second permeability experiment
pg. 15
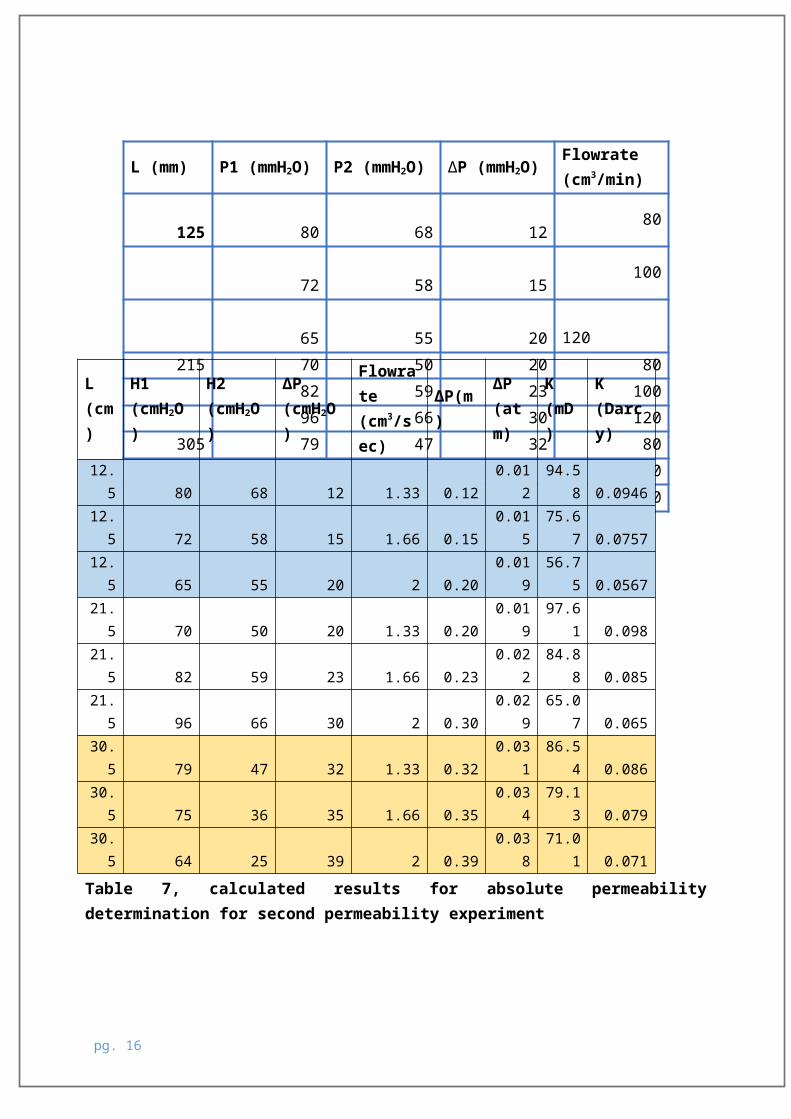
Table 7, calculated results for absolute permeabilitydetermination for second permeability experiment
pg. 16
L (mm) P1 (mmH2O) P2 (mmH2O) ∆P (mmH2O)Flowrate (cm3/min)
80
125 80 68 12
10072 58 15
12065 55 20215 70 50 20 80
82 59 23 100 96 66 30 120
305 79 47 32 80 75 36 35 100 64 25 39 120
L (cm)
H1 (cmH2O)
H2 (cmH2O)
ΔP (cmH2O)
Flowrate (cm3/sec)
ΔP(m)
ΔP (atm)
K (mD)
K (Darcy)
12.5 80 68 12 1.33 0.12
0.012
94.58 0.0946
12.5 72 58 15 1.66 0.15
0.015
75.67 0.0757
12.5 65 55 20 2 0.20
0.019
56.75 0.0567
21.5 70 50 20 1.33 0.20
0.019
97.61 0.098
21.5 82 59 23 1.66 0.23
0.022
84.88 0.085
21.5 96 66 30 2 0.30
0.029
65.07 0.065
30.5 79 47 32 1.33 0.32
0.031
86.54 0.086
30.5 75 36 35 1.66 0.35
0.034
79.13 0.079
30.5 64 25 39 2 0.39
0.038
71.01 0.071
1.2 1.3 1.4 1.5 1.6 1.7 1.8 1.9 2 2.10
0.005
0.01
0.015
0.02
0.025
0.03
0.035
0.04
f(x) = 0.0145231412236412 x − 0.000524534901989903
f(x) = 0.0116098596673597 x − 0.00409575658004159
f(x) = 0.0101532188892189 x + 0.0174271925809326
L = 30.5Linear (L = 30.5)L = 12.5Linear (L = 12.5)L = 21.5Linear (L = 21.5)
Flowrate (cm3/sec)
ΔP (atm)
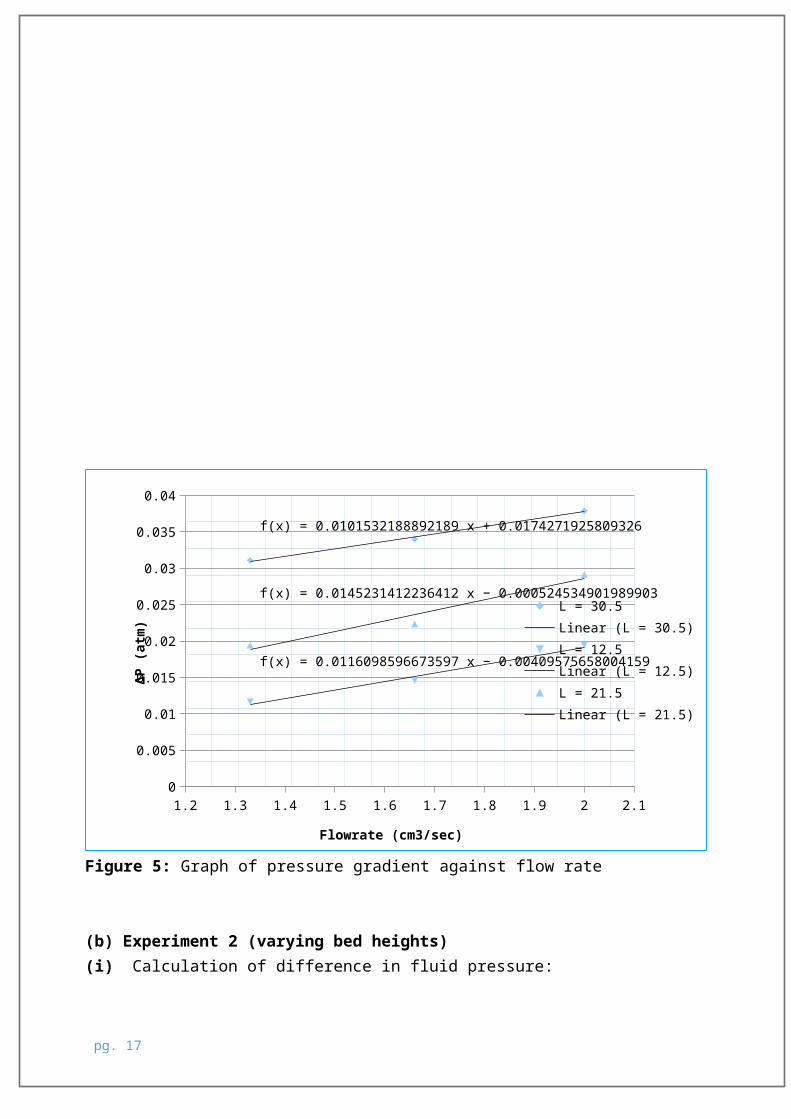
Figure 5: Graph of pressure gradient against flow rate
(b) Experiment 2 (varying bed heights)(i) Calculation of difference in fluid pressure:
pg. 17
Density of the fluid (1000kg/m3), pressure gradient can becalculated from ΔP=ρ.g.hWhere ρ = 1000kg/m3, g = 9.81m/s2 h = h1 – h2 = (80 – 68)cm = 12cm= 0.12m
∴∆P=1000∗9.81∗0.12100000
=12∗10−3atm
(ii) Absolute permeability: Using equation 2: K=μLA∆P
Where: μ = 1 cP, Length of bed (L) = 125mm = 12.5cm, Diameter of bed(d) = 38mm = 3.8cm and gradient for L=12.5 is 0.0116 asdisplayed in figure 5
Area of bed, A=
πd24 =
3.14×(3.8)2
4 =11.34cm2
K=μA
LΔP
=μA
LGradient
=
111.34
12.511.6×10−3 ¿95.03millidarcy = 0.0953 Darcy
Same calculation for when L=21.5cm and L=30.5cm
1.6 PRESENTATION AND ANALYSIS OF RESULT:In figure 1, as the flow rate increases, there was correspondingincrease in the pressure gradient as observed, one can deduce adirect correlation and relationship between flow rate andpressure difference. This can also be seen from table 3 when theflow rate was 0.83 cm3/sec (50 cm3/min), the pressure gradientwas 1.67 atm. (23 mm H2O), also when the flow rate was increasedto 1.67 cm3/s (100 cm3/min), pressure gradient increased to 5.42atm.(56 mmH2O) which was consistence throughout the experiment,pressure gradient increased to 5.42 atm. (56 mm H2O) giving riseto a straight line plot of pressure gradient against flow asshown in figure 1.In table 3 and 7, as the pressure gradient increases, there wasa reduction in permeability. This is in support of theassumption on absolute permeability of porous medium is
pg. 18
independent of the fluid used. It must be noted, that thisassumption will only be true, if viscous flow prevail. That isthe rate of the flowing fluid is sufficiently low to be directlyproportional to the potential gradient (Honarpour and Mahmood,1988).
In part B; relative permeability determination, it was observedthat relative permeability is a function of saturation of thephases present in the medium unlike the case of absolutepermeability where the pores of the medium are 100% saturatedwith a particular type of fluid. It can be seen from the relative permeability curve in figure 3that the relative permeability of the sand medium to water wassharply decreasing when the water saturation was reduced. Thiscould be due to the occupation of the larger pores or flow pathsby the oil phase; that is the water phase has been displaced bythe oil phase. When this happens, it is said that a wet fluid has beendisplaced by a non-wetting fluid, and this process is calleddrainage. The relative permeability in figure 3 curve also showsthat the relative permeability of the oil phase approaches unitywhereas that for the water phase is restricted. Thus at the samesaturation, the value of the oil phase relative permeability wasgreater than that of the water phase.
Referring to figure 4, a relative permeability curve was plottedfor the values of the relative permeabilities of oil and waterversus water saturation calculated using Darcy’s law. It can beseen that there was a similar sort of behaviour for the waterphase but not for the oil phase, this infers that Darcy’s law isnot suitable when the flow is not a single phase flow.For the second experiment where the bed heights were varied, ata particular flowrate with varying bed height, there was anincrease in the differential pressure (∆P), this can be seen intable 7, when the flowrate was 1.33cm3/s at a bed height of12.50cm, the differential pressure was 0.012atm compared to whenthe flowrate was still 1.33cm3/s with a bed height of 21. 50cm
pg. 19
where the differential pressure was 0.019atm. This followsthrough when the flowrate remained the same but at a bed heightof 30.50cm where the differential pressure increased to0.031atm.At a particular bed height with increased flowrate, thedifferential pressure also increased accordingly too. In termsof the permeability, comparing both permeabilities obtained fromboth experiments; the one in the first experiment were the bedheight was constant was higher than the second experiment werethe bed heights were varied. The reason for this could be thatthe first experiment could be likened to highly compactedsandstones while the second one could be likened to lowcompacted sandstone sandstones,From the experiment, the absolute permeability of the sandporous media for the first experiment (when the bed height waskept constant) was estimated to be 591millidarcy. When the bedheights were varied, the estimated absolute permeability carriedaccordingly. For bed height of 12.5 cm, the absolutepermeability was 95.02millidarcy, for bed height of 21.5cm, theabsolute permeability was 130.75 millidarcy, for bed height of30.5cm, and the absolute permeability was 263.69millidarcy. Inaddition, it was found that the values of permeability for thesecond experiment were smaller than those ones for the firstexperiment.
It was also found that using Corey’s law, a relative
permeability curve can be drawn for fluids (oil and water)flowing through a porous media. Based on the curve, it was foundthat relative permeability is saturation dependent. Theproportional relationship between the flow rate, viscosity,length of rock bed sample, permeability, cross sectional area ofthe rock bed sample and the pressure was observed.
1.7 ERROR ANALYSIS:The following errors could have arosen in this experiment;
pg. 20
(1) Systematic error: The packed sand bed may not berepresentative of the reservoir rock because reservoir rocksare not homogeneous rather they are heterogeneous.
(2) Human and random error: There may be a temptation to selectthe best parts of the sand medium for testing and alsoinability to take accurate reading on the manometer
(3) Systematic error; The permeability of the sand medium maybe altered probably when they were gotten from the originalsample, or even when they were cleaned and packed
1.8 CONCLUSION:At the end of this experiment, the following conclusions can bedrawn:(i) For absolute permeability determination, the medium must be
100% saturated with a particular type of fluid.
(ii) The higher the permeability, the easier it will be for
fluids to flow and, hence the higher the production rate from
a particular well (OPITO, 2011). The permeable material that
was used in this lab was a packed bed medium of sand(iii) Absolute permeability does not depend on the
properties of the flowing fluid; it only depends on theproperties of the medium.
(iv) The quality of a reservoir as determined by permeability inmillidarcy (mD) may be judged as poor if k < 1, fair if 1< k < 10,moderate if 10 < k < 50, good if 50 < k < 250 and very good if k> 250 mD. Since there was a permeability of 50mD and above forsand samples from the experiment, it will make a good reservoir
(v) During the flow of fluid through a porous medium, there isproportional relationship between the flow rate and thepressure gradient.
(vi) Relative permeability is dependent on the saturation of thedifferent phases in the medium.
(vii) There is a proportional relationship between flowrate, viscosity, length of rock bed sample, permeability,cross sectional area of the rock bed sample and pressuregradient.
pg. 21
1.9 REFERENCESHonarpour, M and Mahmood, S.M. (1988) Relative-Permeability Measurements: an Overview. Journal of Petroleum Technology. Vol.40, No.8. Texas: Society of Petroleum Engineers. pp 963-966Aristodemu, E. (2014) lab notes for permeability measurement. Ekwere, J.P (2012) Advanced petrophysics ; geology, porosity, absolute permeability, Heterogeneity and geostatistics. Vol 3 1st ed. Live Oak Book Company. Chapter threeTarek, A. (2010) Reservoir Engineering Handbook. 4th ed. Oxford: Elsevier Inc. Chapter 4 & 5. Tiab, D and Donaldson, E.C. (2012) Petrophysics: theory and practice of measuring reservoir rock and fluid transport properties. 3rd ed. Oxford: Gulf Professional Publishing. Chapter 3. OPITO (2011) Oil Well Drilling Technology Workbook: Petroleum Open Learning. Aberden: OPITO.
pg. 22
2.0 POROSITY MEASURMENT2.1 AIM AND OBJECTIVES The main objective of this laboratory work was to estimate someporosity data (bulk volume and pore volume) and ultimately usedthem to calculate the porosity for the different samplesprovided, using three core samples that were given andcalculating the porosity employing the method of directmeasurement and using the buoyancy method by applyingArchimede’s principle.
2.2 EXPERIMENTAL EQUIPMENT AND FUNCTIONSThe following equipment were used in carrying out theexperiment: Vernier Caliper: to measure the length and diameter of the
plug sample, calibrated in inches and millimetres Electronic balance: to weigh the samples, samples were taken
in grammes Beaker containing distilled water to saturate core samples
pg. 23
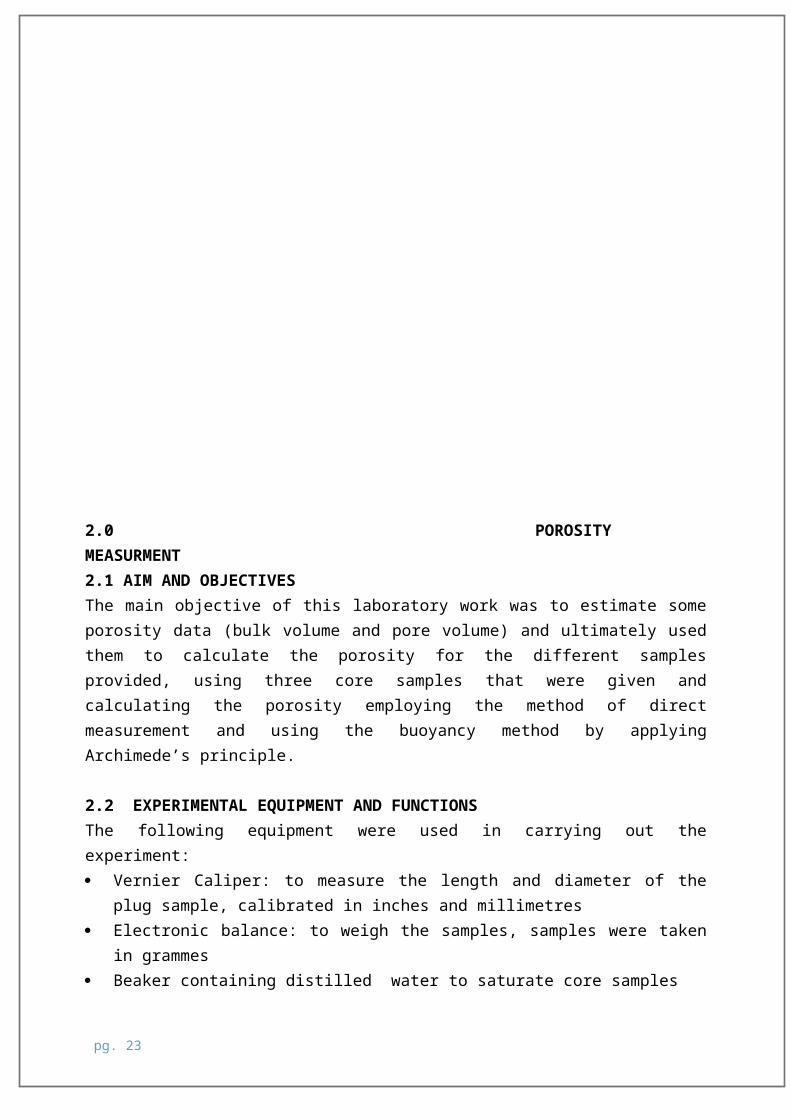
Clamp: to aid the immersing of samples into beaker containingdistilled water (the mass of the beaker, water, and metal wirewas subtracted by using the balance tare)
Vacuum chamber accelerator: to displace air in the samples Saturated cloth or tissue: to dry any excess fluid from the
saturated sample before being weighed
dessicator
Vacuum chamber
Fig.3 Picture of vaccum chamber connected to dessicator
EXPERIMEN
pg. 24
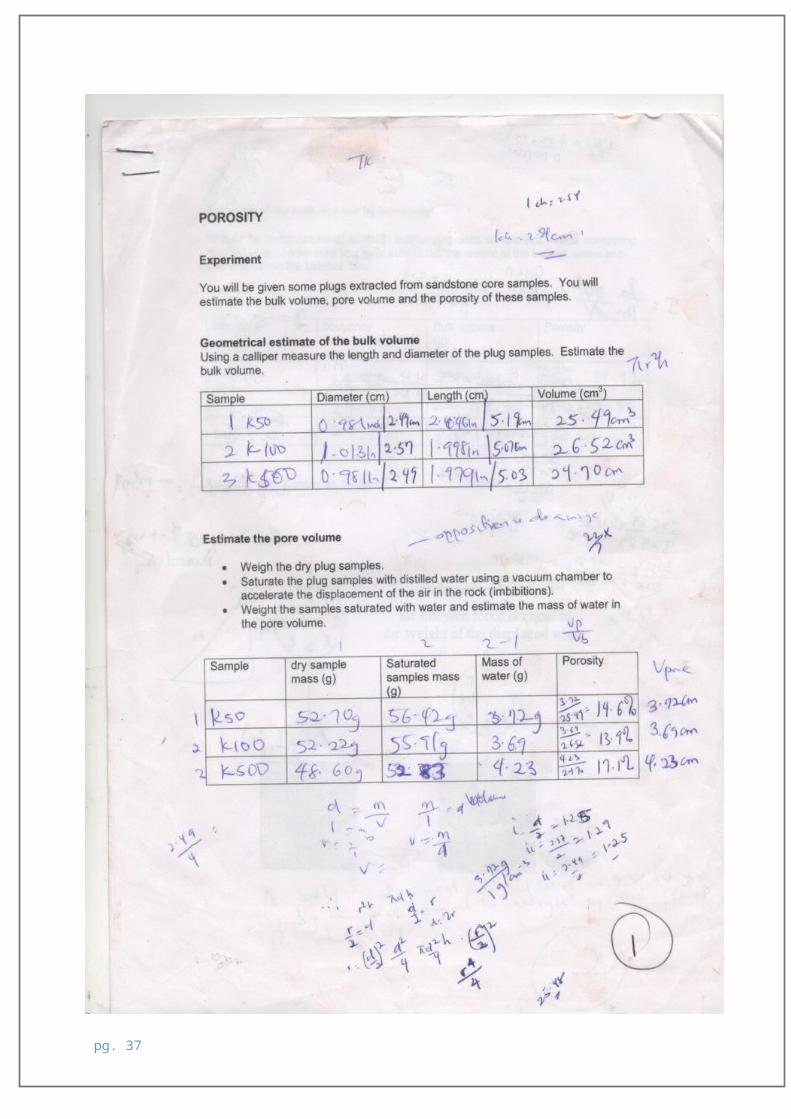
0.248c 2.49cm
2.49cm
5.19cm
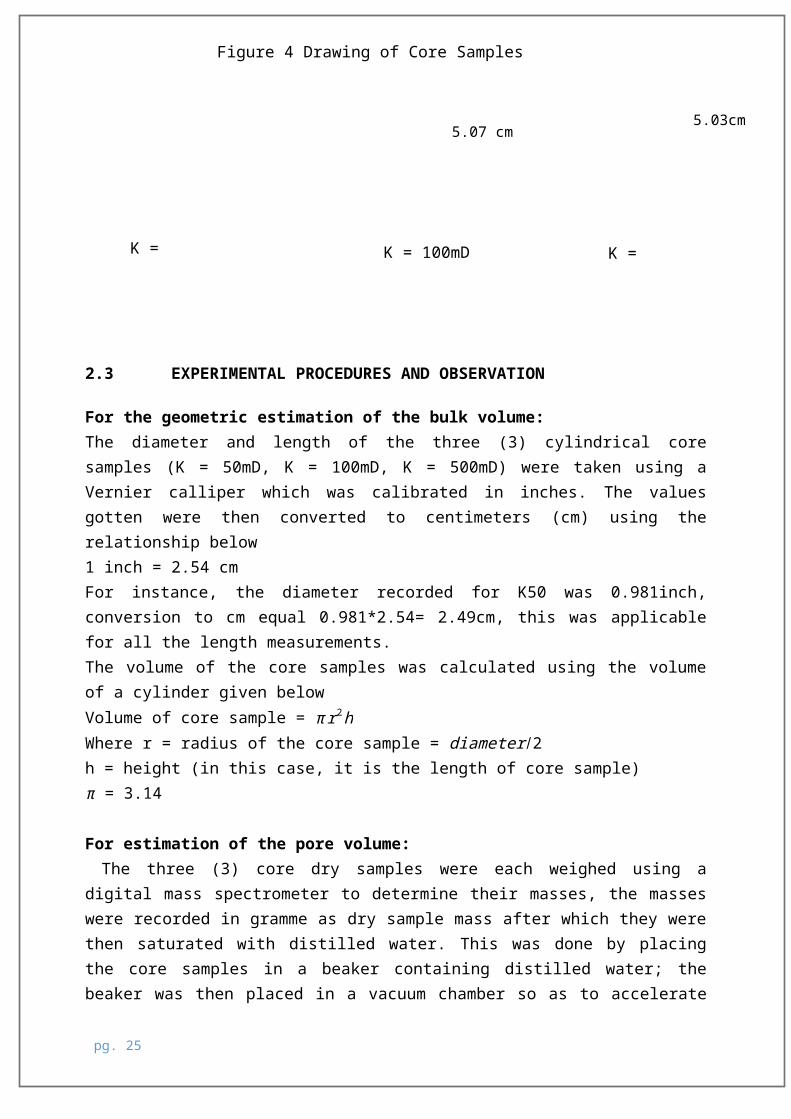
2.3 EXPERIMENTAL PROCEDURES AND OBSERVATION
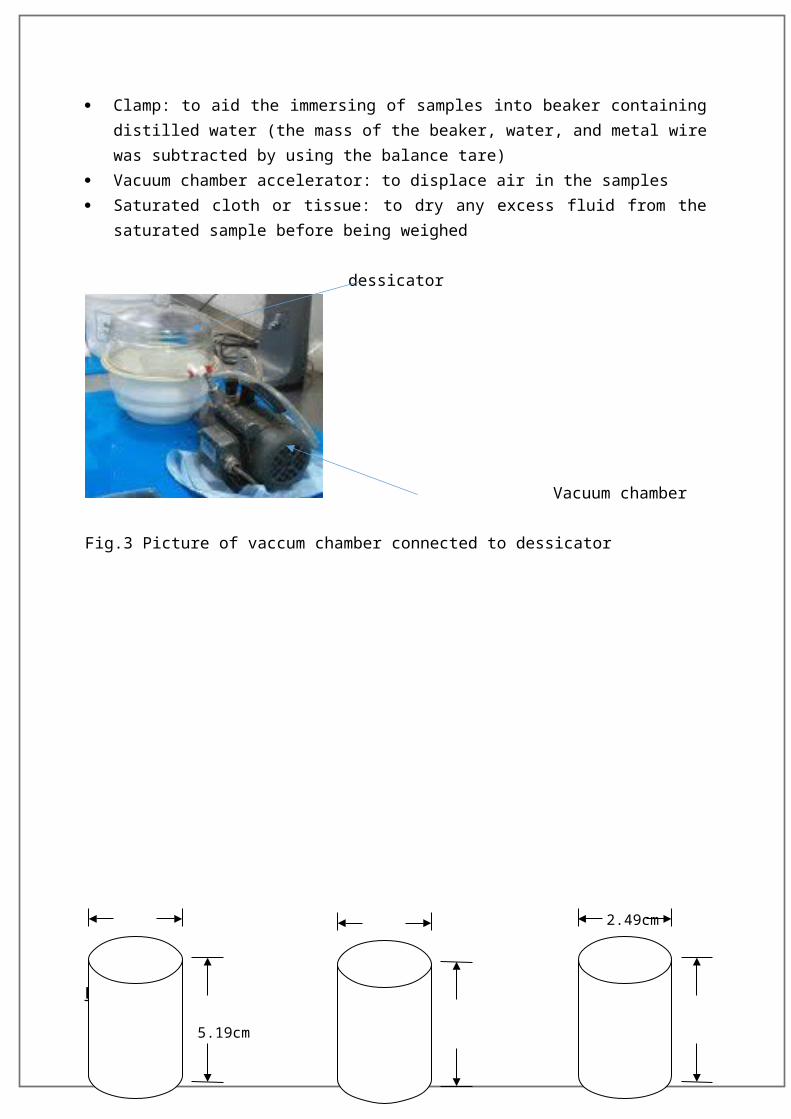
For the geometric estimation of the bulk volume:The diameter and length of the three (3) cylindrical coresamples (K = 50mD, K = 100mD, K = 500mD) were taken using aVernier calliper which was calibrated in inches. The valuesgotten were then converted to centimeters (cm) using therelationship below1 inch = 2.54 cmFor instance, the diameter recorded for K50 was 0.981inch,conversion to cm equal 0.981*2.54= 2.49cm, this was applicablefor all the length measurements.The volume of the core samples was calculated using the volumeof a cylinder given below Volume of core sample = πr2h Where r = radius of the core sample = diameter /2 h = height (in this case, it is the length of core sample)π = 3.14
For estimation of the pore volume: The three (3) core dry samples were each weighed using adigital mass spectrometer to determine their masses, the masseswere recorded in gramme as dry sample mass after which they werethen saturated with distilled water. This was done by placingthe core samples in a beaker containing distilled water; thebeaker was then placed in a vacuum chamber so as to accelerate
pg. 25
5.07 cm 5.03cm
K =
Figure 4 Drawing of Core Samples
K = K = 100mD
the displacement of the air in the rock by water, this is calledimbitions. After saturation, the core samples were again weighedto determine the saturated sample mass. The mass of water in the pore was then calculated using theformula below:Massofwater∈pore∈theporevolume,Mw=Saturatedsamplemass–drysamplemass
While the pore volume was calculated using the relationshipbelow:Porevolume =Massofwater∈pore∈theporevolume ¿densityofwater Where density of water, ρ = 1.0g/cm3
The porosity of each of the samples was also determined usingequation 1.
Estimation of the bulk volume by buoyancyIn this method, A metal wire was suspended from a clamp andplaced in a beaker containing water, then both beaker andsuspended wire was placed on the mass spectrometer. Thecombined mass of the beaker and the wire was zeroed using thebalance tare. Each of the samples was then placed on thesuspended wire and their individual masses recorded. While doingthis, it was ensured that the core samples do not touch the bodyof the beaker as this could affect the readings. The bulk volumeof each of the sample was then computed by dividing their massesby the density of water (density of water, ρ = 1.0g/cm3).
2.4 RESULTS AND CALCULATIONS
SAMPLE CALCULATIONS
(i) Geometrical Estimate of the Bulk Volume, (Vb) as shown intable 1 below
To calculate the volume of the three (3) core cylindricalsamples, the formula for the volume of a cylinder is used. Thisis given belowVolume of a cylinder = πr2hWhere:
pg. 26
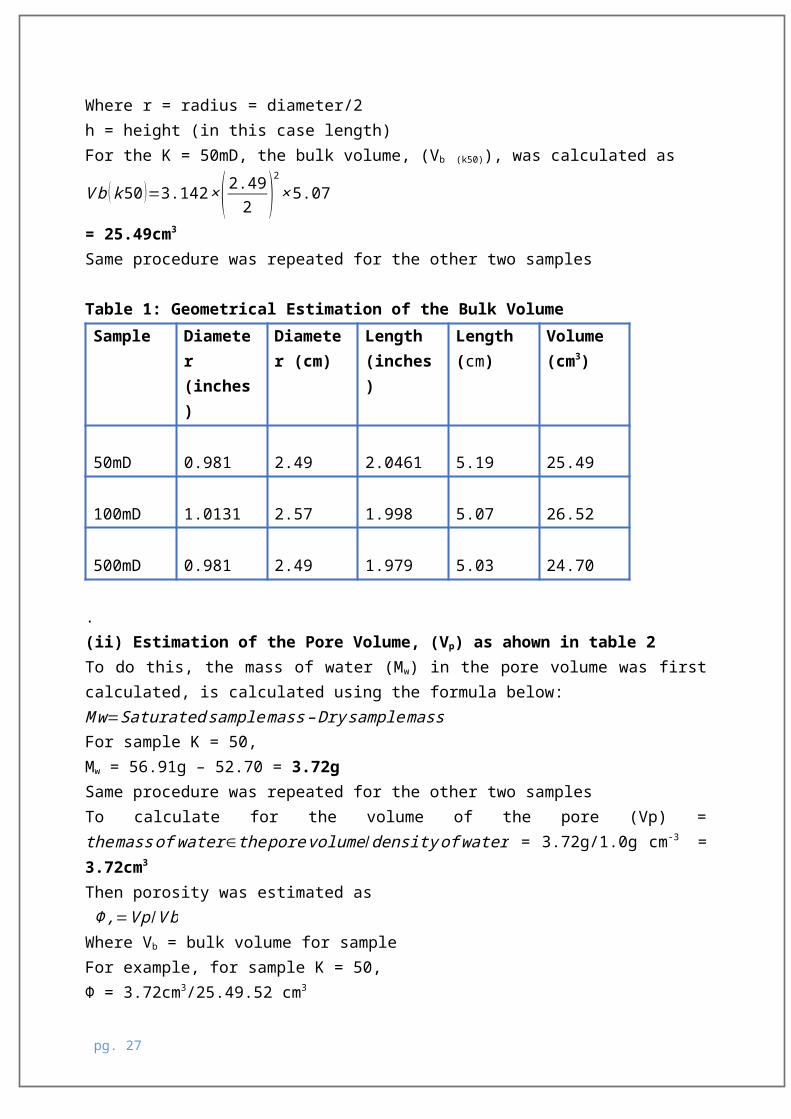
Where r = radius = diameter/2h = height (in this case length) For the K = 50mD, the bulk volume, (Vb (k50)), was calculated as
Vb (k50)=3.142×(2.492 )2
×5.07
= 25.49cm3 Same procedure was repeated for the other two samples
Table 1: Geometrical Estimation of the Bulk VolumeSample Diamete
r(inches)
Diameter (cm)
Length(inches)
Length(cm)
Volume(cm3)
50mD 0.981 2.49 2.0461 5.19 25.49
100mD 1.0131 2.57 1.998 5.07 26.52
500mD 0.981 2.49 1.979 5.03 24.70
.(ii) Estimation of the Pore Volume, (Vp) as ahown in table 2To do this, the mass of water (Mw) in the pore volume was firstcalculated, is calculated using the formula below:Mw=Saturatedsamplemass–DrysamplemassFor sample K = 50, Mw = 56.91g – 52.70 = 3.72gSame procedure was repeated for the other two samplesTo calculate for the volume of the pore (Vp) =themassof water∈theporevolume/densityofwater = 3.72g/1.0g cm-3 =3.72cm3
Then porosity was estimated as Φ,=Vp /VbWhere Vb = bulk volume for sampleFor example, for sample K = 50, Φ = 3.72cm3/25.49.52 cm3
pg. 27
= 0.164 or 16.4%Same procedure was repeated for the other two samples
Table 2: Estimation of the Pore VolumeSample Dry
samplemass (g)
Saturatedsamplemass (g)
Mass ofwater (g)
Volume ofwater(cm3)
Porosity
50mD 52.70 56.42 3.72 3.72 0.146100mD 52.22 55.91 3.69 3.69 0.139500mD 48.60 52.83 4.23 4.23 0.171
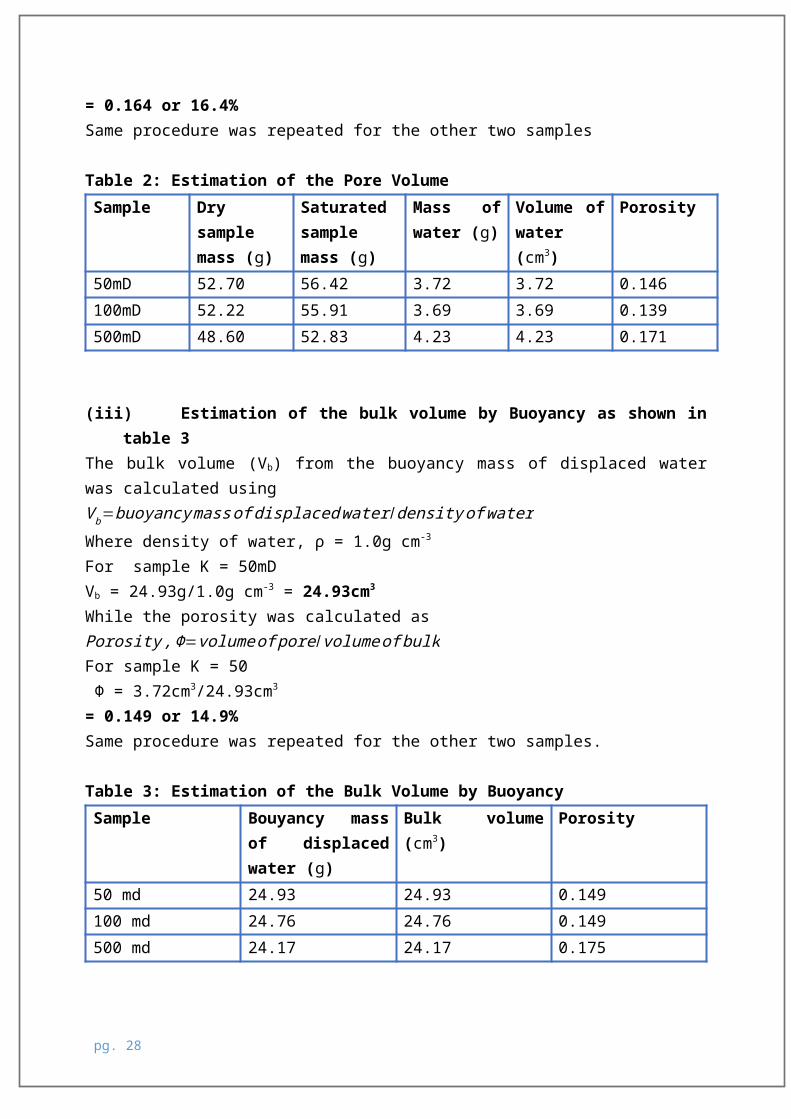
(iii) Estimation of the bulk volume by Buoyancy as shown intable 3
The bulk volume (Vb) from the buoyancy mass of displaced waterwas calculated usingVb=buoyancymassofdisplacedwater/densityofwaterWhere density of water, ρ = 1.0g cm-3
For sample K = 50mDVb = 24.93g/1.0g cm-3 = 24.93cm3
While the porosity was calculated asPorosity,Φ=volumeofpore/volumeofbulkFor sample K = 50 Φ = 3.72cm3/24.93cm3
= 0.149 or 14.9%Same procedure was repeated for the other two samples.
Table 3: Estimation of the Bulk Volume by BuoyancySample Bouyancy mass
of displacedwater (g)
Bulk volume(cm3)
Porosity
50 md 24.93 24.93 0.149100 md 24.76 24.76 0.149500 md 24.17 24.17 0.175
pg. 28
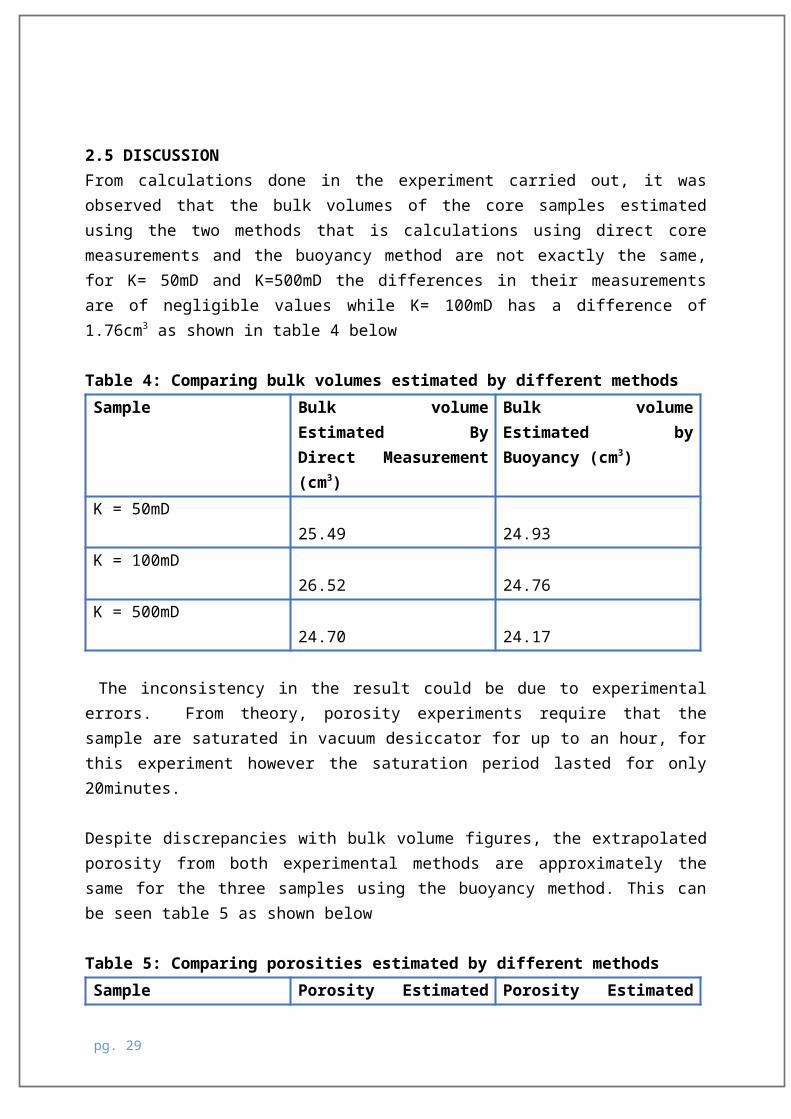
2.5 DISCUSSIONFrom calculations done in the experiment carried out, it wasobserved that the bulk volumes of the core samples estimatedusing the two methods that is calculations using direct coremeasurements and the buoyancy method are not exactly the same,for K= 50mD and K=500mD the differences in their measurementsare of negligible values while K= 100mD has a difference of1.76cm3 as shown in table 4 below
Table 4: Comparing bulk volumes estimated by different methodsSample Bulk volume
Estimated ByDirect Measurement(cm3)
Bulk volumeEstimated byBuoyancy (cm3)
K = 50mD25.49 24.93
K = 100mD26.52 24.76
K = 500mD24.70 24.17
The inconsistency in the result could be due to experimentalerrors. From theory, porosity experiments require that thesample are saturated in vacuum desiccator for up to an hour, forthis experiment however the saturation period lasted for only20minutes.
Despite discrepancies with bulk volume figures, the extrapolatedporosity from both experimental methods are approximately thesame for the three samples using the buoyancy method. This canbe seen table 5 as shown below
Table 5: Comparing porosities estimated by different methodsSample Porosity Estimated Porosity Estimated
pg. 29
By DirectMeasurement (%)
by Buoyancy (%)
K = 50mD 14.6 14.9K = 100mD 13.9 14.9K = 500mD 17.1 17.5
On a theoretical basis, sample K = 500mD has an average porosityof 0.173, K = 100mD (0.144) and K= 50 (0.148), the reduction of porosity of these samples could be as result of compaction, the cementation of the rock sample and the degree of saturation.
Theoretically, another reason for the discrepancy in the valuesof the porosity obtained by direct measurement and that obtainedby the buoyancy method is because the buoyancy method measureseffective or connected porosity as it depends on the saturationof the rock samples with a fluid.
In practical situations, the buoyancy (Archimedes) method ofestimating bulk volume could be accurate in better quality rocksif effective pore spaces can be completely saturated. On theother hand, in poorer quality rocks, it could be difficult tocompletely saturate the sample. In addition, saturating fluidmay react with minerals in the core (e.g. swelling clays). Variations in grain packing could lead core samples not to havethe type of regular shape that may give more accuracy to thedirect measurement method.
2.6 CONCLUSIONS
At the end of the experiment, the following conclusions can bedrawn:
Geometric method of bulk volume estimation for porositydetermination can be effectively applied for regularlyshaped cores.
pg. 30
Comparing the direct measurement (geometric) method and thebuoyancy method, it can be concluded that the buoyancymethod could be more accurate. This is because, the directmeasurement or geometric method can only be effectivelyapplied for regularly shaped cores or core plugs, and thisdoes not paint a true picture of the shapes of the variouscore samples that can be encountered in the Field or lab inreal life.
For the gravimetric or buoyancy method, it could be moreaccurate in better quality rocks if effective pore spacescan be completely saturated. Otherwise, in poorer qualityrocks, it could be difficult to completely saturate thesamples.
The inconsistency between both methods of bulk volumeestimation can be negligible since they are not too much.
Even though the 500mD sample had a higher porosity than the50mD and 100mD, there is still lack of correspondencebetween these two important reservoir properties; porosityand permeability.
The porosity data obtained in this experiment varied as aresult of factors such as cementation, particle shape andsizes which made the 500mD sample had a higher porositythan 50mD and 100mD samples.
The 500mD sample with a porosity value of 17.1% (forvolumetric estimate) and 17.5. 3% (for the buoyancy method)has a higher capacity to store or contain fluids (oil, gas,and water) than the 50mD and 100mD samples.
2.7 SUMMARY
Porosity data are very important to Petroleum Engineers as theyare used to classify reservoirs and to estimate the potentialvolume of hydrocarbons in a reservoir. Thus reservoirs with high
pg. 31
porosity indicate abundant fluids in their pore spaces whilethose with low porosity indicates low capacity to hold fluids.From the experiment, it was found that Sample K = 500mD has aporosity of 0.173 K = 100mD and K= 50mD has almost sameporosity; 0.148 and 0.144 respectively. This shows K= 500mD hasthe capacity to store fluids than the others. After a carefullaboratory study of these samples, it can be concluded thatsample K = 500mD is more porous than the other samples.Also the 500mD sample had a higher porosity than the 50mD and100mD samples, there is actually no specifically definedrelationship between porosity and permeability, although therecould be a qualitative relationship between both properties butnot quantitative.According to Diab and Donaldson (2012), “it is possible to havea very high porosity without having any permeability at all, asin the case of pumice stone (where the effective porosity isnearly zero), and also in clays and shales
2.8 REFERENCES
Aristodemu, E. (2014) lab notes for porosity measurement. Cone, M. P., and Kersey, D. G. (1992) Porosity: Part 5. LaboratoyMethods. AAPG. [Online] Available from:http://archives.datapages.com/data/specpubs/Ekwere, J.P (2012) Advanced petrophysics ; geology, porosity, absolute permeability, Heterogeneity and geostatistics. Vol 3 1st ed. Live Oak Book Company. Chapter threeSchlumberger Oil Field Glossary (2012). [Online] Available from:http://www.glossary.oilfield.slb.com/en/Terms/p/porosity.aspx[accessed 4th November 2014]. Tiab, D., and Donaldson, E.C.(2012) Petrophysics: theory and practice of measuring reservoir rock and fluidtransport properties. 3rd ed. Oxford: Gulf Professional Publishing.
pg. 32

pg. 33
pg. 34
pg. 35

pg. 36
pg. 37
pg. 38