Embed Size (px)
Citation preview
VAPOUR LIQUID EQUILIBRIUM LAB REPORT Page 1
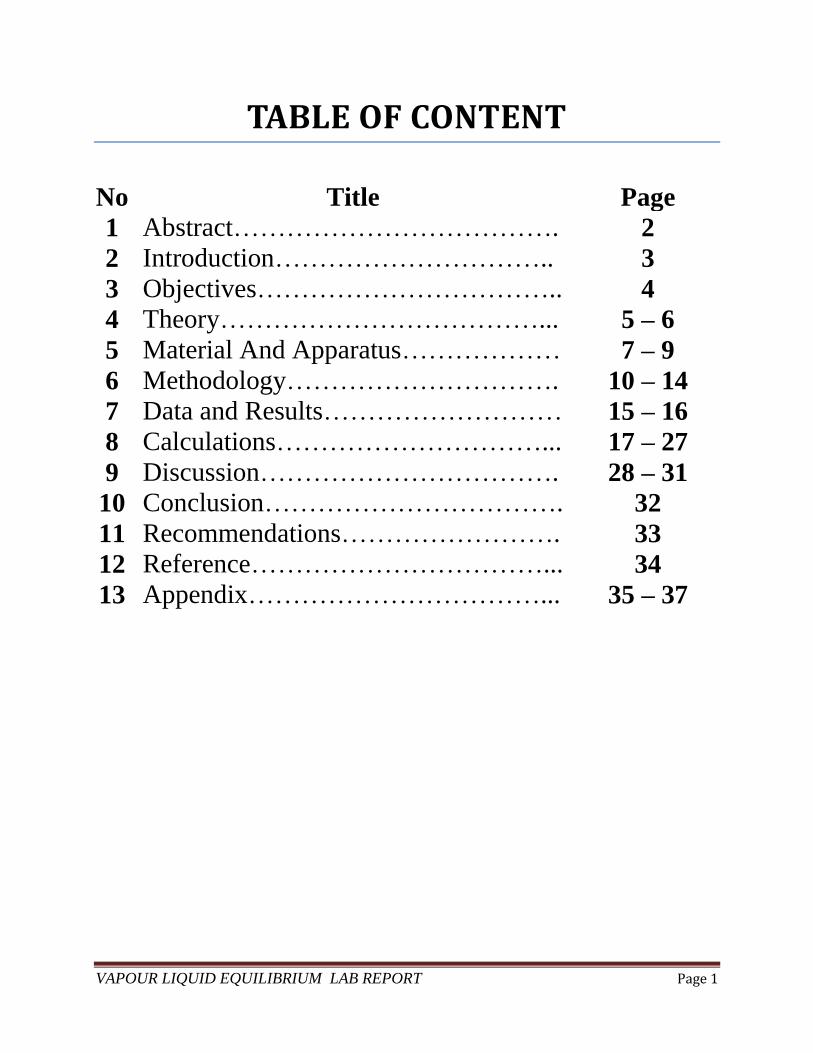
TABLE OF CONTENT
No Title Page
1 Abstract………………………………. 2
2 Introduction………………………….. 3
3 Objectives…………………………….. 4
4 Theory………………………………... 5 – 6
5 Material And Apparatus……………… 7 – 9
6 Methodology…………………………. 10 – 14
7 Data and Results……………………… 15 – 16
8 Calculations…………………………... 17 – 27
9 Discussion……………………………. 28 – 31
10 Conclusion……………………………. 32
11 Recommendations……………………. 33
12 Reference……………………………... 34
13 Appendix……………………………... 35 – 37
VAPOUR LIQUID EQUILIBRIUM LAB REPORT Page 2
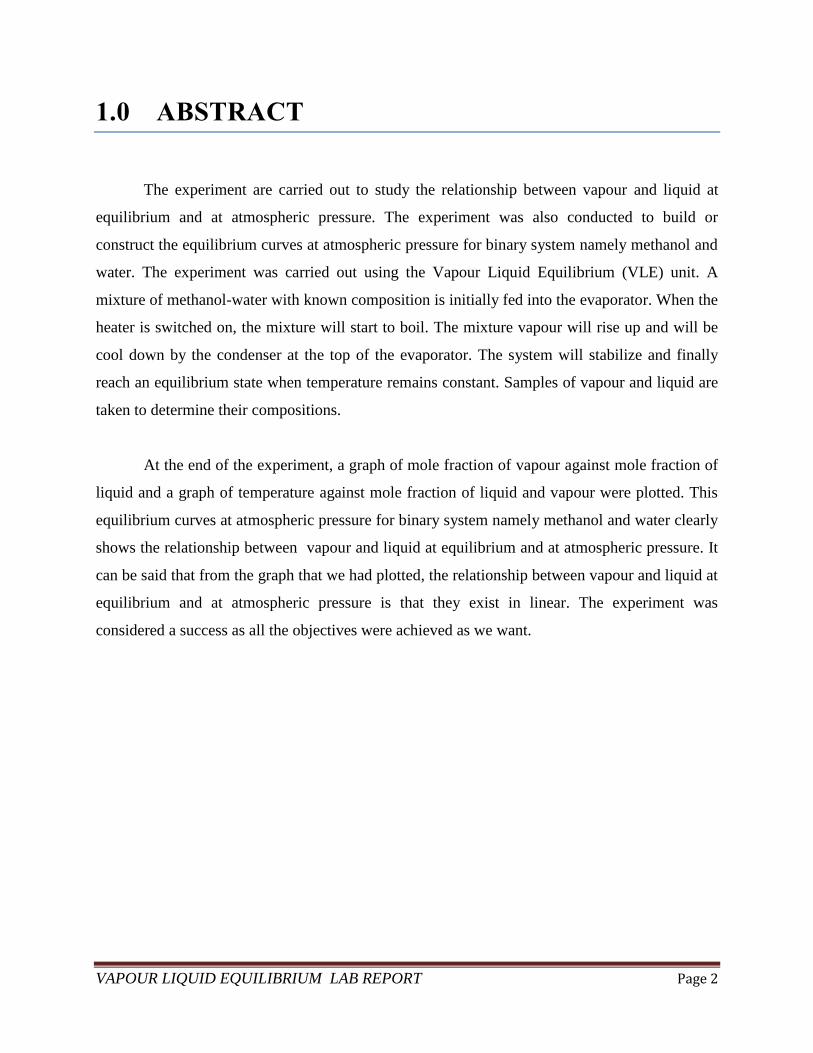
1.0 ABSTRACT
The experiment are carried out to study the relationship between vapour and liquid at
equilibrium and at atmospheric pressure. The experiment was also conducted to build or
construct the equilibrium curves at atmospheric pressure for binary system namely methanol and
water. The experiment was carried out using the Vapour Liquid Equilibrium (VLE) unit. A
mixture of methanol-water with known composition is initially fed into the evaporator. When the
heater is switched on, the mixture will start to boil. The mixture vapour will rise up and will be
cool down by the condenser at the top of the evaporator. The system will stabilize and finally
reach an equilibrium state when temperature remains constant. Samples of vapour and liquid are
taken to determine their compositions.
At the end of the experiment, a graph of mole fraction of vapour against mole fraction of
liquid and a graph of temperature against mole fraction of liquid and vapour were plotted. This
equilibrium curves at atmospheric pressure for binary system namely methanol and water clearly
shows the relationship between vapour and liquid at equilibrium and at atmospheric pressure. It
can be said that from the graph that we had plotted, the relationship between vapour and liquid at
equilibrium and at atmospheric pressure is that they exist in linear. The experiment was
considered a success as all the objectives were achieved as we want.
VAPOUR LIQUID EQUILIBRIUM LAB REPORT Page 3
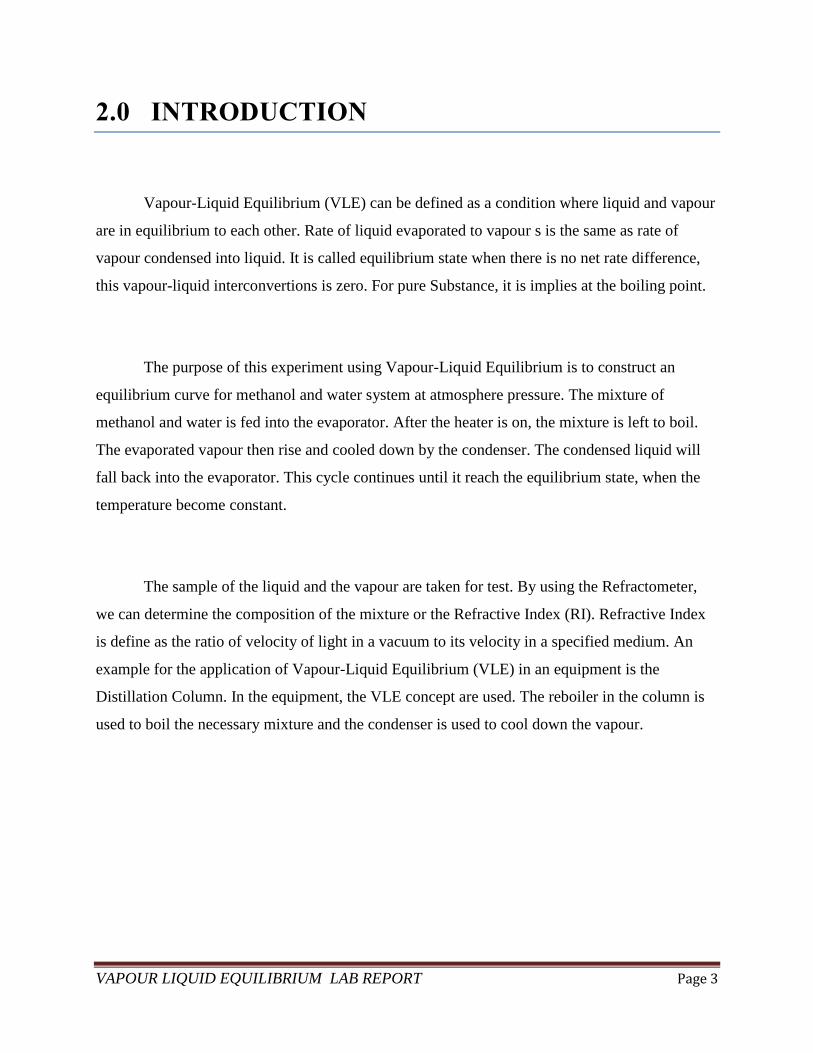
2.0 INTRODUCTION
Vapour-Liquid Equilibrium (VLE) can be defined as a condition where liquid and vapour
are in equilibrium to each other. Rate of liquid evaporated to vapour s is the same as rate of
vapour condensed into liquid. It is called equilibrium state when there is no net rate difference,
this vapour-liquid interconvertions is zero. For pure Substance, it is implies at the boiling point.
The purpose of this experiment using Vapour-Liquid Equilibrium is to construct an
equilibrium curve for methanol and water system at atmosphere pressure. The mixture of
methanol and water is fed into the evaporator. After the heater is on, the mixture is left to boil.
The evaporated vapour then rise and cooled down by the condenser. The condensed liquid will
fall back into the evaporator. This cycle continues until it reach the equilibrium state, when the
temperature become constant.
The sample of the liquid and the vapour are taken for test. By using the Refractometer,
we can determine the composition of the mixture or the Refractive Index (RI). Refractive Index
is define as the ratio of velocity of light in a vacuum to its velocity in a specified medium. An
example for the application of Vapour-Liquid Equilibrium (VLE) in an equipment is the
Distillation Column. In the equipment, the VLE concept are used. The reboiler in the column is
used to boil the necessary mixture and the condenser is used to cool down the vapour.
VAPOUR LIQUID EQUILIBRIUM LAB REPORT Page 4
3.0 OBJECTIVE
1. To investigate the relationship between the vapour and liquid at different temperature.
2. To construct the equilibrium curve for methanol-water system at atmospheric pressure, 1
atm.
3. To understand the concept of Vapour-Liquid Equilibrium (VLE) thoroughly.
4. To find out the application for the Vapour-Liquid Equilibrium (VLE).
5. To differentiate the plotted graph between Refractive Index (RI) and range of
composition mixtures based on the experimental data obtained.
VAPOUR LIQUID EQUILIBRIUM LAB REPORT Page 5
4.0 THEORY
Vapor–liquid equilibrium (VLE) is a condition in which a liquid and its vapor (gas phase) are
in equilibrium with each other, a condition or state where the rate of evaporation(liquid changing
to vapor) equals the rate of condensation (vapor changing to liquid) on a molecular level such
that there is no net (overall) vapor–liquid inter conversion. A substance at vapor–liquid
equilibrium is generally referred to as a saturated fluid. For a pure chemical substance, this
implies that it is at its boiling point. The notion of "saturated fluid" includes saturated liquid
(about to vaporize), saturated liquid–vapor mixture, and saturated vapor (about to condense).
The Vapor-Liquid Equilibrium is used to determine the equilibrium in binary phase by
vaporization and diffusion. Binary mixtures are mixtures of two component and two phase
system. These mixtures are said to be in equilibrium when their internal properties reaches the
same reading. The four internal properties are the reading of temperature, pressure, liquid mol
fractions and vapor mol fractions. According to the phase rule, the condition of two phase
system, when two intensive properties are specified, the extensive properties may be differed.
But, in equilibrium, the intensive properties will be counted.
In this experiment, we use water and methanol which both are in pure substance and in binary
mixtures. Water and methanol are ideal mixtures so it obeys Raoult’s Law.
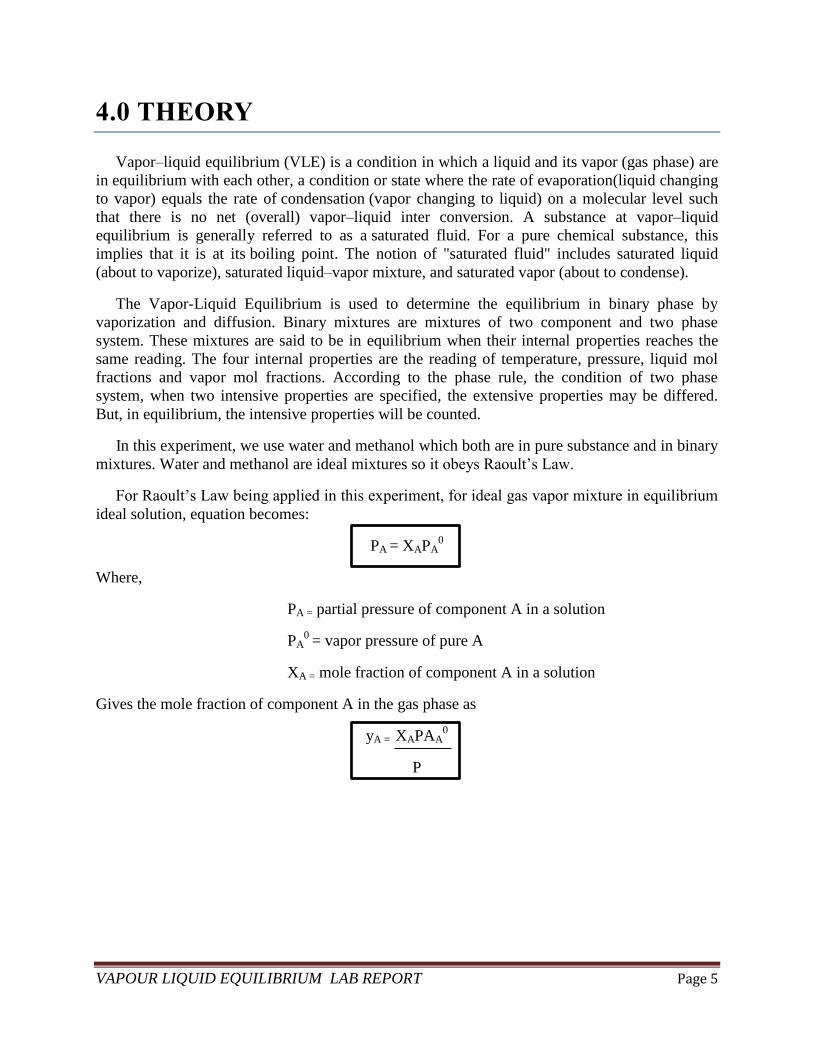
For Raoult’s Law being applied in this experiment, for ideal gas vapor mixture in equilibrium
ideal solution, equation becomes:
PA = XAPA0
Where,
PA = partial pressure of component A in a solution
PA0
= vapor pressure of pure A
XA = mole fraction of component A in a solution
Gives the mole fraction of component A in the gas phase as
yA = XAPAA0
P
VAPOUR LIQUID EQUILIBRIUM LAB REPORT Page 6
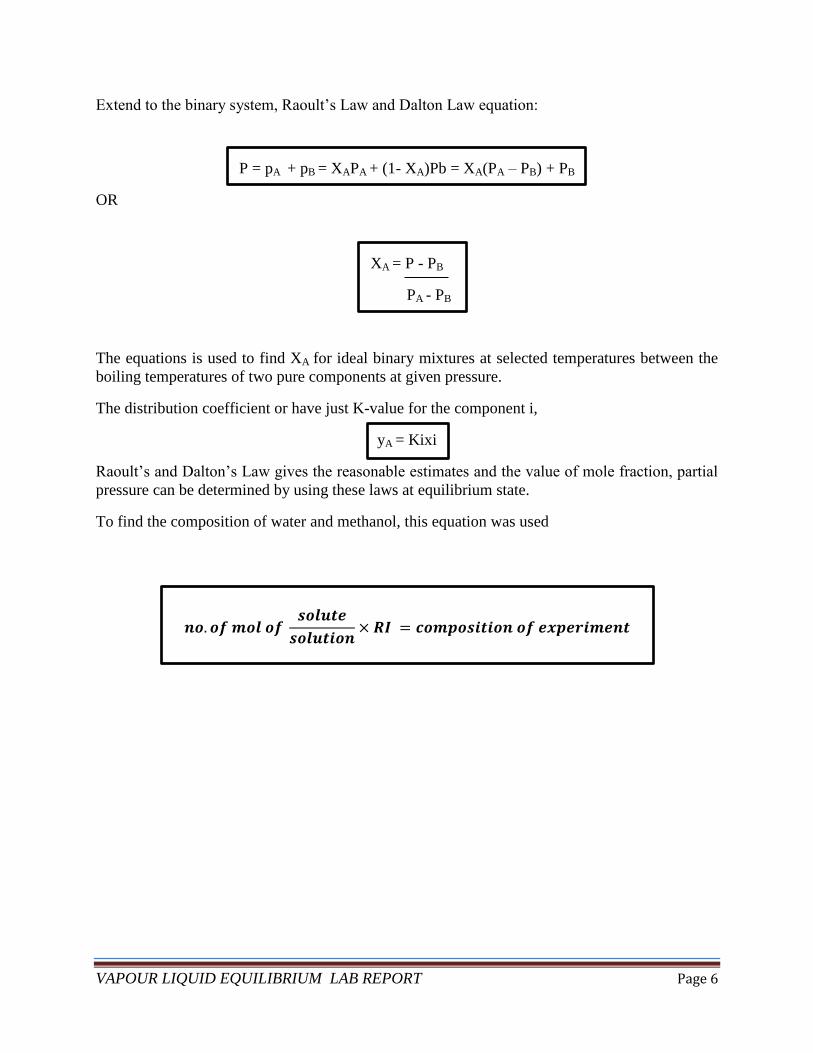
Extend to the binary system, Raoult’s Law and Dalton Law equation:
P = pA + pB = XAPA + (1- XA)Pb = XA(PA – PB) + PB
OR
XA = P - PB
PA - PB
The equations is used to find XA for ideal binary mixtures at selected temperatures between the
boiling temperatures of two pure components at given pressure.
The distribution coefficient or have just K-value for the component i,
yA = Kixi
Raoult’s and Dalton’s Law gives the reasonable estimates and the value of mole fraction, partial
pressure can be determined by using these laws at equilibrium state.
To find the composition of water and methanol, this equation was used
VAPOUR LIQUID EQUILIBRIUM LAB REPORT Page 7
5.0 MATERIAL AND APPARATUS
Material :-
1. Methanol
2. Distilled Water
Apparatus:-
1. SOLTEQ® Vapour Liquid Equilibrium Unit (Model : BP 16)
2. Dropper
3. Sample Collector
4. Refractometer
5. 2-L measuring cylinder
6. 500-ml measuring cylinder
7. 500-ml measuring beaker
8. Goggles
9. Gloves
VAPOUR LIQUID EQUILIBRIUM LAB REPORT Page 8
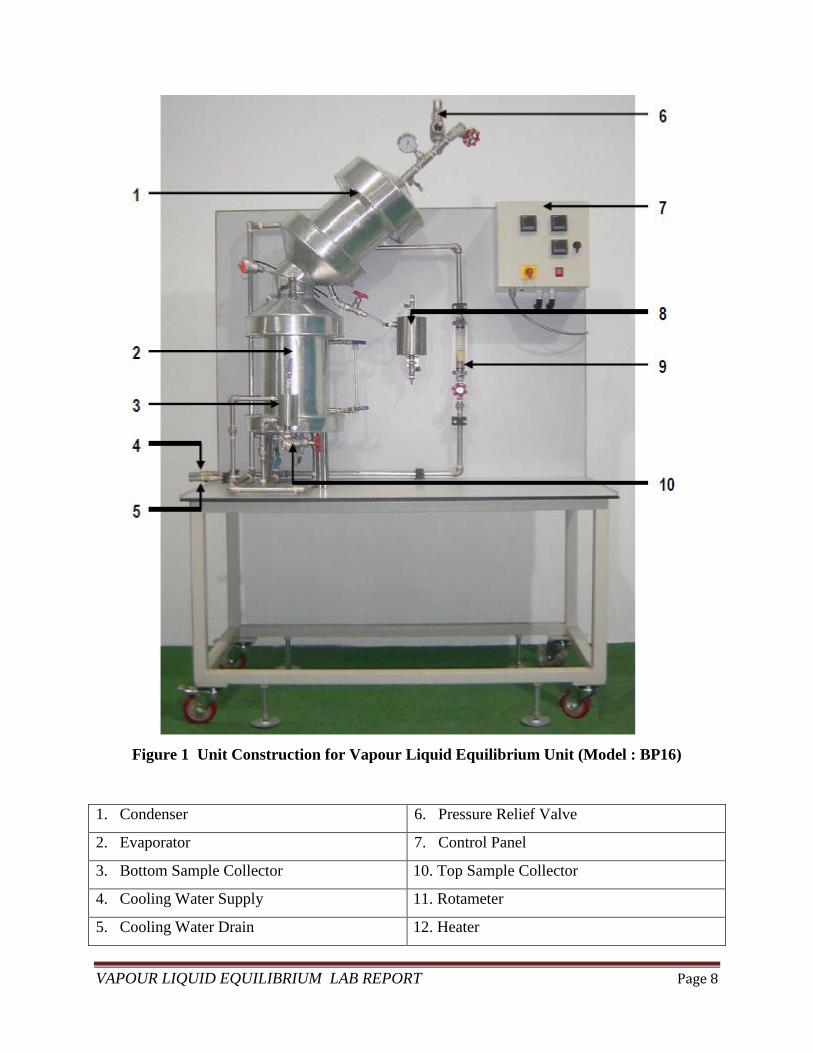
Figure 1 Unit Construction for Vapour Liquid Equilibrium Unit (Model : BP16)
1. Condenser 6. Pressure Relief Valve
2. Evaporator 7. Control Panel
3. Bottom Sample Collector 10. Top Sample Collector
4. Cooling Water Supply 11. Rotameter
5. Cooling Water Drain 12. Heater
VAPOUR LIQUID EQUILIBRIUM LAB REPORT Page 9
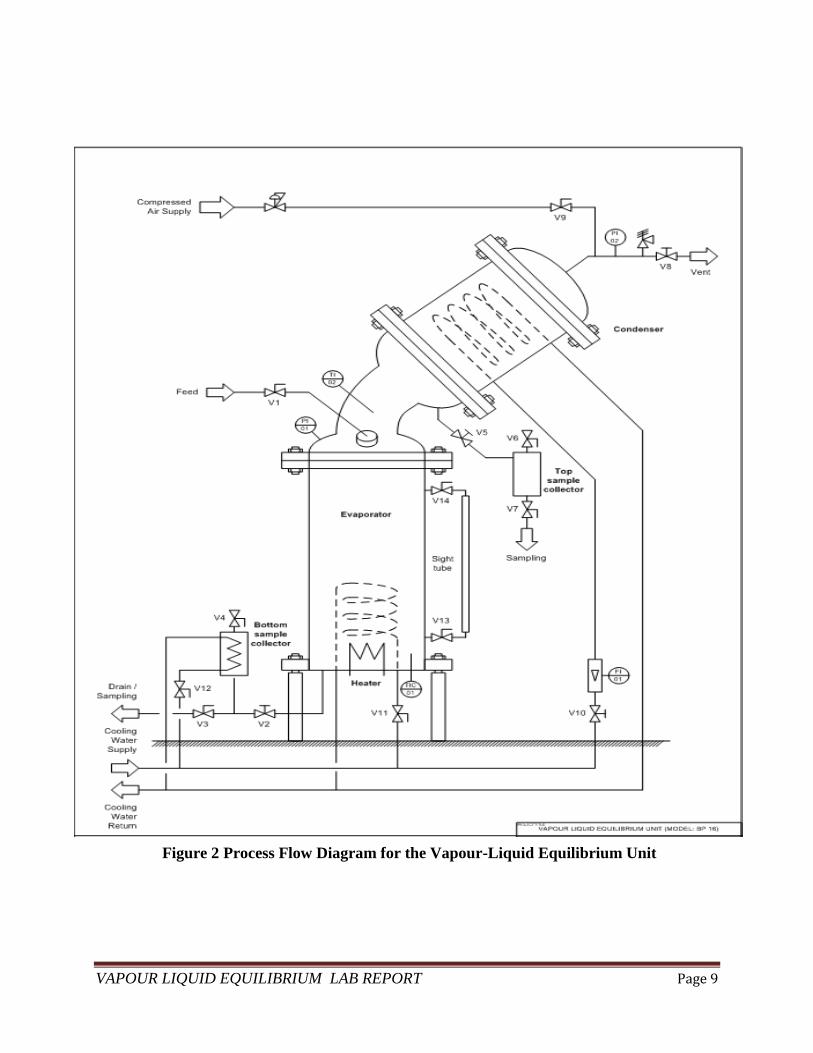
Figure 2 Process Flow Diagram for the Vapour-Liquid Equilibrium Unit
VAPOUR LIQUID EQUILIBRIUM LAB REPORT Page 10
6.0 METHODOLOGY
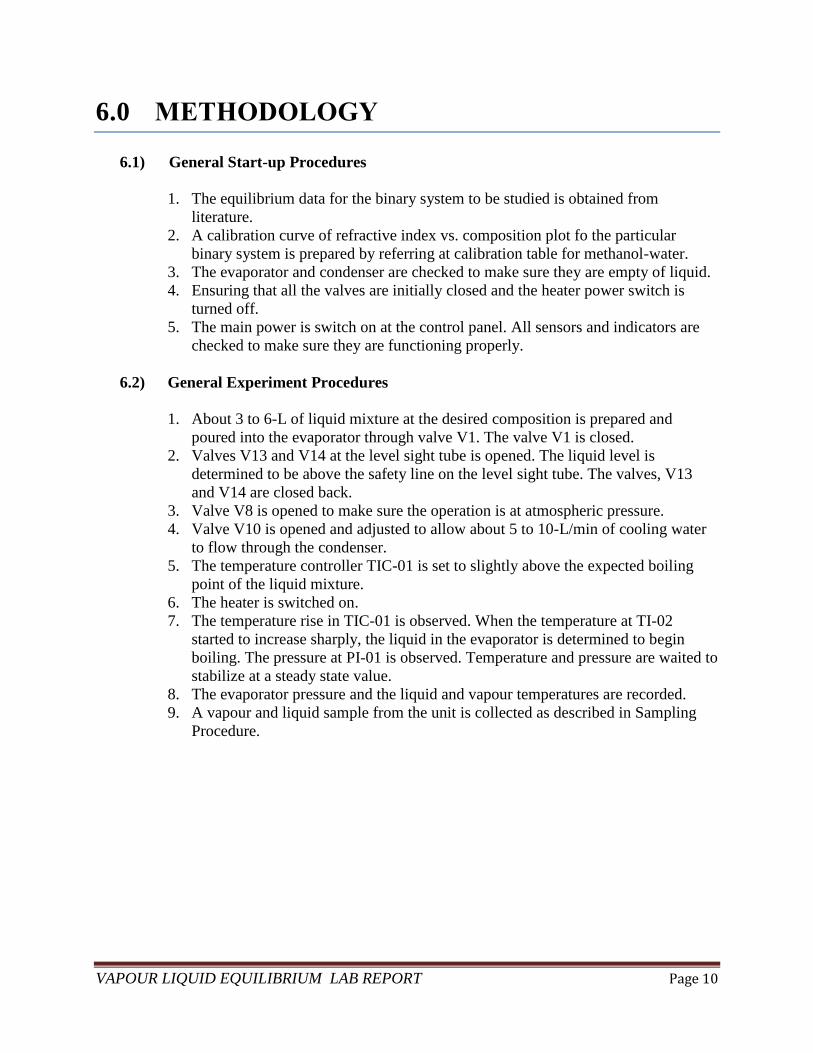
6.1) General Start-up Procedures
1. The equilibrium data for the binary system to be studied is obtained from
literature.
2. A calibration curve of refractive index vs. composition plot fo the particular
binary system is prepared by referring at calibration table for methanol-water.
3. The evaporator and condenser are checked to make sure they are empty of liquid.
4. Ensuring that all the valves are initially closed and the heater power switch is
turned off.
5. The main power is switch on at the control panel. All sensors and indicators are
checked to make sure they are functioning properly.
6.2) General Experiment Procedures
1. About 3 to 6-L of liquid mixture at the desired composition is prepared and
poured into the evaporator through valve V1. The valve V1 is closed.
2. Valves V13 and V14 at the level sight tube is opened. The liquid level is
determined to be above the safety line on the level sight tube. The valves, V13
and V14 are closed back.
3. Valve V8 is opened to make sure the operation is at atmospheric pressure.
4. Valve V10 is opened and adjusted to allow about 5 to 10-L/min of cooling water
to flow through the condenser.
5. The temperature controller TIC-01 is set to slightly above the expected boiling
point of the liquid mixture.
6. The heater is switched on.
7. The temperature rise in TIC-01 is observed. When the temperature at TI-02
started to increase sharply, the liquid in the evaporator is determined to begin
boiling. The pressure at PI-01 is observed. Temperature and pressure are waited to
stabilize at a steady state value.
8. The evaporator pressure and the liquid and vapour temperatures are recorded.
9. A vapour and liquid sample from the unit is collected as described in Sampling
Procedure.
VAPOUR LIQUID EQUILIBRIUM LAB REPORT Page 11
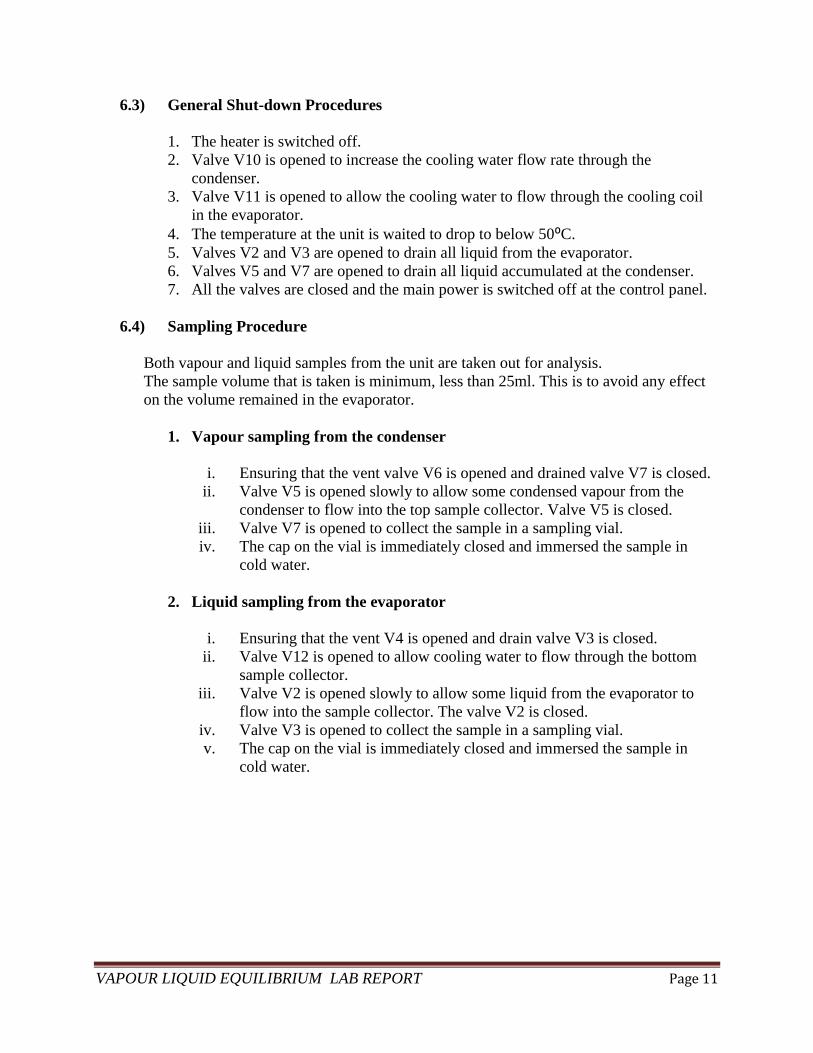
6.3) General Shut-down Procedures
1. The heater is switched off.
2. Valve V10 is opened to increase the cooling water flow rate through the
condenser.
3. Valve V11 is opened to allow the cooling water to flow through the cooling coil
in the evaporator.
4. The temperature at the unit is waited to drop to below 50⁰C.
5. Valves V2 and V3 are opened to drain all liquid from the evaporator.
6. Valves V5 and V7 are opened to drain all liquid accumulated at the condenser.
7. All the valves are closed and the main power is switched off at the control panel.
6.4) Sampling Procedure
Both vapour and liquid samples from the unit are taken out for analysis.
The sample volume that is taken is minimum, less than 25ml. This is to avoid any effect
on the volume remained in the evaporator.
1. Vapour sampling from the condenser
i. Ensuring that the vent valve V6 is opened and drained valve V7 is closed.
ii. Valve V5 is opened slowly to allow some condensed vapour from the
condenser to flow into the top sample collector. Valve V5 is closed.
iii. Valve V7 is opened to collect the sample in a sampling vial.
iv. The cap on the vial is immediately closed and immersed the sample in
cold water.
2. Liquid sampling from the evaporator
i. Ensuring that the vent V4 is opened and drain valve V3 is closed.
ii. Valve V12 is opened to allow cooling water to flow through the bottom
sample collector.
iii. Valve V2 is opened slowly to allow some liquid from the evaporator to
flow into the sample collector. The valve V2 is closed.
iv. Valve V3 is opened to collect the sample in a sampling vial.
v. The cap on the vial is immediately closed and immersed the sample in
cold water.
VAPOUR LIQUID EQUILIBRIUM LAB REPORT Page 12
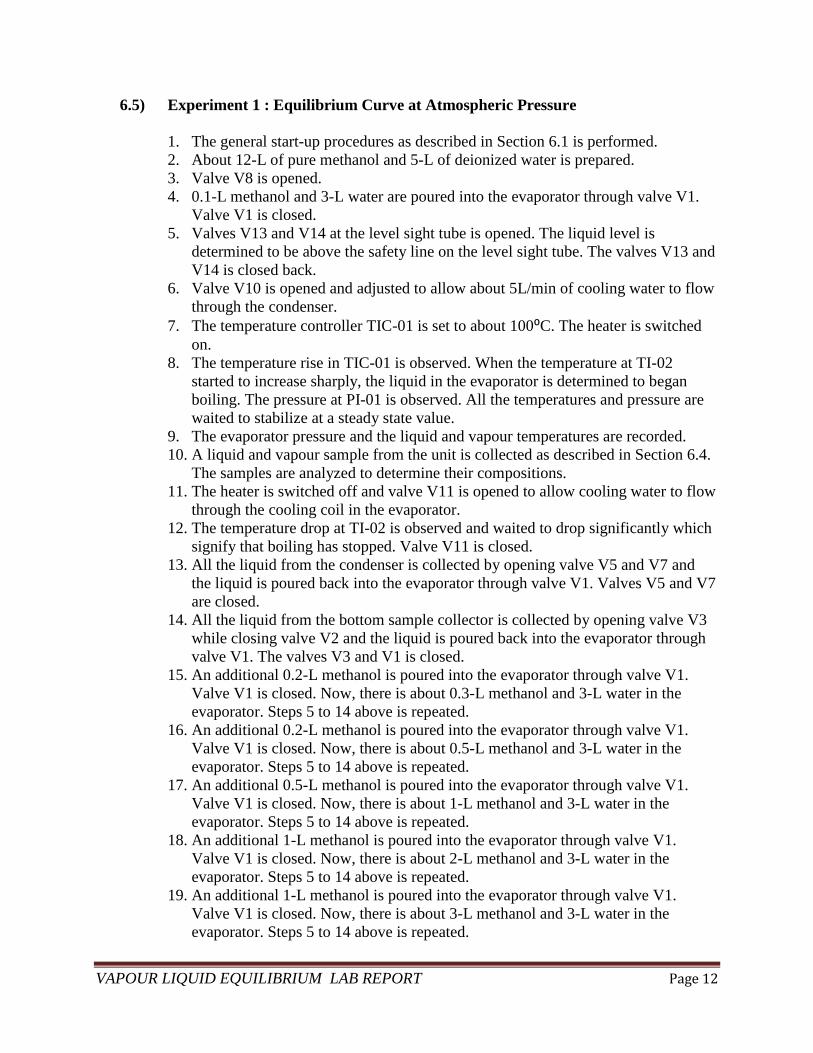
6.5) Experiment 1 : Equilibrium Curve at Atmospheric Pressure
1. The general start-up procedures as described in Section 6.1 is performed.
2. About 12-L of pure methanol and 5-L of deionized water is prepared.
3. Valve V8 is opened.
4. 0.1-L methanol and 3-L water are poured into the evaporator through valve V1.
Valve V1 is closed.
5. Valves V13 and V14 at the level sight tube is opened. The liquid level is
determined to be above the safety line on the level sight tube. The valves V13 and
V14 is closed back.
6. Valve V10 is opened and adjusted to allow about 5L/min of cooling water to flow
through the condenser.
7. The temperature controller TIC-01 is set to about 100⁰C. The heater is switched
on.
8. The temperature rise in TIC-01 is observed. When the temperature at TI-02
started to increase sharply, the liquid in the evaporator is determined to began
boiling. The pressure at PI-01 is observed. All the temperatures and pressure are
waited to stabilize at a steady state value.
9. The evaporator pressure and the liquid and vapour temperatures are recorded.
10. A liquid and vapour sample from the unit is collected as described in Section 6.4.
The samples are analyzed to determine their compositions.
11. The heater is switched off and valve V11 is opened to allow cooling water to flow
through the cooling coil in the evaporator.
12. The temperature drop at TI-02 is observed and waited to drop significantly which
signify that boiling has stopped. Valve V11 is closed.
13. All the liquid from the condenser is collected by opening valve V5 and V7 and
the liquid is poured back into the evaporator through valve V1. Valves V5 and V7
are closed.
14. All the liquid from the bottom sample collector is collected by opening valve V3
while closing valve V2 and the liquid is poured back into the evaporator through
valve V1. The valves V3 and V1 is closed.
15. An additional 0.2-L methanol is poured into the evaporator through valve V1.
Valve V1 is closed. Now, there is about 0.3-L methanol and 3-L water in the
evaporator. Steps 5 to 14 above is repeated.
16. An additional 0.2-L methanol is poured into the evaporator through valve V1.
Valve V1 is closed. Now, there is about 0.5-L methanol and 3-L water in the
evaporator. Steps 5 to 14 above is repeated.
17. An additional 0.5-L methanol is poured into the evaporator through valve V1.
Valve V1 is closed. Now, there is about 1-L methanol and 3-L water in the
evaporator. Steps 5 to 14 above is repeated.
18. An additional 1-L methanol is poured into the evaporator through valve V1.
Valve V1 is closed. Now, there is about 2-L methanol and 3-L water in the
evaporator. Steps 5 to 14 above is repeated.
19. An additional 1-L methanol is poured into the evaporator through valve V1.
Valve V1 is closed. Now, there is about 3-L methanol and 3-L water in the
evaporator. Steps 5 to 14 above is repeated.
VAPOUR LIQUID EQUILIBRIUM LAB REPORT Page 13
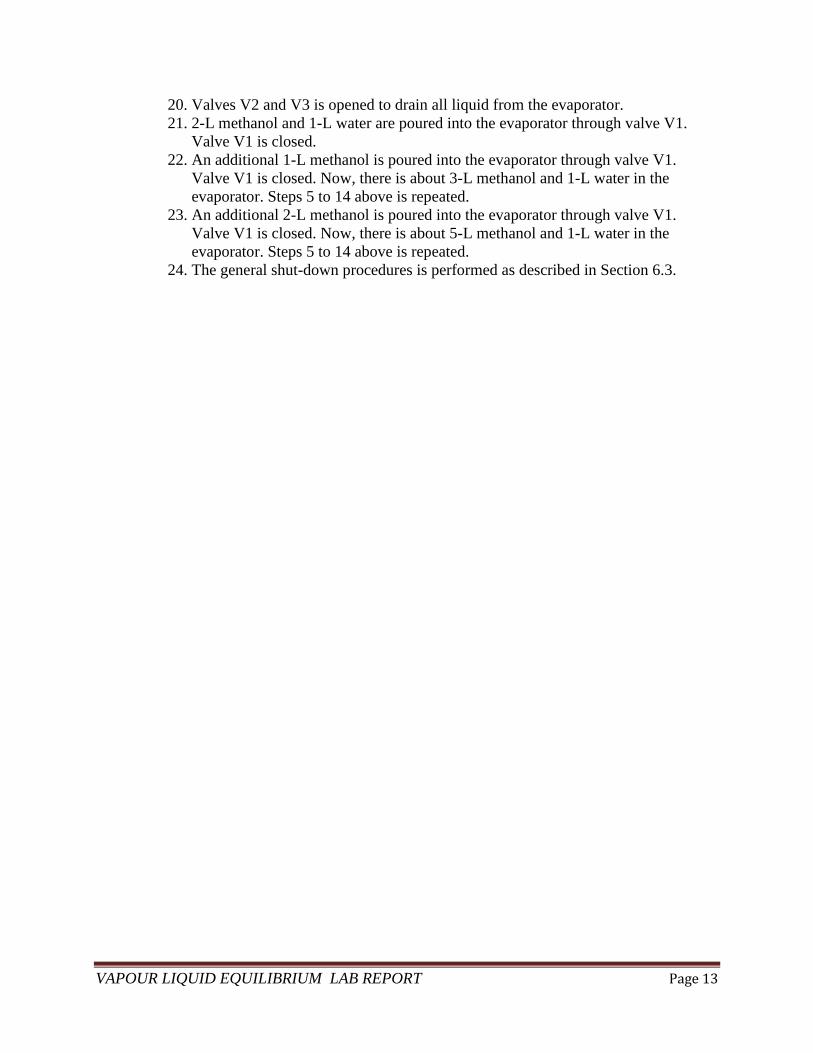
20. Valves V2 and V3 is opened to drain all liquid from the evaporator.
21. 2-L methanol and 1-L water are poured into the evaporator through valve V1.
Valve V1 is closed.
22. An additional 1-L methanol is poured into the evaporator through valve V1.
Valve V1 is closed. Now, there is about 3-L methanol and 1-L water in the
evaporator. Steps 5 to 14 above is repeated.
23. An additional 2-L methanol is poured into the evaporator through valve V1.
Valve V1 is closed. Now, there is about 5-L methanol and 1-L water in the
evaporator. Steps 5 to 14 above is repeated.
24. The general shut-down procedures is performed as described in Section 6.3.
VAPOUR LIQUID EQUILIBRIUM LAB REPORT Page 14
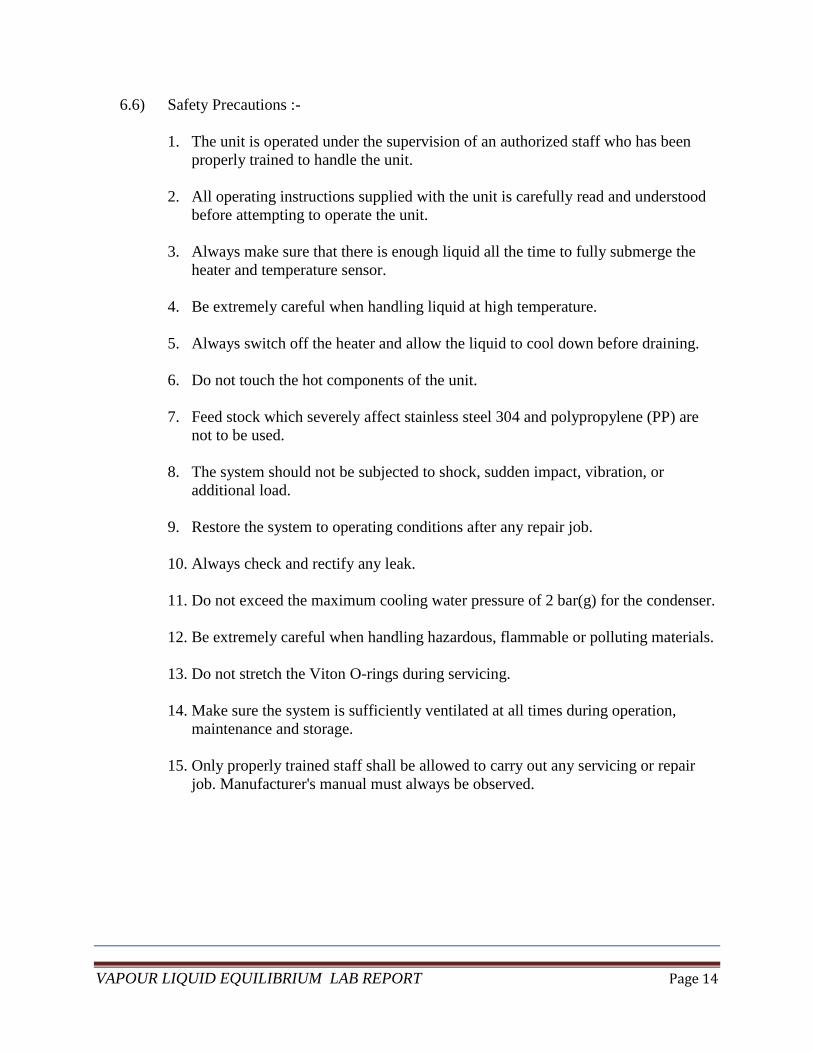
6.6) Safety Precautions :-
1. The unit is operated under the supervision of an authorized staff who has been
properly trained to handle the unit.
2. All operating instructions supplied with the unit is carefully read and understood
before attempting to operate the unit.
3. Always make sure that there is enough liquid all the time to fully submerge the
heater and temperature sensor.
4. Be extremely careful when handling liquid at high temperature.
5. Always switch off the heater and allow the liquid to cool down before draining.
6. Do not touch the hot components of the unit.
7. Feed stock which severely affect stainless steel 304 and polypropylene (PP) are
not to be used.
8. The system should not be subjected to shock, sudden impact, vibration, or
additional load.
9. Restore the system to operating conditions after any repair job.
10. Always check and rectify any leak.
11. Do not exceed the maximum cooling water pressure of 2 bar(g) for the condenser.
12. Be extremely careful when handling hazardous, flammable or polluting materials.
13. Do not stretch the Viton O-rings during servicing.
14. Make sure the system is sufficiently ventilated at all times during operation,
maintenance and storage.
15. Only properly trained staff shall be allowed to carry out any servicing or repair
job. Manufacturer's manual must always be observed.
VAPOUR LIQUID EQUILIBRIUM LAB REPORT Page 15
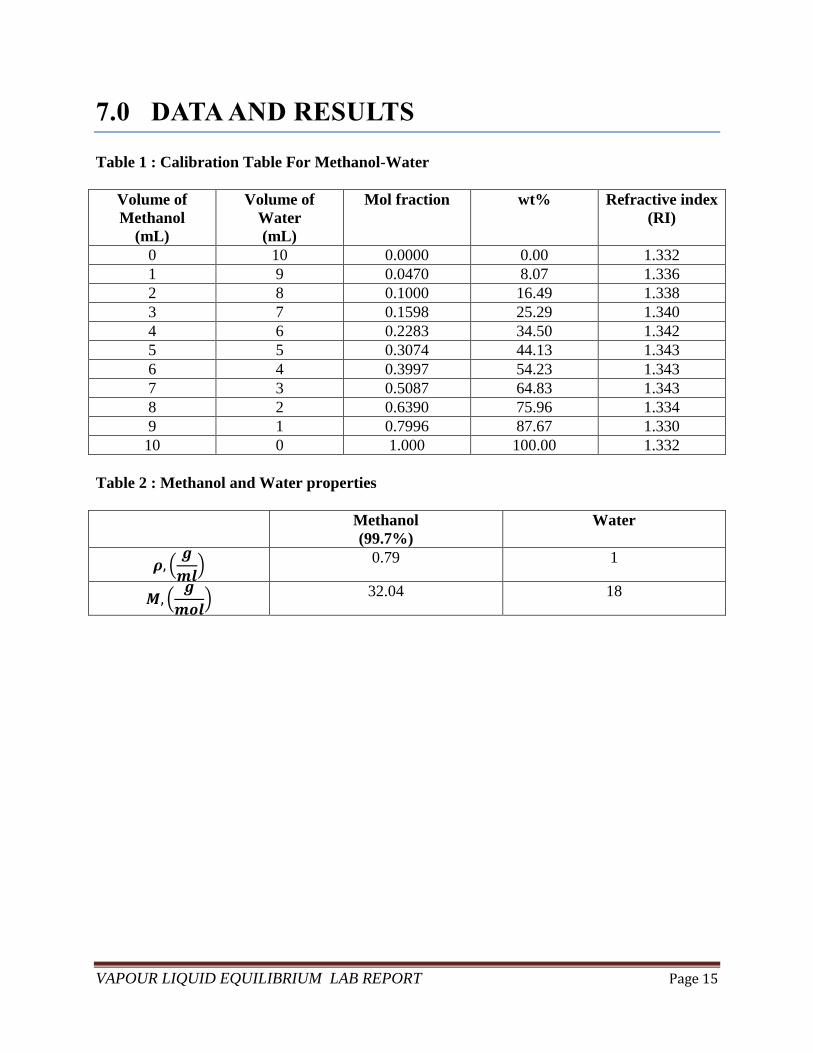
7.0 DATA AND RESULTS
Table 1 : Calibration Table For Methanol-Water
Volume of
Methanol
(mL)
Volume of
Water
(mL)
Mol fraction wt% Refractive index
(RI)
0 10 0.0000 0.00 1.332
1 9 0.0470 8.07 1.336
2 8 0.1000 16.49 1.338
3 7 0.1598 25.29 1.340
4 6 0.2283 34.50 1.342
5 5 0.3074 44.13 1.343
6 4 0.3997 54.23 1.343
7 3 0.5087 64.83 1.343
8 2 0.6390 75.96 1.334
9 1 0.7996 87.67 1.330
10 0 1.000 100.00 1.332
Table 2 : Methanol and Water properties
Methanol
(99.7%)
Water
(
) 0.79 1
(
) 32.04 18
VAPOUR LIQUID EQUILIBRIUM LAB REPORT Page 16
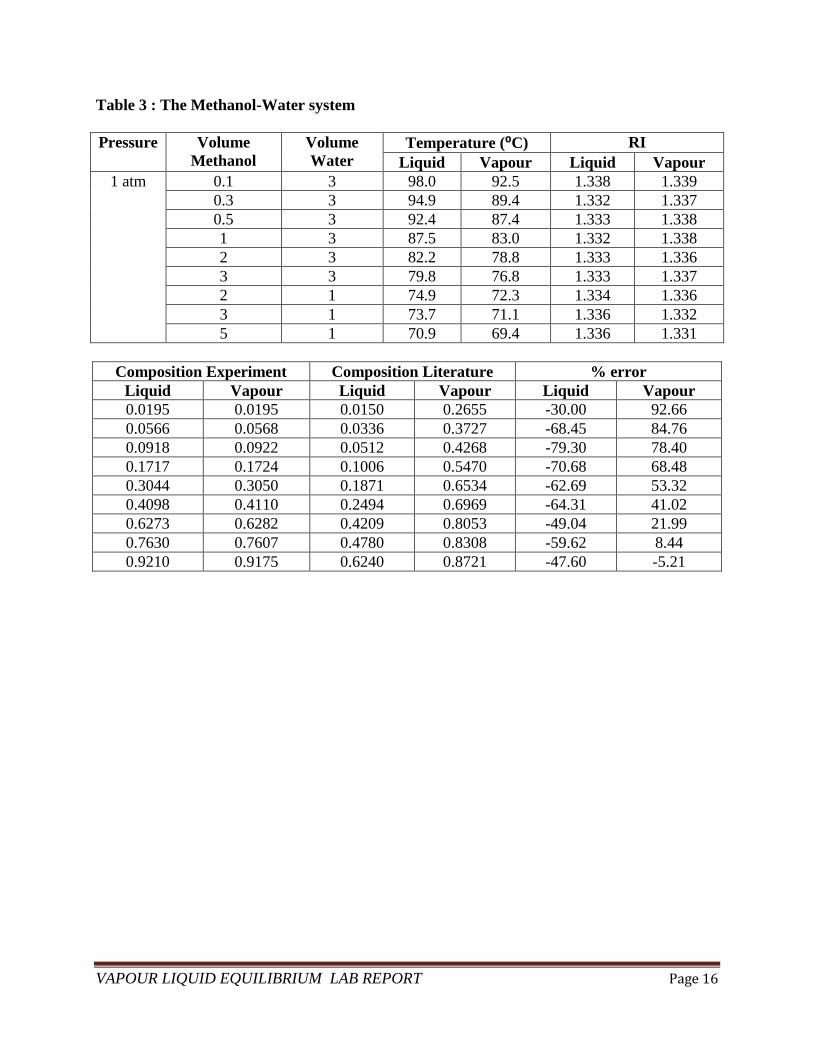
Table 3 : The Methanol-Water system
Pressure Volume
Methanol
Volume
Water
Temperature (⁰C) RI
Liquid Vapour Liquid Vapour
1 atm 0.1 3 98.0 92.5 1.338 1.339
0.3 3 94.9 89.4 1.332 1.337
0.5 3 92.4 87.4 1.333 1.338
1 3 87.5 83.0 1.332 1.338
2 3 82.2 78.8 1.333 1.336
3 3 79.8 76.8 1.333 1.337
2 1 74.9 72.3 1.334 1.336
3 1 73.7 71.1 1.336 1.332
5 1 70.9 69.4 1.336 1.331
Composition Experiment Composition Literature % error
Liquid Vapour Liquid Vapour Liquid Vapour
0.0195 0.0195 0.0150 0.2655 -30.00 92.66
0.0566 0.0568 0.0336 0.3727 -68.45 84.76
0.0918 0.0922 0.0512 0.4268 -79.30 78.40
0.1717 0.1724 0.1006 0.5470 -70.68 68.48
0.3044 0.3050 0.1871 0.6534 -62.69 53.32
0.4098 0.4110 0.2494 0.6969 -64.31 41.02
0.6273 0.6282 0.4209 0.8053 -49.04 21.99
0.7630 0.7607 0.4780 0.8308 -59.62 8.44
0.9210 0.9175 0.6240 0.8721 -47.60 -5.21
VAPOUR LIQUID EQUILIBRIUM LAB REPORT Page 17
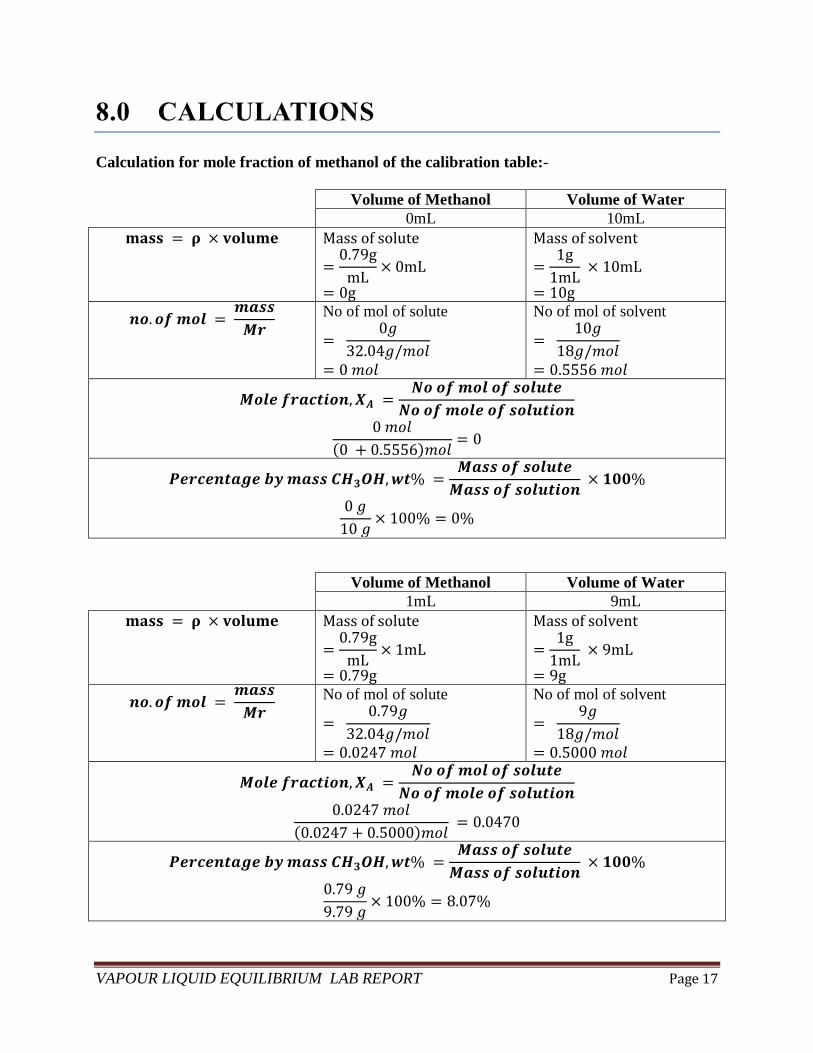
8.0 CALCULATIONS
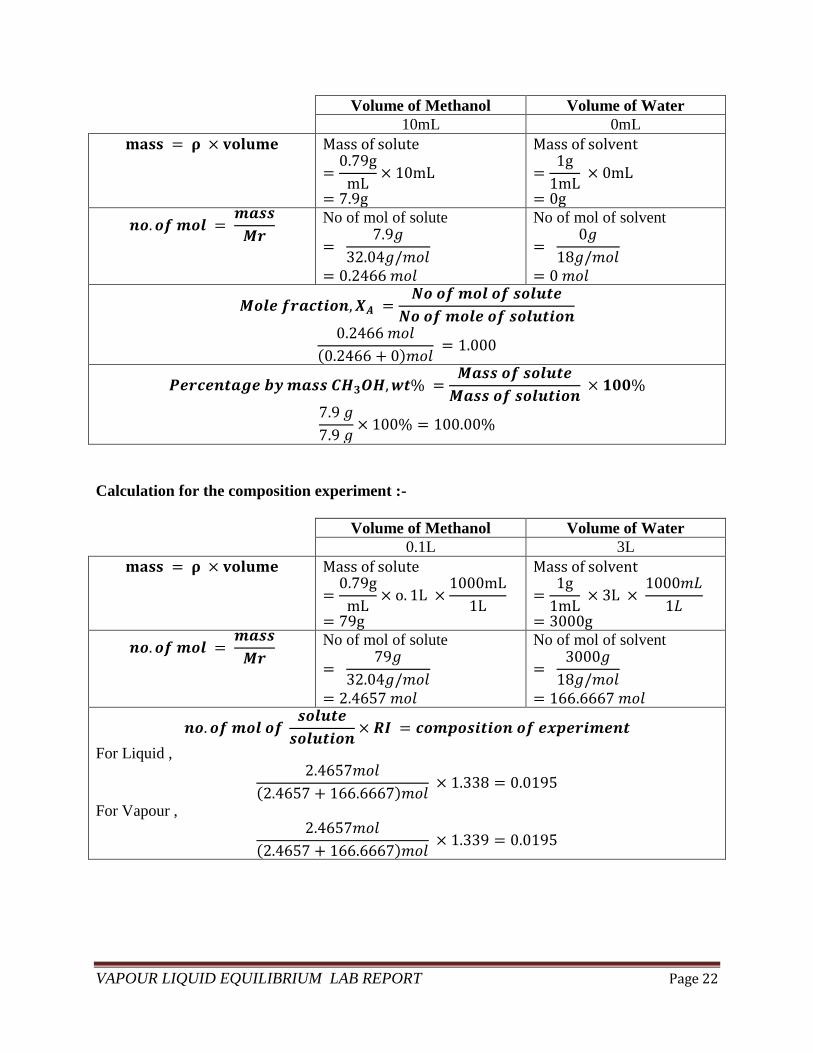
Calculation for mole fraction of methanol of the calibration table:-
Volume of Methanol Volume of Water
0mL 10mL
No of mol of solute
No of mol of solvent
( )
Volume of Methanol Volume of Water
1mL 9mL
No of mol of solute
No of mol of solvent
( )
VAPOUR LIQUID EQUILIBRIUM LAB REPORT Page 18
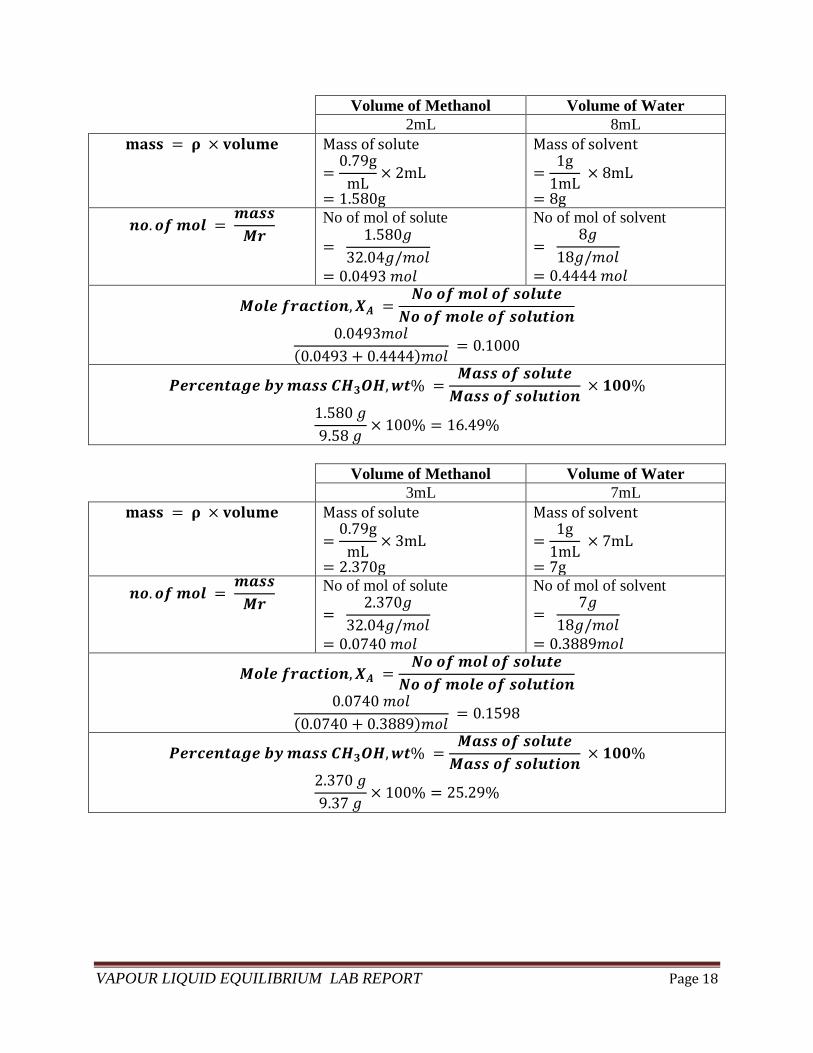
Volume of Methanol Volume of Water
2mL 8mL
No of mol of solute
No of mol of solvent
( )
Volume of Methanol Volume of Water
3mL 7mL
No of mol of solute
No of mol of solvent
( )

VAPOUR LIQUID EQUILIBRIUM LAB REPORT Page 19
Volume of Methanol Volume of Water
4mL 6mL
No of mol of solute
No of mol of solvent
( )
Volume of Methanol Volume of Water
5mL 5mL
No of mol of solute
No of mol of solvent
( )

VAPOUR LIQUID EQUILIBRIUM LAB REPORT Page 20
Volume of Methanol Volume of Water
6mL 4mL
No of mol of solute
No of mol of solvent
( )
Volume of Methanol Volume of Water
7mL 3mL
No of mol of solute
No of mol of solvent
( )
VAPOUR LIQUID EQUILIBRIUM LAB REPORT Page 21
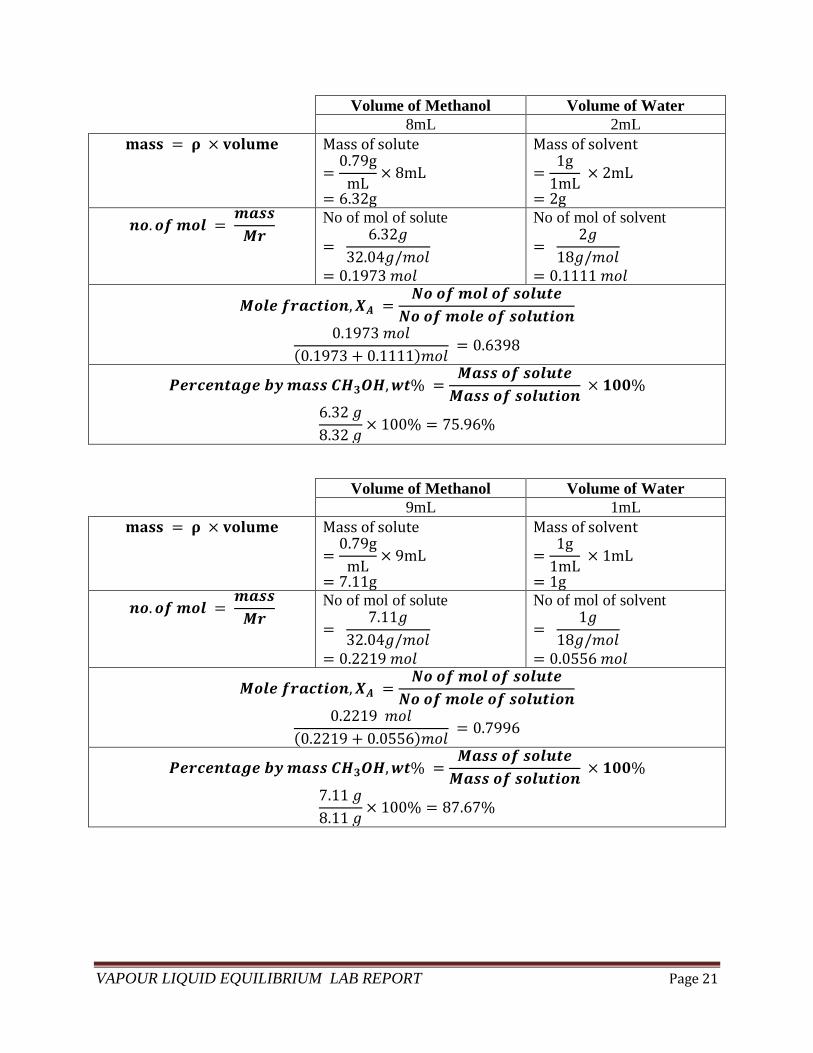
Volume of Methanol Volume of Water
8mL 2mL
No of mol of solute
No of mol of solvent
( )
Volume of Methanol Volume of Water
9mL 1mL
No of mol of solute
No of mol of solvent
( )
VAPOUR LIQUID EQUILIBRIUM LAB REPORT Page 22
Volume of Methanol Volume of Water
10mL 0mL
No of mol of solute
No of mol of solvent
( )
Calculation for the composition experiment :-
Volume of Methanol Volume of Water
0.1L 3L
No of mol of solute
No of mol of solvent
For Liquid ,
( )
For Vapour ,
( )
VAPOUR LIQUID EQUILIBRIUM LAB REPORT Page 23
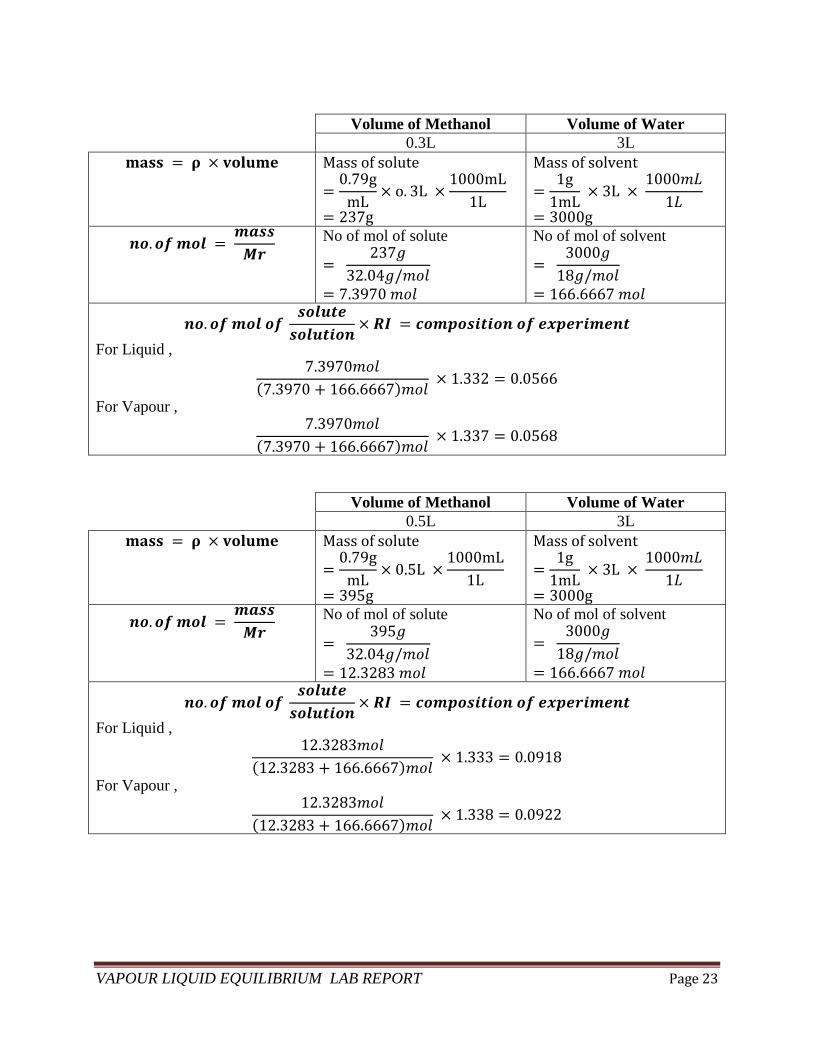
Volume of Methanol Volume of Water
0.3L 3L
No of mol of solute
No of mol of solvent
For Liquid ,
( )
For Vapour ,
( )
Volume of Methanol Volume of Water
0.5L 3L
No of mol of solute
No of mol of solvent
For Liquid ,
( )
For Vapour ,
( )

VAPOUR LIQUID EQUILIBRIUM LAB REPORT Page 24
Volume of Methanol Volume of Water
1L 3L
No of mol of solute
No of mol of solvent
For Liquid ,
( )
For Vapour ,
( )
Volume of Methanol Volume of Water
2L 3L
No of mol of solute
No of mol of solvent
For Liquid ,
( )
For Vapour ,
( )

VAPOUR LIQUID EQUILIBRIUM LAB REPORT Page 25
Volume of Methanol Volume of Water
3L 3L
No of mol of solute
No of mol of solvent
For Liquid ,
( )
For Vapour ,
( )
Volume of Methanol Volume of Water
2L 1L
No of mol of solute
No of mol of solvent
For Liquid ,
( )
For Vapour ,
( )
VAPOUR LIQUID EQUILIBRIUM LAB REPORT Page 26
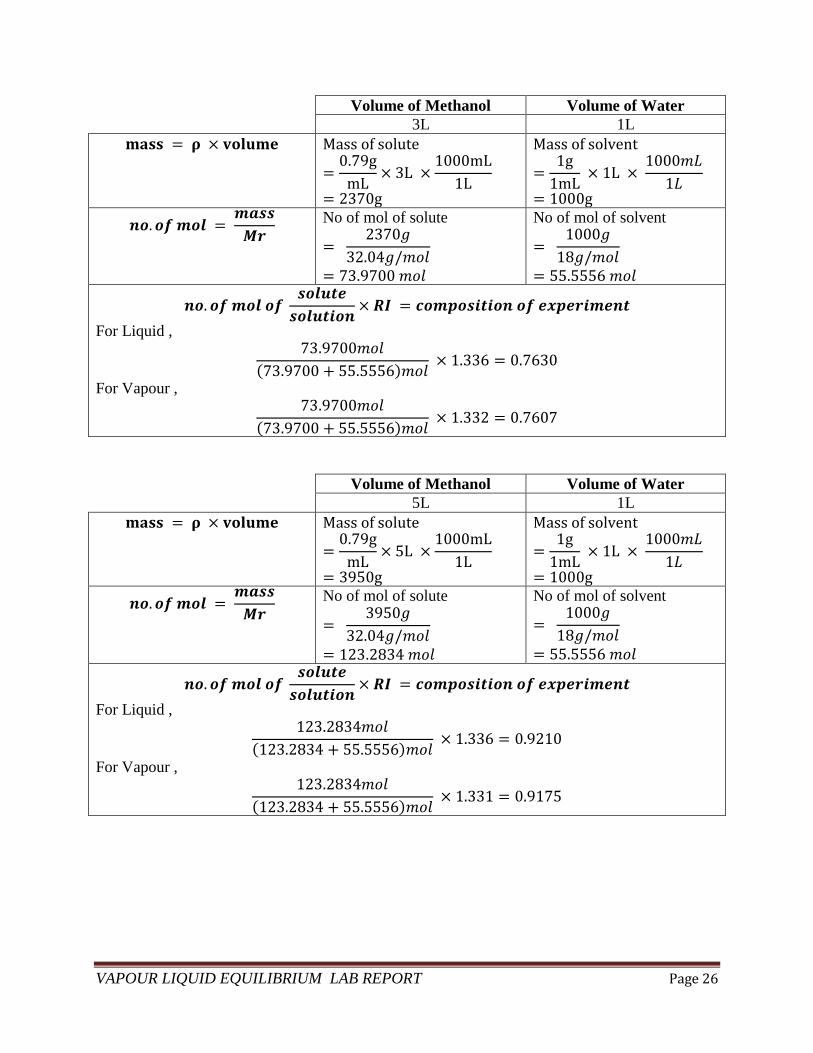
Volume of Methanol Volume of Water
3L 1L
No of mol of solute
No of mol of solvent
For Liquid ,
( )
For Vapour ,
( )
Volume of Methanol Volume of Water
5L 1L
No of mol of solute
No of mol of solvent
For Liquid ,
( )
For Vapour ,
( )
VAPOUR LIQUID EQUILIBRIUM LAB REPORT Page 27
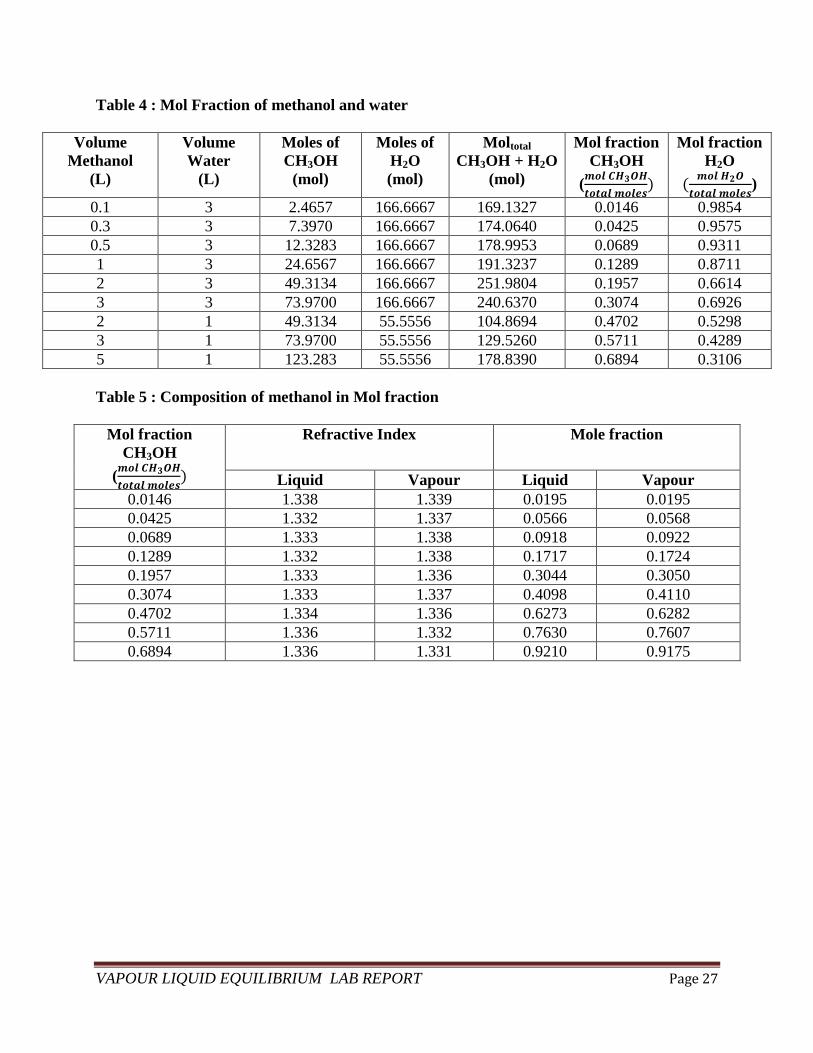
Table 4 : Mol Fraction of methanol and water
Volume
Methanol
(L)
Volume
Water
(L)
Moles of
CH3OH
(mol)
Moles of
H2O
(mol)
Moltotal
CH3OH + H2O
(mol)
Mol fraction
CH3OH
(
)
Mol fraction
H2O
(
)
0.1 3 2.4657 166.6667 169.1327 0.0146 0.9854
0.3 3 7.3970 166.6667 174.0640 0.0425 0.9575
0.5 3 12.3283 166.6667 178.9953 0.0689 0.9311
1 3 24.6567 166.6667 191.3237 0.1289 0.8711
2 3 49.3134 166.6667 251.9804 0.1957 0.6614
3 3 73.9700 166.6667 240.6370 0.3074 0.6926
2 1 49.3134 55.5556 104.8694 0.4702 0.5298
3 1 73.9700 55.5556 129.5260 0.5711 0.4289
5 1 123.283 55.5556 178.8390 0.6894 0.3106
Table 5 : Composition of methanol in Mol fraction
Mol fraction
CH3OH
(
)
Refractive Index Mole fraction
Liquid Vapour Liquid Vapour
0.0146 1.338 1.339 0.0195 0.0195
0.0425 1.332 1.337 0.0566 0.0568
0.0689 1.333 1.338 0.0918 0.0922
0.1289 1.332 1.338 0.1717 0.1724
0.1957 1.333 1.336 0.3044 0.3050
0.3074 1.333 1.337 0.4098 0.4110
0.4702 1.334 1.336 0.6273 0.6282
0.5711 1.336 1.332 0.7630 0.7607
0.6894 1.336 1.331 0.9210 0.9175

VAPOUR LIQUID EQUILIBRIUM LAB REPORT Page 28
9.0 DISCUSSION
Table 6 : Temperature and mol fraction of Methanol
Temperature (⁰C) Mole fraction of Methanol
Liquid Vapour Liquid Vapour
98.0 92.5 0.0195 0.0195
94.9 89.4 0.0566 0.0568
92.4 87.4 0.0918 0.0922
87.5 83.0 0.1717 0.1724
82.2 78.8 0.3044 0.3050
79.8 76.8 0.4098 0.4110
74.9 72.3 0.6273 0.6282
73.7 71.1 0.7630 0.7607
70.9 69.4 0.9210 0.9175
0
20
40
60
80
100
120
1 2 3 4 5 6 7 8 9
Tem
pe
ratu
re (
⁰C)
Vapour/Liquid Mole Fraction (x/y)
T-xy Diagram for Methanol-Water System
Liquid
Vapour
0.1 0.2 0.3 0.4 0.5 0.6 0.7 0.8 0.9
VAPOUR LIQUID EQUILIBRIUM LAB REPORT Page 29
0
0.2
0.4
0.6
0.8
1
1.2
0 0.2 0.4 0.6 0.8 1 1.2
Vap
ou
r m
ol f
ract
ion
Liquid mol fraction
X-Y Equilibrium Diagram for Methanol-Water System at 1atm
0
0.1
0.2
0.3
0.4
0.5
0.6
0.7
0.8
0.9
1
0 0.1 0.2 0.3 0.4 0.5 0.6 0.7 0.8 0.9 1
Vap
ou
r M
ol F
ract
ion
Liquid Mol Fraction
X-Y Equilibrium Graph
VAPOUR LIQUID EQUILIBRIUM LAB REPORT Page 30
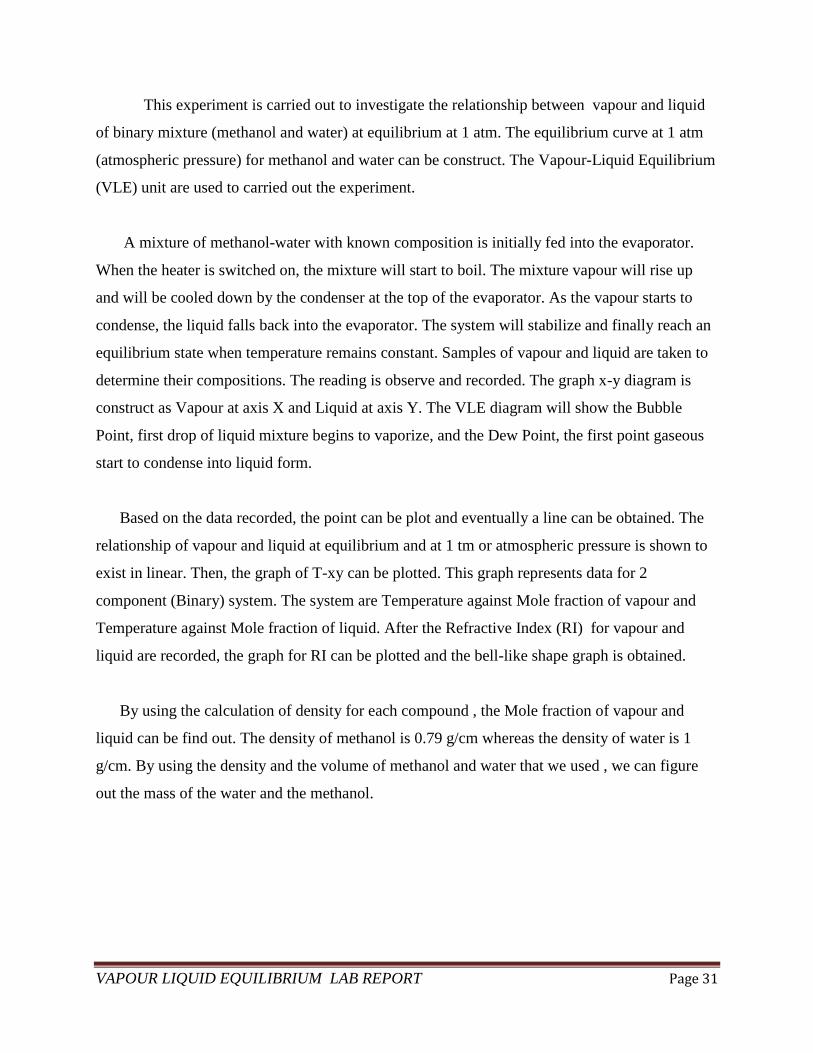
Table 7: Refractive Index and Mol Fraction of methanol from calibration table
Volume of Methanol
(mL)
Mol fraction Refractive index (RI)
0 0.0000 1.332
1 0.0470 1.336
2 0.1000 1.338
3 0.1598 1.340
4 0.2283 1.342
5 0.3074 1.343
6 0.3997 1.343
7 0.5087 1.343
8 0.6390 1.334
9 0.7996 1.330
10 1.000 1.332
1.328
1.33
1.332
1.334
1.336
1.338
1.34
1.342
1.344
1.346
0 0.2 0.4 0.6 0.8 1 1.2
Re
frac
tive
Ind
ex
Mol fraction
Refractive index (RI)
VAPOUR LIQUID EQUILIBRIUM LAB REPORT Page 31
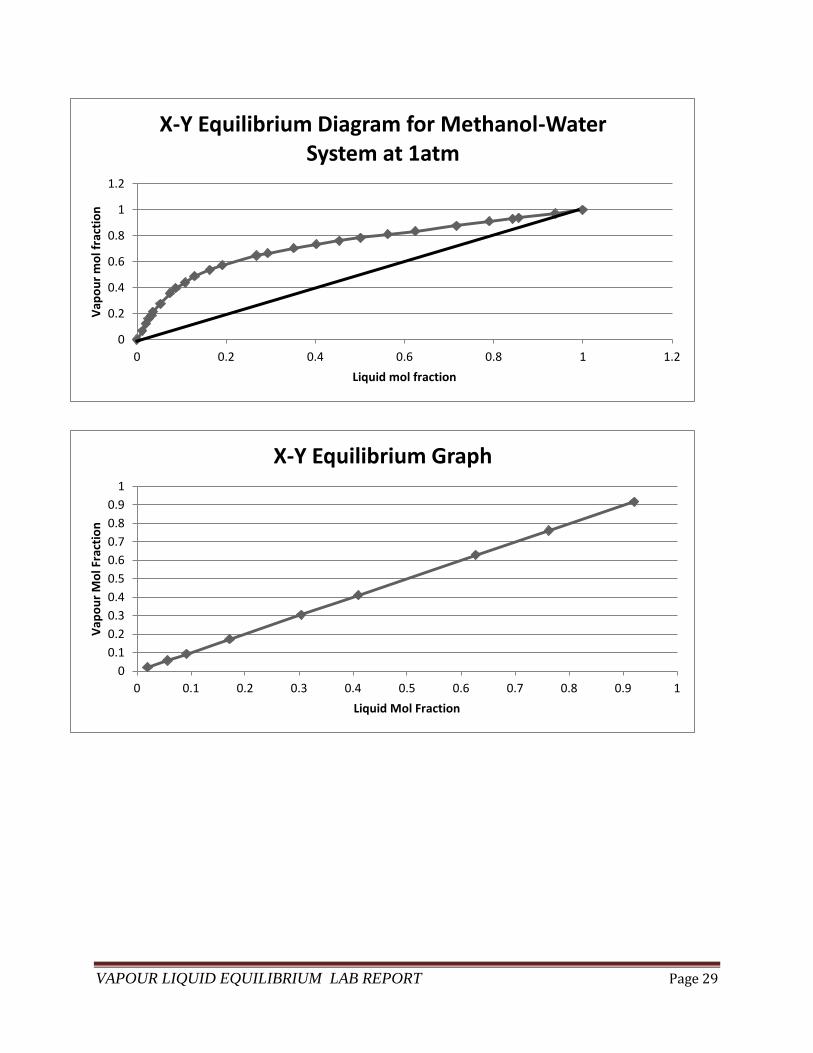
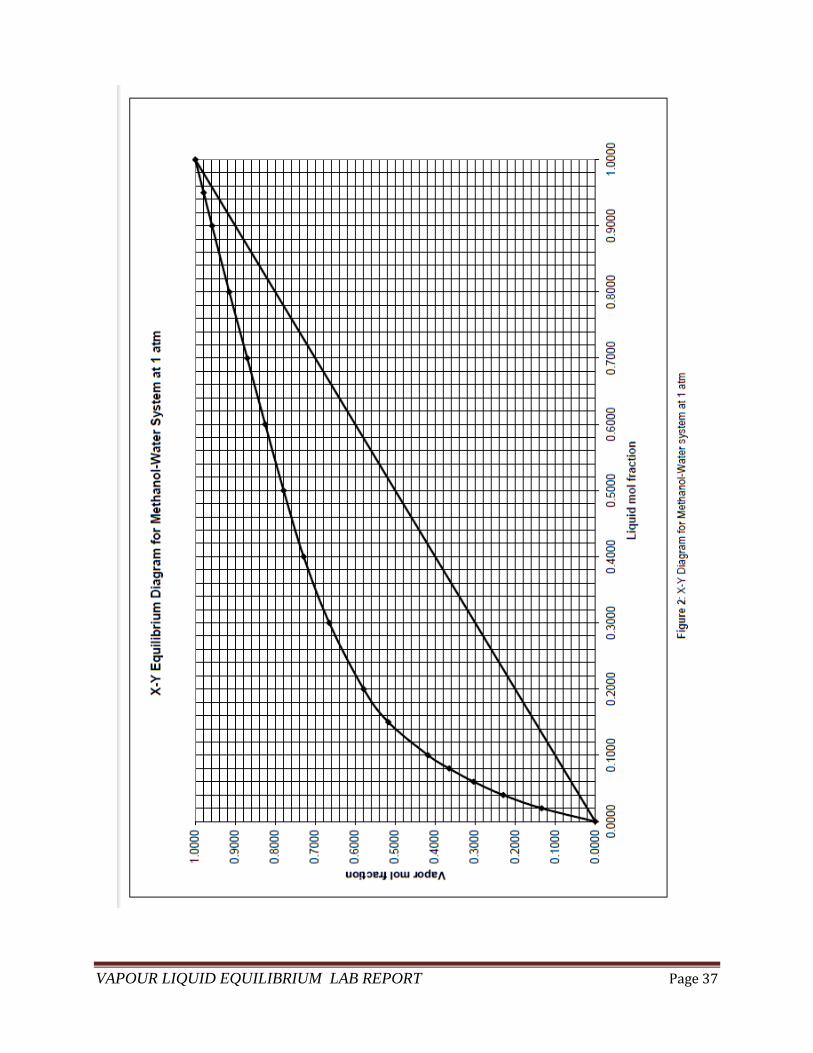
This experiment is carried out to investigate the relationship between vapour and liquid
of binary mixture (methanol and water) at equilibrium at 1 atm. The equilibrium curve at 1 atm
(atmospheric pressure) for methanol and water can be construct. The Vapour-Liquid Equilibrium
(VLE) unit are used to carried out the experiment.
A mixture of methanol-water with known composition is initially fed into the evaporator.
When the heater is switched on, the mixture will start to boil. The mixture vapour will rise up
and will be cooled down by the condenser at the top of the evaporator. As the vapour starts to
condense, the liquid falls back into the evaporator. The system will stabilize and finally reach an
equilibrium state when temperature remains constant. Samples of vapour and liquid are taken to
determine their compositions. The reading is observe and recorded. The graph x-y diagram is
construct as Vapour at axis X and Liquid at axis Y. The VLE diagram will show the Bubble
Point, first drop of liquid mixture begins to vaporize, and the Dew Point, the first point gaseous
start to condense into liquid form.
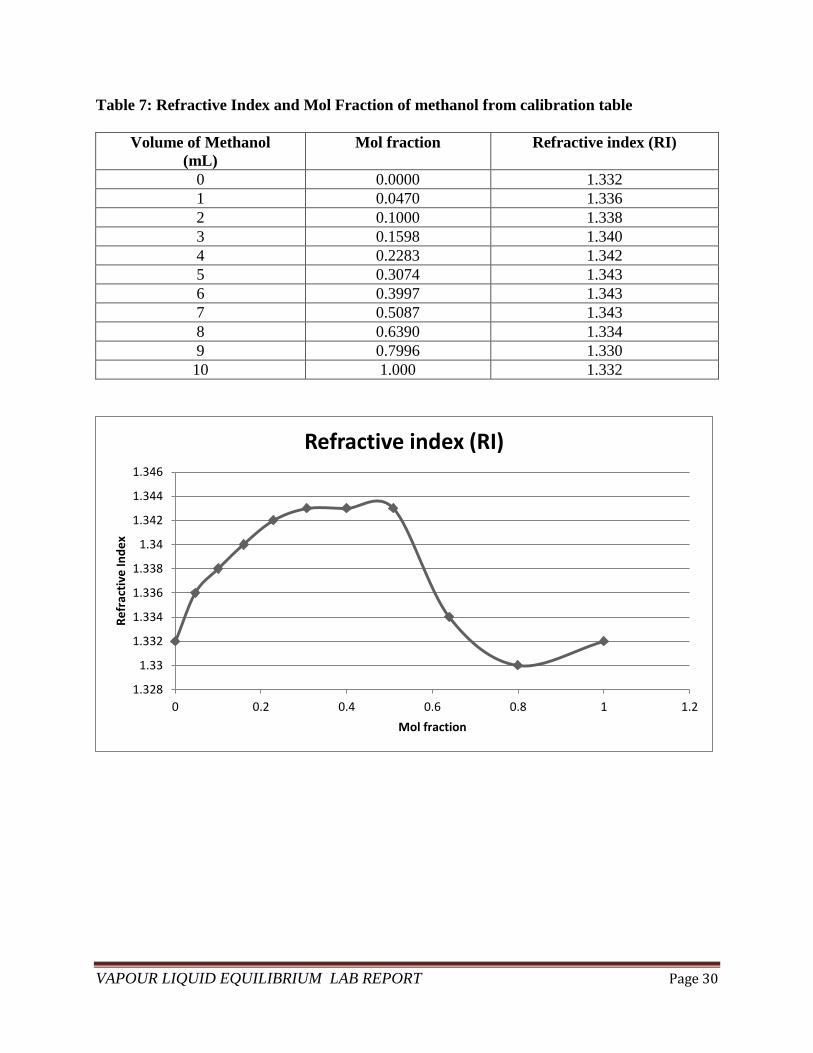
Based on the data recorded, the point can be plot and eventually a line can be obtained. The
relationship of vapour and liquid at equilibrium and at 1 tm or atmospheric pressure is shown to
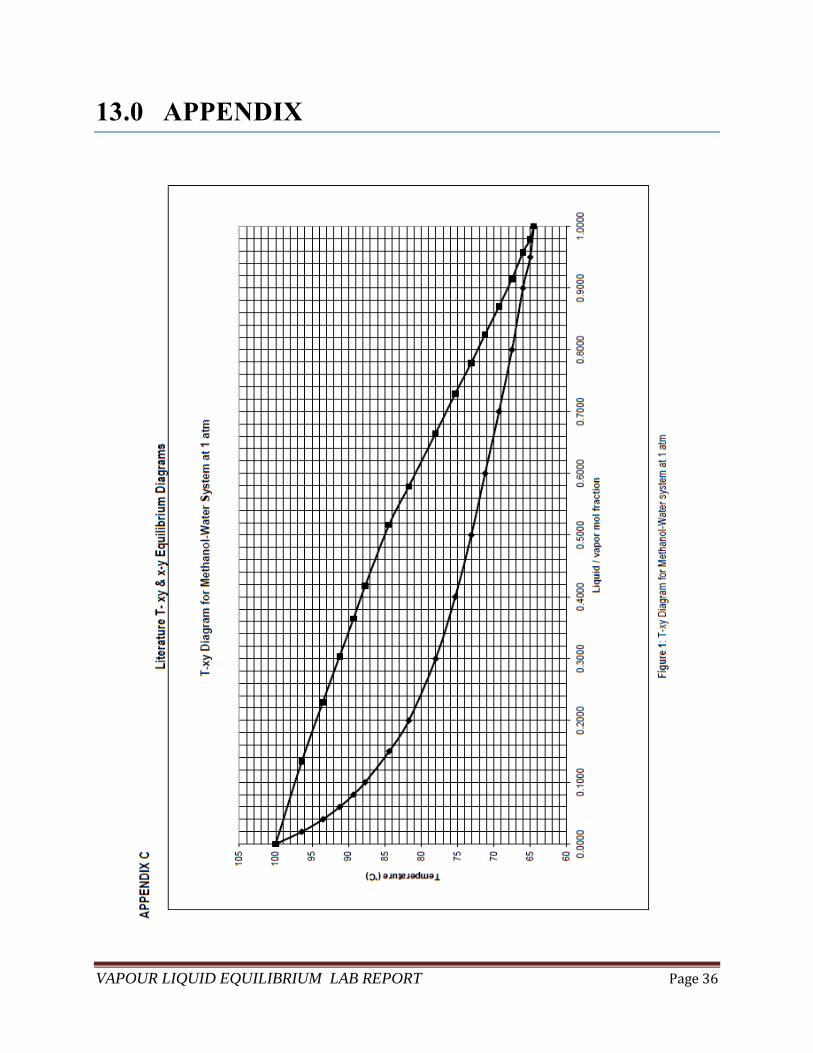
exist in linear. Then, the graph of T-xy can be plotted. This graph represents data for 2
component (Binary) system. The system are Temperature against Mole fraction of vapour and
Temperature against Mole fraction of liquid. After the Refractive Index (RI) for vapour and
liquid are recorded, the graph for RI can be plotted and the bell-like shape graph is obtained.
By using the calculation of density for each compound , the Mole fraction of vapour and
liquid can be find out. The density of methanol is 0.79 g/cm whereas the density of water is 1
g/cm. By using the density and the volume of methanol and water that we used , we can figure
out the mass of the water and the methanol.
VAPOUR LIQUID EQUILIBRIUM LAB REPORT Page 32
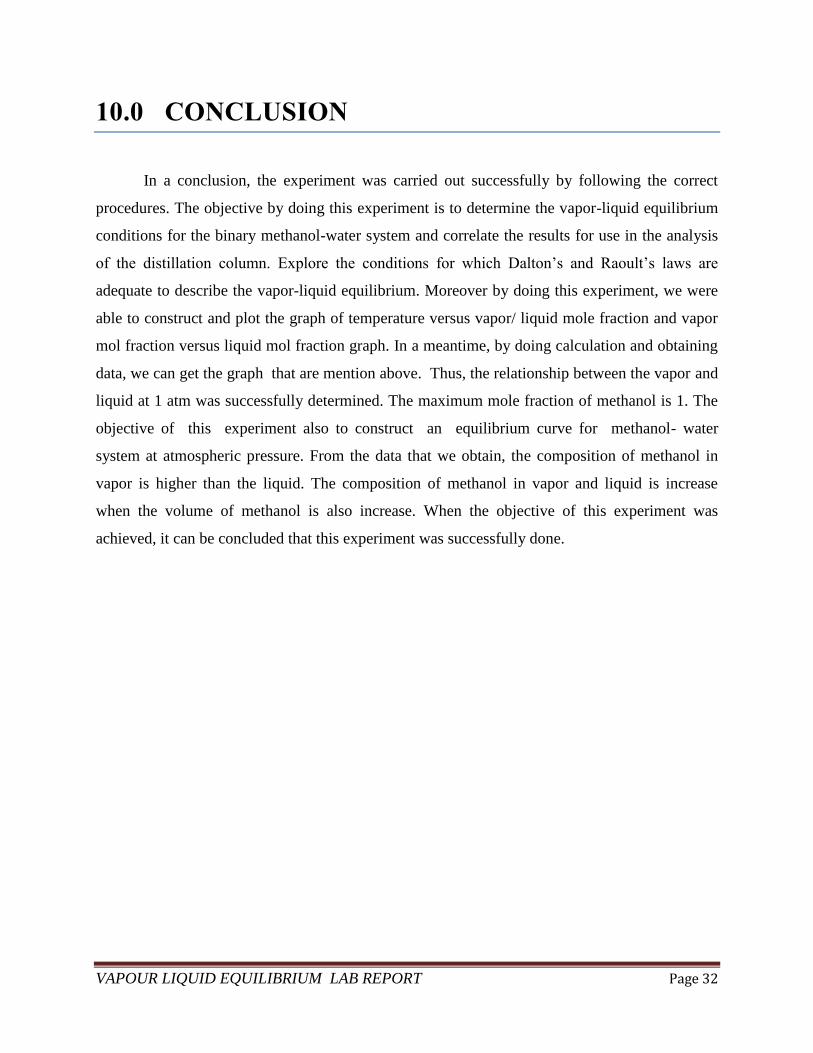
10.0 CONCLUSION
In a conclusion, the experiment was carried out successfully by following the correct
procedures. The objective by doing this experiment is to determine the vapor-liquid equilibrium
conditions for the binary methanol-water system and correlate the results for use in the analysis
of the distillation column. Explore the conditions for which Dalton’s and Raoult’s laws are
adequate to describe the vapor-liquid equilibrium. Moreover by doing this experiment, we were
able to construct and plot the graph of temperature versus vapor/ liquid mole fraction and vapor
mol fraction versus liquid mol fraction graph. In a meantime, by doing calculation and obtaining
data, we can get the graph that are mention above. Thus, the relationship between the vapor and
liquid at 1 atm was successfully determined. The maximum mole fraction of methanol is 1. The
objective of this experiment also to construct an equilibrium curve for methanol- water
system at atmospheric pressure. From the data that we obtain, the composition of methanol in
vapor is higher than the liquid. The composition of methanol in vapor and liquid is increase
when the volume of methanol is also increase. When the objective of this experiment was
achieved, it can be concluded that this experiment was successfully done.
VAPOUR LIQUID EQUILIBRIUM LAB REPORT Page 33
11.0 RECOMMENDATION
To improve the experiment and obtaining the best result, the experiment should have
been repeated three times in order to get the average readings and to get the reading more
accurately. This will reduce the deviation from theoretical result and reduce the error of reading.
Besides, the experiment itself took more than four hours to be done once, however due to
limitation of time, the experiment could only be done once. Therefore, to get better results, the
experiment should have been repeated twice.
In addition, we also can compare our result to the other group or we can make a group
discussion with the other group to make sure that our results are accurate or not. We should also
increase our knowledge on how to handle the experiment better.
VAPOUR LIQUID EQUILIBRIUM LAB REPORT Page 34
12.0 REFERENCE
1. Yunus A. Cengal & Michael A. Boles, “Thermodynamics – An Engineering Approach”,
3rd
Edition, 4th
Edition, McGraw Hill, 2002.
2. T. M. Duncan and J. A. Reimer, “Chemical Engineering Design and Analysis : An
Introduction”, Cambridge University Press, 1998.
3. Gmehling, J. and Onken, U, “Vapor-Liquid Equilibrium Data Collection”, Dechema,
Frankfurt, Germany, Vol. 1, Page 60, 1977.
VAPOUR LIQUID EQUILIBRIUM LAB REPORT Page 35
VAPOUR LIQUID EQUILIBRIUM LAB REPORT Page 36
13.0 APPENDIX
VAPOUR LIQUID EQUILIBRIUM LAB REPORT Page 37