Embed Size (px)
Citation preview
Kinetics of proton pumping in cytochrome c oxidaseAnatoly Yu. Smirnov,1,2,3,a� Lev G. Mourokh,4 and Franco Nori1,3
1Advanced Science Institute, The Institute of Physical and Chemical Research (RIKEN),Wako-shi, Saitama 351-0198, Japan2CREST, Japan Science and Technology Agency, Kawaguchi, Saitama 332-0012, Japan3Department of Physics, Center for Theoretical Physics, The University of Michigan,Ann Arbor, Michigan 48109-1040, USA4Department of Physics, Queens College, The City University of New York, Flushing, New York 11367, USA
�Received 23 February 2009; accepted 27 May 2009; published online 18 June 2009�
We propose a simple model of cytochrome c oxidase, including four redox centers and fourprotonable sites, to study the time evolution of electrostatically coupled electron and protontransfers initiated by the injection of a single electron into the enzyme. We derive a system of masterequations for electron and proton state probabilities and show that an efficient pumping of protonsacross the membrane can be obtained for a reasonable set of parameters. All four experimentallyobserved kinetic phases appear naturally from our model. We also calculate the dependence of thepumping efficiency on the transmembrane voltage at different temperatures and discuss a possiblemechanism of the redox-driven proton translocation. © 2009 American Institute of Physics.�DOI: 10.1063/1.3155213�
I. INTRODUCTION
The last enzyme of the respiratory chain of animal cellsand bacteria, cytochrome c oxidase �CcO�, operates as anefficient nanoscale machine converting electron energy into atransmembrane proton electrochemical gradient.1–7 The ad-enosine triphosphate �ATP� synthase enzyme uses this en-ergy to synthesize ATP molecules serving as the “energy cur-rency” of the cell. The process of energy conversion startswhen a molecular shuttle, cytochrome c, delivers, one byone, high-energy electrons to a dinuclear copper center, CuA,located near a positive side �P-side� of the inner mitochon-drial membrane �see Fig. 1�. In recent time-resolved opticaland electrometric studies8 of the CcO transition from theoxidized �O� state to the one electron reduced form �E�, asingle electron is donated to the CuA redox center by a laser-activated molecule of ruthenium bispyridyl �RubiPy�. There-after, in a few microseconds ��10 �s�, a major part of anelectron density ��70%� is transferred from the CuA centerto the low-spin heme a �Fe-a�. Heme a is located within themembrane domain at a distance about 2/3 of the membranewidth, W, counting from the N-side.8–10 Within a time inter-val of approximately 150 �s, about 60% of the electronpopulation is transferred from heme a to heme a3 �Fe-a3�.Heme a3, jointly with the next electron acceptor in line, acopper ion CuB, form a binuclear center �BNC� �sites R andB in Fig. 1�, serving as an active catalytic site for dioxygenreduction to water. The redox centers a, a3, and CuB arelocated approximately at the same distance �2 /3W� from theN-side of the membrane as heme a.
The next phase �with a time scale of the order of800 �s� is characterized by a complete electron transfer tothe copper ion CuB. Time-resolved measurements8 show thatthe first “10 �s” phase of the electron transfer process is not
accompanied by a proton transfer, but the “slowness” of thesecond “150 �s” and the third “800 �s” phases hints to theproton participation during phases.
The proton path from the negative side of the membrane�N-side� toward the P-side �for pumped protons� and towardthe BNC �for substrate or “chemical” protons� goes throughthe residue E278 �for the Paracoccus denitrificans enzyme8�.These residues are located at the end of the so-calledD-pathway �Fig. 1�. A fraction of the substrate protons canalso be delivered to the BNC via an additional K-pathway,which we will not consider here. The proton to be pumped issupposed to move from E278 �schematically shown as site Din Fig. 1� to an unknown protonable “pumping” site X �likelya heme a3 propionate�, located above the BNC,11 and, there-after, via an additional protonable site C,12,13 to the P-side ofthe membrane. After a fast reprotonation from theD-channel, the residue E278 can donate a substrate proton tothe catalytic site near the BNC �probably, to an OH− ligandof CuB �Refs. 8 and 9��. It is assumed8,9 that during thesecond 150 �s phase, the first �prepumped� proton movesfrom the residue E278 �site D in Fig. 1� to the pump site X,whereas in the third 800 �s phase, the second �substrate orchemical� proton populates a catalytic site Z near the BNC.In the final phase, which occurs in 2.6 ms, the first proton �inX� is translocated �via C� to the P-side, which is character-ized by a higher electrochemical potential than the N-side ofthe membrane.
As a result of all these processes, two protons are takenfrom the N-side of the membrane, and one electron is takenfrom the P-side, and eventually one proton is pumped to theP-side. Moreover, one proton and one electron are consumedat the catalytic site to finally produce a water moleculearound the BNC. It should be noted that kinetic phases witha�Electronic mail: [email protected].
THE JOURNAL OF CHEMICAL PHYSICS 130, 235105 �2009�
0021-9606/2009/130�23�/235105/12/$25.00 © 2009 American Institute of Physics130, 235105-1
Downloaded 28 Jun 2009 to 134.160.214.34. Redistribution subject to AIP license or copyright; see http://jcp.aip.org/jcp/copyright.jsp
similar time scales �10 �s→100 �s→1000 �s� have beenrevealed in other CcO enzymes at various transition stepsbetween the states of the enzyme.12,14,15
Kinetic data obtained in experiments8,12,14,15 reflect im-portant details of the still elusive proton pumping mechanismin CcO. To extract these details and gain a deeper insight intothe operating principles of the CcO proton pump, it is nec-essary to compare results of experiments with theoreticalpredictions. In Ref. 16, a simplified empirical valence bond�EVB� effective potential was combined with a modifiedMarcus equation to model time-dependent electron and pro-ton transfers in CcO in the range of milliseconds. However,this approach was applied to the single transfer event, not tothe sequence of events, and the obtained time scale �1 �s�differs by orders of magnitude from the experimental data�about 100 �s�. A computational analysis of the CcO ener-getics was presented in Refs. 17–21 with molecular modelsreproducing energetic barriers for the proton transfersteps.17,18 The obtained energetic map of the proton and elec-tron pathways in the CcO enzyme can be converted into a setof rate constants, which qualitatively explains the kineticsand unidirectionality of the pumping process. However, thesestudies do not result in a quantitative model of the efficientCcO proton pump. Moreover, the error range of thesesemimicroscopic calculations ��2 kcal /mol� is sometimeshigher than the difference between the energy barriers.18,20
Kinetic models of the proton pumping process were alsodiscussed in Ref. 22. Within the master equation approach, itwas shown that the proton pumping effect can be achieved ina simplified system having one redox and two proton sitesand, with a higher efficiency, ��0.9, for the design with tworedox and two protonable sites, which are electrostaticallycoupled to each other. However, this work does not contain
any predictions for the kinetics of the pumping process inmore realistic setups, with at least four redox sites �CuA,heme a, heme a3, and CuB� and two protonable sites �a resi-due E278 and a pump site X�. To find proper parameters forthe proton pump, the authors of Ref. 22 resort to a MonteCarlo search in a multidimensional parameter space. It ishard to imagine, however, that a random search can providea reasonable set of parameters which will comply with allphysical restrictions of real pumps. In general, for compre-hensive theoretical studies, it is preferable to determine therelevant parameters of the system using detailed microscopiccalculations �see, e.g., Refs. 16–18�. However, the hugecomputational complexity of biological structures makessuch an approach extremely difficult. In our paper, we in-clude reasonable estimates for the system parameters into amodel describing almost-simultaneous electron and protontransfer processes and compare the obtained kinetics to ex-perimentally observed time scales and site populations ofCcO.8
The time evolution of the proton pumping process inCcO, related to the experimental data of Refs. 8, 14, 12, and15, was discussed in Refs. 9, 10, 19, 20, and 23. In theseworks, the kinetics of the electron-proton system is brokendown into a cascade of quasiequilibrium states characterizedby distributions of electrons and protons over the sites, aswell as by a set of transition rates corresponding to specifickinetic phases. It should be emphasized, however, that manyelectron and proton transfers can be separated by only ananosecond time scale, and consequently, the experimentallyobserved kinetic rates comprise contributions of severalalmost-simultaneous individual electron and proton transferevents.10,23 Correspondingly, an approach taking into accountthe kinetic inseparability of electron and proton transitionscan be useful for understanding recent experimentalfindings.8 We note that kinetic coefficients used in the theo-retical analysis of Refs. 10, 19, 20, and 23 were deducedfrom experiments without independent microscopic calcula-tions of the heights of individual electron and proton barri-ers.
In the present paper, we analyze electron and proton ki-netics in CcO within a simple physical model including fourredox centers and four protonable sites electrostaticallycoupled to each other in the presence of a dissipative envi-ronment. Using the master equation approach, we reproduceall four kinetic phases observed in Ref. 8 for a reasonable setof parameters. It should be emphasized that we have per-formed extensive numerical studies for a wide range of pa-rameters and we found that our model of proton pumping isquite robust to significant variations of the parameters. Thespecific set of parameters presented below gives a very goodagreement with the experimental data of Ref. 8. We considera single cycle of events, which starts at t=0 with one elec-tron transfer to the CuA center and finishes at the moment t= tB, when the redox site CuB is completely reduced. Noticethat the injection of additional high-energy electrons is nec-essary to maintain this nonequilibrium state of the CcO en-zyme. We also determine the efficiency of the proton pump-ing for our model and its dependencies on the temperatureand transmembrane voltage.
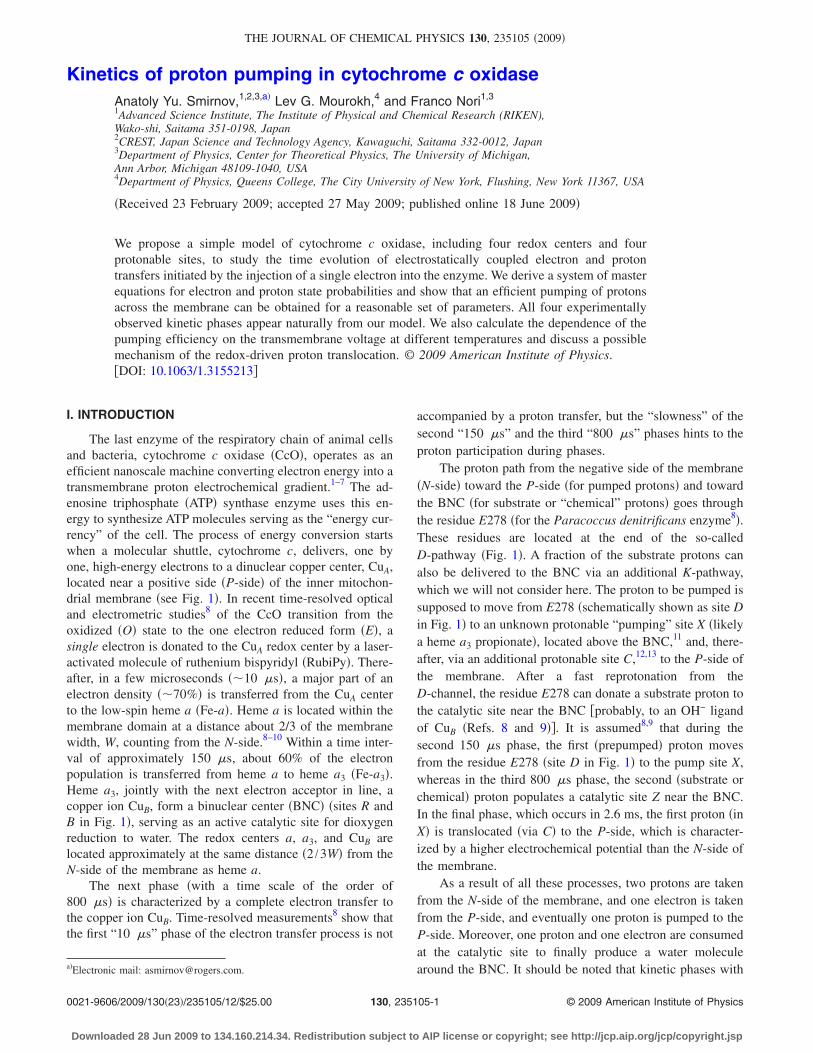
FIG. 1. �Color online� Schematic of CcO. A single electron enters the en-zyme at site A and travels subsequently to sites L, R, and, finally, to site B.Protons, taken at the N-side of the membrane, move to site D, which candonate protons both to the pump site X and to the catalytic site Z. Theprepumped proton is transferred from site X to the P-side of the membranevia site C.
235105-2 Smirnov, Mourokh, and Nori J. Chem. Phys. 130, 235105 �2009�
Downloaded 28 Jun 2009 to 134.160.214.34. Redistribution subject to AIP license or copyright; see http://jcp.aip.org/jcp/copyright.jsp
The rest of paper is structured as follows. Our model andits parameters are presented in Sec. II. Results of numericalstudies are shown in Sec. III and discussed in Sec. IV. Sec-tion V contains the conclusions of our work. The detailedderivation of the master equations and the measurable vari-ables is presented in Appendix A. It should be noted thatwhile the results of this paper are obtained in the classicalregime, our approach �based on quantum transport theory�can be used to examine fine quantum effects and conse-quently, the detailed derivation is worth presenting here.
II. MODEL
As in the real CcO enzyme,24–28 the redox chain of thepresent model includes four centers: CuA �site A�, heme a�Fe-a, site L�, heme a3 �Fe-a3, site R�, and CuB �site B�, asschematically shown in Fig. 1. The transport chain for pro-tons has four sites: D �presumably related to the residueE278 near the end of the D-pathway�, X �the pump siteabove the BNC�, a protonable site C placed on the way fromthe X-site to the P-side of the membrane, and finally, a pro-tonable site Z located in the proximity of the BNC and re-lated to the OH− ligand of CuB �see Fig. 1�. Sites B and Zserve as final destinations for the injected electron and for thesubstrate proton, respectively. We assume that the electroncan be transferred between the pairs of redox states A and L,L and R, R and B; and that protons can be translocated be-tween the pairs of protonable sites D and X, X and C, as wellas D and Z.
To provide an “openness” of the CcO enzyme, which isinherent in the living systems,22 we allow proton transitionsbetween site D and the negative side of the membrane aswell as between site C and the positive side of the mem-brane. Protons are delivered to the catalytic site Z partiallythrough the K-pathway.5,9 This channel can be incorporatedinto our model, but for simplicity, it will be neglected. TheN- and P-sides of the membrane play roles of proton reser-voirs which work as a source �N-side� and a sink �P-side� ofprotons for the enzyme. The redox sites are disconnectedfrom electron reservoirs, and only one electron is injectedinto the redox chain at the initial moment of time, t=0.
With the condition of single occupation of each indi-vidual site, the system can be populated with up to fourprotons. Following the setup of Ref. 8, we assume that CcOis populated with a single electron initially located on site A.To quantitatively describe this system we introduce 64 basisstates ��� ,�=1, . . . ,64 �see Appendix A�. The time evolu-tion of the probability distribution over the basis states,���t��= ����t��, is governed by the system of master equa-tions, Eq. �A32�, with the solution given by Eq. �A34� in theAppendix A. The time-dependent probability distribution���t�� allows us to determine the average populations of allelectron and proton sites, �n�� and �N��, as functions of time.We can also calculate the number of protons, �NP�t��, trans-located to the positive side of the membrane �see AppendixA, Eq. �A36��. The value of �NP� taken at the end of thepumping cycle �t= tB� determines the pumping efficiency �defined22 as the number of protons pumped across the mem-brane per electron consumed:
� = �NP�tB�� . �1�
Note that the efficiency � can take negative values in thecase when protons move back from the positive side to thenegative side of the membrane.
A. Electrostatic interaction
The electrostatic interaction between the redox ��=A ,L ,R ,B� and protonable ��=D ,X ,C ,Z� sites plays a piv-otal role in the electron-proton energy exchange. It should benoted that we consider here only direct Coulomb interactionsbetween electron and proton subsystems and between pro-tons themselves. This removes strict geometrical restrictionson the relative positions of electron and proton active sitesimposed in our previous model29 based on the Förster-typeenergy exchange between electrons and protons. Micro-scopic calculations of the electrostatic parameters, u�� andu���, involved in the Hamiltonian H0 �see Appendix A, Eq.�A1��, require a detailed knowledge of the CcO structurecomplemented by the comprehensive dielectric map of theenzyme.17,30,31 Instead, we tune the Coulomb energies to getthe best possible fitting of the time scales and site popula-tions measured in the experiment.8 The obtained values ofCoulomb parameters correlate well with information aboutthe distances between the active sites24–28 for reasonable val-ues of the effective dielectric constants.
To describe the experimentally observed kinetic phasesof the pumping process, we assume that the coupling, uBZ
=630 meV, between the copper ion CuB and the catalyticsite Z �likely an OH− ligand of CuB �Refs. 8 and 9�� and thecoupling, uRX=555 meV, between heme a3 and the pumpsite X are higher than the electrostatic energies uRZ
=530 meV and uBX=uXZ=510 meV. Structural studies ofthe CcO enzyme24–28 performed at a resolution of about 2 Åshow that the BNC redox sites R �heme a3�, B �CuB� and theprotonable sites X and Z are separated by a distance of theorder of 6 Å. The value of the electrostatic coupling betweenthese sites, u�600 meV, roughly corresponds to the effec-tive dielectric constant, ��4, which is of frequent use for adescription of a dry protein interior.17,20,21 It should be em-phasized, however, that the concept of dielectric constant isnot completely appropriate for a calculation of Coulomb po-tentials in the heterogeneous environment inside and near theBNC.30,31
The distances, rLD ,rRD, between the residue E278 �siteD� and sites L and R are almost the same: rLD=12.3 Å andrRD=12.8 Å.28,32 We estimate the electrostatic coupling be-tween these sites as uLD�uRD�75 meV, which correspondsto the higher dielectric constant ��15. We consider asmaller dielectric constant, ��10, for the interaction, uLX
=100 meV, between sites L and X separated by the distancerLX�14.2 Å.20 Distant-dependent dielectric constants,��r���, are common in protein electrostatics.17,30,31
Note that here, as in the models of Refs. 9 and 19, theelectrostatic coupling, uRX, between heme a3 �site R� and siteX is stronger than the interaction, uLX, between heme a �siteL� and the pump site X. For the other parameters we choosethe following values �in meV�: uDX�60, uDZ�uBD
�70, uXC�100, uAD�25, uAZ�20. The Coulomb ener-
235105-3 Kinetics of proton pumping J. Chem. Phys. 130, 235105 �2009�
Downloaded 28 Jun 2009 to 134.160.214.34. Redistribution subject to AIP license or copyright; see http://jcp.aip.org/jcp/copyright.jsp
gies uCZ, uDC, uAX, uAC, uRC, uLC, and uLZ are assumed to benear 30 meV. Despite the fact that these energies areabout or higher than the temperature energy scale,T=298 K–26 meV, they have a minor influence on the per-formance of the model.
B. Energy levels of the sites
We assume that the difference �� �A37� between theelectrochemical potential �P of the P-side and the potential�N of the N-side of the membrane is about 210 meV atstandard temperature, T=298 K, with �P=105 meV and�N=−105 meV. This corresponds to voltage V�150 meVapplied across the membrane. We include the electron chargein the parameter V and measure voltage, along with otherenergies, in units of meV. According to Eq. �A38�, the energylevels, �� and ��, of the electron and proton centers areshifted from their intrinsic values ��
�0� and ���0� depending on
the voltage V and on the positions x� ,x� of the active sites.To estimate the electron and proton energies, we take intoaccount the facts6 that cytochrome c delivering electrons tothe CcO enzyme has a redox potential of order of 250 meV,and that the total drop of electron energy between cyto-chrome c and the dioxygen reduction site B is about550 meV. The equilibrium midpoint potentials8,9 of the CuA
center �Em�250 meV� and heme a �Em�270 meV� canalso be used as a general guide for estimating energies,33
although the real parameters can deviate from the estimatedvalues.
We find that our model performs with the high effi-ciency, ��0.95, and reproduces all experimentally observedkinetic phases8 for the following set of electron intrinsic en-ergies �in meV�: �A
�0�=−175, �L�0�=−240, �R
�0�=−185, �B�0�
=−155, and for the following energies of protonable sites �inmeV�: �D
�0�=−100, �X�0�=250, �C
�0�=195, and �Z�0�=−65. It
should be noted that in the presence of the transmembranevoltage, V=150 meV, the electron energy levels of A and Lsites, �A=−250, �L=−265, are close to the values extractedfrom equilibrium redox titrations �see also Ref. 34, where anestimation, ��A−�L��18 meV, has been obtained�. Forenergies of other redox sites we use the values: �R
=−210, �B=−180. The energies of the protonable sites arealso shifted with voltage, V=150 meV, present: �D=−85,�X=295, �C=270, and �Z=−40. It should be stressed that theenergy, �X, of the pump site X is set to be higher than thepotentials of the proton reservoirs on both sides of the mem-brane: �X�P�N. However, the presence of an electronon site R decreases the proton energy to the level, ����X
−uRX��−260 meV, which is below the energy of the D-siteand below the electrochemical potential, �N=−105 meV, ofthe N-side of the membrane. As a result, the pump site X ispopulated with a prepumped proton. When the chemical pro-ton moves to site Z and the electron is transferred to theB-site, the energy level of the X-site returns to the initialposition, �X=295 meV, since the electron and protoncharges of the catalytic site compensate each other, uBX
=uXZ. The high-energy prepumped proton can now move tosite C and after that, to the P-side of the membrane charac-terized by the potential �P=105 meV. A large energy gap,
��X−�D��380 meV, significantly suppresses the return ofthe X-proton to site D and to the N-side of the membrane.
C. Reorganization energies and transition rates
Part of the energy delivered to the redox center CuA atthe initial time, t=0, is dissipated to an environment charac-terized by sets of electron ����� and proton ����� reorgani-zation energies. To be efficient, the proton pumping processshould occur with minimal energy dissipation. It is shown inRef. 35 that the reorganization energy for the a to a3 electrontransfer in the CcO enzyme can be as low as 100 meV.Similar estimates apply for the proton reorganizationenergies.36,37 Here, we use the higher energy parameter,AL=200 meV, for the A-to-L transfer and accept the lowervalue, ��������100 meV, for other electron and protontransitions. It is argued in Refs. 34, 38, and 39 that for theCuA→heme a electron transition the reorganization energymust be in the range from 150 to 500 meV, which is muchlower than the typical values of the reorganization energy forelectron transfers in protein. The low values of electron re-organization energies ��2–4 kcal /mol� have also beencalculated for electron transfer reactions in Rhodobactersphaeroides.30
To reproduce the initial kinetic phases, we use the fol-lowing tunneling energies: �AL�0.9 �eV and �LR��BR
�14 �eV. The parameters �LR and �BR describe the elec-tron transfers, which are coupled to the slower proton tran-sitions characterized by the energy scales: �DX��CX
�0.3 �eV and �ZD�0.2 �eV. It should be noted that theelectron transfer between hemes a and a3 can occur in ananosecond time scale.40 The hydrogen-bonded chains inproteins are also able to conduct protons in nanoseconds orfaster.41,42
We also select the values �N��P�17 ms−1 for the pa-rameters �N and �P, which determine the flow of protonsthrough the enzyme. These parameters �N and �P are of thesame order as some of the transition rates �� used inRef. 22.
III. RESULTS
A. Four kinetic phases
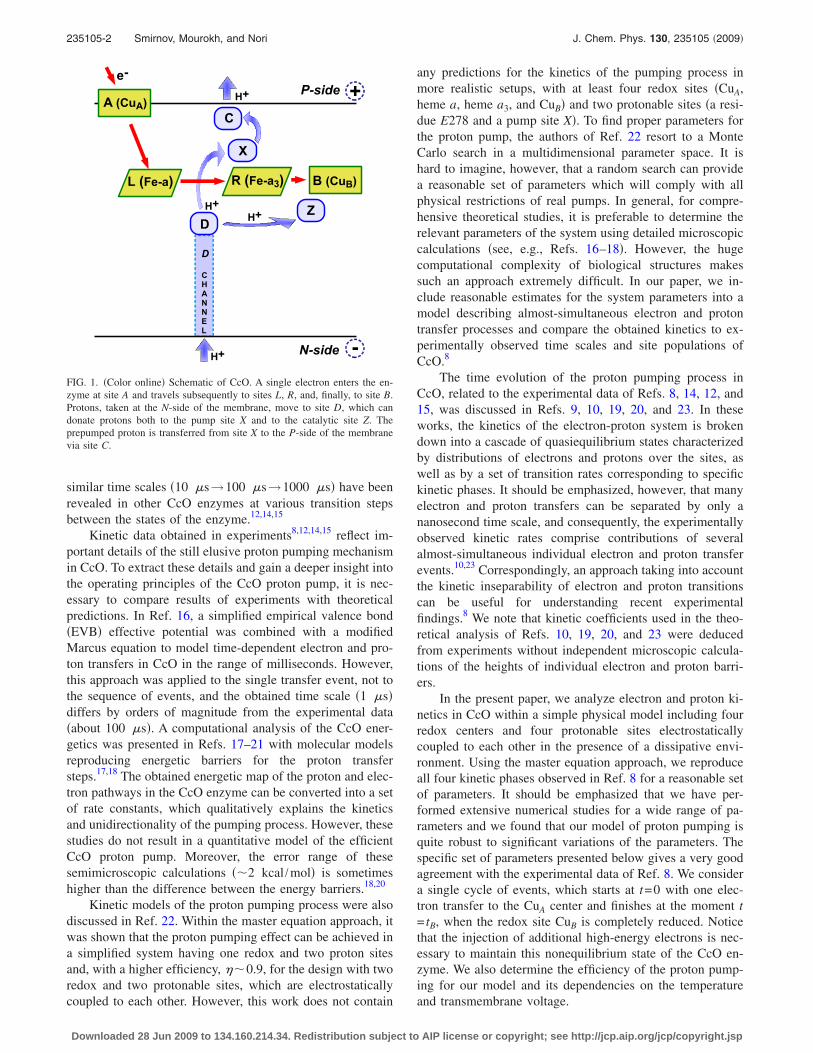
In Fig. 2, starting at t=0.1 �s, we show a process ofpopulation and depopulation of the electron, nA,L,R,B, andproton, ND,X,C,Z, sites as well as the time dependence of theaverage number of protons pumped to the positive side of themembrane, NP. From here on we drop the brackets � . . . �denoting the averaging over the environmental fluctuationsand over the states of the proton reservoirs. The calculationsare performed for the standard conditions ��P=105 meV,�N=−105 meV, �pH=−1, and T=298 K� and for the trans-membrane voltage V=150 meV. We assume that initially asingle electron is located at site A �CuA�, and a proton occu-pies site D. This means that at t=0 only one element of thedensity matrix is not equal to zero: �2�0�=1.
During the first phase of the process the electron movesfrom site A to site L �heme a�. In �10 �s near 70% of theelectron density is transferred to heme a �site L� with theremaining 30% distributed almost equally between site A
235105-4 Smirnov, Mourokh, and Nori J. Chem. Phys. 130, 235105 �2009�
Downloaded 28 Jun 2009 to 134.160.214.34. Redistribution subject to AIP license or copyright; see http://jcp.aip.org/jcp/copyright.jsp
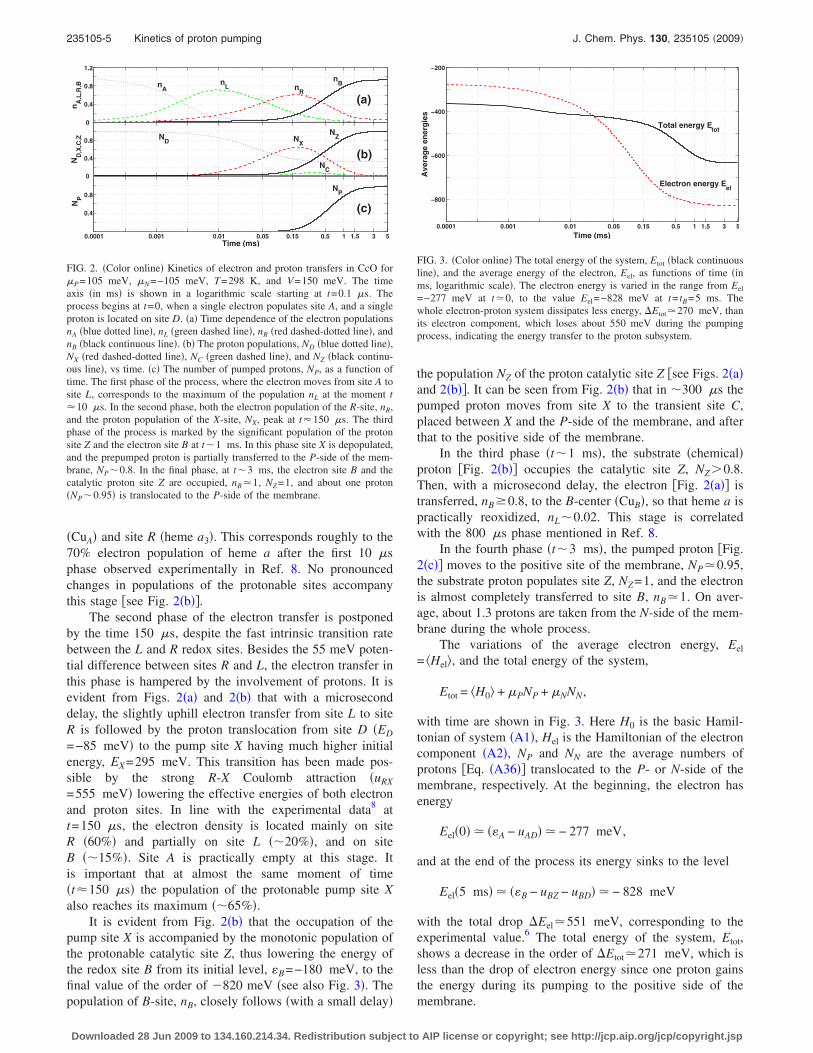
�CuA� and site R �heme a3�. This corresponds roughly to the70% electron population of heme a after the first 10 �sphase observed experimentally in Ref. 8. No pronouncedchanges in populations of the protonable sites accompanythis stage �see Fig. 2�b��.
The second phase of the electron transfer is postponedby the time 150 �s, despite the fast intrinsic transition ratebetween the L and R redox sites. Besides the 55 meV poten-tial difference between sites R and L, the electron transfer inthis phase is hampered by the involvement of protons. It isevident from Figs. 2�a� and 2�b� that with a microseconddelay, the slightly uphill electron transfer from site L to siteR is followed by the proton translocation from site D �ED
=−85 meV� to the pump site X having much higher initialenergy, EX=295 meV. This transition has been made pos-sible by the strong R-X Coulomb attraction �uRX
=555 meV� lowering the effective energies of both electronand proton sites. In line with the experimental data8 att=150 �s, the electron density is located mainly on siteR �60%� and partially on site L ��20%�, and on siteB ��15%�. Site A is practically empty at this stage. Itis important that at almost the same moment of time�t�150 �s� the population of the protonable pump site Xalso reaches its maximum ��65%�.
It is evident from Fig. 2�b� that the occupation of thepump site X is accompanied by the monotonic population ofthe protonable catalytic site Z, thus lowering the energy ofthe redox site B from its initial level, �B=−180 meV, to thefinal value of the order of �820 meV �see also Fig. 3�. Thepopulation of B-site, nB, closely follows �with a small delay�
the population NZ of the proton catalytic site Z �see Figs. 2�a�and 2�b��. It can be seen from Fig. 2�b� that in �300 �s thepumped proton moves from site X to the transient site C,placed between X and the P-side of the membrane, and afterthat to the positive side of the membrane.
In the third phase �t�1 ms�, the substrate �chemical�proton �Fig. 2�b�� occupies the catalytic site Z, NZ0.8.Then, with a microsecond delay, the electron �Fig. 2�a�� istransferred, nB�0.8, to the B-center �CuB�, so that heme a ispractically reoxidized, nL�0.02. This stage is correlatedwith the 800 �s phase mentioned in Ref. 8.
In the fourth phase �t�3 ms�, the pumped proton �Fig.2�c�� moves to the positive site of the membrane, NP�0.95,the substrate proton populates site Z, NZ=1, and the electronis almost completely transferred to site B, nB�1. On aver-age, about 1.3 protons are taken from the N-side of the mem-brane during the whole process.
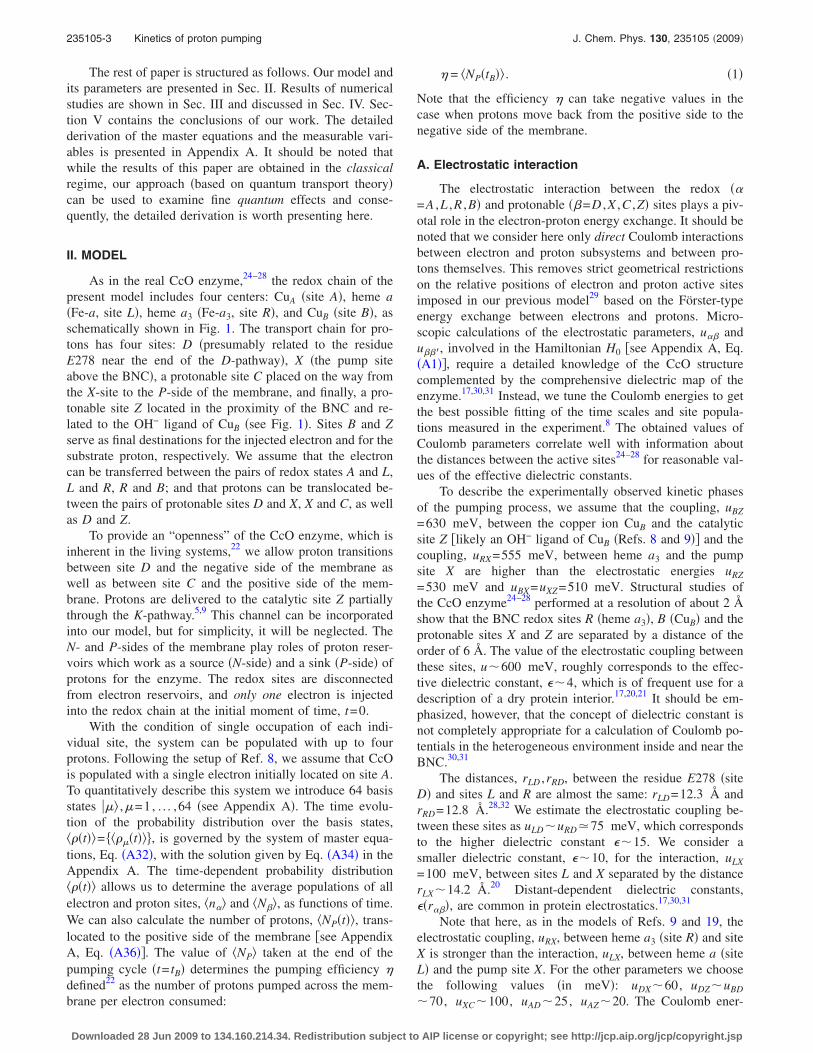
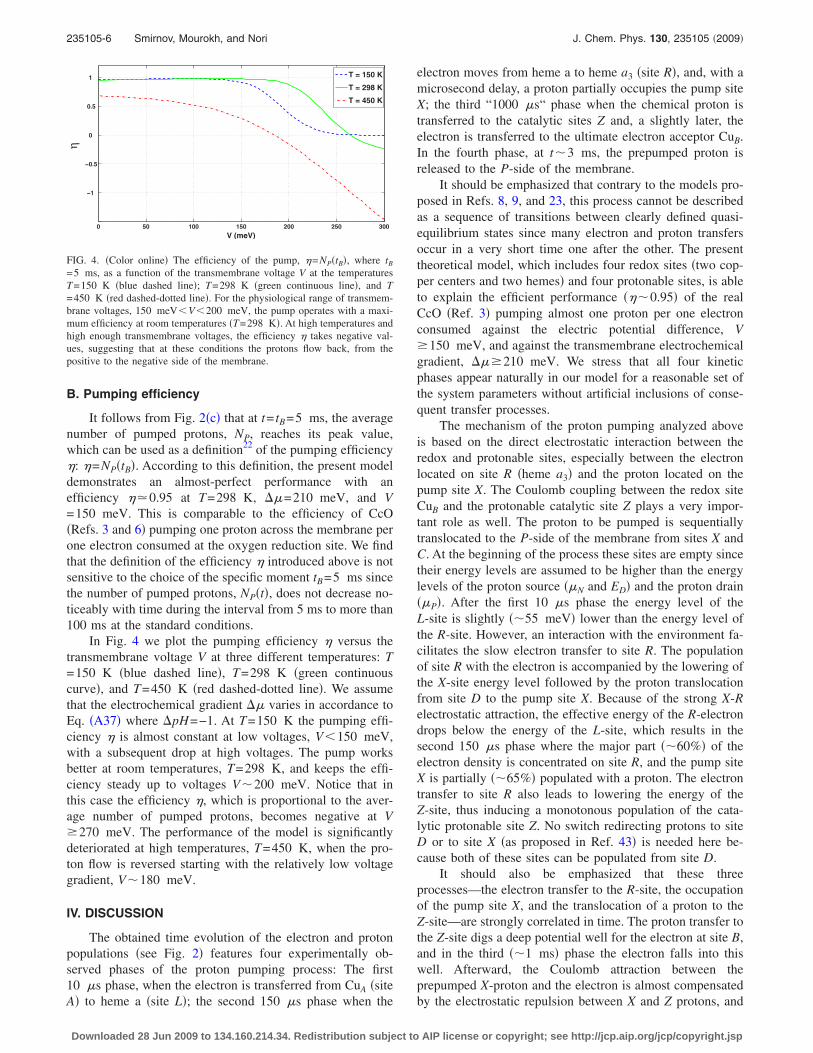
The variations of the average electron energy, Eel
= �Hel�, and the total energy of the system,
Etot = �H0� + �PNP + �NNN,
with time are shown in Fig. 3. Here H0 is the basic Hamil-tonian of system �A1�, Hel is the Hamiltonian of the electroncomponent �A2�, NP and NN are the average numbers ofprotons �Eq. �A36�� translocated to the P- or N-side of themembrane, respectively. At the beginning, the electron hasenergy
Eel�0� � ��A − uAD� � − 277 meV,
and at the end of the process its energy sinks to the level
Eel�5 ms� � ��B − uBZ − uBD� � − 828 meV
with the total drop �Eel�551 meV, corresponding to theexperimental value.6 The total energy of the system, Etot,shows a decrease in the order of �Etot�271 meV, which isless than the drop of electron energy since one proton gainsthe energy during its pumping to the positive side of themembrane.
0
0.4
0.8
1.2n
A,L
,R,B
0
0.4
0.8
ND
,X,C
,Z
0.0001 0.001 0.01 0.05 0.15 0.5 1 1.5 3 5
0.4
0.8
Time (ms)
NP
(a)
(b)
nA
nL n
R
nB
ND N
X
NZ
NC
(c)
NP
FIG. 2. �Color online� Kinetics of electron and proton transfers in CcO for�P=105 meV, �N=−105 meV, T=298 K, and V=150 meV. The timeaxis �in ms� is shown in a logarithmic scale starting at t=0.1 �s. Theprocess begins at t=0, when a single electron populates site A, and a singleproton is located on site D. �a� Time dependence of the electron populationsnA �blue dotted line�, nL �green dashed line�, nR �red dashed-dotted line�, andnB �black continuous line�. �b� The proton populations, ND �blue dotted line�,NX �red dashed-dotted line�, NC �green dashed line�, and NZ �black continu-ous line�, vs time. �c� The number of pumped protons, NP, as a function oftime. The first phase of the process, where the electron moves from site A tosite L, corresponds to the maximum of the population nL at the moment t�10 �s. In the second phase, both the electron population of the R-site, nR,and the proton population of the X-site, NX, peak at t�150 �s. The thirdphase of the process is marked by the significant population of the protonsite Z and the electron site B at t�1 ms. In this phase site X is depopulated,and the prepumped proton is partially transferred to the P-side of the mem-brane, NP�0.8. In the final phase, at t�3 ms, the electron site B and thecatalytic proton site Z are occupied, nB�1, NZ=1, and about one proton�NP�0.95� is translocated to the P-side of the membrane.
0.0001 0.001 0.01 0.05 0.15 0.5 1 1.5 3 5
−800
−600
−400
−200
Time (ms)
Ave
rag
een
erg
ies
Electron energy Eel
Total energy Etot
FIG. 3. �Color online� The total energy of the system, Etot �black continuousline�, and the average energy of the electron, Eel, as functions of time �inms, logarithmic scale�. The electron energy is varied in the range from Eel
=−277 meV at t�0, to the value Eel=−828 meV at t= tB=5 ms. Thewhole electron-proton system dissipates less energy, �Etot�270 meV, thanits electron component, which loses about 550 meV during the pumpingprocess, indicating the energy transfer to the proton subsystem.
235105-5 Kinetics of proton pumping J. Chem. Phys. 130, 235105 �2009�
Downloaded 28 Jun 2009 to 134.160.214.34. Redistribution subject to AIP license or copyright; see http://jcp.aip.org/jcp/copyright.jsp
B. Pumping efficiency
It follows from Fig. 2�c� that at t= tB=5 ms, the averagenumber of pumped protons, NP, reaches its peak value,which can be used as a definition22 of the pumping efficiency�: �=NP�tB�. According to this definition, the present modeldemonstrates an almost-perfect performance with anefficiency ��0.95 at T=298 K, ��=210 meV, and V=150 meV. This is comparable to the efficiency of CcO�Refs. 3 and 6� pumping one proton across the membrane perone electron consumed at the oxygen reduction site. We findthat the definition of the efficiency � introduced above is notsensitive to the choice of the specific moment tB=5 ms sincethe number of pumped protons, NP�t�, does not decrease no-ticeably with time during the interval from 5 ms to more than100 ms at the standard conditions.
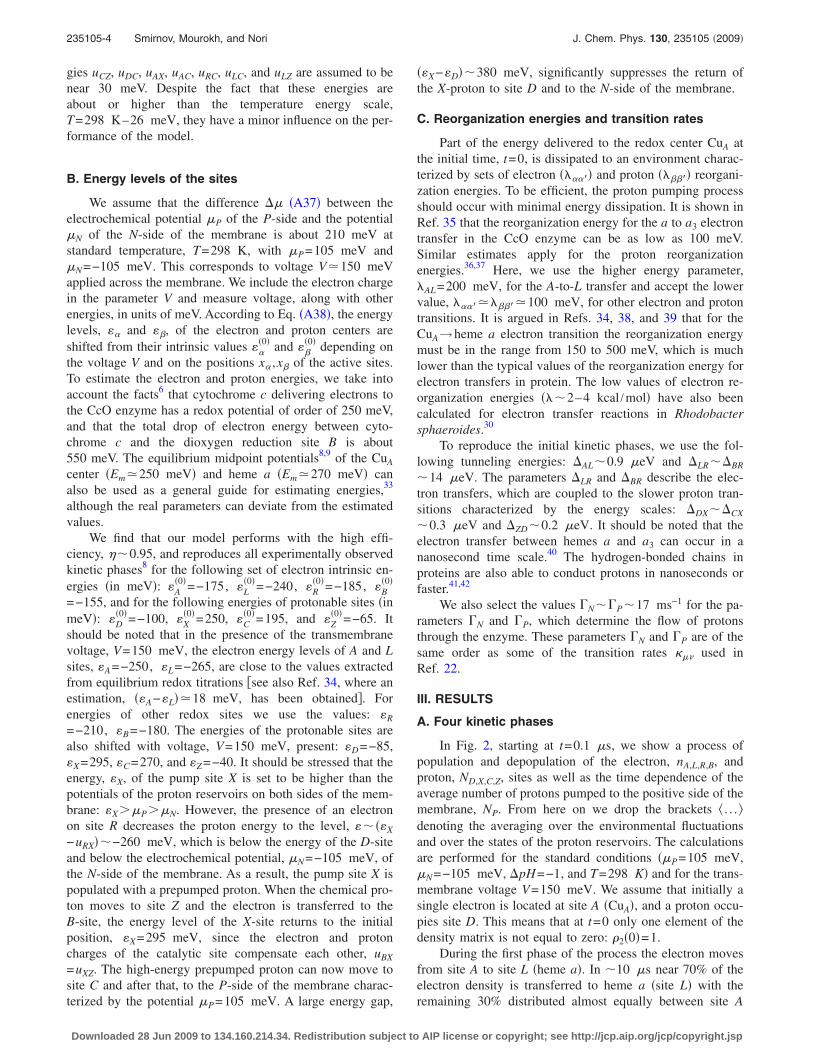
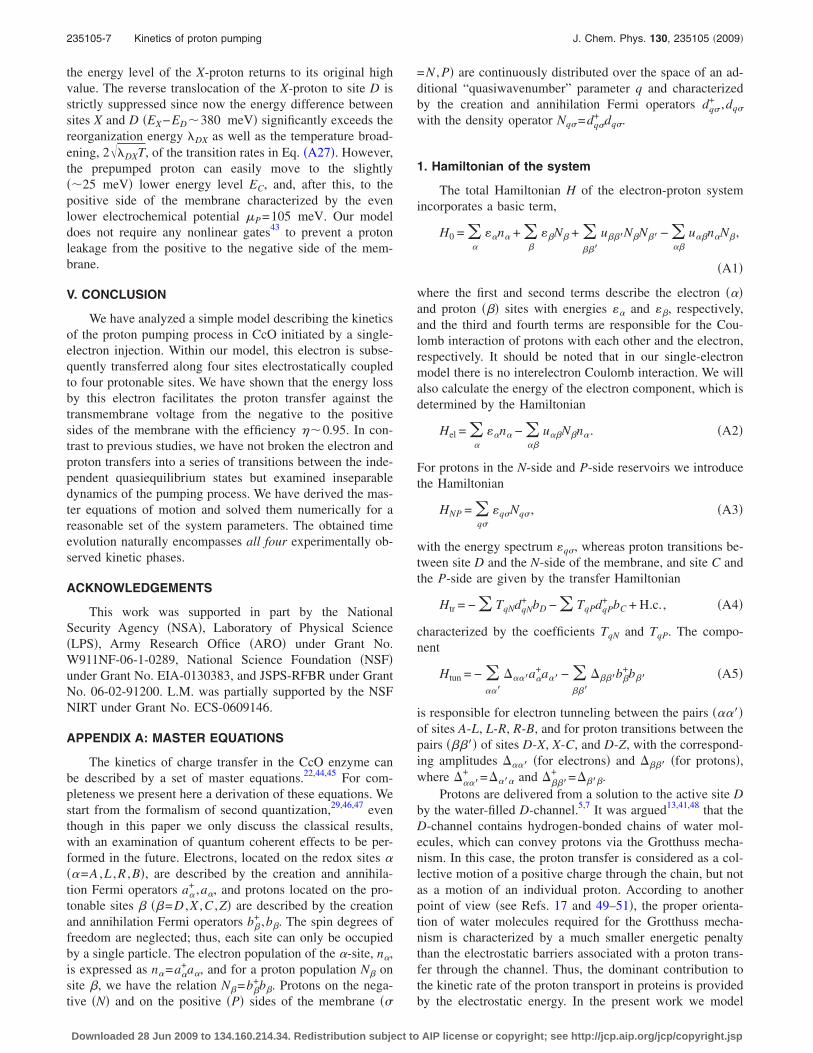
In Fig. 4 we plot the pumping efficiency � versus thetransmembrane voltage V at three different temperatures: T=150 K �blue dashed line�, T=298 K �green continuouscurve�, and T=450 K �red dashed-dotted line�. We assumethat the electrochemical gradient �� varies in accordance toEq. �A37� where �pH=−1. At T=150 K the pumping effi-ciency � is almost constant at low voltages, V�150 meV,with a subsequent drop at high voltages. The pump worksbetter at room temperatures, T=298 K, and keeps the effi-ciency steady up to voltages V�200 meV. Notice that inthis case the efficiency �, which is proportional to the aver-age number of pumped protons, becomes negative at V�270 meV. The performance of the model is significantlydeteriorated at high temperatures, T=450 K, when the pro-ton flow is reversed starting with the relatively low voltagegradient, V�180 meV.
IV. DISCUSSION
The obtained time evolution of the electron and protonpopulations �see Fig. 2� features four experimentally ob-served phases of the proton pumping process: The first10 �s phase, when the electron is transferred from CuA �siteA� to heme a �site L�; the second 150 �s phase when the
electron moves from heme a to heme a3 �site R�, and, with amicrosecond delay, a proton partially occupies the pump siteX; the third “1000 �s“ phase when the chemical proton istransferred to the catalytic sites Z and, a slightly later, theelectron is transferred to the ultimate electron acceptor CuB.In the fourth phase, at t�3 ms, the prepumped proton isreleased to the P-side of the membrane.
It should be emphasized that contrary to the models pro-posed in Refs. 8, 9, and 23, this process cannot be describedas a sequence of transitions between clearly defined quasi-equilibrium states since many electron and proton transfersoccur in a very short time one after the other. The presenttheoretical model, which includes four redox sites �two cop-per centers and two hemes� and four protonable sites, is ableto explain the efficient performance ���0.95� of the realCcO �Ref. 3� pumping almost one proton per one electronconsumed against the electric potential difference, V�150 meV, and against the transmembrane electrochemicalgradient, ���210 meV. We stress that all four kineticphases appear naturally in our model for a reasonable set ofthe system parameters without artificial inclusions of conse-quent transfer processes.
The mechanism of the proton pumping analyzed aboveis based on the direct electrostatic interaction between theredox and protonable sites, especially between the electronlocated on site R �heme a3� and the proton located on thepump site X. The Coulomb coupling between the redox siteCuB and the protonable catalytic site Z plays a very impor-tant role as well. The proton to be pumped is sequentiallytranslocated to the P-side of the membrane from sites X andC. At the beginning of the process these sites are empty sincetheir energy levels are assumed to be higher than the energylevels of the proton source ��N and ED� and the proton drain��P�. After the first 10 �s phase the energy level of theL-site is slightly ��55 meV� lower than the energy level ofthe R-site. However, an interaction with the environment fa-cilitates the slow electron transfer to site R. The populationof site R with the electron is accompanied by the lowering ofthe X-site energy level followed by the proton translocationfrom site D to the pump site X. Because of the strong X-Relectrostatic attraction, the effective energy of the R-electrondrops below the energy of the L-site, which results in thesecond 150 �s phase where the major part ��60%� of theelectron density is concentrated on site R, and the pump siteX is partially ��65%� populated with a proton. The electrontransfer to site R also leads to lowering the energy of theZ-site, thus inducing a monotonous population of the cata-lytic protonable site Z. No switch redirecting protons to siteD or to site X �as proposed in Ref. 43� is needed here be-cause both of these sites can be populated from site D.
It should also be emphasized that these threeprocesses—the electron transfer to the R-site, the occupationof the pump site X, and the translocation of a proton to theZ-site—are strongly correlated in time. The proton transfer tothe Z-site digs a deep potential well for the electron at site B,and in the third ��1 ms� phase the electron falls into thiswell. Afterward, the Coulomb attraction between theprepumped X-proton and the electron is almost compensatedby the electrostatic repulsion between X and Z protons, and
0 50 100 150 200 250 300
−1
−0.5
0
0.5
1
V (meV)
ηT = 150 K
T = 298 K
T = 450 K
FIG. 4. �Color online� The efficiency of the pump, �=NP�tB�, where tB
=5 ms, as a function of the transmembrane voltage V at the temperaturesT=150 K �blue dashed line�; T=298 K �green continuous line�, and T=450 K �red dashed-dotted line�. For the physiological range of transmem-brane voltages, 150 meV�V�200 meV, the pump operates with a maxi-mum efficiency at room temperatures �T=298 K�. At high temperatures andhigh enough transmembrane voltages, the efficiency � takes negative val-ues, suggesting that at these conditions the protons flow back, from thepositive to the negative side of the membrane.
235105-6 Smirnov, Mourokh, and Nori J. Chem. Phys. 130, 235105 �2009�
Downloaded 28 Jun 2009 to 134.160.214.34. Redistribution subject to AIP license or copyright; see http://jcp.aip.org/jcp/copyright.jsp
the energy level of the X-proton returns to its original highvalue. The reverse translocation of the X-proton to site D isstrictly suppressed since now the energy difference betweensites X and D �EX−ED�380 meV� significantly exceeds thereorganization energy DX as well as the temperature broad-ening, 2 DXT, of the transition rates in Eq. �A27�. However,the prepumped proton can easily move to the slightly��25 meV� lower energy level EC, and, after this, to thepositive side of the membrane characterized by the evenlower electrochemical potential �P=105 meV. Our modeldoes not require any nonlinear gates43 to prevent a protonleakage from the positive to the negative side of the mem-brane.
V. CONCLUSION
We have analyzed a simple model describing the kineticsof the proton pumping process in CcO initiated by a single-electron injection. Within our model, this electron is subse-quently transferred along four sites electrostatically coupledto four protonable sites. We have shown that the energy lossby this electron facilitates the proton transfer against thetransmembrane voltage from the negative to the positivesides of the membrane with the efficiency ��0.95. In con-trast to previous studies, we have not broken the electron andproton transfers into a series of transitions between the inde-pendent quasiequilibrium states but examined inseparabledynamics of the pumping process. We have derived the mas-ter equations of motion and solved them numerically for areasonable set of the system parameters. The obtained timeevolution naturally encompasses all four experimentally ob-served kinetic phases.
ACKNOWLEDGEMENTS
This work was supported in part by the NationalSecurity Agency �NSA�, Laboratory of Physical Science�LPS�, Army Research Office �ARO� under Grant No.W911NF-06-1-0289, National Science Foundation �NSF�under Grant No. EIA-0130383, and JSPS-RFBR under GrantNo. 06-02-91200. L.M. was partially supported by the NSFNIRT under Grant No. ECS-0609146.
APPENDIX A: MASTER EQUATIONS
The kinetics of charge transfer in the CcO enzyme canbe described by a set of master equations.22,44,45 For com-pleteness we present here a derivation of these equations. Westart from the formalism of second quantization,29,46,47 eventhough in this paper we only discuss the classical results,with an examination of quantum coherent effects to be per-formed in the future. Electrons, located on the redox sites ���=A ,L ,R ,B�, are described by the creation and annihila-tion Fermi operators a�
+ ,a�, and protons located on the pro-tonable sites � ��=D ,X ,C ,Z� are described by the creationand annihilation Fermi operators b�
+ ,b�. The spin degrees offreedom are neglected; thus, each site can only be occupiedby a single particle. The electron population of the �-site, n�,is expressed as n�=a�
+a�, and for a proton population N� onsite �, we have the relation N�=b�
+b�. Protons on the nega-tive �N� and on the positive �P� sides of the membrane ��
=N , P� are continuously distributed over the space of an ad-ditional “quasiwavenumber” parameter q and characterizedby the creation and annihilation Fermi operators dq�
+ ,dq�
with the density operator Nq�=dq�+ dq�.
1. Hamiltonian of the system
The total Hamiltonian H of the electron-proton systemincorporates a basic term,
H0 = ��
��n� + ��
��N� + ����
u���N�N�� − ���
u��n�N�,
�A1�
where the first and second terms describe the electron ���and proton ��� sites with energies �� and ��, respectively,and the third and fourth terms are responsible for the Cou-lomb interaction of protons with each other and the electron,respectively. It should be noted that in our single-electronmodel there is no interelectron Coulomb interaction. We willalso calculate the energy of the electron component, which isdetermined by the Hamiltonian
Hel = ��
��n� − ���
u��N�n�. �A2�
For protons in the N-side and P-side reservoirs we introducethe Hamiltonian
HNP = �q�
�q�Nq�, �A3�
with the energy spectrum �q�, whereas proton transitions be-tween site D and the N-side of the membrane, and site C andthe P-side are given by the transfer Hamiltonian
Htr = − � TqNdqN+ bD − � TqPdqP
+ bC + H.c., �A4�
characterized by the coefficients TqN and TqP. The compo-nent
Htun = − ����
����a�+a�� − �
���
����b�+b�� �A5�
is responsible for electron tunneling between the pairs �����of sites A-L, L-R, R-B, and for proton transitions between thepairs ����� of sites D-X, X-C, and D-Z, with the correspond-ing amplitudes ���� �for electrons� and ���� �for protons�,where ����
+ =���� and ����+ =����.
Protons are delivered from a solution to the active site Dby the water-filled D-channel.5,7 It was argued13,41,48 that theD-channel contains hydrogen-bonded chains of water mol-ecules, which can convey protons via the Grotthuss mecha-nism. In this case, the proton transfer is considered as a col-lective motion of a positive charge through the chain, but notas a motion of an individual proton. According to anotherpoint of view �see Refs. 17 and 49–51�, the proper orienta-tion of water molecules required for the Grotthuss mecha-nism is characterized by a much smaller energetic penaltythan the electrostatic barriers associated with a proton trans-fer through the channel. Thus, the dominant contribution tothe kinetic rate of the proton transport in proteins is providedby the electrostatic energy. In the present work we model
235105-7 Kinetics of proton pumping J. Chem. Phys. 130, 235105 �2009�
Downloaded 28 Jun 2009 to 134.160.214.34. Redistribution subject to AIP license or copyright; see http://jcp.aip.org/jcp/copyright.jsp
proton transitions �between site D and the N-side as well asbetween site C and the P-side of the membrane� by theHamiltonian Htr �A4� with matrix elements that do notspecify the transfer origin.
The transport of protons between the active sites D-X,X-C, and D-Z are described by phenomenological coeffi-cients ���� in Hamiltonian �A5�. To obtain kinetic rates forproton transitions between active sites in the presence of anenvironment, we resort to the Marcus formulation of theproblem. The relevant approach based on the EVB method52
has been developed in Ref. 51. As shown in Refs. 16, 17, and49, the modified Marcus relations can be successfully ap-plied for modeling the proton transfer steps in CcO.
2. Environment
To take into account the interaction of the electron-proton system with its environment, we introduce a termHenv,
Henv = �j
pj2
2mj+
1
2�j
mj� j2
��xj − ��
xj�n� − ��
xj�N� − ��
xj�N��2, �A6�
where N�=�qNq� is the total number of protons in the�-reservoir ��=N , P�. The environment is represented as aset of harmonic oscillators53,54 with coordinates xj, momentapj, masses mj, and frequencies � j. The shifts xj�, xj�, and xj�
define coupling strengths of electrons and protons to the en-vironment. The total Hamiltonian H is the sum of all above-mentioned components,
H = H0 + HNP + Htr + Htun + Henv. �A7�
With the unitary transformation,
U = exp�− i�j
pj���
xj�n� + ��
xj�N� + ��
xj�N����A8�
the total Hamiltonian, H�=U+HU, can be transformed to theform
H� = H0 + �q�
�q�Nq� + �j� pj
2
2mj+
mj� j2xj
2
2�
− �����
Q���a�+a�� − �
����
Q���b�+b�� − � TqNdqN
+ bD
− � TqN� bD
+ dqN − � TqPdqP+ bC − � TqP
� bC+dqP, �A9�
where the operators,
Q��� = Q���+ = ���� exp�i�
j
pj�xj� − xj���� ,
�A10�Q��� = Q���
+ = ���� exp�i�j
pj�xj� − xj���� ,
describe the effect of the environment on the electron andproton transitions. The protonable site C is located near theP-side of the membrane, and site D is tightly coupled to the
N-side by the D-channel. It is reasonable to assume, there-fore, that C-to-P and N-to-D proton transitions have a neg-ligible effect on the equilibrium position of the j-oscillator ofthe environment: xjC=xjP , xjD=xjN so that the correspond-ing phase factors in Eq. �A10� related to the HamiltonianHtun� =U+HtunU and to the total Hamiltonian �A9� can beomitted.
3. Basis states and eigenenergies
To quantitatively analyze the system with a singleelectron and with up to four protons we introduce a basisof 64 eigenstates of the Hamiltonian H0: �1�=aA
+�0� ,�2�=aA
+bD+ �0� , �3�=aA
+bX+�0� , �4�=aA
+bC+ �0� , �5�=aA
+bZ+�0� ,
�6�=aA+bD
+ bX+�0� , . . . , �64�=aB
+bD+ bX
+bC+bZ
+�0�. Here �0� is thevacuum state of the system with no electrons and no protons,�1� is the state with an electron on site A, �2� is the state withan electron on site A and a proton on site D, �3� has oneelectron on site A and a proton on site X, �4� describes thestate with an electron on site A and a proton on site C, and soon. Finally, �64� is the state with a single electron on site Band with one proton on each site D, X, C, and Z �i.e., a totalof four protons�. The state �1� has the eigenenergy E1=�A,state �2� has the energy E2=�A+ED−uAD, and the last state�64�, fully loaded with four protons, has the energy
E64 = �B + ��=D
�=Z
��� − uB�� + uDX + uDC + uDZ
+ uXC + uXZ + uCZ.
The Hamiltonian H0 �A1� is diagonal in the new basis,
H0 = ��=1
64
E������� . �A11�
Other operators may have a nondiagonal form in the newbasis, for example,
a�+a�� = �
�
�a�+a���� �� ,
b�+b�� = �
�
�b�+b���� �� , �A12�
b� = ��
b�;� �� ,
where
�� = ���� � . �A13�
Here indices � and sweep all integers from 1 to 64.
4. Electron and proton transitions
In addition to the diagonal parts H0 and HNP, the totalHamiltonian of system H contains the term responsible forthe proton transitions between the N-side of the membraneand site D, and between the P-side and site C,
235105-8 Smirnov, Mourokh, and Nori J. Chem. Phys. 130, 235105 �2009�
Downloaded 28 Jun 2009 to 134.160.214.34. Redistribution subject to AIP license or copyright; see http://jcp.aip.org/jcp/copyright.jsp
Htr = − � �TqNbD;� dqN+ + TqPbC;� dqP
+ ��� + H.c.,
�A14�
as well as the off-diagonal term Htun describing the tunnelingof electrons and the transfer of protons between the activesites,
Htun = − ��
A� �� − ��
� �A� + . �A15�
Here the operator A� is represented by a linear combinationof the bath operators QAL , . . . ,QZD �see Eq. �A10��, multi-plied by the nondiagonal ��� � transition matrix elements�aA
+aL�� , . . . , �bZ+bD�� ,
A� = QAL�aA+aL�� + QLR�aL
+aR�� + QRB�aR+aB��
+ QDX�bD+ bX�� + QXC�bX
+bC�� + QDZ�bD+ bZ�� .
�A16�
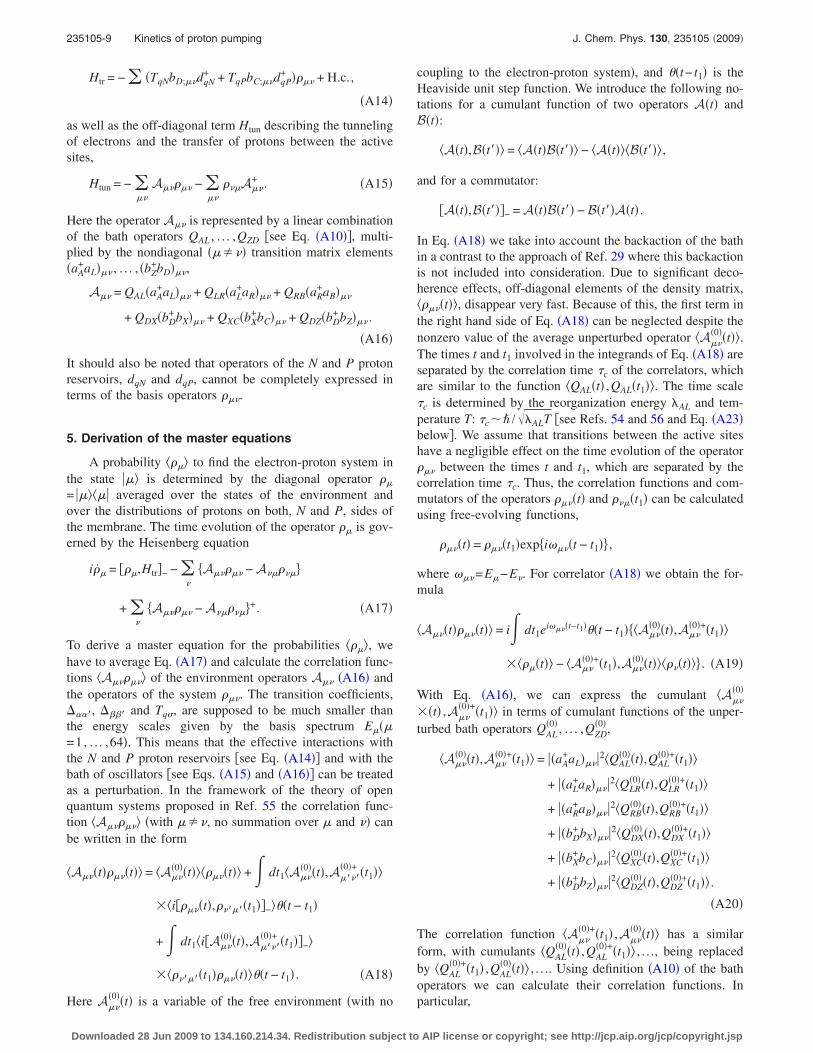
It should also be noted that operators of the N and P protonreservoirs, dqN and dqP, cannot be completely expressed interms of the basis operators �� .
5. Derivation of the master equations
A probability ���� to find the electron-proton system inthe state ��� is determined by the diagonal operator ��
= ������ averaged over the states of the environment andover the distributions of protons on both, N and P, sides ofthe membrane. The time evolution of the operator �� is gov-erned by the Heisenberg equation
i�� = ���,Htr�− − �
A� �� − A �� �
+ �
A� �� − A �� �+. �A17�
To derive a master equation for the probabilities ����, wehave to average Eq. �A17� and calculate the correlation func-tions �A� �� � of the environment operators A� �A16� andthe operators of the system �� . The transition coefficients,����, ���� and Tq�, are supposed to be much smaller thanthe energy scales given by the basis spectrum E���=1, . . . ,64�. This means that the effective interactions withthe N and P proton reservoirs �see Eq. �A14�� and with thebath of oscillators �see Eqs. �A15� and �A16�� can be treatedas a perturbation. In the framework of the theory of openquantum systems proposed in Ref. 55 the correlation func-tion �A� �� � �with �� , no summation over � and � canbe written in the form
�A� �t��� �t�� = �A� �0��t����� �t�� +� dt1�A�
�0��t�,A�� ��0�+ �t1��
��i��� �t�,� ����t1��−���t − t1�
+� dt1�i�A� �0��t�,A�� �
�0�+ �t1��−�
��� ����t1��� �t����t − t1� . �A18�
Here A� �0��t� is a variable of the free environment �with no
coupling to the electron-proton system�, and ��t− t1� is theHeaviside unit step function. We introduce the following no-tations for a cumulant function of two operators A�t� andB�t�:
�A�t�,B�t��� = �A�t�B�t��� − �A�t���B�t��� ,
and for a commutator:
�A�t�,B�t���− = A�t�B�t�� − B�t��A�t� .
In Eq. �A18� we take into account the backaction of the bathin a contrast to the approach of Ref. 29 where this backactionis not included into consideration. Due to significant deco-herence effects, off-diagonal elements of the density matrix,��� �t��, disappear very fast. Because of this, the first term inthe right hand side of Eq. �A18� can be neglected despite thenonzero value of the average unperturbed operator �A�
�0��t��.The times t and t1 involved in the integrands of Eq. �A18� areseparated by the correlation time �c of the correlators, whichare similar to the function �QAL�t� ,QAL�t1��. The time scale�c is determined by the reorganization energy AL and tem-perature T: �c�� / ALT �see Refs. 54 and 56 and Eq. �A23�below�. We assume that transitions between the active siteshave a negligible effect on the time evolution of the operator�� between the times t and t1, which are separated by thecorrelation time �c. Thus, the correlation functions and com-mutators of the operators �� �t� and � ��t1� can be calculatedusing free-evolving functions,
�� �t� = �� �t1�expi�� �t − t1� ,
where �� =E�−E . For correlator �A18� we obtain the for-mula
�A� �t��� �t�� = i� dt1ei�� �t−t1���t − t1��A� �0��t�,A�
�0�+�t1��
�����t�� − �A� �0�+�t1�,A�
�0��t���� �t�� . �A19�
With Eq. �A16�, we can express the cumulant �A� �0�
��t� ,A� �0�+�t1�� in terms of cumulant functions of the unper-
turbed bath operators QAL�0� , . . . ,QZD
�0� ,
�A� �0��t�,A�
�0�+�t1�� = ��aA+aL�� �2�QAL
�0��t�,QAL�0�+�t1��
+ ��aL+aR�� �2�QLR
�0��t�,QLR�0�+�t1��
+ ��aR+aB�� �2�QRB
�0��t�,QRB�0�+�t1��
+ ��bD+ bX�� �2�QDX
�0� �t�,QDX�0�+�t1��
+ ��bX+bC�� �2�QXC
�0��t�,QXC�0�+�t1��
+ ��bD+ bZ�� �2�QDZ
�0��t�,QDZ�0�+�t1�� .
�A20�
The correlation function �A� �0�+�t1� ,A�
�0��t�� has a similarform, with cumulants �QAL
�0��t� ,QAL�0�+�t1�� , . . ., being replaced
by �QAL�0�+�t1� ,QAL
�0��t�� , . . .. Using definition �A10� of the bathoperators we can calculate their correlation functions. Inparticular,
235105-9 Kinetics of proton pumping J. Chem. Phys. 130, 235105 �2009�
Downloaded 28 Jun 2009 to 134.160.214.34. Redistribution subject to AIP license or copyright; see http://jcp.aip.org/jcp/copyright.jsp
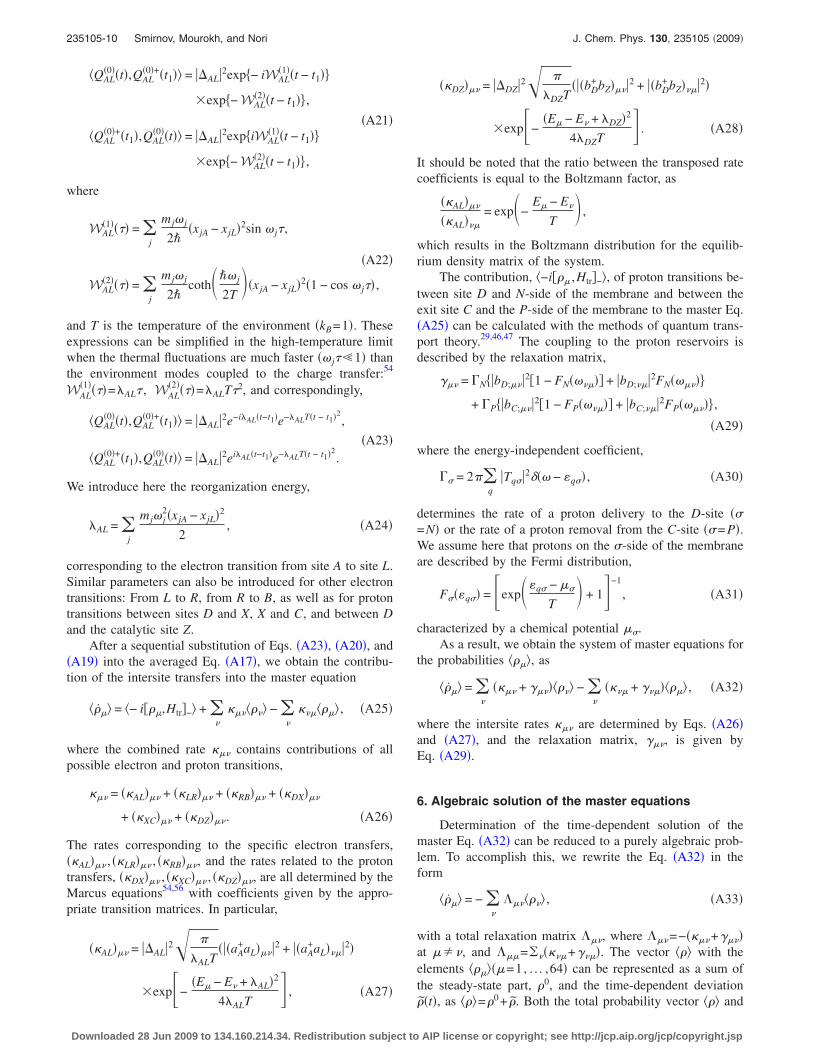
�QAL�0��t�,QAL
�0�+�t1�� = ��AL�2exp− iWAL�1��t − t1�
�exp− WAL�2��t − t1� ,
�A21��QAL
�0�+�t1�,QAL�0��t�� = ��AL�2expiWAL
�1��t − t1�
�exp− WAL�2��t − t1� ,
where
WAL�1���� = �
j
mj� j
2��xjA − xjL�2sin � j� ,
�A22�
WAL�2���� = �
j
mj� j
2�coth��� j
2T��xjA − xjL�2�1 − cos � j�� ,
and T is the temperature of the environment �kB=1�. Theseexpressions can be simplified in the high-temperature limitwhen the thermal fluctuations are much faster �� j��1� thanthe environment modes coupled to the charge transfer:54
WAL�1����=AL� , WAL
�2����=ALT�2, and correspondingly,
�QAL�0��t�,QAL
�0�+�t1�� = ��AL�2e−iAL�t−t1�e−ALT�t − t1�2,
�A23��QAL
�0�+�t1�,QAL�0��t�� = ��AL�2eiAL�t−t1�e−ALT�t − t1�2
.
We introduce here the reorganization energy,
AL = �j
mj� j2�xjA − xjL�2
2, �A24�
corresponding to the electron transition from site A to site L.Similar parameters can also be introduced for other electrontransitions: From L to R, from R to B, as well as for protontransitions between sites D and X, X and C, and between Dand the catalytic site Z.
After a sequential substitution of Eqs. �A23�, �A20�, and�A19� into the averaged Eq. �A17�, we obtain the contribu-tion of the intersite transfers into the master equation
���� = �− i���,Htr�−� + �
�� �� � − �
� ����� , �A25�
where the combined rate �� contains contributions of allpossible electron and proton transitions,
�� = ��AL�� + ��LR�� + ��RB�� + ��DX��
+ ��XC�� + ��DZ�� . �A26�
The rates corresponding to the specific electron transfers,��AL�� , ��LR�� , ��RB�� , and the rates related to the protontransfers, ��DX�� , ��XC�� , ��DZ�� , are all determined by theMarcus equations54,56 with coefficients given by the appro-priate transition matrices. In particular,
��AL�� = ��AL�2 �
ALT���aA
+aL�� �2 + ��aA+aL� ��2�
�exp�−�E� − E + AL�2
4ALT� , �A27�
��DZ�� = ��DZ�2 �
DZT���bD
+ bZ�� �2 + ��bD+ bZ� ��2�
�exp�−�E� − E + DZ�2
4DZT� . �A28�
It should be noted that the ratio between the transposed ratecoefficients is equal to the Boltzmann factor, as
��AL��
��AL� �
= exp�−E� − E
T� ,
which results in the Boltzmann distribution for the equilib-rium density matrix of the system.
The contribution, �−i��� ,Htr�−�, of proton transitions be-tween site D and N-side of the membrane and between theexit site C and the P-side of the membrane to the master Eq.�A25� can be calculated with the methods of quantum trans-port theory.29,46,47 The coupling to the proton reservoirs isdescribed by the relaxation matrix,
�� = �N�bD;� �2�1 − FN�� ��� + �bD; ��2FN��� �
+ �P�bC;� �2�1 − FP�� ��� + �bC; ��2FP��� � ,
�A29�
where the energy-independent coefficient,
�� = 2��q
�Tq��2��� − �q�� , �A30�
determines the rate of a proton delivery to the D-site ��=N� or the rate of a proton removal from the C-site ��= P�.We assume here that protons on the �-side of the membraneare described by the Fermi distribution,
F���q�� = �exp��q� − ��
T� + 1�−1
, �A31�
characterized by a chemical potential ��.As a result, we obtain the system of master equations for
the probabilities ����, as
���� = �
��� + �� ��� � − �
�� � + � ������ , �A32�
where the intersite rates �� are determined by Eqs. �A26�and �A27�, and the relaxation matrix, �� , is given byEq. �A29�.
6. Algebraic solution of the master equations
Determination of the time-dependent solution of themaster Eq. �A32� can be reduced to a purely algebraic prob-lem. To accomplish this, we rewrite the Eq. �A32� in theform
���� = − �
�� �� � , �A33�
with a total relaxation matrix �� , where �� =−��� +�� �at �� , and ���=� �� �+� ��. The vector ��� with theelements ������=1, . . . ,64� can be represented as a sum ofthe steady-state part, �0, and the time-dependent deviation��t�, as ���=�0+ �. Both the total probability vector ��� and
235105-10 Smirnov, Mourokh, and Nori J. Chem. Phys. 130, 235105 �2009�
Downloaded 28 Jun 2009 to 134.160.214.34. Redistribution subject to AIP license or copyright; see http://jcp.aip.org/jcp/copyright.jsp

its steady-state value satisfy the normalization condition:������=����
0 =1. The steady-state distribution can be foundfrom the matrix equation ��0=0, and for a time-dependentpart � we have a rate equation in the form �d /dt��=−��.Using the unitary operator, U, the matrix � can be trans-formed to the diagonal form ��=U−1�U with ��� as the di-agonal elements. This transformation should be accompaniedby the transformation of the vector � as �=U��. Then, thevector ���t� obeys the diagonal equation with a simple solu-
tion for its �-component: ��� �t�=e−��� t��� �0�. Correspond-ingly, the time evolution of the probability vector ��t� fromits initial value ��0� is described by the formula
���t�� = �0 − S�t��0 + S�t���0� , �A34�
where S�t�=UZ�t�U−1, and Z�t� is the diagonal matrix with
the elements Z� �t�=�� e−��� t. It should be noted that S�0�= I and S���=0, where I is the 64�64 unit matrix.
7. Proton current
The time-dependent populations, �n�� and �N��, of allredox and protonable sites in the model are expressed interms of the evolving probability distribution ���t��. We re-call that the index � labels the redox sites �=A �CuA�, L�heme a�, R �heme a3�, and B �CuB�. The index � labels theprotonable sites �=D, X, C, and Z. Finally, the index �labels the two sides of the membrane �=N , P. With the den-sity matrix probability distributions, ����t��, over the states,���, of the system we can also find the proton flows from theN- and P-sides of the membrane into the system, I�
= �d /dt��N��, where �N�� is the total number of protons onthe �-side of the membrane: �N��=�q�Nq��. Using tech-niques developed in quantum transport theory,29,46 we obtainthe formulas for the proton currents IN and IP,
IN = �N��
�bD;� �2�1 − FN�� ����� � − FN�� ������ ,
�A35�IP = �P�
�
�bC;� �2�1 − FP�� ����� � − FP�� ������ .
Note that these currents depend on the time-dependent prob-ability distribution ���t�� and, accordingly, they also varywith time. The total number of protons, �N��, transferred tothe �-side of the membrane ��= P ,N� is calculated as theintegral of the corresponding current,
�N��t�� = �0
t
dt1I��t1� . �A36�
8. Proton-motive force
The proton-motive force across the membrane can bedefined as a difference of electrochemical potentials �P and�N involved in the Fermi distribution �A31� of the protonreservoirs: ��=�P−�N. This gradient includes the trans-membrane concentration difference ��pH� and the trans-membrane voltage V,
�� = V − 2.3�RT/F� � �pH . �A37�
Here R and F are the gas and Faraday constant, respectively,and T is the temperature �in degrees Kelvin, kB=1�.1,2 Bothenergy parameters, �� and V, are measured in meV. At thestandard conditions �T=298 K�, the concentration gradientcontributes about 60 meV per �pH-unit. This results in thetransmembrane voltage V�150 meV, provided that the totalproton-motive force, ��, is about 210 meV, and �pH=−1.1
The transmembrane voltage, V0, elevates the energiesof protonable sites adjacent to the P-side and lowers theenergies of the proton sites located near the N-side.22 Theelectron sites are simultaneously experiencing the oppositeeffect, for the same V. As a result the electron energy levels,��, and the proton energies, ��, involved in the HamiltonianH0 �A1� are shifted from their initial values, ��
�0� and ���0�,
�� = ���0� − V�x�/W� ,
�A38��� = ��
�0� + V�x�/W� ,
where W is the membrane width. The positions of the redoxand protonable sites, x� and x�, are counted here fromthe middle of the membrane with the x-axis directed towardthe P-side: xA�W /2, xL�xR�xB�W /6, xD�0.1W , xX
�0.3W , xC=0.5W , xZ=W /6.8,10
1 B. Alberts, A. Johnson, J. Lewis, M. Raff, K. Roberts, and P. Walter,Molecular Biology of the Cell �Garland Science, New York, 2002�,Chap. 14.
2 D. G. Nicholls and S. J. Ferguson, Bioenergetics 2 �Academic, London,1992�.
3 M. Wikström, Nature �London� 266, 271 �1977�.4 M. Wikström, Biochim. Biophys. Acta 1655, 241 �2004�.5 R. B. Gennis, Front. Biosci. 9, 581 �2004�.6 P. Brzezinski, Trends Biochem. Sci. 29, 380 �2004�.7 G. Bränden, R. B. Gennis, and P. Brzezinski, Biochim. Biophys. Acta
1757, 1052 �2006�.8 I. Belevich, D. A. Bloch, N. Belevich, M. Wikström, and M. I.Verkhovsky, Proc. Natl. Acad. Sci. U.S.A. 104, 2685 �2007�.
9 M. Wikström and M. I. Verkhovsky, Biochim. Biophys. Acta 1767, 1200�2007�.
10 D. M. Medvedev, E. S. Medvedev, A. I. Kotelnikov, and A. A.Stuchebrukhov, Biochim. Biophys. Acta 1710, 47 �2005�.
11 I. Belevich, M. I. Verkhovsky, and M. Wikström, Nature �London� 440,829 �2006�.
12 S. A. Siletsky, A. S. Pawate, K. Weiss, R. G. Gennis, and A. A. Kon-stantinov, J. Biol. Chem. 279, 52558 �2004�.
13 P. Brzezinski and P. Ädelroth, Curr. Opin. Struct. Biol. 16, 465 �2006�.14 M. Ruitenberg, A. Kannt, E. Bamberg, K. Fendler, and H. Michel, Nature
�London� 417, 99 �2002�.15 L. Salomonsson, K. Faxen, P. Ädelroth, and P. Brzezinski, Proc. Natl.
Acad. Sci. U.S.A. 102, 17624 �2005�.16 M. H. M. Olsson and A. Warshel, Proc. Natl. Acad. Sci. U.S.A. 103,
6500 �2006�.17 M. H. M. Olsson, P. E. M. Siegbahn, M. R. A. Blomberg, and A. Warshel,
Biochim. Biophys. Acta 1767, 244 �2007�.18 A. V. Pisliakov, P. K. Sharma, Z. T. Chu, M. Haranczuk, and A. Warshel,
Proc. Natl. Acad. Sci. U.S.A. 105, 7726 �2008�.19 P. E. M. Siegbahn and M. R. A. Blomberg, Biochim. Biophys. Acta
1767, 1143 �2007�.20 P. E. M. Siegbahn and M. R. A. Blomberg, J. Phys. Chem. A 112, 12772
�2008�.21 J. Quenneville, D. M. Popovic, and A. A. Stuchebrukhov, Biochim. Bio-
phys. Acta 1757, 1035 �2006�.22 Y. C. Kim, M. Wikström, and G. Hummer, Proc. Natl. Acad. Sci. U.S.A.
104, 2169 �2007�.23 R. Sugitani, E. S. Medvedev, and A. A. Stuchebrukhov, Biochim. Bio-
phys. Acta 1777, 1129 �2008�.
235105-11 Kinetics of proton pumping J. Chem. Phys. 130, 235105 �2009�
Downloaded 28 Jun 2009 to 134.160.214.34. Redistribution subject to AIP license or copyright; see http://jcp.aip.org/jcp/copyright.jsp
24 S. Iwata, C. Ostermeier, B. Ludwig, and H. Michel, Nature �London�376, 660 �1995�.
25 T. Tsukihara, H. Aoyama, E. Yamashita, T. Tomizaki, H. Yamaguchi, K.Shinzawa-Itoh, R. Nakashima, R. Yaono, and S. Yoshikawa, Science272, 1136 �1996�.
26 S. Yoshikawa, K. Shinzawa-Itoh, R. Nakashima, R. Yaono, E. Yamashita,N. Inoue, M. Yao, M. J. Fei, C. P. Libeu, T. Mizushima, H. Yamaguchi, T.Tomizaki, and T. Tsukihara, Science 280, 1723 �1998�.
27 S. Yoshikawa, K. Muramoto, K. Shinzawa-Itoh, H. Aoyama, T.Tsukihara, K. Shimokata, Y. Katayama, and H. Shimada, Biochim. Bio-phys. Acta 1757, 1110 �2006�.
28 C. Ostermeier, A. Harrenga, U. Ermler, and H. Michel, Proc. Natl. Acad.Sci. U.S.A. 94, 10547 �1998�.
29 A. Yu. Smirnov, L. G. Mourokh, and F. Nori, Phys. Rev. E 77, 011919�2008�.
30 A. Warshel, P. K. Sharma, M. Kato, and W. W. Parson, Biochim. Bio-phys. Acta 1764, 1647 �2006�.
31 C. N. Schutz and A. Warshel, Proteins 44, 400 �2001�.32 H. Michel, Proc. Natl. Acad. Sci. U.S.A. 95, 12819 �1998�.33 C. C. Moser, T. A. Farid, S. E. Chobot, and P. L. Dutton, Biochim.
Biophys. Acta 1757, 1096 �2006�.34 O. Farver, E. Grell, B. Ludwig, H. Michel, and I. Pecht, Biophys. J. 90,
2131 �2006�.35 A. Jasaitis, F. Rapaport, E. Pilet, U. Liebl, and M. H. Vos, Proc. Natl.
Acad. Sci. U.S.A. 102, 10882 �2005�.36 D. N. Silverman, Biochim. Biophys. Acta 1458, 88 �2000�.37 C. A. Wraight, in Biophysical and Structural Aspects of Bioenergetics,
edited by M. Wikström �RSC, Cambridge, 2005�.
38 S. Larsson, B. Källebring, P. Wittung, and B. G. Malmström, Proc. Natl.Acad. Sci. U.S.A. 92, 7167 �1995�.
39 B. E. Ramirez, B. G. Malmström, J. R. Winkler, and H. B. Gray, Proc.Natl. Acad. Sci. U.S.A. 92, 11949 �1995�.
40 E. Pilet, A. Jasaitis, U. Liebl, and M. H. Vos, Proc. Natl. Acad. Sci.U.S.A. 101, 16198 �2004�.
41 J. F. Nagle and H. J. Morowitz, Proc. Natl. Acad. Sci. U.S.A. 75, 298�1978�.
42 F. Bartl, G. Deckers-Hebestreit, K. Altendorf, and G. Zundel, Biophys. J.68, 104 �1995�.
43 M. Wikström, M. I. Verkhovsky, and G. Hummer, Biochim. Biophys.Acta 1604, 61 �2003�.
44 H. Haken, Synergetics �Springer-Verlag, Berlin, 2004�.45 A. M. Ferreira and D. Bashford, J. Am. Chem. Soc. 128, 16778 �2006�.46 N. S. Wingreen, A.-P. Jauho, and Y. Meir, Phys. Rev. B 48, 8487 �1993�.47 A. Yu. Smirnov, S. Savel’ev, L. G. Mourokh, and F. Nori, Phys. Rev. E
78, 031921 �2008�.48 C. A. Wraight, Biochim. Biophys. Acta 1757, 886 �2006�.49 M. H. M. Olsson, P. K. Sharma, and A. Warshel, FEBS Lett. 579, 2026
�2005�.50 M. Kato, A. V. Pisliakov, and A. Warshel, Proteins 64, 829 �2006�.51 S. Braun-Sand, M. Strajbl, and A. Warshel, Biophys. J. 87, 2221 �2004�.52 A. Warshel and R. M. Weiss, J. Am. Chem. Soc. 102, 6218 �1980�.53 A. Garg, J. N. Onuchic, and V. Ambegaokar, J. Chem. Phys. 83, 4491
�1985�.54 D. A. Cherepanov, L. I. Krishtalik, and A. Y. Mulkidjanian, Biophys. J.
80, 1033 �2001�.55 G. F. Efremov and A. Yu. Smirnov, Sov. Phys. JETP 53, 547 �1981�.56 R. Marcus, J. Chem. Phys. 24, 966 �1956�.
235105-12 Smirnov, Mourokh, and Nori J. Chem. Phys. 130, 235105 �2009�
Downloaded 28 Jun 2009 to 134.160.214.34. Redistribution subject to AIP license or copyright; see http://jcp.aip.org/jcp/copyright.jsp


![[8] Cytochrome-c oxidase from Saccharomyces cerevisiae](https://img.dokumen.tips/doc/110x75/635b7a829d85dc43cb0777af/8-cytochrome-c-oxidase-from-saccharomyces-cerevisiae.jpg)


