Embed Size (px)
Citation preview
Orientation Tuning of Cytochrome Oxidase Patches in MacaquePrimary Visual Cortex
John R. Economides1,*, Lawrence C. Sincich2,*, Daniel L. Adams1, and Jonathan C. Horton1
1Beckman Vision Center, University of California, San Francisco, San Francisco, CA 94143 USA2Department of Vision Sciences, School of Optometry, University of Alabama at Birmingham,Birmingham, Alabama
AbstractThe abundant concentration of cytochrome oxidase in patches or blobs of primate striate cortexhas never been explained. Patches are thought to contain unoriented, color-opponent neurons.Lacking orientation selectivity, these cells might endow patches with a high level of metabolicactivity because they respond to all contours in visual scenes. To test this idea, orientation tuningwas measured in layer 2/3 of macaque V1 using acutely implanted 100-electrode arrays. Eachelectrode recording site was identified, and assigned to the patch or interpatch compartment. Themean orientation bandwidth of cells was 28.4° in patches and 25.8° in interpatches. Neurons inpatches were indeed less orientation selective, but the difference was subtle, indicating that theprocessing of form and color is not strictly segregated in V1. The most conspicuous finding wasthat patch cells had a 49% greater overall firing rate. This global difference in neuronalresponsiveness, rather than an absence of orientation tuning, may account for the richmitochondrial enzyme activity that defines patches.
IntroductionIn patients with lesions of the fusiform gyrus the perception of color is abolished, althoughthe ability to detect form remains intact1. It is unclear where the pathways which serve colorand form begin to diverge in the visual system. In the retina, most ganglion cells do doubleduty, conveying information about both form and color. Once their signals have beenfiltered by the lateral geniculate nucleus and reach the primary visual cortex (striate cortex,V1), are the sensations of form and color mediated by separate populations of cells?
There are two compartments in the primary visual cortex, divided by the distribution of amitochrondrial enzyme, cytochrome oxidase (CO). Histochemical staining for the enzymereveals a regular pattern of dark patches (“blobs”, “puffs”), surrounded by paler tissue2, 3.Tangential microelectrode penetrations through striate cortex have shown that neuronswithin blobs do not show orientation selectivity, whereas cells between blobs are highlyorientation-selective. In addition, blob cells have color-opponent receptive field properties.These two key findings – lack of orientation selectivity and color-opponency – have led tothe view that in V1 “a system involved in the processing of color information, especiallycolor-spatial interactions, runs parallel to and separate from the orientation-specific
Corresponding author: Jonathan C. Horton MD PhD, Beckman Vision Center, University of California, San Francisco,[email protected], 10 Koret Way, San Francisco, CA 94143-0730, Phone: 415-476-6057, Fax: 415-476-8309.*These authors contributed equally.Author ContributionsAll authors participated in the physiological recording experiments, data analysis, and preparation of this paper.
NIH Public AccessAuthor ManuscriptNat Neurosci. Author manuscript; available in PMC 2012 June 01.
Published in final edited form as:Nat Neurosci. ; 14(12): 1574–1580. doi:10.1038/nn.2958.
NIH
-PA Author Manuscript
NIH
-PA Author Manuscript
NIH
-PA Author Manuscript
system”4, p. 309. This functional segregation could explain the dissociation of color and formperception in the visual system, but it has hinged on the considerable challenge ofcorrelating the receptive field properties of individual cells with the location of CO patchesin striate cortex5.
Recently, 100-electrode arrays have become available for recording single cells in thecerebral cortex6–9. These devices permit one to carry out a quantitative assessment of anyreceptive field parameter for scores of cells simultaneously, eliminating the one-cell-at-a-time bottleneck of the single microelectrode. They also eliminate the need to extrapolatebetween lesions along a microelectrode trajectory to infer the position of recording sites.Each electrode in the array leaves a small defect, allowing one literally to pinpoint each V1recording site with respect to the cortical layers and the CO patches. Although designed forchronic implantation in alert, behaving animals, multi-electrode arrays can be used for acuterecordings6. Here, they have been employed to examine the orientation specificity of cells inmacaque striate cortex, comparing the tuning of cells in CO patches versus interpatches.
ResultsAlignment of Electrodes with Cytochrome Oxidase Patches
Electrode arrays were implanted in opercular V1, representing eccentricities between 2° – 8°(Supplemental Fig. 1). When most of the electrodes penetrated only the superficial corticallayers, the array footprint was not immediately obvious in histological sections (Fig. 1a).Nonetheless, all 100 holes could be located by searching carefully in tangential sectionsthrough layer 2/3 processed for CO activity (Fig. 1b). It was vital to be sure that each holewas truly from an electrode shaft, not a blood vessel. Occasional blood clots, caused byhemorrhage along the electrode shafts, and small clumps of red blood cells, were helpful foridentifying electrode holes. In addition, electrode holes could be distinguished from bloodvessels by noting their grid-like spacing, absence of bifurcations, lack of endothelium, andtendency to end in the same cortical layer as adjacent holes.
Our goal was to record from cells in layer 2/3, where patches have maximum contrast, tocompare our results directly to those reported previously4. For this reason, it was crucial tofigure out the layer in which each electrode tip ended. This was accomplished bysystematically following each electrode hole from the pial surface, section by sectionthrough the cortex, until it disappeared (Fig. 2). Sometimes, the pneumatic device used toinsert the array propelled the electrode tips more deeply than intended into the cortex. Inthese cases, the resulting 10 × 10 grid was easy to identify because the holes were large,owing to the fact that the electrodes become thicker at their base. Unfortunately, data fromdeep electrodes could not be used because our aim was to examine orientation tuning inlayer 2/3 patches.
The boundaries of the patches were defined by thresholding CO activity in the deepestsection through layer 3. A circle of 75 μm radius, representing the maximum distance overwhich an electrode would be likely to pick up action potentials from a cell, was centered onthe hole left in the tissue by each electrode shaft10. For this array, at 42/61 sites the circlewas located entirely within the territory of a patch or interpatch in layer 2/3 (Fig. 1b). Insuch cases, there was no doubt about the identity of cells recorded by the electrode.However, at 19 sites the circle crossed a patch/interpatch boundary. In this situation, thecells recorded by the electrode were designated as “patch” or “interpatch” based on thelocation of the center of the circle. Usually, the center pixel was relatively far from a patchboundary, so this approach classified most cells accurately. In a later analysis, we deal withthe problem posed by electrodes which happened to straddle a patch boundary.
Economides et al. Page 2
Nat Neurosci. Author manuscript; available in PMC 2012 June 01.
NIH
-PA Author Manuscript
NIH
-PA Author Manuscript
NIH
-PA Author Manuscript
Recordings from Electrode ArraysImmediately after electrode insertion, neurons had low firing rates and their extracellularpotentials were small in amplitude, presumably from the trauma of driving the array into thecortex. Gradually the quality of recordings improved6. The recovery of cortical function wasmonitored at regular intervals by plotting the receptive fields of cells sampled on differentelectrodes. Once responses appeared robust, drifting achromatic sine wave gratings werepresented on a computer monitor. To assess orientation tuning, the gratings were displayedfor 2 sec epochs, randomly varying the orientation in 10° intervals. Data were obtained from8 successful array insertions in 5 animals. From these 8 arrays, 596 distinct waveforms wererecorded from 366 electrodes located in layer 2/3.
Recording electrodes landed by chance in patches or interpatches (Fig. 3a). On about halfthe electrodes, multiple distinct waveforms were observed. K-means cluster analysis wasperformed on the first 3 principal component coefficients (Fig. 3b). Because the clusterswere not always perfectly segregated, it is possible that some waveforms were misassigned.To assess the error rate, a silhouette value was calculated, with negative values denoting awaveform potentially assigned to the wrong cluster (Fig. 3c)11. Less than 10% of the pointsin each cluster had a negative silhouette value. Average waveforms were derived from eachcluster (Fig. 3d).
Firing rates as a function of the motion direction of the oriented grating were plotted foreach distinct average waveform (Fig. 3e). When multiple waveforms were distinguished at agiven electrode, they generally had a similar preferred orientation. However, they oftenvaried considerably in the strength of orientation tuning. This property was defined usingtwo different criteria: peak bandwidth and circular variance. Each measure provides usefulinformation about a neuron’s orientation selectivity12. Bandwidth reflects how sharply thecell’s peak response is tuned, and essentially ignores responses to other orientations.Circular variance takes into account the entire tuning curve, reflecting not only the shape ofthe peak, but the firing rate at other orientations as well13. For these example recordings,circular variance ranged from 0.30 to 0.73 (0 = oriented, 1 = unoriented) and bandwidthranged from 20° to 34°. To determine the impact of events potentially assigned to the wrongcluster, the tuning curves in this example were recompiled after eliminating all points withnegative silhouette values. This precaution altered the values for circular variance andbandwidth by less than 2%, suggesting that overlap of event clusters had only a modesteffect on orientation tuning indices.
Orientation tuning curves were plotted for all the waveforms recorded by electrodes in layer2/3. For the example array insertion (Fig. 1), 65 tips were located in layer 2/3. CO activitywas obscured by local hemorrhage around 4 electrodes, so these sites were excluded fromanalysis. Only background noise was recorded at another 10 electrodes. Of the remaining 51electrodes, 15 were situated in patches and 36 in interpatches. At first glance, the tuningcurves show no striking difference between the orientation selectivity of neurons in patchesversus interpatches (Fig. 4)
Orientation Tuning of Patches versus InterpatchesThe population of neurons recorded in the upper layers exhibited a wide range in circularvariance and bandwidth (Supplemental Fig. 2). For patch cells, the values for circularvariance were mean 0.64 ± 0.19, median 0.66 (n = 177) (Fig. 5a). For interpatch cells, themean was 0.54 ± 0.20, median 0.54 (n = 419). Overall, orientation tuning was weaker inpatches than in interpatches (p < 0.001, Wilcoxon rank-sum test). This was true in 3 of 5monkeys when analyzed individually (p < 0.05), with a non-significant trend in a fourthmonkey. In one animal, the circular variance was equal for patch and interpatch cells.
Economides et al. Page 3
Nat Neurosci. Author manuscript; available in PMC 2012 June 01.
NIH
-PA Author Manuscript
NIH
-PA Author Manuscript
NIH
-PA Author Manuscript
For patch cells, the bandwidth of orientation tuning curves had a mean of 28.4° ± 11.7° anda median of 26.8°. For interpatch cells, the values were mean 25.8° ± 10.9°, median 23.5°(Fig. 5a). The bandwidth difference between these two populations was 2.6° (p < 0.001,Wilcoxon rank-sum test). Neurons in patches had wider orientation bandwidths in 4 of 5individual monkeys, although this trend reached significance (p < 0.05) in only one animal.
To assess orientation tuning, drifting gratings were presented at 4 different spatialfrequencies: 0.5, 1, 2, and 4 cycles/deg. The spatial frequency which produced maximalfiring at a cell’s preferred orientation was used to calculate circular variance and bandwidth.Interestingly, there was no significant difference (p > 0.98 Wilcoxon rank-sum) in theoptimal spatial frequency for patch units (1.40 ± 0.68 cycles/deg) compared with interpatchunits (1.42 ± 0.71 cycles/deg).
Single Unit DataThe electrode arrays yielded a mixture of multiple unit and single unit recordings. Multipleunit activity might provide an inaccurate, low measure of orientation tuning strength, bymerging signals from an ensemble of well-tuned cells which prefer different orientations.For this reason, an analysis was performed on data gathered only from well-isolated, singleunits.
For the 596 recorded waveforms, signal-to-noise ratio (SNR), defined as peak to troughamplitude divided by twice the standard deviation6, ranged from 1.3 to 11.0, with a mean of2.89. The SNR of recordings with 100-electrode arrays is usually lower than those fromconventional microelectrodes6. The lower SNR is due to the fact that array electrodes haverelatively low impedance (mean 280 kΩ for the array in Fig. 4) and they cannot be advancedcloser to cells to increase spike amplitude. Consequently, our data set included low-amplitude, multiple unit recordings that would not have been collected had the recordingsbeen done with mobile, high impedance electrodes.
A histogram of the SNR for our recordings had a two peaked distribution, with a localminima at 2.55 (Fig. 5b). This trough corresponded closely to the intersection between theSNR distributions for average waveforms with a unimodal versus bimodal morphology (Fig.5b). Unimodal average waveforms usually represent composite multiple unit recordings,whereas bimodal waveforms are more likely to constitute single units14–16.
Orientation selectivity was analyzed for all waveforms that met two criteria: bimodalmorphology and SNR > 2.55 (Fig. 5c). This subset was considered separately because it waslikely to consist predominately of single units. For patches (n = 85) the mean circularvariance was 0.65 ± 0.21 (median 0.69). For interpatches (n = 197) the mean circularvariance was 0.53 ± 0.20 (median 0.53). For patches the mean bandwidth was 29.1° ± 12.1°(median 27.0°). For interpatches, it was 24.9° ± 11.6° (median 22.1°). For both measures oforientation selectivity, cells in patches were more broadly tuned than those in interpatches (p< 0.001, Wilcoxon rank-sum test). The elimination of low SNR and unimodal waveformsmade no significant difference in the mean or distribution of circular variance andorientation bandwidth. This implies that SNR and orientation selectivity are not related.Indeed, plots of waveform SNR versus circular variance and bandwidth showed nocorrelation (Supplemental Fig. 3).
Correlation of CO Density with Orientation SelectivityIn histological sections processed for CO activity, the darkest 33% of striate cortex iscommonly designated as patches17, 18. However, the exact percentage chosen to define patchboundaries is arbitrary. As mentioned earlier, the division of V1 into just two zones couldmisclassify cells recorded by electrodes located near the borders of patches. In addition,
Economides et al. Page 4
Nat Neurosci. Author manuscript; available in PMC 2012 June 01.
NIH
-PA Author Manuscript
NIH
-PA Author Manuscript
NIH
-PA Author Manuscript
dichotomizing the cortex into two compartments might miss subtle trends in the spatiallayout of oriented cells. For these reasons, circular variance and orientation bandwidth wereplotted as continuous functions of CO density (Fig. 6). Scatter plots confirmed that neuronswith broader orientation tuning tended to be located in regions of darker CO activity. Thecorrelation was weak, and remained weak even when just single units (bimodal and SNR >2.55) were considered. This analysis shows that changing the proportion of cortical territoryassigned to patches does not alter the basic finding in this study.
Mean Population Tuning CurvesTo compare the firing activity of cells recorded in patches (n = 177) versus interpatches (n =419), the Gaussian fits for the largest peak of each neuron’s orientation tuning curve wereaveraged to generate mean tuning curves (Fig. 7). These showed a 2.3° greater bandwidthfor patch cells.
At the peaks, the firing rate was greater for patch cells (patch mean 13.2 ± 11.9 spikes/s;interpatch mean 10.7 ± 10.6 spikes/s, p < 0.01 Wilcoxon rank-sum test). However, when theoffsets were taken into account, the peak amplitude of the response to visual stimulation wassimilar (patch mean 10.0 ± 9.6 spikes/s; interpatch mean 9.0 ± 9.8 spikes/s, p = 0.28Wilcoxon rank-sum test). The greater offset for patch cells was due to a stronger response tocontours orthogonal to the optimal orientation (3.2 ± 4.2 spikes/sec versus 1.7 ± 1.9 spikes/sec, p < 0.001 Wilcoxon rank-sum test). The spontaneous activity, measured in the dark withno visual stimulation, was also slightly but significantly (p < 0.002 Wilcoxon rank-sum test)greater for patch cells (mean 1.2 ± 1.8 spikes/s) compared with interpatch cells (mean 0.9 ±1.6 spikes/s).
The area under each mean tuning curve represents the overall firing rate for each populationof cells. The integrated area was 49% greater for patch cells compared with interpatch cells.This marked difference in physiological activity during visual stimulation may explain, inpart, the stronger CO activity present in patches.
These population mean tuning curves were compiled using the grating which yielded themaximum peak discharge rate (patch mean 1.40 cycles/deg; interpatch mean 1.42 cyclesdeg). Even at the lowest spatial frequency tested (0.5 cycles/deg), the peak firing rate wassignificantly greater (p < 0.01) for patch cells (mean 8.1 ± 9.6 spikes/s) compared withinterpatch cells (mean 6.1 ± 7.0 spikes/s). It did not appear that at a lower spatial frequencythan optimal, responses of interpatch cells were attenuated more than those of patch cells.
DiscussionThe orientation tuning of cells was analyzed quantitatively by several investigators19–22,following the original report that selectivity is sharply diminished in CO patches of macaquestriate cortex4. In these subsequent studies, no relationship was found between the degree oforientation tuning and the density of CO staining in the upper layers. However, differentprimate species were examined, or histological sections were not cut parallel to the pialsurface to reveal the two-dimensional layout of CO patches. It is difficult to delineatepatches in sections cut perpendicularly or obliquely to the cortical surface, and even moredifficult to achieve reliable alignment with fragments of electrode tracks marked byoccasional lesions in serial sections. For these reasons, the orientation tuning of patch cellsin macaque striate cortex has remained an unresolved issue, although these curiousstructures were discovered more than a quarter century ago2, 3.
The 100-electrode arrays were designed for chronic implantation in alert animals9. No priorstudy has described the appearance of the array footprint post-mortem in cortical tissue. A
Economides et al. Page 5
Nat Neurosci. Author manuscript; available in PMC 2012 June 01.
NIH
-PA Author Manuscript
NIH
-PA Author Manuscript
NIH
-PA Author Manuscript
major advantage of the arrays for acute physiological studies is that for each electrode onecan identify reliably the layer in which it terminates and establish precisely the correlationwith CO patches. Our data confirm that patch cells are more broadly tuned for orientationthan interpatch cells. However, the difference between the populations is exceedingly subtle;most cells in patches retain strong orientation selectivity (Fig. 7).
We harbored some doubts about the health of the cortex during our recordings, becausetransient depression of neural activity occurred after each array implantation andintracortical hemorrhage was usually present post-mortem (Fig. 1). Tissue damage is lesscritical when arrays are used for chronic recordings, because the cortex has more time torecover from the insult of electrode insertion. Several factors, however, suggested that thediscrepancy between our findings and those reported originally4 was not simply an artifactof using electrode arrays rather than single microelectrodes. First, the values for circularvariance and orientation bandwidth we obtained closely resembled published data obtainedfrom V1 using single microelectrodes (Supplemental Fig. 2)12, 19, 23. Second, one wouldexpect injury from array insertion to degrade receptive field properties and reduceorientation selectivity, not increase it. Third, although multi-units were recorded on manyelectrodes, such recordings could not generate well-tuned orientation curves if patch cellstruly do lack orientation selectivity. Fourth, while it is true that cell isolation is generallyinferior with electrode arrays compared with single microelectrodes, our findings held evenafter culling unimodal and low signal-to-noise units (Fig. 5c). This result was consistentwith a report that the orientation tuning of multi-unit and single unit activity recorded fromV1 with 100-electrode arrays is highly correlated24.
Orientation columns in macaque striate cortex converge in regions known as singularities orpinwheels25, 26. Neuronal selectivity for orientation varies systematically according to localmap structure. With 100-electrode arrays, it has been shown that cells near singularities aremore broadly tuned for orientation than cells located in radiating iso-orientation domains8. IfCO patches coincide with singularities, this could explain the modest reduction inorientation selectivity displayed by patch cells (Fig. 5). Unfortunately, the spatialrelationship between pinwheels and patches has been hard to establish, because it is difficultto achieve secure alignment between intrinsic signal orientation maps and CO histology, oreven to define the exact location of pinwheel centers27–31. If there is no systematic overlap,it is worth pointing out that optical imaging has not revealed any other zones in striate cortexwhich might correspond to clusters of poorly oriented cells4.
Cells in patches send an exclusive projection to CO thin stripes in V2. Dual-retrograde tracerinjections into adjacent thin and pale stripes have confirmed that projections from patchesand interpatches to V2 are isolated strictly from one other32, 33. This anatomy hintspowerfully that patches have a specialized function, distinct from interpatches. Given thatpatches receive a direct projection from blue-yellow koniocellular geniculate neurons, it isnatural to postulate that they are dedicated to color processing. Single cell physiology andoptical imaging have provided support for this idea34–37. However, the fact that a structurereceives direct input from a class of color-coded cells does not mean that it constitutes aseparate color system. Layer 4Cβ, for example, receives direct input from red-greenparvocellular neurons, but it is not considered a structure devoted to color, rather than toform. A small population of unoriented cells is likely to exist in patches, fed by directkoniocellular input. These units may contribute to the slightly broader mean orientationtuning of patches. However, the majority of cells in patches are well tuned, presumablybecause their strongest source of input arises from intracortical projections which buildorientation selectivity38.
Economides et al. Page 6
Nat Neurosci. Author manuscript; available in PMC 2012 June 01.
NIH
-PA Author Manuscript
NIH
-PA Author Manuscript
NIH
-PA Author Manuscript
Previously, it was thought that V1 color cells have radially symmetric, unoriented receptivefields4. Patches were expected to contain unoriented cells, because they mediate colorperception rather than edge detection. Subsequently, it has been learned that many neuronsin V1 respond to both equiluminant color and luminance modulation, and that these color-luminance units are well oriented, with a mean circular variance of 0.4039. Numerousstudies have confirmed that color-responsive cells in V1 can be orientation selective22, 40, 41.Even double-opponent cells, reportedly prevalent in patches4, are tuned for orientation42.These observations suggest that there is no contradiction between the finding that patchesretain orientation tuning and the idea that they are involved in color vision.
Several recent fMRI studies have shown that blood oxygen level-dependent signals in striatecortex can discriminate between stimuli that differ in color and orientation, indicating thatorientation-selective chromatic mechanisms emerge early in the human visual system43–45.In one paradigm, subjects viewed gratings which alternated between red and green orbetween +45° and −45°46. In the “double-conjunction” condition, the stimulus alternatedsimultaneously in color and orientation. The voxels that were most informative for thedouble-conjunction condition were distinct from those that were most informative aboutswitches in color and orientation alone. This result implies that V1 contains local groups ofcells jointly sensitive to orientation and color, perhaps corresponding to CO patches.
Our recordings indicated that neurons in patches had a higher mean peak firing rate (13.2spikes/s versus 10.7 spikes/s) in response to visual stimulation (Fig. 7). In addition, theresponse to the anti-preferred orientation was nearly twice as great (3.2 spikes/s versus 1.7spikes/s). This difference in the offset of the tuning curves of patch cells contributed to theirhigher circular variance, but did not account entirely for their broader tuning, because theirpeak orientation bandwidths averaged 10% wider (28.4° versus 25.8°). It would beinteresting to compare surround inhibition for cells in patches versus interpatches, to see ifthis property contributes to the offset in firing rates.
A previous report noted that spike rates recorded in patches are 33% greater than ininterpatches, but the result did not reach statistical significance because a low number ofneurons was sampled47. Our 100-electrode array recordings showed that patch cells have a49% higher mean overall firing rate compared with interpatch cells. This probably explainsin part the greater level of metabolic activity exhibited by patches when V1 is processed forCO histochemistry. It also explains a curious finding from early 2-deoxyglucose studies.Under a wide variety of stimulus conditions, 2-deoxglucose uptake was found to be greatestin patches2, 48, 49. This observation led directly to the idea that patches contain unorientedcells. It was hypothesized that they are more active metabolically because they respondequally to contours of all orientation4. It now appears that most patch cells are well-oriented,but simply have a higher intrinsic mean firing rate than interpatch cells, either underspontaneous conditions or when driven by visual activity.
Supplementary MaterialRefer to Web version on PubMed Central for supplementary material.
AcknowledgmentsThis work was supported by grants EY10217 (J.C.H.), EY13676 (L.C.S.) and EY02162 (Beckman Vision Center)from the National Eye Institute and by Research to Prevent Blindness. The California Regional Primate ResearchCenter is supported by NIH Base Grant RR00169. Christina M. Jocson provided technical assistance and MatthewFeusner assisted with computer programming.
Economides et al. Page 7
Nat Neurosci. Author manuscript; available in PMC 2012 June 01.
NIH
-PA Author Manuscript
NIH
-PA Author Manuscript
NIH
-PA Author Manuscript
References1. Heywood CA, Kentridge RW. Achromatopsia, color vision, and cortex. Neurol Clin. 2003; 21:483–
500. [PubMed: 12916488]2. Horton JC, Hubel DH. Regular patchy distribution of cytochrome oxidase staining in primary visual
cortex of macaque monkey. Nature. 1981; 292:762–764. [PubMed: 6267472]3. Wong-Riley M, Carroll EW. Effect of impulse blockage on cytochrome oxidase activity in monkey
visual system. Nature. 1984; 307:262–264. [PubMed: 6319997]4. Livingstone MS, Hubel DH. Anatomy and physiology of a color system in the primate visual cortex.
J Neurosci. 1984; 4:309–356. [PubMed: 6198495]5. Martin KAC. From enzymes to perception: A bridge too far? Trends in Neuroscience. 1988;
11:380–387.6. Kelly RC, et al. Comparison of recordings from microelectrode arrays and single electrodes in the
visual cortex. J Neurosci. 2007; 27:261–264. [PubMed: 17215384]7. Smith MA, Kohn A. Spatial and temporal scales of neuronal correlation in primary visual cortex. J
Neurosci. 2008; 28:12591–12603. [PubMed: 19036953]8. Nauhaus I, Benucci A, Carandini M, Ringach DL. Neuronal selectivity and local map structure in
visual cortex. Neuron. 2008; 57:673–679. [PubMed: 18341988]9. Nordhausen CT, Maynard EM, Normann RA. Single unit recording capabilities of a 100
microelectrode array. Brain Res. 1996; 726:129–140. [PubMed: 8836553]10. Henze DA, et al. Intracellular features predicted by extracellular recordings in the hippocampus in
vivo. J Neurophysiol. 2000; 84:390–400. [PubMed: 10899213]11. Kaufman, L.; Rousseeuw, PJ. Finding groups in data: an introduction to cluster analysis. Wiley &
Sons; New York: 1990.12. Ringach DL, Shapley RM, Hawken MJ. Orientation selectivity in macaque V1: diversity and
laminar dependence. J Neurosci. 2002; 22:5639–5651. [PubMed: 12097515]13. Swindale NV. Orientation tuning curves: empirical description and estimation of parameters. Biol
Cybern. 1998; 78:45–56. [PubMed: 9518026]14. Eliades SJ, Wang X. Chronic multi-electrode neural recording in free-roaming monkeys. J
Neurosci Methods. 2008; 172:201–214. [PubMed: 18572250]15. Nordhausen CT, Rousche PJ, Normann RA. Optimizing recording capabilities of the Utah
Intracortical Electrode Array. Brain Res. 1994; 637:27–36. [PubMed: 8180807]16. Kim SJ, Manyam SC, Warren DJ, Normann RA. Electrophysiological mapping of cat primary
auditory cortex with multielectrode arrays. Ann Biomed Eng. 2006; 34:300–309. [PubMed:16496084]
17. Purves D, LaMantia A. Development of blobs in the visual cortex of macaques. J Comp Neurol.1993; 334:169–175. [PubMed: 8366193]
18. Farias MF, Gattass R, Piñón MC, Ungerleider LG. Tangential distribution of cytochrome oxidase-rich blobs in the primary visual cortex of macaque monkeys. J Comp Neurol. 1997; 386:217–228.[PubMed: 9295148]
19. Leventhal AG, Thompson KG, Liu D, Zhou Y, Ault SJ. Concomitant sensitivity to orientation,direction, and color of cells in layers 2, 3 and 4 of monkey striate cortex. J Neurosci. 1995;15:1808–1818. [PubMed: 7891136]
20. Lennie P, Krauskopf J, Sclar G. Chromatic mechanisms in striate cortex of macaque. J Neurosci.1990; 10:649–669. [PubMed: 2303866]
21. O’Keefe LP, Levitt JB, Kiper DC, Shapley RM, Movshon JA. Functional organization of owlmonkey lateral geniculate nucleus and visual cortex. J Neurophysiol. 1998; 80:594–609. [PubMed:9705453]
22. Friedman HS, Zhou H, von der Heydt R. The coding of uniform colour figures in monkey visualcortex. The Journal of physiology. 2003; 548:593–613. [PubMed: 12611925]
23. Schiller PH, Finlay BL, Volman SF. Quantitative studies of single-cell properties in monkey striatecortex. II Orientation specificity and ocular dominance. J Neurophysiol. 1976; 39:1320–1333.[PubMed: 825622]
Economides et al. Page 8
Nat Neurosci. Author manuscript; available in PMC 2012 June 01.
NIH
-PA Author Manuscript
NIH
-PA Author Manuscript
NIH
-PA Author Manuscript
24. Nauhaus I, Ringach DL. Precise alignment of micromachined electrode arrays with V1 functionalmaps. J Neurophysiol. 2007; 97:3781–3789. [PubMed: 17344376]
25. Blasdel GG, Salama G. Voltage-sensitive dyes reveal a modular organization in monkey striatecortex. Nature. 1986; 321:579–585. [PubMed: 3713842]
26. Bonhoeffer T, Grinvald A. Iso-orientation domains in cat visual cortex are arranged in pinwheel-like patterns. Nature. 1991; 353:429–431. [PubMed: 1896085]
27. Polimeni JR, Granquist-Fraser D, Wood RJ, Schwartz EL. Physical limits to spatial resolution ofoptical recording: clarifying the spatial structure of cortical hypercolumns. Proc Natl Acad Sci U SA. 2005; 102:4158–4163. [PubMed: 15746240]
28. Blasdel GG. Orientation selectivity, preference, and continuity in monkey striate cortex. JNeurosci. 1992; 12:3139–3161. [PubMed: 1322982]
29. Bartfeld E, Grinvald A. Relationships between orientation-preference pinwheels, cytochromeoxidase blobs, and ocular-dominance columns in primate striate cortex. Proc Natl Acad Sci U S A.1992; 89:11905–11909. [PubMed: 1465416]
30. Landisman CE, Ts’o DY. Color processing in macaque striate cortex: electrophysiologicalproperties. J Neurophysiol. 2002; 87:3138–3151. [PubMed: 12037214]
31. Xu X, et al. Functional organization of visual cortex in the owl monkey. J Neurosci. 2004;24:6237–6247. [PubMed: 15254078]
32. Sincich LC, Horton JC. Divided by cytochrome oxidase: a map of the projections from V1 to V2 inmacaques. Science. 2002; 295:1734–1737. [PubMed: 11872845]
33. Sincich LC, Horton JC. Input to V2 thin stripes arises from V1 cytochrome oxidase patches. JNeurosci. 2005; 25:10087–10093. [PubMed: 16267215]
34. Ts’o DY, Gilbert CD. The organization of chromatic and spatial interactions in the primate striatecortex. J Neurosci. 1988; 8:1712–1727. [PubMed: 3367218]
35. Landisman CE, Ts’o DY. Color processing in macaque striate cortex: relationships to oculardominance, cytochrome oxidase, and orientation. J Neurophysiol. 2002; 87:3126–3137. [PubMed:12037213]
36. Lu HD, Roe AW. Functional organization of color domains in V1 and V2 of macaque monkeyrevealed by optical imaging. Cereb Cortex. 2008; 18:516–533. [PubMed: 17576751]
37. Chatterjee S, Callaway EM. Parallel colour-opponent pathways to primary visual cortex. Nature.2003; 426:668–671. [PubMed: 14668866]
38. Sincich LC, Horton JC. The circuitry of V1 and V2: integration of color, form, and motion. AnnuRev Neurosci. 2005; 28:303–326. [PubMed: 16022598]
39. Johnson EN, Hawken MJ, Shapley R. The spatial transformation of color in the primary visualcortex of the macaque monkey. Nat Neurosci. 2001; 4:409–416. [PubMed: 11276232]
40. Yoshioka T, Dow BM. Color, orientation and cytochrome oxidase reactivity in areas V1, V2 andV4 of macaque monkey visual cortex. Behav Brain Res. 1996; 76:71–88. [PubMed: 8734044]
41. Horwitz GD, Chichilnisky EJ, Albright TD. Cone inputs to simple and complex cells in V1 ofawake macaque. J Neurophysiol. 2007; 97:3070–3081. [PubMed: 17303812]
42. Johnson EN, Hawken MJ, Shapley R. The orientation selectivity of color-responsive neurons inmacaque V1. J Neurosci. 2008; 28:8096–8106. [PubMed: 18685034]
43. Sumner P, Anderson EJ, Sylvester R, Haynes JD, Rees G. Combined orientation and colourinformation in human V1 for both L-M and S-cone chromatic axes. Neuroimage. 2008; 39:814–824. [PubMed: 17964188]
44. Engel SA. Adaptation of oriented and unoriented color-selective neurons in human visual areas.Neuron. 2005; 45:613–623. [PubMed: 15721246]
45. McDonald JS, Mannion DJ, Goddard E, Clifford CW. Orientation-selective chromatic mechanismsin human visual cortex. J Vis. 2010; 10:34. [PubMed: 21047766]
46. Seymour K, Clifford CW, Logothetis NK, Bartels A. Coding and binding of color and form invisual cortex. Cereb Cortex. 2010; 20:1946–1954. [PubMed: 20019147]
47. DeYoe EA, Trusk TC, Wong-Riley MT. Activity correlates of cytochrome oxidase-definedcompartments in granular and supragranular layers of primary visual cortex of the macaquemonkey. Vis Neurosci. 1995; 12:629–639. [PubMed: 8527365]
Economides et al. Page 9
Nat Neurosci. Author manuscript; available in PMC 2012 June 01.
NIH
-PA Author Manuscript
NIH
-PA Author Manuscript
NIH
-PA Author Manuscript

48. Kennedy C, Des Rosiers MH, Sakurada O. Metabolic mapping of the primary visual system of themonkey by means of the autoradiographic 14[C] deoxyglucose technique. Proc Natl Acad Sci U SA. 1976; 73:4230. [PubMed: 825861]
49. Tootell RB, Hamilton SL, Silverman MS, Switkes E. Functional anatomy of macaque striatecortex. I Ocular dominance, binocular interactions, and baseline conditions. J Neurosci. 1988;8:1500–1530. [PubMed: 3367209]
50. Horton JC. Cytochrome oxidase patches: a new cytoarchitectonic feature of monkey visual cortex.Philos Trans R Soc Lond B Biol Sci. 1984; 304:199–253. [PubMed: 6142484]
Economides et al. Page 10
Nat Neurosci. Author manuscript; available in PMC 2012 June 01.
NIH
-PA Author Manuscript
NIH
-PA Author Manuscript
NIH
-PA Author Manuscript
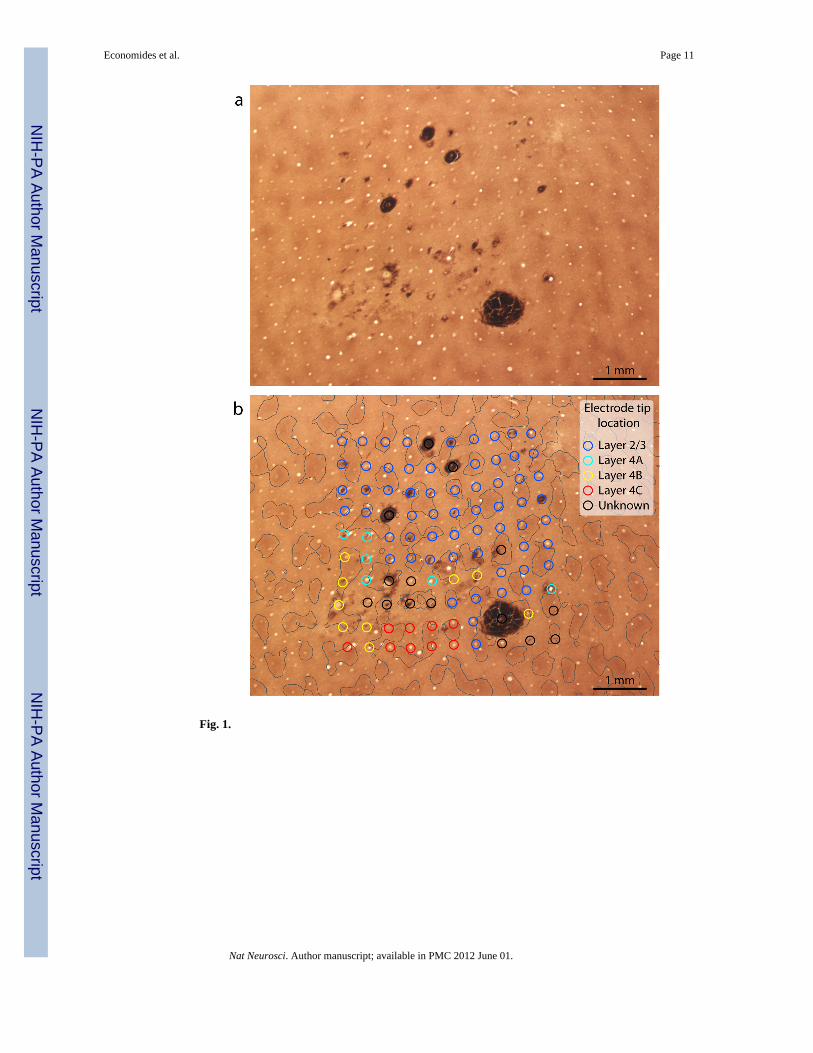
Fig. 1.
Economides et al. Page 11
Nat Neurosci. Author manuscript; available in PMC 2012 June 01.
NIH
-PA Author Manuscript
NIH
-PA Author Manuscript
NIH
-PA Author Manuscript
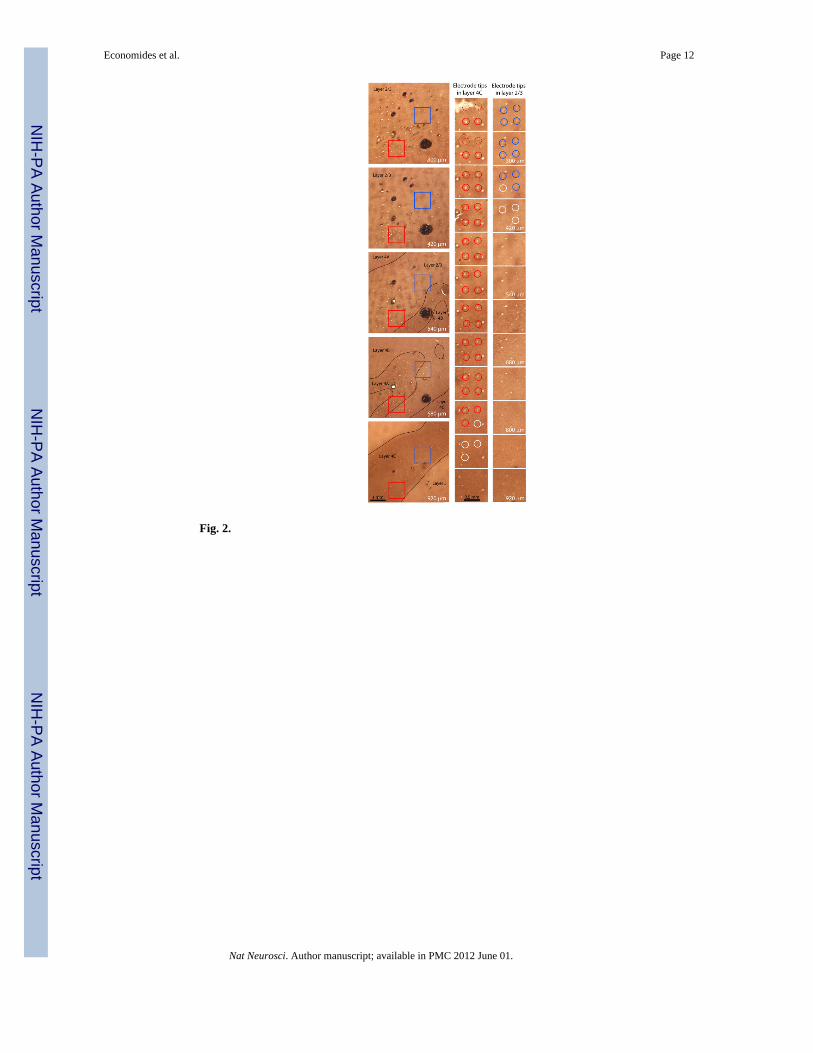
Fig. 2.
Economides et al. Page 12
Nat Neurosci. Author manuscript; available in PMC 2012 June 01.
NIH
-PA Author Manuscript
NIH
-PA Author Manuscript
NIH
-PA Author Manuscript
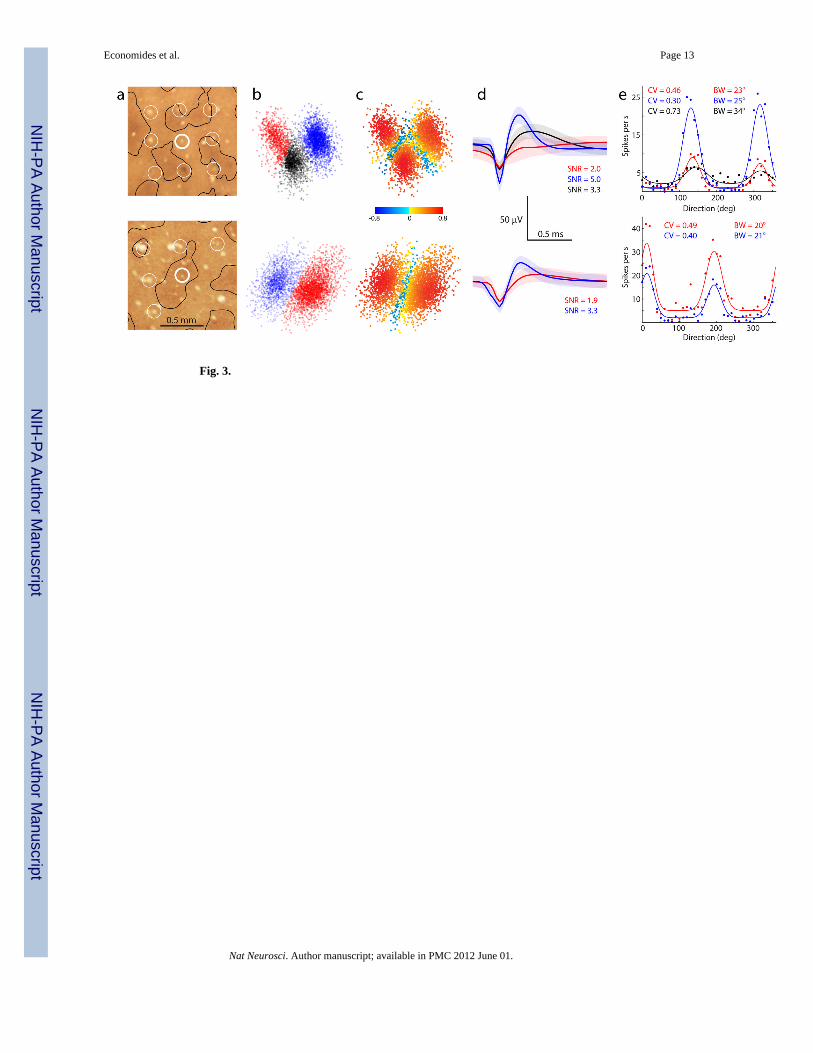
Fig. 3.
Economides et al. Page 13
Nat Neurosci. Author manuscript; available in PMC 2012 June 01.
NIH
-PA Author Manuscript
NIH
-PA Author Manuscript
NIH
-PA Author Manuscript
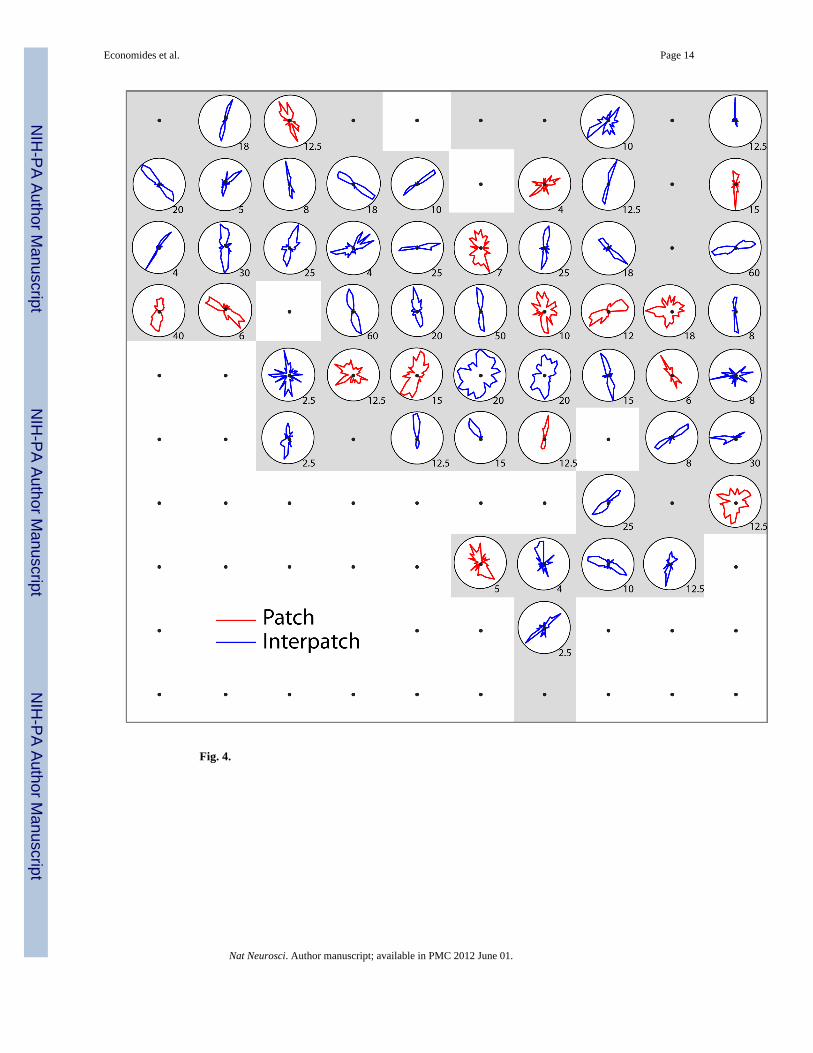
Fig. 4.
Economides et al. Page 14
Nat Neurosci. Author manuscript; available in PMC 2012 June 01.
NIH
-PA Author Manuscript
NIH
-PA Author Manuscript
NIH
-PA Author Manuscript
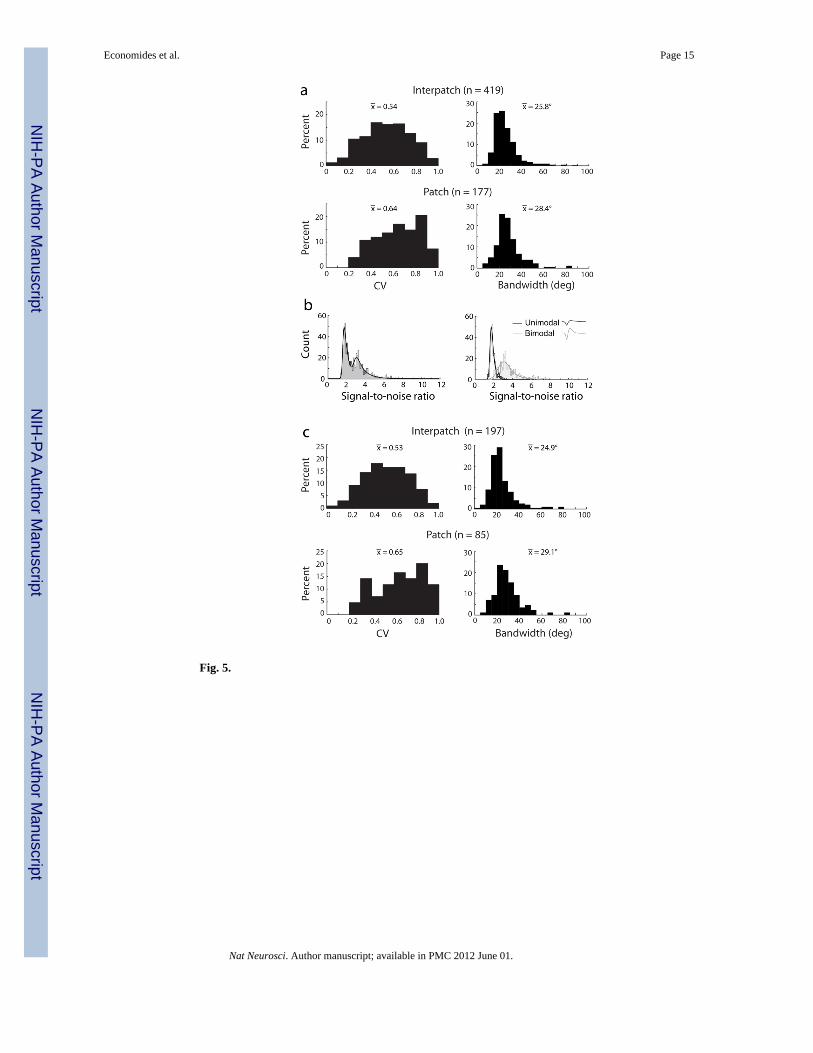
Fig. 5.
Economides et al. Page 15
Nat Neurosci. Author manuscript; available in PMC 2012 June 01.
NIH
-PA Author Manuscript
NIH
-PA Author Manuscript
NIH
-PA Author Manuscript
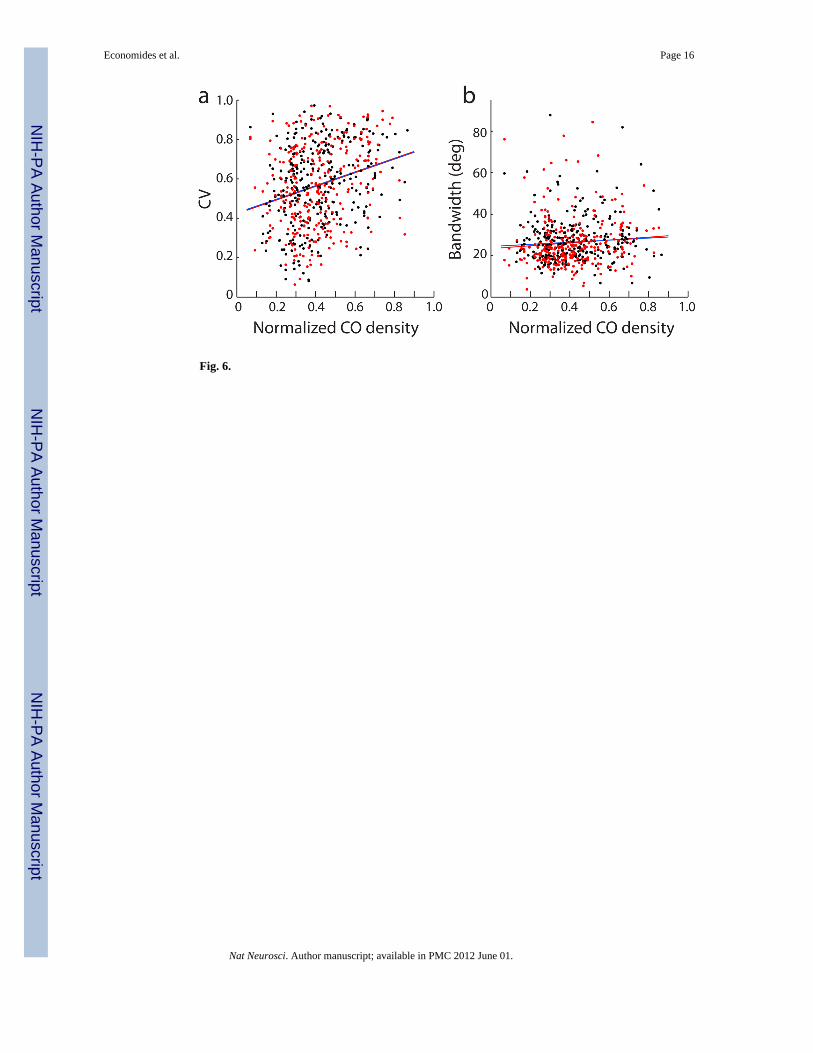
Fig. 6.
Economides et al. Page 16
Nat Neurosci. Author manuscript; available in PMC 2012 June 01.
NIH
-PA Author Manuscript
NIH
-PA Author Manuscript
NIH
-PA Author Manuscript
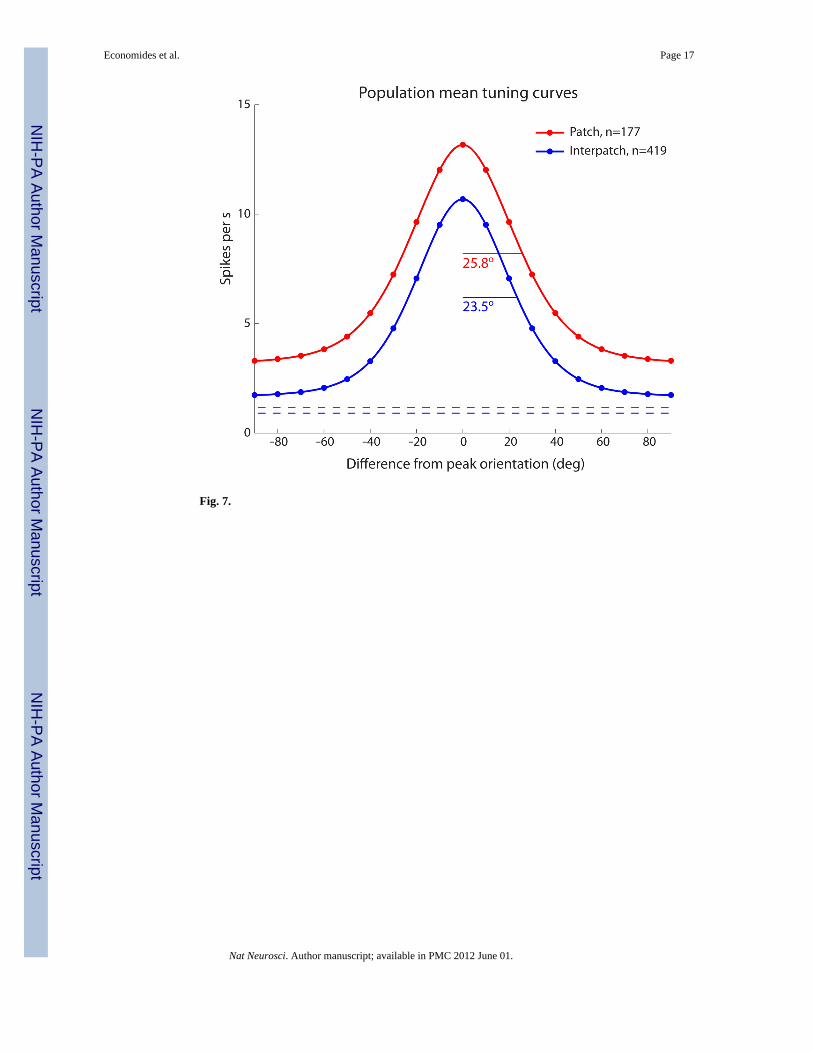
Fig. 7.
Economides et al. Page 17
Nat Neurosci. Author manuscript; available in PMC 2012 June 01.
NIH
-PA Author Manuscript
NIH
-PA Author Manuscript
NIH
-PA Author Manuscript


