Embed Size (px)
Citation preview
Pergamon PII: S0042-6989(97)00108-9
Vision Res., Vol. 37, No. 20, pp. 2813-2828, 1997 © 1997 Elsevier Science Ltd. All rights reserved
Printed in Great Britain 0042-6989/97 $17.00 + 0.00
Rod Inputs to Macaque Ganglion Cells BARRY B. LEE,*~" VIVIANNE C. SMITH,~: JOEL POKORNY,:~ JAN KREMERS§
Received 31 October 1996; in revised form 7 April 1997
The strength of rod inputs to ganglion cells was assessed in the macaque retina at retinal positions within 3-15 deg eccentricity. The experimental paradigm used temporally modulated heterochro- matic Hghts whose relative phase was varied. This paradigm provided a sensitive test to detect rod input. In parvocellular (PC) pathway cells, the gain of the cone-driven signal decreased with decrease in luminance. At 2 td a weak rod response, of a few impulses per second for 100% rod modulation, was revealed in about 60% of cells. For blue-on cells, the cone-driven response also decreased with retinal illuminance, but no rod response could be found. In magnocellular (MC) pathway cells, rod input was much more apparent. Responses became rod dominated at and below 20 td; we cannot exclude rod intrusion at higher retinal illumlnances. Responsivity was maintained even at low retinal illuminances. Temporal-frequency dependent rod-cone interactions were observed in MC-pathway cells. Rod responses were of longer latency than cone responses, but there was no evidence of any difference in rod latency between parvocellular and magnocellular pathways. © 1997 Elsevier Science Ltd
Cones Rods Ganglion cells Magnocellular Parvocellular
INTRODUCTION
The human visual system is sensitive to light stimuli varying over more than a 12 log unit range. It accom- plishes this in part by switching receptor systems, from rods at low light levels to cones at high levels. Rods are active from threshold (absorption of a few quanta) until rod saturation at about 3000 scotopic trolands (Aguilar & Stiles, 1954), although under special conditions rod intrusion can be detected up to much higher levels (Wyszecki & Stiles, 1982; p. 362). Cones are active above cone threshold, 0.1 photopic troland. With broad- band illumination there is an intermediate region above 0.1 trolands (Wyszecki & Stiles, 1982) in which both the rod and cone mechanisms participate significantly in vision.
The visual system is efficient in conveying both rod and cone signals from eye to brain along the same pathways (Daw et al., 1990). Here we evaluate rod input to pathways which have been identified as carrying visual information to the cortex via the lateral geniculate nucleus. Rod inputs reach retinal ganglion cells through a specific set of connections (reviewed in W~isste & Boycott, 1991). Connections occur between the rod terminals and specialized "rod" bipolars, and between the
*Neurobiology, Max Planck Institute for Biophysical Chemistry, 37077 Gtttingen, Germany.
tTo whom all correspondence should be addressed [Tel: 49-551- 2011643; Fax: 49-551-2011039; Email: [email protected]].
:~Visual Sciences Center, University of Chicago, Chicago, IL 60637, U.S.A.
§Department of Experimental Ophthalmology, University of Tiibingen, Ttibingen, Germany.
rod bipolars and specialized (AII) amacrine cells. Rod bipolars depolarize in response to light and, in turn, depolarize the AII amacrine cells. The AII amacrine cells provide a sign-inverted signal to off-center cone bipolar cells through a GABAergic synapse in the inner plexi- form layer, and a sign-conserved signal to on-center cone bipolar cells through gap junctions. This circuitry has been found in every mammal studied, including the primate (Grtinert & Martin, 1991; Grtinert & W~issle, 1996). There exists a second possible pathway for rod signals via rod-cone coupling (Schneeweiss & Schnapf, 1995). In this second pathway, rod signals transmitted to the cone terminals are processed through the cone bipolars and their pathways.
Three major pathways leave the primate retina toward the geniculate, each with a well-established anatomical and physiological basis. Each pathway has subtypes, corresponding to on- and off-center processing. Magno- cellular (MC) pathway cells receive summed input from middle- (M) and long-wavelength (L) sensitive cones. Their anatomical basis is the parasol system. Parvocel- lular (PC) pathway cells receive antagonistic input from M- and L-cones. Their anatomical basis is the midget system. In the third pathway, one class of cell receives excitatory input from short-wavelength (S) sensitive cones opposed by a combination of the other two (L + M) cone types. These S - ( L + M) cells have recently been identified as a morphologically distinct ganglion cell type (Dacey & Lee, 1994), probably with a distinct central projection pattern (Hendry & Yoshioka, 1994). There are also cells with inhibitory S-cone input (Valberg et al., 1986), but their anatomical identification is uncertain. Cells with S-cone input have usually been grouped with
2813
2814 B.B. LEE et al.
PC-pathway cells (Derrington et al., 1984) based on their physiological properties in processing chromatic infor- mation, but from an evolutionary standpoint probably should not be subsumed into the PC-pathway (Mollon, 1991).
The distribution of rod inputs to different cell types in the primate visual pathway is uncertain, as reports in the literature have been inconsistent. Wiesel & Hubel (1966) reported a Purkinje shift and thus rod input to about 30% of cells recorded from the PC-pathway laminae of the lateral geniculate nucleus. Gouras & Link (1966) reported strong rod input to phasic ganglion cells; these were presumably parasol cells of the MC-pathway. Virsu & Lee (1983; Virsu et al., 1987) reported strong rod input to MC-pathway and inter-cell variability in the PC- pathway. Purpura et al. (1988) measured contrast gain as a function of retinal illuminance. Although they did not specifically test for rod input by measuring spectral sensitivity, their data implied strong rod input to MC- pathway and little or no rod input to PC-pathway. Very similar results were reported by Lee et al. (1990).
As well as providing the basis for spatial vision under scotopic conditions, rod signals are known to participate in color matching (Wyszecki & Stiles, 1982) and to interact with chromatic processing in a variety of ways (Stabell & Stabell, 1976, 1977, 1994; Buck, 1985; Shapiro et al., 1994; Buck & Brandt, 1995). Thus, more quantitative data as to the presence and strength of rod input to primate ganglion cells is desirable. One difficulty in such experiments is to identify rod inputs even if they are very weak. We used a paradigm designed to characterize the strength and balance of cone inputs to ganglion cells (Smith et al., 1992). The method involves the manipulation of the relative phase of a pair of heterochromatically modulated lights. The protocol has the advantage of providing a unique amplitude/phase signature for each receptor input. Further, the unique phase signature allows detection of weak inputs, since robust phase data are obtained even if firing rates are only a few impulses per second above baseline. Some of these results have been presented in abstract form (Lee et al., 1996).
METHODS
Animal preparation
We recorded from cells in the retinae of macaques (M. fascicularis). Details of the animal preparation and recording techniques may be found elsewhere (Lee et al., 1989). Briefly, after an initial injection of ketamine, anesthesia was maintained with isofluorane in 70%:30% N2:O2 mixture (1-2% during surgery and 0.5-1.0% during recording). Local anesthesia was applied at the points of surgical intervention. The EEG and EKG were continuously monitored as a control for anesthetic depth. Muscular relaxation was maintained by intravenous infusion of gallamine triethiodide (5 mg/kg/hr) with 3 ml/hr of dextrose Ringer. The end-tidal PCO2 was kept
near 4% by adjusting the rate and depth of ventilation. Body temperature was maintained near 37.5 deg.
Stimuli and calibration
Stimuli were presented through the Maxwellian view system (Lee et al., 1990; Yeh et al., 1996). Light sources were light emitting diodes (LEDs) with dominant wavelengths of 638, 554 and 468 nm, and colorimetric purities of 99, 97, and 96%, respectively. Luminances of the 638 and 554 nm LEDs were set equal by foveal heterochromatic flicker photometry (HFP) by a subject whose luminosity function closely matched that of the Judd (1951) observer. Calibration of the 468 nm LED was first approximated using parafoveal HFP by a human observer. Then, in initial recordings the 468 nm LED level was further adjusted to yield a response null in MC- pathway cells to counterphase 554 and 468 nm LED modulation. These cells have a flicker photometric spectral sensitivity very close to that of human (Lee et al., 1988). Time-averaged retinal illuminances were estimated (Westheimer, 1966) to be 1000td for each LED. Time-averaged chromaticity had a dominant wavelength of 595 nm (CIE coordinates (x, y)= (0.60, 0.40)) when only the 638 and 554 nm LEDs were being used and had CIE coordinates (x, y)= (0.18, 0.15) when the 468 and 554 nm diodes were being used. The LED outputs were controlled by frequency modulation of a constant-amplitude pulse train, giving a high degree of linearity over more than a 3 log unit range. Stimulus waveforms were generated by a computer through 12-bit digital-to-analog converters.
Procedure
The eye was corrected to infinity with a gas-permeable contact lens. After isolation of a ganglion cell's activity, the receptive field location was plotted on a tangent screen. Cells were sampled from approx. 3 to 15 deg retinal eccentricity. Technical limitations of the Max- welfian view system made it difficult to investigate more peripheral cells. PC-pathway cells were identified by their sustained responses to different wavelength stimuli. MC-pathway cells were identified by their phasic responses to all colors, and their high achromatic contrast responsivity. The tests used were developed during recordings in the lateral geniculate nucleus (e.g., Lee et al., 1987), and usually cell classification was unambig- uous. The conjugate focus of the Maxwellian view system was centered on the pupil.
In each protocol a pair of LEDs was placed in temporal sinusoidal modulation. When the 638 and 554 nm LEDs were in use the 468 nm LED was switched off and when the 468 and 554 nm LEDs were used the 638 nm LED was off. The majority of data presented here are for the 638/554 nm pair of lights. The 468/554 nm pair of LEDs was used to confirm that a given response had a rod origin. The major experimental variable was the relative phases of the LEDs (Smith et al., 1992). The phase of the 554 nm LED was changed as the independent variable in
ROD INPUTS TO MACAQUE GANGLION CELLS 2815
+ L - M ( red -on ) Cel l ; 2 0 0 0 Td , 0.61 Hz, 5 0 % m o d .
5o ,8o ,. / / ' ,xo/ • • it.
90 • /
,~ D. o Model
i .oo , . . . . . ,n,=.
0 -180 / ' " ' " ' -180 -90 0 90 180 -180 -90 0 90 180
Relative Diode Phase (Green to Red; deg)
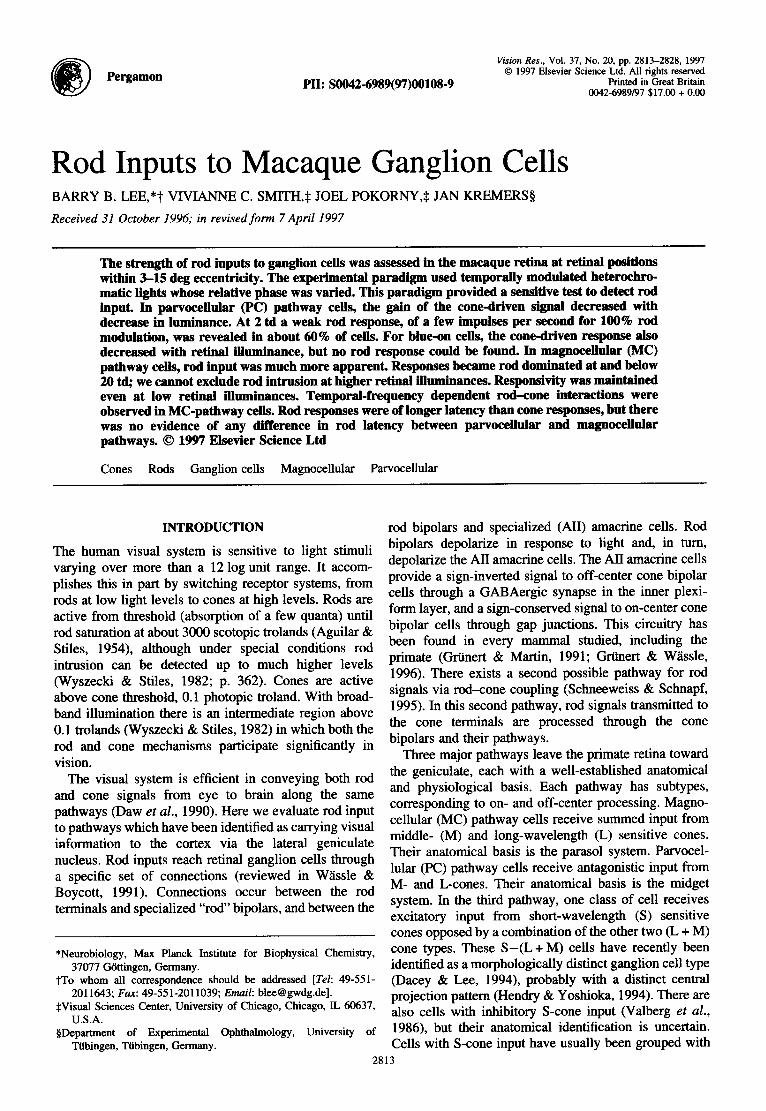
FIGURE 1. Response amplitude and phase for a PC-pathway +L - M cone cell as a function of relative diode phase. Response amplitude is maximum to chromatic modulation (180 deg relative diode phase) and minimum to huninance modulation (0 deg relative diode phase). The solid curve shows the fit of the PC-pathway cone-opponent model to the data (Smith et al., 1992). If rod input had been present, amplitude data should be independent of relative diode phase (dashed line in amplitude plot) and response phase should fall on the 45 deg diagonal. A 180 deg phase difference is expected depending on whether rod input is excitatory or inhibitory (dashed lines in phase plot). Each point is derived from Fourier analyses of an impulse histogram averaged over 6 sec. Fit parameters: amplitude, 40.0 imp/sec; L/M-cone weight, 0.38; L-cone phase 29.3 deg; M-cone phase,
208.2 deg. ER49U8, eccentricity 5 deg.
22.5 deg steps, to give 16 phases, relative to the phase of the 638 or 468 nm LED.
We recorded responses to heterochromatic modulation of the 638 and 554nm LEDs at several temporal frequencies, selected from 0.61, 1.22, 2.44, 4.88, 9.76 and 39.5 Hz. Modulation depth of the LEDs was always equal, and adjusted to give a response modulation of 4 0 - 100 impulses per second at 2000 td. The initial modula- tion depth was usually 20 and 50% for MC- and PC- pathway cells at 2000 td, modulation depth being defined as Michelson contrast. Responses were recorded to 4.7 deg fields. In pilot data we established that field sizes larger than this had little effect on rod responsivity.
Responses were first recorded at 2000 td. Then, a neutral density filter (Schott, Mainz) was inserted into the optical system and the measurements repeated following an adaptation period to the new steady level of approx. 3 min. Responses were measured at 1 log unit steps, as long as a response was present. Modulation depth was adjusted as necessary. About 6 sec of activity were recorded for each condition, and the amplitude and phase of the first-harmonic response components were ex- tracted by Fourier analysis.
RESULTS
Rod inputs to M, L-cone opponent cells
Figure 1 illustrates data obtained at 2000 td from a + L - M cell. Amplitude and phase are shown as a function of the relative phase of the 554 nm LED. A stimulus phase of 0 deg (in phase) corresponds to luminance
modulation, and a phase of 180 deg (counterphase) corresponds to chromatic modulation. Response ampli- tude is maximal for chromatic modulation and minimal for luminance modulation. Response phase changes rapidly near the response amplitude minimum.
The data have been fitted (solid curves) with a model of PC-pathway cone spectral opponency described else- where (Smith et al., 1992). Cone modulations for each relative phase were calculated from the cone funda- mentals (Smith & Pokomy, 1975), and data were fitted using four free parameters; the M-cone phase, the L-cone phase, the L/M-cone weighting and an amplitude scalar. The L- and M-cone phases are usually 180 deg apart at low frequencies: the L/M cone weighting determines the shape of the phase curve. The usual value of the weightings was in the range 0.28-0.38, being higher for red-on cells and lower for green-on cells (Smith et al., 1992). These values reflect not only center/surround strength but also adaptation to the time-average chroma- ticity of the stimulus. The fitting procedure differed slightly from that used in the earlier study. Least-squares error was minimized in the complex plane to give a simultaneous fit of amplitude and phase; previously phase and amplitude data were fitted sequentially. From the L/M cone weighting and amplitude terms, cone contrast gain for the center cone could be calculated in terms of impulses per second percent of cone modulation.
The dashed lines on Fig. 1 show the characteristic amplitude/phase signature of the rod response, based on rod spectral sensitivity to the LED pair. The rod sensitivity to the 638 nm LED is low (about 0.02 that
2816 B.B. LEE et al.
to the 554 nm LED) and in this paradigm the rod is excited primarily by the 554 nm LED. The expected response amplitude is independent of the relative phase of the 554 nm to 638 nm LED, while the response phase is locked to the phase of the 554nm LED. The characteristic rod amplitude/phase signature thus shows a straight line in the amplitude plot and a 45 deg diagonal in the phase plot. Excitatory and inhibitory rod inputs can be distinguished by a 180 deg phase difference.
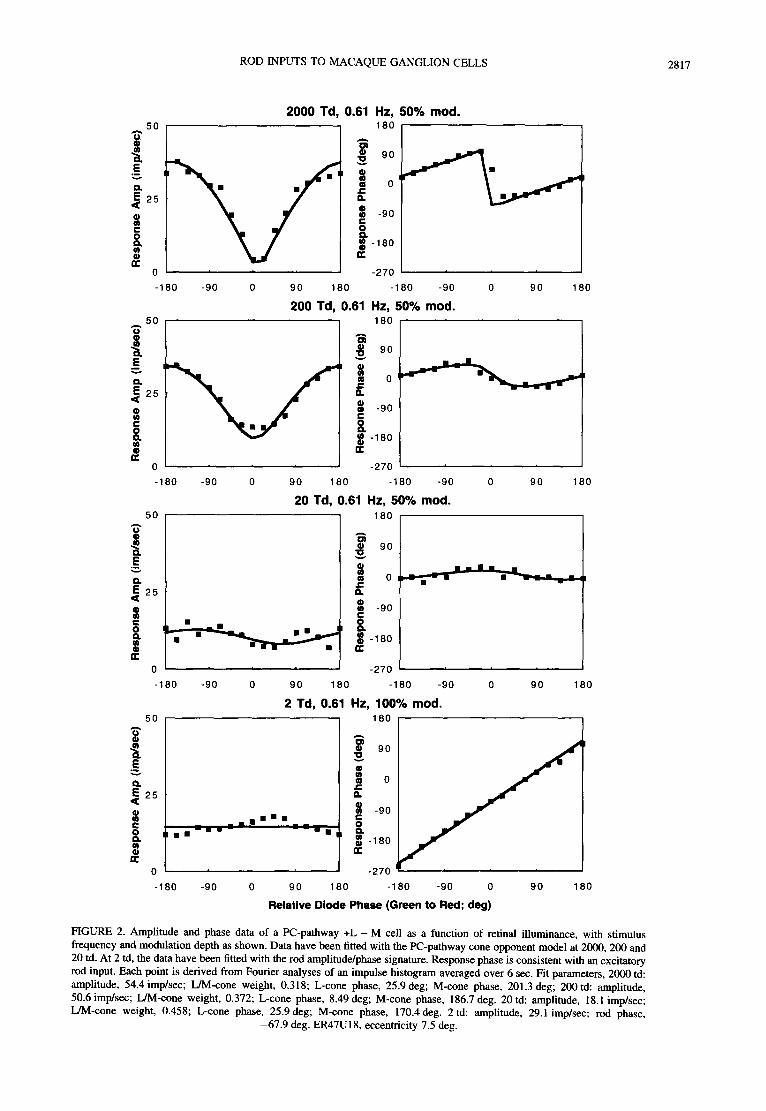
Figure 2 shows data obtained from a +L - M on cell as retinal illuminance was reduced. Temporal frequency was 0.61 Hz; modulation depth is indicated for each luminance level. At the higher retinal illuminances data resemble those in Fig. 1 and have been fitted with the cone-opponent model. The phase curve becomes flatter toward 20 td, and in the model this change is reflected by an increase in the L/M-cone weight. The model provides adequate fits to the data and parameters may be found in the legend. At 2 td the amplitude data are essentially uniform and the phase data fall on a 45 deg line, consistent with the expected rod amplitude/phase signa- ture. Amplitude data are fit with a single amplitude scalar and the phase data are fit with a 45 deg line. The response phase is consistent with an excitatory rod input with some delay relative to the cone signal. The rod signal is excitatory and synergistic to the L-cone providing the center input. It is of note that the cell's response phase to chromatic modulation (a relative phase of 180 deg) undergoes reversal between 20 and 2td, strongly inferring an abrupt switch to rod input.
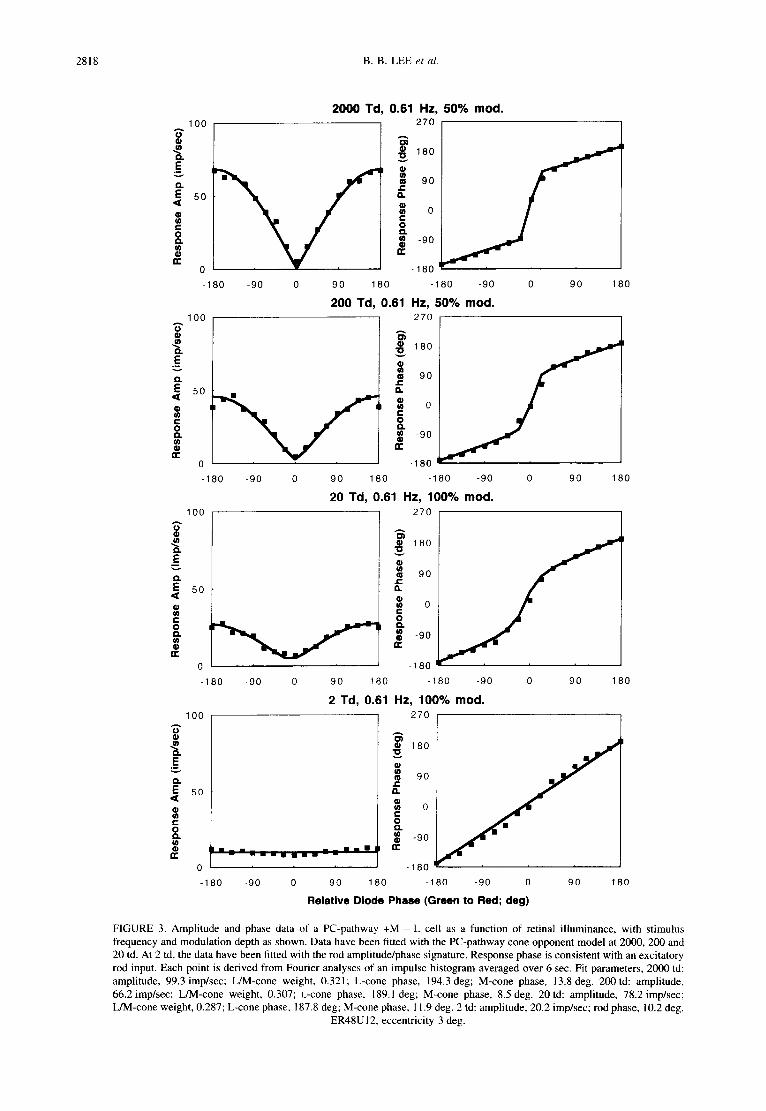
Figure 3 shows equivalent data for a +M - L cell. At high retinal illuminances the cell shows characteristic cone opponent behavior and can be fitted by the cone spectral-opponent model, for which the fit parameters can be found in the legend. As retinal illuminance is reduced, response amplitude becomes weaker. The model output reflects a decrease in L/M-cone weight. At 2 td the response amplitude becomes very weak but the presence of rod input can be inferred from the phase data, which fall upon the 45 deg line. Again, response phase is consistent with an excitatory rod input synergistic to the M-cone input to the center.
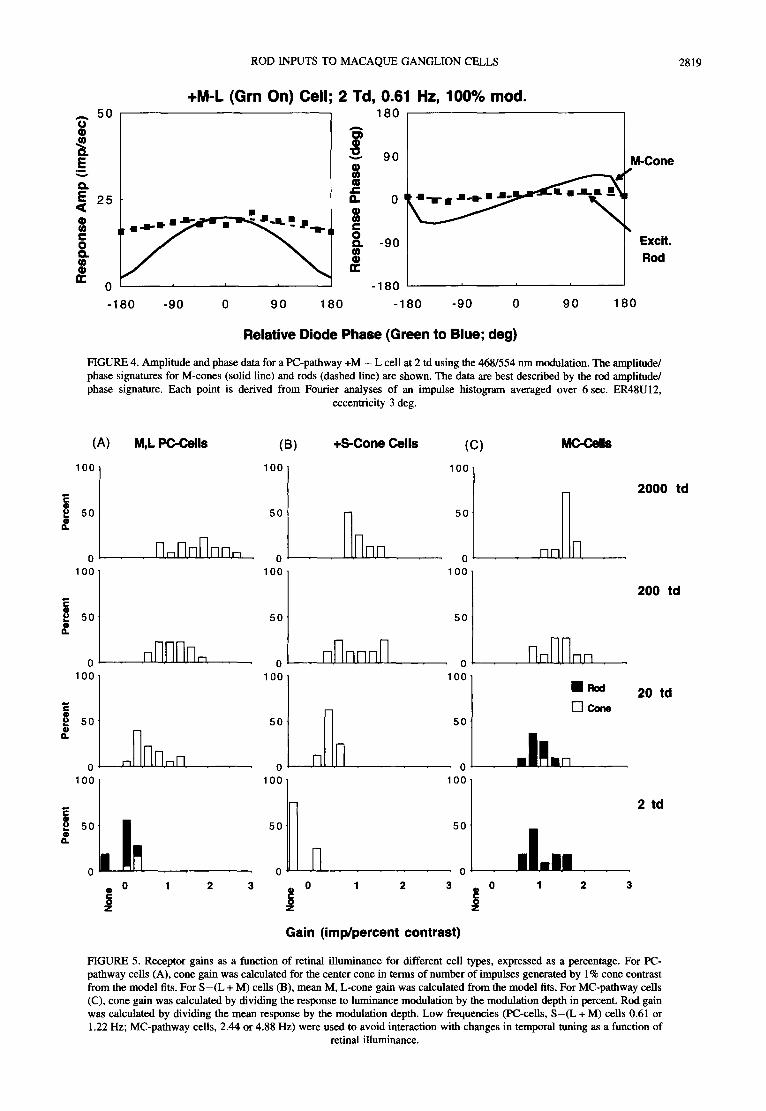
The analysis in Fig. 3 is consistent with rod activity at 2 td. However, suppose the response is driven solely by the M-cone, as might occur if the cell lost spectral opponency and became driven by the receptive field center. Although the M-cone signature (shown in Smith et al., 1992) differs from that of rods, differentiation of the rod and M-cone amplitude/phase signatures is less secure when responsivity is low. These possibilities could be distinguished using the 468-554nm modulation paradigm. The rod sensitivity is almost 30 times greater to the 468 nm LED and its response is now little affected by the phase of the 554 nm LED, while its phase follows the (constant) 468 nm LED phase. The M-cone is only slightly more sensitive to the 468 nm LED and gives a strong amplitude response to the in-phase condition and a phase response characteristic of equal sensitivity to the LEDs. Amplitude/phase signatures for rods and M-cones
were constructed for the 468-554 nm paradigm. For the cell of Fig. 3, results are shown in Fig. 4. Response amplitude and phase are satisfactorily fitted by the rod signature (dashed lines) and not by the M-cone signature. Finally, the M-L spectral opponent is also more sensitive to the in-phase (luminance) component than the counter- phase (chromatic) component of 468-554 nm modula- tion. Thus, the data are also not consistent with an M - L spectral opponent response.
The data in Figs 2 and 3 were typical of the sample of 19 PC-pathway cells tested. Receptor gains as a function of retinal illuminance are summarized as a function of retinal illuminance in Fig. 5(A). Low frequency data (0.61 or 1.22 Hz) were used to derive the gain measure, so as not to influence the measure with adaptation- dependent changes in temporal tuning. With decreasing retinal illuminance cone responses become weaker but are maintained until at 2 td a rod input became evident in approx. 65% of cells. However, this rod input was always weak, with a mean gain of 0.10. Thus, 100% rod modulation (e.g., luminance modulation at 100% Michelson contrast) would only evoke a response of 10 imp/sec.
The polarity of the rod input (excitatory or inhibitory) was always consistent with the center type ( L - M, M - L, - L + M or - M + L) classified under photopic conditions. It was a consistent finding that, for cells with L-cone centers, the center cone became dominant as retinal illuminance decreased, as seen in Fig. 2. This was not consistently the case for cells with M-cone centers, although the cell in Fig. 3 displayed this effect.
We considered the possibility that some rod input could have been presented to M, L-cone opponent cells at 20 td, but may have been masked by the cone response. We therefore attempted to fit the data with a combined cone-rod model, with rod input assumed to the center. Red-on cells gave fits in which the rod input was very weak, less than 5% of the cone weighting. Residual sum of squares was decreased by very small amounts, 0.5- 3%. For green-on cells the 554-638 nm phase condition did not conclusively exclude the possibility of rod input, but as pointed out above the 468-554 nm phase paradigm indicated that such input must be weak.
Rod inputs to S - ( L + M) cells
With the 638 and 554 nm LEDs the photopic response of the S-(L+M) cells is driven by the M- and L-cones of the receptive field surround. Examples of amplitude and phase data are shown in Fig. 6. The cell gives a maximum response to luminance modulation and a minimum response to chromatic modulation. The phase data show a rapid transition near 180 deg. The slope of the phase data is determined by the relative weighting of the L- and M-cones providing the antagonistic surround. The data have been fitted as in Smith et al. (1992). There are three free parameters; the L and M-cone phases (which are assumed to be identical), the L/M-cone weighting and an amplitude scalar. If rod input is dominant, then the rod
ROD INPUTS TO MACAQUE GANGLION CELLS 2817
50
° ~
Q W f -
o D. m @
5O
O. W o
o
E D. E < Q W
o D. Q iv"
"6"
i Q. E
o M c. o Q. w Q
2000 Td, 50%mod.
50
25
0
-180
50
25
0
-180
-90 0
0.61 Hz, 180
, o
~ o n
~ -90
~ - 1 8 0
90 180
200 Td 0.61
-90 0
0 i
-180 -90 0
0
-180
90 180
20 Td, 0.61
-90 0
_ . l Z Z l _ _ I m u - - - m I
=
90 180 -180 -90 0 90 180
Relative Diode Phase (Green to Red; deg)
-270
-180 -90
Hz, 50% rood. 180
0
-90
-180
0 90 180
-270
-180 -90
Hz, 50%mod. 180
~ 90
== o
0 90 180
-90
-180
-270
-180 -90 0 90 180
a. ==
==
i
90 180
2 Td, 0.61 Hz, 100% mod. 180
0
-90
-180 n"
-270
FIGURE 2. Amplitude and phase data of a PC-pathway +L - M cell as a function of retinal illuminance, with stimulus frequency and modulation depth as shown. Data have been fitted with the PC-pathway cone opponent model at 2000, 200 and 20 td. At 2 td, the data have been fitted with the rod amplitude/phase signature. Response phase is consistent with an excitatory rod input. Each point is derived from Fourier analyses of an impulse histogram averaged over 6 sec. Fit parameters, 2000 td: amplitude, 54.4 imp/sec; L/M-cone weight, 0.318; L-cone phase, 25.9 deg; M-cone phase, 201.3 deg; 200 td: amplitude, 50.6 imp/sec; L/M-cone weight, 0.372; L-cone phase, 8.49 deg; M-cone phase, 186.7 deg. 20 td: amplitude, 18.1 imp/sec; L/M-cone weight, 0.458; L-cone phase, 25.9 deg; M-cone phase, 170.4deg. 2 td- amplitude, 29.1 imp/sac; rod phase,
-67.9 deg. ER47UI8, eccentricity 7.5 deg.
10o "6" ®
. m
8
0
-180
Hz, 50% mod.
1
2000 Td
-90 0 90 180
0.61 Hz, 50% mod. 270
180
90
(1,.
~" o 8
-90
-180
-180 -90 0 90 180
200 Td, 0.61 100 270
® "6 18o
• - ~
$ 90
o
g ~ -90
0 - t 8 0
2818 B.B. LEE et al.
-180 -90 0 90 180 -180 -90 0 90 180
20 Td, 0.61 Hz, 100% rood. 100 270
® "6 18o
• - ~
,,~ 50
, o
~ -9o g:
0 -180
®
E , D
Q. E
o e.- o Q. ® n-
-180
100
50
-90 0
i - - ] i J
0
-180 -90
90 180 -180 -90 0 90 180
2 Td, 0.61 Hz, 100% mod. 27O
"~ 180
90 el.
o 8
I~ -90
-180
0 90 180 -180 -90 0 90 180
Re la t i ve D i o d e P h a s e ( G r e e n to Red; deg )
FIGURE 3. Amplitude and phase data of a PC-pathway +M L cell as a function of retinal illuminance, with stimulus frequency and modulation depth as shown. Data have been fitted with the PC-pathway cone opponent model at 2000, 200 and 20 td. At 2 td, the data have been fitted with the rod amplitude/phase signature. Response phase is consistent with an excitatory rod input. Each point is derived from Fourier analyses of an impulse histogram averaged over 6 sec. Fit parameters, 2000 td: amplitude, 99.3 imp/sec; L/M-cone weight, 0.321; L-cone phase, 194.3 deg; M-cone phase, 13.8 deg. 200 td: amplitude, 66.2imp/sec; L/M-cone weight, 0.307; L-cone phase, 189.1 deg; M-cone phase, 8.5 deg. 20td: amplitude, 78.2 imp/sec; L/M-cone weight, 0.287; L-cone phase, 187.8 deg; M-cone phase, 11.9 deg. 2 td: amplitude, 20.2 imp/sec; rod phase, 10.2 deg.
ER48UI2, eccentricity 3 deg.
ROD INPUTS TO MACAQUE GANGLION CELLS 2819
,..., 5O 0 a)
g
0 -180
+M-L (Grn On) Cell
i i i
-90 0 90 180
2 Td, 0.61 Hz, 100% mod. 180
9 0 M-Cone
a . 0 - "
g - 9 0 Excit.
-180 -180 -90 0 90 180
Relat ive Diode Phase (Green to Blue; deg)
FIGURE 4. Amplitude and phase data for a PC-pathway +M - L cell at 2 td using the 468/554 nm modulation. The amplitude/ phase signatures for M-cones (solid line) and rods (dashed line) are shown. The data are best described by the rod amplitude/ phase signature. Each point is derived from Fourier analyses of an impulse histogram averaged over 6 sec. ER48U12,
eccentricity 3 deg.
E @ o O a .
(A) M,L PC-Cells (B) +S-Cone Cells (C) MC-CelIs
lOO lOO lOO
50
Fl.r-,FI.nrl.n n r-, 50 50
0 0 0 100 100 100
50
nOP]On
(D
E 5O
0 0 100 100
nOOO~n
0 E 50 @ il l .
oFIoooFI
50 oln
nnlrl.
0 0
1 0 0 ~ i ~ 100
50 50 g.
0 ® 0
0 Z
50
0 oo . Cone
50
0 100
50
M o o 1 2 3 • 0 1 2 3 • 0 1 2 3
¢: C 0
2000 td
200 td
20 td
2 td
Gain ( imp/percent contrast)
FIGURE 5. Receptor gains as a function of retinal illuminance for different cell types, expressed as a percentage. For PC- pathway cells (A), cone gain was calculated for the center cone in terms of number of impulses generated by 1% cone contrast from the model fits. For S - ( L + M) cells (B), mean M, L-cone gain was calculated from the model fits. For MC-pathway cells (C), cone gain was calculated by dividing the response to luminance modulation by the modulation depth in percent. Rod gain was calculated by dividing the mean response by the modulation depth. Low frequencies (PC-cells, S - ( L + M) cells 0.61 or 1.22 Hz; MC-pathway cells, 2.44 or 4.88 Hz) were used to avoid interaction with changes in temporal tuning as a function of
retinal illuminance.
2820 B.B. LEE et al.
+S-cone Cell; 2000 Td, 0.61 Hz, 50% mod. /
5 0 9 0 • Excit.
• • ~ Rod . ,
~ -180
g .*. t" -27o t"
0 -360
-180 -90 0 90 180 -180 -90 0 90 180
Add. Cone Model
Relative Diode Phase (Green to Red; deg)
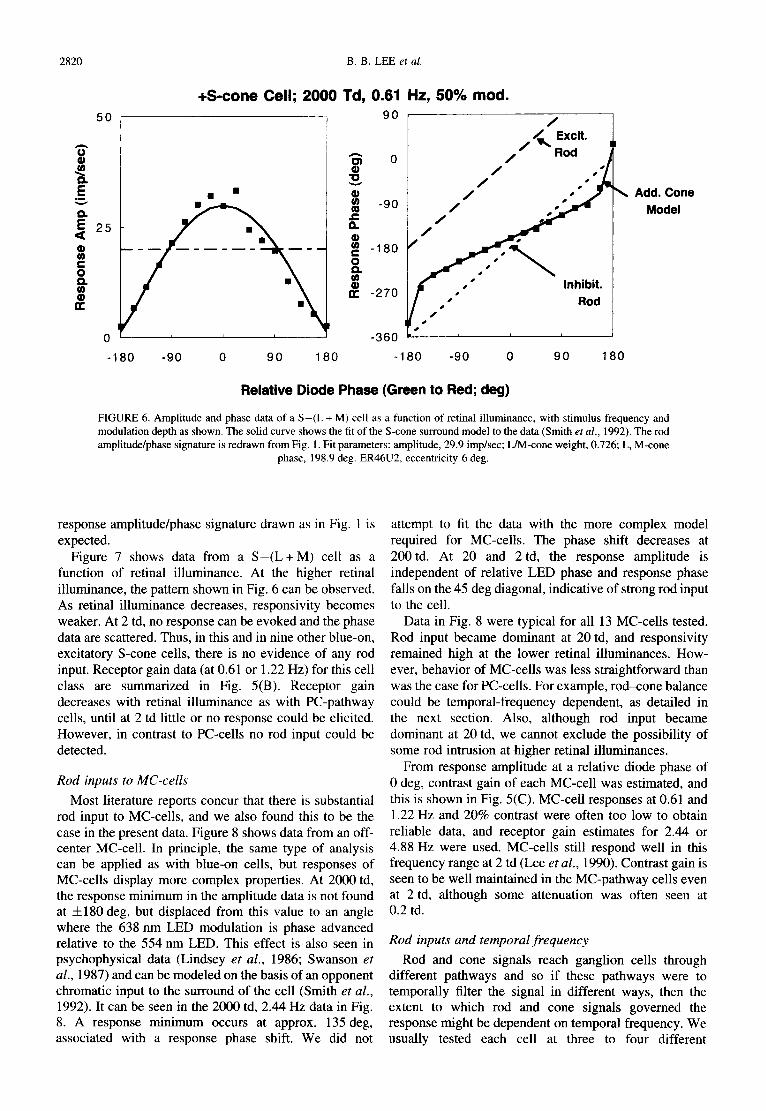
FIGURE 6. Amplitude and phase data of a S-(L + M) cell as a function of retinal illuminance, with stimulus frequency and modulation depth as shown. The solid curve shows the fit of the S-cone surround model to the data (Smith et al., 1992). The rod amplitude/phase signature is redrawn from Fig. 1. Fit parameters: amplitude, 29.9 imp/sec; L/M-cone weight, 0.726; L, M-cone
phase, 198.9 deg. ER46U2, eccentricity 6 deg.
response amplitude/phase signature drawn as in Fig. 1 is expected.
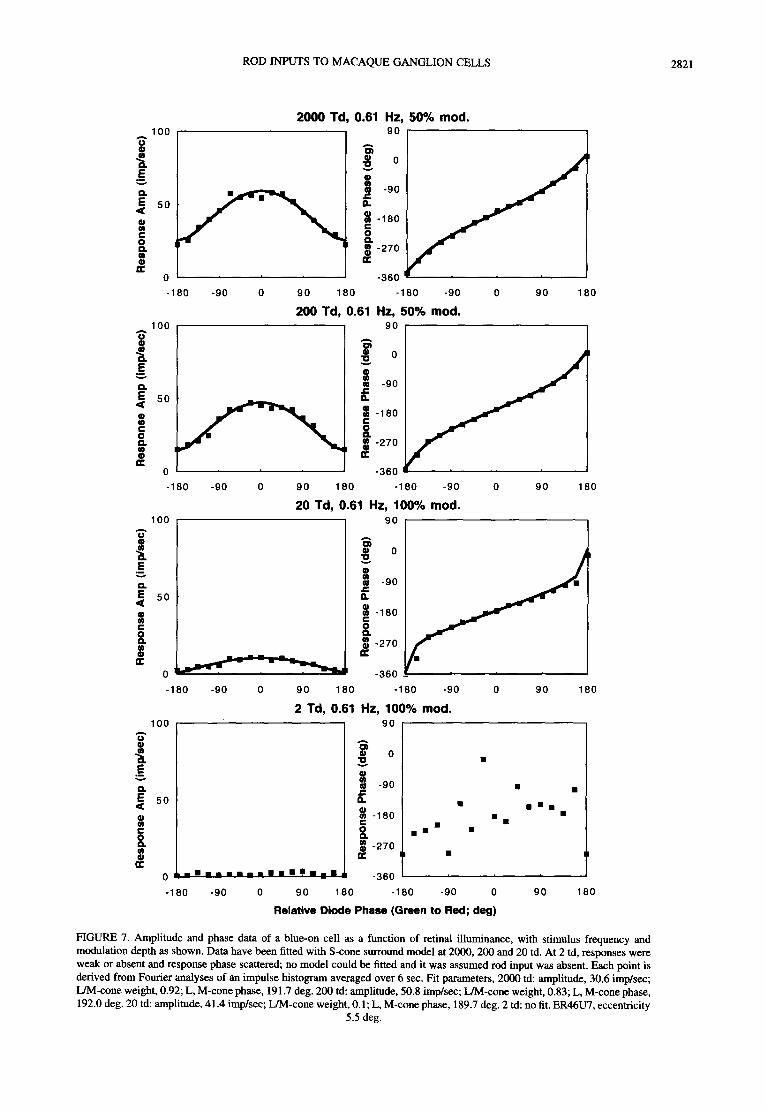
Figure 7 shows data from a S - ( L + M ) cell as a function of retinal illuminance. At the higher retinal illuminance, the pattern shown in Fig. 6 can be observed. As retinal illuminance decreases, responsivity becomes weaker. At 2 td, no response can be evoked and the phase data are scattered. Thus, in this and in nine other blue-on, excitatory S-cone cells, there is no evidence of any rod input. Receptor gain data (at 0.61 or 1.22 Hz) for this cell class are summarized in Fig. 5(B). Receptor gain decreases with retinal illuminance as with PC-pathway cells, until at 2 td little or no response could be elicited. However, in contrast to PC-cells no rod input could be detected.
Rod inputs to MC-cel ls
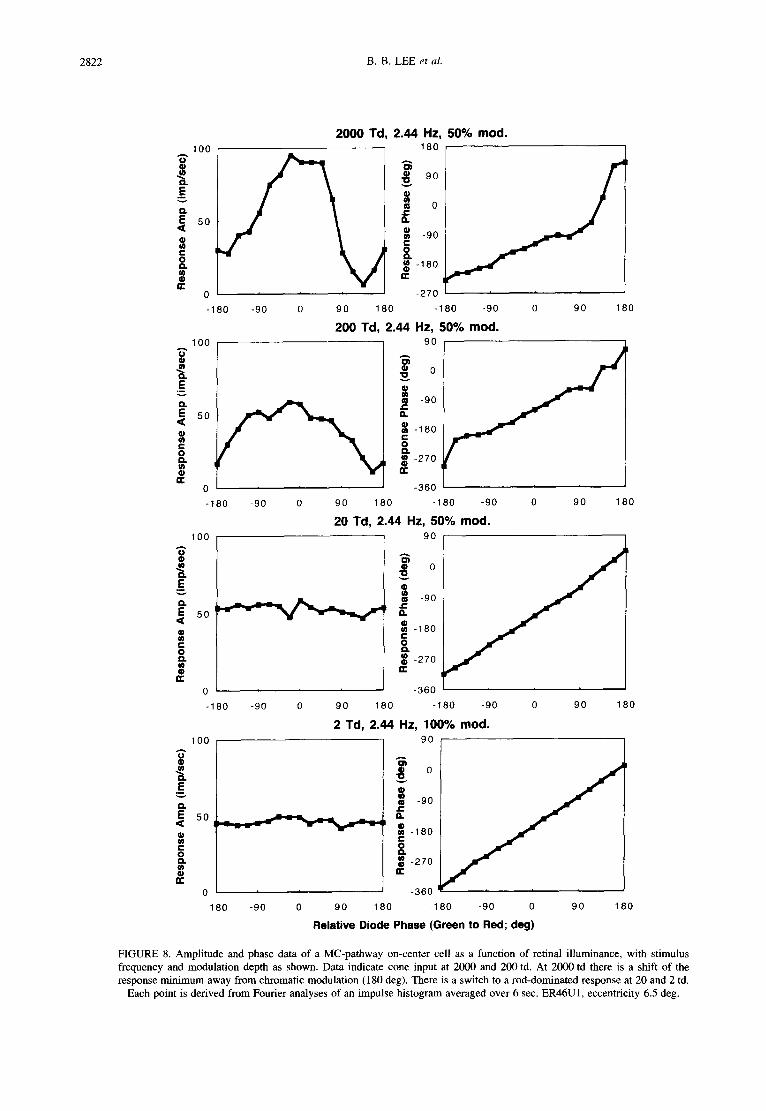
Most literature reports concur that there is substantial rod input to MC-cells, and we also found this to be the case in the present data. Figure 8 shows data from an off- center MC-cell. In principle, the same type of analysis can be applied as with blue-on cells, but responses of MC-cells display more complex properties. At 2000 td, the response minimum in the amplitude data is not found at ± 180 deg, but displaced from this value to an angle where the 638 nm LED modulation is phase advanced relative to the 554 nm LED. This effect is also seen in psychophysical data (Lindsey et al., 1986; Swanson et al., 1987) and can be modeled on the basis of an opponent chromatic input to the surround of the cell (Smith et al., 1992). It can be seen in the 2000 td, 2.44 Hz data in Fig. 8. A response minimum occurs at approx. 135 deg, associated with a response phase shift. We did not
attempt to fit the data with the more complex model required for MC-cells. The phase shift decreases at 200td. At 20 and 2 td, the response amplitude is independent of relative LED phase and response phase falls on the 45 deg diagonal, indicative of strong rod input to the cell.
Data in Fig. 8 were typical for all 13 MC-cells tested. Rod input became dominant at 20 td, and responsivity remained high at the lower retinal illuminances. How- ever, behavior of MC-cells was less straightforward than was the case for PC-cells. For example, rod-cone balance could be temporal-frequency dependent, as detailed in the next section. Also, although rod input became dominant at 20 td, we cannot exclude the possibility of some rod intrusion at higher retinal illuminances.
From response amplitude at a relative diode phase of 0 deg, contrast gain of each MC-cell was estimated, and this is shown in Fig. 5(C). MC-cell responses at 0.61 and 1.22 Hz and 20% contrast were often too low to obtain reliable data, and receptor gain estimates for 2.44 or 4.88 Hz were used. MC-cells still respond well in this frequency range at 2 td (Lee et al., 1990). Contrast gain is seen to be well maintained in the MC-pathway cells even at 2 td, although some attenuation was often seen at 0.2 td.
Rod inputs and temporal f requency
Rod and cone signals reach ganglion cells through different pathways and so if these pathways were to temporally filter the signal in different ways, then the extent to which rod and cone signals governed the response might be dependent on temporal frequency. We usually tested each cell at three to four different
ROD INPUTS TO MACAQUE GANGLION CELLS 2821
100
o
-=
0
2000 Td, 50%mod.
100 "G
==
@
0
-180 -90 0 90 180
200 Td
0.61 Hz 90
m 0
j -90
~ - 1 8 0
-270
-360
-180
0.61 Hz, 90
i ° -90
-180
-270
-360
-9O
50% mod.
0 90 180
-180 -90 0 90 180 -180 -90
20 Td, 0.61 Hz, 100% rood. 100 90
i ° ~ -90
~ so -180
4270
0 -360 -
0 90 180
n =
0 90 180
o
v
D. E < Q 0~ c- O D. t J @ e-
-180
10o
-90 o 90 180 -180 -90
2 Td, 0.61 Hz, 100% rood. 90
~ o •
~ -90
~ -180 c • ~ m • ~ -270
-360
-180 -90 0
Relative Diode Phase (Green to Red; deg)
50
0 i ] n t l i t t ] l • | I . i _
-160 -90 0 90 180
• i •
• •
90 180
FIGURE 7. Amplitude and phase data of a blue-on cell as a function of retinal illuminance, with stimulus frequency and modulation depth as shown. Data have been fitted with S-cone surround model at 2000, 200 and 20 td. At 2 td, responses were weak or absent and response phase scattered; no model could be fitted and it was assumed rod input was absent. Each point is derived from Fourier analyses of an impulse histogram averaged over 6 sec. Fit parameters, 2000 td: amplitude, 30.6 imp/sec; L/M-cone weight, 0.92; L, M-cone phase, 191.7 deg. 200 td: amplitude, 50.8 imp/sec; L/M-cone weight, 0.83; L, M-cone phase, 192.0 deg. 20 td: amplitude, 41.4 imp/sec; L/M-cone weight, 0.1; L, M-cone phase, 189.7 deg. 2 td: no fit. ER46U7, eccentricity
5.5 deg.
2822 B.B. LEE et al.
E_
0
2000 Td 100
2.44 Hz, 50% mod. 180
9 o
~ o
~ -90
-180
-270
-180 -180 -90 0 90 180
200 Td 50% mod. lOO
, B
@
0
100 A
?,
E
=
@
-180 -90 0
n"
0
-180
100
(,,1
-90 0 90 180
2.44 Hz, 90
i -90
-180
~ -270
-360
0 90 180 90 180 -180 -90
20 Td, 2.44 HZ, 50% mod. 9o
t o ~ -90 a. ~ -180
~ -270
-360
90 180 -180 -90
2 Td, 2.44 Hz, 100% mod. 90
Q.
~ -180
~ -270
-360
-90 0 0 90 180
0
-180 -90 0 90 180 -180 -90 0 90 180
Relative Diode Phase (Green to Red; deg)
FIGURE 8. Amplitude and phase data of a MC-pathway on-center cell as a function of retinal illuminance, with stimulus frequency and modulation depth as shown. Data indicate cone input at 2000 and 200 td. At 2000 td there is a shift of the response minimum away from chromatic modulation (180 deg). There is a switch to a rod-dominated response at 20 and 2 td.
Each point is derived from Fourier analyses of an impulse histogram averaged over 6 sec. ER46U1, eccentricity 6.5 deg.
100 50
2000
T
d,
50%
m
od
. 18
0
0.61
H
z 90
0
-90
100 50
2 td
, 10
0%
mo
d.
0.61
H
z
18o/..../
90
0
-90
-180
..
•••=
,,,
_ -1
80
mm
m
um
•--•
l
-270
0
-270
0
100
180
~ 10
0 1
i 90
.=
=
= .=
4.
68
HZ
,.~
90
"~
4.88
H
Z ,.~
0
i "
=0 m
-9
0 0
so
==.
$' s
o
mmm_
5"
"~
-1
80
W'~
mmm:
m ram-m-
-_
-270
0 -2
70
v
0 -3
60
100
180
100
50
V
-180
-9
0 0
90
180
9O
-90
-180
-270
-180
-9
0 0
90
180
50
9.76
H
z
o v"
.-=-.
-~
-1
80
-90
0 90
18
0
180 90
-90
-180
-270
-180
-9
0 0
90
180
> ©
Z
Rel
ativ
e D
iod
e P
has
e (G
reen
to
Red
; de
g)
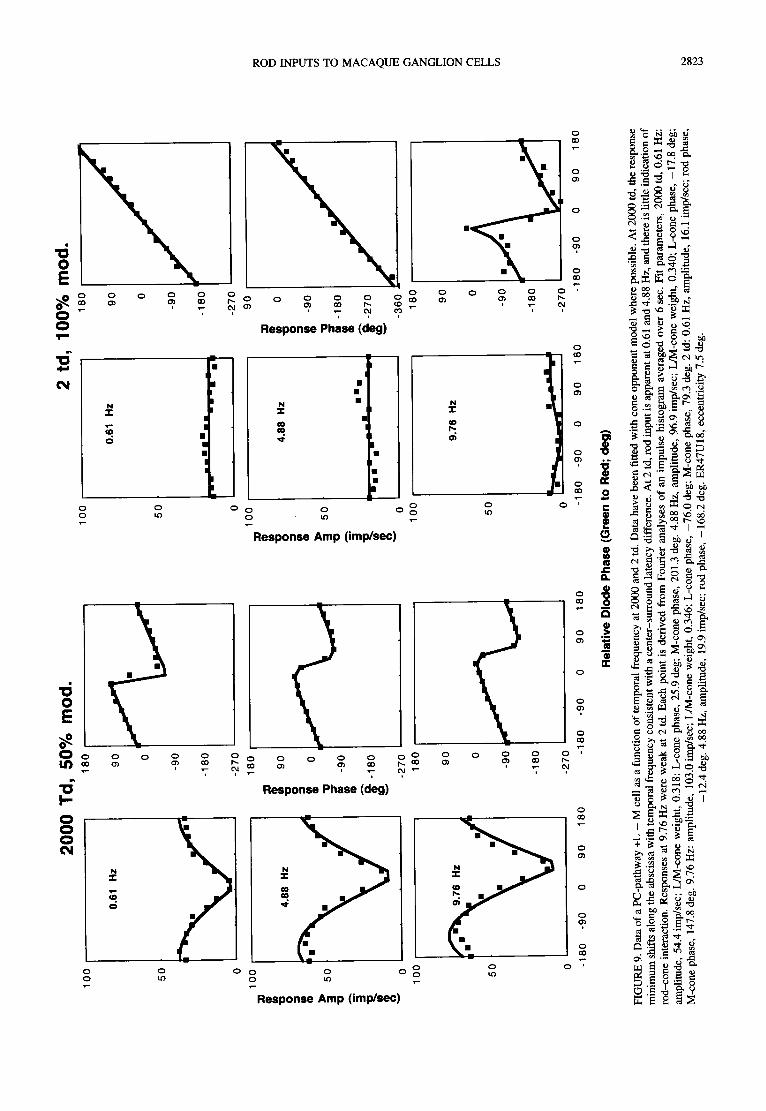
FIG
UR
E 9
. Dat
a of
a P
C-p
athw
ay +
L -
M
cel
l as
a f
unct
ion
of te
mpo
ral
freq
uenc
y at
200
0 an
d 2
td.
Dat
a ha
ve b
een
fitt
ed w
ith
cone
opp
onen
t m
odel
whe
re p
ossi
ble.
At
2000
td,
the
resp
onse
m
inim
um s
hift
s al
ong
the
absc
issa
wit
h te
mpo
ral
freq
uenc
y co
nsis
tent
wit
h a
cent
er-s
urro
und
late
ncy
diff
eren
ce. A
t 2 td
, rod
inpu
t is
appa
rent
at 0
.61
and
4.88
Hz,
and
ther
e is
litt
le in
dica
tion
of
rod-
cone
int
erac
tion
. R
espo
nses
at
9.76
Hz
wer
e w
eak
at 2
td.
Eac
h po
int
is d
eriv
ed f
rom
Fou
rier
ana
lyse
s of
an
impu
lse
hist
ogra
m a
vera
ged
over
6 s
ec.
Fit
par
amet
ers,
200
0 td
, 0.
61 H
z:
ampl
itud
e, 5
4.4
imp/
sec;
L/M
-con
e w
eigh
t, 0
.318
: L
-con
e ph
ase,
25.
9 de
g; M
-con
e ph
ase,
201
.3 d
eg.
4.88
Hz,
am
plit
ude,
96.
9 im
p/se
c; L
/M-c
one
wei
ght,
0.3
40;
L-c
one
phas
e, -
17.8
deg
; M
-con
e ph
ase,
14
7.8
deg.
9.7
6 H
z: a
mpl
itud
e, 1
03.0
im
p/se
c; L
/M-c
one
wei
ght,
0.34
6; L
-con
e ph
ase,
-76
.0 d
eg;
M-c
one
phas
e, 7
9.3
deg.
2 td
: 0.
61 H
z, a
mpl
itud
e, 1
6.1
imp/
sec;
rod
pha
se,
-12.
4 de
g. 4
.88
Hz,
am
plit
ude,
19.
9 im
p/se
c; r
od p
hase
, -1
68.2
deg
. E
R47
U18
, ec
cent
rici
ty 7
.5 d
eg.
L~
60
30
0 6
0
,=
30
0 60
30
2.44
H
z
200
Td,
20%
mod
.
20 T
d, 5
0% m
od.
18
0
90
0
-90
-18
0
-27
0
27
0
~ 18
0
~ 9o
o
~ -9
0
-18
0
18
0
mlm
..m
lm_
._
[ 2 Td
, 50
% m
od
-18
0
-90
0
90
1
80
f 9o/,,
0
-90
-18
0
-27
0 -1
80
-9
0
0 9
0
18
0
60
30 0
6O
30
0 6O
30
9.76
Hz
90
200
Td
•
2 Td
-18
0
-90
0
90
1
80
0
-90
-18
0
-27
0
-36
0
o
~ -90
-1
80
-27
0
~ -3
60
""
-45
0
-90
//
-18
0
-27
0
-36
0
-45
0
-54
0 -1
80
-9
0
0 9
0
18
0
oo
4~
Rel
ativ
e D
iode
Pha
se (
Gre
en t
o R
ed;
deg)
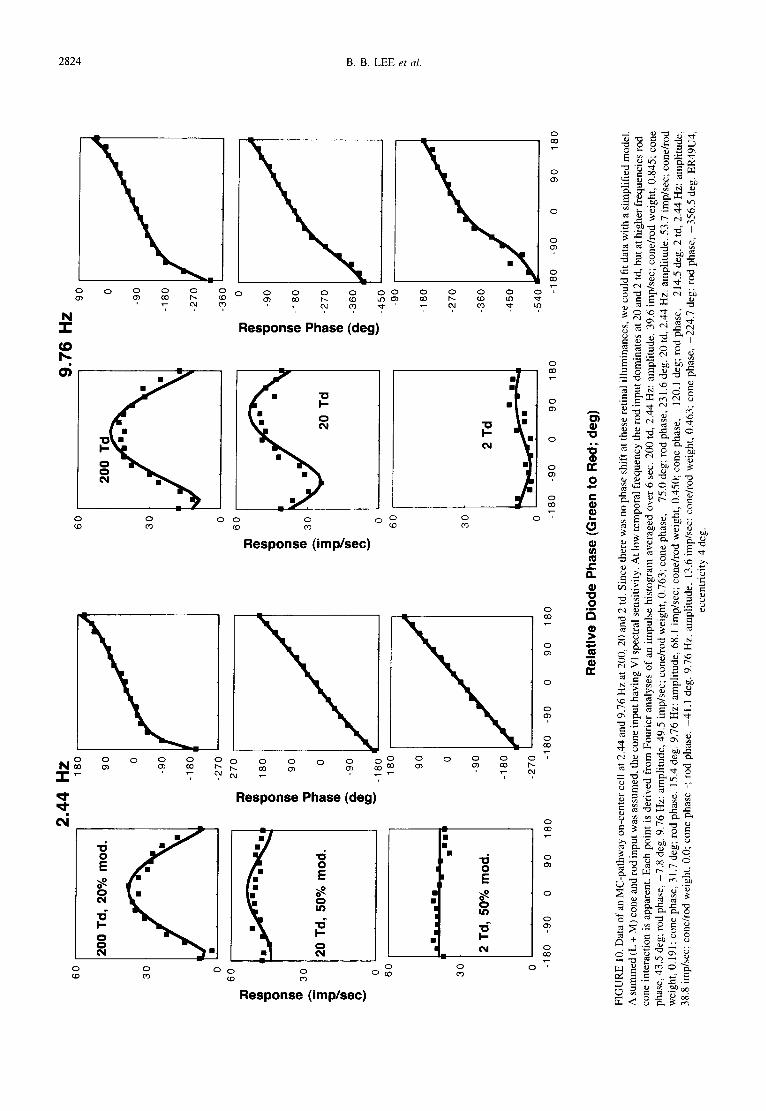
FIG
UR
E 1
0. D
ata
of a
n M
C-p
athw
ay o
n-ce
nter
cel
l at
2.44
and
9.7
6 H
z at
200
, 20
and
2 td
. Si
nce
ther
e w
as n
o ph
ase
shif
t at t
hese
ret
inal
ill
umin
ance
s, w
e co
uld
fit d
ata
wit
h a
sim
plif
ied
mod
el.
A s
umm
ed (
L +
M)
cone
and
rod
inpu
t was
ass
umed
, th
e co
ne in
put h
avin
g V
1 sp
ectr
al s
ensi
tivi
ty. A
t low
tem
pora
l fre
quen
cy th
e ro
d in
put d
omin
ates
at 2
0 an
d 2
td,
but a
t hig
her
freq
uenc
ies
rod-
co
ne i
nter
acti
on i
s ap
pare
nt.
Eac
h po
int
is d
eriv
ed f
rom
Fou
rier
ana
lyse
s of
an
impu
lse
hist
ogra
m a
vera
ged
over
6 s
ec.
200
td,
2.44
Hz:
am
plit
ude,
39.
6 im
p/se
c; c
one/
rod
wei
ght,
0.8
45;
cone
ph
ase,
43.
5 de
g; r
od p
hase
, -7
.8 d
eg. 9
.76
Hz:
am
plit
ude,
49.
5 im
p/se
c; c
one/
rod
wei
ght,
0.76
3; c
one
phas
e, -
75.0
deg
; rod
pha
se,
231.
6 de
g. 2
0 td
, 2.
44 H
z: a
mpl
itud
e, 5
3.7
imp/
sec;
con
e/ro
d w
eigh
t, 0.
191;
con
e ph
ase.
31.
7 de
g; r
od p
hase
, 15
.4 d
eg.
9.76
Hz:
am
plit
ude,
68.
1 im
p/se
c; c
one/
rod
wei
ght,
0.45
0; c
one
phas
e, -
120.
1 de
g; r
od p
hase
, -2
14.5
deg
. 2
td,
2.44
Hz:
am
plit
ude,
38
.8 i
mp/
sec;
con
e/ro
d w
eigh
t, 0.
0; c
one
phas
e -;
rod
pha
se,
-41.
1 de
g. 9
.76
Hz,
am
plit
ude,
13.
6 im
p/se
c: c
one/
rod
wei
ght,
0.46
3; c
one
phas
e, -
224.
7 de
g; r
od p
hase
, -3
56.5
deg
. E
R49
U4,
ec
cent
rici
ty 4
deg
.
ROD INPUTS TO MACAQUE GANGLION CELLS
(B) 180
90 !° - 90
-180
-270
I~ -360
-450
-540
• 2000 td 180
* 200 td 90
A 20 td 0
• 2 td -90
-270
-360
-450
(A)
-540 = i
0 10 20 0 10 20
F r e q u e n c y (Hz)
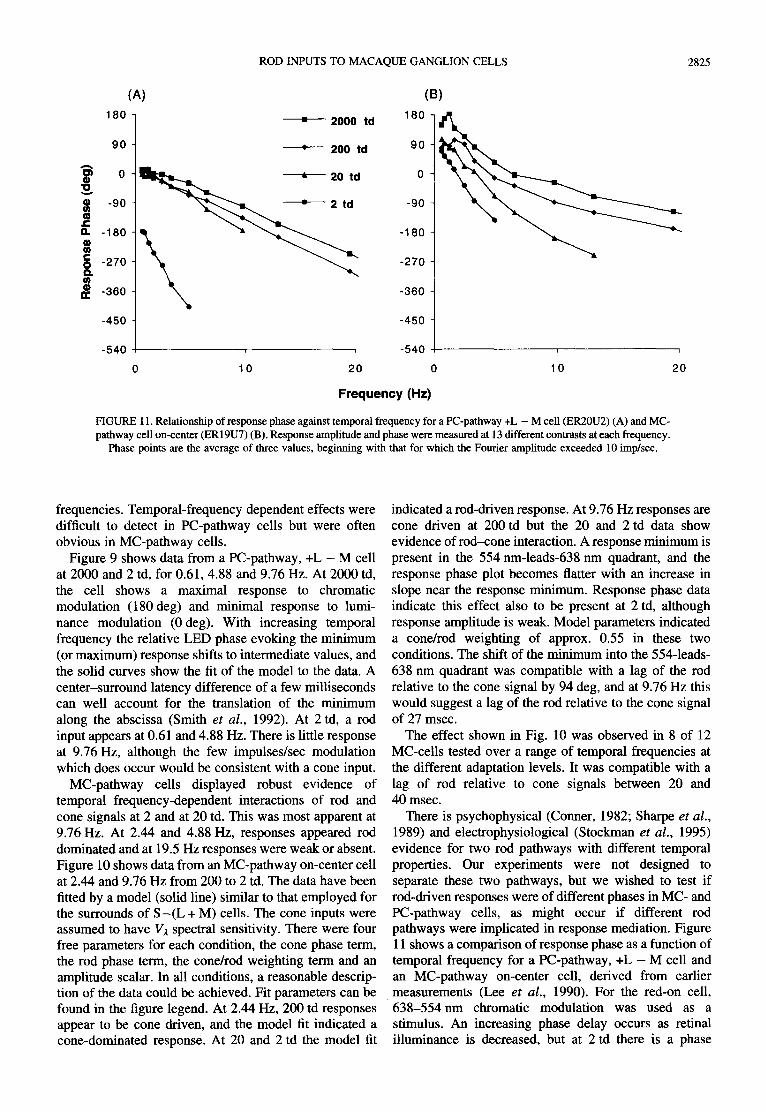
FIGURE 11. Relationship of response phase against temporal frequency for a PC-pathway +L - M cell (ER20U2) (A) and MC- pathway cell on-center (ER19U7) (B). Response amplitude and phase were measured at 13 different contrasts at each frequency.
Phase points are the average of three values, beginning with that for which the Fourier amplitude exceeded 10 imp/sec.
2825
frequencies. Temporal-frequency dependent effects were difficult to detect in PC-pathway cells but were often obvious in MC-pathway cells.
Figure 9 shows data from a PC-pathway, +L - M cell at 2000 and 2 td, for 0.61, 4.88 and 9.76 Hz. At 2000 td, the cell shows a maximal response to chromatic modulation (180 deg) and minimal response to lumi- nance modulation (0 deg). With increasing temporal frequency the relative LED phase evoking the minimum (or maximum) response shifts to intermediate values, and the solid curves show the fit of the model to the data. A center-surround latency difference of a few milliseconds can well account for the translation of the minimum along the abscissa (Smith et al., 1992). At 2 td, a rod input appears at 0.61 and 4.88 Hz. There is little response at 9.76 Hz, although the few impulses/sec modulation which does occur would be consistent with a cone input.
MC-pathway cells displayed robust evidence of temporal frequency-dependent interactions of rod and cone signals at 2 and at 20 td. This was most apparent at 9.76 Hz. At 2.44 and 4.88 Hz, responses appeared rod dominated and at 19.5 Hz responses were weak or absent. Figure 10 shows data from an MC-pathway on-center cell at 2.44 and 9.76 Hz from 200 to 2 td. The data have been fitted by a model (solid line) similar to that employed for the surrounds of S - ( L + M) cells. The cone inputs were assumed to have Va spectral sensitivity. There were four free parameters for each condition, the cone phase term, the rod phase term, the cone/rod weighting term and an amplitude scalar. In all conditions, a reasonable descrip- tion of the data could be achieved. Fit parameters can be found in the figure legend. At 2.44 Hz, 200 td responses appear to be cone driven, and the model fit indicated a cone-dominated response. At 20 and 2 td the model fit
indicated a rod-driven response. At 9.76 Hz responses are cone driven at 200 td but the 20 and 2 td data show evidence of rod-cone interaction. A response minimum is present in the 554 nm-leads-638 nm quadrant, and the response phase plot becomes flatter with an increase in slope near the response minimum. Response phase data indicate this effect also to be present at 2 td, although response amplitude is weak. Model parameters indicated a cone/rod weighting of approx. 0.55 in these two conditions. The shift of the minimum into the 554-leads- 638 nm quadrant was compatible with a lag of the rod relative to the cone signal by 94 deg, and at 9.76 Hz this would suggest a lag of the rod relative to the cone signal of 27 msec.
The effect shown in Fig. 10 was observed in 8 of 12 MC-cells tested over a range of temporal frequencies at the different adaptation levels. It was compatible with a lag of rod relative to cone signals between 20 and 40 msec.
There is psychophysical (Conner, 1982; Sharpe et al., 1989) and electrophysiological (Stockman et al., 1995) evidence for two rod pathways with different temporal properties. Our experiments were not designed to separate these two pathways, but we wished to test if rod-driven responses were of different phases in MC- and PC-pathway cells, as might occur if different rod pathways were implicated in response mediation. Figure 11 shows a comparison of response phase as a function of temporal frequency for a PC-pathway, +L - M cell and an MC-pathway on-center cell, derived from earlier measurements (Lee et al., 1990). For the red-on cell, 638 -554nm chromatic modulation was used as a stimulus. An increasing phase delay occurs as retinal illuminance is decreased, but at 2 td there is a phase
2826 B.B. LEE e t al.
reversal and the slope of the phase vs frequency curve suddenly becomes much steeper. We attribute this to the switch from cone- to rod-driven behavior. The change in slope was equivalent to a delay of about 80 msec of the rod response at 2 td relative to the cone response at 20 td. Response phase of the MC-pathway cell is advanced at low temporal frequencies, as expected from the cell's transient behavior. Decreasing retinal illuminance does not cause such an abrupt change in slope as with the PC- cell, as might be expected if at 20 td both rods and cones contributed to the response. However, at 2 td the slope of the curve is similar to that for the PC-pathway cell. Thus, there is no evidence that the two cells received inputs through different rod pathways with different temporal dynamics.
DISCUSSION
These data help resolve some of the discrepancies in the literature concerning rod inputs to primate ganglion cells. As reported by Wiesel & Hubel (1966), rod inputs are present in a proportion of PC-pathway cells (approx. 60%) but cells are only weakly responsive and rod responses appear only at 2 td. We were unable to confirm an earlier suggestion of greater rod input to green-on than to red-on cells (Virsu & Lee, 1983); no difference was found in the strength of rod input within different subclasses of PC-pathway cells (red on-center, green on- center, red off-center, green off-center). Rod input was always of the polarity appropriate for the center. It was difficult to detect rod input to S - (L + M) cells, and it is interesting to note that Wiesel & Hubel (1966) also failed to detect rod input in their Type II cells, which were almost all S - ( L + M ) opponent. In agreement with previous reports, rod inputs to MC-cells were very pronounced showing both high responsivity and activity at 20 td.
Physiologically, the phase paradigm employed was adequate to enable us to detect rod input even if the modulation in firing was only a few impulses per second. The lowest level of illumination used, 2 photopic trolands, was however high enough to substantially desensitize rods from their dark-adapted level. It would be of interest to track cell responsivity further down toward absolute threshold. In a few cells tested at lower illuminances than 2 td, MC-cells continued to respond, but it became very difficult to get useful data from PC- cells.
One possible objection to these results is that large- field stimuli were used. If there were rod input to both center and surround of M, L-cone opponent cells, then we could have mistaken weak rod input for weak responses owing to center-surround antagonism. However, Purpura et al. (1990), although not specifically testing for rod input as they lowered retinal illuminance, found very similar contrast gain changes to those we observed in these experiments. This earlier study used high spatial frequency gratings to isolate the center response. The consistency of our gain measurements with this earlier work suggests our large field stimuli did not cause us to
substantially underestimate rod input strength owing to our larger stimuli.
Although it was obvious from our data when rod input became dominant (2 td for PC-cells, 20 td for MC-cells), it would be important to know if there were rod intrusions at higher retinal illuminances. When we fitted our PC-cell data at 20 td with a combined cone-rod model, the fits yielded very low rod weightings and mean squared error was not improved to a significant degree. Also, the change in response speed between 20 and 2 td (Fig. 11) appeared sharp, indicating an abrupt change from cone to rod-driven responses. We conclude that rod intrusion to this system must be minimal above 2 td. For MC-cells, it seems more plausible that rod input may have intruded above 20 td. In a large series of cells recorded with the phase paradigm (Smith et al., 1992), we found a few cells in which rod input was apparent even at 2000 td.
It seems likely that the rod bipolar-All amacrine system provides most of the very strong rod inputs to MC-cells. Although the weaker rod input to PC-cells could be generated through rod-cone gap junctions, there was no latency difference of rod signals in MC- and PC- cells; rod signals traversing the cone bipolar route might be expected to arrive at the ganglion cell more quickly. Also, the All amacrine cells make contact with midget bipolars (Grtinert & W~issle, 1996), suggesting that rod signals can reach the PC-pathway through this route. However, although the contacts appear to be dense, PC- pathway cells demonstrate only weak rod signals. The lack of rod input to blue-on cells could indicate that the small bistratified ganglion cell does not participate in AII amacrine contacts.
We recorded from parafoveal retina with cell receptive fields ranging from 3 to 15 deg in eccentricity. A plot of strength of rod input against eccentricity did not yield any systematic change within this range. However, it is possible that stronger rod input might be found in more peripheral retina; in vitro recordings from the far retinal periphery have revealed some rod input to blue-on cells (D. M. Dacey, personal communication).
Relevance to psychophysical data
In heterochromatic flicker photometry, residual flicker at the minimum may be further canceled by adjusting the relative phase of the two lights. The phase adjustment required is in opposite directions under photopic and mesopic conditions. Although under photopic conditions (Cushman & Levinson, 1983), it was ascribed to latency differences of the M- and L-cones, the latency difference required is unrealistically large (Lindsey et al., 1986; Swanson et al., 1987), and the physiological substrate resides in a chromatic input to the MC-cell surround (Smith et al., 1992). For the mesopic phase effect, an origin in a delayed response of rods relative to cones is more plausible (Walraven & Leebeck, 1964; Berg & Spekreijse, 1977; Gr0nau, 1977). We here demonstrate such a phase shift in MC-pathway cells at mesopic levels, compatible with a rod delay of 20--40 msec relative to the cone response. This is less than the approx. 60 msec
ROD INPUTS TO MACAQUE GANGLION CELLS 2827
suggested on the basis of psychophysical data, and presumably reflects experimental and adaptational differ- ences.
The way rods intrude into photopic processing, for example, color matching functions (Wyszecki & Stiles, 1982), is not immediately obvious from our data. PC- cells or cells with S-cone input would appear to be most likely to contribute to color matching, yet these were the cell types where rod input above 2 td was most difficult to detect. Of course, averaging over many cells, or contributions from a few cells with stronger rod input, could become significant under such circumstances. On the other hand, MC-cells (in which rod intrusion at photopic levels was likely) could influence color matching in some way, despite their lack of cone opponency.
The rod input to PC-pathway cells was weak, so that 100% modulation only delivered a few impulses. It is uncertain if these few impulses could be a substrate for scotopic spatial vision, as argued on a sampling theory basis (Lennie & Fairchild, 1994). Summation over many PC-pathway cells might provide a signal to influence color perception, but such summation negates sampling theory a r g ~ in the case of spatial vision.
Rod input to eok~ appearance has been recognized for many decades (e.g., Stromeyer, 1974). It is often suggested that the "rod color" is blue (Stabell & Stabell, 1994) and that S-cone pathways carry a rod signal. It is, thus, of note that the one cell type for which we could not find rod activity is the blue-on cell. Further, since rod signals are evident in all subtypes of PC-pathway cells, if rods influence color appearance it would seem likely they would cause desaturation for many surfaces. However, there is likely to be no single color associated with rod activity. It is of note in this regard that .an experiment which presented a complex scene lit by two chromatic illuminants, one chosen to stimulate cones and one chosen to stimulate rods, generated a compound chro- matic appearance (McCann & Benton, 1969; McKee et al., 1977). A caveat is perhaps in order. Color appearance is a complex phenomenon, and not easy to interpret on a receptor basis (Shevell, 1992; Wei & Shevell, 1995). While chromatic discrimination can be understood within the domain of retinal processing, color appearance cannot. Thus, attempts to predict rod involvement in color appearance on the basis solely of rod inputs to retinal ganglion cells are probably too simplistic.
REFERENCES
Aguilar, M. & Stiles, W. S. (1954). Saturation of the rod mechanism of the retina at high levels of illumination. Optica Acta, 1, 59-65.
Berg, T. J. T. P.v.d. & Spekreijse, H. (1977). Interaction between rod and cone signals studied with temporal sine wave stimulation. Journal of the Optical Society of America, 65, 1210-1217.
Buck, S. L. (1985). Cone-rod interaction over time and space. Vision Research, 25, 907-916.
Buck, S. L. & Brandt, J. L. (1995). The range of simultaneous scotopic contrast colors. Documenta Ophthalmologica Proceedings Series, 58, 309-316.
Conner, J. D. (1982). The temporal properties of rod vision. Journal of Physiology, 332, 139-155.
Cushman, W. B. & Levinson, J. Z. (1983). Phase shift in red and green counterphase flicker at high temporal frequencies. Journal of the Optical Society of America, 73, 1557-1561.
Dacey, D. M. & Lee, B. B. (1994). The blue-ON opponent pathway in primate retina originates from a distinct bistratified ganglion cell type, Nature, 367, 731-735.
Daw, N. W., Jensen, R. J. & Brunken, W. J. (1990). Rod pathways in mammalian retinae. Trends in Neurosciences, 13, 110-115.
Derrington, A. M., Krauskopf, J. & Lermie, P. (1984). Chromatic mechanisms in lateral geniculate nucleus of macaque. Journal of Physiology, 357, 241-265.
Gouras, P. & Link, K. (1966). Rod and cone interaction in dark- adapted monkey ganglion cells. Journal of Physiology, 184, 499- 510.
Griinau, M. W.v. (1977). Lateral interactions and rod intrusion in color flicker. Vision Research, 17, 911-915.
Griinert, U. & Martin, P. R. (1991). Rod bipolar cells in the macaque monkey retina: immunoreactivity and connectivity. Journal of Neuroscience, 11, 2742-2758.
Grtinert, U. & W~sle, H. (1996). Glycine receptors in the rod pathway of the macaque monkey retina. Visual Neuroscience, 13, 101-115.
Hendry, S. H. C. & Yoshioka, T. (1994). A neuroehemically distinct third channel in the macaque dorsal lateral geniculate nucleus. Science, 264, 575-578.
Judd, D. B. (1951). Colorimetry and artificial daylight, in Technical Committee No. 7 Report of Secretariat United States Commission, International Commission on Illumination, Twelfth Session, Stock- holm, pp. 1-60.
Lee, B. B., Martin, P. R. & Valberg, A. (1988). The physiological basis of heterochromatic flicker photometry demonstrated in the ganglion cells of the macaque retina. Journal of Physiology, 404, 323-347.
Lee, B. B., Martin, P. R. & Valberg, A. (1989). Sensitivity of macaque retinal ganglion ceils to chromatic and luminance flicker. Journal of Physiology, 414, 223-243.
Lee, B. B., Pokorny, J., Smith, V. C., Martin, P. R. & Valberg, A. (1990). Luminance and chromatic modulation sensitivity of macaque ganglion cells and human observers. Journal of the Optical Society of America A, 7, 2223-2236.
Lee, B. B., Smith, V. C., Pokorny, J. & Kremers, J. (1996). Rod inputs to macaque ganglion cells and their temporal dynamics. Investiga- tive Ophthalmology and Visual Science Supplement, 37, $689.
Lee, B. B., Valberg, A., Tigwell, D. A. & Tryti, J. (1987). An account of responses of spectrally opponent neurons in macaque lateral geniculate nucleus to successive contrast. Proceedings of the Royal Society of London B, 230, 293-314.
Lennie, P. & Fairchild, M. D. (1994). Ganglion cell pathways for rod vision. Vision Research, 34, 477--482.
Lindsey, D. T., Pokomy, J. & Smith, V. C. (1986). Phase-dependent sensitivity to heterochromatic flicker. Journal of the Optical Society of America A, 3, 921-927.
McCarm, J. J. & Benton, J. L. (1969). Interaction of the long-wave cones and the rods to produce color sensations. Journal of the Optical Society of America, 59, 103-107.
McKee, S. P., McCann, J. J. & Benton, J. L. (1977). Color vision from rod and long-wave cone interactions: conditions in which rods contribute to multicolored images. Vision Research, 17, 175-185.
Mollon, J. D. (1991). Uses and evolutionary origins of primate color vision. In Cronly-Dillon, J. R. & Gregory, R. L. (Eds), Evolution of the eye and visual system (pp. 306-319). London: MacMillan.
Purpura, K., Kaplan, E. & Shapley, R. M. (1988). Background light and the contrast gain of primate P and M retinal ganglion cells. Proceedings of the National Academy of Sciences, USA, 85, 4534- 4537.
Purpura, K., Tranchina, D., Kaplan, E. & Shapley, R. M. (1990). Light adaptation in the primate retina: analysis of changes in gain and dynamics of monkey retinal ganglion cells. Visual Neuroscience, 4, 75-93.
Schneeweiss, D. M. & Schnapf, J. L. (1995). Photovoltages of rods and cones in the macaque retina. Science, 268, 1053-1056.
Shapiro, A. G., Pokorny, J. & Smith, V. C. (1994). Rod contribution to
2828 B.B. LEE et al.
large field color-matching. Color Research and Application, 19, 236-245.
Sharpe, L. T., Stockman, A. & MacLeod, D. I. A. (1989). Scotopic flicker perception: scotopic, duality, phase lags and destructive interference. Vision Research, 29, 1539-1559.
Shevell, S. K. (1992). Redness from short-wavelength-sensitive cones does not induce greenness. Vision Research, 32, 1551-1556.
Smith, V. C., Lee, B. B., Pokorny, J., Martin, P. R. & Valberg, A. (1992). Responses of macaque ganglion cells to the relative phase of heterochromatically modulated lights. Journal of Physiology, 458, 191-221.
Smith, V. C. & Pokorny, J. (1975). Spectral sensitivity of the foveal cone photopigments between 400 and 500 nm. Vision Research, 15, 161-171.
Stabell, B. & Stabell, U. (1976). Rod and cone contributions to peripheral colour vision. Vision Research, 16, 1099-1104.
Stabell, U. & Stabell, B. (1977). Wavelength discrimination of peripheral cones and its change with rod intrusion. Vision Research, 17, 423426.
Stabell, U. & Stabell, B. (1994). Mechanisms of chromatic rod vision in scotopic illumination. Vision Research, 34, 1019-1027.
Stockman, A., Sharpe, L. T., Riither, K. & Nordby, K. (1995). Two signals in the human rod visual system: a model based on electrophysiological data. Visual Neuroscience, 12, 951-970.
Stromeyer, C. F. (1974). Form-specific colour after effects in scotopic illumination. Nature, 250, 260-268.
Swanson, W. H., Pokorny, J. & Smith, V. C. (1987). Effects of temporal frequency on phase-dependent sensitivity to heterochro- matic flicker. Journal of the Optical Society of America A, 4, 2266- 2273.
Valberg, A., Lee, B. B. & Tigwell, D. A. (1986). Neurons with strong inhibitory S-cone inputs in the macaque lateral genicutate nucleus. Vision Research, 26, 1061-1064.
Virsu, V. & Lee, B. B. (1983). Light adaptation in cells of macaque
lateral geniculate nucleus and its relation to human light adaptation. Journal of Neurophysiology, 50, 864-877.
Virsu, V., Lee, B. B. & Creutzfeldt, O. D. (1987). Mesopic spectral responses and the Purkinje shift of macaque lateral geniculate cells. Vision Research, 27, 191-200.
Walraven, P. L. & Leebeck, H. J. (1964). Phase shift of sinusoidally alternating colored stimuli. Journal of the Optical Society of America, 54, 78-82.
W~issle, H. & Boycott, B. B. (1991). Functional architecture of the mammalian retina. Physiological Reviews, 71,447-480.
Wei, J. & Shevell, S. K. (1995). Color appearance under chromatic adaptation varied along theoretically significant axes in color space. Journal of the Optical Society of America A, 12, 36-46.
Westheimer, G. (1966). The Maxwellian view. Vision Research, 6, 669~582.
Wiesel, T. & Hubel, D. H. (1966). Spatial and chromatic interactions in the lateral geniculate body of the rhesus monkey. Journal of Neurophysiology, 29, 1115-1156.
Wyszecki, G. & Stiles, W. S. (1982). Color scienceIconcepts and methods, quantitative data and formulae, 2nd edn. New York: John Wiley.
Yeh, T., Lee, B. B. & Kremers, J. (1996). The time course of adaptation in macaque ganglion cells. Vision Research, 36, 913- 0931.
Acknowledgements--This work was partially supported by USPHS NEI grant 00901 to JP. Publication was supported by an unrestricted grant to the Department of Ophthalmology, University of Chicago from Research to Prevent Blindness. We thank Iris Yeh for assistance with some of the experiments and Paul Martin for comments on a draft of the manuscript.


