Embed Size (px)
Citation preview

finalrepport
This publication is published by Meat & Livestock Australia Limited ABN 39 081 678 364 (MLA). Care is taken to ensure the accuracy of information in the publication. Reproduction in whole or in part of this publication is prohibited without the prior written consent of MLA.
Project code: NBP.225
Prepared by: Peter McEntee1 and Rosemary Bartle2
1Kimberley Aboriginal Pastoralists Association 2Rural Business Solutions
Date published:
January 2006
ISBN: [MLA to provide]
PUBLISHED BY Meat & Livestock Australia Limited Locked Bag 991 NORTH SYDNEY NSW 2059
KAP property economic analysis and benchmarking
Business management

Analysis of Kimberley Indigenous pastoral property performance
Page 2 of 34
Abstract Developing effective management structures for Indigenous cattle enterprises that balance social and economic priorities and juggle Indigenous and non-Indigenous development aspirations has remained a challenge for remote communities and support agencies alike. By collecting and analysing the economic performance of a group of Indigenous properties against non-Indigenous properties in the Kimberley, it is hoped to develop strategies which will enhance a process of on-going improvement in the performance of properties at both the property and regional levels. The outputs of this project have enabled us to provide indications as to which aspects of enterprise management will require the most attention if the economic performance of these businesses is to be improved. Results suggest that for Indigenous stations to improve their profitability and hence improve the personal, family and community wellbeing, there is a need to support, encourage and assist managers to concentrate on increasing the productivity of the cattle enterprises and keep overhead costs, relative to income, in check.

Analysis of Kimberley Indigenous pastoral property performance
Page 3 of 34
Executive Summary Reviews of Indigenous pastoral property performance in the Kimberley and elsewhere over the past 15 years have consistently indicated low stock numbers in relation to carrying capacity, low turnoff (sales), poor profitability, governance problems, erratic cash flow and an inability to break out of a cycle of variable and inconsistent management. A “normal” outcome for most Indigenous pastoral enterprises in the Kimberley is an annual trading loss. The underlying causes of erratic performance are complex and reflect the difficulties experienced by Indigenous land owners in reconciling traditional responsibility for country with running a commercial cattle enterprise on communally owned land. Remote Indigenous communities remain among the most disadvantaged sections of our nation. The manner in which Indigenous pastoral enterprises are consequently structured and managed often reflects this confusion and also the social and cultural responsibilities and realities of day to day living in remote communities. As a result, Indigenous pastoral properties are generally not able to function effectively as conventional commercial enterprises because:
They are not structured to deliver sustainable profits. There are no incentives to invest in the future. There are no pathways to foster the potential of individual indigenous “entrepreneurs”.
Developing effective solutions that balance social and economic priorities and juggle Indigenous and non-Indigenous development aspirations has remained a challenge for remote communities and support agencies alike. The challenge remains to devise a management model that addresses the problems of variable and inconsistent management in a sustainable and affordable manner and at the same time resolving social and cultural relationships so that pastoral enterprises can function effectively on Indigenous lands. As a first step towards addressing some of these issues in a coordinated manner, the Kimberley Aboriginal Pastoralists Association has undertaken a review of the performance of a representative group of properties over a number of years in order to establish some baseline data about the commercial performance of these properties. The project has identified areas within the management of these businesses which are impacting on profitable performance. These include:
Lower productivity of cattle, which is probably being caused by poor nutritional management and the generally lower genetic quality and potential of herds on Indigenous properties.
Indigenous stations, on average receive a lower price for beef which is contributing to lower profit.
Overhead costs are higher relative to the income being generated, particularly those associated with plant, vehicles and buildings.
The majority of Indigenous stations are smaller in size and located on less productive country types than non-Indigenous stations. This has the effect of limiting livestock productivity and of increasing the area required to run a given number of livestock, which in turn results in an increase in overhead costs.

Analysis of Kimberley Indigenous pastoral property performance
Page 4 of 34
While there is a general trend of improvement in the profitability of these Indigenous stations as a group, management strategies can be devised to accelerate this trend and in turn enhance the sustainable operation of these businesses. Several possible solutions to these economic problems have been examined in this project and documented in this report, however implementing such solutions will not be simple. The outcomes will depend not only on the priorities of the owners of Indigenous cattle properties, but also on the provision of appropriate opportunities for Indigenous cattle station managers and employees to acquire the range of training, skills and experience that they need to make land-use decisions that are valued not only by themselves but also by other stakeholders. Results suggest that for Indigenous stations to improve their profitability, and hence the living standards on stations and in communities, there is a need to support, encourage and assist managers to concentrate on increasing the productivity of the cattle and keeping overhead costs, relative to income, in check. The way forward requires careful consideration by the communities involved, by their support agencies and by other stakeholders in the Kimberley pastoral industry. Understanding and agreement is a critical element of the process. This will be the primary tool of the next stage of this project. The communities themselves own the data about their enterprise performance and will be in a position, with the support of key stakeholders, to develop the most appropriate management strategies and support infrastructure for their particular situation. The communities themselves are where the best solutions are most likely to be generated. Indigenous communities are diverse, and the manner in which they will meet the challenges of managing their country will be equally diverse.

Analysis of Kimberley Indigenous pastoral property performance
Page 5 of 34
Contents Page
1 Background ..........................................................6
2 Project Objectives ...............................................7
3 Methodology.........................................................8
3.1 Key Performance Indicators and Business Analysis .................. 8
4 Results and Discussion ................................... 12
4.1.1 Economics and Finance: ............................................................. 14
4.1.2 Return on Assets (ROA): ............................................................. 15 4.1.2.1 Overhead Costs .................................................................................. 15 4.1.2.2 Gross Margins .................................................................................... 20 4.1.2.3 Turnover .............................................................................................. 25
4.2.1 Strategy One: Utilising targetted supplementation .................. 26
5 Success in Achieving Objectives .................... 31
6 Impact on Meat and Livestock Industry ......... 31
7 Conclusions and Recommendations .............. 32
8 References......................................................... 34
9 Bibliography ...................................................... 34

Analysis of Kimberley Indigenous pastoral property performance
Page 6 of 34
1 Background Over the past 29 years, as pastoral holdings in the Kimberley have come onto the market, Indigenous interests have pursued opportunities to acquire them, to the extent that Indigenous communities now own some 30% of the pastoral leases in the Kimberley. This has been done with the dual aim of returning a land base to Indigenous people and enhancing the economic position of the communities related to those lands, using pastoralism as the basis of an economic strategy. Although these purchases have been, in part, a response to the aspirations of traditional owners to regain their traditional lands, the covenants of a pastoral lease require that a livestock grazing enterprise be run. Significant investment has been made by Federal and State agencies into developing property infrastructure and skilling indigenous pastoral enterprise management. However, it is demonstrable that this has been largely unsuccessful in terms of establishing sustainable and profitable pastoral enterprises and there is currently considerable debate about how this land will be used in the future. Instead of encouraging people to develop their own entrepreneurial skills to create wealth and reduce their dependency on government welfare, the dominant characteristic in most Kimberley Indigenous pastoral station communities remains economic dependency rather than wealth creation and empowerment. A “normal” outcome for most Indigenous pastoral enterprises (IPE’s) in the Kimberley is an annual trading loss. Reviews of Indigenous property performance in the Kimberley over the past 10 years have, with few exceptions, consistently indicated very low stock numbers in relation to carrying capacity, low turnoff (sales), poor profitability, governance problems, erratic cash flow and an inability to break out of a cycle of variable and inconsistent management. (See the bibliography at the end of this document for a list of relevant reports). Having highly skilled, intelligent and resourceful Indigenous managers is a necessary, but not sufficient condition for successful IPE’s. Traditionally, the strategy adopted by support agencies to deal with these difficulties has been either to rely on non-Indigenous technical expertise, in the form of an on or off-site site manager or trainer, or to encourage the community towards sub-leasing the property. However, solutions based solely on training and management support to properties have not proved sustainable in the past and are very resource intensive. Although many social and technical reasons have been identified as to why Indigenous owned pastoral enterprises are not succeeding, it is hard to escape the fact that many of these properties, which are debt free, are subsidised through the Community Development Employment Programme (CDEP), and have access to grant funding, could, with an appropriate form of management structure, be successful and profitable. The underlying causes of erratic performance are complex and reflect the difficulties experienced by Indigenous land owners in reconciling traditional responsibility for country with running a commercial cattle enterprise on communally owned land. There remains a profound confusion on the part of most Indigenous owners and managers in remote Australia about western economic and wealth creation processes. This dichotomy between the Indigenous and non-Indigenous understanding of how market economies function, is contributed to by differing “world views”, the communally owned nature of Indigenous land and assets and behavioural responses which have accompanied the disempowerment of Indigenous communities as a result of 30 years of welfare dependency.

Analysis of Kimberley Indigenous pastoral property performance
Page 7 of 34
By collecting and analysing the economic performance of a group of Indigenous properties against non-Indigenous properties in the Kimberley, it is hoped to develop strategies which will enhance a process of on-going improvement in the performance of properties at both the property and regional levels. The data gathered from this project will mean that for the first time a true picture of the business performance of a representative group of Kimberley Indigenous pastoral enterprises will be able to be documented. The communities themselves will own the data about their enterprise performance and will be in a position, with the support of key stakeholders, to develop the most appropriate management strategies and support infrastructure for their particular situation.
2 Project Objectives By 31 December 2005:
1. Complete the economic analysis of 10 Kimberley Aboriginal Pastoralist Association Aboriginal Corporation (KAPA) properties.
2. Develop appropriate key performance indicators (KPI’s).
3. Develop appropriate on-going support services (management strategies, tools, skills development, mentoring, monitoring etc) to suit the needs of a particular property or group of properties.
4. Using a comparison of performance of Indigenous properties against non Indigenous properties in the Kimberley, develop strategies to enhance a process of on-going improvement in the performance of properties at the regional level.

Analysis of Kimberley Indigenous pastoral property performance
Page 8 of 34
3 Methodology The properties participating in this project are considered representative of the “average” Indigenous pastoral business in the Kimberley. The project was looking for typical rather than atypical businesses. The project sought to identify trends and correlations in the data, and particularly to answer the questions: What are the drivers of profitability on Indigenous stations?
What are the trends in the KPI’s on the Indigenous properties and what is driving / impacting
on their profitability and in particular the main indicator of business performance (return on assets) for this group?
What are the differences between Indigenous and non-Indigenous management – i.e. what
are the critical gaps? Which of these gaps are management driven and which are structural (e.g. corporate
governance, scale, community impacts etc)?
The basic steps of the project have been as follows:
Conversations were held with each participating property about economic analysis of business performance and its value to management, the processes involved and ascertaining what financial and herd information is available.
Obtain financial information and livestock data.
In conjunction with specialist staff from Rural Business Solutions Pty Ltd, convert information received from communities into input data and benchmark the data.
In conjunction with specialist staff from Rural Business Solutions Pty Ltd, interpret benchmarking information and define management implications for the properties as a group;
Use the information generated to develop key performance indicators (KPIs) and strategies.
3.1 Key Performance Indicators and Business Analysis
Business performance has been analysed using a series of KPIs. (Refer to Table 1 for an explanation of the KPI’s used in this analysis). These indicators are designed to determine where the strengths and weaknesses lie in a business. The KPIs reported here are the average of the group for a particular financial year. Normally, an average and Top 20% are reported, however with a group size of less than 15 businesses it is not meaningful to include a Top 20% figure. Data for 11 Indigenous stations has been benchmarked for the following years:
2001-02
2002-03
2003-04
2004-05

Analysis of Kimberley Indigenous pastoral property performance
Page 9 of 34
In some years, the quality of some station data was very poor, and where this was the case, the data was omitted from the KPI calculations. This prevented the results being corrupted by unreliable data. The KPIs for the 2001-02 to 2004-05 years have also been compared to benchmarks which were available from previous work done in 1998 for the following years:
1995-96
1996-97
1997-98 There were 4 Indigenous stations with data for these earlier years. All but one of these particular properties are also included in the current project, hence we have been able to examine trends in business performance over a 10 year period (albeit with a gap of 3 years in the middle). The KPIs and trends established for these 7 years of data for the Indigenous stations have then been compared to KPIs and trends for 5 non-Indigenous stations over the same time period.(Table 3)
Analysis of Kimberley Indigenous pastoral property performance
Page 10 of 34
Table 1. An explanation of the Key Performance Indicators used to analyse business performance of participating properties Profitability (economics) Earnings before Interest and Tax (EBIT): Return on Assets Managed (ROA): Cost of Production - beef ($/kg):
The profit from the business (total gross product less direct, overhead costs, depreciation, unpaid labour). EBIT as a percentage of total closing assets. The total cost (direct, overheads excl. finance, depreciation, unpaid labour allowance) to produce a kilogram of beef. Cost of production rolls all the drivers of profit into one indicator – turnover, gross margins and overheads.
Finance Finance Ratio: Expense Ratio: Networth: Equity:
Interest and leases paid as a percentage of gross product. Direct, overhead and finance (cash & non-cash) expenses as a percentage of gross product. Assets less liabilities. Networth as a percentage of total assets (the percentage of the business you actually own).
Gross Margins Gross Margin Ratio: Gross Margin per LSU: Beef produced (kg/LSU): Branding percentage: Death percentage: Beef price ($/kg): Direct costs per LSU:
Gross margin as a percentage of production gross product. The contribution the cattle enterprise makes towards paying the overhead costs of the business. Measured as the enterprise gross product less direct costs and opportunity cost. Kg of liveweight beef produced per LSU. This is a major driver of gross margin. Percentage of calves branded to cows exposed to bulls. Percentage of loss (through death and mustering inefficiency) in the total herd. Gross value of sales divided by kilograms of beef sold. Costs which are proportional to the number of head run, on a per LSU basis.
Overheads Overhead Ratio: Total Overhead Costs: Overhead costs per LSU:
Overhead costs including depreciation and unpaid labour as a percentage of total gross product. Cash overhead costs and non-cash (depreciation and unpaid labour) costs. Total overhead costs on a per LSU basis.

Analysis of Kimberley Indigenous pastoral property performance
Page 11 of 34
Plant to Income Ratio: Gross Product per FTE: LSUs managed per FTE:
The value of plant as a percentage of the total gross product of the business. Gross product produced for each full-time equivalent employee. The number of LSU’s managed per Full Time Equivalent employee.
Turnover Asset Turnover Ratio: Total Gross Product: SDH per 100mm of rainfall: Average LSU or DSE managed: Available land (ha):
Gross product as a percentage of total closing assets. Measures the efficiency with which assets are used. Cash income adjusted for changes in inventory value. The number of stock days or DSE days grazed per hectare of useable land per 100mm of rainfall received in the year. The average of the opening and closing number of large stock units managed during the year. The area of the station which is used for grazing.
NB: One Large Stock Unit (LSU) is the equivalent of a 450kg steer at maintenance.

Analysis of Kimberley Indigenous pastoral property performance
Page 12 of 34
4 Results and Discussion The results are set out in Tables 2 and 3 below: Table 2: Annual average KPIs for Indigenous pastoral stations in the Kimberley region of WA for the financial years 1995-96 to 2004-05.
Kimberley Indigenous Pastoral Stations
Key Performance Indicator1995-
96 1996-
97 1997-
98 2001-
02 2002-
03 2003-
04 2004-
05 Number of Stations in analysis 4 4 4 11 11 11 11Return on Assets -5.00% -8.10% -11.90% 1.60% -1.50% -3.10% 0.50%Finance Ratio 0% 0% 0% 0% 0% 0% 0%Expense Ratio 157% 116% 359% 93% 75% 110% 109%Equity 100% 100% 100% 98% 98% 97% 97% Gross Margin Ratio 14% 22% 1% 20% 41% 32% 35% Cattle Gross Margin per LSU ($/LSU) $0.40 -$5.30 -$8.00 -$1.70 -$23.50 -$17.00 $6.80 Meat produced per LSU (kg/LSU) 38 31 45 47 32 40 32 Branding percentage 64% 61% 63% 60% Death percentage 8.90% 16.70% 13.30% 4.40% 10.60% 10.40% 7.60% Price received $/kg liveweight ($/kg) $1.07 $0.81 $0.70 $1.29 $0.83 $0.69 $0.88 Direct costs per LSU ($/LSU) $14.30 $11.60 $11.10 $29.60 $13.40 $11.20 $6.00 Overhead Ratio 131% 149% 241% 52% 51% 189% 98% Overhead Costs per LSU ($/LSU) $49.56 $40.35 $65.17 $42.28 $27.45 $27.20 $14.59 Administration costs per LSU ($/LSU) $3.76 $2.87 $2.58 $1.67 $1.53 $1.69 $1.23 Building & Plant costs per LSU ($/LSU) $22.08 $20.37 $27.96 $31.03 $18.20 $17.72 $8.43 Labour costs per LSU ($/LSU) $20.39 $15.14 $32.91 $8.27 $6.32 $6.16 $1.17 Land costs per LSU ($/LSU) $3.33 $1.97 $1.71 $1.30 $1.40 $1.62 $3.76 Plant to Income Ratio 169% 35% 175% 91% 80% 55% 111% Gross Product per FTE ($/FTE) $20,378 $16,246 $11,495 $61,216 $26,151 $30,943 $40,057 LSUs Managed per FTE (LSU/FTE) 525 601 425 769 947 1,068 1,025 Asset Turnover Ratio 7.40% 4.10% 5.80% 11.50% 11.30% 8.90% 5.00% Average LSUs managed 2,910 2,754 2,702 2,467 2,814 3,001 3,249 Stockdays per ha per 100mm rainfall 4 10 7 2 2 1 1 Cost of Production for Beef ($/kg) $1.33 $1.69 $1.71 $1.55 $1.28 $0.97 $0.64
Analysis of Kimberley Indigenous pastoral property performance
Page 13 of 34
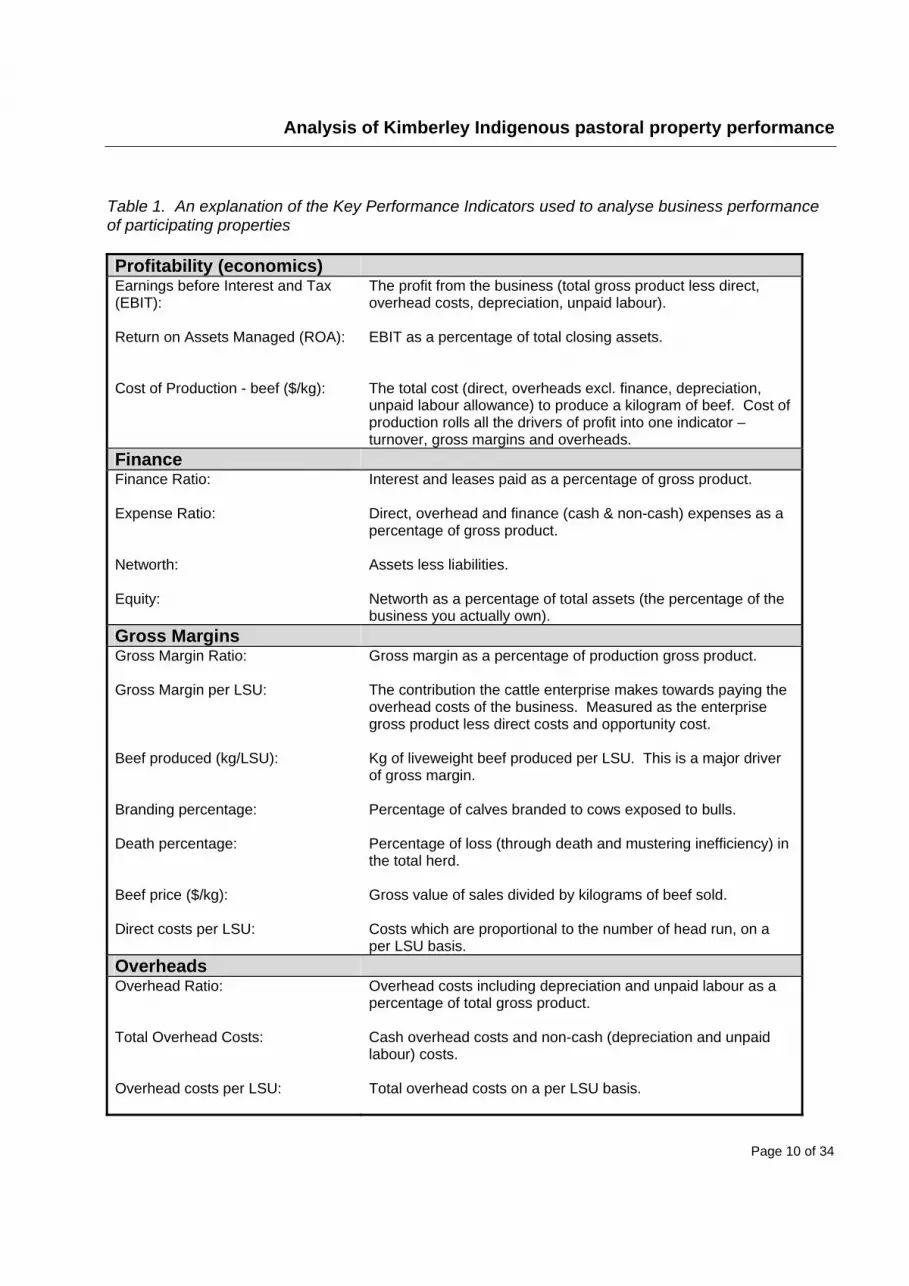
Table 3: Annual average KPIs for 5 non-Indigenous pastoral stations in the Kimberley region of WA for the financial years 1995-96 to 2004-05.
Kimberley Non - Indigenous Pastoral Stations
Key Performance Indicator 1995-
96 1996-
97 1997-
98 2001-
02 2002-
03 2003-
04 2004-
05 Number of Stations in analysis 5 5 5 5 5 5 5Return on Assets 4.10% 5.40% 6.70% 5.60% 5.20% 5.40% 7.00%Finance Ratio 10% 7% 12% 7% 10% 9% 10%Expense Ratio 75% 71% 76% 77% 79% 75% 67%Equity 83% 92% 77% 78% 72% 80% 77% Gross Margin Ratio 71% 56% 66% 64% 61% 64% 65% Cattle Gross Margin per LSU ($/LSU) $56.10 $46.70 $61.33 $53.71 $51.69 $54.26 $64.29 Meat produced per LSU (kg/LSU) 80 78 88 79 83 82 89 Branding percentage 85% 76% 65% 72% 77% Death percentage 3.20% 2.70% 2.30% 3.90% 3.80% 3.25% 2.90% Price received $/kg liveweight ($/kg) $1.21 $0.92 $0.97 $1.39 $1.37 $1.40 $1.32 Direct costs per LSU ($/LSU) $7.00 $8.30 $7.50 $12.00 $14.10 $13.78 $13.52 Overhead Ratio 56% 52% 50% 55% 53% 53% 52% Overhead Costs per LSU ($/LSU) $47.47 $40.83 $44.96 $45.06 $40.93 $42.85 $43.69 Administration costs per LSU ($/LSU) $1.63 $1.93 $3.79 $2.57 $2.74 $2.87 $2.49 Building & Plant costs per LSU ($/LSU) $24.20 $18.19 $19.76 $21.63 $18.54 $19.66 $20.97 Labour costs per LSU ($/LSU) $15.71 $18.77 $18.78 $19.20 $18.21 $18.07 $18.61 Land costs per LSU ($/LSU) $5.93 $1.96 $2.63 $1.66 $1.44 $2.25 $1.62 Plant to Income Ratio 77% 42% 54% 36% 38% 49% 41% Gross Product per FTE ($/FTE) $104,826 $129,855 $138,127 $188,564 $162,956 $164,866 $191,342 LSUs Managed per FTE (LSU/FTE) 1,235 1,663 1,465 1,588 1,326 1,455 1,582 Asset Turnover Ratio 11% 15% 17% 18% 19% 18% 21% Average LSUs managed 5,698 8,283 9,906 7,982 8,242 8,022 8,613 Stockdays per ha per 100mm rainfall 7 4 8 6 9 7 7 Cost of Production for Beef ($/kg) $0.68 $0.63 $0.60 $0.72 $0.74 $0.71 $0.64

Analysis of Kimberley Indigenous pastoral property performance
Page 14 of 34
4.1 ANALYSIS OF BUSINESS PERFORMANCE 4.1.1 Economics and Finance The first area of analysis considered is that of economics and finance. Economics refers to the profitability of a business (measured by return on assets (ROA)), and finance refers to the cashflow and the debt servicing ability of the business (measured by the finance and expense Ratios). The data shows Indigenous pastoral stations have a poor level of profitability. There have been only 2 years (2001-02 and 2004-05) in which the Indigenous stations as a group have reported a profit, and these profits were low at 1.6% ROA and 0.5% ROA respectively. By comparison, the non-Indigenous group of stations showed a profit in all years, ranging from a low of 4.1% ROA in 1995-96 to a high of 7.0% on 2004-05. Both Indigenous and non-Indigenous stations should be aiming for a ROA of at least 10%. This is considered the level of profitability required to ensure that the Indigenous pastoral business are able to meet ongoing operational and development costs. The causes of this low profitability are examined later in this report.
-15.00%
-10.00%
-5.00%
0.00%
5.00%
10.00%
1995-96 1996-97 1997-98 2001-02 2002-03 2003-04 2004-05
Return on Assets
Indigenous Stations
Non-Indigenous Stations
Figure 1: Return on Assets for Indigenous and non-Indigenous Stations
The financial strength of a business is measured using the finance ratio and the expense ratio. Debt levels are very low on the Indigenous pastoral stations, with the lowest equity being 97% in 2003-04 and 2004-05. This debt is made up of creditors, tax and GST owing. As the debt is of a creditor nature, there is no interest paid, and hence the finance ratio for these stations has always been 0%. Therefore, debt is not a problem on the Indigenous stations. Equity is much lower for the non-Indigenous stations, with equity ranging from 72% to 92%. Their finance ratio ranges from 7% to 12%, indicating that these stations have a manageable level of debt and that business survival is not being jeopardised by large interest payments.

Analysis of Kimberley Indigenous pastoral property performance
Page 15 of 34
Only in the 2001-02 and 2002-03 financial years has the expense ratio for the Indigenous stations been below 100%. An expense ratio of greater than 100% indicates that expenses exceed the total gross product (TGP) of the business. In other words, either expenses are too high or income is too low. The question of whether expenses are too high or income is too low is addressed later in the analyses. In contrast, the expense ratio for the non-Indigenous stations ranged from 67% to 79%. 4.1.2 Return on Assets (ROA): There are three drivers of ROA, namely overhead costs, gross margins and turnover. Each of these were examined to determine which driver is having the largest impact on ROA: 4.1.2.1 Overhead Costs Overhead costs are those costs which remain relatively stable irrespective of the number of livestock run. Overhead costs are divided into 4 categories:
Land
Administration
Labour
Buildings and Plant
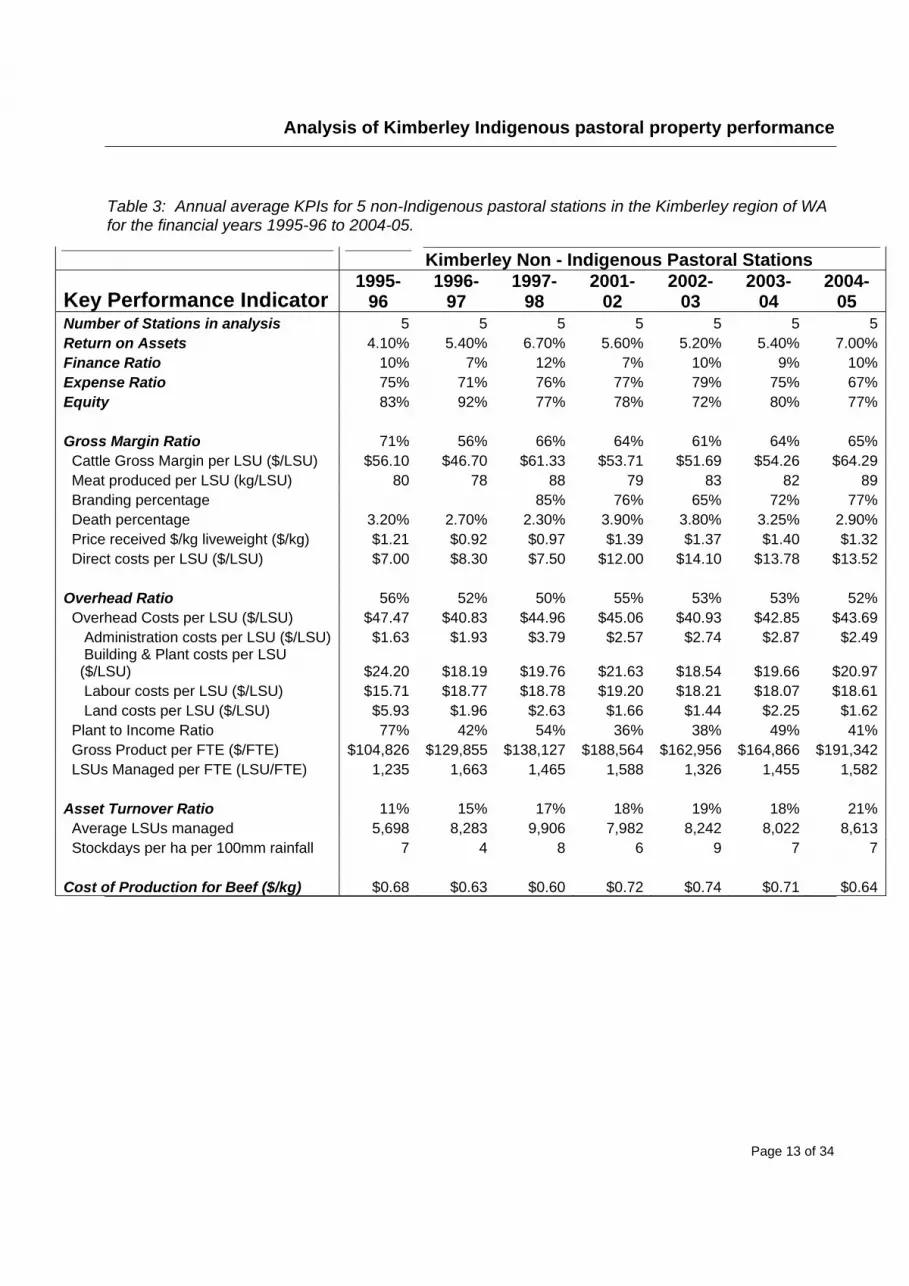
A pastoral business should be aiming for an overhead ratio of less than 45%. The overhead ratio for the Indigenous properties ranges from 51% to 241%, and for the non-Indigenous stations from 52% to 56% (refer to Figure 2). It is considered difficult for the Indigenous stations to achieve this target for a number of reasons:
They often run a sub-economic number of stock;
The Indigenous owned stations are usually smaller in size than non-Indigenous stations;
The Indigenous owned stations are often on poorer country types of lower carrying capacity, resulting in more area being required to run a given number of livestock. This dramatically increases overhead costs on a per LSU basis (particularly labour and plant costs).
Analysis of Kimberley Indigenous pastoral property performance
Page 16 of 34
0%
50%
100%
150%
200%
250%
300%
1995-96 1996-97 1997-98 2001-02 2002-03 2003-04 2004-05
Overhead Ratio
Indigenous Stations
Non-Indigenous Stations
Figure 2: The Overhead Ratio for Indigenous and non-Indigenous Stations
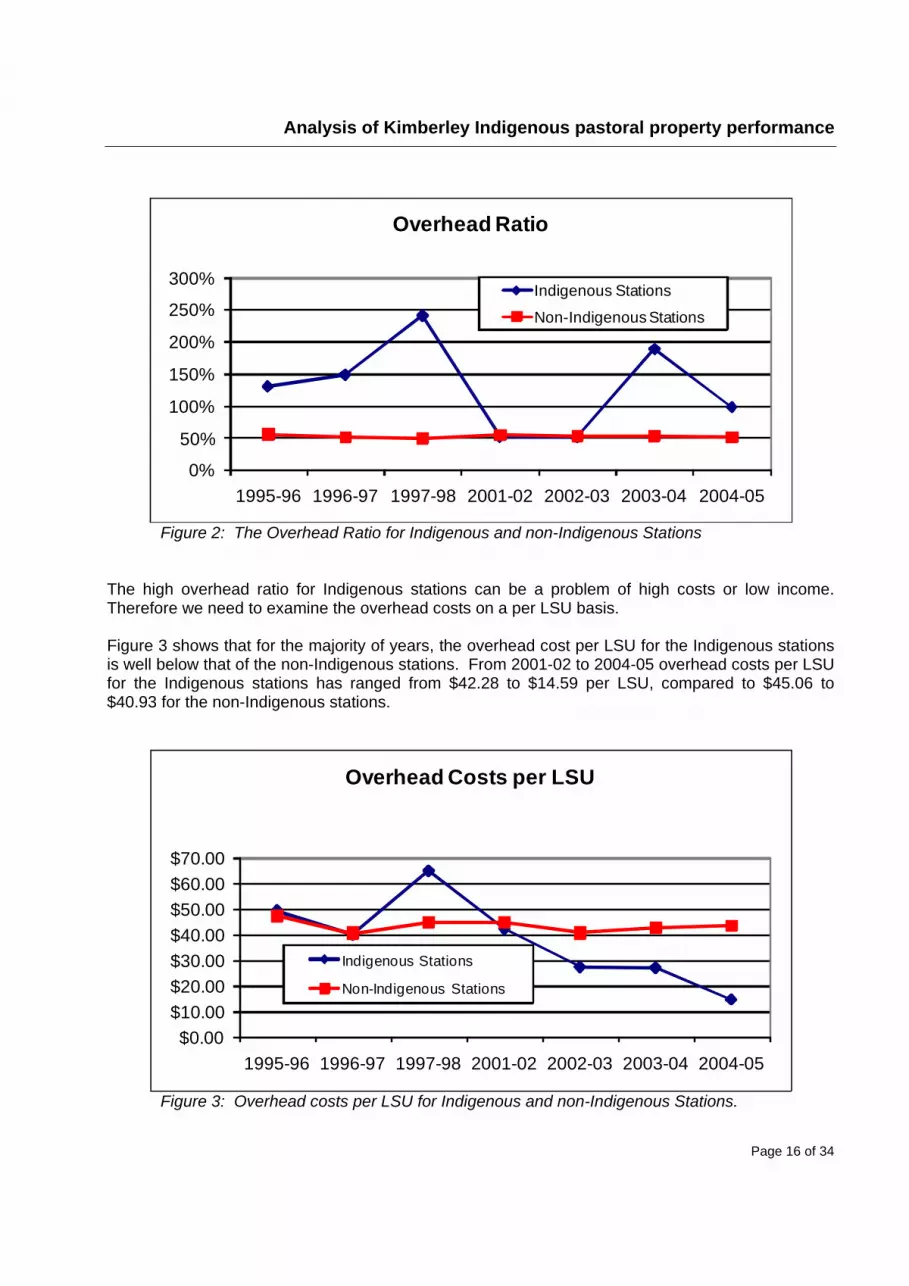
The high overhead ratio for Indigenous stations can be a problem of high costs or low income. Therefore we need to examine the overhead costs on a per LSU basis. Figure 3 shows that for the majority of years, the overhead cost per LSU for the Indigenous stations is well below that of the non-Indigenous stations. From 2001-02 to 2004-05 overhead costs per LSU for the Indigenous stations has ranged from $42.28 to $14.59 per LSU, compared to $45.06 to $40.93 for the non-Indigenous stations.
$0.00
$10.00
$20.00
$30.00
$40.00
$50.00
$60.00
$70.00
1995-96 1996-97 1997-98 2001-02 2002-03 2003-04 2004-05
Overhead Costs per LSU
Indigenous Stations
Non-Indigenous Stations
Figure 3: Overhead costs per LSU for Indigenous and non-Indigenous Stations.

Analysis of Kimberley Indigenous pastoral property performance
Page 17 of 34
The next step is to examine which category of cost results in the main difference between overall overhead costs per-LSU between Indigenous and non-Indigenous businesses. Land costs Land costs cover rates, rent and any land maintenance costs. There is very little difference between land costs between the two classes of stations, with any abnormal figures being due to land maintenance work being undertaken in those years. Administration costs Administration costs include professional fees, telephone, office stationary, postage etc. Administration costs per LSU for the Indigenous stations are lower than for the non-Indigenous stations. This is mainly due to the Indigenous stations having lower telephone, fax and computer costs, and lower professional fees than the non-Indigenous stations. Building and plant costs This is a major category of overhead costs and covers items such as fuel, repairs and maintenance, insurance, vehicle registrations, and depreciation. If overhead costs are a problem in a business, this is one of the first cost categories to examine, and it is more often than not driven by excessive investments in plant, machinery and vehicles and disproportionate repair costs. Figure 4 shows the comparison of building and plant costs per LSU between the Indigenous and non-Indigenous stations. In the majority of years, building and plant costs on the Indigenous stations are actually lower than on the non-Indigenous stations. This was an unexpected result as with the relatively large number of people living and working on an Indigenous station, it is easy for vehicle and plant costs to get out of control. The difference appears to be due to lower insurance costs together with a significantly smaller investment in plant and equipment on the Indigenous stations compared to the non-indigenous stations. However, given this significantly lower investment in plant & equipment on the Indigenous stations, their building and plant costs should be much lower per LSU than they are. There appears to be large repair and maintenance costs on the vehicles and equipment on Indigenous stations.

Analysis of Kimberley Indigenous pastoral property performance
Page 18 of 34
$0.00
$5.00
$10.00
$15.00
$20.00
$25.00
$30.00
$35.00
1995-96 1996-97 1997-98 2001-02 2002-03 2003-04 2004-05
Building & Plant Costs per LSU
Indigenous Stations
Non-Indigenous Stations
Figure 4: Plant and building costs per LSU for Indigenous and non-Indigenous stations.
Labour costs Labour costs include all salaries, wages, on-costs, staff amenities, stores etc, and are another major category of overhead costs. Labour costs on non-Indigenous stations have remained fairly static over the analysis period, ranging from $15.71 to $19.20 per LSU, compared to labour costs on the Indigenous stations which have ranged from $32.91 down to $1.17 per LSU. These labour costs per LSU need to be studied in conjunction with labour use efficiency information; in the form of LSUs managed per full-time equivalent employee (FTE). Examining both Figure 5 and 6 together would indicate that the non-Indigenous stations have kept their labour costs per LSU static despite rising labour costs by being able to run more cattle with fewer employees. The Indigenous stations have lower overall labour costs. This is because much of their labour cost is covered by CDEP payments, with only “top-up” payments being paid by the station. It is interesting to note that labour use efficiency has also increased on the Indigenous stations, with LSUs managed per FTE almost doubling from 525 in 1995-96 to 1,025 in 2004-05. If additional labour could be employed on CDEP, then this additional labour would have very little negative impact on the profitability of the stations and may in fact enable profitability to be increased, as additional labour would enable the level of management on these stations to be improved which in turn would have positive impacts on livestock productivity. CONCLUSION: It would appear that it is not costs per se which are causing the low levels of profitability on the Indigenous properties, so much as the low levels of income.

Analysis of Kimberley Indigenous pastoral property performance
Page 19 of 34
$0.00
$5.00
$10.00
$15.00
$20.00
$25.00
$30.00
$35.00
1995-96 1996-97 1997-98 2001-02 2002-03 2003-04 2004-05
Labour Costs per LSU
Indigenous Stations
Non-Indigenous Stations
Figure 5: A comparison of Labour costs per LSU between Indigenous and non-Indigenous stations.
0200400600800
1,0001,2001,4001,6001,800
1995-96 1996-97 1997-98 2001-02 2002-03 2003-04 2004-05
LSUs Managed per FTE
Indigenous Stations
Non-Indigenous Stations
Figure 6: Labour use efficiency: LSUs Managed per Full time Employee Equivalent (FTE) for Indigenous and non-Indigenous stations.
Analysis of Kimberley Indigenous pastoral property performance
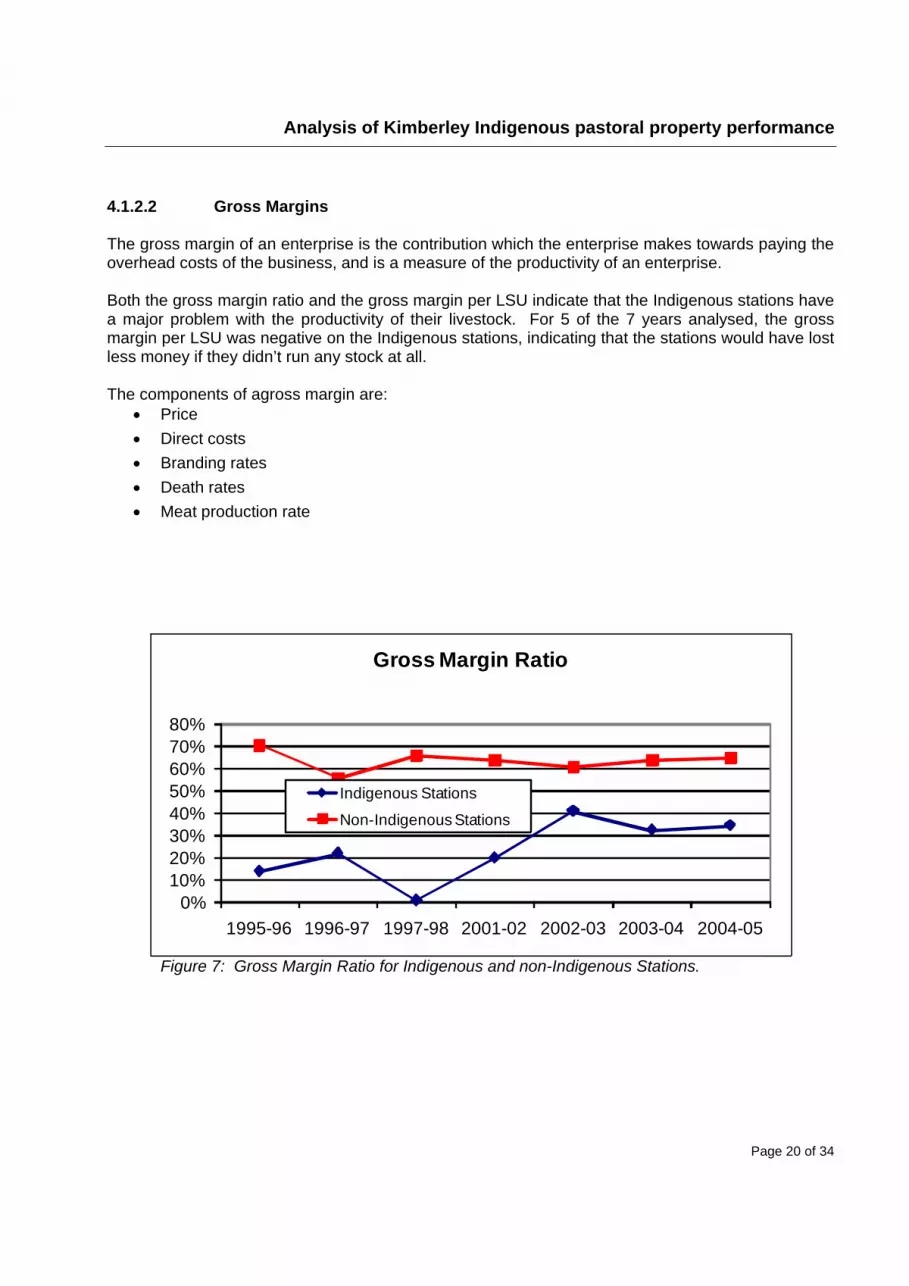
Page 20 of 34
4.1.2.2 Gross Margins The gross margin of an enterprise is the contribution which the enterprise makes towards paying the overhead costs of the business, and is a measure of the productivity of an enterprise. Both the gross margin ratio and the gross margin per LSU indicate that the Indigenous stations have a major problem with the productivity of their livestock. For 5 of the 7 years analysed, the gross margin per LSU was negative on the Indigenous stations, indicating that the stations would have lost less money if they didn’t run any stock at all. The components of agross margin are:
Price
Direct costs
Branding rates
Death rates
Meat production rate
0%10%20%30%40%50%60%70%80%
1995-96 1996-97 1997-98 2001-02 2002-03 2003-04 2004-05
Gross Margin Ratio
Indigenous Stations
Non-Indigenous Stations
Figure 7: Gross Margin Ratio for Indigenous and non-Indigenous Stations.
Analysis of Kimberley Indigenous pastoral property performance
Page 21 of 34
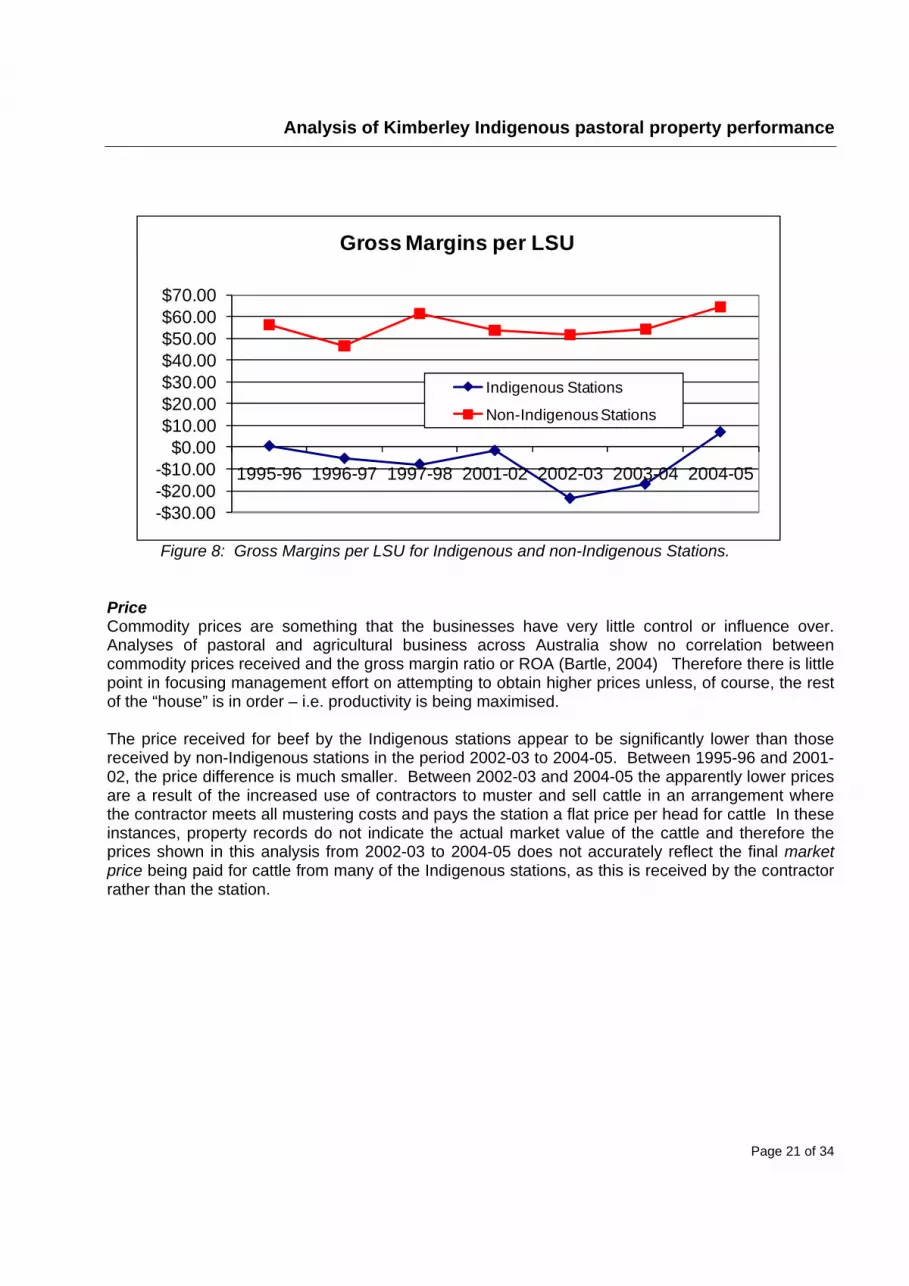
Figure 8: Gross Margins per LSU for Indigenous and non-Indigenous Stations.
Price Commodity prices are something that the businesses have very little control or influence over. Analyses of pastoral and agricultural business across Australia show no correlation between commodity prices received and the gross margin ratio or ROA (Bartle, 2004) Therefore there is little point in focusing management effort on attempting to obtain higher prices unless, of course, the rest of the “house” is in order – i.e. productivity is being maximised. The price received for beef by the Indigenous stations appear to be significantly lower than those received by non-Indigenous stations in the period 2002-03 to 2004-05. Between 1995-96 and 2001-02, the price difference is much smaller. Between 2002-03 and 2004-05 the apparently lower prices are a result of the increased use of contractors to muster and sell cattle in an arrangement where the contractor meets all mustering costs and pays the station a flat price per head for cattle In these instances, property records do not indicate the actual market value of the cattle and therefore the prices shown in this analysis from 2002-03 to 2004-05 does not accurately reflect the final market price being paid for cattle from many of the Indigenous stations, as this is received by the contractor rather than the station.
-$30.00-$20.00-$10.00
$0.00$10.00$20.00$30.00$40.00$50.00$60.00$70.00
1995-96 1996-97 1997-98 2001-02 2002-03 2003-04 2004-05
Gross Margins per LSU
Indigenous Stations
Non-Indigenous Stations

Analysis of Kimberley Indigenous pastoral property performance
Page 22 of 34
$0.00
$0.20
$0.40
$0.60
$0.80
$1.00
$1.20
$1.40
$1.60
1995-96 1996-97 1997-98 2001-02 2002-03 2003-04 2004-05
Average Beef Price Received $/kg
Indigenous Stations
Non-Indigenous Stations
Figure 9: Beef prices received for Indigenous and non-Indigenous Stations.
Direct Costs A direct cost is a cost that is proportional to the number of stock in the enterprise, and is usually paid for on a “per head” basis. Whilst the pastoralist has very little influence over some direct costs (eg commission, levies, freight etc), other direct costs are discretionary and can have a significant influence on productivity and hence profitability (e.g. supplements and animal health expenditure). In many cases, direct costs need to be increased to achieve an improvement in profitability. For example, cattle may suffer from a lack of protein in fodder. Growth rates and hence gross margins can be increased by increasing expenditure on supplements. Direct costs per LSU on the non-Indigenous stations have been gradually increasing over the years, while the trend is for a decrease in direct costs per LSU on the Indigenous stations. On the non-Indigenous stations, the increase can be attributed to higher freight and selling costs, with animal health and supplement costs remaining fairly static. The downward trend in direct costs per LSU on Indigenous stations appears to be a result of three main factors:
A decrease in the use of supplements and fodder; between 2001-02 and 2004-05 only two stations in the analysis have recorded expenditure on supplements and fodder,
Between 1995-96 and 2001-02, there was considerable use of agistment, but no use of agistment between 2002-03 and 2004-05.
As discussed in the section on prices received, on some stations the type of contract mustering arrangement being used means that station records do not show the actual costs of mustering.

Analysis of Kimberley Indigenous pastoral property performance
Page 23 of 34
$0.00$5.00
$10.00$15.00$20.00$25.00$30.00$35.00
1995-96 1996-97 1997-98 2001-02 2002-03 2003-04 2004-05
Direct Costs per LSUIndigenous Stations
Non-Indigenous Stations
Figure 10. Direct costs per LSU for Indigenous and non-Indigenous Stations.
A strategy of increasing direct costs (particularly expenditure on supplements) to improve productivity and hence profitability is considered later in this report. (Section 4.2) Branding rates Branding rates are usually a major driver of gross margins. Branding rates on Indigenous properties appear lower than on non-Indigenous stations and this will be impacting significantly on profitability. Calf branding rates need to increase to around 70-80% to achieve an acceptable gross margin and ROA.
0%10%20%30%40%50%60%70%80%90%
1995-96 1996-97 1997-98 2001-02 2002-03 2003-04 2004-05
Calf Branding Rates
Indigenous Stations
Non-Indigenous Stations
Figure 11. Calf Branding rates on Indigenous and non-Indigenous stations.

Analysis of Kimberley Indigenous pastoral property performance
Page 24 of 34
Death Rates High death rates have a significant impact on gross margins and hence profitability. Livestock mortalities on extensive properties are often a “guesstimate”. However mortalities can be determined with a reasonable degree of confidence when other figures such as opening and closing numbers and sale numbers are known with confidence. Historically, reviews and surveys of the Kimberley pastoral industry have put average mortalities at 10 – 15%. Cattle death rates on Indigenous stations seem to reflect this situation (refer Figure 12). Figures claimed by non-Indigenous operators in the survey of 2-4% are probably over-optimistic, although improved management techniques and the adoption of tropically adapted breeds has probably seen mortalities fall to around 6-8% (WA Department of Agriculture and Food., 2006). Information has been collected on the number of rations supplied by the stations to their communities, with these removed from the mortalities for the period 2001 - 2005. Hence the death rates shown here for Indigenous properties are considered a fairly accurate reflection of what is happening on the stations. Rations have been assigned a value (usually paid to the station in cash) and hence are reflected in the station income and profitability.
0.00%2.00%4.00%6.00%8.00%
10.00%12.00%14.00%16.00%18.00%
1995-96 1996-97 1997-98 2001-02 2002-03 2003-04 2004-05
Cattle Death Rates
Indigenous Stations
Non-Indigenous Stations
Figure 12: Cattle death rates on Indigenous and non-Indigenous Stations.
Meat produced The amount of meat produced by an enterprise is measured as the change in total weight of the herd over the year after allowing for sales and purchases, and is expressed as kg per LSU. The amount of meat produced per LSU by a cattle enterprise is one of the main drivers of gross margin, and hence profitability of the business. As shown in Figure 13, the meat production rates achieved on the Indigenous stations are very low, ranging from 31 to 47 kg per LSU per year, compared with the non-Indigenous stations of 79 to 89 kg per LSU per year. This is a reflection of the poorer quality country types, quality of cattle, lower branding rates, and poorer nutrition of the Indigenous herds.

Analysis of Kimberley Indigenous pastoral property performance
Page 25 of 34
The economics of increasing growth rates through supplementation is considered later in the report.
0102030405060708090
100
1995-96 1996-97 1997-98 2001-02 2002-03 2003-04 2004-05
Cattle Liveweight gains (kg/year) per LSU
Indigenous Stations
Non-Indigenous Stations
Figure 13: Meat produced per LSU on Indigenous and non-Indigenous Stations.
4.1.2.3 Turnover Turnover is measured using the asset turnover ratio which is the total gross product as a percentage of the market value of the assets used in the business. It measures the efficiency with which assets are used. The target for pastoral operations is 32%. The asset turnover ratio for the Indigenous stations has ranged from 4.1% to 11.5%, compared to a range of 11% to 21% for non-Indigenous stations. The lower turnover ratio on Indigenous stations is a reflection of lower herd productivity, lower prices received for beef, and stocking rates being below carrying capacity. As with the gross margin ratio, the major drivers of the asset turnover ratio are:
Ensuring stocking rate is matched to carrying capacity, and Maximising livestock productivity
When analysing the correlations between the asset turnover ratio and its component drivers, it is evident that the most important driver is matching stocking rates to carrying capacity. In the case of the Indigenous stations, it appears that they are generally stocked below capacity with stocking rates in the 2001-02 to 2004-05 period being between 1 and 2 stock days per ha per 100mm of rainfall. Carrying capacity for these stations is generally around 4 stock days per ha per 100mm of rainfall.

Analysis of Kimberley Indigenous pastoral property performance
Page 26 of 34
While it can be argued that increasing the stocking rate will increase the profitability of the Indigenous stations, it is important to ensure that any increase in stocking rate is commensurate with available infrastructure and management capacity.
0.00%
5.00%
10.00%
15.00%
20.00%
25.00%
1995-96 1996-97 1997-98 2001-02 2002-03 2003-04 2004-05
Asset Turnover RatioIndigenous Stations
Non-Indigenous Stations
Figure 14: Asset Turnover Ratio for Indigenous and non-Indigenous Stations.
4.2 IMPLICATIONS AND OPTIONS FOR FUTURE MANAGEMENT It is evident, from the results discussed above, that it is low income (caused by low livestock productivity and small herds) rather than high costs which are limiting the profitability of many of the Indigenous stations. The use of mustering contractors has also tended to see a return to “harvesting” of cattle rather than the implementation of sound management practices. The following section examines the sensitivity of business performance to some specific changes in the management of Indigenous cattle stations, viz:
A supplementation program
A more intensively managed breeder herd being run on the better parts of the station
4.2.1 Strategy One: Utilising targeted supplementation
As discussed earlier, one factor holding back cattle productivity and hence business profitability is the lack of supplementation. Many of the Indigenous stations are made up of poorer land types and hence protein levels in the available feed are inadequate for optimal performance for most of the year, impacting on growth rates, reproductive rates and death rates.

Analysis of Kimberley Indigenous pastoral property performance
Page 27 of 34
In this analysis, KPIs are compared for a herd with its current non-supplemented management, and when supplementation is introduced. Actual station data has been used as the base (one of the Indigenous stations included in the project), with a supplementation program applied to it to determine the effect on business performance. The following assumptions were made:
Lick blocks are fed to all cattle for 6 months of the year. Although the most expensive form of supplementation, lick blocks are considered the safest and easiest method to use.
A cost of 10 cents per head per day (based on a 20kg block), or $18.25 per head per year.
Branding rates increase by 10% (from 65% to 75%).
Death rates are reduced by 3% (from 10% to 7%)
The sale weight of cattle is increased by 20 kg per head.
Prices received increase by $0.05 per kg liveweight.
The blocks can be fed out with existing station vehicles and labour. If additional labour is required the cost is covered by CDEP. This keeps labour costs consistent with the method of analysis used in this project.
Stocking rate is kept the same – i.e. additional cattle are sold rather than numbers building up.
Changes in the economic performance of the business are shown in Table 4 overleaf.

Analysis of Kimberley Indigenous pastoral property performance
Page 28 of 34
Table 4: Differences in KPIs between a non-supplemented and supplemented cattle herd on an Indigenous station.
Key Performance Indicator No Supplementation SupplementedReturn on Assets 1.8% 3.9%Expense Ratio 74.5% 64.6%
Gross Margin Ratio 29% 33% Cattle Gross Margin per LSU ($/LSU) $13.79 $26.93 Meat produced per LSU (kg/LSU) 52 71 Branding percentage 65% 75% Death percentage 10% 7% Price received $/kg liveweight ($/kg) $1.09 $1.14 Direct costs per LSU ($/LSU) $9.49 $25.96
Overhead Ratio 55% 32% Overhead Costs per LSU ($/LSU) $25.92 $25.92 Gross Product per FTE ($/FTE) $52,881 $89,175 LSUs Managed per FTE (LSU/FTE) 1,113 1,113
Asset Turnover Ratio 7% 11% Stockdays per ha per 100mm rainfall 3 3
Cost of Production for Beef ($/kg) $0.68 $0.73 CONCLUSION: On the assumptions stated, introducing some basic supplementation, can improve business performance significantly. Profit and gross margins have doubled, and meat production per LSU has increased by 37%. 4.2.2 Strategy Two: Intensifying management A second alternative for improving the economic performance on Indigenous cattle stations is to intensify management. All of the stations involved in this project have extensive areas of very marginal country which are costly to run, given the distances travelled to check waters and fences and muster cattle, and the relatively small number of stock being run in these areas. It is proposed that a decrease in the cost of operating these stations together with an increase in productivity can be achieved by concentrating production on the better areas of the station. This would require development (fencing and waters) and increased management effort. Details are as follows:

Analysis of Kimberley Indigenous pastoral property performance
Page 29 of 34
Develop approximately 15,000 ha blocks in which 1,500 head of breeders are run.
Each block is subdivided into 6 paddocks to allow for country to be strategically rested.
Development costs are estimated at $135,000 per block which includes 3 wire fences with posts at 20 metres, and 28 kms of poly pipe and troughs. It is assumed that the required bores are already in operation.
With breeders controlled, controlled mating can be introduced and the quality of the herd improves.
Mustering costs are reduced by 25%.
Overhead costs are reduced by 15% as there is less distance to travel in mill runs, saving fuel and vehicle maintenance.
Bull requirements reduce from 5% to 3% due to breeders being more concentrated.
A targeted supplementation program is introduced as per the example in section 4.1.
Steers and surplus heifers are sold as weaners.
Productivity increases assumed over traditional management are: deaths reduced by 5%, calf branding rates increased by 20%, surplus breeders are 30 kg heavier at sale, weaners are 50 kg heavier at sale, and prices received increase by 10 cents per kilogram liveweight.
To keep the comparison consistent, the same station has been used as for the supplementation exercise, with one 15,000 ha block and one 7,500 ha block developed so that the breeder numbers remain the same. Therefore total development cost will be $202,500. The results of this analysis are shown in Table 5 overleaf:

Analysis of Kimberley Indigenous pastoral property performance
Page 30 of 34
Table 5: Differences in KPIs between a “low management” herd and an “intensively managed” herd, compared to a supplemented herd, on a smaller area of an Indigenous station.
Key Performance IndicatorLow Management
HerdIntensively
Managed HerdSupplemented
HerdReturn on Assets 1.8% 4.9% 3.9%Expense Ratio 74.5% 62.6% 64.6%
Gross Margin Ratio 29% 40% 33% Cattle Gross Margin per LSU ($/LSU) $13.79 $43.43 $26.93 Meat produced per LSU (kg/LSU) 52 88 71 Branding percentage 65% 85% 75% Death percentage 10% 5% 7% Price received $/kg liveweight ($/kg) $1.09 $1.19 $1.14 Direct costs per LSU ($/LSU) $9.49 $37.05 $25.96
Overhead Ratio 55% 29% 32% Overhead Costs per LSU ($/LSU) $25.92 $31.56 $25.92 Gross Product per FTE ($/FTE) $52,881 $89,049 $89,175 LSUs Managed per FTE (LSU/FTE) 1,113 812 1,113
Asset Turnover Ratio 7% 13% 11% Stockdays per ha per 100mm rainfall 3 3 3
Cost of Production for Beef ($/kg) $0.68 $0.78 1
Development cost $202,500Return on investment per year 49% CONCLUSION: Intensifying the management of the herd makes a very significant difference to the profitability of the operation and is more profitable than introducing a supplementation program alone. ROA and gross margins increased by around three-fold, the overhead ratio decreased by 26% and the asset turnover ratio increased by 6%. Analyses conducted by Resource Consulting Services Pty Ltd (McCosker & Martyn, 2003) suggest that controlled mating together with more intensive management and a targeted supplementation program can increase the gross margin by around $30 per mated breeder. This is consistent with the results obtained in this analysis. The benefits come about through increases in productivity and through increased efficiency in only having to manage a portion of the station. The added benefit is that substantially more profit is made from running fewer cattle.

Analysis of Kimberley Indigenous pastoral property performance
Page 31 of 34
With development costs assumed at $202,500, the annual return on this investment is 49%, making it a very worthwhile project, even if the required capital had to be borrowed. Of course the obvious question to ask regarding this approach to improving profitability is: “is the management of Indigenous stations capable of this level of management?” With training and guidance there are several stations which would be capable of making these improvements in management, and in other situations there would be an opportunity for the Indigenous stations to form alliances with non-Indigenous stations to assist with the management. This could be arranged on a payment for service basis (cash or cattle) or on some form of a profit-share basis. Dialogue has already commenced between Indigenous and non-Indigenous stations on the possibility of forming strategic alliances to help improve the management and profitability of the Indigenous stations. It is in the interests of both the individual stations and communities as well as the broader industry and regional communities to improve the productivity and profitability on the Indigenous stations.
5 Success in Achieving Objectives Objectives 1 and 2 have been completed. Clearly objectives 3 and 4 are longer term goals. Collecting data from the stations to complete the benchmarking exercise has not been without its difficulties. Inadequate office management, and poor record keeping by many of the properties has resulted in many delays in obtaining the information required which were beyond the control of the project. At the community level, the results for individual properties need to be presented, explained and discussed with community decision makers. Once an understanding of the implications and opportunities within the property reports has been achieved, the development of appropriate management strategies and necessary skilling strategies as outlined by objectives 3 and 4 can commence.
6 Impact on Meat and Livestock Industry An improvement of the economic performance of Indigenous leases is clearly in the interests of all stakeholders in the Kimberley pastoral industry. With the exception of 3 or 4 properties, Indigenous pastoral enterprises in the Kimberley are currently characterised by relatively small herds (an average of less than 3000 LSU). Pastoral potential of these leases varies significantly, as does the level and quality of infrastructure, with many being in relatively remote locations. Leases owned by Indigenous communities are currently estimated to be carrying in the order of 40,000 LSU. The potential carrying capacity of these leases totals over 100,000 LSU with appropriate infrastructure and management control. There is therefore significant potential to raise the productive capacity of these leases. However, this is not something that could be achieved in a short period of time. A doubling of numbers to 80,000 LSU would conservatively add $5 Million to the value of turnoff coming from Indigenous properties.

Analysis of Kimberley Indigenous pastoral property performance
Page 32 of 34
7 Conclusions and Recommendations The data collected and analysed indicates that the economic performance of most Indigenous stations is below that of non-Indigenous stations in the Kimberley. The outputs of this project have also been able to provide indications as to which aspects of enterprise management will require the most attention. Results discussed above indicate that it is low income (caused by low livestock productivity and small herds) rather than high costs which are limiting the profitability of many of the Indigenous stations. There is a need to support, encourage and assist managers to concentrate on increasing the productivity of the cattle and keeping overhead costs, relative to income, in check. This means that education and training in implementing contemporary animal husbandry practices, nutrition and grazing management are critical to the future success of these properties. There is little value to be gained in focusing management effort on attempting to obtain higher prices through marketing strategies unless, of course, the rest of the “house” is in order – i.e. productivity is being maximised. The research and extension functions of MLA clearly have a role here. The project has identified areas within the management of these businesses which are impacting on profitable performance. These include:
Lower productivity of cattle which is probably being caused by poor nutritional management. This is reflected in higher than average death rates, lower reproductive performance, and low annual live weight gains;
Indigenous stations, on average receive a lower price for beef which is contributing to lower profit;
Overhead costs are higher relative to the income being generated, particularly those associated with plant, vehicles and buildings. This is reflective of more people being accommodated and more people being employed in the businesses than on non-Indigenous stations;
Indigenous stations are often smaller in size than non-Indigenous properties, with lower carrying capacities and hence less LSUs over which to spread the overhead costs.
While there is a general trend of improvement in the profitability of these Indigenous stations as a group, management strategies can be devised to accelerate this trend and in turn improve the living conditions in local communities. Several possible solutions to these problems have been examined in this project. One factor impacting on cattle productivity and hence business profitability is the lack of supplementation. Many of the Indigenous stations are made up of poorer land types and hence protein levels in the available feed are inadequate for optimal performance for most of the year, impacting on growth rates, reproductive rates and death rates. The benefits of targeted supplementation have been clearly identified by numerous MLA research trials. Analysis indicates that introducing some basic supplementation, can improve business performance significantly. It is also apparent that communities struggle with the effective management of their vast pastoral leases. Unlike most non-Indigenous pastoral families, the management of the cattle enterprise is but one role of the typical Indigenous station manager. There are constant demands on his time and expertise in a myriad of community activities.

Analysis of Kimberley Indigenous pastoral property performance
Page 33 of 34
The preliminary results of this project would indicate that there is considerable opportunity in intensifying management on a smaller, more manageable portion of most leases. The principal benefit of intensifying management is increased profitability from fewer cattle. It also opens up the opportunity of multiple family-controlled herds being run on the one property, thereby meeting the aspirations of more than one group in a community. Clearly there are risks with intensifying management. However, with appropriate training and guidance there are several stations which would be capable of making these improvements in management, and in other situations there would be an opportunity for the Indigenous stations to form alliances with neighbouring non-Indigenous stations to assist with the management. This could be arranged on a payment for service basis (cash or cattle) or on some form of a profit-share basis. It is certainly worth pursuing these options further. There is clearly an opportunity for a small PIRD trial based around an Indigenous property to determine the potential benefits and problems associated with a strategy based on intensifying management in combination with supplementation. As a result of this current project, baseline property data is now available in KPI form with which to monitor the impact of changes in management for such a trial. At the community level, the results for individual properties need to be presented, explained and discussed with community decision makers. The imparting of knowledge and skills in Indigenous communities happens in conversations - an idea is ‘talked up’ and becomes real. Understanding and agreement is a critical element of the process. This will be the primary tool of the next stage of this project. Once an understanding of the implications and opportunities within the property reports has been achieved, the development of appropriate management strategies and necessary skilling strategies can commence. Understanding would clearly benefit from a PIRD site which is demonstrating improved management strategies and options discussed in this report. At the agency level there is a range of “players” who may need to be invited into the process, from Agriculture specialists (eg AgWA, WA Pastoral Lands Board, MLA, NHT), Indigenous support agencies (WA Dept of Indigenous Affairs, WA Aboriginal Lands Trust, WA Office of Aboriginal Economic Development, ILC, Indigenous Coordination Centres), the Kimberley Land Council, the Kimberley Development Commission, WA Pastoralists and Graziers Association and private sector operators. Not all may wish to play a part, but it is important that they are invited. Above all there is a need to develop the knowledge and skills base of Indigenous land owners to manage a cattle enterprise with a transparent profit incentive. The indigenous cattle manager must be allowed to focus on the main business of running the pastoral enterprise. To do this will require an environment that recognises that people respond to incentives and that clearly separates out interests, and holds the various economic, community and social actors accountable. In other words, a dramatically different approach from the current one which assumes that business, land and community interests do not need to be managed in distinct ways. In taking these decisions, Indigenous communities must be encouraged and supported to take responsibility for themselves. We must pay much more attention to the factors that are most commonly neglected when working with Indigenous pastoral properties. If we can do this, then significant progress can be made, with gains in biodiversity, improved profit, and improvements in personal, family and community wellbeing.

Analysis of Kimberley Indigenous pastoral property performance
Page 34 of 34
8. References
Bartle, R. (2004). Final Report Gascoyne Murchison Strategy: Benchmarking, Financial Advice &
Business Review Project.
McCosker, T. H., & Martyn, S. (2003). [Effects of controlled mating and targeted supplementation Pers Comm].
WA Department of Agriculture and Food. (2006). Performance indicators for Kimberley cattle herds. Perth: Government of Western Australia.
9. Bibliography Following is a list of reviews and reports relevant to Indigenous pastoralism in the Kimberley: WA Dept of Industry & Resources, (2003). Review of the Kimberley Indigenous Pastoral Industry. Indigenous Land Corporation, (2003). Improving outcomes from Indigenous held land. Hassall & Associates Pty Ltd, (2001). Kimberley Aboriginal Beef Strategy: Co-operative pre-feasibility study. Central Land Council, (1997). Participatory Enterprise Planning. Central Land Council, (1996). Aboriginal Pastoral Enterprises: structures, critical success factors & support needs. Kimberley Land Council, (1994). Kimberley Aboriginal Pastoralists Project: a review of Aboriginal participation in the Kimberley Beef Industry & a strategy for improving the performance & productivity of the participating properties. (8 volumes + 24 Individual property reviews / plans). Central Land Council,(1994/5). Report of Pastoral Directors Course (3 Vols). DEET (2 Vols), (1993). Rural Development Skills on Aboriginal Land – Can we meet the challenge? Bureau of Resource Sciences, (1993). Developing management plans for Aboriginal owned pastoral properties. Bureau of Resource Sciences, working paper #92, undated. Goals & strategies for Aboriginal cattle enterprises.