Embed Size (px)
Citation preview

ISSN : 0974-9535
RSM International Journal
of
Engineering, Technology & Management
Chief Editor
Dr. Elwin Chandra Monie
R.M.K. ENGINEERING COLLEGE (ISO 9001:2000 Certified Institution)
RSM Nagar, Kavaraipettai – 601 206
Gummidipoondi Taluk, Thiruvallur, Tamil Nadu, India
Chief Editor
Dr. Elwin Chandra Monie
Co-ordinating Editor
Dr. K. A. Mohamed Junaid
DISCLAIMER
The authors are solely responsible for the contents of the papers compiled in this volume.
The publishers or editors do not take any responsibility for the same in any manner.
Errors, if any, are purely unintentional and readers are requested to communicate such
errors to the editors or publishers to avoid discrepancies in future.
Published by
Printed by
RMK Engineering College, RSM Nagar, Kavaraipettai – 601 206 E-mail: [email protected]
R.M.K. ENGINEERING COLLEGE
(ISO 9001:2000 Certified Institution)
RSM Nagar, Kavaraipettai – 601 206
Gummidipoondi Taluk, Thiruvallur, Tamil Nadu, India
Editorial Board
Dr. Elwin Chandra Monie
Chief Editor, Principal
R.M.K. Engineering College,
RSM Nagar, Tamil Nadu, India.
Dr. A. Jagadeesh
Professor
R.M.K. Engineering College,
RSM Nagar, Tamil Nadu, India.
Dr. Raj Gururajan
Associate Dean
University of Southern Queensland, Australia
Dr. Binu Sukumar, M.Tech.,Ph.D.
Head / CE
R.M.K. Engineering College,
RSM Nagar, Tamil Nadu, India.
Dr. Shunmuganathan K L, M.E,M.S,F.I.E.,Ph.D. Head / CSE
R.M.K. Engineering College,
RSM Nagar, Tamil Nadu, India.
Dr. Geetha Ramdas , M.E, Ph.D.,
Head / EEE
R.M.K. Engineering College,
RSM Nagar, Tamil Nadu, India.
Dr. Sivakumar R , M.E., Ph.D.
Head / ECE
R.M.K. Engineering College,
RSM Nagar, Tamil Nadu, India.
Dr. Mohamed Junaid K A , M.E,Ph.D.
Head / EIE
R.M.K. Engineering College,
RSM Nagar, Tamil Nadu, India.
Dr. K. Vijaya , M.E.,Ph.D.
Head / IT
R.M.K. Engineering College,
RSM Nagar, Tamil Nadu, India.
Dr.K.R. Senthilkumar, M.E, Ph.D (IITM)
Head / MECH
R.M.K. Engineering College,
RSM Nagar, Tamil Nadu, India.
Dr. Bhagavathi Perumal S, M.E.,Ph.D.
Professor / CE
R.M.K. Engineering College,
RSM Nagar, Tamil Nadu, India.
Dr. Jagadeesh Kannan R, M.E.,Ph.D.
Professor / CSE
R.M.K. Engineering College,
RSM Nagar, Tamil Nadu, India.
Dr. Sekar S, M.E.,Ph.D.
Professor / Mech
R.M.K. Engineering College,
RSM Nagar, Tamil Nadu, India.
Dr.Suresh T, M.E.,Ph.D.
Professor / ECE
R.M.K. Engineering College,
RSM Nagar, Tamil Nadu, India.
Dr. Mohamed Junaid K A , M.E,Ph.D.
Co-ordinating Editor, Vice Principal
R.M.K. Engineering College,
RSM Nagar, Tamil Nadu, India.
Message from the
Chairman
Education is primarily a concrete step taken
by every scholar towards a constructive future. I am
privileged to write with profound joy that our
institution was started with the high ambition of
empowering engineering graduation to bear the fruit of
success and enabling them to attain enviable heights in
life. The students of our college are sure to emerge as
full fledged intellectuals with refinement in character
skills, in entrepreneurship and attain zenith in career.
I extend my heartiest congratulations and
that’s to the members of the Editorial Board who
contributed their best for the sincere Endeavour. I am
sure that you would strive to maintain the highest of
standards and quality in bringing out this publication. I
sincerely hope that this journal would bring about a
good exchange of ideas between researchers and
would further their research initiatives. I wish you a
great success in this maiden venture and in all walks
of life.
25th July 2012 R.S. Munirathinam
Chairman
Contents
1. Delimitation Studies in Drilling of Particleboard (PB) Wood Composite Panels Using Taguchi Method T.N. Valarmathi K. Palanikumar S. Sekar 7
2. Material Aspects of High Performance Concrete
M R L Sastry Dr K Srinivasa Rao Dr P Subba Rao 12
3. Comparative Study on Securfe Routing Protocols in MANETs C Geetha M Ramakrishnan R Jagadeesh Kannan 22
4. A Novel Quasi-Orthogonal STBC for 4 Transmit Antennas using Lattice Decoding
G Kanimozhi K Senthilkumar 32
5. A Novel Method of MRI Brain Image Segmentation K S Arun pandian G Babu 39
6. Survey of Architectures and Mobility Model for Ubiquitous Underwater Acoustic
Sensor Networks G Shalini 43
RSM International Journal of Engineering, Technology & Management |7
DELAMINATION STUDIES IN DRILLING OF PARTICLEBOARD (PB)
WOOD COMPOSITE PANELS USING TAGUCHI METHOD
T.N.Valarmathi1,*
, K.Palanikumar2, S.Sekar
3
1Research Scholar, Department of Mechanical & Production Engineering,
Sathyabama University, Chennai-600 119, India
Email: [email protected]
* Corresponding Author 2Principal, Sri Sai Ram Institute of Technology, Chennai-600 044, India
Email: [email protected] 3Research Scholar, Department of Mechanical Engineering,
R.M.K. Engineering College, Kavaraipet- 601 206, India
Email: [email protected]
Abstract
Wood based composites are preferred over
solid wood because of their aesthetic
appearance and favorable properties.
Drilling process is extensively used in
furniture products assembly. Cutting forces
like thrust force developed during drilling
affecst the surface quality of drilled hole and
also causes delamination damages. The aim
of this study is to find out the influence of
drilling parameters on delamination.
Taguchi design of experiments is used to
perform the drilling experiments. From the
experimental results it is revealed that high
spindle speed, low feed rate and smaller
diameter mnimizes the tendency of
delamination.
Keywords: Wood based composites,
Particleboard (PB), drilling, delamination,
Taguchi method.
I. Introduction
Wood based composites are available as
plywood, particleboard, Fiberboard and
hardboard, etc. Wood composite products
are because of their special mechanical and
physical properties [1]. Particleboard panels
are manufactured using waste wood
particles and saw dust. The manufacturing
and assembly of wood composite products
needs machining process like drilling. The
cutting force developed in drilling depends
upon the machining conditions. Dippon et al
[2] expressed the cutting forces as functions
of cutting constants, tool geometry and
uncut chip area. They developed a
mathematical model to predict the cutting
forces when machining wood panels. Nemli
et al [3] observed that board density, raw
material type, pressure and shelling ratio
have great influence on the surface
roughness of Particleboard. Porankiewicz
[4] developed a method to determine the
effect of chemical properties of
particleboard on cemented carbide tool
material. Davim et al [5, 6 and 7] observed
that high cutting speeds minimize the
delamination tendency in drilling of wood
composite panels. Gaitonde et al [8, 9]
found that the cutting speed and feed rate
have influence on delamination in drilling of
MDF panels. Palanikumar et al [10]
performed drilling experiments on MDF and
revealed that the low feed rates minimize the
delamination tendency. In this study the
influence of input process parameters are
studied to minimize the delamination in
drilling of particleboard panels using
Taguchi technique.
Delamination Studies In Drilling Of Particleboard (Pb) Wood Composite Panels Using Taguchi Method
RSM International Journal of Engineering, Technology & Management |8
II. Experimental details
Particleboard (PB) is manufactured in sheet
form using waste wood particles glued
together with synthetic adhesives. The
drilling experiments were performed on
laminated PB of 12mm thickness with high
speed steel (HSS) twist drills on CNC
vertical machining center at dry condition.
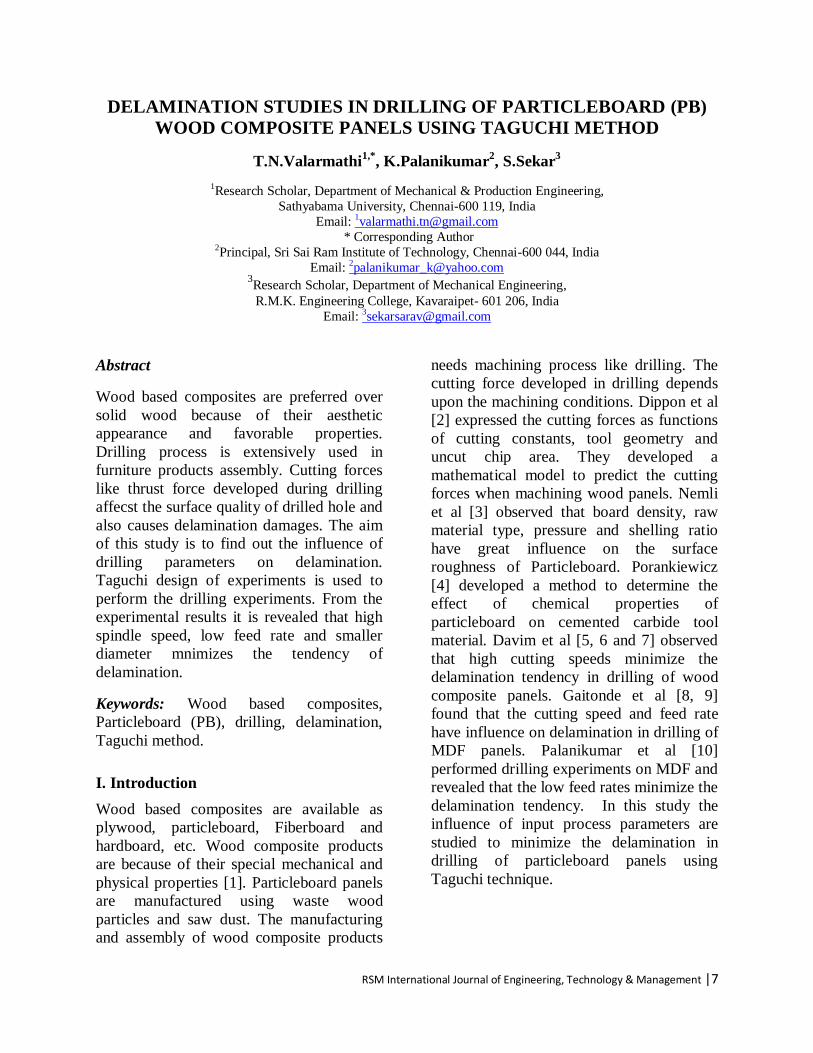
The CNC vertical machining center used for
this experiment is shown in Figure 1. The
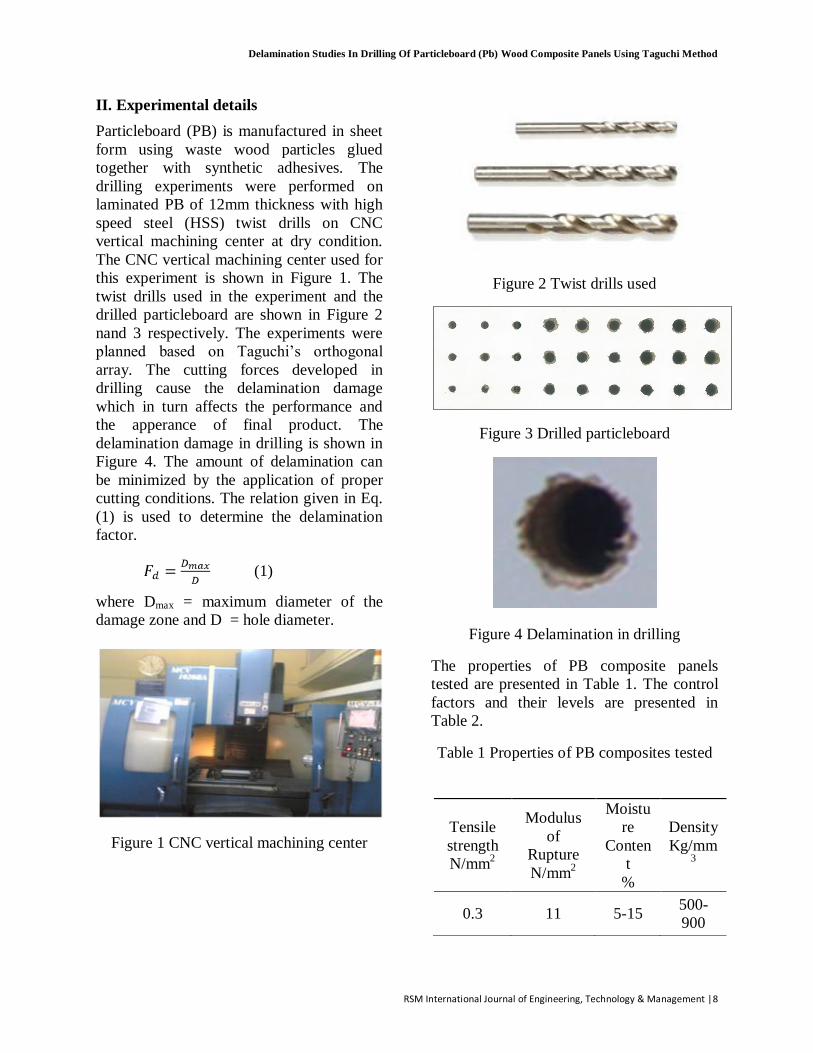
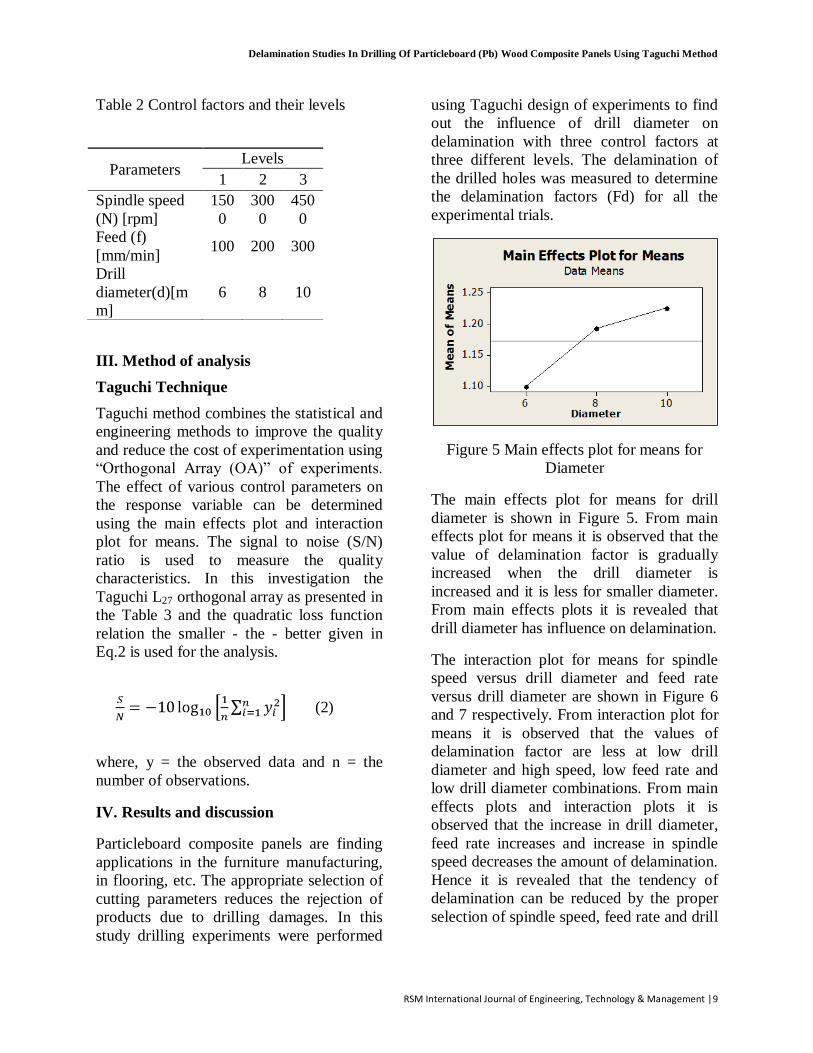
twist drills used in the experiment and the
drilled particleboard are shown in Figure 2
nand 3 respectively. The experiments were
planned based on Taguchi‟s orthogonal
array. The cutting forces developed in
drilling cause the delamination damage
which in turn affects the performance and
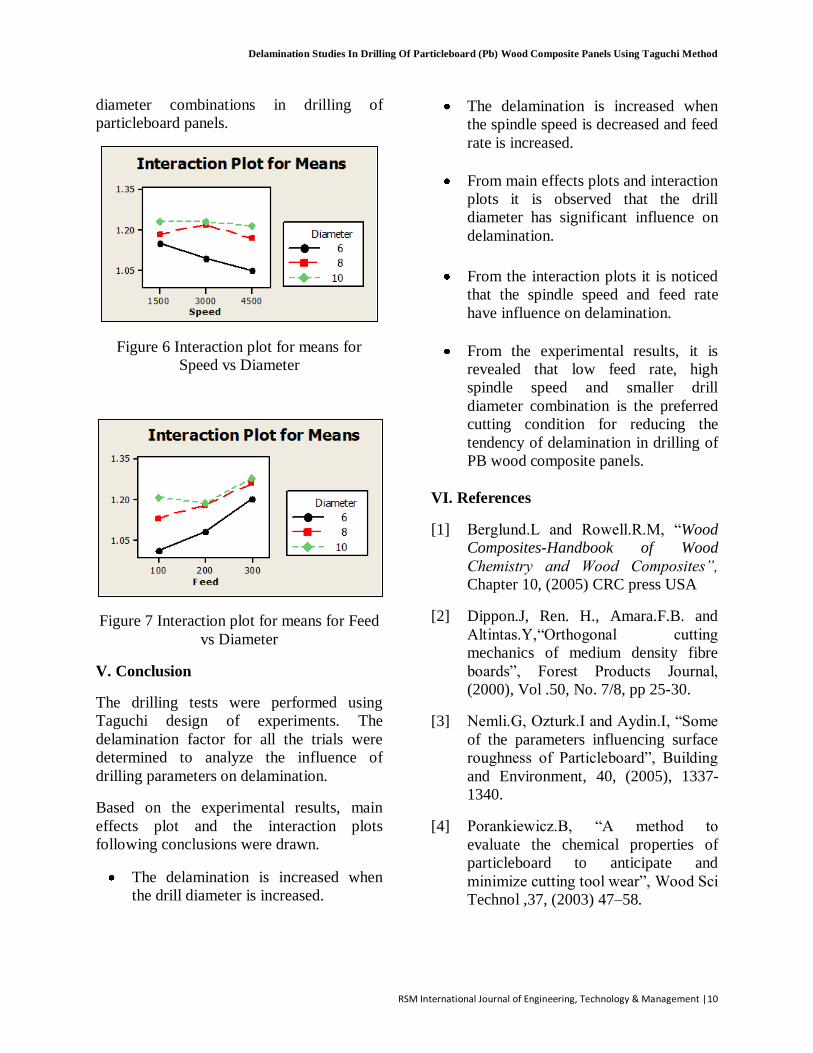
the apperance of final product. The
delamination damage in drilling is shown in
Figure 4. The amount of delamination can
be minimized by the application of proper
cutting conditions. The relation given in Eq.
(1) is used to determine the delamination
factor.
(1)
where Dmax = maximum diameter of the
damage zone and D = hole diameter.
Figure 1 CNC vertical machining center
Figure 2 Twist drills used
Figure 3 Drilled particleboard
Figure 4 Delamination in drilling
The properties of PB composite panels
tested are presented in Table 1. The control
factors and their levels are presented in
Table 2.
Table 1 Properties of PB composites tested
Tensile
strength
N/mm2
Modulus
of
Rupture
N/mm2
Moistu
re
Conten
t
%
Density
Kg/mm3
0.3 11 5-15 500-
900
Delamination Studies In Drilling Of Particleboard (Pb) Wood Composite Panels Using Taguchi Method
RSM International Journal of Engineering, Technology & Management |9
Table 2 Control factors and their levels
III. Method of analysis
Taguchi Technique
Taguchi method combines the statistical and
engineering methods to improve the quality
and reduce the cost of experimentation using
“Orthogonal Array (OA)” of experiments.
The effect of various control parameters on
the response variable can be determined
using the main effects plot and interaction
plot for means. The signal to noise (S/N)
ratio is used to measure the quality
characteristics. In this investigation the
Taguchi L27 orthogonal array as presented in
the Table 3 and the quadratic loss function
relation the smaller - the - better given in
Eq.2 is used for the analysis.
(2)
where, y = the observed data and n = the
number of observations.
IV. Results and discussion
Particleboard composite panels are finding
applications in the furniture manufacturing,
in flooring, etc. The appropriate selection of
cutting parameters reduces the rejection of
products due to drilling damages. In this
study drilling experiments were performed
using Taguchi design of experiments to find
out the influence of drill diameter on
delamination with three control factors at
three different levels. The delamination of
the drilled holes was measured to determine
the delamination factors (Fd) for all the
experimental trials.
Figure 5 Main effects plot for means for
Diameter
The main effects plot for means for drill
diameter is shown in Figure 5. From main
effects plot for means it is observed that the
value of delamination factor is gradually
increased when the drill diameter is
increased and it is less for smaller diameter.
From main effects plots it is revealed that
drill diameter has influence on delamination.
The interaction plot for means for spindle
speed versus drill diameter and feed rate
versus drill diameter are shown in Figure 6
and 7 respectively. From interaction plot for
means it is observed that the values of
delamination factor are less at low drill
diameter and high speed, low feed rate and
low drill diameter combinations. From main
effects plots and interaction plots it is
observed that the increase in drill diameter,
feed rate increases and increase in spindle
speed decreases the amount of delamination.
Hence it is revealed that the tendency of
delamination can be reduced by the proper
selection of spindle speed, feed rate and drill
Parameters Levels
1 2 3
Spindle speed
(N) [rpm]
150
0
300
0
450
0
Feed (f)
[mm/min] 100 200 300
Drill
diameter(d)[m
m]
6 8 10
Delamination Studies In Drilling Of Particleboard (Pb) Wood Composite Panels Using Taguchi Method
RSM International Journal of Engineering, Technology & Management |10
diameter combinations in drilling of
particleboard panels.
Figure 6 Interaction plot for means for
Speed vs Diameter
Figure 7 Interaction plot for means for Feed
vs Diameter
V. Conclusion
The drilling tests were performed using
Taguchi design of experiments. The
delamination factor for all the trials were
determined to analyze the influence of
drilling parameters on delamination.
Based on the experimental results, main
effects plot and the interaction plots
following conclusions were drawn.
The delamination is increased when
the drill diameter is increased.
The delamination is increased when
the spindle speed is decreased and feed
rate is increased.
From main effects plots and interaction
plots it is observed that the drill
diameter has significant influence on
delamination.
From the interaction plots it is noticed
that the spindle speed and feed rate
have influence on delamination.
From the experimental results, it is
revealed that low feed rate, high
spindle speed and smaller drill
diameter combination is the preferred
cutting condition for reducing the
tendency of delamination in drilling of
PB wood composite panels.
VI. References
[1] Berglund.L and Rowell.R.M, “Wood
Composites-Handbook of Wood
Chemistry and Wood Composites”,
Chapter 10, (2005) CRC press USA
[2] Dippon.J, Ren. H., Amara.F.B. and
Altintas.Y,“Orthogonal cutting
mechanics of medium density fibre
boards”, Forest Products Journal,
(2000), Vol .50, No. 7/8, pp 25-30.
[3] Nemli.G, Ozturk.I and Aydin.I, “Some
of the parameters influencing surface
roughness of Particleboard”, Building
and Environment, 40, (2005), 1337-
1340.
[4] Porankiewicz.B, “A method to
evaluate the chemical properties of
particleboard to anticipate and
minimize cutting tool wear”, Wood Sci
Technol ,37, (2003) 47–58.
Delamination Studies In Drilling Of Particleboard (Pb) Wood Composite Panels Using Taguchi Method
RSM International Journal of Engineering, Technology & Management |11
[5] Davim.J.P, Clemente.V.C and Silva.S,
“Evaluation of delamination in drilling
medium density fibreboard”,
Proceedings of the Institution of
Mechanical Engineers, Part B: Journal
of Engineering Manufacture, 221,
(2007a) 655-658.
[6] Davim.J.P, Clemente.V.C and Silva.S,
“Drilling investigation of MDF
(medium density fibreboard)”, Journal
of Materials Processing Technology,
20, (2008b), 537–541.
[7] Davim.J.P, Gaitonde.V.N and Karnik.
S.R, “An investigative study of
delamination in drilling of medium
density fiberboard (MDF) using
response surface models”, Int J Adv
Manuf Technol, 37, (2008c), 49–57.
[8] Gaitonde V.N., Karnik S.R., Davim.
J.P, “Prediction and minimization of
delamination in drilling of medium-
density fiberboard (MDF) using
response surface methodology and
Taguchi design”, Materials and
Manufacturing Processes, 23, (2008a),
377–384.
[9] Gaitonde V.N., Karnik S.R., Davim.
J.P, “Taguchi multiple-performance
characteristics optimization in drilling
of medium density fiberboard (MDF)
to minimize delamination using utility
concept”, Journal of Materials
Processing Technology, 196, (2008b),
73–78.
[10] Palanikumar.K, Prakash.S and
Manoharan.N, “Experimental
investigation and analysis on
delamination in drilling of wood
composite medium density
fiberboards”, Materials and
Manufacturing Processes, Volume 24,
Issue 12, (2009), Pages 1341-1348.
RSM International Journal of Engineering, Technology & Management |12
Material Aspects Of High Performance Concrete
M R L Sastry *, Dr K Srinivasa Rao **, Dr P Subba Rao ***
* Assistant professor,
Department of Civil Engineering,
Chaitanya Engineering College,
Visakhapatnam – 530 048, India. E-mail:
[email protected], Mobile: 9951452459
** Associate Professor, Department of
Civil Engineering, Andhra University,
Visakhapatnam-530 003, India. E-
mail: [email protected], Mobile:
9866037087
*** Professor, Department of Civil Engineering,
J.N.T. University, Kakinada – 533 003, India.
E-mail: [email protected], Mobile: 9959026889
Abstract
Performance of concrete is improved by
limiting nominal maximum size of coarse
aggregate; using fine aggregate having
high fineness modulus; using mineral
admixtures like silica fume, fly ash,
ground granulated blast furnace slag
(GGBS); limiting water binder ratio;
increasing packing density of aggregates
and also cementing materials; improving
bond between coarse aggregate and
cement matrix; using optimum quantities
of different materials along with suitable
type of high range water reducer (HRWR);
and by adopting proper placing,
compaction and curing procedures.
Physical and chemical properties of
various constituent materials play a vital
role in improving the performance
characteristics. Addition of super
plasticizer is inevitable to achieve good
workability. Air entraining admixture is
meant for freeze-thaw durability.
Shrinkage-reducing admixture reduces the
driving force for cracking. Porosity and
pore structure characterize the materials of
high performance concrete (HPC) in
connection with mixture optimization.
Water-cement ratio significantly
influences the brittleness of the concrete.
Keywords: Aggregate, mineral additives,
packing density, interfacial bond, crack
growth, curing.
1. Introduction
American Concrete Institute (ACI) defines
HPC as, “Concrete meeting special
combinations of performance and
uniformity requirements that cannot
always be achieved routinely using
conventional constituents and normal
mixing, placing and curing practices”.
Durability problems of existing concrete
infrastructures, and the increasing use of
concrete in hostile environments-such as
seawater and industrial effluent exposure-
are making new demands in the
development of HPC.
Because of this, HPC is likely to be the
construction industry workhorse in the 21st
century [1]. Chemical and mineral
admixtures are often added to enhance or
to control the properties like strength,
workability, setting time etc. A common
characteristic of HPC is a low water to
cement ratio. As the water-cement ratio is
decreased, paste capillary porosity
decreases, and strength and impermeability
increase. Sometimes, permeability is one
of the deciding factors to check the quality
of HPC. The production of HPC needs
more stringent control on selection of
materials than ordinary concrete to
consistently meet the performance criteria
for workability, strength, durability,
Material Aspects Of High Performance Concrete
RSM International Journal of Engineering, Technology and Management |13
cracking behavior etc. The materials for
HPC should be of good quality because the
performance of HPC both in fresh and
hardened states depends on the properties
of the constituent materials and the roles
they play when combined [2].
The constituent materials of ordinary
concrete may not be sufficient in case of
HPC. Definite sizes of ingredients, mineral
and chemical admixtures are necessary for
the production of HPC. The suitability of a
material to produce HPC must be judged
based on its effect to reach maximum
strength, durability and other desired
properties [3].
Performance of concrete is not only
measured by mechanical properties but by
failure behaviour. The fracture properties
of concrete which are closely related to
mechanical properties are influenced by its
chemical constituents and micro-, mezo-
and macrostructures. Interaction and
fracture parameters influence the design of
HPC [4]. Number, location and extent of
pre-existing cracks depend mainly on type
of cement, mineralogical nature of
aggregate, water-cement ratio and curing
conditions. Evolution of pre-existing
cracks under loading depends mainly on
aggregate-matrix stiffness ratio, type of
matrix-aggregate bond and percentage of
voids in the matrix [5].
2. Cement
Cement is a basic constituent in HPC. Out
of many types of cements, Ordinary
Portland Cement (OPC) is the widely used
type of cement. OPC is a hydraulic cement
produced by pulverizing the clinker
consisting of hydraulic calcium silicates
and usually containing one or more of the
forms of calcium sulphate as an
interground addition. Proper selection of
the type and source of cement needs
attention in the production of HPC.
2.1 Properties
Specific gravity of cement is around 3.15.
Specific surface is 22-40 m2/N. Soundness
with Le Chatelier apparatus as per IS
269:1989 should not be more than 10 mm.
Bulk density is 11000-13000 N/m3. Loss
on ignition is less then 5%. If the cement is
too fine, heat of hydration is too high.
Therefore, a consistent cement with a low
C3A content and high C2S content should
be used.
2.2 Content
Variation in quality of cement affect more
on the concrete compressive strength, than
the variation in the quality of any other
material. There is also an optimum cement
content beyond which little or no
additional increase in strength is achieved
by increasing the cement content.
As per IS 456:2000, cement content ranges
from 3200-4500 N/m3. The specifications
of ACI 211.4R-2008 do not set a minimum
for cement content, but its maximum
content is set as 5900 N/m3. As per British
DOE method, cement content ranges from
3000-4500 N/m3.
3. Supplementary Cementitious
Materials
Cement is the principal cementitious
material. To enhance the properties of
HPC, it is necessary to include
supplementary cementitious materials such
as silica fume, fly ash, GGBS. GGBS, fly
ash, rice husk ash and metakoiline are
pozzolanic materials; these materials
impart higher strengths slowly upto 91
days [6].
Mineral additives save and conserve
energy. Primary benefit of using these
materials is the technical aspects regarding
strength and performance properties. The
secondary benefit is economic and
environmental aspects [7].
Silica fume greatly reduces or even
eliminates bleeding. Inclusion of fly ash to
a lesser extent in the mix has physical
effect of modifying the flocculation of
cement, with a resulting reduction in the
water demand. With the use of these
materials, permeability will be lowered
Material Aspects Of High Performance Concrete
RSM International Journal of Engineering, Technology and Management |14
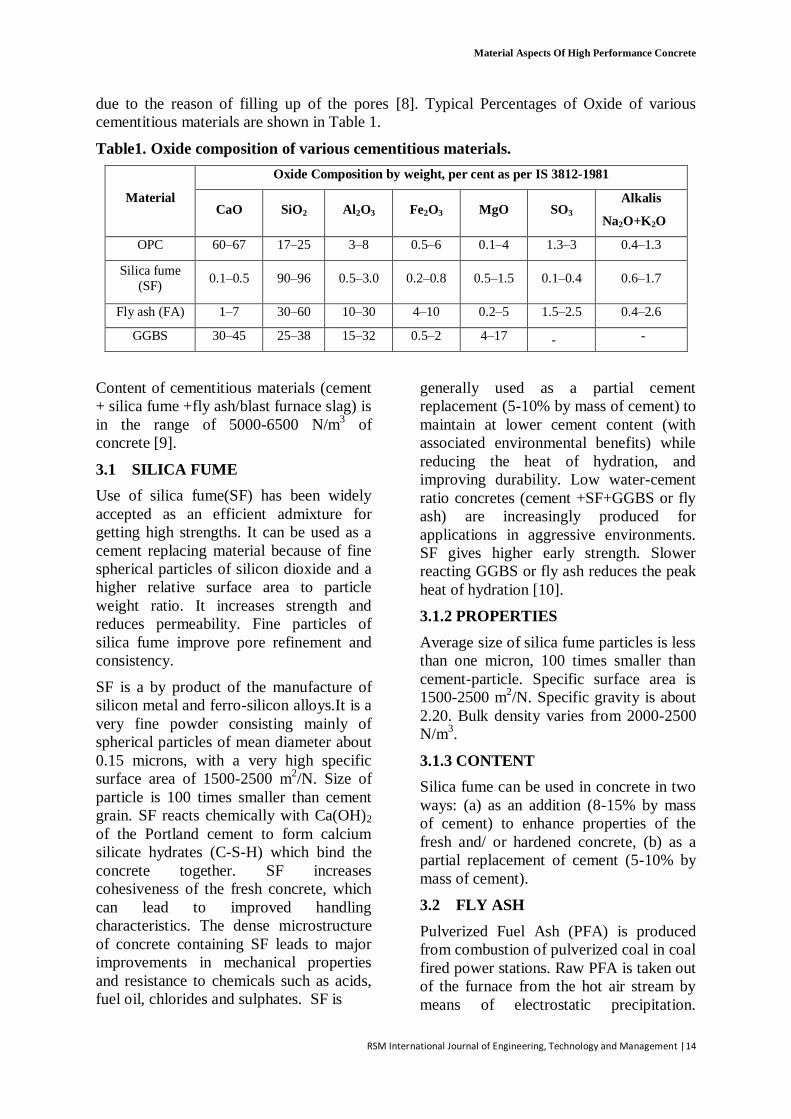
due to the reason of filling up of the pores [8]. Typical Percentages of Oxide of various
cementitious materials are shown in Table 1.
Table1. Oxide composition of various cementitious materials.
Material
Oxide Composition by weight, per cent as per IS 3812-1981
CaO SiO2 Al2O3 Fe2O3 MgO SO3 Alkalis
Na2O+K2O
OPC 60–67 17–25 3–8 0.5–6 0.1–4 1.3–3 0.4–1.3
Silica fume
(SF) 0.1–0.5 90–96 0.5–3.0 0.2–0.8 0.5–1.5 0.1–0.4 0.6–1.7
Fly ash (FA) 1–7 30–60 10–30 4–10 0.2–5 1.5–2.5 0.4–2.6
GGBS 30–45 25–38 15–32 0.5–2 4–17 - -
Content of cementitious materials (cement
+ silica fume +fly ash/blast furnace slag) is
in the range of 5000-6500 N/m3 of
concrete [9].
3.1 SILICA FUME
Use of silica fume(SF) has been widely
accepted as an efficient admixture for
getting high strengths. It can be used as a
cement replacing material because of fine
spherical particles of silicon dioxide and a
higher relative surface area to particle
weight ratio. It increases strength and
reduces permeability. Fine particles of
silica fume improve pore refinement and
consistency.
SF is a by product of the manufacture of
silicon metal and ferro-silicon alloys.It is a
very fine powder consisting mainly of
spherical particles of mean diameter about
0.15 microns, with a very high specific
surface area of 1500-2500 m2/N. Size of
particle is 100 times smaller than cement
grain. SF reacts chemically with Ca(OH)2
of the Portland cement to form calcium
silicate hydrates (C-S-H) which bind the
concrete together. SF increases
cohesiveness of the fresh concrete, which
can lead to improved handling
characteristics. The dense microstructure
of concrete containing SF leads to major
improvements in mechanical properties
and resistance to chemicals such as acids,
fuel oil, chlorides and sulphates. SF is
generally used as a partial cement
replacement (5-10% by mass of cement) to
maintain at lower cement content (with
associated environmental benefits) while
reducing the heat of hydration, and
improving durability. Low water-cement
ratio concretes (cement +SF+GGBS or fly
ash) are increasingly produced for
applications in aggressive environments.
SF gives higher early strength. Slower
reacting GGBS or fly ash reduces the peak
heat of hydration [10].
3.1.2 PROPERTIES
Average size of silica fume particles is less
than one micron, 100 times smaller than
cement-particle. Specific surface area is
1500-2500 m2/N. Specific gravity is about
2.20. Bulk density varies from 2000-2500
N/m3.
3.1.3 CONTENT
Silica fume can be used in concrete in two
ways: (a) as an addition (8-15% by mass
of cement) to enhance properties of the
fresh and/ or hardened concrete, (b) as a
partial replacement of cement (5-10% by
mass of cement).
3.2 FLY ASH
Pulverized Fuel Ash (PFA) is produced
from combustion of pulverized coal in coal
fired power stations. Raw PFA is taken out
of the furnace from the hot air stream by
means of electrostatic precipitation.
Material Aspects Of High Performance Concrete
RSM International Journal of Engineering, Technology and Management |15
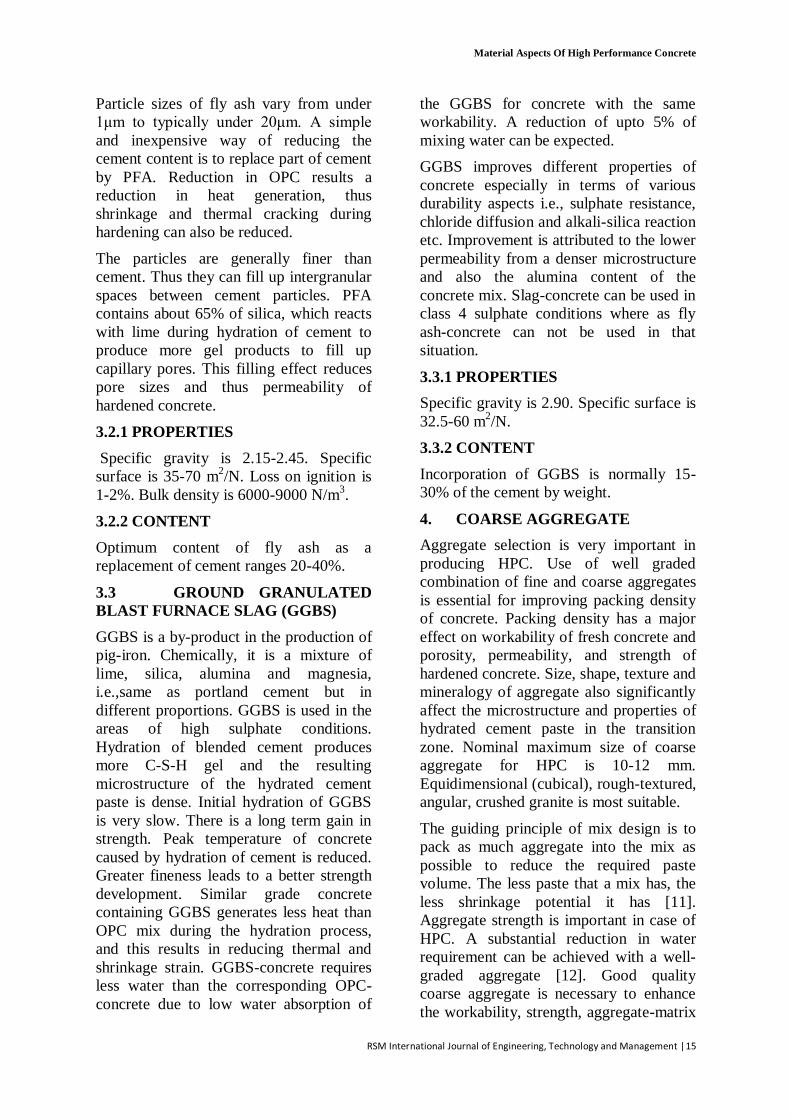
Particle sizes of fly ash vary from under
1μm to typically under 20μm. A simple
and inexpensive way of reducing the
cement content is to replace part of cement
by PFA. Reduction in OPC results a
reduction in heat generation, thus
shrinkage and thermal cracking during
hardening can also be reduced.
The particles are generally finer than
cement. Thus they can fill up intergranular
spaces between cement particles. PFA
contains about 65% of silica, which reacts
with lime during hydration of cement to
produce more gel products to fill up
capillary pores. This filling effect reduces
pore sizes and thus permeability of
hardened concrete.
3.2.1 PROPERTIES
Specific gravity is 2.15-2.45. Specific
surface is 35-70 m2/N. Loss on ignition is
1-2%. Bulk density is 6000-9000 N/m3.
3.2.2 CONTENT
Optimum content of fly ash as a
replacement of cement ranges 20-40%.
3.3 GROUND GRANULATED
BLAST FURNACE SLAG (GGBS)
GGBS is a by-product in the production of
pig-iron. Chemically, it is a mixture of
lime, silica, alumina and magnesia,
i.e.,same as portland cement but in
different proportions. GGBS is used in the
areas of high sulphate conditions.
Hydration of blended cement produces
more C-S-H gel and the resulting
microstructure of the hydrated cement
paste is dense. Initial hydration of GGBS
is very slow. There is a long term gain in
strength. Peak temperature of concrete
caused by hydration of cement is reduced.
Greater fineness leads to a better strength
development. Similar grade concrete
containing GGBS generates less heat than
OPC mix during the hydration process,
and this results in reducing thermal and
shrinkage strain. GGBS-concrete requires
less water than the corresponding OPC-
concrete due to low water absorption of
the GGBS for concrete with the same
workability. A reduction of upto 5% of
mixing water can be expected.
GGBS improves different properties of
concrete especially in terms of various
durability aspects i.e., sulphate resistance,
chloride diffusion and alkali-silica reaction
etc. Improvement is attributed to the lower
permeability from a denser microstructure
and also the alumina content of the
concrete mix. Slag-concrete can be used in
class 4 sulphate conditions where as fly
ash-concrete can not be used in that
situation.
3.3.1 PROPERTIES
Specific gravity is 2.90. Specific surface is
32.5-60 m2/N.
3.3.2 CONTENT
Incorporation of GGBS is normally 15-
30% of the cement by weight.
4. COARSE AGGREGATE
Aggregate selection is very important in
producing HPC. Use of well graded
combination of fine and coarse aggregates
is essential for improving packing density
of concrete. Packing density has a major
effect on workability of fresh concrete and
porosity, permeability, and strength of
hardened concrete. Size, shape, texture and
mineralogy of aggregate also significantly
affect the microstructure and properties of
hydrated cement paste in the transition
zone. Nominal maximum size of coarse
aggregate for HPC is 10-12 mm.
Equidimensional (cubical), rough-textured,
angular, crushed granite is most suitable.
The guiding principle of mix design is to
pack as much aggregate into the mix as
possible to reduce the required paste
volume. The less paste that a mix has, the
less shrinkage potential it has [11].
Aggregate strength is important in case of
HPC. A substantial reduction in water
requirement can be achieved with a well-
graded aggregate [12]. Good quality
coarse aggregate is necessary to enhance
the workability, strength, aggregate-matrix
Material Aspects Of High Performance Concrete
RSM International Journal of Engineering, Technology and Management |16
bond or interfacial bond and durability of
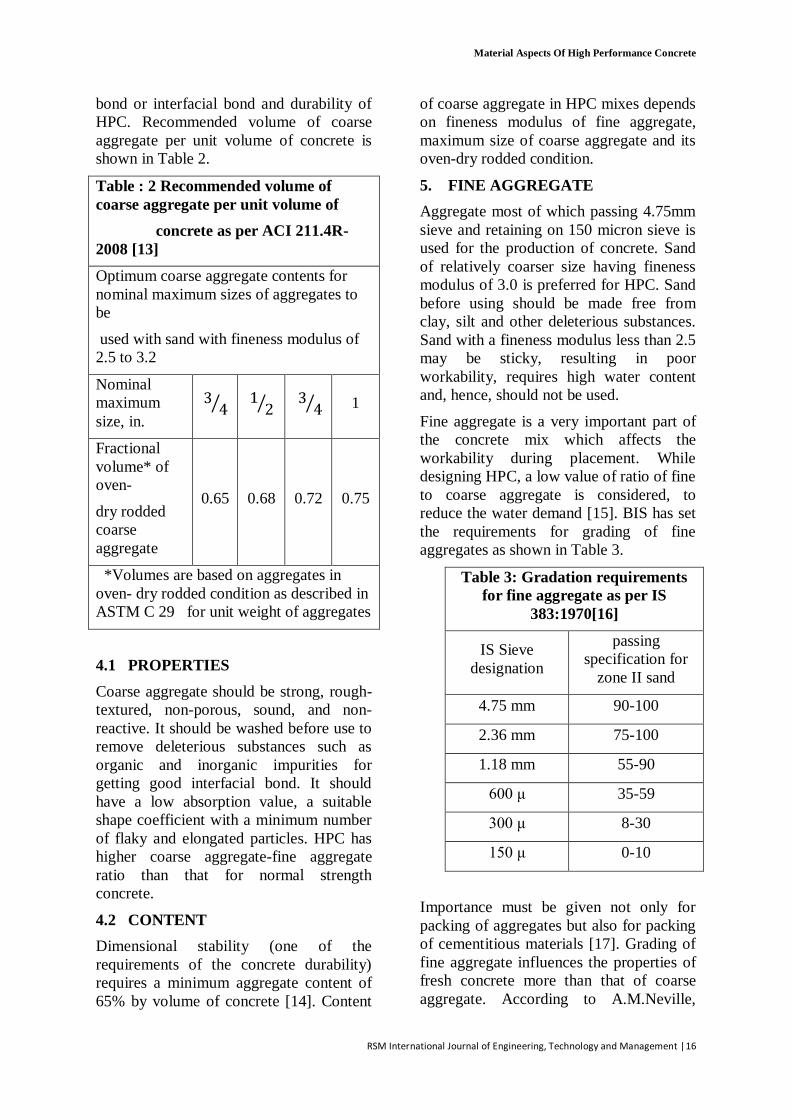
HPC. Recommended volume of coarse
aggregate per unit volume of concrete is
shown in Table 2.
Table : 2 Recommended volume of
coarse aggregate per unit volume of
concrete as per ACI 211.4R-
2008 [13]
Optimum coarse aggregate contents for
nominal maximum sizes of aggregates to
be
used with sand with fineness modulus of
2.5 to 3.2
Nominal
maximum
size, in.
1
Fractional
volume* of
oven-
dry rodded
coarse
aggregate
0.65 0.68 0.72 0.75
*Volumes are based on aggregates in
oven- dry rodded condition as described in
ASTM C 29 for unit weight of aggregates
4.1 PROPERTIES
Coarse aggregate should be strong, rough-
textured, non-porous, sound, and non-
reactive. It should be washed before use to
remove deleterious substances such as
organic and inorganic impurities for
getting good interfacial bond. It should
have a low absorption value, a suitable
shape coefficient with a minimum number
of flaky and elongated particles. HPC has
higher coarse aggregate-fine aggregate
ratio than that for normal strength
concrete.
4.2 CONTENT
Dimensional stability (one of the
requirements of the concrete durability)
requires a minimum aggregate content of
65% by volume of concrete [14]. Content
of coarse aggregate in HPC mixes depends
on fineness modulus of fine aggregate,
maximum size of coarse aggregate and its
oven-dry rodded condition.
5. FINE AGGREGATE
Aggregate most of which passing 4.75mm
sieve and retaining on 150 micron sieve is
used for the production of concrete. Sand
of relatively coarser size having fineness
modulus of 3.0 is preferred for HPC. Sand
before using should be made free from
clay, silt and other deleterious substances.
Sand with a fineness modulus less than 2.5
may be sticky, resulting in poor
workability, requires high water content
and, hence, should not be used.
Fine aggregate is a very important part of
the concrete mix which affects the
workability during placement. While
designing HPC, a low value of ratio of fine
to coarse aggregate is considered, to
reduce the water demand [15]. BIS has set
the requirements for grading of fine
aggregates as shown in Table 3.
Table 3: Gradation requirements
for fine aggregate as per IS
383:1970[16]
IS Sieve
designation
passing
specification for
zone II sand
4.75 mm 90-100
2.36 mm 75-100
1.18 mm 55-90
600 μ 35-59
300 μ 8-30
150 μ 0-10
Importance must be given not only for
packing of aggregates but also for packing
of cementitious materials [17]. Grading of
fine aggregate influences the properties of
fresh concrete more than that of coarse
aggregate. According to A.M.Neville,
Material Aspects Of High Performance Concrete
RSM International Journal of Engineering, Technology and Management |17
grading of coarse as well as fine aggregate
is of vital importance in the proportioning
of concrete mixes. The extent to which an
aggregate can be compacted to produce a
minimum void content is dependent on the
size distribution and shape of the
aggregate particles.
5.1 PROPERTIES
Fine aggregate should be sound, surface
dry, low or non-absorbent. Angular fine
aggregate improves the bond between
coarse aggregate and cement matrix.
Rounded and smooth-textured fine
aggregate requires comparatively less
mixing water.
5.2 CONTENT
Sand conforming to zone-II of IS
383:1970 is preferred for HPC. Content
depends upon the fineness modulus of fine
aggregate, and the quantity of coarse
aggregate. Content should be adequate to
improve the cohesiveness of fresh concrete
mixture with high workability. Content
also depends upon the surface moisture
present if any.
6. WATER
Water is the most important component of
the concrete. Water used for mixing and
curing of concrete must be free from
harmful ingredients. Potable water should
be used for mixing and curing. A part of
mixing water is utilized in the hydration of
cement, and the remaining part of mixing
water serves as a lubricant between the
fine and coarse aggregates and makes the
concrete workable. Water also participates
in pozzolanic reactions to produce
secondary hydration products. Too much
quantity of water reduces the strength of
the concrete.
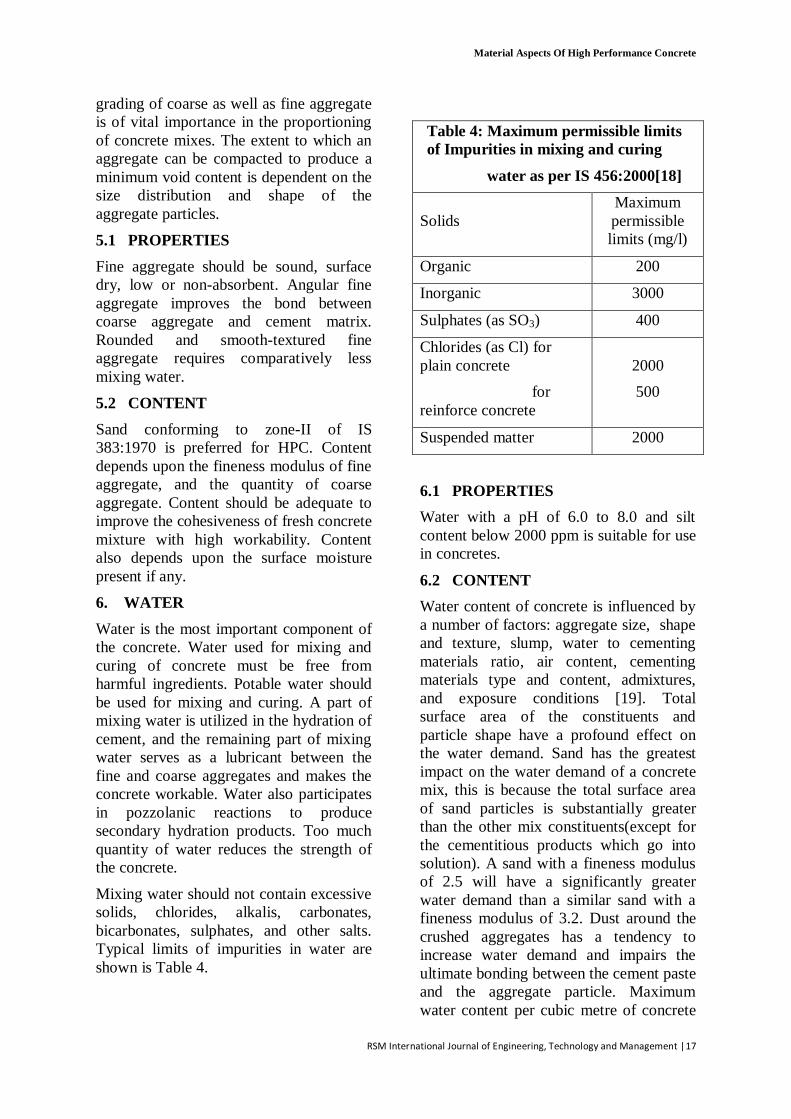
Mixing water should not contain excessive
solids, chlorides, alkalis, carbonates,
bicarbonates, sulphates, and other salts.
Typical limits of impurities in water are
shown is Table 4.
Table 4: Maximum permissible limits
of Impurities in mixing and curing
water as per IS 456:2000[18]
Solids
Maximum
permissible
limits (mg/l)
Organic 200
Inorganic 3000
Sulphates (as SO3) 400
Chlorides (as Cl) for
plain concrete
for
reinforce concrete
2000
500
Suspended matter 2000
6.1 PROPERTIES
Water with a pH of 6.0 to 8.0 and silt
content below 2000 ppm is suitable for use
in concretes.
6.2 CONTENT
Water content of concrete is influenced by
a number of factors: aggregate size, shape
and texture, slump, water to cementing
materials ratio, air content, cementing
materials type and content, admixtures,
and exposure conditions [19]. Total
surface area of the constituents and
particle shape have a profound effect on
the water demand. Sand has the greatest
impact on the water demand of a concrete
mix, this is because the total surface area
of sand particles is substantially greater
than the other mix constituents(except for
the cementitious products which go into
solution). A sand with a fineness modulus
of 2.5 will have a significantly greater
water demand than a similar sand with a
fineness modulus of 3.2. Dust around the
crushed aggregates has a tendency to
increase water demand and impairs the
ultimate bonding between the cement paste
and the aggregate particle. Maximum
water content per cubic metre of concrete
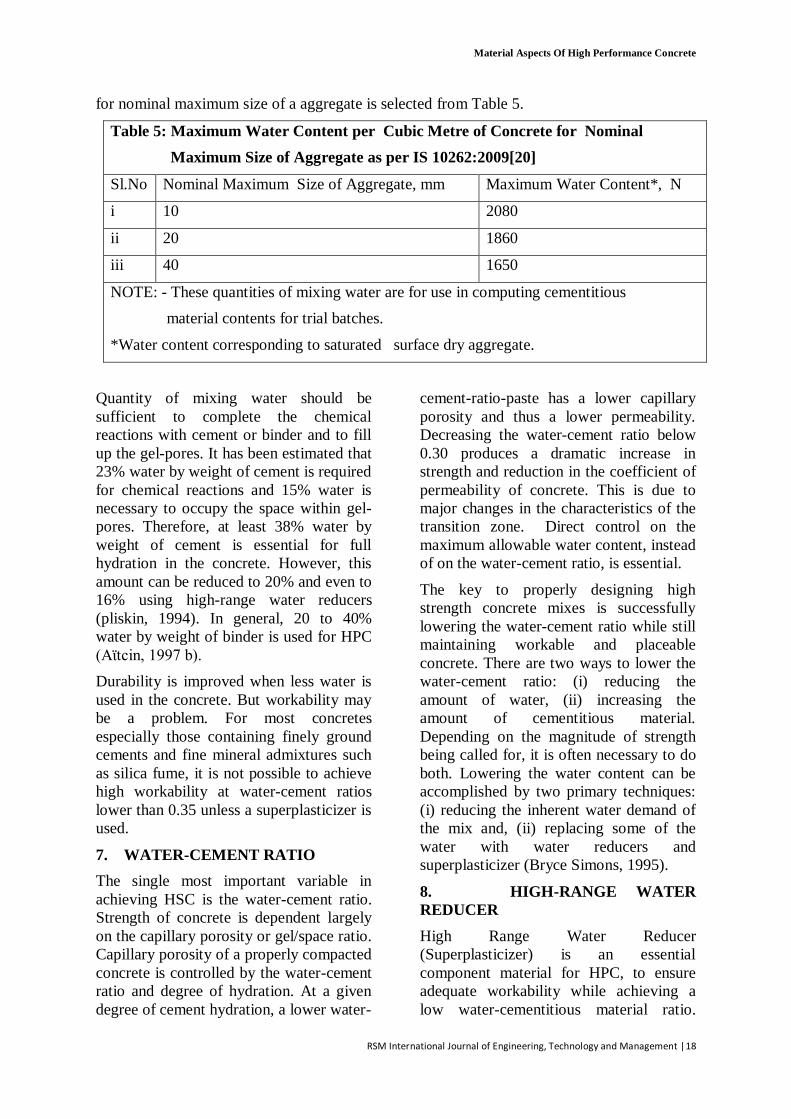
Material Aspects Of High Performance Concrete
RSM International Journal of Engineering, Technology and Management |18
for nominal maximum size of a aggregate is selected from Table 5.
Table 5: Maximum Water Content per Cubic Metre of Concrete for Nominal
Maximum Size of Aggregate as per IS 10262:2009[20]
Sl.No Nominal Maximum Size of Aggregate, mm Maximum Water Content*, N
i 10 2080
ii 20 1860
iii 40 1650
NOTE: - These quantities of mixing water are for use in computing cementitious
material contents for trial batches.
*Water content corresponding to saturated surface dry aggregate.
Quantity of mixing water should be
sufficient to complete the chemical
reactions with cement or binder and to fill
up the gel-pores. It has been estimated that
23% water by weight of cement is required
for chemical reactions and 15% water is
necessary to occupy the space within gel-
pores. Therefore, at least 38% water by
weight of cement is essential for full
hydration in the concrete. However, this
amount can be reduced to 20% and even to
16% using high-range water reducers
(pliskin, 1994). In general, 20 to 40%
water by weight of binder is used for HPC
(Aϊtcin, 1997 b).
Durability is improved when less water is
used in the concrete. But workability may
be a problem. For most concretes
especially those containing finely ground
cements and fine mineral admixtures such
as silica fume, it is not possible to achieve
high workability at water-cement ratios
lower than 0.35 unless a superplasticizer is
used.
7. WATER-CEMENT RATIO
The single most important variable in
achieving HSC is the water-cement ratio.
Strength of concrete is dependent largely
on the capillary porosity or gel/space ratio.
Capillary porosity of a properly compacted
concrete is controlled by the water-cement
ratio and degree of hydration. At a given
degree of cement hydration, a lower water-
cement-ratio-paste has a lower capillary
porosity and thus a lower permeability.
Decreasing the water-cement ratio below
0.30 produces a dramatic increase in
strength and reduction in the coefficient of
permeability of concrete. This is due to
major changes in the characteristics of the
transition zone. Direct control on the
maximum allowable water content, instead
of on the water-cement ratio, is essential.
The key to properly designing high
strength concrete mixes is successfully
lowering the water-cement ratio while still
maintaining workable and placeable
concrete. There are two ways to lower the
water-cement ratio: (i) reducing the
amount of water, (ii) increasing the
amount of cementitious material.
Depending on the magnitude of strength
being called for, it is often necessary to do
both. Lowering the water content can be
accomplished by two primary techniques:
(i) reducing the inherent water demand of
the mix and, (ii) replacing some of the
water with water reducers and
superplasticizer (Bryce Simons, 1995).
8. HIGH-RANGE WATER
REDUCER
High Range Water Reducer
(Superplasticizer) is an essential
component material for HPC, to ensure
adequate workability while achieving a
low water-cementitious material ratio.
Material Aspects Of High Performance Concrete
RSM International Journal of Engineering, Technology and Management |19
Optimum dosage of superplasticizer is
determined by trial mixtures using varying
amounts of each additive as well as with
cement. It is also important to be sure that
the superplasticizer is compatible when
used in combination. Specific gravity of
high range water reducer is nearer to that
of water and therefore it can be easily
dispersed with water. Naphthalene and
melamine-based high-range water reducers
are mostly used in the production of HPC.
8.1 DOSAGE
Dosage of liquid high-range water reducer
for HPC generally varies from 5-20 lit/m3
(Aϊtcin et al., 1994). Dosage of 0.8 to 2%
by weight of cementitious material is
normally used for achieving required
workability. By using a polycarboxylate
based superplasticizer, water content in the
case of high strength concrete can be
reduced to about 130 to 140 lit/m3
of
concrete.
9. CURING
Proper curing regime of concrete should
be adopted to overcome the problems
associated with usual adoption of very low
water content and high cement content in
HPC mixes. Moisture loss from HPC is
maximum during the first 24 hours after
placement. Critical time to start forming of
plastic shrinkage cracks is around the
initial setting time. Therefore, HPC should
be cured at an early stage without applying
water directly on the exposed surface of
fresh concrete. Thus curing of HPC is
generally done in two-stages--initial curing
and wet curing. Water is not used directly
during the initial curing. Objective of
initial curing is to prevent moisture loss
from fresh concrete till the time wet curing
is started. An efficient method of initial
curing is to cover the fresh HPC by plastic
sheet. Wet curing ie., final curing is
adopted as for conventional concrete by
ponding water on the exposed surface [21].
10. CONCLUSIONS
Structures in aggressive marine
environments, harmful sub-soil conditions,
highly polluted industrial and urban areas
and other hostile environments require
HPC. Constituent materials greatly
influence various rheological, mechanical,
performance and fracture properties. Good
quality and specified materials should be
selected for optimum performance to
achieve the purpose. Based on the
technical review made in the present study,
the following conclusions are drawn.
(a) HPC needs more stringent control
on materials selection than
ordinary concrete to consistently
meet the performance criteria for
workability, strength, durability
and fracture properties.
(b) HPC requires materials of highest
quality and their optimum
proportions.
(c) Supplementary cementitious
materials which enhance the
properties of concrete by hydraulic
and pozzolanic activities are
essential from appropriate sources.
(d) Aggregates which occupy nearly
75% of the volume of concrete
must be properly taken care of.
Strong, sound, clean and well-
graded aggregate is essential.
(e) Water content, and its ratio with
cement play a major role in
achieveing the required properties.
(f) Microcracking at the interface
between the paste and aggregate is
fundamentally responsible for
reducing the long-term durability
of concrete. Bond between the
paste and aggregate can be
improved by dispersing the coarse
aggregate in the cement before
mixing with all other ingredients.
(g) HRWR can reduce the water
content without loss of workability.
It is necessary for high strength
Material Aspects Of High Performance Concrete
RSM International Journal of Engineering, Technology and Management |20
concretes for producing flowing
concrete. It permits low water-
cement ratio and consequently
strength is increased.
(h) Not only the selection of proper
materials and mix proportioning
but mixing, placing and curing
practices determine the
performance of the product.
REFERENCES
[1] P.Kumar Mehta, “High
performance concrete durability affected
by many
factors”, 2001, PP.1-3.
[2] P.Kumar Mehta and P.C.Aitcin,
“Principles under laying the production of
High performance concrete”,
ASTM Cement, Concrete and
Aggregates, 1990, Vol.12, No.2,
PP.70-78.
[3] Md.Safinddin, M.N.Islam,
M.F.M.Zain and H.B.Mahmud,
“Materials aspects for High
strength and high performance
concrete”, International Journal of
Mechanical and Materials
Engineering, 2009, Vol.4, No.1,
PP.7-9.
[4] Surendra P Shaw, Stuart E Swartz,
and Chengsheng Ouyang,“Fracture
mechanics of concrete”, John wiley
& Sons, Inc., 1995.
[5] DiTommaso A, Evaluation of
concrete failure, In A.Carpinteri
and A.R.Ingraffea, editors,
“Fracture mechanics of concrete”,
Martinus Nijhoff Publishers,
Boston, 1984.
[6] M.R.L.Sastry, “Modified reactive
powder concrete”, 2009, PP.6-8.
[7] Raymond W M Chan, Peter N L
Ho & Eric P W Chan, “Report on
concrete admixtures for
waterproofing construction”,
Structural Engineering Branch –
Architectural Services Department,
December 1999, PP.16-20.
[8] A.R.Santhakumar, “Concrete
Technology”, 1st Edition-3
rd Impression
2009,
Oxford University Press, New
Delhi, India, PP.294.-297.
[9] A.M.Neville, “Properties of
Concrete”, 4th and final edition,
John Wiley & Sons, New York,
USA, Third Indian Reprint, 2004,
PP.86-89.
[10] M.L.Gambhir, “Concrete
Technology”, 3rd
Edition,1984,
Dhanpat Rai & Co.
(Pvt)Ltd.,Delhi, India, PP.450-474.
[11] Concrete Products, ”High
performance concrete mix
proportions”, 2004, PP.1-2.
[12] Dr.R.B.Khadiranaikar, “High
performance concrete”, 2001, PP.8-13.
[13] -----Guide for selecting proportions
for high strength concrete using
portland cement and other
cementitious materials, ACI
211.4R-2008, American Concrete
Institute, Farmington Hills,
Michigan, 2008.
[14] M.S.Shetty, “Concrete
Technology: Theory and Practice”, Reprint
2009,
S.Chand & Company Ltd,. New
Delhi, India, PP.323-330.
[15] V.S.Ramachandran, “Concrete
admixtures handbook : properties, science,
and technology”, Noyes Publishers,
2006, PP.63-65.
[16] -----Specification for coarse and
fine aggregates from natural
sources for concrete, IS 383:1970,
Bureau of Indian Standards, New
Delhi, India.
Material Aspects Of High Performance Concrete
RSM International Journal of Engineering, Technology and Management |21
[17] Henry H C Wong and Albert K H
Kwan, “Packing density : a key concept
for
mix design of high performance
concrete”, 2004, PP.5-9.
[18] -----Code of practice for plain and
reinforced concrete, IS 456:2000, Bureau
of
Indian Standards, New Delhi,
India.
[19] Johan Magnusson, Mattias
Unosson, Anders Carlberg, “High
performance
concrete “, 2001, PP.9-10.
[20] -----Indian standard recommended
guidelines for concrete mix
proportioning (First Revision), IS
10262:2009, Bureau of Indian
Standards, New Delhi, India.
[21] Sai Prasad and Kamlesh Jha, “High
performance concrete”, 2005, PP.5-6.
RSM International Journal of Engineering, Technology & Management |22
Comparative Study on Secure Routing Protocols in MANETs
Ms. C. Geetha1 Dr. M. Ramakrishnan
2
1Associate Professor
Department of Computer Science & Engineering
R.M.K. Engineering College, Kavaraipettai, Chennai
2Professor & Head
Department of Information Technology
Velammal Engineering College, Surapet, Chennai
Abstract
Mobile Ad-Hoc Network is a set of mobile
nodes without any well defined
infrastructure and central authority to
control or monitor the functioning of mobile
nodes. Because of this nature, nodes can join
and leave whenever they want. Thus it forms
a dynamic topology. Nodes itself makes the
decision regarding the routing and packet
forwarding. Routing and packet forwarding
is a basic function of the MANETs. We
have a lot of protocols which are used to
perform this function. Security is a
significant aspect to be considered in the
MANET. A number of protocols which
implements security are also developed.
This paper presents a comparative study on
the security routing protocols with respect to
various parameters and security mechanisms
used.
Key Words: infrastructure, Routing, Packet
forwarding, dynamic topology, security
mechanisms.
1. Introduction
Nowadays more research is going on in the
area of secured routing in MANETs.
Routing protocols in MANETs are classified
into proactive (Table-driven) and reactive
(On-demand). In the former, frequently or in
the fixed time intervals the routing
information is exchanged. AODV, DSR,
TORA, ABR and SSR fall in this category.
In the latter, routing information are
exchanged when there is a need to a route or
when there is a link breakage. In this till the
end of the communication the route is
maintained. DSDV, OLSR and TBRPF fall
in this category. A third class of routing
protocol is hybrid that combines the
advantages of reactive and proactive.
Example is ZRP. Due to the limited power,
limited bandwidth, and resources, absence
of infrastructure dynamic topology, node
failure and link breakages, security is very
difficult in MANETs. While sending
messages between two nodes, the nodes in
MANETs are more vulnerable to any type of
attacks than the wired networks. The
remaining part of the paper is organized as
follows. Section 2 discusses about the
various security attacks. Section 3 presents
the various secured routing protocols.
Section 4 describes the summary report of
these protocols with respect to various
parameters and security mechanisms used.
Section 5 presents the conclusion.
Comparative Study on Secure Routing Protocols in MANETs
RSM International Journal of Engineering, Technology and Management |23
2. Security Attacks
The attacks are of two types. Passive and
Active. Passive attacks are too difficult to
identify because they will not affect the
functioning of the network. It attempts only
to discover the information like IP address,
location of nodes etc. But active attacks
modify the data to be transmitted and also
affect the functioning of the network. It is
easy to recognize these type attacks.
Impersonation, DoS and Disclosure fall
under this.
Impersonation: nodes may be able to send
false routing information and acting as some
other trusted node. Black hole attack and
worm hole attacks are examples. A
malicious node uses the routing protocol to
advertise itself as having the shortest path is
black hole attack. Creation of a tunnel in the
network between two malicious nodes is
worm hole attack.
Denial of Service: routing table overflow
and sleep deprivation attacks are examples.
In the former, attacker creates to non-
existent nodes and makes the tables
overflow. In the later, attacker consumes the
batteries of other nodes by requesting routes
or by forwarding unnecessary packets.
Disclosure: In MANETs communication
between two nodes are taken place directly
if they are in the same frequency range;
otherwise intermediate nodes (hops)
involved in forwarding the packets. A node
that does not cooperate is called a
misbehaving node. Routing–forwarding
misbehaviors can be caused by nodes that
are malicious or selfish. A malicious node
does not cooperate because it wants to
intentionally damage network functioning
by dropping packets. On the other hand, a
selfish node does not intend to directly
damage other nodes, but is unwilling to
spend battery life, CPU cycles, or available
network bandwidth to forward packets not
of direct interest to it, even though it expects
others to forward packets on its behalf. Such
a node uses the network but does not
cooperate.
To cope with these problems, there is a need
for mechanisms that encourage/enforce
users to behave as „„good citizens‟‟, letting
their device relay packets for the benefit of
others, making their data available, and / or
lending support to the other computations.
In order to overcome these problems a
secure routing protocol is expected to meet
the following requirements.
Confidentiality: Only the intended receivers
should be able to interpret the transmitted
data.
Integrity: Data should not change during the
transmission process, i.e., data integrity
must be ensured.
Availability: Network services should be
available all the time and it should be
possible to correct failures to keep the
connection stable.
Authentication: Every transmitting or
receiving node has its own signature. Nodes
must be able to authenticate that the data has
been sent by the legitimate node.
Non-repudiation: Sender of a message shall
not be able to later deny sending the
message and that the recipients shall not be
able to deny the receipt after receiving the
message.
3. Secure Routing Protocols
Cryptographic systems are classified into
symmetric key and public key. In the
former, same key is used for both encryption

Comparative Study on Secure Routing Protocols in MANETs
RSM International Journal of Engineering, Technology and Management |24
and decryption. But in later, one key is used
for encryption and one key is used for
decryption. Some of the protocols use the
symmetric key cryptography and some uses
the public key cryptography. There are some
protocols which uses the certificates and/or
digital signatures.
3. 1 ARAN – Authenticated Routing for Ad-
Hoc Networks. It uses public key
cryptography to defeat the attacks. It is an
on-demand routing protocol and consists of
a preliminary certification process followed
by a route instantiation process that
guarantees end-to-end authentication. The
protocol is simple compared to most non-
secured ad hoc routing protocols, and does
not include routing optimizations. Route
discovery in ARAN is accomplished by a
broadcast route discovery message. The
routing messages are authenticated end-to-
end and only authorized nodes participate at
each hop between source and destination.
ARAN uses trusted certificate server (T),
whose public key is known to all valid
nodes.
When a node enter into the network, it get a
certificate from T, which contains the IP
address of the node, its public key, a
timestamp of when the certificate was
created and a time at which the certificate
expires along with the signature by T.
T A: certA = [IPA, KA+,t,e]KT-
The source node begins route instantiation to
destination by broadcasting to its neighbors
a route discovery packet (RDP).
ABroadcast: [RDP,IPX, NA,] KA-,certA
The RDP includes a packet type identifier
(“RDP”), the IP address of the destination‟s
certificate, and a nonce, all signed with its
private key. Hop count is not included with
the message.
The receiving node uses public key, which it
extracts from A‟s certificate, to validate the
signature and verify that A‟s certificate has
not expired. The receiving node also checks
the (NA, IPA) tuple to verify that it has not
already processed this RDP. The receiving
node signs the contents of the message,
appends its own certificate, and forward
broadcasts the message to each of its
neighbors. The signature prevents spoofing
attacks that may alter the route or form
loops.
Let B be a neighbor that has received from
A the RDP broadcast, which it subsequently
rebroadcasts.
BBroadcast:[[RDP,IPX, NA,] KA-]KB-,
certA ,certB.
Upon receiving the RDP, B‟s neighbor C
validates the signatures for both, the RDP
initiator, and B, the neighbor it received the
RDP from, using the certificates in the RDP.
Then C removes B‟s certificate and
signature, records B as its predecessor, signs
the contents of the message originally
broadcast by A and appends its own
certificate. C then rebroadcasts the RDP.
CBroadcast:[[RDP,IPX, NA,] KA-]KC-,
certA,certC.
Since the messages are signed at each hop,
malicious nodes have no opportunity to
redirect traffic. Link failures and inactive
routes are intimated through ERR messages.
All ERR messages must be signed. A node
that transmits a large number of ERR
messages should be avoided. The nodes can
easily exchange the session keys using the
certificates and share a symmetric key
generated with their own private key and the
public key of this will reduce the
computational overhead and power
consumption. ARAN specifies that all fields
of RDP and REP packets remain unchanged
Comparative Study on Secure Routing Protocols in MANETs
RSM International Journal of Engineering, Technology and Management |25
between source and destination. Thus,
modification attacks are prevented.
In ARAN, when a certificate needs to be
revoked, the trusted certificate server T
sends a broadcast message to the ad hoc
group that announces the revocation. Any
node receiving this message re-broadcast it
to its neighbors. Revocation notices need to
be stored until the revoked certificate would
have expired normally. Any neighbor of the
node with the revoked certificate needs to
reform routing as necessary to avoid
transmission through the now un-trusted
node.
The disadvantage of this protocol is that the
malicious nodes also have the opportunity in
ARAN to lengthen the measured time of a
path by delaying REPs as they propagate, in
the worse case by dropping REPs, as well as
delaying routing after path instantiation.
ARAN suffers from larger control overhead
due to certificates and signatures stored in
packets. The cryptographic operations cause
additional delays at each hop, and so the
route acquisition latency increases. ARAN
is not immune to the wormhole attack.
3.2 ARIADNE – It is an on-demand secure
ad hoc routing protocol based on DSR. It
relies on symmetric cryptography. It uses
MACs (Message Authentication Code)
derived from shared secret keys to verify the
integrity of the original message. They also
excluded any kind of physical layer or
application layer attacks.
The source sends an 8 tuple to find the path.
All intermediate nodes receive the request
and verify the shared key for that particular
interval specified in the request. This checks
the freshness of the request. Every node
finds a hash using the shared key and
attaches it with the request. Upon arrival at
the destination, the target determines the
validity of the request by checking, that the
keys for the time interval have not yet been
disclosed and that the hash chain field is
consistent. If the request is valid a RREP is
sent to the initiator. When the initiator
receives the RREP, he verifies the validity
of each key in the key list, the target MAC
and of each MAC in the MAC list. If all
tests succeed the RREP is accepted, if not
the packet is discarded.
ARIADNE copes with attacks performed by
malicious nodes that modify and fabricate
routing information, with attacks using
impersonation. The advanced version, using
an extension called TIK (TESLA with
Instant Key disclosure) that requires tight
clock synchronization between the nodes,
overcomes the wormhole attack. Selfish
nodes are not taken into account. Ariadne
does not strive to achieve privacy
3.3 CONFIDANT - CoOperation of Nodes,
Fairness In Dynamic Ad-hoc NeTworks. It
is an extension of DSR. It detects malicious
nodes by means of combined monitoring
and reporting and establishing routes by
avoiding misbehaving nodes. CONFIDANT
consists of the following components, The
Monitor, the Reputation System, the Path
Manager, and the Trust Manager. The
components are present in every node.
Each node monitors the behavior of its next-
hop neighbors. If a suspicious event is
detected, the information is given to the
reputation system. If the event is significant
for the node, it is checked whether it has
occurred more often than a predefined
threshold. If the occurrence threshold is
exceeded, the reputation system updates the
rating of the node that caused the event. If
the rating turns out to be intolerable, the
information is relayed to the path manager,
which proceeds to delete all routes
containing the intolerable node from the
path cache. An ALARM message is sent by
the trust manager component. This message
contains the type of protocol violation, the
Comparative Study on Secure Routing Protocols in MANETs
RSM International Journal of Engineering, Technology and Management |26
number of occurrences observed, whether
the message was self-originated by the
sender, the address of the reporting node, the
address of the observed node, and the
destination address (mostly the source).
When the monitor component of a node
receives such an ALARM message, it passes
it on to the trust manager, where the source
of the message is evaluated. If the source is
at least partially trusted, the table containing
the ALARMs is updated. If there is
sufficient evidence that the node reported in
the ALARM is malicious, the information is
sent to the reputation system where it is
again evaluated for significance, number of
occurrences, and accumulated reputation of
the node.
The limitations of CONFIDANT lie in the
assumptions for detection-based reputation
systems. Events have to be observable and
classifiable for detection, and reputation can
only be meaningful if the identity of each
node is persistent, otherwise it is vulnerable
to spoofing attacks.
3.4 CORE – A Collaborative Reputation
Mechanism to enforce node cooperation in
Mobile Adhoc Networks. It uses the DSR
routing protocol. CORE is suggested as a
generic mechanism that can be integrated
with any network function like packet
forwarding, route discovery, network
management, and location management.
Each network entity in CORE keeps track of
other entities collaboration using a technique
called reputation. The reputation metric is
computed based on data monitored by the
local entity and some information provided
by other nodes involved in each operation.
Each node of the network monitors the
behavior of its neighbors with respect to a
requested function and collects observations
about the execution of that function. From
the collected observations each node
determines a reputation value for all its
neighbors. The trusted nodes have positive
reputation value and malicious nodes have
negative reputation value. Reputation table
is used to store these values. Each row
consists of four entries: the unique identifier
of the entity, a collection of recent
subjective observations made on that entity's
behavior, a list of the recent indirect
reputation values provided by other entities
and the value of the reputation evaluated.
CORE considered only selfishness as a
specific issue to address: selfish nodes do
not intend to directly damage other nodes
while the misbehavior is due to their need to
save battery life for their own
communications. It detects the misbehavior
nodes at the forwarding level.
CORE suffers from the spoofing attack.
Misbehaving nodes are not prevented.
Furthermore, no simulation results prove the
robustness of the protocol. It is an original
approach based on game theory.
3.5 COSR – It is based on DSR. It uses
route reputation to choose the best route
path. Nodes reputation depends on the
information from physical layer, MAC layer
and network layer and it can be computed by
nodes capability of forwarding, history
action etc. COSR can be divided into
monitor, statistics, reputation model,
reputation protocol and routing protocol.
The monitor includes three modules:
Neighbor monitor works with MAC layer
and it monitors neighbors in its radio range
and maintain neighbor list. Data relay
monitor is placed in the network layer. It
could check whether the next hop had
transmitted its packets. CoF would collect
information about capability of forwarding
from physical layer and MAC layer and it
includes node‟s bandwidth, interface state,
mobility status and power. Statistics is
responsible for providing statistics data
about neighbor‟s history behavior.
Reputation model used to evaluate node‟s
reputation. Reputation protocol with routing
Comparative Study on Secure Routing Protocols in MANETs
RSM International Journal of Engineering, Technology and Management |27
protocol and uses routing protocol to
pigback reputation control message and
data. Routing protocol choose the best route
path.
It deals with blackhole, selfish and DoS. The
COSR uses a novel reputation model to
detect malicious and selfish nodes and make
all nodes more cooperative. Further,
reputation is not only used to evaluate the
trustworthiness of any node, but also to
describe its CoF. Due to such design, COSR
can protect network against the primary
routing attacks and balance load on all
secure route paths to avoid hotpoint and
enlarge throughput of whole network
consequently.
3.6 RAODV – Reliable Ad hoc On-demand
Distance Vector. It is an extension of
AODV. It protects the network against
attacks by selfish nodes and malicious nodes
exhibiting black hole attack and replay
attack. In addition to the RouteRequest and
RouteReply used by AODV, RAODV uses
two types of control packets: Reliable Route
Discovery Unit (RRDU) and RRDU Reply
(RRDU_REP). No node other than the
destination can generate RRDU_REP on
behalf of the destination. A field Reliability
List (RL), a triplet (Source address, FDPC,
RRDU-ID) is added in the routing table
entry. Path discovery in RAODV can be
thought of as consisting of two phases.
Phase I is same as that in AODV. In Phase
II, source sends the RRDU to all the nodes
from which it receives the RREPs. Only the
destination will reply. To maintain the
reliability of the path we have introduced the
field FDPC in the routing table. This count
is used to find the selfish nodes.
When a malicious node send RREP to the
source even it does not have the route to the
destination, the source send the RRDU to
this node. Since no one other than the
destination can generate RRDU_REP, the
malicious node can‟t generate the reply and
hence the route through the malicious node
is not selected.
3.7 SAODV - Secure Ad hoc On-Demand
Distance Vector Routing. SAODV is an
extension of the AODV routing protocol that
can be used to protect the route discovery
mechanism providing security features like
integrity, authentication and non-
repudiation.
SAODV assumes that each ad hoc node has
a signature key pair from a suitable
asymmetric cryptosystem. Further, each ad
hoc node is capable of securely verifying the
association between the address of a given
ad hoc node and the public key of that node.
Achieving this is the job of the key
management scheme.
Two mechanisms are used to secure the
AODV messages: Digital signatures to
authenticate the non-mutable fields of the
messages, and hash chains to secure the hop
count information. Every node (generating
or forwarding a route error message) uses
digital signatures to sign the whole message
and that any neighbor that receives verifies
the signature.
3.8 SEAD - Secure Efficient Ad hoc
Distance Vector routing protocol is based on
DSDV and hence consumes network
bandwidth in exchanging routing tables
among nodes. SEAD handles malicious
node but not selfish node. Replay attacks are
also taken into account. SEAD uses efficient
one-way hash chains and Merkle hash trees
and not asymmetric cryptographic
operations. It authenticates the sequence
number and metric of a routing table update
message using hash chains elements. A node
cannot advertise a route better than those for
which it has received an advertisement,
since the metric in an existing route cannot
be decreased due to the on-way nature of the
hash chain.
Comparative Study on Secure Routing Protocols in MANETs
RSM International Journal of Engineering, Technology and Management |28
The source of each routing update message
in SEAD must also be authenticated, since
otherwise, an attacker may be able to create
routing loops through the impersonation
attack.
It uses two schemes: TESLA and MAC
assuming a shared secret key between each
pair of nodes
SEAD does not cope with wormhole attacks.
3.9 SLSP - Secure Link State Routing
Protocol. It based on Link-state protocol and
provides correct (i.e., factual), up-to-date,
and authentic link state information, robust
against Byzantine behavior and failures of
individual nodes.
SLSP protects link state update (LSU)
packets from malicious alteration. Nodes
periodically broadcast their certified key, so
that the receiving nodes validate their
subsequent link state updates. SLSP defines
a secure neighbor discovery that binds each
node to its Medium Access Control (MAC)
address and its IP address, and allows all
other nodes within transmission range.
3.10 SRP – Secure Routing Protocol. SRP is
an extension compatible with a variety of
existing reactive routing protocols. SRP
relies on the availability of a security
association (SA) between the source node
(S) and the destination node (T). The SA
could be established using a hybrid key
distribution based on the public keys of the
communicating parties. SRP copes with
non-colluding malicious nodes that are able
to modify (corrupt), replay and fabricate
routing packets.
The basic version of SRP suffers from the
route cache poisoning attack. Route error
packets are not verified. The neighbor
discovery mechanism maintains information
on the binding of the medium access control
and the IP addresses of nodes, SRP is
proven to be essentially immune to IP
spoofing. SRP is not immune to the
wormhole attack: two colluding malicious
nodes can misroute the routing packets on a
private network connection and alter the
perception of the network topology by
legitimate nodes.
4. Summary of secure Routing Protocols
We summarize the secure routing protocols
explained in the section 3. Each protocol
deals with different types of attacks, uses
different security mechanisms, and solves
one or more attacks and produce efficient
routing and forwarding of packets. Each one
has its own advantages and disadvantages.
The Table 1 summarizes base protocol used,
type of cryptography used, and the security
requirements satisfied by these protocols.
Table 2 gives the various attacks prevented
and detected by these protocols.

Comparative Study on Secure Routing Protocols in MANETs
RSM International Journal of Engineering, Technology and Management |29
Table 1
Table 2 Secure Routing
Protocols
Attacks Deals with Targeted Layer Assumptions Essential Requirements
ARAN Routing Attacks,
Impersonation and
Repudiation
Network,
Application and
Multi-layer
Trusted certificate
server
Online trusted certification
authority
ARIADNE Routing, DoS Network, Multi-
layer
Nodes have loosely
synchronized clocks
TESLA
CONFIDANT Detecting &
isolating
misbehaving nodes
Network, Multi-
layer
Network layer is
based on DSR
Trust calculation
CORE Selfish nodes, DoS Network Bidirectional
communication links
COSR Malicious & selfish
nodes, Routing
attacks
Network Bidirectional
communication
links, Nodes work in promiscuous mode
promiscuous mode
RAODV Malicious & selfish
nodes, Routing
attacks, black hole
and replay attacks
Network A node can‟t
impersonate -
SAODV Black hole attack Network Network should
have distributing
system
Online key management
scheme
SEAD Routing, DoS and
Resource
consumption
Network and Multi-
layer
Secure way of
delivering initial
secrete key, KN
Clock synchronization
SLSP DoS Network Single network
interface per node
TTP
SRP Location disclosure Network Secure way of
delivering Security
Association
Security association between
source and destination
Secure
Routing
Protocols
Base
Protocol
Cryptography Scheme
Used
Security Requirements
confidentiality integrity authentication non-
repudiation ARAN AODV Cryptographic Certificates - Yes Yes Yes
ARIADNE DSR TESLA & MAC - Yes Yes -
CONFIDANT DSR Reputation values - Yes Yes Yes
CORE DSR Reputation values - Yes - -
COSR DSR Reputation values - - - -
RAODV AODV Control Packets & Packet
count - - - -
SAODV AODV Symmetric/asymmetric &
hash link - Yes Yes Yes
SEAD DSDV One way hash function - - Yes -
SLSP Hybrid Digital signature & One
way hash chain - - Yes -
SRP Many on-
demand
protocols
Security association
between nodes - Yes Yes -
Comparative Study on Secure Routing Protocols in MANETs
RSM International Journal of Engineering, Technology and Management |30
5. Conclusion
Security is a major issue in Mobile AdHoc
Networks. A lot of protocols have been
developed to solve the basic requirements
of security like integrity, confidentiality,
authentication and non-repudiation. All the
protocols are distinct and they have their
own mechanisms, advantages and
disadvantages. Each protocol improves the
efficiency of the security measures
(parameters) like the routing delay, end-to-
end delay, path length, throughput (packet
delivery ratio) and overhead on its own
way. In this paper we have analyzed ten
different secure routing protocols and the
mechanisms used and summarize all the
details.
6. References
[1] C. Siva Ram Murthy and B. S. Manoj,
“Ad Hoc Wireless Networks,
Architectures and Protocols,” first Indian
reprint 2005,pearson publication. ISBN
81-297-0945-7
[2] Yih-Chun Hu ,David B. Johnson ,
Adrian Perrig “SEAD: secure efficient
distance vector routing for mobile wireless
ad hoc networks”, 1570-8705/$ 2003
Published by Elsevier B.V.
doi:10.1016/S1570-8705(03)00019-2
[3] Manel Guerrero Zapata:"Secure Ad
hoc On-Demand Distance Vector
(SAODV) Routing" INTERNET-DRAFT
draft-guerrero-manetsaodv - 06.txt.
September 2006.
[4] Sonja Buchegger, JeanYves Le
Boudec,
“Performance Analysis of the
CONFIDANT
Protocol (Cooperation Of Nodes: Fairness
In
Dynamic Adhoc NeTworks)”,
MOBIHOC’02,June 911, 2002, EPFL
Lausanne, Switzerland.Copyright 2002
ACM 1581135017/ 02/0006.
[5] Hu, Yih-Chun, Adrian Perrig, and
Dave Johnson. "Ariadne: A Secure On-
Demand Routing Protocol for Ad Hoc
Networks." In Proceedings of the Eighth
Annual International Conference on
Mobile Computing and Networking (ACM
Mobicom), Atlanta, Georgia, September
23 - 28, 2002
[6] Kimaya Sanzgiri, Daniel LaFlamme,
Bridget Dahill, Brian Neil Levine, Clay
Shields and Elizabeth M. Belding-Royer
“Authenticated Routing for Ad Hoc
Networks” In IEEE JOURNAL ON
SELECTED AREAS IN
COMMUNICATIONS, VOL. 23, NO. 3,
MARCH 2005
[7] Pietro Michiardi – Refik Molva
“CORE: A Collaborative Reputation
Mechanism to enforce node cooperation in
Mobile Adhoc Networks” Institut
Eurécom 2229 Route des Crêtes - BP 193
06904 Sophia-Antipolis, France,
December 2001
[8] FeiWang, FurongWang, Benxiong
Huang and Laurence T. Yang “COSR: A
Reputation-Based Secure Route Protocol
in MANET” EURASIP Journal on
Wireless Communications and Networking
Volume 2010, Article ID 258935, 10
pages doi:10.1155/2010/258935
[9] Sandhya Khurana, Neelima Gupta,
Nagender Aneja, “Reliable Ad-hoc On-
demand Distance Vector Routing
Protocol” Proceedings of the Fifth
International Conference on Networking
(ICN 2006), The International Conference
on Systems (ICONS 2006), and The First
International Conference on Mobile
Communications and Learning (MCL
2006) 0-7695-2522-2/06 $20.00 © 2006
IEEE
[10] Panagiotis Papadimitratos, Zygmunt
J. Haas “Secure Link State Routing for
Mobile Ad Hoc Networks”
[11] Panagiotis Papadimitratos and
Zygmunt J. Haas “Secure Routing for
Mobile Ad hoc Networks” In Proceedings
of the SCS Communication Networks and
Distributed Systems Modeling and
Simulation Conference (CNDS 2002),
San Antonio, TX, January 27-31, 2002
[12] UMANG SINGH, “Secure Routing
Protocols In Mobile Adhoc Networks-A
Survey And Taxanomy” International

Comparative Study on Secure Routing Protocols in MANETs
RSM International Journal of Engineering, Technology and Management |31
Journal of Reviews in Computing 30th
September 2011. Vol. 7
[13] Rajender Nath, Pankaj Kumar Sehgal
“A Review of Secure Routing Protocol in
Mobile Ad Hoc Network” In International
Journal of Computer Science & Emerging
Technologies (E-ISSN: 2044-6004)
Volume 1, Issue 4, December 2010
[14] Loay Abusalah, Ashfaq Khokhar, and
Mohsen Guizani “A Survey of Secure
Mobile Ad Hoc Routing Protocols” IEEE
Communications Surveys & Tutorials,
Vol. 10, No. 4, Fourth Quarter 2008
[15]L.Ertaul, D.Ibrahim, “Evaluation of
Secure Routing Protocols in Mobile Ad Hoc
Networks (MANETs)”
[16] Sonia Boora1, Yogesh Kumar2,
Bhawna Kochar, “A Survey on Security
Issues in Mobile Ad-hoc Networks”
IJCSMS International Journal of Computer
Science and Management Studies, Vol. 11,
Issue 02, Aug 2011ISSN (Online): 2231-
5268
A Novel Quasi-Orthogonal Stbc For 4 Transmit Antennas Using Lattice Decoding
RSM International Journal of Engineering, Technology and Management |32
A NOVEL QUASI-ORTHOGONAL STBC FOR 4 TRANSMIT
ANTENNAS USING LATTICE DECODING G.KANIMOZHI
1 AND K.SENTHIL KUMAR
2
Department of Electronics and Communication Engineering
Rajalakshmi Engineering College, Chennai - 602105
E-mail 1 : [email protected]
E-mail 2: [email protected]
Abstract— This paper presents a novel
Quasi Orthogonal Space Time Block Code
(QOSTBC) for four transmit antennas
using lattice decoding. Quasi Orthogonal
Space Time Block Code (QOSTBC)
belong to the class of Non- Orthogonal
Space Time Block Code (NOSTBC) and
have been extensive area of research. It
achieves full diversity for more than 2
antennas using rotated constellation. A
novel method of extending QOSTBC
constructed for 4 transmit antennas to a
closed-loop scheme is proposed. By
multiplying the entries of QOSTBC code
words by the appropriate phase factors
which depend on the channel information,
the transmit diversity of the proposed
scheme with one bit feedback is improved.
The proposed system uses lattice decoding
algorithm to obtain better bit error rate
compared to the existing methods and
reduced the computational complexity.
Index Terms— QOSTBC, closed loop,
lattice decoding, feedback, wireless
communication, Bit error rate.
I. INTRODUCTION
Multiple-Input and Multiple-Output
(MIMO), is the use of multiple antennas
at both the transmitter and receiver to
improve the performance of the
communication system. For an arbitrary
complex constellation such as PSK and
QAM, space–time block codes are
designed that achieve 1/2 of the maximum
possible transmission rate for any number
of transmit antennas. It is proved that a
complex orthogonal design and the
corresponding space–time block code
which provides full diversity and full
transmission rate is not possible for more
than two antennas[2]. Various QOSTBC
have been proposed to achieve full rate for
more than 2 antennas at the expense of
losing the diversity gain and increased
decoding complexity [3]. Although a lot of
partial feedback method can be adopted to
improve the closed loop system , the major
problem is high cost and high complexity
[6], [8]. For open-loop communication
systems, the optimum constellation
rotation proposed for QOSTBC with
different modulation schemes is the one of
good diversity improvement approaches.
With the quasi-orthogonal structure, the
quasi-orthogonal STBCs still have a fast
ML decoding, but do not have the full
diversity [2], [4]. The code can guarantee
full diversity but the upper bound is
achieved only for four transmit
antennas[9]. Recently lot of researches
have been put into designing the Space
Time Block Code (STBC) with full rate
and full diversity for four transmit
antennas.
Alamouti proposed one kind of
space time coding scheme which uses two
antennas in transmitting end. This method
could maximize the diversity gain and the
full emission rate by using the simple
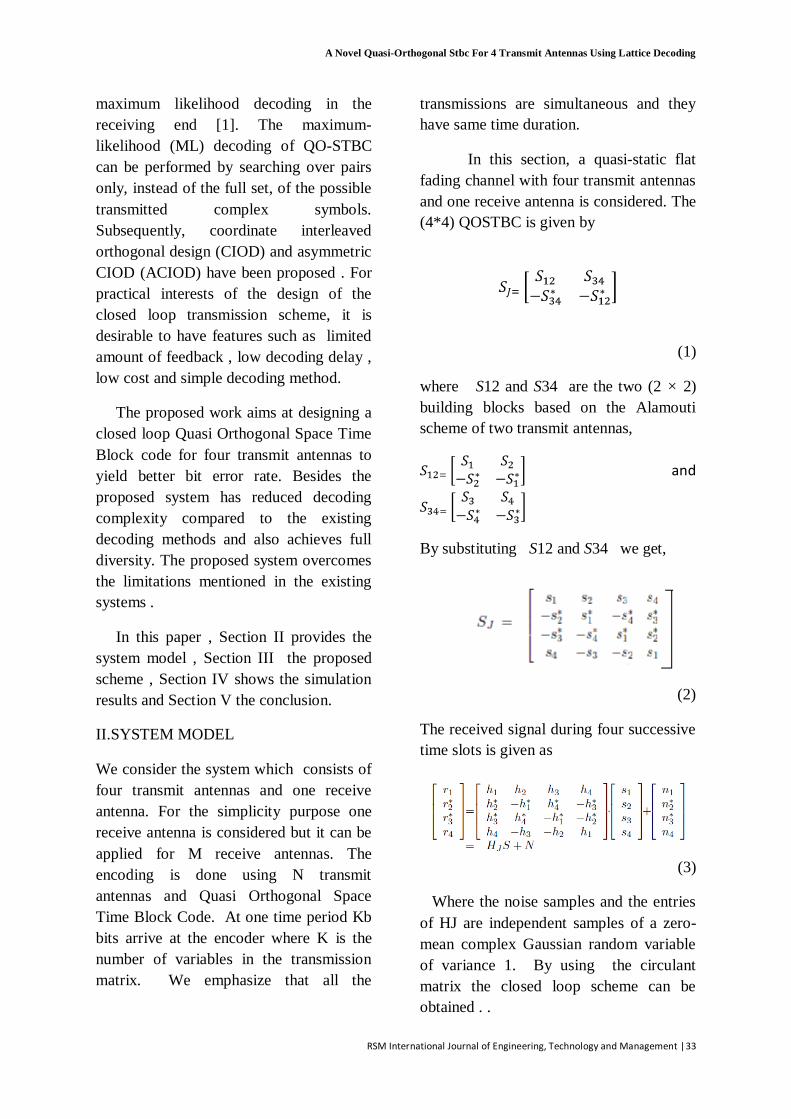
A Novel Quasi-Orthogonal Stbc For 4 Transmit Antennas Using Lattice Decoding
RSM International Journal of Engineering, Technology and Management |33
maximum likelihood decoding in the
receiving end [1]. The maximum-
likelihood (ML) decoding of QO-STBC
can be performed by searching over pairs
only, instead of the full set, of the possible
transmitted complex symbols.
Subsequently, coordinate interleaved
orthogonal design (CIOD) and asymmetric
CIOD (ACIOD) have been proposed . For
practical interests of the design of the
closed loop transmission scheme, it is
desirable to have features such as limited
amount of feedback , low decoding delay ,
low cost and simple decoding method.
The proposed work aims at designing a
closed loop Quasi Orthogonal Space Time
Block code for four transmit antennas to
yield better bit error rate. Besides the
proposed system has reduced decoding
complexity compared to the existing
decoding methods and also achieves full
diversity. The proposed system overcomes
the limitations mentioned in the existing
systems .
In this paper , Section II provides the
system model , Section III the proposed
scheme , Section IV shows the simulation
results and Section V the conclusion.
II.SYSTEM MODEL
We consider the system which consists of
four transmit antennas and one receive
antenna. For the simplicity purpose one
receive antenna is considered but it can be
applied for M receive antennas. The
encoding is done using N transmit
antennas and Quasi Orthogonal Space
Time Block Code. At one time period Kb
bits arrive at the encoder where K is the
number of variables in the transmission
matrix. We emphasize that all the
transmissions are simultaneous and they
have same time duration.
In this section, a quasi-static flat
fading channel with four transmit antennas
and one receive antenna is considered. The
(4*4) QOSTBC is given by
(1)
where S12 and S34 are the two (2 × 2)
building blocks based on the Alamouti
scheme of two transmit antennas,
and
By substituting S12 and S34 we get,
(2)
The received signal during four successive
time slots is given as
(3)
Where the noise samples and the entries
of HJ are independent samples of a zero-
mean complex Gaussian random variable
of variance 1. By using the circulant
matrix the closed loop scheme can be
obtained . .
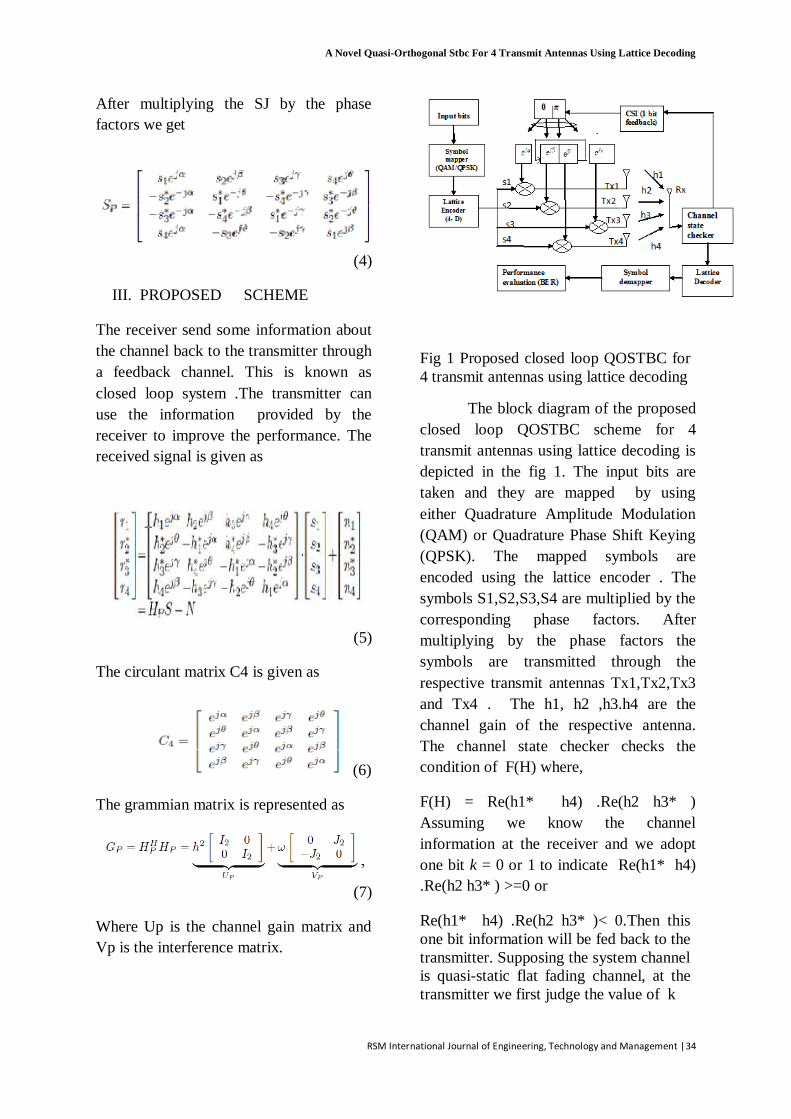
A Novel Quasi-Orthogonal Stbc For 4 Transmit Antennas Using Lattice Decoding
RSM International Journal of Engineering, Technology and Management |34
After multiplying the SJ by the phase
factors we get
(4)
III. PROPOSED SCHEME
The receiver send some information about
the channel back to the transmitter through
a feedback channel. This is known as
closed loop system .The transmitter can
use the information provided by the
receiver to improve the performance. The
received signal is given as
(5)
The circulant matrix C4 is given as
(6)
The grammian matrix is represented as
(7)
Where Up is the channel gain matrix and
Vp is the interference matrix.
Fig 1 Proposed closed loop QOSTBC for
4 transmit antennas using lattice decoding
The block diagram of the proposed
closed loop QOSTBC scheme for 4
transmit antennas using lattice decoding is
depicted in the fig 1. The input bits are
taken and they are mapped by using
either Quadrature Amplitude Modulation
(QAM) or Quadrature Phase Shift Keying
(QPSK). The mapped symbols are
encoded using the lattice encoder . The
symbols S1,S2,S3,S4 are multiplied by the
corresponding phase factors. After
multiplying by the phase factors the
symbols are transmitted through the
respective transmit antennas Tx1,Tx2,Tx3
and Tx4 . The h1, h2 ,h3.h4 are the
channel gain of the respective antenna.
The channel state checker checks the
condition of F(H) where,
F(H) = Re(h1* h4) .Re(h2 h3* )
Assuming we know the channel
information at the receiver and we adopt
one bit k = 0 or 1 to indicate Re(h1* h4)
.Re(h2 h3* ) >=0 or
Re(h1* h4) .Re(h2 h3* )< 0.Then this
one bit information will be fed back to the
transmitter. Supposing the system channel
is quasi-static flat fading channel, at the
transmitter we first judge the value of k
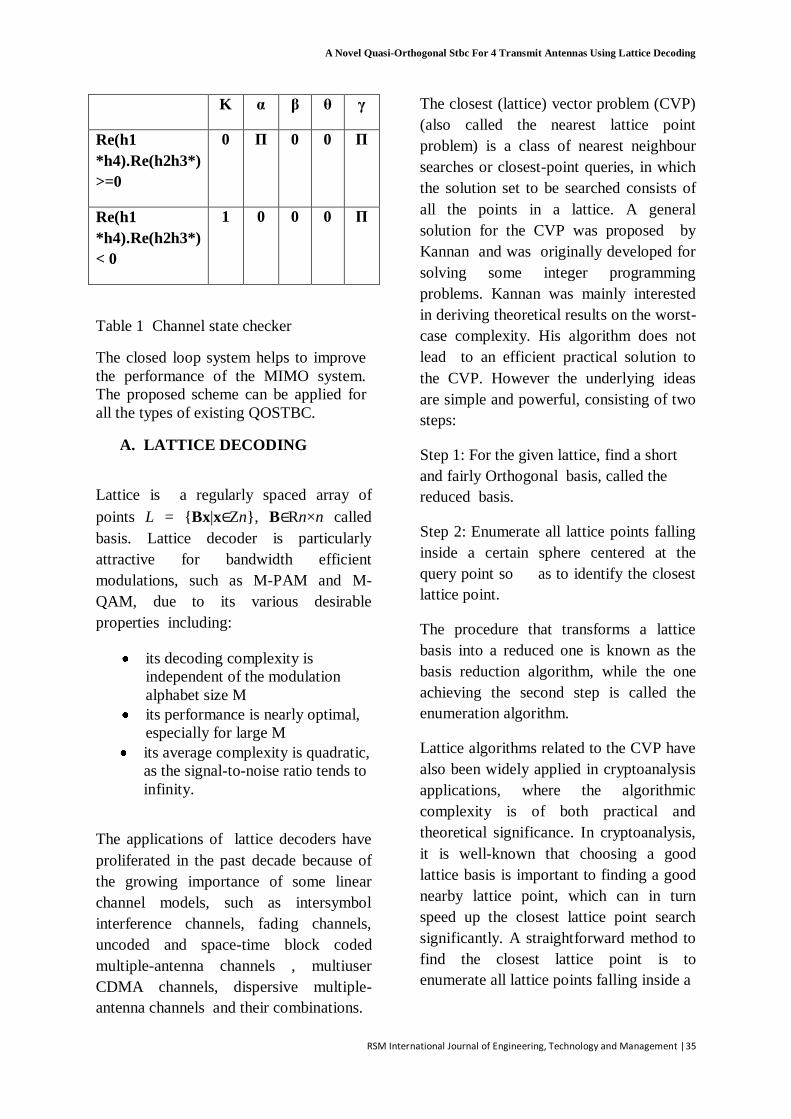
A Novel Quasi-Orthogonal Stbc For 4 Transmit Antennas Using Lattice Decoding
RSM International Journal of Engineering, Technology and Management |35
K α β θ γ
Re(h1
*h4).Re(h2h3*)
>=0
0 Π 0 0 Π
Re(h1
*h4).Re(h2h3*)
< 0
1 0 0 0 Π
Table 1 Channel state checker
The closed loop system helps to improve
the performance of the MIMO system.
The proposed scheme can be applied for
all the types of existing QOSTBC.
A. LATTICE DECODING
Lattice is a regularly spaced array of
points L = {Bx|x∈Zn}, B∈Rn×n called
basis. Lattice decoder is particularly
attractive for bandwidth efficient
modulations, such as M-PAM and M-
QAM, due to its various desirable
properties including:
its decoding complexity is
independent of the modulation
alphabet size M
its performance is nearly optimal,
especially for large M
its average complexity is quadratic,
as the signal-to-noise ratio tends to
infinity.
The applications of lattice decoders have
proliferated in the past decade because of
the growing importance of some linear
channel models, such as intersymbol
interference channels, fading channels,
uncoded and space-time block coded
multiple-antenna channels , multiuser
CDMA channels, dispersive multiple-
antenna channels and their combinations.
The closest (lattice) vector problem (CVP)
(also called the nearest lattice point
problem) is a class of nearest neighbour
searches or closest-point queries, in which
the solution set to be searched consists of
all the points in a lattice. A general
solution for the CVP was proposed by
Kannan and was originally developed for
solving some integer programming
problems. Kannan was mainly interested
in deriving theoretical results on the worst-
case complexity. His algorithm does not
lead to an efficient practical solution to
the CVP. However the underlying ideas
are simple and powerful, consisting of two
steps:
Step 1: For the given lattice, find a short
and fairly Orthogonal basis, called the
reduced basis.
Step 2: Enumerate all lattice points falling
inside a certain sphere centered at the
query point so as to identify the closest
lattice point.
The procedure that transforms a lattice
basis into a reduced one is known as the
basis reduction algorithm, while the one
achieving the second step is called the
enumeration algorithm.
Lattice algorithms related to the CVP have
also been widely applied in cryptoanalysis
applications, where the algorithmic
complexity is of both practical and
theoretical significance. In cryptoanalysis,
it is well-known that choosing a good
lattice basis is important to finding a good
nearby lattice point, which can in turn
speed up the closest lattice point search
significantly. A straightforward method to
find the closest lattice point is to
enumerate all lattice points falling inside a
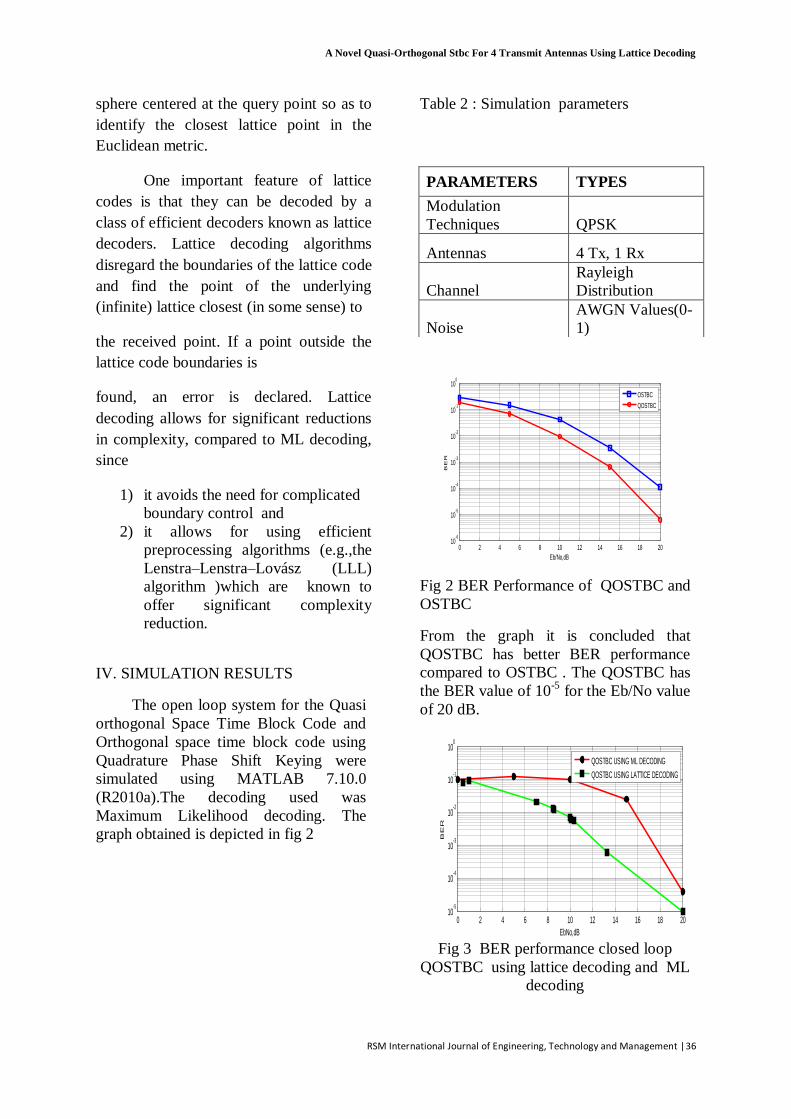
A Novel Quasi-Orthogonal Stbc For 4 Transmit Antennas Using Lattice Decoding
RSM International Journal of Engineering, Technology and Management |36
sphere centered at the query point so as to
identify the closest lattice point in the
Euclidean metric.
One important feature of lattice
codes is that they can be decoded by a
class of efficient decoders known as lattice
decoders. Lattice decoding algorithms
disregard the boundaries of the lattice code
and find the point of the underlying
(infinite) lattice closest (in some sense) to
the received point. If a point outside the
lattice code boundaries is
found, an error is declared. Lattice
decoding allows for significant reductions
in complexity, compared to ML decoding,
since
1) it avoids the need for complicated
boundary control and
2) it allows for using efficient
preprocessing algorithms (e.g.,the
Lenstra–Lenstra–Lovász (LLL)
algorithm )which are known to
offer significant complexity
reduction.
IV. SIMULATION RESULTS
The open loop system for the Quasi
orthogonal Space Time Block Code and
Orthogonal space time block code using
Quadrature Phase Shift Keying were
simulated using MATLAB 7.10.0
(R2010a).The decoding used was
Maximum Likelihood decoding. The
graph obtained is depicted in fig 2
Table 2 : Simulation parameters
Fig 2 BER Performance of QOSTBC and
OSTBC
From the graph it is concluded that
QOSTBC has better BER performance
compared to OSTBC . The QOSTBC has
the BER value of 10-5
for the Eb/No value
of 20 dB.
Fig 3 BER performance closed loop
QOSTBC using lattice decoding and ML
decoding
0 2 4 6 8 10 12 14 16 18 2010
-6
10-5
10-4
10-3
10-2
10-1
100
Eb/No,dB
BE
R
OSTBC
QOSTBC
0 2 4 6 8 10 12 14 16 18 2010
-5
10-4
10-3
10-2
10-1
100
EbNo,dB
BE
R
QOSTBC USING ML DECODING
QOSTBC USING LATTICE DECODING
PARAMETERS TYPES
Modulation
Techniques QPSK
Antennas 4 Tx, 1 Rx
Channel
Rayleigh
Distribution
Noise
AWGN Values(0-
1)
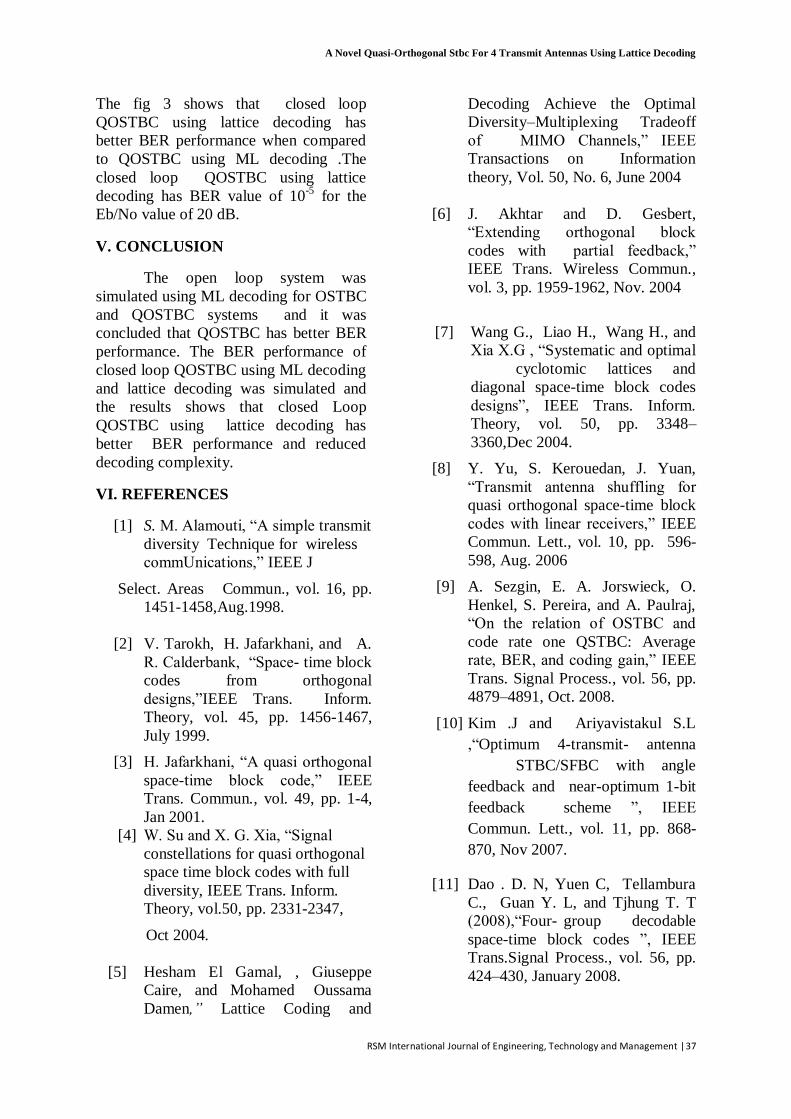
A Novel Quasi-Orthogonal Stbc For 4 Transmit Antennas Using Lattice Decoding
RSM International Journal of Engineering, Technology and Management |37
The fig 3 shows that closed loop
QOSTBC using lattice decoding has
better BER performance when compared
to QOSTBC using ML decoding .The
closed loop QOSTBC using lattice
decoding has BER value of 10-5
for the
Eb/No value of 20 dB.
V. CONCLUSION
The open loop system was
simulated using ML decoding for OSTBC
and QOSTBC systems and it was
concluded that QOSTBC has better BER
performance. The BER performance of
closed loop QOSTBC using ML decoding
and lattice decoding was simulated and
the results shows that closed Loop
QOSTBC using lattice decoding has
better BER performance and reduced
decoding complexity.
VI. REFERENCES
[1] S. M. Alamouti, “A simple transmit
diversity Technique for wireless
commUnications,” IEEE J
Select. Areas Commun., vol. 16, pp.
1451-1458,Aug.1998.
[2] V. Tarokh, H. Jafarkhani, and A.
R. Calderbank, “Space- time block
codes from orthogonal
designs,”IEEE Trans. Inform.
Theory, vol. 45, pp. 1456-1467,
July 1999.
[3] H. Jafarkhani, “A quasi orthogonal
space-time block code,” IEEE
Trans. Commun., vol. 49, pp. 1-4,
Jan 2001.
[4] W. Su and X. G. Xia, “Signal
constellations for quasi orthogonal
space time block codes with full
diversity, IEEE Trans. Inform.
Theory, vol.50, pp. 2331-2347,
Oct 2004.
[5] Hesham El Gamal, , Giuseppe
Caire, and Mohamed Oussama
Damen,” Lattice Coding and
Decoding Achieve the Optimal
Diversity–Multiplexing Tradeoff
of MIMO Channels,” IEEE
Transactions on Information
theory, Vol. 50, No. 6, June 2004
[6] J. Akhtar and D. Gesbert,
“Extending orthogonal block
codes with partial feedback,”
IEEE Trans. Wireless Commun.,
vol. 3, pp. 1959-1962, Nov. 2004
[7] Wang G., Liao H., Wang H., and
Xia X.G , “Systematic and optimal
cyclotomic lattices and
diagonal space-time block codes
designs”, IEEE Trans. Inform.
Theory, vol. 50, pp. 3348–
3360,Dec 2004.
[8] Y. Yu, S. Kerouedan, J. Yuan,
“Transmit antenna shuffling for
quasi orthogonal space-time block
codes with linear receivers,” IEEE
Commun. Lett., vol. 10, pp. 596-
598, Aug. 2006
[9] A. Sezgin, E. A. Jorswieck, O.
Henkel, S. Pereira, and A. Paulraj,
“On the relation of OSTBC and
code rate one QSTBC: Average
rate, BER, and coding gain,” IEEE
Trans. Signal Process., vol. 56, pp.
4879–4891, Oct. 2008.
[10] Kim .J and Ariyavistakul S.L
,“Optimum 4-transmit- antenna
STBC/SFBC with angle
feedback and near-optimum 1-bit
feedback scheme ”, IEEE
Commun. Lett., vol. 11, pp. 868-
870, Nov 2007.
[11] Dao . D. N, Yuen C, Tellambura
C., Guan Y. L, and Tjhung T. T
(2008),“Four- group decodable
space-time block codes ”, IEEE
Trans.Signal Process., vol. 56, pp.
424–430, January 2008.
A Novel Quasi-Orthogonal Stbc For 4 Transmit Antennas Using Lattice Decoding
RSM International Journal of Engineering, Technology and Management |38
[12] Liu W., Sellathurai M., Xiao P.,
Tang C., and We J. “Improved
design of two and four-group
decodable STBCs with larger
diversity product for eight
transmit antennas”, in IEEE
Acoustics, Speech and Signal
Processing(ICASSP 2009), Taipei,
pp.2737–2740 ,May 2009
[13] Zhu Chen and Moon Ho Lee ,
“One Bit Feedback for Quasi-
Orthogonal Space Time Block
Codes Based on Circulant
Matrix”, IEEE Transactions on
wireless communications, Vol. 8,
No. 7, pp . 3386-3389, July 2009.
[14] Lei Liu, Hongzhi Zhang,
Kuanquan Wang and Wangmeng
Zuo “Quasi-orthogonal Space-
Time Block Codes for Four
Antenna,” International Conference
on Networks Security, Wireless
Communications and Trusted
Computing 2009.
[15] Wei Liu, Mathini Sellathurai, Jibo
Wei,, and Chaojing Tang,” A
Cyclotomic Lattice Based
Quasi-Orthogonal STBC for Eight
Transmit Antennas ” ,IEEE signal
processing letters, Vol. 17, No. 4,
April 2010
A Novel Method Of Mri Brain Image Segmentation
RSM International Journal of Engineering, Technology and Management |39
A NOVEL METHOD OF MRI BRAIN IMAGE SEGMENTATION
Arun pandiyan ks1, Babu.g2
1M.E (APPLIED ELECTRONICS) 2 ASST PROF (ECE DEPT)
R.M .K ENGINEERING COLLEGE R.M .K ENGINEERING COLLEGE
[email protected] [email protected]
Abstract--- The accurate and effective
algorithm for segmenting image is very
useful in many fields, especially in
medical image. In this paper we introduced
a novel method that focus on segmenting
the brain MR Image that is important for
cancer and neural diseases. Segmentation
of MRI brain images plays a critical role in
medical image processing and analysis
.The research on MRI brain image
segmentation has been an important field
in medical image processing and analysis.
It does great help to early diagnosis and
treatment of neurological diseases. MRI
brain image are theoretically piecewise
constant with a small number of classes.
They can have relatively high contrast
between different tissues. At present, a
variety of approaches and processing
techniques have been proposed for the
MRI images segmentation, such as
watershed method, artificial neuron
network method , methods based on
Markov Random Field model , and
methods based on mathematical
morphology algorithmic method. By
applying the advantage of both EM and
FCM algorithm for decreasing the
influence of the inhomogeneity and
increasing the segmenting accuracy. With
simulate image and the clinical MRI data,
the experiments shown that our proposed
algorithm is effective.
Keywords--- Unsupervised classification,
fuzzy clustering, brain MRI, image
segmentation.
I. INTRODUCTION
Segmentation of MRI brain images
plays a critical role in medical image
processing and analysis the research on
MRI brain image segmentation has been
an important field in medical image
processing and analysis. It does great help
to early diagnosis and treatment of
neurological diseases. MRI brain image
are theoretically piecewise constant with a
small number of classes. They can have
relatively high contrast between different
tissues. At present, a variety of approaches
and processing techniques have been
proposed for the MRI images
segmentation, such as watershed method ,
artificial neuron network method ,
methods based on Markov Random Field
model , and methods based on
mathematical.
In this project we propose MRI
segmentation method for detecting
cancers, tumors .They are various
segmentation method is existing. In this
project we are developing a new
segmentation method by combining the
two different algorithms by taking the
advantage of these algorithms for better
features in image segmentation.
Recently, many people use the MRI data
to research the relation between white
matter development and neural diseases,
especially, [8]the anatomy image is fusing
with those images from diffusion tensor
imaging, and using the white matter to
lead the fibre tack, the accuracy of
segmenting white matter is key problem.
Attention deficit hyperactivity disorder
(ADHD)[6]
is also needed to segment
white matter. In spite of many algorithms
for segmenting MRI of data, such as
watershed algorithm, eSneke algorithm,
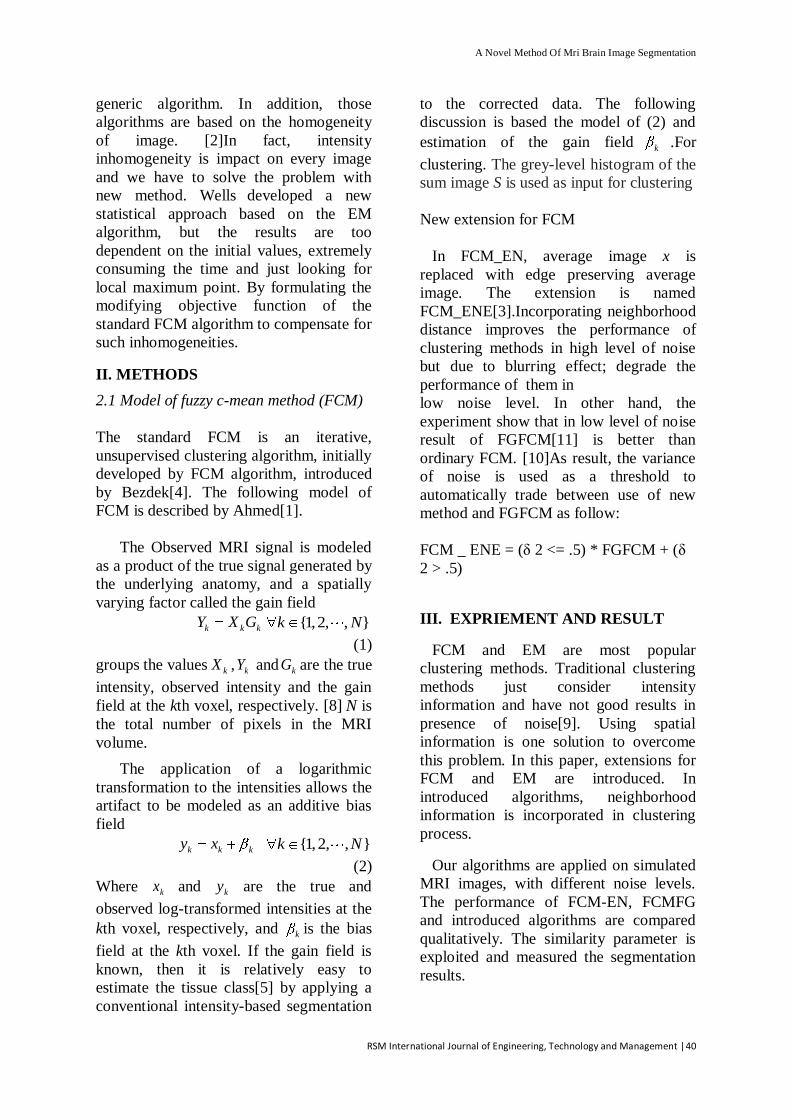
A Novel Method Of Mri Brain Image Segmentation
RSM International Journal of Engineering, Technology and Management |40
generic algorithm. In addition, those
algorithms are based on the homogeneity
of image. [2]In fact, intensity
inhomogeneity is impact on every image
and we have to solve the problem with
new method. Wells
developed a new
statistical approach based on the EM
algorithm, but the results are too
dependent on the initial values, extremely
consuming the time and just looking for
local maximum point. By formulating the
modifying objective function of the
standard FCM algorithm to compensate for
such inhomogeneities.
II. METHODS
2.1 Model of fuzzy c-mean method (FCM)
The standard FCM is an iterative,
unsupervised clustering algorithm, initially
developed by FCM algorithm, introduced
by Bezdek[4]. The following model of
FCM is described by Ahmed[1].
The Observed MRI signal is modeled
as a product of the true signal generated by
the underlying anatomy, and a spatially
varying factor called the gain field
k k kY X G {1,2, , }k N
(1)
groups the values kX , kY and kG are the true
intensity, observed intensity and the gain
field at the kth voxel, respectively. [8] N is
the total number of pixels in the MRI
volume.
The application of a logarithmic
transformation to the intensities allows the
artifact to be modeled as an additive bias
field
k k ky x {1,2, , }k N
(2)
Where kx and ky are the true and
observed log-transformed intensities at the
kth voxel, respectively, and k is the bias
field at the kth voxel. If the gain field is
known, then it is relatively easy to
estimate the tissue class[5] by applying a
conventional intensity-based segmentation
to the corrected data. The following
discussion is based the model of (2) and
estimation of the gain field k .For
clustering. The grey-level histogram of the
sum image S is used as input for clustering
New extension for FCM
In FCM_EN, average image x is
replaced with edge preserving average
image. The extension is named
FCM_ENE[3].Incorporating neighborhood
distance improves the performance of
clustering methods in high level of noise
but due to blurring effect; degrade the
performance of them in
low noise level. In other hand, the
experiment show that in low level of noise
result of FGFCM[11] is better than
ordinary FCM. [10]As result, the variance
of noise is used as a threshold to
automatically trade between use of new
method and FGFCM as follow:
FCM _ ENE = (δ 2 <= .5) * FGFCM + (δ
2 > .5)
III. EXPRIEMENT AND RESULT
FCM and EM are most popular
clustering methods. Traditional clustering
methods just consider intensity
information and have not good results in
presence of noise[9]. Using spatial
information is one solution to overcome
this problem. In this paper, extensions for
FCM and EM are introduced. In
introduced algorithms, neighborhood
information is incorporated in clustering
process.
Our algorithms are applied on simulated
MRI images, with different noise levels.
The performance of FCM-EN, FCMFG
and introduced algorithms are compared
qualitatively. The similarity parameter is
exploited and measured the segmentation
results.
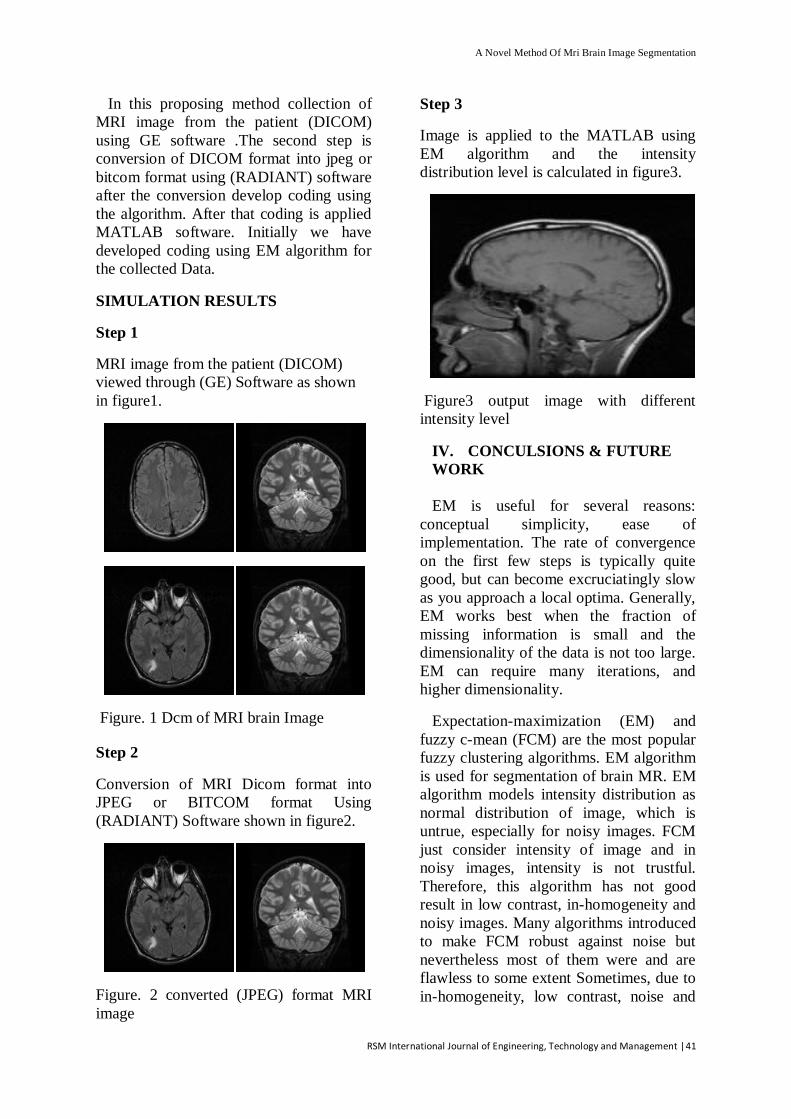
A Novel Method Of Mri Brain Image Segmentation
RSM International Journal of Engineering, Technology and Management |41
In this proposing method collection of
MRI image from the patient (DICOM)
using GE software .The second step is
conversion of DICOM format into jpeg or
bitcom format using (RADIANT) software
after the conversion develop coding using
the algorithm. After that coding is applied
MATLAB software. Initially we have
developed coding using EM algorithm for
the collected Data.
SIMULATION RESULTS
Step 1
MRI image from the patient (DICOM)
viewed through (GE) Software as shown
in figure1.
Figure. 1 Dcm of MRI brain Image
Step 2
Conversion of MRI Dicom format into
JPEG or BITCOM format Using
(RADIANT) Software shown in figure2.
Figure. 2 converted (JPEG) format MRI
image
Step 3
Image is applied to the MATLAB using
EM algorithm and the intensity
distribution level is calculated in figure3.
Figure3 output image with different
intensity level
IV. CONCULSIONS & FUTURE
WORK
EM is useful for several reasons:
conceptual simplicity, ease of
implementation. The rate of convergence
on the first few steps is typically quite
good, but can become excruciatingly slow
as you approach a local optima. Generally,
EM works best when the fraction of
missing information is small and the
dimensionality of the data is not too large.
EM can require many iterations, and
higher dimensionality.
Expectation-maximization (EM) and
fuzzy c-mean (FCM) are the most popular
fuzzy clustering algorithms. EM algorithm
is used for segmentation of brain MR. EM
algorithm models intensity distribution as
normal distribution of image, which is
untrue, especially for noisy images. FCM
just consider intensity of image and in
noisy images, intensity is not trustful.
Therefore, this algorithm has not good
result in low contrast, in-homogeneity and
noisy images. Many algorithms introduced
to make FCM robust against noise but
nevertheless most of them were and are
flawless to some extent Sometimes, due to
in-homogeneity, low contrast, noise and
A Novel Method Of Mri Brain Image Segmentation
RSM International Journal of Engineering, Technology and Management |42
inequality of content with semantic,
automatic methods fail to segment image
correctly. Therefore, for these images, it is
necessary to use user help to correct
method‟s error. When the real data are
fuzzy, such as functional MRI brain data,
the use of M-FCM segmentation is always
more effective than the use of the other
one. Further quantitative validation on
more accuracy and stability of the method
is still necessary, using realistic phantoms
and a large number of clinical scans.
The results presented in this paper are
preliminary and further clinical evaluation
is required. There are also need new
methods for preprocessing the original
image, including denoising and enhancing
to increase the SNR. How to combine
segmenting with preprocessing procedure
is our work in future.
REFERENCES
[1] M. N. Ahmed, S. M. Yamany, “A
Modified Fuzzy C-Means Algorithm
for Bias Field Estimation and
Segmentation of MRI Data”, IEEE Trans.
On Medical Imaging, 2002, 21(3):193-
199.
[2] Atam P. Dhawan and Brian
D'Alessandro “Multi- Parameter
Segmentation of Brain Images” of
IEEE(2009)
[3] M.A. Balafar, A. R. Ramli and S.
Mashohor “ Edge-preserving
clusteringalgorithms and their
application for MRI image Segmentation”
proceedings of the multiconference of
engineers and computer scientists Vol I,
IMECS(20103)
[4] J. C. Bezdek, and S. K. Pal, “Fuzzy
Models for Pattern Recognition”, New
York: IEEE Press, 1992.
[5] M.N Bossa and S.Olmos “Multi-object
statistical pose+shape model
segmentation” Zaragoza university,
spain of IEEE(2007)
[6] M.C. Davidson, K. M. Thomas. and B.
J. Casey, “Imaging the developing brain
with fMRI”, Mental Retardation and
developmental disabilities research
reviews, 2003,9 :161-165.
[7] R. C. Gonzalez and R. E. Woods,
Digital Image Processing.
Massachusetts: Addison-Wesley, 1992
[8] Jonathan Bailleul, Su Ruan and Jean-
Mare Constans “Statistical Shape Model-
based Segmentation of brain MRI Images”
on proceedings of the 29th annual
international conference of the IEEE
EMBS Lyon, France IEEE(2007).
[9] Kehong yuan, Lianwen wu chao chen,
qiansheng cheng, shanglian bao, hongjie
“A fuzzy C-means algorithm and its
Application” LM AM, School of
Mathematics Sciences, Peking University,
Beijing 100871, China
[10] Mounir Sayadi, Lotfi Tlig and Farhat
Fnaiech “A New Texture Segmentation
Method Based on the Fuzzy C-Mean
Algorithm and Statistical Features” of
Applied Mathematical Sciences, Vol. 1,
2007, no. 60, 2999 – 3007
[11] Ping Wang HongLei Wang “A
Modified FCM algorithm for MRI brain
image segmentation” International
Seminar on Future BioMedical
Information Engineering of IEEE(2008)
Survey Of Architectures And Mobility Model For Ubiquitous Underwater Acoustic Sensor Networks
RSM International Journal of Engineering, Technology and Management |43
SURVEY OF ARCHITECTURES AND MOBILITY MODEL FOR UBIQUITOUS
UNDERWATER ACOUSTIC SENSOR NETWORKS
Shalini.G,
TIFAC-CORE in Pervasive Computing Technologies,
Velammal Engineering College, Anna University.
Email: [email protected]
ABSTRACT
Ubiquitous Underwater Acoustic
Sensor Networks (UU-ASN) targets to
provide a comprehensive study of the
technical issues related to realization of
underwater environments. Technical
issues comprises of fundamental sensor
networking problems such as data
gathering, synchronization, localization,
routing protocols, energy minimization.
In this paper, we have a made a detailed
survey of the architectures and appropriate
mobility models for UU-ASN based on
nodes movement. UU-ASN relies on the
use of simulations to evaluate protocol
performance as real time implementation is
complex. A realistic mobility model that
can capture the physical movement of the
sensor nodes with respect to ocean currents
gives better understanding on the above
problems. We study impact of the model
on the coverage and connectivity of the
network under different scenarios.
Keywords: Underwater acoustic sensor
networks, Architecture, Mobility models,
Deployment, sensing coverage.
1.UNDERWATER NETWORKING
COMPONENTS
Some of the key features needed to
design an efficient UU-ASN are use of
low power underwater sensors,
Optimization of the communication
interfaces according to the medium
characteristics, Optimization of the
network and especially the MAC layer.
The main components that interact in
underwater networks are detailed in the
following:
Underwater Sensors are network
devices in charge of sensing and
communicating oceanographic data of
interest[1].
Unmanned or Autonomous
Underwater Vehicles (UUVs, AUVs)
are mobile nodes equipped that have
more energy than normal underwater
sensor nodes and can move
independently. Once surfaced, these
devices can often communicate
directly to shore via satellites or use
satellite- based services such as GPS;
Underwater Sinks are network
components that relay the data
collected by the sensor nodes from the
sea-bottom to the surface. To
communicate with undersea devices
as well as with surface nodes, the
underwater sinks are equipped with
both a horizontal and a vertical
transceiver
Surface Buoys/Stations are
devices endowed with an acoustic
transceiver designed to handle
multiple communications in parallel
with the deployed under-water
sinks[1][2].
Surface Sinks are further network
components that allow coordinating
different surface stations and thus the
overall underwater network.
Onshore Sinks are additional
network components, placed on the
shore, which can communicate with
the rest of the network via radio or
acoustic links
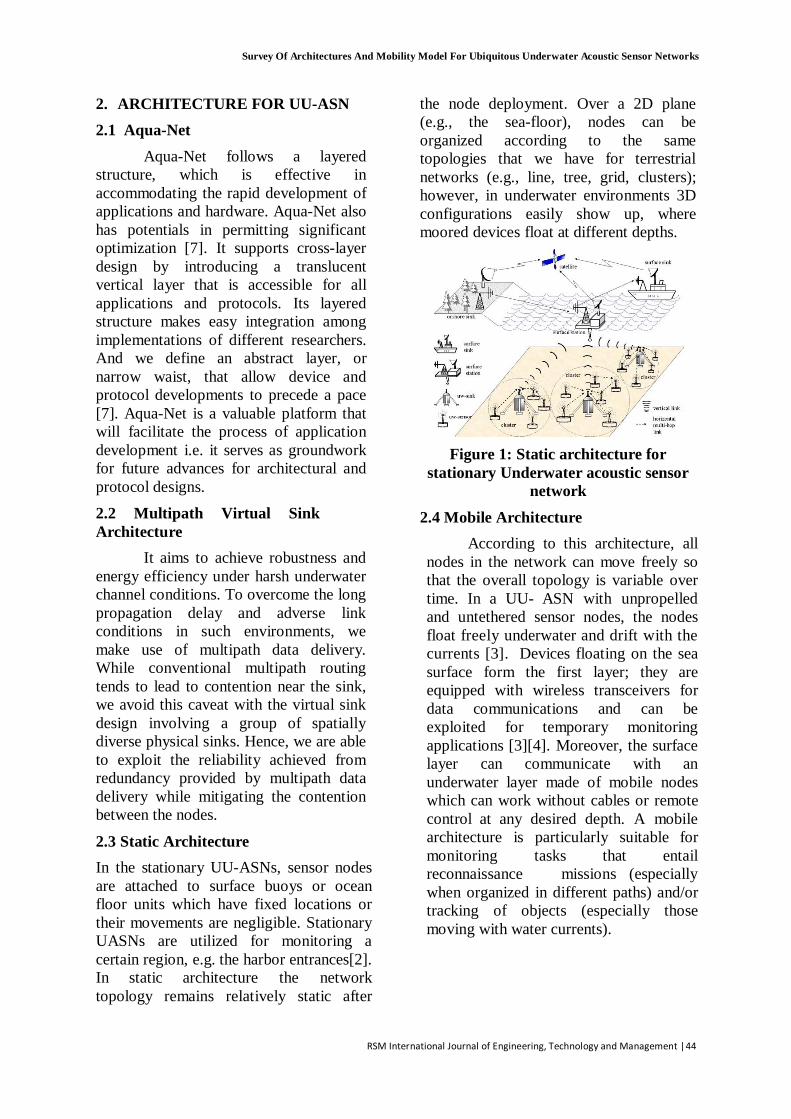
Survey Of Architectures And Mobility Model For Ubiquitous Underwater Acoustic Sensor Networks
RSM International Journal of Engineering, Technology and Management |44
2. ARCHITECTURE FOR UU-ASN
2.1 Aqua-Net
Aqua-Net follows a layered
structure, which is effective in
accommodating the rapid development of
applications and hardware. Aqua-Net also
has potentials in permitting significant
optimization [7]. It supports cross-layer
design by introducing a translucent
vertical layer that is accessible for all
applications and protocols. Its layered
structure makes easy integration among
implementations of different researchers.
And we define an abstract layer, or
narrow waist, that allow device and
protocol developments to precede a pace
[7]. Aqua-Net is a valuable platform that
will facilitate the process of application
development i.e. it serves as groundwork
for future advances for architectural and
protocol designs.
2.2 Multipath Virtual Sink
Architecture
It aims to achieve robustness and
energy efficiency under harsh underwater
channel conditions. To overcome the long
propagation delay and adverse link
conditions in such environments, we
make use of multipath data delivery.
While conventional multipath routing
tends to lead to contention near the sink,
we avoid this caveat with the virtual sink
design involving a group of spatially
diverse physical sinks. Hence, we are able
to exploit the reliability achieved from
redundancy provided by multipath data
delivery while mitigating the contention
between the nodes.
2.3 Static Architecture
In the stationary UU-ASNs, sensor nodes
are attached to surface buoys or ocean
floor units which have fixed locations or
their movements are negligible. Stationary
UASNs are utilized for monitoring a
certain region, e.g. the harbor entrances[2].
In static architecture the network
topology remains relatively static after
the node deployment. Over a 2D plane
(e.g., the sea-floor), nodes can be
organized according to the same
topologies that we have for terrestrial
networks (e.g., line, tree, grid, clusters);
however, in underwater environments 3D
configurations easily show up, where
moored devices float at different depths.
Figure 1: Static architecture for
stationary Underwater acoustic sensor
network
2.4 Mobile Architecture
According to this architecture, all
nodes in the network can move freely so
that the overall topology is variable over
time. In a UU- ASN with unpropelled
and untethered sensor nodes, the nodes
float freely underwater and drift with the
currents [3]. Devices floating on the sea
surface form the first layer; they are
equipped with wireless transceivers for
data communications and can be
exploited for temporary monitoring
applications [3][4]. Moreover, the surface
layer can communicate with an
underwater layer made of mobile nodes
which can work without cables or remote
control at any desired depth. A mobile
architecture is particularly suitable for
monitoring tasks that entail
reconnaissance missions (especially
when organized in different paths) and/or
tracking of objects (especially those
moving with water currents).
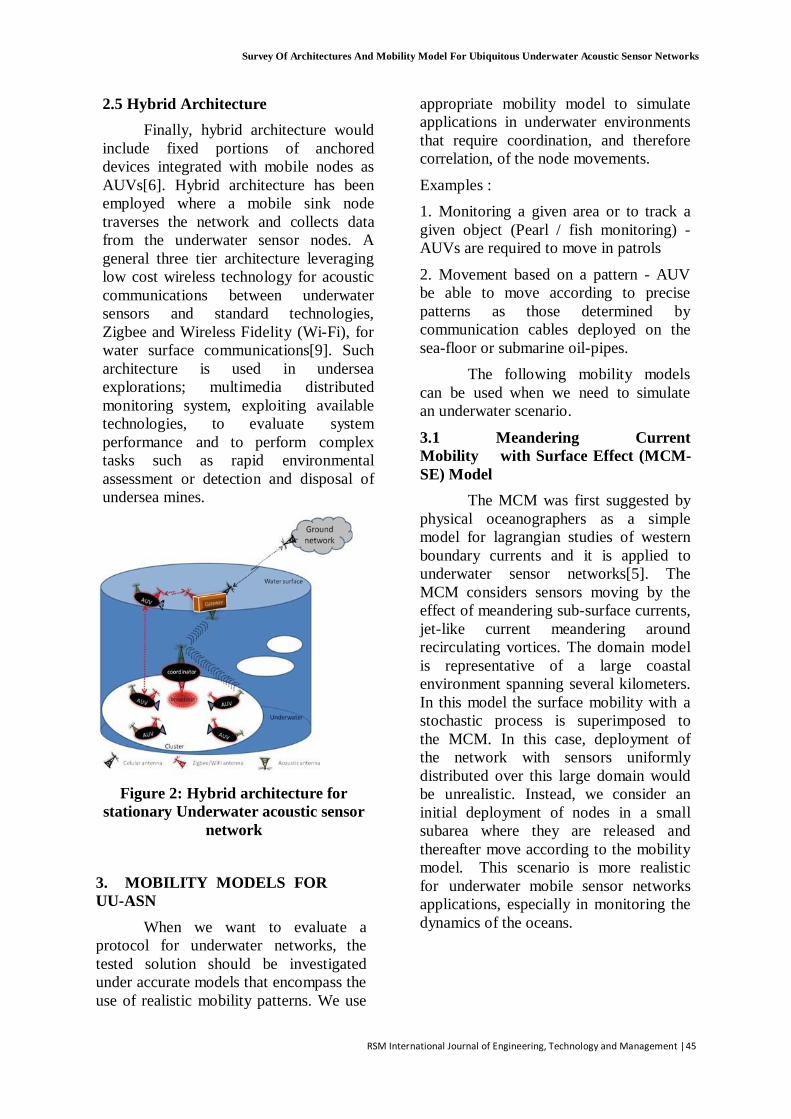
Survey Of Architectures And Mobility Model For Ubiquitous Underwater Acoustic Sensor Networks
RSM International Journal of Engineering, Technology and Management |45
2.5 Hybrid Architecture
Finally, hybrid architecture would
include fixed portions of anchored
devices integrated with mobile nodes as
AUVs[6]. Hybrid architecture has been
employed where a mobile sink node
traverses the network and collects data
from the underwater sensor nodes. A
general three tier architecture leveraging
low cost wireless technology for acoustic
communications between underwater
sensors and standard technologies,
Zigbee and Wireless Fidelity (Wi-Fi), for
water surface communications[9]. Such
architecture is used in undersea
explorations; multimedia distributed
monitoring system, exploiting available
technologies, to evaluate system
performance and to perform complex
tasks such as rapid environmental
assessment or detection and disposal of
undersea mines.
Figure 2: Hybrid architecture for
stationary Underwater acoustic sensor
network
3. MOBILITY MODELS FOR
UU-ASN
When we want to evaluate a
protocol for underwater networks, the
tested solution should be investigated
under accurate models that encompass the
use of realistic mobility patterns. We use
appropriate mobility model to simulate
applications in underwater environments
that require coordination, and therefore
correlation, of the node movements.
Examples :
1. Monitoring a given area or to track a
given object (Pearl / fish monitoring) -
AUVs are required to move in patrols
2. Movement based on a pattern - AUV
be able to move according to precise
patterns as those determined by
communication cables deployed on the
sea-floor or submarine oil-pipes.
The following mobility models
can be used when we need to simulate
an underwater scenario.
3.1 Meandering Current
Mobility with Surface Effect (MCM-
SE) Model
The MCM was first suggested by
physical oceanographers as a simple
model for lagrangian studies of western
boundary currents and it is applied to
underwater sensor networks[5]. The
MCM considers sensors moving by the
effect of meandering sub-surface currents,
jet-like current meandering around
recirculating vortices. The domain model
is representative of a large coastal
environment spanning several kilometers.
In this model the surface mobility with a
stochastic process is superimposed to
the MCM. In this case, deployment of
the network with sensors uniformly
distributed over this large domain would
be unrealistic. Instead, we consider an
initial deployment of nodes in a small
subarea where they are released and
thereafter move according to the mobility
model. This scenario is more realistic
for underwater mobile sensor networks
applications, especially in monitoring the
dynamics of the oceans.
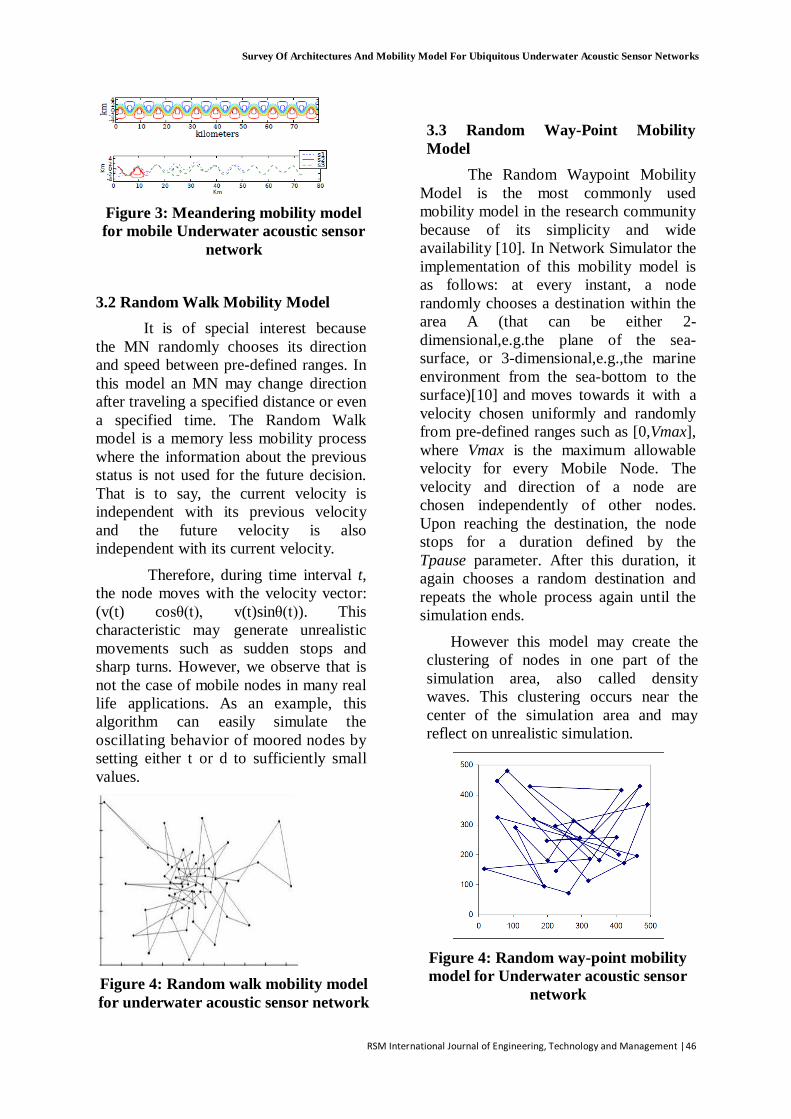
Survey Of Architectures And Mobility Model For Ubiquitous Underwater Acoustic Sensor Networks
RSM International Journal of Engineering, Technology and Management |46
Figure 3: Meandering mobility model
for mobile Underwater acoustic sensor
network
3.2 Random Walk Mobility Model
It is of special interest because
the MN randomly chooses its direction
and speed between pre-defined ranges. In
this model an MN may change direction
after traveling a specified distance or even
a specified time. The Random Walk
model is a memory less mobility process
where the information about the previous
status is not used for the future decision.
That is to say, the current velocity is
independent with its previous velocity
and the future velocity is also
independent with its current velocity.
Therefore, during time interval t,
the node moves with the velocity vector:
(v(t) cosθ(t), v(t)sinθ(t)). This
characteristic may generate unrealistic
movements such as sudden stops and
sharp turns. However, we observe that is
not the case of mobile nodes in many real
life applications. As an example, this
algorithm can easily simulate the
oscillating behavior of moored nodes by
setting either t or d to sufficiently small
values.
Figure 4: Random walk mobility model
for underwater acoustic sensor network
3.3 Random Way-Point Mobility
Model
The Random Waypoint Mobility
Model is the most commonly used
mobility model in the research community
because of its simplicity and wide
availability [10]. In Network Simulator the
implementation of this mobility model is
as follows: at every instant, a node
randomly chooses a destination within the
area A (that can be either 2-
dimensional,e.g.the plane of the sea-
surface, or 3-dimensional,e.g.,the marine
environment from the sea-bottom to the
surface)[10] and moves towards it with a
velocity chosen uniformly and randomly
from pre-defined ranges such as [0,Vmax],
where Vmax is the maximum allowable
velocity for every Mobile Node. The
velocity and direction of a node are
chosen independently of other nodes.
Upon reaching the destination, the node
stops for a duration defined by the
Tpause parameter. After this duration, it
again chooses a random destination and
repeats the whole process again until the
simulation ends.
However this model may create the
clustering of nodes in one part of the
simulation area, also called density
waves. This clustering occurs near the
center of the simulation area and may
reflect on unrealistic simulation.
Figure 4: Random way-point mobility
model for Underwater acoustic sensor
network
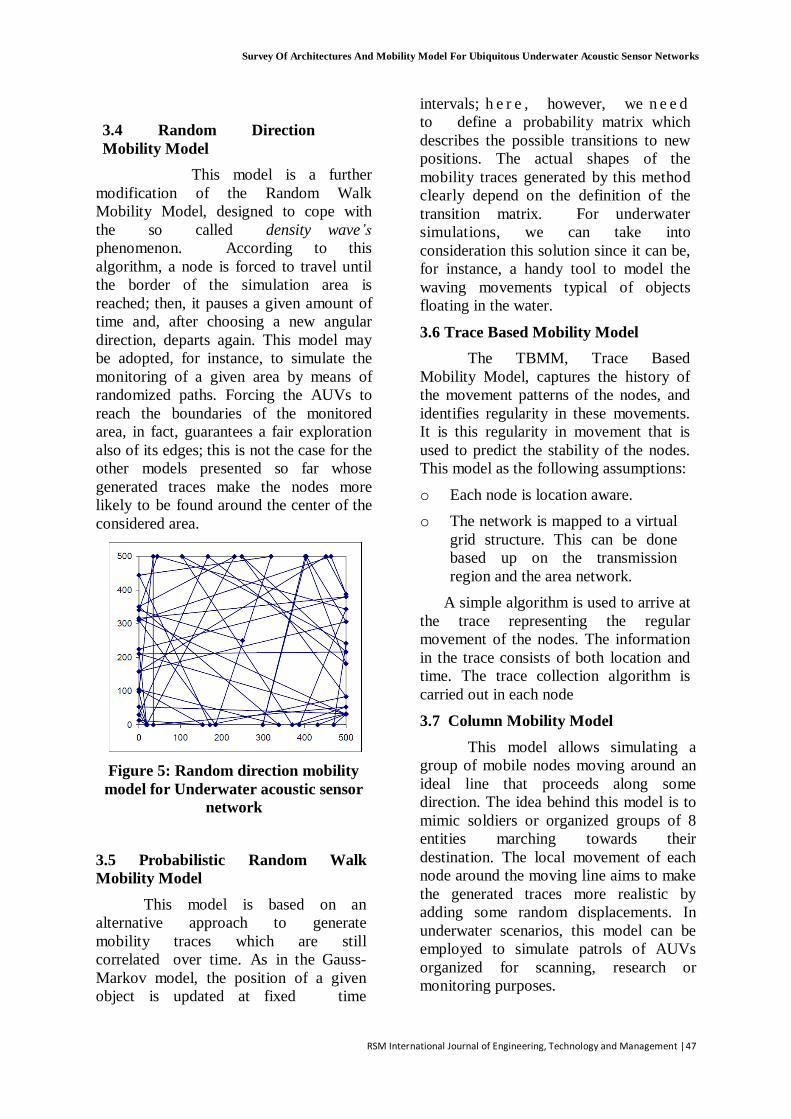
Survey Of Architectures And Mobility Model For Ubiquitous Underwater Acoustic Sensor Networks
RSM International Journal of Engineering, Technology and Management |47
3.4 Random Direction
Mobility Model
This model is a further
modification of the Random Walk
Mobility Model, designed to cope with
the so called density wave’s
phenomenon. According to this
algorithm, a node is forced to travel until
the border of the simulation area is
reached; then, it pauses a given amount of
time and, after choosing a new angular
direction, departs again. This model may
be adopted, for instance, to simulate the
monitoring of a given area by means of
randomized paths. Forcing the AUVs to
reach the boundaries of the monitored
area, in fact, guarantees a fair exploration
also of its edges; this is not the case for the
other models presented so far whose
generated traces make the nodes more
likely to be found around the center of the
considered area.
Figure 5: Random direction mobility
model for Underwater acoustic sensor
network
3.5 Probabilistic Random Walk
Mobility Model
This model is based on an
alternative approach to generate
mobility traces which are still
correlated over time. As in the Gauss-
Markov model, the position of a given
object is updated at fixed time
intervals; h e r e , however, we n e e d
to define a probability matrix which
describes the possible transitions to new
positions. The actual shapes of the
mobility traces generated by this method
clearly depend on the definition of the
transition matrix. For underwater
simulations, we can take into
consideration this solution since it can be,
for instance, a handy tool to model the
waving movements typical of objects
floating in the water.
3.6 Trace Based Mobility Model
The TBMM, Trace Based
Mobility Model, captures the history of
the movement patterns of the nodes, and
identifies regularity in these movements.
It is this regularity in movement that is
used to predict the stability of the nodes.
This model as the following assumptions:
o Each node is location aware.
o The network is mapped to a virtual
grid structure. This can be done
based up on the transmission
region and the area network.
A simple algorithm is used to arrive at
the trace representing the regular
movement of the nodes. The information
in the trace consists of both location and
time. The trace collection algorithm is
carried out in each node
3.7 Column Mobility Model
This model allows simulating a
group of mobile nodes moving around an
ideal line that proceeds along some
direction. The idea behind this model is to
mimic soldiers or organized groups of 8
entities marching towards their
destination. The local movement of each
node around the moving line aims to make
the generated traces more realistic by
adding some random displacements. In
underwater scenarios, this model can be
employed to simulate patrols of AUVs
organized for scanning, research or
monitoring purposes.
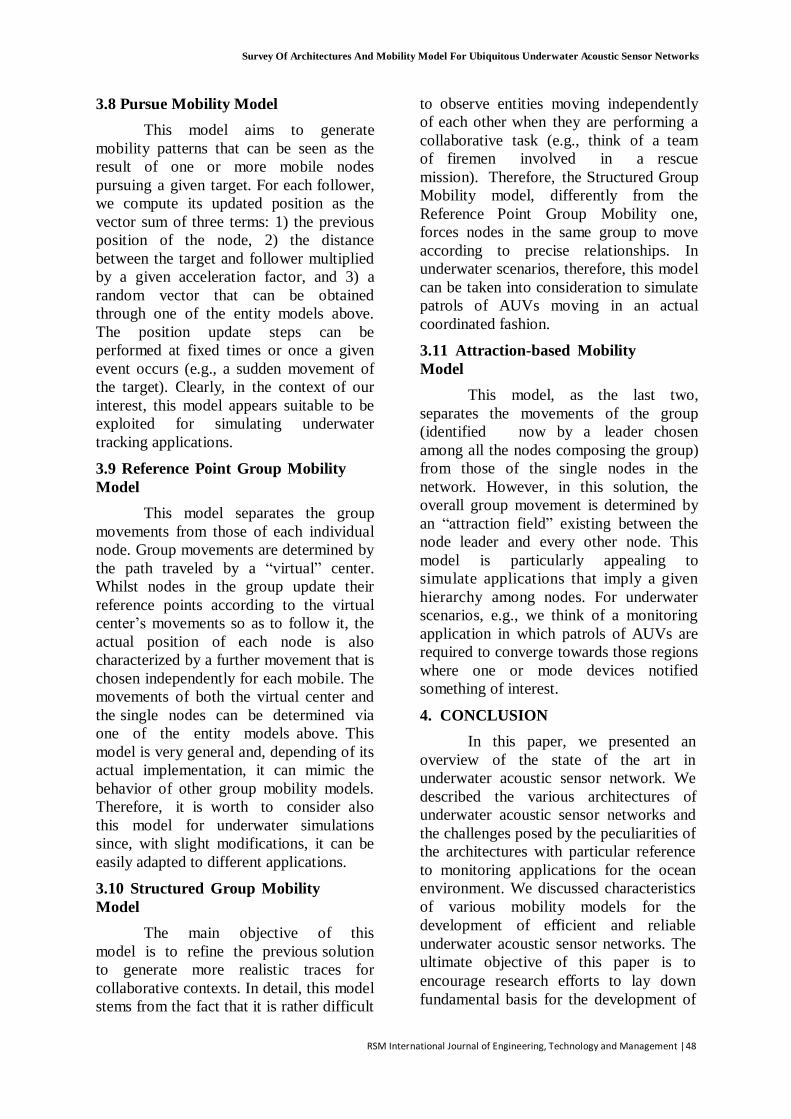
Survey Of Architectures And Mobility Model For Ubiquitous Underwater Acoustic Sensor Networks
RSM International Journal of Engineering, Technology and Management |48
3.8 Pursue Mobility Model
This model aims to generate
mobility patterns that can be seen as the
result of one or more mobile nodes
pursuing a given target. For each follower,
we compute its updated position as the
vector sum of three terms: 1) the previous
position of the node, 2) the distance
between the target and follower multiplied
by a given acceleration factor, and 3) a
random vector that can be obtained
through one of the entity models above.
The position update steps can be
performed at fixed times or once a given
event occurs (e.g., a sudden movement of
the target). Clearly, in the context of our
interest, this model appears suitable to be
exploited for simulating underwater
tracking applications.
3.9 Reference Point Group Mobility
Model
This model separates the group
movements from those of each individual
node. Group movements are determined by
the path traveled by a “virtual” center.
Whilst nodes in the group update their
reference points according to the virtual
center‟s movements so as to follow it, the
actual position of each node is also
characterized by a further movement that is
chosen independently for each mobile. The
movements of both the virtual center and
the single nodes can be determined via
one of the entity models above. This
model is very general and, depending of its
actual implementation, it can mimic the
behavior of other group mobility models.
Therefore, it is worth to consider also
this model for underwater simulations
since, with slight modifications, it can be
easily adapted to different applications.
3.10 Structured Group Mobility
Model
The main objective of this
model is to refine the previous solution
to generate more realistic traces for
collaborative contexts. In detail, this model
stems from the fact that it is rather difficult
to observe entities moving independently
of each other when they are performing a
collaborative task (e.g., think of a team
of firemen involved in a rescue
mission). Therefore, the Structured Group
Mobility model, differently from the
Reference Point Group Mobility one,
forces nodes in the same group to move
according to precise relationships. In
underwater scenarios, therefore, this model
can be taken into consideration to simulate
patrols of AUVs moving in an actual
coordinated fashion.
3.11 Attraction-based Mobility
Model
This model, as the last two,
separates the movements of the group
(identified now by a leader chosen
among all the nodes composing the group)
from those of the single nodes in the
network. However, in this solution, the
overall group movement is determined by
an “attraction field” existing between the
node leader and every other node. This
model is particularly appealing to
simulate applications that imply a given
hierarchy among nodes. For underwater
scenarios, e.g., we think of a monitoring
application in which patrols of AUVs are
required to converge towards those regions
where one or mode devices notified
something of interest.
4. CONCLUSION
In this paper, we presented an
overview of the state of the art in
underwater acoustic sensor network. We
described the various architectures of
underwater acoustic sensor networks and
the challenges posed by the peculiarities of
the architectures with particular reference
to monitoring applications for the ocean
environment. We discussed characteristics
of various mobility models for the
development of efficient and reliable
underwater acoustic sensor networks. The
ultimate objective of this paper is to
encourage research efforts to lay down
fundamental basis for the development of
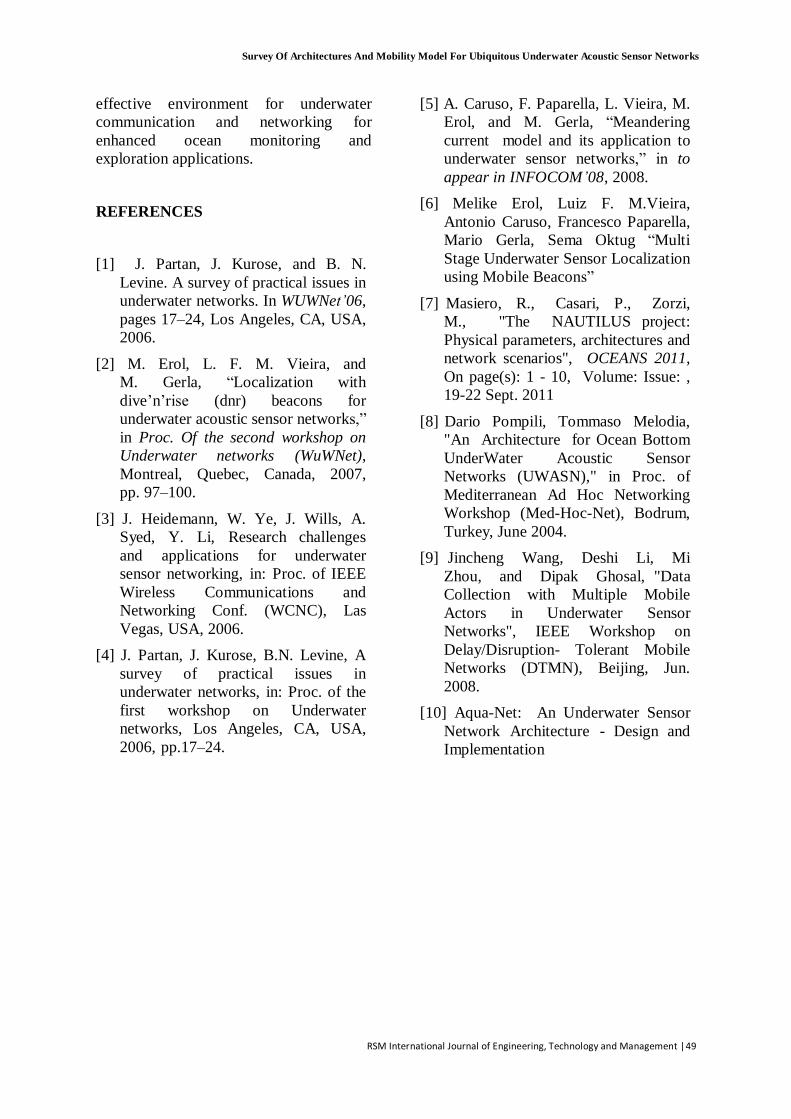
Survey Of Architectures And Mobility Model For Ubiquitous Underwater Acoustic Sensor Networks
RSM International Journal of Engineering, Technology and Management |49
effective environment for underwater
communication and networking for
enhanced ocean monitoring and
exploration applications.
REFERENCES
[1] J. Partan, J. Kurose, and B. N.
Levine. A survey of practical issues in
underwater networks. In WUWNet’06,
pages 17–24, Los Angeles, CA, USA,
2006.
[2] M. Erol, L. F. M. Vieira, and
M. Gerla, “Localization with
dive‟n‟rise (dnr) beacons for
underwater acoustic sensor networks,”
in Proc. Of the second workshop on
Underwater networks (WuWNet),
Montreal, Quebec, Canada, 2007,
pp. 97–100.
[3] J. Heidemann, W. Ye, J. Wills, A.
Syed, Y. Li, Research challenges
and applications for underwater
sensor networking, in: Proc. of IEEE
Wireless Communications and
Networking Conf. (WCNC), Las
Vegas, USA, 2006.
[4] J. Partan, J. Kurose, B.N. Levine, A
survey of practical issues in
underwater networks, in: Proc. of the
first workshop on Underwater
networks, Los Angeles, CA, USA,
2006, pp.17–24.
[5] A. Caruso, F. Paparella, L. Vieira, M.
Erol, and M. Gerla, “Meandering
current model and its application to
underwater sensor networks,” in to
appear in INFOCOM’08, 2008.
[6] Melike Erol, Luiz F. M.Vieira,
Antonio Caruso, Francesco Paparella,
Mario Gerla, Sema Oktug “Multi
Stage Underwater Sensor Localization
using Mobile Beacons”
[7] Masiero, R., Casari, P., Zorzi,
M., "The NAUTILUS project:
Physical parameters, architectures and
network scenarios", OCEANS 2011,
On page(s): 1 - 10, Volume: Issue: ,
19-22 Sept. 2011
[8] Dario Pompili, Tommaso Melodia,
"An Architecture for Ocean Bottom
UnderWater Acoustic Sensor
Networks (UWASN)," in Proc. of
Mediterranean Ad Hoc Networking
Workshop (Med-Hoc-Net), Bodrum,
Turkey, June 2004.
[9] Jincheng Wang, Deshi Li, Mi
Zhou, and Dipak Ghosal, "Data
Collection with Multiple Mobile
Actors in Underwater Sensor
Networks", IEEE Workshop on
Delay/Disruption- Tolerant Mobile
Networks (DTMN), Beijing, Jun.
2008.
[10] Aqua-Net: An Underwater Sensor
Network Architecture - Design and
Implementation

Author Index
A
Arun pandian K S., 39
B
Babu G., 39
G
Geetha C., 22
J
Jagadeesh Kannan R., 22
K
Kanimozhi G., 32
P
Palanikumar K., 7
R
Ramakrishnan M., 22
S
Sastry M R L., 12
Sekar S., 7
Senthilkumar K., 32
Shalini G., 43
Srinivasa Rao K., 12
Subba Rao P., 12
V
Valarmathi T.N., 7

Call for Papers
RSM International Journal of Engineering, Technology & Management
ISSN: 0974-9535
The RSM International Journal on Engineering, Technology & Management is a peer-reviewed,
interdisciplinary international platform for disseminating results of relevant research related to all the disciplines of
engineering, technology & management. The journal aims to cover a wide range of subjects having relevance to the
engineering, technology & management, including but not limited to:
• Automobile Engineering
• Business Management
• Civil Engineering
• Communication Engineering
• Computer Applications
• Computer Science Engineering
• Electrical Engineering
• Electronics Engineering
• Information Technology
• Instrumentation Engineering
• Mechanical Engineering
• Mechatronics Engineering
• Material Science
The journal encourages applied, practical-oriented, problem-solving research having wide relevance. The
Journal seeks contributions in terms of full papers, brief notes, case studies and book reviews for publication in
the journal. Please visit www.rmkec.ac.in for information of the Journal.
Chief Editor:
Principal
R.M.K. Engineering College
RSM Nagar, Kavaraipettai–601 206
Gummidipoondi Taluk, Thiruvallur District
Tamil Nadu, India
Phone: 044-27925338, 339, 102
Fax: 044-27925193
Website: www.rmkec.ac.in
E-mail: [email protected]
Instruction to Author
Authors intending to submit a paper to the journal are available to follow the guidelines.
• Authors are requested to transmit the text and art of the manuscript in electronic form • Each manuscript must also be accompanied by a cover letter, copy right form, and an abstract outlining the
basic findings of the paper and their significance.
• Prior to submitting your paper, please follow the instructions given below.

Types of Contributions
The following types of manuscripts on all topics within the scope of the journal (see separate list) are welcome.
• Full-length papers containing original research work.
• Short Communications giving a complete description of a limited investigation. They should be as completely
documented, both by reference to the literature and by description of the experimental procedures employed, as
a full-length paper. Typically s Short communication will contain no more than four of five figures (graphs or
sets of images) and 2 paper pages.
• Book Reviews by invitation.
• Brief discussion on papers published.
Corresponding Author
Clearly indicate who will handle correspondence at all stages of refereeing and publication, also post
publication. Ensure that telephone and fax numbers (with country and area code) are provided in addition to the
email address and the complete postal address. Full postal addresses must be given for all co-authors.
Length
1. Paper should not exceed 10 pages (including figures, graphs and tables)
2. Review papers may not exceed 15 pages.
Text Area: The following text margins must be used (on size A4 paper; 297X210mm):
Top: 30mm, Bottom: 30mm, Left: 30mm, Right: 20mm
Fonts and line spacing: Use only Times new Roman. Use one-and a half line spacing and justify the text on
both left and right margins. Al body text should be 12 point normal.
Preparation of Manuscripts
1. The language of journal is English. The mode of presentation should be in third person. Poor English can be
reason for rejection of the paper.
2. SI units should be used wherever possible. Other units, if used be given only in parenthesis preceded by SI
units.
3. Mathematical symbols should be types or neatly handwritten, care should be taken to differentiate between
similar characters (e.g. 1 and I), capital and lower case letters and superior and inferior types.
4. Manuscripts should be typed with one and half spacing throughout (including references) on one side of A4
size paper, leaving ample margins; each table should be typed separately. Lengthy mathematical proofs and
extensive test as discouraged.
5. The preferred order of content is:
(a) Title of paper;
(b) Author(s);
(c) Synopsis of not more than 150 words, covering the aim of work, method used, results obtained and
conclusions reached;
(d) Keywords and list of notation, where applicable;
(e) Authors business address as a footnote to the front page;
(f) Body of the paper: Organised into logical sections, with preferably not more than two grades of
subheadings;
(g) Acknowledgement;
(h) References:
References should be listed at the end of the paper and numbered in the order of their appearance in the text.
Authors should ensure that every reference in the text appears in the list of references and vice versa. Numerals
for references should appear in square brackets [ ], and any reference to authors’ names in the text should omit
initials.
A reference to a publication with more than two authors in the text should be to the name the first author et al.,
but in the list of references the names and initials of all authors must be given. In the reference list, periodicals
[1], books [2], and multi-author books [3] should be cited as in the following examples.
1. M.M Benal, I. Finnie, On the size effect in abrasive erosive wear, Mechanical Engg.65(1991)359-373
2. H.K. Shivanand, Engineering Tribology, Oxford University Press, Oxford, 2001, p.468.
3. G.W. Stachowiak, Numerical Characterization of wear particle morphology, in: I.M. Hutchings(Ed.)., New
Directions in Tribology, Mechanical Engineering Publications Ltd., Bury St Edmunds, pp,37–389, 1997.
Tables: These should be numbered consecutively throughout the text and (i) List of captions for the illustrations
which should also be numbered consecutively throughout the text.
Original Material: Submission of an article implies that the work described has not been published previously
(except in the form of an abstract or as part of a published lecture or academic thesis), that it is not under
consideration for publication elsewhere, that its publication is approved by all authors and that, if accepted, it
will not be published elsewhere in the same form, in English or in any other language, without the written
consent of the Publisher.
Illustrations: Original line drawings must neatly be drawn in black Indian ink, on a good quality tracing paper
of A-4 size (210X297). For letters, only mechanical lettering sets (Stencils) should be used. Letterings in the
figure should be large enough such that even the smallest of them would be at least 1.5mm high when the
figures are scanned for printing. Figure captions should be typed out separate list at the end of the manuscript.
Tables: Tables should be numbered consecutively and given suitable caption and each table is laid out with in a
page. No vertical rules should be used. Tables should not duplicate results presented elsewhere in the
manuscript (for example, in graphs). Footnotes to table should be typed below the table and should referred to
by superscript lowercase letters.
Photographs: Photographs should be clear, sharp black and white prints with good contrast in glossy paper.
Again the most suitable size is twice the final size. Cuttings from printed matter of photocopies are unsuitable
for reproduction. Each illustration should be marked with the authors names and the figure number, the top of
each photograph should be indicated. Illustrations will be by authors only if specifically requested for and in the
condition received for the press.
Copyright: Papers are considered for possible publication on the understanding that these have not been
submitted to any other publisher. The copyright of the papers accepted for publication becomes the property of
our journal and reproduction of any part of the paper elsewhere is not allowed without the permission of the
publisher. Contributors are required to sign a declaration to this effect while submitting their papers.