Embed Size (px)
Citation preview
Journal of Analytical and Applied Pyrolysis 163 (2022) 105501
Available online 12 March 20220165-2370/© 2022 Elsevier B.V. All rights reserved.
The evolution of pore structure heterogeneity during thermal maturation in lacustrine shale pyrolysis
Ming Guan a,b,c, Xiaoping Liu a,b,*, Zhijun Jin d,e,*, Jin Lai b,c, Biao Sun a,b, Panpan Zhang f, Kefei Chen g
a State Key Laboratory of Petroleum Resources and Prospecting, China University of Petroleum (Beijing), Beijing 102249, China b College of Geosciences, China University of Petroleum (Beijing), Beijing 102249, China c Research Institute of Petroleum Exploration and Development, China National Petroleum Corporation, Beijing 100083, China d Institute of Energy, Peking University, Beijing 100871, China e State Key Laboratory of Shale Oil and Gas Enrichment Mechanisms and Effective Development, Beijing 100083, China f School of Energy Resources, China University of Geosciences, Beijing 100083, China g National Institute of Natural Hazards, Ministry of Emergency Management of China, Beijing 100085, China
A R T I C L E I N F O
Keywords: Shale Pyrolysis Thermal maturity Pore structure heterogeneity Evolution
A B S T R A C T
Although pore structure variations during thermal maturation have been extensively discussed using natural or artificially matured shale samples, related investigations into pore structure heterogeneity and its evolution remain scarce, posing challenges in fine reservoir evaluation and exploration target prioritization. The variation of pore structure heterogeneity during thermal maturation was determined in this study by integrating multi-fractal theory with nitrogen adsorption-desorption tests using the naturally immature sample and the artificially matured samples, and the governing factors were ascertained. The increasing thermal maturity results in organic matter transformation, hydrocarbon generation, retention and expulsion, and various types of pore formation, driving the variation of pore structure heterogeneity. Pore structure heterogeneity, quantified by the breadth of singular spectra, was chiefly impacted by the pore volume difference between diverse types of pores. Macropores make a main contribution to pore structure heterogeneity due to their higher percentage of total pore volume compared to mesopores and micropores. Through a comparison of pore structure heterogeneity in shale samples with different thermal maturity, the impact of thermal maturity on shales was clarified. At immature to low- mature stages, nonthermal maturity factors make a main contribution to the inherent pore structure of different shales and cause an ambiguous relationship between pore structure heterogeneity and thermal matu-rity. At mature to high-mature stages, pore structure becomes more heterogeneous with increasing thermal maturity, resulting from newly formed organic pores or dissolution pores and the progressive generation and expulsion of liquid and gaseous hydrocarbons. At the over-mature stage, pore structure heterogeneity decreases and then fluctuates on a small scale, related to the collapse of mesopores and macropores caused by compaction and the predominance of newly formed micropores.
1. Introduction
Shales contain complicated pore systems with a wide spectrum of pore sizes, complex pore geometry, and diverse pore types, etc. [1,2], all of which are closely related to complicated pore structure and pore heterogeneity. The pore structure has a significant impact on the occurrence and fluidity of shale oil/gas in these pores [3–6], which is important when designing reservoir stimulation and predicting well
productivity [7,8]. A series of techniques have been employed to explore shale pore
characteristics. 2D/3D imaging approaches are applied to characterize surface porosity, pore geometry, and pore connectivity [9,10], including light microscopy, scan electron microscopy, micro 3D X-ray microscopy, nano 3D X-ray microscopy, and focus ion beam-scan electron micro-scopy, etc. The pore structure of shale reservoirs can be evaluated using relevant parameters [11,12], such as surface area, pore volume, and
* Corresponding author at: College of Geosciences, China University of Petroleum (Beijing), Beijing 102249, China. * Corresponding author at: Institute of Energy, Peking University, Beijing 100871, China.
E-mail addresses: [email protected] (X. Liu), [email protected] (Z. Jin).
Contents lists available at ScienceDirect
Journal of Analytical and Applied Pyrolysis
journal homepage: www.elsevier.com/locate/jaap
https://doi.org/10.1016/j.jaap.2022.105501 Received 19 November 2021; Received in revised form 13 February 2022; Accepted 10 March 2022
Journal of Analytical and Applied Pyrolysis 163 (2022) 105501
2
pore size distribution, which can be acquired using gas adsorption (CO2, N2, Ar), mercury intrusion, nuclear magnetic resonance (NMR), and small/ultra-small angle neutron scattering, etc. Porosity and perme-ability can be determined by gas injection (He), fluid immersion, mer-cury intrusion, NMR, etc. [13,14]. Fractal features of shale pores have been explored by establishing a power-law relationship between scales (gas absorbed relative pressure, capillary pressure, transverse relaxation time) and the corresponding detecting volumes (gas adsorbed volume, mercury intrusion saturation, cumulative porosity), and the resulting fractal dimensions represent pore surface roughness and pore structural complexity. Multifractal theory, which specializes in capturing the local fluctuations and defining the heterogeneity of a system using a contin-uous dimension spectrum, has recently been successfully applied to quantify the variance of pore size distribution in shales. Pore structure heterogeneity of many shales globally has been quantified by processing pore images or pore structure data, including Bakken Fm in the Williston Basin [15,16], Kongdian Fm and Shahejie Fm in the Bahai Bay Basin [17, 18], Lucaogou Fm in the Junggar Basin [19], and Wufeng-longmaxi Fm in the Sichuan Basin [20–22], to evaluate reservoir types and qualities, explore governing mechanism of pore development, and compare the pore structure heterogeneity acquired from different methodologies or different shales.
The diagenesis and evolution of shales have been investigated by using natural samples or artificially matured samples, providing detailed insight into minerals transformation [7,23], kerogen structure changes [24–26], hydrocarbons generation-retention-expulsion [27–29], organ-ic–inorganic interactions [30,31], and pore structure evolution [32–37]
during thermal maturation. Previous studies showed that thermal maturation has a positive impact on pore structure alternations in naturally or artificially matured samples [34,38], and concluded that shales with diverse organic matter types or mineral compositions demonstrate diversified pore structure evolution during thermal matu-ration [34,35]. During the process of hydrocarbon generation and expulsion, oil generative shales often exhibit a larger rise in pore volume and produce large-diameter pores, whereas gas generative shales readily form smaller-diameter pores [35,39]. Because of pore constructiveness or destruction induced by compaction, dissolution, and cementation in conventional reservoirs, pore variation in shale reservoirs is more intricate in view of the superimposition of diagenesis and thermal evo-lution [37,40]. However, research on the relationship between pore structure heterogeneity and hydrocarbon generation/expulsion during thermal maturation is scarce, which impedes the fine evaluation of shale reservoirs and the prediction of shale oil or shale gas occurrence.
In this study, various artificially matured shale samples were ob-tained from hydrous pyrolysis experiments, and pore structure hetero-geneity was quantified by integrating multifractal analysis with nitrogen adsorption-desorption tests. Thermal maturation was established using the naturally immature lacustrine shale sample and its artificially matured counterparts to understand relationships among organic matter transformation, hydrocarbon generation-retention-expulsion, pore structure variation, and the corresponding heterogeneity. This study links variations in pore structure heterogeneity to the transformation of organic matter into petroleum and gas, and it has implications for prioritizing the key stage of oil and gas accumulation and favorable
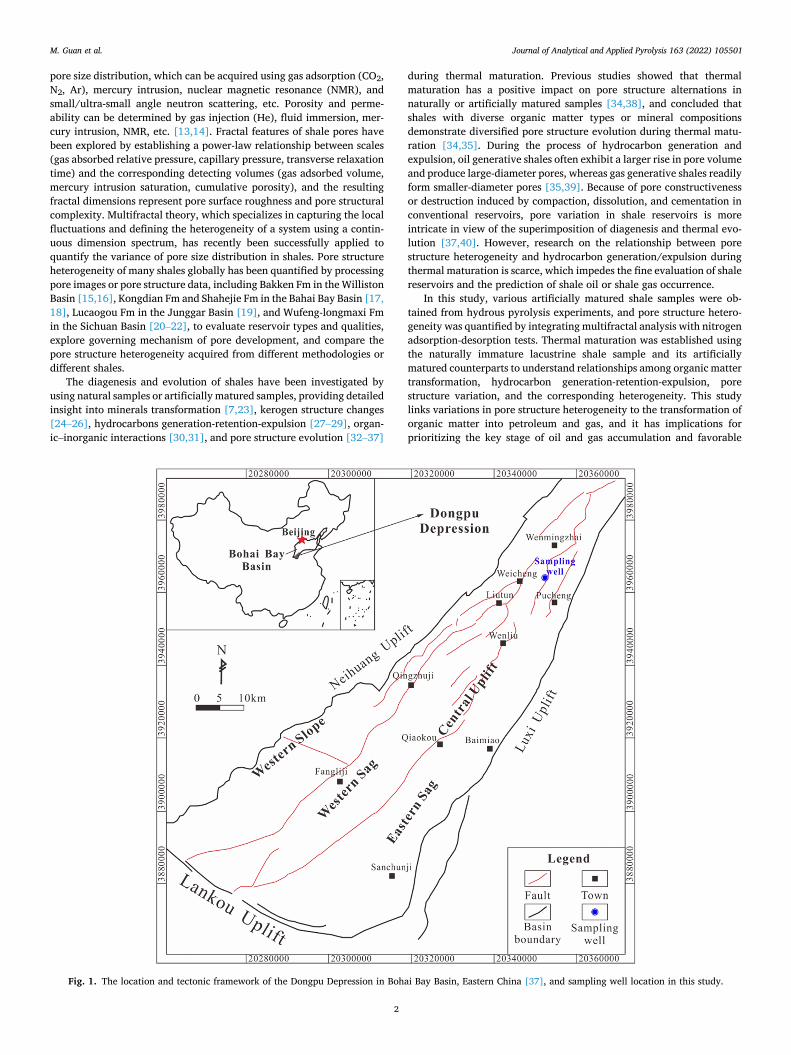
Fig. 1. The location and tectonic framework of the Dongpu Depression in Bohai Bay Basin, Eastern China [37], and sampling well location in this study.
M. Guan et al.
Journal of Analytical and Applied Pyrolysis 163 (2022) 105501
3
reservoirs in self-sourced unconventional reservoirs.
2. Methodology
2.1. Samples
The organic-rich and immature shale sample with total organic carbon (TOC) of 1.77% and vitrinite reflectance (Ro) of 0.5% was collected from the Shahejie Fm in Dongpu Depression of the Bohai Bay Basin, Eastern China (Fig. 1). The shale is a potential source rock for the Dongpu Depression, with an average TOC value of 0.76%. As proven by the high percentage of exinite and sapropelinite, type II of organic matter predominates in the shale. The burial depth of the shale is mostly about 1800~2500 m, corresponding to immature to low-mature stages [41]. The sulfur-rich oil discovered in many regions of the Depression shows immature to low mature characteristics [42]. Six small core col-umns with a diameter of 3.8 cm and a height of 5 cm were drilled from the original sample to conduct hydrous pyrolysis.
2.2. Experiments
Semi-open pyrolysis experiments were conducted by a high- temperature/high-pressure autoclave from Sinopec Petroleum Explora-tion and Production Research Institute (Wuxi, China) [39]. The reactor was heated to 300, 325, 350, 375, 400, and 500 ◦C to obtain artificially matured shale samples with the various evolutionary stages of hydro-carbon generation, and the corresponding samples were named PY-300, PY-325, PY-350, PY-375, PY-400, and PY-500, respectively. The desired temperatures were achieved at a heating rate of 1 ◦C/min and then maintained for 48 h to ensure the thermal equilibrium of the entire system. Samples were saturated with high-pressure deionized water during the process of the pyrolysis experiments. Oil cylinders were used to provide the confining pressures. Pyrolysis products were collected and measured, including hydrocarbon products and sample residues.
The expelled gaseous mixture was identified and their relative con-tributions were determined by using a 3800 Gas Chromatograph, including H2, O2, N2, CO2, gaseous hydrocarbons (CxH2x+2, where 2 ≤
x ≤ 5), etc. The gaseous hydrocarbon amount was calculated according to the ideal gas law [43]. The amount of retained oil was determined in accordance with total solid residue weight and extractible organic matter (EOM) content that was extracted using the Soxhlet extraction procedure. Expelled liquid hydrocarbons were quantified by the liquid hydrocarbons collected from the oil collector and the autoclave wall and pipe. Total hydrocarbon amount was the sum of retained liquid hydro-carbons, expelled liquid hydrocarbons, and expelled gaseous hydrocarbons.
Shale samples were crushed into powder with a grain diameter of <80 mesh, and dilute hydrochloric acid was dropwise added into approximately 100 mg of powder samples to eliminate inorganic car-bon. After that, the samples were introduced into a LECO CS-200 car-bon/sulfur analyzer to measure TOC. Approximately 100 mg of powdered samples (< 100 mesh) were placed into a Rock-Eval 6 device to obtain pyrolysis parameters. Thin sections were produced by being coated with epoxy resin and polished, and Ro values were determined via an AxioSope.A1 microscope equipped with a photomicrometer and an oil immersion lens.
Powder samples (about 0.5 g, < 100 mesh) were degassed for 24 h at 423 K, and then a JWBK-200 C surface area/pore size analyzer was employed to obtain adsorption-desorption volumes of different relative pressures (P/P0) with a range of 0.001~0.999 at -196 ◦C. Pores with a diameter of less than 200 nm were detected, and pores with different pore sizes were identified, including micropores (pore size < 2 nm), mesopores (pore size of 2~50 nm) and macropores (pore size > 50 nm) [44]. Subsequently, a series of pore structure parameters, including specific surface area, total pore volume, micropore volume, and pore size distribution (PSD), were calculated by the modified BET model
[45], the general principle of Gurevich rule [46], HK model [47], and BJH model [48], respectively.
2.3. Multifractal theory
The box-counting method was applied to nitrogen adsorption data to study the multifractal behavior of the shale. A set of different boxes with identical scale (r) were required to cover the total length of the target object. And then the total length was allocated to these boxes by a dyadic scaling down procedure. The density probability in ith box can be written as follows:
Pi(r) = Vi(r)/ ∑N(r)
i=1Vi(r) (1)
where Pi(r) denotes the probability density function; Vi(r) represents the pore volume of ith box; N(r) is the total number of boxes, N(r) = 2k
(k = 0, 1, 2, …). Pi(r), which fits an exponential function of r, can be expressed as [49]:
Pi(r)∝rαi (2)
where αi is the singularity exponent representing the singularity degrees of the system, and relates to number of the boxes Nα(r):
Nα(r)∝r− f (α) (3)
where f(α) indicates the multifractal spectrum or singularity spectrum, meaning the same or close α values in these boxes. Thus, α(q) and f(α) can be calculated as below [50]:
α(q)∝[∑N(r)
i=1Xi(q, r) × logPi(r)]
/
log(r) (4)
f(q)∝[∑N(r)
i=1Xi(q, r) × logXi(q, r)]
/
log(r) (5)
where Xi(q, r) is the partition function derived from the weighed sum of qth power of Pi(r) and also follows a power law function of r:
Xi(q, r) =∑N(r)
i=1Pq
i (r)∝rτq (6)
where q with a range of -10~10 in increments of 1 was used as expo-nents for scrutinizing the denser or sparser regions of measure μi(q, r) [51]; τq is the mass index and can be expressed as:
τq = limr→0
log∑N(r)
i=1 Pqi (r)
log(r)(7)
Generalized dimension Dq, referred to as singular measure [52], can be derived from:
Dq =1
q − 1limr→0
log∑N(r)
i=1 Pqi (r)
log(r)=
τ(q)q − 1
(8)
In this study, multifractal properties were quantified by using the logarithmic form of P/P0 and the density probability of gas adsorption volume derived from nitrogen adsorption-desorption results.
3. Results
3.1. Bulk organic geochemistry
The original sample is immature and has Ro of 0.50%. The desired experimental temperatures bring about an increase in thermal maturity ranging from 0.57% to 2.60% of Ro (Table 1), corresponding to thermal evolution from low-mature to over-mature stages. PY-300 with Ro of 0.57% is at the low mature stage; PY-325 and PY-350 with Ro values of 0.77% and 1.04%, respectively, are at the mature stage (i.e., the main
M. Guan et al.
Journal of Analytical and Applied Pyrolysis 163 (2022) 105501
4
“oil-window”); PY-375 and PY-400 with Ro of 1.42% and 1.74%, respectively, correspond to the high mature stage (i.e., the condensate and wet gas window); and PY-500 with Ro of 2.60% is at the overmature stage (i.e., the dry gas window).
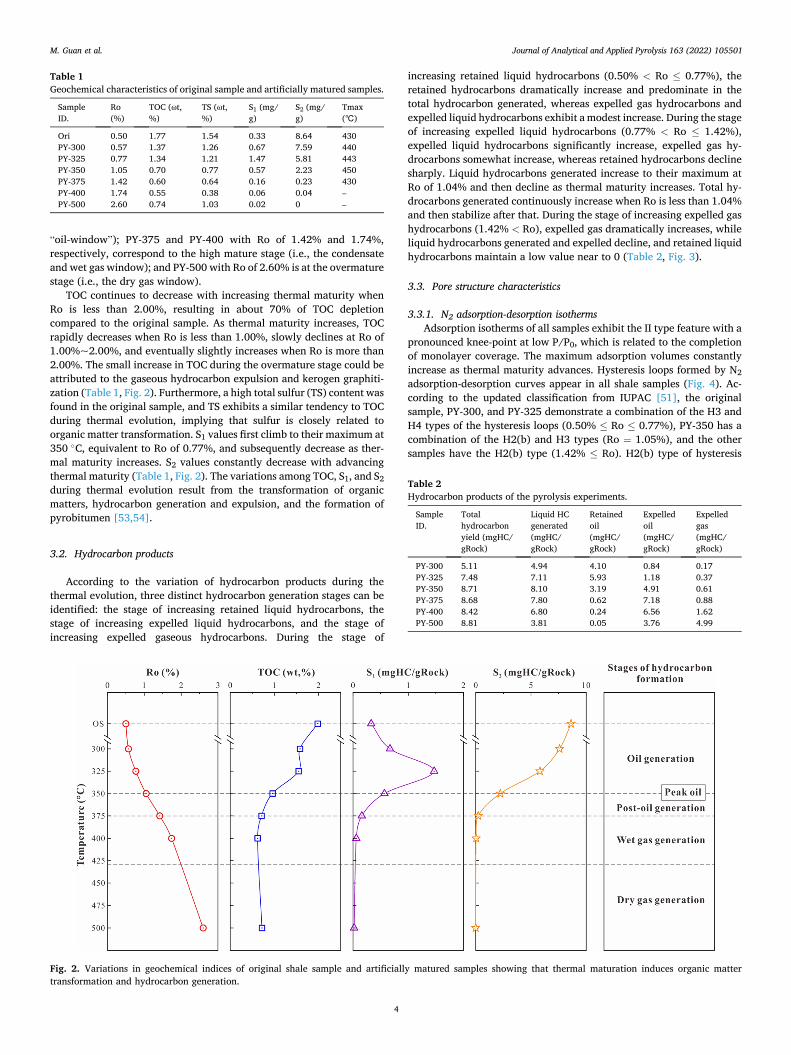
TOC continues to decrease with increasing thermal maturity when Ro is less than 2.00%, resulting in about 70% of TOC depletion compared to the original sample. As thermal maturity increases, TOC rapidly decreases when Ro is less than 1.00%, slowly declines at Ro of 1.00%~2.00%, and eventually slightly increases when Ro is more than 2.00%. The small increase in TOC during the overmature stage could be attributed to the gaseous hydrocarbon expulsion and kerogen graphiti-zation (Table 1, Fig. 2). Furthermore, a high total sulfur (TS) content was found in the original sample, and TS exhibits a similar tendency to TOC during thermal evolution, implying that sulfur is closely related to organic matter transformation. S1 values first climb to their maximum at 350 ◦C, equivalent to Ro of 0.77%, and subsequently decrease as ther-mal maturity increases. S2 values constantly decrease with advancing thermal maturity (Table 1, Fig. 2). The variations among TOC, S1, and S2 during thermal evolution result from the transformation of organic matters, hydrocarbon generation and expulsion, and the formation of pyrobitumen [53,54].
3.2. Hydrocarbon products
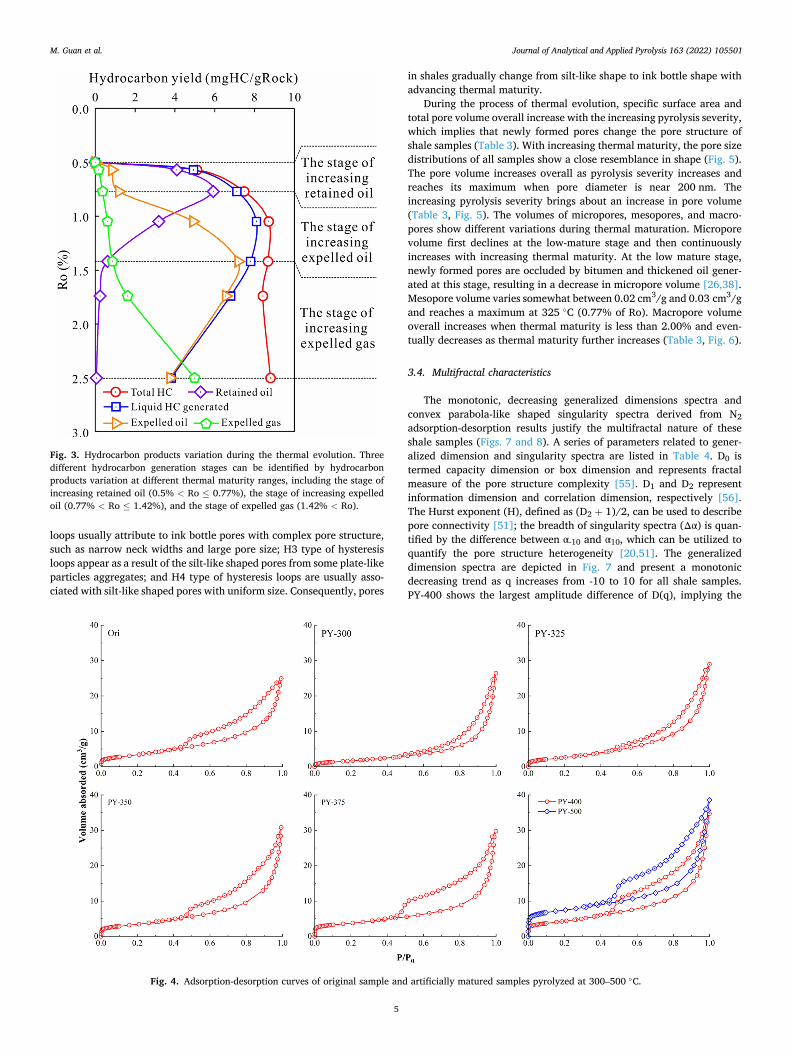
According to the variation of hydrocarbon products during the thermal evolution, three distinct hydrocarbon generation stages can be identified: the stage of increasing retained liquid hydrocarbons, the stage of increasing expelled liquid hydrocarbons, and the stage of increasing expelled gaseous hydrocarbons. During the stage of
increasing retained liquid hydrocarbons (0.50% < Ro ≤ 0.77%), the retained hydrocarbons dramatically increase and predominate in the total hydrocarbon generated, whereas expelled gas hydrocarbons and expelled liquid hydrocarbons exhibit a modest increase. During the stage of increasing expelled liquid hydrocarbons (0.77% < Ro ≤ 1.42%), expelled liquid hydrocarbons significantly increase, expelled gas hy-drocarbons somewhat increase, whereas retained hydrocarbons decline sharply. Liquid hydrocarbons generated increase to their maximum at Ro of 1.04% and then decline as thermal maturity increases. Total hy-drocarbons generated continuously increase when Ro is less than 1.04% and then stabilize after that. During the stage of increasing expelled gas hydrocarbons (1.42% < Ro), expelled gas dramatically increases, while liquid hydrocarbons generated and expelled decline, and retained liquid hydrocarbons maintain a low value near to 0 (Table 2, Fig. 3).
3.3. Pore structure characteristics
3.3.1. N2 adsorption-desorption isotherms Adsorption isotherms of all samples exhibit the II type feature with a
pronounced knee-point at low P/P0, which is related to the completion of monolayer coverage. The maximum adsorption volumes constantly increase as thermal maturity advances. Hysteresis loops formed by N2 adsorption-desorption curves appear in all shale samples (Fig. 4). Ac-cording to the updated classification from IUPAC [51], the original sample, PY-300, and PY-325 demonstrate a combination of the H3 and H4 types of the hysteresis loops (0.50% ≤ Ro ≤ 0.77%), PY-350 has a combination of the H2(b) and H3 types (Ro = 1.05%), and the other samples have the H2(b) type (1.42% ≤ Ro). H2(b) type of hysteresis
Table 1 Geochemical characteristics of original sample and artificially matured samples.
Sample ID.
Ro (%)
TOC (ωt, %)
TS (ωt, %)
S1 (mg/ g)
S2 (mg/ g)
Tmax (℃)
Ori 0.50 1.77 1.54 0.33 8.64 430 PY-300 0.57 1.37 1.26 0.67 7.59 440 PY-325 0.77 1.34 1.21 1.47 5.81 443 PY-350 1.05 0.70 0.77 0.57 2.23 450 PY-375 1.42 0.60 0.64 0.16 0.23 430 PY-400 1.74 0.55 0.38 0.06 0.04 – PY-500 2.60 0.74 1.03 0.02 0 –
Fig. 2. Variations in geochemical indices of original shale sample and artificially matured samples showing that thermal maturation induces organic matter transformation and hydrocarbon generation.
Table 2 Hydrocarbon products of the pyrolysis experiments.
Sample ID.
Total hydrocarbon yield (mgHC/ gRock)
Liquid HC generated (mgHC/ gRock)
Retained oil (mgHC/ gRock)
Expelled oil (mgHC/ gRock)
Expelled gas (mgHC/ gRock)
PY-300 5.11 4.94 4.10 0.84 0.17 PY-325 7.48 7.11 5.93 1.18 0.37 PY-350 8.71 8.10 3.19 4.91 0.61 PY-375 8.68 7.80 0.62 7.18 0.88 PY-400 8.42 6.80 0.24 6.56 1.62 PY-500 8.81 3.81 0.05 3.76 4.99
M. Guan et al.
Journal of Analytical and Applied Pyrolysis 163 (2022) 105501
5
loops usually attribute to ink bottle pores with complex pore structure, such as narrow neck widths and large pore size; H3 type of hysteresis loops appear as a result of the silt-like shaped pores from some plate-like particles aggregates; and H4 type of hysteresis loops are usually asso-ciated with silt-like shaped pores with uniform size. Consequently, pores
in shales gradually change from silt-like shape to ink bottle shape with advancing thermal maturity.
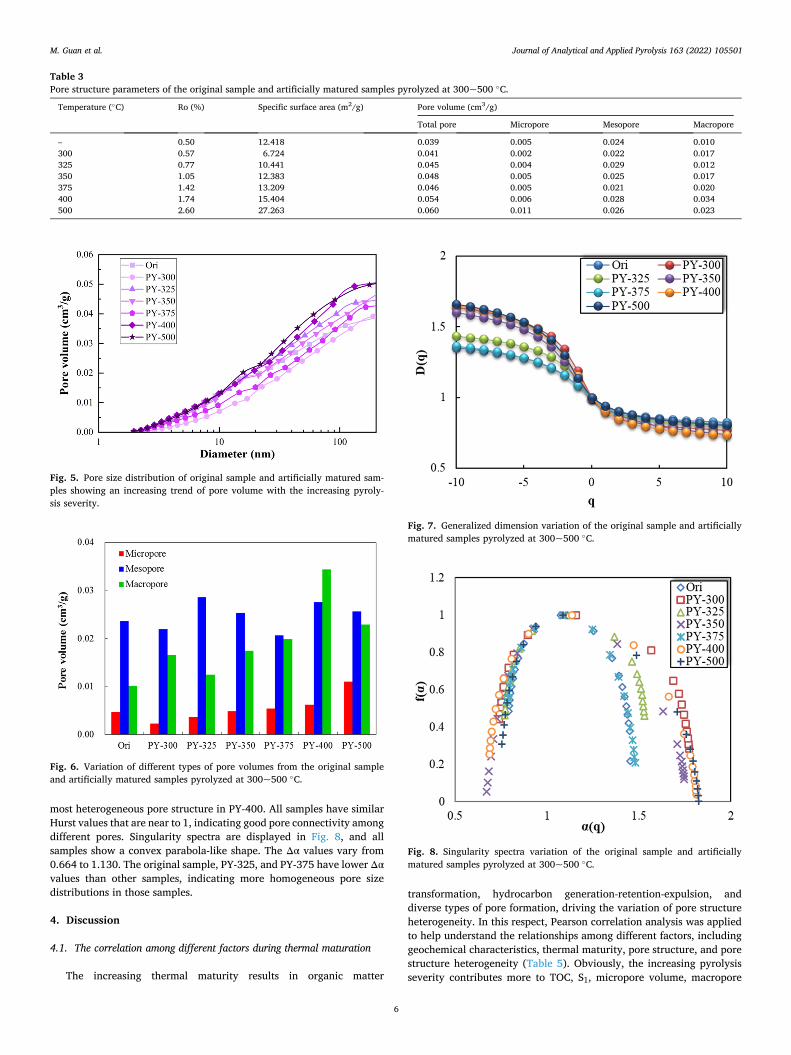
During the process of thermal evolution, specific surface area and total pore volume overall increase with the increasing pyrolysis severity, which implies that newly formed pores change the pore structure of shale samples (Table 3). With increasing thermal maturity, the pore size distributions of all samples show a close resemblance in shape (Fig. 5). The pore volume increases overall as pyrolysis severity increases and reaches its maximum when pore diameter is near 200 nm. The increasing pyrolysis severity brings about an increase in pore volume (Table 3, Fig. 5). The volumes of micropores, mesopores, and macro-pores show different variations during thermal maturation. Micropore volume first declines at the low-mature stage and then continuously increases with increasing thermal maturity. At the low mature stage, newly formed pores are occluded by bitumen and thickened oil gener-ated at this stage, resulting in a decrease in micropore volume [26,38]. Mesopore volume varies somewhat between 0.02 cm3/g and 0.03 cm3/g and reaches a maximum at 325 ◦C (0.77% of Ro). Macropore volume overall increases when thermal maturity is less than 2.00% and even-tually decreases as thermal maturity further increases (Table 3, Fig. 6).
3.4. Multifractal characteristics
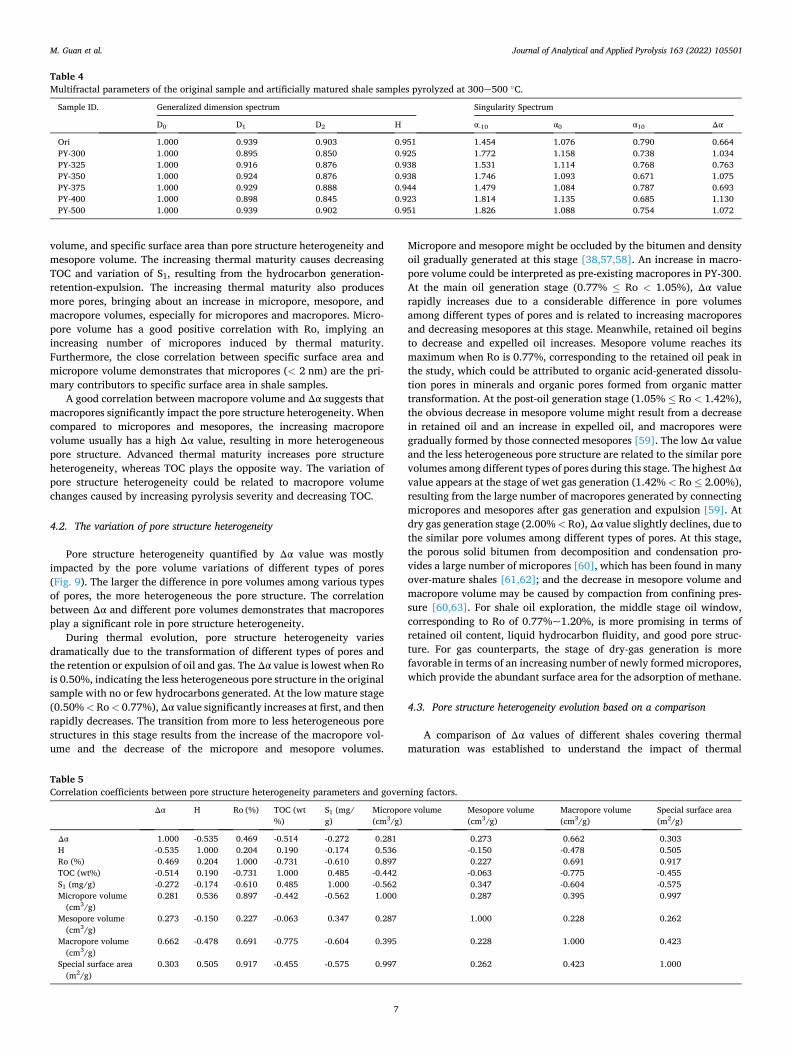
The monotonic, decreasing generalized dimensions spectra and convex parabola-like shaped singularity spectra derived from N2 adsorption-desorption results justify the multifractal nature of these shale samples (Figs. 7 and 8). A series of parameters related to gener-alized dimension and singularity spectra are listed in Table 4. D0 is termed capacity dimension or box dimension and represents fractal measure of the pore structure complexity [55]. D1 and D2 represent information dimension and correlation dimension, respectively [56]. The Hurst exponent (H), defined as (D2 + 1)/2, can be used to describe pore connectivity [51]; the breadth of singularity spectra (Δα) is quan-tified by the difference between α-10 and α10, which can be utilized to quantify the pore structure heterogeneity [20,51]. The generalized dimension spectra are depicted in Fig. 7 and present a monotonic decreasing trend as q increases from -10 to 10 for all shale samples. PY-400 shows the largest amplitude difference of D(q), implying the
Fig. 3. Hydrocarbon products variation during the thermal evolution. Three different hydrocarbon generation stages can be identified by hydrocarbon products variation at different thermal maturity ranges, including the stage of increasing retained oil (0.5% < Ro ≤ 0.77%), the stage of increasing expelled oil (0.77% < Ro ≤ 1.42%), and the stage of expelled gas (1.42% < Ro).
Fig. 4. Adsorption-desorption curves of original sample and artificially matured samples pyrolyzed at 300–500 ◦C.
M. Guan et al.
Journal of Analytical and Applied Pyrolysis 163 (2022) 105501
6
most heterogeneous pore structure in PY-400. All samples have similar Hurst values that are near to 1, indicating good pore connectivity among different pores. Singularity spectra are displayed in Fig. 8, and all samples show a convex parabola-like shape. The Δα values vary from 0.664 to 1.130. The original sample, PY-325, and PY-375 have lower Δα values than other samples, indicating more homogeneous pore size distributions in those samples.
4. Discussion
4.1. The correlation among different factors during thermal maturation
The increasing thermal maturity results in organic matter
transformation, hydrocarbon generation-retention-expulsion, and diverse types of pore formation, driving the variation of pore structure heterogeneity. In this respect, Pearson correlation analysis was applied to help understand the relationships among different factors, including geochemical characteristics, thermal maturity, pore structure, and pore structure heterogeneity (Table 5). Obviously, the increasing pyrolysis severity contributes more to TOC, S1, micropore volume, macropore
Table 3 Pore structure parameters of the original sample and artificially matured samples pyrolyzed at 300~500 ◦C.
Temperature (◦C) Ro (%) Specific surface area (m2/g) Pore volume (cm3/g)
Total pore Micropore Mesopore Macropore
– 0.50 12.418 0.039 0.005 0.024 0.010 300 0.57 6.724 0.041 0.002 0.022 0.017 325 0.77 10.441 0.045 0.004 0.029 0.012 350 1.05 12.383 0.048 0.005 0.025 0.017 375 1.42 13.209 0.046 0.005 0.021 0.020 400 1.74 15.404 0.054 0.006 0.028 0.034 500 2.60 27.263 0.060 0.011 0.026 0.023
Fig. 5. Pore size distribution of original sample and artificially matured sam-ples showing an increasing trend of pore volume with the increasing pyroly-sis severity.
Fig. 6. Variation of different types of pore volumes from the original sample and artificially matured samples pyrolyzed at 300~500 ◦C.
Fig. 7. Generalized dimension variation of the original sample and artificially matured samples pyrolyzed at 300~500 ◦C.
Fig. 8. Singularity spectra variation of the original sample and artificially matured samples pyrolyzed at 300~500 ◦C.
M. Guan et al.
Journal of Analytical and Applied Pyrolysis 163 (2022) 105501
7
volume, and specific surface area than pore structure heterogeneity and mesopore volume. The increasing thermal maturity causes decreasing TOC and variation of S1, resulting from the hydrocarbon generation- retention-expulsion. The increasing thermal maturity also produces more pores, bringing about an increase in micropore, mesopore, and macropore volumes, especially for micropores and macropores. Micro-pore volume has a good positive correlation with Ro, implying an increasing number of micropores induced by thermal maturity. Furthermore, the close correlation between specific surface area and micropore volume demonstrates that micropores (< 2 nm) are the pri-mary contributors to specific surface area in shale samples.
A good correlation between macropore volume and Δα suggests that macropores significantly impact the pore structure heterogeneity. When compared to micropores and mesopores, the increasing macropore volume usually has a high Δα value, resulting in more heterogeneous pore structure. Advanced thermal maturity increases pore structure heterogeneity, whereas TOC plays the opposite way. The variation of pore structure heterogeneity could be related to macropore volume changes caused by increasing pyrolysis severity and decreasing TOC.
4.2. The variation of pore structure heterogeneity
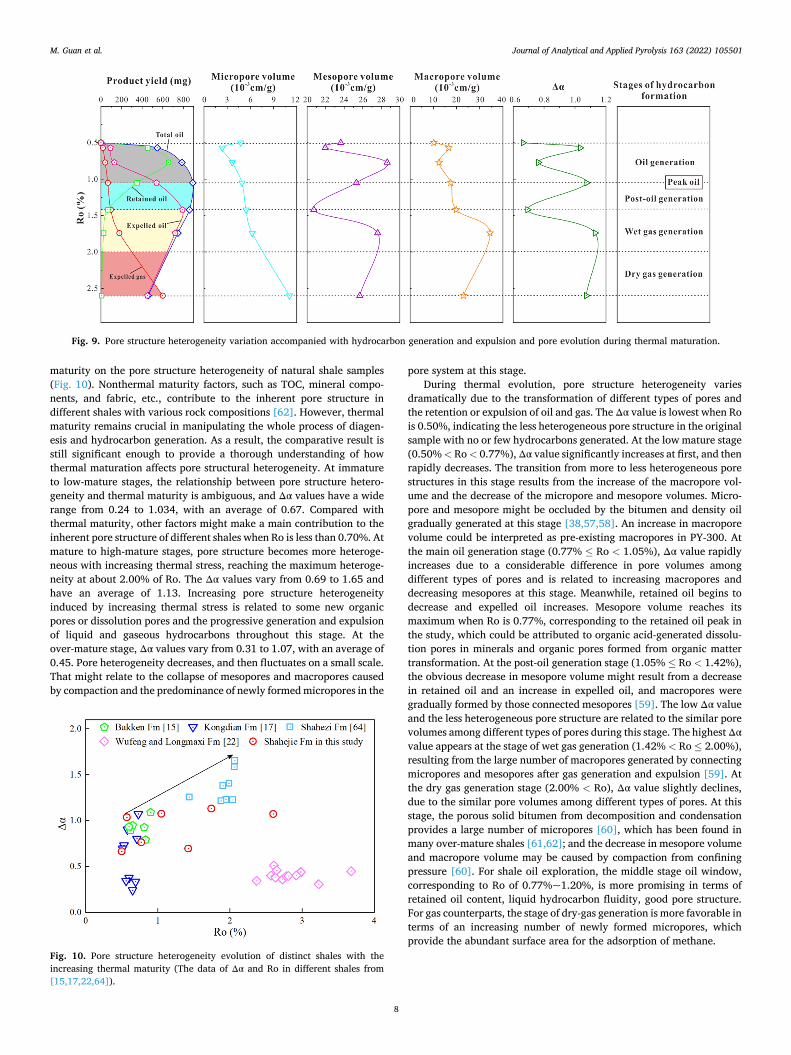
Pore structure heterogeneity quantified by Δα value was mostly impacted by the pore volume variations of different types of pores (Fig. 9). The larger the difference in pore volumes among various types of pores, the more heterogeneous the pore structure. The correlation between Δα and different pore volumes demonstrates that macropores play a significant role in pore structure heterogeneity.
During thermal evolution, pore structure heterogeneity varies dramatically due to the transformation of different types of pores and the retention or expulsion of oil and gas. The Δα value is lowest when Ro is 0.50%, indicating the less heterogeneous pore structure in the original sample with no or few hydrocarbons generated. At the low mature stage (0.50% < Ro < 0.77%), Δα value significantly increases at first, and then rapidly decreases. The transition from more to less heterogeneous pore structures in this stage results from the increase of the macropore vol-ume and the decrease of the micropore and mesopore volumes.
Micropore and mesopore might be occluded by the bitumen and density oil gradually generated at this stage [38,57,58]. An increase in macro-pore volume could be interpreted as pre-existing macropores in PY-300. At the main oil generation stage (0.77% ≤ Ro < 1.05%), Δα value rapidly increases due to a considerable difference in pore volumes among different types of pores and is related to increasing macropores and decreasing mesopores at this stage. Meanwhile, retained oil begins to decrease and expelled oil increases. Mesopore volume reaches its maximum when Ro is 0.77%, corresponding to the retained oil peak in the study, which could be attributed to organic acid-generated dissolu-tion pores in minerals and organic pores formed from organic matter transformation. At the post-oil generation stage (1.05% ≤ Ro < 1.42%), the obvious decrease in mesopore volume might result from a decrease in retained oil and an increase in expelled oil, and macropores were gradually formed by those connected mesopores [59]. The low Δα value and the less heterogeneous pore structure are related to the similar pore volumes among different types of pores during this stage. The highest Δα value appears at the stage of wet gas generation (1.42% < Ro ≤ 2.00%), resulting from the large number of macropores generated by connecting micropores and mesopores after gas generation and expulsion [59]. At dry gas generation stage (2.00% < Ro), Δα value slightly declines, due to the similar pore volumes among different types of pores. At this stage, the porous solid bitumen from decomposition and condensation pro-vides a large number of micropores [60], which has been found in many over-mature shales [61,62]; and the decrease in mesopore volume and macropore volume may be caused by compaction from confining pres-sure [60,63]. For shale oil exploration, the middle stage oil window, corresponding to Ro of 0.77%~1.20%, is more promising in terms of retained oil content, liquid hydrocarbon fluidity, and good pore struc-ture. For gas counterparts, the stage of dry-gas generation is more favorable in terms of an increasing number of newly formed micropores, which provide the abundant surface area for the adsorption of methane.
4.3. Pore structure heterogeneity evolution based on a comparison
A comparison of Δα values of different shales covering thermal maturation was established to understand the impact of thermal
Table 4 Multifractal parameters of the original sample and artificially matured shale samples pyrolyzed at 300~500 ◦C.
Sample ID. Generalized dimension spectrum Singularity Spectrum
D0 D1 D2 H α-10 α0 α10 Δα
Ori 1.000 0.939 0.903 0.951 1.454 1.076 0.790 0.664 PY-300 1.000 0.895 0.850 0.925 1.772 1.158 0.738 1.034 PY-325 1.000 0.916 0.876 0.938 1.531 1.114 0.768 0.763 PY-350 1.000 0.924 0.876 0.938 1.746 1.093 0.671 1.075 PY-375 1.000 0.929 0.888 0.944 1.479 1.084 0.787 0.693 PY-400 1.000 0.898 0.845 0.923 1.814 1.135 0.685 1.130 PY-500 1.000 0.939 0.902 0.951 1.826 1.088 0.754 1.072
Table 5 Correlation coefficients between pore structure heterogeneity parameters and governing factors.
Δα H Ro (%) TOC (wt %)
S1 (mg/ g)
Micropore volume (cm3/g)
Mesopore volume (cm3/g)
Macropore volume (cm3/g)
Special surface area (m2/g)
Δα 1.000 -0.535 0.469 -0.514 -0.272 0.281 0.273 0.662 0.303 H -0.535 1.000 0.204 0.190 -0.174 0.536 -0.150 -0.478 0.505 Ro (%) 0.469 0.204 1.000 -0.731 -0.610 0.897 0.227 0.691 0.917 TOC (wt%) -0.514 0.190 -0.731 1.000 0.485 -0.442 -0.063 -0.775 -0.455 S1 (mg/g) -0.272 -0.174 -0.610 0.485 1.000 -0.562 0.347 -0.604 -0.575 Micropore volume
(cm3/g) 0.281 0.536 0.897 -0.442 -0.562 1.000 0.287 0.395 0.997
Mesopore volume (cm3/g)
0.273 -0.150 0.227 -0.063 0.347 0.287 1.000 0.228 0.262
Macropore volume (cm3/g)
0.662 -0.478 0.691 -0.775 -0.604 0.395 0.228 1.000 0.423
Special surface area (m2/g)
0.303 0.505 0.917 -0.455 -0.575 0.997 0.262 0.423 1.000
M. Guan et al.
Journal of Analytical and Applied Pyrolysis 163 (2022) 105501
8
maturity on the pore structure heterogeneity of natural shale samples (Fig. 10). Nonthermal maturity factors, such as TOC, mineral compo-nents, and fabric, etc., contribute to the inherent pore structure in different shales with various rock compositions [62]. However, thermal maturity remains crucial in manipulating the whole process of diagen-esis and hydrocarbon generation. As a result, the comparative result is still significant enough to provide a thorough understanding of how thermal maturation affects pore structural heterogeneity. At immature to low-mature stages, the relationship between pore structure hetero-geneity and thermal maturity is ambiguous, and Δα values have a wide range from 0.24 to 1.034, with an average of 0.67. Compared with thermal maturity, other factors might make a main contribution to the inherent pore structure of different shales when Ro is less than 0.70%. At mature to high-mature stages, pore structure becomes more heteroge-neous with increasing thermal stress, reaching the maximum heteroge-neity at about 2.00% of Ro. The Δα values vary from 0.69 to 1.65 and have an average of 1.13. Increasing pore structure heterogeneity induced by increasing thermal stress is related to some new organic pores or dissolution pores and the progressive generation and expulsion of liquid and gaseous hydrocarbons throughout this stage. At the over-mature stage, Δα values vary from 0.31 to 1.07, with an average of 0.45. Pore heterogeneity decreases, and then fluctuates on a small scale. That might relate to the collapse of mesopores and macropores caused by compaction and the predominance of newly formed micropores in the
pore system at this stage. During thermal evolution, pore structure heterogeneity varies
dramatically due to the transformation of different types of pores and the retention or expulsion of oil and gas. The Δα value is lowest when Ro is 0.50%, indicating the less heterogeneous pore structure in the original sample with no or few hydrocarbons generated. At the low mature stage (0.50% < Ro < 0.77%), Δα value significantly increases at first, and then rapidly decreases. The transition from more to less heterogeneous pore structures in this stage results from the increase of the macropore vol-ume and the decrease of the micropore and mesopore volumes. Micro-pore and mesopore might be occluded by the bitumen and density oil gradually generated at this stage [38,57,58]. An increase in macropore volume could be interpreted as pre-existing macropores in PY-300. At the main oil generation stage (0.77% ≤ Ro < 1.05%), Δα value rapidly increases due to a considerable difference in pore volumes among different types of pores and is related to increasing macropores and decreasing mesopores at this stage. Meanwhile, retained oil begins to decrease and expelled oil increases. Mesopore volume reaches its maximum when Ro is 0.77%, corresponding to the retained oil peak in the study, which could be attributed to organic acid-generated dissolu-tion pores in minerals and organic pores formed from organic matter transformation. At the post-oil generation stage (1.05% ≤ Ro < 1.42%), the obvious decrease in mesopore volume might result from a decrease in retained oil and an increase in expelled oil, and macropores were gradually formed by those connected mesopores [59]. The low Δα value and the less heterogeneous pore structure are related to the similar pore volumes among different types of pores during this stage. The highest Δα value appears at the stage of wet gas generation (1.42% < Ro ≤ 2.00%), resulting from the large number of macropores generated by connecting micropores and mesopores after gas generation and expulsion [59]. At the dry gas generation stage (2.00% < Ro), Δα value slightly declines, due to the similar pore volumes among different types of pores. At this stage, the porous solid bitumen from decomposition and condensation provides a large number of micropores [60], which has been found in many over-mature shales [61,62]; and the decrease in mesopore volume and macropore volume may be caused by compaction from confining pressure [60]. For shale oil exploration, the middle stage oil window, corresponding to Ro of 0.77%~1.20%, is more promising in terms of retained oil content, liquid hydrocarbon fluidity, good pore structure. For gas counterparts, the stage of dry-gas generation is more favorable in terms of an increasing number of newly formed micropores, which provide the abundant surface area for the adsorption of methane.
Fig. 9. Pore structure heterogeneity variation accompanied with hydrocarbon generation and expulsion and pore evolution during thermal maturation.
Fig. 10. Pore structure heterogeneity evolution of distinct shales with the increasing thermal maturity (The data of Δα and Ro in different shales from [15,17,22,64]).
M. Guan et al.
Journal of Analytical and Applied Pyrolysis 163 (2022) 105501
9
4.4. Pore structure heterogeneity evolution based on a comparison
A comparison of Δα values of different shales covering thermal maturation was established to understand the impact of thermal matu-rity on the pore structure heterogeneity of natural shale samples (Fig. 10). Nonthermal maturity factors, such as TOC, mineral compo-nents, and fabric, etc., contribute to the inherent pore structure in different shales with various rock compositions [65]. However, thermal maturity remains crucial in manipulating the whole process of diagen-esis and hydrocarbon generation. As a result, the comparative result is still significant enough to provide a thorough understanding of how thermal maturation affects pore structural heterogeneity. At immature to low-mature stages, the relationship between pore structure hetero-geneity and thermal maturity is ambiguous, and Δα values have a wide range from 0.24 to 1.034, with an average of 0.67. Compared with thermal maturity, other factors might make a main contribution to the inherent pore structure of different shales when Ro is less than 0.70%. At mature to high-mature stages, pore structure becomes more heteroge-neous with increasing thermal stress, reaching the maximum heteroge-neity at about 2.00% of Ro. The Δα values vary from 0.69 to 1.65 and have an average of 1.13. Increasing pore structure heterogeneity induced by increasing thermal stress is related to some new organic pores or dissolution pores and the progressive generation and expulsion of liquid and gaseous hydrocarbons throughout this stage. At the over-mature stage, Δα values vary from 0.31 to 1.07, with an average of 0.45. Pore heterogeneity decreases, and then fluctuates on a small scale. That might relate to the collapse of mesopores and macropores caused by compaction and the predominance of newly formed micropores in the pore system at this stage.
5. Conclusion
The pore structure and its heterogeneity evolution were studied in the naturally immature shale sample and artificially matured shale samples by integrating the multifractal theory with N2 adsorption re-sults. Thermal maturation impacts organic matter transformation, hy-drocarbon generation-retention-expulsion, and pore structure variation. In general, TOC decreases, S1 attains the oil peak at 1.04% of Ro, and specific surface area and total pore volume increase as pyrolysis severity increases. However, the pore volumes of diverse types of pores are different. Micropore volume and macropore volume gradually increase with increasing thermal maturity, whereas the relationship between mesopore volume and Ro is ambiguous, resulting from the hydrocarbon generation-expulsion and newly formed mesopores.
Furthermore, pore structure heterogeneity is controlled by pore size distribution differentially constituted by micropores, mesopores, and macropores, causing a complicated change of pore structure heteroge-neity during thermal maturation. Pore structure heterogeneity chiefly increases at mature to high-mature stages, closely related to newly formed organic pores or dissolution pores and the progressive genera-tion and expulsion of liquid and gaseous hydrocarbons. This study provides new insight on pore structure evaluation during thermal maturation and has implications for the exploration prioritization of shale oil/gas in similar shales.
CRediT authorship contribution statement
Ming Guan: Conceptualization, Methodology, Formal analysis, Validation, Writing − original draft. Xiaoping Liu: Funding acquisition, Project administration, Writing – review & editing. Zhijun Jin: Project administration, Writing – review & editing. Jin Lai: Visualization, Investigation. Biao Sun, Panpan Zhang, Kefei Chen: Writing − review & editing.
Declaration of Competing Interest
The authors declare that they have no known competing financial interests or personal relationships that could have appeared to influence the work reported in this paper.
Acknowledgments
This work was supported by the National Natural Science Foundation of China [grant number 42072150, 41372144]; and the National Sci-ence and Technology Major Projects of China [grant number 2017ZX05049001–008]. We appreciate the enthusiastic support of Lunju Zheng at the Wuxi Institute of Petroleum Geology, SINOPEC Exploration and Development Research Institute. We acknowledge Prof. Haoquan Hu and two anonymous reviewers for their valuable comments and suggestions, which greatly improved the manuscript of an earlier version.
References
[1] R.G. Loucks, R.M. Reed, S.C. Ruppel, U. Hammes, Spectrum of pore types and networks in mudrocks and a descriptive classification for matrix-related mudrock pores, Aapg Bull. 96 (2012) 1071–1098, https://doi.org/10.1306/08171111061.
[2] A. Ougier-Simonin, F. Renard, C. Boehm, S. Vidal-Gilbert, Microfracturing and microporosity in shales, Earth-Sci. Rev. 162 (2016) 198–226, https://doi.org/ 10.1016/j.earscirev.2016.09.006.
[3] T. Li, Z. Jiang, C. Xu, B. Liu, G. Liu, P. Wang, X. Li, W. Chen, C. Ning, Z. Wang, Effect of pore structure on shale oil accumulation in the lower third member of the Shahejie Formation, Zhanhua Sag, eastern China; Evidence from gas adsorption and nuclear magnetic resonance, Mar. Pet. Geol. 88 (2017) 932–949, https://doi. org/10.1016/j.marpetgeo.2017.09.030.
[4] X. Liu, J. Lai, X. Fan, H. Shu, G. Wang, X. Ma, M. Liu, M. Guan, Y. Luo, Insights in the pore structure, fluid mobility and oiliness in oil shales of Paleogene Funing Formation in Subei Basin, China, Mar. Pet. Geol. 114 (2020), 104228, https://doi. org/10.1016/j.marpetgeo.2020.104228.
[5] A.P. Radlinskia, T. Blach, P. Vu, Y. Ji, L. de Campo, E.P. Gilbert, K. Regenauer-Lieb, M. Mastalerz, Pore accessibility and trapping of methane in Marcellus shale, Int J. Coal Geol. (2021), 103850, https://doi.org/10.1016/j.coal.2021.103850.
[6] C. Zhu, W. Guo, Y. Li, H. Gong, J.J. Sheng, M. Dong, Effect of occurrence states of fluid and pore structures on shale oil movability, Fuel 288 (2021), 119847, https:// doi.org/10.1016/j.fuel.2020.119847.
[7] D. Chandra, V. Vishal, A critical review on pore to continuum scale imaging techniques for enhanced shale gas recovery, Earth-Sci. Rev. 217 (2021), 103638, https://doi.org/10.1016/j.earscirev.2021.103638.
[8] Y. Zhao, Z. Jin, Hydrocarbon mixture phase behavior in multi-scale systems in relation to shale oil recovery: The effect of pore size distributions, Fuel 291 (2021), 120141, https://doi.org/10.1016/j.fuel.2021.120141.
[9] K.L. Milliken, M.E. Curtis, Imaging pores in sedimentary rocks: Foundation of porosity prediction, Mar. Pet. Geol. 73 (2016) 590–608, https://doi.org/10.1016/j. marpetgeo.2016.03.020.
[10] R.E. Simon, S.C. Johnson, O. Khatib, M.B. Raschke, D.A. Budd, Correlative nano- spectroscopic imaging of heterogeneity in migrated petroleum in unconventional reservoir pores, Fuel 300 (2021), 120836, https://doi.org/10.1016/j. fuel.2021.120836.
[11] C.R. Clarkson, N. Solano, R.M. Bustin, A.M.M. Bustin, G.R.L. Chalmers, L. He, Y. B. Melnichenko, A.P. Radlinski, T.P. Blach, Pore structure characterization of North American shale gas reservoirs using USANS/SANS, gas adsorption, and mercury intrusion, Fuel 103 (2013) 606–616, https://doi.org/10.1016/j.fuel.2012.06.119.
[12] M. Wei, L. Zhang, Y. Xiong, J. Li, P. Peng, Nanopore structure characterization for organic-rich shale using the non-local-density functional theory by a combination of N2 and CO2 adsorption, Micro Mesopor Mat. 227 (2016) 88–94, https://doi.org/ 10.1016/j.micromeso.2016.02.050.
[13] L. Wang, D. Yang, Z. Kang, Evolution of permeability and mesostructure of oil shale exposed to high-temperature water vapor, Fuel 290 (2021), 119786, https://doi. org/10.1016/j.fuel.2020.119786.
[14] A.T. Krzyzak, I. Habina-Skrzyniarz, G. Machowski, W. Mazur, Overcoming the barriers to the exploration of nanoporous shales porosity, Micro Mesopor Mat. 298 (2020), 110003, https://doi.org/10.1016/j.micromeso.2020.110003.
[15] K. Liu, M. Ostadhassan, L. Sun, J. Zou, Y. Yuan, T. Gentzis, Y. Zhang, H. Carvajal- Ortiz, R. Rezaee, A comprehensive pore structure study of the Bakken Shale with SANS, N2 adsorption and mercury intrusion, Fuel 245 (2019) 274–285, https:// doi.org/10.1016/j.fuel.2019.01.174.
[16] P. Zhao, X. Wang, J. Cai, M. Luo, J. Zhang, Y. Liu, M. Rabiei, C. Li, Multifractal analysis of pore structure of Middle Bakken formation using low temperature N2 adsorption and NMR measurements, J. Pet. Sci. Eng. 176 (2019) 312–320, https:// doi.org/10.1016/j.petrol.2019.01.040.
[17] M. Guan, X. Liu, Z. Jin, J. Lai, The heterogeneity of pore structure in lacustrine shales: Insights from multifractal analysis using N2 adsorption and mercury intrusion, Mar. Pet. Geol. 114 (2020), 104150, https://doi.org/10.1016/j. marpetgeo.2019.104150.
M. Guan et al.
Journal of Analytical and Applied Pyrolysis 163 (2022) 105501
10
[18] M. Wang, C. Jiao, C. Li, N. Zhou, J. Li, S. Lu, F. Tian, G. Hao, J. Shi, Multi-fractal characteristics of micro-pores of Shahejie Formation shale in Dongying Sag, Pet. Geol. Recovery Effic. 26 (2020) 72–79.
[19] P. Zhao, Z. Wang, Z. Sun, J. Cai, L. Wang, Investigation on the pore structure and multifractal characteristics of tight oil reservoirs using NMR measurements: Permian Lucaogou Formation in Jimusaer Sag, Junggar Basin, Mar. Pet. Geol. 86 (2017) 1067–1081, https://doi.org/10.1016/j.marpetgeo.2017.07.011.
[20] K. Liu, M. Ostadhassan, L. Kong, Multifractal characteristics of Longmaxi Shale pore structures by N2 adsorption: A model comparison, J. Pet. Sci. Eng. 168 (2018) 330–341, https://doi.org/10.1016/j.petrol.2018.04.072.
[21] P. Wang, Z. Jiang, W. Ji, C. Zhang, Y. Yuan, L. Chen, L. Yin, Heterogeneity of intergranular, intraparticle and organic pores in Longmaxi Shale in Sichuan Basin, south China; Evidence from SEM digital images and fractal and multifractal geometries, Mar. Pet. Geol. 72 (2016) 122–138, https://doi.org/10.1016/j. marpetgeo.2016.01.020.
[22] Y. Wang, H. Cheng, Q. Hu, L. Liu, L. Jia, S. Gao, Y. Wang, Pore structure heterogeneity of Wufeng-Longmaxi shale, Sichuan Basin, China: Evidence from gas physisorption and multifractal geometries, in: J Petrol Sci Eng, 208, 2022, https:// doi.org/10.1016/j.petrol.2021.109313.
[23] L. Xu, K. Yang, H. Wei, L. Liu, X. Li, L. Chen, T. Xu, X. Wang, Diagenetic evolution sequence and pore evolution model of Mesoproterozoic Xiamaling organic-rich shale in Zhangjiakou, Hebei, based on pyrolysis simulation experiments, Mar. Pet. Geol. 132 (2021), 105233, https://doi.org/10.1016/j.marpetgeo.2021.105233.
[24] V. Agrawal, S. Sharma, Molecular characterization of kerogen and its implications for determining hydrocarbon potential, organic matter sources and thermal maturity in Marcellus Shale, Fuel 228 (2018) 429–437, https://doi.org/10.1016/j. fuel.2018.04.053.
[25] S.R. Kelemen, M. Sansone, C.C. Walters, P.J. Kwiatek, T. Bolin, Thermal transformations of organic and inorganic sulfur in Type II kerogen quantified by S- XANES, Geochim Cosmochim. Ac 83 (2012) 61–78, https://doi.org/10.1016/j. gca.2011.12.015.
[26] Y. You, X. Wang, X. Han, X. Jiang, Kerogen pyrolysis model based on its chemical structure for predicting product evolution, Fuel 246 (2019) 149–159, https://doi. org/10.1016/j.fuel.2019.02.075.
[27] Z. Kang, Y. Zhao, D. Yang, L. Tian, X. Li, A pilot investigation of pyrolysis from oil and gas extraction from oil shale by in-situ superheated steam injection, J. Pet. Sci. Eng. 186 (2020), 106785, https://doi.org/10.1016/j.petrol.2019.106785.
[28] L. Hou, W. Ma, X. Luo, J. Liu, S. Liu, Z. Zhao, Hydrocarbon generation-retention- expulsion mechanism and shale oil producibility of the permian lucaogou shale in the Junggar Basin as simulated by semi-open pyrolysis experiments, Mar. Pet. Geol. 125 (2021), 104880, https://doi.org/10.1016/j.marpetgeo.2020.104880.
[29] X. Tang, J. Zhang, Z. Jiang, X. Zhao, K. Liu, R. Zhang, J. Xiong, K. Du, Z. Huang, J. Yu, Characteristics of solid residue, expelled and retained hydrocarbons of lacustrine marlstone based on semi-closed system hydrous pyrolysis: Implications for tight oil exploration, Fuel (Guildf. ) 162 (2015) 186–193, https://doi.org/ 10.1016/j.fuel.2015.09.009.
[30] G. Yuan, Y. Cao, N. Zan, S. Hans-Martin, G. Jon, F. Hao, Q. Jin, K. Liu, Y. Wang, Z. Chen, Z. Jia, Coupled mineral alteration and oil degradation in thermal oil- water-feldspar systems and implications for organic-inorganic interactions in hydrocarbon reservoirs, Geochim Cosmochim. Ac 248 (2019) 61–87, https://doi. org/10.1016/j.gca.2019.01.001.
[31] X. Zhu, J. Cai, Y. Wang, H. Liu, S. Zhang, Evolution of organic-mineral interactions and implications for organic carbon occurrence and transformation in shale, GSA Bull. 132 (2019) 784–792, https://doi.org/10.1130/B35223.1.
[32] L. Wang, Y. Zhao, D. Yang, Z. Kang, J. Zhao, Effect of pyrolysis on oil shale using superheated steam: A case study on the Fushun oil shale, China, Fuel 253 (2019) 1490–1498, https://doi.org/10.1016/j.fuel.2019.05.134.
[33] Z. Kang, Y. Zhao, D. Yang, Review of oil shale in-situ conversion technology, Appl. Energ. 269 (2020), 115121, https://doi.org/10.1016/j.apenergy.2020.115121.
[34] J. Chen, X. Xiao, Evolution of nanoporosity in organic-rich shales during thermal maturation, Fuel 129 (2014) 173–181, https://doi.org/10.1016/j. fuel.2014.03.058.
[35] H. Guo, W. Jia, R. He, C. Yu, J. Song, P. Peng, Distinct evolution trends of nanometer-scale pores displayed by the pyrolysis of organic matter-rich lacustrine shales: Implications for the pore development mechanisms, Mar. Pet. Geol. 121 (2020), 104622, https://doi.org/10.1016/j.marpetgeo.2020.104622.
[36] L.T. Ko, S.C. Ruppel, R.G. Loucks, P.C. Hackley, T. Zhang, S. Deyong, T. Gentzis, J. O’Keefe, J. Curiale, T. Demchuk, Pore-types and pore-network evolution in Upper Devonian-Lower Mississippian Woodford and Mississippian Barnett mudstones; Insights from laboratory thermal maturation and organic petrology, Int J. Coal Geol. 190 (2018) 3–28, https://doi.org/10.1016/j.coal.2017.10.001.
[37] M. Mastalerz, A. Schimmelmann, A. Drobniak, Y. Chen, Porosity of Devonian and Mississippian New Albany Shale across a maturation gradient: Insights from organic petrology, gas adsorption, and mercury intrusion, Aapg Bull. 97 (2013) 1621–1643, https://doi.org/10.1306/04011312194.
[38] S. Zargari, K.L. Canter, M. Prasad, Porosity evolution in oil-prone source rocks, Fuel 153 (2015) 110–117, https://doi.org/10.1016/j.fuel.2015.02.072.
[39] S. Wu, Z. Yang, X. Zhai, J. Cui, L. Bai, S. Pan, J. Cui, An experimental study of organic matter, minerals and porosity evolution in shales within high-temperature and high-pressure constraints, Mar. Pet. Geol. 102 (2019) 377–390, https://doi. org/10.1016/j.marpetgeo.2018.12.014.
[40] T. Cao, M. Deng, Q. Cao, Y. Huang, Y. Yu, X. Cao, Pore formation and evolution of organic-rich shale during the entire hydrocarbon generation process: Examination
of artificially and naturally matured samples, J. Nat. Gas. Sci. Eng. 93 (2021), 104020, https://doi.org/10.1016/j.jngse.2021.104020.
[41] Q. Zhang, Z. Shen, Y. Chen, W. Wang, The evaluation of hydrocarbon-generating ability in Member 1 of Shahejie Formation of Dongpu Sag, China, J. Chengdu Univ. Technol. (Sci. Technol. Ed. ) 34 (2007) 69–72.
[42] C. Ke, S. Li, H. Zhang, N. He, K. Grice, T. Xu, P. Greenwood, Compound specific sulfur isotopes of saline lacustrine oils from the Dongpu Depression, Bohai Bay Basin, NE China, J. Asian Earth Sci. 195 (2020), 104361, https://doi.org/10.1016/ j.jseaes.2020.104361.
[43] A.L.D. Spigolon, M.D. Lewan, H.L. de Barros Penteado, L.F.C. Coutinho, J. G. Mendonca Filho, Evaluation of the petroleum composition and quality with increasing thermal maturity as simulated by hydrous pyrolysis; A case study using a Brazilian source rock with Type I kerogen, Org. Geochem 83–84 (2015) 27–53, https://doi.org/10.1016/j.orggeochem.2015.03.001.
[44] K.S.W. Sing, Reporting physisorption data for Gas/Solid systems with special reference to the determination of surface area and porosity, Pure Appl. Chem. 54 (1982) 2201–2218, https://doi.org/10.1351/pac198254112201.
[45] J. Rouquerol, P. Llewellyn, F. Rouquerol, Is the BET equation applicable to microporous adsorbents? Stud. Surf. Sci. Catal. 160 (2007) 49–56.
[46] F. Rouquerol, J. Rouquerol, K. Sing. Adsorption by Powders and Porous Solids, second ed ed.,, Academic Press,, New York, 1999.
[47] G. Horvath, K. Kawazoe, Method for the calculation of effective pore size distribution in molecular sieve carbon, J. Chem. Eng. Jpn 16 (1983) 470–475.
[48] E.P. Barrett, L.G. Joyner, P.P. Halenda, The determination of pore volume and area distributions in porous substances. I. Computations from nitrogen isotherms, J. Am. Chem. Soc. 73 (1951) 373–380, https://doi.org/10.1021/ja01145a126.
[49] T.C. Halsey, M.H. Jensen, L.P. Kadanoff, I. Procaccia, B.I. Shraimant, Fractal measures and their singularities: The characterization of strange sets, Phys. Rev. a 33 (1986) 1141–1151.
[50] A. Chhabra, R.V. Jensen, Direct determination of the f(α) singularity spectrum, Phys. Rev. Lett. 62 (1989) 1327–1330.
[51] F. San Jose Martínez, M.A. Martín, F.J. Caniego, M. Tuller, A. Guber, Y. Pachepsky, C. García-Gutierrez, Multifractal analysis of discretized X-ray CT images for the characterization of soil macropore structures, Geoderma 156 (2010) 32–42, https://doi.org/10.1016/j.geoderma.2010.01.004.
[52] P. Grassberger, Generalized dimensions of strange attractors, Phys. Lett. a 97 (1983).
[53] M. Mastalerz, A. Drobniak, A.B. Stankiewicz, Origin, properties, and implications of solid bitumen in source-rock reservoirs: A review, Int J. Coal Geol. 195 (2018) 14–36, https://doi.org/10.1016/j.coal.2018.05.013.
[54] B.P. Tissot, R. Pelet, P. Ungerer, Thermal history of sedimentary basins, maturation indices, and kinetics of oil and gas generation, Aapg Bull. 71 (1987) 1445–1466, https://doi.org/10.1306/703C80E7-1707-11D7-8645000102C1865D.
[55] F.J. Caniego, M.A. Marti, F. San Jose, M. van Meirvenne, P. Govaerts, Renyi dimensions of soil pore size distribution, Geoderma 112 (2003) 205–216, https:// doi.org/10.1016/S0016-7061(02)00307-5.
[56] J.P. Ferreiro, M. Wilson, E.V. Vazquez, Multifractal description of nitrogen adsorption isotherms, Vadose Zone J. 8 (2009) 209–219.
[57] Y. Han, B. Horsfield, R. Wirth, N. Mahlstedt, S. Bernard, Oil retention and porosity evolution in organic-rich shales, Aapg Bull. 101 (2017) 807–827, https://doi.org/ 10.1306/09221616069.
[58] S.C. Lohr, E.T. Baruch, P.A. Hall, M.J. Kennedy, Is organic pore development in gas shales influenced by the primary porosity and structure of thermally immature organic matter? Org. Geochem 87 (2015) 119–132, https://doi.org/10.1016/j. orggeochem.2015.07.010.
[59] C. Huang, Y. Ju, H. Zhu, G.G. Lash, Y. Qi, K. Yu, H. Feng, L. Ju, P. Qiao, Investigation of formation and evolution of organic matter pores in marine shale by helium ion microscope: An example from the Lower Silurian Longmaxi Shale, South China, Mar. Pet. Geol. 120 (2020), 104550, https://doi.org/10.1016/j. marpetgeo.2020.104550.
[60] T. Borjigin, L. Lu, L. Yu, W. Zhang, A. Pan, B. Shen, Y. Wang, Y. Yang, Z. Gao, Formation, preservation and connectivity control of organic pores in shale, Pet. Explor Dev. + 48 (2021) 798–812, https://doi.org/10.1016/S1876-3804(21) 60067-8.
[61] M.E. Curtis, B.J. Cardott, C.H. Sondergeld, C.S. Rai, Development of organic porosity in the Woodford Shale with increasing thermal maturity, Int J. Coal Geol. 103 (2012) 26–31, https://doi.org/10.1016/j.coal.2012.08.004.
[62] Y. Wang, L. Wang, J. Wang, Z. Jiang, C. Jin, Y. Wang, Characterization of organic matter pores in typical marine and terrestrial shales, China, J. Nat. Gas. Sci. Eng. 49 (2018) 56–65, https://doi.org/10.1016/j.jngse.2017.11.002.
[63] G. Hu, Q. Pang, K. Jiao, C. Hu, Z. Liao, Development of organic pores in the Longmaxi Formation overmature shales: Combined effects of thermal maturity and organic matter composition, Mar. Pet. Geol. 116 (2020), 104314, https://doi.org/ 10.1016/j.marpetgeo.2020.104314.
[64] Z. Liang, Z. Li, L. Li, Z. Jiang, D. Liu, F. Gao, X. Liu, L. Xiao, Y. Yang, Relationship between multifractal characteristics of pore size and lithofacies of shale of Shahezi Formation in Changling fault depression, Songliao Basin, Lithol. Reserv. 32 (2020) 22–35.
[65] D. Gafurova, A. Kalmykov, D. Korost, G. Kalmykov, Macropores generation in the domanic formation shales: Insights from pyrolysis experiments, Fuel 289 (2021), 119933, https://doi.org/10.1016/j.fuel.2020.119933.
M. Guan et al.