Embed Size (px)
Citation preview
National Bureau of Soil Survey andLand Use Planning (I.C.A.R.)
Nagpur - 440 033
National Bureau of Soil Survey andLand Use Planning (I.C.A.R.)
Nagpur - 440 033
jk"Vªh¸k enk los{Z k.k ,oa`Hkwfe mi;k¢x fu;kstu C;wjks ¼Òk-Ñ-vuq-i-½
ukxij & 440 033q
jk"Vªh¸k enk los{Z k.k ,oa`Hkwfe mi;k¢x fu;kstu C;wjks ¼Òk-Ñ-vuq-i-½
ukxij & 440 033q National Bureau of Soil Survey and
Land Use Planning (I.C.A.R.)Nagpur - 440 033
jk"Vªh¸k enk los{Z k.k ,oa`Hkwfe mi;k¢x fu;kstu C;wjks ¼Òk-Ñ-vuq-i-½
ukxij & 440 033q
jk"Vªh¸k enk los{Z k.k ,oa`Hkwfe mi;k¢x fu;kstu C;wjks ¼Òk-Ñ-vuq-i-½
ukxij & 440 033q National Bureau of Soil Survey and
Land Use Planning (I.C.A.R.)Nagpur - 440 033
For further information and to obtain copies of this reportPlease write to:
DIRECTOR
National Bureau of Soil Survey and Land Use Planning (NBSS&LUP)Amravati Road, NAGPUR-440 033
Telephone : (0712) 2500386; 2500226; 2500545; 2500664Telefax : +91(0)712-2500534
E-mail : [email protected] ; [email protected]
ISSN : 0970-9460
Jule, 2011
CITATION
NBSS Staff (2010) Annual Report, 2010-11 NBSS&LUP Publ., Nagpur-440 033, India.
EDITORIAL BOARD
CARTOGRAPHY
PRINTING
WORD PROCESSING
TECHNICAL ASSISTANCE
COVER PAGE
Dipak SarkarT. Bhattacharyya
Jagdish PrasadP. Chandran
Mrs. C. MandalS. ChatterjeeR. Srivastava
J.D. Giri
Cartography Staff and GIS Staff
S.K. Arora
Vaishali ArbatRanjana SharmaRohini Watekar
Wasudha Khandwe
S.S. Nimkhedkar A.P. Nagar
Prakash Ambekar
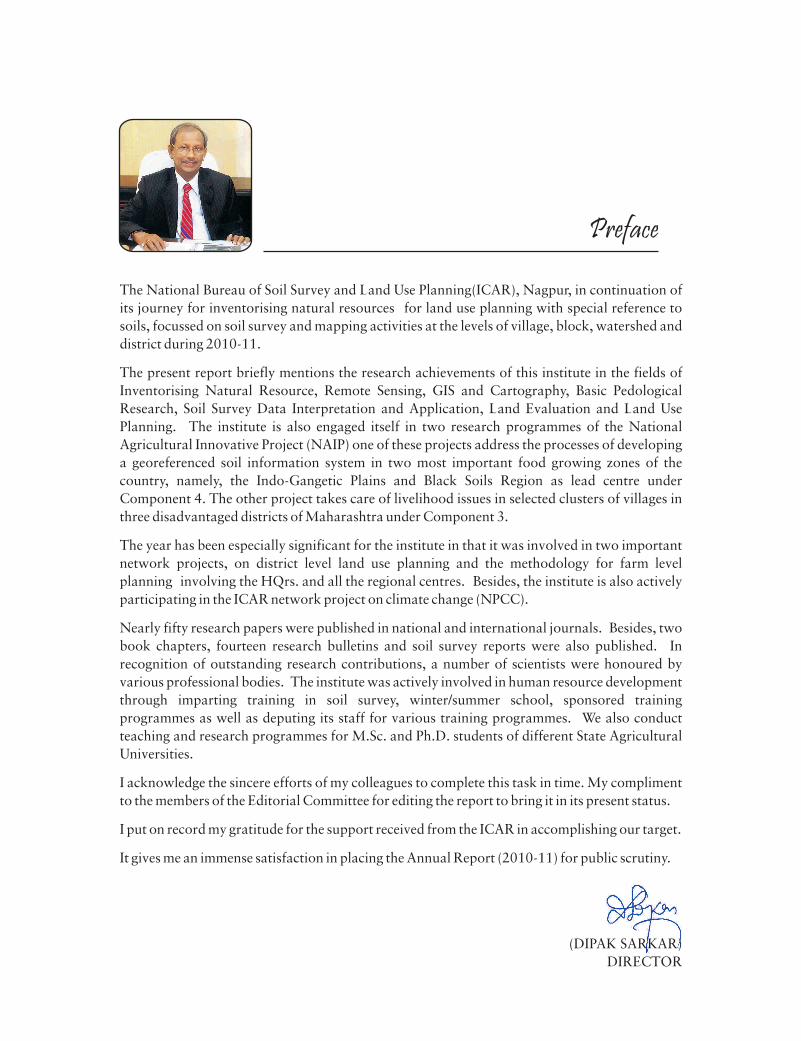
Preface
The National Bureau of Soil Survey and Land Use Planning(ICAR), Nagpur, in continuation of its journey for inventorising natural resources for land use planning with special reference to soils, focussed on soil survey and mapping activities at the levels of village, block, watershed and district during 2010-11.
The present report briefly mentions the research achievements of this institute in the fields of Inventorising Natural Resource, Remote Sensing, GIS and Cartography, Basic Pedological Research, Soil Survey Data Interpretation and Application, Land Evaluation and Land Use Planning. The institute is also engaged itself in two research programmes of the National Agricultural Innovative Project (NAIP) one of these projects address the processes of developing a georeferenced soil information system in two most important food growing zones of the country, namely, the Indo-Gangetic Plains and Black Soils Region as lead centre under Component 4. The other project takes care of livelihood issues in selected clusters of villages in three disadvantaged districts of Maharashtra under Component 3.
The year has been especially significant for the institute in that it was involved in two important network projects, on district level land use planning and the methodology for farm level planning involving the HQrs. and all the regional centres. Besides, the institute is also actively participating in the ICAR network project on climate change (NPCC).
Nearly fifty research papers were published in national and international journals. Besides, two book chapters, fourteen research bulletins and soil survey reports were also published. In recognition of outstanding research contributions, a number of scientists were honoured by various professional bodies. The institute was actively involved in human resource development through imparting training in soil survey, winter/summer school, sponsored training programmes as well as deputing its staff for various training programmes. We also conduct teaching and research programmes for M.Sc. and Ph.D. students of different State Agricultural Universities.
I acknowledge the sincere efforts of my colleagues to complete this task in time. My compliment to the members of the Editorial Committee for editing the report to bring it in its present status.
I put on record my gratitude for the support received from the ICAR in accomplishing our target.
It gives me an immense satisfaction in placing the Annual Report (2010-11) for public scrutiny.
(DIPAK SARKAR)DIRECTOR
Preface
Executive Summary
1. Introduction 1
2. Research Achievements 5
2.1 Inventorising Natural Resources 7
2.2 Remote Sensing, GIS and Cartography 36
2.3 Basic Pedological Research 48
2.4 Soil Survey Data Interpretation and Application 58
2.5 Land Evaluation and Land Use Planning 81
3. Education 100
4. Technology Assessed and Transferred 108
5. Sections and Units 109
5.1 Project Monitoring and Evaluation (PME) Cell 109
5.2 Library and Documentation Unit 110
5.3 Printing Section 111
5.4 Publication Sale Unit 112
5.5 ARIS Cell 115
5.6 Cartography Unit 117
5.7 fgUnh vuqHkkx 117
6. Awards and Recognitions 119
7. Publications 121
8. Participation of scientists in Conferences, Meetings, Workshops, 132Seminars, Symposia etc. in India and abroad
9. Approved On-going projects 134
10. Consultancy, patents, commercialisation of technology 140
11. Meetings 141
12. Workshops, Seminars, Farmers’ Day and other events 145
13. Distinguished Visitors 147
14. Personnel (Managerial Position) 151
dk;Zdkjh lkjak'k
Contents
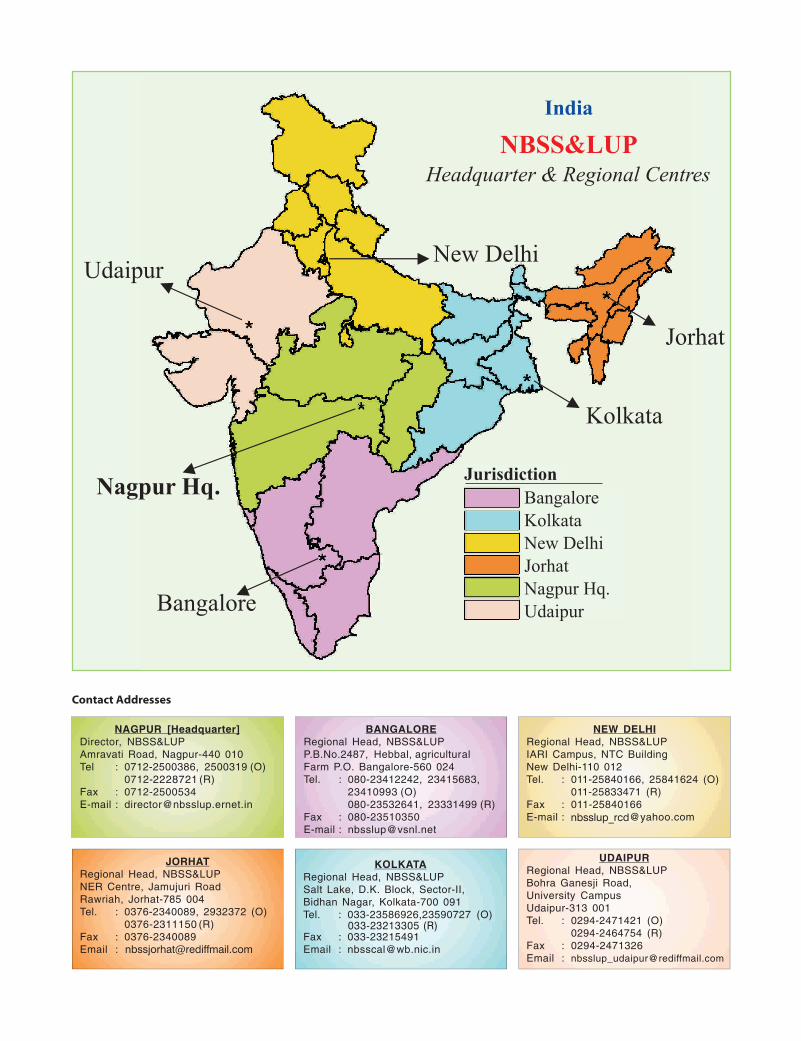
BangaloreKolkataNew DelhiJorhatNagpur Hq.Udaipur
Jurisdiction
Contact Addresses
033-23213305 (R)
nbsslup_rcd
2228721
2311150
i
Annual Report
2010-11
dk;Zdkjh lkjka'k
jk"V™h; e`nk losZ{k.k ,oa Hkwfe mi;ksx fu;kstu C;wjks dk eq[;ky;]ik°p {ks=h; osGUÊ Ákœfrd lalkËku ÁcaËku gsrq e`nk losZ{k.k]oxhZdj.k] lg&lacaËku vkSj ekufp=.k osG dk;Z dj jgk gSA e`nklosZ{k.k ls ÁkIr vkadM+ks dh t:jr dks Hkwfe osG mfpr vkdyuvkSj mi;ksfxrk osG n`f"Vdks.k ls usVooZG ÁdYi (ÁkstsDV) dk vkjaHkfd;k x;k ftlesa C;wjks osG eq[;ky; vkSj {ks=h; osGUÊksa osG dbZoSKkfud dk;Zjr gSaA ;g ÁdYi (ÁkstsDV) okrkoj.k esa cnykovkSj bldk e`nk esa dkcZu vkSj mlosG i`FkDdj.k fofHkUu ekMyksa osG}kjk rFkk Qly iSnkokj ij vlj dk vË;;u djus esa lg;ksxÁnku djsxkA
jk"V™h; e`nk losZ{k.k ,oa Hkwfe mi;ksx fu;kstu C;wjks }kjk ns[ks tk jgsvU; Áeq[k eqn~nksa esa œf"k&tyok;q e.Myksa dh lhekvksa dks iqu%fuËkkZj.k] e`nk ,oa bldh xq.koRrk esa fuEuhdj.k vkSj vkËkqfudlqnwj laosnu ,oa HkkSxksfyd lwpuk Á.kkyh dk Ákœfrd lalkËkuÁcaËku esa mfpr mi;ksx gSA fdlkuksa osG mfpr thou&fuokZg gsrqfofHkUu Ádkj dh Qly&Á.kkyh dks vU; lEcafËkr is'ks ls tksM+usdk Á;kl fd;k x;k gSA C;wjks }kjk MkW- iatkcjko ns'keq[k œf"kfo'ofo|ky;] voGksyk osG lg;ksx ls LukrdksŸkj vkSj ih-,p-Mh-
(Hkwfe lalkËku ÁcaËku) osG Nk=ksa dks mfpr] lkef;d fo"k; KkuvkSj ekxZn'kZu fn;k tk jgk gSA laLFkku osG vËkhuLFk deZpkfj;ksa dksviuh fuiq.krk vkSj rduhdh Kku dks vkSj ifj"œr djus gsrqfofHkUu Áf'k{k.k dk;Zÿeksa@ifjlaokn bR;kfn esa lgHkkxh gksus gsrqHkstk tkrk gSA
vuqlaËkku dh fof'kf"Vrk,a
1- Ákœfrd lalkËku dk vkdyu
• fof'k"V txgksa dk vk°dM+k ÁkIr djus gsrq eq[;ky; vkSjblosG {ks=h; osGUÊksa us fofHkUu œf"k tyok;q eaMyksa dksfo'ks"k vË;;u fd;k x;k ftlesa jksgrd] ekaM;k] tksjgkV]gqxyh] ukxiqj vkSj fpŸkkSM+x<+ osG rglhy@eaMy@gkscyhdh 75469 gsDVs;j tehu dk lekos'k gSA lqYrkuiqj]eFkqjk rFkk fpRrkSM+x<+ osG oqGN Hkkx dk 1%50]000 iSekusij e`nk losZ{k.k dk;Z fd;k x;kA if'pe caxky esa120000 gsDVs;j yo.k&xzflr {ks= dk 1%50]000 osGiSekus ij losZ{k.k gqvkA vkSjaxkckn vkSj jksgrd ftys osGdjhcu 5]35]500 gsDVs;j tehu dk 1%50]000 osG iSekus
ii
Annual Report
2010-11
dk;Zdkjh lkjka'k
ij losZ{k.k dk dk;Z iw.kZ fd;k x;kA ,d lw{e&ty&foHkktd (4032 gsDVs;j) dk foLrr losZ{k.k (1%12]500iSekus ij) Hkh fd;k x;kA
• foLr`r e`nk lg&lacaËku osG }kjk] ckjg e`nk Jsf.k;ksa dksjk"V™h; e`nk Js.kh dk Lrj Ánku fd;k x;k vkSj mudkjk"V™h; e`nk Js.kh iaftdk esa lekos'k gqvkA buesa fgekpyÁns'k dk pkj] jktLFkku] iatkc] vklke vkSj xksok dhnks&nks Jsf.k;kas dk lekos'k gSA bl rjg jk"V™h; iaftdk esae`nk Jsf.k;ksa dh la[;k 265 gks x;h gSA
2- lqnwj laosnu] HkkSxksfyd lwpuk Á.kkyh ,oa ekufp=.k
• mi&xzg ls ÁkIr Nk;k osG vkdyu ls irk yxk fd jk;iqjvkSj jkuhcaËk CykWd ([kVjk mi&foHkkx] ckaoqGjk ftyk)esa lkr Hkw&vkœfrd gSa tSls catjhyk igkM+ vkSj mijhry] dVk&QVk isfMesaUV~l] mcM+&[kkcM+ leryhesfMesUV~l] vosGys fc[kjs igkM+] Hkjh gqbZ ?kkVh] mijhiqjkus vkSj uohu tyksnh; lery HkkxA Hkwfe&mi;[email protected] osG vË;;u ls irk yxk fd œf"k gh eq[; mi;ksxgS vkSj nwljk Hkwfe&mi;ksx taxy gSA lkaf[;dh; vkdyun'kkZrk gS fd cgqr vPNh vkSj vPNh e`nk moZjdrk55 Áfr'kr {ks= esa gSA
• cqY<+kuk ftyk (egkjk"V™) osG esgdj rglhy esa fLFkrljLorh lw{e ty&foHkktd (10]787 gs-) dk {ks.khdj.kvkSj ewY;kadu mi&xzg ls ÁkIr Nk;k (vkbZ-vkj-,l-ih-& 6 fyal AAA) osG vË;;u }kjk fd;k x;kA e`nkvksa dkekufp=.k e`nk Js.kh lEcUËk cukdj rFkk Hkw&vkœfrddks mi;ksx esa ykdj fd;k x;kA vkB e`nkvksa esa yH;u=tu rFkk N% e`nkvksa esa yH; QkLQksjl dh deh gSAftad dh deh oqGN e`nkvksa esa ns[kh x;hA bu lHkh e`nkvksadk dikl dh mi;qDrrk gsrq eqY;kadu fd;k x;kA
• mM+hlk osG mRdy likV esa fLFkfr c<+tksjs ukyk lw{e&tyfoHkktd (596 gs-) dk foLr`r e`nk losZ{k.k fd;k x;kAvË;;u ls irk pyk fd bldh e`nk;sa cgqr vEyh; lsekË;e {kkjh; gS (ih-,p-eku 4-6 ls 8-6 rd) e`nkvEyh;rk] dkcZfud dkcZu] fofue;h {kkj] e`fŸkdk ,oaty&miyCËkrk mijh lery Hkkx ls uhps osG leryHkkx esa c<+ x;k gSA
• lw[ks dh fLFkfr esa œf"k&tyok;q eaMyksa dh n'kkZus gsrqlax.khœr ekWMy rS;kj fd;k x;k gSA fdlh {ks=h; esa
eË;e rFkk vfËkd lw[ks dh fLFkfr gksus dh laHkkouk dksokf"kZd o"kkZ osG vkadM+s ls vkdyu fd;k tk ldrk gStSlk Hkkjrh; ekSle foKku us crk;k gSA
• ekufp= vkSj QksVksxzkQ dks j[kus vkSj mi;ksx esa ykus gsrqfMftVy vkadfyr fd;k x;k gSA LoSGu vkSj Nk;k&fp=dh mfpr xq.koŸkk dks Ë;ku esa j[krs gq, lkS nLrkostksa dksuEcj ns fn;k x;k gSA
• vV~Bkbl ftyksa dk fMftVy <yku ekufp= cuk;k x;kgS ftlesa ik°p ftyksa osG ekufp= esa ck· :i osG varxZrfofHkUu igywvksa tSls fn'kk lery vkSj iwjk >qdko fn[kk;kx;k gSA blosG fy, lVy jMkj VksiksxzkQh fe'ku vkadM+sdk Á;ksx fd;k x;k gS ftldk jstyw'ku 90 ehVj gSA
• xaxk osG eSnkuh Hkkx (iatkc o gfj;k.kk) ls tek fd;sx;s 2092 uewuksa dk LisDV™y fj∂ysDVkul xq.kËkeZ tkapkx;k gSA bldk ,d vPNk le&lEcUËk dkcZfud dkcZu]fo|qr pkydrk] oSGfY'k;e dkcksZusV osG lkFk feyk gS tksbl Á.kkyh dh Á;ksx dh lkFkZdrk dks lkfcr djrk gSA
• egkjk"V™ jkT; osG cqy<kuk ftyk osG ,d Hkkx esa ,dgkbifjvku laosnd dh Nk;k Áÿe.k dks e`nk esa cnykovkSj mlosG foHkktu osG vË;;u gsrq Á;ksx esa yk;k x;kAbl vË;;u ls irk pyk fd dkcZfud vkSj yH;iksVSf'k;e osG n'kZu esa gkbifjvku dh fofHk= rjaxksa osGo.kZÿeksa dk udkjkRed lEcUËk ik;k x;kA
• jk"V™h; lqnwj laosnu osGUÊ] gSnjkckn }kjk cuk, x, e`nkfuEuhdj.k ekufp= (1%50]000) dks C;wjks osG vkadM+s}kjk vkSj vPNk fd;k x;kA ;g vË;;u jk"V™h; lqnwjlaosnu osGUÊ (gSnjkckn) osG lg;ksx vkSj varfj{k mi;ksxosGUÊ (vgenkckn) }kjk ÁnŸk foŸk osG }kjk fd;k x;kA;g vË;;u ckjg Áns'kksa esa gks pqdk gSA
3- vkËkkjHkwr e`nk 'kksËk
• xk°o osG Lrj ij e`nk losZ{k.k gsrq ,d ljy ekWMy cuk;kx;k gS tks Hkw&mRifŸk vkSj blosG blj ij vkËkkfjr gSA ;gekWMy ekuo&gLFk osG i`"Bh; Hkkx rFkk iSGyh gqbZ vaxqfy;ksaosG }kjk Ánf'kZr fd;k tk ldrk gSA chp dk tehu(Ëkjkry) vaxwBs vkSj vxyh maxfy;ksa }kjk fn[kk;k tkldrk gS vkSj ladjs egest (Lij) osG lkFk yEcs fleVsgq, pje fcUnq gSaA
iii
Annual Report
2010-11
dk;Zdkjh lkjka'k
• ekbÿks&rjax ikpu fÿ;k ftlesa e`nk ,oa ikni uewusdks can cjru esa ikpu fÿ;k djkrs gSa mlesa ok"iugkl dks tk°p djus osG fy, ÁksVksdky@rduhdh fodflrdh x;h gSA nwljs dbZ rjg osG inkFkZ vkSj mudh ek=kosG vuqlkj ikpu gsrq ÁksVksdky@rduhd fodflr dhx;h gSA
• dkyh feV~Vh esa LesdVkbZV dh vfËkd ek=k gksuk ;gn'kkZrk gS fd bldh mRifŸk cslkYV es a mifLFkrIySftvksDys'k [kfut ls iwoZ osG tyok;q esa gqvk gSAoSGfY'k;e vkDlkbM vkSj lksfM;e vkDlkbM dk lkUÊ.kNksVs gksrs d.k esa (vkdkj esa) ;g crkrk gS fdIySftvksDys'k [kfut de dBksj gSA e`fŸkdk dklw{e&vkœfrdh vË;;u ls irk pyrk gS fd dkyhfeV~Vh dk ≈ij&uhps gksuk e`fŸkdk lajpuk dks uqdlkuigaqpkus esa l{ke ugha gSA
• e`nk&ty miyCËkrk tkudkjh osG fy, dbZ ih-Vh-,Q-dk rqyukRed vË;;u djus gsrq K-NN vkSj ANN
dk mi;ksx fd;k x;k gSA U;wujy ih-Vh-,Q- dkifj.kke lkaf[;dh ih-Vh-,Q- ls vPNk jgkA Fkksd ?kuRoekiu gsrq vPNs ih-Vh-,Q- osG fy, jsr] flYV] e`nkty dh {ks=h; {kerk vkSj LFkk;h m".krk fcUnq dkvkdM+k pkfg,A bl rjg ls cus vPNs ih-Vh-,Q- esavkj-,e-,l-bZ- (RMSE) rFkk ,e-,-bZ- (MAE) osGvad cgqr de jgs ysfdu Mh (d) rFkk vkj LosGo;j(R2) dk eku T;knk jgkA
• ofeZoqGykV e`fŸkdk&[kfut esa ,Y;wfefu;e osG i`FkDdj.kdh T;knk {kerk gS vkSj blls ;g ikSËkksa dks ,Y;qfefu;edh fo"kk‰rk ls cpkrk gSA vË;;u ls ;g Hkh irk pykgS fd ;s yksg&tfur e`nkvksa esa dkcZfud&dkcZu osGi`FkDdj.k dh Hkh T;knk {kerk gSA blfy, dkcZu inkFkZdh i`FkDdj.k {kerk rFkk ofeZoqGykbZV dh mifLFkfr e`nkxq.koŸkk gsrq ekinaM dks n'kkZrk gSA
xaxk osG eSnkuh Hkkx ls fy, x, lkjHkkx osG e`nk uewus (dkyih% 50ehVj vkSj jkuh;k% 29 ehVj)] eË;e ls Ácy {kkjh; gSa vkSj pwuk;qDrgSaA ih-,p- eku vkSj pwus dh ek=k ;g n'kkZrh gS fd tyks<+h; inkFkZosG ,d= gksus osG ckn ogk° dh tyok;q 'kq"d FkhA bu e`nkvksa esadkQh ek=k esa e`fŸkdk dk ik;k tkuk ;g n'kkZrk gS fd ;g inkFkZdbZ nwljs iSr`d iRFkj ls vk;s gSa ftudk ,d= gksuk eq[;r% ;equkunh osG dkj.k gqvk gSA
4- e`nk losZ{k.k vkadM+ksa dk O;k[;ku ,oa Á;ksx
• rfeyukMq osG œf"k&tyok;q eaMyh; ekufp= nwljhckj osG Á;kl ls bldks vc l=g dfVcaËk esa cnykx;kA bl dfVcaËkksa osG e`nkvksa dks muosG leku xq.koRrkdks Ë;ku esa j[krs gq, ÁcaËk bdkbZ esa cnyk x;kA uhyfxjhdfVcaËk (1-1) esa osGoy ,d ÁcaËk bdkbZ cu ik;htcfd Hkhrjh Hkkx osG lery dfVcaËk (Hkkx) esa nlÁcaËk bdkbZ cuhA
• HkaMkjk] pUÊiqj] xksfUn;k (egkjk"V™)] eqjknkckn vkSjeqTtQj uxj (mŸkj Áns'k) osG e`nk vkËkkfjr vkadM+ksadks ftyk e`nk fu.kkZ;d lwpuk Á.kkyh (1%50]000 iSekus)ij Ánf'kZr fd;k x;kA
• Ëkkj ftyk (eË; Áns'k) osG lks;kchu mxkus okys {ks=ksa esadkcZfud inkFkZ] lYQj] u=tu] QkLQksjl dh deh gSA
• ,d e`nk ty larqfyr ekWMy] eË; Hkkjr dh QVus vkSjiwGyus okyh e`nkvksa osG ty dks vPNh rjg Hkfo";ok.khfd;kA ;g enk ty esa cnyko dks vPNh rjg Hkfo";ok.khfd;k tc e`nk Hkhaxuk 'kq: dh ysfdu tc e`nk tyNksM+uk 'kq: fd;k rks ;g ekWMy vlQy jgkA
• fMcwzx<+ vkSj frulqfd;k ftys (vklke) esa e`nk osG lrghHkkx esa Hkkjh rRoksa dk vË;;u fd;k tks nwf"kr gks x;hgSA blesa ih-,p-eku dkjhcu lHkh Hkkjh rRoksa osG lkFkudkjkRed lg&lacaËk fn[kk;k tcfd dkcZfud dkcZuËkukRed lg&lacaËk jgkA
• osGjy jkT; esa œf"k&tyok;q e.My mi&bdkbZ osG cukusdk vË;;u fd;k x;k vkSj bl rjg 20 mi&bdkbZ;k°cukbZ x;hA Ëkjkry dh n'kk] e`nk vkSj mudh ty&Ëkkj.k{kerk dks bl dk;Z gsrq Á;ksx esa yk;k x;kA
• yEcs le; rd pyus okys moZjd ifj{k.k ftlesa X;kjgtxg dkyh feV~Vh dk vkSj ik°p xaxk osG eSnkuh Hkkx dklekos'k gS] bu txgksa ls ÁkIr vk°dM+s ;g crkrs gSa fddkcZfud dkcZu dh ek=k e`nkvksa esa c<+h gS tc ;gdkcZfud inkFkks± }kjk Mkyk tkrk gSA lEiw.kZ dkcZu esa,dk&,d c<+ksŸkjh tc ns[kh x;h tc [kkn dks moZjdksaosG lkFk e`nk esa Mkyk x;kA lsUpqjh ekWMy 'kq"d {ks= esaT;knk mi;qDr jgk tcfd jksFk&lh ekWMy vºZ&'kq"dvkSj vkÊZ {ks=ksa esa mi;qDr jgkA
iv
Annual Report
2010-11
dk;Zdkjh lkjka'k
• buQksa&ÿkWi ekWMy dikl] lks;kchu] xsgw°] djhc ËkkuvkSj eDdk osG mRiknu dks lgh Hkfo";ok.kh fd;kA
• vklke osG ÁkFkfedrk okys rsjg ftyksa osG vË;;u lsirk pyk fd dksdjk>kj vkSj cksukbZxk°o osG 91 Áfr'kr{ks= esa dkcZfud dkcZu dh ek=k vfËkd gSA djhcu61 Áfr'kr dksdjk>kj ftys dk {ks= yCËk u=tuvkSj iksVSf'k;e esa eË;e gS tcfd cksukbZxk°o ftyk dk86 Áfr'kr yCËk u=tu vkSj 53 Áfr'kr yCËk iksVSf'k;eesa eË;e gSA dksdjk>kj ftys dk 34 Áfr'kr vkSjcksukbZxk°o dk 40 Áfr'kr {ks= yCËk iksVSf'k;e esa dehgSA blh rjg 30 Áfr'kr dksdjk>kj ftys dk {ks= vkSj50 Áfr'kr cksukbZxk°o ftys dk {ks= yCËk QkLQksjl esaeË;e gSA djhcu 34 Áfr'kr dksdjk>kj dk {ks= vkSj64 Áfr'kr cksukbZxk°o osG {ks= esa yCËk ftad esa dehvk°dh x;hA
• eË;Áns'k vkSj egkjk"V™ osG lHkh ftyksa osG œf"k vkSjlEcfUËkr foHkkx dk vkdfLedrk ;kstuk cukus dkdk;Z 'kq: fd;k x;kA egkjk"V™ osG 29 ftys vkSjeË; Áns'k osG 11 ftyksa dk vkdfLedrk ;kstuk cukfn;k x;k gSA bl ;kstuk esa ÁR;sd ftys dh e`nkvksa osGvuqlkj Qlyksa dh tkfr rFkk lL;&fÿ;kvksa dk Hkhlekos'k fd;k gS tks ekulwu osG vkus vkSj tkus dh rkjh[kksaosG vuqlkj gSA
• if'pe caxky esa oqGN LFkwy vkSj lw{e rRoksa osG fuËkkZj.kgsrq ekufp=.k fd;k x;kA djhcu 40 Áfr'kr chjHkweosG {ks= esa yCËk QkLQksjl iksVSf'k;e vkSj ftad esa dehvk°dh x;hA ukfn;k ftyksa esa rRoksa dh miyCËkrk esadeh Qly rhozrk osG c<+us ls gqbZ gSA e`nk d.k dkvkdkj] ih-,p- eku esa lEcUËk LFkkfir djus ls irkpyk fd eghu ykse feV~Vh esa ih-,p- eku c<+us lsQkLQksjl vkSj iksVSf'k;e dh miyCËkrk esa c<+ksŸkjhgqbZ tcfd ftad dh miyCËkrk esa deh vkbZA lw{erRoksa gsrq ih-,p-eku 5-5&6-5 lHkh e`nkvksa esa Qk;nseanik;k x;kA
• ÁfrPNk;kiu osG }kjk ÁLrkforksa dks lw{e rkSj ij ykxwdjus ftlls œf"k&mRiknu c<+s blosG fy, e`nk ijh{k.kdh fofHkUu fofËk;ksa osG lkFk ÁfrPNk;kiu LisDVksLdksihdk Á;ksx fd;k x;kA ;g vË;;u caxykSj vkSj] chtkiqjvkSj gSnjkckn osG {ks=ksa dh e`nkvksa ij vkËkkfjr FkkA
caxykSj dh e`nk,a chtkiqj ftys dh vis{kk T;knkÁfrPNk;kiu fn[kk;haA chtkiqj dh e`nkvksa esa 1900uSuksehVj ij rhoz vo'kks"k.k 2%1 rjg osG [kfut dksn'kkZrk gS tcfd caxykSj dh e`nkvksa dk 950 uSuksehVjij rhoz vo'kks"k.k eqDr ykSg vkDlkbM dks crkrk gSA
5- Hkwfe vkdyu vkSj Hkwfe mi;ksx fu;kstu
• uok'kgj tkyaËkj ftyksa esa Ëkku&xsagw° osG Qly pÿ useDdk] dikl] mnZ] ew°x] Xokj] Tokj] cktjk] ew°xQyh]vjgj] lubZ rFkk xUuk ([kjhQ) rFkk xsgw°$puk] xsgw°] tkS]puk] elwj ljlksa] eVj] rkSfj;k (jch) dks ihNs NksM+fn;k gSA uok'kgj esa xsgw° dk Qlyh {ks= (41¯) ?kVx;k gS vkSj Ëkku dk Qlyh {ks= (28¯) c<+ x;k gS ;fnbu vk°dM+ksa dks 1983&84 vkSj 2006&07 osG eÌsutjns[kk tk,A
• dukZVd osG jkeuxj ftyk osG varxZr fr:ys mi&tykxeesa ?kVrk ty&Lrj] Qlyksa dh de mRikndrk vkSj [ksrhgjetnwjksa dh deh gh eq[; dkj.k gSaA [ksrksa dks lery(lh<+h&uqek) rFkk e`nk dh ≈ijh rFkk uhpyh lrg osGe`nk d.kksa dks vPNk cukdj bu dkj.kksa ls NwVdkjk ikldrs gSaA bl tykxe dk vPNh tyok;q vkSj bldkcaxykSj osG ikl gksuk] lfCt;ksa vkSj Qyksa dh [ksrh dksc<+kok nsrk gSA
• iqjkru [ksrh iºfr osG pyrs Mhfjax&Fkk&xykUx mi&tykxe] dkohZ&,Uxykax vkSj xksykËkj ftyksa esa Ëkku]ljlksa vkSj mnZ dh mRikndrk cgqr de gSA
• chjHkwe ftyk (if'pe caxky) osG [kq'dkjkuh tykxeesa de vkSj vfu;fer o"kkZ] e`nk fuEuhdj.k rFkk demoZjrk dh Áeq[k dkj.k gSaA
• mŸkjh xksok ftys esa ukfj;y dh [ksrh esa mi&vuqowGyreiqf"Vdkjd rRo] vPNh iSnkokj u nsus okys gkbczhM tkfr;ksadk Á;ksx vkSj ukfj;y dh vPNh rjg u LFkkfir djukgh Áeq[k dkj.k gSaA blosG fy, fo'ks"k&txg gsrq HkwfelalkËku rFkk lL;&fÿ;kvksa dk ikyu djuk pkfg,A
• cw°nh ftys esa igys 49 Hkwfe ÁcaËku bdkbZ cukbZ x;h Fkhtks ckn esa mÌs';iw.kZ ÁcaËku gsrq 17 Hkwfe ÁcaËku bdkbZ esarCnhy dj nh x;hA Hkwfe&ÁcaËku bdkbZ la[;k 2] 5] 6]7] 14] 49 esa 3&8 Áfr'kr dh <+ky ij cuh mFkyh
v
Annual Report
2010-11
dk;Zdkjh lkjka'k
iFkjhyh ykse feV~Vh esa eDdk] ljlksa] puk rFkk xsgw° dhiSnkokj cgqr de FkhA Hkwfe Ápyu bdkbZ la[;k 35] 20]31 vkSj 42 dh eghu ykse rFkk eghu fefV~V;ksa esa ykHkka'kT;knk jgkA
• ukfn;k ftyk] if'pe caxky esa iUÊg Hkwfe ÁcaËku bdkbZcuk;h xbZ tks pkj mRiknu iºfr tSls twV vkSj Ëkku%twV@Ëkku vkSj xsgw°@nyguh Qlysa@fryguh Qlysa% xUukvkSj twV@vukt dh Qlysa@nyguh] Qlysa@fryguhQlysa vkSj Qy okys o`{k vkSj twV@vukt dh Qlyksa osGvarxZr gSaA
• eSlwj ftys esa ckjg Hkwfe&ÁcaËku bdkbZ dh igpku dhx;hA pkj vkSj ik°p uEcj dh Hkwfe ÁcaËku bdkbZ(o"kkZ&vkËkkfjr) esa ik°p Hkwfe mi;ksx fu;kstu dk pqukofd;k x;k gS tks Ákœfrd lalkËkuksa rFkk lkekftd&vkfFkZdlwpdksa ij vkËkkfjr gSaA bu Hkwfe&ÁcaËku bdkbZ;ksa dkseq[; flafpr Hkwfe (Hkwfe&ÁcaËku bdkbZ 1] 3)] eq[;o"kkZ&vkËkkfjr Hkwfe (ÁcaËku bdkbZ 5 &12) vkSj U;wureHkwfe (Hkwfe ÁcaËku bdkbZ 4] 8 vkSj 10) esa ckaVk x;k gSA1990&2009 osG nkSjku jkxh vkSj Tokj dk {ks= iwjs Qlyh{ks= vkSj vukt mxkus okys {ks= osG lanHkZ esa 46 ls 41Áfr'kr rd ?kV x;k gS tcfd nyguh Qlyksa dk {ks=Qy15&20 Áfr'kr ls c<+ x;k gSA
• tksjgkV ftys esa vkB Hkwfe ÁcaËku bdkbZ;ksa dh igpkudh x;hA buesa e`nk vEyh;rk vkSj [ksrhgj etnwjksa dk ufeyuk ijs'kkuh dk dkj.k gSaA
• Qly&i'k qikyu tSl s gLr{k so dk s xk s f Un;kftyk(egkjk"V™) osG nks ikl&ikl osG xk°oksa esa pyk;kx;kA lcls vPNh lL;&fÿ;kvksa osG pyrs 214 yksxksaosG [ksrksa esa Ëkku dh iSnkokj ipkl Áfr'kr ls T;knk c<+x;hA U;wure Hkwfe osG Ëkkjd vkSj [ksrh&fofgu fdlkudks cdjh ikyu gsrq mRlkfgr fd;k x;kA bl nkSjkupkSchl yksxksa osG ;gk° uotkr cdfj;ksa dh la[;k 51 rdigq°p x;h gSA eNyh&ikyu 18 yksxksa osG fy, ojnkulkfcr gqvk ftlosG pyrs mudh vk; œf"k vk; lsdkQh c<+ x;hA
• fljlk ftyk (gfj;k.kk) dh jsrhyh feV~Vh esa dikl dhmRikndrk de gSA bu e`nkvksa esa fryguh Qlysa] nyguhQlysa] eksVs vukt vkSj pkjk Qlyksa dks mxkuk pkfg,A
ch-Vh- dikl gsrq lL;&fÿ;kvksa ij dk;Z djuk pkfg,vkSj budks fofHkUu e`nk&bdkb;ksa ij fdlkuksa dks Ánf'kZrdjosG le>kuk pkfg,A
LukrdksŸkj f'k{kk
• MkW- iatkcjko ns'keq[k œf"k fo|kihB] vdksyk osG lg;ksx lsbl pkyw f'k{kk l= osG varxZr ,e-,l-lh- (Hkwfe lalkËkuÁcaËku) osG pkj rFkk ih-,p-Mh- (Hkwfe lalkËku ÁcaËku) osGnks Nk= viuk 'kksËk ÁcaËk ÁLrqr dj pqosG gSaA
Áf'k{k.k dk;Zÿe dk vk;kstu
• bl o"kZ fofHkUu laxBuksa osG 137 dkfeZdksa dks lqnwj laosnu]th-vkbZ-,l-] e`nk losZ{k.k ,oa ekufp=.k rFkk Hkwfe lalkËkuÁcaËku fo"k;ksa ls lacafËkr vR;kËkqfud rduhdh Kku dkÁf'k{k.k fn;k x;kA
Áf'k{k.k ÁkIr djuk
• C;wjks osG oqGy 24 vfËkdkfj;ksa us fofHkUu fo"k; {ks=ksa esa Áf'k{k.kgkfly fd;kA
py jgs vuqlaËkku ÁdYi (ÁkstsDV)
laLFkkxr (py jgs) % 62
Mh-,l-Vh- % 03
,u-,-vkbZ-ih- osG pyk;s tk jgs ÁdYi % 05
jkT; ljdkj osG pyk;s tk jgs ÁdYi % 06
tyok;q ifjorZu (Hkk-œ-vuq-i-) ij pyk;s % 01tk jgs usV&ooZG ÁdYi
oqGy % 77
fyUosGt (vuqcaËk)
• ,u-ch-,l-,l-,aM ,y-;w-ih- μ MkW- ih-Mh-osG-Ogh-] vdksyk
• ,u-ch-,l-,l-,aM ,y-;w-ih- μ lh-vkbZ-lh-vkj-] ukxiqj
• ,u-ch-,l-,l-,aM ,y-;w-ih- μ ,u-vkj-,l-lh-] gSnjkckn
• ,u-ch-,l-,l-,aM ,y-;w-ih- μ jktdh; œf"k foHkkx
• ,u-ch-,l-,l-,aM ,y-;w-ih- μ vkbZ-vkbZ-,l-,l-] Hkksiky
• ,u-ch-,l-,l-,aM ,y-;w-ih- μ lh-,l-MCY;w-lh-vkj-Vh-vkbZ-] nsgjknwu
vi
Annual Report
2010-11
dk;Zdkjh lkjka'k
• ,u-ch-,l-,l-,aM ,y-;w-ih- μ ,l-,-lh-] vgenkckn
• ,u-ch-,l-,l-,aM ,y-;w-ih- μ ,l-,-;w-,l-
• ,u-ch-,l-,l-,aM ,y-;w-ih- μ Mh-,l-Vh-] ubZ fnYyh
• ,u-ch-,l-,l-,aM ,y-;w-ih- μ Mh-MCY;w-,e-] Hkqous'oj
• ,u-ch-,l-,l-,aM ,y-;w-ih- μ lh-vkbZ-,e-,e-ok;-Vh-
• ,u-ch-,l-,l-,aM ,y-;w-ih- μ vkbZ-lh-vkj-vkbZ-,l-,l-,-Vh-] gSnjkckn
• ,u-ch-,l-,l-,aM ,y-;w-ih- μ ch-lh-osG-Ogh-Ogh-]if'pe caxky
Ádk'ku
• Ádkf'kr vuqlaËkku i= % 50
• rduhdh@yksdfÁ;@jsfM;ks okrkZ % 20
• laxks"Bh@ifjlaokn i= % 103
• e`nk losZ{k.k@fjiksVZ@cqysfVu % 14
• cqd psIVlZ@cqd % 02
iqjLdkj ,oa lEeku
• ;g o"kZ C;wjks osG fy, miyfCËk;ksa okyk jgk laLFkku osG oSKkfudksa,oa LVkWQ dks dbZ iqjLdkj ,oa lEeku ÁkIr gq,A
vii
Annual Report
2010-11
Executive Summary
As a part of natural resource management soil survey,classification, correlation and mapping has been the
major thrust areas of work at HQrs., Nagpur and its fiveregional centres. Utilization of soil survey data sets forland evaluation and land use planning received a focussedattention with the initiation of a network project of theInstitute involving many scientists at HQrs. and regionalcentres. Besides, NBSS&LUP is also addressing thecontemporary issues of climate change and its influencein soil carbon and its sequestration and crop yield throughthe help of various models. The other important issuesaddressed by NBSS&LUP are revision of agro-climaticzone boundaries, soil degradation, use of hyperion dataand other remote sensing products, GIS in naturalresource management, spectral properties of soils. Theefforts are being made for livelihood security of farmersby combining the diversified cropping systems and otherallied enterprises. Bureau is also involved in disseminatingstate-of-art information to post-graduate students ofM.Sc. and Ph.D. (Land Resource Management) from Dr.PDKV, Akola. The staff of this institute were also deputedfor various training programmes to improve their skillsand technical knowledge in India and abroad.
RESEARCH HIGHLIGHTS
1. Inventorising Natural Resources
• To generate site-specific database for farm levelplanning case studies were carried out in differentAESRs of country by Regional Centres of NBSS& LUP including the HQrs. The area includespart of Tehsil/Mandal/Hobli of Rohtak, Mandya,Jorhat, Hugli, Nagpur and Chittaurgarh districtscovering an area of 75469 ha. Reconnaissancesoil survey (1:50,000 scale) of Sultanpur,Mathura, part of Chittaurgarh covering an areaof 859384 ha. was completed. Salt affected area(1,20,000 ha) of West Bengal (1:50,000 scale)was also mapped during this period. A total of5,35,500 ha of land was surveyed in Aurangabadand Rohtas districts of Bihar on 1:50,000 scale.A watershed having an area of 4032 ha wassurveyed and mapped (phase of soil series) at1:12,500 scaleAfter intensive correlation, twelvesoil series were finalized and given the status ofEstablished Soil Series and entered into the
viii
Annual Report
2010-11
Executive Summary
National Soil Series Register. These soil seriesbelong to Himachal Pradesh (4 nos.), Rajasthan(2 nos.), Punjab (2 nos.), Assam (2 nos.), andGoa (2 nos.). The National Register nowcontains 265 soil series.
2. Remote Sensing, GIS and Cartography
• The interpretation of satellite imagery in Raipurand Ranibandh Blocks in Khatra sub-divisionof the Bankura district, West Bengal identifiedseven physiographic units viz. denuded hills andcrests, dissected pediments, undulating pedimentplain, isolated hillocks, valley fills, upper alluvialplain (older) and lower alluvial plain (younger).Land use/land cover analysis indicated thatagriculture is the main land use in the areafollowed by forest. Multivariate analysis ofproductivity of soils indicated that very good andgood land together constitute 55% of the totalarea.
• The soils of Saraswati watershed (10,787 ha) inMehkar tehsil of Buldhana district ofMaharashtra were characterized and evaluatedusing IRS P6 LISS-III data. The soils weremapped as association of soil series usingphysiography-soil relationship. Eight soils werefound low in available N, six were low inavailable P and one was low in available K. Zndeficiency was also observed in a few soils. Thesoils were evaluated for suitability for cotton.
• A detailed soil survey was carried out inBadajorenala micro-watershed (596 ha) in Utkalplain of Orissa. The study indicated that soil pHwas strongly acidic to moderately alkaline (pH:4.6 to 8.6). The soil acidity (pH), organic carbon,exchangeable bases, clay, available watercapacity of soils increased from upper to lowerplains.
• A software module for drought analysis wasdeveloped for delineation of agro-ecologicalzones for crop planning. Probability ofoccurrence of moderate and severe drought inthe area can be computed from annual rainfalldata using the method described by IMD.
• A digital database system for storing and retrievalof maps and photographs and preparation ofweb-based library for data transmission is in
process. Scanning, image quality check andindexing of 100 documents have been completed.
• Shuttle Radar Topography Mission (SRTM)elevation data with a resolution of 90 m wasutilized for analysis and characterization ofselected geomorphic parameters. Digital slopemaps of 28 states and parameters like aspect,plane, profile and total curvature have beengenerated for 5 states.
• The spectral reflectance characteristics of soils(2092 samples) of IGP (Punjab and Haryana)were carried out. A good calibration wasobtained for organic carbon, ECe and CaCO3
indicating the use of this tool to predict soilproperties.
• Hyperion hyperspectral data was utilized in soilvariability mapping and zonation in part ofBuldhana district of Maharashtra. The studyindicated that soil organic carbon and availableK showed significant negative correlation withsoil reflectance at different wavelength bands ofHyperion. Relatively good calibration model(R2=0.51*) for organic carbon was obtained.
• The land degradation maps on 1:50,000 scalegenerated by NRSC, Hyderabad were enrichedwith soil/soil loss parameters generated byNBSS&LUP. This study was taken up incollaboration with NRSC funded by SAC,Ahmedabad. Enrichment of land degradationdatasets has been completed for 12 states.
3. Basic Pedological Research
• A simplified model has been developed for easymapping of soils at village level based on theavailable geomorphic processes and theirinfluences. This is represented by the dorsal viewof a person’s hand with the fingers spread over.The midlands are represented by the thumbs andforefinger which have narrow spurs, withelongated, restricted summits.
• The protocols and techniques were developed(i) to standardize microwave (MW) digestiontechnique using soil and plant samples forchecking the evaporation loss as the samples aredigested in closed teflon vessels (ii) to addressthe digestion protocols for different types of
ix
Annual Report
2010-11
Executive Summary
materials i.e. soil and plants and depending uponthe number of samples to be analyzed at a time.
• Pedogenetic processes in Vertisols indicated theformation of huge amount of smectite uponweathering of plagioclase of Deccan basalt inan earlier humid climate. The concentration ofCaO and Na2O appears to decrease withdecreasing particle-size might be due to lessresistant nature of plagioclase feldspars. Presenceof clay pedofeatures amidst papules indicatesthat the pedoturbation was not enough for thecomplete destruction of clay pedofeatures.,
• The comparative evaluation of PTFs to estimateavailable water capacity (AWC) was developedusing k nearest neighbour (k-NN) and artificialneural networks (ANN). Neural PTFs performedbetter than statistical PTFs. The best PTF for bulkdensity required information on four variablesnamely sand, silt, field capacity (FC) andpermanent wilting point (PWP). The bestperforming PTFs (input sand, silt, FC and PWP)had lowest RMSE (0.01), MAE (0.01) the highestd (0.95) and R2 (0.83) when networks were fittedto the measured data.
• Vermiculite has a huge capacity to sequester Alin soils and it acts as a sink for Al+3 releasedduring tropical weathering and protects theplants from Al toxicity. The study also indicatesthat the ferruginous soils also have a capacity tosequester huge quantity of organic carbon (about2%). Therefore capacity of organic carbonsequestration and presence of vermiculite in thesesoils can be used as a land quality parameter.
Core samples (Kalpi:~50 m and Rania: ~29m) in the IGPare moderately to strongly alkaline in reaction and arecalcareous. Both pH and CaCO3 values indicate theinfluence of aridic climatic conditions during the postdepositional period of the sediment. The high content ofclay is not however expected in the core samples untilthere has been the influence of other rock formationamidst the deposition mainly controlled by Yamuna-riversystem.
4. Soil Survey Data Interpretation and Application
• The Agro-Ecological Zone (AEZ) map of TamilNadu after revision resulted in delineation of 17zones. The soils in these zones were grouped into
management units taking similar soil characteristicsand behaviour to management practices intoconsideration. The Nilgiris (1.1) had only 1management unit, while the Inland Plains (5.4)had the maximum 10 units.
• District Soil Information System (DSIS) on1:50000 scale aims to store, process and managethe geospatial database at district level toenhance the utility of soil database and isavailable for six districts viz Bhandara,Chandrapur, Gondia, Nagpur (Maharashtra),Moradabad and Muzzaffarnagar (UttarPradesh).
• In the soybean growing areas of Dhar district inMadhya Pradesh, sulphur, organic carbon,nitrogen and phosphorus are deficient. A soilwater balance model for shrink-swell soils ofcentral India was able to predict soil moisturecontent satisfactorily. It predicted soil moisturevariations while the soil was getting rechargedbut failed to predict changes when the soilmoisture was released.
• Heavy metal pollution has been studied in surfacesoils of contaminated areas of Morigaon,Dibrugarh and Tinsukia districts of Assam. Soilacidity (pH) had a negative correlation with mostheavy metals while organic carbon had a positivecorrelation.
• Delineation of Agro-Ecological subunits (AESUs)for 14 districts of Kerala has been carried outand 20 AESUs have been formed. Landform, soilsand hydrological differences are the parametersused for differentiating subunits.
• Data from a total of 16 long term fertilizerexperimental (LTFE) sites, [11 from black soilregion (BSR) and five from the Indo GangeticPlains (IGP)] indicated that total organic carbon(TOC) increased when organic carbon wasexternally added through organic sources ascompared with the control. Rapid increase inTOC was observed when FYM was added withinorganic fertilizers. The Century model wasmore useful in soils of drier climate while theRothC model works both in humid and semi-arid bio-climatic systems.
• Changes in soil carbon reserves as influenced bydifferent ecosystems and land use has been
x
Annual Report
2010-11
Executive Summary
studied in the BSR and the RothC, Century andInfoCrop models were evaluated. InfoCropmodel simulated yield correctly for crops likecotton, soybean, wheat, kharif rice and maize.
• Assessment and mapping of some important soilparameters including macro- and micronutrientsfor 13 priority districts of Assam showed that91% of area of Kokrajhar and 80% ofBongaigaon district is high in soil organic carbon.About 61% of Kokrajhar and 86% and 53% ofBongaigaon district is medium in available N andK respectively. Nearly 34% and 40% ofKokrajhar and Bongaigaon districts respectivelyare low in available K. Approximately 30% areain Kokrajhar and 50% area in Bongaigaondistricts are medium in available Phosphorus.About 34% area in Kokrajhar and 64% area inBongaigaon districts are deficient in availableZinc.
• District-wise contingency plan for agricultureand allied sectors in Maharashtra and MadhyaPradesh has been initiated. Contingency plansfor 29 districts in Maharashtra and 11 districtsin Madhya Pradesh have been completed. Cropvarieties have been suggested for each type ofsoil of the districts from available literatures forvariation in onset and withdrawal of monsoondates.
• Assessment and mapping of some important soilparameters including macro- and micronutrientfor the state of West Bengal has been carried out.About 40% of the area in Birbhum district isaffected with low availability of phosphorus,potassium and zinc. Increase in crop intensityled to increasing nutrient deficiency in Nadiadistrict. Relationship between particle - size, pHand nutrient availability has been observed andin fine loamy soils increase in pH improved theavailability of phosphorus and potassium whileit decreased the availability of zinc. Formicronutrients, the pH range of 5.5 to 6.5 wasfound to be beneficial in most of the particle sizeclass of soils.
• Evaluation of soil analytical methods includingreflectance spectroscopy to operationalise soiltest based recommendations at micro level forenhancing agricultural productivity of rainfedsystem was carried out in areas from Bengaluru,
Bijapur, and Hyderabad regions. Soils ofBengaluru showed high reflectance values ascompared to Bijapur districts. Strong absorptionat 1900 nm in Bijapur soils are indicative of 2:1mineralogy while strong absorption at 950 nmin Bengaluru soils indicate presence of free ironoxides.
5. Land Evaluation and Land Use Planning
• In general, the rice-wheat cropping systemreplaced maize, cotton, black gram, green gram,clusterbean, sorghum, pearlmillet, groundnut,pigeonpea, sunhemp and sugarcane in kharifwheat+gram(mixed), wheat, barley, gram, lentil,mustard, peas and toria in rabi in Nawashaharand Jalandhar districts of Punjab. The area underwheat (41% of cropped area) decreased whereasthat under rice (28%) increased during 1983-84to 2006-07 in Nawashahar district.
• Declining ground water table, low cropproductivity and labour scarcity are the majorconstraints in Tirulae sub-watershed inRamnagar district, Karnataka. The constraintscan be mitigated by terracing of cultivated fields,favourable textures of top soils and sub-surfacesoils. The suitable climate of watershed and itsnearness to Bangalore invite for growing of fruitand vegetable crops.
• In Diring-Thanglong sub-watershed of Karbi-Anglong and Golaghar districts of Assam, theproductivity of rice, mustard and black gram islowdue to poor and primitive type of farmingpractices.
• Low and erratic rainfall, severely degraded soilsand low soil fertility are the major constraints inKhuskarani watershed in Birbhum district ofWest Bengal.
• In North Goa district of Goa state, majorconstraints reported to coconut cultivation aresub-optimal nutrient management, use of nonHYVs and improper plantations. Interventionssuggested for improving its productivity includegeneration of site-specific land resources andagro-management.
• Forty nine Land Management Units (LMUs)tentatively identified earlier in Bundi district were
xi
Annual Report
2010-11
Executive Summary
re-grouped into manageable and purposeful17 LMUs. The productivity of maize, mustard,gram and wheat was lowest in shallow loamy-skeletal soils on 3-8% slope (LMUs 2, 5, 6, 7,14 and 49). The benefit: cost ratio and netprofit per hectare were higher in LMUs 35, 20,31 and 42 in medium to deep, fine-loamy tofine soils.
• Fifteen land management units were identifiedin Nadia district, West Bengal that were spreadover four production systems, namely, jute andrice; jute/rice and wheat/pulse /oilseed; sugarcaneand jute/cereals/pulses/oilseeds and fruit cropsand jute/cereals.
• Twelve LMUs were identified in Mysore district.For LMUs (rainfed) 4 and 5, five land useplanning options have been proposed based onnatural resources and socio-economic indicators.The LMUs were also grouped under primeirrigated lands (LMU 1, 3), prime rainfed lands(LMU 5-12) and marginal lands (LMUs 4, 8 and10). During 1990-2009 the area under ragi andsorghum (millets) to total gross cropped area andarea under cereals have decreased (46 to 41%)whereas area under pulses has increased (15 to20%).
• Eight LMUs have been identified in Jorhatdistrict of Assam. The major constraints are lowsoil pH and labour scarcity. Crop-animalinterventions were implemented in two clustersof Gondia district, Maharashtra. Bestmanagement practices for paddy cultivationresulted in more than 50% higher yields to 214beneficiaries. Marginal and landless farmers wereencouraged to take up goat rearing and withinthree months 24 beneficiaries increased the no.of animals by 51 (new born). Fish farming is aboon to 18 beneficiaries and their earned incomesurpassed agricultural income.
• The sandy soils occupying 32% in Sirsa districtof Haryana are associated with low cottonproductivity. These soils can be alternativelycultivated for oilseeds, pulses, millets and foddercrops. Agronomic and soil management needsfor recently introduced Bt cotton may be workedout on soil series basis and demonstrated tofarmers.
Post Graduate Education
• Four M.Sc. (LRM) and two Ph.D. (LRM) studentssubmitted their thesis during the current academicsession. This is in collaboration with Dr. PDKV,Akola.
Training Organised
• During the year 137 officials from differentorganizations were trained in the field of latesttechniques of Remote Sensing, GIS, Soil Survey andMapping and Land Resource Management.
Training Received
• Total 24 officials from the Bureau received trainingin various fields.
Projects undertaken
• Institutional (ongoing) : 62
• DST : 03
• Sponsored NAIP Projects : 05
• Sponsored (State Govts.) : 06
• Network project on Climate Change (ICAR) : 01
Total : 77
Linkages
• NBSS&LUP – Dr. PDKV, Akola
• NBSS&LUP – CICR, Nagpur
• NBSS&LUP – NRSC, Hyderabad
• NBSS&LUP – State Agricultural Departments,
• NBSS&LUP – IISS, Bhopal
• NBSS&LUP – CSWCRTI, Dehra Dun
• NBSS&LUP – SAC, Ahemdabad
• NBSS&LUP – SAUs
• NBSS&LUP – DST, New Delhi
• NBSS&LUP – DWM, Bhubaneswar
• NBSS&LUP – CIMMYT
• NBSS&LUP – ICRISAT, Hyderabad
• NBSS&LUP – BCKVV, West Bengal
xii
Annual Report
2010-11
Executive Summary
Publication
• Research papers published : 50• Technical / popular/ Leaflets/Radio talk : 20• Seminar/Symposia papers : 103• Soil Survey Reports/Bulletins : 14• Book chapters/ Books : 02
Awards and Recognition
• This year has particularly rewarding for the Bureauas its scientists and staff were awarded with a numberof Awards and Recognitions.
1
Annual Report
2010-11
Introduction
The National Bureau of Soil Survey and Land UsePlanning has its Headquarters at Nagpur with three
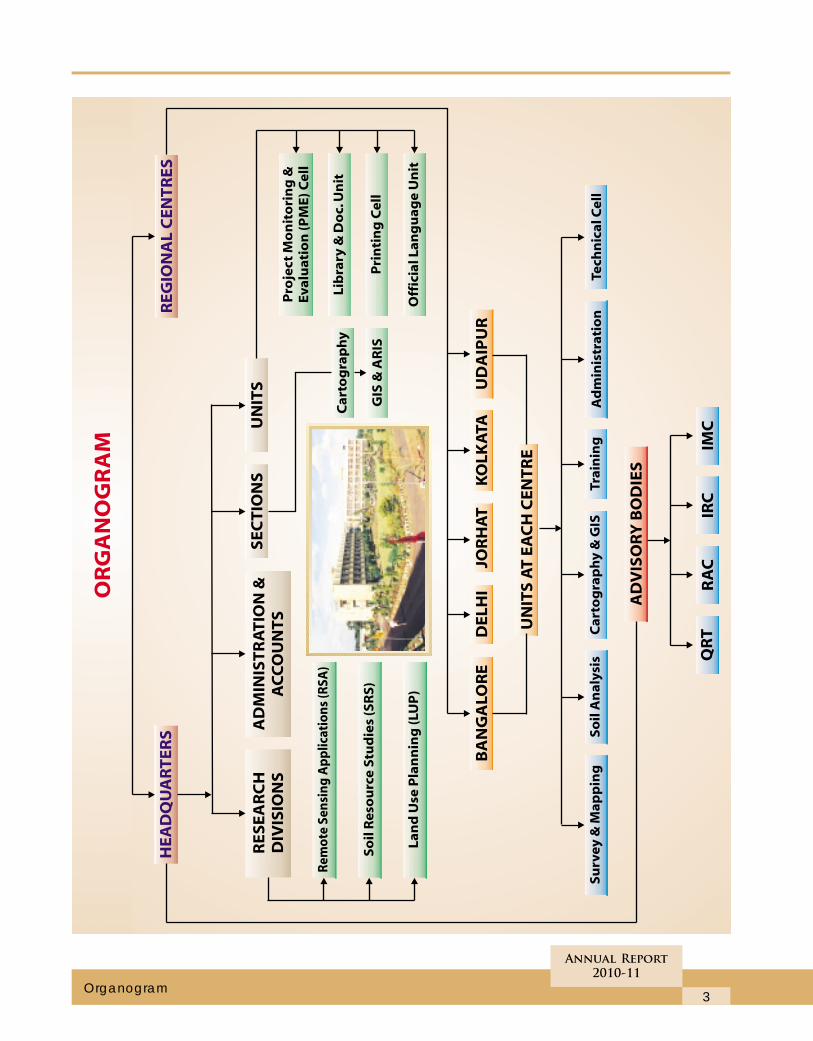
research divisions viz. Land Use Planning, RemoteSensing Applications, Soil Resource Studies. Thedivisions undertake fundamental and applied research,remote sensing applications in resource inventory andland use planning. These divisions also extend necessarysupport to various regional centres. These five regionalcentres located at Bangalore, Delhi, Jorhat, Kolkata andUdaipur, are involved in soil resource mapping,fundamental research on soils, soil correlation andclassification and land use planning.
Mandate
• To conduct survey and mapping of the soils of thecountry at various scale to promote scientific andoptimal land use programmes in collaboration withrelevant institutions and agencies and properdocumentation of Database.
• To conduct and promote research in the NationalAgricultural Research System (NARS) in the areasof Pedology, Remote Sensing Applications in Soil
Resource Mapping, Land degradation, Land evaluationtowards Land Use Planning.
• To create awareness on soil and land resources andtheir state of health.
• To conduct training and education programme incollaboration with SAUs in the country.
Major Research Achievements
The resource inventorization of soils remain the majorfocus of the institute during this year. Most of the areaswere surveyed in 1:10,000 scale for various farms,villages, watershed, etc. Besides a few districts weresurveyed in 1:50,000 scale.
The Bureau has initiated a network project on cadastraland block level survey to provide a commonmethodology. Besides the HQrs. all the five regionalcentres are involved in this effort. The output of thisproject will serve as a model for undertaking detail soilsurveys in different agro-ecological region.
Bureau has initiated another network project ondeveloping model district level land use plan in 6 regions
2
Annual Report
2010-11
Introduction
of the country incorporating socio-economic status andthe land use prevailing in each region. The district isdivided into land management units taking intoconsideration the potential and constraints of soil,climate and socio-economic status. This plan will bedisseminated to the district agricultural departments forimplementation.
As a part of World Bank sponsored National AgriculturalInnovation Project (NAIP) (Component 4) soilinformation system is being developed for black soilregion and the Indo-Gangetic Plains in terms ofmorphological, physical, chemical and microbiologicalproperties. Using this soil information the agro-ecological subregion map of the country is beingmodified. The Bureau is engaged in an other NAIP(Component 3) to develop the package of practice oflivelihood security of farmers in a few selected villageclusters of Maharashtra. Interventions were made in thevillage in terms of improved inputs, managementpractices, natural and common resource managementand introduction of new enterprises. This has improvedthe livelihood status of the villagers.
The Bureau has enriched the National Register for soilseries by the inclusion of 22 soil series representing tomake the total number of soil series in the NationalRegister as 265.
The Bureau has been consistently catering to the need ofvarious State Agricultural Universities, State Government
Officials and others, in terms of teaching and training,use soil survey data for planning and developing varioustypes of soil and crop models.
In total 50 research papers were published in referredjournals during this year besides other publication in theform of popular articles, book chapters, bulletins, soilsurvey reports and symposia papers.
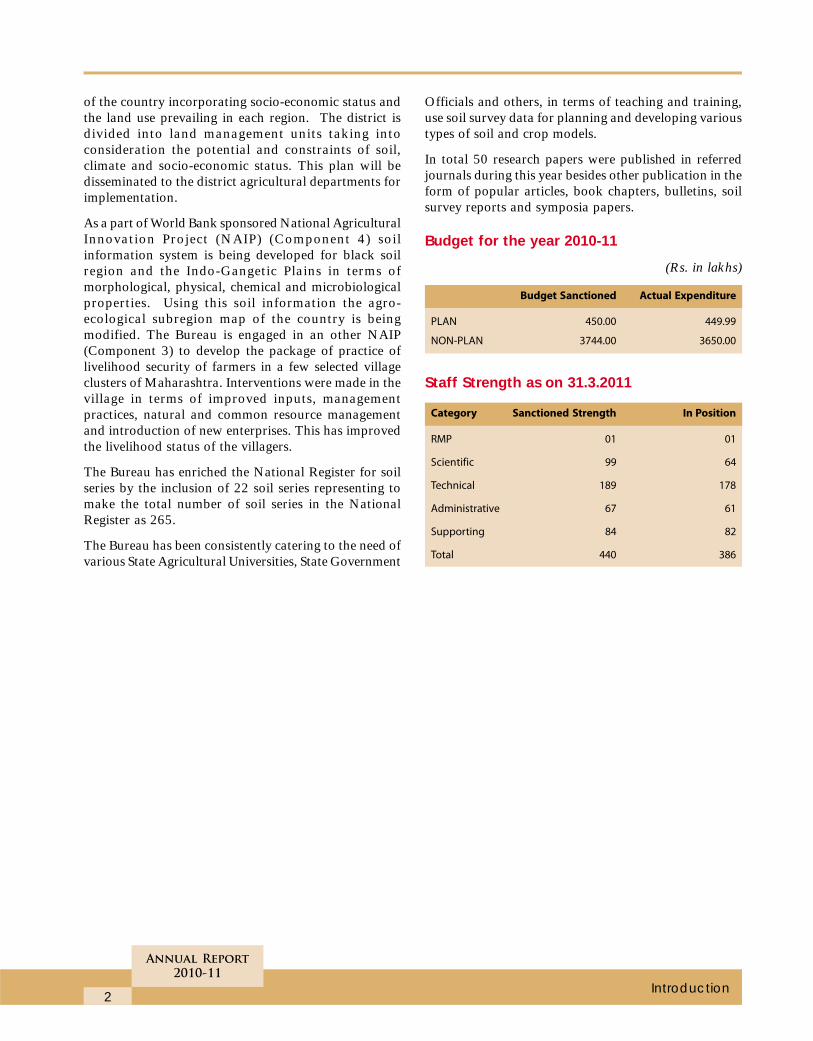
Budget for the year 2010-11
(Rs. in lakhs)
Budget Sanctioned Actual Expenditure
PLAN 450.00 449.99
NON-PLAN 3744.00 3650.00
Staff Strength as on 31.3.2011
Category Sanctioned Strength In Position
RMP 01 01
Scientific 99 64
Technical 189 178
Administrative 67 61
Supporting 84 82
Total 440 386
3
Annual Report
2010-11
Organogram
7
Annual Report
2010-11
Inventorising Natural Resources
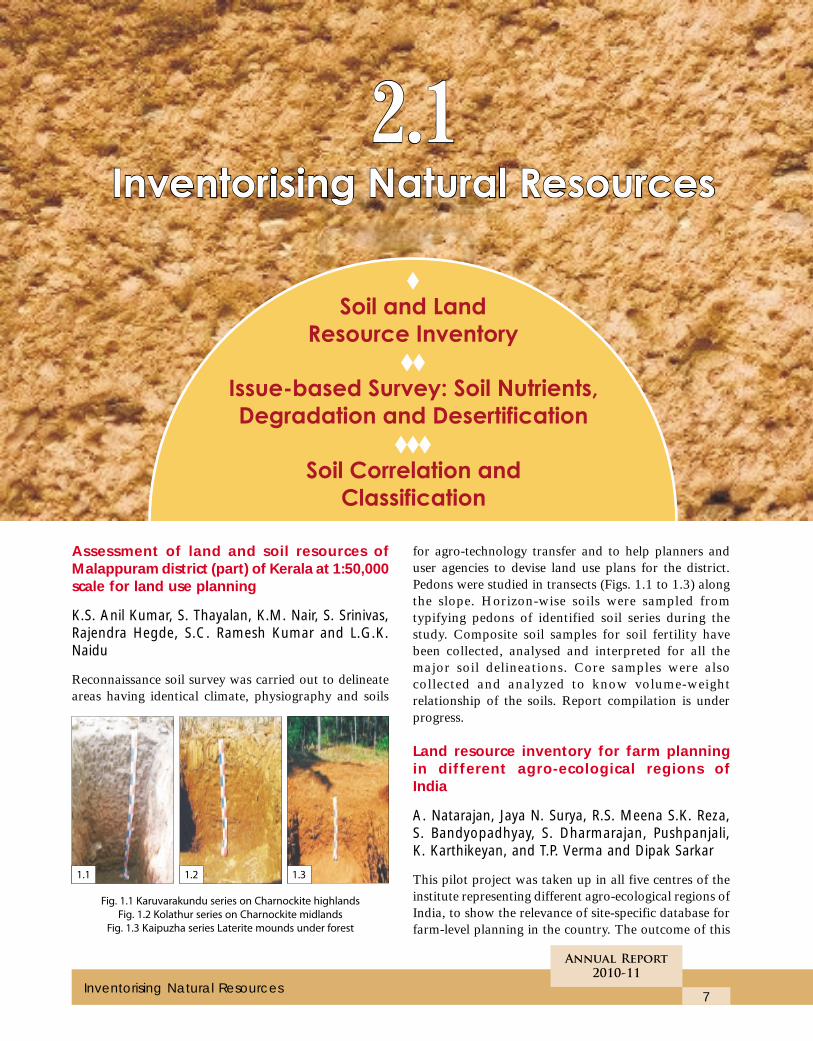
Assessment of land and soil resources ofMalappuram district (part) of Kerala at 1:50,000scale for land use planning
K.S. Anil Kumar, S. Thayalan, K.M. Nair, S. Srinivas,Rajendra Hegde, S.C. Ramesh Kumar and L.G.K.Naidu
Reconnaissance soil survey was carried out to delineateareas having identical climate, physiography and soils
for agro-technology transfer and to help planners anduser agencies to devise land use plans for the district.Pedons were studied in transects (Figs. 1.1 to 1.3) alongthe slope. Horizon-wise soils were sampled fromtypifying pedons of identified soil series during thestudy. Composite soil samples for soil fertility havebeen collected, analysed and interpreted for all themajor soil delineations. Core samples were alsocollected and analyzed to know volume-weightrelationship of the soils. Report compilation is underprogress.
Land resource inventory for farm planningin different agro-ecological regions ofIndia
A. Natarajan, Jaya N. Surya, R.S. Meena S.K. Reza,S. Bandyopadhyay, S. Dharmarajan, Pushpanjali,K. Karthikeyan, and T.P. Verma and Dipak Sarkar
This pilot project was taken up in all five centres of theinstitute representing different agro-ecological regions ofIndia, to show the relevance of site-specific database forfarm-level planning in the country. The outcome of this
Fig. 1.1 Karuvarakundu series on Charnockite highlands
Fig. 1.2 Kolathur series on Charnockite midlands
Fig. 1.3 Kaipuzha series Laterite mounds under forest
1.1 1.2 1.3
8
Annual Report
2010-11
Research Achievements
network project is expected to provide a commonplatform for all the scientists of the Institute to evolvethe necessary protocols required for undertaking cadastrallevel survey in the country. The details of area selectedfor the study by different centres have been given intable 1.1.
Tabe 1.1 Land Resource Inventory Project in operation in
different Blocks/mandals
Location of the study area Area (ha) NBSS&LUP
Regional Centre/
Division
Lakhan Majra Block, Rohtak Tehsil, 16653 Regional Centre,
Rohtak district Delhi
Chikarsinakere Hobli, 16873 Regional Centre,
Mandya district Bangalore
Katonigaon Panchayat, Titabar Block, 475 Regional Centre,
Jorhat district Jorhat
East Lahing Gaon Panchayat 760 Regional Centre,
(Chetiagaon, Sengsoa and Jorhat
Changmaigaon), Jorhat district
Chinchura-Mogra and Polba- 18983 Regional Centre,
Dadpur Block, Hugli district Kolkata
Parseoni Mandal, Parseoni tahsil, 16493 HQrs., Nagpur
Nagpur district
Bhadesar Tehsil, Chittaurgarh district 5232 Regional Centre,
Udaipur
Land resource inventory for farm planning inChikarsinkere Hobli, Maddur Taluk. MandyaDistrict, Karnataka – A Sub-project of the mainproject Land resource inventory for farmplanning in different agro-ecological regions ofIndia
R.S. Meena, A. Natrajan, S. Thayalan, S.C. RameshKumar, V. Ramamurthy and S. Srinivas
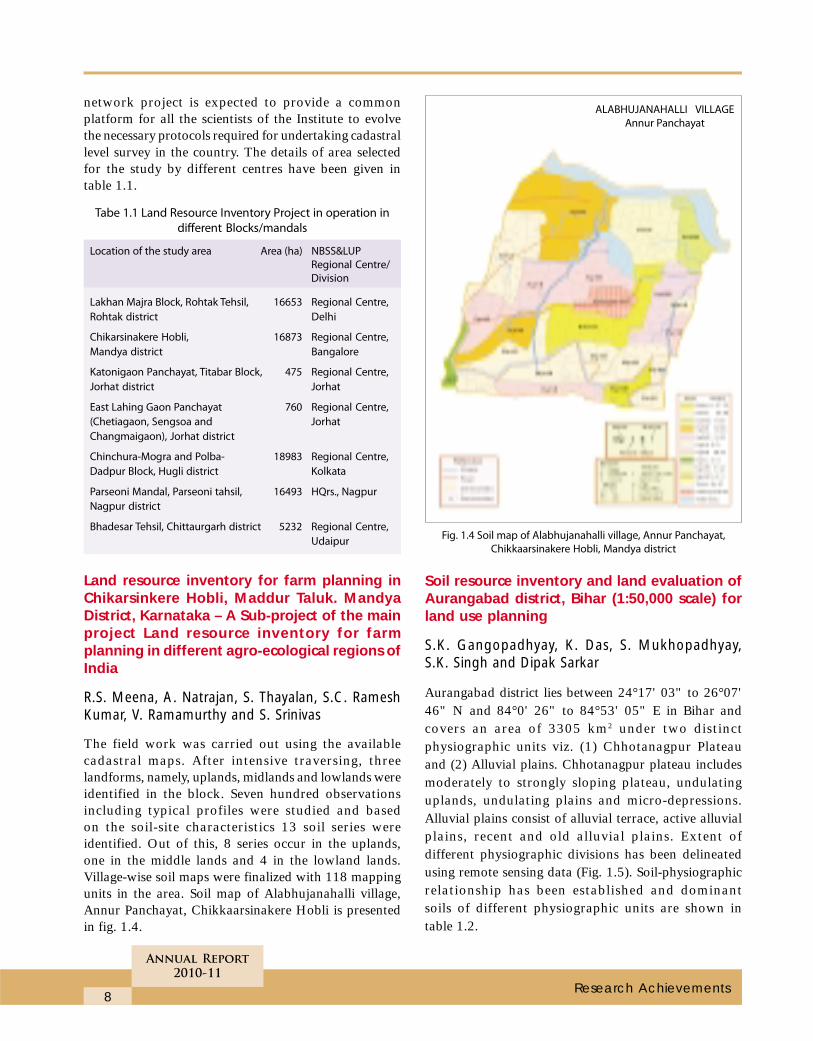
The field work was carried out using the availablecadastral maps. After intensive traversing, threelandforms, namely, uplands, midlands and lowlands wereidentified in the block. Seven hundred observationsincluding typical profiles were studied and basedon the soil-site characteristics 13 soil series wereidentified. Out of this, 8 series occur in the uplands,one in the middle lands and 4 in the lowland lands.Village-wise soil maps were finalized with 118 mappingunits in the area. Soil map of Alabhujanahalli village,Annur Panchayat, Chikkaarsinakere Hobli is presentedin fig. 1.4.
Fig. 1.4 Soil map of Alabhujanahalli village, Annur Panchayat,
Chikkaarsinakere Hobli, Mandya district
Soil resource inventory and land evaluation ofAurangabad district, Bihar (1:50,000 scale) forland use planning
S.K. Gangopadhyay, K. Das, S. Mukhopadhyay,S.K. Singh and Dipak Sarkar
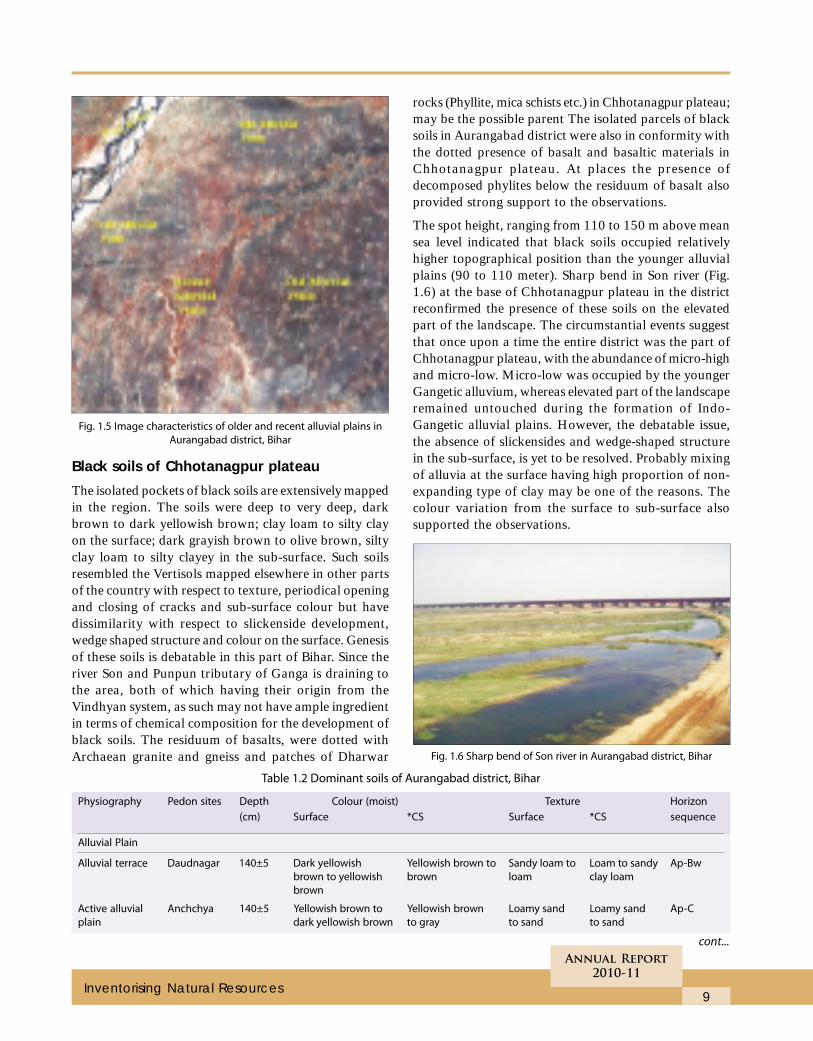
Aurangabad district lies between 24°17' 03" to 26°07'46" N and 84°0' 26" to 84°53' 05" E in Bihar andcovers an area of 3305 km2 under two distinctphysiographic units viz. (1) Chhotanagpur Plateauand (2) Alluvial plains. Chhotanagpur plateau includesmoderately to strongly sloping plateau, undulatinguplands, undulating plains and micro-depressions.Alluvial plains consist of alluvial terrace, active alluvialplains, recent and old alluvial plains. Extent ofdifferent physiographic divisions has been delineatedusing remote sensing data (Fig. 1.5). Soil-physiographicrelationship has been established and dominantsoils of different physiographic units are shown intable 1.2.
ALABHUJANAHALLI VILLAGE
Annur Panchayat
9
Annual Report
2010-11
Inventorising Natural Resources
Fig. 1.5 Image characteristics of older and recent alluvial plains in
Aurangabad district, Bihar
Black soils of Chhotanagpur plateau
The isolated pockets of black soils are extensively mappedin the region. The soils were deep to very deep, darkbrown to dark yellowish brown; clay loam to silty clayon the surface; dark grayish brown to olive brown, siltyclay loam to silty clayey in the sub-surface. Such soilsresembled the Vertisols mapped elsewhere in other partsof the country with respect to texture, periodical openingand closing of cracks and sub-surface colour but havedissimilarity with respect to slickenside development,wedge shaped structure and colour on the surface. Genesisof these soils is debatable in this part of Bihar. Since theriver Son and Punpun tributary of Ganga is draining tothe area, both of which having their origin from theVindhyan system, as such may not have ample ingredientin terms of chemical composition for the development ofblack soils. The residuum of basalts, were dotted withArchaean granite and gneiss and patches of Dharwar
rocks (Phyllite, mica schists etc.) in Chhotanagpur plateau;may be the possible parent The isolated parcels of blacksoils in Aurangabad district were also in conformity withthe dotted presence of basalt and basaltic materials inChhotanagpur plateau. At places the presence ofdecomposed phylites below the residuum of basalt alsoprovided strong support to the observations.
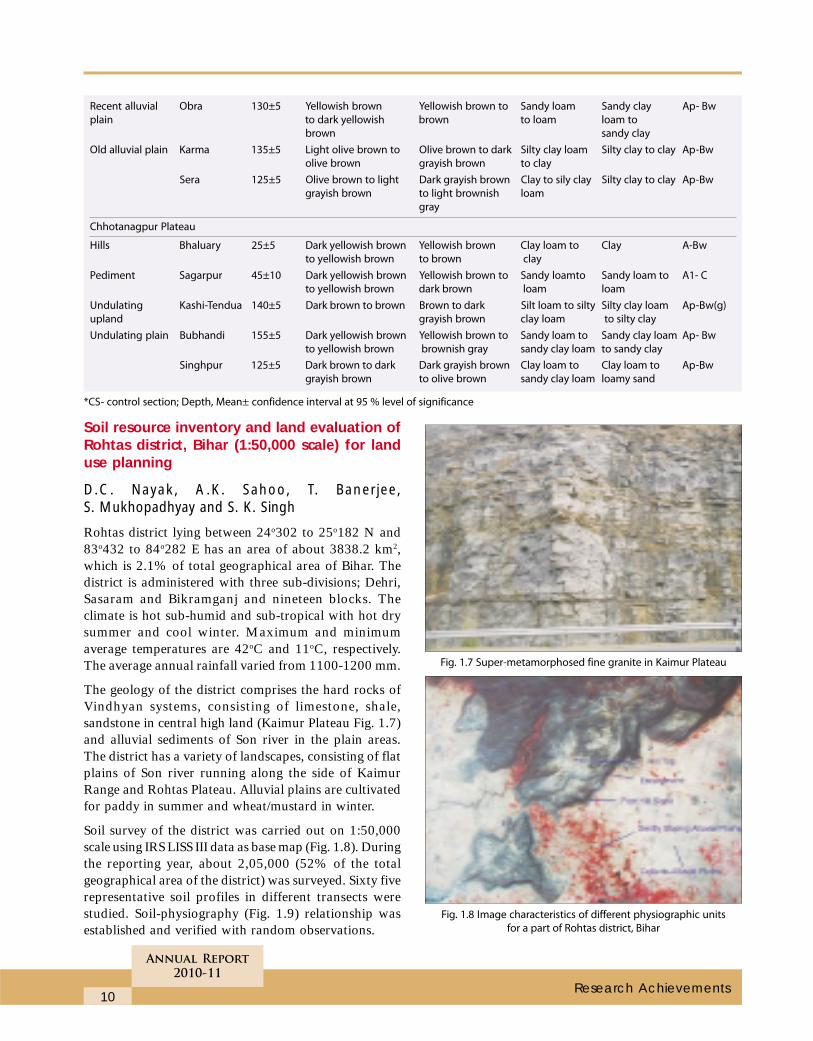
The spot height, ranging from 110 to 150 m above meansea level indicated that black soils occupied relativelyhigher topographical position than the younger alluvialplains (90 to 110 meter). Sharp bend in Son river (Fig.1.6) at the base of Chhotanagpur plateau in the districtreconfirmed the presence of these soils on the elevatedpart of the landscape. The circumstantial events suggestthat once upon a time the entire district was the part ofChhotanagpur plateau, with the abundance of micro-highand micro-low. Micro-low was occupied by the youngerGangetic alluvium, whereas elevated part of the landscaperemained untouched during the formation of Indo-Gangetic alluvial plains. However, the debatable issue,the absence of slickensides and wedge-shaped structurein the sub-surface, is yet to be resolved. Probably mixingof alluvia at the surface having high proportion of non-expanding type of clay may be one of the reasons. Thecolour variation from the surface to sub-surface alsosupported the observations.
Fig. 1.6 Sharp bend of Son river in Aurangabad district, Bihar
Table 1.2 Dominant soils of Aurangabad district, Bihar
Physiography Pedon sites Depth Colour (moist) Texture Horizon
(cm) Surface *CS Surface *CS sequence
Alluvial Plain
Alluvial terrace Daudnagar 140±5 Dark yellowish Yellowish brown to Sandy loam to Loam to sandy Ap-Bw
brown to yellowish brown loam clay loam
brown
Active alluvial Anchchya 140±5 Yellowish brown to Yellowish brown Loamy sand Loamy sand Ap-C
plain dark yellowish brown to gray to sand to sand
cont...
10
Annual Report
2010-11
Research Achievements
Soil resource inventory and land evaluation ofRohtas district, Bihar (1:50,000 scale) for landuse planning
D.C. Nayak, A.K. Sahoo, T. Banerjee,S. Mukhopadhyay and S. K. Singh
Rohtas district lying between 24o302 to 25o182 N and83o432 to 84o282 E has an area of about 3838.2 km2,which is 2.1% of total geographical area of Bihar. Thedistrict is administered with three sub-divisions; Dehri,Sasaram and Bikramganj and nineteen blocks. Theclimate is hot sub-humid and sub-tropical with hot drysummer and cool winter. Maximum and minimumaverage temperatures are 42oC and 11oC, respectively.The average annual rainfall varied from 1100-1200 mm.
The geology of the district comprises the hard rocks ofVindhyan systems, consisting of limestone, shale,sandstone in central high land (Kaimur Plateau Fig. 1.7)and alluvial sediments of Son river in the plain areas.The district has a variety of landscapes, consisting of flatplains of Son river running along the side of KaimurRange and Rohtas Plateau. Alluvial plains are cultivatedfor paddy in summer and wheat/mustard in winter.
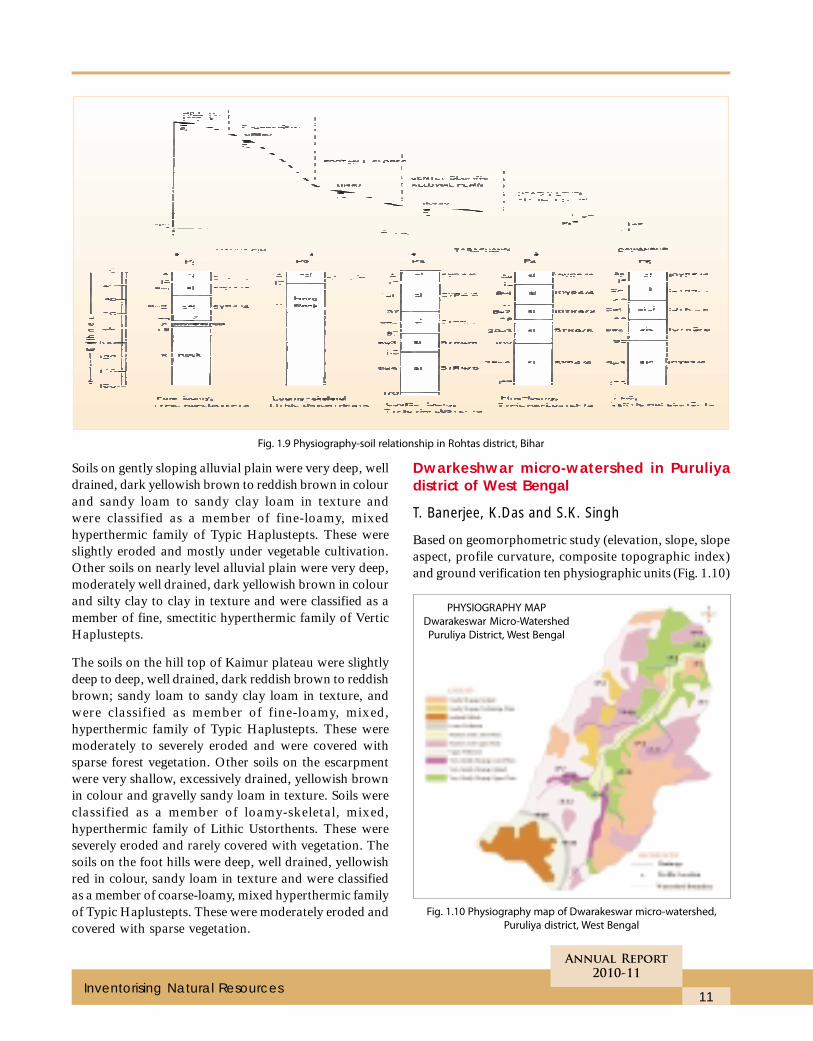
Soil survey of the district was carried out on 1:50,000scale using IRS LISS III data as base map (Fig. 1.8). Duringthe reporting year, about 2,05,000 (52% of the totalgeographical area of the district) was surveyed. Sixty fiverepresentative soil profiles in different transects werestudied. Soil-physiography (Fig. 1.9) relationship wasestablished and verified with random observations.
Recent alluvial Obra 130±5 Yellowish brown Yellowish brown to Sandy loam Sandy clay Ap- Bw
plain to dark yellowish brown to loam loam to
brown sandy clay
Old alluvial plain Karma 135±5 Light olive brown to Olive brown to dark Silty clay loam Silty clay to clay Ap-Bw
olive brown grayish brown to clay
Sera 125±5 Olive brown to light Dark grayish brown Clay to sily clay Silty clay to clay Ap-Bw
grayish brown to light brownish loam
gray
Chhotanagpur Plateau
Hills Bhaluary 25±5 Dark yellowish brown Yellowish brown Clay loam to Clay A-Bw
to yellowish brown to brown clay
Pediment Sagarpur 45±10 Dark yellowish brown Yellowish brown to Sandy loamto Sandy loam to A1- C
to yellowish brown dark brown loam loam
Undulating Kashi-Tendua 140±5 Dark brown to brown Brown to dark Silt loam to silty Silty clay loam Ap-Bw(g)
upland grayish brown clay loam to silty clay
Undulating plain Bubhandi 155±5 Dark yellowish brown Yellowish brown to Sandy loam to Sandy clay loam Ap- Bw
to yellowish brown brownish gray sandy clay loam to sandy clay
Singhpur 125±5 Dark brown to dark Dark grayish brown Clay loam to Clay loam to Ap-Bw
grayish brown to olive brown sandy clay loam loamy sand
*CS- control section; Depth, Mean± confidence interval at 95 % level of significance
Fig. 1.7 Super-metamorphosed fine granite in Kaimur Plateau
Fig. 1.8 Image characteristics of different physiographic units
for a part of Rohtas district, Bihar
11
Annual Report
2010-11
Inventorising Natural Resources
Fig. 1.10 Physiography map of Dwarakeswar micro-watershed,
Puruliya district, West Bengal
PHYSIOGRAPHY MAP
Dwarakeswar Micro-Watershed
Puruliya District, West Bengal
Soils on gently sloping alluvial plain were very deep, welldrained, dark yellowish brown to reddish brown in colourand sandy loam to sandy clay loam in texture andwere classified as a member of fine-loamy, mixedhyperthermic family of Typic Haplustepts. These wereslightly eroded and mostly under vegetable cultivation.Other soils on nearly level alluvial plain were very deep,moderately well drained, dark yellowish brown in colourand silty clay to clay in texture and were classified as amember of fine, smectitic hyperthermic family of VerticHaplustepts.
The soils on the hill top of Kaimur plateau were slightlydeep to deep, well drained, dark reddish brown to reddishbrown; sandy loam to sandy clay loam in texture, andwere classified as member of fine-loamy, mixed,hyperthermic family of Typic Haplustepts. These weremoderately to severely eroded and were covered withsparse forest vegetation. Other soils on the escarpmentwere very shallow, excessively drained, yellowish brownin colour and gravelly sandy loam in texture. Soils wereclassified as a member of loamy-skeletal, mixed,hyperthermic family of Lithic Ustorthents. These wereseverely eroded and rarely covered with vegetation. Thesoils on the foot hills were deep, well drained, yellowishred in colour, sandy loam in texture and were classifiedas a member of coarse-loamy, mixed hyperthermic familyof Typic Haplustepts. These were moderately eroded andcovered with sparse vegetation.
Dwarkeshwar micro-watershed in Puruliyadistrict of West Bengal
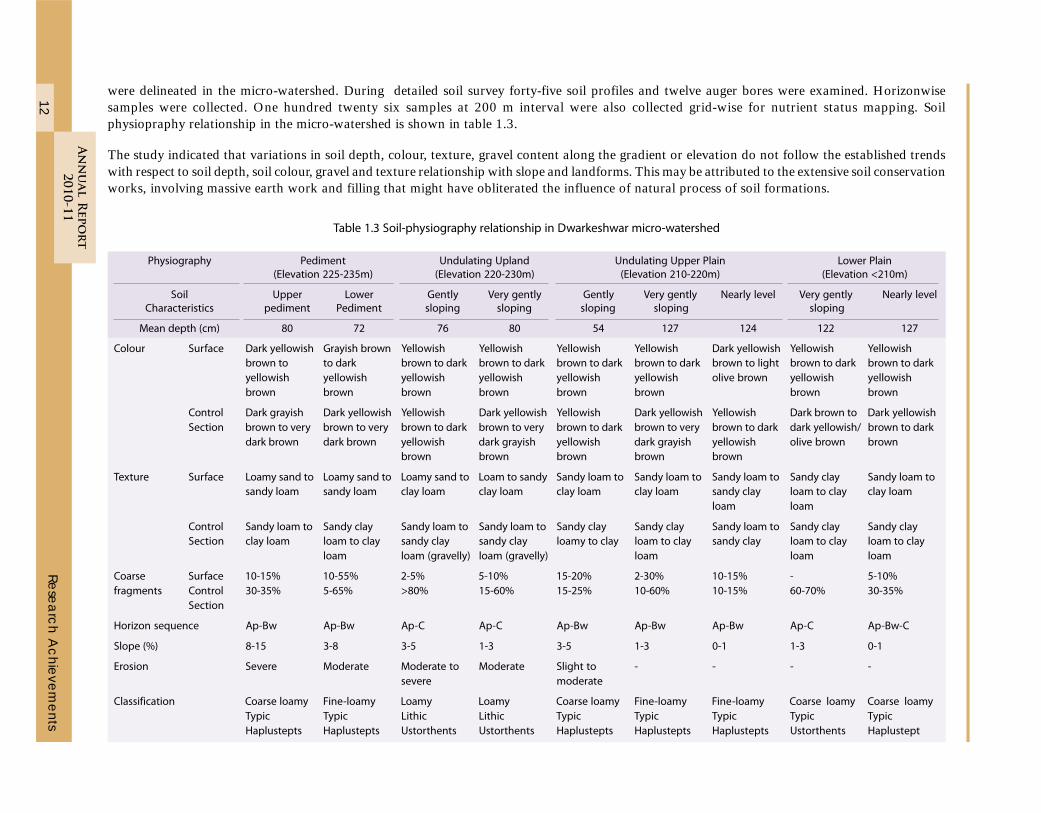
T. Banerjee, K.Das and S.K. Singh
Based on geomorphometric study (elevation, slope, slopeaspect, profile curvature, composite topographic index)and ground verification ten physiographic units (Fig. 1.10)
Fig. 1.9 Physiography-soil relationship in Rohtas district, Bihar
12
An
nu
al R
epo
rt
2010-11
Re
sea
rch
Ac
hie
vem
en
ts
were delineated in the micro-watershed. During detailed soil survey forty-five soil profiles and twelve auger bores were examined. Horizonwisesamples were collected. One hundred twenty six samples at 200 m interval were also collected grid-wise for nutrient status mapping. Soilphysiopraphy relationship in the micro-watershed is shown in table 1.3.
The study indicated that variations in soil depth, colour, texture, gravel content along the gradient or elevation do not follow the established trendswith respect to soil depth, soil colour, gravel and texture relationship with slope and landforms. This may be attributed to the extensive soil conservationworks, involving massive earth work and filling that might have obliterated the influence of natural process of soil formations.
Table 1.3 Soil-physiography relationship in Dwarkeshwar micro-watershed
Physiography Pediment Undulating Upland Undulating Upper Plain Lower Plain
(Elevation 225-235m) (Elevation 220-230m) (Elevation 210-220m) (Elevation <210m)
Soil Upper Lower Gently Very gently Gently Very gently Nearly level Very gently Nearly level
Characteristics pediment Pediment sloping sloping sloping sloping sloping
Mean depth (cm) 80 72 76 80 54 127 124 122 127
Colour Surface Dark yellowish Grayish brown Yellowish Yellowish Yellowish Yellowish Dark yellowish Yellowish Yellowish
brown to to dark brown to dark brown to dark brown to dark brown to dark brown to light brown to dark brown to dark
yellowish yellowish yellowish yellowish yellowish yellowish olive brown yellowish yellowish
brown brown brown brown brown brown brown brown
Control Dark grayish Dark yellowish Yellowish Dark yellowish Yellowish Dark yellowish Yellowish Dark brown to Dark yellowish
Section brown to very brown to very brown to dark brown to very brown to dark brown to very brown to dark dark yellowish/ brown to dark
dark brown dark brown yellowish dark grayish yellowish dark grayish yellowish olive brown brown
brown brown brown brown brown
Texture Surface Loamy sand to Loamy sand to Loamy sand to Loam to sandy Sandy loam to Sandy loam to Sandy loam to Sandy clay Sandy loam to
sandy loam sandy loam clay loam clay loam clay loam clay loam sandy clay loam to clay clay loam
loam loam
Control Sandy loam to Sandy clay Sandy loam to Sandy loam to Sandy clay Sandy clay Sandy loam to Sandy clay Sandy clay
Section clay loam loam to clay sandy clay sandy clay loamy to clay loam to clay sandy clay loam to clay loam to clay
loam loam (gravelly) loam (gravelly) loam loam loam
Coarse Surface 10-15% 10-55% 2-5% 5-10% 15-20% 2-30% 10-15% - 5-10%
fragments Control 30-35% 5-65% >80% 15-60% 15-25% 10-60% 10-15% 60-70% 30-35%
Section
Horizon sequence Ap-Bw Ap-Bw Ap-C Ap-C Ap-Bw Ap-Bw Ap-Bw Ap-C Ap-Bw-C
Slope (%) 8-15 3-8 3-5 1-3 3-5 1-3 0-1 1-3 0-1
Erosion Severe Moderate Moderate to Moderate Slight to - - - -
severe moderate
Classification Coarse loamy Fine-loamy Loamy Loamy Coarse loamy Fine-loamy Fine-loamy Coarse loamy Coarse loamy
Typic Typic Lithic Lithic Typic Typic Typic Typic Typic
Haplustepts Haplustepts Ustorthents Ustorthents Haplustepts Haplustepts Haplustepts Ustorthents Haplustept
13
Annual Report
2010-11
Inventorising Natural Resources
Land resource inventory for farm planning inChinchura-Mogra and Polba-Dadpur block,Hugli district, West Bengal – A Sub-project ofmain project “Land resources inventory for farmplanning in different agro-ecosystems of India”
S. Dharumarajan, S.K. Gangopadhyay, T. Banerjeeand S.K. Singh
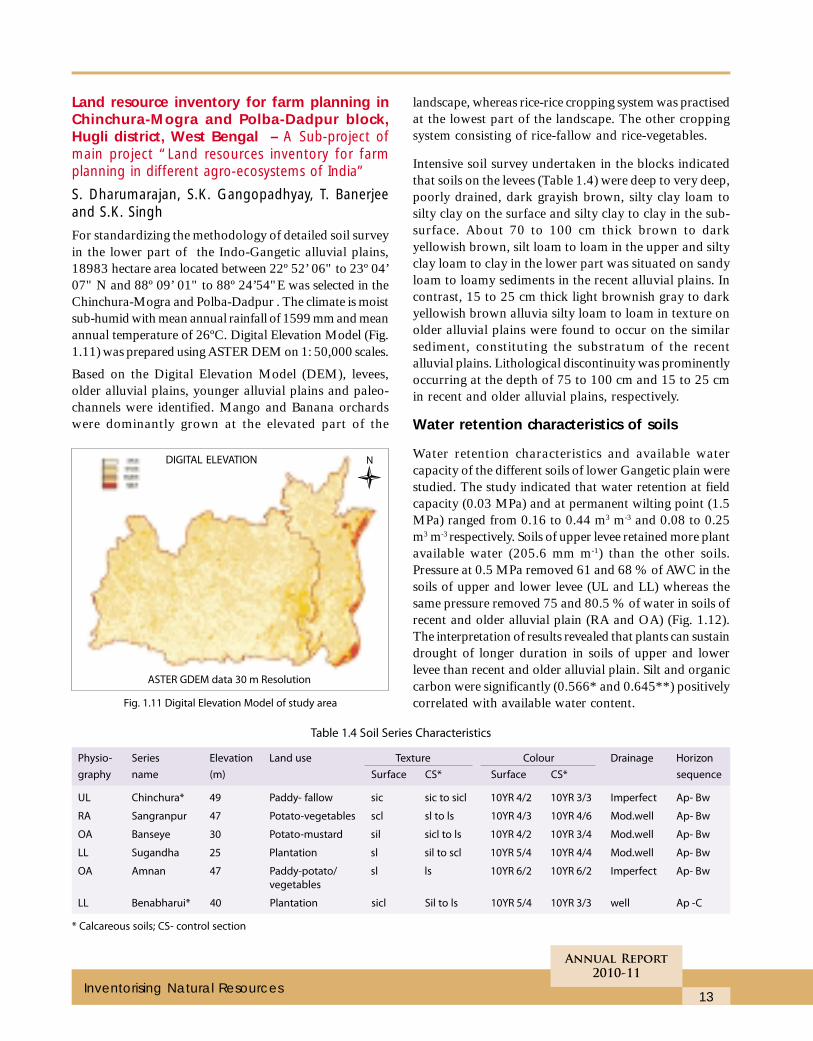
For standardizing the methodology of detailed soil surveyin the lower part of the Indo-Gangetic alluvial plains,18983 hectare area located between 22º 52’ 06" to 23º 04’07" N and 88º 09’ 01" to 88º 24’54"E was selected in theChinchura-Mogra and Polba-Dadpur . The climate is moistsub-humid with mean annual rainfall of 1599 mm and meanannual temperature of 26ºC. Digital Elevation Model (Fig.1.11) was prepared using ASTER DEM on 1: 50,000 scales.
Based on the Digital Elevation Model (DEM), levees,older alluvial plains, younger alluvial plains and paleo-channels were identified. Mango and Banana orchardswere dominantly grown at the elevated part of the
landscape, whereas rice-rice cropping system was practisedat the lowest part of the landscape. The other croppingsystem consisting of rice-fallow and rice-vegetables.
Intensive soil survey undertaken in the blocks indicatedthat soils on the levees (Table 1.4) were deep to very deep,poorly drained, dark grayish brown, silty clay loam tosilty clay on the surface and silty clay to clay in the sub-surface. About 70 to 100 cm thick brown to darkyellowish brown, silt loam to loam in the upper and siltyclay loam to clay in the lower part was situated on sandyloam to loamy sediments in the recent alluvial plains. Incontrast, 15 to 25 cm thick light brownish gray to darkyellowish brown alluvia silty loam to loam in texture onolder alluvial plains were found to occur on the similarsediment, constituting the substratum of the recentalluvial plains. Lithological discontinuity was prominentlyoccurring at the depth of 75 to 100 cm and 15 to 25 cmin recent and older alluvial plains, respectively.
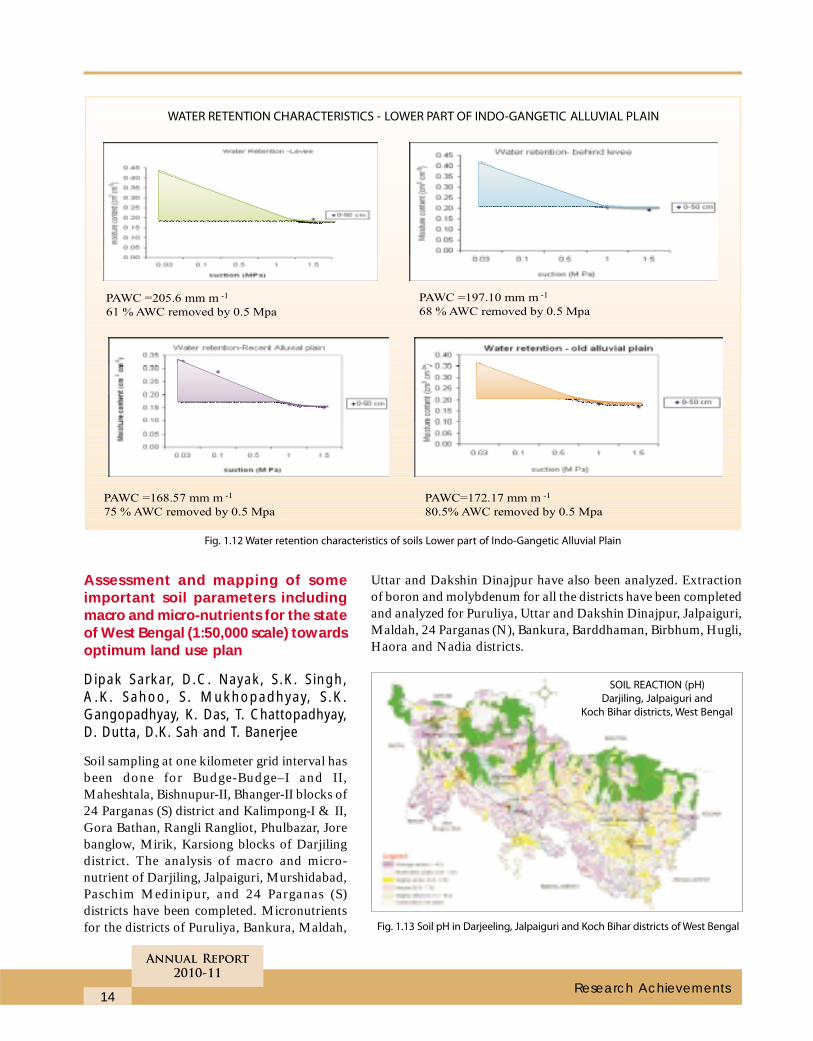
Water retention characteristics of soils
Water retention characteristics and available watercapacity of the different soils of lower Gangetic plain werestudied. The study indicated that water retention at fieldcapacity (0.03 MPa) and at permanent wilting point (1.5MPa) ranged from 0.16 to 0.44 m3 m-3 and 0.08 to 0.25m3 m-3 respectively. Soils of upper levee retained more plantavailable water (205.6 mm m-1) than the other soils.Pressure at 0.5 MPa removed 61 and 68 % of AWC in thesoils of upper and lower levee (UL and LL) whereas thesame pressure removed 75 and 80.5 % of water in soils ofrecent and older alluvial plain (RA and OA) (Fig. 1.12).The interpretation of results revealed that plants can sustaindrought of longer duration in soils of upper and lowerlevee than recent and older alluvial plain. Silt and organiccarbon were significantly (0.566* and 0.645**) positivelycorrelated with available water content.Fig. 1.11 Digital Elevation Model of study area
Table 1.4 Soil Series Characteristics
Physio- Series Elevation Land use Texture Colour Drainage Horizon
graphy name (m) Surface CS* Surface CS* sequence
UL Chinchura* 49 Paddy- fallow sic sic to sicl 10YR 4/2 10YR 3/3 Imperfect Ap- Bw
RA Sangranpur 47 Potato-vegetables scl sl to ls 10YR 4/3 10YR 4/6 Mod.well Ap- Bw
OA Banseye 30 Potato-mustard sil sicl to ls 10YR 4/2 10YR 3/4 Mod.well Ap- Bw
LL Sugandha 25 Plantation sl sil to scl 10YR 5/4 10YR 4/4 Mod.well Ap- Bw
OA Amnan 47 Paddy-potato/ sl ls 10YR 6/2 10YR 6/2 Imperfect Ap- Bw
vegetables
LL Benabharui* 40 Plantation sicl Sil to ls 10YR 5/4 10YR 3/3 well Ap -C
* Calcareous soils; CS- control section
DIGITAL ELEVATION
ASTER GDEM data 30 m Resolution
14
Annual Report
2010-11
Research Achievements
Assessment and mapping of someimportant soil parameters includingmacro and micro-nutrients for the stateof West Bengal (1:50,000 scale) towardsoptimum land use plan
Dipak Sarkar, D.C. Nayak, S.K. Singh,A.K. Sahoo, S. Mukhopadhyay, S.K.Gangopadhyay, K. Das, T. Chattopadhyay,D. Dutta, D.K. Sah and T. Banerjee
Soil sampling at one kilometer grid interval hasbeen done for Budge-Budge–I and II,Maheshtala, Bishnupur-II, Bhanger-II blocks of24 Parganas (S) district and Kalimpong-I & II,Gora Bathan, Rangli Rangliot, Phulbazar, Jorebanglow, Mirik, Karsiong blocks of Darjilingdistrict. The analysis of macro and micro-nutrient of Darjiling, Jalpaiguri, Murshidabad,Paschim Medinipur, and 24 Parganas (S)districts have been completed. Micronutrientsfor the districts of Puruliya, Bankura, Maldah,
Uttar and Dakshin Dinajpur have also been analyzed. Extractionof boron and molybdenum for all the districts have been completedand analyzed for Puruliya, Uttar and Dakshin Dinajpur, Jalpaiguri,Maldah, 24 Parganas (N), Bankura, Barddhaman, Birbhum, Hugli,Haora and Nadia districts.
Fig. 1.12 Water retention characteristics of soils Lower part of Indo-Gangetic Alluvial Plain
Fig. 1.13 Soil pH in Darjeeling, Jalpaiguri and Koch Bihar districts of West Bengal
SOIL REACTION (pH)
Darjiling, Jalpaiguri and
Koch Bihar districts, West Bengal
15
Annual Report
2010-11
Inventorising Natural Resources
Table 1.5 District-wise distribution of soils of West Bengal under different levels of acidity*
Districts Area (km 2) under different classes of soil pH
Strongly Moderately Slightly Neutral Slightly Alkaline Misc. Total
acidic acidic acidic alkaline
<4.5 4.5-5.0 5.0-5.5 5.5-6.5 6.5-7.5 7.5-8.5 >8.5
Darjiling 838.5 1133.2 - 176.5 - - - 1000.8 3149.0
(26.6) (36.0) (5.6) (31.8) (100.0)
Jalpaiguri 1746.1 1729.9 - 485.1 319.5 - - 1946.4 6227.0
(28.0) (27.8) (7.8) (5.1) (31.3) (100.0)
Koch Bihar 889.0 1504.2 - 578.9 194.0 16.6 - 204.3 3387.0
(26.2) (44.3) (17.1) (5.7) (0.5) (6.2) (100.0)
Maldah 44.3 466.9 - 1068.2 908.6 904.1 - 340.9 3733.0
(1.2) (12.5) (28.6) (22.4) (24.2) (9.1) (100.0)
Murshidabad 87.8 597.8 - 1088.8 1746.5 1502.3 54.1 246.7 5324.0
(1.7) (11.2) (20.5) (32.8) (28.2) (1.0) (4.6) (100.0)
Uttar Dinajpur 624.2 1824.2 - 576.3 98.8 - - 16.5 3140.0(
(19.9) (58.1) (18.4) (3.1) (0.5) 100.0)
Dakshin Dinajpur 361.8 1283.0 - 495.0 59.0 - - 20.3 2219.0
(16.3) (57.8) (22.3) (2.7) (0.9) (100.0)
Nadia 27.7 86.4 - 342.1 1856.8 1438.5 - 175.5 3927.0
(0.7) (2.2) (8.7) (47.3) (36.6) (4.5) (100.0)
Haora 27.1 158.1 - 581.6 409.1 95.2 16.5 179.4 1467.0
(21.8) (3.8) (39.7) (27.9) (6.5) (1.1) (12.2) (100.0)
Hugli 77.8 903.4 - 1273.9 645.7 133.0 13.0 102.2 3149.0
(2.5) (28.7) (40.5) (20.5) (4.2) (0.4) (3.2) (100.0)
Barddhaman 588.7 2661.0 - 2493.1 814.9 175.6 65.4 225.3 7024.0
(8.4) (37.9) (35.5) (11.6) (2.5) (0.9) (3.2) (100.0)
Birbhum 98.7 2202.0 - 1648.7 437.1 40.6 - 117.9 4545.0
(2.2) (48.4) (36.3) (9.6) (0.9) (2.6) (100.0)
Puruliya 288.6 4144.4 - 1494.7 218.0 17.0 - 96.3 6259.0
(4.6) (66.2) (23.9) (3.5) (0.3) (1.5) (100.0)
Bankura 480.1 2405.7 2195.7 1316.9 163.5 48.8 - 271.3 6882.0
(7.0) (35.0) (31.9) (19.1) (2.4) (0.7) (3.9) (100.0)
Purba Medinipur 113.8 975.7 - 1731.3 722.6 124.2 - 627.4 4295.0
(2.7) (22.7) (40.3) (16.8) (2.9) (14.6) (100.0)
Paschim Medinipur 1077.0 3285.7 - 1536.9 503.8 105.3 - 239.6 6748.4
(15.9) (48.7) (22.8) (7.5) (1.5) (3.6) (100.0)
24Parganas (N) 248.4 246.8 - 767.9 1591.2 543.0 196.6 500.1 4094.0
(6.1) (6.0) (18.8) (38.8) (13.3) (4.8) (12.2) (100.0)
24Parganas (S) 537.3 1061.2 - 1415.1 916.0 225.6 198.8 5607.0 9961.0
(5.4) (10.7) (14.2) (9.2) (2.3) (2.0) (56.2) (100.0)
Note: Figures within parentheses indicates (%) area of the districts *pH range as suggested by State Department
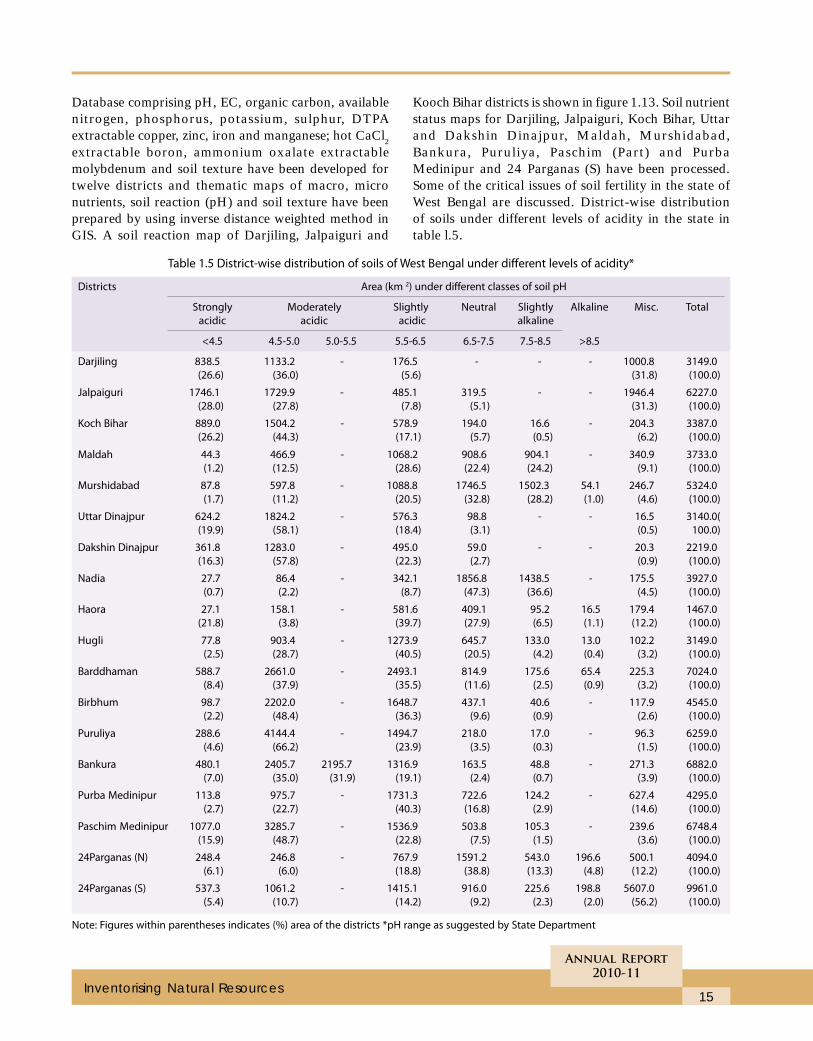
Database comprising pH, EC, organic carbon, availablenitrogen, phosphorus, potassium, sulphur, DTPAextractable copper, zinc, iron and manganese; hot CaCl2extractable boron, ammonium oxalate extractablemolybdenum and soil texture have been developed fortwelve districts and thematic maps of macro, micronutrients, soil reaction (pH) and soil texture have beenprepared by using inverse distance weighted method inGIS. A soil reaction map of Darjiling, Jalpaiguri and
Kooch Bihar districts is shown in figure 1.13. Soil nutrientstatus maps for Darjiling, Jalpaiguri, Koch Bihar, Uttarand Dakshin Dinajpur, Maldah, Murshidabad,Bankura, Puruliya, Paschim (Part) and PurbaMedinipur and 24 Parganas (S) have been processed.Some of the critical issues of soil fertility in the state ofWest Bengal are discussed. District-wise distributionof soils under different levels of acidity in the state intable l.5.
16
Annual Report
2010-11
Research Achievements
Variation in the extent and severity of acidity may beattributed to the nature of material, climate, vegetationand management. High acidic alluvia of easternHimalaya under the influence of high rainfall and lowtemperature acidifying the soils of Darjiling,Jalpaiguri, Koch Bihar, Uttar and Dakshin Dinajpurdistricts. Acidity in the Chhotanagpur region was themajor concern of Puruliya, Bankura, Birbhum, part ofPaschim Medinipur and Barddhaman districts.Sulphur oxidation at places may be attributed to theacidity in the districts of Haora, Hugli, Purba Medinipur,24 Parganas.
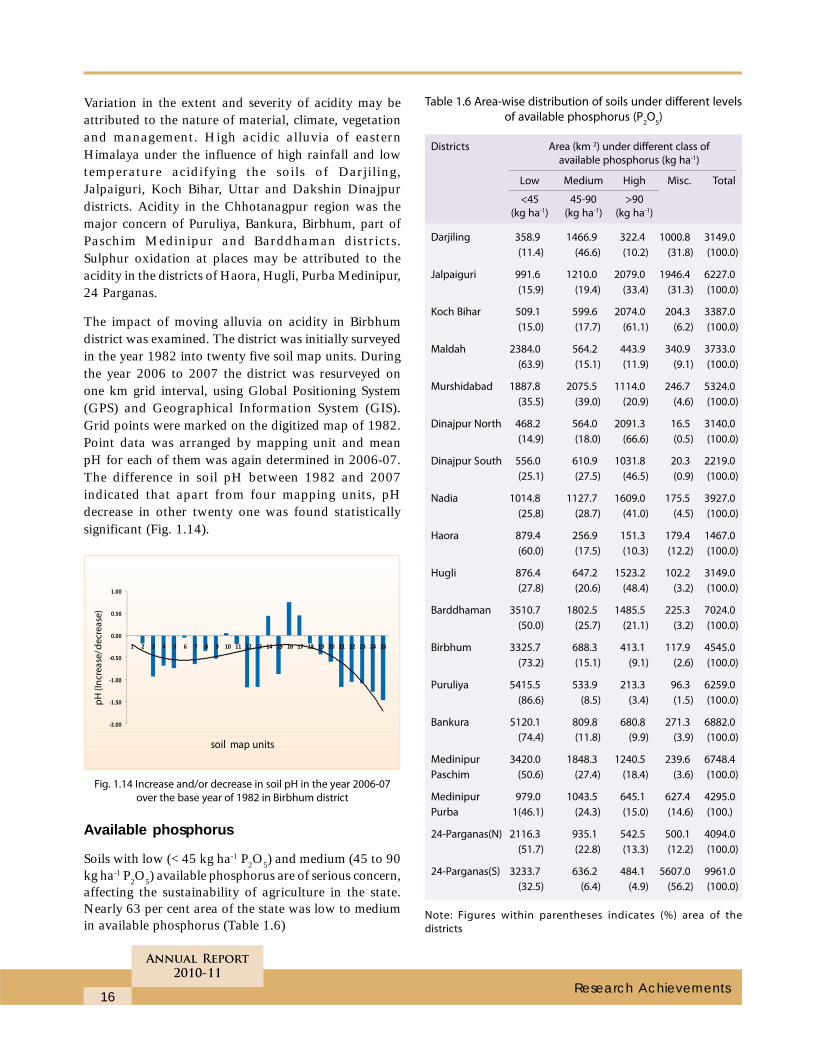
The impact of moving alluvia on acidity in Birbhumdistrict was examined. The district was initially surveyedin the year 1982 into twenty five soil map units. Duringthe year 2006 to 2007 the district was resurveyed onone km grid interval, using Global Positioning System(GPS) and Geographical Information System (GIS).Grid points were marked on the digitized map of 1982.Point data was arranged by mapping unit and meanpH for each of them was again determined in 2006-07.The difference in soil pH between 1982 and 2007indicated that apart from four mapping units, pHdecrease in other twenty one was found statisticallysignificant (Fig. 1.14).
Fig. 1.14 Increase and/or decrease in soil pH in the year 2006-07
over the base year of 1982 in Birbhum district
Available phosphorus
Soils with low (< 45 kg ha-1 P2O5) and medium (45 to 90kg ha-1 P2O5) available phosphorus are of serious concern,affecting the sustainability of agriculture in the state.Nearly 63 per cent area of the state was low to mediumin available phosphorus (Table 1.6)
Table 1.6 Area-wise distribution of soils under different levels
of available phosphorus (P2O
5)
Districts Area (km 2) under different class of
available phosphorus (kg ha-1)
Low Medium High Misc. Total
<45 45-90 >90
(kg ha-1) (kg ha-1) (kg ha-1)
Darjiling 358.9 1466.9 322.4 1000.8 3149.0
(11.4) (46.6) (10.2) (31.8) (100.0)
Jalpaiguri 991.6 1210.0 2079.0 1946.4 6227.0
(15.9) (19.4) (33.4) (31.3) (100.0)
Koch Bihar 509.1 599.6 2074.0 204.3 3387.0
(15.0) (17.7) (61.1) (6.2) (100.0)
Maldah 2384.0 564.2 443.9 340.9 3733.0
(63.9) (15.1) (11.9) (9.1) (100.0)
Murshidabad 1887.8 2075.5 1114.0 246.7 5324.0
(35.5) (39.0) (20.9) (4.6) (100.0)
Dinajpur North 468.2 564.0 2091.3 16.5 3140.0
(14.9) (18.0) (66.6) (0.5) (100.0)
Dinajpur South 556.0 610.9 1031.8 20.3 2219.0
(25.1) (27.5) (46.5) (0.9) (100.0)
Nadia 1014.8 1127.7 1609.0 175.5 3927.0
(25.8) (28.7) (41.0) (4.5) (100.0)
Haora 879.4 256.9 151.3 179.4 1467.0
(60.0) (17.5) (10.3) (12.2) (100.0)
Hugli 876.4 647.2 1523.2 102.2 3149.0
(27.8) (20.6) (48.4) (3.2) (100.0)
Barddhaman 3510.7 1802.5 1485.5 225.3 7024.0
(50.0) (25.7) (21.1) (3.2) (100.0)
Birbhum 3325.7 688.3 413.1 117.9 4545.0
(73.2) (15.1) (9.1) (2.6) (100.0)
Puruliya 5415.5 533.9 213.3 96.3 6259.0
(86.6) (8.5) (3.4) (1.5) (100.0)
Bankura 5120.1 809.8 680.8 271.3 6882.0
(74.4) (11.8) (9.9) (3.9) (100.0)
Medinipur 3420.0 1848.3 1240.5 239.6 6748.4
Paschim (50.6) (27.4) (18.4) (3.6) (100.0)
Medinipur 979.0 1043.5 645.1 627.4 4295.0
Purba 1(46.1) (24.3) (15.0) (14.6) (100.)
24-Parganas(N) 2116.3 935.1 542.5 500.1 4094.0
(51.7) (22.8) (13.3) (12.2) (100.0)
24-Parganas(S) 3233.7 636.2 484.1 5607.0 9961.0
(32.5) (6.4) (4.9) (56.2) (100.0)
Note: Figures within parentheses indicates (%) area of the
districts
17
Annual Report
2010-11
Inventorising Natural Resources
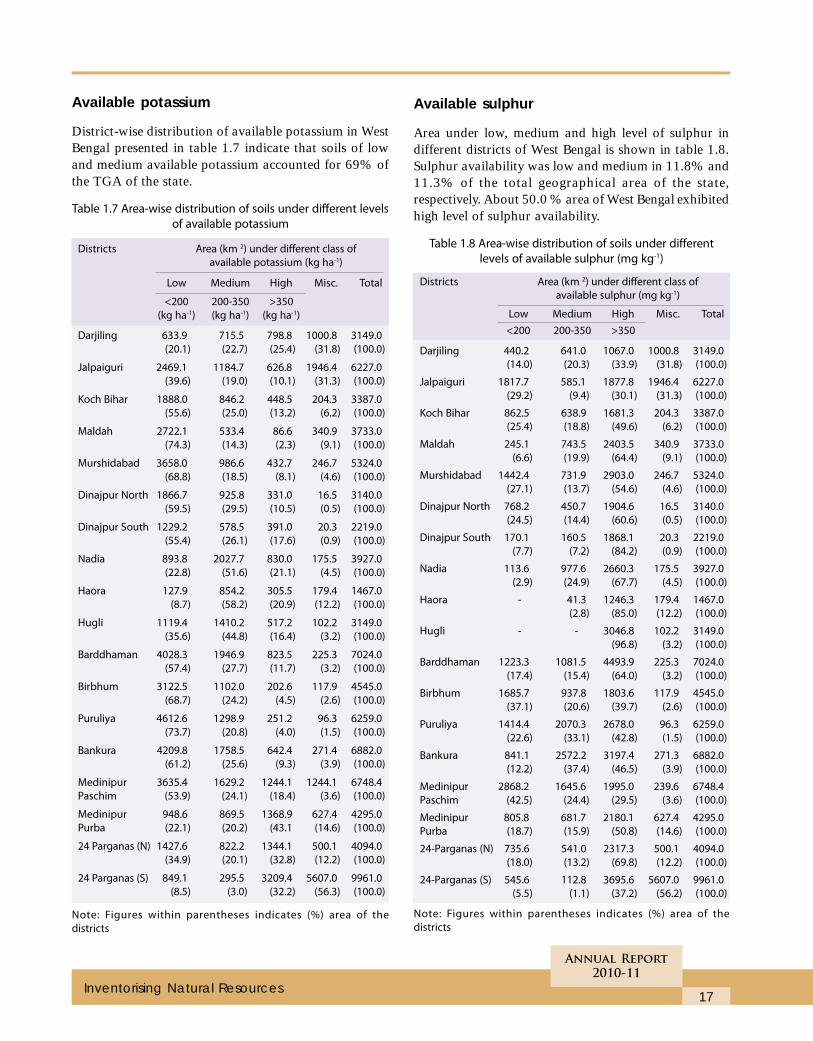
Available potassium
District-wise distribution of available potassium in WestBengal presented in table 1.7 indicate that soils of lowand medium available potassium accounted for 69% ofthe TGA of the state.
Table 1.7 Area-wise distribution of soils under different levels
of available potassium
Districts Area (km 2) under different class of
available potassium (kg ha-1)
Low Medium High Misc. Total
<200 200-350 >350
(kg ha-1) (kg ha-1) (kg ha-1)
Darjiling 633.9 715.5 798.8 1000.8 3149.0
(20.1) (22.7) (25.4) (31.8) (100.0)
Jalpaiguri 2469.1 1184.7 626.8 1946.4 6227.0
(39.6) (19.0) (10.1) (31.3) (100.0)
Koch Bihar 1888.0 846.2 448.5 204.3 3387.0
(55.6) (25.0) (13.2) (6.2) (100.0)
Maldah 2722.1 533.4 86.6 340.9 3733.0
(74.3) (14.3) (2.3) (9.1) (100.0)
Murshidabad 3658.0 986.6 432.7 246.7 5324.0
(68.8) (18.5) (8.1) (4.6) (100.0)
Dinajpur North 1866.7 925.8 331.0 16.5 3140.0
(59.5) (29.5) (10.5) (0.5) (100.0)
Dinajpur South 1229.2 578.5 391.0 20.3 2219.0
(55.4) (26.1) (17.6) (0.9) (100.0)
Nadia 893.8 2027.7 830.0 175.5 3927.0
(22.8) (51.6) (21.1) (4.5) (100.0)
Haora 127.9 854.2 305.5 179.4 1467.0
(8.7) (58.2) (20.9) (12.2) (100.0)
Hugli 1119.4 1410.2 517.2 102.2 3149.0
(35.6) (44.8) (16.4) (3.2) (100.0)
Barddhaman 4028.3 1946.9 823.5 225.3 7024.0
(57.4) (27.7) (11.7) (3.2) (100.0)
Birbhum 3122.5 1102.0 202.6 117.9 4545.0
(68.7) (24.2) (4.5) (2.6) (100.0)
Puruliya 4612.6 1298.9 251.2 96.3 6259.0
(73.7) (20.8) (4.0) (1.5) (100.0)
Bankura 4209.8 1758.5 642.4 271.4 6882.0
(61.2) (25.6) (9.3) (3.9) (100.0)
Medinipur 3635.4 1629.2 1244.1 1244.1 6748.4
Paschim (53.9) (24.1) (18.4) (3.6) (100.0)
Medinipur 948.6 869.5 1368.9 627.4 4295.0
Purba (22.1) (20.2) (43.1 (14.6) (100.0)
24 Parganas (N) 1427.6 822.2 1344.1 500.1 4094.0
(34.9) (20.1) (32.8) (12.2) (100.0)
24 Parganas (S) 849.1 295.5 3209.4 5607.0 9961.0
(8.5) (3.0) (32.2) (56.3) (100.0)
Note: Figures within parentheses indicates (%) area of the
districts
Available sulphur
Area under low, medium and high level of sulphur indifferent districts of West Bengal is shown in table 1.8.Sulphur availability was low and medium in 11.8% and11.3% of the total geographical area of the state,respectively. About 50.0 % area of West Bengal exhibitedhigh level of sulphur availability.
Table 1.8 Area-wise distribution of soils under different
levels of available sulphur (mg kg-1)
Districts Area (km 2) under different class of
available sulphur (mg kg-1)
Low Medium High Misc. Total
<200 200-350 >350
Darjiling 440.2 641.0 1067.0 1000.8 3149.0
(14.0) (20.3) (33.9) (31.8) (100.0)
Jalpaiguri 1817.7 585.1 1877.8 1946.4 6227.0
(29.2) (9.4) (30.1) (31.3) (100.0)
Koch Bihar 862.5 638.9 1681.3 204.3 3387.0
(25.4) (18.8) (49.6) (6.2) (100.0)
Maldah 245.1 743.5 2403.5 340.9 3733.0
(6.6) (19.9) (64.4) (9.1) (100.0)
Murshidabad 1442.4 731.9 2903.0 246.7 5324.0
(27.1) (13.7) (54.6) (4.6) (100.0)
Dinajpur North 768.2 450.7 1904.6 16.5 3140.0
(24.5) (14.4) (60.6) (0.5) (100.0)
Dinajpur South 170.1 160.5 1868.1 20.3 2219.0
(7.7) (7.2) (84.2) (0.9) (100.0)
Nadia 113.6 977.6 2660.3 175.5 3927.0
(2.9) (24.9) (67.7) (4.5) (100.0)
Haora - 41.3 1246.3 179.4 1467.0
(2.8) (85.0) (12.2) (100.0)
Hugli - - 3046.8 102.2 3149.0
(96.8) (3.2) (100.0)
Barddhaman 1223.3 1081.5 4493.9 225.3 7024.0
(17.4) (15.4) (64.0) (3.2) (100.0)
Birbhum 1685.7 937.8 1803.6 117.9 4545.0
(37.1) (20.6) (39.7) (2.6) (100.0)
Puruliya 1414.4 2070.3 2678.0 96.3 6259.0
(22.6) (33.1) (42.8) (1.5) (100.0)
Bankura 841.1 2572.2 3197.4 271.3 6882.0
(12.2) (37.4) (46.5) (3.9) (100.0)
Medinipur 2868.2 1645.6 1995.0 239.6 6748.4
Paschim (42.5) (24.4) (29.5) (3.6) (100.0)
Medinipur 805.8 681.7 2180.1 627.4 4295.0
Purba (18.7) (15.9) (50.8) (14.6) (100.0)
24-Parganas (N) 735.6 541.0 2317.3 500.1 4094.0
(18.0) (13.2) (69.8) (12.2) (100.0)
24-Parganas (S) 545.6 112.8 3695.6 5607.0 9961.0
(5.5) (1.1) (37.2) (56.2) (100.0)
Note: Figures within parentheses indicates (%) area of the
districts
18
Annual Report
2010-11
Research Achievements
Table 1.9 Area-wise distribution of soils under different levels of available zinc (mg kg-1)
Districts Area (km2) under different classes of available zinc(mg kg-1)
Deficient Sufficient Misc. Total
<0.6 0.6-1.0 1.0-2.0 2.0-3.0 3.0-5.0 >5
Darjiling 581.1 400.6 744.7 270.0 140.1 11.7 1000.8 3149.0
(18.5) (12.7) (23.6) (8.6) (4.4) (0.4) (31.8) (100.0)
Jalpaiguri 2519.0 1023.6 501.3 70.9 42.2 123.6 - 6227.0
(40.4) (16.4) (8.1) (1.1) (0.7) (2.0) (100.0)
Koch Bihar 1395.4 1000.1 668.9 101.2 17.1 - 204.3 3387.0
(41.2) (29.4) (19.7) (3.0) (0.5) (6.2) (100.0)
Maldah 2076.0 881.8 375.4 37.7 10.4 10.8 340.9 3733.0
(55.6) (23.6) (10.1) (1.0) (0.3) (0.3) (9.1) (100.0)
Murshidabad 3522.2 1383.2 171.9 - - - 246.7 5324.0
(66.2) (26.0) (3.2) (4.6) (100.0)
Dinajpur North 1644.4 777.8 596.0 89.2 16.1 - 16.5 3140.0
(52.4) (24.8) (19.0) (2.8) (0.5) (0.5) (100.0)
Dinajpur South 698.7 717.5 677.3 73.9 31.3 - 20.3 2219.0
(31.5) (32.4) (30.5) (3.3) (1.4) (0.9) (100.0)
Nadia 1010.5 1535.6 1036.7 142.9 25.8 - 175.5 3927.0
(25.7) (39.1) (26.4) (3.6) (0.7) (4.5) (100.0)
Haora 236.4 660.8 360.7 24.1 4.5 1.1 179.4 1467.0
(16.1) (45.1) (24.6) (1.6) (0.3) (0.1) (12.2) (100.0)
Hugli 1148.4 876.3 774.1 166.7 67.1 14.2 102.2 3149.0
(36.5) (27.8) (24.6) (5.3) (2.1) (0.5) (3.2) (100.0)
Barddhaman 2298.9 1896.2 1780.9 480.4 252.3 90.0 225.3 7024.0
(32.7) (27.0) (25.4) (6.8) (3.6) (1.3) (3.2) (100.0)
Birbhum 3168.2 625.7 419.8 168.2 38.2 7.0 117.9 4545.0
(69.7) (13.8) (9.2) (3.7) (0.8) (0.2) (2.6) (100.0)
Puruliya 1334.5 1938.9 2045.8 454.2 270.5 118.8 96.3 6259.0
(21.3) (31.0) (32.7) (7.3) (4.3) (1.9) (1.5) (100.0)
Bankura 271.4 3348.7 2166.3 570.1 220.5 33.7 271.3 6882.0
(3.9) (48.7) (31.5) (8.3) (3.2) (0.5) (3.9) (100.0)
Medinipur 2948.6 2231.3 1226.6 71.4 30.9 - 239.6 6748.4
Paschim (43.7) (33.0) (18.2) (1.0) (0.5) (3.6) (100.0)
Medinipur 1918.6 1123.9 591.0 34.1 - - 627.4 4295.0
Purba (44.7) (26.1) (13.8) (0.8) (13.6) (100.0)
24-Parganas(N) 273.9 551.8 197.3 105.3 - - 500.1 4094.0
(66.9) (13.5) (4.8) (2.6) (12.2) (100.0)
24-Parganas(S) 2696.2 1015.2 397.9 244.6 - - 5607.0 9961.0
(27.1) (10.2) (4.0) (2.5) (56.2) (100.0)
Note: Figures within parentheses indicates (%) area of the districts
Available zinc
Distribution of deficient and sufficient area with respectto zinc nutrition is shown in different districts of WestBengal (Table 1.9). About 35 % area of the state isaffected with zinc deficiency. The extent of deficiency
was the highest, ranging from 55 to 70 % in Maldah,Murshidabad, Birbhum and 24 Parganas (N) followedby 40 to 50 % in Jalpaiguri, Koch Bihar, Purba andPaschim Medinipur and 30 to 40 % in Dakshin Dinajpur,Hugli and Barddhaman districts. Extent of zinc deficiencyvaried from 3.9 % in Bankura to 27.1% in 24 Parganas(S).
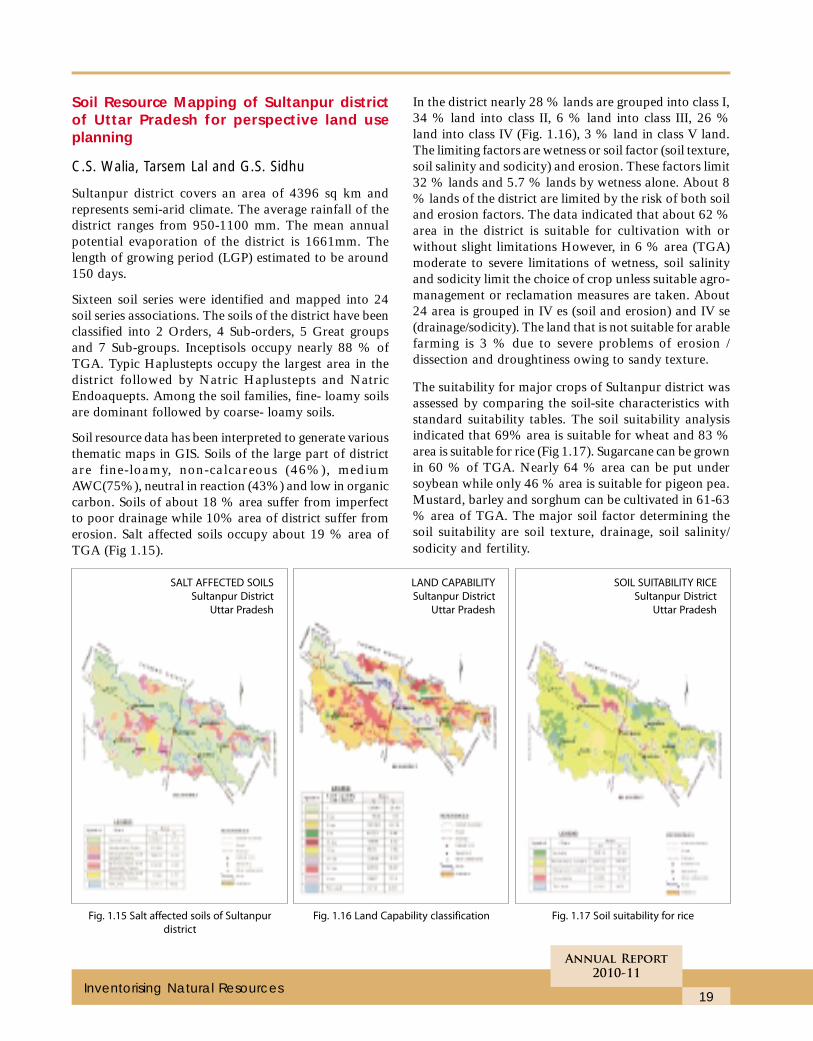
19
Annual Report
2010-11
Inventorising Natural Resources
Soil Resource Mapping of Sultanpur districtof Uttar Pradesh for perspective land useplanning
C.S. Walia, Tarsem Lal and G.S. Sidhu
Sultanpur district covers an area of 4396 sq km andrepresents semi-arid climate. The average rainfall of thedistrict ranges from 950-1100 mm. The mean annualpotential evaporation of the district is 1661mm. Thelength of growing period (LGP) estimated to be around150 days.
Sixteen soil series were identified and mapped into 24soil series associations. The soils of the district have beenclassified into 2 Orders, 4 Sub-orders, 5 Great groupsand 7 Sub-groups. Inceptisols occupy nearly 88 % ofTGA. Typic Haplustepts occupy the largest area in thedistrict followed by Natric Haplustepts and NatricEndoaquepts. Among the soil families, fine- loamy soilsare dominant followed by coarse- loamy soils.
Soil resource data has been interpreted to generate variousthematic maps in GIS. Soils of the large part of districtare fine-loamy, non-calcareous (46%), mediumAWC(75%), neutral in reaction (43%) and low in organiccarbon. Soils of about 18 % area suffer from imperfectto poor drainage while 10% area of district suffer fromerosion. Salt affected soils occupy about 19 % area ofTGA (Fig 1.15).
In the district nearly 28 % lands are grouped into class I,34 % land into class II, 6 % land into class III, 26 %land into class IV (Fig. 1.16), 3 % land in class V land.The limiting factors are wetness or soil factor (soil texture,soil salinity and sodicity) and erosion. These factors limit32 % lands and 5.7 % lands by wetness alone. About 8% lands of the district are limited by the risk of both soiland erosion factors. The data indicated that about 62 %area in the district is suitable for cultivation with orwithout slight limitations However, in 6 % area (TGA)moderate to severe limitations of wetness, soil salinityand sodicity limit the choice of crop unless suitable agro-management or reclamation measures are taken. About24 area is grouped in IV es (soil and erosion) and IV se(drainage/sodicity). The land that is not suitable for arablefarming is 3 % due to severe problems of erosion /dissection and droughtiness owing to sandy texture.
The suitability for major crops of Sultanpur district wasassessed by comparing the soil-site characteristics withstandard suitability tables. The soil suitability analysisindicated that 69% area is suitable for wheat and 83 %area is suitable for rice (Fig 1.17). Sugarcane can be grownin 60 % of TGA. Nearly 64 % area can be put undersoybean while only 46 % area is suitable for pigeon pea.Mustard, barley and sorghum can be cultivated in 61-63% area of TGA. The major soil factor determining thesoil suitability are soil texture, drainage, soil salinity/sodicity and fertility.
Fig. 1.15 Salt affected soils of Sultanpur
district
Fig. 1.16 Land Capability classification Fig. 1.17 Soil suitability for rice
SALT AFFECTED SOILS
Sultanpur District
Uttar Pradesh
LAND CAPABILITY
Sultanpur District
Uttar Pradesh
SOIL SUITABILITY RICE
Sultanpur District
Uttar Pradesh
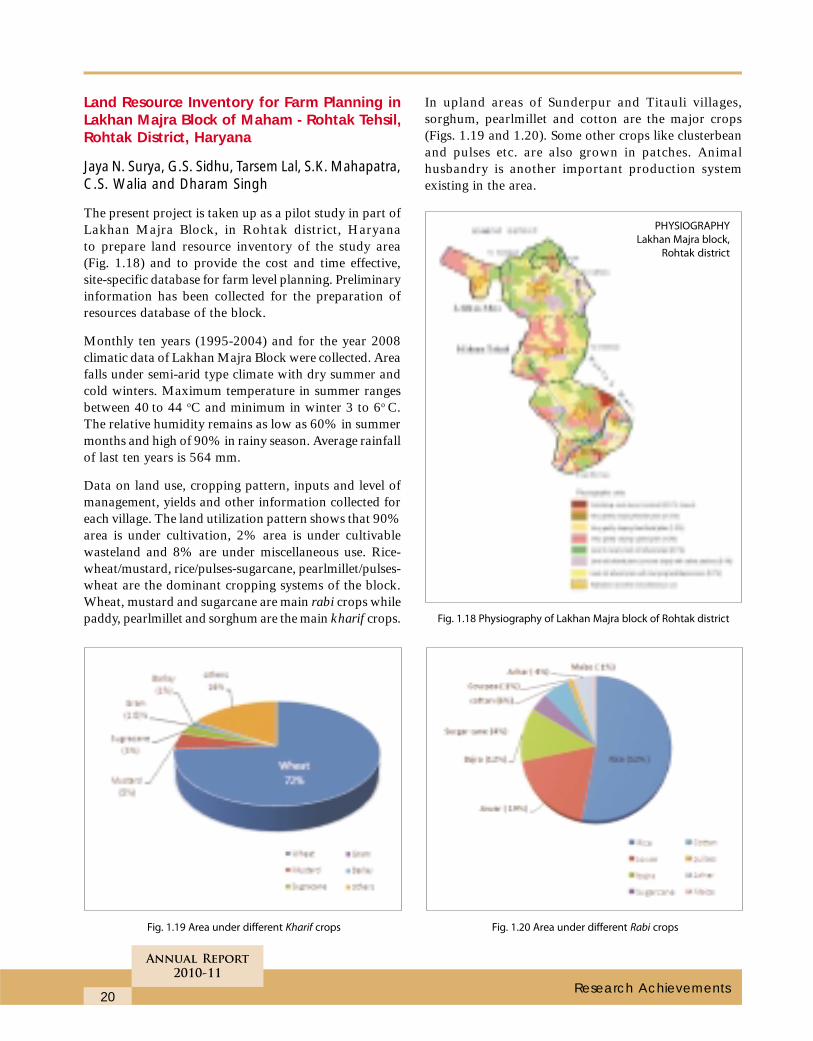
20
Annual Report
2010-11
Research Achievements
Land Resource Inventory for Farm Planning inLakhan Majra Block of Maham - Rohtak Tehsil,Rohtak District, Haryana
Jaya N. Surya, G.S. Sidhu, Tarsem Lal, S.K. Mahapatra,C.S. Walia and Dharam Singh
The present project is taken up as a pilot study in part ofLakhan Majra Block, in Rohtak district, Haryanato prepare land resource inventory of the study area(Fig. 1.18) and to provide the cost and time effective,site-specific database for farm level planning. Preliminaryinformation has been collected for the preparation ofresources database of the block.
Monthly ten years (1995-2004) and for the year 2008climatic data of Lakhan Majra Block were collected. Areafalls under semi-arid type climate with dry summer andcold winters. Maximum temperature in summer rangesbetween 40 to 44 oC and minimum in winter 3 to 6o C.The relative humidity remains as low as 60% in summermonths and high of 90% in rainy season. Average rainfallof last ten years is 564 mm.
Data on land use, cropping pattern, inputs and level ofmanagement, yields and other information collected foreach village. The land utilization pattern shows that 90%area is under cultivation, 2% area is under cultivablewasteland and 8% are under miscellaneous use. Rice-wheat/mustard, rice/pulses-sugarcane, pearlmillet/pulses-wheat are the dominant cropping systems of the block.Wheat, mustard and sugarcane are main rabi crops whilepaddy, pearlmillet and sorghum are the main kharif crops. Fig. 1.18 Physiography of Lakhan Majra block of Rohtak district
In upland areas of Sunderpur and Titauli villages,sorghum, pearlmillet and cotton are the major crops(Figs. 1.19 and 1.20). Some other crops like clusterbeanand pulses etc. are also grown in patches. Animalhusbandry is another important production systemexisting in the area.
PHYSIOGRAPHY
Lakhan Majra block,
Rohtak district
Fig. 1.19 Area under different Kharif crops Fig. 1.20 Area under different Rabi crops
21
Annual Report
2010-11
Inventorising Natural Resources
The area, in general, is plain and its altitude is between219 meters (Chiri village) to 226 meters (Tatauli village)above mean sea level. Canal water is main source ofirrigation. Bhiwani sub-branch and Kalanaur distributariesare the two main canals which make the passage throughmost of the villages and have created a network of sub-branches, minor and distributaries. Titauli and Chiriminors are the important canals and minors irrigatingthe area. Ground water table is very shallow (3 m depth)in northern and western part of block, shallow tomoderate depth (3-10 m) in central, eastern and southernpart.
Total population of the area is 30687 persons with 5222households. Out of the total population, 16859 personsare males while13828 are females. The density ofpopulation in the area is 414 persons /km2 . Village-wiseanalysis shows that the Chiri has highest populationdensity with 471 persons/km2 while Sasrauli has thelowest (209 persons/km2). Analysis of the data show that78% population is literate. Regarding land holding, 38%farmers in the area belong to marginal to small landholdings, 13% to semi-medium and only 5% farmersbelong to medium to large category. Out of the totalworkers, 55.89 % are engaged in agriculture and alliedactivities, 7.68% in cottage and household industries andremaining persons engaged in other activities.
Soil Resource Mapping of Mathura District,Uttar Pradesh for Perspective Land Use Planning(1:50,000 scale)
S.K. Mahapatra, Jaya N. Surya, Tarsem Lal, G.S.Sidhu, J.P. Sharma and R.D. Sharma
Mathura district of Uttar Pradesh (27o13’35’’ to27o57’24’’ N; 77o16’35’’ to 77o59’16’’E) covering an areaof 3303.84 sq km. The alluvium mainly of Yamuna riveris continuous and conformable series of fluvial andalluvial deposits, mainly composed of unconsolidatedbeds of sand, silt and clay and their mixture in varyingproportions, and also hillocks of Aravallis in patches.The district has been divided into 4 physiographic regionsviz active flood plains, recent alluvial plains, old alluvialplains and Aravalli hills and further sub-divided into 10physiographic units based on slopes and elevations. Soilresource inventory has been carried out on 1:50,000 scaleand the map has been prepared. There were 20 seriesmapped into 35 soil series associations. The soils of thedistrict belong to 2 Orders, 5 Suborders, 5 Great groupsand 11 Soil Families. Inceptisols occupy nearly 79.6 %
while Entisols cover 17.2% area. Ustepts occupy themajor part of the district (68.0%) followed by Psamments(17.0%). Amongst the Great groups, Haplustepts occupythe largest area (68.0%) followed by Ustipsamments(17.0%) and Halaquepts (11.2%). Coarse-loamy soilsoccupy largest area followed by fine-loamy soils.
Nearly 70% lands are grouped into class II, 9% landinto class III, 15 % into class IV and 0.2% into class VII.Soil salinity/sodicity, wetness and erosion are the majorproblems of the soil. Seventy eight per cent area ismoderately suitable for irrigation while 18% is marginallysuitable for irrigation owing to limitations of texture,sodicity, drainage and topography. Nearly 25% of thearea is suitable for rice, 59% for wheat, 51% for maize,54% for pigeon-pea, 81% for sugarcane, 72% for potatoand 54% for mustard. Nearly 50% area is suitable forfruit crops like mango, guava, citrus, jujube (ber) andpapaya. Most of the soils of the district are medium inorganic carbon, available P and K content.
Nearly 26 % of the TGA are affected by salinity/sodicityand 12% from imperfect to poor drainage conditions.Nearly 10% area is susceptible to moderate to severeflooding in rainy season. Based on the soil and landqualities, land use plan has been suggested. About 39%area is suitable to all crops. Nearly 27% area is suitableto crops and also suitable to agro-forestry. About 3%area is suitable to salt tolerant crops while 11 % area issuitable for agri-horticulture/agri-floriculture. Thevegetables may be grown in 10 % area. About 0.3% areamay be encouraged for forestry/silvi-pasture.
Land resource inventory of East Lahing GaonPanchayat of East Jorhat development block,Jorhat district, Assam (Sub project of land resourceinventory for farm level planning in different agro-ecological regions of India)
S. Bandyopadhyay, S.K. Reza and Utpal Baruah
The study area (26o49' to 26o51' N, 94o26' to 94o30'E) cover an area of 760 ha in East Lahing Gaon Panchayatof East Jorhat Development Block, Jorhat district.
Farm level survey has been carried out using availablevillage level cadastral maps (1: 4,000) in conjunction withGoogle Earth pictures. Four geomorphic units, viz., verygently sloping land (1-3% slope), nearly level plain(0-1% slope), upper terrace of Janzi river bank andflood plain have been identified associated with built-up, tea garden in very gently sloping land, tea garden
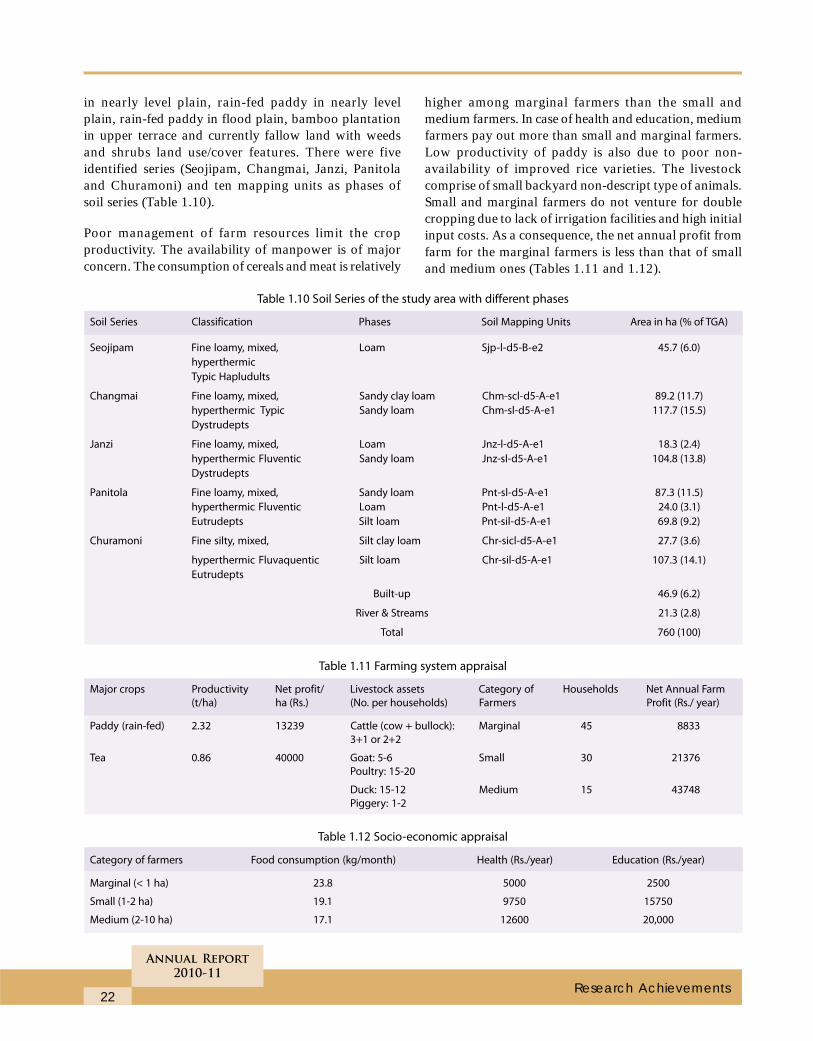
22
Annual Report
2010-11
Research Achievements
in nearly level plain, rain-fed paddy in nearly levelplain, rain-fed paddy in flood plain, bamboo plantationin upper terrace and currently fallow land with weedsand shrubs land use/cover features. There were fiveidentified series (Seojipam, Changmai, Janzi, Panitolaand Churamoni) and ten mapping units as phases ofsoil series (Table 1.10).
Poor management of farm resources limit the cropproductivity. The availability of manpower is of majorconcern. The consumption of cereals and meat is relatively
higher among marginal farmers than the small andmedium farmers. In case of health and education, mediumfarmers pay out more than small and marginal farmers.Low productivity of paddy is also due to poor non-availability of improved rice varieties. The livestockcomprise of small backyard non-descript type of animals.Small and marginal farmers do not venture for doublecropping due to lack of irrigation facilities and high initialinput costs. As a consequence, the net annual profit fromfarm for the marginal farmers is less than that of smalland medium ones (Tables 1.11 and 1.12).
Table 1.10 Soil Series of the study area with different phases
Soil Series Classification Phases Soil Mapping Units Area in ha (% of TGA)
Seojipam Fine loamy, mixed, Loam Sjp-l-d5-B-e2 45.7 (6.0)
hyperthermic
Typic Hapludults
Changmai Fine loamy, mixed, Sandy clay loam Chm-scl-d5-A-e1 89.2 (11.7)
hyperthermic Typic Sandy loam Chm-sl-d5-A-e1 117.7 (15.5)
Dystrudepts
Janzi Fine loamy, mixed, Loam Jnz-l-d5-A-e1 18.3 (2.4)
hyperthermic Fluventic Sandy loam Jnz-sl-d5-A-e1 104.8 (13.8)
Dystrudepts
Panitola Fine loamy, mixed, Sandy loam Pnt-sl-d5-A-e1 87.3 (11.5)
hyperthermic Fluventic Loam Pnt-l-d5-A-e1 24.0 (3.1)
Eutrudepts Silt loam Pnt-sil-d5-A-e1 69.8 (9.2)
Churamoni Fine silty, mixed, Silt clay loam Chr-sicl-d5-A-e1 27.7 (3.6)
hyperthermic Fluvaquentic Silt loam Chr-sil-d5-A-e1 107.3 (14.1)
Eutrudepts
Built-up 46.9 (6.2)
River & Streams 21.3 (2.8)
Total 760 (100)
Table 1.11 Farming system appraisal
Major crops Productivity Net profit/ Livestock assets Category of Households Net Annual Farm
(t/ha) ha (Rs.) (No. per households) Farmers Profit (Rs./ year)
Paddy (rain-fed) 2.32 13239 Cattle (cow + bullock): Marginal 45 8833
3+1 or 2+2
Tea 0.86 40000 Goat: 5-6 Small 30 21376
Poultry: 15-20
Duck: 15-12 Medium 15 43748
Piggery: 1-2
Table 1.12 Socio-economic appraisal
Category of farmers Food consumption (kg/month) Health (Rs./year) Education (Rs./year)
Marginal (< 1 ha) 23.8 5000 2500
Small (1-2 ha) 19.1 9750 15750
Medium (2-10 ha) 17.1 12600 20,000
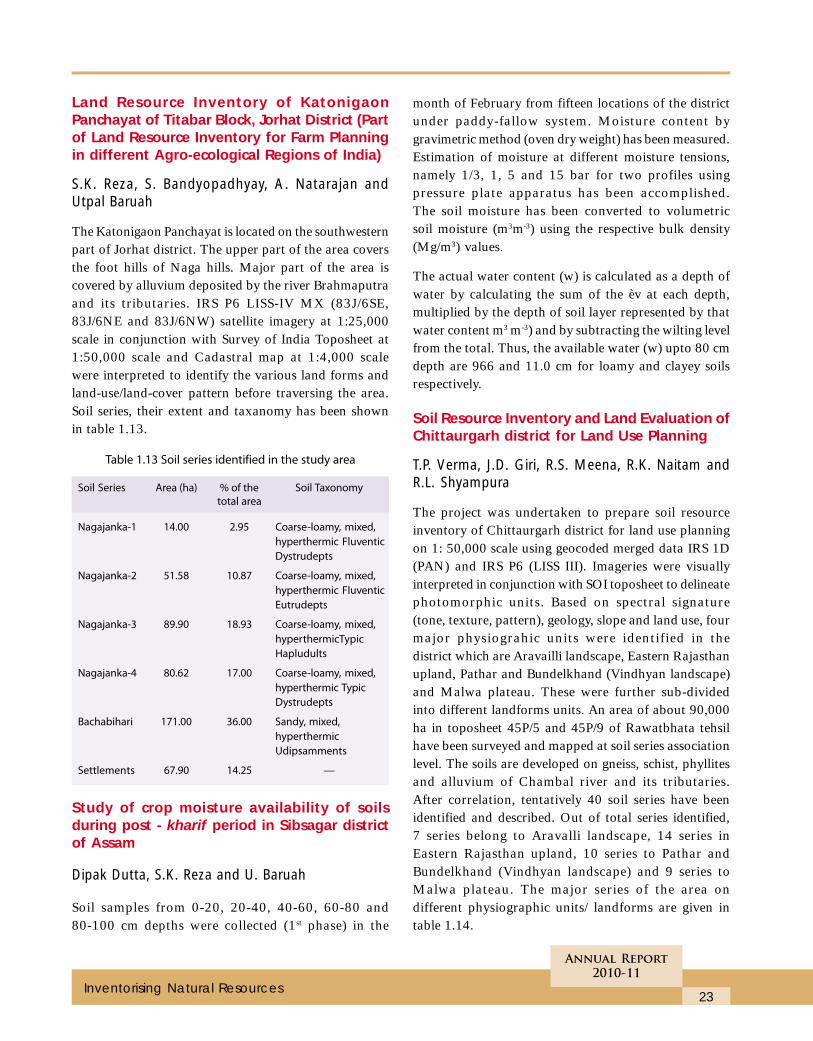
23
Annual Report
2010-11
Inventorising Natural Resources
month of February from fifteen locations of the districtunder paddy-fallow system. Moisture content bygravimetric method (oven dry weight) has been measured.Estimation of moisture at different moisture tensions,namely 1/3, 1, 5 and 15 bar for two profiles usingpressure plate apparatus has been accomplished.The soil moisture has been converted to volumetricsoil moisture (m3m-3) using the respective bulk density(Mg/m3) values.
The actual water content (w) is calculated as a depth ofwater by calculating the sum of the èv at each depth,multiplied by the depth of soil layer represented by thatwater content m3 m-3) and by subtracting the wilting levelfrom the total. Thus, the available water (w) upto 80 cmdepth are 966 and 11.0 cm for loamy and clayey soilsrespectively.
Soil Resource Inventory and Land Evaluation ofChittaurgarh district for Land Use Planning
T.P. Verma, J.D. Giri, R.S. Meena, R.K. Naitam andR.L. Shyampura
The project was undertaken to prepare soil resourceinventory of Chittaurgarh district for land use planningon 1: 50,000 scale using geocoded merged data IRS 1D(PAN) and IRS P6 (LISS III). Imageries were visuallyinterpreted in conjunction with SOI toposheet to delineatephotomorphic units. Based on spectral signature(tone, texture, pattern), geology, slope and land use, fourmajor physiograhic units were identified in thedistrict which are Aravailli landscape, Eastern Rajasthanupland, Pathar and Bundelkhand (Vindhyan landscape)and Malwa plateau. These were further sub-dividedinto different landforms units. An area of about 90,000ha in toposheet 45P/5 and 45P/9 of Rawatbhata tehsilhave been surveyed and mapped at soil series associationlevel. The soils are developed on gneiss, schist, phyllitesand alluvium of Chambal river and its tributaries.After correlation, tentatively 40 soil series have beenidentified and described. Out of total series identified,7 series belong to Aravalli landscape, 14 series inEastern Rajasthan upland, 10 series to Pathar andBundelkhand (Vindhyan landscape) and 9 series toMalwa plateau. The major series of the area ondifferent physiographic units/ landforms are given intable 1.14.
Land Resource Inventory of KatonigaonPanchayat of Titabar Block, Jorhat District (Partof Land Resource Inventory for Farm Planningin different Agro-ecological Regions of India)
S.K. Reza, S. Bandyopadhyay, A. Natarajan andUtpal Baruah
The Katonigaon Panchayat is located on the southwesternpart of Jorhat district. The upper part of the area coversthe foot hills of Naga hills. Major part of the area iscovered by alluvium deposited by the river Brahmaputraand its tributaries. IRS P6 LISS-IV MX (83J/6SE,83J/6NE and 83J/6NW) satellite imagery at 1:25,000scale in conjunction with Survey of India Toposheet at1:50,000 scale and Cadastral map at 1:4,000 scalewere interpreted to identify the various land forms andland-use/land-cover pattern before traversing the area.Soil series, their extent and taxanomy has been shownin table 1.13.
Table 1.13 Soil series identified in the study area
Soil Series Area (ha) % of the Soil Taxonomy
total area
Nagajanka-1 14.00 2.95 Coarse-loamy, mixed,
hyperthermic Fluventic
Dystrudepts
Nagajanka-2 51.58 10.87 Coarse-loamy, mixed,
hyperthermic Fluventic
Eutrudepts
Nagajanka-3 89.90 18.93 Coarse-loamy, mixed,
hyperthermicTypic
Hapludults
Nagajanka-4 80.62 17.00 Coarse-loamy, mixed,
hyperthermic Typic
Dystrudepts
Bachabihari 171.00 36.00 Sandy, mixed,
hyperthermic
Udipsamments
Settlements 67.90 14.25 —
Study of crop moisture availability of soilsduring post - kharif period in Sibsagar districtof Assam
Dipak Dutta, S.K. Reza and U. Baruah
Soil samples from 0-20, 20-40, 40-60, 60-80 and80-100 cm depths were collected (1st phase) in the
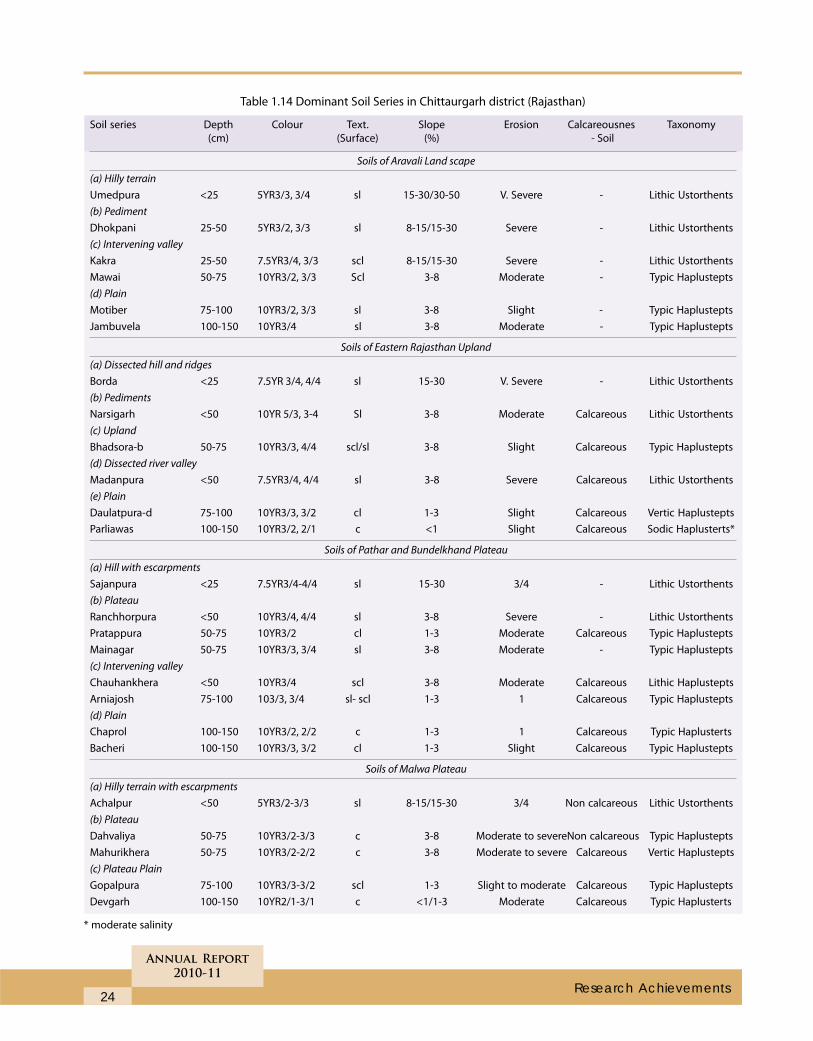
24
Annual Report
2010-11
Research Achievements
Table 1.14 Dominant Soil Series in Chittaurgarh district (Rajasthan)
Soil series Depth Colour Text. Slope Erosion Calcareousnes Taxonomy
(cm) (Surface) (%) - Soil
Soils of Aravali Land scape
(a) Hilly terrain
Umedpura <25 5YR3/3, 3/4 sl 15-30/30-50 V. Severe - Lithic Ustorthents
(b) Pediment
Dhokpani 25-50 5YR3/2, 3/3 sl 8-15/15-30 Severe - Lithic Ustorthents
(c) Intervening valley
Kakra 25-50 7.5YR3/4, 3/3 scl 8-15/15-30 Severe - Lithic Ustorthents
Mawai 50-75 10YR3/2, 3/3 Scl 3-8 Moderate - Typic Haplustepts
(d) Plain
Motiber 75-100 10YR3/2, 3/3 sl 3-8 Slight - Typic Haplustepts
Jambuvela 100-150 10YR3/4 sl 3-8 Moderate - Typic Haplustepts
Soils of Eastern Rajasthan Upland
(a) Dissected hill and ridges
Borda <25 7.5YR 3/4, 4/4 sl 15-30 V. Severe - Lithic Ustorthents
(b) Pediments
Narsigarh <50 10YR 5/3, 3-4 Sl 3-8 Moderate Calcareous Lithic Ustorthents
(c) Upland
Bhadsora-b 50-75 10YR3/3, 4/4 scl/sl 3-8 Slight Calcareous Typic Haplustepts
(d) Dissected river valley
Madanpura <50 7.5YR3/4, 4/4 sl 3-8 Severe Calcareous Lithic Ustorthents
(e) Plain
Daulatpura-d 75-100 10YR3/3, 3/2 cl 1-3 Slight Calcareous Vertic Haplustepts
Parliawas 100-150 10YR3/2, 2/1 c <1 Slight Calcareous Sodic Haplusterts*
Soils of Pathar and Bundelkhand Plateau
(a) Hill with escarpments
Sajanpura <25 7.5YR3/4-4/4 sl 15-30 3/4 - Lithic Ustorthents
(b) Plateau
Ranchhorpura <50 10YR3/4, 4/4 sl 3-8 Severe - Lithic Ustorthents
Pratappura 50-75 10YR3/2 cl 1-3 Moderate Calcareous Typic Haplustepts
Mainagar 50-75 10YR3/3, 3/4 sl 3-8 Moderate - Typic Haplustepts
(c) Intervening valley
Chauhankhera <50 10YR3/4 scl 3-8 Moderate Calcareous Lithic Haplustepts
Arniajosh 75-100 103/3, 3/4 sl- scl 1-3 1 Calcareous Typic Haplustepts
(d) Plain
Chaprol 100-150 10YR3/2, 2/2 c 1-3 1 Calcareous Typic Haplusterts
Bacheri 100-150 10YR3/3, 3/2 cl 1-3 Slight Calcareous Typic Haplustepts
Soils of Malwa Plateau
(a) Hilly terrain with escarpments
Achalpur <50 5YR3/2-3/3 sl 8-15/15-30 3/4 Non calcareous Lithic Ustorthents
(b) Plateau
Dahvaliya 50-75 10YR3/2-3/3 c 3-8 Moderate to severeNon calcareous Typic Haplustepts
Mahurikhera 50-75 10YR3/2-2/2 c 3-8 Moderate to severe Calcareous Vertic Haplustepts
(c) Plateau Plain
Gopalpura 75-100 10YR3/3-3/2 scl 1-3 Slight to moderate Calcareous Typic Haplustepts
Devgarh 100-150 10YR2/1-3/1 c <1/1-3 Moderate Calcareous Typic Haplusterts
* moderate salinity
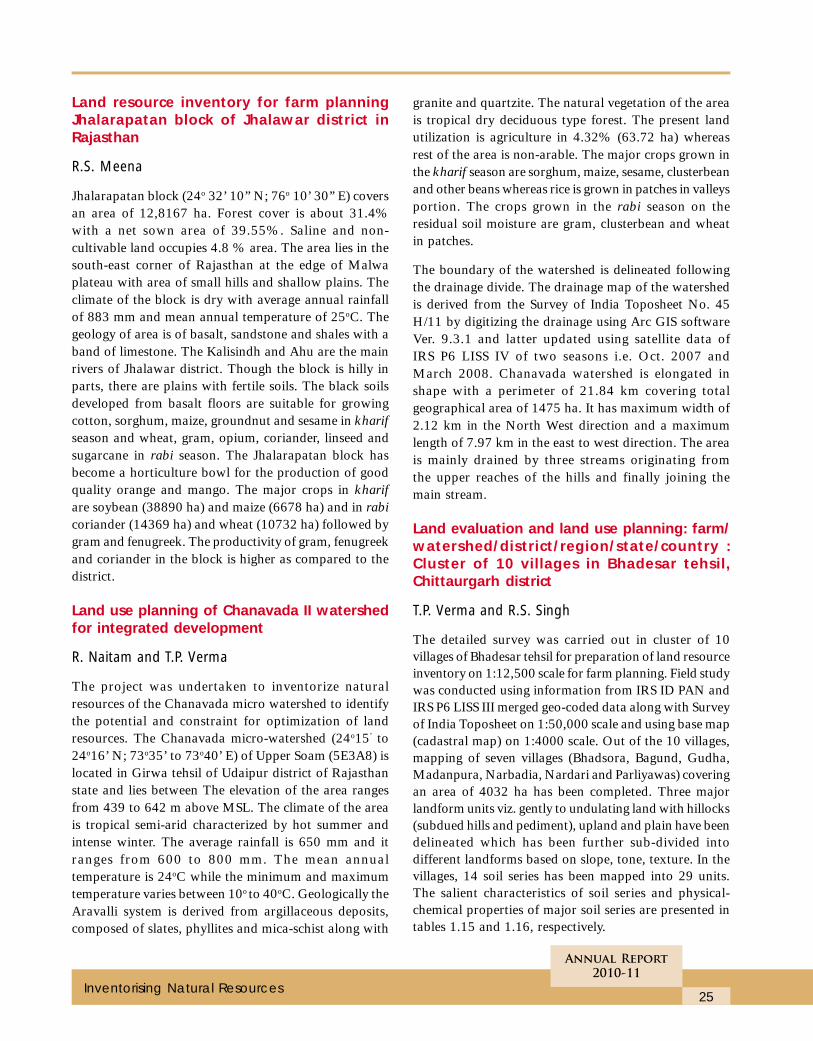
25
Annual Report
2010-11
Inventorising Natural Resources
Land resource inventory for farm planningJhalarapatan block of Jhalawar district inRajasthan
R.S. Meena
Jhalarapatan block (24o 32’ 10’’ N; 76o 10’ 30’’ E) coversan area of 12,8167 ha. Forest cover is about 31.4%with a net sown area of 39.55%. Saline and non-cultivable land occupies 4.8 % area. The area lies in thesouth-east corner of Rajasthan at the edge of Malwaplateau with area of small hills and shallow plains. Theclimate of the block is dry with average annual rainfallof 883 mm and mean annual temperature of 25oC. Thegeology of area is of basalt, sandstone and shales with aband of limestone. The Kalisindh and Ahu are the mainrivers of Jhalawar district. Though the block is hilly inparts, there are plains with fertile soils. The black soilsdeveloped from basalt floors are suitable for growingcotton, sorghum, maize, groundnut and sesame in kharifseason and wheat, gram, opium, coriander, linseed andsugarcane in rabi season. The Jhalarapatan block hasbecome a horticulture bowl for the production of goodquality orange and mango. The major crops in kharifare soybean (38890 ha) and maize (6678 ha) and in rabicoriander (14369 ha) and wheat (10732 ha) followed bygram and fenugreek. The productivity of gram, fenugreekand coriander in the block is higher as compared to thedistrict.
Land use planning of Chanavada II watershedfor integrated development
R. Naitam and T.P. Verma
The project was undertaken to inventorize naturalresources of the Chanavada micro watershed to identifythe potential and constraint for optimization of landresources. The Chanavada micro-watershed (24o15’ to24o16’ N; 73o35’ to 73o40’ E) of Upper Soam (5E3A8) islocated in Girwa tehsil of Udaipur district of Rajasthanstate and lies between The elevation of the area rangesfrom 439 to 642 m above MSL. The climate of the areais tropical semi-arid characterized by hot summer andintense winter. The average rainfall is 650 mm and itranges from 600 to 800 mm. The mean annualtemperature is 24oC while the minimum and maximumtemperature varies between 10o to 40oC. Geologically theAravalli system is derived from argillaceous deposits,composed of slates, phyllites and mica-schist along with
granite and quartzite. The natural vegetation of the areais tropical dry deciduous type forest. The present landutilization is agriculture in 4.32% (63.72 ha) whereasrest of the area is non-arable. The major crops grown inthe kharif season are sorghum, maize, sesame, clusterbeanand other beans whereas rice is grown in patches in valleysportion. The crops grown in the rabi season on theresidual soil moisture are gram, clusterbean and wheatin patches.
The boundary of the watershed is delineated followingthe drainage divide. The drainage map of the watershedis derived from the Survey of India Toposheet No. 45H/11 by digitizing the drainage using Arc GIS softwareVer. 9.3.1 and latter updated using satellite data ofIRS P6 LISS IV of two seasons i.e. Oct. 2007 andMarch 2008. Chanavada watershed is elongated inshape with a perimeter of 21.84 km covering totalgeographical area of 1475 ha. It has maximum width of2.12 km in the North West direction and a maximumlength of 7.97 km in the east to west direction. The areais mainly drained by three streams originating fromthe upper reaches of the hills and finally joining themain stream.
Land evaluation and land use planning: farm/watershed/district/region/state/country :Cluster of 10 villages in Bhadesar tehsil,Chittaurgarh district
T.P. Verma and R.S. Singh
The detailed survey was carried out in cluster of 10villages of Bhadesar tehsil for preparation of land resourceinventory on 1:12,500 scale for farm planning. Field studywas conducted using information from IRS ID PAN andIRS P6 LISS III merged geo-coded data along with Surveyof India Toposheet on 1:50,000 scale and using base map(cadastral map) on 1:4000 scale. Out of the 10 villages,mapping of seven villages (Bhadsora, Bagund, Gudha,Madanpura, Narbadia, Nardari and Parliyawas) coveringan area of 4032 ha has been completed. Three majorlandform units viz. gently to undulating land with hillocks(subdued hills and pediment), upland and plain have beendelineated which has been further sub-divided intodifferent landforms based on slope, tone, texture. In thevillages, 14 soil series has been mapped into 29 units.The salient characteristics of soil series and physical-chemical properties of major soil series are presented intables 1.15 and 1.16, respectively.
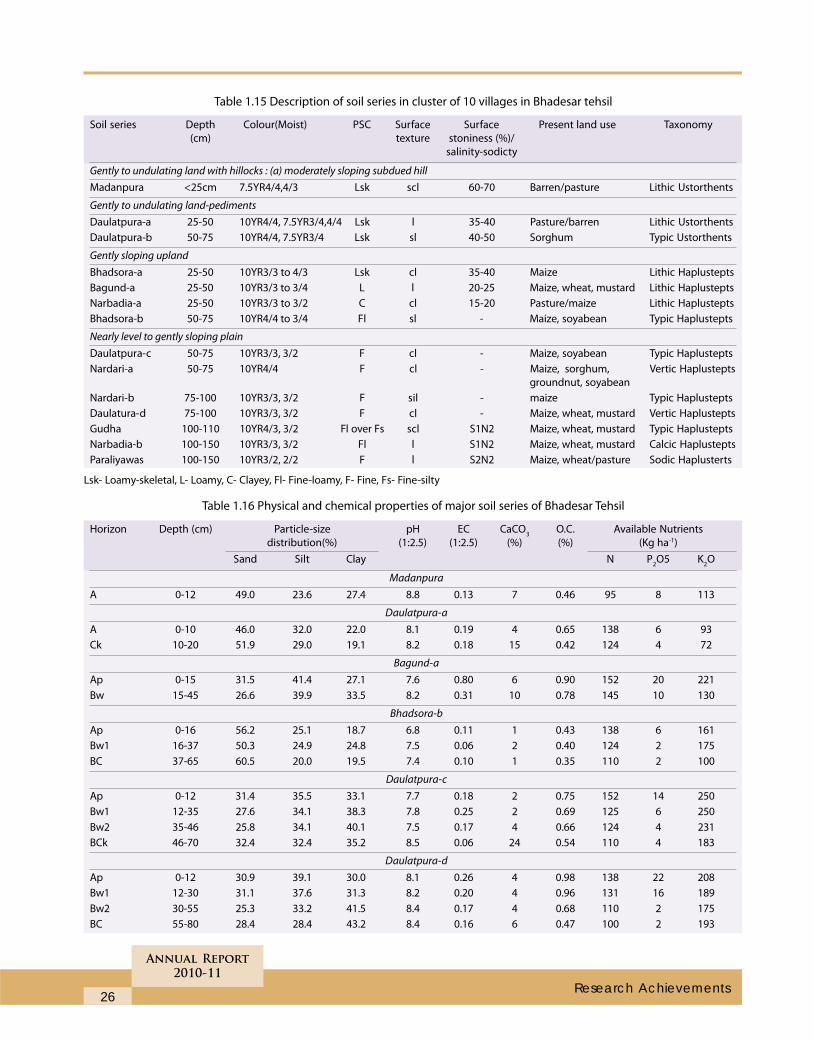
26
Annual Report
2010-11
Research Achievements
Table 1.15 Description of soil series in cluster of 10 villages in Bhadesar tehsil
Soil series Depth Colour(Moist) PSC Surface Surface Present land use Taxonomy
(cm) texture stoniness (%)/
salinity-sodicty
Gently to undulating land with hillocks : (a) moderately sloping subdued hill
Madanpura <25cm 7.5YR4/4,4/3 Lsk scl 60-70 Barren/pasture Lithic Ustorthents
Gently to undulating land-pediments
Daulatpura-a 25-50 10YR4/4, 7.5YR3/4,4/4 Lsk l 35-40 Pasture/barren Lithic Ustorthents
Daulatpura-b 50-75 10YR4/4, 7.5YR3/4 Lsk sl 40-50 Sorghum Typic Ustorthents
Gently sloping upland
Bhadsora-a 25-50 10YR3/3 to 4/3 Lsk cl 35-40 Maize Lithic Haplustepts
Bagund-a 25-50 10YR3/3 to 3/4 L l 20-25 Maize, wheat, mustard Lithic Haplustepts
Narbadia-a 25-50 10YR3/3 to 3/2 C cl 15-20 Pasture/maize Lithic Haplustepts
Bhadsora-b 50-75 10YR4/4 to 3/4 Fl sl - Maize, soyabean Typic Haplustepts
Nearly level to gently sloping plain
Daulatpura-c 50-75 10YR3/3, 3/2 F cl - Maize, soyabean Typic Haplustepts
Nardari-a 50-75 10YR4/4 F cl - Maize, sorghum, Vertic Haplustepts
groundnut, soyabean
Nardari-b 75-100 10YR3/3, 3/2 F sil - maize Typic Haplustepts
Daulatura-d 75-100 10YR3/3, 3/2 F cl - Maize, wheat, mustard Vertic Haplustepts
Gudha 100-110 10YR4/3, 3/2 Fl over Fs scl S1N2 Maize, wheat, mustard Typic Haplustepts
Narbadia-b 100-150 10YR3/3, 3/2 Fl l S1N2 Maize, wheat, mustard Calcic Haplustepts
Paraliyawas 100-150 10YR3/2, 2/2 F l S2N2 Maize, wheat/pasture Sodic Haplusterts
Lsk- Loamy-skeletal, L- Loamy, C- Clayey, Fl- Fine-loamy, F- Fine, Fs- Fine-silty
Table 1.16 Physical and chemical properties of major soil series of Bhadesar Tehsil
Horizon Depth (cm) Particle-size pH EC CaCO3
O.C. Available Nutrients
distribution(%) (1:2.5) (1:2.5) (%) (%) (Kg ha-1)
Sand Silt Clay N P2O5 K
2O
Madanpura
A 0-12 49.0 23.6 27.4 8.8 0.13 7 0.46 95 8 113
Daulatpura-a
A 0-10 46.0 32.0 22.0 8.1 0.19 4 0.65 138 6 93
Ck 10-20 51.9 29.0 19.1 8.2 0.18 15 0.42 124 4 72
Bagund-a
Ap 0-15 31.5 41.4 27.1 7.6 0.80 6 0.90 152 20 221
Bw 15-45 26.6 39.9 33.5 8.2 0.31 10 0.78 145 10 130
Bhadsora-b
Ap 0-16 56.2 25.1 18.7 6.8 0.11 1 0.43 138 6 161
Bw1 16-37 50.3 24.9 24.8 7.5 0.06 2 0.40 124 2 175
BC 37-65 60.5 20.0 19.5 7.4 0.10 1 0.35 110 2 100
Daulatpura-c
Ap 0-12 31.4 35.5 33.1 7.7 0.18 2 0.75 152 14 250
Bw1 12-35 27.6 34.1 38.3 7.8 0.25 2 0.69 125 6 250
Bw2 35-46 25.8 34.1 40.1 7.5 0.17 4 0.66 124 4 231
BCk 46-70 32.4 32.4 35.2 8.5 0.06 24 0.54 110 4 183
Daulatpura-d
Ap 0-12 30.9 39.1 30.0 8.1 0.26 4 0.98 138 22 208
Bw1 12-30 31.1 37.6 31.3 8.2 0.20 4 0.96 131 16 189
Bw2 30-55 25.3 33.2 41.5 8.4 0.17 4 0.68 110 2 175
BC 55-80 28.4 28.4 43.2 8.4 0.16 6 0.47 100 2 193
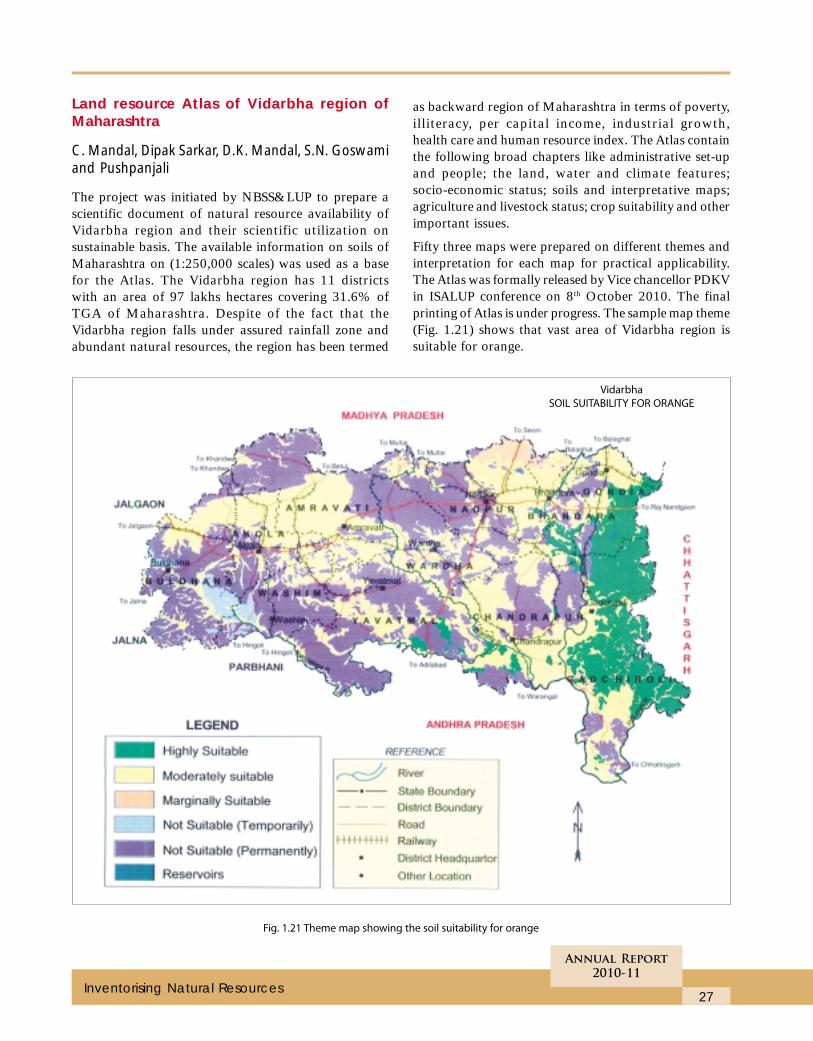
27
Annual Report
2010-11
Inventorising Natural Resources
Land resource Atlas of Vidarbha region ofMaharashtra
C. Mandal, Dipak Sarkar, D.K. Mandal, S.N. Goswamiand Pushpanjali
The project was initiated by NBSS&LUP to prepare ascientific document of natural resource availability ofVidarbha region and their scientific utilization onsustainable basis. The available information on soils ofMaharashtra on (1:250,000 scales) was used as a basefor the Atlas. The Vidarbha region has 11 districtswith an area of 97 lakhs hectares covering 31.6% ofTGA of Maharashtra. Despite of the fact that theVidarbha region falls under assured rainfall zone andabundant natural resources, the region has been termed
as backward region of Maharashtra in terms of poverty,illiteracy, per capital income, industrial growth,health care and human resource index. The Atlas containthe following broad chapters like administrative set-upand people; the land, water and climate features;socio-economic status; soils and interpretative maps;agriculture and livestock status; crop suitability and otherimportant issues.
Fifty three maps were prepared on different themes andinterpretation for each map for practical applicability.The Atlas was formally released by Vice chancellor PDKVin ISALUP conference on 8th October 2010. The finalprinting of Atlas is under progress. The sample map theme(Fig. 1.21) shows that vast area of Vidarbha region issuitable for orange.
Fig. 1.21 Theme map showing the soil suitability for orange
Vidarbha
SOIL SUITABILITY FOR ORANGE
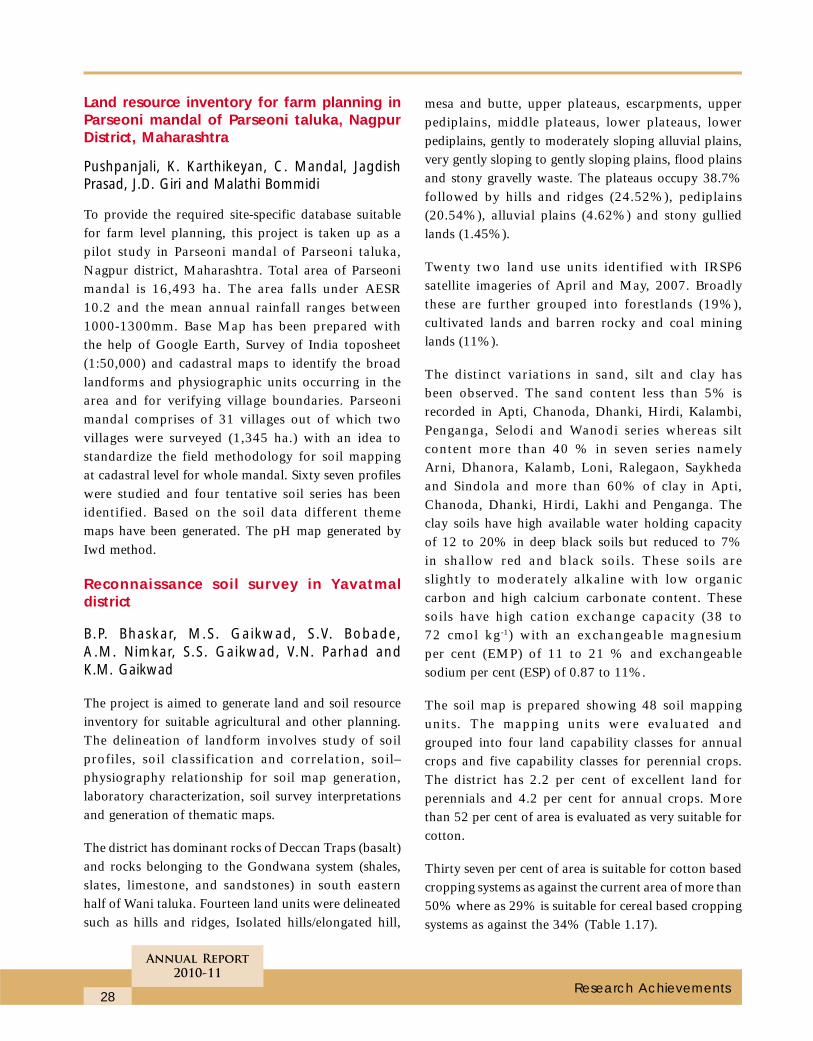
28
Annual Report
2010-11
Research Achievements
Land resource inventory for farm planning inParseoni mandal of Parseoni taluka, NagpurDistrict, Maharashtra
Pushpanjali, K. Karthikeyan, C. Mandal, JagdishPrasad, J.D. Giri and Malathi Bommidi
To provide the required site-specific database suitablefor farm level planning, this project is taken up as apilot study in Parseoni mandal of Parseoni taluka,Nagpur district, Maharashtra. Total area of Parseonimandal is 16,493 ha. The area falls under AESR10.2 and the mean annual rainfall ranges between1000-1300mm. Base Map has been prepared withthe help of Google Earth, Survey of India toposheet(1:50,000) and cadastral maps to identify the broadlandforms and physiographic units occurring in thearea and for verifying village boundaries. Parseonimandal comprises of 31 villages out of which twovillages were surveyed (1,345 ha.) with an idea tostandardize the field methodology for soil mappingat cadastral level for whole mandal. Sixty seven profileswere studied and four tentative soil series has beenidentified. Based on the soil data different thememaps have been generated. The pH map generated byIwd method.
Reconnaissance soil survey in Yavatmaldistrict
B.P. Bhaskar, M.S. Gaikwad, S.V. Bobade,A.M. Nimkar, S.S. Gaikwad, V.N. Parhad andK.M. Gaikwad
The project is aimed to generate land and soil resourceinventory for suitable agricultural and other planning.The delineation of landform involves study of soilprofiles, soil classification and correlation, soil–physiography relationship for soil map generation,laboratory characterization, soil survey interpretationsand generation of thematic maps.
The district has dominant rocks of Deccan Traps (basalt)and rocks belonging to the Gondwana system (shales,slates, limestone, and sandstones) in south easternhalf of Wani taluka. Fourteen land units were delineatedsuch as hills and ridges, Isolated hills/elongated hill,
mesa and butte, upper plateaus, escarpments, upperpediplains, middle plateaus, lower plateaus, lowerpediplains, gently to moderately sloping alluvial plains,very gently sloping to gently sloping plains, flood plainsand stony gravelly waste. The plateaus occupy 38.7%followed by hills and ridges (24.52%), pediplains(20.54%), alluvial plains (4.62%) and stony gulliedlands (1.45%).
Twenty two land use units identified with IRSP6satellite imageries of April and May, 2007. Broadlythese are further grouped into forestlands (19%),cultivated lands and barren rocky and coal mininglands (11%).
The distinct variations in sand, silt and clay hasbeen observed. The sand content less than 5% isrecorded in Apti, Chanoda, Dhanki, Hirdi, Kalambi,Penganga, Selodi and Wanodi series whereas siltcontent more than 40 % in seven series namelyArni, Dhanora, Kalamb, Loni, Ralegaon, Saykhedaand Sindola and more than 60% of clay in Apti,Chanoda, Dhanki, Hirdi, Lakhi and Penganga. Theclay soils have high available water holding capacityof 12 to 20% in deep black soils but reduced to 7%in shallow red and black soils. These soils areslightly to moderately alkaline with low organiccarbon and high calcium carbonate content. Thesesoils have high cation exchange capacity (38 to72 cmol kg-1) with an exchangeable magnesiumper cent (EMP) of 11 to 21 % and exchangeablesodium per cent (ESP) of 0.87 to 11%.
The soil map is prepared showing 48 soil mappingunits. The mapping units were evaluated andgrouped into four land capability classes for annualcrops and five capability classes for perennial crops.The district has 2.2 per cent of excellent land forperennials and 4.2 per cent for annual crops. Morethan 52 per cent of area is evaluated as very suitable forcotton.
Thirty seven per cent of area is suitable for cotton basedcropping systems as against the current area of more than50% where as 29% is suitable for cereal based croppingsystems as against the 34% (Table 1.17).
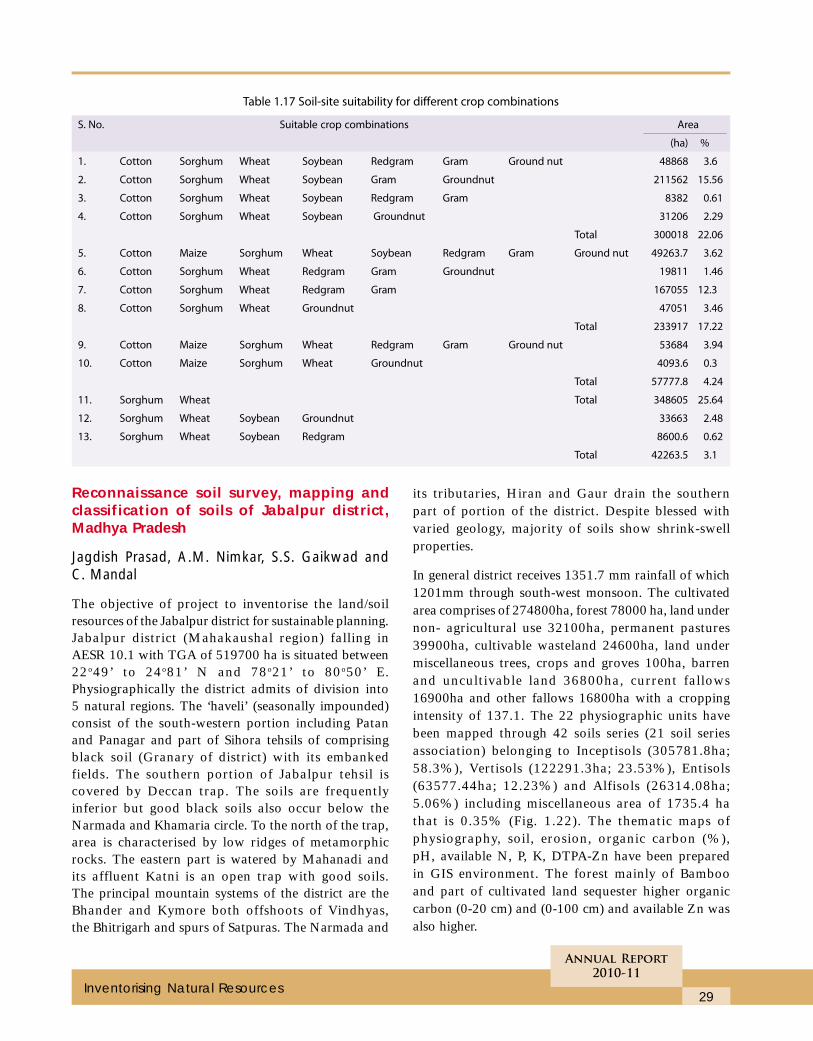
29
Annual Report
2010-11
Inventorising Natural Resources
Table 1.17 Soil-site suitability for different crop combinations
S. No. Suitable crop combinations Area
(ha) %
1. Cotton Sorghum Wheat Soybean Redgram Gram Ground nut 48868 3.6
2. Cotton Sorghum Wheat Soybean Gram Groundnut 211562 15.56
3. Cotton Sorghum Wheat Soybean Redgram Gram 8382 0.61
4. Cotton Sorghum Wheat Soybean Groundnut 31206 2.29
Total 300018 22.06
5. Cotton Maize Sorghum Wheat Soybean Redgram Gram Ground nut 49263.7 3.62
6. Cotton Sorghum Wheat Redgram Gram Groundnut 19811 1.46
7. Cotton Sorghum Wheat Redgram Gram 167055 12.3
8. Cotton Sorghum Wheat Groundnut 47051 3.46
Total 233917 17.22
9. Cotton Maize Sorghum Wheat Redgram Gram Ground nut 53684 3.94
10. Cotton Maize Sorghum Wheat Groundnut 4093.6 0.3
Total 57777.8 4.24
11. Sorghum Wheat Total 348605 25.64
12. Sorghum Wheat Soybean Groundnut 33663 2.48
13. Sorghum Wheat Soybean Redgram 8600.6 0.62
Total 42263.5 3.1
Reconnaissance soil survey, mapping andclassification of soils of Jabalpur district,Madhya Pradesh
Jagdish Prasad, A.M. Nimkar, S.S. Gaikwad andC. Mandal
The objective of project to inventorise the land/soilresources of the Jabalpur district for sustainable planning.Jabalpur district (Mahakaushal region) falling inAESR 10.1 with TGA of 519700 ha is situated between22o49’ to 24o81’ N and 78o21’ to 80o50’ E.Physiographically the district admits of division into5 natural regions. The ‘haveli’ (seasonally impounded)consist of the south-western portion including Patanand Panagar and part of Sihora tehsils of comprisingblack soil (Granary of district) with its embankedfields. The southern portion of Jabalpur tehsil iscovered by Deccan trap. The soils are frequentlyinferior but good black soils also occur below theNarmada and Khamaria circle. To the north of the trap,area is characterised by low ridges of metamorphicrocks. The eastern part is watered by Mahanadi andits affluent Katni is an open trap with good soils.The principal mountain systems of the district are theBhander and Kymore both offshoots of Vindhyas,the Bhitrigarh and spurs of Satpuras. The Narmada and
its tributaries, Hiran and Gaur drain the southernpart of portion of the district. Despite blessed withvaried geology, majority of soils show shrink-swellproperties.
In general district receives 1351.7 mm rainfall of which1201mm through south-west monsoon. The cultivatedarea comprises of 274800ha, forest 78000 ha, land undernon- agricultural use 32100ha, permanent pastures39900ha, cultivable wasteland 24600ha, land undermiscellaneous trees, crops and groves 100ha, barrenand uncultivable land 36800ha, current fallows16900ha and other fallows 16800ha with a croppingintensity of 137.1. The 22 physiographic units havebeen mapped through 42 soils series (21 soil seriesassociation) belonging to Inceptisols (305781.8ha;58.3%), Vertisols (122291.3ha; 23.53%), Entisols(63577.44ha; 12.23%) and Alfisols (26314.08ha;5.06%) including miscellaneous area of 1735.4 hathat is 0.35% (Fig. 1.22). The thematic maps ofphysiography, soil, erosion, organic carbon (%),pH, available N, P, K, DTPA-Zn have been preparedin GIS environment. The forest mainly of Bambooand part of cultivated land sequester higher organiccarbon (0-20 cm) and (0-100 cm) and available Zn wasalso higher.
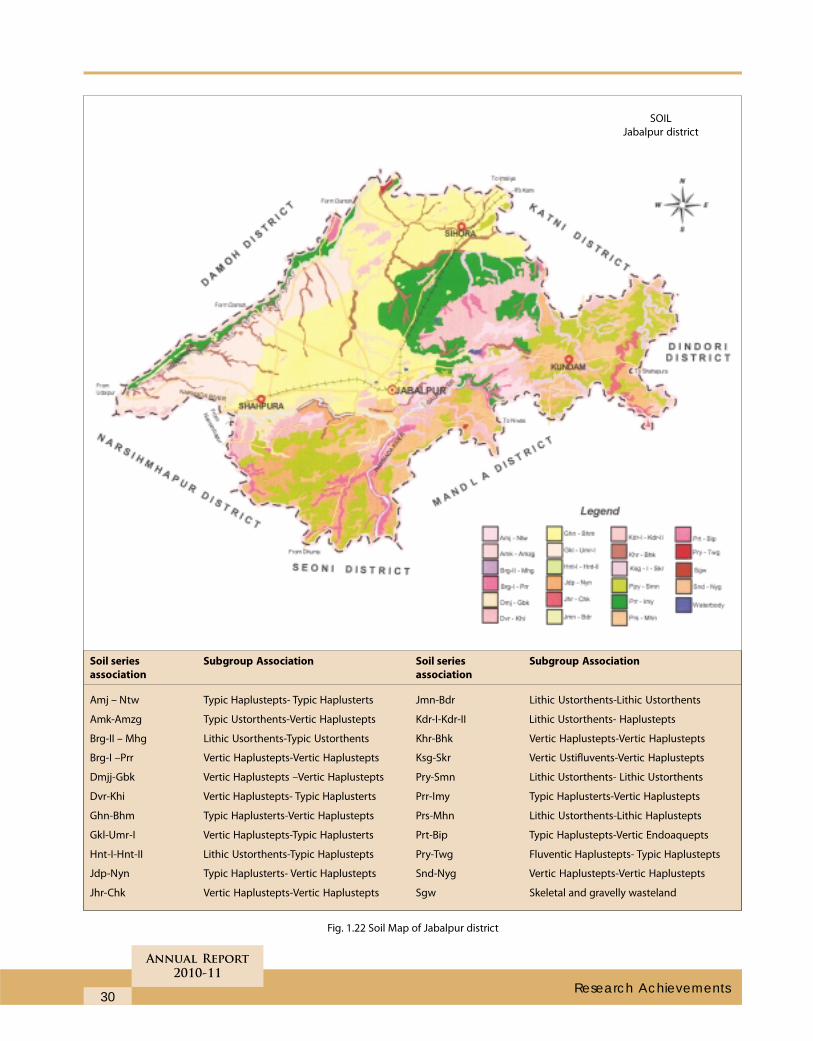
30
Annual Report
2010-11
Research Achievements
Fig. 1.22 Soil Map of Jabalpur district
SOIL
Jabalpur district
Soil series Subgroup Association
association
Amj – Ntw Typic Haplustepts- Typic Haplusterts
Amk-Amzg Typic Ustorthents-Vertic Haplustepts
Brg-II – Mhg Lithic Usorthents-Typic Ustorthents
Brg-I –Prr Vertic Haplustepts-Vertic Haplustepts
Dmjj-Gbk Vertic Haplustepts –Vertic Haplustepts
Dvr-Khi Vertic Haplustepts- Typic Haplusterts
Ghn-Bhm Typic Haplusterts-Vertic Haplustepts
Gkl-Umr-I Vertic Haplustepts-Typic Haplusterts
Hnt-I-Hnt-II Lithic Ustorthents-Typic Haplustepts
Jdp-Nyn Typic Haplusterts- Vertic Haplustepts
Jhr-Chk Vertic Haplustepts-Vertic Haplustepts
Soil series Subgroup Association
association
Jmn-Bdr Lithic Ustorthents-Lithic Ustorthents
Kdr-I-Kdr-II Lithic Ustorthents- Haplustepts
Khr-Bhk Vertic Haplustepts-Vertic Haplustepts
Ksg-Skr Vertic Ustifluvents-Vertic Haplustepts
Pry-Smn Lithic Ustorthents- Lithic Ustorthents
Prr-Imy Typic Haplusterts-Vertic Haplustepts
Prs-Mhn Lithic Ustorthents-Lithic Haplustepts
Prt-Bip Typic Haplustepts-Vertic Endoaquepts
Pry-Twg Fluventic Haplustepts- Typic Haplustepts
Snd-Nyg Vertic Haplustepts-Vertic Haplustepts
Sgw Skeletal and gravelly wasteland
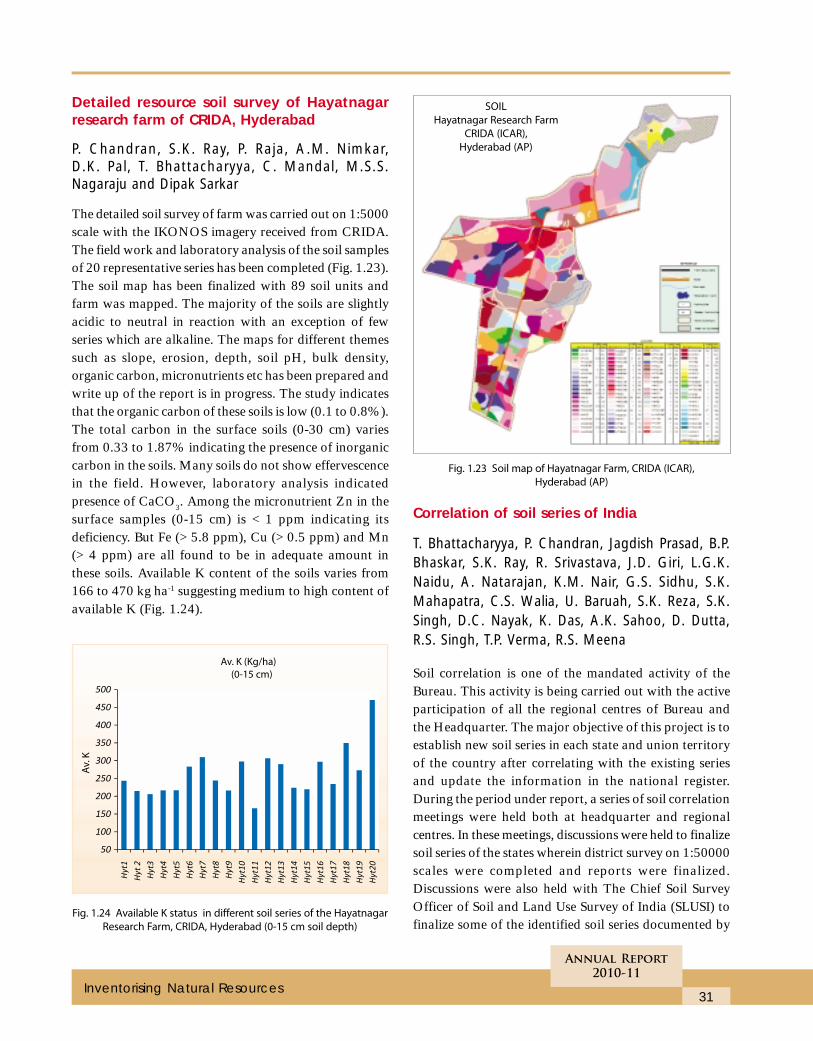
31
Annual Report
2010-11
Inventorising Natural Resources
Detailed resource soil survey of Hayatnagarresearch farm of CRIDA, Hyderabad
P. Chandran, S.K. Ray, P. Raja, A.M. Nimkar,D.K. Pal, T. Bhattacharyya, C. Mandal, M.S.S.Nagaraju and Dipak Sarkar
The detailed soil survey of farm was carried out on 1:5000scale with the IKONOS imagery received from CRIDA.The field work and laboratory analysis of the soil samplesof 20 representative series has been completed (Fig. 1.23).The soil map has been finalized with 89 soil units andfarm was mapped. The majority of the soils are slightlyacidic to neutral in reaction with an exception of fewseries which are alkaline. The maps for different themessuch as slope, erosion, depth, soil pH, bulk density,organic carbon, micronutrients etc has been prepared andwrite up of the report is in progress. The study indicatesthat the organic carbon of these soils is low (0.1 to 0.8%).The total carbon in the surface soils (0-30 cm) variesfrom 0.33 to 1.87% indicating the presence of inorganiccarbon in the soils. Many soils do not show effervescencein the field. However, laboratory analysis indicatedpresence of CaCO3. Among the micronutrient Zn in thesurface samples (0-15 cm) is < 1 ppm indicating itsdeficiency. But Fe (> 5.8 ppm), Cu (> 0.5 ppm) and Mn(> 4 ppm) are all found to be in adequate amount inthese soils. Available K content of the soils varies from166 to 470 kg ha-1 suggesting medium to high content ofavailable K (Fig. 1.24).
Correlation of soil series of India
T. Bhattacharyya, P. Chandran, Jagdish Prasad, B.P.Bhaskar, S.K. Ray, R. Srivastava, J.D. Giri, L.G.K.Naidu, A. Natarajan, K.M. Nair, G.S. Sidhu, S.K.Mahapatra, C.S. Walia, U. Baruah, S.K. Reza, S.K.Singh, D.C. Nayak, K. Das, A.K. Sahoo, D. Dutta,R.S. Singh, T.P. Verma, R.S. Meena
Soil correlation is one of the mandated activity of theBureau. This activity is being carried out with the activeparticipation of all the regional centres of Bureau andthe Headquarter. The major objective of this project is toestablish new soil series in each state and union territoryof the country after correlating with the existing seriesand update the information in the national register.During the period under report, a series of soil correlationmeetings were held both at headquarter and regionalcentres. In these meetings, discussions were held to finalizesoil series of the states wherein district survey on 1:50000scales were completed and reports were finalized.Discussions were also held with The Chief Soil SurveyOfficer of Soil and Land Use Survey of India (SLUSI) tofinalize some of the identified soil series documented by
Fig. 1.23 Soil map of Hayatnagar Farm, CRIDA (ICAR),
Hyderabad (AP)
Fig. 1.24 Available K status in different soil series of the Hayatnagar
Research Farm, CRIDA, Hyderabad (0-15 cm soil depth)
SOIL
Hayatnagar Research Farm
CRIDA (ICAR),
Hyderabad (AP)
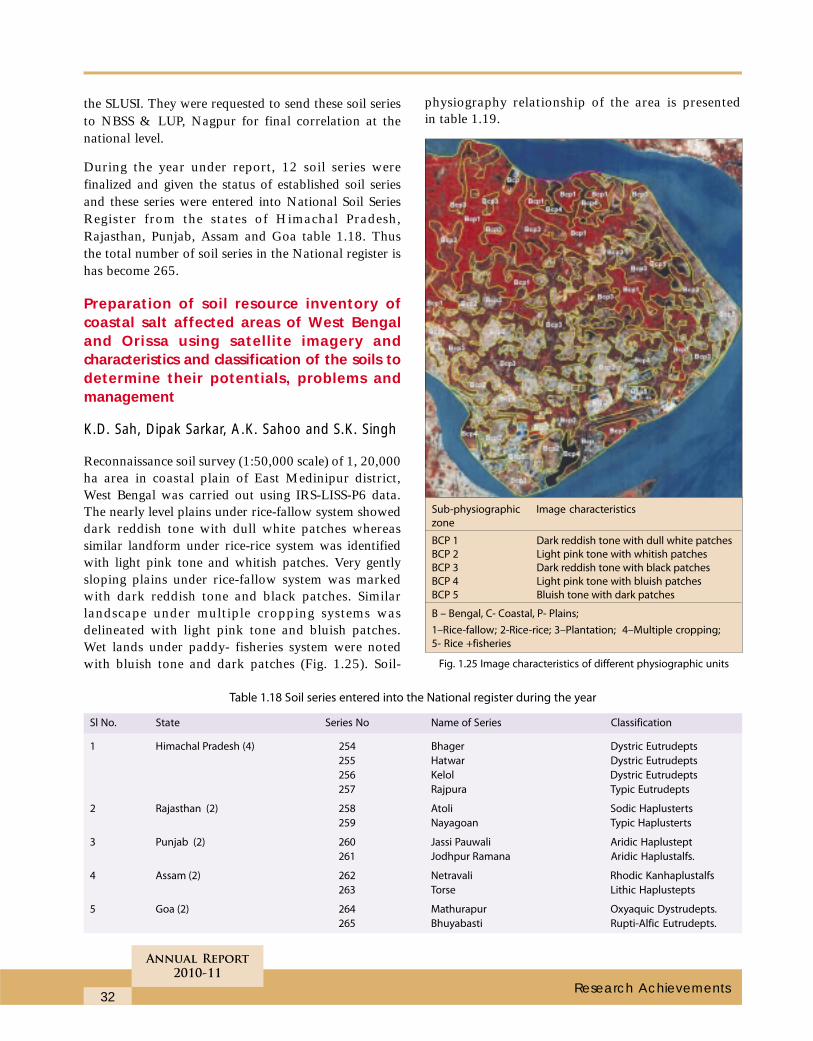
32
Annual Report
2010-11
Research Achievements
the SLUSI. They were requested to send these soil seriesto NBSS & LUP, Nagpur for final correlation at thenational level.
During the year under report, 12 soil series werefinalized and given the status of established soil seriesand these series were entered into National Soil SeriesRegister from the states of Himachal Pradesh,Rajasthan, Punjab, Assam and Goa table 1.18. Thusthe total number of soil series in the National register ishas become 265.
Preparation of soil resource inventory ofcoastal salt affected areas of West Bengaland Orissa using satellite imagery andcharacteristics and classification of the soils todetermine their potentials, problems andmanagement
K.D. Sah, Dipak Sarkar, A.K. Sahoo and S.K. Singh
Reconnaissance soil survey (1:50,000 scale) of 1, 20,000ha area in coastal plain of East Medinipur district,West Bengal was carried out using IRS-LISS-P6 data.The nearly level plains under rice-fallow system showeddark reddish tone with dull white patches whereassimilar landform under rice-rice system was identifiedwith light pink tone and whitish patches. Very gentlysloping plains under rice-fallow system was markedwith dark reddish tone and black patches. Similarlandscape under multiple cropping systems wasdelineated with light pink tone and bluish patches.Wet lands under paddy- fisheries system were notedwith bluish tone and dark patches (Fig. 1.25). Soil-
Table 1.18 Soil series entered into the National register during the year
Sl No. State Series No Name of Series Classification
1 Himachal Pradesh (4) 254 Bhager Dystric Eutrudepts
255 Hatwar Dystric Eutrudepts
256 Kelol Dystric Eutrudepts
257 Rajpura Typic Eutrudepts
2 Rajasthan (2) 258 Atoli Sodic Haplusterts
259 Nayagoan Typic Haplusterts
3 Punjab (2) 260 Jassi Pauwali Aridic Haplustept
261 Jodhpur Ramana Aridic Haplustalfs.
4 Assam (2) 262 Netravali Rhodic Kanhaplustalfs
263 Torse Lithic Haplustepts
5 Goa (2) 264 Mathurapur Oxyaquic Dystrudepts.
265 Bhuyabasti Rupti-Alfic Eutrudepts.
Sub-physiographic Image characteristics
zone
BCP 1 Dark reddish tone with dull white patches
BCP 2 Light pink tone with whitish patches
BCP 3 Dark reddish tone with black patches
BCP 4 Light pink tone with bluish patches
BCP 5 Bluish tone with dark patches
B – Bengal, C- Coastal, P- Plains;
1–Rice-fallow; 2-Rice-rice; 3–Plantation; 4–Multiple cropping;
5- Rice +fisheries
physiography relationship of the area is presentedin table 1.19.
Fig. 1.25 Image characteristics of different physiographic units
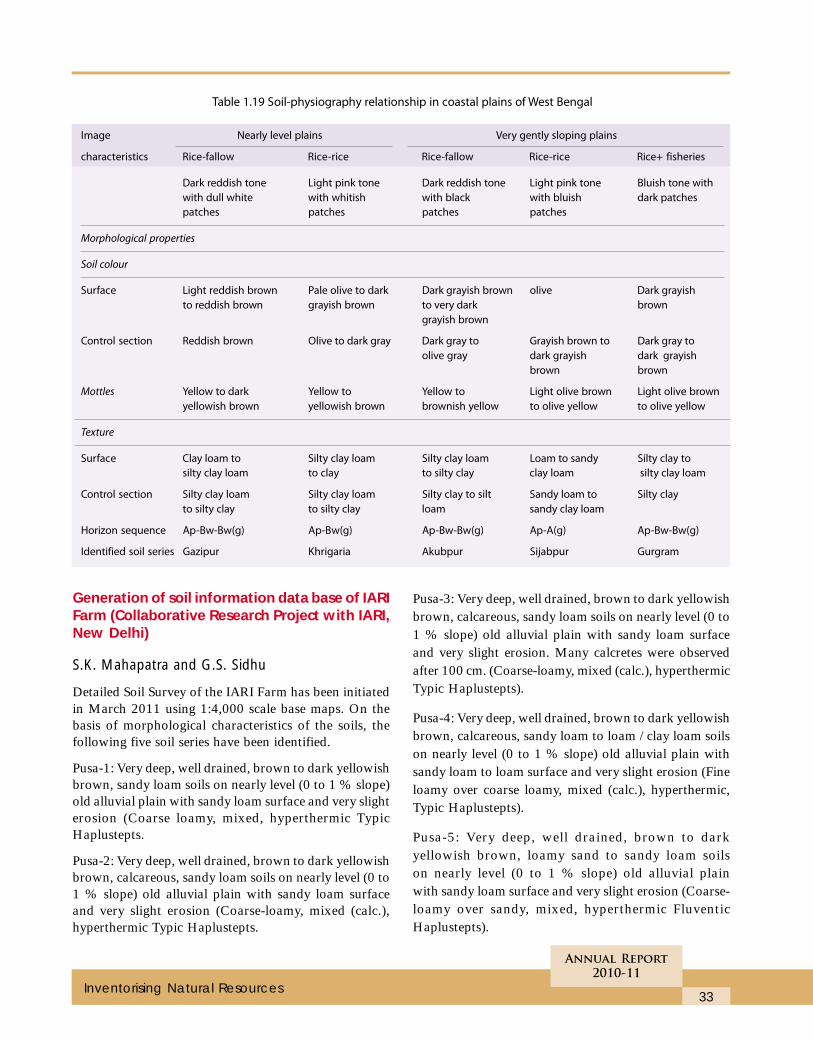
33
Annual Report
2010-11
Inventorising Natural Resources
Table 1.19 Soil-physiography relationship in coastal plains of West Bengal
Image Nearly level plains Very gently sloping plains
characteristics Rice-fallow Rice-rice Rice-fallow Rice-rice Rice+ fisheries
Dark reddish tone Light pink tone Dark reddish tone Light pink tone Bluish tone with
with dull white with whitish with black with bluish dark patches
patches patches patches patches
Morphological properties
Soil colour
Surface Light reddish brown Pale olive to dark Dark grayish brown olive Dark grayish
to reddish brown grayish brown to very dark brown
grayish brown
Control section Reddish brown Olive to dark gray Dark gray to Grayish brown to Dark gray to
olive gray dark grayish dark grayish
brown brown
Mottles Yellow to dark Yellow to Yellow to Light olive brown Light olive brown
yellowish brown yellowish brown brownish yellow to olive yellow to olive yellow
Texture
Surface Clay loam to Silty clay loam Silty clay loam Loam to sandy Silty clay to
silty clay loam to clay to silty clay clay loam silty clay loam
Control section Silty clay loam Silty clay loam Silty clay to silt Sandy loam to Silty clay
to silty clay to silty clay loam sandy clay loam
Horizon sequence Ap-Bw-Bw(g) Ap-Bw(g) Ap-Bw-Bw(g) Ap-A(g) Ap-Bw-Bw(g)
Identified soil series Gazipur Khrigaria Akubpur Sijabpur Gurgram
Pusa-3: Very deep, well drained, brown to dark yellowishbrown, calcareous, sandy loam soils on nearly level (0 to1 % slope) old alluvial plain with sandy loam surfaceand very slight erosion. Many calcretes were observedafter 100 cm. (Coarse-loamy, mixed (calc.), hyperthermicTypic Haplustepts).
Pusa-4: Very deep, well drained, brown to dark yellowishbrown, calcareous, sandy loam to loam / clay loam soilson nearly level (0 to 1 % slope) old alluvial plain withsandy loam to loam surface and very slight erosion (Fineloamy over coarse loamy, mixed (calc.), hyperthermic,Typic Haplustepts).
Pusa-5: Very deep, well drained, brown to darkyellowish brown, loamy sand to sandy loam soilson nearly level (0 to 1 % slope) old alluvial plainwith sandy loam surface and very slight erosion (Coarse-loamy over sandy, mixed, hyperthermic FluventicHaplustepts).
Generation of soil information data base of IARIFarm (Collaborative Research Project with IARI,New Delhi)
S.K. Mahapatra and G.S. Sidhu
Detailed Soil Survey of the IARI Farm has been initiatedin March 2011 using 1:4,000 scale base maps. On thebasis of morphological characteristics of the soils, thefollowing five soil series have been identified.
Pusa-1: Very deep, well drained, brown to dark yellowishbrown, sandy loam soils on nearly level (0 to 1 % slope)old alluvial plain with sandy loam surface and very slighterosion (Coarse loamy, mixed, hyperthermic TypicHaplustepts.
Pusa-2: Very deep, well drained, brown to dark yellowishbrown, calcareous, sandy loam soils on nearly level (0 to1 % slope) old alluvial plain with sandy loam surfaceand very slight erosion (Coarse-loamy, mixed (calc.),hyperthermic Typic Haplustepts.
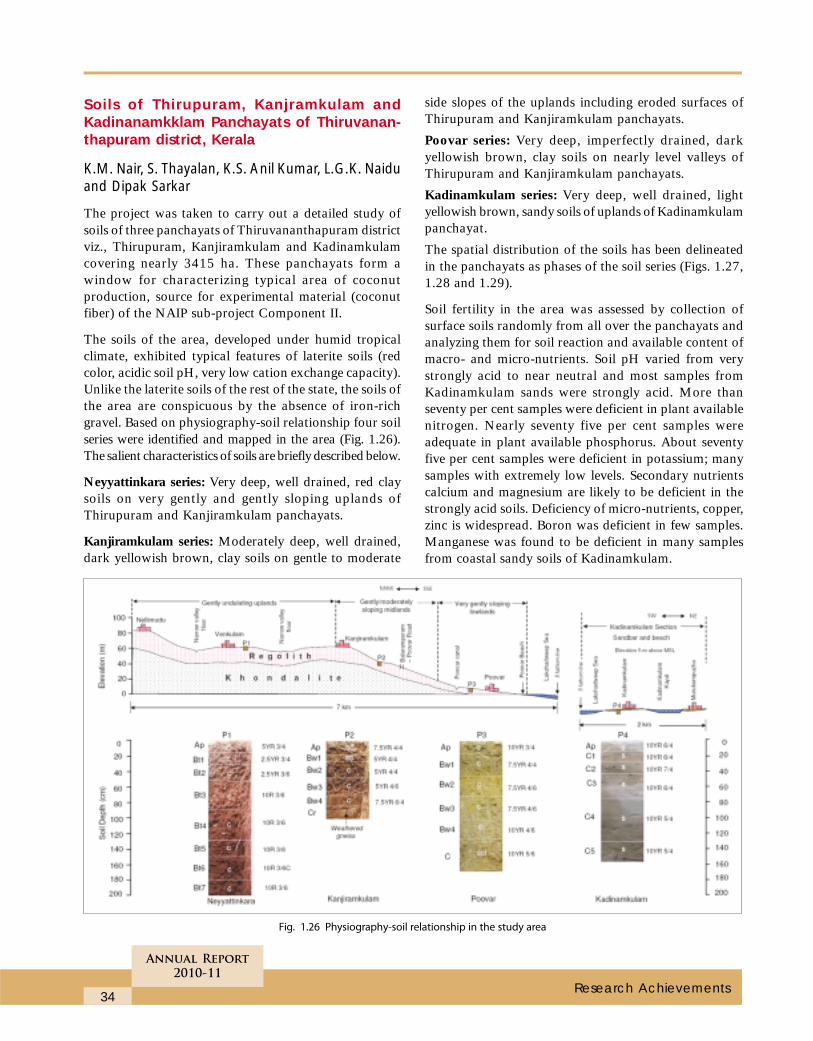
34
Annual Report
2010-11
Research Achievements
Soils of Thirupuram, Kanjramkulam andKadinanamkklam Panchayats of Thiruvanan-thapuram district, Kerala
K.M. Nair, S. Thayalan, K.S. Anil Kumar, L.G.K. Naiduand Dipak Sarkar
The project was taken to carry out a detailed study ofsoils of three panchayats of Thiruvananthapuram districtviz., Thirupuram, Kanjiramkulam and Kadinamkulamcovering nearly 3415 ha. These panchayats form awindow for characterizing typical area of coconutproduction, source for experimental material (coconutfiber) of the NAIP sub-project Component II.
The soils of the area, developed under humid tropicalclimate, exhibited typical features of laterite soils (redcolor, acidic soil pH, very low cation exchange capacity).Unlike the laterite soils of the rest of the state, the soils ofthe area are conspicuous by the absence of iron-richgravel. Based on physiography-soil relationship four soilseries were identified and mapped in the area (Fig. 1.26).The salient characteristics of soils are briefly described below.
Neyyattinkara series: Very deep, well drained, red claysoils on very gently and gently sloping uplands ofThirupuram and Kanjiramkulam panchayats.
Kanjiramkulam series: Moderately deep, well drained,dark yellowish brown, clay soils on gentle to moderate
side slopes of the uplands including eroded surfaces ofThirupuram and Kanjiramkulam panchayats.
Poovar series: Very deep, imperfectly drained, darkyellowish brown, clay soils on nearly level valleys ofThirupuram and Kanjiramkulam panchayats.
Kadinamkulam series: Very deep, well drained, lightyellowish brown, sandy soils of uplands of Kadinamkulampanchayat.
The spatial distribution of the soils has been delineatedin the panchayats as phases of the soil series (Figs. 1.27,1.28 and 1.29).
Soil fertility in the area was assessed by collection ofsurface soils randomly from all over the panchayats andanalyzing them for soil reaction and available content ofmacro- and micro-nutrients. Soil pH varied from verystrongly acid to near neutral and most samples fromKadinamkulam sands were strongly acid. More thanseventy per cent samples were deficient in plant availablenitrogen. Nearly seventy five per cent samples wereadequate in plant available phosphorus. About seventyfive per cent samples were deficient in potassium; manysamples with extremely low levels. Secondary nutrientscalcium and magnesium are likely to be deficient in thestrongly acid soils. Deficiency of micro-nutrients, copper,zinc is widespread. Boron was deficient in few samples.Manganese was found to be deficient in many samplesfrom coastal sandy soils of Kadinamkulam.
Fig. 1.26 Physiography-soil relationship in the study area
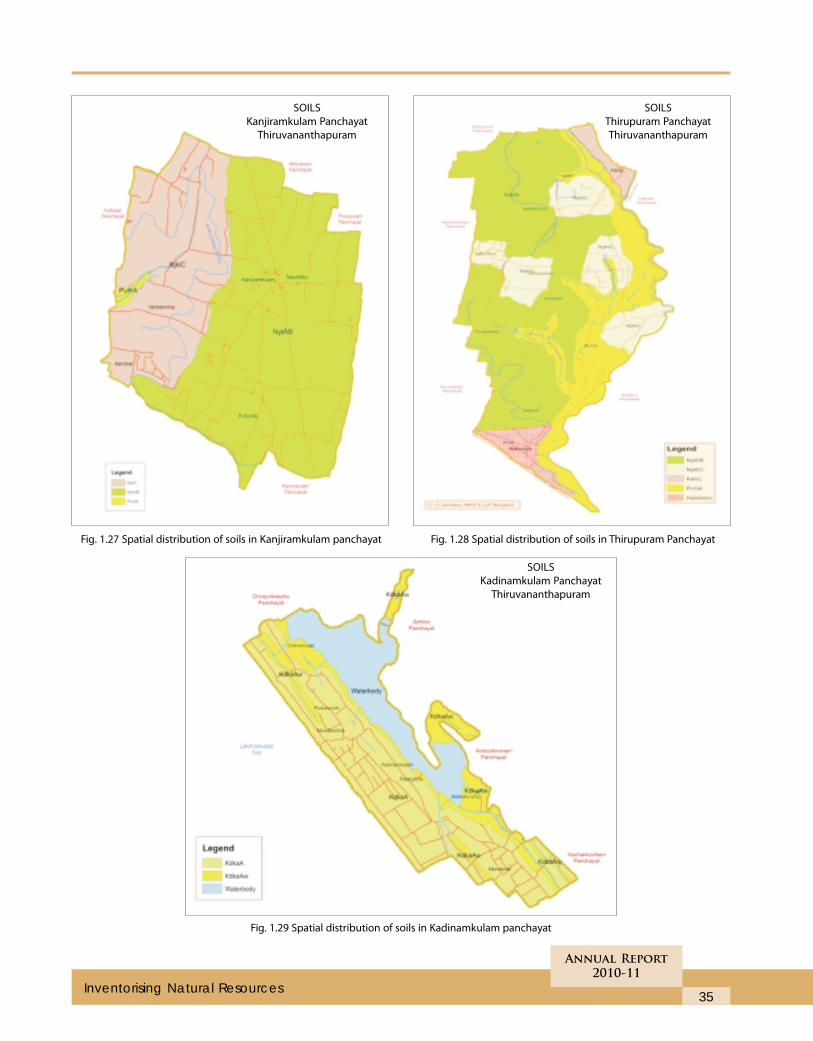
35
Annual Report
2010-11
Inventorising Natural Resources
Fig. 1.27 Spatial distribution of soils in Kanjiramkulam panchayat
Fig. 1.29 Spatial distribution of soils in Kadinamkulam panchayat
SOILS
Kanjiramkulam Panchayat
Thiruvananthapuram
Fig. 1.28 Spatial distribution of soils in Thirupuram Panchayat
SOILS
Thirupuram Panchayat
Thiruvananthapuram
SOILS
Kadinamkulam Panchayat
Thiruvananthapuram
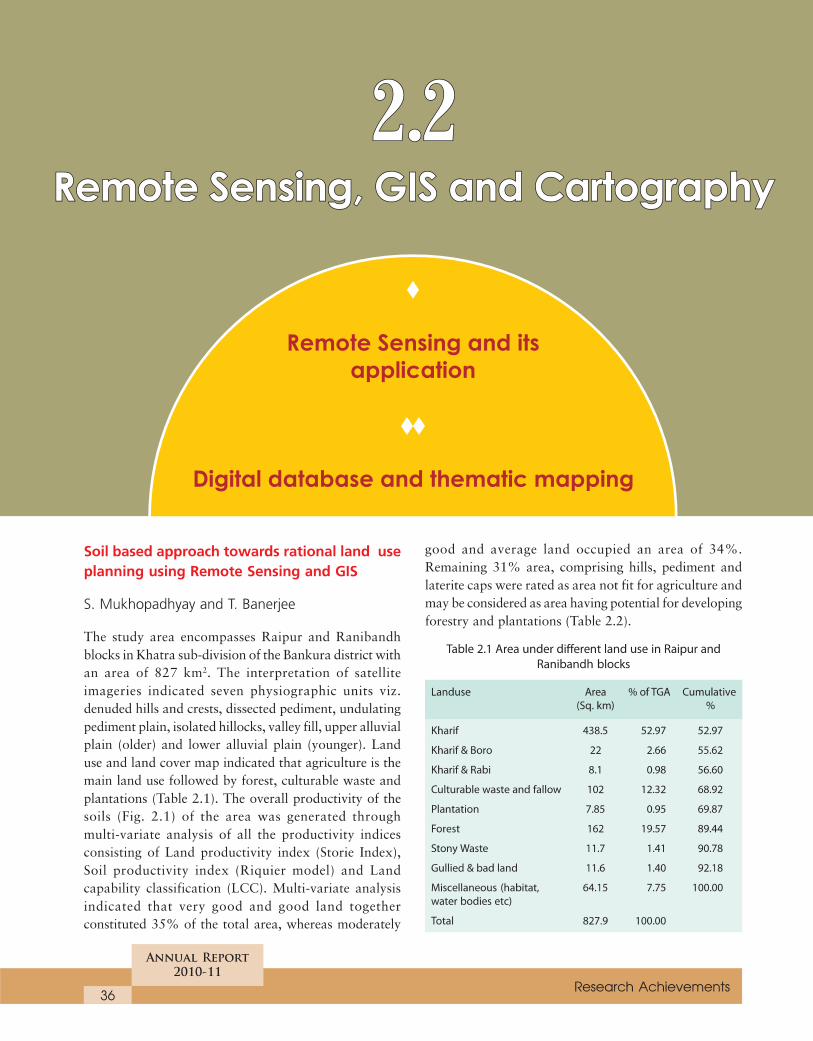
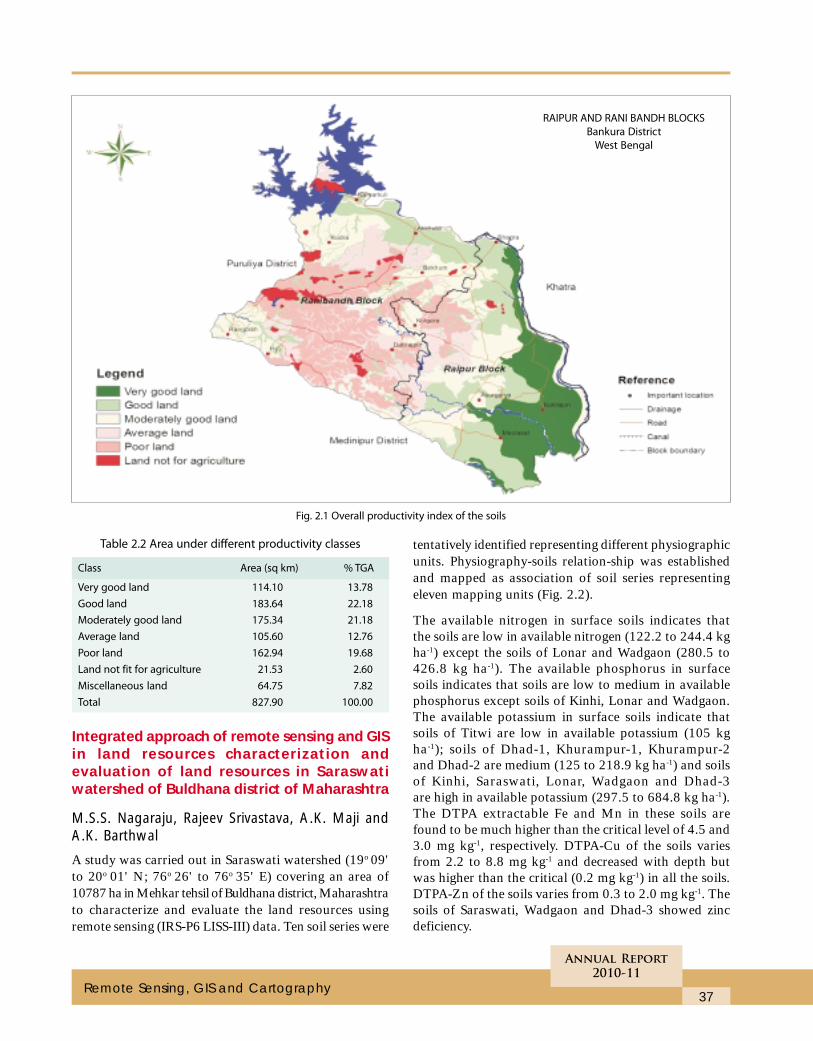
37
Annual Report
2010-11
Remote Sensing, GIS and Cartography
Table 2.2 Area under different productivity classes
Class Area (sq km) % TGA
Very good land 114.10 13.78
Good land 183.64 22.18
Moderately good land 175.34 21.18
Average land 105.60 12.76
Poor land 162.94 19.68
Land not fit for agriculture 21.53 2.60
Miscellaneous land 64.75 7.82
Total 827.90 100.00
Integrated approach of remote sensing and GISin land resources characterization andevaluation of land resources in Saraswatiwatershed of Buldhana district of Maharashtra
M.S.S. Nagaraju, Rajeev Srivastava, A.K. Maji andA.K. Barthwal
A study was carried out in Saraswati watershed (19o 09'to 20o 01' N; 76o 26' to 76o 35' E) covering an area of10787 ha in Mehkar tehsil of Buldhana district, Maharashtrato characterize and evaluate the land resources usingremote sensing (IRS-P6 LISS-III) data. Ten soil series were
tentatively identified representing different physiographicunits. Physiography-soils relation-ship was establishedand mapped as association of soil series representingeleven mapping units (Fig. 2.2).
The available nitrogen in surface soils indicates thatthe soils are low in available nitrogen (122.2 to 244.4 kgha-1) except the soils of Lonar and Wadgaon (280.5 to426.8 kg ha-1). The available phosphorus in surfacesoils indicates that soils are low to medium in availablephosphorus except soils of Kinhi, Lonar and Wadgaon.The available potassium in surface soils indicate thatsoils of Titwi are low in available potassium (105 kgha-1); soils of Dhad-1, Khurampur-1, Khurampur-2and Dhad-2 are medium (125 to 218.9 kg ha-1) and soilsof Kinhi, Saraswati, Lonar, Wadgaon and Dhad-3are high in available potassium (297.5 to 684.8 kg ha-1).The DTPA extractable Fe and Mn in these soils arefound to be much higher than the critical level of 4.5 and3.0 mg kg-1, respectively. DTPA-Cu of the soils variesfrom 2.2 to 8.8 mg kg-1 and decreased with depth butwas higher than the critical (0.2 mg kg-1) in all the soils.DTPA-Zn of the soils varies from 0.3 to 2.0 mg kg-1. Thesoils of Saraswati, Wadgaon and Dhad-3 showed zincdeficiency.
Fig. 2.1 Overall productivity index of the soils
RAIPUR AND RANI BANDH BLOCKS
Bankura District
West Bengal
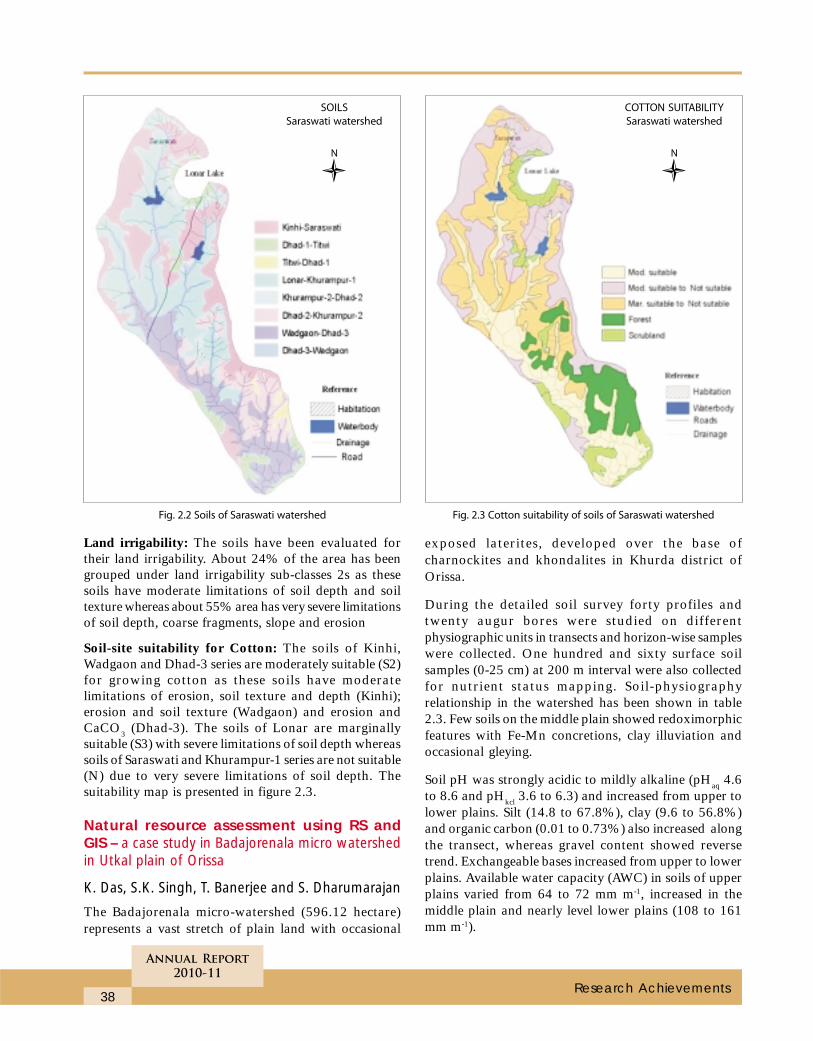
38
Annual Report
2010-11
Research Achievements
Land irrigability: The soils have been evaluated fortheir land irrigability. About 24% of the area has beengrouped under land irrigability sub-classes 2s as thesesoils have moderate limitations of soil depth and soiltexture whereas about 55% area has very severe limitationsof soil depth, coarse fragments, slope and erosion
Soil-site suitability for Cotton: The soils of Kinhi,Wadgaon and Dhad-3 series are moderately suitable (S2)for growing cotton as these soils have moderatelimitations of erosion, soil texture and depth (Kinhi);erosion and soil texture (Wadgaon) and erosion andCaCO3 (Dhad-3). The soils of Lonar are marginallysuitable (S3) with severe limitations of soil depth whereassoils of Saraswati and Khurampur-1 series are not suitable(N) due to very severe limitations of soil depth. Thesuitability map is presented in figure 2.3.
Natural resource assessment using RS andGIS – a case study in Badajorenala micro watershedin Utkal plain of Orissa
K. Das, S.K. Singh, T. Banerjee and S. Dharumarajan
The Badajorenala micro-watershed (596.12 hectare)represents a vast stretch of plain land with occasional
exposed laterites, developed over the base ofcharnockites and khondalites in Khurda district ofOrissa.
During the detailed soil survey forty profiles andtwenty augur bores were studied on differentphysiographic units in transects and horizon-wise sampleswere collected. One hundred and sixty surface soilsamples (0-25 cm) at 200 m interval were also collectedfor nutrient status mapping. Soil-physiographyrelationship in the watershed has been shown in table2.3. Few soils on the middle plain showed redoximorphicfeatures with Fe-Mn concretions, clay illuviation andoccasional gleying.
Soil pH was strongly acidic to mildly alkaline (pHaq 4.6to 8.6 and pHkcl 3.6 to 6.3) and increased from upper tolower plains. Silt (14.8 to 67.8%), clay (9.6 to 56.8%)and organic carbon (0.01 to 0.73%) also increased alongthe transect, whereas gravel content showed reversetrend. Exchangeable bases increased from upper to lowerplains. Available water capacity (AWC) in soils of upperplains varied from 64 to 72 mm m-1, increased in themiddle plain and nearly level lower plains (108 to 161mm m-1).
Fig. 2.3 Cotton suitability of soils of Saraswati watershedFig. 2.2 Soils of Saraswati watershed
SOILS
Saraswati watershed
COTTON SUITABILITY
Saraswati watershed
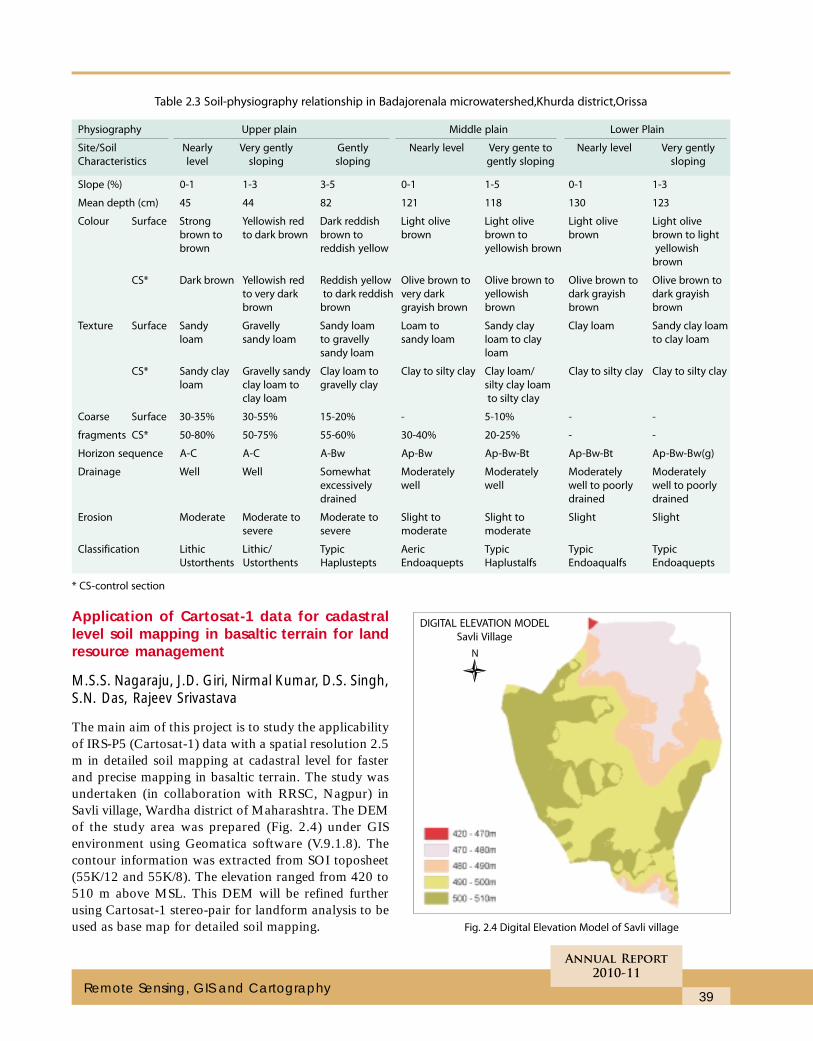
39
Annual Report
2010-11
Remote Sensing, GIS and Cartography
Table 2.3 Soil-physiography relationship in Badajorenala microwatershed,Khurda district,Orissa
Physiography Upper plain Middle plain Lower Plain
Site/Soil Nearly Very gently Gently Nearly level Very gente to Nearly level Very gently
Characteristics level sloping sloping gently sloping sloping
Slope (%) 0-1 1-3 3-5 0-1 1-5 0-1 1-3
Mean depth (cm) 45 44 82 121 118 130 123
Colour Surface Strong Yellowish red Dark reddish Light olive Light olive Light olive Light olive
brown to to dark brown brown to brown brown to brown brown to light
brown reddish yellow yellowish brown yellowish
brown
CS* Dark brown Yellowish red Reddish yellow Olive brown to Olive brown to Olive brown to Olive brown to
to very dark to dark reddish very dark yellowish dark grayish dark grayish
brown brown grayish brown brown brown brown
Texture Surface Sandy Gravelly Sandy loam Loam to Sandy clay Clay loam Sandy clay loam
loam sandy loam to gravelly sandy loam loam to clay to clay loam
sandy loam loam
CS* Sandy clay Gravelly sandy Clay loam to Clay to silty clay Clay loam/ Clay to silty clay Clay to silty clay
loam clay loam to gravelly clay silty clay loam
clay loam to silty clay
Coarse Surface 30-35% 30-55% 15-20% - 5-10% - -
fragments CS* 50-80% 50-75% 55-60% 30-40% 20-25% - -
Horizon sequence A-C A-C A-Bw Ap-Bw Ap-Bw-Bt Ap-Bw-Bt Ap-Bw-Bw(g)
Drainage Well Well Somewhat Moderately Moderately Moderately Moderately
excessively well well well to poorly well to poorly
drained drained drained
Erosion Moderate Moderate to Moderate to Slight to Slight to Slight Slight
severe severe moderate moderate
Classification Lithic Lithic/ Typic Aeric Typic Typic Typic
Ustorthents Ustorthents Haplustepts Endoaquepts Haplustalfs Endoaqualfs Endoaquepts
* CS-control section
Application of Cartosat-1 data for cadastrallevel soil mapping in basaltic terrain for landresource management
M.S.S. Nagaraju, J.D. Giri, Nirmal Kumar, D.S. Singh,S.N. Das, Rajeev Srivastava
The main aim of this project is to study the applicabilityof IRS-P5 (Cartosat-1) data with a spatial resolution 2.5m in detailed soil mapping at cadastral level for fasterand precise mapping in basaltic terrain. The study wasundertaken (in collaboration with RRSC, Nagpur) inSavli village, Wardha district of Maharashtra. The DEMof the study area was prepared (Fig. 2.4) under GISenvironment using Geomatica software (V.9.1.8). Thecontour information was extracted from SOI toposheet(55K/12 and 55K/8). The elevation ranged from 420 to510 m above MSL. This DEM will be refined furtherusing Cartosat-1 stereo-pair for landform analysis to beused as base map for detailed soil mapping.
DIGITAL ELEVATION MODEL
Savli Village
Fig. 2.4 Digital Elevation Model of Savli village
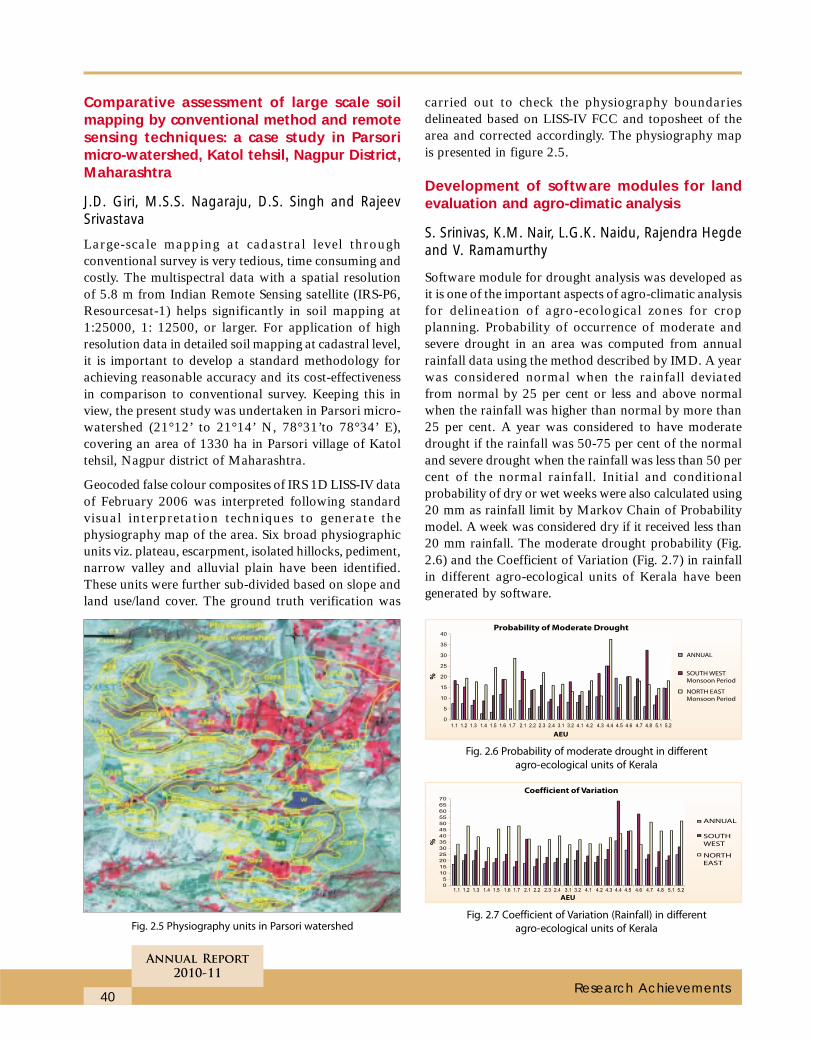
40
Annual Report
2010-11
Research Achievements
Comparative assessment of large scale soilmapping by conventional method and remotesensing techniques: a case study in Parsorimicro-watershed, Katol tehsil, Nagpur District,Maharashtra
J.D. Giri, M.S.S. Nagaraju, D.S. Singh and RajeevSrivastava
Large-scale mapping at cadastral level throughconventional survey is very tedious, time consuming andcostly. The multispectral data with a spatial resolutionof 5.8 m from Indian Remote Sensing satellite (IRS-P6,Resourcesat-1) helps significantly in soil mapping at1:25000, 1: 12500, or larger. For application of highresolution data in detailed soil mapping at cadastral level,it is important to develop a standard methodology forachieving reasonable accuracy and its cost-effectivenessin comparison to conventional survey. Keeping this inview, the present study was undertaken in Parsori micro-watershed (21°12’ to 21°14’ N, 78°31’to 78°34’ E),covering an area of 1330 ha in Parsori village of Katoltehsil, Nagpur district of Maharashtra.
Geocoded false colour composites of IRS 1D LISS-IV dataof February 2006 was interpreted following standardvisual interpretation techniques to generate thephysiography map of the area. Six broad physiographicunits viz. plateau, escarpment, isolated hillocks, pediment,narrow valley and alluvial plain have been identified.These units were further sub-divided based on slope andland use/land cover. The ground truth verification was
carried out to check the physiography boundariesdelineated based on LISS-IV FCC and toposheet of thearea and corrected accordingly. The physiography mapis presented in figure 2.5.
Development of software modules for landevaluation and agro-climatic analysis
S. Srinivas, K.M. Nair, L.G.K. Naidu, Rajendra Hegdeand V. Ramamurthy
Software module for drought analysis was developed asit is one of the important aspects of agro-climatic analysisfor delineation of agro-ecological zones for cropplanning. Probability of occurrence of moderate andsevere drought in an area was computed from annualrainfall data using the method described by IMD. A yearwas considered normal when the rainfall deviatedfrom normal by 25 per cent or less and above normalwhen the rainfall was higher than normal by more than25 per cent. A year was considered to have moderatedrought if the rainfall was 50-75 per cent of the normaland severe drought when the rainfall was less than 50 percent of the normal rainfall. Initial and conditionalprobability of dry or wet weeks were also calculated using20 mm as rainfall limit by Markov Chain of Probabilitymodel. A week was considered dry if it received less than20 mm rainfall. The moderate drought probability (Fig.2.6) and the Coefficient of Variation (Fig. 2.7) in rainfallin different agro-ecological units of Kerala have beengenerated by software.
Fig. 2.5 Physiography units in Parsori watershed
Fig. 2.6 Probability of moderate drought in different
agro-ecological units of Kerala
Fig. 2.7 Coefficient of Variation (Rainfall) in different
agro-ecological units of Kerala
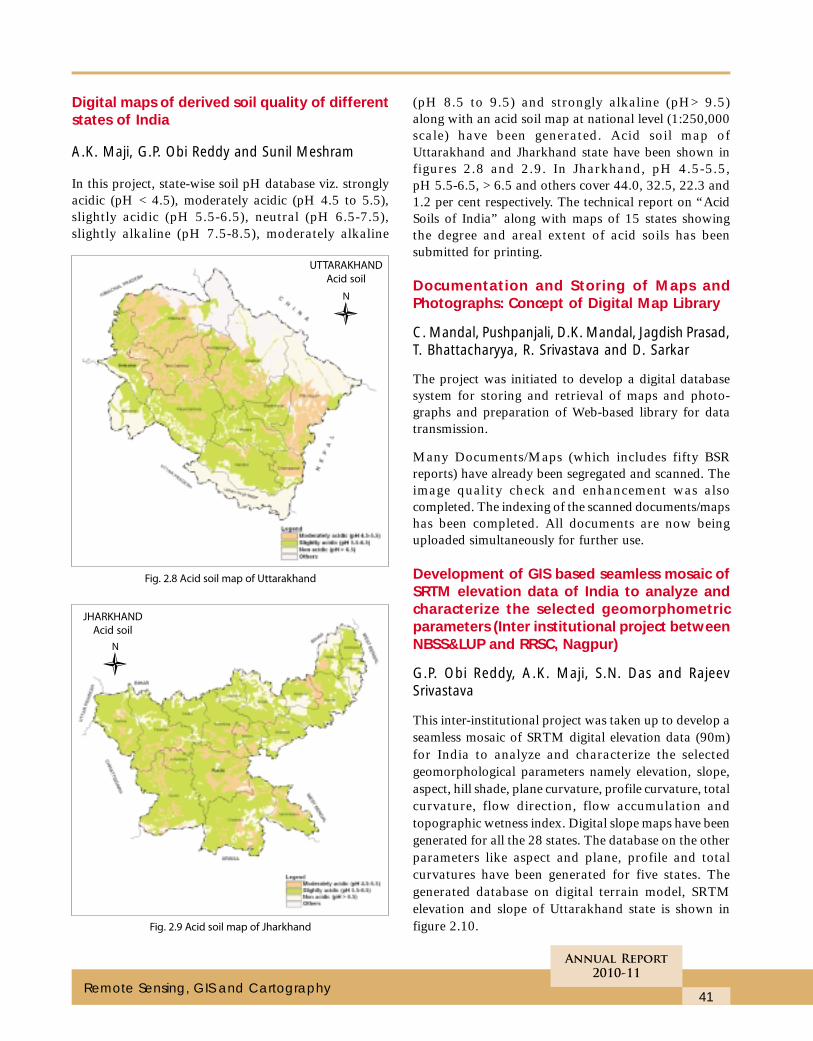
41
Annual Report
2010-11
Remote Sensing, GIS and Cartography
Digital maps of derived soil quality of differentstates of India
A.K. Maji, G.P. Obi Reddy and Sunil Meshram
In this project, state-wise soil pH database viz. stronglyacidic (pH < 4.5), moderately acidic (pH 4.5 to 5.5),slightly acidic (pH 5.5-6.5), neutral (pH 6.5-7.5),slightly alkaline (pH 7.5-8.5), moderately alkaline
(pH 8.5 to 9.5) and strongly alkaline (pH> 9.5)along with an acid soil map at national level (1:250,000scale) have been generated. Acid soil map ofUttarakhand and Jharkhand state have been shown infigures 2.8 and 2.9. In Jharkhand, pH 4.5-5.5,pH 5.5-6.5, > 6.5 and others cover 44.0, 32.5, 22.3 and1.2 per cent respectively. The technical report on “AcidSoils of India” along with maps of 15 states showingthe degree and areal extent of acid soils has beensubmitted for printing.
Documentation and Storing of Maps andPhotographs: Concept of Digital Map Library
C. Mandal, Pushpanjali, D.K. Mandal, Jagdish Prasad,T. Bhattacharyya, R. Srivastava and D. Sarkar
The project was initiated to develop a digital databasesystem for storing and retrieval of maps and photo-graphs and preparation of Web-based library for datatransmission.
Many Documents/Maps (which includes fifty BSRreports) have already been segregated and scanned. Theimage quality check and enhancement was alsocompleted. The indexing of the scanned documents/mapshas been completed. All documents are now beinguploaded simultaneously for further use.
Development of GIS based seamless mosaic ofSRTM elevation data of India to analyze andcharacterize the selected geomorphometricparameters (Inter institutional project betweenNBSS&LUP and RRSC, Nagpur)
G.P. Obi Reddy, A.K. Maji, S.N. Das and RajeevSrivastava
This inter-institutional project was taken up to develop aseamless mosaic of SRTM digital elevation data (90m)for India to analyze and characterize the selectedgeomorphological parameters namely elevation, slope,aspect, hill shade, plane curvature, profile curvature, totalcurvature, flow direction, flow accumulation andtopographic wetness index. Digital slope maps have beengenerated for all the 28 states. The database on the otherparameters like aspect and plane, profile and totalcurvatures have been generated for five states. Thegenerated database on digital terrain model, SRTMelevation and slope of Uttarakhand state is shown infigure 2.10.
Fig. 2.8 Acid soil map of Uttarakhand
Fig. 2.9 Acid soil map of Jharkhand
UTTARAKHAND
Acid soil
JHARKHAND
Acid soil
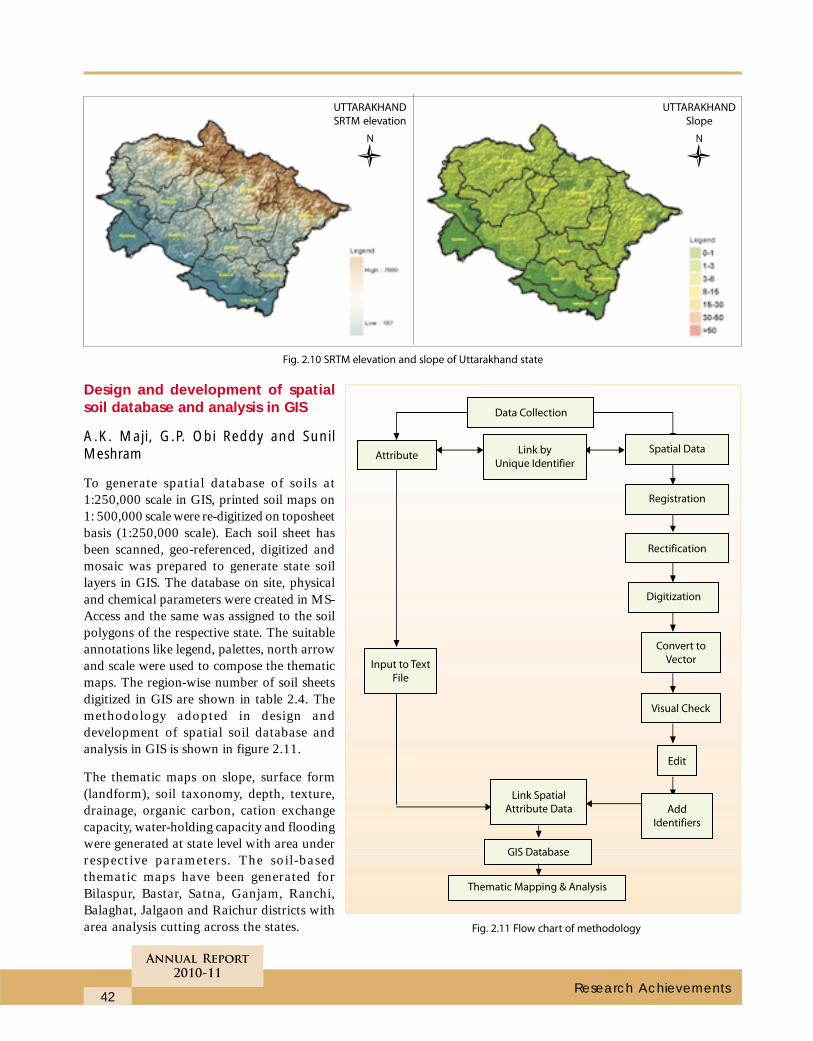
42
Annual Report
2010-11
Research Achievements
Design and development of spatialsoil database and analysis in GIS
A.K. Maji, G.P. Obi Reddy and SunilMeshram
To generate spatial database of soils at1:250,000 scale in GIS, printed soil maps on1: 500,000 scale were re-digitized on toposheetbasis (1:250,000 scale). Each soil sheet hasbeen scanned, geo-referenced, digitized andmosaic was prepared to generate state soillayers in GIS. The database on site, physicaland chemical parameters were created in MS-Access and the same was assigned to the soilpolygons of the respective state. The suitableannotations like legend, palettes, north arrowand scale were used to compose the thematicmaps. The region-wise number of soil sheetsdigitized in GIS are shown in table 2.4. Themethodology adopted in design anddevelopment of spatial soil database andanalysis in GIS is shown in figure 2.11.
The thematic maps on slope, surface form(landform), soil taxonomy, depth, texture,drainage, organic carbon, cation exchangecapacity, water-holding capacity and floodingwere generated at state level with area underrespective parameters. The soil-basedthematic maps have been generated forBilaspur, Bastar, Satna, Ganjam, Ranchi,Balaghat, Jalgaon and Raichur districts witharea analysis cutting across the states.
Fig. 2.10 SRTM elevation and slope of Uttarakhand state
Fig. 2.11 Flow chart of methodology
UTTARAKHAND
SRTM elevation
UTTARAKHAND
Slope
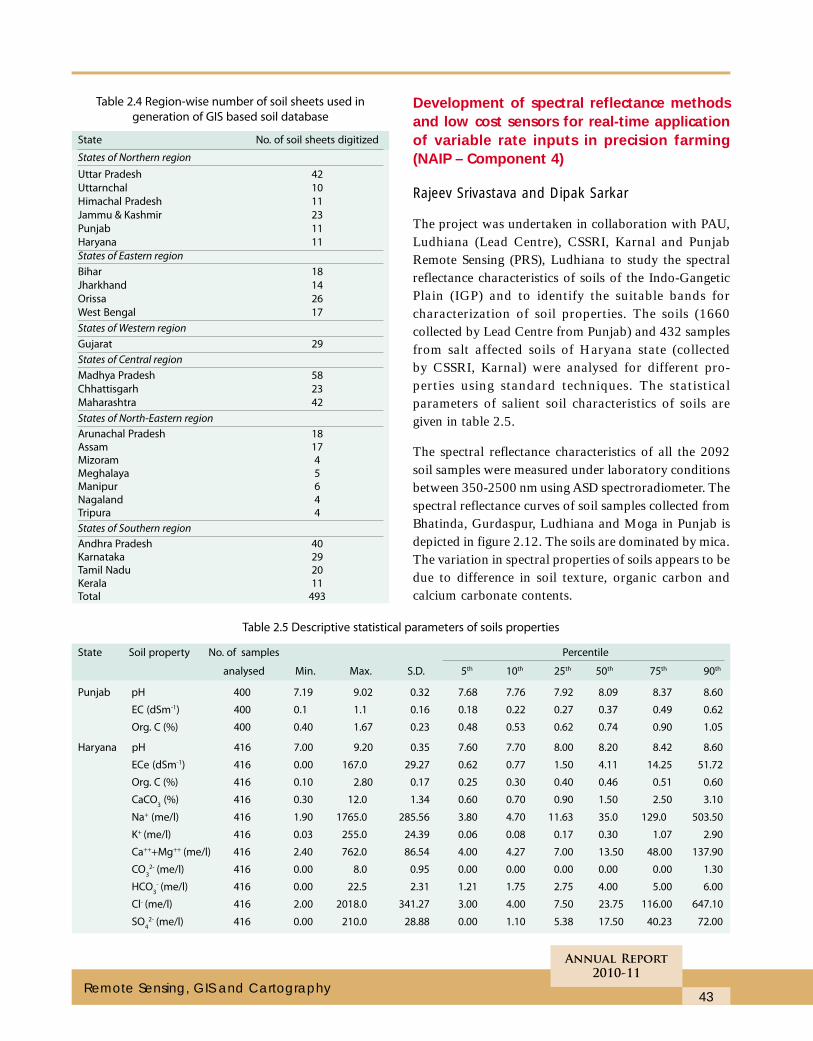
43
Annual Report
2010-11
Remote Sensing, GIS and Cartography
Table 2.4 Region-wise number of soil sheets used in
generation of GIS based soil database
State No. of soil sheets digitized
States of Northern region
Uttar Pradesh 42
Uttarnchal 10
Himachal Pradesh 11
Jammu & Kashmir 23
Punjab 11
Haryana 11
States of Eastern region
Bihar 18
Jharkhand 14
Orissa 26
West Bengal 17
States of Western region
Gujarat 29
States of Central region
Madhya Pradesh 58
Chhattisgarh 23
Maharashtra 42
States of North-Eastern region
Arunachal Pradesh 18Assam 17Mizoram 4Meghalaya 5Manipur 6Nagaland 4Tripura 4
States of Southern region
Andhra Pradesh 40Karnataka 29Tamil Nadu 20Kerala 11Total 493
Development of spectral reflectance methodsand low cost sensors for real-time applicationof variable rate inputs in precision farming(NAIP – Component 4)
Rajeev Srivastava and Dipak Sarkar
The project was undertaken in collaboration with PAU,Ludhiana (Lead Centre), CSSRI, Karnal and PunjabRemote Sensing (PRS), Ludhiana to study the spectralreflectance characteristics of soils of the Indo-GangeticPlain (IGP) and to identify the suitable bands forcharacterization of soil properties. The soils (1660collected by Lead Centre from Punjab) and 432 samplesfrom salt affected soils of Haryana state (collectedby CSSRI, Karnal) were analysed for different pro-perties using standard techniques. The statisticalparameters of salient soil characteristics of soils aregiven in table 2.5.
The spectral reflectance characteristics of all the 2092soil samples were measured under laboratory conditionsbetween 350-2500 nm using ASD spectroradiometer. Thespectral reflectance curves of soil samples collected fromBhatinda, Gurdaspur, Ludhiana and Moga in Punjab isdepicted in figure 2.12. The soils are dominated by mica.The variation in spectral properties of soils appears to bedue to difference in soil texture, organic carbon andcalcium carbonate contents.
Table 2.5 Descriptive statistical parameters of soils properties
State Soil property No. of samples Percentile
analysed Min. Max. S.D. 5th 10th 25th 50th 75th 90th
Punjab pH 400 7.19 9.02 0.32 7.68 7.76 7.92 8.09 8.37 8.60
EC (dSm-1) 400 0.1 1.1 0.16 0.18 0.22 0.27 0.37 0.49 0.62
Org. C (%) 400 0.40 1.67 0.23 0.48 0.53 0.62 0.74 0.90 1.05
Haryana pH 416 7.00 9.20 0.35 7.60 7.70 8.00 8.20 8.42 8.60
ECe (dSm-1) 416 0.00 167.0 29.27 0.62 0.77 1.50 4.11 14.25 51.72
Org. C (%) 416 0.10 2.80 0.17 0.25 0.30 0.40 0.46 0.51 0.60
CaCO3 (%) 416 0.30 12.0 1.34 0.60 0.70 0.90 1.50 2.50 3.10
Na+ (me/l) 416 1.90 1765.0 285.56 3.80 4.70 11.63 35.0 129.0 503.50
K+ (me/l) 416 0.03 255.0 24.39 0.06 0.08 0.17 0.30 1.07 2.90
Ca+++Mg++ (me/l) 416 2.40 762.0 86.54 4.00 4.27 7.00 13.50 48.00 137.90
CO3
2- (me/l) 416 0.00 8.0 0.95 0.00 0.00 0.00 0.00 0.00 1.30
HCO3
- (me/l) 416 0.00 22.5 2.31 1.21 1.75 2.75 4.00 5.00 6.00
Cl- (me/l) 416 2.00 2018.0 341.27 3.00 4.00 7.50 23.75 116.00 647.10
SO4
2- (me/l) 416 0.00 210.0 28.88 0.00 1.10 5.38 17.50 40.23 72.00
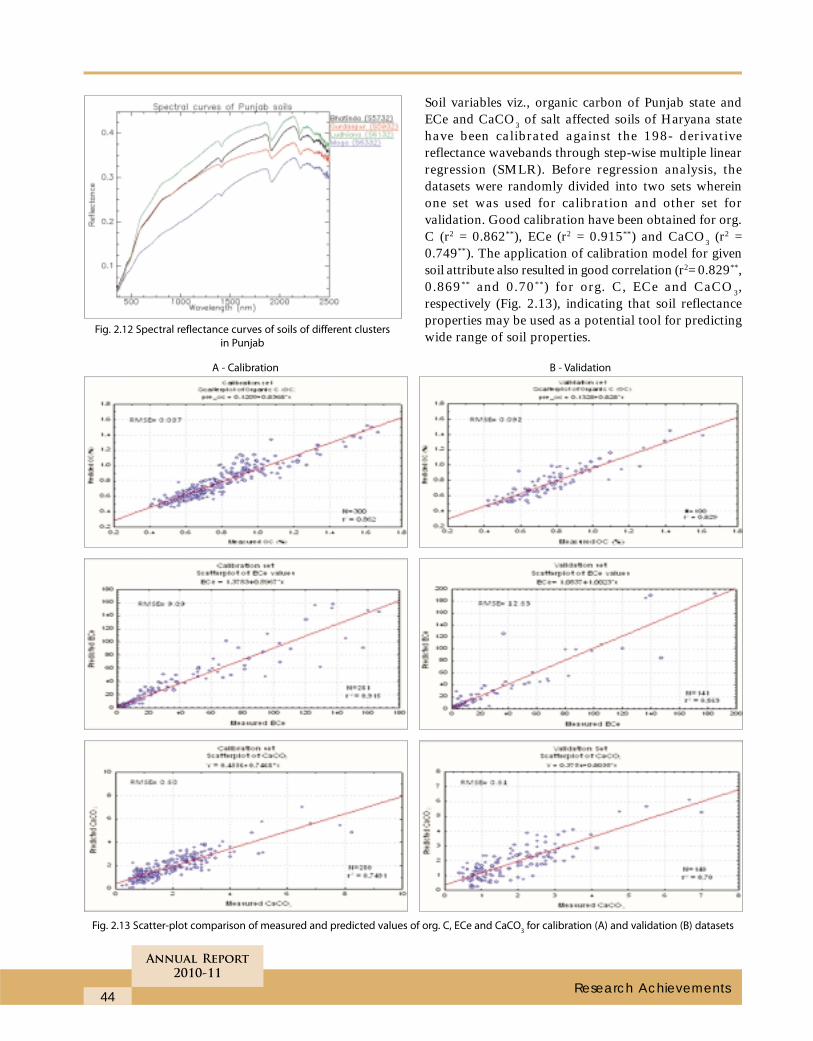
44
Annual Report
2010-11
Research Achievements
Soil variables viz., organic carbon of Punjab state andECe and CaCO3 of salt affected soils of Haryana statehave been calibrated against the 198- derivativereflectance wavebands through step-wise multiple linearregression (SMLR). Before regression analysis, thedatasets were randomly divided into two sets whereinone set was used for calibration and other set forvalidation. Good calibration have been obtained for org.C (r2 = 0.862**), ECe (r2 = 0.915**) and CaCO3 (r2 =0.749**). The application of calibration model for givensoil attribute also resulted in good correlation (r2= 0.829**,0.869** and 0.70**) for org. C, ECe and CaCO3,respectively (Fig. 2.13), indicating that soil reflectanceproperties may be used as a potential tool for predictingwide range of soil properties.
Fig. 2.13 Scatter-plot comparison of measured and predicted values of org. C, ECe and CaCO3 for calibration (A) and validation (B) datasets
Fig. 2.12 Spectral reflectance curves of soils of different clusters
in Punjab
A - Calibration B - Validation
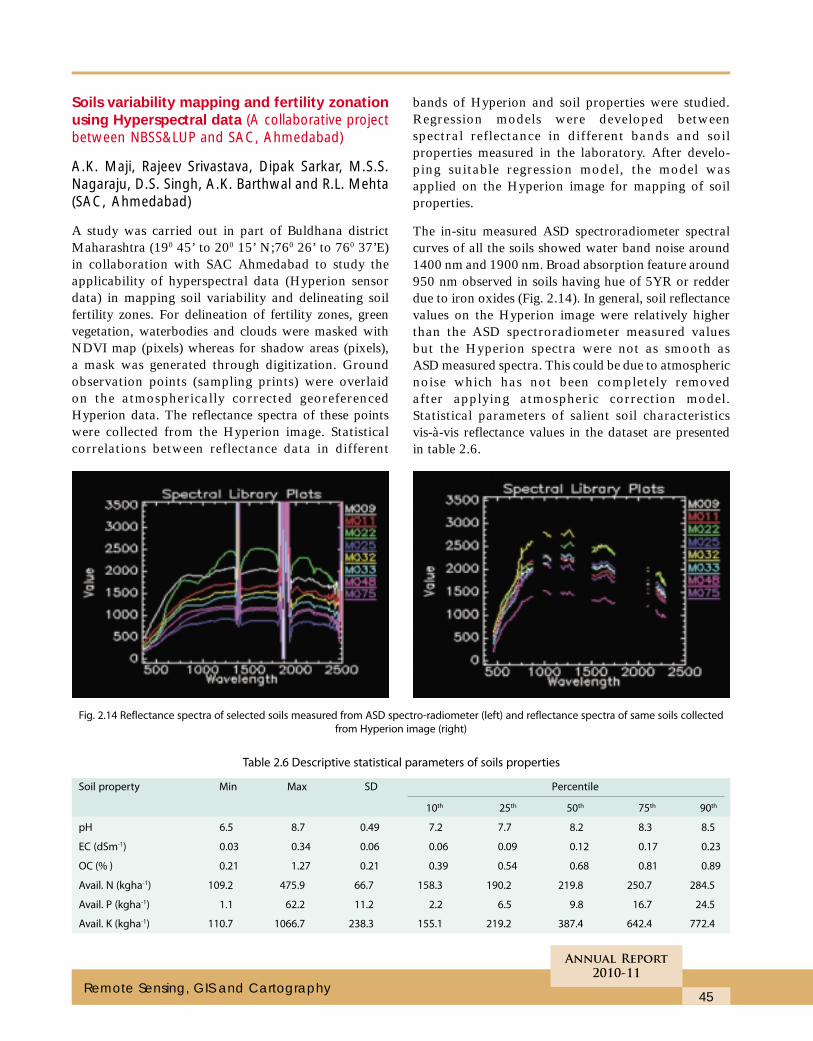
45
Annual Report
2010-11
Remote Sensing, GIS and Cartography
Soils variability mapping and fertility zonationusing Hyperspectral data (A collaborative projectbetween NBSS&LUP and SAC, Ahmedabad)
A.K. Maji, Rajeev Srivastava, Dipak Sarkar, M.S.S.Nagaraju, D.S. Singh, A.K. Barthwal and R.L. Mehta(SAC, Ahmedabad)
A study was carried out in part of Buldhana districtMaharashtra (190 45’ to 200 15’ N;760 26’ to 760 37’E)in collaboration with SAC Ahmedabad to study theapplicability of hyperspectral data (Hyperion sensordata) in mapping soil variability and delineating soilfertility zones. For delineation of fertility zones, greenvegetation, waterbodies and clouds were masked withNDVI map (pixels) whereas for shadow areas (pixels),a mask was generated through digitization. Groundobservation points (sampling prints) were overlaidon the atmospherically corrected georeferencedHyperion data. The reflectance spectra of these pointswere collected from the Hyperion image. Statisticalcorrelations between reflectance data in different
bands of Hyperion and soil properties were studied.Regression models were developed betweenspectral reflectance in different bands and soilproperties measured in the laboratory. After develo-ping suitable regression model, the model wasapplied on the Hyperion image for mapping of soilproperties.
The in-situ measured ASD spectroradiometer spectralcurves of all the soils showed water band noise around1400 nm and 1900 nm. Broad absorption feature around950 nm observed in soils having hue of 5YR or redderdue to iron oxides (Fig. 2.14). In general, soil reflectancevalues on the Hyperion image were relatively higherthan the ASD spectroradiometer measured valuesbut the Hyperion spectra were not as smooth asASD measured spectra. This could be due to atmosphericnoise which has not been completely removedafter applying atmospheric correction model.Statistical parameters of salient soil characteristicsvis-à-vis reflectance values in the dataset are presentedin table 2.6.
Table 2.6 Descriptive statistical parameters of soils properties
Soil property Min Max SD Percentile
10th 25th 50th 75th 90th
pH 6.5 8.7 0.49 7.2 7.7 8.2 8.3 8.5
EC (dSm-1) 0.03 0.34 0.06 0.06 0.09 0.12 0.17 0.23
OC (% ) 0.21 1.27 0.21 0.39 0.54 0.68 0.81 0.89
Avail. N (kgha-1) 109.2 475.9 66.7 158.3 190.2 219.8 250.7 284.5
Avail. P (kgha-1) 1.1 62.2 11.2 2.2 6.5 9.8 16.7 24.5
Avail. K (kgha-1) 110.7 1066.7 238.3 155.1 219.2 387.4 642.4 772.4
Fig. 2.14 Reflectance spectra of selected soils measured from ASD spectro-radiometer (left) and reflectance spectra of same soils collected
from Hyperion image (right)
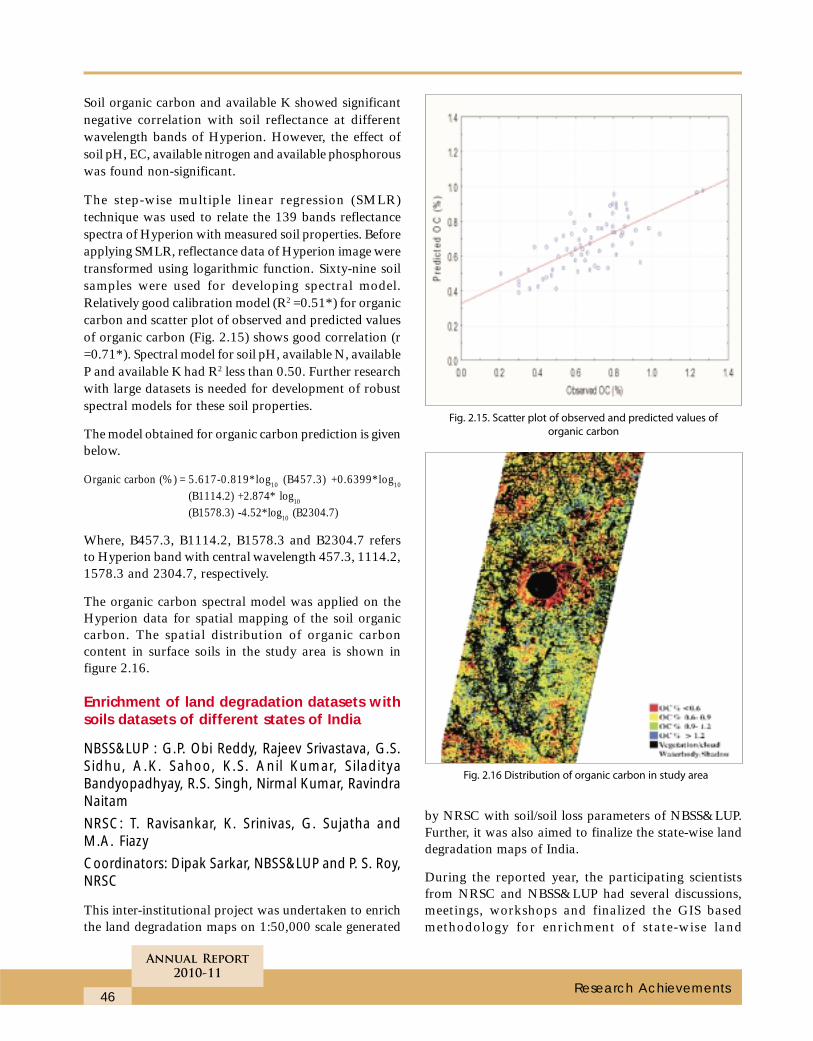
46
Annual Report
2010-11
Research Achievements
Soil organic carbon and available K showed significantnegative correlation with soil reflectance at differentwavelength bands of Hyperion. However, the effect ofsoil pH, EC, available nitrogen and available phosphorouswas found non-significant.
The step-wise multiple linear regression (SMLR)technique was used to relate the 139 bands reflectancespectra of Hyperion with measured soil properties. Beforeapplying SMLR, reflectance data of Hyperion image weretransformed using logarithmic function. Sixty-nine soilsamples were used for developing spectral model.Relatively good calibration model (R2 =0.51*) for organiccarbon and scatter plot of observed and predicted valuesof organic carbon (Fig. 2.15) shows good correlation (r=0.71*). Spectral model for soil pH, available N, availableP and available K had R2 less than 0.50. Further researchwith large datasets is needed for development of robustspectral models for these soil properties.
The model obtained for organic carbon prediction is givenbelow.
Organic carbon (%) = 5.617-0.819*log10 (B457.3) +0.6399*log10
(B1114.2) +2.874* log10
(B1578.3) -4.52*log10 (B2304.7)
Where, B457.3, B1114.2, B1578.3 and B2304.7 refersto Hyperion band with central wavelength 457.3, 1114.2,1578.3 and 2304.7, respectively.
The organic carbon spectral model was applied on theHyperion data for spatial mapping of the soil organiccarbon. The spatial distribution of organic carboncontent in surface soils in the study area is shown infigure 2.16.
Enrichment of land degradation datasets withsoils datasets of different states of India
NBSS&LUP : G.P. Obi Reddy, Rajeev Srivastava, G.S.Sidhu, A.K. Sahoo, K.S. Anil Kumar, SiladityaBandyopadhyay, R.S. Singh, Nirmal Kumar, RavindraNaitam
NRSC: T. Ravisankar, K. Srinivas, G. Sujatha andM.A. Fiazy
Coordinators: Dipak Sarkar, NBSS&LUP and P. S. Roy,NRSC
This inter-institutional project was undertaken to enrichthe land degradation maps on 1:50,000 scale generated
by NRSC with soil/soil loss parameters of NBSS&LUP.Further, it was also aimed to finalize the state-wise landdegradation maps of India.
During the reported year, the participating scientistsfrom NRSC and NBSS&LUP had several discussions,meetings, workshops and finalized the GIS basedmethodology for enrichment of state-wise land
Fig. 2.15. Scatter plot of observed and predicted values of
organic carbon
Fig. 2.16 Distribution of organic carbon in study area
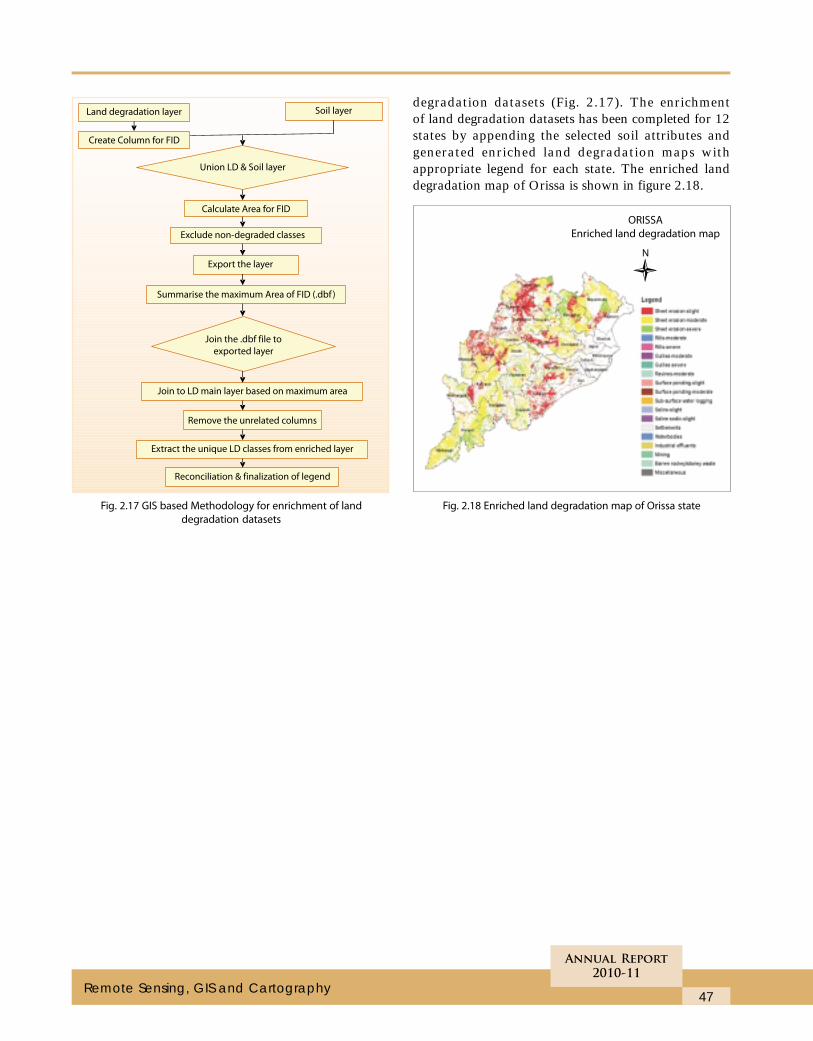
47
Annual Report
2010-11
Remote Sensing, GIS and Cartography
degradation datasets (Fig. 2.17). The enrichmentof land degradation datasets has been completed for 12states by appending the selected soil attributes andgenerated enriched land degradation maps withappropriate legend for each state. The enriched landdegradation map of Orissa is shown in figure 2.18.
Fig. 2.17 GIS based Methodology for enrichment of land
degradation datasets
Fig. 2.18 Enriched land degradation map of Orissa state
ORISSA
Enriched land degradation map
48
Annual Report
2010-11
Research Achievements
Geomorphological analysis and study onlandform-soils-landscape relationship inSouthern India
S. Thayalan, A. Natarajan, K.M. Nair, K.S. Anil Kumar,S.C. Ramesh Kumar, V. Ramamurthy and L.G.K.Naidu
Generalized landform assemblages were delineated fromthe available information such as the geology andphysiographic maps along with the amalgamation ofthe latest Google Earth images (Fig. 3.1). In total, 10divisions were made, which are distinct from one anotherin their relief, geology and form and composition ofslopes.
The lateritic terrain consists of two distinct types thatformed from the outliers of flood basalts representedaround Bidar and Belgaum and the other one is formedfrom the granite-gneissic complex around Bangalore. Thebasalt plateaus are mostly confined to the northernparts of the state, which is in fact an extension ofthe Central Basaltic Province of Maharashtra andMadhya Pradesh. The sedimentary terrain, mainly
consisting of shale, sandstone/conglomerate andlimestone is confined mostly to the northern parts of thestate. The Dharwars occur south of the towns of Hubli,Dharwar and Chitradurga consisting of dissected uplandsnear Dharwar and Chitradurga. The basement complexconsisting of granite and geneiss with later intrusionsoccur extensively in the Mysore, Bangalore andChitradurga plateaus. The residual hills are mostlyavailable as inliers around Nandi hill complex with dykesand lineaments spread around.
The Eastern Ghats are in fact a denudation hill complexrunning south of Mysore especially in parts ofChamrajnagar, Anekal and Kollegal. The dissectedeastern footslopes occur as a narrow, restrictedband running north – south, parallel to the WesternGhats, starting from Dharwar up to Madikere of Coorgdistrict.
The Western Ghats as a distinct landform unit runsparallel to the coast from Belgaum to the south of Mysore.The Coastal plains are a narrow strip of landform nearKarwar, but while moving southwards, it widens outthrough Udipi to Mangalore.
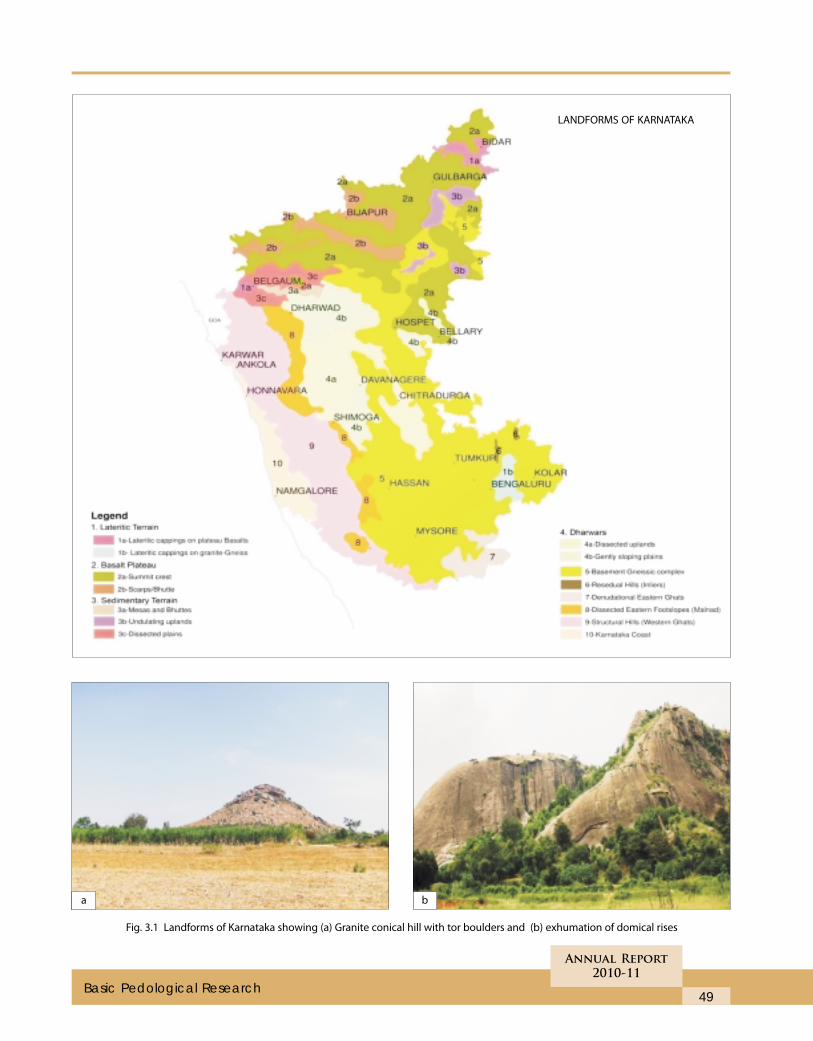
49
Annual Report
2010-11
Basic Pedological Research
Fig. 3.1 Landforms of Karnataka showing (a) Granite conical hill with tor boulders and (b) exhumation of domical rises
LANDFORMS OF KARNATAKA
a b
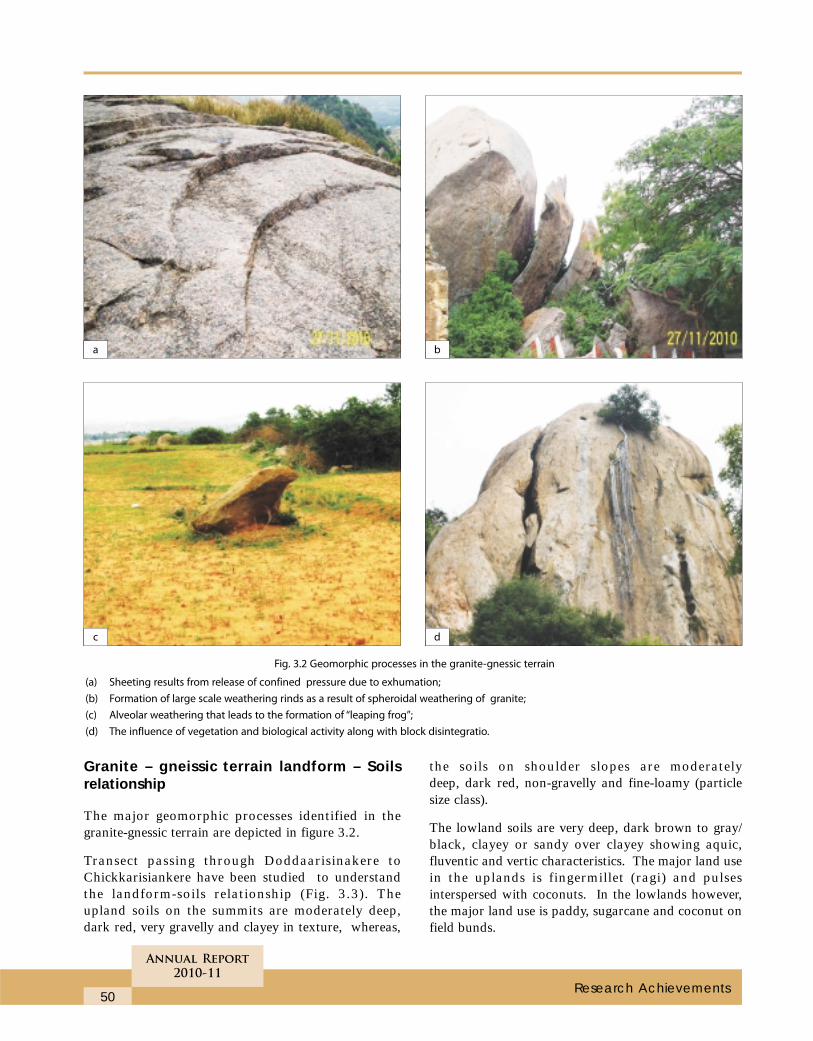
50
Annual Report
2010-11
Research Achievements
Fig. 3.2 Geomorphic processes in the granite-gnessic terrain
(a) Sheeting results from release of confined pressure due to exhumation;
(b) Formation of large scale weathering rinds as a result of spheroidal weathering of granite;
(c) Alveolar weathering that leads to the formation of “leaping frog”;
(d) The influence of vegetation and biological activity along with block disintegratio.
Granite – gneissic terrain landform – Soilsrelationship
The major geomorphic processes identified in thegranite-gnessic terrain are depicted in figure 3.2.
Transect passing through Doddaarisinakere toChickkarisiankere have been studied to understandthe landform-soils relationship (Fig. 3.3). Theupland soils on the summits are moderately deep,dark red, very gravelly and clayey in texture, whereas,
the soils on shoulder slopes are moderatelydeep, dark red, non-gravelly and fine-loamy (particlesize class).
The lowland soils are very deep, dark brown to gray/black, clayey or sandy over clayey showing aquic,fluventic and vertic characteristics. The major land usein the uplands is fingermillet (ragi) and pulsesinterspersed with coconuts. In the lowlands however,the major land use is paddy, sugarcane and coconut onfield bunds.
a b
c d
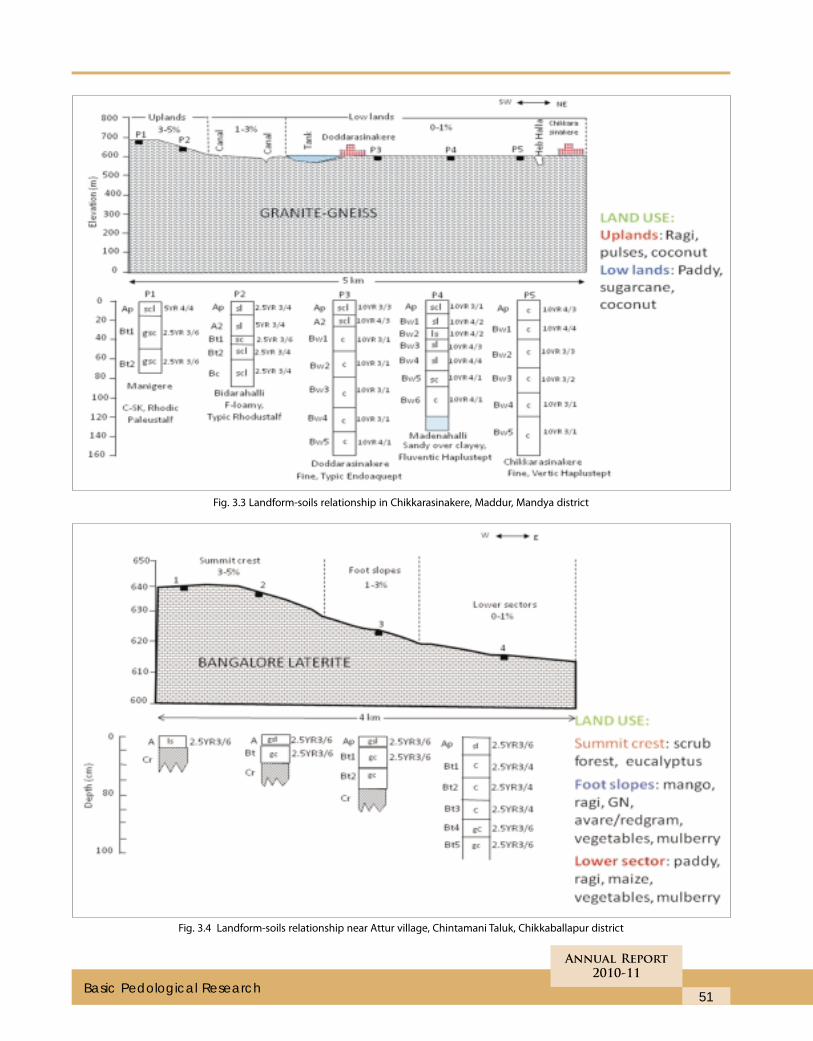
51
Annual Report
2010-11
Basic Pedological Research
Fig. 3.4 Landform-soils relationship near Attur village, Chintamani Taluk, Chikkaballapur district
Fig. 3.3 Landform-soils relationship in Chikkarasinakere, Maddur, Mandya district
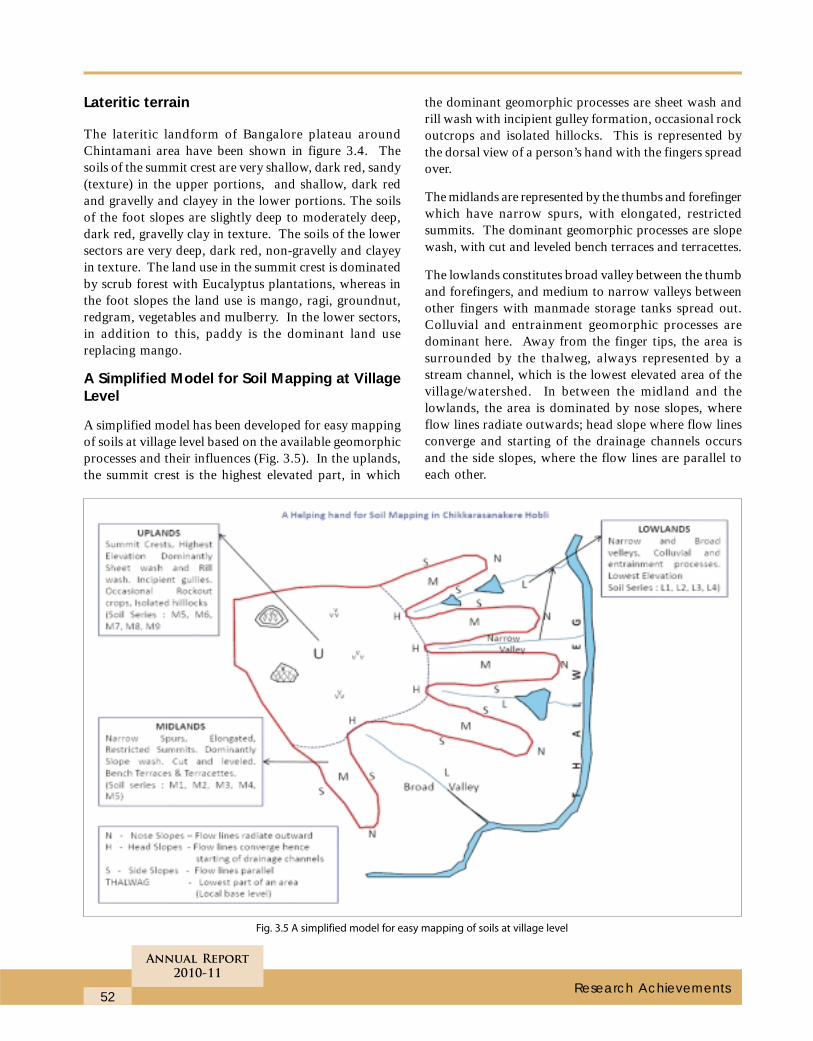
52
Annual Report
2010-11
Research Achievements
Lateritic terrain
The lateritic landform of Bangalore plateau aroundChintamani area have been shown in figure 3.4. Thesoils of the summit crest are very shallow, dark red, sandy(texture) in the upper portions, and shallow, dark redand gravelly and clayey in the lower portions. The soilsof the foot slopes are slightly deep to moderately deep,dark red, gravelly clay in texture. The soils of the lowersectors are very deep, dark red, non-gravelly and clayeyin texture. The land use in the summit crest is dominatedby scrub forest with Eucalyptus plantations, whereas inthe foot slopes the land use is mango, ragi, groundnut,redgram, vegetables and mulberry. In the lower sectors,in addition to this, paddy is the dominant land usereplacing mango.
A Simplified Model for Soil Mapping at VillageLevel
A simplified model has been developed for easy mappingof soils at village level based on the available geomorphicprocesses and their influences (Fig. 3.5). In the uplands,the summit crest is the highest elevated part, in which
the dominant geomorphic processes are sheet wash andrill wash with incipient gulley formation, occasional rockoutcrops and isolated hillocks. This is represented bythe dorsal view of a person’s hand with the fingers spreadover.
The midlands are represented by the thumbs and forefingerwhich have narrow spurs, with elongated, restrictedsummits. The dominant geomorphic processes are slopewash, with cut and leveled bench terraces and terracettes.
The lowlands constitutes broad valley between the thumband forefingers, and medium to narrow valleys betweenother fingers with manmade storage tanks spread out.Colluvial and entrainment geomorphic processes aredominant here. Away from the finger tips, the area issurrounded by the thalweg, always represented by astream channel, which is the lowest elevated area of thevillage/watershed. In between the midland and thelowlands, the area is dominated by nose slopes, whereflow lines radiate outwards; head slope where flow linesconverge and starting of the drainage channels occursand the side slopes, where the flow lines are parallel toeach other.
Fig. 3.5 A simplified model for easy mapping of soils at village level
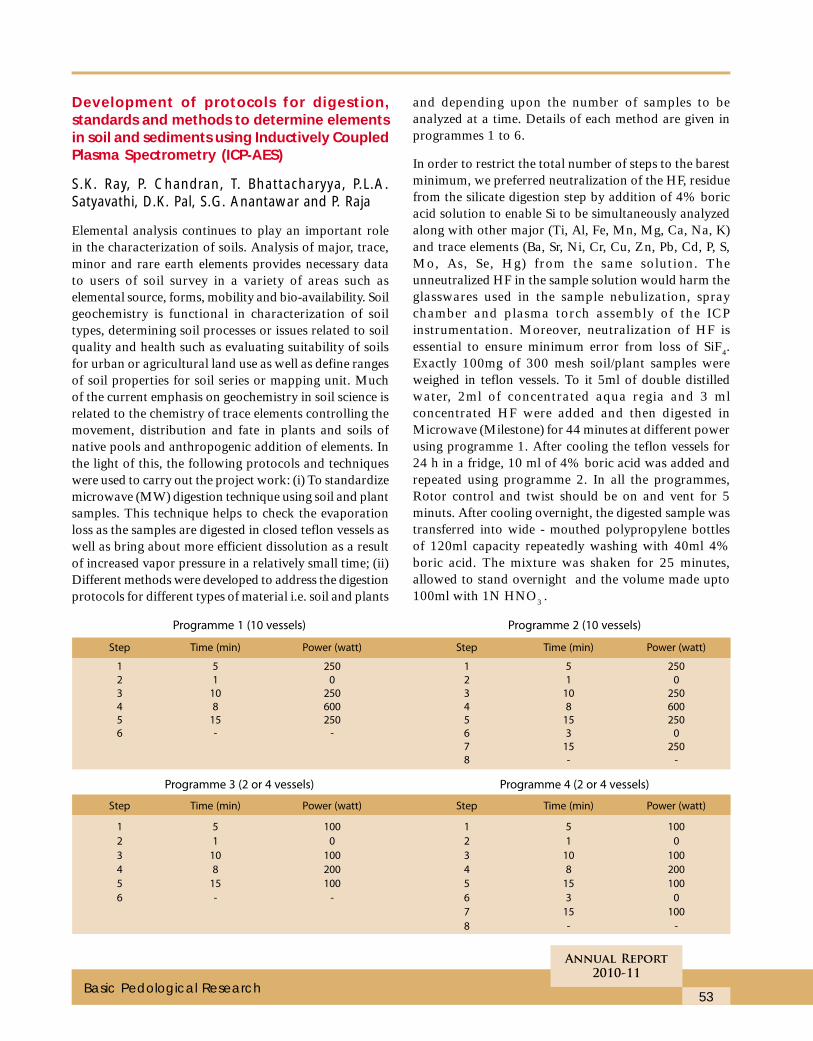
53
Annual Report
2010-11
Basic Pedological Research
Development of protocols for digestion,standards and methods to determine elementsin soil and sediments using Inductively CoupledPlasma Spectrometry (ICP-AES)
S.K. Ray, P. Chandran, T. Bhattacharyya, P.L.A.Satyavathi, D.K. Pal, S.G. Anantawar and P. Raja
Elemental analysis continues to play an important rolein the characterization of soils. Analysis of major, trace,minor and rare earth elements provides necessary datato users of soil survey in a variety of areas such aselemental source, forms, mobility and bio-availability. Soilgeochemistry is functional in characterization of soiltypes, determining soil processes or issues related to soilquality and health such as evaluating suitability of soilsfor urban or agricultural land use as well as define rangesof soil properties for soil series or mapping unit. Muchof the current emphasis on geochemistry in soil science isrelated to the chemistry of trace elements controlling themovement, distribution and fate in plants and soils ofnative pools and anthropogenic addition of elements. Inthe light of this, the following protocols and techniqueswere used to carry out the project work: (i) To standardizemicrowave (MW) digestion technique using soil and plantsamples. This technique helps to check the evaporationloss as the samples are digested in closed teflon vessels aswell as bring about more efficient dissolution as a resultof increased vapor pressure in a relatively small time; (ii)Different methods were developed to address the digestionprotocols for different types of material i.e. soil and plants
and depending upon the number of samples to beanalyzed at a time. Details of each method are given inprogrammes 1 to 6.
In order to restrict the total number of steps to the barestminimum, we preferred neutralization of the HF, residuefrom the silicate digestion step by addition of 4% boricacid solution to enable Si to be simultaneously analyzedalong with other major (Ti, Al, Fe, Mn, Mg, Ca, Na, K)and trace elements (Ba, Sr, Ni, Cr, Cu, Zn, Pb, Cd, P, S,Mo, As, Se, Hg) from the same solution. Theunneutralized HF in the sample solution would harm theglasswares used in the sample nebulization, spraychamber and plasma torch assembly of the ICPinstrumentation. Moreover, neutralization of HF isessential to ensure minimum error from loss of SiF4.Exactly 100mg of 300 mesh soil/plant samples wereweighed in teflon vessels. To it 5ml of double distilledwater, 2ml of concentrated aqua regia and 3 mlconcentrated HF were added and then digested inMicrowave (Milestone) for 44 minutes at different powerusing programme 1. After cooling the teflon vessels for24 h in a fridge, 10 ml of 4% boric acid was added andrepeated using programme 2. In all the programmes,Rotor control and twist should be on and vent for 5minuts. After cooling overnight, the digested sample wastransferred into wide - mouthed polypropylene bottlesof 120ml capacity repeatedly washing with 40ml 4%boric acid. The mixture was shaken for 25 minutes,allowed to stand overnight and the volume made upto100ml with 1N HNO3 .
Programme 1 (10 vessels) Programme 2 (10 vessels)
Step Time (min) Power (watt) Step Time (min) Power (watt)
1 5 250 1 5 250
2 1 0 2 1 0
3 10 250 3 10 250
4 8 600 4 8 6005 15 250 5 15 2506 - - 6 3 0
7 15 2508 - -
Programme 3 (2 or 4 vessels) Programme 4 (2 or 4 vessels)
Step Time (min) Power (watt) Step Time (min) Power (watt)
1 5 100 1 5 100
2 1 0 2 1 0
3 10 100 3 10 100
4 8 200 4 8 200
5 15 100 5 15 100
6 - - 6 3 0
7 15 100
8 - -
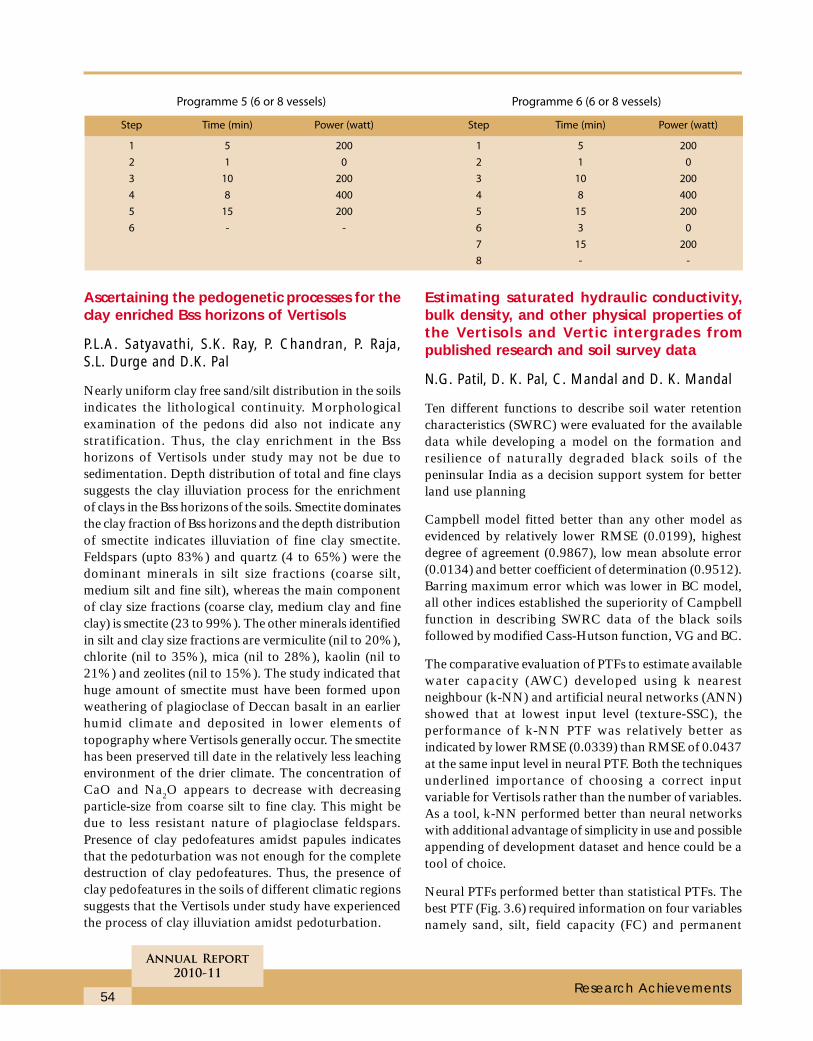
54
Annual Report
2010-11
Research Achievements
Ascertaining the pedogenetic processes for theclay enriched Bss horizons of Vertisols
P.L.A. Satyavathi, S.K. Ray, P. Chandran, P. Raja,S.L. Durge and D.K. Pal
Nearly uniform clay free sand/silt distribution in the soilsindicates the lithological continuity. Morphologicalexamination of the pedons did also not indicate anystratification. Thus, the clay enrichment in the Bsshorizons of Vertisols under study may not be due tosedimentation. Depth distribution of total and fine clayssuggests the clay illuviation process for the enrichmentof clays in the Bss horizons of the soils. Smectite dominatesthe clay fraction of Bss horizons and the depth distributionof smectite indicates illuviation of fine clay smectite.Feldspars (upto 83%) and quartz (4 to 65%) were thedominant minerals in silt size fractions (coarse silt,medium silt and fine silt), whereas the main componentof clay size fractions (coarse clay, medium clay and fineclay) is smectite (23 to 99%). The other minerals identifiedin silt and clay size fractions are vermiculite (nil to 20%),chlorite (nil to 35%), mica (nil to 28%), kaolin (nil to21%) and zeolites (nil to 15%). The study indicated thathuge amount of smectite must have been formed uponweathering of plagioclase of Deccan basalt in an earlierhumid climate and deposited in lower elements oftopography where Vertisols generally occur. The smectitehas been preserved till date in the relatively less leachingenvironment of the drier climate. The concentration ofCaO and Na2O appears to decrease with decreasingparticle-size from coarse silt to fine clay. This might bedue to less resistant nature of plagioclase feldspars.Presence of clay pedofeatures amidst papules indicatesthat the pedoturbation was not enough for the completedestruction of clay pedofeatures. Thus, the presence ofclay pedofeatures in the soils of different climatic regionssuggests that the Vertisols under study have experiencedthe process of clay illuviation amidst pedoturbation.
Estimating saturated hydraulic conductivity,bulk density, and other physical properties ofthe Vertisols and Vertic intergrades frompublished research and soil survey data
N.G. Patil, D. K. Pal, C. Mandal and D. K. Mandal
Ten different functions to describe soil water retentioncharacteristics (SWRC) were evaluated for the availabledata while developing a model on the formation andresilience of naturally degraded black soils of thepeninsular India as a decision support system for betterland use planning
Campbell model fitted better than any other model asevidenced by relatively lower RMSE (0.0199), highestdegree of agreement (0.9867), low mean absolute error(0.0134) and better coefficient of determination (0.9512).Barring maximum error which was lower in BC model,all other indices established the superiority of Campbellfunction in describing SWRC data of the black soilsfollowed by modified Cass-Hutson function, VG and BC.
The comparative evaluation of PTFs to estimate availablewater capacity (AWC) developed using k nearestneighbour (k-NN) and artificial neural networks (ANN)showed that at lowest input level (texture-SSC), theperformance of k-NN PTF was relatively better asindicated by lower RMSE (0.0339) than RMSE of 0.0437at the same input level in neural PTF. Both the techniquesunderlined importance of choosing a correct inputvariable for Vertisols rather than the number of variables.As a tool, k-NN performed better than neural networkswith additional advantage of simplicity in use and possibleappending of development dataset and hence could be atool of choice.
Neural PTFs performed better than statistical PTFs. Thebest PTF (Fig. 3.6) required information on four variablesnamely sand, silt, field capacity (FC) and permanent
Programme 5 (6 or 8 vessels) Programme 6 (6 or 8 vessels)
Step Time (min) Power (watt) Step Time (min) Power (watt)
1 5 200 1 5 200
2 1 0 2 1 0
3 10 200 3 10 200
4 8 400 4 8 400
5 15 200 5 15 200
6 - - 6 3 0
7 15 200
8 - -
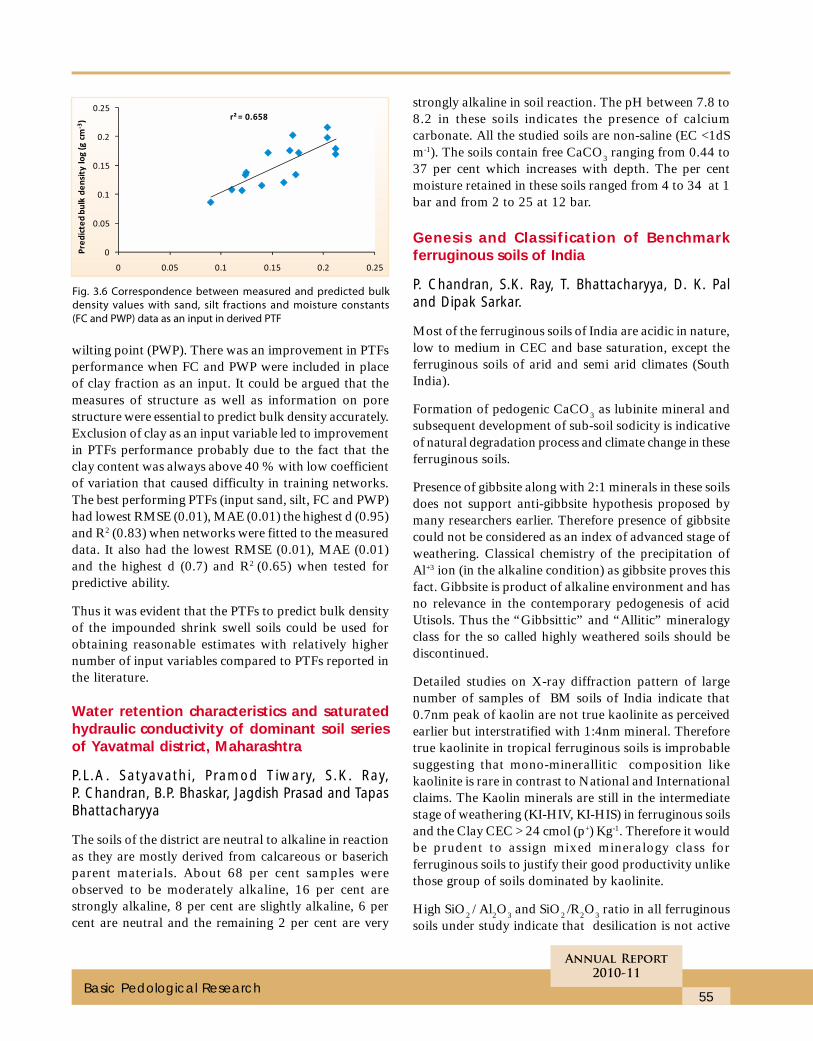
55
Annual Report
2010-11
Basic Pedological Research
wilting point (PWP). There was an improvement in PTFsperformance when FC and PWP were included in placeof clay fraction as an input. It could be argued that themeasures of structure as well as information on porestructure were essential to predict bulk density accurately.Exclusion of clay as an input variable led to improvementin PTFs performance probably due to the fact that theclay content was always above 40 % with low coefficientof variation that caused difficulty in training networks.The best performing PTFs (input sand, silt, FC and PWP)had lowest RMSE (0.01), MAE (0.01) the highest d (0.95)and R2 (0.83) when networks were fitted to the measureddata. It also had the lowest RMSE (0.01), MAE (0.01)and the highest d (0.7) and R2 (0.65) when tested forpredictive ability.
Thus it was evident that the PTFs to predict bulk densityof the impounded shrink swell soils could be used forobtaining reasonable estimates with relatively highernumber of input variables compared to PTFs reported inthe literature.
Water retention characteristics and saturatedhydraulic conductivity of dominant soil seriesof Yavatmal district, Maharashtra
P.L.A. Satyavathi, Pramod Tiwary, S.K. Ray,P. Chandran, B.P. Bhaskar, Jagdish Prasad and TapasBhattacharyya
The soils of the district are neutral to alkaline in reactionas they are mostly derived from calcareous or baserichparent materials. About 68 per cent samples wereobserved to be moderately alkaline, 16 per cent arestrongly alkaline, 8 per cent are slightly alkaline, 6 percent are neutral and the remaining 2 per cent are very
strongly alkaline in soil reaction. The pH between 7.8 to8.2 in these soils indicates the presence of calciumcarbonate. All the studied soils are non-saline (EC <1dSm-1). The soils contain free CaCO3 ranging from 0.44 to37 per cent which increases with depth. The per centmoisture retained in these soils ranged from 4 to 34 at 1bar and from 2 to 25 at 12 bar.
Genesis and Classification of Benchmarkferruginous soils of India
P. Chandran, S.K. Ray, T. Bhattacharyya, D. K. Paland Dipak Sarkar.
Most of the ferruginous soils of India are acidic in nature,low to medium in CEC and base saturation, except theferruginous soils of arid and semi arid climates (SouthIndia).
Formation of pedogenic CaCO3 as lubinite mineral andsubsequent development of sub-soil sodicity is indicativeof natural degradation process and climate change in theseferruginous soils.
Presence of gibbsite along with 2:1 minerals in these soilsdoes not support anti-gibbsite hypothesis proposed bymany researchers earlier. Therefore presence of gibbsitecould not be considered as an index of advanced stage ofweathering. Classical chemistry of the precipitation ofAl+3 ion (in the alkaline condition) as gibbsite proves thisfact. Gibbsite is product of alkaline environment and hasno relevance in the contemporary pedogenesis of acidUtisols. Thus the “Gibbsittic” and “Allitic” mineralogyclass for the so called highly weathered soils should bediscontinued.
Detailed studies on X-ray diffraction pattern of largenumber of samples of BM soils of India indicate that0.7nm peak of kaolin are not true kaolinite as perceivedearlier but interstratified with 1:4nm mineral. Thereforetrue kaolinite in tropical ferruginous soils is improbablesuggesting that mono-minerallitic composition likekaolinite is rare in contrast to National and Internationalclaims. The Kaolin minerals are still in the intermediatestage of weathering (KI-HIV, KI-HIS) in ferruginous soilsand the Clay CEC > 24 cmol (p+) Kg-1. Therefore it wouldbe prudent to assign mixed mineralogy class forferruginous soils to justify their good productivity unlikethose group of soils dominated by kaolinite.
High SiO2 / Al2O3 and SiO2 /R2O3 ratio in all ferruginoussoils under study indicate that desilication is not active
Fig. 3.6 Correspondence between measured and predicted bulk
density values with sand, silt fractions and moisture constants
(FC and PWP) data as an input in derived PTF
56
Annual Report
2010-11
Research Achievements
in the highly weathered ferruginous soils and these soilsstill have good amount of weatherable minerals thoughour study was restricted to Alfisols and Utisols. Silicasolubility in an acid environment is not possible becauseit is soluble in alkaline pH .Thus the theory of formationof kaolinite generally found in acid soils from K-HIV isquestionable. Therefore laterization process (alkalihydrolysis) cannot be active in acid soils. Desilicationcan occur only under alkaline environment. The geneticmodel on the formation of soils in tropical environmentin vogue and also transformation of Utisols to Oxisolsappears to be in error. This raises a doubt on the veryexistence of Oxisols in nature thus needs a revision ofSoil Taxonomy.
Vermiculite has a huge capacity to sequester Al in soilsand it acts as a sink for Al+3 released during tropicalweathering and protects the plants from Al toxicity. Thestudy also indicates that these soils also have a capacityto sequester huge quantity of organic carbon (about 2%).Therefore capacity of organic carbon sequestration andpresence of vermiculite in these soils can be used as aland quality parameter. Besides laterized material is softas long as they are well beneath the soils and irreversiblehardening takes place when the materials are exposed.The method of puncturing the laterite cap and plantationof mango, rubber is followed in these soils. Keeping thesoils under vegetation can restrict the process ofhardening.
Interfluve Stratigraphy, Sedimentology andGeochemistry of Central and Southern GangaPlains (Funded by DST, New Delhi)
T. Bhattacharrya, P. Chandran, S. K. Ray, P. Raja,P.L.A. Satyavathi, Chetna Likhar and ShubhanginiThakre
Samples of two cores of Kalpi(~50 m) and Rania(~29m)were completed and the location of cores are shown inFig. 3.7. Core samples up to the depth of about 16.56 mare moderately to strongly alkaline in reaction. Belowthis depth core is very strongly to extremely alkaline inreaction up to 28.37 m depth with very low concentrationof soluble salts. The entire core is calcareous andmaximum concentration of CaCO3 (~23 %) is noted insediments at about 26.30 m depth, but content of organiccarbon is considerably low (<0.5 %). Bulk density of coreranges between 1.1 to 1.5 Mgm-3. The texture of the coreis silt loam through out depth with high content of siltfraction than clay fraction. There is an appreciable
increase in silt fraction between 2.06 to 6.21 m, 7.85 to12.57 m, 12.97 to 16.14 m and 16.56 to 28.37 m. Clayfraction increase from 2.06 to 8.30 m depth and decreasewith 9.07 to 28.37 m depth (Fig. 3.8).
The Kalpi core samples are moderately (at 8.0 to 15.21m depth) to strongly alkaline (at 7m depth) in reaction,calcareous and contain some amount of soluble salts (8.95m to 10.64m and 11 to 12.50m depth), organic carbon is> 0.1% at 7 to 8.7m depth and below this depth theorganic carbon is less indicates that there was little timelag between episodes of sediment deposition. Both pHand CaCO3 values indicate the influence of aridic climaticconditions during the post depositional period of thesediment. The texture varies from silt loam to clay loam.This indicates that the fluvial deposits were of varioustextural classes. The high content of clay is not howeverexpected in the core samples until there has been theinfluence of other rock formation amidst the depositionmainly controlled by Yamuna-river system. The siltfraction is dominant throughout the depth upto 15.21m. The increase in clay content from 8.28 to 15.21 depthmay indicate the movement of clay but shows the highlyirregular distribution of fine clay content indicates theincrease in clay appears to be associated withsedimentation. Kalpi core resembles the characteristicsof Bhognipur core (Fig. 3.8).
Fig. 3.7 Location map of study area
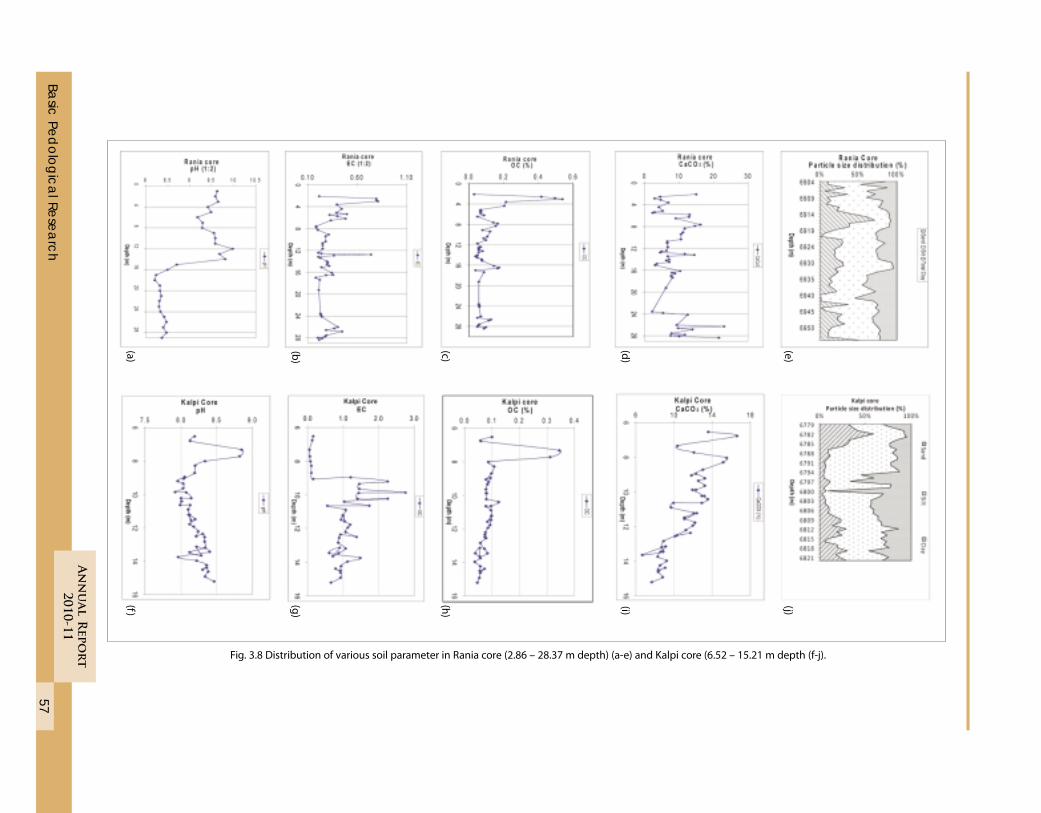
57
An
nu
al R
epo
rt
2010-11
Basic
Ped
olo
gic
al R
ese
arc
h
(a)
(b)
(c)
(d)
(e)
(f)
(g)
(i)
(j)
(h)
Fig. 3.8 Distribution of various soil parameter in Rania core (2.86 – 28.37 m depth) (a-e) and Kalpi core (6.52 – 15.21 m depth (f-j).
58
Annual Report
2010-11
Research Achievements
Soil resource data and their interpretationfor implementation of river link projects-Ken – Betwa river link project
A.K. Maji, G.P. Obi Reddy, S. Thayalan, M.S.S. Nagarajuand A.K. Barthwal
The project was aimed to generate soil resourceinformation and interpret the data for implementationof Ken-Betwa river link project. IRS-IC LISS-III satellitedata in conjunction with contours (20 m) and drainagewas interpreted for delineation of various physiographicunits in the river basin. Slope map of the area wasprepared based on contour information available on SOItoposheet. Similarly, two seasons IRS-IC LISS-III datahave been analysed to delineate different land use/landcover classes based on image interpretation techniques.
The major physiographic region is divided into MalwaPlateau, Pathar and Bundelkhand Upland and VindhyanRanges with Escaprment. The physiography legend ispresented in table 4.1 and the physiography map is infigure 4.1a.
Other soil based thematic maps, namely, soil depth, soiltexture, drainage, soil erosion and soil salinity/sodicitymaps have been generated in ArcGIS software using soildatabases of Madhya Pradesh and Uttar Pradesh stateson 1:250,000 scale. In order to delineate potentialsubmergence zones in the river basin, the parameters liketopography, slope, drainage and land use systems wereconsidered. The area under high, moderate and lowpotential submergence zones constitutes 1515.4, 2505.9and 2153.9 km2 respectively (Fig. 4.1b).
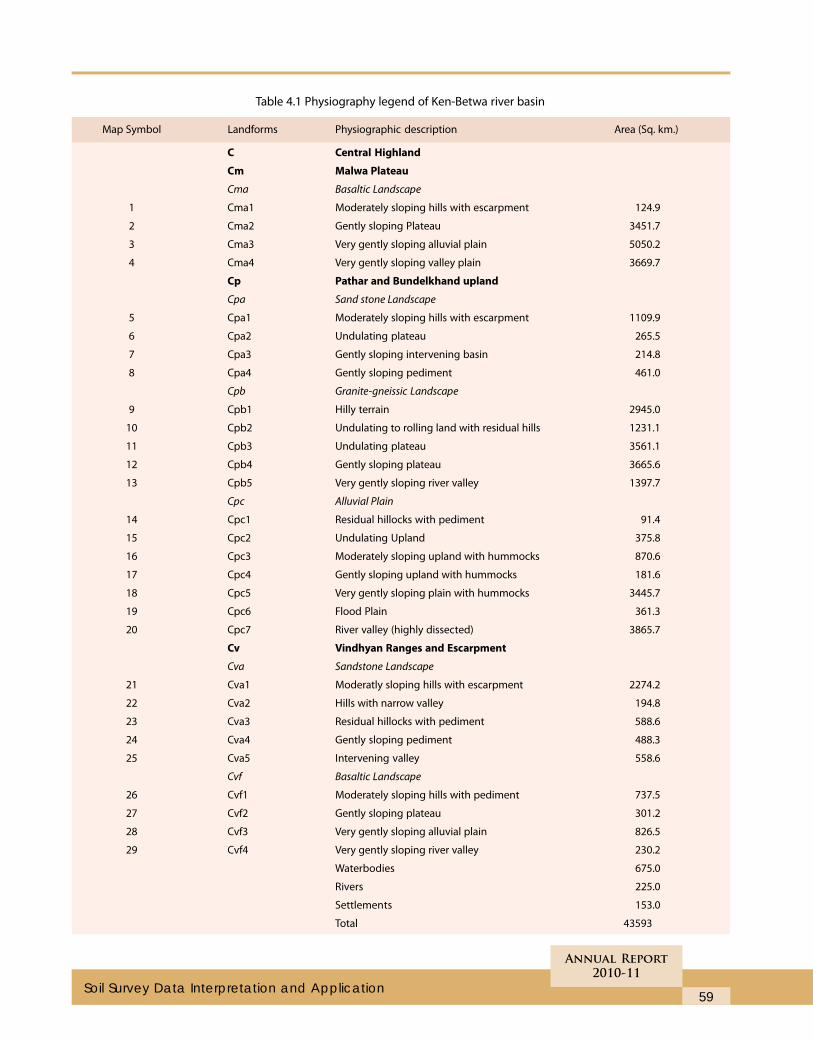
59
Annual Report
2010-11
Soil Survey Data Interpretation and Application
Table 4.1 Physiography legend of Ken-Betwa river basin
Map Symbol Landforms Physiographic description Area (Sq. km.)
C Central Highland
Cm Malwa Plateau
Cma Basaltic Landscape
1 Cma1 Moderately sloping hills with escarpment 124.9
2 Cma2 Gently sloping Plateau 3451.7
3 Cma3 Very gently sloping alluvial plain 5050.2
4 Cma4 Very gently sloping valley plain 3669.7
Cp Pathar and Bundelkhand upland
Cpa Sand stone Landscape
5 Cpa1 Moderately sloping hills with escarpment 1109.9
6 Cpa2 Undulating plateau 265.5
7 Cpa3 Gently sloping intervening basin 214.8
8 Cpa4 Gently sloping pediment 461.0
Cpb Granite-gneissic Landscape
9 Cpb1 Hilly terrain 2945.0
10 Cpb2 Undulating to rolling land with residual hills 1231.1
11 Cpb3 Undulating plateau 3561.1
12 Cpb4 Gently sloping plateau 3665.6
13 Cpb5 Very gently sloping river valley 1397.7
Cpc Alluvial Plain
14 Cpc1 Residual hillocks with pediment 91.4
15 Cpc2 Undulating Upland 375.8
16 Cpc3 Moderately sloping upland with hummocks 870.6
17 Cpc4 Gently sloping upland with hummocks 181.6
18 Cpc5 Very gently sloping plain with hummocks 3445.7
19 Cpc6 Flood Plain 361.3
20 Cpc7 River valley (highly dissected) 3865.7
Cv Vindhyan Ranges and Escarpment
Cva Sandstone Landscape
21 Cva1 Moderatly sloping hills with escarpment 2274.2
22 Cva2 Hills with narrow valley 194.8
23 Cva3 Residual hillocks with pediment 588.6
24 Cva4 Gently sloping pediment 488.3
25 Cva5 Intervening valley 558.6
Cvf Basaltic Landscape
26 Cvf1 Moderately sloping hills with pediment 737.5
27 Cvf2 Gently sloping plateau 301.2
28 Cvf3 Very gently sloping alluvial plain 826.5
29 Cvf4 Very gently sloping river valley 230.2
Waterbodies 675.0
Rivers 225.0
Settlements 153.0
Total 43593
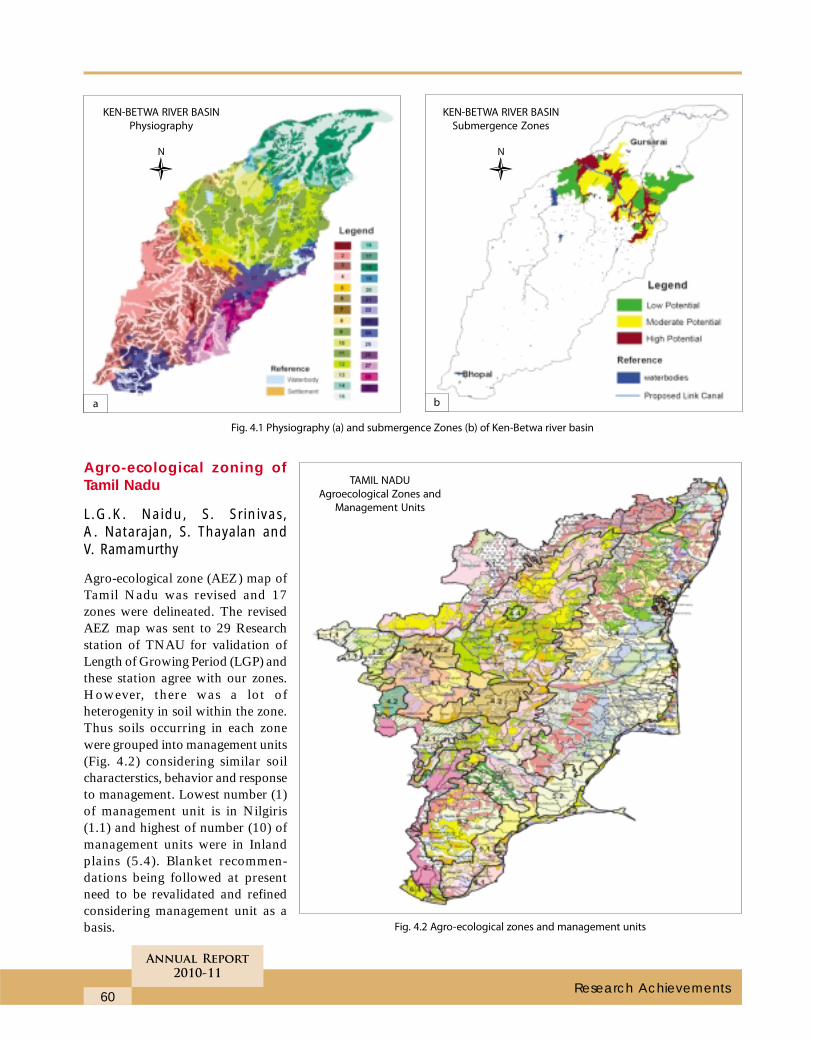
60
Annual Report
2010-11
Research Achievements
Agro-ecological zoning ofTamil Nadu
L.G.K. Naidu, S. Srinivas,A. Natarajan, S. Thayalan andV. Ramamurthy
Agro-ecological zone (AEZ) map ofTamil Nadu was revised and 17zones were delineated. The revisedAEZ map was sent to 29 Researchstation of TNAU for validation ofLength of Growing Period (LGP) andthese station agree with our zones.However, there was a lot ofheterogenity in soil within the zone.Thus soils occurring in each zonewere grouped into management units(Fig. 4.2) considering similar soilcharacterstics, behavior and responseto management. Lowest number (1)of management unit is in Nilgiris(1.1) and highest of number (10) ofmanagement units were in Inlandplains (5.4). Blanket recommen-dations being followed at presentneed to be revalidated and refinedconsidering management unit as abasis.
Fig. 4.1 Physiography (a) and submergence Zones (b) of Ken-Betwa river basin
Fig. 4.2 Agro-ecological zones and management units
KEN-BETWA RIVER BASIN
Physiography
KEN-BETWA RIVER BASIN
Submergence Zones
TAMIL NADU
Agroecological Zones and
Management Units
a b
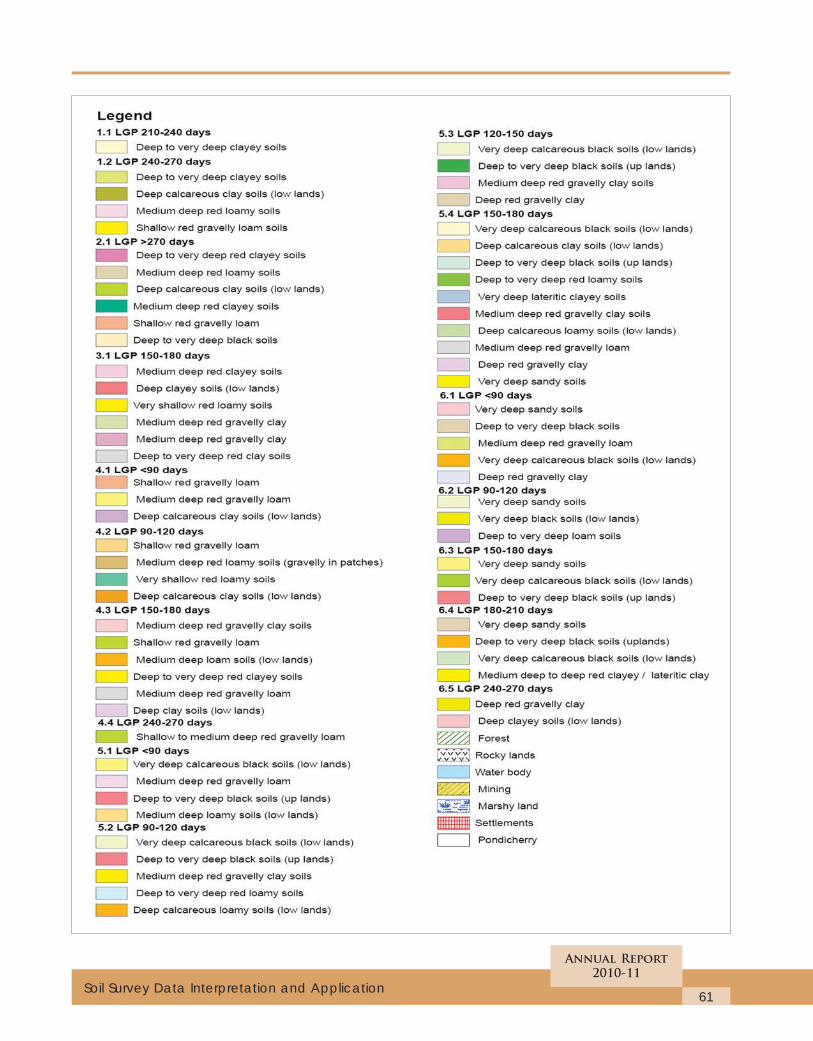
61
Annual Report
2010-11
Soil Survey Data Interpretation and Application
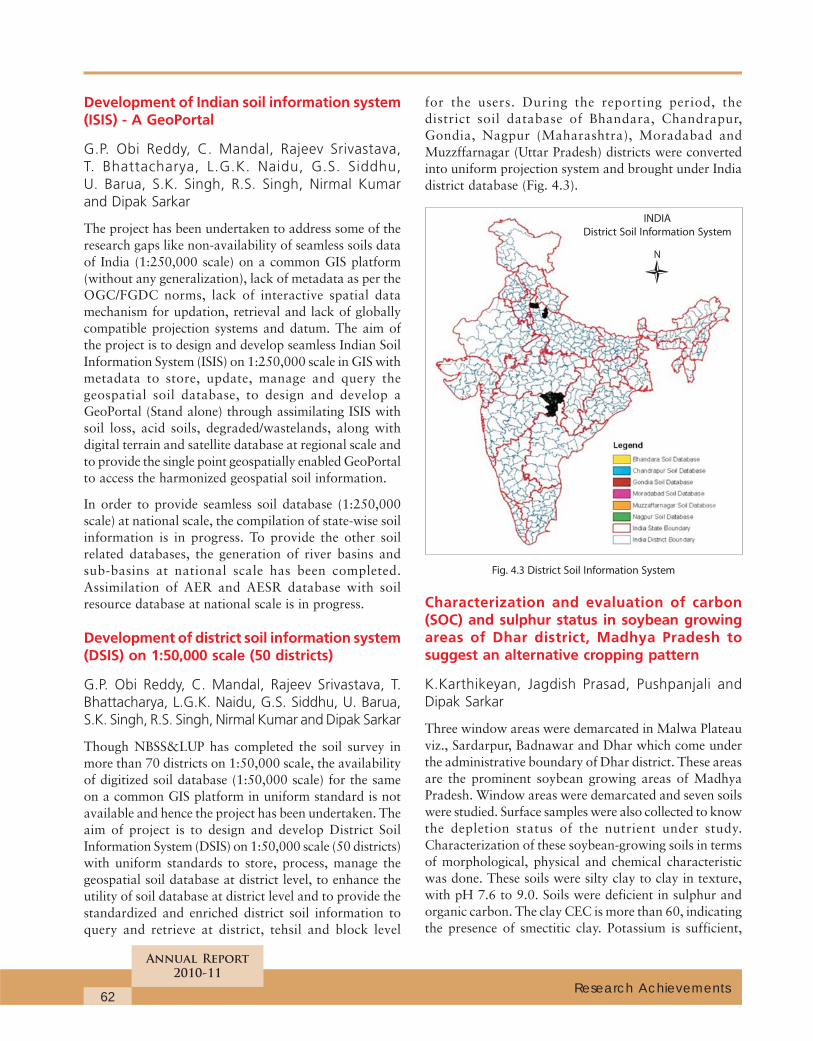
62
Annual Report
2010-11
Research Achievements
Development of Indian soil information system(ISIS) - A GeoPortal
G.P. Obi Reddy, C. Mandal, Rajeev Srivastava,T. Bhattacharya, L.G.K. Naidu, G.S. Siddhu,U. Barua, S.K. Singh, R.S. Singh, Nirmal Kumarand Dipak Sarkar
The project has been undertaken to address some of theresearch gaps like non-availability of seamless soils dataof India (1:250,000 scale) on a common GIS platform(without any generalization), lack of metadata as per theOGC/FGDC norms, lack of interactive spatial datamechanism for updation, retrieval and lack of globallycompatible projection systems and datum. The aim ofthe project is to design and develop seamless Indian SoilInformation System (ISIS) on 1:250,000 scale in GIS withmetadata to store, update, manage and query thegeospatial soil database, to design and develop aGeoPortal (Stand alone) through assimilating ISIS withsoil loss, acid soils, degraded/wastelands, along withdigital terrain and satellite database at regional scale andto provide the single point geospatially enabled GeoPortalto access the harmonized geospatial soil information.
In order to provide seamless soil database (1:250,000scale) at national scale, the compilation of state-wise soilinformation is in progress. To provide the other soilrelated databases, the generation of river basins andsub-basins at national scale has been completed.Assimilation of AER and AESR database with soilresource database at national scale is in progress.
Development of district soil information system(DSIS) on 1:50,000 scale (50 districts)
G.P. Obi Reddy, C. Mandal, Rajeev Srivastava, T.Bhattacharya, L.G.K. Naidu, G.S. Siddhu, U. Barua,S.K. Singh, R.S. Singh, Nirmal Kumar and Dipak Sarkar
Though NBSS&LUP has completed the soil survey inmore than 70 districts on 1:50,000 scale, the availabilityof digitized soil database (1:50,000 scale) for the sameon a common GIS platform in uniform standard is notavailable and hence the project has been undertaken. Theaim of project is to design and develop District SoilInformation System (DSIS) on 1:50,000 scale (50 districts)with uniform standards to store, process, manage thegeospatial soil database at district level, to enhance theutility of soil database at district level and to provide thestandardized and enriched district soil information toquery and retrieve at district, tehsil and block level
for the users. During the reporting period, thedistrict soil database of Bhandara, Chandrapur,Gondia, Nagpur (Maharashtra), Moradabad andMuzzffarnagar (Uttar Pradesh) districts were convertedinto uniform projection system and brought under Indiadistrict database (Fig. 4.3).
Fig. 4.3 District Soil Information System
Characterization and evaluation of carbon(SOC) and sulphur status in soybean growingareas of Dhar district, Madhya Pradesh tosuggest an alternative cropping pattern
K.Karthikeyan, Jagdish Prasad, Pushpanjali andDipak Sarkar
Three window areas were demarcated in Malwa Plateauviz., Sardarpur, Badnawar and Dhar which come underthe administrative boundary of Dhar district. These areasare the prominent soybean growing areas of MadhyaPradesh. Window areas were demarcated and seven soilswere studied. Surface samples were also collected to knowthe depletion status of the nutrient under study.Characterization of these soybean-growing soils in termsof morphological, physical and chemical characteristicwas done. These soils were silty clay to clay in texture,with pH 7.6 to 9.0. Soils were deficient in sulphur andorganic carbon. The clay CEC is more than 60, indicatingthe presence of smectitic clay. Potassium is sufficient,
INDIA
District Soil Information System
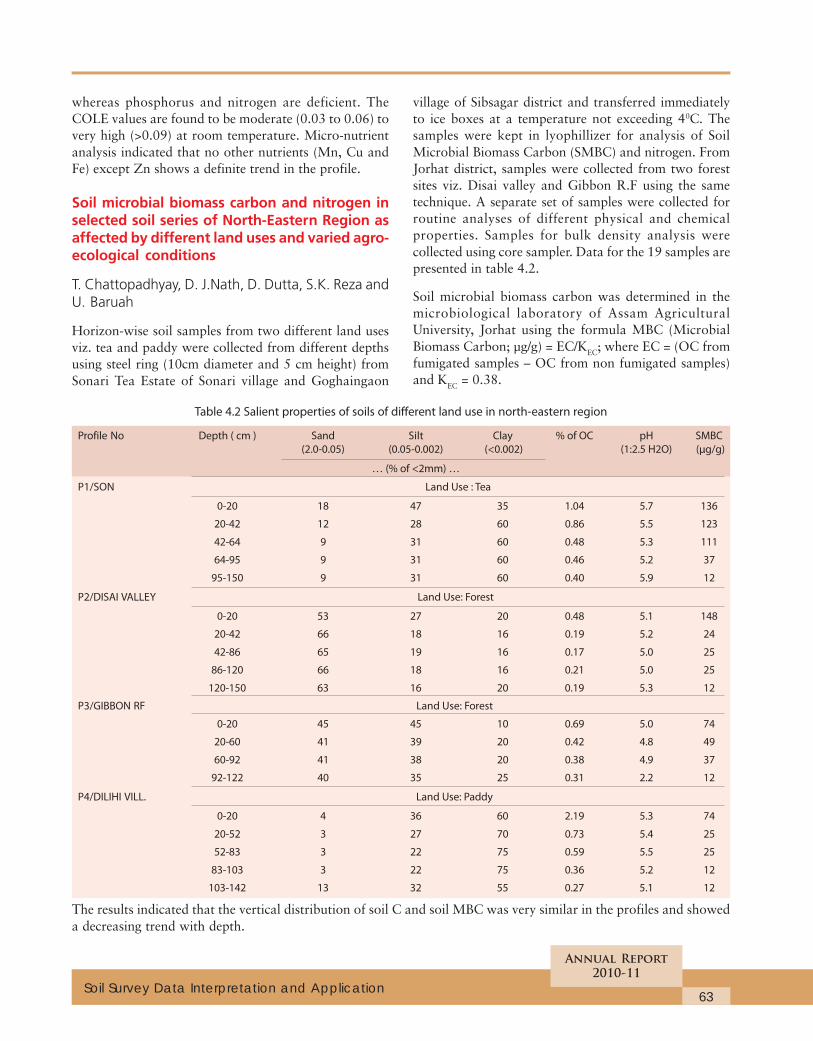
63
Annual Report
2010-11
Soil Survey Data Interpretation and Application
whereas phosphorus and nitrogen are deficient. TheCOLE values are found to be moderate (0.03 to 0.06) tovery high (>0.09) at room temperature. Micro-nutrientanalysis indicated that no other nutrients (Mn, Cu andFe) except Zn shows a definite trend in the profile.
Soil microbial biomass carbon and nitrogen inselected soil series of North-Eastern Region asaffected by different land uses and varied agro-ecological conditions
T. Chattopadhyay, D. J.Nath, D. Dutta, S.K. Reza andU. Baruah
Horizon-wise soil samples from two different land usesviz. tea and paddy were collected from different depthsusing steel ring (10cm diameter and 5 cm height) fromSonari Tea Estate of Sonari village and Goghaingaon
village of Sibsagar district and transferred immediatelyto ice boxes at a temperature not exceeding 40C. Thesamples were kept in lyophillizer for analysis of SoilMicrobial Biomass Carbon (SMBC) and nitrogen. FromJorhat district, samples were collected from two forestsites viz. Disai valley and Gibbon R.F using the sametechnique. A separate set of samples were collected forroutine analyses of different physical and chemicalproperties. Samples for bulk density analysis werecollected using core sampler. Data for the 19 samples arepresented in table 4.2.
Soil microbial biomass carbon was determined in themicrobiological laboratory of Assam AgriculturalUniversity, Jorhat using the formula MBC (MicrobialBiomass Carbon; µg/g) = EC/KEC; where EC = (OC fromfumigated samples – OC from non fumigated samples)and KEC = 0.38.
Table 4.2 Salient properties of soils of different land use in north-eastern region
Profile No Depth ( cm ) Sand Silt Clay % of OC pH SMBC
(2.0-0.05) (0.05-0.002) (<0.002) (1:2.5 H2O) (μg/g)
… (% of <2mm) …
P1/SON Land Use : Tea
0-20 18 47 35 1.04 5.7 136
20-42 12 28 60 0.86 5.5 123
42-64 9 31 60 0.48 5.3 111
64-95 9 31 60 0.46 5.2 37
95-150 9 31 60 0.40 5.9 12
P2/DISAI VALLEY Land Use: Forest
0-20 53 27 20 0.48 5.1 148
20-42 66 18 16 0.19 5.2 24
42-86 65 19 16 0.17 5.0 25
86-120 66 18 16 0.21 5.0 25
120-150 63 16 20 0.19 5.3 12
P3/GIBBON RF Land Use: Forest
0-20 45 45 10 0.69 5.0 74
20-60 41 39 20 0.42 4.8 49
60-92 41 38 20 0.38 4.9 37
92-122 40 35 25 0.31 2.2 12
P4/DILIHI VILL. Land Use: Paddy
0-20 4 36 60 2.19 5.3 74
20-52 3 27 70 0.73 5.4 25
52-83 3 22 75 0.59 5.5 25
83-103 3 22 75 0.36 5.2 12
103-142 13 32 55 0.27 5.1 12
The results indicated that the vertical distribution of soil C and soil MBC was very similar in the profiles and showeda decreasing trend with depth.
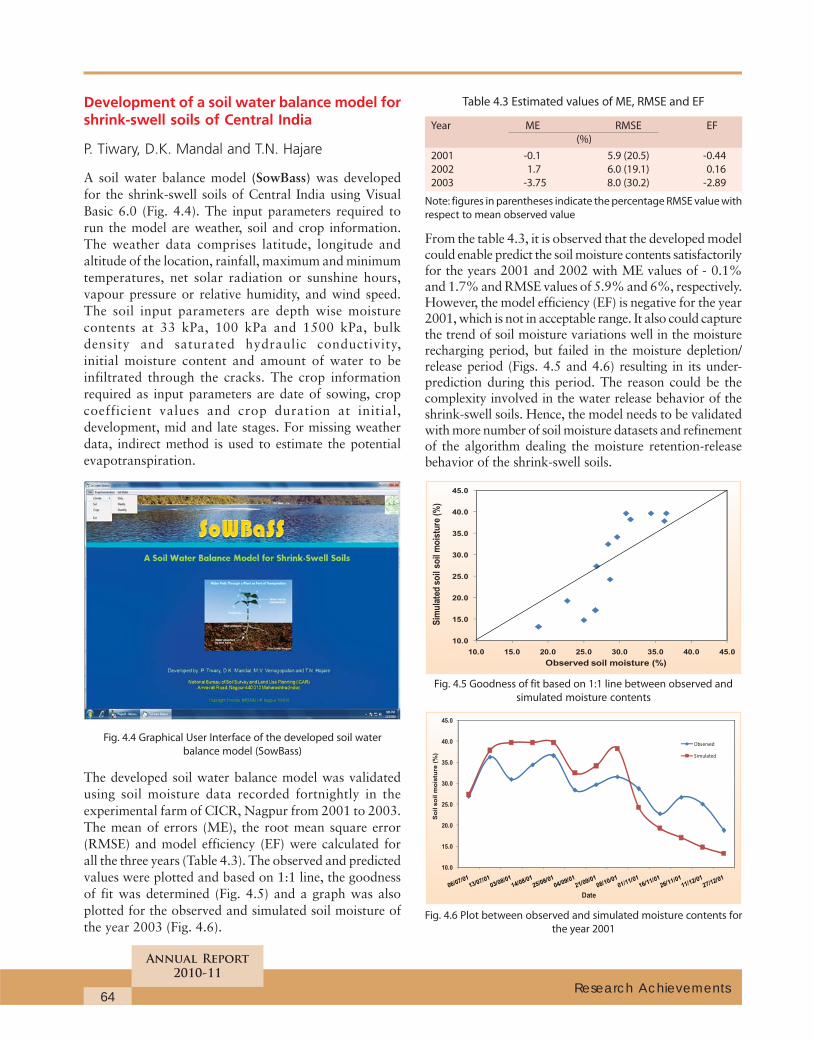
64
Annual Report
2010-11
Research Achievements
Development of a soil water balance model forshrink-swell soils of Central India
P. Tiwary, D.K. Mandal and T.N. Hajare
A soil water balance model (SowBass) was developedfor the shrink-swell soils of Central India using VisualBasic 6.0 (Fig. 4.4). The input parameters required torun the model are weather, soil and crop information.The weather data comprises latitude, longitude andaltitude of the location, rainfall, maximum and minimumtemperatures, net solar radiation or sunshine hours,vapour pressure or relative humidity, and wind speed.The soil input parameters are depth wise moisturecontents at 33 kPa, 100 kPa and 1500 kPa, bulkdensity and saturated hydraulic conductivity,initial moisture content and amount of water to beinfiltrated through the cracks. The crop informationrequired as input parameters are date of sowing, cropcoefficient values and crop duration at initial,development, mid and late stages. For missing weatherdata, indirect method is used to estimate the potentialevapotranspiration.
Fig. 4.4 Graphical User Interface of the developed soil water
balance model (SowBass)
The developed soil water balance model was validatedusing soil moisture data recorded fortnightly in theexperimental farm of CICR, Nagpur from 2001 to 2003.The mean of errors (ME), the root mean square error(RMSE) and model efficiency (EF) were calculated forall the three years (Table 4.3). The observed and predictedvalues were plotted and based on 1:1 line, the goodnessof fit was determined (Fig. 4.5) and a graph was alsoplotted for the observed and simulated soil moisture ofthe year 2003 (Fig. 4.6).
Fig. 4.5 Goodness of fit based on 1:1 line between observed and
simulated moisture contents
Table 4.3 Estimated values of ME, RMSE and EF
Year ME RMSE EF
(%)
2001 -0.1 5.9 (20.5) -0.44
2002 1.7 6.0 (19.1) 0.16
2003 -3.75 8.0 (30.2) -2.89
Note: figures in parentheses indicate the percentage RMSE value with
respect to mean observed value
From the table 4.3, it is observed that the developed modelcould enable predict the soil moisture contents satisfactorilyfor the years 2001 and 2002 with ME values of - 0.1%and 1.7% and RMSE values of 5.9% and 6%, respectively.However, the model efficiency (EF) is negative for the year2001, which is not in acceptable range. It also could capturethe trend of soil moisture variations well in the moisturerecharging period, but failed in the moisture depletion/release period (Figs. 4.5 and 4.6) resulting in its under-prediction during this period. The reason could be thecomplexity involved in the water release behavior of theshrink-swell soils. Hence, the model needs to be validatedwith more number of soil moisture datasets and refinementof the algorithm dealing the moisture retention-releasebehavior of the shrink-swell soils.
Fig. 4.6 Plot between observed and simulated moisture contents for
the year 2001
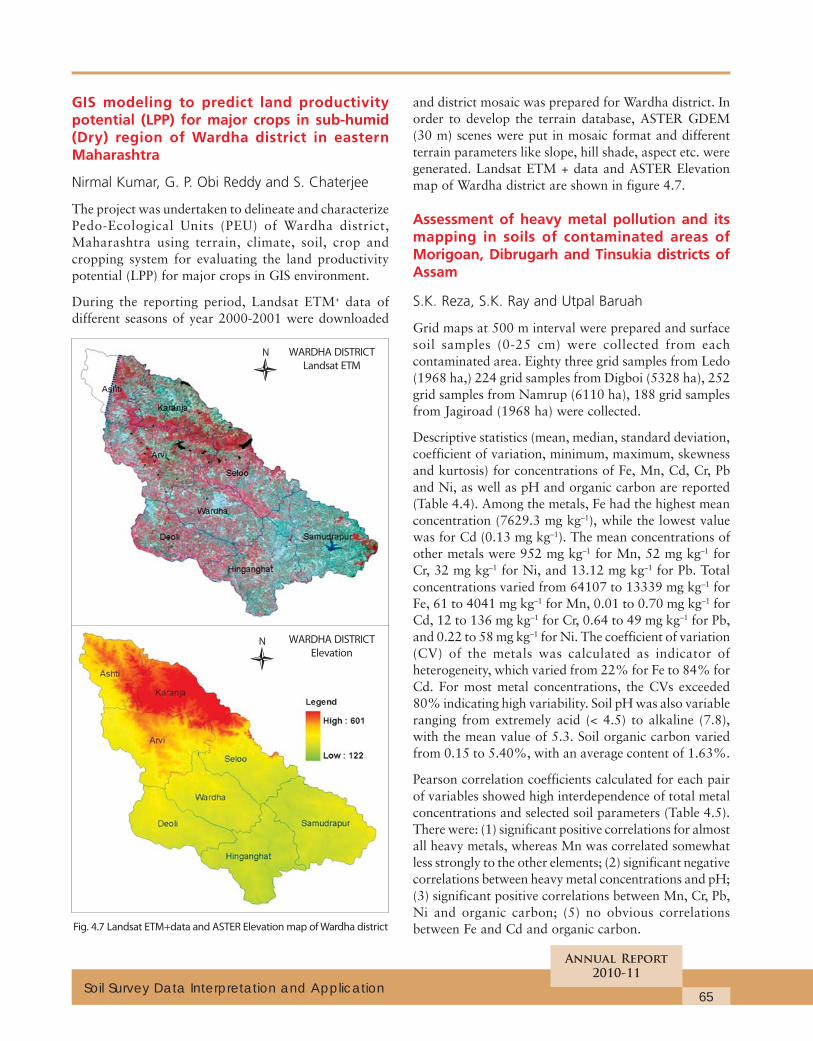
65
Annual Report
2010-11
Soil Survey Data Interpretation and Application
GIS modeling to predict land productivitypotential (LPP) for major crops in sub-humid(Dry) region of Wardha district in easternMaharashtra
Nirmal Kumar, G. P. Obi Reddy and S. Chaterjee
The project was undertaken to delineate and characterizePedo-Ecological Units (PEU) of Wardha district,Maharashtra using terrain, climate, soil, crop andcropping system for evaluating the land productivitypotential (LPP) for major crops in GIS environment.
During the reporting period, Landsat ETM+ data ofdifferent seasons of year 2000-2001 were downloaded
and district mosaic was prepared for Wardha district. Inorder to develop the terrain database, ASTER GDEM(30 m) scenes were put in mosaic format and differentterrain parameters like slope, hill shade, aspect etc. weregenerated. Landsat ETM + data and ASTER Elevationmap of Wardha district are shown in figure 4.7.
Assessment of heavy metal pollution and itsmapping in soils of contaminated areas ofMorigoan, Dibrugarh and Tinsukia districts ofAssam
S.K. Reza, S.K. Ray and Utpal Baruah
Grid maps at 500 m interval were prepared and surfacesoil samples (0-25 cm) were collected from eachcontaminated area. Eighty three grid samples from Ledo(1968 ha,) 224 grid samples from Digboi (5328 ha), 252grid samples from Namrup (6110 ha), 188 grid samplesfrom Jagiroad (1968 ha) were collected.
Descriptive statistics (mean, median, standard deviation,coefficient of variation, minimum, maximum, skewnessand kurtosis) for concentrations of Fe, Mn, Cd, Cr, Pband Ni, as well as pH and organic carbon are reported(Table 4.4). Among the metals, Fe had the highest meanconcentration (7629.3 mg kg–1), while the lowest valuewas for Cd (0.13 mg kg–1). The mean concentrations ofother metals were 952 mg kg–1 for Mn, 52 mg kg–1 forCr, 32 mg kg–1 for Ni, and 13.12 mg kg–1 for Pb. Totalconcentrations varied from 64107 to 13339 mg kg–1 forFe, 61 to 4041 mg kg–1 for Mn, 0.01 to 0.70 mg kg–1 forCd, 12 to 136 mg kg–1 for Cr, 0.64 to 49 mg kg–1 for Pb,and 0.22 to 58 mg kg–1 for Ni. The coefficient of variation(CV) of the metals was calculated as indicator ofheterogeneity, which varied from 22% for Fe to 84% forCd. For most metal concentrations, the CVs exceeded80% indicating high variability. Soil pH was also variableranging from extremely acid (< 4.5) to alkaline (7.8),with the mean value of 5.3. Soil organic carbon variedfrom 0.15 to 5.40%, with an average content of 1.63%.
Pearson correlation coefficients calculated for each pairof variables showed high interdependence of total metalconcentrations and selected soil parameters (Table 4.5).There were: (1) significant positive correlations for almostall heavy metals, whereas Mn was correlated somewhatless strongly to the other elements; (2) significant negativecorrelations between heavy metal concentrations and pH;(3) significant positive correlations between Mn, Cr, Pb,Ni and organic carbon; (5) no obvious correlationsbetween Fe and Cd and organic carbon.Fig. 4.7 Landsat ETM+data and ASTER Elevation map of Wardha district
WARDHA DISTRICT
Landsat ETM
WARDHA DISTRICT
Elevation
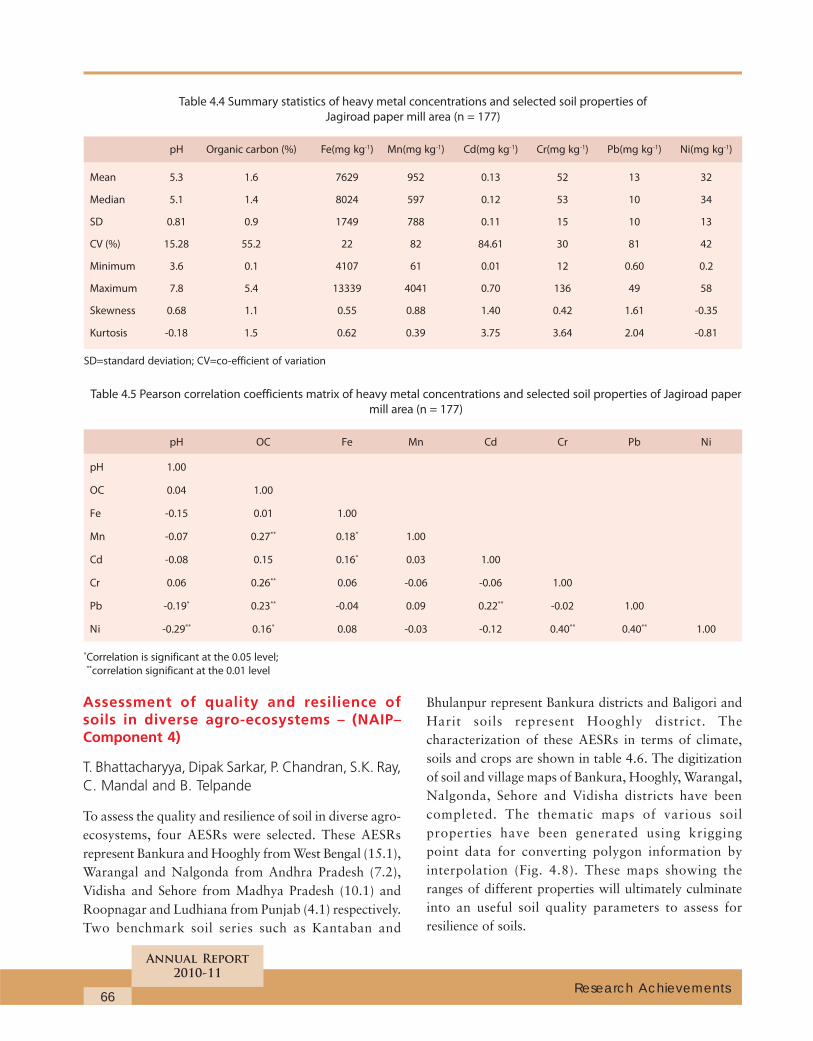
66
Annual Report
2010-11
Research Achievements
Table 4.4 Summary statistics of heavy metal concentrations and selected soil properties of
Jagiroad paper mill area (n = 177)
pH Organic carbon (%) Fe(mg kg-1) Mn(mg kg-1) Cd(mg kg-1) Cr(mg kg-1) Pb(mg kg-1) Ni(mg kg-1)
Mean 5.3 1.6 7629 952 0.13 52 13 32
Median 5.1 1.4 8024 597 0.12 53 10 34
SD 0.81 0.9 1749 788 0.11 15 10 13
CV (%) 15.28 55.2 22 82 84.61 30 81 42
Minimum 3.6 0.1 4107 61 0.01 12 0.60 0.2
Maximum 7.8 5.4 13339 4041 0.70 136 49 58
Skewness 0.68 1.1 0.55 0.88 1.40 0.42 1.61 -0.35
Kurtosis -0.18 1.5 0.62 0.39 3.75 3.64 2.04 -0.81
SD=standard deviation; CV=co-efficient of variation
Table 4.5 Pearson correlation coefficients matrix of heavy metal concentrations and selected soil properties of Jagiroad paper
mill area (n = 177)
pH OC Fe Mn Cd Cr Pb Ni
pH 1.00
OC 0.04 1.00
Fe -0.15 0.01 1.00
Mn -0.07 0.27** 0.18* 1.00
Cd -0.08 0.15 0.16* 0.03 1.00
Cr 0.06 0.26** 0.06 -0.06 -0.06 1.00
Pb -0.19* 0.23** -0.04 0.09 0.22** -0.02 1.00
Ni -0.29** 0.16* 0.08 -0.03 -0.12 0.40** 0.40** 1.00
*Correlation is significant at the 0.05 level;
**correlation significant at the 0.01 level
Assessment of quality and resilience ofsoils in diverse agro-ecosystems – (NAIP–Component 4)
T. Bhattacharyya, Dipak Sarkar, P. Chandran, S.K. Ray,C. Mandal and B. Telpande
To assess the quality and resilience of soil in diverse agro-ecosystems, four AESRs were selected. These AESRsrepresent Bankura and Hooghly from West Bengal (15.1),Warangal and Nalgonda from Andhra Pradesh (7.2),Vidisha and Sehore from Madhya Pradesh (10.1) andRoopnagar and Ludhiana from Punjab (4.1) respectively.Two benchmark soil series such as Kantaban and
Bhulanpur represent Bankura districts and Baligori andHarit soils represent Hooghly district. Thecharacterization of these AESRs in terms of climate,soils and crops are shown in table 4.6. The digitizationof soil and village maps of Bankura, Hooghly, Warangal,Nalgonda, Sehore and Vidisha districts have beencompleted. The thematic maps of various soilproperties have been generated using kriggingpoint data for converting polygon information byinterpolation (Fig. 4.8). These maps showing theranges of different properties will ultimately culminateinto an useful soil quality parameters to assess forresilience of soils.
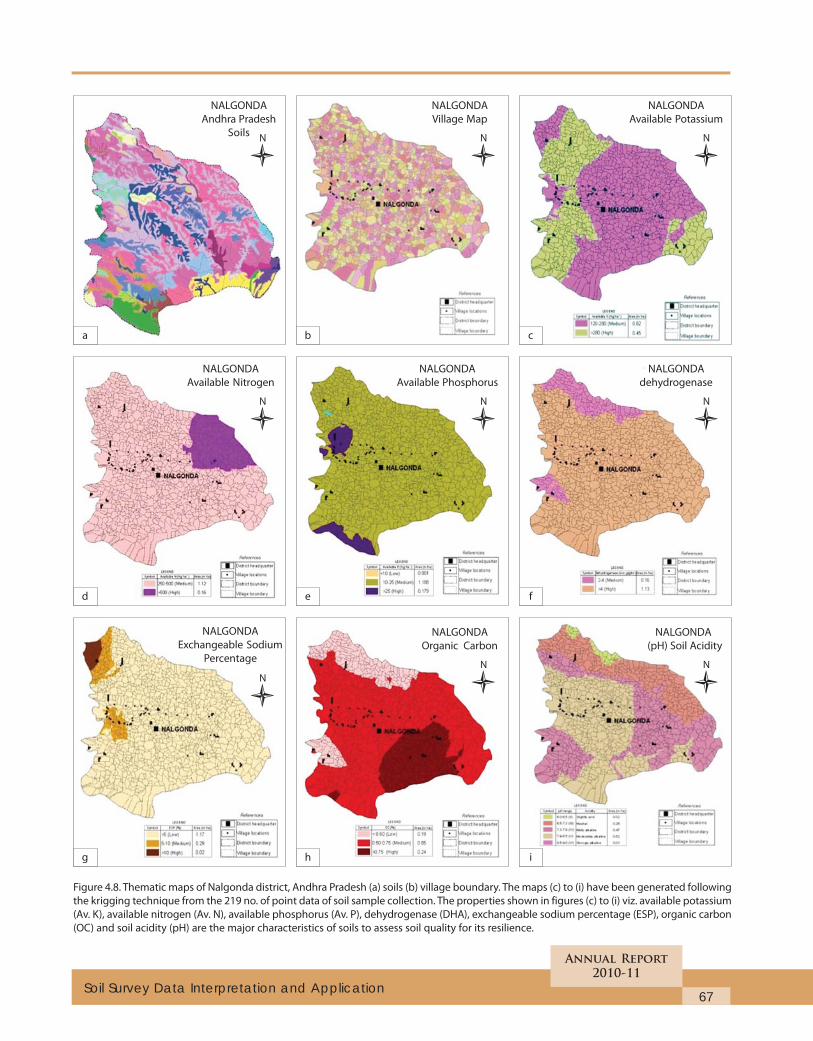
67
Annual Report
2010-11
Soil Survey Data Interpretation and Application
Figure 4.8. Thematic maps of Nalgonda district, Andhra Pradesh (a) soils (b) village boundary. The maps (c) to (i) have been generated following
the krigging technique from the 219 no. of point data of soil sample collection. The properties shown in figures (c) to (i) viz. available potassium
(Av. K), available nitrogen (Av. N), available phosphorus (Av. P), dehydrogenase (DHA), exchangeable sodium percentage (ESP), organic carbon
(OC) and soil acidity (pH) are the major characteristics of soils to assess soil quality for its resilience.
a
d
g
b c
e f
h i
NALGONDA
Andhra Pradesh
Soils
NALGONDA
Village Map
NALGONDA
Available Potassium
NALGONDA
Available Nitrogen
NALGONDA
Available Phosphorus
NALGONDA
dehydrogenase
NALGONDA
Exchangeable Sodium
Percentage
NALGONDA
Organic Carbon
NALGONDA
(pH) Soil Acidity
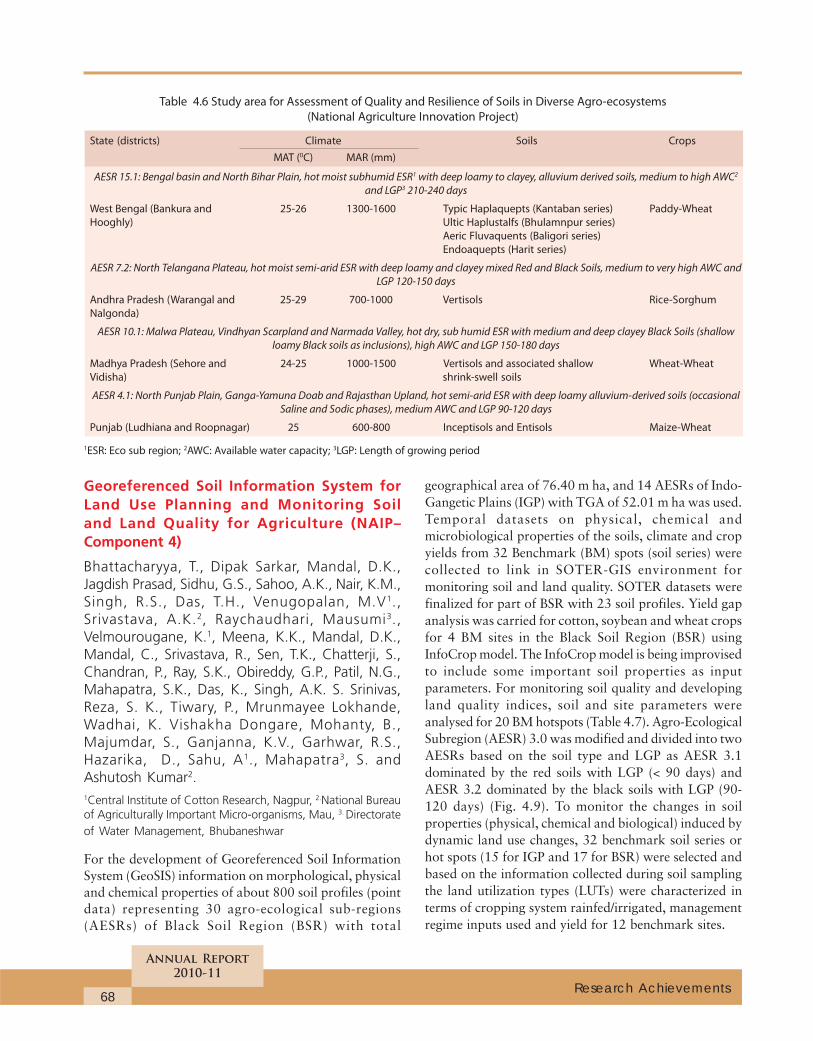
68
Annual Report
2010-11
Research Achievements
Table 4.6 Study area for Assessment of Quality and Resilience of Soils in Diverse Agro-ecosystems
(National Agriculture Innovation Project)
State (districts) Climate Soils Crops
MAT (0C) MAR (mm)
AESR 15.1: Bengal basin and North Bihar Plain, hot moist subhumid ESR1 with deep loamy to clayey, alluvium derived soils, medium to high AWC2
and LGP3 210-240 days
West Bengal (Bankura and 25-26 1300-1600 Typic Haplaquepts (Kantaban series) Paddy-Wheat
Hooghly) Ultic Haplustalfs (Bhulamnpur series)
Aeric Fluvaquents (Baligori series)
Endoaquepts (Harit series)
AESR 7.2: North Telangana Plateau, hot moist semi-arid ESR with deep loamy and clayey mixed Red and Black Soils, medium to very high AWC and
LGP 120-150 days
Andhra Pradesh (Warangal and 25-29 700-1000 Vertisols Rice-Sorghum
Nalgonda)
AESR 10.1: Malwa Plateau, Vindhyan Scarpland and Narmada Valley, hot dry, sub humid ESR with medium and deep clayey Black Soils (shallow
loamy Black soils as inclusions), high AWC and LGP 150-180 days
Madhya Pradesh (Sehore and 24-25 1000-1500 Vertisols and associated shallow Wheat-Wheat
Vidisha) shrink-swell soils
AESR 4.1: North Punjab Plain, Ganga-Yamuna Doab and Rajasthan Upland, hot semi-arid ESR with deep loamy alluvium-derived soils (occasional
Saline and Sodic phases), medium AWC and LGP 90-120 days
Punjab (Ludhiana and Roopnagar) 25 600-800 Inceptisols and Entisols Maize-Wheat
1ESR: Eco sub region; 2AWC: Available water capacity; 3LGP: Length of growing period
Georeferenced Soil Information System forLand Use Planning and Monitoring Soiland Land Quality for Agriculture (NAIP–Component 4)
Bhattacharyya, T., Dipak Sarkar, Mandal, D.K.,Jagdish Prasad, Sidhu, G.S., Sahoo, A.K., Nair, K.M.,Singh, R.S., Das, T.H., Venugopalan, M.V1.,Srivastava, A.K.2, Raychaudhari, Mausumi3.,Velmourougane, K.1, Meena, K.K., Mandal, D.K.,Mandal, C., Srivastava, R., Sen, T.K., Chatterji, S.,Chandran, P., Ray, S.K., Obireddy, G.P., Patil, N.G.,Mahapatra, S.K., Das, K., Singh, A.K. S. Srinivas,Reza, S. K., Tiwary, P., Mrunmayee Lokhande,Wadhai, K. Vishakha Dongare, Mohanty, B.,Majumdar, S., Ganjanna, K.V., Garhwar, R.S.,Hazarika, D., Sahu, A1., Mahapatra3, S. andAshutosh Kumar2.1Central Institute of Cotton Research, Nagpur, 2.National Bureauof Agriculturally Important Micro-organisms, Mau, 3. Directorateof Water Management, Bhubaneshwar
For the development of Georeferenced Soil InformationSystem (GeoSIS) information on morphological, physicaland chemical properties of about 800 soil profiles (pointdata) representing 30 agro-ecological sub-regions(AESRs) of Black Soil Region (BSR) with total
geographical area of 76.40 m ha, and 14 AESRs of Indo-Gangetic Plains (IGP) with TGA of 52.01 m ha was used.Temporal datasets on physical, chemical andmicrobiological properties of the soils, climate and cropyields from 32 Benchmark (BM) spots (soil series) werecollected to link in SOTER-GIS environment formonitoring soil and land quality. SOTER datasets werefinalized for part of BSR with 23 soil profiles. Yield gapanalysis was carried for cotton, soybean and wheat cropsfor 4 BM sites in the Black Soil Region (BSR) usingInfoCrop model. The InfoCrop model is being improvisedto include some important soil properties as inputparameters. For monitoring soil quality and developingland quality indices, soil and site parameters wereanalysed for 20 BM hotspots (Table 4.7). Agro-EcologicalSubregion (AESR) 3.0 was modified and divided into twoAESRs based on the soil type and LGP as AESR 3.1dominated by the red soils with LGP (< 90 days) andAESR 3.2 dominated by the black soils with LGP (90-120 days) (Fig. 4.9). To monitor the changes in soilproperties (physical, chemical and biological) induced bydynamic land use changes, 32 benchmark soil series orhot spots (15 for IGP and 17 for BSR) were selected andbased on the information collected during soil samplingthe land utilization types (LUTs) were characterized interms of cropping system rainfed/irrigated, managementregime inputs used and yield for 12 benchmark sites.
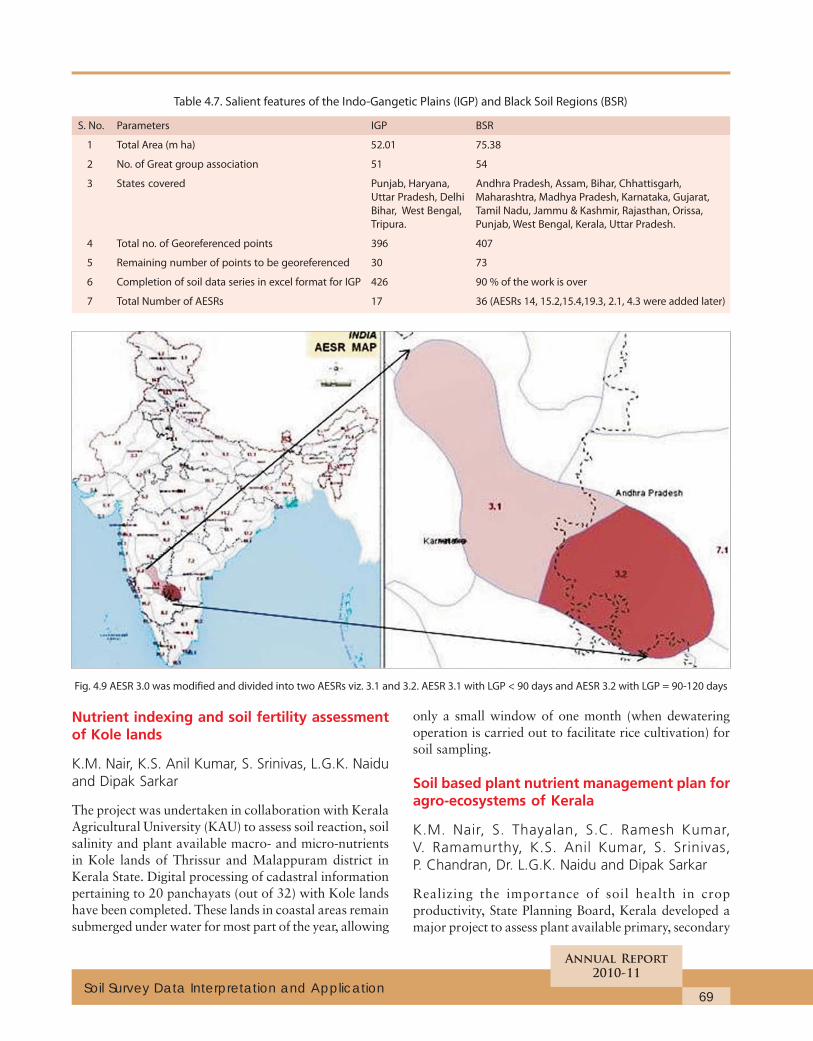
69
Annual Report
2010-11
Soil Survey Data Interpretation and Application
Table 4.7. Salient features of the Indo-Gangetic Plains (IGP) and Black Soil Regions (BSR)
S. No. Parameters IGP BSR
1 Total Area (m ha) 52.01 75.38
2 No. of Great group association 51 54
3 States covered Punjab, Haryana, Andhra Pradesh, Assam, Bihar, Chhattisgarh,
Uttar Pradesh, Delhi Maharashtra, Madhya Pradesh, Karnataka, Gujarat,
Bihar, West Bengal, Tamil Nadu, Jammu & Kashmir, Rajasthan, Orissa,
Tripura. Punjab, West Bengal, Kerala, Uttar Pradesh.
4 Total no. of Georeferenced points 396 407
5 Remaining number of points to be georeferenced 30 73
6 Completion of soil data series in excel format for IGP 426 90 % of the work is over
7 Total Number of AESRs 17 36 (AESRs 14, 15.2,15.4,19.3, 2.1, 4.3 were added later)
Nutrient indexing and soil fertility assessmentof Kole lands
K.M. Nair, K.S. Anil Kumar, S. Srinivas, L.G.K. Naiduand Dipak Sarkar
The project was undertaken in collaboration with KeralaAgricultural University (KAU) to assess soil reaction, soilsalinity and plant available macro- and micro-nutrientsin Kole lands of Thrissur and Malappuram district inKerala State. Digital processing of cadastral informationpertaining to 20 panchayats (out of 32) with Kole landshave been completed. These lands in coastal areas remainsubmerged under water for most part of the year, allowing
Fig. 4.9 AESR 3.0 was modified and divided into two AESRs viz. 3.1 and 3.2. AESR 3.1 with LGP < 90 days and AESR 3.2 with LGP = 90-120 days
only a small window of one month (when dewateringoperation is carried out to facilitate rice cultivation) forsoil sampling.
Soil based plant nutrient management plan foragro-ecosystems of Kerala
K.M. Nair, S. Thayalan, S.C. Ramesh Kumar,V. Ramamurthy, K.S. Anil Kumar, S. Srinivas,P. Chandran, Dr. L.G.K. Naidu and Dipak Sarkar
Realizing the importance of soil health in cropproductivity, State Planning Board, Kerala developed amajor project to assess plant available primary, secondary
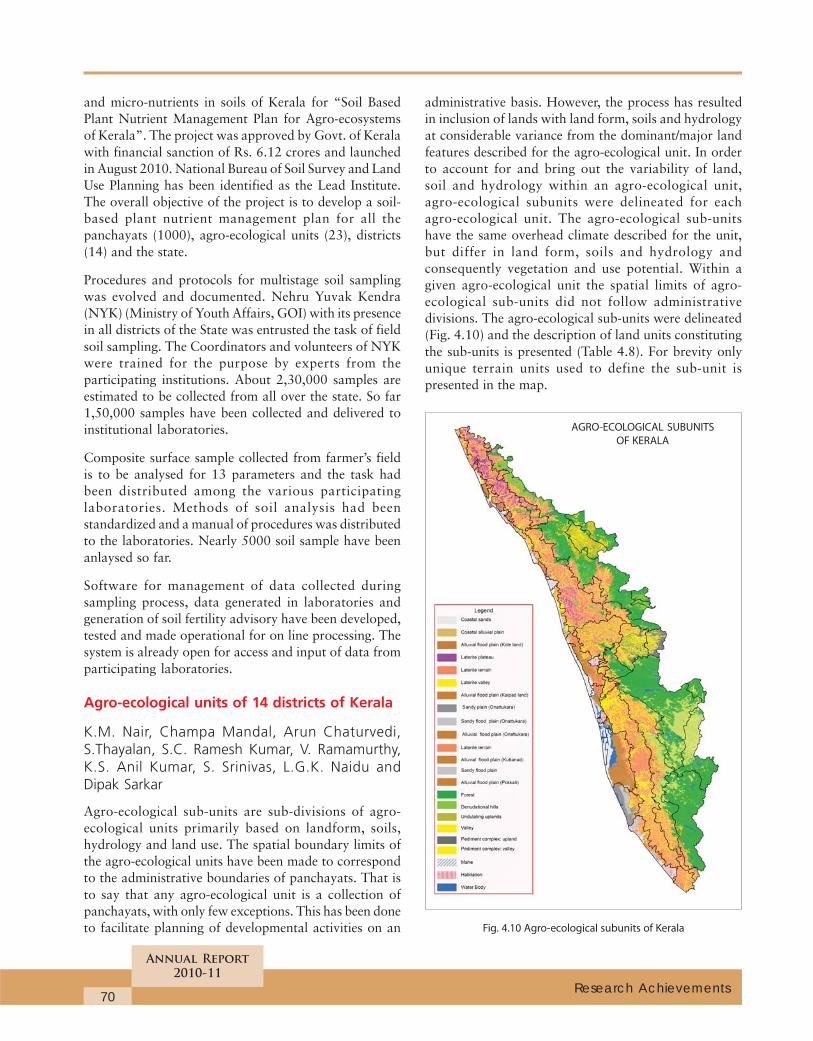
70
Annual Report
2010-11
Research Achievements
and micro-nutrients in soils of Kerala for “Soil BasedPlant Nutrient Management Plan for Agro-ecosystemsof Kerala”. The project was approved by Govt. of Keralawith financial sanction of Rs. 6.12 crores and launchedin August 2010. National Bureau of Soil Survey and LandUse Planning has been identified as the Lead Institute.The overall objective of the project is to develop a soil-based plant nutrient management plan for all thepanchayats (1000), agro-ecological units (23), districts(14) and the state.
Procedures and protocols for multistage soil samplingwas evolved and documented. Nehru Yuvak Kendra(NYK) (Ministry of Youth Affairs, GOI) with its presencein all districts of the State was entrusted the task of fieldsoil sampling. The Coordinators and volunteers of NYKwere trained for the purpose by experts from theparticipating institutions. About 2,30,000 samples areestimated to be collected from all over the state. So far1,50,000 samples have been collected and delivered toinstitutional laboratories.
Composite surface sample collected from farmer’s fieldis to be analysed for 13 parameters and the task hadbeen distributed among the various participatinglaboratories. Methods of soil analysis had beenstandardized and a manual of procedures was distributedto the laboratories. Nearly 5000 soil sample have beenanlaysed so far.
Software for management of data collected duringsampling process, data generated in laboratories andgeneration of soil fertility advisory have been developed,tested and made operational for on line processing. Thesystem is already open for access and input of data fromparticipating laboratories.
Agro-ecological units of 14 districts of Kerala
K.M. Nair, Champa Mandal, Arun Chaturvedi,S.Thayalan, S.C. Ramesh Kumar, V. Ramamurthy,K.S. Anil Kumar, S. Srinivas, L.G.K. Naidu andDipak Sarkar
Agro-ecological sub-units are sub-divisions of agro-ecological units primarily based on landform, soils,hydrology and land use. The spatial boundary limits ofthe agro-ecological units have been made to correspondto the administrative boundaries of panchayats. That isto say that any agro-ecological unit is a collection ofpanchayats, with only few exceptions. This has been doneto facilitate planning of developmental activities on an
administrative basis. However, the process has resultedin inclusion of lands with land form, soils and hydrologyat considerable variance from the dominant/major landfeatures described for the agro-ecological unit. In orderto account for and bring out the variability of land,soil and hydrology within an agro-ecological unit,agro-ecological subunits were delineated for eachagro-ecological unit. The agro-ecological sub-unitshave the same overhead climate described for the unit,but differ in land form, soils and hydrology andconsequently vegetation and use potential. Within agiven agro-ecological unit the spatial limits of agro-ecological sub-units did not follow administrativedivisions. The agro-ecological sub-units were delineated(Fig. 4.10) and the description of land units constitutingthe sub-units is presented (Table 4.8). For brevity onlyunique terrain units used to define the sub-unit ispresented in the map.
Fig. 4.10 Agro-ecological subunits of Kerala
AGRO-ECOLOGICAL SUBUNITS
OF KERALA
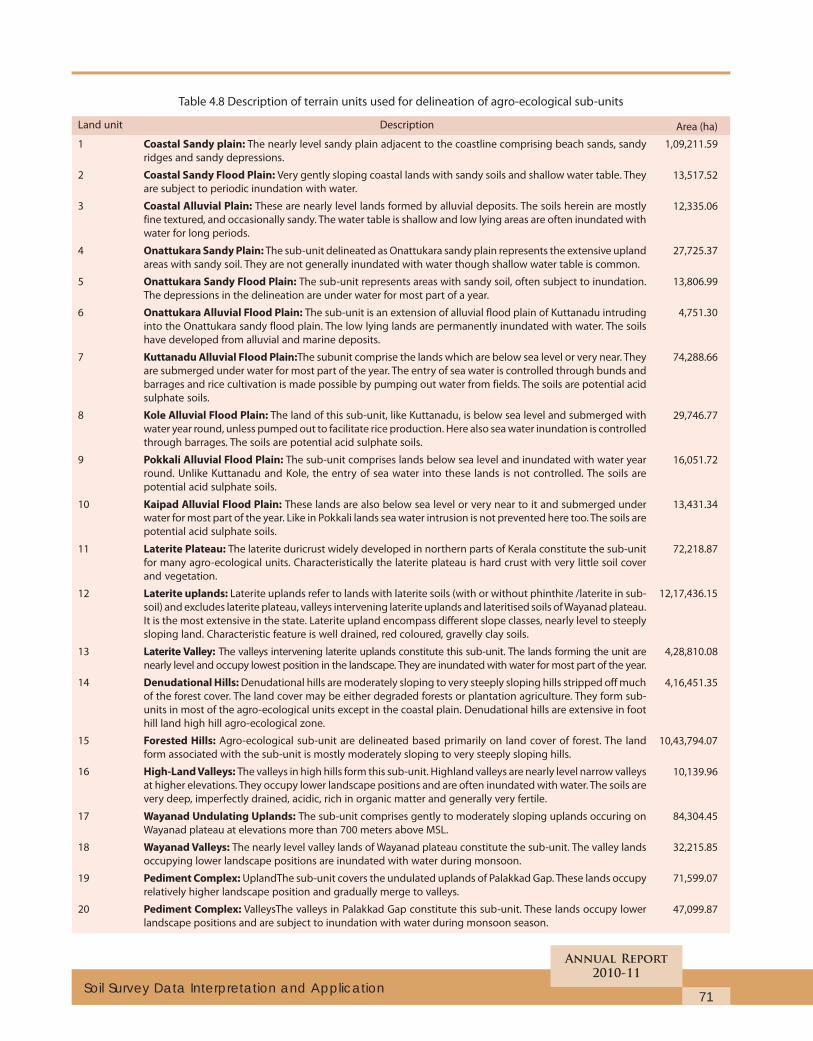
71
Annual Report
2010-11
Soil Survey Data Interpretation and Application
Land unit Description
1 Coastal Sandy plain: The nearly level sandy plain adjacent to the coastline comprising beach sands, sandy
ridges and sandy depressions.
2 Coastal Sandy Flood Plain: Very gently sloping coastal lands with sandy soils and shallow water table. They
are subject to periodic inundation with water.
3 Coastal Alluvial Plain: These are nearly level lands formed by alluvial deposits. The soils herein are mostly
fine textured, and occasionally sandy. The water table is shallow and low lying areas are often inundated with
water for long periods.
4 Onattukara Sandy Plain: The sub-unit delineated as Onattukara sandy plain represents the extensive upland
areas with sandy soil. They are not generally inundated with water though shallow water table is common.
5 Onattukara Sandy Flood Plain: The sub-unit represents areas with sandy soil, often subject to inundation.
The depressions in the delineation are under water for most part of a year.
6 Onattukara Alluvial Flood Plain: The sub-unit is an extension of alluvial flood plain of Kuttanadu intruding
into the Onattukara sandy flood plain. The low lying lands are permanently inundated with water. The soils
have developed from alluvial and marine deposits.
7 Kuttanadu Alluvial Flood Plain:The subunit comprise the lands which are below sea level or very near. They
are submerged under water for most part of the year. The entry of sea water is controlled through bunds and
barrages and rice cultivation is made possible by pumping out water from fields. The soils are potential acid
sulphate soils.
8 Kole Alluvial Flood Plain: The land of this sub-unit, like Kuttanadu, is below sea level and submerged with
water year round, unless pumped out to facilitate rice production. Here also sea water inundation is controlled
through barrages. The soils are potential acid sulphate soils.
9 Pokkali Alluvial Flood Plain: The sub-unit comprises lands below sea level and inundated with water year
round. Unlike Kuttanadu and Kole, the entry of sea water into these lands is not controlled. The soils are
potential acid sulphate soils.
10 Kaipad Alluvial Flood Plain: These lands are also below sea level or very near to it and submerged under
water for most part of the year. Like in Pokkali lands sea water intrusion is not prevented here too. The soils are
potential acid sulphate soils.
11 Laterite Plateau: The laterite duricrust widely developed in northern parts of Kerala constitute the sub-unit
for many agro-ecological units. Characteristically the laterite plateau is hard crust with very little soil cover
and vegetation.
12 Laterite uplands: Laterite uplands refer to lands with laterite soils (with or without phinthite /laterite in sub-
soil) and excludes laterite plateau, valleys intervening laterite uplands and lateritised soils of Wayanad plateau.
It is the most extensive in the state. Laterite upland encompass different slope classes, nearly level to steeply
sloping land. Characteristic feature is well drained, red coloured, gravelly clay soils.
13 Laterite Valley: The valleys intervening laterite uplands constitute this sub-unit. The lands forming the unit are
nearly level and occupy lowest position in the landscape. They are inundated with water for most part of the year.
14 Denudational Hills: Denudational hills are moderately sloping to very steeply sloping hills stripped off much
of the forest cover. The land cover may be either degraded forests or plantation agriculture. They form sub-
units in most of the agro-ecological units except in the coastal plain. Denudational hills are extensive in foot
hill land high hill agro-ecological zone.
15 Forested Hills: Agro-ecological sub-unit are delineated based primarily on land cover of forest. The land
form associated with the sub-unit is mostly moderately sloping to very steeply sloping hills.
16 High-Land Valleys: The valleys in high hills form this sub-unit. Highland valleys are nearly level narrow valleys
at higher elevations. They occupy lower landscape positions and are often inundated with water. The soils are
very deep, imperfectly drained, acidic, rich in organic matter and generally very fertile.
17 Wayanad Undulating Uplands: The sub-unit comprises gently to moderately sloping uplands occuring on
Wayanad plateau at elevations more than 700 meters above MSL.
18 Wayanad Valleys: The nearly level valley lands of Wayanad plateau constitute the sub-unit. The valley lands
occupying lower landscape positions are inundated with water during monsoon.
19 Pediment Complex: UplandThe sub-unit covers the undulated uplands of Palakkad Gap. These lands occupy
relatively higher landscape position and gradually merge to valleys.
20 Pediment Complex: ValleysThe valleys in Palakkad Gap constitute this sub-unit. These lands occupy lower
landscape positions and are subject to inundation with water during monsoon season.
Table 4.8 Description of terrain units used for delineation of agro-ecological sub-units
Area (ha)
1,09,211.59
13,517.52
12,335.06
27,725.37
13,806.99
4,751.30
74,288.66
29,746.77
16,051.72
13,431.34
72,218.87
12,17,436.15
4,28,810.08
4,16,451.35
10,43,794.07
10,139.96
84,304.45
32,215.85
71,599.07
47,099.87
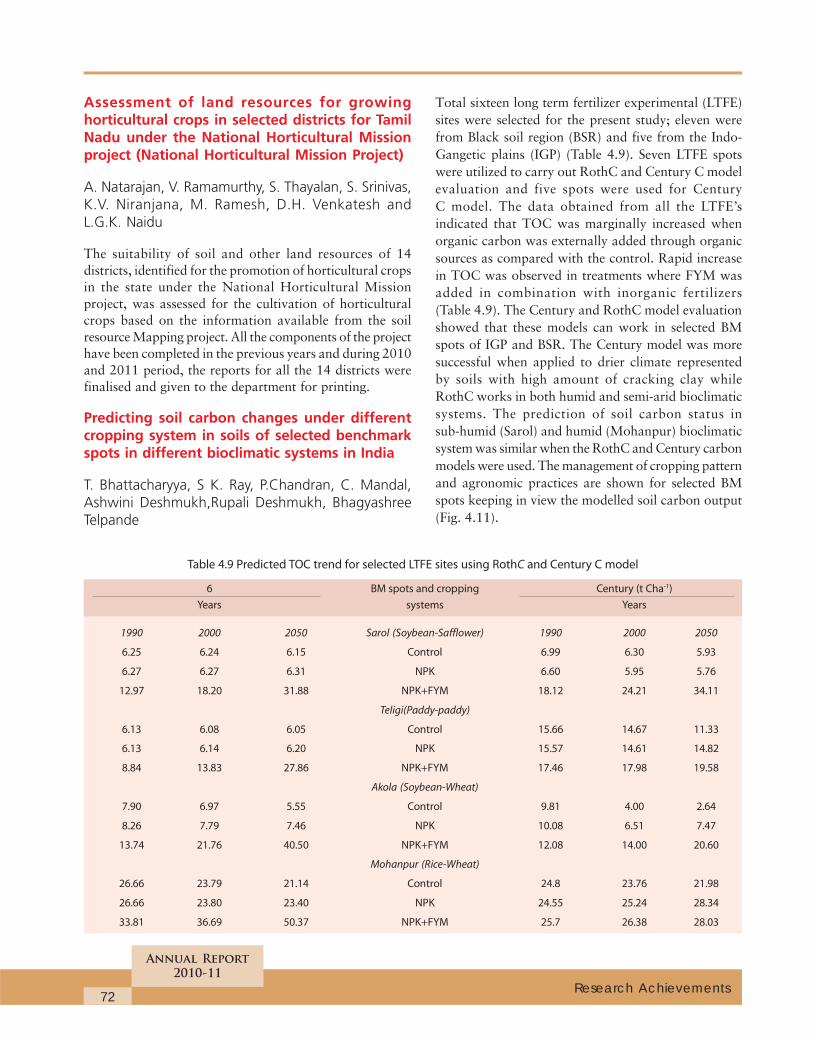
72
Annual Report
2010-11
Research Achievements
Assessment of land resources for growinghorticultural crops in selected districts for TamilNadu under the National Horticultural Missionproject (National Horticultural Mission Project)
A. Natarajan, V. Ramamurthy, S. Thayalan, S. Srinivas,K.V. Niranjana, M. Ramesh, D.H. Venkatesh andL.G.K. Naidu
The suitability of soil and other land resources of 14districts, identified for the promotion of horticultural cropsin the state under the National Horticultural Missionproject, was assessed for the cultivation of horticulturalcrops based on the information available from the soilresource Mapping project. All the components of the projecthave been completed in the previous years and during 2010and 2011 period, the reports for all the 14 districts werefinalised and given to the department for printing.
Predicting soil carbon changes under differentcropping system in soils of selected benchmarkspots in different bioclimatic systems in India
T. Bhattacharyya, S K. Ray, P.Chandran, C. Mandal,Ashwini Deshmukh,Rupali Deshmukh, BhagyashreeTelpande
Total sixteen long term fertilizer experimental (LTFE)sites were selected for the present study; eleven werefrom Black soil region (BSR) and five from the Indo-Gangetic plains (IGP) (Table 4.9). Seven LTFE spotswere utilized to carry out RothC and Century C modelevaluation and five spots were used for CenturyC model. The data obtained from all the LTFE’sindicated that TOC was marginally increased whenorganic carbon was externally added through organicsources as compared with the control. Rapid increasein TOC was observed in treatments where FYM wasadded in combination with inorganic fertilizers(Table 4.9). The Century and RothC model evaluationshowed that these models can work in selected BMspots of IGP and BSR. The Century model was moresuccessful when applied to drier climate representedby soils with high amount of cracking clay whileRothC works in both humid and semi-arid bioclimaticsystems. The prediction of soil carbon status insub-humid (Sarol) and humid (Mohanpur) bioclimaticsystem was similar when the RothC and Century carbonmodels were used. The management of cropping patternand agronomic practices are shown for selected BMspots keeping in view the modelled soil carbon output(Fig. 4.11).
Table 4.9 Predicted TOC trend for selected LTFE sites using RothC and Century C model
6 BM spots and cropping Century (t Cha-1)
Years systems Years
1990 2000 2050 Sarol (Soybean-Safflower) 1990 2000 2050
6.25 6.24 6.15 Control 6.99 6.30 5.93
6.27 6.27 6.31 NPK 6.60 5.95 5.76
12.97 18.20 31.88 NPK+FYM 18.12 24.21 34.11
Teligi(Paddy-paddy)
6.13 6.08 6.05 Control 15.66 14.67 11.33
6.13 6.14 6.20 NPK 15.57 14.61 14.82
8.84 13.83 27.86 NPK+FYM 17.46 17.98 19.58
Akola (Soybean-Wheat)
7.90 6.97 5.55 Control 9.81 4.00 2.64
8.26 7.79 7.46 NPK 10.08 6.51 7.47
13.74 21.76 40.50 NPK+FYM 12.08 14.00 20.60
Mohanpur (Rice-Wheat)
26.66 23.79 21.14 Control 24.8 23.76 21.98
26.66 23.80 23.40 NPK 24.55 25.24 28.34
33.81 36.69 50.37 NPK+FYM 25.7 26.38 28.03
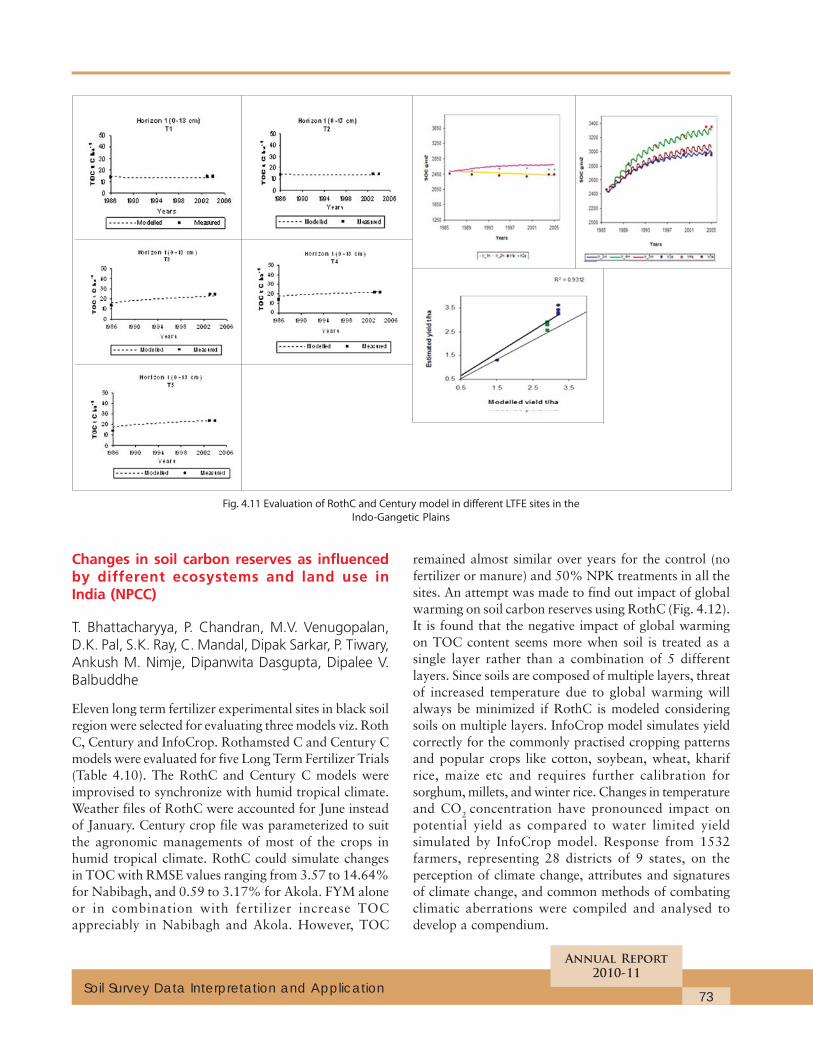
73
Annual Report
2010-11
Soil Survey Data Interpretation and Application
Changes in soil carbon reserves as influencedby different ecosystems and land use inIndia (NPCC)
T. Bhattacharyya, P. Chandran, M.V. Venugopalan,D.K. Pal, S.K. Ray, C. Mandal, Dipak Sarkar, P. Tiwary,Ankush M. Nimje, Dipanwita Dasgupta, Dipalee V.Balbuddhe
Eleven long term fertilizer experimental sites in black soilregion were selected for evaluating three models viz. RothC, Century and InfoCrop. Rothamsted C and Century Cmodels were evaluated for five Long Term Fertilizer Trials(Table 4.10). The RothC and Century C models wereimprovised to synchronize with humid tropical climate.Weather files of RothC were accounted for June insteadof January. Century crop file was parameterized to suitthe agronomic managements of most of the crops inhumid tropical climate. RothC could simulate changesin TOC with RMSE values ranging from 3.57 to 14.64%for Nabibagh, and 0.59 to 3.17% for Akola. FYM aloneor in combination with fertilizer increase TOCappreciably in Nabibagh and Akola. However, TOC
remained almost similar over years for the control (nofertilizer or manure) and 50% NPK treatments in all thesites. An attempt was made to find out impact of globalwarming on soil carbon reserves using RothC (Fig. 4.12).It is found that the negative impact of global warmingon TOC content seems more when soil is treated as asingle layer rather than a combination of 5 differentlayers. Since soils are composed of multiple layers, threatof increased temperature due to global warming willalways be minimized if RothC is modeled consideringsoils on multiple layers. InfoCrop model simulates yieldcorrectly for the commonly practised cropping patternsand popular crops like cotton, soybean, wheat, kharifrice, maize etc and requires further calibration forsorghum, millets, and winter rice. Changes in temperatureand CO2 concentration have pronounced impact onpotential yield as compared to water limited yieldsimulated by InfoCrop model. Response from 1532farmers, representing 28 districts of 9 states, on theperception of climate change, attributes and signaturesof climate change, and common methods of combatingclimatic aberrations were compiled and analysed todevelop a compendium.
Fig. 4.11 Evaluation of RothC and Century model in different LTFE sites in the
Indo-Gangetic Plains
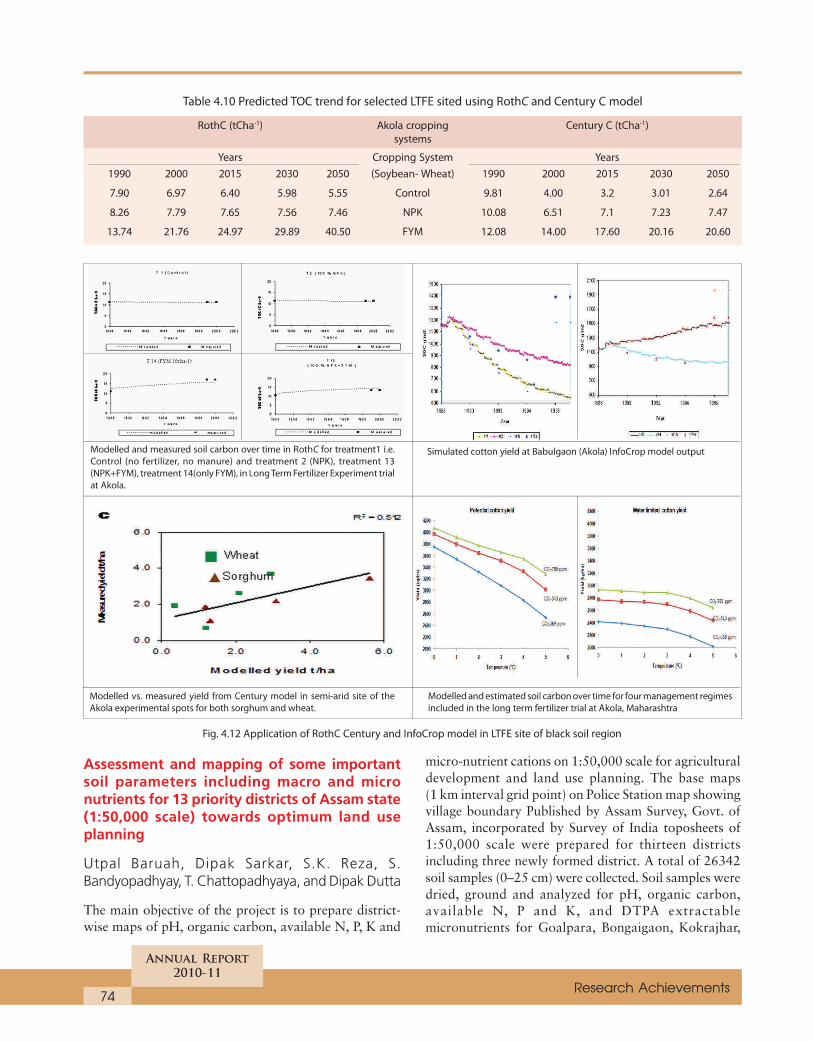
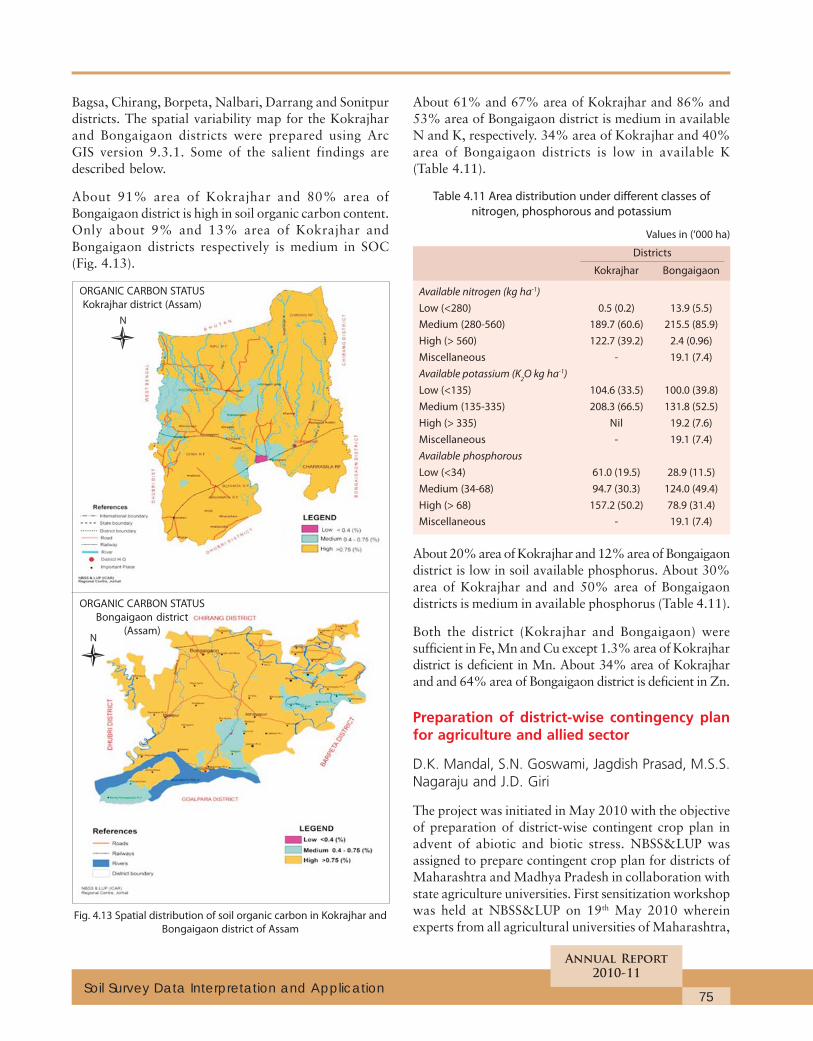
75
Annual Report
2010-11
Soil Survey Data Interpretation and Application
About 61% and 67% area of Kokrajhar and 86% and53% area of Bongaigaon district is medium in availableN and K, respectively. 34% area of Kokrajhar and 40%area of Bongaigaon districts is low in available K(Table 4.11).
Table 4.11 Area distribution under different classes of
nitrogen, phosphorous and potassium
Values in (‘000 ha)
Districts
Kokrajhar Bongaigaon
Available nitrogen (kg ha-1)
Low (<280) 0.5 (0.2) 13.9 (5.5)
Medium (280-560) 189.7 (60.6) 215.5 (85.9)
High (> 560) 122.7 (39.2) 2.4 (0.96)
Miscellaneous - 19.1 (7.4)
Available potassium (K2O kg ha-1)
Low (<135) 104.6 (33.5) 100.0 (39.8)
Medium (135-335) 208.3 (66.5) 131.8 (52.5)
High (> 335) Nil 19.2 (7.6)
Miscellaneous - 19.1 (7.4)
Available phosphorous
Low (<34) 61.0 (19.5) 28.9 (11.5)
Medium (34-68) 94.7 (30.3) 124.0 (49.4)
High (> 68) 157.2 (50.2) 78.9 (31.4)
Miscellaneous - 19.1 (7.4)
About 20% area of Kokrajhar and 12% area of Bongaigaondistrict is low in soil available phosphorus. About 30%area of Kokrajhar and and 50% area of Bongaigaondistricts is medium in available phosphorus (Table 4.11).
Both the district (Kokrajhar and Bongaigaon) weresufficient in Fe, Mn and Cu except 1.3% area of Kokrajhardistrict is deficient in Mn. About 34% area of Kokrajharand and 64% area of Bongaigaon district is deficient in Zn.
Preparation of district-wise contingency planfor agriculture and allied sector
D.K. Mandal, S.N. Goswami, Jagdish Prasad, M.S.S.Nagaraju and J.D. Giri
The project was initiated in May 2010 with the objectiveof preparation of district-wise contingent crop plan inadvent of abiotic and biotic stress. NBSS&LUP wasassigned to prepare contingent crop plan for districts ofMaharashtra and Madhya Pradesh in collaboration withstate agriculture universities. First sensitization workshopwas held at NBSS&LUP on 19th May 2010 whereinexperts from all agricultural universities of Maharashtra,
Bagsa, Chirang, Borpeta, Nalbari, Darrang and Sonitpurdistricts. The spatial variability map for the Kokrajharand Bongaigaon districts were prepared using ArcGIS version 9.3.1. Some of the salient findings aredescribed below.
About 91% area of Kokrajhar and 80% area ofBongaigaon district is high in soil organic carbon content.Only about 9% and 13% area of Kokrajhar andBongaigaon districts respectively is medium in SOC(Fig. 4.13).
Fig. 4.13 Spatial distribution of soil organic carbon in Kokrajhar and
Bongaigaon district of Assam
ORGANIC CARBON STATUS
Kokrajhar district (Assam)
ORGANIC CARBON STATUS
Bongaigaon district
(Assam)
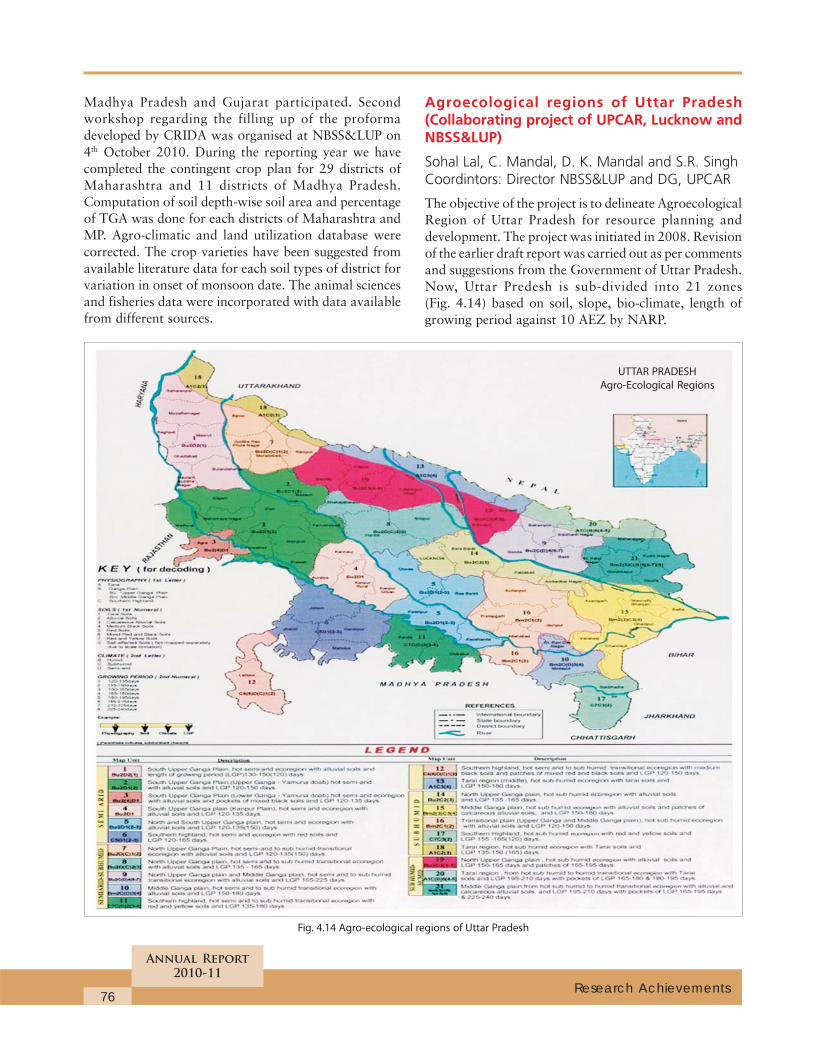
76
Annual Report
2010-11
Research Achievements
Madhya Pradesh and Gujarat participated. Secondworkshop regarding the filling up of the proformadeveloped by CRIDA was organised at NBSS&LUP on4th October 2010. During the reporting year we havecompleted the contingent crop plan for 29 districts ofMaharashtra and 11 districts of Madhya Pradesh.Computation of soil depth-wise soil area and percentageof TGA was done for each districts of Maharashtra andMP. Agro-climatic and land utilization database werecorrected. The crop varieties have been suggested fromavailable literature data for each soil types of district forvariation in onset of monsoon date. The animal sciencesand fisheries data were incorporated with data availablefrom different sources.
Agroecological regions of Uttar Pradesh(Collaborating project of UPCAR, Lucknow andNBSS&LUP)
Sohal Lal, C. Mandal, D. K. Mandal and S.R. SinghCoordintors: Director NBSS&LUP and DG, UPCAR
The objective of the project is to delineate AgroecologicalRegion of Uttar Pradesh for resource planning anddevelopment. The project was initiated in 2008. Revisionof the earlier draft report was carried out as per commentsand suggestions from the Government of Uttar Pradesh.Now, Uttar Predesh is sub-divided into 21 zones(Fig. 4.14) based on soil, slope, bio-climate, length ofgrowing period against 10 AEZ by NARP.
Fig. 4.14 Agro-ecological regions of Uttar Pradesh
UTTAR PRADESH
Agro-Ecological Regions
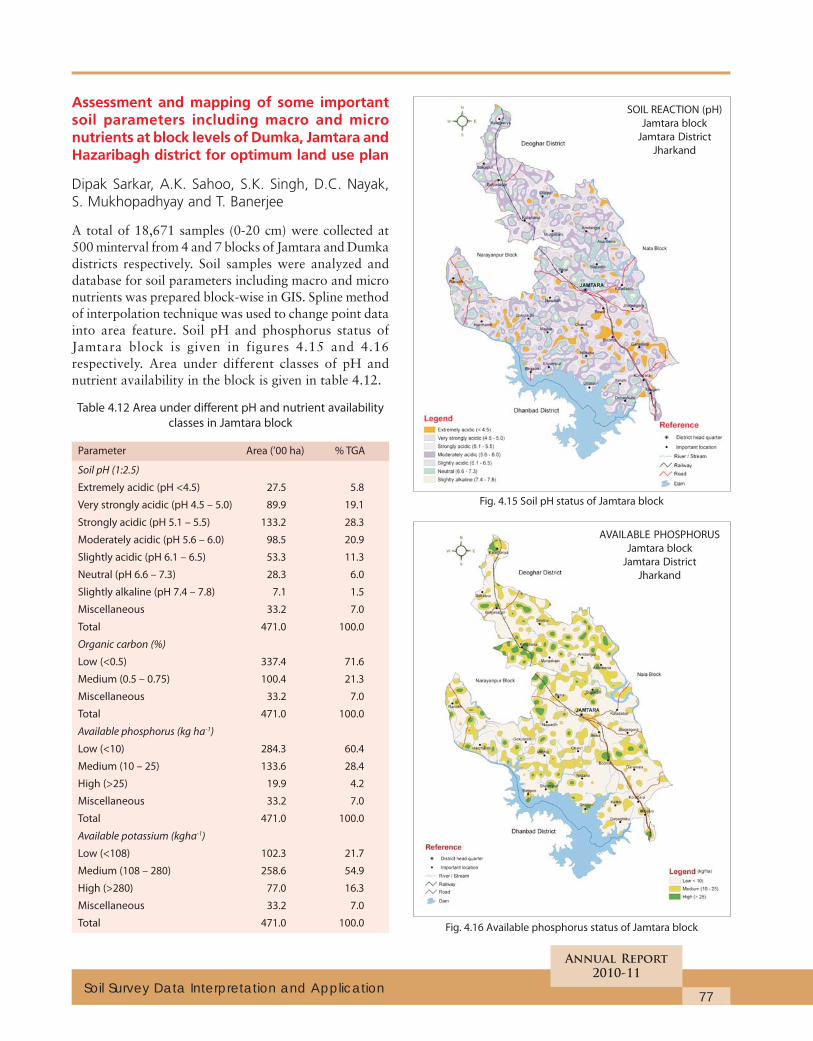
77
Annual Report
2010-11
Soil Survey Data Interpretation and Application
Assessment and mapping of some importantsoil parameters including macro and micronutrients at block levels of Dumka, Jamtara andHazaribagh district for optimum land use plan
Dipak Sarkar, A.K. Sahoo, S.K. Singh, D.C. Nayak,S. Mukhopadhyay and T. Banerjee
A total of 18,671 samples (0-20 cm) were collected at500 minterval from 4 and 7 blocks of Jamtara and Dumkadistricts respectively. Soil samples were analyzed anddatabase for soil parameters including macro and micronutrients was prepared block-wise in GIS. Spline methodof interpolation technique was used to change point datainto area feature. Soil pH and phosphorus status ofJamtara block is given in figures 4.15 and 4.16respectively. Area under different classes of pH andnutrient availability in the block is given in table 4.12.
Table 4.12 Area under different pH and nutrient availability
classes in Jamtara block
Parameter Area (’00 ha) % TGA
Soil pH (1:2.5)
Extremely acidic (pH <4.5) 27.5 5.8
Very strongly acidic (pH 4.5 – 5.0) 89.9 19.1
Strongly acidic (pH 5.1 – 5.5) 133.2 28.3
Moderately acidic (pH 5.6 – 6.0) 98.5 20.9
Slightly acidic (pH 6.1 – 6.5) 53.3 11.3
Neutral (pH 6.6 – 7.3) 28.3 6.0
Slightly alkaline (pH 7.4 – 7.8) 7.1 1.5
Miscellaneous 33.2 7.0
Total 471.0 100.0
Organic carbon (%)
Low (<0.5) 337.4 71.6
Medium (0.5 – 0.75) 100.4 21.3
Miscellaneous 33.2 7.0
Total 471.0 100.0
Available phosphorus (kg ha-1)
Low (<10) 284.3 60.4
Medium (10 – 25) 133.6 28.4
High (>25) 19.9 4.2
Miscellaneous 33.2 7.0
Total 471.0 100.0
Available potassium (kgha-1)
Low (<108) 102.3 21.7
Medium (108 – 280) 258.6 54.9
High (>280) 77.0 16.3
Miscellaneous 33.2 7.0
Total 471.0 100.0 Fig. 4.16 Available phosphorus status of Jamtara block
Fig. 4.15 Soil pH status of Jamtara block
SOIL REACTION (pH)
Jamtara block
Jamtara District
Jharkand
AVAILABLE PHOSPHORUS
Jamtara block
Jamtara District
Jharkand
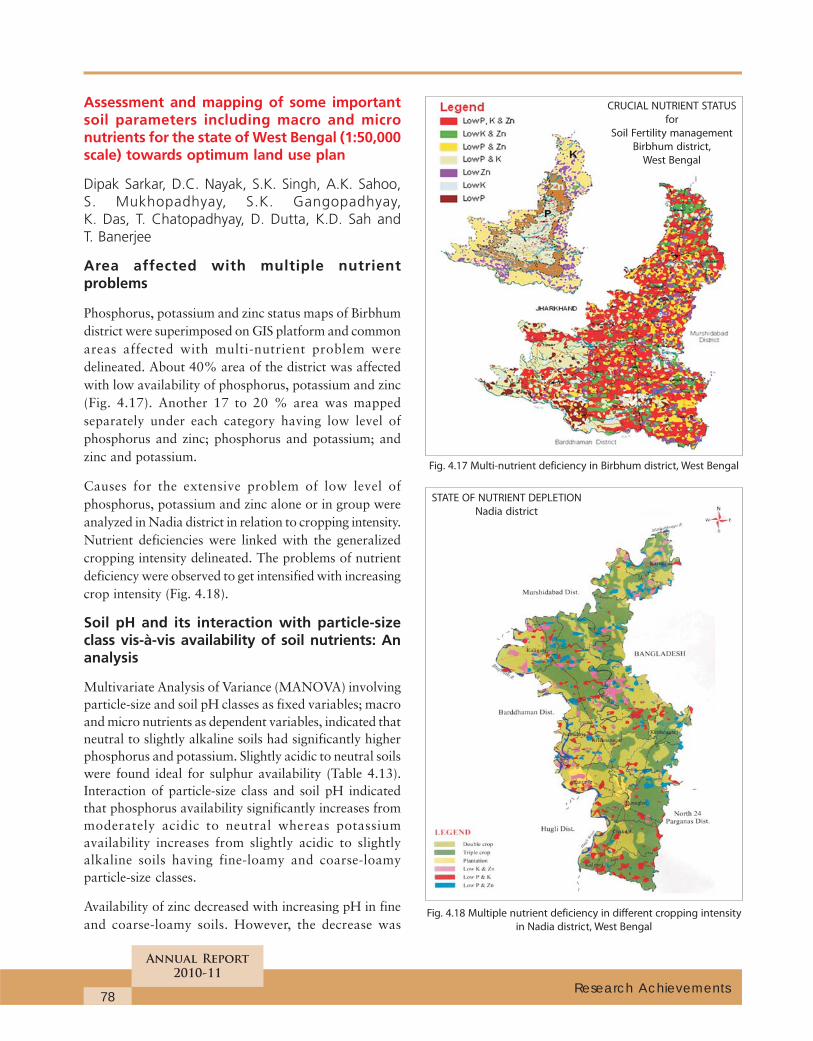
78
Annual Report
2010-11
Research Achievements
Assessment and mapping of some importantsoil parameters including macro and micronutrients for the state of West Bengal (1:50,000scale) towards optimum land use plan
Dipak Sarkar, D.C. Nayak, S.K. Singh, A.K. Sahoo,S. Mukhopadhyay, S.K. Gangopadhyay,K. Das, T. Chatopadhyay, D. Dutta, K.D. Sah andT. Banerjee
Area affected with multiple nutrientproblems
Phosphorus, potassium and zinc status maps of Birbhumdistrict were superimposed on GIS platform and commonareas affected with multi-nutrient problem weredelineated. About 40% area of the district was affectedwith low availability of phosphorus, potassium and zinc(Fig. 4.17). Another 17 to 20 % area was mappedseparately under each category having low level ofphosphorus and zinc; phosphorus and potassium; andzinc and potassium.
Causes for the extensive problem of low level ofphosphorus, potassium and zinc alone or in group wereanalyzed in Nadia district in relation to cropping intensity.Nutrient deficiencies were linked with the generalizedcropping intensity delineated. The problems of nutrientdeficiency were observed to get intensified with increasingcrop intensity (Fig. 4.18).
Soil pH and its interaction with particle-sizeclass vis-à-vis availability of soil nutrients: Ananalysis
Multivariate Analysis of Variance (MANOVA) involvingparticle-size and soil pH classes as fixed variables; macroand micro nutrients as dependent variables, indicated thatneutral to slightly alkaline soils had significantly higherphosphorus and potassium. Slightly acidic to neutral soilswere found ideal for sulphur availability (Table 4.13).Interaction of particle-size class and soil pH indicatedthat phosphorus availability significantly increases frommoderately acidic to neutral whereas potassiumavailability increases from slightly acidic to slightlyalkaline soils having fine-loamy and coarse-loamyparticle-size classes.
Availability of zinc decreased with increasing pH in fineand coarse-loamy soils. However, the decrease was
Fig. 4.18 Multiple nutrient deficiency in different cropping intensity
in Nadia district, West Bengal
Fig. 4.17 Multi-nutrient deficiency in Birbhum district, West Bengal
CRUCIAL NUTRIENT STATUS
for
Soil Fertility management
Birbhum district,
West Bengal
STATE OF NUTRIENT DEPLETION
Nadia district
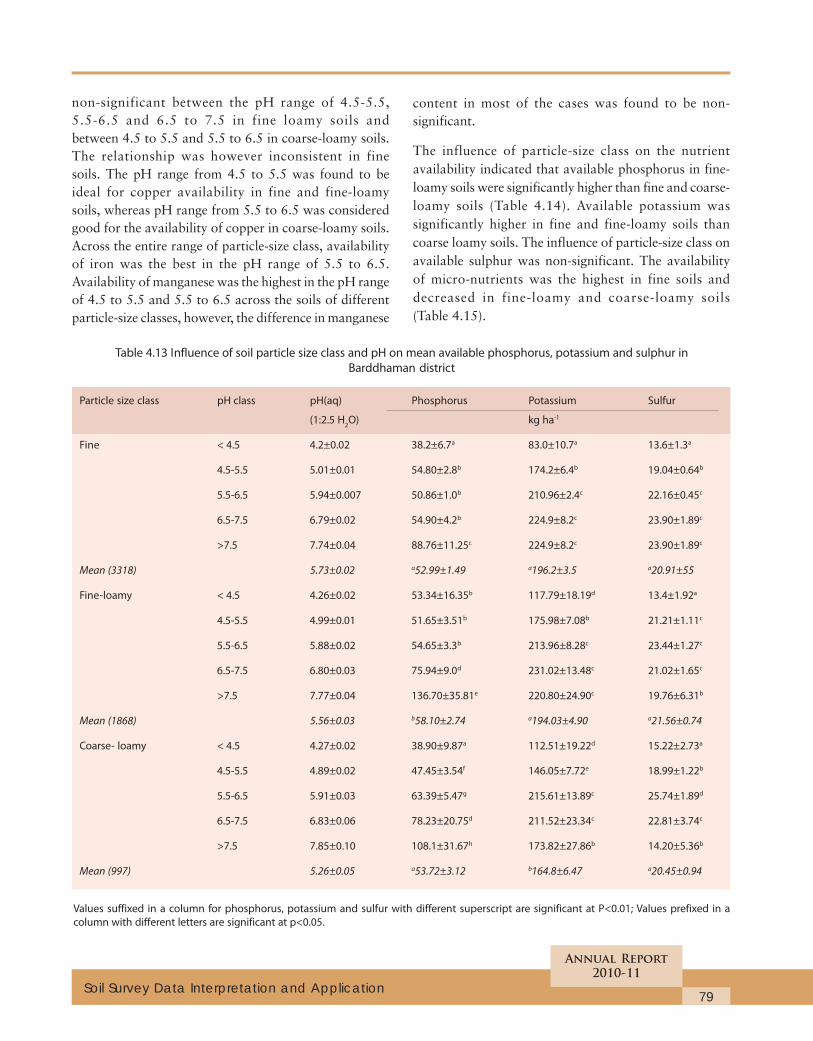
79
Annual Report
2010-11
Soil Survey Data Interpretation and Application
non-significant between the pH range of 4.5-5.5,5.5-6.5 and 6.5 to 7.5 in fine loamy soils andbetween 4.5 to 5.5 and 5.5 to 6.5 in coarse-loamy soils.The relationship was however inconsistent in finesoils. The pH range from 4.5 to 5.5 was found to beideal for copper availability in fine and fine-loamysoils, whereas pH range from 5.5 to 6.5 was consideredgood for the availability of copper in coarse-loamy soils.Across the entire range of particle-size class, availabilityof iron was the best in the pH range of 5.5 to 6.5.Availability of manganese was the highest in the pH rangeof 4.5 to 5.5 and 5.5 to 6.5 across the soils of differentparticle-size classes, however, the difference in manganese
content in most of the cases was found to be non-significant.
The influence of particle-size class on the nutrientavailability indicated that available phosphorus in fine-loamy soils were significantly higher than fine and coarse-loamy soils (Table 4.14). Available potassium wassignificantly higher in fine and fine-loamy soils thancoarse loamy soils. The influence of particle-size class onavailable sulphur was non-significant. The availabilityof micro-nutrients was the highest in fine soils anddecreased in fine-loamy and coarse-loamy soils(Table 4.15).
Table 4.13 Influence of soil particle size class and pH on mean available phosphorus, potassium and sulphur in
Barddhaman district
Particle size class pH class pH(aq) Phosphorus Potassium Sulfur
(1:2.5 H2O) kg ha-1
Fine < 4.5 4.2±0.02 38.2±6.7a 83.0±10.7a 13.6±1.3a
4.5-5.5 5.01±0.01 54.80±2.8b 174.2±6.4b 19.04±0.64b
5.5-6.5 5.94±0.007 50.86±1.0b 210.96±2.4c 22.16±0.45c
6.5-7.5 6.79±0.02 54.90±4.2b 224.9±8.2c 23.90±1.89c
>7.5 7.74±0.04 88.76±11.25c 224.9±8.2c 23.90±1.89c
Mean (3318) 5.73±0.02 a52.99±1.49 a196.2±3.5 a20.91±55
Fine-loamy < 4.5 4.26±0.02 53.34±16.35b 117.79±18.19d 13.4±1.92a
4.5-5.5 4.99±0.01 51.65±3.51b 175.98±7.08b 21.21±1.11c
5.5-6.5 5.88±0.02 54.65±3.3b 213.96±8.28c 23.44±1.27c
6.5-7.5 6.80±0.03 75.94±9.0d 231.02±13.48c 21.02±1.65c
>7.5 7.77±0.04 136.70±35.81e 220.80±24.90c 19.76±6.31b
Mean (1868) 5.56±0.03 b58.10±2.74 a194.03±4.90 a21.56±0.74
Coarse- loamy < 4.5 4.27±0.02 38.90±9.87a 112.51±19.22d 15.22±2.73a
4.5-5.5 4.89±0.02 47.45±3.54f 146.05±7.72e 18.99±1.22b
5.5-6.5 5.91±0.03 63.39±5.47g 215.61±13.89c 25.74±1.89d
6.5-7.5 6.83±0.06 78.23±20.75d 211.52±23.34c 22.81±3.74c
>7.5 7.85±0.10 108.1±31.67h 173.82±27.86b 14.20±5.36b
Mean (997) 5.26±0.05 a53.72±3.12 b164.8±6.47 a20.45±0.94
Values suffixed in a column for phosphorus, potassium and sulfur with different superscript are significant at P<0.01; Values prefixed in a
column with different letters are significant at p<0.05.
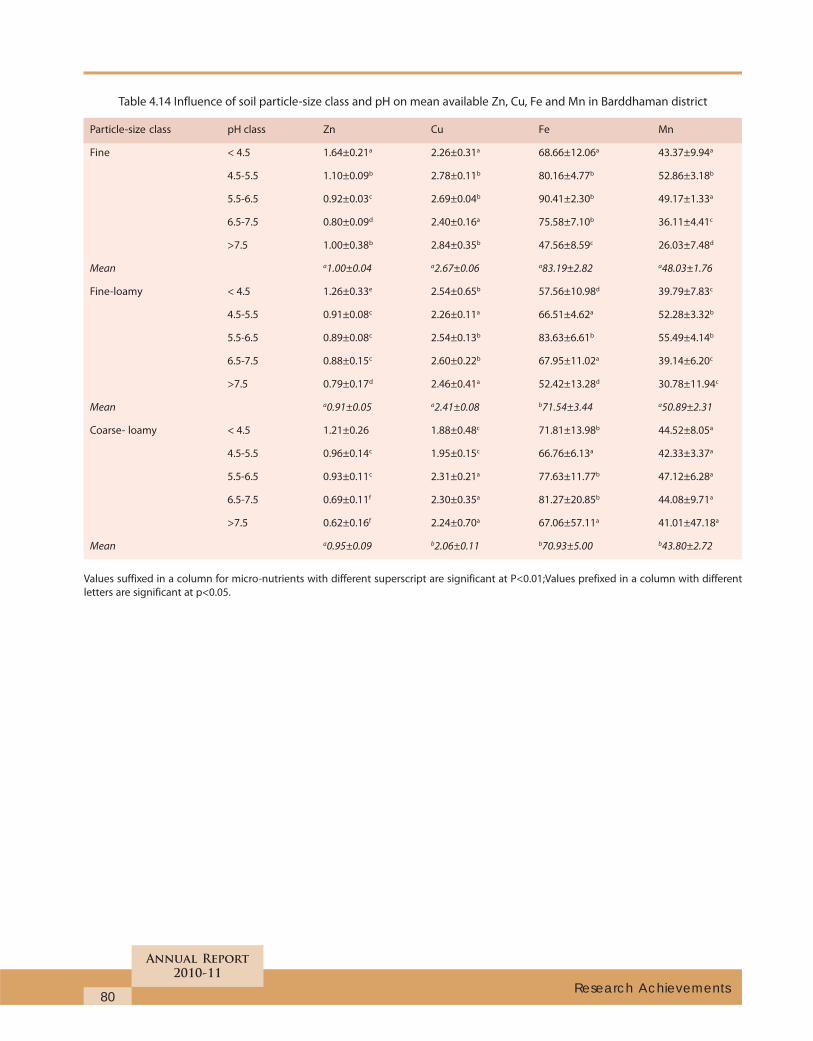
80
Annual Report
2010-11
Research Achievements
Table 4.14 Influence of soil particle-size class and pH on mean available Zn, Cu, Fe and Mn in Barddhaman district
Particle-size class pH class Zn Cu Fe Mn
Fine < 4.5 1.64±0.21a 2.26±0.31a 68.66±12.06a 43.37±9.94a
4.5-5.5 1.10±0.09b 2.78±0.11b 80.16±4.77b 52.86±3.18b
5.5-6.5 0.92±0.03c 2.69±0.04b 90.41±2.30b 49.17±1.33a
6.5-7.5 0.80±0.09d 2.40±0.16a 75.58±7.10b 36.11±4.41c
>7.5 1.00±0.38b 2.84±0.35b 47.56±8.59c 26.03±7.48d
Mean a1.00±0.04 a2.67±0.06 a83.19±2.82 a48.03±1.76
Fine-loamy < 4.5 1.26±0.33e 2.54±0.65b 57.56±10.98d 39.79±7.83c
4.5-5.5 0.91±0.08c 2.26±0.11a 66.51±4.62a 52.28±3.32b
5.5-6.5 0.89±0.08c 2.54±0.13b 83.63±6.61b 55.49±4.14b
6.5-7.5 0.88±0.15c 2.60±0.22b 67.95±11.02a 39.14±6.20c
>7.5 0.79±0.17d 2.46±0.41a 52.42±13.28d 30.78±11.94c
Mean a0.91±0.05 a2.41±0.08 b71.54±3.44 a50.89±2.31
Coarse- loamy < 4.5 1.21±0.26 1.88±0.48c 71.81±13.98b 44.52±8.05a
4.5-5.5 0.96±0.14c 1.95±0.15c 66.76±6.13a 42.33±3.37a
5.5-6.5 0.93±0.11c 2.31±0.21a 77.63±11.77b 47.12±6.28a
6.5-7.5 0.69±0.11f 2.30±0.35a 81.27±20.85b 44.08±9.71a
>7.5 0.62±0.16f 2.24±0.70a 67.06±57.11a 41.01±47.18a
Mean a0.95±0.09 b2.06±0.11 b70.93±5.00 b43.80±2.72
Values suffixed in a column for micro-nutrients with different superscript are significant at P<0.01;Values prefixed in a column with different
letters are significant at p<0.05.
81
Annual Report
2010-11
Land Evaluation and Land Use Planning
Dynamics of land use plan and its impact onsoil properties in Nawanshahr district, Punjabstate
G.S. Sidhu, Tarsem Lal, Jaya N. Surya, J.P. Sharmaand D.K. Katiyar
One hundred twenty farmers were interviewed in differentblocks during the field work and socio-economic datawas collected through comprehensive questionnaire.Besides, secondary data was also collected to supplementthe primary data covering land use and croppingpattern. Data collected have been analysed using the SPSSsoftware and interpreted showing the distribution,variation and temporal change in different socio-economic variables.
According to 2001 census, the total population of thedistrict was 5.06 lakh. The district has experienced 9%growth of population during 1991-2001. The area hasthe joint family system. Literacy study shows that 16.10%of the farmers are illiterate. 21% farmers have primaryeducation while 29% have middle level and 25% havematric level education.
In the sample survey it was observed that 21% farmershave 1-2 acres of land holdings while 26% farmers have2-5 acres, 27% farmers 5-10 acres of land holdings and25% farmers > 10 acres of land. Size of land holdings iscomparatively higher in the active flood plain where theland was comparatively cheaper and also the governmentland was distributed among weaker section on the leasebasis. Thirty two per cent workers in the district areengaged in agriculture work. Further data indicate that70% of the farmers have tractors and others hire thetractors from others.
Twenty four per cent area in the district has groundwaterdepth upto 50 feet, 52% area has a depth of 50-70 feet,20% has 80-140 feet and 27% area has ground waterdepth of >140 feet. Highest depth of ground water tableis observed in Saroya block where the entire area hasdepth of more than 140 feet owing to the terrain featurein the Shiwaliks. Another block where the ground waterhas highest depth is Balachaur block. Its 43% area hasdepth of >140 feet.
The major crops grown in Nawanshahr during 1950 and60s were maize, cotton, blackgram, mungbean,
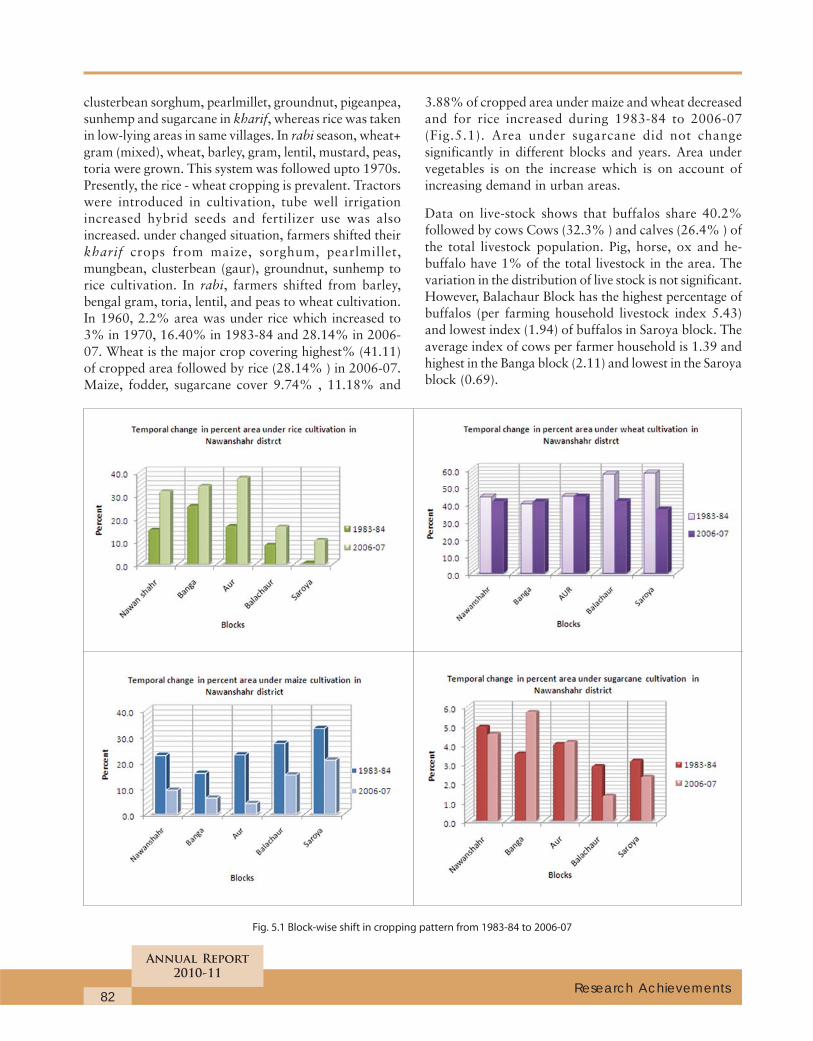
82
Annual Report
2010-11
Research Achievements
clusterbean sorghum, pearlmillet, groundnut, pigeanpea,sunhemp and sugarcane in kharif, whereas rice was takenin low-lying areas in same villages. In rabi season, wheat+gram (mixed), wheat, barley, gram, lentil, mustard, peas,toria were grown. This system was followed upto 1970s.Presently, the rice - wheat cropping is prevalent. Tractorswere introduced in cultivation, tube well irrigationincreased hybrid seeds and fertilizer use was alsoincreased. under changed situation, farmers shifted theirkharif crops from maize, sorghum, pearlmillet,mungbean, clusterbean (gaur), groundnut, sunhemp torice cultivation. In rabi, farmers shifted from barley,bengal gram, toria, lentil, and peas to wheat cultivation.In 1960, 2.2% area was under rice which increased to3% in 1970, 16.40% in 1983-84 and 28.14% in 2006-07. Wheat is the major crop covering highest% (41.11)of cropped area followed by rice (28.14% ) in 2006-07.Maize, fodder, sugarcane cover 9.74% , 11.18% and
3.88% of cropped area under maize and wheat decreasedand for rice increased during 1983-84 to 2006-07(Fig.5.1). Area under sugarcane did not changesignificantly in different blocks and years. Area undervegetables is on the increase which is on account ofincreasing demand in urban areas.
Data on live-stock shows that buffalos share 40.2%followed by cows Cows (32.3% ) and calves (26.4% ) ofthe total livestock population. Pig, horse, ox and he-buffalo have 1% of the total livestock in the area. Thevariation in the distribution of live stock is not significant.However, Balachaur Block has the highest percentage ofbuffalos (per farming household livestock index 5.43)and lowest index (1.94) of buffalos in Saroya block. Theaverage index of cows per farmer household is 1.39 andhighest in the Banga block (2.11) and lowest in the Saroyablock (0.69).
Fig. 5.1 Block-wise shift in cropping pattern from 1983-84 to 2006-07
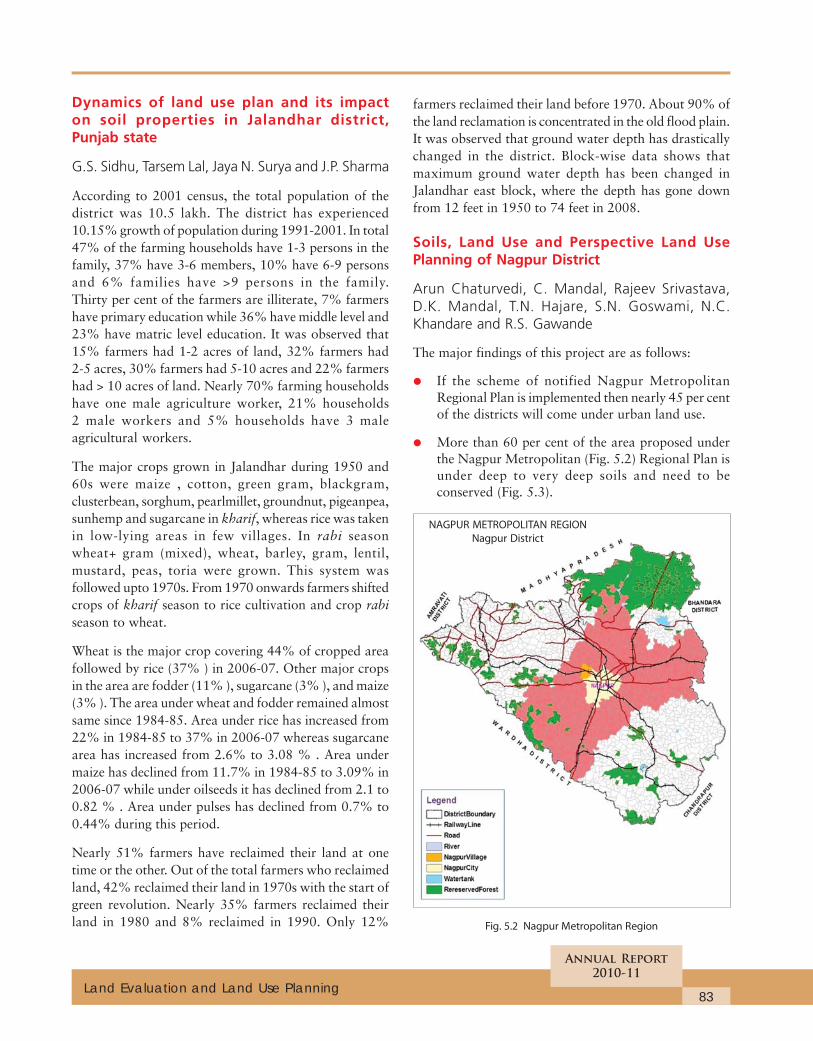
83
Annual Report
2010-11
Land Evaluation and Land Use Planning
Dynamics of land use plan and its impacton soil properties in Jalandhar district,Punjab state
G.S. Sidhu, Tarsem Lal, Jaya N. Surya and J.P. Sharma
According to 2001 census, the total population of thedistrict was 10.5 lakh. The district has experienced10.15% growth of population during 1991-2001. In total47% of the farming households have 1-3 persons in thefamily, 37% have 3-6 members, 10% have 6-9 personsand 6% families have >9 persons in the family.Thirty per cent of the farmers are illiterate, 7% farmershave primary education while 36% have middle level and23% have matric level education. It was observed that15% farmers had 1-2 acres of land, 32% farmers had2-5 acres, 30% farmers had 5-10 acres and 22% farmershad > 10 acres of land. Nearly 70% farming householdshave one male agriculture worker, 21% households2 male workers and 5% households have 3 maleagricultural workers.
The major crops grown in Jalandhar during 1950 and60s were maize , cotton, green gram, blackgram,clusterbean, sorghum, pearlmillet, groundnut, pigeanpea,sunhemp and sugarcane in kharif, whereas rice was takenin low-lying areas in few villages. In rabi seasonwheat+ gram (mixed), wheat, barley, gram, lentil,mustard, peas, toria were grown. This system wasfollowed upto 1970s. From 1970 onwards farmers shiftedcrops of kharif season to rice cultivation and crop rabiseason to wheat.
Wheat is the major crop covering 44% of cropped areafollowed by rice (37% ) in 2006-07. Other major cropsin the area are fodder (11% ), sugarcane (3% ), and maize(3% ). The area under wheat and fodder remained almostsame since 1984-85. Area under rice has increased from22% in 1984-85 to 37% in 2006-07 whereas sugarcanearea has increased from 2.6% to 3.08 % . Area undermaize has declined from 11.7% in 1984-85 to 3.09% in2006-07 while under oilseeds it has declined from 2.1 to0.82 % . Area under pulses has declined from 0.7% to0.44% during this period.
Nearly 51% farmers have reclaimed their land at onetime or the other. Out of the total farmers who reclaimedland, 42% reclaimed their land in 1970s with the start ofgreen revolution. Nearly 35% farmers reclaimed theirland in 1980 and 8% reclaimed in 1990. Only 12%
farmers reclaimed their land before 1970. About 90% ofthe land reclamation is concentrated in the old flood plain.It was observed that ground water depth has drasticallychanged in the district. Block-wise data shows thatmaximum ground water depth has been changed inJalandhar east block, where the depth has gone downfrom 12 feet in 1950 to 74 feet in 2008.
Soils, Land Use and Perspective Land UsePlanning of Nagpur District
Arun Chaturvedi, C. Mandal, Rajeev Srivastava,D.K. Mandal, T.N. Hajare, S.N. Goswami, N.C.Khandare and R.S. Gawande
The major findings of this project are as follows:
• If the scheme of notified Nagpur MetropolitanRegional Plan is implemented then nearly 45 per centof the districts will come under urban land use.
• More than 60 per cent of the area proposed underthe Nagpur Metropolitan (Fig. 5.2) Regional Plan isunder deep to very deep soils and need to beconserved (Fig. 5.3).
Fig. 5.2 Nagpur Metropolitan Region
NAGPUR METROPOLITAN REGION
Nagpur District
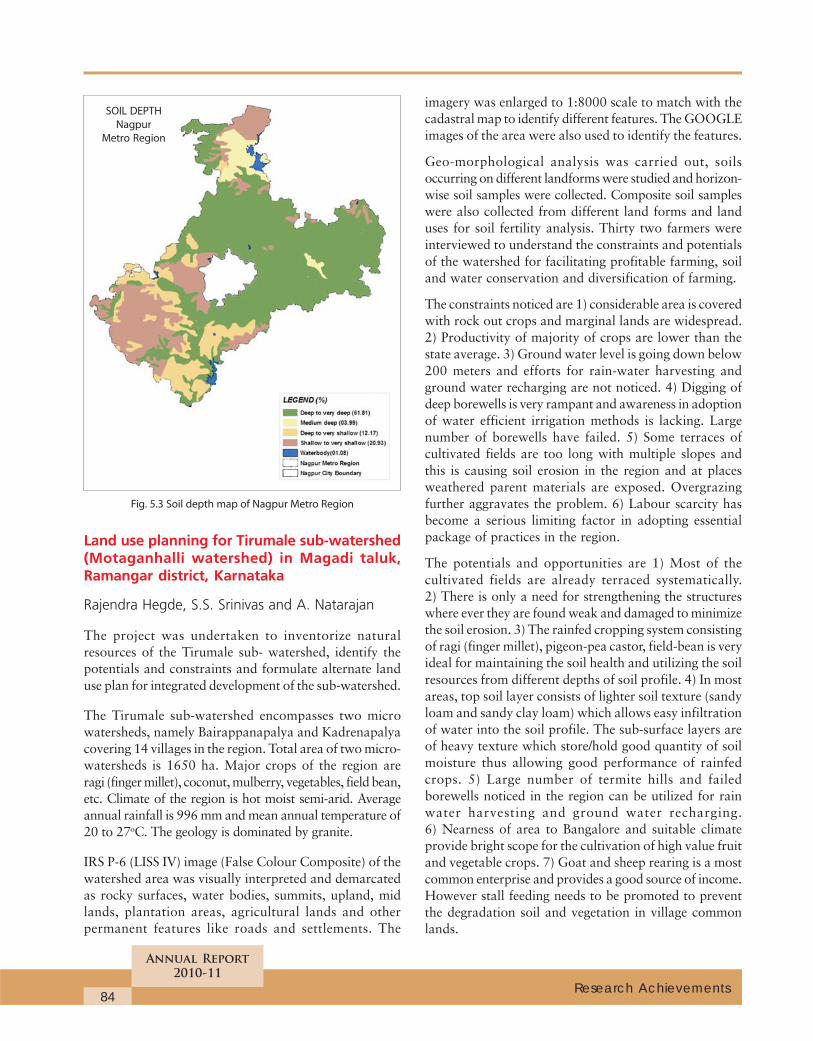
84
Annual Report
2010-11
Research Achievements
Land use planning for Tirumale sub-watershed(Motaganhalli watershed) in Magadi taluk,Ramangar district, Karnataka
Rajendra Hegde, S.S. Srinivas and A. Natarajan
The project was undertaken to inventorize naturalresources of the Tirumale sub- watershed, identify thepotentials and constraints and formulate alternate landuse plan for integrated development of the sub-watershed.
The Tirumale sub-watershed encompasses two microwatersheds, namely Bairappanapalya and Kadrenapalyacovering 14 villages in the region. Total area of two micro-watersheds is 1650 ha. Major crops of the region areragi (finger millet), coconut, mulberry, vegetables, field bean,etc. Climate of the region is hot moist semi-arid. Averageannual rainfall is 996 mm and mean annual temperature of20 to 27oC. The geology is dominated by granite.
IRS P-6 (LISS IV) image (False Colour Composite) of thewatershed area was visually interpreted and demarcatedas rocky surfaces, water bodies, summits, upland, midlands, plantation areas, agricultural lands and otherpermanent features like roads and settlements. The
imagery was enlarged to 1:8000 scale to match with thecadastral map to identify different features. The GOOGLEimages of the area were also used to identify the features.
Geo-morphological analysis was carried out, soilsoccurring on different landforms were studied and horizon-wise soil samples were collected. Composite soil sampleswere also collected from different land forms and landuses for soil fertility analysis. Thirty two farmers wereinterviewed to understand the constraints and potentialsof the watershed for facilitating profitable farming, soiland water conservation and diversification of farming.
The constraints noticed are 1) considerable area is coveredwith rock out crops and marginal lands are widespread.2) Productivity of majority of crops are lower than thestate average. 3) Ground water level is going down below200 meters and efforts for rain-water harvesting andground water recharging are not noticed. 4) Digging ofdeep borewells is very rampant and awareness in adoptionof water efficient irrigation methods is lacking. Largenumber of borewells have failed. 5) Some terraces ofcultivated fields are too long with multiple slopes andthis is causing soil erosion in the region and at placesweathered parent materials are exposed. Overgrazingfurther aggravates the problem. 6) Labour scarcity hasbecome a serious limiting factor in adopting essentialpackage of practices in the region.
The potentials and opportunities are 1) Most of thecultivated fields are already terraced systematically.2) There is only a need for strengthening the structureswhere ever they are found weak and damaged to minimizethe soil erosion. 3) The rainfed cropping system consistingof ragi (finger millet), pigeon-pea castor, field-bean is veryideal for maintaining the soil health and utilizing the soilresources from different depths of soil profile. 4) In mostareas, top soil layer consists of lighter soil texture (sandyloam and sandy clay loam) which allows easy infiltrationof water into the soil profile. The sub-surface layers areof heavy texture which store/hold good quantity of soilmoisture thus allowing good performance of rainfedcrops. 5) Large number of termite hills and failedborewells noticed in the region can be utilized for rainwater harvesting and ground water recharging.6) Nearness of area to Bangalore and suitable climateprovide bright scope for the cultivation of high value fruitand vegetable crops. 7) Goat and sheep rearing is a mostcommon enterprise and provides a good source of income.However stall feeding needs to be promoted to preventthe degradation soil and vegetation in village commonlands.
SOIL DEPTH
Nagpur
Metro Region
Fig. 5.3 Soil depth map of Nagpur Metro Region
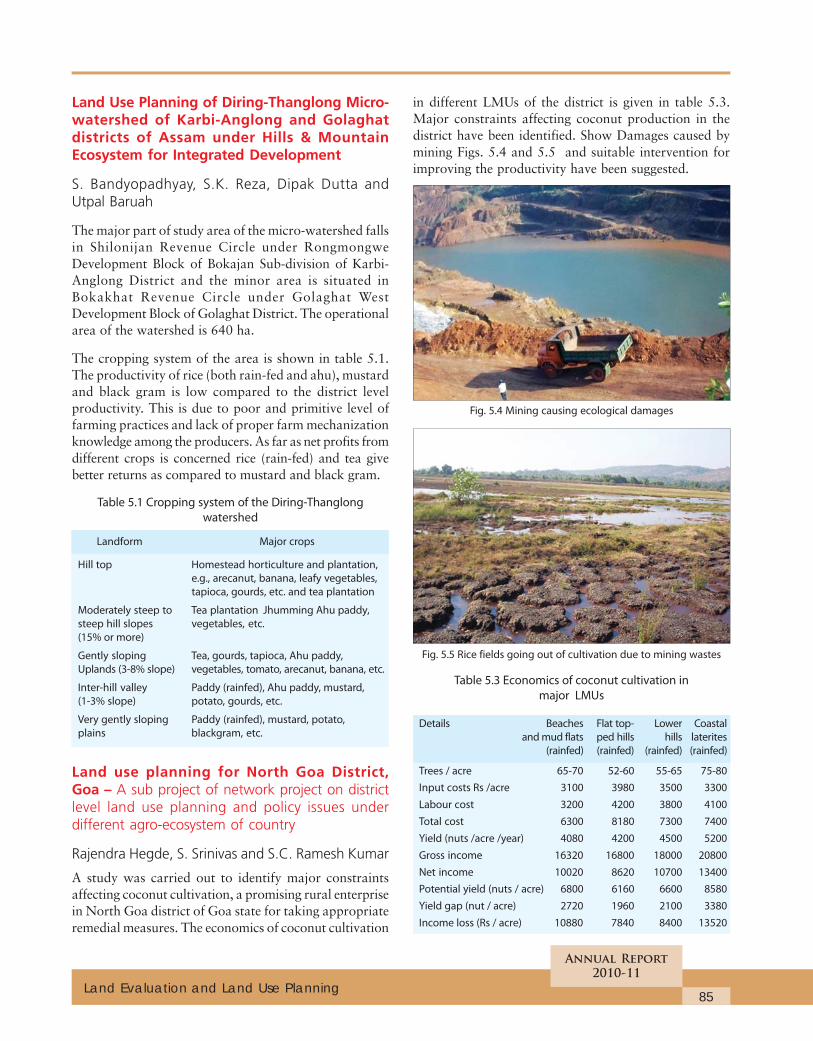
85
Annual Report
2010-11
Land Evaluation and Land Use Planning
Land Use Planning of Diring-Thanglong Micro-watershed of Karbi-Anglong and Golaghatdistricts of Assam under Hills & MountainEcosystem for Integrated Development
S. Bandyopadhyay, S.K. Reza, Dipak Dutta andUtpal Baruah
The major part of study area of the micro-watershed fallsin Shilonijan Revenue Circle under RongmongweDevelopment Block of Bokajan Sub-division of Karbi-Anglong District and the minor area is situated inBokakhat Revenue Circle under Golaghat WestDevelopment Block of Golaghat District. The operationalarea of the watershed is 640 ha.
The cropping system of the area is shown in table 5.1.The productivity of rice (both rain-fed and ahu), mustardand black gram is low compared to the district levelproductivity. This is due to poor and primitive level offarming practices and lack of proper farm mechanizationknowledge among the producers. As far as net profits fromdifferent crops is concerned rice (rain-fed) and tea givebetter returns as compared to mustard and black gram.
Table 5.1 Cropping system of the Diring-Thanglong
watershed
Landform Major crops
Hill top Homestead horticulture and plantation,
e.g., arecanut, banana, leafy vegetables,
tapioca, gourds, etc. and tea plantation
Moderately steep to Tea plantation Jhumming Ahu paddy,
steep hill slopes vegetables, etc.
(15% or more)
Gently sloping Tea, gourds, tapioca, Ahu paddy,
Uplands (3-8% slope) vegetables, tomato, arecanut, banana, etc.
Inter-hill valley Paddy (rainfed), Ahu paddy, mustard,
(1-3% slope) potato, gourds, etc.
Very gently sloping Paddy (rainfed), mustard, potato,
plains blackgram, etc.
Land use planning for North Goa District,Goa – A sub project of network project on districtlevel land use planning and policy issues underdifferent agro-ecosystem of country
Rajendra Hegde, S. Srinivas and S.C. Ramesh Kumar
A study was carried out to identify major constraintsaffecting coconut cultivation, a promising rural enterprisein North Goa district of Goa state for taking appropriateremedial measures. The economics of coconut cultivation
in different LMUs of the district is given in table 5.3.Major constraints affecting coconut production in thedistrict have been identified. Show Damages caused bymining Figs. 5.4 and 5.5 and suitable intervention forimproving the productivity have been suggested.
Fig. 5.4 Mining causing ecological damages
Fig. 5.5 Rice fields going out of cultivation due to mining wastes
Table 5.3 Economics of coconut cultivation in
major LMUs
Details Beaches Flat top- Lower Coastal
and mud flats ped hills hills laterites
(rainfed) (rainfed) (rainfed) (rainfed)
Trees / acre 65-70 52-60 55-65 75-80
Input costs Rs /acre 3100 3980 3500 3300
Labour cost 3200 4200 3800 4100
Total cost 6300 8180 7300 7400
Yield (nuts /acre /year) 4080 4200 4500 5200
Gross income 16320 16800 18000 20800
Net income 10020 8620 10700 13400
Potential yield (nuts / acre) 6800 6160 6600 8580
Yield gap (nut / acre) 2720 1960 2100 3380
Income loss (Rs / acre) 10880 7840 8400 13520
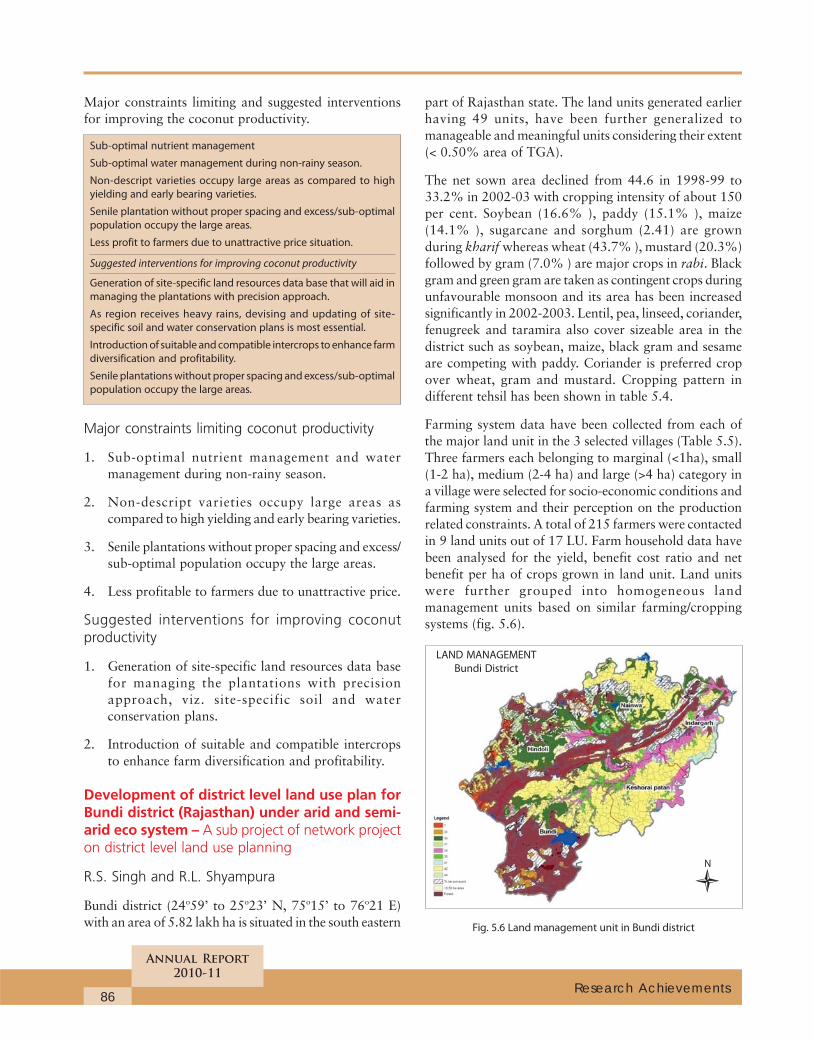
86
Annual Report
2010-11
Research Achievements
Major constraints limiting and suggested interventionsfor improving the coconut productivity.
Sub-optimal nutrient management
Sub-optimal water management during non-rainy season.
Non-descript varieties occupy large areas as compared to high
yielding and early bearing varieties.
Senile plantation without proper spacing and excess/sub-optimal
population occupy the large areas.
Less profit to farmers due to unattractive price situation.
Suggested interventions for improving coconut productivity
Generation of site-specific land resources data base that will aid in
managing the plantations with precision approach.
As region receives heavy rains, devising and updating of site-
specific soil and water conservation plans is most essential.
Introduction of suitable and compatible intercrops to enhance farm
diversification and profitability.
Senile plantations without proper spacing and excess/sub-optimal
population occupy the large areas.
Major constraints limiting coconut productivity
1. Sub-optimal nutrient management and watermanagement during non-rainy season.
2. Non-descript varieties occupy large areas ascompared to high yielding and early bearing varieties.
3. Senile plantations without proper spacing and excess/sub-optimal population occupy the large areas.
4. Less profitable to farmers due to unattractive price.
Suggested interventions for improving coconutproductivity
1. Generation of site-specific land resources data basefor managing the plantations with precisionapproach, viz. site-specific soil and waterconservation plans.
2. Introduction of suitable and compatible intercropsto enhance farm diversification and profitability.
Development of district level land use plan forBundi district (Rajasthan) under arid and semi-arid eco system – A sub project of network projecton district level land use planning
R.S. Singh and R.L. Shyampura
Bundi district (24o59’ to 25o23’ N, 75o15’ to 76o21 E)with an area of 5.82 lakh ha is situated in the south eastern
part of Rajasthan state. The land units generated earlierhaving 49 units, have been further generalized tomanageable and meaningful units considering their extent(< 0.50% area of TGA).
The net sown area declined from 44.6 in 1998-99 to33.2% in 2002-03 with cropping intensity of about 150per cent. Soybean (16.6% ), paddy (15.1% ), maize(14.1% ), sugarcane and sorghum (2.41) are grownduring kharif whereas wheat (43.7% ), mustard (20.3%)followed by gram (7.0% ) are major crops in rabi. Blackgram and green gram are taken as contingent crops duringunfavourable monsoon and its area has been increasedsignificantly in 2002-2003. Lentil, pea, linseed, coriander,fenugreek and taramira also cover sizeable area in thedistrict such as soybean, maize, black gram and sesameare competing with paddy. Coriander is preferred cropover wheat, gram and mustard. Cropping pattern indifferent tehsil has been shown in table 5.4.
Farming system data have been collected from each ofthe major land unit in the 3 selected villages (Table 5.5).Three farmers each belonging to marginal (<1ha), small(1-2 ha), medium (2-4 ha) and large (>4 ha) category ina village were selected for socio-economic conditions andfarming system and their perception on the productionrelated constraints. A total of 215 farmers were contactedin 9 land units out of 17 LU. Farm household data havebeen analysed for the yield, benefit cost ratio and netbenefit per ha of crops grown in land unit. Land unitswere further grouped into homogeneous landmanagement units based on similar farming/croppingsystems (fig. 5.6).
Fig. 5.6 Land management unit in Bundi district
LAND MANAGEMENT
Bundi District
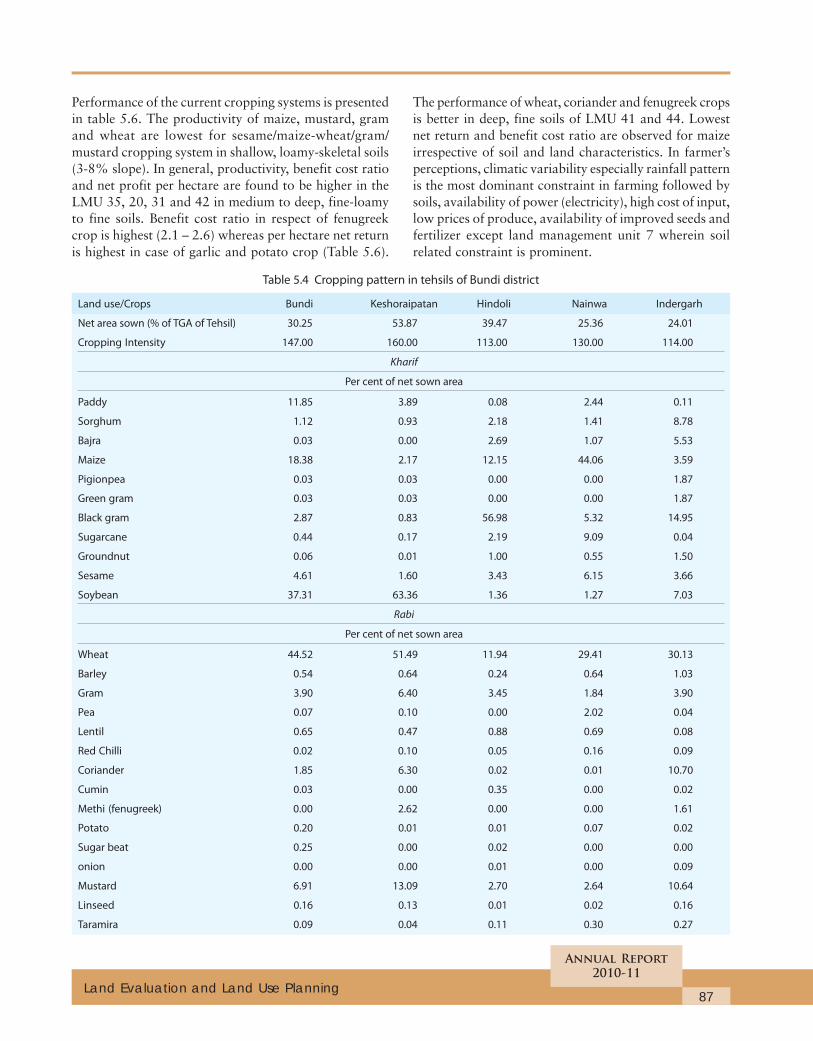
87
Annual Report
2010-11
Land Evaluation and Land Use Planning
Performance of the current cropping systems is presentedin table 5.6. The productivity of maize, mustard, gramand wheat are lowest for sesame/maize-wheat/gram/mustard cropping system in shallow, loamy-skeletal soils(3-8% slope). In general, productivity, benefit cost ratioand net profit per hectare are found to be higher in theLMU 35, 20, 31 and 42 in medium to deep, fine-loamyto fine soils. Benefit cost ratio in respect of fenugreekcrop is highest (2.1 – 2.6) whereas per hectare net returnis highest in case of garlic and potato crop (Table 5.6).
The performance of wheat, coriander and fenugreek cropsis better in deep, fine soils of LMU 41 and 44. Lowestnet return and benefit cost ratio are observed for maizeirrespective of soil and land characteristics. In farmer’sperceptions, climatic variability especially rainfall patternis the most dominant constraint in farming followed bysoils, availability of power (electricity), high cost of input,low prices of produce, availability of improved seeds andfertilizer except land management unit 7 wherein soilrelated constraint is prominent.
Table 5.4 Cropping pattern in tehsils of Bundi district
Land use/Crops Bundi Keshoraipatan Hindoli Nainwa Indergarh
Net area sown (% of TGA of Tehsil) 30.25 53.87 39.47 25.36 24.01
Cropping Intensity 147.00 160.00 113.00 130.00 114.00
Kharif
Per cent of net sown area
Paddy 11.85 3.89 0.08 2.44 0.11
Sorghum 1.12 0.93 2.18 1.41 8.78
Bajra 0.03 0.00 2.69 1.07 5.53
Maize 18.38 2.17 12.15 44.06 3.59
Pigionpea 0.03 0.03 0.00 0.00 1.87
Green gram 0.03 0.03 0.00 0.00 1.87
Black gram 2.87 0.83 56.98 5.32 14.95
Sugarcane 0.44 0.17 2.19 9.09 0.04
Groundnut 0.06 0.01 1.00 0.55 1.50
Sesame 4.61 1.60 3.43 6.15 3.66
Soybean 37.31 63.36 1.36 1.27 7.03
Rabi
Per cent of net sown area
Wheat 44.52 51.49 11.94 29.41 30.13
Barley 0.54 0.64 0.24 0.64 1.03
Gram 3.90 6.40 3.45 1.84 3.90
Pea 0.07 0.10 0.00 2.02 0.04
Lentil 0.65 0.47 0.88 0.69 0.08
Red Chilli 0.02 0.10 0.05 0.16 0.09
Coriander 1.85 6.30 0.02 0.01 10.70
Cumin 0.03 0.00 0.35 0.00 0.02
Methi (fenugreek) 0.00 2.62 0.00 0.00 1.61
Potato 0.20 0.01 0.01 0.07 0.02
Sugar beat 0.25 0.00 0.02 0.00 0.00
onion 0.00 0.00 0.01 0.00 0.09
Mustard 6.91 13.09 2.70 2.64 10.64
Linseed 0.16 0.13 0.01 0.02 0.16
Taramira 0.09 0.04 0.11 0.30 0.27
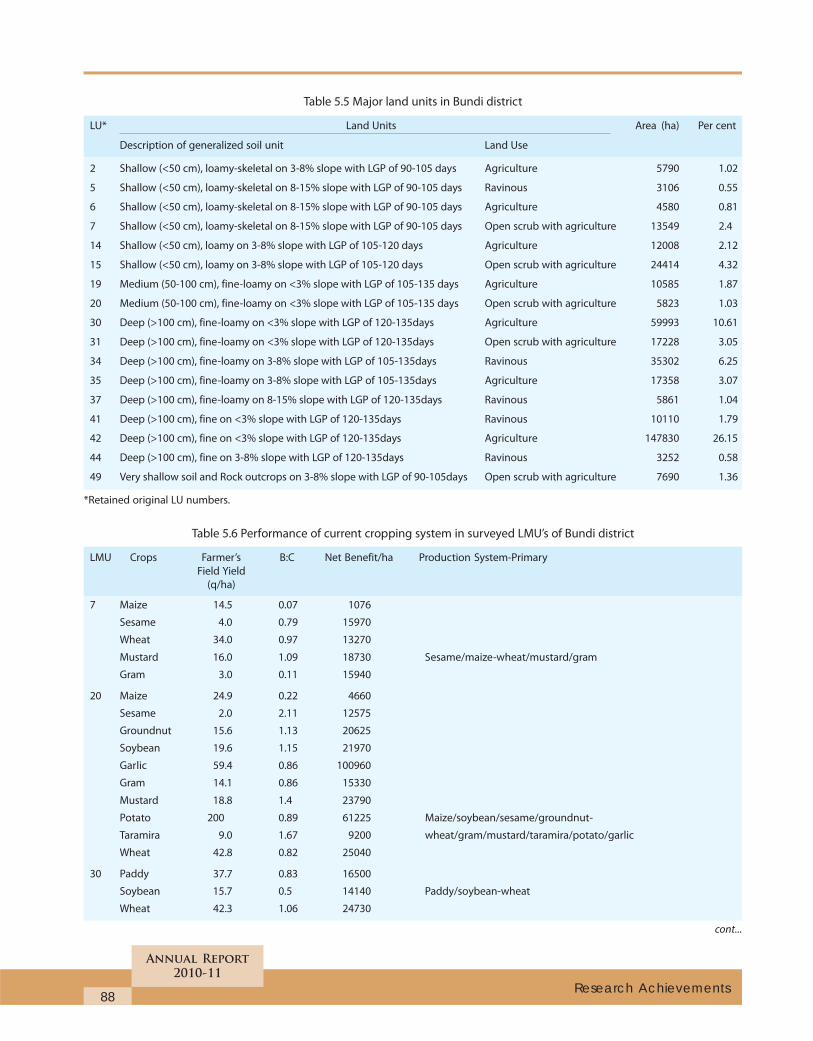
88
Annual Report
2010-11
Research Achievements
Table 5.5 Major land units in Bundi district
LU* Land Units Area (ha) Per cent
Description of generalized soil unit Land Use
2 Shallow (<50 cm), loamy-skeletal on 3-8% slope with LGP of 90-105 days Agriculture 5790 1.02
5 Shallow (<50 cm), loamy-skeletal on 8-15% slope with LGP of 90-105 days Ravinous 3106 0.55
6 Shallow (<50 cm), loamy-skeletal on 8-15% slope with LGP of 90-105 days Agriculture 4580 0.81
7 Shallow (<50 cm), loamy-skeletal on 8-15% slope with LGP of 90-105 days Open scrub with agriculture 13549 2.4
14 Shallow (<50 cm), loamy on 3-8% slope with LGP of 105-120 days Agriculture 12008 2.12
15 Shallow (<50 cm), loamy on 3-8% slope with LGP of 105-120 days Open scrub with agriculture 24414 4.32
19 Medium (50-100 cm), fine-loamy on <3% slope with LGP of 105-135 days Agriculture 10585 1.87
20 Medium (50-100 cm), fine-loamy on <3% slope with LGP of 105-135 days Open scrub with agriculture 5823 1.03
30 Deep (>100 cm), fine-loamy on <3% slope with LGP of 120-135days Agriculture 59993 10.61
31 Deep (>100 cm), fine-loamy on <3% slope with LGP of 120-135days Open scrub with agriculture 17228 3.05
34 Deep (>100 cm), fine-loamy on 3-8% slope with LGP of 105-135days Ravinous 35302 6.25
35 Deep (>100 cm), fine-loamy on 3-8% slope with LGP of 105-135days Agriculture 17358 3.07
37 Deep (>100 cm), fine-loamy on 8-15% slope with LGP of 120-135days Ravinous 5861 1.04
41 Deep (>100 cm), fine on <3% slope with LGP of 120-135days Ravinous 10110 1.79
42 Deep (>100 cm), fine on <3% slope with LGP of 120-135days Agriculture 147830 26.15
44 Deep (>100 cm), fine on 3-8% slope with LGP of 120-135days Ravinous 3252 0.58
49 Very shallow soil and Rock outcrops on 3-8% slope with LGP of 90-105days Open scrub with agriculture 7690 1.36
*Retained original LU numbers.
Table 5.6 Performance of current cropping system in surveyed LMU’s of Bundi district
LMU Crops Farmer’s B:C Net Benefit/ha Production System-Primary
Field Yield
(q/ha)
7 Maize 14.5 0.07 1076
Sesame 4.0 0.79 15970
Wheat 34.0 0.97 13270
Mustard 16.0 1.09 18730 Sesame/maize-wheat/mustard/gram
Gram 3.0 0.11 15940
20 Maize 24.9 0.22 4660
Sesame 2.0 2.11 12575
Groundnut 15.6 1.13 20625
Soybean 19.6 1.15 21970
Garlic 59.4 0.86 100960
Gram 14.1 0.86 15330
Mustard 18.8 1.4 23790
Potato 200 0.89 61225 Maize/soybean/sesame/groundnut-
Taramira 9.0 1.67 9200 wheat/gram/mustard/taramira/potato/garlic
Wheat 42.8 0.82 25040
30 Paddy 37.7 0.83 16500
Soybean 15.7 0.5 14140 Paddy/soybean-wheat
Wheat 42.3 1.06 24730
cont...
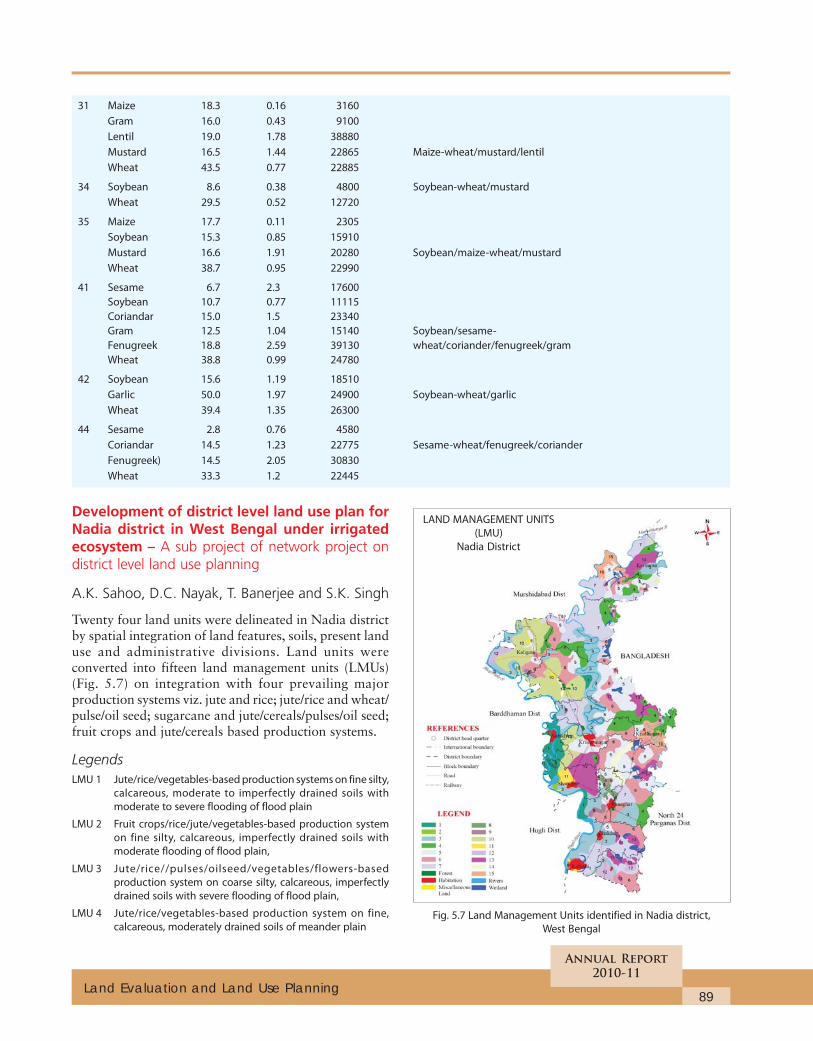
89
Annual Report
2010-11
Land Evaluation and Land Use Planning
Development of district level land use plan forNadia district in West Bengal under irrigatedecosystem – A sub project of network project ondistrict level land use planning
A.K. Sahoo, D.C. Nayak, T. Banerjee and S.K. Singh
Twenty four land units were delineated in Nadia districtby spatial integration of land features, soils, present landuse and administrative divisions. Land units wereconverted into fifteen land management units (LMUs)(Fig. 5.7) on integration with four prevailing majorproduction systems viz. jute and rice; jute/rice and wheat/pulse/oil seed; sugarcane and jute/cereals/pulses/oil seed;fruit crops and jute/cereals based production systems.
LegendsLMU 1 Jute/rice/vegetables-based production systems on fine silty,
calcareous, moderate to imperfectly drained soils with
moderate to severe flooding of flood plain
LMU 2 Fruit crops/rice/jute/vegetables-based production system
on fine silty, calcareous, imperfectly drained soils with
moderate flooding of flood plain,
LMU 3 Jute/rice//pulses/oilseed/vegetables/flowers-based
production system on coarse silty, calcareous, imperfectly
drained soils with severe flooding of flood plain,
LMU 4 Jute/rice/vegetables-based production system on fine,
calcareous, moderately drained soils of meander plainFig. 5.7 Land Management Units identified in Nadia district,
West Bengal
31 Maize 18.3 0.16 3160
Gram 16.0 0.43 9100
Lentil 19.0 1.78 38880
Mustard 16.5 1.44 22865 Maize-wheat/mustard/lentil
Wheat 43.5 0.77 22885
34 Soybean 8.6 0.38 4800 Soybean-wheat/mustard
Wheat 29.5 0.52 12720
35 Maize 17.7 0.11 2305
Soybean 15.3 0.85 15910
Mustard 16.6 1.91 20280 Soybean/maize-wheat/mustard
Wheat 38.7 0.95 22990
41 Sesame 6.7 2.3 17600
Soybean 10.7 0.77 11115
Coriandar 15.0 1.5 23340
Gram 12.5 1.04 15140 Soybean/sesame-
Fenugreek 18.8 2.59 39130 wheat/coriander/fenugreek/gram
Wheat 38.8 0.99 24780
42 Soybean 15.6 1.19 18510
Garlic 50.0 1.97 24900 Soybean-wheat/garlic
Wheat 39.4 1.35 26300
44 Sesame 2.8 0.76 4580
Coriandar 14.5 1.23 22775 Sesame-wheat/fenugreek/coriander
Fenugreek) 14.5 2.05 30830
Wheat 33.3 1.2 22445
LAND MANAGEMENT UNITS
(LMU)
Nadia District
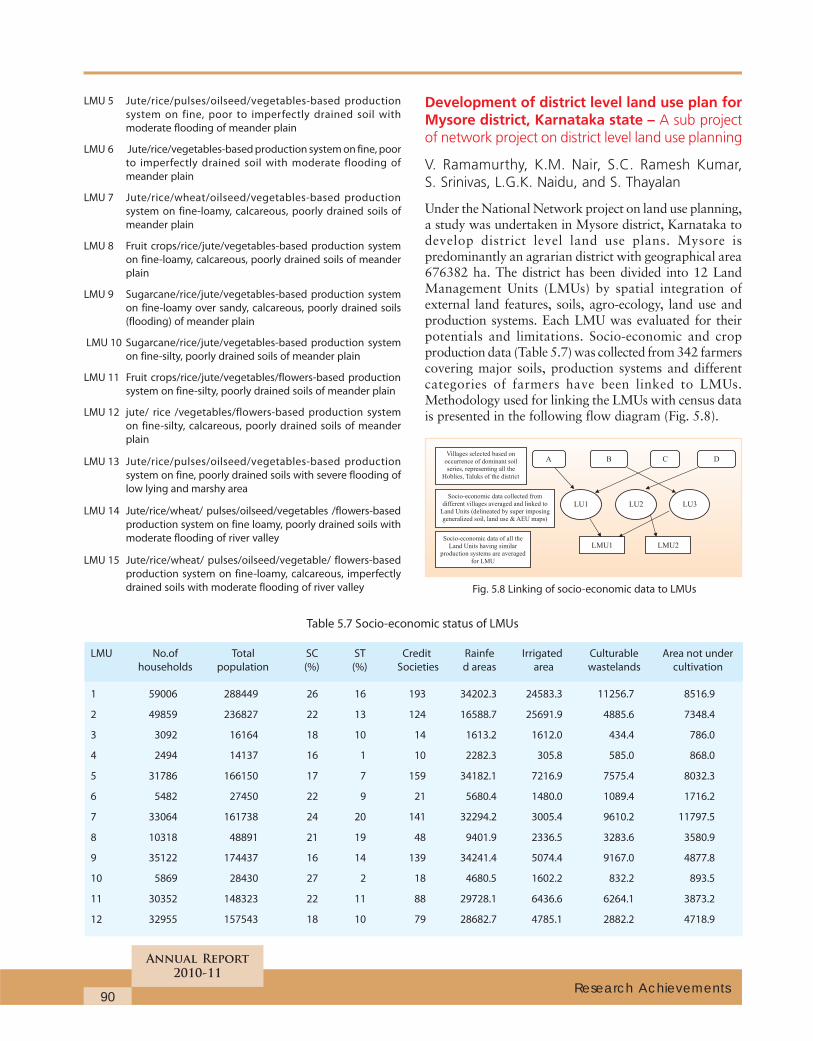
90
Annual Report
2010-11
Research Achievements
LMU 5 Jute/rice/pulses/oilseed/vegetables-based production
system on fine, poor to imperfectly drained soil with
moderate flooding of meander plain
LMU 6 Jute/rice/vegetables-based production system on fine, poor
to imperfectly drained soil with moderate flooding of
meander plain
LMU 7 Jute/rice/wheat/oilseed/vegetables-based production
system on fine-loamy, calcareous, poorly drained soils of
meander plain
LMU 8 Fruit crops/rice/jute/vegetables-based production system
on fine-loamy, calcareous, poorly drained soils of meander
plain
LMU 9 Sugarcane/rice/jute/vegetables-based production system
on fine-loamy over sandy, calcareous, poorly drained soils
(flooding) of meander plain
LMU 10 Sugarcane/rice/jute/vegetables-based production system
on fine-silty, poorly drained soils of meander plain
LMU 11 Fruit crops/rice/jute/vegetables/flowers-based production
system on fine-silty, poorly drained soils of meander plain
LMU 12 jute/ rice /vegetables/flowers-based production system
on fine-silty, calcareous, poorly drained soils of meander
plain
LMU 13 Jute/rice/pulses/oilseed/vegetables-based production
system on fine, poorly drained soils with severe flooding of
low lying and marshy area
LMU 14 Jute/rice/wheat/ pulses/oilseed/vegetables /flowers-based
production system on fine loamy, poorly drained soils with
moderate flooding of river valley
LMU 15 Jute/rice/wheat/ pulses/oilseed/vegetable/ flowers-based
production system on fine-loamy, calcareous, imperfectly
drained soils with moderate flooding of river valley
Development of district level land use plan forMysore district, Karnataka state – A sub projectof network project on district level land use planning
V. Ramamurthy, K.M. Nair, S.C. Ramesh Kumar,S. Srinivas, L.G.K. Naidu, and S. Thayalan
Under the National Network project on land use planning,a study was undertaken in Mysore district, Karnataka todevelop district level land use plans. Mysore ispredominantly an agrarian district with geographical area676382 ha. The district has been divided into 12 LandManagement Units (LMUs) by spatial integration ofexternal land features, soils, agro-ecology, land use andproduction systems. Each LMU was evaluated for theirpotentials and limitations. Socio-economic and cropproduction data (Table 5.7) was collected from 342 farmerscovering major soils, production systems and differentcategories of farmers have been linked to LMUs.Methodology used for linking the LMUs with census datais presented in the following flow diagram (Fig. 5.8).
Table 5.7 Socio-economic status of LMUs
LMU No.of Total SC ST Credit Rainfe Irrigated Culturable Area not under
households population (%) (%) Societies d areas area wastelands cultivation
1 59006 288449 26 16 193 34202.3 24583.3 11256.7 8516.9
2 49859 236827 22 13 124 16588.7 25691.9 4885.6 7348.4
3 3092 16164 18 10 14 1613.2 1612.0 434.4 786.0
4 2494 14137 16 1 10 2282.3 305.8 585.0 868.0
5 31786 166150 17 7 159 34182.1 7216.9 7575.4 8032.3
6 5482 27450 22 9 21 5680.4 1480.0 1089.4 1716.2
7 33064 161738 24 20 141 32294.2 3005.4 9610.2 11797.5
8 10318 48891 21 19 48 9401.9 2336.5 3283.6 3580.9
9 35122 174437 16 14 139 34241.4 5074.4 9167.0 4877.8
10 5869 28430 27 2 18 4680.5 1602.2 832.2 893.5
11 30352 148323 22 11 88 29728.1 6436.6 6264.1 3873.2
12 32955 157543 18 10 79 28682.7 4785.1 2882.2 4718.9
Fig. 5.8 Linking of socio-economic data to LMUs
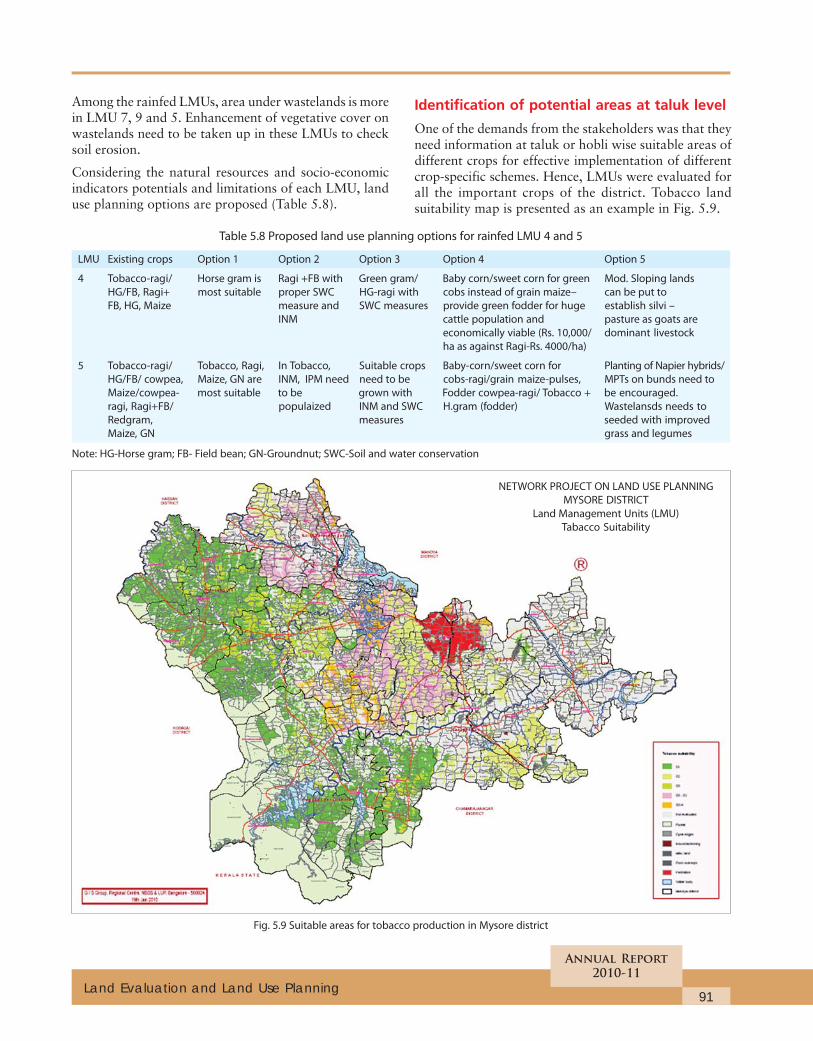
91
Annual Report
2010-11
Land Evaluation and Land Use Planning
Identification of potential areas at taluk level
One of the demands from the stakeholders was that theyneed information at taluk or hobli wise suitable areas ofdifferent crops for effective implementation of differentcrop-specific schemes. Hence, LMUs were evaluated forall the important crops of the district. Tobacco landsuitability map is presented as an example in Fig. 5.9.
Among the rainfed LMUs, area under wastelands is morein LMU 7, 9 and 5. Enhancement of vegetative cover onwastelands need to be taken up in these LMUs to checksoil erosion.
Considering the natural resources and socio-economicindicators potentials and limitations of each LMU, landuse planning options are proposed (Table 5.8).
Fig. 5.9 Suitable areas for tobacco production in Mysore district
Table 5.8 Proposed land use planning options for rainfed LMU 4 and 5
LMU Existing crops Option 1 Option 2 Option 3 Option 4 Option 5
4 Tobacco-ragi/ Horse gram is Ragi +FB with Green gram/ Baby corn/sweet corn for green Mod. Sloping lands
HG/FB, Ragi+ most suitable proper SWC HG-ragi with cobs instead of grain maize– can be put to
FB, HG, Maize measure and SWC measures provide green fodder for huge establish silvi –
INM cattle population and pasture as goats are
economically viable (Rs. 10,000/ dominant livestock
ha as against Ragi-Rs. 4000/ha)
5 Tobacco-ragi/ Tobacco, Ragi, In Tobacco, Suitable crops Baby-corn/sweet corn for Planting of Napier hybrids/
HG/FB/ cowpea, Maize, GN are INM, IPM need need to be cobs-ragi/grain maize-pulses, MPTs on bunds need to
Maize/cowpea- most suitable to be grown with Fodder cowpea-ragi/ Tobacco + be encouraged.
ragi, Ragi+FB/ populaized INM and SWC H.gram (fodder) Wastelansds needs to
Redgram, measures seeded with improved
Maize, GN grass and legumes
Note: HG-Horse gram; FB- Field bean; GN-Groundnut; SWC-Soil and water conservation
NETWORK PROJECT ON LAND USE PLANNING
MYSORE DISTRICT
Land Management Units (LMU)
Tabacco Suitability
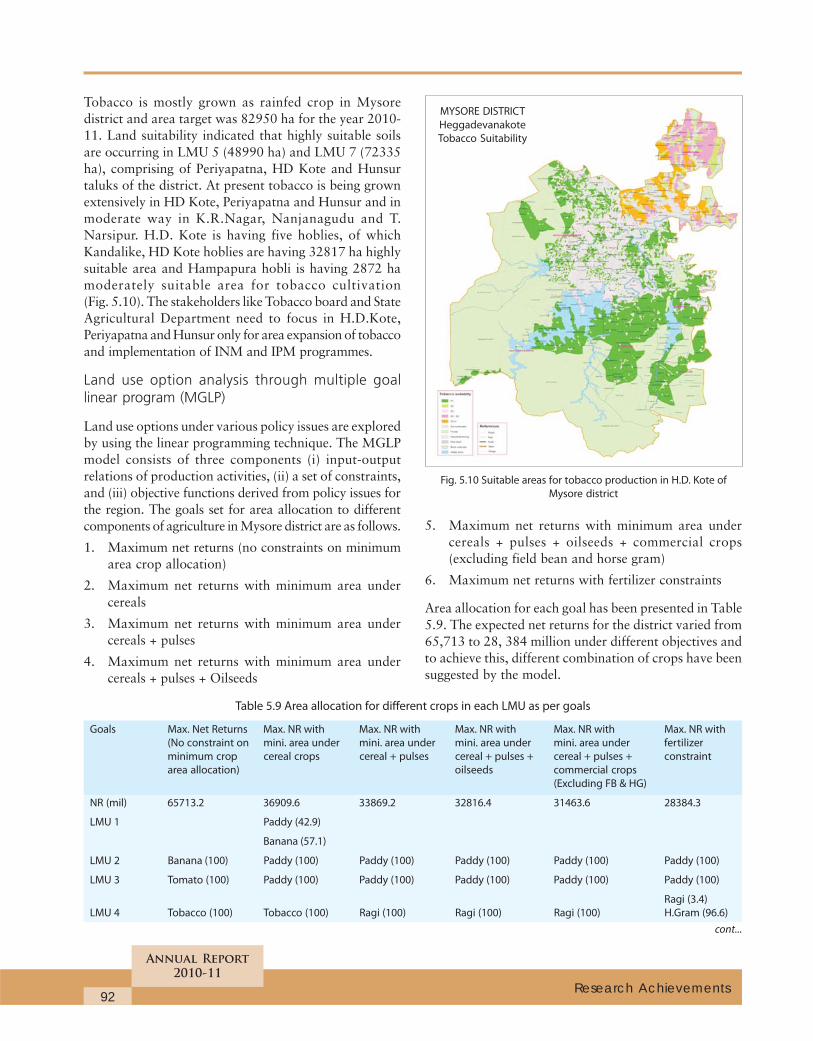
92
Annual Report
2010-11
Research Achievements
Tobacco is mostly grown as rainfed crop in Mysoredistrict and area target was 82950 ha for the year 2010-11. Land suitability indicated that highly suitable soilsare occurring in LMU 5 (48990 ha) and LMU 7 (72335ha), comprising of Periyapatna, HD Kote and Hunsurtaluks of the district. At present tobacco is being grownextensively in HD Kote, Periyapatna and Hunsur and inmoderate way in K.R.Nagar, Nanjanagudu and T.Narsipur. H.D. Kote is having five hoblies, of whichKandalike, HD Kote hoblies are having 32817 ha highlysuitable area and Hampapura hobli is having 2872 hamoderately suitable area for tobacco cultivation(Fig. 5.10). The stakeholders like Tobacco board and StateAgricultural Department need to focus in H.D.Kote,Periyapatna and Hunsur only for area expansion of tobaccoand implementation of INM and IPM programmes.
Land use option analysis through multiple goallinear program (MGLP)
Land use options under various policy issues are exploredby using the linear programming technique. The MGLPmodel consists of three components (i) input-outputrelations of production activities, (ii) a set of constraints,and (iii) objective functions derived from policy issues forthe region. The goals set for area allocation to differentcomponents of agriculture in Mysore district are as follows.
1. Maximum net returns (no constraints on minimumarea crop allocation)
2. Maximum net returns with minimum area undercereals
3. Maximum net returns with minimum area undercereals + pulses
4. Maximum net returns with minimum area undercereals + pulses + Oilseeds
5. Maximum net returns with minimum area undercereals + pulses + oilseeds + commercial crops(excluding field bean and horse gram)
6. Maximum net returns with fertilizer constraints
Area allocation for each goal has been presented in Table5.9. The expected net returns for the district varied from65,713 to 28, 384 million under different objectives andto achieve this, different combination of crops have beensuggested by the model.
Fig. 5.10 Suitable areas for tobacco production in H.D. Kote of
Mysore district
Table 5.9 Area allocation for different crops in each LMU as per goals
Goals Max. Net Returns Max. NR with Max. NR with Max. NR with Max. NR with Max. NR with
(No constraint on mini. area under mini. area under mini. area under mini. area under fertilizer
minimum crop cereal crops cereal + pulses cereal + pulses + cereal + pulses + constraint
area allocation) oilseeds commercial crops
(Excluding FB & HG)
NR (mil) 65713.2 36909.6 33869.2 32816.4 31463.6 28384.3
LMU 1 Paddy (42.9)
Banana (57.1)
LMU 2 Banana (100) Paddy (100) Paddy (100) Paddy (100) Paddy (100) Paddy (100)
LMU 3 Tomato (100) Paddy (100) Paddy (100) Paddy (100) Paddy (100) Paddy (100)
Ragi (3.4)
LMU 4 Tobacco (100) Tobacco (100) Ragi (100) Ragi (100) Ragi (100) H.Gram (96.6)
MYSORE DISTRICT
Heggadevanakote
Tobacco Suitability
cont...
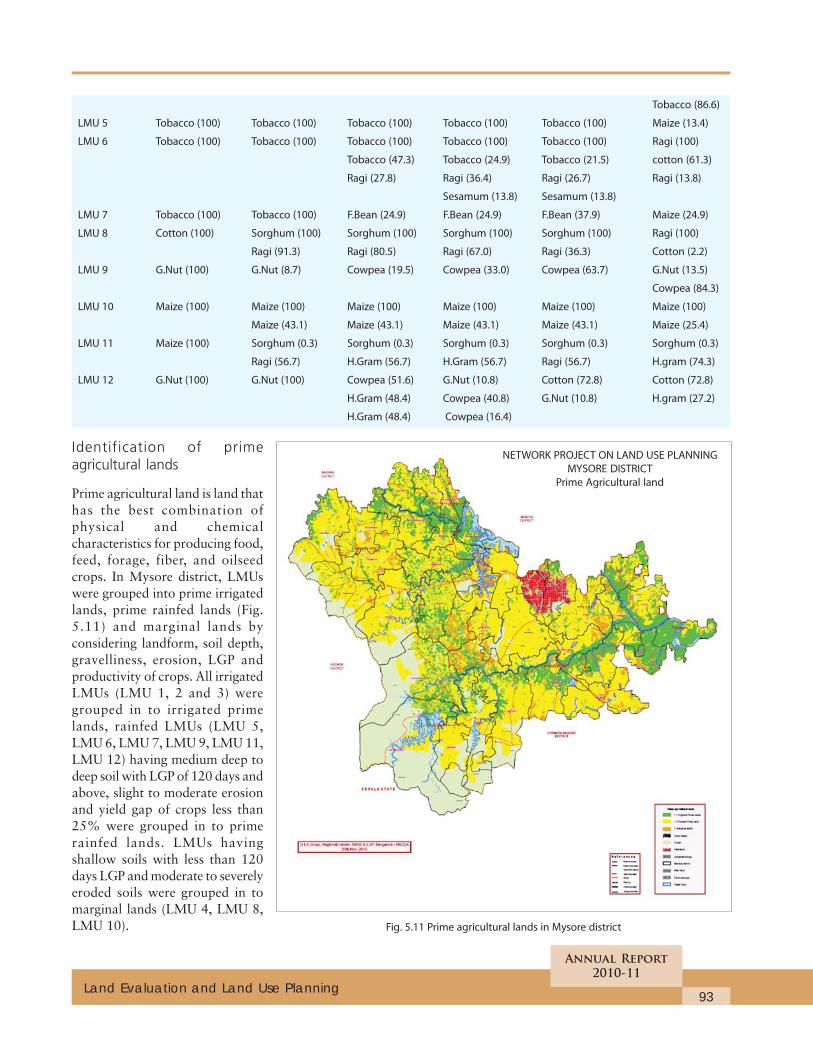
93
Annual Report
2010-11
Land Evaluation and Land Use Planning
Identification of primeagricultural lands
Prime agricultural land is land thathas the best combination ofphysical and chemicalcharacteristics for producing food,feed, forage, fiber, and oilseedcrops. In Mysore district, LMUswere grouped into prime irrigatedlands, prime rainfed lands (Fig.5.11) and marginal lands byconsidering landform, soil depth,gravelliness, erosion, LGP andproductivity of crops. All irrigatedLMUs (LMU 1, 2 and 3) weregrouped in to irrigated primelands, rainfed LMUs (LMU 5,LMU 6, LMU 7, LMU 9, LMU 11,LMU 12) having medium deep todeep soil with LGP of 120 days andabove, slight to moderate erosionand yield gap of crops less than25% were grouped in to primerainfed lands. LMUs havingshallow soils with less than 120days LGP and moderate to severelyeroded soils were grouped in tomarginal lands (LMU 4, LMU 8,LMU 10).
Tobacco (86.6)
LMU 5 Tobacco (100) Tobacco (100) Tobacco (100) Tobacco (100) Tobacco (100) Maize (13.4)
LMU 6 Tobacco (100) Tobacco (100) Tobacco (100) Tobacco (100) Tobacco (100) Ragi (100)
Tobacco (47.3) Tobacco (24.9) Tobacco (21.5) cotton (61.3)
Ragi (27.8) Ragi (36.4) Ragi (26.7) Ragi (13.8)
Sesamum (13.8) Sesamum (13.8)
LMU 7 Tobacco (100) Tobacco (100) F.Bean (24.9) F.Bean (24.9) F.Bean (37.9) Maize (24.9)
LMU 8 Cotton (100) Sorghum (100) Sorghum (100) Sorghum (100) Sorghum (100) Ragi (100)
Ragi (91.3) Ragi (80.5) Ragi (67.0) Ragi (36.3) Cotton (2.2)
LMU 9 G.Nut (100) G.Nut (8.7) Cowpea (19.5) Cowpea (33.0) Cowpea (63.7) G.Nut (13.5)
Cowpea (84.3)
LMU 10 Maize (100) Maize (100) Maize (100) Maize (100) Maize (100) Maize (100)
Maize (43.1) Maize (43.1) Maize (43.1) Maize (43.1) Maize (25.4)
LMU 11 Maize (100) Sorghum (0.3) Sorghum (0.3) Sorghum (0.3) Sorghum (0.3) Sorghum (0.3)
Ragi (56.7) H.Gram (56.7) H.Gram (56.7) Ragi (56.7) H.gram (74.3)
LMU 12 G.Nut (100) G.Nut (100) Cowpea (51.6) G.Nut (10.8) Cotton (72.8) Cotton (72.8)
H.Gram (48.4) Cowpea (40.8) G.Nut (10.8) H.gram (27.2)
H.Gram (48.4) Cowpea (16.4)
Fig. 5.11 Prime agricultural lands in Mysore district
NETWORK PROJECT ON LAND USE PLANNING
MYSORE DISTRICT
Prime Agricultural land
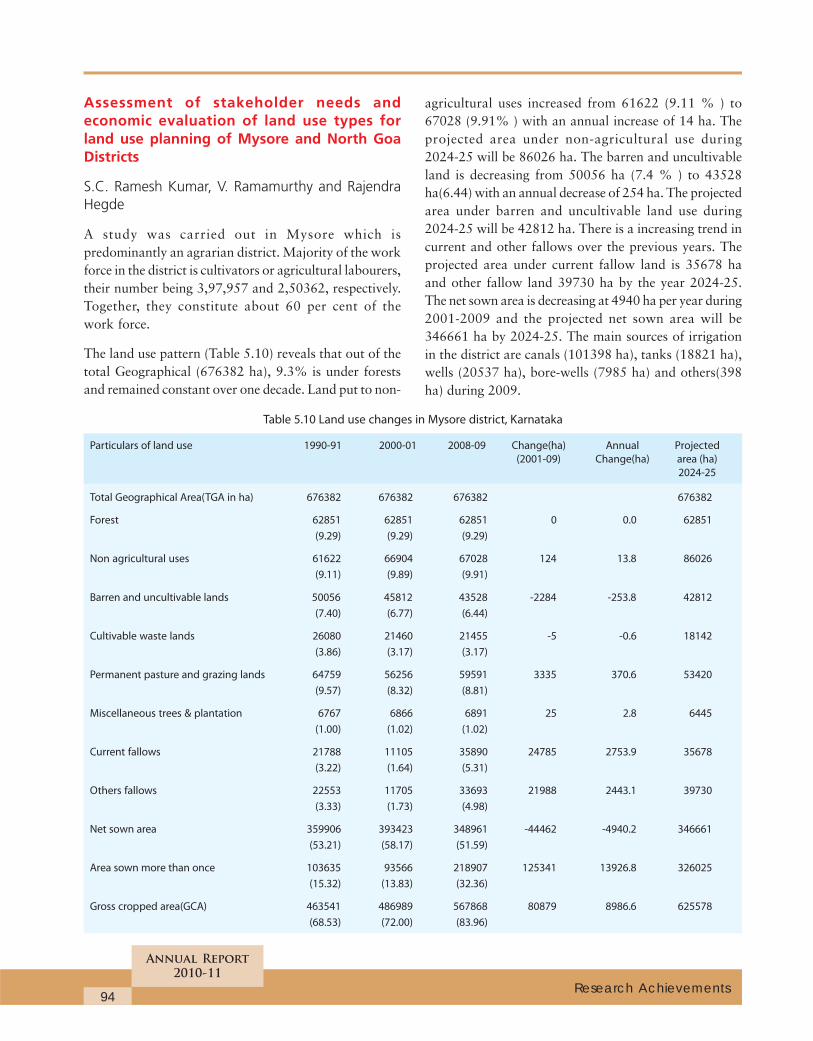
94
Annual Report
2010-11
Research Achievements
Assessment of stakeholder needs andeconomic evaluation of land use types forland use planning of Mysore and North GoaDistricts
S.C. Ramesh Kumar, V. Ramamurthy and RajendraHegde
A study was carried out in Mysore which ispredominantly an agrarian district. Majority of the workforce in the district is cultivators or agricultural labourers,their number being 3,97,957 and 2,50362, respectively.Together, they constitute about 60 per cent of thework force.
The land use pattern (Table 5.10) reveals that out of thetotal Geographical (676382 ha), 9.3% is under forestsand remained constant over one decade. Land put to non-
agricultural uses increased from 61622 (9.11 % ) to67028 (9.91% ) with an annual increase of 14 ha. Theprojected area under non-agricultural use during2024-25 will be 86026 ha. The barren and uncultivableland is decreasing from 50056 ha (7.4 % ) to 43528ha(6.44) with an annual decrease of 254 ha. The projectedarea under barren and uncultivable land use during2024-25 will be 42812 ha. There is a increasing trend incurrent and other fallows over the previous years. Theprojected area under current fallow land is 35678 haand other fallow land 39730 ha by the year 2024-25.The net sown area is decreasing at 4940 ha per year during2001-2009 and the projected net sown area will be346661 ha by 2024-25. The main sources of irrigationin the district are canals (101398 ha), tanks (18821 ha),wells (20537 ha), bore-wells (7985 ha) and others(398ha) during 2009.
Table 5.10 Land use changes in Mysore district, Karnataka
Particulars of land use 1990-91 2000-01 2008-09 Change(ha) Annual Projected
(2001-09) Change(ha) area (ha)
2024-25
Total Geographical Area(TGA in ha) 676382 676382 676382 676382
Forest 62851 62851 62851 0 0.0 62851
(9.29) (9.29) (9.29)
Non agricultural uses 61622 66904 67028 124 13.8 86026
(9.11) (9.89) (9.91)
Barren and uncultivable lands 50056 45812 43528 -2284 -253.8 42812
(7.40) (6.77) (6.44)
Cultivable waste lands 26080 21460 21455 -5 -0.6 18142
(3.86) (3.17) (3.17)
Permanent pasture and grazing lands 64759 56256 59591 3335 370.6 53420
(9.57) (8.32) (8.81)
Miscellaneous trees & plantation 6767 6866 6891 25 2.8 6445
(1.00) (1.02) (1.02)
Current fallows 21788 11105 35890 24785 2753.9 35678
(3.22) (1.64) (5.31)
Others fallows 22553 11705 33693 21988 2443.1 39730
(3.33) (1.73) (4.98)
Net sown area 359906 393423 348961 -44462 -4940.2 346661
(53.21) (58.17) (51.59)
Area sown more than once 103635 93566 218907 125341 13926.8 326025
(15.32) (13.83) (32.36)
Gross cropped area(GCA) 463541 486989 567868 80879 8986.6 625578
(68.53) (72.00) (83.96)
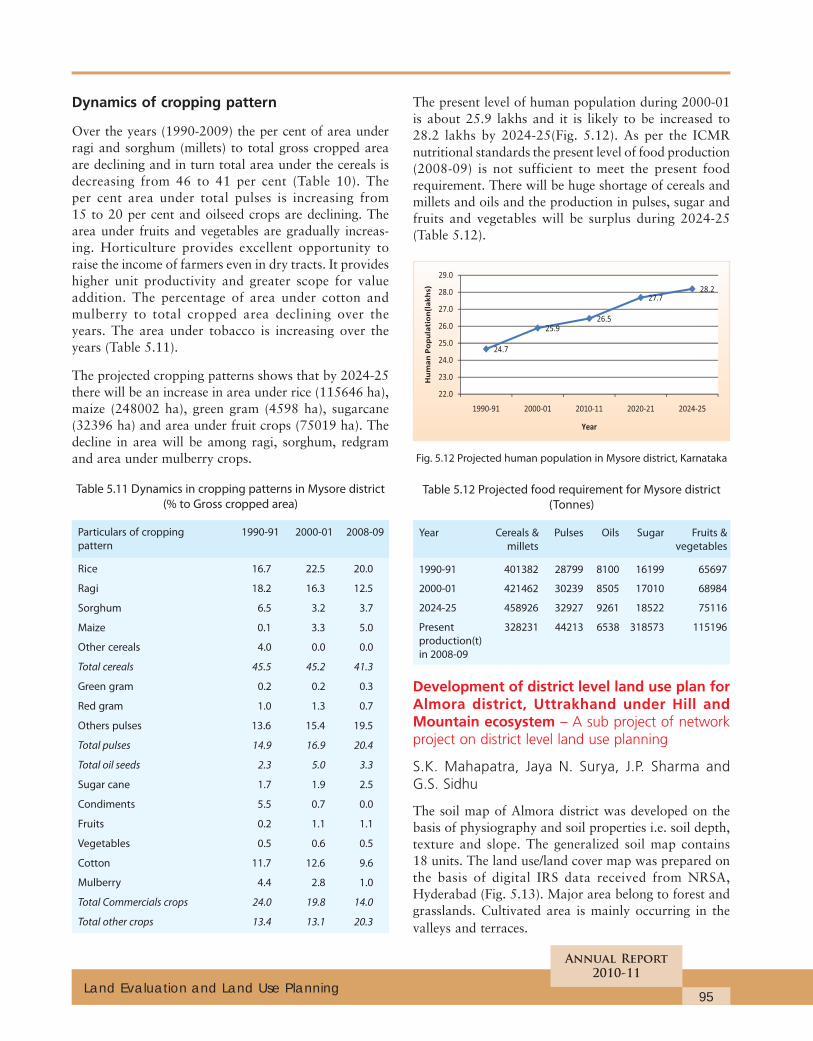
95
Annual Report
2010-11
Land Evaluation and Land Use Planning
The present level of human population during 2000-01is about 25.9 lakhs and it is likely to be increased to28.2 lakhs by 2024-25(Fig. 5.12). As per the ICMRnutritional standards the present level of food production(2008-09) is not sufficient to meet the present foodrequirement. There will be huge shortage of cereals andmillets and oils and the production in pulses, sugar andfruits and vegetables will be surplus during 2024-25(Table 5.12).
Fig. 5.12 Projected human population in Mysore district, Karnataka
Table 5.12 Projected food requirement for Mysore district
(Tonnes)
Year Cereals & Pulses Oils Sugar Fruits &
millets vegetables
1990-91 401382 28799 8100 16199 65697
2000-01 421462 30239 8505 17010 68984
2024-25 458926 32927 9261 18522 75116
Present 328231 44213 6538 318573 115196
production(t)
in 2008-09
Development of district level land use plan forAlmora district, Uttrakhand under Hill andMountain ecosystem – A sub project of networkproject on district level land use planning
S.K. Mahapatra, Jaya N. Surya, J.P. Sharma andG.S. Sidhu
The soil map of Almora district was developed on thebasis of physiography and soil properties i.e. soil depth,texture and slope. The generalized soil map contains18 units. The land use/land cover map was prepared onthe basis of digital IRS data received from NRSA,Hyderabad (Fig. 5.13). Major area belong to forest andgrasslands. Cultivated area is mainly occurring in thevalleys and terraces.
Dynamics of cropping pattern
Over the years (1990-2009) the per cent of area underragi and sorghum (millets) to total gross cropped areaare declining and in turn total area under the cereals isdecreasing from 46 to 41 per cent (Table 10). Theper cent area under total pulses is increasing from15 to 20 per cent and oilseed crops are declining. Thearea under fruits and vegetables are gradually increas-ing. Horticulture provides excellent opportunity toraise the income of farmers even in dry tracts. It provideshigher unit productivity and greater scope for valueaddition. The percentage of area under cotton andmulberry to total cropped area declining over theyears. The area under tobacco is increasing over theyears (Table 5.11).
The projected cropping patterns shows that by 2024-25there will be an increase in area under rice (115646 ha),maize (248002 ha), green gram (4598 ha), sugarcane(32396 ha) and area under fruit crops (75019 ha). Thedecline in area will be among ragi, sorghum, redgramand area under mulberry crops.
Table 5.11 Dynamics in cropping patterns in Mysore district
(% to Gross cropped area)
Particulars of cropping 1990-91 2000-01 2008-09
pattern
Rice 16.7 22.5 20.0
Ragi 18.2 16.3 12.5
Sorghum 6.5 3.2 3.7
Maize 0.1 3.3 5.0
Other cereals 4.0 0.0 0.0
Total cereals 45.5 45.2 41.3
Green gram 0.2 0.2 0.3
Red gram 1.0 1.3 0.7
Others pulses 13.6 15.4 19.5
Total pulses 14.9 16.9 20.4
Total oil seeds 2.3 5.0 3.3
Sugar cane 1.7 1.9 2.5
Condiments 5.5 0.7 0.0
Fruits 0.2 1.1 1.1
Vegetables 0.5 0.6 0.5
Cotton 11.7 12.6 9.6
Mulberry 4.4 2.8 1.0
Total Commercials crops 24.0 19.8 14.0
Total other crops 13.4 13.1 20.3
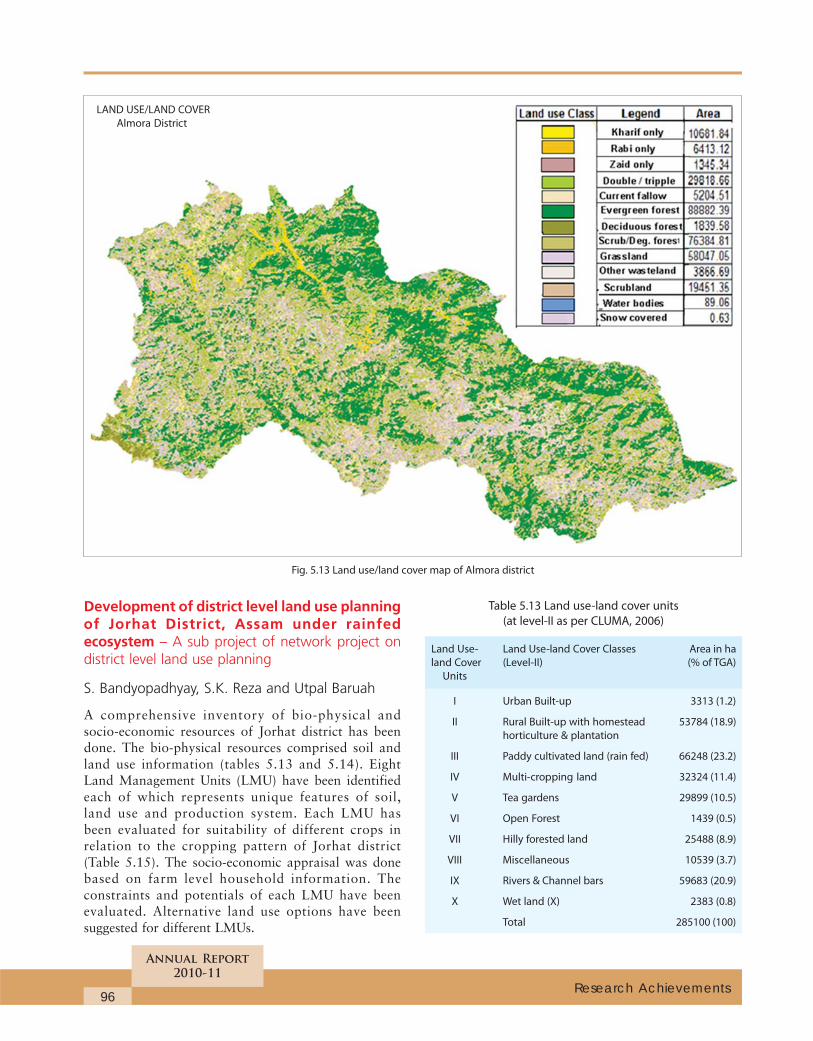
96
Annual Report
2010-11
Research Achievements
Development of district level land use planningof Jorhat District, Assam under rainfedecosystem – A sub project of network project ondistrict level land use planning
S. Bandyopadhyay, S.K. Reza and Utpal Baruah
A comprehensive inventory of bio-physical andsocio-economic resources of Jorhat district has beendone. The bio-physical resources comprised soil andland use information (tables 5.13 and 5.14). EightLand Management Units (LMU) have been identifiedeach of which represents unique features of soil,land use and production system. Each LMU hasbeen evaluated for suitability of different crops inrelation to the cropping pattern of Jorhat district(Table 5.15). The socio-economic appraisal was donebased on farm level household information. Theconstraints and potentials of each LMU have beenevaluated. Alternative land use options have beensuggested for different LMUs.
Table 5.13 Land use-land cover units
(at level-II as per CLUMA, 2006)
Land Use- Land Use-land Cover Classes Area in ha
land Cover (Level-II) (% of TGA)
Units
I Urban Built-up 3313 (1.2)
II Rural Built-up with homestead 53784 (18.9)
horticulture & plantation
III Paddy cultivated land (rain fed) 66248 (23.2)
IV Multi-cropping land 32324 (11.4)
V Tea gardens 29899 (10.5)
VI Open Forest 1439 (0.5)
VII Hilly forested land 25488 (8.9)
VIII Miscellaneous 10539 (3.7)
IX Rivers & Channel bars 59683 (20.9)
X Wet land (X) 2383 (0.8)
Total 285100 (100)
Fig. 5.13 Land use/land cover map of Almora district
LAND USE/LAND COVER
Almora District
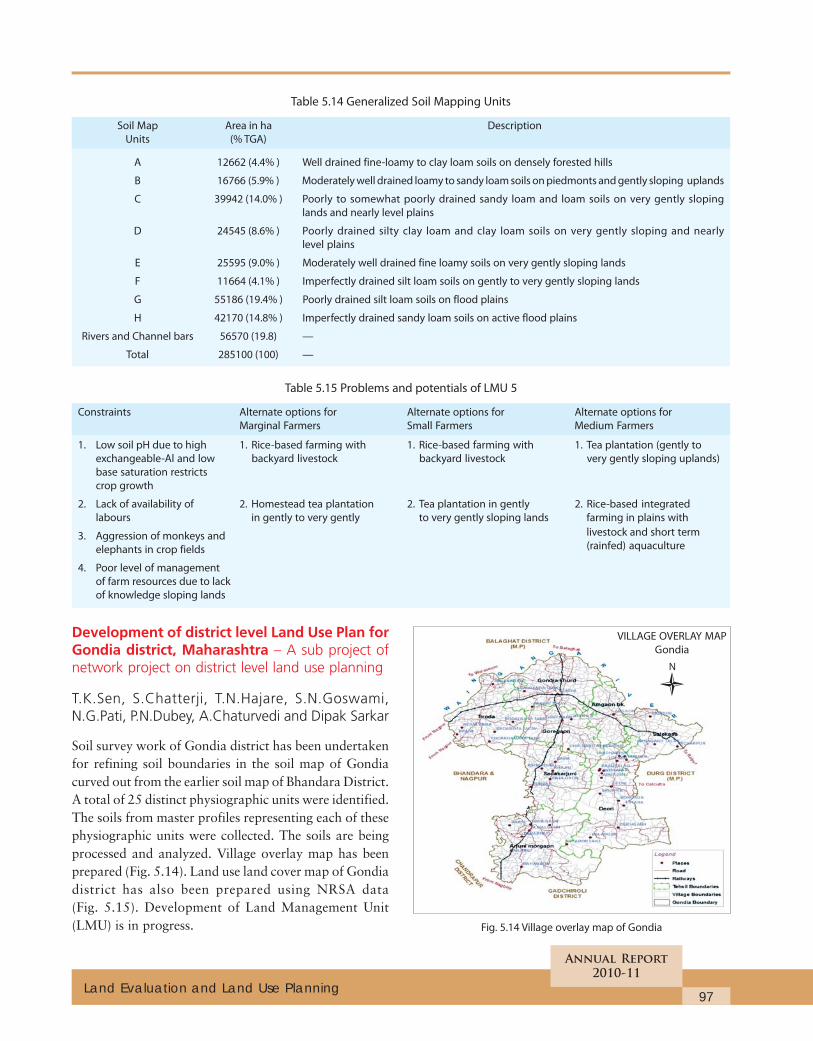
97
Annual Report
2010-11
Land Evaluation and Land Use Planning
Table 5.14 Generalized Soil Mapping Units
Soil Map Area in ha Description
Units (% TGA)
A 12662 (4.4% ) Well drained fine-loamy to clay loam soils on densely forested hills
B 16766 (5.9% ) Moderately well drained loamy to sandy loam soils on piedmonts and gently sloping uplands
C 39942 (14.0% ) Poorly to somewhat poorly drained sandy loam and loam soils on very gently sloping
lands and nearly level plains
D 24545 (8.6% ) Poorly drained silty clay loam and clay loam soils on very gently sloping and nearly
level plains
E 25595 (9.0% ) Moderately well drained fine loamy soils on very gently sloping lands
F 11664 (4.1% ) Imperfectly drained silt loam soils on gently to very gently sloping lands
G 55186 (19.4% ) Poorly drained silt loam soils on flood plains
H 42170 (14.8% ) Imperfectly drained sandy loam soils on active flood plains
Rivers and Channel bars 56570 (19.8) —
Total 285100 (100) —
Table 5.15 Problems and potentials of LMU 5
Constraints Alternate options for Alternate options for Alternate options for
Marginal Farmers Small Farmers Medium Farmers
1. Low soil pH due to high 1. Rice-based farming with 1. Rice-based farming with 1. Tea plantation (gently to
exchangeable-Al and low backyard livestock backyard livestock very gently sloping uplands)
base saturation restricts
crop growth
2. Lack of availability of 2. Homestead tea plantation 2. Tea plantation in gently 2. Rice-based integrated
labours in gently to very gently to very gently sloping lands farming in plains with
3. Aggression of monkeys and livestock and short term
elephants in crop fields (rainfed) aquaculture
4. Poor level of management
of farm resources due to lack
of knowledge sloping lands
Development of district level Land Use Plan forGondia district, Maharashtra – A sub project ofnetwork project on district level land use planning
T.K.Sen, S.Chatterji, T.N.Hajare, S.N.Goswami,N.G.Pati, P.N.Dubey, A.Chaturvedi and Dipak Sarkar
Soil survey work of Gondia district has been undertakenfor refining soil boundaries in the soil map of Gondiacurved out from the earlier soil map of Bhandara District.A total of 25 distinct physiographic units were identified.The soils from master profiles representing each of thesephysiographic units were collected. The soils are beingprocessed and analyzed. Village overlay map has beenprepared (Fig. 5.14). Land use land cover map of Gondiadistrict has also been prepared using NRSA data(Fig. 5.15). Development of Land Management Unit(LMU) is in progress. Fig. 5.14 Village overlay map of Gondia
VILLAGE OVERLAY MAP
Gondia
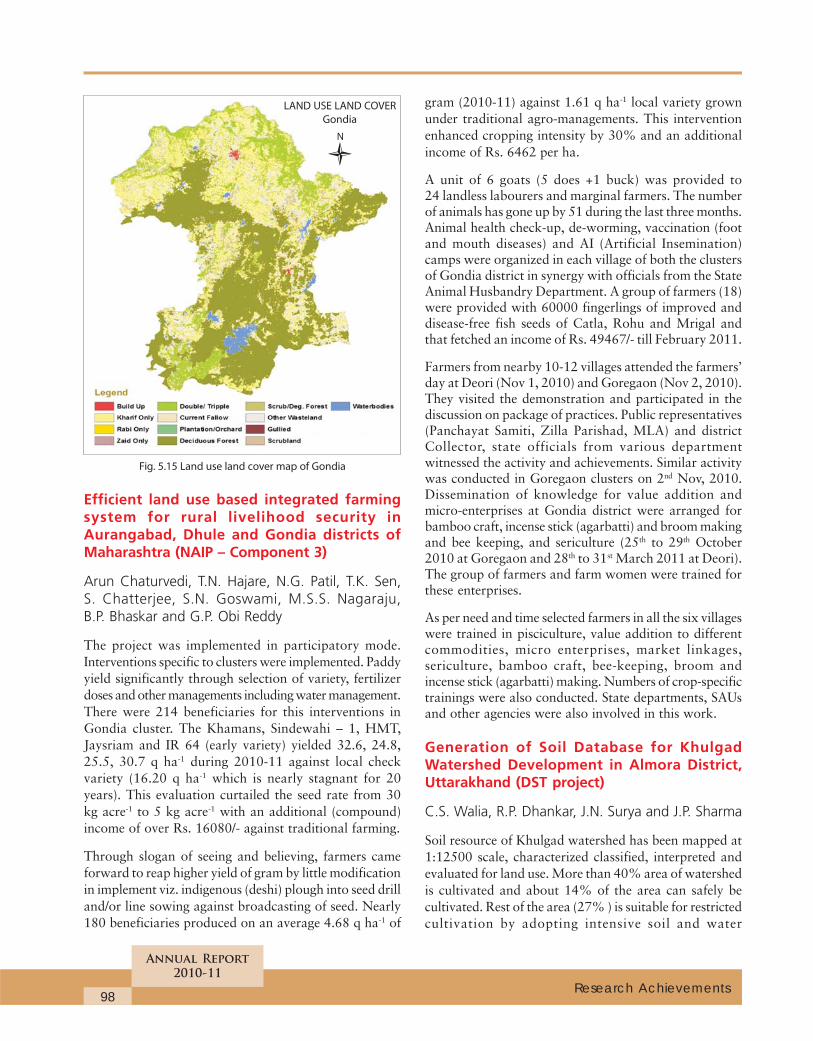
98
Annual Report
2010-11
Research Achievements
Efficient land use based integrated farmingsystem for rural livelihood security inAurangabad, Dhule and Gondia districts ofMaharashtra (NAIP – Component 3)
Arun Chaturvedi, T.N. Hajare, N.G. Patil, T.K. Sen,S. Chatterjee, S.N. Goswami, M.S.S. Nagaraju,B.P. Bhaskar and G.P. Obi Reddy
The project was implemented in participatory mode.Interventions specific to clusters were implemented. Paddyyield significantly through selection of variety, fertilizerdoses and other managements including water management.There were 214 beneficiaries for this interventions inGondia cluster. The Khamans, Sindewahi – 1, HMT,Jaysriam and IR 64 (early variety) yielded 32.6, 24.8,25.5, 30.7 q ha-1 during 2010-11 against local checkvariety (16.20 q ha-1 which is nearly stagnant for 20years). This evaluation curtailed the seed rate from 30kg acre-1 to 5 kg acre-1 with an additional (compound)income of over Rs. 16080/- against traditional farming.
Through slogan of seeing and believing, farmers cameforward to reap higher yield of gram by little modificationin implement viz. indigenous (deshi) plough into seed drilland/or line sowing against broadcasting of seed. Nearly180 beneficiaries produced on an average 4.68 q ha-1 of
gram (2010-11) against 1.61 q ha-1 local variety grownunder traditional agro-managements. This interventionenhanced cropping intensity by 30% and an additionalincome of Rs. 6462 per ha.
A unit of 6 goats (5 does +1 buck) was provided to24 landless labourers and marginal farmers. The numberof animals has gone up by 51 during the last three months.Animal health check-up, de-worming, vaccination (footand mouth diseases) and AI (Artificial Insemination)camps were organized in each village of both the clustersof Gondia district in synergy with officials from the StateAnimal Husbandry Department. A group of farmers (18)were provided with 60000 fingerlings of improved anddisease-free fish seeds of Catla, Rohu and Mrigal andthat fetched an income of Rs. 49467/- till February 2011.
Farmers from nearby 10-12 villages attended the farmers’day at Deori (Nov 1, 2010) and Goregaon (Nov 2, 2010).They visited the demonstration and participated in thediscussion on package of practices. Public representatives(Panchayat Samiti, Zilla Parishad, MLA) and districtCollector, state officials from various departmentwitnessed the activity and achievements. Similar activitywas conducted in Goregaon clusters on 2nd Nov, 2010.Dissemination of knowledge for value addition andmicro-enterprises at Gondia district were arranged forbamboo craft, incense stick (agarbatti) and broom makingand bee keeping, and sericulture (25th to 29th October2010 at Goregaon and 28th to 31st March 2011 at Deori).The group of farmers and farm women were trained forthese enterprises.
As per need and time selected farmers in all the six villageswere trained in pisciculture, value addition to differentcommodities, micro enterprises, market linkages,sericulture, bamboo craft, bee-keeping, broom andincense stick (agarbatti) making. Numbers of crop-specifictrainings were also conducted. State departments, SAUsand other agencies were also involved in this work.
Generation of Soil Database for KhulgadWatershed Development in Almora District,Uttarakhand (DST project)
C.S. Walia, R.P. Dhankar, J.N. Surya and J.P. Sharma
Soil resource of Khulgad watershed has been mapped at1:12500 scale, characterized classified, interpreted andevaluated for land use. More than 40% area of watershedis cultivated and about 14% of the area can safely becultivated. Rest of the area (27% ) is suitable for restrictedcultivation by adopting intensive soil and water
Fig. 5.15 Land use land cover map of Gondia
LAND USE LAND COVER
Gondia
99
Annual Report
2010-11
Land Evaluation and Land Use Planning
conservation measures but has high potential fordeveloping alternative land uses such as pastoral, agro-pastoral, horti-pastoral and silvi-pastoral farming Agri-horticulture will be more profitable for class III and IVlands. The yields of major crops grown in the watershedare low and even well below the state average apparentlydue to decline in soil productivity, lack of awarenessamong the farmers about modern agricultural technologyand absence of irrigation facilities. Water harvestingtechniques and soil and water conservation trainingshould be imparted with larger holdings both at farmand village level. Alternative occupations like cattle andgoat rearing, resin and fuel wood collection silk wormrearing and wood crafts may be popularized especiallyfor marginal and landless farmers. More than 50% areais severely to severely degraded due to soil erosion. Theimmediate concern is to restore the productivity andcarrying capacity of soils by growing grasses and forestspecies and also by adopting the soil and water conservationmeasures. The area under protected forests can easily bedoubled by fresh plantation on degraded lands forimproving ecological balance and potential of soils.
Soil Resource distribution, characterization andevaluation for Cotton based cropping systemsin irrigated eco-system in Northern India
C.S. Walia, S.P. Singh, R.P. Dhankar, Jagat Ram andD. Martin
The soil resource of Sirsa district of Haryana have beenmapped at 1:50, 000 scale, characterized, classified,
interpreted and evaluated for cotton cultivation. Thesandy soils occupy 32% having low productivity of cottondue to poor fertility, high infiltration rate, rapidpermeability and high consumptive use of water for crops.These soils may be put to oilseeds, pulses, millets andfodder crops. Winter vegetables with liberal fertilizationand irrigation may be grown in areas near to town.Agroforestry is recommended for high productivity andprofitability. Coarse loamy soils occupy about 45% ofTGA and suitable for cotton based cropping system underirrigation. Active sand dune areas occupy about 7% maybe stabilized by growing grasses, trees and shrubs toprotect the land from degradation and for moistureconservation.
Soils should be least disturbed in summer particularlysandy soils as they are prone to wind erosion. Zerotillage is suggested for such soils. Field experimentsto be conducted for cotton on dominant soil series todevelop prediction models for suggesting managementneeds and suitability of these soils for various croppingsystems. Agronomic and soil management needs forrecently introduced Bt cotton (hybrids) may be workedout on soil series basis and demonstrated to farmers.Balanced fertilization (includes both macro andmicronutrients) based on soil test need to be followedfor higher crop productivity. Integrated use offertilizers, FYM, farm waste, crop residues may beencouraged to maintain soil health and higher cropproductivity. Application of N-fertilizers in split doses issuggested.
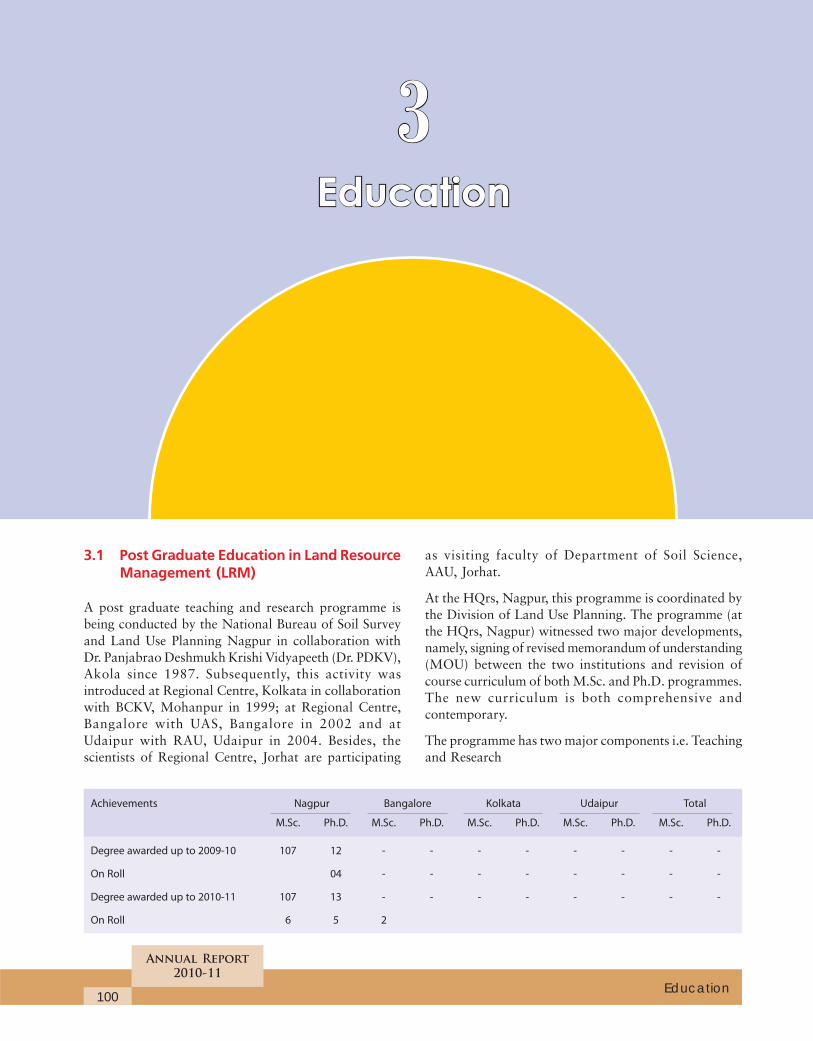
100
Annual Report
2010-11
Education
3.1 Post Graduate Education in Land ResourceManagement (LRM)
A post graduate teaching and research programme isbeing conducted by the National Bureau of Soil Surveyand Land Use Planning Nagpur in collaboration withDr. Panjabrao Deshmukh Krishi Vidyapeeth (Dr. PDKV),Akola since 1987. Subsequently, this activity wasintroduced at Regional Centre, Kolkata in collaborationwith BCKV, Mohanpur in 1999; at Regional Centre,Bangalore with UAS, Bangalore in 2002 and atUdaipur with RAU, Udaipur in 2004. Besides, thescientists of Regional Centre, Jorhat are participating
as visiting faculty of Department of Soil Science,AAU, Jorhat.
At the HQrs, Nagpur, this programme is coordinated bythe Division of Land Use Planning. The programme (atthe HQrs, Nagpur) witnessed two major developments,namely, signing of revised memorandum of understanding(MOU) between the two institutions and revision ofcourse curriculum of both M.Sc. and Ph.D. programmes.The new curriculum is both comprehensive andcontemporary.
The programme has two major components i.e. Teachingand Research
Achievements Nagpur Bangalore Kolkata Udaipur Total
M.Sc. Ph.D. M.Sc. Ph.D. M.Sc. Ph.D. M.Sc. Ph.D. M.Sc. Ph.D.
Degree awarded up to 2009-10 107 12 - - - - - - - -
On Roll 04 - - - - - - - -
Degree awarded up to 2010-11 107 13 - - - - - - - -
On Roll 6 5 2
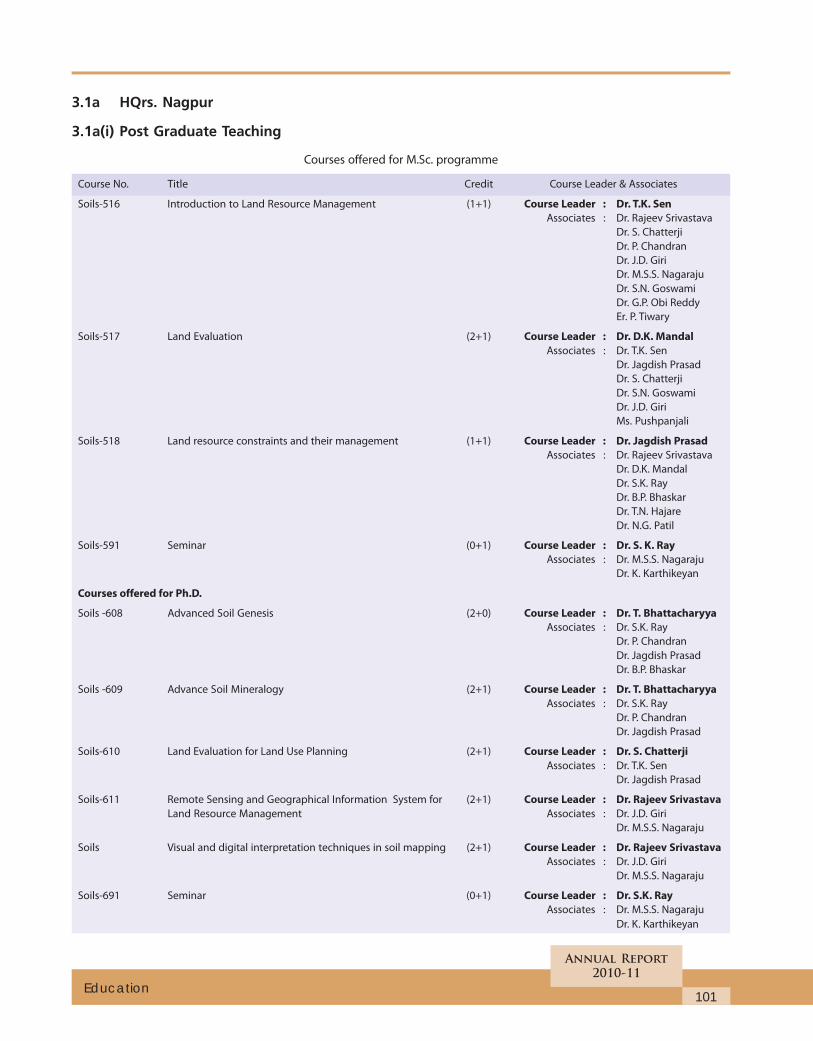
101
Annual Report
2010-11
Education
3.1a HQrs. Nagpur
3.1a(i) Post Graduate Teaching
Courses offered for M.Sc. programme
Course No. Title Credit Course Leader & Associates
Soils-516 Introduction to Land Resource Management (1+1) Course Leader : Dr. T.K. Sen
Associates : Dr. Rajeev Srivastava
Dr. S. Chatterji
Dr. P. Chandran
Dr. J.D. Giri
Dr. M.S.S. Nagaraju
Dr. S.N. Goswami
Dr. G.P. Obi Reddy
Er. P. Tiwary
Soils-517 Land Evaluation (2+1) Course Leader : Dr. D.K. Mandal
Associates : Dr. T.K. Sen
Dr. Jagdish Prasad
Dr. S. Chatterji
Dr. S.N. Goswami
Dr. J.D. Giri
Ms. Pushpanjali
Soils-518 Land resource constraints and their management (1+1) Course Leader : Dr. Jagdish Prasad
Associates : Dr. Rajeev Srivastava
Dr. D.K. Mandal
Dr. S.K. Ray
Dr. B.P. Bhaskar
Dr. T.N. Hajare
Dr. N.G. Patil
Soils-591 Seminar (0+1) Course Leader : Dr. S. K. Ray
Associates : Dr. M.S.S. Nagaraju
Dr. K. Karthikeyan
Courses offered for Ph.D.
Soils -608 Advanced Soil Genesis (2+0) Course Leader : Dr. T. Bhattacharyya
Associates : Dr. S.K. Ray
Dr. P. Chandran
Dr. Jagdish Prasad
Dr. B.P. Bhaskar
Soils -609 Advance Soil Mineralogy (2+1) Course Leader : Dr. T. Bhattacharyya
Associates : Dr. S.K. Ray
Dr. P. Chandran
Dr. Jagdish Prasad
Soils-610 Land Evaluation for Land Use Planning (2+1) Course Leader : Dr. S. Chatterji
Associates : Dr. T.K. Sen
Dr. Jagdish Prasad
Soils-611 Remote Sensing and Geographical Information System for (2+1) Course Leader : Dr. Rajeev Srivastava
Land Resource Management Associates : Dr. J.D. Giri
Dr. M.S.S. Nagaraju
Soils Visual and digital interpretation techniques in soil mapping (2+1) Course Leader : Dr. Rajeev Srivastava
Associates : Dr. J.D. Giri
Dr. M.S.S. Nagaraju
Soils-691 Seminar (0+1) Course Leader : Dr. S.K. Ray
Associates : Dr. M.S.S. Nagaraju
Dr. K. Karthikeyan
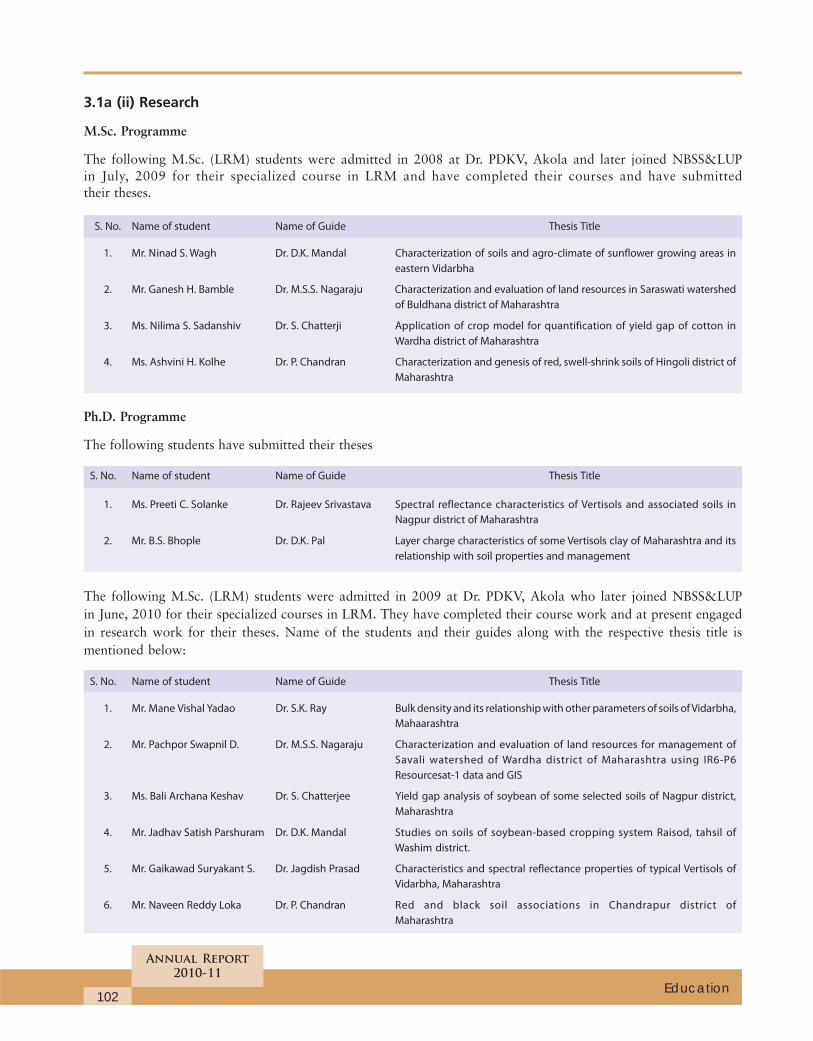
102
Annual Report
2010-11
Education
3.1a (ii) Research
M.Sc. Programme
The following M.Sc. (LRM) students were admitted in 2008 at Dr. PDKV, Akola and later joined NBSS&LUPin July, 2009 for their specialized course in LRM and have completed their courses and have submittedtheir theses.
S. No. Name of student Name of Guide Thesis Title
1. Mr. Ninad S. Wagh Dr. D.K. Mandal Characterization of soils and agro-climate of sunflower growing areas in
eastern Vidarbha
2. Mr. Ganesh H. Bamble Dr. M.S.S. Nagaraju Characterization and evaluation of land resources in Saraswati watershed
of Buldhana district of Maharashtra
3. Ms. Nilima S. Sadanshiv Dr. S. Chatterji Application of crop model for quantification of yield gap of cotton in
Wardha district of Maharashtra
4. Ms. Ashvini H. Kolhe Dr. P. Chandran Characterization and genesis of red, swell-shrink soils of Hingoli district of
Maharashtra
Ph.D. Programme
The following students have submitted their theses
S. No. Name of student Name of Guide Thesis Title
1. Ms. Preeti C. Solanke Dr. Rajeev Srivastava Spectral reflectance characteristics of Vertisols and associated soils in
Nagpur district of Maharashtra
2. Mr. B.S. Bhople Dr. D.K. Pal Layer charge characteristics of some Vertisols clay of Maharashtra and its
relationship with soil properties and management
The following M.Sc. (LRM) students were admitted in 2009 at Dr. PDKV, Akola who later joined NBSS&LUPin June, 2010 for their specialized courses in LRM. They have completed their course work and at present engagedin research work for their theses. Name of the students and their guides along with the respective thesis title ismentioned below:
S. No. Name of student Name of Guide Thesis Title
1. Mr. Mane Vishal Yadao Dr. S.K. Ray Bulk density and its relationship with other parameters of soils of Vidarbha,
Mahaarashtra
2. Mr. Pachpor Swapnil D. Dr. M.S.S. Nagaraju Characterization and evaluation of land resources for management of
Savali watershed of Wardha district of Maharashtra using IR6-P6
Resourcesat-1 data and GIS
3. Ms. Bali Archana Keshav Dr. S. Chatterjee Yield gap analysis of soybean of some selected soils of Nagpur district,
Maharashtra
4. Mr. Jadhav Satish Parshuram Dr. D.K. Mandal Studies on soils of soybean-based cropping system Raisod, tahsil of
Washim district.
5. Mr. Gaikawad Suryakant S. Dr. Jagdish Prasad Characteristics and spectral reflectance properties of typical Vertisols of
Vidarbha, Maharashtra
6. Mr. Naveen Reddy Loka Dr. P. Chandran Red and black soil associations in Chandrapur district of
Maharashtra
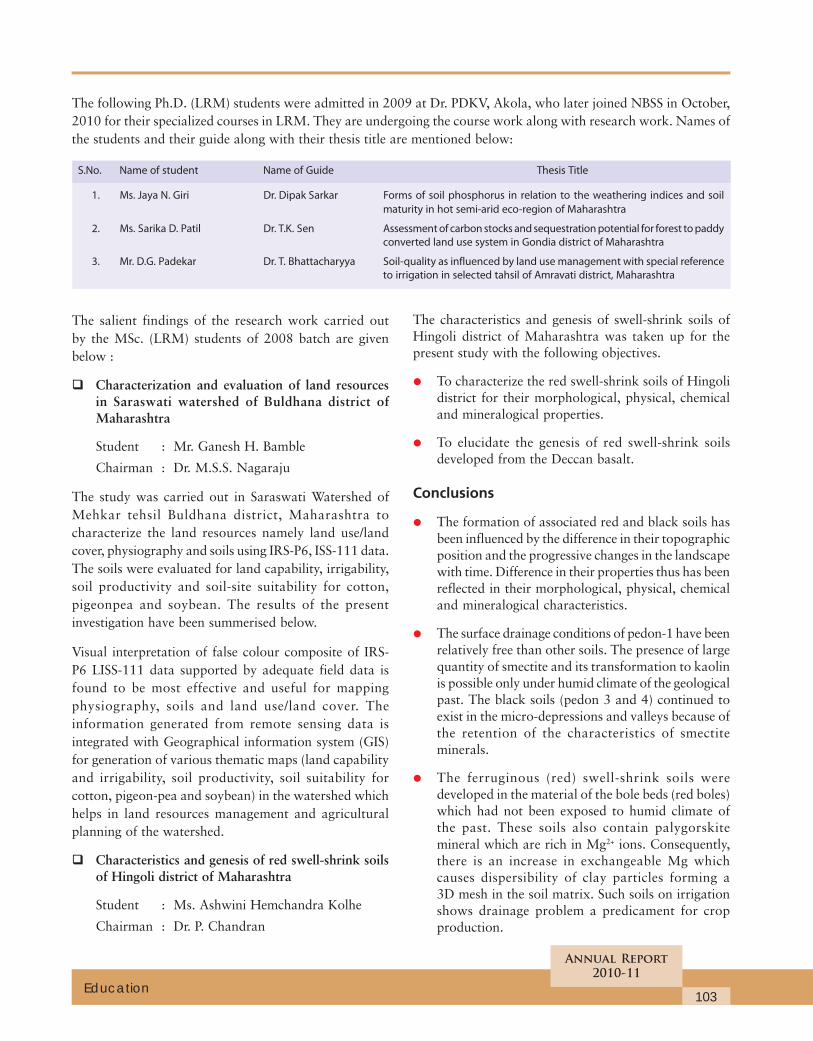
103
Annual Report
2010-11
Education
The salient findings of the research work carried outby the MSc. (LRM) students of 2008 batch are givenbelow :
� Characterization and evaluation of land resourcesin Saraswati watershed of Buldhana district ofMaharashtra
Student : Mr. Ganesh H. Bamble
Chairman : Dr. M.S.S. Nagaraju
The study was carried out in Saraswati Watershed ofMehkar tehsil Buldhana district, Maharashtra tocharacterize the land resources namely land use/landcover, physiography and soils using IRS-P6, ISS-111 data.The soils were evaluated for land capability, irrigability,soil productivity and soil-site suitability for cotton,pigeonpea and soybean. The results of the presentinvestigation have been summerised below.
Visual interpretation of false colour composite of IRS-P6 LISS-111 data supported by adequate field data isfound to be most effective and useful for mappingphysiography, soils and land use/land cover. Theinformation generated from remote sensing data isintegrated with Geographical information system (GIS)for generation of various thematic maps (land capabilityand irrigability, soil productivity, soil suitability forcotton, pigeon-pea and soybean) in the watershed whichhelps in land resources management and agriculturalplanning of the watershed.
� Characteristics and genesis of red swell-shrink soilsof Hingoli district of Maharashtra
Student : Ms. Ashwini Hemchandra Kolhe
Chairman : Dr. P. Chandran
The characteristics and genesis of swell-shrink soils ofHingoli district of Maharashtra was taken up for thepresent study with the following objectives.
• To characterize the red swell-shrink soils of Hingolidistrict for their morphological, physical, chemicaland mineralogical properties.
• To elucidate the genesis of red swell-shrink soilsdeveloped from the Deccan basalt.
Conclusions
• The formation of associated red and black soils hasbeen influenced by the difference in their topographicposition and the progressive changes in the landscapewith time. Difference in their properties thus has beenreflected in their morphological, physical, chemicaland mineralogical characteristics.
• The surface drainage conditions of pedon-1 have beenrelatively free than other soils. The presence of largequantity of smectite and its transformation to kaolinis possible only under humid climate of the geologicalpast. The black soils (pedon 3 and 4) continued toexist in the micro-depressions and valleys because ofthe retention of the characteristics of smectiteminerals.
• The ferruginous (red) swell-shrink soils weredeveloped in the material of the bole beds (red boles)which had not been exposed to humid climate ofthe past. These soils also contain palygorskitemineral which are rich in Mg2+ ions. Consequently,there is an increase in exchangeable Mg whichcauses dispersibility of clay particles forming a3D mesh in the soil matrix. Such soils on irrigationshows drainage problem a predicament for cropproduction.
The following Ph.D. (LRM) students were admitted in 2009 at Dr. PDKV, Akola, who later joined NBSS in October,2010 for their specialized courses in LRM. They are undergoing the course work along with research work. Names ofthe students and their guide along with their thesis title are mentioned below:
S.No. Name of student Name of Guide Thesis Title
1. Ms. Jaya N. Giri Dr. Dipak Sarkar Forms of soil phosphorus in relation to the weathering indices and soil
maturity in hot semi-arid eco-region of Maharashtra
2. Ms. Sarika D. Patil Dr. T.K. Sen Assessment of carbon stocks and sequestration potential for forest to paddy
converted land use system in Gondia district of Maharashtra
3. Mr. D.G. Padekar Dr. T. Bhattacharyya Soil-quality as influenced by land use management with special reference
to irrigation in selected tahsil of Amravati district, Maharashtra
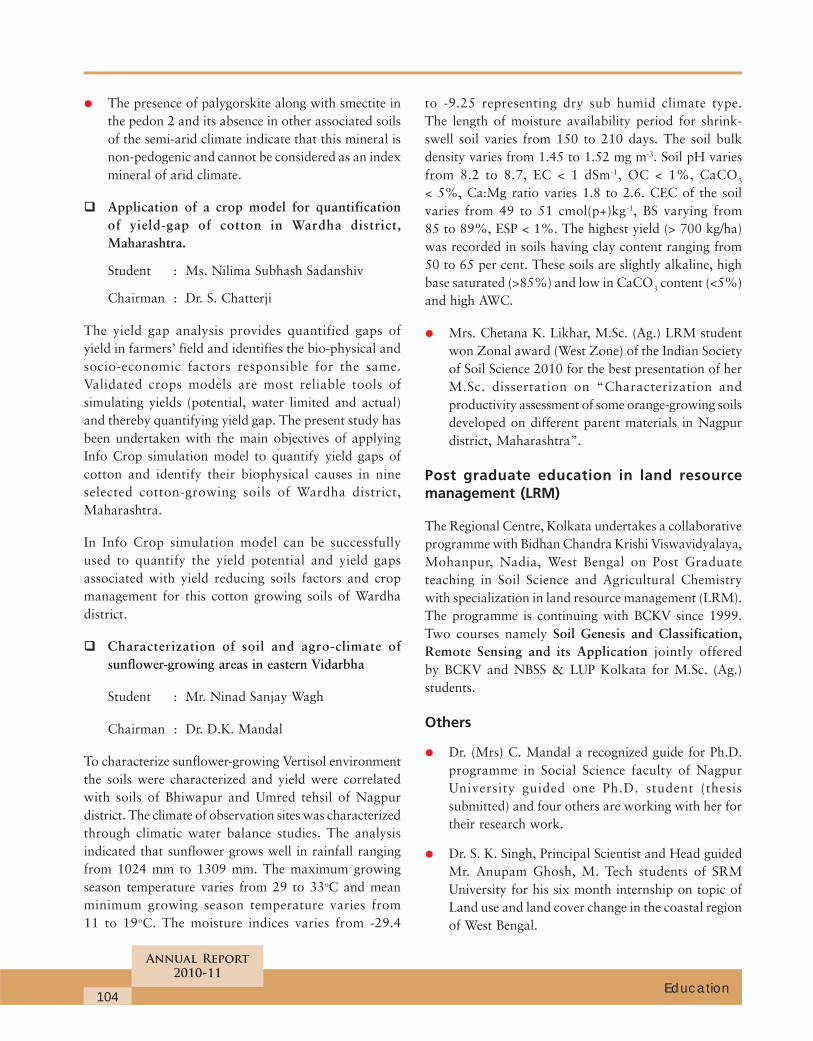
104
Annual Report
2010-11
Education
• The presence of palygorskite along with smectite inthe pedon 2 and its absence in other associated soilsof the semi-arid climate indicate that this mineral isnon-pedogenic and cannot be considered as an indexmineral of arid climate.
� Application of a crop model for quantificationof yield-gap of cotton in Wardha district,Maharashtra.
Student : Ms. Nilima Subhash Sadanshiv
Chairman : Dr. S. Chatterji
The yield gap analysis provides quantified gaps ofyield in farmers’ field and identifies the bio-physical andsocio-economic factors responsible for the same.Validated crops models are most reliable tools ofsimulating yields (potential, water limited and actual)and thereby quantifying yield gap. The present study hasbeen undertaken with the main objectives of applyingInfo Crop simulation model to quantify yield gaps ofcotton and identify their biophysical causes in nineselected cotton-growing soils of Wardha district,Maharashtra.
In Info Crop simulation model can be successfullyused to quantify the yield potential and yield gapsassociated with yield reducing soils factors and cropmanagement for this cotton growing soils of Wardhadistrict.
� Characterization of soil and agro-climate ofsunflower-growing areas in eastern Vidarbha
Student : Mr. Ninad Sanjay Wagh
Chairman : Dr. D.K. Mandal
To characterize sunflower-growing Vertisol environmentthe soils were characterized and yield were correlatedwith soils of Bhiwapur and Umred tehsil of Nagpurdistrict. The climate of observation sites was characterizedthrough climatic water balance studies. The analysisindicated that sunflower grows well in rainfall rangingfrom 1024 mm to 1309 mm. The maximum growingseason temperature varies from 29 to 33oC and meanminimum growing season temperature varies from11 to 19oC. The moisture indices varies from -29.4
to -9.25 representing dry sub humid climate type.The length of moisture availability period for shrink-swell soil varies from 150 to 210 days. The soil bulkdensity varies from 1.45 to 1.52 mg m-3. Soil pH variesfrom 8.2 to 8.7, EC < 1 dSm-1, OC < 1%, CaCO3
< 5%, Ca:Mg ratio varies 1.8 to 2.6. CEC of the soilvaries from 49 to 51 cmol(p+)kg-1, BS varying from85 to 89%, ESP < 1%. The highest yield (> 700 kg/ha)was recorded in soils having clay content ranging from50 to 65 per cent. These soils are slightly alkaline, highbase saturated (>85%) and low in CaCO3 content (<5%)and high AWC.
• Mrs. Chetana K. Likhar, M.Sc. (Ag.) LRM studentwon Zonal award (West Zone) of the Indian Societyof Soil Science 2010 for the best presentation of herM.Sc. dissertation on “Characterization andproductivity assessment of some orange-growing soilsdeveloped on different parent materials in Nagpurdistrict, Maharashtra”.
Post graduate education in land resourcemanagement (LRM)
The Regional Centre, Kolkata undertakes a collaborativeprogramme with Bidhan Chandra Krishi Viswavidyalaya,Mohanpur, Nadia, West Bengal on Post Graduateteaching in Soil Science and Agricultural Chemistrywith specialization in land resource management (LRM).The programme is continuing with BCKV since 1999.Two courses namely Soil Genesis and Classification,Remote Sensing and its Application jointly offeredby BCKV and NBSS & LUP Kolkata for M.Sc. (Ag.)students.
Others
• Dr. (Mrs) C. Mandal a recognized guide for Ph.D.programme in Social Science faculty of NagpurUniversity guided one Ph.D. student (thesissubmitted) and four others are working with her fortheir research work.
• Dr. S. K. Singh, Principal Scientist and Head guidedMr. Anupam Ghosh, M. Tech students of SRMUniversity for his six month internship on topic ofLand use and land cover change in the coastal regionof West Bengal.
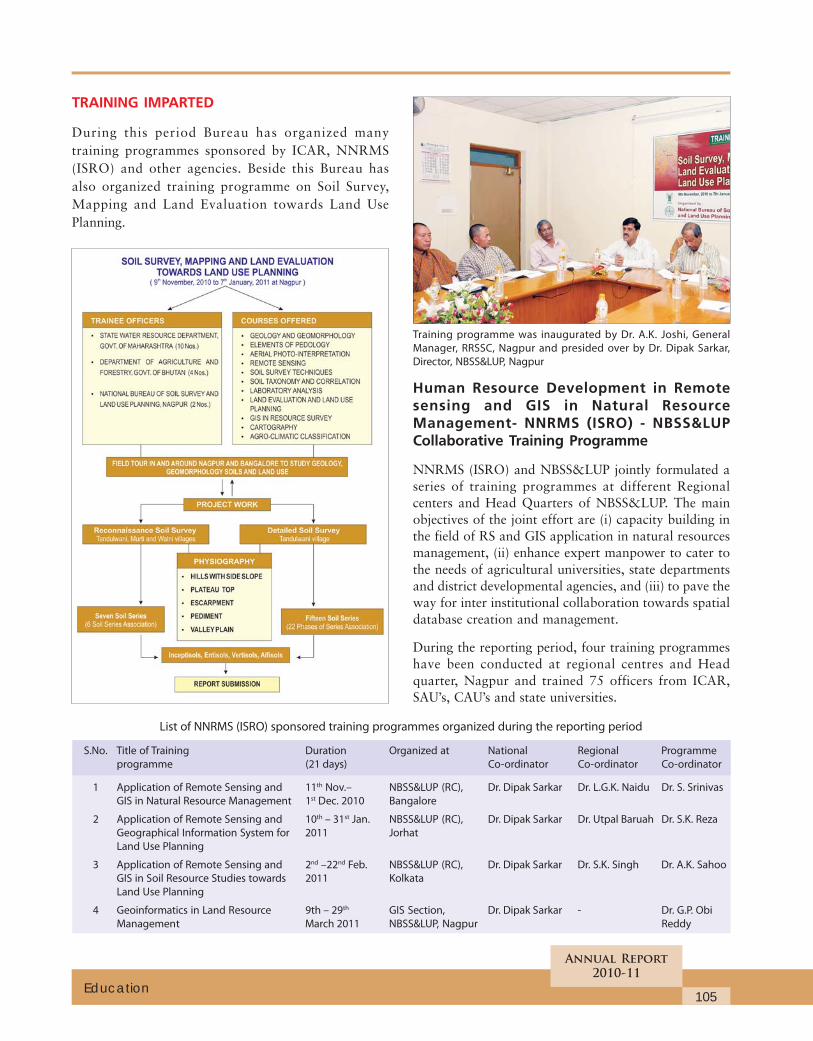
105
Annual Report
2010-11
Education
Training programme was inaugurated by Dr. A.K. Joshi, General
Manager, RRSSC, Nagpur and presided over by Dr. Dipak Sarkar,
Director, NBSS&LUP, Nagpur
Human Resource Development in Remotesensing and GIS in Natural ResourceManagement- NNRMS (ISRO) - NBSS&LUPCollaborative Training Programme
NNRMS (ISRO) and NBSS&LUP jointly formulated aseries of training programmes at different Regionalcenters and Head Quarters of NBSS&LUP. The mainobjectives of the joint effort are (i) capacity building inthe field of RS and GIS application in natural resourcesmanagement, (ii) enhance expert manpower to cater tothe needs of agricultural universities, state departmentsand district developmental agencies, and (iii) to pave theway for inter institutional collaboration towards spatialdatabase creation and management.
During the reporting period, four training programmeshave been conducted at regional centres and Headquarter, Nagpur and trained 75 officers from ICAR,SAU’s, CAU’s and state universities.
List of NNRMS (ISRO) sponsored training programmes organized during the reporting period
S.No. Title of Training Duration Organized at National Regional Programme
programme (21 days) Co-ordinator Co-ordinator Co-ordinator
1 Application of Remote Sensing and 11th Nov.– NBSS&LUP (RC), Dr. Dipak Sarkar Dr. L.G.K. Naidu Dr. S. Srinivas
GIS in Natural Resource Management 1st Dec. 2010 Bangalore
2 Application of Remote Sensing and 10th – 31st Jan. NBSS&LUP (RC), Dr. Dipak Sarkar Dr. Utpal Baruah Dr. S.K. Reza
Geographical Information System for 2011 Jorhat
Land Use Planning
3 Application of Remote Sensing and 2nd –22nd Feb. NBSS&LUP (RC), Dr. Dipak Sarkar Dr. S.K. Singh Dr. A.K. Sahoo
GIS in Soil Resource Studies towards 2011 Kolkata
Land Use Planning
4 Geoinformatics in Land Resource 9th – 29th GIS Section, Dr. Dipak Sarkar - Dr. G.P. Obi
Management March 2011 NBSS&LUP, Nagpur Reddy
TRAINING IMPARTED
During this period Bureau has organized manytraining programmes sponsored by ICAR, NNRMS(ISRO) and other agencies. Beside this Bureau hasalso organized training programme on Soil Survey,Mapping and Land Evaluation towards Land UsePlanning.
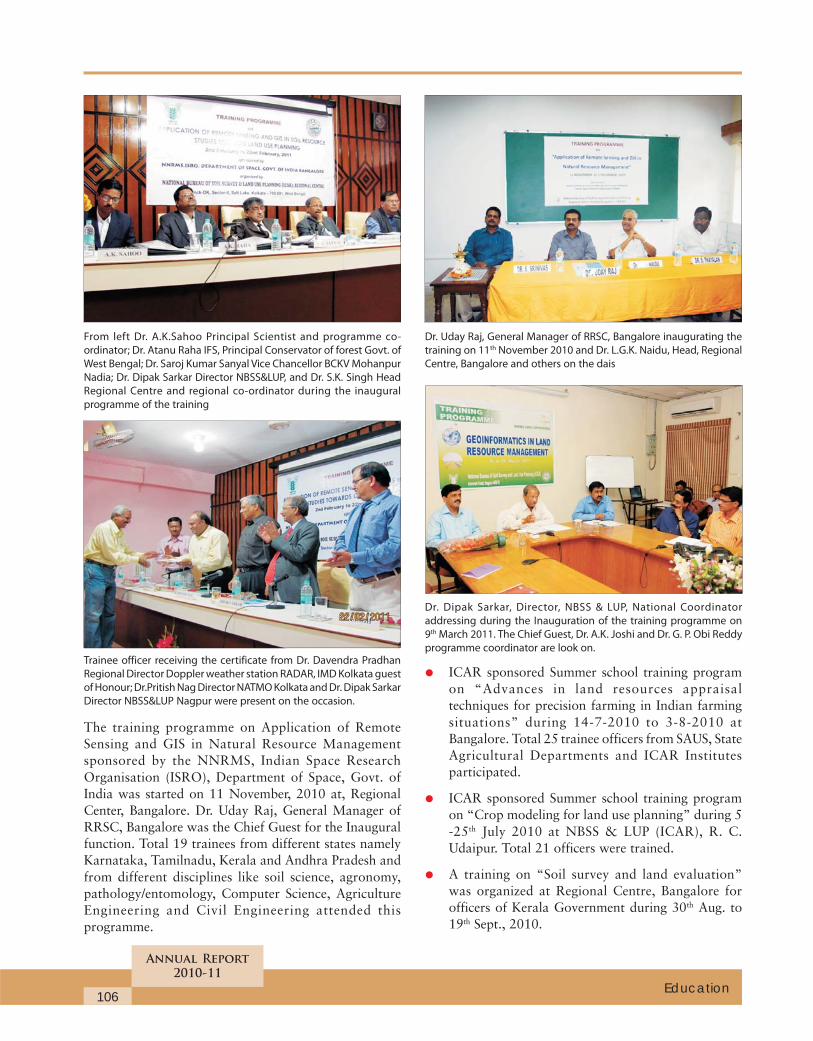
106
Annual Report
2010-11
Education
From left Dr. A.K.Sahoo Principal Scientist and programme co-
ordinator; Dr. Atanu Raha IFS, Principal Conservator of forest Govt. of
West Bengal; Dr. Saroj Kumar Sanyal Vice Chancellor BCKV Mohanpur
Nadia; Dr. Dipak Sarkar Director NBSS&LUP, and Dr. S.K. Singh Head
Regional Centre and regional co-ordinator during the inaugural
programme of the training
Trainee officer receiving the certificate from Dr. Davendra Pradhan
Regional Director Doppler weather station RADAR, IMD Kolkata guest
of Honour; Dr.Pritish Nag Director NATMO Kolkata and Dr. Dipak Sarkar
Director NBSS&LUP Nagpur were present on the occasion.
The training programme on Application of RemoteSensing and GIS in Natural Resource Managementsponsored by the NNRMS, Indian Space ResearchOrganisation (ISRO), Department of Space, Govt. ofIndia was started on 11 November, 2010 at, RegionalCenter, Bangalore. Dr. Uday Raj, General Manager ofRRSC, Bangalore was the Chief Guest for the Inauguralfunction. Total 19 trainees from different states namelyKarnataka, Tamilnadu, Kerala and Andhra Pradesh andfrom different disciplines like soil science, agronomy,pathology/entomology, Computer Science, AgricultureEngineering and Civil Engineering attended thisprogramme.
Dr. Uday Raj, General Manager of RRSC, Bangalore inaugurating the
training on 11th November 2010 and Dr. L.G.K. Naidu, Head, Regional
Centre, Bangalore and others on the dais
Dr. Dipak Sarkar, Director, NBSS & LUP, National Coordinator
addressing during the Inauguration of the training programme on
9th March 2011. The Chief Guest, Dr. A.K. Joshi and Dr. G. P. Obi Reddy
programme coordinator are look on.
• ICAR sponsored Summer school training programon “Advances in land resources appraisaltechniques for precision farming in Indian farmingsituations” during 14-7-2010 to 3-8-2010 atBangalore. Total 25 trainee officers from SAUS, StateAgricultural Departments and ICAR Institutesparticipated.
• ICAR sponsored Summer school training programon “Crop modeling for land use planning” during 5-25th July 2010 at NBSS & LUP (ICAR), R. C.Udaipur. Total 21 officers were trained.
• A training on “Soil survey and land evaluation”was organized at Regional Centre, Bangalore forofficers of Kerala Government during 30th Aug. to19th Sept., 2010.
107
Annual Report
2010-11
Education
Training Received
International Training under NAIP
Under the project entitled, “Geo-referenced soilinformation system for land use planning and monitoringsoil and land quality for agriculture” funded by NAIP,Component-4, Dr. P. Chandran, Principal Scientist wasdeputed to International Soil Reference and InformationCentre (ISRIC), Environmental Science Group (ESG),Wageningen UR, The Netherlands from 17th Jan. to1st Mar. 2011. The purpose of this visit was to understandthe technical knowhow to develop of database on soils,climate and land use in SOTER-GIS environment andlinking the information in a map to prepare soil and otherthematic maps. This baseline database can be utilised forunderstanding many other processes occurring in the soilsand also used for modelling purposes, soil qualityresearch, soil carbon stock studies, etc.
Dr. G. P. Obi Reddy, Sr. Scientist & Incharge GIS Sectionhad undergone the NAIP (ICAR) sponsored training/collaborative research programme in ‘Geoinformatics’under HRD (Component – 1) at Department of EarthSystems Analysis (ESA), International Institute of Geo-Information Science and Earth Observation (ITC),University of Twente, Enschede, The Netherlands from3rd May to 31st July, 2010. The aim of the NAIP (ICAR)sponsored training/collaborative research programmewas to acquire the advance knowledge in the field ofGeoinformatics. During the programme, the scientistgained the advanced skills in digital terrain analysis,extraction of various terrain primary and secondaryvariables and integrated using object oriented multi-resolution segmentation technique in characterization andautomatic delineation of district landform units forregional soil landscape modeling. During the programmethe scientist also gained the advanced skills through handson training in Arc GIS, ELWIS, ERDAS and E-Cognitionsoftwares.
• Dr. S. Dharmurajan and Nirmal Kumar, Scientist,Dr. D.K. Katiyar (Tech. Officer T-6), Sh, V.N. Parhad,Sh. P. S, Butte, Sh. Harjeet Singh Tech. Officers(T-5), Dr. Debabrata Das, Tech. Asstt. (T-4), Sh. A.K. Maitra, Kuldeep Singh, Tech. Asstt. (T-3)participated in “Soil Survey Training Programme forScientists and Technical Officers of the Bureau” at
Regional Centre, Bangalore during 27th April to 21May, 2010.
• Dr. S. Dharmurajan, Ms. R. Vasundhara andSh. R. Naitam, Scientist attended 3 months trainingprogramme on “Remote sensing and GIS technologyand applications” organized by National RemoteSensing Centre, ISRO, Hyderabad from8th November, 2010 to 28th January, 2011.
• Dr. (Mrs.) Tapati Banerjee, Scientist attended thetraining programme on “SAS Statistical Package” atCRIJAF, ICAR, Barrackpore from 14.02.2011 to19.02.2011.
• Sh. Pronobesh Mondal T-2 (D-Man), Sh. S. Sarkar,T-2 (field Asstt.), Sh. M. M. Roy, Driver (T-4)attended the Hindi Training Course (Praveen) fromJuly-November, 2010 at GSI, Kolkata.
• Sh. Nirmal Kumar, Scientist attended two daysinstallation training on “Strengthening Statisticalcomputing for NARS” held at CIFE, Mumbai duringJune 16 – 17, 2010.
• Nirmal Kumar, Scientist attended 30 days “Trainerstraining Programme on Strengthening Statisticalcomputing for NARS” held at CIFE, Mumbai duringJuly 12 – August 13, 2010.
• Nirmal Kumar, Scientist, GIS section attended 5 daytraining programme on “Introduction to RISATApplications” at RRSC, Nagpur from 14th to 19th
February, 2011.
• Dr. (Mrs.) Jaya Niranjane Surya, Sr. Scientist attendeda training programme on “Creative writing onAgriculture” held at Indian Institute of MassCommunication, Orissa from 10th to 15th May 2010.
• Dr. Rajeev Srivastava, Dr. J.D. Giri and Dr. M.S.S.Nagaraju attended training on Scan Ex ImageProcessor V 3.0 software during 22nd to 24th April2010.
• Dr. J.D. Giri, Dr. M.S.S. Nagaraju and Ms. VasundharaR. attended training on “Introduction to RISAT andits Applications” at RRSC- Central Nagpur fromFebruary, 14th to 19th 2011.
108
Annual Report
2010-11
Technology Assessed and Transferred
• The district and theme based atlases and district soilresource reports provide database on naturalresources to formulate soil and water conservationprogramme, watershed management and cropplanning.
• Pedological studies on soil genesis and mineraltransformation helps comprehending basics of soilinformation to develop model for understanding soilsof the Indo-Gangetic Plains (IGP) and Black SoilRegions (BSR).
• Evaluation of soil-site suitability criteria for specificcrop will benefit in selecting appropriate crops andcropping systems in a given area to ensure sustainability
• To reduce the emission of CO2, carbon capture andstorage (CCS) technology is an important option.NBSS&LUP has developed the model to show thatsoil can act as a potential medium for CCS.
• Soil, carbon and crop modelling techniques help inpreparing set of management interventions for bettercrop planning.
109
Annual Report
2010-11
Section and Unit
The following jobs were undertaken andaccomplished
• Monitoring day-to-day Technical/Scientific work andachievements of the Bureau
• Collection, storing and dissemination of scientific andtechnical information on soils to the various institutesas per demand
• Maintenance of scientific/technical files, consultancyprojects and QRT files
• Necessary action on various technical papers/lettersreceived from Director
• Preparation of Bureau’s reports for DARE and ICARAnnual Report
• Preparation of monthly, quarterly target and progressreport
• Monitoring of progress of research project of eachscientists (six monthly) i.e. from Jan-June 2010 andJuly-Dec. 2010
• Preparation of scientific papers and slides forpresentation by the Director at National/International seminars and workshops organized bythe different Scientific Societies/Institutions
• Preparation of material for Directors’ Conference
• Providing audio visual support during seminars/workshops
• Preparation of tables, charts and other displaymaterials on the activities of the Institute
• Preparation of ATR on decisions taken duringdifferent meetings and proceedings of such meetings
• Compilation and finalization of Annual Report ofthe Institute
5.1 PROJECT MONITORING AND EVALUATION CELL
110
Annual Report
2010-11
Section and Unit
Monitoring of Bureau’s research projects mentionedbelow.
• On going projects (Institutional) : 62
• DST sponsored : 03
• Externally aided consultancy projects : 07
• NAIP Projects (5)
– As Consortium Lead Institute : 02
– As Consortium Partner : 03
• Technical inputs for finalization of publications ofthe research bulletins, technical reports etc.
• Preparation of newsletters (half yearly) of theInstitute
• Preparation of material for ICAR News and Reporter
• Organization of research review and other meetingsat Institute level
• Inputs on the preparation on publication “Glorious30 Years of NBSS&LUP”
Library Resource Development
The library procured 324 documents including 260 booksand 64 annual reports. The total collection of the libraryis 15319 which also includes bound journals. The librarysubscribed to 15 foreign and 31 Indian journals for Hqrs.Besides 16 journals were also procured for the librariesof the regional centres. Total collection of bound journalsas on 31.3.2011 was 3113. Nearly 818 readers visitedthe library. Totally 3550 documents were issued, 3728documents were returned and 5623 documents wereconsulted.
Documentation Services
Current Titles Announcement Service (CTAS)
It is a fortnightly in-house publication based on currentjournals available in the library. The photocopy of thecontent pages of journal issues are distributed to all theCentres/Divisions/Sections of the Bureau. This keepsscientific and technical staff abreast of the latestinformation received in library. About twenty four issueswere brought out during the year 2010.
Library Automation Software
Library Automation Software (SOUL : Software forUniversity Libraries) developed by the UGC is being usedfor library automation work. Data input of each book inthe software is completed. Generation of Barcode labelsfor each book is also completed. Computerised issue –return service is in operation.
CD-ROM Service
International bibliographic database viz CABI, AGRIS,
and AGRICOLA in CD-ROM are added during theyear under report. Tulsient CD Mirror Server hasbeen installed and is under LAN, the CD-ROM databases are accessed by 10 nodes spread over twobuildings of the Bureau. The CD-ROM databases areavailable for (i) CABI Database (1972 to present)-CABI, U.K.; (ii) AGRIS Database (1975 to present)-FAO, Rome; (iii) AGRICOLA Database (1970 topresent)- USDA, USA and (iv) SOIL CD (1973 to present)CABI, U.K.
These databases have been extensively used byresearchers, M.Sc., Ph.D. students and also by others fromNagpur. The user agencies have been informed aboutavailability of these databases. Search and retrievalservices have been provided with nominal charges; in printform or through Floppy Diskettes.
ISBN to NBSSLUP Publications
NBSSLUP publishes wide variety of publications inthe form of annual report; research/technicalbulletins, various scale maps of India and differentstates. The ISBN/ISSN numbers are allocated to147 NBSS publications till this period and copiesof each publication are sent to concerned agencies forinclusion in their database. The publications are sent toesteemed journals, abstracting/indexing services forreview purpose in order to achieve wider informationdissemination.
News Paper Clipping Service
The library is receiving 7 newspapers and two periodicals.The relevant cuttings pertaining to topical interest arebrought to the notice of all.
5.2 LIBRARY & DOCUMENTATION UNIT
111
Annual Report
2010-11
Section and Unit
Centralised Services
The Unit provides centralised services like photocopyingcomb/thermal binding and lamination of documents/mapsheets. Photocopying Services are also being extended tolibrary visitors.
Library Services through LAN
Local Area Network (LAN) has been established in theBureau. Five Computer nodes have been provided foraccess to library information system using bibliographicsearching with various query modes. E-mail and Internetfacility has also been provided to two computers.Browsing of international libraries through Internet is infull operation. Down-loading of subscribed onlineelectronic journals are being done using Internet facility.In future library will go for subscription of more numberof electronic journals. CD-ROM reading/writing facilityhas been installed in the library for downloadingelectronic journals, articles and access to publisher’scatalogues. Online agricultural statistics database“Indiastat.com” was subscribed during the reported period.The readers have made extensive use of this database.
On-line Portals/Journals through CeRA (NAIP)
CeRA (Consortium of e-Resources in Agriculture) isConsortium of e-journals (full text),a project under NAIP,ICAR and provided access to 123 libraries of NationalAgriculture Research System (NARS) for the years 2008-
10. NBSS&LUP is also one of the beneficiary of thisinitiative. Presently a total of 1342 on-line journals areavailable on CeRA of following publishers.
i. Springer link: It is a platform of Springer and provideson-line access to 1314 journals on different subjectspublished by Springer.
ii. Annual Reviews: Annual Reviews are authoritative,analytic reviews on 34 focused disciplines within theBiomedical, Life Sciences, Physical Sciences, andSocial Sciences. Users can access the full text ofarticles from 1990 onwards.
iii. CSIRO (Australia): Australia’s CommonwealthScientific and Industrial Organization (CSIRO)provides access to full text of articles.
iv. American Society of Agronomy : 6 journals
v. Oxford University Press: 30 journals
vi. Wiley & Blackwell: 80 journals
Document Delivery System under CeRA
As per guidelines of CeRA, photocopy of the articlerequested by the participating institutes is being providedto the libraries / members. It is continuous process.This facility is also extended to our five Regional Centres.The above e-resources can be accessed by visiting URL:http://www.cera.jccc.in through NBSS&LUP LAN.
The following jobs were undertaken and accomplished
A. Technical Bulletin
1. Soil Erosion in Himachal PradeshPrint Order – 300 copiesNBSS Publ. 132Volume of work – VI + 54 pages
B. Annual Report1. - NBSS & LUP Annual Report (2009-2010)
- Print Order – 500 copies- Volume of work – XX + 200 pages
C. Brochure1. - Training Programme
- Print Order – 800 copies- Volume of work – VI + 20 pages
5.3 PRINTING SECTION
2. Services Offered
Print Order – 1000 copies
Volume of work – IV + 12 pages
D. Newsletter
1. - NBSS&LUP Newsletter (Jan.-June 2010)- Print Order – 350 copies
2. NBSS&LUP Newsletter (July-Dec. 2010)
- Print Order – 350 copies
E. Stationery items
1. Pedon Description form
2. Complimentary slip
3. Director’s Letterhead
4. Regional Centre, Kolkata Letterhead
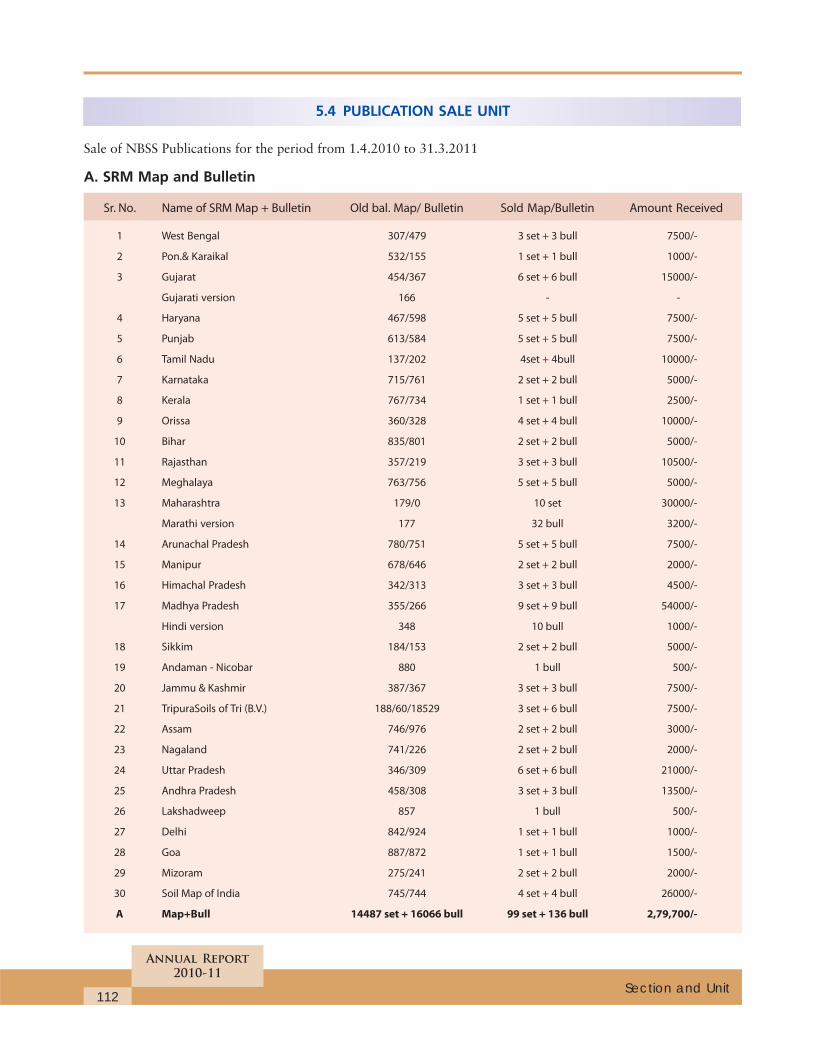
112
Annual Report
2010-11
Section and Unit
5.4 PUBLICATION SALE UNIT
Sale of NBSS Publications for the period from 1.4.2010 to 31.3.2011
A. SRM Map and Bulletin
Sr. No. Name of SRM Map + Bulletin Old bal. Map/ Bulletin Sold Map/Bulletin Amount Received
1 West Bengal 307/479 3 set + 3 bull 7500/-
2 Pon.& Karaikal 532/155 1 set + 1 bull 1000/-
3 Gujarat 454/367 6 set + 6 bull 15000/-
Gujarati version 166 - -
4 Haryana 467/598 5 set + 5 bull 7500/-
5 Punjab 613/584 5 set + 5 bull 7500/-
6 Tamil Nadu 137/202 4set + 4bull 10000/-
7 Karnataka 715/761 2 set + 2 bull 5000/-
8 Kerala 767/734 1 set + 1 bull 2500/-
9 Orissa 360/328 4 set + 4 bull 10000/-
10 Bihar 835/801 2 set + 2 bull 5000/-
11 Rajasthan 357/219 3 set + 3 bull 10500/-
12 Meghalaya 763/756 5 set + 5 bull 5000/-
13 Maharashtra 179/0 10 set 30000/-
Marathi version 177 32 bull 3200/-
14 Arunachal Pradesh 780/751 5 set + 5 bull 7500/-
15 Manipur 678/646 2 set + 2 bull 2000/-
16 Himachal Pradesh 342/313 3 set + 3 bull 4500/-
17 Madhya Pradesh 355/266 9 set + 9 bull 54000/-
Hindi version 348 10 bull 1000/-
18 Sikkim 184/153 2 set + 2 bull 5000/-
19 Andaman - Nicobar 880 1 bull 500/-
20 Jammu & Kashmir 387/367 3 set + 3 bull 7500/-
21 TripuraSoils of Tri (B.V.) 188/60/18529 3 set + 6 bull 7500/-
22 Assam 746/976 2 set + 2 bull 3000/-
23 Nagaland 741/226 2 set + 2 bull 2000/-
24 Uttar Pradesh 346/309 6 set + 6 bull 21000/-
25 Andhra Pradesh 458/308 3 set + 3 bull 13500/-
26 Lakshadweep 857 1 bull 500/-
27 Delhi 842/924 1 set + 1 bull 1000/-
28 Goa 887/872 1 set + 1 bull 1500/-
29 Mizoram 275/241 2 set + 2 bull 2000/-
30 Soil Map of India 745/744 4 set + 4 bull 26000/-
A Map+Bull 14487 set + 16066 bull 99 set + 136 bull 2,79,700/-
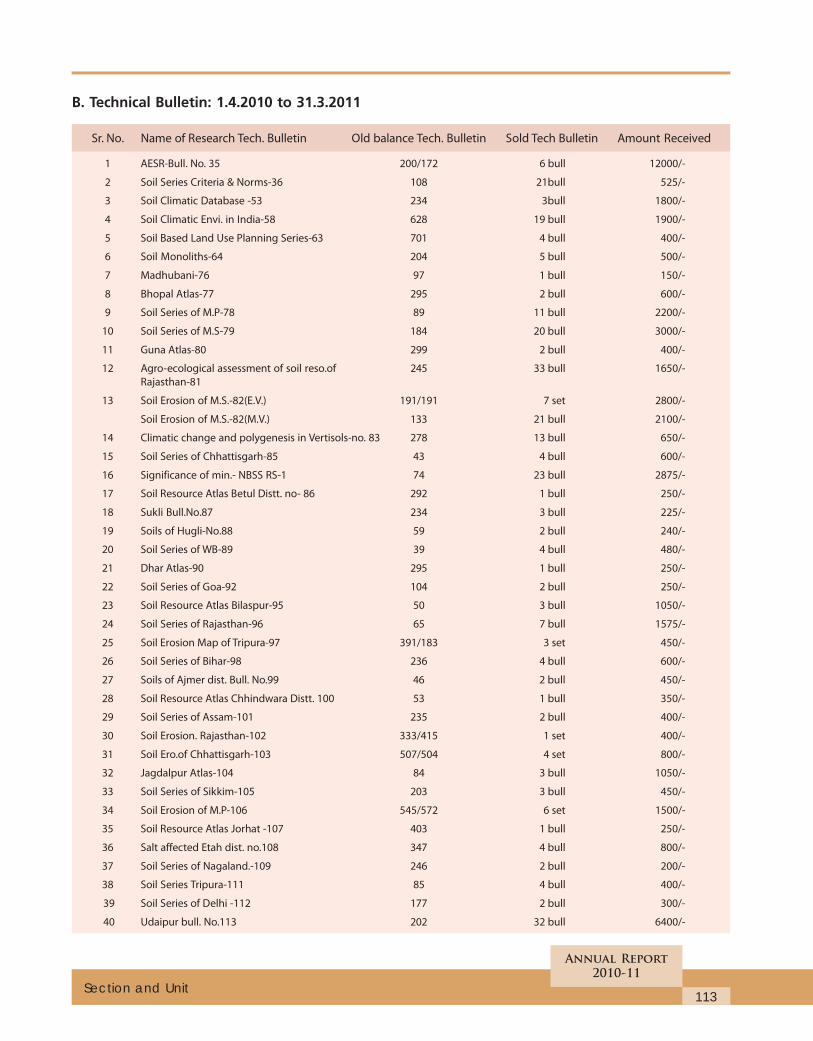
113
Annual Report
2010-11
Section and Unit
B. Technical Bulletin: 1.4.2010 to 31.3.2011
Sr. No. Name of Research Tech. Bulletin Old balance Tech. Bulletin Sold Tech Bulletin Amount Received
1 AESR-Bull. No. 35 200/172 6 bull 12000/-
2 Soil Series Criteria & Norms-36 108 21bull 525/-
3 Soil Climatic Database -53 234 3bull 1800/-
4 Soil Climatic Envi. in India-58 628 19 bull 1900/-
5 Soil Based Land Use Planning Series-63 701 4 bull 400/-
6 Soil Monoliths-64 204 5 bull 500/-
7 Madhubani-76 97 1 bull 150/-
8 Bhopal Atlas-77 295 2 bull 600/-
9 Soil Series of M.P-78 89 11 bull 2200/-
10 Soil Series of M.S-79 184 20 bull 3000/-
11 Guna Atlas-80 299 2 bull 400/-
12 Agro-ecological assessment of soil reso.of 245 33 bull 1650/-
Rajasthan-81
13 Soil Erosion of M.S.-82(E.V.) 191/191 7 set 2800/-
Soil Erosion of M.S.-82(M.V.) 133 21 bull 2100/-
14 Climatic change and polygenesis in Vertisols-no. 83 278 13 bull 650/-
15 Soil Series of Chhattisgarh-85 43 4 bull 600/-
16 Significance of min.- NBSS RS-1 74 23 bull 2875/-
17 Soil Resource Atlas Betul Distt. no- 86 292 1 bull 250/-
18 Sukli Bull.No.87 234 3 bull 225/-
19 Soils of Hugli-No.88 59 2 bull 240/-
20 Soil Series of WB-89 39 4 bull 480/-
21 Dhar Atlas-90 295 1 bull 250/-
22 Soil Series of Goa-92 104 2 bull 250/-
23 Soil Resource Atlas Bilaspur-95 50 3 bull 1050/-
24 Soil Series of Rajasthan-96 65 7 bull 1575/-
25 Soil Erosion Map of Tripura-97 391/183 3 set 450/-
26 Soil Series of Bihar-98 236 4 bull 600/-
27 Soils of Ajmer dist. Bull. No.99 46 2 bull 450/-
28 Soil Resource Atlas Chhindwara Distt. 100 53 1 bull 350/-
29 Soil Series of Assam-101 235 2 bull 400/-
30 Soil Erosion. Rajasthan-102 333/415 1 set 400/-
31 Soil Ero.of Chhattisgarh-103 507/504 4 set 800/-
32 Jagdalpur Atlas-104 84 3 bull 1050/-
33 Soil Series of Sikkim-105 203 3 bull 450/-
34 Soil Erosion of M.P-106 545/572 6 set 1500/-
35 Soil Resource Atlas Jorhat -107 403 1 bull 250/-
36 Salt affected Etah dist. no.108 347 4 bull 800/-
37 Soil Series of Nagaland.-109 246 2 bull 200/-
38 Soil Series Tripura-111 85 4 bull 400/-
39 Soil Series of Delhi -112 177 2 bull 300/-
40 Udaipur bull. No.113 202 32 bull 6400/-
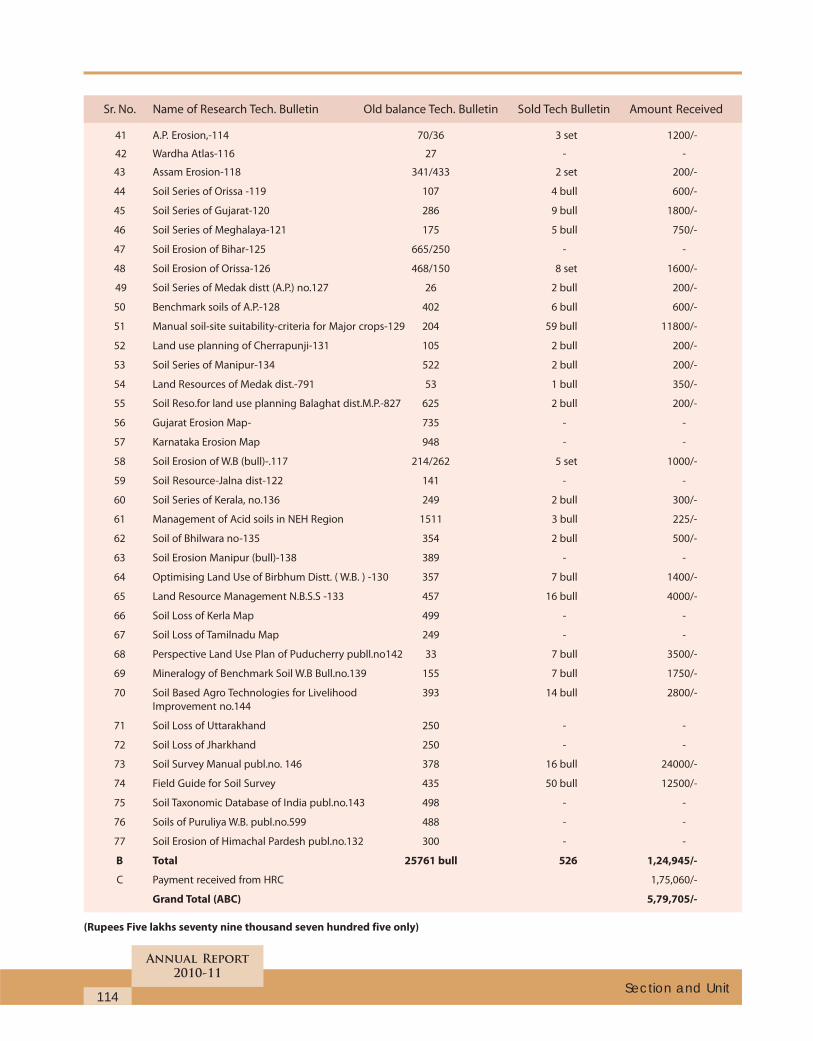
114
Annual Report
2010-11
Section and Unit
41 A.P. Erosion,-114 70/36 3 set 1200/-
42 Wardha Atlas-116 27 - -
43 Assam Erosion-118 341/433 2 set 200/-
44 Soil Series of Orissa -119 107 4 bull 600/-
45 Soil Series of Gujarat-120 286 9 bull 1800/-
46 Soil Series of Meghalaya-121 175 5 bull 750/-
47 Soil Erosion of Bihar-125 665/250 - -
48 Soil Erosion of Orissa-126 468/150 8 set 1600/-
49 Soil Series of Medak distt (A.P.) no.127 26 2 bull 200/-
50 Benchmark soils of A.P.-128 402 6 bull 600/-
51 Manual soil-site suitability-criteria for Major crops-129 204 59 bull 11800/-
52 Land use planning of Cherrapunji-131 105 2 bull 200/-
53 Soil Series of Manipur-134 522 2 bull 200/-
54 Land Resources of Medak dist.-791 53 1 bull 350/-
55 Soil Reso.for land use planning Balaghat dist.M.P.-827 625 2 bull 200/-
56 Gujarat Erosion Map- 735 - -
57 Karnataka Erosion Map 948 - -
58 Soil Erosion of W.B (bull)-.117 214/262 5 set 1000/-
59 Soil Resource-Jalna dist-122 141 - -
60 Soil Series of Kerala, no.136 249 2 bull 300/-
61 Management of Acid soils in NEH Region 1511 3 bull 225/-
62 Soil of Bhilwara no-135 354 2 bull 500/-
63 Soil Erosion Manipur (bull)-138 389 - -
64 Optimising Land Use of Birbhum Distt. ( W.B. ) -130 357 7 bull 1400/-
65 Land Resource Management N.B.S.S -133 457 16 bull 4000/-
66 Soil Loss of Kerla Map 499 - -
67 Soil Loss of Tamilnadu Map 249 - -
68 Perspective Land Use Plan of Puducherry publl.no142 33 7 bull 3500/-
69 Mineralogy of Benchmark Soil W.B Bull.no.139 155 7 bull 1750/-
70 Soil Based Agro Technologies for Livelihood 393 14 bull 2800/-
Improvement no.144
71 Soil Loss of Uttarakhand 250 - -
72 Soil Loss of Jharkhand 250 - -
73 Soil Survey Manual publ.no. 146 378 16 bull 24000/-
74 Field Guide for Soil Survey 435 50 bull 12500/-
75 Soil Taxonomic Database of India publ.no.143 498 - -
76 Soils of Puruliya W.B. publ.no.599 488 - -
77 Soil Erosion of Himachal Pardesh publ.no.132 300 - -
B Total 25761 bull 526 1,24,945/-
C Payment received from HRC 1,75,060/-
Grand Total (ABC) 5,79,705/-
(Rupees Five lakhs seventy nine thousand seven hundred five only)
Sr. No. Name of Research Tech. Bulletin Old balance Tech. Bulletin Sold Tech Bulletin Amount Received
115
Annual Report
2010-11
Section and Unit
Organized the Exhibition cum-sale stall at followingplaces.
1. National Seminar on Issues in Land ResourceManagement ISSLUP, held at Nagpur from 08-10October 2010.
2. Agri Expo-Haritkranti-2010,held at Baramati,Maharashtra from 01-04, November 2010.
3. 75th Annual Convention of Indian Society of Soil Scienceheld at IISS Bhopal from 14 to 17 November, 2010.
4. Rashtriya Kisan Mela on Citrus at NRCC, Nagpurfrom 04 and 05, March, 2011
5. Agrovision 2011 at Reshimbag Ground, Nagpurfrom 04 to 07 March. 2011
List of New Publication received during theyear 2010-11
Sr. No. Name of the publication Publ. Printed
No. copies
1. Soil Taxonomic Database of India 143 498
2. Soils of Puruliya Dist. W.B. for 599 488
Optimizing Land Use
3. Soil Erosion of Himachal Pardesh 132 300
During the period from 01.04.2010 to 31.03.2011organized two Sales and Publication Committeemeeting and fixed the prices of new publication andreviewed the cost of old publications.
5.5 ARIS CELL
Agricultural Knowledge Management Unit(AKMU) (ARIS Cell)
The assigned activities and work done during thereporting period in ARIS Cell is summarized below.
1. Maintenance and management of LAN Networkingin the institute
• Maintained and managed the LAN networkingof the Institute by modernization
• Now uninterrupted internet and E-mail servicesin the institute on round the clock basis isprovided updated the internet bandwidth from512 Kbps to 2 Mbps lease line (1:1) to providebetter internet and email services. InstalledCyberoam and Symantec antivirus for all theusers in the institute.
2. Design and Developing the New Website as per theICAR Guidelines
• As per the ICAR guidelines, the new website(www.nbsslup.in) has been designed anddeveloped in consultation with Phoenix MultiMedia solutions, Nagpur collected allinformation and conducted interactive discussionwith web designers on the structure of thewebsite.
• The institute Website has been designed anddeveloped in Joomla software environment asper the protocols and standards provided byICAR.
• A special Images Gallery has been created toaccommodate the images of events and meetings.Facilities were created at ARIS Cell to uploadthe Website content at any time. Website is hostedon Linux server and is protected from externalthreats and hacking. Logos and all informationcopyright protected.
• Search engine has been created to get theconnation from Google and Yahoo search.
• Various analysis report can be generatedabout the website, like from which country,city site is viewed on particular date, whichpage is more viewed on internet, total no.of visitors with their specific region canbe viewed and many more from googleanalytics.
• Email service on Google Apps server has beenprovided to video chat, voice chat. 7 gb spaceper user id is provided. Maximum 50 email idscan be created.
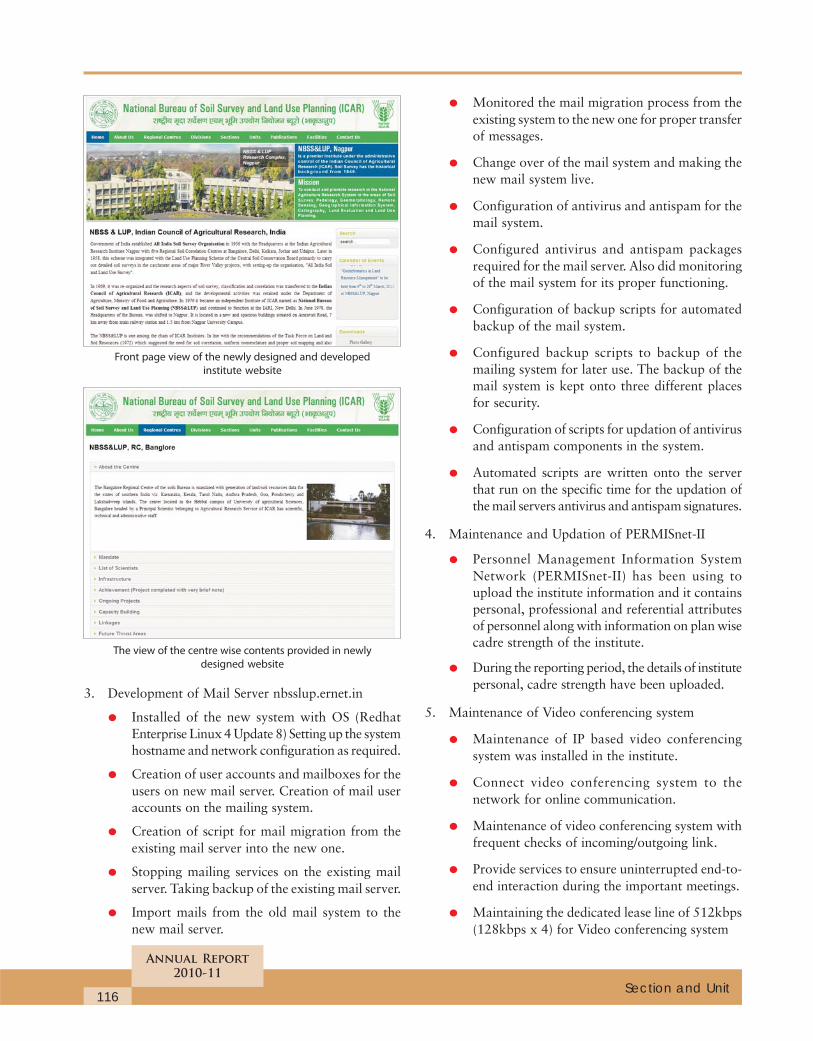
116
Annual Report
2010-11
Section and Unit
Front page view of the newly designed and developed
institute website
The view of the centre wise contents provided in newly
designed website
3. Development of Mail Server nbsslup.ernet.in
• Installed of the new system with OS (RedhatEnterprise Linux 4 Update 8) Setting up the systemhostname and network configuration as required.
• Creation of user accounts and mailboxes for theusers on new mail server. Creation of mail useraccounts on the mailing system.
• Creation of script for mail migration from theexisting mail server into the new one.
• Stopping mailing services on the existing mailserver. Taking backup of the existing mail server.
• Import mails from the old mail system to thenew mail server.
• Monitored the mail migration process from theexisting system to the new one for proper transferof messages.
• Change over of the mail system and making thenew mail system live.
• Configuration of antivirus and antispam for themail system.
• Configured antivirus and antispam packagesrequired for the mail server. Also did monitoringof the mail system for its proper functioning.
• Configuration of backup scripts for automatedbackup of the mail system.
• Configured backup scripts to backup of themailing system for later use. The backup of themail system is kept onto three different placesfor security.
• Configuration of scripts for updation of antivirusand antispam components in the system.
• Automated scripts are written onto the serverthat run on the specific time for the updation ofthe mail servers antivirus and antispam signatures.
4. Maintenance and Updation of PERMISnet-II
• Personnel Management Information SystemNetwork (PERMISnet-II) has been using toupload the institute information and it containspersonal, professional and referential attributesof personnel along with information on plan wisecadre strength of the institute.
• During the reporting period, the details of institutepersonal, cadre strength have been uploaded.
5. Maintenance of Video conferencing system
• Maintenance of IP based video conferencingsystem was installed in the institute.
• Connect video conferencing system to thenetwork for online communication.
• Maintenance of video conferencing system withfrequent checks of incoming/outgoing link.
• Provide services to ensure uninterrupted end-to-end interaction during the important meetings.
• Maintaining the dedicated lease line of 512kbps(128kbps x 4) for Video conferencing system
117
Annual Report
2010-11
Section and Unit
The cartography unit is extending support services fordigital cartography work of the Institute as:
District contingent plan:
• Land Resource Atlas of Vidarbha region ofMaharashtra
• Agro-ecological region of Uttar Pradesh (collaboratingproject of UPCAR and NBSSLUP)
• Other miscellaneous work
As a centralized service centre the following work hasbeen undertaken:
• Final art works/cover page design
• Glorious 30 years of NBSS and LUP
• NBSS and LUP catalogue
• Agenda notes of IMC meeting
• Souvenir ISSLUP
• Dharati 2009
Map redesigned for offset printing (CMYK)
• Soil loss of Bihar and Himachal Pradesh
Exhibition poster:
• Exhibition of posters for Agrovision held at Nagpur
• Twelve poster designed and printed for the differentnational symposium and seminar.
• Designing of certificates, banners, invitations cardsetc. for various programmes and seminars of theBureau.
• Staff identity card designing and preparation(150 nos.)
• Sign board for ICAR residential campus, Nagpur
Digitization work:
• Soil and location of Yavatmal districts
• Soil map of Sikkim
• Base map of Himachal Pradesh, Punjab and Haryana.
• Relief map of India
• State wise location map of Bench mark soils.
Maps published:
• Soil loss of Jharkhand, Bihar, Orissa and West Bengalwere published in collaboration with CSWRTI,Dehradun.
• Documentation of diagrams in digital mode. Itincludes all soil scape diagrams, soil-physiographicrelationship diagrams, water balances and otherdiagrams prepared by NBSS are being redrawn inCorel Draw software format. About 50 nos. havealready been completed. It will form part of digitalmap library
Plotting, Scanning and other printing jobs under takenduring the reported year includes.
• Total 4442 color prints (A3 and A4 size) werebrought out pertaining to different media cover page.Research papers, cover pages, photographs, projectdocuments proforma, Annual Report, Thesis, Report,Brochure, PPT printouts, Maps, Programme and soilseries proforma.
• 5 copies of Yavatmal and Hayatnagar farms andother posters in Ao size.
Xeroxing:
About 44373 copies (monocolour) and 50708 copies(colour) was done during the reported period.
5.6 CARTOGRAPHY UNIT
5-7 fgUnh vuqHkkx
jktHkk"kk vfËkfu;e] 1963 vkSj mlosG varxZr cus jktHkk"kkfu;e] 1976 osG vuqikyu ,oa jktHkk"kk foHkkx (Hkkjr ljdkj)Hkkjrh; œf"k vuqlaËkku ifj"kn~] ubZ fnYyh }kjk le;≤ ijtkjh fd, tkus okys ^okf"kZd dk;Zÿe* esa fuËkkZfjr y{;ksa dks iw.kZdjus osG mÌs'; ls C;wjks (eq[;ky;)] ukxiqj] esa ^fgUnh vuqHkkx*dk;Zjr gSA
fgUnh Ádk'ku % okf"kZd fgUnhœf"k if=dk e`nk niZ.k* ,oa okf"kZdfgUnh if=dk ^Ëkjrh* dk laiknu@Ádk'ku dk;ZA
fgUnh lIrkg dk vk;kstu% C;wjks (eq[;ky;)] ukxiqj rFkk mlosG5 {ks=h; osGUÊksa (ubZ fnYyh@mn;iqj@cSaxyq:@dksydkrk ,oa tksjgkV)esa ^fgUnh lIrkg lekjksg* (fnukad% 14&20 flrEcj] 2010) dk
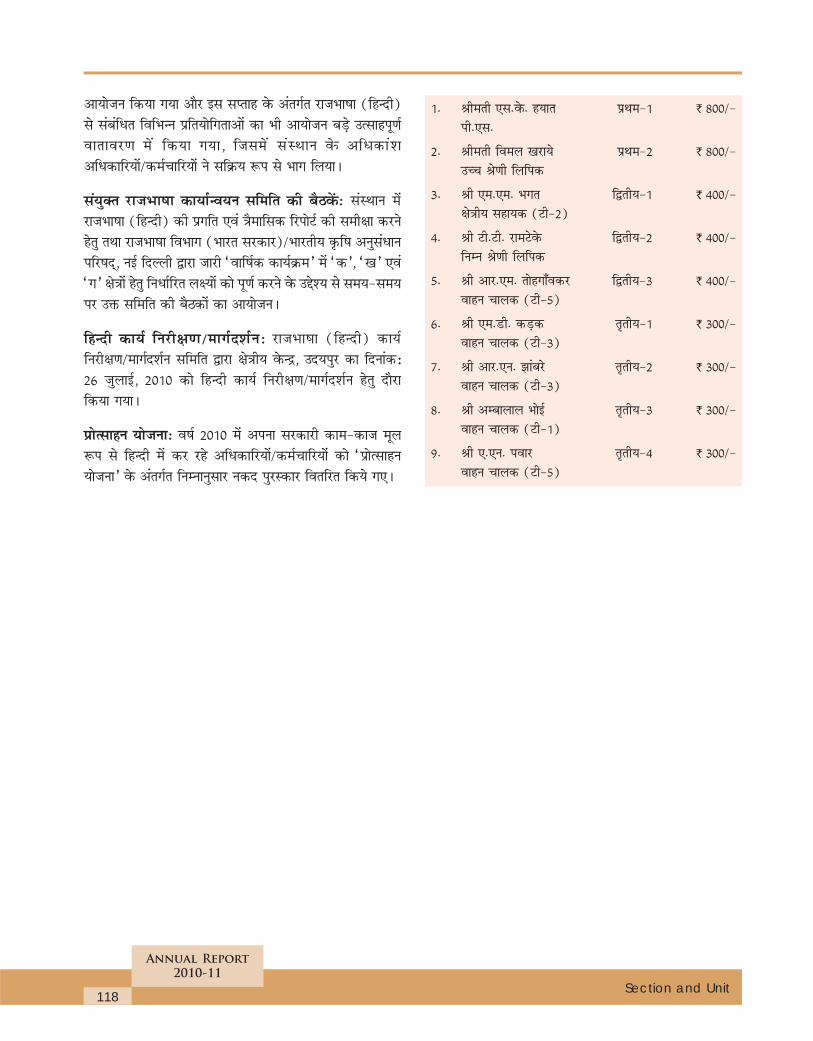
118
Annual Report
2010-11
Section and Unit
vk;kstu fd;k x;k vkSj bl lIrkg osG varxZr jktHkk"kk (fgUnh)ls lacafËkr fofHkUu Áfr;ksfxrkvksa dk Hkh vk;kstu cM+s mRlkgiw.kZokrkoj.k es a fd;k x;k] ftles a laLFkku osG vfËkdk a'kvfËkdkfj;ksa@deZpkfj;ksa us lfÿ; :i ls Hkkx fy;kA
la;qDr jktHkk"kk dk;kZUo;u lfefr dh cSBosaG% laLFkku esajktHkk"kk (fgUnh) dh Áxfr ,oa =Sekfld fjiksVZ dh leh{kk djusgsrq rFkk jktHkk"kk foHkkx (Hkkjr ljdkj)@Hkkjrh; œf"k vuqlaËkkuifj"kn~] ubZ fnYyh }kjk tkjh ^okf"kZd dk;Zÿe* esa ^d*] ^[k* ,oa^x* {ks=ksa gsrq fuËkkZfjr y{;ksa dks iw.kZ djus osG mÌs'; ls le;≤ij m‰ lfefr dh cSBdksa dk vk;kstuA
fgUnh dk;Z fujh{k.k@ekxZn'kZu% jktHkk"kk (fgUnh) dk;Zfujh{k.k@ekxZn'kZu lfefr }kjk {ks=h; osGUÊ] mn;iqj dk fnukad%26 tqykbZ] 2010 dks fgUnh dk;Z fujh{k.k@ekxZn'kZu gsrq nkSjkfd;k x;kA
ÁksRlkgu ;kstuk% o"kZ 2010 esa viuk ljdkjh dke&dkt ewy:i ls fgUnh esa dj jgs vfËkdkfj;ksa@deZpkfj;ksa dks ^ÁksRlkgu;kstuk* osG varxZr fuEukuqlkj udn iqjLdkj forfjr fd;s x,A
1- Jherh ,l-osG- g;kr ÁFke&1 ` 800@&ih-,l-
2- Jherh foey [kjk;s ÁFke&2 ` 800@&mPp Js.kh fyfid
3- Jh ,e-,e- Hkxr f}rh;&1 ` 400@&{ks=h; lgk;d (Vh&2)
4- Jh Vh-Vh- jkeVsosG f}rh;&2 ` 400@&fuEu Js.kh fyfid
5- Jh vkj-,e- rksgxk°odj f}rh;&3 ` 400@&okgu pkyd (Vh&5)
6- Jh ,e-Mh- dM+d r`rh;&1 ` 300@&okgu pkyd (Vh&3)
7- Jh vkj-,u- >kacjs r`rh;&2 ` 300@&okgu pkyd (Vh&3)
8- Jh vEckyky HkksbZ r`rh;&3 ` 300@&okgu pkyd (Vh&1)
9- Jh ,-,u- iokj r`rh;&4 ` 300@&okgu pkyd (Vh&5)
• Dr. A.K.Sahoo, Principal Scientist has been electedas a fellow of the National EnvironmentalScience Academy (NESA), New Delhi during theyear 2010.
• Dr. K. D. Sah, Senior Scientist has been elected aFellow of the Institution of Chemists (India) duringthe year 2010.
• S.K. Reza, U. Baruah, Dipak Sarkar and D.P. Duttaobtained the Best Poster presentation Award atNational Seminar on “Issues on Land ResourceManagement: Land degradation, Climate Changeand Land Diversification” for the poster entitled‘Spatial heterogeneity of soil-DTPA extractablemicronutrients in piedmont area of Chirang districtof Assam: A Geo-statistical approach” organized byISSLUP, at NBSS & LUP, Nagpur held on 8-10th
October, 2010.
• Dr. S.K. Mahapatra, Principal Scientist wasawarded Distinction Certificate by CabinetSecretariat, Government of India for attending
Workshop on Result Framework Document(RFD) held at Vigyan Bhawan, New Delhi onJanuary 22, 2011.
• Dr. T. N. Hajare received Senior Scientist GoldMedal Award 2010 in appreciation of theresearch contribution for advancement of scientificknowledge in the field of bio informatics and lifesciences on 13th December, 2010 during IIIrdInternational Consortium of contemporaryBiologists and Madhawi-Shyam EducationalTrust, Ranchi, Jharkhand organized by ICBRD&NRMCU-10.
• Dr. N. G. Patil, A. Chaturvedi, T. N. Hajare,A. Gattani, Layant Borkar, Mamta Mokde and AnjuNair received Best Poster Award in the poster entitled,‘Issues in Water Management and Sustainability ofAgriculture in Gondia District’ during NationalSeminar on Issues in Land Resource management:Land degradation, Climate Change and Land usediversification held at Nagpur (8-10 Oct. 2010).
119
Annual Report
2010-11
Awards and Recognitions
• Dr. Jagdish Prasad was nominated as Member onthe Institute Management Committee of NationalInstitute of Abiotic Stress Management (ICAR),Malegaon, Baramati, Pune for a period of three yearsw.e.f. 04.10.2010 to 03. 10 .2013
• Dr. Jagdish Prasad was nominated as Member in the
Editorial Board (2010-2011) of Indian Society of SoilScience, New Delhi.
• Dr. Jagdish Prasad was appointed as a member onthe Board of studies in Soil Science & AgriculturalChemistry, Banaras Hindu University for a period oftwo years with effect tow 24.07. 2010.
120
Annual Report
2010-11
Awards and Recognitions
121
Annual Report
2010-11
Publications
Research Papers
Anil Kumar, K.S. and Shalima Devi, G.M. (2009). Soilorganic carbon stocks as a land quality indicatorunder the coffee land use system in Karnataka.Journal of Coffee Research 37: 43-65.
Ardak, Sweta, A., Nagaraju, M.S.S., Jagdish Prasad,Rajeev Srivastava and Barthwal, A.K. (2010).Characterization and evaluation of land resourcesin Khapri village of Nagpur district, Maharashtrausing high resolution satellite data and GIS.Agropedology 20: 7-18.
Ashokkumar, H.P. and Jagdish Prasad (2010). Sometypical sugarcane-growing soils of Ahmadnagardistrict of Maharashtra: Their characteristics andclassification and nutritional status of soils andplants. Journal of the Indian Society of Soil Science58: 257-266.
Banerjee Tapati, Dutta, D., Sarkar Dipak and DasDebabrata (2010). Soil moisture based cropplanning for farmers land – A case study for Silai
Sub-watershed of West Bengal. Journal of SoilConservation 38: 89-93.
Bhaskar, B.P., Dipak Sarkar and Utpal Baruah. (2010).Characterization of hydric soils in rice growingareas of Disang inland valley, Sibsagar district,Assam. Gondwana Geological Magazine 12:355-363.
Bhaskar, B.P., Raja, P., Gajbhiye, K.S., Maji, A.K., Singh,S.R., Anantwar, S.G., and Nimkar, A.M. (2010).Topographic appraisal for irrigaton suitability ina part of Jayakwadi command area, Parbhanidistrict, Maharashtra. Journal of the Indian Societyof Soil Science 58:363-370.
Bhaskar, B.P., Utpal Baruah, Vadivelu, S., Raja, P. andSarkar. D. (2010). Remote sensing and GIS in themanagement of wetland resources of Majuli island,Assam, India. Tropical Ecology 51:31-40.
Bhattacharyya, T., Pal, D.K., Williams, S., Telpande, B.A.,Deshmukh, A.S., Chandran, P., Ray, S.K., Mandal,C., Easter, M. and Paustian, K. (2010). Evaluating
122
Annual Report
2010-11
Publications
the Century C model using two long-term fertilizertrials representing humid and semi-arid sites fromIndia. Agriculture, Ecosystems and Environment139:264-272.
Bhattacharyya, T., Ray, S.K., Pal, D.K. and Chandran,P. (2009). Mineralogy class of calcareous zeolitisedVertisols. Clay Research 28: 73-82.
Bobade, S.V., Bhaskar, B.P., Gaikwad, M.S., Raja, P.,Gaikwad, S.S., Anantwar, S.G., Patil, S.V., Singh,S.R. and Maji, A.K. (2010). A GIS based land usesuitability assessment in Seoni District, MadhyaPradesh, India. Tropical Ecology 51:41-54.
Chattaopadhyay, T., Varadachari Chandrika and Ghosh,Kunal (2010). Complexion of humic substancesby allophone. Clay Research 29: 15-22.
Gangopadhyay, S. K., Obi Reddy, G. P., Sarkar Dipak,Srinivas C. V., Khan, Q.I., Krishnamurthy, T.(2010). Soil suitability evaluation using remotesensing data and GIS – A case study for semi-aridtropics of India. International Journal ofGeoinformatics, Thailand 6: 35-47.
Ghawade, A.R., Kadu, P.R. and Ray, S.K. (2009). Physicaland chemical properties of soils affecting drainagein Upper Wardha command area. Agropedology19:92-98.
Ghosh Saurav, Sarkar Dipak and Sahoo, A.K. (2009).Distribution of micro-nutrient cations in soils ofPatloi Nala micro-watershed of Puruliya district,West Bengal. Agropedology 19 :112-116.
Goswami S.N., Mandal D.K. and Mandal, C. (2010).Reducing methane emission through managementof cattle population and grass land – A case studyin different regions of Maharashtra. Indian Journalof Animal Sciences 80: 764-767.
Hebbar, K.B., Venugopalan, M.V., Ray, S.K., Blaise, D.and Gokulpure, P.P. (2010). Differential responseof cultivated cotton species (Gossypium species)to salinity. Geobios 37: 3-8.
Jagdish Prasad (2010). Forms of potassium in shallowsoils of different origin and land uses in Nagpurdistrict of Maharashtra. Journal of the IndianSociety of Soil Science 58: 327-330.
Jagdish Prasad, Ashokkumar, H.P. and Ramamurthy, V.(2010). Sugarcane in shrink-swell soils of
Ahmadnagar, boon or bane? Science India (theNational Science Magazine) 13: 37-38.
Jagdish Prasad, Ray, S.K., Gajbhiye, K.S. and Singh, S.R.(2009). Soils of Selsura research farm in Wardhadistrict, Maharashtra and their suitability for crops.Agropedology 19: 75-83.
Kapse, K. V., Ray, S.K., Chandran, P., Bhattacharyya, T.and Pal, D.K. (2010). Calculating charge densityof clays : an improvised method. Clay Research29: 1-13.
Mandal D.K., Agarkar Deepti and Khandare, N.C.(2010). Rational of international land evaluationmethods under aberrant climate conditions inshrink-swell soils of India in semi arid tropics.Journal of the Indian Society of Soil Science 58:141-146.
Mandal D.K., Goswami S.N., Mandal C., and Sarkar,Dipak (2011). Potential areas for diversified pulsesproduction- An agro-eco based study. IndianJournal of Fertilisers 7 : 32-44.
Mandal D.K., Khandare N.C., Mandal C., Challa O. andJagdish Prasad. (2010). Parametric land capabilityclassification : A new approach. Journal of theIndian Society of Soil Science 58: 99-104.
Mandal, D. K. Mandal, C., Raja, P. and Goswami, S. N.(2010). Identification of suitable area for aerobicrice cultivation in humid tropics of eastern India.Current Science 99 :1-5.
Mandal, D.K., Goswami, S.N., Mandal, C., and Sarkar,Dipak (2010). Potential areas for diversifiedoilseeds production and productivity improvement-An agro-eco based study. Agriculture Situation inIndia 66 : 601-608.
Meena, H.B., Giri, J.D. and Mishra, H.K. (2010).Nutrient availability in soils as affected byphysiography in Chittorgarh district, Rajasthan.Agropedology 20: 85-87.
Nagaraju, M.S.S., Obi Reddy, G.P., Maji, A.K.,Srivastava, R., Raja, P., Barthwal, A.K. (2010). Soilloss mapping for sustainable development andmanagement of land resources in Warora tehsil ofChandrapur district of Maharashtra: An integratedapproach using remote sensing and GIS. Journalof the Indian Society of Remote Sensing 39:51-61.
123
Annual Report
2010-11
Publications
Nagaraju, M.S.S., Srivastava, Rajeev, Barthwal, A.K. andMaji, A.K. (2010). Characterization andevaluation of land resources for management ofChandanpardi watershed in basaltic terrain ofNagpur district of Maharashtra using remotesensing and GIS. Journal of Water Management17 : 1-11.
Naidu, L.G.K., Ramamurthy, V. and Ramesh Kumar, S.C.(2010). Potassium deficiency in soil and crops.Indian Journal of Fertilisers 6: 32-38.
Natarajan, A., Hegde, R., Naidu, L.G.K., Raizada, A.,Adhikari, R.N., Patil, S.L., Rajan, K. and Sarkar,Dipak (2010). Soil and plant nutrient loss duringthe recent floods in North Karnataka: Implicationsand ameliorative measures. Current Science 99:1333-1340.
Niranjana, K.V., Vadivelu, S., Maria Violet D’Souza,Nagaraj, J.S., Arti Koyal and Ramesh, M. (2009).Soils of coffee growing areas of Western Ghats inChikmagalur district of Karnataka. Journal ofCoffee Research 37: 1-9.
Pal, D.K., Mandal, D.K., Bhattacharyya, T., Mandal, C.and Sarkar, D. (2009). Revisiting the agro-ecological zones for crop evaluation. Indian Journalof Genetics 69: 315-318.
Pal, S., Datta, S.C. and Reza, S.K. (2011).Interrelationship of organic acids and aluminumconcentration in rhizosphere and non-rhizospheresoil solution of rice in acidic soil. Communicationsin Soil Science and Plant Analysis 42: 932-944.
Pal, S., Patra., A.K., Reza, S.K., Wildi, W. and Pote, J.(2010). Use of bio-resources for remediation of soilpollution. Natural Resources 1: 110-125.
Pandey, C.B., Singh, G.B., Singh, S.K. and Singh, R.K.(2010). Soil nitrogen and microbial biomassdynamics in natural forest and derived agriculturalland use in humid tropical climate of India. Plantand Soils 353:453-467.
Patil, Girish B., Nagaraju, M.S.S., Jagdish Prasad andRajeev Srivastava (2010). Characterization,evaluation and mapping of land resources inLendi watershed, Chandrapur district ofMaharashtra using remote sensing andGIS. Journal of the Indian Society of Soil Science58: 442-448.
Patil, Shilpa S., Nagaraju, M.S.S. and Rajeev Srivastava(2010). Characterization and evaluation of landresources of basaltic terrain for watershedmanagement using remote sensing and GIS. IndianJournal of Soil Conservation 38: 16-23.
Raja, P., Bhaskar, B.P., Deepak Malpe, Anantwar, S.G.and Tapaswi, P.M. (2010). Geochemistry of saltaffected soils in Purna valley, Maharashtra, India:their paleoclimatic implications. Journal of AppliedGeochemistry 12:491-501.
Rajan, K., Natarajan, A., Anil Kumar, K.S., Badrinath,M.S. and Gowda, R.C. (2010). Soil organic carbon-the most reliable indicator for monitoring landdegradation by soil erosion. Current Science99: 823-827.
Reza, S.K., Ahmed, Nayan and Pal, S. (2010). Evaluationof pedological development of soils developed onlower reaches of Siwalik hills through fieldmorphological rating system. Indian Journal of SoilConservation 38 : 101-104.
Reza, S.K., Sarkar, Dipak., Baruah., Utpal and Das, T.H.(2010). Evaluation and comparison of ordinarykriging and inverse distance weighting methods forprediction of spatial variability of some chemicalparameters of Dhalai district, Tripura.Agropedology 20 : 38-48.
Sah, K.D., Sarkar Dipak, Seal, A. and Singh, D. S. (2010).Micro-level planning for optimum land use in acoastal area of West Bengal – A case study.Agropedology 20: 19-29.
Sahoo, A. K., Sarkar, Dipak, Baruah, U. and Butte, P. S.(2010). Characterization, classification andevaluation of soils of Langol Hill, Manipur forrational land use planning. Journal of the IndianSociety of Soil Science 58 : 355-362.
Satyavathi, P.L.A., Ray, S.K., Raja, P., Bhattacharyya, T.and Pal, D.K. (2010). Smectite distribution in threerepresentative Vertisol pedons of different agro-climatic regions of India. Clay Research29: 57-62.
Shalima Devi, G.M. and Anil Kumar, K.S., (2010).Characterisation and classification of coffee-growing soils of Karnataka. Journal of the IndianSociety of Soil Science 58: 125-132.
124
Annual Report
2010-11
Publications
Sharma, R.P., Rathore, M.S., Singh, R.S. and Qureshi,F.M. (2010). Mineralogical framework of alluvialsoils developed on Aravalli sediments. Journal ofthe Indian Society of Soil Science 58:70-75.
Sidhu, G.S., Sharma, A.K., Samul, R.C., Surya, J.N,Kamble, H. Kalpana and Sharma J.P. (2011).Source and quality of irrigation water in differentagro-climatic zones of upper, middle and lowerGangetic Plains region. Indian Journal ofAgricultural Sciences 81: 181-84.
Srinivas, C.V., Murthy, K.P.R.V., Krishnamurthy, Y.V.N.,Raja, P. and Obi Reddy, G.P. (2010). A study ofatmosphere-biosphere exchange of CO2 in atropical Indian region using NOAA AVHRR dataand field observations. Asian Journal ofGeoinformatics 10: 9-18.
Venugopalan M.V., Tiwary P., Mandal D.K. and Challa,O. (2010). Validation and application of WOFOSTmodel for yield gap analysis in selected soils ofMaharashtra. Agropedology 20: 30-37.
Yadav, R.P. and Sidhu, G.S. (2010). Assessment of soilerosion in Himachal Pradesh. Journal of the IndianSociety of Soil Science 58: 212-220.
Reports/Bulletins
Ray, S.K., Bhattacharyya, T., Sarkar, D., Mandal, C.,Sidhu, G.S., Sahoo, A.K., Nair, K.M., Singh, R.S.,Dutta, D., Chandran, P., Pal, D. K., Tiwary, P.,Mandal, D.K., Prasad, J., Venugopalan, M.V.,Srivastava, A.K., Rayachaudhury, M.,Velmourougane, K., Srivastava, R., Sen, T.K.,Chatterji, S., Obireddy, G.P., Patil, N.G.,Mahapatra, S.K., Das, K., Singh, A.K., SrinivasS., Reza, S. K., Balbuddhe, D. V., MrunmayeeLokhande, Wadhai, K. N., Vishakha Dongare,Mohanty, B., Majumdar, S., Ganjanna, K.V.,Garhwar, R.S., Meena, K.K., Hazarika, D., Sahu,A., Mahapatra, S. and Ashutosh Kumar, Nimje,A. N., Deshmukh, R. R., Deshmukh, A. D., Thakre,S. W., Dasgupta, D., Telpande, B. A., Likhar, C.K., Sheikh, S., (2011). “Georeferenced SoilInformation System for Land Use Planning andMonitoring Soil and Land Quality for Agriculture”Baseline Data for the Indo-Gangetic Plains andthe Black Soil Region, Vol- I IGP, Divisionof Soil Resource Studies, NBSS&LUP,Nagpur, p563.
Ray, S.K., Bhattacharyya, T., Sarkar, D., Mandal, C.,Sidhu, G.S., Sahoo, A.K., Nair, K.M., Singh, R.S.,Dutta, D., Chandran, P., Pal, D. K., Tiwary, P.,Mandal, D.K., Prasad, J., Venugopalan, M.V.,Srivastava, A.K., Rayachaudhury, M.,Velmourougane, K., Srivastava, R., Sen, T.K.,Chatterji, S., Obireddy, G.P., Patil, N.G.,Mahapatra, S.K., Das, K., Singh, A.K., SrinivasS., Reza, S. K., Balbuddhe, D. V., MrunmayeeLokhande, Wadhai, K. N., Vishakha Dongare,Mohanty, B., Majumdar, S., Ganjanna, K.V.,Garhwar, R.S., Meena, K.K., Hazarika, D., Sahu,A., Mahapatra, S. and Ashutosh Kumar, Nimje,A. N., Deshmukh, R. R., Deshmukh, A. D., Thakre,S. W., Dasgupta, D., Telpande, B. A., Likhar, C.K., Sheikh, S., (2011). “Georeferenced SoilInformation System for Land Use Planning andMonitoring soil and land quality for Agriculture”Baseline Data for the Indo-Gangetic Plains andthe Black Soil Region, Vol- II BSR, Divisionof Soil Resource Studies, NBSS&LUP, Nagpur,p.548.
Bhattacharya, T., Chandran , P., Venugopalan, M.V., Pal,D.K., Ray, S.K.,Mandal, C., Tiwary, P., Sarkar,Dipak., Singh,A.K., Aggarwal, P.K., Pathak, H.,Kumar, S.N., Venkateswaralu, B., DasGupta, D.,Balbuddhe, D. V., and Nimje, A. M., (2010).Indigenous Technical Knowledge (ITK) for ClimateChange in Indian Agriculture. Special Publicationfor the National Project on Climate Change(NPCC), ICAR on “Changes in soil carbon reservesas influenced by different ecosystems and land usein India” NBSS & LUP, Publ. Nagpur, p-27.
Anonymous (2010). Land Resources of Keelvelur block,Nagapattinam district, Tamil Nadu NBSS&LUP,SS&LUO, Palayamkottai, TNAU and AgriculturalEngineering Department. Nodal Officer (NADP1.5), SS&LUO, Coimbatore Publ. No. 127, p 122.
Anonymous (2010). Land Resources of Nagapattinamblock, Nagapattinam district, Tamil Nadu.NBSS&LUP, SS&LUO, Palayamkottai, TNAU andAgricultural Engineering Department, Chennai.Nodal Officer (NADP 1.5), SS&LUO, CoimbatorePubl. No. 128, 139 p.
Anonymous (2010). Land Resources of Cuddalore block,Cuddalore district, Tamil Nadu NBSS&LUP,SS&LUO, Palayamkottai, TNAU and AgriculturalEngineering Department, Chennai. Nodal Officer
125
Annual Report
2010-11
Publications
(NADP 1.5), SS&LUO, Coimbatore, Publ. No.129, 263 p.
Walia, C.S., Surya, J.N., Dhankar,R.P., Sharma, J.P andSarkar, Dipak (2010). Generation of Soil Databasefor Khulgad Watershed Development in AlmoraDistrict, Uttarakhand. DST Funded Project Report,NBSS Publ.
Walia, C.S., Martin,D., Singh,S.P., Dhankar, R.P., DharamSingh, Katiyar, D.K and Sarkar, Dipak (2010). Soilresource distribution, characterization andevaluation for cotton based cropping systems inirrigated eco-system in Northern India, (ProjectReport) NBSS Publ.
Mahapatra, S.K., Sharma, J.P. and Sarkar, Dipak (2010)Soils resource mapping of Mathura district of UttarPradesh for Perspective Land Use Planning. NBSSPubl. 156 p + (i-xii).
Maji, A.K., Srivastava, Rajeev, Sarkar, Dipak Mehta,R.L. and Ray, S.S (2010) Soils variability mappingand fertility zonation using Hyperspectraldata. National Bureau of Soil Survey and LandUse Planning (ICAR), Nagpur and SpaceApplication centre (DOS), Ahmedabad. ProjectReport 39p
Srivastava, Rajeev, Maji, A.K. and Nagaraju, M.S.S.(2010) Development of soil reflectance libraries forcharacterization of soil properties in Nagpurdistrict, Maharashtra. National Bureau ofSoil Survey and Land Use Planning (ICAR),Nagpur. 40p
Satyavathi, P.L.A., Ray, S.K., Chandran, P., Raja, P.,Durge, S.L. and Pal D.K. (2010). Acertaining thepedogenic processes for the clay enriched Bsshorizon of Vertisols. Final Project ReportNBSS&LUP, p. 45.
Chaturvedi, A., Hajare, T.N., Patil, N.G. and Sarkar, D.(2011). Enhancing tribal livelihood: A ResourceManagement Approach(Bulletin) 56p.
Anonymous (2010). Baseline Report on “IntegratedFarming System for Rural Livelihood Security inAurangabad, Dhule & Gondia Districts ofMaharashtra’. Submitted to NAIP (component 3)ICAR, New Delhi.
Popular articles
Ramamurthy, V., 2010. Sweet maize cultivation(Kannada). Vokkaligara Pathrike 1 (2):24-25.
Ramamurthy, V. (2010) Yecchina labhake baby cornkrishi. Vokkaligara Pathrike 1 (6):31-32.
Radio Talks
• Dr. V. Ramamurthy delivered a radio talk onImportance of Maize on 12-05-10 from Bangalore AIR
• Dr. Rajendra Hegde gave a radio interview onSignificance of world food day celebrations 16th
October 2010 from AIR, Bangalore
• Dr. Rajendra Hegde gave radio talk on Achievementsand agonies of 2010 and protection of Consumerrights on 6th Dec. 2010 from AIR Bangalore.
• Dr. Rajendra Hegde gave radio talk on Organicfarming issues and practices to make it work on 16th
Sept. 2010 from All India radio Bangalore.
Book Chapters/Books
Singh, A.K. and Singh, R.S. (2009) Soil Suitability forCrop Productivity Agrotech Publishing HouseUdaipur.
Natarajan, A., Janakiraman, M., Manoharan, S., AnilKumar, K.S., Vadivelu, S. and Dipak Sarkar, (2010).Zdruli, P. et al. Land Degradation andDesertification: Assessment, Mitigation andRemediation, DOI 10.1007/978_18, SpringerScience+Business Media B.V.2010 pp.
Seminars/Symposia abstracts/ConferencePapers
National seminar on “Issues in Land Resource Management:Land Degradation, Climate change and Land useDiversification” held on 8th -10th October, 2010
Bhaskar, B.P. Sarkar, Dipak, Gaikwad, M.S., Bobade, S.V.,Gaikwad, S.S., Anantwar, S.G., Nimkar, A.M.,Parad, V.N. and Patil, S.V. (2010). Soils and LandUse in Yavatmal district, Maharashtra. Abstr. p.60.
Raja, P., Sharma, J.P., Sarkar, Dipak., Mandal, C.,Bhaskar, B.P. and Gharami, S. (2010). Landscapeanalyses for cotton suitability in Wardha district,Maharashtra, India Abstr. p.58.
126
Annual Report
2010-11
Publications
Bhattacharyya, T., Pal, D.K., Telpande, Bhagyashree A.,Deshmukh, Ashwini, S., Deshmukh, Rupali, R.,Nimje, A.M., Ray, S.K., Chandran, P. and Mandal,C. (2010). Soil carbon reserves in Some Bio-climaticregions of India as influenced by global warming.Abstr. pp. 20-21.
Bhattacharyya, T., Pal, D.K., Telpande, Bhagyashree A.,Deshmukh, Ashwini S., Chandran, P., Ray, S.K.and Mandal, C. (2010). Predicting soil organiccarbon changes under paddy-wheat and sorghum-wheat cropping system – the Century C modelexperience. Abstr. pp. 113-114.
Bobade, S.V., Gaikwad, S.S., Gaikwad, M.S., Anantwar,S.G., Patil, S.V., and Bhaskar, B.P. 2010. Mappingunit approach for NPK management in soils ofSeoni District, Madhya Pradesh. Abstr. PP.49
Kadu, P.R., Surawase, S.A., Ray, S.K. and Kuchanwar,O.D. (2010). Use of free CaCO3 to evaluate thesuitability of shrink-swell soils for Mandarin inNagpur district of Maharashtra. Abstr. pp. 67-68.
Pal, D.K., Likhar, Chetna K., Thakre, Shubhangini W.,Sinha, Rajiv, Bhattacharyya, T., Chandran, P. andRay, S.K. (2010). Depthwise distribution of variousparameters in sediments of Rania core of GangaBasin. Abstr. pp. 76.
Pal, D.K., Sarkar, Dipak, Bhattacharyya, T., Mandal,D.K., Prasad, Jagdish, Sidhu, G.S., Sahoo, A.K.,Nair, K.M., Singh, R.S., Das, T.H., Venugopalan,M.V., Srivastava, A.K., Kundu, D.K.,Velmourougane, K., Meena, K.K., Mandal, K.G.,Mandal, C., Srivastava, R., Sen, T.K., Chatterji,S., Chandran, P., Ray, S.K., Obi Reddy, G.P., Patil,N.G., Mahapatra, S.K., Das, K., Singh, A.K.,Srinivas, S., Reza, S.K., Tiwary, P., Lokhande,Mrunmayee, Wadhai, Kushal, Dongare, Vishakha,Mohanty, B., Majumdar, Supriya, Ganjanna, K.V.,Garhwar, R.S., Hazarika, D., Sahu, Apeksha,Mahapatra, Suchitra and Kumar, A. (2010).Developing georeferenced soil information systemfor monitoring soil and land quality for agriculture.Abstr. pp. 112-113.
Tiwary, P., Venugopalan, M.V., Bhattacharyya, T.,Dasgupta, D., Pal, D.K., Ray, S.K., Chandran, P.and Mandal, C. (2010). Simulating yield of wheatunder the influence of climate change usingInfoCrop model. Abstr. pp. 21-22.
Karthikeyan, K., Pushpanjali, and Natarajan, A. (2010).An alternative approach to facilitate soil surveymethodology. Abstr. pp.115
Roy, Ratna, Jagdish Prasad and Gupta Rashmi (2010).Well water quality assessment for drinking anddomestic purpose in Nari, North Nagpur, Nagpur,Maharashtra. Abstr. p.116.
Bamble, Ganesh, H., Nagaraju, M.S.S., Rajeev Srivastava,Jagdish Prasad, Barthwal, A.K. and Nasre, R.A.(2010). Characterization and evaluation of landresources in Saraswati watershed of Buldhanadistrict, Maharashtra using remote sensing andGIS. Abstr. p.104.
Sanjay, Dhale A. and Jagdish Prasad (2010). Productivitypotential assessment of sweet orange-growing soilsof Jalna district, Maharashtra. Abstr. p.52.
Pal D.K., Dipak Sarkar, Bhattacharyya T., Mandal D.K.,Jagdish Prasad, Sidhu G.S., Sahoo A.K., NairK.M., Singh R.S., Das T.H., Venugopalan M.V.,Srivastava A.K., Kundu D.K., Velmourougane K.,Meena K.K., Mandal K.G., Mandal C.,Srivastava R., Sen T.K., Chatterjee S., ChandranP., Ray S.K., Obi Reddy G.P., Patil N.G.,Mahapatra S.K., Das K., Singh A.K., Srinivas S.,Reza S.K., Tiwary P., Lokhande Mrunmayee,Wadhai Khushal, Dongare Vishakha, MohantyB., Majumdar Supriya, Ganjanna K.V., GarhwarR.S., Hazarika D., Sahu Apeksha, MohapatraSucharita and Kumar A. (2010). DevelopingGeoreferenced Soil Information System forMonitoring Soil and Land Quality for Agriculture.Abstr. p.112-113.
Natarajan, A. presented invited paper on ‘Soil Surveytechniques and options for land resourcemanagement in India’.
Ramamurthy, V., Naidu, L.G.K. and Sarkar, Dipak(2010). Participatory Land Resource Management:principles, issues and challenges.
Thayalan,S., Ramamurthy, V., Anil Kumar, K.S. andNaidu, L.G.K. (2010). Geomorphological analysisa tool to interpret landform-soil-land userelationship. In abstr. A127:51
Ramesh Kumar, S.C. (2010). “Development of Web-based Economic Land Evaluation System forPlanning Sustainable Land Use: A ConceptualFramework”.
127
Annual Report
2010-11
Publications
Anil Kumar, K.S., Thayalan, S., Nair, K.M., Niranjana,K.V., Srinivas, S. Bhooraprasad and Arti Koyal(2010). Assessment of land and soil resources ofPonnani taluk, Malappuram district at 1:50,000scale for land use planning” Abstr. A055, 51 p.
Sheela Rani, S., Anil Kumar, K.S., Nalina, C.N.,Jayaramaiah, M., Sudhir, K. and Natarajan, A.,(2010). Assessment of land degradation in amicrowatershed in Eastern Dry Zone (Karnataka)using cadastral map and Google earth images,Abstr. in A. 028, 24-25 p.
Nalina, C.N., Anil Kumar, K.S., Sheela Rani, S.,Venkatesh, D.H., Natarajan, A. andSrinivasamurty, C.A., (2010). Detailed soil surveyfor soil fertility management in a microwatershedin Bangalore Rural District” Abstr. A 066, 51 p.
Dhanorkar, B.A., Thayalan, S., Nair, K.M., Naidu, L.G.K.and Sarkar, Dipak (2010). Soils of SouthernThirvananthapuram, Kerala and theirManagement for Sustainable Agriculture.
Sarkar Dipak, Singh, S. K., Sen Pradip, Nayak, D. C.,Sahoo, A. K., Gangopadhyay, S. K., Das, K., DuttaDipak, Chattopadhyay, T., Sah, K. D.,Mukhopadhyay, S. and Banerjee, T. (2010).Problems of soil fertility in intensive rice basedmultiple cropping system of West Bengal
Sahoo, A. K., Sarkar Dipak, Singh, S. K. and Butte, P. S.(2010). Soil Resource Mapping of LohardagaDistrict, Jharkhand for Land Use Planning.
Gangopadhyay, S. K., Sarkar Dipak and Singh, S. K.(2010). Characterization of soils of Simana sub-watershed in Subarnarekha catchment of WestBengal for land use planning.
Das, K., Singh, S. K. and Sarkar Dipak (2010). Erodabilitystudies of soils of Mayurbhanj district, Orissa underdifferent land use system.
Dharumarajan, S. and Singh, S. K. (2010). Waterretention characteristics of soils on levees andrecent alluvial plains in a part of West Bengal.
Singh, R.S., Giri, J.D. and Shyampura, R.L. (2010).Suitability of so soils for major crops in Bhilwaradistrict of Rajasthan.
Dutta, D., Baruah, Utpal, Sarkar, Dipak and Maji, A.K.(2010). Soil erosion status of Meghalaya State.Abstr. p. 23.
Bandyopadhyay, S., Reza, S.K. and Baruah, Utpal (2010).Development of land management unit maptowards district level land use plan of Jorhat(Assam) under rainfed eco-system. Abstr. p. 48.
Das, T.H., Baruah, Utpal and Dutta, D.P. (2010). Soilsof Bhareli river basin in North East Region – Theircharacterization and evaluation towards land useplan. Abstr. p. 63.
Sarkar, Dipak, Barauh, Utpal and Das, T.H. (2010).Assessment and mapping of soil nutrient status ofTripura towards land use planning. Abstr. p. 67.
Reza, S.K., Baruah, Utpal, Sarkar, Dipak and Dutta, D.P.(2010). Spatial heterogeneity of soil DTPA-extractable micronutrients in piedmont area ofChirang district, Assam: A geostatistical approach.Abstr. p. 110.
Pal, D.K., Sarkar, Dipak, Bhattacharya, T., Mandal, D.K.,Prasad, Jagdish, Sidhu, G.S.,Sahoo, A.K., Nair,K.M., Singh, R.S., Das, T.H., Venugopalan, M.V.,Srivastava, A.K., Kundu, D.K., Mandal, C.,Srivastava, Rajeev, Sen, T.K., Chatterji, S.,Chandran, P., Ray, S.K., Obireddy, G.P., Patil,N.G., Mahapatra, S.K., Das, K., Singh, A.K.,Srinivas, S., Reza, S.K., Tiwary, P., Lokhande,Mrunmayee, Wadhai, K., Dongre, Vishakha,Mohanty, B., Majumdar, Supriya, Ganjanna, K.V.,Garhwal5, R.S., Hazarika, D., Sahu, Apeksha,Mohapatra, Sucharita, Kumar, A. (2010).Developing georeferenced soil information Systemfor monitoring soil and land quality for agriculture.Abstr. p. 112.
T. Bhattacharyya, D.K. Pal, Bhagyashree Telpande,Ashwini S. Deshmukh, P. Chandran, S.K. Ray andMandal, C. (2010). Predicting soil organic carbonchanges under paddy- wheat and sorghum- wheatcropping system – The century C ModelExperience.
Mandal, C., Mandal, D.K. and Gharami, S. (2010). Soilsuitability assessment for rice in Bilaspur district,Chhattisgarh.
Obi Reddy, G.P., I.K. Ramteke, V. Ramamurthy, M.S.S.Nagaraju, Nirmal Kumar, A.K. Maji and DipakSarkar (2010). Geospatial application in analysisof spatio-temporal dynamics of land use system insemi-arid region of central India – A case study”.
128
Annual Report
2010-11
Publications
Pal, D.K., Dipak Sarkar, T. Bhattacharyya, D.K. Mondal,Jagdish Prasad, G.S. Sidhu, A.K. Sahoo, K.M. Nair,R.S. Singh, T.H. Das, M.V. Venugopalan, A.K.Srivastava, D.K. Kundu, K. Velmurugane, K.K.Meena, K.G. Mondal, C. Mondal, R. Srivastava,T.K. Sen, S. Chatterjee, P. Chandran, S.K. Ray, G.P.Obi Reddy, N.G. Patil, S.K. Mahapatra, K. Das,A.K. singh, S. Srinivas, S.K. Reza, P. Tiwary,Mrunmayee Lokhande, Khusal Wadhani, Vishakadongare, B. Mohanty, Supriya Majumdar, K.V.Gajanna, R.S. Garhwar, D. Hazarika, ApekshaSahu, Suchitra Mahapatra and A. Kumar (2010).Developing Georeferenced soil Information systemfor Monitoring Soil and Land Quality foragriculture.
Sidhu G.S., Surya N. Jaya, Lal Tarsem, Katiyar D.K. andSharma J.P. (2010). Soil Resource Information inNawanshahr (Saheed Bhagat Singh Nagar) district,Punjab state for land use planning. Abstr. Pp62-63
Mahapatra, S.K., Surya, N. Jaya, Sidhu G.S., Lal Tarsem,Sharma, J.P. and Sharma, R.D. (2010) Abstr. Pp 63.
Walia, C.S., .Surya, J.N., Dhankar, R.P.,Sharma, J.P.,Singh, Harjit, Khajuria Vishal, and Goya, Vishal.(2010). Soil Resource Characterization in KumaonHills Using Remote Sensing and GIS for Land UsePlanning.
Bamble, Ganesh H., Nagaraju, M.S.S., Srivastava, Rajeev,Jagdish Prasad, Barthwal, A.K. and Nasre, R.A.(2010) Characterization and Evaluation of LandResources in Saraswati Watershed of BuldanaDistrict, Maharashtra using Remote Sensingand GIS.
Giri, J.D. (2010) Application of FAO Framework forLand Use Planning- A Case Study in Ajmer Districtof Rajasthan, India.
Nasre, R.A., Maji, A.K., Nagaraju, M.S.S., Srivastava,Rajeev and Barthwal, A.K. (2010) Application ofRemote Sensing and GIS Techniques in Evaluationof Land Resources of Karanji Watershed ofYavatmal District, Maharashtra.
Singh, R.S., Giri, J.D. and Shyampura, R.L. (2010)Suitability of soils for major crops in Bhilwaradistrict of Rajasthan.
Srivastava, Rajeev, Maji, A.K., Mehta, R.L., Ray, S.S.,Sarkar, Dipak, Nagaraju, M.S.S. and Singh, D.S.
(2010) Application of Hyperspectral Data (EO-1Hyperion) in Quantitative Mapping of Soil OrganicCarbon- A Case Study in Basaltic Terrain.
Patil, N. G., A. Chaturvedi, T. N. Hajare, A. Gattani,Layant Borkar, Mamta Mokde and Anju Nair(2010). Issues in Water Management andSustainability of Agriculture in Gondia District.
Hajare, T. N., N. G. Patil, A. Chaturvedi, Layant Borkarand Mamta Mokde (2010). Sustainability ofagriculture in tribal villages of Gondia district-ACase Study.
Mandal D.K., Goswami S.N. and C. Mandal (2010).Increasing Pulse Production Through Agro-ecological Zoning Approach.
Mandal D.K., Goswami S.N. and C. Mandal (2010).Increasing Pulse Production through Agro-ecological Zoning Approach.
Mandal D.K., Goswami S.N. and C. Mandal (2010).Estimation of Methane Emission for CattlePopulation in Different Agro-Ecological Sub-Regions (AESRS) of Maharashtra.
Mandal D.K., Gharami and C. Mandal (2010). SoilSuitability Assessment for Rice in Bilaspur districts,Chhattisgarh.
Mandal D.K. and N.C. Khandare (2010). Soil Site SuitabilityAssessment for Pigeon Pea Shrink-Swell Soils ofCentral Demonstration Farm of PDKV, Akola.
Rajendra Hegde, Srinivas, S., L.G.K. Naidu and DipakSarkar (2010). Study of Land Management Unitsof North Goa district for effective land useplanning.
National Symposium on “Application of clay science :Agriculture, Environment and Industry”. February18th -19th, 2011 at Nagpur.
Bhaskar, B.P., Sarkar, D. and Utpal, B. 2011.Geochemistry of hydric soils in Majuli river island,Assam, India.. Abstr. T2/6.pp14.
Bhattacharyya, T., Ray, S.K., Chandran, P., Raja, P.,Sarkar, D., Pal, D.K. and Karthikeyan, K. (2011).Potassium supplying capacity of K- bearingminerals, (Abstract), pp. 36.
Bhople, B.S., Pal, D.K., Ray, S.K., Bhattacharyya, T.,Chandran, P. and Venugopalan, M.V. (2011). Seatof charge in smectites from some Vertisols clays ofMaharashtra, Abstr. pp. 66.
129
Annual Report
2010-11
Publications
Das, K., Sahoo, A.K., Ray, S.K., Bhattacharyya, T.,Majumder, S., Singh, S.K. and Sarkar, D. (2011).Assessment of land quality index for rainfed ricein some benchmark soils of the lower Indo-Gangetic Plains: an NAIP experience, Abstr.pp. 22-24.
Deshmukh, V.V., Ray, S.K., Chandran, P., Bhattacharyya,T., Sarkar, D. and Pal, D.K. (2011). Problem ofdetermining layer charge of shrink-swell soils ofPeninsular India Abstr. pp. 50.
Kolhe, A.H., Chandran, P., Ray, S.K., Bhattacharyya, T.,Pal, D.K. and Sarkar, D. (2011). Genesis ofassociated black and red Vertisols in Hingoli districtof Maharashtra Abstr. pp. 51.
Raja, P., Pal, D.K., Bhattacharyya, T., Maurya, U.K., Ray,S.K. and Chandran, P. (2011). Clay pedofeaturesof soils in a climosequence of the Indo-GangeticPlains, India Abstr. pp. 62.
Satyavati, P.L.A., Bhaskar, B.P., Raja, P., Ray, S.K,Bhattacharyya, T., anantwar, S.G. and Pal, D.K.2011. Geochemistry and mineralogy in basalticclay(Cracking clay) soils as related to silt and clayfractions in semiarid and arid tracts of GujaratState, India. Abstr. T2/5.pp12-13.
Tiwary, P., Mandal, D.K., Mandal, C., Pal, D.K., Patil,N.G., Ray, S.K., Chandran, P., Sarkar, D. andBhattacharyya, T. (2011). Estimation of saturatedhydraulic conductivity for the cracking clay soilsof central India Abstr. pp. 27.
Satyavathi, P.L.A., Bhaskar, B.P., Raja, P., Ray, S.K., TapasBhattacharyya, Anantwar, S.G. and Pal, D.K. 2011.Geochemistry and mineralogy in basaltic clay(cracking clay) soils as related to silt and clayfractions in semi-arid and arid tracts of Gujaratstate, India.
Srivastava Rajeev, Diapk Sarkar, Saxena R.K., VermaK.S., Jagdish Prasad, Pal D.K., Verma T.P., SinghS.K., Anilkumar K.S., Patel N.K., Singh Rakio,Bhargava G.P., Giri G.D., Nayak D.C., MohanS.C., Bhaskar B.P., Solanke Priti, Nagaraju M.S.S.,Patil N.G., Singh D.S., Nasre R.A., Barthwal A.K.,Dhale A. S., Mohekar D.S., Sethi Madhurama,Mukhipadhyay S.S. and Manjeet Singh, (2011 ).Visible and near –infrared diffuse reflectancespectroscopy (DRS) of soil for prediction of soilproperties. Abstr. p.60-61
Mandal D.K., Mandal C. Prasad J., Patil N.G., TiwaryP., Bhattachharyya T., Pal D.K., Dipak Sarkar,Lokhande M. and K. Wadhai (2011). Developmentof land quality map of Indo-Gangetic Plain foridentification of constraints in rice production.Abstr. p.31
Naidu, L.G.K., V. Ramamurthy, K.M.Nair, S.Srinivas andDipak Sarkar. (2010). Potassium deficiency in soilsof Southern India.
Nair, K.M., K.S. Anil Kumar, P. Krishnan, L.G.K. Naiduand Dipak Sarkar (2011). Variability of LateriticSoil Development in Humid Tropical Environment,T3/3.
Singh, S. K., Sarkar Dipak, Sen Pradip, Nayak, D. C.,Sahoo, A. K., Das, K., Gangopadhyay, S. K., Sah,K. D., Mukhopadhyay, S. and Banerjee, T. (2011).Soil health assessment in the Eastern part of Indo-Gangetic plains, India.
Nayak, D.C. and Sarkar, Dipak (2011). MineralogicalStudies of Some Benchmark Soils of ChhotanagpurPlateau Region of West Bengal.
Das, K., Sahoo, A.K., Ray, S.K., Bhattachrya, T.,Majumdar, S and Singh, S.K. (2011) Assessmentof land quality index for rainfed rice in somebenchmark soils of the lower Indo- Ganetic plainand NAIP experience.
Baruah, U., Dutta, D. and Bandyopadhyay, S. (2011).Role of Brahmaputra sediments in formation ofMajuli islands. Abstr. p. 15.
Mandal, D.K., Mandal, C., Prasad, J., Patil, N.G., Tiwary,P. Bhattacharyya, T., Pal, D.K., Sarkar, Dipak,Lokhande, M. and Wadhai, K. (2011).Development of Land quality map of Indo-Gangetic Plain for Identification of Constraints inRice Productivity.
Tiwary, P., Mandal, D.K., Mandal, C., Pal, D.K., Patil,N.G., Ray, S.K., Chandran, P., Sarkar, Dipak andBhattacharyya, T. Estimation of saturatedhydraulic conductivity for the cracking clay soilsof central India.
Ahmed, Nayan, Walia, C.S., Datta, S.C., Sharma,R.K.(2010) Clay Mineralogy of some soils ofKumaon Hills. Pp 48-49.
130
Annual Report
2010-11
Publications
Walia, C.S and Sidhu, G.S.(2011). Mineralogicalinvestigation of some soils of Ganga Plain.pp52-53
Sidhu, G.S and Walia, C.S. (2011) Overview of SoilMineralogy in Trans Gangetic Plains vis-à-visHimalayan region of N-W region. Pp 54-58.
Surya, Jaya Niranjane, Gaikawad, S.T. Gaikawad, K.S.and Thayalan, S.(2011) Clay MineralsComposition of Soils Derived From Sedimentaryand Metamorphic Formations of Eastern Part ofMaharashtra. pp 16-20.
Srivastava, Rajeev, Sarkar, Dipak, Saxena, R.K., Verma,K.S., Jagdish Prasad, Pal, D.K., Verma, T.P., Singh,S.K. Anil Kumar, K.S., Patel1, N.K., Singh, Rajio,Bhargava, G.P., Giri, J.D., Nayak, D.C. Mohan,S.C., Bhaskar, B.P., Solanke, Preeti, Nagaraju,M.S.S., Patil, N.G., Singh, D.S., Nasre, R.A.,Barthwal, A.K., Dhale, Sanjay A., Mohekar, D.S.,Madhurama Sethi, Mukhopadhyay, S.S. andManjeet Singh (2011) Visible and near infrareddiffused reflectance spectroscopy (DRS) of soil forprediction of soil properties.
Mandal, D. K. Mandal, C. Prasad, Jagdish Patil, N. G.Tiwary, P. Bhattacharya, T. Pal D. K. Sarkar, Dipak,Lokhande, M and Wadhai, K.(2011) opment ofland quality map of Indo-Gangetic plain foridentification of constraints in rice production.
Mandal D.K., Mandal C., Prasad J.,Patil N.G., TiwaryP., Bhattacharyya T., Pal D.K.,Sarkar Dipak,Lokhande M. and K. Wadhai(2011). Developmentof Land quality map of Indo-Gangetic Plain foridentification of constraints in rice productivity.
Tiwary P., Mandal D.K., Mandal C., Pal D.K., Patil N.G.,Ray S.K., Chandran P., Sarkar Dipak and T.Bhattacharyya (2011). Estimation of saturatedhydraulic conductivity for the cracking clay soilsof central India.
International Symposium on Review and Refinementof Fertilizer K Recommendations in Vertisols, IPNI –IPI Workshop at NBSS&LUP, August 24-25, 2010,Nagpur
Bhattacharyya, T., Sarkar, D., Pal, D.K., Chandran, P.,Ray, S.K. and Mandal, C. (2010). Potassium statusof shrink-swell soils of India vis-à-vis theirmineralogical composition, p 1-4.
75th Annual Convention of Indian Society of Soil Science,2010 at Indian Institute of Soil Science, Bhopal duringNovember, 14-17, 2010.
Sahoo, A. K., Sarkar Dipak, Singh, S. K., Nayak, D. C.and Butte, P. S. (2010). Assessment of soil foragricultural development in the Upper KasaiWaytershed of Puruliya district, West Bengal.
Nayak, D. C., Sarkar Dipak and Sahoo, A. K. (2010).Charactrisation of arsenic contaminated soils inlower Indo-Gangetic Plains West Bengal.
Das, K., Banerjee, T. and Singh, S. K. (2010). Geomorphicanalysis and characterization of soil in DwarkeswarMicro-watershsed under Chhotanagpur Plateau ofPuruliya district.
Verma,T.P., Singh, R.S., Singh,A.K.,Shyampura, R.L.,Singh,R and Tailor,B.L. (2010) Large scale soilmapping of eastern Rajasthan upland forsustainable agriculture- A case study in villageDaulatpura, District Chittaurgarh.
19th National Symposium on “Resource ManagementApproaches towards Livelihood security” held atBangalore from 02-04, December 2010
Naidu, L.G.K., K.V. Niranjan, V. Ramamurthy, S.C.Ramesh Kumar and Dipak Sarkar. (2010).Optimum land use plan for Pulivendala region ofAndhra Pradesh.
Rajendra Hegde and K.S.Anil Kumar, 2010. Study of landresource constraints and management interventionsto overcome the constraints and enhance resourceproductivity of a watershed in Eastern dry zone ofKarnataka.
Ramamurthy, V., K.M. Nair, S.C. Ramesh Kumar, S.Srinivas, L.G.K. Naidu and Dipak Sarkar. (2010)Land management unit approach: Step towardsprecision farming
Naidu, L.G.K. (2010). Use of land resource informationfor agricultural development research and transferof technology-A case study of Andhra Pradesh on3rd Dec.2010 under Land Use Systems.
Meeting of the American Geophysical Union, Brazil.91(26) during 8th to 12th, August, 2010
Bhaskar, B.P., Sarkar, D., Raja, P., and Baruah, U. (2010).Taxonomy and genesis of rice growing hydric soilsin Disang valley, Assam, India. Abstr. B23A-12.
131
Annual Report
2010-11
Publications
Raja, P., Bhaskar, B.P. and Malpe, D. (2010). Paleoclimaticinferences from mineralogical, micromorphologicaland geochemical investigations of red andblack soils in purna valley, Central India. Abstr.No. PP 22A
National seminar on “Sedimentary Basins of India:Recent Developments” held at Department of Geology,RTM Nagpur University
Bhaskar, B.P., Sarkar, D. and Utpal, B. (2010).Characterization of Hydric soils in Rice growingareas of Disang inland valley, Sibsagar district,Assam.. Ed. by Pradeep, K and Pophare, A.M.)special volume No.12.
National conference on “Groundwater ResourceDevelopment and Management in Hard rocks”, heldon February, 2010 held at Department of Geology,University Pune
Raja, P., Malpe, D.B., Bhaskar, B.P. and Tapaswi, P.M.(2010). Hydrogeochemical characterization ofgroundwater for irrigation in Purna Basin,Maharashtra India. Abstr. PP.31.
National symposium on “Potash: Yield and quality ofhigh potash requiring commercial crops” organized byIPNI and UAS, Dharwad from 17-18th Jan. 2011 atUAS, Dharwad
L.G.K. Naidu, V. Ramamurthy, G.S.Sidhu and DipakSarkar (2011). Emerging Deficiency of Potassiumin soils and crops of India.
9th National Seminar on “Recent Outlook on SustainableAgriculture , Livelihood Security and Ecology of CoastalRegion” organized by Indian Society of CoastalAgricultural Research (ISCAR), CSSRI, RRS, CanningTown, West Bengal at Calangute, Goa from October27-30, 2010.
Sah, K. D., Seal Antara, Sarkar Dipak and Singh, S.K.(2010). Impact analysis of paddy based croppingsequence on physico-chemical and nutrient statusin Vertic Endoaquepts of Coastal Soils of WestBengal”
Interface Meeting for Development of Agriculture andAllied Sectors in Nagaland on 4th Feb, 2011.
Baruah. U and Dutta .D (2011) Soil Resources of Nagalandtowards Land Use Planning in Compendium ofStatus Papers, pp 20-21.
19th World Congress of Soil Science, Brisbane, Australia,Aug. 1-6, 2010, Commission
Mahapatra, S.K., Sharma, J.P., Martin D. and SharmaR.D. (2010). Soil resource assessment of KumaonHimalayan Mountains of India. Abstract : 1.4.1,Pp 37-39.
Annual Convention and National Seminar of ISRS heldduring Dec. 1-3, 2010 at Lonavala, Pune
Sahoo, R.N., Kadupitiya, H.K., Ray, Govil, Vidhi,Ahmed, N., Sahoo, P.M., Gupta, V.K. Surya, J.N.Sidhu, G.S. and Singh, R. (2010) Prediction of SoilOrganic Carbon in Spatial Scale fromHyperspectral Remote Sensing data in the P.103.
National workshop on MDS of health indicators forsoil resources under varied Agro-climatic Waterregimes in India, January 29-30, 2011 at DWMBhubaneswar
Ashutosh Kumar, Srivastava, Alok K., Sidhu, G.S.,Bhattacharyya, T. and Sarkar, Dipak (2011)Microbial analysis and enzymatic dynamics of IGPsoil : A case study for Land Use Planning.
National Conference on Watershed management onSloping Lands for Environment and Livelihood Security,held at Shillong during 11-13 Nov. 2010
Chaturvedi, T. N. Hajare, N. G. Patil, Layant Borkar,and Mamta Mokde (2010). BMP for Paddy-Acompetent alternative to SRI: A Case Study fromCentral India.
Hajare, T. N., A. Chaturvedi, N. G. Patil, Layant Borkar,A. Gattani, Mamta Mokde and Anju Nair (2010).Lessons from Tribal Dominant High rainfallRegion of Central India in Utilizing Surface WaterResources to Augment Income.
State Level Conference on Science and Technologyfor Sustainable Development IISC, Bangalore during17-19th April 2010
Dr. Rajendra Hegde
Mass Media Support for Popularization of AgriculturalTechnology (NAIP Project) during 26-27th July 2010
Dr. Rajendra Hegde
Dr. V. Ramamurthy
National Seminar on “Issues in Land ResourceManagement: Land Degradation, Climate Change andLand Use Diversification organized by Indian Society ofSoil Survey and Land Use Planning at NBSSLUP, Nagpurduring 8 to10 October, 2010
Dr. Dipak Sarkar, Dr. S. K. Singh , Dr. L.G.K. Naidu,Dr. A. Natarajan, Dr. U. Baruah, Dr. R.L. Shyampura,Dr. S. Thayalan, Dr. R.S. Singh, Dr. A. Chaturvedi, D r .Rajeev Srivastava, Dr. T. Bhattacharyya, Dr. (Mrs.) C.Mandal, Dr. G.S. Sidhu, Dr. T.H. Das, Dr. A.K. Sahoo,Dr. S.K. Gangopadhyay, Dr. D.S. Singh, Dr. V.
Ramamurthy, Dr. S.C. Ramesh Kumar, Dr. Anil Kumar,Dr. S. Bandyopadhyay, Dr. S.K. Reza, Dr.G.P. Obi Reddy,Er. Pramod Tiwary, Dr. Jagdish Prasad, Dr. S.K. Ray,Dr. B.P. Bhaskar, Dr. P. Chandran, Dr. S.K. Mahapatra,Dr. J.D. Giri, Dr. D.K. Mandal, Dr. S.N. Goswami,Dr. S. Chatterjee, Dr. T.K. Sen, Dr. N.G. Patil, Dr. T.N.Hajare, Dr. M.S.S. Nagaraju, Dr. R.S. Nasre,Mrs. Pushpanjali, Mr. S.S. Nimkhedkar, Dr. A.P. Nagar,Mr. Prakash Ambekar, Dr. B.A. Dhanorkar, Mr. A.K.Barthwal, Mr. S.V. Bobade, Dr. P. Raja, Dr. A.M. Nimkar,Dr. N.C. Khandare
9th National Seminar on “Recent Outlook on SustainableAgriculture , Livelihood Security and Ecology of CoastalRegion” organized by Indian Society of CoastalAgricultural Research (ISCAR), CSSRI, RRS, CanningTown, West Bengal at Calangute, Goa duringOctober 27-30, 2010
Dr. Dipak Sarkar
Dr. S.K. Singh
Dr. K.D. Sah
132
Annual Report
2010-11 Participation of Scientist in Conferences, Meetings, Workshops,Seminars, Symposia etc. in India and Abroad
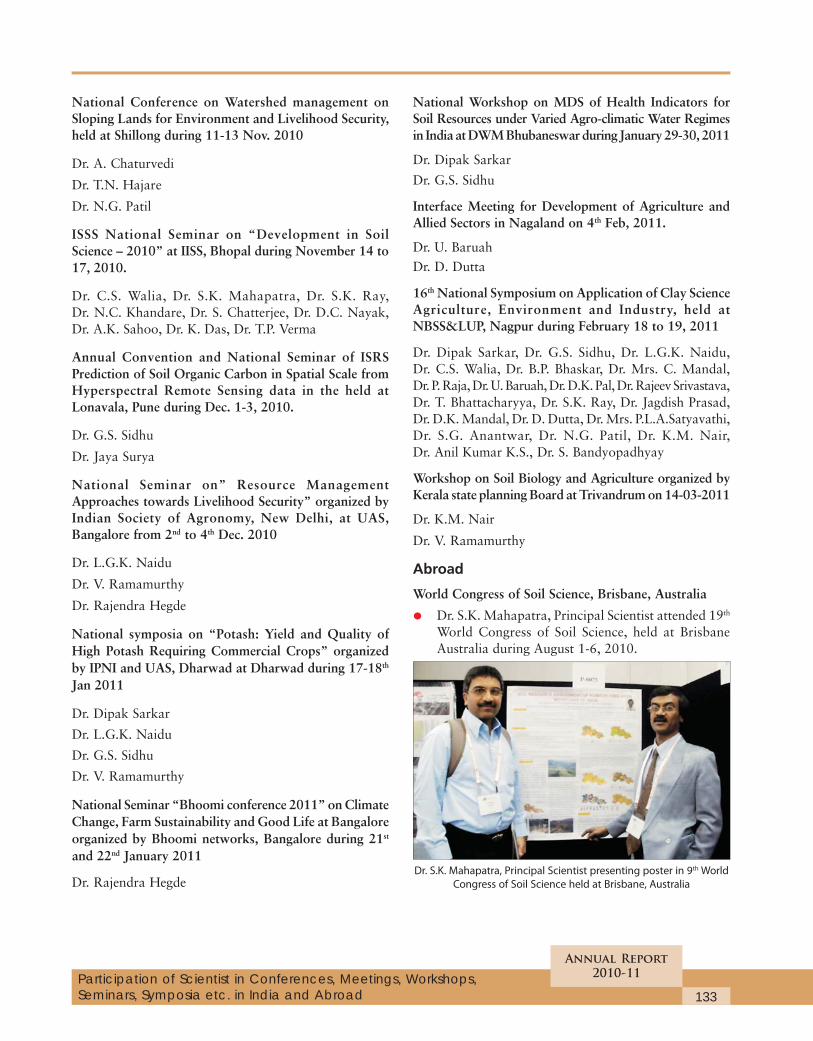
National Conference on Watershed management onSloping Lands for Environment and Livelihood Security,held at Shillong during 11-13 Nov. 2010
Dr. A. Chaturvedi
Dr. T.N. Hajare
Dr. N.G. Patil
ISSS National Seminar on “Development in SoilScience – 2010” at IISS, Bhopal during November 14 to17, 2010.
Dr. C.S. Walia, Dr. S.K. Mahapatra, Dr. S.K. Ray,Dr. N.C. Khandare, Dr. S. Chatterjee, Dr. D.C. Nayak,Dr. A.K. Sahoo, Dr. K. Das, Dr. T.P. Verma
Annual Convention and National Seminar of ISRSPrediction of Soil Organic Carbon in Spatial Scale fromHyperspectral Remote Sensing data in the held atLonavala, Pune during Dec. 1-3, 2010.
Dr. G.S. Sidhu
Dr. Jaya Surya
National Seminar on” Resource ManagementApproaches towards Livelihood Security” organized byIndian Society of Agronomy, New Delhi, at UAS,Bangalore from 2nd to 4th Dec. 2010
Dr. L.G.K. Naidu
Dr. V. Ramamurthy
Dr. Rajendra Hegde
National symposia on “Potash: Yield and Quality ofHigh Potash Requiring Commercial Crops” organizedby IPNI and UAS, Dharwad at Dharwad during 17-18th
Jan 2011
Dr. Dipak Sarkar
Dr. L.G.K. Naidu
Dr. G.S. Sidhu
Dr. V. Ramamurthy
National Seminar “Bhoomi conference 2011” on ClimateChange, Farm Sustainability and Good Life at Bangaloreorganized by Bhoomi networks, Bangalore during 21st
and 22nd January 2011
Dr. Rajendra Hegde
National Workshop on MDS of Health Indicators forSoil Resources under Varied Agro-climatic Water Regimesin India at DWM Bhubaneswar during January 29-30, 2011
Dr. Dipak Sarkar
Dr. G.S. Sidhu
Interface Meeting for Development of Agriculture andAllied Sectors in Nagaland on 4th Feb, 2011.
Dr. U. BaruahDr. D. Dutta
16th National Symposium on Application of Clay ScienceAgriculture, Environment and Industry, held atNBSS&LUP, Nagpur during February 18 to 19, 2011
Dr. Dipak Sarkar, Dr. G.S. Sidhu, Dr. L.G.K. Naidu,Dr. C.S. Walia, Dr. B.P. Bhaskar, Dr. Mrs. C. Mandal,Dr. P. Raja, Dr. U. Baruah, Dr. D.K. Pal, Dr. Rajeev Srivastava,Dr. T. Bhattacharyya, Dr. S.K. Ray, Dr. Jagdish Prasad,Dr. D.K. Mandal, Dr. D. Dutta, Dr. Mrs. P.L.A.Satyavathi,Dr. S.G. Anantwar, Dr. N.G. Patil, Dr. K.M. Nair,Dr. Anil Kumar K.S., Dr. S. Bandyopadhyay
Workshop on Soil Biology and Agriculture organized byKerala state planning Board at Trivandrum on 14-03-2011
Dr. K.M. Nair
Dr. V. Ramamurthy
Abroad
World Congress of Soil Science, Brisbane, Australia
• Dr. S.K. Mahapatra, Principal Scientist attended 19th
World Congress of Soil Science, held at BrisbaneAustralia during August 1-6, 2010.
Dr. S.K. Mahapatra, Principal Scientist presenting poster in 9th World
Congress of Soil Science held at Brisbane, Australia
133
Annual Report
2010-11Participation of Scientist in Conferences, Meetings, Workshops,Seminars, Symposia etc. in India and Abroad
134
Annual Report
2010-11
Approved On-going Projects
THEME A – Inventorising Natural Resources
1. Assessment of land and soil resources of Malappuramdistrict (part) of Kerala at 1:50,000 scale for landuse planning
K.S. Anil Kumar, S. Thayalan, K.M. Nair, S.Srinivas,Rajendra Hegde, S.C. Ramesh Kumar and L.G.K.Naidu
2. Land resource inventory for farm planning indifferent agro-ecological regions of India
A.Natarajan, Jaya N. Surya, R.S.Meena S.K.Reza,S.Bandyopadhyay, S.Dharmarajan, Pushpanjali,K.Karthikeyan, T.P.Verma and Dipak Sarkar
3. Land resource inventory for farm planning inChikarsinkere Hobli, Maddur Taluk. MandyaDistrict, Karnataka – a sub-project of Land resourceinventory for farm planning in different agro-ecological regions of India
R.S. Meena, A.Natrajan S. Thayalan, S.C.RameshKumar, V. Ramamurthy, S. Srinivas
4. Soil resource inventory and land evaluation ofAurangabad district, Bihar (1:50,000 scale) for landuse planning
S.K. Gangopadhyay, K. Das, S. Mukhopadhyay andSK Singh
5. Soil resource inventory and land evaluation of Rohtasdistrict, Bihar (1:50,000 scale) for land use planning
DC Nayak, AK Sahoo, T. Banerjee, S.Mukhopadhyay, SK Singh
6. Land resource inventory for farm planning inChinchura-Mogra and Polba-Dadpur block, Huglidistrict, West Bengal
S. Dharumarajan, S.K. Gangopadhyay, T. Banerjeeand S.K. Singh
7. Correlation of Soil Series of Eastern States (WestBengal, Bihar, Jharkhand, Orissa, Sikkim and A&N Islands)
A.K. Sahoo, D.C. Nayak, T. Banerjee andS.K. Singh
135
Annual Report
2010-11
Approved On-going Projects
8. Soil Resource Mapping of Sultanpur district of UttarPradesh for perspective Land use planning
C.S.Walia, Tarsem Lal and G.S. Sidhu
9. Land Resource Inventory for Farm Planning inLakhan Majra Block of Maham - Rohtak Tehsil,Rohtak District, Haryana
Jaya N. Surya, G.S.Sidhu, Tarsem Lal, S.K.Mahapatra, C.S.Walia and Dharam Singh
10. Soil Resource Mapping of Mathura District,Uttar Pradesh for Perspective Land Use Planning(1:50,000 scale)
S.K. Mahapatra, Jaya N Surya, Tarsem Lal,G.S. Sidhu, J.P. Sharma and R.D. Sharma
11. Land Resource Inventory of East Lahing GaonPanchayat of East Jorhat Development Block, JorhatDistrict, Assam (Sub project Land Resource Inventoryfor Farm Level Planning in Different Agro-ecologicalRegions of India)
S. Bandyopadhyay, S.K. Reza and Utpal Baruah
12. Land Resource Inventory of Katonigaon Panchayatof Titabar Block, Jorhat District (Part of LandResource Inventory for Farm Planning in differentAgro-ecological Regions of India)
S.K. Reza, S. Bandyopadhyay, A. Natarajan andUtpal Baruah
13. Study of crop moisture availability of soils duringpost- kharif period in Sibsagar district of Assam
Dipak Dutta, S.K. Reza and U. Baruah
14. Soil Resource Inventory and Land Evaluation ofChittaurgarh district for Land Use Planning
T.P. Verma, J.D. Giri, R.S. Meena, R.K. Naitam andR.L. Shyampura
15. Land resource inventory for farm planningJhalarapatan block of Jhalawar district in Rajasthan
R.S. Meena and G.L. Meena
16. Land use planning of Chanavada II watershed forintegrated development
R. Naitam and T.P. Verma
17. Land use planning of Bhadesar tehsil, Chittorgarhdistrict, Rajasthan
T.P. Verma and R.S. Singh
18. Land Resource Inventory for Farm Planning inParseoni mandal of Parseoni taluka, Nagpur District,Maharashtra
Pushpanjali, K. Karthikeyan, C. Mandal, JagdishPrasad, J.D. Giri and Malathi Bommidi
19. Reconnaissance Soil Survey in Yavatmal District ofMaharashtra on 1: 50,000 scale
B.P. Bhaskar, M.S. Gaikwad, S.V. Bobade, A.M.Nimkar, S.S. Gaikwad, V.N. Parhad and K.M.Gaikwad
20. Reconnaissance soil survey, mapping andclassification of soils of Jabalpur district, MadhyaPradesh
Jagdish Prasad, A.M. Nimkar, S.S. Gaikwad and C.Mandal
21. Detailed Resource Soil Survey of HayatnagarResearch Farm of CRIDA, Hyderabad
P. Chandran, S.K. Ray, P. Raja, A. M. Nimkar, D. K.Pal, T. Bhattacharyya, C. Mandal , M.S.S. Nagarajuand Dipak Sarkar
22. Soil Correlation and Classification, Benchmark soilsand agrotechnology transfer
Dipak Sarkar, T. Bhattacharyya et.al.
23. Generation of soil information Data Base of IARIFarm (Collaborative Research Project with IARI,New Delhi)
S.K. Mahapatra and G.S. Sidhu
THEME B – Remote Sensing, GIS and Cartography
1. Soil based approach towards rational land useplanning using Remote Sensing and GIS
S. Mukhopadhyay, SK Singh
2. Integrated approach of remote sensing and GIS inland resources characterization and evaluation ofland resources in Saraswati watershed of Buldhanadistrict of Maharashtra
M.S.S. Nagaraju, Rajeev Srivastava, A.K. Maji andA.K. Barthwal
3. Natural resource assessment using RS and GIS – acase study in Badajorenala micro watershed in Utkalplain of Orissa
K. Das, S.K. Singh, T. Banerjee and S. Dharumarajan
136
Annual Report
2010-11
Approved On-going Projects
4. Application of Cartosat-1 data for cadastral level soilmapping in basaltic terrain for land resourcemanagement
M.S.S. Nagaraju, J.D. Giri, Nirmal Kumar,D.S. Singh, S.N. Das, Rajeev Srivastava
5. Comparative assessment of large scale soil mappingby conventional method and remote sensingtechniques: a case study in Parsori micro-watershed,Katol tehsil, Nagpur District, Maharashtra
J.D. Giri, M.S.S. Nagaraju, D.S. Singh and RajeevSrivastava
6. Development of software modules for landevaluation and agro-climatic analysis
S. Srinivas, K.M. Nair, L.G.K. Naidu, RajendraHegde and V. Ramamurthy
7. Digital maps of derived soil quality of different statesof India
A.K. Maji, G.P. Obi Reddy and Sunil Meshram
8. Documentation and Storing of Maps andPhotographs: Concept of Digital Map Library
C. Mandal, Pushpanjali, D.K Mandal, JagdishPrasad, T Bhattacharyya, R. Srivastava andDipak Sarkar.
9. Development of GIS based seamless mosaic of SRTMelevation data of India to analyze and characterizethe selected geomorphometric parameters (Interinstitutional project between NBSS&LUP andRRSC, Nagpur)
G.P. Obi Reddy, A.K. Maji, S.N. Das and RajeevSrivastava
THEME C – Basic Pedological Research
1. Geomorphological analysis and study on landform-soils-landscape relationship in Southern India
S. Thayalan, A. Natarajan, K. M. Nair, K.S. AnilKumar, S.C. Ramesh Kumar, V. Ramamurthy andL.G.K. Naidu
2. Development of protocols for digestion, standardsand methods to determine elements in soil andsediments using Inductively Coupled PlasmaSpectrometry (ICP-AES)
S.K. Ray, P. Chandran, T. Bhattacharyya, P.L.A.Satyavathi, D.K. Pal, S. G. Anantawar and P. Raja
3. Ascertaining the pedogenetic processes for the clayenriched Bss horizons of Vertisols
P.L.A. Satyavathi, S.K. Ray, P. Chandran, P. Raja,S.L. Durge and D.K. Pal
4. Estimating Saturated Hydraulic Conductivity, BulkDensity, and other Physical Properties of the Vertisolsand Vertic Intergrades from Published Research andSoil Survey Data
N.G. Patil, D. K. Pal, C. Mandal and D. K. Mandal
5. Design and development of spatial soil database andanalysis in GIS
A.K. Maji, G.P. Obi Reddy and Sunil Meshram
6. Water retention characteristics and saturatedhydraulic conductivity of dominant soil series ofYavatmal district, Maharashtra
P.L.A. Satyavathi, Pramod Tiwary, S.K. Ray, P.Chandran, B.P. Bhaskar, Jagdish Prasad and TapasBhattacharyya
7. Genesis and Classification of Benchmark ferruginoussoils of India
P. Chandran, S.K. Ray, T. Bhattacharyya, D. K. Paland Dipak Sarkar
THEME D – Soil Survey Data Interpretationand Application
1. Soil resource data and their interpretation forimplementation of river link projects -Ken – Betwariver link project
A.K. Maji, G.P. Obi Reddy, S. Thayalan, M.S.S.Nagaraju and A.K. Barthwal
2. Agro-ecological zoning of Tamil Nadu
L.G.K. Naidu, S. Srinivas, A. Natarajan, S. Thayalanand V. Ramamurthy
3. Development of District Soil Information System(DSIS) on 1:50,000 Scale (50 Districts)
G.P. Obi Reddy, C. Mandal, Nirmal Kumar,S. Srinivas, Subrato Mukhopadyay, Tarsem Lal,R.S. Singh, S.K. Reza, Heads of the Rc’s andDipak Sarkar
137
Annual Report
2010-11
Approved On-going Projects
4. Soil Survey Data Interpretation and Application LandResource Management Development of Indian SoilInformation System (ISIS) - A GeoPortal
G.P. Obi Reddy, Rajeev Srivastava, C. Mandal,Nirmal Kumar, S. Srinivas, Subrato Mukhopadyay,Tarsim Lal, R.S. Singh, S.K. Reza, Heads of the Rc’sand Dipak Sarkar
5. Soil microbial biomass Carbon and Nitrogen inselected soil series of North-Eastern Region asaffected by different land uses and varied agro-ecological conditions
T. Chattopadhyay, D. J.Nath, D. Dutta, S.K. Rezaand U. Baruah
6. Characterization and Evaluation of Carbon (SOC)& Sulphur Status in soybean growing Areas of Dhardistrict, Madhya Pradesh to Suggest an AlternativeCropping pattern
K.Karthikeyan, Jagdish Prasad, Pushpanjali andDipak Sarkar
7. Development of a soil water balance model forshrink-swell soils of Central India
P. Tiwary, D. K. Mandal and T. N. Hajare
THEME E – Land Evaluation and Land UsePlanning
1. Land use planning for North Goa District, Goa
Rajendra Hegde, S. Srinivas and S.C. Ramesh Kumar
2. Dynamics of land use plan and its impact on soilproperties in Nawanshahr district, Punjab state
G.S. Sidhu, Tarsem Lal, Jaya N. Surya, J.P. Sharmaand D.K. Katiyar
3. Dynamics of land use plan and its impact on soilproperties in Jalandhar district, Punjab state
G.S. Sidhu, Tarsem Lal, Jaya N. Surya andJ.P. Sharma
4. Land Use Planning of Diring-Thanglong Micro-watershed of Karbi-Anglong and Golaghat districtsof Assam under Hills & Mountain Ecosystem forIntegrated Development
S. Bandyopadhyay, S.K. Reza, Dipak Dutta andUtpal Baruah
5. Soils, Land Use and Perspective Land Use Planningof Nagpur District
Arun Chaturvedi, C. Mandal, Rajeev Srivastava,D.K. Mandal, T.N. Hajare, S.N. Goswami, N.C.Khandare and R.S. Gawande
6. Land use planning for Tirumale sub-watershed(Motaganhalli watershed) in Magadi taluk,Ramangar district, Karnataka
Rajendra Hegde, S. S. Srinivas and A. Natarajan
7. Net-work project on district level Land Use Planningand Policy Issues under different agro-ecosystems ofthe country
National Coordinator: Dr. Dipak Sarkar, Director.Principal Investigator: Dr. Arun Chaturvedi
8. Development of district level Land Use Plan for Bundidistrict (Rajasthan) under arid and semi-arid ecosystem
R.S. Singh, R.L. Shyampura etc.
9. Development of district level land use plan for Nadiadistrict in West Bengal under irrigated ecosystem
A.K. Sahoo, D.C. Nayak, T. Banerjee and S.K. Singh
10. Development of district level land use plan forMysore district, Karnataka state
Ramamurthy, V., Nair, K. M., Ramesh Kumar, S.C.,Srinivas, S., Naidu, L.G.K., and Thayalan, S.
11. Assessment of stakeholder needs and economicevaluation of land use types for land use planning ofMysore and North Goa Districts
S.C. Ramesh Kumar, V.Ramamurthy and RajendraHegde
12. Development of district level land use plan forAlmora district, Uttrakhand under Hill andMountain ecosystem
S.K. Mahapatra, Jaya N. Surya, J.P. Sharma and G.S.Sidhu
13. National network sub- project on Development ofdistrict level Land Use Plan for Gondia district,Maharashtra
T.K. Sen, S. Chatterji, T.N. Hajare, S.N. Goswami,N.G. Pati, P.N. Dubey, A. Chaturvedi and DipakSarkar
138
Annual Report
2010-11
Approved On-going Projects
14. Development of District Level Land Use Planning ofJorhat District, Assam under Rain-fed Ecosystem
S. Bandyopadhyay, S.K. Reza and Utpal Baruah
THEME F – Externally Funded Projects
1. Georeferenced Soil Information System for Land UsePlanning and Monitoring Soil and Land Quality forAgriculture (NAIP)
Bhattacharyya, T., Sarkar, Dipak, Mandal, D.K.,Jagdish Prasad, Sidhu, G.S., Sahoo, A.K., Nair, K.M.,Singh, R.S., Das, T.H., Venugopalan, M.V1., Srivastava,A.K.2, Raychaudhari, Mausumi3., Velmourougane,K.1, Meena, K.K., Mandal, D.K.., Mandal, C.,Srivastava, R., Sen, T.K., Chatterji, S., Chandran, P.,Ray, S.K., Obireddy, G.P., Patil, N.G., Mahapatra,S.K., Das, K., Singh, A.K. S. Srinivas, Reza, S. K.,Tiwary, P., Mrunmayee Lokhande, Wadhai, K.Vishakha Dongare, Mohanty, B., Majumdar, S.,Ganjanna, K.V., Garhwar, R.S., Hazarika, D., Sahu,A1., Mahapatra3, S. and Ashutosh Kumar2
2. Development of spectral reflectance methods and lowcost sensors for real-time application of variable rateinputs in precision farming (NAIP)
Rajeev Srivastava and Dipak Sarkar
3. Efficient Land Use Based Integrated Farming Systemfor Rural Livelihood Security in Aurangabad, Dhuleand Gondia districts of Maharashtra (NAIP)
Dipak Sarkar, A. Chaturvedi, T.N. Hajare, N.G.Patil, T.K. Sen, S. Chatterjee, S.N. Goswami, M.S.S.Nagaraju, B.P. Bhaskar and G.P Obi Reddy
4. Assessment of Quality and Resilience of Soils inDiverse Agro-ecosystems (NAIP)
T. Bhattacharyya, D. Sarkar, P. Chandran, S.K. Ray,C. Mandal and B. Telpande
5. Soils of Thirupuram, Kanjramkulam andKadinanamkklam Panchayats ofThiruvananthapuram district, Kerala (NAIP)
K.M. Nair, S. Thayalan, K.S. Anil Kumar, L.G.K.Naidu and Dipak Sarkar
6. Nutrient indexing and soil fertility assessment ofKole lands
K.M. Nair, K.S. Anil Kumar, S. Srinivas, L.G.K.Naidu and Dipak Sarkar
7. Soil based plant nutrient management plan for agro-ecosystems of Kerala
K.M. Nair, S. Thayalan, S.C. Ramesh Kumar, V.Ramamurthy, K.S. Anil Kumar, S. Srinivas, P.Chandran, Dr. L.G.K. Naidu and Dipak Sarkar
8. Agro-ecological units of 14 districts of Kerala
K.M. Nair, Champa Mandal, Arun Chaturvedi,S.Thayalan, S.C. Ramesh Kumar, V. Ramamurthy,K.S. Anil Kumar, S. Srinivas, L.G.K. Naidu andDipak Sarkar
9. Assessment of land resources for growing horticulturalcrops in selected districts for Tamil Nadu under theNational Horticultural Mission project
ANatarajan, V. Ramamurthy, S. Thayalan, S.Srinivas, K.V. Niranjana, M. Ramesh, D.H.Venkatesh and L.G.K. Naidu
10. Interfluve Stratigraphy, Sedimentology and Geochemistryof Central and Southern Ganga Plains (DST)
T. Bhattacharrya, P. Chandran, S. K. Ray, P. Rajaand P.L.A. Satyavathi,
11. Generation of Soil Database for Khulgad WatershedDevelopment in Almora District, Uttarakhand (DST)
C.S Walia, R.P.Dhankar, J.N Surya and J.P. Sharma
12. Predicting soil carbon changes under differentcropping system in soils of selected benchmark spotsin different bioclimatic systems in India (DST)
T. Bhattacharyya, S K. Ray, P. Chandran andC. Mandal,
13. Soils variability mapping and fertility zonation usingHyperspectral data (A collaborative project betweenNBSS&LUP and SAC, Ahmedabad)
A.K. Maji, Rajeev Srivastava, Dipak Sarkar, M.S.S.Nagaraju, D.S. Singh, A.K. Barthwal and R.L. Mehta
14. Enrichment of land degradation datasets with soilsdatasets of different states of India (NRSC –NBSS&LUP Collaborative project)
G.P. Obi Reddy et al.
15. Changes in soil carbon reserves as influenced bydifferent ecosystems and land use in India (NationalProject on Climate Change)
T. Bhattacharyya, P. Chandran, M.V. Venugopalan,D.K. Pal, S.K. Ray, C. Mandal, Dipak Sarkar, P. Tiwary
139
Annual Report
2010-11
Approved On-going Projects
16. Assessment and mapping of some important soilparameters including macro and micro nutrients for13 priority districts of Assam state (1:50,000 scale)towards optimum land use planning
Utpal Baruah, Dipak Sarkar, S.K. Reza, S.Bandyopadhyay, T. Chattopadhyaya, and DipakDutta
17. Soil Resource Distribution, Characterization andEvaluation for Cotton Based Cropping Systems inIrrigated Eco-system in Northern India
C.S Walia, S.P.Singh, R.P.Dhankar,Jagat Ram andD.Martin
18. Preparation of District-wise contingency Plan forAgriculture and Allied Sector
DK Mandal et al
19. Agroecological regions of Uttar Pradesh(Collaborating project of UPCAR and NBSS&LUP)
Sohal Lal, C. Mandal, D. K. Mandal and S.R. Singh
20. Assessment and mapping of some important soilparameters including macro and micro nutrients atblock levels of Dumka, Jamtara and Hazaribaghdistrict for optimum land use plan
Dipak Sarkar, A.K. Sahoo et al
21. Assessment and mapping of some important soilparameters including macro and micro nutrients forthe state of West Bengal (1:50,000 scale) towardsoptimum land use plan
Dipak Sarkar, D.C. Nayak, S.K. Singh, A.K. Sahoo,S. Mukhopadhyay, S.K. Gangopadhyay, K. Das, T.Chatopadhyay, D. Dutta, K.D. Sah and T. Banerjee
140
Annual Report
2010-11
Consultancy, Patents, Commercialisation of Technology
The Bureau is undertaking the Soil Nutrient Mapping ofdifferent states at 1 to 2 km grid samples. All the samplesare geo-referenced. Important soil nutrient maps suchas organic carbon, available nitrogen, phosphorus andpotassium, micro nutrients and other thematic maps arebeing prepared and supplied to the sponsoring agencies.
These maps and reports are being used by the concernedagricultural departments for input supply regulations andawareness among the farmers to use precious subsidizedfertilizer according to the soil/crop requirements. Theseconsultancy projects are being operated for the states ofWest Bengal, Assam and Jharkhand.
141
Annual Report
2010-11
Meetings
• Dr. Nair Attended CIS meeting pertaining to theNAIP project on 19 April at Nagpur and presentedthe progress of work.
• Dr. L.G.K. Naidu attended 22nd regional committeemeeting of zone VIII from 13th to 15th May, 2010 atIVRI campus, Bangalore.
• Dr. Dipak Sarkar and Dr. L.G.K. Naidu attended thenew project discussion with Zuari fertilizers companymarketing managers (Mr. Bhakole, Mr. Joshi andDr. Palaniappan, Consultant) on development ofcustomized fertilizer recommendation for Paddy(Bellary dist), Maize and Sugarcane (Belguam dist)in Karnataka on 21st May, 2010
• Dr. K.S. Anil Kumar attended a meeting atDepartment of Watershed development, Govt. ofKarnataka as core committee member on 31st May,2010 to finalise training programmes for watersheddevelopment implementing personnel.
• Dr. L.G.K. Naidu and Dr. V. Ramamurthy attendedreview meeting of network project on district LUP
at Hq on 15-6-10 and 16.6.10 at Nagpur andpresented the progress of the project.
• Dr. Natarajan Presented the project details pertainingto newly prposed project on “Soil Resource Mappingfor Farm Planning in India” to the high-level meeting,chaired by the DDG, Dr.A.K.Singh and atteded bythe DDG, Dr.M.Moni, NIC, our Director and otherofficials from ICAR and NIC at New Delhi on1.6.10.
• Dr. Rajendra Hegde Participated in the meeting ofwatershed development department regarding theorganization of Human resources developmentprograms under IWMP (28-6-2010).
• Dr. Rajendra Hegde Participated in the meeting atUAS (Bangalore) GKVK regarding contingencyplanning for districts of NARP Zone 5 of Karnatakaorganised by Associate Director of Research.Provided the feedback on soil information being usedfor the report preparation.
• Dr. Anil Kumar and Ramesh Kumar visited Chittoordistrict of A.P. and met Joint Director of Agriculture
142
Annual Report
2010-11
Meetings
and other district officials for finalizing the dateconducting for user interaction meet and release ofKuppam Mandal report.
• Dr. L.G.K. Naidu, Dr. A. Natarajan and Dr. V.Ramamurthy had a meeting with Dr.Appavu,Director, NRM, TNAU on 16th July at Coimbatoorand discussed about possibilities of detailed soilsurvey in TN and assessment of LGP and requestedall the agricultural research stations in the state toverify the LGP assessment and convey theirsuggestions for finalizing the LGP map for TN.
• Dr.V.Ramamurthy and Dr.Rajendra Hedgeparticipated in the Brainstorming session on “Humanand animal health through soil health”: for preparinga policy paper for NAAS, New Delhi, organized atIIHR, Bangalore from 6th and 7th Sept 2010.
• Dr. Rajendra Hegde and Dr A. NatarajanParticipated in a meeting with Principal Secretary,Agriculture, GoK in connection with farm level landresources data base generation (19-1-11).
• Scientists from Rubber Research Institute, Kottayamvisited Regional centre on 21-01-11 to discuss aboutnew project proposal for monitoring of soil qualityof rubber growing soils.
• Dr. LGK Naidu, Dr Natarajan and Dr. RajendraHegde had a meeting with Commissioner andDirector for Watershed Development, Govt. ofKarnataka to discuss on the “Detailed land resourcesdatabase generation for Karnataka”.
• Dr. K.M. Nair and Dr. V.Ramamurthy attendedreview meeting of ‘Soil based Nutrient ManagementPlan for Agro-ecosystems of Kerala’ atThiruvanathapuram to review the progress of workunder the project – soil sampling by NYK and soilanalysis by various labs assigned with the task.
Meetings Attended
i) Meeting with the professors and lecturers Dept. ofSoil Science, Dept. of Agronomy and other Scientistof Assam Agricultural University under theChairmanship of Dr. K.M. Bujarbaruah, Hon’bleVice-Chancellor of Assam Agricultural University,Jorhat on 17th March, 2010 regarding involvementof scientists of Regional Centre, Jorhat in teaching
and research at various courses in the Dept. ofSoil Science.
• Dr. Dipak Sarkar
• Dr. Utpal Baruah
• Dr. T.H. Das
• Dr. Dipak Dutta
• Dr. S. K. Reza
ii) Annual Group Meeting on ‘ AICRP on Micro- andSecondary Nutrients’ ICAR held on 13th March, 2011at Assam Agricultural University ( AAU), Jorhat .
• Dr U. Baruah
Meetings (RC Delhi)
• Dr. G.S. Sidhu, Principal Scientist attended CICmeeting on NAIP at Nagpur on April 19 -20, 2010.
• Dr. G.S. Sidhu, Principal Scientist attended NAIP-World Bank Meet on 21-22 May, 2010 held at NASCNew Delhi.
• Dr. S.K. Mahapatra, Principal Scientist attendedmeeting of NSDI held at Khosala Hall, NSDI, EastBlock – 7, Level 5, Sector 1, R.K. Puram, New Delhion June 11, 2010.
• Dr. J.P. Sharma, Principal Scientist & Head and Dr.S.K. Mahapatra, Principal Scientist, attended 2nd
Review Meeting of Networking Project on Land UsePlanning on 15th June, 2010 and Meeting onIdentification and Land Use Planning of MicroWatersheds on 16th June, 2010 at NBSS&LUP,Nagpur.
• Dr. S.K. Mahapatra, Principal Scientist, attended theCouncil Meeting of Indian Society of Soil Science on19th June, 2010 at IARI, New Delhi.
• Dr. C.S. Walia, Principal Scientist attendedconsultation meeting on partnership forstrengthening the man and biosphere reservesprogramme in India held at Munnar, Kerala on June22-23, 2010.
• Dr. J.P. Sharma, Head & Principal Scientist and Dr.G.S.Sidhu, Principal Scientist attended meeting toreview NAIP Geosis Progress on 3rd August, 2010 atDelhi.
143
Annual Report
2010-11
Meetings
• Dr. J.P. Sharma, Head & Principal Scientist andDr. G.S. Sidhu, Principal Scientist attended OrganizingCommitttee Meeting of CMSI at Division of SSAC,IARI on 5th August, 2010.
• Dr. (Mrs.) Jaya N. Surya, Sr. Scientist attended reviewmeeting of the project “Land resource inventory forfarm planning in different Agro-ecological regionsof India” at NBSS&LUP, Nagpur on 22nd August,2010.
• Dr. G.S. Sidhu, Principal Scientist & Acting Headattended Institute Management Committee meetingof Sugarcane Breeding Institute, Coimbatore on 23rd
September, 2010.
• Dr. G.S. Sidhu, Principal Scientist attended RACMeeting on 20th to 21st August and 7th October, 2010at NBSS&LUP, Nagpur.
• Dr. G.S.Sidhu, Principal Scientist & Head andDr. S.K. Mahapatra, Principal Scientist attended SoilCorrelation Meetings at SLUSI, New Delhi on 17thSeptember and 10th October, 2010.
• Dr. G.S.Sidhu, Principal Scientist & Acting Headattended meeting with DDG (NRM) and DirectorGeneral & DDG NIC at Delhi on 11th and 13th
October, 2010.
• Dr. G.S.Sidhu, Principal Scientist attended CIC &CAC Meetings of NAIP-GEOSIS Project on 31st
October and 1st Nov, 2010 at NBSS&LUP, Nagpur.
• Dr.G.S. Sidhu, Principal Scientist and Head,Dr.C.S.Walia and Dr.A. Natarajan, PrincipalScientists attended a meeting with Dr.R.S.Paroda,Chairman, Farmers Commission, Govt. of Haryanato discuss about farm level land use planning inHaryana state.
• Dr. C.S.Walia and Dr. S.K. Mahapatra, PrincipalScientists attended Annual General Body Meeting ofthe Indian Society of Soil Science on 15th Novemberat IISS, Bhopal.
• Dr. G.S.Sidhu, Principal Scientist & Head and Dr.S.K. Mahapatra, Principal Scientist attended CIC &CAC Meetings of NAIP Project on 13-14 December,2010 at NBSS&LUP, Nagpur.
• Dr. G.S. Sidhu, Principal Scientist & Head attendedmeeting of Research Project Enrichment of LandDegradation Datasets with Soil Dataset atNBSS&LUP, Nagpur on 15th December, 2010.
• Dr. Dipak Sarkar, Director, NBSS&LUP, Nagpur andScientists of Regional Centre Delhi attended a Meetingwith Dr. R.S. Praoda, Chairman, Farmers Commission,Govt. of Haryana on December 22, 2010.
• Dr. G.S. Sidhu, Principal Scientist & Head attendedInstitute Management Committee meeting ofSugarcane Breeding Institute, Coimbatore on 18th
January, 2011.
• Scientists of Regional Centre Delhi attended aMeeting with Director on Lakhan Majra researchproject on January 25, 2011.
• Dr. G.S. Sidhu, Principal Scientist & Head attendedmeeting of Research Project Enrichment of LandDegradation Datasets with Soil Dataset atNBSS&LUP, Nagpur on 21st February, 2011.
• Dr. G.S.Sidhu, Principal Scientist & Head, Dr.C.S.Walia and Dr. S.K. Mahapatra, PrincipalScientists attended a Meeting on Soil CorrelationActivities with UPRSAC, Lucknow, on March 16-17 2011.
• Dr. S.K. Mahapatra, Principal Scientist attended theCouncil Meetings of the Indian Society of Soil Scienceon 19th June 2010, 1st November 2010 and 26th March2011 at Division of Soil Science & AgriculturalChemistry, New Delhi
Meetings (RC Kolkata)
• Dr. D. C. Nayak and Dr. A. K. Sahoo, PrincipalScientists attended the Group Meeting with the fieldworker of the project on Block level soil nutrientmapping at Dumka, Jharkhand at ATMA, Jamtaraduring 11-12th May, 2010 and at ATMA, Dumkaon 13-14thy May, 2010 in presence of scientist ofKVK, Dumka and Jamtara and Birsa AgriculturalUniversity, Ranchi.
• Dr. S. K. Singh, Principal Scientist and Head attendedXXth meeting of OCAR Regional Committee – IIheld at Port Blair on 14-15 September, 2010 andexplained the activities of the centre, especially issuesrelated to effective land use planning and mappingof acid soils in West Bengal.
• Dr. S. K. Singh, Principal Scientist and Head and Dr.A. K. Sahoo, Principal Scientist attended workshopon Block level soil nutrient mapping of Dumka,Jamtara and Hazaribag districts of Jharkhand on
144
Annual Report
2010-11
Meetings
12th April, 2010 at Zonal Research Station, BirsaAgricultural University, Dumka.
• Dr. A. K. Sahoo, Principal Scientist attended 4th CICmeeting of the NAIP project held at NBSS & LUP(ICAR), Nagpur during 19th to 20th April, 2010.
• Dr. A. K. Sahoo and Dr. K. Das, Principal Scientistsattended 5th CIC meeting of the NAIP project heldat NBSS & LUP (ICAR), Nagpur during 30th and31st October, 2010.
• Dr. A. K. Sahoo, Principal Scientist attended 2nd
Review Meeting of National Network project on landUse planning held at NBSS & LUP (ICAR), Nagpurduring 15th and 16th June, 2010.
• Dr. S. K. Singh, Principal Scientist and Head and Dr.A. K. Sahoo, Principal Scientist attended preliminarymeeting of Research Advisory Committee held atNBSS & LUP (ICAR), Nagpur during 21st and 22nd
August, 2010 and presented achievements and futurestrategies of research and development of Regionalcenter, Kolkata.
• Dr. A. K. Sahoo, Principal Scientist attended thereview meeting for finalization of methodology of
the project on “Enrichment of land degradationdataset of NRSC with the soil dataset of NBSS &LUP” during 7th and 8th September 2010 at NBSS &LUP (ICAR), Nagpur.
• Dr. A. K. Sahoo, Principal Scientist attended thereview meeting of the project on “Enrichment of landdegradation dataset of NRSC with the soil datasetof NBSS & LUP” during 21st February, 2011 at NBSS& LUP (ICAR), Nagpur.
• Dr. A. K. Sahoo, Principal Scientist attended meetingat Zonal Research Station (ZRS), Dumka with Dean,BAU, Scientists and Agriculture Officers of BAU,Ranchi, KVK and ZRS, Dumka alongwith the fieldworkers regarding soil nutrient mapping ofSaraiyahat, Kathikund and Gopikanda blocks ofDumka district on 1st March, 2011.
• Dr. A. K. Sahoo, Principal Scientist attended 41st
Institute Management Committee Meeting at NBSS& LUP (ICAR), Nagpur on 25th March, 2011 andalso the review meeting on “Enrichment of landdegradation dataset of NRSC with the soil datasetof NBSS & LUP” on 26th March, 2011 at NBSS &LUP (ICAR), Nagpur.
A) Workshop
• An Interaction Meet was organized on “Developmentof district level land use planning of Jorhat (Assam)under rainfed eco-system” involving differentstakeholders of Jorhat district at Regional Centre ,Jorhat on16.09.2010 under the chairmanship ofDr. K.M. Buzarbaruah, Hon’ble Vice Chancellor ofAAU and with other high officials viz. Dr DipakSarkar, Director, NBSS&LUP; Director of Research,AAU; Director of Extension Education, AAU;Principal, Extension Education Institute, Jorhat;Professors of Soil Science and Agronomy, AAU;representatives of NABARD; District Agricultureoffices; District Fishery office and twenty farmers ofdifferent category belonging to different LandManagement Units ( LMU).
B) Extension Activities
• Regional Centre Delhi participated in “PUSA KRISHIVIGYAN MELA -2011” held at IARI, New Delhi,during March 3-5, 2011 and displayed various maps,publications & highlighting activities of the Bureau
145
Annual Report
2010-11
Workshop, Seminars, Farmers’ Day and other events
besides interaction with scientists, farmers and othervisitors.
• The Regional Centre, Jorhat participated in KishanMela organized by Assam Agricultural University atTitabar on 13th November, 2010. Soil and thematicmaps, bulletins etc. were displayed at the stall.
• First Hindi Karyashala on ‘Hindi Mein VeagnikLekho Ke Lyi Computer ka Prayog” was organizedat Regional Centre, Delhi on 22nd October, 2010. ForScientists.
• Second Hindi Karyashala on “ Hindi RajbhashaNeeti avam Prasahnik Daetva” was organized on25th November, 2010 for the staff of AdministrationSection.
• Third Hindi Karyashala on “Hindi Mein VigyanLekhan” was organized at Regional Centre Delhion 26th November, 2010 for the Technical Officers.
• Fourth Hindi Karyashala on “Rajbhasha NeyamAdhineyam” was organized at Regional Centre Delhion 30th December, 2010 for the Field & TechnicalAssistants.
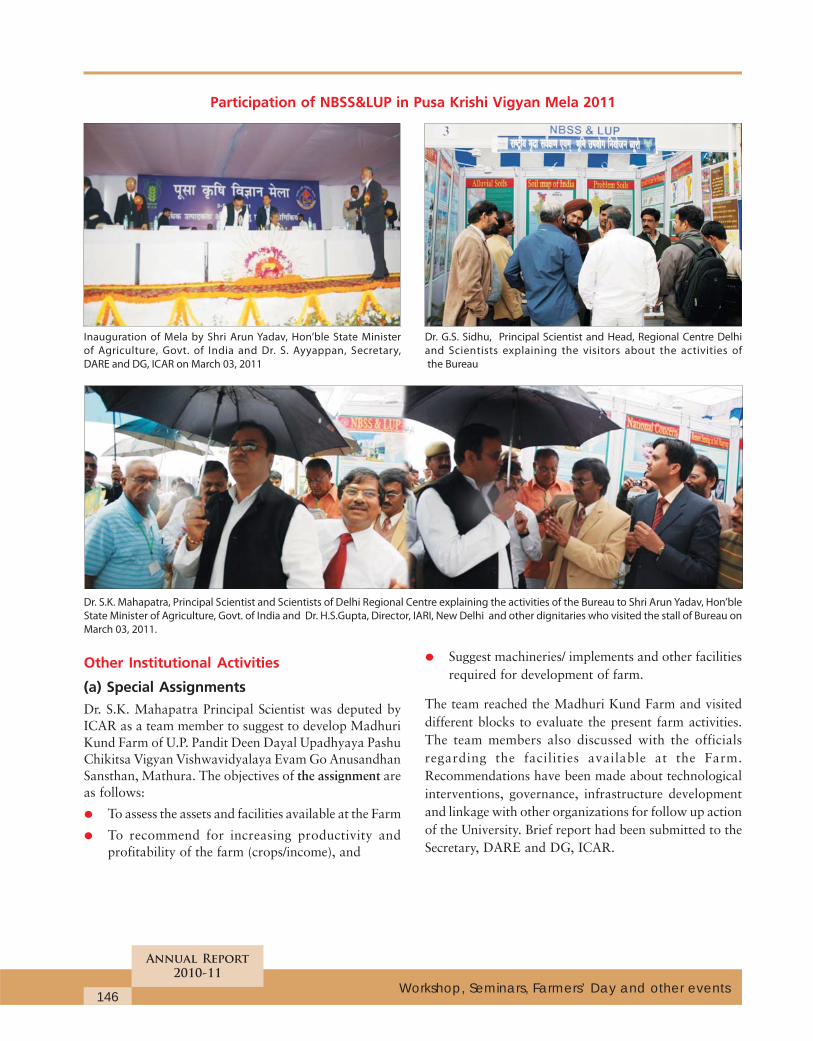
Participation of NBSS&LUP in Pusa Krishi Vigyan Mela 2011
Inauguration of Mela by Shri Arun Yadav, Hon’ble State Minister
of Agriculture, Govt. of India and Dr. S. Ayyappan, Secretary,
DARE and DG, ICAR on March 03, 2011
Other Institutional Activities
(a) Special Assignments
Dr. S.K. Mahapatra Principal Scientist was deputed byICAR as a team member to suggest to develop MadhuriKund Farm of U.P. Pandit Deen Dayal Upadhyaya PashuChikitsa Vigyan Vishwavidyalaya Evam Go AnusandhanSansthan, Mathura. The objectives of the assignment areas follows:
• To assess the assets and facilities available at the Farm
• To recommend for increasing productivity andprofitability of the farm (crops/income), and
Dr. G.S. Sidhu, Principal Scientist and Head, Regional Centre Delhi
and Scientists explaining the visitors about the activities of
the Bureau
Dr. S.K. Mahapatra, Principal Scientist and Scientists of Delhi Regional Centre explaining the activities of the Bureau to Shri Arun Yadav, Hon’ble
State Minister of Agriculture, Govt. of India and Dr. H.S.Gupta, Director, IARI, New Delhi and other dignitaries who visited the stall of Bureau on
March 03, 2011.
146
Annual Report
2010-11
Workshop, Seminars, Farmers’ Day and other events
• Suggest machineries/ implements and other facilitiesrequired for development of farm.
The team reached the Madhuri Kund Farm and visiteddifferent blocks to evaluate the present farm activities.The team members also discussed with the officialsregarding the facilities available at the Farm.Recommendations have been made about technologicalinterventions, governance, infrastructure developmentand linkage with other organizations for follow up actionof the University. Brief report had been submitted to theSecretary, DARE and DG, ICAR.
Headquarters, Nagpur
• Dr. S. Ayyappan, Hon’ble Secretary DARE,Government of India and Director General of ICARalong with Dr. A.K. Singh, DDG (NRM), ICAR andother dignitaries on 22nd January, 2011.
• Dr. U.C. Sharma, Member, Research AdvisoryCouncil (RAC)
• Dr. Ir Prem S. Bindraban, Director, ISRIC, TheNetherlands
• A team of M. Sc. Geography Students from FergussonCollege, Pune visited the Section
• Dr. N. P. Tyagi, Member ASRB, New Delhi
• A team of scientists from Bidhan Chandra KirishiVishvavidyalaya (BCKV), West Bengal
• Mr. Abinash Chandra, Senior Agriculture Officer,Navada (Bihar)
• Dr. A.L. Pharande, Associate Dean, Collage ofAgriculture, Kolhapur
• Dr. Manjit Singh, Associate Professor, PAU, Ludhiana
147
Annual Report
2010-11
Distinguished Visitors
Regional Centre, Bangalore
• Dr S.A. Patil, Chairman, Karnataka Krishi Mission
• Dr Krishna Manohar Professor(Hort.) UASBangalore
• Dr Bhaskar UAS Professor (Agronomy) UAS,Bangalore
• Dr Ramachandra, Professor (Agronomy) and Co-ordinator Weed Control Scheme, UAS (B)
• Dr B.K. Ramachandrappa, Professor & Chiefscientist (Dry farming ) UAS (B)
• Dr A.N. Ganeshamurthy, Principal Scientist (Soil sci),IIHR, Hessarghatta, Bangalore
• Dr Prakash Rao, Head, CIMAP (CSIR), Yelahanka,Bangalore
• Dr Brahmaprakash Professor (Agri. Microbiology)UAS, Bangalore
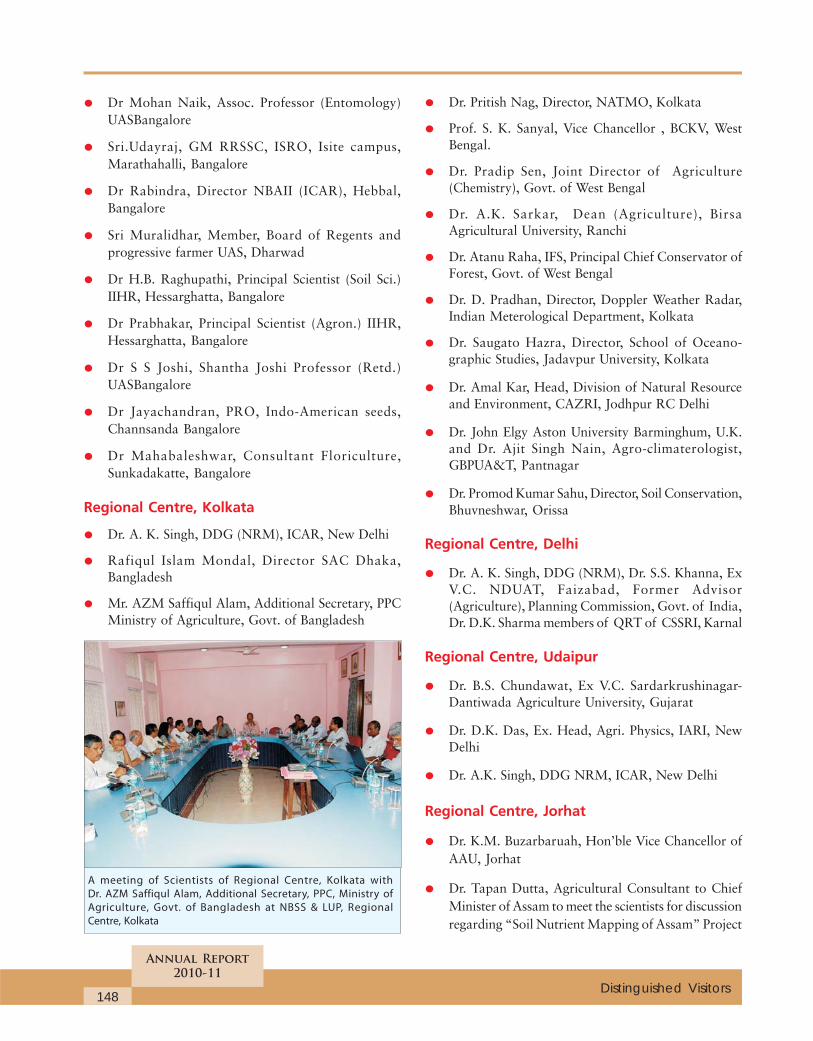
• Dr Mohan Naik, Assoc. Professor (Entomology)UASBangalore
• Sri.Udayraj, GM RRSSC, ISRO, Isite campus,Marathahalli, Bangalore
• Dr Rabindra, Director NBAII (ICAR), Hebbal,Bangalore
• Sri Muralidhar, Member, Board of Regents andprogressive farmer UAS, Dharwad
• Dr H.B. Raghupathi, Principal Scientist (Soil Sci.)IIHR, Hessarghatta, Bangalore
• Dr Prabhakar, Principal Scientist (Agron.) IIHR,Hessarghatta, Bangalore
• Dr S S Joshi, Shantha Joshi Professor (Retd.)UASBangalore
• Dr Jayachandran, PRO, Indo-American seeds,Channsanda Bangalore
• Dr Mahabaleshwar, Consultant Floriculture,Sunkadakatte, Bangalore
Regional Centre, Kolkata
• Dr. A. K. Singh, DDG (NRM), ICAR, New Delhi
• Rafiqul Islam Mondal, Director SAC Dhaka,Bangladesh
• Mr. AZM Saffiqul Alam, Additional Secretary, PPCMinistry of Agriculture, Govt. of Bangladesh
• Dr. Pritish Nag, Director, NATMO, Kolkata
• Prof. S. K. Sanyal, Vice Chancellor , BCKV, WestBengal.
• Dr. Pradip Sen, Joint Director of Agriculture(Chemistry), Govt. of West Bengal
• Dr. A.K. Sarkar, Dean (Agriculture), BirsaAgricultural University, Ranchi
• Dr. Atanu Raha, IFS, Principal Chief Conservator ofForest, Govt. of West Bengal
• Dr. D. Pradhan, Director, Doppler Weather Radar,Indian Meterological Department, Kolkata
• Dr. Saugato Hazra, Director, School of Oceano-graphic Studies, Jadavpur University, Kolkata
• Dr. Amal Kar, Head, Division of Natural Resourceand Environment, CAZRI, Jodhpur RC Delhi
• Dr. John Elgy Aston University Barminghum, U.K.and Dr. Ajit Singh Nain, Agro-climaterologist,GBPUA&T, Pantnagar
• Dr. Promod Kumar Sahu, Director, Soil Conservation,Bhuvneshwar, Orissa
Regional Centre, Delhi
• Dr. A. K. Singh, DDG (NRM), Dr. S.S. Khanna, ExV.C. NDUAT, Faizabad, Former Advisor(Agriculture), Planning Commission, Govt. of India,Dr. D.K. Sharma members of QRT of CSSRI, Karnal
Regional Centre, Udaipur
• Dr. B.S. Chundawat, Ex V.C. Sardarkrushinagar-Dantiwada Agriculture University, Gujarat
• Dr. D.K. Das, Ex. Head, Agri. Physics, IARI, NewDelhi
• Dr. A.K. Singh, DDG NRM, ICAR, New Delhi
Regional Centre, Jorhat
• Dr. K.M. Buzarbaruah, Hon’ble Vice Chancellor ofAAU, Jorhat
• Dr. Tapan Dutta, Agricultural Consultant to ChiefMinister of Assam to meet the scientists for discussionregarding “Soil Nutrient Mapping of Assam” Project
148
Annual Report
2010-11
Distinguished Visitors
A meeting of Scientists of Regional Centre, Kolkata with
Dr. AZM Saffiqul Alam, Additional Secretary, PPC, Ministry of
Agriculture, Govt. of Bangladesh at NBSS & LUP, Regional
Centre, Kolkata
• Dr. N. N. Sharma, Director of Research, AAU,Jorhat
• Dr. B.C. Bhowmick, Director of Extension, AAU,Jorhat
• Dr. Mridul Hazarika , Director, Tocklai ExperimentalTea Research Station, Jorhat
• Dr. R. K. Rajan, Director, Central Muga Eri Researchand Training Institute, Central Silk Board, Lahdoigarh,Jorhat
• Dr. Durgeswar Das, Director of Post GraduateStudies, AAU, Jorhat
• Dr. L. Hazarika, Dean, Faculty of Agriculture, AAU,Jorhat.
149
Annual Report
2010-11
Distinguished Visitors
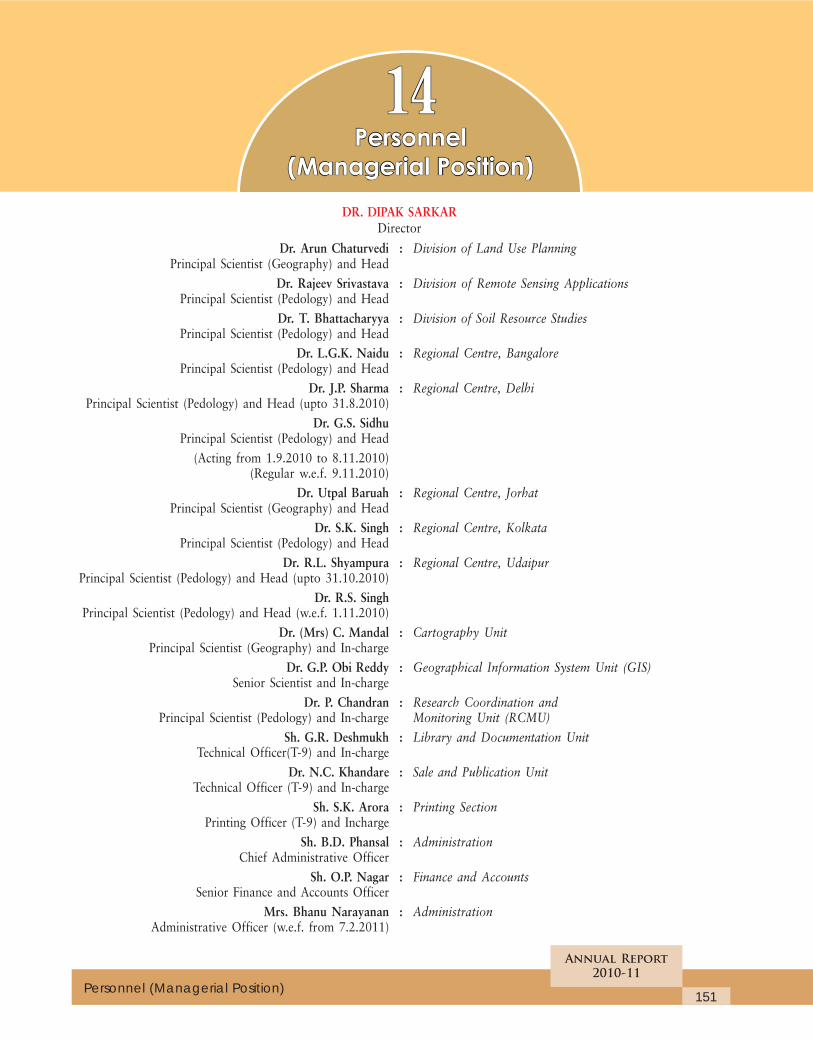
DR. DIPAK SARKARDirector
Dr. Arun Chaturvedi : Division of Land Use PlanningPrincipal Scientist (Geography) and Head
Dr. Rajeev Srivastava : Division of Remote Sensing ApplicationsPrincipal Scientist (Pedology) and Head
Dr. T. Bhattacharyya : Division of Soil Resource StudiesPrincipal Scientist (Pedology) and Head
Dr. L.G.K. Naidu : Regional Centre, BangalorePrincipal Scientist (Pedology) and Head
Dr. J.P. Sharma : Regional Centre, DelhiPrincipal Scientist (Pedology) and Head (upto 31.8.2010)
Dr. G.S. SidhuPrincipal Scientist (Pedology) and Head
(Acting from 1.9.2010 to 8.11.2010)(Regular w.e.f. 9.11.2010)
Dr. Utpal Baruah : Regional Centre, JorhatPrincipal Scientist (Geography) and Head
Dr. S.K. Singh : Regional Centre, KolkataPrincipal Scientist (Pedology) and Head
Dr. R.L. Shyampura : Regional Centre, UdaipurPrincipal Scientist (Pedology) and Head (upto 31.10.2010)
Dr. R.S. SinghPrincipal Scientist (Pedology) and Head (w.e.f. 1.11.2010)
Dr. (Mrs) C. Mandal : Cartography UnitPrincipal Scientist (Geography) and In-charge
Dr. G.P. Obi Reddy : Geographical Information System Unit (GIS)Senior Scientist and In-charge
Dr. P. Chandran : Research Coordination andPrincipal Scientist (Pedology) and In-charge Monitoring Unit (RCMU)
Sh. G.R. Deshmukh : Library and Documentation UnitTechnical Officer(T-9) and In-charge
Dr. N.C. Khandare : Sale and Publication UnitTechnical Officer (T-9) and In-charge
Sh. S.K. Arora : Printing SectionPrinting Officer (T-9) and Incharge
Sh. B.D. Phansal : AdministrationChief Administrative Officer
Sh. O.P. Nagar : Finance and AccountsSenior Finance and Accounts Officer
Mrs. Bhanu Narayanan : AdministrationAdministrative Officer (w.e.f. from 7.2.2011)
151
Annual Report
2010-11
Personnel (Managerial Position)
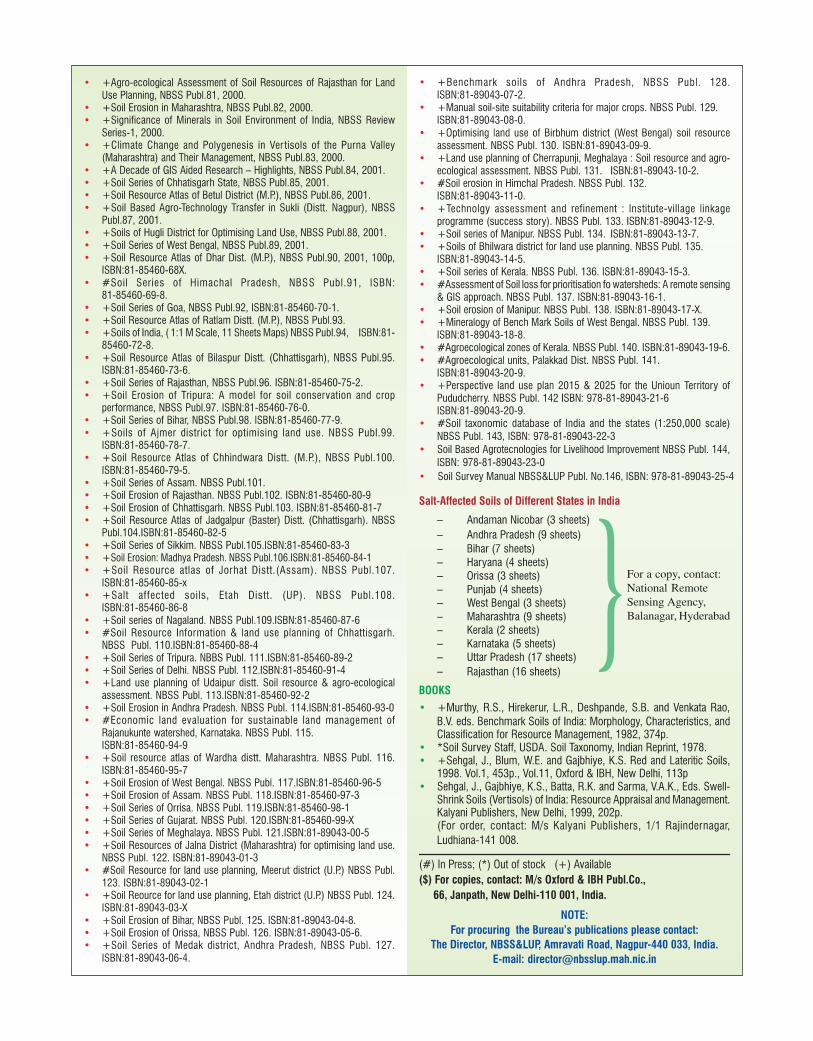
Soil Survey Manual NBSS&LUP Publ. No.146, ISBN: 978-81-89043-25-4
033
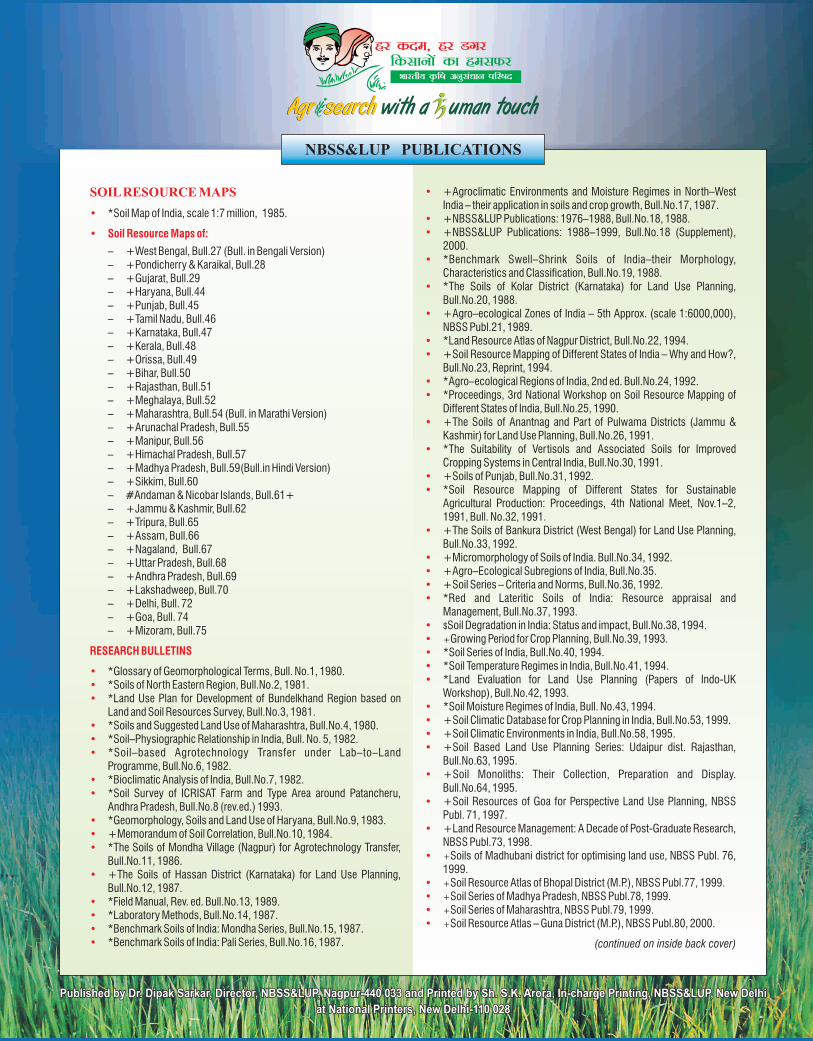
Published by Dr. Dipak Sarkar, Director, NBSS&LUP, Nagpur-440 033 and Printed by Sh. S.K. Arora, In-charge Printing, NBSS&LUP, New Delhi
at National Printers, New Delhi-110 028
Published by Dr. Dipak Sarkar, Director, NBSS&LUP, Nagpur-440 033 and Printed by Sh. S.K. Arora, In-charge Printing, NBSS&LUP, New Delhi
at National Printers, New Delhi-110 028
NBSS&LUP PUBLICATIONS
SOIL RESOURCE MAPS
•
• Soil Resource Maps of:
RESEARCH BULLETINS
•••
•••
••
•••
•
••••
*Soil Map of India, scale 1:7 million, 1985.
– +West Bengal, Bull.27 (Bull. in Bengali Version)– +Pondicherry & Karaikal, Bull.28– +Gujarat, Bull.29– +Haryana, Bull.44– +Punjab, Bull.45– +Tamil Nadu, Bull.46– +Karnataka, Bull.47– +Kerala, Bull.48– +Orissa, Bull.49– +Bihar, Bull.50– +Rajasthan, Bull.51– +Meghalaya, Bull.52– +Maharashtra, Bull.54 (Bull. in Marathi Version)– +Arunachal Pradesh, Bull.55– +Manipur, Bull.56– +Himachal Pradesh, Bull.57– +Madhya Pradesh, Bull.59(Bull.in Hindi Version)– +Sikkim, Bull.60– #Andaman & Nicobar Islands, Bull.61+– +Jammu & Kashmir, Bull.62– +Tripura, Bull.65– +Assam, Bull.66– +Nagaland, Bull.67– +Uttar Pradesh, Bull.68– +Andhra Pradesh, Bull.69– +Lakshadweep, Bull.70– +Delhi, Bull. 72– +Goa, Bull. 74– +Mizoram, Bull.75
*Glossary of Geomorphological Terms, Bull. No.1, 1980.*Soils of North Eastern Region, Bull.No.2, 1981.*Land Use Plan for Development of Bundelkhand Region based on Land and Soil Resources Survey, Bull.No.3, 1981.*Soils and Suggested Land Use of Maharashtra, Bull.No.4, 1980.*Soil–Physiographic Relationship in India, Bull. No. 5, 1982.*Soil–based Agrotechnology Transfer under Lab–to–Land Programme, Bull.No.6, 1982.*Bioclimatic Analysis of India, Bull.No.7, 1982.*Soil Survey of ICRISAT Farm and Type Area around Patancheru, Andhra Pradesh, Bull.No.8 (rev.ed.) 1993.*Geomorphology, Soils and Land Use of Haryana, Bull.No.9, 1983. +Memorandum of Soil Correlation, Bull.No.10, 1984.*The Soils of Mondha Village (Nagpur) for Agrotechnology Transfer, Bull.No.11, 1986.+The Soils of Hassan District (Karnataka) for Land Use Planning, Bull.No.12, 1987.*Field Manual, Rev. ed. Bull.No.13, 1989.*Laboratory Methods, Bull.No.14, 1987.*Benchmark Soils of India: Mondha Series, Bull.No.15, 1987.*Benchmark Soils of India: Pali Series, Bull.No.16, 1987.
•
••
•
•
•
••
••
•
•
••
•
••••
•••••
••••
•
•
•
•
••••
+Agroclimatic Environments and Moisture Regimes in North–West India – their application in soils and crop growth, Bull.No.17, 1987.+NBSS&LUP Publications: 1976–1988, Bull.No.18, 1988.+NBSS&LUP Publications: 1988–1999, Bull.No.18 (Supplement), 2000.*Benchmark Swell–Shrink Soils of India–their Morphology, Characteristics and Classification, Bull.No.19, 1988.*The Soils of Kolar District (Karnataka) for Land Use Planning, Bull.No.20, 1988.+Agro–ecological Zones of India – 5th Approx. (scale 1:6000,000), NBSS Publ.21, 1989.*Land Resource Atlas of Nagpur District, Bull.No.22, 1994.+Soil Resource Mapping of Different States of India – Why and How?, Bull.No.23, Reprint, 1994.*Agro–ecological Regions of India, 2nd ed. Bull.No.24, 1992. *Proceedings, 3rd National Workshop on Soil Resource Mapping of Different States of India, Bull.No.25, 1990.+The Soils of Anantnag and Part of Pulwama Districts (Jammu & Kashmir) for Land Use Planning, Bull.No.26, 1991.*The Suitability of Vertisols and Associated Soils for Improved Cropping Systems in Central India, Bull.No.30, 1991. +Soils of Punjab, Bull.No.31, 1992.*Soil Resource Mapping of Different States for Sustainable Agricultural Production: Proceedings, 4th National Meet, Nov.1–2, 1991, Bull. No.32, 1991.+The Soils of Bankura District (West Bengal) for Land Use Planning, Bull.No.33, 1992. +Micromorphology of Soils of India. Bull.No.34, 1992.+Agro–Ecological Subregions of India, Bull.No.35.+Soil Series – Criteria and Norms, Bull.No.36, 1992. *Red and Lateritic Soils of India: Resource appraisal and Management, Bull.No.37, 1993.$Soil Degradation in India: Status and impact, Bull.No.38, 1994.+Growing Period for Crop Planning, Bull.No.39, 1993.*Soil Series of India, Bull.No.40, 1994.*Soil Temperature Regimes in India, Bull.No.41, 1994.*Land Evaluation for Land Use Planning (Papers of Indo-UK Workshop), Bull.No.42, 1993.*Soil Moisture Regimes of India, Bull. No.43, 1994.+Soil Climatic Database for Crop Planning in India, Bull.No.53, 1999.+Soil Climatic Environments in India, Bull.No.58, 1995.+Soil Based Land Use Planning Series: Udaipur dist. Rajasthan, Bull.No.63, 1995.+Soil Monoliths: Their Collection, Preparation and Display. Bull.No.64, 1995.+Soil Resources of Goa for Perspective Land Use Planning, NBSS Publ. 71, 1997.+Land Resource Management: A Decade of Post-Graduate Research, NBSS Publ.73, 1998.+Soils of Madhubani district for optimising land use, NBSS Publ. 76, 1999.+Soil Resource Atlas of Bhopal District (M.P.), NBSS Publ.77, 1999. +Soil Series of Madhya Pradesh, NBSS Publ.78, 1999.+Soil Series of Maharashtra, NBSS Publ.79, 1999.+Soil Resource Atlas – Guna District (M.P.), NBSS Publ.80, 2000.
(continued on inside back cover)

![jk"Vªh; izkS|ksfxdh laLFkku] fetksje - NIT Mizoram](https://img.dokumen.tips/doc/110x75/63260a886d480576770c967d/jkvah-izksksfxdh-lalfkku-fetksje-nit-mizoram.jpg)


![dk;kZy; funs'kd] ek/;fed f'k{kk] jktLFkku chdkusj - eduraj.in](https://img.dokumen.tips/doc/110x75/631b2a1c5e4c963afd06bb5d/dkkzy-funskd-ekfed-fkkk-jktlfkku-chdkusj-edurajin.jpg)
![kZy; egkys[kkdkj ¼vkfFkZd ,oa jktLo {ks= ys[kkijh{kk½ jktLFkku] t](https://img.dokumen.tips/doc/110x75/632768de5c2c3bbfa80429cf/kzy-egkyskkdkj-vkffkzd-oa-jktlo-ks-yskkijhkk-jktlfkku-t.jpg)


![ek/;fed f'k{kk e.My] e/;izns'k] Hkksiky - SAITEDUCATION](https://img.dokumen.tips/doc/110x75/631a747c5d5809cabd0f6898/ekfed-fkkk-emy-eiznsk-hkksiky-saiteducation.jpg)


![dk;kZy; funs'kd] ek/;fed f'k{kk jktLFkku] chdkusj](https://img.dokumen.tips/doc/110x75/6319be904cd7b34424092a6a/dkkzy-funskd-ekfed-fkkk-jktlfkku-chdkusj.jpg)